FILED BY BLACKROCK TCP CAPITAL CORP.
PURSUANT TO RULE 425 UNDER THE SECURITIES ACT OF 1933
PURSUANT TO RULE 425 UNDER THE SECURITIES ACT OF 1933
AND DEEMED FILED PURSUANT TO RULE 14A-12
UNDER THE SECURITIES EXCHANGE ACT OF 1934
SUBJECT COMPANY: BLACKROCK TCP CAPITAL CORP.
FILE NO. OF RELATED REGISTRATION STATEMENT: 814-00899
BlackRock TCP Capital Corp. Investor Presentation December 31, 2023
Prospective investors considering an investment in BlackRock TCP Capital Corp. (“we”, “us”, “our”, “TCPC” or the “Company”) should consider the investment objectives, risks and expenses of the Company carefully before investing. This information and other information about the Company are available in the Company's filings with the Securities and Exchange Commission ("SEC"). Copies are available on the SEC's website at www.sec.gov and the Company's website at www.tcpcapital.com. Prospective investors should read these materials carefully before investing. This presentation (the “Presentation”) is solely for information and discussion purposes and must not be relied upon for any other purpose. This Presentation includes the slides that follow, the oral presentation of the slides by members of TCPC, BlackRock or any person on their behalf, the question-and-answer session that follows that oral presentation, copies of this Presentation and any materials distributed at, or in connection with, this Presentation. By participating in the meeting, or by reading the Presentation slides, you will be deemed to have (i) agreed to the following limitations and notifications and made the following undertakings and (ii) acknowledged that you understand the legal and regulatory sanctions attached to the misuse, disclosure or improper circulation of this Presentation. Forward-Looking Statements Some of the statements in this Presentation constitute forward-looking statements because they relate to future events, future performance or financial condition or the merger of BCIC with and into a subsidiary of the Company (the “Merger”). The forward-looking statements may include statements as to: future operating results of TCPC, BCIC or, following the Merger, the combined company and distribution projections; business prospects of TCPC, BCIC or, following the Merger, the combined company and the prospects of each of their respective portfolio companies; and the impact of the investments that TCPC, BCIC or, following the Merger, the combined company expect to make. In addition, words such as “anticipate,” “believe,” “expect,” “seek,” “plan,” “should,” “estimate,” “project” and “intend” indicate forward-looking statements, although not all forward-looking statements include these words. The forward-looking statements contained in this Presentation involve risks and uncertainties. Certain factors could cause actual results and conditions to differ materially from those projected, including the uncertainties associated with (i) the timing or likelihood of the Merger closing; (ii) the expected synergies and savings associated with the Merger; (iii) the ability to realize the anticipated benefits of the Merger, including the expected accretion to net investment income and the elimination or reduction of certain expenses and costs due to the Merger; (iv) the percentage of BCIC and TCPC stockholders voting in favor of the proposals submitted for their approval; (v) the possibility that competing offers or acquisition proposals will be made; (vi) the possibility that any or all of the various conditions to the consummation of the Merger may not be satisfied or waived; (vii) risks related to diverting management’s attention from ongoing business operations; (viii) the risk that stockholder litigation in connection with the Merger may result in significant costs of defense and liability; (ix) changes in the economy, financial markets and political environment, including the impacts of inflation and rising interest rates; (x) risks associated with possible disruption in the operations of BCIC and TCPC or the economy generally due to terrorism, war or other geopolitical conflict (including the current conflict between Russia and Ukraine), natural disasters or public health crises and epidemics; (xi) future changes in laws or regulations (including the interpretation of these laws and regulations by regulatory authorities); (xii) conditions in BCIC’s and TCPC’s operating areas, particularly with respect to business development companies or regulated investment companies; and (xiii) other considerations that may be disclosed from time to time in BCIC’s and TCPC’s publicly disseminated documents and filings. TCPC has based the forward-looking statements included in this Presentation on information available to it on the date of this Presentation, and TCPC assumes no obligation to update any such forward-looking statements. Although TCPC undertakes no obligation to revise or update any forward- looking statements, whether as a result of new information, future events or otherwise, you are advised to consult any additional disclosures that it may make directly to you or through reports that TCPC in the future may file with the Securities and Exchange Commission, including annual reports on Form 10-K, quarterly reports on Form 10-Q and current reports on Form 8-K. 2 Forward-Looking Statements & Legal Disclaimers
No Offer or Solicitation This Presentation is not, and under no circumstances is it to be construed as, a prospectus or an advertisement and this Presentation is not, and under no circumstances is it to be construed as, an offer to sell or a solicitation of an offer to purchase any securities in BCIC, TCPC or in any fund or other investment vehicle managed by BlackRock or any of its affiliates. Additional Information and Where to Find It This Presentation relates to the Merger, along with related proposals for which stockholder approval is being sought (collectively, the “Proposals”). In connection with the Merger, each of BCIC and TCPC have filed with the SEC a registration statement on Form N-14 (the “Registration Statement”), which includes a joint proxy statement of BCIC and TCPC and prospectus of TCPC (the “Joint Proxy Statement”). The Joint Proxy Statement and Registration Statement contain important information about BCIC, TCPC, the Merger and related matters. This Presentation does not constitute an offer to sell or the solicitation of an offer to buy any securities or a solicitation of any vote or approval. No offer of securities shall be made except by means of a prospectus meeting the requirements of Section 10 of the Securities Act of 1933, as amended. STOCKHOLDERS OF BCIC AND TCPC ARE URGED TO READ THE JOINT PROXY STATEMENT AND REGISTRATION STATEMENT AND OTHER DOCUMENTS THAT ARE FILED OR WILL BE FILED WITH THE SEC, AS WELL AS ANY AMENDMENTS OR SUPPLEMENTS TO THESE DOCUMENTS, CAREFULLY AND IN THEIR ENTIRETY BECAUSE THEY WILL CONTAIN IMPORTANT INFORMATION ABOUT BCIC, TCPC, THE MERGER AND RELATED MATTERS. Investors and security holders are able to obtain the documents filed with the SEC free of charge at the SEC’s website, http://www.sec.gov and, for documents filed by BCIC, from BCIC’s website at http://www.blackrockbkcc.com, and, for documents filed by TCPC, from TCPC’s website at http://www.tcpcapital.com. Participants in the Solicitation BCIC and TCPC and their respective directors, certain of their respective executive officers and certain other members of management and employees and officers of BlackRock Capital Investment Advisors, LLC and Tennenbaum Capital Partners, LLC, as applicable, and their respective affiliates may be deemed to be participants in the solicitation of proxies from the stockholders of BCIC and TCPC in connection with the Proposals and the Merger. Information about the directors and executive officers of BCIC and TCPC is set forth in the Joint Proxy Statement. Information regarding the persons who may, under the rules of the SEC, be considered participants in the solicitation of the BCIC and TCPC stockholders in connection with the Merger is contained in the Joint Proxy Statement and other relevant materials filed with the SEC. These documents may be obtained free of charge from the sources indicated above. 3 Forward-Looking Statements & Legal Disclaimers

Fourth Quarter and Full Year 2023 Financial Highlights and Portfolio Overview 4 Continued Strong Financial Performance FY2023 Net investment income of $1.84 per share increased 20% over FY2022, primarily as a result of higher base rates and marginally wider spreads in 2023 Declared a first quarter dividend of $0.34 per share, payable on March 29 to shareholders of record as of the close of business on March 14 Continuous coverage of the dividend with net investment income each quarter as a public company; dividend coverage ratio of 129% in the fourth quarter of 2023 Diversified Portfolio with an Emphasis on Less-Cyclical Businesses Total portfolio fair value of $1.6 billion diversified across 142 portfolio companies 89% invested in senior secured debt; 78% of the total portfolio is 1st lien Weighted average yield of the debt portfolio is 14.1%(1) FY 2023 total acquisitions of $226.1 million, dispositions of $218.7 million Flexible Capital With Available Liquidity Diverse leverage program totaling $1.2 billion, with well laddered maturities 58% of outstanding leverage as of December 31 is unsecured $247 million of available credit facility capacity Net regulatory leverage ratio of 1.07x, well within our 2:1 regulatory leverage limitation Proposed Merger with BlackRock Capital Investment Corp. (BCIC) On September 6, announced that TCPC and BCIC, an affiliated BDC, have entered into a definitive agreement pursuant to which BCIC will merge with and into a wholly owned, indirect subsidiary of TCPC, subject to shareholder approval and customary closing conditions The proposed merger is expected to result in enhanced scale, including a larger asset base which may lead to better and more efficient access to capital, and combined operating efficiencies Same investment team will continue to manage the combined Company’s portfolio and investments As of December 31, 2023 (1) Weighted average annual effective yield includes amortization of deferred debt origination and end-of-term fees and accretion of original issue discount, but excludes market discount, any prepayment and make-whole fee income, and any debt investments that are distressed or on non-accrual status. Weighted average effective yield on the total portfolio (including debt investments that are distressed or on non- accrual status and equity investments) was 13.3% as of 12/31/2023. Past performance does not guarantee future returns.
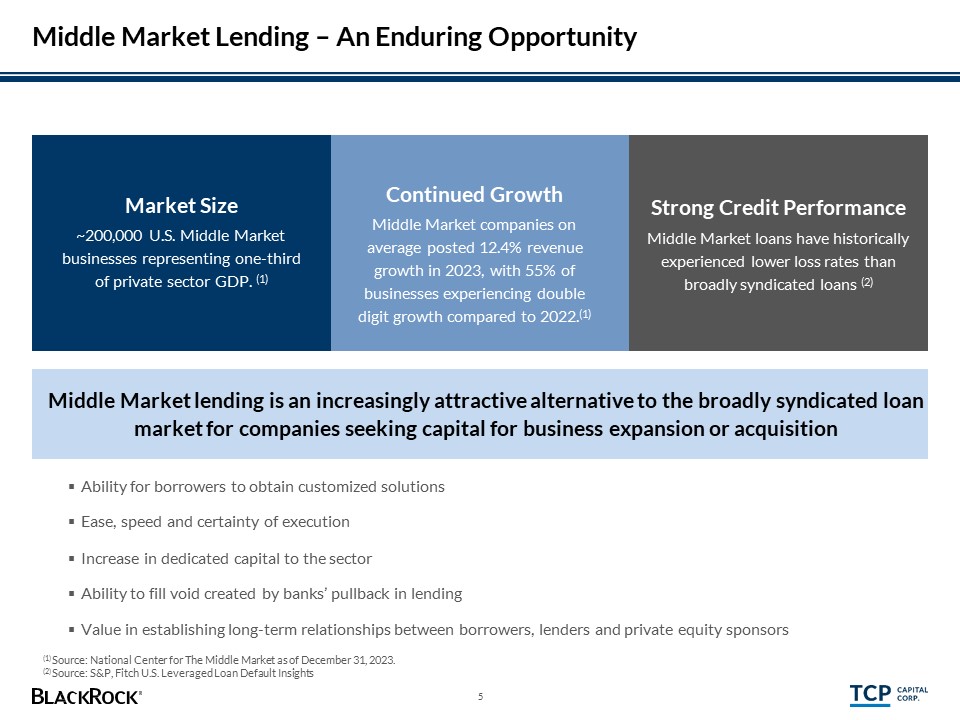
Middle Market Lending – An Enduring Opportunity (2) Source: S&P, Fitch U.S. Leveraged Loan Default Insights 5 Market Size ~200,000 U.S. Middle Market businesses representing one-third of private sector GDP. (1) Strong Credit Performance Middle Market loans have historically experienced lower loss rates than broadly syndicated loans (2) Middle Market lending is an increasingly attractive alternative to the broadly syndicated loan market for companies seeking capital for business expansion or acquisition Ability for borrowers to obtain customized solutions Ease, speed and certainty of execution Increase in dedicated capital to the sector Ability to fill void created by banks’ pullback in lending Value in establishing long-term relationships between borrowers, lenders and private equity sponsors (1) Source: National Center for The Middle Market as of December 31, 2023. Continued Growth Middle Market companies on average posted 12.4% revenue growth in 2023, with 55% of businesses experiencing double digit growth compared to 2022.(1)
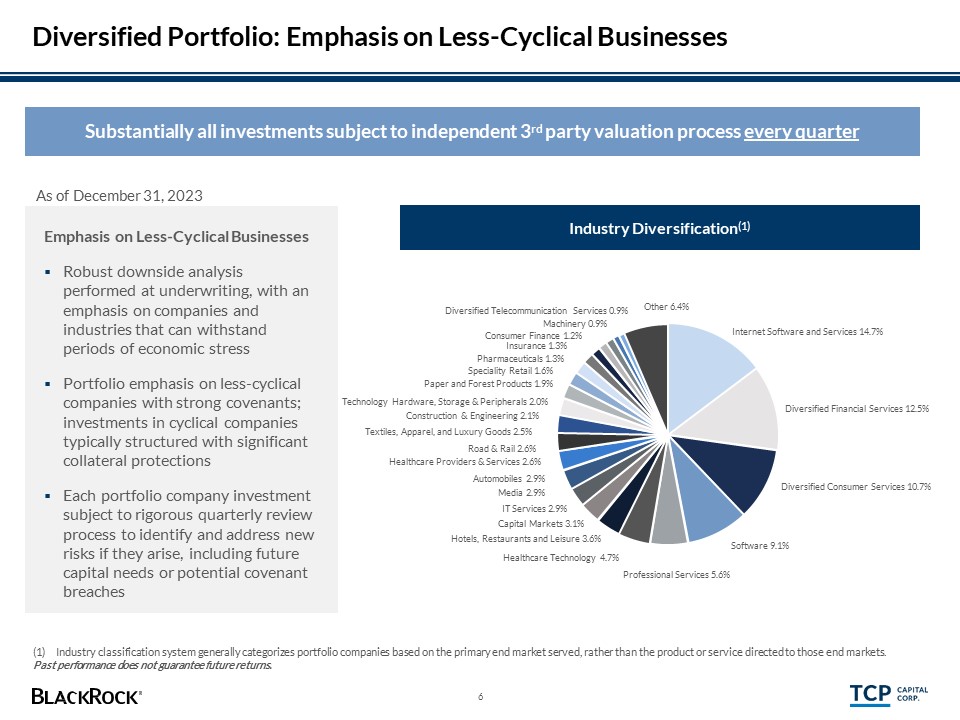
Internet Software and Services 14.7% Past performance does not guarantee future returns. 6 Diversified Consumer Services 10.7% Software 9.1% Diversified Telecommunication Services 0.9% Machinery 0.9% Consumer Finance 1.2% Insurance 1.3% Pharmaceuticals 1.3% Speciality Retail 1.6% Paper and Forest Products 1.9% Technology Hardware, Storage & Peripherals 2.0% Construction & Engineering 2.1% Textiles, Apparel, and Luxury Goods 2.5% Road & Rail 2.6% Healthcare Providers & Services 2.6% Automobiles 2.9% Media 2.9% IT Services 2.9% Capital Markets 3.1% Hotels, Restaurants and Leisure 3.6% Healthcare Technology 4.7% Professional Services 5.6% Diversified Financial Services 12.5% Other 6.4% Diversified Portfolio: Emphasis on Less-Cyclical Businesses (1) Industry classification system generally categorizes portfolio companies based on the primary end market served, rather than the product or service directed to those end markets. Industry Diversification(1) Substantially all investments subject to independent 3rd party valuation process every quarter Emphasis on Less-Cyclical Businesses Robust downside analysis performed at underwriting, with an emphasis on companies and industries that can withstand periods of economic stress Portfolio emphasis on less-cyclical companies with strong covenants; investments in cyclical companies typically structured with significant collateral protections Each portfolio company investment subject to rigorous quarterly review process to identify and address new risks if they arise, including future capital needs or potential covenant breaches As of December 31, 2023
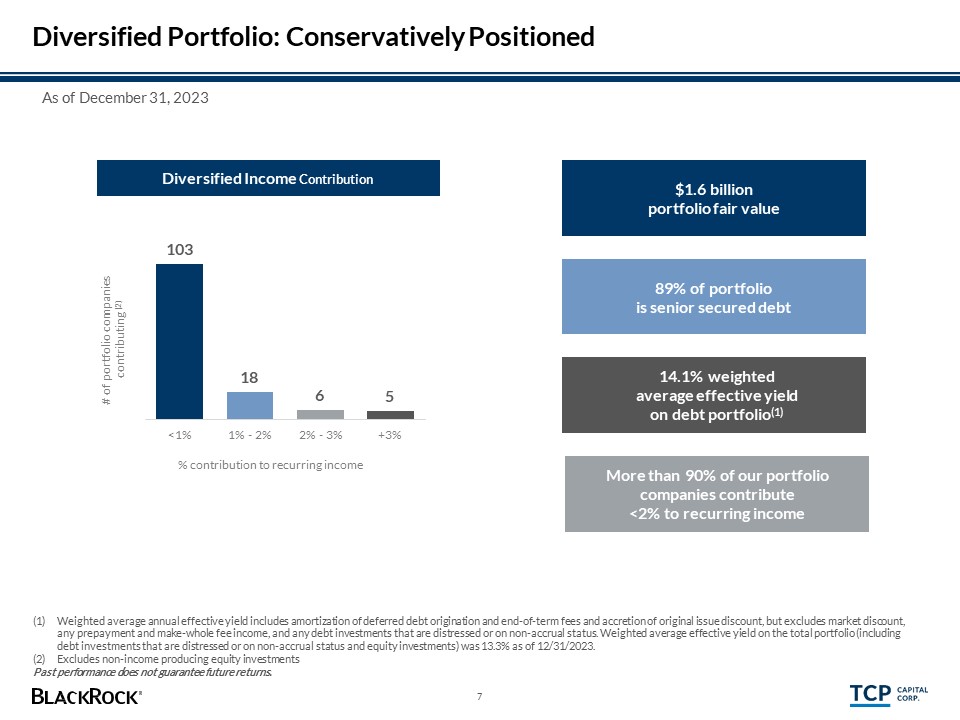
Diversified Portfolio: Conservatively Positioned Weighted average annual effective yield includes amortization of deferred debt origination and end-of-term fees and accretion of original issue discount, but excludes market discount, any prepayment and make-whole fee income, and any debt investments that are distressed or on non-accrual status. Weighted average effective yield on the total portfolio (including debt investments that are distressed or on non-accrual status and equity investments) was 13.3% as of 12/31/2023. Excludes non-income producing equity investments Past performance does not guarantee future returns. $1.6 billion portfolio fair value 89% of portfolio is senior secured debt More than 90% of our portfolio companies contribute <2% to recurring income 14.1% weighted average effective yield on debt portfolio(1) Diversified Income Contribution 103 7 18 6 5 <1% 1% - 2% 2% - 3% % contribution to recurring income +3% # of portfolio companies contributing (2) As of December 31, 2023

Strategically Positioned Balance Sheet Predominantly First Lien, Floating Rate Asset Portfolio Diverse Capital Structure(3) SBA Debentures 9% 8 Credit Facilities 16% Unsecured Debt 34% Equity 41% Fixed / Floating(2) Floating Rate 96% Fixed Rate 4% Seniority(1) First Lien 78% Second Lien 11% Junior 0% Equity 11% As a percent of total investments at fair value as of December 31, 2023. As a percent of debt investments at fair value as of December 31, 2023. SBA Debentures structured as long-term facilities and not subject to regulatory minimum asset coverage. As of December 31, 2023
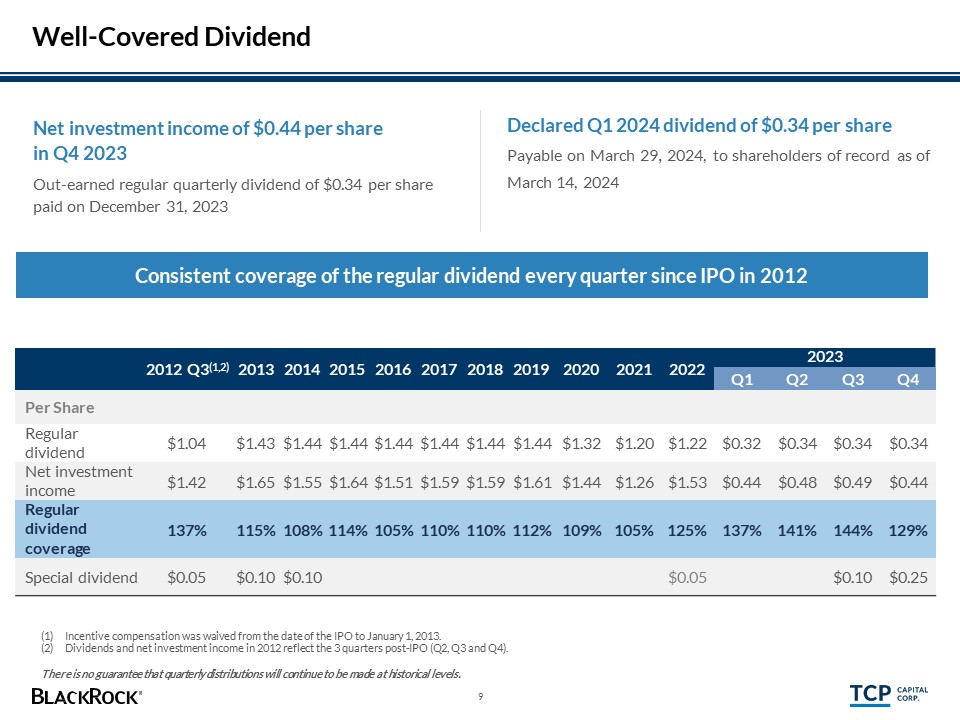
Well-Covered Dividend Consistent coverage of the regular dividend every quarter since IPO in 2012 Net investment income of $0.44 per share in Q4 2023 Out-earned regular quarterly dividend of $0.34 per share paid on December 31, 2023 Incentive compensation was waived from the date of the IPO to January 1, 2013. Dividends and net investment income in 2012 reflect the 3 quarters post-IPO (Q2, Q3 and Q4). There is no guarantee that quarterly distributions will continue to be made at historical levels. 9 2012 Q3(1,2) 2013 2014 2015 2016 2017 2018 2019 2020 2021 2022 2023 Q1 Q2 Q3 Q4 Per Share Regular dividend $1.04 $1.43 $1.44 $1.44 $1.44 $1.44 $1.44 $1.44 $1.32 $1.20 $1.22 $0.32 $0.34 $0.34 $0.34 Net investment income $1.42 $1.65 $1.55 $1.64 $1.51 $1.59 $1.59 $1.61 $1.44 $1.26 $1.53 $0.44 $0.48 $0.49 $0.44 Regular dividend coverage 137% 115% 108% 114% 105% 110% 110% 112% 109% 105% 125% 137% 141% 144% 129% Special dividend $0.05 $0.10 $0.10 $0.05 $0.10 $0.25 Declared Q1 2024 dividend of $0.34 per share Payable on March 29, 2024, to shareholders of record as of March 14, 2024
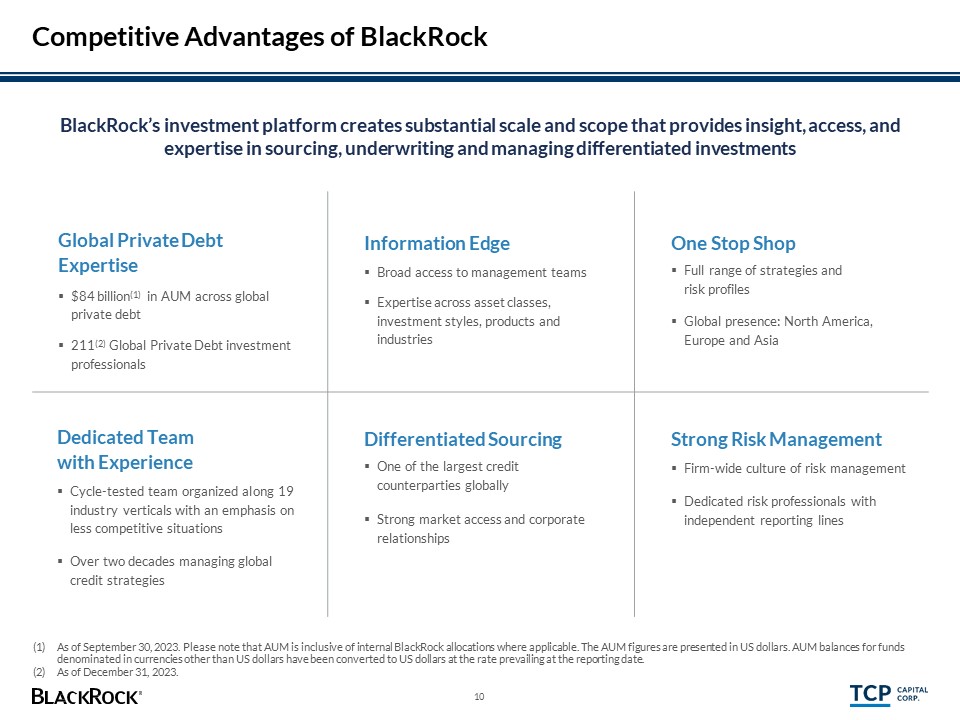
Competitive Advantages of BlackRock Global Private Debt Expertise $84 billion(1) in AUM across global private debt 211(2) Global Private Debt investment professionals Information Edge Broad access to management teams Expertise across asset classes, investment styles, products and industries One Stop Shop Full range of strategies and risk profiles Global presence: North America, Europe and Asia Dedicated Team with Experience Cycle-tested team organized along 19 industry verticals with an emphasis on less competitive situations Over two decades managing global credit strategies Differentiated Sourcing One of the largest credit counterparties globally Strong market access and corporate relationships Strong Risk Management Firm-wide culture of risk management Dedicated risk professionals with independent reporting lines As of September 30, 2023. Please note that AUM is inclusive of internal BlackRock allocations where applicable. The AUM figures are presented in US dollars. AUM balances for funds denominated in currencies other than US dollars have been converted to US dollars at the rate prevailing at the reporting date. As of December 31, 2023. 10 BlackRock’s investment platform creates substantial scale and scope that provides insight, access, and expertise in sourcing, underwriting and managing differentiated investments
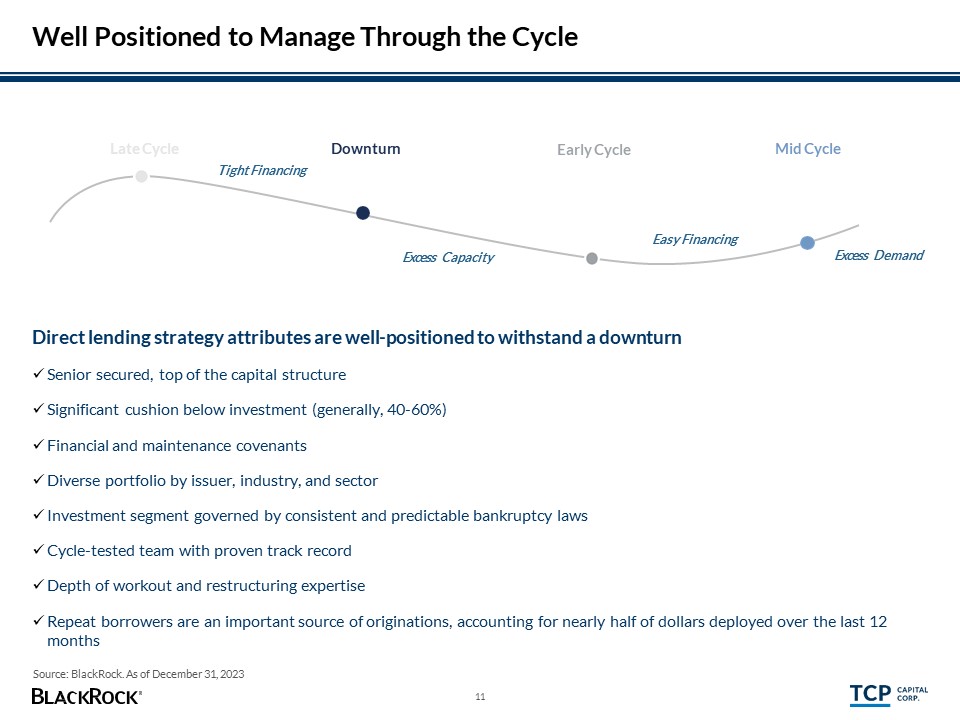
Well Positioned to Manage Through the Cycle Source: BlackRock. As of December 31, 2023 Late Cycle 11 Early Cycle Downturn Mid Cycle Tight Financing Easy Financing Excess Capacity Excess Demand Direct lending strategy attributes are well-positioned to withstand a downturn Senior secured, top of the capital structure Significant cushion below investment (generally, 40-60%) Financial and maintenance covenants Diverse portfolio by issuer, industry, and sector Investment segment governed by consistent and predictable bankruptcy laws Cycle-tested team with proven track record Depth of workout and restructuring expertise Repeat borrowers are an important source of originations, accounting for nearly half of dollars deployed over the last 12 months
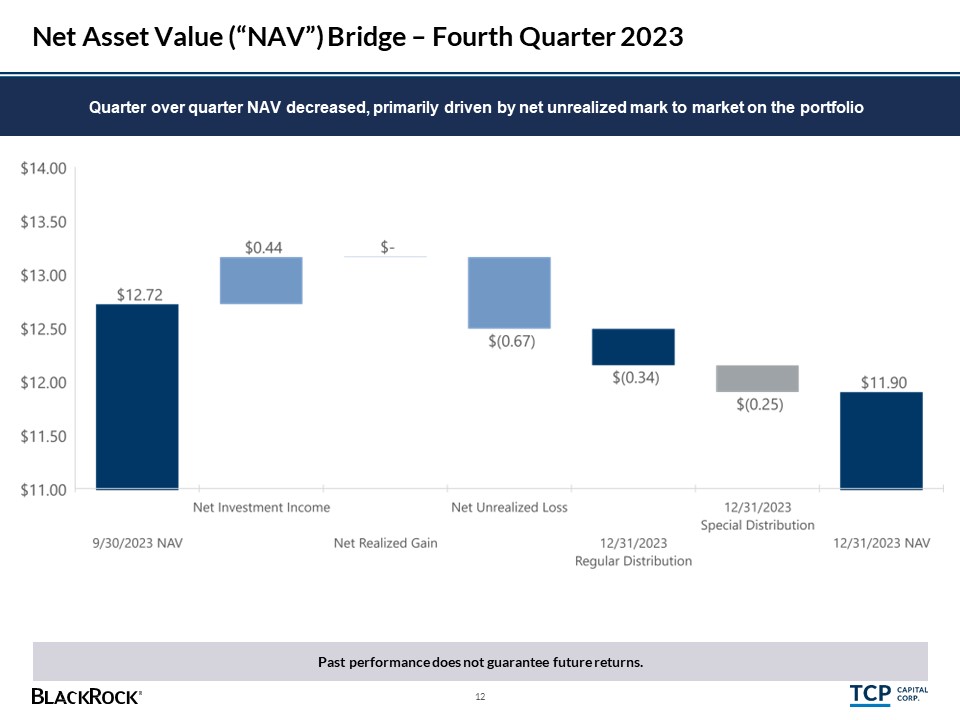
Net Asset Value (“NAV”) Bridge – Fourth Quarter 2023 Past performance does not guarantee future returns. Quarter over quarter NAV decreased, primarily driven by net unrealized mark to market on the portfolio 12

$20.00 $15.00 $10.00 $5.00 $0.00 $25.00 $30.00 $35.00 Book Value per Share Cumulative Dividends Paid per Share (Post IPO) Annualized return on assets calculated as total investment income (gross of expenses) plus realized and unrealized gains and losses divided by average total investments between April 6, 2012 and December 31, 2023. Cash return calculated as total distributions from April 6, 2012 through December 31, 2023, divided by opening NAV of $14.76 on April 6, 2012. Total return calculated as the change in net asset value plus dividends distributed between April 6, 2012 and December 31, 2023. Past performance does not guarantee future returns. Strong Track Record Book Value per Share and Dividends Paid 13 As of 12/31/2023: $28.74 Annualized return on invested assets(1): 10.1% Annualized cash return(2): 9.7% Annualized total return on equity(3): 8.1%
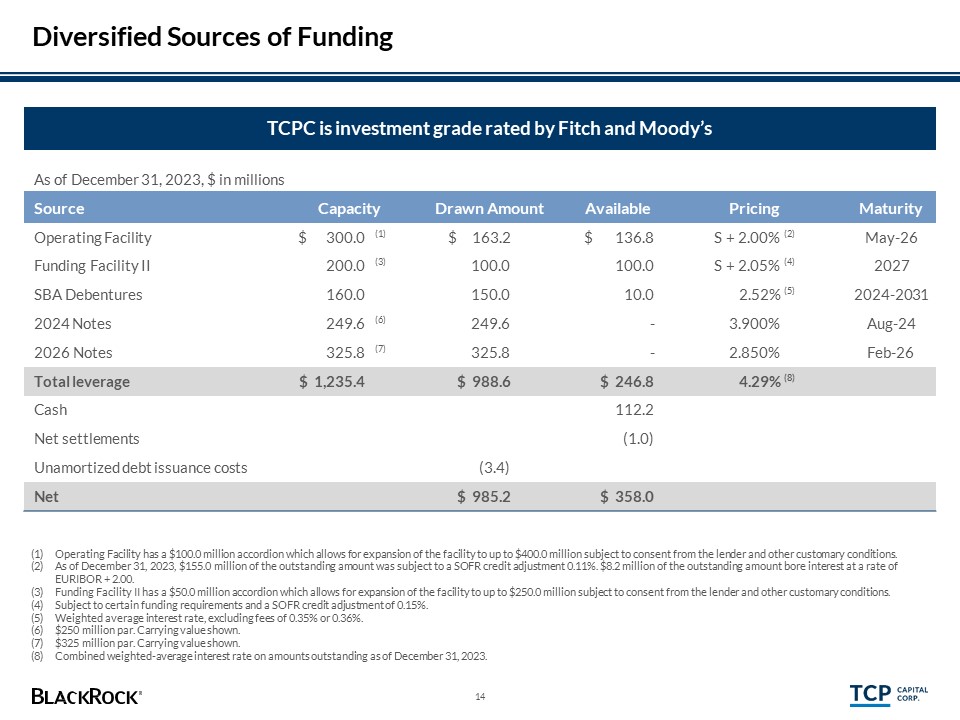
Diversified Sources of Funding 14 Operating Facility has a $100.0 million accordion which allows for expansion of the facility to up to $400.0 million subject to consent from the lender and other customary conditions. As of December 31, 2023, $155.0 million of the outstanding amount was subject to a SOFR credit adjustment 0.11%. $8.2 million of the outstanding amount bore interest at a rate of EURIBOR + 2.00. Funding Facility II has a $50.0 million accordion which allows for expansion of the facility to up to $250.0 million subject to consent from the lender and other customary conditions. Subject to certain funding requirements and a SOFR credit adjustment of 0.15%. Weighted average interest rate, excluding fees of 0.35% or 0.36%. $250 million par. Carrying value shown. $325 million par. Carrying value shown. Combined weighted-average interest rate on amounts outstanding as of December 31, 2023. As of December 31, 2023, $ in millions Source Capacity Drawn Amount Available Pricing Maturity Operating Facility $ 300.0 (1) $ 163.2 $ 136.8 S + 2.00% (2) May-26 Funding Facility II 200.0 (3) 100.0 100.0 S + 2.05% (4) 2027 SBA Debentures 160.0 150.0 10.0 2.52% (5) 2024-2031 2024 Notes 249.6 (6) 249.6 - 3.900% Aug-24 2026 Notes 325.8 (7) 325.8 - 2.850% Feb-26 Total leverage $ 1,235.4 $ 988.6 $ 246.8 4.29% (8) Cash 112.2 Net settlements (1.0) Unamortized debt issuance costs (3.4) Net $ 985.2 $ 358.0 TCPC is investment grade rated by Fitch and Moody’s
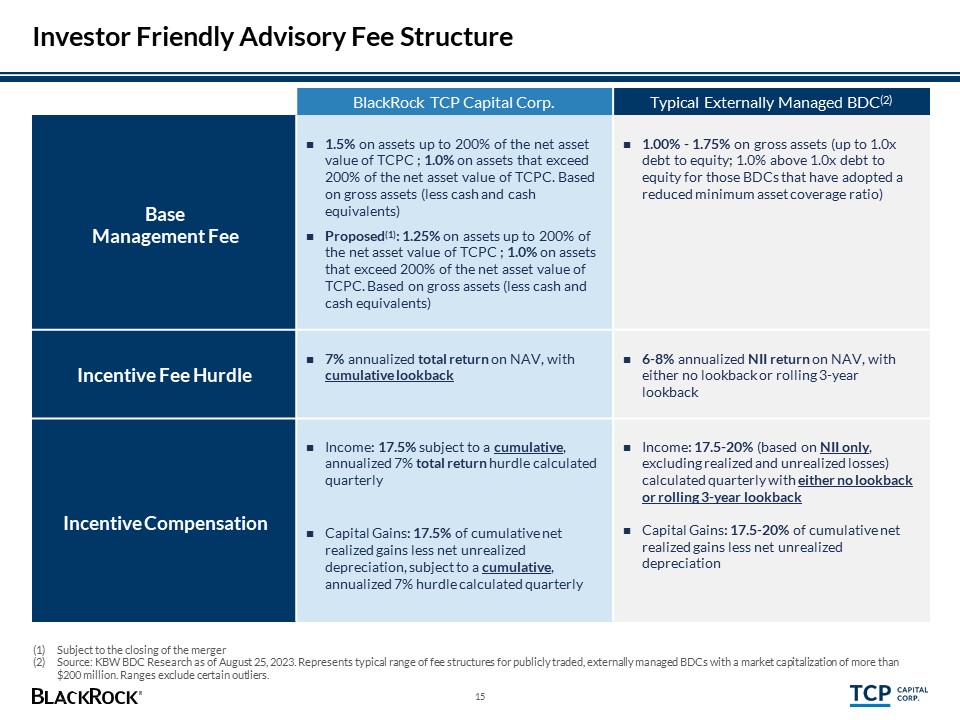
Investor Friendly Advisory Fee Structure 15 Subject to the closing of the merger Source: KBW BDC Research as of August 25, 2023. Represents typical range of fee structures for publicly traded, externally managed BDCs with a market capitalization of more than $200 million. Ranges exclude certain outliers. BlackRock TCP Capital Corp. Typical Externally Managed BDC(2) Base Management Fee 1.5% on assets up to 200% of the net asset value of TCPC ; 1.0% on assets that exceed 200% of the net asset value of TCPC. Based on gross assets (less cash and cash equivalents) Proposed(1): 1.25% on assets up to 200% of the net asset value of TCPC ; 1.0% on assets that exceed 200% of the net asset value of TCPC. Based on gross assets (less cash and cash equivalents) 1.00% - 1.75% on gross assets (up to 1.0x debt to equity; 1.0% above 1.0x debt to equity for those BDCs that have adopted a reduced minimum asset coverage ratio) Incentive Fee Hurdle 7% annualized total return on NAV, with cumulative lookback 6-8% annualized NII return on NAV, with either no lookback or rolling 3-year lookback Incentive Compensation Income: 17.5% subject to a cumulative, annualized 7% total return hurdle calculated quarterly Capital Gains: 17.5% of cumulative net realized gains less net unrealized depreciation, subject to a cumulative, annualized 7% hurdle calculated quarterly Income: 17.5-20% (based on NII only, excluding realized and unrealized losses) calculated quarterly with either no lookback or rolling 3-year lookback Capital Gains: 17.5-20% of cumulative net realized gains less net unrealized depreciation
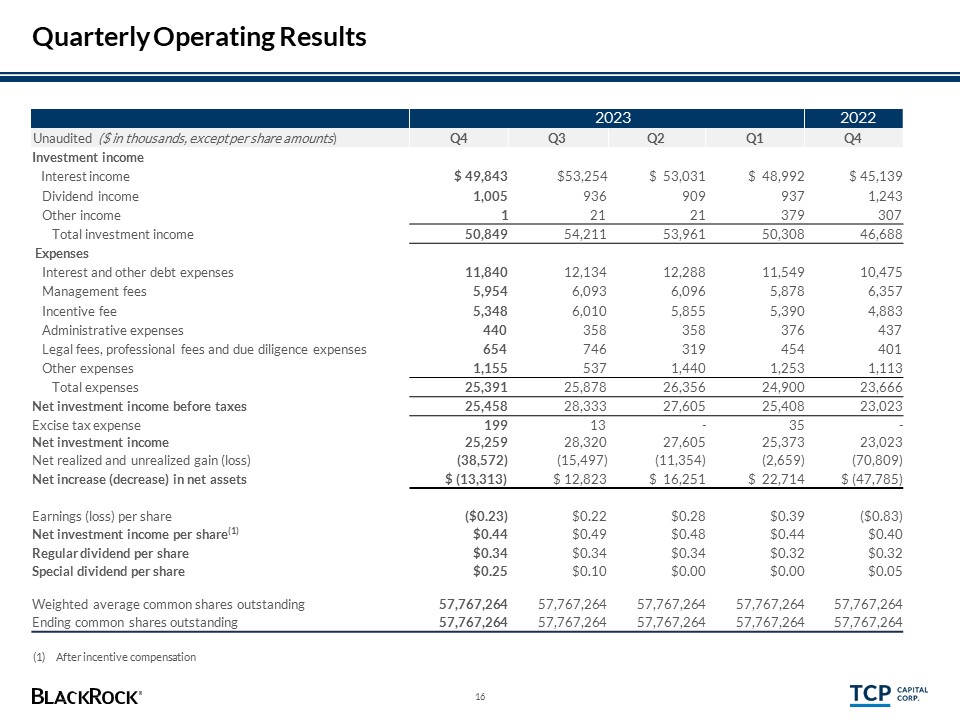
Quarterly Operating Results 2023 2022 Unaudited ($ in thousands, except per share amounts) Q4 Q3 Q2 Q1 Q4 Investment income Interest income $ 49,843 $53,254 $ 53,031 $ 48,992 $ 45,139 Dividend income 1,005 936 909 937 1,243 Other income 1 21 21 379 307 Total investment income 50,849 54,211 53,961 50,308 46,688 Expenses Interest and other debt expenses 11,840 12,134 12,288 11,549 10,475 Management fees 5,954 6,093 6,096 5,878 6,357 Incentive fee 5,348 6,010 5,855 5,390 4,883 Administrative expenses 440 358 358 376 437 Legal fees, professional fees and due diligence expenses 654 746 319 454 401 Other expenses 1,155 537 1,440 1,253 1,113 Total expenses 25,391 25,878 26,356 24,900 23,666 Net investment income before taxes 25,458 28,333 27,605 25,408 23,023 Excise tax expense 199 13 - 35 - Net investment income 25,259 28,320 27,605 25,373 23,023 Net realized and unrealized gain (loss) (38,572) (15,497) (11,354) (2,659) (70,809) Net increase (decrease) in net assets $ (13,313) $ 12,823 $ 16,251 $ 22,714 $ (47,785) Earnings (loss) per share ($0.23) $0.22 $0.28 $0.39 ($0.83) Net investment income per share(1) $0.44 $0.49 $0.48 $0.44 $0.40 Regular dividend per share $0.34 $0.34 $0.34 $0.32 $0.32 Special dividend per share $0.25 $0.10 $0.00 $0.00 $0.05 Weighted average common shares outstanding 57,767,264 57,767,264 57,767,264 57,767,264 57,767,264 Ending common shares outstanding 57,767,264 57,767,264 57,767,264 57,767,264 ��57,767,264 (1) After incentive compensation 16
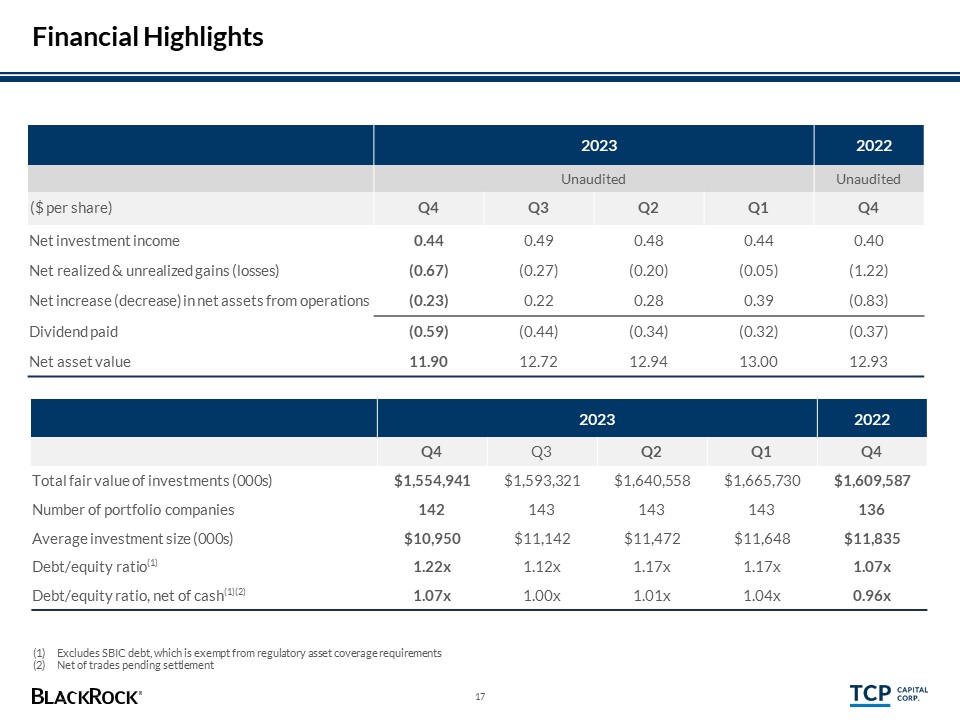
Financial Highlights 17 2023 2022 Unaudited Unaudited ($ per share) Q4 Q3 Q2 Q1 Q4 Net investment income 0.44 0.49 0.48 0.44 0.40 Net realized & unrealized gains (losses) (0.67) (0.27) (0.20) (0.05) (1.22) Net increase (decrease) in net assets from operations (0.23) 0.22 0.28 0.39 (0.83) Dividend paid (0.59) (0.44) (0.34) (0.32) (0.37) Net asset value 11.90 12.72 12.94 13.00 12.93 2023 2022 Q4 Q3 Q2 Q1 Q4 Total fair value of investments (000s) $1,554,941 $1,593,321 $1,640,558 $1,665,730 $1,609,587 Number of portfolio companies 142 143 143 143 136 Average investment size (000s) $10,950 $11,142 $11,472 $11,648 $11,835 Debt/equity ratio(1) 1.22x 1.12x 1.17x 1.17x 1.07x Debt/equity ratio, net of cash(1)(2) 1.07x 1.00x 1.01x 1.04x 0.96x Excludes SBIC debt, which is exempt from regulatory asset coverage requirements Net of trades pending settlement
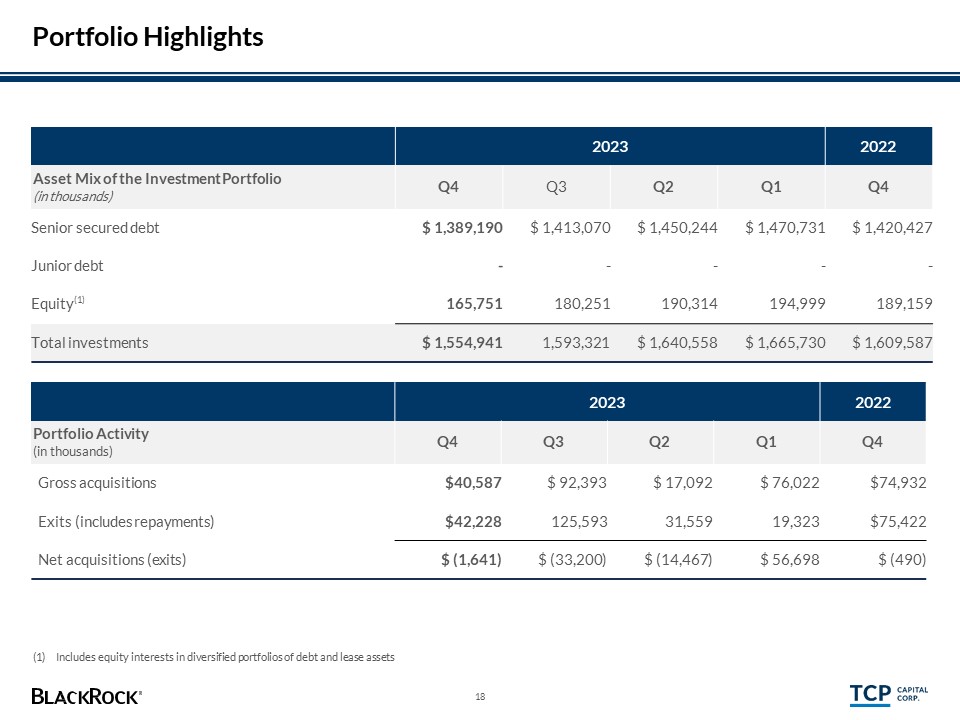
Portfolio Highlights 18 2023 2022 Asset Mix of the Investment Portfolio (in thousands) Q4 Q3 Q2 Q1 Q4 Senior secured debt $ 1,389,190 $ 1,413,070 $ 1,450,244 $ 1,470,731 $ 1,420,427 Junior debt - - - - - Equity(1) 165,751 180,251 190,314 194,999 189,159 Total investments $ 1,554,941 1,593,321 $ 1,640,558 $ 1,665,730 $ 1,609,587 2023 2022 Portfolio Activity (in thousands) Q4 Q3 Q2 Q1 Q4 Gross acquisitions $40,587 $ 92,393 $ 17,092 $ 76,022 $74,932 Exits (includes repayments) $42,228 125,593 31,559 19,323 $75,422 Net acquisitions (exits) $ (1,641) $ (33,200) $ (14,467) $ 56,698 $ (490) (1) Includes equity interests in diversified portfolios of debt and lease assets
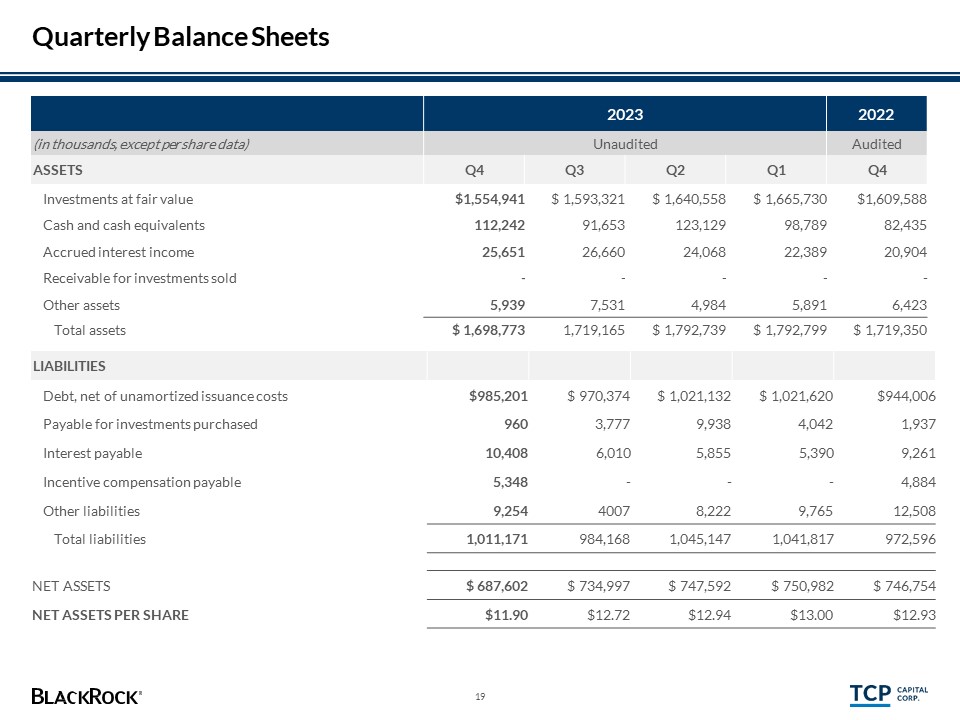
Quarterly Balance Sheets 19 2023 2022 (in thousands, except per share data) Unaudited Audited ASSETS Q4 Q3 Q2 Q1 Q4 Investments at fair value $1,554,941 $ 1,593,321 $ 1,640,558 $ 1,665,730 $1,609,588 Cash and cash equivalents 112,242 91,653 123,129 98,789 82,435 Accrued interest income 25,651 26,660 24,068 22,389 20,904 Receivable for investments sold - - - - - Other assets 5,939 7,531 4,984 5,891 6,423 Total assets $ 1,698,773 1,719,165 $ 1,792,739 $ 1,792,799 $ 1,719,350 LIABILITIES Debt, net of unamortized issuance costs $985,201 $ 970,374 $ 1,021,132 $ 1,021,620 $944,006 Payable for investments purchased 960 3,777 9,938 4,042 1,937 Interest payable 10,408 6,010 5,855 5,390 9,261 Incentive compensation payable 5,348 - - - 4,884 Other liabilities 9,254 4007 8,222 9,765 12,508 Total liabilities 1,011,171 984,168 1,045,147 1,041,817 972,596 NET ASSETS $ 687,602 $ 734,997 $ 747,592 $ 750,982 $ 746,754 NET ASSETS PER SHARE $11.90 $12.72 $12.94 $13.00 $12.93
20 Corporate Information NASDAQ: TCPC JMP Securities Keefe, Bruyette & Woods Ladenburg Thalmann Oppenheimer Raymond James Wells Fargo Computershare Inc. (866) 333-6433 (from U.S.) (201) 680-6578 (from outside U.S.) wwww.computershare.com/investor 2951 28th Street Suite 1000 Santa Monica, CA 90405 Katie McGlynn (310) 566-1094 investor.relations@tcpcapital.com www.tcpcapital.com Securities Listing Research Coverage Transfer Agent Corporate Headquarters Investor Relations ALTM1123U/S-3207383-21/21