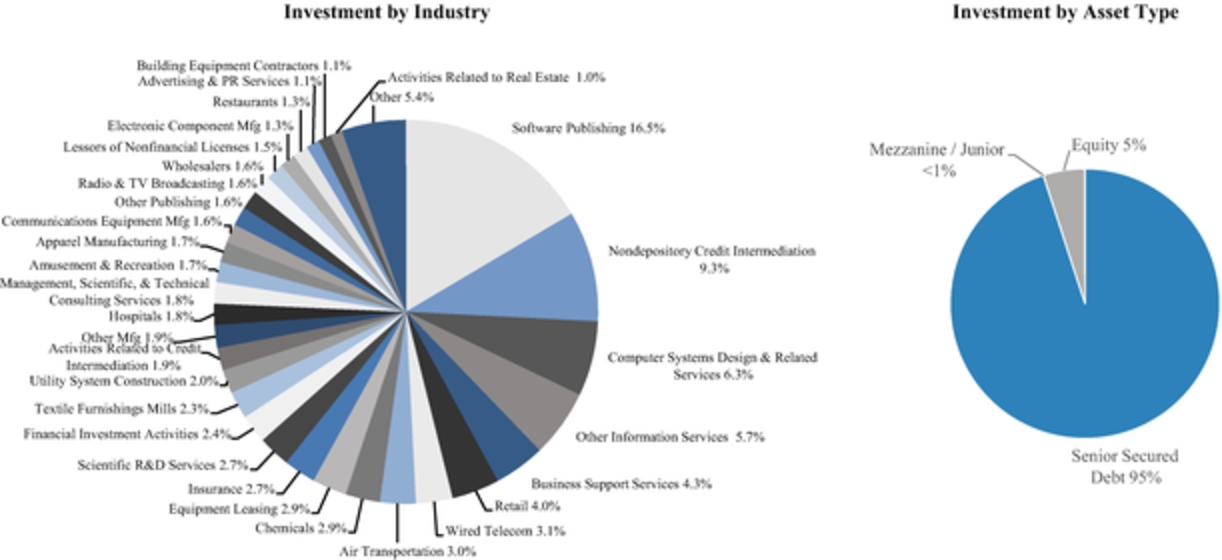
interest based on an interest rate floor was 77.0% at December 31, 2016. At December 31, 2015, 80.4% of debt investments in our portfolio bore interest based on floating rates, such as LIBOR, EURIBOR, the Federal Funds Rate or the Prime Rate, and 19.6% bore interest at fixed rates. The percentage of floating rate debt investments in our portfolio that bore interest based on an interest rate floor was 77.9% at December 31, 2015.
Results of operations
Investment income
Investment income totaled $148.2 million, $146.9 million and $106.6 million, respectively, for the years ended December 31, 2016, 2015 and 2014, of which $145.0 million, $142.0 million and $100.9 million were attributable to interest and fees on our debt investments, $0.0 million, $0.0 million and $2.0 million to dividends from equity securities, $1.6 million, $1.4 million and $1.3 million to lease income and $1.6 million, $3.5 million and $2.4 million to other income, respectively. Other income is primarily comprised of fee income earned in respect of amendments to various debt investments. Included in interest and fees on our debt investments were $10.6 million, $12.5 million and $3.1 million of non-recurring income related to prepayments for the years ended December 31, 2016, 2015 and 2014, respectively. The increase in investment income in the year ended December 31, 2016 compared to the year ended December 31, 2015 reflects an increase in interest income due to the larger portfolio size and an increase in lease income in the year ended December 31, 2016 compared to the year ended December 31, 2015, partially offset by a decrease in other income. The increase in investment income in the year ended December 31, 2015 compared to the year ended December 31, 2014 reflects an increase in interest income due to the larger investment portfolio during the year ended December 31, 2015 compared to the year ended December 31, 2014 and an increase in other income primarily due to higher amendment, restructuring and commitment fees received during the year ended December 31, 2015, partially offset by a decrease in dividend income.
Expenses
Total operating expenses for the years ended December 31, 2016, 2015 and 2014 were $52.3 million, $45.5 million and $28.5 million, respectively, comprised of $25.2 million, $18.9 million and $9.8 million in interest expense and related fees, $18.9 million, $18.6 million and $13.6 million in base management fees, $2.3 million, $2.8 million $1.4 million in legal and professional fees, $1.7 million, $1.6 million and $1.4 million in administrative expenses, and $4.2 million, $3.6 million and $2.3 million in other expenses, respectively. The increase in expenses in the year ended December 31, 2016 compared to the year ended December 31, 2015 primarily reflects the increase in interest expense and other costs related to the increase in available and outstanding debt, including the conversion of the Preferred Interests to term debt, as well as the higher average interest rate following the issuance of the 2022 Convertible Notes and the increase in LIBOR rates, as well as $1.3 million in non-recurring legal costs incurred in 2016. The increase in expenses in the year ended December 31, 2015 compared to the year ended December 31, 2014 primarily reflects the increase in management fees due to the larger portfolio and the increase in interest and other debt expenses related to the increase in available and outstanding debt.
Net investment income
Net investment income was $95.3 million, $100.5 million and $77.3 million, respectively, for the years ended December 31, 2016, 2015 and 2014. The decrease in net investment income in the year ended December 31, 2016 compared to the year ended December 31, 2015 primarily reflects the increase in expenses, partially offset by the increase in investment income in the year ended December 31, 2016. The increase in net investment income in the year ended December 31, 2015 compared to the year ended December 31, 2014 primarily reflects the increased interest income in the year ended December 31, 2015, partially offset by the increase in expenses.
Net realized and unrealized gain or loss
Net realized losses for the years ended December 31, 2016, 2015 and 2014 were $15.0 million, $17.7 million and $21.1 million, respectively. Net realized losses during the year ended December 31, 2016 were comprised primarily of a $12.6 million realization on the restructuring of our loan to CORE Entertainment, Inc. and a $3.0 million loss due to the taxable reorganization of our investment in Boomerang Tube, LLC. Substantially all of the loss on CORE Entertainment, Inc. had been recognized on an unrealized basis in prior years.