UNITED STATES
SECURITIES AND EXCHANGE COMMISSION
Washington, D.C. 20549
______________________________________
FORM 10-K
______________________________________
☑ ANNUAL REPORT PURSUANT TO SECTION 13 OR 15(d) OF THE SECURITIES EXCHANGE ACT OF 1934
For the fiscal year ended December 31, 2024
or
☐ TRANSITION REPORT PURSUANT TO SECTION 13 OR 15(d) OF THE SECURITIES EXCHANGE ACT OF 1934
For the transition period from to
Commission File Number: 1-33100
______________________________________
Owens Corning
(Exact name of registrant as specified in its charter)
______________________________________
| | | | | | | | | | | | | | |
| Delaware | 43-2109021 |
| (State or other jurisdiction of incorporation or organization) | (I.R.S. Employer Identification No.) |
One Owens Corning Parkway
Toledo, OH 43659
(Address of principal executive offices) (Zip Code)
(419) 248-8000
(Registrant’s telephone number, including area code)
Securities registered pursuant to Section 12(b) of the Act:
| | | | | | | | |
| Title of each class | Trading Symbol | Name of each exchange on which registered |
| Common Stock, par value $0.01 per share | OC | New York Stock Exchange |
Securities registered pursuant to Section 12(g) of the Act: None
Indicate by check mark if the registrant is a well-known seasoned issuer, as defined in Rule 405 of the Securities Act. Yes þ No r
Indicate by check mark if the registrant is not required to file reports pursuant to Section 13 or Section 15(d) of the Act. Yes r No þ
Indicate by check mark whether the registrant (1) has filed all reports required to be filed by Section 13 or Section 15(d) of the Securities Exchange Act of 1934 during the preceding 12 months (or for such shorter period that the registrant was required to file such reports), and (2) has been subject to such filing requirements for the past 90 days. Yes þ No r
Indicate by check mark whether the registrant has submitted electronically every Interactive Data File required to be submitted pursuant to Rule 405 of Regulation S-T (§232.405 of this chapter) during the preceding 12 months (or for such shorter period that the registrant was required to submit such files). Yes þ No r
Indicate by check mark whether the registrant is a large accelerated filer, an accelerated filer, a non-accelerated filer, a smaller reporting company, or an emerging growth company. See the definitions of “large accelerated filer,” “accelerated filer,” “smaller reporting company,” and “emerging growth company” in Rule 12b-2 of the Exchange Act.
Large accelerated filer þ Accelerated filer r Non-accelerated filer r Smaller reporting company ☐ Emerging growth company ☐
If an emerging growth company, indicate by check mark if the registrant has elected not to use the extended transition period for complying with any new or revised financial accounting standards provided pursuant to Section 13(a) of the Exchange Act. r
Indicate by check mark whether the registrant has filed a report on and attestation to its management's assessment of the effectiveness of its internal control over financial reporting under Section 404(b) of the Sarbanes-Oxley Act (15 U.S.C. 7262(b)) by the registered public accounting firm that prepared or issued its audit report. ☑
If securities are registered pursuant to Section 12(b) of the Act, indicate by check mark whether the financial statements of the registrant included in the filing reflect the correction of an error to previously issued financial statements. r
Indicate by check mark whether any of those error corrections are restatements that required a recovery analysis of incentive-based compensation received by any of the registrant’s executive officers during the relevant recovery period pursuant to §240.10D-1(b). r
Indicate by check mark whether the registrant is a shell company (as defined in Rule 12b-2 of the Act). Yes ☐ No þ
On June 28, 2024, the last business day of the registrant’s most recently completed second fiscal quarter, the aggregate market value of $0.01 par value common stock (the voting stock of the registrant) held by non-affiliates (assuming for purposes of this computation only that the registrant had no affiliates) was approximately $15,103,269,437.
As of February 20, 2025, 85,540,564 shares of the registrant’s common stock, par value $0.01 per share, were outstanding.
DOCUMENTS INCORPORATED BY REFERENCE
Portions of Owens Corning’s proxy statement to be delivered to stockholders in connection with the Annual Meeting of Stockholders to be held on or about April 15, 2025 (the “2025 Proxy Statement”) are incorporated by reference into Part III hereof.
OWENS CORNING AND SUBSIDIARIES
INDEX TO ANNUAL REPORT ON FORM 10-K
December 31, 2024
| | | | | | | | | | | |
| | | | Page |
| | | |
| | | |
| Item 1. | | | |
| | | |
| | | |
| | | |
| | | |
| | | |
| Item 1A. | | | |
| | | |
| Item 1B. | | | |
| | | |
| Item 1C. | | | |
| | | |
| Item 2. | | | |
| | | |
| Item 3. | | | |
| | | |
| Item 4. | | | |
| | | |
| | | |
| | | |
| | | |
| | | |
| Item 5. | | | |
| | | |
| Item 6. | | | |
| | | |
| Item 7. | | | |
| | | |
| Item 7A. | | | |
| | | |
| Item 8. | | | |
| | | |
| | | |
| | | |
| | | |
| | | |
| | | |
| Item 9. | | | |
| | | |
| Item 9A. | | | |
| | | |
| Item 9B. | | | |
| | | |
| Item 9C. | | | |
| | | |
| | | |
| | | |
| Item 10. | | | |
| | | |
| Item 11. | | | |
| | | |
| Item 12. | | | |
| | | |
| Item 13. | | | |
| | | |
| Item 14. | | | |
| | | |
| | | |
| | | |
| Item 15. | | | |
| | | |
| Item 16. | | | |
| | | |
| | | |
| | | |
| | | |
| | | |
PART I
Unless the context requires otherwise, the terms “Owens Corning,” “Company,” “we,” “its,” and “our” in this Annual Report on Form 10-K refer to Owens Corning and its subsidiaries.
OVERVIEW
Owens Corning is a residential and commercial building products leader committed to building a sustainable future through material innovation. Its roofing products and systems enhance curb appeal and protect people’s homes. Its insulation products conserve energy and improve acoustics, fire resistance and air quality in the spaces where people live, work and play. Its doors and door systems provide comfort, safety and style for the interior and exterior of homes. Its fiberglass composites make thousands of products lighter, stronger and more durable.
We are global in scope, human in scale with more than 25,000 employees in 31 countries dedicated to generating value for our customers and shareholders and making a difference in the communities where we work and live. Founded in 1938 and based in Toledo, Ohio, Owens Corning recorded net sales in 2024 of $11.0 billion.
Glass Reinforcements Divestiture
On February 13, 2025, the Company entered into a definitive agreement for the sale of our global glass reinforcements (“GR”) business for a purchase price of approximately $436 million, less costs to sell. The GR business, part of the Company’s Composites segment, manufactures, fabricates, and sells glass fiber reinforcements for a wide variety of applications in wind energy, infrastructure, industrial, transportation and consumer markets. In 2024, the GR business generated annual revenues of approximately $1.1 billion. The sale will complete Owens Corning’s review of strategic alternatives for the business, announced on February 9, 2024, and aligns with the strategy to reshape the Company to focus on residential and commercial building products in North America and Europe.
The transaction is expected to close in 2025 and is subject to customary regulatory approvals and other conditions. The Company expects to incur a material loss on disposal which cannot be estimated at this time.
The transaction represents a strategic shift that has a major effect on the Company's operations and financial results and therefore, beginning with the quarterly report on Form 10-Q for the period ending March 31, 2025, the GR business’ financial results will be reflected in the Company’s consolidated financial statements as discontinued operations for all periods presented. The Company intends to reorganize its operations and reporting structure and begin to manage its operations under three reporting segments.
Masonite Acquisition
On May 15, 2024, the Company acquired all of the outstanding shares of Masonite International Corporation (“Masonite”), a leading global designer, manufacturer, marketer and distributor of interior and exterior doors and door systems, for $3.2 billion primarily funded with debt proceeds and cash on hand. The acquisition of Masonite's market-leading doors business creates a new growth platform for the Company, strengthening the Company's position in building and construction and expanding the Company's offering of branded residential building products. Masonite's operating results and preliminary purchase price allocation have been included in the Company's newly established Doors reportable segment from May 15, 2024, within the Consolidated Financial Statements.
SEGMENT OVERVIEW
At December 31, 2024, the Company had an integrated business model with four reportable segments: Roofing, Insulation, Doors and Composites, which accounted for approximately 36%, 32%, 13% and 19% of our total reportable segment net sales, respectively, in 2024.
Roofing
Our primary products in the Roofing segment are laminate and strip asphalt roofing shingles. Other products include roofing components and oxidized asphalt. We have been able to service the growing demand for longer lasting, aesthetically attractive laminate products with efficient capital investment.
| | | | | |
| ITEM 1. | BUSINESS (continued) |
We sell shingles and roofing components primarily through distributors, home centers and lumberyards in the United States. Oxidized asphalt is a significant input used in the production of our asphalt roofing shingles. We are vertically integrated and have manufacturing facilities that process asphalt for use in our roofing shingles manufacturing process. In addition, we sell processed asphalt to other shingle manufacturers, to roofing contractors for built-up roofing asphalt systems and to manufacturers in a variety of other industries, including automotive, chemical, rubber and construction. Asphalt input costs and third-party asphalt sales prices are correlated to crude oil prices.
Demand for products in our Roofing segment is generally driven by both residential repair and remodeling activity and by new residential construction. Roofing damage from major storms can significantly increase demand in this segment. As a result, sales in this segment do not always follow seasonal home improvement, remodeling and new construction industry patterns as closely as our Insulation segment.
Our Roofing segment competes primarily with asphalt shingle manufacturers in the United States. According to various industry reports and Company estimates, Owens Corning’s Roofing segment is the second largest producer of asphalt roofing shingles in the United States. Principal methods of competition include innovation and product design, proximity to customers, quality and price.
Our manufacturing operations are generally continuous in nature, and we warehouse much of our production prior to sale since we operate with relatively short delivery cycles. One of the raw materials important to this segment is sourced from a sole supplier. We have a long-term supply contract for this material, and have no reason to believe that any availability issues will exist. If this supply was to become unavailable, our production could be interrupted until such time as the supplies again became available or the Company reformulated its products. Additionally, the supply of asphalt, another significant raw material in this segment, has been constricted at times. Although this has not caused a significant interruption of our production in the past, prolonged asphalt shortages would restrict our ability to produce products in this segment.
Insulation
Our insulating products provide a variety of benefits such as energy conservation, thermal functionality, improved acoustical performance and convenience of installation and use. Our Insulation segment includes a diverse portfolio of high, mid and low-temperature products with a geographic mix of United States, Canada, Europe, Asia-Pacific and Latin America, a market mix of residential, commercial, industrial and other markets, and a channel mix of retail, contractor and distribution.
Our products in the North American residential market include thermal and acoustical batts, loosefill insulation, spray foam, foam sheathing and accessories, and are sold under well-recognized brand names and trademarks, such as Owens Corning PINK® Next Gen™ FIBERGLAS™ Insulation. Our products in the commercial and industrial markets include glass fiber pipe insulation, energy efficient flexible duct media, bonded and granulated stone wool insulation, cellular glass insulation and foam insulation used in above- and below-grade construction applications, and are sold under well-recognized brand names and trademarks, such as FOAMULAR®, FOAMGLAS® and Paroc®. We sell our insulation products primarily to insulation installers, home centers, lumberyards, retailers and distributors in the United States, Canada, Europe, Asia-Pacific and Latin America.
Demand for Owens Corning’s insulating products is driven by North American new residential construction, repair and remodeling activity, commercial and industrial construction activity in the United States, Canada, Europe, Asia-Pacific and Latin America, and increasingly stringent building codes and the growing need for energy efficiency. Demand in the segment typically follows seasonal home improvement, remodeling and renovation and residential, commercial and industrial construction industry patterns. Demand for residential insulation in North America typically follows housing starts on a three-month lagged basis, although the new residential construction cycle can elongate due to labor availability and other factors beyond our control. The peak season for home construction and remodeling in our geographic markets generally corresponds with the second and third calendar quarters. Demand for commercial and industrial applications is more heavily tied to industrial production growth, commercial construction activity and overall economic conditions in the global markets we serve.
Our Insulation segment competes primarily with fiberglass insulation manufacturers in the United States, with an international presence in Canada, Europe, Asia-Pacific and Latin America. According to industry reports and Company estimates, Owens Corning is North America’s largest producer of residential, commercial and industrial fiberglass insulation. Principal methods of competition include innovation and product design, service, location, quality, price and compatibility of systems solutions.
| | | | | |
| ITEM 1. | BUSINESS (continued) |
Doors
Our primary products in the Doors segment are residential interior and exterior doors made of wood, glass, fiberglass and metal, and door components such as frames, sills, weather-stripping, hinges and locks. Other products in this segment are aluminum-framed glass doors and window solutions for luxury homes. Our doors are available in good, better and best options and provide a range of benefits including energy efficiency, comfort, privacy and security and curb appeal.
We serve the needs of the residential repair, remodel and new construction markets in the United States, Canada and the United Kingdom. Doors are sold through wholesale and retail distribution channels. In the wholesale channel, we sell through distribution partners to homebuilders, contractors, lumberyards, dealers and building products retailers. One-step distributors sell doors directly to homebuilders and remodeling contractors, while two-step distributors purchase doors in bulk quantities for local door dealers who often perform additional value-added services such as pre-hanging or pre-finishing the door before installation. The retail channel serves consumers and contractors through retail home centers, both in-store and online.
Demand for products in Owens Corning’s Doors segment is driven by new construction and overall economic conditions in the markets we serve. The Doors segment’s vertically integrated operations extend from raw material to final assembly and fabrication. According to various industry reports and Company estimates, Owens Corning is one of North America’s largest producers of interior and exterior doors. Primary methods of competition include service, quality, innovation, and product customization.
Composites
Owens Corning glass fiber materials can be found in over 40,000 end-use applications primarily within three markets: building and construction, renewable energy and infrastructure. Such end-use applications include building structures, roofing shingles, tubs and showers, pools, decking, flooring, marine, auto, pipes and tanks, poles, electrical equipment and wind-energy turbine blades. Our products are manufactured and sold worldwide. We primarily sell our products directly to parts molders and fabricators. Within the building and construction market, our Composites segment sells glass fiber and/or glass mat directly to a small number of major shingle manufacturers, including our own Roofing segment.
Our Composites segment includes vertically integrated material solutions. The Company manufactures, fabricates and sells glass reinforcements in the form of fiber and mats. Glass reinforcement materials are also used downstream by the Composites segment to manufacture and sell glass fiber products in the form of non-wovens, fabrics and composite lumber.
Demand for composites is driven by general global economic activity and, more specifically, by the increasing replacement of traditional materials, such as aluminum, wood, paper and steel with composites that offer lighter weight, improved strength, lack of conductivity and corrosion resistance.
We compete with glass fiber and building material manufacturers worldwide. According to various industry reports and Company estimates, our Composites segment is a world leader in the production of glass fiber reinforcement and other building materials. Primary methods of competition include innovation, quality, customer service, global geographic reach, sustainability and product customization.
GENERAL
Intellectual Property
The Company relies on a combination of intellectual property laws, as well as confidentiality procedures and contractual provisions, to protect our intellectual property, proprietary technology and our brands. Through continuous and extensive use of the color PINK® since 1956, Owens Corning became the first owner of a single color trademark registration. In addition to our Owens Corning and PINK® brands, the Company has registered, and applied for the registration of, U.S. and international trademarks, service marks and domain names. Additionally, the Company owns numerous U.S. and international patents and patent applications, covering certain of our proprietary technology resulting from research and development efforts. Over time, the Company has assembled a portfolio of intellectual property rights including patents, trademarks, service marks, copyrights, domain names, know-how and trade secrets covering our products, services and manufacturing processes. Our proprietary technology is not dependent on any single or group of intellectual property rights and the Company does not expect the expiration of existing intellectual property to have a material adverse effect on the business as a whole. The Company believes the duration of our patents is adequate relative to the expected lives of our products. Although the Company protects its intellectual property and proprietary technology, any significant impairment of, or third-party claim against, our intellectual property rights could harm our business or our ability to compete.
| | | | | |
| ITEM 1. | BUSINESS (continued) |
Environmental Control
Owens Corning has established policies and procedures that are intended to ensure that its operations are conducted in compliance with all relevant laws and regulations and that enable the Company to meet its high standards for corporate sustainability and environmental stewardship. Our manufacturing facilities are subject to numerous foreign, federal, state and local laws and regulations relating to the presence of hazardous materials, pollution and protection of the environment, including emissions to air, reductions of greenhouse gases, discharges to water, management of hazardous materials, handling and disposal of solid wastes, use of chemicals in our manufacturing processes and remediation of contaminated sites. All Company manufacturing facilities are either ISO 14001 certified or deploy environmental management systems based on ISO 14001 principles. The Company’s 2030 Sustainability Goals include targets related to significant global reductions in energy use, water consumption, waste to landfill, and emissions of greenhouse gases, fine particulate matter, and volatile organic air emissions, and protection of biodiversity. The Company is dedicated to continuous improvement in its environmental, health and safety performance and to achieving its 2030 Sustainability Goals.
The Company has not experienced a material adverse effect upon its capital expenditures or competitive position as a result of environmental control legislation and regulations. Operating costs associated with environmental compliance were approximately $59 million in 2024. The Company continues to invest in equipment and process modifications to remain in compliance with applicable environmental laws and regulations worldwide.
Our manufacturing facilities are subject to numerous national, state and local environmental protection laws and regulations. Regulatory activities of particular importance to our operations include those addressing air pollution, water pollution, waste disposal and chemical control. It is possible that new laws and regulations will specifically address climate change, volatile organic compounds, ozone forming emissions and fine particulate matter. New environmental and chemical regulations could impact our ability to expand production or construct new facilities in geographic regions in which we operate. However, based on information known to the Company, including the nature of our manufacturing operations and associated air emissions, at this time we do not expect any of these new laws, regulations or activities to have a material adverse effect on our results of current operations, financial condition or long-term liquidity.
Owens Corning is involved in remedial response activities and is responsible for environmental remediation at a number of sites, including certain of its currently owned or formerly owned plants. These responsibilities arise under a number of laws, including, but not limited to, the Federal Resource Conservation and Recovery Act, and similar state or local laws pertaining to the management and remediation of hazardous materials and petroleum. The Company has also been named a potentially responsible party under the United States Federal Superfund law, similar state or local laws pertaining to the management and remediation of hazardous materials and petroleum. The Company became involved in these sites as a result of government action or in connection with business acquisitions. At the end of 2024, the Company was involved with a total of 24 sites worldwide, including 9 Superfund and state or country equivalent sites and 15 owned or formerly owned sites. None of the liabilities for these sites are individually significant to the Company.
Remediation activities generally involve a potential range of activities and costs related to soil, groundwater and sediment contamination. This can include pre-cleanup activities such as fact finding and investigation, risk assessment, feasibility studies, remedial action design and implementation (where actions may range from monitoring to removal of contaminants, to installation of longer-term remediation systems). A number of factors affect the cost of environmental remediation, including the number of parties involved in a particular site, the determination of the extent of contamination, the length of time the remediation may require, the complexity of environmental regulations, variability in clean-up standards, the need for legal action, and changes in remediation technology. Taking these factors into account, Owens Corning estimates the costs of remediation to be paid over a period of years. The Company accrues an amount on an undiscounted basis, when a liability is probable and reasonably estimable. Actual cost may differ from these estimates for the reasons mentioned above.
At December 31, 2024, the Company had an accrual totaling $4 million for its environmental liabilities, of which the current portion is $2 million. Changes in required remediation procedures or timing of those procedures at existing legacy sites, or discovery of contamination at additional sites, could result in material increases to the Company’s environmental obligations.
Additional Government Laws and Regulations
In addition to environmental laws and regulations, we are subject to various laws and regulations around the world. For example, trade regulations, including tariffs or other import or export restrictions, may increase the cost of some of our raw materials or cross-border shipments, and limit our ability to do business in certain countries or with certain individuals. Our business is also subject to competition laws in the various jurisdictions where we operate, including the Sherman Antitrust Act and related federal and state antitrust laws in the United States, as well as similar foreign laws and regulations. These laws and regulations generally prohibit competitors from fixing prices, boycotting competitors, or engaging in other conduct that
| | | | | |
| ITEM 1. | BUSINESS (continued) |
unreasonably restrains competition, and such laws and regulations may impact potential business relationships or transactions with third parties in the future. In addition, health and safety regulations have necessitated, and may continue to necessitate, increased operating costs or capital investments to promote a safe working environment. The Company is also required to comply with increasingly complex and changing laws and regulations enacted to protect business and personal data in the United States and other jurisdictions regarding privacy, data protection and data security, including those related to the collection, storage, use, transmission and protection of personal information and other consumer, customer, vendor or employee data. Further, an increasing number of laws and regulations focused on product and chemical hazards, including regulations concerning the impact of product manufacturing and use on climate change, and resulting preferential product selection could also impact our ability to manufacture and sell certain products or require significant research and development investment and capital expenditures to meet regulatory requirements. With respect to the laws and regulations noted above, as well as other applicable laws and regulations, the Company’s compliance programs, may under certain circumstances, involve material investments in the form of additional processes, training, personnel, information technology and capital. For a discussion of the risks associated with certain applicable laws and regulations, see Item 1A, “Risk Factors.”
Sustainability
As a worldwide leader in our industry, our goal is to be at the forefront of corporate sustainability efforts. It is our ambition to be a company whose positive impact of our people and products, is greater than the negative impact of manufacturing our products. We work to continually increase the good our people and products do while we concurrently strive to reduce the negative environmental impact of our operations.
Our climate-related sustainability efforts have led Owens Corning to develop a range of strategies and tactics that have had a significant impact on the way we conduct our business. We strive to reduce the greenhouse gas emissions released throughout the entire life cycle of our products by improving the use-phase impacts of our products, making our manufacturing processes more energy-efficient, sourcing more renewable electricity, improving our supply chain logistics, increasing recycled content and developing end-of-life recycling solutions. Together, this work helps to reduce the environmental impact of our operations and lowers the embodied carbon in our products – an attribute of growing importance to our customers.
Many of Owens Corning’s products are made using heavy, industrialized manufacturing processes. While we strive to continue our progress to reduce our impact, our factories produce various emissions, including greenhouse gases. Owens Corning is subject to or has chosen to voluntarily participate in Emissions Trading Schemes around the world. Broad and gradual tightening of national, regional, and state government limits on emissions could disrupt our access to energy sources or specific raw materials, which in turn could disrupt the manufacturing of products dependent upon them. Owens Corning invests in research and development on climate-related risks and opportunities.
Human Capital Resources
The Company’s long-term success is dependent upon its access to and development of management and primary employees who are sufficiently skilled and capable of the work necessary to achieve the Company’s short- and long-term business objectives. To maintain employee engagement, Owens Corning strives to ensure its people feel valued, included, and engaged – from recruitment to retirement. That is why Owens Corning is dedicated to fostering an environment of learning and growth within a supportive, caring culture. We are committed to providing a safe, healthy workplace and a meaningful, engaging employee experience.
As of December 31, 2024, Owens Corning had approximately 25,000 employees, of which approximately 12,000 were located outside the United States. Approximately 60% of hourly employees are subject to collective bargaining agreements. The Company regularly engages its salaried, non-represented and represented primary employees to collect feedback. In 2024, the Company engaged in the Pulse Survey, a new biannual survey that is designed to improve the employee experience, which had a 71% participation rate. Out of the 19,000 employees that participated, approximately 80% found their work engaging and were satisfied with their jobs. In 2023, the Company also engaged in an Employee Value Proposition survey and considered employee feedback in formulating its value proposition, including changes to compensation and benefits offerings such as sick leave enhancements for primary employees and improvements to our facilities, including the roll-out of personal dignity spaces.
| | | | | |
| ITEM 1. | BUSINESS (continued) |
Safety and Well-Being
One of our primary objectives is the safety and well-being of our employees. Working safely is an unconditional, organization-wide expectation at Owens Corning, which we believe directly benefits employees’ lives, improves our manufacturing processes and reduces our costs. The Company maintains comprehensive safety programs focused on identifying hazards and eliminating risks that can lead to severe injuries. Since 2023, the Company has utilized its employee-developed “Safer Together” initiative, which is intended to increase employee focus and collective engagement on safety. One of our primary safety measures is the Recordable Incident Rate (“RIR”) as defined by the United States Bureau of Labor Statistics. For the year ended December 31, 2024, our RIR, excluding the impact from our Doors segment as a result of the recent Masonite acquisition, was 0.48, compared to 0.60 as reported in the same period for the prior year.
Additionally, with our Healthy Living platform, we provide a multifaceted well-being program designed to drive sustainable, long-term change, improve the health and lives of employees, and strengthen the culture and work experience.
Employee Performance and Related Objectives
We also focus on evaluating and managing employee performance, development, succession planning and turnover. Our goal is to create a high-performance culture and teams that are diverse, capable and engaged. We strive to have clear objectives, effective performance management, and a structure that includes regular feedback, talent reviews, succession planning, development, and compensation analysis.
Corporate Culture
Another objective we pursue is maintaining a corporate culture focused on inclusion and diversity, ethics and compliance, training and positive employee relations and engagement. The Company believes its success and sustainability are enhanced by an inclusive and diverse workforce. We believe that inclusion and diversity add value to the business by fostering an environment that leads to high engagement and innovative thinking in the workplace.
Ethics and compliance efforts include our support of the Owens Corning Code of Conduct (“Code of Conduct”), which is dedicated to encouraging compliance with a range of legal guidelines and our corporate values. Our training efforts encompass the Code of Conduct and other areas of compliance and development as relevant to employees. We also seek to foster positive and productive relations with the labor organizations representing them.
Owens Corning employees contribute service hours to boards, special causes and nonprofit organizations in the communities where they live and operate. These programs aim to enable the Company’s employees to connect with the community, further improve its reputation locally and globally, and instill a sense of pride in the workforce.
AVAILABILITY OF INFORMATION
Owens Corning makes available, free of charge, through its website, the Company’s Annual Report on Form 10-K, Quarterly Reports on Form 10-Q, Current Reports on Form 8-K and all amendments to those reports as soon as reasonably practicable after such material is electronically filed with or furnished to the Securities and Exchange Commission (the "SEC"). These documents are available through the Investor Relations page of the Company’s website at www.owenscorning.com. Copies of any materials we file with the SEC can also be obtained free of charge through the SEC’s website at http://www.sec.gov. The information on our website is not, and will not be deemed to be, a part of this Annual Report on Form 10-K or incorporated into any of our other filings with the SEC.
In an enterprise as diverse as ours, a wide range of factors could affect future performance. We discuss in this section some of the risk factors that could materially and adversely affect our business, financial condition, value and results of operations. You should not interpret the disclosure of any risk factor to imply that the risk has not already materialized. You should consider these risk factors in connection with evaluating the forward-looking statements contained in this Annual Report on Form 10-K because these risk factors could cause our actual results and financial condition to differ materially from those projected in forward-looking statements.
The Company maintains processes that aim to manage enterprise risks through identification and mitigation of those risks. Despite our efforts, we may fail to identify or mitigate certain risks, which could have a material and adverse impact on our business, financial condition, value and results of operations in future periods.
MACROECONOMIC, MARKET AND OPERATIONAL RISKS
Low levels of residential, commercial or industrial construction activity can have a material adverse impact on our business and results of operations.
A large portion of our products are used in the markets for residential and commercial construction and repair and remodeling. Demand for certain of our products is affected in part by the level of new residential construction in the United States and elsewhere, although typically not until a number of months after the change in the level of construction. Lower demand in the regions and markets where our products are sold could result in lower revenues and lower profitability. Historically, construction activity has been cyclical and is influenced by prevailing economic conditions, including the level of interest rates and availability of financing, inflation, employment levels, consumer spending habits, consumer confidence and other macroeconomic factors outside our control. Interest rates increased substantially in the past few years, remained elevated in 2024, and are currently expected to decrease slightly but stay relatively high in 2025. The combination of high interest rates and high levels of inflation reduces the affordability of mortgages and other financing options, and increases the cost of home improvement projects. These trends have likely resulted in reduced levels of repair and remodel as well as new construction activity and demand for our products. Additionally, market reactions to the new U.S. federal administration's trade policies, deregulation efforts, and stance towards the Federal Reserve could create economic uncertainty, potentially leading to fluctuations in inflation and interest rates. Due to this uncertainty, we cannot predict if or when interest rates or inflation levels will stabilize or the impact that this uncertainty may have on repair and remodel activity, new construction activity, demand for our products, our business generally, or our financial condition.
Residential and commercial construction is also affected by the cost and availability of skilled labor, which could impact both the cost and pace of construction activity, as well as the construction methods used, all of which could adversely affect demand for our products.
Some of our products, particularly in our Insulation business, are used in industrial applications, such as piping and storage tanks. Lower levels of industrial production and other macroeconomic factors affecting industrial construction activity could lessen demand for those products and lead to lower revenues or profitability.
We may be exposed to cost increases or reduced availability of raw materials or transportation, which could reduce our margins and have a material adverse impact on our business, financial condition and results of operations.
Our business relies heavily on certain commodities and raw materials used in our manufacturing processes. Additionally, we spend a significant amount on inputs that are influenced by energy prices, such as asphalt, chemicals, resins and transportation. Price increases for these inputs could raise costs and reduce our margins if we are not able to offset them by increasing the prices of our products, improving productivity or hedging, where appropriate.
Availability of certain of the raw materials we use has occasionally been limited, and our sourcing of some of these raw materials from a limited number of suppliers, and in some cases a sole supplier, increases the risk of unavailability. For example, if one of the raw materials important to our business is sourced from a sole supplier, our production could be interrupted regardless of whether we have a long-term supply contract for the material. Global economic conditions may also result in global or regional supply chain issues that adversely impact our access to raw materials and supplies. Despite our contractual supply agreements with many of our suppliers, and despite any programs we may undertake to mitigate supply risks, it is possible that we could experience a lack of certain raw materials that limits our ability to manufacture our products, thereby materially and adversely impacting our business, financial condition and results of operations.
| | | | | |
| ITEM 1A. | RISK FACTORS (continued) |
In addition, steps taken by the United States government to apply or increase tariffs on certain products and materials could potentially disrupt our existing supply chains and impose additional costs on our business, including costs with respect to raw materials upon which our business depends. The increased costs may negatively impact our margins as we may not be able to pass on the additional costs to customers by increasing the prices of our products. For example, market reactions to the new U.S. federal administration’s proposed tariffs and evolving trade policies with countries such as Canada, Mexico and China could disrupt our supply chains, increase our costs for raw materials, and negatively impact our business margins and financial results.
We are also dependent on third-party freight carriers to transport some of our raw materials and products. We may be unable to transport our raw materials or products in a timely manner or at economically favorable rates in certain circumstances, particularly in cases of adverse market conditions or disruptions to transportation infrastructure.
Supply constraints and increases in the cost of energy could have a material adverse impact on our business or results of operations.
The cost of producing our products is sensitive to the price of energy, including its impact on transport costs which is subject to factors outside of our control. Energy prices, in particular oil and natural gas, have fluctuated in recent years. For example, natural gas forms the primary energy source for our European operations and our European operations can be directly affected by volatility in the cost and availability of natural gas. Natural gas supply shortages could lead to additional price increases, energy supply rationing, or temporary reduction in our European operations, which could have a material adverse impact on our business or results of operations.
We are subject to risks and uncertainties associated with our international operations.
We sell products and operate plants throughout the world. Our international sales and operations are subject to risks and uncertainties, including:
•difficulties and costs associated with complying with a wide variety of complex and changing laws, including securities laws, climate-related laws, tax laws, employment and pension-related laws, competition laws, U.S. and foreign export and trading laws, and laws governing improper business practices, treaties and regulations;
•limitations on our ability to enforce legal rights and remedies;
•adverse domestic or international economic and political conditions, business interruption, war and civil disturbance;
•changes to tax, currency, or other laws or policies that may adversely impact our ability to repatriate cash from non-United States subsidiaries, make cross-border investments, or engage in other intercompany transactions;
•future tax legislation, regulations, or related guidance or interpretations;
•changes to import or export restrictions, penalties or sanctions, including modification or elimination of international agreements covering trade or investment;
•costs and availability of shipping and transportation;
•nationalization or forced relocation of properties by foreign governments;
•currency exchange rate fluctuations between the United States Dollar and foreign currencies; and
•uncertainty with respect to any potential changes to laws, regulations and policies that could exacerbate the risks described above.
We may have difficulty anticipating and effectively managing these and other risks that our international operations may face, which may adversely impact our business, financial condition and results of operations.
| | | | | |
| ITEM 1A. | RISK FACTORS (continued) |
In addition, we operate in many parts of the world that have experienced governmental corruption and we could be adversely affected by violations of the Foreign Corrupt Practices Act (“FCPA”) and similar worldwide anti-corruption laws. The FCPA and similar anti-corruption laws in other jurisdictions generally prohibit companies and their intermediaries from making improper payments to officials for the purpose of obtaining or retaining business. Although we mandate compliance with these anti-corruption laws and maintain an anti-corruption compliance program, these measures may not prevent our employees or agents from violating these laws. If we were found liable for violations of anti-corruption laws, we could be liable for criminal or civil penalties or other sanctions, which could have a material adverse impact on our business, financial condition and results of operations.
Our sales may fall rapidly in response to declines in demand because of customer concentration in certain segments and because we do not operate under long-term volume agreements to supply our customers .
Many of our customer volume commitments are short-term; therefore, we do not have a significant manufacturing backlog. As a result, we do not benefit from the visibility provided by long-term volume contracts against downturns in customer demand and sales. Further, we are not able to immediately adjust our costs in response to declines in sales. Our ability to sell some of the products in our Insulation, Roofing, and Doors segments is dependent on a limited number of customers, who account for a significant portion of such sales. In 2024, we had two customers that represented 13% and 11% of our annual net sales. The loss of one or more of these key customers, a consolidation of key customers or a significant reduction in sales to those customers could significantly reduce our revenues from these products. In addition, if key customers experience financial pressure or consolidate, they could attempt to demand more favorable contractual terms, which would place additional pressure on our margins and cash flows. Lower demand for our products, loss of key customers and material changes to contractual terms could materially and adversely impact our business, financial condition and results of operations. Furthermore, some of our sales are concentrated in certain geographic areas, and market growth that is skewed to other geographic areas may negatively impact our rate of growth or market share.
We face significant competition in the markets we serve and we may not be able to compete successfully.
All of the markets we serve are highly competitive. We compete with manufacturers and distributors, both within and outside the United States. Some of our competitors may have superior financial, technical, marketing and other resources. In some cases, we face competition from manufacturers in countries able to produce similar products at lower costs. Price competition or overcapacity may limit our ability to raise prices for our products, may force us to reduce prices and may also result in reduced levels of demand for our products and cause us to lose market share. We also face competition from the introduction of new products or technologies, by competitors, that may address our customers’ needs in a better manner, whether based on considerations of pricing, usability, effectiveness, sustainability, quality or other features or benefits. In addition, to effectively compete, we must continue to develop new products that meet changing consumer preferences and successfully develop, manufacture and market these new products. If we are not able to successfully commercialize our innovation efforts, we may lose market share. Our inability to effectively compete could result in the loss of customers and reduce the sales of our products, which could have a material adverse impact on our business, financial condition and results of operations.
Although price is a significant basis of competition in our industry, we also compete on the basis of on-time delivery and our reputation for quality and customer service. If we fail to maintain our current standards for product quality, the scope of our distribution capabilities or our customer relationships, our reputation, financial condition, results of operations and cash flows could be adversely affected.
Our efforts in acquiring and integrating other businesses, establishing joint ventures, expanding our production capacity or divesting assets are subject to a number of risks.
Some of the ways we have historically grown or restructured our business have been through acquisitions, including our 2024 acquisition of Masonite, joint ventures, the expansion of our production capacity and divestitures, including the divestiture of our GR business. Our ability to grow or restructure our business depends upon our ability to identify, negotiate and finance suitable arrangements. If we cannot successfully execute on such arrangements or receive any required regulatory approvals on a timely basis, we may be unable to generate desired returns, and our expectations of future results of operations, including cost savings and synergies, may not be achieved. Acquisitions, joint ventures, production capacity expansions and divestitures involve substantial risks, including:
•unforeseen difficulties in operations, technologies, products, services, accounting and personnel;
•increased cybersecurity threats or incidents;
•diversion of financial and management resources from existing operations;
| | | | | |
| ITEM 1A. | RISK FACTORS (continued) |
•unforeseen difficulties related to entering geographic regions, markets or product lines where we do not have prior experience;
•risks relating to obtaining sufficient financing;
•difficulty in integrating the acquired business’ standards, processes, procedures and controls with our existing operations;
•potential loss of key employees;
•unanticipated competitive responses;
•potential loss of customers or suppliers; and
•undisclosed or undiscovered liabilities or claims, or retention of unpredictable future liabilities.
Our failure to address these risks or other problems encountered in connection with our past or future acquisitions, including the acquisition of Masonite, investments and divestitures, including the divestiture of our GR business, could cause us to fail to realize the anticipated benefits of such transactions, incur unanticipated liabilities, and harm our business generally. On February 13, 2025, the Company entered into a definitive agreement for the sale of our GR business (see "Item 1 - Business - Overview"). There can be no assurance that we will obtain the required regulatory or third-party approvals and consents to the sale, or that we will close the sale within the anticipated time period, or at all. Future acquisitions and investments could also result in dilutive issuances of our equity securities, the incurrence of debt, contingent liabilities, or amortization expenses, or write-offs of goodwill, any of which could have a material adverse impact on our business, financial condition and results of operations. Also, the anticipated benefits of our investments may not materialize.
We may not realize the growth opportunities and cost synergies that are anticipated from the acquisition of Masonite.
The benefits that are expected to result from the acquisition of Masonite will depend, in part, on our ability to realize the anticipated growth opportunities and cost synergies as a result of the acquisition. Our success in realizing these growth opportunities and cost synergies, and the timing of this realization, depends on the successful integration of Masonite. There can be no assurance that we will successfully or cost-effectively integrate Masonite. The failure to do so could have a material adverse effect on our business, financial condition, and results of operations.
Even if we are able to integrate Masonite successfully, this integration may not result in the realization of the full benefits of the growth opportunities and cost synergies that we currently expect from this integration, and we cannot guarantee that these benefits will be achieved within anticipated time frames or at all. While it is anticipated that certain expenses will be incurred to achieve cost synergies, such expenses are difficult to estimate accurately, and may exceed current estimates. Accordingly, the benefits from the acquisition may be offset by costs incurred to, or delays in, integrating the businesses.
Worldwide economic conditions and credit tightening could have a material adverse impact on the Company.
The Company’s business may be materially and adversely impacted by changes in United States or global economic conditions, including inflation, deflation, interest rates, availability of capital, consumer spending rates, energy availability and commodity prices, trade laws, and the effects of governmental initiatives to manage economic conditions. Changes in and/or new laws, regulations and policies that may be enacted in the United States or elsewhere could also materially impact economic conditions and the Company's business and results of operations. These changes and conditions could materially and adversely impact the Company’s operations, financial results and/or liquidity, including:
•the financial stability of our customers or suppliers may be compromised, which could result in reduced demand for our products, additional bad debts for the Company or non-performance by suppliers;
•one or more of the financial institutions associated with our credit facilities could cease to fulfill their funding obligations, or the amount of eligible receivables under our receivables securitization facility could decrease, which could materially and adversely impact our liquidity;
•it may become more expensive or difficult to obtain financing or refinance the Company’s debt in the future;
•the value of the Company’s assets held in pension plans may decline; and
•the Company’s assets may be impaired or subject to write-down or write-off.
| | | | | |
| ITEM 1A. | RISK FACTORS (continued) |
With the volatility in the current global economic climate, inflation and geopolitical events around the world, it is difficult for us to predict the future impact of the foregoing matters on our business and results of operations.
Uncertainty about global economic conditions may also cause consumers of our products to reduce or postpone spending or purchase alternative products in response to tighter credit, negative financial news and/or declines in income or asset values. This could have a material adverse impact on the demand for our products and on our financial condition and operating results. A deterioration of economic conditions may exacerbate these adverse effects and could result in a wide-ranging and prolonged impact on general business conditions, thereby negatively impacting our operations, financial results and/or liquidity.
We are subject to risks relating to our information technology systems (including cybersecurity) risks, and any failure to adequately protect our critical information technology systems could materially affect our operations and financial results.
We rely on information technology systems, including information technology systems of our third-party business partners, across our operations, including for management, supply chain and financial information and various other processes and transactions. Our ability to effectively manage our business depends on the security, reliability and capacity of these systems. Our information technology systems, some of which are dependent on services provided by third parties, may be vulnerable to damage, interruption, or shutdown due to any number of causes outside of our control such as catastrophic events, natural disasters, fires, power outages, systems failures, telecommunications failures, employee error or malfeasance, security breaches, computer viruses or other malicious codes, ransomware, unauthorized access attempts, denial of service attacks, phishing or other social engineering attempts, hacking, and other cybersecurity incidents. Cybersecurity threat actors also may attempt to exploit vulnerabilities in software that is commonly used by companies in cloud-based services and bundled software. In addition, our operations in certain geographic locations may be particularly vulnerable to cybersecurity incidents or other problems. Any such damage, interruption, or shutdown could cause delays or cancellation of customer orders or impede the manufacture or shipment of products, processing of transactions or reporting of financial results. A cybersecurity incident or other problem with our systems could also result in the disclosure of proprietary information about our business or confidential information concerning our customers, suppliers or employees, which could result in significant damage to our business and our reputation.
We have established a range of security measures that are designed to protect against the unauthorized access to and misappropriation of our information, corruption or alteration of data, intentional or unintentional disclosure of confidential information, or disruption of operations. However, advanced cybersecurity threats, such as malware, ransomware, and phishing attacks, attempts to access information, and other security breaches, are persistent and continue to evolve, making them increasingly difficult to identify and prevent. Protecting against these threats requires significant resources, and is expected to continue to require significant resources, and we may not be able to implement measures that will protect against all of the significant risks to our information technology systems. In addition, we rely on a number of third-party business partners to execute certain business processes and maintain certain information technology systems and infrastructure, evaluate defenses and implement recommendations and any breach of security on their part could impair our ability to effectively operate.
Although we experience cybersecurity incidents from time to time as part of our operations, we have not identified any risks from cybersecurity threats, including as a result of previous cybersecurity incidents, that have had or are reasonable likely to have, a material impact on our business strategy, results of systems, operations or financial condition. Any breach of our security measures, or those of our third-party business partners, could result in unauthorized access to and misappropriation of our information, corruption or alteration of data or disruption of operations or transactions, any of which could have a material adverse effect on our business strategy, results of operations or financial condition, including costs related to remediation or the payment of ransom, litigation including individual claims or consumer class actions, commercial litigation, administrative, and civil or criminal investigations or actions, regulatory intervention and sanctions or fines, investigation and remediation costs, damage to our reputation and relationships with our business partners, and possible prolonged negative publicity.
Additionally, we regularly move data across national borders to conduct our operations and, consequently, are subject to a variety of laws and regulations in the United States and other jurisdictions regarding privacy, data protection, and data security, including those related to the collection, storage, handling, use, disclosure, transfer, and security of personal data, including the European Union General Data Protection Regulation. Our efforts to comply with privacy and data protection laws may impose significant costs and challenges that are likely to increase over time.
Emerging issues related to our development, integration and use of artificial intelligence (“AI”) could give rise to legal or regulatory action, damage our reputation or otherwise materially harm our business.
Our development, integration and use of AI technology in our operations remains in the early phases. We have started to assess the use of AI technology to drive productivity and data analytics. While we aim to develop, integrate and use AI responsibly,
| | | | | |
| ITEM 1A. | RISK FACTORS (continued) |
we may ultimately be unsuccessful in identifying or resolving issues, such as accuracy issues, cybersecurity risks, unintended biases, and discriminatory outputs, before they arise. AI is a new and emerging technology in early stages of commercial use and presents a number of risks inherent in its use by us, our customers, suppliers and other business partners and third-party providers, or through the use of third-party hardware and software. These risks include, but are not limited to, ethical considerations, public perception, intellectual property protection, regulatory compliance, privacy concerns and data security, all of which could have a material adverse effect on our business, results of operations and financial position. As a result, we cannot predict future developments in AI and related impacts to our business and our industry. If we are unable to successfully and accurately develop, integrate and use AI technology, as well as address the risks and challenges associated with AI, our business, results of operations and financial position could be negatively impacted. Additionally, if the content, analyses, or recommendations that AI applications assist in producing are or are alleged to be deficient, inaccurate, or biased, our reputation, business, financial condition, and results of operations may be materially adversely affected.
Climate change, weather conditions and storm activity could have a material adverse impact on our business, financial condition and results of operations.
Climate change could have an impact on several aspects of our business, financial condition and results of operations. Weather phenomena associated with climate change, such as flooding or altered storm activity, may impact our ability to operate our manufacturing facilities and corporate offices in some locations. For example, our Doors headquarters is located in Tampa, Florida, a coastal area that is susceptible to hurricanes and tropical storms. In addition, customer preferences for lower-carbon and more environmentally friendly solutions could impact demand for our products. Although we believe that some of our product categories, such as insulation and composites, could experience increased demand due to environmental benefits, such as energy efficiency and renewable energy, the timing and impact of such increased demand is uncertain.
Weather conditions and the level of severe storms can have a significant impact on the markets for residential and commercial construction, repair and improvement projects. These factors could impact our business as follows:
•generally, any weather conditions that slow or limit residential or commercial construction activity can adversely impact demand for our products; and
•a portion of our annual product demand is attributable to the repair of damage caused by severe storms. In periods with below average levels of severe storms, demand for such products could be reduced.
Lower demand for our products as a result of either of these weather-related scenarios could have a material adverse impact on our business, financial condition and results of operations. Additionally, severely low or high temperatures may lead to significant and immediate spikes in costs of natural gas, electricity and other commodities that could negatively affect our results of operations.
We may not be insured against potential material manufacturing losses or disruptions and could be seriously harmed by natural disasters, catastrophes, pandemics, theft or sabotage.
Many of our business activities globally involve substantial investments in manufacturing facilities and many products are produced at a limited number of locations. These facilities could be materially damaged by natural disasters such as floods, tornados, hurricanes, fires, earthquakes, pandemics or by theft or sabotage. We could incur uninsured losses and liabilities arising from such events, including damage to our reputation, and/or suffer material losses in operational capacity, which could have a material adverse impact on our business, financial condition and results of operations.
LEGAL, REGULATORY AND COMPLIANCE RISKS
We could face potential product liability and warranty claims, we may not accurately estimate costs related to such claims, and we may not have sufficient insurance coverage available to cover such claims.
Our products are used and have been used in a wide variety of residential, commercial and industrial applications. We face an inherent business risk of exposure to product liability or other claims in the event our products are alleged to be defective or that the use of our products is alleged to have resulted in harm to others or to property. We may, in the future, incur liability if product liability lawsuits against us are successful. Moreover, any such lawsuits, whether or not successful, could result in adverse publicity to us, which could cause our sales to decline. We maintain insurance coverage to protect us against product liability claims, but that coverage may not be adequate to cover all claims that may arise or we may not be able to maintain adequate insurance coverage in the future at an acceptable cost. Any liability not covered by insurance or that exceeds our established reserves could materially and adversely impact our business, financial condition and results of operations.
| | | | | |
| ITEM 1A. | RISK FACTORS (continued) |
For example, during the second quarter of 2023, the Company’s subsidiary, Paroc Group OY (“Paroc”), which was acquired in 2018, notified the appropriate European maritime regulatory authorities that specific insulation products in its marine insulation product line may not meet certain fire safety requirements in accordance with their certifications. Paroc voluntarily withdrew these specific products from the market, issued recalls, and suspended distribution and sales of these products. Paroc is cooperating with the applicable regulatory and government authorities, and continues to work with its customers and end-users to assist with remediation. Although we established an estimated liability for expected future costs related to this matter, it is reasonably possible that additional product recall costs could be incurred that exceed the estimated liability by amounts that could be material to our consolidated financial statements. Due to these nonconformances, the Company reviewed the Paroc insulation product portfolio. The review has concluded. In addition to addressing the recalled marine products, the Company continues to assess potential nonconformances related to certain ventilation duct and steel beam insulation products. These matters may also result in harm to our reputation and results of operations.
In addition, consistent with industry practice, we provide warranties on many of our products. We may experience costs of warranty claims when the product is not performing to the satisfaction of the claimant even though it has not caused harm to others or property. We estimate our future warranty costs based on historical trends and product sales, but we may fail to accurately estimate those costs and thereby fail to establish adequate warranty reserves for them. Warranty claims are not insurable.
We may be subject to liability under and may make substantial future expenditures to comply with environmental and emerging product-based laws and regulations.
Our manufacturing facilities are subject to numerous foreign, federal, state and local laws and regulations relating to the presence of hazardous materials, pollution and the protection of the environment, including those governing emissions to air, discharges to water, use, storage and transport of hazardous materials, storage, treatment and disposal of waste, remediation of contaminated sites and protection of worker health and safety. We are also subject to laws, rules and regulations relating to certain raw materials used in our business or in our products.
Liability under these laws involves inherent uncertainties. Environmental liability estimates may be affected by changing determinations of what constitutes an environmental exposure or an acceptable level of cleanup. For example, remediation activities generally involve a potential range of activities and costs related to soil and groundwater contamination. This can include pre-cleanup activities, such as fact finding and investigation, risk assessment, feasibility studies, remedial action design and implementation (where actions may range from monitoring to removal of contaminants, to installation of longer-term remediation systems). Please see “Item 1 - Business - Environmental Control” for information on costs and accruals related to environmental remediation. To the extent that the required remediation procedures or timing of those procedures change, additional contamination is identified, or the financial condition of other potentially responsible parties is adversely affected, the estimate of our environmental liabilities may change. Change in required remediation procedures or timing of those procedures at existing legacy sites, or discovery of contamination at additional sites, could result in increases to our environmental obligations. Violations of environmental, health and safety laws are subject to civil, and, in some cases, criminal sanctions.
As a result of these uncertainties, we may incur unexpected interruptions to operations, fines, penalties or other reductions in income which could adversely impact our business, financial condition and results of operations. It is possible that new laws and regulations will specifically address climate change, toxic air emissions, ozone forming emissions and fine particulate matter. New environmental and chemical regulations could impact our ability to expand production or construct new facilities in every geographic region in which we operate. Continued and increased government and public emphasis on environmental issues is expected to result in increased future investments for environmental controls at ongoing operations, which will be charged against income from future operations. Present and future environmental laws and regulations applicable to our operations, and changes in their interpretation, may require substantial capital expenditures or may require or cause us to modify or curtail our operations, which may have a material adverse impact on our business, financial condition and results of operations. Although emerging in nature, an increasing number of laws and regulations focused on product and chemical hazards, including regulations concerning the impact of product manufacturing and use on climate change, and resulting preferential product selection could also impact our ability to manufacture and sell certain products or require significant research and development investment and capital expenditures to meet regulatory requirements.
| | | | | |
| ITEM 1A. | RISK FACTORS (continued) |
Proposed or future laws or regulations aimed at addressing climate change, including, but not limited to, local building codes, Environmental Protection Agency regulations on greenhouse gas emissions (“GHG”), laws or regulations impacting energy supply, and climate-related disclosure requirements, may materially impact demand for our products or our cost of doing business.
We believe that ongoing scientific and political focus on climate change may lead to new and more restrictive environmental laws and regulations in certain jurisdictions, which may impact our financial condition, results of operations, and cash flows. Foreign, federal, state and local regulatory and legislative bodies have enacted or proposed various legislative and regulatory measures relating to increased transparency and standardization of reporting matters that may include climate change, regulating GHG emissions, water usage, deforestation, recycling of plastic materials, and energy policies, including waste tax, and other governmental charges and mandates. As a result, we expect to be subject to overlapping, yet distinct, climate-related disclosure requirements in multiple jurisdictions. Compliance with foreign, federal, state and local legislation and regulations concerning climate-related disclosures, including compliance with the European Commission’s Corporate Sustainability Reporting Directive and climate disclosure requirements that may be implemented by the SEC, may result in additional costs and capital expenditures, and the failure to comply with such legislation and regulations could result in fines to us and could affect our business, financial condition, results of operations and cash flows. In addition, judicial decisions or executive actions limiting the authority of regulatory agencies, or decisions impacting current regulations and policies implemented by such agencies, could create uncertainty regarding the regulatory landscape and impact the Company’s ability to plan for future investments. We could also face increased costs related to defending and resolving legal claims and other litigation related to climate change and the alleged impact of our operations on climate change. In addition, energy prices could increase as a result of climate change legislation or other environmental mandates, which could have an adverse effect on our results of operations.
In addition, from time to time, we establish targets, strategies and expectations related to climate change and other environmental matters. Our ability to achieve any such targets, strategies or expectations is subject to risks and uncertainties, many of which are outside of our control. These risks and uncertainties include, but are not limited to, our ability to execute our strategies and achieve our goals within the currently projected costs and expected timeframes, availability, use and success of on and off-site renewable energy, evolving regulatory and other standards, processes, and assumptions, the pace of scientific and technological developments, increased costs and availability of requisite financing, market trends that may alter business opportunities, the conduct of third-party manufacturers and suppliers, constraints or disruptions to our supply chain, and changes in carbon markets. There are no assurances that we will be able to successfully execute our strategies and achieve our targets. Failures or delays (whether actual or perceived) to achieve our targets or strategies related to climate change and other environmental matters could damage our reputation, customer and investor relationships, adversely affect our business, operations and increase risk of litigation.
Our intellectual property rights may not provide meaningful commercial protection for our products or brands and third parties may assert that we violate their intellectual property rights, which could have a material adverse impact on our business, financial condition and results of operations.
We rely on our intellectual property, including numerous patents, trademarks, trade secrets, confidential information, as well as our licensed intellectual property, to differentiate our products and brands in the marketplace. We monitor and protect against activities that might infringe, dilute, or otherwise harm our intellectual property and rely on the laws of the United States and other countries to protect our rights. However, in some instances, we may be unaware of unauthorized use of our intellectual property. To the extent we cannot protect our innovations or are unable to enforce our intellectual property rights, unauthorized use and misuse of our intellectual property or innovations could harm our competitive position and have a material adverse impact on our business, financial condition and results of operations. In addition, the laws of some foreign jurisdictions provide less protection for our proprietary rights than the laws of the United States and we therefore may not be able to effectively enforce our intellectual property rights in these jurisdictions. If we are unable to maintain certain exclusive licenses, our brand recognition and sales could be adversely impacted. Current employees, contractors and suppliers have, and former employees, contractors and suppliers may have, access to trade secrets and confidential information regarding our operations that could be disclosed improperly and in breach of contract to our competitors or otherwise used to harm us.
Third parties may also claim that we are infringing upon their intellectual property rights. If we are unable to successfully defend or license such alleged infringing intellectual property or if we are required to substitute similar technology from another source, our operations could be adversely affected. Even if we believe that such intellectual property claims are without merit, defending such claims can be costly, time consuming and require significant resources. Claims of intellectual property infringement also may require us to redesign affected products, pay costly damage awards, or face injunctions prohibiting us from manufacturing, importing, marketing or selling certain of our products. Even if we have agreements to indemnify us, indemnifying parties may be unable or unwilling to do so.
| | | | | |
| ITEM 1A. | RISK FACTORS (continued) |
We are subject to various legal and regulatory proceedings, including litigation in the ordinary course of business, and uninsured judgments or a rise in insurance premiums may have a material adverse impact on our business, financial condition and results of operations.
In the ordinary course of business, we are subject to various legal and regulatory proceedings, which may include but are not limited to those involving antitrust, tax, trade, environmental, intellectual property, data privacy and other matters, including general commercial litigation. Any claims raised in legal and regulatory proceedings, whether with or without merit, could be time consuming and expensive to defend and could divert management’s attention and resources. Additionally, the outcome of legal and regulatory proceedings may differ from our expectations because the outcomes of these proceedings are often difficult to predict reliably. Various factors and developments can lead to changes in our estimates of liabilities and related insurance receivables, where applicable, or may require us to make additional estimates, including new or modified estimates, that may be appropriate due to a judicial ruling or judgment, a settlement, regulatory developments or changes in applicable law. A future adverse ruling, settlement or unfavorable development could result in charges that could have a material adverse effect on our results of operations in any particular period.
In accordance with customary practice, we maintain insurance against some, but not all, of these potential claims. In the future, we may not be able to maintain insurance at commercially acceptable premium levels. In addition, the levels of insurance we maintain may not be adequate to fully cover any and all losses or liabilities. If any significant judgment or claim is not fully insured or indemnified against, it could have a material adverse impact on our business, financial condition and results of operations.
FINANCIAL RISKS
Our level of indebtedness could adversely impact our business, financial condition or results of operations.
In connection with our acquisition of Masonite, we significantly increased our outstanding indebtedness, including the issuance of $2.0 billion of senior notes. At December 31, 2024, we had total debt of approximately $5.1 billion. As a result, our debt service obligations for 2025 and beyond have increased from prior amounts.
Our debt level and degree of leverage could have important consequences, including the following:
•our ability to obtain additional debt or equity financing for working capital, capital expenditures, debt service requirements, acquisitions and general corporate or other purposes may be limited;
•a substantial portion of our cash flow could be required for the payment of principal and interest on our indebtedness, and may not be available for other business purposes;
•certain of our available borrowings are at variable rates of interest, exposing us to the risk of increased interest rates to borrow in the future;
•if due to liquidity needs we must replace any indebtedness upon maturity, we would be exposed to the risk that we may not be able to refinance such indebtedness;
•our ability to adjust to changing market conditions may be limited and place us at a competitive disadvantage compared to our competitors if they have less debt; and
•we may be vulnerable in a downturn in general economic conditions or in our business, or we may be unable to carry out important capital spending.
The credit agreement governing our senior revolving credit facility, the indentures governing our senior notes, and the receivables purchase agreement governing our receivables securitization facility contain various covenants that impose operating and financial restrictions on us and our subsidiaries. Additionally, instruments and agreements governing our future indebtedness may impose other restrictive conditions or covenants that could restrict our ability to conduct our business operations or pursue growth strategies.
Downgrades of our credit ratings could adversely impact us.
Our credit ratings are important to our cost of capital. The major debt rating agencies routinely evaluate our debt based on a number of factors, which include financial strength and business risk as well as transparency with rating agencies and timeliness of financial reporting. A downgrade in our debt rating could result in increased interest on our existing variable interest rate debt, increased interest and other expenses for future borrowings, and reduced ability for our suppliers to utilize supply chain financing programs. Downgrades in our debt rating could also restrict our access to capital markets and affect the value and marketability of our outstanding senior notes.
| | | | | |
| ITEM 1A. | RISK FACTORS (continued) |
Our operations require substantial capital, leading to high levels of fixed costs that will be incurred regardless of our level of business activity.
Our businesses are capital intensive, and regularly require capital expenditures to expand operations, maintain equipment, increase operating efficiency and comply with applicable laws and regulations, leading to high fixed costs, including depreciation expense. Increased regulatory requirements for our operations could lead to additional or higher fixed costs in the future. We are limited in our ability to reduce fixed costs quickly in response to reduced demand for our products and these fixed costs may not be fully absorbed, resulting in higher average unit costs and lower gross margins if we are not able to offset this higher unit cost with price increases. Alternatively, we may be limited in our ability to quickly respond to unanticipated increased demand for our products, which could result in an inability to satisfy demand for our products and loss of market share.
Our ongoing efforts to increase productivity and reduce costs may not result in anticipated savings in operating costs.
Our cost reduction and productivity efforts, including those related to our existing operations, production capacity expansions, new manufacturing platforms, or other capital expenditures, may not produce anticipated results. Our ability to achieve cost savings and other benefits within expected time frames is subject to many estimates and assumptions. These estimates and assumptions are subject to significant economic, competitive, legal and other uncertainties, some of which are beyond our control. If these estimates and assumptions are incorrect, if we experience delays, or if other unforeseen events occur, our business, financial condition and results of operations could be adversely impacted.
Our results of operations in a given period may be impacted by price volatility in certain renewable-generated energy markets.
In connection with our sustainability goals to reduce GHG and toxic air emissions, we entered into contracts pursuant to which we have agreed to purchase renewable-generated electricity from third parties. Under these contracts, we do not take physical delivery of renewable-generated electricity. The generated electricity is instead sold by our counterparties to local grid operators at the prevailing market price and we obtain the associated non-tax renewable energy credits. The prevailing market pricing for renewable-generated electricity can be affected by factors beyond our control and is subject to significant period over period volatility. For example, renewable-generated energy output fluctuates due to climactic and other factors beyond our control and can be constrained by available transmission capacity, thereby significantly impacting pricing. Due to this potential volatility, it is possible that these contracts, or similar contracts we execute in the future, could have an impact on our results of operations in a given reporting period.
Our hedging activities to address energy price fluctuations may not be successful in offsetting increases in those costs or may reduce or eliminate the benefits of any decreases in those costs.
To mitigate short-term variation in our operating results due to commodity price fluctuations in certain geographic markets, we may hedge a portion of our near-term exposure to the cost of energy. The results of our hedging practices could be positive, neutral or negative in any period depending on price changes of the hedged exposures.
Our hedging activities are not designed to mitigate long-term commodity price fluctuations and, therefore, would not protect us from long-term commodity price increases. In addition, in the future, our hedging positions may not correlate to our actual energy costs, which would cause acceleration in the recognition of unrealized gains and losses on our hedging positions in our operating results.
If we were required to write down all or part of our goodwill or other indefinite-lived intangible assets, our results of operations or financial condition could be materially adversely affected in a particular period.
Declines in our business may result in an impairment of our tangible and intangible assets, which could result in a material non-cash charge. A significant or prolonged decrease in our market capitalization, including a decline in stock price, a negative long-term performance outlook, or an increase in discount rates could result in an impairment of our tangible and intangible assets which results when the carrying value of the Company’s assets exceed their fair value.
At least annually, we assess our goodwill and intangible assets for impairment. When we utilize a discounted cash flow methodology to calculate the fair value of our reporting units, weak demand for a specific product line or business could result in an impairment.
| | | | | |
| ITEM 1A. | RISK FACTORS (continued) |
As a result of the acquisition of Masonite in 2024, we acquired $1.5 billion in goodwill and $1.4 billion in intangible assets. The Company has not yet finalized the valuation of these acquired assets as of December 31, 2024. Additional adjustments may be recorded to the fair value of goodwill and intangible assets during the measurement period, a period not to exceed 12 months from the acquisition date. Accordingly, any determination requiring the write-off of a significant portion of goodwill or intangible assets could negatively impact our results of operations.
HUMAN CAPITAL RISKS
We depend on our senior management team and other skilled and experienced personnel to operate our business effectively, and the loss of any of these individuals or the failure to attract additional qualified personnel could adversely impact our business, financial condition and results of operations.
We are highly dependent on the skills and experience of our senior management team and other skilled and experienced personnel. These individuals possess sales, marketing, manufacturing, logistical, financial, business strategy and administrative skills that are important to the operation of our business. We cannot assure that we will be able to retain all of our existing senior management personnel and skilled and experienced personnel. The loss of any of these individuals or an inability to attract additional qualified personnel could prevent us from implementing our business strategy and could adversely impact our business and our future financial condition or results of operations. The current and future labor markets may impact our ability to retain these individuals.
Labor shortages and increased turnover rates, increased employee-related costs, and labor disputes could have a material adverse impact on our operations, results of operations, liquidity and cash flows.
Our operations depend on the availability and relative costs of labor and maintaining good relations with our personnel and the labor unions. Several factors have had and may continue to have adverse effects on the labor force available to us, including general economic uncertainty, government regulations, laws and regulations related to workers’ health and safety, inflation, wage and hour practices and immigration. Labor shortages and increased turnover rates within our personnel have led to and could in the future lead to increased costs, such as increased costs associated with training new employees and increased wage rates to attract and retain employees. An overall or prolonged labor shortage, lack of skilled labor, increased turnover or labor inflation could have a material adverse impact on our operations, results of operations, liquidity and cash flows.
We are also subject to the risk that labor strikes or other types of conflicts with personnel may arise or that we may become the subject of union organizing activity at additional facilities. Renewal of collective bargaining agreements typically involves negotiation, with the potential for work stoppages or increased costs at affected facilities.
We may incur rationalization costs and there can be no assurance that our efforts to reduce costs will be successful.
We continually review our manufacturing operations to address market conditions and have reorganized portions of our operations from time to time. We expect to continue to implement initiatives necessary or desirable to improve our business portfolio, address underperforming assets, improve our cost structure, and generate additional cash. The optimization of our manufacturing operations and cost savings programs involve substantial planning and may require additional capital investment, consolidation, integration and upgrading of facilities, functions and systems. These actions could result in a decrease in our short-term earnings as a result of restructuring charges and related impairments and other expenses, including severance costs.
While we expect these initiatives to result in profit opportunities and savings throughout our organization, our estimated profits and savings are based on assumptions that may prove to be inaccurate, and as a result, there can be no assurance that we will realize profits and cost savings or that, if realized, these profits and cost savings will be sustained. Failure to achieve or delays in achieving projected levels of efficiencies and cost savings from such measures, or unanticipated inefficiencies resulting from in-process or contemplated manufacturing and administrative reorganization actions, could adversely affect our business, financial condition, results of operations and cash flows.
| | | | | |
| ITEM 1A. | RISK FACTORS (continued) |
Significant changes in the factors and assumptions used to measure our defined benefit plan obligations, actual investment returns on pension assets and other factors could have a negative impact on our financial condition or liquidity.
We have certain defined benefit pension plans and other post-employment benefit (“OPEB”) plans. Our future funding requirements for defined benefit pension and OPEB plans depend upon a number of factors and assumptions, including our actual experience against assumptions with regard to interest rates used to determine funding levels, return on plan assets, benefit levels, participant experience (e.g., mortality and retirement rates), health care cost trends, and applicable regulatory changes. To the extent actual results are less favorable than our assumptions, there could be a material adverse impact on our financial condition and results of operations.
Additional risks exist due to the nature and magnitude of our investments, including the implementation of or changes to the investment policy, insufficient market capacity to absorb a particular investment strategy or high-volume transactions, and the inability to quickly rebalance illiquid and long-term investments.
If our cash flows and capital resources are insufficient to fund our pension or OPEB obligations, we could be forced to reduce or delay investments and capital expenditures, seek additional capital, or restructure or refinance our indebtedness.
RISKS RELATED TO OWNERSHIP OF OUR COMMON STOCK
The market price of our common stock is subject to volatility.
The market price of our common stock could be subject to wide fluctuations in response to numerous factors, many of which are beyond our control. These factors include actual or anticipated variations in our operational results and cash flow, our earnings relative to our competition, changes in financial estimates by securities analysts, trading volume, sales by holders of large amounts of our common stock, short selling, market conditions within the industries in which we operate, seasonality of our business operations, the general state of the securities markets and the market for stocks of companies in our industry, governmental legislation or regulation and currency and exchange rate fluctuations, as well as general economic and market conditions, such as recessions.
We are a holding company with no operations of our own and depend on our subsidiaries for cash.
As a holding company, most of our assets are held by our direct and indirect subsidiaries and we will primarily rely on dividends and other payments or distributions from our subsidiaries to meet our debt service and other obligations and to enable us to pay dividends. The ability of our subsidiaries to pay dividends or make other payments or distributions to us will depend on their respective operating results and may be restricted by, among other things, the laws of their jurisdiction of organization (which may limit the amount of funds available for the payment of dividends or other payments), agreements of those subsidiaries, agreements with any co-investors in non-wholly-owned subsidiaries, the terms of our credit and receivables facilities and senior notes and the covenants of any future indebtedness we or our subsidiaries may incur.
Provisions in our amended and restated certificate of incorporation and bylaws or Delaware law may discourage, delay or prevent a change in control of the Company or changes in our management and therefore depress the trading price of our common stock.
Our amended and restated certificate of incorporation and bylaws contain provisions that could depress the trading price of our common stock through provisions that may discourage, delay or prevent a change in control of the Company or changes in our management that our stockholders may deem advantageous.
Additionally, we are subject to Section 203 of the Delaware General Corporation Law, which generally prohibits a Delaware corporation from engaging in any of a broad range of business combinations with any “interested” stockholder for a period of three years following the date on which the stockholder became an “interested” stockholder and which may discourage, delay or prevent a change in control of our company.
Dividend payments on our common stock are not guaranteed and are declared at the discretion of our Board of Directors.
Since February 2014, our Board of Directors has declared a quarterly dividend on our common stock. The payment of any future cash dividends to our stockholders is not guaranteed and will depend on decisions that will be made by our Board of Directors and will depend on then-existing conditions, including our operating results, financial conditions, contractual restrictions, corporate law restrictions, capital agreements, applicable laws of the State of Delaware and business prospects.
| | | | | |
| ITEM 1B. | UNRESOLVED STAFF COMMENTS |
None.
Risk Management and Strategy
We have a range of security measures that are designed to protect against the unauthorized access to and misappropriation of our information, corruption of data, intentional or unintentional disclosure of confidential information, or disruption of operations. These security measures include controls, security processes and monitoring of our manufacturing systems. We have cloud security and other tools and governance processes designed to assess, identify and manage material risks from cybersecurity threats. In addition, we maintain an information security training program designed to address phishing and email security, password security, data handling security, cloud security, operational technology security processes, and cybersecurity incident response and reporting processes.
Our cybersecurity strategy includes defense in depth, zero trust, and standards-based controls intended to protect our information technology systems. We perform incident response tabletop exercises that include members of the Company’s senior management team to validate, test, and assess the effectiveness and adequacy of certain roles and decision-making processes in the event of a cybersecurity incident. We also assess, identify, and manage cybersecurity risk associated with divestiture and merger and acquisition activities.
The oversight of our cybersecurity risk management process is integrated into our overall risk management process. The risk committee is responsible for overseeing and monitoring our risk assessment and mitigation-related actions, including with respect to cybersecurity risks. The risk committee is not a committee of our Board of Directors. It is a cross-functional committee that includes members across many areas of expertise and is structurally independent of our business lines. The risk committee’s membership is designed to provide diversity of thought and perspective related to risk, including cybersecurity risks. The risk committee identifies risks and mitigation strategies, and it provides key updates to executive officers and the Audit Committee of our Board of Directors.
We use third-party service providers to execute certain business processes, maintain certain information systems and infrastructure, evaluate defenses and implement recommendations. We periodically have external information security assessments performed by third parties to analyze our information technology systems and to stay informed of information security risks. Additionally, we have a supplier validation process, which provides for review and approval by our cybersecurity group for cloud services.
Although we experience cybersecurity incidents from time to time as part of our operations, we have not identified any risks from cybersecurity threats, including as a result of previous cybersecurity incidents, that have had or are reasonably likely to have, a material impact on our business strategy, results of operations or financial condition. Any breach of our security measures, or those of our third-party service providers, could result in unauthorized access to and misappropriation of our information, corruption of data or disruption of systems, operations or transactions, any of which could have a material adverse effect on our business strategy, results of operations or financial condition. See Item 1A. Risk Factors of this Annual Report on Form 10-K for further discussion of the risks related to cybersecurity threats.
Governance
The Board of Directors is responsible for overseeing risk for the Company and has delegated to the Audit Committee responsibility for overseeing the cybersecurity risk management strategy for the Company. The Audit Committee receives regular updates on our cybersecurity risk management process from members of management, including our Chief Information Officer (“CIO”). The Audit Committee reviews our comprehensive cybersecurity framework, including reviewing our cybersecurity reporting protocol that provides for the notification, escalation and communication of significant cybersecurity events to a crisis management team and appropriate levels of management, including our CIO, as well as to the Audit Committee. Management also provides the Audit Committee with a cybersecurity dashboard, which the full Board of Directors can access as well. Additionally, the Audit Committee regularly provides updates to the Board on the status of the Company’s cybersecurity risk management process.
| | | | | |
| ITEM 1C. | CYBERSECURITY (continued) |
The Company’s cybersecurity program is overseen by our CIO, who is responsible for global information technology, including cybersecurity. Our Vice President, Global Information Security, is primarily responsible for assessing and managing material risks from cybersecurity threats, including monitoring the measures used for prevention, detection, mitigation and remediation of cybersecurity incidents. Our CIO is responsible for our information security organization, which is comprised of internal Owens Corning employees and external security suppliers. Our information security organization provides security monitoring and response and provides regular reports to our CIO and Vice President, Global Information Security. These regular reports inform our CIO and Vice President, Global Information Security as they monitor the prevention, detection, mitigation, and remediation of cybersecurity incidents under the oversight of the risk committee. Our Global Information Services team is regularly engaged in cybersecurity training and awareness and incorporates relevant reviews in technology design and development.
Our CIO has 20 years of experience in the information technology industry, including engagement with cybersecurity strategy and oversight. Our CIO reports directly to our Chief Executive Officer.
Our Vice President, Global Information Security has 28 years of experience in the cybersecurity industry, including previous experience in the U.S. Air Force, consulting, and 22 years with Owens Corning, and reports directly to our CIO.
Our principal executive offices are located at the Owens Corning World Headquarters in Toledo, Ohio, an owned facility of approximately 400,000 square feet. Our research and development activities are primarily conducted at our Science and Technology Center, located on approximately 500 acres of land owned by the Company outside of Granville, Ohio. It consists of approximately 20 structures totaling more than 650,000 square feet. In addition, we have application development and other product and market focused research and development centers in various locations. As of December 31, 2024, we operated in 152 manufacturing facilities, of which 110 were owned. The following table summarizes manufacturing facilities by reportable segment and geographical region:
| | | | | | | | | | | | | | | | | |
| Roofing | Insulation | Doors | Composites | Total |
| | | | | |
| United States | 29 | 20 | 34 | 11 | 94 |
| Europe | — | | 8 | 7 | 7 | 22 |
| Asia-Pacific | 1 | 7 | 1 | 4 | 13 |
| Rest of world | 3 | 5 | 10 | 5 | 23 |
| Total manufacturing facilities | 33 | 40 | 52 | 27 | 152 |
| | | | | |
| | | | | |
| | | | | |
| | | | | |
| | | | | |
| | | | | |
| | | | | |
| | | | | |
| | | | | |
The capacity of each plant varies depending upon product mix. We believe that these properties are in good condition and well maintained, and are suitable and adequate to carry on our business.
Environmental Legal Proceedings
None.
Litigation, Other Regulatory Proceedings and Environmental Matters
Additional information required by this item is incorporated by reference to Note 17, Contingent Liabilities and Other Matters.
| | | | | |
| ITEM 4. | MINE SAFETY DISCLOSURES |
Not applicable.
INFORMATION ABOUT OUR EXECUTIVE OFFICERS
The name, age and business experience during the past five years of Owens Corning’s executive officers are set forth below. Each executive officer holds office until his or her successor is elected and qualified or until his or her earlier resignation, retirement or removal. All of the listed executive officers have been employees of Owens Corning during the past five years except as indicated below.
| | | | | | | | |
| Name and Age | | Position* |
| Christopher Ball (47) | | President, Doors since May 2024; formerly President of the Global Residential Door Business, Masonite (a door manufacturer to the residential construction industry) (formerly NYSE: DOOR) (2021); formerly President - Americas, Cooper Tire & Rubber Company (a tire manufacturing company) (formerly NYSE: CTB) (2018) |
| | |
| Gina A. Beredo (50) | | Executive Vice President, General Counsel and Corporate Secretary since June 2021; formerly Executive Vice President, General Counsel and Corporate Secretary of Nordson Corporation (a precision technology manufacturing company) (NASDAQ: NDSN) (2018) |
| | |
| Brian D. Chambers (58) | | Board Chair, President and Chief Executive Officer since April 2020; formerly President and Chief Executive Officer (2019) |
| | |
| Nicolas Del Monaco (47) | | President, Insulation since September 2023; formerly Senior Vice President and Managing Director, Europe (2021); formerly Vice President for Non-Wovens and Glass Reinforcements Europe (2018) |
| | |
| Mari K. Doerfler (42) | | Vice President and Controller since April 2023; formerly Assistant Controller (2021); formerly Americas Accounting Director (2019) |
| | |
| Todd W. Fister (50) | | Executive Vice President and Chief Financial Officer since September 2023; formerly President, Insulation (2019); formerly Vice President of Global Insulation and Strategy (2019) |
| | |
| José L. Méndez-Andino (51) | | Executive Vice President, Chief Research and Development Officer since April 2021; formerly Vice President of Science and Technology for Insulation and Roofing (2019) |
| | |
| Paula J. Russell (47) | | Executive Vice President, Chief Human Resources Officer since January 2021; formerly Senior Vice President, Chief Human Resources Officer (December 2019); formerly Vice President, Chief Human Resources Officer (April 2019) |
| |
| Gunner S. Smith (51) | | President, Roofing since August 2018 |
| | | | | |
| * | Information in parentheses indicates year during the past five years in which service in position began. The last item listed for each individual represents the position held by such individual at the beginning of the five-year period. |
| |
| |
Part II
| | | | | |
| ITEM 5. | MARKET FOR OWENS CORNING’S COMMON EQUITY, RELATED STOCKHOLDER MATTERS AND ISSUER PURCHASES OF EQUITY SECURITIES |
Market Information
Owens Corning’s common stock trades on the New York Stock Exchange under the symbol “OC.”
Holders of Common Stock
The number of stockholders of record of Owens Corning’s common stock on February 20, 2025 was 55.
Cash Dividends
The payment of any future cash dividends to our stockholders will depend on decisions that will be made by our Board of Directors and will depend on then existing conditions, including our operating results, financial conditions, contractual restrictions, corporate law restrictions, capital agreements, applicable laws of the State of Delaware and business prospects.
Under the credit agreement applicable to our senior revolving credit facility, the Company may not declare a cash dividend if a default or event of default exists or would come to exist at the time of declaration or if a dividend declaration violates the provisions of our formation documents or other material agreements.
The Company’s subsidiaries are subject to certain restrictions on their ability to pay dividends under the agreements governing our senior revolving credit facility and our receivables securitization facility.
Recent Sales of Unregistered Securities; Use of Proceeds from Registered Securities
None.
Issuer Purchases of Equity Securities
The following table provides information about Owens Corning’s purchases of its common stock during the three months ended December 31, 2024:
| | | | | | | | | | | | | | | | | | | | | | | | |
| Period | Total Number of Shares (or Units) Purchased* | | | Average Price Paid per Share (or Unit) | | Total Number of Shares (or Units) Purchased as Part of Publicly Announced Plans or Programs** | | Maximum Number of Shares (or Units) that May Yet Be Purchased Under the Plans or Programs** |
| October 1-31, 2024 | 6,190 | | | | $ | 178.52 | | | — | | | 6,863,687 | |
| November 1-30, 2024 | 425,787 | | | | 194.78 | | | 422,211 | | | 6,441,476 | |
| December 1-31, 2024 | 91,551 | | | | 198.59 | | | 89,370 | | | 6,352,106 | |
| Total | 523,528 | | | | $ | 195.25 | | | 511,581 | | | |
| | | | | |
| * | The Company retained 11,947 shares surrendered to satisfy tax withholding obligations in connection with the vesting of restricted stock units granted to our employees. |
| | | | | |
| ** | On December 1, 2022, the Board of Directors approved a new share repurchase program under which the Company is authorized to repurchase up to an aggregate of 10 million shares of the Company's outstanding common stock (the “Repurchase Authorization”). The Repurchase Authorization enables the Company to repurchase shares through the open market, privately negotiated or other transactions. The actual number of shares repurchased will depend on timing, market conditions and other factors and will be at the Company's discretion. The Company repurchased 0.5 million shares of its common stock for $101 million, inclusive of applicable taxes, during the three months ended December 31, 2024 under the Repurchase Authorization. As of December 31, 2024, 6.4 million shares remain available for repurchase under the Repurchase Authorization.
|
| |
| | | | | |
| ITEM 5. | MARKET FOR OWENS CORNING’S COMMON EQUITY, RELATED STOCKHOLDER MATTERS AND ISSUER PURCHASES OF EQUITY SECURITIES (continued)
|
Performance Graph
The annual changes for the five-year period shown in the graph below are based on the assumption that $100 had been invested in Owens Corning (OC) stock, the Standard & Poor’s 500 Stock Index (“S&P 500”), and a peer group index on December 31, 2019, and that all quarterly dividends were reinvested. The total cumulative dollar returns shown on the graph represent the value that such investments would have had on December 31, 2024. We chose to use a self-selected peer group consisting of the companies noted below to include in the performance graph as we believe this peer group aligns with our specific industry, markets and global exposure. The criteria used in determining this peer group included the size of the companies (measured in terms of annual revenue and market capitalization), industries and geographies in which the companies operate, stock price correlation and volatility relative to Owens Corning, and increased representation of comparator companies used by shareholder advisory firms.
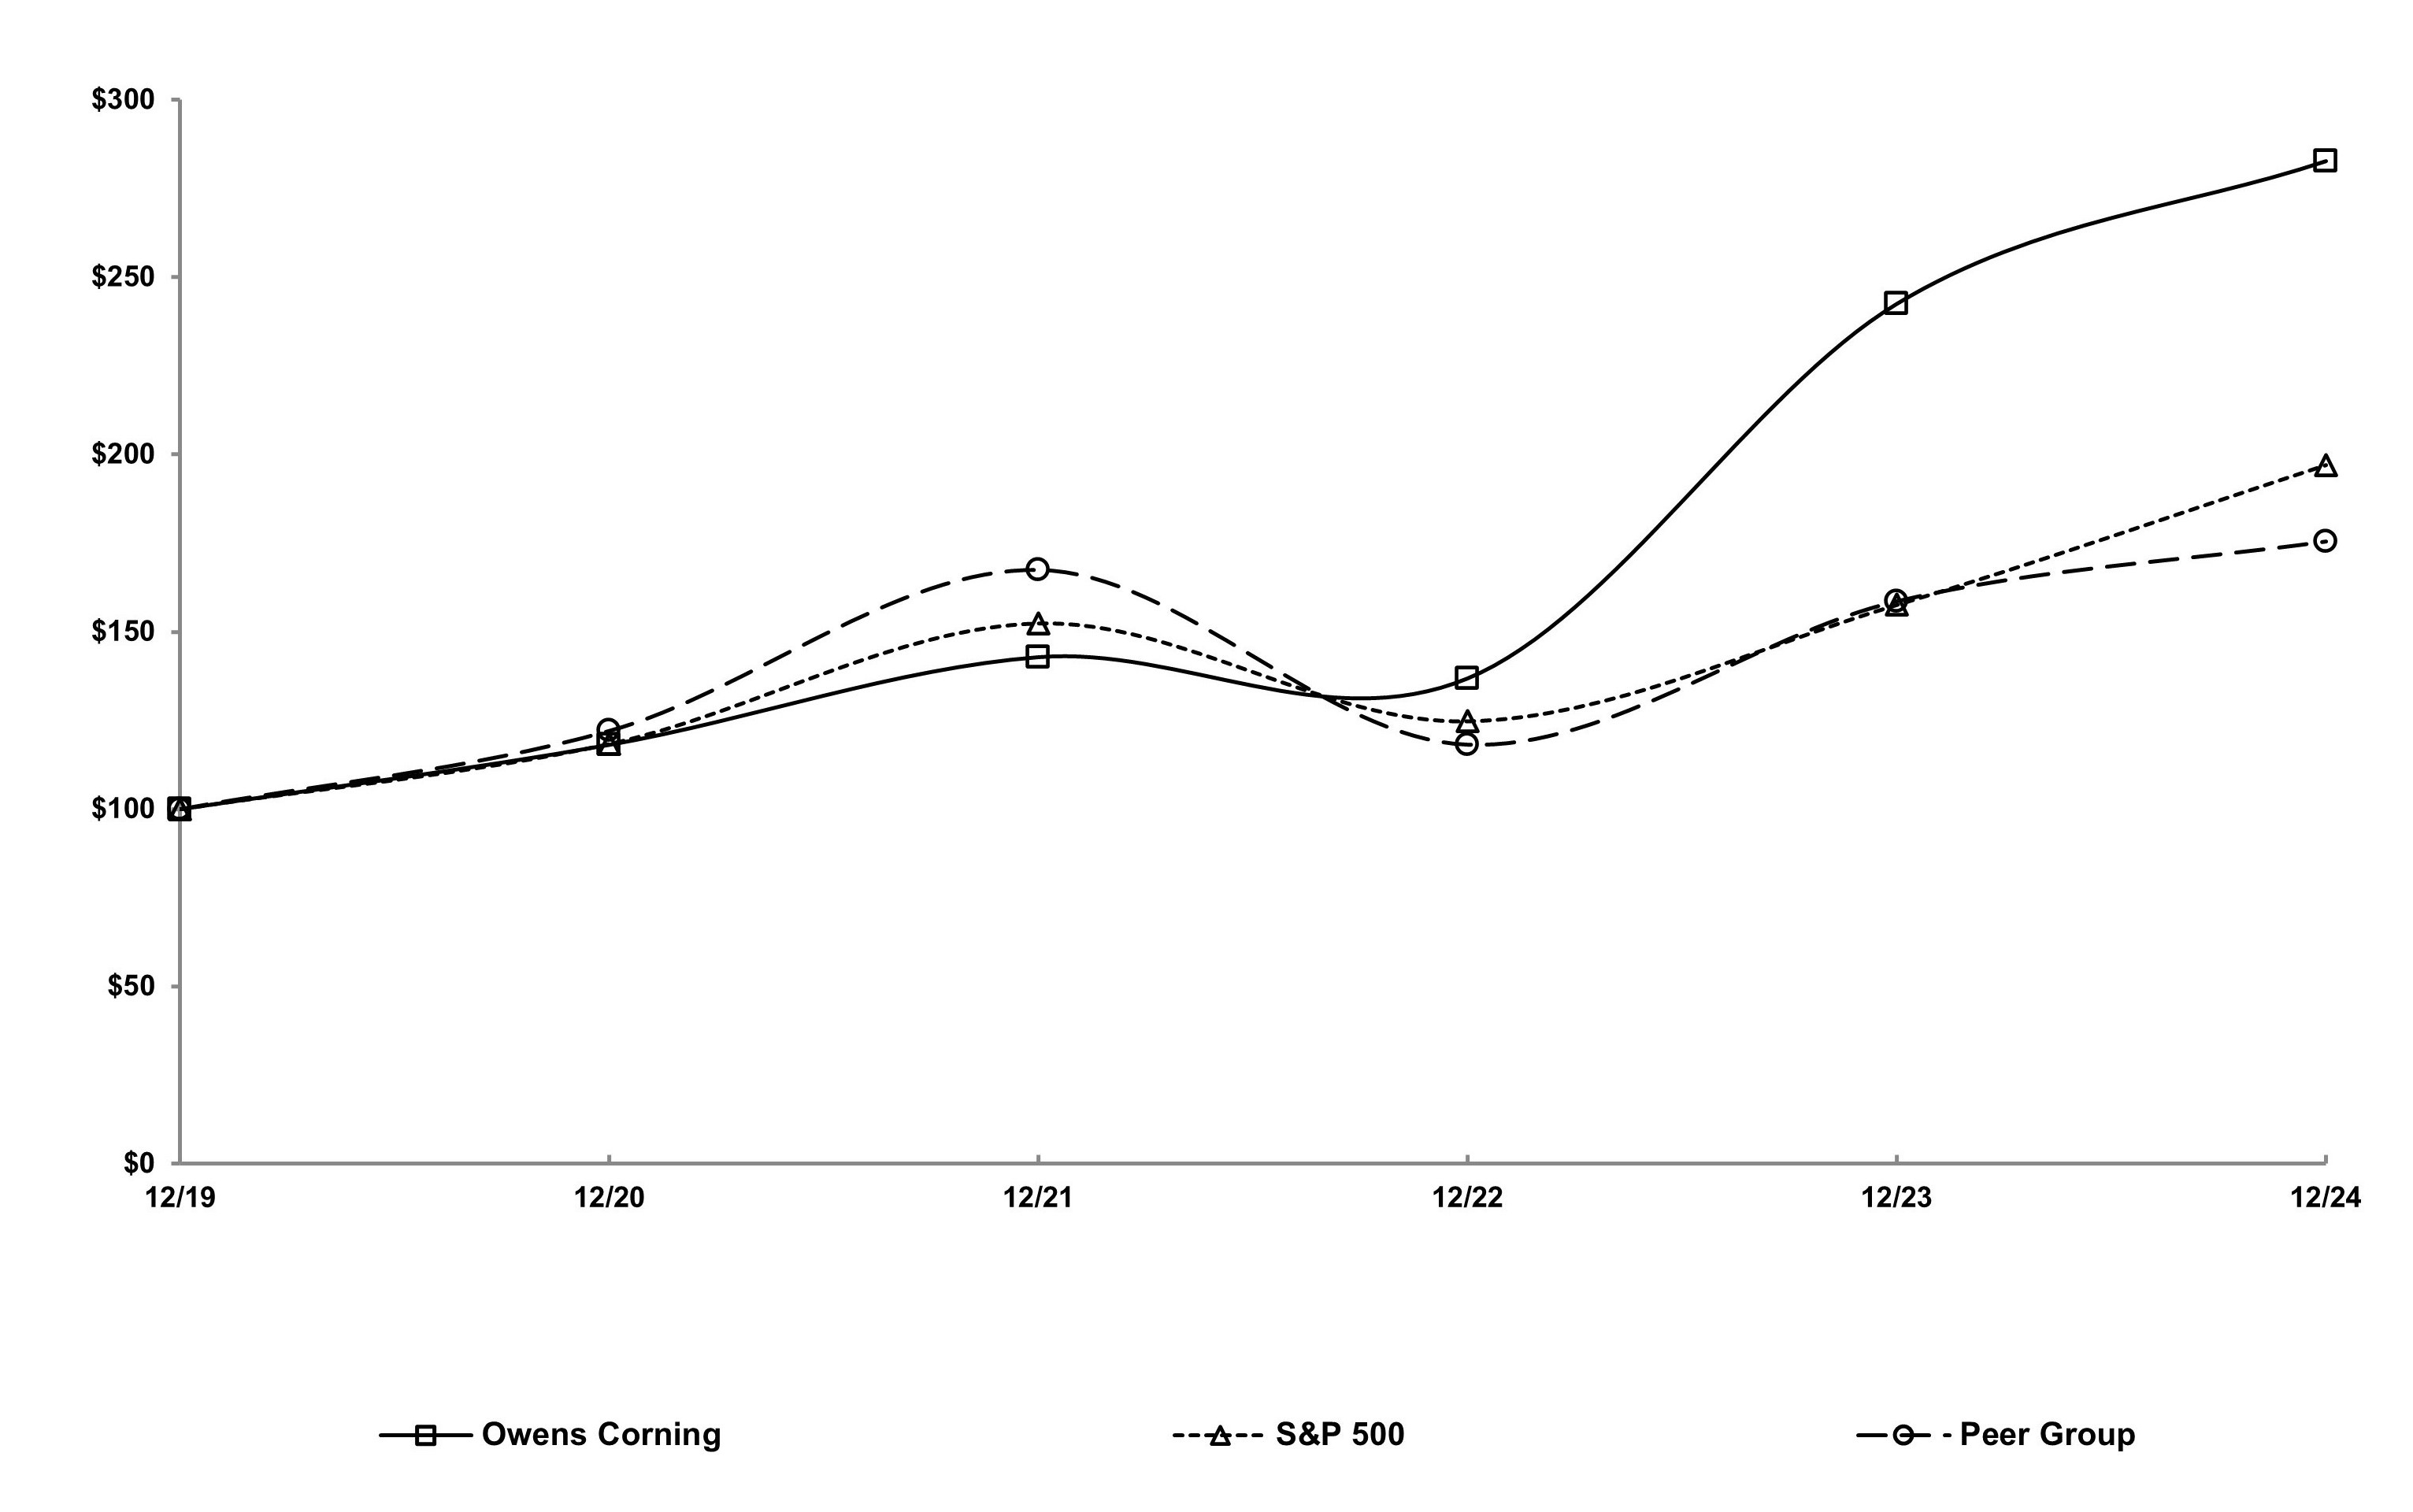
Performance Graph
| | | | | | | | | | | | | | | | | | | | | | | | | | | | | | | | | | | |
| 2019 | | 2020 | | 2021 | | 2022 | | 2023 | | 2024 |
| OC | $ | 100 | | | $ | 118 | | | $ | 143 | | | $ | 137 | | | $ | 242 | | | $ | 283 | |
| S&P 500 | $ | 100 | | | $ | 118 | | | $ | 152 | | | $ | 125 | | | $ | 158 | | | $ | 197 | |
| Peer Group | $ | 100 | | | $ | 122 | | | $ | 167 | | | $ | 118 | | | $ | 159 | | | $ | 175 | |
The peer group index is comprised of the following companies: A.O. Smith Corporation; Advance Drainage Systems, Inc.; Allegion plc; Armstrong World Industries, Inc.; Ball Corporation; Builders FirstSource, Inc.; Carlisle Companies Incorporated; Carrier Global Corporation; Celanese Corporation; Eastman Chemical Company; Fortune Brands Innovations, Inc.; Greif, Inc.; JELD-WEN Holding, Inc.; Johnson Controls International plc; Lennox International Inc.; Louisiana-Pacific Corporation; Masco Corporation; Mohawk Industries, Inc.; O-I Glass, Inc.; PPG Industries, Inc.; Resideo Technologies, Inc.; RPM International Inc.; Stanley Black & Decker, Inc.; The Sherwin-Williams Company; Trane Technologies; Trex Company, Inc.; and UFP Industries, Inc.
With the acquisition of Masonite, Masonite International Corporation has been removed from the peer group index for all years presented.
| | | | | |
| ITEM 7. | MANAGEMENT’S DISCUSSION AND ANALYSIS OF FINANCIAL CONDITION AND RESULTS OF OPERATIONS |
This Management’s Discussion and Analysis (“MD&A”) is intended to help investors understand Owens Corning, our operations and our present business environment. MD&A is provided as a supplement to, and should be read in conjunction with, our Consolidated Financial Statements and the accompanying Notes thereto contained in this Annual Report on Form 10-K. Unless the context requires otherwise, the terms “Owens Corning,” “Company,” “we,” “its,” and “our” in this Annual Report on Form 10-K refer to Owens Corning and its subsidiaries.
This section of this Annual Report on Form 10-K generally discusses 2024 and 2023 items and year-to-year comparisons between 2024 and 2023. Discussions of 2022 items and year-to-year comparisons between 2023 and 2022 that are not included in this Form 10-K can be found in “Management's Discussion and Analysis of Financial Condition and Results of Operations” in Part II, Item 7 of the Company's Annual Report on Form 10-K for the fiscal year ended December 31, 2023.
GENERAL
Owens Corning is a residential and commercial building products leader committed to building a sustainable future through material innovation. The Company has four reportable segments: Roofing, Insulation, Doors and Composites. Through these lines of business, the Company manufactures and sells products worldwide. We are a market leader in many of our major product categories.
EXECUTIVE OVERVIEW
Net earnings attributable to Owens Corning were $647 million in 2024, compared to $1,196 million in 2023. The Company generated $2,038 million in adjusted earnings before interest and taxes (“Adjusted EBIT”) in 2024 compared to $1,805 million in 2023. See the Adjusted Earnings Before Interest and Taxes paragraph of the MD&A for further information regarding Adjusted EBIT, including the reconciliation to net earnings attributable to Owens Corning. Segment earnings before interest and taxes (“EBIT”) performance compared to 2023 increased $124 million in our Roofing segment, increased $63 million in our Insulation segment and decreased $27 million in our Composites segment. The Doors segment contributed revenues of $1,448 million and EBIT of $99 million to the Company for the period from May 15, 2024 to December 31, 2024. Within our Corporate, Other and Eliminations category, General corporate expenses and other increased by $26 million.
Glass Reinforcements Divestiture
On February 13, 2025, the Company entered into a definitive agreement for the sale of our global glass reinforcements (“GR”) business for a purchase price of approximately $436 million, less costs to sell. The GR business, part of the Company’s Composites segment, manufactures, fabricates, and sells glass fiber reinforcements for a wide variety of applications in wind energy, infrastructure, industrial, transportation and consumer markets. In 2024, the GR business generated annual revenues of approximately $1.1 billion. The sale will complete Owens Corning’s review of strategic alternatives for the business, announced on February 9, 2024, and aligns with the strategy to reshape the Company to focus on residential and commercial building products in North America and Europe. During 2024, the Company incurred $46 million of costs related to this review.
The transaction is expected to close in 2025 and is subject to customary regulatory approvals and other conditions. The Company expects to incur a material loss on disposal which cannot be estimated at this time.
The transaction represents a strategic shift that has a major effect on the Company's operations and financial results and therefore, beginning with the quarterly report on Form 10-Q for the period ending March 31, 2025, the GR business’ financial results will be reflected in the Company’s consolidated financial statements as discontinued operations for all periods presented. The Company intends to reorganize its operations and reporting structure and begin to manage its operations under three reporting segments.
During the fourth quarter of 2024, the Company determined that certain asset groups should be tested for recoverability, primarily as a result of the progression of the strategic review of the GR business. The comparison indicated that the GR asset group was not recoverable. As a result of the analysis performed, the Company recorded pre-tax asset impairment charges for the amount by which the carrying value exceeds its fair value of $483 million for the year ended December 31, 2024, which is included in Impairment due to strategic review on the Consolidated Statements of Earnings. These charges include $439 million related to property, plant and equipment, $30 million related to operating lease right-of-use assets and $14 million related to definite-lived intangible assets.
| | | | | |
| ITEM 7. | MANAGEMENT’S DISCUSSION AND ANALYSIS OF FINANCIAL CONDITION AND RESULTS OF OPERATIONS (continued) |
Assets Held for Sale
On November 4, 2024, the Company entered into a related party agreement to sell its building materials business in China and Korea to a member of the business’ management team, meeting the assets held for sale criteria. The transaction includes six insulation manufacturing facilities in China and a roofing manufacturing facility in Korea. The building materials business, within the Insulation segment, represents annual revenues of approximately $130 million. The Company reclassified $2 million as held for sale within Other current liabilities on the Consolidated Balance Sheets. The Company recorded the assets at the fair value less cost to sell, which was less than the carrying value and resulted in an impairment of $91 million related primarily to Property, Plant and Equipment and Goodwill. The transaction is expected to close mid-2025, and any additional loss on disposal is expected to be immaterial.
Masonite Acquisition
On May 15, 2024, the Company acquired all of the outstanding shares of Masonite International Corporation (“Masonite”), a leading global designer, manufacturer, marketer and distributor of interior and exterior doors and door systems, for $3.2 billion primarily funded with debt proceeds and cash on hand. The acquisition of Masonite's market-leading doors business creates a new growth platform for the Company, strengthening the Company's position in building and construction and expanding the Company's offering of branded residential building products. Masonite's operating results and preliminary purchase price allocation have been included in the Company's newly established Doors reportable segment from May 15, 2024, within the Consolidated Financial Statements. The Company issued $2.0 billion of senior notes, the proceeds of which were used to repay a portion of the outstanding borrowings under the 364-Day Credit Facility, which was used to fund a portion of the acquisition, and to pay related fees and expenses. Refer to Liquidity, Capital Resources and Other Related Matters for further discussions on the current year debt instruments.
Paroc Recall
During the second quarter of 2023, the Company’s subsidiary, Paroc Group OY (“Paroc”), which the Company acquired in 2018, notified the appropriate European maritime regulatory authorities that specific products in its marine insulation product line may not meet certain fire safety requirements in accordance with their certifications. Paroc voluntarily withdrew these specific products from the market, issued recalls and suspended distribution and sales of these products (the “Recalled Products”). Paroc continues to cooperate with the applicable regulatory and government authorities and work with its customers and end-users to assist with remediation for the recall. The Company has included an estimated liability for expected future costs related to the Recalled Products on its Consolidated Balance Sheets as of December 31, 2024 and December 31, 2023.
Due to these nonconformances, the Company reviewed the Paroc insulation product portfolio. The review has concluded. In addition to addressing the Recalled Products, the Company continues to assess potential nonconformances related to certain ventilation duct and steel beam insulation products. Paroc suspended sales of these affected insulation products as a precautionary measure while it reviews the potential nonconformances, but has not issued recalls. We expect to incur costs associated with the resolution of this matter. The amount or range of any potential loss cannot be reasonably estimated at this time.
| | | | | |
| ITEM 7. | MANAGEMENT’S DISCUSSION AND ANALYSIS OF FINANCIAL CONDITION AND RESULTS OF OPERATIONS (continued) |
RESULTS OF OPERATIONS
Consolidated Results | | | | | | | | | | | | | |
| Twelve Months Ended December 31, |
| (In millions) | 2024 | | 2023 | | |
| Net sales | $ | 10,975 | | | $ | 9,677 | | | |
| Gross margin | $ | 3,254 | | | $ | 2,683 | | | |
| % of net sales | 30 | % | | 28 | % | | |
| Marketing and administrative expenses | $ | 1,044 | | | $ | 831 | | | |
| | | | | |
| | | | | |
| Loss on sale of business | $ | 91 | | | $ | — | | | |
| Impairment due to strategic review | $ | 483 | | | $ | — | | | |
| Gain on sale of site | $ | — | | | $ | (189) | | | |
| Other expense, net | $ | 365 | | | $ | 106 | | | |
| Non-operating (income) expense, net | $ | (1) | | | $ | 145 | | | |
| Earnings before interest and taxes | $ | 1,128 | | | $ | 1,667 | | | |
| Interest expense, net | $ | 212 | | | $ | 76 | | | |
| | | | | |
| Income tax expense | $ | 275 | | | $ | 401 | | | |
| Net earnings attributable to Owens Corning | $ | 647 | | | $ | 1,196 | | | |
The Consolidated Results discussion below provides a summary of our results and the trends affecting our business, and should be read in conjunction with the more detailed Segment Results discussion that follows.
NET SALES
Net sales increased $1,298 million in 2024 compared to 2023. The increase in net sales was primarily driven by the revenues from our Doors segment as a result of the Masonite acquisition, which was partially offset by lower sales volumes.
GROSS MARGIN
Gross margin increased $571 million in 2024 compared to 2023. The increase was primarily driven by the margins from our Doors segment as a result of the Masonite acquisition. Also contributing to the increase were higher selling prices, slightly offset by lower sales volumes.
MARKETING AND ADMINISTRATIVE EXPENSES
Marketing and administrative expenses increased $213 million in 2024 compared to 2023. The increase was primarily driven by the addition of the Doors segment selling, general and administrative expenses and ongoing inflationary pressures throughout the organization.
LOSS ON SALE OF BUSINESS
In 2024, the Company entered into a related party agreement to sell its building materials business in China and Korea. As a result of classifying the business as held for sale at December 31, 2024, we recorded a loss of $91 million included in Loss on sale of business on the Consolidated Statements of Earnings.
IMPAIRMENT DUE TO STRATEGIC REVIEW
As a result of the ongoing strategic review of the glass reinforcements business, in 2024 the Company recorded a $483 million impairment charge included in Impairment due to strategic review on the Consolidated Statements of Earnings, and was included in the Corporate, Other and Eliminations reporting category.
GAIN ON SALE OF SITE
In 2023, the Company finalized the sale of the Company's Insulation site in Santa Clara, California resulting in the recognition of a pre-tax gain of $189 million.
| | | | | |
| ITEM 7. | MANAGEMENT’S DISCUSSION AND ANALYSIS OF FINANCIAL CONDITION AND RESULTS OF OPERATIONS (continued) |
OTHER EXPENSE, NET
Other expense, net increased $259 million in 2024 compared to 2023. The increase was primarily driven by higher acquisition and strategic review-related costs.
NON-OPERATING (INCOME) EXPENSE, NET
Non-operating (income) expense, net was income of $1 million in 2024 compared to $145 million of expense in 2023. The decrease is due to the pension settlement loss in the fourth quarter of 2023.
INTEREST EXPENSE, NET
Interest expense, net increased $136 million in 2024 compared to 2023. The increase was driven by higher interest on the 364-Day Credit Facility and higher long-term debt balances in connection with the Masonite acquisition.
INCOME TAX EXPENSE
Income tax expense for 2024 was $275 million compared to $401 million in 2023. The Company’s effective tax rate for 2024 was 30% on pre-tax income of $916 million. The difference between the 30% effective tax rate and the U.S. federal statutory tax rate of 21% is primarily due to U.S. state and local income tax expense, valuation allowances and uncertain tax positions.
The Company’s effective tax rate for 2023 was 25% on pre-tax income of $1,591 million. The difference between the 25% effective tax rate and the U.S. federal statutory tax rate of 21% is primarily attributable to U.S. state and local income tax expense.
See Note 21 for additional information.
Restructuring, Acquisition and Divestiture-Related Costs
The Company has incurred restructuring, transaction and integration costs related to acquisitions and divestitures, along with restructuring and other exit costs in connection with our global cost reduction, product line and productivity initiatives and growth strategy. These costs are recorded within Corporate, Other and Eliminations. Please refer to Note 13 of the Consolidated Financial Statements for further information on the nature of these costs.
The following table presents the impact and respective location of these income (expense) items on the Consolidated Statements of Earnings:
| | | | | | | | | | | | | | | | |
| | | Twelve Months Ended December 31, |
| (In millions) | Location | 2024 | | 2023 | | |
| Restructuring costs | Cost of sales | $ | (21) | | | $ | (102) | | | |
| Restructuring costs | Marketing and administrative expenses | (2) | | | (2) | | | |
| Severance | Other expense, net | (63) | | | (34) | | | |
| Other exit costs | Other expense, net | — | | | (31) | | | |
| | | | | | |
| | | | | | |
| | | | | | |
| Acquisition-related integration costs | Other expense, net | (83) | | | — | | | |
| | | | | | |
| Acquisition-related transaction costs | Other expense, net | (49) | | | — | | | |
| Loss on sale of business | Loss on sale of business | (91) | | | — | | | |
| Gain on sale of Santa Clara, California site | Gain on sale of site | — | | | 189 | | | |
| | | | | | |
| | | | | | |
| | | | | | |
| | | | | | |
| Total restructuring, acquisition and divestiture-related (costs) gains | | $ | (309) | | | $ | 20 | | | |
| | | | | |
| ITEM 7. | MANAGEMENT’S DISCUSSION AND ANALYSIS OF FINANCIAL CONDITION AND RESULTS OF OPERATIONS (continued) |
Adjusted Earnings Before Interest and Taxes (“Adjusted EBIT”)
Adjusted EBIT is a non-GAAP measure that excludes certain items that management does not allocate to our segment results because it believes they are not representative of the Company’s ongoing operations. Adjusted EBIT is used internally by the Company for various purposes, including reporting results of operations to the Board of Directors of the Company, analysis of performance and related employee compensation measures. Although management believes that these adjustments result in a measure that provides a useful representation of our operational performance, the adjusted measure should not be considered in isolation or as a substitute for Net earnings (loss) attributable to Owens Corning as prepared in accordance with accounting principles generally accepted in the United States.
Adjusting (expense) income items to EBIT are shown in the table below:
| | | | | | | | | | | | | |
| | Twelve Months Ended December 31, |
| (In millions) | 2024 | | 2023 | | |
| Restructuring costs | $ | (86) | | | $ | (169) | | | |
| Acquisition-related integration costs | (83) | | | — | | | |
| Gains on sale of certain precious metals | 19 | | | 2 | | | |
| Loss on sale of business | (91) | | | — | | | |
| | | | | |
| Strategic review-related charges | (46) | | | — | | | |
| | | | | |
| | | | | |
| Recognition of acquisition inventory fair value step-up | (18) | | | — | | | |
| | | | | |
| | | | | |
| | | | | |
| | | | | |
| | | | | |
| Pension settlement losses | — | | | (145) | | | |
| Impairment due to strategic review | (483) | | | — | | | |
| Acquisition-related transaction costs | (49) | | | — | | | |
| Gain on sale of Santa Clara, California site | — | | | 189 | | | |
| | | | | |
| | | | | |
| Paroc marine recall | (58) | | | (15) | | | |
| | | | | |
| | | | | |
| Impairment of venture investments | $ | (15) | | | $ | — | | | |
| Total adjusting items | $ | (910) | | | $ | (138) | | | |
| | | | | |
The reconciliation from Net earnings attributable to Owens Corning to EBIT and Adjusted EBIT is shown in the table below:
| | | | | | | | | | | | | |
| | Twelve Months Ended December 31, |
| (In millions) | 2024 | | 2023 | | |
| NET EARNINGS ATTRIBUTABLE TO OWENS CORNING | $ | 647 | | | $ | 1,196 | | | |
| Net loss attributable to non-redeemable and redeemable noncontrolling interests | — | | | (3) | | | |
| NET EARNINGS | 647 | | | 1,193 | | | |
| Equity in net earnings of affiliates | 6 | | | 3 | | | |
| Income tax expense | 275 | | | 401 | | | |
| EARNINGS BEFORE TAXES | 916 | | | 1,591 | | | |
| Interest expense, net | 212 | | | 76 | | | |
| | | | | |
| EARNINGS BEFORE INTEREST AND TAXES | 1,128 | | | 1,667 | | | |
| Less: Adjusting items from above | (910) | | | (138) | | | |
| ADJUSTED EBIT | $ | 2,038 | | | $ | 1,805 | | | |
Segment Results
EBIT by segment consists of net sales less related costs and expenses and is presented on a basis that is used internally for evaluating segment performance. Certain items, such as general corporate expenses or income and certain other expense or income items, are excluded from the internal evaluation of segment performance. Accordingly, these items are not reflected in EBIT for our reportable segments and are included in the Corporate, Other and Eliminations category, which is presented following the discussion of our reportable segments.
| | | | | |
| ITEM 7. | MANAGEMENT’S DISCUSSION AND ANALYSIS OF FINANCIAL CONDITION AND RESULTS OF OPERATIONS (continued) |
Earnings before interest, taxes, depreciation and amortization (“EBITDA”) by segment is a non-GAAP measure that consists of EBIT plus depreciation and amortization. Segment EBITDA is used internally by the Company for analysis of our performance. However, segment EBIT is the principal measure used by the chief operating decision maker ("CODM") to assess segment performance and make decisions on the allocation of resources.
Roofing
The table below provides a summary of net sales, EBIT, depreciation and amortization expense, and EBITDA for the Roofing segment: | | | | | | | | | | | | | |
| | Twelve Months Ended December 31, |
| (In millions) | 2024 | | 2023 | | |
| Net sales | $ | 4,052 | | | $ | 4,030 | | | |
| % change from prior year | 1 | % | | 10 | % | | |
| EBIT | $ | 1,298 | | | $ | 1,174 | | | |
| EBIT as a % of net sales | 32 | % | | 29 | % | | |
| Depreciation and amortization expense | $ | 62 | | | $ | 64 | | | |
| EBITDA | $ | 1,360 | | | $ | 1,238 | | | |
| EBITDA as a % of net sales | 34 | % | | 31 | % | | |
NET SALES
In our Roofing segment, net sales increased $22 million in 2024 compared to 2023 due to higher selling prices of $165 million and favorable product mix, mostly offset by lower volumes of approximately 6%.
EBIT
In our Roofing segment, EBIT increased $124 million in 2024 compared to 2023 driven primarily by higher selling prices of $165 million, favorable product mix and favorable delivery of $22 million, slightly offset by lower sales volumes and input cost inflation.
OUTLOOK
In our Roofing segment, the Company expects residential repair and remodeling activity to remain solid. Other uncertainties that may impact Roofing demand include demand from storms and other weather-related events, competitive pricing pressure and the cost and availability of raw materials, particularly asphalt. The Company will continue to focus on managing costs, capital expenditures and working capital to best service the market demand.
Insulation
The table below provides a summary of net sales, EBIT, depreciation and amortization expense and EBITDA for the Insulation segment:
| | | | | | | | | | | | | |
| | Twelve Months Ended December 31, |
| (In millions) | 2024 | | 2023 | | |
| Net sales | $ | 3,692 | | | $ | 3,668 | | | |
| % change from prior year | 1 | % | | -1 | % | | |
| EBIT | $ | 682 | | | $ | 619 | | | |
| EBIT as a % of net sales | 18 | % | | 17 | % | | |
| Depreciation and amortization expense | $ | 210 | | | $ | 210 | | | |
| EBITDA | $ | 892 | | | $ | 829 | | | |
| EBITDA as a % of net sales | 24 | % | | 23 | % | | |
| | | | | |
| ITEM 7. | MANAGEMENT’S DISCUSSION AND ANALYSIS OF FINANCIAL CONDITION AND RESULTS OF OPERATIONS (continued) |
NET SALES
In our Insulation segment, 2024 net sales increased $24 million compared to 2023. The increase was driven primarily by higher selling prices of $81 million and favorable product mix, partially offset by lower sales volumes of approximately 2% and unfavorable customer mix.
EBIT
In our Insulation segment, EBIT increased $63 million in 2024 compared to 2023. The increase was driven by higher selling prices of $81 million, favorable delivery of $34 million, lower start-up costs and favorable product mix, which more than offset higher manufacturing costs of $35 million, higher operating expenses, inclusive of incremental costs associated with evaluating manufacturing investments, lower sales volumes and unfavorable customer mix.
OUTLOOK
The outlook for Insulation demand is driven by North American new residential construction, remodeling and repair activity, as well as commercial and industrial construction activity in the United States, Canada, Europe, Asia-Pacific and Latin America. Demand in commercial and industrial insulation markets is most closely correlated to industrial production growth and overall economic activity in the global markets we serve. Demand for residential insulation is most closely correlated to U.S. housing starts.
During the fourth quarter of 2024, the average Seasonally Adjusted Annual Rate (“SAAR”) of U.S. housing starts was approximately 1.379 million starts, which is down from 1.454 million starts in the fourth quarter of 2023.
The Company expects the new residential construction market in North America to be temporarily challenged as the market starts to return to a more normal seasonal pattern, while the North America commercial and industrial construction markets are expected to remain stable. However, due to a period of slow economic growth, the global commercial and industrial construction markets are expected to remain soft temporarily. The Company continues to concentrate on managing costs, capital expenditures and working capital as we position ourselves to expand capacity within our existing manufacturing network.
Doors
The table below provides a summary of net sales, EBIT, depreciation and amortization expense and EBITDA for the Doors segment:
| | | | | | | | | | | | | |
| | Twelve Months Ended December 31, |
| (In millions) | 2024 | | 2023 | | |
| Net sales | $ | 1,448 | | | $ | — | | | |
| % change from prior year | — | % | | N/A | | |
| EBIT | $ | 99 | | | $ | — | | | |
| EBIT as a % of net sales | 7 | % | | N/A | | |
| Depreciation and amortization expense | $ | 133 | | | $ | — | | | |
| EBITDA | $ | 232 | | | $ | — | | | |
| EBITDA as a % of net sales | 16 | % | | N/A | | |
NET SALES
In our new Doors segment, 2024 net sales were $1,448 million due to the acquisition of Masonite, which was completed on May 15, 2024.
EBIT
In our newly acquired Doors segment, EBIT was $99 million in 2024 due to the acquisition of Masonite, which was completed on May 15, 2024.
| | | | | |
| ITEM 7. | MANAGEMENT’S DISCUSSION AND ANALYSIS OF FINANCIAL CONDITION AND RESULTS OF OPERATIONS (continued) |
OUTLOOK
The outlook for the Doors segment is driven by the residential new construction and residential repair and remodeling markets in North America and Europe. The Company expects the North America residential new construction market to be temporarily challenged, with discretionary residential repair and remodeling activity in North America to remain soft. Due to a weaker macroeconomic outlook and higher interest rates in Europe, the Company expects these markets to remain challenged. The Company will concentrate on managing costs, capital expenditures and working capital.
Composites
The table below provides a summary of net sales, EBIT, depreciation and amortization expense and EBITDA for the Composites segment:
| | | | | | | | | | | | | |
| | Twelve Months Ended December 31, |
| (In millions) | 2024 | | 2023 | | |
| | | | | |
| Net sales | $ | 2,118 | | | $ | 2,286 | | | |
| % change from prior year | -7 | % | | -14 | % | | |
| EBIT | $ | 215 | | | $ | 242 | | | |
| EBIT as a % of net sales | 10 | % | | 11 | % | | |
| Depreciation and amortization expense | $ | 182 | | | $ | 172 | | | |
| EBITDA | $ | 397 | | | $ | 414 | | | |
| EBITDA as a % of net sales | 19 | % | | 18 | % | | |
NET SALES
Net sales in our Composites segment decreased $168 million in 2024 compared to 2023. The decrease was primarily driven by lower selling prices of $83 million, lower sales volumes of approximately 1%, unfavorable customer mix and $11 million of unfavorable impact of translating sales denominated in foreign currencies into United States dollars.
EBIT
EBIT in our Composites segment decreased $27 million in 2024 compared to 2023. Lower selling prices of $83 million, unfavorable customer mix, higher start-up costs of $18 million, higher production downtime of $13 million and $7 million of unfavorable impact of translating sales denominated in foreign currencies into United States dollars, which more than offset lower manufacturing costs of $90 million and $23 million of favorable delivery and input costs.
OUTLOOK
Global glass reinforcements market demand has several economic indicators, including residential, non-residential construction and manufacturing production indices, as well as global wind installations. The Company anticipates continued impacts of economic uncertainty in a dynamic global environment, as well as competitive pricing pressure. The Company remains focused on managing costs, capital expenditures and working capital.
Corporate, Other and Eliminations
Certain items, such as general corporate expenses or income and certain other expense or income items, are excluded from the internal evaluation of segment performance. Accordingly, these items are not reflected in EBIT for our reportable segments and are included within Corporate, Other and Eliminations.
| | | | | |
| ITEM 7. | MANAGEMENT’S DISCUSSION AND ANALYSIS OF FINANCIAL CONDITION AND RESULTS OF OPERATIONS (continued) |
The following table summarizes these items and depreciation and amortization expense included within Corporate, Other and Eliminations:
| | | | | | | | | | | | | |
| | Twelve Months Ended December 31, |
| (In millions) | 2024 | | 2023 | | |
| Restructuring costs | $ | (86) | | | $ | (169) | | | |
| Gain on sale of Santa Clara, California site | — | | | 189 | | | |
| Pension settlement losses | — | | | (145) | | | |
| Acquisition-related integration costs | (83) | | | — | | | |
| | | | | |
| Gains on sale of certain precious metals | 19 | | | 2 | | | |
| Strategic review-related charges | (46) | | | — | | | |
| | | | | |
| Acquisition-related transaction costs | (49) | | | — | | | |
| Loss on sale of business | (91) | | | — | | | |
| Recognition of acquisition inventory fair value step-up | (18) | | | — | | | |
| Paroc marine recall | (58) | | | (15) | | | |
| | | | | |
| | | | | |
| | | | | |
| Impairment of venture investments | (15) | | | — | | | |
| | | | | |
| Impairment due to strategic review | (483) | | | — | | | |
| General corporate expense and other | (256) | | | (230) | | | |
| Total Corporate, Other and Eliminations EBIT | $ | (1,166) | | | $ | (368) | | | |
| Depreciation and amortization | $ | 90 | | | $ | 163 | | | |
EBIT
The impact on EBIT from Corporate, Other and Eliminations in 2024 was $798 million higher compared to 2023. The increase was primarily driven by impairment charges on the glass reinforcements strategic review, the prior year pre-tax gain on the sale of the Santa Clara, California site, loss on the sale of our building materials business in China and Korea in the current year as well as higher acquisition-related costs, partially offset by gains on sales of precious metals and lower year over year restructuring charges.
General corporate expense and other in 2024 was $26 million higher than in 2023.
OUTLOOK
In 2025, we expect general corporate expenses to range between $240 and $260 million.
LIQUIDITY, CAPITAL RESOURCES AND OTHER RELATED MATTERS
Liquidity
The Company's primary sources of liquidity are its balance of Cash and cash equivalents of $361 million as of December 31, 2024, its senior revolving credit facility (the “Senior Revolving Credit Facility”) and Receivables Securitization Facility.
The Company has a $1.0 billion Senior Revolving Credit Facility that has been amended from time to time. The Senior Revolving Credit Facility was most recently amended in March 2024 to increase the borrowing limit from $800 million to $1.0 billion and extend the maturity date to March 2029. No other significant terms impacting liquidity were amended.
The Company has a $300 million Receivables Securitization Facility that has been amended from time to time. The Receivables Securitization Facility was most recently amended in March 2024 to increase the borrowing limit from $280 million to $300 million and extend the maturity date to February 2025. No other significant terms impacting liquidity were amended. With the maturity of our Receivables Securitization Facility, we may consider other sources of liquidity, including the issuance of commercial paper.
| | | | | |
| ITEM 7. | MANAGEMENT’S DISCUSSION AND ANALYSIS OF FINANCIAL CONDITION AND RESULTS OF OPERATIONS (continued) |
The following table shows how the Company utilized its primary sources of liquidity:
| | | | | | | | | |
| | As of December 31, 2024 |
| (In millions) | | Senior Revolving Credit Facility | Receivables Securitization Facility |
| Facility size or borrowing limit | | $ | 1,000 | | $ | 300 | |
| Collateral capacity limitation on availability | | N/A | — | |
| Outstanding borrowings | | — | | — | |
| Outstanding letters of credit | | 4 | | 1 | |
| Availability on facility | | $ | 996 | | $ | 299 | |
The agreements governing our Senior Revolving Credit Facility and Receivables Securitization Facility contain various covenants that we believe are usual and customary. These covenants include a maximum allowed leverage ratio. We were in compliance with these covenants as of December 31, 2024.
As a holding company, we have no operations of our own and most of our assets are held by our direct and indirect subsidiaries. Dividends and other payments or distributions from our subsidiaries will be used to meet our debt service and other obligations and to enable us to pay dividends to our stockholders. Please refer to the Risk Factors disclosed in Item 1A of this Annual Report on Form 10-K for details on the factors that could inhibit our subsidiaries' abilities to pay dividends or make other distributions to the parent company.
We have no material off-balance sheet arrangements that have or are reasonably likely to have a material current or future effect on our financial condition, results of operations, liquidity, capital expenditures or other resources.
Cash Flows
Cash and cash equivalents were $361 million as of December 31, 2024, compared to $1.6 billion as of December 31, 2023. Cash and cash equivalents held by foreign subsidiaries may be subject to foreign withholding taxes upon repatriation to the U.S. As of December 31, 2024 and December 31, 2023, the Company had $95 million and $114 million, respectively, in cash and cash equivalents in certain of its foreign subsidiaries. The Company continues to assert indefinite reinvestment in accordance with Accounting Standards Codification (“ASC”) 740 based on the laws as of enactment of the tax legislation commonly known as the U.S. Tax Cuts and Jobs Act of 2017.
Operating activities: Net cash flow provided by operating activities increased by $173 million for the twelve months ended December 31, 2024 compared to the same period in 2023. The increase in cash provided by operating activities was primarily due to lower increases in accounts payable and higher decreases in inventory when compared to the same period in 2023. These were slightly offset by increases in accounts receivable during the period.
Investing activities: Net cash flow used for investing activities increased by $3.0 billion for the twelve months ended December 31, 2024 compared to the same period in 2023. The increase was primarily driven by the Masonite acquisition and lower proceeds from sale of assets in 2024 due to the sale of the Santa Clara site in 2023.
Financing activities: Net cash flow provided by financing activities increased by $1.2 billion for the twelve months ended December 31, 2024 compared to the same period in 2023. The increase was primarily driven by net proceeds from long-term debt related to the Masonite acquisition, as well as lower treasury stock repurchases. These were slightly offset by payments related to the tender offer to purchase Masonite senior notes due 2028 and the repayment at maturity of the Company's 2024 senior notes.
Material Cash Requirements
Our anticipated uses of cash include capital expenditures, working capital needs, share repurchases, meeting financial obligations, payments of any dividends authorized by our Board of Directors, acquisitions, restructuring actions and pension contributions. We expect that our cash on hand, coupled with future cash flows from operations and other available sources of liquidity, including our Senior Revolving Credit Facility and our Receivables Securitization Facility, will provide ample liquidity to enable us to meet our cash requirements for at least the next 12 months and foreseeable future thereafter.
| | | | | |
| ITEM 7. | MANAGEMENT’S DISCUSSION AND ANALYSIS OF FINANCIAL CONDITION AND RESULTS OF OPERATIONS (continued) |
The following discussion of material cash requirements evaluates known contractual and other obligations, but does not include amounts that are contingent on events or other factors that are uncertain or unknown at this time including legal contingencies and uncertain tax positions among others. The amounts presented are based on various estimates, including estimates regarding the timing of payments, prevailing interest rates, the occurrence of certain events and other factors. Actual results may vary materially from the amounts discussed below.
Capital Expenditures
Our capital expenditures are primarily related to the maintenance and rebuild of our long-term assets, as well as investing in projects that support growth and innovation to further our enterprise strategy. Our capital expenditures were $647 million in 2024. We expect to have capital expenditures of approximately $800 million in 2025. The anticipated increase in capital expenditures in 2025 is primarily driven by growth, manufacturing productivity and sustainability projects. We expect that capital expenditures will be funded through cash flows from operations. See Note 2 and Note 6 of the Consolidated Financial Statements for additional information on Property, plant and equipment.
Long-term Debt Obligations, including Current Portion of Long-term Debt
As of December 31, 2024, the Company had $5.1 billion of total debt, which mostly consists of long-term debt relating to various outstanding senior notes. In addition, the Company's current portion of long-term debt of $38 million primarily relates to the current portion of finance leases. In the fourth quarter of 2024, the Company repaid the 2024 senior notes of $400 million at maturity. Further discussion of the amount and timing of the future scheduled maturities of our senior notes can be found in Note 14 of the Consolidated Financial Statements. There were no outstanding borrowings on our Senior Revolving Credit Facility or our Receivables Securitization Facility as of December 31, 2024.
Interest on Debt
We are obligated to make periodic interest payments at fixed rates, depending on the terms of the applicable debt agreements. Based on interest rates and scheduled maturities as of December 31, 2024, these interest obligations range from $199 million to $242 million annually over the next five years.
Finance Lease Obligations
Our finance lease obligations primarily consist of real estate, oxygen plants, computers and software and fleet vehicles. As of December 31, 2024, we had a total of $463 million of minimum finance lease payments. Further discussion of the future maturities of these lease liabilities can be found in Note 10 of the Consolidated Financial Statements.
Operating Lease Obligations
Our operating lease obligations primarily consist of real estate and material handling equipment. As of December 31, 2024, we had a total of $580 million of minimum operating lease payments. Further discussion of the future maturities of these lease liabilities can be found in Note 10 of the Consolidated Financial Statements.
Purchase Obligations
Purchase obligations are commitments to suppliers to purchase goods or services, and include take-or-pay arrangements, capital expenditures, and contractual commitments to purchase equipment. As of December 31, 2024, the total of these obligations was $411 million, inclusive of $287 million payable in the next 12 months. The Company did not include ordinary course of business purchase orders in this amount as the majority of such purchase orders may be canceled and are reflected in historical operating cash flow trends. The Company does not believe such purchase orders will adversely affect our liquidity position.
Pension Contributions
The Company has several defined benefit pension plans. The Company made cash contributions of $7 million and $18 million to the plans during the twelve months ended December 31, 2024 and 2023, respectively. The Company expects to contribute $20 million in cash to its pension plans during 2025. Actual contributions to the plans may change as a result of several factors, including changes in laws that impact funding requirements. The ultimate cash flow impact to the Company, if any, of the pension plan liability and the timing of any such impact will depend on numerous variables, including future changes in actuarial assumptions, legislative changes to pension funding laws, and market conditions. Further discussion of the Company's defined benefit pension plans can be found in Note 15 of the Consolidated Financial Statements.
| | | | | |
| ITEM 7. | MANAGEMENT’S DISCUSSION AND ANALYSIS OF FINANCIAL CONDITION AND RESULTS OF OPERATIONS (continued) |
Share Repurchases
On December 1, 2022, the Board of Directors approved a new share repurchase program under which the Company is authorized to repurchase up to an aggregate of 10 million shares of the Company’s outstanding common stock (the “Repurchase Authorization”). The Repurchase Authorization enables the Company to repurchase shares through the open market, privately negotiated, or other transactions. The actual number of shares repurchased will depend on timing, market conditions and other factors and will be at the Company’s discretion. The Company repurchased 2.6 million shares of the Company’s common stock for $433 million, inclusive of applicable taxes, under previously announced repurchase authorizations. As of December 31, 2024, 6.4 million shares remained available for repurchase under the repurchase authorizations.
Other Strategic Uses of Cash
We will evaluate and consider payments of any dividends authorized by our Board of Directors, strategic acquisitions, joint ventures, debt repurchases or repayments and other transactions to create stockholder value and enhance financial performance. Such transactions may require cash expenditures beyond current sources of liquidity or generated proceeds.
Debt
On March 1, 2024, the Company entered into an unsecured term loan agreement in an aggregate principal amount of $3.0 billion (the “364-Day Credit Facility”). On May 15, 2024, to fund a portion of the Masonite acquisition, the Company borrowed $2.8 billion using Term SOFR plus a spread on the 364-Day Credit Facility. As a result of the borrowing, the Company incurred approximately $16 million of financing fees which were amortized to Interest expense, net on the Consolidated Statements of Earnings. During the second quarter of 2024, the Company completely repaid the 364-Day Credit Facility with a combination of proceeds from the issuance of new senior notes, borrowings on the Receivables Securitization Facility and cash on hand. Based on terms of the agreement, no further amounts can be drawn.
On April 15, 2024, in connection with the acquisition of Masonite, we commenced a tender offer (the “Tender Offer”) to purchase any and all of Masonite's outstanding 5.375% Senior Notes due 2028 (the “Masonite 2028 notes”) with an aggregate value of $501 million. On May 13, 2024, 94.25% of the outstanding Masonite 2028 notes were validly tendered, with Owens Corning making a cash payment on May 16, 2024 of approximately $480 million, inclusive of $7 million of interest and $1 million premium on tender. Following the settlement of the Tender Offer, approximately $29 million of the Masonite 2028 notes that were not tendered remain outstanding, which has been recorded on the Consolidated Balance Sheets. Interest on the Masonite 2028 notes is payable semiannually in arrears on February 1 and August 1 each year.
On May 1, 2024 in connection with the acquisition of Masonite, we commenced an offer to exchange (the “Exchange Offer”) any and all of Masonite’s outstanding 3.50% Senior Notes due 2030 (the “Masonite 2030 notes”) for new 3.50% Senior Notes due 2030 of Owens Corning (the “Owens Corning 2030 notes”). On May 22, 2024, 99.51% of the outstanding Masonite 2030 notes were exchanged and we issued $373 million of aggregate principal amount of Owens Corning 2030 notes. Interest on the notes is payable semiannually in arrears on February 15 and August 15 each year, beginning on August 15, 2024. Following the settlement of the Exchange Offer, approximately $2 million of the Masonite 2030 notes that were not exchanged remain outstanding, which has been recorded on the Consolidated Balance Sheets.
On May 15, 2024, the Company initially borrowed $295 million under the Receivables Securitization Facility which was used to pay down a portion of the 364-Day Credit Facility. Subsequent to the May 15, 2024 borrowing, the Company repaid and re-borrowed on the Receivables Securitization Facility throughout the year principally to pay down the 364-Day Credit Facility. As of December 31, 2024, there was no outstanding balance on the Receivables Securitization Facility.
On May 31, 2024, the Company issued $500 million of 2027 senior notes with an annual interest rate of 5.500%, $800 million of 2034 senior notes with an annual interest rate of 5.700% and $700 million of 2054 senior notes with an annual interest rate of 5.950%. These senior notes are net of discounts and issuance costs of $4 million, $11 million and $17 million, respectively. The proceeds from these notes were used to repay a portion of the outstanding borrowings under the 364-Day Credit Facility that was used to fund a portion of the Masonite acquisition in the second quarter of 2024 and to pay related fees and expenses.
Supplier Finance Programs
We review supplier terms and conditions on an ongoing basis, and have negotiated payment terms extensions in recent years in connection with our efforts to reduce working capital and improve cash flow. Separate from those terms extension actions, certain of our subsidiaries have entered into paying agency agreements with third-party administrators. These voluntary supply chain finance programs (collectively, the “Programs”) generally give participating suppliers the ability to sell, or otherwise
| | | | | |
| ITEM 7. | MANAGEMENT’S DISCUSSION AND ANALYSIS OF FINANCIAL CONDITION AND RESULTS OF OPERATIONS (continued) |
pledge as collateral, their receivables from the Company to the participating financial institutions, at the sole discretion of both the suppliers and financial institutions. The Company is not a party to the arrangements between the suppliers and the financial institutions. The Company’s obligations to its suppliers, including amounts due and scheduled payment dates, are not impacted by the suppliers’ decisions to sell, or otherwise pledge as collateral, amounts under these arrangements. The Company’s payment terms to the financial institutions, including the timing and amount of payments, are based on the original supplier invoices. One of the Programs includes a parent guarantee to the participating financial institution for a certain U.S. subsidiary that, at the time of the respective program’s inception in 2015, was a guarantor subsidiary of the Company’s credit agreement. The obligations are presented as Accounts payable within Total current liabilities on the Consolidated Balance Sheets and all activity related to the obligations is presented within operating activities on the Consolidated Statements of Cash Flow.
The desire of suppliers and financial institutions to participate in the Programs could be negatively impacted by, among other factors, the availability of capital committed by the participating financial institutions, the cost and availability of our suppliers’ capital, a credit rating downgrade or deteriorating financial performance of the Company or its participating subsidiaries, or other changes in financial markets beyond our control. We do not expect these risks, or potential long-term growth of our Programs, to materially affect our overall financial condition, as we expect a significant portion of our payments to continue to be made outside of the Programs. Accordingly, we do not believe the Programs have materially impacted our current period liquidity, and do not believe that the Programs are reasonably likely to materially affect liquidity in the future.
Please refer to the Supplier Finance Programs section in Note 1 of the Consolidated Financial Statements for a rollforward of outstanding obligations under the supplier finance programs.
Derivatives
Please refer to Note 4 of the Consolidated Financial Statements.
Fair Value Measurement
Please refer to Notes 1, 4, 14, 15 and 16 of the Consolidated Financial Statements.
CRITICAL ACCOUNTING ESTIMATES
Our discussion and analysis of our financial condition and results of operations is based upon our Consolidated Financial Statements, which have been prepared in accordance with accounting principles generally accepted in the United States. The preparation of these financial statements requires management to make estimates and assumptions that affect the reported amounts of assets and liabilities and the disclosure of contingent assets and liabilities at the date of the financial statements and the reported amounts of revenues and expenses during the reporting period. On an ongoing basis, management evaluates its estimates and judgments related to these assets, liabilities, revenues and expenses. We believe these estimates to be reasonable under the circumstances. Management bases its estimates and judgments on historical experience, expected future outcomes, and on various other factors that are believed to be reasonable under the circumstances, the results of which form the basis for making judgments about the carrying values of assets and liabilities that are not readily apparent from other sources. Actual results may differ from these estimates.
The Company believes that the following accounting estimates are critical to our financial results:
Fair Values of Assets Acquired and Liabilities Assumed in Acquisitions
Assets acquired and liabilities assumed in a business combination are recorded at their estimated fair values on the date of acquisition. The difference between the purchase price amount and the net fair value of assets acquired and liabilities assumed is recognized as goodwill on the balance sheet if the purchase price exceeds the estimated net fair value or as a bargain purchase gain on the income statement if the purchase price is less than the estimated net fair value. We apply significant judgment in estimating the fair value of assets acquired and liabilities assumed, which involves the use of significant estimates and assumptions. Changes in these judgments or estimates can have a material impact on the valuation of the respective assets and liabilities acquired and our results of operations in periods after acquisition. The allocation of the purchase price is preliminary for up to one year after the acquisition date as more information is obtained about the fair value of assets acquired and liabilities assumed. See Note 7 of the Consolidated Financial Statements for further information on the fair values of assets acquired and liabilities assumed in recent business combinations, as well as the measurement period adjustments to the purchase price allocation.
| | | | | |
| ITEM 7. | MANAGEMENT’S DISCUSSION AND ANALYSIS OF FINANCIAL CONDITION AND RESULTS OF OPERATIONS (continued) |
On May 15, 2024, the Company completed the acquisition of Masonite for a total purchase price of $3.2 billion. As part of the acquisition the Company acquired $979 million of intangible assets related to customer relationships, which mainly consists of one customer relationship. The fair value of customer relationships was determined using the multi-period excess earnings method. Key assumptions under this method are the revenue growth rate, adjusted EBITDA margin (including the adjusted terminal EBITDA margin), customer attrition rate, discount rate, tax rate and contributory asset charges.
Tax Estimates
The determination of our tax provision is complex due to operations in several tax jurisdictions outside the United States. We apply a more-likely-than-not recognition threshold for all tax uncertainties. Such uncertainties include any claims by the Internal Revenue Service for income taxes, interest, and penalties attributable to audits of open tax years.
In addition, we record a valuation allowance to reduce our deferred tax assets to the amount that we believe is more likely than not to be realized. We estimate future taxable income and the effect of tax planning strategies in our consideration of whether deferred tax assets will more likely than not be realized. In the event we were to determine that we would not be able to realize all or part of our net deferred tax assets in the future, an adjustment to reduce the net deferred tax assets would be charged to earnings in the period such determination was made. Conversely, if we were to determine that we would be able to realize our net deferred tax assets in the future in excess of their currently recorded amount, an adjustment to increase the net deferred tax assets would be credited to earnings in the period such determination was made.
Impairment of Assets
The Company exercises judgment in evaluating assets for impairment. Goodwill and other indefinite-lived intangible assets are tested for impairment annually, or when circumstances arise which indicate there may be an impairment. Long-lived assets are tested for impairment when economic conditions or management decisions indicate an impairment may exist. These tests require comparing recorded values to estimated fair values for the assets under review.
The Company has recorded its goodwill and conducted testing for potential goodwill impairment at a reporting unit level. Our reporting units represent a business for which discrete financial information is available and segment management regularly reviews the operating results. The Company has four reporting units: Roofing, Insulation, Doors and Composites.
2024 Goodwill Impairment Assessments
Goodwill is an intangible asset that is not subject to amortization; however, annual tests are required to be performed to determine whether impairment exists. Prior to performing the impairment testing process described in ASC 350-20, the guidance permits companies to assess qualitative factors to determine if it is more likely than not that a reporting unit’s fair value is less than its carrying value. If, based on the review of the qualitative factors, we determine it is not more likely than not that the fair value of a reporting unit is less than its carrying value, we would bypass the quantitative impairment test. Events and circumstances we consider in performing the qualitative assessment include macro-economic conditions, market and industry conditions, internal cost factors, and the operational stability and the overall financial performance of the reporting units. If it is more likely than not that a reporting unit’s fair value is less than or close to its carrying value, then the quantitative impairment test must be performed to determine if impairment is required.
When it is determined necessary for the Company to perform the quantitative impairment process for goodwill, we estimate fair values using a discounted cash flow approach from the perspective of a market participant, as well as the market approach. Significant assumptions used in the discounted cash flow approach are the revenue growth rates and EBIT margins used in estimating discrete period cash flow forecasts of the reporting unit, the discount rate, the reporting unit tax rate and the long-term revenue growth rate and EBIT margin used in estimating the terminal business value. The cash flow forecasts of the reporting unit are based upon management’s long-term view of our markets and are the forecasts that are used by senior management and the Board of Directors to evaluate operating performance. The discount rate utilized is management’s estimate of what the market’s weighted average cost of capital is for a company with a similar debt rating and stock volatility, as measured by beta. The reporting unit specific tax rate is based on blended global historical rates. The terminal business value is determined by applying the long-term growth rate to the latest year for which a forecast exists. For the market approach, we use market multiples derived from a set of similar companies. As part of our goodwill quantitative testing process, the Company evaluates whether there are reasonably likely changes to management’s estimates that would have a material impact on the results of the goodwill impairment testing.
| | | | | |
| ITEM 7. | MANAGEMENT’S DISCUSSION AND ANALYSIS OF FINANCIAL CONDITION AND RESULTS OF OPERATIONS (continued) |
Third Quarter Goodwill Triggering Event
The annual impairment tests performed in the fourth quarter of 2023 indicated that the business enterprise value of the Composites reporting unit exceeded its carrying value by approximately 5%. Given this narrow cushion of Composites reporting unit fair value in excess of carrying value and the ongoing strategic review of the glass reinforcements business, the Company performed an interim goodwill impairment test as of September 30, 2024 for the Composites reporting unit. The interim testing indicated that the business enterprise value of the Composites reporting unit exceeded its carrying value by less than 10%.
Annual Goodwill Testing
Our annual test of goodwill for impairment was conducted as of October 1, 2024. The Company elected to perform the qualitative approach on all of its reporting units. After evaluating and weighing all relevant events and circumstances, we concluded it is more likely than not that the fair value of the Roofing and Insulation reporting units exceeds their respective carrying value amounts while the Doors reporting unit business enterprise value approximates its carrying value given the acquisition that occurred in May 2024. Given the narrow cushion of the Composites reporting unit fair value in excess of carrying value as a result of the third quarter impairment testing, the Company performed a quantitative analysis for the Composites reporting unit as of October 1, 2024. Testing indicated that the cushion remained less than 10 %.
Due to the passage of time since the last quantitative analysis, the Company elected to perform a quantitative analysis for the Roofing and Insulation reporting units. The fair value of each of our reporting units was in excess of its carrying value and thus, no impairment exists. The fair value of the Roofing and Insulation reporting units substantially exceeded the carrying value as of the date of our assessment.
Fourth Quarter Goodwill Triggering Event
Subsequent to the annual test for the Composites reporting unit, the Company performed an interim goodwill impairment test during the fourth quarter of 2024 primarily as a result of the progression of the strategic review of the glass reinforcements business. As a result of this test, we determined that no impairment existed for the reporting unit. Testing indicated that the business enterprise value for the Composites reporting unit exceeded its carrying value by less than 5%.
There was uncertainty as to the outcome of the strategic review of our glass reinforcements business and the macroeconomic factors that impact this reporting unit. The likelihood of a future impairment could be increased by a sustained downturn in these macroeconomic factors, a change in the long-term revenue growth rate or profitability for this reporting unit, or the outcome of the strategic review. The most significant assumptions used in our analysis to determine the fair value of the Composites reporting unit are the revenue growth rates, EBIT margins, long-term growth rate, and the discount rate.
If all other assumptions remain constant, a 2% decrease in the base year revenue would decrease the fair value by approximately 1%, a 1% decrease in the revenue growth rates would decrease the fair value by approximately 1%, a 50 basis point decrease in forecasted annual EBIT margins would decrease the fair value by approximately 2%, a 50 basis point decrease in the selected long-term growth rate of 2% would decrease the fair value by approximately 2%, and a 50 basis point increase in the selected discount rate of 11.5% would decrease the fair value by approximately 3%.
The following table summarizes the segment allocation of recorded goodwill on our Consolidated Balance Sheet as of December 31, 2024:
| | | | | | | | | | |
| (In millions) | December 31, 2024 | Percent of Total | | |
| Roofing | $ | 392 | | 14 | % | | |
| Insulation | 550 | | 19 | % | | |
| Doors | 1,478 | | 52 | % | | |
| Composites | 423 | | 15 | % | | |
| Total goodwill | $ | 2,843 | | 100 | % | | |
| | | | | |
| ITEM 7. | MANAGEMENT’S DISCUSSION AND ANALYSIS OF FINANCIAL CONDITION AND RESULTS OF OPERATIONS (continued) |
Annual 2024 Indefinite-lived Intangible Asset Impairment Assessment
Fair values used in testing for potential impairment of our trademarks and trade names are calculated by applying an estimated market value royalty rate to the forecasted revenues of the businesses that utilize those assets. The assumed cash flows from this calculation are discounted at a rate based on a market-participant discount rate. Our annual test of indefinite-lived intangibles was conducted as of October 1, 2024. The fair value of each of our indefinite-lived intangible assets exceeded the carrying value as of the date of our assessment.
Testing indicated that the fair value of a trade name used by our European building and technical insulation business exceeded its carrying values by 3%. A change in the estimated long-term revenue growth rate or increase in the discount rate assumption could increase the likelihood of a future impairment for this asset. If all other assumptions remain constant, a 50 basis point increase in the selected discount rate of 11.5% would decrease the fair value by approximately 5%, and a 50 basis point decrease in the selected long-term growth rate of 2.0% would decrease the fair value by approximately 4%. The carrying value of the European building and technical insulation trade name is $84 million as of December 31, 2024. This asset is included within the Insulation segment.
The fair value of the remaining assets substantially exceeded their carrying value as of the date of our assessment.
Long-lived Asset Recoverability and Impairment Assessments
The recoverable value for long-lived asset testing are calculated by estimating the undiscounted cash flows from the use and ultimate disposition of the asset. For impairment testing, long-lived assets are grouped at the lowest level for which identifiable cash flows are largely independent of the cash flows of other groups of assets and liabilities. The Company groups long-lived assets based on manufacturing facilities that produce similar products either globally or within a geographic region. Management tests asset groups for potential impairment whenever events or changes in circumstances indicate that the carrying value may not be recoverable.
During the fourth quarter of 2024, the Company determined that certain asset groups should be tested for recoverability, primarily as a result of the progression of the strategic review of the glass reinforcements business. Recoverability of the long-lived assets was measured by comparing the carrying amount of the asset groups to the future net undiscounted cash flows expected to be generated by the asset groups. Specifically for the glass reinforcements asset group, the Company used an undiscounted cash flow model giving consideration to probability weighted cash flows of differing outcomes of the strategic review. The comparison indicated that one of the asset groups, the glass reinforcements asset group, was not recoverable.
Fair value of the glass reinforcements asset group was calculated using a discounted cash flow model and market information obtained through the strategic review to estimate the fair value of the asset group, with weighting applied. As a result of the analysis performed, the Company recorded pre-tax asset impairment charges for the amount by which the carrying value exceeded its fair value of $483 million for the year ended December 31, 2024, which is included in Impairment due to strategic review on the Consolidated Statements of Earnings. These charges include $439 million related to property, plant and equipment, $30 million related to operating lease right-of-use assets and $14 million related to definite-lived intangible assets.
The most significant assumption used in the fair value analysis was the weighting of the discounted cash flow model and market information. If all other assumptions remain constant, a 5% change in the weighting would change the fair value of the asset group by approximately 2%.
Please refer to Note 5, Note 6 and Note 10 for additional detail on impairment charges recorded in 2024.
However, changes in management intentions, market conditions, operating performance and other similar circumstances could affect the assumptions used in these impairment tests. Changes in the assumptions could result in additional impairment charges that could be material to our Consolidated Financial Statements in any given period.
Product Warranty
The Company records a liability for warranty obligations at the date the related products are sold. Most significant are the standard warranties on our roofing products. The standard warranties generally provide full coverage of labor and materials for a period of 5-10 years from the original installation date and prorated materials for the remaining life of the roof.
Our estimated cost of our standard warranty obligations is calculated using a 10-year historical average of claims paid for each major product category, the estimated future cost to manufacture the replacement shingles, and the estimated future cost for contractor labor, subject to the applicable warranty coverage, for a 20-year period from the date of installation.
| | | | | |
| ITEM 7. | MANAGEMENT’S DISCUSSION AND ANALYSIS OF FINANCIAL CONDITION AND RESULTS OF OPERATIONS (continued) |
Additionally, the Company sells contractors extended warranties that extend coverage beyond our standard product warranty. The extended warranties revenue is deferred and recognized over the related coverage period, ranging from 16 to 20 years.
Pensions and Other Postretirement Benefits
Accounting for pensions and other postretirement benefits involves estimating the cost of benefits to be provided well into the future and attributing that cost over the time period each employee works. To accomplish this, extensive use is made of assumptions about investment returns, discount rates, inflation, mortality, turnover and medical costs. Changes in assumptions used could result in a material impact to our Consolidated Financial Statements in any given period.
Two key assumptions that could have a significant impact on the measurement of pension liabilities and pension expense are the discount rate and the expected return on plan assets. For our largest plan, the United States plan, the discount rate used for the December 31, 2024 measurement date is based on a yield curve approach where the expected future benefit payments are matched with a yield curve derived from certain AA-rated corporate bonds.
The result supported a discount rate of 5.65% at December 31, 2024 compared to 5.00% at December 31, 2023. A 25 basis point increase (decrease) in the discount rate would (decrease) increase the December 31, 2024 projected benefit obligation for the United States pension plan by approximately $8 million. A 25 basis point increase (decrease) in the discount rate would (decrease) increase 2025 net periodic pension cost by less than $1 million.
The expected return on plan assets in the United States was derived by taking into consideration the target plan asset allocation, historical rates of return on those assets, projected future asset class returns and net out performance of the market by active investment managers and plan related and investment related expenses paid from the plan trust. The Company uses the target plan asset allocation because we rebalance our portfolio to target on at least a quarterly basis. An asset return model was used to develop an expected range of returns on plan investments over a 20-year period, with the expected rate of return selected from a best estimate range within the total range of projected results. This process resulted in the selection of an expected return of 6.00% at the December 31, 2024 measurement date, which is used to determine net periodic pension cost for the year 2025. The expected return selected at the December 31, 2023 measurement date was 5.75%, which was used to determine the net periodic pension cost for the year 2024. A 25 basis point decrease in return on plan assets assumption would result in a respective increase of 2025 net periodic pension cost by less than $1 million.
The discount rate for our United States postretirement plan was selected using the same method as described for the pension plan. The result supported a discount rate of 5.55% at December 31, 2024 compared to 4.90% at December 31, 2023. A 25 basis point increase (decrease) in the discount rate would (decrease) increase the United States postretirement benefit obligation by approximately $2 million and (decrease) increase 2025 net periodic postretirement benefit cost by less than $1 million.
The methods corresponding to those described above are used to determine the discount rate and expected return on assets for non-U.S. pension and postretirement plans, to the extent applicable.
RECENT ACCOUNTING PRONOUNCEMENTS
Please refer to Note 1 of the Consolidated Financial Statements.
ENVIRONMENTAL MATTERS
Please refer to Note 17 of the Consolidated Financial Statements.
| | | | | |
| ITEM 7. | MANAGEMENT’S DISCUSSION AND ANALYSIS OF FINANCIAL CONDITION AND RESULTS OF OPERATIONS (continued) |
CAUTIONARY STATEMENT CONCERNING FORWARD-LOOKING STATEMENTS
Our disclosures and analysis in this report, including Management’s Discussion and Analysis of Financial Condition and Results of Operations, contain forward-looking statements within the meaning of Section 27A of the Securities Act of 1933 and Section 21E of the Securities Exchange Act of 1934 (the “Exchange Act”). Forward-looking statements present our current forecasts and estimates of future events. These statements do not strictly relate to historical or current results and can be identified by words such as “anticipate,” “appear,” “assume,” “believe,” “estimate,” “expect,” “forecast,” “intend,” “likely,” “may,” “plan,” “project,” “seek,” “should,” “strategy,” “will” and other terms of similar meaning or import in connection with any discussion of future operating, financial or other performance. These forward-looking statements are subject to risks, uncertainties and other factors and actual results may differ materially from those results projected in the statements. These risks, uncertainties and other factors include, without limitation:
•levels of residential and commercial or industrial construction activity;
•demand for our products;
•industry and economic conditions including, but not limited to, supply chain disruptions, recessionary conditions, inflationary pressures and interest rate and financial markets volatility;
•changes to tariff, trade or investment policies or laws;
•availability and cost of energy and raw materials;
•competitive and pricing factors;
•relationships with key customers and customer concentration in certain areas;
•our ability to achieve expected synergies, cost reductions and/or productivity improvements;
•issues related to acquisitions, divestitures and joint ventures or expansions;
•our ability to complete the announced divestiture of our GR business on the expected terms and within the anticipated time period, or at all, which is dependent on the parties' ability to satisfy certain closing conditions;
•climate change, weather conditions and storm activity;
•legislation and related regulations or interpretations, in the United States or elsewhere;
•domestic and international economic and political conditions, policies or other governmental actions, as well as war and civil disturbance;
•uninsured losses or major manufacturing disruptions, including those from natural disasters, catastrophes, pandemics, theft or sabotage;
•environmental, product-related or other legal and regulatory liabilities, proceedings or actions;
•research and development activities and intellectual property protection;
•issues involving implementation and protection of information technology systems;
•foreign exchange and commodity price fluctuations;
•our level of indebtedness;
•our liquidity and the availability and cost of credit;
•the level of fixed costs required to run our business;
•levels of goodwill or other indefinite-lived intangible assets;
•price volatility in certain wind energy markets in the U.S.;
•loss of key employees and labor disputes or shortages; and
•defined benefit plan funding obligations.
All forward-looking statements in this Annual Report on Form 10-K should be considered in the context of the risks and other factors described herein, and in Item 1A above, and as detailed from time to time in the Company’s filings with the U.S. Securities and Exchange Commission. Any forward-looking statements speak only as of the date the statement is made and we undertake no obligation to update or revise any forward-looking statements, whether as a result of new information, future events or otherwise, except as required by federal securities laws. It is not possible to identify all of the risks, uncertainties and other factors that may affect future results. In light of these risks and uncertainties, the forward-looking events and circumstances discussed in this Annual Report on Form 10-K may not occur and actual results may differ materially from those anticipated or implied in the forward-looking statements. Accordingly, users of this Annual Report on Form 10-K are cautioned not to place undue reliance on the forward-looking statements.
| | | | | |
| ITEM 7A. | QUANTITATIVE AND QUALITATIVE DISCLOSURES ABOUT MARKET RISK |
The Company is exposed to the impact of changes in foreign currency exchange rates, interest rates and the prices of various commodities used in the normal course of business. To mitigate some of the near-term volatility in our earnings and cash flows, the Company manages certain of our exposures through the use of financial contracts, contracts for physical delivery of a particular commodity, and derivative financial instruments. The Company’s objective with these instruments is to reduce exposure to near-term fluctuations in earnings and cash flows. The Company’s policy enables the use of foreign currency, interest rate and commodity derivative financial instruments only to the extent necessary to manage exposures as described above. The Company does not enter into such transactions for trading purposes.
A discussion of the Company’s accounting policies for derivative financial instruments, as well as the Company’s exposure to market risk, is included in Notes 1 and 4 to the Consolidated Financial Statements. Please refer to Note 4 for details of the fair values of derivative financial instruments and their classification on the Consolidated Balance Sheets.
For purposes of disclosing the market risk inherent in its derivative financial instruments the Company uses sensitivity analysis disclosures that express the potential loss in fair values of market rate sensitive instruments resulting from changes in interest rates, foreign currency exchange rates, and commodity prices that assume instantaneous, parallel shifts in exchange rates, interest rate yield curves, and commodity prices. The following analysis provides such quantitative information regarding market risk. There are certain shortcomings inherent in the sensitivity analysis presented, primarily due to the assumption that exchange rates change instantaneously and that interest rates change in a parallel fashion. In addition, the analyses are unable to reflect the complex market reactions that normally would arise from the market shifts modeled.
Foreign Exchange Rate Risk
The Company has transactional foreign currency exposures related to buying, selling and financing in currencies other than the local currencies in which it operates. The Company enters into various forward contracts, which change in value as foreign currency exchange rates change, to preserve the carrying amount of foreign currency-denominated assets, liabilities, commitments and certain anticipated foreign currency transactions. Exposures in U.S. Dollars primarily relate to the Indian Rupee, Brazilian Real, South Korean Won, Chinese Yuan, Hong Kong Dollar and the European Euro exchange rates. In addition, exposures in European Euro primarily relate to the Polish Złoty, Danish Krone and the U.S. Dollar. These transactional risks are mitigated through the use of derivative financial instruments and balancing of cash deposits and loans. The net fair value of derivative financial instruments used to limit exposure to foreign currency risk was a liability of less than $1 million as of December 31, 2024. As of December 31, 2024, the potential change in fair value for such financial instruments from an increase of 10% in the quoted foreign currency exchange rates would be a decrease of approximately $6 million.
We have translation exposure resulting from translating the financial statements of foreign subsidiaries into United States Dollars. Our most significant translation exposures are the European Euro, Canadian Dollar, Chinese Yuan, Polish Złoty and Great Britain Pound in relation to the United States Dollar.
Interest Rate Risk
The Company is subject to market risk from exposure to changes in interest rates due to its financing, investing and cash management activities. The Company has a Senior Revolving Credit Facility, Receivables Securitization Facility, other floating rate debt and cash and cash equivalents which are exposed to floating interest rates and may impact cash flow. As of December 31, 2024 and 2023, the Company had no borrowings on its Senior Revolving Credit Facility or Receivables Securitization Facility, with the balance of other floating-rate debt of $1 million. Cash and cash equivalents were $361 million and $1.6 billion at December 31, 2024 and 2023, respectively. Based on the year-end outstanding balances on floating rate debt, a one percentage point increase in interest rates at December 31, 2024 would increase our annual net interest expense by less than $1 million.
The fair market value of the Company’s senior notes are subject to interest rate risk. The following table shows how a one percentage point increase in interest rates would impact the fair market value of the senior notes:
| | | | | | | | | | | | | | | | | | | | | | | | | | | | | | | | | |
| | Senior Notes Maturity Year |
| As of December 31, 2024: | | 2026 | 2027 | 2028 | 2029 | 2030 | 2034 | 2036 | 2047 | 2048 | 2054 |
| | | | | | | | | | | |
| Decrease in fair value | | 2% | 2% | 3% | 4% | 5% | 7% | 8% | 12% | 12% | 12% |
| | | | | | | | | | | |
| | | | | | | | | | | |
| | | | | | | | | | | |
| | | | | | | | | | | |
| | | | | | | | | | | |
| | | | | | | | | | | |
| | | | | | | | | | | |
| | | | | | | | | | | |
| | | | | |
| ITEM 7A. | QUANTITATIVE AND QUALITATIVE DISCLOSURES ABOUT MARKET RISK (continued) |
Commodity Price Risk
The Company is exposed to changes in prices of commodities used in its operations, primarily associated with energy, such as natural gas, and raw materials, such as asphalt and polystyrene. The Company enters into cash-settled natural gas swap contracts in certain markets to protect against changes in natural gas prices that mature within 15 months; however, no financial instruments are currently used to protect against changes in raw material costs. At December 31, 2024, the net fair value of such swap contracts was an asset of $3 million. An increase of 10% in the underlying commodity prices would result in an increase in fair value of $4 million as of December 31, 2024. This amount excludes the offsetting impact of the price risk inherent in the physical purchase of the underlying commodities.
| | | | | |
| ITEM 8. | FINANCIAL STATEMENTS AND SUPPLEMENTARY DATA |
INDEX TO CONSOLIDATED FINANCIAL STATEMENTS
December 31, 2024
Management’s Report on Internal Control Over Financial Reporting
Management of the Company is responsible for establishing and maintaining adequate internal control over financial reporting as such term is defined in Rules 13a-15(f) and 15d-15(f) under the Securities Exchange Act of 1934.
Management has assessed the effectiveness of the Company’s internal control over financial reporting as of December 31, 2024 based on criteria established in the Internal Control-Integrated Framework in 2013 issued by the Committee of Sponsoring Organizations of the Treadway Commission (COSO).
On May 15, 2024, the Company completed its acquisition of Masonite International Corporation ("Masonite"). As a result, the Company's management excluded the operations of Masonite from its assessment of internal control over financial reporting as of December 31, 2024. Masonite represented 11% of the Company's consolidated total assets as of December 31, 2024, and 13% of the Company's consolidated Net sales for the year ended December 31, 2024. SEC guidelines permit companies to omit an acquired entity's internal control over financial reporting from its management assessment during the first year of the acquisition. We plan to fully integrate Masonite into our internal control over financial reporting in 2025.
PricewaterhouseCoopers LLP has audited the effectiveness of the internal controls over financial reporting as of December 31, 2024, as stated in their Report of Independent Registered Public Accounting Firm within Item 8. Financial Statements and Supplementary Data.
Based on our assessment, management determined that, as of December 31, 2024, the Company’s internal control over financial reporting was effective.
Report of Independent Registered Public Accounting Firm
To the Board of Directors and Stockholders of Owens Corning
Opinions on the Financial Statements and Internal Control over Financial Reporting
We have audited the accompanying consolidated balance sheets of Owens Corning and its subsidiaries (the "Company") as of December 31, 2024 and 2023, and the related consolidated statements of earnings, of comprehensive earnings, of stockholders’ equity and of cash flows for each of the three years in the period ended December 31, 2024, including the related notes (collectively referred to as the "consolidated financial statements"). We also have audited the Company's internal control over financial reporting as of December 31, 2024, based on criteria established in Internal Control - Integrated Framework (2013) issued by the Committee of Sponsoring Organizations of the Treadway Commission (COSO).
In our opinion, the consolidated financial statements referred to above present fairly, in all material respects, the financial position of the Company as of December 31, 2024 and 2023, and the results of its operations and its cash flows for each of the three years in the period ended December 31, 2024 in conformity with accounting principles generally accepted in the United States of America. Also in our opinion, the Company maintained, in all material respects, effective internal control over financial reporting as of December 31, 2024, based on criteria established in Internal Control - Integrated Framework (2013) issued by the COSO.
Basis for Opinions
The Company's management is responsible for these consolidated financial statements, for maintaining effective internal control over financial reporting, and for its assessment of the effectiveness of internal control over financial reporting, included in the accompanying Management’s Report on Internal Control Over Financial Reporting. Our responsibility is to express opinions on the Company’s consolidated financial statements and on the Company's internal control over financial reporting based on our audits. We are a public accounting firm registered with the Public Company Accounting Oversight Board (United States) (PCAOB) and are required to be independent with respect to the Company in accordance with the U.S. federal securities laws and the applicable rules and regulations of the Securities and Exchange Commission and the PCAOB.
We conducted our audits in accordance with the standards of the PCAOB. Those standards require that we plan and perform the audits to obtain reasonable assurance about whether the consolidated financial statements are free of material misstatement, whether due to error or fraud, and whether effective internal control over financial reporting was maintained in all material respects.
Our audits of the consolidated financial statements included performing procedures to assess the risks of material misstatement of the consolidated financial statements, whether due to error or fraud, and performing procedures that respond to those risks. Such procedures included examining, on a test basis, evidence regarding the amounts and disclosures in the consolidated financial statements. Our audits also included evaluating the accounting principles used and significant estimates made by management, as well as evaluating the overall presentation of the consolidated financial statements. Our audit of internal control over financial reporting included obtaining an understanding of internal control over financial reporting, assessing the risk that a material weakness exists, and testing and evaluating the design and operating effectiveness of internal control based on the assessed risk. Our audits also included performing such other procedures as we considered necessary in the circumstances. We believe that our audits provide a reasonable basis for our opinions.
As described in Management’s Report on Internal Control Over Financial Reporting, management has excluded Masonite International Corporation from its assessment of internal control over financial reporting as of December 31, 2024 because it was acquired by the Company in a purchase business combination during 2024. We have also excluded Masonite International Corporation from our audit of internal control over financial reporting. Masonite International Corporation is a wholly-owned subsidiary whose total assets and total revenues excluded from management’s assessment and our audit of internal control over financial reporting represent 11% and 13%, respectively, of the related consolidated financial statement amounts as of and for the year ended December 31, 2024.
Definition and Limitations of Internal Control over Financial Reporting
A company’s internal control over financial reporting is a process designed to provide reasonable assurance regarding the reliability of financial reporting and the preparation of financial statements for external purposes in accordance with generally accepted accounting principles. A company’s internal control over financial reporting includes those policies and procedures that (i) pertain to the maintenance of records that, in reasonable detail, accurately and fairly reflect the transactions and dispositions of the assets of the company; (ii) provide reasonable assurance that transactions are recorded as necessary to permit preparation of financial statements in accordance with generally accepted accounting principles, and that receipts and expenditures of the company are being made only in accordance with authorizations of management and directors of the company; and (iii) provide reasonable assurance regarding prevention or timely detection of unauthorized acquisition, use, or disposition of the company’s assets that could have a material effect on the financial statements.
Because of its inherent limitations, internal control over financial reporting may not prevent or detect misstatements. Also, projections of any evaluation of effectiveness to future periods are subject to the risk that controls may become inadequate because of changes in conditions, or that the degree of compliance with the policies or procedures may deteriorate.
Critical Audit Matters
The critical audit matters communicated below are matters arising from the current period audit of the consolidated financial statements that were communicated or required to be communicated to the audit committee and that (i) relate to accounts or disclosures that are material to the consolidated financial statements and (ii) involved our especially challenging, subjective, or complex judgments. The communication of critical audit matters does not alter in any way our opinion on the consolidated financial statements, taken as a whole, and we are not, by communicating the critical audit matters below, providing separate opinions on the critical audit matters or on the accounts or disclosures to which they relate.
Acquisition of Masonite – Valuation of Certain Customer Relationships
As described in Notes 1 and 7 to the consolidated financial statements, on May 15, 2024, the Company completed the acquisition of Masonite for a total purchase price of $3.2 billion. Of the acquired intangible assets, certain customer relationships made up the majority of total customer relationships recorded of $979 million. The fair value of customer relationships was determined using the multi-period excess earnings method. Key assumptions under this method are the revenue growth rate, adjusted EBITDA margin (including the adjusted terminal EBITDA margin), customer attrition rate, discount rate, tax rate and contributory asset charges.
The principal considerations for our determination that performing procedures relating to the valuation of certain customer relationships acquired in the acquisition of Masonite is a critical audit matter are (i) the significant judgment by management when developing the fair value estimate of the customer relationships acquired; (ii) a high degree of auditor judgment, subjectivity, and effort in performing procedures and evaluating management’s significant assumptions related to the revenue growth rates, adjusted terminal EBITDA margin, customer attrition rate, discount rate, tax rate and contributory asset charges; and (iii) the audit effort involved the use of professionals with specialized skill and knowledge.
Addressing the matter involved performing procedures and evaluating audit evidence in connection with forming our overall opinion on the consolidated financial statements. These procedures included testing the effectiveness of controls relating to the acquisition accounting, including controls over management’s valuation of certain customer relationships acquired. These procedures also included, among others, (i) reading the purchase agreement; (ii) testing management’s process for developing the fair value estimate of the customer relationships acquired; (iii) evaluating the appropriateness of the multi-period excess earnings method used by management; (iv) testing the completeness and accuracy of the underlying data used in the multi-period excess earnings method; and (v) evaluating the reasonableness of the significant assumptions used by management related to the revenue growth rates, adjusted terminal EBITDA margin, customer attrition rate, discount rate, tax rate, and contributory asset charges. Evaluating management’s assumptions related to the revenue growth rates, adjusted terminal EBITDA margin, and tax rate involved considering (i) the current and past performance of the Masonite business; (ii) the consistency with external market and industry data; and (iii) whether the assumptions were consistent with evidence obtained in other areas of the audit. Professionals with specialized skill and knowledge were used to assist in evaluating (i) the appropriateness of the multi-period excess earnings method and (ii) the reasonableness of the customer attrition rate, discount rate, and contributory asset charges assumptions.
Interim Goodwill Impairment Test – Composites Reporting Unit
As described in Notes 1 and 5 to the consolidated financial statements, the Company’s goodwill balance was $2.8 billion as of December 31, 2024, and the goodwill associated with the Composites reporting unit was $423 million. Management tests goodwill for impairment as of October 1 each year, or more frequently should circumstances change or events occur that would
more likely than not reduce the fair value of a reporting unit below its carrying amount. Subsequent to the annual test for the Composites reporting unit, management performed an interim goodwill impairment test during the fourth quarter of 2024 primarily as a result of the progression of the strategic review of the glass reinforcements business, which resulted in no impairment for the reporting unit. Management estimates fair value using a discounted cash flow approach from the perspective of a market participant, as well as the market approach. Significant assumptions used to determine fair value of the Composites reporting unit are the revenue growth rates, earnings before interest and taxes (“EBIT”) margins, long-term growth rate, and the discount rate.
The principal considerations for our determination that performing procedures relating to the interim goodwill impairment test of the Composites reporting unit is a critical audit matter are (i) the significant judgment by management when developing the fair value estimate of the Composites reporting unit; (ii) a high degree of auditor judgment, subjectivity and effort in performing procedures and evaluating management’s significant assumptions in the discounted cash flow approach related to revenue growth rates, EBIT margins, the long-term growth rate and discount rate for a portion of the Composites reporting unit; and (iii) the audit effort involved the use of professionals with specialized skill and knowledge.
Addressing the matter involved performing procedures and evaluating audit evidence in connection with forming our overall opinion on the consolidated financial statements. These procedures included testing the effectiveness of controls relating to management’s goodwill impairment test, including controls over the valuation of the Composites reporting unit. These procedures also included, among others (i) testing management’s process for developing the fair value estimate; (ii) evaluating the appropriateness of the discounted cash flow and market approaches used by management; (iii) testing the completeness and accuracy of data used in the discounted cash flow and market approaches; and (iv) evaluating the reasonableness of the significant assumptions used by management related to the revenue growth rates, EBIT margins, long-term growth rate and discount rate for a portion of the Composites reporting unit. Evaluating management’s assumptions related to the revenue growth rates and EBIT margins for a portion of the Composites reporting unit involved evaluating whether the assumptions used by management were reasonable considering (i) the current and past performance of a portion of the Composites reporting unit; (ii) the consistency with external market and industry data; and (iii) whether the assumptions were consistent with evidence obtained in other areas of the audit. Professionals with specialized skill and knowledge were used to assist in evaluating (i) the appropriateness of the discounted cash flow and market approaches and (ii) the reasonableness of the long-term growth rate and discount rate assumptions.
| | |
| /s/ PricewaterhouseCoopers LLP |
| Toledo, Ohio |
| February 24, 2025 |
We have served as the Company’s auditor since 2002.
OWENS CORNING AND SUBSIDIARIES
CONSOLIDATED STATEMENTS OF EARNINGS
(in millions, except per share amounts)
| | | | | | | | | | | | | | | | | |
| | Twelve Months Ended December 31, |
| | 2024 | | 2023 | | 2022 |
| NET SALES | $ | 10,975 | | | $ | 9,677 | | | $ | 9,761 | |
| COST OF SALES | 7,721 | | | 6,994 | | | 7,145 | |
| Gross margin | 3,254 | | | 2,683 | | | 2,616 | |
| OPERATING EXPENSES | | | | | |
| Marketing and administrative expenses | 1,044 | | | 831 | | | 803 | |
| Science and technology expenses | 144 | | | 123 | | | 106 | |
| | | | | |
| Loss on sale of business | 91 | | | — | | | — | |
| Impairment due to strategic review | 483 | | | — | | | — | |
| Gain on sale of site | — | | | (189) | | | — | |
| Gain on equity method investment | — | | | — | | | (130) | |
| Other expense, net | 365 | | | 106 | | | 123 | |
| Total operating expenses | 2,127 | | | 871 | | | 902 | |
| OPERATING INCOME | 1,127 | | | 1,812 | | | 1,714 | |
| Non-operating (income) expense, net | (1) | | | 145 | | | (9) | |
| EARNINGS BEFORE INTEREST AND TAXES | 1,128 | | | 1,667 | | | 1,723 | |
| Interest expense, net | 212 | | | 76 | | | 109 | |
| | | | | |
| EARNINGS BEFORE TAXES | 916 | | | 1,591 | | | 1,614 | |
| Income tax expense | 275 | | | 401 | | | 373 | |
| Equity in net earnings of affiliates | 6 | | | 3 | | | — | |
| NET EARNINGS | 647 | | | 1,193 | | | 1,241 | |
| Net loss attributable to non-redeemable and redeemable noncontrolling interests | — | | | (3) | | | — | |
| NET EARNINGS ATTRIBUTABLE TO OWENS CORNING | $ | 647 | | | $ | 1,196 | | | $ | 1,241 | |
| EARNINGS PER COMMON SHARE ATTRIBUTABLE TO OWENS CORNING COMMON STOCKHOLDERS | | | | | |
| Basic | $ | 7.45 | | | $ | 13.27 | | | $ | 12.85 | |
| Diluted | $ | 7.37 | | | $ | 13.14 | | | $ | 12.70 | |
| | | | | |
| | | | | |
| | | | | |
| | | | | |
| | | | | |
The accompanying Notes to the Consolidated Financial Statements are an integral part of these Statements.
OWENS CORNING AND SUBSIDIARIES
CONSOLIDATED STATEMENTS OF COMPREHENSIVE EARNINGS
(in millions)
| | | | | | | | | | | | | | | | | | | | |
| | | Twelve Months Ended December 31, |
| | | 2024 | | 2023 | | 2022 |
| NET EARNINGS | $ | 647 | | | $ | 1,193 | | | $ | 1,241 | |
| Other comprehensive (loss) income, net of tax | | | | | |
| Currency translation adjustment (net of tax of $0, $(2) and $(1), for the periods ended December 31, 2024, 2023 and 2022, respectively) | (221) | | | 61 | | | (104) | |
| Pension and other postretirement adjustment (net of tax of $(5), $(36) and $(3), for the periods ended December 31, 2024, 2023 and 2022, respectively) | 15 | | | 105 | | | 17 | |
| Hedging adjustment (net of tax of $(4), $(4) and $6, for the periods ended December 31, 2024, 2023 and 2022, respectively) | 13 | | | 11 | | | (16) | |
| Total other comprehensive (loss) income, net of tax | (193) | | | 177 | | | (103) | |
| TOTAL COMPREHENSIVE EARNINGS | 454 | | | 1,370 | | | 1,138 | |
| Comprehensive loss attributable to non-redeemable and redeemable noncontrolling interests | (6) | | | (4) | | | (3) | |
| COMPREHENSIVE EARNINGS ATTRIBUTABLE TO OWENS CORNING | $ | 460 | | | $ | 1,374 | | | $ | 1,141 | |
| | | | | | |
The accompanying Notes to the Consolidated Financial Statements are an integral part of these Statements.
OWENS CORNING AND SUBSIDIARIES
CONSOLIDATED BALANCE SHEETS
(in millions)
| | | | | | | | | | | |
| December 31, |
| ASSETS | 2024 | | 2023 |
| CURRENT ASSETS | | | |
| Cash and cash equivalents | $ | 361 | | | $ | 1,615 | |
| Receivables, less allowance of $4 at December 31, 2024 and $11 at December 31, 2023 | 1,244 | | | 987 | |
| Inventories | 1,587 | | | 1,198 | |
| | | |
| Other current assets | 186 | | | 117 | |
| Total current assets | 3,378 | | | 3,917 | |
| Property, plant and equipment, net | 4,164 | | | 3,841 | |
| Operating lease right-of-use assets | 414 | | | 222 | |
| Goodwill | 2,843 | | | 1,392 | |
| Intangible assets, net | 2,688 | | | 1,528 | |
| Deferred income taxes | 54 | | | 24 | |
| Other non-current assets | 534 | | | 313 | |
| TOTAL ASSETS | $ | 14,075 | | | $ | 11,237 | |
| LIABILITIES AND EQUITY | | | |
| CURRENT LIABILITIES | | | |
| Accounts payable | $ | 1,430 | | | $ | 1,216 | |
| | | |
| Current operating lease liabilities | 87 | | | 62 | |
| Long-term debt – current portion | 38 | | | 431 | |
| Other current liabilities | 742 | | | 615 | |
| Total current liabilities | 2,297 | | | 2,324 | |
| Long-term debt, net of current portion | 5,116 | | | 2,615 | |
| Pension plan liability | 49 | | | 69 | |
| Other employee benefits liability | 102 | | | 112 | |
| Non-current operating lease liabilities | 375 | | | 165 | |
| Deferred income taxes | 719 | | | 427 | |
| Other liabilities | 297 | | | 315 | |
| Total liabilities | 8,955 | | | 6,027 | |
| Redeemable noncontrolling interest | — | | | 25 | |
| OWENS CORNING STOCKHOLDERS’ EQUITY | | | |
| Preferred stock, par value $0.01 per share (a) | — | | | — | |
| Common stock, par value $0.01 per share (b) | 1 | | | 1 | |
| Additional paid in capital | 4,228 | | | 4,166 | |
| Accumulated earnings | 5,224 | | | 4,794 | |
| Accumulated other comprehensive deficit | (691) | | | (503) | |
| Cost of common stock in treasury (c) | (3,685) | | | (3,292) | |
| Total Owens Corning stockholders’ equity | 5,077 | | | 5,166 | |
| Noncontrolling interests | 43 | | | 19 | |
| Total equity | 5,120 | | | 5,185 | |
| TOTAL LIABILITIES AND EQUITY | $ | 14,075 | | | $ | 11,237 | |
(a)10 shares authorized; none issued or outstanding at December 31, 2024 and December 31, 2023
(b)400 shares authorized; 135.5 issued and 85.4 outstanding at December 31, 2024; 135.5 issued and 87.2 outstanding at December 31, 2023
(c)50.1 shares at December 31, 2024 and 48.3 shares at December 31, 2023
The accompanying Notes to the Consolidated Financial Statements are an integral part of these Statements.
OWENS CORNING AND SUBSIDIARIES
CONSOLIDATED STATEMENTS OF STOCKHOLDERS’ EQUITY
(in millions)
| | | | | | | | | | | | | | | | | |
| December 31, |
| 2024 | | 2023 | | 2022 |
| Total equity, beginning of period | $ | 5,185 | | | $ | 4,596 | | | $ | 4,355 | |
| Common stock, $0.01 par value per share | | | | | |
| Beginning of period | 1 | | | 1 | | | 1 | |
| | | | | |
| | | | | |
| End of period | 1 | | | 1 | | | 1 | |
| | | | | |
| Treasury stock, $0.01 par value per share | | | | | |
| Beginning of period | (3,292) | | | (2,678) | | | (1,922) | |
| Issuance of common stock under share-based payment plans | 95 | | | 48 | | | 39 | |
| Purchase of treasury stock | (488) | | | (662) | | | (795) | |
| End of period | (3,685) | | | (3,292) | | | (2,678) | |
| | | | | |
| Additional paid-in capital (APIC): | | | | | |
| Beginning of period | 4,166 | | | 4,139 | | | 4,092 | |
| Redeemable noncontrolling interest adjustment to redemption value | (1) | | | (2) | | | (2) | |
| Reductions of noncontrolling interest | — | | | — | | | 8 | |
| Issuance of common stock under share-based payment plans | (65) | | | (22) | | | (10) | |
| Stock-based compensation expense | 93 | | | 51 | | | 51 | |
| Fair value of awards included in transaction consideration | 35 | | | — | | | — | |
| End of period | 4,228 | | | 4,166 | | | 4,139 | |
| | | | | |
| Accumulated earnings: | | | | | |
| Beginning of period | 4,794 | | | 3,794 | | | 2,706 | |
| Net earnings attributable to Owens Corning | 647 | | | 1,196 | | | 1,241 | |
| Dividends declared (Dividend declarations of $2.49 per share as of December 31, 2024, $2.16 per share as of December 31, 2023, and $1.57 per share as of December 31, 2022.) | (217) | | | (196) | | | (153) | |
| End of period | 5,224 | | | 4,794 | | | 3,794 | |
| | | | | |
| Accumulated other comprehensive earnings/deficit (AOCI): | | | | | |
| Beginning of period | (503) | | | (681) | | | (581) | |
| Currency translation adjustment | (216) | | | 62 | | | (101) | |
| Pension and other postretirement adjustment (net of tax) | 15 | | | 105 | | | 17 | |
| Deferred gain (loss) on hedging transactions (net of tax) | 13 | | | 11 | | | (16) | |
| End of period | (691) | | | (503) | | | (681) | |
| | | | | |
| Noncontrolling Interest (NCI): | | | | | |
| Beginning of period | 19 | | | 21 | | | 39 | |
| Net earnings attributable to non-redeemable noncontrolling interests | — | | | 1 | | | 2 | |
| Return of capital to non-redeemable noncontrolling interests | (3) | | | — | | | — | |
| Dividends distributed to non-redeemable noncontrolling interests | (3) | | | (2) | | | — | |
| Currency translation adjustment | (5) | | | (1) | | | (3) | |
| Purchases (reductions) of noncontrolling interest | 35 | | | — | | | (17) | |
| End of period | 43 | | | 19 | | | 21 | |
| | | | | |
| Total equity, end of period | $ | 5,120 | | | $ | 5,185 | | | $ | 4,596 | |
| | | | | |
| Common shares outstanding: | | | | | |
| Beginning of period | 87.2 | | | 91.9 | | | 100.4 | |
| Issuance of common stock under share-based payment plans | 1.1 | | | 1.1 | | | 0.7 | |
| Purchase of treasury stock | (2.9) | | | (5.8) | | | (9.2) | |
| End of period | 85.4 | | | 87.2 | | | 91.9 | |
| | | | | |
| Treasury shares outstanding: | | | | | |
| Beginning of period | 48.3 | | | 43.6 | | | 35.1 | |
| Issuance of common stock under share-based payment plans | (1.1) | | | (1.1) | | | (0.7) | |
| Purchase of treasury stock | 2.9 | | | 5.8 | | | 9.2 | |
| End of period | 50.1 | | | 48.3 | | | 43.6 | |
The accompanying Notes to the Consolidated Financial Statements are an integral part of these Statements.
OWENS CORNING AND SUBSIDIARIES
CONSOLIDATED STATEMENTS OF CASH FLOWS
(in millions)
| | | | | | | | | | | | | | | | | | |
| | Twelve Months Ended December 31, | |
| | 2024 | | 2023 | | 2022 | |
| NET CASH FLOW PROVIDED BY OPERATING ACTIVITIES | | | | | | |
| Net earnings | $ | 647 | | | $ | 1,193 | | | $ | 1,241 | | |
| Adjustments to reconcile net earnings to cash provided by operating activities | | | | | | |
| Depreciation and amortization | 677 | | | 609 | | | 531 | | |
| Loss on sale of business | 91 | | | — | | | — | | |
| Impairment due to strategic review | 483 | | | — | | | — | | |
| | | | | | |
| Deferred income taxes | (92) | | | 26 | | | 37 | | |
| | | | | | |
| Pension annuity settlement charge | — | | | 145 | | | — | | |
| Stock-based compensation expense | 93 | | | 51 | | | 51 | | |
| | | | | | |
| Intangible assets impairment charge | — | | | — | | | 96 | | |
| | | | | | |
| | | | | | |
| Gains on sale certain precious metals | (19) | | | (2) | | | (18) | | |
| Gain on equity method investment | — | | | — | | | (130) | | |
| Gain on sale of site | — | | | (189) | | | — | | |
| Net loss on sale of assets or affiliates | — | | | — | | | 36 | | |
| Other adjustments to reconcile net earnings to cash provided by operating activities | (15) | | | (44) | | | 4 | | |
| Change in operating assets and liabilities: | | | | | | |
| Changes in receivables, net | 6 | | | (26) | | | (14) | | |
| Changes in inventories | (43) | | | 148 | | | (287) | | |
| Changes in accounts payable and accrued liabilities | 13 | | | (158) | | | 363 | | |
| Changes in other operating assets and liabilities | 71 | | | 3 | | | (81) | | |
| | | | | | |
| Pension fund contribution | (7) | | | (18) | | | (8) | | |
| Payments for other employee benefits liabilities | (10) | | | (11) | | | (11) | | |
| | | | | | |
| Other | (3) | | | (8) | | | (50) | | |
| Net cash flow provided by operating activities | 1,892 | | | 1,719 | | | 1,760 | | |
| NET CASH FLOW USED BY INVESTING ACTIVITIES | | | | | | |
| Cash paid for property, plant and equipment | (647) | | | (526) | | | (446) | | |
| Derivative settlements | — | | | — | | | 44 | | |
| Proceeds from the sale of assets or affiliates | 115 | | | 194 | | | 212 | | |
| Investment in subsidiaries and affiliates, net of cash acquired | (2,857) | | | (6) | | | (417) | | |
| | | | | | |
| | | | | | |
| | | | | | |
| Other | (4) | | | (18) | | | (16) | | |
| Net cash flow used by investing activities | (3,393) | | | (356) | | | (623) | | |
| NET CASH FLOW PROVIDED (USED) BY FINANCING ACTIVITIES | | | | | | |
| Proceeds from senior revolving credit and receivables securitization facilities | 720 | | | — | | | — | | |
| Payments on senior revolving credit and receivables securitization facilities | (720) | | | — | | | — | | |
| Proceeds from term loan borrowing | 2,784 | | | — | | | — | | |
| Payments on term loan borrowing | (2,800) | | | — | | | — | | |
| Proceeds from long-term debt | 1,968 | | | — | | | — | | |
| Payments on long-term debt | (873) | | | — | | | — | | |
| Purchase of noncontrolling interest | — | | | — | | | (9) | | |
| Dividends paid | (208) | | | (188) | | | (136) | | |
| | | | | | |
| Purchases of treasury stock | (491) | | | (657) | | | (795) | | |
| Finance lease payments | (41) | | | (33) | | | (30) | | |
| Other | (5) | | | 1 | | | (4) | | |
| Net cash flow provided (used) by financing activities | 334 | | | (877) | | | (974) | | |
| Effect of exchange rate changes on cash | (87) | | | 30 | | | (22) | | |
| Net (decrease) increase in cash, cash equivalents and restricted cash | (1,254) | | | 516 | | | 141 | | |
| Cash, cash equivalents and restricted cash at beginning of period | 1,623 | | | 1,107 | | | 966 | | |
| CASH, CASH EQUIVALENTS AND RESTRICTED CASH AT END OF PERIOD | $ | 369 | | | $ | 1,623 | | | $ | 1,107 | | |
| | | | | | |
| | | | | | |
| | | | | | |
The accompanying Notes to the Consolidated Financial Statements are an integral part of these Statements.
OWENS CORNING AND SUBSIDIARIES
NOTES TO CONSOLIDATED FINANCIAL STATEMENTS
1. BUSINESS AND SUMMARY OF SIGNIFICANT ACCOUNTING POLICIES
Unless the context requires otherwise, the terms “Owens Corning,” “Company,” “we” and “our” in these notes refer to Owens Corning and its subsidiaries.
Description of Business
Owens Corning, a Delaware corporation, is a residential and commercial building products leader committed to building a sustainable future through material innovation. The Company operates within four segments: Roofing, Insulation, Doors and Composites. Through these lines of business, Owens Corning manufactures and sells products worldwide. We are a market leader in many of our major product categories.
Acquisition of Masonite International Corporation
On May 15, 2024, the Company acquired all of the outstanding shares of Masonite International Corporation (“Masonite”) at a purchase price of $133.00 per share (the "Arrangement"). Masonite is a leading global designer, manufacturer, marketer and distributor of interior and exterior doors and door systems for residential new construction and residential repair and remodeling. The addition of Masonite's market-leading doors business creates a new growth platform for the Company, strengthening the Company's position in building and construction and expanding its offering of branded residential building products.
Masonite's operating results and preliminary purchase price allocation have been included in the Company's newly established Doors reportable segment from May 15, 2024, the effective date of the Arrangement, within the Consolidated Financial Statements. Please refer to Note 7 of the Consolidated Financial Statements for further information.
Glass Reinforcements Divestiture
On February 13, 2025, the Company entered into a definitive agreement for the sale of the global glass reinforcements (“GR”) business for a purchase price of approximately $436 million, less costs to sell. The sale will complete Owens Corning’s review of strategic alternatives for the business, announced on February 9, 2024, and aligns with the strategy to reshape the Company to focus on residential and commercial building products in North America and Europe. During 2024, the Company incurred $46 million of costs related to this review. Please refer to Note 23 of the Consolidated Financial Statements for further information.
Dividends
On February 6, 2025, the Board of Directors declared a quarterly dividend of $0.69 per common share payable on April 10, 2025 to shareholders of record as of March 10, 2025.
Basis of Presentation
The accompanying Consolidated Financial Statements have been prepared in accordance with accounting principles generally accepted in the United States.
Principles of Consolidation
The Consolidated Financial Statements of the Company include the accounts of majority-owned subsidiaries. Intercompany accounts and transactions are eliminated.
Reclassifications
Certain reclassifications have been made to the 2023 and 2022 Consolidated Financial Statements and Notes to the Consolidated Financial Statements to conform to the classifications used in 2024.
Use of Estimates and Assumptions
The preparation of financial statements in conformity with accounting principles generally accepted in the United States requires management to make estimates and assumptions that affect the reported amounts of assets and liabilities and disclosure of contingent assets and liabilities at the date of the financial statements and the reported amounts of revenues and expenses during the reporting period. Actual results could differ materially from those estimates.
OWENS CORNING AND SUBSIDIARIES
NOTES TO CONSOLIDATED FINANCIAL STATEMENTS (continued)
1. BUSINESS AND SUMMARY OF SIGNIFICANT ACCOUNTING POLICIES (continued)
Revenue Recognition
We recognize revenue as the amount of consideration that we expect to receive in exchange for transferring promised goods or services to customers. We do not adjust the transaction price for the effects of a significant financing component, as the time period between control transfer of goods and services and expected payment is one year or less. At the time of sale, we estimate provisions for different forms of variable consideration (discounts, rebates, returns and other refund liabilities) based on historical experience, current conditions and contractual obligations, as applicable. The estimated transaction price is typically not subject to significant reversals. We adjust these estimates when the most likely amount of consideration we expect to receive changes, although these changes are typically minor. Sales, value-added and other similar taxes that we collect are excluded from revenue.
Many of our customer volume commitments are short-term and our performance obligations are generally limited to single purchase orders. Substantially all of our revenue is recognized at a point-in-time when control of goods transfers to the customer. Control transfer typically occurs when goods are shipped from our facilities or at other predetermined control transfer points (for instance, destination terms or consignment arrangements).
We typically do not satisfy performance obligations without obtaining an unconditional right to payment from customers and, therefore, do not carry contract asset balances on the Consolidated Balance Sheets. Contract liability balances are recorded separately from receivables on the Consolidated Balance Sheets in either Total current liabilities or Other liabilities, depending on the timing of performance obligation satisfaction.
We sell separately-priced warranties that extend certain product and workmanship coverages beyond our standard product warranty, which is described in Note 12. The up-front consideration on extended warranty contracts is deferred and recognized as revenue over time, based on the respective coverage period, ranging from 16 to 20 years. On an annual basis, we expect to recognize approximately $9 million of revenue associated with these extended warranty contracts. Additionally, in certain limited cases, we receive consideration before goods or services are transferred to the customer. These customer down payments and deposits are deferred, and typically recognized as revenue in the following quarters when we satisfy the related performance obligations.
As of December 31, 2024, our contract liability balances (for extended warranties, down payments and deposits, collectively) totaled $118 million. As of December 31, 2023, our contract liability balances totaled $101 million, of which $21 million was recognized as revenue throughout 2024. As of December 31, 2022, our contract liability balances (for extended warranties, down payments and deposits, collectively) totaled $89 million, of which $18 million was recognized as revenue throughout 2023. As of December 31, 2021, our contract liability balances (for extended warranties, down payments and deposits, collectively) totaled $76 million, of which $17 million was recognized as revenue throughout 2022.
As a practical expedient, we recognize incremental costs of obtaining a contract, if any, as an expense when incurred if the amortization period of the asset would have been one year or less. We do not have any costs to obtain or fulfill a contract that are capitalized under Accounting Standards Codification (“ASC”) 606.
Cost of Sales
Cost of sales includes material, labor, energy and manufacturing overhead costs, including depreciation and amortization expense associated with the manufacture and distribution of the Company’s products. Provisions for warranties are provided in the same period that the related sales are recorded and are based on historical experience, current conditions and contractual obligations, as applicable. Distribution costs include inbound freight costs; purchasing and receiving costs; inspection costs; warehousing costs; shipping and handling costs, which include costs incurred relating to preparing, packaging, and shipping products to customers; and other costs of the Company’s distribution network. We account for shipping and handling activities that occur after control of the related good transfers as fulfillment activities instead of performance obligations. All shipping and handling costs billed to the customer are included as net sales in the Consolidated Statements of Earnings.
Marketing and Administrative Expenses
Marketing and administrative expenses on the Consolidated Statements of Earnings are primarily related to employee salary and benefits, outside service fees, contributions to retirement plans, healthcare plans and other administrative expenses. Marketing and advertising expenses are included in Marketing and administrative expenses. These costs include advertising and marketing communications, which are expensed the first time the advertisement takes place. Marketing and advertising expenses for the years ended December 31, 2024, 2023 and 2022 were $148 million, $134 million and $125 million, respectively.
OWENS CORNING AND SUBSIDIARIES
NOTES TO CONSOLIDATED FINANCIAL STATEMENTS (continued)
1. BUSINESS AND SUMMARY OF SIGNIFICANT ACCOUNTING POLICIES (continued)
Science and Technology Expenses
The Company incurs certain expenses related to science and technology. These expenses include salaries, building and equipment costs, utilities, administrative expenses, materials and supplies associated with the improvement and development of the Company’s products and manufacturing processes. These costs are expensed as incurred.
Earnings per Share
Basic earnings per share are computed using the weighted-average number of common shares outstanding during the period. Diluted earnings per share reflect the dilutive effect of common equivalent shares and increased shares that would result from the conversion of equity securities. The effects of anti-dilution are not presented.
Cash, Cash Equivalents and Restricted Cash
The Company defines cash and cash equivalents as cash and time deposits with maturities of three months or less when purchased. Restricted cash primarily represents amounts received from a counterparty related to its performance assurance on an executory contract, and is included in Other current assets on the Consolidated Balance Sheets. These amounts are contractually required to be set aside, and the counterparty can exchange the cash for another form of performance assurance at its discretion. Please refer to Note 22 for additional disclosures related to Supplemental Cash Flow Information.
Accounts Receivable
Trade accounts receivable are recorded at the invoiced amount and do not bear interest. Consistent with the requirements of ASU 2016-13, “Financial Instruments - Credit Losses (Topic 236),” the allowance for credit losses is based on the Company’s assessment of the expected losses of customer accounts. The Company regularly reviews the allowance by considering factors such as historical experience, credit quality, the age of the accounts receivable balances, and current economic conditions that may affect a customer’s ability to pay. Account balances are charged off against the allowance when the Company believes it is probable the receivable will not be recovered.
Inventory Valuation
Inventory costs include material, labor, and manufacturing overhead costs, including depreciation and amortization expense associated with the manufacture and distribution of the Company’s products. Inventories are stated at lower of cost or net realizable value and expense estimates are made for excess and obsolete inventories. Cost is determined by the first-in, first-out (“FIFO”) method.
Investments in Affiliates
The Company accounts for investments in affiliates of 20% to 50% ownership when the Company does not have a controlling financial interest using the equity method under which the Company’s share of earnings and losses of the affiliate is reflected in earnings, and dividends are credited against the investment in affiliate when declared. Investments in affiliates are recorded in Other non-current assets on the Consolidated Balance Sheets, and as of December 31, 2024 and 2023, the total value of investments was $86 million and $29 million, respectively.
Goodwill and Other Intangible Assets
Goodwill assets are not amortized but are tested for impairment on at least an annual basis. The Company has the option to use a qualitative approach to determine whether it is more likely than not that the fair value of a reporting unit is less than its carrying value as a basis for determining whether it is necessary to perform a quantitative test. In the current year, as part of the annual assessment, the Company used both a qualitative and quantitative approach to determine whether the fair value of a reporting unit was less than its carrying amount.
Events and circumstances we consider in performing the qualitative assessment include macro-economic conditions, market and industry conditions, internal cost factors, and the operational stability and the overall financial performance of the reporting units. When it is determined necessary for the Company to perform the quantitative testing process for goodwill, the Company estimates fair values using a discounted cash flow approach from the perspective of a market participant. Significant assumptions used in the discounted cash flow approach are revenue growth rates and earnings before interest and taxes (“EBIT”) margins used in estimating discrete period cash flow forecasts of the reporting unit, the discount rate, and the long-term revenue growth rate and EBIT margin used in estimating the terminal business value. The cash flow forecasts of the reporting units are based upon management’s long-term view of our markets and are the forecasts that are used by senior
OWENS CORNING AND SUBSIDIARIES
NOTES TO CONSOLIDATED FINANCIAL STATEMENTS (continued)
1. BUSINESS AND SUMMARY OF SIGNIFICANT ACCOUNTING POLICIES (continued)
management and the Board of Directors to evaluate operating performance. The discount rate utilized is management’s estimate of what the market’s weighted average cost of capital is for a company with a similar debt rating and stock volatility, as measured by beta. The terminal business value is determined by applying the long-term growth rate to the latest year for which a forecast exists. As part of our goodwill quantitative testing process, we would evaluate whether there are reasonably likely changes to management’s estimates that would have a material impact on the results of the goodwill impairment testing.
Other indefinite-lived intangible assets are not amortized but are tested for impairment on at least an annual basis or when determined to have a finite useful life. Substantially all of the indefinite-lived intangible assets are in trademarks and trade names. The Company uses the royalty relief approach to determine whether it is more likely than not that the fair value of these assets is less than its carrying amount. This review is performed annually, or when circumstances arise which indicate there may be impairment. When applying the royalty relief approach, the Company performs a discounted cash flow analysis based on the value derived from owning these trademarks and trade names and being relieved from paying royalty to third parties. Significant assumptions used include the discrete period revenue growth rates, long-term revenue growth rate, royalty rates, discount rates and terminal value.
The inputs for the goodwill and indefinite-lived intangible tests are considered Level 3 inputs under the fair value hierarchy as they are the Company’s own data, and are unobservable in the marketplace. Indefinite-lived intangible assets purchased through acquisitions are generally tested qualitatively for impairment in the first year following the acquisition before transitioning to the standard methodology described herein in subsequent years.
Please refer to Note 5 for additional disclosures related to Goodwill and Other Intangible Assets.
Emissions Rights
The Company is allotted carbon emission credit allowances (“emissions rights”) from several of the governments under which it operates. These emissions rights are recorded at market value as of the date of issuance and are classified as Intangible assets on the Consolidated Balance Sheets. When the Company emits more than the allotted amounts, additional emissions rights must be purchased.
Property, Plant and Equipment
Property, plant and equipment are stated at cost and depreciated over their estimated useful lives using the straight-line method. The range of useful lives for the major components of the Company’s property, plant and equipment is as follows:
| | | | | |
| Useful Life (Years) |
| Buildings and leasehold improvements | 15 – 40 years |
| Machinery and equipment | |
| Furnaces | 4 – 15 years |
| Information systems | 5 – 10 years |
| Equipment | 5 – 20 years |
When assets are retired or otherwise disposed, their carrying values and accumulated depreciation are removed from the accounts and any gain or loss is included in the Consolidated Statements of Earnings. Expenditures for normal maintenance and repairs are expensed as incurred.
Precious metals used in our production tooling are included in property, plant and equipment and are depleted as they are consumed during the production process. Depletion typically represents an annual expense of 2% of the outstanding value and is recorded in Cost of sales on the Consolidated Statements of Earnings.
Leases
The Company leases certain equipment and facilities under both operating and finance leases expiring on various dates through 2050. The nature of these leases generally fall into the following five categories: real estate, material handling equipment, fleet vehicles, office equipment and energy equipment.
OWENS CORNING AND SUBSIDIARIES
NOTES TO CONSOLIDATED FINANCIAL STATEMENTS (continued)
1. BUSINESS AND SUMMARY OF SIGNIFICANT ACCOUNTING POLICIES (continued)
For leases with initial terms greater than 12 months, we consider these our right-of-use assets and record the related asset and obligation at the present value of lease payments over the term. For leases with initial terms equal to or less than 12 months, we do not consider them as right-of-use assets and instead consider them short-term lease costs that are recognized on a straight-line basis over the lease term.
Our leases may include escalation clauses, renewal options and/or termination options that are factored into our determination of lease payments when reasonably certain. These options to extend or terminate a lease are at our discretion. We have elected to take the practical expedient and not separate lease and non-lease components of contracts. We estimate our incremental borrowing rate to discount the lease payments based on information available at lease commencement. Our lease agreements do not contain any material residual value guarantees.
Asset Impairments
The Company evaluates tangible and intangible long-lived assets for impairment when triggering events have occurred. This requires significant assumptions including projected cash flows, projected income tax rate and terminal business value. These inputs are considered Level 3 inputs under the fair value hierarchy as they are the Company’s own data and are unobservable in the marketplace. Changes in management intentions, market conditions or operating performance could indicate that impairment charges might be necessary that could be material to the Company’s Consolidated Financial Statements in any given period.
Please refer to Note 5, Note 6 and Note 10 for additional detail on impairment charges recorded in 2022 and 2024.
Supplier Finance Programs
We review supplier terms and conditions on an ongoing basis, and have negotiated payment terms extensions in recent years in connection with our efforts to reduce working capital and improve cash flow. Separate from those terms extension actions, certain of our subsidiaries have entered into paying agency agreements with third-party administrators. These voluntary supply chain finance programs (collectively, the “Programs”) generally give participating suppliers the ability to sell, or otherwise pledge as collateral, their receivables from the Company to the participating financial institutions, at the sole discretion of both the suppliers and financial institutions. The Company is not a party to the arrangements between the suppliers and the financial institutions. The Company’s obligations to its suppliers, including amounts due and scheduled payment dates, are not impacted by the suppliers’ decisions to sell, or otherwise pledge as collateral, amounts under these arrangements. The Company's payment terms to the financial institutions, including the timing and amount of payments, are based on the original supplier invoices. One of our Programs includes a parent guarantee to the participating financial institution for a certain U.S. subsidiary that, at the time of the respective program’s inception in 2015, was a guarantor subsidiary of the Company’s credit agreement. The obligations are presented as Accounts payable within Total current liabilities on the Consolidated Balance Sheets and all activity related to the obligations is presented within operating activities on the Consolidated Statements of Cash Flow.
The Company's outstanding obligations under the Programs for the twelve months ended December 31, 2024 and 2023 are as follows:
| | | | | | | | | | | |
| Twelve Months Ended December 31, |
| (In millions) | 2024 | | 2023 |
| Confirmed obligations outstanding at the beginning of the year | $ | 211 | | | $ | 234 | |
| Invoices confirmed during the year | 566 | | | 569 | |
| Confirmed invoices paid during the year | (543) | | | (592) | |
| Confirmed obligations outstanding at the end of the year | $ | 234 | | | $ | 211 | |
OWENS CORNING AND SUBSIDIARIES
NOTES TO CONSOLIDATED FINANCIAL STATEMENTS (continued)
1. BUSINESS AND SUMMARY OF SIGNIFICANT ACCOUNTING POLICIES (continued)
Income Taxes
The Company recognizes current tax liabilities and assets for the estimated taxes payable or refundable on the tax returns for the current year. Deferred tax balances reflect the impact of temporary differences between the carrying amount of assets and liabilities and their tax basis. Amounts are stated at enacted tax rates expected to be in effect when taxes are actually paid or recovered. In addition, realization of certain deferred tax assets is dependent upon our ability to generate future taxable income. The Company records a valuation allowance to reduce its deferred tax assets to the amount that it believes is more likely than not to be realized. In addition, the Company estimates tax reserves to cover potential taxing authority claims for income taxes and interest attributable to audits of open tax years. Please refer to Note 21 for additional disclosures related to Income Taxes.
Taxes Collected from Customers and Remitted to Government Authorities and Taxes Paid to Vendors
Taxes are assessed by various governmental authorities at different rates on many different types of transactions. The Company charges sales tax or value-added tax (“VAT”) on sales to customers where applicable, as well as captures and claims back all available VAT that has been paid on purchases. VAT is recorded in separate payable or receivable accounts and does not affect Net Sales or Cost of Sales line items on the Consolidated Statement of Earnings. VAT receivable is recorded as a percentage of qualifying purchases at the time the vendor invoice is processed. VAT payable is recorded as a percentage of qualifying sales at the time an Owens Corning sale to a customer subject to VAT occurs. Amounts are paid to the taxing authority according to the method and collection prescribed by local regulations. Where applicable, VAT payable is netted against VAT receivable. The Company also pays sales tax to vendors who include a tax, required by government regulations, to the purchase price charged to the Company.
Pension and Other Postretirement Benefits
Accounting for pensions and other postretirement benefits involves estimating the cost of benefits to be provided well into the future and attributing that cost over the time period each employee works. To accomplish this, extensive use is made of assumptions about investment returns, discount rates, inflation, mortality, turnover and medical costs. Please refer to Notes 15 and 16 for additional disclosures related to pension plans and other postretirement benefits, respectively.
Derivative Financial Instruments
The Company recognizes all derivative instruments as either assets or liabilities at fair value on the balance sheet. Please refer to Note 4 for further disclosure on derivatives.
The Company performs an analysis for effectiveness of its derivatives designated as hedging instruments at the end of each quarter based on the terms of the contracts and the underlying items being hedged. The change in the fair value of cash flow hedges is deferred in Accumulated other comprehensive deficit (“AOCI”) and is subsequently recognized in Cost of sales (for commodity and foreign currency cash flow hedges) on the Consolidated Statements of Earnings in order to mirror the location of the hedged items impacting earnings. Cash settlements for commodity and foreign currency hedges qualifying as cash flow hedges are included in Operating activities in the Consolidated Statements of Cash Flows.
The Company has translation exposure resulting from translating the financial statements of foreign subsidiaries into U.S. Dollars, which is recognized in Currency translation adjustment (a component of AOCI). The Company uses cross-currency forward contracts to hedge portions of the net investment in foreign subsidiaries against fluctuations in foreign exchange rates. The changes in fair values of these derivative instruments are recognized in Currency translation adjustment (a component of AOCI), with recognition of the excluded components amortized to Interest expense, net on the Consolidated Statements of Earnings. Cash settlements for derivatives qualifying as net investment hedges are included in Investing activities in the Consolidated Statements of Cash Flows.
The Company uses forward currency exchange contracts to manage existing exposures to foreign exchange rate risks related to assets and liabilities recorded on the Consolidated Balance Sheets. Gains and losses resulting from the changes in fair value of these instruments are recorded in Other expense, net on the Consolidated Statements of Earnings, and are substantially offset by net revaluation impacts on foreign currency denominated balance sheet exposures (which are also recorded in Other expense, net). Cash settlements for non-designated derivatives are included in the Consolidated Statements of Cash Flows in the category that is consistent with the nature of the derivative instrument, which is generally the same category as the underlying item being hedged.
OWENS CORNING AND SUBSIDIARIES
NOTES TO CONSOLIDATED FINANCIAL STATEMENTS (continued)
1. BUSINESS AND SUMMARY OF SIGNIFICANT ACCOUNTING POLICIES (continued)
Fair Value Measurements
The carrying value of cash and cash equivalents, accounts receivable and short-term debt approximate fair value because of the short-term maturity of the instruments.
Please refer to Notes 4, 7, 14, 15 and 16 for fair value disclosures of derivative financial instruments, acquisitions, long-term debt, pension plans and postemployment and postretirement benefits other than pensions.
Foreign Currency
The functional currency of the Company’s subsidiaries is generally the applicable local currency. Assets and liabilities of foreign subsidiaries are translated into United States Dollars at the period-end rate of exchange, and their Statements of Earnings (Loss) and Statements of Cash Flows are converted at the monthly average rate. The resulting translation adjustment is included in AOCI in the Consolidated Balance Sheets and Consolidated Statements of Stockholders’ Equity. Transaction gains and losses that arise from exchange rate fluctuations on transactions denominated in a currency other than the functional currency are recorded in Other expense, net in the Consolidated Statements of Earnings as incurred. As discussed in the Derivative Financial Instruments section above, the Company uses non-designated foreign currency derivative financial instruments to mitigate this risk. The Company recorded foreign currency transactional losses, net of associated derivative activity, of less than $1 million for the year ended December 31, 2024. The Company recorded foreign currency transactional losses, net of associated derivative activity, of $2 million and $4 million during the years ended December 31, 2023 and 2022, respectively. Please refer to Note 4 for additional disclosures related to non-designated derivatives.
Related Party Transactions
In the first quarter of 2021, a related party relationship was established as a result of a member of the Company’s Board of Directors being named an executive officer of one of the Company’s preexisting suppliers. The related party transactions with this supplier consist of the purchase of raw materials. Purchases from the related party supplier were $100 million, $92 million and $129 million for the twelve months ended December 31, 2024, 2023 and 2022, respectively. As of December 31, 2024, 2023 and 2022, amounts due to the related party supplier were $3 million, $5 million and $3 million, respectively.
Failed Sale-Leaseback - Fort Smith, Arkansas Municipal Tax Incentive
In the fourth quarter of 2023, the Company signed a municipal tax incentive agreement, as part of which, the Company sold its Fort Smith, Arkansas plant and equipment (together, the “facility”) to the municipality of Fort Smith for cash of $165 million. The Company then, on the same day, entered into an agreement to lease the facility from the municipality of Fort Smith over ten years for a total lease liability of $165 million and immediately purchased ten-year municipal bonds at 6.7% interest issued by the municipality of Fort Smith with cash of $165 million. In the Consolidated Statements of Cash Flows, the cash proceeds from the sale of the facility and the cash used for the bond purchase are presented on a net basis within the Net cash flows used by investing activities.
The monthly lease payments under the financing lease obligation and the semi-annual bond coupon payments associated with the bond investment are legally offset and, as such, the offset lease obligation and bond investment amounts are presented on a net basis on the Consolidated Balance Sheets. There will be no cash payments made by either party over the ten-year period. At the termination of the lease agreement, a non-cash exchange will occur where the municipality will call the bond and return title of the facility to the Company.
The Company will have the opportunity to purchase additional bonds representing the incremental capital expenditures up to $240 million. In the fourth quarter of 2024, the Company sold additional equipment purchased after the initial bonds for cash of $15 million. Accordingly, on December 27, 2024, the Company purchased additional ten-year municipal bonds at 6.7% interest issued by the municipality of Fort Smith with cash of $15 million based on eligible spend incurred in 2024. In the Consolidated Statements of Cash Flows, the cash proceeds from the sale of the equipment and the cash used for the bond purchase are presented on a net basis within the Net cash flows used by investing activities.
The transactions did not qualify for sale-leaseback treatment under ASC 842 and, therefore, the plant’s net book value, as well as the net book value of the equipment sold, remains in Property, plant and equipment, net on the Consolidated Balance Sheets. Depreciation expense on the assets sold remains within Cost of Sales on the Consolidated Statements of Earnings.
OWENS CORNING AND SUBSIDIARIES
NOTES TO CONSOLIDATED FINANCIAL STATEMENTS (continued)
1. BUSINESS AND SUMMARY OF SIGNIFICANT ACCOUNTING POLICIES (continued)
Accounting Pronouncements
The following table summarizes recent Accounting Standard Updates (“ASU”) issued by the Financial Accounting Standards Board (“FASB”) that could have an impact on the Company's Consolidated Financial Statements:
| | | | | | | | | | | |
| Standard | Description | Effective Date for Company | Effect on the Consolidated Financial Statements |
| ASU 2025-01, "Income Statement—Reporting Comprehensive Income—Expense Disaggregation Disclosures (Subtopic 220-40)" | The amendment in this update clarifies the effective date of update 2024-03, which is that public business entities are required to adopt the guidance in interim periods within annual reporting periods beginning after December 15, 2027. | January 1, 2027 | We are currently assessing the impact adopting this standard will have on our Consolidated Financial Statement disclosures. We do not believe the adoption of this guidance will have a material effect on our results of operations. |
| ASU 2024-03, "Income Statement – Reporting Comprehensive Income- Expense Disaggregation Disclosures (Subtopic 220-40) | The amendments in this update require disclosure, in the notes to financial statements, of specified information about certain costs and expenses. | January 1, 2027 | We are currently assessing the impact adopting this standard will have on our Consolidated Financial Statement disclosures. We do not believe the adoption of this guidance will have a material effect on our results of operations. |
| ASU 2024-02 "Codification Improvements - Amendments to Remove References to the Concepts Statements" | Amendments in this update remove references to various FASB Concepts Statements. | January 1, 2025 | We have assessed and determined that this guidance does not have a material effect on our Consolidated Financial Statements. |
| ASU 2024-01 "Compensation - Stock Compensation" (Topic 718): Scope Application of Profits Interest and Similar Awards" | This amendment adds an illustrative example to demonstrate how an entity should apply the scope guidance in paragraph 718-10-15-3 to determine whether profits interest and similar awards should be accounted for in accordance with Topic 718. | January 1, 2025 | We have assessed and determined that this guidance does not have a material effect on our Consolidated Financial Statements. |
| ASU 2023-09 “Income Taxes (Topic 740): Improvements to Income Tax Disclosures” | This standard modifies the rate reconciliation and income taxes paid disclosures by requiring consistent categories and greater disaggregation of information in the rate reconciliation, as well as requiring income taxes paid to be disaggregated by jurisdiction. | January 1, 2025 | We have assessed and determined that this guidance does not have a material effect on our Consolidated Financial Statement disclosures. |
| ASU 2023-07 “Segment Reporting (Topic 280): Improvements to Reportable Segment Disclosures” | The amendments in this update improve reportable segment disclosure requirements, primarily through enhanced disclosures about significant segment expenses. | January 1, 2024 | We have adopted and determined that this guidance does not have a material effect on our Consolidated Financial Statement disclosures. |
| ASU 2023-06 “Disclosure Improvements” | The amendments in this update modify the disclosure or presentation requirements of a variety of Topics | The effective date for each topic is contingent on future SEC rule setting. | We are currently assessing the impact adopting this standard will have on our Consolidated Financial Statement disclosures. We do not believe the adoption of this guidance will have a material effect on our results of operations. |
OWENS CORNING AND SUBSIDIARIES
NOTES TO CONSOLIDATED FINANCIAL STATEMENTS (continued)
2. SEGMENT INFORMATION
The Company has four reportable segments: Roofing, Insulation, Doors and Composites. Accounting policies for the segments are the same as those for the Company. The Company’s four reportable segments are defined as follows:
Roofing – Within our Roofing segment, the Company manufactures and sells residential roofing shingles, oxidized asphalt materials and roofing components primarily used in residential and commercial construction.
Insulation – Within our Insulation segment, the Company manufactures and sells thermal and acoustical batts, loosefill insulation, spray foam insulation, foam sheathing and accessories. It also manufactures and sells glass fiber pipe insulation, energy efficient flexible duct media, bonded and granulated stone wool insulation, cellular glass insulation and foam insulation used in above- and below-grade construction applications.
Doors - Within our new Doors segment, the Company manufactures and sells interior and exterior doors and door systems primarily used in residential construction.
Composites – Within our Composites segment, the Company manufactures, fabricates and sells glass reinforcements in the form of fiber. Glass reinforcement materials are also used by the Composites segment to manufacture and sell high value applications in the form of non-wovens, fabrics and composite lumber.
NET SALES
The following tables show a disaggregation of our net sales by segment and geographic region. Corporate eliminations (shown below) largely reflect intercompany sales from Composites to Roofing. External customer sales are attributed to geographic region based upon the location from which the product is sold to the external customer.
| | | | | | | | | | | | | | | | | | | | | |
| Twelve Months Ended December 31, 2024 |
| (In millions) | Roofing | Insulation | Doors | Composites | | Eliminations | Consolidated |
| Disaggregation Categories | | | | | | | |
| U.S. residential | $ | 3,867 | | $ | 1,578 | | $ | 1,127 | | $ | 476 | | | $ | (323) | | $ | 6,725 | |
| U.S. commercial and industrial | 128 | | 809 | | — | | 715 | | | (9) | | $ | 1,643 | |
| Total United States | 3,995 | | 2,387 | | 1,127 | | 1,191 | | | (332) | | $ | 8,368 | |
| Europe | — | | 711 | | 143 | | 450 | | | (3) | | $ | 1,301 | |
| Asia-Pacific | — | | 133 | | 1 | | 355 | | | — | | $ | 489 | |
| Rest of world | 57 | | 461 | | 177 | | 122 | | | — | | $ | 817 | |
| NET SALES | $ | 4,052 | | $ | 3,692 | | $ | 1,448 | | $ | 2,118 | | | $ | (335) | | $ | 10,975 | |
| | | | | | | | | | | | | | | | | | | | |
| Twelve Months Ended December 31, 2023 |
| (In millions) | Roofing | Insulation | Doors | Composites | Eliminations | Consolidated |
| Disaggregation Categories | | | | | | |
| U.S. residential | $ | 3,781 | | $ | 1,407 | | $ | — | | $ | 359 | | $ | (296) | | $ | 5,251 | |
| U.S. commercial and industrial | 137 | | 869 | | — | | 845 | | (8) | | $ | 1,843 | |
| Total United States | 3,918 | | 2,276 | | — | | 1,204 | | (304) | | $ | 7,094 | |
| Europe | 19 | | 771 | | — | | 492 | | (3) | | $ | 1,279 | |
| Asia-Pacific | 1 | | 147 | | — | | 429 | | — | | $ | 577 | |
| Rest of world | 92 | | 474 | | — | | 161 | | — | | $ | 727 | |
| NET SALES | $ | 4,030 | | $ | 3,668 | | $ | — | | $ | 2,286 | | $ | (307) | | $ | 9,677 | |
OWENS CORNING AND SUBSIDIARIES
NOTES TO CONSOLIDATED FINANCIAL STATEMENTS (continued)
2. SEGMENT INFORMATION (continued)
| | | | | | | | | | | | | | | | | | | | |
| Twelve Months Ended December 31, 2022 |
| (In millions) | Roofing | Insulation | Doors | Composites | Eliminations | Consolidated |
| Disaggregation Categories | | | | | | |
| U.S. residential | $ | 3,355 | | $ | 1,523 | | $ | — | | $ | 352 | | $ | (262) | | $ | 4,968 | |
| U.S. commercial and industrial | 160 | | 796 | | — | | 872 | | (4) | | $ | 1,824 | |
| Total United States | 3,515 | | 2,319 | | — | | 1,224 | | (266) | | $ | 6,792 | |
| Europe | 21 | | 805 | | — | | 671 | | (5) | | $ | 1,492 | |
| Asia-Pacific | 6 | | 160 | | — | | 550 | | — | | $ | 716 | |
| Rest of world | 116 | | 430 | | — | | 215 | | — | | $ | 761 | |
| NET SALES | $ | 3,658 | | $ | 3,714 | | $ | — | | $ | 2,660 | | $ | (271) | | $ | 9,761 | |
Our contracts with customers are broadly similar in nature throughout our reportable segments, but the amount, timing and uncertainty of revenue and cash flows may vary in each reportable segment due to geographic and end-market economic factors.
Sales to major customer - The Company had two customers that exceeded 10% of consolidated net sales for the twelve months ended December 31, 2024. The first customer, which is a customer of the Roofing, Insulation and Doors segments, accounted for approximately 13% of the Company's consolidated net sales in 2024. The second customer, which is a customer of both the Roofing and Insulation segments, accounted for approximately 11% of the Company's consolidated sales in 2024 and 2023. No individual customers accounted for 10% or more of consolidated sales in 2022.
In the United States, sales are primarily related to the residential housing market and commercial and industrial applications. Residential market demand is driven by housing starts and repair and remodeling activity (influenced by existing home sales, seasonal home improvement and damage from major storms). Significant portions of our residential products across our four reportable segments are used interchangeably in both new construction and repair and remodeling, and our customers typically distribute (or use) the products for both applications. U.S. commercial and industrial revenues are largely driven by U.S. industrial production growth, commercial construction activity and overall economic conditions in the U.S.
Outside of the United States (Europe, Asia-Pacific and Rest of world), sales are primarily related to commercial and industrial applications and, to a lesser extent, residential applications in certain countries. Throughout the international regions, demand is primarily driven by industrial production growth, commercial construction activity and overall economic conditions in each respective geographical region.
EARNINGS BEFORE INTEREST AND TAXES
The Company identifies the Chief Executive Officer as the chief operating decision maker ("CODM"). In applying the criteria set forth in the standards for reporting information about segments in financial statements, we have determined that we have four reportable segments – Roofing, Insulation, Doors and Composites. The key factors used to identify these reportable segments are the organization and alignment of our internal operations and the nature of our products. The CODM uses Earnings Before Interest and Taxes ("EBIT") for each reportable segment to assess segment performance and make decisions on the allocation of resources. Segment EBIT targets are established on an annual basis and used by the CODM throughout the year to compare with actual results. Quarterly forecasts supplement annual targets and provide incremental information utilized to assess the performance of a segment. Segment EBIT variance analysis further provides insight into segment operational cost optimization.
The Company does not regularly provide significant segment expense detail to the CODM. EBIT by segment consists of net sales less related costs and expenses, which are mainly comprised of cost of sales and marketing and administrative costs. EBIT is presented on a basis that is used internally for evaluating segment performance. Certain items, such as general corporate expenses or income and certain other expense or income items, are excluded from the internal evaluation of segment performance. Accordingly, these items are not reflected in EBIT for our reportable segments and are included within Corporate, Other and Eliminations.
OWENS CORNING AND SUBSIDIARIES
NOTES TO CONSOLIDATED FINANCIAL STATEMENTS (continued)
2. SEGMENT INFORMATION (continued)
The following table summarizes EBIT by segment:
| | | | | | | | | | | | | | | | | | |
| | Twelve Months Ended December 31, | |
| (In millions) | 2024 | | 2023 | | 2022 | |
| Reportable Segments | | | | | | |
| Roofing | $ | 1,298 | | | $ | 1,174 | | | $ | 831 | | |
| Insulation | 682 | | | 619 | | | 612 | | |
| Doors | 99 | | | — | | | — | | |
| Composites | 215 | | | 242 | | | 498 | | |
| Total reportable segments | 2,294 | | | 2,035 | | | 1,941 | | |
| Corporate, Other and Eliminations | | | | | | |
| Restructuring costs | (86) | | | (169) | | | (48) | | |
| Gain on sale of Santa Clara, California site | — | | | 189 | | | — | | |
| Pension settlement losses | — | | | (145) | | | — | | |
| Acquisition-related integration costs | (83) | | | — | | | — | | |
| Gain on sale of Shanghai, China facility | — | | | — | | | 27 | | |
| Gains on sale of certain precious metals | 19 | | | 2 | | | 18 | | |
| Strategic review-related charges | (46) | | | — | | | — | | |
| Intangible assets impairment charge | — | | | — | | | (96) | | |
| Acquisition-related transaction costs | (49) | | | — | | | (7) | | |
| Loss on sale of business | (91) | | | — | | | — | | |
| | | | | | |
| Recognition of acquisition inventory fair value step-up | (18) | | | — | | | — | | |
| | | | | | |
| | | | | | |
| Impairment due to strategic review | (483) | | | — | | | | |
| Paroc marine recall | (58) | | | (15) | | | — | | |
| Loss on sale of Chambery, France DUCS business | — | | | — | | | (30) | | |
| Loss on sale of Russian operations | — | | | — | | | (33) | | |
| Gain on remeasurement of Fiberteq equity investment | — | | | — | | | 130 | | |
| Impairment of venture investments | (15) | | | — | | | — | | |
| General corporate expense and other | (256) | | | (230) | | | (179) | | |
| Total Corporate, other and eliminations | (1,166) | | | (368) | | | (218) | | |
| CONSOLIDATED EBIT | 1,128 | | | 1,667 | | | 1,723 | | |
| Interest expense, net | 212 | | | 76 | | | 109 | | |
| | | | | | |
| EARNINGS BEFORE TAXES | $ | 916 | | | $ | 1,591 | | | $ | 1,614 | | |
| | | | | | |
OWENS CORNING AND SUBSIDIARIES
NOTES TO CONSOLIDATED FINANCIAL STATEMENTS (continued)
2. SEGMENT INFORMATION (continued)
TOTAL ASSETS AND PROPERTY, PLANT AND EQUIPMENT
The following table summarizes total assets by segment:
| | | | | | | | | | | |
| December 31, |
| (In millions) | 2024 | | 2023 |
| Net assets allocated to reportable segments | | | |
| Roofing | $ | 2,026 | | | $ | 1,863 | |
| Insulation | 3,912 | | | 3,934 | |
| Doors | 4,454 | | | — | |
| Composites | 2,523 | | | 3,153 | |
| Total net assets allocated to reportable segments | 12,915 | | | 8,950 | |
| Net assets not allocated to reportable segments | | | |
| Cash and cash equivalents | 361 | | | 1,615 | |
| Noncurrent deferred income taxes | 54 | | | 24 | |
| Investments in affiliates | 86 | | | 29 | |
| | | |
| Corporate property, plant and equipment, other assets and eliminations | 659 | | | 619 | |
| CONSOLIDATED TOTAL ASSETS | $ | 14,075 | | | $ | 11,237 | |
The following table summarizes total property, plant and equipment, net by geographic region:
| | | | | | | | | | | |
| December 31, |
| (In millions) | 2024 | | 2023 |
| United States | $ | 3,114 | | | $ | 2,508 | |
| Europe | 573 | | | 606 | |
| Asia-Pacific | 167 | | | 462 | |
| Rest of world | 310 | | | 265 | |
| CONSOLIDATED PROPERTY, PLANT AND EQUIPMENT, NET | $ | 4,164 | | | $ | 3,841 | |
| | | |
| | | |
Property, plant and equipment, net in any single country, excluding the United States, was less than 10% of consolidated property, plant and equipment, net.
OWENS CORNING AND SUBSIDIARIES
NOTES TO CONSOLIDATED FINANCIAL STATEMENTS (continued)
2. SEGMENT INFORMATION (continued)
DEPRECIATION AND AMORTIZATION EXPENSE
The following table summarizes the depreciation and amortization expense by segment:
| | | | | | | | | | | | | | | | | |
| | Twelve Months Ended December 31, |
| (In millions) | 2024 | | 2023 | | 2022 |
| Reportable Segments | | | | | |
| Roofing | $ | 62 | | | $ | 64 | | | $ | 62 | |
| Insulation | 210 | | | 210 | | | 206 | |
| Doors | 133 | | | — | | | — | |
| Composites | 182 | | | 172 | | | 175 | |
| Total reportable segments | 587 | | | 446 | | | 443 | |
| General corporate depreciation and amortization (a) | 90 | | | 163 | | | 88 | |
| CONSOLIDATED DEPRECIATION AND AMORTIZATION EXPENSE | $ | 677 | | | $ | 609 | | | $ | 531 | |
(a)In 2024, 2023 and 2022, General corporate depreciation and amortization expense included $13 million, $101 million and $26 million, respectively, of accelerated depreciation and amortization related to restructuring actions further explained in Note 13 to the Consolidated Financial Statements.
ADDITIONS TO PROPERTY, PLANT AND EQUIPMENT
The following table summarizes cash paid for property, plant and equipment by segment:
| | | | | | | | | | | | | | | | | |
| | Twelve Months Ended December 31, |
| (In millions) | 2024 | | 2023 | | 2022 |
| Reportable Segments | | | | | |
| Roofing | $ | 125 | | | $ | 65 | | | $ | 50 | |
| Insulation | 221 | | | 182 | | | 196 | |
| Doors | 73 | | | — | | | — | |
| Composites | 173 | | | 212 | | | 151 | |
| Total reportable segments | 592 | | | 459 | | | 397 | |
| General corporate additions | 55 | | | 67 | | | 49 | |
| CONSOLIDATED ADDITIONS TO PROPERTY, PLANT AND EQUIPMENT | $ | 647 | | | $ | 526 | | | $ | 446 | |
| | | | | |
| | | | | |
3. INVENTORIES
Inventories consist of the following: | | | | | | | | | | | |
| December 31, |
| (In millions) | 2024 | | 2023 |
| Finished goods | $ | 868 | | | $ | 742 | |
| Materials and supplies | 719 | | | 456 | |
| Total inventories | $ | 1,587 | | | $ | 1,198 | |
| | | |
| | | |
4. DERIVATIVE FINANCIAL INSTRUMENTS
The Company is exposed to, among other risks, the impact of changes in commodity prices, foreign currency exchange rates, and interest rates in the normal course of business. The Company’s risk management program is designed to manage the exposure and volatility arising from these risks, and utilizes derivative financial instruments to offset a portion of these risks. The Company uses derivative financial instruments only to the extent necessary to hedge identified business risks, and does not enter into such transactions for trading purposes.
OWENS CORNING AND SUBSIDIARIES
NOTES TO CONSOLIDATED FINANCIAL STATEMENTS (continued)
4. DERIVATIVE FINANCIAL INSTRUMENTS (continued)
The Company generally does not require collateral or other security with counterparties to these financial instruments and is therefore subject to credit risk in the event of nonperformance; however, the Company monitors credit risk and currently does not anticipate nonperformance by other parties. Contracts with counterparties generally contain right of offset provisions. These provisions effectively reduce the Company’s exposure to credit risk in situations where the Company has gain and loss positions outstanding with a single counterparty. It is the Company’s policy to offset on the Consolidated Balance Sheets the amounts recognized for derivative instruments with any cash collateral arising from derivative instruments executed with the same counterparty under a master netting agreement. As of December 31, 2024 and 2023, the Company did not have any amounts on deposit with any of its counterparties, nor did any of its counterparties have any amounts on deposit with the Company.
Derivative Fair Values
Our derivatives consist of natural gas forward swaps, cross-currency swaps, foreign exchange forward contracts and U.S. treasury rate lock agreements, all of which are over-the-counter and not traded through an exchange. The Company uses widely accepted valuation tools to determine fair value, such as discounting cash flows to calculate a present value for the derivatives. The models use Level 2 inputs, which are observable market-based inputs or unobservable inputs that are corroborated by market data. Examples include forward curves and other commonly quoted observable transactions and prices. The fair value of our derivatives and hedging instruments are all classified as Level 2 investments within the three-tier hierarchy.
The following table presents the fair value of derivatives and hedging instruments and the respective location on the Consolidated Balance Sheets:
| | | | | | | | | | | | | | | | | |
| | | | Fair Value at |
| (In millions) | Location | | December 31, 2024 | | December 31, 2023 |
| Derivative assets designated as hedging instruments: | | | | | |
| | | | | |
| | | | | |
| | | | | |
| | | | | |
| Cash flow hedges: | | | | | |
| Natural gas forward swaps | Other current assets | | $ | 4 | | | $ | — | |
| | | | | |
| | | | | |
| | | | | |
| | | | | |
| | | | | |
| Derivative liabilities designated as hedging instruments: | | | | | |
| | | | | |
| | | | | |
| | | | | |
| | | | | |
| | | | | |
| | | | | |
| | | | | |
| Cash flow hedges: | | | | | |
| Natural gas forward swaps | Other current liabilities | | $ | 1 | | | $ | 15 | |
| | | | | |
| | | | | |
| | | | | |
| | | | | |
| | | | | |
| | | | | |
| Derivative assets not designated as hedging instruments: | | | | | |
| | | | | |
| Foreign exchange forward contracts | Other current assets | | $ | 1 | | | $ | 1 | |
| | | | | |
| Derivative liabilities not designated as hedging instruments: | | | | | |
| | | | | |
| Foreign exchange forward contracts | Other current liabilities | | $ | 2 | | | $ | 1 | |
OWENS CORNING AND SUBSIDIARIES
NOTES TO CONSOLIDATED FINANCIAL STATEMENTS (continued)
4. DERIVATIVE FINANCIAL INSTRUMENTS (continued)
Consolidated Statements of Earnings Activity
The following table presents the impact and respective location of derivative activities on the Consolidated Statements of Earnings:
| | | | | | | | | | | | | | |
| | Twelve Months Ended
December 31, |
| (In millions) | Location | 2024 | 2023 | 2022 |
| Derivative activity designated as hedging instruments: | | | | |
| Natural gas cash flow hedges: | | | | |
| Amount of loss (gain) reclassified from AOCI (as defined below) into earnings (a) | Cost of sales | $ | 17 | | $ | 52 | | $ | (52) | |
| | | | |
| | | | |
| | | | |
| Cross-currency swap net investment hedges: | | | | |
| Amount of gain recognized in earnings on derivative amounts excluded from effectiveness testing | Interest expense, net | $ | — | | $ | — | | $ | (1) | |
| | | | |
| Treasury interest rate lock: | | | | |
| Amount of (gain) reclassified from AOCI (as defined below) into earnings (a) | Interest expense, net | $ | (1) | | $ | — | | $ | — | |
| Derivative activity not designated as hedging instruments: | | | | |
| | | | |
| | | | |
| Foreign currency: | | | | |
| Amount of (gain) loss recognized in earnings (b) | Other expense, net | $ | (5) | | $ | 10 | | $ | (29) | |
| Treasury interest rate lock: | | | | |
| Amount of gain recognized in earnings | Other expense, net | $ | — | | $ | — | | $ | (6) | |
| | | | |
(a)Accumulated Other Comprehensive Earnings (Deficit) (“AOCI”)
(b)(Gains) losses related to foreign currency derivatives were substantially offset by net revaluation impacts on foreign currency denominated balance sheet exposures, which were also recorded in Other expense, net. Please refer to the “Other Derivatives” section below for additional detail.
Consolidated Statements of Comprehensive Earnings Activity
The following table presents the impact of derivative activities on the Consolidated Statements of Comprehensive Earnings:
| | | | | | | | | | | | | | |
| | Amount of Gain (Loss) Recognized in Comprehensive Earnings |
| (In millions) | | Twelve Months Ended December 31, |
| Hedging Type | Derivative Financial Instrument | 2024 | 2023 | 2022 |
| Net investment hedge | Cross-currency swaps | $ | — | | $ | — | | $ | 5 | |
| Cash flow hedge | Natural gas forward swaps | $ | 18 | | $ | 15 | | $ | (40) | |
| Cash flow hedge | Treasury interest rate lock | $ | — | | $ | — | | $ | 20 | |
| | | | |
| | | | |
| | | | |
Cash Flow Hedges
The Company uses a combination of derivative financial instruments, which qualify as cash flow hedges, and physical contracts to manage forecasted exposure to electricity and natural gas prices. As of December 31, 2024 and 2023 the notional amounts of these natural gas forward swaps were 7 million MMBTu (or MMBTu equivalent based on U.S. and European indices). The Company has designated these natural gas forward swaps as cash flow hedges, with the last hedge maturing no later than March 2026. A net unrecognized gain of $3 million related to these natural gas forward swaps was included in AOCI as of December 31, 2024, $3 million of which is expected to be reclassified into earnings in the next 12 months.
OWENS CORNING AND SUBSIDIARIES
NOTES TO CONSOLIDATED FINANCIAL STATEMENTS (continued)
4. DERIVATIVE FINANCIAL INSTRUMENTS (continued)
In 2020, the Company entered into a $175 million forward U.S. Treasury rate lock agreement to manage the U.S. Treasury portion of its interest rate risk associated with the anticipated issuance of certain 10-year fixed rate senior notes. The Company designated this outstanding forward U.S. Treasury rate lock agreement, which expired on December 15, 2022, as a cash flow hedge. The locked fixed rate of this agreement was 0.994%. In September 2022, a gain of $6 million was recognized as a result of a change in the forecasted issuance of certain senior notes. In December 2022, the Company received cash of $37 million upon the settlement of the rate lock agreement, of which $31 million will be amortized as a component of interest expense upon the future issuance of senior notes. In May 2024, the Company issued new senior notes and began amortizing the $31 million over the life of the Company's 5.700% senior notes due 2034, of which $1 million was recognized during the twelve months ended December 31, 2024. The unrecognized gain of $30 million was included in AOCI as of December 31, 2024.
Net Investment Hedges
The Company has translation exposure resulting from translating the financial statements of foreign subsidiaries into U.S. Dollars, which is recognized in Currency translation adjustment (a component of AOCI). In the second quarter of 2022, the Company terminated the remaining cross-currency forward contracts related to the hedged portions of the net investment in foreign subsidiaries, resulting in cash proceeds of $11 million.
Other Derivatives
The Company uses forward currency exchange contracts to manage existing exposures to foreign exchange risk related to assets and liabilities recorded on the Consolidated Balance Sheets. As of December 31, 2024, the Company had notional amounts of $176 million for non-designated derivative financial instruments related to foreign currency exposures in U.S. Dollars primarily related to the Indian Rupee, Brazilian Real, South Korean Won, Chinese Yuan, Hong Kong Dollar and the European Euro. In addition, the Company had notional amounts of $98 million for non-designated derivative financial instruments related to foreign currency exposures in European Euro primarily related to the Polish Złoty, Danish Krone and the U.S. Dollar.
5. GOODWILL AND OTHER INTANGIBLE ASSETS
The Company tests goodwill and indefinite-lived intangible assets for impairment as of October 1st each year, or more frequently should circumstances change or events occur that would more likely than not reduce the fair value of a reporting unit below its carrying amount.
Goodwill
The changes in the net carrying amount of goodwill by segment are as follows:
| | | | | | | | | | | | | | | | | | | | | | | | | | | | | |
| (In millions) | Roofing | | Insulation | | Doors | | Composites | | Total |
| Gross carrying amount at December 31, 2023 | $ | 395 | | | $ | 1,520 | | | $ | — | | | $ | 425 | | | $ | 2,340 | |
| Acquisitions (see Note 7) | — | | | — | | | 1,491 | | | — | | | 1,491 | |
| | | | | | | | | |
| | | | | | | | | |
| Foreign currency translation | (3) | | | (34) | | | (13) | | | (2) | | | (52) | |
| Gross carrying amount at December 31, 2024 | 392 | | | 1,486 | | | 1,478 | | | 423 | | | 3,779 | |
| | | | | | | | | |
| Accumulated impairment losses at December 31, 2023 | — | | | (948) | | | — | | | — | | | (948) | |
| Impairment charge | — | | | (10) | | | — | | | — | | | (10) | |
| Foreign currency translation | — | | | 22 | | | — | | | — | | | 22 | |
| Accumulated impairment losses at December 31, 2024 | — | | | (936) | | | — | | | — | | | (936) | |
| | | | | | | | | |
| Balance, net of impairment at December 31, 2024 | $ | 392 | | | $ | 550 | | | $ | 1,478 | | | $ | 423 | | | $ | 2,843 | |
| | | | | | | | | |
| | | | | | | | | |
OWENS CORNING AND SUBSIDIARIES
NOTES TO CONSOLIDATED FINANCIAL STATEMENTS (continued)
5. GOODWILL AND OTHER INTANGIBLE ASSETS (continued)
| | | | | | | | | | | | | | | | | | | | | | | | | | | | | |
| (In millions) | Roofing | | Insulation | | Doors | | Composites | | Total |
| Gross carrying amount at December 31, 2022 | $ | 394 | | | $ | 1,499 | | | $ | — | | | $ | 425 | | | $ | 2,318 | |
| Acquisitions (see Note 7) | — | | | — | | | — | | | (1) | | | (1) | |
| | | | | | | | | |
| | | | | | | | | |
| Foreign currency translation | 1 | | | 21 | | | — | | | 1 | | | 23 | |
| Gross carrying amount at December 31, 2023 | 395 | | | 1,520 | | | — | | | 425 | | | 2,340 | |
| | | | | | | | | |
| Accumulated impairment losses at December 31, 2022 | — | | | (935) | | | — | | | — | | | (935) | |
| | | | | | | | | |
| Foreign currency translation | — | | | (13) | | | — | | | — | | | (13) | |
| Accumulated impairment losses at December 31, 2023 | — | | | (948) | | | — | | | — | | | (948) | |
| | | | | | | | | |
| Balance, net of impairment at December 31, 2023 | $ | 395 | | | $ | 572 | | | $ | — | | | $ | 425 | | | $ | 1,392 | |
| | | | | | | | | |
| | | | | | | | | |
Third Quarter Triggering Event
The annual impairment tests performed in the fourth quarter of 2023 indicated that the business enterprise value of the Composites reporting unit exceeded its carrying value by approximately 5%. Given this narrow cushion of Composites reporting unit fair value in excess of carrying value and the ongoing strategic review of the glass reinforcements business, the Company performed an interim goodwill impairment test as of September 30, 2024 for the Composites reporting unit. The interim testing indicated that the business enterprise value of the Composites reporting unit exceeded its carrying value by less than 10%.
Annual Impairment Test
The annual tests performed in the fourth quarter of 2024 and 2023 resulted in no impairment of goodwill. The Company elected to perform the qualitative approach on all of its reporting units. After evaluating and weighing all relevant events and circumstances, we concluded it is more likely than not that the fair value of the Roofing and Insulation reporting units exceeds their respective carrying value amounts while the Doors reporting unit business enterprise value approximates its carrying value given the acquisition that occurred in May 2024.
Given the narrow cushion of Composites reporting unit fair value in excess of carrying value as a result of the third quarter of 2024 impairment testing, the Company performed a quantitative analysis for the Composites reporting unit as of October 1, 2024. Testing indicated that the cushion remained less than 10%.
Due to the passage of time since the last quantitative analysis, the Company elected to perform a quantitative analysis for the Roofing and Insulation reporting units. The fair value of each of our reporting units was in excess of its carrying value and thus, no impairment exists. The fair value of the Roofing and Insulation reporting units continues to substantially exceeded the carrying value as of the date of our assessment.
Fourth Quarter Triggering Event
Subsequent to the annual test for the Composites reporting unit, the Company performed an interim goodwill impairment test during the fourth quarter of 2024 primarily as a result of the progression of the strategic review of the glass reinforcements business. As a result of this test, we determined that no impairment existed for the reporting unit. Testing indicated that the business enterprise value for the Composites reporting unit exceeded its carrying value by less than 5%.
There was uncertainty as to the outcome of the strategic review of our glass reinforcements business and the macroeconomic factors that impact this reporting unit. The likelihood of a future impairment could be increased by a sustained downturn in these macroeconomic factors, a change in the long-term revenue growth or profitability for this reporting unit, or the outcome of the strategic review.
As part of our quantitative testing process for goodwill of the Composites reporting unit, we estimate fair value using a discounted cash flow approach from the perspective of a market participant, as well as the market approach. For the market approach, we use market multiples derived from a set of similar companies. Significant assumptions used in the discounted cash flow approach are the revenue growth rates, EBIT margins, long-term growth rate, and the discount rate. The terminal business value is determined by applying the long-term growth rate to the latest year for which a forecast exists.
OWENS CORNING AND SUBSIDIARIES
NOTES TO CONSOLIDATED FINANCIAL STATEMENTS (continued)
5. GOODWILL AND OTHER INTANGIBLE ASSETS (continued)
Other Intangible Assets
Other intangible assets consist of the following:
| | | | | | | | | | | | | | | | | | | | | | | | | | | | | | | | | | | |
| December 31, 2024 | | December 31, 2023 |
| (In millions) | Gross Carrying Amount | | Accumulated Amortization | | Net Carrying Amount | | Gross
Carrying
Amount | | Accumulated
Amortization | | Net
Carrying
Amount |
| Indefinite-lived trademarks and trade names | $ | 1,225 | | | $ | — | | | $ | 1,225 | | | $ | 992 | | | $ | — | | | $ | 992 | |
| Amortizable intangible assets | | | | | | | | | | | |
| Customer relationships | 1,570 | | | (367) | | | 1,203 | | | 614 | | | (283) | | | 331 | |
| Technology | 373 | | | (199) | | | 174 | | | 326 | | | (203) | | | 123 | |
| Trademarks and trade names | 31 | | | (4) | | | 27 | | | 12 | | | (2) | | | 10 | |
| Other (a) | 60 | | | (1) | | | 59 | | | 74 | | | (2) | | | 72 | |
| Total other intangible assets | $ | 3,259 | | | $ | (571) | | | $ | 2,688 | | | $ | 2,018 | | | $ | (490) | | | $ | 1,528 | |
| | | | | | | | | | | |
| | | | | | | | | | | |
(a) Other primarily includes emissions rights.
Indefinite-Lived Intangible Assets
Fair values used in testing for potential impairment of our trademarks and trade names are calculated using the relief-from-royalty method by applying an estimated market value royalty rate to the forecasted revenues of the businesses that utilize those assets. The assumed cash flows from this calculation are discounted at a rate based on a market participant discount rate.
The annual test performed in the fourth quarter of 2024 resulted in no impairment of indefinite-lived intangible assets.
As of December 31, 2024, there is one indefinite-lived intangible asset that is at an increased risk of impairment, of which is used by our Insulation segment and was partially impaired in the fourth quarter of 2022. A change in the estimated long-term revenue growth rate or discount rate for the segment could increase the likelihood of a future impairment. The following table presents the carrying values of this asset as of December 31, 2024:
| | | | | |
| (In millions) | December 31, 2024 |
| European building and technical insulation trade name | $ | 84 | |
| |
All remaining indefinite-lived intangible assets substantially exceeded their carrying values as of December 31, 2024.
The annual test performed in the fourth quarter of 2023 resulted in no impairment of indefinite-lived intangible assets. As of December 31, 2023, there were two indefinite-lived intangible assets that were at an increased risk of impairment, both of which are used by our Insulation segment and were partially impaired in the fourth quarter of 2022.
The annual tests performed in the fourth quarter of 2022 resulted in impairment of five of the Company's indefinite-lived intangible assets. Based on the results of this testing, the Company recorded pre-tax non-cash impairment charges totaling $96 million in the fourth quarter of 2022. These charges were recorded in Other expense, net on the Consolidated Statements of Earnings, and were included in the Corporate, Other and Eliminations reporting category.
These charges included the following within the Insulation segment: a pre-tax impairment charge of $63 million for a trade name used by our European building and technical insulation business due to the effect of a higher discount rate, associated with rising interest rates, and general economic and geopolitical uncertainty within the European markets resulting in a slightly lower profitability outlook; a pre-tax impairment charge of $12 million related to a trademark used on global cellular glass insulation products due to the effect of a higher discount rate, associated with rising interest rates, and general economic and geopolitical uncertainty within the European markets; a pre-tax impairment charge of $8 million for a trademark used on stone wool insulation products sold in the United States due to forecasted profitability of the product line.
The remaining $13 million pre-tax impairment charge for trademarks used within the components business in our Roofing segment was due to the effect of a higher discount rate, associated with rising interest rates, and forecasted profitability of a specific product line.
OWENS CORNING AND SUBSIDIARIES
NOTES TO CONSOLIDATED FINANCIAL STATEMENTS (continued)
5. GOODWILL AND OTHER INTANGIBLE ASSETS (continued)
Definite-Lived Intangible Assets
The Company amortizes the cost of other intangible assets over their estimated useful lives which, individually, range up to 25 years. The Company's future cash flows are not materially impacted by its ability to extend or renew agreements related to its amortizable intangible assets.
During the fourth quarter of 2024, the Company determined that certain asset groups should be tested for recoverability, primarily as a result of the progression of the strategic review of the glass reinforcements business. Recoverability of the long-lived assets was measured by comparing the carrying amount of the asset groups to the future net undiscounted cash flows expected to be generated by the asset groups. Specifically for the glass reinforcements asset group, the Company used an undiscounted cash flow model giving consideration to probability weighted cash flows of differing outcomes of the strategic review. The comparison indicated that one of the asset groups, the glass reinforcements asset group, was not recoverable.
Fair value of the glass reinforcements asset group was calculated using a discounted cash flow model and market information obtained through the strategic review to estimate the fair value of the asset group, with weighting applied. As a result of the analysis performed, the Company recorded pre-tax asset impairment charges for the amount by which the carrying value exceeded its fair value of $483 million for the year ended December 31, 2024 which is included in Impairment due to strategic review on the Consolidated Statements of Earnings. These charges include $439 million related to property, plant and equipment, $30 million related to operating lease right-of-use assets and $14 million related to definite-lived intangible assets.
The primary assumption used in the fair value analysis was the weighting of the discounted cash flow model and market information. The fair value measurements are classified as Level 3 within the fair value hierarchy as defined in ASC 820, "Fair Value Measurement" due to the unobservable inputs used.
Amortization expense for intangible assets for the years ended December 31, 2024, 2023 and 2022 was $132 million, $94 million and $55 million, respectively. In 2023, amortization expense included $25 million of accelerated amortization related to restructuring actions further explained in Note 13 to the Consolidated Financial Statements.
The estimated amortization expense for intangible assets for the next five years is as follows:
| | | | | |
| (In millions) | Amortization |
| |
| 2025 | $ | 147 | |
| 2026 | $ | 132 | |
| 2027 | $ | 124 | |
| 2028 | $ | 123 | |
| 2029 | $ | 103 | |
6. PROPERTY, PLANT AND EQUIPMENT
Property, plant and equipment consist of the following:
| | | | | | | | | | | |
| December 31, |
| (In millions) | 2024 | | 2023 |
| Land | $ | 211 | | | $ | 168 | |
| Buildings and leasehold improvements | 1,371 | | | 1,263 | |
| Machinery and equipment | 5,727 | | | 5,402 | |
| Construction in progress | 586 | | | 665 | |
| Property, plant and equipment, gross | 7,895 | | | 7,498 | |
| Accumulated depreciation | (3,731) | | | (3,657) | |
| Property, plant and equipment, net | $ | 4,164 | | | $ | 3,841 | |
Machinery and equipment includes certain precious metals used in our production tooling, which comprise approximately 7% and 10% of total machinery and equipment as of December 31, 2024 and December 31, 2023, respectively.
OWENS CORNING AND SUBSIDIARIES
NOTES TO CONSOLIDATED FINANCIAL STATEMENTS (continued)
6. PROPERTY, PLANT AND EQUIPMENT (continued)
Our production tooling needs in our Composites segment are changing due to a strategic shift in the Company's metal ownership portfolio, as well as, in response to changes in economic and technological factors. As a result, the Company sold certain precious metals resulting in gains of $19 million for the twelve months ended months ended December 31, 2024. There were no significant sales of precious metals resulting in gains or losses during the twelve months ended December 31, 2023 and December 31, 2022. These gains are included in Other expense, net on the Consolidated Statements of Earnings and are reflected in the Corporate, Other and Eliminations reporting category. The cash proceeds from the sales are included in Net cash flow used for investing activities in the Consolidated Statements of Cash Flow.
From time-to-time we also exchange certain precious metals used in production tooling for certain other precious metals to be used in production tooling. There were no significant non-cash exchanges during the twelve months ended December 31, 2024 and December 31, 2023. During the twelve months ended December 31, 2022, these non-cash exchanges resulted in a net increase to Machinery and equipment of $18 million and gains totaling $18 million. These gains are included in Other expense, net on the Consolidated Statements of Earnings and reflected in the Corporate, Other and Eliminations reporting category. These non-cash investing activities are not included in Net cash flow used by investing activities in the Consolidated Statements of Cash Flows. We do not expect these non-cash exchanges to materially impact our current or future capital expenditure requirements or rate of depletion.
During the fourth quarter of 2024, the Company determined that certain asset groups should be tested for recoverability, primarily as a result of the progression of the strategic review of the glass reinforcements business. Recoverability of the long-lived assets was measured by comparing the carrying amount of the asset groups to the future net undiscounted cash flows expected to be generated by the asset groups. Specifically for the glass reinforcements asset group, the Company used an undiscounted cash flow model giving consideration to probability weighted cash flows of differing outcomes of the strategic review. The comparison indicated that one of the asset groups, the glass reinforcements asset group, was not recoverable.
Fair value of the glass reinforcements asset group was calculated using a discounted cash flow model and market information obtained through the strategic review to estimate the fair value of the asset group, with weighting applied. As a result of the analysis performed, the Company recorded pre-tax asset impairment charges for the amount by which the carrying value exceeded its fair value of $483 million for the year ended December 31, 2024 which is included in Impairment due to strategic review on the Consolidated Statements of Earnings. These charges include $439 million related to property, plant and equipment, $30 million related to operating lease right-of-use assets and $14 million related to definite-lived intangible assets.
The primary assumption used in the fair value analysis was the weighting of the discounted cash flow model and market information. The fair value measurements are classified as Level 3 within the fair value hierarchy as defined in ASC 820, "Fair Value Measurement" due to the unobservable inputs used.
For the years ended December 31, 2024, 2023 and 2022, depreciation expense was $503 million, $481 million and $447 million, respectively, which includes depletion expense related to precious metals used in our production tooling. In 2024, 2023 and 2022, depreciation expense included $13 million, $76 million and $26 million, respectively, of accelerated depreciation related to restructuring actions further explained in Note 13 to the Consolidated Financial Statements.
7. ACQUISITIONS
Masonite
On February 8, 2024, the Company entered into an Arrangement Agreement (the "Arrangement Agreement") with Masonite International Corporation, a British Columbia corporation ("Masonite"), pursuant to which the Company agreed to acquire all of the issued and outstanding common shares of Masonite at a purchase price of $133.00 per share (the "Arrangement"). On May 15, 2024, as determined by the Arrangement Agreement, the Company completed the acquisition of 100% of the issued and outstanding shares of Masonite for $133.00 per share in cash, without interest for a total purchase price of $3.2 billion. The acquisition was funded primarily with debt proceeds of $2.8 billion and cash on hand. Please refer to the discussion under "364-Day Credit Facility" in Note 14 of the Consolidated Financial Statements for further information.
Masonite is a leading global designer, manufacturer, marketer and distributor of interior and exterior doors and door systems for the residential new construction and residential repair and remodeling markets. The addition of Masonite's market-leading doors business creates a new growth platform for the Company, strengthening the Company's position in building and construction and expanding its offering of branded residential building products.
OWENS CORNING AND SUBSIDIARIES
NOTES TO CONSOLIDATED FINANCIAL STATEMENTS (continued)
7. ACQUISITIONS (continued)
Masonite's operating results and preliminary purchase price allocation have been included in the Company's newly established Doors reportable segment from May 15, 2024, the effective date of the Arrangement, within the Consolidated Financial Statements. Doors contributed revenues of $1,448 million and earnings of $74 million to the Company for the period from May 15, 2024 to December 31, 2024. Please refer to Note 2 of the Consolidated Financial Statements for further information.
For the twelve months ended months ended December 31, 2024, the Company incurred $49 million of transaction costs, related to the Arrangement. These expenses are included in Other expense, net on the Company's Consolidated Statements of Earnings.
The fair value of the total purchase consideration transferred was determined as follows:
| | | | | |
| (In millions) | Fair Value of Purchase Consideration |
| Closing cash consideration | $ | 2,935 | |
| Pre-combination vesting portion of fair value of Masonite outstanding equity awards converted to Owens Corning time vesting RSUs | 35 |
| Repayment of Masonite term loan facility | 216 |
| Total transaction consideration | $ | 3,186 | |
The closing cash as part of preliminary estimated consideration was calculated at the price of $133.00 per outstanding Masonite common share. At the close of the acquisition of Masonite, there were 22.07 million Masonite common shares outstanding.
The preliminary estimated fair value of Owens Corning common stock underlying Masonite outstanding equity awards that have been converted into awards with respect to Owens Corning common stock is calculated as follows:
| | | | | |
| (In millions, except share and per share amounts) | Amount |
| Number of Masonite stock awards outstanding (a) | 639,608 | |
| Exchange ratio (b) | 0.7642 |
| Owens Corning equity awards issued for Masonite outstanding equity awards | 488,778 | |
| 10-day weighted average closing share price of Owens Corning common stock (c) | $ | 174.03 | |
| Fair value of Owens Corning time vesting RSUs issued for Masonite outstanding equity awards | $ | 85 | |
| Less: Estimated fair value allocated to post-transaction compensation expense | (50) | |
| Fair value of awards included in transaction consideration | $ | 35 | |
(a) Represents the Masonite stock awards that have been converted into Owens Corning equity awards upon completion of the acquisition of Masonite, based on awards outstanding at May 15, 2024. Masonite equity awards include awards issued under various stock incentive plans of Masonite.
(b) The exchange rate was determined by the consideration amount divided by the volume weighted average closing sale price of one share of Owens Corning common stock for the ten consecutive trading days ended May 15, 2024, in accordance with the terms of the Arrangement Agreement.
(c) The ten-day weighted average closing share price was calculated for the ten consecutive trading days ended May 15, 2024, in accordance with the terms of the Arrangement Agreement.
On May 15, 2024, the effective date of the Arrangement, the Company transferred consideration to Masonite to repay the Masonite 2027 term loan facility (the "Masonite term loan facility"). This repayment was required by the change in control provision within the terms of the Masonite term loan facility.
The Company has applied the acquisition method of accounting in accordance with Accounting Standards Codification ("ASC") Topic 805, Business Combinations, and recognized assets acquired and liabilities assumed at their fair values as of the effective date of the Arrangement, with the excess purchase consideration recorded to goodwill. The Company has not yet finalized the valuation of the assets acquired and liabilities assumed as of December 31, 2024. The Company is continuing to obtain information to complete its valuation of certain assets and liabilities, and during the twelve months ended December 31, 2024, the Company recorded measurement period adjustments to the purchase price allocation. Additional adjustments may be recorded to the fair value of intangible assets, property, plant and equipment, goodwill and deferred income taxes among other items during the measurement period, a period not to exceed 12 months from the acquisition date.
OWENS CORNING AND SUBSIDIARIES
NOTES TO CONSOLIDATED FINANCIAL STATEMENTS (continued)
7. ACQUISITIONS (continued)
The following table summarizes the preliminary acquisition date fair value net of measurement period adjustments of net tangible and intangible assets acquired, net of liabilities assumed as part of the Arrangement:
| | | | | | | | | | | |
| (In millions) | As originally reported | Measurement period adjustments | As adjusted |
| Cash and cash equivalents | $ | 282 | | $ | — | | $ | 282 | |
| Receivables, net | 330 | | — | | 330 | |
| Inventories | 379 | | — | | 379 | |
| Other current assets | 82 | | (4) | | 78 | |
| Property, plant and equipment, net | 861 | | (2) | | 859 | |
| Operating lease right-of-use assets | 253 | | — | | 253 | |
| Intangible assets | 1,579 | | (221) | | 1,358 | |
| Deferred income taxes | 14 | | — | | 14 | |
| Other non-current assets | 91 | | — | | 91 | |
| Total assets | 3,871 | | (227) | | 3,644 | |
| Accounts payable | 196 | | — | | 196 | |
| Current operating lease liabilities | 28 | | — | | 28 | |
| Other current liabilities | 187 | | — | | 187 | |
| Long-term debt | 867 | | — | | 867 | |
| Non-current operating lease liabilities | 235 | | — | | 235 | |
| Deferred income taxes | 413 | | (47) | | 366 | |
| Other non-current liabilities | 32 | | 3 | | 35 | |
| Net assets acquired | 1,913 | | (183) | | 1,730 | |
| Non-controlling interest | (35) | | — | | (35) | |
| Goodwill | 1,308 | | 183 | | 1,491 | |
| Total net assets acquired | $ | 3,186 | | $ | — | | $ | 3,186 | |
The details on the methodology and significant inputs used for fair value of valuation are outlined below.
Goodwill
Preliminary purchase consideration allocation resulted in $1.5 billion in goodwill. During the twelve months ended December 31, 2024 the Company increased the value of goodwill by $183 million as a result of measurement period adjustments. The goodwill is not deductible for tax purposes. The factors contributing to the recognition of the amount of goodwill are based on several strategic and synergistic benefits that are expected to be realized from the acquisition.
Receivables
The fair value of receivables acquired is $330 million, with the gross contractual amount being $331 million. The Company expects $1 million to be uncollectible.
Inventory
The fair value of inventory was determined by the market selling price of the inventory, less the remaining manufacturing and selling costs and a normal profit margin on those manufacturing and selling efforts. The fair value of inventory has been stepped up by $18 million, this amount has been fully amortized to Cost of Sales as the inventory was sold.
Property, Plant and Equipment
The preliminary fair value of property, plant and equipment is $859 million and was determined using cost and market approaches. The cost approach reflects the amount that would be required to replace the asset to service capacity, this approach was used where there was historical data available. Where there was not historical data available the market approach was used, this approach reflects recent sales of identical or comparable assets.
OWENS CORNING AND SUBSIDIARIES
NOTES TO CONSOLIDATED FINANCIAL STATEMENTS (continued)
7. ACQUISITIONS (continued)
Intangible Assets
The preliminary fair value of acquired intangible assets is $1.4 billion. During the twelve months ended December 31, 2024, the Company reduced the value of acquired intangibles by $221 million, as we continue to obtain information used to determine the fair value during the measurement period. There were no material impacts to the Consolidated Statements of Earnings as a result of this adjustment. The fair value of customer relationships was determined using the multi-period excess earnings method. Key assumptions under this method are the revenue growth rate, adjusted EBITDA margin (including the adjusted terminal EBITDA margin), customer attrition rate, discount rate, tax rate and contributory asset charges. The fair value of trade names were determined using the relief from royalty method. Key assumptions under this method are future cash flow estimates, royalty rate and discount rate.
| | | | | | | | | | | | | | |
| (In millions, except useful life amounts) | | Estimated
Useful Life
(in years) | | Preliminary Estimated Asset Fair Value |
| Customer relationships | | 10 - 21 | | $ | 979 | |
| Technology | | 5 | | 120 | |
| Trademarks and trade names (indefinite-lived) | | Indefinite | | 240 | |
| Trademarks and trade names | | 10 | | 19 | |
| Identifiable intangible assets, net | | | | $ | 1,358 | |
Debt
The fair value of Masonite's unsecured senior notes was determined using the market approach, based on the trading value of the notes in the market.
Joint Ventures and Non-Controlling Interests
The Company's acquisition of Masonite included joint ventures with Dominance Industries, Inc., 45% owned, and Vanair Design Inc., 30% owned. The acquisition also included a 25% non-controlling interest in Sacopan Inc. for the portion owned by a third party and a 50% non-controlling interest in Magna Foremost SDN BHD for the portion owned by a third party. The value of these investments and non-controlling interests were determined using an equally weighted value from the income approach and the market approach.
Pro Forma Financial Information
The following table summarizes, on an unaudited pro forma basis, the combined results of operations of the Company for the twelve months ended December 31, 2024 and 2023, assuming the acquisition had occurred on January 1, 2023.
| | | | | | | | | | | | | | | | | | | | | | |
| | | | | | | | | | | | | Twelve months ended December 31, |
| (In millions) | | | | | | | | | 2024 | 2023 |
| Net sales | | | | | | | | | | | | | $ | 11,875 | | $ | 12,170 | |
| Net earnings | | | | | | | | | | | | | $ | 751 | | $ | 1,093 | |
| | | | | | | | | | | | | | |
The pro forma financial information includes certain adjustments to adhere to the Company's accounting policies and adjustments to the historical results with pro forma adjustments, net of tax, that assume the acquisition occurred on January 1, 2023. This includes removing the results of the Architectural segment that was sold by Masonite prior to the close of the Arrangement, an adjustment to cost of goods sold to expense the step-up of inventory to fair value, increased depreciation expense to reflect the fair value of property, plant and equipment, and increased amortization expense related to the fair value of identifiable amortizable intangible assets. Adjustments were also made to recognize transaction costs incurred by the Company in the beginning of the comparative pro forma period and remove Masonite transaction costs. In addition, adjustments were made to reflect the interest and financing costs of the 364-Day Credit Facility (as defined below) used to fund the purchase price, and the interest, discount amortization, and capitalized financing cost amortization for the 2027, 2034 and 2054 senior notes that were issued to pay off the 364-Day Credit Facility in the comparative pro forma period, see Note 14 for further detail. Finally, adjustments were made to remove interest expense for the pro forma period related to the Masonite term loan facility that was paid off at closing as part of the consideration for the Arrangement.
OWENS CORNING AND SUBSIDIARIES
NOTES TO CONSOLIDATED FINANCIAL STATEMENTS (continued)
7. ACQUISITIONS (continued)
Significant adjustments to the pro forma financial information are as follows:
1.Net sales were decreased by $119 million and $337 million for the twelve months ended December 31, 2024 and 2023, respectively, to remove the sales of the Architectural segment that was sold by Masonite prior to the close of the Arrangement.
2.Net earnings were decreased by $7 million and $70 million for the twelve months ended December 31, 2024 and 2023, respectively, to reflect increased amortization expense related to the fair value of identified amortizable intangible assets.
3.Net earnings were adjusted by $56 million, for the twelve months ended December 31, 2024, to remove transaction costs incurred by Masonite.
4.Net earnings were adjusted by $49 million each, for the twelve months ended December 31, 2024 and 2023, to move transaction costs incurred by the Company to the beginning of the comparative period.
5.Net earnings were decreased by $49 million and $107 million for the twelve months ended December 31, 2024 and 2023, respectively, to reflect the interest expense, discount amortization, and capitalized financing cost amortization for the 2027, 2034 and 2054 senior notes that were issued to pay off the 364-Day Credit Facility.
6.Net earnings were decreased by $90 million and increased by $67 million for the twelve months ended December 31, 2024 and 2023, respectively, to give effect to the tax impact of pro forma adjustments.
The pro forma financial information does not reflect any anticipated synergies or dis-synergies, operating efficiencies or cost savings that may result from the Arrangement and integration costs that may be incurred.
Fiberteq
On September 1, 2022, the Company acquired the remaining 50% interest in Fiberteq, LLC (“Fiberteq”), the joint venture between Owens Corning and IKO Industries, Ltd, which produces high-quality wet-formed fiberglass mat for roofing applications for $140 million, net of cash acquired. During the third quarter of 2023, an additional $6 million of consideration was paid as a result of final working capital adjustments. The acquisition advances the Composites strategy to focus on high-value material solutions and expands Owens Corning's capacity to produce non-woven mat. The Company's 50% interest in Fiberteq was accounted for as an equity-method investment and had a carrying value of $17 million at the acquisition date. The Company used the discounted cash flow method to remeasure the previously held equity method investment to its fair value of $147 million, resulting in the recognition of a gain of $130 million, which is recorded in Gain on equity method investment on the 2022 Consolidated Statements of Earnings. The operating results for Fiberteq have been included in the Composites segment within the Consolidated Financial Statements since the date of the acquisition. The purchase price allocation included $58 million in intangible assets, which primarily consists of customer relationships with an estimated weighted average life of 3 years, a $62 million unfavorable contract liability and $242 million in goodwill, of which 50% is tax deductible. The factors contributing to the recognition of the amount of goodwill are based on several strategic and synergistic benefits that are expected to be realized from the acquisition. The pro-forma effect of this acquisition on revenues and earnings was not material.
Natural Polymers
On August 1, 2022, the Company acquired Natural Polymers, LLC (“Natural Polymers”), an innovative manufacturer of spray polyurethane foam insulation for building and construction applications for $111 million, net of cash acquired. The acquisition advances the Owens Corning strategy to strengthen the Company's core building and construction products and expand its addressable markets into higher-growth segments. The operating results for Natural Polymers have been included in the Insulation segment within the Consolidated Financial Statements since the date of the acquisition. The purchase price allocation included $44 million in intangible assets and $62 million in goodwill, of which all is tax deductible. The intangible assets consist of definite-lived trademarks of $5 million with an estimated weighted average life of 10 years, technology of $12 million with an estimated weighted average life of 6 years and customer relationships of $27 million with an estimated weighted average life of 17 years. The factors contributing to the recognition of the amount of goodwill are based on several strategic and synergistic benefits that are expected to be realized from the acquisition. The pro-forma effect of this acquisition on revenues and earnings was not material.
OWENS CORNING AND SUBSIDIARIES
NOTES TO CONSOLIDATED FINANCIAL STATEMENTS (continued)
7. ACQUISITIONS (continued)
WearDeck®
On June 1, 2022, the Company acquired all of the outstanding assets of WearDeck®, a premium producer of composite weather-resistant decking for commercial and residential applications, for $133 million, net of cash acquired. The acquisition advances the Composites business growth strategy to focus on high-value material solutions within the building and construction industry. The operating results for WearDeck® have been included in the Composites segment within the Consolidated Financial Statements since the date of the acquisition. The purchase price allocation included $38 million in intangible assets and $68 million in goodwill, of which $61 million is tax deductible. The intangible assets consist of definite-lived trademarks of $7 million with an estimated average life of 10 years, technology of $10 million with an estimated weighted average life of 11 years and customer relationships of $21 million with an estimated weighted average life of 15 years. The factors contributing to the recognition of the amount of goodwill are based on several strategic and synergistic benefits that are expected to be realized from the acquisition. The pro-forma effect of this acquisition on revenues and earnings was not material.
8. DIVESTITURES
On March 3, 2023, the Company finalized the sale of its Insulation site in Santa Clara, California for total proceeds of $234 million, net of transaction fees. Total proceeds included a non-refundable deposit of $50 million received in the third quarter of 2021. As a result of this sale, the Company recognized a pre-tax gain of $189 million in the first quarter of 2023, which is recorded in Gain on sale of site on the Consolidated Statements of Earnings.
On November 24, 2022, the Company finalized the sale of its Russian operations within the Composites and Insulation segments. As a result of this sale, the Company received $104 million, net of cash sold, in consideration and recorded a pre-tax loss of $33 million in Other expense, net on the Consolidated Statements of Earnings.
On July 1, 2022, the Company finalized the sale of the European portion of the dry-use chopped strands (“DUCS”) product line located in Chambéry, France, within the Composites segment. As a result of this sale, the Company received $80 million, net of cash sold, in consideration and recorded a pre-tax loss of $30 million in Other expense, net on the Consolidated Statements of Earnings.
9. ASSETS HELD FOR SALE
On November 4, 2024, the Company entered into a related party agreement to sell its building materials business in China and Korea to a member of the business' management team. At this time the Company met the assets held for sale criteria. The disposal further aligns with the Company's strategy to be a more North America and Europe focused business. The transaction includes six insulation manufacturing facilities in China and a roofing manufacturing facility in Korea. The building materials business, within the Insulation segment, represents annual revenues of approximately $130 million.
The Company reclassified $2 million as held for sale within Other current liabilities on the Consolidated Balance Sheets. The Company recorded the assets at the fair value less cost to sell, which was less than the carrying value and resulted in an impairment of $91 million primarily related to Property, Plant and Equipment and Goodwill. The impairment is included in Loss on sale of business on the Consolidated Statements of Earnings. The Company estimated the fair value of these assets, less cost to sell, using Level 3 inputs.
The transaction is expected to close mid-2025, any additional loss on disposal is expected to be immaterial.
OWENS CORNING AND SUBSIDIARIES
NOTES TO CONSOLIDATED FINANCIAL STATEMENTS (continued)
10. LEASES
Balance Sheet Classification
The table below presents the lease-related assets and liabilities recorded on the balance sheet:
| | | | | | | | | | | | | | |
| (In millions) | | December 31, |
| Leases | Classification on Balance Sheet | 2024 | | 2023 |
| Assets | | | | |
| Operating lease assets | Operating lease right-of-use assets | $ | 414 | | | $ | 222 | |
| Finance lease assets | Other non-current assets | 310 | | | 149 | |
| Total lease assets | | $ | 724 | | | $ | 371 | |
| | | | |
| Liabilities | | | | |
| Current | | | | |
| Operating | Current operating lease liabilities | $ | 87 | | | $ | 62 | |
| Finance | Long-term debt – current portion | 38 | | | 32 | |
| Non-current | | | | |
| Operating | Non-current operating lease liabilities | 375 | | | 165 | |
| Finance | Long-term debt, net of current portion | 284 | | | 122 | |
| Total lease liabilities | | $ | 784 | | | $ | 381 | |
During the fourth quarter of 2024, the Company determined that certain asset groups should be tested for recoverability, primarily as a result of the progression of the strategic review of the glass reinforcements business. Recoverability of the long-lived assets was measured by comparing the carrying amount of the asset groups to the future net undiscounted cash flows expected to be generated by the asset groups. Specifically for the glass reinforcements asset group, the Company used an undiscounted cash flow model giving consideration to probability weighted cash flows of differing outcomes of the strategic review. The comparison indicated that one of the asset groups, the glass reinforcements asset group, was not recoverable.
Fair value of the glass reinforcements asset group was calculated using a discounted cash flow model and market information obtained through the strategic review to estimate the fair value of the asset group, with weighting applied. As a result of the analysis performed, the Company recorded pre-tax asset impairment charges for the amount by which the carrying value exceeded its fair value of $483 million for the year ended December 31, 2024 which is included in Impairment due to strategic review on the Consolidated Statements of Earnings. These charges include $439 million related to property, plant and equipment, $30 million related to operating lease right-of-use assets and $14 million related to definite-lived intangible assets.
The primary assumption used in the fair value analysis was the weighting of the discounted cash flow model and market information. The fair value measurements are classified as Level 3 within the fair value hierarchy as defined in ASC 820, "Fair Value Measurement" due to the unobservable inputs used.
Lease Costs
The table below presents lease-related costs:
| | | | | | | | | | | | | | | | | |
| Twelve Months Ended December 31, |
| (In millions) | 2024 | | 2023 | | 2022 |
| Operating lease cost | $ | 103 | | | $ | 81 | | | $ | 67 | |
| Finance lease cost | | | | | |
| Amortization of right-of-use asset | $ | 45 | | | $ | 35 | | | $ | 30 | |
| Interest on lease liabilities | $ | 11 | | | $ | 6 | | | $ | 4 | |
| Short-term lease cost | $ | 8 | | | $ | 6 | | | $ | 12 | |
| Variable lease cost | $ | 11 | | | $ | 8 | | | $ | 6 | |
OWENS CORNING AND SUBSIDIARIES
NOTES TO CONSOLIDATED FINANCIAL STATEMENTS (continued)
10. LEASES (continued)
Other Information
The tables below present supplemental information related to leases:
| | | | | | | | | | | | | | | | | |
| December 31, |
| Weighted-average remaining lease term (years) | 2024 | | 2023 | | 2022 |
| Operating leases | 8.2 | | 4.6 | | 4.8 |
| Finance leases | 13.6 | | 9.5 | | 9.6 |
| | | | | | | | | | | | | | | | | |
| December 31, |
| Weighted-average discount rate | 2024 | | 2023 | | 2022 |
| Operating leases | 5.22 | % | | 3.79 | % | | 3.32 | % |
| Finance leases | 4.88 | % | | 4.02 | % | | 3.46 | % |
Maturities of Lease Liabilities
The table below reconciles the undiscounted cash flows for each of the first five years and the total of the remaining years to the finance lease liabilities and operating lease liabilities recorded on the balance sheet as of December 31, 2024:
| | | | | | | | | | | |
| (In millions) | Operating Leases | | Finance Leases |
| Fiscal Year: | | | |
| 2025 | $ | 108 | | | $ | 54 | |
| 2026 | 86 | | | 46 | |
| 2027 | 70 | | | 38 | |
| 2028 | 60 | | | 33 | |
| 2029 | 47 | | | 25 | |
| 2030 and beyond | 209 | | | 267 | |
| Total minimum lease payments | 580 | | | 463 | |
| Less: implied interest | 118 | | | 141 | |
| Present value of future minimum lease payments | 462 | | | 322 | |
| Less: current lease obligations | 87 | | | 38 | |
| Long-term lease obligations | $ | 375 | | | $ | 284 | |
11. OTHER CURRENT LIABILITIES
Other current liabilities consist of the following:
| | | | | | | | | | | |
| | December 31, |
| (In millions) | 2024 | | 2023 |
| Payroll, vacation pay and incentive compensation | $ | 255 | | | $ | 224 | |
| Income, property and other non-payroll taxes | 102 | | | 91 | |
| Other | 385 | | | 300 | |
| Total other current liabilities | $ | 742 | | | $ | 615 | |
OWENS CORNING AND SUBSIDIARIES
NOTES TO CONSOLIDATED FINANCIAL STATEMENTS (continued)
12. WARRANTIES
The Company records a liability for warranty obligations at the date the related products are sold. Adjustments are made as new information becomes available. Please refer to Note 1 for information about our separately-priced extended warranty contracts. A reconciliation of the warranty liability is as follows:
| | | | | | | | | | | |
| | December 31, |
| (In millions) | 2024 | | 2023 |
| Beginning balance | $ | 97 | | | $ | 88 | |
| Amounts accrued for current year | 21 | | | 26 | |
| Acquired obligations | 4 | | | — | |
| Settlements of warranty claims | (23) | | | (17) | |
| Ending balance | $ | 99 | | | $ | 97 | |
13. RESTRUCTURING, ACQUISITION AND DIVESTITURE-RELATED COSTS
The Company may incur restructuring, transaction and integration costs related to acquisitions and divestitures, and may incur restructuring and other exit costs in connection with our global cost reduction, product line and productivity initiatives and the Company’s growth strategy.
ACQUISITION-RELATED TRANSACTION COSTS
During 2024, the Company incurred $49 million of transaction costs related to its acquisition of Masonite. Please refer to Note 7 of the Consolidated Financial Statements for further information.
ACQUISITION-RELATED INTEGRATION COSTS
During 2024, the Company incurred $83 million of integration costs related to its acquisition of Masonite.
Please refer to Note 7 of the Consolidated Financial Statements for further information.
RESTRUCTURING RELATED COSTS
Building Materials Business Exit Restructuring
On November 4, 2024, the Company entered into a related party agreement to sell its Insulation segment's building materials business in China and Korea to a member of the business’ management team. The Company recorded the assets at the fair value less cost to sell, which was less than the carrying value and resulted in an impairment of $91 million related primarily to Property, Plant and Equipment and Goodwill.
Following the signing of the agreement, the Company took actions to reduce headcount and implement cost savings initiatives. These actions are expected to result in cumulative costs of approximately $15 million, primarily related to severance and other exit costs. During 2024, the Company recorded $6 million of cash charges, primarily related to severance.
Acquisition-Related Restructuring
Following the acquisition of Masonite, within the Company's Doors segment, the Company took actions to realize expected synergies from the newly acquired operations. These actions include the decision to exit the Santiago, Chile facility within the segment.
During 2024, the Company recorded $55 million of charges, of which $28 million were non-cash charges, primarily related to the accelerated vesting of equity awards and $27 million of cash charges, primarily related to severance. The Company is continuing to review synergies as a result of this acquisition and expects to incur a material amount of incremental costs into future years.
OWENS CORNING AND SUBSIDIARIES
NOTES TO CONSOLIDATED FINANCIAL STATEMENTS (continued)
13. RESTRUCTURING, ACQUISITION AND DIVESTITURE-RELATED COSTS (continued)
Global Composites Restructuring
In December 2023, the Company took actions to reduce costs throughout our global Composites segment given current market conditions, primarily through global workforce reductions, as well as streamlining manufacturing and supply chain operations. These actions primarily include salaried workforce reductions and the relocation of the Changzhou, China operations to Hangzhou, China.
In connection with these actions, the Company estimates it will incur cash charges in the range of $20 million to $30 million, primarily related to severance and other exit costs, including termination costs, and non-cash charges in the range of $15 million to $20 million, primarily related to accelerated depreciation.
During 2024, the Company recorded $17 million of charges, of which $10 million were non-cash charges, primarily related to accelerated depreciation and $7 million of cash charges, primarily related to severance and other exit costs.
Building Materials Asia-Pacific Optimization
In December 2023, the Company took actions to further its ongoing cost optimization strategy for the Insulation segment by permanently closing the Xi'an, China facility, which had previously ceased operations, and permanently closing one idled production line at the Guangde, China facility. These actions resulted in cumulative costs of approximately $20 million, primarily related to accelerated depreciation. During 2024, the Company did not incur any charges relating to this project and does not expect any future charges.
Protective Packaging Exit
In May 2023, the Company made the decision to exit the Protective Packaging business within the Roofing segment, including the production and sale of wood packaging, metal packaging and custom products. Exiting Protective Packaging will allow the Company to focus resources on the growth of its building materials products, which supports the future growth aspirations of the enterprise. With the exit of the Protective Packaging business, the Company closed its plants in Dorval, Quebec and Mission, British Columbia, Canada. The Company also ceased operations at its Qingdao, China facility.
In connection with the exit of the Protective Packaging business, the Company estimated that it would incur cash charges of approximately $15 million, primarily related to severance and other exit costs. Additionally, the Company estimated that it would incur total non-cash charges in the range of $70 to $75 million, primarily related to accelerated depreciation of property, plant and equipment and accelerated amortization of definite-lived intangibles.
During 2024, the Company recorded $5 million of cash charges, primarily related to other exit costs. The Company does not expect to recognize significant incremental costs related to these actions.
Wabash Facility Closure
In April 2023, the Company took actions to support its strategy to operate a flexible and cost-efficient manufacturing network through decisions to relocate the Wabash, Indiana mineral wool operations to Joplin, Missouri and to exit the U.S. granulated mineral wool market. These actions resulted in cumulative costs of approximately $30 million, primarily related to severance and accelerated depreciation.
During 2024, the Company did not incur any charges relating to this project and does not expect to incur any future charges.
European Operating Structure Optimization
In March 2023, the Company took actions to optimize the operating structure of its segments across Europe to increase its competitiveness. These actions are expected to result in cumulative costs of approximately $20 million, primarily related to severance and other exit costs. During 2024, the Company recorded $3 million of charges primarily related to severance costs. The Company does not expect to recognize significant incremental costs related to these actions.
OWENS CORNING AND SUBSIDIARIES
NOTES TO CONSOLIDATED FINANCIAL STATEMENTS (continued)
13. RESTRUCTURING, ACQUISITION AND DIVESTITURE-RELATED COSTS (continued)
Composites Strategic Realignment Actions
On July 1, 2022, the Company finalized the sale of the European portion of the DUCS product line located in Chambéry, France, within the Company's Composites segment. The Company recorded a pre-tax charge of $30 million in Other expense, net on the Consolidated Statements of Earnings in 2022 to reflect the fair value less cost to sell the assets. The Company also took actions to convert the DUCS manufacturing facilities located in Anderson, South Carolina and Kimchon, Korea to produce other glass fiber products needed to support our growth strategy in building and construction applications. During 2023, the Company recorded $2 million of charges primarily related to other exit costs. During 2024, the Company did not incur any charges relating to this project and does not expect any future charges.
Roofing Restructuring Actions
In December 2021, the Company took actions to restructure operations within the Roofing segment's components product line by relocating production assets from China to India, which allowed the business to optimize its manufacturing network and support a tariff mitigation strategy. During 2022, the Company recorded $3 million of charges primarily related to severance and other exit costs. During 2023, the Company recorded $2 million of charges primarily related to other exit costs. During 2024, the Company did not incur any charges relating to this project and does not expect any further charges.
Santa Clara Insulation Site
During the third quarter of 2021, the Company entered into a sales agreement for the Company's Insulation site in Santa Clara, California as part of the Company's on-going strategy to operate a flexible, cost-efficient manufacturing network and geographically locate its assets to better serve its customers. On March 3, 2023, the Company finalized the sale of this site for total proceeds of $234 million, net of transaction fees. Total proceeds included a non-refundable deposit of $50 million received in the third quarter of 2021. During 2024, the Company did not incur any charges relating to this project and does not expect any further charges.
Consolidated Statements of Earnings Classification
The following table presents the impact and respective location of total restructuring, acquisition and divestiture-related costs on the Consolidated Statements of Earnings, which are included within Corporate, Other and Eliminations:
| | | | | | | | | | | | | | |
| | Twelve Months Ended December 31, |
| (In millions) | Location | 2024 | 2023 | 2022 |
| Accelerated depreciation | Cost of sales | $ | (13) | | $ | (76) | | $ | (26) | |
| Other exit costs | Cost of sales | (8) | | (26) | | (16) | |
| | | | |
| Other exit costs | Marketing and administrative expenses | (2) | | (2) | | — | |
| Acquisition and divestiture-related costs | Marketing and administrative expenses | — | | — | | (7) | |
| Severance | Other expense, net | (63) | | (34) | | (1) | |
| Other exit costs | Other expense, net | — | | (6) | | (41) | |
| Accelerated amortization | Other expense, net | — | | (25) | | — | |
| Acquisition and divestiture-related gains | Gain on equity method investment | — | | — | | 130 | |
| Gain on sale of Santa Clara, California site | Gain on sale of site | — | | 189 | | — | |
| Acquisition-related transaction costs | Other expense, net | (49) | | — | | — | |
| Acquisition-related integration costs | Other expense, net | (83) | | — | | — | |
| Loss on sale of business | Loss on sale of business | (91) | | — | | — | |
| Total restructuring, acquisition and divestiture-related (costs) gains | | $ | (309) | | $ | 20 | | $ | 39 | |
OWENS CORNING AND SUBSIDIARIES
NOTES TO CONSOLIDATED FINANCIAL STATEMENTS (continued)
13. RESTRUCTURING, ACQUISITION AND DIVESTITURE-RELATED COSTS (continued)
Summary of Unpaid Liabilities
The following tables summarize the status of the unpaid liabilities from the Company’s restructuring activities:
| | | | | | | | | | | | | | | | | | | | |
| | December 31, 2024 |
| (In millions) | Building Materials Business exit | Acquisition-related Restructuring | Global Composites Restructuring | Protective Packaging Exit | Wabash Facility Closure | European Operating Structure Optimization |
| Balance at December 31, 2023 | $ | — | | $ | — | | $ | 12 | | $ | 1 | | $ | 3 | | $ | 6 | |
| Restructuring costs | 6 | | 55 | | 17 | | 5 | | — | | 3 | |
| Payments | — | | (24) | | (5) | | (3) | | (3) | | (4) | |
| Accelerated depreciation and other non-cash items | — | | (28) | | (10) | | (3) | | — | | — | |
| Balance at December 31, 2024 | $ | 6 | | $ | 3 | | $ | 14 | | $ | — | | $ | — | | $ | 5 | |
| Cumulative charges incurred | $ | 6 | | $ | 55 | | $ | 33 | | $ | 83 | | $ | 33 | | $ | 15 | |
As of December 31, 2024, the remaining liability balance is primarily comprised of $25 million related to severance, which the Company expects to pay over the next twelve months.
As previously stated, we have engaged in restructuring programs over the past several years. For the purposes of this table, the Building Materials Asia-Pacific Optimization, Composites Strategic Realignment Actions, Roofing Restructuring Actions and Santa Clara Insulation Site restructuring programs have been aggregated as "Other Programs" for this note. As of December 31, 2024, we do not expect to incur any material future charges related to the Other Programs.
| | | | | | | | | | | | | | | | | |
| December 31, 2023 |
| (In millions) | Global Composites Restructuring | Protective Packaging Exit | Wabash Facility Closure | European Operating Structure Optimization | Other Programs |
| Balance at December 31, 2022 | $ | — | | $ | — | | $ | — | | $ | — | | $ | 8 | |
| Restructuring costs | 16 | | 78 | | 33 | | 12 | | 28 | |
| Payments | — | | (8) | | (4) | | (6) | | (18) | |
| Accelerated depreciation and other non-cash items | (4) | | (69) | | (26) | | — | | (18) | |
| Balance at December 31, 2023 | $ | 12 | | $ | 1 | | $ | 3 | | $ | 6 | | $ | — | |
| Cumulative charges incurred | $ | 16 | | $ | 78 | | $ | 33 | | $ | 12 | | $ | 105 | |
OWENS CORNING AND SUBSIDIARIES
NOTES TO CONSOLIDATED FINANCIAL STATEMENTS (continued)
14. DEBT
Details of the Company’s outstanding long-term debt, as well as the fair values, are as follows:
| | | | | | | | | | | | | | | | | |
| December 31, 2024 | | December 31, 2023 |
| (In millions) | Carrying Value | Fair
Value | | Carrying Value | Fair
Value |
| 4.200% senior notes, net of discount and financing fees, due 2024 | $ | — | | — | % | | $ | 399 | | 99 | % |
| 3.400% senior notes, net of discount and financing fees, due 2026 | 399 | | 98 | % | | 398 | | 96 | % |
| 5.500% senior notes, net of discount and financing fees, due 2027 | 497 | | 102 | % | | N/A | N/A |
| 5.375% senior notes, net of discount and financing fees, due 2028 | 29 | | 99 | % | | N/A | N/A |
| 3.950% senior notes, net of discount and financing fees, due 2029 | 447 | | 95 | % | | 447 | | 95 | % |
| 3.500% senior notes, net of discount and financing fees, due 2030 | 2 | | 89 | % | | N/A | N/A |
| 3.500% senior notes, net of discount and financing fees, due 2030 | 338 | | 93 | % | | N/A | N/A |
| 3.875% senior notes, net of discount and financing fees, due 2030 | 298 | | 94 | % | | 298 | | 94 | % |
| 5.700% senior notes, net of discount and financing fees, due 2034 | 790 | | 102 | % | | N/A | N/A |
| 7.000% senior notes, net of discount and financing fees, due 2036 | 369 | | 112 | % | | 369 | | 116 | % |
| 4.300% senior notes, net of discount and financing fees, due 2047 | 589 | | 80 | % | | 589 | | 88 | % |
| 4.400% senior notes, net of discount and financing fees, due 2048 | 391 | | 80 | % | | 391 | | 87 | % |
| | | | | |
| | | | | |
| 5.950% senior notes, net of discount and financing fees, due 2054 | 683 | | 99 | % | | N/A | N/A |
| Various finance leases, due through 2050 (a) | 322 | | 100 | % | | 154 | | 100 | % |
| Other | — | | N/A | | 1 | | N/A |
| Total long-term debt | 5,154 | | N/A | | 3,046 | | N/A |
| Less – current portion of senior notes | — | | — | % | | 399 | | 99 | % |
| Less – current portion of finance leases and other (a) | 38 | | 100 | % | | 32 | | 100 | % |
| Long-term debt, net of current portion | $ | 5,116 | | N/A | | $ | 2,615 | | N/A |
(a) The Company determined that the book value of the above noted long-term debt instruments approximates fair value.
The fair values of the Company's outstanding long-term debt instruments were estimated using market observable inputs, including quoted prices in active markets, market indices and interest rate measurements. Within the hierarchy of fair value measurements, these are Level 2 fair values.
Senior Notes
The Company issued $500 million of 2027 senior notes with an annual interest rate of 5.500%, $800 million of 2034 senior notes with an annual interest rate of 5.700% and $700 million of 2054 senior notes with an annual interest rate of 5.950% on May 31, 2024. These senior notes are net of discounts and issuance costs of $4 million, $11 million and $17 million, respectively. The proceeds from these notes were used to repay a portion of the outstanding borrowings under the 364-Day Credit Facility (as defined below) that was used to fund a portion of the purchase of Masonite in the second quarter of 2024 and to pay related fees and expenses.
On May 1, 2024, in connection with the acquisition of Masonite, we commenced an offer to exchange (the “Exchange Offer”) any and all of Masonite’s outstanding 3.50% Senior Notes due 2030 (the “Masonite 2030 notes”) for new 3.50% Senior Notes due 2030 of Owens Corning (the “Owens Corning 2030 notes”). On May 22, 2024, 99.51% of the outstanding Masonite 2030 notes were exchanged and we issued $373 million aggregate principal amount of Owens Corning 2030 notes, which was a non-cash financing transaction for the Company. Interest on the notes is payable semiannually in arrears on February 15 and August 15 each year, beginning on August 15, 2024. Following the settlement of the Exchange Offer, approximately $2 million of the Masonite 2030 notes that were not exchanged remain outstanding, which has been recorded on the Consolidated Balance Sheets.
OWENS CORNING AND SUBSIDIARIES
NOTES TO CONSOLIDATED FINANCIAL STATEMENTS (continued)
14. DEBT (continued)
On April 15, 2024, in connection with the acquisition of Masonite, we commenced a tender offer (the “Tender Offer”) to purchase any and all of Masonite's outstanding 5.375% Senior Notes due 2028 (the “Masonite 2028 notes”) with an aggregate value of $501 million. On May 13, 2024, 94.25% of the outstanding Masonite 2028 notes were validly tendered, with Owens Corning making a cash payment on May 16, 2024 of approximately $480 million, inclusive of $7 million of interest and $1 million premium on tender. Following the settlement of the Tender Offer, approximately $29 million of the Masonite 2028 notes that were not tendered remain outstanding, which has been recorded on the Consolidated Balance Sheets. Interest on the Masonite 2028 notes is payable semiannually in arrears on February 1 and August 1 each year.
The Company issued $300 million of 2030 senior notes on May 12, 2020. Interest on the notes is payable semiannually in arrears on June 1 and December 1 each year, beginning on December 1, 2020. The proceeds from these notes were used for general corporate purposes.
The Company issued $450 million of 2029 senior notes on August 12, 2019. Interest on the notes is payable semiannually in arrears on February 15 and August 15 each year, beginning on February 15, 2020. The proceeds from these notes were used to repay $416 million of our 2022 senior notes and $34 million of our 2036 senior notes.
The Company issued $400 million of 2048 senior notes on January 25, 2018. Interest on the notes is payable semiannually in arrears on January 30 and July 30 each year, beginning on July 30, 2018. The proceeds from these notes were used, along with borrowings on a $600 million term loan commitment and borrowings on the Receivables Securitization Facility (as defined below), to fund the purchase of Paroc in the first quarter of 2018.
The Company issued $600 million of 2047 senior notes on June 26, 2017. Interest on the notes is payable semiannually in arrears on January 15 and July 15 each year, beginning on January 15, 2018. A portion of the proceeds from these notes was used to fund the purchase of Pittsburgh Corning in 2017 and for general corporate purposes. The remaining proceeds were used to repay $144 million of our 2019 senior notes and $140 million of our 2036 senior notes.
The Company issued $400 million of 2026 senior notes on August 8, 2016. Interest on the notes is payable semiannually in arrears on February 15 and August 15 each year, beginning on February 15, 2017. A portion of the proceeds from these notes was used to redeem $158 million of our 2016 senior notes. The remaining proceeds were used to pay down portions of our Receivables Securitization Facility and for general corporate purposes.
The Company issued $400 million of 2024 senior notes on November 12, 2014. Interest on the notes is payable semiannually in arrears on June 1 and December 1 each year, beginning on June 1, 2015. A portion of the proceeds from these notes was used to repay $242 million of our 2016 senior notes and $105 million of our 2019 senior notes. The remaining proceeds were used to pay down our Senior Revolving Credit Facility (as defined below), finance general working capital needs, and for general corporate purposes. In the fourth quarter of 2024, the Company fully repaid the 2024 senior notes of $400 million at maturity.
The Company issued $550 million of 2036 senior notes on October 31, 2006. Interest on the notes is payable semiannually in arrears on June 1 and December 1 each year, beginning on June 1, 2007. The proceeds of these notes were used to pay certain unsecured and administrative claims, finance general working capital needs and for general corporate purposes.
Collectively, the Company's senior notes above, other than the Masonite 2028 notes or the Masonite 2030 notes, are referred to as the “Senior Notes.” The Senior Notes are general unsecured obligations of the Company and rank pari passu with all existing and future senior unsecured indebtedness of the Company. The Company has the option to redeem all or part of the Senior Notes at any time at a “make-whole” redemption price. The Company is subject to certain covenants in connection with the issuance of the Senior Notes that it believes are usual and customary. The Company was in compliance with these covenants as of December 31, 2024.
Senior Revolving Credit Facility
On March 1, 2024, the Company entered into an amended and restated senior revolving credit facility (the “Senior Revolving Credit Facility”) to increase the available principal amount from $800 million to $1.0 billion and to extend the maturity to March 2029. The Senior Revolving Credit Facility includes both borrowings and letters of credit. Borrowings under the Senior Revolving Credit Facility may be used for general corporate purposes and working capital. The Company has the discretion to borrow under multiple options, which provide for varying terms and interest rates including the United States prime rate, federal funds rate plus a spread or forward-looking term rate based on the Secured Overnight Financing Rate (“Term SOFR”) plus a spread. In May 2023, the Senior Revolving Credit Facility was amended to formally adopt Term SOFR plus a spread as the benchmark reference rate in anticipation of the June 30, 2023 discontinuation of the London Interbank Offered Rate.
OWENS CORNING AND SUBSIDIARIES
NOTES TO CONSOLIDATED FINANCIAL STATEMENTS (continued)
14. DEBT (continued)
The Senior Revolving Credit Facility contains various covenants, including a maximum allowed leverage ratio, that the Company believes are usual and customary for a senior unsecured credit agreement. The Company was in compliance with these covenants as of December 31, 2024. Please refer to the Credit Facility Utilization section below for liquidity information as of December 31, 2024.
Receivables Securitization Facility
For the receivables securitization facility (the "Receivables Securitization Facility"), the Company has a Receivables Purchase Agreement (“RPA”) that is accounted for as secured borrowings in accordance with ASC 860, “Accounting for Transfers and Servicing.” Owens Corning Sales, LLC and Owens Corning Receivables LLC, each a subsidiary of the Company, have an RPA with certain financial institutions. On March 1, 2024, the Company amended and restated the RPA to increase the facility limit from $280 million to $300 million and to extend the scheduled maturity date to February 2025. Under the RPA, the Company has the ability to borrow at the lenders’ cost of funds, which approximates Term SOFR plus a spread; alternatively, the Company may borrow at the higher of the United States prime rate or the Overnight Bank Funding Rate plus a spread.
The RPA contains various covenants, including a maximum allowed leverage ratio, that the Company believes are usual and customary for a securitization facility. The Company was in compliance with these covenants as of December 31, 2024. Please refer to the Credit Facility Utilization section below for liquidity information as of December 31, 2024.
Owens Corning Receivables LLC’s sole business consists of the purchase or acceptance through capital contributions of trade receivables and related rights from Owens Corning Sales, LLC and the subsequent retransfer of or granting of a security interest in such trade receivables and related rights to certain purchasers who are party to the RPA. Owens Corning Receivables LLC is a separate legal entity with its own separate creditors who will be entitled, upon its liquidation, to be satisfied out of Owens Corning Receivables LLC’s assets prior to any assets or value in Owens Corning Receivables LLC becoming available to Owens Corning Receivables LLC’s equity holders. The assets of Owens Corning Receivables LLC are not available to pay creditors of the Company or any other affiliates of the Company or Owens Corning Sales, LLC.
On May 15, 2024, the Company initially borrowed $295 million on the Receivables Securitization Facility, which was used to pay down a portion of the 364-Day Credit Facility. Subsequent to the May 15, 2024 borrowing, the Company repaid and re-borrowed on the Receivables Securitization Facility throughout the year to pay down the 364-Day Credit Facility and support working capital needs. As of December 31, 2024, there was no outstanding balance on the Receivables Securitization Facility. Please refer to the Credit Facility Utilization section below for liquidity information as of December 31, 2024.
364-Day Credit Facility
On March 1, 2024, the Company entered into an unsecured term loan agreement in an aggregate principal amount of $3.0 billion, which matures 364 days after the facility is initially funded with a single drawing (the “364-Day Credit Facility”).
In May 2024, to fund a portion of the purchase of Masonite, the Company borrowed $2.8 billion using Term SOFR plus a spread on the 364-Day Credit Facility. As a result of the borrowing, the Company incurred approximately $16 million of financing fees which were amortized to Interest expense, net on the Consolidated Statements of Earnings. During the second quarter of 2024, the Company completely repaid the 364-Day Credit Facility with a combination of proceeds from the issuance of new senior notes, borrowings on the Receivables Securitization Facility and cash on hand. Based on terms of the agreement, no further amounts can be drawn.
OWENS CORNING AND SUBSIDIARIES
NOTES TO CONSOLIDATED FINANCIAL STATEMENTS (continued)
14. DEBT (continued)
Credit Facility Utilization
The following table shows how the Company utilized its primary sources of liquidity:
| | | | | | | | | |
| | Balance at December 31, 2024 |
| (In millions) | | Senior Revolving Credit Facility | Receivables Securitization Facility |
| Facility size or borrowing limit | | $ | 1,000 | | $ | 300 | |
| Collateral capacity limitation on availability | | N/A | — | |
| Outstanding borrowings | | — | | — | |
| Outstanding letters of credit | | 4 | | 1 | |
| Availability on facility | | $ | 996 | | $ | 299 | |
Debt Maturities
The aggregate maturities for all outstanding long-term debt borrowings for each of the five years following December 31, 2024 and thereafter are presented in the table below. The maturities below are the aggregate par amounts of the outstanding senior notes and finance lease liabilities:
| | | | | |
| (In millions) | Maturities |
| Fiscal Year: | |
| 2025 | $ | 38 | |
| 2026 | 433 | |
| 2027 | 526 | |
| 2028 | 52 | |
| 2029 | 473 | |
| 2030 and beyond | 3,730 | |
| Total | $ | 5,252 | |
Short-Term Debt
At December 31, 2024 and December 31, 2023, short-term borrowings were approximately $1 million. The short-term borrowings for both periods consisted of various operating lines of credit. The weighted average interest rate on all short-term borrowings was approximately 3.8% and 5.1% for December 31, 2024 and December 31, 2023, respectively.
15. PENSION PLANS
Pension Plans
The Company sponsors defined benefit pension plans. Under the plans, pension benefits are based on an employee’s years of service and, for certain categories of employees, qualifying compensation. Company contributions to these pension plans are determined by an independent actuary to meet or exceed minimum funding requirements. In our U.S. plan, the unrecognized cost of any retroactive amendments and actuarial gains and losses are amortized over the average remaining life expectancy of inactive participants. In all of our Non-U.S. plans, the unrecognized cost of any retroactive amendments and actuarial gains and losses are amortized over the average future service period of plan participants expected to receive benefits.
During the fourth quarter of 2023, the Company entered into two agreements to purchase non-participating annuity contracts from insurance companies to transfer $291 million of the Company's outstanding pension projected benefit obligation (“PBO”) related to certain U.S. and non-U.S. pension plans. These transactions were funded with pension plan assets of $268 million. As a result of these transactions, the Company recognized a pre-tax settlement charge of $145 million in the fourth quarter of 2023 from the accelerated recognition of a pro rata portion of plan actuarial losses. This charge was recorded in Non-operating (income) expense, net on the Consolidated Statements of Earnings. These transactions did not have a material effect on the plans' funded statuses.
OWENS CORNING AND SUBSIDIARIES
NOTES TO CONSOLIDATED FINANCIAL STATEMENTS (continued)
15. PENSION PLANS (continued)
The following tables provide a reconciliation of the change in the projected benefit obligation, the change in plan assets and the net amount recognized in the Consolidated Balance Sheets:
| | | | | | | | | | | | | | | | | | | | | | | | | | | | | | | | | | | |
| December 31, 2024 | | December 31, 2023 |
| (In millions) | U.S. | | Non-U.S. | | Total | | U.S. | | Non-U.S. | | Total |
| Change in Plan Assets | | | | | | | | | | | |
| Fair value of assets at beginning of period | $ | 341 | | | $ | 281 | | | $ | 622 | | | $ | 602 | | | $ | 302 | | | $ | 904 | |
| Actual return on plan assets | 19 | | | (1) | | | 18 | | | 22 | | | 14 | | | 36 | |
| Currency (loss) gain | — | | | (9) | | | (9) | | | — | | | 9 | | | 9 | |
| Company contributions | 1 | | | 6 | | | 7 | | | — | | | 18 | | | 18 | |
| Benefits paid | (23) | | | (17) | | | (40) | | | (36) | | | (20) | | | (56) | |
| Settlements/curtailments | (1) | | | (3) | | | (4) | | | (247) | | | (42) | | | (289) | |
| Acquisition | — | | | 22 | | | 22 | | | — | | | — | | | — | |
| Other | — | | | 1 | | | 1 | | | — | | | — | | | — | |
| Fair value of assets at end of period | 337 | | | 280 | | | 617 | | | 341 | | | 281 | | | 622 | |
| | | | | | | | | | | |
| Change in Projected Benefit Obligation | | | | | | | | | | | |
| Benefit obligation at beginning of period | $ | 366 | | | $ | 304 | | | $ | 670 | | | $ | 638 | | | $ | 326 | | | $ | 964 | |
| Service cost | 3 | | | 3 | | | 6 | | | 3 | | | 3 | | | 6 | |
| Interest cost | 18 | | | 14 | | | 32 | | | 29 | | | 16 | | | 45 | |
| Actuarial (gain) loss | (19) | | | (15) | | | (34) | | | (21) | | | 9 | | | (12) | |
| Currency (gain) loss | — | | | (10) | | | (10) | | | — | | | 11 | | | 11 | |
| Benefits paid | (23) | | | (17) | | | (40) | | | (36) | | | (20) | | | (56) | |
| | | | | | | | | | | |
| Settlements/curtailments | (1) | | | (3) | | | (4) | | | (247) | | | (42) | | | (289) | |
| Acquisition | — | | | 23 | | | 23 | | | — | | | — | | | — | |
| Other | — | | | 1 | | | 1 | | | — | | | 1 | | | 1 | |
| Benefit obligation at end of period | 344 | | | 300 | | | 644 | | | 366 | | | 304 | | | 670 | |
| Funded status | $ | (7) | | | $ | (20) | | | $ | (27) | | | $ | (25) | | | $ | (23) | | | $ | (48) | |
| | | | | | | | | | | |
The following table presents the amount recorded and respective location in the Consolidated Balance sheets:
| | | | | | | | | | | | | | | | | | | | | | | | | | | | | | | | | | | | | | |
| | | December 31, 2024 | | December 31, 2023 |
| (In millions) | Location | U.S. | | Non-U.S. | | Total | | U.S. | | Non-U.S. | | Total |
| Prepaid pension cost | Other non-current assets | $ | — | | | $ | 24 | | | $ | 24 | | | $ | — | | | $ | 23 | | | $ | 23 | |
| Accrued pension cost – current | Other current liabilities | — | | | (2) | | | (2) | | | — | | | (2) | | | (2) | |
| Accrued pension cost – non-current | Pension plan liability | (7) | | | (42) | | | (49) | | | (25) | | | (44) | | | (69) | |
| Total amount recorded | | $ | (7) | | | $ | (20) | | | $ | (27) | | | $ | (25) | | | $ | (23) | | | $ | (48) | |
The following table represents the amounts recorded to Accumulated Other Comprehensive Income:
| | | | | | | | | | | | | | | | | | | | | | | | | | | | | | | | | | | |
| December 31, 2024 | | December 31, 2023 |
| (In millions) | U.S. | | Non-U.S. | | Total | | U.S. | | Non-U.S. | | Total |
| Net actuarial loss | $ | (173) | | | $ | (70) | | | $ | (243) | | | $ | (191) | | | $ | (74) | | | $ | (265) | |
| Net prior service cost | — | | | (5) | | | (5) | | | — | | | (5) | | | (5) | |
| Total amount recorded | $ | (173) | | | $ | (75) | | | $ | (248) | | | $ | (191) | | | $ | (79) | | | $ | (270) | |
OWENS CORNING AND SUBSIDIARIES
NOTES TO CONSOLIDATED FINANCIAL STATEMENTS (continued)
15. PENSION PLANS (continued)
For the twelve months ended December 31, 2024, the actuarial gain of $34 million was largely the result of increased discount rates. In the U.S. plan, the actuarial gain was primarily driven by the increase in the discount rate along with a small gain due to the impact of differences between expected and actual pension experience. In the Non-U.S. plans, the actuarial gain was primarily driven by an increase in discount rates across a majority of the plans offset by an actuarial loss due to the impact of differences between expected and actual pension experience in Canada.
For the twelve months ended December 31, 2023, the actuarial gain of $12 million was largely the result of the impacts related to the annuity purchase settlement offset by losses due to decreased discount rates. In the U.S. plan, the actuarial gain was primarily driven by the settling of the annuity purchase at a lower value relative to the PBO held at the time. The gain was slightly offset by an actuarial loss due to the decrease in the discount rate. In the Non-U.S. plans, the actuarial loss was primarily driven by a decrease in the discount rates across all the plans.
The following table presents information about the projected benefit obligation, accumulated benefit obligation (“ABO”) and plan assets of the Company’s pension plans:
| | | | | | | | | | | | | | | | | | | | | | | | | | | | | | | | | | | |
| | December 31, 2024 | | December 31, 2023 |
| (In millions) | U.S. | | Non-U.S. | | Total | | U.S. | | Non-U.S. | | Total |
| Plans with PBO in excess of fair value of plan assets: | | | | | | | | | | | |
| Projected benefit obligation | $ | 344 | | | $ | 201 | | | $ | 545 | | | $ | 366 | | | $ | 221 | | | $ | 587 | |
| Fair value of plan assets | $ | 337 | | | $ | 157 | | | $ | 494 | | | $ | 341 | | | $ | 174 | | | $ | 515 | |
| Plans with ABO in excess of fair value of plan assets: | | | | | | | | | | | |
| Accumulated benefit obligation | $ | 344 | | | $ | 183 | | | $ | 527 | | | $ | 366 | | | $ | 203 | | | $ | 569 | |
| Fair value of plan assets | $ | 337 | | | $ | 147 | | | $ | 484 | | | $ | 341 | | | $ | 164 | | | $ | 505 | |
Weighted-Average Assumptions Used to Determine Benefit Obligation
The following table presents weighted average assumptions used to determine benefit obligations at the measurement dates:
| | | | | | | | | | | |
| | December 31, |
| | 2024 | | 2023 |
| United States Plans | | | |
| Discount rate | 5.65 | % | | 5.00 | % |
| Cash balance interest crediting rate | 3.90 | % | | 4.63 | % |
| Non-United States Plans | | | |
| Discount rate | 5.23 | % | | 4.62 | % |
| Rate of compensation increase | 3.35 | % | | 3.25 | % |
OWENS CORNING AND SUBSIDIARIES
NOTES TO CONSOLIDATED FINANCIAL STATEMENTS (continued)
15. PENSION PLANS (continued)
Components of Net Periodic Pension Cost
The following table presents the components of net periodic pension cost:
| | | | | | | | | | | | | | | | | |
| | Twelve Months Ended December 31, |
| (In millions) | 2024 | | 2023 | | 2022 |
| United States Plans | | | | | |
| Service cost | $ | 3 | | | $ | 3 | | | $ | 5 | |
| Interest cost | 18 | | | 29 | | | 23 | |
| Expected return on plan assets | (23) | | | (37) | | | (36) | |
| Amortization of actuarial loss | 3 | | | 5 | | | 11 | |
| Settlement/curtailment | — | | | 138 | | | — | |
| Other | (1) | | | — | | | — | |
| Net periodic pension cost | $ | — | | | $ | 138 | | | $ | 3 | |
| | | | | |
| Non-United States Plans | | | | | |
| Service cost | $ | 3 | | | $ | 3 | | | $ | 4 | |
| Interest cost | 14 | | | 16 | | | 11 | |
| Expected return on plan assets | (15) | | | (15) | | | (16) | |
| Amortization of actuarial loss | 3 | | | 3 | | | 2 | |
| Settlement/curtailment | — | | | 7 | | | (1) | |
| Other | 1 | | | 1 | | | — | |
| Net periodic pension cost | $ | 6 | | | $ | 15 | | | $ | — | |
| | | | | |
| Total | | | | | |
| Service cost | $ | 6 | | | $ | 6 | | | $ | 9 | |
| Interest cost | 32 | | | 45 | | | 34 | |
| Expected return on plan assets | (38) | | | (52) | | | (52) | |
| Amortization of actuarial loss | 6 | | | 8 | | | 13 | |
| Settlement/curtailment | — | | | 145 | | | (1) | |
| Other | — | | | 1 | | | — | |
| Net periodic pension cost | $ | 6 | | | $ | 153 | | | $ | 3 | |
OWENS CORNING AND SUBSIDIARIES
NOTES TO CONSOLIDATED FINANCIAL STATEMENTS (continued)
15. PENSION PLANS (continued)
Weighted-Average Assumptions Used to Determine Net Periodic Pension Cost
The following table presents weighted-average assumptions used to determine net periodic pension costs for the periods noted:
| | | | | | | | | | | | | | | | | |
| | Twelve Months Ended December 31, |
| | 2024 | | 2023 | | 2022 |
| United States Plans | | | | | |
| Discount rate | 5.00 | % | | 5.15 | % | | 2.85 | % |
| Expected return on plan assets | 5.75 | % | | 5.75 | % | | 4.75 | % |
| Cash balance interest crediting rate | 4.63 | % | | 3.76 | % | | 1.26 | % |
| Rate of compensation increase (a) | N/A | | N/A | | N/A |
| Non-United States Plans | | | | | |
| Discount rate | 4.62 | % | | 5.02 | % | | 2.35 | % |
| Expected return on plan assets | 5.15 | % | | 5.00 | % | | 3.93 | % |
| Rate of compensation increase | 3.25 | % | | 3.31 | % | | 3.31 | % |
(a) Not applicable due to changes in plan made on August 1, 2009 that were effective beginning January 1, 2010.
The expected return on plan assets assumption is derived by taking into consideration the target plan asset allocation, historical rates of return on those assets, projected future asset class returns and net outperformance of the market by active investment managers. An asset return model is used to develop an expected range of returns on plan investments over a 30 year period, with the expected rate of return selected from a best estimate range within the total range of projected results. The result is then rounded down to the nearest 25 basis points.
Items Measured at Fair Value
The Company classifies and discloses pension plan assets in one of the following three categories:
Level 1: Quoted market prices in active markets for identical assets.
Level 2: Observable market-based inputs or unobservable inputs that are corroborated by market data.
Level 3: Unobservable inputs that are not corroborated by market data.
Plan Assets
The tables in this section show pension plan asset fair values and fair value leveling information. The assets are categorized into one of the three levels of the fair value hierarchy or are not subject to leveling, in the case of investments that are valued using the net asset value per share (or its equivalent) practical expedient (“NAV”).
OWENS CORNING AND SUBSIDIARIES
NOTES TO CONSOLIDATED FINANCIAL STATEMENTS (continued)
15. PENSION PLANS (continued)
The following tables summarize the fair values and applicable fair value hierarchy levels of United States pension plan assets: | | | | | | | | | | | | | | | | | | | | | | | | | | | |
| (In millions) | Level 1 | | Level 2 | | Level 3 | | Total | | | | |
| As of December 31, 2024 | | | | | | | | | | | |
| Equities: | | | | | | | | | | | |
| Domestic | $ | — | | | $ | — | | | $ | — | | | $ | — | | | | | |
| International | — | | | — | | | — | | | — | | | | | |
| Fixed income and cash equivalents: | | | | | | | | | | | |
| Corporate bonds | 25 | | | 103 | | | — | | | 128 | | | | | |
| Government debt | — | | | 44 | | | — | | | 44 | | | | | |
| | | | | | | | | | | |
| Total United States plan assets subject to leveling | $ | 25 | | | $ | 147 | | | $ | — | | | $ | 172 | | | | | |
| | | | | | | | | | | |
| As of December 31, 2023 | | | | | | | | | | | |
| Equities: | | | | | | | | | | | |
| Domestic | $ | — | | | $ | — | | | $ | — | | | $ | — | | | | | |
| International | — | | | — | | | — | | | — | | | | | |
| Fixed income and cash equivalents: | | | | | | | | | | | |
| Corporate bonds | 12 | | | 82 | | | — | | | 94 | | | | | |
| Government debt | — | | | 20 | | | — | | | 20 | | | | | |
| | | | | | | | | | | |
| Total United States plan assets subject to leveling | $ | 12 | | | $ | 102 | | | $ | — | | | $ | 114 | | | | | |
| | | | | | | | | | | |
| December 31, |
| (In millions) | 2024 | | 2023 |
| Plan assets measured at NAV: | | | |
| Equities | $ | 56 | | | $ | 69 | |
| Real assets | 51 | | | 11 | |
| Fixed income and cash equivalents | 47 | | | 110 | |
| Absolute return strategies | 11 | | | 37 | |
| Total United States plan assets not subject to leveling | 165 | | | 227 | |
| Total United States plan assets subject to leveling (above) | 172 | | | 114 | |
| Total United States plan assets | $ | 337 | | | $ | 341 | |
OWENS CORNING AND SUBSIDIARIES
NOTES TO CONSOLIDATED FINANCIAL STATEMENTS (continued)
15. PENSION PLANS (continued)
The following tables summarize the fair values and applicable fair value hierarchy levels of non-United States pension plan assets:
| | | | | | | | | | | | | | | | | | | | | | | | | | | |
| (In millions) | Level 1 | | Level 2 | | Level 3 | | Total | | | | |
| As of December 31, 2024 | | | | | | | | | | | |
| Equities | $ | — | | | $ | 1 | | | $ | — | | | $ | 1 | | | | | |
| Fixed income and cash equivalents: | | | | | | | | | | | |
| Cash and cash equivalents | — | | | 52 | | | — | | | 52 | | | | | |
| Fixed income | — | | | 10 | | | — | | | 10 | | | | | |
| Total non-United States plan assets subject to leveling | $ | — | | | $ | 63 | | | $ | — | | | $ | 63 | | | | | |
| | | | | | | | | | | |
| As of December 31, 2023 | | | | | | | | | | | |
| Equities | $ | — | | | $ | 1 | | | $ | — | | | $ | 1 | | | | | |
| Fixed income and cash equivalents: | | | | | | | | | | | |
| Cash and cash equivalents | — | | | 57 | | | — | | | 57 | | | | | |
| Fixed income | — | | | 11 | | | — | | | 11 | | | | | |
| Total non-United States plan assets subject to leveling | $ | — | | | $ | 69 | | | $ | — | | | $ | 69 | | | | | |
| | | | | | | | | | | |
| December 31, |
| (In millions) | 2024 | | 2023 |
| Plan assets measured at NAV: | | | |
| Equities | $ | 41 | | | $ | 28 | |
| Fixed income and cash equivalents | 112 | | | 122 | |
| Absolute return strategies | 64 | | | 62 | |
| Total non-United States plan assets not subject to leveling | 217 | | | 212 | |
| Total non-United States plan assets subject to leveling (above) | 63 | | | 69 | |
| Total non-United States plan assets | $ | 280 | | | $ | 281 | |
Investment Strategy
The current targeted asset allocation for the United States pension plan is to have 15% of assets invested in equities, 67% in intermediate and long-term fixed income securities, high yield and cash and 18% in other strategies. Assets are rebalanced at least quarterly to conform to policy tolerances. The Company actively evaluates the reasonableness of its asset mix given changes in the projected benefit obligation and market dynamics. Our investment policy and asset mix for the non-United States pension plans varies by location and is based on projected benefit obligation and market dynamics.
Estimated Future Benefit Payments
The following table shows estimated future benefit payments from the Company’s pension plans:
| | | | | |
| (In millions) | Estimated Benefit Payments |
| Fiscal Year: | |
| 2025 | $ | 48 | |
| 2026 | $ | 51 | |
| 2027 | $ | 45 | |
| 2028 | $ | 47 | |
| 2029 | $ | 48 | |
| 2030-2034 | $ | 249 | |
OWENS CORNING AND SUBSIDIARIES
NOTES TO CONSOLIDATED FINANCIAL STATEMENTS (continued)
15. PENSION PLANS (continued)
Contributions
The Company expects to contribute $20 million in cash to its defined benefit pension plans during 2025. Actual contributions to the plans may change as a result of a variety of factors, including changes in laws that impact funding requirements.
Defined Contribution Plans
The Company sponsors two defined contribution plans which are available to substantially all United States employees. The Company matches a percentage of employee contributions up to a maximum level. The Company recognized expense of $73 million, $65 million and $57 million during the years ended December 31, 2024, 2023 and 2022, respectively, related to these plans.
16. POSTEMPLOYMENT AND POSTRETIREMENT BENEFITS OTHER THAN PENSIONS
The Company maintains health care and life insurance benefit plans for certain retired employees and their dependents. The health care plans in the United States are non-funded and pay either (1) stated percentages of covered medically necessary expenses, after subtracting payments by Medicare or other providers and after stated deductibles have been met, or (2) fixed amounts of medical expense reimbursement.
Employees hired on or before December 31, 2005 become eligible to participate in the United States health care plans upon retirement if they have accumulated 10 years of service after age 45, 48 or 50, depending on the category of employee. For employees hired after December 31, 2005, the Company does not provide subsidized retiree health care. Some of the plans are contributory, with some retiree contributions adjusted annually. The Company has reserved the right to change or eliminate these benefit plans subject to the terms of collective bargaining agreements.
The following table provides a reconciliation of the change in the projected benefit obligation and the net amount recognized in the Consolidated Balance Sheets for the years ended December 31, 2024 and 2023:
| | | | | | | | | | | | | | | | | | | | | | | | | | | | | | | | | | | |
| | December 31, 2024 | | December 31, 2023 |
| (In millions) | U.S. | | Non-U.S. | | Total | | U.S. | | Non-U.S. | | Total |
| Change in Projected Benefit Obligation | | | | | | | | | | | |
| Benefit obligation at beginning of period | $ | 108 | | | $ | 11 | | | $ | 119 | | | $ | 115 | | | $ | 10 | | | $ | 125 | |
| Service cost | 1 | | | — | | | 1 | | | 1 | | | — | | | 1 | |
| Interest cost | 5 | | | 1 | | | 6 | | | 5 | | | 1 | | | 6 | |
| Actuarial gain | (6) | | | — | | | (6) | | | (2) | | | — | | | (2) | |
| Currency gain | — | | | (1) | | | (1) | | | — | | | — | | | — | |
| | | | | | | | | | | |
| Benefits paid | (10) | | | (1) | | | (11) | | | (11) | | | — | | | (11) | |
| | | | | | | | | | | |
| | | | | | | | | | | |
| Benefit obligation at end of period | $ | 98 | | | $ | 10 | | | $ | 108 | | | $ | 108 | | | $ | 11 | | | $ | 119 | |
| Funded status | $ | (98) | | | $ | (10) | | | $ | (108) | | | $ | (108) | | | $ | (11) | | | $ | (119) | |
The following table presents the amount recorded and respective location in the Consolidated Balance sheet:
| | | | | | | | | | | | | | | | | | | | | | | | | | | | | | | | | | | | | | |
| | December 31, 2024 | | December 31, 2023 |
| | U.S. | | Non-U.S. | | Total | | U.S. | | Non-U.S. | | Total |
| (In millions) | Location | | | | | | | | | | | |
| Accrued benefit obligation – current | Other current liabilities | $ | (10) | | | $ | (1) | | | $ | (11) | | | $ | (11) | | | $ | (1) | | | $ | (12) | |
| Accrued benefit obligation – non-current | Other employee benefits liability | (88) | | | (9) | | | (97) | | | (97) | | | (10) | | | (107) | |
| Net amount recorded | | $ | (98) | | | $ | (10) | | | $ | (108) | | | $ | (108) | | | $ | (11) | | | $ | (119) | |
OWENS CORNING AND SUBSIDIARIES
NOTES TO CONSOLIDATED FINANCIAL STATEMENTS (continued)
16. POSTEMPLOYMENT AND POSTRETIREMENT BENEFITS OTHER THAN PENSIONS (continued)
The following table represents the amounts recorded to Accumulated Other Comprehensive Income:
| | | | | | | | | | | | | | | | | | | | | | | | | | | | | | | | | | | |
| (In millions) | December 31, 2024 | | December 31, 2023 |
| Amounts Recorded in AOCI | U.S. | | Non-U.S. | | Total | | U.S. | | Non-U.S. | | Total |
| Net actuarial loss | $ | (53) | | | $ | (2) | | | $ | (55) | | | $ | (54) | | | $ | (4) | | | $ | (58) | |
| | | | | | | | | | | |
| | | | | | | | | | | |
| | | | | | | | | | | |
Weighted-Average Assumptions Used to Determine Benefit Obligations
The following table presents weighted average assumptions used to determine benefit obligations at the measurement dates:
| | | | | | | | | | | |
| | December 31, |
| | 2024 | | 2023 |
| United States plans | | | |
| Discount rate | 5.55 | % | | 4.90 | % |
| Rate of compensation increase | N/A | | N/A |
| Non-United States plans | | | |
| Discount rate | 5.49 | % | | 5.64 | % |
| Rate of compensation increase | 3.00 | % | | 3.00 | % |
Components of Net Periodic Postretirement Benefit Income
The following table presents the components of net periodic postretirement benefit income:
| | | | | | | | | | | | | | | | | |
| | Twelve Months Ended December 31, |
| (In millions) | 2024 | | 2023 | | 2022 |
| United States plans | | | | | |
| | | | | |
| | | | | |
| | | | | |
| | | | | |
| | | | | |
| | | | | |
| | | | | |
| | | | | |
| | | | | |
| | | | | |
| | | | | |
| | | | | |
| | | | | |
| | | | | |
| Service cost | $ | 1 | | | $ | 1 | | | $ | 1 | |
| Interest cost | 5 | | | 5 | | | 4 | |
| | | | | |
| Amortization of actuarial loss | (8) | | | (8) | | | (7) | |
| | | | | |
| Net periodic postretirement benefit income | $ | (2) | | | $ | (2) | | | $ | (2) | |
There was no significant net periodic postretirement income attributable to non-U.S. plans.
Weighted-Average Assumptions Used to Determine Net Periodic Postretirement Benefit Income
The following table presents the discount rates used to determine net periodic postretirement benefit income:
| | | | | | | | | | | | | | | | | |
| | Twelve Months Ended December 31, |
| | 2024 | | 2023 | | 2022 |
| United States plans | 4.90 | % | | 5.10 | % | | 2.70 | % |
| Non-United States plans | 5.64 | % | | 5.93 | % | | 3.63 | % |
OWENS CORNING AND SUBSIDIARIES
NOTES TO CONSOLIDATED FINANCIAL STATEMENTS (continued)
16. POSTEMPLOYMENT AND POSTRETIREMENT BENEFITS OTHER THAN PENSIONS (continued)
The following table presents health care cost trend rates used to determine net periodic postretirement benefit income, as well as information regarding the ultimate rate and the year in which the ultimate rate is reached:
| | | | | | | | | | | | | | | | | |
| | Twelve Months Ended December 31, |
| | 2024 | | 2023 | | 2022 |
| United States plans: | | | | | |
| Initial rate at end of year | 11.80 | % | | 11.27 | % | | 8.86 | % |
| Ultimate rate | 4.50 | % | | 4.50 | % | | 4.50 | % |
| Year in which ultimate rate is reached | 2034 | | 2033 | | 2031 |
| Non-United States plans: | | | | | |
| Initial rate at end of year | 5.46 | % | | 4.97 | % | | 4.65 | % |
| Ultimate rate | 4.46 | % | | 4.31 | % | | 4.13 | % |
| Year in which ultimate rate is reached | 2038 | | 2037 | | 2040 |
Estimated Future Benefit Payments
The following table shows estimated future benefit payments from the Company’s postretirement benefit plans:
| | | | | |
| (In millions) | Estimated Benefit Payments |
| Fiscal Year: | |
| 2025 | $ | 11 | |
| 2026 | $ | 11 | |
| 2027 | $ | 11 | |
| 2028 | $ | 10 | |
| 2029 | $ | 10 | |
| 2030-2034 | $ | 44 | |
Postemployment Benefits
The Company may also provide benefits to former or inactive employees after employment but before retirement under certain conditions. These benefits include continuation of benefits such as health care and life insurance coverage. The accrued postemployment benefits liability was $5 million at December 31, 2024 and 2023. The net periodic postemployment benefit expense for the years ended December 31, 2024, 2023 and 2022 was approximately $1 million.
17. CONTINGENT LIABILITIES AND OTHER MATTERS
The Company may be involved in various legal and regulatory proceedings relating to employment, antitrust, tax, product liability, environmental, contracts, intellectual property and other matters (collectively, “Proceedings”). The Company regularly reviews the status of such Proceedings along with legal counsel. Liabilities for such Proceedings are recorded when it is probable that the liability has been incurred and when the amount of the liability can be reasonably estimated. Liabilities are adjusted when additional information becomes available. Except as set forth below under "Litigation and Regulatory Proceedings", management believes that the amount of any reasonably possible losses in excess of any amounts accrued, if any, with respect to such Proceedings or any other known claim, including the matters described below under the caption Environmental Matters (the “Environmental Matters”), are not material to the Company’s financial statements. While the likelihood is remote, the disposition of the Proceedings and Environmental Matters could have a material impact on the results of operations, cash flows or liquidity in any given reporting period.
Litigation and Regulatory Proceedings
The Company is involved in litigation and regulatory proceedings from time to time in the regular course of its business. The Company believes that adequate provisions for resolution of all contingencies, claims and pending matters have been made for probable losses that are reasonably estimable.
OWENS CORNING AND SUBSIDIARIES
NOTES TO CONSOLIDATED FINANCIAL STATEMENTS (continued)
17. CONTINGENT LIABILITIES AND OTHER MATTERS (continued)
During the second quarter of 2023, the Company's subsidiary, Paroc Group OY (“Paroc”), which the Company acquired in 2018, notified the appropriate European maritime regulatory authorities that specific products in its marine insulation product line may not meet certain fire safety requirements in accordance with their certifications. Paroc voluntarily withdrew these specific products from the market, issued recalls and suspended distribution and sales of these products (the "Recalled Products"). Paroc continues to cooperate with the applicable regulatory and government authorities and work with its customers and end-users to assist with remediation for the recall. The Company has included an estimated liability for expected future costs related to the Recalled Products on its Consolidated Balance Sheets as of December 31, 2024 and December 31, 2023. The estimated liability is primarily based on claims received, as well as assumptions related to the estimated costs of the remedy for the Recalled Products. At this time, we cannot estimate a range of loss for any additional costs related to the Recalled Products that exceed the current estimated liability. We reevaluate these assumptions each period and the related liability may be adjusted when factors indicate that the liability is either not sufficient to cover or exceeds the estimated costs related to the Recalled Products. Based on the factors currently known, we believe the appropriate liability has been established at this time. It is reasonably possible that additional costs related to the Recalled Products could be incurred that exceed the estimated liability by amounts that could be material to our Consolidated Financial Statements.
Due to these nonconformances, the Company reviewed the Paroc insulation product portfolio. The review has concluded. In addition to addressing the Recalled Products, the Company continues to assess potential nonconformances related to certain ventilation duct and steel beam insulation products. Paroc suspended sales of these affected insulation products as a precautionary measure while it reviews the potential nonconformances, but has not issued recalls. We expect to incur costs associated with the resolution of this matter. The amount or range of any potential loss cannot be reasonably estimated at this time.
Environmental Matters
The Company has established policies and procedures designed to ensure that its operations are conducted in compliance with all relevant laws and regulations and that enable the Company to meet its high standards for corporate sustainability and environmental stewardship. Our manufacturing facilities are subject to numerous foreign, federal, state and local laws and regulations relating to the presence of hazardous materials, pollution and protection of the environment, including emissions to air, reductions of greenhouse gases, discharges to water, management of hazardous materials, handling and disposal of solid wastes, use of chemicals in our manufacturing processes and remediation of contaminated sites. All Company manufacturing facilities are either ISO 14001 certified or deploy environmental management systems based on ISO 14001 principles. The Company’s 2030 Sustainability Goals include significant global reductions in energy use, water consumption, waste to landfill, and emissions of greenhouse gases, fine particulate matter, and volatile organic air emissions and protection of biodiversity.
Owens Corning is involved in remedial response activities and is responsible for environmental remediation at a number of sites, including certain of its currently owned or formerly owned plants. These responsibilities arise under a number of laws, including, but not limited to, the Federal Resource Conservation and Recovery Act, and similar state or local laws pertaining to the management and remediation of hazardous materials and petroleum. The Company has also been named a potentially responsible party under the U.S. Federal Superfund law, similar state or local laws pertaining to the management and remediation of hazardous materials and petroleum. The Company became involved in these sites as a result of government action or in connection with business acquisitions. As of December 31, 2024, the Company was involved with a total of 24 sites worldwide, including 9 Superfund and state or country equivalent sites and 15 owned or formerly owned sites. None of the liabilities for these sites are individually significant to the Company.
Remediation activities generally involve a potential range of activities and costs related to soil, groundwater and sediment contamination. This can include pre-cleanup activities such as fact-finding and investigation, risk assessment, feasibility studies, remedial action design and implementation (where actions may range from monitoring to removal of contaminants, to installation of longer-term remediation systems). A number of factors affect the cost of environmental remediation, including the number of parties involved in a particular site, the determination of the extent of contamination, the length of time the remediation may require, the complexity of environmental regulations, variability in clean-up standards, the need for legal action and changes in remediation technology. Taking these factors into account, Owens Corning reasonably estimates the costs of remediation to be paid over a period of years. The Company accrues an amount on an undiscounted basis, when a liability is probable and reasonably estimable. Actual cost may differ from these estimates for the reasons mentioned above. At December 31, 2024, the Company had an accrual totaling $4 million for these costs, of which the current portion is $2 million. Changes in required remediation procedures or timing of those procedures, or discovery of contamination at additional sites, could result in material increases to the Company’s environmental obligations.
OWENS CORNING AND SUBSIDIARIES
NOTES TO CONSOLIDATED FINANCIAL STATEMENTS (continued)
17. CONTINGENT LIABILITIES AND OTHER MATTERS (continued)
During the first quarter of 2024, the Procuraduría Federal de Protección al Ambiente (“PROFEPA”) issued a ruling to Owens Corning Mexico, S. de R.L. de C.V., a subsidiary of the Company (“OC Mexico”), citing violations of Mexico’s air emissions regulations at OC Mexico’s facility in Mexico City, Mexico and imposing monetary sanctions of approximately $1 million. OC Mexico previously performed all related corrective action and, as of the date of this report, is in compliance with applicable federal and local environmental laws. OC Mexico is in the process of appealing PROFEPA’s ruling and the resulting monetary sanctions.
18. STOCK COMPENSATION
Description of the Plan
On April 20, 2023, the Company's stockholders approved the Owens Corning 2023 Stock Plan (the “2023 Stock Plan”) which authorizes grants of stock options, stock appreciation rights, stock awards (including restricted stock awards, restricted stock units and bonus stock awards), performance share awards and performance share units. At December 31, 2024, the number of shares remaining available under the 2023 Stock Plan for all stock awards was 3.0 million.
Prior to the 2023 Stock Plan, employees were eligible to receive stock awards under the Owens Corning 2019 Stock Plan.
Total Stock-Based Compensation Expense
Stock-based compensation expense included in Marketing and administrative expenses in the accompanying Consolidated Statements of Earnings is as follows:
| | | | | | | | | | | | | | | | | |
| Twelve Months Ended December 31, |
| (In millions) | 2024 | | 2023 | | 2022 |
| Total stock-based compensation expense | $ | 93 | | | $ | 51 | | | $ | 51 | |
| Income tax benefit recognized on stock-based compensation expense | $ | 21 | | | $ | 14 | | | $ | 11 | |
Restricted Stock Units
The Company has granted restricted stock units (“RSUs”) under its stockholder-approved stock plans. Generally, all outstanding RSUs will fully settle in stock. Compensation expense for RSUs is measured based on the closing market price of the stock at date of grant and is recognized on a straight-line basis over the vesting period, which is typically three or four years. The Stock Plan allows alternate vesting schedules for death, disability and retirement.
The weighted average grant date fair value of RSUs granted in 2024, 2023 and 2022 was $155.14, $104.27 and $90.41, respectively.
Masonite Equity Awards
On May 15, 2024, the Company converted outstanding Masonite stock-based incentive awards to Masonite employees at a 0.8 equity award exchange ratio. Masonite equity awards include outstanding and unvested awards of restricted stock units and performance stock units (“PRSUs”) under the Masonite International Corporation 2021 Omnibus Incentive Plan (“Masonite Stock Plan”) that were held by employees of Masonite, which were exchanged for time-vesting restricted stock units of Owens Corning RSUs in connection with the completion of the transactions contemplated by the Arrangement Agreement. The converted stock-based incentive awards include 0.2 million PRSUs and 0.3 million restricted stock units.
The equity award exchange ratio was determined by the consideration amount of $133 per share divided by the volume weighted average closing sale price of one share of Owens Corning common stock for the ten consecutive trading days ended March 15, 2024 of $174.03 per share, in accordance with the terms of the Arrangement Agreement.
In accordance with the Arrangement Agreement, the number of Masonite shares underlying the PRSUs was equal to (i) 107.33% of target for PRSUs granted in February 2022, (ii) 100% of target for PRSUs granted in August 2022 and (iii) 122% of target for PRSUs granted in February 2023.
OWENS CORNING AND SUBSIDIARIES
NOTES TO CONSOLIDATED FINANCIAL STATEMENTS (continued)
18. STOCK COMPENSATION (continued)
The fair value of the Owens Corning RSUs issued for Masonite outstanding equity awards was $85 million as of the date of acquisition, of which $35 million was related to pre-combination expense and was included in the purchase price. The remaining portion of $50 million relates to post-combination expense, of which 25 million was accelerated as of December 31, 2024. As of December 31, 2024, the future unrecognized expense related to the converted outstanding RSUs was approximately $14 million which will be recognized over the remaining service period of approximately 1.63 years. Please refer to Note 7 and 13 of the Consolidated Financial Statements for further information. Future equity-based awards to Company employees who were former Masonite employees may be granted from the remaining available shares under the Masonite Stock Plan. At December 31, 2024, the number of shares remaining available under the Masonite Stock Plan was 0.6 million shares of Owens Corning common stock.
The following table shows a summary of the Company’s RSU activity:
| | | | | | | | | | | |
| | Number of
RSUs | | Weighted-
Average
Fair Value |
| Balance at January 1, 2024 | 1,225,668 | | | $ | 79.72 | |
| Granted | 238,221 | | | 155.14 | |
| Assumed (converted Masonite equity awards) | 488,778 | | | 174.03 | |
| Vested | (655,825) | | | 121.58 | |
| Forfeited | (47,696) | | | 124.74 | |
| Balance at December 31, 2024 | 1,249,146 | | | $ | 107.31 | |
As of December 31, 2024, there was $51 million of total unrecognized compensation cost related to RSUs. This total includes $14 million of unrecognized compensation related to converted Masonite equity awards and $37 million related to Owens Corning Stock Plans. That cost is expected to be recognized over a weighted-average period of 1.82 years. The total grant date fair value of stock vested during the years ended December 31, 2024, 2023 and 2022 was $80 million, $27 million and $22 million, respectively.
Performance Share Units
The Company has granted performance share units (“PSUs”) as a part of its long-term incentive plan. All outstanding PSUs will fully settle in stock. The amount of shares ultimately distributed from the 2024, 2023 and 2022 grants is contingent on meeting internal company-based metrics or an external-based stock performance metric.
In 2024, 2023 and 2022, the Company granted both internal company-based and external-based metric PSUs.
Internal Company-based metrics
The internal Company-based metric PSUs are based on various Company metrics and typically vest after a three-year period. The amount of stock distributed will vary from 0% to 200% of PSUs awarded depending on each award's design and performance versus the Company-based metrics.
The initial fair value for all internal Company-based metric PSUs assumes that the performance goals will be achieved and is based on the grant date stock price. This assumption is monitored quarterly and if it becomes probable that such goals will not be achieved or will be exceeded, compensation expense recognized will be adjusted and previous surplus compensation expense recognized will be reversed or additional expense will be recognized. The expected term represents the period from the grant date to the end of the three-year performance period. Pro-rata vesting may be utilized in the case of death, disability or retirement, and awards, if earned, will be paid at the end of the three-year period.
The following table provides a summary of the grant date fair values of the internal Company-based metric PSUs:
| | | | | | | | | | | | | | | | | |
| Twelve Months Ended December 31, |
| 2024 | | 2023 | | 2022 |
| Grant date fair value of units granted | $ | 147.18 | | | $ | 92.97 | | | $ | 87.06 | |
OWENS CORNING AND SUBSIDIARIES
NOTES TO CONSOLIDATED FINANCIAL STATEMENTS (continued)
18. STOCK COMPENSATION (continued)
External based metrics
The external-based metric PSUs vest after a three-year period. Outstanding grants issued in or after 2018 until 2022 were based on the Company’s total stockholder return relative to the performance of the Dow Jones U.S. Construction & Materials Index. Outstanding grants issued in or after 2023 are based on the Company’s total stockholder return relative to a peer group. The amount of stock distributed will vary from 0% to 200% of PSUs awarded depending on the relative stockholder return performance. The fair value of external-based metric PSUs has been estimated at the grant date using a Monte Carlo simulation that uses various assumptions.
The following table provides a summary of the assumptions for PSUs granted in 2024, 2023 and 2022:
| | | | | | | | | | | | | | | | | |
| Twelve Months Ended December 31, |
| 2024 | | 2023 | | 2022 |
| Expected volatility | 33.88% | | 44.66% | | 41.65% |
| Risk free interest rate | 3.94% | | 3.75% | | 1.36% |
| Expected term (in years) | 2.91 | | 2.91 | | 2.91 |
| Grant date fair value of units granted | $195.95 | | $119.33 | | $122.69 |
The risk-free interest rate was based on zero-coupon United States Treasury STRIPS at the grant date. The expected term represents the period from the grant date to the end of the three-year performance period.
PSU Summary
As of December 31, 2024, there was $16 million total unrecognized compensation cost related to PSUs. That cost is expected to be recognized over a weighted-average period of 1.65 years. The total grant date fair value of shares vested during the years ended December 31, 2024, 2023 and 2022, was $21 million, $21 million and $9 million, respectively.
The following table shows a summary of the Company's PSU activity:
| | | | | | | | | | | |
| | Number of
PSUs | | Weighted- Average Grant Date Fair Value |
| Balance as of January 1, 2024 | 268,677 | | | $ | 100.57 | |
| Granted | 179,749 | | | 134.40 | |
| Vested | (210,775) | | | 101.30 | |
| Forfeited | (18,576) | | | 107.00 | |
| Balance as of December 31, 2024 | 219,075 | | | $ | 117.23 | |
Employee Stock Purchase Plan
The Owens Corning Employee Stock Purchase Plan (“ESPP”) is a tax-qualified plan under Section 423 of the Internal Revenue Code. The purchase price of shares purchased under the ESPP is equal to 85% of the lower of the fair market value of shares of Owens Corning common stock at the beginning or ending of the offering period, which is a six month period ending on May 31 and November 30 of each year. On April 16, 2020, the Company's stockholders approved the Amended and Restated Owens Corning Employee Stock Purchase Plan which increased the number of shares available for issuance under the plan by 4.2 million shares. As of December 31, 2024, 3.0 million shares remain available for purchase.
Included in total stock-based compensation expense is $8 million, $7 million and $6 million of expense related to the Company's ESPP for the years ended December 31, 2024, 2023 and 2022, respectively. As of December 31, 2024, the Company had $4 million of total unrecognized compensation costs related to the ESPP.
OWENS CORNING AND SUBSIDIARIES
NOTES TO CONSOLIDATED FINANCIAL STATEMENTS (continued)
18. STOCK COMPENSATION (continued)
The following table shows a summary of employee purchase activity under the ESPP:
| | | | | | | | | | | | | | | | | |
| Twelve Months Ended December 31, |
| 2024 | | 2023 | | 2022 |
| Total shares purchased by employees | 211,607 | | | 287,732 | | | 293,364 | |
| Average purchase price | $ | 132.88 | | | $ | 83.51 | | | $ | 74.19 | |
19. CHANGES IN ACCUMULATED OTHER COMPREHENSIVE DEFICIT
The following table summarizes the changes in accumulated other comprehensive income (deficit):
| | | | | | | | | | | |
| Twelve Months Ended December 31, |
| (In millions) | 2024 | | 2023 |
| Currency Translation Adjustment | | | |
| Beginning balance | $ | (318) | | | $ | (380) | |
| | | |
| (Loss) gain on foreign currency translation | (216) | | | 62 | |
| | | |
| | | |
| | | |
| | | |
| Other comprehensive income (loss), net of tax | (216) | | | 62 | |
| Ending balance | $ | (534) | | | $ | (318) | |
| Pension and Other Postretirement Adjustment | | | |
| Beginning balance | $ | (196) | | | $ | (301) | |
| | | |
| | | |
| | | |
| | | |
| | | |
| | | |
| Amounts reclassified from AOCI to net earnings, net of tax (a) | (2) | | | — | |
| | | |
| | | |
| | | |
| Pension annuity settlement charge reclassified from AOCI, net of tax (b) | — | | | 109 | |
| Amounts classified into AOCI, net of tax | 17 | | | (4) | |
| Other comprehensive income, net of tax | 15 | | | 105 | |
| Ending balance | $ | (181) | | | $ | (196) | |
| Hedging Adjustment | | | |
| Beginning balance | $ | 11 | | | $ | — | |
| | | |
| | | |
| Amounts reclassified from AOCI to net earnings, net of tax (c) | 12 | | | 39 | |
| | | |
| | | |
| | | |
| | | |
| | | |
| Amounts classified into AOCI, net of tax | 1 | | | (28) | |
| Other comprehensive income (loss), net of tax | 13 | | | 11 | |
| Ending balance | $ | 24 | | | $ | 11 | |
| Total AOCI ending balance | $ | (691) | | | $ | (503) | |
(a)These AOCI components are included in the computation of total Pension and Other Postretirement cost and are recorded in Non-operating (income) expense, net. See Notes 15 and 16 for additional information.
(b)These amounts reclassified from AOCI relate to a pension annuity settlement which occurred in the fourth quarter of 2023. See Note 15 for additional information.
(c)Amounts reclassified from (loss) gain on cash flow hedges are reclassified from AOCI to income when the hedged item affects earnings and is recognized in Cost of sales or Interest expense, net depending on the hedged item. See Note 4 for additional information.
OWENS CORNING AND SUBSIDIARIES
NOTES TO CONSOLIDATED FINANCIAL STATEMENTS (continued)
20. EARNINGS PER SHARE
The following table is a reconciliation of weighted-average shares for calculating basic and diluted earnings per-share:
| | | | | | | | | | | | | | | | | |
| | Twelve Months Ended December 31, |
| (In millions, except per share amounts) | 2024 | | 2023 | | 2022 |
| Net earnings attributable to Owens Corning | $ | 647 | | | $ | 1,196 | | | $ | 1,241 | |
| Weighted-average number of shares outstanding used for basic earnings per share | 86.9 | | | 90.1 | | | 96.6 | |
| Non-vested restricted and performance shares | 0.9 | | | 0.9 | | | 1.1 | |
| | | | | |
| Weighted-average number of shares outstanding and common equivalent shares used for diluted earnings per share | 87.8 | | | 91.0 | | | 97.7 | |
| Earnings per common share attributable to Owens Corning common stockholders: | | | | | |
| Basic | $ | 7.45 | | | $ | 13.27 | | | $ | 12.85 | |
| Diluted | $ | 7.37 | | | $ | 13.14 | | | $ | 12.70 | |
| | | | | |
Basic earnings per share is calculated by dividing earnings attributable to Owens Corning by the weighted-average number of shares of the Company’s common stock outstanding during the period. Outstanding shares consist of issued shares less treasury stock.
On December 1, 2022, the Board of Directors approved a new share repurchase program under which the Company is authorized to repurchase up to 10 million shares of the Company’s outstanding common stock (the “Repurchase Authorization”). The Repurchase Authorization enables the Company to repurchase shares through the open market, privately negotiated, or other transactions. The actual number of shares repurchased will depend on timing, market conditions and other factors and will be at the Company’s discretion. The Company repurchased 2.6 million shares of its common stock for $433 million, inclusive of applicable taxes, during the twelve months ended December 31, 2024 under the Repurchase Authorization. As of December 31, 2024, 6.4 million shares remained available for repurchase under the Repurchase Authorization. The Company repurchased 5.4 million shares of its common stock for $629 million, inclusive of applicable taxes, during the twelve months ended December 31, 2023.
For the years ended December 31, 2024, December 31, 2023 and December 31, 2022, the Company did not have any non-vested restricted stock units or non-vested performance share units that had an anti-dilutive effect on earnings per share.
OWENS CORNING AND SUBSIDIARIES
NOTES TO CONSOLIDATED FINANCIAL STATEMENTS (continued)
21. INCOME TAXES
The following table summarizes our Earnings before taxes and Income tax expense:
| | | | | | | | | | | | | | | | | |
| | Twelve Months Ended December 31, |
| (In millions) | 2024 | | 2023 | | 2022 |
| Earnings before taxes: | | | | | |
| United States | $ | 1,194 | | | $ | 1,360 | | | $ | 1,286 | |
| Foreign | (278) | | | 231 | | | 328 | |
| Total | $ | 916 | | | $ | 1,591 | | | $ | 1,614 | |
| | | | | |
| | | | | | | | | | | | | | | | | |
| Income tax expense: | | | | | |
| Current | | | | | |
| United States | $ | 222 | | | $ | 286 | | | $ | 180 | |
| State and local | 39 | | | 62 | | | 38 | |
| Foreign | 106 | | | 65 | | | 125 | |
| Total current | 367 | | | 413 | | | 343 | |
| Deferred | | | | | |
| United States | (12) | | | (4) | | | 50 | |
| State and local | 3 | | | 5 | | | (6) | |
| Foreign | (83) | | | (13) | | | (14) | |
| Total deferred | (92) | | | (12) | | | 30 | |
| Total income tax expense | $ | 275 | | | $ | 401 | | | $ | 373 | |
The reconciliation between the United States federal statutory rate and the Company’s effective income tax rate from continuing operations is:
| | | | | | | | | | | | | | | | | |
| Twelve Months Ended December 31, |
| 2024 | | 2023 | | 2022 |
| United States federal statutory rate | 21 | % | | 21 | % | | 21 | % |
| State and local income taxes, net of federal tax benefit | 4 | | | 3 | | | 2 | |
| | | | | |
| U.S. tax expense on Foreign Earnings | (2) | | | — | | | — | |
| | | | | |
| | | | | |
| Valuation allowance | 8 | | | 1 | | | — | |
| R&D Credits | (1) | | | — | | | (1) | |
| | | | | |
| | | | | |
| | | | | |
| UTP/Audit and Provision to Return | (3) | | | — | | | — | |
| Non-deductible Executive Compensation | 1 | | | 1 | | | — | |
| Other, net | 2 | | | (1) | | | 1 | |
| Effective tax rate | 30 | % | | 25 | % | | 23 | % |
The Company continues to assert indefinite reinvestment on the majority of its foreign subsidiaries and affiliates in accordance with ASC 740 based on the laws as of enactment of the Tax Act. During the fourth quarter of 2024, the Company removed the permanent reinvestment assertion related to certain business divestitures including the business operations that are subject to Held for Sale accounting. The Company accrued deferred tax liabilities of $8 million as a result of the current year changes. As of December 31, 2024, the Company has not provided for withholding or income taxes on approximately $1.4 billion of undistributed reserves of the foreign subsidiaries and affiliates that are considered by management to be permanently reinvested. Quantification of the deferred tax liability associated with these undistributed reserves is not practicable.
OWENS CORNING AND SUBSIDIARIES
NOTES TO CONSOLIDATED FINANCIAL STATEMENTS (continued)
21. INCOME TAXES (continued)
The cumulative temporary differences giving rise to the deferred tax assets and liabilities are as follows:
| | | | | | | | | | | | | | | | | | | | | | | |
| | December 31, 2024 | | December 31, 2023 |
| (In millions) | Deferred
Tax
Assets | | Deferred
Tax
Liabilities | | Deferred
Tax
Assets | | Deferred
Tax
Liabilities |
| Other employee benefits | $ | 48 | | | $ | — | | | $ | 57 | | | $ | — | |
| Pension plans | 9 | | | — | | | 13 | | | — | |
| Loss and tax credit carryforwards | 107 | | | — | | | 92 | | | — | |
| Depreciation | — | | | 381 | | | — | | | 363 | |
| Capitalized R&D | 74 | | | — | | | 53 | | | — | |
| Leases - right of use assets | — | | | 137 | | | — | | | 70 | |
| Leases - liabilities | 137 | | | — | | | 62 | | | — | |
| Amortization | — | | | 530 | | | — | | | 293 | |
| Inventory | 35 | | | — | | | 30 | | | — | |
| Foreign tax credit carryforwards | 57 | | | — | | | 53 | | | — | |
| | | | | | | |
| Other | 129 | | | — | | | 103 | | | — | |
| Subtotal | 596 | | | 1,048 | | | 463 | | | 726 | |
| Valuation allowances | (213) | | | — | | | (140) | | | — | |
| Total deferred taxes | $ | 383 | | | $ | 1,048 | | | $ | 323 | | | $ | 726 | |
The following table summarizes the amount and expiration dates of our deferred tax assets related to operating loss and tax credit carryforwards and foreign tax credit carryforwards at December 31, 2024:
| | | | | | | | | | | |
| (In millions) | Expiration Dates | | Amounts |
| Domestic loss and tax credit carryforwards (a) | 2025 - 2043 | | $ | 102 | |
| | | |
| Foreign loss and tax credit carryforwards (b) | 2025 - Indefinite | | 62 | |
| | | |
| | | |
| | | |
| | | |
| Total loss and tax credit carryforwards | | | $ | 164 | |
| | | |
(a)The use of certain of the Company's domestic loss carryforwards is limited pursuant to Internal Revenue Code (IRC) Section 382. IRC Section 382 imposes an annual limitation on a corporation's ability to use loss carryforwards that arose before a change in control. A change in control is generally defined as a cumulative change of more than 50% in the ownership positions of certain stockholders during a rolling three-year period. The Company believes that these limitations will not result in the loss of any of the loss carryforwards.
(b)The foreign net operating losses ("NOLs") are related to various jurisdictions that provide for both indefinite carryforward periods and others with carryforward periods that range from the tax years 2025 to 2035.
The following is a rollforward of the valuation allowances for deferred taxes:
| | | | | | | | | | | | | | | | | |
| | December 31, |
| (In millions) | 2024 | | 2023 | | 2022 |
| Balance at beginning of period | $ | 140 | | | $ | 129 | | | $ | 132 | |
| Additions charged to expense | 77 | | | 11 | | | 5 | |
| Additions charged to other | (4) | | | 1 | | | (2) | |
| Deductions | (3) | | | (1) | | | (6) | |
| Acquisitions and divestitures | 3 | | | — | | | — | |
| Balance at end of period | $ | 213 | | | $ | 140 | | | $ | 129 | |
OWENS CORNING AND SUBSIDIARIES
NOTES TO CONSOLIDATED FINANCIAL STATEMENTS (continued)
21. INCOME TAXES (continued)
Deferred income taxes are provided for temporary differences between amounts of assets and liabilities for financial reporting purposes and the basis of such assets and liabilities as measured under enacted tax laws and regulations, as well as NOLs, tax credits and other tax carryforwards. We have a variety of deferred tax assets in numerous tax jurisdictions. These deferred tax assets are subject to periodic assessment as to recoverability and if it is determined that it is more likely than not that the benefits will not be realized, valuation allowances are recognized. In evaluating whether it is more likely than not that we would recover these deferred tax assets, future taxable income, the reversal of existing temporary differences and tax planning strategies are considered.
We believe that our estimates for the valuation allowances recorded against deferred tax assets are appropriate based on current facts and circumstances. During the fourth quarter of 2024, we recorded $76 million of valuation allowances related to the announced business divestitures. As of December 31, 2024 we had $213 million of valuation allowances on deferred tax assets, on a tax-effected basis, primarily related to U.S. federal foreign tax credit carryforwards and certain foreign deferred tax attributes as it is more likely than not that some portion or all of these tax attributes will not be realized.
We file a consolidated federal income tax return in the United States as well as tax returns in multiple state, local and foreign jurisdictions. In the normal course of business, the Company is subject to examination by the taxing authorities in each of the jurisdictions where we file tax returns. During 2024, the U.S. Internal Revenue Service (“IRS”) initiated an audit of the Company’s 2021 consolidated federal income tax return. The IRS also initiated an audit of Masonite International Corporation’s pre-acquisition amended U.S. income tax filings. The Company is no longer subject to U.S. federal tax examinations for years before 2021 or state and foreign examinations for years before 2014.
We have on-going audits in various stages of completion in several state and foreign jurisdictions, one or more of which may conclude within the next 12 months. Such settlements could involve some or all of the following: the payment of additional taxes, the adjustment of certain deferred taxes and/or the recognition of unrecognized tax benefits. The resolution of these matters, in combination with the expiration of certain statutes of limitations in various jurisdictions, make it reasonably possible that our unrecognized tax benefits may decrease as a result of either payment or recognition by up to $10 million in the next 12 months, excluding interest.
A reconciliation of the beginning and ending amounts of unrecognized tax benefits is as follows:
| | | | | | | | | | | | | | | | | |
| | Twelve Months Ended December 31, |
| (In millions) | 2024 | | 2023 | | 2022 |
| Balance at beginning of period | $ | 70 | | | $ | 71 | | | $ | 74 | |
| Tax positions related to the current year | | | | | |
| Gross additions | — | | | — | | | — | |
| Tax positions related to prior years | | | | | |
| Gross additions | — | | | — | | | 2 | |
| Gross reductions | — | | | — | | | — | |
| Additions from Acquisitions | 7 | | | — | | | — | |
| Settlements | — | | | — | | | (1) | |
| Expiration of statute of limitations | (47) | | | (1) | | | (3) | |
| Impact of currency changes | — | | | — | | | (1) | |
| Balance at end of period | $ | 30 | | | $ | 70 | | | $ | 71 | |
During 2024, we recognized uncertain tax benefits of $47 million related primarily to the expiration of the statute of limitations in the U.S. for the 2020 tax year for both the Company and Masonite.
If these unrecognized tax benefits as of December 31, 2024, were to be recognized in the future, they would decrease the Company’s income tax expense by about $28 million.
The Company recognizes all interest and penalties related to unrecognized tax benefits as a component of income tax expense. Accrued interest and penalties, which are not presented in the rollforward table above, were $6 million, $9 million and $7 million as of December 31, 2024, 2023 and 2022, respectively. Related to interest and penalties, we recognized an income tax benefit of $5 million as of December 31, 2024. As of December 31, 2023 and 2022, we recognized income tax expense of $2 million and $1 million, respectively.
OWENS CORNING AND SUBSIDIARIES
NOTES TO CONSOLIDATED FINANCIAL STATEMENTS (continued)
22. SUPPLEMENTAL CASH FLOW INFORMATION
Certain cash and non-cash transactions were as follows for the periods indicated:
| | | | | | | | | | | | | | | | | | |
| | Twelve Months Ended December 31, | |
| (In millions) | 2024 | | 2023 | | 2022 | |
| Transactions involving cash: | | | | | | |
| Cash paid during the year for income taxes | $ | 423 | | | $ | 428 | | | $ | 319 | | |
| Cash paid during the year for interest | $ | 226 | | | $ | 135 | | | $ | 123 | | |
| Cash paid for operating leases | $ | 102 | | | $ | 76 | | | $ | 68 | | |
| Cash paid for finance leases for financing activities | $ | 41 | | | $ | 33 | | | $ | 30 | | |
| Cash paid for finance leases for operating activities | $ | 10 | | | $ | 6 | | | $ | 4 | | |
| Non-cash transactions from operating activities | | | | | | |
| Right-of-use assets acquired under operating leases | $ | 84 | | | $ | 104 | | | $ | 119 | | |
| Right-of-use assets acquired under finance leases | $ | 196 | | | $ | 61 | | | $ | 70 | | |
The following reconciles total cash, cash equivalents and restricted cash as of the dates indicated:
| | | | | | | | | | | | | | | | | |
| | December 31, |
| (In millions) | 2024 | | 2023 | | 2022 |
| Cash and cash equivalents | $ | 361 | | | $ | 1,615 | | | $ | 1,099 | |
| Restricted cash | 8 | | | 8 | | | 8 | |
| Total cash, cash equivalents and restricted cash | $ | 369 | | | $ | 1,623 | | | $ | 1,107 | |
| | | | | |
| | | | | |
| | | | | |
Property, plant and equipment additions in accounts payable were $30 million, $30 million and $59 million as of December 31, 2024, 2023 and 2022, respectively.
23. SUBSEQUENT EVENTS
On February 13, 2025, the Company entered into a definitive agreement for the sale of the GR business for a purchase price of approximately $436 million, less costs to sell. The purchase price is inclusive of $225 million of promissory notes to be issued to the Company by the purchasers. The GR business, part of the Company’s Composites segment, manufactures, fabricates, and sells glass fiber reinforcements for a wide variety of applications in wind energy, infrastructure, industrial, transportation and consumer markets. In 2024, the GR business generated annual revenues of approximately $1.1 billion. The sale will complete Owens Corning’s review of strategic alternatives for the business, announced on February 9, 2024, and aligns with the Company’s strategy to reshape the Company to focus on residential and commercial building products in North America and Europe.
The transaction is expected to close in 2025 and is subject to customary regulatory approvals and other conditions. The Company expects to incur a material loss on disposal which cannot be estimated at this time.
| | | | | |
| ITEM 9. | CHANGES IN AND DISAGREEMENTS WITH ACCOUNTANTS ON ACCOUNTING AND FINANCIAL DISCLOSURE |
None. | | | | | |
| ITEM 9A. | CONTROLS AND PROCEDURES |
The Company maintains (a) disclosure controls and procedures (as such term is defined in Rules 13a-15(e) and 15d-15(e) under the Exchange Act), and (b) internal control over financial reporting (as such term is defined in Rules 13a-15(f) and 15d-15(f) under the Exchange Act).
Management, with the participation of the Company’s Chief Executive Officer and Chief Financial Officer, has evaluated the effectiveness of the Company’s disclosure controls and procedures as of the end of the period covered by this Annual Report on Form 10-K. Based on such evaluation, the Company’s Chief Executive Officer and Chief Financial Officer have concluded that, as of the end of such period, the Company’s disclosure controls and procedures are effective.
There has been no change in the Company's internal control over financial reporting during the quarter ended December 31, 2024 that materially affected, or is reasonably likely to materially affect, the Company's internal control over financial reporting.
On May 15, 2024, the Company completed its acquisition of Masonite International Corporation ("Masonite"). As a result, the Company's management excluded the operations of Masonite from its assessment of internal control over financial reporting as of December 31, 2024. Masonite represented 11% of the Company's consolidated total assets as of December 31, 2024 and 13% of the Company's consolidated Net sales for the year ended December 31, 2024. SEC guidelines permit companies to omit an acquired entity's internal control over financial reporting from its management assessment during the first year of the acquisition. We plan to fully integrate Masonite into our internal control over financial reporting in 2025.
A report of the Company’s management on the Company’s internal control over financial reporting is included in Management's Report on Internal Control Over Financial Reporting within Item 8. Financial Statements and Supplementary Data. PricewaterhouseCoopers LLP’s report on the effectiveness of internal control over financial reporting is included in the Report of Independent Registered Public Accounting Firm within Item 8. Financial Statements and Supplementary Data.
| | | | | |
| ITEM 9B. | OTHER INFORMATION |
10b5-1 Plans
On November 8, 2024, Gina A. Beredo, the Company's Executive Vice President, General Counsel and Corporate Secretary, entered into a written plan for the sale of up to 4,511 shares of Company common stock, intended to satisfy the affirmative defense conditions of Rule 10b5-1(c) under the Exchange Act. This plan is scheduled to terminate no later than March 31, 2025.
On November 8, 2024, Nicolas Del Monaco, the Company's President, Insulation, entered into a written plan for the sale of up to 1,750 shares of Company common stock, intended to satisfy the affirmative defense conditions of Rule 10b5-1(c) under the Exchange Act. This plan is scheduled to terminate no later than November 7, 2025.
On November 12, 2024, Todd W. Fister, the Company's Executive Vice President and Chief Financial Officer, entered into a written plan for the sale of up to 17,211 shares of Company common stock, intended to satisfy the affirmative defense conditions of Rule 10b5-1(c) under the Exchange Act. This plan is scheduled to terminate no later than November 7, 2025.
On November 22, 2024, Marcio A. Sandri, the Company's President, Composites, entered into a written plan for the sale of up to 11,127 shares of Company common stock, intended to satisfy the affirmative defense conditions of Rule 10b5-1(c) under the Exchange Act. This plan is scheduled to terminate no later than November 21, 2025. Effective February 13, 2025, in connection with the signing of the agreement to divest our GR business, Mr. Sandri no longer serves as an executive officer of the Company.
| | | | | |
| ITEM 9C. | DISCLOSURE REGARDING FOREIGN JURISDICTIONS THAT PREVENT INSPECTIONS |
Not applicable.
Part III
| | | | | |
| ITEM 10. | DIRECTORS, EXECUTIVE OFFICERS AND CORPORATE GOVERNANCE |
Information with respect to directors, corporate governance, and compliance with Section 16(a) of the Exchange Act will be presented in the 2025 Proxy Statement in the sections titled “Information Concerning Directors,” “Governance Information,” and “Delinquent Section 16(a) Reports,” and such information is incorporated herein by reference. Information with respect to the Company’s insider trading policy and procedures will be presented in the 2025 Proxy Statement in the section titled "The Company's Policies on Business Ethics and Conduct" and such information is incorporated herein by reference.
Information with respect to our executive officers is included herein under Part I, “Information about our Executive Officers”.
Code of Ethics
Owens Corning has adopted an Ethics Policy for Chief Executive and Senior Financial Officers (“Ethics Policy”) that applies to our Chief Executive Officer, Chief Financial Officer and Controller. This Ethics Policy is available on our website (www.owenscorning.com) under the “Corporate Governance” tab located in the “Investors” section and print copies will be made available free of charge upon request to the Corporate Secretary of the Company. To the extent required by applicable SEC rules or New York Stock Exchange listing standards, the Company intends to post any amendments or waivers to the above referenced codes of ethics to our website, under the tab entitled “Corporate Governance.”
| | | | | |
| ITEM 11. | EXECUTIVE COMPENSATION |
Information regarding executive officer and director compensation will be presented in the 2025 Proxy Statement under the section titled “Executive Compensation,” exclusive of the subsection titled “Compensation Committee Report,” and the section titled “2024 Non-Management Director Compensation,” and such information is incorporated herein by reference.
| | | | | |
| ITEM 12. | SECURITY OWNERSHIP OF CERTAIN BENEFICIAL OWNERS AND MANAGEMENT AND RELATED STOCKHOLDER MATTERS |
Information regarding security ownership of certain beneficial owners and management and related stockholder matters, as well as equity compensation plan information, will be presented in the 2025 Proxy Statement under the sections titled “Beneficial Ownership of Shares,” “Security Ownership of Executive Officers and Directors” and “Equity Compensation Plan Information,” and such information is incorporated herein by reference.
| | | | | |
| ITEM 13. | CERTAIN RELATIONSHIPS AND RELATED TRANSACTIONS, AND DIRECTOR INDEPENDENCE |
Information regarding certain relationships and related transactions and director independence will be presented in the 2025 Proxy Statement under the sections titled “Review, Approval or Ratification of Transactions with Related Persons,” “Director Qualifications Standards” and “Director Independence,” and such information is incorporated herein by reference.
| | | | | |
| ITEM 14. | PRINCIPAL ACCOUNTANT FEES AND SERVICES |
Information regarding principal accounting fees and services will be presented in the 2025 Proxy Statement under the sections titled “Principal Accountant Fees and Services,” and such information is incorporated herein by reference.
Part IV
| | | | | |
| ITEM 15. | EXHIBITS AND FINANCIAL STATEMENT SCHEDULES |
(a)DOCUMENTS FILED AS PART OF THIS REPORT
1.See Index to Consolidated Financial Statements on page 44 hereof. EXHIBIT INDEX
Pursuant to the rules and regulations of the SEC, the Company has filed or incorporated by reference certain agreements as exhibits to this Annual Report on Form 10-K. These agreements may contain representations and warranties by the parties. These representations and warranties have been made solely for the benefit of the other party or parties to such agreements and (i) may have been qualified by disclosures made to such other party or parties, (ii) were made only as of the date of such agreements or such other date(s) as may be specified in such agreements and are subject to more recent developments, which may not be fully reflected in the Company’s public disclosure, (iii) may reflect the allocation of risk among the parties to such agreements and (iv) may apply materiality standards different from what may be viewed as material to investors. Accordingly, these representations and warranties may not describe the Company’s actual state of affairs at the date hereof and should not be relied upon.
| | | | | |
| Exhibit No. | Description |
2.1+ | |
| 3.1 | |
| 3.2 | |
| 4.1 | |
| 4.2 | |
| 4.3 | |
| 4.4 | |
| 4.5 | |
| 4.6 | |
| 4.7 | |
| 4.8 | |
| 4.9 | |
| 4.10 | |
| | | | | |
| 4.11 | |
| 4.12 | |
| 4.13 | |
| 4.14 | |
| 4.15 | |
| 4.16 | |
| 4.17 | |
| 4.18 | |
| 4.19 | |
| 4.2 | |
| 4.21 | |
| 4.22 | |
| 4.23 | |
| 4.24 | |
| 4.25 | |
| 4.26 | |
| 4.27 | |
| 4.28 | |
| 4.29 | |
| 4.3 | |
| 4.31 | |
| 4.32 | |
| | | | | |
| 4.33 | |
| 4.34 | |
| 4.35 | |
| 10.1 | |
| 10.2 | |
| 10.3 | |
| 10.4 | |
| 10.5 | |
| 10.6 | |
| 10.7 | |
| 10.8 | |
| 10.9 | |
| 10.10 | |
| 10.11 | |
| 10.12* | |
| 10.13 | |
| 10.14* | |
| 10.15* | |
| 10.16* | |
| 10.17* | |
| 10.18* | |
| | | | | |
| 10.19* | |
| 10.20* | |
| 10.21* | |
| 10.22* | |
| 10.23* | |
| 10.24* | |
| 10.25* | |
| 10.26* | |
| 10.27* | |
| 10.28* | |
| 10.29* | |
| 10.30* | |
| 10.31* | |
| 10.32* | |
| 10.33* | |
| 10.34* | |
| 10.35* | |
| 19.1 | |
| 21.1 | |
| 23.1 | |
| 31.1 | |
| 31.2 | |
| 32.1 | |
| 32.2 | |
| | | | | |
| 97.1 | |
| 101 | The following materials from the Annual Report on Form 10-K for Owens Corning for the period ended December 31, 2024, formatted in iXBRL (Inline Extensible Business Reporting Language): (i) Consolidated Statements of Earnings; (ii) Consolidated Statements of Comprehensive Earnings; (iii) Consolidated Balance Sheets; (iv) Consolidated Statements of Stockholders' Equity, (v) Consolidated Statements of Cash Flows; (vi) related notes to these financial statements; and (vii) document and entity information. |
| 104 | The cover page from this Annual Report on Form 10-K, formatted as Inline XBRL |
| | | | | |
| + | Schedules and similar attachments have been omitted from this filing pursuant to Item 601(a)(5) of Regulation S-K. A copy of any omitted schedule or similar attachment will be furnished to the Securities and Exchange Commission upon request. |
| * | Denotes management contract or compensatory plan or arrangement required to be filed as an exhibit pursuant to Form 10-K. |
Owens Corning agrees to furnish to the U.S. Securities and Exchange Commission, upon request, copies of all instruments defining the rights of holders of long-term debt of Owens Corning where the total amount of securities authorized under each issue does not exceed 10% of the total assets of Owens Corning and its subsidiaries on a consolidated basis.
| | | | | |
| ITEM 16. | FORM 10-K SUMMARY |
None.
SIGNATURES
Pursuant to the requirements of Section 13 or 15(d) of the Securities Exchange Act of 1934, the Registrant has duly caused this report to be signed on its behalf by the undersigned, thereunto duly authorized.
OWENS CORNING | | | | | | | | | | | | | | |
| | | | |
| By | | /s/ Brian D. Chambers | | February 24, 2025 |
| | Brian D. Chambers | | |
| | Chief Executive Officer
(Principal Executive Officer) | | |
Pursuant to the requirements of the Securities Exchange Act of 1934, this report has been signed below by the following persons on behalf of the Registrant and in the capacities and on the dates indicated.
| | | | | | | | | | | | | | |
| | | | |
| | /s/ Brian D. Chambers | | February 24, 2025 |
| | Brian D. Chambers, | | |
| | Chief Executive Officer and Director
(Principal Executive Officer) | | |
| | | | |
| | /s/ Todd W. Fister | | February 24, 2025 |
| | Todd W. Fister, | | |
| | Chief Financial Officer
(Principal Financial Officer) | | |
| | | | |
| | /s/ Mari K. Doerfler | | February 24, 2025 |
| | Mari K. Doerfler, | | |
| | Vice President and Controller | | |
| | | | |
| | /s/ Michelle T. Collins | | February 24, 2025 |
| | Michelle T. Collins, | | |
| | Director | | |
| | | | |
| | /s/ Eduardo E. Cordeiro | | February 24, 2025 |
| | Eduardo E. Cordeiro, | | |
| | Director | | |
| | | | |
| | /s/ Adrienne D. Elsner | | February 24, 2025 |
| | Adrienne D. Elsner, | | |
| | Director | | |
| | | | |
| | /s/ Alfred E. Festa | | February 24, 2025 |
| | Alfred E. Festa, | | |
| | Director | | |
| | | | |
| | /s/ Edward F. Lonergan | | February 24, 2025 |
| | Edward F. Lonergan, | | |
| | Director | | |
| | | | |
| | | | |
| | | | | | | | | | | | | | |
| | /s/ Maryann T. Mannen | | February 24, 2025 |
| | Maryann T. Mannen, | | |
| | Director | | |
| | | | |
| | /s/ Paul E. Martin | | February 24, 2025 |
| | Paul E. Martin, | | |
| | Director | | |
| | | | |
| | /s/ W. Howard Morris | | February 24, 2025 |
| | W. Howard Morris, | | |
| | Director | | |
| | | | |
| | /s/ Suzanne P. Nimocks | | February 24, 2025 |
| | Suzanne P. Nimocks, | | |
| | Director | | |
| | | | |
| | /s/ John D. Williams | | February 24, 2025 |
| | John D. Williams, | | |
| | Director | | |
