Lehman Brothers Financial Services Conference
September 9, 2008

This document is intended solely for the use of the party to whom FBR Capital Markets
has provided it, and is not to be reprinted or redistributed without the permission of FBR
Capital Markets. All references to “FBR Capital Markets” refer to FBR Capital
Markets Corporation and its subsidiaries as appropriate. Investment banking, sales,
trading and research services are provided by Friedman, Billings, Ramsey & Co.,
Inc. (FBRC), and those services in the U.K. and Europe are provided by Friedman,
Billings, Ramsey International, Ltd. (FBRIL). FBRC is a broker-dealer registered with the
SEC and is a member of FINRA, the Nasdaq Stock Market and the Securities Investor
Protection Corporation. FBRIL, based in the UK, is Authorised and regulated by the
Financial Services Authority. Asset management services, including managed hedge
funds, mutual funds, private equity and venture capital funds, are provided by FBR
Capital Markets subsidiaries FBR Investment Management, Inc. (FBRIM) and FBR
Fund Advisers, Inc., which are investment advisers registered with the SEC.
FBR Capital Markets Corporation was formed as a Virginia
corporation in June 2006 to be the holding company for FBRC,
FBRIL, FBRIM and FBR Fund Advisers, Inc.
This document is intended for information purposes only, and
shall not constitute a solicitation or an offer to buy or sell any
security or services, or an endorsement of any particular
investment strategy.
CAUTIONS ABOUT FORWARD-LOOKING INFORMATION
This presentation and the information incorporated by reference in this presentation include forward looking statements within the meaning of Section 27A of the Securities Act of 1933, as amended, and
Section 21E of the Securities Exchange Act of 1934, as amended. Some of the forward-looking statements can be identified by the use of forward-looking words such as “believes,” “expects,” “may,” “will,” “should,” “seeks,” “approximately,” “plans,” “estimates” or “anticipates” or the negative of those words or other comparable terminology. Statements concerning projections, future performance developments, events, revenues, expenses, earnings, run rates, and any other guidance on present or future periods constitute forward-looking statements. Such statements include, but are not limited to, those relating to the effects of growth, revenues and earnings, our principal investing activities, levels of assets under management and our current equity capital levels. Forward-looking statements involve risks and uncertainties. You should be aware that a number of important factors could cause our actual results to differ materially from those in the forward-looking statements. These factors include, but are not limited to, deterioration in the business environment in the specific sectors in which we focus or a decline in the market for securities of companies within these sectors, substantial fluctuations in our financial results, our ability to retain senior professionals, pricing and other competitive pressures, changes in laws and regulations and industry practices that affect our sales and trading business, incurrence of losses in the future, the singular nature of our capital markets and strategic advisory engagements, competition among financial services firms for business and personnel, larger and more frequent capital commitments in our trading and underwriting business, limitations on our access to capital, infrastructure or operational failures, the overall environment for interest rates, changes in our business strategy, and our ability to deploy offering proceeds. We will not necessarily update the information presented or incorporated by reference in this presentation if any of these forward-looking statements turn out to be inaccurate. Risks affecting our business are described throughout our Registration Statement on Form S-1, as amended, File Number 33-138824, especially in the section entitled “Risk Factors.” The entire Registration Statement, including the Consolidated Financial Statements and the notes and any other documents incorporated by reference into the Registration Statement, as well as the Forms 10-Q and 8-K filed subsequent to the Registration Statement, should be read for a complete understanding of our business and the risks associated with that business.
1.
Research is provided by FBRC’s Research department, which is independent from the Investment Banking department of FBRC, and has the sole authority to determine which
companies receive research coverage and the recommendation contained in the coverage. In the normal course of its business, FBRC seeks to perform investment banking and other
fee-generating services for companies that are the subject of FBRC research reports. Research analysts are eligible to receive bonus compensation that is based on FBRC’s overall
operating revenues, including revenues generated by FBRC’s Investment Banking department. Specific information is contained in each research report concerning FBRC’s relationship
with the company that is the subject of the report.
FBR Capital Markets Corporation (NASDAQ: FBCM)
CAUTIONARY STATEMENT
2

FBR Capital Markets at a Glance
Leading Investment Banking platform
Largest underwriter of small cap equity
Unique equity distribution capability
Balanced presence in seven focus industries
M&A capabilities across all industries and broad financial sponsors coverage
Recent addition of Equity Linked Securities Group
Institutional Brokerage with 5-year share volume CAGR approaching 20%
Asset management business positioned for growth
Strong, liquid balance sheet
Equity of $482 million, of which $300 million is in the form of cash
3

Strategic Objectives: Growth and Diversification
Broaden corporate finance capabilities to more fully serve middle market issuers
in our focus industries
Continue growth of institutional brokerage, leveraging our strong research
product
Expand existing asset management business, both organically and through
targeted acquisitions
Maintain the strength of our capital position and liquidity
4
Investment Banking
OVERVIEW
Leading underwriter of domestic small cap equity
#1 book-running manager of common stock offerings for U.S. companies valued
$1 billion and under over the last five years 1
#2 in raising initial equity capital for U.S. and Bermuda small and mid-cap companies (<$5B market cap)
over the past five years 2
Balance among industries where FBR Capital Markets has developed in-depth expertise
and relationships with a focus on the middle market
Wide spectrum of equity capital markets expertise and services among 150 professionals
% Share
12.12
11.27
10.98
10.12
9.33
8.17
7.43
7.15
5.36
3.78
# of Deals
112
82
106
129
107
104
91
81
68
59
Deal Value ($m)
$ 19,072.8
17,728.6
17,283.4
15,931.8
14,676.8
12,864.3
11,245.6
8,438.8
5,944.7
3,745.8
Book-Running Mgr.
Goldman Sachs
FBR Capital Markets
Morgan Stanley
JP Morgan
Merrill Lynch
Credit Suisse
Lehman Brothers
Citigroup
UBS
Banc of America
Top 10 Book Runners of Initial Equity for Small and Mid
Cap Companies 3
Market Cap $5B and Under – IPOs and
144A Common Stock Combined
US and Bermuda Issuers — 7/1/2003 thru 6/30/2008
1. Source: Dealogic; (07/1/2003 – 06/30/2008).
2. Source: Dealogic; initial common equity includes IPOs and PIPOs (Pre-IPOs) (07/1/2003 – 06/30/2008).
3. Source: Dealogic; includes IPOs and PIPOs.
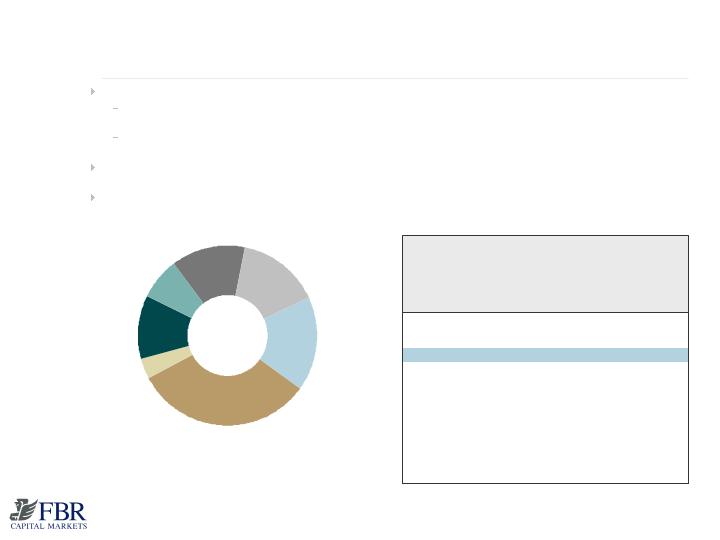
Investment Banking Transactions by Industry
(% to total; LTM Q2 2008)
Energy & Natural
Resources
17%
INDUSTRY
COMPOSITION
Technology, Media &
Telecom.
13%
Consumer
4%
Diversified Industrials
15%
Real Estate
11%
Financial Institutions
32%
Insurance
8%
5

Investment Banking
PROVEN BUSINESS MODEL
Sustainable competitive advantage
Unique capability and intense focus on speed and execution
All resources of firm dedicated to every transaction
Integrated knowledge of capital markets and industry
FBR Capital Markets is the industry leader in 144A private equity
offerings
Alternative to IPO
Added value to financial sponsors
Alternative to M&A
6

Investment Banking
EXPANDING THE SERVICE OFFERING
Leading middle-market advisory platform
Building from January 2007 acquisition of Legacy Partners
Dedicated senior M&A professionals averaging more than 15 years of
experience1
Bulge bracket experience and capabilities with boutique level attention
Small, knowledgeable transaction teams focused on middle-market companies
Extensive M&A experience within specific industry sectors complemented by
FBR Capital Markets’ widely respected corporate finance and capital markets
expertise
Recently added convertible securities origination, Sales/Trading
Permanent asset class likely to support a significant amount of issuers’ growth
capital and recapitalization
U.S. convertible market today has ~$350B of market cap
Companies of all sizes use convertible market to achieve low cost debt
financing or equity capital alternatives
For existing FBCM banking clients, convertible product is additional tool to
continue life-cycle banking service
1. As of 6/30/2008
7

Unprecedented disruption in the financial markets has created a need for
innovative solutions to re-capitalize impacted firms
Scope of the current need for financing covers the broad spectrum of regulated
and non-regulated financial services companies
FBCM has historically thrived in similar times of acute market stress
Deep industry research and corporate finance experience in this sector position
the firm to be a leader in successfully re-capitalizing quality franchises
Combination of our convertibles product addition and “speed to market”
capabilities positions us well to meet meaningful demand
Current Environment
CHALLENGES AND OPPORTUNITIES
8
OTC
Listed
2008 5
931.9
1,436.2
1,334.8
1,651.3
1,916.6
2,288.5
554.4
788.6
1,025.2
1,165.1
1,376.6
849.9
2003
2004
2005
2006
2007
1,486.3
2,286.1
2,123.4
2,676.5
3,081.7
3,665.1
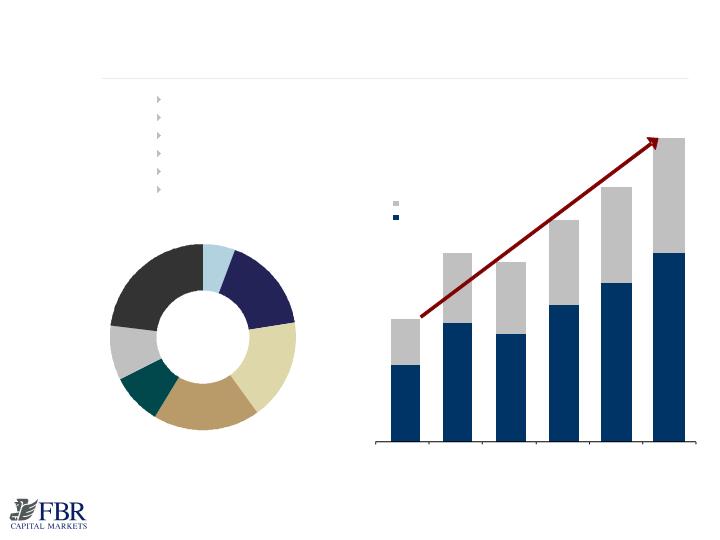
CAGR 19.8%
Institutional Brokerage
RESEARCH AND SALES, TRADING & SALES TRADING
1.
Headcount numbers approximate as of 7/15/08. 2. Compound Annual Growth Rate (CAGR) of customer equities trading volume. 3. As of 7/15/08. Research is provided by FBRC’s Research department, which is independent from the Investment Banking department of FBRC, and has the sole authority to determine which companies receive research coverage and the recommendation contained in the coverage. In the normal course of its business, FBRC seeks to perform investment banking and other fee-generating services for companies that are the subject of FBRC research reports. Research analysts are eligible to receive bonus compensation that is based on FBRC’s overall operating revenues, including revenues generated by FBRC’s Investment Banking department. Specific information is contained in each research report concerning FBRC’s relationship with the company that is the subject of the report. 4. As of 6/4/08 5. 2008: 1st 6 months Annualized
Customer Equities Trading Volumes
(millions of shares)
Research Coverage: All Companies
(number of companies; as of July 15, 2008)
Insurance
9%
Technology, Media
& Telecom
22%
Real Estate
10%
Financial Institutions
18%
Energy & Natural
Resources
18%
Diversified
Industrials
17%
Consumer
6%
107
26
82
86
45
41
79
178 institutional brokers, traders and sales traders; 80 research analysts 1
Comprehensive investment philosophy leads to powerful distribution platform
19.8% trading volume CAGR from 2003 through Q2 2008 2
Currently provide research on 24% of S&P 500 by market capitalization 3
Over 460 companies under research coverage 3
Market-maker 975 securities 4
9

Institutional Brokerage
STRONG, SUSTAINED GROWTH
A key component of our strategy is acquiring, on an opportunistic basis,
high-quality, senior-level talent
The current shakeout in large U.S. investment banks provides ample
opportunity to upgrade talent in all areas, including Sales, Trading and
Research
Industry trend toward shrinking per share commissions not as prevalent
in our “high touch” business model
International share volume and revenue growth outpace overall rates
during last two years
Addition of convertibles securities team will accelerate growth rate
10
Asset Management
POSITIONED FOR GROWTH
Current capabilities and proprietary strategies
Domestic equity strategies
Small, mid and large-cap
Value, Growth and Blend
Sector and specialty strategies
Financial, Technology and Utilities
Focus
Alternative
Fund of hedge funds
Equity long-short
Money Market
Private Wealth Advisory services
Gross Assets Under Management in excess of $1.9
billion 1
Seed new asset management vehicles including
Externally managed companies, separately
managed accounts, alternative partnerships and
LLCs
Exploring strategic acquisitions
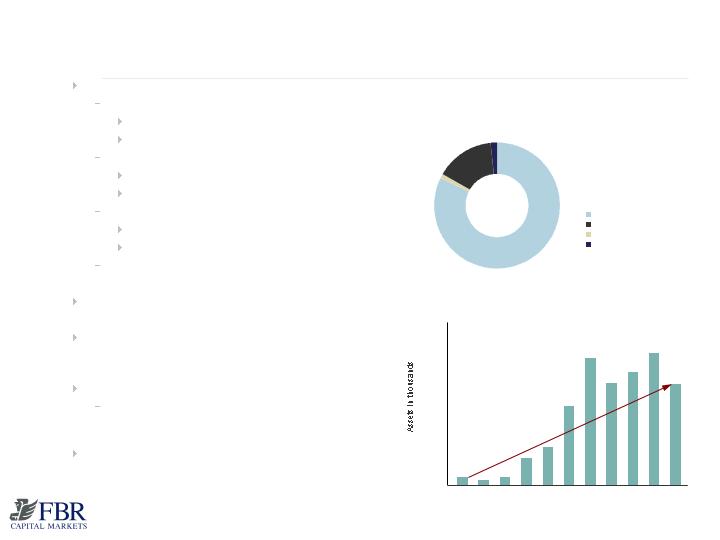
Gross Assets Under Management
as of 6/30/2008
Mutual Funds
Managed Accounts
Hedge Funds – Onshore
Private Equity/Venture Capital Funds
1. As of 06/30/08
2. Source: Strategic Insight; FBR Accounting.
Equity Mutual Fund Assets
(for 10 years ended 6/30/08) 2
CAGR 28%
0
500
1,000
1,500
2,000
2,500
1998
1999
2000
2001
2002
2003
2004
2005
2006
2007
2008
1.8%
1.1%
14.8%
82.3%
11

Financial Initiatives
Reduce fixed expenses by annualized $28 million
Includes net reduction in headcount by ~12% since January 2008
Enhance variable margin, primarily through compensation adjustments
Fully deploy capital resources to enhance returns
Expected result is cash breakeven on Capital Markets business at
annual revenues of $270 million
We will continue to make strategic hires and build businesses in focus
areas
12

FBCM Culture and Employees
Renewed focus on ownership culture at all levels throughout the firm
Partnership program covering broad leadership group
Expansion of equity component to employee compensation
Historically, low turnover among senior professionals
Non-Wall Street culture
Washington, DC headquarters
Growing financial services community
Capital Markets employer of choice
Senior executive involvement in day-to-day operations
Opportunity to execute creative industry-leading transactions and products
13

Addendum
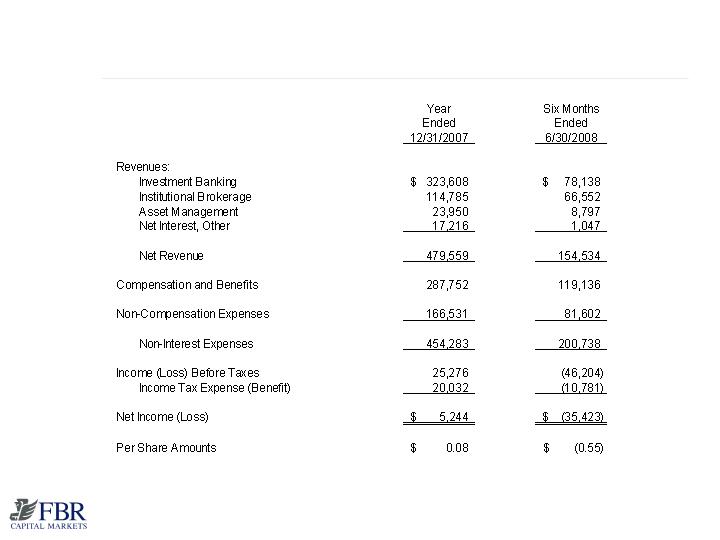
Condensed Financial Results
(Unaudited, Dollars in Thousands)
15
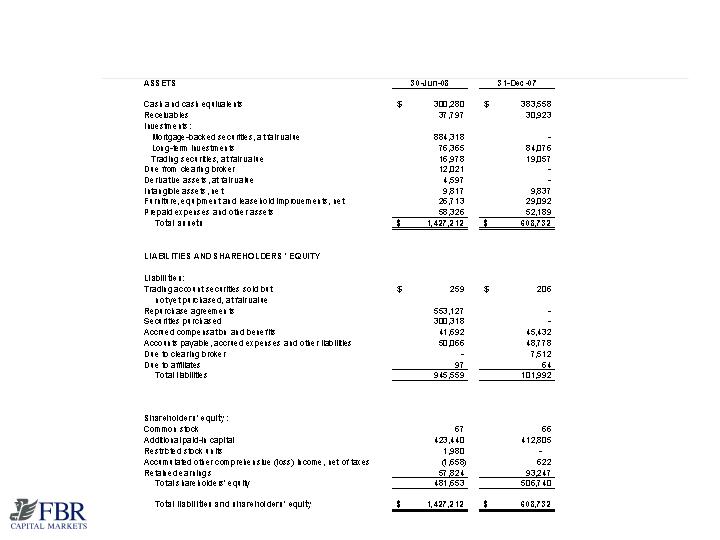
Consolidated Balance Sheets
(UNAUDITED, DOLLARS IN THOUSANDS)
16

Boston
100 Federal Street, 29 th Floor Boston, MA 02110
617.757.2900
Dallas
2100 McKinney Avenue, Suite 1940 Dallas, TX 75201
469.341.1200
Houston
600 Travis Street, Suite 6070 Houston, TX 77002
713.343.1000
Irvine (Los Angeles)
18101 Von Karman Ave., Suite 950 Irvine, CA 92612
949.477.3100
New York
299 Park Avenue, 7th Floor New York, NY 10171
212.457.3300
San Francisco
4 Embarcadero Center, Suite 1950 San Francisco, CA 94111
415.248.2900
FBR International Ltd.
London, United Kingdom
8th Floor, Berkeley Square House
Berkeley Square
London WIJ 6DB
011.44.20.7409.5300
Sydney, Australia
Level 31
88 Phillip Street
Sydney, NSW 2000
011.61.2.8211.0563
NOTE: Not all services are available from all offices.
FBR Capital Markets Corporation
Metropolitan Washington, D.C. Headquarters
1001 Nineteenth Street North . Arlington, VA 22209
703.312.9500 T . 703.312.9501 F . www.fbrcapitalmarkets.com