UNITED STATES
SECURITIES AND EXCHANGE COMMISSION
Washington, D.C. 20549
FORM 10-Q
(Mark One)
| x | QUARTERLY REPORT PURSUANT TO SECTION 13 OR 15(d) OF THE SECURITIES EXCHANGE ACT OF 1934 |
For the quarterly period ended June 30, 2011
OR
| ¨ | TRANSITION REPORT PURSUANT TO SECTION 13 OR 15(d) OF THE SECURITIES EXCHANGE ACT OF 1934 |
For the transition period from to
Commission file number: 001-33518
FBR & CO.
(Exact name of Registrant as specified in its charter)
| | |
| Virginia | | 20-5164223 |
(State or other jurisdiction of incorporation or organization) | | (I.R.S. Employer Identification No.) |
| |
1001 Nineteenth Street North Arlington, VA | | 22209 |
| (Address of principal executive offices) | | (Zip code) |
(703) 312-9500
(Registrant’s telephone number including area code)
Indicate by check mark whether the registrant (1) has filed all reports required to be filed by Section 13 or 15(d) of the Securities Exchange Act of 1934 during the preceding 12 months (or for such shorter period that the registrant was required to file such reports), and (2) has been subject to such filing requirements for the past 90 days. Yes x No ¨
Indicate by check mark whether the registrant has submitted electronically and posted on its corporate Web site, if any, every Interactive Data File required to be submitted and posted pursuant to Rule 405 of Regulation S-T (§232.405 of this chapter) during the preceding 12 months (or for such shorter period that the registrant was required to submit and post such files). Yes x No ¨
Indicate by check mark whether the registrant is a large accelerated filer, an accelerated filer, a non-accelerated filer or a smaller reporting company. See definitions of “large accelerated filer,” “accelerated filer” and “smaller reporting company” in Rule 12b-2 of the Exchange Act.
| | | | | | |
| Large accelerated filer | | ¨ | | Accelerated filer | | x |
| | | |
| Non-accelerated filer | | ¨ | | Smaller reporting company | | ¨ |
Indicate by check mark whether the registrant is a shell company (as defined in Rule 12b-2 of the Exchange Act.): Yes ¨ No x
The number of shares outstanding of the registrant’s common stock, $0.001 par value per share, as of July 31, 2011 was 60,728,412 shares.
FBR & CO.
FORM 10-Q
FOR THE QUARTER ENDED JUNE 30, 2011
INDEX
PART I
FINANCIAL INFORMATION
| Item 1. | Financial Statements |
FBR & CO.
CONSOLIDATED BALANCE SHEETS
(Dollars in thousands, except per share data)
(Unaudited)
| | | | | | | | |
| | | June 30,
2011 | | | December 31,
2010 | |
Assets | | | | | | | | |
Cash and cash equivalents | | $ | 176,944 | | | $ | 236,077 | |
Receivables: | | | | | | | | |
Due from brokers, dealers and clearing organizations | | | 6,017 | | | | 15,463 | |
Customers | | | 13,147 | | | | 10,280 | |
Other | | | 9,316 | | | | 11,635 | |
Financial instruments owned, at fair value | | | 155,723 | | | | 86,400 | |
Other investments, at cost | | | 25,744 | | | | 45,224 | |
Goodwill | | | 5,882 | | | | 5,882 | |
Intangible assets, net | | | 2,352 | | | | 2,583 | |
Furniture, equipment, software and leasehold improvements, net of accumulated depreciation and amortization | | | 7,361 | | | | 9,741 | |
Prepaid expenses and other assets | | | 9,617 | | | | 8,182 | |
| | | | | | | | |
Total assets | | $ | 412,103 | | | $ | 431,467 | |
| | | | | | | | |
Liabilities and Shareholders’ Equity | | | | | | | | |
Liabilities | | | | | | | | |
Securities sold but not yet purchased, at fair value | | $ | 93,985 | | | $ | 55,444 | |
Accrued compensation and benefits | | | 16,195 | | | | 53,305 | |
Accounts payable, accrued expenses and other liabilities | | | 15,447 | | | | 23,904 | |
Due to brokers, dealers and clearing organizations | | | 2,539 | | | | 7,323 | |
| | | | | | | | |
Total liabilities | | | 128,166 | | | | 139,976 | |
| | | | | | | | |
Commitments and Contingencies (Note 6) | | | | | | | | |
Shareholders’ Equity | | | | | | | | |
Preferred stock, $0.001 par value, 100,000,000 shares authorized, none issued and outstanding | | | — | | | | — | |
Common stock, $0.001 par value, 300,000,000 shares authorized, 60,667,355 and 61,717,837 shares issued and outstanding, respectively | | | 61 | | | | 62 | |
Additional paid-in capital | | | 425,054 | | | | 424,641 | |
Employee stock loan receivable, including accrued interest (103,450 and 115,950 shares, respectively) | | | (660 | ) | | | (706 | ) |
Restricted stock units | | | 30,784 | | | | 34,239 | |
Accumulated other comprehensive income (loss), net of taxes | | | 22 | | | | (53 | ) |
Accumulated deficit | | | (171,324 | ) | | | (166,692 | ) |
| | | | | | | | |
Total shareholders’ equity | | | 283,937 | | | | 291,491 | |
| | | | | | | | |
Total liabilities and shareholders’ equity | | $ | 412,103 | | | $ | 431,467 | |
| | | | | | | | |
See notes to consolidated financial statements.
1
FBR & CO.
CONSOLIDATED STATEMENTS OF OPERATIONS
(Dollars in thousands, except per share data)
(Unaudited)
| | | | | | | | |
| | | Three Months Ended
June 30, | |
| | | 2011 | | | 2010 | |
Revenues: | | | | | | | | |
Investment banking: | | | | | | | | |
Capital raising | | $ | 22,925 | | | $ | 37,421 | |
Advisory | | | 7,074 | | | | 3,022 | |
Institutional brokerage: | | | | | | | | |
Principal transactions | | | 5,139 | | | | 2,678 | |
Agency commissions | | | 15,953 | | | | 21,606 | |
Asset management fees | | | 3,914 | | | | 3,815 | |
Net investment (loss) income | | | (7,215 | ) | | | 46 | |
Interest income, dividends and other | | | 1,392 | | | | 1,118 | |
| | | | | | | | |
Total revenues | | | 49,182 | | | | 69,706 | |
Interest expense | | | — | | | | — | |
| | | | | | | | |
Revenues, net of interest expense | | | 49,182 | | | | 69,706 | |
| | | | | | | | |
Non-Interest Expenses: | | | | | | | | |
Compensation and benefits | | | 29,510 | | | | 51,291 | |
Professional services | | | 2,890 | | | | 7,550 | |
Business development | | | 3,586 | | | | 3,921 | |
Clearing and brokerage fees | | | 3,314 | | | | 3,685 | |
Occupancy and equipment | | | 5,819 | | | | 6,129 | |
Communications | | | 4,102 | | | | 5,371 | |
Other operating expenses | | | 2,899 | | | | 3,914 | |
| | | | | | | | |
Total non-interest expenses | | | 52,120 | | | | 81,861 | |
| | | | | | | | |
Loss before income taxes | | | (2,938 | ) | | | (12,155 | ) |
Income tax (benefit) provision | | | (211 | ) | | | 13,612 | |
| | | | | | | | |
Net loss | | $ | (2,727 | ) | | $ | (25,767 | ) |
| | | | | | | | |
Basic and diluted loss per share | | $ | (0.04 | ) | | $ | (0.41 | ) |
| | | | | | | | |
Basic and diluted weighted average shares outstanding (in thousands) | | | 62,726 | | | | 62,957 | |
| | | | | | | | |
See notes to consolidated financial statements.
2
FBR & CO.
CONSOLIDATED STATEMENTS OF OPERATIONS
(Dollars in thousands, except per share data)
(Unaudited)
| | | | | | | | |
| | | Six Months Ended
June 30, | |
| | | 2011 | | | 2010 | |
Revenues: | | | | | | | | |
Investment banking: | | | | | | | | |
Capital raising | | $ | 38,035 | | | $ | 45,132 | |
Advisory | | | 8,534 | | | | 6,456 | |
Institutional brokerage: | | | | | | | | |
Principal transactions | | | 10,975 | | | | 10,548 | |
Agency commissions | | | 33,208 | | | | 41,266 | |
Asset management fees | | | 7,895 | | | | 7,143 | |
Net investment (loss) income | | | (1,616 | ) | | | 48 | |
Interest income, dividends and other | | | 2,249 | | | | 3,330 | |
| | | | | | | | |
Total revenues | | | 99,280 | | | | 113,923 | |
Interest expense | | | — | | | | — | |
| | | | | | | | |
Revenues, net of interest expense | | | 99,280 | | | | 113,923 | |
| | | | | | | | |
Non-Interest Expenses: | | | | | | | | |
Compensation and benefits | | | 58,511 | | | | 94,035 | |
Professional services | | | 6,845 | | | | 11,653 | |
Business development | | | 7,232 | | | | 7,772 | |
Clearing and brokerage fees | | | 5,988 | | | | 7,067 | |
Occupancy and equipment | | | 10,924 | | | | 12,621 | |
Communications | | | 8,453 | | | | 10,138 | |
Other operating expenses | | | 6,235 | | | | 7,333 | |
| | | | | | | | |
Total non-interest expenses | | | 104,188 | | | | 150,619 | |
| | | | | | | | |
Loss before income taxes | | | (4,908 | ) | | | (36,696 | ) |
Income tax benefit | | | (276 | ) | | | (2,667 | ) |
| | | | | | | | |
Net loss | | $ | (4,632 | ) | | $ | (34,029 | ) |
| | | | | | | | |
Basic and diluted loss per share | | $ | (0.07 | ) | | $ | (0.54 | ) |
| | | | | | | | |
Basic and diluted weighted average shares outstanding (in thousands) | | | 63,116 | | | | 63,489 | |
| | | | | | | | |
See notes to consolidated financial statements.
3
FBR & CO.
CONSOLIDATED STATEMENTS OF CHANGES IN SHAREHOLDERS’ EQUITY
(Dollars and shares in thousands)
(Unaudited)
| | | | | | | | | | | | | | | | | | | | | | | | | | | | | | | | | | | | |
| | | Common
Stock
Shares | | | Common
Stock
Amount | | | Additional
Paid-in
Capital | | | Employee
Stock
Loan
Receivable | | | Restricted
Stock
Units | | | Accumulated
Other
Comprehensive
Income (Loss) | | | Accumulated
Deficit | | | Total | | | Comprehensive
Loss | |
Balances at December 31, 2009 | | | 64,065 | | | $ | 64 | | | $ | 429,052 | | | $ | (391 | ) | | $ | 19,979 | | | $ | (71 | ) | | $ | (129,134 | ) | | $ | 319,499 | | | | | |
| | | | | | | | | | | | | | | | | | | | | | | | | | | | | | | | | | | | |
Net loss | | | — | | | | — | | | | — | | | | — | | | | — | | | | — | | | | (37,558 | ) | | | (37,558 | ) | | $ | (37,558 | ) |
Issuance of common stock, net of forfeitures | | | 850 | | | | 1 | | | | 6,655 | | | | (315 | ) | | | (4,453 | ) | | | — | | | | — | | | | 1,888 | | | | | |
Repurchase of common stock | | | (3,197 | ) | | | (3 | ) | | | (15,902 | ) | | | — | | | | — | | | | — | | | | — | | | | (15,905 | ) | | | | |
Stock compensation expense for options granted to purchase common stock | | | — | | | | — | | | | 4,836 | | | | — | | | | — | | | | — | | | | — | | | | 4,836 | | | | | |
Issuance of restricted stock units | | | — | | | | — | | | | — | | | | — | | | | 18,713 | | | | — | | | | — | | | | 18,713 | | | | | |
Other comprehensive income: | | | | | | | | | | | | | | | | | | | | | | | | | | | | | | | | | | | | |
Change in unrealized gain (loss) on available-for-sale investment securities, net of taxes | | | — | | | | — | | | | — | | | | — | | | | — | | | | 18 | | | | — | | | | 18 | | | | 18 | |
| | | | | | | | | | | | | | | | | | | | | | | | | | | | | | | | | | | | |
Comprehensive loss | | | | | | | | | | | | | | | | | | | | | | | | | | | | | | | | | | $ | (37,540 | ) |
| | | | | | | | | | | | | | | | | | | | | | | | | | | | | | | | | | | | |
Balances at December 31, 2010 | | | 61,718 | | | $ | 62 | | | $ | 424,641 | | | $ | (706 | ) | | $ | 34,239 | | | $ | (53 | ) | | $ | (166,692 | ) | | $ | 291,491 | | | | | |
| | | | | | | | | | | | | | | | | | | | | | | | | | | | | | | | | | | | |
Net loss | | | — | | | | — | | | | — | | | | — | | | | — | | | | — | | | | (4,632 | ) | | | (4,632 | ) | | $ | (4,632 | ) |
Issuance of common stock, net of forfeitures | | | 854 | | | | 1 | | | | 6,099 | | | | 46 | | | | (7,573 | ) | | | — | | | | — | | | | (1,427 | ) | | | | |
Repurchase of common stock | | | (1,905 | ) | | | (2 | ) | | | (6,902 | ) | | | — | | | | — | | | | — | | | | — | | | | (6,904 | ) | | | | |
Stock compensation expense for options granted to purchase common stock | | | — | | | | — | | | | 1,216 | | | | — | | | | — | | | | — | | | | — | | | | 1,216 | | | | | |
Issuance of restricted stock units | | | — | | | | — | | | | — | | | | — | | | | 4,118 | | | | — | | | | — | | | | 4,118 | | | | | |
Other comprehensive income: | | | | | | | | | | | | | | | | | | | | | | | | | | | | | | | | | | | | |
Change in unrealized gain (loss) on available-for-sale investment securities, net of taxes | | | — | | | | — | | | | — | | | | — | | | | — | | | | 75 | | | | — | | | | 75 | | | | 75 | |
| | | | | | | | | | | | | | | | | | | | | | | | | | | | | | | | | | | | |
Comprehensive loss | | | | | | | | | | | | | | | | | | | | | | | | | | | | | | | | | | $ | (4,557 | ) |
| | | | | | | | | | | | | | | | | | | | | | | | | | | | | | | | | | | | |
Balances at June 30, 2011 | | | 60,667 | | | $ | 61 | | | $ | 425,054 | | | $ | (660 | ) | | $ | 30,784 | | | $ | 22 | | | $ | (171,324 | ) | | $ | 283,937 | | | | | |
| | | | | | | | | | | | | | | | | | | | | | | | | | | | | | | | | | | | |
See notes to consolidated financial statements.
4
FBR & CO.
CONSOLIDATED STATEMENTS OF CASH FLOWS
(Dollars in thousands)
(Unaudited)
| | | | | | | | |
| | | Six Months Ended
June 30, | |
| | | 2011 | | | 2010 | |
Cash flows from operating activities: | | | | | | | | |
Net loss | | $ | (4,632 | ) | | $ | (34,029 | ) |
Adjustments to reconcile net loss to net cash used in operating activities: | | | | | | | | |
Depreciation and amortization | | | 2,359 | | | | 4,014 | |
Stock compensation | | | 4,790 | | | | 11,025 | |
Net investment loss (income) from investments | | | 1,616 | | | | (48 | ) |
Other | | | 1,411 | | | | 791 | |
Changes in operating assets: | | | | | | | | |
Receivables: | | | | | | | | |
Brokers, dealers and clearing organizations | | | 9,446 | | | | 64,349 | |
Customers | | | (3,298 | ) | | | (5,887 | ) |
Interest, dividends and other | | | 2,274 | | | | 3,230 | |
Trading securities | | | (48,348 | ) | | | (10,365 | ) |
Prepaid expenses and other assets | | | (1,436 | ) | | | (5,777 | ) |
Changes in operating liabilities: | | | | | | | | |
Trading securities sold but not yet purchased | | | 38,540 | | | | 9,880 | |
Accrued compensation and benefits | | | (36,157 | ) | | | (36,230 | ) |
Accounts payable, accrued expenses and other liabilities | | | (10,849 | ) | | | 695 | |
Brokers, dealers and clearing organizations | | | (4,784 | ) | | | (53,525 | ) |
| | | | | | | | |
Net cash used in operating activities | | | (49,068 | ) | | | (51,877 | ) |
| | | | | | | | |
Cash flows from investing activities: | | | | | | | | |
Purchases of investments | | | (25,001 | ) | | | (32,469 | ) |
Proceeds from sales of and distributions from investments | | | 22,467 | | | | 19,559 | |
Securities sold but not yet purchased, net | | | — | | | | (7,446 | ) |
Purchases of furniture, equipment, software, and leasehold improvements | | | (741 | ) | | | (2,485 | ) |
Payments for other investing activities | | | (500 | ) | | | (488 | ) |
| | | | | | | | |
Net cash used in investing activities | | | (3,775 | ) | | | (23,329 | ) |
| | | | | | | | |
Cash flows from financing activities: | | | | | | | | |
Repurchases of common stock | | | (6,904 | ) | | | (14,274 | ) |
Proceeds from sales of common stock | | | 554 | | | | 1,817 | |
Proceeds from repayment of employee stock purchase plan | | | 60 | | | | — | |
| | | | | | | | |
Net cash used in financing activities | | | (6,290 | ) | | | (12,457 | ) |
| | | | | | | | |
Net decrease in cash and cash equivalents | | | (59,133 | ) | | | (87,663 | ) |
Cash and cash equivalents, beginning of period | | | 236,077 | | | | 275,506 | |
| | | | | | | | |
Cash and cash equivalents, end of period | | $ | 176,944 | | | $ | 187,843 | |
| | | | | | | | |
Supplemental Cash Flow Information: | | | | | | | | |
Cash payments for taxes | | $ | 100 | | | $ | 5,088 | |
See notes to consolidated financial statements.
5
FBR & CO.
NOTES TO CONSOLIDATED FINANCIAL STATEMENTS
(Dollars in thousands, except per share data)
(Unaudited)
The consolidated financial statements of FBR & Co., formerly known as FBR Capital Markets Corporation, and subsidiaries (collectively, the “Company”) have been prepared in accordance with accounting principles generally accepted in the United States of America for interim financial information and with the instructions to Form 10-Q. Therefore, they do not include all information required by accounting principles generally accepted in the United States of America for complete financial statements. The interim financial statements reflect all adjustments (consisting only of normal recurring adjustments) which are, in the opinion of management, necessary for a fair statement of the results for the periods presented. All significant intercompany accounts and transactions have been eliminated in consolidation. The results of operations for the three and six months ended June 30, 2011 and 2010 are not necessarily indicative of the results for the entire year or any subsequent interim period. These financial statements should be read in conjunction with the audited consolidated financial statements and notes thereto included in the Company’s Annual Report on Form 10-K for the fiscal year ended December 31, 2010.
The preparation of financial statements in conformity with accounting principles generally accepted in the United States of America requires management to make estimates and assumptions affecting the reported amounts of assets and liabilities and disclosure of contingent assets and liabilities at the date of the financial statements and the reported amounts of revenues and expenses during the reporting period. Although the Company bases its estimates and assumptions on historical experience, when available, market information, and on various other factors that it believes to be reasonable under the circumstances, management exercises significant judgment in the final determination of its estimates. Actual results may differ from those estimates.
| 2. | Financial Instruments and Long-Term Investments: |
Fair Value of Financial Instruments
The Financial Accounting Standards Board’s Accounting Standards Codification (“ASC”) 820 “Fair Value Measurements and Disclosures” (“ASC 820”) defines fair value as the price that would be received to sell an asset or paid to transfer a liability in an orderly transaction between market participants at the measurement date, not adjusted for transaction costs. ASC 820 also establishes a fair value hierarchy that prioritizes the inputs to valuation techniques used to measure fair value into three broad levels giving the highest priority to quoted prices in active markets for identical assets or liabilities (Level 1) and the lowest priority to unobservable inputs (Level 3) as described below:
| | | | |
Level 1 Inputs | | — | | Unadjusted quoted prices in active markets for identical assets or liabilities that are accessible by the Company; |
| | |
Level 2 Inputs | | — | | Quoted prices in markets that are not active or financial instruments for which all significant inputs are observable, either directly or indirectly; |
| | |
Level 3 Inputs | | — | | Unobservable inputs for the asset or liability, including significant assumptions of the Company and other market participants. |
The Company determines fair values for the following assets and liabilities:
Equity securities and listed options— The Company classifies marketable equity securities and listed options within Level 1 of the fair value hierarchy because quoted market prices are used to value these securities. Non-public equity securities are classified within Level 3 of the fair value hierarchy if enterprise values are used to value these securities. In determining the enterprise value, the Company analyzes various financial, performance and market factors to estimate the value, including where applicable market trading activity, which may be reported by The PORTAL MarketSM, a subsidiary of The NASDAQ Stock Market, Inc.
Convertible and fixed income debt instruments— The Company classifies convertible and fixed income debt instruments within Level 2 of the fair value hierarchy as they are valued using quoted market prices provided by a broker or dealer, or alternative pricing services that provide reasonable levels of price transparency.
Other—The Company invests in proprietary investment funds that are valued at net asset value (“NAV”) determined by the fund administrator. Investments in mutual funds are classified within Level 1 of the fair value hierarchy because investments within the funds are primarily exchange-traded securities and no restrictions exist on the redemption of the amounts invested by the Company. For investments in non-registered investment companies (private equity and fund of funds), the Company classifies these investments within Level 3 as the underlying securities held by these investment companies are primarily private-equity securities and restrictions exist on the redemption of amounts invested by the Company.
6
As a practical expedient, the Company relies on the NAV of these investments as their fair value. The NAVs that have been provided by investees are derived from the fair values of the underlying investments as of the reporting date.
Fair Value Hierarchy
The following tables set forth, by level within the fair value hierarchy, financial instruments accounted for under ASC 820 as of June 30, 2011 and December 31, 2010. As required by ASC 820, assets and liabilities that are measured at fair value are classified in their entirety based on the lowest level of input that is significant to the fair value measurement.
Items Measured at Fair Value on a Recurring Basis
| | | | | | | | | | | | | | | | |
| | | June 30,
2011 | | | Level 1 | | | Level 2 | | | Level 3 | |
Financial instruments owned, at fair value: | | | | | | | | | | | | | | | | |
Financial instruments held for trading activities at broker-dealer subsidiaries: | | | | | | | | | | | | | | | | |
Marketable and non-public equity securities | | $ | 26,127 | | | $ | 22,505 | | | $ | — | | | $ | 3,622 | |
Listed options | | | 3,043 | | | | 3,043 | | | | — | | | | — | |
Convertible and fixed income debt instruments | | | 99,969 | | | | — | | | | 99,969 | | | | — | |
| | | | | | | | | | | | | | | | |
| | | 129,139 | | | | 25,548 | | | | 99,969 | | | | 3,622 | |
Financial instruments held for investment activities: | | | | | | | | | | | | | | | | |
Designated as trading: | | | | | | | | | | | | | | | | |
Corporate equity securities | | | 25,136 | | | | 20,533 | | | | — | | | | 4,603 | |
Designated as available-for-sale: | | | | | | | | | | | | | | | | |
Corporate equity securities | | | 230 | | | | 230 | | | | — | | | | — | |
| | | | | | | | | | | | | | | | |
| | | 25,366 | | | | 20,763 | | | | — | | | | 4,603 | |
| | | | |
Other | | | 1,218 | | | | 572 | | | | — | | | | 646 | |
| | | | | | | | | | | | | | | | |
Total | | $ | 155,723 | | | $ | 46,883 | | | $ | 99,969 | | | $ | 8,871 | |
| | | | | | | | | | | | | | | | |
Securities sold but not yet purchased, at fair value: | | | | | | | | | | | | | | | | |
Marketable equity securities | | $ | 72,244 | | | $ | 72,244 | | | $ | — | | | $ | — | |
Listed options | | | 2,588 | | | | 2,588 | | | | — | | | | — | |
Convertible and fixed income debt instruments | | | 19,153 | | | | — | | | | 19,153 | | | | — | |
| | | | | | | | | | | | | | | | |
Total | | $ | 93,985 | | | $ | 74,832 | | | $ | 19,153 | | | $ | — | |
| | | | | | | | | | | | | | | | |
As of June 30, 2011, financial assets measured and reported at fair value on a recurring basis and classified within Level 3 were $8,871, or 2.2% of the Company’s total assets at that date.
7
| | | | | | | | | | | | | | | | |
| | | December 31,
2010 | | | Level 1 | | | Level 2 | | | Level 3 | |
Financial instruments owned, at fair value: | | | | | | | | | | | | | | | | |
Financial instruments held for trading activities at broker-dealer subsidiaries: | | | | | | | | | | | | | | | | |
Marketable and non-public equity securities | | $ | 14,165 | | | $ | 9,703 | | | $ | — | | | $ | 4,462 | |
Listed options | | | 2,474 | | | | 2,474 | | | | — | | | | — | |
Convertible and fixed income debt instruments | | | 65,215 | | | | — | | | | 65,215 | | | | — | |
| | | | | | | | | | | | | | | | |
| | | 81,854 | | | | 12,177 | | | | 65,215 | | | | 4,462 | |
| | | | |
Financial instruments held for investment activities: | | | | | | | | | | | | | | | | |
Designated as trading: | | | | | | | | | | | | | | | | |
Corporate equity securities | | | 3,484 | | | | 3,484 | | | | — | | | | — | |
Designated as available-for-sale: | | | | | | | | | | | | | | | | |
Corporate equity securities | | | 139 | | | | 139 | | | | — | | | | — | |
| | | | | | | | | | | | | | | | |
| | | 3,623 | | | | 3,623 | | | | — | | | | — | |
| | | | |
Other | | | 923 | | | | 368 | | | | — | | | | 555 | |
| | | | | | | | | | | | | | | | |
Total | | $ | 86,400 | | | $ | 16,168 | | | $ | 65,215 | | | $ | 5,017 | |
| | | | | | | | | | | | | | | | |
Securities sold but not yet purchased, at fair value: | | | | | | | | | | | | | | | | |
Marketable equity securities | | $ | 34,448 | | | $ | 34,448 | | | $ | — | | | $ | — | |
Listed options | | | 887 | | | | 887 | | | | — | | | | — | |
Convertible and fixed income debt instruments | | | 20,109 | | | | — | | | | 20,109 | | | | — | |
| | | | | | | | | | | | | | | | |
Total | | $ | 55,444 | | | $ | 35,335 | | | $ | 20,109 | | | $ | — | |
| | | | | | | | | | | | | | | | |
As of December 31, 2010, financial assets measured and reported at fair value on a recurring basis and classified within Level 3 were $5,017, or 1.2% of the Company’s total assets at that date.
Level 3 Gains and Losses
The tables below set forth a summary of changes in the fair value of the Company’s Level 3 financial assets that are measured at fair value on a recurring basis for the three months ended June 30, 2011 and 2010. As of June 30, 2011 and 2010, the Company did not have any net unrealized gains (losses) included in accumulated other comprehensive income on Level 3 financial assets.
| | | | | | | | | | | | |
| | | Trading
Securities | | | Other | | | Total | |
Beginning balance, April 1, 2011 | | $ | 4,171 | | | $ | 650 | | | $ | 4,821 | |
Total net gains (losses) (realized/unrealized) | | | | | | | | | | | | |
Included in earnings | | | 1,153 | | | | (4 | ) | | | 1,149 | |
Included in other comprehensive income | | | — | | | | — | | | | — | |
Purchases | | | 325,632 | | | | — | | | | 325,632 | |
Sales/Distributions | | | (321,108 | ) | | | — | | | | (321,108 | ) |
Transfers out of level 3 | | | (1,623 | ) | | | — | | | | (1,623 | ) |
| | | | | | | | | | | | |
Ending balance, June 30, 2011 | | $ | 8,225 | | | $ | 646 | | | $ | 8,871 | |
| | | | | | | | | | | | |
The amount of total gains or losses for the period included in earnings attributable to the change in unrealized gains or losses relating to assets still held at the reporting date | | $ | 344 | | | $ | (4 | ) | | $ | 340 | |
| | | | | | | | | | | | |
8
| | | | | | | | | | | | |
| | | Trading
Securities | | | Other | | | Total | |
| | | |
Beginning balance, April 1, 2010 | | $ | 9,441 | | | $ | 920 | | | $ | 10,361 | |
Total net gains (losses) (realized/unrealized) | | | | | | | | | | | | |
Included in earnings | | | 49 | | | | (13 | ) | | | 36 | |
Included in other comprehensive income | | | — | | | | — | | | | — | |
Purchases | | | 52,942 | | | | — | | | | 52,942 | |
Sales/Distributions | | | (62,278 | ) | | | (100 | ) | | | (62,378 | ) |
| | | | | | | | | | | | |
Ending balance, June 30, 2010 | | $ | 154 | | | $ | 807 | | | $ | 961 | |
| | | | | | | | | | | | |
The amount of total gains or losses for the period included in earnings attributable to the change in unrealized gains or losses relating to assets still held at the reporting date | | $ | 8 | | | $ | (13 | ) | | $ | (5 | ) |
| | | | | | | | | | | | |
There were no transfers of securities in to, or out of, Level 2 financial assets during the three months ended June 30, 2011. One transfer was made out of Level 3 and into Level 1 during the six months ended June 30, 2011 for an equity security that was previously a non-public equity security and during the period became publicly traded.
There were no transfers of securities in to, or out of, Level 1, 2, and 3 financial assets during the three months ended June 30, 2010.
The tables below set forth a summary of changes in the fair value of the Company’s Level 3 financial assets that are measured at fair value on a recurring basis for the six months ended June 30, 2011 and 2010.
| | | | | | | | | | | | |
| | | Trading
Securities | | | Other | | | Total | |
Beginning balance, January 1, 2011 | | $ | 4,462 | | | $ | 555 | | | $ | 5,017 | |
Total net gains (losses) (realized/unrealized) | | | | | | | | | | | | |
Included in earnings | | | 1,135 | | | | (59 | ) | | | 1,076 | |
Included in other comprehensive income | | | — | | | | — | | | | — | |
Purchases | | | 474,916 | | | | 150 | | | | 475,066 | |
Sales/Distributions | | | (470,665 | ) | | | — | | | | (470,665 | ) |
Transfers out of level 3 | | | (1,623 | ) | | | — | | | | (1,623 | ) |
| | | | | | | | | | | | |
Ending balance, June 30, 2011 | | $ | 8,225 | | | $ | 646 | | | $ | 8,871 | |
| | | | | | | | | | | | |
The amount of total gains or losses for the period included in earnings attributable to the change in unrealized gains or losses relating to assets still held at the reporting date | | $ | 137 | | | $ | (59 | ) | | $ | 78 | |
| | | | | | | | | | | | |
9
| | | | | | | | | | | | |
| | | Trading
Securities | | | Other | | | Total | |
| | | |
Beginning balance, January 1, 2010 | | $ | 15,481 | | | $ | 914 | | | $ | 16,395 | |
Total net gains (losses) (realized/unrealized) | | | | | | | | | | | | |
Included in earnings | | | (90 | ) | | | 28 | | | | (62 | ) |
Included in other comprehensive income | | | — | | | | — | | | | — | |
Purchases | | | 124,621 | | | | — | | | | 124,621 | |
Sales/Distributions | | | (139,858 | ) | | | (135 | ) | | | (139,993 | ) |
| | | | | | | | | | | | |
Ending balance, June 30, 2010 | | $ | 154 | | | $ | 807 | | | $ | 961 | |
| | | | | | | | | | | | |
The amount of total gains or losses for the period included in earnings attributable to the change in unrealized gains or losses relating to assets still held at the reporting date | | $ | 332 | | | $ | 28 | | | $ | 360 | |
| | | | | | | | | | | | |
There were no transfers of securities in to, or out of, Level 2 financial assets during the six months ended June 30, 2011. One transfer was made out of Level 3 and into Level 1 during the six months ended June 30, 2011 for an equity security that was previously a non-public equity security and during the period became publicly traded.
There were no transfers of securities in to, or out of, Level 1, 2, and 3 financial assets during the six months ended June 30, 2010.
Gains and losses from Level 3 financial assets that are measured at fair value on a recurring basis, included in earnings for the three and six months ended June 30, 2011 and 2010, are reported in the following line descriptions on the Company’s statements of operations:
| | | | | | | | | | | | | | | | |
| | | Three Months Ended
June 30, | | | Six Months Ended
June 30, | |
| | | 2011 | | | 2010 | | | 2011 | | | 2010 | |
Total gains and losses included in earnings for the period: | | | | | | | | | | | | | | | | |
| | | | |
Principal transactions | | $ | 750 | | | $ | 49 | | | $ | 732 | | | $ | (90 | ) |
Net investment income (loss) | | | 399 | | | | (13 | ) | | | 344 | | | | 28 | |
Change in unrealized gains or losses relating to assets still held at the end of the respective period: | | | | | | | | | | | | | | | | |
Principal transactions | | $ | (59 | ) | | $ | 8 | | | $ | (266 | ) | | $ | 332 | |
Net investment income (loss) | | | 399 | | | | (13 | ) | | | 344 | | | | 28 | |
Financial Instruments Held for Investment—Designated as Trading
As of June 30, 2011, the Company has certain investments in marketable equity securities held by other than the Company’s broker-dealer subsidiaries that are classified as trading securities. These investments are designated as trading based on the Company’s intent at the time of designation. In accordance with ASC 320, these securities are carried at fair value with resulting realized and unrealized gains and losses reflected as net investment income (loss) in the statements of operations. Net gains and losses on these securities as of the dates indicated were as follows:
| | | | | | | | | | | | | | | | |
| | | Three Months Ended
June 30, | | | Six Months Ended
June 30, | |
| | | 2011 | | | 2010 | | | 2011 | | | 2010 | |
Net losses recognized on trading securities | | $ | (562 | ) | | $ | — | | | $ | (433 | ) | | $ | — | |
Less: Net (gains) losses recognized on trading securitiessold during the period | | | (39 | ) | | | — | | | | (56 | ) | | | — | |
| | | | | | | | | | | | | | | | |
Unrealized losses recognized on trading securitiesstill held at the reporting | | $ | (601 | ) | | $ | — | | | $ | (489 | ) | | $ | — | |
| | | | | | | | | | | | | | | | |
10
Financial Instruments Held for Investment—Designated as Available-for-Sale
As of June 30, 2011 and December 31, 2010, the Company has certain investments in marketable equity securities held by other than the Company’s broker-dealer subsidiaries that are classified as available-for-sale securities. These investments are designated as available-for-sale due to the Company’s intent at the time of designation to hold these securities for investment purposes over an extended period. However, these investments are available to be sold should economic conditions warrant such a transaction. In accordance with ASC 320, these securities are carried at fair value with resulting unrealized gains and losses reflected as other comprehensive income or loss. Gross unrealized gains and losses on these securities as of the dates indicated were as follows:
| | | | | | | | | | | | | | | | |
| | | June 30, 2011 | |
| | | Cost
Basis | | | Unrealized | | | Fair Value | |
| | | Gains | | | Losses(1) | | |
Marketable equity securities | | $ | 208 | | | $ | 22 | | | $ | — | | | $ | 230 | |
| |
| | | December 31, 2010 | |
| | | Cost
Basis | | | Unrealized | | | Fair Value | |
| | | Gains | | | Losses(1) | | |
Marketable equity securities | | $ | 192 | | | $ | — | | | $ | (53 | ) | | $ | 139 | |
| (1) | Duration of unrealized losses is less than 12 months |
The Company evaluates its portfolio of marketable equity securities for impairment as of each reporting date and more frequently when economic or market concerns warrant such evaluation. For the securities with unrealized losses, the Company will review the underlying cause for the impairments, as well as the severity and duration of the impairments. If the impairment is determined to be other-than-temporary, the Company will recognize an other-than-temporary impairment loss in its statement of operations. During the three and six months ended June 30, 2011, the Company recorded other-than-temporary impairment losses of $7,499 in the statement of operations relating to two marketable equity securities. During the three and six months ended 2010, the Company did not record any other-than-temporary impairment losses in the statements of operations relating to marketable equity securities. The Company recognized the impairment losses in 2011 due to the severity of the decline in the fair value of these securities below its cost basis during the second quarter of 2011. These results include an impairment loss of $7,416 related to an entity operating in the maritime transportation industry. This entity completed a secondary public offering in June 2011 that significantly diluted previous shareholders and severely impacted the market value of the entity’s shares. The carrying value of the security after the recognition of the impairment loss was $8,054. Subsequent to the recognition of this impairment loss, based on the increased liquidity of the shares resulting from the offering and the Company’s intentions with respect to the investment, the Company elected to transfer the security from designated as available-for-sale to designated as trading.
During the three and six months ended June 30, 2011, the Company received $6,360 from sales of marketable equity securities resulting in gross gains of $1,386. During the three and six months ended June 30, 2010, the Company received $206 from sales of marketable equity securities resulting in gross gains of $10.
Other Investments, at Cost
Other investments consisted of the following as of the dates indicated:
| | | | | | | | |
| | | June 30,
2011 | | | December 31,
2010 | |
Non-public equity securities | | $ | 25,427 | | | $ | 44,907 | |
Note receivable | | | 317 | | | | 317 | |
| | | | | | | | |
| | $ | 25,744 | | | $ | 45,224 | |
| | | | | | | | |
The Company evaluates its portfolio of investments, carried at cost, for impairment as of each reporting date. Based on its evaluations, including consideration of the severity and duration of factors affecting the fair values of the Company’s investments, the Company recorded no impairment losses during the three and six months ended June 30, 2011 and 2010.
During the three and six months ended June 30, 2011, the Company received $2,785 and $8,285, respectively, from sales of non-public equity securities, resulting in gross gains of $-0- and $5,500, respectively and gross losses of $(22) and $(22), respectively. During the three and six months ended June 30, 2010, the Company received $623 and $9,130, respectively, from sales of, or distributions from, non-public equity securities, resulting in gross gains of $176 and $179, respectively.
11
During the three and six months ended June 30, 2011, there were no redemptions of investments in investment funds. During the three and six months ended June 30, 2010, the Company received $4,919 and $8,223, respectively, from the redemption of investments in investment funds.
During the three and six months ended June 30, 2011, the Company recorded a tax benefit of $(211) and $(276), respectively. During the three and six months ended June 30, 2010, the Company recorded a tax provision of $13,612 and a tax benefit of $(2,667), respectively. The Company’s effective tax rates for the three and six months ended June 30, 2011 were 7.2% and 5.6%, respectively. The Company’s effective tax rates for the three and six months ended June 30, 2010 were (112.0%) and 7.3%, respectively. These tax rates differed from statutory tax rates primarily due to a full valuation allowance on the deferred tax benefits of book losses incurred during these periods, and tax benefits of the net operating losses utilized or expected to be utilized. In addition, the tax rates for the three months ended June 30, 2011 and 2010 reflect changes in the estimated tax rate for the full year from the prior quarter based on changes in the Company’s forecasted annual taxable and book income.
As of June 30, 2011, the Company continues to provide a full valuation allowance against its net deferred tax assets since, based on the application of the criteria in ASC 740 “Income Taxes” (“ASC 740”), it is more likely than not that the benefits of these assets will not be realized in the future.
| 4. | Net Capital Requirements: |
FBR Capital Markets & Co. (“FBRCM”), the Company’s principal U.S. broker-dealer subsidiary, is registered with the Securities and Exchange Commission (“SEC”) and is a member of the Financial Industry Regulatory Authority, Inc. (“FINRA”). Additionally, FBR Capital Markets International, Ltd. (“FBRIL”) is registered with the Financial Services Authority (“FSA”) of the United Kingdom. As such, they are subject to the minimum net capital requirements promulgated by the SEC and FSA. As of June 30, 2011, FBRCM had net capital of $46,120, which was $40,886 in excess of its required net capital of $5,234. As of June 30, 2011, FBRIL had net capital in excess of required amounts.
12
Basic earnings per share includes no dilution and is computed by dividing net income or loss available to common shareholders by the weighted average number of common shares outstanding for the period. Diluted earnings per share includes the impact of dilutive securities such as stock options, unvested shares of restricted stock and restricted stock units (“RSUs”), all of which are subject to forfeiture. Due to the Company’s reported net loss for the three and six months ended June 30, 2011 and 2010, all stock options, unvested shares of restricted stock and unvested RSUs were considered anti-dilutive for these periods. The following table presents the computations of basic and diluted earnings per share for the periods indicated:
| | | | | | | | | | | | | | | | |
| | | Three Months Ended
June 30, 2011 | | | Three Months Ended
June 30, 2010 | |
| | | Basic | | | Diluted | | | Basic | | | Diluted | |
Weighted average shares outstanding: | | | | | | | | | | | | | | | | |
Common stock (in thousands) | | | 62,726 | | | | 62,726 | | | | 62,957 | | | | 62,957 | |
Stock options, unvested restricted stock and unvested RSUs (in thousands) | | | — | | | | — | | | | — | | | | — | |
| | | | | | | | | | | | | | | | |
Weighted average common and common equivalent shares outstanding (in thousands) | | | 62,726 | | | | 62,726 | | | | 62,957 | | | | 62,957 | |
| | | | | | | | | | | | | | | | |
Net loss applicable to common stock | | $ | (2,727 | ) | | $ | (2,727 | ) | | $ | (25,767 | ) | | $ | (25,767 | ) |
| | | | | | | | | | | | | | | | |
Net loss per common share | | $ | (0.04 | ) | | $ | (0.04 | ) | | $ | (0.41 | ) | | $ | (0.41 | ) |
| | | | | | | | | | | | | | | | |
| | |
| | | Six Months Ended
June 30, 2011 | | | Six Months Ended
June 30, 2010 | |
| | | Basic | | | Diluted | | | Basic | | | Diluted | |
Weighted average shares outstanding: | | | | | | | | | | | | | | | | |
Common stock (in thousands) | | | 63,116 | | | | 63,116 | | | | 63,489 | | | | 63,489 | |
Stock options, unvested restricted stock and unvested RSUs (in thousands) | | | — | | | | — | | | | — | | | | — | |
| | | | | | | | | | | | | | | | |
Weighted average common and common equivalent shares outstanding (in thousands) | | | 63,116 | | | | 63,116 | | | | 63,489 | | | | 63,489 | |
| | | | | | | | | | | | | | | | |
Net loss applicable to common stock | | $ | (4,632 | ) | | $ | (4,632 | ) | | $ | (34,029 | ) | | $ | (34,029 | ) |
| | | | | | | | | | | | | | | | |
Net loss per common share | | $ | (0.07 | ) | | $ | (0.07 | ) | | $ | (0.54 | ) | | $ | (0.54 | ) |
| | | | | | | | | | | | | | | | |
The following table presents the number of anti-dilutive stock options, unvested restricted stock and unvested RSUs for the periods indicated (in thousands):
| | | | | | | | | | | | | | | | |
| | | Three Months Ended
June 30, | | | Six Months Ended
June 30, | |
| | | 2011 | | | 2010 | | | 2011 | | | 2010 | |
Stock Options – Employees and directors | | | 7,976 | | | | 8,904 | | | | 7,976 | | | | 8,904 | |
Stock Options – Non-employee | | | 3,424 | | | | 3,256 | | | | 3,424 | | | | 3,256 | |
Restricted Stock, unvested | | | 287 | | | | 854 | | | | 287 | | | | 854 | |
Restricted Stock Units, unvested | | | 7,177 | | | | 9,309 | | | | 7,177 | | | | 9,309 | |
| | | | | | | | | | | | | | | | |
| | | 18,864 | | | | 22,323 | | | | 18,864 | | | | 22,323 | |
| | | | | | | | | | | | | | | | |
13
| 6. | Commitments and Contingencies: |
As of June 30, 2011, except as described below, the Company was neither a defendant nor plaintiff in any lawsuits or arbitrations nor involved in any governmental or self-regulatory organization matters that are expected to have a material adverse effect on its financial condition, results of operations or liquidity. The Company has been named as a defendant in a small number of civil lawsuits and arbitrations relating to its various businesses. In addition, the Company is subject to various reviews, examinations, investigations and other inquiries by governmental agencies and self regulatory organizations. There can be no assurance that these matters individually or in aggregate will not have a material adverse effect on the Company’s financial condition, results of operations, or liquidity in a future period. However, based on management’s review with counsel, resolution of these matters is not expected to have a material adverse effect on the Company’s financial condition, results of operations or liquidity.
Many aspects of the Company’s business involve substantial risks of liability and litigation. Underwriters, broker-dealers and investment advisers are exposed to liability under Federal and state securities laws, other Federal and state laws and court decisions, including decisions with respect to underwriters’ liability and limitations on indemnification, as well as with respect to the handling of customer accounts. For example, underwriters may be held liable for material misstatements or omissions of fact in a prospectus used in connection with the securities being offered and broker-dealers may be held liable for statements made by their securities analysts or other personnel. FBRCM has been named as a defendant in a small number of securities claims involving investment banking clients of FBRCM as a result of FBRCM’s role as an underwriter. In these cases, the underwriting agreement provides, subject to certain conditions, that the investment banking client is required to indemnify FBRCM against certain claims or liabilities, including claims or liabilities under the Securities Act of 1933, as amended (the “Securities Act”), or contribute to payments which FBRCM is required to make as a result of the litigation. There can be no assurance that such indemnification or contribution will ultimately be available to the Company or that an investment banking client will be able to satisfy its indemnity or contribution obligations when due.
In May 2008, the lead plaintiff in a previously filed and consolidated action filed an amended consolidated class action complaint that, for the first time, named Friedman, Billings, Ramsey & Co., Inc. (now FBRCM) and eight other underwriters as defendants. The lawsuit, styled In Re Thornburg Mortgage, Inc. Securities Litigation and pending in the United States District Court for the District of New Mexico, was originally filed in August 2007 against Thornburg Mortgage, Inc. (“TMI”), and certain of its officers and directors, alleging material misrepresentations and omissions about, inter alia, the financial position of TMI. The amended complaint included claims under Sections 11 and 12 of the Securities Act against nine underwriters relating to five separate offerings (May 2007, June 2007, September 2007 and two offerings in January 2008). The allegations against FBRCM related only to its role as underwriter or member of the syndicate that underwrote TMI’s total of three offerings in September 2007 and January 2008—each of which occurred after the filing of the original complaint—with an aggregate offering price of approximately $818,000. The plaintiffs sought restitution, unspecified compensatory damages and reimbursement of certain costs and expenses. Although FBRCM is contractually entitled to be indemnified by TMI in connection with this lawsuit, TMI filed for bankruptcy on May 1, 2009 and this likely will decrease or eliminate the value of the indemnity that FBRCM receives from TMI. On June 2, 2011 the Court granted FBRCM’s motion to dismiss the consolidated class action complaint as to FBRCM and then entered final judgment for FBRCM on July 25, 2011. The deadline for the plaintiffs to notice an appeal from the Order of Dismissal, should they chose to do so, is the end of August 2011.
FBRCM has been named as a defendant in a case relating to its role as an underwriter in residential mortgage-backed securities (“RMBS”) offerings. FBRCM is among dozens of underwriter, securitization trust and depositor defendants in an individual action filed by Cambridge Place Investment Management, Inc. in Massachusetts state court (Cambridge Place Investment Management Inc. v. Morgan Stanley et al). Cambridge’s complaint relates to the more than $2.4 billion in RMBS purchases it made in numerous underwritten offerings (of which the claims concerning FBRCM are limited to Cambridge’s purchases of a combined $22 million of RMBS in two separate offerings) and alleges that each of the defendants made misrepresentations and omissions relating to, among other things, loan-to-value ratios, appraisals, and underwriting standards, in violation of state securities laws. FBRCM has contractual indemnification claims against the RMBS issuers and contribution claims against co-underwriters involved in the two offerings for which claims have been made against it.
FBRCM has been named a defendant in the putative class action lawsuit MHC Mutual Conversion Fund, L.P. v. United Western Bancorp, Inc., et al. pending in the United States District Court for the District of Colorado. The complaint, filed in March 2011 against United Western Bancorp, Inc. (“the Bank”), its officers and directors, underwriters and outside auditors, alleges material misrepresentations and omissions in the registration statement and prospectus issued in connection with the Bank’s September 2009 offering. The complaint alleges claims under Sections 11 and 12 of the Securities Act against the lead underwriter of the offering and FBRCM as a member of the underwriting syndicate. The underwriters have notified the Bank that they are contractually entitled to be indemnified by the Bank as to all related expenses and losses incurred by the underwriters in connection with this action.
14
Although these cases involving FBRCM are at a preliminary stage, based on management’s review with counsel and present information currently known by management, resolution of such matters is not expected to have a material effect on the Company’s financial condition, results of operations, or liquidity.
In certain circumstances, broker-dealers and asset managers may also be held liable by customers and clients for losses sustained on investments. In recent years, there has been an increasing incidence of litigation and actions by government agencies and self regulatory organizations involving the securities industry, including class actions that seek substantial damages. The Company is also subject to the risk of litigation, including litigation that may be without merit. As the Company intends to actively defend such litigation, significant legal expenses could be incurred. An adverse resolution of any future litigation against the Company could materially affect its financial condition, operating results and liquidity.
Share Repurchases
During the three and six months ended June 30, 2011, the Company repurchased 1,228,780 and 1,904,578 shares, respectively, of its common stock in open market transactions at a weighted average share price of $3.57 and $3.62 per share, respectively, for a total cost of $4,392 and $6,904, respectively. As a result of the repurchases during the six months ended June 30, 2011, the Company has remaining authority to repurchase 3,316,933 additional shares under the Board of Directors’ July 2010 directive.
Employee Stock Purchase Plan
Under the Company’s Employee Stock Purchase Plan (the “Purchase Plan”), eligible employees may purchase common stock through payroll deductions at a price that is 85% of the lower of the market value of the common stock on the first day of the offering period or the last day of the offering period. The Company recognizes compensation expense relating to shares offered under the Purchase Plan. For the three and six months ended June 30, 2011, the Company recognized compensation (credit) expense of $(27) and $171, respectively. For the three and six months ended June 30, 2010, the Company recognized compensation expense of $22 and $277, respectively.
Partner Leveraged Stock Purchase Program
The Company initiated the Partner Leveraged Stock Purchase Program (“PLSPP”) in December 2009. Under the PLSPP, non-executive officer employees who are members of the Company’s Partnership Group as well as the Company’s Chief Financial Officer and General Counsel were granted the right to purchase shares of the Company’s common stock on four specific offering dates during the fourth quarter of 2009 and the first half of 2010. Each participant was initially granted the right to purchase up to either 25,000 shares or 50,000 shares. The Company offered to provide a full recourse loan at market rates and terms to each non-executive officer participant for up to 50% of the aggregate purchase price, collateralized by the shares purchased, bearing interest at market rates, and maturing three years from the date of issuance. For each share purchased by the participant, the Company would grant two options (three options in the case of each of the Company’s Chief Financial Officer and General Counsel) to purchase the Company’s common stock under our Long-Term Incentive Plan (described below) that are subject to a 3-year cliff vesting requirement. For the three and six months ended June 30, 2010, participants purchased 197,900 and 264,535 shares, respectively, for an aggregate purchase price of $904 and $1,286, respectively. As of June 30, 2011 and December 31, 2010, the Company had loans outstanding to participants of $660 and $706, respectively, including accrued interest. The employee stock loan receivable balance is included in shareholders’ equity in the balance sheets.
Stock Compensation Plans
Under the Company’s 2006 Long-Term Incentive Plan, as amended, the Company may grant options to purchase stock, stock appreciation rights, performance awards, restricted and unrestricted stock and RSUs for up to an aggregate of 22,069,985 shares of common stock, subject to increase under certain provisions of the plan, to eligible participants. Participants include employees, officers and directors of the Company and its subsidiaries. The Long-Term Incentive Plan has a term of 10 years and options granted may have an exercise period of up to 10 years. Options may be incentive stock options, as defined by Section 422 of the Internal Revenue Code, or nonqualified stock options.
15
The Company grants options to purchase stock, restricted shares of common stock and RSUs to employees that vest based on meeting specified service conditions of three to five years and in certain cases achievement of specified market conditions. The following table presents compensation expense related to these awards for the periods indicated:
| | | | | | | | | | | | | | | | |
| | | Three Months Ended
June 30, | | | Six Months Ended
June 30, | |
| | | 2011 | | | 2010 | | | 2011 | | | 2010 | |
Stock options | | $ | 652 | | | $ | 1,044 | | | $ | 845 | | | $ | 2,083 | |
Restricted shares | | $ | 100 | | | $ | 698 | | | $ | 407 | | | $ | 1,820 | |
RSUs | | $ | 1,617 | | | $ | 3,254 | | | $ | 3,155 | | | $ | 6,034 | |
The following table presents issuance activity related to grants of these awards for the period indicated:
| | | | | | | | | | | | | | | | | | | | | | | | |
| | | Three Months Ended June 30, 2011 | | | Six Months Ended June 30, 2011 | |
| | | Stock
Options | | | Restricted
Shares | | | RSUs | | | Stock
Options | | | Restricted
Shares | | | RSUs | |
Stock-based award issuances | | | 318,066 | | | | — | | | | 380,754 | | | | 318,066 | | | | — | | | | 1,632,437 | |
Grant date fair value per share | | $ | 1.27 | | | $ | — | | | $ | 3.60 | | | $ | 1.27 | | | $ | — | | | $ | 3.68 | |
The fair value of each option grant is estimated on the date of grant using the Black-Scholes option-pricing model. Due to the relatively short period in which the Company has been publicly-traded, the Company has not based its volatility assumption solely on historical data. The Company has used a combination of its historical volatility, historical industry comparisons, and other market data in order to determine the volatility assumption. The risk-free interest rate is based on the rates of the U.S. Treasury with similar maturities as the expected life of the award. The expected life of the award is based on the length of time from the grant date to the midpoint of the vesting date and the contractual expiration date of the award. The Company uses this methodology for determining expected life as the Company does not have sufficient historical data to estimate an expected life as a majority of the stock options issued by the Company since its inception became exercisable in the past year. The dividend yield is based on the expected dividend payout over the expected life of the award. The following weighted average assumptions used for options granted for the period indicated:
| | | | | | | | |
| | | Three Months
Ended
June 30, 2011 | | | Six Months
Ended
June 30, 2011 | |
Volatility | | | 39.8 | % | | | 39.8 | % |
Risk-free interest rate | | | 1.62 | % | | | 1.62 | % |
Expected life | | | 4.5 years | | | | 4.5 years | |
Dividend yield | | | — | | | | — | |
The following table presents the unrecognized compensation related to unvested options to purchase stock, restricted shares of common stock, and RSUs and the weighted average vesting period in which the expense will be recognized:
| | | | | | | | | | | | |
| | | As of June 30, 2011 | |
| | | Stock
Options | | | Restricted
Shares | | | RSUs | |
Unrecognized compensation | | $ | 4,273 | | | $ | 862 | | | $ | 16,244 | |
Unvested awards | | | 4,819,801 | | | | 286,900 | | | | 7,177,392 | |
Weighted average vesting period | | | 2.2 years | | | | 1.1 years | | | | 2.6 years | |
16
In addition, as part of the Company’s satisfaction of incentive compensation earned for past service under the Company’s variable compensation programs, employees may receive RSUs in lieu of cash payments. These RSUs are issued to an irrevocable trust and are not returnable to the Company. In settlement of such accrued incentive compensation, the Company granted the following RSUs for the periods indicated:
| | | | | | | | |
| | | Three Months
Ended
June 30, 2011 | | | Six Months
Ended
June 30, 2011 | |
RSU issuances | | | 2,895 | | | | 260,174 | |
Aggregate grant date fair value | | $ | 11 | | | $ | 963 | |
| 8. | Related Party Transactions: |
Professional Services Agreement
Under the professional services agreement, as amended, with Crestview Partners, L.P (“Crestview”), the Company agreed to pay Crestview Advisors, L.L.C. a $1,000 annual strategic advisory fee plus reimbursement of reasonable out-of-pocket expenses as long as Crestview continues to own at least 50% of the shares purchased by certain Crestview affiliates in our 2006 private offering. In June 2011 and 2010, Crestview elected to receive a portion of the management fee in options to purchase shares of the Company’s common stock as allowed for under the agreement. Based on Crestview’s election, the Company issued 168,067 and 153,846 options, respectively, to Crestview Advisors, L.L.C. valued at $200 and $200, respectively. During the three and six months ended June 30, 2011, the Company recognized $250 and $500, respectively, of expense associated with this agreement. During the three and six months ended June 30, 2010, the Company recognized $250 and $500, respectively, of expense associated with this agreement
Receivables and Payables
From time to time, the Company has made advances to affiliates that were used for general operating purposes and are settled in cash on a regular basis. Receivables from affiliates, including private equity and hedge funds, totaled $51 and $701 as of June 30, 2011 and December 31, 2010, respectively.
The Company considers its capital markets, asset management and principal investing operations to be separate reportable segments. The capital markets segment includes the Company’s investment banking and institutional sales, trading and research operations. These businesses operate as a single integrated unit to deliver capital raising, advisory and sales and trading services to corporate and institutional clients. Asset management includes the Company’s fee-based asset management operations. Principal investing includes investments in merchant banking and other investments.
The Company has developed systems and methodologies to allocate overhead costs to its business units and, accordingly, presents segment information consistent with internal management reporting. Revenue generating transactions between the individual segments have been included in the net revenue and pre-tax income of each segment. The Company’s revenues from foreign operations totaled $843 and $2,727 for the three months ended June 30, 2011 and 2010, respectively, and $2,671 and $5,676 for the six months ended June 30, 2011 and 2010, respectively. The following tables illustrate the financial information for the Company’s segments for the periods indicated:
17
| | | | | | | | | | | | | | | | |
| | | Three Months Ended June 30, 2011 | |
| | | Capital
Markets | | | Asset
Management | | | Principal
Investing | | | Total | |
Revenues, net of interest expense: | | | | | | | | | | | | | | | | |
Investment banking | | $ | 29,999 | | | $ | — | | | $ | — | | | $ | 29,999 | |
Institutional brokerage | | | 21,092 | | | | — | | | | — | | | | 21,092 | |
Asset management fees | | | — | | | | 3,914 | | | | — | | | | 3,914 | |
Net investment loss | | | — | | | | (5 | ) | | | (7,210 | ) | | | (7,215 | ) |
Net interest income, dividends and other | | | 919 | | | | 1 | | | | 472 | | | | 1,392 | |
| | | | | | | | | | | | | | | | |
Total | | | 52,010 | | | | 3,910 | | | | (6,738 | ) | | | 49,182 | |
| | | | | | | | | | | | | | | | |
Operating Expenses: | | | | | | | | | | | | | | | | |
Variable | | | 13,092 | | | | 1,882 | | | | — | | | | 14,974 | |
Fixed | | | 34,869 | | | | 2,180 | | | | 97 | | | | 37,146 | |
| | | | | | | | | | | | | | | | |
Total | | | 47,961 | | | | 4,062 | | | | 97 | | | | 52,120 | |
| | | | | | | | | | | | | | | | |
Pre-tax income (loss) | | $ | 4,049 | | | $ | (152 | ) | | $ | (6,835 | ) | | $ | (2,938 | ) |
| | | | | | | | | | | | | | | | |
Compensation and benefits: | | | | | | | | | | | | | | | | |
Variable | | $ | 7,952 | | | $ | 863 | | | $ | — | | | $ | 8,815 | |
Fixed | | | 19,599 | | | | 1,048 | | | | 48 | | | | 20,695 | |
| | | | | | | | | | | | | | | | |
Total | | $ | 27,551 | | | $ | 1,911 | | | $ | 48 | | | $ | 29,510 | |
| | | | | | | | | | | | | | | | |
| |
| | | Three Months Ended June 30, 2010 | |
| | | Capital
Markets | | | Asset
Management | | | Principal
Investing | | | Total | |
Revenues, net of interest expense: | | | | | | | | | | | | | | | | |
Investment banking | | $ | 40,443 | | | $ | — | | | $ | — | | | $ | 40,443 | |
Institutional brokerage | | | 24,284 | | | | — | | | | — | | | | 24,284 | |
Asset management fees | | | — | | | | 3,815 | | | | — | | | | 3,815 | |
Net investment income | | | — | | | | — | | | | 46 | | | | 46 | |
Net interest income, dividends and other | | | 607 | | | | 5 | | | | 506 | | | | 1,118 | |
| | | | | | | | | | | | | | | | |
Total | | | 65,334 | | | | 3,820 | | | | 552 | | | | 69,706 | |
| | | | | | | | | | | | | | | | |
Operating Expenses: | | | | | | | | | | | | | | | | |
Variable | | | 28,258 | | | | 1,924 | | | | (13 | ) | | | 30,169 | |
Fixed | | | 48,962 | | | | 2,714 | | | | 16 | | | | 51,692 | |
| | | | | | | | | | | | | | | | |
Total | | | 77,220 | | | | 4,638 | | | | 3 | | | | 81,861 | |
| | | | | | | | | | | | | | | | |
Pre-tax (loss) income | | $ | (11,886 | ) | | $ | (818 | ) | | $ | 549 | | | $ | (12,155 | ) |
| | | | | | | | | | | | | | | | |
Compensation and benefits: | | | | | | | | | | | | | | | | |
Variable | | $ | 18,210 | | | $ | 1,100 | | | $ | (13 | ) | | $ | 19,297 | |
Fixed | | | 30,475 | | | | 1,495 | | | | 24 | | | | 31,994 | |
| | | | | | | | | | | | | | | | |
Total | | $ | 48,685 | | | $ | 2,595 | | | $ | 11 | | | $ | 51,291 | |
| | | | | | | | | | | | | | | | |
18
| | | | | | | | | | | | | | | | |
| | | Six Months Ended June 30, 2011 | |
| | | Capital
Markets | | | Asset
Management | | | Principal
Investing | | | Total | |
Revenues, net of interest expense: | | | | | | | | | | | | | | | | |
Investment banking | | $ | 46,569 | | | $ | — | | | $ | — | | | $ | 46,569 | |
Institutional brokerage | | | 44,183 | | | | — | | | | — | | | | 44,183 | |
Asset management fees | | | — | | | | 7,895 | | | | — | | | | 7,895 | |
Net investment income (loss) | | | — | | | | 15 | | | | (1,631 | ) | | | (1,616 | ) |
Net interest income, dividends and other | | | 1,553 | | | | 3 | | | | 693 | | | | 2,249 | |
| | | | | | | | | | | | | | | | |
Total | | | 92,305 | | | | 7,913 | | | | (938 | ) | | | 99,280 | |
| | | | | | | | | | | | | | | | |
Operating Expenses: | | | | | | | | | | | | | | | | |
Variable | | | 27,002 | | | | 3,828 | | | | 4 | | | | 30,834 | |
Fixed | | | 68,867 | | | | 4,265 | | | | 222 | | | | 73,354 | |
| | | | | | | | | | | | | | | | |
Total | | | 95,869 | | | | 8,093 | | | | 226 | | | | 104,188 | |
| | | | | | | | | | | | | | | | |
Pre-tax loss | | $ | (3,564 | ) | | $ | (180 | ) | | $ | (1,164 | ) | | $ | (4,908 | ) |
| | | | | | | | | | | | | | | | |
Compensation and benefits: | | | | | | | | | | | | | | | | |
Variable | | $ | 14,910 | | | $ | 1,856 | | | $ | 1 | | | $ | 16,767 | |
Fixed | | | 39,497 | | | | 2,127 | | | | 120 | | | | 41,744 | |
| | | | | | | | | | | | | | | | |
Total | | $ | 54,407 | | | $ | 3,983 | | | $ | 121 | | | $ | 58,511 | |
| | | | | | | | | | | | | | | | |
| |
| | | Six Months Ended June 30, 2010 | |
| | | Capital
Markets | | | Asset
Management | | | Principal
Investing | | | Total | |
Revenues, net of interest expense: | | | | | | | | | | | | | | | | |
Investment banking | | $ | 51,588 | | | $ | — | | | $ | — | | | $ | 51,588 | |
Institutional brokerage | | | 51,814 | | | | — | | | | — | | | | 51,814 | |
Asset management fees | | | — | | | | 7,143 | | | | — | | | | 7,143 | |
Net investment income | | | — | | | | — | | | | 48 | | | | 48 | |
Net interest income, dividends and other | | | 1,004 | | | | 10 | | | | 2,316 | | | | 3,330 | |
| | | | | | | | | | | | | | | | |
Total | | | 104,406 | | | | 7,153 | | | | 2,364 | | | | 113,923 | |
| | | | | | | | | | | | | | | | |
Operating Expenses: | | | | | | | | | | | | | | | | |
Variable | | | 48,070 | | | | 3,723 | | | | 18 | | | | 51,811 | |
Fixed | | | 92,734 | | | | 5,580 | | | | 494 | | | | 98,808 | |
| | | | | | | | | | | | | | | | |
Total | | | 140,804 | | | | 9,303 | | | | 512 | | | | 150,619 | |
| | | | | | | | | | | | | | | | |
Pre-tax (loss) income | | $ | (36,398 | ) | | $ | (2,150 | ) | | $ | 1,852 | | | $ | (36,696 | ) |
| | | | | | | | | | | | | | | | |
Compensation and benefits: | | | | | | | | | | | | | | | | |
Variable | | $ | 31,804 | | | $ | 2,113 | | | $ | 14 | | | $ | 33,931 | |
Fixed | | | 56,795 | | | | 3,001 | | | | 308 | | | | 60,104 | |
| | | | | | | | | | | | | | | | |
Total | | $ | 88,599 | | | $ | 5,114 | | | $ | 322 | | | $ | 94,035 | |
| | | | | | | | | | | | | | | | |
19
| 10. | Recent Accounting Pronouncements: |
In May 2011, the Financial Accounting Standards Board (“FASB”) amended its fair value measurement guidance in order to improve the comparability of fair value measurements presented and disclosed in financial statements between U.S. generally accepted accounting principles (“U.S. GAAP”) and International Financial Reporting Standards (“IFRS”). Although many of the changes for U.S. GAAP purposes are clarifications of existing guidance or wording changes to align with IFRS, additional disclosures about fair value measurements would be required. These amendments will result in the following additional disclosures: (i) a quantitative disclosure of the unobservable inputs and assumptions used in the measurement, (ii) the valuation processes used and the sensitivity of fair value measurements related to investments categorized within Level 3 of the hierarchy of fair value measurements to changes in unobservable inputs and the interrelationships between those unobservable inputs, if any, and (iii) the categorization by level of the fair value hierarchy for items that are not measured at fair value in the statement of financial condition but for which the fair value is required to be disclosed. These changes are effective for interim and annual periods beginning after December 15, 2011. Early application is not permitted. The Company does not anticipate that the adoption of the amended fair value measurement guidance will have a material impact on the Company’s consolidated financial statements.
In June 2011, the FASB amended its guidance regarding the presentation of comprehensive income, which it states was designed to improve comparability, consistency and transparency and to increase the prominence of items reported in other comprehensive income. The amendment eliminates the option to present components of other comprehensive income as part of the statement of changes in shareholders’ equity allowable under current U.S. GAAP. Entities will be required to present all changes in comprehensive income either in a single continuous statement of comprehensive income or in two separate but consecutive statements. This amendment is to be applied retrospectively and is effective with interim and annual periods beginning after December 15, 2011, with early adoption permitted.
On August 2, 2011, the Company commenced a tender offer to purchase up to 5,000,000 shares, or about 8%, of its outstanding common stock at a price of $3.05 per share. The offer to purchase shares, which is not conditioned upon any minimum number of shares being tendered, will expire on August 29, 2011, unless extended. FBRCM is the dealer manager for the tender offer.
20
| Item 2. | Management’s Discussion and Analysis of Financial Condition and Results of Operations |
The following discussion and analysis of the consolidated financial condition and results of operations of FBR & Co., formerly known as FBR Capital Markets Corporation, and its subsidiaries (collectively, “we”, “us”, “our” or the “Company”) should be read in conjunction with the unaudited consolidated financial statements and the notes thereto appearing elsewhere in this report on Form 10-Q and the audited consolidated financial statements and notes thereto appearing in the Company’s Annual Report on Form 10-K for the fiscal year ended December 31, 2010.
The discussion of the Company’s consolidated financial condition and results of operations below may contain forward-looking statements. These statements, which reflect management’s beliefs and expectations, are subject to risks and uncertainties that may cause actual results to differ materially. For a discussion of the risks and uncertainties that may affect the Company’s future results, please see “Forward-Looking Statements” immediately preceding Part I of, and other items throughout, the Company’s Annual Report on Form 10-K for the fiscal year ended December 31, 2010. Please also see “Risk Factors” in Part I, Item 1A of the Company’s Annual Report on Form 10-K for the year fiscal ended December 31, 2010.
Business Environment
The first half of 2011 demonstrated the significant uncertainty that still surrounds the strength of the global economic recovery. The uncertainty surrounding the United States’ fiscal policy, has weighed on consumer confidence, while high gas and food prices have combined to slow economic growth and consumer spending. In financial markets, these factors have resulted in significantly lower trading volumes in equity and fixed income products until recently, when increased volumes were accompanied by high volatility and steep price declines. Additionally, the price and availability of credit could be altered dramatically, depending on the actions of sovereign and financial institutions in the U.S. and Europe. The outlook for the end of 2011 and 2012 is still unclear and marked by significant risks, including; continued high levels of unemployment, the continued overhang of foreclosed and unsold homes, world-wide sovereign debt challenges and continued political instability in many regions around the world.
Executive Summary
For the three months ended June 30, 2011, our total revenues, net of interest expense, were $49.2 million, our pre-tax loss was $2.9 million and our net loss was $2.7 million, compared to total net revenues of $69.7 million, a pre-tax loss of $12.2 million and a net loss of $25.8 million for the three months ended June 30, 2010. Included in the second quarter of 2011 net loss is a $0.2 million tax benefit as compared to a $13.6 million tax provision for the three months ended June 30, 2010. The tax provision for the three months ended June 30, 2010 substantially reversed the tax benefit recorded in the first quarter of 2010. Our tax (benefit) provision is recorded pursuant to an effective tax rate approach for calculating tax provisions in interim periods based on forecasted annual taxable and book income. Changes to our tax provision during interim periods within a year are primarily the result of changes in our projected effective tax rate for the full year.
For the six months ended June 30, 2011, our total revenues, net of interest expense, were $99.3 million, our pre-tax loss was $4.9 million and our net loss was $4.6 million, compared to total net revenues of $113.9 million, a pre-tax loss of $36.7 million and a net loss of $34.0 million for the six months ended June 30, 2010. Included in the six months ended June 30, 2011 net loss is a $0.3 million tax benefit compared to a $2.7 million tax benefit for the six months ended June 30, 2010. Our tax benefit for the six months ended June 30, 2011 and 2010 is recorded pursuant to an effective tax rate approach for calculating tax provisions in interim periods based on forecasted annual taxable and book income.
The following is an analysis of our operating results by segment for the three and six months ended June 30, 2011 and 2010.
21
Capital Markets
Our capital markets segment includes investment banking and institutional sales, trading and research. These business units operate as a single integrated segment to deliver capital raising, advisory and sales and trading services to corporate and institutional clients. Our investment banking and institutional brokerage businesses are focused on the consumer, diversified industrials, energy and natural resources, financial institutions, insurance, real estate, and technology, media and telecommunications sectors. By their nature, our capital markets business activities are highly competitive and are subject to general market conditions, volatile trading markets, and fluctuations in the volume of market activity, as well as to the conditions affecting the companies and markets in our areas of focus. As a result, our capital markets revenues and profits are subject to significant volatility from period to period. The following tables provide a summary of our results within the capital markets segment (dollars in thousands).
| | | | | | | | |
| | | Three Months Ended
June 30, | |
| | | 2011 | | | 2010 | |
Revenues, net of interest expense: | | | | | | | | |
Investment banking | | $ | 29,999 | | | $ | 40,443 | |
Institutional brokerage | | | 21,092 | | | | 24,284 | |
Net interest income, dividends and other | | | 919 | | | | 607 | |
| | | | | | | | |
Total | | | 52,010 | | | | 65,334 | |
| | | | | | | | |
| | |
Operating Expenses: | | | | | | | | |
Variable | | | 13,092 | | | | 28,258 | |
Fixed | | | 34,869 | | | | 48,962 | |
| | | | | | | | |
Total | | | 47,961 | | | | 77,220 | |
| | | | | | | | |
Pre-tax income (loss) | | $ | 4,049 | | | $ | (11,886 | ) |
| | | | | | | | |
The pre-tax income from our capital markets segment was $4.0 million for the second quarter of 2011 compared to a pre-tax loss of $11.9 million for the second quarter of 2010. This increase in pre-tax income was attributable to a decrease in both variable and fixed costs, partially offset by a decrease in total revenues. Variable expenses decreased $15.2 million, or 53.7%, in 2011 reflecting a decrease in variable compensation and costs related to investment banking transactions. The decrease in variable compensation was attributable to a 24% reduction in employees since the end of the second quarter of 2010, changes made to our variable compensation programs in 2011 and the reduction in net revenues as compared to 2010. The decrease in costs related to investment banking transactions is directly attributable to the lower investment banking activity in 2011 compared to 2010. Fixed expenses decreased $14.1 million, or 28.8%, in 2011. The 2010 fixed expenses included $3.9 million of severance costs that are not comparable to 2011. This decrease in fixed expenses was also attributable to the reduction in employees noted above and the impact of other non-compensation cost reduction initiatives.
Investment banking revenues decreased $10.4 million to $30.0 million during the second quarter of 2011 from $40.4 million during the second quarter of 2010. While second quarter of 2011 investment banking revenues were generated from 20 transactions across six industry segments, the decrease as compared to 2010 was attributable to a decrease in sole managed private placements. The results for second quarter of 2010 include fees earned from a private placement that in-total raised in excess of $1.2 billion of equity capital. This decrease in capital raising revenue was partially offset by an increase in revenues from merger and acquisition assignments in the current quarter compared to the prior year.
Our institutional brokerage revenues decreased $3.2 million to $21.1 million for the second quarter of 2011 from $24.3 million for the second quarter of 2010. This decrease was primarily a result of a decrease in overall industry-wide equity trading volume during the second quarter of 2011. The decrease in equity trading revenues was partially offset by improved results from our listed options, convertible securities, and credit trading desks. In the prior year, these desks had incurred trading losses due to market volatility primarily during April and May 2010.
22
| | | | | | | | |
| | | Six Months Ended
June 30, | |
| | | 2011 | | | 2010 | |
Revenues, net of interest expense: | | | | | | | | |
Investment banking | | $ | 46,569 | | | $ | 51,588 | |
Institutional brokerage | | | 44,183 | | | | 51,814 | |
Net interest income, dividends and other | | | 1,553 | | | | 1,004 | |
| | | | | | | | |
Total | | | 92,305 | | | | 104,406 | |
| | | | | | | | |
Operating Expenses: | | | | | | | | |
Variable | | | 27,002 | | | | 48,070 | |
Fixed | | | 68,867 | | | | 92,734 | |
| | | | | | | | |
Total | | | 95,869 | | | | 140,804 | |
| | | | | | | | |
Pre-tax loss | | $ | (3,564 | ) | | $ | (36,398 | ) |
| | | | | | | | |
The pre-tax loss from our capital markets segment decreased to $3.6 million for the six months ended June 30, 2011 from $36.4 million for the six months ended June 30, 2010. This decrease in pre-tax loss was attributable to a decrease in both variable and fixed costs, partially offset by a decrease in total revenues. Variable expenses decreased $21.1 million, or 43.8%, in 2011 reflecting a decrease in variable compensation, costs related to investment banking transactions, and a decrease in clearing and brokerage costs. The decrease in variable compensation was attributable to a 24% reduction in employees since the end of the second quarter of 2010, changes made to our variable compensation programs in 2011 and the reduction in net revenues as compared to 2010. The decrease in costs related to investment banking transaction and clearing and brokerage costs in 2011 was directly related to the decrease in related transaction and trading volumes for the six months ended June 30, 2011. Fixed expenses decreased $23.9 million, or 25.7%, for the six months ended June 30, 2011. The 2010 fixed expenses included $4.9 million of severance costs that are not comparable to 2011. This decrease was also attributable to both the reduction in employees noted above and the impact of other non-compensation cost reduction initiatives.
Investment banking revenues decreased $5.0 million to $46.6 million during the six months ended June 30, 2011 from $51.6 million during the six months ended June 30, 2010. The decrease was attributable to a decrease in sole managed private placements. The results for six months ended June 30, 2010 include fees earned from a private placement that in-total raised in excess of $1.2 billion of equity capital. This decrease was partially offset by an increase in revenues from lead managed public offerings and merger and acquisition assignments in the current year as compared to the prior year.
Our institutional brokerage revenues decreased $7.6 million to $44.2 million for the six months ended June 30, 2011 from $51.8 million for the six months ended June 30, 2010. This decrease was primarily a result of a decrease in overall industry-wide equity trading volume during the six months ended June 30, 2011.
23
Asset Management
Our asset management segment consists primarily of the management of The FBR Funds, a family of mutual funds. Our mutual fund assets under management remained consistent at $1.6 billion for both June 30, 2011 and December 31, 2010 and increased 14.3% from $1.4 billion at June 30, 2010. The following tables provide a summary of our results within the asset management segment (dollars in thousands).
| | | | | | | | |
| | | Three Months Ended
June 30, | |
| | | 2011 | | | 2010 | |
Revenues, net of interest expense: | | | | | | | | |
Asset management fees | | $ | 3,914 | | | $ | 3,815 | |
Other | | | (4 | ) | | | 5 | |
| | | | | | | | |
Total | | | 3,910 | | | | 3,820 | |
| | | | | | | | |
Operating Expenses: | | | | | | | | |
Variable | | | 1,882 | | | | 1,924 | |
Fixed | | | 2,180 | | | | 2,714 | |
| | | | | | | | |
Total | | | 4,062 | | | | 4,638 | |
| | | | | | | | |
Pre-tax loss | | $ | (152 | ) | | $ | (818 | ) |
| | | | | | | | |
The pre-tax loss from our asset management segment decreased to $0.2 million for the second quarter of 2011 from $0.8 million for the second quarter of 2010. The decrease in pre-tax loss was a result of a decrease in fixed expenses during the second quarter of 2011 due to compensation and non-compensation cost reduction initiatives undertaken during the second half of 2010.
| | | | | | | | |
| | | Six Months Ended
June 30, | |
| | | 2011 | | | 2010 | |
Revenues, net of interest expense: | | | | | | | | |
Asset management fees | | $ | 7,895 | | | $ | 7,143 | |
Other | | | 18 | | | | 10 | |
| | | | | | | | |
Total | | | 7,913 | | | | 7,153 | |
| | | | | | | | |
Operating Expenses: | | | | | | | | |
Variable | | | 3,828 | | | | 3,723 | |
Fixed | | | 4,265 | | | | 5,580 | |
| | | | | | | | |
Total | | | 8,093 | | | | 9,303 | |
| | | | | | | | |
Pre-tax loss | | $ | (180 | ) | | $ | (2,150 | ) |
| | | | | | | | |
The pre-tax loss from our asset management segment decreased to $0.2 million for the six months ended June 30, 2011 from $2.2 million for the six months ended June 30, 2010. The decrease in pre-tax loss was attributable to an increase in asset management fees as a result of an increase in our average assets under management during six months ended June 30, 2011 as compared to the six months ended June 30, 2010. Fixed expenses also decreased during the six months ended June 30, 2011 due to compensation and non-compensation cost reduction initiatives undertaken during the second half of 2010. Variable expenses increased during the six months ended June 30, 2011 as a result of the increase in average assets under management mentioned above.
The following table provides details relating to our assets under management (dollars in millions):
| | | | | | | | |
| | | June 30, 2011 | | | December 31, 2010 | |
Mutual funds: | | | | | | | | |
Equity | | $ | 1,516.6 | | | $ | 1,470.6 | |
Balanced and fixed income | | | 118.7 | | | | 112.1 | |
Private equity and hedge funds | | | 4.1 | | | | 4.3 | |
| | | | | | | | |
Total | | $ | 1,639.4 | | | $ | 1,587.0 | |
| | | | | | | | |
24
Principal Investing
As of June 30, 2011, our principal investing activity consists of investments in merchant banking and other equity investments and investment funds. The following tables provide a summary of our results within the principal investing segment (dollars in thousands):
| | | | | | | | |
| | | Three Months Ended
June 30, | |
| | | 2011 | | | 2010 | |
Revenues, net of interest expense: | | | | | | | | |
Net investment (loss) income | | $ | (7,210 | ) | | $ | 46 | |
Net interest income, dividends and other | | | 472 | | | | 506 | |
| | | | | | | | |
Total | | | (6,738 | ) | | | 552 | |
| | | | | | | | |
Operating Expenses: | | | | | | | | |
Variable | | | — | | | | (13 | ) |
Fixed | | | 97 | | | | 16 | |
| | | | | | | | |
Total | | | 97 | | | | 3 | |
| | | | | | | | |
Pre-tax (loss) income | | $ | (6,835 | ) | | $ | 549 | |
| | | | | | | | |
The pre-tax loss from our principal investing segment was $6.8 million for the second quarter of 2011 compared to pre-tax income of $0.5 million for the second quarter of 2010. The pre-tax loss in 2011 was primarily attributable to other-than-temporary impairment losses of $7.5 million related to two equity investments and $0.6 million in net unrealized losses on trading securities held for investment purposes, offset partially by $0.9 million in net realized gains from the sale of several investments during the second quarter of 2011. This activity in not comparable to the three months ended June 30, 2010. We recognized the impairment losses in 2011 due to the severity of the decline in the fair value of these securities below our cost basis during the second quarter of 2011.
| | | | | | | | |
| | | Six Months Ended
June 30, | |
| | | 2011 | | | 2010 | |
Revenues, net of interest expense: | | | | | | | | |
Net investment (loss) income | | $ | (1,631 | ) | | $ | 48 | |
Net interest income, dividends and other | | | 693 | | | | 2,316 | |
| | | | | | | | |
Total | | | (938 | ) | | | 2,364 | |
| | | | | | | | |
Operating Expenses: | | | | | | | | |
Variable | | | 4 | | | | 18 | |
Fixed | | | 222 | | | | 494 | |
| | | | | | | | |
Total | | | 226 | | | | 512 | |
| | | | | | | | |
Pre-tax (loss) income | | $ | (1,164 | ) | | $ | 1,852 | |
| | | | | | | | |
The pre-tax loss from our principal investing segment was $1.2 million for the six months ended June 30, 2011 compared to pre-tax income of $1.9 million for the six months ended June 30, 2010. The pre-tax loss in 2011 is primarily attributable to the decrease in net investment income due to other-than-temporary impairment losses of $7.5 million related to two equity investments and $0.5 million in net unrealized losses on trading securities held for investment purposes, offset partially by $6.4 million in net realized gains from the sale of several investments during the six months ended June 30, 2011. Net interest income, dividends and other also decreased $1.6 million for the six months ended June 30, 2011 due to a reduction in dividend income compared to the six months ended June 30, 2010.
25
Investments
The total value of our investment portfolio was $51.8 million as of June 30, 2011. Of this total, $25.8 million was held in non-public investments recorded at cost associated with our merchant banking portfolio, $25.4 million was held in marketable equity securities and $0.6 million was held in investment funds.
The following table provides additional detail regarding our merchant banking and other long-term investments as of June 30, 2011 (dollars in thousands):
| | | | | | | | |
| | | June 30, 2010 | |
| | | Number
of Shares | | | Carrying Value/
Fair Value | |
Investment, at cost: | | | | | | | | |
NBH Holdings Corp.(1) | | | 1,049,906 | | | $ | 20,472 | |
North American Financial Holdings, Inc. (1) | | | 257,499 | | | | 4,955 | |
Institutional Financial Markets, Inc. (Note) | | | n/a | | | | 317 | |
| | | | | | | | |
Total | | | | | | $ | 25,744 | |
Marketable equity securities, at fair value | | | | | | | 25,366 | |
Investment funds, at fair value | | | | | | | 646 | |
| | | | | | | | |
Total investments | | | | | | $ | 51,756 | |
| | | | | | | | |
| (1) | As of June 30, 2011, these shares represent investments in non-public securities in which the sale of these shares was subject to restrictive covenants. |
Results of Operations
Three months ended June 30, 2011 compared to three months ended June 30, 2010
Net loss decreased to $2.7 million in the second quarter of 2011 from a net loss of $25.8 million in the second quarter of 2010. The decrease in net loss was primarily the result of the effects of cost reduction initiatives that were implemented during the second half of 2010, including a 24% reduction in our headcount since the second quarter of 2010. Our net loss for the second quarter of 2011 also includes a $0.2 million tax benefit in the second quarter of 2011 compared to a $13.6 million tax provision in the second quarter of 2010. Our pre-tax loss decreased to $2.9 million in the second quarter of 2011 from $12.2 million in the second quarter of 2010 as a result of a decrease in operating expenses to $52.1 million in 2011 from $81.9 million in 2010, offset partially by a decrease in net revenues to $49.2 million in the second quarter of 2011 from $69.7 million in the second quarter of 2010.
The pre-tax income in our capital markets segment was $4.0 million during the second quarter of 2011 compared to a pre-tax loss of $11.9 million during the second quarter of 2010 due to a decrease in operating expenses, offset partially by a decrease in investment banking capital raising revenues and institutional brokerage revenues. The pre-tax loss from our asset management segment decreased to $0.2 million during the second quarter of 2011 from $0.8 million during the second quarter of 2010 due primarily to decreases in operating expenses. The pre-tax loss from our principal investing segment was $6.8 million during the second quarter of 2011 compared to pre-tax income of $0.5 million during the second quarter of 2010. The results for 2011 reflect losses from the other-than-temporary impairment of two merchant banking investments, offset partially by gains on the sale of certain investments during the second quarter of 2011.
Our net revenues decreased 29.4% to $49.2 million during the second quarter of 2011 from $69.7 million during the second quarter of 2010 due to the changes in revenues discussed below.
Capital raising revenues decreased to $22.9 million in the second quarter of 2011 from $37.4 million in the second quarter of 2010. Our revenues from private placements during the second quarter of 2011 were $19.2 million compared to $31.7 million in the second quarter of 2010. The results for second quarter of 2010 include fees earned from a private placement that in-total raised in excess of $1.2 billion of equity capital.
Advisory revenues increased to $7.1 million in the second quarter of 2011 from $3.0 million generated in the second quarter of 2010. We completed four assignments in the second quarter of 2011 as compared to two assignments in the second quarter of 2010.
Institutional brokerage revenues from agency commissions and principal transactions decreased 13.2% to $21.1 million in the second quarter of 2011 from $24.3 million in the second quarter of 2010. This decrease was primarily a result of a decrease in overall
26
industry-wide equity trading volume during the second quarter of 2011. The decrease in equity trading revenues was partially offset by improved results from our listed options, convertible securities, and credit trading desks. In the prior year, these desks had incurred trading losses due to market volatility primarily during April and May 2010.
Asset management fees increased 2.6% to $3.9 million in the second quarter of 2011from $3.8 million in the second quarter of 2010. The increase was primarily attributable to an increase in average mutual fund assets under management.
Net investment loss was $7.2 million in the second quarter of 2011 compared to net investment income of $0.1 million in the second quarter of 2010. Net investment loss for the second quarter of 2011 is primarily attributable to other-than-temporary impairment losses of $7.5 million related to two equity investments and $0.6 million in net unrealized losses on trading securities held for investment purposes, offset partially by $0.9 million in net realized gains from the sale of several investments during the three months ended June 30, 2011. This activity in not comparable to the three months ended June 30, 2010.
Net interest income, dividends and other revenues increased to $1.4 million in the second quarter of 2011 from $1.1 million in the second quarter of 2010. This increase was primarily attributable to an increase in interest income from our convertible securities positions as a result of an increase in the average balance held on our trading desks for the three months ended June 30, 2011.
Total non-interest expenses decreased 36.4% to $52.1 million in the second quarter of 2011 from $81.9 million in the second quarter of 2010. This decrease was caused by the changes in non-interest expenses described below.
Compensation and benefits expenses decreased 42.5% to $29.5 million in the second quarter of 2011 from $51.3 million in the second quarter of 2010. Fixed compensation decreased $11.3 million in 2011 due to a 24% decrease in headcount since the second quarter of 2010. Also, the 2010 fixed expenses included $3.9 million of severance costs that are not comparable to 2011. Variable compensation decreased $10.5 million in 2011 due to the decrease in headcount discussed above, changes in our variable compensation programs in 2011 and the reduction in net revenues as compared to 2010.
Professional services expenses decreased 61.8% to $2.9 million in the second quarter of 2011 from $7.6 million in the second quarter of 2010 primarily due to a decrease in expenses related to investment banking transactions in the second quarter of 2011 as compared to 2010. Also contributing to the decrease were lower costs related to recruiting, legal and consulting fees.
Business development expenses decreased 7.7% to $3.6 million in the second quarter of 2011 from $3.9 million in the second quarter of 2010. This decrease was primarily the result of decreased costs associated with our investment banking transactions.
Clearing and brokerage fees decreased 10.8% to $3.3 million in the second quarter of 2011 from $3.7 million in the second quarter of 2010. The decrease was primarily due to a lower volume of trading activity, in particular related to our equity trading desk.
Occupancy and equipment expenses decreased 4.9% to $5.8 million in the second quarter of 2011 from $6.1 million in the second quarter of 2010. The decrease in occupancy costs was primarily the result of reductions in depreciation expense associated with reduced capital expenditures over the past two years and reductions in our leased office space from prior year. These reductions were partially offset by a $1.0 million charge in 2011 associated with the consolidation of office space in our Arlington, VA headquarters.
Communications expenses decreased 24.1% to $4.1 million in the second quarter of 2011 from $5.4 million in the second quarter of 2010. The decrease in these expenses was primarily due to decreased costs related to market data and customer trading services as a result of the reduction in our workforce.
Other operating expenses decreased 25.6% to $2.9 million in the second quarter of 2011 from $3.9 million in the second quarter of 2010. The decrease in expenses was primarily due to a decrease in corporate insurance costs and printing, postage and office supplies as well as a bad debt charge in 2010 that is not comparable to 2011.
Our income tax benefit was $0.2 million in the second quarter of 2011 compared to a tax provision of $13.6 million in the second quarter of 2010. Our quarterly income tax provision is determined pursuant to ASC 740, which requires using an estimated annual effective tax rate based on the forecasted taxable income for the full year. Based on this approach, our effective tax rate was 7.2% and (112.0%) in the second quarters of 2011 and 2010, respectively. These tax rates differed from statutory tax rates primarily due to a full valuation allowance on the deferred tax benefits of book losses incurred during these periods and as a result of the benefit of tax losses realized or expected to be realized in these periods. Also, our tax rates for the three months ended June 30, 2011 and 2010 reflect the changes in the estimated effective tax rates for the full year based on changes to our forecasted annual taxable and book income. The Company believes there is potential for volatility in its 2011 effective tax rate from quarter-to-quarter due to the impact of any prospective changes in its forecasted earnings for the year.
27
Six months ended June 30, 2011 compared to six months ended June 30, 2010
Net loss decreased to $4.6 million in the first six months of 2011 from $34.0 million in the first six months of 2010. The decrease in net loss was primarily the result of the effects of cost reduction initiatives that were implemented during the second half of 2010, including a 24% reduction in our headcount since the second quarter of 2010. Income tax benefit decreased to $0.3 million in the first half of 2011 from $2.7 million in the first half of 2010. Our pre-tax loss decreased to $4.9 million in the first six months of 2011 from $36.7 million in the first six months of 2010.
The pre-tax loss from our capital markets segment decreased to $3.6 million in the first six months of 2011 from $36.4 million in the first six months of 2010 due to decreased operating expenses, offset partially by a decrease in investment banking capital raising revenues and institutional brokerage revenues. The pre-tax loss in our asset management segment decreased to $0.2 million in the first six months of 2011 from $2.2 million in the first six months of 2010 due to a reduction in operating expenses, as well as an increase in asset management fees due to increased average assets under management. The pre-tax loss from our principal investing segment was $1.2 million during the first half of 2011 compared to pre-tax income of $1.9 million during the first half of 2010. The results for 2011 reflect losses from the other than temporary impairment losses from two merchant banking investments, partially offset by gains on the sale of certain investments.
Our net revenues decreased 12.8% to $99.3 million during the first six months of 2011 from $113.9 million during the first six months of 2010 due to the changes in revenues discussed below.
Capital raising revenues decreased 15.7% to $38.0 million in the first six months of 2011 from $45.1 million in the first six months of 2010. The decrease was attributable to a decrease in sole managed private placements. Our revenues from private placements during the first half of 2011 were $25.6 million compared to $36.5 million in the first half of 2010. The results for six months ended June 30, 2010 include fees earned from a private placement that in-total raised in excess of $1.2 billion of equity capital. This decrease was partially offset by an increase in revenues from lead managed public offerings in 2011 as compared to 2010.
Advisory revenues increased 30.8% to $8.5 million in the first six months of 2011 from $6.5 million generated in the first six months of 2010. We completed seven assignments in the first six months of 2011 as compared to six assignments in the first six months of 2010.
Institutional brokerage revenues from agency commissions and principal transactions decreased 14.7% to $44.2 million in the first six months of 2011 from $51.8 million in the first six months of 2010. The decrease is primarily a result of a decrease in overall equity trading volume during the first six months of 2011.
Asset management fees increased 11.3% to $7.9 million in the first six months of 2011 from $7.1 million in the first six months of 2010. The increase is primarily attributable to an increase in average mutual fund assets under management.
Net investment loss was $1.6 million in the first six months of 2011 compared to income of $0.1 million in the first six months of 2010. Net investment loss for the first six months of 2011 is primarily due to other-than-temporary impairment losses of $7.5 million related to two equity investments and $0.5 million in net unrealized losses on trading securities held for investment purposes, offset partially by $6.4 million in net realized gains from the sale of several investments during the six months ended June 30, 2011. Net investment income for the first six months of 2010 is related to income from investment funds due to fund performance and the sale of certain merchant banking investments, partially offset by losses on short positions in certain exchange-traded funds that are intended to hedge the fund investments.
Net interest income, dividends and other revenues decreased to $2.2 million in the first six months of 2011 from $3.3 million in the first six months of 2010. This decrease is primarily attributable to decreased dividend income from certain equity investments.
Total non-interest expenses decreased 30.8% to $104.2 million in the first six months of 2011 from $150.6 million in the first six months of 2010. This decrease was caused by the changes in non-interest expenses described below.
Compensation and benefits expenses decreased 37.8% to $58.5 million in the first six months of 2011 from $94.0 million in the first six months of 2010. Fixed compensation decreased $18.4 million due to a 24% decrease in headcount since the second quarter of 2010. Also, the 2010 fixed expenses included $4.9 million of severance costs that are not comparable to 2011. Variable compensation decreased $17.2 million due to the decrease in headcount discussed above, changes in our variable compensation programs in 2011 and a decrease in net revenues during the six months ended June 30, 2011.
Professional services expenses decreased 41.9% to $6.8 million in the first six months of 2011 from $11.7 million in the first six months of 2010 primarily due to decreased expenses related to investment banking transactions in the second quarter of 2011 as compared to 2010. Also contributing to the decrease were lower costs related to recruiting, legal and consulting fees.
28
Business development expenses decreased 7.7% to $7.2 million in the first six months of 2011 from $7.8 million in the first six months of 2010. This decrease is primarily the result of decreased costs associated with our investment banking transactions.
Clearing and brokerage fees decreased 15.5% to $6.0 million in the first six months of 2011 from $7.1 million in the first six months of 2010. This decrease is primarily the result of a lower volume of trading activity, particularly related to our equity trading desk.
Occupancy and equipment expenses decreased 13.5% to $10.9 million in the first six months of 2011 from $12.6 million in the first six months of 2010. The decrease in occupancy costs is primarily the result of reductions in depreciation expense associated with reduced capital expenditures over the past two years and reductions in our leased office space. These reductions were partially offset by a $1.0 million charge in 2011 associated with the consolidation of office space in our Arlington, VA headquarters.
Communications expenses decreased 15.8% to $8.5 million in the first six months of 2011 from $10.1 million in the first six months of 2010. The decrease in these expenses is primarily due to decreased costs related to market data and customer trading services as a result of the reduction in our workforce.
Other operating expenses decreased 15.1% to $6.2 million in the first six months of 2011 from $7.3 million in the first six months of 2010. The decrease in expenses is primarily due to a decrease in corporate insurance costs and printing, postage and office supplies.
Our income tax benefit decreased to $0.3 million in the first six months of 2011 from $2.7 million in the first six months of 2010. Our income tax provision is determined pursuant to ASC 740, which requires using an estimated annual effective tax rate based on the forecasted taxable income for the full year. Based on this approach, our effective tax rates were 5.6% and 7.3% in the first six months of 2011 and 2010. These rates differed from statutory tax rates primarily due to a full valuation allowance on the deferred tax benefits of book losses incurred in these periods and as a result of the benefit of tax losses realized/expected to be realized in these periods. The Company believes there is potential for volatility in its 2011 effective tax rate from quarter-to-quarter due to the impact of any prospective changes in its forecasted earnings for the year.
Liquidity and Capital Resources
Liquidity is a measurement of our ability to meet potential cash requirements, including ongoing funding for investments, and for other general business purposes. Regulatory requirements applicable to our broker-dealer subsidiaries require minimum capital levels for these entities. The primary sources of funds for liquidity consist of existing cash balances (i.e., available liquid capital not invested in our operating businesses), proceeds from sales of securities, internally generated funds, dividends on equity securities that we own, and credit provided by margin accounts, banks, clearing brokers, and affiliates of our principal clearing broker. Potential future sources of liquidity for us include internally generated funds, borrowing capacity through margin accounts, corporate lines of credit and other credit facilities which we may enter into in the future, and future issuances of common stock, preferred stock or debt securities.
Cash Flows
As of June 30, 2011, our cash and cash equivalents totaled $176.9 million representing a net decrease of $59.1 million for the six months ended June 30, 2011. The decrease is attributable to $49.5 million of cash used in operating activities, $3.3 million of cash used in investing activities and $6.3 million of cash used in financing activities. Due to the cyclical nature of our industry and the industries in which we provide services, we maintain liquid capital to cover potential cash outflows in periods of decreased revenues and earnings.
Net cash used in our operating activities of $49.5 million during the first six months of 2011, compares to $51.9 million of cash used in operating activities during the first six months of 2010. The cash used in operating activities for the first six months of 2011 reflects an increase in our capital invested in our trading desks and for the first six months of 2010 resulted from incurring net operating losses over that period.
Net cash used in investing activities of $3.3 million during the first six months of 2011 compares to net cash used in investing activities of $23.3 million during the first six months of 2010, reflecting the difference in investing activity during the periods. The activity for both periods reflects the purchase and sale of certain equity securities held for investment purposes.
Net cash used in financing activities of $6.3 million during the first six months of 2011, compares to net cash used in financing activities of $12.5 million during the first six months of 2010. The 2011 and 2010 activity primarily represents the repurchase of 1.9 million and 2.8 million shares of our common stock, respectively.
29
Sources of Funding
We believe that our existing cash and cash equivalents balances (totaling $176.9 million at June 30, 2011) comprised primarily of investments in money market funds investing in short-term U.S. Treasury securities, cash flows from operations, borrowing capacity, other sources of liquidity and execution of our financing strategies will be sufficient to meet our cash requirements. We have obtained, and believe we will be able to continue to obtain, short-term financing, such as margin financing and temporary subordinated financing, in amounts and at interest rates consistent with our financing objectives. We may, however, seek debt or equity financings, in public or private transactions, to provide capital for corporate purposes and/or strategic business opportunities, including possible acquisitions, joint ventures, alliances or other business arrangements which could require substantial capital outlays. Our policy is to evaluate strategic business opportunities, including acquisitions and divestitures, as they arise. There can be no assurance that we will be able to generate sufficient funds from future operations, or raise sufficient debt or equity on acceptable terms, to take advantage of investment opportunities that become available. Should our needs ever exceed these sources of liquidity, we believe that most of our investments could be sold, in most circumstances, to provide cash.
We monitor and manage our leverage and liquidity risk through various committees and processes we have established. We assess our leverage and liquidity risk based on considerations and assumptions of market factors, as well as factors specific to us, including the amount of our available liquid capital (i.e., the amount of our cash and cash equivalents not invested in our operating business). At June 30, 2011, we had no outstanding borrowings.
Assets
As of June 30, 2011, our principal assets consist of cash and cash equivalents, receivables, trading securities and investments. As of June 30, 2011 and December 31, 2010, liquid assets consisted primarily of cash and cash equivalents of $176.9 million and $236.1 million, respectively.
The decrease in our total assets to $412.1 million as of June 30, 2011 compared to $431.5 million as of December 31, 2010, is primarily the result of a $59.1 million decrease in cash and cash equivalents discussed above and an $8.9 million decrease in receivables, offset partially by a $49.8 million increase in our long positions on the trading desks.
Our due from and to brokers, dealers, and clearing organizations balances primarily represent unsettled trades associated with our credit sales and trading platform. These transactions include corporate bond and syndicated loan trades. A decrease in unsettled trades outstanding associated with these activities was the primary reason for the decrease in the receivable from and corresponding payable to brokers, dealers and clearing organization. The total amount of outstanding unsettled trade receivables and payables related to these instruments was $1.9 million and $2.5 million, respectively, as of June 30, 2011 compared to $11.4 million and $7.3 million, respectively, as of December 31, 2010. Due to the extended settlement nature of most par and distressed bank loan transactions, we are subject to certain market and counterparty credit risks. See our discussion related to these risks included in theQuantitative and Qualitative Disclosures about Market Risk. The remaining components of the due from and to brokers, dealers, and clearing organizations includes receivables related to commissions and receivables and payables related to unsettled trades that are settled on a regular basis.
As of June 30, 2011, our $51.8 million of investments primarily consist of investments in non-public equity securities, marketable equity securities and investment funds. These investments are funded in cash and are not financed with debt. Accordingly, a decline in value of these assets, should it occur, would impact our return on our investment, however, it would not impact our current liquidity requirements.
Regulatory Capital
FBRCM, our principal U.S. broker-dealer, is registered with the SEC and is a member of the FINRA. Additionally, FBRIL, our U.K. broker-dealer, is registered with the FSA of the United Kingdom. As such, they are subject to the minimum net capital requirements promulgated by the SEC and FSA, respectively. As of June 30, 2011, FBRCM had total regulatory net capital of $46.1 million, which exceeded its required net capital of $5.2 million by $40.9 million. In addition, FBRIL had regulatory capital as defined in excess of required amounts. Regulatory net capital requirements increase when the broker-dealers are involved in underwriting activities based upon a percentage of the amount being underwritten.
Share Repurchases
During the three and six months ended June 30, 2011, we repurchased 1,228,780 and 1,904,578 shares, respectively, of our common stock in open market transactions at weighted average share prices of $3.57 and $3.62 per share, respectively, for a total cost of $4.4 million and $6.9 million, respectively. As of June 30, 2011, we have a remaining authority to repurchase up to 3.3 million additional shares.
On August 2, 2011, we commenced a tender offer to purchase up to 5,000,000 shares, or about 8%, of our outstanding common stock at a price of $3.05 per share. The offer to purchase shares, which is not conditioned upon any minimum number of shares being tendered, will expire on August 29, 2011, unless extended. FBRCM is the dealer manager for the tender offer.
30
Off-Balance Sheet Arrangements
Through indemnification provisions in agreements with clearing organizations, customer activities may expose us to off-balance sheet credit risk. Financial instruments may have to be purchased or sold at prevailing market prices in the event a customer fails to settle on a trade on its original terms or in the event cash and securities in customer margin accounts are not sufficient to fully cover customer obligations. We seek to manage the risks associated with customer activities through customer screening and selection procedures as well as through requirements on customers to maintain margin collateral in compliance with various regulations and clearing organization policies.
31
| Item 3. | Quantitative and Qualitative Disclosures about Market Risk |
Overall Risk Management
We monitor market and business risk, including credit risk, operations, liquidity, compliance, legal, and reputational risk through a number of control procedures designed to identify and evaluate the various risks to which our business and investments are exposed. We have established various committees and processes to assess and to manage risk associated with our investment banking, trading, and merchant banking activities. We review, among other things, business and transactional risks associated with potential investment banking clients and engagements as well as our capital subjected to risk through our trading activities. We seek to manage the risks associated with our investment banking and merchant banking activities by review and approval of transactions by the relevant committee, prior to accepting an engagement or pursuing a material investment transaction.
Market Risk
Market risk is the risk that a change in the level of one or more market prices, rates, indices, or other market factors, such as market liquidity, will result in losses for a position or portfolio. Our activities as an underwriter, market maker and principal investor, as well as our activities as a financial intermediary in customer trading transactions, expose us to market risk.
We use a number of quantitative measures to manage our exposure to market risk in our trading businesses. These measures include:
Inventory position limits—we establish inventory position limits on gross and net positions, at both the trading desk and individual position level, and we monitor exposures against limits on a daily basis.
Scenario analysis—we apply stress tests and scenario analysis to estimate the potential impact on our trading revenues of highly stressful market environments in both the credit and equity markets.
Value at Risk—we utilize a statistical measure of potential trading loss, called Value at Risk (“VaR”), to estimate the potential loss from adverse market moves in an ordinary market environment. We also establish VaR limits, as appropriate.
Value at Risk. We calculate VaR for our trading businesses using a historical simulation model that isolates various risk elements associated with each of our trading positions over a one-day time horizon and at a 95% confidence level. The simulation is based on data for the previous twelve months. This approach assumes that historical changes in market values are representative of future changes.
Using the results of this simulation, VaR measures the potential gains and losses on net trading positions at a 95% confidence level over a one-day time horizon. A 95% confidence level implies that, on average, we anticipate that 5% of the time we may realize trading losses in excess of our VaR amount. Our one-day 95% VaR at June 30, 2011 was approximately $570 thousand.
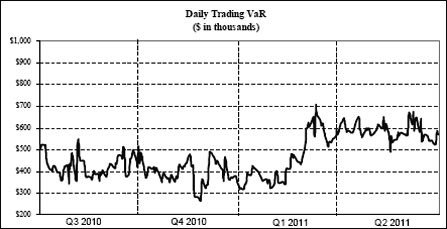
32
VaR is a model that quantifies potential losses using historical data. We could incur losses greater than the reported VaR because the historical market prices used may not be an accurate measure of future market events and conditions, especially in highly stressful market environments. In addition, the VaR model measures the risk of the current net trading positions and does not take into account future position changes arising from transaction and/or hedging activity. Our VaR includes positions actively managed and held by our trading desks and does not include positions associated with investment banking transactions that may be held on our trading desk in order to facilitate distribution. In most instances, these positions are held only for a short period and sold at or above our costs. To the extent we hold these positions on a long-term basis, they are reflected as long-term investments and risk related to these positions are discussed below underEquity Price Risk.
The comparison of actual daily trading revenue fluctuations with a daily VaR estimate is the primary method used to test the reasonableness of the VaR measure. The following table provides the distribution of daily trading revenues and losses during the six months ended June 30, 2011. The table shows data reflecting that the actual lowest 5 percentile daily trading revenues during the six months ended June 30, 2011 was $67 thousand. Over the same period, the worst one-day trading revenues were $(79) thousand which is below the $526 thousand daily trading loss implied by the average one-day VaR for the first six months of 2011.
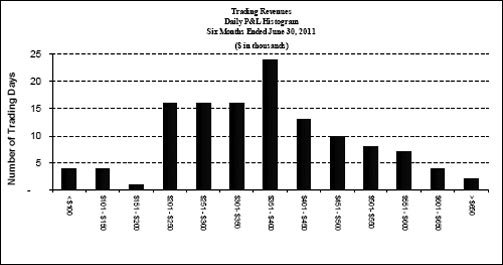
Equity Price Risk. Equity price risk represents the potential loss in value of a position due to adverse changes in the level or volatility of equity prices. We generally attempt to limit exposure to equity price risk on securities held as a result of our daily equity trading activities by limiting our intra-day and overnight inventory of trading securities to that needed to provide the appropriate level of liquidity in the securities for which we are a market maker. We also seek to manage these risks by diversifying exposures, controlling position sizes, and establishing economic hedges in related securities, principally through short sale transactions.
While it is impossible to project exactly what factors may affect the prices of equity securities and how much the effect might be, the impact of a ten percent increase and a ten percent decrease in the price of equities held by us would be as follows as of June 30, 2011. The fair value of the $26.1 million of trading equity securities held at our broker-dealer subsidiaries would increase or decrease to $28.7 million and $23.5 million, respectively, and the fair value of the $51.8 million of other equity investments would increase or decrease to $57.0 million and $46.6 million respectively.
Except to the extent that we sell our equity securities designated as available-for-sale or our cost method equity investments, or a decrease in their fair value is deemed to be other-than-temporary, an increase or decrease in the fair value of those assets will not directly affect our earnings. However, an increase or decrease in the value of trading securities held by broker-dealer subsidiaries, investment securities designated as trading, or investment funds will directly affect our earnings.
33
Credit Risk.Our broker-dealer subsidiaries clear all of their securities transactions through a clearing broker on a fully disclosed basis. Pursuant to the terms of the agreements between our broker-dealer subsidiaries and the clearing broker, the clearing broker has the right to charge us for losses that result from a counterparty’s failure to fulfill its contractual obligations. As the right to charge us has no maximum amount and applies to all trades executed through the clearing broker, we believe there is no maximum amount assignable to this right. At June 30, 2011 and December 31, 2010, we have recorded no liabilities with regard to this right. During the six months ended June 30, 2011 and 2010, amounts paid to the clearing broker related to these guarantees have been immaterial. In addition, we have the right to pursue collection of performance from the counterparties who do not perform under their contractual obligations. We monitor the credit standing of the clearing broker and all counterparties with which we conduct business.
We attempt to limit our credit spread risk by offsetting long or short positions in various related securities, but may also hedge credit risk exposure through the use of credit derivatives such as credit default swaps.
Our due from and to brokers, dealers and clearing organizations balances primarily represent unsettled trades associated with our credit sales and trading platform. These transactions include corporate bonds and syndicated loan trades. As part of this activity, we incur market and counterparty credit risk due to the extended settlement nature of most par and distressed bank loan transactions. Par loan and distressed bank loan trades have extended settlement periods due to the administrative and legal requirements associated with transferring title of such instruments. During this period whereby a trade has been executed but not settled, we are at risk if one of our counterparties defaults on a trade obligation and we have to meet this obligation at market prices that are adverse relative to the original trade. We manage this exposure by calculating the current and potential default exposure on each trade and maintaining risk limits for each counterparty with whom we have outstanding bank loan trades.
The securities industry is subject to numerous risks, including the risk of loss associated with the underwriting, ownership, and trading of securities, and the risk of reduced revenues in periods of reduced demand for security offerings and activity in secondary trading markets. Changing economic and market trends may negatively impact the liquidity and value of our investments and the level of security offerings underwritten by us, which may adversely affect our revenues and profitability.
Our equity and debt investments include non-investment grade securities of privately held issuers with no ready markets. The concentration and illiquidity of these investments expose us to a higher degree of risk than associated with readily marketable securities.
Interest Rate Risk. Interest rate risk represents the potential loss in value of a position or portfolio from adverse changes in market interest rates. We are exposed to interest rate risk through our trading activities in convertible and fixed income securities, however, based on our daily monitoring of this risk, we believe we currently have limited exposure to interest rate risk in these activities.
| Item 4. | Controls and Procedures |
Conclusion Regarding the Effectiveness of Disclosure Controls and Procedures
As of the end of the period covered by this report on Form 10-Q, our management carried out an evaluation, with the participation of our Chief Executive Officer, Richard J. Hendrix, and our Chief Financial Officer, Bradley J. Wright, of the effectiveness of our disclosure controls and procedures (as defined under Rule 13a-15(e) of the Securities Exchange Act of 1934 (the “Exchange Act”)) pursuant to Rule 13a-15(b) under the Exchange Act. Based upon that evaluation, our Chief Executive Officer and our Chief Financial Officer concluded that our disclosure controls and procedures, as of June 30, 2011, are effective to ensure that information required to be disclosed by us in the reports that we file or submit under the Exchange Act is recorded, processed, summarized and reported, within the time periods specified in the SEC’s rules and forms, and that such information is accumulated and communicated to our management, including our Chief Executive Officer and Chief Financial Officer, as appropriate, to allow timely decisions regarding disclosure.
Changes in Internal Controls over Financial Reporting
During the six months ended June 30, 2011, we have not made any changes that have materially affected, or are reasonably likely to materially affect, our internal control over financial reporting (as defined in Rule 13a-15(f) under the Exchange Act).
34
PART II
OTHER INFORMATION
As of June 30, 2011, except as described below, the Company was neither a defendant nor plaintiff in any lawsuits or arbitrations nor involved in any governmental or self-regulatory organization matters that are expected to have a material adverse effect on its financial condition, results of operations or liquidity. The Company has been named as a defendant in a small number of civil lawsuits and arbitrations relating to its various businesses. In addition, the Company is subject to various reviews, examinations, investigations and other inquiries by governmental agencies and self regulatory organizations. There can be no assurance that these matters individually or in aggregate will not have a material adverse effect on the Company’s financial condition, results of operations or liquidity in a future period. However, based on management’s review with counsel, resolution of these matters is not expected to have a material adverse effect on the Company’s financial condition, results of operations or liquidity.
Many aspects of the Company’s business involve substantial risks of liability and litigation. Underwriters, broker-dealers and investment advisers are exposed to liability under Federal and state securities laws, other Federal and state laws and court decisions, including decisions with respect to underwriters’ liability and limitations on indemnification, as well as with respect to the handling of customer accounts. For example, underwriters may be held liable for material misstatements or omissions of fact in a prospectus used in connection with the securities being offered and broker-dealers may be held liable for statements made by their securities analysts or other personnel. FBRCM has been named as a defendant in a small number of securities claims involving investment banking clients of FBRCM as a result of FBRCM’s role as an underwriter. In these cases, the underwriting agreement provides, subject to certain conditions, that the investment banking client is required to indemnify FBRCM against certain claims or liabilities, including claims or liabilities under the Securities Act of 1933, as amended (the “Securities Act”), or contribute to payments which FBRCM is required to make as a result of the litigation. There can be no assurance that such indemnification or contribution will ultimately be available to the Company or that an investment banking client will be able to satisfy its indemnity or contribution obligations when due.
In May 2008, the lead plaintiff in a previously filed and consolidated action filed an amended consolidated class action complaint that, for the first time, named Friedman, Billings, Ramsey & Co., Inc. (now FBRCM) and eight other underwriters as defendants. The lawsuit, styledIn Re Thornburg Mortgage, Inc. Securities Litigation and pending in the United States District Court for the District of New Mexico, was originally filed in August 2007 against Thornburg Mortgage, Inc. (“TMI”), and certain of its officers and directors, alleging material misrepresentations and omissions about,inter alia, the financial position of TMI. The amended complaint now included claims under Sections 11 and 12 of the Securities Act against nine underwriters relating to five separate offerings (May 2007, June 2007, September 2007 and two offerings in January 2008). The allegations against FBRCM related only to its role as underwriter or member of the syndicate that underwrote TMI’s total of three offerings in September 2007 and January 2008—each of which occurred after the filing of the original complaint—with an aggregate offering price of approximately $818 million. The plaintiffs sought restitution, unspecified compensatory damages and reimbursement of certain costs and expenses. Although FBRCM is contractually entitled to be indemnified by TMI in connection with this lawsuit, TMI filed for bankruptcy on May 1, 2009 and this likely will decrease or eliminate the value of the indemnity that FBRCM receives from TMI. On June 2, 2011, the Court granted FBRCM’s motion to dismiss the consolidated class action complaint as to FBRCM and then entered final judgment for FBRCM on July 25, 2011. The deadline for the plaintiffs to notice an appeal from the Order of Dismissal, should they choose to do so, is the end of August 2011.
FBRCM has been named as a defendant in a case relating to its role as an underwriter in residential mortgage-backed securities (“RMBS”) offerings. FBRCM is among dozens of underwriter, securitization trust and depositor defendants in an individual action filed by Cambridge Place Investment Management, Inc. in Massachusetts state court (Cambridge Place Investment Management Inc. v. Morgan Stanley et al). Cambridge’s complaint relates to the more than $2.4 billion in RMBS purchases it made in numerous underwritten offerings (of which the claims concerning FBRCM are limited to Cambridge’s purchases of a combined $22 million of RMBS in two separate offerings) and alleges that each of the defendants made misrepresentations and omissions relating to, among other things, loan-to-value ratios, appraisals, and underwriting standards, in violation of state securities laws. FBRCM has contractual indemnification claims against the RMBS issuers and contribution claims against co-underwriters involved in the two offerings for which claims have been made against it.
FBRCM has been named a defendant in the putative class action lawsuitMHC Mutual Conversion Fund, L.P. v. United Western Bancorp, Inc., et al. pending in the United States District Court for the District of Colorado. The complaint, filed in March 2011 against United Western Bancorp, Inc. (“the Bank”), its officers and directors, underwriters and outside auditors, alleges material misrepresentations and omissions in the registration statement and prospectus issued in connection with the Bank’s September 2009 offering. The complaint alleges claims under Sections 11 and 12 of the Securities Act against the lead underwriter of the offering and FBRCM as a member of the underwriting syndicate. The underwriters have notified the Bank that they are contractually entitled to be indemnified by the Bank as to all related expenses and losses incurred by the underwriters in connection with this action.
35
Although these cases involving FBRCM are at a preliminary stage, based on management’s review with counsel and present information currently known by management, resolution of such matters is not expected to have a material effect on the Company’s financial condition, results of operations, or liquidity.
In certain circumstances, broker-dealers and asset managers may also be held liable by customers and clients for losses sustained on investments. In recent years, there has been an increasing incidence of litigation and actions by government agencies and self regulatory organizations involving the securities industry, including class actions that seek substantial damages. The Company is also subject to the risk of litigation, including litigation that may be without merit. As the Company intends to actively defend such litigation, significant legal expenses could be incurred. An adverse resolution of any future litigation against the Company could materially affect its financial condition, operating results and liquidity.
As of June 30, 2011, there have been no material changes to our risk factors as previously disclosed in Item 1A, “Risk Factors”, in our Annual Report on Form 10-K for the fiscal year ended December 31, 2010.
| Item 2. | Unregistered Sales of Equity Securities and Use of Proceeds |
The following table provides information on the Company’s share repurchases during the second quarter of 2011:
| | | | | | | | | | | | | | | | |
| | | Total Number of
Shares Purchased | | | Average Price Paid
per Share | | | Total Number of Shares
Purchased as Part of
Publicly Announced
Plans or Programs(1) | | | Maximum Number of
Shares that May Yet Be
Purchased Under the
Plans or Programs | |
April 1 to April 30, 2011 | | | — | | | $ | — | | | | — | | | | 4,545,713 | |
May 1 to May 31, 2011 | | | 612,018 | | | | 3.64 | | | | 612,018 | | | | 3,933,695 | |
June 1 to June 30, 2011 | | | 616,762 | | | | 3.51 | | | | 616,762 | | | | 3,316,933 | |
| | | | | | | | | | | | | | | | |
Total | | | 1,228,780 | | | $ | 3.57 | | | | 1,228,780 | | | | 3,316,933 | |
| | | | | | | | | | | | | | | | |
| (1) | On July 27, 2010, the Board of Directors of the Company approved a 5,000,000 share increase to the number shares of common stock that the Company is authorized to repurchase. This directive increased the total number of shares authorized to repurchase to 5,650,500 shares of which 3,316,933 shares remain authorized to be repurchased. |
| | |
Exhibit
Number | | Exhibit Title |
| |
| 3.1 | | Amended and Restated Articles of Incorporation of the Registrant.* |
| |
| 3.2 | | Amended and Restated Bylaws of the Registrant.** |
| |
| 12.01 | | Statement regarding Computation of Ratio of Earnings to Fixed Charges. |
| |
| 31.01 | | Certification of Chief Executive Officer pursuant to Rule 13a-14(a) under the Securities Exchange Act of 1934, as amended, adopted pursuant to Section 302 of the Sarbanes-Oxley Act of 2002. |
| |
| 31.02 | | Certification of Chief Financial Officer pursuant to Rule 13a-14(a) under the Securities Exchange Act of 1934, as amended, adopted pursuant to Section 302 of the Sarbanes-Oxley Act of 2002. |
| |
| 32.01 | | Certification of Chief Executive Officer pursuant to 18 U.S.C. Section 1350, as adopted pursuant to Section 906 of the Sarbanes-Oxley Act of 2002. |
| |
| 32.02 | | Certification of Chief Financial Officer pursuant to 18 U.S.C. Section 1350, as adopted pursuant to Section 906 of the Sarbanes-Oxley Act of 2002. |
| |
| 101 | | The following financial information from the Quarterly Report on Form 10-Q for the quarter ended June 30, 2011, formatted in XBRL (Extensible Business Reporting Language): (i) the Consolidated Balance Sheets, (ii) the Consolidated Statements of Operations, (iii) the Consolidated Statements of Changes in Shareholders’ Equity, (iv) the Consolidated Statements of Cash Flows, and (v) the Notes to the Consolidated Financial Statements, tagged as blocks of text. |
| * | Previously filed as an exhibit to the Registrant’s Registration Statement on Form S-8 (Registration No. 333-175088), which was filed with the SEC on June 23, 2011, and incorporated herein by reference. |
| ** | Previously filed as an exhibit to the Registrant’s Current Report on Form 8-K, which was filed with the SEC on June 23, 2011, and incorporated herein by reference. |
36
SIGNATURE
Pursuant to the requirements of the Securities Exchange Act of 1934, the registrant has duly caused this report to be signed on its behalf by the undersigned, thereunto duly authorized.
| | | | |
| | FBR & Co. |
| | |
| Date: August 9, 2011 | | By: | | /S/ BRADLEY J. WRIGHT |
| | | | Bradley J. Wright |
| | | | Executive Vice President, Chief Financial Officer |
| | | | (Principal Financial Officer) |
| | |
| Date: August 9, 2011 | | By: | | /S/ ROBERT J. KIERNAN |
| | | | Robert J. Kiernan |
| | | | Senior Vice President, Controller and |
| | | | Chief Accounting Officer |
| | | | (Principal Accounting Officer) |
37