UNITED STATES
SECURITIES AND EXCHANGE COMMISSION
Washington, D.C. 20549
FORM 10-Q
(Mark One)
| x | QUARTERLY REPORT PURSUANT TO SECTION 13 OR 15(d) OF THE SECURITIES EXCHANGE ACT OF 1934 |
For the quarterly period ended June 30, 2013
OR
| ¨ | TRANSITION REPORT PURSUANT TO SECTION 13 OR 15(d) OF THE SECURITIES EXCHANGE ACT OF 1934 |
For the transition period from to
Commission file number: 001-33518
FBR & CO.
(Exact name of Registrant as specified in its charter)
| | |
| Virginia | | 20-5164223 |
(State or other jurisdiction of incorporation or organization) | | (I.R.S. Employer Identification No.) |
| |
1001 Nineteenth Street North Arlington, VA | | 22209 |
| (Address of principal executive offices) | | (Zip code) |
(703) 312-9500
(Registrant’s telephone number including area code)
Indicate by check mark whether the registrant (1) has filed all reports required to be filed by Section 13 or 15(d) of the Securities Exchange Act of 1934 during the preceding 12 months (or for such shorter period that the registrant was required to file such reports), and (2) has been subject to such filing requirements for the past 90 days. Yes x No ¨
Indicate by check mark whether the registrant has submitted electronically and posted on its corporate Web site, if any, every Interactive Data File required to be submitted and posted pursuant to Rule 405 ofRegulation S-T (§232.405 of this chapter) during the preceding 12 months (or for such shorter period that the registrant was required to submit and post such files). Yes x No ¨
Indicate by check mark whether the registrant is a large accelerated filer, an accelerated filer, a non-accelerated filer or a smaller reporting company. See definitions of “large accelerated filer,” “accelerated filer” and “smaller reporting company” in Rule 12b-2 of the Exchange Act.
| | | | | | |
| Large accelerated filer | | ¨ | | Accelerated filer | | x |
| | | |
| Non-accelerated filer | | ¨ | | Smaller reporting company | | ¨ |
Indicate by check mark whether the registrant is a shell company (as defined in Rule 12b-2 of the Exchange Act.): Yes ¨ No x
The number of shares outstanding of the registrant’s common stock, $0.001 par value per share, as of July 31, 2013 was 12,002,952 shares.
FBR & CO.
FORM 10-Q
FOR THE QUARTER ENDED JUNE 30, 2013
INDEX
PART I
FINANCIAL INFORMATION
| Item 1. | Financial Statements |
FBR & CO.
CONSOLIDATED BALANCE SHEETS
(Dollars in thousands, except per share data)
(Unaudited)
| | | | | | | | |
| | | June 30,
2013 | | | December 31,
2012 | |
| Assets | | | | | | | | |
Cash and cash equivalents | | $ | 226,734 | | | $ | 174,925 | |
Receivables: | | | | | | | | |
Due from brokers, dealers and clearing organizations | | | 25,631 | | | | 4,670 | |
Customers | | | 6,589 | | | | 2,579 | |
Other | | | 14,613 | | | | 10,902 | |
Financial instruments owned, at fair value | | | 139,262 | | | | 121,404 | |
Other investments, at cost | | | 5,681 | | | | 8,388 | |
Furniture, equipment, software and leasehold improvements, net of accumulated depreciation and amortization | | | 3,150 | | | | 3,693 | |
Deferred tax assets, net of valuation allowance | | | 29,783 | | | | — | |
Prepaid expenses and other assets | | | 5,301 | | | | 6,883 | |
| | | | | | | | |
Total assets | | $ | 456,744 | | | $ | 333,444 | |
| | | | | | | | |
| Liabilities and Shareholders’ Equity | | | | | | | | |
| Liabilities | | | | | | | | |
Securities sold but not yet purchased, at fair value | | $ | 40,042 | | | $ | 56,929 | |
Accrued compensation and benefits | | | 62,928 | | | | 19,075 | |
Accounts payable, accrued expenses and other liabilities | | | 14,019 | | | | 13,878 | |
Due to brokers, dealers and clearing organizations | | | 24,296 | | | | 3,698 | |
| | | | | | | | |
Total liabilities | | | 141,285 | | | | 93,580 | |
| | | | | | | | |
| Commitments and Contingencies (Note 6) | | | | | | | | |
| Shareholders’ Equity | | | | | | | | |
Preferred stock, $0.001 par value, 100,000,000 shares authorized, none issued and outstanding | | | — | | | | — | |
Common stock, $0.001 par value, 75,000,000 shares authorized, 11,930,365 and 12,224,527 shares issued and outstanding, respectively | | | 12 | | | | 12 | |
Additional paid-in capital | | | 401,402 | | | | 402,668 | |
Employee stock loan receivable, including accrued interest (0 and 4,238 shares, respectively) | | | — | | | | (307 | ) |
Restricted stock units | | | 18,755 | | | | 25,235 | |
Accumulated other comprehensive income (loss), net of taxes | | | 147 | | | | (1,094 | ) |
Accumulated deficit | | | (104,857 | ) | | | (186,650 | ) |
| | | | | | | | |
Total shareholders’ equity | | | 315,459 | | | | 239,864 | |
| | | | | | | | |
Total liabilities and shareholders’ equity | | $ | 456,744 | | | $ | 333,444 | |
| | | | | | | | |
See notes to consolidated financial statements.
1
FBR & CO.
CONSOLIDATED STATEMENTS OF OPERATIONS
(Dollars in thousands, except per share data)
(Unaudited)
| | | | | | | | | | | | | | | | |
| | | Three Months Ended
June 30, | | | Six Months Ended
June 30, | |
| | | 2013 | | | 2012 | | | 2013 | | | 2012 | |
| Revenues: | | | | | | | | | | | | | | | | |
Investment banking: | | | | | | | | | | | | | | | | |
Capital raising | | $ | 49,165 | | | $ | 16,841 | | | $ | 148,851 | | | $ | 31,015 | |
Advisory | | | 2,872 | | | | 2,118 | | | | 4,476 | | | | 4,124 | |
Institutional brokerage: | | | | | | | | | | | | | | | | |
Principal transactions | | | 4,798 | | | | 3,753 | | | | 10,659 | | | | 10,255 | |
Agency commissions | | | 8,324 | | | | 8,567 | | | | 16,168 | | | | 18,117 | |
Net investment income | | | 1,209 | | | | 1,090 | | | | 3,307 | | | | 2,991 | |
Interest income, dividends and other | | | 874 | | | | 1,363 | | | | 1,707 | | | | 2,175 | |
| | | | | | | | | | | | | | | | |
Total revenues | | | 67,242 | | | | 33,732 | | | | 185,168 | | | | 68,677 | |
| | | | | | | | | | | | | | | | |
| Expenses: | | | | | | | | | | | | | | | | |
Compensation and benefits | | | 37,923 | | | | 16,880 | | | | 104,334 | | | | 34,728 | |
Professional services | | | 3,379 | | | | 3,759 | | | | 6,835 | | | | 6,591 | |
Business development | | | 2,610 | | | | 2,444 | | | | 4,743 | | | | 5,004 | |
Clearing and brokerage fees | | | 1,307 | | | | 1,900 | | | | 2,911 | | | | 4,284 | |
Occupancy and equipment | | | 3,068 | | | | 3,499 | | | | 6,350 | | | | 7,541 | |
Communications | | | 2,776 | | | | 3,063 | | | | 5,745 | | | | 6,608 | |
Other operating expenses | | | 1,547 | | | | 1,865 | | | | 3,711 | | | | 3,626 | |
| | | | | | | | | | | | | | | | |
Total expenses | | | 52,610 | | | | 33,410 | | | | 134,629 | | | | 68,382 | |
| | | | | | | | | | | | | | | | |
Income from continuing operations before income taxes | | | 14,632 | | | | 322 | | | | 50,539 | | | | 295 | |
Income tax (benefit) provision | | | (29,591 | ) | | | 15 | | | | (28,132 | ) | | | 22 | |
| | | | | | | | | | | | | | | | |
Income from continuing operations, net of taxes | | | 44,223 | | | | 307 | | | | 78,671 | | | | 273 | |
Income from discontinued operations, net of taxes | | | 2,316 | | | | 184 | | | | 3,122 | | | | 656 | |
| | | | | | | | | | | | | | | | |
Net income | | $ | 46,539 | | | $ | 491 | | | $ | 81,793 | | | $ | 929 | |
| | | | | | | | | | | | | | | | |
| Basic income per share: | | | | | | | | | | | | | | | | |
Income from continuing operations, net of taxes | | $ | 3.64 | | | $ | 0.03 | | | $ | 6.45 | | | $ | 0.02 | |
Income from discontinued operations, net of taxes | | | 0.19 | | | | 0.01 | | | | 0.25 | | | | 0.05 | |
| | | | | | | | | | | | | | | | |
Net income | | $ | 3.83 | | | $ | 0.04 | | | $ | 6.70 | | | $ | 0.07 | |
| | | | | | | | | | | | | | | | |
| Diluted income per share: | | | | | | | | | | | | | | | | |
Income from continuing operations, net of taxes | | $ | 3.35 | | | $ | 0.02 | | | $ | 6.00 | | | $ | 0.02 | |
Income from discontinued operations, net of taxes | | | 0.17 | | | | 0.01 | | | | 0.24 | | | | 0.04 | |
| | | | | | | | | | | | | | | | |
Net income | | $ | 3.52 | | | $ | 0.03 | | | $ | 6.24 | | | $ | 0.06 | |
| | | | | | | | | | | | | | | | |
Basic weighted average shares outstanding (in thousands) | | | 12,166 | | | | 13,874 | | | | 12,201 | | | | 13,984 | |
| | | | | | | | | | | | | | | | |
Diluted weighted average shares outstanding (in thousands) | | | 13,216 | | | | 14,314 | | | | 13,102 | | | | 14,306 | |
| | | | | | | | | | | | | | | | |
See notes to consolidated financial statements.
2
FBR & CO.
CONSOLIDATED STATEMENTS OF COMPREHENSIVE INCOME
(Dollars in thousands)
(Unaudited)
| | | | | | | | | | | | | | | | |
| | | Three Months Ended
June 30, | | | Six Months Ended
June 30, | |
| | | 2013 | | | 2012 | | | 2013 | | | 2012 | |
Net income | | $ | 46,539 | | | $ | 491 | | | $ | 81,793 | | | $ | 929 | |
Other comprehensive income, net of tax: | | | | | | | | | | | | | | | | |
Change in unrealized gain (loss) on available-for-sale investment securities, net of taxes | | | 1,359 | | | | (40 | ) | | | 1,241 | | | | (41 | ) |
| | | | | | | | | | | | | | | | |
Comprehensive income | | $ | 47,898 | | | $ | 451 | | | $ | 83,034 | | | $ | 888 | |
| | | | | | | | | | | | | | | | |
See notes to consolidated financial statements.
3
FBR & CO.
CONSOLIDATED STATEMENTS OF CHANGES IN SHAREHOLDERS’ EQUITY
(Dollars and shares in thousands)
(Unaudited)
| | | | | | | | | | | | | | | | | | | | | | | | | | | | | | | | |
| | | Common
Stock
Shares | | | Common
Stock
Amount | | | Additional
Paid-in
Capital | | | Employee
Stock
Loan
Receivable | | | Restricted
Stock
Units | | | Accumulated
Other
Comprehensive
Income (Loss) | | | Accumulated
Deficit | | | Total | |
Balances at December 31, 2011 | | | 13,745 | | | $ | 13 | | | $ | 413,266 | | | $ | (673 | ) | | $ | 29,013 | | | $ | 19 | | | $ | (216,341 | ) | | $ | 225,297 | |
| | | | | | | | | | | | | | | | | | | | | | | | | | | | | | | | |
Net income | | | — | | | | — | | | | — | | | | — | | | | — | | | | — | | | | 29,691 | | | | 29,691 | |
Issuance of common stock, net of forfeitures | | | 342 | | | | 1 | | | | 8,371 | | | | 366 | | | | (9,437 | ) | | | — | | | | — | | | | (699 | ) |
Repurchase of common stock | | | (1,863 | ) | | | (2 | ) | | | (20,868 | ) | | | — | | | | — | | | | — | | | | — | | | | (20,870 | ) |
Stock compensation expense for options granted to purchase common stock | | | — | | | | — | | | | 1,899 | | | | — | | | | — | | | | — | | | | — | | | | 1,899 | |
Issuance of restricted stock units | | | — | | | | — | | | | — | | | | — | | | | 5,659 | | | | — | | | | — | | | | 5,659 | |
Other comprehensive income: | | | | | | | | | | | | | | | | | | | | | | | | | | | | | | | | |
Change in unrealized gain (loss) on available-for-sale investment securities, net of taxes | | | — | | | | — | | | | — | | | | — | | | | — | | | | (1,113 | ) | | | — | | | | (1,113 | ) |
| | | | | | | | | | | | | | | | | | | | | | | | | | | | | | | | |
Balances at December 31, 2012 | | | 12,224 | | | $ | 12 | | | $ | 402,668 | | | $ | (307 | ) | | $ | 25,235 | | | $ | (1,094 | ) | | $ | (186,650 | ) | | $ | 239,864 | |
| | | | | | | | | | | | | | | | | | | | | | | | | | | | | | | | |
Net income | | | — | | | | — | | | | — | | | | — | | | | — | | | | — | | | | 81,793 | | | | 81,793 | |
Issuance of common stock, net of forfeitures | | | 421 | | | | 1 | | | | 10,292 | | | | 307 | | | | (12,342 | ) | | | — | | | | — | | | | (1,742 | ) |
Repurchase of common stock | | | (715 | ) | | | (1 | ) | | | (12,283 | ) | | | — | | | | — | | | | — | | | | — | | | | (12,284 | ) |
Stock compensation expense for options granted to purchase common stock | | | — | | | | — | | | | 725 | | | | — | | | | | | | | — | | | | — | | | | 725 | |
Issuance of restricted stock units | | | — | | | | — | | | | | | | | | | | | 5,862 | | | | — | | | | — | | | | 5,862 | |
Other comprehensive income: | | | | | | | | | | | | | | | | | | | | | | | | | | | | | | | | |
Change in unrealized gain (loss) on available-for-sale investment securities, net of taxes | | | — | | | | — | | | | — | | | | — | | | | — | | | | 1,241 | | | | — | | | | 1,241 | |
| | | | | | | | | | | | | | | | | | | | | | | | | | | | | | | | |
Balances at June 30, 2013 | | | 11,930 | | | $ | 12 | | | $ | 401,402 | | | $ | 0 | | | $ | 18,755 | | | $ | 147 | | | $ | (104,857 | ) | | $ | 315,459 | |
| | | | | | | | | | | | | | | | | | | | | | | | | | | | | | | | |
See notes to consolidated financial statements.
4
FBR & CO.
CONSOLIDATED STATEMENTS OF CASH FLOWS
(Dollars in thousands)
(Unaudited)
| | | | | | | | |
| | | Six Months Ended
June 30, | |
| | | 2013 | | | 2012 | |
Cash flows from operating activities: | | | | | | | | |
Net income | | $ | 81,793 | | | $ | 929 | |
Adjustments to reconcile net income to net cash provided by operating activities: | | | | | | | | |
Deferred income taxes | | | (29,885 | ) | | | — | |
Depreciation and amortization | | | 697 | | | | 1,365 | |
Stock compensation | | | 4,046 | | | | 3,941 | |
Net investment income from investments | | | (3,307 | ) | | | (3,066 | ) |
Gain on sale of assets | | | (3,430 | ) | | | — | |
Securities received in lieu of cash | | | — | | | | (810 | ) |
Other | | | 71 | | | | 904 | |
Changes in operating assets: | | | | | | | | |
Receivables: | | | | | | | | |
Brokers, dealers and clearing organizations | | | (20,961 | ) | | | (5,617 | ) |
Customers | | | (3,568 | ) | | | (1,305 | ) |
Other | | | (685 | ) | | | 4,087 | |
Trading securities | | | 10,247 | | | | 25,209 | |
Prepaid expenses and other assets | | | 1,582 | | | | 1,473 | |
Changes in operating liabilities: | | | | | | | | |
Trading securities sold but not yet purchased | | | (16,887 | ) | | | (646 | ) |
Accrued compensation and benefits | | | 45,851 | | | | (3,975 | ) |
Accounts payable, accrued expenses and other liabilities | | | (2,954 | ) | | | (2,481 | ) |
Brokers, dealers and clearing organizations | | | 20,599 | | | | 1,531 | |
| | | | | | | | |
Net cash provided by operating activities | | | 83,209 | | | | 21,539 | |
| | | | | | | | |
Cash flows from investing activities: | | | | | | | | |
Purchases of investments | | | (29,411 | ) | | | (22,514 | ) |
Proceeds from sales of and distributions from investments | | | 8,653 | | | | 28,885 | |
Securities sold but not yet purchased, net | | | — | | | | 1,291 | |
Purchases of furniture, equipment, software, and leasehold improvements | | | (154 | ) | | | (379 | ) |
| | | | | | | | |
Net cash (used in) provided by investing activities | | | (20,912 | ) | | | 7,283 | |
| | | | | | | | |
Cash flows from financing activities: | | | | | | | | |
Repurchases of common stock | | | (12,284 | ) | | | (19,556 | ) |
Proceeds from sales of common stock and repayment of employee stock purchase plan | | | 1,796 | | | | 476 | |
| | | | | | | | |
Net cash used in financing activities | | | (10,488 | ) | | | (19,080 | ) |
| | | | | | | | |
Net increase in cash and cash equivalents | | | 51,809 | | | | 9,742 | |
Cash and cash equivalents, beginning of period | | | 174,925 | | | | 135,792 | |
| | | | | | | | |
Cash and cash equivalents, end of period | | $ | 226,734 | | | $ | 145,534 | |
| | | | | | | | |
Supplemental Cash Flow Information: | | | | | | | | |
Income tax payments | | $ | 2,422 | | | $ | 80 | |
Non-cash investing activities: | | | | | | | | |
Securities received in exchange for services provided, at fair value at receipt date | | $ | — | | | $ | 810 | |
See notes to consolidated financial statements.
5
FBR & CO.
NOTES TO CONSOLIDATED FINANCIAL STATEMENTS
(Dollars in thousands, except per share data)
(Unaudited)
1. Basis of Presentation:
The consolidated financial statements of FBR & Co. and subsidiaries (collectively, the “Company”) have been prepared in accordance with accounting principles generally accepted in the United States of America for interim financial information and with the instructions to Form 10-Q. Therefore, they do not include all information required by accounting principles generally accepted in the United States of America for complete annual financial statements. The interim financial statements reflect all adjustments (consisting only of normal recurring adjustments) which are, in the opinion of management, necessary for a fair statement of the results for the periods presented. All significant intercompany accounts and transactions have been eliminated in consolidation. The results of operations for the three and six months ended June 30, 2013 and 2012 are not necessarily indicative of the results for the entire year or any subsequent interim period. These financial statements should be read in conjunction with the audited consolidated financial statements and notes thereto included in the Company’s Annual Report on Form 10-K for the fiscal year ended December 31, 2012.
The preparation of financial statements in conformity with accounting principles generally accepted in the United States of America requires management to make estimates and assumptions affecting the reported amounts of assets and liabilities and disclosure of contingent assets and liabilities at the date of the financial statements and the reported amounts of revenues and expenses during the reporting period. Although the Company bases its estimates and assumptions on historical experience and market information (when available) and on various other factors that it believes to be reasonable under the circumstances, management exercises significant judgment in the final determination of its estimates. Actual results may differ from those estimates.
In June 2012, the Company entered into a definitive agreement to sell the assets related to the management of the FBR Funds and on October 26, 2012, completed this sale (“sale of the FBR Funds”). As a result of the Company’s decisions, during the second quarter of 2012 the Company began reporting the results of its asset management operations as discontinued operations (see Note 9). As a result of this change, certain previously reported amounts in the consolidated financial statements and notes have been reclassified to conform to the current period presentation. These reclassifications had no effect on the results of operations of the Company.
On February 28, 2013, the Company affected a one-for-four reverse stock split of the Company’s issued and outstanding common stock. While this reverse stock split reduced the number of issued and outstanding common shares, and resulted in the reclassification of certain previously reported amounts in the consolidated financial statements, these changes and reclassifications had no effect on the Company’s total shareholder’s equity. Pursuant to the requirements of the FBR & Co. Long Term Incentive Plan and the provisions of the reverse stock split, all outstanding stock awards under the plan have been adjusted. These adjustments reduced the number of outstanding awards and, in addition for options to purchase common stock increased the applicable exercise price, but had no effect on the unrecognized compensation expense applicable to these awards.
6
2. Financial Instruments and Long-Term Investments:
Fair Value of Financial Instruments
The Financial Accounting Standards Board’s (“FASB”) Accounting Standards Codification (“ASC”) 820 “Fair Value Measurements and Disclosures” (“ASC 820”) defines fair value as the price that would be received to sell an asset or paid to transfer a liability in an orderly transaction between market participants at the measurement date, not adjusted for transaction costs. ASC 820 also establishes a fair value hierarchy that prioritizes the inputs to valuation techniques used to measure fair value into three broad levels giving the highest priority to quoted prices in active markets for identical assets or liabilities (Level 1) and the lowest priority to unobservable inputs (Level 3) as described below:
| | | | | | |
Level 1 Inputs | | | — | | | Unadjusted quoted prices in active markets for identical assets or liabilities that are accessible by the Company; |
| | |
Level 2 Inputs | | | — | | | Quoted prices in markets that are not active or financial instruments for which all significant inputs are observable, either directly or indirectly; |
| | |
Level 3 Inputs | | | — | | | Unobservable inputs for the asset or liability, including significant assumptions of the Company and other market participants. |
The Company determines fair values for the following assets and liabilities:
Equity securities, listed options and warrants—The Company classifies marketable equity securities and listed options within Level 1 of the fair value hierarchy because quoted market prices are used to value these securities. Non-public equity securities are classified within Level 3 of the fair value hierarchy if enterprise values are used to value these securities. In determining the enterprise value, the Company analyzes various financial, performance and market factors to estimate the value, including where applicable over-the-counter market trading activity. Warrants to purchase non-public equity securities are classified as Level 3 as both enterprise value and Black-Scholes valuation are used to value these securities.
Convertible and fixed income debt instruments—The Company classifies convertible and fixed income debt instruments within Level 2 of the fair value hierarchy as they are valued using quoted market prices provided by a broker or dealer, or alternative pricing services that provide reasonable levels of price transparency.
Investment funds—The Company invests in proprietary investment funds that are valued at net asset value (“NAV”) determined by the fund administrator. For investments in non-registered investment companies (private equity and debt funds and fund of funds), the Company classifies these investments within Level 3 as the underlying securities held by these investment companies are primarily private-equity and debt securities and restrictions exist on the redemption of amounts invested by the Company.
As a practical expedient, the Company relies on the NAV of these investments as their fair value. The NAVs that have been provided by investees are derived from the fair values of the underlying investments as of the reporting date.
Fair Value Hierarchy
The following tables set forth, by level within the fair value hierarchy, financial instruments accounted for under ASC 820 as of June 30, 2013 and December 31, 2012. As required by ASC 820, assets and liabilities that are measured at fair value are classified in their entirety based on the lowest level of input that is significant to the fair value measurement.
7
Items Measured at Fair Value on a Recurring Basis
| | | | | | | | | | | | | | | | |
| | | June 30,
2013 | | | Level 1 | | | Level 2 | | | Level 3 | |
Financial instruments owned, at fair value: | | | | | | | | | | | | | | | | |
Financial instruments held for trading activities at broker-dealer subsidiary: | | | | | | | | | | | | | | | | |
Marketable and non-public equity securities | | $ | 20,275 | | | $ | 17,363 | | | $ | — | | | $ | 2,912 | |
Listed options | | | 1,807 | | | | 1,807 | | | | — | | | | — | |
Convertible and fixed income debt instruments | | | 41,897 | | | | — | | | | 41,897 | | | | — | |
| | | | | | | | | | | | | | | | |
| | | 63,979 | | | | 19,170 | | | | 41,897 | | | | 2,912 | |
Financial instruments held for investment activities: | | | | | | | | | | | | | | | | |
Designated as trading: | | | | | | | | | | | | | | | | |
Marketable and non-public equity securities | | | 22,346 | | | | 16,520 | | | | — | | | | 5,826 | |
Warrants | | | 1,463 | | | | — | | | | — | | | | 1,463 | |
Fixed income debt instruments | | | 1,920 | | | | | | | | 1,920 | | | | — | |
Designated as available-for-sale: | | | | | | | | | | | | | | | | |
Marketable equity securities | | | 20,821 | | | | 20,821 | | | | — | | | | — | |
| | | | | | | | | | | | | | | | |
| | | 46,550 | | | | 37,341 | | | | 1,920 | | | | 7,289 | |
Investment funds | | | 28,733 | | | | — | | | | — | | | | 28,733 | |
| | | | | | | | | | | | | | | | |
Total | | $ | 139,262 | | | $ | 56,511 | | | $ | 43,817 | | | $ | 38,934 | |
| | | | | | | | | | | | | | | | |
Securities sold but not yet purchased, at fair value: | | | | | | | | | | | | | | | | |
Marketable equity securities | | $ | 27,872 | | | $ | 27,872 | | | $ | — | | | $ | — | |
Listed options | | | 776 | | | | 776 | | | | — | | | | — | |
Convertible and fixed income debt instruments | | | 11,394 | | | | — | | | | 11,394 | | | | — | |
| | | | | | | | | | | | | | | | |
Total | | $ | 40,042 | | | $ | 28,648 | | | $ | 11,394 | | | $ | — | |
| | | | | | | | | | | | | | | | |
As of June 30, 2013, financial assets measured and reported at fair value on a recurring basis and classified within Level 3 were $38,934, or 8.5% of the Company’s total assets at that date. Regarding these Level 3 financial assets, in determining fair value, the Company analyzes various financial, performance and market factors to estimate the value, including where applicable over-the-counter market trading activity. The following table provides the valuation technique and unobservable inputs primarily used in assessing the value of these securities as of June 30, 2013:
| | | | | | | | | | | | |
Valuation Technique | | Fair Value | | | Unobservable Input | | Range | | Weighted
Average | |
Market approach | | $ | 8,738 | | | Over-the-counter trading activity | | $0.95 – $7,326/share | | $ | 2,038 | |
Black-Scholes | | $ | 1,463 | | | Volatility | | 35% | | | 35 | % |
| | | | | | Dividend yield | | 0% | | | 0 | % |
| | | | | | Interest rate | | 2.6% | | | 2.6 | % |
| | | | | | Discount rate | | 30% | | | 30 | % |
For those non-public equity securities valued using a market approach, adverse industry market conditions or events experienced by the underlying entities could result in lower over-the-counter trading prices for the securities. Such lower trading prices would result in a decline in the estimated fair value of these securities. For warrants valued using Black-Scholes, adverse industry market conditions or events experienced by this entity could result in a lower over-the counter trading price for this security and therefore a lower value of these warrants. A reduction in the estimated volatility or an increase in the discount rate would also result in a lower value of the warrants. The table above excludes $28,733 of investments in non-registered investment funds that are valued at NAV as determined by the fund administrators. The underlying fund investments consist primarily of fixed income securities.
8
| | | | | | | | | | | | | | | | |
| | | December 31,
2012 | | | Level 1 | | | Level 2 | | | Level 3 | |
Financial instruments owned, at fair value: | | | | | | | | | | | | | | | | |
Financial instruments held for trading activities at broker-dealer subsidiary: | | | | | | | | | | | | | | | | |
Marketable and non-public equity securities | | $ | 8,514 | | | $ | 7,885 | | | $ | — | | | $ | 629 | |
Listed options | | | 20 | | | | 20 | | | | — | | | | — | |
Convertible and fixed income debt instruments | | | 65,692 | | | | — | | | | 65,692 | | | | — | |
| | | | | | | | | | | | | | | | |
| | | 74,226 | | | | 7,905 | | | | 65,692 | | | | 629 | |
Financial instruments held for investment activities: | | | | | | | | | | | | | | | | |
Designated as trading: | | | | | | | | | | | | | | | | |
Marketable and non-public equity securities | | | 2,278 | | | | 1,186 | | | | — | | | | 1,092 | |
Warrants | | | 894 | | | | — | | | | — | | | | 894 | |
Fixed income debt instruments | | | 2,090 | | �� | | — | | | | 2,090 | | | | — | |
Designated as available-for-sale: | | | | | | | | | | | | | | | | |
Marketable equity securities | | | 24,316 | | | | 24,316 | | | | — | | | | — | |
| | | | | | | | | | | | | | | | |
| | | 29,578 | | | | 25,502 | | | | 2,090 | | | | 1,986 | |
Investment funds | | | 17,600 | | | | — | | | | — | | | | 17,600 | |
| | | | | | | | | | | | | | | | |
Total | | $ | 121,404 | | | $ | 33,407 | | | $ | 67,782 | | | $ | 20,215 | |
| | | | | | | | | | | | | | | | |
Securities sold but not yet purchased, at fair value: | | | | | | | | | | | | | | | | |
Marketable equity securities | | $ | 45,816 | | | $ | 45,816 | | | $ | — | | | $ | — | |
Listed options | | | 287 | | | | 287 | | | | — | | | | — | |
Convertible and fixed income debt instruments | | | 10,826 | | | | — | | | | 10,826 | | | | — | |
| | | | | | | | | | | | | | | | |
Total | | $ | 56,929 | | | $ | 46,103 | | | $ | 10,826 | | | $ | — | |
| | | | | | | | | | | | | | | | |
As of December 31, 2012, financial assets measured and reported at fair value on a recurring basis and classified within Level 3 were $20,215, or 6.1% of the Company’s total assets at that date.
Regarding these Level 3 financial assets, in determining fair value, the Company analyzes various financial, performance and market factors to estimate the value, including where applicable over-the-counter market trading activity. The following table provides the valuation technique and unobservable inputs primarily used in assessing the value of these securities as of December 31, 2012:
| | | | | | | | | | | | |
Valuation Technique | | Fair Value | | | Unobservable Input | | Range | | Weighted
Average | |
Market approach | | $ | 1,721 | | | Over-the-counter trading activity | | $0.51 – $20.50/share | | $ | 7.78 | |
Black-Scholes | | $ | 894 | | | Volatility | | 39% | | | 39 | % |
| | | | | | Dividend yield | | 0% | | | 0 | % |
| | | | | | Interest rate | | 2% | | | 2 | % |
| | | | | | Discount rate | | 50% | | | 50 | % |
For those non-public equity securities valued using a market approach, adverse industry market conditions or events experienced by the underlying entities could result in lower over-the-counter trading prices for the securities. Such lower trading prices would result in a decline in the estimated fair value of these securities. For warrants valued using Black-Scholes, adverse industry market conditions or events experienced by this entity could result in a lower over-the counter trading price for this security and therefore a lower value of these warrants. A reduction in the estimated volatility or an increase in the discount rate would also result in a lower value of the warrants. The table above excludes $17,600 of investments in non-registered investment funds that are valued at NAV as determined by the fund administrators. The underlying fund investments consist primarily of fixed income securities.
9
Level 3 Gains and Losses
The tables below set forth a summary of changes in the fair value of the Company’s Level 3 financial assets that are measured at fair value on a recurring basis for the three months ended June 30, 2013 and 2012. As of June 30, 2013 and 2012, the Company did not have any net unrealized gains (losses) included in accumulated other comprehensive income on Level 3 financial assets.
| | | | | | | | | | | | |
| | | Trading
Securities | | | Other | | | Total | |
Beginning balance, April 1, 2013 | | $ | 2,207 | | | $ | 28,544 | | | $ | 30,751 | |
Total net gains (losses) (realized/unrealized) | | | | | | | | | | | | |
Included in earnings | | | 486 | | | | 1,933 | | | | 2,419 | |
Included in other comprehensive income | | | — | | | | — | | | | — | |
Purchases | | | 178,520 | | | | 4,842 | | | | 183,362 | |
Sales/Distributions | | | (176,308 | ) | | | (124 | ) | | | (176,432 | ) |
Transfers out of level 3 | | | (8 | ) | | | (1,158 | ) | | | (1,166 | ) |
| | | | | | | | | | | | |
Ending balance, June 30, 2013 | | $ | 4,897 | | | $ | 34,037 | | | $ | 38,934 | |
| | | | | | | | | | | | |
The amount of total gains or losses for the period included in earnings attributable to the change in unrealized gains or losses relating to assets still held at the reporting date | | $ | 19 | | | $ | 1,933 | | | $ | 1,952 | |
| | | | | | | | | | | | |
| | | | | | | | | | | | |
| | | Trading
Securities | | | Other | | | Total | |
Beginning balance, April 1, 2012 | | $ | 7,585 | | | $ | 505 | | | $ | 8,090 | |
Total net gains (losses) (realized/unrealized) | | | | | | | | | | | | |
Included in earnings | | | 417 | | | | 27 | | | | 444 | |
Included in other comprehensive income | | | — | | | | — | | | | — | |
Purchases | | | 46,129 | | | | 6,150 | | | | 52,279 | |
Sales/Distributions | | | (44,885 | ) | | | (37 | ) | | | (44,922 | ) |
Transfers out of level 3 | | | — | | | | — | | | | — | |
| | | | | | | | | | | | |
Ending balance, June 30, 2012 | | $ | 9,246 | | | $ | 6,645 | | | $ | 15,891 | |
| | | | | | | | | | | | |
The amount of total gains or losses for the period included in earnings attributable to the change in unrealized gains or losses relating to assets still held at the reporting date | | $ | 328 | | | $ | 27 | | | $ | 355 | |
| | | | | | | | | | | | |
There were no transfers of securities in to, or out of, Level 2 financial assets during the three months ended June 30, 2013. One transfer was made out of Level 3 and into Level 1 during the three months ended June 30, 2013 for an equity security that was previously a non-public equity security and during the period became publicly traded. There were no transfers of securities in to, or out of, Level 1, 2, and 3 financial assets during the three months ended June 30, 2012.
10
The tables below set forth a summary of changes in the fair value of the Company’s Level 3 financial assets that are measured at fair value on a recurring basis for the six months ended June 30, 2013 and 2012.
| | | | | | | | | | | | |
| | | Trading
Securities | | | Other | | | Total | |
Beginning balance, January 1, 2013 | | $ | 2,615 | | | $ | 17,600 | | | $ | 20,215 | |
Total net gains (losses) (realized/unrealized) | | | | | | | | | | | | |
Included in earnings | | | 487 | | | | 3,906 | | | | 4,393 | |
Included in other comprehensive income | | | — | | | | — | | | | — | |
Purchases | | | 231,368 | | | | 13,842 | | | | 245,210 | |
Sales/Distributions | | | (229,565 | ) | | | (153 | ) | | | (229,718 | ) |
Transfers out of level 3 | | | (8 | ) | | | (1,158 | ) | | | (1,166 | ) |
| | | | | | | | | | | | |
Ending balance, June 30, 2013 | | $ | 4,897 | | | $ | 34,037 | | | $ | 38,934 | |
| | | | | | | | | | | | |
The amount of total gains or losses for the period included in earnings attributable to the change in unrealized gains or losses relating to assets still held at the reporting date | | $ | 128 | | | $ | 3,877 | | | $ | 4,005 | |
| | | | | | | | | | | | |
| | | |
| | | Trading
Securities | | | Other | | | Total | |
Beginning balance, January 1, 2012 | | $ | 7,826 | | | $ | 516 | | | $ | 8,342 | |
Total net gains (losses) (realized/unrealized) | | | | | | | | | | | | |
Included in earnings | | | 665 | | | | 29 | | | | 694 | |
Included in other comprehensive income | | | — | | | | — | | | | — | |
Purchases | | | 142,762 | | | | 6,150 | | | | 148,912 | |
Sales/Distributions | | | (142,007 | ) | | | (50 | ) | | | (142,057 | ) |
Transfers out of level 3 | | | 0 | | | | 0 | | | | 0 | |
| | | | | | | | | | | | |
Ending balance, June 30, 2012 | | $ | 9,246 | | | $ | 6,645 | | | $ | 15,891 | |
| | | | | | | | | | | | |
The amount of total gains or losses for the period included in earnings attributable to the change in unrealized gains or losses relating to assets still held at the reporting date | | $ | 454 | | | $ | 29 | | | $ | 483 | |
| | | | | | | | | | | | |
There were no transfers of securities in to, or out of, Level 2 financial assets during the six months ended June 30, 2013. One transfer was made out of Level 3 and into Level 1 during the six months ended June 30, 2013 for an equity security that was previously a non-public equity security and during the period became publicly traded.
There were no transfers of securities in to, or out of, Level 1, 2, and 3 financial assets during the six months ended June 30, 2012.
Gains and losses from Level 3 financial assets that are measured at fair value on a recurring basis, included in earnings for the three and six months ended June 30, 2013 and 2012, are reported in the following line descriptions on the Company’s statements of operations:
| | | | | | | | | | | | | | | | |
| | | Three Months Ended
June 30, | | | Six Months Ended
June 30, | |
| | | 2013 | | | 2012 | | | 2013 | | | 2012 | |
Total gains and losses included in earnings for the period: | | | | | | | | | | | | | | | | |
Principal transactions | | $ | 486 | | | $ | 72 | | | $ | 487 | | | $ | 192 | |
Net investment income (loss) | | | 1,933 | | | | 372 | | | | 3,906 | | | | 502 | |
Change in unrealized gains or losses relating to assets still held at the end of the respective period: | | | | | | | | | | | | | | | | |
Principal transactions | | $ | 19 | | | $ | (17 | ) | | $ | 128 | | | $ | (19 | ) |
Net investment income (loss) | | | 1,933 | | | | 372 | | | | 3,877 | | | | 502 | |
11
Financial Instruments Held for Investment—Designated as Trading
As of June 30, 2013, the Company has certain investments in marketable equity securities held by other than its broker-dealer subsidiary that are classified as trading securities. These investments are designated as trading based on the Company’s intent at the time of designation. In accordance with ASC 320, these securities are carried at fair value with resulting realized and unrealized gains and losses reflected as net investment income (loss) in the statements of operations. Net gains and losses on these securities as of the dates indicated were as follows:
| | | | | | | | | | | | | | | | |
| | | Three Months Ended
June 30, | | | Six Months Ended
June 30, | |
| | | 2013 | | | 2012 | | | 2013 | | | 2012 | |
Net gains (losses) recognized on trading securities | | $ | 310 | | | $ | 1,068 | | | $ | 1,016 | | | $ | 2,967 | |
Less: Net (gains) losses recognized on trading securitiessold during the period | | | 27 | | | | (748 | ) | | | (634 | ) | | | (2,145 | ) |
| | | | | | | | | | | | | | | | |
Unrealized gains (losses) recognized on trading securitiesstill held at the reporting date | | $ | 337 | | | $ | 320 | | | $ | 382 | | | $ | 822 | |
| | | | | | | | | | | | | | | | |
Financial Instruments Held for Investment—Designated as Available-for-Sale
As of June 30, 2013 and December 31, 2012, the Company has certain investments in marketable equity securities held by other than the Company’s broker-dealer subsidiary that are classified as available-for-sale securities. These investments are designated as available-for-sale due to the Company’s intent at the time of designation to hold these securities for investment purposes over an extended period. However, these investments are available to be sold should economic conditions warrant such a transaction. In accordance with ASC 320, these securities are carried at fair value with resulting unrealized gains and losses reflected as other comprehensive income or loss. Gross unrealized gains and losses on these securities as of the dates indicated were as follows:
| | | | | | | | | | | | | | | | |
| | | June 30, 2013 | |
| | | Cost
Basis | | | Unrealized | | | | |
| | | | Gains | | | Losses | | | Fair Value | |
Marketable equity securities | | $ | 20,572 | | | $ | 249 | | | $ | 0 | | | $ | 20,821 | |
| | | | | | | | | | | | | | | | |
| | | December 31, 2012 | |
| | | Cost
Basis | | | Unrealized | | | | |
| | | | Gains | | | Losses(1) | | | Fair Value | |
Marketable equity securities | | $ | 25,410 | | | $ | 0 | | | $ | 1,094 | | | $ | 24,316 | |
| (1) | Duration of unrealized losses is less than 12 months |
The Company evaluates its portfolio of marketable equity securities for impairment as of each reporting date. For the securities with unrealized losses, the Company will review the underlying cause for the impairments, as well as the severity and duration of the impairments. If the impairment is determined to be other-than-temporary, the Company will recognize an other-than-temporary impairment loss in its statement of operations. During the three months ended June 30, 2013, the Company did not recognize any other-than-temporary impairment losses, however during the six months ended June 30, 2013, the Company recorded an other-than-temporary impairment charge of $545 related to an investment in a company in the financial services industry. The Company recognized this impairment charge as a result of a change in its intent to hold this investment for a period of time sufficient for a forecasted recovery of its fair value. In this case the change in intent was a result of changes in market conditions during the quarter specific to this investment. The carrying value of this investment subsequent to the impairment was $4,257. During the three and six months ended June 30, 2012, the Company did not record any other-than-temporary impairment losses in the statements of operations relating to marketable equity securities.
12
During the three months ended June 30, 2013, the Company received proceeds of $4,225 from sales of marketable equity securities resulting in gross losses of $(32). During the six months ended June 30, 2013, the Company received proceeds of $4,297 from sales of marketable equity securities resulting in gross gains of $36 and gross losses of $(32). There were no sales of marketable equity securities during the three and six months ended June 30, 2012.
Other Comprehensive Income (Loss)
The following tables set forth the changes in the Company’s accumulated other comprehensive income (loss) by component for the period indicated along with detail regarding reclassifications from other comprehensive income (loss). All such reclassifications from other comprehensive income (loss) are included in net investment income in the Company’s consolidated statements of operations.
| | | | | | | | |
| | | Three Months Ended
June 30, 2013 | | | Six Months Ended
June 30, 2013 | |
Accumulated Other Comprehensive Loss, Beginning Balance | | $ | (1,212 | ) | | $ | (1,094 | ) |
Other comprehensive income before reclassifications | | | 1,359 | | | | 732 | |
Amounts reclassified from other comprehensive loss | | | — | | | | 509 | |
| | | | | | | | |
Accumulated Other Comprehensive Income, June 30, 2013 | | $ | 147 | | | $ | 147 | |
| | | | | | | | |
| | | | | | | | |
| | | Three Months Ended
June 30, 2013 | | | Six Months Ended
June 30, 2013 | |
Reclassifications from other comprehensive income (loss) | | | | | | | | |
Other-than-temporary impairment loss | | | — | | | | 545 | |
Realized gains on sale of securities | | | — | | | | (36 | ) |
| | | | | | | | |
Total | | | — | | | $ | 509 | |
| | | | | | | | |
Other Investments, at Cost
Other investments consisted of the following as of the dates indicated:
| | | | | | | | |
| | | June 30,
2013 | | | December 31,
2012 | |
Non-public equity securities | | $ | 681 | | | $ | 3,071 | |
Corporate debt investments | | | 5,000 | | | | 5,317 | |
| | | | | | | | |
| | $ | 5,681 | | | $ | 8,388 | |
| | | | | | | | |
The Company evaluates its non-public equity securities and corporate debt investments, carried at cost, for impairment as of each reporting date. This evaluation includes consideration of the operating performance of the respective companies, their financial condition and their near-term and long-term prospects. Based on its evaluations of these investments, the Company recorded no impairment losses during the three and six months ended June 30, 2013 and 2012.
During the three and six months ended June 30, 2013, there were no sales of non-public equity securities or corporate debt investments carried at cost. During the three months ended June 30, 2013, the Company received $317 from the maturity of a note receivable that was carried at cost. In addition, during the three months ended June 30, 2013, a non-public equity security carried at cost with a basis of $2,390 became publicly traded during the period. The Company designated this security as trading at the time it became publicly traded. During the three and six months ended June 30, 2012, the Company received proceeds of $52, from sales of, or distributions from, non-public equity securities, resulting in gross gains of $52.
13
3. Income Taxes:
As of December 31, 2012 and March 31, 2013, the Company provided a full valuation allowance against its net deferred tax assets since, based on the application of the criteria in ASC 740, “Income Taxes” (“ASC 740”), it concluded that it was more likely than not that the benefits of these assets would not be realized in the future. Following the criteria in ASC 740, the Company reviews this valuation allowance on a quarterly basis assessing the positive and negative evidence to determine if it is more likely than not that some or all of the deferred tax assets will be realized. Based on its assessment as of June 30, 2013, the Company determined that the release of a significant component of this valuation allowance was appropriate. This conclusion was based on management’s consideration of various factors, including the Company’s improved operating performance, its cumulative operating results over the prior twelve quarters and the outlook regarding the Company’s prospective operating performance. As of June 30, 2013, the Company’s valuation allowance relates primarily to capital loss carryforwards and other-than-temporary investment write downs. In addition, the Company maintains a valuation allowance for net operating loss carryforwards that are projected to be utilized during the remainder of 2013 and are incorporated into the Company’s effective tax rate. The Company’s remaining valuation allowance as of June 30, 2013 is approximately $26,300.
During the three and six months ended June 30, 2013, the Company recorded income tax benefits from continuing operations of $29,591 and $28,132, respectively. The Company’s 2013 net tax benefits reflect the benefit for the valuation allowance reversal offset by the provision for projected state tax obligations. The Company’s quarterly tax provision is determined pursuant to ASC 740, which requires using an estimated annual effective rate based on forecasted taxable income for the full year. The Company’s effective tax rates for the three and six months ended June 30, 2013 were (202.2)% and (55.7)%, respectively. These tax rates differed from statutory tax rates primarily due to the effects of the valuation allowance reversal.
During the three and six months ended June 30, 2012, the Company recorded tax provisions from continuing operations of $15 and $22, respectively. The Company’s effective tax rates for the three and six months ended June 30, 2012 were 4.7% and 7.5%, respectively. These tax rates differed from statutory tax rates primarily due to the effects of the full valuation allowance on the Company’s net deferred tax assets at that time. The annual estimated effective tax rate for three and six months ended June 30, 2012 also incorporated the benefit of net operating losses expected to be utilized during 2012.
4. Net Capital Requirements:
FBR Capital Markets & Co. (“FBRCM”), the Company’s broker-dealer subsidiary, is registered with the Securities and Exchange Commission (“SEC”) and is a member of the Financial Industry Regulatory Authority, Inc. (“FINRA”). As such, it is subject to the minimum net capital requirements promulgated by the SEC. As of June 30, 2013, FBRCM had net capital of $109,434 which was $104,500 in excess of its required net capital of $4,934.
14
5. Earnings Per Share:
Basic earnings per share includes no dilution and is computed by dividing net income or loss available to common shareholders by the weighted average number of common shares outstanding and not subject to forfeiture for the period. Diluted earnings per share includes the impact of dilutive securities such as stock options, unvested shares of restricted stock and restricted stock units (“RSUs”), all of which are subject to forfeiture. The following table presents the computations of basic and diluted earnings per share for the periods indicated:
| | | | | | | | | | | | | | | | |
| | | Three Months Ended
June 30, 2013 | | | Three Months Ended
June 30, 2012 | |
| | | Basic | | | Diluted | | | Basic | | | Diluted | |
Weighted average shares outstanding: | | | | | | | | | | | | | | | | |
Common stock (in thousands) | | | 12,166 | | | | 12,166 | | | | 13,874 | | | | 13,874 | |
Stock options, unvested restricted stock and unvested RSUs (in thousands) | | | — | | | | 1,050 | | | | — | | | | 440 | |
| | | | | | | | | | | | | | | | |
Weighted average common and common equivalent shares outstanding (in thousands) | | | 12,166 | | | | 13,216 | | | | 13,874 | | | | 14,314 | |
| | | | | | | | | | | | | | | | |
Net income applicable to common stock | | $ | 46,539 | | | $ | 46,539 | | | $ | 491 | | | $ | 491 | |
| | | | | | | | | | | | | | | | |
Net income per common share | | $ | 3.83 | | | $ | 3.52 | | | $ | 0.04 | | | $ | 0.03 | |
| | | | | | | | | | | | | | | | |
| | | | | | | | | | | | | | | | |
| | | Six Months Ended
June 30, 2013 | | | Six Months Ended
June 30, 2012 | |
| | | Basic | | | Diluted | | | Basic | | | Diluted | |
Weighted average shares outstanding: | | | | | | | | | | | | | | | | |
Common stock (in thousands) | | | 12,201 | | | | 12,201 | | | | 13,984 | | | | 13,984 | |
Stock options, unvested restricted stock and unvested RSUs (in thousands) | | | — | | | | 901 | | | | — | | | | 322 | |
| | | | | | | | | | | | | | | | |
Weighted average common and common equivalent shares outstanding (in thousands) | | | 12,201 | | | | 13,102 | | | | 13,984 | | | | 14,306 | |
| | | | | | | | | | | | | | | | |
Net income applicable to common stock | | $ | 81,793 | | | $ | 81,793 | | | $ | 929 | | | $ | 929 | |
| | | | | | | | | | | | | | | | |
Net income per common share | | $ | 6.70 | | | $ | 6.24 | | | $ | 0.07 | | | $ | 0.06 | |
| | | | | | | | | | | | | | | | |
The following table presents the number of anti-dilutive stock options, unvested restricted stock and unvested RSUs for the periods indicated (in thousands):
| | | | | | | | | | | | | | | | |
| | | Three Months Ended
June 30, | | | Six Months Ended
June 30, | |
| | | 2013 | | | 2012 | | | 2013 | | | 2012 | |
Stock Options—Employees and directors | | | 4 | | | | 1,710 | | | | 71 | | | | 1,710 | |
Stock Options—Non-employee | | | 592 | | | | 917 | | | | 592 | | | | 917 | |
Restricted Stock, unvested | | | 10 | | | | 3 | | | | 10 | | | | 3 | |
Restricted Stock Units, unvested | | | 1,058 | | | | 1,294 | | | | 1,140 | | | | 1,324 | |
| | | | | | | | | | | | | | | | |
| | | 1,664 | | | | 3,924 | | | | 1,813 | | | | 3,954 | |
| | | | | | | | | | | | | | | | |
6. Commitments and Contingencies:
As of June 30, 2013, except as described below, the Company was neither a defendant nor plaintiff in any lawsuits or arbitrations nor involved in any governmental or self-regulatory organization matters that are expected to have a material adverse effect on its financial condition, results of operations or liquidity. The
15
Company has been named as a defendant in a small number of civil lawsuits relating to its various businesses. In addition, the Company is subject to various reviews, examinations, investigations and other inquiries by governmental agencies and self regulatory organizations. There can be no assurance that these matters individually or in aggregate will not have a material adverse effect on the Company’s financial condition, results of operations, or liquidity in a future period. However, based on management’s review with counsel, resolution of these matters is not expected to have a material adverse effect on the Company’s financial condition, results of operations or liquidity.
Many aspects of the Company’s business involve substantial risks of liability and litigation. Underwriters, broker-dealers and investment advisers are exposed to liability under Federal and state securities laws, other Federal and state laws and court decisions, including decisions with respect to underwriters’ liability and limitations on indemnification, as well as with respect to the handling of customer accounts. For example, underwriters may be held liable for material misstatements or omissions of fact in a prospectus used in connection with the securities being offered and broker-dealers may be held liable for statements made by their securities analysts or other personnel. FBRCM has been named as a defendant in a small number of securities claims involving investment banking clients of FBRCM as a result of FBRCM’s role as an underwriter. In these cases, the underwriting agreement provides, subject to certain conditions, that the investment banking client is required to indemnify FBRCM against certain claims or liabilities, including claims or liabilities under the Securities Act of 1933, as amended (the “Securities Act”), or contribute to payments which FBRCM is required to make as a result of the litigation. There can be no assurance that such indemnification or contribution will ultimately be available to the Company or that an investment banking client will be able to satisfy its indemnity or contribution obligations when due.
On July 9, 2013, Friedman, Billings, Ramsey & Co., Inc. (now FBRCM) and eight other underwriter defendants were dismissed from the lawsuit styled In Re Thornburg Mortgage, Inc. Securities Litigation alleging material misrepresentations and omissions in securities offerings by Thornburg Mortgage Inc. between May 2007 and January 2008. The 10th Circuit Court of Appeals affirmed the United States District Court for the District of New Mexico’s dismissal and concluded that there had been no misrepresentations or omissions in the three remaining offerings still at issue (May 2007, June 2007 and September 2007 (the two offerings in January 2008 were previously dismissed with prejudice)). The time has expired for plaintiffs to file a petition for rehearing en banc to the Court of Appeals.
FBRCM has been named as a defendant in a case relating to its role as an underwriter in residential mortgage-backed securities (“RMBS”) offerings. FBRCM is among dozens of underwriter, securitization trust and depositor defendants in an individual action filed by Cambridge Place Investment Management, Inc. in Massachusetts state court (Cambridge Place Investment Management Inc. v. Morgan Stanley et al). Cambridge’s complaint relates to the more than $2,400,000 in RMBS purchases it made in numerous underwritten offerings (of which the claims concerning FBRCM are limited to Cambridge’s purchases of a combined $22,000 of RMBS in two separate offerings) and alleges that each of the defendants made misrepresentations and omissions relating to, among other things, loan-to-value ratios, appraisals, and underwriting standards, in violation of state securities laws. FBRCM has contractual indemnification claims against the RMBS issuers and contribution claims against co-underwriters involved in the two offerings for which claims have been made against it.
FBRCM has been named a defendant in the putative class action lawsuit MHC Mutual Conversion Fund, L.P. v. United Western Bancorp, Inc., et al. pending in the United States District Court for the District of Colorado. The complaint, filed in March 2011 against United Western Bancorp, Inc. (the “Bank”), its officers and directors, underwriters and outside auditors, alleges material misrepresentations and omissions in the registration statement and prospectus issued in connection with the Bank’s September 2009 offering. The complaint alleges claims under Sections 11 and 12 of the Securities Act against the lead underwriter of the offering and FBRCM as a member of the underwriting syndicate. Although FBRCM is contractually entitled to be indemnified by the Bank in connection with this lawsuit, the Bank filed for bankruptcy on March 5, 2012 and this likely will decrease or eliminate the value of the indemnity that FBRCM receives from the Bank. On
16
December 19, 2012 the Court granted Defendants’ motion to dismiss the class action complaint with prejudice and entered final judgment for the underwriters. Class plaintiffs filed a timely notice of appeal to the 10th Circuit Court of Appeals, challenging the District Court’s findings; briefing on the appeal is complete and oral argument has been scheduled for September 26, 2013.
FBRCM has been named a defendant in four putative class action lawsuits all alleging substantially identical claims against Imperial Holdings, Inc. (“Imperial”), its officers and directors and underwriters for material misrepresentations and omissions in the registration statement and prospectus issued in connection with Imperial’s February 2011 initial public offering. The cases, all currently pending in the Southern District of Florida, are captioned: Martin J. Fuller v. Imperial Holdings, Inc., et al.; City of Roseville Employees Retirement System v. Imperial Holdings, et al.; Sauer v. Imperial Holdings, et al.; and Pondick v. Imperial Holdings, et al. The complaints allege claims under Sections 11 and 12 of the Securities Act against the lead underwriters of the offering. Imperial has assumed its contractual obligation to indemnify the underwriters. As of July 31, 2013, Imperial and all other relevant parties, including FBRCM, executed a final settlement and release agreement to settle the class action lawsuits with no direct contribution from FBRCM; all appropriate motions for preliminary court approval of the class-action settlement are expected to be filed in the third quarter of 2013.
In accordance with applicable accounting guidance, the Company establishes an accrued liability for litigation and regulatory matters when those matters present loss contingencies that are both probable and estimable. In such cases, there may be an exposure to loss in excess of any amounts accrued. When a loss contingency is not both probable and estimable, the Company does not establish an accrued liability. As a litigation or regulatory matter develops, management, in conjunction with counsel, evaluates on an ongoing basis whether such matter presents a loss contingency that is probable and estimable. The cases discussed above involving the Company are at a preliminary stage, based on management’s review with counsel and present information known by management, loss contingencies for these matters are not probable and estimable as of June 30, 2013.
In certain circumstances, broker-dealers and asset managers may also be held liable by customers and clients for losses sustained on investments. In recent years, there has been an increasing incidence of litigation and actions by government agencies and self regulatory organizations involving the securities industry, including class actions that seek substantial damages. The Company is also subject to the risk of litigation, including litigation that may be without merit. As the Company intends to actively defend such litigation, significant legal expenses could be incurred. An adverse resolution of any future litigation against the Company could materially affect its financial condition, operating results and liquidity.
7. Shareholders’ Equity:
Share Repurchases
During the three and six months ended June 30, 2013, the Company repurchased 150,064 shares and 715,537 shares, respectively, of its common stock primarily in privately negotiated or open market transactions at weighted average share prices of $20.95 per share and $17.17 per share, respectively, for a total cost, including transaction costs, of $3,144 and $12,284, respectively. As of June 30, 2013, the Company has remaining authority to repurchase 777,712 additional shares.
During the three and six months ended June 30, 2012, in privately negotiated or open market transactions the Company repurchased 369,644 and 494,519 shares, respectively, of its common stock at weighted average share prices of $11.00 and $10.84 per share, respectively, for a total cost, including transaction costs, of $4,081 and $5,354, respectively.
In June 2012, the Company completed a tender offer to repurchase shares of its stock. Pursuant to the modified “Dutch auction” tender offer, the Company repurchased 1,276,750 shares of its common stock at a weighted average share price of $11.00 per share for a total cost, including transaction costs, of $14,202.
17
Employee Stock Purchase Plan
Under the Company’s Employee Stock Purchase Plan (the “Purchase Plan”), eligible employees may purchase common stock through payroll deductions at a price that is 85% of the lower of the market value of the common stock on the first day of the offering period or the last day of the offering period. The Company recognizes compensation expense relating to shares offered under the Purchase Plan. For the three and six months ended June 30, 2013, the Company recognized compensation expense of $83 and $163, respectively. For the three and six months ended June 30, 2012, the Company recognized compensation (credit) expense of $(2) and $86, respectively
Stock Compensation Plans
FBR & Co. 2006 Long-Term Incentive Plan (“FBR & Co. Long-Term Incentive Plan”)
Under the FBR & Co. Long-Term Incentive Plan, as amended, the Company may grant options to purchase stock, stock appreciation rights, performance awards, restricted and unrestricted stock and RSUs for up to an aggregate of 5,517,496 shares of common stock, subject to increase under certain provisions of the plan, to eligible participants. Participants include employees, officers and directors of the Company and its subsidiaries. The FBR & Co. Long-Term Incentive Plan has a term of 10 years and options granted may have an exercise period of up to 10 years. Options may be incentive stock options, as defined by Section 422 of the Internal Revenue Code, or nonqualified stock options.
The Company grants options to purchase stock, restricted shares of common stock and RSUs to employees that vest based on meeting specified service conditions of three to five years and in certain cases achievement of specified market conditions or performance goals. The following table presents compensation expense related to these awards for the periods indicated:
| | | | | | | | | | | | | | | | |
| | | Three Months Ended
June 30, | | | Six Months Ended
June 30, | |
| | | 2013 | | | 2012 | | | 2013 | | | 2012 | |
Stock options | | $ | 115 | | | $ | 396 | | | $ | 333 | | | $ | 797 | |
Restricted shares | | $ | 15 | | | $ | 104 | | | $ | 20 | | | $ | 130 | |
RSUs | | $ | 1,975 | | | $ | 1,338 | | | $ | 3,511 | | | $ | 2,688 | |
The following table presents issuance activity related to grants of these awards for the period indicated:
| | | | | | | | | | | | | | | | | | | | | | | | |
| | | Three Months Ended June 30, 2013 | | | Six Months Ended June 30, 2013 | |
| | | Stock
Options | | | Restricted
Shares | | | RSUs | | | Stock
Options | | | Restricted
Shares | | | RSUs | |
Stock-based award issuances | | | — | | | | 10,421 | | | | 56,737 | | | | — | | | | 10,421 | | | | 686,911 | |
Grant date fair value per share | | $ | — | | | $ | 24.23 | | | $ | 20.01 | | | $ | — | | | $ | 24.23 | | | $ | 17.53 | |
Included in the RSUs granted during the six months ended June 30, 2013 are 375,000 RSU awards that will vest based on both individual service requirements and the Company’s achievement of a specified performance goal. For these awards, the performance goal will be met at (1) a 100% rate if the combined net worth of the Company, measured on a per share basis has increased by an amount equal to a 7% compound annual growth rate over the three year period beginning on April 1, 2013 (the “performance period”), (2) a 50% rate if the combined net worth of the Company, measured on a per share basis has increased by an amount equal to a 4% compound annual growth over the performance period and (3) a proportional rate between 50% and 100% in the event that the combined net worth of the Company, measured on a per share basis has increased by an amount between 4% and 7% compound annual growth over the performance period.
18
The following table presents the unrecognized compensation related to unvested options to purchase stock, restricted shares of common stock, and RSUs and the weighted average vesting period in which the expense will be recognized:
| | | | | | | | | | | | |
| | | As of June 30, 2013 | |
| | | Stock
Options | | | Restricted
Shares | | | RSUs | |
Unrecognized compensation | | $ | 287 | | | $ | 238 | | | $ | 17,128 | |
Unvested awards | | | 266,680 | | | | 10,421 | | | | 1,845,118 | |
Weighted average vesting period | | | 0.65 years | | | | 0.93 years | | | | 2.38 years | |
In addition, as part of the Company’s satisfaction of incentive compensation earned for past service under the Company’s variable compensation programs, employees may receive RSUs in lieu of cash payments. These RSUs are issued to an irrevocable trust for the benefit of the employees and are not returnable to the Company. In settlement of such accrued incentive compensation, for the six months ended June 30, 2013, the Company granted 127,978 such RSUs with an aggregate fair value upon grant date of $2,099. There were no comparable grants in 2012.
8. Related Party Transactions:
Professional Services Agreement
Under the professional services agreement, as amended, with Crestview Partners, L.P. (together with its affiliates, “Crestview”), the Company agreed to pay Crestview Advisors, L.L.C. a $1,000 annual strategic advisory fee plus reimbursement of reasonable out-of-pocket expenses as long as Crestview continues to own at least 50% of the shares purchased by certain Crestview affiliates in our 2006 private offering. In June 2013 and 2012, Crestview elected to receive a portion of the management fee in options to purchase shares of the Company’s common stock as allowed for under the agreement. Based on Crestview’s election, the Company issued 32,432 and 61,225 options, respectively, to Crestview Advisors, L.L.C. valued at $270 and $240, respectively. During the three and six months ended June 30, 2013, the Company recognized $250 and $500, respectively, of expense associated with this agreement. During the three and six months ended June 30, 2012, the Company recognized $250 and $500, respectively, of expense associated with this agreement.
9. Discontinued Operations:
In June 2012, the Company entered into a definitive agreement to sell the assets related to the FBR Funds, a family of mutual funds. This sale was completed in October 2012 and subsequent to the sale closing the Company has no continuing involvement in the management of these funds. As a result of this sale transaction, the Company reports the results of its asset management operations as discontinued operations. The results related to the asset management operations reflected in the consolidated statements of operations are presented in the following table.
| | | | | | | | | | | | | | | | |
| | | Three Months Ended
June 30, | | | Six Months Ended
June 30, | |
| | | 2013 | | | 2012 | | | 2013 | | | 2012 | |
Revenues | | $ | — | | | $ | 4,157 | | | $ | — | | | $ | 8,290 | |
Gain on sale of assets, net | | | 2,582 | | | | — | | | | 3,430 | | | | — | |
Expenses | | | 215 | | | | 3,954 | | | | 223 | | | | 7,599 | |
| | | | | | | | | | | | | | | | |
Income from discontinued operations before income taxes | | | 2,367 | | | | 203 | | | | 3,207 | | | | 691 | |
Income tax provision | | | 51 | | | | 19 | | | | 85 | | | | 35 | |
| | | | | | | | | | | | | | | | |
Income from discontinued operations, net of taxes | | $ | 2,316 | | | $ | 184 | | | $ | 3,122 | | | $ | 656 | |
| | | | | | | | | | | | | | | | |
For the three and six months ended June 30, 2013, the Company’s net income from discontinued operations was primarily the result of the change in the estimated value of the Company’s receivable from the sale of the FBR Funds. The Company’s 2012 results from discontinued operations during the period prior to October 2012
19
reflect the activities of our former fee-based asset management operations. In accordance with the asset sale agreement, the Company received an initial payment upon closing in October 2012 and will receive a subsequent payment upon the first anniversary of closing in October 2013, in each case based on a percentage of assets under management for the applicable funds. Specifically, in October 2012, the Company received proceeds of $19,692 representing an initial payment equal to 60% of the sales price as calculated on the closing date and the Company will receive the remaining 40% of the sales price as calculated on the first anniversary of the closing. As of June 30, 2013, the Company has valued this contingent payment at $13,375. This value reflects an approximate 15% discount to the assets under management at June 30, 2013 and is recorded as a receivable on the Company’s balance sheet. The value recorded is based on the Company’s consideration of various factors outside of its control that can have a significant effect on the value of prospective assets under management, including, for example, uncertainties related to fund performance, market conditions as well as investor demand for equity mutual funds. Other considerations included the Company’s historical asset levels and potential asset attrition as a result of the sale transaction. The Company will continue to monitor the value of the assets under management and adjust the corresponding value of this receivable through the first anniversary of the closing.
10. Segment Information:
The Company considers its capital markets and principal investing operations to be separate reportable segments. The capital markets segment includes the Company’s investment banking and institutional sales, trading and research operations. These businesses operate as a single integrated unit to deliver capital raising, advisory and sales and trading services to corporate and institutional clients. Principal investing includes investments in merchant banking and other investments.
The Company has developed systems and methodologies to allocate overhead costs to its business units and, accordingly, presents segment information consistent with internal management reporting. When applicable, revenue generating transactions between the individual segments are included in the net revenue and pre-tax income of each segment.
In prior periods, the Company included the results of its fee-based asset management operations in continuing operations and reported these operations as a separate reportable segment. However, due to the transaction described in Note 9 and the reclassification of asset management’s results as discontinued operations, the Company no longer includes the results of its asset management operations in its segment information. Corporate overhead costs that were allocated to the asset management operations in 2012 are included in the segment disclosure as these costs would remain part of the Company’s continuing operations upon the disposal of the asset management operations. There are no comparable overhead allocations in 2013 as a result of the sale of the FBR Funds in October 2012.
20
The following tables illustrate the financial information for the Company’s segments for the periods indicated:
| | | | | | | | | | | | |
| | | Three Months Ended June 30, 2013 | |
| | | Capital
Markets | | | Principal
Investing | | | Total | |
Revenues: | | | | | | | | | | | | |
Investment banking | | $ | 52,037 | | | $ | — | | | $ | 52,037 | |
Institutional brokerage | | | 13,122 | | | | — | | | | 13,122 | |
Net investment income | | | — | | | | 1,209 | | | | 1,209 | |
Net interest income, dividends and other | | | 442 | | | | 432 | | | | 874 | |
| | | | | | | | | | | | |
Total | | | 65,601 | | | | 1,641 | | | | 67,242 | |
| | | | | | | | | | | | |
Operating Expenses: | | | | | | | | | | | | |
Variable | | | 29,464 | | | | 108 | | | | 29,572 | |
Fixed | | | 22,666 | | | | 372 | | | | 23,038 | |
| | | | | | | | | | | | |
Total | | | 52,130 | | | | 480 | | | | 52,610 | |
| | | | | | | | | | | | |
Pre-tax income | | $ | 13,471 | | | $ | 1,161 | | | $ | 14,632 | |
| | | | | | | | | | | | |
Compensation and benefits: | | | | | | | | | | | | |
Variable | | $ | 25,002 | | | $ | 106 | | | $ | 25,108 | |
Fixed | | | 12,563 | | | | 252 | | | | 12,815 | |
| | | | | | | | | | | | |
Total | | $ | 37,565 | | | $ | 358 | | | $ | 37,923 | |
| | | | | | | | | | | | |
| | | | | | | | | | | | | | | | |
| | | Three Months Ended June 30, 2012 | |
| | | Capital
Markets | | | Principal
Investing | | | Other1 | | | Total | |
Revenues: | | | | | | | | | | | | | | | | |
Investment banking | | $ | 18,959 | | | $ | 0 | | | $ | 0 | | | $ | 18,959 | |
Institutional brokerage | | | 12,320 | | | | 0 | | | | 0 | | | | 12,320 | |
Net investment income | | | 0 | | | | 1,090 | | | | 0 | | | | 1,090 | |
Net interest income, dividends and other | | | 1,186 | | | | 177 | | | | 0 | | | | 1,363 | |
| | | | | | | | | | | | | | | | |
Total | | | 32,465 | | | | 1,267 | | | | 0 | | | | 33,732 | |
| | | | | | | | | | | | | | | | |
Operating Expenses: | | | | | | | | | | | | | | | | |
Variable | | | 8,783 | | | | (1 | ) | | | 7 | | | | 8,789 | |
Fixed | | | 24,164 | | | | 100 | | | | 357 | | | | 24,621 | |
| | | | | | | | | | | | | | | | |
Total | | | 32,947 | | | | 99 | | | | 364 | | | | 33,410 | |
| | | | | | | | | | | | | | | | |
Pre-tax income (loss) | | $ | (482 | ) | | $ | 1,168 | | | $ | (364 | ) | | $ | 322 | |
| | | | | | | | | | | | | | | | |
Compensation and benefits: | | | | | | | | | | | | | | | | |
Variable | | $ | 3,091 | | | $ | (2 | ) | | $ | 2 | | | $ | 3,091 | |
Fixed | | | 13,566 | | | | 39 | | | | 184 | | | | 13,789 | |
| | | | | | | | | | | | | | | | |
Total | | $ | 16,657 | | | $ | 37 | | | $ | 186 | | | $ | 16,880 | |
| | | | | | | | | | | | | | | | |
| (1) | Included in “Other” are net revenues and operating expenses related to the Company’s continuing operations that are allocated to the Asset Management segment. |
21
| | | | | | | | | | | | |
| | | Six Months Ended June 30, 2013 | |
| | | Capital
Markets | | | Principal
Investing | | | Total | |
Revenues: | | | | | | | | | | | | |
Investment banking | | $ | 153,327 | | | $ | — | | | $ | 153,327 | |
Institutional brokerage | | | 26,827 | | | | — | | | | 26,827 | |
Net investment income | | | — | | | | 3,307 | | | | 3,307 | |
Net interest income, dividends and other | | | 970 | | | | 737 | | | | 1,707 | |
| | | | | | | | | | | | |
Total | | | 181,124 | | | | 4,044 | | | | 185,168 | |
| | | | | | | | | | | | |
Operating Expenses: | | | | | | | | | | | | |
Variable | | | 86,780 | | | | 758 | | | | 87,538 | |
Fixed | | | 46,377 | | | | 714 | | | | 47,091 | |
| | | | | | | | | | | | |
Total | | | 133,157 | | | | 1,472 | | | | 134,629 | |
| | | | | | | | | | | | |
Pre-tax income | | $ | 47,967 | | | $ | 2,572 | | | $ | 50,539 | |
| | | | | | | | | | | | |
Compensation and benefits: | | | | | | | | | | | | |
Variable | | $ | 77,788 | | | $ | 756 | | | $ | 78,544 | |
Fixed | | | 25,302 | | | | 488 | | | | 25,790 | |
| | | | | | | | | | | | |
Total | | $ | 103,090 | | | $ | 1,244 | | | $ | 104,334 | |
| | | | | | | | | | | | |
| | | | | | | | | | | | | | | | |
| | | Six Months Ended June 30, 2012 | |
| | | Capital
Markets | | | Principal
Investing | | | Other1 | | | Total | |
Revenues: | | | | | | | | | | | | | | | | |
Investment banking | | $ | 35,139 | | | $ | 0 | | | $ | 0 | | | $ | 35,139 | |
Institutional brokerage | | | 28,372 | | | | 0 | | | | 0 | | | | 28,372 | |
Net investment income | | | 0 | | | | 2,991 | | | | 0 | | | | 2,991 | |
Net interest income, dividends and other | | | 1,649 | | | | 526 | | | | 0 | | | | 2,175 | |
| | | | | | | | | | | | | | | | |
Total | | | 65,160 | | | | 3,517 | | | | 0 | | | | 68,677 | |
| | | | | | | | | | | | | | | | |
Operating Expenses: | | | | | | | | | | | | | | | | |
Variable | | | 16,673 | | | | 115 | | | | 20 | | | | 16,808 | |
Fixed | | | 50,627 | | | | 188 | | | | 759 | | | | 51,574 | |
| | | | | | | | | | | | | | | | |
Total | | | 67,300 | | | | 303 | | | | 779 | | | | 68,382 | |
| | | | | | | | | | | | | | | | |
Pre-tax income (loss) | | $ | (2,140 | ) | | $ | 3,214 | | | $ | (779 | ) | | $ | 295 | |
| | | | | | | | | | | | | | | | |
Compensation and benefits: | | | | | | | | | | | | | | | | |
Variable | | $ | 5,465 | | | $ | 113 | | | $ | 11 | | | $ | 5,589 | |
Fixed | | | 28,664 | | | | 85 | | | | 390 | | | | 29,139 | |
| | | | | | | | | | | | | | | | |
Total | | $ | 34,129 | | | $ | 198 | | | $ | 401 | | | $ | 34,728 | |
| | | | | | | | | | | | | | | | |
| (1) | Included in “Other” are net revenues and operating expenses related to the Company’s continuing operations that are allocated to the Asset Management segment. |
22
11. Recent Accounting Pronouncements:
In December 2011, the FASB amended its guidance for disclosure of assets and liabilities netted for financial statement purposes. This guidance was subsequently amended in January 2013 to clarify that its scope includes only certain financial instruments that are either offset on the balance sheet or are subject to an enforceable master netting arrangement or similar agreement. These amendments are designed to enhance disclosures by requiring improved information about financial instruments and derivative instruments that are either offset in accordance with current standards or subject to an enforceable master netting arrangement or similar agreement. The disclosure enhancements include providing in the notes to the financial statements the gross assets and gross liabilities recognized on the balance sheet, those amounts netted in accordance with current standards, those net positions subject to an enforceable master netting arrangement or similar agreement, and the net positions presented on the balance sheet. This information should be presented in a tabular format. This amendment became effective for annual reporting periods beginning January 1, 2013 and interim periods within those annual reporting periods. The adoption of this guidance did not have any effect on our disclosures, financial condition, results of operations or cash flows.
In February 2013, the FASB issued guidance to improve the transparency of reporting classifications out of accumulated other comprehensive income (“AOCI”). This guidance does not change the current requirements for reporting net income or comprehensive income in financial statements. However, it does require additional disclosures about the amounts reclassified out of AOCI by component. In addition, the guidance requires that significant amounts reclassified out of AOCI be presented, either on the face of the financial statement where net income is presented or in the notes. These amounts must be presented based on the respective lines of net income if the amount reclassified is required to be reclassified to net income in its entirety in the same reporting period. For other amounts that are not required to be reclassified in their entirety to net income, cross-reference to other required disclosures that provide additional detail about these other amounts is required. This guidance became effective for interim and annual periods beginning on January 1, 2013 and was applied prospectively. The adoption of this guidance resulted in additional financial statement disclosures that are included in Note 2 to the financial statements, but did not have any effect on our financial condition, results of operations or cash flows.
23
| Item 2. | Management’s Discussion and Analysis of Financial Condition and Results of Operations |
The following discussion and analysis of the consolidated financial condition and results of operations of FBR & Co. and its subsidiaries (collectively, “we”, “us”, “our” or the “Company”) should be read in conjunction with the unaudited consolidated financial statements and the notes thereto appearing elsewhere in this report on Form 10-Q and the audited consolidated financial statements and notes thereto appearing in the Company’s Annual Report on Form 10-K for the fiscal year ended December 31, 2012.
The discussion of the Company’s consolidated financial condition and results of operations below may contain forward-looking statements. These statements, which reflect management’s beliefs and expectations, are subject to risks and uncertainties that may cause actual results to differ materially. For a discussion of the risks and uncertainties that may affect the Company’s future results, please see “Forward-Looking Statements” immediately preceding Part I of, and other items throughout, the Company’s Annual Report on Form 10-K for the fiscal year ended December 31, 2012. Please also see “Risk Factors” in Part I, Item 1A of the Company’s Annual Report on Form 10-K for the year fiscal ended December 31, 2012.
Business Environment
U.S. equity markets continued their overall strong performance in the second quarter of 2013. Equity indices were largely up during the quarter despite increased volatility in June. Despite this investment performance and positive fund flows, equity trading volumes continued their multi-year trend lower which maintained pressure on trading businesses. Increases in capital raised in the equity capital markets as well as transaction volume through the first six months of 2013 are indicative of improved market conditions compared to the first half of last year.
Competition in our business remains intense. There continues to be consolidation and, in some cases, liquidation of underperforming brokerage platforms. This has resulted in a contraction of industry participants and, in particular, the number of mid-sized independent firms has continued to shrink. Large global banks are in some cases choosing to exit particular parts of their capital markets businesses as they focus on higherreturn-on-equity businesses and their own home markets. Large U.S.-based universal banks continue to use their capital as an advantage in the market, tying lending activity to capital markets mandates.
From an economic perspective, the U.S. housing market continued to demonstrate signs of recovery with prices up during the first half of the year in most markets and with the supply of homes for sale at recent historical lows. These conditions have provided a favorable environment for a broad range of industries and companies that will benefit from a sustained recovery in the housing market.
Much of the improvement in this market can be traced to the Federal Reserve’s continuing commitment to purchase over $1 trillion in mortgage securities annually. Any change of intent by the Federal Reserve will likely have a significant impact on both fixed income and equity markets. The scope of this market support is unprecedented, and during the second quarter the market demonstrated what may happen to interest rates and equity prices when the Federal Reserve pulls back this support. Based on comments from Federal Reserve officials regarding the potential tapering of mortgage securities purchases, interest rates rose by more than 50 basis points in the quarter and yield sensitive equities sold off significantly. Similar concerns regarding interest rates have led investors out of bond mutual funds during the quarter, with weekly bond fund outflows reaching historically high levels by the end of June.
During the first half of the year, the reality surrounding debt-challenged European economies was highlighted again by the negotiation of the Cyprus bailout. Markets overall remain exposed to risks from a European economy in recession and its undercapitalized banking system. These risks coupled with a tepid jobs recovery in the U.S. and the overhang of continuing regulatory changes are giving investors reasons to remain cautious even with strong recent equity market performance.
24
Executive Summary
For the second quarter of 2013, our total revenues from continuing operations were $67.2 million, our pre-tax income was $14.6 million and our net income from continuing operations, reflecting a $29.6 million income tax benefit, was $44.2 million, compared to total revenues from continuing operations of $33.7 million, and pre-tax income and net income of $0.3 million in the second quarter of 2012. In addition, during the second quarter of 2013, our income from discontinued operations, net of taxes, was $2.3 million compared to income from discontinued operations, net of taxes, of $0.2 million for the second quarter of 2012. Our net income, including discontinued operations, was $46.5 million in 2013 compared to $0.5 million in 2012.
The $29.6 million income tax benefit recognized in the second quarter of 2013 reflects the reversal of a significant component of the valuation allowance that had been recorded against the Company’s deferred tax assets as well as the utilization during 2013 of net operating loss carryforwards against current year projected taxable income. The valuation allowance reversal was recognized based on management’s consideration of various factors, including the Company’s improved operating performance, its cumulative operating results over the prior twelve quarters and the outlook regarding the Company’s prospective operating performance.
For the six months ended June 30, 2013, our total revenues from continuing operations were $185.2 million, our pre-tax income was $50.5 million and our net income from continuing operations, reflecting a $28.1 million income tax benefit, was $78.7 million, compared to total revenues from continuing operations of $68.7 million, and pre-tax income and net income from continuing operations of $0.3 million for the six months ended June 30, 2012. In addition, for the six months ended June 30, 2013, our income from discontinued operations, net of taxes, was $3.1 million compared to income from discontinued operations, net of taxes, of $0.7 million for the six months ended June 30, 2012. Our net income, including discontinued operations, was $81.8 million in the first half of 2013 compared to $0.9 million in the first half of 2012.
Consistent with the discussion above, the $28.1 million income tax benefit recognized in the six months ended June 30, 2013 reflects the reversal of a significant component of the valuation allowance that had been recorded against the Company’s deferred tax assets as well as the utilization during 2013 of net operating loss carryforwards against current year projected taxable income.
The improvement in our operating results in both the three and six months ended June 30, 2013 compared to 2012 was primarily due to increases in investment banking revenue of $33.1 million and $118.2 million, respectively, in 2013 compared to 2012. Our second quarter 2013 investment banking revenue totaled $52.0 million compared to $19.0 million in 2012. Our investment banking revenue through June 30, 2013 was $153.3 million compared to $35.1 million through June 30, 2012. Our 2013 investment banking revenue included $120.7 million in capital raising revenue from five sole-managed institutional private placements.
Our institutional brokerage revenue was $13.1 million in the second quarter of 2013 and $26.8 million for the six months ended June 30, 2013, compared to $12.3 million in the second quarter of 2012 and $28.4 million for the six months ended June 30, 2012. In addition, we generated $1.2 million of net investment income from principal investing in the second quarter of 2013 and $3.3 million for the six months ended June 30, 2013, compared to $1.1 million in the second quarter of 2012 and $3.0 million for the six months ended June 30, 2012.
Although our total expenses increased 57.5% to $52.6 million and 96.8% to $134.6 million in the three and six months ended June 30, 2013, respectively, compared to $33.4 million and $68.4 million in the three and six months ended June 30, 2012, respectively, the increases are due entirely to the increases in our revenues and related increases in variable costs. Specifically, our variable costs increased $20.8 million to $29.6 million in the second quarter of 2013 from $8.8 million in 2012 while our fixed costs decreased $1.6 million to $23.0 million in 2013 from $24.6 million in 2012. In addition, for the six months ended June 30, 2013, our variable costs increased $70.7 million to $87.5 million from $16.8 million in 2012 while our fixed costs decreased $4.5 million to $47.1 million in 2013 from $51.6 million in 2012. Our results in both 2013 and 2012, reflect the impact of the restructuring activities that we initiated in the fourth quarter of 2011 and the resulting reductions to our fixed costs that we began to realize in the first quarter of 2012.
25
The following is an analysis of our operating results by segment for the three and six months ended June 30, 2013 and 2012.
Capital Markets
Our capital markets segment includes investment banking and institutional sales, trading and research. These business units operate as a single integrated segment to deliver capital raising, advisory and sales and trading services to corporate and institutional clients. Our investment banking and institutional brokerage businesses are focused on the consumer, diversified industrials, energy and natural resources, financial institutions, insurance, real estate, and technology, media and telecommunications sectors. By their nature, our capital markets business activities are highly competitive and are subject to general market conditions, volatile trading markets, and fluctuations in the volume of market activity, as well as to the conditions affecting the companies and markets in our areas of focus. As a result, our capital markets revenues and profits are subject to significant volatility from period to period. The following tables provide a summary of our results within the capital markets segment (dollars in thousands).
| | | | | | | | |
| | | Three Months Ended
June 30, | |
| | | 2013 | | | 2012 | |
Revenues: | | | | | | | | |
Investment banking | | $ | 52,037 | | | $ | 18,959 | |
Institutional brokerage | | | 13,122 | | | | 12,320 | |
Net interest income, dividends and other | | | 442 | | | | 1,186 | |
| | | | | | | | |
Total | | | 65,601 | | | | 32,465 | |
| | | | | | | | |
Operating Expenses: | | | | | | | | |
Variable | | | 29,464 | | | | 8,783 | |
Fixed | | | 22,666 | | | | 24,164 | |
| | | | | | | | |
Total(1) | | | 52,130 | | | | 32,947 | |
| | | | | | | | |
Pre-tax income (loss) | | $ | 13,471 | | | $ | (482 | ) |
| | | | | | | | |
| (1) | For the three months ended June 30, 2013 and 2012, total operating expenses includes the allocation of corporate overhead costs of $5,725 and $6,311, respectively. |
The pre-tax income from our capital markets segment increased to $13.5 million for the second quarter of 2013 from a pre-tax loss of $0.5 million for the second quarter of 2012. The improvement in our pre-tax results is primarily attributable to a $33.1 million increase in investment banking revenue in 2013. Variable expenses, including $25.0 million of variable compensation, increased to $29.5 million in 2013 from $8.8 million in 2012 as a result of the increase in revenues. Our total compensation as a percentage of revenues in this segment was 57.3% in 2013 compared to 51.3% in 2012. Fixed expenses decreased $1.5 million, or 6.2%, in 2013 as a result of a reduction in fixed compensation and the impact of non-compensation cost reduction initiatives, in particular related to occupancy and equipment and market data and communications. The decrease in fixed compensation reflects the impact of changes in certain compensation arrangements that reduced our fixed compensation, but are offset by increased variable compensation.
Investment banking revenues increased $33.1 million to $52.0 million during the second quarter of 2013 from $19.0 million during the second quarter of 2012. Our second quarter 2013 investment banking revenue was generated from 16 client engagements representing a range of private and public transactions across the industry groups that we cover. Included in those transactions and representing $39.7 million of our capital raising revenue were three sole-managed institutional private placements.
26
Our institutional brokerage revenues increased $0.8 million to $13.1 million for the second quarter of 2013 from $12.3 million for the second quarter of 2012. This increase in our brokerage revenue reflects the addition of new client relationships and gains in market share from existing clients. Factors such as the increase in capital raising transactions in 2013 as well as our continued investment in research have contributed to this increase.
| | | | | | | | |
| | | Six Months Ended
June 30, | |
| | | 2013 | | | 2012 | |
Revenues: | | | | | | | | |
Investment banking | | $ | 153,327 | | | $ | 35,139 | |
Institutional brokerage | | | 26,827 | | | | 28,372 | |
Net interest income, dividends and other | | | 970 | | | | 1,649 | |
| | | | | | | | |
Total | | | 181,124 | | | | 65,160 | |
| | | | | | | | |
Operating Expenses: | | | | | | | | |
Variable | | | 86,780 | | | | 16,673 | |
Fixed | | | 46,377 | | | | 50,627 | |
| | | | | | | | |
Total(1) | | | 133,157 | | | | 67,300 | |
| | | | | | | | |
Pre-tax income (loss) | | $ | 47,967 | | | $ | (2,140 | ) |
| | | | | | | | |
| (1) | For the six months ended June 30, 2013 and 2012, total operating expenses includes the allocation of corporate overhead costs of $12,857 and $12,865, respectively. |
The pre-tax income from our capital markets segment increased to $48.0 million for the six months ended June 30, 2013 from a pre-tax loss of $2.1 million for the six months ended June 30, 2012. The improvement in our pre-tax results is primarily attributable to a $118.2 million increase in investment banking revenue in 2013. Variable expenses, including $77.8 million of variable compensation, increased to $86.8 million in 2013 from $16.7 million in 2012 as a result of the increase in revenues. Our total compensation as a percentage of revenues in this segment was 56.9% in 2013 compared to 52.4% in 2012. Fixed expenses decreased $4.2 million, or 8.3%, in 2013 as a result of a reduction in fixed compensation and the impact of non-compensation cost reduction initiatives, in particular related to occupancy and equipment and market data and communications. The decrease in fixed compensation reflects the impact of changes in certain compensation arrangements that reduced our fixed compensation, but are offset by increased variable compensation.
Investment banking revenues increased $118.2 million to $153.3 million during the first half of 2013 from $35.1 million during 2012. Our investment banking revenue in 2013 was generated from 34 client transactions with contributions from each of the Company’s industry groups. Included in those transactions and representing $120.7 million of our capital raising revenue were five sole-managed institutional private placements. One of these private placements, representing $38.3 million of that revenue was executed in the second quarter of 2012; however the issuer did not receive the required regulatory approvals necessary for us to recognize this revenue until the first quarter of 2013.
Our institutional brokerage revenues decreased $1.5 million to $26.8 million for the six months ended June 30, 2013 from $28.4 million for the six months ended June 30, 2012. This decrease in revenue is primarily due to lower market volatility during the first half of 2013 compared to 2012 resulting in lower equity-linked product revenues in the current year compared to 2012.
27
Principal Investing
As of June 30, 2013, our principal investing activity consists of investments in merchant banking and other equity investments, investment funds and corporate debt investments. The following tables provide a summary of our results within the principal investing segment (dollars in thousands):
| | | | | | | | |
| | | Three Months Ended
June 30, | |
| | | 2013 | | | 2012 | |
Revenues: | | | | | | | | |
Net investment income | | $ | 1,209 | | | $ | 1,090 | |
Net interest income, dividends and other | | | 432 | | | | 177 | |
| | | | | | | | |
Total | | | 1,641 | | | | 1,267 | |
| | | | | | | | |
Operating Expenses: | | | | | | | | |
Variable | | | 108 | | | | (1 | ) |
Fixed | | | 372 | | | | 100 | |
| | | | | | | | |
Total(1) | | | 480 | | | | 99 | |
| | | | | | | | |
Pre-tax income | | $ | 1,161 | | | $ | 1,168 | |
| | | | | | | | |
| (1) | For the three months ended June 30, 2013 and 2012, total operating expenses includes the allocation of corporate overhead costs of $111 and $77, respectively. |
The pre-tax income from our principal investing segment was unchanged at $1.2 million for the second quarter of 2013 compared to the second quarter of 2012. Although our total revenues increased to $1.6 million in 2013 from $1.3 million in 2012, higher direct costs as well as allocated costs in 2013 resulted in comparable pre-tax income levels in both periods. Net investment income for the second quarter of 2013 includes $0.9 million of net unrealized gains from investment funds and $0.3 million of net realized and unrealized gains from trading securities held for investment purposes. There were no significant realized gains in the second quarter of 2013. Our 2012 net investment income includes net unrealized gains of $0.4 million on trading securities held for investment purposes and net realized gains of $0.7 million on such trading securities sold during the period.
| | | | | | | | |
| | | Six Months Ended
June 30, | |
| | | 2013 | | | 2012 | |
Revenues: | | | | | | | | |
Net investment income | | $ | 3,307 | | | $ | 2,991 | |
Net interest income, dividends and other | | | 737 | | | | 526 | |
| | | | | | | | |
Total | | | 4,044 | | | | 3,517 | |
| | | | | | | | |
Operating Expenses: | | | | | | | | |
Variable | | | 758 | | | | 115 | |
Fixed | | | 714 | | | | 188 | |
| | | | | | | | |
Total(1) | | | 1,472 | | | | 303 | |
| | | | | | | | |
Pre-tax income | | $ | 2,572 | | | $ | 3,214 | |
| | | | | | | | |
| (1) | For the six months ended June 30, 2013 and 2012, total operating expenses includes the allocation of corporate overhead costs of $249 and $169, respectively. |
The pre-tax income from our principal investing segment decreased to $2.6 million for the six months ended June 30, 2013 from $3.2 million for the six months ended June 30, 2012. The decrease in our pre-tax income was due to higher direct costs as well as allocated costs in 2013 compared to 2012 as our total revenues increased to
28
$4.0 million in 2013 from $3.5 million in 2012. Net investment income for the six months ended June 30, 2013 includes $2.2 million of net unrealized gains from investment funds, $1.6 million of net realized and unrealized gains from trading securities held for investment purposes, and a $0.5 million impairment loss related to an available-for-sale investment security. There were no significant realized gains in the first six months of 2013. Our 2012 net investment income includes net unrealized gains of $0.9 million on trading securities held for investment purposes and net realized gains of $2.1 million on such trading securities sold during the period.
Investments
The total value of our investment portfolio was $81.0 million as of June 30, 2013. Of this total, $5.7 million was held in non-public investments recorded at cost, $46.6 million was held in marketable and non-public equity securities, warrants and fixed income securities, at fair value, and $28.7 million was held in non-registered investment funds that primarily invest in fixed income securities.
The following table provides additional detail regarding our merchant banking and other long-term investments as of June 30, 2013 (dollars in thousands):
| | | | | | |
| | | Number
of Shares | | Carrying Value/
Fair Value | |
Investments, at cost: | | | | | | |
Oil and Gas Equipment Manufacturer (Note) | | n/a | | | 5,000 | |
Other | | n/a | | | 681 | |
| | | | | | |
Total | | | | $ | 5,681 | |
Marketable and non-public equity securities and warrants, at fair value | | | | | 46,550 | |
Investment funds, at fair value | | | | | 28,733 | |
| | | | | | |
Total investments | | | | $ | 80,964 | |
| | | | | | |
Discontinued Operations
The Company completed the sale of the FBR Funds, a family of mutual funds, in October 2012. Subsequent to the sale closing, the Company has no continuing involvement in the management of these funds. As a result of this sale transaction, the Company reports the results of its asset management operations as discontinued operations. The results related to the asset management operations reflected in the consolidated statements of operations are presented in the following table (dollars in thousands):
| | | | | | | | | | | | | | | | |
| | | Three Months Ended
June 30, | | | Six Months Ended
June 30, | |
| | | 2013 | | | 2012 | | | 2013 | | | 2012 | |
Revenues | | $ | — | | | $ | 4,157 | | | $ | — | | | $ | 8,290 | |
Gain on sale of assets, net | | | 2,582 | | | | — | | | | 3,430 | | | | — | |
Expenses | | | 215 | | | | 3,954 | | | | 223 | | | | 7,599 | |
| | | | | | | | | | | | | | | | |
Income from discontinued operations before income taxes | | | 2,367 | | | | 203 | | | | 3,207 | | | | 691 | |
Income tax provision | | | 51 | | | | 19 | | | | 85 | | | | 35 | |
| | | | | | | | | | | | | | | | |
Income from discontinued operations, net of taxes | | $ | 2,316 | | | $ | 184 | | | $ | 3,122 | | | $ | 656 | |
| | | | | | | | | | | | | | | | |
For the three and six months ended June 30, 2013, the Company’s net income from discontinued operations was the result of the change in the estimated value of the Company’s receivable from the sale of the FBR Funds. The 2012 results from discontinued operations during the period prior to October 2012 reflect the activities of our former fee-based asset management operations. In accordance with the asset sale agreement, the Company
29
received an initial payment upon closing in October 2012 and will receive a subsequent payment upon the first anniversary of closing in October 2013, in each case based on a percentage of assets under management for the applicable funds. Specifically, in October 2012, the Company received proceeds of $19.7 million representing an initial payment equal to 60% of the sales price as calculated on the closing date and the Company will receive the remaining 40% of the sales price as calculated on the first anniversary of the closing. As of June 30, 2013, the Company has valued this contingent payment at $13.4 million. This value reflects an approximate 15% discount to the assets under management at June 30, 2013 and is recorded as a receivable on the Company’s balance sheet. The value recorded is based on the Company’s consideration of various factors outside of its control that can have a significant effect on the value of prospective assets under management, including, for example, uncertainties related to fund performance, market conditions as well as investor demand for equity mutual funds. Other considerations included the Company’s historical asset levels and potential asset attrition as a result of the sale transaction. The Company will continue to monitor the value of the assets under management and adjust the corresponding value of this receivable through the first anniversary of the closing.
Results of Operations
Three months ended June 30, 2013 compared to three months ended June 30, 2012
We generated net income of $46.5 million in the second quarter of 2013 compared to $0.5 million in the second quarter of 2012. This increase in net income was primarily the result of a $33.1 million increase in investment banking revenue in 2013 compared to 2012 and a $29.6 million tax benefit, reflecting the reversal of a significant component of the valuation allowance that had been recorded against our deferred tax assets, recognized in the second quarter of 2013.
Pre-tax income in our capital markets segment increased to $13.5 million during the second quarter of 2013 from a pre-tax loss of $0.5 million during the second quarter of 2012. This increase in pre-tax income is due primarily to the increase in investment banking revenue discussed above. Pre-tax income from our principal investing segment was $1.2 million in both 2013 and 2012. Our net income for the second quarter of 2013 also includes $2.3 million of net income from discontinued operations compared to $0.2 million in 2012.
Revenues
Our revenues increased 99.4% to $67.2 million during the second quarter of 2013 from $33.7 million during the second quarter of 2012 due to the changes in revenues discussed below.
Capital raising revenues increased 192.9% to $49.2 million in the second quarter of 2013 from $16.8 million in the second quarter of 2012. In the second quarter of 2013, we completed 12 client engagements, representing a range of private and public transactions, including three sole-managed private placements that generated $39.7 million of revenue in the period. In the second quarter of 2012, we completed eight capital raising transactions, including two sole-managed private placements, however the size of these transactions completed in 2012 was not comparable to the transactions completed in 2013.
Advisory revenues increased 38.1% to $2.9 million in the second quarter of 2013 from $2.1 million in the second quarter of 2012. We completed four M&A and advisory assignments in the second quarters of both 2013 and 2012.
Institutional brokerage revenues from agency commissions and principal transactions increased 6.5% to $13.1 million in the second quarter of 2013 from $12.3 million in the second quarter of 2012. This increase in our brokerage revenue reflects the addition of new client relationships and gains in market share from existing clients. Factors such as the increase in capital raising transactions in 2013 as well as our continued investment in research have contributed to this increase.
Net investment income increased 9.1% to $1.2 million in the second quarter of 2013 from $1.1 million in the second quarter of 2012. Net investment income for the second quarter of 2013 includes $0.9 million of net unrealized gains from investment funds and $0.3 million of net realized and unrealized gains from trading
30
securities held for investment purposes. There were no significant realized gains in the second quarter of 2013. Our 2012 net investment income includes net unrealized gains of $0.4 million on trading securities held for investment purposes and net realized gains of $0.7 million on such trading securities sold during the period.
Net interest income, dividends and other revenues decreased 35.7% to $0.9 million in the second quarter of 2013 from $1.4 million in second quarter of 2012. These revenues include interest from convertible and fixed income securities held on our trading desks as well as interest and dividends generated from our investing activities. The decrease in 2013 revenue was the result of differences in our trading desk and investment positions in these periods.
Expenses
Total expenses increased 57.5% to $52.6 million in the second quarter of 2013 from $33.4 million in the second quarter of 2012. The increase was caused by the changes in expenses discussed below.
Compensation and benefits expenses increased 124.3% to $37.9 million in the second quarter of 2013 from $16.9 million in the second quarter of 2012 as a result of a $22.0 million increase in variable compensation. The increase in variable compensation during the second quarter of 2013 was due to the significant increase in investment banking revenue. This increase was partially offset by a $1.0 million decrease in fixed compensation during the second quarter of 2013. The Company’s compensation and benefits expenses were 56% of total revenue during the second quarter of 2013 compared to 50% in the second quarter of 2012.
Professional services expenses decreased 10.5% to $3.4 million in the second quarter of 2013 from $3.8 million in the second quarter of 2012 primarily due to the net effects of reductions in corporate legal costs in 2013 offset by an increase in recruiting costs.
Business development expenses increased 8.3% to $2.6 million in the second quarter of 2013 from $2.4 million in the second quarter of 2012. The increase in these costs is primarily due to increased travel costs related to overall business development activities offset by a small decrease in costs related to investment banking transactions. Despite the increase in investment banking revenue, the related travel costs were largely unchanged during 2013 compared to 2012 based on differences in the nature of the transactions in the two periods.
Clearing and brokerage fees decreased 31.6% to $1.3 million in the second quarter of 2013 from $1.9 million in the second quarter of 2012. The decrease is due to the impact of cost reduction initiatives directed at reducing our brokerage execution costs as well as a lower volume of trading activity in equity-linked products.
Occupancy and equipment expenses decreased 11.4% to $3.1 million in the second quarter of 2013 from $3.5 million in the second quarter of 2012. The decrease in occupancy costs is primarily the result of reductions in depreciation expense associated with reduced capital expenditures over the past several years and reductions in our leased office space.
Communications expenses decreased 9.7% to $2.8 million in the second quarter of 2013 from $3.1 million in the second quarter of 2012. The decrease in these expenses is primarily due to decreased costs related to market data and customer trading services as a result of cost reduction initiatives.
Other operating expenses decreased 21.1% to $1.5 million in the second quarter of 2013 from $1.9 million in the second quarter of 2012. The decrease in expenses is primarily due to the recognition of a $0.5 million bad debt expense in 2012 that is not comparable to 2013.
We recognized a tax benefit of $29.6 million in the second quarter of 2013 compared to a $15 thousand tax provision in the second quarter of 2012. As described below, our 2013 tax benefit reflects the reversal of a significant component of the valuation allowance that had been recorded against the Company’s deferred tax assets as well as the utilization during 2013 of net operating loss carryforwards against current year projected taxable income.
31
The Company’s quarterly tax provision is determined pursuant to ASC 740, which requires using an estimated annual effective rate based on forecasted taxable income for the full year. The Company’s effective tax rate for the second quarter of 2013 was (202.2)%. This tax rate differed from statutory tax rates primarily due to the effects of the valuation allowance reversal. The Company’s effective tax rate for the second quarter of 2012 was 4.7%. This tax rate differed from statutory tax rates primarily due to the effects of the full valuation allowance on the Company’s net deferred tax assets at that time. The annual estimated effective tax rate for three months ended June 30, 2012 also incorporated the benefit of net operating losses expected to be utilized during 2012. The Company believes there is potential for volatility in its effective tax rate from quarter-to-quarter due to the impact of any prospective changes in its forecasted earnings for the year.
As of December 31, 2012 and March 31, 2013, the Company provided a full valuation allowance against its net deferred tax assets since, based on the application of the criteria in ASC 740, it concluded that it was more likely than not that the benefits of these assets would not be realized in the future. Following the criteria in ASC 740, the Company reviews this valuation allowance on a quarterly basis assessing the positive and negative evidence to determine if it is more likely than not that some or all of the deferred tax assets will be realized. Based on its assessment as of June 30, 2013, the Company determined that the release of a significant component of this valuation allowance was appropriate. This conclusion was based on management’s consideration of various factors, including the Company’s improved operating performance, its cumulative operating results over the prior twelve quarters and the outlook regarding the Company’s prospective operating performance. As of June 30, 2013, the Company’s valuation allowance relates primarily to capital loss carryforwards and other-than-temporary investment write downs. In addition, the Company maintains a valuation allowance for net operating loss carryforwards that are projected to be utilized during the remainder of 2013 and are incorporated into the Company’s effective tax rate. The Company’s remaining valuation allowance as of June 30, 2013 is approximately $26.3 million.
Discontinued Operations
Income from discontinued operations, net of taxes, increased to $2.3 million in the second quarter of 2013 compared to $0.2 million in the second quarter of 2012. For the three months ended June 30, 2013, the Company’s net income from discontinued operations was the result of the change in the estimated value of the Company’s receivable from the sale of the FBR Funds. The 2012 results from discontinued operations during the period prior to the completion of the sale of the FBR Funds in October 2012 reflect the activities of our former fee-based asset management operations.
Six months ended June 30, 2013 compared to six months ended June 30, 2012
We recognized net income of $81.8 million in the first six months of 2013 compared to a net income of $0.9 million in the first six months of 2012. This increase in net income was primarily the result of a $118.2 million increase in investment banking revenue in 2013 compared to 2012 and a $28.1 million tax benefit, reflecting the reversal of a significant component of the valuation allowance that had been recorded against our deferred tax assets, recognized in the first six months of 2013.
The pre-tax income in our capital markets segment increased to $48.0 million during the first six months of 2013 from a loss of $2.1 million during the first six months of 2012. This increase in pre-tax income is due primarily to the increase in investment banking revenue discussed above. Offsetting this increase was a $0.6 million decrease in pre-tax income from our principal investing segment to $2.6 million in 2013 from $3.2 million in 2012. This decrease in pre-tax income is due to an increase in direct costs as well as allocated costs in 2013 compared to 2012. Our 2013 net income also includes $3.1 million of net income from discontinued operations compared to $0.7 million in 2012.
Revenues
Our revenues increased 169.6% to $185.2 million during the first six months of 2013 from $68.7 million during the first six months of 2012 due to the changes in revenues discussed below.
32
Capital raising revenues increased 380.3% to $148.9 million in the first six months of 2013 from $31.0 million in the first six months of 2012. In the first six months of 2013, we completed 26 client engagements with contributions from each of the Company’s industry groups, including five sole-managed private placements that generated $120.7 million of our capital raising revenue in the period. One of these private placements, representing $38.3 million of that revenue, was executed in the second quarter of 2012; however, the issuer did not receive the required regulatory approvals necessary for us to recognize this revenue until the first quarter of 2013. In the first six months of 2012, we completed two book-run initial public offerings and four sole-managed private placements, however the size of these transactions completed in 2012 was not comparable to the transactions completed in 2013.
Advisory revenues increased 9.8% to $4.5 million in the first six months of 2013 from $4.1 million in the first six months of 2012. We completed eight assignments in the first six months of 2013 compared to ten assignments in the first six months of 2012.
Institutional brokerage revenues from agency commissions and principal transactions decreased 5.6% to $26.8 million in the first six months of 2013 from $28.4 million in the first six months of 2012. This decrease in revenue is primarily due to lower market volatility during the first half of 2013 compared to 2012 resulting in lower equity-linked product revenues in the current year compared to 2012.
Net investment income increased 10% to $3.3 million in the first six months of 2013 from $3.0 million in the first six months of 2012. Net investment income for the six months ended June 30, 2013 includes $2.2 million of net unrealized gains from investment funds, $1.6 million of net realized and unrealized gains from trading securities held for investment purposes, and a $0.5 million impairment loss related to an available-for-sale investment security. There were no significant realized gains in the first six months of 2013. Our 2012 net investment income includes net unrealized gains of $0.9 million on trading securities held for investment purposes and net realized gains of $2.1 million on such trading securities sold during the period.
Interest income, dividends and other revenues decreased 22.7% to $1.7 million in the first six months of 2013 from $2.2 million in the first six months of 2012. These revenues include interest from convertible and fixed income securities held on our trading desks as well as interest and dividends generated from our investing activities. The decrease in 2013 revenue was the result of differences in our trading desk and investment positions in these periods.
Expenses
Total expenses increased 96.8% to $134.6 million in the first six months of 2013 from $68.4 million in the first six months of 2012. This increase was caused by the changes in expenses described below.
Compensation and benefits expenses increased 200.6% to $104.3 million in the first six months of 2013 from $34.7 million in the first six months of 2012 as a result of a $73.0 million increase in variable compensation. The increase in variable compensation during 2013 was due to the significant increase in investment banking revenue. This increase was partially offset by a $3.3 million decrease in fixed compensation during 2013. The Company’s compensation and benefits expenses were 56% of total revenue during the first six months of 2013 compared to 51% in the first half of 2012.
Professional services expenses increased 3% to $6.8 million in the first six months of 2013 from $6.6 million in the first six months of 2012 primarily due to increased recruiting costs incurred in 2013.
Business development expenses decreased 6% to $4.7 million in the first six months of 2013 from $5.0 million in the first six months of 2012. This decrease is the result of reductions in travel costs related to investment banking transactions offset by a small increase in travel costs related to overall business development activities. Despite the increase in investment banking revenue, related travel costs decreased by $0.5 million in 2013 compared to 2012 based on differences in the nature of the transactions in the two periods.
33
Clearing and brokerage fees decreased 32.6% to $2.9 million in the first six months of 2013 from $4.3 million in the first six months of 2012. The decrease is due to the impact of cost reduction initiatives directed at reducing our brokerage execution costs as well as a lower volume of trading activity in equity-linked products.
Occupancy and equipment expenses decreased 14.7% to $6.4 million in the first six months of 2013 from $7.5 million in the first six months of 2012. The decrease in occupancy costs is primarily the result of reductions in depreciation expense associated with reduced capital expenditures over the past several years and reductions in our leased office space.
Communications expenses decreased 13.6% to $5.7 million in the first six months of 2013 from $6.6 million in the first six months of 2012. The decrease in these expenses is primarily due to decreased costs related to market data and customer trading services as a result of cost reduction initiatives.
Other operating expenses increased 2.8% to $3.7 million in the first six months of 2013 from $3.6 million in the first six months of 2012. The increase in these expenses is primarily due to increased SIPC charges in 2013 as a result of increased revenues. In addition, the change includes the net effects of the recognition of approximately $0.7 million of bad debt expenses in 2012 that are not comparable to 2013 amounts, partially offset by a $0.5 million charge related to an arbitration settlement in 2013 that is not comparable to 2012 amounts.
We recognized a tax benefit of $28.1 million in the first six months of 2013 compared to a $22 thousand tax provision in the first six months of 2012. As described below, our 2013 tax benefit reflects the reversal of a significant component of the valuation allowance that had been recorded against the Company’s deferred tax assets as well as the utilization during 2013 of net operating loss carryforwards against current year projected taxable income.
The Company’s quarterly tax provision is determined pursuant to ASC 740, which requires using an estimated annual effective rate based on forecasted taxable income for the full year. The Company’s effective tax rate for the first six months of 2013 was (55.7)%. This tax rate differed from statutory tax rates primarily due to the effects of the valuation allowance reversal. The Company’s effective tax rate for the first six months of 2012 was 7.5%. This tax rate differed from statutory tax rates primarily due to the effects of the full valuation allowance on the Company’s net deferred tax assets at that time. The annual estimated effective tax rate for six months ended June 30, 2012 also incorporated the benefit of net operating losses expected to be utilized during 2012. The Company believes there is potential for volatility in its effective tax rate from quarter-to-quarter due to the impact of any prospective changes in its forecasted earnings for the year.
As of December 31, 2012 and March 31, 2013, the Company provided a full valuation allowance against its net deferred tax assets since, based on the application of the criteria in ASC 740, it concluded that it was more likely than not that the benefits of these assets would not be realized in the future. Following the criteria in ASC 740, the Company reviews this valuation allowance on a quarterly basis assessing the positive and negative evidence to determine if it is more likely than not that some or all of the deferred tax assets will be realized. Based on its assessment as of June 30, 2013, the Company determined that the release of a significant component of this valuation allowance was appropriate. This conclusion was based on management’s consideration of various factors, including the Company’s improved operating performance, its cumulative operating results over the prior twelve quarters and the outlook regarding the Company’s prospective operating performance. As of June 30, 2013, the Company’s valuation allowance relates primarily to capital loss carryforwards and other-than-temporary investment write downs. In addition, the Company maintains a valuation allowance for net operating loss carryforwards that are projected to be utilized during the remainder of 2013 and are incorporated into the Company’s effective tax rate. The Company’s remaining valuation allowance as of June 30, 2013 is approximately $26.3 million.
34
Discontinued Operations
Income from discontinued operations, net of taxes, was $3.1 million for the six months ended June 30, 2013 compared to $0.7 million for the six months ended June 30, 2012. For the six months ended June 30, 2013, the Company’s net income from discontinued operations was the result of the change in the estimated value of the Company’s receivable from the sale of the FBR Funds. The 2012 results from discontinued operations during the period prior to the completion of the sale of the FBR Funds in October 2012 reflect the activities of our former fee-based asset management operations.
Liquidity and Capital Resources
Liquidity is a measurement of our ability to meet potential cash requirements, including ongoing funding for investments, and for other general business purposes. Regulatory requirements applicable to our broker-dealer subsidiary require minimum capital levels. The primary sources of funds for liquidity consist of existing cash balances (i.e., available liquid capital not invested in our operating businesses), proceeds from sales of securities, internally generated funds, dividends on equity securities that we own, and credit provided by margin accounts, banks, clearing brokers, and affiliates of our principal clearing broker. Potential future sources of liquidity for us include internally generated funds, borrowing capacity through margin accounts, corporate lines of credit and other credit facilities which we may enter into in the future, and future issuances of common stock, preferred stock or debt securities.
Cash Flows
As of June 30, 2013, our cash and cash equivalents totaled $226.7 million representing a net increase of $51.8 million for the first six months of 2013. The increase is attributable to cash provided by operating activities of $83.2 million, which resulted primarily from operating income during the period. Cash provided by operating activities was offset by $20.9 million of cash used in investing activities and $10.5 million of cash used in financing activities. Due to the cyclical nature of our industry and the industries in which we provide services, we maintain liquid capital to cover potential cash outflows in periods of decreased revenues and earnings.
Net cash provided by operating activities of $83.2 million during the first six months of 2013, compares to $21.5 million of cash provided by operating activities during the first six months of 2012. The cash provided by operating activities during 2013 reflects our cash operating income during the period and the impact of a $45.8 million increase related to accrued compensation. This 2013 activity was offset by increases in customer receivables and decreases in payables that total $7.2 million as well as $6.6 million of cash used on our trading desk positions. The cash provided by operating activities during the first six months of 2012 reflects our net operating income for the period, decreases in our trading positions and the net change in our due to/from brokers, dealers and clearing organizations balances.
Net cash used in investing activities of $20.9 million during the first six months of 2013 compares to net cash provided by investing activities of $7.3 million during the first half of 2012. The $20.9 million used in 2013 reflects principal investments purchased during the period, including $9.1 million of investment funds and $20.3 million of trading securities, offset by proceeds from securities sold during the period. The $7.3 million provided by investing activities in the first six months of 2012 included $7.6 million of net sales of principal investments during the period.
Net cash used in financing activities of $10.5 million during the first six months of 2013 compares to $19.1 million used during the first half of 2012. The 2013 activity primarily represents the repurchase of 0.7 million shares of our common stock for $12.3 million. The 2012 activity primarily represents the repurchase of 1.8 million shares of our common stock for $19.6 million.
Sources of Funding
We believe that our existing cash and cash equivalents balances (totaling $226.7 million at June 30, 2013) comprised primarily of investments in money market funds investing in short-term U.S. Treasury securities, cash flows from operations, borrowing capacity, other sources of liquidity and execution of our financing strategies
35
will be sufficient to meet our cash requirements. We have obtained, and believe we will be able to continue to obtain, short-term financing, such as margin financing and temporary subordinated financing, in amounts and at interest rates consistent with our financing objectives. We may, however, seek debt or equity financings, in public or private transactions, to provide capital for corporate purposes and/or strategic business opportunities, including possible acquisitions, joint ventures, alliances or other business arrangements which could require substantial capital outlays. Our policy is to evaluate strategic business opportunities, including acquisitions and divestitures, as they arise. There can be no assurance that we will be able to generate sufficient funds from future operations, or raise sufficient debt or equity on acceptable terms, to take advantage of investment opportunities that become available. Should our needs ever exceed these sources of liquidity, we believe that many of our investments could be sold, in most circumstances, to provide cash.
We monitor and manage our leverage and liquidity risk through various committees and processes we have established. We assess our leverage and liquidity risk based on considerations and assumptions of market factors, as well as factors specific to us, including the amount of our available liquid capital (i.e., the amount of our cash and cash equivalents not invested in our operating business). At June 30, 2013, we had no outstanding borrowings.
Assets
As of June 30, 2013, our principal assets consisted of cash and cash equivalents, financial instruments at fair value, receivables, and investments carried at cost. As of June 30, 2013 and December 31, 2012, our liquid assets consisted primarily of cash and cash equivalents of $226.7 million and $174.9 million, respectively.
The increase in our total assets to $456.7 million as of June 30, 2013 compared to $333.4 million as of December 31, 2012 was primarily the result of a $51.8 million increase in cash and cash equivalents discussed previously and a $29.8 million increase in deferred tax assets due to the release of a significant component of the valuation allowance that had been recorded against our deferred tax assets. In addition, the increase in our total assets includes a $21.0 million increase in due from brokers, dealers and clearing organizations, a $17.9 million increase in financial instruments at fair value and a $7.7 million increase in customer and other receivables.
Our due from and to brokers, dealers, and clearing organizations balances primarily represent unsettled trades associated with our credit sales and trading platform and also includes unsettled equity, option and convertible securities trades. An increase in unsettled credit and options sales transactions was the primary reason for the increase in the receivable from brokers, dealers and clearing organizations as of June 30, 2013. Such credit transactions include corporate bond and syndicated loan trades. The total amount of outstanding unsettled trade receivables and payables related to these instruments was $25.7 million and $24.3 million, respectively, as of June 30, 2013 compared to $3.8 million and $3.7 million, respectively, as of December 31, 2012. Due to the extended settlement nature of most par and distressed bank loan transactions, we are subject to certain market and counterparty credit risks. See our discussion related to these risks included in theQuantitative and Qualitative Disclosures about Market Risk.
As of June 30, 2013, our $81.0 million of investments primarily consisted of investments in marketable equity securities, investment funds, non-public equity securities and corporate debt investments. These investments are funded in cash and are not financed with debt.
Regulatory Capital
FBRCM, our broker-dealer subsidiary, is registered with the SEC and is a member of the FINRA. As such, FBRCM is subject to the minimum net capital requirements promulgated by the SEC. As of June 30, 2013, FBRCM had total regulatory net capital of $109.4 million, which exceeded its required net capital of $4.9 million by $104.5 million. Regulatory net capital requirements increase when the broker-dealer is involved in underwriting activities based upon a percentage of the amount being underwritten.
36
Share Repurchases
During the six months ended June 30, 2013, we repurchased 0.7 million shares of our common stock primarily in privately negotiated or open market transactions at weighted average share prices of $17.17 per share, for a total cost, including transaction costs, of $12.3 million. As of June 30, 2013, we have remaining authority to repurchase up to 0.8 million additional shares.
Off-Balance Sheet Arrangements
Through indemnification provisions in agreements with clearing organizations, customer activities may expose us to off-balance sheet credit risk. Financial instruments may have to be purchased or sold at prevailing market prices in the event a customer fails to settle on a trade on its original terms or in the event cash and securities in customer margin accounts are not sufficient to fully cover customer obligations. We seek to manage the risks associated with customer activities through customer screening and selection procedures as well as through requirements on customers to maintain margin collateral in compliance with various regulations and clearing organization policies.
| Item 3. | Quantitative and Qualitative Disclosures about Market Risk |
Overall Risk Management
We monitor market and business risk, including credit risk, operations, liquidity, compliance, legal, and reputational risk through a number of control procedures designed to identify and evaluate the various risks to which our business and investments are exposed. We have established various committees and processes to assess and to manage risk associated with our investment banking, trading, and merchant banking activities. We review, among other things, business and transactional risks associated with potential investment banking clients and engagements as well as our capital subjected to risk through our trading activities. We seek to manage the risks associated with our investment banking and merchant banking activities by review and approval of transactions by the relevant committee, prior to accepting an engagement or pursuing a material investment transaction.
Market Risk
Market risk is the risk that a change in the level of one or more market prices, rates, indices, or other market factors, such as market liquidity, will result in losses for a position or portfolio. Our activities as an underwriter, market maker and principal investor, as well as our activities as a financial intermediary in customer trading transactions, expose us to market risk.
We use a number of quantitative measures to manage our exposure to market risk in our trading businesses. These measures include:
Inventory position limits—we establish inventory position limits on gross and net positions, at both the trading desk and individual position level, and we monitor exposures against limits on a daily basis.
Scenario analysis—we apply stress tests and scenario analysis to estimate the potential impact on our trading revenues of highly stressful market environments in both the credit and equity markets.
Value at Risk—we utilize a statistical measure of potential trading loss, called Value at Risk (“VaR”), to estimate the potential loss from adverse market moves in an ordinary market environment. We also establish VaR limits, as appropriate.
Value at Risk. We calculate VaR for our trading businesses using a historical simulation model that isolates various risk elements associated with each of our trading positions over a one-day time horizon and at a 95% confidence level. The simulation is based on data for the previous twelve months. This approach assumes that historical changes in market values are representative of future changes.
37
Using the results of this simulation, VaR measures the potential gains and losses on net trading positions at a 95% confidence level over a one-day time horizon. A 95% confidence level implies that, on average, we anticipate that 5% of the time we may realize trading losses in excess of our VaR amount. Our one-day 95% VaR at June 30, 2013 was approximately $243 thousand.
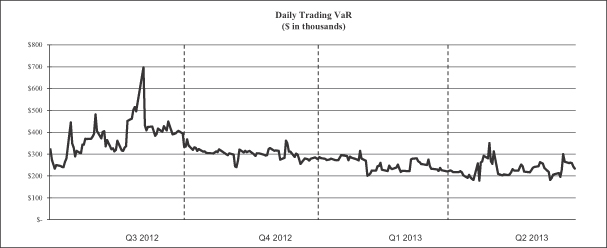
VaR is a model that quantifies potential losses using historical data. We could incur losses greater than the reported VaR because the historical market prices used may not be an accurate measure of future market events and conditions, especially in highly stressful market environments. In addition, the VaR model measures the risk of the current net trading positions and does not take into account future position changes arising from transaction and/or hedging activity. Our VaR includes positions actively managed and held by our trading desks and does not include positions associated with investment banking transactions that may be held on our trading desk in order to facilitate distribution. In most instances, these positions are held only for a short period and sold at or above our costs. To the extent we hold these positions on a long-term basis, they are reflected as long-term investments and risk related to these positions are discussed below underEquity Price Risk.
38
The comparison of actual daily trading revenue fluctuations with a daily VaR estimate is the primary method used to test the reasonableness of the VaR measure. The following table provides the distribution of daily trading revenues and losses during the six months ended June 30, 2013. The table shows data reflecting that the average lowest 5 percentile daily trading revenues during the six months ended June 30, 2013 was net gains of $73 thousand. Over the same period, the worst one-day trading revenues were net gains of $33 thousand which is $276 thousand less than the daily trading loss implied by the average one-day VaR for the six months ended June 30, 2013.
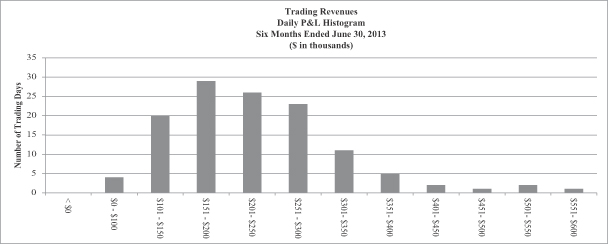
Equity Price Risk. Equity price risk represents the potential loss in value of a position due to adverse changes in the level or volatility of equity prices. We generally attempt to limit exposure to equity price risk on securities held as a result of our daily equity trading activities by limiting our intra-day and overnight inventory of trading securities to that needed to provide the appropriate level of liquidity in the securities for which we are a market maker. We also seek to manage these risks by diversifying exposures, controlling position sizes, and establishing economic hedges in related securities, principally through short sale transactions.
While it is impossible to project exactly what factors may affect the prices of equity securities and how much the effect might be, the impact of a ten percent increase and a ten percent decrease in the price of equities held by us would be as follows as of June 30, 2013. The fair value of the $20.3 million of trading equity securities held at our broker-dealer subsidiary would increase or decrease to $22.3 million and $18.3 million, respectively, and the fair value of the $43.2 million of other equity investments would increase or decrease to $47.5 million and $38.9 million, respectively.
Except to the extent that we sell our equity securities designated as available-for-sale or our cost method equity investments, or a decrease in their fair value is deemed to be other-than-temporary, an increase or decrease in the fair value of those assets will not directly affect our earnings. However, an increase or decrease in the value of trading securities held by our broker-dealer subsidiary, investment securities designated as trading, or investment funds will directly affect our earnings.
Credit Risk. Our broker-dealer subsidiary clears all of its securities transactions through a clearing broker on a fully disclosed basis. Pursuant to the terms of the agreements between our broker-dealer subsidiary and the clearing broker, the clearing broker has the right to charge us for losses that result from a counterparty’s failure to fulfill its contractual obligations. As the right to charge us has no maximum amount and applies to all trades executed through the clearing broker, we believe there is no maximum amount assignable to this right. At June 30, 2013 and December 31, 2012, we have recorded no liabilities with regard to this right. During the three and six months ended June 30, 2013 and 2012, amounts paid to the clearing broker related to these guarantees
39
have been immaterial. In addition, we have the right to pursue collection of performance from the counterparties who do not perform under their contractual obligations. We monitor the credit standing of the clearing broker and all counterparties with which we conduct business.
We attempt to limit our credit spread risk by offsetting long or short positions in various related securities, but may also hedge credit risk exposure through the use of credit derivatives.
Our due from and to brokers, dealers and clearing organizations balances primarily represent unsettled trades associated with our credit sales and trading platform. These transactions include corporate bonds and syndicated loan trades. As part of this activity, we incur market and counterparty credit risk due to the extended settlement nature of most par and distressed bank loan transactions. Par loan and distressed bank loan trades have extended settlement periods due to the administrative and legal requirements associated with transferring title of such instruments. During this period whereby a trade has been executed but not settled, we are at risk if one of our counterparties defaults on a trade obligation and we have to meet this obligation at market prices that are adverse relative to the original trade. We manage this exposure by calculating the current and potential default exposure on each trade and maintaining risk limits for each counterparty with whom we have outstanding bank loan trades.
The securities industry is subject to numerous risks, including the risk of loss associated with the underwriting, ownership, and trading of securities, and the risk of reduced revenues in periods of reduced demand for security offerings and activity in secondary trading markets. Changing economic and market trends may negatively impact the liquidity and value of our investments and the level of security offerings underwritten by us, which may adversely affect our revenues and profitability.
Our equity and debt investments include non-investment grade securities of privately held issuers with no ready markets. The concentration and illiquidity of these investments expose us to a higher degree of risk than associated with readily marketable securities.
Interest Rate Risk. Interest rate risk represents the potential loss in value of a position or portfolio from adverse changes in market interest rates. We are exposed to interest rate risk through our trading activities in convertible and fixed income securities, however, based on our daily monitoring of this risk, we believe we currently have limited exposure to interest rate risk in these activities.
| Item 4. | Controls and Procedures |
Conclusion Regarding the Effectiveness of Disclosure Controls and Procedures
As of the end of the period covered by this report on Form 10-Q, our management carried out an evaluation, with the participation of our Chief Executive Officer, Richard J. Hendrix, and our Chief Financial Officer, Bradley J. Wright, of the effectiveness of our disclosure controls and procedures (as defined underRule 13a-15(e) of the Securities Exchange Act of 1934 (the “Exchange Act”)) pursuant to Rule 13a-15(b) under the Exchange Act. Based upon that evaluation, our Chief Executive Officer and our Chief Financial Officer concluded that our disclosure controls and procedures, as of June 30, 2013, are effective to ensure that information required to be disclosed by us in the reports that we file or submit under the Exchange Act is recorded, processed, summarized and reported, within the time periods specified in the SEC’s rules and forms, and that such information is accumulated and communicated to our management, including our Chief Executive Officer and Chief Financial Officer, as appropriate, to allow timely decisions regarding disclosure.
Changes in Internal Controls over Financial Reporting
During the three months ended June 30, 2013, we have not made any changes that have materially affected, or are reasonably likely to materially affect, our internal control over financial reporting (as defined inRule 13a-15(f) under the Exchange Act).
40
PART II
OTHER INFORMATION
As of June 30, 2013, except as described below, the Company was neither a defendant nor plaintiff in any lawsuits or arbitrations nor involved in any governmental or self-regulatory organization matters that are expected to have a material adverse effect on its financial condition, results of operations or liquidity. The Company has been named as a defendant in a small number of civil lawsuits relating to its various businesses. In addition, the Company is subject to various reviews, examinations, investigations and other inquiries by governmental agencies and self regulatory organizations. There can be no assurance that these matters individually or in aggregate will not have a material adverse effect on the Company’s financial condition, results of operations, or liquidity in a future period. However, based on management’s review with counsel, resolution of these matters is not expected to have a material adverse effect on the Company’s financial condition, results of operations or liquidity.
Many aspects of the Company’s business involve substantial risks of liability and litigation. Underwriters, broker-dealers and investment advisers are exposed to liability under Federal and state securities laws, other Federal and state laws and court decisions, including decisions with respect to underwriters’ liability and limitations on indemnification, as well as with respect to the handling of customer accounts. For example, underwriters may be held liable for material misstatements or omissions of fact in a prospectus used in connection with the securities being offered and broker-dealers may be held liable for statements made by their securities analysts or other personnel. FBRCM has been named as a defendant in a small number of securities claims involving investment banking clients of FBRCM as a result of FBRCM’s role as an underwriter. In these cases, the underwriting agreement provides, subject to certain conditions, that the investment banking client is required to indemnify FBRCM against certain claims or liabilities, including claims or liabilities under the Securities Act of 1933, as amended (the “Securities Act”), or contribute to payments which FBRCM is required to make as a result of the litigation. There can be no assurance that such indemnification or contribution will ultimately be available to the Company or that an investment banking client will be able to satisfy its indemnity or contribution obligations when due.
On July 9, 2013, Friedman, Billings, Ramsey & Co., Inc. (now FBRCM) and eight other underwriter defendants were dismissed from the lawsuit styled In Re Thornburg Mortgage, Inc. Securities Litigation alleging material misrepresentations and omissions in securities offerings by Thornburg Mortgage Inc. between May 2007 and January 2008. The 10th Circuit Court of Appeals affirmed the United States District Court for the District of New Mexico’s dismissal and concluded that there had been no misrepresentations or omissions in the three remaining offerings still at issue (May 2007, June 2007 and September 2007 (the two offerings in January 2008 were previously dismissed with prejudice)). The time has expired for plaintiffs to file a petition for rehearing en banc to the Court of Appeals.
FBRCM has been named as a defendant in a case relating to its role as an underwriter in residential mortgage-backed securities (“RMBS”) offerings. FBRCM is among dozens of underwriter, securitization trust and depositor defendants in an individual action filed by Cambridge Place Investment Management, Inc. in Massachusetts state court (Cambridge Place Investment Management Inc. v. Morgan Stanley et al). Cambridge’s complaint relates to the more than $2.4 billion in RMBS purchases it made in numerous underwritten offerings (of which the claims concerning FBRCM are limited to Cambridge’s purchases of a combined $22 million of RMBS in two separate offerings) and alleges that each of the defendants made misrepresentations and omissions relating to, among other things, loan-to-value ratios, appraisals, and underwriting standards, in violation of state securities laws. FBRCM has contractual indemnification claims against the RMBS issuers and contribution claims against co-underwriters involved in the two offerings for which claims have been made against it.
FBRCM has been named a defendant in the putative class action lawsuit MHC Mutual Conversion Fund, L.P. v. United Western Bancorp, Inc., et al. pending in the United States District Court for the District of Colorado. The complaint, filed in March 2011 against United Western Bancorp, Inc. (the “Bank”), its officers
41
and directors, underwriters and outside auditors, alleges material misrepresentations and omissions in the registration statement and prospectus issued in connection with the Bank’s September 2009 offering. The complaint alleges claims under Sections 11 and 12 of the Securities Act against the lead underwriter of the offering and FBRCM as a member of the underwriting syndicate. Although FBRCM is contractually entitled to be indemnified by the Bank in connection with this lawsuit, the Bank filed for bankruptcy on March 5, 2012 and this likely will decrease or eliminate the value of the indemnity that FBRCM receives from the Bank. On December 19, 2012 the Court granted Defendants’ motion to dismiss the class action complaint with prejudice and entered final judgment for the underwriters. Class plaintiffs filed a timely notice of appeal to the 10th Circuit Court of Appeals, challenging the District Court’s findings; briefing on the appeal is complete and oral argument has been scheduled for September 26, 2013.
FBRCM has been named a defendant in four putative class action lawsuits all alleging substantially identical claims against Imperial Holdings, Inc. (“Imperial”), its officers and directors and underwriters for material misrepresentations and omissions in the registration statement and prospectus issued in connection with Imperial’s February 2011 initial public offering. The cases, all currently pending in the Southern District of Florida, are captioned: Martin J. Fuller v. Imperial Holdings, Inc., et al.; City of Roseville Employees Retirement System v. Imperial Holdings, et al.; Sauer v. Imperial Holdings, et al.; and Pondick v. Imperial Holdings, et al. The complaints allege claims under Sections 11 and 12 of the Securities Act against the lead underwriters of the offering. Imperial has assumed its contractual obligation to indemnify the underwriters. As of July 31, 2013, Imperial and all other relevant parties, including FBRCM, executed a final settlement and release agreement to settle the class action lawsuits with no direct contribution from FBRCM; all appropriate motions for preliminary court approval of the class-action settlement are expected to be filed in the third quarter of 2013.
In accordance with applicable accounting guidance, the Company establishes an accrued liability for litigation and regulatory matters when those matters present loss contingencies that are both probable and estimable. In such cases, there may be an exposure to loss in excess of any amounts accrued. When a loss contingency is not both probable and estimable, the Company does not establish an accrued liability. As a litigation or regulatory matter develops, management, in conjunction with counsel, evaluates on an ongoing basis whether such matter presents a loss contingency that is probable and estimable. The cases discussed above involving the Company are at a preliminary stage, based on management’s review with counsel and present information known by management, loss contingencies for these matters are not probable and estimable as of June 30, 2013.
In certain circumstances, broker-dealers and asset managers may also be held liable by customers and clients for losses sustained on investments. In recent years, there has been an increasing incidence of litigation and actions by government agencies and self regulatory organizations involving the securities industry, including class actions that seek substantial damages. The Company is also subject to the risk of litigation, including litigation that may be without merit. As the Company intends to actively defend such litigation, significant legal expenses could be incurred. An adverse resolution of any future litigation against the Company could materially affect its financial condition, operating results and liquidity.
As of June 30, 2013, there have been no material changes to our risk factors as previously disclosed in Item 1A, “Risk Factors,” in our Annual Report on Form 10-K for the fiscal year ended December 31, 2012.
42
| Item 2. | Unregistered Sales of Equity Securities and Use of Proceeds |
The following table provides information on the Company’s share repurchases during the second quarter of 2013:
| | | | | | | | | | | | | | | | |
| | | Total Number of
Shares Purchased | | | Average Price Paid
per Share | | | Total Number of Shares
Purchased as Part of
Publicly Announced
Plans or Programs | | | Maximum Number of
Shares that May Yet Be
Purchased Under the
Plans or Programs | |
April 1 to April 30, 2013 | | | 150,000 | | | $ | 20.47 | | | | 150,000 | | | | 777,712 | |
May 1 to May 31, 2013 | | | — | | | | — | | | | — | | | | 777,712 | |
June 1 to June 30, 2013 | | | 64 | (1) | | | 23.10 | | | | — | | | | 777,712 | |
| | | | | | | | | | | | | | | | |
Total | | | 150,064 | | | $ | 20.47 | | | | 150,000 | | | | 777,712 | |
| | | | | | | | | | | | | | | | |
| (1) | In May 2013, the Company announced a tender offer to repurchase up to 1,250,000 shares of its stock at a price between $22.50 and $23.50 per share. Pursuant to this offer, on June 19, 2013, the Company repurchased 64 shares of its common stock at a price of $23.50 per share through a modified “Dutch auction.” |
| Item 4. | Mine Safety Disclosures |
Not applicable.
| | |
Exhibit Number | | Exhibit Title |
| |
| 3.01 | | Amended and Restated Bylaws of FBR & Co., dated April 23, 2013. |
| |
| 31.01 | | Certification of Chief Executive Officer pursuant to Rule 13a-14(a) under the Securities Exchange Act of 1934, as amended, adopted pursuant to Section 302 of the Sarbanes-Oxley Act of 2002. |
| |
| 31.02 | | Certification of Chief Financial Officer pursuant to Rule 13a-14(a) under the Securities Exchange Act of 1934, as amended, adopted pursuant to Section 302 of the Sarbanes-Oxley Act of 2002. |
| |
| 32.01 | | Certification of Chief Executive Officer pursuant to 18 U.S.C. Section 1350, as adopted pursuant to Section 906 of the Sarbanes-Oxley Act of 2002. |
| |
| 32.02 | | Certification of Chief Financial Officer pursuant to 18 U.S.C. Section 1350, as adopted pursuant to Section 906 of the Sarbanes-Oxley Act of 2002. |
| |
| 101 | | The following financial information from the Quarterly Report on Form 10-Q for the quarter ended June 30, 2013, formatted in XBRL (Extensible Business Reporting Language): (i) the Consolidated Balance Sheets, (ii) the Consolidated Statements of Operations, (iii) the Consolidated Statements of Comprehensive Income, (iv) the Consolidated Statements of Changes in Shareholders’ Equity, (v) the Consolidated Statements of Cash Flows, and (vi) the Notes to the Consolidated Financial Statements. |
43
SIGNATURE
Pursuant to the requirements of the Securities Exchange Act of 1934, the registrant has duly caused this report to be signed on its behalf by the undersigned, thereunto duly authorized.
| | | | |
| | FBR & Co. |
| | |
Date: August 9, 2013 | | By: | | /S/ BRADLEY J. WRIGHT |
| | | | Bradley J. Wright |
| | | | Executive Vice President, Chief Financial Officer (Principal Financial Officer) |
| | | | |
Date: August 9, 2013 | | By: | | /S/ ROBERT J. KIERNAN |
| | | | Robert J. Kiernan |
| | | | Senior Vice President, Controller and Chief Accounting Officer (Principal Accounting Officer) |
44