
Capital Strategy Update August 2015
FBR & CO. (NASDAQ: FBRC) CAUTIONARY STATEMENT
This document is intended solely for the use of the party to whom FBR has provided it, and is not to be reprinted or redistributed without the permission of FBR. All references to “FBR” refer to FBR & Co. and its subsidiaries as appropriate. Investment banking, sales, trading, and research services1 are provided by FBR Capital Markets & Co., Inc. (FBRC). FBRC is a broker-dealer registered with the SEC and is a member of FINRA. Loan Trading services are provided by FBR’s affiliate – FBR Capital Markets LT, Inc.
FBR & Co. was formed as a Virginia corporation in June 2006 to be the holding company for FBRC.
This document is intended for information purposes only, and shall not constitute a solicitation or an offer to buy or sell, any security or services, or an endorsement of any particular investment strategy.
CAUTIONS ABOUT FORWARD-LOOKING INFORMATION
This presentation and the information incorporated by reference in this presentation include forward looking statements within the meaning of Section 27A of the Securities Act of 1933, as amended, and Section 21E of the Securities Exchange Act of 1934, as amended. Some of the forward-looking statements can be identified by the use of forward-looking words such as “believes,” “expects,” “may,” “will,” “should,” “seeks,” “approximately,” “plans,” “estimates” or “anticipates” or the negative of those words or other comparable terminology. Statements concerning projections, future performance developments, events, revenues, expenses, earnings, run rates, and any other guidance on present or future periods constitute forward-looking statements. Such statements include, but are not limited to, those relating to the effects of growth, revenues and earnings, our principal investing activities, levels of assets under management and our current equity capital levels. Forward-looking statements involve risks and uncertainties. You should be aware that a number of important factors could cause our actual results to differ materially from those in the forward-looking statements. These factors include, but are not limited to, deterioration in the business environment in the specific sectors in which we focus or a decline in the market for securities of companies within these sectors, substantial fluctuations in our financial results, our ability to retain senior professionals, pricing and other competitive pressures, changes in laws and regulations and industry practices that affect our sales and trading business, incurrence of losses in the future, the singular nature of our capital markets and strategic advisory engagements, competition among financial services firms for business and personnel, larger and more frequent capital commitments in our trading and underwriting business, limitations on our access to capital, infrastructure or operational failures, the overall environment for interest rates, changes in our business strategy, and our ability to deploy offering proceeds. We will not necessarily update the information presented or incorporated by reference in this presentation if any of these forward looking statements turn out to be inaccurate. Risks affecting our business are described throughout our annual report on Form 10-K and our quarterly reports on Form 10-Q, especially in the section entitled “Risk Factors”, filed with the Securities and Exchange Commission. Our latest annual report and quarterly reports should be read for a complete understanding of our business and the risks associated with our business.
1. Research is provided by FBRC’s Research department, which is independent from the Investment Banking department of FBRC, and has the sole authority to determine which companies receive research coverage and the recommendation contained in the coverage. In the normal course of its business, FBRC seeks to perform investment banking and other fee generating services for companies that are the subject of FBRC research reports. Research analysts are eligible to receive bonus compensation that is based on FBRC’s overall operating revenues, including revenues generated by FBRC’s investment 1 banking department. Specific information is contained in each research report concerning FBRC’s relationship with the company that is the subject of the report.

SHARES OUTSTANDING1
FBR has repurchased 50 percent of its outstanding shares since December 2009. A steady approach to repurchases over this time frame has resulted in an accretive impact to book value per share of approximately $5.44.
Shares Outstanding (millions)
1. Reflects common shares outstanding for book value per share purposes and 1 for 4 reverse stock split effected on 2/28/13.
2
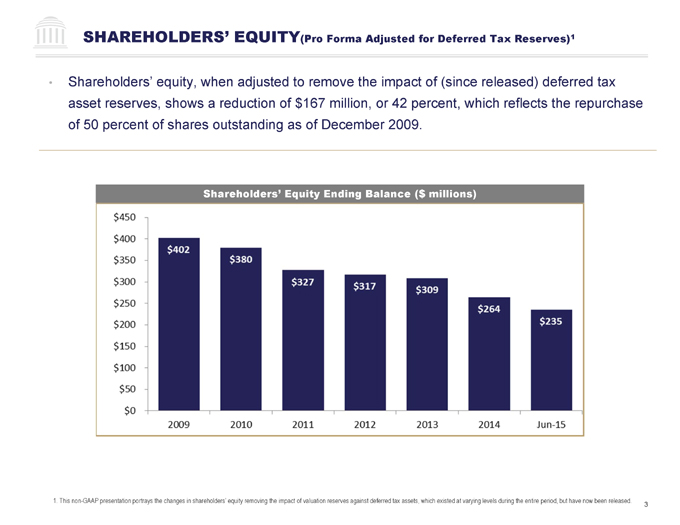
SHAREHOLDERS’ EQUITY(Pro Forma Adjusted for Deferred Tax Reserves)1
Shareholders’ equity, when adjusted to remove the impact of (since released) deferred tax asset reserves, shows a reduction of $167 million, or 42 percent, which reflects the repurchase of 50 percent of shares outstanding as of December 2009.
Shareholders’ Equity Ending Balance ($ millions)
1. This non-GAAP presentation portrays the changes in shareholders’ equity removing the impact of valuation reserves against deferred tax assets, which existed at varying levels during the entire period, but have now been released.
3

GROWTH IN TANGIBLE BOOK VALUE PER SHARE
| • | The final stage of restructuring was accomplished late in 2011. Resulting business focus and streamlined cost structure ensure profitability in most foreseeable economic environments. |
| • | Tangible book value has grown over $12.50 per share since the end of 2011 – a compound annual growth rate of 18.4 percent, reflecting a combination of earnings and the accretive share repurchases. |
4 |
|
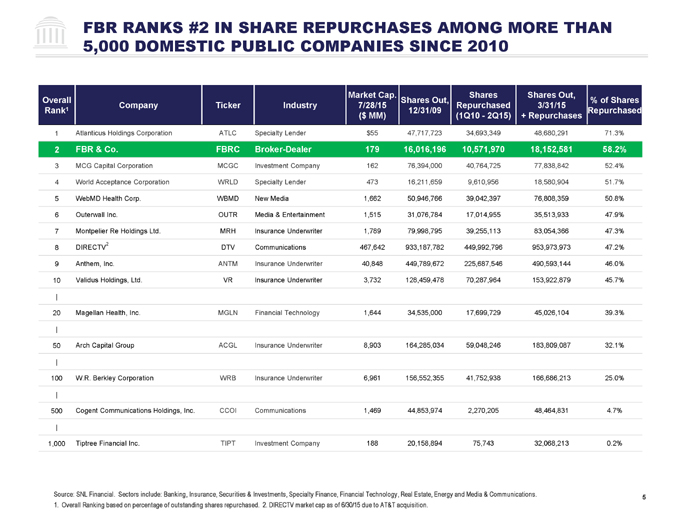
FBR RANKS #2 IN SHARE REPURCHASES AMONG MORE THAN 5,000 DOMESTIC PUBLIC COMPANIES SINCE 2010
Market Cap. Shares Shares Out,
Overall Shares Out, % of Shares
Company Ticker Industry 7/28/15 Repurchased 3/31/15
Rank1 ($ MM) 12/31/09 (1Q10—2Q15) + Repurchases Repurchased
1 Atlanticus Holdings Corporation ATLC Specialty Lender $55 47,717,723 34,693,349 48,680,291 71.3%
2 FBR & Co. FBRC Broker-Dealer 179 16,016,196 10,571,970 18,152,581 58.2%
3 MCG Capital Corporation MCGC Investment Company 162 76,394,000 40,764,725 77,838,842 52.4%
4 World Acceptance Corporation WRLD Specialty Lender 473 16,211,659 9,610,956 18,580,904 51.7%
5 WebMD Health Corp. WBMD New Media 1,662 50,946,766 39,042,397 76,808,359 50.8%
6 Outerwall Inc. OUTR Media & Entertainment 1,515 31,076,784 17,014,955 35,513,933 47.9%
7 Montpelier Re Holdings Ltd. MRH Insurance Underwriter 1,789 79,998,795 39,255,113 83,054,366 47.3%
2
8 DIRECTV DTV Communications 467,642 933,187,782 449,992,796 953,973,973 47.2%
9 Anthem, Inc. ANTM Insurance Underwriter 40,848 449,789,672 225,687,546 490,593,144 46.0%
10 Validus Holdings, Ltd. VR Insurance Underwriter 3,732 128,459,478 70,287,964 153,922,879 45.7% |
20 Magellan Health, Inc. MGLN Financial Technology 1,644 34,535,000 17,699,729 45,026,104 39.3% |
50 Arch Capital Group ACGL Insurance Underwriter 8,903 164,285,034 59,048,246 183,809,087 32.1% | 100 W.R. Berkley Corporation WRB Insurance Underwriter 6,961 156,552,355 41,752,938 166,686,213 25.0% | 500 Cogent Communications Holdings, Inc. CCOI Communications 1,469 44,853,974 2,270,205 48,464,831 4.7% | 1,000 Tiptree Financial Inc. TIPT Investment Company 188 20,158,894 75,743 32,068,213 0.2%
Source: SNL Financial. Sectors include: Banking, Insurance, Securities & Investments, Specialty Finance, Financial Technology, Real Estate, Energy and Media & Communications. 5
1. Overall Ranking based on percentage of outstanding shares repurchased. 2. DIRECTV market cap as of 6/30/15 due to AT&T acquisition.

CAPITAL MANAGEMENT – CLOSE PEER TREND
Within its peer group, FBR has been the most aggressive in managing share count and tangible book value.
December 31, 2009—June 30, 2015 ($ millions)
Financial Metric FBR & Co. Piper Jaffray Cowen Group JMP Group
Total share repurchases $206 $306 $111 $38 Common dividends paid $2 — $20 Change in share count -50% -11% 47% 4% Change in TBV / share 47% 3% 1% 9% Change in share price1 -4.9% -11.4% -4.6% -24.6%
Source: SEC filings and FactSet.
6
1. Reflects price change for the period December 31, 2009 through July 31, 2015.
Metropolitan Washington, D.C. Headquarters
1300 North Seventeenth Street . Arlington, VA 22209 703.312.9500 T . 703.312.9501 F . www.fbr.com
Boston Houston Irvine (Los Angeles) New York San Francisco
100 Federal Street, 29th Floor 9 Greenway Plaza, Suite 2050 18101 Von Karman Ave., Suite 950 299 Park Avenue, 7th Floor New 1 Embarcadero Center, Suite 2140 Boston, MA 02110 Houston, TX 77046 Irvine, CA 92612 York, NY 10171 San Francisco, CA 94111 617.757.2900 713.226.4700 949.477.3100 212.457.3300 415.248.2900
Note: Not all services available from all offices