Financial data as of June 30, 2015 Exhibit 99.1 |
FBR & CO. (NASDAQ: FBRC) CAUTIONARY STATEMENT 1 FBR & Co. was formed as a Virginia corporation in June 2006 to be the holding company for FBRC. This document is intended for information purposes only, and shall not constitute a solicitation or an offer to buy or sell, any security or services, or an endorsement of any particular investment strategy. This document is intended solely for the use of the party to whom FBR has provided it, and is not to be reprinted or redistributed without the permission of FBR. All references to “FBR” refer to FBR & Co. and its subsidiaries as appropriate. Investment banking, sales, trading, and research services 1 are provided by FBR Capital Markets & Co., Inc. (FBRC). FBRC is a broker-dealer registered with the SEC and is a member of FINRA. Loan Trading services are provided by FBR’s affiliate – FBR Capital Markets LT, Inc. CAUTIONS ABOUT FORWARD-LOOKING INFORMATION This presentation and the information incorporated by reference in this presentation include forward looking statements within the meaning of Section 27A of the Securities Act of 1933, as amended, and Section 21E of the Securities Exchange Act of 1934, as amended. Some of the forward-looking statements can be identified by the use of forward-looking words such as “believes,” “expects,” “may,” “will,” “should,” “seeks,” “approximately,” “plans,” “estimates” or “anticipates” or the negative of those words or other comparable terminology. Statements concerning projections, future performance developments, events, revenues, expenses, earnings, run rates, and any other guidance on present or future periods constitute forward-looking statements. Such statements include, but are not limited to, those relating to the effects of growth, revenues and earnings, our principal investing activities, levels of assets under management and our current equity capital levels. Forward-looking statements involve risks and uncertainties. You should be aware that a number of important factors could cause our actual results to differ materially from those in the forward-looking statements. These factors include, but are not limited to, deterioration in the business environment in the specific sectors in which we focus or a decline in the market for securities of companies within these sectors, substantial fluctuations in our financial results, our ability to retain senior professionals, pricing and other competitive pressures, changes in laws and regulations and industry practices that affect our sales and trading business, incurrence of losses in the future, the singular nature of our capital markets and strategic advisory engagements, competition among financial services firms for business and personnel, larger and more frequent capital commitments in our trading and underwriting business, limitations on our access to capital, infrastructure or operational failures, the overall environment for interest rates, changes in our business strategy, and our ability to deploy offering proceeds. We will not necessarily update the information presented or incorporated by reference in this presentation if any of these forward looking statements turn out to be inaccurate. Risks affecting our business are described throughout our annual report on Form 10-K and our quarterly reports on Form 10-Q, especially in the section entitled “Risk Factors”, filed with the Securities and Exchange Commission. Our latest annual report and quarterly reports should be read for a complete understanding of our business and the risks associated with our business. 1. Research is provided by FBRC’s Research department, which is independent from the Investment Banking department of FBRC, and has the sole authority to determine which companies receive research coverage and the recommendation contained in the coverage. In the normal course of its business, FBRC seeks to perform investment banking and other fee generating services for companies that are the subject of FBRC research reports. Research analysts are eligible to receive bonus compensation that is based on FBRC’s overall operating revenues, including revenues generated by FBRC’s investment banking department. Specific information is contained in each research report concerning FBRC’s relationship with the company that is the subject of the report. |
Ticker: FBRC Founded: 1989 Employees 1 : 293 Headquarters: Arlington, VA Offices: Boston, MA Houston, TX Irvine, CA New York, NY San Francisco, CA Top Tier Middle Market Equities Franchise Leading market share in two execution categories – 144As and At-the-Market (ATM) issuances Experienced, specialized sales force combined with focused, high-touch trading department Deep research within seven industries and highly regarded Washington policy research Experienced senior management team Inside employee ownership aligns management and shareholder interests Well Capitalized, Stable Financial Profile 35 percent operating margin before non-comp fixed expenses provide significant operating leverage Unlevered balance sheet with $235 million in shareholders’ equity Tangible book value per share of $28.52 2 , up 81 percent since 1/1/2012 Committed to effective, accretive return of capital to shareholders; Since 2010 3 , returned significant value to shareholders with over $206 million in accretive share repurchases Initiation of quarterly $0.20 per share cash dividend provides another avenue to return capital consistently over time FBR & CO. HIGHLIGHTS 2 1. Employee data as of 6/30/2015. 2. Balance sheet data as of 6/30/2015; total shares outstanding of 8,070,000 used for per share calculations. 3. Repurchase data through 6/30/2015 |
3 Stability of business platform and balance sheet supports strategic growth in industry verticals and complementary business lines to capitalize on competitive advantages GROWTH INITIATIVES Capitalizing on expanded banking opportunities in growth industries and products – Addition of Healthcare focus provides access to the biggest sector of the economy, leading to more opportunistic executions in our core IPO and 144A products – Expanding our product footprint through enhanced capabilities, such as At-the-Market (ATM) offerings and retail distribution Organically building momentum in advisory business with several dedicated M&A bankers embedded across industry verticals Enhancing services through complementary securities lending business – High margin business with balances and profitability progressing according to expectations NOTE: Research is provided by FBRC’s Research department, which is independent from the Investment Banking department of FBRC, and has the sole authority to determine which companies receive research coverage and the recommendation contained in the coverage. In the normal course of its business, FBRC seeks to perform investment banking and other fee generating services for companies that are the subject of FBRC research reports. Research analysts are eligible to receive bonus compensation that is based on FBRC’s overall operating revenues, including revenues generated by FBRC’s Investment Banking Department. Specific information is contained in each research report concerning FBRC’s relationship with the company that is the subject of the report. |
MLV & Co. Acquisition |
FBR ACQUIRES MLV & CO. 5 Broadens FBR’s equity capital markets presence and expands its investment banking capabilities Compatible industry expertise, additive capabilities and complementary professionals Expands capital markets product suite of equity and equity-linked financing solutions that are relevant to small cap issuers Increases FBR’s ability to extend issuer relationships deeper into their corporate life cycles through the addition of At-the-Market (ATM), preferred and debt (“Baby Bond”) offering expertise Highly complementary industry expertise in key areas of opportunity o Healthcare, Energy and Specialty Finance Transaction details Acquisition will be immediately accretive to revenue per head and earnings Transaction expected to close in early September 2015 Approximately 20 employees added to headcount |
6 ACQUISITION MERGES TWO MARKET LEADERS At-the-Market Issuance 01/01/2013 - 05/11/2015 All Industries | All Market Caps Rank Investment Bank No. 1 $MM 2 % Deals 1 MLV 119 $ 4,144 24.0 2 Bank of America 96 $ 7,640 19.4 3 Cantor Fitzgerald 86 $ 3,579 17.3 4 Wells Fargo 84 $ 5,355 16.9 5 RBC 65 $ 3,752 13.1 Institutional privates for early-stage issuers and ownership transitions ATM offerings for public companies Applicable to small & large cap companies Preferred and Convertible securities “Baby Bond” issues Source: Dealogic, Company Filings; See Appendix I for expanded ATM league tables 1. The sum of the deals in the Number of Deals column is greater than the actual number of deals completed to account for co-managed transactions. Excludes quarterly refilings for closed-end funds. 2. Amount filed, split equally among bookruners. Combining FBR and MLV capabilities will make us the market leader in 144A Equity offerings and At-the-Market (ATM) issuances serving a broad client base: 144A Equity Offerings (PIPO) 01/01/2010 - 06/30/2015 All Industries | All Market Caps Rank Bookrunner No. $MM % Volume 1 FBR 21 $ 6,042 59.3 2 Deutsche Bank 1 $ 720 7.1 3 Macquarie Group 5 $ 370 3.6 4 Astrup Fearnley AS 3 $ 303 3.0 5 BMO 3 $ 270 2.7 |
Our Revenue / Expense Strategy Leads to Profitability |
REVENUE MIX WEIGHTED TO HIGH MARGIN BANKING BUSINESS 8 Revenue Mix – High mix of banking-to- brokerage revenue results in competitive revenue per head By generating the largest portion of our revenue from the highest ROE business (i.e., initial capital raising), FBR is able to pay for production and retain key employees Compensation / Net Revenue – Maintain an appropriate and sustainable ratio of compensation to net revenue Low Fixed Costs – Leaner back office provides more profitable employee base; ongoing strict management of non-comp fixed expenses keeps break-even low Source: 10K and 10Q filings Revenue Mix – Banking vs. Brokerage July 1, 2014 – June 30, 2015 Compensation-to-Net Revenue Ratio (percent) |
REVENUE GENERATED THROUGH BROAD INDUSTRY COVERAGE 9 FBR maintains and continues to grow expertise in multiple verticals, creating sustained value for clients and generating revenue across economic market environments Annual Banking and Trading Revenues by Industry Vertical ($ millions) |
EXPENSE DISCIPLINE 10 LTM is defined as July 1, 2014 – June 30, 2015 FBR’s focus on expenses has led to predictability within those elements of the income statement that are more controllable Significantly limits the likelihood and degree of losses that may be sustained, even in very weak revenue environments Non-Compensation Fixed Costs ($ millions) |
COMPENSATION-TO-NET REVENUE RATIO 11 LTM is defined as July 1, 2014 – June 30, 2015 FBR’s discipline around this ratio, despite varying revenue generation, is an important element of our expense strategy and our commitment to creating value for shareholders in all environments Compensation-to-Net Revenue Ratio ($ millions) |
12 POSITIONED TO DELIVER POSITIVE NET REVENUE Median quarterly revenue ~ $43mm Quarterly Net Revenue ($ millions) 1,2 1. Results as originally reported (asset management operations included in 2009 – 2011, excluded in 2012 and beyond as discontinued operations). 2008 Net Revenue excludes $81.3 million in investment losses. 2. Revenue from NMI Holdings, Inc. investment banking transaction of $38.3 million removed from 1Q13 net revenue and added to 2Q12 net revenue to reflect its April 2012 transaction closing date. GAAP Net Revenue for 2013 and 2012 was $259.8 million and $151.5 million, respectively, and for 1Q13 and 2Q12 and was $117.9 and $32.7, respectively. Earnings impact of change is estimated to be $20.5 million, which assumes $17 million variable compensation and 4% effective tax rate. Despite quarterly volatility, the implementation of our restructuring plan in 2011 has positioned FBR to deliver positive annual revenue and earnings Annual Net Revenue ($ thousands) 1,2 |
13 NET REVENUE PER HEAD – KEY METRIC FOR FBR Revenue per Employee ($ thousands) 2 $500K per Head benchmark 1. Beginning of year headcount. 2. Source: SEC filings. Revenue from NMI Holdings, Inc. investment banking transaction of $38.3 million removed from 2013 net revenue and added to 2012 net revenue to reflect its April 2012 transaction closing date. GAAP Net Revenue for 2013 and 2012 was $259.8 million and $151.5 million, respectively. Earnings impact of change is estimated to be $20.5 million, which assumes $17 million variable compensation and 4% effective tax rate FBR is consistently profitable at revenue levels exceeding $500K in revenue per head Reaching this benchmark allows us to properly balance the interests of shareholders and employees Number of Employees 1 |
14 BUSINESS MODEL DELIVERS PROFITABILITY Adjustments to cost and capital structure position FBR to deliver positive annual returns at normalized revenue levels $000s Annual Expense Rate Assumptions 2009 Recast 2010 Recast 2011 Recast 2012 Recast 2 2013 Actual 2 2014 Actual Adjusted net revenue ("NR") 1 NA $292,233 $246,587 $147,151 $189,814 $221,521 $182,125 Compensation and benefits 57% of NR 166,573 140,555 83,876 108,194 127,720 103,811 Other variable costs 8% of NR 23,379 19,727 11,772 15,185 14,188 17,102 Non-comp fixed costs $43mm 43,000 43,000 43,000 43,000 43,643 43,852 Net income before taxes $59,282 $43,305 $8,503 $23,435 $35,970 $17,360 Operating Margin 20.3% 17.6% 5.8% 12.3% 16.2% 9.5% Revenue / Head $512 $452 $362 $739 $811 $607 Net income (taxed @ 39%) 3 $36,162 $26,416 $5,187 $14,295 $21,941 $10,590 ROE (@ $220MM Equity) 16.4% 12.0% 2.4% 6.5% 10.0% 4.8% EPS - 8 MM shares $4.52 $3.30 $0.65 $1.79 $2.74 $1.32 For Illustrative Purposes Only. 2008 – 2012 expense and net income amounts recast using current strategy expense rates / levels (see Annual Expense Rate Assumptions above). 1. As originally reported except as otherwise noted (i.e., asset management operations included in 2008 – 2011, excluded in 2012 and 2013 as discontinued operations). 2. Revenue of $38.3 million from NMI Holdings, Inc. investment banking transaction removed from 2013 Adjusted Net Revenue and added to 2012 Adjusted Net Revenue to reflect the transaction’s April 2012 closing date. GAAP Net Revenue for 2013 and 2012 was $259.8 million and $151.5 million, respectively. Related variable compensation of $17 million removed from 2013 Compensation & Benefits. Net effect on 2013 Net Income is $21.3 million. 3. Reflects recast results for 2013 and 2014 based on a 39 percent tax rate. |
Our Capital Strategy |
16 SHARES OUTSTANDING 1 FBR has repurchased 50 percent of its outstanding shares since December 2009. A steady approach to repurchases over this time frame has resulted in an accretive impact to book value per share of approximately $5.44 1. Reflects common shares outstanding for book value per share purposes and 1 for 4 reverse stock split effected on 2/28/13. Committed to holding share count at current levels or lower Targeting inside ownership for 30%, which we believe to be achievable over the next two years, further aligning management and shareholder interests Shares Outstanding (millions) |
17 SHAREHOLDERS’ EQUITY(Pro Forma Adjusted for Deferred Tax Reserves) 1 Shareholders’ equity, when adjusted to remove the impact of (since released) deferred tax asset reserves, shows a reduction of $167 million, or 42 percent, which reflects the repurchase of 50 percent of shares outstanding as of December 2009 1. This non-GAAP presentation portrays the changes in shareholders’ equity removing the impact of valuation reserves against deferred tax assets, which existed at varying levels during the entire period, but have now been released. Shareholders’ Equity Ending Balance ($ millions) |
18 GROWTH IN TANGIBLE BOOK VALUE PER SHARE The final stage of restructuring was accomplished late in 2011. Resulting business focus and streamlined cost structure ensure profitability in most foreseeable economic environments Tangible book value has grown over $12.50 per share since the end of 2011 – a compound annual growth rate of 18.4 percent, reflecting a combination of earnings and the accretive share repurchases |
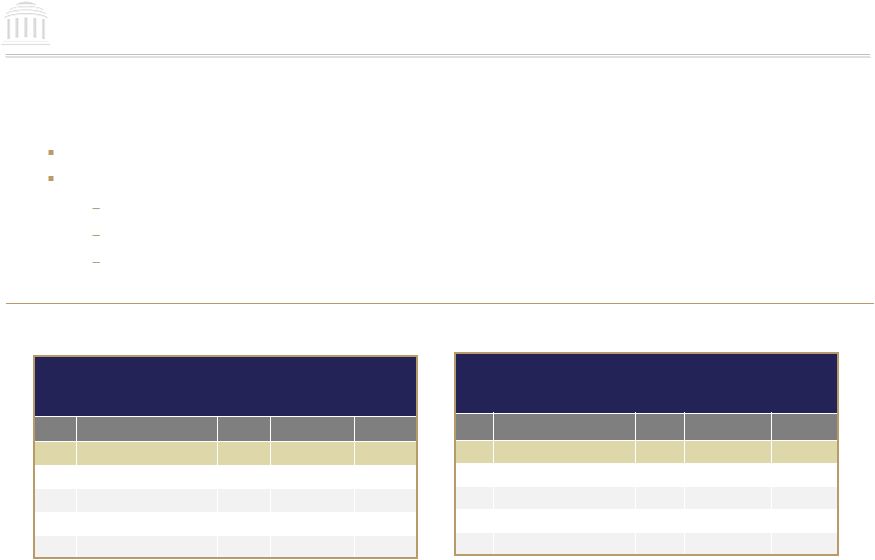
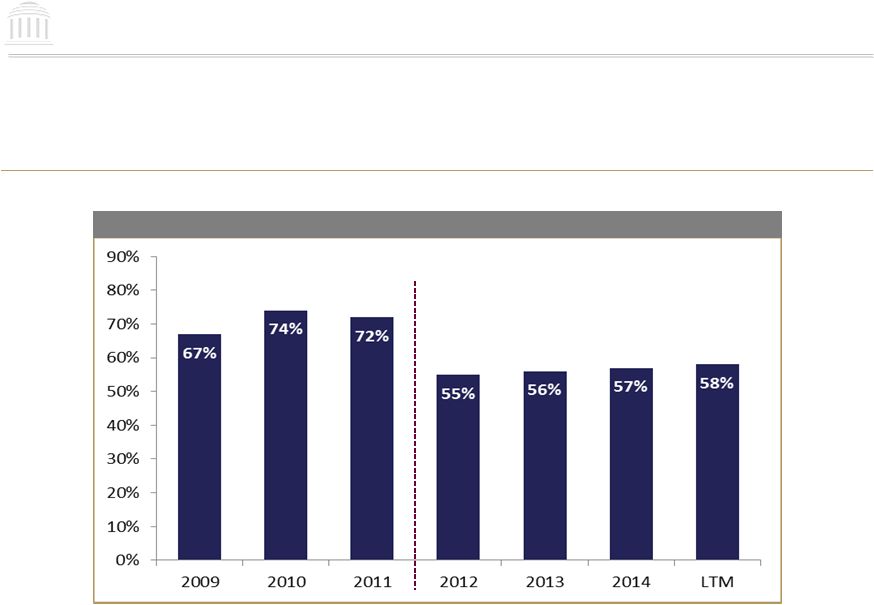
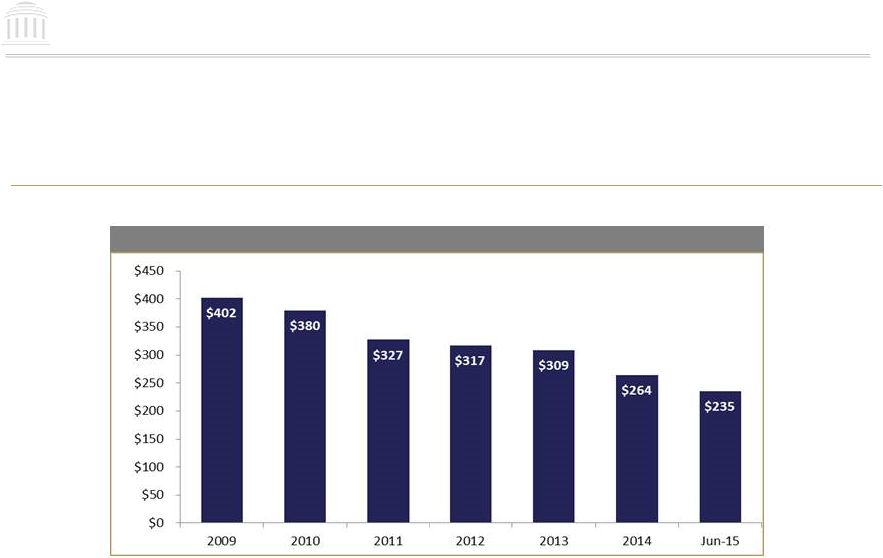
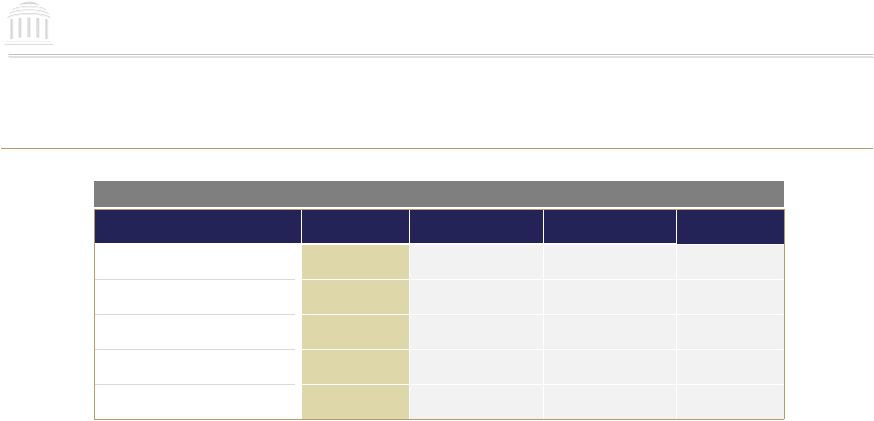
19 Source: SNL Financial. Sectors include: Banking, Insurance, Securities & Investments, Specialty Finance, Financial Technology, Real Estate, Energy and Media & Communications. 1. Overall Ranking based on percentage of outstanding shares repurchased. 2. DIRECTV market cap as of 6/30/15 due to AT&T acquisition. Overall Rank 1 Company Ticker Industry Market Cap. 7/28/15 ($ MM) Shares Out, 12/31/09 Shares Repurchased (1Q10 - 2Q15) Shares Out, 3/31/15 + Repurchases % of Shares Repurchased 1 Atlanticus Holdings Corporation ATLC Specialty Lender $55 47,717,723 34,693,349 48,680,291 71.3% 2 FBR & Co. FBRC Broker-Dealer 179 16,016,196 10,571,970 18,152,581 58.2% 3 MCG Capital Corporation MCGC Investment Company 162 76,394,000 40,764,725 77,838,842 52.4% 4 World Acceptance Corporation WRLD Specialty Lender 473 16,211,659 9,610,956 18,580,904 51.7% 5 WebMD Health Corp. WBMD New Media 1,662 50,946,766 39,042,397 76,808,359 50.8% 6 Outerwall Inc. OUTR Media & Entertainment 1,515 31,076,784 17,014,955 35,513,933 47.9% 7 Montpelier Re Holdings Ltd. MRH Insurance Underwriter 1,789 79,998,795 39,255,113 83,054,366 47.3% 8 DIRECTV 2 DTV Communications 467,642 933,187,782 449,992,796 953,973,973 47.2% 9 Anthem, Inc. ANTM Insurance Underwriter 40,848 449,789,672 225,687,546 490,593,144 46.0% 10 Validus Holdings, Ltd. VR Insurance Underwriter 3,732 128,459,478 70,287,964 153,922,879 45.7% | 20 Magellan Health, Inc. MGLN Financial Technology 1,644 34,535,000 17,699,729 45,026,104 39.3% | 50 Arch Capital Group ACGL Insurance Underwriter 8,903 164,285,034 59,048,246 183,809,087 32.1% | 100 W.R. Berkley Corporation WRB Insurance Underwriter 6,961 156,552,355 41,752,938 166,686,213 25.0% | 500 Cogent Communications Holdings, Inc. CCOI Communications 1,469 44,853,974 2,270,205 48,464,831 4.7% | 1,000 Tiptree Financial Inc. TIPT Investment Company 188 20,158,894 75,743 32,068,213 0.2% FBR RANKS #2 IN SHARE REPURCHASES AMONG MORE THAN 5,000 DOMESTIC PUBLIC COMPANIES SINCE 2010 |
20 CAPITAL MANAGEMENT – CLOSE PEER TREND Within its peer group, FBR has been the most aggressive in managing share count and tangible book value Source: SEC filings and FactSet. 1. Reflects price change for the period December 31, 2009 through July 31, 2015. December 31, 2009 - June 30, 2015 ($ millions) Financial Metric FBR & Co. Piper Jaffray Cowen Group JMP Group Total share repurchases $206 $306 $111 $38 Common dividends paid $2 - - $20 Change in share count -50% -11% 47% 4% Change in TBV / share 47% 3% 1% 9% Change in share price¹ -4.9% -11.4% -4.6% -24.6% |
Our Financials and Valuation |
22 Balance Sheet Income Statement Unlevered balance sheet and no debt $71 million in cash $235 million in shareholders’ equity FINANCIAL STATEMENTS 1 GAAP presentation. Does not include adjustment for NMI Holdings, Inc. transaction. 1. Balance Sheet and Income Statement $ in thousands, except per share amounts Jun 30, 2015 Dec. 31, 2014 Cash and cash equivalents $71,170 $108,962 Securities borrowed 683,269 594,674 Other receivables 332,791 103,065 Investments 127,949 173,047 Deferred tax assets, net 28,497 28,648 Other assets 25,293 26,701 Total assets $1,268,969 $1,035,097 Debt $0 $0 Securities loaned 685,266 595,717 Other liabilities 348,838 178,974 Shareholders' equity 234,865 260,406 Total liabilities & shareholders' equity $1,268,969 $1,035,097 Tangible book value per share $28.52 $28.63 Balances as of 2014 2013 Investment banking $115,255 $196,213 Institutional brokerage 56,182 53,738 Net investment and interest & other income 10,688 9,870 Revenues, net of interest expense $182,125 $259,821 Compensation and benefits $103,811 $144,720 Professional services 13,259 12,326 Business development 11,689 9,602 Clearing and brokerage fees 4,757 4,922 Occupancy and other operating expenses 31,249 30,981 Total expense $164,765 $202,551 Income (loss) from cont. operations before taxes $17,360 $57,270 Income tax (benefit) provision 341 (27,483) Income (loss) from cont. operations, net of taxes $17,019 $84,753 Income from discontinued operations, net of taxes - 8,159 Net income (loss) $17,019 $92,912 Compensation & benefits / revenue 57% 56% Basic earnings per share $1.66 $7.77 Diluted earnings per share $1.48 $7.17 Weighted average shares - basic 10,283 11,963 Weighted average shares - diluted 11,465 12,960 Year ended December 31, |
PEER COMPARABILITY ANALYSIS PRICE AS OF 8/28/2015, INCOME STATEMENT AND BALANCE SHEET DATA AS OF 6/30/2015 23 Annualized YTD 6/30/15 8/28/15 % of 52 Market BV TBV Price/ Price/ Total Revenue Employees Net Revenue/ Comp & Ben/ Price Week High Cap. Per Share Per Share 2015E 2016E BV TBV YTD as of 2Q as of 2Q Employee Net Revenue Ticker Company Name ($) (%) ($MM) ($) ($) (x) (x) (x) (x) ($MM) (#) ($'000s) (%) FBRC FBR & Co. $22.28 74.3% $166.1 $29.10 $28.52 15.3x 13.6x 0.8x 0.8x $71.4 293 $490 59.1% Institutional Only COWN Cowen Group, Inc. $5.23 79.4% $575.3 $7.14 $6.76 10.0x 8.4x 0.7x 0.8x $240.7 664 (1) $725 71.1% PJC Piper Jaffray Companies $40.87 68.2% $617.3 $52.16 $36.37 9.7x 9.9x 0.8x 1.1x $325.9 1,055 (1) $618 61.2% JMP JMP Group Inc. $7.24 81.8% $153.8 $6.41 $6.41 8.1x 8.0x 1.1x 1.1x $81.4 235 $693 67.1% Median 79.4% $575.3 9.7x 8.4x 0.8x 1.1x $693 67.1% Average 76.5% $448.8 9.3x 8.8x 0.9x 1.0x $679 66.5% Institutional and Retail SF Stifel Financial Corp. $47.07 78.5% $3,268.2 $37.99 $23.72 15.5x 12.1x 1.2x 2.0x $1,158.7 6,200 (2) $374 66.1% OPY Oppenheimer Holdings Inc. $19.87 71.0% $271.5 $39.02 $26.57 20.0x 8.9x 0.5x 0.7x $484.5 3,434 (2) $282 66.3% Average 74.8% $1,769.8 17.7x 10.5x 0.9x 1.4x $328 66.2% Advisory EVR Evercore Partners Inc $52.81 88.9% $1,916.3 $13.47 $5.74 16.3x 14.1x 3.9x 9.2x $506.1 1,300 (2) $779 66.4% GHL Greenhill & Co Inc $35.53 71.3% $1,041.8 $7.12 $1.76 20.0x 15.3x 5.0x 20.2x $135.2 305 (2) $887 54.0% MC Moelis & Company $27.20 72.8% $549.2 $6.71 $6.71 16.5x 14.9x 4.1x 4.1x $225.3 650 $693 55.5% Median 72.8% $1,041.8 16.5x 14.9x 4.1x 9.2x $779 55.5% Average 77.7% $1,169.1 17.6x 14.8x 4.3x 11.2x $786 58.7% All Peers - Median 75.7% $596.3 15.9x 11.0x 1.2x 1.6x $693 66.2% All Peers - Average 76.5% $1,049.2 14.5x 11.5x 2.2x 4.9x $631 63.5% Valuation P/E Source: Factset as of August 28, 2015 and SEC Filings as of August 2015. 1. Annualized. 2. As of February 2015. 3. As of December 31, 2014. |
SUMMARY 24 FBR & Co. is a uniquely valuable equity capital markets franchise – A transaction driven business model focused on ideas and execution that make money for our clients – Dominant in the high margin initial equity capital raising arena – Operating on a low fixed cost structure – Allowing us to achieve profitability across market conditions FBR’s well capitalized, stable financial profile has positioned us for: – Pro-active growth initiatives – Strategic management of capital – Attractive returns on equity – Returning capital to shareholders |
Metropolitan Washington, D.C. Headquarters 1300 North Seventeenth Street . Arlington, VA 22209 703.312.9500 T . 703.312.9501 F . www.fbr.com Boston Houston Irvine (Los Angeles) New York San Francisco 100 Federal Street, 29th Floor Boston, MA 02110 617.757.2900 9 Greenway Plaza, Suite 2050 Houston, TX 77046 713.226.4700 18101 Von Karman Ave., Suite 950 Irvine, CA 92612 949.477.3100 299 Park Avenue, 7th Floor New York, NY 10171 212.457.3300 1 Embarcadero Center, Suite 2140 San Francisco, CA 94111 415.248.2900 Note: Not all services available from all offices |