UNITED STATES
SECURITIES AND EXCHANGE COMMISSION
Washington, D.C. 20549
SCHEDULE 14A
Proxy Statement Pursuant to Section 14(a) of the
Securities Exchange Act of 1934
Filed by the Registrant x Filed by a Party other than the Registrant ¨
Check the appropriate box:
| | |
| ¨ | | Preliminary Proxy Statement |
| ¨ | | Confidential, for Use of the Commission Only (as permitted by Rule 14a-6(e)(2)) |
| ¨ | | Definitive Proxy Statement |
| x | | Definitive Additional Materials |
| ¨ | | Soliciting Material Pursuant to Section 240.14a-12 |
FBR & CO.
(Name of Registrant as Specified in Its Charter)
(Name of Person(s) Filing Proxy Statement if Other Than the Registrant)
Payment of Filing Fee (Check the appropriate box):
| | | | |
| |
| x | | No fee required. |
| |
| ¨ | | Fee computed on table below per Exchange Act Rules 14a-6(i)(1) and 0-11. |
| | |
| | (1) | | Title of each class of securities to which transaction applies: |
| | (2) | | Aggregate number of securities to which transaction applies: |
| | (3) | | Per unit price or other underlying value of transaction computed pursuant to Exchange Act Rule 0-11 (set forth the amount on which the filing fee is calculated and state how it was determined): |
| | (4) | | Proposed maximum aggregate value of transaction: |
| | (5) | | Total fee paid: |
| |
| ¨ | | Fee paid previously with preliminary materials. |
| |
| ¨ | | Check box if any part of the fee is offset as provided by Exchange Act Rule 0-11(a)(2) and identify the filing for which the offsetting fee was paid previously. Identify the previous filing by registration statement number, or the form or schedule and the date of its filing. |
| | |
| | (1) | | Amount previously paid: |
| | (2) | | Form, Schedule or Registration Statement No.: |
| | (3) | | Filing Party: |
| | (4) | | Date Filed: |
Investor Update May 2016
Cautionary Statement FBR & Co. was formed as a Virginia corporation in June 2006 to be the holding company for FBRC. This document is intended for information purposes only, and shall not constitute a solicitation or an offer to buy or sell, any security or services, or an endorsement of any particular investment strategy. This document is intended solely for the use of the party to whom FBR has provided it, and is not to be reprinted or redistributed without the permission of FBR. All references to “FBR” refer to FBR & Co. and its subsidiaries as appropriate. Investment banking, sales, trading, and research services1 are provided by FBR Capital Markets & Co., Inc. (FBRC) and MLV & Co., LLC (MLV). FBRC and MLV are each broker-dealers registered with the SEC and members of FINRA. Loan Trading services are provided by FBR’s affiliate – FBR Capital Markets LT, Inc. CAUTIONS ABOUT FORWARD-LOOKING INFORMATION This presentation and the information incorporated by reference in this presentation include forward looking statements within the meaning of Section 27A of the Securities Act of 1933, as amended, and Section 21E of the Securities Exchange Act of 1934, as amended. Some of the forward-looking statements can be identified by the use of forward-looking words such as “believes,” “expects,” “may,” “will,” “should,” “seeks,” “approximately,” “plans,” “estimates” or “anticipates” or the negative of those words or other comparable terminology. Statements concerning projections, future performance developments, events, revenues, expenses, earnings, run rates, and any other guidance on present or future periods constitute forward-looking statements. Such statements include, but are not limited to, those relating to the effects of growth, revenues and earnings, our principal investing activities, levels of assets under management and our current equity capital levels. Forward-looking statements involve risks and uncertainties. You should be aware that a number of important factors could cause our actual results to differ materially from those in the forward-looking statements. These factors include, but are not limited to, deterioration in the business environment in the specific sectors in which we focus or a decline in the market for securities of companies within these sectors, substantial fluctuations in our financial results, our ability to retain senior professionals, pricing and other competitive pressures, changes in laws and regulations and industry practices that affect our sales and trading business, incurrence of losses in the future, the singular nature of our capital markets and strategic advisory engagements, competition among financial services firms for business and personnel, larger and more frequent capital commitments in our trading and underwriting business, limitations on our access to capital, infrastructure or operational failures, the overall environment for interest rates, changes in our business strategy, and our ability to deploy offering proceeds. We will not necessarily update the information presented or incorporated by reference in this presentation if any of these forward looking statements turn out to be inaccurate. Risks affecting our business are described throughout our annual report on Form 10-K and our quarterly reports on Form 10-Q, especially in the section entitled “Risk Factors”, filed with the Securities and Exchange Commission. Our latest annual report and quarterly reports should be read for a complete understanding of our business and the risks associated with our business. Important Additional Information FBR, its directors and certain of its executive officers are participants in the solicitation of proxies in connection with FBR’s 2016 Annual Meeting of Shareholders. FBR has filed a definitive proxy statement and form of WHITE proxy card with the Securities and Exchange Commission (the “SEC”) in connection with such solicitation of proxies from FBR’s shareholders. WE URGE INVESTORS TO READ THE DEFINITIVE PROXY STATEMENT AND ACCOMPANYING WHITE PROXY CARD CAREFULLY AND IN THEIR ENTIRETY BECAUSE THEY CONTAIN IMPORTANT INFORMATION. Information regarding the names of FBR’s directors and executive officers and their respective interests in FBR by security holdings or otherwise is set forth in FBR’s definitive proxy statement for its 2016 Annual Meeting of Shareholders, filed with the SEC on May 9, 2016. Shareholders are able to obtain at no charge copies of these documents, including any proxy statement and accompanying WHITE proxy card and other documents filed with the SEC, at the SEC’s website at www.sec.gov. In addition, copies are also available at no charge at the Investor Relations section of FBR’s website at www.fbr.com. 1. Research is provided by FBRC’s Research department, which is independent from the Investment Banking department of FBRC and MLV, and has the sole authority to determine which companies receive research coverage and the recommendation contained in the coverage. In the normal course of its business, FBRC and MLV seek to perform investment banking and other fee generating services for companies that are the subject of FBRC research reports. Research analysts are eligible to receive bonus compensation that is based on FBRC’s and MLV’s overall operating revenues, including revenues generated by FBRC’s and MLV’s investment banking departments. Specific information is contained in each research report concerning FBRC’s relationship with the company that is the subject of the report.
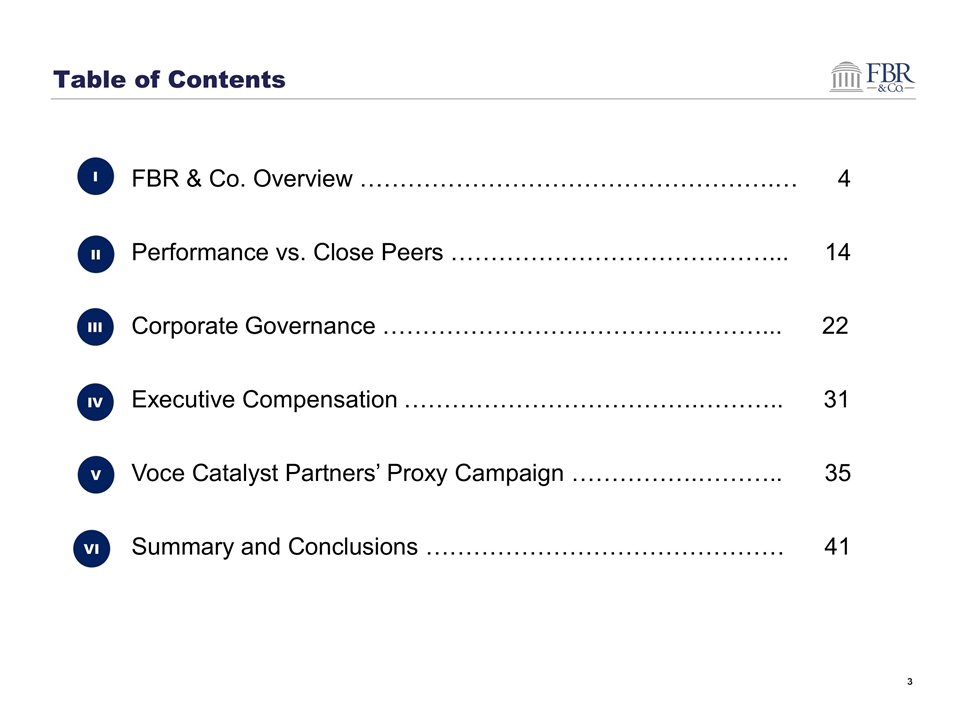
Table of Contents FBR & Co. Overview …………………………………………….… 4 Performance vs. Close Peers …………………………….……... 14 Corporate Governance …………………….…………..………... 22 Executive Compensation ……………………………….……….. 31 Voce Catalyst Partners’ Proxy Campaign …………….……….. 35 Summary and Conclusions ……………………………………… 41 I II III IV V VI
Section I: FBR & Co. Overview
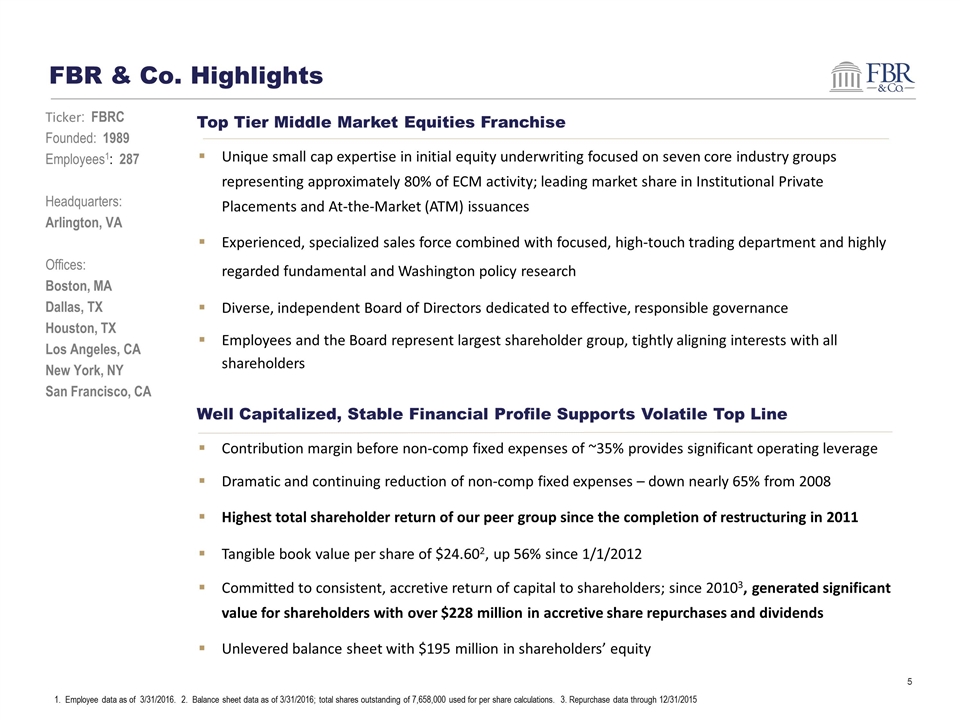
Ticker: FBRC Founded: 1989 Employees1: 287 Headquarters: Arlington, VA Offices: Boston, MA Dallas, TX Houston, TX Los Angeles, CA New York, NY San Francisco, CA Top Tier Middle Market Equities Franchise Unique small cap expertise in initial equity underwriting focused on seven core industry groups representing approximately 80% of ECM activity; leading market share in Institutional Private Placements and At-the-Market (ATM) issuances Experienced, specialized sales force combined with focused, high-touch trading department and highly regarded fundamental and Washington policy research Diverse, independent Board of Directors dedicated to effective, responsible governance Employees and the Board represent largest shareholder group, tightly aligning interests with all shareholders Well Capitalized, Stable Financial Profile Supports Volatile Top Line Contribution margin before non-comp fixed expenses of ~35% provides significant operating leverage Dramatic and continuing reduction of non-comp fixed expenses – down nearly 65% from 2008 Highest total shareholder return of our peer group since the completion of restructuring in 2011 Tangible book value per share of $24.602, up 56% since 1/1/2012 Committed to consistent, accretive return of capital to shareholders; since 20103, generated significant value for shareholders with over $228 million in accretive share repurchases and dividends Unlevered balance sheet with $195 million in shareholders’ equity FBR & Co. Highlights 1. Employee data as of 3/31/2016. 2. Balance sheet data as of 3/31/2016; total shares outstanding of 7,658,000 used for per share calculations. 3. Repurchase data through 12/31/2015
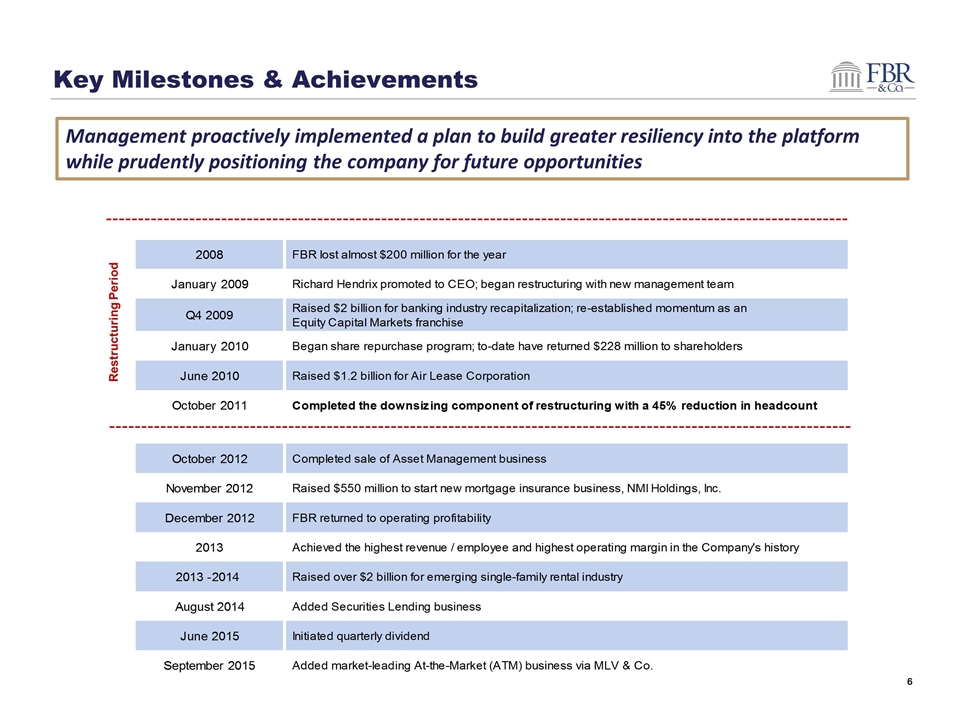
Key Milestones & Achievements Management proactively implemented a plan to build greater resiliency into the platform while prudently positioning the company for future opportunities Restructuring Period
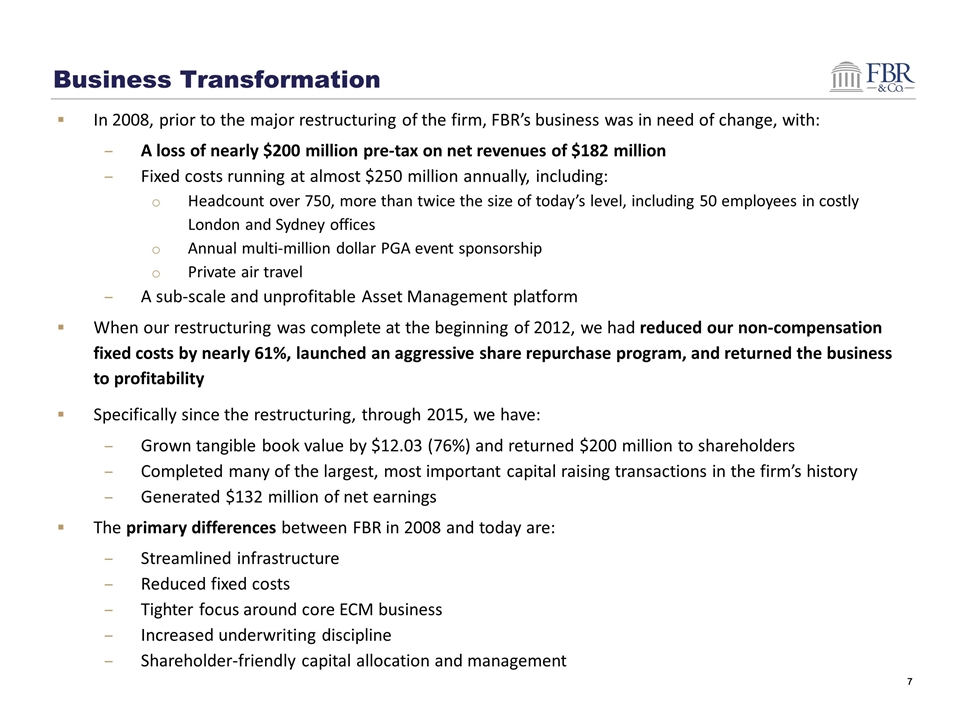
Business Transformation In 2008, prior to the major restructuring of the firm, FBR’s business was in need of change, with: A loss of nearly $200 million pre-tax on net revenues of $182 million Fixed costs running at almost $250 million annually, including: Headcount over 750, more than twice the size of today’s level, including 50 employees in costly London and Sydney offices Annual multi-million dollar PGA event sponsorship Private air travel A sub-scale and unprofitable Asset Management platform When our restructuring was complete at the beginning of 2012, we had reduced our non-compensation fixed costs by nearly 61%, launched an aggressive share repurchase program, and returned the business to profitability Specifically since the restructuring, through 2015, we have: Grown tangible book value by $12.03 (76%) and returned $200 million to shareholders Completed many of the largest, most important capital raising transactions in the firm’s history Generated $132 million of net earnings The primary differences between FBR in 2008 and today are: Streamlined infrastructure Reduced fixed costs Tighter focus around core ECM business Increased underwriting discipline Shareholder-friendly capital allocation and management
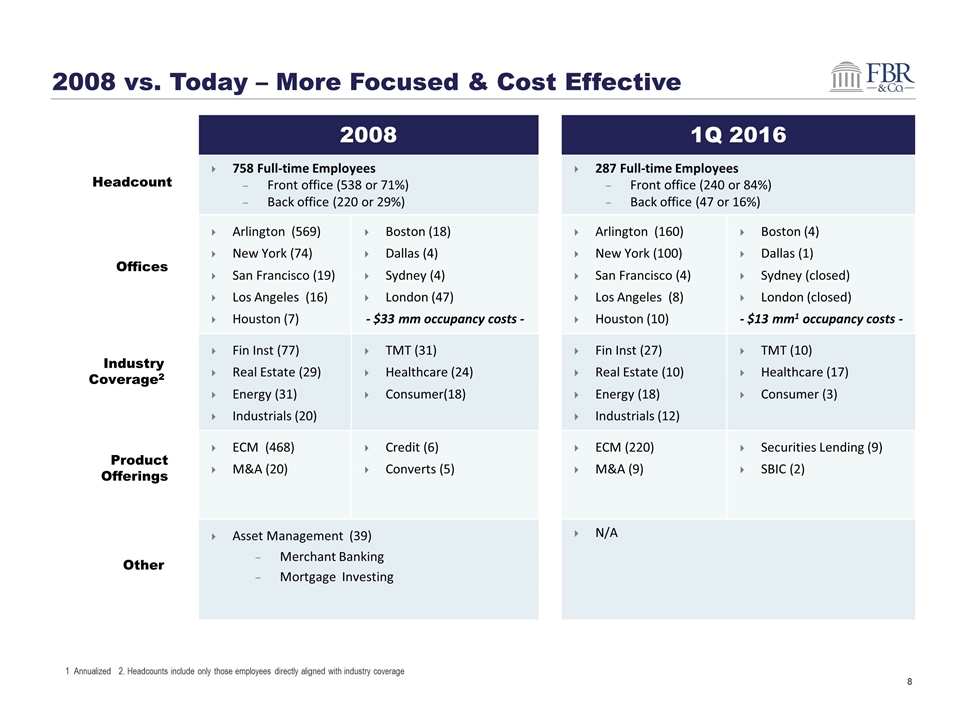
2008 vs. Today – More Focused & Cost Effective 2008 1Q 2016 758 Full-time Employees Front office (538 or 71%) Back office (220 or 29%) 287 Full-time Employees Front office (240 or 84%) Back office (47 or 16%) Arlington (569) New York (74) San Francisco (19) Los Angeles (16) Houston (7) Boston (18) Dallas (4) Sydney (4) London (47) - $33 mm occupancy costs - Arlington (160) New York (100) San Francisco (4) Los Angeles (8) Houston (10) Boston (4) Dallas (1) Sydney (closed) London (closed) - $13 mm1 occupancy costs - Fin Inst (77) Real Estate (29) Energy (31) Industrials (20) TMT (31) Healthcare (24) Consumer(18) Fin Inst (27) Real Estate (10) Energy (18) Industrials (12) TMT (10) Healthcare (17) Consumer (3) ECM (468) M&A (20) Credit (6) Converts (5) ECM (220) M&A (9) Securities Lending (9) SBIC (2) Asset Management (39) Merchant Banking Mortgage Investing N/A Headcount Offices Industry Coverage2 Product Offerings Other 1 Annualized 2. Headcounts include only those employees directly aligned with industry coverage
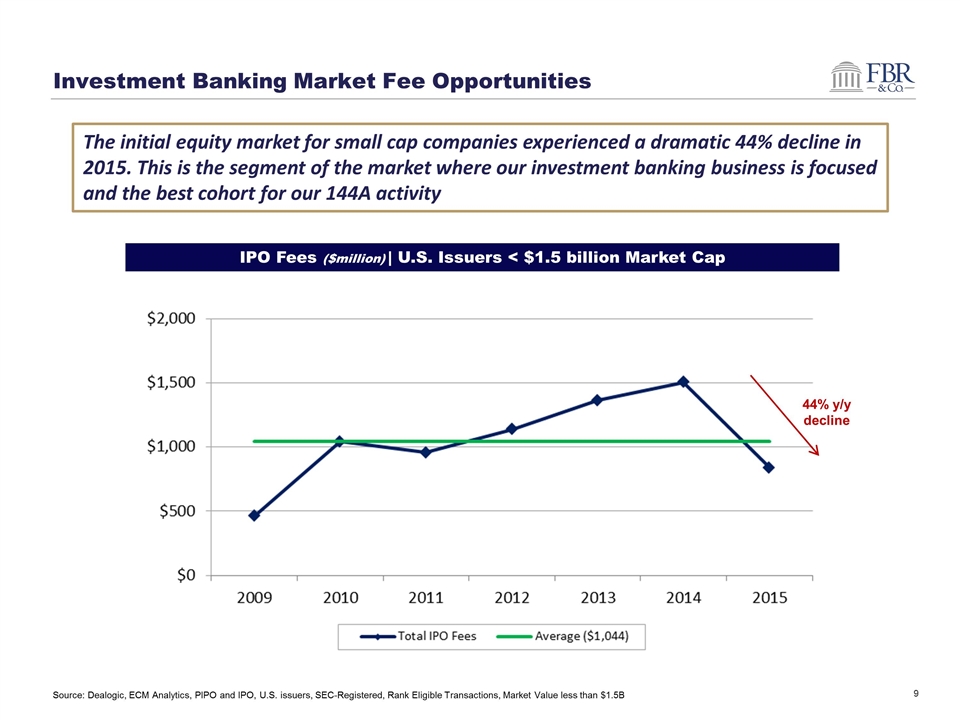
Investment Banking Market Fee Opportunities Source: Dealogic, ECM Analytics, PIPO and IPO, U.S. issuers, SEC-Registered, Rank Eligible Transactions, Market Value less than $1.5B The initial equity market for small cap companies experienced a dramatic 44% decline in 2015. This is the segment of the market where our investment banking business is focused and the best cohort for our 144A activity IPO Fees ($million) | U.S. Issuers < $1.5 billion Market Cap 44% y/y decline
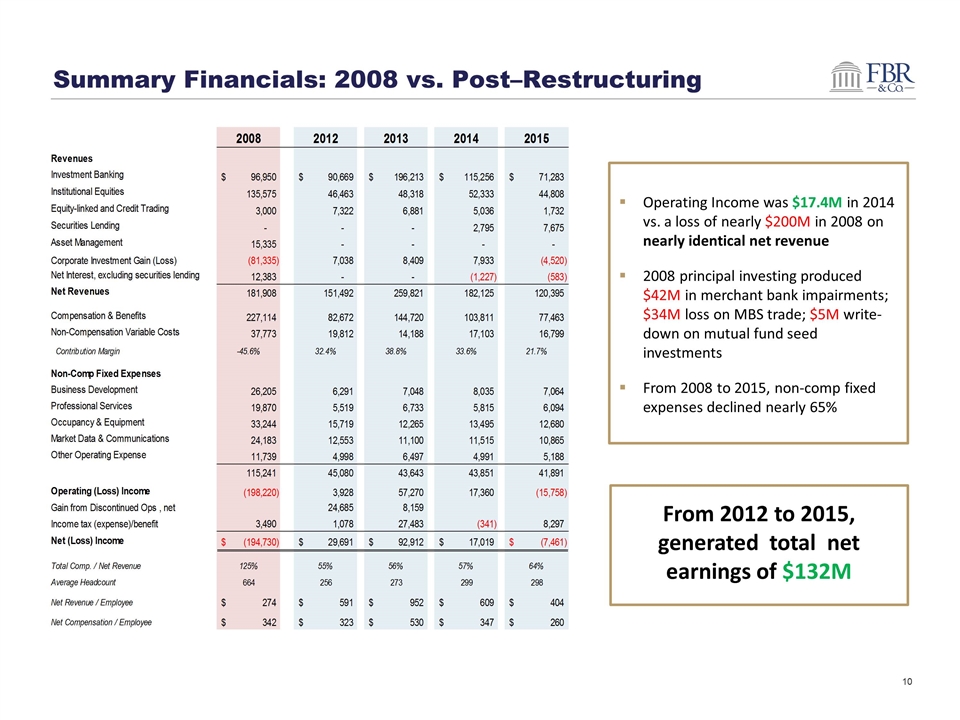
Summary Financials: 2008 vs. Post–Restructuring Operating Income was $17.4M in 2014 vs. a loss of nearly $200M in 2008 on nearly identical net revenue 2008 principal investing produced $42M in merchant bank impairments; $34M loss on MBS trade; $5M write-down on mutual fund seed investments From 2008 to 2015, non-comp fixed expenses declined nearly 65% From 2012 to 2015, generated total net earnings of $132M
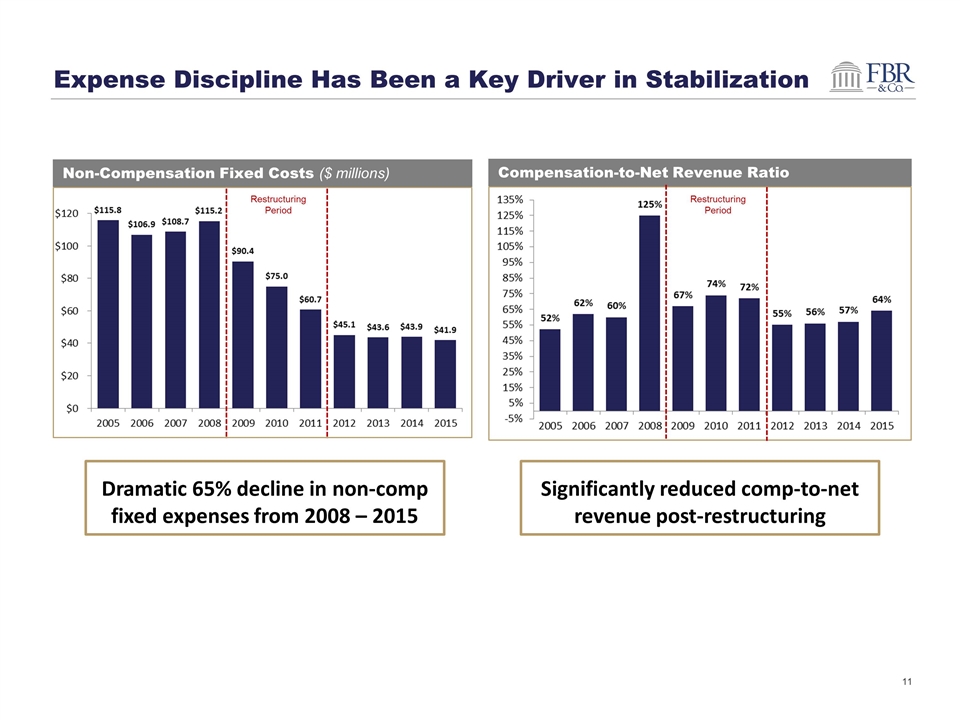
Expense Discipline Has Been a Key Driver in Stabilization Non-Compensation Fixed Costs ($ millions) Compensation-to-Net Revenue Ratio Restructuring Period Restructuring Period Dramatic 65% decline in non-comp fixed expenses from 2008 – 2015 Significantly reduced comp-to-net revenue post-restructuring

~60% of FBR outstanding shares repurchased since December 2009 – steady approach over time resulted in accretive impact to book value per share of ~$5.49 Reflects common shares outstanding for book value per share purposes and 1 for 4 reverse stock split effected on 2/28/13. This non-GAAP presentation portrays the changes in shareholders’ equity removing the impact of valuation reserves against deferred tax assets, which existed at varying levels during the entire period, but have now been released. Years where GAAP reporting differs were 2009 ($319), 2010 ($291), 2011 ($225), 2012 ($240), 2013 ($291), 2014 ($260) and 2015 ($211). Shareholders’ equity (adjusted to remove impact of since-released DTA reserves) shows reduction of $191 million, or 48%, reflecting significant share repurchase activity Shares Outstanding1 (millions) Shareholders’ Equity2 Ending Balance ($ millions) Maintaining a highly liquid and unleveraged balance sheet has helped ensure FBR is positioned to withstand revenue troughs and inspire counterparty confidence. It has also positioned the firm to aggressively repurchase stock over the years, resulting in an accretive impact to book value of $5.49 per share Some of this value has also been returned to shareholders in the form of a quarterly dividend, which was initiated in the third quarter of 2015 FBR Ranks #2 in Share Repurchases FBR Has Returned Over $228 Million to Shareholders through Buybacks and Dividends
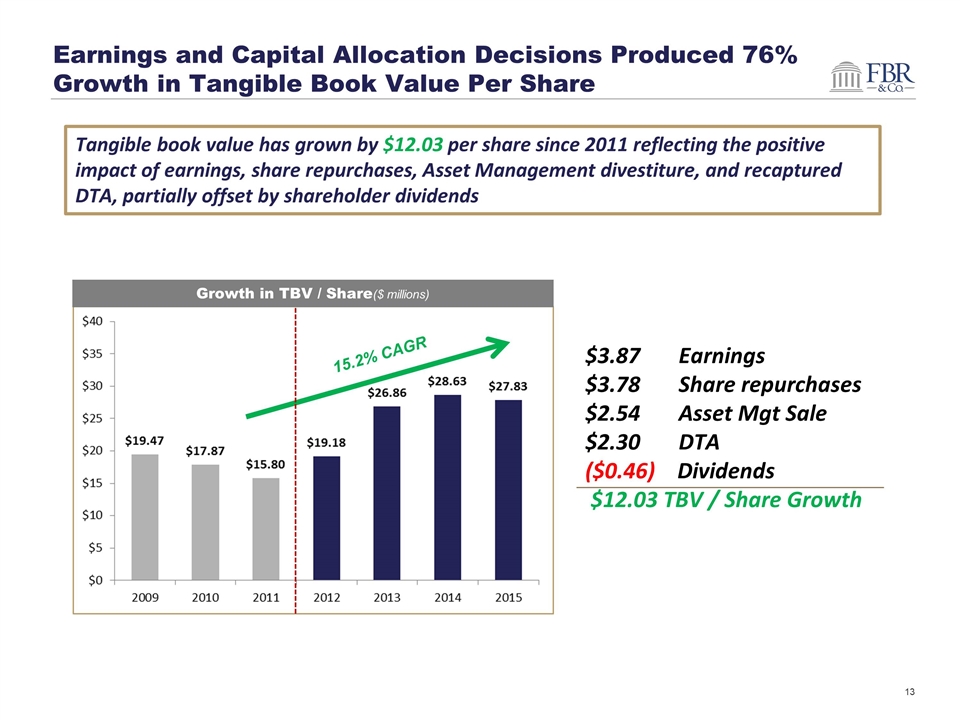
Tangible book value has grown by $12.03 per share since 2011 reflecting the positive impact of earnings, share repurchases, Asset Management divestiture, and recaptured DTA, partially offset by shareholder dividends Earnings and Capital Allocation Decisions Produced 76% Growth in Tangible Book Value Per Share $3.87 Earnings $3.78 Share repurchases $2.54 Asset Mgt Sale $2.30 DTA ($0.46) Dividends $12.03 TBV / Share Growth Growth in TBV / Share($ millions) 15.2% CAGR
Section II: Performance vs. Close Peers
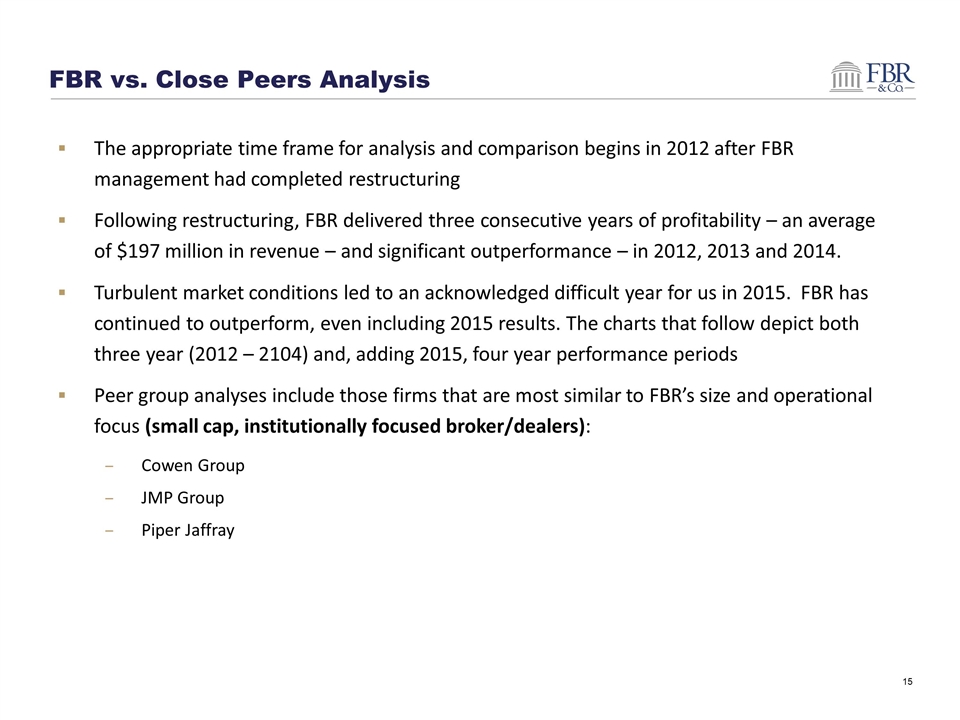
FBR vs. Close Peers Analysis The appropriate time frame for analysis and comparison begins in 2012 after FBR management had completed restructuring Following restructuring, FBR delivered three consecutive years of profitability – an average of $197 million in revenue – and significant outperformance – in 2012, 2013 and 2014. Turbulent market conditions led to an acknowledged difficult year for us in 2015. FBR has continued to outperform, even including 2015 results. The charts that follow depict both three year (2012 – 2104) and, adding 2015, four year performance periods Peer group analyses include those firms that are most similar to FBR’s size and operational focus (small cap, institutionally focused broker/dealers): Cowen Group JMP Group Piper Jaffray G
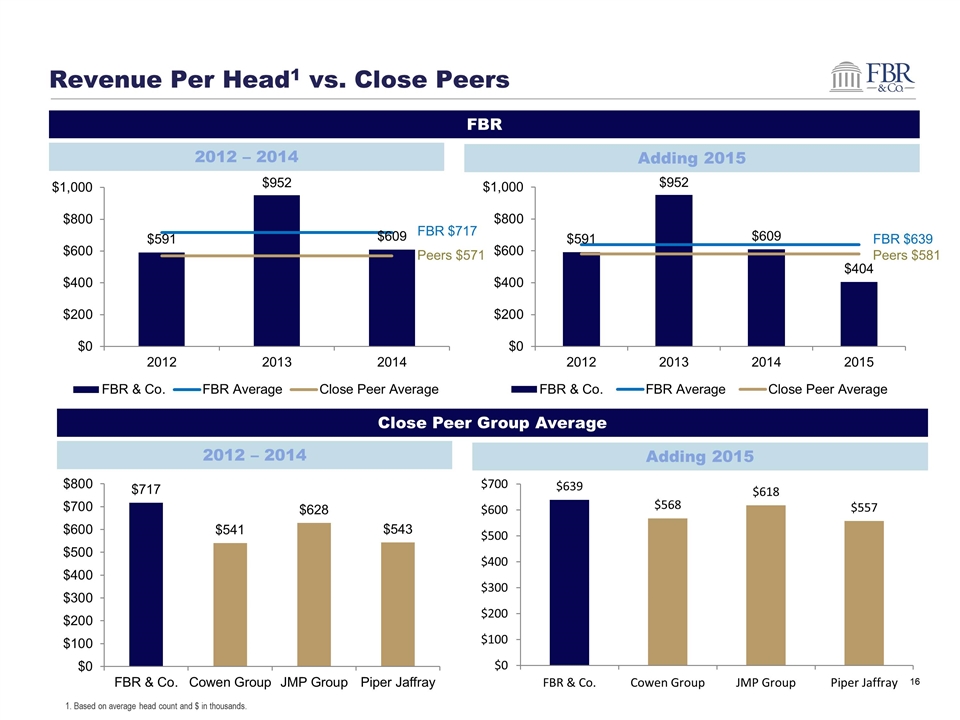
Revenue Per Head1 vs. Close Peers FBR $639 Peers $581 FBR Close Peer Group Average 2012 – 2014 Adding 2015 2012 – 2014 Adding 2015 FBR $717 Peers $571 1. Based on average head count and $ in thousands.
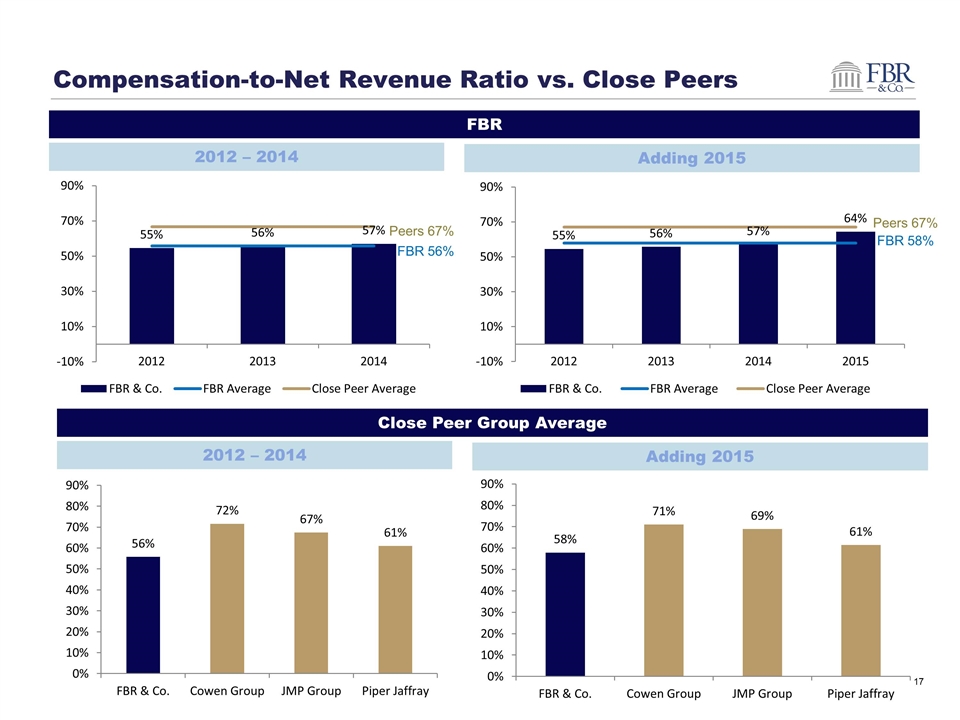
Compensation-to-Net Revenue Ratio vs. Close Peers FBR Close Peer Group Average 2012 – 2014 Adding 2015 2012 – 2014 Adding 2015 FBR 56% FBR 58% Peers 67% Peers 67%
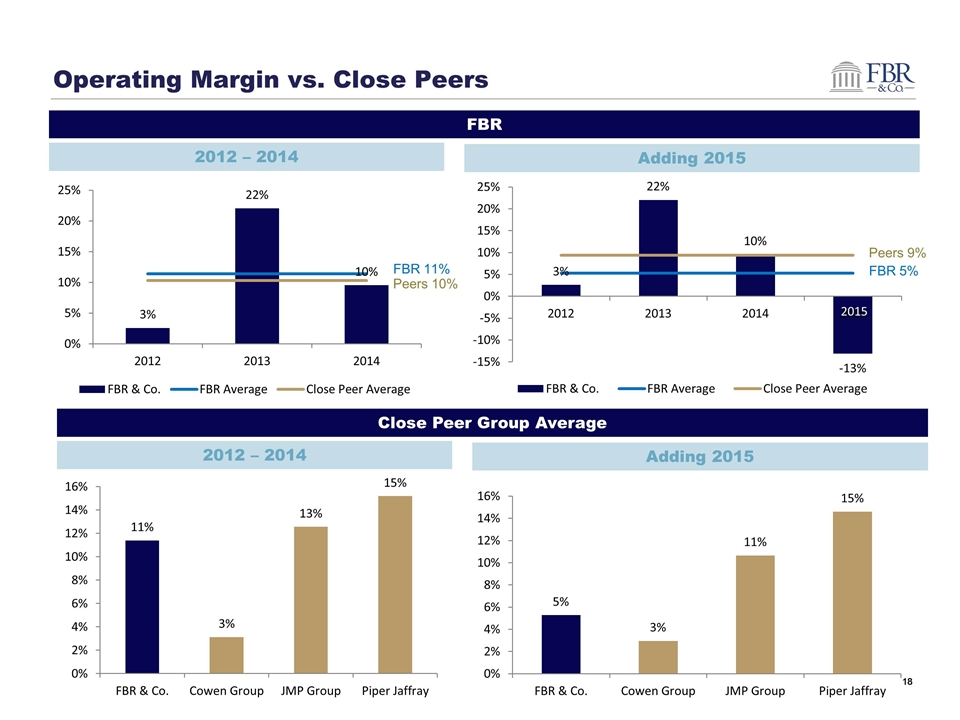
Operating Margin vs. Close Peers FBR 5% Peers 9% FBR Close Peer Group Average 2012 – 2014 Adding 2015 2012 – 2014 Adding 2015 FBR 11% Peers 10% 2015
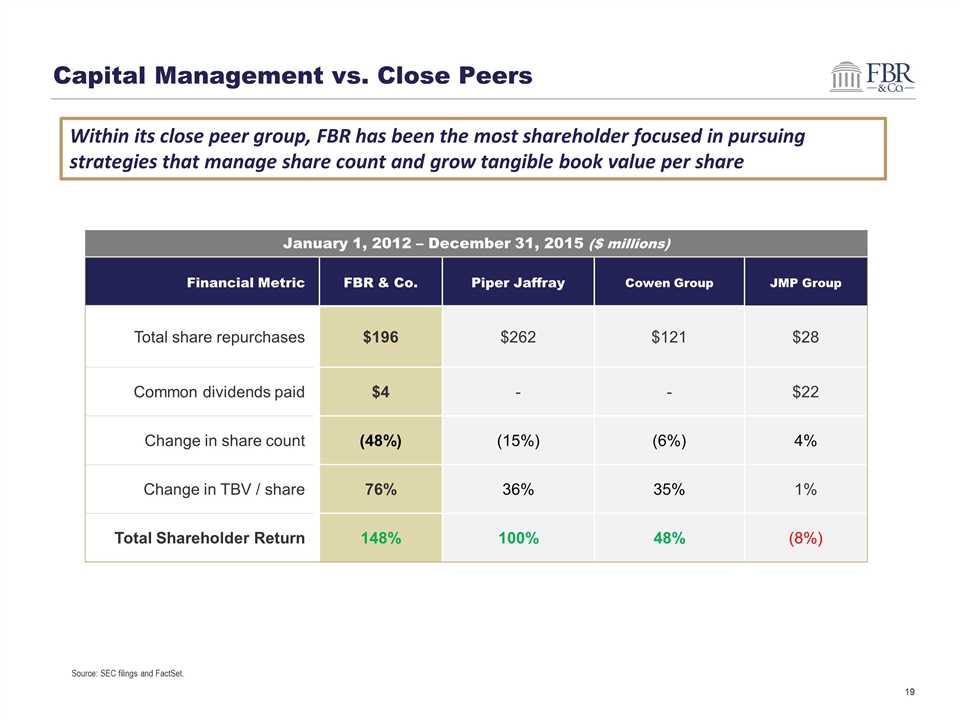
Capital Management vs. Close Peers January 1, 2012 – December 31, 2015 ($ millions) Financial Metric FBR & Co. Piper Jaffray Cowen Group JMP Group Total share repurchases $196 $262 $121 $28 Common dividends paid $4 - - $22 Change in share count (48%) (15%) (6%) 4% Change in TBV / share 76% 36% 35% 1% Total Shareholder Return 148% 100% 48% (8%) Source: SEC filings and FactSet. Within its close peer group, FBR has been the most shareholder focused in pursuing strategies that manage share count and grow tangible book value per share
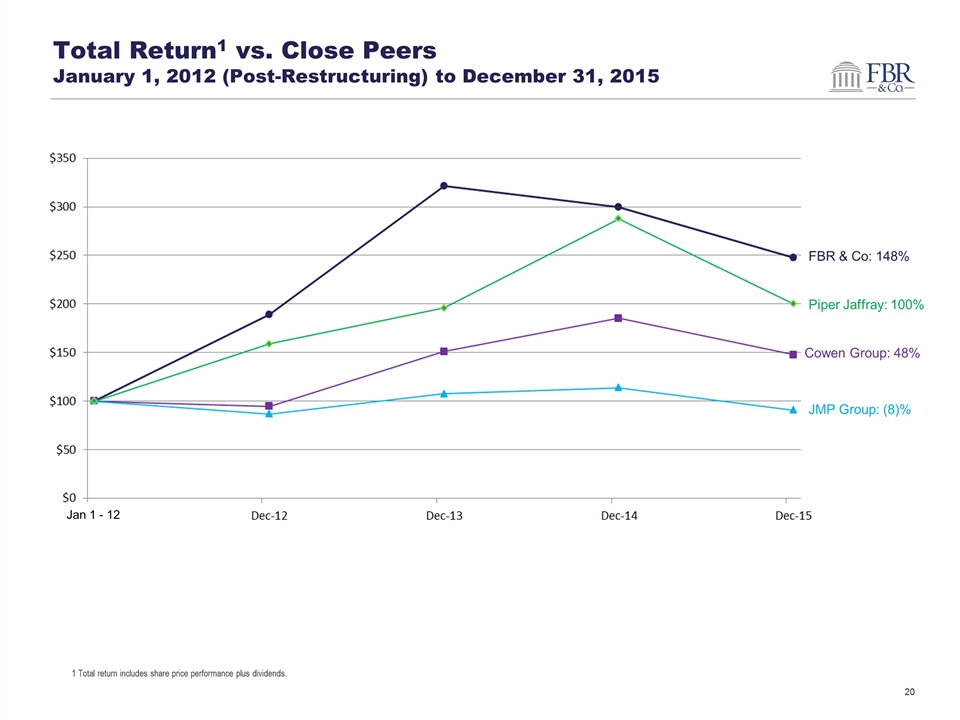
Total Return1 vs. Close Peers January 1, 2012 (Post-Restructuring) to December 31, 2015 Jan 1 - 12 Cowen Group: 48% JMP Group: (8)% FBR & Co: 148% Piper Jaffray: 100% 1 Total return includes share price performance plus dividends.
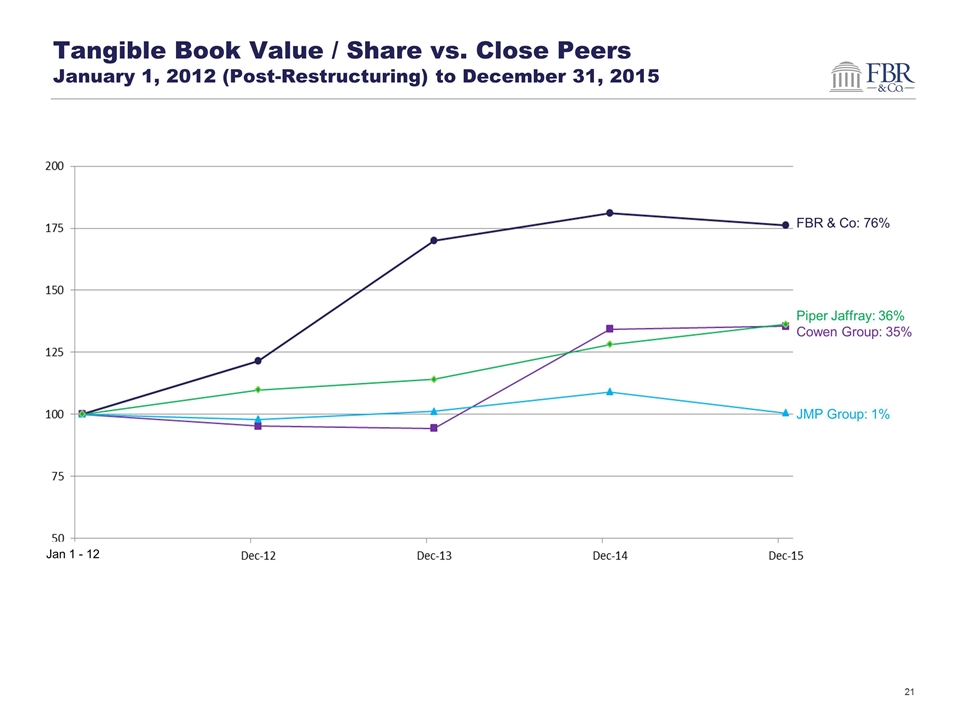
Tangible Book Value / Share vs. Close Peers January 1, 2012 (Post-Restructuring) to December 31, 2015 Jan 1 - 12 FBR & Co: 76% Piper Jaffray: 36% Cowen Group: 35% JMP Group: 1%
Section III: Corporate Governance
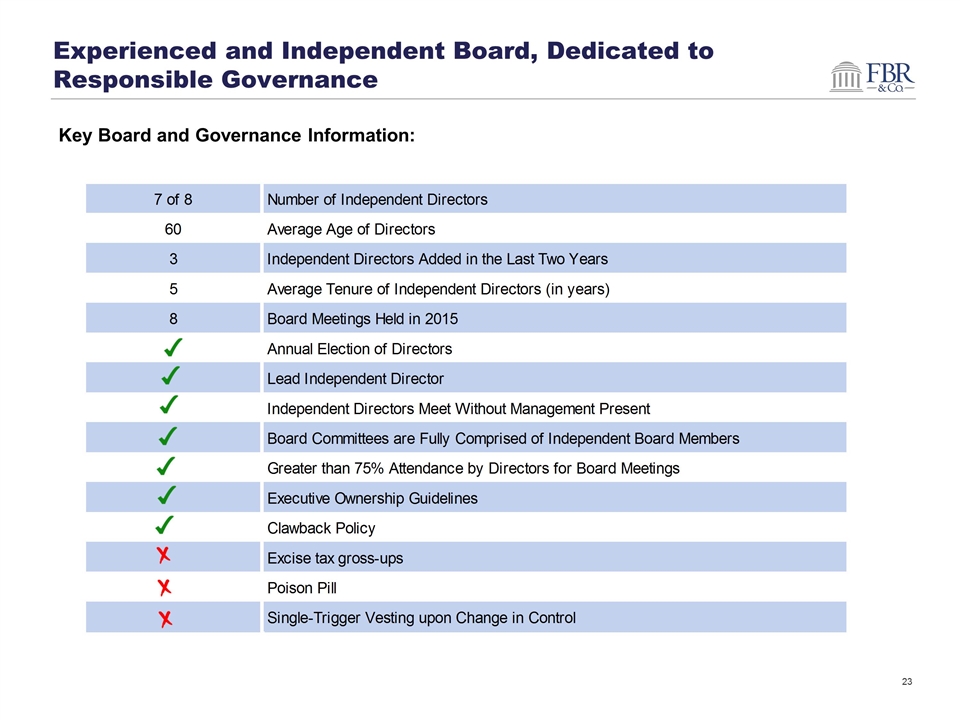
Experienced and Independent Board, Dedicated to Responsible Governance Key Board and Governance Information:
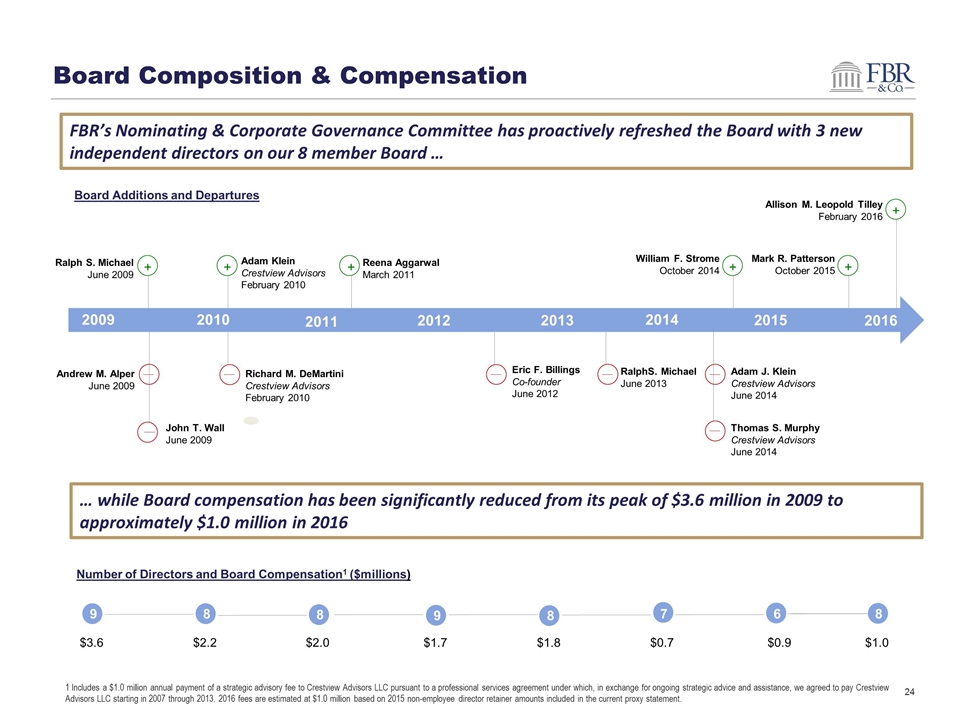
Board Composition & Compensation 1 Includes a $1.0 million annual payment of a strategic advisory fee to Crestview Advisors LLC pursuant to a professional services agreement under which, in exchange for ongoing strategic advice and assistance, we agreed to pay Crestview Advisors LLC starting in 2007 through 2013. 2016 fees are estimated at $1.0 million based on 2015 non-employee director retainer amounts included in the current proxy statement. Number of Directors and Board Compensation1 ($millions) 9 8 6 8 7 $1.7 $1.8 $0.7 $0.9 $1.0 8 8 9 $2.2 $2.0 $3.6 2009 2016 2015 2013 2014 Eric F. Billings Co-founder June 2012 RalphS. Michael June 2013 Adam J. Klein Crestview Advisors June 2014 Thomas S. Murphy Crestview Advisors June 2014 + Mark R. Patterson October 2015 William F. Strome October 2014 + + Allison M. Leopold Tilley February 2016 Board Additions and Departures 2012 2011 2010 + Reena Aggarwal March 2011 Adam Klein Crestview Advisors February 2010 + Andrew M. Alper June 2009 John T. Wall June 2009 + Ralph S. Michael June 2009 Richard M. DeMartini Crestview Advisors February 2010 FBR’s Nominating & Corporate Governance Committee has proactively refreshed the Board with 3 new independent directors on our 8 member Board … … while Board compensation has been significantly reduced from its peak of $3.6 million in 2009 to approximately $1.0 million in 2016
Alignment with Shareholders Board members, executives, and employees are significant stockholders – a total of 25% of shares outstanding - whose interests are aligned with outside holders (percentage ownership as of May 6, 2016) Independent Board Members – 4.3% Executive Committee – 10.0% Non-Executive Employees – 10.7% Ownership guidelines ensure that executives are appropriately motivated to increase share value Executive committee ownership to exceed three-times (3X) average annual compensation over the preceding three years Current Board Members have spent over $6.4 million dollars to acquire FBR stock over the past 9 years Employee ownership of 20% accumulated primarily through mandated annual bonus deferral
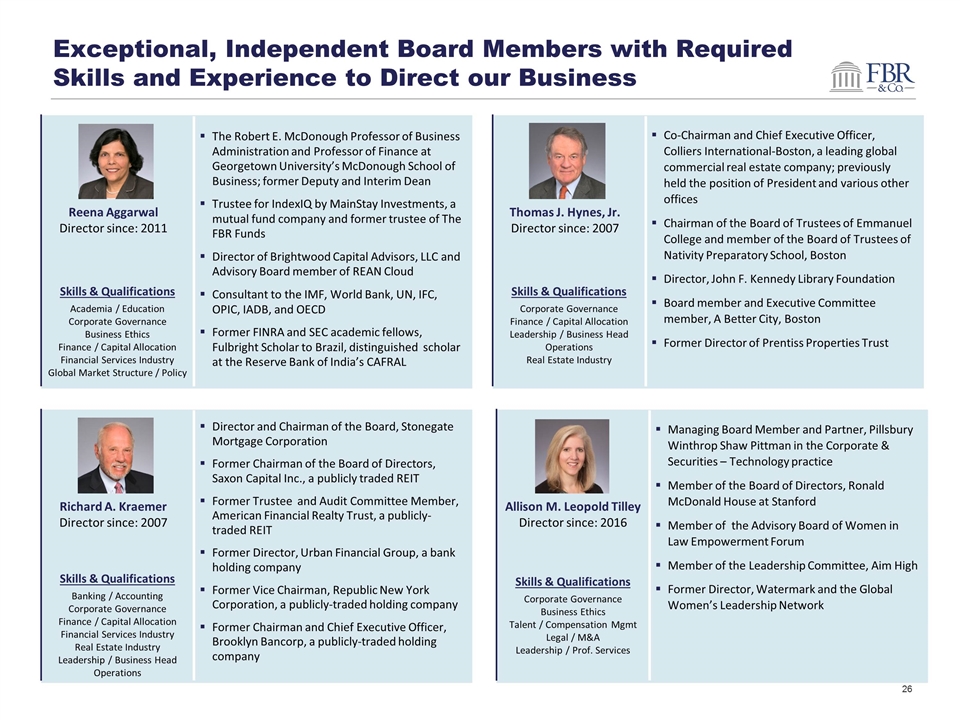
Exceptional, Independent Board Members with Required Skills and Experience to Direct our Business Reena Aggarwal Director since: 2011 The Robert E. McDonough Professor of Business Administration and Professor of Finance at Georgetown University’s McDonough School of Business; former Deputy and Interim Dean Trustee for IndexIQ by MainStay Investments, a mutual fund company and former trustee of The FBR Funds Director of Brightwood Capital Advisors, LLC and Advisory Board member of REAN Cloud Consultant to the IMF, World Bank, UN, IFC, OPIC, IADB, and OECD Former FINRA and SEC academic fellows, Fulbright Scholar to Brazil, distinguished scholar at the Reserve Bank of India’s CAFRAL Skills & Qualifications Academia / Education Corporate Governance Business Ethics Finance / Capital Allocation Financial Services Industry Global Market Structure / Policy Thomas J. Hynes, Jr. Director since: 2007 Co-Chairman and Chief Executive Officer, Colliers International-Boston, a leading global commercial real estate company; previously held the position of President and various other offices Chairman of the Board of Trustees of Emmanuel College and member of the Board of Trustees of Nativity Preparatory School, Boston Director, John F. Kennedy Library Foundation Board member and Executive Committee member, A Better City, Boston Former Director of Prentiss Properties Trust Skills & Qualifications Corporate Governance Finance / Capital Allocation Leadership / Business Head Operations Real Estate Industry Richard A. Kraemer Director since: 2007 Director and Chairman of the Board, Stonegate Mortgage Corporation Former Chairman of the Board of Directors, Saxon Capital Inc., a publicly traded REIT Former Trustee and Audit Committee Member, American Financial Realty Trust, a publicly-traded REIT Former Director, Urban Financial Group, a bank holding company Former Vice Chairman, Republic New York Corporation, a publicly-traded holding company Former Chairman and Chief Executive Officer, Brooklyn Bancorp, a publicly-traded holding company Skills & Qualifications Banking / Accounting Corporate Governance Finance / Capital Allocation Financial Services Industry Real Estate Industry Leadership / Business Head Operations Allison M. Leopold Tilley Director since: 2016 Managing Board Member and Partner, Pillsbury Winthrop Shaw Pittman in the Corporate & Securities – Technology practice Member of the Board of Directors, Ronald McDonald House at Stanford Member of the Advisory Board of Women in Law Empowerment Forum Member of the Leadership Committee, Aim High Former Director, Watermark and the Global Women’s Leadership Network Skills & Qualifications Corporate Governance Business Ethics Talent / Compensation Mgmt Legal / M&A Leadership / Prof. Services
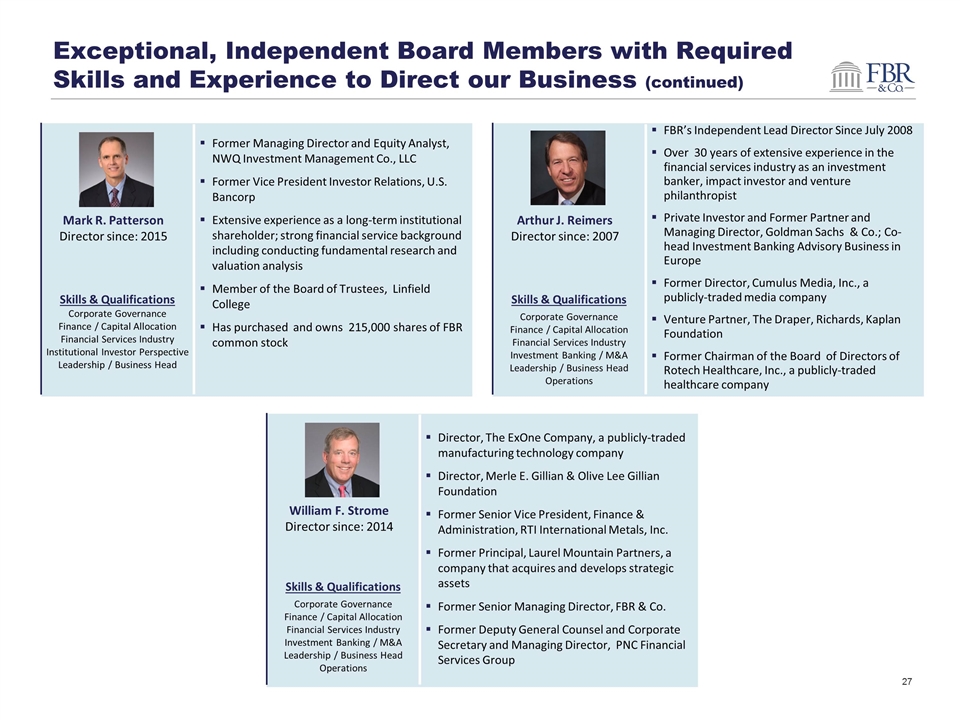
Exceptional, Independent Board Members with Required Skills and Experience to Direct our Business (continued) Mark R. Patterson Director since: 2015 Former Managing Director and Equity Analyst, NWQ Investment Management Co., LLC Former Vice President Investor Relations, U.S. Bancorp Extensive experience as a long-term institutional shareholder; strong financial service background including conducting fundamental research and valuation analysis Member of the Board of Trustees, Linfield College Has purchased and owns 215,000 shares of FBR common stock Skills & Qualifications Corporate Governance Finance / Capital Allocation Financial Services Industry Institutional Investor Perspective Leadership / Business Head Arthur J. Reimers Director since: 2007 FBR’s Independent Lead Director Since July 2008 Over 30 years of extensive experience in the financial services industry as an investment banker, impact investor and venture philanthropist Private Investor and Former Partner and Managing Director, Goldman Sachs & Co.; Co-head Investment Banking Advisory Business in Europe Former Director, Cumulus Media, Inc., a publicly-traded media company Venture Partner, The Draper, Richards, Kaplan Foundation Former Chairman of the Board of Directors of Rotech Healthcare, Inc., a publicly-traded healthcare company Skills & Qualifications Corporate Governance Finance / Capital Allocation Financial Services Industry Investment Banking / M&A Leadership / Business Head Operations William F. Strome Director since: 2014 Director, The ExOne Company, a publicly-traded manufacturing technology company Director, Merle E. Gillian & Olive Lee Gillian Foundation Former Senior Vice President, Finance & Administration, RTI International Metals, Inc. Former Principal, Laurel Mountain Partners, a company that acquires and develops strategic assets Former Senior Managing Director, FBR & Co. Former Deputy General Counsel and Corporate Secretary and Managing Director, PNC Financial Services Group Skills & Qualifications Corporate Governance Finance / Capital Allocation Financial Services Industry Investment Banking / M&A Leadership / Business Head Operations
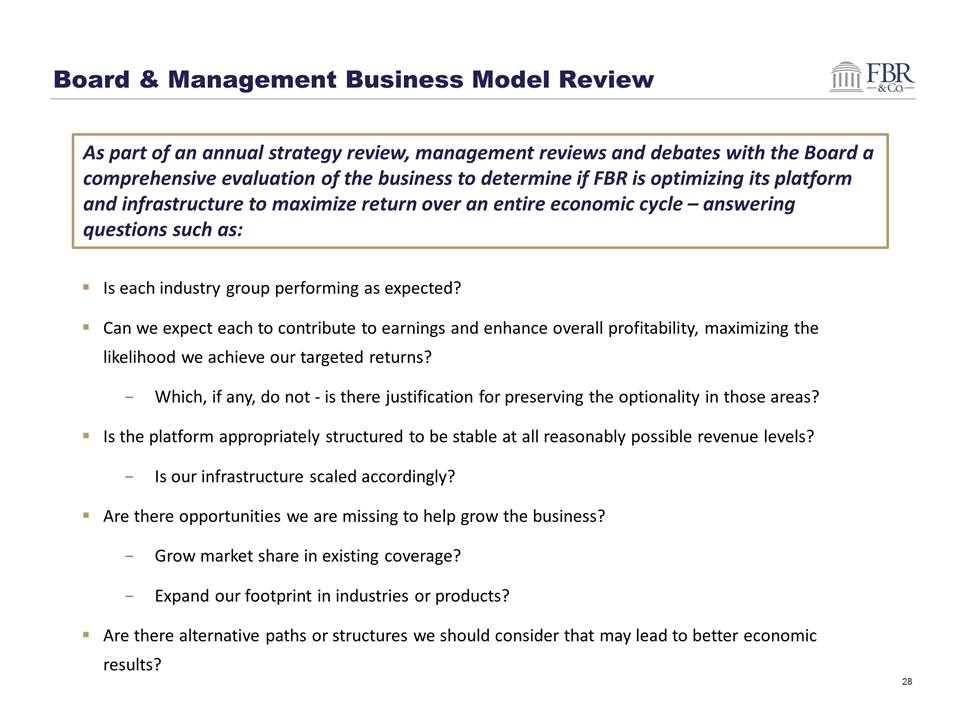
Board & Management Business Model Review Is each industry group performing as expected? Can we expect each to contribute to earnings and enhance overall profitability, maximizing the likelihood we achieve our targeted returns? Which, if any, do not - is there justification for preserving the optionality in those areas? Is the platform appropriately structured to be stable at all reasonably possible revenue levels? Is our infrastructure scaled accordingly? Are there opportunities we are missing to help grow the business? Grow market share in existing coverage? Expand our footprint in industries or products? Are there alternative paths or structures we should consider that may lead to better economic results? As part of an annual strategy review, management reviews and debates with the Board a comprehensive evaluation of the business to determine if FBR is optimizing its platform and infrastructure to maximize return over an entire economic cycle – answering questions such as:
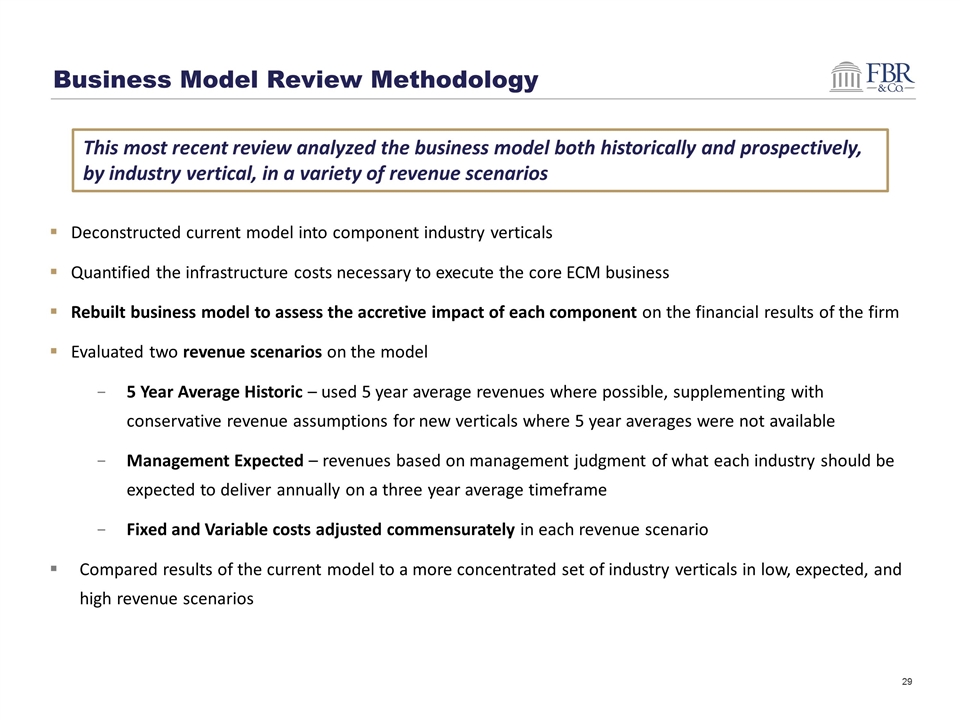
Business Model Review Methodology Deconstructed current model into component industry verticals Quantified the infrastructure costs necessary to execute the core ECM business Rebuilt business model to assess the accretive impact of each component on the financial results of the firm Evaluated two revenue scenarios on the model 5 Year Average Historic – used 5 year average revenues where possible, supplementing with conservative revenue assumptions for new verticals where 5 year averages were not available Management Expected – revenues based on management judgment of what each industry should be expected to deliver annually on a three year average timeframe Fixed and Variable costs adjusted commensurately in each revenue scenario Compared results of the current model to a more concentrated set of industry verticals in low, expected, and high revenue scenarios This most recent review analyzed the business model both historically and prospectively, by industry vertical, in a variety of revenue scenarios
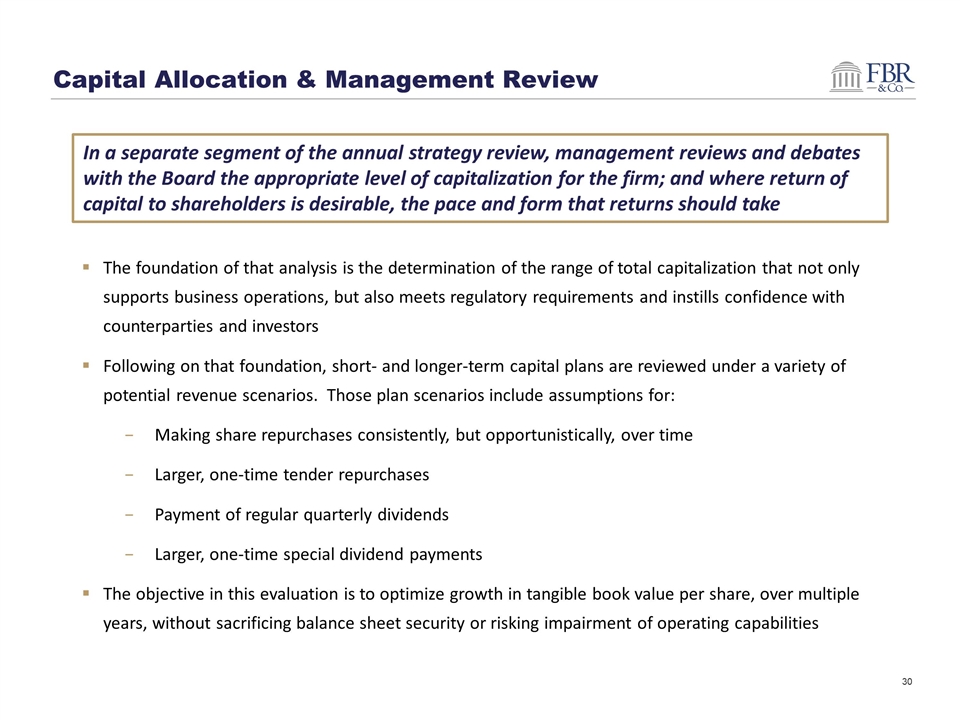
Capital Allocation & Management Review The foundation of that analysis is the determination of the range of total capitalization that not only supports business operations, but also meets regulatory requirements and instills confidence with counterparties and investors Following on that foundation, short- and longer-term capital plans are reviewed under a variety of potential revenue scenarios. Those plan scenarios include assumptions for: Making share repurchases consistently, but opportunistically, over time Larger, one-time tender repurchases Payment of regular quarterly dividends Larger, one-time special dividend payments The objective in this evaluation is to optimize growth in tangible book value per share, over multiple years, without sacrificing balance sheet security or risking impairment of operating capabilities In a separate segment of the annual strategy review, management reviews and debates with the Board the appropriate level of capitalization for the firm; and where return of capital to shareholders is desirable, the pace and form that returns should take
Section IV: Executive Compensation
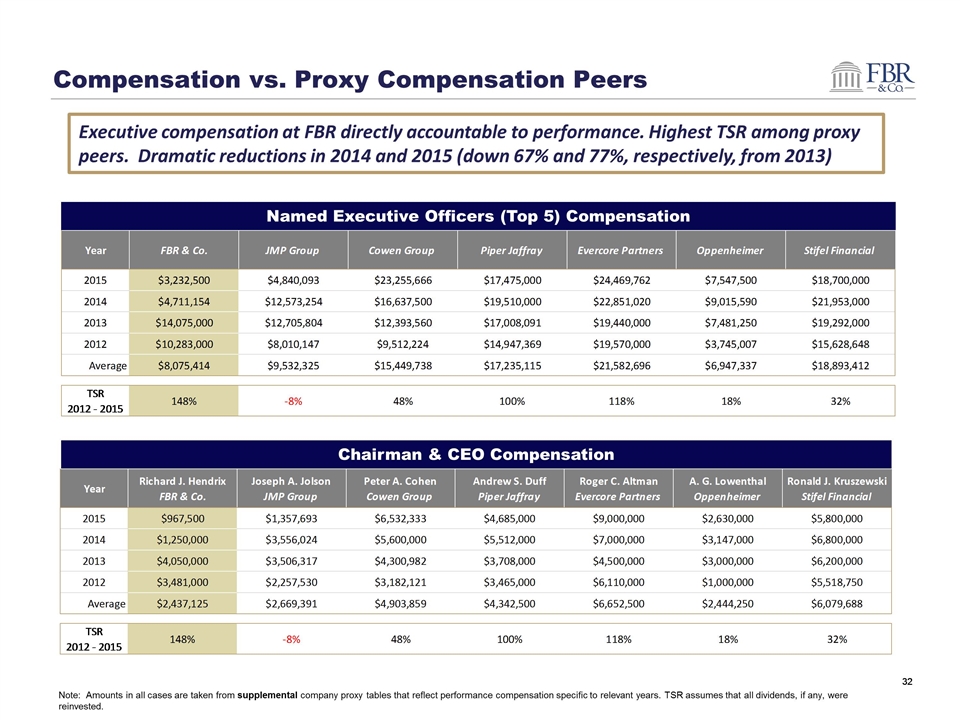
Compensation vs. Proxy Compensation Peers Executive compensation at FBR directly accountable to performance. Highest TSR among proxy peers. Dramatic reductions in 2014 and 2015 (down 67% and 77%, respectively, from 2013) Note: Amounts in all cases are taken from supplemental company proxy tables that reflect performance compensation specific to relevant years. TSR assumes that all dividends, if any, were reinvested. Chairman & CEO Compensation Named Executive Officers (Top 5) Compensation
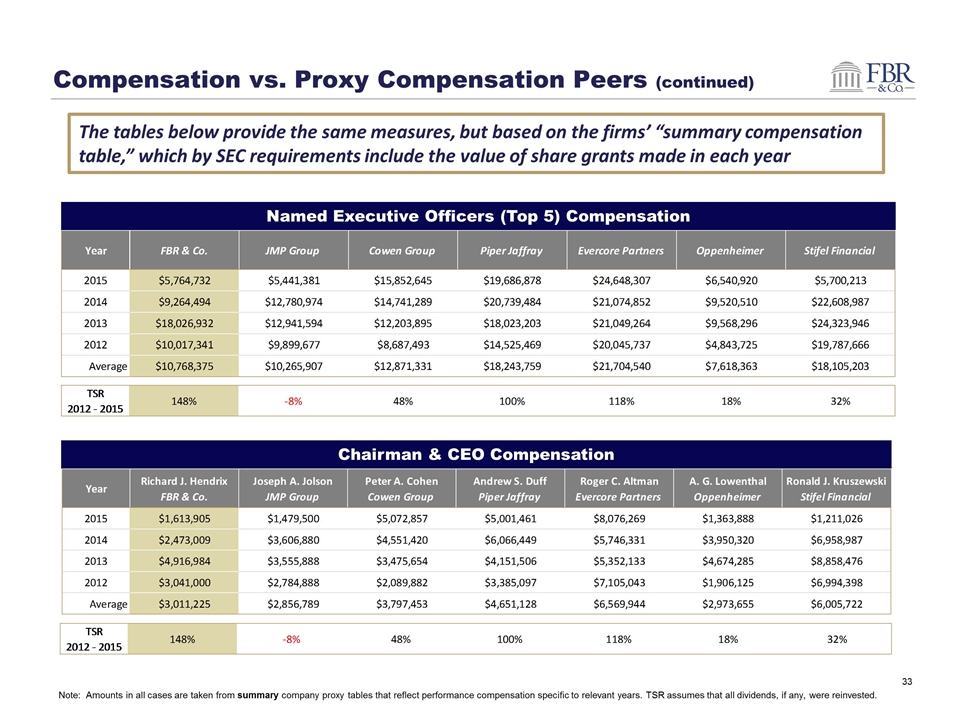
Compensation vs. Proxy Compensation Peers (continued) The tables below provide the same measures, but based on the firms’ “summary compensation table,” which by SEC requirements include the value of share grants made in each year Note: Amounts in all cases are taken from summary company proxy tables that reflect performance compensation specific to relevant years. TSR assumes that all dividends, if any, were reinvested. Named Executive Officers (Top 5) Compensation Chairman & CEO Compensation
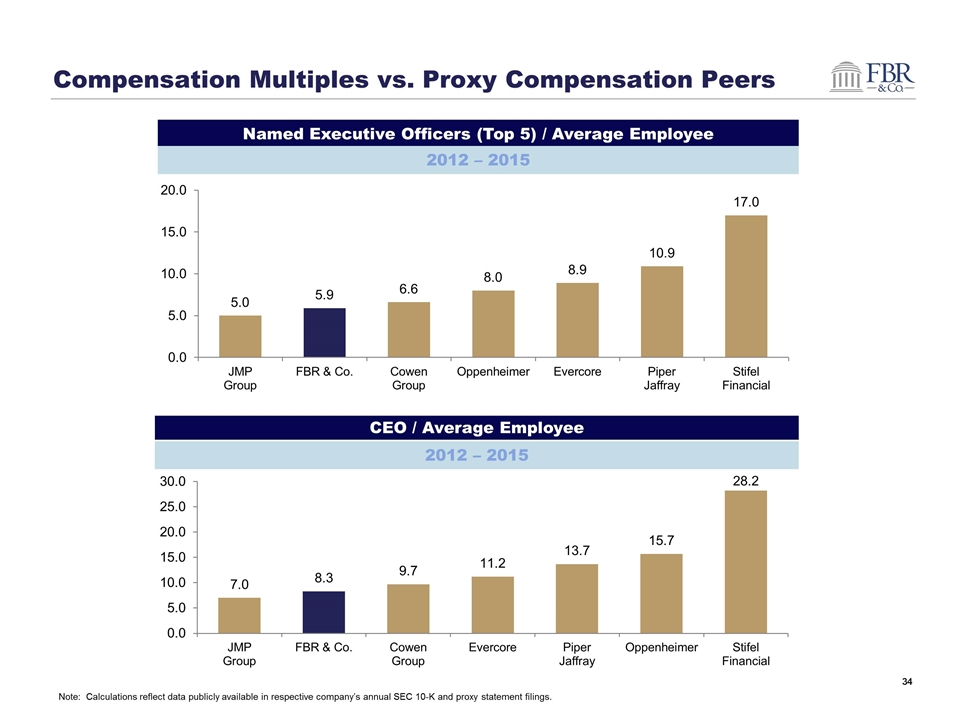
Compensation Multiples vs. Proxy Compensation Peers 2012 – 2015 CEO / Average Employee Note: Calculations reflect data publicly available in respective company’s annual SEC 10-K and proxy statement filings. Named Executive Officers (Top 5) / Average Employee 2012 – 2015
Section V: Voce Catalyst Partners’ Proxy Campaign
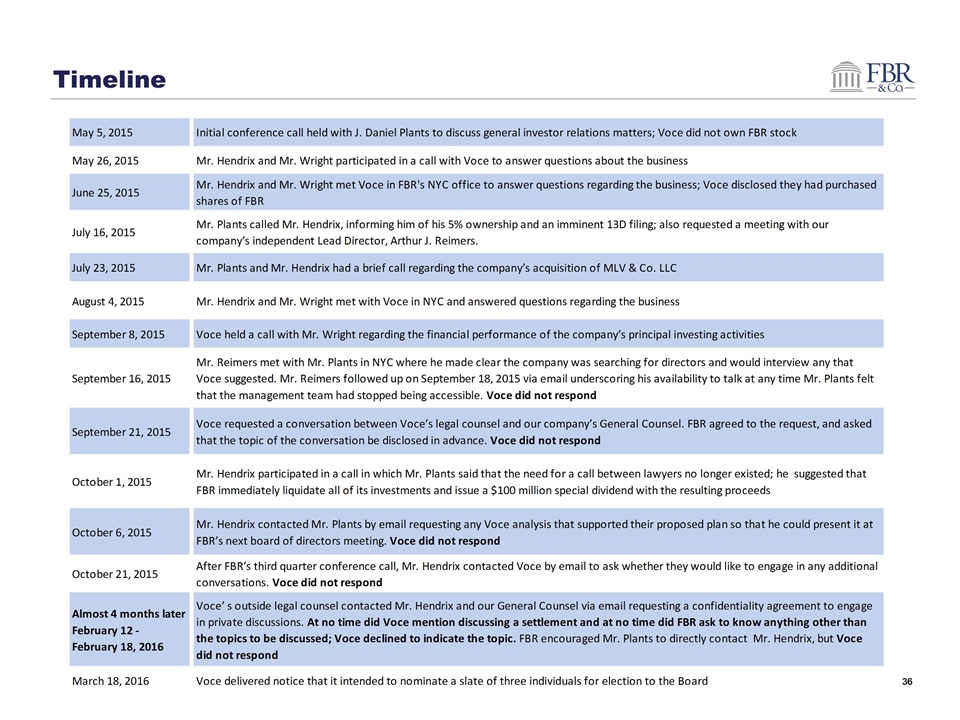
Timeline
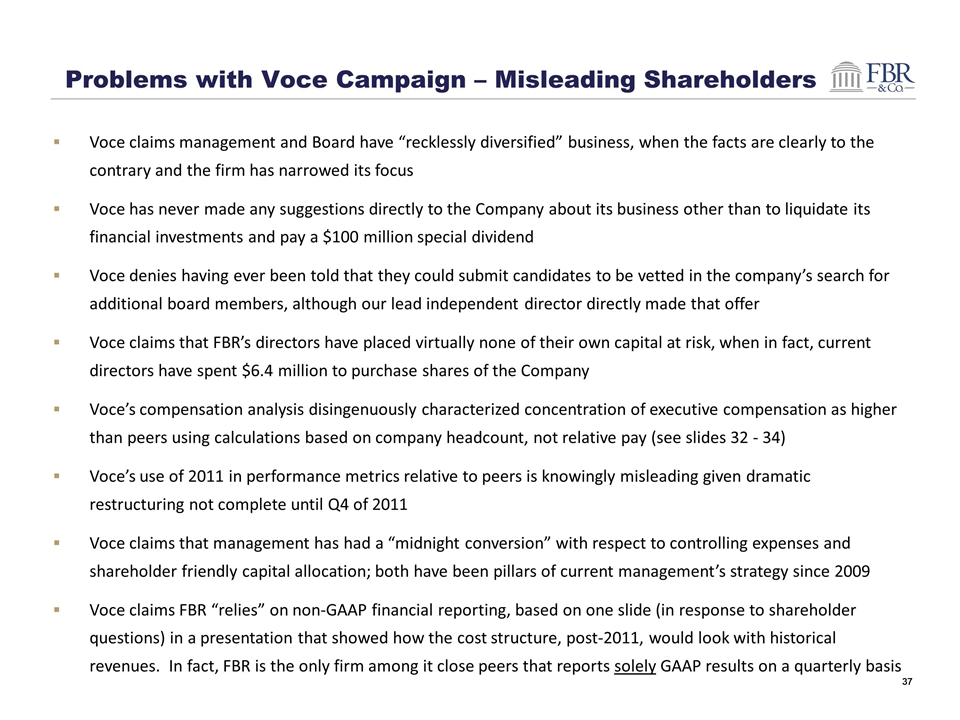
Problems with Voce Campaign – Misleading Shareholders Voce claims management and Board have “recklessly diversified” business, when the facts are clearly to the contrary and the firm has narrowed its focus Voce has never made any suggestions directly to the Company about its business other than to liquidate its financial investments and pay a $100 million special dividend Voce denies having ever been told that they could submit candidates to be vetted in the company’s search for additional board members, although our lead independent director directly made that offer Voce claims that FBR’s directors have placed virtually none of their own capital at risk, when in fact, current directors have spent $6.4 million to purchase shares of the Company Voce’s compensation analysis disingenuously characterized concentration of executive compensation as higher than peers using calculations based on company headcount, not relative pay (see slides 32 - 34) Voce’s use of 2011 in performance metrics relative to peers is knowingly misleading given dramatic restructuring not complete until Q4 of 2011 Voce claims that management has had a “midnight conversion” with respect to controlling expenses and shareholder friendly capital allocation; both have been pillars of current management’s strategy since 2009 Voce claims FBR “relies” on non-GAAP financial reporting, based on one slide (in response to shareholder questions) in a presentation that showed how the cost structure, post-2011, would look with historical revenues. In fact, FBR is the only firm among it close peers that reports solely GAAP results on a quarterly basis
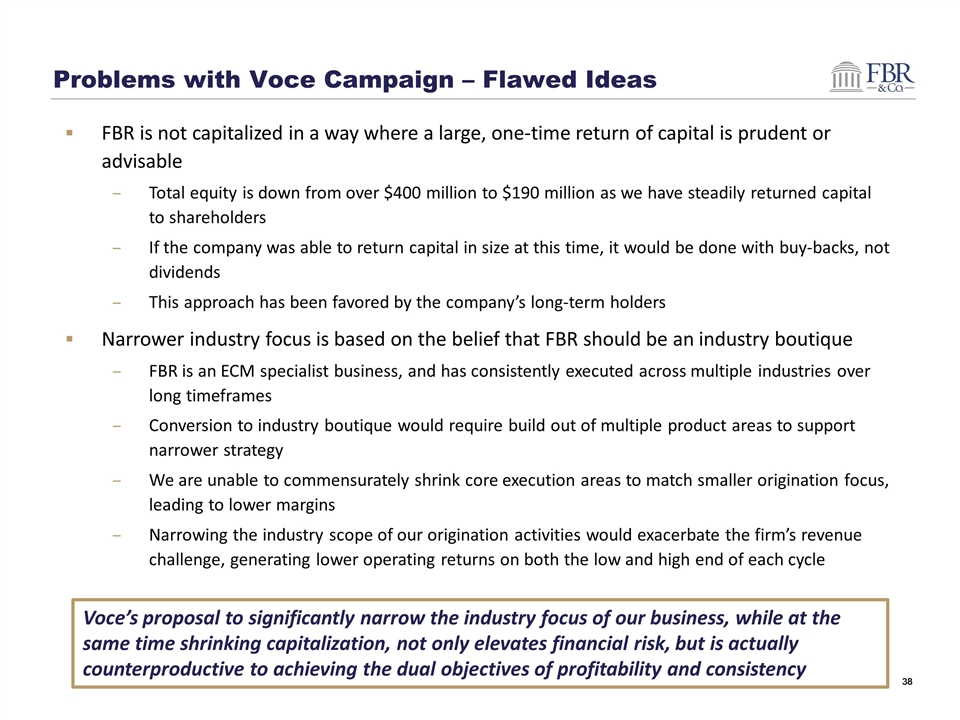
Problems with Voce Campaign – Flawed Ideas FBR is not capitalized in a way where a large, one-time return of capital is prudent or advisable Total equity is down from over $400 million to $190 million as we have steadily returned capital to shareholders If the company was able to return capital in size at this time, it would be done with buy-backs, not dividends This approach has been favored by the company’s long-term holders Narrower industry focus is based on the belief that FBR should be an industry boutique FBR is an ECM specialist business, and has consistently executed across multiple industries over long timeframes Conversion to industry boutique would require build out of multiple product areas to support narrower strategy We are unable to commensurately shrink core execution areas to match smaller origination focus, leading to lower margins Narrowing the industry scope of our origination activities would exacerbate the firm’s revenue challenge, generating lower operating returns on both the low and high end of each cycle Voce’s proposal to significantly narrow the industry focus of our business, while at the same time shrinking capitalization, not only elevates financial risk, but is actually counterproductive to achieving the dual objectives of profitability and consistency
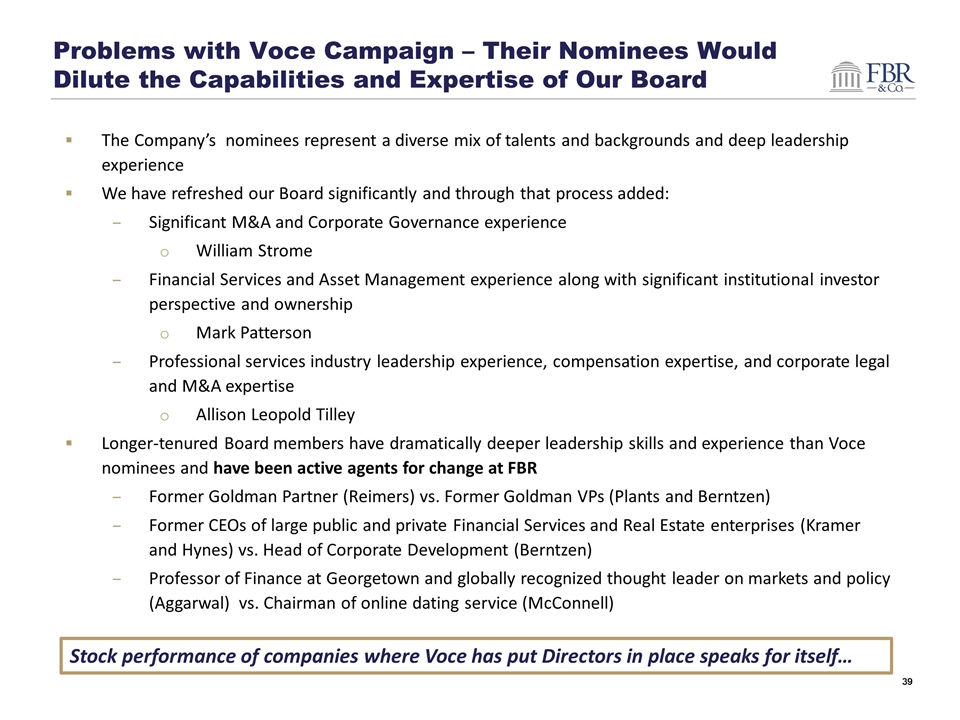
Problems with Voce Campaign – Their Nominees Would Dilute the Capabilities and Expertise of Our Board The Company’s nominees represent a diverse mix of talents and backgrounds and deep leadership experience We have refreshed our Board significantly and through that process added: Significant M&A and Corporate Governance experience William Strome Financial Services and Asset Management experience along with significant institutional investor perspective and ownership Mark Patterson Professional services industry leadership experience, compensation expertise, and corporate legal and M&A expertise Allison Leopold Tilley Longer-tenured Board members have dramatically deeper leadership skills and experience than Voce nominees and have been active agents for change at FBR Former Goldman Partner (Reimers) vs. Former Goldman VPs (Plants and Berntzen) Former CEOs of large public and private Financial Services and Real Estate enterprises (Kramer and Hynes) vs. Head of Corporate Development (Berntzen) Professor of Finance at Georgetown and globally recognized thought leader on markets and policy (Aggarwal) vs. Chairman of online dating service (McConnell) Stock performance of companies where Voce has put Directors in place speaks for itself…
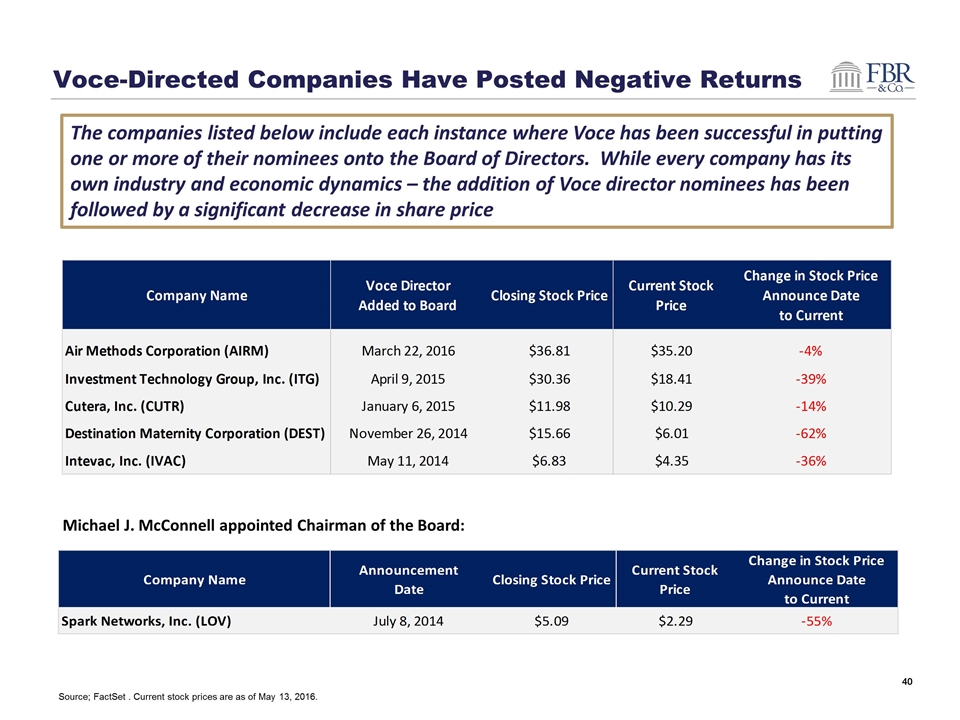
Voce-Directed Companies Have Posted Negative Returns The companies listed below include each instance where Voce has been successful in putting one or more of their nominees onto the Board of Directors. While every company has its own industry and economic dynamics – the addition of Voce director nominees has been followed by a significant decrease in share price Source; FactSet . Current stock prices are as of May 13, 2016. Michael J. McConnell appointed Chairman of the Board:
Section VI: Summary and Conclusion
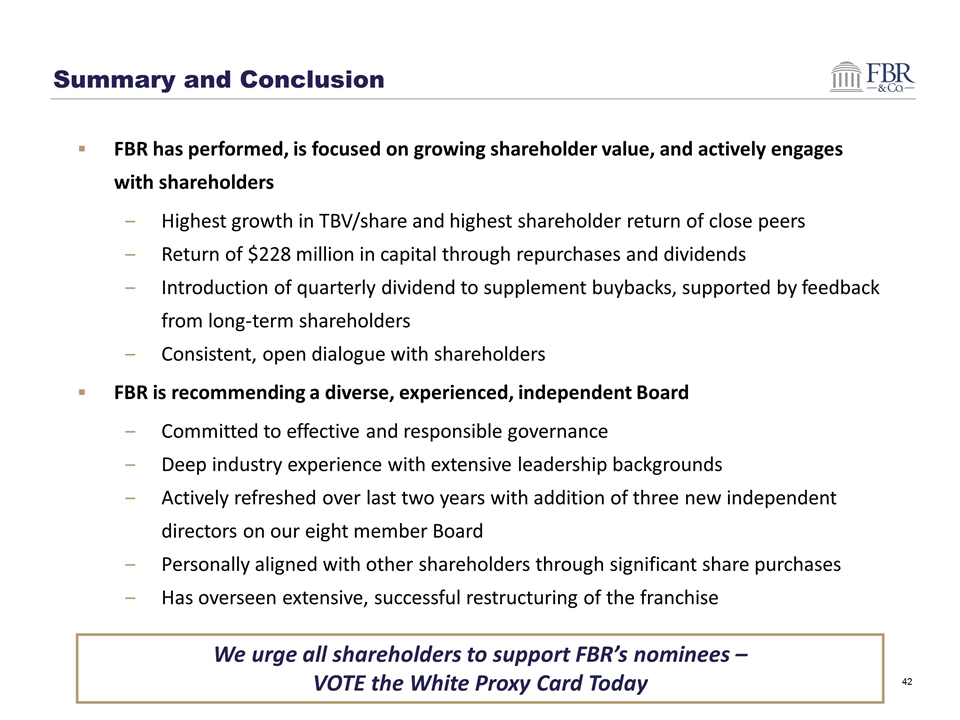
Summary and Conclusion FBR has performed, is focused on growing shareholder value, and actively engages with shareholders Highest growth in TBV/share and highest shareholder return of close peers Return of $228 million in capital through repurchases and dividends Introduction of quarterly dividend to supplement buybacks, supported by feedback from long-term shareholders Consistent, open dialogue with shareholders FBR is recommending a diverse, experienced, independent Board Committed to effective and responsible governance Deep industry experience with extensive leadership backgrounds Actively refreshed over last two years with addition of three new independent directors on our eight member Board Personally aligned with other shareholders through significant share purchases Has overseen extensive, successful restructuring of the franchise We urge all shareholders to support FBR’s nominees – VOTE the White Proxy Card Today
Metropolitan Washington, D.C. Headquarters 1300 North 17th Street Arlington, VA 22209 703.312.9500 . www.fbr.com Boston Houston Los Angeles New York San Francisco One International Place, Suite 1350 Boston, MA 02110 617.951.6900 9 Greenway Plaza, Suite 2050 Houston, TX 77046 713.226.4700 Dallas 100 Crescent Court 7th Floor Dallas, TX 75201 2101 Rosecrans Avenue Suite 3270 El Segundo, CA 90245 424.367.5700 299 Park Avenue, 7th Floor New York, NY 10171 212.457.3300 1 Embarcadero Center, Suite 2140 San Francisco, CA 94111 415.248.2900 Note: Not all services available from all offices


