Exhibit 99.1
| October 2, 2007 + |
| Safe Harbor statement Important Legal Information: In connection with the proposed acquisition, ISG has prepared a preliminary proxy statement that has been filed with the SEC. After regulatory review, a definitive proxy statement and a form of proxy will be mailed to the shareholders of ISG. Before making any voting decision, ISG’s shareholders are urged to read the proxy statement regarding the acquisition carefully and in its entirety because it will contain important information about the proposed acquisition. ISG’s shareholders will be able to obtain, without charge, a copy of the proxy statement and other relevant documents filed with the SEC from the SEC’s website at http://www.sec.gov. ISG’s shareholders will also be able to obtain, without charge, a copy of the proxy statement and other relevant documents by directing a request by mail or telephone to Corporate Secretary, Information Services Group, Inc., Four Stamford Plaza, 107 Elm Street, Stamford, CT 06902, telephone: 203-517-3100, or from ISG’s website at http://www.informationsg.com. ISG and its directors and officers may be deemed to be participants in the solicitation of proxies from ISG’s shareholders with respect to the proposed acquisition. Information about ISG’s directors and executive officers and their ownership of ISG’s common stock is set forth in ISG’s annual report on Form 10-K for the fiscal year ended December 31, 2006. Shareholders may obtain additional information regarding the interests of ISG and its directors and executive officers in the acquisition, which may be different than those of ISG’s shareholders generally, by reading the proxy statement and other relevant documents regarding the proposed acquisition. Forward-Looking Statements: This communication contains “forward-looking statements” which represent the current expectations and beliefs of management of ISG concerning the proposed acquisition of TPI and other future events and their potential effects on ISG and TPI. The statements, analyses, and other information contained herein relating to the proposed acquisition, as well as other statements including words such as “anticipate,” “believe,” “contemplate,” “plan,” “estimate,” “expect,” “intend,” “will,” “continue,” “should,” “may,” and other similar expressions, are “forward-looking statements” under the Private Securities Litigation Reform Act of 1995. These forward-looking statements are not guarantees of future results and are subject to certain risks and uncertainties that could cause actual results to differ materially from those anticipated. Those factors include, without limitation: (1) whether the stockholders of ISG approve the proposed acquisition; (2) the number and percentage of stockholders seeking conversion; (3) the satisfaction of the other conditions specified in the purchase agreement; (4) the ability to successfully combine the businesses of ISG and TPI; (5) the amount of cash available, operating costs and business disruption following the acquisition, including adverse effects on relationships with employees; (6) changes in the stock market and interest rate environment that affect revenues; (7) diversion of management time on acquisition related issues; (8) reaction of TPI clients to the transaction; (9) retention of key employees upon announcement of the proposed acquisition and following closing; (10) general economic conditions such as inflation; and (11) general political and social conditions such as war, political unrest and terrorism. The risks also relate to inherent business, economic and competitive uncertainties and contingencies relating to the business of TPI including: (1) failure to secure new engagements or loss of important clients; (2) ability to hire and retain enough qualified employees to support operations; (3) ability to maintain or increase billing and utilization rates; (4) management of rapid growth; (5) success of expansion internationally; (6) competition; (7) ability to move the product mix into higher margin businesses; (8) operating TPI as a public company; (9) healthcare and benefit cost management; (10) ability to protect ISG and TPI’s intellectual property and the intellectual property of others; (11) currency fluctuations and exchange rate adjustments; (12) ability to successfully consummate or integrate strategic acquisitions; and (13) ability to achieve the cost reduction and productivity improvements contemplated by the “Value Creation Plan” ISG intends to initiate after closing. Certain of these and other applicable risks, cautionary statements and factors that could cause actual results to differ from ISG’s forward-looking statements are included in ISG’s filings with the U.S. Securities and Exchange Commission (“SEC”), specifically as described in ISG's annual report on Form 10-K for the fiscal year ended December 31, 2006, and ISG’s proxy statement. ISG undertakes no obligation to update or revise any forward-looking statements to reflect subsequent events or circumstances. |
| ISG Vision “Build a Billion Dollar + Company in 3 Years” Selected SPAC as optimal vehicle $258 million raised, upsized significantly due to strong investor demand Targeted an information-based company to serve as our platform with the following criteria: #1 market position Double digit revenue growth Significant margin enhancement potential Data driven assets Further acquisition opportunities Ability to replicate value creation track record |
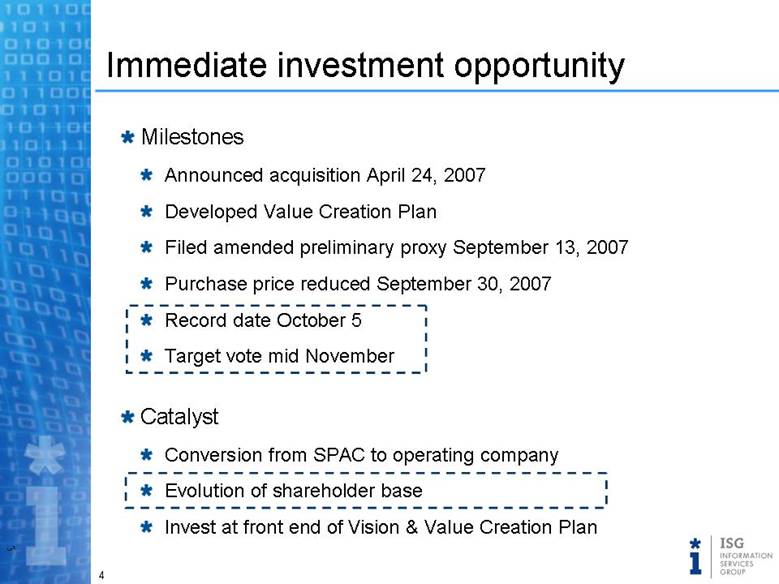
| Immediate investment opportunity Milestones Announced acquisition April 24, 2007 Developed Value Creation Plan Filed amended preliminary proxy September 13, 2007 Purchase price reduced September 30, 2007 Record date October 5 Target vote mid November Catalyst Conversion from SPAC to operating company Evolution of shareholder base Invest at front end of Vision & Value Creation Plan |
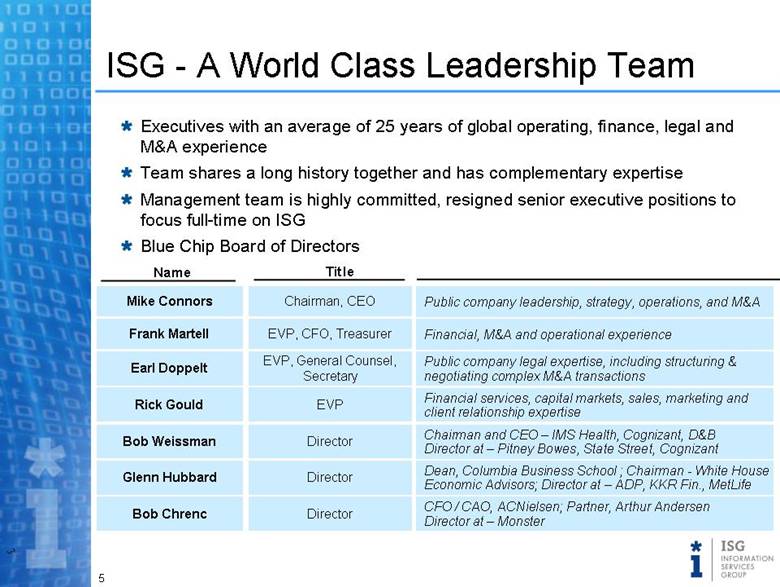
| ISG - A World Class Leadership Team Executives with an average of 25 years of global operating, finance, legal and M&A experience Team shares a long history together and has complementary expertise Management team is highly committed, resigned senior executive positions to focus full-time on ISG Blue Chip Board of Directors Title Name Mike Connors Chairman, CEO Public company leadership, strategy, operations, and M&A Earl Doppelt EVP, General Counsel, Secretary Public company legal expertise, including structuring & negotiating complex M&A transactions Rick Gould EVP Financial services, capital markets, sales, marketing and client relationship expertise Frank Martell EVP, CFO, Treasurer Financial, M&A and operational experience Bob Weissman Director Chairman and CEO – IMS Health, Cognizant, D&B Director at – Pitney Bowes, State Street, Cognizant Glenn Hubbard Director Dean, Columbia Business School ; Chairman - White House Economic Advisors; Director at – ADP, KKR Fin., MetLife Bob Chrenc Director CFO / CAO, ACNielsen; Partner, Arthur Andersen Director at – Monster |
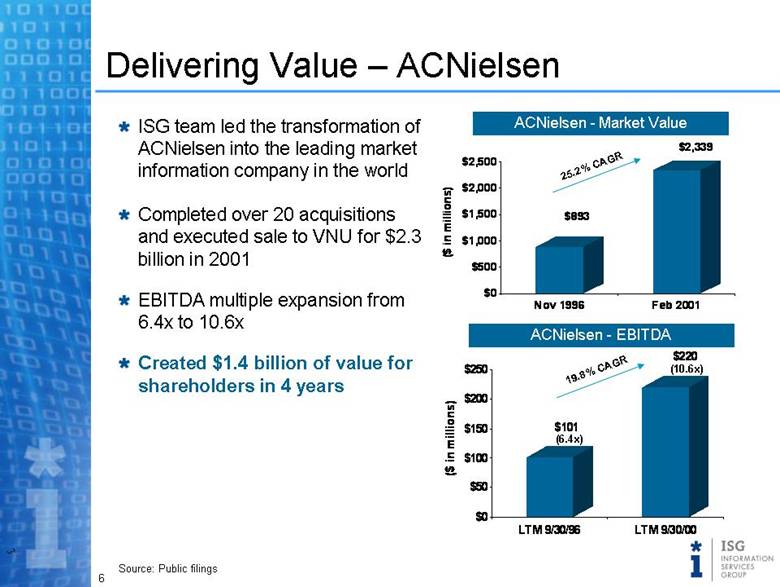
| Delivering Value — ACNielsen ISG team led the transformation of ACNielsen into the leading market information company in the world Completed over 20 acquisitions and executed sale to VNU for $2.3 billion in 2001 EBITDA multiple expansion from 6.4x to 10.6x Created $1.4 billion of value for shareholders in 4 years ACNielsen - Market Value ACNielsen - EBITDA (6.4x) (10.6x) 19.8% CAGR 25.2% CAGR Source: Public filings $893 $2,339 $0 $500 $1,000 $1,500 $2,000 $2,500 ($ in millions) Nov 1996 Feb 2001 $101 $220 $0 $50 $100 $150 $200 $250 ($ in millions) LTM 9/30/96 LTM 9/30/00 |
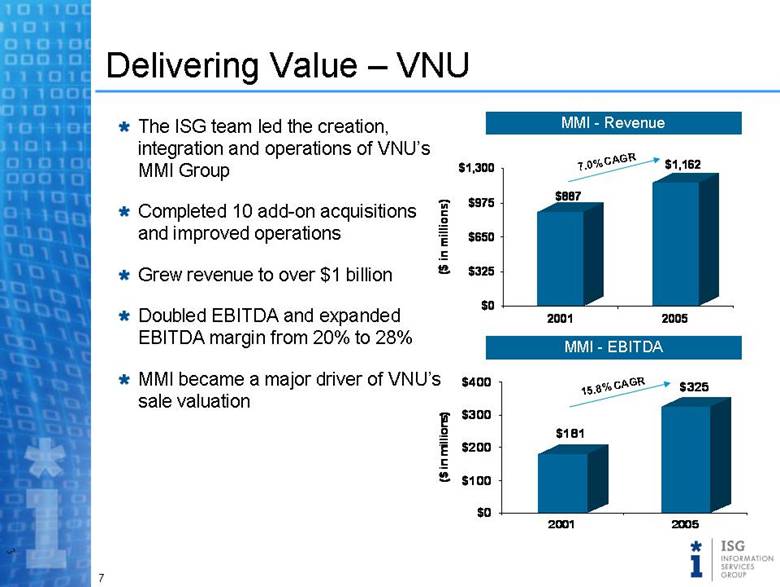
| Delivering Value – VNU The ISG team led the creation, integration and operations of VNU’s MMI Group Completed 10 add-on acquisitions and improved operations Grew revenue to over $1 billion Doubled EBITDA and expanded EBITDA margin from 20% to 28% MMI became a major driver of VNU’s sale valuation 7.0% CAGR 15.8% CAGR MMI - Revenue MMI - EBITDA $887 $1,162 $0 $325 $650 $975 $1,300 ($ in millions) 2001 2005 $181 $325 $0 $100 $200 $300 $400 ($ in millions) 2001 2005 |
| The #1 independent sourcing data and advisory firm in the world Provides professional advisory services and proprietary data to major corporations to optimize their business processes through offshoring insourcing shared services outsourcing Founded in 1989 and currently privately held by Monitor Clipper Partners, TPI founder, and management 460 employees globally – industry thought leaders with 20+ years experience Blue Chip Clients – Global 2000 companies at a glance |
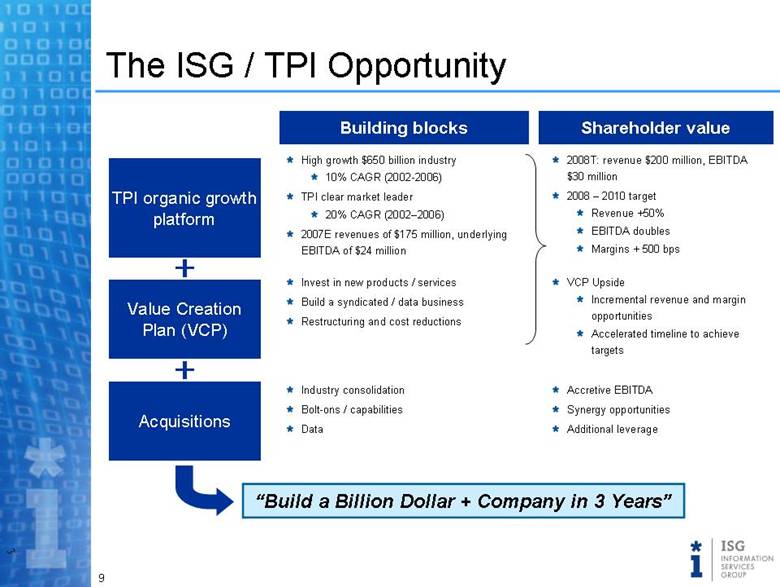
| The ISG / TPI Opportunity High growth $650 billion industry 10% CAGR (2002-2006) TPI clear market leader 20% CAGR (2002–2006) 2007E revenues of $175 million, underlying EBITDA of $24 million Invest in new products / services Build a syndicated / data business Restructuring and cost reductions Industry consolidation Bolt-ons / capabilities Data 2008T: revenue $200 million, EBITDA $30 million 2008 – 2010 target Revenue +50% EBITDA doubles Margins + 500 bps VCP Upside Incremental revenue and margin opportunities Accelerated timeline to achieve targets Accretive EBITDA Synergy opportunities Additional leverage Acquisitions Value Creation Plan (VCP) TPI organic growth platform Building blocks Shareholder value “Build a Billion Dollar + Company in 3 Years” |
| TPI is the clear market leader – only Global Player Operates in a high growth, “mega trend” industry Non-cyclical High client satisfaction / loyalty Data driven assets Upside Potential High organic growth Margin improvement to Best in Class Syndicated revenue opportunity Further acquisition opportunities is our Platform Company |
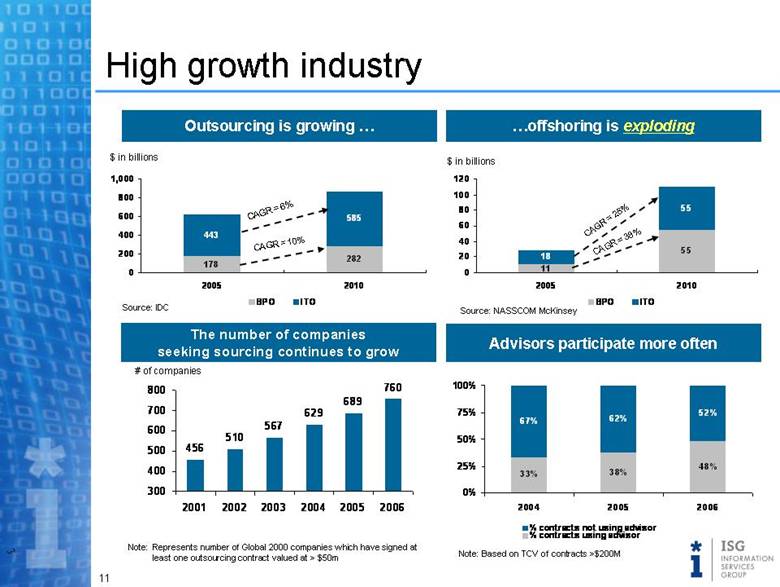
| High growth industry CAGR = 38% Source: IDC $ in billions CAGR = 6% CAGR = 10% CAGR = 25% Source: NASSCOM McKinsey $ in billions Outsourcing is growing The number of companies seeking sourcing continues to grow # of companies Note: Represents number of Global 2000 companies which have signed at least one outsourcing contract valued at > $50m Advisors participate more often Note: Based on TCV of contracts >$200M 11 55 18 55 0 20 40 60 80 100 120 2005 2010 BPO ITO 456 510 567 629 689 760 300 400 500 600 700 800 2001 2002 2003 2004 2005 2006 33% 38% 48% 67% 62% 52% 0% 25% 50% 75% 100% 2004 2005 2006 % contracts not using advisor % contracts using advisor 178 282 443 585 0 200 400 600 800 1,000 2005 2010 BPO ITO offshoring is exploding |
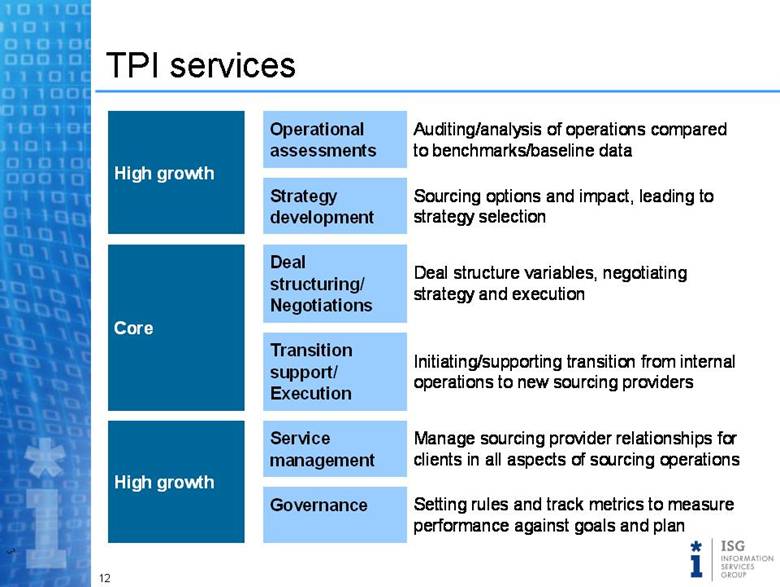
| TPI services Operational assessments Auditing/analysis of operations compared to benchmarks/baseline data High growth Strategy development Sourcing options and impact, leading to strategy selection Deal structuring/ Negotiations Deal structure variables, negotiati ng strategy and execution Core Transition support/ Execution Initiating/supporting transition from internal operations to new sourcing providers Service management Manage sourcing provider relationships for clients in all aspects of sourcing operations High growth Governance Setting rules and track metrics to measure performance against goals and plan |
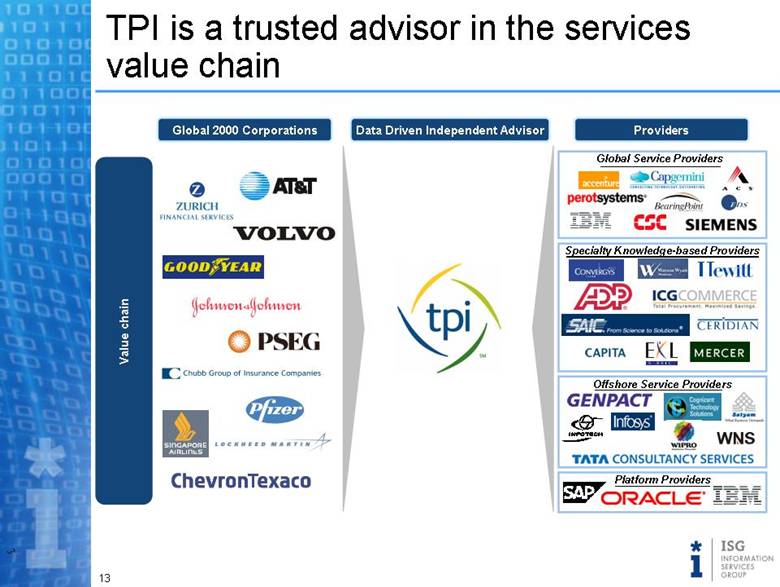
| TPI is a trusted advisor in the services value chain Global 2000 Corporations Data Driven Independent Advisor Providers Value chain Global Service Providers Specialty Knowledge-based Providers Offshore Service Providers Platform Providers |
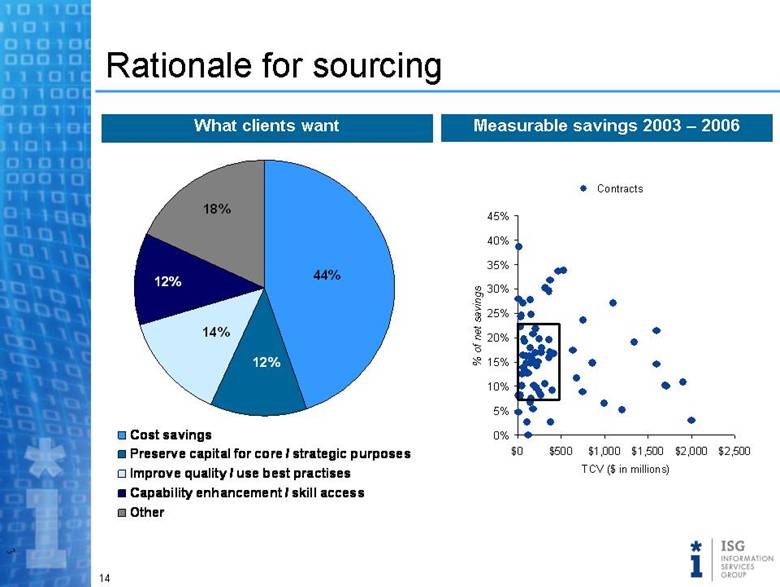
| Rationale for sourcing What clients want Measurable savings 2003 – 2006 18% 12% 12% 44% 14% Cost savings Preserve capital for core / strategic purposes Improve quality / use best practises Capability enhancement / skill access Other Contracts % of net savings TCV ($ in millions) 45% 40% 35% 30% 25% 20% 15% 10% 5% 0% $0 $500 $1,000 $1,500 $2,000 $2,500 |
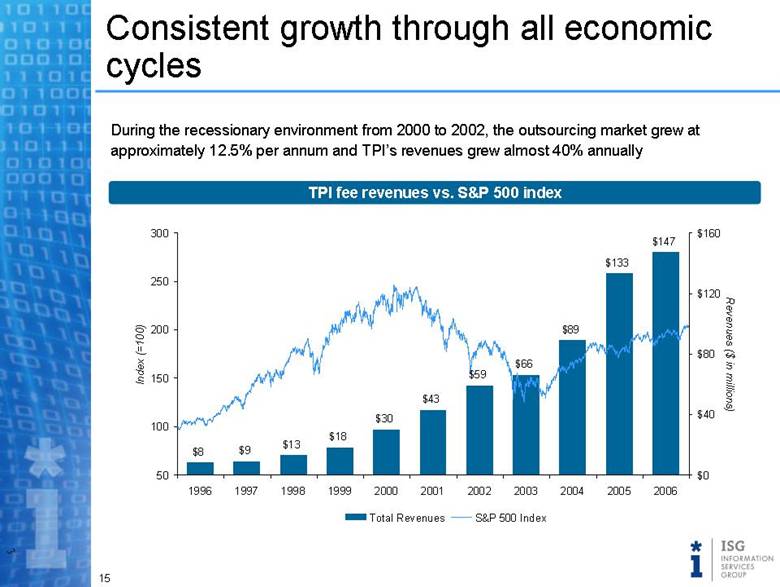
| Consistent growth through all economic cycles TPI fee revenues vs. S&P 500 index During the recessionary environment from 2000 to 2002, the outsourcing market grew at approximately 12.5% per annum and TPI’s revenues grew almost 40% annually $8 $9 $13 $18 $30 $43 $59 $66 $89 $133 $147 $0 $40 $80 $120 $160 1996 1997 1998 1999 2000 2001 2002 2003 2004 2005 2006 Revenues ($ in millions) 50 100 150 200 250 300 Index (=100) Total Revenues S&P 500 Index |
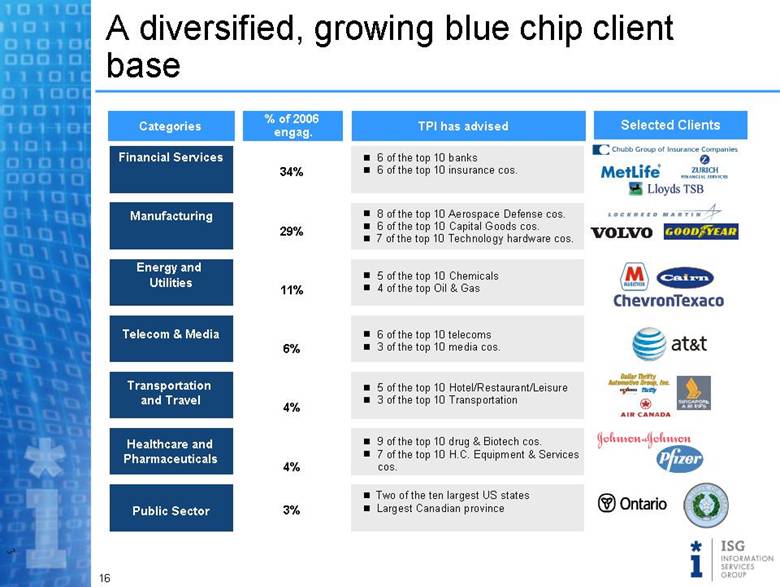
| A diversified, growing blue chip client base Selected Clients Categories % of 2006 engag. TPI has advised Financial Services Manufacturing Energy and Utilities Telecom & Media Transportation and Travel Healthcare and Pharmaceuticals Public Sector - 6 of the top 10 banks n 6 of the top 10 insurance cos. - 8 of the top 10 Aerospace Defense cos. - 6 of the top 10 Capital Goods cos. - 7 of the top 10 Technology hardware cos. - 6 of the top 10 telecoms - 3 of the top 10 media cos. - 5 of the top 10 Hotel/Restaurant/Leisure - 3 of the top 10 Transportation n 9 of the top 10 drug & Biotech cos. - 7 of the top 10 H.C. Equipment & Services cos. - Two of the ten largest US states - Largest Canadian province - 5 of the top 10 Chemicals - 4 of the top Oil & Gas 34% 6% 29% 11% 4% 4% 3% |
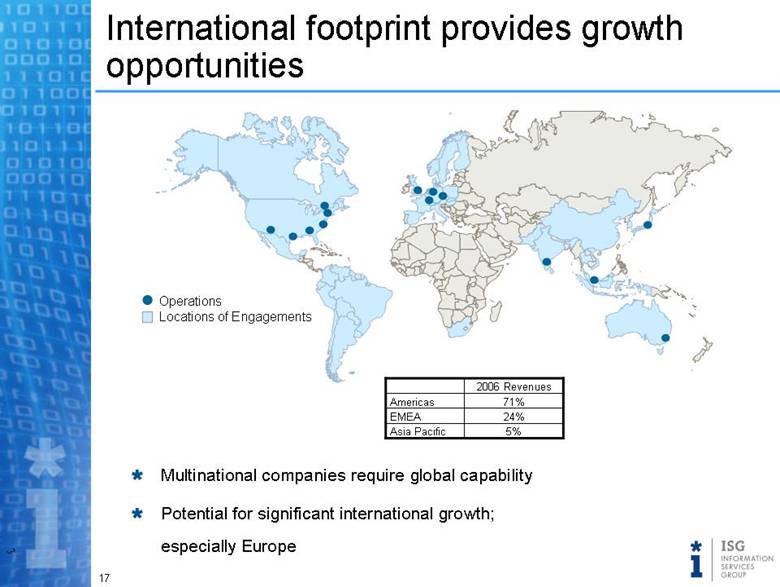
| International footprint provides growth opportunities Operations Locations of Engagements 5% Asia Pacific 24% EMEA 71% Americas 2006 Revenues Multinational companies require global capability Potential for significant international growth; especially Europe |
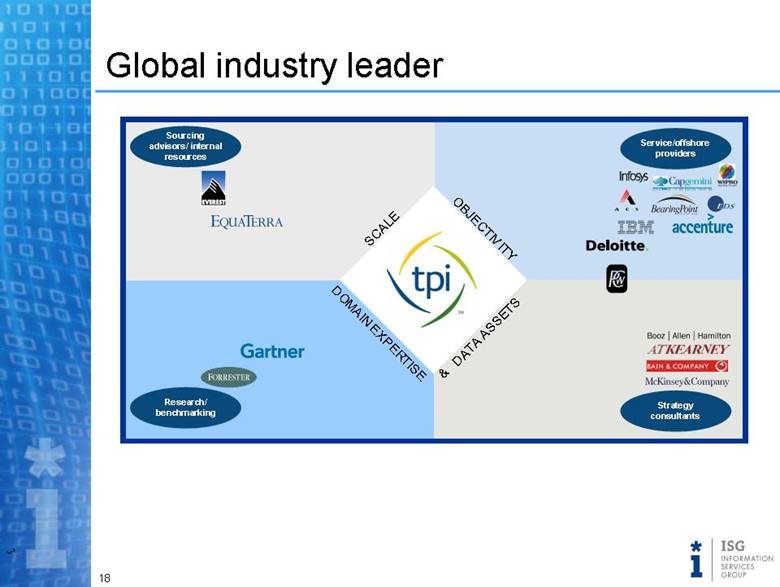
| Global industry leader Sourcing advisors/ internal resources Research/ benchmarking Strategy consultants Service/offshore providers SCALE DATA ASSETS OBJECTIVITY DOMAIN EXPERTISE & |
| ISG team has been fully engaged in TPI since acquisition announcement Intensive one-on-one meetings held with 50 TPI leaders and high-potentials Town hall meetings in four cities (100+ associates) Extensive business reviews – North America, Europe, Asia Pacific, and General Motors Attended sourcing leadership conference Three day revenue growth summit Developed Value Creation Plan Acquisition planning and research |

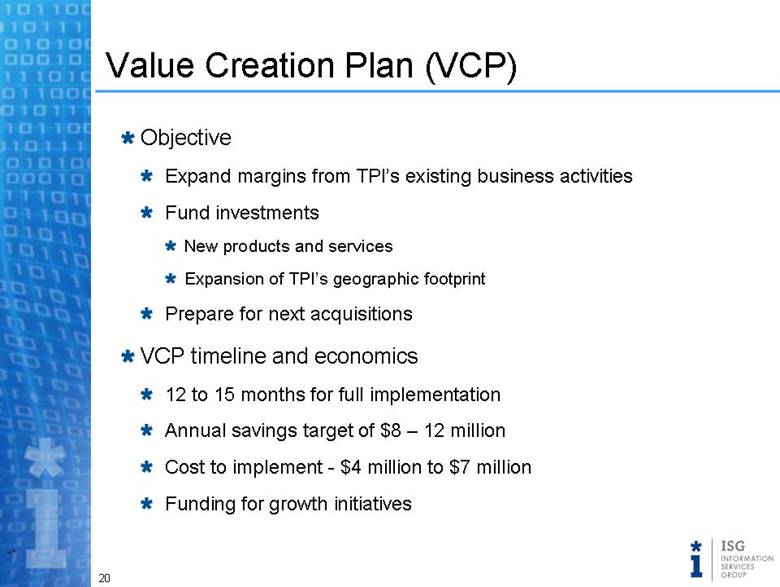
| Value Creation Plan (VCP) Objective Expand margins from TPI’s existing business activities Fund investments New products and services Expansion of TPI’s geographic footprint Prepare for next acquisitions VCP timeline and economics 12 to 15 months for full implementation Annual savings target of $8 – 12 million Cost to implement - $4 million to $7 million Funding for growth initiatives |
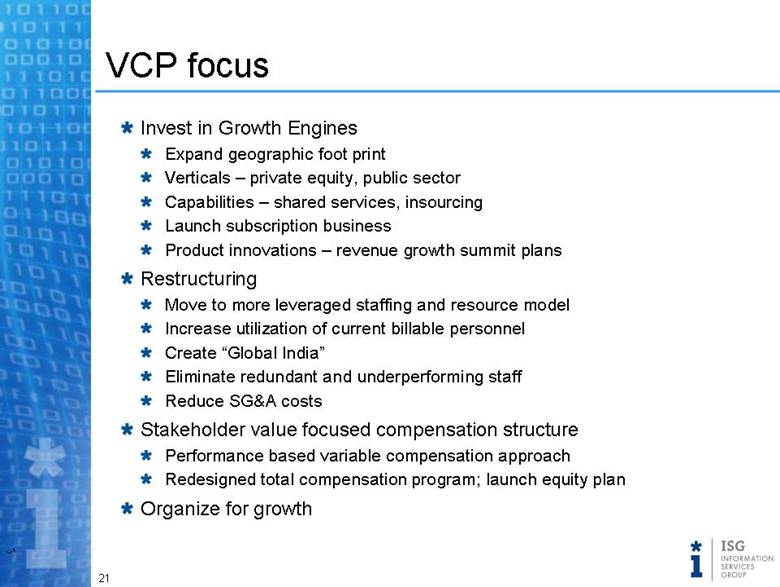
| VCP focus Invest in Growth Engines Expand geographic foot print Verticals – private equity, public sector Capabilities – shared services, insourcing Launch subscription business Product innovations – revenue growth summit plans Restructuring Move to more leveraged staffing and resource model Increase utilization of current billable personnel Create “Global India” Eliminate redundant and underperforming staff Reduce SG&A costs Stakeholder value focused compensation structure Performance based variable compensation approach Redesigned total compensation program; launch equity plan Organize for growth |
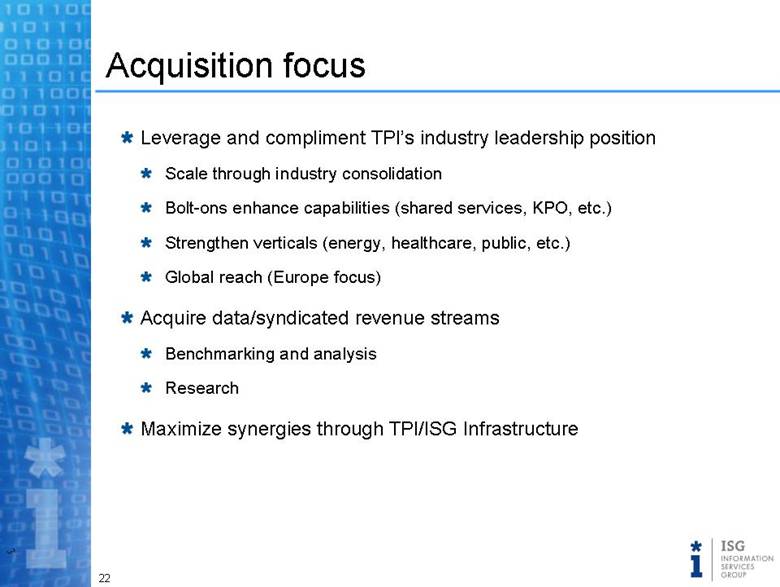
| Acquisition focus Leverage and compliment TPI’s industry leadership position Scale through industry consolidation Bolt-ons enhance capabilities (shared services, KPO, etc.) Strengthen verticals (energy, healthcare, public, etc.) Global reach (Europe focus) Acquire data/syndicated revenue streams Benchmarking and analysis Research Maximize synergies through TPI/ISG Infrastructure |
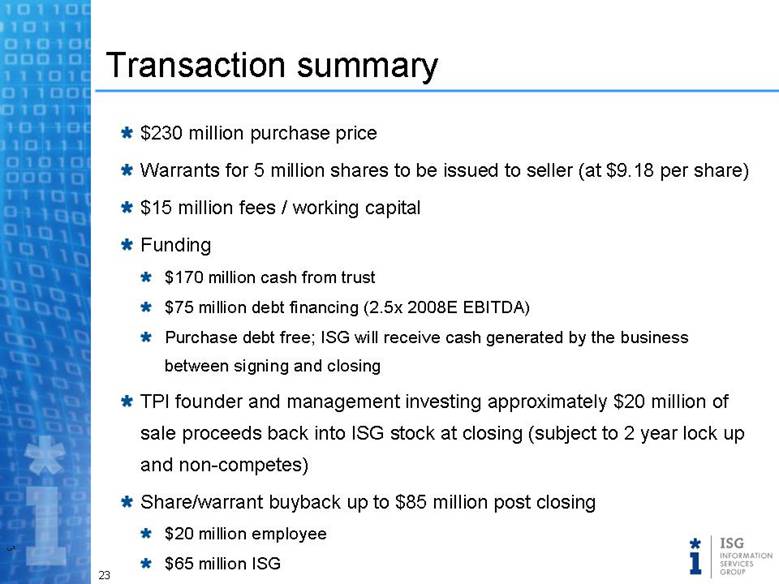
| Transaction summary $230 million purchase price Warrants for 5 million shares to be issued to seller (at $9.18 per share) $15 million fees / working capital Funding $170 million cash from trust $75 million debt financing (2.5x 2008E EBITDA) Purchase debt free; ISG will receive cash generated by the business between signing and closing TPI founder and management investing approximately $20 million of sale proceeds back into ISG stock at closing (subject to 2 year lock up and non-competes) Share/warrant buyback up to $85 million post closing $20 million employee $65 million ISG |
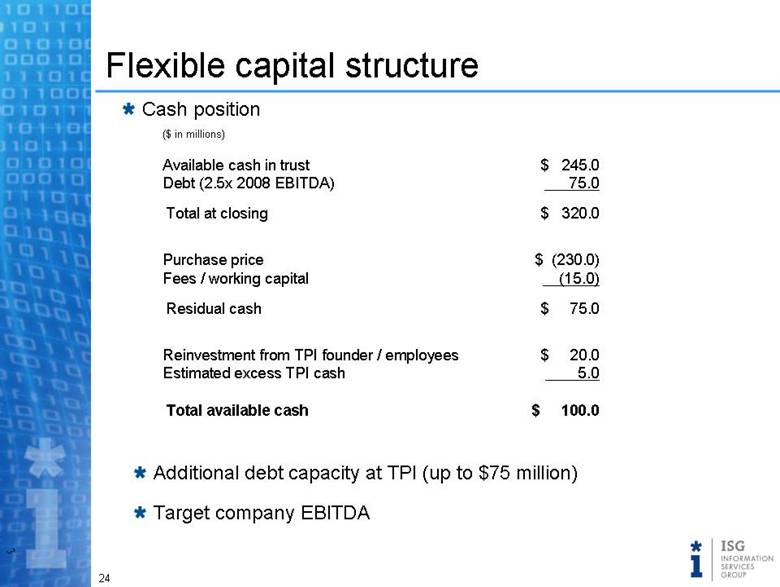
| Flexible capital structure $ 100.0 Total available cash Estimated excess TPI cash $ 20.0 Reinvestment from TPI founder / employees $ 75.0 Residual cash Fees / working capital $ (230.0) Purchase price $ 320.0 Total at closing Debt (2.5x 2008 EBITDA) $ 245.0 Available cash in trust Additional debt capacity at TPI (up to $75 million) Target company EBITDA Cash position ($ in millions) 75.0 (15.0) 5.0 |
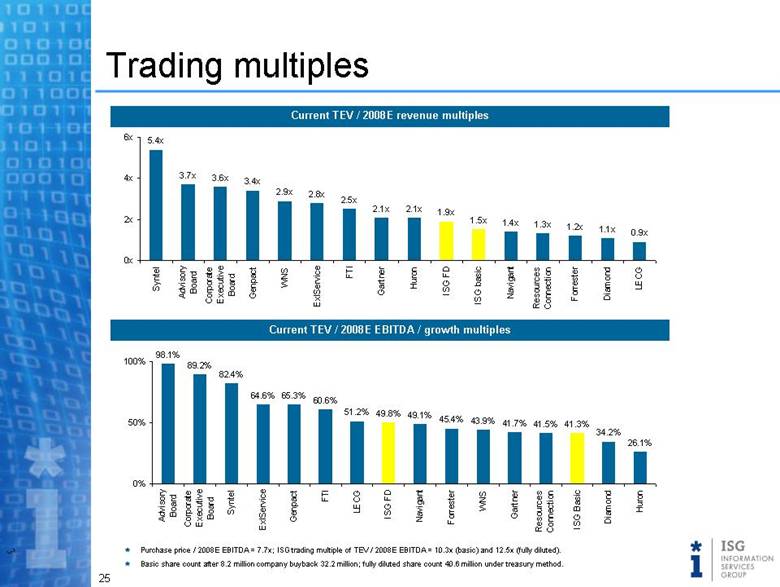
| Trading multiples Current TEV / 2008E revenue multiples Current TEV / 2008E EBITDA / growth multiples Purchase price / 2008E EBITDA = 7.7x; ISG trading multiple of TEV / 2008E EBITDA = 10.3x (basic) and 12.5x (fully diluted). Basic share count after 8.2 million company buyback 32.2 million; fully diluted share count 40.6 million under treasury method. 5.4x 3.7x 3.6x 3.4x 2.9x 2.8x 2.5x 2.1x 2.1x 1.9x 1.5x 1.4x 1.3x 1.2x 1.1x 0.9x 0x 2x 4x 6x Syntel Advisory Board Corporate Executive Board Genpact WNS ExlService FTI Gartner Huron ISG FD ISG basic Navigant Resources Connection Forrester Diamond LECG 98.1% 89.2% 82.4% 64.6% 65.3% 60.6% 51.2% 49.8% 49.1% 45.4% 43.9% 41.7% 41.5% 41.3% 34.2% 26.1% 0% 50% 100% Advisory Board Corporate Executive Board Syntel ExlService Genpact FTI LECG ISG FD Navigant Forrester WNS Gartner Resources Connection ISG Basic Diamond Huron |
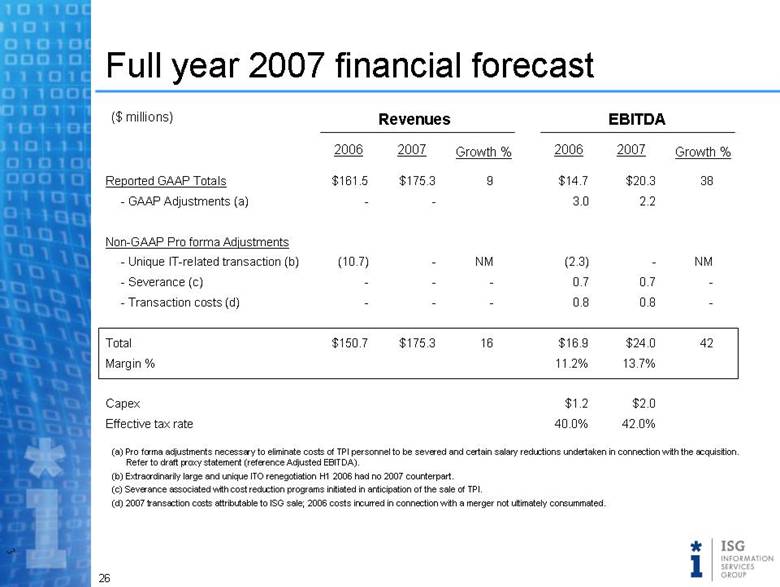
| Full year 2007 financial forecast Reported GAAP Totals - GAAP Adjustments (a) Non-GAAP Pro forma Adjustments - Unique IT-related transaction (b) - Severance (c) - Transaction costs (d) Total Margin % Capex Effective tax rate ($ millions) Revenues EBITDA $161.5 - (10.7) - - $150.7 Growth % 9 NM - - 16 2006 $175.3 - - - - $175.3 2007 $14.7 3.0 (2.3) 0.7 0.8 $16.9 11.2% $1.2 40.0% Growth % 38 NM - - 42 2006 $20.3 2.2 - 0.7 0.8 $24.0 13.7% $2.0 42.0% 2007 (a) Pro forma adjustments necessary to eliminate costs of TPI personnel to be severed and certain salary reductions undertaken in connection with the acquisition. Refer to draft proxy statement (reference Adjusted EBITDA). (b) Extraordinarily large and unique ITO renegotiation H1 2006 had no 2007 counterpart. (c) Severance associated with cost reduction programs initiated in anticipation of the sale of TPI. (d) 2007 transaction costs attributable to ISG sale; 2006 costs incurred in connection with a merger not ultimately consummated. |
| Exiting 2007 with momentum Europe and Asia Pacific booming 16% year-to-date and accelerating Breakthrough wins in the U.S. public sector Texas, Georgia Current pipeline at an all time high 70% of revenue from existing relationships or referrals Sole sourced 65% of time YTD competitive hit rate of 66% $6 million in new wins from financial services in the past 6 weeks |
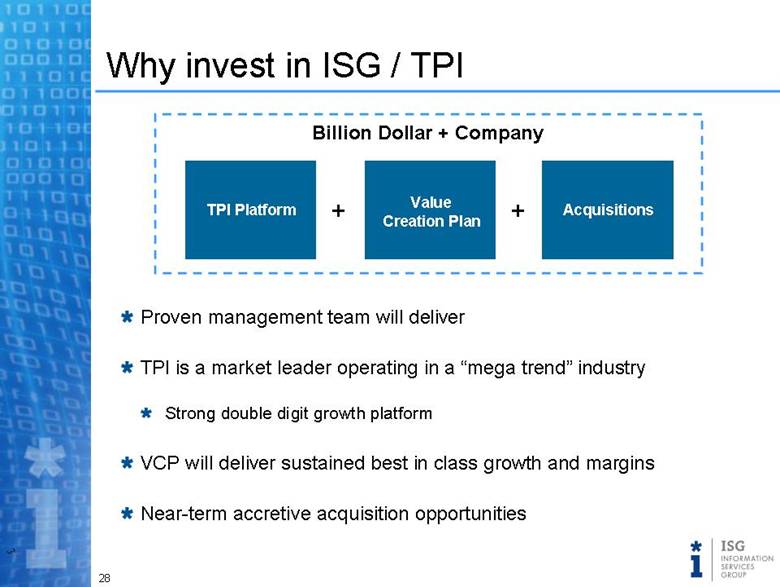
| Why invest in ISG / TPI Proven management team will deliver TPI is a market leader operating in a “mega trend” industry Strong double digit growth platform VCP will deliver sustained best in class growth and margins Near-term accretive acquisition opportunities TPI Platform Value Creation Plan Acquisitions + + Billion Dollar + Company |
| A Powerful Combination Shareholder value creation + = World class global operators Sourcing industry leaders A Compelling Investment Opportunity |

| Appendix |
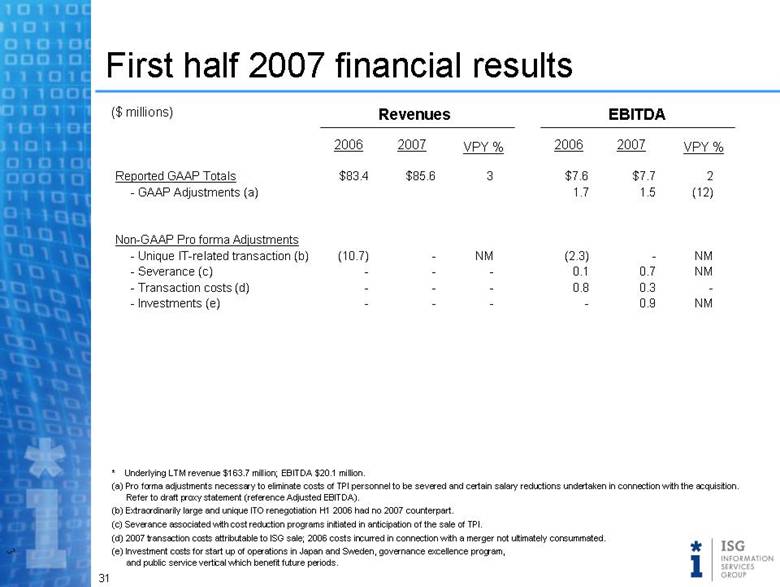
| First half 2007 financial results Reported GAAP Totals - GAAP Adjustments (a) Non-GAAP Pro forma Adjustments - Unique IT-related transaction (b) - Severance (c) - Transaction costs (d) - Investments (e) ($ millions) Revenues EBITDA $83.4 (10.7) - - - VPY % 3 NM - - - 2006 $85.6 - - - - 2007 $7.6 1.7 (2.3) 0.1 0.8 - VPY % 2 (12) NM NM - NM 2006 $7.7 1.5 - 0.7 0.3 0.9 2007 * Underlying LTM revenue $163.7 million; EBITDA $20.1 million. (a) Pro forma adjustments necessary to eliminate costs of TPI personnel to be severed and certain salary reductions undertaken in connection with the acquisition. Refer to draft proxy statement (reference Adjusted EBITDA). (b) Extraordinarily large and unique ITO renegotiation H1 2006 had no 2007 counterpart. (c) Severance associated with cost reduction programs initiated in anticipation of the sale of TPI. (d) 2007 transaction costs attributable to ISG sale; 2006 costs incurred in connection with a merger not ultimately consummated. (e) Investment costs for start up of operations in Japan and Sweden, governance excellence program, and public service vertical which benefit future periods. |
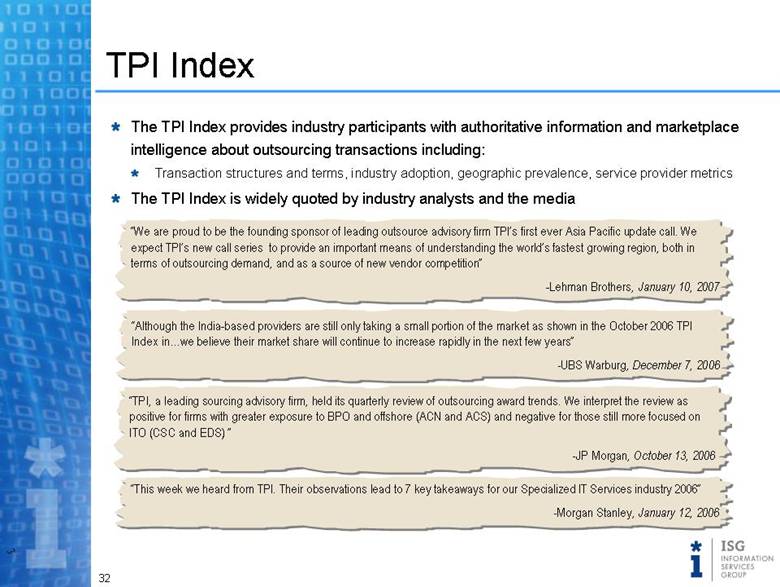
| “We are proud to be the founding sponsor of leading outsource advisory firm TPI’s first ever Asia Pacific update call. We expect TPI’s new call series to provide an important means of understanding the world’s fastest growing region, both in terms of outsourcing demand, and as a source of new vendor competition” -Lehman Brothers, January 10, 2007 “Although the India-based providers are still only taking a small portion of the market as shown in the October 2006 TPI Index in... we believe their market share will continue to increase rapidly in the next few years” -UBS Warburg, December 7, 2006 “TPI, a leading sourcing advisory firm, held its quarterly review of outsourcing award trends. We interpret the review as positive for firms with greater exposure to BPO and offshore (ACN and ACS) and negative for those still more focused on ITO (CSC and EDS) ” -JP Morgan, October 13, 2006 “This week we heard from TPI. Their observations lead to 7 key takeaways for our Specialized IT Services industry 2006” -Morgan Stanley, January 12, 2006 TPI Index The TPI Index provides industry participants with authoritative information and marketplace intelligence about outsourcing transactions including: Transaction structures and terms, industry adoption, geographic prevalence, service provider metrics The TPI Index is widely quoted by industry analysts and the media |
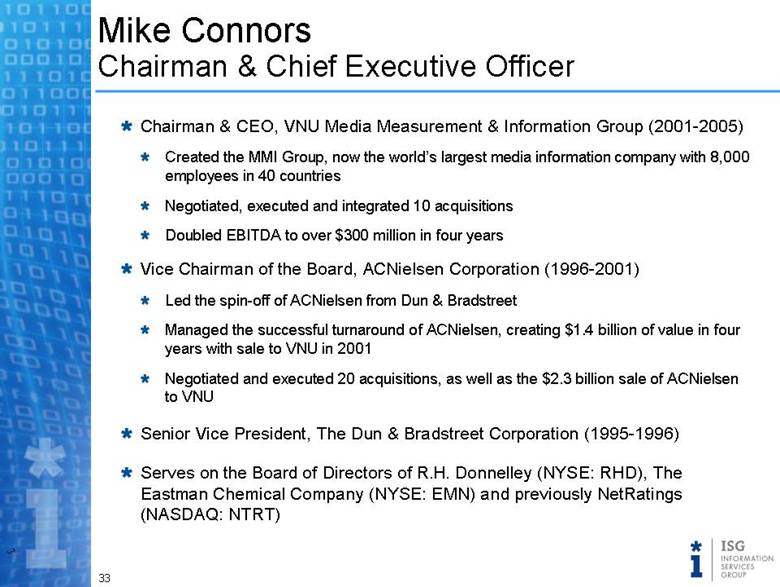
| Mike Connors Chairman & Chief Executive Officer Chairman & CEO, VNU Media Measurement & Information Group (2001-2005) Created the MMI Group, now the world’s largest media information company with 8,000 employees in 40 countries Negotiated, executed and integrated 10 acquisitions Doubled EBITDA to over $300 million in four years Vice Chairman of the Board, ACNielsen Corporation (1996-2001) Led the spin-off of ACNielsen from Dun & Bradstreet Managed the successful turnaround of ACNielsen, creating $1.4 billion of value in four years with sale to VNU in 2001 Negotiated and executed 20 acquisitions, as well as the $2.3 billion sale of ACNielsen to VNU Senior Vice President, The Dun & Bradstreet Corporation (1995-1996) Serves on the Board of Directors of R.H. Donnelley (NYSE: RHD), The Eastman Chemical Company (NYSE: EMN) and previously NetRatings (NASDAQ: NTRT) |
| Leadership Team Frank Martell Chief Operating Officer of ACNielsen President and CEO of ACNielsen Europe & Emerging Markets President and CEO, ACNielsen Asia Pacific Head of Internal Audit, Dun & Bradstreet Corporation 15 years GE Financial Management 25 years of management experience including several senior management positions at ACNielsen, D&B and GE Earl Doppelt EVP and Chief Legal Officer of VNU EVP and General Counsel of ACNielsen Corporation SVP and General Counsel of Dun & Bradstreet Corporation SVP and Deputy General Counsel of Paramount Communications Litigator at Paul, Weiss, Rifkind, Wharton and Garrison 30 years of management experience including senior positions at VNU, ACNielsen and D&B Rick Gould Co-Head of North America Equity Distribution Head of Global Derivatives Sales Senior executive roles in Tokyo, London and the US A member of Morgan Stanley’s Capital Markets Committee 20 years of Global Capital Markets experience at Morgan Stanley EVP, CFO, Treasurer EVP, General Counsel, Secretary EVP |

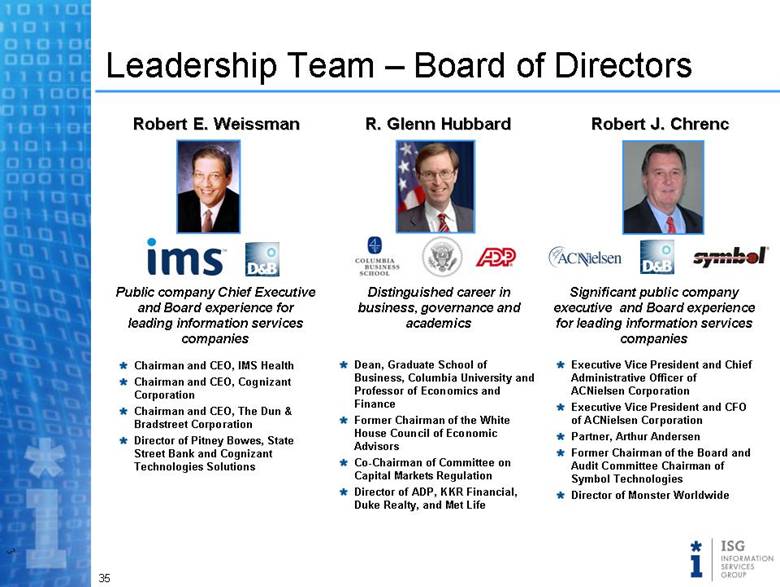
| Robert E. Weissman R. Glenn Hubbard Robert J. Chrenc Leadership Team – Board of Directors Dean, Graduate School of Business, Columbia University and Professor of Economics and Finance Former Chairman of the White House Council of Economic Advisors Co-Chairman of Committee on Capital Markets Regulation Director of ADP, KKR Financial, Duke Realty, and Met Life Distinguished career in business, governance and academics Executive Vice President and Chief Administrative Officer of ACNielsen Corporation Executive Vice President and CFO of ACNielsen Corporation Partner, Arthur Andersen Former Chairman of the Board and Audit Committee Chairman of Symbol Technologies Director of Monster Worldwide Significant public company executive and Board experience for leading information services companies Chairman and CEO, IMS Health Chairman and CEO, Cognizant Corporation Chairman and CEO, The Dun & Bradstreet Corporation Director of Pitney Bowes, State Street Bank and Cognizant Technologies Solutions Public company Chief Executive and Board experience for leading information services companies |
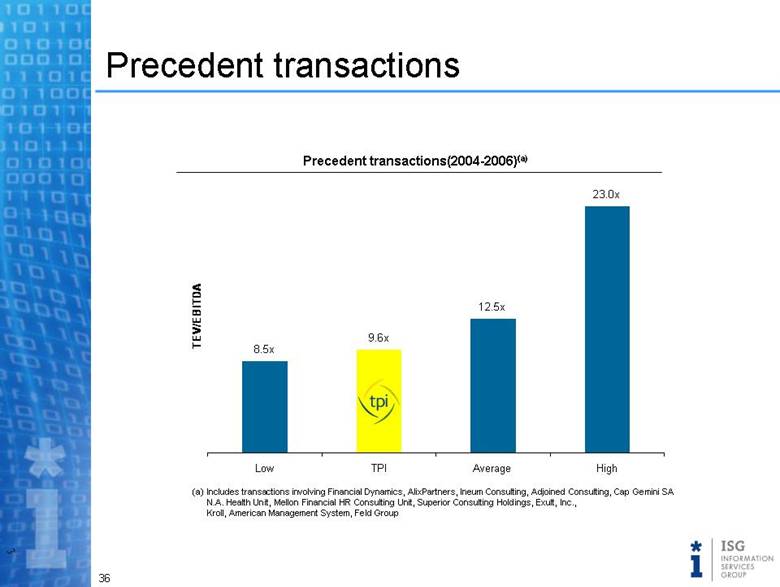
| Precedent transactions (a) Includes transactions involving Financial Dynamics, AlixPartners, Ineum Consulting, Adjoined Consulting, Cap Gemini SA N.A. Health Unit, Mellon Financial HR Consulting Unit, Superior Consulting Holdings, Exult, Inc., Kroll, American Management System, Feld Group Precedent transactions(2004-2006)(a) 8.5x 9.6x 12.5x 23.0x Low TPI Average High TEV/EBITDA |