UNITED STATES
SECURITIES AND EXCHANGE COMMISSION
Washington, DC 20549
FORM 20-F
| ¨ | REGISTRATION STATEMENT PURSUANT TO SECTION 12(b) OR (g) OF THE SECURITIES EXCHANGE ACT OF 1934 |
OR
| x | ANNUAL REPORT PURSUANT TO SECTION 13 OR 15(d) OF THE SECURITIES EXCHANGE ACT OF 1934 |
For the fiscal year ended: December 31, 2013
OR
| ¨ | TRANSITION REPORT PURSUANT TO SECTION 13 OR 15(d) OF THE SECURITIES EXCHANGE ACT OF 1934 |
OR
| ¨ | SHELL COMPANY REPORT PURSUANT TO SECTION 13 OR 15(d) OF THE SECURITIES EXCHANGE ACT OF 1934 |
Date of event requiring this shell company report
For the transition period from to
Commission file number: 1- 33208
HANWHA SOLARONE CO., LTD.
(Exact name of Registrant as specified in its charter)
| | |
| Not Applicable | | Cayman Islands |
| (Translation of Registrant’s name into English) | | (Jurisdiction of Incorporation or Organization) |
888 Linyang Road, Qidong, Jiangsu Province 226200, People’s Republic of China
(Address of Principal Executive Offices)
Mr. Jung Pyo Seo
Chief Financial Officer
Telephone: +86-21-3852-1666
Fax: +86-21-3852-1668
RM 605-606, YongDa International Tower
2277 Longyang Road
Shanghai 201204
People’s Republic of China
(Name, Telephone, E-mail and/or Facsimile Number and Address of Company Contact Person)
Securities registered or to be registered pursuant to Section 12(b) of the Act:
| | |
Title of Each Class | | Name of Each Exchange on Which Registered |
American Depositary Shares Ordinary Shares, par value US$0.0001 per share | | Nasdaq Global Market |
Securities registered or to be registered pursuant to Section 12(g) of the Act:
None
Securities for which there is a reporting obligation pursuant to Section 15(d) of the Act:
None
Indicate the number of outstanding shares of each of the issuer’s classes of capital or common stock as of the close of the period covered by the annual report.
471,658,155 Ordinary Shares, par value US$0.0001 per share, as of December 31, 2013
Indicate by check mark if the registrant is a well-known seasoned issuer, as defined in Rule 405 of the Securities Act. ¨ Yes x No
If this report is an annual or transition report, indicate by check mark if the registrant is not required to file reports pursuant to Section 13 or 15(d) of the Securities Exchange Act of 1934. ¨ Yes x No
Indicate by check mark whether the registrant: (1) has filed all reports required to be filed by Section 13 or 15(d) of the Securities Exchange Act of 1934 during the preceding 12 months (or for such shorter period that the registrant was required to file such reports), and (2) has been subject to such filing requirements for the past 90 days. x Yes ¨ No
Indicate by check mark whether the registrant has submitted electronically and posted on its corporate Web site, if any, every Interactive Data File required to be submitted and posted pursuant to Rule 405 ofRegulation S-T (§232.405 of this chapter) during the preceding 12 months (or for such shorter period that the registrant was required to submit and post such files). x Yes ¨ No
Indicate by check mark whether the registrant is a large accelerated filer, an accelerated filer, or a non-accelerated filer. See definition of “accelerated filer and large accelerated filer” in Rule 12b-2 of the Exchange Act. (Check one):
Large accelerated filer ¨ Accelerated filer x Non-accelerated filer ¨
Indicate by check mark which basis of accounting the registrant has used to prepare the financial statements included in this filing:
| | | | |
U.S. GAAP x | | International Financial Reporting Standards as issued by the International Accounting Standards Board ¨ | | Other ¨ |
If “Other” has been checked in response to the previous question, indicate by check mark which financial statement item the registrant has elected to follow.
Item 17 ¨ Item 18 ¨
If this is an annual report, indicate by check mark whether the registrant is a shell company (as defined in Rule 12b-2 of the Exchange Act). ¨ Yes x No
(APPLICABLE ONLY TO ISSUERS INVOLVED IN BANKRUPTCY PROCEEDINGS DURING THE PAST FIVE YEARS)
Indicate by check mark whether the registrant has filed all documents and reports required to be filed by Sections 12,13 or 15(d) of the Securities Exchange Act of 1934 subsequent to the distribution of securities under a plan confirmed by a court. ¨ Yes ¨ No
Table of Contents
INTRODUCTION
Unless otherwise indicated, references in this annual report to:
| | • | | “ADRs” are to the American depositary receipts that evidence the ADSs; |
| | • | | “ADSs” are to our American depositary shares, each of which represents five ordinary shares; |
| | • | | “China” or the “PRC” are to the People’s Republic of China, excluding, for the purpose of this annual report only, Taiwan and the special administrative regions of Hong Kong and Macau; |
| | • | | “conversion efficiency” are to the ability of photovoltaic, or PV, products to convert sunlight into electricity, and “conversion efficiency rates” are commonly used in the PV industry to measure the percentage of light energy from the sun that is actually converted into electricity; |
| | • | | “cost per watt” and “price per watt” are to the method by which the cost and price of PV products, respectively, are commonly measured in the PV industry. A PV product is priced based on the number of watts of electricity it can generate; |
| | • | | “GW” are to gigawatt, representing 1,000,000,000 watts, a unit ofpower-generating capacity or consumption; |
| | • | | “MW” refers to megawatt, representing 1,000,000 watts, a unit of power-generating capacity or consumption. In this annual report, it is assumed that, based on a yield rate of 97%, 420,000 125 mm x 125 mm or 233,645 156 mm x 156 mm silicon wafers are required to produce PV products capable of generating 1 MW, that each 125 mm x 125 mm and 156 mm x 156 mm PV cell generates 2.4 W and 4.28 W of power, respectively, and that each PV module contains 72 125 mm x 125 mm PV cells, 60 156 mm x 156 mm PV cells or 72 156 mm x 156 mm PV cells; |
| | • | | “PV” are to photovoltaic. The photovoltaic effect is a process by which sunlight is converted into electricity; |
| | • | | “RMB” and “Renminbi” are to the legal currency of China; |
| | • | | “series A convertible preference shares” are to our series A convertible preference shares, par value US$0.0001 per share; |
| | • | | “shares” or “ordinary shares” are to our ordinary shares, par value US$0.0001 per share. For the purpose of computing and reporting our outstanding ordinary shares and our basic or diluted earnings per share we do not consider outstanding: (i) the remaining 4,014,075 ADSs we issued to facilitate the convertible bond offering in January 2008; (ii) the remaining 20,062,348 ordinary shares we issued to Hanwha Solar in connection with Hanwha Solar’s purchase of 36,455,089 ordinary shares of our company in September 2010; and (iii) the ADSs which have been reserved by our company to allow for the participation in the ADS program by our employees pursuant to our equity incentive plans from time to time; |
| | • | | “SolarOne Qidong” are to Hanwha SolarOne (Qidong) Co., Ltd., our wholly owned operating subsidiary in China; |
| | • | | “W” are to watt, a unit ofpower-generating capacity or consumption; and |
| | • | | “US$” and “U.S. dollars” are to the legal currency of the United States. |
References in this annual report on Form20-F to our annual manufacturing capacity assume 24 hours of operation per day for 350 days per year.
Unless the context indicates otherwise, “we,” “us,” “our company”, “Hanwha SolarOne” and “our” refer to Hanwha SolarOne Co., Ltd., its predecessor entities and its consolidated subsidiaries.
i
We completed the initial public offering of 12,000,000 ADSs, each representing five ordinary shares on December 26, 2006. On December 20, 2006, we listed the ADSs on the Nasdaq Global Market, which are traded under the symbol “HSOL.”
On January 29, 2008, we closed an offering of US$172.5 million 3.50% convertible senior notes due 2018, or 2018 convertible bonds, to qualified institutional buyers pursuant to Rule 144A under the Securities Act of 1933, as amended, or the Securities Act, and received net proceeds of US$167.9 million. Concurrently with this convertible bond offering, we closed an offering of 9,019,611 ADSs, representing 45,098,055 ordinary shares, to facilitate the convertible bond offering. We did not receive any proceeds, other than the par value of the ADSs, from such offering of ADSs. A portion of these ADSs were subsequently repurchased as described below.
From July 17, 2008 to August 12, 2008, we issued and sold 5,421,093 ADSs with an aggregate sale price of US$73.9 million.
From September 17, 2009 to November 18, 2009, we issued and sold 3,888,399 ADSs with an aggregate sale price of US$23.1 million.
In September 2010, we issued and sold to Hanwha Solar Holdings Co., Ltd., or Hanwha Solar, 36,455,089 ordinary shares for an aggregate sale price of US$78.2 million. Concurrently with the closing of this offering, we issued 30,672,689 ordinary shares to Hanwha Solar at par value of the ordinary shares and subsequently an additional 14,407,330 ordinary shares at par value, which shares were to remain outstanding so long as and to the extent that the 9,019,611 ADSs we issued to facilitate our convertible bond offering in January 2008 remain outstanding. A portion of these ordinary shares were subsequently repurchased as described below. At the same time, Hanwha Solar completed the acquisitions from Good Energies II LP and Yonghua Solar Power Investment Holding Ltd., the company owned by Mr. Yonghua Lu, our former chairman, of a total of 120,407,700 ordinary shares and 1,281,011 ADSs of our company, representing all of the ordinary shares and ADSs held by them. Hanwha Solar, a company that engages in solar business, is a wholly owned subsidiary of Hanwha Chemical Corporation, a leading chemical producer publicly traded on the Korea Exchange whose principal activities are the production ofchlor-alkali, or CA, polyethylene, or PE, andpolyvinyl-chloride, or PVC, products.
In November 2010, we issued and sold 9,200,000 ADSs with an aggregate sale price of US$82.8 million. In order for Hanwha Solar to maintain after this offering the same level of beneficial ownership in our company before this offering, we also issued and sold to Hanwha Solar 45,981,604 ordinary shares for an aggregate sale price of US$82.8 million.
In October 2011, we repurchased and cancelled 5,005,536 ADSs and the ordinary shares represented by such ADSs, which were issued pursuant to a share issuance and repurchase agreement dated January 23, 2008 to facilitate our convertible bond offering in January 2008, from Morgan Stanley & Co. International PLC. We also repurchased and cancelled 25,017,671 ordinary shares, which were issued pursuant to a share issuance and repurchase agreement dated September 16, 2010, from Hanwha Solar. These ADSs and ordinary shares were repurchased at par value of US$0.0005 per ADS and US$0.0001 per ordinary share, respectively.
In 2012, we repurchased our 2018 convertible bonds in a total principal amount of US$71.9 million.
From November 15, 2013 to January 29, 2014, we issued and sold 6,716,966 ADSs with an aggregate sale price of US$21.5 million.
ii
PART I
ITEM 1 IDENTITY OF DIRECTORS, SENIOR MANAGEMENT AND ADVISORS
Not applicable.
ITEM 2 OFFER STATISTICS AND EXPECTED TIMETABLE
Not applicable.
ITEM 3 KEY INFORMATION
A.Selected Financial Data
The following selected consolidated financial data, except for “Other Operating Data,” have been derived from our audited consolidated financial statements, which have been audited by Ernst & Young Hua Ming LLP, an independent registered public accounting firm. The report of Ernst & Young Hua Ming LLP on our consolidated financial statements as of December 31, 2012 and 2013 and for the years ended December 31, 2011, 2012 and 2013 is included elsewhere in this annual report on Form20-F. The consolidated statement of comprehensive income data for the years ended December 31, 2009 and 2010 and the consolidated balance sheet data as of December 31, 2009, 2010 and 2011 have been derived from our audited consolidated financial statements, which are not included in this annual report on Form20-F. The selected consolidated financial information for those periods and as of those dates are qualified by reference to those financial statements and the related notes, and should be read in conjunction with them and with “Item 5. Operating and Financial Review and Prospects.” Our consolidated financial statements are prepared and presented in accordance with United States generally accepted accounting principles, or U.S. GAAP. Our historical results do not necessarily indicate our results expected for any future periods.
| | | | | | | | | | | | | | | | | | | | | | | | |
| | | Year Ended December 31, | |
| | | 2009 | | | 2010 | | | 2011 | | | 2012 | | | 2013 | |
| | | (RMB) | | | (RMB) | | | (RMB) | | | (RMB) | | | (RMB) | | | (US$) | |
| | | (In thousands, except share and per share data) | |
Consolidated Statement of Comprehensive Income Data | | | | | | | | | | | | | | | | | | | | | | | | |
Net revenues | | | | | | | | | | | | | | | | | | | | | | | | |
Third parties | | | 3,443,813 | | | | 7,072,789 | | | | 5,832,628 | | | | 2,639,453 | | | | 2,782,772 | | | | 459,681 | |
Related parties | | | 336,485 | | | | 475,756 | | | | 583,857 | | | | 1,038,927 | | | | 1,942,920 | | | | 320,948 | |
Total net revenues | | | 3,780,298 | | | | 7,548,545 | | | | 6,416,485 | | | | 3,678,380 | | | | 4,725,692 | | | | 780,629 | |
Cost of revenues | | | (3,309,969 | ) | | | (5,869,503 | ) | | | (6,633,542 | ) | | | (4,003,885 | ) | | | (4,390,718 | ) | | | (725,295 | ) |
Gross profit (loss) | | | 470,329 | | | | 1,679,042 | | | | (217,057 | ) | | | (325,505 | ) | | | 334,974 | | | | 55,334 | |
Operating expenses | | | | | | | | | | | | | | | | | | | | | | | | |
Selling expenses | | | (137,421 | ) | | | (269,202 | ) | | | (279,788 | ) | | | (348,568 | ) | | | (325,422 | ) | | | (53,756 | ) |
General and administrative expenses | | | (177,266 | ) | | | (172,117 | ) | | | (340,405 | ) | | | (278,033 | ) | | | (295,482 | ) | | | (48,811 | ) |
Provision for doubtful accounts receivable and other receivables | | | (3,723 | ) | | | 278 | | | | (56,234 | ) | | | (137,674 | ) | | | (28,562 | ) | | | (4,718 | ) |
Research and development expenses | | | (32,025 | ) | | | (53,500 | ) | | | (68,217 | ) | | | (90,820 | ) | | | (92,256 | ) | | | (15,240 | ) |
Impairment of goodwill | | | — | | | | — | | | | (134,735 | ) | | | — | | | | — | | | | — | |
Total operating expenses | | | (350,435 | ) | | | (494,541 | ) | | | (879,379 | ) | | | (855,095 | ) | | | (741,722 | ) | | | (122,525 | ) |
Operating profit (loss) | | | 119,894 | | | | 1,184,501 | | | | (1,096,436 | ) | | | (1,180,600 | ) | | | (406,748 | ) | | | (67,191 | ) |
Interest expense | | | (157,907 | ) | | | (161,677 | ) | | | (171,059 | ) | | | (299,515 | ) | | | (323,820 | ) | | | (53,491 | ) |
Interest income | | | 5,002 | | | | 6,141 | | | | 11,763 | | | | 15,841 | | | | 21,212 | | | | 3,504 | |
1
| | | | | | | | | | | | | | | | | | | | | | | | |
| | | Year Ended December 31, | |
| | | 2009 | | | 2010 | | | 2011 | | | 2012 | | | 2013 | |
| | | (RMB) | | | (RMB) | | | (RMB) | | | (RMB) | | | (RMB) | | | (US$) | |
| | | (In thousands, except share and per share data) | |
Exchange gains (losses) | | | (23,814 | ) | | | (89,272 | ) | | | (3,965 | ) | | | 8,875 | | | | 43,687 | | | | 7,217 | |
Changes in fair value of derivative contracts | | | 9,594 | | | | 77,531 | | | | (70,778 | ) | | | 5,326 | | | | 63,739 | | | | 10,529 | |
Changes in fair value of conversion feature of convertible bonds | | | (73,887 | ) | | | 31,623 | | | | 264,384 | | | | (5,692 | ) | | | (6,105 | ) | | | (1,008 | ) |
Loss on extinguishment of debt | | | — | | | | — | | | | — | | | | (82,713 | ) | | | — | | | | — | |
Other income | | | 11,965 | | | | 12,396 | | | | 5,144 | | | | 9,265 | | | | 7,805 | | | | 1,289 | |
Other expenses | | | (11,835 | ) | | | (5,903 | ) | | | (14,102 | ) | | | (18,391 | ) | | | (16,194 | ) | | | (2,675 | ) |
Income (loss) before income taxes | | | (120,988 | ) | | | 1,055,340 | | | | (1,075,049 | ) | | | (1,547,604 | ) | | | (616,424 | ) | | | (101,826 | ) |
Income tax benefit/(expenses) | | | (23,928 | ) | | | (297,983 | ) | | | 144,945 | | | | (15,255 | ) | | | (257,666 | ) | | | (42,563 | ) |
Net income (loss) | | | (144,916 | ) | | | 757,357 | | | | (930,104 | ) | | | (1,562,859 | ) | | | (874,090 | ) | | | (144,389 | ) |
Net (income) loss attributable tonon-controlling interest | | | (311 | ) | | | — | | | | — | | | | — | | | | — | | | | — | |
Net income (loss) attributable to shareholders | | | (145,227 | ) | | | 757,357 | | | | (930,104 | ) | | | (1,562,859 | ) | | | (874,090 | ) | | | (144,389 | ) |
Net income (loss) attributable to shareholders per share Hanwha SolarOne Co., Ltd. | | | | | | | | | | | | | | | | | | | | | | | | |
—Basic | | | (0.53 | ) | | | 2.43 | | | | (2.21 | ) | | | (3.70 | ) | | | (2.06 | ) | | | (0.34 | ) |
—Diluted | | | (0.53 | ) | | | 2.36 | | | | (2.21 | ) | | | (3.70 | ) | | | (2.06 | ) | | | (0.34 | ) |
Number of shares used in computation of net income (loss) per share | | | | | | | | | | | | | | | | | | | | | | | | |
—Basic | | | 274,067,760 | | | | 311,263,308 | | | | 420,325,701 | | | | 422,167,505 | | | | 423,675,429 | | | | 423,675,429 | |
—Diluted | | | 274,067,760 | | | | 357,272,605 | | | | 420,325,701 | | | | 422,167,505 | | | | 423,675,429 | | | | 423,675,429 | |
Net income (loss) per ADS | | | | | | | | | | | | | | | | | | | | | | | | |
—Basic | | | (2.65 | ) | | | 12.17 | | | | (11.05 | ) | | | (18.51 | ) | | | (10.32 | ) | | | (1.70 | ) |
—Diluted | | | (2.65 | ) | | | 11.82 | | | | (11.05 | ) | | | (18.51 | ) | | | (10.32 | ) | | | (1.70 | ) |
Number of ADS used in computation of net income (loss) per ADS | | | | | | | | | | | | | | | | | | | | | | | | |
—Basic | | | 54,813,552 | | | | 62,252,662 | | | | 84,065,140 | | | | 84,433,501 | | | | 84,735,086 | | | | 84,735,086 | |
—Diluted | | | 54,813,552 | | | | 71,454,521 | | | | 84,065,140 | | | | 84,433,501 | | | | 84,735,086 | | | | 84,735,086 | |
Other Financial Data
| | | | | | | | | | | | | | | | | | | | |
| | | Year Ended December 31, | |
| | | 2009 | | | 2010 | | | 2011 | | | 2012 | | | 2013 | |
Gross margin | | | 12.4 | % | | | 22.2 | % | | | (3.4 | )% | | | (8.8 | )% | | | 7.1 | % |
Operating margin | | | 3.2 | % | | | 15.7 | % | | | (17.1 | )% | | | (32.1 | )% | | | (8.6 | )% |
Net margin | | | (3.8 | )% | | | 10.0 | % | | | (14.5 | )% | | | (42.5 | )% | | | (18.5 | )% |
2
| | | | | | | | | | | | | | | | | | | | | | | | |
| | | Year Ended December 31, | |
| | | 2009 | | | 2010 | | | 2011 | | | 2012 | | | 2013 | |
| | | (RMB) | | | (RMB) | | | (RMB) | | | (RMB) | | | (RMB) | | | (US$) | |
| | | (In thousands) | |
Net cash (used in) provided by operating activities | | | 688,895 | | | | 266,760 | | | | 255,494 | | | | (1,052,213 | ) | | | 386,718 | | | | 63,882 | |
Other Operating Data
| | | | | | | | | | | | | | | | | | | | |
| | | Year Ended December 31, | |
| | | 2009 | | | 2010 | | | 2011 | | | 2012 | | | 2013 | |
| | | (MW) | | | (MW) | | | (MW) | | | (MW) | | | (MW) | |
Amount of PV modules shipped (including PV module processing) | | | 313.4 | | | | 797.9 | | | | 844.4 | | | | 829.8 | | | | 1,280.3 | |
| | | | | | | | | | | | | | | | | | | | | | | | |
| | | Year Ended December 31, | |
| | | 2009 | | | 2010 | | | 2011 | | | 2012 | | | 2013 | |
| | | (RMB/W) | | | (RMB/W) | | | (RMB/W) | | | (RMB/W) | | | (RMB/W) | | | (US$/W) | |
Average selling price of PV modules (excluding PV module processing) | | | 15.27 | | | | 11.58 | | | | 8.87 | | | | 4.47 | | | | 4.10 | | | | 0.68 | |
| | | | | | | | | | | | | | | | | | | | | | | | |
| | | As of December 31, | |
| | | 2009 | | | 2010 | | | 2011 | | | 2012 | | | 2013 | |
| | | (RMB) | | | (RMB) | | | (RMB) | | | (RMB) | | | (RMB) | | | (US$) | |
| | | (In thousands) | |
Consolidated Balance Sheet Data | | | | | | | | | | | | | | | | | | | | | | | | |
Cash and cash equivalents | | | 645,720 | | | | 1,630,777 | | | | 1,976,555 | | | | 676,476 | | | | 1,249,481 | | | | 206,400 | |
Restricted cash | | | 60,539 | | | | 100,490 | | | | 281,626 | | | | 150,462 | | | | 163,948 | | | | 27,082 | |
Accounts receivable—net | | | 587,488 | | | | 1,282,807 | | | | 537,540 | | | | 956,969 | | | | 744,739 | | | | 123,022 | |
Notes receivable | | | — | | | | 10,000 | | | | 60,208 | | | | 2,681 | | | | 10,780 | | | | 1,781 | |
Inventories—net | | | 783,973 | | | | 790,773 | | | | 684,049 | | | | 838,727 | | | | 752,291 | | | | 124,270 | |
Advance to suppliers—net | | | 540,145 | | | | 764,063 | | | | 475,645 | | | | 166,838 | | | | 182,129 | | | | 30,086 | |
Other current assets | | | 180,315 | | | | 255,432 | | | | 528,572 | | | | 356,784 | | | | 301,561 | | | | 49,812 | |
Deferred tax assets—net | | | 76,904 | | | | 108,370 | | | | 281,083 | | | | 257,601 | | | | 2,946 | | | | 487 | |
Derivative contracts | | | 7,360 | | | | 7,489 | | | | 29,091 | | | | — | | | | 26,632 | | | | 4,399 | |
Amount due from related parties—net | | | 12,458 | | | | 27,819 | | | | 241,453 | | | | 420,610 | | | | 530,732 | | | | 87,669 | |
Long-term prepayments | | | 439,617 | | | | 394,282 | | | | 204,570 | | | | 184,065 | | | | 132,011 | | | | 21,807 | |
Amount due from relatedparties—non-current portion | | | — | | | | 15,000 | | | | — | | | | — | | | | — | | | | — | |
Fixed assets—net | | | 1,586,283 | | | | 2,084,027 | | | | 4,715,962 | | | | 4,779,873 | | | | 4,482,656 | | | | 740,482 | |
Land use rights—net | | | 208,563 | | | | 205,763 | | | | 334,987 | | | | 335,047 | | | | 272,444 | | | | 45,005 | |
Long-term deferred expenses | | | 33,158 | | | | 27,273 | | | | 49,702 | | | | 25,200 | | | | 9,594 | | | | 1,585 | |
Goodwill | | | 134,735 | | | | 134,735 | | | | — | | | | — | | | | — | | | | — | |
Total assets | | | 5,297,258 | | | | 7,839,100 | | | | 10,401,043 | | | | 9,151,333 | | | | 8,861,944 | | | | 1,463,887 | |
Short-term bank borrowings | | | 404,764 | | | | 318,919 | | | | 1,764,251 | | | | 1,162,372 | | | | 1,105,575 | | | | 182,628 | |
Long-term bank borrowings, current portion | | | 120,000 | | | | 215,000 | | | | 242,604 | | | | 467,204 | | | | 234,121 | | | | 38,674 | |
Accounts payable | | | 441,768 | | | | 478,129 | | | | 1,024,947 | | | | 1,061,723 | | | | 695,530 | | | | 114,893 | |
Notes payable | | | 186,921 | | | | 181,265 | | | | 462,602 | | | | 314,517 | | | | 494,462 | | | | 81,679 | |
Accrued expenses and other liabilities | | | 191,895 | | | | 404,826 | | | | 375,238 | | | | 400,537 | | | | 388,747 | | | | 64,216 | |
Customer deposits | | | 59,685 | | | | 33,538 | | | | 84,871 | | | | 36,314 | | | | 47,763 | | | | 7,890 | |
Deferred tax liabilities | | | 26,566 | | | | 25,977 | | | | 25,387 | | | | 24,798 | | | | 24,209 | | | | 3,999 | |
3
| | | | | | | | | | | | | | | | | | | | | | | | |
| | | As of December 31, | |
| | | 2009 | | | 2010 | | | 2011 | | | 2012 | | | 2013 | |
| | | (RMB) | | | (RMB) | | | (RMB) | | | (RMB) | | | (RMB) | | | (US$) | |
| | | (In thousands) | |
Unrecognized tax benefit | | | 27,385 | | | | 143,473 | | | | 143,473 | | | | 143,473 | | | | 143,473 | | | | 23,700 | |
Derivative contracts | | | 1,148 | | | | 8,047 | | | | 30,670 | | | | 17,311 | | | | 6,513 | | | | 1,076 | |
Amount due to related parties | | | 16,765 | | | | 13,183 | | | | 42,342 | | | | 72,045 | | | | 255,033 | | | | 42,128 | |
Long-term bank borrowings | | | 350,000 | | | | 135,000 | | | | 1,352,373 | | | | 2,285,106 | | | | 2,446,076 | | | | 404,063 | |
Long-term notes | | | — | | | | — | | | | — | | | | — | | | | 609,690 | | | | 100,714 | |
Long-term payable | | | — | | | | — | | | | 50,000 | | | | 50,000 | | | | 50,000 | | | | 8,259 | |
Convertible bonds | | | 658,653 | | | | 687,435 | | | | 498,646 | | | | 368,590 | | | | 470,357 | | | | 77,697 | |
Total liabilities | | | 2,485,550 | | | | 2,644,792 | | | | 6,097,404 | | | | 6,403,990 | | | | 6,971,549 | | | | 1,151,616 | |
Redeemable ordinary shares | | | 55 | | | | 55 | | | | 24 | | | | 24 | | | | 24 | | | | 4 | |
Total shareholders’ equity | | | 2,811,653 | | | | 5,194,253 | | | | 4,303,615 | | | | 2,747,319 | | | | 1,890,371 | | | | 312,267 | |
Total liabilities, redeemable ordinary shares and shareholders’ equity | | | 5,297,258 | | | | 7,839,100 | | | | 10,401,043 | | | | 9,151,333 | | | | 8,861,944 | | | | 1,463,887 | |
Exchange Rate Information
This annual report on Form20-F contains translations of certain RMB amounts into U.S. dollar amounts at specified rates. Unless otherwise stated, the translations of RMB into U.S. dollars have been made at the exchange rate as set forth on December 31, 2013 in the H.10 statistical release of the Federal Reserve Board, which was RMB6.0537 to US$1.00. We make no representation that the RMB or U.S. dollar amounts referred to in this annual report could have been or could be converted into U.S. dollars or RMB, as the case may be, at any particular rate or at all. See “Item 3.D. Risk Factors—Risks Related to Our Company and Our Industry—Fluctuations in exchange rates could adversely affect our business as well as result in foreign currency exchange losses” and “Item 3.D. Risk Factors—Risks Related to Doing Business in China—Restrictions on currency exchange may limit our ability to receive and use our revenue effectively” for discussions of the effects of fluctuating exchange rates and currency control on the value of the ADSs. On April 4, 2014, the exchange rate as set forth in the H.10 statistical release of the Federal Reserve Board was RMB6.2118 to US$1.00.
The following table sets forth information concerning exchange rates between the RMB and the U.S. dollar for the periods indicated, reflecting the exchange rates as set forth in the H.10 statistical release of the Federal Reserve Board. These rates are provided solely for your convenience and are not necessarily the exchange rates that we used in this annual report or will use in the preparation of our periodic reports or any other information to be provided to you.
| | | | | | | | | | | | | | | | |
| | | Renminbi per U.S. Dollar Noon Buying Rate | |
| | | Period End | | | Average(1) | | | Low | | | High | |
2009 | | | 6.8259 | | | | 6.8295 | | | | 6.8470 | | | | 6.8176 | |
2010 | | | 6.6000 | | | | 6.7603 | | | | 6.8330 | | | | 6.6000 | |
2011 | | | 6.2939 | | | | 6.4475 | | | | 6.6364 | | | | 6.2939 | |
2012 | | | 6.2301 | | | | 6.2990 | | | | 6.3879 | | | | 6.2221 | |
2013 | | | 6.0537 | | | | 6.1412 | | | | 6.2438 | | | | 6.0537 | |
October 2013 | | | 6.0943 | | | | 6.1032 | | | | 6.1209 | | | | 6.0815 | |
November 2013 | | | 6.0922 | | | | 6.0929 | | | | 6.0993 | | | | 6.0903 | |
December 2013 | | | 6.0537 | | | | 6.0738 | | | | 6.0927 | | | | 6.0537 | |
2014 (through April 4, 2014) | | | 6.2118 | | | | 6.1580 | | | | 6.0402 | | | | 6.2273 | |
January 2014 | | | 6.0590 | | | | 6.0509 | | | | 6.0600 | | | | 6.0402 | |
February 2014 | | | 6.1448 | | | | 6.0816 | | | | 6.1448 | | | | 6.0591 | |
March 2014 | | | 6.2117 | | | | 6.1707 | | | | 6.2273 | | | | 6.1183 | |
April 2014 (through April 4, 2014) | | | 6.2118 | | | | 6.2085 | | | | 6.2118 | | | | 6.2054 | |
Notes:
| (1) | Annual averages are calculated frommonth-end rates. Monthly averages are calculated using the average of the daily rates during the relevant period. |
4
B.Capitalization and Indebtedness
Not Applicable.
C.Reasons for the Offer and Use of Proceeds
Not Applicable.
D.Risk Factors
Risks Related to Our Company and Our Industry
Demand for our PV products has been, and may continue to be, adversely affected by volatile market and industry trends.
Demand for our PV products has been affected by global economic conditions, capital markets fluctuations and credit disruptions. During the second half of 2008 and the first half of 2009, many of our key markets, including Germany, Spain and the United States, and other national economies experienced a period of economic contraction or significantly slower economic growth. The global financial crisis, weak consumer confidence and diminished consumer and business spending have contributed to a significant slowdown in the market demand for PV products due to decreased energy requirements. In addition, many of our customers and many end-users of our PV products depend on debt financing to fund the initial capital expenditure required to purchase our PV products. During the global credit crisis, many of our customers and many end-users of our PV products experienced difficulties in obtaining financing, and even if they were able to obtain financing, the cost of such financing had increased. As a result, they changed their decision or changed the timing of their decision to purchase our PV products. In 2010, as the effect of the global economic crisis subsided, the combination of increased availability of financing for downstream buyers and decreased average selling prices of solar power products contributed to an overall increase in demand for solar power products.
Since 2011, a decrease in payment to PV product producers, in the form of feed-in tariffs and other reimbursements, and a reduction in available financing have caused a decrease in the growth in a number of PV projects in the European markets. Payments to PV product producers decreased as governments in Europe, under pressure to reduce sovereign debt levels, reduced subsidies such as feed-in tariffs. Furthermore, many downstream purchasers of PV products were unable to secure sufficient financing for PV projects due to the global credit crunch. These market conditions were exacerbated by an over-supply of PV products driven by increased manufacturing capacity, which adversely affected the prices of PV products. Although the global economy has improved since 2011, the demand for solar modules in Europe fell around 40% to 10.2GW in 2013 from 16.5GW in 2012. As a result, many solar power producers that typically purchase solar power products from manufacturers like us were unable or unwilling to expand their operations.
There can be no assurance that our customers or end-users will be able to obtain financing on a timely basis or on reasonable terms, which could have a negative impact on their demand for our products. Rising interest rates may make it difficult for end-users to finance the cost of PV systems and therefore limit the demand for our PV products and/or lead to a reduction in the average selling price of our PV products. A protracted disruption in the ability of our customers to obtain financing, economic downturn or an increase in manufacturing capacity of the PV industry has led to, and may continue to have, a protracted material adverse effect on our business, financial condition and results of operations. In the past few years, the decrease in demand for our products has led to, and may continue to result in, idle capacity. The reduction in demand has resulted in, and may continue to lead to, a significant amount of our capacity not being utilized, and our assets being impaired.
The average selling price of our PV products may continue to decrease.
Beginning in the fourth quarter of 2008, the supply of PV products has increased significantly as many manufacturers of PV products worldwide, including our company, have engaged in significant production
5
capacity expansion in recent years. As a result, this state of over-supply has resulted in reductions in the prevailing market prices of PV products as manufacturers have reduced their average selling prices in an attempt to obtain sales. The average selling price of our PV modules per watt was RMB8.87, RMB4.47, and RMB4.10 (US$0.68) in 2011, 2012 and 2013, respectively. We recorded a negative net margin of 14.5%, 42.5% and 18.5% in 2011, 2012 and 2013, respectively. The average selling prices of our PV products may decline further, which could cause our sales and/or our profit margins to decline and have a material adverse effect on our business, financial condition, results of operations and prospects.
As silicon supply increases, the corresponding increase in the global supply of PV modules may adversely affect our ability to increase or maintain our market share. Fluctuation in silicon price may also adversely impact our business and results of operations.
Silicon is an essential raw material used in the production of solar cells and modules. Prior to mid-2008, there was an industry-wide shortage of silicon. Increases in the price of silicon have in the past increased our production costs, and any significant price increase in the future may adversely affect our business and results of operations. Due to the historical scarcity of silicon, supply chain management and financial strength were the key barriers to entry. In late 2008 and 2009, however, newly available silicon capacity has resulted in an increased supply of silicon, which resulted in downward pressure on the price of silicon. Although the silicon price rebounded between the third quarter of 2010 and the first quarter of 2011 due to the recovery of demand for PV products in certain markets, the silicon price has decreased significantly again starting from the second quarter of 2011 as the result of increased silicon manufacturing capacity for silicon and the pressure from the decreasing average selling price of PV modules. In 2012, the polysilicon price continued to decline, reached a historical low of approximately US$14 per kilogram in November 2012, and remained low through 2013.
On July 18, 2013, the Ministry of Commerce of People’s Republic of China, or MOFCOM, issued a preliminary ruling imposing provisionary anti-dumping duties commencing on July 24, 2013 and ending on January 19, 2014, and on January 20, 2014, a final ruling imposing anti-dumping duties, commencing on January 20, 2014, on certain importers of solar grade polysilicon products from the United States and South Korea, based on its determination of the dumping margin of the relevant original manufacturer. On September 16, 2013, MOFCOM issued a preliminary ruling imposing provisionary countervailing duties, commencing on September 20, 2013 and ending on January 19, 2014, and on January 20, 2014, a final ruling imposing countervailing duties commencing on January 20, 2014 on certain importers of solar grade polysilicon products from the United States, based on its determination of the ad valorem subsidy rate of the relevant original manufacturer. MOFCOM has also investigated imposing anti-dumping and anti-subsidy investigations on certain importers of solar grade polysilicon products from the European Union, and, on October 31, 2013, MOFCOM extended the deadline of the investigation to May 1, 2014. On January 24, 2014, MOFCOM issued a preliminary ruling which determined that the dumping and subsidies have been found in relation to solar grade polysilicon products from the European Union, but considering the unique market situation, MOFCOM decided not to impose provisionary anti-dumping or countervailing duties for the time being. While these tariffs did not materially increase our cost of production in 2013, we cannot guarantee that these tariffs will not have a material and adverse effect in the future.
Since polysilicon is one of our major raw materials and we obtain a portion of our polysilicon from overseas markets, if there is any AD or CVD imposed, whether retroactively or not, our cost of production for solar modules may be adversely affected. Partly due to China’s AD and anti-subsidy investigations against the United States, South Korean and European polysilicon manufactures, polysilicon prices rebounded slightly since December 2012 and was US$19 per kilogram as of December 31, 2013.
We cannot assure you that the price of silicon will continue to decline or remain at its current levels, especially if the global solar power market regains its growth momentum. As the shortage of silicon eases, industry barriers to entry become less significant and the PV market may become more competitive. If we fail to compete successfully, our business may suffer and we may lose or be unable to gain market share and our
6
financial condition and results of operations may be materially and adversely affected. Such price reductions could have a negative impact on our revenues and net income, and materially and adversely affect our business and results of operations.
The reduction or elimination of government subsidies and economic incentives for on-grid solar energy applications could have a material adverse effect on our business and prospects.
We believe that the near-term growth of the market for “on-grid” applications, where solar energy is used to supplement a customer’s electricity purchased from the electric utility, depends in large part on the availability and size of government subsidies and economic incentives. The on-grid market, the reduction or elimination of government subsidies and economic incentives may hinder the growth of this market, which could decrease demand for our products and reduce our revenue.
The cost of solar energy currently exceeds the cost of power furnished by the electric utility grid in many countries. As a result, federal, state and local governmental bodies in many countries, most notably Japan, Germany, Spain, Italy, the United States, Australia, China, Korea, France and the Czech Republic, have provided subsidies and economic incentives in the form of rebates, tax credits and other incentives to end users, distributors, system integrators and manufacturers of PV products to promote the use of solar energy in on-grid applications and to reduce dependency on other forms of energy. Government economic incentives are set to be reduced and may be reduced further, or eliminated. For instance, the German government reduced feed-in-tariffs in 2009, 2010 and 2012. In 2011, 2012 and 2013, Germany accounted for 41.3%, 40.5% and 14.7% of our net revenues, respectively. In 2011, 2012 and 2013, Japan accounted for 0.2%, 6.7% and 25.0% of our net revenues, respectively.
In addition, political changes in a particular country could result in significant reductions or eliminations of subsidies or economic incentives. Electric utility companies that have significant political lobbying powers may also seek changes in the relevant legislation in their markets that may adversely affect the development and commercial acceptance of solar energy. The reduction or elimination of government subsidies and economic incentives for on-grid solar energy applications, especially those in our target markets, could cause demand for our products and our net revenues to decline, and have a material adverse effect on our business, financial condition, results of operations and prospects.
We may be subject to legal proceedings in connection with the multi-year supply agreements we entered into previously and such proceedings can be both costly and time consuming and may significantly divert the efforts and resources of our management personnel.
During the course of renegotiation of some of the multi-year supply agreements we entered into previously, we may be subject to legal, administrative or other proceedings if mutual agreement cannot be reached between us and our suppliers. For example, on June 8, 2009, LDK, one of our silicon suppliers, submitted an arbitration request and an amendment of this arbitration request to the Shanghai Arbitration Commission alleging that we failed to perform under the terms of a multi-year framework supply agreement, seeking to enforce our performance and claiming monetary relief. Deliveries of silicon under the agreement halted in early 2009 and have not recommenced. In the hearing held by the Shanghai Arbitration Commission on March 23, 2012, all claims filed by LDK were dismissed and LDK was required to refund the deposit amounting to RMB104.5 million to us within 30 days from the date of the hearing. While we are pursuing the enforcement of the awards, LDK submitted a new and separate arbitration request to the Shanghai Arbitration Commission updating its arbitration claim to seek damages of RMB446 million plus legal cost for our alleged failure to perform the aforesaid multi-year framework supply agreement on August 8, 2012. In December, 2013, we reached a settlement agreement with LDK, which was recognized by the Shanghai Arbitration Commission and became effective in January 2014. According to the settlement agreement, LDK agrees to fully and irrevocably withdraw their arbitration claim in the amount of RMB446 million and refrain from bringing any future claims based on that long-term supply agreement, and in return, we agree to waive the right to seek enforcement of the arbitral award in the amount of RMB104.5 million. See “Item 8. Financial Information—A. Consolidated Statements and Other Financial Information—Legal & Administrative Proceedings”.
7
There is no assurance that we will be able to successfully defend or resolve such legal or administrative proceedings in the near future or at all. Such legal and administrative proceedings can be both costly and time consuming and may significantly divert the efforts and resources of our management personnel. If there are any adverse judgments, our financial condition, results of operations and liquidity could be materially and adversely affected.
Prepayments we have provided to our silicon and silicon wafer suppliers expose us to the credit and performance risks of such suppliers and may not be recovered.
Most of our multi-year supply agreements that we entered into during the earlier periods of supply shortage required us to make prepayments of a portion of the total contract price to our suppliers without receiving collateral for such prepayments. As of December 31, 2011, 2012 and 2013, we had advanced RMB680.2 million, RMB350.9 million and RMB314.1 million (US$51.9 million), respectively, to our suppliers. We recorded charges to cost of revenues of RMB287.7 million, RMB186.0 million and RMB15.6 million (US$2.6 million) in 2011, 2012 and 2013, respectively, to reflect the probable loss arising from the suppliers’ failure to perform under the contracts. In addition, we reclassify advances to other current assets when legal proceedings have commenced where we are claiming a breach of contract and are seeking monetary recovery of the remaining deposit. We recorded charges to general and administrative expenses of RMB54.5 million, RMB50.0 million and nil in 2011, 2012 and 2013, respectively, to provide for losses in relation to prepayments to suppliers that were in contractual default where we have termination rights that require repayment of the remaining deposits. In the event that a supplier fails to fulfill its delivery obligation or we have disputes with any of our suppliers and we are unable to reach an agreement on terms acceptable to us, we may not be able to recover our prepayments made to such suppliers. For example, Hoku Corporation and Hoku Materials, Inc., or Hoku collectively, have failed to fulfill their delivery obligations under their multi-year framework polysilicon supply agreement entered into on November 19, 2007 and refused to return our prepayment of US$49 million. On July 2, 2013, Hoku Corporation and Hoku Materials, Inc. both filed for Chapter 7 Bankruptcy. See “Item 8. Financial Information—A. Consolidated Statements and Other Financial Information—Legal & Administrative Proceedings”.
Most of our claims for prepayments are unsecured claims, which expose us to the credit risks of our suppliers in the event of their insolvency or bankruptcy. Our claims against the defaulting suppliers would rank below those of secured creditors which would undermine our chances of obtaining the return of our prepayments. If such suppliers fail to fulfill their delivery obligations under the contracts or if there is any dispute between us and such suppliers that jeopardizes our ongoing relationship, we may have to record a provision relating to or write down prepayments made to such suppliers, which could materially and adversely affect our financial condition and results of operations.
Evaluating our business and prospects may be difficult because of the rapid changes in our industry, and our past results may not be indicative of our future performance.
We began operations in August 2004 and shipped our first PV modules and our first PV cells in February 2005 and November 2005, respectively. With the rapid growth of the PV industry prior to the fourth quarter of 2008, our business grew and evolved at a rapid rate but subsequently experienced a slowdown in 2011 and 2012. As a result, our historical operating results may not provide a meaningful basis for evaluating our business, financial performance and prospects and we may not be able to achieve growth in future periods. Therefore, you should consider our business and prospects in light of the risks, expenses and challenges that we will face as a company in a competitive industry seeking to develop and manufacture new products in a rapidly growing market, and you should not rely on our past results or our historic rate of growth as an indication of our future performance.
8
Our future success substantially depends on our ability to manage our production effectively and to reduce our manufacturing costs. Our ability to achieve such goals is subject to a number of risks and uncertainties.
Our future success substantially depends on our ability to manage our production effectively and to reduce our manufacturing costs. Our efforts to reduce our manufacturing costs include lowering our silicon and auxiliary material costs, improving manufacturing productivity and processes, and improving product quality. We may not expand our manufacturing capacity as planned, if demand for our products weakens.
We have, in the past, halted expansion in response to reduced demand. For example, one of our subsidiaries, Hanwha SolarOne Technology Co., Ltd., owns approximately 639,785 square meters of land which is currently undeveloped. If such land is identified by competent government agencies as idle land under the applicable PRC laws, Hanwha SolarOne Technology Co., Ltd. may be subject to a fine of up to 20% of the land premium of such land or, if the land is determined to be idle for over two years, the relevant government agencies may reclaim the land. In addition, since we have halted expansion, our construction plans have been adversely affected and we may need to negotiate with the construction company to develop a new construction plan. If we are unable to reach a resolution, we may be engaged in legal proceedings to resolve the dispute. We may explore all possible alternatives to dispose of our halted or pending projects. Even if we do expand our manufacturing capacity, we might not be able to generate sufficient customer demand for our solar power products to support our increased production levels. We may explore different ways of disposing of those projects and we may not expand our manufacturing capacity as planned.
If we are unable to achieve these goals, we may be unable to decrease our costs per watt, to maintain our competitive position or to improve our operating margins. Our ability to achieve such goals is subject to significant risks and uncertainties, including:
| | • | | our ability to maintain our quality level and keep pace with changes in technology; |
| | • | | our ability to source various raw materials; |
| | • | | our ability to adjust inventory levels to respond to rapidly changing market demand; |
| | • | | our ability to successfully position our assets to meet opportunities without incurring excessive costs; |
| | • | | delays in obtaining or denial of required approvals by relevant government authorities; and |
| | • | | diversion of significant management attention and other resources to other matters. |
If we are unable to establish or successfully make improvements to our manufacturing facilities or to reduce our manufacturing costs, or if we encounter any of the risks described above, we may be unable to improve our business as planned.
We depend on a limited number of customers and countries for a high percentage of our revenues and the loss of, a significant reduction in orders from, or failure to collect payments from, any of these customers or countries, if not immediately replaced, would significantly reduce our revenue and decrease our operating margins.
We currently sell a substantial portion of our PV products to a limited number of customers and countries. Our five largest customers accounted for an aggregate of 45.0%, 29.8% and 53.5% of our net revenues in 2011, 2012 and 2013, respectively. Our largest customer in 2011, 2012 and 2013 accounted for 15.1%, 7.6% and 25.0% of our net revenues, respectively. In 2013, three of our five largest customers were members of Hanwha Group. Members of Hanwha Group accounted for 41.1% of our net revenues in 2013. In 2011, 2012 and 2013, Japan accounted for 0.2%, 6.7% and 25.0% of our net revenues, respectively. In 2011, 2012 and 2013, Germany accounted for 41.3%, 40.5% and 14.7% of our net revenues, respectively. In 2013, Japan, South Africa and Germany were the top three countries in terms of percentage contribution to our net revenues. The loss of sales to any one of these customers or countries would have a significant negative impact on our business. Sales to our
9
customers are mostly made through non-exclusive arrangements. Any one of the following events may cause material fluctuations or declines in our net revenues and have a material adverse effect on our financial condition and results of operations:
| | • | | reduction, delay or cancellation of orders from one or more of our significant customers; |
| | • | | selection by one or more of our significant customers of our competitors’ products; |
| | • | | loss of one or more of our significant customers and our failure to identify additional or replacement customers, including as a result of the insolvency or bankruptcy of our customers; |
| | • | | any adverse change in local policies toward solar projects in countries where we receive most orders; |
| | • | | any adverse change in the bilateral or multilateral trade relationships between China and the United States or European countries, particularly Germany; |
| | • | | any duty imposed on import of PV products as a result of anti-dumping measures or other measures against unfair trade practices; and |
| | • | | failure of any of our significant customers to make timely payment for our products. |
We face payment collection difficulties with respect to certain customers. For example, on June 8, 2012, we submitted an arbitration request to Guangzhou Arbitration Commission requiring Guangdong Guo Hua New Energy Investment Co., Ltd., or Guo Hua, owner of a PV project for which we acted as an engineering, procurement and construction contractor, or an EPC contractor, to pay a total amount of RMB92 million including, among others, overdue payment of the EPC contract price, accrued interest, damages and legal costs in accordance with the EPC contract. On August 5, 2012, Guo Hua filed a counterclaim to Guangzhou Arbitration Commission alleging that we have substantially breached the EPC contract, and Guo Hua requested to terminate the EPC contract and demanded us to pay a total amount of RMB187 million for breach of contract. As of the date of this annual report, we have been pursuing our claim and defending against Guo Hua’s counterclaim. See “Item 8. Financial Information—A. Consolidated Statements and Other Financial Information—Legal & Administrative Proceedings”. There is no assurance that we will prevail in this claim or similar claims against our customers for payment collections and if we fail to succeed in such claims, we may not be able to recover the fees due to us, which may have a material adverse effect on our results of operations.
We expect our operating results to continue to depend on sales to a relatively small number of customers or countries for a high percentage of our revenue for the foreseeable future, as well as the ability of these customers to sell PV products that incorporate our PV products.
We enter into framework agreements with many of our customers that set forth our customers’ purchase goals and the general conditions under which our sales are to be made. However, such framework agreements are only binding to the extent a purchase order for a specific amount of our products is issued. In addition, certain key sales terms of the framework agreements may be adjusted from time to time. In addition, we have in the past re-negotiated some of our framework agreements due to the disagreements with our customers relating to the volumes, delivery schedules and pricing terms contained in such agreements. However, it may not always be in our best interests to re-negotiate our framework agreements and disagreements on terms may escalate into formal disputes that could cause us to experience order cancellations or harm our reputation.
Furthermore, our customer relationships have been developed over a relatively short period of time. We cannot be certain that these customers will generate significant revenue for us in the future or if these customer relationships will continue to develop. If our relationships with customers do not continue to develop, we may not be able to expand our customer base or maintain or increase our customers and revenue.
10
Our dependence on a limited number of suppliers for a substantial majority of silicon-related materials may prevent us from delivering our products in a timely manner to our customers in the required quantities, which could result in order cancellations, decreased revenue and loss of market share.
In 2011, 2012 and 2013, our five largest silicon material suppliers supplied in the aggregate 40.6%, 72.4% and 81.1% respectively, of our total silicon and silicon wafer purchases. If we fail to develop or maintain our relationships with these or our other suppliers and we are unable to obtain these materials from alternative sources in a timely manner or on commercially reasonable terms, we may be unable to manufacture our products in a timely manner or at a reasonable cost, or at all, and as a result, we may not be able to deliver our products to our customers in the required quantities, at competitive prices and on acceptable terms of delivery. Problems of this kind could cause us to experience order cancellations, increased manufacturing costs, decreased revenue and loss of market share. In addition, some of our suppliers have a limited operating history and limited financial resources, and the contracts we entered into with these suppliers do not clearly provide for adequate remedies to us in the event any of these suppliers is not able to, or otherwise does not, deliver, in a timely manner or at all, any materials it is contractually obligated to deliver. Suppliers typically require a significant amount of capital to fund their operating activities, expand their manufacturing facilities, and conduct research and development activities. The inability of our suppliers to access capital or the insolvency of our suppliers could lead to their failure to deliver silicon materials to us. Any disruption in the supply of silicon materials to us may adversely affect our business, financial condition and results of operations.
Our failure to obtain sufficient quantities of silicon-related materials in a timely manner could disrupt our operations, prevent us from operating at full capacity or limit our ability to expand as planned, which would reduce, and limit the growth of, our manufacturing output and revenue.
We depend on the timely delivery by our suppliers of silicon-related materials in sufficient volumes. Until mid-2008, there was an industry-wide shortage of silicon-related materials. Currently, the market is experiencing an over-capacity of silicon-related materials. While we do not believe a shortage of silicon-related materials will re-occur in the short term because of current market conditions and the expansion of silicon and silicon wafer manufacturing capacity in recent years, we cannot assure you that market conditions will not again rapidly change or we will always be able to obtain sufficient quantities of silicon-related materials in a timely manner. We may experience actual shortages of silicon-related materials or late or failed delivery for the following reasons:
| | • | | the terms of our silicon and silicon wafer contracts with, or purchase orders to, our suppliers may be altered or cancelled as a result of our ongoing re-negotiations with them; |
| | • | | there are a limited number of silicon and silicon wafer suppliers, and many of our competitors also purchase silicon-related materials from these suppliers and may have longer and stronger relationship with these suppliers than we do; |
| | • | | some of our silicon and silicon wafer suppliers do not manufacture silicon themselves, but instead purchase their requirements from other vendors. It is possible that these suppliers will not be able to obtain sufficient silicon or silicon wafers to satisfy their contractual obligations to us; and |
| | • | | our purchase of silicon-related materials is subject to the business risk of our suppliers, one or more of which may go out of business for any one of a number of reasons beyond our control in the current economic environment. |
If we fail to obtain delivery of silicon-related materials in amounts and according to time schedules that we expect, we may be forced to reduce production, which will adversely affect our revenues. Our failure to obtain the required amounts of silicon-related materials on time and at commercially reasonable prices could substantially limit our ability to meet our contractual obligations to deliver PV products to our customers. Any failure by us to meet such obligations could have a material adverse effect on our reputation, retention of customers, market share, business and results of operations and may subject us to claims from our customers and other disputes.
11
We currently have a significant amount of debt outstanding and can incur additional indebtedness. Our substantial indebtedness may limit our future financing capabilities and could adversely affect our business, financial condition and results of operations.
The principal amount of our total bank borrowings outstanding was RMB3,785.8 million (US$625.4 million) as of December 31, 2013, of which RMB1,105.6 million (US$182.6 million) were short-term bank borrowings. In addition, we had US$100.6 million principal amount of convertible bonds, with carrying value of RMB470.4 million (US$77.7 million) outstanding, and RMB609.7 million (US$100.7 million) in long-term notes as of December 31, 2013. We may also incur additional indebtedness. Our debt could have a significant impact on our future operations and cash flow, including:
| | • | | making it more difficult for us to fulfill payment and other obligations under our outstanding debt, including repayment of our long- and short-term credit facilities should we be unable to obtain extensions for any such facilities before they mature, as well as our obligations under our convertible bonds; |
| | • | | triggering an event of default, if we fail to comply with any of our payment or other obligations contained in our debt agreements and fail to obtain waivers, which could result in cross-defaults causing all or a substantial portion of our debt to become immediately due and payable and other penalties; |
| | • | | reducing the availability of cash flow to fund working capital, capital expenditures, acquisitions and other general corporate purposes, and adversely affecting our ability to obtain additional financing for these purposes; |
| | • | | potentially increasing the cost of any additional financing; and |
| | • | | putting pressure on the ADS price due to concerns of our inability to repay our debt and making it more difficult for us to conduct equity financings in the capital markets. |
Our ability to meet our payment and other obligations under our outstanding debt depends on our ability to generate cash flow in the future or to refinance such debt. We may not be able to generate sufficient cash flow from operations to enable us to meet our obligations under our outstanding debt and to fund other liquidity needs. If we are not able to generate sufficient cash flow to meet such obligations, we may need to refinance or restructure our debt, to sell our assets, to reduce or delay our capital investments, or to seek additional equity or debt financing. We cannot assure you that future financing will be available in amounts or on terms acceptable to us, if at all. In addition, the incurrence of additional indebtedness would result in increased interest rate risk and debt service obligations, and could result in operating and financing covenants that would further restrict our operations and limit our ability to obtain the financing required to fund future capital expenditures and working capital. As a result, our ability to plan for, or react effectively to, changing market conditions may be adversely and materially affected.
We require a significant amount of capital to fund our operations as well as meet future capital requirements. If we cannot obtain additional capital when we need it, our growth prospects and future profitability may be materially and adversely affected.
We typically require a significant amount of capital to fund our operations. We also require cash generally to meet future capital requirements, which are difficult to plan in the rapidly changing PV industry. The principal amount of our total bank borrowings and notes outstanding was RMB3,785.8 million (US$625.4 million) and RMB609.7 million (US$100.7 million) as of December 31, 2013. We cannot assure you that future financing will be available on satisfactory terms, or at all. Our ability to obtain external financing in the future is subject to a variety of uncertainties, including:
| | • | | our future financial condition, results of operations and cash flows; |
| | • | | general market conditions for financing activities by manufacturers of PV and related products; and |
| | • | | economic, political and other conditions in the PRC and elsewhere in the world. |
12
If we are unable to obtain necessary financing in a timely manner or on commercially acceptable terms, or at all, our growth prospects and future profitability may decrease materially.
Our subsidiaries’ loan agreements and other debt instruments contain financial covenants that require the borrower and the guarantor to maintain certain financial ratios.
Certain of our subsidiaries have outstanding bank loans and other debt instruments that require such subsidiary, and our parent company as guarantor, to maintain certain financial ratios that are testedsemi-annually. Such debt instruments also contain standard cross-default provisions under which an event of default under one such instrument would trigger a right to accelerate payment under another instrument.
From time to time there have been a few instances where these financial ratios have not been met at the relevant measurement dates. In such cases, we and our subsidiaries and parent company, where applicable, have obtained waivers from the lenders to cure such defaults and avoid cross-acceleration of other debt instruments. In the future, our subsidiaries and parent company may similarly fail to maintain such financial ratios or violate other covenants contained in such debt instruments, and may not be able to obtain waivers for or otherwise cure such defaults, which may cause our indebtedness to become immediately due and payable.
We face risks associated with the marketing, distribution and sale of our PV products internationally, and if we are unable to effectively manage these risks, our expansion may be materially and adversely affected.
A substantial majority of our revenue has been generated by sales to customers outside of China. The marketing, distribution and sale of our PV products overseas expose us to a number of risks, including:
| | • | | fluctuations in currency exchange rates of the U.S. dollar, Euro and other foreign currencies against the Renminbi; |
| | • | | difficulty in engaging and retaining distributors and agents who are knowledgeable about, and can function effectively in, overseas markets; |
| | • | | increased costs associated with maintaining marketing and sales activities in various countries; |
| | • | | difficulty and costs relating to compliance with different commercial and legal requirements in the jurisdictions in which we offer our products; |
| | • | | inability to obtain, maintain or enforce intellectual property rights; and |
| | • | | trade barriers, such as export requirements, tariffs, taxes and other restrictions and expenses, which could increase the prices of our products and make us less competitive in some countries. |
If we are unable to effectively manage these risks, our ability to conduct or expand our business abroad would be impaired, which may in turn have a material adverse effect on our business, financial condition, results of operations and prospects.
Changes in international trade policies and international barriers to trade may material adversely affect our ability to export our products worldwide.
In October 2011, a trade action was filed with the U.S. Department of Commerce, or USDOC, and the U.S. International Trade Commission, or USITC, by seven U.S. firms, accusing Chinese producers of crystalline silicon photovoltaic cells, or CSPV cells, of selling their products into the United States at less than fair value, or dumping, and of receiving countervailable subsidies from the Chinese authorities.
On October 9, 2012, the USDOC issued final affirmative determinations in the anti-dumping and countervailing duty investigations. On November 7, 2012, the USITC ruled that imports of CSPV cells had caused material injury to the U.S. CSPV industry. Finally, on December 7, 2012, the USDOC issued AD and
13
CVD orders. Consequently, imports of solar panels from SolarOne Qidong are subject to a combined effective AD and CVD deposit rate of 29.18%, of which 15.24% is attributable to the CVD. Imports of solar panels from SolarOne Hong Kong are subject to a combined effective rate of 254.66%, which is comprised of an AD of 239.42% and a CVD of 15.24%.
Actual AD and CVD ultimately due will be determined by the DOC after its review of actual transactions. Such review takes place annually in the anniversary month of the publication of the AD and CVD Orders upon request, and covers the preceding one-year period. As noted above, the anniversary month of the AD and CVD orders is December; accordingly. In December 2013, the U.S. industry requested administrative reviews in both the AD and CVD cases and the resulting reviews were initiated by the USDOC on February 3, 2014. The U.S. industry requested that SolarOne Qidong be reviewed in both the AD and the CVD case. Those reviews are ongoing and expected to be completed in 12 to 18 months.
On December 31, 2013, SolarWorld Industries America, Inc. filed new AD cases against similar CSPV products from China and Taiwan and a new CVD case against China. These new cases seek AD and CVD against (i) CSPV products with cells with any stage of production in China, if the cells are assembled in China, regardless of the country of origin of the cells, as well as (ii) CSPV products containing cells that were of Taiwanese origin. The USDOC and USITC initiated investigations on January 21, 2014. On February 24, 2014, the USITC issued a preliminary determination that there is a reasonable indication that imports of these products had caused material injury to the U.S. industry.
On September 6 and November 8, 2012, the European Commission initiated an anti-dumping proceeding and an anti-subsidy proceeding concerning imports of crystalline silicon PV modules and key components, such as cells and wafers, originating in China. On July 27, 2013, the European Union and Chinese trade negotiators announced that an agreement has been reached pursuant to which Chinese manufacturers, including us, would limit our export of solar panels and cells to the European Union and for no less than a minimum price, in exchange for the European Union agreeing to forgo the imposition of anti-dumping duties on these solar panels from China. The offer was approved by the European Commission on August 2, 2013, and the final version was published on December 5, 2013. The Chamber of Commerce Import and Export of Machinery and Electronic Product (CCCME) of China will be responsible for allocating the quota between PV companies, and we have been allocated a portion of the quota. Solar panels and cells imported in excess of the annual quota will be subject to anti-dumping and anti-subsidy duties. This price undertaking and annual quota have also resolved the parallel anti-subsidy investigation. For companies that would violate the price undertaking or the quota, or which do not form part of the agreement, definitive duties will be levied as per the definitive anti-dumping andanti-subsidy Regulations that were published on December 5, 2013. Finally, it should be noted that wafers have been excluded from the scope of both the anti-dumping and anti-subsidy measures.
It is also possible that other AD or CVD or other import restrictive proceedings may be initiated in other jurisdictions. For example, in November 2012, India initiated AD investigations against solar cell imported from China, the United States, Malaysia and Taiwan. We cannot guarantee that the proceeding will be determined in our favor. In addition, if such proceedings were successfully pursued in jurisdictions where we export the majority of our products, our business, financial condition and results of operations and prospects could be materially and adversely affected. Violations of laws of AD and CVD can result in significant additional duties imposed on exports of our products into these countries, which could increase our costs of accessing future additional markets.
On July 18, 2013, the Ministry of Commerce of People’s Republic of China, or MOFCOM, issued a preliminary ruling imposing provisionary anti-dumping duties commencing on July 24, 2013 and ending on January 19, 2014, and on January 20, 2014, a final ruling imposing anti-dumping duties, commencing on January 20, 2014, on certain importers of solar grade polysilicon products from the United States and South Korea, based on its determination of the dumping margin of the relevant original manufacturer. On September 16, 2013, MOFCOM issued a preliminary ruling imposing provisionary countervailing duties,
14
commencing on September 20, 2013 and ending on January 19, 2014, and on January 20, 2014, a final ruling imposing countervailing duties commencing on January 20, 2014 on certain importers of solar grade polysilicon products from the United States, based on its determination of the ad valorem subsidy rate of the relevant original manufacturer. MOFCOM has also investigated imposing anti-dumping and anti-subsidy investigations on certain importers of solar grade polysilicon products from the European Union, and, on October 31, 2013, MOFCOM extended the deadline of the investigation to May 1, 2014. On January 24, 2014, MOFCOM issued a preliminary ruling which determined that the dumping and subsidies have been found in relation to solar grade polysilicon products from the European Union, but considering the unique market situation, MOFCOM decided not to impose provisionary anti-dumping or countervailing duties for the time being. While these tariffs did not materially increase our cost of production in 2013, we cannot guarantee that these tariffs will not have a material and adverse effect in the future.
In response to increasing trade tensions in the international solar market, we are undertaking efforts to avoid or alleviate the impacts from the present and foreseeable AD and CVD proceedings. However, we cannot assure you that these efforts will be successful due to potential policy changes or other changes in the activities and practices of the various national trade authorities responsible for AD and CVD enforcement.
If we are unable to compete in the highly competitive PV market, our revenue and profits may decrease and we may lose market share.
The PV market is very competitive. We face competition from a number of PV manufacturers, including domestic, foreign and multinational corporations. We believe that the principal competitive factors in the markets for our products are:
| | • | | manufacturing capacity; |
| | • | | product offerings and quality of products; |
| | • | | strength of supply chain and distribution network; |
| | • | | after-sales services; and |
| | • | | brand name recognition. |
Our competitors include domestic companies owned or controlled by PRC persons or entities, who may be more competitive when obtaining government support, local financing or otherwise expanding in local markets. Many of our current and potential competitors have longer operating histories, access to larger customer bases and resources and significantly greater economies of scale than we do. In particular, many of our competitors are developing and manufacturing solar energy products based on new technologies that may ultimately have costs similar to, or lower than, our projected costs. In addition, our competitors may be able to respond more quickly to changing customer demands or devote more resources to the development, promotion and sales of their products than we can. Furthermore, competitors with more diversified product offerings may be better positioned to withstand a decline in the demand for PV products. Some of our competitors have also become vertically integrated, with businesses ranging from upstream silicon wafer manufacturing to solar power system integration. We have only recently expanded our business to include solar power system integration and we may not have the same level of expertise and customer base as our competitors, which may affect our ability to successfully expand this business line. It is possible that new competitors or alliances among existing competitors could emerge and rapidly acquire significant market share, which would harm our business. For instance, several semiconductor manufacturers have already announced their intention to commence production of PV cells and PV modules. If we fail to compete successfully, our business would suffer and we may lose or be unable to gain market share and our financial condition and results of operations would be materially and adversely affected.
15
In addition, the PV market in general competes with other sources of renewable energy as well as conventional power generation. If prices for conventional and other renewable energy resources decline, or if these resources enjoy greater policy support than solar power, the PV market and our business and prospects could be materially and adversely affected.
Our success depends on our ability to respond to rapid market changes in the PV industry, including by developing new technologies and offering additional products and services.
The PV industry is characterized by rapid changes in the diversity and complexity of technologies, products and services. In particular, the ongoing evolution of technological standards requires products with improved features, such as more efficient and higher power output and improved aesthetics. As a result, we expect that we will need to develop, or obtain access to, advances in technologies on a continuous basis in order for us to respond to competitive market conditions and customer demands. In addition, advances in technologies typically lead to declining average selling prices for products using older technologies or make our current products less competitive or obsolete. As a result, the profitability of any given product, and our overall profitability, may decrease over time.
In addition, we will need to invest significant financial resources in research and development to maintain our competitiveness and keep pace with technological advances in the PV industry. However, commercial acceptance by customers of new products we offer may not occur at the rate or level expected, and we may not be able to successfully adapt existing products to effectively and economically meet customer demands, thus impairing the return from our investments. We may also be required under the applicable accounting standards to recognize a charge for the impairment of assets to the extent our existing products become uncompetitive or obsolete, or if any new products fail to achieve commercial acceptance. Any such charge may have a material adverse effect on our financial condition and results of operations.
Moreover, in response to the rapidly evolving conditions in the PV industry, we started to expand our business downstream to provide system integration products and services in 2010. This expansion requires significant investment and management attention from us, and we are likely to face intense competition from companies that have extensive experience and well-established businesses and customer bases in the system integration sector. We cannot assure you that we will succeed in expanding our business downstream.
Our ability to successfully implement our downstream business integration is subject to various risks and uncertainties, including:
| | • | | our short history in the new businesses; |
| | • | | our possible lack of competitiveness in product quality and cost structure in the new businesses; |
| | • | | the need for additional capital to finance our new business operations, which may not be available on reasonable terms or at all; |
| | • | | the need to recruit additional skilled employees, including technicians and managers at different levels; |
| | • | | the need to grant longer credit terms to our customers and to maintain a higher level of inventory, resulting in longer cash conversion cycles compared with our traditional solar business; |
| | • | | the need to expand certain warranty liabilities associated with the solar module business, with the warranty period for PV modules lasting for 25 years if determined not to be remote; |
| | • | | the need to accrue warranty from sales of solar modules, which may not be adequate and we may have to incur substantial expense to repair or replace defective solar modules in the future; |
| | • | | the nature of the business model and key success factors of our EPC service, which are significantly different from those of our traditional business in solar product manufacturing; |
16
| | • | | potential conflict with our downstream customers as a result of our direct competition with them in the solar module and EPC businesses; and |
| | • | | new risks associated with solar modules, EPC service and project development businesses yet to be fully understood by the industry and market. |
If we are not able to bring quality products and services to market in a timely and cost-effective manner and successfully market and sell these products and services, our ability to continue penetrating the PV market, as well as our results of operations and profitability, will be materially and adversely affected.
Our future success also depends on our ability to make strategic acquisitions and investments and to establish and maintain strategic alliances, and failure to do so could have a material adverse effect on our market penetration, revenue growth and profitability. In addition, such strategic acquisitions, alliances and investments themselves entail significant risks that could materially and adversely affect our business.
We are pursuing expansion into PV system integration services through our subsidiaries, Hanwha SolarOne (Shanghai) Co., Ltd. and Hanwha SolarOne Electric Power Engineering Co., Ltd., and we may pursue upstream silicon feedstock sourcing through strategic partnerships and investments in the future. We may also establish strategic alliances with third parties in the PV industry to develop new technologies and to expand our marketing channels. These types of transactions could require that our management develop expertise in new areas, make significant investments in research and development, manage new business relationships and attract new types of customers. They may also require significant attention from our management, which could have a material adverse effect on our ability to manage our business. We may also experience difficulties integrating acquisitions and investments into our existing business and operations and retaining key technical and managerial personnel of acquired companies.
Strategic acquisitions, investments and alliances with third parties may be expensive to implement and could subject us to a number of risks, including risks associated with sharing proprietary information and loss of control of operations that are material to our business. We may assume unknown liabilities or other unanticipated events or circumstances through acquisitions and investments. Moreover, strategic acquisitions, investments and alliances subject us to the risk of non-performance by a counterparty, which may in turn lead to monetary losses that materially and adversely affect our business. As a result, we may not be able to successfully make such strategic acquisitions and investments or to establish strategic alliances with third parties that will be effective or beneficial for our business. Any difficulty we face in this regard could have a material adverse effect on our market penetration, results of operations and profitability.
Problems with product quality or product performance could result in a decrease in customers and revenue, unexpected expenses and loss of market share. In addition, product liability or warranty claims against us could result in adverse publicity and potentially significant monetary damages.
Prior to 2012, our PV products were typically sold with a 2 to 5-year warranty for technical defects, and a 10 to 12-year limited warranty against declines of greater than 10%, a 15-year limited warranty against declines of greater than 12% for our mono PV modules and 11% for our poly PV modules and a 25-year limited warranty against declines of greater than 20%, in their initial power generation capacity. Since January 2012, we started to extend our material and workmanship warranty for PV modules to 12 years and replace our existing warranty for power generation capacity with an improved 25-year linear warranty. Under the new 25-year linear warranty, we guarantee no less than 97% of the nominal power generation capacity for our typical multicrystalline PV modules and 96% of the nominal power generation capacity for our typical monocrystalline PV modules in the first year and an annual output degradation of no more than 0.7% thereafter. By the end of the 25th year, the actual power output shall be no less than 82% of the nominal power generation capacity. Our warranties may be transferred to third parties who purchase our PV modules.
17
Since our products have been in use for only a relatively short period, our assumptions regarding the durability and reliability of our products may not be accurate. In particular, the performance of newly developed products may be especially difficult to predict. We consider various factors when determining the likelihood of product defects, including an evaluation of our quality controls, technical analysis, industry information on comparable companies and our own experience. We estimate the amount of our warranty obligation primarily based on the results of technical analyses, our historical warranty claims experience, the warranty accrual practices of comparable companies, and the expected failure rate and future costs to service failed products. The results of the technical analyses support the future operational efficiency of the PV modules at levels significantly above the minimum guaranteed levels over the respective warranty periods. The estimate of warranty costs is affected by the estimated and actual product failure rates, the costs to repair or replace failed products and potential service and delivery costs incurred in correcting a product failure. Based on the considerations above and management’s ability and intention to provide repairs, replacements or refunds for defective products, we have accrued for warranty costs for the 2 to 12-year warranty against technical defects based on 1% of revenue for PV modules. No warranty cost accrual has been recorded for the 10-year and 20 to 25-year warranties for decline from initial power generation capacity because we determined the likelihood of claims arising from these warranties to be remote based on internal and external testing of the PV modules and strong quality control procedures in the production process. Based on the results of analysis and technical testing, the revision to our warranty policy in January 2012 did not have a material effect on our warranty accrual rate. The basis for the warranty accrual will be reviewed periodically based on actual experience.
As of December 31, 2011, our accrued warranty costs totaled RMB162.1 million for the 3 to 5-year warranty against technical and material defects, and as of December 31, 2012 and 2013, totaled RMB177.9 million and RMB181.4 million (US$30.0 million) for the 5 to 12-year warranty against technical and material defects, respectively.
If our PV modules fail to perform to the standards of the performance guarantee, we could incur substantial expenses and substantial cash outlays to repair, replace or provide refunds for the under-performing products, which could negatively impact our overall cash position. In addition, we may also suffer increased accounts receivables, as customers in certain circumstances refuse to accept and pay for defective products. Any increase in the defect rate of our products would increase the amount of our warranty costs and we may not have adequate warranty provision to cover such warranty costs, which would have a negative impact on our results of operations.
In addition, we purchase silicon-related materials and other components that we use in our products from third parties. Unlike PV modules, which are subject to certain uniform international standards, silicon-related materials generally do not have uniform international standards, and it is often difficult to determine whether product defects are caused by defects in silicon, silicon wafers or other components of our products or caused by other reasons. Even assuming that our product defects are caused by defects in raw materials, we may not be able to recover our warranty costs from our suppliers because the agreements we entered into with our suppliers typically contain no or only limited warranties. The possibility of future product failures could cause us to incur substantial expense to provide refunds or resolve disputes with regard to warranty claims through litigation, arbitration or other means, or damage our market reputation and cause our sales to decline.
As with other PV product manufacturers, we are exposed to risks associated with product liability claims if the use of the PV products we sell results in injury, death or damage to property. We cannot predict whether product liability claims will be brought against us in the future or the effect of any resulting negative publicity on our business. See “—We have limited insurance coverage and may incur losses resulting from product liability claims or business interruptions.”
18
If PV technology is not suitable for widespread adoption, or sufficient demand for PV products does not develop or takes longer to develop than we anticipated, our sales may not continue to increase or may even decline, and our revenue and profitability would be reduced.
The PV market is at a relatively early stage of development and the extent to which PV products will be widely adopted is uncertain. Furthermore, market data in the PV industry are not as readily available as those in other more established industries, where trends can be assessed more reliably from data gathered over a longer period of time. If PV technology, in particular the type of PV technology that we have adopted, proves unsuitable for widespread adoption or if demand for PV products fails to develop sufficiently, we may not be able to grow our business or generate sufficient revenue to be profitable. In addition, demand for PV products in our targeted markets, including China, may not develop or may develop to a lesser extent than we anticipated. Many factors may affect the viability of widespread adoption of PV technology and demand for PV products, including:
| | • | | cost-effectiveness of PV products compared to conventional and other non-solar energy sources and products; |
| | • | | performance and reliability of PV products compared to conventional and other non-solar energy sources and products; |
| | • | | availability of government subsidies and incentives to support the development of the PV industry or other energy resource industries; |
| | • | | success of other alternative energy generation technologies, such as fuel cells, wind power and biomass; |
| | • | | fluctuations in economic and market conditions that affect the viability of conventional and non-solar alternative energy sources, such as increases or decreases in the prices of oil and other fossil fuels; |
| | • | | capital expenditures by end users of PV products, which tend to decrease when the overall economy slows down; and |
| | • | | deregulation of the electric power industry and the broader energy industry. |
One of our existing shareholders has substantial influence over our company and its interests may not always be aligned with the interests of our other shareholders.
Hanwha Solar owns approximately 48.6% of our outstanding share capital, as of December 31, 2013. Pursuant to a shareholder agreement between Hanwha Solar and our company dated September 16, 2010, as amended on November 12, 2013, Hanwha Solar has the right to nominate directors to the board according to a formula based on its share ownership in the company and veto major corporate actions. Hanwha Solar has substantial influence over our business, including decisions regarding mergers, consolidations and the sale of all or substantially all of our assets, election of directors and other significant corporate actions. This concentration of ownership may discourage, delay or prevent a change in control of our company, which could deprive our shareholders of an opportunity to receive a premium for its shares as part of a sale of our company and might reduce the price of the ADSs. In addition, without the consent of Hanwha Solar, we could be prevented from entering into transactions that could be beneficial to us. Hanwha Solar may cause us to take actions that are opposed by other shareholders as its interests may differ from those of other shareholders. Hanwha Group, a company that controls Hanwha Solar, also has several subsidiaries in the solar industry, some of which are our key customers. We depend to a certain extent on the support of Hanwha Group. For example, entities of Hanwha Group are our existing customers and we may also source raw materials from entities of Hanwha Group in the future. If Hanwha Group reduces its shareholding in our company or chooses to devote resources to other priorities, such as other companies in which it holds interests, including other companies in the solar industry, for any reason and not to us, our results of operations could be adversely affected. How Hanwha Group positions our company among its subsidiaries and other investments could have a material impact on our results of operations. Hanwha Group’s strategic plan involving our company may not always be aligned with the interests of our other shareholders. Additionally, Hanwha Group could increase its ownership in us above 50%, which would make it our majority shareholder, and could trigger repurchase obligations under certain of our indebtedness.
19
Existing regulations and policies governing the electricity utility industry, as well as changes to regulations and policies affecting PV products, may adversely affect demand for our products and materially reduce our revenue and profits.
The electric utility industry is subject to extensive regulation, and the market for PV products is heavily influenced by these regulations as well as the policies promulgated by electric utilities. These regulations and policies often affect electricity pricing and technical interconnection of end-user power generation. As the market for solar and other alternative energy sources continues to evolve, these regulations and policies are being modified and may continue to be modified. Customer purchases of, or further investment in research and development of, solar and other alternative energy sources may be significantly affected by these regulations and policies, which could significantly reduce demand for our products and materially reduce our revenue and profits.
Moreover, we expect that our PV products and their installation will be subject to oversight and regulation in accordance with national and local ordinances relating to building codes, safety, environmental protection, utility interconnection and metering and related matters in various countries. We also have to comply with the requirements of individual localities and design equipment to comply with varying standards applicable in the jurisdictions where we conduct business. Any new government regulations or utility policies pertaining to our PV products may result in significant additional expenses to us, our distributors and end users and, as a result, could cause a significant reduction in demand for our PV products, as well as materially and adversely affect our financial condition and results of operations.
The lack or inaccessibility of subsidies or financing for off-grid solar energy applications could cause our sales to decline.
Some of our products are used for “off-grid” solar energy applications in developed and developing countries, where solar energy is provided to end users independent of an electricity transmission grid. In some countries, government agencies and the private sector have, from time to time, provided subsidies or financing on preferred terms for rural electrification programs. We believe that the availability of financing could have a significant effect on the level of sales of off-grid solar energy applications, particularly in developing countries where users may not have sufficient resources or credit to otherwise acquire PV systems. If existing subsidies or financing programs for off-grid solar energy applications are eliminated or if financing becomes inaccessible, the growth of the market for off-grid solar energy applications may be materially and adversely affected, which may cause our sales to decline.
Our failure to protect our intellectual property rights may undermine our competitive position, and litigation to protect our intellectual property rights may be costly.
We rely primarily on patents, trademarks, trade secrets, copyrights and other contractual restrictions to protect our intellectual property. Nevertheless, these afford only limited protection and the actions we take to protect our intellectual property rights may not be adequate. In particular, implementation of PRC intellectual property-related laws has historically been lacking, primarily because of ambiguities in the PRC laws and difficulties in enforcement. Accordingly, intellectual property rights and confidentiality protections in China may not be as effective as in the United States or other countries. Policing unauthorized use of our proprietary technologies can be difficult and expensive. In addition, litigation may be necessary to enforce our intellectual property rights, protect our trade secrets or determine the validity and scope of the proprietary rights of others. We also cannot assure you that the outcome of any such litigation would be in our favor. An adverse determination in any such litigation will impair our intellectual property rights and may harm our business, prospects and reputation. Furthermore, any such litigation may be costly and may divert management attention away from our business as well as require us to expend other resources. We have no insurance coverage against litigation costs and would have to bear all costs arising from such litigation to the extent we are unable to recover them from other parties. The occurrence of any of the foregoing could have a material adverse effect on our business, financial condition and results of operations.
20
We may be exposed to infringement or misappropriation claims by third parties, particularly in jurisdictions outside China which, if determined adversely against us, could disrupt our business and subject us to significant liability to third parties, as well as have a material adverse effect on our financial condition and results of operations.
Our success depends, in large part, on our ability to use and develop our technologies and know-how without infringing the intellectual property rights of third parties. As we continue to market and sell our products internationally, and as litigation becomes more common in the PRC, we face a higher risk of being the subject of claims for intellectual property infringement, as well as having indemnification relating to other parties’ proprietary rights held to be invalid. Our current or potential competitors, many of which have substantial resources and have made substantial investments in competing technologies, may have or may obtain patents that will prevent, limit or interfere with our ability to make, use or sell our products in the European Union, the PRC or other countries. The validity and scope of claims relating to PV technology patents involve complex, scientific, legal and factual questions and analysis and, therefore, may be highly uncertain. In addition, the defense of intellectual property claims, including patent infringement suits, and related legal and administrative proceedings can be both costly and time consuming, and may significantly divert the efforts and resources of our technical and management personnel. Furthermore, an adverse determination in any such litigation or proceeding to which we may become a party could cause us to:
| | • | | seek licenses from third parties; |
| | • | | redesign our products; or |
| | • | | be restricted by injunctions, |
each of which could effectively prevent us from pursuing some or all of our business and result in our customers or potential customers deferring or limiting their purchase or use of our products, which could have a material adverse effect on our financial condition and results of operations.
We may not be able to obtain sufficient patent protection on the technologies embodied in the PV products we currently manufacture and sell, which could reduce our competitiveness and increase our expenses.
Although we rely primarily on trade secret laws and contractual restrictions to protect the technologies in the PV cells and PV modules we currently manufacture and sell, our success and ability to compete in the future may also depend to a significant degree on obtaining patent protection for our proprietary technologies. As of the date of this annual report, we had 52 issued patents and 18 pending patent applications in the PRC.
We do not have, and have not applied for, any material patents for our proprietary technologies outside the PRC. As the protections afforded by our patents are effective only in the PRC, our competitors and other companies may independently develop substantially equivalent technologies or otherwise gain access to our proprietary technologies, and obtain patents for such technologies in other jurisdictions, including the countries in which we sell our products. Moreover, our patent applications in the PRC may not result in issued patents, and even if they do result in issued patents, the patents may not have claims of the scope we seek. In addition, any issued patents may be challenged, invalidated or declared unenforceable. As a result, our present and future patents may provide only limited protection for our technologies, and may not be sufficient to provide competitive advantages to us.
We depend on our key personnel, and our business and growth may be severely disrupted if we lose their services or fail to recruit new qualified personnel.
Our future success depends substantially on the continued services of some of our directors and key executives. If we lose the services of one or more of our current directors and executive officers, we may not be
21
able to replace them readily, if at all, with suitable or qualified candidates, and may incur additional time and expenses to recruit, retain and integrate new directors and officers, particularly those with a significant mix of both international and China-based PV industry experience similar to our current directors and officers, which could severely disrupt our business and growth. In addition, if any of our directors or executives joins a competitor or forms a competing company, we may lose some of our customers. Each of the executive officers has entered into an employment agreement with us, which contains confidentiality and non-competition provisions. However, if any disputes arise between these directors or executive officers and us, it is not clear the extent to which any of these agreements could be enforced outside of the United States, where most of these directors and executive officers reside and hold some of their assets, particularly in light of uncertainties associated with the PRC legal system. See “—Risks Related to Doing Business in China—Uncertainties with respect to the PRC legal system could have a material adverse effect on us.” Furthermore, as we expect to continue to expand our operations and develop new products, we will need to continue attracting and retaining experienced management and key research and development personnel.
Competition for personnel in the PV industry in China is intense, and the availability of suitable and qualified candidates is limited. In particular, we compete to attract and retain qualified research and development personnel with other PV technology companies, universities and research institutions. Competition for these individuals could cause us to offer higher compensation and other benefits in order to attract and retain them, which could have a material adverse effect on our financial condition and results of operations. We may also be unable to attract or retain the personnel necessary to achieve our business objectives, and any failure in this regard could severely disrupt our business and growth.
Any failure to achieve and maintain effective internal control could have a material adverse effect on our business, results of operations and the market price of the ADSs.
The SEC, as required by Section 404 of the Sarbanes-Oxley Act of 2002, or the Sarbanes-Oxley Act, adopted rules requiring most public companies to include a management report on such company’s internal control over financial reporting in its annual report, which contains management’s assessment of the effectiveness of the company’s internal control over financial reporting. In addition, when a company meets the SEC’s criteria, an independent registered public accounting firm must report on the effectiveness of the company’s internal control over financial reporting.
Our management and independent registered public accounting firm have concluded that our internal control over financial reporting as of December 31, 2013 was effective. However, we cannot assure you that in the future our management or our independent registered public accounting firm will not identify material weaknesses during the Section 404 of the Sarbanes-Oxley Act audit process or for other reasons. In addition, because of the inherent limitations of internal control over financial reporting, including the possibility of collusion or improper management override of controls, material misstatements due to error or fraud may not be prevented or detected on a timely basis. As a result, if we fail to maintain effective internal control over financial reporting or should we be unable to prevent or detect material misstatements due to error or fraud on a timely basis, investors could lose confidence in the reliability of our financial statements, which in turn could harm our business, results of operations and negatively impact the market price of the ADSs, and harm our reputation. Furthermore, we have incurred and expected to continue to incur considerable costs and to use significant management time and other resources in an effort to comply with Section 404 and other requirements of the Sarbanes-Oxley Act.
We have limited insurance coverage and may incur losses resulting from business interruptions or product liability claims.
We are subject to risk of explosion and fires, as highly flammable gases, such as silane and nitrogen gas, are generated in our manufacturing processes. While we have not experienced to date any major explosion or fire, the risks associated with these gases cannot be completely eliminated. In addition, natural disasters such as floods or earthquakes, or other unanticipated catastrophic events, including power interruption, telecommunications
22
failures, equipment failures, explosions, fires, break-ins, terrorist attacks or acts of war, could significantly disrupt our ability to manufacture our products and to operate our business. If any of our production facilities or material equipment were to experience any significant damage or downtime, we might be unable to meet our production targets and our business could suffer. Although we have obtained business interruption insurance, it may not be able to fully cover losses caused by the business interruption because business interruption insurance available in China offers limited coverage compared to that offered in many other countries.
We are also exposed to risks associated with product liability claims in the event that the use of the PV products we sell results in injury, death or damage to property. Due to limited historical experience, we are unable to predict whether product liability claims will be brought against us in the future or the effect of any resulting adverse publicity on our business. Moreover, we only have limited product liability insurance and may not have adequate resources to satisfy a judgment in the event of a successful claim against us. The successful assertion of product liability claims against us could result in potentially significant monetary damages and require us to make significant payments, which could materially and adversely affect our business, financial condition and results of operations.
Any environmental claims or failure to comply with any present or future environmental regulations may require us to spend additional funds and may materially and adversely affect our financial condition and results of operations.
We are subject to a variety of laws and regulations relating to the use, storage, discharge and disposal of chemical by products of, and water used in, our manufacturing operations and research and development activities, including toxic, volatile and otherwise hazardous chemicals and wastes. As of the date of this annual report, we are still in the process of obtaining certain necessary environmental licenses and approvals for our factories. Although we have not suffered material environmental claims in the past, failure to comply with any present or future regulations could result in the assessment of damages or imposition of fines against us, suspension of production or a cessation of our operations. New regulations could also require us to acquire costly equipment or to incur other significant expenses. Any failure by us to control the use of, or to adequately restrict the discharge of, hazardous substances could subject us to potentially significant monetary damages and fines or suspension of our business, as well as our financial condition and results of operations.
The use of certain hazardous substances, such as lead, in various products is also coming under increasingly stringent governmental regulation. Increased environmental regulation in this area could adversely impact the manufacture and sale of solar modules that contain lead and could require us to make unanticipated environmental expenditures. For example, the European Union Directive 2002/96/EC on Waste Electrical and Electronic Equipment, or the WEEE Directive, requires manufacturers of certain electrical and electronic equipment to be financially responsible for the collection, recycling, treatment and disposal of specified products placed on the market in the European Union. In addition, European Union Directive 2002/95/EC on the Restriction of the use of Hazardous Substances in electrical and electronic equipment, or the RoHS Directive, restricts the use of certain hazardous substances, including lead, in specified products. Other jurisdictions are considering adopting similar legislation. Currently, we are not required under the WEEE or RoHS Directives to collect, recycle or dispose any of our products. However, the Directives allow for future amendments subjecting additional products to the Directives’ requirements. If, in the future, our PV products become subject to such requirements, we may be required to apply for an exemption. If we were unable to obtain an exemption, we would be required to redesign our PV products in order to continue to offer them for sale within the European Union, which would be impractical. Failure to comply with the Directives could result in fines and penalties, inability to sell our PV products in the European Union, competitive disadvantages and loss of net sales, all of which could have a material adverse effect on our business, financial condition and results of operations.
23
Our business benefits from certain PRC government incentives. Expiration of, or changes to, these incentives could have a material adverse effect on our results of operations.
On March 16, 2007, the PRC government promulgated the Law of the People’s Republic of China on the Enterprise Income Tax, or the EIT, which took effect on January 1, 2008. Under the EIT, domestically owned enterprises and foreign invested enterprises, or FIEs, are subject to a uniform tax rate of 25%. While the EIT equalizes the tax rates for FIEs and domestically owned enterprises, preferential tax treatment continues to be granted to companies in certain encouraged sectors, and entities classified as “high and new technology enterprises” are entitled to a 15% EIT rate, whether domestically owned enterprises or FIEs. The EIT also provided a five-year transition period starting from its effective date for those enterprises which were established before the promulgation date of the EIT and which were entitled to a preferential lower tax rate or tax holiday under the then effective tax laws or regulations. The tax rate of such enterprises transitioned to the uniform tax rate within a five-year transition period and the tax holiday, which was enjoyed by such enterprises before the effective date of the EIT, continued to be enjoyed until the end of the holiday. SolarOne Qidong was approved to be qualified as a “high and new technology enterprise” on October 21, 2008. The “high and new technology enterprise” status is valid for a period of three years from the date of issuance of the certificate and is subject to an annual self-review process whereby a form is submitted to relevant tax authority for approval to use a beneficial income tax rate. If there are significant changes in the business operations, manufacturing technologies or other criteria that cause the enterprise to no longer meet the criteria as a “high and new technology enterprise,” such status will be terminated from the year of such change. The “high and new technology enterprise” status of SolarOne Qidong was renewed and approved in October 2011. If SolarOne Qidong fails to qualify as a “high and new technology enterprise” in future periods, our income tax expenses would increase, which could have a material and adverse effect on our net income and results of operations.
Any reduction or elimination of the preferential tax treatments currently enjoyed by us may significantly increase our income tax expense and materially reduce our net income, which could have a material adverse effect on our financial condition and results of operations.
Under the EIT, we may be classified as a “Resident Enterprise” of the PRC. Such classification would likely result in negative tax consequences to us and could result in negative tax consequences to our non-PRC shareholders and ADS holders.
Under the EIT, enterprises established under the laws of non-PRC jurisdictions but whose “de facto management body” is located in the PRC are considered “resident enterprises” for PRC tax purposes and are subject to the EIT. According to the Implementation Regulations for the EIT of the PRC issued by the State Council on December 6, 2007, a de facto management body is defined as an establishment that exerts substantial and comprehensive management and control over the business operations, staff, accounting, assets and other aspects of the enterprise. Since substantially all of our management is currently based in the PRC, and may remain in the PRC in the foreseeable future, it is likely that we will be regarded as a “resident enterprise” on a strict interpretation of the EIT and its Implementation Regulations. As of December 31, 2013, we recorded unrecognized tax benefits of RMB143.5 million (US$23.7 million), of which RMB27.4 million (US$4.5 million) was recorded because based on our judgment, we may be deemed as a PRC tax resident pursuant to the EIT. If Hanwha SolarOne Co., Ltd., our holding company, or any of its non-PRC subsidiaries is treated as a “resident enterprise” for PRC tax purposes, Hanwha SolarOne or such subsidiary will be subject to PRC income tax on worldwide income at a uniform tax rate of 25%, which would have a material adverse effect on our financial condition and results of operations.
In addition, although the EIT provides that dividend income payments between qualified “resident enterprises” are exempted from the 10% withholding tax, it is not clear whether we will be considered as a qualified “resident enterprise” under the EIT. If we are considered a “non-resident enterprise,” dividends paid to us by our subsidiaries in the PRC (through our holding company structure), if any, may be subject to the 10% withholding tax. If we are deemed by the PRC tax authorities to be a “resident enterprise” and declare dividends, under the existing Implementation Regulations of the EIT, dividends paid by us to our shareholders and ADS
24
holders, which are “non-resident enterprises” and do not have an establishment or place of business in the PRC, or which have such an establishment or place of business but the relevant income is not effectively connected with the establishment or place of business, might be subject to PRC withholding tax at 10% or a lower treaty rate.
Similarly, any gain realized on the transfer of ADSs or shares by non-PRC investors which are “non-resident enterprises” is also subject to PRC withholding income tax at 10% or a lower treaty rate if such gain is regarded as income derived from sources within the PRC.
According to the Law of the People’s Republic of China on the Individual Income Tax, or the IIT, as amended, PRC income tax at the rate of 20% is applicable to dividends payable to individual investors if such dividends are regarded as income derived from sources within the PRC. Similarly, any gain realized on the transfer of ADSs or ordinary shares by individual investors is also subject to PRC tax at 20% if such gain is regarded as income derived from sources within the PRC. If we are deemed by the PRC tax authorities as a “resident enterprise,” the dividends we pay to our individual investors with respect to our ordinary shares or ADSs, or the gain the individual investors may realize from the transfer of our ordinary shares or ADSs, might be treated as income derived from sources within the PRC and be subject to PRC tax at 20% or a lower treaty rate.
Fluctuations in exchange rates could adversely affect our business as well as result in foreign currency exchange losses.
Our financial statements are expressed in, and our functional currency is Renminbi. The change in value of the Renminbi against the U.S. dollar, Euro, Japanese Yen and other currencies is affected by, among other things, changes in China’s political and economic conditions. On July 21, 2005, the PRC government changed its decade-old policy of pegging the value of the Renminbi to the U.S. dollar. Under the new policy, the Renminbi is permitted to fluctuate within a narrow and managed band against a basket of certain foreign currencies. This change in policy has resulted in appreciation of the Renminbi against the U.S. dollar. The PRC government may decide to adopt an even more flexible currency policy in the future, which could result in a further and more significant appreciation of the Renminbi against the U.S. dollar. An appreciation of the Renminbi relative to other foreign currencies could decrease the per unit revenue generated from our international sales. If we increased our pricing to compensate for the reduced purchasing power of foreign currencies, we may decrease the market competitiveness, on a price basis, of our products. This could result in a decrease in our international sales and materially and adversely affect our business.
A substantial portion of our sales is denominated in U.S. dollars, Euros and Japanese Yen, while a substantial portion of our costs and expenses is denominated in Renminbi. As a result, the revaluation of the Renminbi starting in July 2005 has increased, and further revaluations could further increase, our costs. The value of, and any dividends payable on, the ADSs in foreign currency terms will also be affected. Conversely, if we decide to convert our Renminbi into U.S. dollars for the purpose of making payments for dividends on our ordinary shares or ADSs or for other business purposes, an appreciation of the U.S. dollar against the Renminbi would have a negative effect on the U.S. dollar amount available to us.
Fluctuations in exchange rates, particularly among the U.S. dollar, Renminbi, Euro and Japanese Yen, also affect our gross and net profit margins and could result in fluctuations in foreign exchange and operating gains and losses. We incurred net foreign currency losses of RMB4.0 million in 2011, gains of RMB8.9 million and RMB43.7 million (US$7.2 million) in 2012 and 2013. In particular, a substantial portion of our net revenues is currently denominated in Euros. Since December 2009, the Euro has fluctuated significantly. A depreciation of the Euro may also have a negative impact on the selling prices of our products in Renminbi terms. We cannot predict the impact of future exchange rate fluctuations on our financial condition and results of operations, and we may incur net foreign currency losses in the future.
25
While we have entered into economic hedging transactions to minimize the impact of short-term foreign currency fluctuations on our revenues that are denominated in a currency other than Renminbi, the effectiveness of these transactions may be limited and we may not be able to successfully hedge all of our exposure.
Our estimates of future revenues that are denominated in foreign currencies may not be accurate, which could result in foreign exchange losses. Any default by the counterparties to these transactions could also adversely affect our financial condition and results of operations. In addition, our foreign currency exchange losses may be magnified by PRC exchange control regulations that restrict our ability to convert Renminbi into foreign currencies.
Risks Related to Doing Business in China
Adverse changes in political and economic policies of the PRC government could have a material adverse effect on the overall economic growth of China, which could reduce the demand for our products and materially and adversely affect our competitive position.
Substantially all of our operations are conducted in China and some of our sales are made in China. Accordingly, our business, financial condition, results of operations and prospects are affected significantly by economic, political and legal developments in China. The PRC economy differs from the economies of most developed countries in many respects, including:
| | • | | the amount of government involvement; |
| | • | | the level of development; |
| | • | | the control of foreign exchange; and |
| | • | | the allocation of resources. |
While the PRC economy has grown significantly since the late 1970s, the growth has been uneven, both geographically and among various sectors of the economy. The PRC government has implemented various measures to encourage economic growth and guide the allocation of resources. Some of these measures benefit the overall PRC economy, but may also have a negative effect on us. For example, our financial condition and results of operations may be adversely affected by government control over capital investments or changes in tax regulations that are applicable to us.
The PRC economy has been transitioning from a planned economy to a more market-oriented economy. Although the PRC government has in recent years implemented measures emphasizing the utilization of market forces for economic reform, the reduction of state ownership of productive assets and the establishment of sound corporate governance in business enterprises, a substantial portion of the productive assets in China is still owned by the PRC government. The continued control of these assets and other aspects of the national economy by the PRC government could materially and adversely affect our business. The PRC government also exercises significant control over economic growth in China through the allocation of resources, controlling payment of foreign currency-denominated obligations, setting monetary policy and providing preferential treatment to particular industries or companies. Efforts by the PRC government to slow the pace of growth of the PRC economy could result in decreased capital expenditure by solar energy users, which in turn could reduce demand for our products.
Any adverse change in the economic conditions or government policies in China could have a material adverse effect on the overall economic growth and the level of renewable energy investments and expenditures in China, which in turn could lead to a reduction in demand for our products and consequently have a material adverse effect on our business and prospects. In particular, the PRC government has, in recent years, promulgated certain laws and regulations and initiated certain government-sponsored programs to encourage the
26
utilization of new forms of energy, including solar energy. We cannot assure you that the implementation of these laws, regulations and government programs will be beneficial to us. In particular, any adverse change in the PRC government’s policies towards the PV industry may have a material adverse effect on our operations as well as on our plans to expand our business into downstream system integration services.
We face uncertainty with respect to the implementation of the PV Manufacturing Industry Qualification Standards.
On July 4, 2013, the China’s State Council issued the Several Opinions on Promoting the Healthy Development of the PV Industry, regulating the PV industry in China. In addition, on September 16, 2013, the Ministry of Industry and Information Technology of the PRC, or MIIT, issued the PV Manufacturing Industry Qualification Standards, which became effective as of October 16, 2013. The MIIT standards outline certain requirements for PV manufacturers in China, aiming to reduce the overcapacity of production and promote the healthy development of the industry. For example, the MIIT standards provide detailed requirements for product quality and energy consumption and require that PV manufacturers invest no less than 3% of their annual total sales, and at least a minimum of RMB10 million, in their research and development activities and technology upgrades each year. New manufactures which fail to comply with the relevant requirements under the MIIT standards will not be approved for investment. Existing manufacturers which fail to comply with the relevant requirements will not be entitled to enjoy certain government preferential policies, such as the export tax rebate and domestic financial subsidies.
We believe we have materially complied with the qualification requirements under the MIIT standards. However, as the MIIT standards are relatively new, there is uncertainty as to how such standards would be implemented and enforced by the MIIT and how they would affect China’s PV industry or us. If we fail to comply with the MIIT standards, such as the capital expenditure requirement on research and development activities and technology upgrades, we could lose certain government benefits, such as the export tax rebate and domestic financial subsidies, which could have an adverse effect on our business, financial condition and results of operations.
On October 11, 2013, the MIIT issued the Tentative Measures for Management of the Qualification Publication of the PV Manufacturing Industry. Under the tentative measures, a PV manufacturer meeting the industry qualification standards required by the MIIT may apply for pre-review of its qualification status by the provincial counterpart of the MIIT, which, upon completion of its pre-review, will submit the application to the MIIT for final review and certification. Upon the certification by the MIIT, the PV manufacturer will be published as a “Qualified PV Manufacturing Enterprise” periodically. A qualified PV manufacturing enterprise can also be disqualified and delisted from qualification publication by the MIIT in the event that the enterprise no longer complies with the MIIT standards. On December 30, 2013, SolarOne Qidong was certified by the MIIT as a “Qualified PV Manufacturing Enterprise”.
Uncertainties with respect to the PRC legal system could have a material adverse effect on us.
We conduct substantially all of our business through our operating subsidiary in the PRC, SolarOne Qidong, a Chinese wholly foreign-owned enterprise. SolarOne Qidong is generally subject to laws and regulations applicable to foreign investment in China and, in particular, laws applicable to wholly foreign-owned enterprises. The PRC legal system is based on written statutes, and prior court decisions may be cited for reference but have limited precedential value. Since 1979, PRC legislation and regulations have significantly enhanced the protections afforded to various forms of foreign investments in China. However, since these laws and regulations are relatively new and the PRC legal system continues to rapidly evolve, the interpretations of many laws, regulations and rules are not always uniform and enforcement of these laws, regulations and rules involve uncertainties, which may limit legal protections available to us. In addition, any litigation in China may be protracted and result in substantial costs and diversion of resources and management attention.
27
Limitations on the ability of our operating subsidiary to pay dividends or other distributions to us could have a material adverse effect on our ability to conduct our business.
We are a holding company and conduct substantially all of our business through our operating subsidiary, SolarOne Qidong, which is a limited liability company established in China. The payment of dividends by entities organized in, if any, China is subject to limitations. In particular, regulations in the PRC currently permit payment of dividends only out of accumulated profits as determined in accordance with PRC accounting standards and regulations. SolarOne Qidong is also required to set aside at least 10% of its annual after-tax profit based on PRC accounting standards each year to its general reserves until the accumulative amount of such reserves reaches 50% of its registered capital. These reserves are not distributable as cash dividends. In addition, SolarOne Qidong is required to allocate a portion of its after-tax profit to its staff welfare and bonus fund at the discretion of its board of directors. Moreover, if SolarOne Qidong incurs debt on its own behalf in the future, the instruments governing the debt may restrict its ability to pay dividends or make other distributions to us.
Restrictions on currency exchange may limit our ability to receive and use our revenue effectively.
A portion of our revenue and a substantial portion of our expenses are denominated in Renminbi. The Renminbi is currently convertible under the “current account,” which includes dividends, trade and service-related foreign exchange transactions, but not under the “capital account,” which includes foreign direct investment and loans. Currently, SolarOne Qidong may purchase foreign currencies for settlement of current account transactions, including payments of dividends to us, without the approval of the State Administration of Foreign Exchange, or SAFE. However, the relevant PRC government authorities may limit or eliminate our ability to purchase foreign currencies in the future. Since a significant amount of our future revenue will be denominated in Renminbi, any existing and future restrictions on currency exchange may limit our ability to utilize revenue generated in Renminbi to fund our business activities outside China that are denominated in foreign currencies.
Foreign exchange transactions by SolarOne Qidong under the capital account continue to be subject to significant foreign exchange controls and require the approval of or need to register with PRC governmental authorities, including SAFE. In particular, if SolarOne Qidong borrows foreign currency loans from us or other foreign lenders, these loans must be registered with SAFE, and if we finance SolarOne Qidong by means of additional capital contributions, these capital contributions must be approved by certain government authorities, including the National Development and Reform Commission, or the NDRC, the Ministry of Commerce or their respective local counterparts. These limitations could affect the ability of SolarOne Qidong to obtain foreign exchange through debt or equity financing.
PRC regulations relating to the establishment of offshore special purpose companies by PRC residents may subject our PRC resident shareholders to personal liability and limit our ability to acquire PRC companies or to inject capital into our PRC subsidiary, limit our PRC subsidiary’s ability to distribute profits to us, or otherwise materially and adversely affect us.
SAFE issued a public notice in October 2005, or the SAFE notice, requiring PRC residents, including both legal persons and natural persons, to register with the competent local SAFE branch before establishing or controlling any company outside of China, referred to as an “offshore special purpose company,” for the purpose of acquiring any assets of or equity interest in PRC companies and raising fund from overseas. In addition, any PRC resident that is the shareholder of an offshore special purpose company is required to amend its SAFE registration with the local SAFE branch, with respect to that offshore special purpose company in connection with any increase or decrease of capital, transfer of shares, merger, division, equity investment or creation of any security interest over any assets located in China. If any PRC shareholder of any offshore special purpose company fails to make the required SAFE registration and amendment, the PRC subsidiaries of that offshore special purpose company may be prohibited from distributing their profits and proceeds from any reduction in capital, share transfer or liquidation to the offshore special purpose company. Moreover, failure to comply with the SAFE registration and amendment requirements described above could result in liability under PRC laws for
28
evasion of applicable foreign exchange restrictions. Our current beneficial owners who are PRC residents have registered with the local SAFE branch as required under the SAFE notice. The failure of these beneficial owners to amend their SAFE registrations in a timely manner pursuant to the SAFE notice or the failure of future beneficial owners of our company who are PRC residents to comply with the registration procedures set forth in the SAFE notice may subject such beneficial owners to fines and legal sanctions and may also result in a restriction on our PRC subsidiary’s ability to distribute profits to us or otherwise materially and adversely affect our business. In addition, the NDRC promulgated a rule in October 2004, or the NDRC Rule, requiring overseas investment projects made by PRC entities to be approved by NDRC. The NDRC Rule also sets out the approval procedures for overseas investment projects of PRC individuals. However, uncertainties in terms of interpretation of the NDRC Rule with respect to its application to a PRC individual’s overseas investment remain, and in practice, we are not aware of any precedents that a PRC individual’s overseas investment has been approved by the NDRC or challenged by the NDRC based on the absence of an NDRC approval. We cannot predict how and to what extent this will affect our business operations or future strategy. For example, the failure of our shareholders who are PRC individuals to comply with the NDRC Rule may subject these persons or our PRC subsidiary to certain liabilities under PRC laws, which could adversely affect our business.
We face uncertainties with respect to application of the Circular on Strengthening the Administration of Enterprise Income Tax for Share Transfer of Non-PRC Resident Enterprises.
Pursuant to the Notice on Strengthening Administration of Enterprise Income Tax for Share Transfers by Non-PRC Resident Enterprises, or SAT Circular 698, issued by the State Administration of Taxation on December 10, 2009 with retroactive effect from January 1, 2008, where a non-resident enterprise transfers its equity interests in a PRC resident enterprise indirectly via disposing of the equity interests of an overseas holding company, or an Indirect Transfer, and such overseas holding company is located in a tax jurisdiction that (i) has an effective tax rate less than 12.5% or (ii) does not tax foreign income of its residents, the foreign investor shall report such Indirect Transfer to the competent tax authority of the PRC resident enterprise. The PRC tax authority will examine the true nature of the Indirect Transfer, and if the tax authority considers that the foreign investor has adopted an abusive arrangement in order to avoid PRC tax, it will disregard the existence of the overseas holding company and re-characterize the Indirect Transfer and, as a result, gains derived from such Indirect Transfer may be subject to PRC withholding tax at the rate of up to 10%. SAT Circular 698 also provides that, where a non-PRC resident enterprise transfers its equity interests in a PRC resident enterprise to its related parties at a price lower than the fair market value, the relevant tax authority has the power to make a reasonable adjustment to the taxable gain of the transaction.
There is uncertainty as to the application of SAT Circular 698. The relevant PRC authority has not yet promulgated any formal provisions or formally declared or stated how to calculate the effective tax in a foreign jurisdiction and how a foreign investor shall report to the competent tax authority an Indirect Transfer. SAT Circular 698 states that it does not apply to purchases or sales of stock on a stock exchange. If we transfer our equity interest in our PRC subsidiaries or when our non-resident investors transfer their shares, we or our non-resident investors may be taxed under SAT Circular 698 and may be required to expend valuable resources to comply with SAT Circular 698 or to establish that we or our non-resident investors should not be taxed under SAT Circular 698, which may have an adverse effect on our financial condition and results of operations or such non-resident investors’ investment in us.
Labor laws in the PRC may adversely affect our results of operations.
On June 29, 2007, the PRC government promulgated the Labor Contract Law of the PRC, or the Labor Contract Law, which became effective on January 1, 2008. On December 28, 2012, the PRC government promulgated the amendment to the Labor Contract Law, and such amendment became effective on July 1, 2013. The Labor Contract Law, as amended, imposes greater liabilities on employers and significantly impacts the cost of an employer’s decision to reduce its workforce. Further, it requires certain terminations to be based upon
29
seniority and not merit. In the event we decide to significantly change or decrease our workforce, the Labor Contract Law, as amended, could adversely affect our ability to enact such changes in a manner that is most advantageous to our business or in a timely and cost-effective manner, thus materially and adversely affecting our financial condition and results of operations.
On December 20, 2013, the Ministry of Human Resources and Social Security of the PRC promulgated the Interim Provisions on Labor Dispatch, or Provisions on Labor Dispatch, which took effect on March 1, 2014. The Provisions on Labor Dispatch provides, among other things, that an employer can hire temporary employees only for temporary, auxiliary and replaceable jobs. The number of temporary employees cannot exceed 10% of the total workforce. If the number of temporary employees exceeds 10% of the total workforce as of March 1, 2014, the employer shall, as a principle, adjust its employment plan and ensure such percentage be reduced to 10% or below no later than March 1, 2016. Before such percentage is adjusted to 10% or below, the employer shall not hire any new temporary employees. Our number of temporary employees is currently over 10% of our total workforce. We may not be able to reduce such percentage to 10% or below prior to March 1, 2016. As a result, we may not be able to retain any additional temporary employees and such inability to retain additional temporary employees could render us less competitive than other manufacturers, which may materially and adversely affect our financial condition and results of operation.
We face risks related to health epidemics and other outbreaks.
Adverse public health epidemics or pandemics could disrupt business and the economics of the PRC and other countries where we do business. In 2009, there were outbreaks of swine flu, caused by H1N1 virus, in certain regions of the world, including China. In the past few years, there were reports on the occurrences of avian flu in various parts of China, including a few confirmed human cases. In April 2013, there were reports of cases of H7N9 avian flu in southeast China, including deaths in Shanghai and Zhejiang Province. Any future outbreak of severe acute respiratory syndrome, or SARS, avian flu, swine flu or other similar adverse public developments in China may, among other things, significantly disrupt our business, including limiting our ability to travel or ship our products within or outside China and forcing us to temporary close our manufacturing facilities. Furthermore, an outbreak may severely restrict the level of economic activity in affected areas, which may in turn materially and adversely affect our financial condition and results of operations. We have not adopted any written preventive measures or contingency plans to combat any future outbreak of swine flu, avian flu, SARS or any other epidemic.
Our auditor, like other independent registered public accounting firms operating in China, is not permitted to be subject to inspection by Public Company Accounting Oversight Board, and as such, investors may be deprived of the benefits of such inspection.
Our independent registered public accounting firm that issues the audit reports included in our annual reports filed with the SEC, as an auditor of companies that are traded publicly in the United States and a firm registered with PCAOB, is required by the laws of the United States to undergo regular inspections by PCAOB to assess its compliance with the laws of the United States and professional standards. Because our auditor is located in China, a jurisdiction where PCAOB is currently unable to conduct inspections without the approval of the PRC authorities, our auditor, like other independent registered public accounting firms operating in China, is currently not inspected by PCAOB. In May 2013, PCAOB announced that it had entered into a Memorandum of Understanding on Enforcement Cooperation with the CSRC and the PRC Ministry of Finance, which establishes a cooperative framework between the parties for the production and exchange of audit documents relevant to investigations undertaken by PCAOB, the CSRC or the PRC Ministry of Finance in the United States and the PRC, respectively. PCAOB continues to be in discussions with the CSRC and the PRC Ministry of Finance to permit joint inspections in the PRC of audit firms that are registered with PCAOB and audit Chinese companies that trade on U.S. exchanges.
Inspections of other firms that PCAOB has conducted outside of China have identified deficiencies in those firms’ audit procedures and quality control procedures, which may be addressed as part of the inspection process
30
to improve future audit quality. The inability of PCAOB to conduct inspections of independent registered public accounting firms operating in China makes it more difficult to evaluate the effectiveness of our auditor’s audit procedures or quality control procedures. As a result, investors may be deprived of the benefits of PCAOB inspections.
We may be adversely affected by the outcome of the administrative proceedings brought by the SEC against the Big Four PRC-based accounting firms.
In December 2012, the SEC brought administrative proceedings against the Big Four accounting firms in China, including our independent registered public accounting firm, alleging that these accounting firms had violated U.S. securities laws and the SEC’s rules and regulations thereunder by failing to provide to the SEC the firms’ audit papers and other documents related to certain PRC-based companies that are publicly traded in the United States. On January 22, 2014, the Administrative Law Judge presiding over the matter reached an initial decision that the firms had each violated the SEC’s rules of practice by failing to produce the audit work papers and related documents directly to the SEC. The initial decision further determined that each of the firms should be censured and barred from practicing before the SEC for a period of six months. The Big Four PRC-based accounting firms recently appealed the initial administrative law decision to the SEC. The initial administrative law decision will not become effective until and unless it is endorsed by the full SEC. The accounting firms can then further appeal the final decision of the SEC through the federal appellate courts. We were not and are not subject to any SEC investigations, nor are we involved in the proceedings brought by the SEC against the accounting firms. However, the independent registered public accounting firm that issues the audit reports included in our annual reports filed with the SEC is one of the four accounting firms subject to the six month suspension from practicing before the SEC in the initial administrative law decision. We may therefore be adversely affected by the outcome of the proceedings, along with other U.S.-listed companies audited by these accounting firms.
While we cannot predict the outcome of the SEC’s review, nor that of any subsequent appeal process, if the Big Four PRC-based accounting firms, including our independent registered public accounting firm, are ultimately temporarily barred from practicing before the SEC, and we were unable to timely find another registered public accounting firm to audit and issue an opinion on our financial statements, our financial statements could be determined to not be in compliance with the requirements of the Securities Exchange Act of 1934, as amended, or the Exchange Act. Such a determination could ultimately lead to our delisting from the Nasdaq Global Market or deregistration from the SEC, or both, which would substantially reduce or effectively terminate the trading of our ADSs in the United States.
Risks Related to Our Ordinary Shares and ADSs
The market price of the ADSs may be volatile.
The market price of the ADSs has exhibited, and may continue to exhibit, significant volatility. For the period from December 20, 2006 to April 11, 2014, the closing price of the ADSs on the Nasdaq Global Market has ranged from a low of US$0.77 per ADS to a high of US$37.64 per ADS.
Numerous factors, including many over which we have no control, may have a significant impact on the market price of the ADSs, including, among other things:
| | • | | announcements of technological or competitive developments; |
| | • | | regulatory developments in our target markets affecting us, our customers or our competitors; |
| | • | | announcements regarding patent litigation or the issuance of patents to us or our competitors; |
| | • | | announcements of studies and reports relating to the conversion efficiencies of our products or those of our competitors; |
31
| | • | | actual or anticipated fluctuations in our quarterly operating results; |
| | • | | changes in financial estimates or other material comments by securities analysts relating to us, our competitors or our industry in general; |
| | • | | announcements by other companies in our industry relating to their operations, strategic initiatives, financial condition or financial performance or to our industry in general; |
| | • | | announcements of acquisitions or consolidations involving industry competitors or industry suppliers; |
| | • | | changes in the economic performance or market valuations of other PV technology companies; |
| | • | | changes in international trade policies and international barriers to trade; |
| | • | | addition or departure of our executive officers and key research personnel; and |
| | • | | sales or perceived sales of additional ordinary shares or ADSs. |
In addition, the stock market in recent years has experienced extreme price and trading volume fluctuations that often have been unrelated or disproportionate to the operating performance of individual companies. These broad market fluctuations may adversely affect the price of the ADSs, regardless of our operating performance.
Future issuances of ordinary shares, ADSs or equity-related securities may depress the trading price of the ADSs.
Any issuance of equity securities could dilute the interests of our existing shareholders and could substantially decrease the trading price of the ADSs. We may issue equity securities through public offerings or private placements in the future for a number of reasons, including to finance our operations and business strategy (including in connection with acquisitions, strategic collaborations or other transactions), to adjust our ratio of debt to equity and to satisfy our obligations upon the exercise of outstanding warrants or options or for other reasons.
Sales of a substantial number of ADSs or other equity-related securities in the public market could depress the market price of the ADSs, and impair our ability to raise capital through the sale of additional equity securities. We cannot predict the effect that future sales of the ADSs or other equity-related securities would have on the market price of the ADSs. In addition, the price of the ADSs could be affected by possible sales of the ADSs by investors who view the convertible notes as a more attractive means of obtaining equity participation in our company and by hedging or arbitrage trading activity that we expect to develop involving our convertible notes.
Our articles of association contain anti-takeover provisions that could have a material adverse effect on the rights of holders of our ordinary shares and ADSs.
Our amended and restated articles of association limit the ability of others to acquire control of our company or cause us to engage in change-of-control transactions. These provisions could have the effect of depriving our shareholders of an opportunity to sell their shares at a premium over prevailing market prices by discouraging third parties from seeking to obtain control of our company in a tender offer or similar transaction. For example, our board of directors has the authority, without further action by our shareholders, to issue preferred shares in one or more series and to fix their designations, powers, preferences, privileges, and relative participating, optional or special rights and the qualifications, limitations or restrictions, including dividend rights, conversion rights, voting rights, terms of redemption and liquidation preferences, any or all of which may be greater than the rights associated with our ordinary shares, in the form of ADS or otherwise. Preferred shares could be issued quickly with terms calculated to delay or prevent a change in control of our company or make removal of management more difficult. If our board of directors decides to issue preferred shares, the price of the ADSs may fall and the voting and other rights of the holders of our ordinary shares and ADSs may be materially and adversely affected.
32
Holders of ADSs have fewer rights than shareholders and must act through the depositary to exercise those rights.
Holders of ADSs do not have the same rights as our shareholders and may only exercise the voting rights with respect to the underlying ordinary shares in accordance with the provisions of the deposit agreement. Under our amended and restated articles of association, the minimum notice period required to convene an annual general meeting or any extraordinary general meeting calling for the passing of a special resolution is 20 days and the minimum notice period required to convene any other extraordinary general meeting is 14 days. When a general meeting is convened, you may not receive sufficient notice of a shareholders’ meeting to permit you to withdraw your ordinary shares to allow you to cast your vote with respect to any specific matter. If requested in writing by us, the depositary will mail a notice of such a meeting to you. In addition, the depositary and its agents may not be able to send voting instructions to you or carry out your voting instructions in a timely manner. We will make all reasonable efforts to cause the depositary to extend voting rights to you in a timely manner, but you may not receive the voting materials in time to ensure that you can instruct the depositary to vote your ADSs. Furthermore, the depositary and its agents will not be responsible for any failure to carry out any instructions to vote, for the manner in which any vote is cast or for the effect of any such vote. As a result, you may not be able to exercise your right to vote and you may lack recourse if your ADSs are not voted as you requested. In addition, in your capacity as an ADS holder, you will not be able to call a shareholders’ meeting.
You may be subject to limitations on transfers of your ADSs.
Your ADSs are transferable on the books of the depositary. However, the depositary may close its transfer books at any time or from time to time when it deems expedient in connection with the performance of its duties. In addition, the depositary may refuse to deliver, transfer or register transfers of ADSs generally when our books or the books of the depositary are closed, or at any time if we or the depositary deem it advisable to do so because of any requirement of law or of any government or governmental body, or under any provision of the deposit agreement, or for any other reason.
Your right to participate in any future rights offerings may be limited, which may cause dilution to your holdings and you may not receive cash dividends if it is impractical to make them available to you.
We may from time to time distribute rights to our shareholders, including rights to acquire our securities. However, we cannot make rights available to you in the United States unless we register the rights and the securities to which the rights relate under the Securities Act or an exemption from the registration requirements is available. Also, under the deposit agreement, the depositary will not make rights available to you unless the distribution to ADS holders of both the rights and any related securities are either registered under the Securities Act, or exempted from registration under the Securities Act. We are under no obligation to file a registration statement with respect to any such rights or securities or to endeavor to cause such a registration statement to be declared effective. Moreover, we may not be able to establish an exemption from registration under the Securities Act. Accordingly, in the event we conduct any rights offering in the future, the depositary may not make such rights available to you or may dispose of such rights and make the net proceeds available to you. As a result, you may be unable to participate in our rights offerings and may experience dilution in your holdings.
In addition, the depositary for the ADS facility has agreed to pay to you the cash dividends or other distributions it or the custodian receives on our ordinary shares or other deposited securities after deducting its fees and expenses. You will receive these distributions in proportion to the number of ordinary shares your ADSs represent. However, the depositary may, at its discretion, decide that it is inequitable or impractical to make a distribution available to any holders of ADSs. As a result, the depositary may decide not to make the distribution and you will not receive such distribution.
33
We are a Cayman Islands company and, because judicial precedent regarding the rights of shareholders is more limited under Cayman Islands law than that under U.S. law, ADS holders may have less protection for their shareholder rights than such holders would under U.S. law.
Our corporate affairs are governed by our amended and restated memorandum and articles of association as may be amended from time to time, the Cayman Islands Companies Law (as amended) and the common law of the Cayman Islands. The rights of shareholders to take action against the directors, actions by minority shareholders and the fiduciary responsibilities of our directors to us under Cayman Islands law are to a large extent governed by the common law of the Cayman Islands. The common law of the Cayman Islands is derived in part from comparatively limited judicial precedent in the Cayman Islands as well as that from English common law, which has persuasive, but not binding, authority on a court in the Cayman Islands. The rights of our shareholders and the fiduciary responsibilities of our directors under Cayman Islands law are not as clearly established as they would be under statutes or judicial precedent in some jurisdictions in the United States. In particular, the Cayman Islands has a less developed body of securities laws than the United States. In addition, Cayman Islands companies may not have standing to initiate a shareholder derivative action in a federal court of the United States.
In addition, most of our directors and officers are nationals and residents of countries other than the United States. Substantially all of our assets and a substantial portion of the assets of these persons are located outside the United States.
There are uncertainties as to whether Cayman Islands courts would:
| | • | | recognize or enforce against us or our directors, judgments of courts of the United States based on certain civil liability provisions of U.S. securities laws; and |
| | • | | entertain original actions brought in the Cayman Islands, based on certain civil liability provisions of U.S. securities laws that are penal in nature. |
There is no statutory recognition in the Cayman Islands of judgments obtained in the United States, although the courts of the Cayman Islands will in certain circumstances recognize and enforce a non-penal judgment of a foreign court of competent jurisdiction without retrial on the merits.
As a result of all of the above, our public shareholders may have more difficulty in protecting their interests in the face of actions taken against management, members of the board of directors or controlling shareholders than they would as shareholders of a U.S. public company.
You may have difficulty enforcing judgments obtained against us.
We are a Cayman Islands company and substantially all of our assets are located outside of the United States. Substantially all of our current operations are conducted in the PRC. In addition, most of our directors and officers are nationals and residents of countries other than the United States. A substantial portion of the assets of these persons are located outside the United States. As a result, it may be difficult for you to effect service of process within the United States upon these persons. It may also be difficult for you to enforce in U.S. courts judgments obtained in U.S. courts based on the civil liability provisions of the U.S. federal securities laws against us and our officers and directors, most of whom are not residents in the United States and the substantial majority of whose assets are located outside of the United States. In addition, there is uncertainty as to whether the courts of the Cayman Islands or the PRC would recognize or enforce judgments of U.S. courts based on certain civil liability provisions of U.S. securities laws.
We may be classified as a passive foreign investment company for U.S. federal income tax purposes, which could result in adverse U.S. federal income tax consequences to U.S. Holders.
We do not currently expect to be a passive foreign investment company, or PFIC, for U.S. federal income tax purposes for our current taxable year or the foreseeable future. Our actual PFIC status for the current taxable
34
year, however, will not be determinable until the close of the current taxable year ending December 31, 2014, and accordingly, there is no guarantee that we will not be a PFIC for the current taxable year or any future taxable year.
A non-U.S. corporation, such as our company, is considered to be a PFIC for any taxable year if either (1) at least 75% of its gross income is passive income; or (2) at least 50% of the value of its assets (based on an average of the quarterly values of the assets during a taxable year) is attributable to assets that produce or are held for the production of passive income.
If we are a PFIC for any taxable year during which a U.S. Holder (as defined below under “Taxation—U.S. Federal Income Taxation”) holds the ADSs or ordinary shares, such U.S. Holder will generally be subject to special tax rules with respect to any “excess distribution” received on the ADSs or ordinary shares and any gain realized from a sale or other disposition (including a pledge) of the ADSs or ordinary shares. A U.S. Holder may be subject to adverse U.S. federal income tax consequences as a result of these rules. For more information, see “Taxation—U.S. Federal Income Taxation—Passive Foreign Investment Company Status.”
ITEM 4 INFORMATION ON THE COMPANY
A.History and Development of the Company
We commenced operations through SolarOne Qidong in August 2004. In anticipation of our initial public offering, we incorporated Hanwha SolarOne, formerly known as Solarfun Power Holdings Co., Ltd., in the Cayman Islands on May 12, 2006 as our listing vehicle. To enable us to raise equity capital from investors outside of China, we established a wholly owned holding company structure, Hanwha SolarOne Investment Holding Ltd., or SolarOne BVI, in the British Virgin Islands in May 2006, which purchased all of the equity interests in SolarOne Qidong.
In March 2006, April 2007 and May 16, 2007, we established Hanwha SolarOne (Shanghai) Co., Ltd., or Solar Shanghai, Hanwha Solar Engineering Research and Development Center Co., Ltd., or Solar R&D, and Hanwha SolarOne Hong Kong Limited, or SolarOne Hong Kong, respectively.
We acquired a 52% interest in Hanwha SolarOne Technology Co., Ltd., or SolarOne Technology, in July 2007 and acquired the remaining 48% in August 2008. In September 2007, we established a wholly owned subsidiary, Hanwha SolarOne U.S.A. Inc., or SolarOne U.S.A., as part of our plan to enter the United States market. On November 30, 2007, SolarOne BVI transferred all of the equity interests in SolarOne Qidong to SolarOne Hong Kong for consideration of US$199.0 million. In February 2008, we established a wholly owned subsidiary, Hanwha SolarOne GmbH in Germany to sell solar products in the European markets. In November 2009, we acquired the remaining 17% equity interest in Solar Shanghai and Solar Shanghai became our wholly owned subsidiary after the completion of this transaction. We established Hanwha Solar Electric Power Engineering Co., Ltd., or Solar Engineering, in May 2010 under SolarOne Qidong to engage in the solar power project business.
In September 2010, we issued and sold to Hanwha Solar Holdings Co., Ltd., or Hanwha Solar, 36,455,089 ordinary shares for an aggregate sale price of US$78.2 million. Concurrently with the closing of this offering, we issued 30,672,689 ordinary shares to Hanwha Solar at par value of the ordinary shares and subsequently an additional 14,407,330 ordinary shares at par value, which shares were to remain outstanding so long as and to the extent that the 9,019,611 ADSs we issued to facilitate our convertible bond offering in January 2008 remain outstanding. In October 2011, we repurchased and cancelled 25,017,671 ordinary shares from Hanwha Solar at par value of US$0.0001 per ordinary share. At the same time, Hanwha Solar completed the acquisitions from Good Energies II LP and Yonghua Solar Power Investment Holding Ltd., the company owned by Mr. Yonghua Lu, our former chairman, of a total of 120,407,700 ordinary shares and 1,281,011 ADSs of our company, representing all of the ordinary shares and ADSs held by them. Hanwha Solar, a company that engages in solar business, is a wholly owned subsidiary of Hanwha Chemical Corporation, a leading chemical producer publicly traded on the Korea Exchange whose principal activities are the production of CA, PE and PVC products.
35
In November 2010, we issued and sold 9,200,000 ADSs with an aggregate sale price of US$82.8 million. In order for Hanwha Solar to maintain after this offering the same level of beneficial ownership in our company before this offering, we also issued and sold to Hanwha Solar 45,981,604 ordinary shares for an aggregate sale price of US$82.8 million.
We changed our name from “Solarfun Power Holdings Co., Ltd.” to “Hanwha SolarOne Co., Ltd.” on December 20, 2010 and our ticker from “SOLF” to “HSOL” on February 15, 2011.
In April 2011, we established Nantong Hanwha Import & Export Co., Ltd., or Nantong Hanwha I&E, under SolarOne Qidong to engage in import and export of PV products and technology and Hanwha SolarOne (Nantong) Co., Ltd., or SolarOne Nantong, under SolarOne Hong Kong to develop, manufacture and sell PV products.
In February 2012, we established Hanwha Solar Canada Inc. under SolarOne Hong Kong to sell solar products in Canada.
In May 2012, we acquired Hanwha Solar Australia Pty Ltd. from Hanwha Corporation to sell solar products in Australia.
In July 2013, we established Nantong Hanwha PV-Tech Energy Co., Ltd. under SolarOne Qidong to provide solar system integration services in China.
Our principal executive offices are located at 888 Linyang Road, Qidong, Jiangsu Province, 226200, People’s Republic of China. Our telephone number at this address is(86-513) 8330-7688 and our fax number is(86-513) 8311-0367. Our registered office in the Cayman Islands is at the offices of Maples Corporate Services Limited, P.O. Box 309, Ugland House, Grand Cayman,KY1-1104, Cayman Islands.
Investor inquiries should be directed to us at the address and telephone number of our principal executive offices set forth above. Our website ishttp://www.hanwha-solarone.com. The information contained on our website does not constitute a part of this annual report. Our agent for service of process in the United States is CT Corporation System, located at 111 Eighth Avenue, New York, New York 10011.
We made capital expenditures of RMB2,437.9 million, RMB534.5 and RMB421.4 million (US$69.6 million) in 2011, 2012 and 2013, respectively, all of which related primarily to the purchases of manufacturing equipment and facility construction costs for SolarOne Nantong, SolarOne Qidong and SolarOne Technology. Based on the current market conditions, we have no plan for substantial capacity expansion in 2014. We expect to incur capital expenditures of approximately US$80.0 million in 2014, which will be used primarily to pay for automation of existing manufacturing lines. However, we will actively review our capacity expansion plan on a regular basis as the business environment evolves. We plan to fund the balance of our capital expenditure requirements for 2014 with cash from operations, proceeds from our securities offerings, additional bank borrowings, and other forms of financing, if necessary.
B.Business Overview
Overview
We are a vertically integrated manufacturer of silicon ingots, silicon wafers, PV cells and PV modules in China. We manufacture a variety of silicon ingots, silicon wafers, PV cells and PV modules using advanced manufacturing process technologies that have helped us to rapidly increase our operational efficiency. We also provide PV module processing services. We sell PV cells and PV modules both directly to system integrators and through third party distributors. In 2013, we sold our products to over 250 customers, mostly in Japan, South Africa, Germany, China, the United States, Korea, Canada and the United Kingdom. We conduct our business in China primarily through SolarOne Qidong.
36
As of December 31, 2013, we had annual production capacities of 1.5 GW for PV modules, 1.3 GW for PV cells and 800 MW for ingots and wafers. In addition, we have achieved improvements in process technology and product quality since we commenced our commercial production in November 2005. Our multicrystalline PV cells achieved conversion efficiency rates of 17.58% in 2013.
Our net revenues were RMB6,416.5 million, RMB3,678.4 million and RMB4,725.7 million (US$780.6 million) in 2011, 2012 and 2013, respectively. We recorded net losses of RMB930.1 million, RMB1,562.9 million and RMB874.1 million (US$144.4 million) in 2011, 2012 and 2013, respectively.
Our Products and Services
Our products primarily include silicon ingots, silicon wafers, PV cells and PV modules. Substantially all of the ingots, wafers and PV cells we produce are used for our own PV module production. We also provide PV module processing services.
Our Products
PV Cells
A PV cell is a semiconductor device that converts sunlight into electricity by a process known as the photovoltaic effect. The key technical efficiency measurement of PV cells is the conversion efficiency rate. Assuming other things being the same, the higher the conversion efficiency rate, the lower the production cost of PV modules per watt because more power can be incorporated into a given size package. We currently produce multicrystalline silicon cells that are 156 mm x 156 mm, with conversion efficiencies of 17.60%, thickness of 180 to 200 microns and maximum power output of 4.28 W. In order to further lower our production costs, we intend to focus on producing PV cells with decreasing thickness levels.
PV Modules
A PV module is an assembly of PV cells that have been electrically interconnected and laminated in a durable andweather-proof package. We have been selling a wide range of PV modules, currently ranging from 180 W to 305 W in power output specification, made primarily from the PV cells we manufacture. We are developing modules with higher power to meet the rising demand foron-grid configurations. The majority of the PV modules we currently offer to our customers range in power between 240 W and 305 W. We sell approximately 91.0% of our PV modules under our proprietary “SolarOne” brand names, and approximately 9.0%, respectively, of our PV modules under the brand names of our customers.
The following table sets forth the types of PV modules we currently manufacture with the specifications indicated:
| | | | | | |
PV Module Manufactured with: | | Dimensions
(mm) | | Weight (Kg) | | Power (W) |
Multicrystalline silicon | | 1494 x 1000 x 35 | | 17±0.5 | | 170-225 |
| | 1652 x 1000 x 45 | | 20±0.5 | | 200-255 |
| | 1966 x 1000 x 50 | | 28.5±0.5 | | 250-325 |
| | 1636 x 988 x 40 | | 19±0.5 | | 200-270 |
| | 1956 x 988 x 45 | | 27±0.5 | | 250-325 |
We believe our PV cells and modules are competitive with other products in the PV market in terms of efficiency and quality. We expect to continue improving the conversion efficiency and power, and reducing the thickness, of our solar products as we continue to devote significant financial and human resources in our various research and development programs. We also introduced solar modules with anti-PID features in 2013, by improving the materials used for encapsulation and upgrading the technology of cells used in modules.
37
Ingots and Wafers
We also manufacture ingots through SolarOne Technology, an ingot plant that commenced operations in October 2007. As of December 31, 2013, we had annual production capacities of 1.5 GW for PV modules, 1.3 GW for PV cells and 800 MW for ingots and wafers. The ingots manufactured by SolarOne Technology are generally used for our manufacture of wafers. The wafers manufactured by SolarOne Qidong and SolarOne Technology are generally used for our manufacture of PV cells and PV modules.
Our Services
We provide PV module processing services to convert PV cells into PV modules on behalf of a related party. For these PV module processing services, we “purchase” PV cells from a customer and at the same time agree to “sell” a specified quantity of PV modules back to the same customer. The quantity of PV modules sold back to the customer under this processing arrangement is consistent with the amount of PV cells purchased from the customer after factoring in conversion efficiency. We record the amount of revenue from these processing transactions based on the amount received for PV modules sold less the amount paid for the PV cells purchased from the customer. The production costs incurred related to providing the module processing services are recorded within our cost of revenues.
In response to the rapidly evolving conditions in the PV industry, we started to expand our business downstream to provide system integration services in 2010. Our PV system integration services may include services such as engineering, procurement of permits and equipment, construction management, monitoring and maintenance. We offer PV system integration services through Solar Shanghai and Solar Engineering.
Raw Materials Supply Management
Manufacturing of our solar products requires reliable supplies of various raw materials, including silicon wafers, ethylene vinyl acetate, triphenyltin, tempered glass, connecting bands, welding bands, silica gel, aluminum alloy and junction boxes. We seek to diversify the supply sources of raw materials and have not in the past experienced any material disruption of our manufacturing process due to insufficient supply of raw materials. The aggregate costs attributable to our five largest silicon materials suppliers in 2011, 2012 and 2013 were 40.6%, 72.4% and 76.7%, respectively, of our total silicon material purchases.
We maintain different inventory levels of our raw materials, depending on the type of product and the lead time required to obtain additional supplies. We seek to maintain reasonable inventory levels that achieve a balance between our efforts to reduce our storage costs and optimize working capital on one hand, and the need to ensure that we have access to adequate supplies on the other. As of December 31, 2011, 2012 and 2013, we had RMB194.0 million, RMB187.4 million and RMB276.5 million (US$45.7 million), respectively, of raw materials in inventory.
Silicon-based Raw Materials
Among the various raw materials required for our manufacturing process, silicon wafers are the most important for producing PV cells. A silicon wafer is a flat piece of crystalline silicon that can be processed into a PV cell. We currently use5-inch and6-inch wafers in our production.
We procure our silicon and silicon wafer supplies undershort-term supply agreements. In 2013, we purchased all of our silicon and silicon wafers and 20.1% of PV cells fromthird-party suppliers. We purchase silicon, wafers and cells from both domestic and overseas suppliers, with the majority of our purchases being made in the domestic market.
38
We use ingots manufactured by SolarOne Technology, one of our wholly owned subsidiaries, in our manufacturing process. The key raw material for our production of ingots is polysilicon. Currently, our principal silicon suppliers include Wacker Chemie AG, or Wacker, Hemlock Semiconductor Corporation, or Hemlock, GCL Silicon Technology Holdings Limited, or GCL, and Chongqing Daqo New Energy Co., Ltd., or Daqo.
Other Raw Materials
In addition to silicon and silicon wafers, we use a variety of other raw materials for our production. As part of our continuing cost control efforts, we source a significant portion of these raw materials locally. We believe that our policy to use primarily locally sourced raw materials and our continuing price negotiations with our local raw material suppliers have contributed significantly to our operating margins. The use of locally sourced raw materials also shortens our lead order time and provides us with better access to technical and other support from our suppliers.
Production
We manufacture our wafers, PV cells and PV modules through SolarOne Qidong, our wholly owned PRC subsidiary, with facilities occupying a gross floor area of 173,220 square meters in Qidong, Jiangsu Province, China. We commenced commercial production on our first PV cell production line in November 2005 and we had annual production capacities of 1.5 GW for PV modules, 1.3 GW for PV cells and 800 MW for ingots and wafers, as of December 31, 2013. We produce multicrystalline silicon wafers with a dimension of 156 mm x 156 mm. The thickness of our silicon wafers is 180 microns.
We manufacture our silicon ingots through SolarOne Technology, one of our wholly owned subsidiaries, with facilities occupying a gross floor area of approximately 104,479 square meters in Lianyungang, Jiangsu Province, China. SolarOne Technology commenced its operations in October 2007.
We were able to lower our initial investment by purchasing key equipment with more sophisticated technology from overseas suppliers while procuring other equipment domestically. In 2013, we integrated new cell technology into our production processes, reducing silver paste consumption and increasing the efficiency and power of PV products manufactured.
39
We plan our production on an annual,semi-annual and monthly basis in accordance with anticipated demand and make weekly adjustments to our production schedule based on actual orders received.
Production Process
The following diagram shows the general production stages for our PV cells:
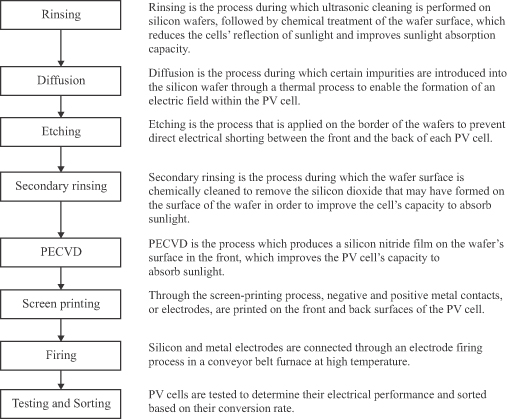
The following diagram shows the production procedures for our PV modules:
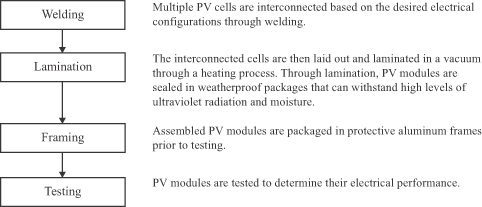
40
The following diagram shows the general production stages for our ingots:
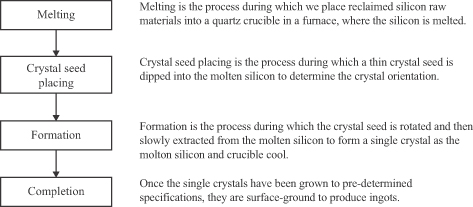
Quality Control and Certifications
Our finished PV cells and PV modules are inspected and tested according to standardized procedures. In addition, we have established multiple inspection points at key production stages to identify product defects during the production process. Unfinished products that are found to be below standard are repaired or replaced. Our quality control procedures also include raw material quality inspection and testing. Moreover, we provide regular training and specific guidelines to our operators to ensure that production processes meet our quality inspection and other quality control procedures.
We maintain several certifications for our quality control procedures, which demonstrate our compliance with international and domestic operating standards. We believe that our quality control procedures are enhanced by the use of sophisticated production system designs and a high degree of automation in our production process. The certifications we currently maintain include ISO 9001:2008 quality management system certification for the process of design, production and sale of our PV modules, ISO 14001:2004 environmental management system certification, OHSAS 18001:2007 occupational health and safety management system certification and the IEC certification for our PV modules and the UL certification. The IEC certification is issued by independent institutes TÜV and VDE in Germany to certify our PV modules are qualified under IEC 61215 and IEC 61730 safety test standards and consistent production quality inspections are performed periodically. Maintaining this certification has greatly enhanced our sales in European countries, as well as countries in Asia, the Middle East and South Africa. We obtained UL certification issued by Underwriters Laboratories Inc. and Canadian Standard Association, independentproduct-safety testing and certification organizations in the United States and Canada, which will enable us to sell our products to customers in the North America. Furthermore, in the United States, our modules have been certified by the California Energy Commission, the state’s primary energy policy and planning agency. We obtained a certification issued by KEMCO, an independentproduct-safety testing and certification organization in Korea, which enables us to sell our products to customers in Korea. We obtained MCS certificate which enables us to sell products to UK and Clean Energy Council listing for Australia market. We also obtainedJ-PEC listing and passed JET qualification for entry into the Japan market. Further, our PV lab was recognized by VDE and CSA for Test Data Acceptable Program, which means that our lab is now qualified to conduct IEC and UL1703 testing by ourselves and reflects our lab`s capabilities and management.
Capacity Expansion and Technology Upgrade Plans
As of December 31, 2013, we had annual production capacities of 1.5 GW for PV modules, 1.3 GW for PV cells and 800 MW for ingots and wafers. Based on the current market conditions, we expect to incur capital expenditures of US$80.0 million for 2014, which will be used primarily to pay for automation of existing
41
manufacturing lines. We plan to fund the balance of our capital expenditure requirements for 2014 with cash from operations, proceeds from our securities offerings, additional bank borrowings, and other forms of financing, if necessary.
Sales and Distribution
We sell our PV modules through distributors and directly to system integrators. Our customers include international solar power system integrators and distributors. Our system integrator customers providevalue-added services and typically design and sell complete systems that use our PV modules.
Customers that accounted for a significant portion of our total net revenues in 2013 included Hanwha Q CELLS Japan Co., Ltd., Hanwha Q.Cells GmbH, Conycento Proprietary Limited, Firefly Investment 261 Pty Ltd. and Hanwha Q CELLS Korea Corp. Our five largest customers accounted for an aggregate of 45.0%, 29.8% and 53.5% of our net revenues in 2011, 2012 and 2013, respectively. Our largest customer in 2011, 2012 and 2013 accounted for 15.1%, 7.6% and 25.0% of our net revenues of the respective year.
We have established three wholly owned subsidiaries, namely SolarOne U.S.A., SolarOne Canada and SolarOne GmbH, and acquired SolarOne Australia to market our products and provide customer support and service in these markets. The following table sets forth our net revenues by geographic region, based on the location that our invoices are sent to, and the percentage contribution of each of these regions to our net revenues, for the periods indicated:
| | | | | | | | | | | | | | | | | | | | | | | | | | | | |
| | | Year Ended December 31, | |
| | | 2011 | | | 2012 | | | 2013 | |
| Region | | Net Revenues
(RMB) | | | % of Net
Revenues | | | Net Revenues
(RMB) | | | % of Net
Revenues | | | Net Revenues
(RMB) | | | Net Revenues
(US$) | | | % of Net
Revenues | |
| | | (In thousands, except percentages) | |
Japan | | | 13,508 | | | | 0.2 | % | | | 248,047 | | | | 6.7 | % | | | 1,179,308 | | | | 194,808 | | | | 25.0 | % |
South Africa | | | 1,081 | | | | — | | | | 814 | | | | — | | | | 728,960 | | | | 120,416 | | | | 15.4 | % |
Germany | | | 2,652,159 | | | | 41.3 | % | | | 1,489,499 | | | | 40.5 | % | | | 694,148 | | | | 114,665 | | | | 14.7 | % |
PRC | | | 599,247 | | | | 9.3 | % | | | 382,469 | | | | 10.4 | % | | | 539,866 | | | | 89,180 | | | | 11.4 | % |
USA | | | 859,290 | | | | 13.4 | % | | | 513,163 | | | | 14.0 | % | | | 421,473 | | | | 69,622 | | | | 8.9 | % |
Korea | | | 76,954 | | | | 1.2 | % | | | 260,887 | | | | 7.1 | % | | | 218,844 | | | | 36,150 | | | | 4.6 | % |
Canada | | | 157,650 | | | | 2.5 | % | | | 1,506 | | | | — | | | | 187,343 | | | | 30,947 | | | | 4.0 | % |
UK | | | 14,821 | | | | 0.2 | % | | | 15,491 | | | | 0.4 | % | | | 115,289 | | | | 19,044 | | | | 2.5 | % |
Netherlands | | | 330,920 | | | | 5.2 | % | | | — | | | | — | | | | 90,741 | | | | 14,989 | | | | 1.9 | % |
India | | | 136,249 | | | | 2.1 | % | | | 263,228 | | | | 7.2 | % | | | 84,310 | | | | 13,927 | | | | 1.8 | % |
Spain | | | 152,133 | | | | 2.4 | % | | | 7,043 | | | | 0.2 | % | | | 63,075 | | | | 10,419 | | | | 1.3 | % |
Portugal | | | 20,730 | | | | 0.3 | % | | | 22,252 | | | | 0.6 | % | | | 62,420 | | | | 10,311 | | | | 1.3 | % |
Australia | | | 448,498 | | | | 7.0 | % | | | 27,773 | | | | 0.8 | % | | | 59,317 | | | | 9,799 | | | | 1.3 | % |
Belgium | | | 132,932 | | | | 2.1 | % | | | 44,941 | | | | 1.2 | % | | | 57,719 | | | | 9,535 | | | | 1.2 | % |
Malaysia | | | — | | | | — | | | | 251 | | | | — | | | | 48,882 | | | | 8,075 | | | | 1.0 | % |
France | | | 303,328 | | | | 4.7 | % | | | 62,507 | | | | 1.7 | % | | | 35,155 | | | | 5,807 | | | | 0.8 | % |
Israel | | | — | | | | — | | | | 170 | | | | — | | | | 24,536 | | | | 4,053 | | | | 0.5 | % |
Thailand | | | 36,673 | | | | 0.6 | % | | | 189 | | | | — | | | | 19,259 | | | | 3,181 | | | | 0.4 | % |
Greece | | | 44,938 | | | | 0.7 | % | | | 80,381 | | | | 2.2 | % | | | 16,384 | | | | 2,706 | | | | 0.3 | % |
Italy | | | 358,121 | | | | 5.6 | % | | | 149,196 | | | | 4.1 | % | | | 14,113 | | | | 2,332 | | | | 0.3 | % |
Others | | | 77,253 | | | | 1.2 | % | | | 108,573 | | | | 2.9 | % | | | 64,550 | | | | 10,663 | | | | 1.4 | % |
| | | | | | | | | | | | | | | | | | | | | | | | | | | | |
Total | | | 6,416,485 | | | | 100.0 | % | | | 3,678,380 | | | | 100.0 | % | | | 4,725,692 | | | | 780,629 | | | | 100.0 | % |
| | | | | | | | | | | | | | | | | | | | | | | | | | | | |
In 2013, we shipped our products to over 250 customers. In 2011 and 2013, customers individually accounting for 10.0% or more of our net revenues collectively accounted for 25.9% and 25.0% of our net
42
revenues. In 2012, no customer accounted for 10.0% or more of our net revenues. Sales to our largest customer accounted for 15.1%, 7.6% and 25.0% of our net revenues in 2011, 2012 and 2013, respectively. We seek to further diversify our geographic presence and customer base in order to achieve a balanced and sustainable growth. The Company signed two supply agreements to supply 155 MW PV modules to two solar projects in South Africa in December 2012. The delivery of PV modules under these supply agreements has been completed by August 2013.
Warranty
Prior to 2012, our PV products were typically sold with a 2 to5-year warranty for technical defects, and a10-year limited warranty against declines of greater than 10% and a25-year limited warranty against declines of greater than 20%, in their initial power generation capacity. Since January 2012, we started to extend our material and workmanship warranty for PV modules to 12 years and replace our existing warranty for power generation capacity with an improved25-year linear warranty. Under the new 25-year linear warranty, we guarantee no less than 97% of the nominal power generation capacity for our typical multicrystalline PV modules in the first year and an annual output degradation of no more than 0.7% thereafter. By the end of the 25th year, the actual power output shall be no less than 82% of the nominal power generation capacity. Since 2013, we started to allow our warranty to be transferred to third parties along with ownership of our PV modules.
We also have outstanding warranties for our monocrystalline PV modules. Prior to 2012, we sold monocrystalline PV modules with 2 to 5-year warranties for technical defects, 10-year limited warranties against declines of greater than 10% in their initial power generation capacity and 25-year limited warranties against declines of greater than 20%. Since January 2012, we extended the material and workmanship warranty to 12 years and replaced the existing warranty for power generation capacity with an improved 25-year linear warranty. Under the 25-year linear warranty, we guaranteed no less than 96% of the nominal power generation capacity in the first year and an annual output degradation of no more than 0.7% thereafter, with a guarantee of actual power output no less than 82% of the nominal power generation capacity by the end of the 25th year.
Since our products have been in use for only a relatively short period, our assumptions regarding the durability and reliability of our products may not be accurate. We estimate the amount of our warranty obligation primarily based on the results of technical analyses, our historical warranty claims experience, the warranty accrual practices of comparable companies, and the expected failure rate and future costs to service failed products. The results of the technical analyses support the future operational efficiency of the PV modules at levels significantly above the minimum guaranteed levels over the respective warranty periods. The estimate of warranty costs is affected by the estimated and actual product failure rates, the costs to repair or replace failed products and potential service and delivery costs incurred in correcting a product failure. Based on the considerations above and management’s ability and intention to provide repairs, replacements or refunds for defective products, we have accrued for warranty costs for the 2 to12-year warranty against technical defects based on 1% of revenue for PV modules. No warranty cost accrual has been recorded for the10-year and20 to 25-year warranties for decline from initial power generation capacity because we determined the likelihood of claims arising from these warranties to be remote based on internal and external testing of the PV modules and strong quality control procedures in the production process. Based on the results of analysis and technical testing, the revision to our warranty policy in January 2012 did not have a material effect on our warranty accrual rate. The basis for the warranty accrual will be reviewed periodically based on actual experience.After-sales services for our PV modules and solar application systems covered by warranties are provided by our international customer support team.
As of December 31, 2011, our accrued warranty costs totaled RMB162.1 million for the three to five year warranty against technical and material defects, and as of December 31, 2012 and 2013, totaled RMB177.9 million and RMB181.4 million (US$30.0 million) for the five to 12 year warranty against technical and material defects, respectively. In 2011, 2012 and 2013, we accrued RMB64.7 million, RMB33.1 million and RMB41.3 million (US$6.8 million) in warranty costs, respectively.
43
Intellectual Property and Proprietary Rights
Our intellectual property is an essential element of our business. We rely on patent, copyright, trademark, trade secret and other intellectual property law, as well asnon-competition and confidentiality agreements with our employees, suppliers, business partners and others, to protect our intellectual property rights.
As of the date of this annual report, we had been granted 52 patents by the State Intellectual Property Office of China and had 18 patent applications pending in China. Our issued patents and pending patent applications relate primarily to process technologies for manufacturing PV cells.
We are the owner of this trademark, as a Community Trade Mark, in the European Union. In 2011, we also filed applications for the trademark in Brazil, China, India, South Africa, Thailand and the United States and such applications are pending.
On April 28, 2012, we registered “Shuo Wang” in Chinese character, our trademark for our secondary class modules, with the China Trademark Office, which allows us to use this trademark in China.
We rely on trade secret protection and confidentiality agreements to protect our proprietary information andknow-how. Our management and each of our research and development personnel have entered into a standard annual employment contract, which includes confidentiality undertakings and an acknowledgement and agreement that all inventions, designs, trade secrets, works of authorship, developments and other processes generated by them on our behalf are our property, and assigns to us any ownership rights that they may claim in those works. Our supply contracts with our customers also typically include confidentiality undertakings. Despite these precautions, it may be possible for third parties to obtain and use intellectual property that we own or license without consent. Unauthorized use of our intellectual property by third parties, and the expenses incurred in protecting our intellectual property rights, may materially and adversely affect our business, financial condition, results of operations and prospects. See “Item 3.D. Risk Factors—Risks Related to Our Company and Our Industry—Our failure to protect our intellectual property rights may undermine our competitive position, and litigation to protect our intellectual property rights may be costly.”
Competition
Due to various government incentive programs implemented in China, Europe, the United States, Japan and other countries in recent years, the global PV market has been rapidly evolving and has become highly competitive. In particular, a large number of manufacturers have entered the solar market.
Our competitors in China include Trina Solar Ltd., Yingli Green Energy Holdings Co., Ltd., Canadian Solar Inc. and Jinko Solar Co., Ltd. We compete primarily on the basis of the power efficiency, quality, performance and appearance of our products, price, strength of supply chain and distribution network,after-sales service and brand image. Many of our competitors have longer operating histories and significantly greater financial or technological resources than we do and enjoy greater brand recognition. Some of our competitors are vertically integrated and produce upstream silicon and silicon wafers,mid-stream PV cells and modules and downstream solar application systems, which provide them with greater synergies to achieve lower production costs. During periods when there was a supply shortage of silicon and silicon wafers, we competed intensely with our competitors in obtaining adequate supplies of silicon and silicon wafers.
Moreover, many of our competitors are developingnext-generation products based on new PV technologies, including amorphous silicon, transparent conductive oxide thin film, carbon material andnano-crystalline technologies, which, if successful, will compete with the crystalline silicon technology we currently use in our manufacturing processes. Through our research collaborations, we are also seeking to develop new technologies and products. If we fail to develop new technologies and products in a timely manner, we may lose our competitive advantage.
44
We, like other solar energy companies, also face competition from traditionalnon-solar energy industries, such as the petroleum and coal industries. The production cost per watt of solar energy is significantly higher than other types of energy. As a result, we cannot assure you that solar energy will be able to compete with other energy industries, especially if there is a reduction or termination of government incentives and other forms of support.
Environmental Matters
Our manufacturing processes generate noise, waste water, gaseous wastes and other industrial wastes. Our manufacturing facilities are subject to various pollution control regulations with respect to noise and air pollution and the disposal of waste and hazardous materials. We are also subject to periodic inspections by local environmental protection authorities. We have established a pollution control system and installed various equipment to process and dispose of our industrial waste and hazardous materials. We also maintain an ISO 14001 environmental management system certification, which is issued by International Organization for Standardization to demonstrate our compliance with international environmental standards. We have not been subject to any material proceedings or fines for environmental violations.
Insurance
We maintain property insurance for our equipment, automobiles, facilities and inventory. A significant portion of our fixed assets are covered by these insurance policies. We also maintain business interruption insurance, product liability insurance, product quality guarantee insurance and export credit insurance. We believe our insurance coverage is customary and standard for companies of comparable size in comparable industries in China. However, our existing insurance policies may not be sufficient to insulate us from all losses and liabilities that we may incur.
Regulation
This section sets forth a summary of the most significant regulations or requirements that affect our business activities in China or our shareholders’ right to receive dividends and other distributions from us.
Renewable Energy Law and Other Government Directives
In February 2005, China’s Standing Committee of National People’s Congress, or SCNPC, enacted the Renewable Energy Law, which has become effective on January 1, 2006. On December 26, 2009, the Renewable Energy Law was amended by SCNPC. The Renewable Energy Law, as amended, sets forth the national policy to encourage and support the development and use of solar and other renewable energy and the use ofon-grid generation.
The law also sets forth the national policy to encourage the installation and use of solar energywater-heating systems, solar energy heating and cooling systems, solar photovoltaic systems and other solar energy utilization systems. In addition, the law provides financial incentives, such as national funding, preferential loans and tax preferences for the development of renewable energy projects.
China’s Ministry of Construction also issued a directive in June 2005 that sought to expand the use of solar energy in residential and commercial buildings and encouraged the increased application of solar energy in different townships. In addition, China’s State Council promulgated a directive in July 2005 that set forth principles with regard to the conservation of energy resources and the development and use of solar energy in the western part of China, which has not been covered by electricity transmission grids and rural areas.
In January 2006, the NDRC issued two implementing rules relating to the Renewable Energy Law: (1) the Trial Measures on the Administration over the Pricing and Cost Allocation of Renewable Energy Power
45
Generation and (2) the Administrative Regulations Relating to the Renewable Energy Power Generation. These implementing rules, among other things, set forth general policies for the pricing ofon-grid power generated by solar and other renewable energy. In addition, the PRC Ministry of Finance issued the Provisional Measures for Administration of Specific Funds for Development of Renewable Energy in June 2006, which provides that the PRC government will establish a fund specifically for the purpose of supporting the development of the renewable energy industry, including the PV industry.
On March 3, 2008, the NDRC issued the “11thFive-Year Plan for the Development of Energy Resources,” which announced the PRC government’s support for the development of renewable energy resources in China, including solar power.
On March 23, 2009, the PRC Ministry of Finance promulgated the Interim Measures for Administration of Government Subsidy Funds for Application of Solar Photovoltaic Technology in Building Construction, or the Interim Measures, to support the demonstration and the promotion of solar photovoltaic application in China. Local governments are encouraged to issue and implement supporting policies for the development of PV technology. Under these Interim Measures, the PRC Ministry of Finance provides subsidies for projects with individual solar installations that are greater than 50kilowatt-peak in size and have more than 16% conversion efficiency for monocrystalline PV products, more than 14% conversion efficiency for multicrystalline PV products and more than 6% conversion efficiency for amorphous silicon PV products, and gives priority support to solar PV technology integrated into building construction,grid-connected PV building applications and some public PV building applications such as schools, hospitals and offices. For 2009, the standard subsidy is set at RMB20 per watt in principle and the detailed standard is to be determined by factors including, but not limited to, the level of integration of building with PV and the technology of PV products. The Interim Measures do not apply to projects completed before March 23, 2009, the promulgation date of the Interim Measures.
On April 16, 2009, the General Offices of the PRC Ministry of Finance and the PRC Ministry of Housing andUrban-Rural Development jointly issued the Guidelines for Declaration of Demonstration Project of Solar Photovoltaic Building Applications. These guidelines set the subsidy given out in 2009 to qualified solar projects at no more than RMB20 per watt for projects involving the integration of PV components into buildings’ structural elements and at no more than RMB15 per watt for projects involving the installation of PV components onto building rooftops and wall surfaces.
On May 27, 2010, the Ministry of Housing andUrban-Rural Development issued the City Illumination Administration Provisions, or the Illumination Provisions, effective as of July 1, 2010. The Illumination Provisions encourage the installation and use of renewable energy systems such as PV systems in the process of construction andre-construction of city illumination projects.
On March 8, 2011, the Notice on Further Promotion of Buildings with Renewable Energy, or the Notice, was jointly released by the PRC Ministry of Finance and the PRC Ministry of Housing andUrban-Rural Development. The Notice expressly specifies the goal of promoting the application of renewable energy in buildings under the TwelfthFive-Year Plan to substantially improve the proportion of renewable energy used in buildings, including solar energy, shallow geothermal energy and biomass energy, so that the consumption of renewable energy in buildings shall account for over 15% of the total building energy consumption by the end of 2020. The TwelfthFive-Year Plan provides that efforts shall be made to increase the gross floor areas of buildings serviced by renewable energy to over 2.5 billion square meters and to use renewable energy to substitute 30 million tons of coal by the end of 2015.
In August 2011, the NDRC released a directive which set forth a uniform nationalfeed-in-tariff for the solar energy generated by power plants. The law also encourages the installation and use of solar energy water heating systems, solar energy heating and cooling systems, PV systems and other solar energy utilization systems. It contemplates and permits financial incentives, such as governmental funding, preferential loans and tax preferences for the development of renewable energy projects.
46
On February 24, 2012, the TwelfthFive-Year Plan on the PV industry was issued by the PRC Ministry of Industry and Information Technology. This plan specifies the goal of, by the end of 2015, promoting (i) leading polysilicon producers with annual production of at least 50,000 tons and large polysilicon producers with annual production of at least 10,000 tons, (ii) leading PV cell producers with annual production of at least 5 GW and large PV cell producers with annual production of at least 1 GW, and (iii) at least one PV producer with sales revenue of at least RMB100 billion per annum and three to five PV producers each with sales revenue of at least RMB50 billion per annum.
In July 2012, the Notice of Circulating TwelfthFive-Year Plan on the PV Industry was issued by the State Energy Bureau which stated that priority shall be given to developing locally generated solar energy power.
In September 2012, the Notice of Applications for Establishing Model Zones Utilizing Local Solar Energy Generated Power By Scale was issued by the State Energy Bureau, consisting of a nationwide plan to promote locally generated solar energy power.
In October 2012, the Opinion of Administrating Grid Connection Services for Model of Distributed PV Power Generation was issued by the State Grid Company, with the purpose of optimizing and simplifying grid connection procedures and improving service efficiency.
In July 2013, the Circular of the Ministry of Finance promulgated Relevant Issues concerning Implementation of the Policy to Grant Subsidies to Distributed PV Power Generation Based on Electricity Amount, with the purpose of providing standardization and procedure for subsidy payments for distributed PV power generation.
In August 2013, the Interim Measures for Administration of PV Power Station Projects were promulgated by the National Energy Administration, with the purpose of standardizing the management of PV power station projects and promoting stable and healthy development of PV power generation industry.
In November 2013, the Interim Measures for Administration of Distributed PV Power Generation Projects were promulgated by the National Energy Administration, which provides the management of distributed PV power projects to promote and encourage the development of distributed PV power generation.
In November 2013, the Ministry of Finance promulgated the Circular regarding Exemption of Governmental Funds on Distributed PV Power Generation Unit’s Self-Generated Electricity for Self-use, which exempts several kinds of governmental funds for Self-Generated Electricity for Self-use from Distributed PV Power Generation.
In January 2014, the National Energy Administration announced the Circular regarding Planned Capacity of New PV Power Generation Units to be Constructed in 2014, which among other things, states that the planned capacity of new PV power generation in 2014 is 14 million kilowatts, including 8 million kilowatts distributed PV power generation and 6 million kilowatts PV power station generation.
Environmental Regulations
We use, generate and discharge toxic, volatile or otherwise hazardous chemicals and wastes in our research and development and manufacturing activities. We are subject to a variety of governmental regulations related to the storage, use and disposal of hazardous materials. The major environmental regulations applicable to us include the Environmental Protection Law of the PRC, the Law of PRC on the Prevention and Control of Water Pollution, Implementation Rules of the Law of PRC on the Prevention and Control of Water Pollution, the Law of PRC on the Prevention and Control of Air Pollution, the Law of PRC on the Prevention and Control of Solid Waste Pollution, and the Law of PRC on the Prevention and Control of Noise Pollution.
47
Restriction on Foreign Businesses
The principal regulation governing foreign ownership of solar photovoltaic businesses in the PRC is the Foreign Investment Industrial Guidance Catalogue (effective as of December 1, 2007). Under the regulation, a PV business falls into the category of encouraged foreign investment industry. However, the amended catalogue (effective as of January 30, 2012) removed polysilicon production from the category of encouraged foreign investment industry, while other areas of solar photovoltaic businesses remain within the category of encouraged foreign investment industry.
Tax
PRC enterprise income tax is calculated based on taxable income determined under PRC accounting principles. On March 16, 2007, the National People’s Congress of the PRC passed the EIT, which took effect as of January 1, 2008. In accordance with the EIT, a unified enterprise income tax rate of 25% and unified tax deduction standards are applied equally to bothdomestic-invested enterprises andforeign-invested enterprises, such as SolarOne Qidong. Enterprises established prior to March 16, 2007 eligible for preferential tax treatment in accordance with the former tax laws and administrative regulations, under the regulation of the State Council, gradually became subject to the new tax rate over afive-year transition period that started on the date of effectiveness of the EIT. In accordance with the Notice of the State Council on the Implementation of the Transitional Preferential Policies in respect of Enterprise Income Tax,foreign-invested enterprises established prior to March 16, 2007 and eligible for preferential tax treatment, such as SolarOne Qidong, continued to enjoy the preferential tax treatment in the manner and during the period as former laws and regulations provided until such period expired. While the EIT equalizes the tax rates for FIEs and domestically owned enterprises, preferential tax treatment continues to be granted to companies in certain encouraged sectors and to companies classified as “high and new technology enterprises,” which enjoy a tax rate of 15% as compared to the uniform tax rate of 25%. SolarOne Qidong was approved to be qualified as a “high and new technology enterprise” on October 21, 2008. The “high and new technology enterprise” status is valid for a period of three years from the date of issuance of a “high and new technology enterprise” certificate. The “high and new technology enterprise” status of SolarOne Qidong was renewed and approved in October 2011. In addition, SolarOne Qidong was required to perform annualself-assessment of compliance as a “high and new technology enterprise.” If there is any significant change in the company’s business operations, manufacturing technologies or other areas that cause it to no longer qualify as a “high and new technology enterprise”, such status will be terminated from the year of such change.
From 2005 until the end of 2009, SolarOne Qidong was also exempt from the 3% local income tax applicable toforeign-invested enterprises in Jiangsu Province. In addition, under relevant PRC tax rules and regulations, SolarOne Qidong was entitled to atwo-year income tax exemption on income generated from additional investment in the production capacity of SolarOne Qidong resulting from our contribution to SolarOne Qidong of funds we received through issuances of series A convertible preference shares in a private placement in June and August 2006, and was entitled to a reduced tax rate of 12.5% for the three years thereafter. In addition, our subsidiaries, SolarOne Technology and Solar Shanghai, are subject to an enterprise income tax rate of 25% from 2008 onwards.
Pursuant to SAT Circular 698, issued by the State Administration of Taxation on December 10, 2009 with retroactive effect from January 1, 2008, if anon-resident enterprise transfers its equity interests in a PRC resident indirectly via disposing of the equity interests of an overseas holding company, or Indirect Transfer, and such overseas holding company is located in a tax jurisdiction that (i) has an effective tax rate less than 12.5% or (ii) does not tax foreign income of its residents, the foreign investor shall report such Indirect Transfer to the competent tax authority of the PRC resident enterprise. The PRC tax authority will examine the true nature of the Indirect Transfer, and if the tax authority considers that the foreign investor has adopted an abusive arrangement in order to avoid PRC tax, it will disregard the existence of the overseas holding company andre-characterize the Indirect Transfer and, as a result, gains derived from such Indirect Transfer may be subject to PRC withholding
48
tax at the rate of up to 10%. SAT Circular 698 also provides that, where anon-PRC resident enterprise transfers its equity interests in a PRC resident enterprise to its related parties at a price lower than the fair market value, the relevant tax authority has the power to make a reasonable adjustment to the taxable gain of the transaction. SAT Circular 698 states that it does not apply to purchases or sales of stock on a stock exchange.
Pursuant to the Provisional Regulation of China onValue-Added Tax and their implementing rules, all entities and individuals that are engaged in the sale of goods, the provision of repairs and replacement services and the importation of goods in China are generally required to payvalue-added tax at a rate of 17% of the gross sales proceeds received, less any deductiblevalue-added tax already paid or borne by the taxpayer. Furthermore, when exporting goods, the exporter is entitled to a portion of or all the refund ofvalue-added tax that it has already paid or borne. Our imported raw materials that are used for manufacturing export products and are deposited in bonded warehouses are exempt from importvalue-added tax.
Foreign Currency Exchange
Foreign currency exchange in China is primarily governed by the following regulations:
| | • | | Foreign Exchange Administration Rules (1996), as amended; and |
| | • | | Regulations of Settlement, Sale and Payment of Foreign Exchange (1996). |
Under the Foreign Exchange Administration Rules, the Renminbi is convertible for current account items, including distribution of dividends, payment of interest, trade andservice-related foreign exchange transactions. Conversion of Renminbi for capital account items, such as direct investment, loan, securities investment and repatriation of investment, however, is still subject to the approval of SAFE.
Under the Regulations of Settlement, Sale and Payment of Foreign Exchange,foreign-invested enterprises may only buy, sell and/or remit foreign currencies at those banks authorized to conduct foreign exchange business after valid commercial documents are provided and, in the case of capital account item transactions, after obtaining the approval from SAFE. Capital investments byforeign-invested enterprises outside of China are also subject to limitations, which include approvals by the Ministry of Commerce, SAFE and the NDRC.
Dividend Distribution
The principal regulations governing distribution of dividends paid by whollyforeign-owned enterprises include:
| | • | | WhollyForeign-Owned Enterprise Law (1986), as amended; and |
| | • | | WhollyForeign-Owned Enterprise Law Implementation Rules (1990), as amended. |
Under these regulations, whollyforeign-owned enterprises in China may pay dividends only out of their accumulated profits, if any, determined in accordance with PRC accounting standards and regulations. In addition, whollyforeign-owned enterprises in China are required to set aside at least 10% of theirafter-tax profit based on PRC accounting standards each year to its general reserves until the accumulated amount of such reserves reaches 50% of its registered capital. These reserves are not distributable as cash dividends. The board of directors of aforeign-invested enterprise has the discretion to allocate a portion of itsafter-tax profits to staff welfare and bonus funds, which may not be distributed to equity owners except in the event of liquidation.
C.Organizational Structure
Hanwha Solar Holdings Co., Ltd., or Hanwha Solar, became our largest shareholder through a series of transactions in September 2010. Hanwha Solar, a company that engages in solar business, is a wholly owned subsidiary of Hanwha Chemical Corporation, a leading chemical producer publicly traded on the Korea Exchange whose principal activities are the production of CA, PE, and PVC products. After Hanwha Solar
49
became our largest shareholder, we changed our name from “Solarfun Power Holdings Co., Ltd.” to “Hanwha SolarOne Co., Ltd.” on December 20, 2010 and our ticker from “SOLF” to “HSOL” on February 15, 2011. We also changed the names of our subsidiaries. The diagram below sets forth the entities directly or indirectly controlled by us as of the date of this annual report. We may from time to time make adjustments to our subsidiaries based on our business strategy and the performance of such subsidiaries.

D.Property, Plant and Equipment
Our corporate headquarters and manufacturing facilities are located in the Linyang Industrial Park, Qidong, Jiangsu Province, China, where we hold land use rights for a total area of 259,219 square meters, which expire between 2053 and 2061. We own office and manufacturing facilities for a total gross floor area of approximately 173,220 square meters in Qidong, Jiangsu Province. We leased manufacturing facilities with a total gross floor area of approximately 24,500 square meters in Qidong, Jiangsu Province. The leases will expire in May 2014. In addition, SolarOne Technology holds land use rights for a total area of approximately 976,905 square meters and owns office and manufacturing facilities for a total gross floor area of approximately 76,500 square meters in Lianyungang, Jiangsu Province. We have also renewed the lease having a gross floor area of approximately 1,500 square meters for our Hanwha SolarOne Engineering, Research and Development Center Co., Ltd. in Shanghai in May 2010, and the renewed lease will expire in May 2014. We entered into a contract with Shanghai Yongda Property Development Co., Ltd to lease an office with a gross floor area of 764.5 square meters from August, 2013 to August, 2016. In 2011, 2012 and 2013, our rental expenses were RMB10.3 million, RMB12.8 million and RMB9.3 million (US$1.5 million), respectively.
As of December 31, 2013, we had annual production capacities of 1.5 GW for PV modules, 1.3 GW for PV cells and 800 MW for ingots and wafers.
We believe that our existing facilities are adequate and suitable to meet our present needs. We are now constructing buildings in SolarOne Qidong and SolarOne Technology to accommodate our planned expansion of
50
production capacity. In December 2010, we entered into an investment letter of intent with Nantong Economic and Technological Development Zone to build cell and module production facilities with an annual production capacity of 2 GW in Nantong, Jiangsu Province.
ITEM 4A UNRESOLVED STAFF COMMENTS
None.
ITEM 5 OPERATING AND FINANCIAL REVIEW AND PROSPECTS
The following discussion should be read in conjunction with the rest of this annual report, including the consolidated financial statements and notes thereto contained elsewhere in this annual report. The results discussed below are not necessarily indicative of the results to be expected in any future periods.
A.Operating Results
Overview
We are a vertically integrated manufacturer of silicon ingots, silicon wafers, PV cells and PV modules in China. We manufacture a variety of silicon ingots, silicon wafers, PV cells and PV modules using advanced manufacturing process technologies that have helped us rapidly increase our operational efficiency. Substantially all of the ingots, wafers and PV cells we produce are used for our own PV module production. We also provide PV module processing services. We sell PV cells and PV modules both directly to system integrators and throughthird-party distributors and provide solar system integration services.
We changed our name from “Solarfun Power Holdings Co., Ltd.” to “Hanwha SolarOne Co., Ltd.” on December 20, 2010 and our ticker from “SOLF” to “HSOL” on February 15, 2011. In April 2011, we established Nantong Hanwha Import & Export Co., Ltd., or Nantong Hanwha I&E, under SolarOne Qidong to engage in import and export of PV products and technology and Hanwha SolarOne (Nantong) Co., Ltd., or SolarOne Nantong, under SolarOne Hong Kong to develop, manufacture and sell PV products. In February 2012, we established Hanwha Solar Canada Inc. under SolarOne Hong Kong to sell solar products in Canada. In May 2012, we acquired Hanwha Solar Australia Pty Ltd. from Hanwha Corporation to sell solar products in Australia. In July 2013, we established Nantong Hanwha PV-Tech Energy Co., Ltd. under SolarOne Qidong to provide solar system integration services in China.
We shipped 844.4 MW, 829.8 MW and 1,280.3 MW of PV modules (including PV module processing) in 2011, 2012 and 2013, respectively. The average selling price of our PV modules (excluding PV module processing) was RMB8.87, RMB4.47 and RMB4.10 (US$0.68) per watt in 2011, 2012 and 2013, respectively. In 2011, 2012 and 2013, 90.7%, 89.6% and 88.6%, respectively, of our net revenues were attributable to sales to customers outside of the PRC. Moreover, in 2011 and 2013, customers individually accounting for 10.0% or more of our net revenues collectively accounted for 25.9% and 25.0% of our net revenues, respectively. In 2012, no customer accounted for 10.0% or more of our net revenues.
Our net revenues were RMB6,416.5 million, RMB3,678.4 million and RMB4,725.7 million (US$780.6 million) in 2011, 2012 and 2013, respectively. We recorded net losses of RMB930.1 million, RMB1,562.9 million and RMB874.1 million (US$144.4 million) in 2011, 2012 and 2013, respectively.
Key Factors Affecting Our Financial Performance
The most significant factors affecting our financial performance are:
| | • | | average selling price of our PV products; |
51
| | • | | price and availability of silicon and silicon wafers; |
| | • | | manufacturing capacity; and |
Industry Demand
Our business and revenue growth depends on PV industry demand.
In the second half of 2008, many of our key markets, including Germany, Spain and the United States, and other national economies experienced a period of economic contraction or significantly slower economic growth. In particular, the credit crisis, weak consumer confidence and diminished consumer and business spending contributed to a significant slowdown in the market demand for PV products due to decreased energy requirements. Many of our customers experienced difficulty in obtaining financing, and even if they were able to obtain financing, the cost of such financing increased and affected the purchasing decisions of our customers. In 2010, as the effect of the global economic crisis subsided, the combination of increased availability of financing for downstream buyers and decreased average selling prices of solar power products contributed to an overall increase in demand for solar power products.
A protracted disruption in the ability of our customers to obtain financing could lead to a significant reduction in their future orders for our products, which in turn could have a material adverse effect on our business, financial condition and results of operations. See “Item 3.D. Risk Factors—Risks related to Our Company and Our Industry—Demand for our PV products has been, and may continue to be, adversely affected by volatile market and industry trend.”
From the second half of 2008 to the first half of 2009, increased manufacturing capacity in the industry also contributed to a decline in the selling price of PV products. As global economic condition began improving in the second half of 2009, demand for PV products began to increase during 2010, which contributed to an increase in the selling price of PV products in 2010 along with the increased manufacturing capacity in 2010. Such increase was offset by the sale of inventory accumulated during the economic downturn. In 2011, a decrease in payment to PV product producers, in the form offeed-in tariffs and other reimbursements, and a reduction in available financing caused a decrease in the growth in a number of PV projects in the European markets. Payments to PV product producers decreased as governments in Europe, under pressure to reduce sovereign debt levels, reduced subsidies such asfeed-in tariffs. Furthermore, many downstream purchasers of PV products were unable to secure sufficient financing for PV projects due to the global credit crunch. These market conditions were exacerbated by anover-supply of PV products driven by increased manufacturing capacity in 2011, which adversely affected the prices of PV products. Although the global economy has improved since 2011, demand for solar modules in Europe fell significantly in 2013. As a result, many solar power producers that typically purchase solar power products from manufacturers like us were unable or unwilling to expand their operations.
Average Selling Price of Our PV Products
PV products are priced based on the number of watts of electricity they can generate. Pricing of PV products is principally affected by manufacturing costs, including the costs of silicon and silicon wafers, as well as the overall demand in the PV industry. Increased economies of scale and advancement of process technologies over the past decade have also led to a reduction in manufacturing costs and the prices of PV products. The pricing of PV products may also affected by currency fluctuations. For example, a large portion of our sales in 2010 were denominated in Euros. The depreciation of Euro in the first half of 2010 and the appreciation of Euro in the second half of 2010 contributed to a change of our average selling price per watt of our PV modules in 2010.
We generally price our products based on the prevailing market price at the time our customers issue purchase orders, taking into account the size of the purchase order, the strength and history of our relationship
52
with each customer and our capacity utilization. Beginning in the fourth quarter of 2008, demand for PV products decreased as a result of the global financial crisis, but the supply of PV products increased significantly as many manufacturers of PV products worldwide, including our company, engaged in significant production capacity expansion in recent years. This state ofover-supply reduced the prevailing market prices of PV products. Beginning in the first quarter of 2013, the pricing of PV products began to improve, as a large number of inefficient players exited the market.
The average selling price per watt of our PV modules (excluding PV module processing) was RMB8.87, RMB4.47 and RMB4.10 (US$0.68) in 2011, 2012 and 2013, respectively. The changes in the average selling prices of our PV modules primarily reflected the prevailing market trend. We expect that the prices of PV products will continue to decline over time due to increased supply of PV products, reduced manufacturing costs from improving technology and economies of scale.
Price and Availability of Silicon and Silicon Wafers
Since the fourth quarter of 2008, the market prices for silicon and silicon wafers have been decreasing significantly. The rapid declines in the prices of silicon and silicon wafers coupled with decreases in demand for PV products have hampered our ability to pass on to our customers the cost of our raw materials which were procured at higher prices during the earlier period of supply shortage. As a result, ourwrite-down of inventories amounted to RMB583.1 million, RMB326.1 million and RMB113.2 million (US$18.7 million) in 2011, 2012 and 2013, respectively.
Due to the continuous significant decrease in prices of silicon and silicon wafers since 2009, we have continued to re-negotiate all of ourmulti-year supply agreements. Afterre-negotiation, the terms of price of suchmulti-year agreements were generally subject to review either periodically or upon significant changes in prices on the spot market and the unit price of thesilicon-related materials has been lowered. However, because the oversupply situation of silicon materials worsened in 2012, some of our previousmulti-year suppliers are facing difficulties in continuing their business: some of our suppliers shut down their factories for certain period of time in 2012 and some of them are in a liquidation process. We may not receive our prepayments made under those priormulti-year agreements if those suppliers become bankrupt. Some of ourmulti-year agreement suppliers have the difficulties in supplying us with silicon materials with fixed quantity or qualified materials and we have instituted legal proceedings against them. See “Item 3.D. Risk Factors—Risks Related to Our Company and Our Industry—We may be subject to legal proceedings in connection with themulti-year supply agreements we entered into previously and such proceedings can be both costly and time consuming and may significantly divert the efforts and resources of our management personnel.” and “Item 3.D. Risk Factors—Risks Related to Our Company and Our Industry—Prepayments we have provided to our silicon and silicon wafer suppliers expose us to the credit and performance risks of such suppliers and may not be recovered, which could in turn have a material adverse effect on our liquidity.”
The Chinese government has initiated ananti-dumping investigation of polysilicon imported from Germany, the U.S. and Korea in 2012 and the tariff on polysilicon will be announced in the second quarter of 2013. While these tariffs did not increase our cost of production in 2013, we do not expect to source any significant amount of our polysilicon from the United States or South Korea during 2013, we cannot guarantee that these tariffs will not have a material and adverse effect in the future.
On September 6 and November 8, 2012, the European Commission initiated an anti-dumping proceeding and an anti-subsidy proceeding concerning imports of crystalline silicon PV modules and key components, such as cells and wafers, originating in China. On July 27, 2013, the European Union and Chinese trade negotiators announced that an agreement has been reached pursuant to which Chinese manufacturers, including us, would limit our export of solar panels and cells to the European Union and for no less than a minimum price, in exchange for the European Union agreeing to forgo the imposition of anti-dumping duties on these solar panels from China. The offer was approved by the European Commission on August 2, 2013, and the final version was
53
published on December 5, 2013. The Chamber of Commerce Import and Export of Machinery and Electronic Product (CCCME) of China will be responsible for allocating the quota between PV companies, and we have been allocated a portion of the quota. Solar panels and cells imported in excess of the annual quota will be subject to anti-dumping and anti-subsidy duties. This price undertaking and annual quota have also resolved the parallel anti-subsidy investigation. For companies that would violate the price undertaking or the quota, or which do not form part of the agreement, definitive duties will be levied as per the definitive anti-dumping andanti-subsidy Regulations that were published on December 5, 2013. Finally, it should be noted that wafers have been excluded from the scope of both the anti-dumping and anti-subsidy measures. See “Item 3.D. Risk Factors—Risks Related to Our Company and Our Industry—Changes in international trade policies and international barriers to trade may material adversely affect our ability to export our products worldwide.”
We also acquire a portion of our polysilicon and silicon wafers throughshort-term supply arrangements for periods ranging from several months to one year. The prices we pay for silicon and silicon wafers pursuant toshort-term supply arrangements vary according to the prevailing market price around the time of delivery, which can be subject to significant fluctuations.
Manufacturing Capacity
Capacity and capacity utilization are key factors in growing our net revenues and gross profit. In order to accommodate the growing demand for our products, we had significantly expanded our manufacturing capacity in the past. An increase in capacity has a significant effect on our financial results, both by allowing us to produce and sell more PV products and achieve higher net revenues, and by lowering our average manufacturing costs per unit as a result of increased economies of scale.
We have been seeking to maximize the utilization of our available manufacturing capacity as it comeson-line, so as to allow us to spread our fixed costs over a higher production volume, thereby reducing our per unit and per MW fixed costs. As we build additional production facilities, our fixed costs will increase, and the overall utilization rate of our production facility could decline, which could negatively impact our gross profit. However, regardless of the capacity of a particular manufacturing facility, our capacity utilization may vary greatly depending on the mix of products we produce at any particular time.
We produced 939.5 MW, 856.0MW and 1,190.5 MW of PV modules in 2011, 2012 and 2013, respectively. The following table sets forth the production volume of silicon ingots, wafer PV cells and PV modules for the periods indicated:
| | | | | | | | | | | | | | | | | | | | |
| | | Year Ended December 31, | |
| | | 2009 | | | 2010 | | | 2011 | | | 2012 | | | 2013 | |
| | | (MW) | |
Volume of ingots produced | | | 154.1 | | | | 360.0 | | | | 367.2 | | | | 237.7 | | | | 224.1 | |
Volume of wafer produced | | | 164.6 | | | | 387.4 | | | | 383.7 | | | | 242.6 | | | | 227.6 | |
Volume of PV cells produced (including PV cell processing) | | | 260.2 | | | | 502.4 | | | | 687.3 | | | | 708.4 | | | | 896.5 | |
Volume of PV cells produced used in our PV module production | | | 240.2 | | | | 490.4 | | | | 660.3 | | | | 704.7 | | | | 860.2 | |
Volume of PV modules produced (including PV module processing) | | | 342.8 | | | | 758.9 | | | | 939.5 | | | | 856.0 | | | | 1,190.5 | |
As of December 31, 2013, we had annual production capacities of 1.5 GW for PV modules, 1.3 GW for PV cells and 800 MW for ingots and wafers.
Process Technologies
Advancements of process technologies have improved the quality of PV products and enhanced their conversion efficiencies. Assuming other things being the same, high conversion efficiencies reduce the manufacturing cost per watt of PV products and could thereby contribute to increasing gross profit margins. For this reason, solar energy companies, including us, are continuously developing advanced process technologies forlarge-scale manufacturing while reducing costs to maintain and improve profit margins.
54
We have achieved improvements in process technology and product quality since we commenced our commercial production in November 2005. Our multicrystalline PV cells achieved conversion efficiency rates in the range of 17.10% to 17.86% in 2013 by introducing a new generation of solar cells with anti-PID features, EStar 2.0, and we are now able to process wafers as thin as 180 microns. Our advanced ingot growing and wafer sewing process technologies have also significantly improved our productivity and increased the efficiency of our raw material usage, both of which have led to the lowering of the cost per watt of our products and improved our gross profit margins.
Net Revenues
We currently generate a substantial majority of our net revenues from the production and sale of PV modules. We also generate a small portion of our net revenues from the sale of PV cells and raw materials and scrap materials to third parties.
We commenced manufacturing and selling PV modules in February 2005, and had net revenues of RMB6,416.5 million, RMB3,678.4 million and RMB4,725.7 million (US$780.6 million) in 2011, 2012 and 2013, respectively.
We began manufacturing PV cells in November 2005, primarily to supply our PV module production. As a result, we only sold a small number of the total PV cells we manufactured to certain customers to maintain business relationships. Since our business strategy is focused on increasing our own output of PV modules on acost-efficient basis, we plan to continue to use the substantial majority of our PV cells in manufacturing our PV modules and will maintain our sale of PV cells to third parties at a relatively low level. In 2011, 2012 and 2013, our net revenues from the sale of PV cells were RMB49.2 million, RMB29.6 million and RMB43.1 million (US$7.1 million), respectively.
We began to provide PV module processing services to produce PV modules from PV cells provided by our customers in 2007. We recorded the amount of net revenues on PV module processing transactions based on the amount received from a customer for PV modules sold less the amount paid for PV cells purchased from the same customer.
In the event we pay the shipping costs on behalf of our customers, we include the shipping costs passed on to our customers in our net revenues.
In 2011, 2012 and 2013, a small portion of our net revenues was derived from the sale of raw materials to our customers.
We record revenues net of allvalue-added taxes imposed by governmental authorities and collected by us from customers concurrent withrevenue-producing transactions.
Customers who individually accounted for more than 10% of our net revenues accounted for an aggregate of 25.9% and 25.0% of our net revenues in 2011 and 2013. In 2012, no customer accounted for 10.0% or more of our net revenues. Based on the location that our invoices are sent to, in 2011, 2012 and 2013, our sales to European customers accounted for 66.1%, 52.9% and 25.2%, respectively, of our net revenues, with German customers accounting for 41.3%, 40.5% and 14.7%, respectively, in such periods. Our sales to Japan accounted for 0.2%, 6.7% and 25.0%, respectively, of our net revenues. Although we anticipate that our dependence on a limited number of customers in a few concentrated geographic regions will continue for the foreseeable future, we are actively expanding our customer base and geographic coverage through various marketing efforts, especially in other developing PV markets, such as the United States, China, India, Korea, Japan, Italy, Greece, France, Belgium and Australia.
Sales to our customers are typically made throughnon-exclusive,short-term arrangements. Before the beginning of 2009, we generally required deposits of a certain percentage of the contract price from our
55
customers which we recorded under customer deposits in our consolidated balance sheets. Once the revenue recognition criteria are met, we then recognize these payments as net revenues. In line with market trends, this practice of requiring our customers to make deposits is on the decline. As of December 31, 2011, 2012 and 2013, we had received deposits of RMB84.9 million, RMB36.3 million and RMB47.8 million (US$7.9 million), respectively.
Cost of Revenues and Operating Expenses
The following table sets forth our cost of revenues and operating expenses and these amounts calculated as percentages of our net revenues for the periods indicated.
| | | | | | | | | | | | | | | | | | | | | | | | | | | | |
| | | Year Ended December 31, | |
| | | 2011 | | | 2012 | | | 2013 | |
| | | Amount
(RMB) | | | % of Net
Revenues | | | Amount
(RMB) | | | % of Net
Revenues | | | Amount | | | % of Net
Revenues | |
| | | | | | | (RMB) | | | (US$) | | |
| | | (In thousands, except percentages) | |
Cost of revenues | | | (6,633,542 | ) | | | 103.4 | % | | | (4,003,885 | ) | | | 108.8 | % | | | (4,390,718 | ) | | | (725,295 | ) | | | 92.9 | % |
Operating expenses: | | | | | | | | | | | | | | | | | | | | | | | | | | | | |
Selling expenses | | | (279,788 | ) | | | 4.4 | % | | | (348,568 | ) | | | 9.4 | % | | | (325,422 | ) | | | (53,756 | ) | | | 6.8 | % |
General and administrative expenses | | | (340,405 | ) | | | 5.2 | % | | | (278,033 | ) | | | 7.6 | % | | | (295,482 | ) | | | (48,811 | ) | | | 6.3 | % |
Provision for doubtful accounts receivable and other receivables | | | (56,234 | ) | | | 0.9 | % | | | (137,674 | ) | | | 3.7 | % | | | (28,562 | ) | | | (4,718 | ) | | | 0.6 | % |
Research and development expenses | | | (68,217 | ) | | | 1.1 | % | | | (90,820 | ) | | | 2.5 | % | | | (92,256 | ) | | | (15,240 | ) | | | 2.0 | % |
Impairment of goodwill | | | (134,735 | ) | | | 2.1 | % | | | — | | | | — | | | | — | | | | — | | | | — | |
Total operating expenses | | | (879,379 | ) | | | 13.7 | % | | | (855,095 | ) | | | 23.2 | % | | | (741,722 | ) | | | (122,525 | ) | | | 15.7 | % |
Cost of Revenues
Our cost of revenues includes the cost of raw materials used for our PV module and PV cell production and PV module processing, such as silicon and silicon wafers, other direct raw materials and components including ethylene vinyl acetate, triphenyltin, tempered glass, connecting bands, welding bands, silica gel, aluminum alloy and junction boxes, inventorywrite-down as a result of reduced cost or market assessment and a regular provision for obsolescence, and provisions for advance payments arising from the suppliers’ failure to perform under the contracts. The costs relating to providing the PV module processing services were recorded within cost of revenues. We expect the cost of silicon and silicon wafers, our primary raw material for the manufacturing of PV products, to continue constituting a substantial portion of our cost of revenues in the near future.
Other items contributing to our cost of revenues are direct labor, which includes salaries and benefits for personnel directly involved in manufacturing activities, manufacturing overhead, which consists of utility, maintenance of production equipment, and other support expenses associated with the manufacturing of our PV products, and depreciation and amortization of manufacturing equipment and facilities.
We expect our cost of revenues to increase as we increase our production volume. Future increases or decreases in our suppliers’ cost of silicon wafers may also contribute to fluctuations in cost of revenues.
Silicon and silicon wafers are the most important raw materials for our products. We record the purchase price of silicon and silicon wafers and other raw materials initially as inventory in our consolidated balance sheets, and then transfer this amount to our cost of revenues after the raw materials are consumed in our manufacturing process and the finished products are sold and delivered. As of December 31, 2011, 2012 and 2013, our inventory of raw materials totaled RMB194.0 million, RMB187.4 million and RMB276.5 million (US$45.7 million), respectively, of which RMB76.6 million, RMB83.6 million and RMB70.7 million (US$11.7 million), respectively, represented silicon and silicon wafers. Silicon suppliers generally require prepayments from us in advance of delivery. We classify such prepayments as advances to suppliers and record
56
such prepayments under eithernon-current assets or current assets in our consolidated balance sheets. However, if such suppliers fail to fulfill their delivery obligations under the silicon supply agreements or if there is any dispute between us and such suppliers that jeopardizes our ongoing relationship, we may not be able to recover such prepayments and would suffer losses. See “Item 3.D. Risk Factors—Risks Related to Our Company and Our Industry—Prepayments we have provided to our silicon and silicon wafer suppliers expose us to the credit and performance risks of such suppliers and may not be recovered, which could in turn have a material adverse effect on our liquidity.”
Operating Expenses
Our operating expenses consist of selling expenses, general and administrative expenses and research and development expenses.
Selling Expenses
Our selling expenses primarily consist of warranty costs, shipping and handling costs for products sold, advertising and other promotional expenses, and salaries, commissions, traveling expenses and benefits for our sales and marketing personnel. In 2011, 2012 and 2013, our selling expenses were RMB279.8 million, RMB348.6 million and RMB325.4 million (US$53.8 million), respectively.
Prior to 2012, our PV products were typically sold with a 2 to5-year warranty for technical defects, and a10-year limited warranty against declines of greater than 10% and a25-year limited warranty against declines of greater than 20%, in their initial power generation capacity. Since January 2012, we started to extend our material and workmanship warranty for PV modules to 12 years and replace our existing warranty for power generation capacity with an improved25-year linear warranty. Under the new 25-year linear warranty, we guarantee no less than 97% of the nominal power generation capacity for our typical multicrystalline PV modules and 96% of the nominal power generation capacity for our typical monocrystalline PV modules in the first year and an annual output degradation of no more than 0.7% thereafter. By the end of the 25th year, the actual power output shall be no less than 82% of the nominal power generation capacity. Since 2013, we started to allow our warranty to be transferred to third parties along with ownership of our PV modules.
Since our products have been in use for only a relatively short period, our assumptions regarding the durability and reliability of our products may not be accurate. We estimate the amount of our warranty obligation primarily based on the results of technical analyses, our historical warranty claims experience, the warranty accrual practices of comparable companies, and the expected failure rate and future costs to service failed products. The results of the technical analyses support the future operational efficiency of the PV modules at levels significantly above the minimum guaranteed levels over the respective warranty periods. The estimate of warranty costs is affected by the estimated and actual product failure rates, the costs to repair or replace failed products and potential service and delivery costs incurred in correcting a product failure. Based on the considerations above and management’s ability and intention to provide repairs, replacements or refunds for defective products, we have accrued for warranty costs for the 2 to12-year warranty against technical defects based on 1% of revenue for PV modules. No warranty cost accrual has been recorded for the10-year and 20 to25-year warranties for decline from initial power generation capacity because we determined the likelihood of claims arising from these warranties to be remote based on internal and external testing of the PV modules and strong quality control procedures in the production process. Based on the results of analysis and technical testing, the revision to our warranty policy in January 2012 did not have a material effect on our warranty accrual rate. The basis for the warranty accrual will be reviewed periodically based on actual experience. We do not sell extended warranty coverage that is separately priced or optional.After-sales services for our PV modules and solar application systems covered by warranties are provided by our international customer support team.
In 2011, 2012 and 2013, we accrued RMB64.7 million, RMB33.1 million and RMB41.3 million (US$6.8 million), respectively, in warranty costs.
57
General and Administrative Expenses and Provision for Doubtful Accounts Receivable and Other Receivables
Our general and administrative expenses primarily consist of salaries and benefits of our administrative staff, depreciation charges of fixed assets used for administrative purposes, as well as administrative office expenses including consumables, traveling expenses, insurance, share compensation expenses, and provision for doubtful debts and losses in relation to prepayments to suppliers that were in contractual default where we have asserted our termination rights that require repayment of the remaining deposits. In 2011, 2012 and 2013, our general and administrative expenses were RMB340.4 million, RMB278.0 million and RMB295.5 million (US$48.8 million), respectively.
Research and Development Expenses
Our research and development expenses primarily consist of salaries and benefits of our research and development staff, other expenses including depreciation, materials used for research and development purposes, and the travel expenses incurred by our research and development staff or otherwise in connection with our research and development activities. We expense our research and development costs as incurred. In 2011, 2012 and 2013, our research and development expenses were RMB68.2 million, RMB90.8 million and RMB92.3 million (US$15.2 million), respectively. We believe that research and development is critical to our strategic objectives of enhancing our technologies, reducing manufacturing costs and meeting the changing requirements of our customers. We expect that our total research and development expenses will increase in the future.
Share-based Compensation Charges
We adopted our 2006 share option plan in November 2006 pursuant to which we may issue up to 10,799,685 ordinary shares upon exercise of awards granted under the plan. As of December 31, 2013, options to purchase 1,572,650 ordinary shares have been granted and were outstanding under this plan.
We adopted our 2007 equity incentive plan in August 2007 which provides for the grant of options, restricted stock, restricted stock units, stock appreciation rights, performance units and performance stock to our employees, directors and consultants. The maximum aggregate number of our ordinary shares that may be issued under the 2007 equity incentive plan is 10,799,685. In addition, the plan provides for an annual increase in the number of shares available for issuance on the first day of each fiscal year, beginning with our 2008 fiscal year, equal to 2% of our then outstanding ordinary shares or such lesser amount as our board of directors may determine. As of December 31, 2013, options to purchase 1,823,850 ordinary shares have been granted and were outstanding under this plan.
In 2011, 2012 and 2013, we recorded RMB38.3 million, RMB7.8 million and RMB2.7 million (US$0.4 million), respectively, asshare-based compensation charges.
Taxation
PRC Enterprise Income Tax
PRC enterprise income tax is calculated based on taxable income determined under PRC accounting principles. On March 16, 2007 the National People’s Congress of the PRC passed the EIT, which took effect as of January 1, 2008. On December 6, 2007, the State Council of the PRC issued Implementation Regulations regarding the EIT which took effect as of January 1, 2008. In accordance with the EIT and it Implementation Regulations, a unified enterprise income tax rate of 25% and unified tax deduction standards are applied equally to botdomestic-invested enterprises andforeign-invested enterprises such as SolarOne Qidong. Enterprises established prior to March 16, 2007 and eligible for preferential tax treatment in accordance with the former tax laws and administrative regulations, under the regulations of the State Council, gradually became subject to the new tax rate over afive-year transition period starting from the date of effectiveness of the EIT. In accordance with the Notice of the State Council on the Implementation of the Transitional Preferential Policies in respect to Enterprise Income Tax,foreign-invested enterprises established prior to March 16, 2007 and eligible for
58
preferential tax treatment, such a SolarOne Qidong, continue to enjoy the preferential tax treatment in the manner and during the period as former laws and administrative regulations provided until such period expires. While the EIT equalizes the tax rates for FIEs and domestically owned enterprise preferential tax treatment continues to be granted to companies in certain encouraged sectors and to companies classified as “high and new technology enterprises,” which enjoy a tax rate of 15% as compared to the uniform tax rate of 25%. SolarOne Qidong was approved to be qualified as a “high and new technology enterprise” on October 21, 2008. The “high and new technology enterprise” status is valid for period of three years from the date of issuance of a “high and new technology enterprise” certificate. If there is any significant change in the company’s business operations, manufacturing technologies or other areas that cause it to no longer qualify as a “high and new technology enterprise”, such status will be terminated from the year of such change. SolarOne Qidong’s “high and new technology enterprise” status was renewed and approved in October 2011.
Critical Accounting Policies and Estimates
We prepare our consolidated financial statements in conformity with U.S. GAAP, which requires us to make estimates and assumptions that affect the reported amounts of, among other things, assets, liabilities, revenue and expenses. We base our estimates on our own historical experience and on various other factors that we believe to be relevant under the circumstances. Actual results may differ from these estimates under different assumptions or conditions. Some of our accounting policies require higher degrees of judgment than others i their application. We consider the policies discussed below to be critical to an understanding of our financial statements as their application places the most significant demands on our management’s judgment.
Revenue Recognition
Our primary business activity is to produce and sell PV modules. We periodically, upon special request from customers, sell PV cell and silicon ingots. We record revenue related to the sale of PV modules, PV cells and silicon ingots when the criteria of Accounting Standards Codification, or ASC,605-10, “Revenue Recognition: Overall” are met. These criteria include all of the following: persuasive evidence of an arrangement exists; delivery has occurred; the sales price is fixed or determinable; and collection is reasonably assured.
More specifically, our sales arrangements are evidenced by either framework sales agreements and/or by individual sales agreement for each transaction. The shipping terms of our sales arrangements are generally “Cost, Insurance and Freight,” or CIF, and “Free on Board, or FOB, shipping point whereby the customer takes title and assumes the risks and rewards of ownership of the products upon delivery to the shipper. The customer bears all costs and risks of loss or damage to the goods from that point. Under some sales arrangements, we require our customers to prepay prior to shipment. We performon-going credit assessment of each customer, including reviewing the customer’s latest financial information and historical payment record and performing necessary due diligence to determine acceptable credit terms. In instances where we granted longer credit terms to certain customers, the timing of revenue recognition has not been impacted as we have historically been able to collect under the original payment terms without making concessions. Other than warranty obligations, we do not have any commitments or obligations to deliver additional products or services to the customers. Based on the above, we record revenue related to product sales upon delivery of the product to the shipper, provided that all other revenue recognition criteria are met at that time.
We enter into processing service arrangements to process PV cells into PV modules. For these service arrangements, we “purchase” PV cells from a customer and contemporaneously agree to “sell” a specified quantity of PV modules back to the same customer. The quantity of PV modules sold back to the customers under these processing arrangements is consistent with the amount of PV cells purchased from the customer based on current production conversion rates. In accordance with ASC845-15, “Accounting for Purchases and Sales of Inventory with the Same Counterparty”, we record the amount of revenue on these processing transactions based on the amount received for PV modules sold less the amount paid for the PV cells purchased from the customer. These sales are subject to all of theabove-noted criteria relating to revenue recognition.
59
Revenue is recognized net of allvalue-added taxes imposed by governmental authorities and collected from customers concurrent withrevenue-producing transactions. We do not offer implicit or explicit rights of return, regardless of whether goods were shipped to distributors or shipped directly to theend-users, other than due to product defects.
We recognize revenue related to solar systems integration services using thepercentage-of-completion method. We estimate our revenues by using thecost-to-cost method, whereby we derive a ratio by comparing the costs incurred to date to the total costs expected to be incurred on the project. We apply the ratio computed in thecost-to-cost analysis to the contract price to determine the estimated revenues earned in each period. A contract may be regarded as substantially completed if the remaining costs are not significant in amount. When we determine that total estimated costs will exceed total revenues under a contract, we record a loss accordingly.
Fixed Assets, Net
Fixed assets are stated at cost net of accumulated depreciation and are depreciated using thestraight-line method over the estimated useful lives of the assets, as follows:
| | |
Buildings | | 20 years |
Plant and machinery | | 10 years |
Furniture, fixtures and office equipment | | 5 years |
Computer software | | 5 years |
Motor vehicles | | 5 years |
Leasehold improvements | | Over the shorter of the lease term or their estimated useful lives |
Repair and maintenance costs are charged to expenses when incurred, while the cost of renewals and betterment that extend the useful life of fixed assets are capitalized as additions to the related assets. Retirement, sale and disposals of assets are recorded by removing the cost and accumulated depreciation with any resulting gain or loss reflected in the consolidated statements of comprehensive income.
Costs incurred in constructing new facilities, including progress payments, interest and other costs relating to the construction are capitalized and transferred to fixed assets upon completion and depreciation commences when the asset is available for its intended use.
Interest costs are capitalized if they are incurred during the acquisition, construction or production of a qualifying asset. Capitalization of interest costs commences when the activities to prepare the asset are in progress and expenditures and borrowing costs are being incurred. Interest costs are capitalized until the assets are ready for their intended use. Interest capitalized in 2011, 2012 and 2013 amounted to RMB59.0 million, RMB41.1 million and RMB5.1 million (US$0.8 million), respectively.
Warranty Costs
We primarily provide standard warranty coverage on our PV modules sold to customers. Prior to 2012, the standard warranty provided for a 2 to5-year warranty against technical defects, a10- to 12- year warranty against declines of greater than 10%, a 15-year limited warranty against declines of greater than 12% for our mono PV modules and 11% for our poly PV modules and a25-year warranty against declines of greater than 20%, in their initial power generation capacity. Since January 2012, we started to extend our material and workmanship warranty for PV modules to 12 years and replace our existing warranty for power generation capacity with an improved25-year linear warranty. Under the new 25-year linear warranty, we guarantee no less than 97% of the nominal power generation capacity for our typical multicrystalline PV modules and 96% of the nominal power generation capacity for our typical monocrystalline PV modules in the first year and an annual output
60
degradation of no more than 0.7% thereafter. By the end of the 25th year, the actual power output shall be no less than 82% of the nominal power generation capacity. Since 2013, we started to allow our warranty to be transferred to third parties along with ownership of our PV modules.
Our estimate of the amount of warranty obligation is primarily based on the following considerations: (1) the results of technical analyses, including simulation tests performed on our products by anindustry-recognized external certification body as well as internally developed damp heat testing procedures conducted by our engineering team, (2) our historical warranty claims experience, (3) the warranty accrual practices of other companies in the industry that produce PV products that are comparable in engineering design, raw material input and functionality to our products, and which sell products to a similar class of customers, and (4) our expected failure rate and future costs to service failed products. The results of the technical analyses support the future operational efficiency of our PV modules at levels significantly above the minimum guaranteed levels over the respective warranty periods. Our estimate of warranty costs will be affected by the estimated and actual product failure rates, the costs to repair or replace failed products and potential service and delivery costs incurred in correcting a product failure. Based on the above considerations and management’s ability and intention to provide repairs, replacements or refunds for defective products, we have accrued for warranty costs for the 2 to 12-year warranty against technical defects based on 1% of net revenues for PV modules. No warranty cost accrual has been recorded for the10-year and 20 to25-year warranties in place through 2012 because we determined the likelihood of claims arising from these warranties to be remote based on internal and external testing of our PV modules and strong quality control procedures in our production process. Based on the results of analysis and technical testing, the revision to our warranty policy in January 2012 did not have a material effect on our warranty accrual rate. The basis for the warranty accrual will be reviewed periodically based on actual experience.
If our PV modules fail to perform to the standards of the performance guarantee, we could incur substantial expenses and substantial cash outlays to repair, replace or provide refunds for theunder-performing products, which could negatively impact our overall cash position. The basis for the warranty accrual will be reviewed periodically based on actual experience. We do not sell extended warranty coverage that is separately priced or optional.
Impairment ofLong-Lived Assets
We evaluate ourlong-lived assets or asset groups, including land use rights with finite lives, for impairment whenever events or changes in circumstances (such as a significant adverse change to market conditions that will impact the future use of the assets) indicate that the carrying amount of a group oflong-lived assets may not be recoverable. When these events occur, we evaluate for impairment by comparing the carrying amount of the assets to the future undiscounted net cash flows expected to result from the use of the assets and their eventual disposition. If the sum of the expected undiscounted cash flows is less than the carrying amount of the assets, we would recognize an impairment loss based on the excess of the carrying amount of the asset group over its fair value.
Goodwill
Goodwill represents the excess of the purchase price over the fair value of the assets acquired and the liabilities assumed of the acquired business. Goodwill is reviewed at least annually for impairment, or earlier if there is an indication of impairment, in accordance with ASC 350, “Goodwill and Other Intangible Assets.” We assign and assess goodwill for impairment at the reporting unit level.
The performance of the impairment test involves atwo-step process. The first step of the impairment test involves comparing the fair value of the reporting unit with its carrying amount, including goodwill. Fair value is primarily determined by computing the future discounted cash flows expected to be generated by the reporting unit. If the reporting unit’s carrying value exceeds its fair value, goodwill may be impaired. If this occurs, we perform the second step of the goodwill impairment test to determine the amount of impairment loss. The fair
61
value of the reporting unit is allocated to its assets and liabilities in a manner similar to a purchase price allocation in order to determine the implied fair value of the reporting unit’s goodwill. If the implied goodwill fair value is less than its carrying value, the difference is recognize an impairment loss.
We determined the fair value of the reporting unit using the income approach based on the discounted expected future cash flows associated with the reporting unit. The discounted cash flows for the reporting unit were based onfive-year projections. Cash flow projections were based on past experience, actual operating results and management’s best estimates about future developments, as well as certain market assumptions. Cash flow after the fifth year were estimated using a terminal value calculation, which considered terminal value growth rate at 3%, consideringlong-term revenue growth rates for entities in the relevant industries in the PRC. The discount rate of approximately 16% was used in the valuations, which reflect the market assessment of the risks specific to our industry and are based on theweighted-average cost of capital for that particular reporting unit.
As of December 31, 2011, we had determined that the carrying value of the reporting unit exceeded its implied fair value, estimated using a discounted cash flow methodology, and recorded an impairment loss of RMB134.7 million in 2011, which is included in “impairment of goodwill” in our consolidated statements of comprehensive income.
Financial Instruments—Foreign Currency Derivative Contracts, Commodity Contracts and Interest Rate Swap Contract
Our foreign currency derivative contracts, commodity derivative contracts and interest rate swap contract are used to manage our foreign currency risks principally arising from sales contracts denominated in Euros, maintain the stability of the purchase prices for silver and aluminum, the raw materials used in the production of PV products, and manage the interest rate risk for ourlong-term bank borrowings. We record these derivative instruments as current assets or current liabilities, measured at fair value.
In 2011, 2012 and 2013, we entered intocross-currency exchange rate agreements to receive Renminbi and sell other currencies and commodity agreements to purchase silver and aluminum, and an interest rate swap agreement to pay fixed interest rate rather than floating rate. Changes in the fair value of these derivative instruments are recognized in our consolidated statements of comprehensive income. These derivative instruments are not designated and do not qualify hedges and are adjusted to fair value through current earnings. As of December 31, 2013, we had outstandingcross-currency exchange rate contracts with notional amounts of EUR15.0 million, US$120.4 million and JPY4,277.5 million, and an interest rate swap contract with notional amount of US$50.0 million. We estimate the fair value of our foreign currency and interest rate swap derivatives using a pricing model based on market observable inputs.
Share-based Compensation
We account for the share options granted under our 2006 share option plan and our 2007 equity incentive plan in accordance with ASC718-10,“Share-Based Compensation” and ASC505-50, “Accounting for Equity Instruments that Are Entered to Offer the Employees for Acquiring, or in conjunction with Selling Goods or Services,” respectively. In accordance with ASC718-10, all grants of share options are recognized in the financial statements based on theirgrant-date fair values. We have elected to recognize compensation expense using thestraight-line method for all share options granted with services conditions that have a graded vesting schedule.
With the assistance of an independentthird-party valuer, we have applied theBlack-Scholes option valuation model in determining the fair value of the options granted before January 1, 2008. We estimate expected volatility at the date of grant based on a combination of historical volatilities from comparable publicly listed companies. Forfeiture rate is estimated based on historical forfeiture patterns and adjusted to reflect future change in facts and circumstances, if any.
For share options granted after January 1, 2008, the fair value of each grant is estimated on the date of grant using abinomial-lattice model. The expected exercise multiple was based on research regarding exercise pattern and historical statistic data. Similar to theBlack-Scholes model, thebinomial-lattice option model takes into
62
account variables such as expected volatility, dividend yield, andrisk-free interest rates.Risk-free interest rates are based on zero coupon U.S.risk-free rates for the terms consistent with the expected life of the award at the time of grant. Expected dividend yield is determined based on our historical dividend payout rate. Expected volatility is estimated based on a combination of our historical performance and the historical performance of comparable publicly listed companies.
In addition, thebinomial-lattice model considers the contractual term of the option, the probability that the option will be exercised prior to the end of its contractual life, and the probability of termination or retirement of the option holder in computing the value of the option.
Accounting for Income Taxes and Uncertain Income Tax Positions
We account for income taxes in accordance with ASC 740, “Accounting for Income Taxes.” Under this method, deferred tax assets and liabilities are determined based on the difference between the financial reporting and tax bases of assets and liabilities using enacted tax rates that will be in effect in the period in which the differences are expected to reverse. We record a valuation allowance to offset deferred tax assets if, based on the weight of available evidence, it is more likely than not that some portion, or all, of the deferred tax assets will not be realized. The effect on deferred taxes of a change in tax rates is recognized in income in the period that includes the enactment date.
We also apply ASC740-10, “Accounting for Uncertainty in Income Taxes”, which prescribes the recognition threshold a tax position is required to meet before being recognized in the financial statements. As of December 31, 2012 and 2013, we recorded unrecognized tax benefits of RMB143.5 million and RMB143.5 million (US$23.7 million), respectively.
We have elected to classify interest and/or penalties related to an uncertain position, if and when required, as part of “other operating expenses” in the consolidated statements of comprehensive income. No such amounts have been incurred or accrued through December 31, 2013.
Based on existing PRC tax regulations, the tax years of SolarOne Qidong, Solar Shanghai, SolarOne Technology, Solar R&D, and Solar Engineering for the years ended December 31, 2008 through 2013 remain open for examination by the tax authorities.
Advance to Suppliers andLong-term Prepayments
Advance to suppliers andlong-term prepayments representinterest-free cash deposits paid to suppliers for future purchases of raw materials. Due to the continuous significant decrease in prices of silicon and silicon wafers since 2009, we have continued to re-negotiate all of ourmulti-year supply through either supplemental agreements or amended and restated multi-year framework supply agreements.
The risk of loss arising fromnon-performance by or bankruptcy of the suppliers is assessed prior to making the deposits and credit quality of the suppliers is continually assessed. If there is any deterioration in the creditworthiness of the suppliers, we will seek to recover the advances from the suppliers and provide for losses on advances in cost of revenues because of the suppliers’ inability to fulfill their supply obligations. A charge to cost of revenues will be recorded in the period in which a loss is determined to be probable and the amount can be reasonably estimated. We recorded a charge to cost of revenues of RMB287.7 million, RMB186.0 million and RMB15.6 million in 2011, 2012 and 2013, respectively, to reflect the probable loss arising from the suppliers’ failure to perform under the contracts.
In circumstances where a supplier is in contractual default and we have termination rights that require repayment of the remaining deposit and we have asserted such rights, the advances are reclassified to other current assets in our consolidated balance sheets. Similarly, we reclassify advances to other current assets when legal proceedings have commenced where we are claiming a breach of contract and are seeking monetary recovery of the remaining deposit. A provision for loss is recognized in provision for doubtful accounts receivable and other receivables in the period in which the loss on such assets is determined to be probable and the amount can be reasonably estimated. We recorded charges to “provision for doubtful accounts receivable and other receivables” of RMB54.5 million and RMB50.0 million in 2011 and 2012, respectively.
63
Shipping and Handling Costs
Effective January 1, 2011, we changed the method of accounting for shipping and handling costs and have recorded such expenses in the line item “operating expenses—selling expenses” in our consolidated statements of comprehensive income, while in prior years, shipping and handling costs were recorded as part of “cost of revenue.” We believe the classification of shipping and handling costs as “operating expenses—selling expenses” is preferable because it (1) better reflects the nature of the expenses; and (2) increases the comparability of information with our competitors. Our comparative financial statements of prior years have been adjusted retrospectively to reflect this reclassification and enhance comparability between periods.
Consolidated Results of Operations
Since substantially all of our revenues are derived from the sale of PV products, we presented our net revenues and cost of revenues for all product sales on a combined basis in accordance with U.S. GAAP. We believe that this presentation provides sufficient information in assessing our operating and financial performance. The following table sets forth our summary consolidated statements of comprehensive income for the periods indicated:
| | | | | | | | | | | | | | | | | | | | | | | | | | | | |
| | | Year Ended December 31, | |
| | | 2011 | | | 2012 | | | 2013 | |
| | | (In RMB
Thousands) | | | % of Net
Revenues | | | (In RMB
Thousands) | | | % of Net
Revenues | | | (In RMB
Thousands) | | | (In US$
Thousands) | | | % of Net
Revenues | |
Consolidated Statement of Comprehensive Income Data | | | | | | | | | | | | | | | | | | | | | | | | | | | | |
Net revenues | | | | | | | | | | | | | | | | | | | | | | | | | | | | |
Third parties | | | 5,832,628 | | | | 90.9 | % | | | 2,639,453 | | | | 71.8 | % | | | 2,787,772 | | | | 459,681 | | | | 58.9 | % |
Related parties | | | 583,857 | | | | 9.1 | % | | | 1,038,927 | | | | 28.2 | % | | | 1,942,920 | | | | 320,948 | | | | 41.1 | % |
Total net revenues | | | 6,416,485 | | | | 100.0 | % | | | 3,678,380 | | | | 100.0 | % | | | 4,725,692 | | | | 780,629 | | | | 100.0 | % |
Cost of revenues | | | (6,633,542 | ) | | | (103.4 | )% | | | (4,003,885 | ) | | | (108.8 | )% | | | (4,390,718 | ) | | | (725,295 | ) | | | (92.9 | )% |
Gross profit (loss) | | | (217,057 | ) | | | (3.4 | )% | | | (325,505 | ) | | | (8.8 | )% | | | 334,974 | | | | 55,334 | | | | 7.1 | % |
Operating expenses Selling expenses | | | (279,788 | ) | | | (4.4 | )% | | | (348,568 | ) | | | (9.4 | )% | | | (325,422 | ) | | | (53,756 | ) | | | (6.8 | )% |
General and administrative expenses | | | (340,405 | ) | | | (5.2 | )% | | | (278,033 | ) | | | (7.6 | )% | | | (295,482 | ) | | | (48,811 | ) | | | (6.3 | )% |
Provision for doubtful accounts receivable and other receivables | | | (56,234 | ) | | | (0.9 | )% | | | (137,674 | ) | | | (3.7 | )% | | | (28,562 | ) | | | (4,718 | ) | | | (0.6 | )% |
Research and development expenses | | | (68,217 | ) | | | (1.1 | )% | | | (90,820 | ) | | | (2.5 | )% | | | (92,256 | ) | | | (15,240 | ) | | | (2.0 | )% |
Impairment of goodwill | | | (134,735 | ) | | | (2.1 | )% | | | — | | | | — | | | | — | | | | — | | | | — | |
Total operating expenses | | | (879,379 | ) | | | (13.7 | )% | | | (855,095 | ) | | | (23.2 | )% | | | (741,722 | ) | | | (122,525 | ) | | | (15.7 | )% |
Operating loss | | | (1,096,436 | ) | | | (17.1 | )% | | | (1,180,600 | ) | | | (32.1 | )% | | | (406,748 | ) | | | (67,191 | ) | | | (8.6 | )% |
Interest expense | | | (171,059 | ) | | | (2.7 | )% | | | (299,515 | ) | | | (8.1 | )% | | | (323,820 | ) | | | (53,491 | ) | | | (6.9 | )% |
Interest income | | | 11,763 | | | | 0.2 | % | | | 15,841 | | | | 0.4 | % | | | 21,212 | | | | 3,504 | | | | 0.4 | % |
Exchange gains (losses) | | | (3,965 | ) | | | (0.1 | )% | | | 8,875 | | | | 0.2 | % | | | 43,687 | | | | 7,217 | | | | 0.9 | % |
Changes in fair value of derivative contracts | | | (70,778 | ) | | | (1.1 | )% | | | 5,326 | | | | 0.1 | % | | | 63,739 | | | | 10,529 | | | | 1.4 | % |
Changes in fair value of conversion feature of convertible bonds | | | 264,384 | | | | 4.1 | % | | | (5,692 | ) | | | (0.2 | )% | | | (6,105 | ) | | | (1,008 | ) | | | (0.1 | )% |
Loss on extinguishment of debt | | | — | | | | — | | | | (82,713 | ) | | | (2.2 | )% | | | — | | | | — | | | | — | |
Other income | | | 5,144 | | | | 0.1 | % | | | 9,265 | | | | 0.3 | % | | | 7,805 | | | | 1,289 | | | | 0.2 | % |
Other expenses | | | (14,102 | ) | | | (0.2 | )% | | | (18,391 | ) | | | (0.5 | )% | | | (16,194 | ) | | | (2,675 | ) | | | (0.3 | )% |
Loss before income taxes | | | (1,075,049 | ) | | | (16.8 | )% | | | (1,547,604 | ) | | | (42.1 | )% | | | (616,424 | ) | | | (101,826 | ) | | | (13.0 | )% |
Income tax expense | | | 144,945 | | | | 2.3 | % | | | (15,255 | ) | | | (0.4 | )% | | | (257,666 | ) | | | (42,563 | ) | | | (5.5 | )% |
Net loss | | | (930,104 | ) | | | (14.5 | )% | | | (1,562,859 | ) | | | (42.5 | )% | | | (874,090 | ) | | | (144,389 | ) | | | (18.5 | )% |
64
2013 Compared to 2012
Net Revenues
Our total net revenues increased by 28.5% to RMB4,725.7 million (US$780.6 million) in 2013 from RMB3,678.4 million in 2012. Our net revenues derived from our PV module business (excluding PV module processing) increased by 25.4% to RMB4,151.4 million (US$685.8 million) in 2013 from RMB3,310.7 million in 2012, due primarily to increase in PV module shipments, partially offset by a decrease in the average selling price of our PV modules from RMB4.47 in 2012 to RMB4.10 in 2013. In 2013, we derived 87.8% of our total net revenues from the sale of PV modules, compared to 90.0% in 2012.
Cost of Revenues and Gross Profit
Our cost of revenues increased by 9.7% to RMB4,390.7 million (US$725.3 million) in 2013 from RMB4,003.9 million in 2012. In particular, we recorded charges to cost of revenues of RMB186.0 million and RMB15.6 million (US$2.6 million) in 2012 and 2013, respectively, to reflect the probable loss arising from the suppliers’ failure to perform under the contracts, and an inventorywrite-down of RMB326.1 million and RMB113.2 million (US$18.7 million) in 2012 and 2013, respectively. In addition, the costs associated with PV module production increased by 6.0% to RMB3,871.4 million (US$639.5 million) in 2013 from RMB3,650.8 million in 2012, due primarily to an increase in PV module shipments, partially offset by a decrease in the blended cost of goods sold taking into account the production cost (silicon andnon-silicon) using internally sourced wafers, purchase costs and additional processing costs of externally sourced wafers and cells.
As a result of the foregoing, our gross profit was RMB335.0 million (US$55.3 million) in 2013, compared to negative RMB325.5 million in 2012. Our gross profit margin was 7.1% in 2013, compared to negative 8.8% in 2012.
Operating Expenses and Operating Profit (Loss)
Our operating expenses decreased by 13.3% to RMB741.7 million (US$122.5 million) in 2013 from RMB855.1 million in 2012. Our operating expenses as a percentage of our total net revenues decreased to 15.7% in 2013 from 23.2% in 2012.
Our selling expenses primarily consist of warranty costs, marketing and promotional expenses, shipping and handling costs and salaries, commissions, traveling expenses and benefits of our sales and marketing personnel. Our selling expenses decreased by 6.6% to RMB325.4 million (US$53.8 million) in 2013 from RMB348.6 million in 2012, due primarily to the decrease in shipping and handling costs, promotional expenses and personnel expenses, partially offset by an increase in sales commissions along with the increase in shipments. Selling expenses as a percentage of our total net revenues decreased to 6.8% in 2013 from 9.4% in 2012.
Our general and administrative expenses primarily consist of salaries and benefits of our administrative staff, depreciation charges of fixed assets used for administrative purposes, as well as administrative office expenses, including consumables, traveling expenses, insurance and share compensation charges for our administrative personnel. Our general and administrative expenses increased by 6.3% to RMB295.5 million (US$48.8 million) in 2013 from RMB278.0 million in 2012, due primarily to the decrease in operating government grants with offset effect on general and administrative expenses. General and administrative expenses as a percentage of our total net revenues decreased to 6.3% in 2013 from 7.6% in 2012.
Provision for doubtful debts mainly relate to provision made for losses for account receivables and provision for losses in relation to advance to suppliers that were in contractual default where we have asserted our termination rights that require repayment of the remaining deposits. Our provision for doubtful debts decreased by 79.3% from RMB137.7 million in 2012 to RMB28.6 million (US$4.7 million) in 2013, primarily due to the improvement in our accounts receivable collection.
65
Our research and development expenses primarily consist of materials used for research and development purposes, salaries and benefits of our research and development staff, depreciation charges, and travel expenses incurred by our research and development staff or otherwise in connection with our research and development activities. Our research and development expenses increased by 1.6% to RMB92.3 million (US$15.2 million) in 2013 from RMB90.8 million in 2012. The increase was primarily because we expanded our research and development team and conducted additional research and development activities. Research and development expenses as a percentage of our total net revenues decreased to 2.0% in 2013 from 2.5% in 2012.
As a result of the foregoing, our operating loss was RMB406.7 million (US$67.2 million) in 2013, compared to an operating loss of RMB1,180.6 million in 2012. Our operating profit margin was negative 8.6% in 2013, compared to negative 32.1% in 2012.
Interest Expense, Exchange Losses, Other Income, Changes in Fair Value of Derivative Contracts and Changes in Fair Value of Conversion Feature of Convertible Bonds
We generated interest income of RMB21.2 million (US$3.5 million) and incurred interest expense of RMB323.8 million (US$53.5 million) in 2013, compared to interest income of RMB15.8 million and interest expense of RMB299.5 million in 2012. The increase in interest expense was due primarily to an increase in the amount ofinterest-bearing bank borrowings.
We incurred exchange gain of RMB43.7 million (US$7.2 million) in 2013, compared to exchange gain of RMB8.9 million in 2012, primarily due to the fluctuation of the U.S. dollar and Euro against the Renminbi.
Our other income decreased to RMB7.8 million (US$1.3 million) in 2013 from RMB9.3 million in 2012, due primarily to the decrease in compensation from insurance. Our other expenses decreased to RMB16.2 million (US$2.7 million) in 2013 from RMB18.4 million in 2012, due primarily to a decrease in donations made to universities and charity organizations.
We recorded RMB63.7 million (US$10.5 million) in changes in fair value of derivative contracts to reflect the realized and unrealized net gain arising from the changes of fair value of our foreign currency derivative, commodity and interest rate swap contracts in 2013, compared to RMB5.3 million in 2012, as a result of greater foreign exchange rate volatility.
We recorded RMB6.1 million (US$1.0 million) in changes in fair value of convertible feature of our convertible bonds in 2013, compared to RMB5.7 million in 2012, due primarily to the changes in the ADS price.
Income Tax Expense
Our income tax expense was RMB257.7 million (US$42.6 million) in 2013, compared to an income tax expense was RMB15.3 million in 2012, due primarily to the provision of valuation allowance of deferred tax assets.
Net Loss
As a result of the cumulative effect of the above factors, we had a net loss of RMB874.1 million in 2013, compared to a net loss of RMB1,562.9 million in 2012. Our net profit margin improved to negative 18.5% in 2013 from negative 42.5% in 2012.
2012 Compared to 2011
Net Revenues
Our total net revenues decreased by 42.7% to RMB3,678.4 million in 2012 from RMB6,416.5 million in 2011. Our net revenues derived from our PV module business (excluding PV module processing) decreased by
66
42.4% to RMB3,310.7 million in 2012 from RMB5,748.3 million in 2011, due primarily to the decrease in the average selling price of our PV modules from RMB8.87 in 2011 to RMB4.47 in 2012. In 2012, we derived 90.0% of our total net revenues from the sale of PV modules, compared to 89.6% in 2011.
Cost of Revenues and Gross Profit
Our cost of revenues decreased by 39.6% to RMB4,003.9 million in 2012 from RMB6,633.5 million in 2011. In particular, we recorded charges to cost of revenues of RMB287.7 million and RMB186.0 million in 2011 and 2012, respectively, to reflect the probable loss arising from the suppliers’ failure to perform under the contracts, and an inventorywrite-down of RMB583.1 million and RMB326.1 million in 2011 and 2012, respectively. In addition, the costs associated with PV module production decreased by 39.8% to RMB3,650.8 million in 2012 from RMB6,060.3 million in 2011, due primarily to the decrease in blended cost of goods sold taking into account the production cost (silicon andnon-silicon) using internally sourced wafers, purchase costs and additional processing costs of externally sourced wafers and cells.
As a result of the foregoing, our gross profit was negative RMB325.5 million in 2012, compared to gross profit of negative RMB217.1 million in 2011. Our gross profit margin was negative 8.8% in 2012, compared to negative 3.4% in 2011, primarily because the decrease in the average selling price of our PV modules outpaced the decrease in thesilicon-based raw materials.
Operating Expenses and Operating Profit (Loss)
Our operating expenses decreased by 2.8% to RMB855.1 million in 2012 from RMB879.4 million in 2011. Our operating expenses as a percentage of our total net revenues increased to 23.2% in 2012 from 13.7% in 2011.
Our selling expenses primarily consist of warranty costs, marketing and promotional expenses, shipping and handling costs and salaries, commissions, traveling expenses and benefits of our sales and marketing personnel. Our selling expenses increased by 24.6% to RMB348.6 million in 2012 from RMB279.8 million in 2011, due primarily to the increase in shipping cost and expansion of our sales force. Selling expenses as a percentage of our total net revenues increased to 9.4% in 2012 from 4.4% in 2011.
Our general and administrative expenses primarily consist of salaries and benefits of our administrative staff, depreciation charges of fixed assets used for administrative purposes, as well as administrative office expenses, including consumables, traveling expenses, insurance and share compensation charges for our administrative personnel. Our general and administrative expenses decreased by 18.3% to RMB278.0 million in 2012 from RMB340.4 million in 2011, due primarily to the decrease of stock option expenses and consulting service expenses. General and administrative expenses as a percentage of our total net revenues increased to 7.6% in 2012 from 5.2% in 2011.
Provision for doubtful debts and other receivables mainly relate to provision made for losses for account receivables and provision for losses in relation to advance to suppliers that were in contractual default where we have asserted our termination rights that require repayment of the remaining deposits. Our provision for doubtful debts and other receivables increased by 144.8% to RMB137.7 million from RMB56.2 million. The increase was primarily due to our dispute with Guo Hua to collect the remaining accounts receivable under the EPC contract.
Our research and development expenses primarily consist of materials used for research and development purposes, salaries and benefits of our research and development staff, depreciation charges, and travel expenses incurred by our research and development staff or otherwise in connection with our research and development activities. Our research and development expenses increased by 33.1% to RMB90.8 million in 2012 from RMB68.2 million in 2011. The increase was primarily because we expanded our research and development team and conducted additional research and development activities. Research and development expenses as a percentage of our total net revenues increased to 2.5% in 2012 from 1.1% in 2011.
67
As a result of the foregoing, our operating loss was RMB1,180.6 million in 2012, compared to an operating loss of RMB1,096.4 million in 2011. Our operating profit margin decreased to negative 32.1% in 2012 from negative 17.1% in 2011.
Interest Expense, Exchange Losses, Other Income, Changes in Fair Value of Derivative Contracts and Changes in Fair Value of Conversion Feature of Convertible Bonds
We generated interest income of RMB15.8 million and incurred interest expense of RMB299.5 million in 2012, compared to interest income of RMB11.8 million and interest expense of RMB171.1 million in 2011. The increase in interest expense was due primarily to an increase in the amount ofinterest-bearing bank borrowings.
We incurred exchange gain of RMB8.9 million in 2012, compared to exchange losses of RMB4.0 million in 2011, primarily due to the fluctuation of the U.S. dollar and Euro against the Renminbi.
Our other income increased to RMB9.3 million in 2012 from RMB5.1 million in 2011 due primarily to compensation from insurance. Our other expenses increased to RMB18.4 million in 2012 from RMB14.1 million in 2011, due primarily to an increase in bank charges.
We recorded RMB5.3 million in changes in fair value of derivative contracts to reflect the realized and unrealized net gain arising from the changes of fair value of our foreign currency derivative, commodity and interest rate swap contracts in 2012.
We recorded RMB5.7 million in changes in fair value of convertible feature of our convertible bonds in 2012, due primarily to the changes in the ADS price.
Income Tax Expense
Our income tax expense was RMB15.3 million in 2012, compared to an income tax benefit of RMB144.9 million in 2011, due primarily to the provision of valuation allowance of deferred tax assets.
Net Loss
As a result of the cumulative effect of the above factors, we had a net loss of RMB1,562.9 million in 2012, compared to a net loss of RMB930.1 million in 2011. Our net profit margin decreased to negative 42.5% in 2012 from negative 14.5% in 2011.
Inflation
Since our inception, inflation in China has not materially affected our results of operations. According to the National Bureau of Statistics of China, changes in the consumer price index in China were 5.4%, 2.6% and 2.6% in 2011, 2012 and 2013, respectively.
B.Liquidity and Capital Resources
We are a holding company, and conduct substantially all of our business through SolarOne Qidong, our wholly owned PRC operating subsidiary. The payment of dividends by entities organized in China is subject to limitations. Current PRC regulations permit our subsidiaries to pay dividends to us only out of their accumulated profits, if any, determined in accordance with PRC accounting standards and regulations. In addition, each of our subsidiaries in China is required to set aside a certain amount of itsafter-tax profits each year, if any, to fund certain statutory reserves. These reserves are not distributable as cash dividends. As of December 31, 2013, a total of RMB3,401.4 million (US$561.9 million) was not available for distribution to us in the form of dividends due to these PRC regulations.
68
Liquidity
The following table sets forth a summary of our cash flows for the periods indicated:
| | | | | | | | | | | | | | | | |
| | | Year Ended December 31, | |
| | | 2011 | | | 2012 | | | 2013 | |
| | | (RMB) | | | (RMB) | | | (RMB) | | | (US$) | |
| | | (In thousands) | |
Net cash provided by (used in) operating activities | | | 255,494 | | | | (1,052,213 | ) | | | 386,718 | | | | 63,882 | |
Net cash used in investing activities | | | (2,437,924 | ) | | | (534,517 | ) | | | (421,350 | ) | | | (69,602 | ) |
Net cash provided by financing activities | | | 2,528,208 | | | | 286,651 | | | | 607,637 | | | | 100,374 | |
Net increase (decrease) in cash and cash equivalents | | | 345,778 | | | | (1,300,079 | ) | | | 573,005 | | | | 94,654 | |
Cash Flows from Operating Activities
Net cash provided by operating activities primarily consists of net income (loss), as adjusted fornon-cash items such as change in fair value of the conversion feature of our convertible bonds, depreciation and amortization, warranty provision,share-based compensation expenses, provision for doubtful debts, provision for losses for advances to suppliers, deferred tax benefit, and the effect of changes in certain operating assets and liabilities line items such as inventories, other assets (including advance to suppliers,long-term prepayments and accounts receivable), amounts due to related parties, accounts payable, customer deposits, accrued expenses and other liabilities.
Our net cash provided by operating activities was RMB386.7 million (US$63.9 million) in 2013, which was derived from net loss of RMB874.1 million, adjusted to reflect a net increase relating tonon-cash items and a net increase relating to changes in operating assets and liabilities. The adjustments relating tonon-cash items were primarily comprised of depreciation and amortization of RMB436.1 million (US$72.0 million), a deferred tax expense of RMB254.1 million (US$42.0 million),write-down of inventories of RMB113.2 million (US$18.7 million) and the amortization of convertible bonds discount of RMB95.7 million (US$15.8 million). The adjustments relating to changes in operating assets and liabilities, which resulted in a net increase of RMB337.8 million, were primarily comprised of:
| | • | | an increase of RMB180.2 million (US$29.8 million) in notes payable and an increase in amount due to related parties of RMB103.2 million (US$17.1 million) due primarily to the increased purchase to meet the demand of gradually recovered solar market; and |
| | • | | a decrease of RMB68.4 million (US$11.3 million) in other current assets due primarily to less tax recoverable and less unbilled project revenue under percentage-of-completion method. |
Our net cash used in operating activities was RMB1,052.2 million in 2012, which was derived from net loss of RMB1,562.9 million, adjusted to reflect a net increase relating tonon-cash items and a net decrease relating to changes in operating assets and liabilities. The adjustments relating tonon-cash items were primarily comprised of an increase inwrite-down of inventories of RMB326.1 million, depreciation and amortization of RMB373.2 million, provision for doubtful collection of advances to supplier of RMB170.0 million, amortization of convertible bonds discount of RMB88.5 million and provision for doubtful collection of accounts receivable of RMB87.6 million. The adjustments relating to changes in operating assets and liabilities, which resulted in a net decrease of RMB781.3 million, were primarily comprised of:
| | • | | an increase of RMB508.3 million in accounts receivable and an increase in amount due from related parties of RMB195.1 million, due primarily to greater sales near the end of the year; |
| | • | | an increase of RMB480.7 million in inventories primarily as a result of increased finished goods due primarily to a decrease in sales; and |
| | • | | a decrease in advance to suppliers andlong-term prepayments of RMB159.3 million, primarily due to the decrease in silicon material price and smaller advances required by suppliers. |
69
Our net cash provided by operating activities was RMB255.5 million in 2011, which was derived from net loss of RMB930.1 million, adjusted to reflect a net increase relating tonon-cash items and a net decrease relating to changes in operating assets and liabilities. The adjustments relating tonon-cash items were primarily comprised of an increase inwrite-down of inventories of RMB583.1 million, depreciation and amortization of RMB218.6 million, provision for doubtful collection of advances to supplier of RMB287.7 million, provision for doubtful collection of other receivables of RMB54.0 million and impairment of goodwill of RMB134.7 million. The adjustments relating to changes in operating assets and liabilities, which resulted in a net increase of RMB184.3 million, were primarily comprised of:
| | • | | a decrease of RMB743.5 million in accounts receivable, due primarily to a decrease in sales; |
| | • | | an increase of RMB476.4 million in inventories primarily as a result of increased finished goods due primarily to a decrease in sales; |
| | • | | an increase in notes payable of RMB260.0 million and an increase in accounts payable of RMB121.9 million due primarily to costs incurred as a result of our capacity expansion in 2011; and |
| | • | | an increase of RMB206.4 million in other current assets, primarily because we were able to receive additional cash refund of VAT tax due to an increase in acquisition of fixed assets in 2011. |
Cash Flows from Investing Activities
Our net cash used in investing activities primarily consists of cash used for the acquisition of fixed assets.
Our net cash used in investing activities was RMB421.4 million (US$69.6 million) in 2013, primarily consisting of RMB426.3 million (US$70.4 million) of cash used for the acquisition of fixed assets, primarily our manufacturing machinery and equipment.
Our net cash used in investing activities was RMB534.5 million in 2012, primarily consisting of RMB598.0 million of cash used for the acquisition of fixed assets, primarily our manufacturing machinery and equipment.
Our net cash used in investing activities was RMB2,437.9 million in 2011, primarily consisting of RMB2,400.5 million of cash used for the acquisition of fixed assets, primarily our manufacturing machinery and equipment.
Cash Flows from Financing Activities
Our net cash generated from financing activities primarily consists of capital contributions by shareholders and proceeds fromshort-term bank borrowings, as offset by payments ofshort-term andlong-term bank borrowings.
Our net cash provided by financing activities was RMB607.6 million (US$100.4 million) in 2013. This was mainly attributable to proceeds fromshort-term borrowings of RMB2,152.7 million (US$355.6 million) and proceeds fromlong-term borrowings of RMB618.0 million (US$102.1 million), partially offset by payment ofshort-term borrowings of RMB2,209.5 million (US$365.0 million).
Our net cash provided by financing activities was RMB286.7 million in 2012. This was mainly attributable to proceeds fromshort-term borrowings of RMB2,661.2 million and proceeds fromlong-term borrowings of RMB1,369.4 million, partially offset by payment ofshort-term borrowings of RMB3,263.1 million.
Our net cash provided by financing activities was RMB2,528.2 million in 2011. This was mainly attributable to proceeds fromshort-term borrowings of RMB3,322.5 million and proceeds fromlong-term borrowings of RMB1,595.0 million, partially offset by payment ofshort-term borrowings of RMB1,877.1 million.
70
Capital Resources and Capital Expenditures
We have financed our operations primarily through cash flows from operations and also through bank loans andrelated-party loans and proceeds from our initial public offering, the convertible bond offering in January 2008, the continuous ADS offerings from July 2008 to August 2008 and from September 2009 to November 2009 and the ADS offering in November 2010. We believe our working capital is sufficient for our present requirements.
As of December 31, 2013, we hadshort-term bank borrowings from various commercial banks with an aggregate outstanding balance of RMB1,105.6 million (US$182.6 million). Ourshort-term bank borrowings bore average interest rates of 4.93%, 4.20% and 3.49% per annum in 2011, 2012 and 2013, respectively. Theseshort-term bank borrowings have terms of one month to one year, and expire at various times throughout the year. Some of ourshort-term bank borrowings were secured by land use rights and building ownership. As of December 31, 2013, the aggregate outstanding balance of the current portion of ourlong-term bank borrowings, which is due for repayment from January 1, 2014 to December 31, 2014, was RMB234.1 million (US$38.7 million) and the aggregate outstanding balance of the noncurrent portion of ourlong-term bank borrowings, which will be due after one year, but before three years, was RMB2,446.1 million (US$404.1 million). Ourlong-term bank borrowings outstanding as of December 31, 2013 bore an average interest rate of 3.54% per annum. We expect to continue to rollover our bank borrowings when they become due. To the extent we are unable to rollover our bank borrowings for whatever reason, we will repay such borrowings with cash generated from operating activities or alternative funding sources.
We have been buying back our convertible bonds from time to time since January 1, 2012 and may continue to do so in the future, subject to market conditions and other factors. In 2012, we repurchased our 2018 convertible bonds in a total principal amount of US$71.9 million. As of December 31, 2013, we had US$100.6 million principal amount of 2018 convertible bonds outstanding. The holders of the 2018 convertible bonds have the right to require us to repurchase all or a portion of the bonds on January 15, 2015 at a repurchase price equal to 100% of the principal amount of the bonds to be repurchased, plus accrued and unpaid interest, if any.
As of December 31, 2013, we had cash and cash equivalents in the amount of RMB1,249.5 million (US$206.4 million). Our cash and cash equivalents primarily consist of cash on hand and bank deposits, which are unrestricted as to withdrawal and use. Our advance to suppliers andlong-term prepayments in total was RMB680.2 million, RMB350.9 million and RMB314.1 million (US$51.9 million) as of December 31, 2011, 2012 and 2013, respectively. Our fixed assets were RMB4,716.0 million, RMB4,780.0 million and RMB4,482.7 million (US$740.5 million) as of December 31, 2011, 2012 and 2013, respectively.
As of December 31, 2013, we had commitments of approximately RMB4.1 million (US$0.8 million) related to the acquisition of fixed assets. The commitment for acquisition of fixed assets is expected to be settled within 2014.
Our capital expenditures were RMB2,437.9 million, RMB534.5 million and RMB421.4 million (US$69.6 million) in 2011, 2012 and 2013, respectively, all of which related primarily to the purchases of manufacturing equipment and facility construction costs. Based on the current market conditions, we expect to incur capital expenditures of approximately US$80.0 million in 2014, which will be used primarily to pay for automation of existing manufacturing lines. However, we will actively review our capacity expansion plan on a regular basis as the business environment evolves.
In January 2013, Hanwha SolarOne Hong Kong Limited entered into a subscription agreement with Samsung Securities (Asia) Ltd. and Kookmin Bank Hong Kong Ltd. to issue outside the United States US$100 million in floating rate notes due 2016 guaranteed by Hanwha Chemical Corporation. On June 27, 2013, SolarOne Qidong, secured a three-year US$100 million term loan facility from the Export-Import Bank of Korea (KEXIM) with a floating interest rate of three-month LIBOR, plus 1.99% per annum for working capital purposes, all of which was drawn down on June 27, 2013. We plan to fund the balance of our capital expenditure
71
requirements for 2013 with cash from operations, additional bank borrowings, and other forms of financing, if necessary. In December 2013, we entered into a framework agreement with the Bank of Beijing for access of up to RMB3.5 billion of credit over the a three-year period, with specific drawdowns subject to the approval procedures of the Bank of Beijing, including reviews of the specific applicable project information.
Recent Accounting Pronouncements
In March 2013, the Financial Accounting Standards Board (“FASB”) issued Accounting Standards Update (“ASU”) No. 2013-05 (“ASU 2013-05”), Parent’s Accounting for the Cumulative Translation Adjustment upon Derecognition of Certain Subsidiaries or Groups of Assets within a Foreign Entity or of an Investment in a Foreign Entity, which specifies that a cumulative translation adjustment (“CTA”) should be released into earnings when an entity ceases to have a controlling financial interest in a subsidiary or group of assets within a consolidated foreign entity and the sale or transfer results in the complete or substantially complete liquidation of the foreign entity. For sales of an equity method investment that is a foreign entity, a pro rata portion of CTA attributable to the investment would be recognized in earnings when the investment is sold. When an entity sells either a part or all of its investment in a consolidated foreign entity, CTA would be recognized in earnings only if the sale results in the parent no longer having a controlling financial interest in the foreign entity. In addition, CTA should be recognized in earnings in a business combination achieved in stages. For public entities, ASU 2013-05 is effective for reporting periods beginning after December 15, 2013, with early adoption permitted. We will adopt ASU 2013-05 on January 1, 2014 and does not expect the adoption to have a material impact on our consolidated financial statements.
In July 2013, the FASB issued ASU No. 2013-11, Income Taxes (Topic 740) (“ASU 2013-11”) to provide guidance on the financial statement presentation of an unrecognized tax benefit when a net operating loss carryforward, similar tax loss, or tax credit carryforward exists. ASU 2013-11 requires an unrecognized tax benefit, or a portion of an unrecognized tax benefit, to be presented in the financial statements as a reduction to a deferred tax asset for a net operating loss carryforward, a similar tax loss, or a tax credit carryforward, with certain exceptions. The modifications to ASC Topic 740 resulting from the issuance of ASU 2013-11 are effective for fiscal years beginning after December 15, 2013 and interim periods within those years. Early adoption is permitted. We will adopt ASU 2013-11 beginning January 1, 2014 and does not expect the adoption to have a material impact on our consolidated financial statements and disclosures.
C.Research and Development, Patents and Licenses
The PV industry is characterized by rapidly evolving technology advancements. Achieving fast and continual technology improvements is of critical importance to maintaining our competitive advantage. Our research and development efforts concentrate on lowering production costs per watt by increasing the conversion efficiency rate of our products and reducing silicon usage by reducing the thickness of PV cells.
We have been developing advanced technologies to improve the conversion efficiency and reduce the production cost of our PV products. We have successfully applied shallow emitters and metal contacting pastes optimized for shallow emitters to our production lines, and we have implemented novel metallization patterns that reduce silver usage. We have successfully tested advanced texturing and rear passivation technologies in our pilot line and are evaluating the cost effectiveness of commercializing these technologies. We have demonstratedgood-quality cells usinglow-cost poly silicon mixtures. We have designed, built and tested new module product designs that increase modulesunlight-to-electricity conversion efficiency, decrease systems installation costs, increase module tolerance ofnon-uniform illumination, and facilitate new applications, such aslow-cost frameless laminate installation andbuilding-integrated installation. In 2011, 2012 and 2013, our research and development expenses were RMB68.2 million, RMB90.8 million and RMB92.3 million (US$15.2 million), respectively.
Our research and development department works closely with our manufacturing department to lower production costs by improving our production efficiency. In April 2007, we established the SolarOne PV
72
Engineering Center. The SolarOne PV Engineering Center is located near our manufacturing facilities in Qidong, Jiangsu Province, and equipped with a pilot production line and various characterization tools. The center focuses on improving cell conversion efficiency and expanding the application of solar cells. We are also working together with universities and research institutes to develop new technology and products.
D.Trend Information
Other than as disclosed elsewhere in this annual report, we are not aware of any trends, uncertainties, demands, commitments or events since January 1, 2014 that are reasonably likely to have a material adverse effect on our net revenues, income, profitability, liquidity or capital resources, or that caused the disclosed financial information to be not necessarily indicative of future operating results or financial conditions.
E.Off-Balance Sheet Arrangements
We have not entered into any financial guarantees or other commitments to guarantee the payment obligations of third parties. We have not entered into any derivative contracts that are indexed to our shares and classified as shareholders’ equity, or that are not reflected in our consolidated financial statements. Furthermore, we do not have any retained or contingent interest in assets transferred to an unconsolidated entity that serves as credit, liquidity or market risk support to such entity. We do not have any variable interest in any unconsolidated entity that provides financing, liquidity, market risk or credit support to us or that engages in leasing, hedging or research and development services with us.
F.Tabular Disclosure of Contractual Obligations
The following table sets forth our contractual obligations as of December 31, 2013:
| | | | | | | | | | | | | | | | | | | | |
| | | Payment Due by Period | |
| | | Total | | | Less than 1
Year | | | 1-3 Years | | | 3-5 Years | | | More than
5 Years | |
| | | (In RMB thousands) | |
Operating lease obligations | | | 5,014 | | | | 2,759 | | | | 2,255 | | | | — | | | | — | |
Long-term debt obligations(1) | | | 4,105,295 | | | | 312,640 | | | | 3,792,655 | | | | — | | | | — | |
Commitments relating to the acquisition of fixed assets | | | 4,098 | | | | 4,098 | | | | — | | | | — | | | | — | |
Unrecognized tax benefit | | | 143,473 | | | | 143,473 | | | | — | | | | — | | | | — | |
Total | | | | | | | | | | | | | | | | | | | | |
| (1) | The long-term debt obligations represent the principals and interests of (i) long-term bank borrowings, (ii) convertible bonds and (iii) long-term notes. Please see “Bank Borrowings” under Note 11, “Long-Term Notes” under Note 17 and “Convertible Bonds” under Note 22 to our audited consolidated financial statements. |
G.Safe Harbor
This annual report on Form20-F containsforward-looking statements that relate to future events, including our future operating results and conditions, our prospects and our future financial performance and condition, all of which are largely based on our current expectations and projections. Theforward-looking statements are contained principally in the sections entitled “Item 3.D. Risk Factors,” “Item 4. Information on the Company” and “Item 5. Operating and Financial Review and Prospects.” These statements are made under the “safe harbor” provisions of the U.S. Private Securities Litigation Reform Act of 1995. You can identify theseforward-looking statements by terminology such as “may,” “will,” “expect,” “anticipate,” “future,” “intend,” “plan,” “believe,” “estimate,” “is/are likely to” or other and similar expressions.Forward-looking statements involve inherent risks and uncertainties. A number of factors could cause actual results to differ materially from those contained in anyforward-looking statement, including but not limited to the following:
| | • | | our expectations regarding the worldwide demand for electricity and the market for solar energy; |
| | • | | our beliefs regarding the effects of environmental regulation, lack of infrastructure reliability andlong-term fossil fuel supply constraints; |
73
| | • | | our beliefs regarding the inability of traditional fossilfuel-based generation technologies to meet the demand for electricity; |
| | • | | our beliefs regarding the importance of environmentally friendly power generation; |
| | • | | our expectations regarding governmental support for the deployment of solar energy; |
| | • | | our beliefs regarding the acceleration of adoption of solar technologies; |
| | • | | our expectations with respect to advancements in our technologies; |
| | • | | our beliefs regarding the competitiveness of our solar products; |
| | • | | our expectations regarding the scaling of our manufacturing capacity; |
| | • | | our expectations with respect to revenue growth and profitability; |
| | • | | our expectations with respect to our ability to secure raw materials, especially silicon and silicon wafers, in the future; |
| | • | | competition from other manufacturers of PV products and conventional energy suppliers; |
| | • | | our future business development, results of operations and financial condition; and |
| | • | | future economic or capital market conditions. |
This annual report on Form20-F also contains data related to the PV market worldwide and in China taken fromthird-party reports. The PV market may not grow at the rates projected by the market data, or at all. The failure of the market to grow at the projected rates may have a material adverse effect on our business and the market price of the ADSs. In addition, the rapidly changing nature of the PV market subjects any projections or estimates relating to the growth prospects or future condition of our market to significant uncertainties. If any one or more of the assumptions underlying the market data turns out to be incorrect, actual results may differ from the projections based on these assumptions. You should not place undue reliance on theseforward-looking statements.
Theforward-looking statements made in this annual report on Form20-F relate only to events or information as of the date on which the statements are made in this annual report on Form20-F. Except as required by law, we undertake no obligation to update or revise publicly anyforward-looking statements, whether as a result of new information, future events or otherwise, after the date on which the statements are made or to reflect the occurrence of unanticipated events. You should read this annual report on Form20-F completely and with the understanding that our actual future results may be materially different from what we expect.
ITEM 6 DIRECTORS, SENIOR MANAGEMENT AND EMPLOYEES
A.Directors and Senior Management
Directors and Executive Officers
The following table sets forth information regarding our directors and executive officers.
| | | | | | |
Name | | Age | | | Position/Title |
Ki-Joon Hong | | | 64 | | | Chairman and Chief Executive Officer |
Min Su Kim | | | 49 | | | Director and President |
Thomas J. Toy | | | 59 | | | Independent Director |
Ernst A. Bütler | | | 70 | | | Independent Director |
David N. K. Wang | | | 68 | | | Independent Director |
Jung Pyo Seo | | | 48 | | | Chief Financial Officer |
74
Directors
Mr. Ki-Joon Hong has served as our chairman of the board since December 20, 2010 and chief executive officer since July 2011. He is the CEO of Hanwha Chemical Corporation. Prior to his current position,Ki-Joon was the CEO of Hanwha Chemical’s pharmaceutical and refinery businesses. Under his leadership, Hanwha Chemical entered into solar energy and secondary battery businesses and also actively expanded its overseas operations, forming a joint venture in Saudi Arabia and building a PVC factory in Ningbo, Zhejiang. He received a B.S. in Chemical Engineering from Seoul National University.
Mr. Min Su Kim has served as our president since October 2012 and our director since November 2012. He also serves as a member of our corporate governance and nominating committee. Mr. Kim has over 25 years of experience in corporate planning, finance, marketing and sales. He most recently served as the vice president of the planning office of Hanwha Group Headquarters, responsible for developingshort- andlong-term strategic plans for the group. Mr. Kim served as the vice president of the corporate planning office of Hanwha Chemical Corporation from 2008 to 2011, senior manager of PE & CA marketing team of Hanwha Chemical Corporation from 2000 to 2008 and general manager of the marketing team of Kemira Chemicals Korea Corporation from 1998 to 2000, and held various positions at Hanwha Chemical Corporation from 1987 to 1998. Mr. Kim received his bachelor’s degree in business administration from Seoul National University in 1987, and received his master’s degree in business administration from London Business School in 2011.
Mr. Thomas J. Toy has served as our independent director since November 2006. He also serves as the chairman of our audit committee and corporate governance and nominating committee and as a member of our compensation committee. His other current positions include director of several privately held companies. Mr. Toy is co founder and managing director of PacRim Venture Partners, a venture capital firm based in Menlo Park, California, since 1999, is a venture partner/advisor for ICCP Ventures, a venture capital firm, and a general partner of Startup Capital Ventures. Formerly, he was a partner with SmartForest Ventures, a venture capital firm based in Portland, Oregon and a partner and managing director of the Corporate Finance Division of Technology Funding, a venture capital firm based in San Mateo, California. From 1979 to 1987, Mr. Toy held several positions at Bank of America National Trust and Savings Association, including vice president. He received his bachelor’s and master’s degrees from Northwestern University in the United States.
Mr. Ernst A. Bütler has served as our independent director since November 2006. He also serves as the chairman of our compensation committee and as a member of our audit committee and as a member of our corporate governance and nominating committee. Mr. Bütler has been an independent board member/consultant and owner of E.A. Bütler Management in Zürich since 2005. His other current positions include chairman of the board of AA-Partners, Zurich, and chairman of the board of Asset Finance Partners Ltd., Zurich, member of the advisory board of XBiotech Inc., Austin/Texas/USA, member of the board of XBiotech Switzerland AG, Zug, XBiotech Germany GmbH, Frankfurt, ImmNeuweg AG, Dubendorf, ImmForch AG, Forch, Switzerland and Lhotse Capital Advisors Limited, Hamilton/Bermuda. From 1999 to 2005, he was a partner of Partners Group in Zug, the largest independent Asset Manager of Private Equity in Europe. Mr. Bütler spent over 25 years with Credit Suisse and Credit Suisse First Boston, with his last assignments being Managing Director and co-head of Corporate and Investment Banking Switzerland and Global Head of Multinational Division. He received a bachelor’s degree from the School of Economics and Business Administration in Zürich in 1973, and attended post-graduate programs at the University of Massachusetts in the United States, the INSEAD, Fontainebleau, Paris, and at the Massachusetts Institute of Technology, Boston, USA.
Dr. David N.K. Wang has served as our independent director since April 2009. He also serves as a member of our audit committee, compensation committee and corporate governance and nominating committee. Dr. Wang is currently the chairman of the board of Ether Optronics Inc. and was the president and chief executive officer of Semiconductor Manufacturing International Corporation (SMIC) and an overseas advisor to the Ministry of Science and Technology of the People’s Republic of China from 2009 to 2011. He is also an advisor to the Greater China Innovation and Entrepreneurship project of Stanford University in the United States.
75
He was a member of the board of directors of Semiconductor Equipment and Materials International (SEMI) and chairman of its China Regional Advisory Board. From September 2005 to June 2007, Dr. Wang served as the chief executive officer of Huahong Group and concurrently chairman of Huahong NEC, a subsidiary of Huahong Group. Prior to joining Huahong Group, Dr. Wang served as executive vice president of Applied Materials and president of Applied Materials Asia. Dr. Wang was responsible for Applied Materials’ business strategy, planning and execution throughout Asia. Dr. Wang has also been a member of, chaired and helped found a variety of councils, committees and associations related to technology and Asia Pacific business and economy. He received his Ph.D. degree in Materials Science from the University of California, Berkeley.
Non-Director Executive Officers
Mr. Jung Pyo Seo has served as our chief financial officer since July 2011. Prior to his current position, Mr. Seo served as chief financial officer and chief operating officer of Azdel Inc., in Virginia from 2008 to 2011. While with Azdel Inc., Mr. Seo rebuilt the company’s cash and debt management systems and processes, implemented a new ERP system, managed commercial banking relationships, raised capital and helped the company expand market share in a competitive market with rising raw material prices. He also played an important role in the acquisition andpost-acquisition integration of Azdel Inc. by Hanwha Corporation. Prior to that, Mr. Seo held a variety of accounting, finance andsales-related positions at Hanwha Resorts Corporation and Hanwha Chemical Corporation for 12 years. Mr. Seo received an MBA with a concentration in Finance from the University of Washington, and a B.A. with a concentration in Finance and Accounting from Seoul National University.
B.Compensation
Compensation
In 2011, 2012 and 2013, we paid aggregate cash compensation of RMB3.0 million, RMB9.2 million and RMB6.1 million (US$1.0 million), respectively, to our directors and executive officers. For options granted to officers and directors, see “—2006 Share Option Plan” and “—2007 Equity Incentive Plan.”
The purposes of our 2006 share option plan and 2007 equity incentive plan are to attract and retain the best available personnel for positions of substantial responsibility, provide additional incentive to employees, directors and consultants and promote the success of our business. Our board of directors believes that our company’slong-term success is dependent upon our ability to attract and retain superior individuals who, by virtue of their ability, experience and qualifications, make important contributions to our business.
2006 Share Option Plan
We adopted our 2006 share option plan in November 2006. Our 2006 share option plan provides for the grant of options to purchase our ordinary shares, subject to vesting.
Administration. Our 2006 share option plan is administered by the compensation committee of our board of directors. The committee will determine the provisions, terms and conditions of each option grant, including, but not limited to, the exercise price for the options, vesting schedule, forfeiture provisions, form of payment of exercise price and other applicable terms. The exercise price may be adjusted in the event of certain share or rights issuances by our company.
Option Exercise. Our 2006 Share Option Plan requires the options be vested over five years in equal portions, except that the vesting schedule of options granted to certain of our professionals, independent directors and advisors may be less than five years if our compensation committee deems it necessary and appropriate. The options, once vested, are exercisable at any time before November 30, 2016, at which time the options will become null and void. The exercise prices of the options are determined by the compensation committee.
76
Termination of Awards. Options granted under our 2006 share option plan have specified terms set forth in a share option agreement. Each employee who has been granted options shall undertake to work for our company for at least five years starting from the grant date, or for such term as is otherwise specified in the individual’s share option agreement. In the event that the employee’s employment with our company terminates without cause, the employee shall be entitled to exercise his or her vested options within three months of his or her termination, and any unvested options will be forfeited to our company. However, if instead the employee’s employment is terminated by our company for cause, all of his or her unexercised options, whether vested or unvested, will be forfeited to our company.
Share Split or Combination. In the event of a share split or combination of our ordinary shares, the options, whether exercised or not, shall be split or combined at the same ratio.
Amendment and Termination of Plan. Our compensation committee may at any time amend, suspend or terminate our 2006 share option plan. Amendments to our 2006 share option plan are subject to shareholder approval, to the extent required by law, or by stock exchange rules or regulations. Any amendment, suspension or termination of our 2006 share option plan may not adversely affect awards already granted without written consent of the recipient of such awards.
Our board of directors authorized the issuance of up to 10,799,685 ordinary shares upon exercise of awards granted under our 2006 share option plan. The following table sets forth certain information regarding our outstanding options under our 2006 share option plan as of the date of this annual report.
| | | | | | | | | | | | | | | | |
Name | | Ordinary Shares
Underlying
Outstanding Option | | | Exercise Price | | | Grant Date | | | Expiration Date | |
| | | | | | (US$/share) | | | | | | | |
Ki-Joon Hong | | | — | | | | — | | | | — | | | | — | |
Min Su Kim | | | — | | | | — | | | | — | | | | — | |
Thomas J. Toy | | | 120,000 | | | | 1.8 | | | | November 30, 2006 | | | | November 30, 2016 | |
Verena Maria Bütler (wife of Ernst A. Bütler) | | | 180,000 | | | | 1.8 | | | | November 30, 2006 | | | | November 30, 2016 | |
David N.K. Wang | | | — | | | | — | | | | — | | | | — | |
Jung Pyo Seo | | | — | | | | — | | | | — | | | | — | |
Other individuals as a group | | | 246,400 | | | | 1.8 | | | | November 30, 2006 | | | | November 30, 2016 | |
| | | 150,000 | | | | 2.02 | | | | August 16, 2007 | | | | November 30, 2016 | |
| | | 100,000 | | | | 2.58 | | | | October 26, 2007 | | | | November 30, 2016 | |
| | | 50,000 | | | | 2.73 | | | | November 1, 2007 | | | | November 30, 2016 | |
| | | 100,000 | | | | 5.31 | | | | December 13, 2007 | | | | November 30, 2016 | |
| | | 146,250 | | | | 2.15 | | | | March 6, 2008 | | | | November 30, 2016 | |
Total | | | 1,092,650 | | | | | | | | | | | | | |
| — | No outstanding share option was held by such person. |
2007 Equity Incentive Plan
We adopted our 2007 equity incentive plan in August 2007. It provides for the grant of options, restricted stock, restricted stock units, stock appreciation rights, performance units and performance stock to our employees, directors and consultants. The maximum aggregate number of our ordinary shares that may be issued under the 2007 equity incentive plan is 10,799,685. In addition, the plan provides for an annual increase in the number of shares available for issuance on the first day of each fiscal year, beginning with our 2008 fiscal year, equal to 2% of our then outstanding ordinary shares or such lesser amount as our board of directors may determine.
77
Administration. Different committees with respect to different groups of service providers, comprised of members of our board or other individuals appointed by the board, may administer our 2007 equity incentive plan. The administrator has the power to determine which individuals are eligible to receive an award, the terms of the awards, including the exercise price (if any), the number of shares subject to an award, the exercisability of the awards and the form of consideration payable upon exercise.
Options. The exercise price of incentive stock options must be at least equal to the fair market value of our ordinary shares on the date of grant; however, the overseas price of ournon-statutory stock options may be as determined by the administrator. The term of an incentive stock option may not exceed ten years, except that with respect to any participant who owns 10% of the voting power of all classes of our outstanding shares as of the grant date, the term must not exceed five years and the exercise price must equal at least 110% of the fair market value on the grant date. The administrator determines the term of all other options. Upon the termination of the service of a participant, he or she may exercise his or her vested options for the period of time stated in the option agreement, and any unvested options are forfeited to our company. Generally, if termination is due to death or disability, the option will remain exercisable for twelve months. In all other cases, the option will generally remain exercisable for three months. However, an option generally may not be exercised later than the expiration of its term.
Restricted Stock. Restricted stock awards are ordinary shares that vest in accordance with terms and conditions established by the administrator and set forth in an award agreement. The administrator will determine the number of shares of restricted stock granted to any employee and may impose whatever conditions to vesting it determines to be appropriate.
Stock Appreciation Rights. Stock appreciation rights allow the recipient to receive the appreciation in the fair market value of our ordinary shares between the date of grant and the exercise date. The exercise price of stock appreciation rights granted under our plan may be as determined by the administrator. Stock appreciation rights expire under the same rules that apply to options.
Performance Units and Performance Shares. Performance units and performance shares are awards that will result in a payment to a participant generally only if performance goals established by the administrator are achieved. The administrator will establish organizational or individual performance goals in its discretion, which, depending on the extent to which they are met, will determine the number and the value of performance units and performance shares to be paid out to participants.
Restricted Stock Units. Restricted stock units are similar to awards of restricted stock, but are not settled unless the award vests. Restricted stock units may consist of restricted stock, performance share or performance unit awards, and the administrator may set forth restrictions based on the achievement of specific performance goals.
Amendment and Termination. Our 2007 equity incentive plan will automatically terminate in 2017, unless we terminate it sooner. Our board of directors has the authority to amend, alter, suspend or terminate the plan provided such action does not impair the rights of any participant with respect to any outstanding awards.
78
Our board of directors authorized the issuance of up to 10,799,685 ordinary shares upon exercise of awards granted under our 2007 equity incentive plan. The following table sets forth certain information regarding our outstanding options under our 2007 equity incentive plan as of the date of this annual report.
| | | | | | | | | | | | | | | | |
Name | | Ordinary Shares
Underlying
Outstanding Option | | | Exercise Price | | | Date of Grant | | | Expiration Date | |
| | | | | | (US$/share) | | | | | | | |
Ki-Joon Hong | | | — | | | | — | | | | — | | | | — | |
Min Su Kim | | | — | | | | — | | | | — | | | | — | |
Thomas J. Toy | | | — | | | | — | | | | — | | | | — | |
Ernst A. Bütler | | | — | | | | — | | | | — | | | | — | |
David N.K. Wang | | | 300,000 | | | | 0.88 | | | | April 2, 2009 | | | | April 2, 2019 | |
Jung Pyo Seo | | | — | | | | — | | | | — | | | | — | |
Other individuals as a group | | | 20,000 | | | | 4.376 | | | | May 28, 2008 | | | | May 28, 2018 | |
| | | 20,000 | | | | 2.42 | | | | September 26, 2008 | | | | September 26, 2018 | |
| | | 511,300 | | | | 1.344 | | | | October 16, 2008 | | | | October 16, 2018 | |
| | | 5,000 | | | | 1.344 | | | | March 17, 2009 | | | | March 17, 2019 | |
| | | 121,500 | | | | 1.188 | | | | September 11, 2009 | | | | September 11, 2019 | |
| | | 373,800 | | | | 1.372 | | | | December 3, 2009 | | | | December 3, 2019 | |
| | | 150,000 | | | | 1.08 | | | | December 28, 2009 | | | | December 28, 2019 | |
| | | 50,000 | | | | 1.496 | | | | June 28, 2010 | | | | June 28, 2010 | |
Total | | | 1,551,600 | | | | | | | | | | | | | |
| — | No outstanding share option was held by such person. |
The following table sets forth certain information regarding our granted restricted stock units under our 2007 equity incentive plan as of the date of this annual report.
| | | | | | | | | | | | |
Name | | Ordinary Shares
Underlying Granted
Restricted Stock
Units | | | Date of Grant | | | Expiration Date | |
Ki-Joon Hong | | | — | | | | — | | | | — | |
Min Su Kim | | | — | | | | — | | | | — | |
Thomas J. Toy | | | 37,500 | | | | January 1, 2011 | | | | January 1, 2021 | |
| | | 37,500 | | | | January 1, 2012 | | | | January 1, 2022 | |
| | | 75,000 | | | | January 1, 2013 | | | | January 1, 2023 | |
| | | 75,000 | | | | January 1, 2014 | | | | January 1, 2024 | |
Verena Maria Bütler (wife of Ernst A. Bütler) | | | 37,500 | | | | January 1, 2011 | | | | January 1, 2021 | |
| | | 37,500 | | | | January 1, 2012 | | | | January 1, 2022 | |
| | | 75,000 | | | | January 1, 2013 | | | | January 1, 2023 | |
| | | 75,000 | | | | January 1, 2014 | | | | January 1, 2024 | |
David N.K. Wang | | | 37,500 | | | | January 1, 2011 | | | | January 1, 2021 | |
| | | 37,500 | | | | January 1, 2012 | | | | January 1, 2022 | |
| | | 75,000 | | | | January 1, 2013 | | | | January 1, 2023 | |
| | | 75,000 | | | | January 1, 2014 | | | | January 1, 2024 | |
Jung Pyo Seo | | | — | | | | — | | | | — | |
Other individuals as a group | | | 110,000 | | | | February 28, 2011 | | | | February 28, 2021 | |
| | | 225,000 | | | | May 31, 2011 | | | | May 31, 2021 | |
| | | 112,500 | | | | July 28, 2011 | | | | July 28, 2021 | |
| | | 412,500 | | | | November 29, 2011 | | | | November 29, 2021 | |
| | | 225,000 | | | | April 30, 2012 | | | | April 30, 2022 | |
| | | 112,500 | | | | June 28, 2012 | | | | June 28, 2022 | |
| | | 25,000 | | | | May 28, 2013 | | | | May 28, 2023 | |
Total | | | 1,897,500 | | | | | | | | | |
| — | No restricted stock units have been granted to such person. |
79
C.Board Practices
Committees of the Board of Directors
Audit Committee
Our audit committee consists of Mr. Thomas J. Toy, Mr. Ernst A. Bütler and Mr. David N.K. Wang, and is chaired by Mr. Thomas J. Toy, a director with accounting and financial management expertise as required by the Nasdaq corporate governance rules, or the Nasdaq Rules.
All of the members of our audit committee all satisfy the “independence” requirements of the Nasdaq Rules. The audit committee oversees our accounting and financial reporting processes and the audits of the financial statements of our company. The audit committee is responsible for, among other things:
| | • | | selecting our independent auditors andpre-approving all auditing andnon-auditing services permitted to be performed by our independent auditors; |
| | • | | reviewing with our independent auditors any audit problems or difficulties and management’s response; |
| | • | | reviewing and approving all proposed related party transactions, as defined in Item 404 ofRegulation S-K under the Securities Act; |
| | • | | discussing the annual audited financial statements with management and our independent auditors; |
| | • | | reviewing major issues as to the adequacy of our internal control and any special audit steps adopted in light of material control deficiencies; |
| | • | | annually reviewing and reassessing the adequacy of our audit committee charter; |
| | • | | such other matters that are specifically delegated to our audit committee by our board of directors from time to time; |
| | • | | meeting separately and periodically with management and our internal and independent auditors; and |
| | • | | reporting regularly to our board of directors. |
Our audit committee has established a “whistleblower” reporting system to allow individuals to make anonymous communications to the audit committee regarding financial and accounting matters relating to our company.
Compensation Committee
Our compensation committee consists of Mr. Ernst A. Bütler, Mr. Thomas J. Toy and Mr. David N.K. Wang, and is chaired by Mr. Ernst A. Bütler. All of the members of our compensation committee satisfy the “independence” requirements of the Nasdaq Rules.
Our compensation committee assists our board of directors in reviewing and approving the compensation structure of our directors and executive officers, including all forms of compensation to be provided to our directors and executive officers. Members of the compensation committee are not prohibited from direct involvement in determining their own compensation. Our chief executive officer may not be present at any committee meeting during which his compensation is deliberated. The compensation committee is responsible for, among other things:
| | • | | approving and overseeing the compensation package for our executive officers; |
| | • | | reviewing and making recommendations to our board of directors with respect to the compensation of our directors; |
80
| | • | | reviewing and approving corporate goals and objectives relevant to the compensation of our chief executive officer, evaluating the performance of our chief executive officer in light of those goals and objectives, and setting the compensation level of our chief executive officer based on this evaluation; and |
| | • | | reviewing periodically and making recommendations to our board of directors regarding anylong-term incentive compensation or equity plans, programs or similar arrangements, annual bonuses, employee pension and welfare benefit plans. |
Corporate Governance and Nominating Committee
Our corporate governance and nominating committee consists of Mr. Thomas J. Toy, Mr. Ernst A. Bütler, Mr. David N.K. Wang and Mr. Minsu Kim, and is chaired by Mr. Thomas J. Toy.
The corporate governance and nominating committee assists our board of directors in identifying individuals qualified to become our directors and in determining the composition of our board of directors and its committees. The corporate governance and nominating committee is responsible for, among other things:
| | • | | identifying and recommending nominees for election orre-election to our board of directors, or for appointment to fill any vacancy; |
| | • | | reviewing annually with our board of directors its current composition in light of the characteristics of independence, age, skills, experience and availability of service to us; |
| | • | | identifying and recommending to our board the directors to serve as members of committees; |
| | • | | advising the board periodically with respect to significant developments in the law and practice of corporate governance as well as our compliance with applicable laws and regulations, and making recommendations to our board of directors on all matters of corporate governance and on any corrective action to be taken; and |
| | • | | monitoring compliance with our code of business conduct and ethics, including reviewing the adequacy and effectiveness of our procedures to ensure proper compliance. |
Duties of Directors
Under Cayman Islands law, our directors have a fiduciary duty to act honestly, in good faith and with a view to our best interests. Our directors also have a duty to exercise the skill they actually possess and such care and diligence that a reasonably prudent person would exercise in comparable circumstances. In fulfilling their duty of care to us, our directors must ensure compliance with our memorandum and articles of association, as amended and restated from time to time.
Terms of Directors and Executive Officers
Our directors hold office until the expiration of the term of their election or until such time as they resign, which may take place from time to time, or they are removed from office by ordinary resolution or the unanimous written resolution of all shareholders. A director will be removed from office automatically if, among other things, the director becomes bankrupt or makes any arrangement or composition with his creditors, or dies or is found by our company to be or to have become of unsound mind. Our officers are appointed by and serve at the discretion of our board of directors.
The service contracts of our directors do not provide for benefits upon termination of their directorship.
81
Employment Agreements
We have entered into employment agreements with all of our executive officers. Under these agreements, each of our executive officers is employed for a specified time period. We may terminate his or her employment for cause at any time for certain acts of the employee.
Each executive officer has agreed to hold, both during and subsequent to the terms of his or her agreement, in confidence and not to use, except in pursuance of his or her duties in connection with the employment, any of our confidential information, technological secrets, commercial secrets andknow-how. Our executive officers have also agreed to disclose to us all inventions, designs and techniques which resulted from work performed by them, and to assign us all right, title and interest of such inventions, designs and techniques.
Additionally, our executive officers are typically bound bynon-competition provisions contained in their employment agreements that prohibit them from engaging in activities that compete with our business during and for a certain period after their employment with our company.
On June 29, 2007, China has adopted the New Employment Contract Law, or the New Employment Law, which came into effect on January 1, 2008. The New Employment Law sets forth certain key requirements, such as the requirement for a written employment contract, limitations on probation period, and clauses on severance pay that might marginally affect the cost of employment in China. However, we do not expect the New Employment Law will substantially impact our business.
D.Employees
The following table sets forth the number of ourfull-time employees by function as of December 31, 2011, 2012 and 2013:
| | | | | | | | | | | | |
| | | As of December 31, | |
| | | 2011 | | | 2012 | | | 2013 | |
Manufacturing and engineering | | | 7,691 | | | | 4,839 | | | | 5,904 | |
General and administration | | | 351 | | | | 300 | | | | 353 | |
Quality control | | | 921 | | | | 630 | | | | 277 | |
Research and development | | | 165 | | | | 104 | | | | 102 | |
Purchasing and logistics | | | 377 | | | | 271 | | | | 260 | |
Marketing and sales | | | 119 | | | | 108 | | | | 109 | |
| | | | | | | | | | | | |
Total | | | 9,624 | | | | 6,252 | | | | 7,005 | |
We offer our employees competitive compensation packages and various training programs, and as a result we have generally been able to attract and retain qualified personnel.
As required by PRC regulations, we participate in various employee benefit plans that are organized by municipal and provincial governments, including housing, pension, medical and unemployment benefit plans. We are required under PRC law to make contributions to the employee benefit plans at specified percentages of the salaries, bonuses and certain allowances of our employees, up to a maximum amount specified by the local government from time to time. Members of the retirement plan are entitled to a pension equal to a fixed proportion of their salaries. The total amount of contributions we made to employee benefit plans in 2011, 2012 and 2013 was RMB84.5 million, RMB79.5 million and RMB84.5 million (US$14.0 million), respectively.
We adopted our 2006 share option plan in November 2006, which provides an additional means to attract, motivate, retain and reward selected directors, officers, managers, employees and other eligible persons. An aggregate of 10,799,685 ordinary shares has been reserved for issuance under this plan. As of December 31, 2013, there were outstanding options to purchase 1,572,650 ordinary shares under our 2006 share option plan.
82
We adopted our 2007 equity incentive plan in August 2007. It provides for the grant of options, restricted stock, restricted stock units, stock appreciation rights, performance units and performance stock to our employees, directors and consultants. The maximum aggregate number of our ordinary shares that may be issued under the 2007 equity incentive plan is 10,799,685. In addition, the plan provides for an annual increase in the number of shares available for issuance on the first day of each fiscal year, beginning with our 2008 fiscal year, equal to 2% of our then outstanding ordinary shares or such lesser amount as our board of directors may determine. As of December 31, 2013, there were outstanding options to purchase 1,816,038 ordinary shares under our 2007 share option plan.
We typically enter into a standard confidentiality andnon-competition agreement with our management and research and development personnel. These contracts include a covenant that prohibits these individuals from engaging in any activities that compete with our business during, and for two years after, the period of their employment with our company.
We believe we maintain a good working relationship with our employees, and we have not experienced any significant labor disputes or any difficulty in recruiting staff for our operations. On March 29, 2013, SolarOne Qidong signed a collective bargaining agreement in accordance with the guidelines of the PRC labor law. The collective bargaining agreement covers all of the employees of SolarOne Qidong who are PRC citizens and is effective from March 29, 2013 to March 28, 2016.
E.Share Ownership
The following table sets forth information with respect to the beneficial ownership of our ordinary shares as of the date of this annual report, by:
| | • | | each of our directors and executive officers; and |
| | • | | each person known to us to own beneficially more than 5.0% of our ordinary shares. |
| | | | | | | | |
| | | Shares Beneficially Owned(1)(2) | |
| | | Number | | | % | |
Directors and Executive Officers: | | | | | | | | |
Ki-Joon Hong | | | — | | | | — | |
Min Su Kim | | | — | | | | — | |
Thomas J. Toy | | | 106,250 | | | | 0.02 | % |
Verena Maria Bütler (wife of Ernst A. Bütler) | | | 479,990 | | | | 0.10 | % |
David N.K. Wang | | | 425,000 | | | | 0.09 | % |
Jung Pyo Seo | | | — | | | | — | |
All Directors and Executive Officers as a Group(3) | | | — | | | | — | |
Major Shareholders: | | | | | | | | |
Hanwha Solar Holdings Co., Ltd.(4) | | | 209,249,448 | | | | 45.77 | % |
| — | The person does not beneficially own any ordinary share or options exercisable within 60 days of the date of this annual report. |
Notes:
| (1) | Beneficial ownership is determined in accordance with Rule13d-3 of the General Rules and Regulations under the Securities Exchange Act of 1934, as amended, and includes voting or investment power with respect to the securities. |
| (2) | The number of ordinary shares outstanding in calculating the percentages for each listed person includes the ordinary shares underlying options exercisable by such person within 60 days of March 20, 2014. Percentage of beneficial ownership of each listed person is based on 457,172,907 ordinary shares outstanding as of March 20, 2014, as well as the ordinary shares underlying share options exercisable by |
83
| | such person within 60 days of the date of this annual report on Form20-F. This number excludes: (i) the remaining 4,014,075 ADSs which were issued to facilitate our convertible bond offering in January 2008; (ii) the remaining 20,062,348 ordinary shares issued to Hanwha Solar at par value of US$0.0001 per ordinary share, in connection with Hanwha Solar’s purchase of 36,455,089 ordinary shares of our company in September 2010; and (iii) the 161,471 ADSs which have been reserved by our company as of March 20, 2014 to allow for the participation in the ADS program by our employees pursuant to our equity incentive plans from time to time. We excluded those shares as we do not believe that they will increase the number of ordinary shares considered outstanding for the purpose of calculating beneficial ownership. Our total outstanding ordinary shares would be 498,112,985 if those numbers mentioned above are to be included. |
| (3) | Includes ordinary shares held by all of our directors and senior executive officers as a group, as well as the ordinary shares underlying share options held by such directors and senior executive officers exercisable within 60 days of the date of this annual report on Form20-F. |
| (4) | Held 202,844,393 ordinary shares (excluding the remaining 20,062,348 ordinary shares issued to Hanwha Solar at par value of US$0.0001 per ordinary share, in connection with Hanwha Solar’s purchase of 36,455,089 ordinary shares of our company in September 2010) and 1,281,011 ADSs as of March 20, 2014. The address of Hanwha Solar Holdings Co., Ltd. is c/o Hanwha Chemical Corporation, Hanwha Building,1, Janggyo-dong,Jung-gu, Seoul100-797, Korea. Hanwha Solar is a wholly owned subsidiary of Hanwha Chemical. |
We entered into a share purchase agreement on August 3, 2010 with Hanwha Chemical, under which Hanwha Chemical agreed to purchase 36,455,089 ordinary shares from us at a price of US$2.144 per ordinary share, which corresponds to a price of US$10.72 per ADS. Hanwha Chemical subsequently assigned and transferred its rights and obligations under the share purchase agreement to Hanwha Solar, a wholly owned subsidiary of Hanwha Chemical and the sale and purchase of these ordinary shares was consummated on September 16, 2010. In addition, we entered into a share issuance and repurchase agreement on September 16, 2010 with Hanwha Solar, under which we agreed to issue to Hanwha Solar a total of 45,080,019 ordinary shares at par value of US$0.0001 per ordinary share, which shares were to remain outstanding so long as and to the extent that the 9,019,611 ADSs we issued to facilitate our convertible bond offering in January 2008 remain outstanding. Pursuant to the share issuance and repurchase agreement, we issued to Hanwha Solar 30,672,689 ordinary shares on September 16, 2010 and an additional 14,407,330 ordinary shares on March 10, 2011. The total proceeds to us from these transactions amounted to approximately US$78.2 million. At the same time, Hanwha Solar completed the acquisition from Good Energies II LP and Yonghua Solar Power Investment Holding Ltd. of a total of 120,407,700 ordinary shares and 1,281,011 ADSs of our company, representing all of the ordinary shares and ADSs held by them. In connection with our public offering of 9,200,000 ADSs in November 2010, we issued to Hanwha Solar an additional 45,981,604 ordinary shares at a price of US$1.80 per ordinary share pursuant to a shareholder agreement we and Hanwha Solar entered into on September 16, 2010. In October 2011, we repurchased and cancelled 25,017,671 ordinary shares, which were issued pursuant to a share issuance and repurchase agreement dated September 16, 2010, from Hanwha Solar at par value of US$0.0001 per ordinary share. As a result of these transactions, as of December 31, 2013 Hanwha Solar owned an approximately 48.6% equity interest in our company, including both ordinary shares and ADSs.
As of March 20, 2014, approximately 58.3% of our outstanding ordinary shares, represented by approximately 55,015,250 ADSs, were held by 43 record holders in the United States.
ITEM 7 MAJOR SHAREHOLDERS AND RELATED PARTY TRANSACTIONS
A.Major Shareholders
Please refer to “Item 6.E. Share Ownership.”
84
B.Related Party Transactions
After the completion of our initial public offering on December 26, 2006, we adopted an audit committee charter, which requires that the audit committee review all related party transactions on an ongoing basis and all such transactions be approved by the committee.
Private Placement
In September 2010, we issued in a private placement an aggregate of 36,455,089 ordinary shares to Hanwha Solar at a purchase price of US$2.144 per share for an aggregate sale price of US$78.2 million. Concurrently with the closing of this offering, we issued 30,672,689 ordinary shares to Hanwha Solar at par value of the ordinary shares and subsequently an additional 14,407,330 ordinary shares at par value, which shares were to remain outstanding so long as and to the extent that the 9,019,611 ADSs we issued to facilitate our convertible bond offering in January 2008 remain outstanding. In October 2011, we repurchased and cancelled 25,017,671 ordinary shares from Hanwha Solar at par value of US$0.0001 per ordinary share.
In connection with our public offering of 9,200,000 ADSs in November 2010, we issued in a private placement to Hanwha Solar an additional 45,981,604 ordinary shares at a price of US$1.8 per ordinary share for an aggregate sale price of US$82.8 million pursuant to a shareholder agreement we and Hanwha Solar entered into on September 16, 2010.
Registration Rights
Pursuant to the registration rights agreement entered into in connection with the private placement transaction with Hanwha Solar in September 2010, we granted to Hanwha Solar certain registration rights, which primarily include:
| | • | | Demand Registrations. Upon request of Hanwha Solar to effect any registration with respect to the registrable securities it held then outstanding having an anticipated aggregate offering price of at least US$15 million, we shall effect registration with respect to such registrable securities on a form other than FormF-3 (or any comparable form for a registration for an offering in a jurisdiction other than the United States), provided that we shall only be obligated to effect three such registrations. |
| | • | | Piggyback Registrations.Hanwha Solar and its permitted transferees are entitled to “piggyback” registration rights, whereby they may require us to register all or any part of the registrable securities that they hold at the time when we register any of our ordinary shares. |
| | • | | Registrations on FormF-3. We have granted Hanwha Solar and its permitted transferees the right to an unlimited number of registrations under FormF-3 (or any comparable form for a registration in a jurisdiction other than the United States), for a public offering of registrable securities with a reasonably anticipated aggregate price to the public not less than US$10 million, to the extent we are eligible to use such form to offer securities. |
Equity Incentive Plan
See “Item 6.B. Compensation—2006 Share Option Plan” and “Item 6.B. Compensation—2007 Equity Incentive Plan.”
Material Transactions with Certain Shareholders and Affiliated Companies
| | • | | From September 13, 2010 to July 12, 2011, SolarOne Qidong entered into several purchase orders with Hanwha Chemical, the holding company of Hanwha Solar, to purchase multicrystalline PV cells from Hanwha Chemical for a total amount of US$12.7 million. |
85
| | • | | On February 11, 2011, SolarOne Qidong entered into a consulting service agreement with Hanwha S&C Co., Ltd., or Hanwha S&C, a company affiliated with Hanwha Solar, under which Hanwha S&C Co., Ltd. provided various consulting services related to information strategic planning from January 10, 2011 to April 8, 2011 for RMB1.5 million. |
| | • | | From January 18, 2011 to November 22, 2011, SolarOne Qidong entered into several purchase agreements with Hanwha L&C to purchase EVA sheets from Hanwha L&C for a total amount of US$11.6 million. |
| | • | | On May 17, 2011, SolarOne Qidong entered into a purchase agreement with Hanwha TechM Co., Ltd., or Hanwha TechM, a company affiliated with Hanwha Solar, under which SolarOne Qidong agreed to purchase an auto module system layout from Hanwha TechM for US$4.8 million. |
| | • | | On May 19, 2011, June 21, 2011 and February 14, 2012, Hanwha Corporation, the holding company of Hanwha Solar, entered into three purchase orders with Hanwha SolarOne to purchase PV products from Hanwha SolarOne for a total amount of US$0.1 million and EUR3.0 million. |
| | • | | From May 26, 2011 to April 11, 2012, Hanwha Corporation entered into several purchase orders with SolarOne Hong Kong to purchase PV products from SolarOne Hong Kong for a total amount of US$32.1 million and EUR1.9 million. |
| | • | | On June 10, 2011, SolarOne Qidong entered into a purchase agreement with Hanwha TechM, under which SolarOne Qidong agreed to purchase amulti-wire saw from Hanwha TechM for US$0.8 million. |
| | • | | From July 12, 2011 to December 22, 2012, Hanwha Corporation entered into several purchase orders with SolarOne Qidong to purchase PV products from SolarOne Qidong for a total amount of US$81.8 million and EUR1.6 million. |
| | • | | On July 15, 2011, SolarOne Qidong entered into an SAP softwareend-user license agreement with Hanwha S&C, under which SolarOne Qidong agreed to purchase SAP software licenses from Hanwha S&C for US$0.7 million. |
| | • | | On July 20 and September 29, 2011, SolarOne Qidong entered into two catering service management agreements with Foodist Food Culture (Shanghai) Co., Ltd., a company affiliated with Hanwha Solar, under which SolarOne Qidong agreed to engage Foodist Food Culture (Shanghai) Co., Ltd. to provide catering services for two cafeterias of SolarOne Qidong from August 1, 2011 to July 31, 2012 and from September 30, 2011 to September 30, 2013, respectively. |
| | • | | On September 28, 2011, we entered into an agreement with Hanwha S&C, under which Hanwha SolarOne agreed to engage Hanwha S&C to build ane-approval system and a linkage system between the SAP Enterprise Resource Planning, or ERP, and gateway for US$0.1 million. |
| | • | | On November 2, 2011, SolarOne Qidong entered into a consulting service agreement with Hanwha S&C, under which SolarOne Qidong agreed to engage Hanwha S&C to provide various consulting services related to ERP and information technology from October 1, 2011 to February 28, 2012 for US$0.1 million. |
| | • | | On March 7, 2012, SolarOne Qidong entered into a purchase agreement with Hanwha L&C, under which SolarOne Qidong agreed to purchase EUA sheets from Hanwha L&C from January 1, 2012 to December 31, 2012 at a unit price of US$2.2. |
| | • | | On April 13, 2012, Hanwha Europe entered into a purchase order with SolarOne Hong Kong to purchase PV products from SolarOne Hong Kong for EUR2.6 million. |
| | • | | On April 4 and April 5, 2012, Hanwha International LLC, a company affiliated with Hanwha SolarOne, entered into five purchase orders with SolarOne Hong Kong to purchase PV products from SolarOne Hong Kong for a total amount of US$0.9 million. |
| | • | | On March 5 and July 10, 2012, Hanwha Q.Cells. GmbH entered into two purchase agreement with SolarOne Hong Kong to purchase PV products from SolarOne Hong Kong for US$27.5 million. |
86
| | • | | On May 1, 2012, SolarOne Hong Kong entered into a business acquisition agreement with Hanwha Resources Australia Pty Ltd. to acquire Hanwha Solar Australia Pty Ltd. from Hanwha Corporation to sell solar products in Australia for AUD16,732.1. |
| | • | | From May 29, 2012 to October 31, 2012, Hanwha Corporation entered into several purchase orders with SolarOne Hong Kong to purchase PV modules from SolarOne Hong Kong for a total amount of US$6.0 million and EUR0.4 million. |
| | • | | From May 11, 2012 to March 1, 2013, Hanwha Europe entered into several purchase orders with SolarOne Hong Kong to purchase PV products from SolarOne Hong Kong for a total amount of EUR22.6 million. |
| | • | | From March 21, 2012 to May 15, 2012, Hanwha Q CELLS Korea Corp, formerly known as Hanwha SolarEnergy Co., Ltd., a company affiliated with Hanwha Solar, entered into several purchase orders with SolarOne Qidong to purchase PV products from SolarOne Qidong for a total amount of US$27.7 million. |
| | • | | From June 27, 2012 to July 4, 2012, Hanwha Q CELLS Korea Corp, formerly known as Hanwha SolarEnergy Co., Ltd., a company affiliated with Hanwha Solar, entered into several purchase orders with SolarOne Hong Kong to purchase PV products from SolarOne Hong Kong for a total amount of US$6.5 million. |
| | • | | From May 11, 2012 to April 15, 2013, Hanwha Q CELLS Korea Corp, formerly known as Hanwha SolarEnergy Co., Ltd., a company affiliated with Hanwha Solar, entered into several purchase orders with SolarOne Qidong to purchase PV products from Solar R&D for a total amount of US$32.3 million. |
| | • | | From May 10, 2012 to March 12, 2013, Hanwha Japan Co., Ltd. entered into several purchase orders with SolarOne Hong Kong to purchase PV products from SolarOne Hong Kong for a total amount of US$70.3 million and JPY866.4 million. |
| | • | | On June 7, 2012, SolarOne Qidong entered into a purchase agreement with Hanwha TechM, a company affiliated with Hanwha Solar, under which SolarOne Qidong agreed to purchase a module line from Hanwha TechM for US$570,000. |
| | • | | From June 14, 2012 to January 29, 2013, Hanwha International LLC, a company affiliated with Hanwha SolarOne, entered into several purchase orders with SolarOne U.S.A. to purchase PV products from SolarOne U.S.A. for a total amount of US$12.1 million. |
| | • | | From June 22, 2012 to July 20, 2012, Komodo Enterprises Inc., a company affiliated with Hanwha Corporation, entered into several purchase orders with SolarOne U.S.A. to purchase PV products from SolarOne U.S.A. for a total amount of US$1.0 million. |
| | • | | On August 22, 2012, SolarOne Qidong entered into a purchase agreement with Hanwha TechM, a company affiliated with Hanwha Solar, under which SolarOne Qidong agreed to purchase a module automation and packing system from Hanwha TechM for US$3.25 million. |
| | • | | On September 21, 2012, SolarOne U.S.A. entered into a 3PL Service Agreement with Hanwha International LLC, a company affiliated with Hanwha SolarOne and KCC Transport Systems, Inc., an independent third party, to purchase logistics services, including customs clearance and warehousing. |
| | • | | On December 5, 2012, SolarOne Qidong entered into a purchase agreement with Hanwha TechM, a company affiliated with Hanwha Solar, under which SolarOne Qidong agreed to purchase an automatic spraying equipment from Hanwha TechM for US$95,000. |
| | • | | On June 12, 2013, Hanwha Chemical Corporation, a company affiliated with Hanwha Solar, provided a letter of guarantee to the Export-Import Bank of Korea (KEXIM) to irrevocably and unconditionally guarantee the payment to KEXIM by SolarOne Qidong under a loan agreement dated June 12, 2013 for a three-year US$100 million term loan facility. |
87
| | • | | On July 1, 2013, Hanwha Solar Canada Inc. entered into a sales agreement with Hanwha QCells Canada Inc., a company affiliated with Hanwha Solar, under which Hanwha QCells Canada Inc. agreed to purchase PV modules from Hanwha Solar Canada Inc. for a total amount of CAD37.5 million. |
| | • | | On September 10, 2013, SolarOne Qidong entered into a 2013 annual purchase contract with Hanwha L&C Co., Ltd, a company affiliated with Hanwha Solar, under which SolarOne Qidong purchased EVA sheets from Hanwha L&C Co., Ltd for US$16.4 million. |
| | • | | On September 12, 2013, Hanwha Solar Canada Inc. entered into an intercompany loan agreement with Hanwha International LLC, a company affiliated with Hanwha Solar, under which Hanwha International LLC provided a six-month US$10 million loan to Hanwha Solar Canada Inc. with accrued interest of 6% per annum on any unpaid balance. |
| | • | | On November 12, 2013, we amended the shareholder agreement dated as of September 16, 2010, by and among the Company and Hanwha Solar, and the share issuance and repurchase agreement, dated September 16, 2010, by and among the Company and Hanwha Solar to (i) eliminate certain restrictions that limited Hanwha Solar’s ability to increase its ownership in our Company above 49.9%, (ii) remove the requirement that the board be comprised of seven directors and (iii) allow Hanwha Solar to nominate directors to the board according to a formula based on its share ownership in our Company; however, the number of directors that Hanwha Solar may nominate will in any event be less than a majority of the board. |
| | • | | On January 3, 2014, Hanwha SolarOne provided a guarantee letter to Marubeni Corporation, under which Hanwha SolarOne guarantee the full and timely performance and observance by Hanwha Q CELLS Japan Co., Ltd. of all the terms and conditions under a sales and purchase contract dated October 1, 2012 between Hanwha Q CELLS Japan Co., Ltd. and Marubeni Corporation. |
C.Interests of Experts and Counsel
Not applicable.
ITEM 8 FINANCIAL INFORMATION
A.Consolidated Statements and Other Financial Information
We have appended consolidated financial statements filed as part of this annual report.
Export Sales
Our export sales in 2011, 2012 and 2013 were RMB5,817.2 million, RMB3,295.9 million and RMB4,185.8 million (US$691.4 million), respectively, and accounted for 90.7%, 89.6% and 88.6% of our net revenues, respectively.
Legal and Administrative Proceedings
Most of themulti-year supply agreements that we entered into during the earlier periods of supply shortage required us to make prepayments of a portion of the total contract price to our suppliers without receiving collateral for such prepayments. Due to doubtful recovery of advances to suppliers, we recorded a provision of RMB15.6 million (US$2.6 million) in 2013 to reflect the probable loss arising from the suppliers’ failure to perform under the contracts. On June 8, 2009, LDK, one of our suppliers of silicon, submitted an arbitration request to the Shanghai Arbitration Commission, alleging that we had failed to perform under the terms of along-term supply agreement, seeking to enforce our performance and claiming for monetary relief. Deliveries of silicon under the agreement halted in early 2009 and have not recommenced. On July 9, 2009, we submitted an arbitration request to the Shanghai Arbitration Commission requesting that LDK refund the outstanding prepayments of RMB104.5 million that we made under the contract, plus compensation of RMB35 million from
88
LDK for estimated losses incurred by us as a result of the stoppage of deliveries under the framework supply agreement and legal fees of RMB4 million. On March 23, 2012, a hearing was held by the Shanghai Arbitration Commission, and all the requests filed by LDK were dismissed. LDK was also required to refund the deposit amounting to RMB104.5 million to us within 30 days from the date of the hearing. The requests filed by us for compensation of RMB35 million and legal fees of RMB4 million were dismissed. On April 26, 2012, LDK submitted a separate and new arbitration request to the Shanghai Arbitration Commission updating its arbitration claim to seek damages of RMB446 million plus legal cost for our alleged failure to perform the aforesaidmulti-year framework supply agreement. In December, 2013, we reached a settlement agreement with LDK, which was recognized by the Shanghai Arbitration Commission and became effective in January 2014. According to the settlement agreement, LDK agrees to withdraw their arbitration claim in the amount of RMB446 million and refrain from bringing any future claims based on that long-term supply agreement, and in return, we agree to waive the right to seek enforcement of the arbitral award in the amount of RMB104.5 million. See “Item 3.D. Risk Factors Risks Related to Our Company and Our Industry—We may be subject to legal proceedings in connection with themulti-year supply agreements we entered into previously and such proceedings can be both costly andtime-consuming and may significantly divert the efforts and resources of our management personnel.”
On July 26, 2012, we brought a lawsuit against Hoku Corporation and Hoku Materials, Inc., or Hoku collectively, one of our polysilicon suppliers, at the Los Angeles Superior Court for Hoku’s failure to perform amulti-year framework polysilicon supply agreement entered into on November 19, 2007. Hoku has never made any delivery of polysilicon, and has also failed to return a US$49 million prepayment to us. We demanded Hoku to return the prepayment and have vigorously pursued our claims against Hoku and based on the underlying facts. Hoku Corporation and Hoku Materials, Inc. each filed a Chapter 7 Petition in the Bankruptcy Court of Pocatello, Idaho on July 2, 2013. We continued to pursue recovery of the prepayment after that. See “Item 3.D. Risk Factors—Risks Related to Our Company and Our Industry—Prepayments we have provided to our silicon and silicon wafer suppliers expose us to the credit and performance risks of such suppliers and may not be recovered, which could in turn have a material adverse effect on our liquidity.”
We face payment collection difficulties with respect to certain customers, which may materially and adversely impact our operating margins. For example, on June 8, 2012, we submitted an arbitration request to Guangzhou Arbitration Commission requiring Guo Hua, owner of a PV project for which we acted as an EPC, to pay a total amount of RMB92 million including, among others, overdue payment of EPC contract price, accrued interest, damages and legal cost in accordance with the EPC contract. On August 5, 2012, Guo Hua submitted an counterclaim to Guangzhou Arbitration Commission alleging that we have substantially breached the EPC contract, and Guo Hua requested termination of the EPC contract and demanded us to pay a total amount of RMB187 million for breach of contract. As of the date of this annual report, we have been pursuing our claim and defending against Guo Hua’s counterclaim. Based on the facts of the case and our discussion with our external counsels, we believe the contract termination claim of Guo Hua is unlikely to be supported by the Guangzhou Arbitration Commission and our liability for damages, if any, would likely be limited and substantially lower than the claim made by Guo Hua in the arbitration. See “Item 3.D. Risk Factors—Risks Related to Our Company and Our Industry—We depend on a limited number of customers and countries for a high percentage of our revenues and the loss of, a significant reduction in orders from, or failure to collect payments from, any of these customers or countries, if not immediately replaced, would significantly reduce our revenue and decrease our operating margins.”
As a result of a petition filed on October 9, 2011 by U.S. producers of solar crystalline silicon PV cells, or solar panels, the Department of Commerce, or the DOC, published an Antidumping Duty Order, or an AD Order, and a Countervailing Duty Order, or a CVD Order, on solar panels imported from China on December 7, 2012. Consequently, imports of solar panels from SolarOne Qidong are subject to a combined effective AD and CVD deposit rate of 29.18%, of which 15.24% is attributable to the CVD. Imports of solar panels from SolarOne Hong Kong are subject to a combined effective rate of 254.66%, which is comprised of an AD of 239.42% and a CVD of 15.24%. Actual AD and CVD ultimately due will be determined by the DOC after its review of actual
89
transactions. Such review takes place annually in the anniversary month of the publication of the AD and CVD Orders, and covers the precedingone-year period. SolarOne Qidong is undertaking efforts to protect itself against the potential increases of AD and CVD in these reviews. SolarOne Qidong is monitoring the challenge to the final determination of material injury made by the USITC, which seeks on behalf of the Chinese industry to overturn this decision. There is no assurance that the challenge will succeed in overturning the final rulings of the DOC and the USITC or that the AD and CVD will be eliminated and the duty deposit rates will be reduced. The imposition of the AD and CVD and any increase in the rate of AD or CVD or their respective deposit ratios will significantly increase the price of our products, negatively affect our sales in the U.S. and adversely affect our results of operations.
In addition, on December 31, 2013, SolarWorld Industries America, Inc. filed new AD cases against similar CSPV products from China and Taiwan and a new CVD case against China. These new cases seek AD and CVD against (i) CSPV products with cells with any stage of production in China, if the cells are assembled in China, regardless of the country of origin of the cells, as well as (ii) CSPV products containing cells that were of Taiwanese origin. The USDOC and USITC initiated investigations on January 21, 2014. On February 24, 2014, the USITC issued a preliminary determination that there is a reasonable indication that imports of these products had caused material injury to the U.S. industry.
As a result of this determination, the USDOC will conduct full-scale investigations of the Chinese companies to determine whether AD and CVD should be imposed on these additional CSPV products. The USDOC preliminary determination in the AD investigation is due by June 9, 2014, with a possible and likely extension until July 29, 2014. The USDOC preliminary determination in the CVD investigation is due by June 2, 2014.
SolarOne Qidong and SolarOne HK have entered an appearance in these new AD and CVD investigations and are actively engaged in defending their interests, which will necessarily be dependent on the results applied to the largest Chinese exporters involved in these investigations. The average of their results will likely be the rates that will apply to SolarOne Qidong and SolarOne HK. See “Item 3.D. Risk Factors Risks Related to Our Company and Our Industry—Changes in international trade policies and international barriers to trade may material adversely affect our ability to export our products worldwide.”
On September 6 and November 8, 2012, the European Commission initiated an anti-dumping proceeding and an anti-subsidy proceeding concerning imports of crystalline silicon PV modules and key components, such as cells and wafers, originating in China. On July 27, 2013, the European Union and Chinese trade negotiators announced that an agreement has been reached pursuant to which Chinese manufacturers, including us, would limit our export of solar panels and cells to the European Union and for no less than a minimum price, in exchange for the European Union agreeing to forgo the imposition of anti-dumping duties on these solar panels from China. The offer was approved by the European Commission on August 2, 2013, and the final version was published on December 5, 2013. The Chamber of Commerce Import and Export of Machinery and Electronic Product (CCCME) of China will be responsible for allocating the quota between PV companies, and we have been allocated a portion of the quota. Solar panels and cells imported in excess of the annual quota will be subject to anti-dumping and anti-subsidy duties. This price undertaking and annual quota have also resolved the parallel anti-subsidy investigation. For companies that would violate the price undertaking or the quota, or which do not form part of the agreement, definitive duties will be levied as per the definitive anti-dumping and anti-subsidy Regulations that were published on December 5, 2013. Finally, it should be noted wafers have been excluded from the scope of both the anti-dumping and anti-subsidy measures. See “Item 3.D. Risk Factors—Risks Related to Our Company and Our Industry—Changes in international trade policies and international barriers to trade may material adversely affect our ability to export our products worldwide.”
Other than as described above, there are no material legal proceedings, regulatory inquiries or investigations pending or threatened against us. We may from time to time be subject to various legal or administrative proceedings arising in the ordinary course of our business.
90
Dividend Policy
We made aone-time cash dividend payment in the aggregate amount of RMB7.2 million to the holders of the series A convertible preference shares on December 31, 2006. Except for the forgoing, we have never declared or paid any cash dividends, nor do we have any present plan to pay any cash dividends on our capital stock in the foreseeable future. We currently intend to retain all of our available funds and any future earnings to operate and expand our business.
The holders of our ordinary shares are entitled to such dividends as may be declared by our board of directors subject to the Cayman Islands Companies Law. Even if our board of directors decides to pay dividends, the form, frequency and amount will depend upon our future operations and earnings, capital requirements and surplus, general financial condition, contractual restrictions and other factors that the board of directors may deem relevant. If we pay any dividends, we will pay ADS holders to the same extent as holders of our ordinary shares, subject to the terms of the deposit agreement, including the fees and expenses payable thereunder.
B.Significant Changes
There have been no significant changes since December 31, 2013, the date of the annual consolidated financial statements in this annual report.
ITEM 9 THE OFFER AND LISTING
A.Offering and Listing Details
The ADSs, each representing five of our ordinary shares, have been listed on the Nasdaq Global Market since December 20, 2006. Our ticker symbol is “HSOL.”
In 2013, the trading price of the ADSs on the Nasdaq Global Market ranged from US$0.86 to US$5.70 per ADS.
The following table provides the high and low trading prices for the ADSs on the Nasdaq Global Market for the periods indicated.
| | | | | | | | |
| | | Sales Price | |
| | | High | | | Low | |
Annually High and Low | | | | | | | | |
2009 | | | 8.95 | | | | 2.27 | |
2010 | | | 13.48 | | | | 5.61 | |
2011 | | | 9.78 | | | | 0.91 | |
2012 | | | 2.51 | | | | 0.77 | |
2013 | | | 5.70 | | | | 0.86 | |
Quarterly High and Low | | | | | | | | |
First Quarter 2012 | | | 2.51 | | | | 1.00 | |
Second Quarter 2012 | | | 1.37 | | | | 0.81 | |
Third Quarter 2012 | | | 1.35 | | | | 0.94 | |
Fourth Quarter 2012 | | | 1.13 | | | | 0.77 | |
First Quarter 2013 | | | 1.53 | | | | 0.86 | |
Second Quarter 2013 | | | 2.20 | | | | 0.86 | |
Third Quarter 2013 | | | 4.78 | | | | 2.12 | |
Fourth Quarter 2013 | | | 5.70 | | | | 2.31 | |
First Quarter 2014 | | | | | | | | |
Monthly Highs and Lows | | | | | | | | |
October 2013 | | | 5.70 | | | | 3.98 | |
November 2013 | | | 5.25 | | | | 3.30 | |
December 2013 | | | 3.60 | | | | 2.31 | |
January 2014 | | | 3.27 | | | | 2.67 | |
February 2014 | | | 3.01 | | | | 2.60 | |
March 2014 | | | 3.72 | | | | 2.97 | |
April 2014 (through April 11, 2014) | | | 3.13 | | | | 2.52 | |
91
B.Plan of Distribution
Not applicable.
C.Markets
The ADSs, each representing five of our ordinary shares, have been listed on the Nasdaq Global Market since December 20, 2006 and are under the symbol “HSOL.”
D.Selling Shareholders
Not applicable.
E.Dilution
Not applicable.
F.Expenses of the Issue
Not applicable.
ITEM 10 ADDITIONAL INFORMATION
A.Share Capital
Not applicable.
B.Memorandum and Articles of Association
We incorporate by reference into this annual report the description of our amended and restated memorandum of association contained in ourF-1 registration statement (FileNo. 333-139258), as amended, initially filed with the Commission on December 11, 2006. Our shareholders adopted our amended and restated memorandum and articles of association by special resolutions passed on December 18, 2006. The amended and restated memorandum and articles of association became effective on December 26, 2006. Our shareholders adopted some further amendments to our amended and restated memorandum and articles of association by special resolutions passed at an extraordinary general meeting on February 21, 2011. Such amendments include our name change, the increase of our authorized share capital from US$50,000 to US$100,000 and the deletion of the requirement of prior majority shareholder approval for issuance of shares in an amount equal to or more than 20% of all the shares issued and outstanding.
C.Material Contracts
We have not entered into any material contracts other than in the ordinary course of business and other than those described in “Item 4. Information on the Company” or elsewhere in this annual report on Form20-F.
D.Exchange Controls
Foreign Currency Exchange
Foreign currency exchange in China is primarily governed by the following regulations:
| | • | | Foreign Exchange Administration Rules (1996), as amended; and |
| | • | | Regulations of Settlement, Sale and Payment of Foreign Exchange (1996). |
92
Under the Foreign Exchange Administration Rules, the Renminbi is convertible for current account items, including distribution of dividends, payment of interest, trade andservice-related foreign exchange transactions. Conversion of Renminbi for capital account items, such as direct investment, loan, securities investment and repatriation of investment, however, is still subject to the approval of SAFE.
Under the Regulations of Settlement, Sale and Payment of Foreign Exchange,foreign-invested enterprises may only buy, sell and/or remit foreign currencies at those banks authorized to conduct foreign exchange business after valid commercial documents are provided and, in the case of capital account item transactions, after obtaining the approval from SAFE. Capital investments byforeign-invested enterprises outside of China are also subject to limitations, which include approvals by the Ministry of Commerce, SAFE and the NDRC.
E.Taxation
Cayman Islands Taxation
The Cayman Islands currently levies no taxes on individuals or corporations based upon profits, income, gains or appreciation and there is no taxation in the nature of inheritance tax or estate duty. No Cayman Islands stamp duty will be payable unless an instrument is executed in, brought to, or produced before a court of the Cayman Islands. The Cayman Islands is not party to any double tax treaties. There are no exchange control regulations or currency restrictions in the Cayman Islands.
PRC Taxation
Under the EIT, which took effect as of January 1, 2008, enterprises established under the laws of non-PRC jurisdictions but whose “de facto management body” is located in the PRC are considered “resident enterprises” for PRC tax purposes. The EIT does not define the term “de facto management.” However, the Implementation Regulations for the Enterprise Income Tax Law of the PRC issued by the State Council on December 6, 2007 defined de facto management body as an establishment that exerts substantial and comprehensive management and control over the business operations, staff, accounting, assets and other aspects of the enterprise. Since substantially all of our management is currently based in the PRC, and may remain in the PRC in the foreseeable future, it is likely that we will be regarded as a “resident enterprise” on a strict application of the EIT and its Implementation Regulations. If we are treated as a “resident enterprise” for PRC tax purposes, we will be subject to PRC income tax on our worldwide income at a uniform tax rate of 25%, excluding the dividend income we receive from our PRC subsidiaries which should have been subject to PRC income tax already.
Moreover, the EIT provides that an income tax rate of 10% is normally applicable to dividends payable to non-PRC investors who are “non-resident enterprises,” to the extent such dividends are derived from sources within the PRC. We are a Cayman Islands holding company and substantially all of our income may be derived from dividends we receive from our operating subsidiaries located in the PRC (through our holding company structure). Thus, dividends paid to us by our subsidiaries in China may be subject to the 10% income tax if we are considered a “non-resident enterprise” under the EIT.
Similarly, any gain realized on the transfer of ADSs or shares by non-PRC investors who are “non-resident enterprises,” is also subject to 10% PRC withholding income tax if such gain is regarded as income derived from sources within the PRC. If we are considered a “resident enterprise”, it is unclear whether the dividends we pay with respect to our ordinary shares or ADSs, or the gain you may realize from the transfer of our ordinary shares or ADSs, would be treated as income derived from sources within the PRC and subject to PRC tax.
If we are deemed by the PRC tax authorities as a “resident enterprise” and declare dividends, under the existing Implementation Regulations of the EIT, dividends paid by us to our ultimate shareholders, which are “non- resident enterprises” and do not have an establishment or place of business in the PRC, or which have an establishment or place of business in the PRC but the relevant income is not effectively connected with that establishment or place of business, might be subject to PRC withholding tax at 10% or a lower treaty rate.
93
According to the IIT, PRC income tax at the rate of 20% is applicable to dividends payable to individual investors if such dividends are regarded as income derived from sources within the PRC. Similarly, any gain realized on the transfer of ADSs or ordinary shares by individual investors is also subject to PRC tax at 20% if such gain is regarded as income derived from sources within the PRC. If we are deemed by the PRC tax authorities as a “resident enterprise,” the dividends we pay to our individual investors with respect to our ordinary shares or ADSs, or the gain the individual investors may realize from the transfer of our ordinary shares or ADSs, might be treated as income derived from sources within the PRC and be subject to PRC tax at 20% or a lower treaty rate. Under the current double taxation treaty between the PRC and the United States, for beneficial owners of shares who are tax-resident in the United States who qualify for the benefits of the treaty, and whose ownership of the shares is not attributable to a permanent establishment or fixed place of business in the PRC, the applicable treaty rate on dividends is 10% (the “Treaty Rate”).
U.S. Federal Income Taxation
The following discussion describes the material U.S. federal income tax consequences to U.S. Holders (defined below) under present law of an investment in the ADSs or ordinary shares. This summary applies only to investors that hold the ADSs or ordinary shares as capital assets. This discussion is based on the tax laws of the United States as in effect on the date of this annual report and on U.S. Treasury regulations in effect or in some cases, proposed, as of the date of this annual report, as well as judicial and administrative interpretations thereof available on or before such date. All of the foregoing authorities are subject to change, which change could apply retroactively and could affect the tax consequences described below.
The following discussion does not deal with the tax consequences to any particular investor or to persons in special tax situations such as:
| | • | | certain financial institutions; |
| | • | | traders that elect to mark-to-market their securities holdings; |
| | • | | persons liable for alternative minimum tax; |
| | • | | persons whose functional currency is not the U.S. dollar; |
| | • | | persons holding an ADS or ordinary share as part of a straddle, hedging, conversion or integrated transaction; or |
| | • | | persons that actually or constructively own 10% or more of our voting stock. |
This discussion also does not real with any state, local, or non-income tax consequences or any tax consequences related to the Medicare tax on net investment income.
YOU ARE URGED TO CONSULT YOUR TAX ADVISORS ABOUT THE APPLICATION OF THE U.S. FEDERAL TAX RULES TO YOUR PARTICULAR CIRCUMSTANCES AS WELL AS THE STATE, LOCAL AND FOREIGN TAX CONSEQUENCES TO YOU OF THE PURCHASE, OWNERSHIP AND DISPOSITION OF ADSS OR ORDINARY SHARES.
The discussion below of the U.S. federal income tax consequences to “U.S. Holders” will apply if you are a beneficial owner of ADSs or ordinary shares and you are, for U.S. federal income tax purposes:
| | • | | an individual who is a citizen or resident of the United States; |
| | • | | a corporation (or other entity taxable as a corporation for U.S. federal income tax purposes) organized under the laws of the United States, any state in the United States or the District of Columbia; |
94
| | • | | an estate whose income is subject to U.S. federal income taxation regardless of its source; or |
| | • | | a trust that (1) is subject to the primary supervision of a court within the United States and one or more U.S. persons have the authority to control all substantial decisions of the trust or (2) was in existence on August 20, 1996, was treated as a U.S. person under the U.S. Internal Revenue Code of 1986, as amended, on the previous day and has a valid election in effect under applicable U.S. Treasury regulations to be treated as a U.S. person. |
If you are a partner in a partnership or other entity taxable as a partnership for U.S. federal income tax purposes that holds ADSs or ordinary shares, your tax treatment generally will depend on your status and the activities of the partnership. If you are a partner or partnership holding ADSs or ordinary shares, you should consult your own tax advisors.
The discussion below assumes that the representations contained in the deposit agreement are true and that the obligations in the deposit agreement and any related agreement will be complied with in accordance with their terms. If you hold ADSs, you generally will be treated as the holder of the underlying ordinary shares represented by those ADSs for U.S. federal income tax purposes. Exchanges of ordinary shares for ADSs and ADSs for ordinary shares generally will not be subject to U.S. federal income tax.
Taxation of Dividends and Other Distributions on the ADSs or Ordinary Shares
Subject to the PFIC rules discussed below, the gross amount of any distribution (including constructive dividends) to you with respect to the ADSs or ordinary shares generally will be included in your gross income as dividend income on the date of actual or constructive receipt by the depositary, in the case of ADSs, or by you, in the case of ordinary shares, but only to the extent that the distribution is paid out of our current or accumulated earnings and profits (as determined under U.S. federal income tax principles). We do not currently intend to calculate our earnings and profits under U.S. federal income tax principles. Therefore, you should expect that any distribution we make will generally be treated as a dividend. The dividends will not be eligible for the dividends-received deduction allowed to corporations in respect of dividends received from other U.S. corporations.
With respect to certain non-corporate U.S. Holders, including individual U.S. Holders, dividends may constitute “qualified dividend income” and be taxed at the lower applicable capital gains rate, provided that (1) the ADSs or ordinary shares with respect to which the dividends are paid are readily tradable on an established securities market in the United States, or we are eligible for one of certain income tax treaties with the United States, including the current income tax treaty between the United States and the PRC, (2) we are not a PFIC (as discussed below) for either our taxable year in which the dividend was paid or the preceding taxable year, and (3) certain holding period requirements are met. Under U.S. Internal Revenue Service authority, ordinary shares, or ADSs representing such shares, are considered for the purpose of clause (1) above to be readily tradable on an established securities market in the United States if they are listed on the Nasdaq Global Market, as the ADSs are. Furthermore, in the event that we are deemed to be a PRC resident enterprise under the EIT (as described above under “Taxation—PRC Taxation”), we may be eligible for the benefits of the current income tax treaty between the United States and the PRC for the purpose of clause (1) above. You should consult your tax advisors regarding the availability of the lower rate for dividends paid with respect to the ADSs or ordinary shares.
Dividends will constitute foreign source income for U.S. foreign tax credit limitation purposes and will generally constitute “passive category income” but could, in the case of certain U.S. Holders, constitute “general category income.”
Subject to certain conditions and limitations, PRC withholding taxes on dividends at a rate not exceeding the Treaty Rate may be treated as foreign taxes eligible for credit against your U.S. federal income tax. You should consult your own tax advisors regarding the creditability of any PRC tax.
95
Taxation of Disposition of ADSs or Ordinary Shares
Subject to the PFIC rules discussed below, you will recognize taxable gain or loss on any sale, exchange or other taxable disposition of an ADS or ordinary share equal to the difference between the amount realized for the ADS or ordinary share and your tax basis in the ADS or ordinary share. The gain or loss generally will be capital gain or loss. If you are a non-corporate U.S. Holder, including an individual U.S. Holder, who has held the ADS or ordinary share for more than one year, you will be eligible for reduced tax rates. The deductibility of capital losses is subject to limitations. Any such gain or loss that you recognize will generally be treated as U.S. source income or loss for foreign tax credit limitation purposes. You generally would only be able to claim a foreign tax credit for any foreign taxes to the extent that you have foreign source income. However, as described above under “Taxation—PRC Taxation,” any gain from the disposition of an ADS or ordinary share may be subject to PRC tax. In such event, a U.S. Holder that is eligible for the benefits of the income tax treaty between the United States and the PRC may be able to treat the gain from a disposition of an ADS or ordinary share as foreign source gain for foreign tax credit purposes. You should consult your own tax advisor regarding your eligibility for the benefits of the income tax treaty between the United States and the PRC and the creditability of any PRC tax.
Passive Foreign Investment Company Status
We do not believe that we were a PFIC for U.S. federal income tax purposes for the taxable year that ended December 31, 2013, and we do not currently expect to be a PFIC for U.S. federal income tax purposes for our current taxable year or the foreseeable future. Our actual PFIC status for the current taxable year, however, will not be determinable until the close of the current taxable year ending December 31, 2014, and accordingly, there is no guarantee that we will not be a PFIC for the current taxable year or any future taxable year. A non-U.S. corporation is considered to be a PFIC for any taxable year if either:
| | • | | at least 75% of its gross income is passive income; or |
| | • | | at least 50% of the value of its assets (based on an average of the quarterly values of the assets during a taxable year) is attributable to assets that produce or are held for the production of passive income. |
For this purpose, passive income generally includes dividends, interest, royalties and rents (other than royalties and rents derived in the active conduct of a trade or business and not derived from a related person). We will be treated as owning our proportionate share of the assets and receiving our proportionate share of the income of any other corporation in which we own, directly or indirectly, more than 25% (by value) of the stock.
We must make a separate determination each year as to whether we are a PFIC. As a result, our PFIC status may change. If we are a PFIC for any year during which you hold ADSs or ordinary shares, unless you make a “mark-to-market” election as discussed below, we generally will continue to be treated as a PFIC for all succeeding years during which you hold ADSs or ordinary shares.
If we are a PFIC for any taxable year during which you hold ADSs or ordinary shares, you will be subject to special tax rules with respect to any “excess distribution” that you receive and any gain you realize from a sale or other disposition (including a pledge) of the ADSs or ordinary shares, unless you make a “mark-to-market” election as discussed below. Distributions you receive in a taxable year that are greater than 125% of the average annual distributions you received during the shorter of the three preceding taxable years or your holding period for the ADSs or ordinary shares will be treated as an excess distribution. Under these special tax rules:
| | • | | the excess distribution or gain will be allocated ratably over your holding period for the ADSs or ordinary shares; |
| | • | | the amount allocated to the current taxable year, and any taxable year prior to the first taxable year in which we became a PFIC, will be treated as ordinary income; and |
| | • | | the amount allocated to each other year will be subject to the highest tax rate in effect for that year and the interest charge generally applicable to underpayments of tax will be imposed on the resulting tax attributable to each such year. |
96
The tax liability for amounts allocated to years prior to the year of disposition or “excess distribution” cannot be offset by any net operating losses for such years, and gains (but not losses) realized on the sale of the ADSs or ordinary shares cannot be treated as capital, even if you hold the ADSs or ordinary shares as capital assets.
Alternatively, a U.S. Holder of “marketable stock” (as defined below) in a PFIC may make a mark-to-market election for such stock of a PFIC to elect out of the tax treatment under the excess distribution regime described above. If you make a mark-to-market election for the ADSs or ordinary shares, you will include in income each year an amount equal to the excess, if any, of the fair market value of the ADSs or ordinary shares as of the close of your taxable year over your adjusted basis in such ADSs or ordinary shares. You are allowed a deduction for the excess, if any, of the adjusted basis of the ADSs or ordinary shares over their fair market value as of the close of the taxable year. However, deductions are allowable only to the extent of any net mark-to-market gains on the ADSs or ordinary shares included in your income for prior taxable years. Amounts included in your income under a mark-to-market election, as well as gain on the actual sale or other disposition of the ADSs or ordinary shares, are treated as ordinary income. Ordinary loss treatment also applies to the deductible portion of any mark-to-market loss on the ADSs or ordinary shares, as well as to any loss realized on the actual sale or disposition of the ADSs or ordinary shares, to the extent that the amount of such loss does not exceed the net mark-to-market gains previously included for such ADSs or ordinary shares. Your basis in the ADSs or ordinary shares will be adjusted to reflect any such income or loss amounts.
The mark-to-market election is available only for “marketable stock,” which is stock that is regularly traded in other thande minimis quantities on at least 15 days during each calendar quarter on a qualified exchange, including the Nasdaq Global Market, or other market, as defined in applicable U.S. Treasury regulations. The ADSs are listed on the Nasdaq Global Market, and we expect that they will continue to be regularly traded on the Nasdaq Global Market. Consequently, if you are a holder of ADSs, the mark-to-market election should be available to you were we to be or become a PFIC.
If you hold ADSs or ordinary shares in any year in which we are a PFIC, you generally will be required to file U.S. Internal Revenue Service Form on an annual basis as described in the instructions to Form 8621, subject to certain exceptions based on the value of PFIC stock held.
In addition, if we are a PFIC, we do not intend to prepare or provide you with the information necessary to make a “qualified electing fund” election.
You are urged to consult your tax advisor regarding the application of the PFIC rules to your investment in ADSs or ordinary shares and any applicable filing requirements.
Information Reporting and Backup Withholding
Dividend payments with respect to ADSs or ordinary shares and proceeds from the sale, exchange or redemption of ADSs or ordinary shares may be subject to information reporting to the U.S. Internal Revenue Service and possible U.S. backup withholding. Backup withholding will not apply, however, if you are a corporation or a U.S. Holder who furnishes a correct taxpayer identification number and makes any other required certification or if you are otherwise exempt from backup withholding. If you are a U.S. Holder who is required to establish exempt status, you generally must provide such certification on U.S. Internal Revenue Service Form W-9. You should consult your tax advisor regarding the application of the U.S. information reporting and backup withholding rules.
Backup withholding is not an additional tax. Amounts withheld as backup withholding may be credited against your U.S. federal income tax liability, and you may obtain a refund of any excess amounts withheld under the backup withholding rules by filing the appropriate claim for refund with the U.S. Internal Revenue Service and furnishing any required information in a timely manner.
97
Certain U.S. Holders who are individuals that hold certain foreign financial assets (which may include the ADSs or ordinary shares) are required to report information relating to such assets, subject to certain exceptions. You should consult your tax advisor regarding the effect, if any, of these rules on your ownership and disposition of the ADSs or ordinary shares.
F.Dividends and Paying Agents
Not applicable.
G.Statement by Experts
Not applicable.
H.Documents on Display
You may read and copy documents referred to in this annual report on Form20-F that have been filed with the U.S. Securities and Exchange Commission at the Commission’s public reference room located at 100 F Street, N.E., Room 1580, Washington, D.C. 20549. Please call the Commission at1-800-SEC-0330 for further information on the public reference rooms and their copy charges.
The Commission allows us to “incorporate by reference” the information we file with the Commission. This means that we can disclose important information to you by referring you to another document filed separately with the Commission. The information incorporated by reference is considered to be part of this annual report on Form20-F.
I.Subsidiary Information
For a listing of our significant subsidiaries, see “Item 4.C. Organizational Structure.”
ITEM 11 QUANTITATIVE AND QUALITATIVE DISCLOSURES ABOUT MARKET RISK
Foreign Exchange Risk
A portion of our revenue and a significant portion of expenses are denominated in Renminbi. The Renminbi is currently convertible under the “current account,” which includes dividends, trade andservice-related foreign exchange transactions, but not under the “capital account,” which includes foreign direct investment and loans. Currently, SolarOne Qidong may purchase foreign currencies for settlement of current account transactions, including payments of dividends to us, without the approval of SAFE. However, the relevant PRC government authorities may limit or eliminate our ability to purchase foreign currencies in the future. Since a significant amount of our future revenue will be denominated in Renminbi, any existing and future restrictions on currency exchange may limit our ability to utilize revenue generated in Renminbi to fund our business activities outside China that are denominated in foreign currencies.
In 2013, we entered into foreign currency derivative contracts to manage risks associated with foreign currency fluctuations for our sales contracts denominated in a currency other than Renminbi. As of December 31, 2013, a notional amount of EUR15.0 million, US$112.9 million and JPY5,024.5 million was outstanding under these foreign currency derivative contracts. We may enter into additional forward contracts or enter into economic hedges in the future.
Foreign exchange transactions by SolarOne Qidong under the capital account continue to be subject to significant foreign exchange controls and require the approval of or need to register with PRC governmental authorities, including SAFE. In particular, if SolarOne Qidong borrows foreign currency loans from us or other foreign lenders, these loans must be registered with SAFE, and if we finance SolarOne Qidong by means of
98
additional capital contributions, these capital contributions must be approved by certain government authorities, including the NDRC, the Ministry of Commerce or their respective local counterparts. These limitations could affect the ability of SolarOne Qidong to obtain foreign exchange through debt or equity financing.
As of December 31, 2011, 2012 and 2013, we held equivalents of RMB537.5 million, RMB957.0 million and RMB744.7 million (US$123.0 million) in accounts receivable, respectively, of which RMB223.0 million, RMB130.6 million and RMB191.7 million (US$31.7 million) were denominated in U.S. dollars, respectively, and RMB194.3 million, RMB559.1 million and RMB190.7 million (US$31.5 million) were denominated in Euros, respectively.
Without taking into account of the effect of the use of hedging or other derivative financial instruments, if there were a 10% appreciation of Renminbi based on the foreign exchange rate on December 31, 2011, 2012 and 2013, our accounts receivable denominated in U.S. dollars would have been Renminbi equivalents of RMB200.7 million, RMB117.5 million and RMB172.5 million (US$28.5 million), respectively. These amounts represent net losses of RMB22.3 million, RMB13.1 million and RMB19.2 million (US$3.2 million), respectively, to our accounts receivable denominated in U.S. dollars.
Without taking into account of the effect of the use of hedging or other derivative financial instruments, if there were a 10% appreciation of Renminbi based on the foreign exchange rate on December 31, 2011, 2012 and 2013, our accounts receivable denominated in Euro would have been Renminbi equivalents of RMB174.8 million, RMB503.2 million and RMB171.6 million (US$28.3 million), respectively. These amounts represent net losses of RMB19.5 million, RMB55.9 million and RMB19.1 million (US$3.2 million), respectively, to our accounts receivable denominated in Euro.
Interest Rate Risk
Our exposure to interest rate risks relates to interest expense incurred in connection with ourshort-term andlong-term borrowings, as well as interest income generated by excess cash invested in demand deposits and liquid investments with original maturities of three months or less. As of December 31, 2013, our totalinterest-bearing borrowings and notes were RMB4,395.5 million (US$726.1 million), of which RMB4,282.5 million (US$707.4 million) were denominated in U.S. dollars. In 2012, we entered into an interest rate swap agreement to manage risk with respect to ourlong-term borrowings with a floating rate. We estimate the fair value of interest rate swap derivatives using a pricing model based on market observable inputs. We have not been exposed to, nor do we anticipate being exposed to, material risks due to changes in interest rates. However, our future interest expense may increase due to changes in market interest rates.
ITEM 12 DESCRIPTION OF SECURITIES OTHER THAN EQUITY SECURITIES
A.Debt Securities
Not applicable.
B.Warrants and Rights
Not applicable.
C.Other Securities
Not applicable.
D.American Depositary Shares
The Bank of New York Mellon, the depositary of our ADS program, collects its fees for depositing shares or surrendering ADSs for the purpose of withdrawal or from intermediaries acting for them. The depositary
99
collects fees for making distributions to investors by deducting those fees from the amounts distributed or by selling a portion of distributable property to pay the fees. The depositary may collect its annual fee for depositary services by deducting from cash distributions or by directly billing investors or by charging thebook-entry system accounts of participants acting for them. The depositary may generally refuse to providefee-attracting services until its fees for those services are paid.
| | |
Persons depositing or withdrawing shares must pay: | | For: |
| |
$5.00 (or less) per 100 ADSs (or portion of 100 ADSs) | | Issuance of ADSs, including issuances resulting from a distribution of shares or rights or other property |
| |
| | Cancellation of ADSs for the purpose of withdrawal, including if the deposit agreement terminates |
| |
$0.02 (or less) per ADS | | Any cash distribution to ADS holders |
| |
A fee equivalent to the fee that would be payable if securities distributed to you had been shares and the shares had been deposited for issuance of ADSs | | Distribution of securities distributed to holders of deposited securities which are distributed by the depositary to ADS holders |
| |
$0.02 (or less) per ADSs per calendar year | | Depositary services |
| |
Registration or transfer fees | | Transfer and registration of shares on our share register to or from the name of the depositary or its agent when you deposit or withdraw shares |
| |
Expenses of the depositary | | Cable, telex and facsimile transmissions (when expressly provided in the deposit agreement) |
| |
| | Converting foreign currency to U.S. dollars |
| |
Taxes and other governmental charges the depositary or the custodian have to pay on any ADS or share underlying an ADS, for example, stock transfer taxes, stamp duty or withholding taxes | | As necessary |
| |
Any charges incurred by the depositary or its agents for servicing the deposited securities | | As necessary |
The fees described above may be amended from time to time.
The depositary has agreed to reimburse us annually for our expenses incurred in connection with ADR program. The amount of such reimbursements is subject to certain limits, but the amount of reimbursement available to us is not related to the amounts of fees the depositary collects from investors. In 2013, we did not receive any reimbursement from the depositary.
100
PART II
ITEM 13 DEFAULTS, DIVIDEND ARREARAGES AND DELINQUENCIES
None.
ITEM 14 MATERIAL MODIFICATIONS TO THE RIGHTS OF SECURITY HOLDERS AND USE OF PROCEEDS
See “Item 10. Additional Information” for a description of the rights of securities holders, which remain unchanged.
We completed our initial public offering of 60,000,000 ordinary shares, in the form of ADSs, at US$12.50 per ADS on December 26, 2006, after our ordinary shares and American Depositary Receipts were registered under the Securities Act. The aggregate price of the offering amount registered and sold was US$150 million, of which we received net proceeds of US$135.9 million. The effective date of our registration statement on FormF-1 (File number:333-139258) was December 19, 2006. Goldman Sachs (Asia) L.L.C. was the sole global coordinator and bookrunner for the global offering of the ADSs.
The net proceeds from our initial public offering have been used as follows:
| | • | | approximately US$68.0 million to purchase or prepay for raw materials; |
| | • | | approximately US$40.0 million to expand our manufacturing capacity; |
| | • | | approximately US$17.9 million to acquire SolarOne Technology; and |
| | • | | approximately US$10.0 million to invest in our research and development activities. |
On January 29, 2008, we closed an offering of US$172.5 million 3.50% convertible senior notes due 2018, or 2018 convertible bonds, to qualified institutional buyers pursuant to Rule 144A under the Securities Act and received net proceeds of US$167.9 million. Holders may convert the bonds into the ADSs. Concurrently with this convertible bond offering, we closed an offering of 9,019,611 ADSs, representing 45,098,055 ordinary shares, to facilitate the convertible bond offering. We did not receive any proceeds, other than the par value of the ADSs, from such offering of ADSs. The effective date of our registration statement on FormF-1 (File number:333-147627) was January 23, 2008. Morgan Stanley & Co. Incorporated was the sole bookrunning manager of this offering. We have from time to time been buying back our convertible bonds since January 1, 2012 and may do so in the future, subject to market conditions and other factors.
The net proceeds from the January 2008 convertible bond offering have been used as follows:
| | • | | approximately US$95.6 million for wafer and polysiliconpre-payments; |
| | • | | approximately US$37.4 million for capital expenditure; |
| | • | | US$19.2 million to repay loans from Hong Kong Huaerli, a company controlled by Mr. Yonghua Lu, our former chairman, to SolarOne Hong Kong, our 100% indirect subsidiary; and |
| | • | | the remainder for working capital and repayment of our existing bank borrowings. |
From July 17, 2008 to August 12, 2008, we issued and sold 5,421,093 ADSs with an aggregate sale price of US$73.9 million, of which we received net proceeds of US$71.8 million. The effective date of our registration statement on FormF-3 (File number:333-152005) was July 16, 2008. Morgan Stanley & Co. Incorporated acted as our sales agent. The net proceeds from this offering have been used for silicon and silicon waferpre-payments and working capital.
101
From September 17, 2009 to November 18, 2009, we issued and sold 3,888,399 ADSs with an aggregate sale price of US$23.1 million, of which we received net proceeds of US$21.8 million. The effective date of our registration statement on FormF-3 (File number: 333 152005) was July 16, 2008. Morgan Stanley & Co. Incorporated acted as manager for the sale. The net proceeds from this offering have been used for capital expenditures, working capital and partial repayment of our existing bank loans.
In September 2010, we issued and sold to Hanwha Solar in a private placement 36,455,089 ordinary shares with an aggregate sale price of US$78.2 million, of which we received net proceeds of US$76.0 million. The net proceeds from this private placement have been used for capital expenditures and working capital.
In November 2010, we issued and sold 9,200,000 ADSs with an aggregate sale price of US$82.8 million, of which we received net proceeds of US$78.5 million. The effective date of our registration statement on FormF-3 (File number:333-152005) was July 16, 2008. Morgan Stanley & Co. International plc and UBS Securities LLC acted as managers of the underwriters for the sale. The net proceeds from this offering have been used for capital expenditures and working capital. In order for Hanwha Solar to maintain after this public offering the same level of beneficial ownership in our company as before the offering, we issued and sold to Hanwha Solar 45,981,604 ordinary shares with an aggregate sale price of US$82.8 million. The net proceeds from this private placement have been used for capital expenditures and general working capital purposes.
From November 2013 to January 2014, we issued and sold 6,716,966 ADSs with an aggregate sale price of US$21.5 million pursuant to a distribution agency agreement. The effective date of our registration statement on FormF-3 (File number:333-192049) was November 13, 2013. Credit Suisse Securities (USA) LLC acted as the sales agent and principal under the distribution agency agreement. The net proceeds from this offering will be used for general corporate purposes.
As of December 31, 2013, our cash resources amounted to RMB1,249.5 million (US$206.4 million), comprising cash on hand and demand deposits.
ITEM 15 CONTROLS AND PROCEDURES
Disclosure Controls and Procedures
Under the supervision and with the participation of our management, including our chief executive officer and our chief financial officer, we conducted an evaluation of our disclosure controls and procedures, as such term is defined under Rule13a-15(e) under the Securities Exchange Act of 1934, as amended. Based on that evaluation, our chief executive officer and chief financial officer have concluded that our disclosure controls and procedures were effective as of the end of the period covered by this annual report.
Management’s Annual Report on Internal Control Over Financial Reporting
Our management is responsible for establishing and maintaining adequate internal control over financial reporting, as such term is defined under Rule13a-15(f) under the Securities Exchange Act of 1934, as amended, for our company. Internal control over financial reporting is a process designed to provide reasonable assurance regarding the reliability of financial reporting and the preparation of consolidated financial statements in accordance with generally accepted accounting principles and includes those policies and procedures that (1) pertain to the maintenance of records that, in reasonable detail, accurately and fairly reflect the transactions and dispositions of a company’s assets, (2) provide reasonable assurance that transactions are recorded as necessary to permit preparation of consolidated financial statements in accordance with generally accepted accounting principles, and that a company’s receipts and expenditures are being made only in accordance with authorizations of a company’s management and directors, and (3) provide reasonable assurance regarding prevention or timely detection of unauthorized acquisition, use, or disposition of a company’s assets that could have a material effect on the consolidated financial statements.
102
Because of its inherent limitations, a system of internal control over financial reporting can provide only reasonable assurance with respect to the preparation and presentation of consolidated financial statement and may not prevent or detect misstatements. Also, projections of any evaluation of effectiveness to future periods are subject to the risk that controls may become inadequate because of changes in conditions, or that the degree of compliance with the policies or procedures may deteriorate.
As required by Section 404 of theSarbanes-Oxley Act and related rules as promulgated by the SEC, our company’s management assessed the effectiveness of our internal control over financial reporting as of December 31, 2013 using criteria established in InternalControl-Integrated Framework issued by the Committee of Sponsoring Organizations of the Treadway Commission (1992 Framework). Based on this assessment, our company’s management concluded that our internal control over financial reporting was effective as of December 31, 2013.
Our independent registered public accounting firm, Ernst & Young Hua Ming LLP, has audited the effectiveness of internal control over financial reporting as of December 31, 2013, as stated in its report, which is included immediately below. Ernst & Young Hua Ming LLP has also audited our consolidated financial statements for the year ended December 31, 2013, as stated in its report which is included on pageF-2 in this annual report.
Report of Independent Registered Public Accounting Firm
To the Board of Directors and Shareholders of
Hanwha SolarOne Co., Ltd.
We have audited Hanwha SolarOne Co., Ltd.’s (the “Company”) internal control over financial reporting as of December 31, 2013, based on criteria established in Internal Control—Integrated Framework issued by the Committee of Sponsoring Organizations of the Treadway Commission (1992 framework) (the “COSO criteria”). The Company’s management is responsible for maintaining effective internal control over financial reporting, and for its assessment of the effectiveness of internal control over financial reporting included in the accompanying Management’s Annual Report on Internal Control Over Financial Reporting. Our responsibility is to express an opinion on the Company’s internal control over financial reporting based on our audit.
We conducted our audit in accordance with the standards of the Public Company Accounting Oversight Board (United States). Those standards require that we plan and perform the audit to obtain reasonable assurance about whether effective internal control over financial reporting was maintained in all material respects. Our audit included obtaining an understanding of internal control over financial reporting, assessing the risk that a material weakness exists, testing and evaluating the design and operating effectiveness of internal control based on the assessed risk, and performing such other procedures as we considered necessary in the circumstances. We believe that our audit provides a reasonable basis for our opinion.
A company’s internal control over financial reporting is a process designed to provide reasonable assurance regarding the reliability of financial reporting and the preparation of financial statements for external purposes in accordance with generally accepted accounting principles. A company’s internal control over financial reporting includes those policies and procedures that (1) pertain to the maintenance of records that, in reasonable detail, accurately and fairly reflect the transactions and dispositions of the assets of the company; (2) provide reasonable assurance that transactions are recorded as necessary to permit preparation of financial statements in accordance with generally accepted accounting principles, and that receipts and expenditures of the company are being made only in accordance with authorizations of management and directors of the company; and (3) provide reasonable assurance regarding prevention or timely detection of unauthorized acquisition, use, or disposition of the company’s assets that could have a material effect on the financial statements.
103
Because of its inherent limitations, internal control over financial reporting may not prevent or detect misstatements. Also, projections of any evaluation of effectiveness to future periods are subject to the risk that controls may become inadequate because of changes in conditions, or that the degree of compliance with the policies or procedures may deteriorate.
In our opinion, Hanwha SolarOne Co., Ltd. maintained, in all material respects, effective internal control over financial reporting as of December 31, 2013, based on the COSO criteria.
We also have audited, in accordance with the standards of the Public Company Accounting Oversight Board (United States), the consolidated balance sheets of Hanwha SolarOne Co., Ltd. as of December 31, 2013 and 2012, and the related consolidated statements of comprehensive loss, changes in shareholders’ equity, and cash flows for each of the three years in the period ended December 31, 2013 of Hanwha SolarOne Co., Ltd., and our report dated April 14, 2014 expressed an unqualified opinion thereon.
/s/ Ernst & Young Hua Ming LLP
Shanghai, the People’s Republic of China
April 14, 2014
Changes in Internal Controls
There were no changes in our internal control over financial reporting that occurred during the year ended December 31, 2013 that have materially affected, or are reasonably likely to materially affect, our internal control over financial reporting.
ITEM 16A AUDIT COMMITTEE FINANCIAL EXPERT
Our Board of Directors has determined that Mr. Thomas J. Toy qualifies as an “audit committee financial expert” as defined in Item 16A. of Form20-F. Each of the members of the Audit Committee is an “independent director” as defined in the Nasdaq Marketplace Rules.
ITEM 16B CODE OF ETHICS
Our board of directors has adopted a code of ethics that applies to our directors, officers, employees and agents. We have previously filed our code of business conduct and ethics, and posted the code on our websitehttp://www.hanwha-solarone.com. We hereby undertake to provide to any person without charge, a copy of our code of business conduct and ethics within ten working days after we receive such person’s written request.
ITEM 16C PRINCIPAL ACCOUNTANT FEES AND SERVICES
The following table sets forth the aggregate fees by categories specified below in connection with certain professional services rendered by Ernst & Young Hua Ming LLP, our principal external auditors, for the periods indicated.
| | | | | | | | | | | | | | | | |
| | | Year Ended December 31, | |
| | | 2011 | | | 2012 | | | 2013 | |
| | | (RMB) | | | (RMB) | | | (RMB) | | | (US$) | |
Audit fees(1) | | | 6,000,000 | | | | 5,900,000 | | | | 5,850,000 | | | | 966,351 | |
Tax fees(2) | | | 102,650 | | | | 1,070,000 | | | | 180,000 | | | | 29,734 | |
All other fees(3) | | | — | | | | — | | | | 1,200,000 | | | | 198,226 | |
Notes:
| (1) | “Audit fees” means the aggregate fees billed in each of the fiscal years listed for professional services rendered by our principal auditors. In 2011, 2012 and 2013, RMB6.0 million, RMB5.9 million and RMB5.9 million (US$1.0 million), respectively, are for the audits of our annual consolidated financial |
104
| | statements and our internal control over financial reporting pursuant to Section 404(b) of theSarbanes-Oxley Act of 2002. |
| (2) | “Tax fees” means the aggregated fees for services rendered in connection with technical tax advice. |
| (3) | “All other fees” means the aggregate fees for services rendered in connection with our equity offerings. |
The policy of our audit committee is topre-approve all audit andnon-audit services provided by Ernst & Young Hua Ming LLP, including audit services and other services as described above, other than those forde minimus services which are approved by the Audit Committee prior to the completion of the audit.
ITEM 16D EXEMPTIONS FROM THE LISTING STANDARDS FOR AUDIT COMMITTEES
None.
ITEM 16E PURCHASES OF EQUITY SECURITIES BY THE ISSUER AND AFFILIATED PURCHASERS
None.
ITEM 16F CHANGE IN REGISTRANT’S CERTIFYING ACCOUNTANT
Not applicable.
ITEM 16G CORPORATE GOVERNANCE
Nasdaq Marketplace Rule 5605(e)(1)(B) requires that the Director nominees must either be selected, or recommended for the Board’s selection, either by: (A) independent directors constituting a majority of the Board’s independent directors in a vote in which only independent directors participate, or (B) a nominations committee comprised solely of independent directors. Nasdaq Marketplace Rule 5635 (b) requires shareholder approval prior to the issuance of securities when the issuance or potential issuance will result in a change of control of the company. Marketplace Rule 5635(d) requires shareholder approval prior to the issuance of securities in connection with a transaction other than a public offering involving the sale, issuance or potential issuance by the company of common stock (or securities convertible into or exercisable common stock) equal to 20% or more of the common stock or 20% or more of the voting power outstanding before the issuance for less than the greater of book or market value of the stock. However, Nasdaq Marketplace Rule 5615(a)(3) allows a foreign private issuer to follow its home country practice in lieu of the requirement under Nasdaq Marketplace Rules 5605(e)(1)(B), 5635(b) and 5635(d). Our home country practice does not impose similar requirements to Nasdaq Marketplace Rules 5605(e)(1)(B), 5635(b) and 5635(d).
Except as stated above, we have followed and intend to continue to follow the applicable corporate governance standards under Nasdaq Marketplace Rules.
ITEM 16H MINE SAFETY DISCLOSURE
Not applicable.
105
PART III
ITEM 17 FINANCIAL STATEMENTS
We have elected to provide financial statements pursuant to Item 18.
ITEM 18 FINANCIAL STATEMENTS
The following financial statements are filed as part of this Annual Report on Form20-F, together with the report of the independent auditors:
| | • | | Report of Independent Registered Public Accounting Firm |
| | • | | Consolidated Balance Sheets as of December 31, 2012 and 2013 |
| | • | | Consolidated Statements of Comprehensive Income for the Years Ended December 31, 2011, 2012 and 2013 |
| | • | | Consolidated Statements of Cash Flows for the Years Ended December 31, 2011, 2012 and 2013 |
| | • | | Consolidated Statements of Changes in Shareholders’ Equity for the Years Ended December 31, 2011, 2012 and 2013 |
| | • | | Notes to the Consolidated Financial Statements |
ITEM 19 EXHIBITS
The following exhibits are furnished along with annual report or are incorporated by reference as indicated.
| | |
Exhibit Number | | Description of Document |
| |
1.1 | | Memorandum and Articles of Association of Solarfun Power Holdings Co., Ltd. (incorporated by reference to Exhibit 3.1 from ourF-1 registration statement (File No.333-139258), as amended, initially filed with the Commission on December 11, 2006) |
| |
1.2 | | Form of Amended and Restated Memorandum and Articles of Association of Solarfun Power Holdings Co., Ltd. (incorporated by reference to Exhibit 3.2 from ourF-1 registration statement (File No.333-139258), as amended, initially filed with the Commission on December 11, 2006) |
| |
1.3 | | Amended and Restated Memorandum and Articles of Association of Hanwha SolarOne Co., Ltd., as adopted by Special Resolution passed on December 18, 2006 and effective on December 26, 2006, as amended by Special Resolution passed on February 21, 2011 (incorporated by reference to Exhibit 1.3 from our20-F annual report, as amended, initially filed with the Commission on June 3, 2011) |
| |
2.1 | | Specimen Certificate for Ordinary Shares of Solarfun Power Holdings Co., Ltd. (incorporated by reference to Exhibit 4.2 from ourF-1 registration statement (File No.333-139258), as amended, initially filed with the Commission on December 11, 2006) |
| |
2.2 | | Form of American Depositary Receipt of Solarfun Power Holdings Co., Ltd. (incorporated by reference to Exhibit 4.1 from ourF-1 registration statement (File No.333-139258), as amended, initially filed with the Commission on December 11, 2006) |
| |
2.3 | | Form of Deposit Agreement Form of Deposit Agreement, among Solarfun Power Holdings Co., Ltd., the depositary and owners and holders of the American Depositary Shares (incorporated by reference to Exhibit 4.3 from ourF-1 registration statement (File No.333-139258), as amended, initially filed with the Commission on December 11, 2006) 2006 Share Incentive Plan (incorporated by reference to Exhibit 10.1 from ourF-1 registration statement(File No. 333-139258), as amended, initially filed with the Commission on December 11, 2006) |
106
| | |
Exhibit Number | | Description of Document |
| |
4.1 | | 2007 Equity Incentive Plan (incorporated by reference to Exhibit 99.2 from our FormS-8 registration statement (File No. 333 147644), as amended, initially filed with the Commission on November 27, 2007) |
| |
4.2 | | Form of Employment Agreement between Solarfun Power Holdings Co., Ltd. and a Senior Executive Officer of the Registrant (incorporated by reference to Exhibit 10.2 from ourF-1 registration statement (File No.333-139258), as amended, initially filed with the Commission on December 11, 2006) |
| |
4.3 | | Shareholders Agreement between Solarfun Power Holdings Co., Ltd. and Hanwha Solar Holdings Co., Ltd. dated September 16, 2010 (incorporated by reference to Exhibit 99.2 from Form6-K submitted with the Commission on November 9, 2010) |
| |
4.4 | | Amendment No. 1, dated November 12, 2013, to the Shareholder Agreement, dated as of September 16, 2010 by and among Hanwha SolarOne Co., Ltd., and Hanwha Solar Holdings Co., Ltd. (incorporated by reference to Exhibit 99.2 from Form 6-K submitted with the Commission on November 14, 2013) |
| |
4.5 | | Share Purchase Agreement between Solarfun Power Holdings Co., Ltd. and Hanwha Chemical Corporation, dated August 3, 2010 (incorporated by reference to Exhibit 99.1 from Form6-K submitted with the Commission on November 9, 2010) |
| |
4.6 | | Share Issuance and Repurchase Agreement between Solarfun Power Holdings Co., Ltd. and Hanwha Solar Holdings Co., Ltd. dated September 16, 2010 (incorporated by reference to Exhibit 99.3 from Form6-K submitted with the Commission on November 9, 2010) |
| |
4.7 | | Amendment No. 1, dated November 12, 2013, to the Share Issuance and Repurchase Agreement, dated as of September 16, 2010 by and among Hanwha SolarOne Co., Ltd., and Hanwha Solar Holdings Co., Ltd. (incorporated by reference to Exhibit 99.3 from Form 6-K submitted with the Commission on November 14, 2013) |
| |
8.1* | | Subsidiaries of Solarfun Power Holdings Co., Ltd. |
| |
11.1 | | Code of Business Conduct and Ethics of Solarfun Power Holdings Co., Ltd. (incorporated by reference to Exhibit 99.1 from ourF-1 registration statement (File No.333-139258), as amended, initially filed with the Commission on December 11, 2006) |
| |
12.1* | | CEO Certification Pursuant to Section 302 of theSarbanes-Oxley Act of 2002 |
| |
12.2* | | CFO Certification Pursuant to Section 302 of theSarbanes-Oxley Act of 2002 |
| |
13.1* | | CEO and CFO Certification Pursuant to Section 906 of theSarbanes-Oxley Act of 2002 |
| |
23.1* | | Consent of Independent Registered Public Accounting Firm |
| |
101* | | Interactive data files pursuant to Rule 405 of RegulationS-T: (i) Consolidated Balance Sheets as of December 31, 2013 and 2012; (ii) Consolidated Statements of Comprehensive Income for the years ended December 31, 2013, 2012 and 2011; (iii) Consolidated Statements of Cash Flows for the years ended December 31, 2013, 2012 and 2011; (iv) Consolidated Statements of Changes in Equity for the years ended December 31, 2013, 2012 and 2011; (v) Notes to Consolidated Financial Statements, tagged as blocks of text; and (vi) Schedule I—Condensed Financial Information Of Registrant. |
Note:
| * | Filed with this Annual Report on Form20-F. |
107
SIGNATURE
The registrant hereby certifies that it meets all of the requirements for filing on Form20-F and that it has duly caused and authorized the undersigned to sign this annual report on its behalf.
| | |
| HANWHA SOLARONE CO., LTD. |
|
/s/Ki-Joon Hong |
| Name: | | Ki-Joon Hong |
| Title: | | Chairman and Chief Executive Officer |
Date: April 14, 2014
108
HANWHA SOLARONE CO., LTD.
INDEX TO CONSOLIDATED FINANCIAL STATEMENTS
F-1
REPORT OF INDEPENDENT REGISTERED PUBLIC ACCOUNTING FIRM
The Board of Directors and Shareholders of
Hanwha SolarOne Co., Ltd.
We have audited the accompanying consolidated balance sheets of Hanwha SolarOne Co., Ltd. (the “Company”) as of December 31, 2013 and 2012, and the related consolidated statements of comprehensive loss, changes in shareholders’ equity, and cash flows for each of the three years in the period ended December 31, 2013. These financial statements are the responsibility of the Company’s management. Our responsibility is to express an opinion on these financial statements based on our audits.
We conducted our audits in accordance with the standards of the Public Company Accounting Oversight Board (United States). Those standards require that we plan and perform the audit to obtain reasonable assurance about whether the financial statements are free of material misstatement. An audit includes examining, on a test basis, evidence supporting the amounts and disclosures in the financial statements. An audit also includes assessing the accounting principles used and significant estimates made by management, as well as evaluating the overall financial statement presentation. We believe that our audits provide a reasonable basis for our opinion.
In our opinion, the financial statements referred to above present fairly, in all material respects, the consolidated financial position of Hanwha SolarOne Co., Ltd. at December 31, 2013 and 2012, and the consolidated results of its operations and its cash flows for each of the three years in the period ended December 31, 2013, in conformity with U.S. generally accepted accounting principles.
We also have audited, in accordance with the standards of the Public Company Accounting Oversight Board (United States), the Company’s internal control over financial reporting as of December 31, 2013, based on the criteria established in Internal Control – Integrated Framework issued by the Committee of Sponsoring Organizations of the Treadway Commission (1992 Framework) and our report dated April 14, 2014 expressed an unqualified opinion thereon.
/s/ Ernst & Young Hua Ming LLP
Shanghai, the People’s Republic of China
April 14, 2014
F-2
HANWHA SOLARONE CO., LTD.
CONSOLIDATED BALANCE SHEETS
| | | | | | | | | | | | | | |
| | | | | As of December 31, | |
| | | Note | | 2012 | | | 2013 | | | 2013 | |
| | | | | (RMB’000) | | | (RMB’000) | | | (US$’000) | |
ASSETS | | | | | | | | | | | | | | |
Current assets: | | | | | | | | | | | | | | |
Cash and cash equivalents | | | | | 676,476 | | | | 1,249,481 | | | | 206,400 | |
Restricted cash | | | | | 150,462 | | | | 163,948 | | | | 27,082 | |
Accounts receivable – net | | 3 | | | 956,969 | | | | 744,739 | | | | 123,022 | |
Notes receivable | | 3 | | | 2,681 | | | | 10,780 | | | | 1,781 | |
Inventories | | 4 | | | 838,727 | | | | 752,291 | | | | 124,270 | |
Advance to suppliers – net | | 5 | | | 166,838 | | | | 182,129 | | | | 30,086 | |
Derivative contracts | | 16 | | | — | | | | 26,632 | | | | 4,399 | |
Deferred tax assets – net | | 24 | | | 150,297 | | | | — | | | | — | |
Amount due from related parties – net | | 25 | | | 420,610 | | | | 530,732 | | | | 87,669 | |
Other current assets – net | | 6 | | | 356,784 | | | | 301,561 | | | | 49,812 | |
| | | | | | | | | | | | | | |
Total current assets | | | | | 3,719,844 | | | | 3,962,293 | | | | 654,521 | |
| | | | |
Non-current assets: | | | | | | | | | | | | | | |
Long-term prepayments | | 5 | | | 184,065 | | | | 132,011 | | | | 21,807 | |
Fixed assets – net | | 7 | | | 4,779,873 | | | | 4,482,656 | | | | 740,482 | |
Land use rights – net | | 8 | | | 335,047 | | | | 272,444 | | | | 45,005 | |
Deferred tax assets – net | | 24 | | | 107,304 | | | | 2,946 | | | | 487 | |
Long-term deferred expenses | | 10 | | | 25,200 | | | | 9,594 | | | | 1,585 | |
| | | | | | | | | | | | | | |
Total non-current assets | | | | | 5,431,489 | | | | 4,899,651 | | | | 809,366 | |
| | | | | | | | | | | | | | |
Total assets | | | | | 9,151,333 | | | | 8,861,944 | | | | 1,463,887 | |
| | | | | | | | | | | | | | |
LIABILITIES AND SHAREHOLDERS’ EQUITY | | | | | | | | | | | | | | |
Current liabilities: | | | | | | | | | | | | | | |
Short-term bank borrowings | | 11 | | | 1,162,372 | | | | 1,105,575 | | | | 182,628 | |
Long-term bank borrowings, current portion | | 11 | | | 467,204 | | | | 234,121 | | | | 38,674 | |
Accounts payable | | | | | 1,061,723 | | | | 695,530 | | | | 114,893 | |
Notes payable | | 15 | | | 314,517 | | | | 494,462 | | | | 81,679 | |
Accrued expenses and other liabilities | | 12 | | | 400,537 | | | | 388,747 | | | | 64,216 | |
Customer deposits | | 14 | | | 36,314 | | | | 47,763 | | | | 7,890 | |
Unrecognized tax benefit | | 24 | | | 143,473 | | | | 143,473 | | | | 23,700 | |
Derivative contracts | | 16 | | | 17,311 | | | | 6,513 | | | | 1,076 | |
Amount due to related parties | | 25 | | | 72,045 | | | | 255,033 | | | | 42,128 | |
| | | | | | | | | | | | | | |
Total current liabilities | | | | | 3,675,496 | | | | 3,371,217 | | | | 556,884 | |
| | | | |
Non-current liabilities: | | | | | | | | | | | | | | |
Long-term bank borrowings | | 11 | | | 2,285,106 | | | | 2,446,076 | | | | 404,063 | |
Long-term notes | | 17 | | | — | | | | 609,690 | | | | 100,714 | |
Long-term payables | | 23 | | | 50,000 | | | | 50,000 | | | | 8,259 | |
Deferred tax liabilities | | 24 | | | 24,798 | | | | 24,209 | | | | 3,999 | |
Convertible bonds | | 22 | | | 368,590 | | | | 470,357 | | | | 77,697 | |
| | | | | | | | | | | | | | |
Total non-current liabilities | | | | | 2,728,494 | | | | 3,600,332 | | | | 594,732 | |
| | | | | | | | | | | | | | |
Total liabilities | | | | | 6,403,990 | | | | 6,971,549 | | | | 1,151,616 | |
| | | | |
Commitments and contingencies | | 28 | | | | | | | | | | | | |
| | | | |
Redeemable ordinary shares (par value US$0.0001 per share; 20,070,375 shares issued and outstanding at December 31, 2012 and 2013) | | 21 | | | 24 | | | | 24 | | | | 4 | |
| | | | |
Shareholders’ equity | | | | | | | | | | | | | | |
Ordinary shares (par value US$0.0001 per share; 1,000,000,000 and 1,000,000,000 shares authorized; 423,395,432 shares and 431,525,432 shares issued and outstanding at December 31, 2012 and 2013, respectively) | | | | | 316 | | | | 321 | | | | 53 | |
Additional paid-in capital | | | | | 4,004,199 | | | | 4,022,147 | | | | 664,411 | |
Statutory reserves | | 33 | | | 174,456 | | | | 174,456 | | | | 28,818 | |
Accumulated deficit | | | | | (1,430,433 | ) | | | (2,304,523 | ) | | | (380,680 | ) |
Accumulated other comprehensive loss | | 19 | | | (1,219 | ) | | | (2,030 | ) | | | (335 | ) |
| | | | | | | | | | | | | | |
Total shareholders’ equity | | | | | 2,747,319 | | | | 1,890,371 | | | | 312,267 | |
| | | | | | | | | | | | | | |
Total liabilities, redeemable ordinary shares and shareholders’ equity | | | | | 9,151,333 | | | | 8,861,944 | | | | 1,463,887 | |
| | | | | | | | | | | | | | |
The accompanying notes are an integral part of the consolidated financial statements.
F-3
HANWHA SOLARONE CO., LTD.
CONSOLIDATED STATEMENTS OF COMPREHENSIVE LOSS
| | | | | | | | | | | | | | | | | | | | |
| | | | | | For the year ended December 31, | |
| | | Note | | | 2011 | | | 2012 | | | 2013 | | | 2013 | |
| | | | | | (RMB’000) | | | (RMB’000) | | | (RMB’000) | | | (US$’000) | |
Net revenues: | | | | | | | | | | | | | | | | | | | | |
Third parties | | | | | | | 5,832,628 | | | | 2,639,453 | | | | 2,782,772 | | | | 459,681 | |
Related parties | | | 25 | | | | 583,857 | | | | 1,038,927 | | | | 1,942,920 | | | | 320,948 | |
| | | | | | | | | | | | | | | | | | | | |
Total net revenues | | | 29 | | | | 6,416,485 | | | | 3,678,380 | | | | 4,725,692 | | | | 780,629 | |
| | | | | | | | | | | | | | | | | | | | |
Cost of revenues | | | | | | | (6,633,542 | ) | | | (4,003,885 | ) | | | (4,390,718 | ) | | | (725,295 | ) |
| | | | | | | | | | | | | | | | | | | | |
Gross (loss) profit | | | | | | | (217,057 | ) | | | (325,505 | ) | | | 334,974 | | | | 55,334 | |
| | | | | |
Operating expenses: | | | | | | | | | | | | | | | | | | | | |
Selling expenses | | | | | | | (279,788 | ) | | | (348,568 | ) | | | (325,422 | ) | | | (53,756 | ) |
General and administrative expenses | | | | | | | (340,405 | ) | | | (278,033 | ) | | | (295,482 | ) | | | (48,811 | ) |
Provision for doubtful accounts receivable and other receivable | | | | | | | (56,234 | ) | | | (137,674 | ) | | | (28,562 | ) | | | (4,718 | ) |
Research and development expenses | | | | | | | (68,217 | ) | | | (90,820 | ) | | | (92,256 | ) | | | (15,240 | ) |
Impairment of goodwill | | | 9 | | | | (134,735 | ) | | | — | | | | — | | | | — | |
| | | | | | | | | | | | | | | | | | | | |
Total operating expenses | | | | | | | (879,379 | ) | | | (855,095 | ) | | | (741,722 | ) | | | (122,525 | ) |
| | | | | | | | | | | | | | | | | | | | |
Operating loss | | | | | | | (1,096,436 | ) | | | (1,180,600 | ) | | | (406,748 | ) | | | (67,191 | ) |
| | | | | |
Interest expense | | | | | | | (171,059 | ) | | | (299,515 | ) | | | (323,820 | ) | | | (53,491 | ) |
Interest income | | | | | | | 11,763 | | | | 15,841 | | | | 21,212 | | | | 3,504 | |
Exchange (losses) gains | | | | | | | (3,965 | ) | | | 8,875 | | | | 43,687 | | | | 7,217 | |
Changes in fair value of derivative contracts | | | 16 | | | | (70,778 | ) | | | 5,326 | | | | 63,739 | | | | 10,529 | |
Changes in fair value of conversion feature of convertible bonds | | | 22 | | | | 264,384 | | | | (5,692 | ) | | | (6,105 | ) | | | (1,008 | ) |
Loss on extinguishment of debt | | | 22 | | | | — | | | | (82,713 | ) | | | — | | | | — | |
Other income | | | | | | | 5,144 | | | | 9,265 | | | | 7,805 | | | | 1,289 | |
Other expenses | | | | | | | (14,102 | ) | | | (18,391 | ) | | | (16,194 | ) | | | (2,675 | ) |
| | | | | | | | | | | | | | | | | | | | |
Loss before income taxes | | | | | | | (1,075,049 | ) | | | (1,547,604 | ) | | | (616,424 | ) | | | (101,826 | ) |
| | | | | |
Income tax benefit (expenses) | | | 24 | | | | 144,945 | | | | (15,255 | ) | | | (257,666 | ) | | | (42,563 | ) |
| | | | | | | | | | | | | | | | | | | | |
Net loss | | | | | | | (930,104 | ) | | | (1,562,859 | ) | | | (874,090 | ) | | | (144,389 | ) |
| | | | | | | | | | | | | | | | | | | | |
Net loss per share: | | | | | | | | | | | | | | | | | | | | |
Basic | | | 30 | | | | RMB (2.21 | ) | | | RMB (3.70 | ) | | | RMB (2.06 | ) | | | US$ (0.34 | ) |
Diluted | | | 30 | | | | RMB (2.21 | ) | | | RMB (3.70 | ) | | | RMB (2.06 | ) | | | US$ (0.34 | ) |
| | | | | |
Number of shares used in computation of net loss per share: | | | | | | | | | | | | | | | | | | | | |
Basic | | | 30 | | | | 420,325,701 | | | | 422,167,505 | | | | 423,675,429 | | | | 423,675,429 | |
Diluted | | | 30 | | | | 420,325,701 | | | | 422,167,505 | | | | 423,675,429 | | | | 423,675,429 | |
| | | | | |
Other comprehensive loss, net of tax | | | | | | | | | | | | | | | | | | | | |
Foreign currency translation adjustment | | | 19 | | | | — | | | | (1,219 | ) | | | (811 | ) | | | (134 | ) |
| | | | | | | | | | | | | | | | | | | | |
Comprehensive loss | | | | | | | (930,104 | ) | | | (1,564,078 | ) | | | (874,901 | ) | | | (144,523 | ) |
| | | | | | | | | | | | | | | | | | | | |
The accompanying notes are an integral part of the consolidated financial statements.
F-4
HANWHA SOLARONE CO., LTD.
CONSOLIDATED STATEMENTS OF CASH FLOWS
| | | | | | | | | | | | | | | | | | |
| | | | | For the year ended December 31, | |
| | | Note | | 2011 | | | 2012 | | | 2013 | | | 2013 | |
| | | | | (RMB’000) | | | (RMB’000) | | | (RMB’000) | | | (US$’000) | |
Cash flows from operating activities: | | | | | | | | | | | | | | | | | | |
Consolidated net loss | | | | | (930,104 | ) | | | (1,562,859 | ) | | | (874,090 | ) | | | (144,389 | ) |
Adjustments to reconcile net loss to net cash provided by (used in) operating activities: | | | | | | | | | | | | | | | | | | |
Unrealized loss (gain) from derivative contracts | | 16 | | | 1,021 | | | | 15,732 | | | | (37,430 | ) | | | (6,183 | ) |
Changes in fair value of conversion feature of convertible bonds | | 22 | | | (264,384 | ) | | | 5,692 | | | | 6,105 | | | | 1,008 | |
Loss from disposal of fixed assets | | | | | 1,714 | | | | 8,497 | | | | 9,677 | | | | 1,599 | |
Loss on extinguishment of debt | | 22 | | | — | | | | 82,713 | | | | — | | | | — | |
Amortization of convertible bonds discount | | | | | 75,595 | | | | 88,507 | | | | 95,662 | | | | 15,802 | |
Depreciation and amortization | | | | | 218,641 | | | | 373,155 | | | | 436,074 | | | | 72,034 | |
Impairment of goodwill | | 9 | | | 134,735 | | | | — | | | | — | | | | — | |
Amortization of long-term deferred expense | | | | | 11,408 | | | | 21,577 | | | | 21,064 | | | | 3,480 | |
Stock compensation expenses | | 20 | | | 38,331 | | | | 7,782 | | | | 2,660 | | | | 439 | |
Write-down of inventories | | 4 | | | 583,097 | | | | 326,051 | | | | 113,236 | | | | 18,705 | |
Provision for doubtful collection of accounts receivable | | 3 | | | 1,778 | | | | 87,626 | | | | 28,562 | | | | 4,718 | |
Provision for doubtful collection of advance to suppliers | | 5 | | | 287,742 | | | | 170,012 | | | | 15,565 | | | | 2,571 | |
Provision for doubtful debt of other current assets | | 6 | | | 54,456 | | | | 50,048 | | | | — | | | | — | |
Provision (reversal) for doubtful collection of amount due from a related party | | 25 | | | — | | | | 15,960 | | | | (7,980 | ) | | | (1,318 | ) |
Deferred tax (benefit) expense | | 24 | | | (173,303 | ) | | | 22,893 | | | | 254,066 | | | | 41,969 | |
Warranty provision | | 13 | | | 64,730 | | | | 33,108 | | | | 41,327 | | | | 6,827 | |
Warranty settlements and reversals | | 13 | | | (34,286 | ) | | | (17,372 | ) | | | (37,790 | ) | | | (6,243 | ) |
Foreign currency exchange gains | | | | | — | | | | — | | | | (17,760 | ) | | | (2,934 | ) |
Changes in operating assets and liabilities: | | | | | | | | | | | | | | | | | | |
Restricted cash | | | | | (28,693 | ) | | | 12,379 | | | | (66,815 | ) | | | (11,037 | ) |
Accounts receivable | | | | | 743,489 | | | | (508,274 | ) | | | 182,857 | | | | 30,206 | |
Notes receivable | | | | | (50,208 | ) | | | 57,527 | | | | (8,099 | ) | | | (1,338 | ) |
Inventories | | | | | (476,373 | ) | | | (480,729 | ) | | | (26,800 | ) | | | (4,427 | ) |
Advance to suppliers and long-term prepayments | | | | | 85,883 | | | | 159,300 | | | | 21,198 | | | | 3,502 | |
Other current assets | | | | | (206,408 | ) | | | 135,524 | | | | 68,414 | | | | 11,302 | |
Land use rights | | 8 | | | (134,719 | ) | | | (7,104 | ) | | | 56,335 | | | | 9,306 | |
Long-term deferred expense | | | | | (2,322 | ) | | | (1,484 | ) | | | (505 | ) | | | (83 | ) |
Long-term payable | | 23 | | | 50,000 | | | | — | | | | — | | | | — | |
Amount due from related parties | | | | | (198,634 | ) | | | (195,117 | ) | | | (102,142 | ) | | | (16,873 | ) |
Accounts payable | | | | | 121,866 | | | | 175,126 | | | | (84,981 | ) | | | (14,038 | ) |
Notes payable | | | | | 259,975 | | | | (126,976 | ) | | | 180,198 | | | | 29,767 | |
Accrued expenses and other liabilities | | | | | (60,025 | ) | | | 17,347 | | | | 3,444 | | | | 569 | |
Amount due to related parties | | | | | 29,159 | | | | 29,703 | | | | 103,217 | | | | 17,050 | |
Customer deposits | | | | | 51,333 | | | | (48,557 | ) | | | 11,449 | | | | 1,891 | |
| | | | | | | | | | | | | | | | | | |
Net cash provided by (used in) operating activities | | | | | 255,494 | | | | (1,052,213 | ) | | | 386,718 | | | | 63,882 | |
| | | | | |
Cash flows from investing activities: | | | | | | | | | | | | | | | | | | |
Acquisition of fixed assets | | | | | (2,400,481 | ) | | | (597,978 | ) | | | (426,294 | ) | | | (70,419 | ) |
Change in restricted cash | | | | | (37,443 | ) | | | 63,461 | | | | 2,381 | | | | 393 | |
Proceeds from disposal of fixed assets | | | | | — | | | | — | | | | 2,563 | | | | 424 | |
| | | | | | | | | | | | | | | | | | |
Net cash used in investing activities | | | | | (2,437,924 | ) | | | (534,517 | ) | | | (421,350 | ) | | | (69,602 | ) |
The accompanying notes are an integral part of the consolidated financial statements.
F-5
HANWHA SOLARONE CO., LTD.
CONSOLIDATED STATEMENTS OF CASH FLOWS – CONT’D
| | | | | | | | | | | | | | | | | | |
| | | | | For the year ended December 31, | |
| | | Note | | 2011 | | | 2012 | | | 2013 | | | 2013 | |
| | | | | (RMB’000) | | | (RMB’000) | | | (RMB’000) | | | (US$’000) | |
Cash flows from financing activities: | | | | | | | | | | | | | | | | | | |
Proceeds from issuance of redeemable ordinary shares pursuant to the Share Issuance and Repurchase Agreement with Hanwha Solar Holdings Co., Ltd. | | 27 | | | 9 | | | | — | | | | — | | | | — | |
Payment for repurchase of redeemable ordinary shares which were issued pursuant to the Share Issuance and Repurchase Agreement with Hanwha Solar Holdings Co., Ltd. | | 27 | | | (16 | ) | | | — | | | | — | | | | — | |
Net proceeds from issuance of ordinary shares | | 18 | | | — | | | | — | | | | 15,293 | | | | 2,526 | |
Proceeds from exercise of stock options | | | | | 1,135 | | | | — | | | | — | | | | — | |
Proceeds from short-term bank borrowings | | | | | 3,322,480 | | | | 2,661,172 | | | | 2,152,680 | | | | 355,598 | |
Repayment of short-term bank borrowings | | | | | (1,877,148 | ) | | | (3,263,051 | ) | | | (2,209,477 | ) | | | (364,980 | ) |
Change in restricted cash | | | | | (115,000 | ) | | | 55,324 | | | | 50,948 | | | | 8,416 | |
Change in amount due to related parties | | | | | — | | | | — | | | | 79,771 | | | | 13,177 | |
Repurchase of convertible bonds | | 22 | | | — | | | | (299,271 | ) | | | — | | | | — | |
Repurchase of redeemable ordinary shares | | 21 | | | (18 | ) | | | — | | | | — | | | | — | |
Proceeds from long-term bank borrowings | | | | | 1,594,977 | | | | 1,369,370 | | | | 617,970 | | | | 102,082 | |
Repayment of long-term bank borrowings | | | | | (350,000 | ) | | | (212,037 | ) | | | (690,083 | ) | | | (113,994 | ) |
Arrangement fee and other related costs for long-term bank borrowings | | | | | (42,586 | ) | | | (18,355 | ) | | | (18,771 | ) | | | (3,101 | ) |
Arrangement fee for short-term bank borrowings | | | | | (5,625 | ) | | | (6,501 | ) | | | (12,567 | ) | | | (2,076 | ) |
Proceeds from the issuance of long-term notes | | | | | — | | | | — | | | | 627,450 | | | | 103,647 | |
Arrangement fee and other related costs for long-term notes | | | | | — | | | | — | | | | (5,577 | ) | | | (921 | ) |
| | | | | | | | | | | | | | | | | | |
Net cash provided by financing activities | | | | | 2,528,208 | | | | 286,651 | | | | 607,637 | | | | 100,374 | |
| | | | | | | | | | | | | | | | | | |
Net increase (decrease) in cash and cash equivalents | | | | | 345,778 | | | | (1,300,079 | ) | | | 573,005 | | | | 94,654 | |
Cash and cash equivalents at the beginning of year | | | | | 1,630,777 | | | | 1,976,555 | | | | 676,476 | | | | 111,746 | |
| | | | | | | | | | | | | | | | | | |
Cash and cash equivalents at the end of year | | | | | 1,976,555 | | | | 676,476 | | | | 1,249,481 | | | | 206,400 | |
| | | | | | | | | | | | | | | | | | |
Supplemental disclosure of cash flow information: | | | | | | | | | | | | | | | | | | |
Interest paid | | | | | 54,828 | | | | 164,536 | | | | 166,516 | | | | 27,506 | |
Income taxes paid (refund) | | | | | 152,681 | | | | 47,212 | | | | (45,864 | ) | | | (7,576 | ) |
Realized gain (loss) from derivative contracts | | | | | (69,757 | ) | | | 21,059 | | | | 26,309 | | | | 4,346 | |
Supplemental schedule of non-cash activities: | | | | | | | | | | | | | | | | | | |
Acquisition of fixed assets included in accounts payable, accrued expenses and other liabilities | | | | | 446,314 | | | | (159,459 | ) | | | (281,465 | ) | | | (46,495 | ) |
The accompanying notes are an integral part of the consolidated financial statements.
F-6
HANWHA SOLARONE CO., LTD.
CONSOLIDATED STATEMENTS OF CHANGES IN SHAREHOLDERS’ EQUITY
| | | | | | | | | | | | | | | | | | | | | | | | | | | | | | | | |
| | | Note | | | Number of
ordinary
shares | | | Ordinary
shares | | | Additional
paid-in
capital | | | Statutory
reserves | | | Retained
earnings
(accumulated
deficit) | | | Accumulated
other
comprehensive
loss | | | Total
shareholders’
equity | |
| �� | | | | | | | | (RMB’000) | | | (RMB’000) | | | (RMB’000) | | | (RMB’000) | | | (RMB’000) | | | (RMB’000) | |
Balance as of January 1, 2011 | | | | | | | 420,645,432 | | | | 314 | | | | 3,956,953 | | | | 170,000 | | | | 1,066,986 | | | | — | | | | 5,194,253 | |
| | | | | | | | |
Exercise of stock options and vesting of restricted stock units | | | 20 | | | | 2,358,200 | | | | 1 | | | | 1,134 | | | | — | | | | — | | | | — | | | | 1,135 | |
Settlement of stock options exercised with shares held by depository bank | | | | | | | (2,358,200 | ) | | | — | | | | — | | | | — | | | | — | | | | — | | | | — | |
Share-based compensation | | | 20 | | | | — | | | | — | | | | 38,331 | | | | — | | | | — | | | | — | | | | 38,331 | |
Shares issued to depository bank | | | | | | | 1,750,000 | | | | — | | | | — | | | | — | | | | — | | | | — | | | | — | |
Net loss for the year | | | | | | | — | | | | — | | | | — | | | | — | | | | (930,104 | ) | | | — | | | | (930,104 | ) |
Appropriation of statutory reserves | | | 33 | | | | — | | | | — | | | | — | | | | 4,456 | | | | (4,456 | ) | | | — | | | | — | |
| | | | | | | | | | | | | | | | | | | | | | | | | | | | | | | | |
Balance as of December 31, 2011 | | | | | | | 422,395,432 | | | | 315 | | | | 3,996,418 | | | | 174,456 | | | | 132,426 | | | | — | | | | 4,303,615 | |
| | | | | | | | |
Vesting of restricted stock units | | | | | | | 1,090,610 | | | | 1 | | | | (1 | ) | | | — | | | | — | | | | — | | | | — | |
Settlement of stock options exercised with shares held by depository bank | | | | | | | (1,090,610 | ) | | | — | | | | — | | | | — | | | | — | | | | — | | | | — | |
Share-based compensation | | | 20 | | | | — | | | | — | | | | 7,782 | | | | — | | | | — | | | | — | | | | 7,782 | |
Shares issued to depository bank | | | | | | | 1,000,000 | | | | — | | | | — | | | | — | | | | — | | | | — | | | | — | |
Net loss for the year | | | | | | | — | | | | — | | | | — | | | | — | | | | (1,562,859 | ) | | | — | | | | (1,562,859 | ) |
Other comprehensive loss | | | 19 | | | | — | | | | — | | | | — | | | | — | | | | — | | | | (1,219 | ) | | | (1,219 | ) |
| | | | | | | | | | | | | | | | | | | | | | | | | | | | | | | | |
Balance as of December 31, 2012 | | | | | | | 423,395,432 | | | | 316 | | | | 4,004,199 | | | | 174,456 | | | | (1,430,433 | ) | | | (1,219 | ) | | | 2,747,319 | |
| | | | | | | | |
Vesting of restricted stock units | | | | | | | 757,495 | | | | 1 | | | | (1 | ) | | | — | | | | — | | | | — | | | | — | |
Settlement of restricted stock units vested with shares held by depository bank | | | | | | | (757,495 | ) | | | — | | | | — | | | | — | | | | — | | | | — | | | | — | |
Share-based compensation | | | 20 | | | | — | | | | — | | | | 2,660 | | | | — | | | | — | | | | — | | | | 2,660 | |
Shares issued to depository bank | | | | | | | 1,000,000 | | | | — | | | | — | | | | — | | | | — | | | | — | | | | — | |
Shares issued to the public | | | 18 | | | | 7,130,000 | | | | 4 | | | | 15,289 | | | | — | | | | — | | | | — | | | | 15,293 | |
Net loss for the year | | | | | | | — | | | | — | | | | — | | | | — | | | | (874,090 | ) | | | — | | | | (874,090 | ) |
Other comprehensive loss | | | 19 | | | | — | | | | — | | | | — | | | | — | | | | — | | | | (811 | ) | | | (811 | ) |
| | | | | | | | | | | | | | | | | | | | | | | | | | | | | | | | |
Balance as of December 31, 2013 | | | | | | | 431,525,432 | | | | 321 | | | | 4,022,147 | | | | 174,456 | | | | (2,304,523 | ) | | | (2,030 | ) | | | 1,890,371 | |
| | | | | | | | | | | | | | | | | | | | | | | | | | | | | | | | |
Balance as of December 31, 2013, in US$’000 | | | | | | | | | | | 53 | | | | 664,411 | | | | 28,818 | | | | (380,680 | ) | | | (335 | ) | | | 312,267 | |
| | | | | | | | | | | | | | | | | | | | | | | | | | | | | | | | |
The accompanying notes are an integral part of the consolidated financial statements.
F-7
HANWHA SOLARONE CO., LTD.
NOTES TO THE CONSOLIDATED FINANCIAL STATEMENTS
AS OF DECEMBER 31, 2012 AND 2013 AND
FOR EACH OF THE THREE YEARS ENDED DECEMBER 31, 2011, 2012 AND 2013
| 1. | ORGANIZATION AND BASIS OF PRESENTATION |
Hanwha SolarOne Co., Ltd. (the “Company”) was incorporated under the laws of the Cayman Islands on June 12, 2006 and its principal activity is investment holding. The principal activities of its subsidiaries are described in the table below. The Company together with its subsidiaries listed below are referred to as the “Group” hereinafter.
On April 15, 2011, the Group established two wholly-owned subsidiaries, Hanwha SolarOne (Nantong) Co., Ltd. (“SolarOne Nantong”) and Nantong Hanwha Import & Export Co., Ltd. (“Nantong Hanwha I&E”). The registered capital of SolarOne Nantong and Nantong Hanwha I&E is US$40,000,000 and RMB5,000,000, respectively, which has been received as of December 31, 2013. The principal activity of SolarOne Nantong is to develop, manufacture and sell photovoltaic (“PV”) products to both domestic and overseas customers. Nantong Hanwha I&E is mainly engaged in import and export business. SolarOne Nantong and Nantong Hanwha I&E have not yet commenced operations as of December 31, 2013.
On April 26, 2012, the Group established a wholly-owned subsidiary, Hanwha Solar Canada Inc. (“Solar Canada”). The registered capital of Solar Canada is Canadian Dollar (“CAD”) 450,000, which has been received as of December 31, 2013. The principal activity of Solar Canada is to sell PV products in Canada.
On May 1, 2012, the Group acquired 100% equity interests in Hanwha Solar Australia Pty Ltd. (“Solar Australia”) from Hanwha Corporation with a total cash consideration of Australian Dollar (“AUD”) 16,732, which was the total carrying value of the assets and liabilities in Solar Australia at the point of acquisition. Solar Australia was established in January 2012 by Hanwha Resources Australia Pty Ltd., a wholly-owned subsidiary of Hanwha Corporation. Before the acquisition, the registered and paid-in capital of Solar Australia was AUD50,000. Subsequent to the acquisition, the Company invested additional AUD450,000 in Solar Australia. As of December 31, 2013, the registered capital of Solar Australia was AUD500,000, which has been received as of December 31, 2013. The principal activity of Solar Australia is to sell PV products in Australia.
On July 8, 2013, the Group established a wholly-owned subsidiary, Nantong Hanwha PV-Tech Energy Co., Ltd. (“Nantong Tech”). The registered capital of Nantong Tech is RMB 500,000, which has been received by Nantong Tech as of December 31, 2013. The principal activity of Nantong Tech is to provide solar systems integration services in the PRC. Nantong Tech has not yet commenced operations as of December 31, 2013.
F-8
HANWHA SOLARONE CO., LTD.
NOTES TO THE CONSOLIDATED FINANCIAL STATEMENTS
AS OF DECEMBER 31, 2012 AND 2013 AND
FOR EACH OF THE THREE YEARS ENDED DECEMBER 31, 2011, 2012 AND 2013
| 1. | ORGANIZATION AND BASIS OF PRESENTATION (CONT’D) |
As of December 31, 2013, the Company’s subsidiaries included the following entities:
| | | | | | | | |
Name of subsidiary | | Date of incorporation/
establishment/
acquisition | | Place of
incorporation/
establishment | | Percentage of
shareholding/
ownership | | Principal activities |
Hanwha SolarOne Investment Holding Ltd. (“SolarOne Investment”) | | May 17, 2006 | | British Virgin
Islands | | 100% | | Investment holding |
| | | | |
Hanwha SolarOne Hong Kong Limited (“SolarOne HK”) | | May 16, 2007 | | Hong Kong | | 100% | | Investment holding and international procurements/sales |
| | | | |
Hanwha SolarOne U.S.A. Inc. (“SolarOne USA”) | | September 18, 2007 | | United States of
America | | 100% | | Sales in USA |
| | | | |
Hanwha SolarOne GmbH (“SolarOne GmbH”) | | February 14, 2008 | | Germany | | 100% | | International sales |
| | | | |
Solar Canada | | April 26,2012 | | Canada | | 100% | | International sales |
| | | | |
Solar Australia | | May 1, 2012 | | Australia | | 100% | | International sales |
| | | | |
Hanwha SolarOne (Qidong) Co., Ltd. (“SolarOne Qidong”) | | August 27, 2004 | | PRC | | 100% | | Development, manufacturing and sales of PV products to both domestic and overseas customers |
| | | | |
Hanwha SolarOne (Shanghai) Co., Ltd. (“SolarOne Shanghai”) (previously known as Shanghai Linyang Solar Technology Co., Ltd.) | | March 29, 2006 | | PRC | | 100% | | Sales of PV products to PRC customers |
| | | | |
Hanwha Solar Engineering Research and Development Center Co., Ltd. (“Solar R&D”) | | April 9, 2007 | | PRC | | 100% | | Research and development |
| | | | |
Hanwha SolarOne Technology Co., Ltd. (“SolarOne Technology”) | | July 31, 2007 | | PRC | | 100% | | Manufacturing of silicon ingots and wafers |
| | | | |
Hanwha Solar Electric Power Engineering Co., Ltd. (“Solar Engineering”) | | May 25, 2010 | | PRC | | 100% | | Provide solar system integration services in the PRC and sales of PV products |
| | | | |
Nantong Hanwha I&E | | April 15, 2011 | | PRC | | 100% | | Import and export business |
F-9
HANWHA SOLARONE CO., LTD.
NOTES TO THE CONSOLIDATED FINANCIAL STATEMENTS
AS OF DECEMBER 31, 2012 AND 2013 AND
FOR EACH OF THE THREE YEARS ENDED DECEMBER 31, 2011, 2012 AND 2013
| 1. | ORGANIZATION AND BASIS OF PRESENTATION (CONT’D) |
| | | | | | | | |
Name of subsidiary | | Date of incorporation/
establishment/
acquisition | | Place of
incorporation/
establishment | | Percentage of
shareholding/
ownership | | Principal activities |
SolarOne Nantong | | April 15, 2011 | | PRC | | 100% | | Development, manufacturing and sales of PV products to both domestic and overseas customers |
| | | | |
Nantong Tech | | July 8, 2013 | | PRC | | 100% | | Provide solar system integration services in the PRC |
| 2. | SUMMARY OF SIGNIFICANT ACCOUNTING POLICIES |
Basis of Presentation
The consolidated financial statements are prepared in accordance with U.S. generally accepted accounting principles (“US GAAP”).
Principles of Consolidation
The consolidated financial statements include the financial statements of the Company and its subsidiaries. All significant inter-company transactions and balances between the Company and its subsidiaries are eliminated upon consolidation.
Foreign Currency
The functional currency of the Company and each of its subsidiaries is Renminbi as determined based on the criteria of ASC 830,Foreign Currency Translation except SolarOne USA, Solar Australia, Solar Canada and SolarOne Gmbh which have determined their functional currency to be their respective local currency. The reporting currency of the Company is also Renminbi. Transactions denominated in foreign currencies are remeasured into the functional currency at the exchange rates prevailing on the transaction dates. Foreign currency denominated financial assets and liabilities are remeasured at the balance sheet date exchange rate. Exchange gains and losses are separately reported in the consolidated statements of comprehensive income. The Company uses the average exchange rate prevailing during the year and the exchange rate at the balance sheet date to translate its operating results and financial position, respectively. The resulting translation adjustments are recorded in other comprehensive loss.
Convenience Translation
Amounts in United States dollars are presented for the convenience of the reader and are translated at the noon buying rate of US$1.00 to RMB6.0537 on December 31, 2013, the last business day in fiscal year 2013, in the City of New York for cable transfers of Renminbi as certified for customs purposes by the Federal Reserve Bank of New York. No representation is made that the Renminbi amounts could have been, or could be, converted into United States dollars at such rate.
F-10
HANWHA SOLARONE CO., LTD.
NOTES TO THE CONSOLIDATED FINANCIAL STATEMENTS
AS OF DECEMBER 31, 2012 AND 2013 AND
FOR EACH OF THE THREE YEARS ENDED DECEMBER 31, 2011, 2012 AND 2013
| 2. | SUMMARY OF SIGNIFICANT ACCOUNTING POLICIES (CONT’D) |
Use of Estimates
The preparation of the consolidated financial statements in conformity with US GAAP requires management to make estimates and assumptions that affect the reported amount of assets and liabilities and disclosures of contingent assets and liabilities at the date of the financial statements and the reported amounts of revenues and expenses during the periods. Area where management uses subjective judgment include, provision for doubtful debts, provision for advance to suppliers, provision for warranty, inventory write-down, useful lives of fixed assets and land use rights, impairment of fixed assets, land use rights and goodwill, valuation allowances on deferred tax assets, stock-based compensation expenses, fair values of derivative contracts and fair value of conversion feature of convertible bonds. Changes in facts and circumstances may result in revised estimates. Actual results could differ from these estimates, and as such, differences may be material to the financial statements.
Cash and Cash Equivalents
Cash and cash equivalents are stated at cost, which approximates fair value, and consist of cash on hand and bank deposits, which are unrestricted as to withdrawal and use and have original maturities less than 90 days.
Restricted Cash
Restricted cash represents amounts held by a bank as security for letters of credit facilities, notes payable and bank borrowings and, therefore, are not available for the Group’s use. Changes in restricted cash that relate to the purchase of raw materials or sale of goods are classified within cash flows from operating activities, changes in restricted cash that relate to the purchase of fixed assets are classified within cash flows from investing activities and changes in restricted cash that relate to bank borrowings are classified within cash flows from financing activities. The restriction on cash is expected to be released within the next twelve months.
Accounts and Notes Receivable
Accounts and notes receivable are recognized and carried at original invoiced amounts less an allowance for potential uncollectible amounts. An allowance for doubtful accounts is recorded in the period in which collection is determined to be not probable based on historical experience, account balance aging, prevailing economic conditions and an assessment of specific evidence indicating troubled collection. A receivable is written off after all collection efforts have ceased.
Debt Issuance Costs
Debt issuance costs represent the incurred costs directly attributable to the issuance of the convertible bonds. These costs are deferred and amortized ratably using the effective interest method from the debt issuance date over the life of the convertible bonds. Upon the conversion of the bonds, the related debt issuance costs will be debited to shareholders’ equity.
Arrangement Fees
Arrangement fees represent the incurred costs directly attributable to the bank borrowings. These costs are deferred and amortized using the effective interest method over the term of the bank borrowings.
F-11
HANWHA SOLARONE CO., LTD.
NOTES TO THE CONSOLIDATED FINANCIAL STATEMENTS
AS OF DECEMBER 31, 2012 AND 2013 AND
FOR EACH OF THE THREE YEARS ENDED DECEMBER 31, 2011, 2012 AND 2013
| 2. | SUMMARY OF SIGNIFICANT ACCOUNTING POLICIES (CONT’D) |
Inventories
Inventories are stated at the lower of cost or market value. Cost is determined by the weighted-average method. Raw material cost is based on purchase costs while work-in-progress and finished goods comprise direct materials, direct labor and an allocation of manufacturing overhead costs.
Fixed Assets
Fixed assets are stated at cost and are depreciated using the straight-line method over the estimated useful lives of the assets as follows:
| | |
Buildings | | 20 years |
Plant and machinery | | 10 years |
Furniture, fixtures and office equipment | | 5 years |
Computer software | | 5 years |
Motor vehicles | | 5 years |
Leasehold improvements | | Over the shorter of the lease term or their estimated useful lives |
Repair and maintenance costs are charged to expense when incurred, whereas the cost of renewals and betterments that extend the useful life of fixed assets are capitalized as additions to the related assets. Retirement, sale and disposal of assets are recorded by removing the cost and accumulated depreciation with any resulting gain or loss reflected in the consolidated statements of comprehensive income.
Cost incurred in constructing new facilities, including progress payments, interest and other costs relating to the construction are capitalized and transferred to fixed assets upon completion and depreciation commences when the asset is available for its intended use.
Interest costs are capitalized if they are incurred during the acquisition, construction or production of a qualifying asset and such costs could have been avoided if expenditures for the assets have not been made. Capitalization of interest costs commences when the activities to prepare the asset are in progress and expenditures and borrowing costs are being incurred. Interest costs are capitalized until the assets are ready for their intended use. Total interest costs incurred during 2011, 2012 and 2013 were RMB 230,093,000, RMB340,583,000 and RMB328,962,000 (US$54,340,651) and interest capitalized during 2011, 2012 and 2013 amounted to RMB59,034,000, RMB41,068,000 and RMB5,142,000 (US$849,398), respectively.
Land use rights
Land use rights represent amounts paid for the right to use land in the PRC and are recorded at purchase cost less accumulated amortization. Amortization is provided on a straight-line basis over the lives of the land use rights agreements, which have terms of tenure and weighted-average amortization period of 50 years.
Goodwill
Goodwill represents the excess of the purchase price over the amounts assigned to the fair value of the assets acquired and the liabilities assumed of the acquired business.
F-12
HANWHA SOLARONE CO., LTD.
NOTES TO THE CONSOLIDATED FINANCIAL STATEMENTS
AS OF DECEMBER 31, 2012 AND 2013 AND
FOR EACH OF THE THREE YEARS ENDED DECEMBER 31, 2011, 2012 AND 2013
| 2. | SUMMARY OF SIGNIFICANT ACCOUNTING POLICIES (CONT’D) |
Goodwill (Cont’d)
Goodwill is reviewed at least annually at December 31 for impairment, or earlier if there is an indication of impairment, in accordance with ASC 350,Goodwill and Other Intangible Assets. The Group assigns and assesses goodwill for impairment at the reporting unit level.
The performance of the impairment test involves a two-step process. The first step of the impairment test involves comparing the fair value of the reporting unit with its carrying amount, including goodwill. Fair value is primarily determined by computing the future discounted cash flows expected to be generated by the reporting unit. If the reporting unit’s carrying value exceeds its fair value, goodwill may be impaired. If this occurs, the Group performs the second step of the goodwill impairment test to determine the amount of impairment loss.
The fair value of the reporting unit is allocated to its assets and liabilities in a manner similar to a purchase price allocation in order to determine the implied fair value of the reporting unit’s goodwill. If the implied goodwill fair value is less than its carrying value, the difference is recognized an impairment loss.
In accordance with ASC 350, the Group assigned and assessed goodwill for impairment at the reporting unit level. A reporting unit is an operating segment or one level below the operating segment. The Group has determined that goodwill is only allocable to one of our reporting units, SolarOne Technology. As of December 31, 2011, the Group performed impairment tests on goodwill in a two-step process. The Group determined the fair value of the reporting unit using the income approach based on the discounted expected future cash flows associated with the reporting unit. The discounted cash flows for the reporting unit were based on five-year projections. Cash flow projections were based on past experience, actual operating results and management’s best estimates about future developments, as well as certain market assumptions. Cash flow after the fifth year were estimated using a terminal value calculation, which considered terminal value growth rate at 3%, considering long-term revenue growth rates for entities in the relevant industries in the PRC. The discount rate of approximately 16% was used in the valuations which reflect the market assessment of the risks specific to the Group’s industry and is based on the weighted-average cost of capital for that particular reporting unit.
The Group recognized an impairment loss of RMB134,735,000 for the entire goodwill as of December 31, 2011.
Impairment of Long-Lived Assets
The Group evaluates its long-lived assets or asset groups, including land use rights with finite lives, for impairment whenever events or changes in circumstances (such as a significant adverse change to market conditions that will impact the future use of the assets) indicate that the carrying amount of a group of long-lived assets may not be recoverable. When these events occur, the Group evaluates for impairment by comparing the carrying amount of the assets to the future undiscounted net cash flows expected to result from the use of the assets and their eventual disposition. If the sum of the expected undiscounted cash flows is less than the carrying amount of the assets, the Group would recognize an impairment loss based on the excess of the carrying amount of the asset group over its fair value.
During the years ended December 31, 2011, 2012 and 2013, the significant decline in the market price of its PV products provided indication that the carrying value of its long-lived assets, including fixed assets and land use
F-13
HANWHA SOLARONE CO., LTD.
NOTES TO THE CONSOLIDATED FINANCIAL STATEMENTS
AS OF DECEMBER 31, 2012 AND 2013 AND
FOR EACH OF THE THREE YEARS ENDED DECEMBER 31, 2011, 2012 AND 2013
| 2. | SUMMARY OF SIGNIFICANT ACCOUNTING POLICIES (CONT’D) |
Impairment of Long-Lived Assets (Cont’d)
rights, may not be recoverable. As of December 31, 2011, 2012 and 2013, based on the impairment assessment performed, the Company concluded the carrying amount of the long-lived assets is recoverable, and no impairment loss is recognized.
Fair Value of Financial Instruments
Financial instruments include cash and cash equivalents, restricted cash, accounts and notes receivable, other receivables, accounts and notes payable, short-term bank borrowings, amounts due to/from related parties, long-term bank borrowings, long-term notes, convertible bonds and derivative contracts. The carrying amounts of these financial instruments other than long-term bank borrowings, long term notes and convertible bonds approximate their fair values due to the short-term maturity of these instruments. The carrying amount of the long-term bank borrowings and long-term notes also approximate their fair value since they bear floating interest rates which approximate market interest rates.
The conversion option was bifurcated from the convertible bonds at its fair value and the residual value allocated to the convertible bonds was accreted to the redemption amount using the effective interest method. The Group determined the fair value of the conversion option using binomial model with the assistance of an independent third-party valuation firm.
As of December 31, 2012 and 2013, the fair value and carrying value of the convertible bonds is as follows:
| | | | | | | | | | | | | | | | |
| | | | | | As of December 31, | |
| | | Note | | | 2012 | | | 2013 | | | 2013 | |
| | | | | | (RMB’000) | | | (RMB’000) | | | (US$’000) | |
Fair value * | | | | | | | 486,767 | | | | 565,673 | | | | 93,443 | |
Carrying value | | | 31 | | | | 368,590 | | | | 470,357 | | | | 77,697 | |
| * | The fair value of the convertible bonds is determined using binomial model with reference to market quote on the trade price of the convertible bonds as of December 31, 2012 and 2013. |
Financial Instruments – Foreign Currency Derivative Contracts, Commodity Contracts and Interest Rate Swap Contract
The Group’s primary objective for holding foreign currency derivative contracts, commodity derivative contracts and interest rate swap contract is to manage its foreign currency risks principally arising from sales contracts denominated in Euros and Japanese Yen, the stability of the purchase price for silver and aluminum (which are two kinds of raw materials required in the production of PV products), and the interest rate risk for the long-term bank borrowings. The Group records these derivative instruments as current assets or current liabilities, measured at fair value.
During the years ended December 31, 2011, 2012 and 2013, the Group entered into cross-currency exchange rate agreements to receive RMB and sell other currencies, commodity agreements to purchase silver and aluminum,
F-14
HANWHA SOLARONE CO., LTD.
NOTES TO THE CONSOLIDATED FINANCIAL STATEMENTS
AS OF DECEMBER 31, 2012 AND 2013 AND
FOR EACH OF THE THREE YEARS ENDED DECEMBER 31, 2011, 2012 AND 2013
| 2. | SUMMARY OF SIGNIFICANT ACCOUNTING POLICIES (CONT’D) |
Financial Instruments – Foreign Currency Derivative Contracts, Commodity Contracts and Interest Rate Swap Contract (Cont’d)
and an interest rate swap agreement to pay fixed interest rate rather than floating rate. Changes in the fair value of these derivative instruments are recognized in the consolidated statements of comprehensive income. These derivative instruments are not designated and do not qualify as hedges and are adjusted to fair value through current earnings. As of December 31, 2013, the Group had outstanding cross-currency exchange rate contracts with notional amounts of Euro15,000,000 (2012: Euro44,000,000), US$120,415,000 (2012: US$46,250,000) and JPY4,277,500,000 (2012: Nil), and an interest rate swap contract with notional amount of US$50,000,000 (2012: US$50,000,000). In addition, the Group had outstanding commodity contracts with a quantity of 140,000 ounces of silver as of December 31, 2012. The Group estimates the fair value of its foreign currency, commodity and interest rate swap derivatives using a pricing model based on market observable inputs.
Revenue Recognition
The Group’s primary business activity is to produce and sell PV modules. The Group periodically, upon special request from customers, sells PV cells and silicon ingots. The Group records revenue related to the sale of PV modules, PV cells and silicon ingots when the criteria of ASC 605-10,Revenue Recognition: Overall, are met. These criteria include all of the following: persuasive evidence of an arrangement exists; delivery has occurred; the sales price is fixed or determinable; and collectability is reasonably assured.
More specifically, the Group’s sales arrangements are evidenced by framework sales agreements and/or by individual sales agreements for each transaction. The shipping terms of the Group’s sales arrangements are generally “Cost, Insurance and Freight” (“CIF”) and “Free on Board” (“FOB”) shipping point whereby the customer takes title and assumes the risks and rewards of ownership of the products upon delivery to the shipper. The customer bears all costs and risks of loss or damage to the goods from that point. Under some sales arrangements, the Group requires its customers to prepay prior to shipment. The Company performs ongoing credit assessment of each customer, including reviewing the customer’s latest financial information and historical payment record and performing necessary due diligence to determine acceptable credit terms. In instances where longer credit terms are granted to certain customers, the timing of revenue recognition was not impacted as the Company has historically been able to collect under the original payment terms without making concessions. Other than warranty obligations, the Group does not have any commitments or obligations to deliver additional products or services to the customers. Based on the above, the Group records revenue related to product sales upon delivery of the product to the shipper, assuming all other revenue recognition criteria are met.
Payments received from customers for shipping and handling costs are included in net revenues. Shipping and handling costs relating to sales and purchases are included in selling expenses and cost of revenue, respectively.
The Group entered into a processing service arrangement to process PV cells into PV modules. For this service arrangement, the Group “purchases” PV cells from the customer and contemporaneously agrees to “sell” a specified quantity of PV modules back to the same customer. The quantity of PV modules sold back to the customers under these processing arrangements is consistent with the amount of PV cells purchased from the customer based on current production conversion rates. In accordance with ASC 845-10,Accounting for Purchases and Sales of Inventory with the Same Counterparty, the Group records the amount of revenue on these
F-15
HANWHA SOLARONE CO., LTD.
NOTES TO THE CONSOLIDATED FINANCIAL STATEMENTS
AS OF DECEMBER 31, 2012 AND 2013 AND
FOR EACH OF THE THREE YEARS ENDED DECEMBER 31, 2011, 2012 AND 2013
| 2. | SUMMARY OF SIGNIFICANT ACCOUNTING POLICIES (CONT’D) |
Revenue Recognition (Cont’d)
processing transactions based on the amount received for PV modules sold less the amount paid for the PV cells purchased from the customer. These sales are subject to all of the above-noted criteria relating to revenue recognition.
The Company recognizes revenue related to long-term solar systems integration services on the percentage-of-completion method. The Company estimates its revenues by using the cost-to-cost method, whereby it derives a ratio by comparing the costs incurred to date to the total costs expected to be incurred on the project. The Company applies the ratio computed in the cost-to-cost analysis to the contract price to determine the estimated revenues earned in each period. A contract may be regarded as substantially completed if remaining costs are not significant in amount. When the Company determines that total estimated costs will exceed total revenues under a contract, it records a loss accordingly. Unbilled amounts are included in the consolidated balance sheets as “unbilled solar systems integration revenue”.
Revenue is recognized net of all value-added taxes imposed by governmental authorities and collected from customers concurrent with revenue-producing transactions. The Group does not offer implicit or explicit rights of return, regardless of whether goods were shipped to the distributors or shipped directly to the end user, other than due to product defect.
Cost of Revenue
Cost of revenue includes direct and indirect production costs.
Research and Development Costs
Research and development costs are expensed as incurred.
Advertising Expenditures
Advertising costs are expensed when incurred and are included in “selling expenses.” Advertising expenses were RMB13,087,000, RMB29,255,000 and RMB7,902,000 (US$1,305,317) for the years ended December 31, 2011, 2012 and 2013, respectively.
Warranty Cost
The Group primarily provides standard warranty coverage on PV modules sold to customers. Before 2012, the standard warranty provides for a 2 to 5-year warranty against technical defects, a 10-year warranty against a decline from initial power generation capacity of more than 10% and a 20 to 25-year warranty against a decline from initial power generation capacity of more than 20%. From January 1, 2012, the standard warranty provides a 12-year warranty against technical defects, and a 25-year linear warranty, which guarantees: 1) no less than 97% of the nominal power generation capacity for multicrystalline PV modules and 96% of the nominal power generation capacity for monocrystalline PV modules in the first year, 2) an annual output degradation of no more than 0.7% thereafter, and 3) by the end of the 25th year, the actual power output shall be no less than 82% of initial power generation capacity.
F-16
HANWHA SOLARONE CO., LTD.
NOTES TO THE CONSOLIDATED FINANCIAL STATEMENTS
AS OF DECEMBER 31, 2012 AND 2013 AND
FOR EACH OF THE THREE YEARS ENDED DECEMBER 31, 2011, 2012 AND 2013
| 2. | SUMMARY OF SIGNIFICANT ACCOUNTING POLICIES (CONT’D) |
Warranty Cost (Cont’d)
The estimate of the amount of warranty obligation is primarily based on the following considerations: 1) the results of technical analyses, including simulation tests performed on the products by an industry-recognized external certification body as well as internally developed testing procedures conducted by the Company’s engineering team, 2) the Company’s historical warranty claims experience, 3) the warranty accrual practices of other companies in the industry that produce PV products that are comparable in engineering design, raw material input and functionality to the products, and which sell products to a similar class of customers, and 4) the expected failure rate and future costs to service failed products. The results of the technical analyses support the future operational efficiency of the PV modules at levels significantly above the minimum guaranteed levels over the respective warranty periods. The estimate of warranty costs are affected by the estimated and actual product failure rates, the costs to repair or replace failed products and potential service and delivery costs incurred in correcting a product failure. Based on the above considerations and management’s ability and intention to provide repairs, replacements or refunds for defective products, the Group accrues for warranty costs for the 2 to 12-year warranty against technical defects based on 1% of revenue for PV modules. No warranty cost accrual has been recorded for the 10-year or 20 to 25-year warranties for decline from initial power generation capacity because the Group determined the likelihood of claims arising from these warranties to be remote based on internal and external testing of the PV modules and strong quality control procedures in the production process. The basis for the warranty accrual will be reviewed periodically based on actual experience. The Group does not sell extended warranty coverage that is separately priced or optional.
Government Grants
Government grants received by the Company consist of unrestricted grants and subsidies. The amount of such government grants are determined solely at the discretion of the relevant government authorities and there is no assurance that the Group will continue to receive these government grants in the future. Government grants are recognized when all the conditions attached to the grants have been met and the grants are received. For the government grants that is of a non-operating nature and with no further conditions to be met, the amounts are recorded as a non-operating income by offsetting to its operating expenses when received; whereas for the government grants with certain operating conditions, the amounts are recorded as liabilities when received and will be recorded as an operating income when the conditions are met.
During the years ended December 31, 2011, 2012 and 2013, the Group recorded RMB14,437,000, RMB25,911,000 and RMB3,870,000 (US$639,278), respectively, of government subsidies as an offset to its operating expenses, because these government grants were received due to the reason that the Group qualifies as a “high and new technology enterprise” in Jiangsu Province in the PRC. During the years ended December 31, 2011, 2012 and 2013, the Group received nil, nil and RMB5,000,000 (US$825,941), respectively, as reimbursement for interest expense incurred for imported equipment, which are recorded as other income. The government grants recorded in operating expense or other income are not subject to adjustment and do not have any restrictions as to the use of funds.
As of December 31, 2012 and 2013, the Group recorded RMB50,000,000 and RMB50,000,000 (US$8,259,412), respectively, of government grants received as long-term payable because the Group has not fulfilled the conditions required by the government.
F-17
HANWHA SOLARONE CO., LTD.
NOTES TO THE CONSOLIDATED FINANCIAL STATEMENTS
AS OF DECEMBER 31, 2012 AND 2013 AND
FOR EACH OF THE THREE YEARS ENDED DECEMBER 31, 2011, 2012 AND 2013
| 2. | SUMMARY OF SIGNIFICANT ACCOUNTING POLICIES (CONT’D) |
Accounting for Income Taxes and Uncertain Tax Positions
The Group accounts for income taxes in accordance with ASC 740,Accounting for Income Taxes. Under this method, deferred tax assets and liabilities are determined based on the difference between the financial reporting and tax bases of assets and liabilities using enacted tax rates that will be in effect in the period in which the differences are expected to reverse. The Group records a valuation allowance to offset deferred tax assets if, based on the weight of available evidence, it is more-likely-than-not that some portion, or all, of the deferred tax assets will not be realized. The effect on deferred taxes of a change in tax rates is recognized in income in the period that includes the enactment date.
The Group applies ASC 740-10, Accounting for Uncertainty in Income Taxes,which clarifies the accounting for uncertainty in income taxes by prescribing the recognition threshold a tax position is required to meet before being recognized in the financial statements. The Group has elected to classify interest and/or penalties related to an uncertain position, if and when required, as part of “other operating expenses” in the consolidated statements of comprehensive income.
Value-Added Tax (“VAT”)
In accordance with the relevant tax laws in the PRC, VAT is levied on the invoiced value of sales and is payable by the purchaser. The Group is required to remit the VAT it collects to the tax authority, but may deduct the VAT it has paid on eligible purchases. To the extent the Group paid more than collected, the difference represents a net VAT recoverable balance at the balance sheet date.
Leases
Leases are classified at the inception date as either a capital lease or an operating lease. For the lessee, a lease is a capital lease if any of the following conditions exist: a) ownership is transferred to the lessee by the end of the lease term; b) there is a bargain purchase option; c) the lease term is at least 75% of the property’s estimated remaining economic life; or d) the present value of the minimum lease payments at the beginning of the lease term is 90% or more of the fair value of the leased property to the lessor at the inception date. A capital lease is accounted for as if there was an acquisition of an asset and an incurrence of an obligation at the inception of the lease. All other leases are accounted for as operating leases wherein rental payments are expensed on a straight-line basis over the periods of their respective leases. Rental expenses were RMB10,270,000, RMB12,787,000 and RMB10,042,000 (US$1,658,820) for the years ended December 31, 2011, 2012 and 2013, respectively. The Group had no capital leases during any of the periods stated herein.
Net Loss Per Share
Net loss per share is calculated in accordance with ASC 260-10,Earnings Per Share.Basic loss per ordinary share is computed by dividing loss attributable to holders of ordinary shares by the weighted-average number of ordinary shares outstanding during the period. Diluted loss per ordinary share reflects the potential dilution that could occur if securities or other contracts to issue ordinary shares were exercised or converted into ordinary shares. Ordinary shares issuable upon the conversion of convertible bonds are included in the computation of diluted loss per ordinary share on an “if-converted” basis, when the impact is dilutive. Dilutive ordinary
F-18
HANWHA SOLARONE CO., LTD.
NOTES TO THE CONSOLIDATED FINANCIAL STATEMENTS
AS OF DECEMBER 31, 2012 AND 2013 AND
FOR EACH OF THE THREE YEARS ENDED DECEMBER 31, 2011, 2012 AND 2013
| 2. | SUMMARY OF SIGNIFICANT ACCOUNTING POLICIES (CONT’D) |
Net Loss Per Share (Cont’d)
equivalent shares consist of ordinary shares issuable upon the exercise of outstanding share options and restricted stock units. Ordinary share equivalents are excluded from the computation of diluted loss per share if their effects would be anti-dilutive.
Stock Compensation
Stock awards granted to employees and non-employees are accounted for under ASC 718-10,Share-Based Payment, and ASC 505-50,Accounting for Equity Instruments That Are Issued to Other Than Employees for Acquiring, or in Conjunction with Selling, Goods or Services, respectively.
In accordance with ASC 718-10, all grants of share options to employees are recognized in the financial statements based on their grant-date fair values. The Group has elected to recognize compensation expense using the straight-line method for all share options granted with service conditions that have a graded vesting schedule.
ASC 718-10 requires forfeitures to be estimated at the time of grant and revised, if necessary, in subsequent periods if actual forfeitures differ from initial estimates. Share-based compensation expense was recorded net of estimated forfeitures such that expense was recorded only for those share-based awards that are expected to vest.
Recent Accounting Pronouncements
In March 2013, the Financial Accounting Standards Board (“FASB”) issued Accounting Standards Update (“ASU”) No. 2013-05 (“ASU 2013-05”), Parent’s Accounting for the Cumulative Translation Adjustment upon Derecognition of Certain Subsidiaries or Groups of Assets within a Foreign Entity or of an Investment in a Foreign Entity, which specifies that a cumulative translation adjustment (“CTA”) should be released into earnings when an entity ceases to have a controlling financial interest in a subsidiary or group of assets within a consolidated foreign entity and the sale or transfer results in the complete or substantially complete liquidation of the foreign entity. For sales of an equity method investment that is a foreign entity, a pro rata portion of CTA attributable to the investment would be recognized in earnings when the investment is sold. When an entity sells either a part or all of its investment in a consolidated foreign entity, CTA would be recognized in earnings only if the sale results in the parent no longer having a controlling financial interest in the foreign entity. In addition, CTA should be recognized in earnings in a business combination achieved in stages. For public entities, ASU 2013-05 is effective for reporting periods beginning after December 15, 2013, with early adoption permitted. The Company will adopt ASU 2013-05 on January 1, 2014 and does not expect the adoption to have a material impact on its consolidated financial statements.
In July 2013, the FASB issued ASU No. 2013-11, Income Taxes (Topic 740) (‘‘ASU 2013-11’’) to provide guidance on the financial statement presentation of an unrecognized tax benefit when a net operating loss carryforward, similar tax loss, or tax credit carryforward exists. ASU 2013-11 requires an unrecognized tax benefit, or a portion of an unrecognized tax benefit, to be presented in the financial statements as a reduction to a deferred tax asset for a net operating loss carryforward, a similar tax loss, or a tax credit carryforward, with certain exceptions. The modifications to ASC Topic 740 resulting from the issuance of ASU 2013-11 are effective for fiscal years beginning after December 15, 2013 and interim periods within those years. Early adoption is permitted. The Company will adopt ASU 2013-11 beginning January 1, 2014 and does not expect the adoption to have a material impact on its consolidated financial statements and disclosures.
F-19
HANWHA SOLARONE CO., LTD.
NOTES TO THE CONSOLIDATED FINANCIAL STATEMENTS
AS OF DECEMBER 31, 2012 AND 2013 AND
FOR EACH OF THE THREE YEARS ENDED DECEMBER 31, 2011, 2012 AND 2013
| 2. | SUMMARY OF SIGNIFICANT ACCOUNTING POLICIES (CONT’D) |
Concentration of Risks
Concentration of credit risk
Assets that potentially subject the Group to significant concentration of credit risk are primarily cash and cash equivalents, accounts receivable, advance to suppliers and long-term prepayments.
The Group has RMB1,210,529,000 (US$199,965,145) of cash and bank deposits in the PRC, which constitute about 97% of total cash and cash equivalents. Historically, deposits in Chinese banks are secured due to the state policy on protecting depositors’ interests. However, China promulgated a new Bankruptcy Law in August 2006 that came into effect on June 1, 2007, which contains a separate article expressly stating that the State Council promulgates implementation measures for the bankruptcy of Chinese banks based on the Bankruptcy Law when necessary. Under the new Bankruptcy Law, a Chinese bank can go into bankruptcy. In addition, since China’s concession to the World Trade Organization (“WTO”), foreign banks have been gradually permitted to operate in China which has led to increased competition for Chinese banks. Further, the global financial crisis arising in the third quarter of 2008 has increase the risk of bank bankruptcy in the PRC. In the event of bankruptcy, it is uncertain whether the Group will be able to receive its deposits back in full since it is unlikely to be classified as a secured creditor based on PRC laws. The Group mitigates its risk of loss by continuing to monitor the financial strength of the financial institutions in which it makes deposits.
Advances to suppliers and long-term prepayments are typically unsecured and arise from deposits paid in advance for future purchases of raw materials. As a percentage of total advances to suppliers, including long-term prepayments, the five suppliers with largest advance balance accounted for an aggregate of 79.3% and 74.4% of total advance to suppliers balance as of December 31, 2012 and 2013, respectively. Due to the Group’s concentration of advances made to a limited number of suppliers and the significant prepayments that are made to them, any negative events or deterioration in financial strength with respect to the Group’s suppliers may cause a material loss to the Group and have a material adverse effect on the Group’s financial condition and results of operations (Note 5). The risk with respect to advances made to suppliers is mitigated by credit evaluations that the Group performs on its suppliers prior to making any advances and the ongoing monitoring of its suppliers’ performance.
With respect to accounts receivable, the Group conducts periodic credit evaluation of its customers but does not require collateral or other security from its customers.
Concentration of customers
The Group currently sells a substantial portion of its PV products to a limited number of customers. As a percentage of revenues, the top five customers accounted for an aggregate of 45.0%, 29.8% and 53.5% for the years ended December 31, 2011, 2012 and 2013, respectively. The loss of sales from any of these customers would have a significant negative impact on the Group’s business. Sales to customers are mostly made through non-exclusive, short-term arrangements. Due to the Group’s dependence on a limited number of customers, any negative events with respect to the Group’s customers may cause material fluctuations or declines in the Group’s revenue and have a material adverse effect on the Group’s financial condition and results of operations.
F-20
HANWHA SOLARONE CO., LTD.
NOTES TO THE CONSOLIDATED FINANCIAL STATEMENTS
AS OF DECEMBER 31, 2012 AND 2013 AND
FOR EACH OF THE THREE YEARS ENDED DECEMBER 31, 2011, 2012 AND 2013
| 2. | SUMMARY OF SIGNIFICANT ACCOUNTING POLICIES (CONT’D) |
Concentration of Risks (Cont’d)
Concentration of suppliers
A significant portion of the Group’s raw materials are sourced from its five largest silicon material suppliers who collectively accounted for an aggregate of 40.6%, 72.4% and 76.7% of the Group’s total silicon material purchases for the years ended December 31, 2011, 2012 and 2013, respectively. Failure to develop or maintain relationships with these suppliers may cause the Group to be unable to source adequate raw materials needed to manufacture its PV products. Any disruption in the supply of raw materials to the Group may adversely affect the Group’s business, financial condition and results of operations.
| 3. | ACCOUNTS AND NOTES RECEIVABLE |
The Group’s accounts receivable is net of the allowance for doubtful accounts. The allowance for doubtful accounts activity is as follows:
| | | | | | | | | | | | |
| | | As of December 31, | |
| | | 2012 | | | 2013 | | | 2013 | |
| | | (RMB’000) | | | (RMB’000) | | | (US$’000) | |
Beginning balance | | | 1,462 | | | | 89,088 | | | | 14,716 | |
Provision for doubtful debt | | | 87,626 | | | | 28,562 | | | | 4,718 | |
| | | | | | | | | | | | |
Ending balance | | | 89,088 | | | | 117,650 | | | | 19,434 | |
| | | | | | | | | | | | |
Notes receivable represents bank drafts that are non-interest bearing and due within six months. Such bank drafts have been arranged with third-party financial institutions by certain customers to settle their purchases from the Company. The carrying amount of notes receivable approximates fair value.
Inventories consist of the following:
| | | | | | | | | | | | |
| | | As of December 31, | |
| | | 2012 | | | 2013 | | | 2013 | |
| | | (RMB’000) | | | (RMB’000) | | | (US$’000) | |
Raw materials | | | 187,392 | | | | 276,542 | | | | 45,682 | |
Work-in-progress | | | 26,800 | | | | 68,851 | | | | 11,373 | |
Finished goods | | | 624,535 | | | | 406,898 | | | | 67,215 | |
| | | | | | | | | | | | |
| | | 838,727 | | | | 752,291 | | | | 124,270 | |
| | | | | | | | | | | | |
As of December 31, 2012 and 2013, raw materials of RMB10,989,000 and nil, respectively, of the Group were held in custody by other parties for processing. The write-down of inventories amounted to RMB583,097,000, RMB326,051,000 and RMB113,236,000 (US$18,705,255) for the years ended December 31, 2011,2012 and 2013, respectively.
F-21
HANWHA SOLARONE CO., LTD.
NOTES TO THE CONSOLIDATED FINANCIAL STATEMENTS
AS OF DECEMBER 31, 2012 AND 2013 AND
FOR EACH OF THE THREE YEARS ENDED DECEMBER 31, 2011, 2012 AND 2013
| 5. | ADVANCE TO SUPPLIERS AND LONG-TERM PREPAYMENTS |
Advance to suppliers and long-term prepayments represent interest-free cash deposits paid to suppliers for future purchases of raw materials. These deposits are required in order to secure supply of silicon due to limited availability.
The multi-year supply agreements entered into between the Group and its suppliers typically state minimum quantities with associated pricing set for the annual periods under the agreements with deliveries to be made over a general timeframe, subject to change based on the Group’s purchasing needs and/or the suppliers’ product availability.
The risk of loss arising from non-performance by or bankruptcy of the suppliers is assessed prior to making the deposits and credit quality of the suppliers is continually assessed. If there is deterioration in the creditworthiness of the suppliers, the Group may seek to recover the advances from the suppliers and will provide for losses on advances in cost of revenue where the Group believes the suppliers will be unable to fulfill their supply obligations. In such cases, a charge to cost of revenue will be recorded in the period in which a loss is determined to be probable and the amount can be reasonably estimated. The Group has recorded charges to cost of revenue amounting to RMB287,742,000, RMB170,012,000 and RMB15,565,000(US$2,571,155), for the years ended December 31, 2011, 2012 and 2013, respectively, to reflect the probable loss arising from the suppliers’ failure to perform under the contracts.
In circumstances where a supplier is in contractual default and the Group has termination rights that require repayment of its remaining deposit and the Group has asserted such rights, the advances are reclassified to other current assets in the consolidated balance sheets. Similarly, the Group reclassifies advances to other current assets (Note 6) when legal proceedings have commenced wherein the Group is claiming a breach of contract and is seeking monetary recovery of the remaining deposit. A provision for loss is recognized in operating expenses in the period in which the loss on such assets is determined to be probable and the amount can be reasonably estimated.
| 6. | OTHER CURRENT ASSETS – NET |
Other current assets consist of the following:
| | | | | | | | | | | | |
| | | As of December 31, | |
| | | 2012 | | | 2013 | | | 2013 | |
| | | (RMB’000) | | | (RMB’000) | | | (US$’000) | |
VAT recoverable | | | 162,195 | | | | 193,818 | | | | 32,016 | |
Income taxes recoverable | | | 48,268 | | | | 1,987 | | | | 328 | |
Unbilled solar systems integration revenue | | | 60,822 | | | | 25,775 | | | | 4,258 | |
Other receivables – net | | | 20,064 | | | | 33,544 | | | | 5,540 | |
Prepaid expenses – net | | | 65,435 | | | | 46,437 | | | | 7,670 | |
| | | | | | | | | | | | |
| | | 356,784 | | | | 301,561 | | | | 49,812 | |
| | | | | | | | | | | | |
VAT recoverable represents the excess of VAT expended on purchases over the VAT collected from sales. This amount can be applied against future VAT collected from customers or may be reimbursed by the tax authorities under certain circumstances.
F-22
HANWHA SOLARONE CO., LTD.
NOTES TO THE CONSOLIDATED FINANCIAL STATEMENTS
AS OF DECEMBER 31, 2012 AND 2013 AND
FOR EACH OF THE THREE YEARS ENDED DECEMBER 31, 2011, 2012 AND 2013
| 6. | OTHER CURRENT ASSETS – NET (CONT’D) |
Income taxes recoverable represent the excess of income taxes paid to tax authority over the current income taxes. This amount can be applied against income taxes in future years or may be reimbursed by the tax authorities.
Unbilled solar systems integration revenue represents amounts recognized as revenue for which invoices have not yet been sent to customers as of the balance sheet date.
The balance of other receivables as of December 31, 2012 and 2013 included RMB104,504,000 and RMB104,504,000 (US$17,262,831) respectively, for an advanced payment to one supplier which was reclassified from advance to suppliers to other receivables in 2011 because the Group has claimed the counterparty’s breach of a supply contract and was seeking monetary recovery of the outstanding deposit through legal methods. A provision of RMB54,456,000 and RMB50,048,000 were recorded for the years ended December 31, 2011 and 2012, respectively, as a result of the Group’s assessment of probable loss.
Fixed assets consist of the following:
| | | | | | | | | | | | |
| | | As of December 31, | |
| | | 2012 | | | 2013 | | | 2013 | |
| | | (RMB’000) | | | (RMB’000) | | | (US$’000) | |
Buildings | | | 1,181,044 | | | | 1,227,249 | | | | 202,727 | |
Plant and machinery | | | 3,787,272 | | | | 3,931,239 | | | | 649,394 | |
Furniture, fixtures and office equipment | | | 83,330 | | | | 84,407 | | | | 13,943 | |
Computer software | | | 28,107 | | | | 30,710 | | | | 5,073 | |
Motor vehicles | | | 16,778 | | | | 15,557 | | | | 2,571 | |
Leasehold improvement | | | 562 | | | | 711 | | | | 117 | |
| | | | | | | | | | | | |
| | | 5,097,093 | | | | 5,289,873 | | | | 873,825 | |
Less: Accumulated depreciation | | | (990,487 | ) | | | (1,413,888 | ) | | | (233,558 | ) |
| | | | | | | | | | | | |
| | | 4,106,606 | | | | 3,875,985 | | | | 640,267 | |
Construction-in-progress | | | 673,267 | | | | 606,671 | | | | 100,215 | |
| | | | | | | | | | | | |
| | | 4,779,873 | | | | 4,482,656 | | | | 740,482 | |
| | | | | | | | | | | | |
Depreciation expenses were RMB213,146,000, RMB366,111,000 and RMB429,806,000 (US$70,998,893) for the years ended December 31, 2011, 2012 and 2013, respectively.
As of December 31, 2013, buildings with a net book value of RMB123,844,000 (US$20,457,571), and plant and machinery with a net book value of RMB323,982,000 (US$53,518,014), were pledged for short-term bank borrowings of RMB394,671,000 (US$65,195,005) and long-term bank borrowings of RMB973,065,000 (US$160,738,887) (Note 11). As of December 31, 2012, buildings with a net book value of RMB109,386,000, plant and machinery with a net book value of RMB364,783,000 were pledged for short-term bank borrowings of RMB498,148,000, and long-term bank borrowings of RMB1,169,480,000 (Note 11).
F-23
HANWHA SOLARONE CO., LTD.
NOTES TO THE CONSOLIDATED FINANCIAL STATEMENTS
AS OF DECEMBER 31, 2012 AND 2013 AND
FOR EACH OF THE THREE YEARS ENDED DECEMBER 31, 2011, 2012 AND 2013
| | | | | | | | | | | | |
| | | As of December 31, | |
| | | 2012 | | | 2013 | | | 2013 | |
| | | (RMB’000) | | | (RMB’000) | | | (US$’000) | |
Land use rights | | | | | | | | | | | | |
Cost | | | 358,585 | | | | 300,207 | | | | 49,591 | |
Less: Accumulated amortization | | | (23,538 | ) | | | (27,763 | ) | | | (4,586 | ) |
| | | | | | | | | | | | |
| | | 335,047 | | | | 272,444 | | | | 45,005 | |
| | | | | | | | | | | | |
Land use rights represent amounts paid for the rights to use eleven parcels of land in the PRC where the Group’s premises are located.
As of December 31, 2013, land use rights with a net book value of RMB32,681,000 (US$5,398,517) was pledged for short-term bank borrowings of RMB195,668,000 (US$32,322,051) (Note 11). As of December 31, 2012, land use rights with a net book value of RMB56,076,000 was pledged for short-term bank borrowings of RMB498,148,000 and long-term bank borrowings of RMB540,930,000 (Note 11).
The amortization expense for the years ended December 31, 2011, 2012 and 2013 was RMB5,495,000, RMB7,044,000 and RMB6,268,000 (US$1,035,400), respectively. For each of the next five years, the estimated annual amortization expense of land use rights is RMB6,167,000 (US$1,018,716).
As of December 31, 2011, the Company assessed impairment on its goodwill derived from its acquisition of SolarOne Technology. As of December 31, 2011, the Company had determined that the carrying value of the reporting unit exceeded its implied fair value, estimated using a discounted cash flow methodology, and an impairment loss of RMB134,735,000 was recorded to impair the entire goodwill for the year ended December 31, 2011, which is included in “Impairment of goodwill” in the consolidated statements of comprehensive income (loss).
| 10. | LONG-TERM DEFERRED EXPENSES |
| | | | | | | | | | | | |
| | | As of December 31, | |
| | | 2012 | | | 2013 | | | 2013 | |
| | | (RMB’000) | | | (RMB’000) | | | (US$’000) | |
Convertible bond issuance costs (Note 22) | | | 4,080 | | | | 166 | | | | 27 | |
Arrangement fees for long-term bank borrowings | | | 20,931 | | | | 9,114 | | | | 1,506 | |
Others | | | 189 | | | | 314 | | | | 52 | |
| | | | | | | | | | | | |
| | | 25,200 | | | | 9,594 | | | | 1,585 | |
| | | | | | | | | | | | |
During the year ended December 31, 2012 and 2013, the arrangement fees paid for long-term bank borrowings and the issuance costs of convertible bonds were amortized based on the duration of the related bank borrowings and convertible bonds, using the effective interest rate method.
F-24
HANWHA SOLARONE CO., LTD.
NOTES TO THE CONSOLIDATED FINANCIAL STATEMENTS
AS OF DECEMBER 31, 2012 AND 2013 AND
FOR EACH OF THE THREE YEARS ENDED DECEMBER 31, 2011, 2012 AND 2013
| | | | | | | | | | | | |
| | | As of December 31, | |
| | | 2012 | | | 2013 | | | 2013 | |
| | | (RMB’000) | | | (RMB’000) | | | (US$’000) | |
Total bank borrowings | | | 3,914,682 | | | | 3,785,772 | | | | 625,365 | |
| | | | | | | | | | | | |
Comprised of: | | | | | | | | | | | | |
Short-term | | | 1,162,372 | | | | 1,105,575 | | | | 182,628 | |
Long-term, current portion | | | 467,204 | | | | 234,121 | | | | 38,674 | |
| | | | | | | | | | | | |
| | | 1,629,576 | | | | 1,339,696 | | | | 221,302 | |
Long-term, non-current portion | | | 2,285,106 | | | | 2,446,076 | | | | 404,063 | |
| | | | | | | | | | | | |
| | | 3,914,682 | | | | 3,785,772 | | | | 625,365 | |
| | | | | | | | | | | | |
The short-term bank borrowings outstanding as of December 31, 2012 and 2013 bore an average interest rate of 4.204% and 3.489% per annum, respectively, and were denominated in Renminbi and U.S. Dollar. These borrowings were obtained from financial institutions and have terms of one month to one year.
The long-term bank borrowings outstanding as of December 31, 2012 and 2013 bore an average interest rate of 4.245% and 3.538% per annum, respectively, and were denominated in Renminbi and U.S. Dollar. These borrowings were obtained from financial institutions and will mature serially during 2014 to 2016.
As of December 31, 2013, the Group breached one of the bank covenants on its long-term borrowing agreements with KDB Asia Limited (as the lead lenders in the agreement) with outstanding borrowings of RMB1,097,442,000 (US$181,284,504).
In March 2014, the Group obtained a waiver letter from KDB Asia Limited as a remedy for the breach of the loan covenant as of December 31, 2013 and it is probable that the Group will be able to cure the default at measurement dates that are within the next 12 months ending December 31, 2014. Accordingly, RMB1,097,442,000 (US$181,284,504) under the bank borrowing agreements with KDB Asia Limited continued to be classified as non-current as of December 31, 2013.
The current and non-current portions of long-term bank borrowings as of December 31, 2013 will be due in installments between the periods of January 1, 2014 to December 31, 2014, and January 1, 2015 to September 30, 2016, respectively.
As of December 31, 2012 and 2013, unused loan facilities for short-term and long-term borrowings amounted to RMB1,191,722,000 and RMB4,016,333,000 (US$663,450,947), respectively.
F-25
HANWHA SOLARONE CO., LTD.
NOTES TO THE CONSOLIDATED FINANCIAL STATEMENTS
AS OF DECEMBER 31, 2012 AND 2013 AND
FOR EACH OF THE THREE YEARS ENDED DECEMBER 31, 2011, 2012 AND 2013
| 11. | BANK BORROWINGS (CONT’D) |
Bank borrowings as of December 31, 2012 and 2013 were secured/guaranteed by the following:
December 31, 2012
| | | | |
Amount | | | Secured/guaranteed by |
| (RMB’000) | | | |
| | 1,131,390 | | | Guaranteed by Hanwha Chemical Corporation (“Hanwha Chemical”) |
| | 1,003,782 | | | Guaranteed by the Company and other subsidiaries of the Group |
| | 634,773 | | | Jointly guaranteed by (i) the Company and other subsidiaries of the Group, and (ii) the Group’s buildings and land use rights with net book value of RMB53,127,000 and RMB22,660,000, respectively (Notes 7 and 8) |
| | 628,550 | | | Guaranteed by the Group’s plant and machinery with net book value of RMB364,783,000 (Notes 7) |
| | 404,305 | | | Jointly guaranteed by (i) the Company, and (ii) the Group’s buildings and land use rights with net book value of RMB56,259,000 and RMB33,416,000, respectively (Notes 7 and 8) |
| | 111,882 | | | Guaranteed by letters of credit for lenders issued by Bank of Shanghai Nanjing Branch, which was valued as US$20,000,000 |
| | | | |
| | 3,914,682 | | | |
| | | | |
December 31, 2013
| | | | |
Amount | | | Secured/guaranteed by |
| (RMB’000) | | | |
| | 1,707,132 | | | Guaranteed by Hanwha Chemical Corporation (“Hanwha Chemical”) |
| | 649,935 | | | Guaranteed by the Company and other subsidiaries of the Group |
| | 609,690 | | | Guaranteed by the Group’s plant and machinery with net book value of RMB323,982,000 (US$53,518,014) (Note 7) |
| | 562,378 | | | Jointly guaranteed by (i) the Company and other subsidiaries of the Group, and (ii) the Group’s buildings with net book value of RMB67,882,000 (US$11,213,308) (Note 7) |
| | 195,668 | | | Jointly guaranteed by (i) the Company and other subsidiaries of the Group, and (ii) the Group’s buildings and land use rights with net book value of RMB55,962,000 (US$9,244,264) and RMB32,681,000 (US$5,398,517), respectively (Notes 7 and 8) |
| | 60,969 | | | Guaranteed by restricted deposit held by Bank of China Qidong Branch, which was valued as US$10,000,000 |
| | | | |
| | 3,785,772 | | | |
| | | | |
As of December 31, 2013, the maturities of these long-term bank borrowings were as follows:
| | | | | | | | |
| | | December 31, | |
| | | 2013 | | | 2013 | |
| | | (RMB’000) | | | (US$’000) | |
Within 1 year | | | 234,121 | | | | 38,674 | |
Between 1 and 2 years | | | 1,573,000 | | | | 259,841 | |
Between 2 and 3 years | | | 873,076 | | | | 144,222 | |
F-26
HANWHA SOLARONE CO., LTD.
NOTES TO THE CONSOLIDATED FINANCIAL STATEMENTS
AS OF DECEMBER 31, 2012 AND 2013 AND
FOR EACH OF THE THREE YEARS ENDED DECEMBER 31, 2011, 2012 AND 2013
| 12. | ACCRUED EXPENSES AND OTHER LIABILITIES |
The components of accrued expenses and other liabilities are as follows:
| | | | | | | | | | | | |
| | | As of December 31, | |
| | | 2012 | | | 2013 | | | 2013 | |
| | | (RMB’000) | | | (RMB’000) | | | (US$’000) | |
Accrued warranty costs (Note 13) | | | 177,869 | | | | 181,406 | | | | 29,966 | |
Accrued wages and other employee welfare | | | 81,514 | | | | 68,325 | | | | 11,286 | |
Accrued professional service fees | | | 26,972 | | | | 31,913 | | | | 5,272 | |
Accrued sales commission | | | — | | | | 17,891 | | | | 2,955 | |
Accrued interest expense for bank borrowings | | | 14,499 | | | | 17,438 | | | | 2,881 | |
Accrued utility expenses | | | 9,263 | | | | 12,175 | | | | 2,011 | |
Interest payable for convertible bonds | | | 10,068 | | | | 9,766 | | | | 1,613 | |
Taxes payable | | | 9,846 | | | | 8,801 | | | | 1,454 | |
Interest payable for long-term notes (Note 17) | | | — | | | | 3,224 | | | | 533 | |
Accrued freight and export related expense | | | 38,938 | | | | 2,167 | | | | 358 | |
Share Issuance and Repurchase Agreement with Hanwha Solar Holdings Co., Ltd. (“Hanwha Solar”) (Note 27) | | | 13 | | | | 13 | | | | 2 | |
Other accrued expenses and liabilities | | | 31,555 | | | | 35,628 | | | | 5,885 | |
| | | | | | | | | | | | |
| | | 400,537 | | | | 388,747 | | | | 64,216 | |
| | | | | | | | | | | | |
| 13. | ACCRUED WARRANTY COSTS |
The Group’s warranty activity is summarized below:
| | | | | | | | | | | | |
| | | For the year ended December 31, | |
| | | 2012 | | | 2013 | | | 2013 | |
| | | (RMB’000) | | | (RMB’000) | | | (US$’000) | |
Beginning balance | | | 162,133 | | | | 177,869 | | | | 29,382 | |
Warranty provision | | | 33,108 | | | | 41,327 | | | | 6,827 | |
Warranty reversal | | | (9,958 | ) | | | (12,875 | ) | | | (2,127 | ) |
Warranty claims | | | (7,414 | ) | | | (24,915 | ) | | | (4,116 | ) |
| | | | | | | | | | | | |
Ending balance | | | 177,869 | | | | 181,406 | | | | 29,966 | |
| | | | | | | | | | | | |
Customer deposits represent cash payments received from customers in advance of the delivery of PV modules. These deposits are recognized as revenue when the conditions for revenue recognition have been met. The customer deposits are non-refundable unless the Group fails to fulfill the terms of the sales contract.
As of December 31, 2013, notes payable were non-interest bearing and were secured by RMB152,166,000 (US$25,136,033) of the Group’s restricted cash. The Group did not pay any commission to the banks to obtain the notes payable facilities. These notes are due for repayment over the next six months ending June 30, 2014.
F-27
HANWHA SOLARONE CO., LTD.
NOTES TO THE CONSOLIDATED FINANCIAL STATEMENTS
AS OF DECEMBER 31, 2012 AND 2013 AND
FOR EACH OF THE THREE YEARS ENDED DECEMBER 31, 2011, 2012 AND 2013
The Group is exposed to certain risks related to its business operations. The risks that the Group seeks to manage by using derivative instruments are fluctuations in foreign exchange rates, the purchase price for silver and aluminum and interest rates. The Group recognizes all derivative instruments as either assets or liabilities at fair value in the consolidated balance sheets (Note 31). The Group’s derivatives are not designated and do not qualify as hedges and are adjusted to fair value through current earnings.
The following table reflects the location in the consolidated statements of comprehensive income and the amount of realized and unrealized gains/(losses) recognized in income for the derivative contracts not designated as hedging instruments for the years ended December 31, 2011, 2012 and 2013:
| | | | | | | | | | | | | | | | | | |
| | | Statement of
comprehensive income location | | Year ended December 31, | |
| | | | 2011 | | | 2012 | | | 2013 | |
| | | | | (RMB’000) | | | (RMB’000) | | | (RMB’000) | | | (US$’000) | |
Foreign exchange derivative contracts (not designated as hedging instruments) – realized | | Changes in fair value of derivative contracts | | | (50,593 | ) | | | 38,835 | | | | 41,096 | | | | 6,789 | |
Foreign exchange derivative contracts (not designated as hedging instruments) – unrealized | | Changes in fair value of derivative contracts | | | 32,316 | | | | (36,824 | ) | | | 34,364 | | | | 5,676 | |
| | | | | |
Commodity derivative contracts (not designated as hedging instruments) – realized | | Changes in fair value of derivative contracts | | | (19,164 | ) | | | (17,777 | ) | | | (13,536 | ) | | | (2,236 | ) |
Commodity derivative contracts (not designated as hedging instruments) – unrealized | | Changes in fair value of derivative contracts | | | (28,550 | ) | | | 24,074 | | | | 1,809 | | | | 299 | |
| | | | | |
Interest rate swap derivative contracts (not designated as hedging instruments) – realized | | Changes in fair value of derivative contracts | | | — | | | | — | | | | (1,251 | ) | | | (207 | ) |
Interest rate swap derivative contracts (not designated as hedging instruments) – unrealized | | Changes in fair value of derivative contracts | | | (4,787 | ) | | | (2,982 | ) | | | 1,257 | | | | 208 | |
| | | | | | | | | | | | | | | | | | |
| | | | | (70,778 | ) | | | 5,326 | | | | 63,739 | | | | 10,529 | |
| | | | | | | | | | | | | | | | | | |
F-28
HANWHA SOLARONE CO., LTD.
NOTES TO THE CONSOLIDATED FINANCIAL STATEMENTS
AS OF DECEMBER 31, 2012 AND 2013 AND
FOR EACH OF THE THREE YEARS ENDED DECEMBER 31, 2011, 2012 AND 2013
| 16. | DERIVATIVE CONTRACTS (CONT’D) |
The following table reflects the fair values of derivatives included in the consolidated balance sheets as of December 31, 2012 and 2013:
| | | | | | | | | | | | | | |
| | | Balance sheet location | | Fair value as of December 31, | |
| | | | 2012 | | | 2013 | |
| | | | | (RMB’000) | | | (RMB’000) | | | (US$’000) | |
Derivative assets (not designated as hedging instruments): | | | | | | | | | | | | | | |
Foreign exchange derivative contracts | | Current assets: Derivative contracts | | | — | | | | 26,632 | | | | 4,399 | |
| | | | | | | | | | | | | | |
Derivative liabilities (not designated as hedging instruments): | | | | | | | | | | | | | | |
Foreign exchange derivative contracts | | Current liabilities: Derivative contracts | | | 7,732 | | | | — | | | | — | |
Commodity derivative contracts | | Current liabilities: Derivative contracts | | | 1,809 | | | | — | | | | — | |
Interest rate swap derivative contracts | | Current liabilities: Derivative contracts | | | 7,770 | | | | 6,513 | | | | 1,076 | |
| | | | | | | | | | | | | | |
| | | | | 17,311 | | | | 6,513 | | | | 1,076 | |
| | | | | | | | | | | | | | |
On January 16, 2013, SolarOne HK completed its issuance of three-year-period notes of US$100,000,000 (“2013 Notes”). The 2013 Notes bear interests at a floating rate indexed to three-month LIBOR plus a margin of 2.23% per annum. Interests are payable on a quarterly basis from January 15, 2013 to January 15, 2016. The 2013 Notes will mature on January 15, 2016 and repayable at its principal amount plus accrued and unpaid interest thereon.
The net proceeds from the issuance, after deducting offering expenses, were US$99,700,000, which are being used by the Group for general working capital purposes. All the payments on the Notes are guaranteed by Hanwha Chemical (“Guarantor”). In addition, the notes are unsecured and rank lower than any secured obligation of the group and have the same liquidation priority as any other unsecured liabilities of the Group, but senior to those expressly subordinated obligations, if any. SolarOne HK may redeem the 2013 Notes upon certain taxation reasons at a price equal to 100% of the principal amount of the 2013 Notes plus accrued and unpaid interest thereon. In addition, SolarOne HK may, at its discretion, redeem all or any portion of the 2013 Notes in the market at any time at the then prevailing market price. As of December 31, 2013, SolarOne HK does not intend to redeem any portion of the Notes prior to the stated maturity date.
The Notes were issued at par. Direct debt issuance costs of RMB1,882,000 (US$310,884) are deferred and amortized over the life of the 2013 Notes using the effective interest rate method.
F-29
HANWHA SOLARONE CO., LTD.
NOTES TO THE CONSOLIDATED FINANCIAL STATEMENTS
AS OF DECEMBER 31, 2012 AND 2013 AND
FOR EACH OF THE THREE YEARS ENDED DECEMBER 31, 2011, 2012 AND 2013
| 18. | ISSUANCE OF ORDINARY SHARES FROM EQUITY OFFERING |
In November and December 2013, the Company issued 1,426,000 ADSs in a public offering, representing 7,130,000 of the Company’s ordinary shares. Total proceeds from this equity offering were US$4,403,000 (approximately RMB26,944,000), of which US$3,671,000 (approximately RMB22,482,000) was received as of December 31, 2013. Net proceeds received as of December 31, 2013 was US$2,493,000 (approximately RMB15,293,000) after deduction of related issuance costs
| 19. | ACCUMULATED OTHER COMPREHENSIVE LOSS |
The movement of accumulated other comprehensive loss is as follows:
| | | | |
| | | Foreign currency
translation adjustment | |
| | | (RMB’000) | |
Balance as of December 31, 2012 | | | 1,219 | |
Other comprehensive loss | | | 811 | |
| | | | |
Balance as of December 31, 2013 | | | 2,030 | |
| | | | |
Balance as of December 31, 2013, in US$’000 | | | 335 | |
| | | | |
The accumulated other comprehensive loss as of December 31, 2012 represented the foreign currency translation adjustment generated in the year ended December 31, 2012.
| 20. | SHARE-BASED COMPENSATION PLANS |
In November 2006, the Company adopted a stock option scheme (the “2006 Option Plan”) which allows the Company to offer a variety of incentive awards to employees, directors and consultants of the Company (the “2006 Option Plan Participants”). Under the 2006 Option Plan, the Company may issue options to the 2006 Option Plan Participants to purchase not more than 10,799,685 ordinary shares. All options granted under the 2006 Option Plan will expire on November 30, 2016 and generally vest over 3 to 5 years.
On August 22, 2007, the Company’s Board of Directors approved the 2007 Equity Incentive Plan (the “2007 Incentive Plan”). The 2007 Incentive Plan permits the grant of Incentive Stock Options, Non-statutory Stock Options, Restricted Stock, Stock Appreciation Rights, Restricted Stock Units, Performance Units, Performance Shares, and other stock-based awards to employees, directors and consultants of the Group (the “Participants”). Under the 2007 Incentive Plan, the Company may issue up to 10,799,685 ordinary shares plus an annual increase of 2% of the outstanding ordinary shares on the first day of the fiscal year, or such lesser amount of shares as determined by the Board of Directors. The 2007 Incentive Plan will expire on August 21, 2017.
By a resolution of the Board of Directors on November 30, 2007, 59,994 Restricted Stock Units (“RSUs”) were granted to the Company’s existing three independent directors. As of December 31, 2009, the 59,994 RSUs have vested. By resolutions of the Board of Directors in 2007 and 2013, 7,500 RSUs were authorized to be granted to each of the independent directors annually from 2008 to 2012, and 15,000 RSUs were authorized to be granted to each of the independent directors annually from January 1, 2013. The 7,500 RSUs granted on January 1, 2008 to each of the independent directors vest in batches of 2,500 RSUs each year beginning on January 1, 2009. The 7,500 RSUs granted respectively on January 1, 2010, 2011 and 2012 to each of the independent directors vest in batches of 1,250 RSUs each half year beginning on July 1, 2010, 2011 and 2012, respectively. The 15,000 RSUs granted on January 1, 2013 to each of the independent directors vest in batches of 2,500 RSUs each half year
F-30
HANWHA SOLARONE CO., LTD.
NOTES TO THE CONSOLIDATED FINANCIAL STATEMENTS
AS OF DECEMBER 31, 2012 AND 2013 AND
FOR EACH OF THE THREE YEARS ENDED DECEMBER 31, 2011, 2012 AND 2013
| 20. | SHARE-BASED COMPENSATION PLANS (CONT’D) |
beginning on July 1, 2013. During 2011, 2012 and 2013, the Board of Directors also approved grant of 1,337,625, 420,000 and 5,000 RSUs, respectively, to certain of the Participants. Each RSU represents one ADS of the Company, which is equal to five ordinary shares.
The following tables summarized the Company’s share option activity under 2006 Option Plan and 2007 Incentive Plan:
| | | | | | | | | | | | | | | | |
| | | Number of
options | | | Weighted-
average
exercise
price | | | Weighted-
average
remaining
contractual life | | | Aggregate
intrinsic
value | |
| | | | | | (US$) | | | (Years) | | | (US$) | |
Outstanding, January 1, 2013 | | | 4,186,725 | | | | 1.86 | | | | 5.53 | | | | — | |
Forfeited | | | (790,225 | ) | | | 1.47 | | | | | | | | | |
| | | | | | | | | | | | | | | | |
Outstanding, December 31, 2013 | | | 3,396,500 | | | | 1.95 | | | | 4.28 | | | | — | |
| | | | | | | | | | | | | | | | |
Vested and expected to be vested at December 31, 2013 | | | 3,396,500 | | | | 1.95 | | | | 4.28 | | | | — | |
| | | | | | | | | | | | | | | | |
Exercisable at December 31, 2013 | | | 3,388,688 | | | | 1.74 | | | | 4.28 | | | | — | |
| | | | | | | | | | | | | | | | |
The aggregate intrinsic value in the table above represents the total intrinsic value (the aggregate difference between the Company’s closing stock price of US$0.554 per ordinary share as of December 31, 2013 and the exercise price for in-the-money options) that would have been received by the option holders if all in-the-money options had been exercised on December 31, 2013.
The aggregate fair value of share options that vested during 2011, 2012 and 2013 was US$3,161,594, US$862,762 and US$245,541, respectively. The weighted-average grant-date fair value of share options granted during 2011 was US$1.07. No share options were granted during 2012 and 2013.
The aggregate intrinsic value of share options exercised during 2011 was US$60,481. No share options were exercised during 2012 and 2013.
The aggregate fair value of the share options outstanding as of December 31, 2013 measured based on respective grant-date fair values was US$4,366,202 and such amount shall be recognized as compensation expense using the straight-line method with graded vesting based on service conditions.
As of December 31, 2013, there was US$7,578 of unrecognized share-based compensation cost related to share options which is expected to be recognized over a weighted-average vesting period of 0.5 years after December 31, 2013. To the extent the actual forfeiture rate is different from the current estimation, actual share-based compensation related to these awards may be different from the expectation.
F-31
HANWHA SOLARONE CO., LTD.
NOTES TO THE CONSOLIDATED FINANCIAL STATEMENTS
AS OF DECEMBER 31, 2012 AND 2013 AND
FOR EACH OF THE THREE YEARS ENDED DECEMBER 31, 2011, 2012 AND 2013
| 20. | SHARE-BASED COMPENSATION PLANS (CONT’D) |
The following table summarized the Company’s RSU activity under 2007 Incentive Plan:
| | | | | | | | | | | | |
| | | Number of RSUs | | | Weighted-average
grant date fair value | | | Aggregate intrinsic
value | |
| | | | | | (US$) | | | (US$) | |
Unvested, January 1, 2013 | | | 666,565 | | | | 2.45 | | | | 673,231 | |
Granted | | | 65,000 | | | | 3.84 | | | | | |
Vested | | | (151,499 | ) | | | 3.10 | | | | 311,193 | |
Forfeited | | | (381,501 | ) | | | 1.97 | | | | | |
| | | | | | | | | | | | |
Unvested, December 31, 2013 | | | 198,565 | | | | 3.33 | | | | 550,025 | |
| | | | | | | | | | | | |
The aggregate fair value of vested RSUs for 2011, 2012 and 2013 measured based on respective grant-date fair values was US$3,583,331, US$1,105,941 and US$470,145, respectively. The aggregate fair value of the unvested RSUs as of December 31, 2013 was US$661,221 based on the quoted market price of the Company’s ordinary shares at the respective grant dates, and such amount shall be recognized as compensation expenses using the straight-line method with graded vesting based on service conditions. The weighted-average grant-date fair values of RSUs granted during 2011, 2012 and 2013 were US$6.26, US$1.10 and US$3.84, respectively. The total intrinsic value of RSUs vested during 2011, 2012 and 2013 was US$2,533,282, US$241,553 and US$311,193, respectively.
As of December 31, 2013, there was US$389,528 of unrecognized share-based compensation cost related to RSUs which is expected to be recognized over a weighted-average vesting period of 1.65 years. To the extent the actual forfeiture rate is different from current estimation, actual share-based compensation related to these awards may be different from the expectation.
For stock options granted before January 1, 2008, the fair value of each share option grant was estimated on the date of grant using the Black-Scholes option pricing model. For share options granted after January 1, 2008, the fair value of each award is estimated on the date of grant using a binomial-lattice option valuation model. The binomial-lattice model considers characteristics of fair value option pricing that are not available under the Black-Scholes model. Similar to the Black-Scholes model, the binomial-lattice model takes into account variables such as volatility, dividend yield, and risk-free interest rate. However, in addition, the binomial-lattice model considers the contractual term of the option, the probability that the option will be exercised prior to the end of its contractual life, and the probability of termination or retirement of the option holder in computing the value of the option. For these reasons, the Company believes that the binomial-lattice model provides a fair value for its share-based compensation plans that is more representative of actual experience and future expected experience than the value calculated using the Black-Scholes model.
F-32
HANWHA SOLARONE CO., LTD.
NOTES TO THE CONSOLIDATED FINANCIAL STATEMENTS
AS OF DECEMBER 31, 2012 AND 2013 AND
FOR EACH OF THE THREE YEARS ENDED DECEMBER 31, 2011, 2012 AND 2013
| 20. | SHARE-BASED COMPENSATION PLANS (CONT’D) |
The Company calculated the estimated fair value of share options on the grant date using the binomial-lattice model for 2011 with the following assumptions. No share options were granted in 2012 and 2013, respectively.
| | | | |
| | | Granted in 2011 | |
Risk-free interest rate | | | 3.33% | |
Expected dividend yield | | | 0% | |
Expected volatility | | | 80% | |
Sub-optimal early exercise factor | | | 2.5 times | |
Fair value of ordinary shares | | | US$1.71 | |
Risk-free interest rate was based on a zero coupon U.S. bond rate for the terms consistent with the expected life of the award at the time of grant. Expected dividend yield was determined in view of the Company’s historical dividend payout rate. The Company estimated expected volatility at the date of grant based on a combination of historical and implied volatilities from comparable publicly listed companies. Forfeiture rate of Nil was estimated based on historical forfeiture patterns and adjusted to reflect future change in facts and circumstances, if any. The sub-optimal early exercise factor was determined based on the expected price multiple at which employees were likely to exercise stock options.
Total compensation expense relating to share options and RSUs recognized for the years ended December 31, 2011, 2012 and 2013 is as follows:
| | | | | | | | | | | | | | | | |
| | | For the year ended December 31, | |
| | | 2011 | | | 2012 | | | 2013 | | | 2013 | |
| | | (RMB’000) | | | (RMB’000) | | | (RMB’000) | | | (US$’000) | |
Cost of revenues | | | 5,177 | | | | 2,971 | | | | 234 | | | | 39 | |
Selling expenses | | | 4,223 | | | | 971 | | | | 436 | | | | 72 | |
General and administrative expenses | | | 27,929 | | | | 3,264 | | | | 1,951 | | | | 322 | |
Research and development expenses | | | 1,002 | | | | 576 | | | | 39 | | | | 6 | |
| | | | | | | | | | | | | | | | |
| | | 38,331 | | | | 7,782 | | | | 2,660 | | | | 439 | |
| | | | | | | | | | | | | | | | |
| 21. | REDEEMABLE ORDINARY SHARES |
On January 29, 2008 and concurrently with the convertible bond issuance (Note 22), the Company issued and sold 9,019,611 ADSs, representing 45,098,055 of the Company’s ordinary shares at the par value per share of US$0.0001.
The Company is entitled to repurchase any or all of the ADSs at par value on any business day after the entire principal amount of the convertible bonds ceases to be outstanding. Such rights will expire one month after the maturity of the convertible bonds. In addition, the holders of the ADSs have the right to request the Company to repurchase the ADSs at par value at any time by giving prior notice. Since the holders have the ability to require the repurchase of the ADSs, which is outside the control of the Company, the ordinary shares underlying the ADSs have been classified as mezzanine equity. The holders are entitled to receive all cash and non-cash distributions that an ordinary shareholder would receive but such distributions are required to be paid back to the Company upon repurchase of the ADSs.
F-33
HANWHA SOLARONE CO., LTD.
NOTES TO THE CONSOLIDATED FINANCIAL STATEMENTS
AS OF DECEMBER 31, 2012 AND 2013 AND
FOR EACH OF THE THREE YEARS ENDED DECEMBER 31, 2011, 2012 AND 2013
| 21. | REDEEMABLE ORDINARY SHARES (CONT’D) |
The adoption of ASU 2009-15, Accounting for Own-Share Lending Arrangements in Contemplation of Convertible Debt Issuance or Other Financing, on January 1, 2010 revised the Company’s accounting for the redeemable ordinary shares. The Company evaluated the redeemable ordinary shares concurrently with the bonds upon adoption of ASU 2009-15 and determined that the redeemable ordinary shares issued qualified as an own-share lending arrangement because the purpose of issuance of the shares was to increase the availability of the Company’s shares and facilitate the ability of the holders to hedge the conversion option in the Company’s convertible debt and the Company is entitled to repurchase any or all of the ADSs at par value on any business day after the entire principal amount of the convertible bonds ceases to be outstanding.
Accordingly, the share-lending arrangement upon adoption of ASU 2009-15 is measured at fair value, and recognized as an issuance cost with an offset to redeemable ordinary shares. ASU 2009-15 requires the Company to recognize the cumulative effect of the change in accounting principle as an adjustment to the opening balance of retained earnings. An adjustment of US$3,076 (approximately RMB22,000), which represents the fair value that would have been recognized if the guidance in ASU 2009-15 had been applied from the issuance date on January 29, 2008, was recorded on January 1, 2010 to issuance cost with an offset to redeemable ordinary shares.
On October 25, 2011, the Company repurchased and cancelled 5,005,536 ADSs, representing 25,027,680 of the Company’s ordinary shares at the par value per share of US$0.0001.
On January 29, 2008, the Company issued in aggregate principal amount of US$172,500,000 Convertible Senior Notes (the “2008 Notes”) due January 15, 2018 to third-party investors (the “Holders”). The Notes bear interest at a rate of 3.5% per annum, payable on January 15 and July 15 of each year, commencing on July 15, 2008.
The Holders may require the Company to redeem all or a portion of the 2008 Notes on January 15, 2015, at a price equal to 100% of the principal amount of the 2008 Notes to be repurchased plus accrued and unpaid interest. The Holders may also require the Company to redeem all or a portion of the 2008 Notes at a price equal to 100% of principal amount of the 2008 Notes to be repurchased plus accrued and unpaid interest upon the occurrence of a fundamental change, which is defined as a change in control or a termination of trading. In addition, the Company may redeem part or all of the Notes on and after January 20, 2015, at a price equal to 100% of the principal amount of the 2008 Notes to be repurchased plus accrued and unpaid interest, provided the Company’s ADSs trading price meets certain conditions. At the Holders’ option, the principal amount of the Notes may be converted into the Company’s ADSs initially at a conversion rate of 52.2876 ADSs (equivalent to an initial conversion price of approximately US$19.125 per ADS) per US$1,000 principal amount of the 2008 Notes, at any time prior to maturity. The applicable conversion rate will be subject to adjustment in certain circumstances.
The 2008 Notes were initially recorded at the principal amount of US$172,500,000. Direct debt issuance costs of RMB40,459,000 are deferred and amortized over the life of the 2008 Notes using the effective interest rate method. At the commitment date on January 29, 2008, the Company evaluated and determined that the redemption and put options do not require bifurcation from the 2008 Notes under the requirements of ASC815-10 because they are clearly and closely related to the debt host instrument. No beneficial conversion feature was recognized as the effective conversion price per ADS of US$19.125 was higher than the fair value per ADS of the Company at the commitment date (January 29, 2008) of US$17.73.
F-34
HANWHA SOLARONE CO., LTD.
NOTES TO THE CONSOLIDATED FINANCIAL STATEMENTS
AS OF DECEMBER 31, 2012 AND 2013 AND
FOR EACH OF THE THREE YEARS ENDED DECEMBER 31, 2011, 2012 AND 2013
| 22. | CONVERTIBLE BONDS (CONT’D) |
The adoption of ASC 815-40, Derivatives and Hedging: Contracts in Entity’s Own Equity, on January 1, 2009 revised the Company’s accounting for the conversion option of the 2008 Notes. The Company evaluated the conversion option of the 2008 Notes upon adoption of ASC 815-40 and determined that the conversion option qualified for derivative accounting because the conversion option, if freestanding, is not considered to be indexed to the Company’s own stock.
Accordingly, the conversion option was bifurcated from the 2008 Notes upon adoption of ASC 815-40 as a derivative liability at an initial fair value of RMB962,993,000. Changes in fair value of the conversion options are recognized through the statements of comprehensive income. For the year ended December 31, 2013, the Company recorded a loss of RMB6,105,000 (US$1,008,474) (2012: a loss of RMB5,692,000) resulting from the change in fair value of the conversion option. As of December 31, 2013, the conversion option, which has been combined with the 2008 Notes on the balance sheet, was recorded at a fair value of RMB14,013,000 (US$2,314,783) (2012: RMB7,908,000).
In the year ended December 31, 2012, the Company repurchased the 2008 Notes with total principal amount of US$71,900, 000 with total consideration of RMB299,271,000 from the open market, and recognized a loss on the extinguishment of debt of RMB82,713,000 as a result of the repurchase. No 2008 Notes were repurchased during 2013.
For the year ended December 31, 2013, the interest expense for the Notes was RMB133,587,000 (US$22,067,000).
As of December 31, 2013 and 2012, the Group recorded RMB50,000,000 (US$8,259,412) of government grants received as a long-term payable because the Group has not fulfilled the conditions required by the local government. According to the agreement entered in 2010 with the administration committee of Nantong Economic and Technological Development Zone (“NETDZ”), SolarOne Nantong would need to achieve certain specified requirements on its production capacity in three years after the completion of its construction. Failure to meet the requirement upon assessment date (i.e. three years from start of construction) may result in a proportional refund of the government subsidies received for any actual production capacity not achieved in accordance with the capacity stipulated in the agreement. In 2013, SolarOne Nantong entered into an amendment agreement with the administration committee of NETDZ, according to which the assessment date was postponed by one year. As of December 31, 2013, the construction has not been completed.
Current taxation
The Company is a tax-exempt company incorporated in the Cayman Islands and conducts substantially all of its business through its subsidiaries located in the PRC. In addition, the Group also has several non-PRC subsidiaries, including SolarOne Investment, SolarOne HK, SolarOne USA, SolarOne GmbH, Solar Canada and Solar Australia.
F-35
HANWHA SOLARONE CO., LTD.
NOTES TO THE CONSOLIDATED FINANCIAL STATEMENTS
AS OF DECEMBER 31, 2012 AND 2013 AND
FOR EACH OF THE THREE YEARS ENDED DECEMBER 31, 2011, 2012 AND 2013
Current taxation (Cont’d)
PRC
The Company’s subsidiaries registered in the PRC are subject to PRC enterprise income tax (“EIT”) on the taxable income as reported in their PRC statutory accounts adjusted in accordance with relevant PRC Income Tax Laws. Pursuant to the PRC Income Tax Laws, the Group’s PRC subsidiaries are subject to EIT at a statutory rate of 25%.
In 2008, SolarOne Qidong received approval from the PRC taxation authorities as a “High and New Technology Enterprise” (“HNTE”) and obtained an HNTE certificate. In 2011, the Company successfully renewed its HNTE status for another three years from 2011 to 2013. In accordance with the new PRC Enterprise Income Tax Laws effective from January 1, 2008 (the “PRC Income Tax Laws”), an enterprise awarded with the HNTE status may enjoy a reduced EIT rate of 15%. For the 2011, 2012 and 2013 tax years, the income tax rate for SolarOne Qidong was 15%.
SolarOne Shanghai, SolarOne Technology, Solar Engineering, Solar R&D, SolarOne Nantong, Nantong Hanwha I&E and Nantong Tech, the domestic companies in the PRC, are subject to EIT at a rate of 25% for the years ended December 31, 2011, 2012 and 2013.
Other Countries
The applicable income tax rates of non-PRC subsidiaries having significant operations were as follows:
| | | | | | | | | | | | |
| | | For the year ended December 31, | |
| | | 2011 | | | 2012 | | | 2013 | |
SolarOne HK | | | 16.5 | % | | | 16.5 | % | | | 16.5 | % |
SolarOne USA | | | 35 | % | | | 35 | % | | | 35 | % |
SolarOne GmbH | | | 15.83 | % | | | 15.83 | % | | | 15.83 | % |
Solar Canada | | | Not applicable | | | | 15 | % | | | 15 | % |
Solar Australia | | | Not applicable | | | | 30 | % | | | 30 | % |
In accordance with the PRC Income Tax Laws, enterprises established under the laws of foreign countries or regions and whose “place of effective management” is located within the PRC territory are considered PRC resident enterprises and subject to the PRC income tax at the rate of 25% on worldwide income. The definition of “place of effective management” shall refer to an establishment that exercises, in substance, overall management and control over the production and business, personnel, accounting, properties, etc. of an enterprise. As of December 31, 2013, no detailed interpretation or guidance has been issued to define “place of effective management.” Furthermore, as of December 31, 2013, the administrative practice associated with interpreting and applying the concept of “place of effective management” is unclear. The Group has analyzed the applicability of this law and will continue to monitor the related development and application.
F-36
HANWHA SOLARONE CO., LTD.
NOTES TO THE CONSOLIDATED FINANCIAL STATEMENTS
AS OF DECEMBER 31, 2012 AND 2013 AND
FOR EACH OF THE THREE YEARS ENDED DECEMBER 31, 2011, 2012 AND 2013
Current taxation (Cont’d)
Other Countries (Cont’d)
Loss before income taxes consists of:
| | | | | | | | | | | | | | | | |
| | | For the year ended December 31, | |
| | | 2011 | | | 2012 | | | 2013 | | | 2013 | |
| | | (RMB’000) | | | (RMB’000) | | | (RMB’000) | | | (US$’000) | |
Non-PRC | | | (334,470 | ) | | | (948,417 | ) | | | (422,128 | ) | | | (69,731 | ) |
PRC | | | (740,579 | ) | | | (599,187 | ) | | | (194,296 | ) | | | (32,095 | ) |
| | | | | | | | | | | | | | | | |
| | | (1,075,049 | ) | | | (1,547,604 | ) | | | (616,424 | ) | | | (101,826 | ) |
| | | | | | | | | | | | | | | | |
The income tax benefit (expense) is comprised of:
| | | | | | | | | | | | | | | | |
| | | For the year ended December 31, | |
| | | 2011 | | | 2012 | | | 2013 | | | 2013 | |
| | | (RMB’000) | | | (RMB’000) | | | (RMB’000) | | | (US$’000) | |
Current | | | (28,358 | ) | | | 7,638 | | | | (3,600 | ) | | | (594 | ) |
Deferred | | | 173,303 | | | | (22,893 | ) | | | (254,066 | ) | | | (41,969 | ) |
| | | | | | | | | | | | | | | | |
| | | 144,945 | | | | (15,255 | ) | | | (257,666 | ) | | | (42,563 | ) |
| | | | | | | | | | | | | | | | |
The reconciliation of tax computed by applying the statutory income tax rate of 25% applicable to PRC operations to income tax benefit (expense) is as follows:
| | | | | | | | | | | | | | | | |
| | | For the year ended December 31, | |
| | | 2011 | | | 2012 | | | 2013 | | | 2013 | |
| | | (RMB’000) | | | (RMB’000) | | | (RMB’000) | | | (US$’000) | |
Income tax computed at tax rate at 25% | | | 268,762 | | | | 386,901 | | | | 154,106 | | | | 25,457 | |
Non-deductible expenses | | | (55,004 | ) | | | (17,722 | ) | | | (13,519 | ) | | | (2,233 | ) |
Preferential tax treatment | | | 4,233 | | | | 2,189 | | | | — | | | | — | |
Research and development expense | | | 4,020 | | | | 5,227 | | | | — | | | | — | |
Tax rate differences | | | (21,151 | ) | | | (54,212 | ) | | | (53,780 | ) | | | (8,884 | ) |
Changes in the valuation allowance | | | (55,915 | ) | | | (337,638 | ) | | | (344,473 | ) | | | (56,903 | ) |
| | | | | | | | | | | | | | | | |
| | | 144,945 | | | | (15,255 | ) | | | (257,666 | ) | | | (42,563 | ) |
| | | | | | | | | | | | | | | | |
F-37
HANWHA SOLARONE CO., LTD.
NOTES TO THE CONSOLIDATED FINANCIAL STATEMENTS
AS OF DECEMBER 31, 2012 AND 2013 AND
FOR EACH OF THE THREE YEARS ENDED DECEMBER 31, 2011, 2012 AND 2013
Deferred taxation
Deferred tax assets (liabilities) reflect the tax effects of temporary differences between the carrying amounts of assets and liabilities for financial reporting purposes and the amounts used for income tax purposes. The components of deferred tax assets (liabilities) are as follows:
| | | | | | | | | | | | |
| | | As of December 31, | |
| | | 2012 | | | 2013 | | | 2013 | |
| | | (RMB’000) | | | (RMB’000) | | | (US$’000) | |
Deferred tax assets: | | | | | | | | | | | | |
Current: | | | | | | | | | | | | |
- Warranty provision | | | 44,467 | | | | 45,361 | | | | 7,493 | |
- Inventory write-off | | | 45,629 | | | | 17,124 | | | | 2,829 | |
- Allowance for advance to suppliers | | | 157,840 | | | | 164,695 | | | | 27,206 | |
- Allowance for doubtful accounts | | | 47,581 | | | | 54,479 | | | | 8,999 | |
- Allowance for amount due from related parties | | | 3,990 | | | | 1,995 | | | | 330 | |
- Others | | | 13,898 | | | | 668 | | | | 110 | |
Valuation allowance | | | (163,108 | ) | | | (284,322 | ) | | | (46,967 | ) |
| | | | | | | | | | | | |
Net current deferred tax assets | | | 150,297 | | | | — | | | | — | |
| | | | | | | | | | | | |
Non-current: | | | | | | | | | | | | |
- Tax losses | | | 383,640 | | | | 477,436 | | | | 78,867 | |
- Fixed assets | | | 39,214 | | | | 64,301 | | | | 10,622 | |
- Others | | | 63 | | | | 81 | | | | 13 | |
Valuation allowance | | | (315,613 | ) | | | (538,872 | ) | | | (89,015 | ) |
| | | | | | | | | | | | |
Net non-current deferred tax assets | | | 107,304 | | | | 2,946 | | | | 487 | |
| | | | | | | | | | | | |
Deferred tax liabilities: | | | | | | | | | | | | |
Non-current: | | | | | | | | | | | | |
- Land use rights | | | 24,798 | | | | 24,209 | | | | 3,999 | |
| | | | | | | | | | | | |
Non-current deferred tax liabilities | | | 24,798 | | | | 24,209 | | | | 3,999 | |
| | | | | | | | | | | | |
In assessing the realizability of deferred tax assets, the Group has considered whether it is more-likely-than-not that some portion or all of the deferred tax assets will not be realized. The ultimate realization of deferred tax assets is dependent upon the generation of future taxable income during the periods in which those temporary differences become deductible. The Group records a valuation allowance to reduce deferred tax assets to a net amount that management believes is more-likely-than-not of being realizable based on the weight of all available evidence. During the year ended December 31, 2013, an adjustment of RMB254,066,000 (US$41,968,713) was made on the beginning-of-the-year balance of a valuation allowance because of a change in circumstances that causes a change in judgment about the realizability of the related deferred tax asset in future years.
As of December 31, 2012 and 2013, the Group has a net tax operating loss from its PRC subsidiaries of RMB627,705,000 and RMB844,706,000 (US$139,535,491), respectively, which starts to expire in 2016. As of December 31, 2012 and 2013, the Group has a net tax operating loss from its non-PRC subsidiaries of RMB884,532,000and RMB1,032,221,000 (US$170,510,762), respectively, which starts to expire in 2029.
F-38
HANWHA SOLARONE CO., LTD.
NOTES TO THE CONSOLIDATED FINANCIAL STATEMENTS
AS OF DECEMBER 31, 2012 AND 2013 AND
FOR EACH OF THE THREE YEARS ENDED DECEMBER 31, 2011, 2012 AND 2013
Deferred taxation (Cont’d)
As of December 31, 2013, the Group intends to permanently reinvest the undistributed earnings from its foreign subsidiaries to fund future operations. The amount of unrecognized deferred tax liabilities for temporary differences related to investments in foreign subsidiaries is not determined because such a determination is not practicable.
Uncertain Tax Positions
As of December 31, 2013, the Group’s unrecognized tax benefit is RMB143,473,000 (US$23,700,051) which related to tax incentives received and tax resident status.
It is possible that the amount accrued will change in the next 12 months as a result of new interpretive guidance released by the PRC tax authorities; however, an estimate of the range of the possible change cannot be made at this time. The unrecognized tax benefits, if ultimately recognized, will impact the effective tax rate. Reconciliation of accrued unrecognized tax benefits is as follows:
| | | | | | | | | | | | | | | | |
| | | For the year ended December 31, | |
| | | 2011 | | | 2012 | | | 2013 | | | 2013 | |
| | | (RMB’000) | | | (RMB’000) | | | (RMB’000) | | | (US$’000) | |
Beginning and ending balance | | | 143,473 | | | | 143,473 | | | | 143,473 | | | | 23,700 | |
| | | | | | | | | | | | | | | | |
Based on existing PRC tax regulations, the tax periods of SolarOne Qidong, SolarOne Shanghai, SolarOne Technology, Solar R&D, Solar Engineering, SolarOne Nantong, Nantong Hanwha I&E and Nantong Tech for the years ended December 31, 2009 to December 31, 2013 remain open to potential examination by the tax authorities. The tax periods for the Company’s non-PRC subsidiaries’ for the years ended December 31, 2009 to December 31, 2013 also remain open to potential examination by the respective tax authorities.
As of December 31, 2013 and 2012, the Group did not accrue any penalties and interests related to the unrecognized tax benefits.
F-39
HANWHA SOLARONE CO., LTD.
NOTES TO THE CONSOLIDATED FINANCIAL STATEMENTS
AS OF DECEMBER 31, 2012 AND 2013 AND
FOR EACH OF THE THREE YEARS ENDED DECEMBER 31, 2011, 2012 AND 2013
| 25. | RELATED PARTY TRANSACTIONS |
Name and Relationship with Related Parties
| | |
Name of related party | | Relationship with the Group |
Hanwha Chemical | | Holding company of Hanwha Solar |
Hanwha Corporation | | Holding company of Hanwha Chemical |
Hanwha Q.Cells GmbH (“Q.Cells”) (previously known as Q-Cells SE) * | | A wholly-owned subsidiary of Hanwha Chemical |
Hanwha Q CELLS Japan Co., Ltd. (“Q.Cells Japan”) (previously known as Hanwha Japan Co., Ltd.) | | A wholly-owned subsidiary of Hanwha Corporation |
Hanwha Q CELLS Korea Corp. (“Q.Cells Korea”) (previously known as Hanwha Solarenergy Corporation) | | A subsidiary of Hanwha Corporation |
Hanwha Q CELLS Canada Inc. (“Q.Cells Canada”) | | A company controlled by Q.Cells Korea |
Hanwha L&C Corporation | | A wholly-owned subsidiary of Hanwha Chemical |
Hanwha L&C Trading (Shanghai) Co., Ltd. (“Hanwha L&C Trading”) | | A wholly-owned subsidiary of Hanwha Chemical |
Hanwha L&C Canada Inc. | | A wholly-owned subsidiary of Hanwha Chemical |
Hanwha L&C Alabama LLC. (“Hanwha L&C Alabama”) | | A subsidiary of Hanwha Chemical |
Hanwha Europe GmbH (“Hanwha Europe”) | | A wholly-owned subsidiary of Hanwha Corporation |
Hanwha International LLC. (“Hanwha International”) | | A wholly-owned subsidiary of Hanwha Chemical |
Hanwha Solar America LLC. (“Hanwha America”) | | A subsidiary of Hanwha Chemical |
Ya An Yongwang Silicon Co., Ltd. (“Ya An”) | | A wholly-owned subsidiary of HongKong YongWang Silicon Investment Co., Ltd., whose significant shareholder is Hanwha Chemical |
Hanwha TechM Co., Ltd. (“Hanwha TechM”) | | A wholly-owned subsidiary of Hanwha Corporation |
Food1st Food Culture Co., Ltd. (“Food1st”) | | A wholly-owned subsidiary of Hanwha Corporation |
Hanwha 63 City C., Ltd. (“Hanwha 63 City”) | | A wholly-owned subsidiary of Hanwha Life Insurance Co., Ltd., whose significant shareholder is Hanwha Corporation |
Komodo Enterprise Inc. (“Komodo”) | | A company whose significant shareholder is Q.Cells Korea |
Hanwha S&C Co., Ltd. (“Hanwha S&C”) | | A company controlled by Hanwha Corporation |
Hancomm, Inc. (“Hancomm”) | | A company whose significant shareholder is Hanwha S&C |
Semiconductor Manufacturing International (Shanghai) Corporation (“SMIC Shanghai”) ** | | A wholly-owned subsidiary of Semiconductor Manufacturing International Corporation where David N.K. Wang, one of the Company’s independent directors, served as president and chief executive officer |
| * | On October 24, 2012, as a result of Hanwha Chemical acquiring a 100% interest in Q.Cells from its original shareholders, Q.Cells became a related party of the Group. |
| ** | Subsequent to David N.K. Wang’s resignation from SMIC in July 2011, SMIC Shanghai ceased to be a related party of the Group. |
F-40
HANWHA SOLARONE CO., LTD.
NOTES TO THE CONSOLIDATED FINANCIAL STATEMENTS
AS OF DECEMBER 31, 2012 AND 2013 AND
FOR EACH OF THE THREE YEARS ENDED DECEMBER 31, 2011, 2012 AND 2013
| 25. | RELATED PARTY TRANSACTIONS (CONT’D) |
Significant Related Party Transactions
The Group had the following significant related party transactions during the years presented:
| | | | | | | | | | | | | | | | |
| | | For the year ended December 31, | |
| | | 2011 | | | 2012 | | | 2013 | | | 2013 | |
| | | (RMB’000) | | | (RMB’000) | | | (RMB’000) | | | (US$’000) | |
Advance paid to related parties: | | | | | | | | | | | | | | | | |
- Hanwha TechM | | | — | | | | 6,545 | | | | — | | | | — | |
- Ya An | | | 108,446 | | | | — | | | | — | | | | — | |
- Hanwha Chemical | | | 76,436 | | | | — | | | | — | | | | — | |
- Hanwha L&C Trading | | | 43,481 | | | | — | | | | — | | | | — | |
| | | | | | | | | | | | | | | | |
| | | 228,363 | | | | 6,545 | | | | — | | | | — | |
| | | | | | | | | | | | | | | | |
Purchase of raw materials from: | | | | | | | | | | | | | | | | |
- Hanwha Corporation | | | — | | | | — | | | | 216,146 | | | | 35,705 | |
- Q.Cells | | | — | | | | 4,080 | | | | 95,633 | | | | 15,798 | |
- Hanwha L&C Corporation | | | — | | | | 63,241 | | | | 82,314 | | | | 13,597 | |
- Q.Cells Japan | | | — | | | | — | | | | 15,160 | | | | 2,504 | |
- Hanwha L&C Trading | | | 63,129 | | | | 68,792 | | | | 823 | | | | 136 | |
- Hanwha TechM | | | — | | | | — | | | | 98 | | | | 16 | |
- Hanwha International | | | — | | | | 10,358 | | | | — | | | | — | |
- Ya An | | | 116,943 | | | | 6,440 | | | | — | | | | — | |
- Hanwha Chemical | | | 86,735 | | | | — | | | | — | | | | — | |
| | | | | | | | | | | | | | | | |
| | | 266,807 | | | | 152,911 | | | | 410,174 | | | | 67,756 | |
| | | | | | | | | | | | | | | | |
Purchase of services from: | | | | | | | | | | | | | | | | |
- Food1st | | | 8,177 | | | | 27,147 | | | | 30,760 | | | | 5,081 | |
- Hanwha International | | | — | | | | — | | | | 20,379 | | | | 3,367 | |
- Hanwha Chemical | | | — | | | | — | | | | 7,041 | | | | 1,163 | |
- Hancomm | | | 27,235 | | | | 14,993 | | | | 4,911 | | | | 811 | |
- Hanwha S&C | | | 5,876 | | | | 2,246 | | | | 553 | | | | 91 | |
- Hanwha Corporation | | | — | | | | — | | | | 85 | | | | 14 | |
- Q.Cells Korea | | | 570 | | | | — | | | | — | | | | — | |
| | | | | | | | | | | | | | | | |
| | | 41,858 | | | | 44,386 | | | | 63,729 | | | | 10,527 | |
| | | | | | | | | | | | | | | | |
Purchase of fixed assets from: | | | | | | | | | | | | | | | | |
- Hanwha TechM | | | 30,026 | | | | 3,586 | | | | 23,902 | | | | 3,948 | |
| | | | | | | | | | | | | | | | |
| | | 30,026 | | | | 3,586 | | | | 23,902 | | | | 3,948 | |
| | | | | | | | | | | | | | | | |
F-41
HANWHA SOLARONE CO., LTD.
NOTES TO THE CONSOLIDATED FINANCIAL STATEMENTS
AS OF DECEMBER 31, 2012 AND 2013 AND
FOR EACH OF THE THREE YEARS ENDED DECEMBER 31, 2011, 2012 AND 2013
| 25. | RELATED PARTY TRANSACTIONS (CONT’D) |
Significant Related Party Transactions (Cont’d)
The Group had the following significant related party transactions during the years presented (cont’d):
| | | | | | | | | | | | | | | | |
| | | For the year ended December 31, | |
| | | 2011 | | | 2012 | | | 2013 | | | 2013 | |
| | | (RMB’000) | | | (RMB’000) | | | (RMB’000) | | | (US$’000) | |
Sales of products to: | | | | | | | | | | | | | | | | |
- Q.Cells Japan | | | 67 | | | | 248,047 | | | | 1,179,308 | | | | 194,808 | |
- Q.Cells Korea | | | 87,702 | | | | 281,252 | | | | 213,751 | | | | 35,309 | |
- Q.Cells Canada | | | — | | | | — | | | | 112,798 | | | | 18,633 | |
- Hanwha Europe | | | 228 | | | | 147,582 | | | | 17,439 | | | | 2,881 | |
- Hanwha International | | | — | | | | 82,549 | | | | 3,381 | | | | 559 | |
- Hanwha Corporation | | | 468,381 | | | | 250,012 | | | | 496 | | | | 82 | |
- Hanwha Chemical | | | 24,106 | | | | 62 | | | | 26 | | | | 4 | |
- Komodo | | | — | | | | 29,298 | | | | — | | | | — | |
- Others | | | 3,373 | | | | 125 | | | | 7,161 | | | | 1,183 | |
| | | | | | | | | | | | | | | | |
| | | 583,857 | | | | 1,038,927 | | | | 1,534,360 | | | | 253,459 | |
| | | | | | | | | | | | | | | | |
Processing services provided to: | | | | | | | | | | | | | | | | |
- Q.Cells | | | — | | | | — | | | | 408,560 | | | | 67,489 | |
| | | | | | | | | | | | | | | | |
| | | — | | | | — | | | | 408,560 | | | | 67,489 | |
| | | | | | | | | | | | | | | | |
Buildings leased from: | | | | | | | | | | | | | | | | |
- SMIC Shanghai | | | 4,291 | | | | — | | | | — | | | | — | |
| | | | | | | | | | | | | | | | |
| | | 4,291 | | | | — | | | | — | | | | — | |
| | | | | | | | | | | | | | | | |
Borrowings from: | | | | | | | | | | | | | | | | |
- Hanwha International * | | | — | | | | — | | | | 61,480 | | | | 10,156 | |
- Hanwha L&C Alabama ** | | | — | | | | — | | | | 18,291 | | | | 3,021 | |
| | | | | | | | | | | | | | | | |
| | | — | | | | — | | | | 79,771 | | | | 13,177 | |
| | | | | | | | | | | | | | | | |
Interest paid to: | | | | | | | | | | | | | | | | |
- Hanwha International | | | — | | | | — | | | | 697 | | | | 115 | |
| | | | | | | | | | | | | | | | |
| | | — | | | | — | | | | 697 | | | | 115 | |
| | | | | | | | | | | | | | | | |
Commission fee for bank borrowings andlong-term notes: | | | | | | | | | | | | | | | | |
- Hanwha Chemical *** | | | — | | | | 4,526 | | | | 12,337 | | | | 2,038 | |
| | | | | | | | | | | | | | | | |
| | | — | | | | 4,526 | | | | 12,337 | | | | 2,038 | |
| | | | | | | | | | | | | | | | |
On May 1, 2012, the Group acquired 100% equity interest in Solar Australia from Hanwha Corporation with a cash consideration of AUD16,732 (Note 1).
F-42
HANWHA SOLARONE CO., LTD.
NOTES TO THE CONSOLIDATED FINANCIAL STATEMENTS
AS OF DECEMBER 31, 2012 AND 2013 AND
FOR EACH OF THE THREE YEARS ENDED DECEMBER 31, 2011, 2012 AND 2013
| 25. | RELATED PARTY TRANSACTIONS (CONT’D) |
Significant Related Party Transactions (Cont’d)
The Group had the following significant related party transactions during the years presented (cont’d):
| * | Solar Canada borrowed a short-term loan of US$10 million from Hanwha International on September 18, 2013, which bears an annual interest rate of 6% and will be due on March 18, 2014. |
| ** | Solar Canada borrowed a short-term loan of US$3,000,000 from Hanwha L&C Alabama on November 21, 2013, which bears an annual interest rate of 6% and will be due on May 21, 2014. |
| *** | The commission fees to Hanwha Chemical include: |
| | 1) | Annual commission fee which is 0.6% of long-term bank borrowings of US$180,000,000 with the term from April 26, 2012 to April 26, 2015; |
| | 2) | Annual commission fee which is 0.6% of long-term bank borrowings of US$100,000,000 with the term from June 26, 2013 to June 26, 2016; |
| | 3) | Annual commission fee which is 0.6% of long-term notes of US$100,000,000 (Note 17). |
Balances with Related Parties
As of December 31, 2012 and 2013, balances with related parties are comprised of the following:
| | | | | | | | | | | | |
| | | As of December 31, | |
| | | 2012 | | | 2013 | | | 2013 | |
| | | (RMB’000) | | | (RMB’000) | | | (US$’000) | |
Amount due from related parties-net: | | | | | | | | | | | | |
- Q.Cells Japan | | | 130,008 | | | | 205,935 | | | | 34,018 | |
- Q.Cells | | | — | | | | 162,156 | | | | 26,786 | |
- Hanwha Q.Cells Canada | | | — | | | | 95,156 | | | | 15,719 | |
- Q.Cells Korea | | | 137,288 | | | | 61,569 | | | | 10,170 | |
- Hanwha Chemical | | | 4,868 | | | | 4,721 | | | | 780 | |
- Hanwha Corporation | | | 15,312 | | | | 1,146 | | | | 188 | |
- Hanwha Europe | | | 94,215 | | | | 26 | | | | 4 | |
- Komodo | | | 23,101 | | | | 13 | | | | 2 | |
- Hanwha International | | | 14,844 | | | | — | | | | — | |
- Hancomm | | | 884 | | | | — | | | | — | |
- Others | | | 90 | | | | 10 | | | | 2 | |
| | | | | | | | | | | | |
| | | 420,610 | | | | 530,732 | | | | 87,669 | |
| | | | | | | | | | | | |
F-43
HANWHA SOLARONE CO., LTD.
NOTES TO THE CONSOLIDATED FINANCIAL STATEMENTS
AS OF DECEMBER 31, 2012 AND 2013 AND
FOR EACH OF THE THREE YEARS ENDED DECEMBER 31, 2011, 2012 AND 2013
| 25. | RELATED PARTY TRANSACTIONS (CONT’D) |
Balances with Related Parties (Cont’d)
| | | | | | | | | | | | |
| | | As of December 31, | |
| | | 2012 | | | 2013 | | | 2013 | |
| | | (RMB’000) | | | (RMB’000) | | | (US$’000) | |
Amount due to related parties: | | | | | | | | | | | | |
- Hanwha Corporation | | | — | | | | 95,086 | | | | 15,707 | |
- Hanwha International | | | 2,241 | | | | 59,390 | | | | 9,811 | |
- Hanwha L&C Corporation | | | 49,207 | | | | 45,185 | | | | 7,464 | |
- Hanwha L&C Alabama | | | — | | | | 18,388 | | | | 3,037 | |
- Q.Cells Japan | | | — | | | | 15,158 | | | | 2,504 | |
- Q.Cells | | | 6,388 | | | | 12,847 | | | | 2,122 | |
- Hanwha Chemical | | | 4,475 | | | | 4,340 | | | | 717 | |
- Hanwha TechM | | | 717 | | | | 3,577 | | | | 591 | |
- Hanwha L&C Trading | | | 3,682 | | | | 1,033 | | | | 170 | |
- Food1st | | | 232 | | | | 16 | | | | 3 | |
- Komodo | | | — | | | | 13 | | | | 2 | |
- Hancomm | | | 2,016 | | | | — | | | | — | |
- Hanwha S&C | | | 1,738 | | | | — | | | | — | |
- Hanwha L&C Canada Inc. | | | 1,349 | | | | — | | | | — | |
| | | | | | | | | | | | |
| | | 72,045 | | | | 255,033 | | | | 42,128 | |
| | | | | | | | | | | | |
In the year ended December 31, 2012, the Group provided provision of RMB15,960,000 for the advanced payment to Ya An, due to the liquidation of Ya An in 2013. In 2013, the Group reversed provision of RMB7,980,000 (US$1,318,202) as a result of actual subsequent collection of the payments from Ya An.
As of December 31, 2012 and 2013, except for the short-term borrowings from Hanwha International and Hanwha L&C Alabama disclosed in this note, all other balances with related parties were unsecured, non-interesting bearing and repayable on demand.
| 26. | EMPLOYEE DEFINED CONTRIBUTION PLAN |
Full-time employees of the Company’s subsidiaries in the PRC participate in a government-mandated defined contribution plan pursuant to which certain pension benefits, medical care, unemployment insurance, employee housing fund and other welfare benefits are provided to employees. Chinese labor regulations require that the PRC subsidiaries of the Company make contributions to the government for these benefits based on about 41% of the employees’ salaries on a monthly basis. The Group’s PRC subsidiaries have no legal obligation for the benefits beyond the contributions made. The total amounts for such employee benefits, which were expensed as incurred, were RMB84,493,000, RMB79,464,000 and RMB84,493,000 (US$13,957,249) for the years ended December 31, 2011, 2012 and 2013, respectively.
| 27. | SHARE ISSUANCE AND REPURCHASE AGREEMENT |
On August 3, 2010, a major shareholder of the Company, Good Energies Investments (Jersey) Limited (“Good Energies”) entered into a Share Purchase Agreement (the “GE Sales Agreement”) with Hanwha Chemical, a
F-44
HANWHA SOLARONE CO., LTD.
NOTES TO THE CONSOLIDATED FINANCIAL STATEMENTS
AS OF DECEMBER 31, 2012 AND 2013 AND
FOR EACH OF THE THREE YEARS ENDED DECEMBER 31, 2011, 2012 AND 2013
| 27. | SHARE ISSUANCE AND REPURCHASE AGREEMENT (CONT’D) |
Korean Company, pursuant to which Good Energies agreed to sell its 81,772,950 ordinary shares and 1,281,011 ADSs to Hanwha Chemical. Concurrently with the execution of the GE Sales Agreement, Hanwha Chemical entered into (i) a Share Purchase Agreement with the Company (the “Issuer Sales Agreement”), pursuant to which the Company agreed to sell to Hanwha Chemical 36,455,089 ordinary shares and (ii) a Share Purchase Agreement with Yonghua Solar Power Investment Holding Ltd. (“Yonghua”), pursuant to which Yonghua agreed to sell to Hanwha Chemical 38,634,750 ordinary shares (the “Yonghua Sales Agreement”). Hanwha Chemical subsequently assigned and transferred to Hanwha Solar, a wholly owned subsidiary of Hanwha Chemical, its rights and obligations under the Issuer Sales Agreement, the GE Sales Agreement and the Yonghua Sales Agreement. In connection with the transaction, Hanwha Solar requested the Company to issue 45,080,019 new ordinary shares at par value of US$0.0001 per share in a Share Issuance and Repurchase Agreement (“Share Issuance and Repurchase Agreement”).
Pursuant to the GE Sales Agreement and the Yonghua Sales Agreement, Hanwha Solar paid cash consideration of approximately US$202 million and US$90 million to Good Energies and Yonghua, respectively. Concurrently, pursuant to the Issuer Sales Agreement, the Company received net proceeds of approximately US$76 million for the issuance of 36,455,089 ordinary shares. On September 16, 2010, the respective parties to the GE Sales Agreement, the Issuer Sales Agreement and the Yonghua Sales Agreement consummated the purchase and sale of the ordinary shares and ADSs contemplated thereby. As a result, Good Energies and Yonghua ceased to own any ordinary shares or ADSs of the Company as of September 16, 2010.
The Company recorded the shares issued in the Share Issuance and Repurchase Agreement with Hanwha Solar as a liability in accordance ASC 480-10,Accounting for Certain Financial Instruments with Characteristics of both Liabilities and Equity, as there is an unconditional obligation that requires the Company to redeem the shares by transferring assets at a determinable date at the par value per share of US$0.0001. As of December 31, 2010, the Company has issued 30,672,689 ordinary shares to Hanwha Solar and recorded a liability of RMB20,554 in other current liabilities in connection with the Share Issuance and Repurchase Agreement.
In March 2011, the Company issued 14,407,330 ordinary shares to Hanwha Solar in connection with the Share Issuance and Repurchase Agreement and recorded an additional liability of US$1,441 in other current liabilities in connection with the Share Issuance and Repurchase Agreement.
On October 25, 2011, in connection with the repurchase of redeemable ordinary shares (Note 20), the Company repurchased and cancelled 25,017,671 ordinary shares in connection with the Share Issuance and Repurchase Agreement and reversed an amount of US$2,502. Accordingly, as of December 31, 2011, the Company has 20,062,348 outstanding shares issued to Hanwha Solar under the Share Issuance and Repurchase Agreement with a corresponding liability of RMB13,000 (US$2,147) recorded in other current liabilities (Note 12). Such balance remained unchanged in 2012 and 2013.
| 28. | COMMITMENTS AND CONTINGENCIES |
Acquisition of fixed assets
As of December 31, 2013, the Group had commitments of approximately RMB4,098,000 (US$810,744) related to the acquisition of fixed assets, which is expected to be settled within the next twelve months.
F-45
HANWHA SOLARONE CO., LTD.
NOTES TO THE CONSOLIDATED FINANCIAL STATEMENTS
AS OF DECEMBER 31, 2012 AND 2013 AND
FOR EACH OF THE THREE YEARS ENDED DECEMBER 31, 2011, 2012 AND 2013
| 28. | COMMITMENTS AND CONTINGENCIES (CONT’D) |
Operating lease commitments
The Group has entered into leasing arrangements relating to office premises and other facilities that are classified as operating leases. Future minimum lease payments for non-cancelable operating leases as of December 31, 2013 are as follows:
| | | | | | | | |
| | | As of December 31, 2013 | |
| | | (RMB’000) | | | (US$’000) | |
Year 2014 | | | 2,759 | | | | 456 | |
Year 2015 | | | 1,353 | | | | 223 | |
Year 2016 | | | 902 | | | | 149 | |
Year 2017 and thereafter | | | — | | | | — | |
| | | | | | | | |
Total | | | 5,014 | | | | 828 | |
| | | | | | | | |
The terms of the leases do not contain rent escalation or contingent rent.
Litigation
The Group was involved in certain cases pending in various PRC and U.S. courts and arbitration as of December 31, 2013. For certain proceedings, the Group is currently unable to estimate the reasonably possible loss or a range of reasonably possible losses. The Group is often unable to estimate the possible loss or range of loss until developments in such matters have provided sufficient information to support an assessment of the range of possible loss, such as quantification of a damage demand from plaintiffs, discovery from other parties and investigation of factual allegations, rulings by the court on motions or appeals, analysis by experts, or the progress of settlement negotiations. On an annual basis, the Group reviews relevant information with respect to litigation contingencies, and updates its accruals, disclosures and estimates of reasonably possible losses or ranges of loss based on such reviews.
For certain proceedings that the Group is involved as the plaintiff and expects favorable outcome, an estimated gain from a gain contingency is not reflected in the statement of financial position or statements of comprehensive loss until the realization of the gain contingency.
Income Taxes
Effective from January 1, 2007, the Group adopted ASC 740-10, which prescribes a more-likely-than-not threshold for financial statement recognition and measurement of a tax position taken in the tax return.ASC 740-10 also provides guidance on de-recognition of income tax assets and liabilities, classification current and deferred income tax assets and liabilities, accounting for interest and penalties associated with tax positions, accounting for income taxes in interim periods and income tax disclosures. As of December 31, 2012 and 2013, the Group has recorded an unrecognized tax benefit for RMB143,473,000 (US$23,700,051).
F-46
HANWHA SOLARONE CO., LTD.
NOTES TO THE CONSOLIDATED FINANCIAL STATEMENTS
AS OF DECEMBER 31, 2012 AND 2013 AND
FOR EACH OF THE THREE YEARS ENDED DECEMBER 31, 2011, 2012 AND 2013
The Group operates in a single business segment, which is the development, manufacturing, and sale ofPV-related products. The following table summarizes the Group’s net revenues by geographic region based on the location of the customers:
| | | | | | | | | | | | | | | | |
| | | For the year ended December 31, | |
| | | 2011 | | | 2012 | | | 2013 | | | 2013 | |
| | | (RMB’000) | | | (RMB’000) | | | (RMB’000) | | | (US$’000) | |
Japan | | | 13,508 | | | | 248,047 | | | | 1,179,308 | | | | 194,808 | |
South Africa | | | 1,081 | | | | 814 | | | | 728,960 | | | | 120,416 | |
Germany | | | 2,652,159 | | | | 1,489,499 | | | | 694,148 | | | | 114,665 | |
The PRC | | | 599,247 | | | | 382,469 | | | | 539,866 | | | | 89,180 | |
USA | | | 859,290 | | | | 513,163 | | | | 421,473 | | | | 69,622 | |
South Korea | | | 76,954 | | | | 260,887 | | | | 218,844 | | | | 36,150 | |
Canada | | | 157,650 | | | | 1,506 | | | | 187,343 | | | | 30,947 | |
United Kingdom | | | 14,821 | | | | 15,491 | | | | 115,289 | | | | 19,044 | |
Netherlands | | | 330,920 | | | | — | | | | 90,741 | | | | 14,989 | |
India | | | 136,249 | | | | 263,228 | | | | 84,310 | | | | 13,927 | |
Spain | | | 152,133 | | | | 7,043 | | | | 63,075 | | | | 10,419 | |
Portugal | | | 20,730 | | | | 22,252 | | | | 62,420 | | | | 10,311 | |
Australia | | | 448,498 | | | | 27,773 | | | | 59,317 | | | | 9,799 | |
Belgium | | | 132,932 | | | | 44,941 | | | | 57,719 | | | | 9,535 | |
Malaysia | | | — | | | | 251 | | | | 48,882 | | | | 8,075 | |
France | | | 303,328 | | | | 62,507 | | | | 35,155 | | | | 5,807 | |
Israel | | | — | | | | 170 | | | | 24,536 | | | | 4,053 | |
Thailand | | | 36,673 | | | | 189 | | | | 19,259 | | | | 3,181 | |
Greece | | | 44,938 | | | | 80,381 | | | | 16,384 | | | | 2,706 | |
Italy | | | 358,121 | | | | 149,196 | | | | 14,113 | | | | 2,332 | |
Others | | | 77,253 | | | | 108,573 | | | | 64,550 | | | | 10,663 | |
| | | | | | | | | | | | | | | | |
Total net revenue | | | 6,416,485 | | | | 3,678,380 | | | | 4,725,692 | | | | 780,629 | |
| | | | | | | | | | | | | | | | |
Over 99% of the long-lived assets of the Group are located in the PRC.
For the year ended December 31, 2012, there was no customer that accounted for 10% or more of total net revenue. The customers that accounted for 10% or more of total net revenue for the year ended December 31, 2011 and 2013 are as follows:
| | | | | | | | | | | | |
| | | For the year ended December 31, | |
| | | 2011 | | | 2013 | | | 2013 | |
| | | (RMB’000) | | | (RMB’000) | | | (US$’000) | |
Schueco International KG | | | 967,398 | | | | * | | | | * | |
MEMC Singapore Pte Ltd. | | | 695,680 | | | | * | | | | * | |
Q.Cells Japan | | | * | | | | 1,179,308 | | | | 194,808 | |
F-47
HANWHA SOLARONE CO., LTD.
NOTES TO THE CONSOLIDATED FINANCIAL STATEMENTS
AS OF DECEMBER 31, 2012 AND 2013 AND
FOR EACH OF THE THREE YEARS ENDED DECEMBER 31, 2011, 2012 AND 2013
Basic and diluted net loss per share for each period presented are calculated as follows (in thousands, except share and per share amounts):
| | | | | | | | | | | | | | | | |
| | | For the year ended December 31, | |
| | | 2011 | | | 2012 | | | 2013 | | | 2013 | |
| | | RMB | | | RMB | | | RMB | | | US$ | |
Numerator: | | | | | | | | | | | | | | | | |
Loss attributable to ordinary shareholders – basic and diluted | | | (930,104 | ) | | | (1,562,859 | ) | | | (874,090 | ) | | | (144,389 | ) |
| | | | |
Denominator: | | | | | | | | | | | | | | | | |
Weighted-average number of shares outstanding – basic and diluted | | | 420,325,701 | | | | 422,167,505 | | | | 423,675,429 | | | | 423,675,429 | |
Basic and diluted net loss per share | | | (RMB2.21 | ) | | | (RMB3.70 | ) | | | (RMB2.06 | ) | | | (US$0.34 | ) |
| | | | | | | | | | | | | | | | |
During the years ended December 31, 2011, 2012 and 2013, the Company issued 1,750,000, 1,000,000 and 1,000,000 ordinary shares, respectively, to its share depository bank which have been and will continue to be used to settle stock option awards upon their exercise. No consideration was received by the Company for this issuance of ordinary shares. As of December 31, 2012 and 2013, the used ordinary shares issued to share depository bank were 628,590 and 871,095 respectively. The unused ordinary issued to share depository bank are legally issued and outstanding but are treated as escrowed shares for accounting purposes and, therefore, have been excluded from the computation of earnings per share. Any ordinary shares not used in the settlement of stock option awards will be returned to the Company.
For the years ended December 31, 2011, 2012 and 2013, the potential dilutive effect in relation to the stock options, unvested RSUs and convertible bonds were excluded as they have an anti-dilutive effect. The redeemable shares have been excluded in both basic and diluted net loss per share as they are not entitled to the earnings of the Company.
| 31. | FAIR VALUE MEASUREMENTS |
ASC subtopic 820-10 (“ASC 820-10”),Fair Value Measurements and Disclosures, establishes a three-tier fair value hierarchy, which prioritizes the inputs used in measuring fair value as follows:
| | | | |
Level 1 | | – | | Observable inputs that reflect quoted prices (unadjusted) for identical assets or liabilities in active markets |
Level 2 | | – | | Include other inputs that are directly or indirectly observable in the marketplace |
Level 3 | | – | | Unobservable inputs which are supported by little or no market activity |
ASC 820-10 describes three main approaches to measuring the fair value of assets and liabilities: (1) market approach; (2) income approach; and (3) cost approach. The market approach uses prices and other relevant information generated from market transactions involving identical or comparable assets or liabilities. The income approach uses valuation techniques to convert future amounts to a single present value amount. The measurement is based on the value indicated by current market expectations about those future amounts. The cost approach is based on the amount that would currently be required to replace an asset.
F-48
HANWHA SOLARONE CO., LTD.
NOTES TO THE CONSOLIDATED FINANCIAL STATEMENTS
AS OF DECEMBER 31, 2012 AND 2013 AND
FOR EACH OF THE THREE YEARS ENDED DECEMBER 31, 2011, 2012 AND 2013
| 31. | FAIR VALUE MEASUREMENTS (CONT’D) |
Foreign currency and commodity derivatives and interest rate swap are classified within Level 2 because they are valued using models utilizing market observable and other inputs.
The inputs used to measure the fair value of the conversion option of convertible bonds were largely unobservable, and, accordingly, the measurement was classified as Level 3. The fair value of the conversion option of convertible bonds was estimated using the binomial approach. The following assumptions were used for estimating the fair value:
| | | | | | | | |
| | | As of December 31, | |
| | | 2012 | | | 2013 | |
Underlying share price | | | US$1.01 | | | | US$2.77 | |
Conversion price | | | US$19.125 | | | | US$19.125 | |
Time to maturity | | | 5.04 years | | | | 4.04 years | |
Risk-free rate | | | 0.73% | | | | 1.28% | |
Expected volatility (Level 3 input) | | | 99.74% | | | | 84.40% | |
Comparable yield to maturity | | | 17.32% | | | | 10.55% | |
Underlying share price is the Company’s closing price as listed on NASDAQ on December 31, 2012 and 2013. The conversion price is the initial conversion price of the convertible bonds. Time to maturity is the remaining years from balance sheet date to January 15, 2018, the maturity date of the convertible bonds. The risk-free rate is derived from the United States Treasury zero coupon risk-free rates with the remaining terms equal to the time to maturity as of December 31, 2012 and 2013. The Company estimates the expected volatility based on the historical volatility of the Company’s common shares. The comparable yield to maturity is estimated based on the average yield of bonds with same credit rating of the Company with maturities close to the time to maturity as of December 31, 2012 and 2013.
Assets and liabilities measured at fair value on a recurring basis as of December 31, 2012 and 2013 are summarized below:
| | | | | | | | | | | | | | | | |
| | | Fair value measurements at December 31, 2012 using: | | | | |
| | | Quoted prices in
active markets for
identical assets
(Level 1) | | | Significant other
observable inputs
(Level 2) | | | Significant
unobservable inputs
(Level 3) | | | Total fair value at
December 31,
2012 | |
| | | (RMB’000) | | | (RMB’000) | | | (RMB’000) | | | (RMB’000) | |
Cash and cash equivalents | | | | | | | | | | | | | | | | |
- Time deposits | | | 676,476 | | | | — | �� | | | — | | | | 676,476 | |
- Restricted cash | | | 150,462 | | | | — | | | | — | | | | 150,462 | |
| | | | |
Foreign currency / commodity / interest rate swap derivatives | | | | | | | | | | | | | | | | |
- Financial liabilities | | | — | | | | 17,311 | | | | — | | | | 17,311 | |
| | | | |
Conversion option of convertible bonds | | | — | | | | — | | | | 7,908 | | | | 7,908 | |
F-49
HANWHA SOLARONE CO., LTD.
NOTES TO THE CONSOLIDATED FINANCIAL STATEMENTS
AS OF DECEMBER 31, 2012 AND 2013 AND
FOR EACH OF THE THREE YEARS ENDED DECEMBER 31, 2011, 2012 AND 2013
| 31. | FAIR VALUE MEASUREMENTS (CONT’D) |
| | | | | | | | | | | | | | | | | | | | |
| | | Fair value measurements at December 31, 2013 using: | | | Total fair value at
December 31,
2013 | |
| | | Quoted prices in
active markets for
identical assets
(Level 1) | | | Significant other
observable inputs
(Level 2) | | | Significant
unobservable inputs
(Level 3) | | |
| | | (RMB’000) | | | (RMB’000) | | | (RMB’000) | | | (RMB’000) | | | (US$’000) | |
Cash and cash equivalents | | | | | | | | | | | | | | | | | | | | |
- Time deposits | | | 1,249,481 | | | | — | | | | — | | | | 1,249,481 | | | | 206,400 | |
- Restricted cash | | | 163,948 | | | | — | | | | — | | | | 163,948 | | | | 27,082 | |
| | | | | |
Foreign currency / interest rate swap derivatives | | | | | | | | | | | | | | | | | | | | |
- Financial assets | | | — | | | | 26,632 | | | | — | | | | 26,632 | | | | 4,399 | |
- Financial liabilities | | | — | | | | 6,513 | | | | — | | | | 6,513 | | | | 1,076 | |
| | | | | |
Conversion option of convertible bonds | | | — | | | | — | | | | 14,013 | | | | 14,013 | | | | 2,315 | |
The following is a reconciliation of the liabilities measured at fair value on a recurring basis using significant unobservable inputs (Level 3) for the year ended December 31, 2013.
| | | | |
| | | Conversion option of
convertible bonds | |
| | | (RMB’000) | |
Balance as of December 31, 2012 | | | 7,908 | |
Unrealized loss | | | 6,105 | |
| | | | |
Balance as of December 31, 2013 | | | 14,013 | |
| | | | |
The amount of realized or unrealized gain/loss is included in the consolidated statements of comprehensive loss in “Changes in fair value of conversion feature of convertible bonds.”
Issuance of ordinary shares
In January 2014, the Company issued 5,290,966 ADSs in a public offering, representing 26,454,830 of the Company’s ordinary shares. Total proceeds from this equity offering were approximately US$17.1 million.
| 33. | ADDITIONAL FINANCIAL INFORMATION OF THE COMPANY |
In accordance with the PRC Regulations on Enterprises with Foreign Investment, an enterprise established in the PRC with foreign investment is required to provide for certain statutory reserves, namely (i) General Reserve Fund, (ii) Enterprise Expansion Fund and (iii) Staff Welfare and Bonus Fund, which are appropriated from net profit as reported in the enterprise’s PRC statutory accounts. A wholly-owned foreign enterprise (“WOFE”) is required to allocate at least 10% of its annual after-tax profit to the General Reserve Fund until the balance of such fund has reached 50% of its respective registered capital. A non wholly-owned foreign invested enterprise is permitted to provide for the above allocation at the discretion of its board of directors. Appropriations to the
F-50
HANWHA SOLARONE CO., LTD.
NOTES TO THE CONSOLIDATED FINANCIAL STATEMENTS
AS OF DECEMBER 31, 2012 AND 2013 AND
FOR EACH OF THE THREE YEARS ENDED DECEMBER 31, 2011, 2012 AND 2013
| 33. | ADDITIONAL FINANCIAL INFORMATION OF THE COMPANY (CONT’D) |
Enterprise Expansion Fund and Staff Welfare and Bonus Fund are at the discretion of the board of directors for all foreign invested enterprises. The aforementioned reserves can only be used for specific purposes and are not distributable as cash dividends.
SolarOne Nantong is an WOFE since its establishment in 2011. SolarOne Qidong became a WOFE in May 2006 and, therefore, is subject to the above mandated restrictions on distributable profits. Prior to May 2006, although SolarOne Qidong was a Sino-foreign joint venture enterprise, it was required to allocate at least 10% of itsafter-tax profit to the General Reserve Fund in accordance with the joint venture agreements entered into among the then joint venture partners and the appropriations to the Enterprise Expansion Fund and Staff Welfare and Bonus Fund were at the discretion of the board of directors.
For other subsidiaries incorporated in PRC, including SolarOne Technology, SolarOne Shanghai, Solar R&D, Solar Engineering, Nantong Hanwha I&E and Nantong Tech, the General Reserve Fund was appropriated based on 10% of net profits as reported in each subsidiary’s PRC statutory accounts.
The Group provided RMB4,456,000 statutory reserves for the year ended December 31, 2011. There were no statutory reserves provided for the year ended December 31, 2012 and 2013 as all of the Group’s PRC subsidiaries incurred net losses in these two years.
Under PRC laws and regulations, the Company’s PRC subsidiaries are restricted in their ability to transfer their net assets to the Company in the form of dividend payments, loans, or advances. As determined pursuant to PRC generally accepted accounting principles, net assets of the Company’s PRC subsidiaries which are restricted from transfer amounted to RMB3,401,404,000 (US$561,871,913) as of December 31, 2013.
F-51
HANWHA SOLARONE CO., LTD.
NOTES TO THE CONSOLIDATED FINANCIAL STATEMENTS
AS OF DECEMBER 31, 2012 AND 2013 AND
FOR EACH OF THE THREE YEARS ENDED DECEMBER 31, 2011, 2012 AND 2013
| 33. | ADDITIONAL FINANCIAL INFORMATION OF THE COMPANY (CONT’D) |
Condensed Balance Sheets
| | | | | | | | | | | | | | | | |
| | | | | | As of December 31, | |
| | | Note | | | 2012 | | | 2013 | | | 2013 | |
| | | | | | (RMB’000) | | | (RMB’000) | | | (US$’000) | |
ASSETS | | | | | | | | | | | | | | | | |
Current assets: | | | | | | | | | | | | | | | | |
Cash and cash equivalents | | | | | | | 3,216 | | | | 4,671 | | | | 772 | |
Other receivables | | | | | | | 98 | | | | 98 | | | | 16 | |
Deferred expenses | | | | | | | 3,969 | | | | 4,155 | | | | 686 | |
Amount due from subsidiaries | | | b | | | | 3,600,276 | | | | 3,480,154 | | | | 574,881 | |
| | | | | | | | | | | | | | | | |
Total current assets | | | | | | | 3,607,559 | | | | 3,489,078 | | | | 576,355 | |
| | | | |
Non-current assets: | | | | | | | | | | | | | | | | |
Long-term deferred expenses | | | c | | | | 4,090 | | | | 175 | | | | 29 | |
| | | | | | | | | | | | | | | | |
Total non-current assets | | | | | | | 4,090 | | | | 175 | | | | 29 | |
| | | | | | | | | | | | | | | | |
Total assets | | | | | | | 3,611,649 | | | | 3,489,253 | | | | 576,384 | |
| | | | | | | | | | | | | | | | |
LIABILITIES AND SHAREHOLDERS’ EQUITY | | | | | | | | | | | | | | | | |
Current liabilities: | | | | | | | | | | | | | | | | |
Accrued expenses and other payables | | | d | | | | 11,654 | | | | 14,987 | | | | 2,476 | |
Derivative contracts | | | | | | | 8,127 | | | | — | | | | — | |
Amount due to subsidiaries | | | b | | | | 21,073 | | | | 20,441 | | | | 3,377 | |
| | | | | | | | | | | | | | | | |
Total current liabilities | | | | | | | 40,854 | | | | 35,428 | | | | 5,853 | |
| | | | | | | | | | | | | | | | |
Non-current liabilities: | | | | | | | | | | | | | | | | |
Convertible bonds | | | | | | | 368,590 | | | | 470,357 | | | | 77,697 | |
Loss in excess of investments | | | a | | | | 454,862 | | | | 1,093,073 | | | | 180,563 | |
| | | | | | | | | | | | | | | | |
Total non-current liabilities | | | | | | | 823,452 | | | | 1,563,430 | | | | 258,260 | |
| | | | | | | | | | | | | | | | |
Total liabilities | | | | | | | 864,306 | | | | 1,598,858 | | | | 264,113 | |
| | | | | | | | | | | | | | | | |
Redeemable ordinary shares (par value US$0.0001 per share; 20,070,375 and 20,070,375 shares issued and outstanding at December 31, 2012 and 2013, respectively) | | | | | | | 24 | | | | 24 | | | | 4 | |
| | | | |
Shareholders’ equity | | | | | | | | | | | | | | | | |
Ordinary shares (par value US$0.0001 per share; 1,000,000,000 and 1,000,000,000 shares authorized; 423,395,432 shares and 431,525,432 shares issued and outstanding at December 31, 2012 and 2013, respectively) | | | | | | | 316 | | | | 321 | | | | 53 | |
Additional paid-in capital | | | | | | | 4,004,199 | | | | 4,022,147 | | | | 664,411 | |
Accumulated deficit | | | | | | | (1,255,977 | ) | | | (2,130,067 | ) | | | (351,862 | ) |
Accumulated other comprehensive loss | | | | | | | (1,219 | ) | | | (2,030 | ) | | | (335 | ) |
| | | | | | | | | | | | | | | | |
Total shareholders’ equity | | | | | | | 2,747,319 | | | | 1,890,371 | | | | 312,267 | |
| | | | | | | | | | | | | | | | |
Total liabilities, redeemable ordinary shares and shareholders’ equity | | | | | | | 3,611,649 | | | | 3,489,253 | | | | 576,384 | |
| | | | | | | | | | | | | | | | |
F-52
HANWHA SOLARONE CO., LTD.
NOTES TO THE CONSOLIDATED FINANCIAL STATEMENTS
AS OF DECEMBER 31, 2012 AND 2013 AND
FOR EACH OF THE THREE YEARS ENDED DECEMBER 31, 2011, 2012 AND 2013
| 33. | ADDITIONAL FINANCIAL INFORMATION OF THE COMPANY (CONT’D) |
Condensed Statements of Comprehensive Loss
| | | | | | | | | | | | | | | | | | |
| | | | | For the year ended December 31, | |
| | | Note | | 2011 | | | 2012 | | | 2013 | | | 2013 | |
| | | | | (RMB’000) | | | (RMB’000) | | | (RMB’000) | | | (US$’000) | |
Net revenues | | | | | — | | | | — | | | | — | | | | — | |
Cost of revenues | | | | | — | | | | — | | | | — | | | | — | |
| | | | | | | | | | | | | | | | | | |
Gross loss | | | | | — | | | | — | | | | — | | | | — | |
Operating expenses | | | | | (20,574 | ) | | | (7,753 | ) | | | (10,355 | ) | | | (1,710 | ) |
| | | | | | | | | | | | | | | | | | |
Operating loss | | | | | (20,574 | ) | | | (7,753 | ) | | | (10,355 | ) | | | (1,710 | ) |
| | | | | |
Share of loss from subsidiaries | | | | | (843,703 | ) | | | (1,336,805 | ) | | | (642,447 | ) | | | (106,125 | ) |
Interest expenses – net | | | | | (142,404 | ) | | | (118,680 | ) | | | (133,585 | ) | | | (22,067 | ) |
Changes in fair value of derivative contracts | | | | | (7,508 | ) | | | (4,784 | ) | | | 6,564 | | | | 1,084 | |
Changes in fair value of conversion feature of convertible bonds | | | | | 264,384 | | | | (5,692 | ) | | | (6,105 | ) | | | (1,008 | ) |
Loss on extinguishment of debt | | | | | — | | | | (82,713 | ) | | | — | | | | — | |
Exchange losses | | | | | (180,299 | ) | | | (7,651 | ) | | | (88,973 | ) | | | (14,697 | ) |
| | | | | | | | | | | | | | | | | | |
Loss before tax | | | | | (930,104 | ) | | | (1,564,078 | ) | | | (874,901 | ) | | | (144,523 | ) |
Income tax expenses | | | | | — | | �� | | — | | | | — | | | | — | |
| | | | | | | | | | | | | | | | | | |
Net loss | | | | | (930,104 | ) | | | (1,564,078 | ) | | | (874,901 | ) | | | (144,523 | ) |
| | | | | | | | | | | | | | | | | | |
Condensed Statements of Cash Flows
| | | | | | | | | | | | | | | | |
| | | For the year ended December 31, | |
| | | 2011 | | | 2012 | | | 2013 | | | 2013 | |
| | | (RMB’000) | | | (RMB’000) | | | (RMB’000) | | | (US$’000) | |
Net cash used in operating activities | | | (56,383 | ) | | | (41,176 | ) | | | (2,500 | ) | | | (413 | ) |
| | | | | | | | | | | | | | | | |
Net cash used in investing activities | | | (5,105 | ) | | | (13,001 | ) | | | (11,338 | ) | | | (1,873 | ) |
| | | | | | | | | | | | | | | | |
Net cash provided by financing activities | | | 40,449 | | | | 50,623 | | | | 15,293 | | | | 2,527 | |
| | | | | | | | | | | | | | | | |
Net increase (decrease) in cash and cash equivalents | | | (21,039 | ) | | | (3,554 | ) | | | 1,455 | | | | 241 | |
Cash and cash equivalents at the beginning of year | | | 27,809 | | | | 6,770 | | | | 3,216 | | | | 531 | |
| | | | | | | | | | | | | | | | |
Cash and cash equivalents at the end of year | | | 6,770 | | | | 3,216 | | | | 4,671 | | | | 772 | |
| | | | | | | | | | | | | | | | |
Notes to the Condensed Financial Statements of the Company
In the Company-only condensed financial statements, the Company’s investment in subsidiaries is stated at cost plus equity in undistributed earnings of subsidiaries since inception or acquisition. The Company-only condensed financial statements should be read in conjunction with the Company’s consolidated financial statements.
F-53
HANWHA SOLARONE CO., LTD.
NOTES TO THE CONSOLIDATED FINANCIAL STATEMENTS
AS OF DECEMBER 31, 2012 AND 2013 AND
FOR EACH OF THE THREE YEARS ENDED DECEMBER 31, 2011, 2012 AND 2013
| 33. | ADDITIONAL FINANCIAL INFORMATION OF THE COMPANY (CONT’D) |
Notes to the Condensed Financial Statements of the Company (Cont’d)
| (a) | Basis of presentation (Cont’d) |
The Company records its investment in its subsidiaries under the equity method of accounting as prescribed in ASC 323-10,Investments-Equity Method and Joint Ventures. Such investment is presented on the condensed balance sheets as “Investment in subsidiaries” and share of the subsidiaries’ profit or loss as “Share of profit (loss) from subsidiaries” on the condensed statements of comprehensive income. Under the equity method of accounting, the Company shall adjust the carrying amount of the investment for its share of the subsidiary’s cumulative losses until the investment balance reaches zero, unless it is contractually obligated to continue to pick up the subsidiary’s losses. The Company confirmed its unlimited financial support to its subsidiaries for their operations. Consequently, the Company recognized RMB1,093,073,000 (US$180,562,796) of its share of cumulative losses in excess of its investment in “Losses in excess of investments” as of December 31, 2013 (2012: RMB454,862,000).
The subsidiaries did not pay any dividends to the Company for the periods presented.
Certain information and footnote disclosures normally included in financial statements prepared in accordance with US GAAP have been condensed or omitted.
| (b) | Related party transactions and balances |
As of December 31, 2012 and 2013, the Company paid on behalf of its subsidiaries of RMB3,600,276,000 and RMB3,480,154,000 (US$574,880,486), respectively, and subsidiaries of the Company paid on behalf the Company of RMB21,073,000 and RMB20,441,000 (US$3,376,613), respectively.
For the years ended December 31, 2012 and 2013, the Company paid on behalf of its subsidiaries of RMB34,466,000 and RMB9,775,000 (US$1,614,715), respectively, and subsidiaries of the Company paid operating expenses, interest expense and consideration for repurchase of convertible bonds of RMB359,325,000 and RMB129,265,000 (US$21,353,057), respectively, on behalf of the Company.
As of December 31, 2012 and 2013, all balances with related parties were unsecured, non-interesting bearing and repayable on demand.
| (c) | Long-term deferred expenses |
The long-term deferred expenses as of December 31, 2012 and 2013 mainly included the cost related to issuance of convertible bonds (Note 22) amortized over 7 years using the effective interest rate method since January 2008. These issuance costs have been recorded as “Long-term deferred expenses.” As of December 31, 2012 and 2013, the unamortized costs recorded in long-term deferred expenses related to the issuance of convertible bonds amounted to RMB4,080,000 and RMB166,000 (US$27,421), respectively.
| (d) | Accrued expenses and other payables |
As of December 31, 2012 and 2013, other payables mainly included interest payable to the holders of the convertible bonds of RMB10,068,000 and RMB9,766,000 (US$1,613,228), respectively.
F-54
HANWHA SOLARONE CO., LTD.
NOTES TO THE CONSOLIDATED FINANCIAL STATEMENTS
AS OF DECEMBER 31, 2012 AND 2013 AND
FOR EACH OF THE THREE YEARS ENDED DECEMBER 31, 2011, 2012 AND 2013
| 33. | ADDITIONAL FINANCIAL INFORMATION OF THE COMPANY (CONT’D) |
Notes to the Condensed Financial Statements of the Company (Cont’d)
The Company did not have any significant commitments or long-term obligations, other than the convertible bonds, as of December 31, 2012 or 2013.
| (f) | Convenience translation |
Amounts in United States dollars are presented for the convenience of the reader and are translated at the noon buying rate of US$1.00 to RMB6.0537 on December 31, 2013 in the City of New York for cable transfers of Renminbi as certified for customs purposes by the Federal Reserve Bank of New York. No representation is made that the Renminbi amounts could have been, or could be, converted into United States dollars at such rate.
F-55