Table of Contents
As filed with the Securities and Exchange Commission on November 14, 2006
Registration No. 333-137038
UNITED STATES SECURITIES AND EXCHANGE COMMISSION
Washington, D.C. 20549
Amendment No. 3
to
Form S-1
REGISTRATION STATEMENT UNDER THE SECURITIES ACT OF 1933
WSB Financial Group, Inc.
(Name of registrant as specified in its charter)
| Washington | 6022 | 20-3153598 | ||
| (State or other jurisdiction of incorporation or organization) | (Primary standard industrial classification code number) | (I.R.S. employer identification number) |
607 Pacific Avenue, Bremerton, Washington 98337, (360) 405-1200
(Address, including zip code, and telephone number, including area
code, of principal executive offices and principal place of business)
| David K. Johnson | ||||
| President and Chief | ||||
| Copies of communications to: | Executive Officer | Copies of communications to: | ||
| 607 Pacific Avenue | ||||
| Glen P. Garrison, Esq. | Bremerton, Washington 98337 | Christopher J. Voss, Esq. | ||
| Thomas A. Sterken, Esq. | (360) 405-1200 | Douglas S. Silin, Esq. | ||
| Keller Rohrback L.L.P. | (Name, address, and telephone number | Stoel Rives LLP | ||
| 1201 Third Avenue, Suite 3200 | of agent for service) | 600 University Street, Suite 3600 | ||
| Seattle, Washington 98101 | Seattle, Washington 98101 | |||
| Telephone: (206) 623-1900 | Telephone: (206) 624-0900 | |||
| Fax: (206) 623-3384 | Fax: (206) 386-7500 |
Approximate date of commencement of proposed sale of securities to the public: As soon as practicable after this registration statement becomes effective.
If any of the securities being registered on this Form are to be offered on a delayed or continuous basis pursuant to Rule 415 under the Securities Act of 1933 check the following box: o
If this Form is filed to register additional securities for an offering pursuant to Rule 462(b) under the Securities Act, please check the following box and list the Securities Act registration statement number of the earlier effective registration statement for the same offering. o
If this Form is a post-effective amendment filed pursuant to Rule 462(c) under the Securities Act, check the following box and list the Securities Act registration statement number of the earlier effective registration statement for the same offering. o
If this Form is a post-effective amendment filed pursuant to Rule 462(d) under the Securities Act, check the following box and list the Securities Act registration statement number of the earlier effective registration statement for the same offering. o
CALCULATION OF REGISTRATION FEE
| Proposed Maximum | Proposed Maximum | |||||||||||
| Title of Each Class of | Amount to be | Offering Price | Aggregate Offering | Amount of | ||||||||
| Securities to be Registered | Registered | Per Share(1) | Price(1)(2) | Registration Fee(3) | ||||||||
| Common Stock, $1.00 par value | 2,645,000 shares | $16.00 | $42,320,000 | $4,528 | ||||||||
| (1) | Estimated solely for the purpose of calculating the registration fee pursuant to Rule 457. |
| (2) | Including shares of common stock which may be purchased by the underwriters to cover over-allotments, if any. |
| (3) | Previously paid. |
The Registrant hereby amends this Registration Statement on such date or dates as may be necessary to delay its effective date until the Registrant shall file a further amendment which specifically states that this Registration Statement shall thereafter become effective in accordance with Section 8(a) of the Securities Act of 1933 or until this Registration Statement shall become effective on such date as the Commission, acting pursuant to said Section 8(a), may determine.
Table of Contents
| The information contained in this prospectus is not complete and may be changed. We may not sell these securities until the registration statement filed with the Securities and Exchange Commission is effective. This prospectus is not an offer to sell these securities and we are not soliciting offers to buy these securities in any jurisdiction where the offer or sale is not permitted. |
SUBJECT TO COMPLETION, DATED NOVEMBER 14, 2006
PRELIMINARY PROSPECTUS
2,300,000 Shares

Common Stock
We are the bank holding company for Westsound Bank, a Washington chartered bank headquartered in Bremerton, Washington. This is an initial public offering of 2,300,000 shares of our common stock. All of the offered shares will be purchased by the underwriters on a firm-commitment basis.
Prior to this offering there has been no public market for our common stock. We currently anticipate that the initial public offering price will be between $14.00 and $16.00 per share. We have applied to list our common stock on the Nasdaq Global® Market under the symbol “WSFG.”
Investing in our common stock involves risk. See “Risk Factors” beginning on page 8.
| Per Share | Total | |||||||
| Initial public offering price | $ | $ | ||||||
Underwriting discounts and commissions(1) | $ | $ | ||||||
Proceeds, before expenses, to us(1) | $ | $ | ||||||
(1) Assumes all shares reserved for sale under the directed share program described in this prospectus are sold to the general public. If all such shares are sold to participants in the program, then we will receive an additional $ in proceeds, and the aggregate underwriting discounts will be reduced by the equivalent amount.
We have granted the underwriters an option to purchase up to 345,000 additional shares of our common stock at the initial public offering price within 30 days following the date of this prospectus to cover over-allotments, if any.
NEITHER THE SECURITIES AND EXCHANGE COMMISSION NOR ANY STATE SECURITIES COMMISSION HAS APPROVED OR DISAPPROVED OF THE SECURITIES OR PASSED UPON THE ADEQUACY OR ACCURACY OF THIS PROSPECTUS. ANY REPRESENTATION TO THE CONTRARY IS A CRIMINAL OFFENSE.
THE SECURITIES OFFERED HEREBY ARE NOT SAVINGS OR DEPOSIT ACCOUNTS OR OTHER OBLIGATIONS OF ANY BANK SUBSIDIARY OF WSB FINANCIAL GROUP, AND THEY ARE NOT INSURED BY THE FEDERAL DEPOSIT INSURANCE CORPORATION OR ANY OTHER GOVERNMENTAL AGENCY.
The underwriters expect to deliver the shares of our common stock to purchasers on or about , 2006.
D.A. Davidson & Co.
The date of this prospectus is , 2006.
Table of Contents

TABLE OF CONTENTS
| 1 | ||||||||
| 8 | ||||||||
| 17 | ||||||||
| 18 | ||||||||
| 18 | ||||||||
| 19 | ||||||||
| 20 | ||||||||
| 21 | ||||||||
| 56 | ||||||||
| 72 | ||||||||
| 80 | ||||||||
| 87 | ||||||||
| 88 | ||||||||
| 90 | ||||||||
| 94 | ||||||||
| 98 | ||||||||
| 99 | ||||||||
| 100 | ||||||||
| 100 | ||||||||
| F-1 | ||||||||
| EXHIBIT 1.1 | ||||||||
| EXHIBIT 4.1 | ||||||||
| EXHIBIT 5.1 | ||||||||
| EXHIBIT 16.1 | ||||||||
| EXHIBIT 23.1 | ||||||||
| EXHIBIT 23.2 | ||||||||
| EXHIBIT 23.4 | ||||||||
You should rely only on the information contained in this prospectus or in any related free writing prospectus filed with the Securities and Exchange Commission and used or referred to in this offering. We have not authorized anyone to provide you with different information. If anyone provides you with different or inconsistent information, you should not rely on it. We are offering to sell, and seeking offers to buy, shares of our common stock only in jurisdictions where offers and sales are permitted. The information contained in this prospectus is accurate only as of the date of this prospectus, regardless of the time of delivery of this prospectus or any sale of our common stock. Our business, financial condition, results of operations and prospects may have changed since that date.
Until , 2006, all dealers that buy, sell or trade our common stock, whether or not participating in this offering, may be required to deliver a prospectus. This is in addition to the dealers’ obligation to deliver a prospectus when acting as an underwriter and with respect to their unsold allotments or subscriptions.
i
Table of Contents
PROSPECTUS SUMMARY
This is only a summary and does not contain all the information that you should consider before investing in our common stock. You should read the entire prospectus, including “Risk Factors” and our consolidated financial statements and related notes appearing elsewhere in this prospectus, before deciding to invest in our common stock. Unless the context suggests otherwise, references in this prospectus to “we,” “us,” and “our” refer to WSB Financial Group Inc. and its subsidiary, Westsound Bank.
WSB Financial Group, Inc.
We are a bank holding company headquartered in Bremerton, Washington. We emphasize a service-oriented culture with a sales-based delivery model of an array of commercial bank and real estate lending products. At September 30, 2006 we had total assets of $338.1 million, net loans of $306.1 million, total deposits of $308.1 million and stockholders’ equity of $20.2 million. Approximately 93.6% of our loans as of September 30, 2006 were secured by real estate located primarily in Kitsap County.
Westsound Bank, our wholly-owned subsidiary, opened in March 1999. We currently operate through seven full service branches and three loan production offices that are located in the west Puget Sound area, an area encompassing the Kitsap and Olympic peninsulas and islands west of Seattle. We believe this is an attractive market that benefits not only from its proximity to the economic activity in the Seattle metropolitan area, but also the high quality of living it offers its residents and seasonal visitors.
Our business model has produced strong loan and deposit growth, which has been complemented by steady net income growth. According to financial data published by the Federal Deposit Insurance Corporation, or FDIC, we have been the fastest growing bank in the Pacific Northwest (Washington, Oregon and Idaho) based on percentage annual growth rates of assets from December 31, 2001 to June 30, 2006 (the most recent FDIC data available) for banks formed in 1999 or earlier.
From December 31, 2001 to September 30, 2006 we have increased:
| • | Total assets from $32.5 million to $338.1 million; | |
| • | Total net loans from $25.3 million to $306.1 million; | |
| • | Total deposits from $28.1 million to $308.1 million; | |
| • | Net income from $15,000 for the twelve months ended December 31, 2001, to $3.5 million for the twelve months ended September 30, 2006; and | |
| • | Our return on average equity and return on average assets from 0.4% and 0.06%, respectively, to 23.5% and 1.44%, respectively. |
While we have focused on real estate lending, we also offer a full range of short-term to long-term commercial and industrial, or C&I, and consumer lending products and services. As of September 30, 2006 our loan portfolio was comprised of approximately 93.6% real estate related loans (of which 53.9% were construction and development, 21.2% commercial real estate and 18.5% residential real estate), and approximately 5.3% were C&I loans and 1.1% were consumer loans. Further, approximately 61.1% of our loans were interest-only loans, primarily construction and development loans for projects in the west Puget Sound area.
Our directors, executive officers and principal shareholders will beneficially own approximately 33% of our shares upon completion of this offering (and approximately 34% of our stock on a fully-diluted basis, assuming exercise of all outstanding stock options). Another 346,765 shares of common stock are reserved for future options. Consequently, if they were to vote their shares in concert, they could significantly influence the outcome of all matters submitted to our shareholders for approval, including the election of directors. For stock compensation and related purposes, our shares were valued as of June 30, 2006 by an independent valuation consultant at $13.15 per share, which included a discount for lack of marketability.
1
Table of Contents
Our Strategy
Our goal is to be a high performing financial institution that delivers superior returns to our shareholders through exceptional employees and focus on our customers. Key elements of our strategy include the following:
Business Strategies
| • | Hire motivated, sales-oriented personnel. We believe successful employees are developed from talented, motivated people. We seek to find such individuals with varied backgrounds and then train them to be successful in delivering financial services. We combine an internal training program with a newstate-of-the-art training center to ensure that our employees are skilled in their respective areas of responsibility, and to enable us to responsibly maintain our growth. Moreover, our compensation structure allows for some employees to be paid largely on production, which provides incentives for superior performance and customer development. Our variable compensation totaled 44% of total compensation in 2005. | |
| • | Grow through de novo branches in attractive communities. Since 2001, we have added six branches and three loan production offices and we intend to add two or three branches or loan production offices per year over the next several years. Our focus is on finding prospective locations that have positive long-term demographic and business trends. Historically, we have achieved profitability in our new branches within 12 months, on average. Our branching strategy is often initiated with loan production offices, which we open in attractive markets with the intent of transitioning these offices into full-service branches. With strong loan demand in our west Puget Sound market, we are also exploring markets with high deposit potential. | |
| • | Deliver extraordinary customer service via a professional sales culture. We emphasize and train our staff to provide superior customer service. We believe that the models employed by high-end department stores and other successful retailers can be effectively applied to the financial services industry. Our staffing structure and business practices reflect a professional retail sales culture, rather than a traditional banking environment. We separate the sales and credit functions that are typically both performed by a single loan officer in conventionally-organized commercial banks. Our salespeople are the calling officers and business generators that are supported by credit analysts who underwrite the loan and manage the back-office lending functions. We also have relationship managers who are the primary points of contact for deposit customers and the initial contact persons for customers who come into our branches. | |
| • | Proactively manage credit quality and pricing. We focus on originating and maintaining a high quality loan portfolio by employing focused credit analysts, applying disciplined underwriting standards, and benefiting from our directors’ and officers’ thorough knowledge of the markets we serve. Our loan personnel are expected to monitor projects and we require third-party inspections to approve construction loan draws. All loans over $100,000 must be approved by our loan committee, which includes our CEO and three directors of Westsound Bank. Our loan approval process is highly collaborative, with the committee taking an active role in the structuring and pricing of loans. Our loan officers have no discretionary authority with respect to pricing loans except for rate sheet pricing for residential mortgage loans sold in the secondary market. Loan personnel are incentivized to produce high quality loans, and receive deductions to their variable compensation packages for loans that go into non-accrual status or receive an internal risk rating of anything below a “pass.” | |
| • | Continue to identify opportunities in real estate lending. Our loan portfolio is comprised of 93.6% in real estate loans, including 53.9% construction and development, 21.2% commercial real estate, and 18.5% residential real estate. We believe we are the most active community bank in this segment in the west Puget Sound market and have an experienced group of professionals with expertise in real estate lending. We focus on maintaining strong relationships with commercial and residential builders and on the life cycle of a project, from construction to take-out financing. |
2
Table of Contents
| • | Emphasize our risk management functions. We believe that our growth requires us to proactively address our risk management efforts and as such, we have devoted significant resources to this area, including recently appointing a chief risk officer. We seek to (i) identify risks in all functions of our business, including credit, operations and asset and liability management, (ii) evaluate such risks and their trends and (iii) adopt strategies to manage such risks based upon our evaluations. In particular, we actively manage interest rate and market risks by matching the volume and maturity of our rate sensitive assets to our interest sensitive liabilities in order to mitigate adverse effects of changes in interest rates. |
Growth Strategies
| • | Add new sales personnel focused on high-quality growth. We are constantly looking to hire talented, motivated employees to help support the planned expansion of our business. In the near term, we are focused on expanding our lending and deposit operations and enhancing our deposit salesforce while maintaining our pricing discipline and asset quality. | |
| • | Establish new branches and loan production offices. We continually monitor and track opportunities in contiguous, attractive growth or deposit-rich markets in Washington. We plan on opening our eighth branch in the fourth quarter of 2006 in Federal Way and we are currently targeting two to three additional branches or loan production offices per year. | |
| • | Continue to emphasize our real estate lending practice to both existing and new customers. We believe our expertise in real estate loan products, that run from land acquisition to permanent financing on both residential and commercial properties, distinguishes us from most of the local community banks. Our track record of timeliness and responsiveness to our real estate loan customers has made us a desired lender in our markets and a beneficiary of customer referrals. | |
| • | Expand our commercial lending activities in our existing footprint. We are focused on growing and diversifying our loan portfolio by expanding our commercial and industrial, or C&I, lending through our existing branch structure. We intend to add experienced commercial lenders who desire to be associated with a successful, customer-oriented community bank. | |
| • | Grow our core deposits to help fund our existing and anticipated loan growth. In order to maintain our net interest margin at current levels, we are focused on funding as much of our growth as possible with local, core deposits. We incentivize our producers to leverage relationships to produce both loan and deposit growth. | |
| • | Become a public company and create a liquid market for our common stock. In addition to providing access to growth capital, we believe a “public currency” will provide us flexibility in structuring prospective acquisitions and will allow us to more effectively attract and retain qualified employees through equity-based compensation. |
Our Market Area
Our operations are located primarily in Kitsap County in the west Puget Sound area, which encompasses the Kitsap and Olympic peninsulas and islands west of Seattle. In addition, we have expanded our footprint to include a location in Gig Harbor, along the“I-5” corridor south of Seattle. We believe that our high-service, sales-based culture has resonated with the real estate community as well as small- and medium-sized businesses within our markets.
The west Puget Sound market benefits from a high quality of life, with significant outdoor recreational opportunities and a small community lifestyle. Our headquarters and approximately 69% of our deposits and approximately 88% of our loans are in Kitsap County, which has garnered national attention for its economic success, includingInc. magazine which in May 2006 called Bremerton one of the country’s “hottest small cities” with an employment base under 150,000 people. According to the U.S. Department of Housing and Urban Development, the estimated median family income for Kitsap
3
Table of Contents
County in 2005 was $62,000, ranking it sixth highest out of 39 counties in the state of Washington. We also have operations in Clallam, Pierce and King counties, all of which have seen increases in economic activity over the past few years. In addition, we benefit from the significant economic activity generated in and around the Seattle metropolitan area, which includes King, Pierce and Snohomish counties. The Seattle metropolitan area is expected to add nearly 50,000 jobs annually over the next two years, according toConway and Pedersen’s Economic Forecaster.
Our Employees and Management Team
We seek to attract and retain relationship-oriented employees that combine a sales mentality with a customer service attitude. Our management team is focused on creating a dynamic, growth-oriented, and high production culture. Our experienced management team consists of the following individuals:
| • | David K. Johnson, President and Chief Executive Officer, joined us in 2001. Previously, Mr. Johnson was executive vice president of Pueblo Bank & Trust, a community bank in Colorado, and a senior vice president of Norwest Bank (now operating as Wells Fargo Bank) in New Mexico. Mr. Johnson has been involved in the banking industry for more than 25 years. | |
| • | Mark D. Freeman, Executive Vice President of Finance and Operations and Chief Financial Officer, joined us in 2005. Prior to 2005, Mr. Freeman was the chief financial officer of two other community banks, Islander’s Bank in Friday Harbor, Washington, and North Sound Bank in Poulsbo, Washington. Mr. Freeman has 30 years of experience in the banking industry. | |
| • | Brett T. Green, Executive Vice President of Sales and Lending, has over 15 years of banking and mortgage experience and joined us in 2004. Previously he worked in 2003 as branch manager and loan originator for First Horizon Home Loans in Silverdale, Washington, and prior to that with a local mortgage company, Bay Mortgage, as a branch manager and loan originator from 2001 to 2002. | |
| • | Veronica R. Colburn, Senior Vice President and Chief Risk Officer, joined us in 1999 when we commenced operations, with more than 25 years of experience in the banking industry. She previously served as a branch manager of First National Bank in Port Orchard, Washington and as assistant vice president and internal auditor for National Bank of Bremerton. | |
| • | Brent A. Stenman, Senior Vice President and Chief Lending Officer, joined us in 2004 and has over 15 years of banking experience in commercial lending and management positions. Prior to joining us, Mr. Stenman was vice president and lending manager of another community bank in west Puget Sound, Frontier Bank, and also held lending positions with American Marine Bank and Seafirst Bank (now operating as Bank of America). | |
| • | Robin A. Seelye,Senior Vice President, Operations, joined us in 2006 and has over 10 years of banking experience primarily in regulatory compliance and bank operations. Prior to joining us, Ms. Seelye was vice president and administrative officer of a community bank in Montana, Bank of Bozeman, and previously was with Heritage Bank, a Montana subsidiary of a publicly-traded company, United Financial Corp. |
Corporate Information
Our headquarters is located at 607 Pacific Avenue, Bremerton, Washington 98337, and our telephone number is (360) 405-1200. We maintain a website atwww.westsoundbank.com. Information on the website is not incorporated by reference and is not a part of this prospectus.
Risk Factors
See “Risk Factors” beginning on page 8 for a description of material risks related to an investment in our common stock.
4
Table of Contents
The Offering
| Common stock offered by WSB Financial Group, Inc. | 2,300,000 shares | |
| Common stock to be outstanding immediately after the offering | 5,184,254 shares | |
| Use of proceeds | We estimate that our net proceeds from this offering will be approximately $31.6 million, or $36.5 million if the over-allotment option is exercised by the underwriters, based on an assumed price of $15.00 per share (which is the midpoint of the range indicated on the front of this prospectus), assuming all shares reserved for sale under the directed share program described in this prospectus are sold to the general public. We expect to use the net proceeds from this offering to enhance our current capital ratios in order to increase our deposit and loan portfolios, to expand our operations through the opening of new branches and loan production offices and for general corporate purposes. Our use of proceeds is more fully described under “Use of Proceeds.” | |
| Dividend policy | We have never paid a cash dividend and do not expect to pay cash dividends in the foreseeable future. See “Dividend Policy.” | |
Proposed Nasdaq Global® Market symbol | We have applied to have our common stock listed for quotation on the Nasdaq Global® Market under the symbol “WSFG.” | |
The number of shares of our common stock outstanding after this offering is based on the number of shares outstanding on September 30, 2006 and excludes 970,887 shares of common stock issuable upon the exercise of stock options at September 30, 2006 at a weighted average exercise price per share of $7.59.
Unless we indicate otherwise, the number of shares as well as all share, per share and financial information in this prospectus:
| • | assumes a public offering price of $15.00 per share, which is the mid-point of the range indicated on the front cover of this prospectus; | |
| • | assumes all 325,000 shares reserved for sale under the directed share program described in this prospectus are sold to the general public; | |
| • | does not give effect to the use of the proceeds of the offering; | |
| • | assumes no exercise of the underwriters’ over-allotment option to purchase any of the additional 345,000 shares of our common stock subject to that option; and | |
| • | has been adjusted to reflect a 6.1429-to-1 stock split in August 2006. |
5
Table of Contents
Summary Consolidated Financial Information
You should read the summary consolidated financial data set forth below in conjunction with our historical consolidated financial statements and related notes and “Management’s Discussion and Analysis of Financial Condition and Results of Operations,” included elsewhere in this prospectus. The summary consolidated statement of operations data for the years ended December 31, 2005, 2004 and 2003 and the summary consolidated balance sheet data as of December 31, 2005 and 2004 have been derived from our audited consolidated financial statements included elsewhere in this prospectus. The summary consolidated statement of operations data for the years ended December 31, 2002 and 2001 and the summary consolidated balance sheet data as of December 31, 2003, 2002 and 2001 have been derived from our audited financial statements that are not included in this prospectus.
The summary consolidated financial data as of and for the nine-month periods ended September 30, 2006 and 2005 is derived from our unaudited consolidated financial statements, which are included elsewhere in this prospectus. The unaudited consolidated financial statements have been prepared on the same basis as our audited consolidated financial statements and include all adjustments (consisting only of normal recurring accruals) that we consider necessary for a fair presentation of our financial position and operating results for such periods. Historical results are not necessarily indicative of future results and results for the nine-month period ended September 30, 2006 are not necessarily indicative of our expected results for the full year ending December 31, 2006.
During the year ended December 31, 2005, shareholders of Westsound Bank exchanged their common stock in Westsound Bank for common stock in the newly formed holding company, WSB Financial Group, Inc. The transaction was accounted for based on historical carrying amounts. The consolidated financial statements include the accounts of WSB Financial Group, Inc. and its wholly owned subsidiary, Westsound Bank. Year-end data for 2001, 2002, 2003 and 2004 reflect financial data for Westsound Bank.
| Nine Months Ended | ||||||||||||||||||||||||||||
| September 30, | Years Ended December 31, | |||||||||||||||||||||||||||
| 2006 | 2005 | 2005 | 2004 | 2003 | 2002 | 2001 | ||||||||||||||||||||||
| (Dollars in thousands, except share and per share data) | ||||||||||||||||||||||||||||
Consolidated Balance Sheet Data: | ||||||||||||||||||||||||||||
| Cash due from banks | $ | 8,310 | $ | 6,679 | $ | 8,158 | $ | 2,534 | $ | 2,852 | $ | 1,284 | $ | 1,085 | ||||||||||||||
| Federal funds sold | 5,500 | 20,700 | 18,400 | 8,650 | 6,500 | 4,400 | 2,000 | |||||||||||||||||||||
| Investment securities | 8,238 | 8,533 | 8,235 | 4,558 | 6,273 | 5,318 | 2,802 | |||||||||||||||||||||
| Loans, net(1) | 306,056 | 181,464 | 207,172 | 117,623 | 58,222 | 39,769 | 25,255 | |||||||||||||||||||||
| Total assets | 338,080 | 224,375 | 249,998 | 137,416 | 76,012 | 52,765 | 32,458 | |||||||||||||||||||||
| Deposits | 308,066 | 199,398 | 224,167 | 123,593 | 68,003 | 48,017 | 28,112 | |||||||||||||||||||||
| Junior subordinated debt | 8,248 | 8,248 | 8,248 | 0 | 0 | 0 | 0 | |||||||||||||||||||||
| Stockholders’ equity | 20,215 | 15,413 | 16,006 | 12,912 | 7,901 | 4,619 | 4,226 | |||||||||||||||||||||
Consolidated Income Data: | ||||||||||||||||||||||||||||
| Interest income | $ | 20,091 | $ | 10,815 | $ | 15,693 | $ | 7,943 | $ | 4,396 | $ | 3,113 | $ | 2,079 | ||||||||||||||
| Interest expense | 8,098 | 3,363 | 5,182 | 1,705 | 1,110 | 1,035 | 871 | |||||||||||||||||||||
| Net interest income | 11,993 | 7,452 | 10,511 | 6,238 | 3,286 | 2,078 | 1,208 | |||||||||||||||||||||
| Provision for loan losses | 1,267 | 875 | 1,352 | 654 | 231 | 138 | 181 | |||||||||||||||||||||
| Net interest income after provision for loan losses | 10,726 | 6,577 | 9,159 | 5,584 | 3,055 | 1,940 | 1,027 | |||||||||||||||||||||
| Non-interest income | 3,419 | 3,708 | 5,241 | 2,806 | 293 | 202 | 115 | |||||||||||||||||||||
| Non-interest expense | 9,477 | 7,252 | 10,692 | 6,370 | 2,384 | 1,710 | 1,128 | |||||||||||||||||||||
| Income before income taxes | 4,668 | 3,033 | 3,708 | 2,020 | 964 | 432 | 14 | |||||||||||||||||||||
| Provision for income taxes | 1,561 | 1,051 | 1,296 | 680 | 333 | 146 | (1 | ) | ||||||||||||||||||||
| Net income | $ | 3,107 | $ | 1,982 | $ | 2,412 | $ | 1,340 | $ | 631 | $ | 286 | $ | 15 | ||||||||||||||
6
Table of Contents
| Nine Months Ended | |||||||||||||||||||||||||||||
| September 30, | Years Ended December 31, | ||||||||||||||||||||||||||||
| 2006 | 2005 | 2005 | 2004 | 2003 | 2002 | 2001 | |||||||||||||||||||||||
| (Dollars in thousands, except share and per share data) | |||||||||||||||||||||||||||||
Share Data: | |||||||||||||||||||||||||||||
| Earnings per share | |||||||||||||||||||||||||||||
| Basic | $ | 1.13 | $ | 0.76 | $ | 0.91 | $ | 0.59 | $ | 0.36 | $ | 0.19 | $ | 0.01 | |||||||||||||||
| Diluted | 0.99 | 0.69 | 0.82 | 0.55 | 0.35 | 0.19 | 0.01 | ||||||||||||||||||||||
| Book value per share | 7.01 | 5.70 | 5.88 | 4.98 | 3.91 | 3.07 | 2.85 | ||||||||||||||||||||||
| Shares outstanding at period end | 2,884,254 | 2,705,057 | 2,722,048 | 2,594,485 | 2,019,171 | 1,505,318 | 1,481,975 | ||||||||||||||||||||||
| Weighted average shares outstanding | |||||||||||||||||||||||||||||
| Basic | 2,738,775 | 2,621,475 | 2,642,628 | 2,270,211 | 1,734,434 | 1,489,006 | 1,190,296 | ||||||||||||||||||||||
| Diluted | 3,149,552 | 2,881,203 | 2,925,092 | 2,429,577 | 1,801,667 | 1,526,723 | 1,190,296 | ||||||||||||||||||||||
Selected Performance Ratios: | |||||||||||||||||||||||||||||
| Return on average assets(2) | 1.44 | % | 1.52 | % | 1.28 | % | 1.37 | % | 1.04 | % | 0.68 | % | 0.06 | % | |||||||||||||||
| Return on average stockholders’ equity(2) | 23.5 | % | 18.8 | % | 16.6 | % | 13.6 | % | 9.9 | % | 6.5 | % | 0.4 | % | |||||||||||||||
| Net interest margin(2) | 5.80 | % | 6.04 | % | 5.90 | % | 6.78 | % | 5.71 | % | 5.18 | % | 4.91 | % | |||||||||||||||
| Efficiency ratio | 62.1 | % | 65.0 | % | 67.9 | % | 70.4 | % | 66.6 | % | 75.0 | % | 85.3 | % | |||||||||||||||
Selected Liquidity and Asset Ratios: | |||||||||||||||||||||||||||||
| Net loan to deposit ratio | 99.3 | % | 91.0 | % | 92.4 | % | 95.2 | % | 85.6 | % | 82.8 | % | 89.9 | % | |||||||||||||||
| Average stockholders’ equity to average assets | 6.1 | % | 8.1 | % | 7.8 | % | 10.1 | % | 10.4 | % | 10.4 | % | 14.3 | % | |||||||||||||||
| Risk-based capital ratios: | |||||||||||||||||||||||||||||
| Leverage capital | 8.5 | % | 10.0 | % | 9.3 | % | 10.6 | % | 11.8 | % | 8.9 | % | 13.0 | % | |||||||||||||||
| Tier 1 risk-based capital | 8.7 | % | 11.3 | % | 10.2 | % | 11.2 | % | 13.1 | % | 11.3 | % | 15.4 | % | |||||||||||||||
| Total risk-based capital | 10.4 | % | 14.1 | % | 12.8 | % | 12.2 | % | 14.0 | % | 12.2 | % | 16.5 | % | |||||||||||||||
Selected Asset Quality Ratios: | |||||||||||||||||||||||||||||
| Non-performing loans to total loans | 0.00 | % | 0.00 | % | 0.06 | % | 0.09 | % | 0.00 | % | 0.27 | % | 0.29 | % | |||||||||||||||
| Non-performing assets to total assets | 0.00 | % | 0.00 | % | 0.05 | % | 0.09 | % | 0.04 | % | 0.27 | % | 0.23 | % | |||||||||||||||
| Allowance for loan losses to total loans | 1.20 | % | 1.11 | % | 1.20 | % | 1.00 | % | 0.98 | % | 0.87 | % | 1.14 | % | |||||||||||||||
| Allowance for loan losses to non-performing loans | N/A | N/A | 1968.8 | % | 1189.0 | % | N/A | 319.1 | % | 391.9 | % | ||||||||||||||||||
| Net charge-offs (recoveries) to average loans | 0.01 | % | 0.00 | % | 0.00 | % | 0.03 | % | (0.01 | )% | 0.20 | % | 0.03 | % | |||||||||||||||
| (1) | Includes loans held for sale. |
| (2) | Annualized for the nine-month periods ended September 30, 2006 and 2005. |
7
Table of Contents
RISK FACTORS
An investment in our common stock involves a high degree of risk. Before investing in our common stock, you should carefully consider the risks described below, as well as the other information contained in this prospectus, including our consolidated financial statements and the notes thereto and “Management’s Discussion and Analysis of Financial Condition and Results of Operations.” Any of the risks described below could significantly and adversely affect our business, prospects, financial condition and results of operations. If one or more of these risks and uncertainties is realized, the trading price of our common stock could decline, and you could lose all or part of your investment.
Risks Relating to Our Business and Market
If we are not able to maintain our past level of growth, our future prospects and competitive position could be diminished and our profitability could be reduced.
We may not be able to sustain our growth at the rate we have enjoyed during the past several years. Our business strategy calls for, among other things:
| • | continued growth of our assets, loans, deposits and customer base through our existing locations and new branches and loan production offices; | |
| • | recruitment of sales-oriented personnel and other key employees; and | |
| • | expansion of our real estate lending activities. |
Our rapid growth over the past several years has been driven in part by a strong residential housing market in west Puget Sound and our ability to identify attractive expansion opportunities. A downturn in local economic market conditions, particularly in the real estate market, a failure to attract and retain high performing employees, heightened competition from other financial services providers, and an inability to attract additional core deposits and lending customers, among other factors, could limit our ability to grow as rapidly as we have in the past.
Over 93% of our loans are real estate related, including loans for construction and land development projects and for the purchase, improvement or refinancing of residential and commercial real estate. An adverse change in the real estate market could cause collateral for loans made by us to decline in value, and loan delinquencies and problem assets to increase.
Approximately 93.6% of our loan portfolio as of September 30, 2006 was comprised of loans secured by real estate, including construction and development, commercial and residential real estate loans. Approximately 70.0% of our residential real estate loans are single family (1-4 units) and 30.0% are multifamily. A downturn in the real estate market could increase loan delinquencies, defaults and foreclosures, and significantly impair the value of our collateral and our ability to sell the collateral upon foreclosure. The real estate collateral in each case provides an alternate source of repayment in the event of default by the borrower and may deteriorate in value during the time the credit is extended. If real estate values decline, it is also more likely that we would be required to increase our allowance for loan losses. If during a period of reduced real estate values we are required to liquidate the property collateralizing a loan to satisfy the debt or to increase our allowance for loan losses, it could materially reduce our profitability and adversely affect our financial condition.
Over 53% of our loans are real estate construction and development loans, which have a higher degree of risk and a greater potential for losses that would reduce our earnings.
Approximately 53.9% of our loan portfolio as of September 30, 2006 consisted of real estate construction and development loans, which generally have a higher degree of risk than long-term financing of existing properties because repayment depends on the completion of the project and usually on the sale of the property. In addition, these loans are normally interest only. Interest-only loans carry greater risk than principal and interest loans do, to the extent that no principal is paid prior to maturity, particularly
8
Table of Contents
during a period of rising interest rates and declining real estate values. If there is a significant decline in the real estate market due to a material increase in interest rates or for other reasons, many of these loans could default and result in foreclosure. Moreover, most of these loans are for projects located in the west Puget Sound area. If we are forced to foreclose on a project prior to completion, we may not be able to recover all of the unpaid portion of the loan or we may be required to fund additional money to complete the project or hold the property for an indeterminate period of time. Any of these outcomes may result in losses and reduce our earnings.
Our allowance for loan losses may not be adequate to cover actual losses.
A significant source of risk arises from the possibility that we could sustain losses due to loan defaults and non-performance on loans. We maintain an allowance for loan losses in accordance with accounting principles generally accepted in the United States to provide for such defaults and other non-performance. As of September 30, 2006, our allowance for loan losses as a percentage of loans was 1.20%. The determination of the appropriate level of loan loss allowance is an inherently difficult process and is based on numerous assumptions. The amount of future losses is susceptible to changes in economic, operating and other conditions, including changes in interest rates, that may be beyond our control. In addition, our underwriting policies, adherence to credit monitoring processes, and risk management systems and controls may not prevent unexpected losses. Our allowance for loan losses may not be adequate to cover actual loan losses. Moreover, any increase in our allowance for loan losses will adversely affect our earnings.
We serve a limited geographic area, and an economic downturn in the west Puget Sound or Seattle metropolitan area could limit our growth and reduce our profitability.
Our current geographic market consists primarily of the west Puget Sound area, including Kitsap County. As of September 30, 2006, our Kitsap County customers accounted for approximately 69% of our deposits and 88% of our loans. Because of our relatively small size and geographic concentration, adverse changes in local economic conditions, such as income levels, deposits and housing starts, would have a relatively greater affect on us than they would on the larger national and regional competitors that are active in our market areas. If local or regional economic conditions were to deteriorate, demand for our products and services likely would decline and the quality of our loan portfolio could be reduced.
Kitsap County’s economy substantially depends on the military and tourism. While we believe that the local economy is diverse, the military has a significant presence in Kitsap County, including two major Navy bases which account for significant employment in the county. Although the federal government recently decided not to close any military bases in our market area, we cannot be certain that it will not do so in the future. We believe that few of our customers come from the military or its members, because most of their needs are met by a credit union. However, a significant reduction in the military presence in our market could have a material adverse effect on the local economy and potentially on our customers and business. In addition, the west Puget Sound area serves as a seasonal destination for many residents of the Seattle metropolitan area and a decline in that economy could affect real estate prices due to a slowdown in purchases by Seattle area residents as well as service businesses that rely on the seasonal traffic.
Our loan portfolio is concentrated in real estate and a substantial majority of our loans and operations are in west Puget Sound, and therefore our business is particularly vulnerable to a downturn in the local real estate market.
As of September 30, 2006 approximately 93.6% of our loans were secured by real estate, primarily located in our west Puget Sound market. If the local economy, and particularly the real estate market, declines, the rates of delinquencies, foreclosures, bankruptcies and losses in our loan portfolio would likely increase. As a result of this lack of diversification in our loan portfolio a downturn in the local real estate market could significantly reduce our profitability and adversely affect our financial condition.
9
Table of Contents
We have a relatively high percentage of unseasoned credits, which are considered to pose a potential greater repayment risk than loans that have been outstanding for a longer period of time.
As a result of our strong growth during the past five years and our focus on real estate construction and development lending, a significant portion of our loan portfolio is represented by new credits. Generally, loans that are relatively new, referred to as unseasoned loans, do not have sufficient repayment history to determine the likelihood of repayment in accordance with their terms. At September 30, 2006, 86.8% of our total loan portfolio consisted of loans booked within the past two years, including loan renewals.
If we are unable to manage our growth effectively, we may incur higher than anticipated costs and our ability to execute our growth strategy could be impaired.
We expect to continue to grow our assets and deposits by increasing our product and services offerings and expanding our operations through new branches, loan production offices and possibly acquisitions. Our ability to manage growth successfully will depend on our ability to:
| • | identify suitable markets for expansion; | |
| • | attract and retain qualified management; | |
| • | attract funding to support additional growth; | |
| • | maintain asset quality and cost controls; and | |
| • | maintain adequate regulatory capital and profitability to support our lending activities. |
If we do not manage our growth effectively, we may be unable to realize the benefit from the investments in technology, infrastructure, and personnel that we have made to support our expansion. In addition, we may incur higher costs and realize less revenue growth than we expect, which would reduce our earnings and diminish our future prospects, and we may not be able to continue to implement our business strategy and successfully conduct our operations. Risks associated with failing to maintain effective financial and operational controls as we grow, such as maintaining appropriate loan underwriting procedures, determining adequate allowances for loans losses and complying with regulatory accounting requirements, include increased loan losses, reduced earnings and potential regulatory penalties and restrictions on growth.
Our growth could be hindered unless we are able to recruit additional qualified employees. We may have difficulty attracting additional necessary personnel, which may divert resources and limit our ability to successfully expand our operations.
The west Puget Sound and Seattle metropolitan area is experiencing a period of significant growth, placing a premium on highly qualified employees in a number of industries, including the financial services industry. Our business plan includes, and is dependent upon, our hiring and retaining highly qualified and motivated employees at every level. In addition, we anticipate that the reporting and related obligations to which we will become subject as a public reporting company will require us to hire additional accounting and finance staff. We expect to experience substantial competition in identifying, hiring and retaining top-quality employees. If we are unable to hire and retain qualified employees in the near term, we may be unable to successfully execute our business strategy and manage our growth.
The unexpected loss of key officers would materially and adversely affect our ability to execute our business strategy, and diminish our future prospects.
We believe that our success to date and our prospects for success in the future are substantially dependent on our senior management team, which includes our president and chief executive officer, David K. Johnson, and certain other key executives. The loss of Mr. Johnson’s services or that of other key executives could materially and adversely affect our ability to successfully implement our business plan and, as a result, our future prospects. In light of the relatively small pool of persons involved in the
10
Table of Contents
banking industry in western Washington, we could have difficulty replacing any of our senior management team or senior officers with equally competent persons who also are familiar with our market area.
We are subject to extensive government regulation. Non-compliance with or material changes to existing regulations could adversely affect our business, financial condition, results of operations or cash flows.
We are subject to extensive regulation by federal, state and local governmental authorities and are subject to various laws and judicial and administrative decisions imposing requirements and restrictions on part or all of our operations. Because our business is highly regulated, the laws, rules and regulations applicable to us are subject to regular modification and change. Our failure to comply with applicable laws and regulations, or changes to the existing regulatory structure, could adversely affect our business, financial condition, results of operations or cash flows.
The FDIC recently found that we violated the reporting requirements of the Home Mortgage Disclosure Act and other consumer banking laws, imposed penalties of $6,000 and required our board to enter into a memorandum of understanding to correct the violations and related deficiencies in our internal controls. Our failure to correct violations in our reporting procedures could result in further regulatory action.
The FDIC recently conducted an examination relating to Westsound Bank’s compliance with various banking regulations, which examination was unrelated to safety and soundness of the Bank. The FDIC noted deficiencies in the Bank’s regulatory compliance management system relating to oversight, procedures, training and our audit program for compliance. The FDIC found failures to comply with the reporting requirements of the Home Mortgage Disclosure Act, or HMDA, and violations of other banking-related consumer laws, including the Equal Credit Opportunity Act, the Truth-in-Lending Act and the Truth-in-Savings Act. In addition, the FDIC imposed civil money penalties of $6,000 for violations that it characterized as significant and repeated, and required Westsound Bank and our board to enter into a confidential memorandum of understanding with the FDIC in May 2006 to correct the regulatory violations and deficiencies in our internal controls for regulatory compliance. We have taken the corrective measures outlined in the memorandum and believe we are in substantial compliance with the memorandum. If we fail to comply with the memorandum in the future, the FDIC has the authority to impose civil monetary penalties of up to $5,500 per day for violations of this nature, depending on our financial resources as compared to other financial institutions, the severity of the violations, whether our failure to comply was intentional, the duration and frequency of the violations, our cooperation with the agency to resolve the problem and other facts and circumstances. In addition, the Bank’s record of compliance will be an additional factor in any application filed with federal regulators, including applications for new bank branches and acquisitions.
As a result of this offering, we will become a public reporting company subject to financial reporting and other requirements for which our accounting, internal audit and other management systems and resources may not be adequately prepared.
As a result of this offering, we will become subject to reporting and other obligations under the Securities Exchange Act of 1934, as amended, or the Exchange Act, including the requirements of Section 404 of the Sarbanes-Oxley Act. Section 404 requires annual management assessment of the effectiveness of our internal controls over financial reporting and a report by our independent auditors addressing these assessments. These reporting and other obligations will place significant demands on our management, administrative, operational, internal audit and accounting resources. We anticipate that we will need to upgrade our reporting systems and procedures, implement additional financial and management controls, enhance our internal audit function, and hire additional accounting and finance staff. If we are unable to accomplish these objectives in a timely and effective fashion, our ability to comply with our financial reporting requirements and other rules that apply to reporting companies could be impaired. Any failure to maintain effective internal controls could have a material adverse effect on our business, operating results and stock price. In addition, expenses related to services rendered by our
11
Table of Contents
accountants, legal counsel and consultants will increase in order to ensure compliance with these laws and regulations.
Our profitability depends on interest rates generally, and we may be adversely affected by changes in market interest rates.
Our profitability depends in substantial part on our net interest income. Our net interest income depends on many factors that are partly or completely outside of our control, including competition, federal economic, monetary and fiscal policies, and economic conditions generally. Our net interest income will be adversely affected if market interest rates change so that the interest we pay on deposits and borrowings increases faster than the interest we earn on loans and investments. In addition, an increase in interest rates could adversely affect borrowers’ ability to pay the principal or interest on existing loans or reduce their desire to borrow more money. This may lead to an increase in our nonperforming assets, a decrease in loan originations, or a reduction in the value of and income from our loans, any of which could have a material and negative effect on our results of operations. Fluctuations in market rates and other market disruptions are neither predictable nor controllable and may adversely affect our financial condition and earnings.
The ratio of variable to fixed rate loans in our loan portfolio, the ratio of short-term (maturing at a given time within 12 months) to long-term loans, and the ratio of our demand, money market and savings deposits to CDs (and their time periods), are the primary factors affecting the sensitivity of our net interest income to changes in market interest rates. As of September 30, 2006, 47.4% of our $310.4 million gross loan portfolio were variable rate loans and 52.6% were fixed rate loans. Our short-term loans are typically priced at prime plus a margin, and our long-term loans are typically priced based on a U.S. Treasury index for comparable maturities, plus a margin. In addition, approximately 68.7% of our fixed-rate loans receivable were short-term and approximately 31.3% were long-term, and 49.7% of our deposits were demand, money market and savings accounts and 50.3% were CDs. The composition of our rate sensitive assets or liabilities is subject to change and could result in a more unbalanced position that would cause market rate changes to have a greater impact on our earnings.
We face strong competition from banks and other financial services providers that offer banking services, which may limit our ability to attract and retain banking clients.
Competition in the banking industry generally, and in our geographic market specifically, is intense. Competitors include banks, as well as other financial services providers, such as savings and loan institutions, consumer finance companies, brokerage firms, insurance companies, credit unions, mortgage banks and other financial intermediaries. In particular, our competitors include several larger national and regional financial institutions whose greater resources may afford them a marketplace advantage by enabling them to maintain numerous banking locations and ATMs, offer a wider array of banking services and conduct extensive promotional and advertising campaigns. Additionally, banks and other financial institutions with larger capitalization and financial intermediaries not subject to bank regulatory restrictions have larger lending limits and are thereby able to serve the credit needs of a broader customer base than us. Larger competitors may also be able to offer better lending and deposit rates to customers, and could increase their competition as we become a public company and our growth becomes more visible. Moreover, larger competitors may not be as vulnerable as us to downturns in the local economy and real estate market since they have a broader geographic area and their loan portfolio is diversified. We also compete against community banks that have strong local ties. These smaller institutions are likely to cater to the same small- and medium-sized businesses that we target. If we are unable to attract and retain banking customers, we may be unable to continue to grow our loan and deposit portfolios and our results of operations and financial condition may otherwise be adversely affected. Ultimately, we may be unable to compete successfully against current and future competitors.
12
Table of Contents
If we need additional capital in the future to continue our growth, we may not be able to obtain it on terms that are favorable. This could negatively affect our performance and the value of our common stock.
Our business strategy calls for continued growth. We anticipate that we will be able to support this growth through the net proceeds from this offering, as well as by adding deposits at existing and new branch locations. However, we may need to raise additional capital in the future to support our continued growth and to maintain our capital levels. Our ability to raise capital through the sale of additional securities will depend primarily upon our financial condition and the condition of financial markets at that time. We may not be able to obtain additional capital in the amounts or on terms satisfactory to us. Our growth may be constrained if we are unable to raise additional capital as needed.
We are exposed to risk of environmental liabilities with respect to properties to which we take title.
Approximately 93.6% of our outstanding loan portfolio at September 30, 2006 was secured by real estate. In the course of our business, we may foreclose and take title to real estate, and could be subject to environmental liabilities with respect to these properties. We may be held liable to a governmental entity or to third-parties for property damage, personal injury, investigation andclean-up costs incurred by these parties in connection with environmental contamination, or may be required to investigate or clean up hazardous or toxic substances, or chemical releases at a property. The costs associated with investigation or remediation activities could be substantial. In addition, if we are the owner or former owner of a contaminated site, we may be subject to common law claims by third-parties based on damages and costs resulting from environmental contamination emanating from the property. If we ever become subject to significant environmental liabilities, our business, financial condition, liquidity and results of operations could be materially and adversely affected.
We may grow through acquisitions, which strategy may not be successful or, if successful, may produce risks in successfully integrating and managing the acquisition.
As part of our growth strategy, we intend to pursue acquisitions of financial institutions within and outside of our market. At this time we have no agreements or understandings to acquire any financial institution, and may not find suitable acquisition opportunities. Acquisitions involve numerous risks, any of which could harm our business, including:
| • | difficulties in integrating the operations, technologies, existing contracts, accounting processes and personnel of the target and realizing the anticipated synergies of the combined businesses; | |
| • | difficulties in supporting and transitioning customers of the target company; | |
| • | diversion of financial and management resources from existing operations; | |
| • | the price we pay or other resources that we devote may exceed the value we realize, or the value we could have realized if we had allocated the purchase price or other resources to another opportunity; | |
| • | risks of entering new markets or areas in which we have limited or no experience; | |
| • | potential loss of key employees and customers from either our business or the target’s business; | |
| • | assumption of unanticipated problems or latent liabilities of the target; and | |
| • | inability to generate sufficient revenue to offset acquisition costs. |
Acquisitions also frequently result in the recording of goodwill and other intangible assets which are subject to potential impairments in the future that could harm our financial results. In addition, if we finance acquisitions by issuing convertible debt or equity securities, our existing shareholders may be diluted, which could affect the market price of our common stock. As a result, if we fail to properly evaluate acquisitions or investments, we may not achieve the anticipated benefits of any such acquisitions, and we may incur costs in excess of what we anticipate. The failure to successfully evaluate and execute
13
Table of Contents
acquisitions or investments or otherwise adequately address these risks could materially harm our business and financial results.
We may be unable to, or choose not to, pay dividends on our common stock.
Our ability to pay dividends depends on the following factors, among others:
| • | we may not have sufficient earnings since our primary source of income, the payment of dividends to us by our subsidiary, Westsound Bank, is subject to federal and state laws that limit the ability of the Bank to pay dividends; | |
| • | Federal Reserve Board policy requires bank holding companies to pay cash dividends on common stock only out of net income available over the past year and only if prospective earnings retention is consistent with the organization’s expected future needs and financial condition; | |
| • | we are also restricted from paying dividends on our common stock if we have deferred payments of the interest on, or an event of default has occurred with respect to, our junior subordinated debentures; and | |
| • | our board of directors may determine that, even though funds are available for dividend payments, retaining the funds for internal uses, such as expansion of our operations, is a better strategy. |
We have not paid, and currently have no plans to pay, cash dividends to our shareholders after this offering.
We face a variety of threats from technology based frauds and scams.
Financial institutions are a prime target of criminal activities through various channels of information technology. We attempt to mitigate risk from such activities through policies, procedures, and preventative and defensive measures. In addition, we maintain insurance coverage designed to provide a level of financial protection to our business. However, risks posed by business interruption, fraud losses, business recovery expenses, and other potential losses or expenses that we may incur from a significant event are not readily predictable and, therefore, could have an impact on our results of operations.
We rely on our information technology and telecommunications systems and third-party servicers, and the failure of these systems could adversely affect our business.
Our business is highly dependent on the successful and uninterrupted functioning of our information technology and telecommunications systems and third-party servicers. We outsource our major systems including our electronics funds transfer, or EFT, credit card and transaction processing and our online Internet bill payment and banking services. We rely on these systems to process new and renewal loans, provide customer service, facilitate collections and share data across our organization. The failure of these systems, or the termination of a third-party software license or service agreement on which any of these systems is based, could interrupt our operations. Because our information technology and telecommunications systems interface with and depend on third-party systems, we could experience service denials if demand for such services exceeds capacity or such third-party systems fail or experience interruptions. If sustained or repeated, a system failure or service denial could result in a deterioration of our ability to process new and renewal loans and provide customer service or compromise our ability to collect loan payments in a timely manner.
Risks Related to the Offering
There has been no prior active trading market for our common stock. We cannot assure you that an active public trading market will develop after the offering and, even if it does, our stock price may trade below the public offering price.
There has been no public market for our common stock prior to this offering. We cannot predict the extent to which investor interest in our company will lead to the development of an active trading market on the Nasdaq or otherwise, or how liquid that market may become, especially if few stock analysts follow our stock or issue research reports concerning our business. If an active trading market does not develop, you may have difficulty selling any shares that you buy in this offering. Neither the underwriters nor any other market maker in our common stock will be obligated to make a market in our shares, and any such
14
Table of Contents
market making may be discontinued at any time in the sole discretion of each such market maker. In addition, we estimate that immediately following this offering, approximately 33% of our outstanding common stock will be beneficially owned by our principal shareholders, executive officers and directors, who also will hold options exercisable for an additional 156,645 shares of our common stock. The substantial amount of common stock that is owned by and issuable to our principal shareholders, executive officers and directors may adversely affect the development of an active and liquid trading market.
Even if a market develops for our common stock after the offering, the market price of our common stock may experience significant volatility. Factors that may affect the price of our common stock include the depth and liquidity of the market for our common stock, investor perception of our financial strength, conditions in the banking industry such as credit quality and monetary policies, and general economic and market conditions. Our quarterly operating results, changes in analysts’ earnings estimates, changes in general conditions in the economy or financial markets or other developments affecting us could cause the market price of our common stock to fluctuate substantially. In addition, the initial public offering price has been determined through negotiations between us and the underwriters, and may bear no relationship to the price at which the common stock will trade upon completion of the offering.
We will have broad discretion as to the use of the net proceeds from this offering, and we may not use the proceeds effectively.
Although we plan to use the net proceeds from this offering for expansion purposes, including new branches or loan production offices, we have not designated the amount of net proceeds we will use for any particular purpose. Accordingly, our management will have broad discretion as to the application of the net proceeds and could use them for purposes other than those contemplated at the time of this offering. Our shareholders may not agree with the manner in which our management chooses to allocate and spend the net proceeds. Moreover, our management may use the net proceeds for corporate purposes that may not increase our market value or profitability.
One of the intended use of proceeds of this offering is to implement our growth strategy, which includes expansion in the west Puget Sound and the Seattle metropolitan area. We may not successfully implement our growth strategy and therefore, our intended use of proceeds from this offering may not result in an increase in our market value and profitability.
One of the principal reasons for our raising the capital in this offering is to be able to create a source of funds to be used for growth of our current operations and opening new branches and loan production offices. If we are not successful in implementing our growth strategy, our market value and profitability may suffer.
A significant number of shares of our common stock will become eligible for sale in the public market 180 days (and in one case 60 days) after the date of this offering, which could cause the price of our common stock to decline.
Our officers, directors, and one of our principal shareholders (shareholders holding more than 5.0% of our common stock), have agreed with the underwriters not to sell or otherwise dispose of any of their shares for a period of 180 days after the date of this offering, except that one of our directors will be permitted to sell up to 3,000 shares for living expenses after this offering, subject to the resale restrictions of Rule 144 under the Securities Act. In addition, Rodney R. Parr, a former director who will beneficially own approximately five percent of our outstanding common stock after this offering, has agreed with the underwriters not to sell or otherwise dispose of any of his shares for a period of 60 days after the date of this offering; provided, that if the closing price of our common stock on the Nasdaq Global Market is greater than 120% of the initial public offering price for ten consecutive trading days during such 60-day period, then the lock-up restrictions on Mr. Parr’s shares will no longer apply. When theselock-up agreements expire, these shares and the shares underlying any options held by these individuals will become eligible for sale, in some cases subject only to the volume, manner of sale and notice requirements of Rule 144 of the Securities Act. Sales of a substantial number of these shares in the public market after this offering, or the perception that these sales could occur, could cause the market price of our common stock to decline. In addition, the sale of these shares could impair our ability to raise capital through the
15
Table of Contents
sale of additional equity securities. See “Shares Eligible for Future Sale” for further discussion of the shares that will be freely tradable 180 days after the date of this offering.
Washington law and the provisions of our articles of incorporation and bylaws could deter or prevent our acquisition by a third-party that would be willing to pay you a premium for your shares of our common stock.
Our articles of incorporation and bylaws contain certain provisions that may make it substantially more difficult for a third-party to acquire control of us without the approval of our board of directors, even if doing so might be beneficial to our shareholders. These charter provisions provide for, among other things, a staggered board, advance notice for nomination of directors and limitations on the ability of shareholders to call a special meeting of shareholders, which can make minority shareholder representation on the board of directors more difficult to establish. In addition, the Washington Business Corporation Act contains provisions designed to protect Washington corporations and employees from the adverse effects of hostile corporate takeovers. These statutory provisions reduce the possibility that a third-party could effect a change in control without the support of our incumbent directors and may also strengthen the position of current management by restricting the ability of shareholders to change the composition of the board, to affect its policies generally and to benefit from actions which are opposed by the current board. Collectively, these charter and statutory provisions may delay, prevent or deter a merger, acquisition, tender offer, proxy contest or other transaction that might otherwise result in our shareholders receiving a premium over the market price for their common stock.
Our directors and senior management will exert significant influence over us after the completion of this offering. Their interests may not coincide with yours and they may make decisions with which you may disagree.
After this offering, our executive officers, directors, and principal shareholders will beneficially own, in the aggregate, approximately 33% of our outstanding common stock and approximately 34% of our common stock on a fully-diluted basis, assuming exercise of all outstanding stock options for 970,877 shares. Another 346,765 shares are reserved for future issuance under our Stock Option Plan. As a result, these shareholders, acting together, could control substantially all matters requiring shareholder approval, including the election of directors and approval of significant corporate transactions. In addition, this concentration of ownership may delay or prevent a change in control of our company and make some transactions more difficult or impossible without the support of these shareholders. The interests of these shareholders may not always coincide with our interests as a company or the interest of other shareholders. Accordingly, these shareholders could cause us to enter into transactions or agreements that you would not approve or make decisions with which you may disagree.
You will experience immediate and substantial dilution in the book value of the shares you purchase in this offering.
Investors purchasing shares of our common stock in this offering will pay more for their shares than the amount paid by existing shareholders who acquired shares prior to this offering. Based upon the issuance and sale of 2,300,000 shares of our common stock at an assumed initial public offering price of $15.00 per share, you will incur immediate dilution of approximately $5.00 in the net tangible book value per share if you purchase common stock in this offering. As soon as practicable after completion of this offering, we intend to register on a registration statement on Form S-8 approximately 1,317,652 shares of common stock issuable upon the exercise of options or reserved for awards of future options under our Stock Option Plan. To the extent that options are exercised or other options are awarded, there will be further dilution to new investors. If the holders of outstanding stock options exercise those options, you will incur further dilution of $0.39 per share.
16
Table of Contents
CAUTIONARY NOTE REGARDING FORWARD-LOOKING STATEMENTS
This prospectus contains certain forward-looking statements, which are not historical facts, but rather predictions. These statements may include statements regarding projected performance for periods following the completion of this offering. These statements can generally be identified by use of phrases such as “believe,” “expect,” “will,” “seek,” “should,” “anticipate,” “estimate,” “intend,” “plan,” “target,” “foresee” or other words of similar import. Similarly, statements that describe our future financial condition, results of operations, objectives, strategies, plans, goals or future performance and business are also forward-looking statements. These forward-looking statements involve known and unknown risks, uncertainties and other factors, including, but not limited to, those described in the “Risk Factors” and “Management’s Discussion and Analysis of Financial Condition and Results of Operations” sections and other parts of this prospectus that could cause our actual results to differ materially from those anticipated in these forward-looking statements. The following factors, among others, could cause our financial performance to differ materially from our goals, objectives, intentions, expectations and other forward-looking statements:
| • | changes in general economic conditions, either nationally or locally in the west Puget Sound and Seattle metropolitan area; | |
| • | inflation, interest rate, market and monetary fluctuations; | |
| • | changes in consumer spending habits and savings habits; | |
| • | increases in competitive pressures among financial institutions and businesses offering similar products and services; | |
| • | higher defaults on our loan portfolio than we expect; | |
| • | changes in management’s estimate of the adequacy of the allowance for loan losses; | |
| • | risks associated with our growth and expansion strategy and related costs; | |
| • | increased lending risks associated with our high concentrations of real estate loans; | |
| • | ability to successfully grow our business in west Puget Sound and the Seattle metropolitan area; | |
| • | legislative or regulatory changes or changes in accounting principles, policies or guidelines; | |
| • | technological changes; and | |
| • | regulatory or judicial proceedings. |
You should read this prospectus and the documents that we reference in this prospectus and that are filed as exhibits to the registration statement on Form S-1, of which this prospectus is a part, that we have filed with the SEC, completely and with the understanding that our actual future results, levels of activity, performance and achievements may be materially different from what we expect. We qualify all of our forward-looking statements by these cautionary statements. We do not undertake any obligation to release publicly our revisions to such forward-looking statements to reflect events or circumstances after the date of this prospectus.
17
Table of Contents
USE OF PROCEEDS
We estimate that we will receive net proceeds of $31.6 million from the sale of the 2,300,000 shares of common stock offered by us in the offering, based upon an assumed initial public offering price per share of $15.00, after deducting estimated underwriting discounts and commissions and estimated offering expenses payable by us.
We expect to use the net proceeds we will receive from this offering to enhance our current capital ratios in order to increase our deposit and loan portfolios, expand our operations through the opening of new branches and loan production offices and for general corporate purposes. We estimate our costs (excluding employee-related costs) of opening a new branch at $1.5 million to $2.5 million, and the costs of opening a new loan production office at $150,000 to $350,000. Additionally, we may use a portion of the net proceeds to finance acquisitions of other financial services companies, although we have no present plans in that regard. We currently plan to contribute a substantial portion of the net proceeds from this offering to the capital of Westsound Bank.
The amounts and timing of these expenditures will depend on numerous factors, including the amount of our future revenues and net income, our ability to identify attractive expansion opportunities and the success of our marketing efforts. Accordingly, our management will retain broad discretion in deploying the net proceeds from this offering. Pending the uses described above, we plan to invest the net proceeds in investment-grade, short-term, interest-bearing investments.
DIVIDEND POLICY
We have not paid, and currently have no plans to pay, cash dividends to our shareholders after this offering. The payment of dividends is within the discretion of our board of directors and will depend upon our earnings, capital requirements and operating and financial position, among other factors. We expect to retain all of our earnings to finance the expansion and development of our business.
Additionally, our junior subordinated debt agreement prohibits us from paying dividends if we have deferred payment of interest on outstanding trust preferred securities. See “Management’s Discussion and Analysis of Financial Condition and Results of Operations — Capital Resources.”
We are a legal entity separate and distinct from Westsound Bank. Because we are a holding company with no significant assets other than Westsound Bank, we will be dependent upon dividends from Westsound Bank for cash with which to pay dividends when, and if, our dividend policy changes. For a discussion of the regulatory limitations on Westsound Bank’s ability to pay dividends, see “Supervision and Regulation — Federal and State Regulation of Westsound Bank — Dividends.”
18
Table of Contents
CAPITALIZATION
The following table sets forth our capitalization as of September 30, 2006 on an actual and as adjusted basis. The as adjusted basis reflects the receipt and application by us of the estimated net proceeds of this offering at an assumed public offering price of $15.00 per share (the midpoint of the range set forth on the cover page of this prospectus), after deducting estimated underwriting discounts and commissions and offering expenses payable by us.
You should read this table in conjunction with the consolidated financial statements and the other financial information included in this prospectus.
| September 30, 2006 | |||||||||
| Actual | As Adjusted | ||||||||
| (Dollars in thousands, | |||||||||
| except per share data) | |||||||||
Indebtedness: | |||||||||
| Junior subordinated debt | $ | 8,248 | $ | 8,248 | |||||
Stockholders’ Equity: | |||||||||
| Common stock, $1.00 par value, shares authorized: 15,357,250; shares outstanding: 2,884,254 at September 30, 2006(1) | 2,884 | 5,184 | |||||||
| Additional paid-in capital | 9,975 | 39,288 | |||||||
| Retained earnings | 7,400 | 7,400 | |||||||
| Accumulated other comprehensive income (loss) | (44 | ) | (44 | ) | |||||
| Total stockholders’ equity | 20,215 | 51,828 | |||||||
| Total capitalization | 28,463 | 60,076 | |||||||
| Book value per share | $ | 7.01 | $ | 10.00 | |||||
| Stockholders’ equity to total assets | 6.0 | % | 14.0% | ||||||
| Regulatory capital ratios(2) | |||||||||
| Tier 1 leverage capital ratio | 8.5 | % | 17.0% | ||||||
| Tier 1 risk-based capital ratio | 8.7 | % | 19.0% | ||||||
| Total risk-based capital ratio | 10.4 | % | 20.2% | ||||||
| (1) | The number of authorized shares and the number of outstanding shares have been adjusted as a result of a 6.1429-to-1 stock split in August 2006. |
| (2) | The net proceeds from our sale of common stock in this offering are presumed to be invested in 20% risk weighted U.S. Agency bonds or Federal Funds sold for purposes of pro forma risk-based regulatory capital ratios. |
19
Table of Contents
DILUTION
If you invest in our common stock, you will suffer dilution to the extent the initial public offering price per share of our common stock exceeds the tangible book value of our common stock immediately after this offering. The tangible book value of our common stock as of September 30, 2006 was approximately $20.2 million, or $7.01 per share of common stock. The tangible book value per share represents total tangible assets less total liabilities, divided by the 2,884,254 shares of our common stock outstanding as of that date.
After giving effect to the issuance and sale of 2,300,000 shares of our common stock in this offering and our receipt of approximately $31.6 million in net proceeds from such sale, based on an assumed public offering price of $15.00 per share (the midpoint of the range set forth on the cover page of this prospectus), and after deducting the estimated underwriters’ discounts and commissions and the expenses of the offering, our as adjusted tangible book value as of September 30, 2006 would have been approximately $51.8 million, or $10.00 per share. This amount represents an immediate increase in tangible book value per share of $2.99 to existing shareholders and an immediate dilution of $5.00 per share to purchasers of our common stock in this offering. Dilution is determined by subtracting the tangible book value per share as adjusted for this offering from the amount of cash paid by a new investor for a share of our common stock.
The following table illustrates the per share dilution as of September 30, 2006:
| Assumed initial public offering price per share | $ | 15.00 | |||||||
| Tangible book value per share as of September 30, 2006 | $ | 7.01 | |||||||
| Increase in tangible book value per share attributable to new investors | $ | 2.99 | |||||||
| As adjusted tangible book value per share after this offering | $ | 10.00 | |||||||
| Dilution in tangible book value per share to new investors | $ | 5.00 | |||||||
The following table summarizes as of September 30, 2006, on an as adjusted basis as described above, the total number of shares of common stock purchased from us, the total consideration paid to us, and before deducting estimated underwriting discounts and commissions and offering expenses, and the average price per share paid by existing shareholders and by new investors who purchase shares of common stock in this offering at the assumed initial public offering price of $15.00 per share (the midpoint of the range set forth on the cover page of this prospectus).
| Shares Purchased | Total Consideration | ||||||||||||||||||||
| Average | |||||||||||||||||||||
| Number | Percent | Amount | Percent | Per Share | |||||||||||||||||
| Existing shareholders | 2,884,254 | 56% | $ | 12,859,250 | 27% | $ | 4.46 | ||||||||||||||
| New investors | 2,300,000 | 44% | $ | 34,500,000 | 73% | $ | 15.00 | ||||||||||||||
| Total | 5,184,254 | 100% | $ | 47,359,250 | 100% | ||||||||||||||||
The shares of common stock outstanding exclude shares of common stock reserved for issuance under our 1999 Incentive Stock Option Plan, or Stock Option Plan, of which 970,887 shares were subject to outstanding options as of September 30, 2006, at a weighted average exercise price of $7.59 per share, and 346,765 shares are reserved for future options. As soon as practicable after completion of this offering, we intend to register on a registration statement on Form S-8 approximately 1,317,652 shares of common stock issuable upon the exercise of options or reserved for awards of future options under our Stock Option Plan. To the extent that options are exercised or other options are awarded, there will be further dilution to new investors. If all of our outstanding options are exercised, you will experience further dilution of $0.39 per share.
20
Table of Contents
MANAGEMENT’S DISCUSSION AND ANALYSIS OF
FINANCIAL CONDITION AND RESULTS OF OPERATIONS
You should read the following discussion and analysis of our financial condition and results of operations together with “Summary Consolidated Financial Information” and our consolidated financial statements and related notes appearing elsewhere in this prospectus. This discussion and analysis contains forward-looking statements that involve risks, uncertainties and assumptions. Our actual results may differ materially from those anticipated in these forward-looking statements as a result of many factors, including those set forth under “Risk Factors” and elsewhere in this prospectus.
Overview
We are a bank holding company headquartered in Bremerton, Washington. We emphasize a service-oriented culture with a sales-based delivery model of an array of commercial bank and real estate lending products. We deliver these products through seven full service branches and three loan production offices that are located primarily in the west Puget Sound area.
We currently have, on a consolidated basis, $338.1 million in total assets, net loans of $306.1 million, total deposits of $308.1 million, and stockholders’ equity of $20.2 million. Since our founding we have experienced consistent growth and rapid expansion. In addition, we have maintained profitability as reflected by our 1.44% annualized return on assets for the first nine months of 2006. This growth is a result of our ability to attract and retain high-quality employees and add branches and loan production offices in attractive markets.
We generate most of our revenue from interest on loans and investments, loan fees, service charges, and mortgage banking income. As of September 30, 2006, 66.2% of our revenue was interest on loans, 16.9% loan fees, 10.9% mortgage banking income, 3.6% service charges and 2.3% interest on investments. We offer a variety of loans to our customers, including commercial and residential real estate loans, construction and land development loans, commercial and industrial loans, and to a lesser extent, consumer loans. As of September 30, 2006, approximately 93.6% of our loans related to the construction or development, purchase, improvement or refinancing of commercial and residential real estate, approximately 5.3% were C&I loans and 1.1% were consumer loans. After several years of rapid growth in housing starts, sales of existing homes and prices, the housing market has shown signs of slowing down. Nationally, sales of existing homes and the median price for an existing home have declined over the past twelve months and recently construction of new homes and apartments has dropped. Signs of slowing are emerging in the Washington housing market too, according to the Washington state profile for Fall 2006 recently released by the FDIC, with an 8.8% decline in building permits and a 2.4% decline in sales activity compared to the second quarter of 2005. On the other hand, average home prices in the state were 17.4% higher in the second quarter than a year ago, a pace that was slightly higher than in second quarter 2005, and conditions in commercial real estate markets continue to improve across Washington state, according to the FDIC. Multifamily permit growth has also increased dramatically over the past year statewide and in Kitsap County. We have not experienced a slowdown in our overall real estate lending activities and housing prices continue to rise in our west Puget Sound market. According to the FDIC report, Washington’s economy remains strong, with job growth ranking eighth among all states and the pace of employment growth is accelerating with a 3.2% rate of year-over-year employment growth in the second quarter of 2006 compared to 2.7% a year earlier. The FDIC report also cautions though, that recent declines in housing permit and sales activity in Washington point to slower residential construction activity in the months ahead with possible adverse implications for overall job growth and the demand for construction financing.
An adverse change in the economy affecting values of real estate generally, or in west Puget Sound, could, because of our high concentration of loans secured by real estate, materially and adversely affect our profitability, growth and financial condition. Further, because approximately 61.1% of our loans are interest-only (primarily real estate construction and development) and 47.4% are variable rate, significant increases in interest rates could also result in increased loan delinquencies, defaults and foreclosures.
21
Table of Contents
Deposits are our primary source of funding. Our largest expenses are interest on these deposits and salaries and employee benefits. We measure our performance by calculating our net interest margin, return on average assets, and return on average equity. Net interest margin is calculated by dividing net interest income, which is the difference between interest income on interest-earning assets (such as loans and securities) and interest expense on interest-bearing liabilities (such as customer deposits and other borrowings which are used to fund those assets), by total average earning assets. Net interest income is our largest source of revenue. Interest rate fluctuations, as well as changes in the amount and type of earning assets and liabilities, combine to affect net interest income. We also measure our performance by our efficiency ratio, which is calculated by dividing non-interest expense less amortization of core deposit intangibles by the sum of net interest income on a tax equivalent basis and non-interest income.
Since 2005, market interest rates have been steadily increasing as a result of the Federal Reserve Board’s monetary policies. Our net interest margin has remained relatively constant at 5.80% to 6.04% from January 1, 2005 through September 30, 2006. In the current interest rate environment, however, because we are in an “asset neutral” position, based on our current net interest income simulation. In addition, a substantial percentage of our loan portfolio (47.4% of our total loans as of September 30, 2006) has been comprised of variable rate loans that reprice as interest rates rise. Recently, the Federal Reserve stopped raising rates. If interest rates decline, our margins could also decrease until we can adjust the mix of our assets and liabilities to compensate for the changed interest rate environment.
| Key Financial Measures | ||||||||||||||||||||
| Nine Months Ended | ||||||||||||||||||||
| September 30, | Years Ended December 31, | |||||||||||||||||||
| 2006 | 2005 | 2005 | 2004 | 2003 | ||||||||||||||||
| (Dollars in thousands, except per share data) | ||||||||||||||||||||
| Net income | $ | 3,107 | $ | 1,982 | $ | 2,412 | $ | 1,340 | $ | 631 | ||||||||||
| Basic earnings per share | 1.13 | 0.76 | 0.91 | 0.59 | 0.36 | |||||||||||||||
| Diluted earnings per share | 0.99 | 0.69 | 0.82 | 0.55 | 0.35 | |||||||||||||||
| Total assets | 338,080 | 224,375 | 249,998 | 137,416 | 76,012 | |||||||||||||||
| Net loans(1) | 306,056 | 181,464 | 207,172 | 117,623 | 58,222 | |||||||||||||||
| Total deposits | 308,066 | 199,398 | 224,167 | 123,593 | 68,003 | |||||||||||||||
| Net interest margin(2) | 5.80 | % | 6.04 | % | 5.90 | % | 6.78 | % | 5.71 | % | ||||||||||
| Efficiency ratio | 62.1 | % | 65.0 | % | 67.9 | % | 70.4 | % | 66.6 | % | ||||||||||
| Return on average assets(2) | 1.44 | % | 1.52 | % | 1.28 | % | 1.37 | % | 1.04 | % | ||||||||||
| Return on average equity(2) | 23.5 | % | 18.8 | % | 16.6 | % | 13.6 | % | 9.9 | % | ||||||||||
| (1) | Includes loans held for sale. |
| (2) | Ratios for the nine months ended September 30, 2006 and 2005 have been annualized for comparative purposes. |
We have focused on correcting the regulatory compliance procedures that were addressed in the memorandum of understanding with the FDIC in 2006. As described in more detail below, we made a number of managerial and operational changes in order to strengthen our documentation practices, compliance and training programs to help ensure that similar violations do not occur in the future. We do not expect the memorandum of understanding to adversely affect our operations or our ability to execute our growth strategy.
Following the offering, our non-interest expenses will increase as a result of the financial, accounting, legal and other additional expenses usually associated with operating as a public company. The federal securities laws and the regulations of the Securities and Exchange Commission require that we file annual, quarterly and current reports and that we maintain effective disclosure controls and procedures and internal control over financial reporting. This will require that we increase staffing and implement additional finance and accounting systems, procedures and controls in order to satisfy our new public company reporting requirements. We estimate these additional costs at $200,000 in 2007.
22
Table of Contents
The costs associated with being a public company will increase our operating costs and in turn may detrimentally affect our efficiency ratio, to the extent we are unable to offset these costs through increased efficiencies in other areas or through the recognition of additional non-interest income. We expect, however, to use a portion of the proceeds of this offering to improve our profitability as we leverage the available capacity of our newer branches, loan production offices and employees. We believe our investments in our branch and office network and centralized technology infrastructure are sufficient to support a larger organization, and therefore believe that overall increases in our expenses should be lower than the corresponding increases in our revenues following the offering.
Key Factors in Evaluating Financial Condition and Results of Operations
As a bank holding company, we focus on a number of key factors in evaluating our financial condition and results of operations including:
| • | Return on Average Equity; | |
| • | Return on Average Assets; | |
| • | Asset Quality; | |
| • | Asset Growth; | |
| • | Capital and Liquidity; | |
| • | Net Interest Margin; and | |
| • | Operating Efficiency. |
Return on Average Equity. Our return to our shareholders is measured in the form of return on average equity, or ROE. Our net income for the nine months ended September 30, 2006 increased 56.8% to $3.1 million compared to $2.0 million for the nine months ended September 30, 2005. Net income increased due to the significant increase in loans and fees associated with loan growth. Basic earnings per share, or EPS, increased to $1.13 for the nine months ended September 30, 2006 compared to $0.76 for the nine months ended September 30, 2005. Diluted EPS increased to $0.99 for the nine months ended September 30, 2006 compared to $0.69 for the nine months ended September 30, 2005. Our increase in net income drove our ROE to 23.5% for the nine months ended September 30, 2006 compared to 18.8% for the nine months ended September 30, 2005. Our ROE for the year ended December 31, 2005 was 16.6%.
Return on Average Assets. Our return on average assets, or ROA, for the nine months ended September 30, 2006 was 1.44% compared to 1.52% for the nine months ended September 30, 2005. Our ROA remained at approximately the same level despite the significant increase in our net income, due to overall asset growth. Our ROA for the year ended December 31, 2005 was 1.28%.
Asset Quality. For all banks and bank holding companies, asset quality has a significant impact on the overall financial condition and results of operations. Asset quality is measured in terms of nonperforming loans and assets as a percentage of total loans and total assets, and net charge-offs as a percentage of average loans. These measures are key elements in estimating the future earnings of a financial institution. We had no non-performing loans as of September 30, 2006 compared to $128,000 at December 31, 2005. The decrease in non-performing loans is due to improved loan quality and performance. Non-performing loans as a percentage of total loans decreased to 0% as of September 30, 2006 compared to 0.06% at December 31, 2005. For the nine months ended September 30, 2006 net charge-offs to average loans were 0.01%, as compared to no net charge-offs for the year ended December 31, 2005. The average net charge-offs to average loans for the three years ended December 31, 2005 was 0.01%
Asset Growth. Because revenues from both net interest income and non-interest income are a function of asset size, the continued growth in assets has a direct impact on increasing net income and EPS. The majority of our assets are loans, and the majority of our liabilities are deposits, and therefore the
23
Table of Contents
ability to generate loans and deposits are fundamental to our asset growth. Total assets increased 35.3% during the first nine months of 2006 from $249.9 million as of December 31, 2005 to $338.1 million as of September 30, 2006 and grew from 80.8% to 81.9% annually between December 31, 2003 and December 31, 2005. Total deposits increased 37.4% to $308.1 million as of September 30, 2006 compared to $224.2 million as of December 31, 2005 and grew from 81.4% to 81.7% annually between December 31, 2003 and December 31, 2005. Net loans increased 47.7% to $306.1 million as of September 30, 2006 compared to $207.2 million as of December 31, 2005 and grew from 76.1% to 102.0% annually between December 31, 2003 and December 31, 2005.
Capital and Liquidity. Maintaining adequate capital levels in light of our rapid growth has been one of our primary areas of focus. Our average equity to average assets has declined from 8.1% for the nine months ended September 30, 2005 to 6.1% for the nine months ended September 30, 2006. In order to maintain our current growth rates, additional capital is needed. We monitor liquidity levels to ensure we have adequate sources available to fund our loan growth. The key measure we use to monitor liquidity is the net loan to deposit ratio. At September 30, 2006 the net loan to deposit ratio had increased to 99.3%, up from 91.0% at September 30, 2005. Maintaining appropriate liquidity levels is imperative to us in order to continue our strong growth levels.
Net Interest Margin. Our net interest margin decreased to 5.80% for the first nine months of 2006 compared to 6.04% for the first nine months of 2005. Our net interest margin for the year ended December 31, 2005 was 5.90%.
Operating Efficiency. Operating efficiency is the measure of how efficiently earnings before taxes are generated as a percentage of revenue. Our efficiency ratio (operating expenses divided by net interest income plus non-interest income) decreased to 62.1% for the nine months of 2006 compared to 65.0% for the first nine months of 2005. Our efficiency ratio for the year ended December 31, 2005 was 67.9%.
Critical Accounting Policies
Our accounting policies are integral to understanding our financial results. Our most complex accounting policies require management’s judgment to ascertain the valuation of assets, liabilities, commitments and contingencies. We have established detailed policies and control procedures that are intended to ensure valuation methods are well controlled and applied consistently from period to period. In addition, the policies and procedures are intended to ensure that the process for changing methodologies occurs in an appropriate manner. The following is a brief description of our current accounting policies involving significant management valuation judgments.
Allowance for Loan Losses. The allowance for loan losses represents our best estimate of the probable losses inherent in the existing loan portfolio. The allowance for loan losses is increased by the provision for loan losses charged to expense and reduced by loans charged off, net of recoveries.
We evaluate our allowance for loan losses monthly. We believe that the allowance for loan losses, or ALLL, is a “critical accounting estimate” because it is based upon management’s assessment of various factors affecting the collectibility of the loans, including current economic conditions, past credit experience, delinquency status, the value of the underlying collateral, if any, and a continuing review of the portfolio of loans. For a discussion of the allowance and our methodology, see “Financial Condition — Allowance for Loan Losses.”
We maintain an ALLL based on a number of quantitative and qualitative factors, including levels and trends of past due and non-accrual loans, asset classifications, loan grades, change in volume and mix of loans, collateral value, historical loss experience, size and complexity of individual credits and economic conditions. Provisions for loan losses are provided on both a specific and general basis. Specific allowances are provided for impaired credits for which the expected/anticipated loss is measurable. General valuation allowances are based on a portfolio segmentation based on risk grading, with a further evaluation of various quantitative and qualitative factors noted above.
24
Table of Contents
We periodically review the assumptions and formulae by which additions are made to the specific and general valuation allowances for losses in an effort to refine such allowances in light of the current status of the factors described above.
Although we believe the levels of the allowance as of September 30, 2006 and December 31, 2005 and 2004, were adequate to absorb probable losses in the loan portfolio, a decline in local economic, or other factors, could result in increasing losses that cannot be reasonably predicted at this time.
Available for Sale Securities. Statement of Financial Accounting Standards No. 115,Accounting for Certain Investments in Debt and Equity Securities, requires that available-for-sale securities be carried at fair value. We believe this is a “critical accounting estimate” in that the fair value of a security is based on quoted market prices or if quoted market prices are not available, fair values are extrapolated from the quoted prices of similar instruments. Management utilizes the services of a reputable third-party vendor to assist with the determination of estimated fair values. Adjustments to the available-for-sale securities fair value impact the consolidated financial statements by increasing or decreasing assets and stockholders’ equity.
Income Taxes. We use the liability method in accounting for income taxes. Under this method, deferred tax assets and liabilities are determined based upon the difference between the values of the assets and liabilities as reflected in the financial statements and their related tax basis using enacted tax rates in effect for the year in which the differences are expected to be recovered or settled. As changes in tax laws or rates are enacted, deferred tax assets and liabilities are adjusted through the provision for income taxes. Any estimated tax exposure items identified would be considered in a tax contingency reserve. Changes in any tax contingency reserve would be based on specific developments, events, or transactions.
Stock Options. Prior to 2006, we elected to follow Accounting Principles Board Option No. 25,Accounting for Stock Issued to Employees, or APB 25, and related interpretations in accounting for employee stock options using the fair value method, and provided the required pro forma disclosures of SFAS No. 123, or SFAS 123, “Accounting for Stock-Based Compensation.” Under APB 25, because the exercise price of the options equals the estimated market price of the stock on the issuance date, no compensation expense is recorded. As required, on January 1, 2006 we adopted SFAS No. 123R, or SFAS 123R,Share-Based Payment(Revised 2004) which establishes standards for the accounting for transactions in which an entity (i) exchanges its equity instruments for goods and services, or (ii) incurs liabilities in exchange for goods and services that are based on the fair value of the entity’s equity instruments or that may be settled by the issuance of the equity instruments. SFAS 123R eliminates the ability to account for stock-based compensation using APB 25 and requires that such transactions be recognized over the service period, which is usually the same as the vesting period, as compensation cost in the income statement based on their fair values on the measurement date, which is generally the date of the grant.
We adopted SFAS 123R using a modified prospective approach. Under the modified prospective approach, prior periods are not revised for comparative purposes. The valuation provisions of SFAS 123R apply to new awards and to awards that are outstanding on the effective date and subsequently modified or cancelled. Compensation expense, net of estimated forfeitures, for awards outstanding at the effective date is recognized over the remaining service period using the compensation cost calculated in prior periods.
We have granted nonqualified and qualified stock options under our Stock Option Plan prior to 2006. We have not granted any options in 2006 to date, but intend to grant options in the future. Our stock options for employees include a service condition that relates only to vesting. The stock options generally vest over five years at the rate of 20% per year. Compensation expense is amortized on a straight-line basis over the vesting period of the award.
The determination of the fair value of stock options using an option-pricing model is affected by our stock price as well as assumptions regarding a number of complex and subjective variables. The methods used to determine these variables are generally similar to the methods used prior to fiscal 2006 for
25
Table of Contents
purposes of our pro forma information under SFAS 123. The volatility assumption is based on a combination of the historical volatility of our common stock and the volatilities of similar companies over a period of time equal to the expected term of the stock options. The volatilities of similar companies are used in conjunction with our historical volatility because of the lack of sufficient relevant history equal to the expected term. The expected term of employee stock options represents the weighted-average period the stock options are expected to remain outstanding. The expected term assumption is estimated based primarily on the options’ vesting terms and remaining contractual life and employees’ expected exercise and post-vesting employment termination behavior. The risk-free interest rate assumption is based upon observed interest rates on the grant date appropriate for the term of the employee stock options. The dividend yield assumption is based on the expectation of no future dividend payouts by us.
As share-based compensation expense under SFAS 123R is based on awards ultimately expected to vest, it is reduced for estimated forfeitures. SFAS 123R requires forfeitures to be estimated at the time of grant and revised, if necessary, in subsequent periods if actual forfeitures differ from those estimates.
Recent FDIC Findings of Numerous Violations of Banking Laws and Regulations, Numerous Deficiencies in Internal Controls Related to Regulatory Compliance and Assessment of Penalties
The FDIC recently found that we had violated banking laws and regulations that the FDIC characterized as “significant violations,” required us to pay $6,000 in fines, and required our board of directors to enter into a memorandum of understanding with the FDIC dated May 2006. These violations included our submitting to the Federal Reserve Board what the FDIC characterized as a “high level of inaccurate data” relative to our loans and for failing to cure these violations despite being repeatedly cited by the FDIC in its examination reports. The violations related to the Bank’s compliance with applicable consumer protection and fair lending laws and regulations, including errors in the collection and reporting of required data with respect to consumer loans under the Home Mortgage Division Act, or HMDA, which were caused by system errors (including errors in the amount of the applicants’ income, application dates, ethnicity, race and other loan data), failures to notify credit card applicants of adverse actions, which the Bank thought were being provided by its third-party party credit card processor, miscalculations of finance charges to be disclosed to consumer borrowers under the Truth in Lending Act, and failures to include required disclosures to consumers in the Bank’s advertisements for rates on CDs, as required by the Truth in Savings Act. HMDA imposes on financial institutions reporting obligations relating to home purchase and home improvement loans to consumers originated or purchased, or for which the financial institution receives applications. This loan data is used by regulatory agencies to help determine whether a financial institution is serving the housing needs of the communities it serves, to assist public officials in the distribution of public sector investments where it is needed, and to assist federal bank regulators in identifying possible discriminatory lending patterns. The deficiencies were discovered in the FDIC’s annual review of the Bank’s policies and procedures as of January 31, 2006.
The FDIC found that our regulatory compliance suffered from weak oversight of the compliance function, lack of adequate compliance procedures, deficient compliance training, insufficient monitoring procedures for all regulations, and a weak audit program.
The memorandum requires the Bank and our board of directors to:
| • | correct all violations found and implement procedures to prevent their recurrence; | |
| • | take action to ensure that the Bank’s compliance officer receives adequate time and resources to perform his duties and effect corrective action on discovering deficiencies and provides monthly reports to the board detailing the actions taken to comply with the memorandum; | |
| • | develop and implement a written compliance program and procedures identifying all regulations and providing bank personnel with information needed to properly complete and report transactions; | |
| • | implement procedures to enhance internal monitoring to ensure compliance with all applicable lending and deposit operations, detect compliance weaknesses and ensure exceptions are corrected; |
26
Table of Contents
| • | provide for an adequate training program for all Bank personnel, including the board of directors, covering all applicable laws and regulations to be reviewed and updated at least annually; | |
| • | strengthen our audit process to cover all areas of compliance risk as needed for the operations of the Bank with audit results reported to the board’s audit committee and the board and documented in their minutes; and | |
| • | furnish quarterly progress reports to the Regional Director of the FDIC detailing the actions taken to secure compliance with the memorandum until the Regional Director has released the institution, in writing, from submitting further reports. |
We have taken corrective measures outlined in the memorandum and believe we are in substantial compliance with the memorandum.
Promptly after we became aware of these violations, our management instructed our consumer loan personnel to correct and resubmit all of our 2004 and 2005 HMDA data, and began strengthening our regulatory compliance and training programs. We have made the following managerial and operational changes in order to strengthen our compliance and training programs to help ensure that similar violations do not occur in the future:
| • | appointed a chief risk officer to supervise, monitor and plan the compliance process; | |
| • | arranged additional HMDA training and general compliance training throughout 2006; | |
| • | conducted a compliance risk assessment and presented it to our board’s audit committee; | |
| • | expanded training for our internal auditor and compliance officer; and | |
| • | overhauled our regulatory compliance program and procedures and developed a matrix of potential deficiencies continually monitored by the chief risk officer. |
While compliance with the terms of the memorandum resulted in additional HMDA compliance expenses and continued HMDA compliance will result in some additional expense, these expenses did not have a material adverse effect on our financial condition for the period ending September 30, 2006, and are not anticipated to have a material adverse effect on our financial condition in future periods.
Results of Operations
Our results of operations depend primarily on net interest income, which is the difference between interest income and interest expense. Interest income is the earnings we receive on our interest earning assets, such as loans and investments, and interest expense is the expense we incur on our interest bearing liabilities, such as interest bearing deposits and other borrowings. Factors that determine the level of net income include the volume of earning assets and interest bearing liabilities, yields earned and rates paid, fee income, non-interest expense, the level of non-performing loans and other non-earning assets, and the amount of non-interest bearing liabilities supporting earning assets. Non-interest income includes service charges and other deposit related fees, and non-interest expense consists primarily of employee compensation and benefits, occupancy, equipment and depreciation expense, and other operating expenses.
27
Table of Contents
Financial Overview for the Nine Months Ended September 30, 2006 and 2005
| Nine Months Ended | ||||||||||||
| September 30, | ||||||||||||
| Increase | ||||||||||||
| 2006 | 2005 | (Decrease) | ||||||||||
| (Dollars in thousands, except per | ||||||||||||
| share data) | ||||||||||||
Consolidated Statement of Earnings Data: | ||||||||||||
| Interest income | $ | 20,091 | $ | 10,815 | $ | 9,276 | ||||||
| Interest expense | 8,098 | 3,363 | 4,735 | |||||||||
| Net interest income | 11,993 | 7,452 | 4,541 | |||||||||
| Provision for loan losses | 1,267 | 875 | 392 | |||||||||
| Net interest income after provision for loan losses | 10,726 | 6,577 | 4,149 | |||||||||
| Non-interest income | 3,419 | 3,708 | (289 | ) | ||||||||
| Non-interest expense | 9,477 | 7,252 | 2,225 | |||||||||
| Income before provision for income taxes | 4,668 | 3,033 | 1,635 | |||||||||
| Provision for income taxes | 1,561 | 1,051 | 510 | |||||||||
| Net income | $ | 3,107 | $ | 1,982 | $ | 1,125 | ||||||
| Earnings per share — basic | $ | 1.13 | $ | 0.76 | $ | 0.37 | ||||||
| Earnings per share — diluted | $ | 0.99 | $ | 0.69 | $ | 0.30 | ||||||
Our net income grew by 56.8% to $3.1 million for the nine months ended September 30, 2006 as compared to $2.0 million for the nine months ended September 30, 2005. This was attributable principally to an increase in net interest income of $4.5 million partially offset by a $2.2 million increase in non-interest expense. The increase in net interest income was the result of an increase in the volume of interest-earning assets, primarily loans offset by an increase in our cost of funds resulting from a increase in market rates for interest-bearing deposits. Our return on average equity was 23.5% and return on average assets was 1.44% for the nine months ended September 30, 2006, compared to 18.8% and 1.52%, respectively for the nine months ended September 30, 2005.
Net Interest Income and Net Interest Margin. The $4.5 million, 60.9% increase in net interest income for the period was due to (i) an increase in interest income of $9.3 million, reflecting the effect of a $111.4 million increase in average interest-earning assets offset by (ii) an increase in interest expense of $4.7 million.
The average yield on our interest-earning assets was 9.72% for the 2006 period compared to 8.77% for the same period of 2005, an increase of 0.95%. The increase in the average yield on our interest-earning assets resulted from an increase in market rates, repricing on our adjustable rate loans, and new loans originated with higher interest rates because of the rising interest rate environment.
The cost of our average interest-bearing liabilities increased to 4.45% for the nine months ended September 30, 2006 from 3.21% for the same period in 2005. In addition to broad increases in the average rates paid by Westsound Bank on deposit balances, the increase was the result of a change in the mix of deposits toward higher-paying money market accounts and time certificates of deposits, as well as the addition of our junior subordinated debt.
Our average rate on our interest-bearing deposits increased 1.17% from 3.19% during the nine months ended September 30, 2005 to 4.36% for the nine months ended September 30, 2006, reflecting increases in general market rates as well as change in mix of deposits toward higher-paying time deposits. Our average rate on total deposits (including non-interest bearing deposits) increased to 4.03% for the nine months ended September 30, 2006 from 2.83% for the same period in the prior year.
28
Table of Contents
The 24 basis point decrease in our net interest margin, which decreased to 5.80% for the nine months ended September 30, 2006 from 6.04% for the nine months ended September 30, 2005, was due to our higher cost of funding that was somewhat offset by an increase in earning assets yield.
The following table sets forth a summary of average balances with corresponding interest income and interest expense as well as average yield and cost information for the periods presented. Average balances are derived from daily balances, and non-accrual loans are included as interest earning assets for purposes of this table.
| Nine Months Ended September 30, | |||||||||||||||||||||||||
| 2006 | 2005 | ||||||||||||||||||||||||
| Average | Average | ||||||||||||||||||||||||
| Average | Yield or | Average | Yield or | ||||||||||||||||||||||
| Balance | Interest | Cost(6) | Balance | Interest | Cost(6) | ||||||||||||||||||||
| (Dollars in thousands) | |||||||||||||||||||||||||
| Assets | |||||||||||||||||||||||||
| Interest-earning assets: | |||||||||||||||||||||||||
| Loans(1)(2)(3) | $ | 259,774 | $ | 19,539 | 10.06% | $ | 149,525 | $ | 10,425 | 9.32% | |||||||||||||||
| Investment securities — taxable | 6,387 | 199 | 4.17% | 4,528 | 137 | 4.05% | |||||||||||||||||||
| Investment securities — non-taxable(3) | 1,824 | 57 | 4.18% | 1,705 | 43 | 3.37% | |||||||||||||||||||
| Federal funds sold | 6,525 | 229 | 4.69% | 8,490 | 192 | 3.02% | |||||||||||||||||||
| Other investments(4) | 1,808 | 67 | 4.95% | 662 | 18 | 3.64% | |||||||||||||||||||
| Total interest-earning assets | 276,318 | 20,091 | 9.72% | 164,910 | 10,815 | 8.77% | |||||||||||||||||||
| Non-earning assets: | |||||||||||||||||||||||||
| Cash and due from banks | 6,521 | 5,101 | |||||||||||||||||||||||
| Unearned loan fees | (471 | ) | (158 | ) | |||||||||||||||||||||
| Allowance for loan losses | (3,065 | ) | (1,527 | ) | |||||||||||||||||||||
| Other assets | 8,438 | 5,698 | |||||||||||||||||||||||
| Total assets | $ | 287,741 | $ | 174,024 | |||||||||||||||||||||
29
Table of Contents
| Nine Months Ended September 30, | |||||||||||||||||||||||||
| 2006 | 2005 | ||||||||||||||||||||||||
| Average | Average | ||||||||||||||||||||||||
| Average | Yield or | Average | Yield or | ||||||||||||||||||||||
| Balance | Interest | Cost(6) | Balance | Interest | Cost(6) | ||||||||||||||||||||
| (Dollars in thousands) | |||||||||||||||||||||||||
| Liabilities and Stockholders’ Equity | |||||||||||||||||||||||||
| Interest-bearing liabilities: | |||||||||||||||||||||||||
| Deposits | |||||||||||||||||||||||||
| Interest-bearing demand | $ | 12,886 | $ | 51 | 0.53% | $ | 10,427 | $ | 32 | 0.41% | |||||||||||||||
| Money market | 116,217 | 3,897 | 4.48% | 62,348 | 1,765 | 3.78% | |||||||||||||||||||
| Savings | 3,844 | 40 | 1.39% | 4,422 | 33 | 1.00% | |||||||||||||||||||
| Time certificates of deposit | 101,497 | 3,662 | 4.82% | 60,933 | 1,466 | 3.22% | |||||||||||||||||||
| Total interest-bearing deposits | 234,444 | 7,650 | 4.36% | 138,130 | 3,296 | 3.19% | |||||||||||||||||||
| Short-term borrowings | 731 | 31 | 5.67% | 190 | 5 | 3.52% | |||||||||||||||||||
| Junior subordinated debt | 8,248 | 417 | 6.76% | 1,833 | 62 | 4.52% | |||||||||||||||||||
| Total interest-bearing liabilities | 243,423 | 8,098 | 4.45% | 140,153 | 3,363 | 3.21% | |||||||||||||||||||
| Non-interest-bearing liabilities | |||||||||||||||||||||||||
| Demand deposits | 25,192 | 18,942 | |||||||||||||||||||||||
| Other liabilities | 1,458 | 830 | |||||||||||||||||||||||
| Total liabilities | 270,064 | 159,925 | |||||||||||||||||||||||
| Stockholders’ equity | 17,668 | 14,099 | |||||||||||||||||||||||
| Total liabilities and stockholders’ equity | $ | 287,741 | $ | 174,024 | |||||||||||||||||||||
| Net interest income | $ | 11,993 | $ | 7,452 | |||||||||||||||||||||
| Net interest spread(5) | 5.27% | 5.56% | |||||||||||||||||||||||
| Net interest margin | 5.80% | 6.04% | |||||||||||||||||||||||
| (1) | Includes average non-accrual loans of $64,000 at September 30, 2006 and $52,000 at September 30, 2005. |
| (2) | Loan fees of $4.0 million and $2.2 million are included in the yield computations for September 30, 2006 and 2005, respectively. |
| (3) | Yields on loans and securities have not been adjusted to a tax-equivalent basis. |
| (4) | Includes interest-bearing deposits with correspondent banks. |
| (5) | Net interest spread represents the average yield earned on interest earning assets less the average rate paid on interest bearing liabilities. |
| (6) | Annualized. |
30
Table of Contents
The following table shows the change in interest income and interest expense and the amount of change attributable to variances in volume, rates and the combination of volume and rates based on the relative changes of volume and rates.
| Nine Months Ended September 30, 2006 | |||||||||||||||||
| Compared to Nine Months Ended September 30, | |||||||||||||||||
| 2005 | |||||||||||||||||
| Net Change | Rate | Volume | Mix | ||||||||||||||
| (In thousands) | |||||||||||||||||
| Loans | $ | 9,114 | $ | 1,098 | $ | 10,277 | $ | (2,261 | ) | ||||||||
| Investment securities — taxable | 62 | 5 | 75 | (18 | ) | ||||||||||||
| Investment securities — non-taxable | 14 | 14 | 4 | (4 | ) | ||||||||||||
| Federal funds sold | 37 | 142 | (59 | ) | (46 | ) | |||||||||||
| Other investments | 49 | 9 | 42 | (2 | ) | ||||||||||||
| Total interest income | 9,276 | 1,268 | 10,339 | (2,331 | ) | ||||||||||||
| Interest expense: | |||||||||||||||||
| Interest-bearing demand | 19 | 12 | 10 | (3 | ) | ||||||||||||
| Money market | 2,132 | 435 | 2,039 | (342 | ) | ||||||||||||
| Savings | 7 | 17 | (6 | ) | (4 | ) | |||||||||||
| Time certificates of deposit | 2,196 | 980 | 1,305 | (89 | ) | ||||||||||||
| Short-term borrowings | 26 | 4 | 19 | 3 | |||||||||||||
| Junior subordinated debt | 355 | 41 | 290 | 24 | |||||||||||||
| Total interest expense | 4,735 | 1,489 | 3,657 | (411 | ) | ||||||||||||
| Net interest income | $ | 4,541 | $ | (221 | ) | $ | 6,682 | $ | (1,920 | ) | |||||||
Provision for Loan Losses. The provision for loan losses in each period is a charge against earnings in that period. The provision is that amount required to maintain the allowance for loan losses at a level that, in management’s judgment, is adequate to absorb probable loan losses inherent in the loan portfolio.
The provision for loan losses for the nine months ended September 30, 2006 was $1.3 million compared to $875,000 for the nine months ended September 30, 2005. We experienced $20,000 of net loan charge-offs in the first nine months of 2006 compared to no loan charge-offs for the same period of 2005. The provision increased because of the significant increase in loans and management’s decision to increase the allowance for loan losses. Total net loans increased by $98.9 million for the first nine months of 2006 and $63.8 million for the same period of 2005.
Non-Interest Income. The following table presents, for the periods indicated, the major categories of non-interest income:
| Nine Months | |||||||||||||
| Ended | |||||||||||||
| September 30, | |||||||||||||
| Increase | |||||||||||||
| 2006 | 2005 | (Decrease) | |||||||||||
| (In thousands) | |||||||||||||
| Service charges and other income | $ | 845 | $ | 492 | $ | 353 | |||||||
| Loan brokerage and referral fees | 1,374 | 1,305 | 69 | ||||||||||
| Net gain/(loss) on sale of loans | 1,200 | 1,893 | (693 | ) | |||||||||
| Net gain/(loss) on sale of securities | 0 | 18 | (18 | ) | |||||||||
| Total non-interest income | $ | 3,419 | $ | 3,708 | $ | (289 | ) | ||||||
The $289,000 or 7.8% decrease in total non-interest income during the nine months ended September 30, 2006 was primarily influenced by the decrease in gains on sale of loans.
31
Table of Contents
Non-Interest Expense. The following tables present, for the periods indicated, the major categories of non-interest expense, which represent a re-classification of certain categories as presented in our consolidated financial statements and related notes appearing elsewhere in this prospectus:
| Nine Months Ended | |||||||||||||
| September 30, | |||||||||||||
| Increase | |||||||||||||
| 2006 | 2005 | (Decrease) | |||||||||||
| (In thousands) | |||||||||||||
| Salaries, wages and employee benefits | $ | 6,246 | $ | 4,850 | $ | 1,396 | |||||||
| Occupancy, equipment and depreciation | 1,092 | 806 | 286 | ||||||||||
| Data and item processing | 370 | 253 | 117 | ||||||||||
| Advertising expense | 173 | 132 | 41 | ||||||||||
| Printing, stationery and supplies | 200 | 207 | (7 | )* | |||||||||
| Telephone expense | 84 | 55 | 29 | ||||||||||
| Postage and courier | 99 | 79 | 20 | ||||||||||
| Legal fees | 33 | 31 | 2 | ||||||||||
| Director fees | 232 | 145 | 87 | ||||||||||
| Foreclosed assets, net | 0 | 2 | (2 | ) | |||||||||
| Business & occupation taxes | 219 | 138 | 81 | ||||||||||
| Other | 729 | 554 | 175 | ||||||||||
| Total non-interest expense | $ | 9,477 | $ | 7,252 | $ | 2,225 | |||||||
The $2.2 million or 30.7% increase in non-interest expense for the nine months ended September 30, 2006 is primarily attributable to the salary, occupancy and other costs associated with our new offices.
Provision for Income Taxes. We recorded tax provisions of $1.6 million for the nine months ended September 30, 2006 compared to $1.1 million for the same period in the prior year. Our effective tax rate was approximately 33.4% for the nine months ended September 30, 2006 and 34.7% for the nine months ended September 30, 2005. Any difference from the expected rate in either periods was largely due to the non-taxable nature of income from municipal securities.
Financial Overview for the Years Ended December 31, 2005, 2004 and 2003
| Year Ended December 31, 2005 Compared to Year Ended December 31, 2004 |
| Years Ended December 31, | ||||||||||||
| Increase | ||||||||||||
| 2005 | 2004 | (Decrease) | ||||||||||
| (Dollars in thousands, | ||||||||||||
| except per share data) | ||||||||||||
Consolidated Statement of Earnings Data: | ||||||||||||
| Interest income | $ | 15,693 | $ | 7,943 | $ | 7,750 | ||||||
| Interest expense | 5,182 | 1,705 | 3,477 | |||||||||
| Net interest income | 10,511 | 6,238 | 4,273 | |||||||||
| Provision for loan losses | 1,352 | 654 | 698 | |||||||||
| Net interest income after provision for loan losses | 9,159 | 5,584 | 3,575 | |||||||||
| Non-interest income | 5,241 | 2,806 | 2,435 | |||||||||
| Non-interest expense | 10,692 | 6,370 | 4,322 | |||||||||
| Income before provision for income taxes | 3,708 | 2,020 | 1,688 | |||||||||
| Provision for income taxes | 1,296 | 680 | 616 | |||||||||
| Net income | $ | 2,412 | $ | 1,340 | $ | 1,072 | ||||||
| Earnings per share — basic | $ | 0.91 | $ | 0.59 | $ | 0.32 | ||||||
| Earnings per share — diluted | $ | 0.82 | $ | 0.55 | $ | 0.27 | ||||||
32
Table of Contents
Our net income grew by 80.0% to $2.4 million for the year ended December 31, 2005, as compared to $1.3 million for the year ended December 31, 2004. The increase in net income was attributable principally to increases in net interest income and non-interest income of $4.3 million and $2.4 million, respectively, partially offset by an increase of $4.3 million in non-interest expense. Our return on average equity was 16.6% and return on average assets was 1.28% for the year ended December 31, 2005, compared to 13.6% and 1.37%, respectively for the year ended December 31, 2004.
Net Interest Income and Net Interest Margin. The $4.3 million, 68.5% increase in our net interest income for the year ended December 31, 2005 was primarily due to an increase in interest income of $7.8 million, offset by an increase of $3.5 million in interest expense. Average interest-earning assets increased to $178.1 million during 2005 as compared to $92.2 million during 2004, reflecting our continuing growth trend. Total interest expense increased as a result of ongoing increases in interest rates throughout the financial marketplace over the course of the year.
The average yield on our interest-earning assets was 8.81% in 2005 compared to 8.63% in 2004, an increase of 0.18%. The increase in the average yield on our interest-earning assets resulted from both a general increase in interest rate levels and increase in loan fees.
The cost of our average interest-bearing liabilities increased to 3.40% in 2005 from 2.27% in 2004. This increase was due to the general increase in interest rate levels and a change in the mix of deposits toward higher-paying money market accounts and time certificates of deposit.
The 87 basis point decrease in our net interest margin, which decreased to 5.90% for the year ended December 31, 2005 from 6.78% for the year ended December 31, 2004, was due primarily to our higher cost of funding offsetting the increase in earning assets yield.
The following table sets forth a summary of average balances with corresponding interest income and interest expense as well as average yield and cost information for the periods presented. Average balances are derived from daily balances, and non-accrual loans are included as interest earning assets for purposes of this table.
| Year Ended December 31, 2005 | Year Ended December 31, 2004 | ||||||||||||||||||||||||
| Average | Average | ||||||||||||||||||||||||
| Average | Yield | Average | Yield | ||||||||||||||||||||||
| Balance | Interest | or Cost | Balance | Interest | or Cost | ||||||||||||||||||||
| (Dollars in thousands) | |||||||||||||||||||||||||
| Assets | |||||||||||||||||||||||||
| Interest-earning assets: | |||||||||||||||||||||||||
| Loans(1)(2)(3) | $ | 161,357 | $ | 15,088 | 9.35 | % | $ | 82,118 | $ | 7,725 | 9.41 | % | |||||||||||||
| Investment securities — taxable | 5,003 | 202 | 4.04 | % | 3,928 | 124 | 3.16 | % | |||||||||||||||||
| Investment securities — non-taxable(3) | 1,736 | 62 | 3.57 | % | 1,297 | 45 | 3.47 | % | |||||||||||||||||
| Federal funds sold | 8,938 | 295 | 3.30 | % | 4,664 | 56 | 1.20 | % | |||||||||||||||||
| Other investments(4) | 1,051 | 46 | 4.37 | % | 203 | 3 | 1.48 | % | |||||||||||||||||
| Total interest-earning assets | 178,085 | 15,693 | 8.81 | % | 92,210 | 7,953 | 8.63 | % | |||||||||||||||||
| Non-earning assets: | |||||||||||||||||||||||||
| Cash and due from banks | 5,317 | 3,190 | |||||||||||||||||||||||
| Unearned loan fees | (191 | ) | (109 | ) | |||||||||||||||||||||
| Allowance for loan losses | (1,708 | ) | (778 | ) | |||||||||||||||||||||
| Other assets | 6,217 | 3,062 | |||||||||||||||||||||||
| Total assets | $ | 187,720 | $ | 97,572 | |||||||||||||||||||||
33
Table of Contents
| Year Ended December 31, 2005 | Year Ended December 31, 2004 | ||||||||||||||||||||||||
| Average | Average | ||||||||||||||||||||||||
| Average | Yield | Average | Yield | ||||||||||||||||||||||
| Balance | Interest | or Cost | Balance | Interest | or Cost | ||||||||||||||||||||
| (Dollars in thousands) | |||||||||||||||||||||||||
| Liabilities and Stockholders’ Equity | |||||||||||||||||||||||||
| Interest-bearing liabilities: | |||||||||||||||||||||||||
| Deposits | |||||||||||||||||||||||||
| Interest-bearing demand | $ | 10,895 | $ | 44 | 0.40 | % | $ | 6,196 | $ | 23 | 0.37 | % | |||||||||||||
| Money market | 69,722 | 2,765 | 3.97 | % | 23,469 | 485 | 2.07 | % | |||||||||||||||||
| Savings | 4,474 | 44 | 0.98 | % | 3,841 | 30 | 0.78 | % | |||||||||||||||||
| Time certificates of deposit | 63,576 | 2,145 | 3.37 | % | 41,748 | 1,167 | 2.80 | % | |||||||||||||||||
| Total interest-bearing deposits | 148,667 | 4,998 | 3.36 | % | 75,254 | 1,705 | 2.27 | % | |||||||||||||||||
| Short-term borrowings | 142 | 5 | 3.52 | % | 9 | 0 | 0.00 | % | |||||||||||||||||
| Junior subordinated debt | 3,437 | 179 | 5.21 | % | 0 | 0 | 0.00 | % | |||||||||||||||||
| Total interest-bearing liabilities | 152,246 | 5,182 | 3.40 | % | 75,263 | 1,705 | 2.27 | % | |||||||||||||||||
| Non-interest-bearing liabilities | |||||||||||||||||||||||||
| Demand deposits | 19,855 | 12,088 | |||||||||||||||||||||||
| Other liabilities | 1,069 | 369 | |||||||||||||||||||||||
| Total liabilities | 173,170 | 87,720 | |||||||||||||||||||||||
| Stockholders’ equity | 14,550 | 9,852 | |||||||||||||||||||||||
| Total liabilities and stockholders’ equity | $ | 187,720 | $ | 97,572 | |||||||||||||||||||||
| Net interest income | $ | 10,511 | $ | 6,248 | |||||||||||||||||||||
| Net interest spread(5) | 5.41 | % | 6.36 | % | |||||||||||||||||||||
| Net interest margin | 5.90 | % | 6.78 | % | |||||||||||||||||||||
| (1) | Includes average non-accrual loans of $39,000 in 2005 and $1,000 in 2004. |
| (2) | Loan fees of $3.1 million and $2.0 million are included in the yield computations for 2005 and 2004, respectively. |
| (3) | Yields on loans and securities have not been adjusted to a tax-equivalent basis. |
| (4) | Includes interest-bearing deposits with correspondent banks. |
| (5) | Net interest spread represents the average yield earned on interest earning assets less the average rate paid on interest bearing liabilities. |
34
Table of Contents
The following table shows the change in interest income and interest expense and the amount of change attributable to variances in volume, rates and the combination of volume and rates based on the relative changes of volume and rates.
| Year Ended December 31, 2005 | |||||||||||||||||
| Compared to Year Ended December 31, 2004 | |||||||||||||||||
| Net Change | Rate | Volume | Mix | ||||||||||||||
| (In thousands) | |||||||||||||||||
| Loans | $ | 7,368 | $ | (44 | ) | $ | 7,454 | $ | (42 | ) | |||||||
| Investment securities — taxable | 88 | 45 | 31 | 12 | |||||||||||||
| Investment securities — non-taxable | 17 | 1 | 15 | 1 | |||||||||||||
| Federal funds sold | 239 | 98 | 51 | 90 | |||||||||||||
| Other investments | 38 | 5 | 13 | 20 | |||||||||||||
| Total interest income | 7,750 | 105 | 7,564 | 81 | |||||||||||||
| Interest expense: | |||||||||||||||||
| Interest-bearing demand | 21 | 2 | 17 | 2 | |||||||||||||
| Money market | 2,280 | 446 | 956 | 878 | |||||||||||||
| Savings | 14 | 8 | 5 | 1 | |||||||||||||
| Time certificates of deposit | 978 | 242 | 610 | 126 | |||||||||||||
| Short-term borrowings | 5 | 0 | 0 | 5 | |||||||||||||
| Junior subordinated debt | 179 | 0 | 0 | 179 | |||||||||||||
| Total interest expense | 3,477 | 698 | 1,588 | 1,191 | |||||||||||||
| Net interest income | $ | 4,273 | $ | (593 | ) | $ | 5,976 | $ | (1,110 | ) | |||||||
Provision for Loan Losses. The provision for loan losses for the year ended December 31, 2005 was $1.4 million compared to $654,000 in the year ended December 31, 2004. We experienced no net loan charge-offs in 2005 compared to net loan charge-offs of $21,000 for 2004. The amount in the provision for loan losses each year relates primarily to the significant growth in loans. Total net loans increased by $89.5 million in 2005 and $59.4 million in 2004. Non-performing loans to total loans decreased slightly from 0.09% at December 31, 2004 to 0.06% as of December 31, 2005.
Non-Interest Income. The following table presents, for the periods indicated, the major categories of non-interest income:
| Years Ended | |||||||||||||
| December 31, | |||||||||||||
| Increase | |||||||||||||
| 2005 | 2004 | (Decrease) | |||||||||||
| (In thousands) | |||||||||||||
| Service charges and other income | $ | 858 | $ | 444 | $ | 414 | |||||||
| Loan brokerage and referral fees | 1,799 | 1,505 | 294 | ||||||||||
| Net gain/(loss) on sale of loans | 2,584 | 857 | 1,727 | ||||||||||
| Total non-interest income | $ | 5,241 | $ | 2,806 | $ | 2,435 | |||||||
The $2.4 million, or 86.8% increase in total non-interest income was primarily due to net gains on mortgage loans sold.
35
Table of Contents
Non-Interest Expense. The following table presents, for the periods indicated, the major categories of non-interest expense:
| Years Ended | |||||||||||||
| December 31, | |||||||||||||
| Increase | |||||||||||||
| 2005 | 2004 | (Decrease) | |||||||||||
| (In thousands) | |||||||||||||
| Salaries, wages and employee benefits | $ | 7,250 | $ | 4,097 | $ | 3,153 | |||||||
| Occupancy, equipment and depreciation | 1,115 | 783 | 332 | ||||||||||
| Data and item processing | 363 | 256 | 107 | ||||||||||
| Advertising expense | 183 | 136 | 47 | ||||||||||
| Printing, stationary and supplies | 213 | 132 | 81 | ||||||||||
| Telephone expense | 78 | 54 | 24 | ||||||||||
| Postage and courier | 109 | 80 | 29 | ||||||||||
| Legal fees | 28 | 34 | (6 | ) | |||||||||
| Director fees | 233 | 122 | 111 | ||||||||||
| Business & occupation taxes | 188 | 130 | 58 | ||||||||||
| Other | 932 | 546 | 386 | ||||||||||
| Total non-interest expense | $ | 10,692 | $ | 6,370 | $ | 4,322 | |||||||
The $4.3 million, or 67.8% increase in total non-interest expense was principally the result of increases in salary, occupancy and other costs associated with our new residential mortgage activities.
Provision for Income Taxes. We recorded tax provisions of $1.3 million in 2005 and $680,000 in 2004. Our effective tax rates were 35.0% and 33.7% for 2005 and 2004, respectively, as compared to the expected effective tax rate of 34.0%. Any difference from the expected rate in either years was largely due to the non-taxable nature of income from municipal securities.
| Year Ended December 31, 2004 Compared to Year Ended December 31, 2003 |
| Years Ended December 31, | ||||||||||||
| Increase | ||||||||||||
| 2004 | 2003 | (Decrease) | ||||||||||
| (Dollars in thousands, | ||||||||||||
| except per share data) | ||||||||||||
Consolidated Statement of Earnings Data: | ||||||||||||
| Interest income | $ | 7,943 | $ | 4,396 | $ | 3,547 | ||||||
| Interest expense | 1,705 | 1,110 | 595 | |||||||||
| Net interest income | 6,238 | 3,286 | 2,952 | |||||||||
| Provision for loan losses | 654 | 231 | 423 | |||||||||
| Net interest income after provision for loan losses | 5,584 | 3,055 | 2,529 | |||||||||
| Non-interest income | 2,806 | 293 | 2,513 | |||||||||
| Non-interest expense | 6,370 | 2,384 | 3,986 | |||||||||
| Income before provision for income taxes | 2,020 | 964 | 1,056 | |||||||||
| Provision for income taxes | 680 | 333 | 347 | |||||||||
| Net income | $ | 1,340 | $ | 631 | $ | 709 | ||||||
| Earnings per share — basic | $ | 0.59 | $ | 0.36 | $ | 0.23 | ||||||
| Earnings per share — diluted | $ | 0.55 | $ | 0.35 | $ | 0.20 | ||||||
36
Table of Contents
Our net income grew by 112.4% to $1.3 million for the year ended December 31, 2004, as compared to $631,000 for the year ended December 31, 2003. The increase in net income was attributable principally to increases in net interest income and non-interest income of $3.0 million and $2.5 million, respectively, partially offset by a $4.0 million increase in non-interest income. Our return on average equity was 13.6% and return on average assets was 1.37% for the year ended December 31, 2004, compared to 9.9% and 1.04% respectively for the year ended December 31, 2003.
Net Interest Income and Net Interest Margin. The $3.0 million, 89.8%, increase in our net interest income for the year ended December 31, 2004 was due to an increase in interest income of $3.5 million, offset by an increase of $595,000 in interest expense. Average interest-earning assets increased to $92.2 million during 2004 as compared to $57.5 million during 2003, reflecting our growth. Total interest expense increased as a result of ongoing increases in interest rates throughout the financial marketplace over the course of the year.
The average yield on our interest-earning assets increased to 8.63% for the year ended December 31, 2004 as compared to 7.64% for the year ended December 31, 2003, an increase of 0.97%. This resulted primarily from a general increase in interest rate levels and the increase of loans as a percentage of earning assets.
The cost of our average interest-bearing liabilities decreased slightly to 2.27% in 2004 from 2.32% in 2003. This decrease was due to small declines in the average rates paid by the bank on deposit balances and the decrease in average time certificates of deposit as a percentage of average total deposits to 55.5% as of December 31, 2004 from 60.6% in the prior year.
The 107 basis point increase in our net interest margin, which increased to 6.78% for the year ended December 31, 2004 from 5.71% for the year ended December 31, 2003, was due primarily to higher yields on our earning assets.
The following table sets forth a summary of average balances with corresponding interest income and interest expense as well as average yield and cost information for the periods presented. Average balances are derived from daily balances, and non-accrual loans are included as interest earning assets for purposes of this table.
| *Year Ended December 31, 2004 | Year Ended December 31, 2003 | ||||||||||||||||||||||||
| Average | Average | ||||||||||||||||||||||||
| Average | Yield | Average | Yield or | ||||||||||||||||||||||
| Balance | Interest | or Cost | Balance | Interest | Cost | ||||||||||||||||||||
| (Dollars in thousands) | |||||||||||||||||||||||||
Assets | |||||||||||||||||||||||||
| Interest-earning assets: | |||||||||||||||||||||||||
| Loans(1)(2)(3) | $ | 82,118 | $ | 7,725 | 9.41 | % | $ | 47,535 | $ | 4,181 | 8.80 | % | |||||||||||||
| Investment securities — taxable | 3,928 | 124 | 3.16 | % | 5,436 | 142 | 2.61 | % | |||||||||||||||||
| Investment securities — non-taxable(3) | 1,297 | 45 | 3.47 | % | 871 | 33 | 3.79 | % | |||||||||||||||||
| Federal funds sold | 4,664 | 56 | 1.20 | % | 3,065 | 32 | 1.04 | % | |||||||||||||||||
| Other investments(4) | 203 | 3 | 1.48 | % | 596 | 8 | 1.34 | % | |||||||||||||||||
| Total interest-earning assets | 92,210 | 7,953 | 8.63 | % | 57,503 | 4,396 | 7.64 | % | |||||||||||||||||
| Non-earning assets: | |||||||||||||||||||||||||
| Cash and due from banks | 3,190 | 1,927 | |||||||||||||||||||||||
| Unearned loan fees | (109 | ) | (72 | ) | |||||||||||||||||||||
| Allowance for loan losses | (778 | ) | (451 | ) | |||||||||||||||||||||
| Other assets | 3,062 | 1,998 | |||||||||||||||||||||||
| Total assets | $ | 97,572 | $ | 60,905 | |||||||||||||||||||||
37
Table of Contents
| Year Ended December 31, 2004 | Year Ended December 31, 2003 | ||||||||||||||||||||||||
| Average | Average | ||||||||||||||||||||||||
| Average | Yield | Average | Yield or | ||||||||||||||||||||||
| Balance | Interest | or Cost | Balance | Interest | Cost | ||||||||||||||||||||
| (Dollars in thousands) | |||||||||||||||||||||||||
Liabilities and Stockholders’ Equity | |||||||||||||||||||||||||
| Interest-bearing liabilities: | |||||||||||||||||||||||||
| Deposits | |||||||||||||||||||||||||
| Interest-bearing demand | $ | 6,196 | $ | 23 | 0.37 | % | $ | 3,611 | $ | 11 | 0.30 | % | |||||||||||||
| Money market | 23,469 | 485 | 2.07 | % | 12,807 | 210 | 1.64 | % | |||||||||||||||||
| Savings | 3,841 | 30 | 0.78 | % | 2,455 | 19 | 0.77 | % | |||||||||||||||||
| Time certificates of deposit | 41,748 | 1,167 | 2.80 | % | 28,981 | 870 | 3.00 | % | |||||||||||||||||
| Total interest-bearing deposits | 75,254 | 1,705 | 2.27 | % | 47,854 | 1,110 | 2.32 | % | |||||||||||||||||
| Short-term borrowings | 9 | 0 | 0.00 | % | 5 | 0 | 0.00 | % | |||||||||||||||||
| Junior subordinated debt | 0 | 0 | 0.00 | % | 0 | 0 | 0.00 | % | |||||||||||||||||
| Total interest-bearing liabilities | 75,263 | 1,705 | 2.27 | % | 47,859 | 1,110 | 2.32 | % | |||||||||||||||||
| Non-interest-bearing liabilities | |||||||||||||||||||||||||
| Demand deposits | 12,088 | 6,516 | |||||||||||||||||||||||
| Other liabilities | 369 | 173 | |||||||||||||||||||||||
| Total liabilities | 87,720 | 54,548 | |||||||||||||||||||||||
| Stockholders’ equity | 9,852 | 6,357 | |||||||||||||||||||||||
| Total liabilities and stockholders’ equity | $ | 97,572 | $ | 60,905 | |||||||||||||||||||||
| Net interest income | $ | 6,248 | $ | 3,286 | |||||||||||||||||||||
| Net interest spread(5) | 6.36 | % | 5.32 | % | |||||||||||||||||||||
| Net interest margin | 6.78 | % | 5.71 | % | |||||||||||||||||||||
| (1) | Includes average non-accrual loans of $1,000 in 2004 and none in 2003. |
| (2) | Loan fees of $2.0 million and $0.7 million are included in the yield computations for 2004 and 2003, respectively. |
| (3) | Yields on loans and securities have not been adjusted to a tax-equivalent basis. |
| (4) | Includes interest-bearing deposits with correspondent banks. |
| (5) | Net interest spread represents the average yield earned on interest earning assets less the average rate paid on interest bearing liabilities. |
38
Table of Contents
The following table shows the change in interest income and interest expense and the amount of change attributable to variances in volume, rates and the combination of volume and rates based on the relative changes of volume and rates.
| Year Ended December 31, 2004 | |||||||||||||||||
| Compared to Year Ended December 31, 2003 | |||||||||||||||||
| Net Change | Rate | Volume | Mix | ||||||||||||||
| (In thousands) | |||||||||||||||||
| Loans | $ | 3,544 | $ | 291 | $ | 3,042 | $ | 211 | |||||||||
| Investment securities — taxable | (28 | ) | 16 | (39 | ) | (5 | ) | ||||||||||
| Investment securities — non-taxable | 12 | (3 | ) | 16 | (1 | ) | |||||||||||
| Federal funds sold | 24 | 5 | 17 | 2 | |||||||||||||
| Other investments | (5 | ) | 1 | (5 | ) | (1 | ) | ||||||||||
| Total interest income | 3,547 | 310 | 3,031 | 206 | |||||||||||||
| Interest expense: | |||||||||||||||||
| Interest-bearing demand | 12 | 2 | 8 | 2 | |||||||||||||
| Money market | 275 | 55 | 175 | 45 | |||||||||||||
| Savings | 11 | 0 | 11 | 0 | |||||||||||||
| Time certificates of deposit | 297 | (60 | ) | 383 | (26 | ) | |||||||||||
| Short-term borrowings | 0 | 0 | 0 | 0 | |||||||||||||
| Junior subordinated debt | 0 | 0 | 0 | 0 | |||||||||||||
| Total interest expense | 595 | (3 | ) | 577 | 21 | ||||||||||||
| Net interest income | $ | 2,952 | $ | 313 | $ | 2,454 | $ | 185 | |||||||||
Provision for Loan Losses. The provision for loan losses for the year ended December 31, 2004 was $654,000 compared to $231,000 in the year ended December 31, 2003. We experienced net loan charge-offs of $21,000 in 2004 compared to a net loan recovery of $5,000 in 2003. The amount in the provision for loan losses each year relates primarily to the significant growth in loans. Total net loans increased by 59.4 million in 2004 and $18.5 million in 2003. Nonperforming loans to total loans increased slightly from 0.00% at December 31, 2003 to 0.09% as of December 31, 2004.
Non-Interest Income. The following table presents, for the periods indicated, the major categories of non-interest income:
| Years Ended | |||||||||||||
| December 31, | |||||||||||||
| Increase | |||||||||||||
| 2004 | 2003 | (Decrease) | |||||||||||
| (In thousands) | |||||||||||||
| Service charges and other income | $ | 444 | $ | 289 | $ | 155 | |||||||
| Loan brokerage and referral fees | 1,505 | 4 | 1,501 | ||||||||||
| Net gain/(loss) on sale of loans | 857 | 0 | 857 | ||||||||||
| Total non-interest income | $ | 2,806 | $ | 293 | $ | 2,513 | |||||||
The $2.5 million, or 857.7% increase in total non-interest income was primarily due to loan brokerage fees generated from our new residential mortgage activities.
39
Table of Contents
| Non-Interest Expense |
The following tables present, for the periods indicated, the major categories of non-interest expense:
| Years Ended | |||||||||||||
| December 31, | |||||||||||||
| Increase | |||||||||||||
| 2004 | 2003 | (Decrease) | |||||||||||
| (In thousands) | |||||||||||||
| Salaries, wages and employee benefits | $ | 4,097 | $ | 1,136 | $ | 2,961 | |||||||
| Occupancy, equipment and depreciation | 783 | 411 | 372 | ||||||||||
| Data and item processing | 256 | 207 | 49 | ||||||||||
| Advertising expense | 136 | 62 | 74 | ||||||||||
| Printing, stationary and supplies | 132 | 60 | 72 | ||||||||||
| Telephone expense | 54 | 26 | 28 | ||||||||||
| Postage and courier | 80 | 46 | 34 | ||||||||||
| Legal fees | 34 | 1 | 33 | ||||||||||
| Director fees | 122 | 68 | 54 | ||||||||||
| Business & occupation taxes | 130 | 50 | 80 | ||||||||||
| Other | 546 | 317 | 229 | ||||||||||
| Total non-interest expense | $ | 6,370 | $ | 2,384 | $ | 3,986 | |||||||
The $4.0 million, or 167.2%, increase in total non-interest expense was principally the result of increases in salary, occupancy and other costs associated with our new residential mortgage activities.
Provision for Income Taxes. We recorded tax provisions of $680,000 in 2004 compared to $333,000 in 2003. Our effective tax rate was 33.7% and 34.5% for each of 2004 and 2003, respectively.
Financial Condition
Our total assets at September 30, 2006, December 31, 2005 and December 31, 2004 were $338.1 million, $249.9 million and $137.4 million, respectively. Our average earning assets for the nine months ended September 30, 2006, and the fiscal years ended December 31, 2005 and December 31, 2004 were $276.3 million, $178.1 million and $92.2 million, respectively. Total deposits at September 30, 2006, December 31, 2005 and December 31, 2004 were $308.1 million, $224.2 million and $123.6 million, respectively.
| Loans |
Our net loans at September 30, 2006, December 31, 2005 and December 31, 2004 were $306.1 million, $207.2 million, and $117.6 million, respectively, an annual increase of 68.7% (from September 30, 2005), 76.2%, and 102.0% over the prior period, respectively. Net loans include loans held for sale. Our overall steady growth in loans from 2001 to September 30, 2006 is consistent with our historical focus and strategy to grow our loan portfolio. Since December 31, 2001, construction and development loans experienced the highest growth within our portfolio, growing from $6.9 million to $167.4 million at September 30, 2006, followed by commercial real estate loans which grew from $8.8 million at December 31, 2001 to $65.8 million at September 30, 2006. While we will continue to focus on our strong real estate lending portfolio, we intend to diversify the portfolio in future periods. See “Business — Our Strategy.”
40
Table of Contents
The following table shows the amounts of loans outstanding at the end of each of the periods indicated.
| December 31, | |||||||||||||||||||||||||
| September 30, | |||||||||||||||||||||||||
| 2006 | 2005 | 2004 | 2003 | 2002 | 2001 | ||||||||||||||||||||
| (In thousands) | |||||||||||||||||||||||||
| Real estate loans: | |||||||||||||||||||||||||
| Construction | $ | 167,361 | $ | 103,772 | $ | 41,211 | $ | 15,592 | $ | 11,408 | $ | 6,919 | |||||||||||||
| Commercial real estate | 65,776 | 46,947 | 36,191 | 13,987 | 11,986 | 8,820 | |||||||||||||||||||
| Residential real estate | 57,433 | 43,689 | 24,659 | 13,162 | 11,082 | 5,885 | |||||||||||||||||||
| Commercial & industrial loans | 16,538 | 13,123 | 14,549 | 14,117 | 4,568 | 2,845 | |||||||||||||||||||
| Consumer loans | 3,244 | 2,484 | 2,202 | 1,942 | 1,076 | 1,080 | |||||||||||||||||||
| Gross loans | 310,352 | 210,015 | 118,812 | 58,800 | 40,120 | 25,549 | |||||||||||||||||||
| Allowance for loan losses | 3,725 | 2,520 | 1,189 | 578 | 351 | 290 | |||||||||||||||||||
| Deferred loan fees, net | 571 | 323 | 0 | 0 | 0 | 0 | |||||||||||||||||||
| Net loans | $ | 306,056 | $ | 207,172 | $ | 117,623 | $ | 58,222 | $ | 39,769 | $ | 25,259 | |||||||||||||
The following tables show the amounts of loans outstanding as of September 30, 2006, and December 31, 2005, which, based on remaining scheduled repayments of principal, were due in one year or less, more than one year through five years, and more than five years. Lines of credit or other loans having no stated maturity and no stated schedule of repayments are reported as due in one year or less. In the table below, loans are classified as real estate- related if they are collateralized by real estate. The table also presents, for loans with maturities over one year, an analysis with respect to fixed interest rate loans and floating interest rate loans.
As of September 30, 2006:
| Rate Structure for | |||||||||||||||||||||||||
| Maturity | Loans Maturing Over | ||||||||||||||||||||||||
| One Year | |||||||||||||||||||||||||
| One | |||||||||||||||||||||||||
| One Year | through | Over | Floating | ||||||||||||||||||||||
| or Less | Five Years | Five Years | Total | Fixed Rate | Rate | ||||||||||||||||||||
| (In thousands) | |||||||||||||||||||||||||
| Real estate loans: | |||||||||||||||||||||||||
| Construction | $ | 140,657 | $ | 20,673 | $ | 6,031 | $ | 167,361 | $ | 15,124 | $ | 11,580 | |||||||||||||
| Commercial real estate | 2,092 | 8,757 | 54,927 | 65,776 | 11,604 | 52,080 | |||||||||||||||||||
| Residential real estate | 24,987 | 11,468 | 20,978 | 57,433 | 17,411 | 15,035 | |||||||||||||||||||
| Commercial & industrial loans | 5,809 | 6,624 | 4,105 | 16,538 | 4,801 | 5,928 | |||||||||||||||||||
| Consumer loans | 1,165 | 1,917 | 162 | 3,244 | 1,854 | 225 | |||||||||||||||||||
| Total | $ | 174,710 | $ | 49,439 | $ | 86,203 | $ | 310,352 | $ | 50,794 | $ | 84,848 | |||||||||||||
41
Table of Contents
As of December 31, 2005:
| Rate Structure for | |||||||||||||||||||||||||
| Maturity | Loans Maturing Over | ||||||||||||||||||||||||
| One Year | |||||||||||||||||||||||||
| One | |||||||||||||||||||||||||
| One Year | through | Over | Floating | ||||||||||||||||||||||
| or Less | Five Years | Five Years | Total | Fixed Rate | Rate | ||||||||||||||||||||
| (In thousands) | |||||||||||||||||||||||||
| Real estate loans: | |||||||||||||||||||||||||
| Construction | $ | 87,969 | $ | 11,972 | $ | 3,831 | $ | 103,772 | $ | 6,811 | $ | 8,992 | |||||||||||||
| Commercial real estate | 1,652 | 5,570 | 39,725 | 46,947 | 5,465 | 39,830 | |||||||||||||||||||
| Residential real estate | 14,586 | 11,090 | 18,013 | 43,689 | 16,668 | 12,435 | |||||||||||||||||||
| Commercial & industrial loans | 4,258 | 5,201 | 3,664 | 13,123 | 4,036 | 4,829 | |||||||||||||||||||
| Consumer loans | 447 | 1,984 | 53 | 2,484 | 2,036 | 1 | |||||||||||||||||||
| Total | $ | 108,912 | $ | 35,817 | $ | 65,286 | $ | 210,015 | $ | 35,016 | $ | 66,087 | |||||||||||||
Concentrations. As of September 30, 2006, in management’s judgment, a concentration of loans existed in real estate-related loans. At that date, real estate-related loans comprised 93.6% of total loans. At December 31, 2005, real estate-related loans comprised 92.6% of total loans, of which approximately 49.4%, 22.4% and 20.8% were construction, commercial real estate and residential real estate, respectively.
Additionally, as of September 30, 2006, in management’s judgment, a concentration of loans existed in interest-only loans, primarily construction and development loans secured by real estate. At that date, interest-only loans comprised 61.1% of total loans, of which approximately 76.2% were construction, 12.0% were residential, 9.3% were commercial real estate, 2.4% were commercial and industrial, and 0.1% were consumer. As of December 31, 2005, interest-only loans comprised 57.1% of total loans.
Our interest-only loans are secured by real estate or in the case of commercial and industrial loans, may also be secured by other business assets, such as accounts receivable, equipment and inventory. These loans generally mature within 6 to 30 months depending on the estimated completion date of the project in the case of construction, land development, residential and commercial real estate loans. Commercial and industrial loans normally mature within 12 months. Interest-only loans bear interest at a variable or fixed rate, with accrued interest payable monthly or in the case of our construction, land development, commercial and residential mortgage loans, interest may, at borrower’s option be accrued and paid upon completion of the project. We monitor our interest-only loans for collectibility through our credit underwriting policies and procedures which are described below under “Business — Our Business Activities — Lending,” by taking prompt action if any required payments are not made, and by requiring our lending staff to monitor and provide progress reports to senior management periodically with respect to the percentage of completion of the project, borrower’s project costs to date and any variance from the budget established for the project, and the performance by borrower of all other financial and other loan covenants. As of September 30, 2006, we did not have any option ARMs or negative amortizing loans.
42
Table of Contents
The following table shows the amounts of our interest-only loans in each loan category at the end of the periods indicated.
| September 30, 2006 | December 31, 2005 | |||||||||
| (In thousands) | ||||||||||
| Real estate loans: | ||||||||||
| Construction | ||||||||||
| Interest only | $ | 144,511 | $ | 84,679 | ||||||
| Principal and interest | 22,850 | 19,093 | ||||||||
| Commercial real estate | ||||||||||
| Interest only | 17,615 | 17,329 | ||||||||
| Principal and interest | 48,161 | 29,618 | ||||||||
| Residential real estate | ||||||||||
| Interest only | 22,803 | 15,034 | ||||||||
| Principal and interest | 34,630 | 28,655 | ||||||||
| Commercial & industrial loans | ||||||||||
| Interest only | 4,526 | 2,592 | ||||||||
| Principal and interest | 12,012 | 10,531 | ||||||||
| Consumer loans | ||||||||||
| Interest only | 281 | 312 | ||||||||
| Principal and interest | 2,963 | 2,172 | ||||||||
| Total | $ | 310,352 | $ | 210,015 | ||||||
A substantial decline in the performance of the economy, in general, or a decline in real estate values in our primary market areas, in particular, could have an adverse impact on collectibility, increase the level of real estate-related non-performing loans, or have other adverse effects which alone or in the aggregate could have a material adverse effect on our business, financial condition, results of operations and cash flows. Interest-only loans also carry greater risk than principal and interest loans do, to the extent that no principal is paid prior to maturity, particularly during a period of rising interest rates and declining real estate values.
Non-Performing Assets. Generally, loans are placed on non-accrual status when they become 90 days or more past due or at such earlier time as management determines timely recognition of interest to be in doubt. Accrual of interest is discontinued on a loan when management believes, after considering economic and business conditions and collection efforts that the borrower’s financial condition is such that collection of interest is doubtful. The following table summarizes the loans for which the accrual of interest has been discontinued and loans more than 90 days past due and still accruing interest, including those loans that have been restructured, and other real estate owned, which we refer to as OREO:
| December 31, | |||||||||||||||||||||||||
| September 30, | |||||||||||||||||||||||||
| 2006 | 2005 | 2004 | 2003 | 2002 | 2001 | ||||||||||||||||||||
| (Dollars in thousands) | |||||||||||||||||||||||||
| Non-accrual loans, not restructured | $ | — | $ | 128 | $ | 100 | $ | — | $ | 110 | $ | 74 | |||||||||||||
| Accruing loans past due 90 days or more | — | — | — | — | — | — | |||||||||||||||||||
| Restructured loans | — | — | — | — | — | — | |||||||||||||||||||
| Total non-performing loans (NPLs) | — | 128 | $ | 100 | — | 110 | 74 | ||||||||||||||||||
| OREO | — | — | 30 | 30 | 30 | — | |||||||||||||||||||
| Total non-performing assets (NPAs) | $ | — | $ | 128 | $ | 130 | $ | 30 | $ | 140 | $ | 74 | |||||||||||||
| Selected ratios | |||||||||||||||||||||||||
| NPLs to total loans | 0.00 | % | 0.06 | % | 0.09 | % | 0.00 | % | 0.27 | % | 0.29 | % | |||||||||||||
| NPAs to total assets | 0.00 | % | 0.05 | % | 0.09 | % | 0.04 | % | 0.27 | % | 0.23 | % | |||||||||||||
43
Table of Contents
OREO Properties. At September 30, 2006, we had no OREO property.
All OREO properties are recorded by us at amounts which are equal to or less than the fair market value of the properties based on current independent appraisals reduced by estimated selling costs.
Impaired Loans. “Impaired loans” are loans for which it is probable that we will not be able to collect all amounts due according to the original contractual terms of the loan agreement. The category of “impaired loans” is not coextensive with the category of “non-accrual loans”, although the two categories overlap. Non-accrual loans include impaired loans, which are not reviewed on a collective basis for impairment, and are those loans on which the accrual of interest is discontinued when collectibility of principal and interest is uncertain or payments of principal or interest have become contractually past due 90 days. Management may choose to place a loan on non-accrual status due to payment delinquency or uncertain collectibility, while not classifying the loan as impaired if it is probable that we will collect all amounts due in accordance with the original contractual terms of the loan or the loan is not a commercial, commercial real estate or an individually significant mortgage or consumer loan.
In determining whether or not a loan is impaired, we apply our normal loan review procedures on a case-by-case basis taking into consideration the circumstances surrounding the loan and borrower, including the collateral value, the reasons for the delay, the borrower’s prior payment record, the amount of the shortfall in relation to the principal and interest owed and the length of the delay. We measure impairment on a loan-by-loan basis using either the present value of expected future cash flows discounted at the loan’s effective interest rate or at the fair value of the collateral if the loan is collateral dependent, less estimated selling costs. Loans for which an insignificant shortfall in amount of payments is anticipated, but where we expect to collect all amounts due, are not considered impaired.
As a separate categorization, any troubled debt restructurings are defined as loans that we have agreed to modify by accepting below-market terms, either by granting interest rate concessions or by deferring principal and/or interest payments.
We had no impaired loans at September 30, 2006, December 31, 2005 or December 31, 2004.
At September 30, 2006, we had no loans not disclosed above as non-accrual loans, as to which we had serious doubts as to the ability of the borrower to comply with the present loan repayment terms and which may result in disclosure of these loans as non-accrual loans.
| Allowance for Loan Losses |
We must maintain an adequate allowance for loan losses, or ALLL, based on a comprehensive methodology that assesses the probable losses inherent in the loan portfolio. We maintain an ALLL based on a number of quantitative and qualitative factors, including levels and trends of past due and non-accrual loans, asset classifications, loan grades, change in volume and mix of loans, collateral value, historical loss experience, size and complexity of individual credits and economic conditions. Provisions for loan losses are provided on both a specific and general basis. Specific allowances are provided for impaired credits for which the expected/anticipated loss is measurable. General valuation allowances are based on a portfolio segmentation based on risk grading with a further evaluation of various quantitative and qualitative factors noted above.
We periodically review the assumptions and formulae by which additions are made to the specific and general valuation allowances for losses in an effort to refine such allowances in light of the current status of the factors described above. The methodology is presented to and approved by the board of directors.
Specific Allocations. All classified loans are carefully evaluated for loss portions or potential loss exposure. The evaluation occurs at the time the loan is classified and on a regular basis thereafter (at least quarterly). This evaluation is documented in a problem asset status report relating to a specific loan or relationship. Specific allocation of reserves considers the value of the collateral, the financial condition of the borrower, and industry and current economic trends. We review the collateral value, cash flow, and tertiary support on each classified credit. Any deficiency outlined by a real estate collateral evaluation
44
Table of Contents
liquidation analysis, or cash flow shortfall is accounted for through a specific allocation reserve calculation for the loan.
General Allowances. We perform a portfolio segmentation based on risk grading. Credits are rated into seven different categories (Grades 1-7), with a percentage of the portfolio, based on grade, allocated to the allowance. The loss factors for each risk grade are determined by management based on management’s overall assessment of the overall credit quality at month end taking into account various quantitative and qualitative factors such as trends of past due and non-accrual loans, asset classifications, loan grades, collateral value, historical loss experience and economic conditions. The first three grades are considered satisfactory. The other four grades range from a “Watch/ Pass” category to a “Loss” category. For a discussion of these four grades, see “Business — Credit Policies”.
The following table sets forth the activity in our allowance for loan losses for the periods indicated:
| Nine Months Ended | |||||||||||||||||||||||||||||||
| September 30, | Years Ended December 31, | ||||||||||||||||||||||||||||||
| 2006 | 2005 | 2005 | 2004 | 2003 | 2002 | 2001 | |||||||||||||||||||||||||
| (Dollars in thousands) | |||||||||||||||||||||||||||||||
| Allowance for loan losses: | |||||||||||||||||||||||||||||||
| Beginning balance | $ | 2,575 | $ | 1,224 | $ | 1,224 | $ | 591 | $ | 356 | $ | 295 | $ | 121 | |||||||||||||||||
| Loans charged off | |||||||||||||||||||||||||||||||
| Real estate loans: | |||||||||||||||||||||||||||||||
| Construction | — | — | — | — | — | 22 | — | ||||||||||||||||||||||||
| Commercial real estate | — | — | — | — | — | — | — | ||||||||||||||||||||||||
| Residential real estate | — | — | — | — | 20 | — | — | ||||||||||||||||||||||||
| Commercial & industrial loans | 20 | — | — | — | — | 87 | 2 | ||||||||||||||||||||||||
| Consumer loans | — | — | 1 | 22 | — | 5 | 6 | ||||||||||||||||||||||||
| Total | 20 | — | 1 | 22 | 20 | 114 | 8 | ||||||||||||||||||||||||
| Recoveries: | |||||||||||||||||||||||||||||||
| Real estate loans: | |||||||||||||||||||||||||||||||
| Construction | — | — | — | — | — | — | — | ||||||||||||||||||||||||
| Commercial real estate | — | — | — | — | — | — | — | ||||||||||||||||||||||||
| Residential real estate | — | — | — | — | 13 | — | — | ||||||||||||||||||||||||
| Commercial & industrial loans | — | — | 1 | — | 12 | 30 | — | ||||||||||||||||||||||||
| Consumer loans | — | — | — | 1 | — | 7 | — | ||||||||||||||||||||||||
| Total | — | — | 1 | 1 | 25 | 37 | — | ||||||||||||||||||||||||
| Net loan charge-off (recovery) | 20 | — | — | 21 | (5 | ) | 77 | 8 | |||||||||||||||||||||||
| Reclassification of unfunded credit commitments to other liabilities | (42 | ) | (15 | ) | (20 | ) | (22 | ) | (8 | ) | 0 | (5 | ) | ||||||||||||||||||
| Provision for loan losses | 1,267 | 875 | 1,351 | 654 | 230 | 138 | 182 | ||||||||||||||||||||||||
| Ending balance | $ | 3,725 | $ | 2,049 | $ | 2,520 | $ | 1,189 | $ | 578 | $ | 351 | $ | 290 | |||||||||||||||||
| Loans | $ | 310,352 | $ | 183,777 | $ | 210,015 | $ | 118,812 | $ | 58,800 | $ | 40,120 | $ | 25,549 | |||||||||||||||||
| Average loans | 259,774 | 149,525 | 161,256 | 82,118 | 47,535 | 38,953 | 24,925 | ||||||||||||||||||||||||
| Non-performing loans | — | — | 128 | 100 | — | 110 | 74 | ||||||||||||||||||||||||
| Selected ratios: | |||||||||||||||||||||||||||||||
| Net charge-offs to average loans | 0.01 | % | 0.00 | % | 0.00% | 0.03 | % | (0.01 | )% | 0.20 | % | 0.03 | % | ||||||||||||||||||
| Provision for loan losses to average loans | 0.49 | % | 0.59 | % | 0.65% | 0.55 | % | 0.39 | % | 0.35 | % | 0.71 | % | ||||||||||||||||||
| Allowance for loan losses to loans outstanding at end of period | 1.20 | % | 1.11 | % | 1.20% | 1.00 | % | 0.98 | % | 0.87 | % | 1.14 | % | ||||||||||||||||||
| Allowance for loan losses to non-performing loans | N/A | N/A | 1968.8% | 1189.0 | % | N/A | 319.1 | % | 391.9 | % | |||||||||||||||||||||
45
Table of Contents
Our construction portfolio reflects some borrower concentration risk, and also carries the enhanced risks encountered with construction loans generally. We also finance contractors on a speculative basis. Construction loans are generally more risky than permanent mortgage loans because they are dependent upon the borrower’s ability to generate cash to service the loan (by selling or leasing the project), and the value of the collateral depends on project completion when market conditions may have changed. For these reasons, a higher allocation is justified in this loan category.
Our commercial real estate loans are a mixture of new and seasoned properties, retail, office, warehouse, and some industrial properties. Loans on properties are generally underwritten at a loan to value ratio of less than 80% with a minimum debt coverage ratio of 1.2 times. Our grading system allows our loan portfolio, including real estate, to be ranked across four “pass” risk grades. Generally, the real estate loan portfolio is risk rated “4 — Acceptable Risk.” The risk rated reserve factor increases with each grade increase, and the general real estate portfolio grade of “4” is more reflective of the various risks inherent in the real estate portfolio, such as large size and complexity of individual credits, and overall concentration of credit risk. Accordingly, a greater allowance allocation is provided on commercial real estate loans.
We allocate our allowance for loan losses by assigning general percentages to our major loan categories (construction, commercial real estate, residential real estate, C&I and consumer), assigning specific percentages to each category of loans rated from 4 through 7 in accordance with the guidelines established by the regulatory agencies, and making specific allocations when factors are present requiring a greater reserve than would be required using the assigned risk rating allocation, which is typically based on a review of appraisals or other collateral analysis. The following table indicates management’s allocation of the allowance and the percent of loans in each category to total loans as of each of the following dates:
| December 31, | |||||||||||||||||||||||||||||||||||||||||||||||||
| September 30, | |||||||||||||||||||||||||||||||||||||||||||||||||
| 2006 | 2005 | 2004 | 2003 | 2002 | 2001 | ||||||||||||||||||||||||||||||||||||||||||||
| Percent | Percent | Percent | Percent | Percent | Percent | ||||||||||||||||||||||||||||||||||||||||||||
| of Loans | of Loans | of Loans | of Loans | of Loans | of Loans | ||||||||||||||||||||||||||||||||||||||||||||
| in Each | in Each | in Each | in Each | in Each | in Each | ||||||||||||||||||||||||||||||||||||||||||||
| Allocation | Category | Allocation | Category | Allocation | Category | Allocation | Category | Allocation | Category | Allocation | Category | ||||||||||||||||||||||||||||||||||||||
| of the | to Total | of the | to Total | of the | to Total | of the | to Total | of the | to Total | of the | to Total | ||||||||||||||||||||||||||||||||||||||
| Allowance | Loans | Allowance | Loans | Allowance | Loans | Allowance | Loans | Allowance | Loans | Allowance | Loans | ||||||||||||||||||||||||||||||||||||||
| (Dollars in thousands) | |||||||||||||||||||||||||||||||||||||||||||||||||
| Real estate loans: | |||||||||||||||||||||||||||||||||||||||||||||||||
| Construction | $ | 1,255 | 53.9 | % | $ | 777 | 49.3% | $ | 309 | 34.7% | $ | 117 | 26.5% | $ | 86 | 28.4% | $ | 52 | 27.1% | ||||||||||||||||||||||||||||||
| Commercial real estate | 493 | 21.2 | % | 352 | 22.4% | 271 | 30.5% | 105 | 23.8% | 90 | 29.9% | 66 | 34.5% | ||||||||||||||||||||||||||||||||||||
| Residential real estate | 144 | 18.5 | % | 109 | 20.8% | 62 | 20.8% | 33 | 22.4% | 28 | 27.6% | 15 | 23.1% | ||||||||||||||||||||||||||||||||||||
| Commercial & industrial loans | 124 | 5.3 | % | 99 | 6.3% | 109 | 12.2% | 106 | 24.0% | 34 | 11.4% | 21 | 11.1% | ||||||||||||||||||||||||||||||||||||
| Consumer loans | 33 | 1.1 | % | 26 | 1.2% | 22 | 1.8% | 19 | 3.3% | 11 | 2.7% | 11 | 4.2% | ||||||||||||||||||||||||||||||||||||
| Direct and Unallocated | 1,583 | 1,112 | 369 | 171 | 75 | 39 | |||||||||||||||||||||||||||||||||||||||||||
| Total | $ | 3,725 | 100.0 | % | $ | 2,520 | 100.0% | $ | 1,189 | 100.0% | $ | 578 | 100.0% | $ | 351 | 100.0% | $ | 290 | 100.0% | ||||||||||||||||||||||||||||||
Because there are additional risks of losses that cannot be quantified precisely or attributed to particular loans or types of loans, including general economic and business conditions and credit quality trends, we have established an unallocated portion of the allowance for loan losses based on our evaluation of these risks. The unallocated portion of our allowance is determined based on various factors including, but not limited to, general economic conditions of our market area, the growth, composition and diversification of our loan portfolio, types of collateral securing our loans, the experience level of our lending officers and staff, the quality of our credit risk management and the results of independent third party reviews of our classification of credits. The unallocated portion of our allowance has increased in recent years primarily as a result of our loan growth and because a relatively high percentage of our loans are unseasoned. At September 30, 2006, 86.8% of our total loan portfolio consisted of loans booked in the last two years, including loan renewals. We have also increased the unallocated portion of the allowance,
46
Table of Contents
and thereby our overall allowance for loan losses over the past two years because of our concentration of real estate-related loans and the potential softening of the housing market. As of September 30, 2006, the unallocated portion of the allowance for loan losses was $1,583, or 42.5% of the total allowance, compared with $1,112, or 44.1% of the total allowance as of December 31, 2005, and $369, or 31.0% of the total allowance as of December 31, 2004.
| Investments |
The carrying value of our investment securities totaled $8.2 million at September 30, 2006 and December 31, 2005, $4.6 million at December 31, 2004 and $6.3 million at December 31, 2003. Our portfolio of investment securities during 2006, 2005, 2004 and 2003 consisted primarily of federal and state government securities.
The carrying value of our portfolio of investment securities at September 30, 2006, December 31, 2005, 2004 and 2003 was as follows:
| Carrying Value | |||||||||||||||||
| At | At December 31, | ||||||||||||||||
| September 30, | |||||||||||||||||
| 2006 | 2005 | 2004 | 2003 | ||||||||||||||
| (In thousands) | |||||||||||||||||
| U.S. government agencies | $ | 6,364 | $ | 6,327 | $ | 3,091 | $ | 4,304 | |||||||||
| Obligations of states and political subdivisions | 1,815 | 1,825 | 1,310 | 1,319 | |||||||||||||
| Mortgage-backed securities | 59 | 83 | 157 | 450 | |||||||||||||
| Other securities | — | — | — | 200 | |||||||||||||
| Total investment securities | $ | 8,238 | $ | 8,235 | $ | 4,558 | $ | 6,273 | |||||||||
The following tables show the maturities of investment securities at September 30, 2006 and December 31, 2005, and the weighted average yields of such securities, excluding the benefit of tax-exempt securities:
| September 30, 2006 | |||||||||||||||||||||||||||||||||
| After Five Years | |||||||||||||||||||||||||||||||||
| Within One | After One Year but | but within Ten | |||||||||||||||||||||||||||||||
| Year | within Five Years | Years | After Ten Years | ||||||||||||||||||||||||||||||
| Amount | Yield | Amount | Yield | Amount | Yield | Amount | Yield | ||||||||||||||||||||||||||
| (Dollars in thousands) | |||||||||||||||||||||||||||||||||
| U.S. government agencies | $ | 2,297 | 4.66 | % | $ | 3,079 | 4.50 | % | $ | 988 | 6.55 | % | $ | — | 0.00 | % | |||||||||||||||||
| Obligations of states and political subdivisions | — | 0.00 | % | 246 | 3.80 | % | 398 | 4.25 | % | 1,171 | 4.21 | % | |||||||||||||||||||||
| Mortgage-backed securities | 22 | 4.82 | % | 37 | 4.40 | % | — | 0.00 | % | — | 0.00 | % | |||||||||||||||||||||
| Total available-for-sale | $ | 2,319 | 4.67 | % | $ | 3,362 | 4.45 | % | $ | 1,386 | 5.89 | % | $ | 1,171 | 4.21 | % | |||||||||||||||||
| December 31, 2005 | |||||||||||||||||||||||||||||||||
| After Five Years | |||||||||||||||||||||||||||||||||
| Within One | After One Year but | but within Ten | |||||||||||||||||||||||||||||||
| Year | within Five Years | Years | After Ten Years | ||||||||||||||||||||||||||||||
| Amount | Yield | Amount | Yield | Amount | Yield | Amount | Yield | ||||||||||||||||||||||||||
| (Dollars in thousands) | |||||||||||||||||||||||||||||||||
| U.S. government agencies | $ | — | — | $ | 5,344 | 4.27 | % | $ | 983 | 6.26 | % | $ | — | — | |||||||||||||||||||
| Obligations of states and political subdivisions | — | — | 248 | 3.80 | % | 399 | 4.25 | % | 1,178 | 4.21 | % | ||||||||||||||||||||||
| Mortgage-backed securities | 20 | 4.59 | % | 63 | 4.31 | % | — | — | — | — | |||||||||||||||||||||||
| Total available-for-sale | $ | 20 | 4.59 | % | $ | 5,655 | 4.25 | % | $ | 1,382 | 5.70 | % | $ | 1,178 | 4.21 | % | |||||||||||||||||
47
Table of Contents
| Deposits |
Total deposits were $308.1 million at September 30, 2006 compared to $224.2 million at December 31, 2005 and $123.6 million at December 31, 2004. The increase in total deposits since December 31, 2004 is attributed primarily to our current market growth and entering into new markets. Non-interest-bearing demand deposits increased to $26.5 million, or 8.6% of total deposits, at September 30, 2006, from $21.8 million, or 9.8% of total deposits, at December 31, 2005, and from $14.7 million, or 11.9% of total deposits, at December 31, 2004. Interest-bearing deposits are comprised of money market accounts, regular savings accounts, time deposits of under $100,000 and time deposits of $100,000 or more.
The following table shows the average amount and average rate paid on the categories of deposits for each of the periods indicated:
| Years Ended December 31, | |||||||||||||||||||||||||||||||||
| Nine Months Ended | |||||||||||||||||||||||||||||||||
| September 30, 2006 | 2005 | 2004 | 2003 | ||||||||||||||||||||||||||||||
| Average | Average | Average | Average | Average | Average | Average | Average | ||||||||||||||||||||||||||
| Balance | Rate | Balance | Rate | Balance | Rate | Balance | Rate | ||||||||||||||||||||||||||
| (Dollars in thousands) | |||||||||||||||||||||||||||||||||
| Interest-bearing demand | $ | 12,886 | 0.53 | % | $ | 10,895 | 0.40 | % | $ | 6,196 | 0.37 | % | $ | 3,611 | 0.30 | % | |||||||||||||||||
| Money market | 116,217 | 4.48 | % | 69,722 | 3.97 | % | 23,469 | 2.07 | % | 12,807 | 1.64 | % | |||||||||||||||||||||
| Savings | 3,844 | 1.39 | % | 4,474 | 0.98 | % | 3,841 | 0.78 | % | 2,455 | 0.77 | % | |||||||||||||||||||||
| Time certificates of deposit | 101,497 | 4.82 | % | 63,576 | 3.37 | % | 41,748 | 2.80 | % | 28,981 | 3.00 | % | |||||||||||||||||||||
| Non-interest bearing deposits | 25,192 | 0.00 | % | 19,855 | 0.00 | % | 12,088 | 0.00 | % | 6,516 | 0.00 | % | |||||||||||||||||||||
| Total | $ | 259,636 | 3.94 | % | $ | 168,522 | 2.97 | % | $ | 87,342 | 1.95 | % | $ | 54,370 | 2.04 | % | |||||||||||||||||
Additionally, the following table shows the maturities of CDs of $100,000 or more at September 30, 2006:
| September 30, 2006 | ||||
| (In thousands) | ||||
| Due in three months or less | $ | 8,196 | ||
| Due in over three months through six months | 7,118 | |||
| Due in over six months through twelve months | 12,621 | |||
| Due in over twelve months | 44,729 | |||
| Total | $ | 72,664 | ||
Deposits are gathered from individuals, partnerships and corporations in our market areas. Our policy also permits the acceptance of brokered deposits. The interest rates paid are competitively priced for each particular deposit product and structured to meet our funding requirements. We will continue to manage interest expense through deposit pricing. The increase in interest rates paid since 2003 is reflective of the Federal Reserve increasing the Federal Funds rate beginning in 2004.
| Shareholders’ Equity |
September 30, 2006 Overview. As of September 30, 2006, our shareholders’ equity totaled $20.2 million, and our equity to asset ratio was 6.0%, compared to 6.4% as of December 31, 2005. This decrease is reflective of the continued leveraging of our balance sheet, and is associated with the organic growth of our loans, deposits and total assets during the first nine months of 2006.
2005 Overview. As of December 31, 2005, our shareholders’ equity totaled $16.0 million, and our equity to asset ratio was 6.4%, compared to 9.4% as of December 31, 2004. This decease is primarily the result of our asset growth.
48
Table of Contents
Stock Split. In August 2006, we completed a6.1429-to-1 stock split effected in the form of a stock dividend. This resulted in issuing 5.1429 additional shares of stock to the common shareholders for each share previously held. We paid cash to our shareholders in lieu of issuing fractional shares resulting from the split at $13.15 per share, which was based on an independent valuation of our shares as of June 30, 2006. As a result of the stock split, the accompanying consolidated financial statements reflect an increase in the number of outstanding shares of common stock and the $2,295,899 transfer of the par value of these additional shares from capital surplus. All share and per share amounts have been restated to reflect the retroactive effect of the stock split, except for our capitalization.
Capital Resources
Current risk-based regulatory capital standards generally require banks and bank holding companies to maintain a minimum ratio of “core” or “Tier I” capital (consisting principally of common equity) to risk-weighted assets of at least 4%, a ratio of Tier I capital to adjusted total assets (leverage ratio) of at least 4% and a ratio of total capital (which includes Tier I capital plus certain forms of subordinated debt, a portion of the allowance for loan losses and preferred stock) to risk-weighted assets of at least 8%. Risk-weighted assets are calculated by multiplying the balance in each category of assets by a risk factor, which ranges from zero for cash assets and certain government obligations to 100% for some types of loans, and adding the products together.
| Regulatory Requirements | ||||||||||||||||
| (Greater than or equal to | ||||||||||||||||
| stated percentage) | Actual at September 30, 2006 | |||||||||||||||
| Adequately | WSB Financial | |||||||||||||||
| Capitalized | Well Capitalized | Westsound Bank | Group, Inc. | |||||||||||||
| Tier 1 leverage capital ratio | 4.0 | % | 5.0 | % | 8.7 | % | 8.5 | % | ||||||||
| Tier 1 risk-based capital | 4.0 | % | 6.0 | % | 8.9 | % | 8.7 | % | ||||||||
| Total risk-based capital | 8.0 | % | 10.0 | % | 10.2 | % | 10.4 | % | ||||||||
| Regulatory Requirements | ||||||||||||||||
| (Greater than or equal to | ||||||||||||||||
| stated percentage) | Actual at December 31, 2005 | |||||||||||||||
| Adequately | WSB Financial | |||||||||||||||
| Capitalized | Well Capitalized | Westsound Bank | Group, Inc. | |||||||||||||
| Tier 1 leverage capital ratio | 4.0 | % | 5.0 | % | 10.4 | % | 9.3 | % | ||||||||
| Tier 1 risk-based capital | 4.0 | % | 6.0 | % | 11.3 | % | 10.2 | % | ||||||||
| Total risk-based capital | 8.0 | % | 10.0 | % | 12.5 | % | 12.8 | % | ||||||||
We were well capitalized at both the bank and holding company at September 30, 2006 and December 31, 2005 for federal regulatory purposes.
In order to manage our capital position more efficiently, we formed WSB Financial Group Trust I, a Delaware statutory trust formed with capital of $248,000, for the sole purpose of issuing trust preferred securities. During the third quarter of 2005, WSB Financial Group Trust I issued 8,000 Capital Securities, or the trust preferred securities, with liquidation value of $1,000 per security, for gross proceeds of $8.0 million. The entire proceeds of the issuance were invested by WSB Financial Group Trust I in $8.248 million of Junior Subordinated Deferrable Interest Debentures, or the subordinated debentures, issued by us, with identical maturity, repricing and payment terms as the trust preferred securities. The subordinated debentures represent the sole assets of WSB Financial Group Trust I. The subordinated debentures mature on September 15, 2035, and bear an interest rate at September 30, 2006 of 7.01% (based on3-month LIBOR plus 1.73%), with repricing occurring and interest payments due quarterly. We injected $7.9 million of the net proceeds from the sale of the subordinated debentures into Westsound Bank and retained the remaining proceeds for the needs of WSB Financial Group, Inc.
The subordinated debentures are redeemable by us, subject to our receipt of prior approval from the Federal Reserve Bank of San Francisco, on any March 15, June 15, September 15 or December 15 on or after September 15, 2010.
49
Table of Contents
The redemption price is par plus accrued and unpaid interest, except in the case of redemption under a special event which is defined in the debenture occurring prior to September 15, 2010. The trust preferred securities are subject to mandatory redemption to the extent of any early redemption of the subordinated debentures and upon maturity of the subordinated debentures on September 15, 2035.
Holders of the trust preferred securities are entitled to a cumulative cash distribution on the liquidation amount of $1,000 per security at an interest rate at September 30, 2006 of 7.08%. For each successive period beginning on March 15 of each year, the rate will be adjusted to equal the3-month LIBOR plus 1.73%. WSB Financial Group Trust I has the option to defer payment of the distributions for a period of up to five years, as long as we are not in default on the payment of interest on the subordinated debentures. We have guaranteed, on a subordinated basis, distributions and other payments due on the trust preferred securities. For financial reporting purposes, our investment in the trust is accounted for under the equity method and is included in other assets on the accompanying consolidated balance sheet. The subordinated debentures issued and guaranteed by us and held by the trust are reflected on our consolidated balance sheet in accordance with provisions of Interpretation No. 46 issued by the Financial Accounting Standards Board, or FASB, No. 46, Consolidation of Variable Interest Entities. Under applicable regulatory guidelines, all of the trust preferred securities currently qualify as Tier 1 capital, although this classification may be subject to future change.
Contractual Obligations
The following table sets forth our significant contractual obligations at September 30, 2006:
| Payments Due by Period | ||||||||||||||||||||
| Less Than | After | |||||||||||||||||||
| Contractual Obligations | Total | 1 Year | 1-3 Years | 3-5 Years | 5 Years | |||||||||||||||
| (In Thousands) | ||||||||||||||||||||
| Junior subordinated deferrable interest debentures | $ | 8,248 | $ | — | $ | — | $ | — | $ | 8,248 | ||||||||||
| Time certificates of deposit | 154,877 | 70,302 | 74,002 | 10,573 | — | |||||||||||||||
| Operating lease obligations | 1,489 | 347 | 678 | 449 | 15 | |||||||||||||||
| Total | $ | 164,614 | $ | 70,649 | $ | 74,680 | $ | 11,022 | $ | 8,263 | ||||||||||
The following table sets forth our other significant commitments at September 30, 2006:
| Amount of Commitment Expiration Per Period | ||||||||||||||||||||
| Total | ||||||||||||||||||||
| Amounts | Less Than | After 5 | ||||||||||||||||||
| Other Commitments | Committed | 1 Year | 1-3 Years | 3-5 Years | Years | |||||||||||||||
| (In Thousands) | ||||||||||||||||||||
| Commitments to extend credit | $ | 100,314 | $ | 79,465 | $ | 20,849 | $ | — | $ | — | ||||||||||
| Credit cards | 2,299 | — | 2,299 | — | — | |||||||||||||||
| Standby letters of credit | 486 | 486 | — | — | — | |||||||||||||||
| Total | $ | 103,099 | $ | 79,951 | $ | 23,148 | $ | — | $ | — | ||||||||||
Liquidity
The ability to have readily available funds sufficient to repay fully maturing liabilities is of primary importance to depositors, creditors and regulators. Our liquidity, represented by cash and due from banks, federal funds sold and available-for-sale securities, is a result of its operating, investing and financing activities and related cash flows. In order to ensure funds are available at all times, we devote resources to projecting on a monthly basis the amount of funds that will be required and maintain relationships with a diversified customer base so funds are accessible. Liquidity requirements can also be met through short-term borrowings or the disposition of short-term assets. We have borrowing lines at correspondent banks totaling $15.0 million. In addition, our current borrowing line with the FHLB, totaling $26.9 million as of September 30, 2006, is available under a blanket pledge agreement. As of September 30, 2006 we had $7.0 million in securities available to be sold or pledged to the FHLB.
50
Table of Contents
We have a formal liquidity policy, and in the opinion of management, our liquid assets are considered adequate to meet our cash flow needs for loan funding and deposit cash withdrawal for the next 60 to 90 days. At September 30, 2006, we had approximately $28.0 million in liquid assets comprised of $13.8 million in cash and cash equivalents (including fed funds sold of $5.5 million), $8.2 million in available-for-sale securities and $5.9 million in loans held for sale.
On a long term basis, our liquidity will be met by changing the relative distribution of its asset portfolios, i.e., reducing investment or loan volumes, or selling or encumbering assets. Further, it will increase liquidity by soliciting higher levels of deposit accounts through promotional activities and/or borrowing from our correspondent banks as well as Federal Home Loan Bank. At the current time, our long-term liquidity needs primarily relate to funds required to support loan originations and commitments and deposit withdrawals. All of these needs can currently be met by cash flows from investment payments and maturities, and investment sales if the need arises. Another attractive source of liquidity if necessary to fund our future growth, could be the issuance of additional trust preferred securities.
Our liquidity is comprised of three primary classifications: cash flows from or used in operating activities; cash flows from or used in investing activities; and cash flows provided by or used in financing activities.
Net cash provided by or used in operating activities has consisted primarily of net income adjusted for certain non-cash income and expense items such as the loan loss provision, investment and other amortization and depreciation.
Our primary investing activities are the origination of real estate, commercial and consumer loans and purchase and sale of securities. Increases in net loans for the nine months ended September 30, 2006, and the years ended December 31, 2005, 2004 and 2003, were $98.9 million, $89.5 million, $59.4 million and $18.5 million, respectively. Investment securities were $8.2 million at September 30, 2006 and December 31, 2005. Investment securities increased $3.7 million from December 31, 2004 to December 31, 2005. At September 30, 2006 we had outstanding loan commitments of $102.6 million and outstanding letters of credit of $486,000. We anticipate that we will have sufficient funds available to meet current loan commitments.
Net cash provided by financing activities has been impacted significantly by increases in deposit levels. During the nine months ended September 30, 2006, and the years ended December 31, 2005, 2004 and 2003, deposits increased by $83.9 million, $100.6 million, $55.6 million and $20.0 million, respectively. During the year ended December 31, 2005, proceeds from the issuance of cumulative trust preferred securities provided an additional $8.0 million cash.
Quantitative and Qualitative Disclosures about Market Risk
Market risk is the risk of loss in a financial instrument arising from adverse changes in market prices and rates, foreign currency exchange rates, commodity prices and equity prices. Our market risk arises primarily from interest rate risk inherent in our lending and deposit taking activities. To that end, management actively monitors and manages our interest rate risk exposure. We do not have any market risk sensitive instruments entered into for trading purposes. We manage our interest rate sensitivity by matching the re-pricing opportunities on our earning assets to those on our funding liabilities.
Management uses various asset/liability strategies to manage the re-pricing characteristics of our assets and liabilities designed to ensure that exposure to interest rate fluctuations is limited within our guidelines of acceptable levels of risk-taking. Hedging strategies, including the terms and pricing of loans and deposits, and managing the deployment of our securities, are used to reduce mismatches in interest rate re-pricing opportunities of portfolio assets and their funding sources.
Interest rate risk is addressed by our Asset Liability Management Committee, or the ALCO, which is comprised of the chief executive officer, chief financial officer and chief risk officer. The ALCO monitors interest rate risk by analyzing the potential impact on the net portfolio of equity value and net interest income from potential changes in interest rates, and considers the impact of alternative strategies or changes in balance sheet structure. The ALCO manages our balance sheet in part to maintain the
51
Table of Contents
potential impact on net portfolio value and net interest income within acceptable ranges despite changes in interest rates.
Our exposure to interest rate risk is reviewed on at least a quarterly basis by the ALCO and our Board of Directors. Interest rate risk exposure is measured using interest rate sensitivity analysis to determine our change in net portfolio value in the event of hypothetical changes in interest rates. If potential changes to net portfolio value and net interest income resulting from hypothetical interest rate changes are not within the limits established by our Board of Directors, the Board of Directors may direct management to adjust the asset and liability mix to bring interest rate risk within board-approved limits.
Market Value of Portfolio Equity. We measure the impact of market interest rate changes on the net present value of estimated cash flows from our assets, liabilities and off-balance sheet items, defined as market value of portfolio equity, using a simulation model. This simulation model assesses the changes in the market value of interest rate sensitive financial instruments that would occur in response to an instantaneous and sustained increase or decrease (shock) in market interest rates of 100 and 200 basis points.
At September 30, 2006, our market value of portfolio equity exposure related to these hypothetical changes in market interest rates was within the current guidelines established by us. The following table shows our projected change in market value of portfolio equity for this set of rate shocks as of September 30, 2006.
Market Value of Portfolio Equity
| Percentage | Percentage of | |||||||||||||||
| Change from | Percentage of | Portfolio Equity | ||||||||||||||
| Interest Rate Scenario | Market Value | Base | Total Assets | Book Value | ||||||||||||
| (Dollars in thousands) | ||||||||||||||||
| Up 200 basis points | $ | 22,766 | 7.9 | % | 6.7 | % | 112.62 | % | ||||||||
| Up 100 basis points | 21,959 | 4.1 | % | 6.5 | % | 108.63 | % | |||||||||
| BASE | 21,098 | — | 6.2 | % | 104.37 | % | ||||||||||
| Down 100 basis points | 20,027 | (5.1 | )% | 5.9 | % | 99.07 | % | |||||||||
| Down 200 basis points | 18,821 | (10.8 | )% | 5.6 | % | 93.10 | % | |||||||||
The computation of prospective effects of hypothetical interest rate changes are based on numerous assumptions, including relative levels of market interest rates, asset prepayments and deposit decay, and should not be relied upon as indicative of actual results. Further, the computations do not contemplate any actions we may undertake in response to changes in interest rates. Actual amounts may differ from the projections set forth above should market conditions vary from the underlying assumptions.
Net Interest Income Simulation. In order to measure interest rate risk at September 30, 2006, we used a simulation model to project changes in net interest income that result from forecasted changes in interest rates. This analysis calculates the difference between net interest income forecasted using a rising and a falling interest rate scenario and a net interest income forecast using a base market interest rate derived from the current treasury yield curve. The income simulation model includes various assumptions regarding the re-pricing relationships for each of our products. Many of our assets are floating rate loans, which are assumed to re-price immediately, and to the same extent as the change in market rates according to their contracted index. Some loans and investment vehicles include the opportunity of prepayment (embedded options), and accordingly the simulation model uses national indexes to estimate these prepayments and reinvest their proceeds at current yields. Our non-term deposit products re-price more slowly, usually changing less than the change in market rates and at our discretion.
This analysis indicates the impact of changes in net interest income for the given set of rate changes and assumptions. It assumes the balance sheet grows modestly, but that its structure will remain similar to the structure at year-end. It does not account for all factors that impact this analysis, including changes by management to mitigate the impact of interest rate changes or secondary impacts such as changes to our credit risk profile as interest rates change.
52
Table of Contents
Furthermore, loan prepayment rate estimates and spread relationships change regularly. Interest rate changes create changes in actual loan prepayment rates that will differ from the market estimates incorporated in this analysis. Changes that vary significantly from the assumptions may have significant effects on our net interest income.
For the rising and falling interest rate scenarios, the base market interest rate forecast was increased or decreased, on an instantaneous and sustained basis, by 100 and 200 basis points. At September 30, 2006, our net interest margin exposure related to these hypothetical changes in market interest rates was within the current guidelines established by us.
Sensitivity of Net Interest Income
| Percentage | Net Interest | |||||||||||||||
| Adjusted Net | Change from | Net Interest | Margin Change | |||||||||||||
| Interest Rate Scenario | Interest Income(1) | Base | Margin Percent(1) | (in basis points) | ||||||||||||
| (Dollars in thousands) | ||||||||||||||||
| Up 200 basis points | $ | 19,327 | 0.8 | % | 5.96 | % | 4 | |||||||||
| Up 100 basis points | 19,258 | 0.4 | % | 5.94 | % | 2 | ||||||||||
| BASE | 19,175 | — | 5.92 | % | — | |||||||||||
| Down 100 basis points | 18,992 | (1.0 | )% | 5.86 | % | (6 | ) | |||||||||
| Down 200 basis points | 18,792 | (2.0 | )% | 5.80 | % | (12 | ) | |||||||||
| (1) | These percentages are not comparable to other information discussing the percent of net interest margin since the income simulation does not take into account loan fees. |
Gap Analysis. Another way to measure the impact that future changes in interest rates will have on net interest income is through a cumulative gap measure. The gap represents the net position of assets and liabilities subject to re-pricing in specified time periods.
The following table sets forth the distribution of re-pricing opportunities of our interest-earning assets and interest-bearing liabilities, the interest rate sensitivity gap (that is, interest rate sensitive assets less interest rate sensitive liabilities), cumulative interest-earning assets and interest-bearing liabilities, the cumulative interest rate sensitivity gap, the ratio of cumulative interest-earning assets to cumulative interest-bearing liabilities and the cumulative gap as a percentage of total assets and total interest-earning assets as of September 30, 2006. The table also sets forth the time periods during which interest-earning assets and interest-bearing liabilities will mature or may re-price in accordance with their contractual terms. The interest rate relationships between the re-priceable assets and re-priceable liabilities are not necessarily constant and may be affected by many factors, including the behavior of customers in response to changes in interest rates. This table should, therefore, be used only as a guide as to the possible effect changes in interest rates might have on our net interest margins.
| September 30, 2006 | ||||||||||||||||||||||||
| Amounts Maturing or Re-pricing in | ||||||||||||||||||||||||
| Over 3 | Over 1 | |||||||||||||||||||||||
| 3 Months | Months to | Year to | Over 5 | Non- | ||||||||||||||||||||
| or Less | 12 Months | 5 Years | Years | Sensitive(1) | Total | |||||||||||||||||||
| (Dollars in thousands) | ||||||||||||||||||||||||
| Assets | ||||||||||||||||||||||||
| Cash and due from banks | $ | — | $ | 588 | $ | — | $ | — | $ | 7,722 | $ | 8,310 | ||||||||||||
| Federal funds sold | 5,500 | — | — | — | — | 5,500 | ||||||||||||||||||
| Investment securities | 2,014 | 314 | 3,352 | 2,558 | — | 8,238 | ||||||||||||||||||
| Loans | 155,911 | 101,390 | 44,354 | 8,696 | — | 310,351 | ||||||||||||||||||
| Other assets(2) | — | — | — | — | 5,681 | 5,681 | ||||||||||||||||||
| Total assets | $ | 163,425 | $ | 102,292 | $ | 47,706 | $ | 11,254 | $ | 13,403 | $ | 338,080 | ||||||||||||
53
Table of Contents
| September 30, 2006 | |||||||||||||||||||||||||
| Amounts Maturing or Re-pricing in | |||||||||||||||||||||||||
| Over 3 | Over 1 | ||||||||||||||||||||||||
| 3 Months | Months to | Year to | Over 5 | Non- | |||||||||||||||||||||
| or Less | 12 Months | 5 Years | Years | Sensitive(1) | Total | ||||||||||||||||||||
| (Dollars in thousands) | |||||||||||||||||||||||||
| Liabilities and Stockholders’ Equity | |||||||||||||||||||||||||
| Non-interest-bearing demand deposits | $ | — | $ | — | $ | — | $ | — | $ | 26,542 | $ | 26,542 | |||||||||||||
| Interest-bearing demand, money market and savings | 92,277 | — | 34,368 | — | — | 126,645 | |||||||||||||||||||
| Time certificates of deposit | 24,957 | 45,345 | 84,575 | — | — | 154,877 | |||||||||||||||||||
| Short-term debt | — | — | — | — | — | — | |||||||||||||||||||
| Long-term debt | 8,248 | — | — | — | — | 8,248 | |||||||||||||||||||
| Other liabilities | — | — | — | — | 1,553 | 1,553 | |||||||||||||||||||
| Shareholders’ equity | — | — | — | — | 20,215 | 20,215 | |||||||||||||||||||
| Total liabilities and stockholders’ equity | $ | 125,482 | $ | 45,345 | $ | 118,943 | $ | — | $ | 48,310 | $ | 338,080 | |||||||||||||
| Period gap | 37,943 | 56,947 | (71,237 | ) | 11,254 | (34,907 | ) | ||||||||||||||||||
| Cumulative interest-earning assets | 163,425 | 265,717 | 313,423 | 324,677 | |||||||||||||||||||||
| Cumulative interest-bearing liabilities | 125,482 | 170,827 | 289,770 | 289,770 | |||||||||||||||||||||
| Cumulative gap | 37,943 | 94,890 | 23,653 | 34,907 | |||||||||||||||||||||
| Cumulative interest-earning assets to cumulative interest-bearing liabilities | 130.2 | % | 155.5 | % | 108.2 | % | 112.0 | % | |||||||||||||||||
| Cumulative gap as a percent of: | |||||||||||||||||||||||||
| Total assets | 11.2 | % | 28.1 | % | 7.0 | % | 10.3 | % | |||||||||||||||||
| Interest-earning assets | 11.7 | % | 29.2 | % | 7.3 | % | 10.8 | % | |||||||||||||||||
| (1) | Assets or liabilities and equity which are not interest rate-sensitive. |
| (2) | Allowance for loan losses of $3.7 million as of September 30, 2006 is included in other assets. |
At September 30, 2006, we had $265.7 million in assets and $170.8 million in liabilities re-pricing within one year. This means that $94.9 million more of our interest rate sensitive assets than our interest rate sensitive liabilities will change to the then current rate (changes occur due to the instruments being at a variable rate or because the maturity of the instrument requires its replacement at the then current rate). The ratio of interest-earning assets to interest-bearing liabilities maturing or re-pricing within one year at September 30, 2006 is 155.5%. This analysis indicates that at September 30, 2006, if interest rates were to increase, the gap would result in a higher net interest margin. However, changes in the mix of earning assets or supporting liabilities can either increase or decrease the net interest margin without affecting interest rate sensitivity. In addition, the interest rate spread between an asset and its supporting liability can vary significantly while the timing of re-pricing of both the asset and its supporting liability can remain the same, thus impacting net interest income. This characteristic is referred to as basis risk, and generally relates to the re-pricing characteristics of short-term funding sources such as certificates of deposit.
Gap analysis has certain limitations. Measuring the volume of re-pricing or maturing assets and liabilities does not always measure the full impact on the portfolio value of equity or net interest income. Gap analysis does not account for rate caps on products; dynamic changes such as increasing prepayment speeds as interest rates decrease, basis risk, embedded options or the benefit of no-rate funding sources. The relation between product rate re-pricing and market rate changes (basis risk) is not the same for all products. The majority of interest-earning assets generally re-price along with a movement in market rates, while non-term deposit rates in general move more slowly and usually incorporate only a fraction of the
54
Table of Contents
change in market rates. Products categorized as non-rate sensitive, such as our non-interest-bearing demand deposits, in the gap analysis behave like long term fixed rate funding sources. Management uses income simulation, net interest income rate shocks and market value of portfolio equity as its primary interest rate risk management tools.
Recent Accounting Pronouncements
| SFAS No. 155, “Accounting for Certain Hybrid Financial Instruments,” which amends SFAS No. 133, “Accounting for Derivative Instruments and Hedging Activities,” and SFAS No. 140, “Accounting for Transfers and Servicing of Financial Assets and Extinguishments of Liabilities.” |
SFAS 155 resolves issues addressed in SFAS 133 related to beneficial interests in securitized financial assets and permits fair value remeasurement for any hybrid financial that contains an embedded derivative. SFAS 155 is effective for all financial instruments acquired or issued for fiscal years beginning after September 15, 2006. The adoption of this statement is not expected to have a material effect on financial condition or the results of operations.
| SFAS No. 156, “Accounting for Servicing of Financial Assets,” which amends SFAS No. 140, “Accounting for Transfers and Servicing of Financial Assets and Extinguishments of Liabilities.” |
SFAS 156 requires all separately recognized servicing assets and servicing liabilities be initially measured at fair value. SFAS 156 is effective for fiscal years beginning after September 15, 2006. The adoption of this statement is not expected to have a material effect on financial condition or the results of operations.
| FIN No. 48, “Accounting for Income Tax Uncertainties,” which supplements FAS 109, “Accounting for Income Taxes.” |
FIN 48 supplements FAS 109 by defining the threshold for recognizing the benefits in the financial statements as “more-likely-than-not” to be sustained by the applicable taxing authority. The benefit recognized for a tax position that meets the “more-likely-than-not” criterion is measured based on the largest benefit that is more than 50% likely to be realized, taking into consideration the amounts and probabilities of the outcomes upon settlement. We will adopt FIN 48 on January 1, 2007, as required. Adoption of FIN 48 is not anticipated to have a material effect on our financial statements.
| SFAS No. 157, “Fair Value Measurements.” |
SFAS 157 addresses how companies should measure fair value when they are required to use a fair value measure for recognition or disclosure purposes under generally accepted accounting principles. The FASB believes that the new standard will make the measurement of fair value more consistent and comparable and improve disclosures about those measures. We will be required to adopt SFAS 157 for fiscal years beginning after November 15, 2007, and interim periods within those fiscal years. We are assessing SFAS 157 and do not believe it will have a material impact on our future financial statements.
| SFAS 158, “Employers Accounting for Defined Benefit Pension and Other Postretirement Plans — an amendment of FASB Statements No. 87, 88, 106, and 132(R).” |
SFAS 158 requires an employer to recognize the over-funded or under-funded status of a defined benefits postretirement plan (other than a multiemployer plan) as an asset or liability in its statement of financial position and to recognize changes in that funded status through comprehensive income in the year in which the changes occur. SFAS 158 also requires additional disclosures of defined benefit postretirement plans. SFAS 158 is effective for fiscal years ending after December 15, 2006. We do not expect the adoption of SFAS 158 to have a material effect on our financial statements.
55
Table of Contents
BUSINESS
Overview and History
We are a bank holding company headquartered in Bremerton, Washington. We emphasize a service-oriented culture with a sales-based delivery model of an array of commercial bank and real estate lending products. We currently operate through seven full service branches and three loan production offices that are located primarily in the west Puget Sound area. At September 30, 2006, we had total assets of $338.1 million, net loans of $306.1 million, total deposits of $308.1 million and stockholders’ equity of $20.2 million.
Westsound Bank, our wholly owned subsidiary, is a Washington commercial bank that was opened for business in March 1999 by local community leaders and experienced bankers with the mission of providing a superior community banking service model to the west Puget Sound area. We believe this is an attractive market that benefits not only from its proximity to the economic activity in the Seattle metropolitan area, but also the high quality of living it offers its residents and seasonal visitors. From our base in Bremerton, we quickly expanded into other Puget Sound markets, adding three branches between 2001 and 2004. Our growth has accelerated recently, with openings of two new branches and a loan production office in 2005 and a branch and two loan production offices so far in 2006. Additionally, we plan to convert our Federal Way loan production office into a branch this year. We formed our holding company, WSB Financial Group, Inc., in 2005.
Our business model has produced strong loan and deposit growth, which has been complemented by steady net income growth. According to financial data published by the FDIC, from December 31, 2001 to June 30, 2006 (the most recent FDIC data available)we have been the fastest growing bank in the Pacific Northwest (Washington, Oregon, and Idaho), based on percentage annual growth rates of assets. We have been ranked in thePuget Sound Business Journal’s Top 100 list of the fastest growing private companies in Washington for the past two years, and were ranked 28th in the 2006 edition.
Specifically, from December 31, 2001 to September 30, 2006, we have increased:
| • | Total assets from $32.5 million to $338.1 million; | |
| • | Total net loans from $25.3 million to $306.1 million; | |
| • | Total deposits from $28.1 million to $308.1 million; | |
| • | Net income from $15,000 for the twelve months ended December 31, 2001 to $3.5 million for the twelve months ended September 30, 2006; and | |
| • | Our ROE and ROA from 0.4% and 0.06%, respectively, to 23.5% and 1.44%, respectively. |
56
Table of Contents
The graph below shows, on a quarterly basis, the growth in our assets and trailing 12 months’ net income:
Growth Chart
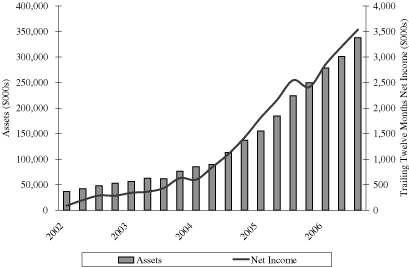
This growth has been due to a variety of factors, including the addition of offices in growing communities, adding sales-oriented employees with a customer-service mentality, expansion of our product offerings, continued growth of our real estate and business lending, and selling additional products and services to our real estate and business customers.
Our headquarters and administrative offices are located at our downtown branch at 607 Pacific Avenue, Bremerton, Washington 98337 and our telephone number is (360) 405-1200. We maintain a website at www.westsoundbank.com.
Our Market Area
We operate in the west Puget Sound area, which encompasses the Kitsap and Olympic peninsulas and islands west of Seattle. The west Puget Sound market benefits from a high quality of life, with significant outdoor recreational opportunities, median home prices significantly below the Seattle metro area, and a small community lifestyle. In addition, our markets are benefiting from a growing base of small- and medium-sized businesses, as well as a number of growing military operations. We also benefit from the significant economic activity generated in and around the greater Seattle metro area, which includes King, Pierce and Snohomish counties. The Seattle metro area has a diversified economy with major employers in a number of growth industries including aerospace, technology, health care, computer and telecommunications. Approximately 6,000 commuters ride the state ferries each day between their homes on Bainbridge Island and in other Kitsap County communities and downtown Seattle.
| Kitsap County |
With four branches, Kitsap County is the largest market we serve. Along with our headquarters, approximately 69% of our deposits and approximately 88% of our loans, are in Kitsap County. Based on FDIC data as of June 30, 2006, we had an 8.5% deposit market share in Kitsap County. In Kitsap County, total bank and thrift deposits grew at an 8.0% rate in 2006, and have increased on average 7.3% annually since 2000. As of August 2006, the unemployment rate for Kitsap County was 5.2% which was slightly above the rate for the Seattle metro area for the same period of 4.2%. Job growth is strong, with the area adding 1,700 jobs between the first quarter of 2005 and 2006. The median home price for Kitsap
57
Table of Contents
County increased 20.8% in 2005 to $250,000, but remained 35.8% below the median home price for the Seattle metro area. According to the U.S. Department of Housing and Urban Development, the estimated median family income for Kitsap County in 2005 was $62,000, ranking it sixth highest out of 39 counties in the state of Washington.
The military is a major source of employment, providing approximately 32,000 jobs or approximately 27.6% of the employment within the county. Most of the military jobs in the county are associated with two major U.S. Navy bases, the nuclear submarine base in Bangor (which is the only deep water port for nuclear submarines on the West Coast) and the ship repair and dry dock facilities in Bremerton (which is the only facility with the capacity for aircraft carriers on the West Coast). While many naval installations were being considered for downsizing during the latest Base Realignment and Closure Committee review in 2005, Kitsap was slated for a modest gain in jobs. Although a number of military bases have been closed in recent years in other parts of the country, we believe the risk of a base closure is remote because of these bases’ unique capabilities and strategic importance on the West Coast.
Kitsap County, and Bremerton in particular, are beginning to garner national attention.Inc. magazine recently ranked Bremerton as one of the country’s “hottest small cities,” in its May 1, 2006 issue for cities with an employment base under 150,000 people. In addition, in June 2004MONEYmagazine called Bremerton “one of the top 5 up and coming ‘hot’ cities in the country with populations under 250,000.” The accolades can be partly attributed to $500 million in building and revitalization projects currently underway and recently completed. A luxury condominium complex, four-star hotel, and waterfront maritime park are only a few of the projects currently being undertaken. A $27 million tunnel project is scheduled to commence in 2007 in Bremerton to improve traffic flow and the city is also testing higher speed and passenger-only ferries. The Kitsap County Trends report claims the investments will produce more than 3,000 new jobs by 2010.
| Clallam County |
We have two branches in Clallam County. Based on FDIC data as of June 30, 2006, we had a 5.0% deposit market share in Clallam County. In terms of population growth, Clallam County, which includes the city of Port Angeles, is the fastest expanding market we serve and has grown at an average annual rate of 1.6% from 2000 through 2005. In Clallam County, total bank and thrift deposits grew 5.1% in 2006. Unemployment in the county as of August 2006 is 5.7%. While slightly higher than surrounding counties, the unemployment rate has seen steep declines, falling more than 30% since January 2005. Health care and tourism from Canada are among the key industries.The Kiplinger Letterrecently named Port Angeles as a top area to start a new business. The city of Sequim, long known as a retirement haven, is establishing itself as a regional shopping center for the Olympic Peninsula. With an abundance of adequately zoned lot inventory, the population of Sequim, currently at 6,800, has been projected to double by 2011.
| Pierce County |
We currently have one branch in Pierce County. Based on FDIC data as of June 30, 2006, we had a deposit market share of less than 1.0% in Pierce County, which includes the city of Tacoma, located thirty miles south of Seattle. In Pierce County, total bank and thrift deposits as of June 30, 2006 were $8.1 billion, up 6.4% from the same period in 2005. Between 2000 and 2005 the county added new residents at a rate 40% faster than the nation as a whole. The Port of Tacoma, which is a major center of business in the county, is expected to grow approximately 50% in the next five years according to the Pierce County Economic Index. A vibrant real estate market offered homeowners significant gains. The median home price in the county increased 20.6% to $240,000 in 2005. A second Tacoma Narrows bridge linking Pierce County commuters with Gig Harbor in west Puget Sound is also scheduled to be completed in 2008. We believe the opening of the second bridge could bring numerous additional residents to the Gig Harbor/ South Kitsap area, by making commuting from Tacoma and the south King County area to Seattle a viable option.
58
Table of Contents
| South King County |
We opened a loan production office in south King County in Federal Way in 2005 and plan to convert it into a branch later this year. Like our west Puget Sound market area, south King County enjoys lower housing costs than the Seattle metro area generally. The largest employer in south King County is Weyerhaeuser Company, a paper and wood products manufacturer.
| Seattle Metropolitan Area |
The Seattle metro area economy is currently one of the top performing major markets in the nation. The metropolitan area added 58,600 jobs in the twelve months ended August 2006. Driven by the increase in jobs, unemployment has decreased steadily over the last year, declining from 4.8% in August 2005 to 4.2% in August 2006. Home prices continue to appreciate and experienced yearly gains of 17.8% in the fourth quarter of 2005 to a median of $390,000.Conway and Pedersen’s Economic Forecasterexpects the Seattle metro area to add nearly 50,000 jobs annually over the next two years. For example, Microsoft recently announced plans to spend $1 billion to expand its campus, making room for another 12,000 potential employees.
Our Business Strategy
We strive to be a high performing financial institution that delivers superior returns to our shareholders through exceptional employees and focus on our customers. We have built our company based on the following fundamental business strategies:
| • | Hire motivated, sales-oriented personnel. We believe successful employees are developed from talented, motivated people. We seek to find such individuals with varied backgrounds and then train them to be successful in delivering financial services. We combine an internal training program with a newstate-of-the-art training center to ensure that our employees are skilled in their respective areas of responsibility, and to enable us to responsibly maintain our growth. Moreover, our compensation structure allows for some employees to be paid largely on production, which provides incentives for superior performance and customer development. Our variable compensation totaled 40% of total compensation in 2005. | |
| • | Grow through de novo branches in attractive communities. Since 2001, we have added six branches and three loan production offices and we intend to add two or three branches or loan production offices per year over the next several years. Our focus is on finding prospective locations that have positive long-term demographic and business trends. Historically, we have achieved profitability in our new branches within 12 months, on average. Our branching strategy is often initiated with loan production offices, which we open in attractive markets with the intent of transitioning these offices into full-service branches. With strong loan demand in our west Puget Sound market, we are also exploring markets with high deposit potential. | |
| • | Deliver extraordinary customer service via a professional sales culture. We emphasize and train our staff to provide superior customer service. We believe that the models employed by high-end department stores and other successful retailers can be effectively applied to the financial services industry. Our staffing structure and business practices reflect a professional retail sales culture, rather than a traditional banking environment. We separate the sales and credit functions that are typically both performed by a single loan officer in conventionally-organized commercial banks. Our salespeople are the calling officers and business generators that are supported by credit analysts who underwrite the loan and manage the back-office lending functions. We also have relationship managers who are the primary points of contact for deposit customers and the initial contact persons for customers who come into our branches. |
59
Table of Contents
| • | Proactively manage credit quality and pricing. We focus on originating and maintaining a high quality loan portfolio by employing focused credit analysts, applying disciplined underwriting standards, and benefiting from our directors’ and officers’ thorough knowledge of the markets we serve. Our loan personnel are expected to monitor projects and we require third-party inspections to approve construction loan draws. All loans over $100,000 must be approved by our loan committee, which includes our chief executive officer and three of our directors. Our loan approval process is highly collaborative, with the committee taking an active role in the structuring and pricing of loans. Our loan officers have no discretionary authority with respect to pricing loans except for rate sheet pricing for residential mortgage loans sold in the secondary market. Loan personnel are incentivized to produce high quality loans, and receive deductions to their variable compensation packages for loans that go into non-accrual status or receive an internal risk rating of anything below a “pass.” | |
| • | Continue to identify opportunities in real estate and construction lending. Our loan portfolio is comprised of 93.6% in real estate loans, including 53.9% construction, 21.2% commercial real estate, and 18.5% residential real estate. We believe we are the most active community bank in this segment in the west Puget Sound market and have an experienced group of professionals with expertise in real estate lending. We focus on maintaining strong relationships with commercial and residential builders and on the life cycle of a project, from construction to take-out financing. | |
| • | Emphasize our risk management functions. We believe that our growth requires us to proactively address our risk management efforts and as such, we have devoted significant resources to this area, including recently appointing a chief risk officer. We seek to (i) identify risks in all functions of our business, including credit, operations and asset and liability management, (ii) evaluate such risks and their trends and (iii) adopt strategies to manage such risks based upon our evaluations. In particular, we actively manage interest rate and market risks by matching the volume and maturity of our rate sensitive assets to our interest sensitive liabilities in order to mitigate adverse effects of changes in interest rates. |
Our Growth Strategy
According to financial data published by the FDIC, we have been the fastest growing bank in the Pacific Northwest (Washington, Oregon and Idaho) based on percentage annual growth rates of assets from December 31, 2001 to June 30, 2006 (the most recent FDIC data available) for banks formed in 1999 or earlier. In order to continue to grow responsibly, we are deploying the following strategies:
| • | Add new sales personnel focused on high-quality growth. We are constantly looking to hire talented, motivated employees to help support the planned expansion of our business. In the short term, we are focused on expanding our lending and deposit operations and enhancing our deposit salesforce while maintaining our pricing discipline and asset quality. | |
| • | Establish new branches and loan production offices. We continually monitor and track opportunities in contiguous, attractive growth or deposit-rich markets in Washington. We plan on opening our eighth branch in the fourth quarter of 2006 in Federal Way and we are currently targeting two to three additional branches or loan production offices per year. | |
| • | Continue to emphasize our real estate lending practice to both existing and new customers. We believe our expertise in real estate loan products, that run from land acquisition to permanent financing on both residential and commercial properties, distinguishes us from most of the local community banks. Our track record of timeliness and responsiveness to our real estate loan customers has made us a desired lender in our markets and a beneficiary of customer referrals. | |
| • | Expand our commercial lending activities in our existing footprint. We are focused on growing and diversifying our loan portfolio by expanding our commercial and industrial, or C&I, lending through our existing branch structure. We intend to add experienced commercial lenders who desire to be associated with a successful, customer-oriented community bank. |
60
Table of Contents
| • | Grow our core deposits to help fund our existing and anticipated loan growth. In order to maintain our net interest margin at current levels, we are focused on funding as much of our growth as possible with local, core deposits. We incentivize our producers to leverage relationships to produce both loan and deposit growth. | |
| • | Become a public company and create a liquid market for our common stock. In addition to providing access to growth capital, we believe a “public currency” will provide us flexibility in structuring prospective acquisitions and will allow us to more effectively attract and retain qualified employees through equity-based compensation. |
Our Business Activities
The principal business of the bank is to utilize deposits and other funding sources in making loans which generate interest income. The principal sources of funds for the bank’s loans and investments are demand, time, savings and other deposits, repayment of loans and borrowings. The principal expenses associated with the bank are interest paid on deposits, employee compensation, office expenses and other operating expenses. The bank does not currently offer trust or fiduciary services.
We provide banking services throughout our primary market area to real estate developers, contractors and small- to medium-sized businesses in our market. Many of our real estate customers are involved in the development, construction and resale of commercial and residential properties in and around the west Puget Sound and the Seattle metropolitan area. Our business customers are involved in light manufacturing, distribution or other services. We also provide a broad range of banking services and products to individuals, including personal checking and savings accounts and other consumer banking products, including electronic banking.
We staff our bank with sales oriented employees who are focused on service and customer attention. We also structure our staffing to provide the appropriate checks and balances and to provide an environment that allows individuals to excel in the areas of their core competencies. For example, we employ sales people who are responsible for maintaining lending relationships with our existing and prospective customers. Rather than having the sales person focus on anything but customer service, we have credit analysts that perform analysis and credit review as specific opportunities are identified. Finally, we have relationship managers who are responsible for new, unsolicited customers and ensuring that deposit products are an integral part of the customer sales package.
| Lending |
While our historical focus has been on real estate lending, we also offer a full range of short- to long-term C&I and consumer lending products and services. We have established portfolio thresholds for each of our lending categories and constantly monitor the diversification of our portfolio. We originate a variety of types of loans, including construction, commercial real estate, residential real estate, commercial, and to a lesser extent consumer based loans. From time to time we purchase and sell commercial loan participations to or from other banks within our market area. All loan participations purchased have been underwritten using the bank’s standard and customary underwriting criteria and are performing.
Our customers are generally comprised of the following groups:
| • | Real estate developers and contractors in need of land, construction and permanent financing for commercial and residential developments; | |
| • | Small- to medium-sized businesses in need of secured and unsecured lines of credit or permanent C&I loans; | |
| • | Individuals in need of residential mortgage products and consumer loan products; and | |
| • | Professionals and professional firms, such as architectural, engineering, and insurance and financial firms, in need of operating facilities. |
61
Table of Contents
Our lending activities are concentrated in two main categories: real estate and commercial/consumers.
| Real Estate: |
We are focused on commercial and residential real estate lending throughout a project’s life cycle, from acquisition and development loans to acquire property, to permanent, long-term mortgage financing.
Construction and Development Loans. Our construction loan portfolio consists of single-family residential properties, multi-family properties and commercial projects. Construction lending entails significant additional risks compared with residential mortgage lending. Construction loans often involve larger loan balances concentrated with single borrowers or groups of related borrowers. Construction loans also involve additional risks since funds are advanced while the property is under construction, which property has uncertain value prior to the completion of construction. Thus, it is more difficult to evaluate accurately the total loan funds required to complete a project and whether relatedloan-to-value ratios will be sufficient to compensate for fluctuations in the real estate market to minimize the risk of loss. Maturities for construction loans generally range from 6 to 18 months for residential property and from 12 to 24 months for non-residential and multifamily properties.
Our development loans are secured by the entire property being platted and developed. Lending on raw land carries the significant risk of a change in market conditions during the development process. Our borrowers’ projects currently range from short plats (2-6 lots) to subdivisions with up to 55 lots. During the development process, we fund costs for site clearing and grading and infrastructure, including utilities and roads. Lot release minimum prices are agreed upon at loan closing. We target most developments to be paid out at 75% of sales. Loan to value ratios typically range from 65% to 75%, depending on the financial strength and experience of the developer. Most development loans have maturities of 18 to 30 months.
Commercial Mortgage Loans. We also originate commercial mortgage loans. These loans are primarily secured by commercial real estate, including office, retail, warehouse, industrial, and other non-residential properties and are made to the owners and/or occupants of such properties. The majority of these loans have maturities generally ranging from one to ten years.
Commercial mortgage lending entails significant additional risk compared with the residential mortgage lending. Commercial mortgage loans typically involve larger loan balances concentrated with single borrowers or groups of related borrowers. Additionally, the repayment of loans secured by income-producing properties is typically dependent on the successful operation of a business or a real estate project and thus may be subject, to a greater extent than is the case with residential mortgage loans, to adverse conditions in the commercial real estate market or in the general economy. Our commercial real estate loan underwriting criteria require an examination of debt service coverage ratios, the borrower’s creditworthiness and prior credit history and reputation, and we generally require personal guarantees or endorsements with respect to these loans. In the loan underwriting process, we also carefully consider the location of the property that will be collateral for the loan.
Loan-to-value ratios for commercial mortgage loans generally do not exceed 75%. We permitloan-to-value ratios of up to 80% if the property is owner occupied and the borrower has unusually strong liquidity, net worth and cash flow. We have been active in both the construction lending and permanent financing of our commercial real estate portfolio. Construction and raw land loans are short-term in nature and generally do not exceed 18 months. Permanent commitments are primarily restricted to no greater than 10 year maturities with rate adjustment periods every 36 months when fixed commitments exist.
62
Table of Contents
As of September 30, 2006 our commercial real estate portfolio was comprised of the following property types.
| Loan Type | $ Outstanding | % of Loan Portfolio | ||||||
| (In thousands) | ||||||||
| Retail | $ | 20,023 | 6.5 | |||||
| Office | 15,548 | 5.0 | ||||||
| Warehouse | 4,586 | 1.5 | ||||||
| Industrial | 5,070 | 1.6 | ||||||
| Hotel | 3,440 | 1.1 | ||||||
| Restaurant/ Bar | 1,310 | 0.4 | ||||||
| Other | 15,799 | 5.1 | ||||||
Residential Mortgage Loans. Our residential mortgage loans consist of residential first and second mortgage loans, residential construction loans and home equity line of credit and term loans secured by first and second mortgages on the residences of borrowers. Second mortgage loans and home equity lines of credit are used for home improvements, education and other personal expenditures. We make mortgage loans with a variety of terms, including fixed, floating and variable interest rates and a variety of loan maturities. We sell the majority of the residential mortgage loans that we originate (95% in 2005) to larger financial institutions.
Residential mortgage loans generally are made on the basis of the borrower’s ability to repay the loan from his or her salary and other income and are secured by residential real estate, the value of which is generally readily ascertainable. These loans are made consistent with our appraisal and real estate lending policies, which detail maximumloan-to-value ratios and maturities. Residential mortgage loans and home equity lines of credit secured by owner-occupied property generally are made with aloan-to-value ratio of up to 80%.Loan-to-value ratios of up to 90% may be allowed on residential owner-occupied property, certain land loans, or if it is the intent to convert to a construction loan in a relatively quick timeframe, and the borrower exhibits unusually strong liquidity, net worth and cash flow.
| Commercial and Consumer: |
Commercial and Industrial Loans. We make C&I loans to qualified businesses in our market area. Our commercial lending portfolio consists primarily of commercial and industrial loans for the financing of accounts receivable, inventory, property, plant and equipment. We also offer loans guaranteed by the U.S. Small Business Administration, or SBA.
Commercial and industrial loans generally have a higher degree of risk than commercial real estate loans, but have commensurately higher yields. Commercial real estate loans generally are made on the basis of the value of an income-producing property and the ability to repay the loan is dependent upon the successful operation of a business. In contrast, C&I loans typically are made on the basis of the borrower’s ability to repay the loan from the cash flow from its business and are secured by business assets with less easily determinable or achievable value, such as accounts receivable, equipment and inventory. Lines of credit typically have a 12 month commitment and will be secured by the trading asset that is being financed. In cases of larger commitments, a borrowing base certificate may be required to determine eligible collateral and advance parameters. Term loans seldom exceed 60 months, but in no case exceed the depreciable life of the tangible asset being financed.
To manage these risks, our policy is to secure the commercial loans we make with both the assets of the borrowing business and other additional collateral and guarantees that may be available. In addition, we actively monitor certain measures of the borrower, including advance rate, cash flow, collateral value and other appropriate credit factors.
63
Table of Contents
Consumer Loans. Our consumer loans consist primarily of installment loans made to individuals for personal, family and household purposes. The specific types of consumer loans we make include home improvement loans, automobile loans, debt consolidation loans and general consumer lending.
Consumer loans may entail greater risk than real estate loans, particularly in the case of consumer loans that are unsecured, such as lines of credit, or secured by rapidly depreciable assets, such as automobiles. In such cases, any repossessed collateral for a defaulted consumer loan may not provide an adequate source of repayment of the outstanding loan balance as a result of the greater likelihood of damage, loss or depreciation. The remaining deficiency often does not warrant further substantial collection efforts against the borrower. In addition, consumer loan collections are dependent on the borrower’s continuing financial stability, and thus are more likely to be adversely affected by job loss, divorce, illness, or personal bankruptcy. Furthermore, the application of various federal and state laws, including federal and state bankruptcy and insolvency laws, may limit the amount that can be recovered on such loans. A loan may also give rise to claims and defenses by a consumer loan borrower against an assignee of such loan, such as the bank, and a borrower may be able to assert against such assignee claims and defenses that it has against the seller of the underlying collateral.
Our policy for consumer loans is to accept moderate risk while minimizing losses, primarily through a careful credit and financial analysis of the borrower. In evaluating consumer loans, we require our lending officers to review the borrower’s level and stability of income, past credit history, amount of debt currently outstanding and the impact of these factors on the ability of the borrower to repay the loan in a timely manner. In addition, we require our banking officers to maintain an appropriate margin between the loan amount and collateral value.
We also issue credit cards to certain of our customers. In determining to whom we will issue credit cards, we evaluate the borrower’s level and stability of income, past credit history and other factors. Finally, we make additional loans that are not classified in one of the above categories. In making such loans, we attempt to ensure that the borrower meets our loan underwriting standards.
| Credit Policies: |
We have historically maintained very strong credit quality. Generally, the developers of multifamily construction loans for apartment type dwellings do not have any leases in place for these projects, but we require a maximum loan to value of 85%, minimum debt service coverage ratio of 1.2:1 at stabilized occupancy, full recourse to the borrower and personal guarantees from the principals of corporate borrowers to reduce our risks associated with these loans. For construction loans for commercial and industrial projects, we usually require a minimum of 50% of the space leased with reasonable projections supporting a minimum debt service coverage ratio of 1.2:1 at stabilized occupancy, or executed leases must be in place to provide a minimum debt service coverage ratio of 1.1:1 with reasonable projections to meet the minimum stabilized coverage ratio of 1.2:1. While we prefer a minimum of 50% of the project’s space to be leased, a lesser percentage may be approved depending on the amount by which the projected debt service coverage ratio exceeds the minimum debt service coverage ratio. Because this type of loan represents a higher degree of risk to the Bank, normally this loan is only made to developers with well-established track records in the industry, substantial cash flow, and with tenants with strong credit supporting the loan. We also provide land development loans to qualified developers and builders who are experienced and well-capitalized. Normally the principals of the developer are required to personally guarantee the loan, although exceptions may be made on a case-by-case basis for well-established builders/developers or exceptionally strong properties that have a substantial debt coverage ratios. Where possible, permanent take out commitments from financially sound lenders or other evidence of a source of repayment acceptable to the Bank may be required, or the Bank may offer permanent financing at the conclusion of the project.
The board of directors of Westsound Bank establishes our lending policies. These lending policies are reviewed at least annually and evaluated from time to time by the board. Key elements of our current
64
Table of Contents
policies are debt service coverage, monitoring concentration levels and maintaining strict approval and underwriting procedures.
Debt Service Coverage. Our risk management philosophy is to extend credit only when an applicant has proven cash flow to service the proposed debt. Additionally, it is generally necessary for the applicant to demonstrate an independent secondary source of repayment.
Monitor Concentration Levels. We have established maximum levels of concentration levels for each loan type to ensure diversification of our loan portfolio and mitigate concentration risks.
Strict Approval and Underwriting Procedures. If a credit falls outside of the guidelines set forth in our lending policies, the loan is not approved until it is reviewed by a higher level of credit approval authority. Credit approval authority has three levels, as listed below from lowest to highest level. Based on the historical strong emphasis on business development, the board of directors of Westsound Bank has intentionally kept approval authorities low to assure a high degree of secondary review for a credit consideration. Management believes that the current authority levels provide satisfactory management and a reasonable percentage of secondary review. Any conditions placed on loans in the approval process must be satisfied before our credit administration will release loan documentation for execution. Our credit administration works entirely independent of loan production and has full responsibility for all loan disbursements.
| • | Individual Authorities. Individual loan officers have approval authority up to $25,000 for secured and unsecured loans. The chief executive officer and the chief lending officer have approval authority of up to $100,000 for secured and unsecured loans. | |
| • | Senior Loan Committee. The senior loan committee consists of the chief executive officer, the chief lending officer and the executive vice president of sales and lending. The committee has approval authority up to $100,000 for secured and unsecured loans. | |
| • | Directors Loan Committee. The directors loan committee consists of four directors of Westsound Bank, and the chief executive officer. It has approval authority up to our legal lending limit, which was approximately $5.5 million at September 30, 2006. |
Loan Grading and Loan Review. We seek to quantify the risk in our lending portfolio by maintaining a loan grading system consisting of seven different categories (Grades 1-7). The grading system is used to determine, in part, the provision for loan losses. The first three grades in the system are considered satisfactory. The other four grades range from a “Watch/ Pass” category to a “Loss” category. These four grades are further discussed below under the section subtitled “Classified Assets.”
The originating loan officer initially assigns a grade to each credit as part of the loan approval process. Such grade may be changed as a loan application moves through the approval process. In addition to any dollar limitations that may require higher credit approval authority, each loan that is graded “Watch/ Pass” or worse requires prior approval of the directors loan committee of Westsound Bank.
The grade on each individual loan is subject to review from time to time, and may be changed if warranted. The board of directors of Westsound Bank reviews monthly the aggregate amount of all loans graded as special mention, substandard or loss. Additionally, changes in the grade for a loan may occur through any of the following means:
| • | random reviews of the loan portfolio conducted by loan administration; | |
| • | annual reviews conducted by an outside loan reviewer; | |
| • | bank regulatory examinations; | |
| • | monthly action plans submitted to loan administration by the responsible lending officers for each credit graded 4-7; or | |
| • | at the monthly credit risk managers meeting if a loan is exhibiting certain delinquency tendencies. |
65
Table of Contents
Loan Delinquencies. When a borrower fails to make a committed payment, we attempt to cure the deficiency by contacting the borrower to seek payment. Habitual delinquencies and loans delinquent 10 days or more are reviewed at the weekly directors loan committee meeting for possible changes in grading.
Classified Assets. Federal regulations require that each insured bank classify its assets on a regular basis. In addition, in connection with examinations of insured institutions, examiners have authority to identify problem assets, and, if appropriate, classify them. We use grades 4-7 of our loan grading system to identify potential problem assets. There were $1.6 million, $637,000, $121,000 and $167,000 in classified loans at September 30, 2006, December 31, 2005, December 31, 2004 and December 31, 2003, respectively.
The following describes grades 4-7 of our loan grading system:
| • | Special Mention — Grade 4. These assets have potential weaknesses that may result in deterioration of the repayment prospects and, therefore, deserve the attention of management. Usually, these assets are long-term problems that are likely to remain and require management action plans. These loans exhibit an increasing reliance on collateral for repayment. | |
| • | Substandard — Grade 5. These assets are inadequately protected by the current worth and paying capacity of the borrower or of the collateral pledged, if any. Although loss may not be imminent, if the weaknesses are not corrected, there is a good possibility that we will sustain some loss. | |
| • | Doubtful — Grade 6. These assets have all the weaknesses inherent in an asset classified as “substandard,” with the added characteristic that the weaknesses make collection or liquidation in full, on the basis of currently existing facts, condition and values, highly questionable and improbable. At the point where a loss is identified, all or that portion deemed a loss is immediately classified as “Loss” and charged off. | |
| • | Loss — Grade 7. These assets have been determined to have identifiable, uncollectible components. Typically, a partial charge-off of the loss will have occurred, and the balance remaining would be reflective of management’s best estimate of collectibility. |
| Our Investment Activities |
Our investment strategy is designed to be complementary to and interactive with the our other activities (i.e. cash position; borrowed funds; quality, maturity, stability and earnings of loans; nature and stability of deposits; capital and tax planning). Investment securities consist primarily of U.S. Agency issues and municipal bonds. In addition, for bank liquidity purposes, we use Fed Funds Sold which are temporary overnight sales of excess funds to correspondent banks. Our securities portfolio is managed in accordance with guidelines set by our investment policy. Specificday-to-day transactions affecting the securities portfolio are managed by our chief financial officer. These securities activities are reviewed monthly or more often, as needed, by our investment committee and are reported monthly to our board of directors.
Our general objectives with respect to our investment portfolio are to:
| • | maintain collateral for pledging requirements; | |
| • | achieve an acceptable asset/liability gap position (based on our separate policy related to asset/liability management that provides guidance for how investments are to be used to manage asset/liability gaps); and | |
| • | provide a suitable balance of quality and diversification to our assets. |
66
Table of Contents
| Deposit Products and Other Sources of Funds |
Our primary sources of funds for use in our lending and investing activities consist of:
| • | deposits; | |
| • | maturities and principal and interest payments on loans and securities; | |
| • | other borrowings; and | |
| • | funds down-streamed into Westsound Bank from time to time by WSB Financial Group. |
We closely monitor rates and terms of competing sources of funds and utilize those sources we believe to be the most cost effective, consistent with our asset and liability management policies.
Deposits. An important balance sheet component affecting our net interest margin is the composition and cost of our deposit base. We can improve our net interest margin to the extent that growth in deposits can be focused in the less volatile and somewhat more traditional core deposits, or total deposits less CDs greater than $100,000, commonly referred to as Jumbo CDs. We attempt to price our deposit products in order to promote deposit growth and satisfy our liquidity requirements and offer a variety of deposit products in order to satisfy our customers’ needs.
We provide a wide array of deposit products. We have historically relied upon, and expect to continue to rely upon, deposits to satisfy our needs for sources of funds. We offer regular checking, savings, NOW and money market deposit accounts. We also offer fixed-rate, fixed maturity retail CDs ranging in terms from 30 days to five years, individual retirement accounts and Jumbo CDs. The primary sources of deposits are small-and medium-sized businesses and individuals within our target market. Senior management has the authority to set rates within specified parameters in order to remain competitive with other financial institutions in our market area. All deposits are insured by the Federal Deposit Insurance Corporation up to the maximum amount permitted by law. We have a service fee schedule, which is competitive with other financial institutions in our market, covering such matters as maintenance fees on checking accounts, per item processing fees on checking accounts, returned check charges and other similar fees.
We intend to continue our efforts at attracting deposits from our business lending relationships in order to reduce our cost of funds and improve our net interest margin. Also, we believe that we have the ability to attract sufficient additional funding by re-pricing the yields on our CDs in order to meet loan demands during times that growth in core deposits differs from loan demand. In order to fund loan demand, we have also utilized wholesale funding from time to time, as well as Internet-based rate offerings to attract large sums of deposits.
In addition to our traditional marketing methods, we attract new clients and deposits by:
| • | expanding long-term business customer relationships, including referrals from our customers; and | |
| • | building deposit relationships through our branch relationship officers who are compensated based upon the profitability of such relationships. |
Other Borrowings. We may occasionally use our Fed funds lines of credit to support liquidity needs created by seasonal deposit flows, to temporarily satisfy funding needs from increased loan demand, and for other short-term purposes. We have three Fed funds lines with other financial institutions pursuant to which we can borrow up to $15 million on an unsecured basis. These lines may be terminated by the respective lending institutions at any time.
We also borrow from the Federal Home Loan Bank, or FHLB, pursuant to an existing commitment based on the value of the collateral pledged (either loans or securities). FHLB borrowings have been only occasional and based upon pricing opportunities.
67
Table of Contents
| Other Products and Services |
We offer a variety of other products and services, including:
| • | Courier Services. We offer courier services to our business customers. Courier services permit us to provide the convenience and personalized service that our customers require by scheduling pick-ups of deposits and facilitating other banking transactions. | |
| • | Telephone and Internet Banking. We believe there is a strong demand within our market for telephone and Internet banking. These services allow both consumer and business customers to access detailed account information and manage their accounts, including on-line balance transfers and bill payment. These services enable our customers to conduct their banking business and monitor their bank accounts from remote locations and at any time. We believe our telephone and Internet banking services are invaluable in attracting and retaining customers and encourage them to consider Westsound Bank for all their banking and financial needs. | |
| • | Automatic Teller Machines (ATM). In 2005 we analyzed our ATM services and found that it would be more cost effective for us, and more beneficial to our customers, to discontinue ATMs at our branches and instead offer ATM fee reimbursement to our customers, allowing them to use ATMs nationwide without paying a per transaction fee. Each checking and deposit account has a monthly reimbursement limit. | |
| • | Real Estate Services. We offer certain fee-based services to real estate contractors, including project inspections and mortgage banking consulting. | |
| • | Other Products. We offer other banking-related specialized products and services to our customers, such as cashier’s checks, money orders, debit/credit cards, wire transfers, travelers’ checks and safe deposit services. While we sell many of our consumer and commercial real estate term loans, we have not engaged in any securitizations of loans. |
Our Concentrations/ Customers
No individual or single group of related accounts is considered material in relation to our assets or deposits or in relation to our overall business. However, approximately 93.6% of our loan portfolio at September 30, 2006 consisted of real estate-secured loans, including commercial loans secured by real estate, construction loans and real estate mortgage loans. Moreover, our business activities are currently focused in west Puget Sound, particularly Kitsap County. Consequently, our business is dependent on the trends of this local economy, and in particular, the commercial and residential real estate markets. At September 30, 2006, we had 11 loans in excess of $1.5 million each, totaling $23.0 million. These loans comprise approximately 0.7% of our loan portfolio by number of loans and 7.4% by total loans outstanding. Not including credit card and consumer overdraft lines and purchased participation loans, our average loan size as of September 30, 2006 was approximately $200,000.
Our lending policies also establish customer and product concentration guidelines to control single customer and product exposures. As these guidelines are not absolute, at any particular point in time the ratios may be higher or lower because of funding on outstanding commitments. Set forth below are our concentration guidelines and the segmentation of our loan portfolio by loan type as of September 30, 2006.
| Percent of Total Tier 1 Capital | Percent of Total Loans | ||||||||||||
| Actual | Policy Limit | Actual | |||||||||||
| Real Estate | |||||||||||||
| Construction | 411% | 50% | 38% | ||||||||||
| Land development | 177% | 25% | 16% | ||||||||||
| Commercial real estate | 231% | 40% | 21% | ||||||||||
| Residential real estate | 202% | 40% | 19% | ||||||||||
| Commercial and industrial | 58% | 50% | 5% | ||||||||||
| Consumer | 11% | 25% | 1% | ||||||||||
68
Table of Contents
Risk Management
Our strategic plan continues to promote a rapid growth rate. We are equally committed to maintaining internal controls to manage the risk associated with such growth. Our risk management committee has defined our most significant risks and measures the trends from low to high. The committee has identified credit risk and operational risk as the two areas that could have the greatest impact on capital. In order to mitigate and proactively manage these areas of risk, we have established sound procedures and committed experienced human resources to this effort.
We have focused on enhancing two functions:
| • | Credit administration has been staffed to maintain all credit policies and procedures, loan documentation, disbursement of loan proceeds and to review the integrity of the credit risk rating system; and | |
| • | Operations support has been significantly enhanced by the board’s appointment of Veronica R. Colburn as our chief risk officer. She is familiar with our overall operations, having previously served as our chief financial officer and as our chief operating officer. Ms. Colburn is responsible for enhancing our risk management program and directing our compliance staff, and will work with the chair of the audit committee to identify particular risks that may require the attention of our internal and external auditors. |
We believe that the established organization allows management to maintain an accurate understanding of risk levels at all times. With this level of understanding, strategic plans are developed with the necessary risk parameters to adequately protect our capital.
Training Program
With the move to our new headquarters in Bremerton, Washington in 2006, we now have astate-of-the-art training facility which houses 16 interactive training stations in a classroom type setting. We are using the training program to provide both continuing education and regulatory training, as well as general operational and sales training for all new hires. The program covers all aspects of banking, from regulatory and financial topics to customer courtesy and sales. This has allowed us to hire individuals without prior banking experience that meet the criteria for our high achieving culture. It has afforded us the luxury of hiring for attitude, then training for aptitude, enabling us to replicate our culture and business service model each time a new branch or loan production office is opened.
Our marketing department has also taken advantage of the training facility by offering classes to our customers and the general public, to better educate our customers on our products and services. Some recent topics have included accounting for builders, banking on-line, and balancing a checkbook.
Information Technology Systems
We have recently made significant investments in core informational technology systems for our banking and lending operations and management activities. These computer systems automate bank transactions for our branches, mortgage originations, other loans and electronic banking, database and direct response marketing, and provide cash management, streamlined reporting and reconciliation support as well as sales support.
With this investment in technology, the bank offers Internet-based delivery of products for both its consumer and business customers. Customers can open accounts, apply for loans, check balances, check account history, transfer funds, pay bills, use interactive calculators and correspond viae-mail with the bank over the Internet. The Internet provides an inexpensive way for the bank to expand its geographic reach and branch activities while providing the kinds of services one would expect from larger banks.
We outsource our major systems including our EFT, credit card and transaction processing and our online Internet bill payment and banking services to third-party service providers to the banking and lending industries, principally Fiserv, Inc. and its affiliates. While there are risks associated with
69
Table of Contents
outsourcing these systems, including the potential interruption of our operations as a result of the failure of a third-party’s system or the termination of its service, we believe these risks are outweighed by the advantages of outsourcing, particularly the flexibility these systems offer us to upgrade and scale these systems and services to accommodate our growth without requiring us to invest substantial additional capital and staff resources.
Our Competition
The banking and financial services business in the west Puget Sound and greater Seattle metro area is highly competitive. This competitive environment is a result primarily of growth in community banks, changes in regulation, changes in technology and product delivery systems, and the accelerating pace of consolidation among financial services providers. We compete for loans, deposits and customers with other commercial banks, savings and loan associations, securities and brokerage companies, mortgage companies, insurance companies, finance companies, money market funds, credit unions, and other nonbank financial service providers. Many of these competitors are much larger in total assets and capitalization, have greater access to capital markets and offer a broader range of financial services than we offer.
According to the FDIC’s deposit market share report, as of June 30, 2006 18 banks operated in Kitsap County and 14 operated in Clallam county. In Kitsap County, two large national banks, Bank of America, N.A. and Washington Mutual Bank, had approximately 34% of all deposits and two other community banks, American Marine Bank and Kitsap Bank, had approximately 30% of all deposits. According to our CRA Performance Evaluation dated January 31, 2006, we ranked 20th out of 330 mortgage lenders in Kitsap County with a 1.2% market share.
We believe that our focus on customer service and relationship-banking distinguishes us from the larger banks, and that our professional retail sales culture and real estate lending expertise, provide us with a sustainable competitive advantage over our competitors in the west Puget Sound market, including other community banks.
Management believes that the principal competitive factors affecting our markets include interest rates paid on deposits and charged on loans, the range of banking products available and customer service and support. Although management believes that our products currently compete favorably with respect to these factors, there can be no assurance that we can maintain our competitive position against current and potential competitors, especially those with significantly greater financial resources.
Legal Proceedings
There are no material pending legal proceedings to which we or Westsound Bank is a party or to which any of our properties are subject, except the memorandum of understanding with the FDIC with respect to Westsound Bank’s compliance with HMDA and certain other banking-related consumer laws, which is described above in “Management’s Discussion and Analysis of Financial Condition and Results of Operations — Regulatory Compliance.” There are no material proceedings known to us to be contemplated by any governmental authority. We are involved in a variety of litigation matters in the ordinary course of our business and anticipate that we will become involved in new litigation matters from time to time in the future.
Properties
We own the buildings and land for four of our offices, in addition to our headquarters. These properties are not subject to any mortgages or encumbrances and consist of the following:
| • | Headquarters located at 607 Pacific Avenue, Bremerton, Washington, which is 20,196 square feet. Our headquarters and administrative offices are located in the main branch. | |
| • | Bremerton support facility located at 190 Pacific Avenue, Bremerton, Washington, which is 6,668 square feet. |
70
Table of Contents
| • | Port Angeles branch located at 602 E. Front Street, Port Angeles, Washington, which is 2,358 square feet. | |
| • | Poulsbo branch located at 21895 Viking Way NW, Poulsbo, Washington, which is 2,000 square feet. | |
| • | Sequim branch located at 1320 W. Washington, Sequim, Washington, which is 924 square feet. |
We lease three of our branches and three of our LPOs:
| • | Port Orchard branch located at 100 Bethel Avenue, Port Orchard, Washington, which is 1,400 square feet. The lease is for a five-year term, expiring May 2008. Our current monthly rent is $2,100. | |
| • | Silverdale branch located at 9960 Silverdale Way NW, Silverdale, Washington, which is 6,031 square feet. The lease expires in October 2011. Our current monthly rent is $11,090, which increases to $14,307 by the end of the lease. | |
| • | Gig Harbor branch located at 5775 Soundview Drive, Gig Harbor, Washington, which is 3,950 square feet. The lease is for a five-year term, expiring April 2010. Our current monthly rent is $4,806, which increases to $5,409 by the end of the lease. | |
| • | Federal Way LPO located at 2505 South 320th Street, Federal Way, Washington, which is 3,420 square feet. The lease is for a five-year term, expiring June 2010. Our current monthly rent is $8,783, which increases to $10,676 by the end of the lease. | |
| • | Belfair LPO located at 23552 NE State Route 3, Belfair, Washington, which is 800 square feet. The lease is for a one-year term, expiring June 2007. Our current monthly rent is $1,200. | |
| • | Port Townsend LPO located at 2500 West Sims Way, Port Townsend, Washington, which is for a single office of approximately 100 square feet. The lease is on amonth-to-month basis with monthly rent of $500. |
We plan to convert our Federal Way loan production office to a branch later this year.
Although we are currently targeting two to three branches or loan production offices per year, we believe that our existing facilities are adequate for our present purposes. We presently have no preliminary agreements or understandings with any third-party to acquire additional branch locations.
Employees
We had a total of 118 full-time equivalent employees at September 30, 2006. Our employees are not represented by a labor organization, and we are not aware of any activity seeking such organization. We believe that our relationship with our employees is good.
We believe that a key reason for our success is our unique incentive compensation package that we have developed to directly reward our employees for their individual production and sales. A substantial portion of our loan production staff’s pay is based on commissions. The incentives are tiered to emphasize cross-selling of our products and services, with higher rewards for gaining multiple relationships with customers. Our senior management is not eligible to receive incentive compensation based on account production.
71
Table of Contents
SUPERVISION AND REGULATION
The following discussion is only intended to provide summaries of significant statutes and regulations that affect the banking industry and is therefore not complete. Changes in applicable laws or regulations, and in the policies of regulators, may have a material effect on our business and prospects. We cannot accurately predict the nature or extent of the effects on our business and earnings that fiscal or monetary policies, or new federal or state laws, may have in the future.
General
We are extensively regulated under federal and state law. These laws and regulations are primarily intended to protect depositors, not shareholders. The discussion below describes and summarizes certain statutes and regulations. These descriptions and summaries are qualified in their entirety by reference to the particular statute or regulation. Changes in applicable laws or regulations may have a material effect on our business and prospects. Our operations may also be affected by changes in the policies of banking and other government regulators. We cannot accurately predict the nature or extent of the possible future effects on our business and earnings of changes in fiscal or monetary policies, or new federal or state laws and regulations.
Compliance
In order to assure that we are in compliance with the laws and regulations that apply to our operations, including those summarized below, we employ a compliance officer, and we engage an independent compliance auditing firm. We are regularly reviewed by the Federal Reserve, the FDIC, and the Washington Department of Financial Institutions, Division of Banks, or DFI, during which reviews such agencies assess our compliance with applicable laws and regulations. Based on the assessments of our outside compliance consultants and the FDIC, we believe that we materially comply with all of the laws and regulations that apply to our operations.
Federal Bank Holding Company Regulation
General. WSB Financial Group, Inc. is a registered financial holding company as defined in the Bank Holding Company Act of 1956, as amended, or the Bank Holding Company Act, and is therefore subject to regulation, supervision and examination by the Federal Reserve. In general, the Bank Holding Company Act limits the business of bank holding companies to owning or controlling banks and engaging in other activities closely related to banking. WSB Financial Group must file reports with the Federal Reserve and must provide it with such additional information as it may require.
The Federal Reserve may require WSB Financial Group to terminate an activity or terminate control or liquidate or divest certain subsidiaries, affiliates or investments when the Federal Reserve believes the activity or the control of the subsidiary or affiliates constitutes a significant risk to the financial safety, soundness or stability of any of its banking subsidiaries.
The Federal Reserve also has the authority to regulate provisions of certain bank holding company debt, including the authority to impose interest ceilings and reserve requirements on such debt. Under certain circumstances, WSB Financial Group must file written notice and obtain Federal Reserve approval prior to purchasing or redeeming its equity securities. Additionally, WSB Financial Group is required by the Federal Reserve to maintain certain levels of capital. See “Capital Adequacy” below for a discussion of the applicable federal capital requirements.
Financial Holding Company Status. Under the Financial Services Modernization Act of 1999, a bank holding company may apply to the Federal Reserve to become a financial holding company, and thereby engage (directly or through a subsidiary) in certain activities deemed financial in nature. WSB Financial Group’s election of financial holding company status was effective October 3, 2006.
72
Table of Contents
As a financial holding company, WSB Financial Group may affiliate with securities firms and insurance companies and engage in other activities that are financial in nature or are incidental or complementary to activities that are financial in nature. “Financial in nature” activities include:
| • | Securities underwriting; | |
| • | Dealing and market making; | |
| • | Sponsoring mutual funds and investment companies; | |
| • | Insurance underwriting and brokerage; merchant banking; and | |
| • | Activities that the Federal Reserve, in consultation with the Secretary of the Treasury, determines from time to time to be so closely related to banking or managing or controlling banks as to be a proper incident thereto. |
In order to become or remain a financial holding company, Westsound Bank must be well capitalized, well managed, and, except in limited circumstances, in satisfactory compliance with the Community Reinvestment Act. Failure to sustain compliance with such requirements or correct any non-compliance within a fixed time period could lead to divesture of subsidiary banks or require us to conform all of our activities to those permissible for a bank holding company. A bank holding company that is not also a financial holding company can only engage in banking and such other activities determined by the Federal Reserve to be so closely related to banking or managing or controlling banks as to be a proper incident thereto.
We do not believe that the Financial Services Modernization Act will negatively affect our operations in the short term. However, to the extent the legislation permits banks, securities firms and insurance companies to affiliate, the financial services industry may experience further consolidation. This consolidation could result in a growing number of larger financial institutions that offer a wider variety of financial services than we currently offer, and these companies may be able to aggressively compete in the markets we currently serve.
Acquisition of Banks. The Bank Holding Company Act requires every bank holding company to obtain the Federal Reserve Board’s prior approval before:
| • | acquiring direct or indirect ownership or control of any voting shares of any bank if, after the acquisition, the bank holding company will directly or indirectly own or control more than 5% of the bank’s voting shares; | |
| • | acquiring all or substantially all of the assets of any bank; or | |
| • | merging or consolidating with any other bank holding company. |
Additionally, the Bank Holding Company Act provides that the Federal Reserve Board may not approve any of these transactions if it would result in or tend to create a monopoly, substantially lessen competition or otherwise function as a restraint of trade, unless the anti-competitive effects of the proposed transaction are clearly outweighed by the public interest in meeting the convenience and needs of the community to be served. The Federal Reserve Board is also required to consider the financial and managerial resources and future prospects of the bank holding companies and banks concerned and the convenience and needs of the community to be served. The Federal Reserve Board’s consideration of financial resources generally focuses on capital adequacy, which is discussed below.
Restrictions on Ownership of WSB Financial Group. The Bank Holding Company Act requires any “bank holding company” (as defined in that Act) to obtain the approval of the Board of Governors of the Federal Reserve System prior to acquiring more than 5% of WSB Financial Group’s outstanding common stock. Any person other than a bank holding company is required to obtain prior approval of the Federal Reserve Board to acquire 10% or more of WSB Financial Group’s outstanding common stock under the Change in Bank Control Act. Any holder of 25% or more of WSB Financial Group’s outstanding common
73
Table of Contents
stock, other than an individual, is subject to regulation as a bank holding company under the Bank Holding Company Act.
Holding Company Control of Nonbanks. With some exceptions, the Bank Holding Company Act also prohibits a bank holding company from acquiring or retaining direct or indirect ownership or control of more than 5% of the voting shares of any company which is not a bank or bank holding company, or from engaging directly or indirectly in activities other than those of banking, managing or controlling banks, or providing services for its subsidiaries. The principal exceptions to these prohibitions involve certain non-bank activities which, by statute or by Federal Reserve regulation or order, have been identified as activities closely related to the business of banking or of managing or controlling banks.
Transactions with Affiliates. Subsidiary banks of a bank holding company are subject to restrictions imposed by the Federal Reserve Act on extensions of credit to the holding company or its subsidiaries, on investments in their securities and on the use of their securities as collateral for loans to any borrower. These regulations and restrictions may limit WSB Financial Group’s ability to obtain funds from Westsound Bank for its cash needs, including funds for payment of dividends, interest and operational expenses.
Tying Arrangements. We are prohibited from engaging in certain tie-in arrangements in connection with any extension of credit, sale or lease of property or furnishing of services. For example, with certain exceptions, neither WSB Financial Group nor Westsound Bank may condition an extension of credit to a customer on either (i) a requirement that the customer obtain additional services provided by us or (ii) an agreement by the customer to refrain from obtaining other services from a competitor.
Support of Subsidiary Banks. Under Federal Reserve policy, WSB Financial Group is expected to act as a source of financial and managerial strength to Westsound Bank. This means that WSB Financial Group is required to commit, as necessary, resources to support Westsound Bank. Any capital loans a bank holding company makes to its subsidiary banks are subordinate to deposits and to certain other indebtedness of those subsidiary banks.
State Law Restrictions. As a Washington corporation, WSB Financial Group is subject to certain limitations and restrictions under applicable Washington corporate law. For example, state law restrictions in Washington include limitations and restrictions relating to indemnification of directors; distributions to shareholders; transactions involving directors, officers, or interested shareholders; maintenance of books, records, and minutes; and observance of certain corporate formalities.
Federal and State Regulation of Westsound Bank
General. Westsound Bank is a Washington chartered commercial bank with deposits insured by the FDIC. As a result, Westsound Bank is subject to supervision and regulation by the Washington DFI and the FDIC. These agencies have the authority to prohibit banks from engaging in what they believe constitute unsafe or unsound banking practices.
Lending Limits. Washington banking law generally limits the amount of funds that a bank may lend to a single borrower to 20% of stockholders’ equity.
Control of Financial Institutions. The acquisition of 25% or more of a state chartered bank’s voting power by any individual, group or entity, is deemed a change in control under Washington banking law, requiring notice and application and prior approval of the DFI.
Community Reinvestment. The Community Reinvestment Act requires that, in connection with examinations of financial institutions within their jurisdiction, the FDIC evaluate the record of the financial institution in meeting the credit needs of its local communities, including low and moderate income neighborhoods, consistent with the safe and sound operation of the institution. These factors are also considered in evaluating mergers, acquisitions and applications to open a branch or facility.
Insider Credit Transactions. Banks are also subject to certain FDIC restrictions on extensions of credit to executive officers, directors, principal shareholders or any related interests of such persons (i.e.,
74
Table of Contents
insiders). Extensions of credit (i) must be made on substantially the same terms and pursuant to the same credit underwriting procedures as those for comparable transactions with persons who are neither insiders nor employees, and (ii) must not involve more than the normal risk of repayment or present other unfavorable features. Banks are also subject to certain lending limits and restrictions on overdrafts to insiders. A violation of these restrictions may result in regulatory sanctions on the bank or its insiders.
Regulation of Management. Federal law sets forth circumstances under which officers or directors of a bank may be removed by the institution’s federal supervisory agency. Federal law also prohibits management personnel of a bank from serving as a director or in a management position of another financial institution whose assets exceed a specified amount or which has an office within a specified geographic area.
Safety and Soundness Standards. Federal law imposes upon banks certain non-capital safety and soundness standards. These standards cover internal controls, information systems, internal audit systems, loan documentation, credit underwriting, interest rate exposure, asset growth, compensation and benefits. Additional standards apply to asset quality, earnings and stock valuation. An institution that fails to meet these standards must develop a plan acceptable to its regulators, specifying the steps that the institution will take to meet the standards. Failure to submit or implement such a plan may subject the institution to regulatory sanctions. Under Washington state law, if the stockholders’ equity of a Washington state-chartered bank becomes impaired, the Commissioner of the Washington DFI will require the bank to make the impairment good. Failure to make the impairment good may result in the Commissioner’s taking possession of the bank and liquidating it.
Dividends. The principal source of WSB Financial Group’s cash reserves will be dividends received from Westsound Bank. Washington law limits the bank’s ability to pay cash dividends. Under these restrictions, a bank may not declare or pay any dividend greater than its retained earnings without approval of the Washington DFI. The Washington DFI has the power to require any state-chartered bank to suspend the payment of any and all dividends.
In addition, a bank may not pay cash dividends if doing so would reduce its capital below minimum applicable federal capital requirements. See “Capital Adequacy” below for a discussion of the applicable federal capital requirements.
Other Regulations. The loan operations of our Bank are subject to state usury laws and federal laws concerning interest rates.
Federal Laws Applicable to Credit Transactions. The loan operations of our Bank are also subject to federal laws applicable to credit transactions, such as the:
| • | Truth-In-Lending Act, governing disclosures of credit terms to consumer borrowers; | |
| • | Home Mortgage Disclosure Act of 1975, requiring financial institutions to provide information to enable the public and public officials to determine whether a financial institution is fulfilling its obligation to help meet the housing needs of the community it serves; | |
| • | Equal Credit Opportunity Act, prohibiting discrimination on the basis of race, creed or other prohibited factors in extending credit; | |
| • | Fair Credit Reporting Act of 1978, governing the use and provision of information to credit reporting agencies; | |
| • | Fair Debt Collection Practices Act, governing the manner in which consumer debts may be collected by collection agencies; | |
| • | Servicemembers Civil Relief Act, which amended the Soldiers’ and Sailors’ Civil Relief Act of 1940, governing the repayment terms of, and property rights underlying, secured obligations of persons in military service; and |
75
Table of Contents
| • | the rules and regulations of the various federal agencies charged with the responsibility of implementing these federal laws. |
Federal Laws Applicable to Deposit Operations. The deposit operations of our Bank are subject to:
| • | the Right to Financial Privacy Act, which imposes a duty to maintain confidentiality of consumer financial records and prescribes procedures for complying with administrative subpoenas of financial records; and | |
| • | the Electronic Funds Transfer Act and Regulation E issued by the Federal Reserve Board to implement that act, which govern automatic deposits to and withdrawals from deposit accounts and customers’ rights and liabilities arising from the use of automated teller machines and other electronic banking services. |
Brokered Deposits. Under the Federal Deposit Insurance Corporation Improvement Act, or FDICIA, banks may be restricted in their ability to accept brokered deposits, depending on their capital classification. “Well-capitalized” banks are permitted to accept brokered deposits, but all banks that are not well-capitalized are not permitted to accept such deposits. The FDIC may, on a case-by-case basis, permit banks that are adequately capitalized to accept brokered deposits if the FDIC determines that acceptance of such deposits would not constitute an unsafe or unsound banking practice with respect to the bank. As of September 30, 2006, we had $24.9 million of brokered deposits. As described below, the Bank is currently well-capitalized and therefore is not subject to any limitations with respect to their brokered deposits.
Check Clearing for the 21st Century Act. On October 28, 2003, President Bush signed into law the Check Clearing for the 21st Century Act, also known as Check 21. The new law gives “substitute checks,” such as a digital image of a check and copies made from that image, the same legal standing as the original paper check. Some of the major provisions include:
| • | allowing check truncation without making it mandatory; | |
| • | demanding that every financial institution communicate to accountholders in writing a description of its substitute check processing program and their rights under the law; | |
| • | legalizing substitutions for and replacements of paper checks without agreement from consumers; | |
| • | retaining in place the previously mandated electronic collection and return of checks between financial institutions only when individual agreements are in place; | |
| • | requiring that when accountholders request verification, financial institutions produce the original check (or a copy that accurately represents the original) and demonstrate that the account debit was accurate and valid; and | |
| • | requiring recrediting of funds to an individual’s account on the next business day after a consumer proves that the financial institution has erred. |
This new legislation will likely affect bank capital spending as many financial institutions assess whether technological or operational changes are necessary to stay competitive and take advantage of the new opportunities presented by Check 21.
Federal Home Loan Bank System. The Federal Home Loan Bank system, of which our Bank is a member, consists of 12 regional FHLBs governed and regulated by the Federal Housing Finance Board, or FHFB. The FHLBs serve as reserve or credit facilities for member institutions within their assigned regions. They are funded primarily from proceeds derived from the sale of consolidated obligations of the FHLB system. They make loans (i.e., advances) to members in accordance with policies and procedures established by the FHLB and the boards of directors of each regional FHLB.
As a system member, our Bank is entitled to borrow from the FHLB of its region and is required to own a certain amount of capital stock in the FHLB. Our Bank is in compliance with the stock ownership rules described above with respect to such advances, commitments and letters of credit and home
76
Table of Contents
mortgage loans and similar obligations. All loans, advances and other extensions of credit made by the FHLB to our Bank are secured by a portion of its mortgage loan portfolio, certain other investments and the capital stock of the FHLB held by the Bank.
Mortgage Banking Operations. Our Bank is subject to the rules and regulations of FHA, VA, FNMA, FHLMC and GNMA with respect to originating, processing, selling and servicing mortgage loans and the issuance and sale of mortgage-backed securities. Those rules and regulations, among other things, prohibit discrimination and establish underwriting guidelines which include provisions for inspections and appraisals, require credit reports on prospective borrowers and fix maximum loan amounts, and, with respect to VA loans, fix maximum interest rates. Mortgage origination activities are subject to, among others, the Equal Credit Opportunity Act, FederalTruth-in-Lending Act and the Real Estate Settlement Procedures Act and the regulations promulgated thereunder which, among other things, prohibit discrimination and require the disclosure of certain basic information to mortgagors concerning credit terms and settlement costs.
Privacy
Federal banking rules limit the ability of banks and other financial institutions to disclose non-public information about consumers to nonaffiliated third-parties. Pursuant to these rules, financial institutions must provide:
| • | initial notices to customers about their privacy policies, describing the conditions under which they may disclose nonpublic personal information to nonaffiliated third-parties and affiliates; | |
| • | annual notices of their privacy policies to current customers; and | |
| • | a reasonable method for customers to “opt out” of disclosures to nonaffiliated third-parties. |
These privacy provisions affect how consumer information is transmitted through diversified financial companies and conveyed to outside vendors. We have implemented privacy policies in accordance with the law.
Interstate Banking And Branching
The Riegle-Neal Interstate Banking and Branching Efficiency Act of 1994 (“Interstate Act”) permits nationwide interstate banking and branching under certain circumstances. This legislation generally authorizes interstate branching and relaxes federal law restrictions on interstate banking. Currently, bank holding companies may purchase banks in any state, and states may not prohibit these purchases. Additionally, banks are permitted to merge with banks in other states, as long as the home state of neither merging bank has opted out under the legislation. The Interstate Act requires regulators to consult with community organizations before permitting an interstate institution to close a branch in a low-income area.
FDIC regulations prohibit banks from using their interstate branches primarily for deposit production. The FDIC has implemented aloan-to-deposit ratio screen to ensure compliance with this prohibition.
Washington enacted “opting in” legislation in accordance with the Interstate Act, allowing banks to engage in interstate merger transactions, subject to certain “aging” requirements. Until recently, Washington restrictedout-of-state banks from opening de novo branches; however, in 2005, Washington interstate branching laws were amended so that anout-of-state bank may, subject to the DFI’s approval, open de novo branches in Washington or acquire an in-state branch so long as the home state of theout-of-state bank has reciprocal laws with respect to de novo branching or branch acquisitions. Once anout-of-state bank has acquired a bank within Washington, either through merger or acquisition of all or substantially all of the bank’s assets or through authorized de novo branching, theout-of-state bank may open additional branches within the state.
77
Table of Contents
Deposit Insurance
Westsound Bank’s deposits are currently insured to a maximum of $100,000 per depositor through the Bank Insurance Fund administered by the FDIC. Westsound Bank is required to pay deposit insurance premiums, which are assessed semiannually and paid quarterly. The premium amount is based upon a risk classification system established by the FDIC. Banks with higher levels of capital and a low degree of supervisory concern are assessed lower premiums than banks with lower levels of capital or a higher degree of supervisory concern.
The FDIC is also empowered to make special assessments on insured depository institutions in amounts determined by the FDIC to be necessary to give it adequate assessment income to repay amounts borrowed from the U.S. Treasury and other sources or for any other purpose the FDIC deems necessary.
Legislative reforms to modernize the Federal Deposit Insurance System, including merging the Bank Insurance Fund and the Savings Association Insurance Fund into a new Deposit Insurance Fund, were approved by Congress as part of a $39 billion budget bill that was signed by President Bush on February 15, 2006. In addition to merging the insurance funds, the legislation will:
| • | raise the deposit insurance limit on certain retirement accounts to $250,000 and index that limit for inflation; | |
| • | require the FDIC and National Credit Union Administration boards, starting in 2010 and every succeeding five years, to consider raising the standard maximum deposit insurance; and | |
| • | eliminate the current fixed 1.25 percent Designated Reserve Ratio and provide the FDIC with the discretion to set the DRR within a range of 1.15 to 1.50 percent for any given year. |
Capital Adequacy
Regulatory Capital Guidelines. Federal bank regulatory agencies use capital adequacy guidelines in the examination and regulation of bank holding companies and banks. The guidelines are “risk-based,” meaning that they are designed to make capital requirements more sensitive to differences in risk profiles among banks and bank holding companies.
Tier I and Tier II Capital. Under the guidelines, an institution’s capital is divided into two broad categories, Tier I capital and Tier II capital. Tier I capital generally consists of common stockholders’ equity, surplus and undivided profits. Tier II capital generally consists of the allowance for loan losses, hybrid capital instruments, and subordinated debt. The sum of Tier I capital and Tier II capital represents an institution’s total capital. The guidelines require that at least 50% of an institution’s total capital consist of Tier I capital.
Risk-based Capital Ratios. The adequacy of an institution’s capital is gauged primarily with reference to the institution’s risk weighted assets. The guidelines assign risk weightings to an institution’s assets in an effort to quantify the relative risk of each asset and to determine the minimum capital required to support that risk. An institution’s risk weighted assets are then compared with its Tier I capital and total capital to arrive at a Tier I risk-based ratio and a total risk-based ratio, respectively. The guidelines provide that an institution must have a minimum Tier I risk-based ratio of 4% and a minimum total risk-based ratio of 8%.
Leverage Ratio. The guidelines also employ a leverage ratio, which is Tier I capital as a percentage of total assets less intangibles, to be used as a supplement to risk-based guidelines. The principal objective of the leverage ratio is to constrain the maximum degree to which a bank holding company may leverage its equity capital base. The minimum leverage ratio is 3%; however, for all but the most highly rated bank holding companies and for bank holding companies seeking to expand, regulators generally expect an additional cushion of at least 1% to 2%.
Prompt Corrective Action. Under the guidelines, an institution is assigned to one of five capital categories depending on its total risk-based capital ratio, Tier I risk-based capital ratio, and leverage ratio,
78
Table of Contents
together with certain subjective factors. The categories range from “well capitalized” to “critically undercapitalized.” Institutions that are deemed to be “undercapitalized,” depending on the category to which they are assigned, are subject to certain mandatory supervisory corrective actions.
Corporate Governance and Accounting Legislation
Sarbanes-Oxley Act of 2002. On July 30, 2002, the Sarbanes-Oxley Act of 2002, or SOX, was signed into law to address corporate and accounting fraud. SOX establishes a new accounting oversight board that will enforce auditing standards and restricts the scope of services that accounting firms may provide to their public company audit clients. Among other things, SOX also (i) requires chief executive officers and chief financial officers to certify to the accuracy of periodic reports filed with the SEC; (ii) imposes new disclosure requirements regarding internal controls, off-balance-sheet transactions, and pro forma (non-GAAP) disclosures; (iii) accelerates the time frame for reporting of insider transactions and periodic disclosures by public companies; and (iv) requires companies to disclose whether or not they have adopted a code of ethics for senior financial officers and whether the audit committee includes at least one “audit committee financial expert.”
Under SOX, the SEC is required to regularly and systematically review corporate filings, based on certain enumerated factors. To deter wrongdoing, SOX (i) subjects bonuses issued to top executives to disgorgement if a restatement of a company’s financial statements was due to corporate misconduct; (ii) prohibits an officer or director from misleading or coercing an auditor; (iii) prohibits insider trades during pension fund “blackout periods”; (iv) imposes new criminal penalties for fraud and other wrongful acts; and (v) extends the period during which certain securities fraud lawsuits can be brought against a company or its officers.
As a public reporting company, we will be subject to the requirements of SOX and related rules and regulations issued by the SEC and Nasdaq. We anticipate that we will incur additional expense as a result of the Act, but we do not expect that such compliance will have a material impact on our business.
Anti-terrorism Legislation
USA Patriot Act of 2001. On October 26, 2001, President Bush signed the Uniting and Strengthening America by Providing Appropriate Tools Required to Intercept and Obstruct Terrorism, or the Patriot Act, of 2001. Among other things, the Patriot Act (i) prohibits banks from providing correspondent accounts directly to foreign shell banks; (ii) imposes due diligence requirements on banks opening or holding accounts for foreign financial institutions or wealthy foreign individuals; (iii) requires financial institutions to establish an anti-money-laundering compliance program; and (iv) eliminates civil liability for persons who file suspicious activity reports. The Patriot Act also increases governmental powers to investigate terrorism, including expanded government access to account records. The Department of the Treasury is empowered to administer and make rules to implement the Patriot Act. While we believe the Patriot Act may, to some degree, affect our recordkeeping and reporting expenses, we do not believe that it will have a material adverse effect on our business and operations.
Effects of Government Monetary Policy
Our earnings and growth are affected not only by general economic conditions, but also by the fiscal and monetary policies of the federal government, particularly the Federal Reserve. The Federal Reserve can and does implement national monetary policy for such purposes as curbing inflation and combating recession. The nature and impact of future changes in monetary policies and their impact on us cannot be predicted with certainty.
Nonbank Subsidiary
Our non-bank subsidiary, WSB Financial Group Trust I, a Delaware statutory trust, is subject to the laws and regulations of both the federal government and the state in which it conducts business.
79
Table of Contents
MANAGEMENT
Directors and Executive Officers
Our directors and executive officers are as follows:
| Director | ||||||||||
| Name | Age | Since | Position(s) Held | |||||||
| David K. Johnson | 41 | 2006 | President, Chief Executive Officer and Director | |||||||
| Mark D. Freeman | 53 | Executive Vice President of Finance and Operations, Chief Financial Officer | ||||||||
| Brett T. Green | 44 | Executive Vice President of Sales and Lending | ||||||||
| Veronica R. Colburn | 43 | Senior Vice President, Chief Risk Officer | ||||||||
| Brent A. Stenman | 41 | Senior Vice President, Chief Lending Officer | ||||||||
| Robin A. Seelye | 35 | Senior Vice President, Operations | ||||||||
| Louis J. Weir | 65 | 1999 | Chairman of the Board | |||||||
| Larry C. Westfall | 69 | 1999 | Vice Chairman of the Board | |||||||
| Richard N. Christopherson | 63 | 1999 | Director | |||||||
| James H. Lamb | 59 | 1999 | Director | |||||||
| Brian B. McLellan | 57 | 1999 | Director | |||||||
| Dean Reynolds | 64 | 1999 | Director | |||||||
| Donald H. Tucker | 64 | 1999 | Director | |||||||
There are no family relationships among any of our directors and executive officers.
David K. Johnson, age 41, is the President, Chief Executive Officer and a Director of WSB Financial Group and Westsound Bank. Mr. Johnson has more than 25 years of banking experience, and has been President and CEO of Westsound Bank since April 2001. Previously, Mr. Johnson served as the executive vice president at Pueblo Bank & Trust, a community bank in Colorado, and as a senior vice president at Norwest Bank (now operating as Wells Fargo Bank) in New Mexico. Mr. Johnson attended Eastern New Mexico University, and is a graduate of the Western States School of Banking, Anderson School of Management, University of New Mexico.
Mark D. Freeman, age 53, is the Executive Vice President of Finance and Operations and Chief Financial Officer of WSB Financial Group and Westsound Bank. Mr. Freeman joined us in 2005 with 30 years of banking experience starting as a state bank examiner and including more than 20 years as the chief financial officer of two other community banks, Islander’s Bank in Friday Harbor, Washington and North Sound Bank in Poulsbo, Washington. He is experienced in financial and business planning, cash management, general and cost accounting, budgeting, investment management, payroll accounting, internal audit planning, financial analysis, forecasting, and financial reporting. Mr. Freeman has a bachelor’s degree in economics from Pacific Lutheran University in Seattle, Washington.
Brett T. Green, age 44, is the Executive Vice President of Sales and Lending of Westsound Bank. Mr. Green joined us in 2004, with extensive experience in the mortgage industry, including supervision, loan origination, sales and marketing programs, customer relations, back-end processes, and the secondary market. Previously he worked in 2003 as branch manager and loan originator for First Horizon Home Loans in Silverdale, Washington, and from 2001 to 2002 as a branch manager and loan originator for a local mortgage company, Bay Mortgage. He graduated from the University of Puget Sound in Tacoma, Washington, with a B.A. in business administration.
Veronica R. Colburn, age 43, is the Senior Vice President, Chief Risk Officer and Secretary of WSB Financial Group and Westsound Bank. Ms. Colburn has more than 25 years of banking experience and also served as chief financial officer of Westsound Bank from 1999 to 2005 and as chief operating officer from 2005 to 2006. Previously, Ms. Colburn was an assistant vice president and branch manager for First
80
Table of Contents
National Bank, a community bank in Port Orchard, Washington, and an assistant vice president for the National Bank of Bremerton, a community bank in Bremerton, Washington where her primary duties were that of internal compliance auditor, operations and lending. Ms. Colburn is a graduate of the IBAA School of Auditing and Compliance.
Brent A. Stenman, age 41, is the Senior Vice President and Chief Lending Officer of Westsound Bank. Mr. Stenman joined us in 2004, having previously served for eight years as a vice president and manager of another community bank, Frontier Bank, where for a time he was also a branch manager and commercial lender responsible for a large portfolio of loans and deposits. He also previously held lending positions at American Marine Bank and Seafirst Bank (now operating as Bank of America). Mr. Stenman graduated with a B.A. in business administration from Seattle University, majoring in management, and is also a graduate of Pacific Coast Banking School.
Robin A. Seelye, age 35, is the Senior Vice President, Operations of Westsound Bank. Prior to joining us in 2006, Ms. Seelye served most recently for two years as vice president and administration officer of Bank of Bozeman in Montana, where she was also the compliance officer and served as a non-director member of its audit committee. For several years prior to that, she was director of operations for Northwestern Mutual Financial Network and previously she was with Heritage Bank, a Montana subsidiary of a publicly-traded company, United Financial Corp. Ms. Seelye has a B.A. degree with a major in management from California State University, Fresno.
Louis J. Weir, age 65, is Chairman of the Board of WSB Financial Group and Westsound Bank. Mr. Weir is an active investor and property manager in Kitsap County. Until 1994, he was the owner and manager of Weir’s Appliance Center, an appliance and electronics retailer with locations in Bremerton and Silverdale, Washington, since 1968.
Larry C. Westfall, age 69, is the Vice Chairman of the Board of WSB Financial Group and Westsound Bank. After 36 years in the banking industry, Mr. Westfall entered semi-retirement in 1997. Prior to semi-retirement, Mr. Westfall was Vice President of Wells Fargo Bank in charge of its branch offices in Silverdale and Bremerton. While semi-retired, Mr. Westfall is a consultant for small businesses. Mr. Westfall is a graduate of San Jose State University in Industrial Relations and of Pacific Coast Banking School.
Richard N. Christopherson, age 63, is a Director of WSB Financial Group and Westsound Bank. Mr. Christopherson is the president of Ace Paving Inc., a privately-held paving contractor in Kitsap County, a position he has held since 1984. Mr. Christopherson additionally holds the title of Managing Partner of Samsons Rentals, an equipment rental company, and Five C’s, a land and real estate holdings company. Mr. Christopherson holds degrees from Olympic College and Pacific Lutheran University.
James H. Lamb, age 59, is a Director of WSB Financial Group and Westsound Bank. Mr. Lamb is a retired U.S. Navy supply corps officer who owned and managed Lamb’s Office Supply in Bremerton, a re-seller of office products until 1999 when he sold his business and retired. Mr. Lamb has degrees in Finance and Marketing from the University of Washington.
Brian B. McLellan, age 57 is a Director of WSB Financial Group and Westsound Bank. Mr. McLellan is the President of B.H.C.M. LLC, a land development company he started in 2001. In addition, Mr. McLellan is associated with Windermere Real Estate in Belfair, Washington.
Dean Reynolds, age 64, is a Director of WSB Financial Group and Westsound Bank. Mr. Reynolds is the Manager of T.T.I.C., LLC, a thermoplastics coating company in Monroe, a position he has held since 1999. Mr. Reynolds also recently participated in the development of Teal Lake Center in Port Ludlow, Washington.
Donald H. Tucker, age 64, is a Director of WSB Financial Group and Westsound Bank. Mr. Tucker is the retired chief executive officer of Kitsap Public Services, Inc., which he left in 1999. Mr. Tucker also manages numerous rental properties in Kitsap County.
81
Table of Contents
Corporate Governance
Our board of directors currently consists of eight members and is divided pursuant to our articles of incorporation into three classes. A total of nine directors is authorized. Each director is elected for a three year term. Class I directors will be elected in 2007, Class II directors will be elected in 2008 and Class III directors will be elected in 2009. In all cases, the terms of the directors will continue until their respective successors are duly elected. Class I directors are Messrs. Lamb, McLellan and Reynolds. Class II directors are Messrs. Tucker, Weir and Westfall. Class III directors are Messrs. Christopherson and Johnson.
Director Independence. Our objective is that at least a majority of the board consist of independent directors. For a director to be considered independent, the board must determine that the director does not have any material relationship with WSB Financial Group or its subsidiaries and is otherwise an “independent director” within the meaning of the Nasdaq rules. The board has determined that the following six directors satisfy Nasdaq’s requirements: Messrs. Weir, Westfall, Christopherson, Lamb, McLellan and Tucker.
The Nasdaq rules require all members of the audit, compensation, and corporate governance committees be independent directors, except in limited circumstances. Members of the audit committee must also satisfy an additional SEC requirement, which provides that they may not accept, directly or indirectly, any consulting, advisory, or other compensatory fee from us or any of our subsidiaries other than their director’s compensation. The board has determined that all members of the audit, compensation, and corporate governance committee satisfy the relevant independence requirements.
Code of Conduct. We expect all of our directors and employees to adhere to the highest standards of ethics and business conduct with each other, customers, shareholders and the communities we serve, and to comply with all applicable laws, rules and regulations that govern our business. These principles are embodied in our various policies relating to director, officer and employee conduct including such subjects as employment policies, conflicts of interest, professional conduct, and protection of confidential information. Recently, the board adopted a comprehensive code of conduct reflecting these policies. The code of ethics will be posted on our website, located at www.westsoundbank.com.
Committees of the Board. The board of directors has an audit committee, a compensation committee and a corporate governance/nominating committee, each of which has the composition and responsibilities described below.
Audit Committee. Messrs. Westfall, Lamb, McLellan and Tucker, each of whom is a non-employee member of our board of directors, comprise our audit committee. Mr. Westfall serves as chairman of the audit committee. Our board has determined that each member of our audit committee meets the requirements for independence and financial sophistication under Nasdaq requirements and SEC rules and regulations.
Our board has determined that we do not currently have a financial expert, as defined in SEC rules, serving on our audit committee. The board has undertaken a search to identify a potential nominee to the board who would qualify as a financial expert and be willing to serve on our audit committee.
The audit committee is responsible for, among other things:
| • | evaluating the quality and integrity of our accounting systems and internal controls; | |
| • | appointing of our external auditors and pre-approving of fees and non-audit services; | |
| • | reviewing the independence of our external auditors; | |
| • | assessing our financial reporting processes; | |
| • | identifying and assessing of business risks, and overseeing of internal audit activities; and | |
| • | the adequacy of overall control environment within WSB Financial Group. |
The committee’s authorities and responsibilities are set forth in the audit committee charter.
82
Table of Contents
Corporate Governance/ Nominating Committee. Messrs. Westfall, Lamb and Weir, each of whom is a non-employee member of our board of directors, comprise our corporate governance/nominating committee. Mr. Westfall serves as the chairman of the committee.
The corporate governance/nominating committee is responsible for, among other things:
| • | identifying individuals believed to be qualified to become board members, consistent with criteria approved by the board, and recommend to the board the nominees to stand for election as directors at the annual meeting of shareholders; | |
| • | developing and recommend to the board standards to be applied in making determinations as to the absence of material relationships between WSB Financial Group and its directors; | |
| • | conducting an annual evaluation of the performance of the board and report conclusions to the board; | |
| • | developing and recommend to the board a set of corporate governance principles applicable to WSB Financial Group and review those principles at least once a year; and | |
| • | reviewing and recommend any needed changes, and address questions which may arise with respect to, the code of conduct. |
Compensation Committee. Messrs. McLellan, Christopherson, Weir and Westfall, each of whom is a non-employee member of our board of directors, comprise our compensation committee. Mr. McLellan serves as the chairman of the committee.
The compensation committee is responsible for, among other things:
| • | establishing compensation goals for the chief executive officer and other executive officers and recommend to the board for action at an executive session the compensation of these officers based on their performance in light of these goals; | |
| • | making recommendations to the board with respect to incentive compensation and equity-based compensation plans; and | |
| • | evaluating management succession plans. |
Compensation Committee Interlocks and Insider Participation. No member of the compensation committee is an officer or employee of WSB Financial Group or Westsound Bank. None of our executive officers serves, or in the past year has served, as a member of the board of directors or compensation committee of any entity that has one or more executive officers serving on our board of directors or compensation committee.
Director Compensation
Effective July 1, 2006, our directors are entitled to receive up to an aggregate of $288,000 in cash for each calendar year as their directors’ fees, to be allocated among the individual directors based on their board and committee responsibilities, attendance at board and committee meetings, and other considerations. Directors are also eligible to receive grants of non-qualified stock options under our Stock Option Plan. Prior to June 30, 2006 each of our directors received an annual retainer of $9,000 and fees for meetings attended payable in cash and shares of our common stock. In August 2006, Messrs. Christopherson, Lamb, McLellan, Reynolds, Tucker, Weir, Westfall and a former director received an aggregate of 10,474 shares of our common stock for their compensation as directors accrued from January 1, 2006 through June 30, 2006. The number of shares paid as their compensation was based on independent valuations of our shares by LC Financial Advisors, LLC as of December 31, 2005 and March 31, 2006, at an average price of $11.83 per share.
83
Table of Contents
Executive Compensation
The following table sets forth information concerning the compensation awarded to or paid by us for services rendered in all capacities during the last three fiscal years to the chief executive officer and executive officers earning $100,000 or more in salary and bonus, or named executive officers, during fiscal year 2005.
Summary Compensation Table
| Long-Term | |||||||||||||||||||||
| Compensation | |||||||||||||||||||||
| Awards | |||||||||||||||||||||
| Annual Compensation(1) | Securities | ||||||||||||||||||||
| Underlying | All Other | ||||||||||||||||||||
| Salary | Bonus(2) | Options | Compensation(3) | ||||||||||||||||||
| Name and Principal Position | Year | ($) | ($) | (#) | ($) | ||||||||||||||||
| David K. Johnson | 2005 | 228,121 | 150,000 | 49,143 | 2,500 | ||||||||||||||||
| President and Chief Executive Officer | 2004 | 175,000 | 99,482 | 24,572 | |||||||||||||||||
| 2003 | 115,017 | 47,450 | — | — | |||||||||||||||||
| Mark D. Freeman(4) | 2005 | 81,859 | 35,000 | 36,857 | 808 | ||||||||||||||||
| Executive Vice President of Finance and | 2004 | — | — | — | — | ||||||||||||||||
| Operations and Chief Financial Officer | 2003 | — | — | — | — | ||||||||||||||||
| Brett T. Green | 2005 | 300,516 | 350,229 | 36,857 | 2,500 | ||||||||||||||||
| Executive Vice President of Sales and | 2004 | 343,750 | 260,373 | 21,500 | — | ||||||||||||||||
| Lending | 2003 | — | — | — | — | ||||||||||||||||
| Veronica R. Colburn | 2005 | 98,000 | 25,000 | 15,357 | 1,250 | ||||||||||||||||
| Senior Vice President and Chief Risk | 2004 | 91,250 | 30,610 | 12,286 | — | ||||||||||||||||
| Officer | 2003 | 71,648 | 14,600 | 6,143 | — | ||||||||||||||||
| Brent A. Stenman(5) | 2005 | 117,200 | 12,236 | 24,572 | 2,874 | ||||||||||||||||
| Senior Vice President and Chief Lending | 2004 | 35,481 | 10,007 | — | — | ||||||||||||||||
| Officer | 2003 | — | — | — | — | ||||||||||||||||
| (1) | Does not include amounts attributable to miscellaneous benefits received by executive officers, including the use of company-owned automobiles and the payment of certain club dues. The costs to us of providing such benefits to any individual executive officer during the year ended December 31, 2005, did not exceed the lesser of $50,000 or 10% of the total of annual salary and bonus reported for the individual. |
| A group life insurance policy is offered to all employees as part of our group benefit plans. There are no other life insurance policies issued on our executive officers, except a bank-owned life insurance, or BOLI, policy on Mr. Johnson with a cash surrender value of $18,000 on December 31, 2005, and a term life insurance policy on Mr. Green. Westsound Bank is the owner and beneficiary of both policies. |
| (2) | Includes bonuses paid or to be paid during the subsequent year but accrued in the year indicated. |
| (3) | Reflects employer matching contributions to 401(k) plan accounts. |
| (4) | Mr. Freeman commenced employment with us on March 7, 2005. |
| (5) | Mr. Stenman commenced employment with us on August 9, 2004. |
Stock Option Grants in Last Fiscal Year
All options granted to our named executive officers are incentive stock options, to the extent permissible under the Internal Revenue Code of 1986, as amended. The exercise price per share of each option granted to our named executive officers was equal to the fair market value of our common stock as determined by our board of directors on the date of the grant.
84
Table of Contents
The following table provides information regarding grants of options to purchase shares of our common stock to our named executive officers in the fiscal year ended December 31, 2005.
| Grant Date | ||||||||||||||||||||
| Individual Grants | Value | |||||||||||||||||||
| Number of | ||||||||||||||||||||
| Securities | Percent of Total | |||||||||||||||||||
| Underlying | Options Granted | Grant Date | ||||||||||||||||||
| Options | to Employees in | Exercise or Base | Fair Value(2) | |||||||||||||||||
| Name | Granted (#) | Fiscal Year(1) | Price ($/Sh) | Expiration Date | $ | |||||||||||||||
| David K. Johnson | 24,572 | 34.1 | % | 10.78 | December 20, 2015 | 52,332 | ||||||||||||||
| 24,572 | 7.57 | March 15, 2015 | 35,382 | |||||||||||||||||
| Mark D. Freeman | 15,357 | 25.5 | % | 10.78 | December 20, 2015 | 32,708 | ||||||||||||||
| 21,500 | 7.57 | March 15, 2015 | 30,959 | |||||||||||||||||
| Brett T. Green | 15,357 | 10.6 | % | 10.78 | December 20, 2015 | 32,708 | ||||||||||||||
| Veronica R. Colburn | 15,357 | 10.6 | % | 10.78 | December 20, 2015 | 32,708 | ||||||||||||||
| Brent A. Stenman | 15,357 | 17.0 | % | 10.78 | December 20, 2015 | 32,708 | ||||||||||||||
| 9,214 | 7.57 | March 15, 2015 | 13,268 | |||||||||||||||||
| (1) | Based on 144,358 options granted to employees during the fiscal year ended December 31, 2005 under our Stock Option Plan, including grants to executive officers. |
| (2) | The present value for these options was estimated at the date of grant, using the Black-Scholes option-pricing model. The following assumptions were used to obtain the grant-date present value for the options granted: |
| March 15, 2005 | December 20, 2005 | |||||||
| Risk free interest rate | 4.22 | % | 4.40 | % | ||||
| Expected life (years) | 5 | 5 | ||||||
| Volatility | 0.00 | % | 0.00 | % | ||||
| Dividend yield | 0.00 | % | 0.00 | % | ||||
All options granted to employees, including our executive officers, have a term of ten years and vest over five years at 20% per year.
Aggregated Option Exercises in Last Fiscal Year and Fiscal Year-End Option Values
The following table provides information regarding options exercised by each of our named executive officers during the fiscal year ended December 31, 2005, as well as the number of shares of common stock subject to exercisable and unexercisable stock options held as of December 31, 2005 by each of our named executive officers.
| Number of | ||||||||||||||||||||||||
| Securities Underlying | Value of Unexercised | |||||||||||||||||||||||
| Shares | Unexercised Options at | In-the-Money Options at | ||||||||||||||||||||||
| Acquired on | December 31, 2005 | December 31, 2005(1)($) | ||||||||||||||||||||||
| Exercise | Value | |||||||||||||||||||||||
| Name | (#) | Realized ($) | Exercisable | Unexercisable | Exercisable | Unexercisable | ||||||||||||||||||
| David K. Johnson | 60,200 | 344,600 | 2,457 | 90,915 | 15,588 | 268,205 | ||||||||||||||||||
| Mark D. Freeman | — | — | — | 36,857 | 0 | 69,022 | ||||||||||||||||||
| Brett T. Green | — | — | 4,300 | 32,557 | 16,954 | 67,817 | ||||||||||||||||||
| Veronica R. Colburn | — | — | 17,200 | 31,943 | 115,817 | 82,395 | ||||||||||||||||||
| Brent A. Stenman | — | — | — | 24,572 | 0 | 29,581 | ||||||||||||||||||
| (1) | Options are“in-the-money” at the fiscal year-end if the fair market value of the underlying securities on such date exceeds the exercise price of the option. The amounts set forth represent the difference between the fair market value of the securities underlying the options on December 31, 2005, based on the fair market valuation of $10.78 per share of common stock and the exercise price of the |
85
Table of Contents
| options, multiplied by the number of shares issuable upon exercise of the options, without taking into account any taxes that may be payable in connection with the transaction. |
Employment Contracts and Change of Control Arrangements
In August 2006, we entered into an employment agreement with David K. Johnson, our president and chief executive officer. This agreement is for an indefinite term, until terminated by Mr. Johnson or us. Under this agreement, Mr. Johnson receives a base salary set by our board and reviewed by our compensation committee each year, and is eligible for an annual bonus in the discretion of our compensation committee. If we experience a change of control, all of his options will vest, and if his employment terminates, voluntarily or involuntarily, within 12 months after the change of control and executes a separation release, he will be entitled to a change of control payment equal to two times his base salary plus bonus before salary deferrals for the12-month period preceding the change in control. If we terminate Mr. Johnson without cause, other than by reason of a change in control, he is entitled to salary and benefits accrued through the effective date of the termination, the reimbursement of any expenses and, provided he does not compete or solicit employees or customers and executes a separation release, a severance payment equal to his base salary plus bonus before salary deferrals for the12-month period preceding his termination of employment, payable in a lump sum or in accordance with our regular payroll schedule. If we terminate Mr. Johnson with cause he is entitled to his salary and benefits accrued through the effective date of the termination and the reimbursement of any expenses. Mr. Johnson is prohibited from competing with us or soliciting our employees for two years after termination of his employment if he receives a severance or a change of control payment.
In August 2006, we also entered into employment agreements with each of our other named executive officers, Messrs. Freeman, Green, Stenman and Ms. Colburn and with our other executive officer, Robin A. Seelye. These agreements are substantially the same as Mr. Johnson’s except the change of control payment in each agreement is equal to the base salary plus bonus before salary deferrals of the respective individual (rather than two times such amount), with the exception of our agreement with Mr. Freeman which contains a change of control provision identical to Mr. Johnson’s agreement.
1999 Incentive Stock Option Plan
Westsound Bank adopted its 1999 Incentive Stock Option Plan, or the Stock Option Plan, in 1999 which was adopted by WSB Financial Group upon the completion of the holding company formation transaction in 2005. The purpose of the Stock Option Plan is to increase ownership interest in WSB Financial Group by employees and directors of the corporation and to provide an incentive to serve as an employee or director of WSB Financial Group. The responsibilities and duties of a particular employee or director are considered when the recipients and terms of the grants are determined.
The Stock Option Plan provides that in the event of a change in control of WSB Financial Group or Westsound Bank, all outstanding and unexercised options (i) shall become immediately exercisable, and (ii) such options shall either be assumed by the successor, or parent thereof, or be replaced with a comparable award for the purchase of shares of the capital stock of the successor, except that if such options are not so assumed or replaced, then (iii) the board may, in the exercise of its sole discretion, terminate all outstanding options as of a date fixed by the board which may be sooner than the originally stated option term. The board shall notify each optionee of such action in writing not less than sixty (60) days prior to the termination date fixed by the board, and each optionee shall have the right to exercise his or her option to and including said termination date.
The Stock Option Plan provides for incentive stock options (within the meaning of Section 422 of the Internal Revenue Code) for our employees, and non-qualified stock options for directors and any other individuals to whom our board of directors determines to grant options. While the Stock Option Plan provides that the exercise price of options granted under the plan may be determined by our board of directors, provided that such price is in no event less than the fair market value (or at least 110% of the fair market value in the case of a grant to an employee owning stock representing more than ten percent
86
Table of Contents
of the total voting power of all stock), all incentive stock options, and in fact all options granted to date, have had an exercise price equal to the estimated fair market value of our stock as of the date of grant. No option may have a term of greater than ten years, except that the term of an incentive stock option shall be no more than five years in the case of a grant to an employee owning stock representing more than ten percent of the total voting power of all stock.
As of the date hereof, we had options outstanding to purchase a total of 970,887 shares of our common stock under the Stock Option Plan and 346,765 shares available for grant. Our board of directors recently adopted a policy reserving all remaining option shares available under the plan, or 346,765 shares plus any shares related to any expired or terminated options, for grants to our officers and employees.
401(k) Plan
We maintain a defined contribution employee retirement plan for our employees. The plan is intended to qualify as a tax-qualified plan under Section 401(k) of the Internal Revenue Code. The plan provides that each participant may contribute up to 90% of his or her pre-tax compensation, up to a statutory limit, which is $15,000 for calendar year 2006. Participants that are 50 years or older can also make “catch-up” contributions, which in calendar year 2006 may be up to an additional $5,000 above the statutory limit. Under the plan, each employee is fully vested in his or her deferred salary contributions. Employee contributions are held and invested by the plan’s trustee. The plan also permits us to make discretionary contributions and matching contributions, subject to established limits and a vesting schedule. We made discretionary or matching contributions of $46,000 to the plan on behalf of participating employees in 2005.
CERTAIN RELATIONSHIPS AND RELATED PARTY TRANSACTIONS
We lease our Silverdale Branch offices from Louis J. Weir, the chairman of our board of directors. The leases are approximately eight years, with two five-year extension options. We paid $132,966, $127,204 and $66,538 in rent under this lease in 2005, 2004 and 2003, respectively, and $99,810 through September 30, 2006. This lease was approved by a majority of our independent disinterested directors, pursuant to our bylaws and applicable law.
Some of our directors and officers and the business organizations with which they are associated, have been customers of, and have had banking transactions with us, in the ordinary course of our business, and we expect to have such banking transactions in the future. All loans and commitments to loan included in such transactions were made on substantially the same terms, including interest rates and collateral, as those prevailing at the time for comparable transactions with other persons of similar creditworthiness and, in our opinion, these transactions do not involve more than a normal risk of collectibility or present other unfavorable features.
At September 30, 2006, our officers and directors, or companies in which they have 10% or more of beneficial interest, were indebted to us in the aggregate amount of $8.1 million in connection with the banking transactions referred to above. This amount represents approximately 2.6% of our outstanding net loans. All such loans are currently performing in accordance with their terms.
87
Table of Contents
PRINCIPAL SHAREHOLDERS
The following table sets forth information regarding the beneficial ownership of our common stock as of the date of this prospectus and after giving effect to the completion of this offering by:
| • | each person, or group of affiliated persons, known to us to beneficially own more than 5% of the outstanding shares of our common stock; | |
| • | each of our directors; | |
| • | each of our named executive officers; and | |
| • | all of our executive officers and directors as a group. |
Beneficial ownership is determined in accordance with the rules of the SEC and includes voting or investment power with respect to the securities. Common stock subject to options that are currently exercisable or exercisable within 60 days of September 30, 2006 are deemed to be outstanding and beneficially owned by the person holding such options. Such shares, however, are not deemed outstanding for the purposes of computing the percentage ownership of any other person.
Except as indicated by footnote, and subject to applicable community property laws, the persons named in the table below have sole voting and investment power with respect to all shares of common stock shown as beneficially owned by them, and their address is 607 Pacific Avenue, Bremerton, Washington 98337. The percentage of beneficial ownership before the offering is based on 2,884,254 shares of common stock outstanding as of the date of this prospectus. The percentage of beneficial ownership after the offering is based on 5,529,254 shares of common stock outstanding, including the shares of common stock to be sold by us in this offering, assuming the exercise of the underwriters’ over-allotment option.
| Percentage of Shares | |||||||||||||
| Beneficially Owned | |||||||||||||
| Number of Shares | |||||||||||||
| Name and Address of Beneficial Owner | Beneficially Owned | Before Offering | After Offering | ||||||||||
5% Shareholders | |||||||||||||
| PWH Trust, Patrick W. Hopper, Trustee | |||||||||||||
| 2624 Pebblegold Avenue, | |||||||||||||
| Henderson, NV 89074 | 149,887 | 5.2 | % | 2.7 | % | ||||||||
| Rodney R. Parr | |||||||||||||
| 6596 NW Puddington Lane, | |||||||||||||
| Silverdale, WA 98383 | 275,362 | 9.5 | % | 5.0 | % | ||||||||
Directors and Named Executive Officers | |||||||||||||
| David K. Johnson(1) | 109,725 | 3.8 | % | 2.0 | % | ||||||||
| Mark D. Freeman(2) | 5,682 | * | * | ||||||||||
| Brett T. Green(3) | 82,186 | 2.8 | % | 1.5 | % | ||||||||
| Veronica R. Colburn(4) | 28,565 | 1.0 | % | * | |||||||||
| Brent A. Stenman(5) | 2,611 | * | * | ||||||||||
| Louis J. Weir(6) | 361,541 | 12.2 | % | 6.4 | % | ||||||||
| Larry C. Westfall(7) | 136,667 | 4.6 | % | 2.4 | % | ||||||||
| Richard N. Christopherson(8) | 185,588 | 6.2 | % | 3.3 | % | ||||||||
| James H. Lamb(9) | 162,842 | 5.4 | % | 2.9 | % | ||||||||
| Brian B. McLellan(10) | 138,872 | 4.6 | % | 2.5 | % | ||||||||
| Dean Reynolds(11) | 257,356 | 8.6 | % | 4.6 | % | ||||||||
| Donald H. Tucker(12) | 155,784 | 5.2 | % | 2.8 | % | ||||||||
| All Directors and Executive Officers as a Group (13 people) | 1,627,419 | 45.1 | % | 26.0 | % | ||||||||
| * | Represents beneficial ownership of less than 1%. |
88
Table of Contents
| (1) | Includes 20,886 shares issuable to Mr. Johnson, upon the exercise of options that are exercisable within 60 days. | |
| (2) | Includes 4,300 shares issuable to Mr. Freeman, upon the exercise of options that are exercisable within 60 days. | |
| (3) | Includes 8,600 shares issuable to Mr. Green, upon the exercise of options that are exercisable within 60 days. | |
| (4) | Includes 4,301 shares issuable to Ms. Colburn, upon the exercise of options that are exercisable within 60 days. | |
| (5) | Includes 1,843 shares issuable to Mr. Stenman, upon the exercise of options that are exercisable within 60 days. | |
| (6) | Includes 79,858 shares issuable to Mr. Weir, upon the exercise of options that are exercisable within 60 days. | |
| (7) | Includes 98,286 shares issuable to Mr. Westfall, upon the exercise of options that are exercisable within 60 days. | |
| (8) | Includes 104,429 shares issuable to Mr. Christopherson, upon the exercise of options that are exercisable within 60 days and 50,525 shares held by Five C’s Partnership, of which he is the managing partner and a 25% owner with his siblings. | |
| (9) | Includes 104,429 shares issuable to Mr. Lamb, upon the exercise of options that are exercisable within 60 days. |
| (10) | Includes 104,429 shares issuable to Mr. McLellan, upon the exercise of options that are exercisable within 60 days. |
| (11) | Includes 104,429 shares issuable to Mr. Reynolds, upon the exercise of options that are exercisable within 60 days. |
| (12) | Includes 92,144 shares issuable to Mr. Tucker, upon the exercise of options that are exercisable within 60 days. |
89
Table of Contents
DESCRIPTION OF CAPITAL STOCK
General
Our articles of incorporation dated February 22, 2005, as amended, authorize us to issue up to 15,357,250 shares of common stock, $1.00 par value, and no other class of shares is authorized. There were 2,884,254 shares of common stock issued and 2,884,254 shares outstanding at September 30, 2006. After this offering, and based on the number of shares of common stock outstanding at September 30, 2006, 5,184,254 shares of common stock will be outstanding, or 5,529,254 shares if the underwriters’ over-allotment option is exercised in full. In addition, as of the date hereof, options to purchase 970,887 shares of our common stock have been granted, but have not been exercised, pursuant to our Stock Option Plan. There are 346,765 shares remaining available for future grant pursuant to our Stock Option Plan. Our shares do not represent or constitute deposit accounts and are not insured by the FDIC.
Common Stock
Dividends. Our shareholders are entitled to receive such dividends, if any, as may be declared by the board of directors out of funds legally available for such purpose. Our ability to make dividend payments to our shareholders is subject to statutory and regulatory restrictions that apply to Westsound Bank. See “Supervision and Regulation — Federal and State Regulation of Westsound Bank — Dividends.” If we issue preferred stock in the future, those holders may have a priority over the holders of common stock with respect to dividends.
Voting Rights. Each share of common stock is entitled to one vote on all matters presented for a vote. Cumulative voting for the election of directors is not authorized.
Liquidation. In the event of any liquidation, dissolution or winding up of WSB Financial Group, the holders of the common stock would be entitled to receive, after payment of all debts and liabilities of the corporation (including all deposit accounts and accrued interest thereon), all assets of the corporation available for distribution.
Preemptive Rights. Holders of WSB Financial Group common stock do not have any preemptive, conversion or other subscription rights with respect to any additional shares of WSB Financial Group common stock which may be issued. Therefore, the board may authorize the issuance and sale of shares of common stock of WSB Financial Group without first offering them to existing shareholders of WSB Financial Group. WSB Financial Group common stock is not subject to any redemption or sinking fund provisions.
Assessment. The outstanding shares of WSB Financial Group common stock are, and the shares to be issued in this offering will be, fully paid and non-assessable.
Articles of Incorporation and Bylaws
Shareholders’ rights and related matters are governed by our articles of incorporation, bylaws and Washington law. For public companies, including WSB Financial Group upon the completion of this offering, an amendment to the articles of incorporation must be approved by holders of a majority of the outstanding shares of WSB Financial Group’s common stock, except for certain limited amendments that can be effected by the board of directors without shareholder approval. Our bylaws may be amended by the vote of 60% of our board of directors or by a majority of our outstanding shares.
Board of Directors
Our articles of incorporation and bylaws provide that the number of directors must fall within a range between five and 25, the exact number to be fixed by resolution of the board, or a vote by a majority of our outstanding shares. The board of directors recently adopted a resolution limiting the current size of the board to nine persons. WSB Financial Group’s articles of incorporation provide that the board of directors will be divided into three classes of directors as nearly equal as possible, with each class being elected to a
90
Table of Contents
staggered three-year term following the initial term of directors in classes one, two and three, which are fixed at one, two and three years, respectively.
Indemnification
Indemnification. Pursuant to our bylaws, we will, to the fullest extent permitted by the Washington Business Corporation Act, or WBCA, indemnify our directors and officers with respect to expenses, settlements, judgments and fines in suits (including actions brought against a director or officer in the name of the corporation, commonly referred to as a derivative action) in which such person was made a party by reason of the fact that he or she is or was a director or officer, or being or having been such a director or officer, such person was serving as a director, officer, employee or other agent (i) for an enterprise of which we hold the majority of shares entitled to vote in the election of its directors (such as Westsound Bank), or (ii) at our request, for another enterprise. No such indemnification may be given if the acts or omissions of the person are finally adjudged to be intentional misconduct or a knowing violation of law, if such person is liable to the corporation for an unlawful distribution, or if such person personally received a benefit to which he or she was not entitled.
We have entered into separate indemnification agreements with our directors, in addition to the indemnification provided for in our bylaws. These agreements, among other things, require us to indemnify our directors for certain expenses, including attorneys’ fees, judgments, fines and settlement amounts incurred by a director in any action or proceeding arising out of their services as one of our directors, or as a director of any of our subsidiaries or any other company or enterprise to which the person provides services at our request.
Limitation of Liability. In addition, as authorized by WBCA, WSB Financial Group’s articles of incorporation provide that the directors shall not be personally liable for monetary damages to the corporation for conduct as a director, except for liabilities that involve intentional misconduct or a knowing violation of law by the directors, the authorization or illegal distributions to shareholders or loans to directors or receipt of an improper personal benefit from their actions as directors. This provision might, in certain instances, discourage or deter shareholders or management from bringing a lawsuit against directors for an alleged breach of their duties.
Insofar as indemnification for liabilities arising under the Securities Act of 1933 may be permitted to officers, directors and controlling persons of WSB Financial Group pursuant to the foregoing provisions, WSB Financial Group has been advised that in the opinion of the Securities and Exchange Commission, such indemnification is against public policy as expressed in the Securities Act of 1933 and is, therefore, unenforceable.
Defensive Provisions of Washington Law
Certain provisions of the WBCA summarized below may be considered to have an anti-takeover effect and may delay, deter, or prevent a tender offer, proxy contest or other takeover attempt that shareholders might consider to be in their best interest, including such an attempt that might result in the payment of a premium over the market price of our common stock.
The WBCA prohibits a “target corporation” (as defined below), with certain exceptions, from engaging in certain “significant business transactions” (as defined below) with a person or group of persons that beneficially owns 10% or more of the voting securities of the target corporation (an “acquiring person”) for a period of five years after the acquiring person acquired its securities, unless the significant business transaction or acquisition of securities is approved by a majority of the members of the target corporation’s board of directors before the date of the acquisition of the target corporation’s securities. A “significant business transaction” includes, among other transactions:
| • | a merger or consolidation with an acquiring person; | |
| • | sales or other dispositions of assets to an acquiring company, in one or more transactions having an aggregate market value equal to five percent or more of all assets or outstanding shares of the |
91
Table of Contents
| target corporation over the five-year period following the share acquisition by the acquiring person; or | ||
| • | allowing the acquiring person to receive any benefit from the corporation, other than proportionately as a shareholder. |
“Target corporations” include all domestic corporations with securities registered under the Securities Exchange Act of 1934, as amended. A corporation with securities registered under the Securities Exchange Act of 1934, as amended, may not “opt out” of this statute. WSB Financial Group will, therefore, be subject to the statute upon closing of this offering. Such provisions could have the effect of discouraging a third-party from making a tender offer or otherwise attempting to obtain control of WSB Financial Group, even though such an attempt might be beneficial to the corporation and its shareholders.
Defensive Provisions in Articles or Bylaws
Our articles of incorporation provide certain procedures that must be complied with in order for a shareholder to propose a nominee for director to be considered by our corporate governance/nominating committee. Nominations for the election of directors may be made by the board of directors or by any shareholder entitled to vote for directors. Such nominations other than by the board of directors shall be made by notice in writing, not less than sixty days prior to the first anniversary of the date of the last meeting of shareholders of the corporation called for the election of directors. Each notice shall set forth (i) the name, age, business address and, if known, residence address of each nominee proposed in such notice; (ii) the principal occupation or employment of each such nominee; (iii) the number of shares of stock of the corporation which are beneficially owned by each such nominee; and (iv) such other information as would be required by the federal securities laws and the rules and regulations promulgated thereunder in respect to any individual nominated as a director of the corporation and for whom proxies are solicited by the board of directors of the corporation. Shareholders of WSB Financial Group interested in submitting a proposal for inclusion in the proxy materials for a shareholders’ meeting must comply with the rules and regulations of the SEC applicable to shareholder proposals.
Our articles of incorporation prohibit cumulative voting in the election of directors. Cumulative voting could facilitate a shareholder or group of shareholders in electing one or more candidates to our board of directors in opposition to our slate of proposed directors.
The bylaws of WSB Financial Group provide that special meetings of shareholders may be called by the president, the board or by the holders of not less than 10% of all the shares of the corporation entitled to vote at the meeting. This restriction on the calling of special shareholders’ meetings may deter hostile takeovers of WSB Financial Group by making it more difficult for a person or entity to obtain immediate control of the corporation between one annual meeting and the next.
Under Washington law, because the articles of incorporation do not provide otherwise, subject to certain exceptions, any proposed merger of WSB Financial Group with another company, in which WSB Financial Group is not the surviving corporation, requires approval by holders of two-thirds of the outstanding shares of WSB Financial Group’s common stock.
Our articles of incorporation authorize the issuance of 15,357,250 shares of common stock. The shares of common stock were authorized to provide our board of directors with as much flexibility as possible to effect, among other transactions, financings, acquisitions, stock dividends, and the exercise of employee stock options. However, these additional authorized shares may also be used by the board of directors, to the extent consistent with its fiduciary duty, to deter future attempts to gain control of WSB Financial Group. As a result of the ability to issue additional shares of common stock, the board has the power to issue stock to persons friendly to management in order to attempt to block a tender offer, merger or other transaction by which a third-party seeks control of WSB Financial Group, and thereby allow members of management to retain their positions.
Our articles of incorporation allow the board of directors to consider certain factors other than price when considering a possible tender offer, merger or consolidation of the Bank with another entity or the
92
Table of Contents
purchase of substantially all of the assets of Westsound Bank by another entity. In determining what is in the best interest of the corporation and its shareholders, the board may consider the social and economic effects of the proposed transaction on our employees and customers, and the communities in which our facilities are located and which we serve, in addition to any other factors deemed relevant by the board.
The provisions described above may be considered to have an anti-takeover effect and may delay, defer or prevent a tender offer or other takeover attempt that a shareholder might consider to be in such shareholder’s best interest, including such an attempt as might result in the receipt of a premium over the market price for the shares of common stock held by such shareholder.
Transfer Agent and Registrar
The transfer agent and registrar for our common stock is Transfer Online, Inc.
Subordinated Debentures; Trust Preferred Securities
We have raised $8.2 million through the issuance of floating rate junior subordinated debentures in connection with trust preferred securities issuances by our statutory trust subsidiary, WSB Financial Trust I. The interest payments on the trust preferred securities and related junior subordinated debentures are currently expected to be funded by dividends paid to us by Westsound Bank. Our principal and interest payments on the junior subordinated debentures are in a superior position to the liquidation rights of holders of our common stock. See “Management’s Discussion and Analysis of Financial Condition and Results of Operations — Capital Resources” for additional information.
93
Table of Contents
UNDERWRITING
Under the terms and subject to the conditions contained in an underwriting agreement, D.A. Davidson & Co. has agreed to purchase, and we have agreed to sell to it, all of the shares initially offered hereby.
The shares of common stock are being offered by D.A. Davidson, as underwriter, subject to prior sale, when, as and if issued to and accepted by it, subject to the satisfaction of the conditions specified in the underwriting agreement. D.A. Davidson & Co. must purchase all of the shares of common stock offered hereby if any of the shares are purchased, except for the shares covered by the over-allotment option described below, to the extent the option is exercised.
Over-Allotment Option
We have granted D.A. Davidson & Co. an option to purchase up to 345,000 additional shares of our common stock at the initial public offering price, less the underwriting discount. D.A. Davidson & Co. may exercise this option solely for the purpose of covering over-allotments, if any, made in connection with the offering of the shares of common stock offered by this prospectus. D.A. Davidson & Co. may exercise this option, in whole or in part, at any time and from time to time for 30 days from the date of the underwriting agreement. To the extent that D.A. Davidson & Co. exercises this option, it will be committed, as long as the conditions of the underwriting agreement are satisfied, to purchase the additional shares of common stock from us, and we will be obligated to sell the shares of common stock to D.A. Davidson & Co. If purchased, the additional shares will be sold by D.A. Davidson & Co. on the same terms as those on which the other shares are sold.
Underwriting Discounts and Commissions; Offering Expenses
The following table shows the per share and total public offering price, underwriting discount to be paid to D.A. Davidson & Co., and the net proceeds to us before expenses. This information is presented assuming both no exercise and full exercise by the underwriter of its over-allotment option, and assuming that all of the shares reserved for sale in the directed share program described below are sold to the general public.
| Without | With | |||||||||||
| Over-allotment | Over-allotment | |||||||||||
| Per Share | Exercise | Exercise | ||||||||||
| Public offering price | $ | $ | $ | |||||||||
| Underwriting discount paid by us | $ | $ | $ | |||||||||
| Proceeds, before expenses, to us | $ | $ | $ | |||||||||
If all shares reserved for sale under the directed share program described below are sold to participants thereof, then the aggregate underwriting discount paid by us would be reduced by $ , and the proceeds, before expenses, to us would be increased by an equivalent amount.
D.A. Davidson & Co. has advised us that it proposes to offer part of the shares of common stock directly to the public and part to certain dealers at the initial public offering price set forth on the cover page of this prospectus, and part to certain dealers at the initial public offering price less a selling concession not to exceed $ per share. D.A. Davidson & Co. also may allow, and dealers may reallow, a concession not to exceed $ per share to brokers and dealers. If the shares are not sold at a price within the initial public offering price range, D.A. Davidson & Co. may change the offering price and other selling terms.
In connection with NASD guidelines, the maximum compensation to D.A. Davidson & Co. in connection with the sale of shares pursuant to this prospectus will not exceed 8% of the total offering price to the public of the shares as set forth on the cover page of this prospectus.
94
Table of Contents
In addition to the underwriting fees described above, we have agreed to pay D.A. Davidson & Co. a non-accountable expense allowance of $50,000. Including this amount, we estimate that the expenses of this offering payable by us, exclusive of the underwriting discount, will be approximately $644,260.
Lock-up Agreements
We, and our executive officers, directors and one of our principal shareholders (greater than 5% shareholders) have agreed, for a period of 180 days after the date of this prospectus (which we refer to as the “restricted period”), not to offer, sell, agree or contract to sell, hypothecate, pledge, grant any option to purchase, or otherwise dispose of or hedge, directly or indirectly, any shares of our common stock or securities that are convertible into, or exchangeable or exercisable for, any shares of our common stock or warrants or other rights to purchase shares of our common stock or similar securities, without, in each case, the prior written consent of D.A. Davidson & Co. D.A. Davidson & Co. has agreed to permit James H. Lamb, a current director who will beneficially own approximately 2.9% of our outstanding common stock after this offering, to sell up to 3,000 shares for living expenses after this offering, subject to the resale restrictions of Rule 144 under the Securities Act. The restricted period is subject to a limited extension in certain circumstances if shares of our common stock are not “actively traded securities,” as defined in Rule 101(c)(1) of Regulation M under the Securities Exchange Act of 1934, as amended.
The foregoing restrictions do not apply to:
| • | the sale by us of shares of common stock to D.A. Davidson & Co. in this offering; | |
| • | the issuance by us of shares of common stock pursuant to, or the grant of options under, our existing stock option plan; | |
| • | the sale of shares of common stock acquired in the public market after the closing of the offering; or | |
| • | transfers of shares of common stock or securities convertible into or exercisable or exchangeable for common stock by any of the persons subject to alock-up agreement (a) as a bona fide gift or gifts, or (b) to any affiliate or member of such person’s immediate family or a trust created for the direct or indirect benefit of such person or the immediate family thereof; provided that, in any such case, the transferee or transferees shall execute and deliver to D.A. Davidson & Co., before such transfer, an agreement to be bound by the restrictions on transfer described above. |
In addition, Rodney R. Parr, a former director who will beneficially own approximately five percent of our outstanding common stock after this offering, has agreed to enter into a lock-up agreement with D.A. Davidson & Co. that contains terms and conditions substantially similar to those described above, except that the restricted period with respect to his shares will expire 60 days after the date of this offering; provided, that if the closing price of our common stock on the Nasdaq Global Market is greater than 120% of the initial public offering price for ten consecutive trading days during the 60-day restricted period, then D.A. Davidson & Co. will release Mr. Parr’s shares from the lock-up restrictions as of and from the following trading day.
In addition, during the restricted period, subject to certain exceptions, we have also agreed not to file any registration statement for the registration of any shares of common stock or any securities convertible into or exercisable or exchangeable for common stock without the prior written consent of D.A. Davidson & Co.
No Public Market
Prior to this offering, there has been no public market for our common stock. The public offering price for our common stock was negotiated between D.A. Davidson & Co. and us. The principal factors that were considered in determining the offering price were:
| • | prevailing market and general economic conditions; | |
| • | our results of operations, including, but not limited to, our recent financial performance; |
95
Table of Contents
| • | our current financial position, including, but not limited to, our stockholders’ equity and the composition of assets and liabilities reflected on our balance sheet; | |
| • | our business potential and prospects in our principal market area; | |
| • | an assessment of our management; and | |
| • | the present state of our business. |
The factors described above were not assigned any particular weight. Rather, these factors, along with market valuations and the financial performance of other publicly traded bank holding companies, were considered as a totality in our negotiation with the underwriter over our initial public offering price. Based on the assumed initial public offering price per share of $15.00, but without giving effect to the shares to be issued in this offering, the ratio of our initial public offering price per share to our earning per share for the last twelve months ended September 30, 2006 is 13.4x, and the ratio of our initial public offering price per share to our book value per share as of September 30, 2006 is 214%.
Stabilization and Short Positions
In connection with this underwriting, the underwriter may engage in stabilizing transactions, over-allotment transactions, syndicate covering transactions and penalty bids.
| • | Stabilizing transactions permit bids to purchase shares of common stock so long as the stabilizing bids do not exceed a specified maximum, and are engaged in for the purpose of preventing or retarding a decline in the market price of the common stock while the offering is in progress. | |
| • | Over-allotment transactions involve sales by the underwriter of shares of common stock in excess of the number of shares the underwriter is obligated to purchase. This creates a syndicate short position that may be either a covered short position or a naked short position. In a covered short position, the number of shares over-allotted by the underwriter is not greater than the number of shares that it may purchase in the over-allotment option. In a naked short position, the number of shares involved is greater than the number of shares in the over-allotment option. The underwriter may close out any short position by exercising its over-allotment option and/or purchasing shares in the open market. | |
| • | Syndicate covering transactions involve purchases of common stock in the open market after the distribution has been completed in order to cover syndicate short positions. In determining the source of shares to close out the short position, the underwriter will consider, among other things, the price of shares available for purchase in the open market as compared with the price at which it may purchase shares through exercise of the over-allotment option. If the underwriter sells more shares than could be covered by exercise of the over-allotment option and, therefore, have a naked short position, the position can be closed out only by buying shares in the open market. A naked short position is more likely to be created if the underwriter is concerned that after pricing there could be downward pressure on the price of the shares in the open market that could adversely affect investors who purchase in the offering. | |
| • | Penalty bids permit the underwriter to reclaim a selling concession from a syndicate member when the common stock originally sold by that syndicate member is purchased in a stabilizing or syndicate covering transaction to cover syndicate short positions. |
These stabilizing transactions, syndicate covering transactions and penalty bids may have the effect of raising or maintaining the market price of our common stock or preventing or retarding a decline in the market price of our common stock. As a result, the price of our common stock in the open market may be higher than it would otherwise be in the absence of these transactions. Neither we nor the underwriter make any representation or prediction as to the effect that the transactions described above may have on the price of our common stock. These transactions may be effected on the Nasdaq Global® Market, in theover-the-counter market or otherwise and, if commenced, may be discontinued at any time.
96
Table of Contents
Listing
We have applied to have our common stock listed for quotation on the Nasdaq Global® Market under the symbol “WSFG.”
Indemnification
We have agreed to indemnify the underwriter against specified liabilities, including liabilities under the Securities Act of 1933, as amended, and to contribute to payments that the underwriter may be required to make in respect thereof.
Affiliations
D.A. Davidson & Co. and its affiliates may in the future provide investment banking and other financial services for us and our affiliates, for which they may in the future receive customary fees. D.A. Davidson & Co. has advised us that, except as specifically contemplated in the underwriting agreement, it owes no fiduciary or other duties to us in connection with this offering, and that it has agreements and relationships with, and owes duties to, third parties, including potential purchasers of the securities in this offering, that may create actual, potential or apparent conflicts of interest between the underwriter and us.
Directed Share Program
At our request, D.A. Davidson & Co. has reserved for sale, at the initial public offering price, up to 325,000 shares of common stock offered in this prospectus for our directors, officers, employees, business associates and other related persons. We will not pay D.A. Davidson & Co. an underwriting discount with respect to the sale of these shares to participants in our directed share program. Shares purchased through the directed share program will be subject to the lock-up agreements described above, to the extent that our executive officers, directors and principal shareholders participate in the program and otherwise may not be sold or otherwise disposed for a period of 60 days after the closing of this offering. The number of shares of common stock available for sale to the general public will be reduced to the extent such persons purchase such reserved shares. Any reserved shares that are not so purchased will be offered by D.A. Davidson & Co. to the general public on the same basis as the other shares offered in this prospectus.
Online Offering
A prospectus in electronic format may be made available on the websites maintained by D.A. Davidson & Co. Shares may be sold by D.A. Davidson & Co. to securities dealers who resell shares to online brokerage account holders. Other than the prospectus in electronic format, the information on any such website, or accessible through any such website, is not part of the prospectus.
97
Table of Contents
SHARES ELIGIBLE FOR FUTURE SALE
Prior to this offering our common stock has not been traded on an established public trading market and quotations from our common stock were not reported on any market. As of September 30, 2006, there were 2,884,254 shares of our common stock outstanding, held by approximately 487 holders of record.
No prediction can be made as to the effect, if any, that sales of common stock or the availability of common stock for sale will have on the market price of our shares. The market price of our common stock could decline because of the sale of a large number of shares of our common stock or the perception that such sales could occur. These factors could also make it more difficult to raise funds through future offerings of common stock.
Sales of Restricted Shares
After this offering, 5,184,254 shares of common stock will be outstanding, or 5,529,254 shares if the underwriters’ over-allotment option is exercised in full. Of these shares, the 2,300,000 shares sold in this offering, or 2,645,000 shares if the underwriters’ over-allotment option is exercised in full, will be freely tradable without restriction under the Securities Act, except that any shares held by our “affiliates,” as defined in Rule 144 under the Securities Act, may be sold only in compliance with the limitations described below. The remaining 2,884,254 shares of common stock are “restricted securities,” within the meaning of Rule 144 under the Securities Act. The restricted securities generally may not be sold unless they are registered under the Securities Act or are sold pursuant to an exemption from registration under the Securities Act.
In connection with this offering, our existing officers, directors and one of our principal shareholders (greater than 5% shareholders), who will beneficially own a total of 1,777,306 shares after this offering, which includes 727,934 shares upon exercise of their outstanding options, have entered intolock-up agreements pursuant to which they have agreed not to sell any shares of common stock for a period of 180 days after the date of this prospectus without the prior written consent of the underwriter, D.A. Davidson & Co., except that James H. Lamb, a current director who will beneficially hold approximately 162,842 shares of common stock after this offering, will be permitted after this offering to sell up to 3,000 shares for living expenses, subject to the resale restrictions of Rule 144 under the Securities Act. The underwriter may, in its sole discretion, at any time and without notice, waive any of the terms of theselock-up agreements. In addition, Rodney R. Parr, a former director who will beneficially own approximately 275,362 shares of our outstanding common stock after this offering, has entered into a lock-up agreement with the underwriter that contains substantially similar resale restrictions, except that the period during which Mr. Parr is restricted from selling his shares will expire 60 days after the date of this offering; provided, that if the closing price of our common stock on the Nasdaq Global Market is greater than 120% of the initial public offering price for ten consecutive trading days during such 60-day period, then the underwriter will release Mr. Parr’s shares from the lock-up restrictions as of and from the following trading day. Except as described above, the underwriter presently has no intention to allow any shares of common stock to be sold or otherwise offered by us prior to the expiration of the 180 daylock-up period. Following thelock-up period, these shares will not be eligible for sale in the public market without registration under the Securities Act unless such sale meets the conditions and restrictions of Rule 144 as described below.
Rule 144
In general, under Rule 144, as currently in effect, any person or persons whose shares are required to be aggregated, including an affiliate of ours, and who has beneficially owned shares for a period of at least one year is entitled to sell, within any three month period, commencing 90 days after the date of this prospectus, a number of shares that does not exceed the greater of:
| • | 1% of the number of shares of our common stock then outstanding, which will equal approximately 51,843 shares (or, in the event the underwriters’ over-allotment option is exercised in full, 55,293) immediately after the offering; or |
98
Table of Contents
| • | the average weekly trading volume of our common stock during the four calendar weeks immediately preceding the date on which a notice of such sale on Form 144 is filed with the SEC. |
Sales under Rule 144 are also subject to provisions relating to notice and manner of sale and the availability of current public information about us during the 90 days immediately preceding a sale.
Rule 144(k)
Under Rule 144(k), a person who is not currently an affiliate of ours, and who has not been an affiliate of ours for at least three months before the sale, and who has beneficially owned the shares proposed to be sold for at least two years, including the holding period of any prior owner other than an affiliate, is entitled to sell these shares without complying with the manner of sale, public information, volume limitation or notice provisions of Rule 144.
Option Shares
Our directors, officers and employees who purchased our shares in connection with a written compensatory plan or contract may be entitled to rely on the resale provisions of Rule 701. Rule 701 permits non-affiliates to sell their Rule 701 shares without having to comply with the public information, holding period, volume limitation or notice provisions of Rule 144. Affiliates may sell their Rule 701 shares without having to comply with Rule 144’s holding period restrictions. In each of these cases, Rule 701 allows the shareholders to sell 90 days after the date of this prospectus. Subject to the lock-up agreements described above, approximately 279,501 shares of our common stock will be eligible for sale pursuant to Rule 701.
As soon as practicable after completion of this offering, we intend to register on a registration statement on Form S-8 a total of 1,317,652 shares of common stock issuable upon the exercise of options or reserved for future issuance under our stock option plan. The Form S-8 registration will permit the resale in the public market of shares so registered by non-affiliates without restriction under the Securities Act.
EXPERTS
Moss Adams LLP, independent registered public accounting firm, has audited the consolidated financial statements of WSB Financial Group at December 31, 2005 and 2004, and for the years then ended, as set forth in their report. The consolidated financial statements are included in the prospectus and registration statement in reliance on Moss Adams LLP’s report given on their authority as experts in accounting and auditing.
Our consolidated financial statements for the year ended December 31, 2003 included in this prospectus have been audited by Ball & Treger, LLP, independent certified public accountants, as set forth in their report thereon appearing elsewhere herein and in the registration statement, and are included in reliance upon the report of this firm given upon the authority as experts in accounting and auditing.
Effective March 24, 2004, Moss Adams LLP was engaged to replace Ball & Treger, LLP, who was dismissed effective March 24, 2004, as our independent certified public accountants. In connection with the audits prepared by Ball & Treger, LLP, we did not have any disagreements with them on any matter of accounting principles or practices, financial statement disclosures or auditing scope or procedures. Reports on our financial statements did not contain an adverse opinion or disclaimer of opinion, or disclosures that they were qualified or modified as to uncertainty, audit scope or accounting principles. The decision to change accountants was recommended and approved by our audit committee. Prior to the decision to change accounting firms in 2004, we had not consulted with Moss Adams LLP concerning the application of accounting principles to any specific completed or contemplated transaction, or the type of audit opinion that might be rendered by them on our consolidated financial statements, or any other matter or reportable event.
99
Table of Contents
LC Financial Advisors, LLC, an independent financial consultant, prepared the valuations of our stock paid to directors and issued under the Stock Option Plan in August 2006 and in prior fiscal years, as described in this registration statement. LC Financial Advisors, LLC has consented to the references to its valuation reports in this document.
CERTAIN LEGAL MATTERS
Keller Rohrback L.L.P., Seattle, Washington, has advised us in connection with certain legal matters in connection with this offering, and will pass upon the validity of our common stock offered by this prospectus. Stoel Rives LLP, Seattle Washington, will pass upon certain legal matters in connection with this offering for the underwriter.
WHERE YOU CAN FIND MORE INFORMATION
We have filed with the SEC a registration statement on Form S-1 under the Securities Act of 1933 that registers the shares of our common stock to be sold in this offering. The registration statement, including the attached exhibits and schedules, contains additional relevant information about us. The rules and regulations of the SEC allow us to omit from this prospectus certain information included in the registration statement. For further information about us and our common stock, you should refer to the registration statement and the exhibits and schedules filed with the registration statement. With respect to the statements in this prospectus regarding the contents of any agreement or other document, in each instance, the statement is qualified in all respects by the complete text of the agreement or document, a copy of which has been filed as an exhibit to the registration statement. You may review a copy of the registration statement on Form S-1 including the attached exhibits, at the SEC’s public reference facilities at 100 F Street, NE, Washington, D.C. 20549 or the SEC’s website referred to below. You may also obtain information on the operation of the public reference rooms by calling the SEC at1-800-SEC-0330. The SEC also maintains an Internet website that contains periodic reports, proxy statements and other information about issuers, like us, that we will file electronically with the SEC following the completion of this offering. The address of that site is www.sec.gov.
Upon completion of this offering, we will be subject to the information reporting requirements of the Securities Exchange Act of 1934, as amended, and we will file reports, proxy statements and other information with the SEC. These reports, proxy statements and other information will be available for inspection and copying at the public reference room and website of the SEC referred to above. We also maintain a website at http://www.westsoundbank.com, at which you may access these materials free of charge as soon as reasonably practicable after they are electronically filed with, or furnished to, the SEC. The content of our website is not a part of this prospectus.
100
Table of Contents
WSB FINANCIAL GROUP, INC.
INDEX TO FINANCIAL STATEMENTS
| F-2 | ||
| F-3 | ||
| F-5 | ||
| F-6 | ||
| F-7 | ||
| F-16 | ||
| F-17 | ||
| F-18 | ||
| F-19 | ||
| F-21 | ||
| F-22 | ||
| F-23 |
F-1
Table of Contents
WSB FINANCIAL GROUP, INC. AND SUBSIDIARIES
CONSOLIDATED STATEMENT OF FINANCIAL CONDITION
| September 30, | December 31, | |||||||||
| 2006 | 2005 | |||||||||
| (Unaudited) | ||||||||||
| ASSETS | ||||||||||
| CASH AND CASH EQUIVALENTS | ||||||||||
| Cash and due from banks | $ | 8,310,368 | $ | 8,157,828 | ||||||
| Federal funds sold | 5,500,000 | 18,400,000 | ||||||||
| Total cash and cash equivalents | 13,810,368 | 26,557,828 | ||||||||
| INVESTMENT SECURITIES AVAILABLE FOR SALE, at fair value | 8,237,657 | 8,235,191 | ||||||||
| FEDERAL HOME LOAN BANK STOCK | 234,200 | 234,200 | ||||||||
| LOANS HELD FOR SALE | 5,947,334 | 8,731,863 | ||||||||
| LOANS | 303,833,714 | 200,960,273 | ||||||||
| Less allowance for loan losses | (3,724,929 | ) | (2,520,323 | ) | ||||||
| Total loans, net | 300,108,785 | 198,439,950 | ||||||||
| PREMISES AND EQUIPMENT, net | 6,603,641 | 6,016,723 | ||||||||
| ACCRUED INTEREST RECEIVABLE | 1,637,494 | 999,022 | ||||||||
| OTHER ASSETS | 1,500,288 | 783,300 | ||||||||
| Total assets | $ | 338,079,767 | $ | 249,998,077 | ||||||
| LIABILITIES AND STOCKHOLDERS’ EQUITY | ||||||||||
| DEPOSITS | ||||||||||
| Non-interest-bearing deposits | $ | 26,542,372 | $ | 21,789,810 | ||||||
| Interest-bearing deposits | 281,523,454 | 202,376,963 | ||||||||
| Total deposits | 308,065,826 | 224,166,773 | ||||||||
| ACCRUED INTEREST PAYABLE | 989,126 | 234,174 | ||||||||
| OTHER LIABILITIES | 561,613 | 1,343,372 | ||||||||
| JUNIOR SUBORDINATED DEBENTURES PAYABLE | 8,248,000 | 8,248,000 | ||||||||
| Total liabilities | 317,864,565 | 233,992,319 | ||||||||
| STOCKHOLDERS’ EQUITY | ||||||||||
| Common stock, $1 par value; 15,357,250 shares authorized; 2,884,254 and 2,722,048 shares issued and outstanding at September 30, 2006 and December 31, 2005, respectively | 2,884,254 | 2,722,048 | ||||||||
| Additional paid-in-capital | 9,974,996 | 9,052,658 | ||||||||
| Retained earnings | 7,399,893 | 4,295,429 | ||||||||
| Accumulated other comprehensive loss | (43,941 | ) | (64,377 | ) | ||||||
| Total stockholders’ equity | 20,215,202 | 16,005,758 | ||||||||
| Total liabilities and stockholders’ equity | $ | 338,079,767 | $ | 249,998,077 | ||||||
See accompanying notes to unaudited consolidated financial statements.
F-2
Table of Contents
WSB FINANCIAL GROUP, INC. AND SUBSIDIARIES
UNAUDITED CONSOLIDATED STATEMENT OF INCOME
| Nine Months Ended | |||||||||||
| September 30, | |||||||||||
| 2006 | 2005 | ||||||||||
| (Unaudited) | (Unaudited) | ||||||||||
| INTEREST INCOME | |||||||||||
| Interest and fees on loans | $ | 19,538,749 | $ | 10,424,854 | |||||||
| Interest and dividends on investments | |||||||||||
| Taxable | 266,420 | 155,951 | |||||||||
| Tax-exempt | 56,888 | 42,658 | |||||||||
| Interest income on federal funds sold | 228,800 | 191,824 | |||||||||
| Total interest income | 20,090,857 | 10,815,287 | |||||||||
| INTEREST EXPENSE | |||||||||||
| Deposits | 7,681,071 | 3,300,991 | |||||||||
| Junior subordinated debentures payable | 417,041 | 61,774 | |||||||||
| Total interest expense | 8,098,112 | 3,362,765 | |||||||||
| NET INTEREST INCOME | 11,992,745 | 7,452,522 | |||||||||
| PROVISION FOR LOAN LOSSES | 1,266,500 | 874,642 | |||||||||
| Net interest income after provision for loan losses | 10,726,245 | 6,577,880 | |||||||||
| NONINTEREST INCOME | |||||||||||
| Service charges on deposit accounts | 180,934 | 126,380 | |||||||||
| Other customer fees | 611,868 | 343,623 | |||||||||
| Net gain on sale of loans | 2,573,857 | 3,197,847 | |||||||||
| Gain on sale of investments | — | 18,330 | |||||||||
| Rental income | 8,509 | 21,462 | |||||||||
| Other income | 43,978 | 513 | |||||||||
| Total other income | 3,419,146 | 3,708,155 | |||||||||
See accompanying notes to unaudited consolidated financial statements.
F-3
Table of Contents
WSB FINANCIAL GROUP, INC. AND SUBSIDIARIES
UNAUDITED CONSOLIDATED STATEMENT OF INCOME — (Continued)
| Nine Months Ended | ||||||||||
| September 30, | ||||||||||
| 2006 | 2005 | |||||||||
| (Unaudited) | (Unaudited) | |||||||||
| NONINTEREST EXPENSE | ||||||||||
| Salaries and employee benefits | 6,246,052 | 4,849,778 | ||||||||
| Occupancy | 439,956 | 330,654 | ||||||||
| Depreciation | 428,861 | 253,330 | ||||||||
| Equipment expenses | 223,200 | 222,478 | ||||||||
| Deposit insurance | 27,000 | 10,146 | ||||||||
| Professional fees | 373,032 | 237,174 | ||||||||
| Printing and office supplies | 199,604 | 206,657 | ||||||||
| Postage and freight | 98,598 | 79,342 | ||||||||
| Advertising | 173,310 | 131,671 | ||||||||
| Telephone | 83,862 | 55,035 | ||||||||
| Debit and credit cards | 104,770 | 74,911 | ||||||||
| Business development and travel | 98,303 | 75,173 | ||||||||
| EDP expense | 370,456 | 252,752 | ||||||||
| Dues and subscriptions | 27,727 | 22,075 | ||||||||
| Business taxes | 218,804 | 139,377 | ||||||||
| Services charges | 57,982 | 50,695 | ||||||||
| Other expenses | 305,016 | 261,370 | ||||||||
| Total other expenses | 9,476,533 | 7,252,618 | ||||||||
| INCOME BEFORE PROVISION FOR INCOME TAXES | 4,668,858 | 3,033,417 | ||||||||
| PROVISION FOR INCOME TAXES | 1,561,400 | 1,051,058 | ||||||||
| NET INCOME | $ | 3,107,458 | $ | 1,982,359 | ||||||
| EARNINGS PER SHARE | ||||||||||
| Basic | $ | 1.13 | $ | 0.76 | ||||||
| Diluted | $ | 0.99 | $ | 0.69 | ||||||
| Basic weighted average shares outstanding | 2,738,775 | 2,621,475 | ||||||||
| Diluted weighted average shares outstanding | 3,149,552 | 2,881,203 | ||||||||
See accompanying notes to unaudited consolidated financial statements.
F-4
Table of Contents
WSB FINANCIAL GROUP, INC. AND SUBSIDIARIES
UNAUDITED CONSOLIDATED STATEMENT OF CHANGES IN STOCKHOLDERS’ EQUITY
| Common Stock | Accumulated | |||||||||||||||||||||||||
| Additional | Other | |||||||||||||||||||||||||
| Number of | Paid-In | Retained | Comprehensive | |||||||||||||||||||||||
| Shares | Amount | Capital | Earnings | Loss | Total | |||||||||||||||||||||
| BALANCE, December 31, 2004 | 2,594,485 | $ | 2,594,485 | $ | 8,441,366 | $ | 1,883,859 | $ | (8,148 | ) | $ | 12,911,562 | ||||||||||||||
| Net income for the nine months ended September 30, 2005 | 1,982,359 | 1,982,359 | ||||||||||||||||||||||||
| Other comprehensive loss, net of tax | (20,686 | ) | (20,686 | ) | ||||||||||||||||||||||
| Total comprehensive income | 1,961,673 | |||||||||||||||||||||||||
| Issuance of stock | 110,572 | 110,572 | 428,928 | 539,500 | ||||||||||||||||||||||
| BALANCE, September 30, 2005 (unaudited) | $ | 2,705,057 | $ | 2,705,057 | $ | 8,870,294 | $ | 3,866,218 | $ | (28,834 | ) | $ | 15,412,735 | |||||||||||||
| BALANCE, December 31, 2005 | 2,722,048 | $ | 2,722,048 | $ | 9,052,658 | $ | 4,295,429 | $ | (64,377 | ) | $ | 16,005,758 | ||||||||||||||
| Net income for the nine months ended September 30, 2006 | 3,107,458 | 3,107,458 | ||||||||||||||||||||||||
| Other comprehensive income, net of tax | 20,436 | 20,436 | ||||||||||||||||||||||||
| Total comprehensive income | 3,127,894 | |||||||||||||||||||||||||
| Issuance of Stock | 10,473 | 10,473 | 105,820 | 116,293 | ||||||||||||||||||||||
| Fractional Shares Payout | (2,994 | ) | (2,994 | ) | ||||||||||||||||||||||
| Stock options exercised | 151,733 | 151,733 | 816,518 | 968,251 | ||||||||||||||||||||||
| BALANCE, September 30, 2006 (unaudited) | $ | 2,884,254 | $ | 2,884,254 | $ | 9,974,996 | $ | 7,399,893 | $ | (43,941 | ) | $ | 20,215,202 | |||||||||||||
See accompanying notes to unaudited consolidated financial statements.
F-5
Table of Contents
WSB FINANCIAL GROUP, INC. AND SUBSIDIARIES
UNAUDITED CONSOLIDATED STATEMENT OF CASH FLOWS
| Nine Months Ended September 30, | |||||||||||
| 2006 | 2005 | ||||||||||
| (Unaudited) | (Unaudited) | ||||||||||
| CASH FLOWS FROM OPERATING ACTIVITIES | |||||||||||
| Net income | $ | 3,107,458 | $ | 1,982,359 | |||||||
| Adjustments to reconcile net income to net cash from operating activities | |||||||||||
| Provision for loan losses | 1,266,500 | 874,642 | |||||||||
| Depreciation | 428,861 | 253,330 | |||||||||
| Amortization (accretion) of premiums/discounts | (5,112 | ) | (41,066 | ) | |||||||
| Director fees paid by stock in lieu of cash | 116,293 | — | |||||||||
| Fractional share payout | (2,994 | ) | — | ||||||||
| Gain on sale of loans | (2,573,857 | ) | (3,197,847 | ) | |||||||
| Deferred income taxes | 169,253 | 309,436 | |||||||||
| Net change in | |||||||||||
| Accrued interest receivable | (638,472 | ) | (341,109 | ) | |||||||
| Other assets | (716,988 | ) | 396,618 | ||||||||
| Loans held for sale | 5,358,386 | (529,847 | ) | ||||||||
| Accrued interest payable | 754,952 | 70,714 | |||||||||
| Other liabilities | (993,315 | ) | 8,810 | ||||||||
| Net cash from operating activities | 6,270,965 | (213,960 | ) | ||||||||
| CASH FLOWS FROM INVESTING ACTIVITIES | |||||||||||
| Net change in loans | (102,893,335 | ) | (60,971,905 | ) | |||||||
| Purchases of investments available-for-sale | — | (3,790,000 | ) | ||||||||
| Principal repayments of mortgage-backed securities | 23,384 | 69,688 | |||||||||
| Purchase of FHLB stock | — | (133,000 | ) | ||||||||
| Purchases of premises and equipment | (1,015,778 | ) | (3,359,216 | ) | |||||||
| Net cash from investing activities | (103,885,729 | ) | (68,184,433 | ) | |||||||
| CASH FLOWS FROM FINANCING ACTIVITIES | |||||||||||
| Net change in non-interest-bearing deposits | 4,752,562 | 7,042,208 | |||||||||
| Net change in interest-bearing deposits | 79,146,491 | 68,763,236 | |||||||||
| Proceeds from the issuance of junior subordinated debentures payable | 8,248,000 | ||||||||||
| Proceeds from sale of stock and the exercise of stock options | 968,251 | 539,500 | |||||||||
| Net cash from financing activities | 84,867,304 | 84,592,944 | |||||||||
| NET INCREASE IN CASH AND CASH EQUIVALENTS | (12,747,460 | ) | 16,194,551 | ||||||||
| CASH AND CASH EQUIVALENTS, beginning of period | 26,557,828 | 11,184,416 | |||||||||
| CASH AND CASH EQUIVALENTS, end of period | $ | 13,810,368 | $ | 27,378,967 | |||||||
| SUPPLEMENTAL DISCLOSURES OF CASH FLOW INFORMATION | |||||||||||
| Cash paid for interest | $ | 7,343,160 | $ | 3,230,277 | |||||||
| Income taxes paid | $ | 1,890,000 | $ | 355,000 | |||||||
See accompanying notes to unaudited consolidated financial statements.
F-6
Table of Contents
WSB FINANCIAL GROUP, INC. AND SUBSIDIARIES
NOTES TO CONSOLIDATED FINANCIAL STATEMENTS
Note 1 — Summary of Significant Accounting Policies
Nature of operations and basis of consolidation — On March 12, 1999, Westsound Bank (the Bank) was granted a state charter as a commercial bank whose principal activity is to engage in general commercial banking business in the Bremerton area of Kitsap County, Washington. The Bank generates commercial, mortgage and consumer loans and receives deposits from customers located primarily in Bremerton, Washington. As a Washington State chartered financial institution, the Bank is subject to regulations by the Washington State Banking Department of Financial Institutions and the Federal Deposit Insurance Corporation. Westsound Bank has branches and/or loan production offices in Bremerton, Silverdale, Port Angeles, Port Orchard, Sequim, Gig Harbor, and Federal Way, Washington.
The Bank is located in an area that has a significant U.S. Department of Defense presence. Closure or downsizing of one of the two large bases could affect operating results adversely. No such indication of closure or downsizing has been made in Department of Defense plans as indicated in budgets.
In July, 2005, WSB Financial Group, Inc. (the Company), a bank holding company, was issued a certificate of incorporation as a Washington Profit Corporation. During 2005, the Federal Reserve Bank of San Francisco granted authority to WSB Financial Group, Inc. to become a bank holding company through a reorganization of the ownership interests of Westsound Bank.
WSB Financial Group Trust (Trust), a subsidiary of WSB Financial Group, Inc., was formed in July 2005 for the exclusive purpose of issuing Trust Preferred Securities and common securities and using the $8 million in proceeds from the issuance to acquire junior subordinated debentures issued by WSB Financial Group, Inc. In accordance with Interpretation No. 46,Consolidation of Variable Interest Entities, the Trust is not consolidated in the Company’s financial statements.
The consolidated financial statements include the accounts of WSB Financial Group, Inc. and its wholly owned subsidiaries, excluding the Trust, after eliminating all intercompany transactions.
Unaudited Interim Financial Information — The accompanying interim consolidated financial statements as of September 30, 2006 and for the nine months ended September 30, 2006 and 2005 are unaudited. The unaudited interim financial statements have been prepared on the same basis as the annual financial statements and, in the opinion of management, reflect all adjustments, which include only normal recurring adjustments, necessary to present fairly the Company’s financial position as of September 30, 2006, and its results of operations and cash flows for the nine months ended September 30, 2006 and 2005. The results of operations for the interim period are not necessarily indicative of the results for the full year. Certain information and footnote disclosures included in the Company’s financial statements for the year ended December 31, 2005 have been condensed or omitted from this report. Accordingly, the statements should be read with the financial statements and notes thereto included in the Company’s December 31, 2005 financial statements.
Use of estimates — The preparation of financial statements in conformity with accounting principles generally accepted in the United States of America requires management to make estimates and assumptions that affect the reporting amounts of assets and liabilities and disclosure of contingent assets and liabilities at the date of the financial statements and the reported amounts of revenues and expenses during the reporting period. Actual results could differ from those estimates. A material estimate that is particularly susceptible to significant change relates to the determination of the allowance for loan losses.
Cash and cash equivalents — For purposes of reporting cash flows, cash and cash equivalents are cash on hand, amounts due from banks, and federal funds sold, and have maturities of three months or less. The Bank places its cash with high credit quality institutions. The amounts on deposit fluctuate and, at times, exceed the insured limit by the U.S. Federal Deposit Insurance Corporation, which potentially subjects the Bank to credit risk. Generally, federal funds are purchased and sold for one-day periods.
F-7
Table of Contents
WSB FINANCIAL GROUP, INC. AND SUBSIDIARIES
NOTES TO CONSOLIDATED FINANCIAL STATEMENTS — (Continued)
Investment securities — Investment securities are classified into one of three categories: (1) held-to-maturity, (2) available-for-sale, or (3) trading. Investment securities are categorized asheld-to-maturity when the Bank has the positive intent and ability to hold those securities to maturity. Securities which areheld-to-maturity are stated at cost and adjusted for amortization of premiums and accretion of discounts, which are recognized as adjustments to interest income. The Bank had no securities classified asheld-to-maturity as of September 30, 2006 and December 31, 2005. The Bank had no trading securities as of September 30, 2006 and December 31, 2005.
Investment securities categorized as available-for-sale are generally held for investment purposes (to maturity), although unanticipated future events may result in the sale of some securities. Available-for-sale securities are recorded at estimated fair value, with the net unrealized gain or loss included in comprehensive income, net of the related tax effect. Realized gains or losses on dispositions are based on the net proceeds and the adjusted carrying amount of securities sold, using the specific identification method.
Declines in the fair value of individualheld-to-maturity, and available-for-sale securities below their cost that are other than temporary are recognized by write-downs of the individual securities to their fair value. Such write-downs would be included in earnings as realized losses. In estimating other-than-temporary impairment losses, management considers (1) the length of time and the extent to which the fair value has been less than cost, (2) the financial condition and near-term prospects of the issuer, and (3) the intent and ability of the Bank to retain its investment in the issuer for a period of time sufficient to allow for any anticipated recovery in fair value. Gains and losses on the sale of securities are recorded on the trade date and are determined using the specific identification method.
Premiums and discounts are recognized in interest income using the interest method over the period to maturity.
Federal Home Loan Bank stock — The Bank’s investment in Federal Home Loan Bank (the FHLB) stock is carried at par value ($100 per share), which reasonably approximates its fair value. As a member of the FHLB system, the Bank is required to maintain a minimum level of investment in FHLB stock based on specified percentages of its outstanding FHLB advances. The Bank may request redemption at par value of any stock in excess of the amount the Bank is required to hold. Stock redemptions are at the discretion of the FHLB.
Loans held for sale — Loans originated and intended for sale in the secondary market are carried at the lower of aggregate cost or fair value, as determined by aggregate outstanding commitments from investors or current investor yield requirements. Net unrealized losses are recognized through a valuation allowance by charges to income.
Mortgage loans held for sale are generally sold with the mortgage servicing rights released by the Bank. Gains or losses on sales of mortgage loans are recognized based on the difference between the selling price and the carrying value of the related mortgage loans sold.
Accounting for derivatives — The Bank is engaged in the production of loans for sale to buyers and investors in the secondary mortgage market. These loan production activities expose the Bank to risk that a loan’s market value may decline between the date the Bank enters into an interest rate lock commitment with a borrower to fund a loan, or with a seller to purchase a loan, and the loan’s ultimate sale into the secondary market. The Bank reduces its exposure to this risk by entering into contracts to sell loans to buyers at specified prices to hedge against the economic risk of market value declines. The Bank considers its commitments to extend secondary market qualifying loans (the pipeline) with interest rate lock commitments to be derivatives, as well as its firm commitments to deliver loans, all of which are recognized at their estimated fair values. The fair value and notional amount of interest rate locked loan commitments was approximately $7,400 and $6,224,000, respectively, at September 30, 2006. The fair
F-8
Table of Contents
WSB FINANCIAL GROUP, INC. AND SUBSIDIARIES
NOTES TO CONSOLIDATED FINANCIAL STATEMENTS — (Continued)
value and notional amount of forward sale commitments was approximately $(7,400) and $6,224,000, respectively, at September 30, 2006. The fair value and notional amount of interest rate locked loan commitments was approximately $(132,000) and $15,000,000, respectively, at December 31, 2005. The fair value and notional amount of forward sale commitments was approximately $132,000 and $15,000,000, respectively, at December 31, 2005.
Loans and allowances for loan losses — Loans that management has the intent and ability to hold for the foreseeable future or until maturity or pay-off are reported at their outstanding principal adjusted for any charge-offs, the allowance for loan losses, any deferred fees or costs on originated loans and unamortized premiums or discounts on purchased loans. Interest income is accrued on the unpaid principal balance. Loan origination fees, net of certain direct origination costs, are deferred and recognized as an adjustment of the related loan yield using the interest method.
The Bank considers loans impaired when it is probable the Bank will be unable to collect all amounts as scheduled under the loan agreement. Impaired loans are measured based on the present value of expected future cash flows discounted at the loan’s effective interest rate, or, as a practical expedient, at the loan’s observable market price or the fair value of the collateral, if the loan is collateral dependent. Changes in these values will be reflected in income and as adjustments to the allowance for possible credit losses.
The accrual of interest on impaired loans is discontinued at the time the loan is 90 days past due or when, in management’s opinion, the borrower may be unable to meet payments as they become due. Factors considered by management in determining impairment include payment status, collateral value and the probability of collecting scheduled principal and interest payments when due. Loans that experience insignificant payment delays and payment shortfalls generally are not classified as impaired. Management determines the significance of payment delays and payment shortfalls on a case-by-case basis, taking into consideration all of the circumstances surrounding the loan and the borrower, including the length of the delay, the reasons for the delay, the borrower’s prior payment record and the amount of the shortfall in relation to the principal and interest owed. When interest accrual is discontinued, all unpaid accrued interest is reversed. Interest income is subsequently recognized only to the extent cash payments are received, or payment is considered certain. Loans are returned to accrual status when all the principal and interest amounts contractually due are brought current and future payments are reasonably assured.
The allowance is based on a continuing review of loans which includes consideration of actual loss experience, changes in the size and character of the portfolio, identification of individual problem situations which may affect the borrower’s ability to repay, and evaluations of the prevailing and anticipated economic conditions. This evaluation is inherently subjective, as it requires estimates that are susceptible to significant revision, as more information becomes available.
The allowance for loan losses is increased by charges to income and decreased by charge-offs (net of recoveries). While management uses available information to recognize losses on loans, changes in economic conditions may necessitate revision of the estimate in future years. In addition, various regulatory agencies, as an integral part of their examination processes, periodically review the Bank’s allowance for loan losses. Such agencies may require the Bank to recognize additional losses based on their judgment using information available to them at the time of their examination.
The allowance consists of specific, general and unallocated components. The specific component relates to loans that are classified as either doubtful, substandard or special mention. For such loans that are also classified as impaired, an allowance is established when the discounted cash flows (or collateral value or observable market price) of the impaired loan are lower than the carrying value of that loan. The general component covers non-classified loans and is based on historical loss experience adjusted for qualitative factors. An unallocated component is maintained to cover uncertainties that could affect
F-9
Table of Contents
WSB FINANCIAL GROUP, INC. AND SUBSIDIARIES
NOTES TO CONSOLIDATED FINANCIAL STATEMENTS — (Continued)
management’s estimate of probable losses. The unallocated component of the allowance reflects the margin of imprecision inherent in the underlying assumptions used in the methodologies for estimating specific and general losses in the portfolio.
Large groups of smaller balance homogeneous loans are collectively evaluated for impairment. Accordingly, the Bank does not separately identify individual consumer and residential loans for impairment disclosures, unless such loans are the subject of a restructuring agreement.
Transfers of financial assets — Transfers of financial assets are accounted for as sales, when control over the assets has been surrendered. Control over transferred assets is deemed to be surrendered when (1) the assets have been isolated from the Bank, (2) the transferee obtains the right (free of conditions that constrain it from taking advantage of that right) to pledge or exchange the transferred assets, and (3) the Bank does not maintain effective control over the transferred assets through an agreement to repurchase them before their maturity.
Premises and equipment — Land is carried at cost. Other premises and equipment are carried at cost net of accumulated depreciation. Depreciation is computed using the straight-line method based on the estimated useful lives of the related assets, ranging from 3 to 25 years. Maintenance and repairs are expensed as incurred while major additions and improvements are capitalized. Leasehold improvements are amortized over the life of the building lease.
Foreclosed assets — Assets acquired through, or in lieu of, loan foreclosure are held for sale and are initially recorded at fair value at the date of foreclosure, establishing a new cost basis. Subsequent to foreclosure, valuations are periodically performed by management and the assets are carried at the lower of carrying amount or fair value less cost to sell. Revenue and expenses from operations and changes in the valuation allowance are included in net expenses from foreclosed assets.
Income taxes — Income taxes are provided for the tax effects of the transactions reported in the financial statements and consist of taxes currently due plus deferred taxes related primarily to differences between the basis of the allowance for loan losses, organization costs, depreciation, and benefit associated with net operating losses. The deferred tax assets and liabilities are determined using the liability method and represent the future tax return consequences of those differences, which will either be taxable or deductible when the assets and liabilities are recovered or settle. Deferred tax assets and liabilities are reflected at income tax rates applicable to the period in which the deferred tax assets or liabilities are expected to be realized or settle. As changes in the tax laws or rates are enacted, deferred tax assets and liabilities are adjusted through the provision for income taxes.
Off-balance sheet credit related financial instruments — In the ordinary course of business, the Bank has entered into commitments to extend credit, including commitments under credit card arrangements, commercial letters of credit, and standby letters of credit. Such financial instruments are recorded when they are funded.
Stock option plans — Effective January 1, 2006, the Bank adopted Statement of Financial Accounting Standards No. 123(R),Share-Based Payment, which is a revision of FASB Statement No. 123,Accounting for Stock-Based Compensation. Statement 123(R) supersedes Accounting Principles Board Opinion No. 25,Accounting for Stock Issued to Employees, and amends FASB Statement No. 95,Statement of Cash Flows. Generally, the approach in Statement 123(R) is similar to the approach described in Statement 123. However, Statement 123(R) requires all share-based payments to employees, including grants of employee stock options, to be recognized in the income statement based on their fair values.
Prior to the Bank’s adoption of SFAS 123(R) on January 1, 2006, employee stock options were accounted for under the intrinsic value method as allowed under Accounting Principles Board Opinion
F-10
Table of Contents
WSB FINANCIAL GROUP, INC. AND SUBSIDIARIES
NOTES TO CONSOLIDATED FINANCIAL STATEMENTS — (Continued)
(APB) No. 25. Stock options are generally granted at exercise prices not less than the fair market value of common stock on the date of grant. Under APB No. 25, no compensation expense was recognized pursuant to the Bank’s stock option plans for stock options that are granted at exercise prices not less than the fair market value of common stock on the date of grant.
The proforma effect on the Bank’s earnings as a result of options issuances (determined using the minimum value method) was as follows for the nine months ended September 30, 2005:
| Net income as reported | $ | 1,982,359 | |||
| Additional compensation for fair | |||||
| value of stock options, net of tax | (376,265 | ) | |||
| Pro forma net income | $ | 1,606,094 | |||
| Basic earnings per share | |||||
| As reported | $ | 0.76 | |||
| Additional compensation for stock options, net of tax | $ | (0.15 | ) | ||
| Pro forma | $ | 0.61 | |||
| Diluted earnings per share | |||||
| As reported | $ | 0.69 | |||
| Additional compensation for stock options, net of tax | $ | (0.13 | ) | ||
| Pro forma | $ | 0.56 | |||
Earnings per common share — Basic earnings per share represents income available to common stockholders divided by the weighted-average number of common shares outstanding during the period. Diluted earnings per share reflects additional common shares that would have been outstanding if dilutive potential common shares had been issued, as well as any adjustment to income that would result from the assumed issuance. Potential common shares that may be issued by the Company relate solely to outstanding stock options, and are determined using the treasury stock method.
Earnings per common share have been computed based on the following:
| Nine Months Ended | |||||||||
| September 30, | |||||||||
| 2006 | 2005 | ||||||||
| Numerator | |||||||||
| Net income | $ | 3,107,458 | $ | 1,982,359 | |||||
| Denominator | |||||||||
| Weighted-average number of common shares outstanding | 2,738,775 | 2,621,475 | |||||||
| Incremental shares assumed for stock options | 410,777 | 259,728 | |||||||
| 3,149,552 | 2,881,203 | ||||||||
| Basic earnings per common share | $ | 1.13 | $ | 0.76 | |||||
| Diluted earnings per common share | $ | 0.99 | $ | 0.69 | |||||
There were no anti-dilutive options at September 30, 2006 or December 31, 2005.
Comprehensive income — Accounting principles generally require that recognized revenue, expenses, gains and losses be included in net income. Although certain changes in assets and liabilities, such as unrealized gains and losses on available-for-sale securities, are reported as a separate component of the equity section of the balance sheet, such items, along with net income, are components of comprehensive income.
F-11
Table of Contents
WSB FINANCIAL GROUP, INC. AND SUBSIDIARIES
NOTES TO CONSOLIDATED FINANCIAL STATEMENTS — (Continued)
The components of other comprehensive income (loss) and related tax effects are as follows:
| Nine Months Ended | |||||||||
| September 30, | |||||||||
| 2006 | 2005 | ||||||||
| Unrealized holding gain (loss) on available-for-sale securities | $ | 30,964 | $ | (31,344 | ) | ||||
| Tax (provision) benefit | (10,528 | ) | 10,658 | ||||||
| Net-of-tax-amount | $ | 20,436 | $ | (20,686 | ) | ||||
The components of accumulated other comprehensive income (loss), included in stockholders’ equity are as follows:
| September 30, | December 31, | ||||||||
| 2006 | 2005 | ||||||||
| Net unrealized loss on available-for-sale securities | $ | (65,773 | ) | $ | (96,737 | ) | |||
| Tax benefit | 21,832 | 32,360 | |||||||
| Net-of-tax-amount | $ | (43,941 | ) | $ | (64,377 | ) | |||
Lease income and expense — The Bank enters into agreements to lease property and equipment to or from third parties under operating lease agreements. Income and expense related to these agreements is recorded straight line over the life of the agreements. Lease income is recorded on the statement of income under the description “rental income”. Lease expense is included in occupancy.
Advertising costs — Advertising costs are expensed when incurred. Total advertising expenses were $173,310 and $131,671 for the nine months ended September 30, 2006 and 2005, respectively.
Recent accounting pronouncements — In July 2006, the FASB issued Interpretation No. 48,Accounting for Uncertainty in Income Taxes (FIN No. 48). This pronouncement requires a certain methodology for measuring and reporting uncertain tax positions, as well as disclosures. Adoption may result in a cumulative adjustment to income tax liabilities and retained earnings, if applicable. This statement will be effective as of January 1, 2007, and is not expected to have a material effect on the Company.
In September 2006, the FASB issued SFAS No. 158, “Employers’ Accounting for Defined Benefit Pension and other Postretirement Plans — an amendment of FASB Statements No. 87, 88, 106, and 132(R).” This Statement improves financial reporting by requiring an employer to recognize the overfunded or underfunded status of a defined benefit postretirement plan as an asset or liability in its statement of financial position and to recognize changes in that funded status in the year in which the changes occur through comprehensive income of a business entity or changes in unrestricted net assets of a not-for-profit organization. This Statement also improves financial reporting by requiring an employer to measure the funded status of a plan as of the date of its year-end statement of financial position, with limited exceptions. An employer with publicly traded equity securities is required to initially recognize the funded status of a defined benefit postretirement plan and to provide the required disclosures as of the end of the fiscal year ending after December 15, 2006. The requirement to measure plan assets and benefit obligations as of the date of the employer’s fiscal year-end statement of financial position is effective for fiscal years ending after December 15, 2008. SFAS No. 158 is not expected to have a material impact on the Company.
In September 2006, the FASB issued SFAS No. 157, “Fair Value Measurements.” This Statement defines fair value, establishes a framework for measuring fair value in generally accepted accounting principles, and expands disclosures about fair value measurements. This Statement applies under other accounting pronouncements that require or permit fair value measurements. Accordingly, this Statement
F-12
Table of Contents
WSB FINANCIAL GROUP, INC. AND SUBSIDIARIES
NOTES TO CONSOLIDATED FINANCIAL STATEMENTS — (Continued)
does not require any new fair value measurements. This Statement is effective for financial statements issued for fiscal years beginning after November 15, 2007, and interim periods within those fiscal years. SFAS No. 157 is not expected to have a material impact on the Company.
In March 2006, the FASB issued SFAS No. 156,Accounting for Servicing of Financial Assets, an amendment of SFAS No. 140 (SFAS No. 156). This pronouncement requires the recognition of a servicing asset or liability under specified circumstances, and if practicable, all separately recognized servicing assets and liabilities to be initially measured at fair value. Additionally, the pronouncement allows an entity to choose one of two methods when subsequently measuring its servicing assets and liabilities: the amortization method or the fair value method. The amortization method provided under SFAS No. 140, employs lower of cost or market (LOCOM) valuation. The new fair value method allows mark ups, in addition to the mark downs under LOCOM. SFAS No. 156 permits a one-time reclassification of available-for-sale securities to the trading classification. SFAS No. 156 is not expected to have a material effect on the Company.
In February 2006, the FASB issued SFAS No. 155,Accounting for Certain Hybrid Financial Instruments, an amendment of SFAS No. 133 and SFAS No. 140. This statement addresses the accounting for certain hybrid financial instruments (a financial instrument with an embedded derivative) and also clarifies which interest-only strips and principal-only strips are not subject to the requirements of SFAS No. 133. SFAS No. 155 allows combined valuation and accounting. This statement will be effective as of January 1, 2007. SFAS No. 155 is not expected to have a material effect on the Company.
Note 2 — Loans and Allowance for Loan Losses
Loans are summarized as follows:
| September 30, | December 31, | |||||||
| 2006 | 2005 | |||||||
| Real estate loans | $ | 284,047,607 | $ | 185,352,741 | ||||
| Commercial and industrial loans | 16,538,393 | $ | 13,123,344 | |||||
| Individual loans for household and other personal expenditures | 2,419,884 | 1,712,179 | ||||||
| Other loans | 827,830 | 772,009 | ||||||
| $ | 303,833,714 | $ | 200,960,273 | |||||
| Nine Months Ended | |||||||||
| September 30, | |||||||||
| 2006 | 2005 | ||||||||
| Allowance for loan losses | |||||||||
| Balances, beginning of period | $ | 2,520,323 | $ | 1,188,939 | |||||
| Provision for losses | 1,266,500 | 874,642 | |||||||
| Recoveries | 555 | 524 | |||||||
| Loans charged off | (20,449 | ) | (285 | ) | |||||
| Reclassification of allowance for unfunded credit commitments to other liabilities | (42,000 | ) | (15,000 | ) | |||||
| Balances, end of period | $ | 3,724,929 | $ | 2,048,820 | |||||
F-13
Table of Contents
WSB FINANCIAL GROUP, INC. AND SUBSIDIARIES
NOTES TO CONSOLIDATED FINANCIAL STATEMENTS — (Continued)
Note 3 — Deposits
Deposit account balances are summarized as follows:
| September 30, | December 31, | |||||||
| 2006 | 2005 | |||||||
| Non-interest-bearing | $ | 26,542,372 | $ | 21,789,810 | ||||
| Interest-bearing demand | 12,913,106 | 16,586,348 | ||||||
| Money market accounts | 110,004,086 | 115,006,053 | ||||||
| Savings deposits | 3,729,168 | 4,394,654 | ||||||
| Certificates of deposit exceeding $100,000 | 72,664,336 | 24,142,814 | ||||||
| Certificates of deposit less than $100,000 | 82,212,758 | 42,247,094 | ||||||
| $ | 308,065,826 | $ | 224,166,773 | |||||
Note 4 — Incentive stock option plan
The Company’s stockholders approved an Incentive Stock Option Plan on May 19, 1999. The purpose of the plan is to increase ownership interest in the Company by employees and directors of the Company, and to provide an incentive to serve as an employee and/or director of the Company. The stockholders originally approved 184,287 shares of common stock to the Plan. In 2002, the stockholders approved an additional allocation of 184,287 shares. The stockholders approved additional allocations of 614,290 shares in 2005 and 614,290 shares in 2004. The Board of Directors administers the plan. The maximum term of a stock option granted under the plan is ten years. Incentive stock options generally vest over a five year period while non-qualified stock options generally vest immediately.
Effective January 1, 2006, the Company adopted Statement of Financial Accounting Standards No. 123(R),Share-Based Payment, which is a revision of FASB Statement No. 123,Accounting for Stock-Based Compensation. Statement 123(R) supersedes Accounting Principles Board Opinion No. 25,Accounting for Stock Issued to Employees, and amends FASB Statement No. 95,Statement of Cash Flows. Generally, the approach in Statement 123(R) is similar to the approach described in Statement 123. However, Statement 123(R) requires all share-based payments to employees, including grants of employee stock options, to be recognized in the income statement based on their fair values. On January 1, 2006, the Company was a non-public entity that had historically used the minimum value method of the Black-Scholes model. Accordingly, the value of options granted prior to January 1, 2006, regardless of vesting, will not be reflected in the income statement of the Company for any period. No options were granted from January 1, 2006 through September 30, 2006. Therefore, no compensation expense was recorded during the nine months ended September 30, 2006 related to stock options. The weighted average fair value of options granted during the nine months ended September 30, 2005 was $367,000.
F-14
Table of Contents
WSB FINANCIAL GROUP, INC. AND SUBSIDIARIES
NOTES TO CONSOLIDATED FINANCIAL STATEMENTS — (Continued)
The following table summarizes the stock option activity for the nine months ended September 30, 2006:
| Options | Weighted | ||||||||
| Granted for | Average | ||||||||
| Common | Exercise | ||||||||
| Stock | Price | ||||||||
| Balance, December 31, 2005 | 1,125,686 | $ | 7.43 | ||||||
| Authorized | — | — | |||||||
| Granted | — | — | |||||||
| Exercised | (151,733 | ) | 6.44 | ||||||
| Forfeited | (3,066 | ) | 7.57 | ||||||
| Balance, September 30, 2006 | 970,887 | $ | 7.59 | ||||||
The weighted average remaining terms for outstanding and exercisable stock options at September 30, 2006 were approximately 8 years each. The aggregate intrinsic value at September 30, 2006 was approximately $5.4 million for stock options outstanding and $4.4 million for stock options exercisable. The intrinsic value for stock options is calculated based on the exercise price of the underlying awards and the market price of our common stock as of the reporting date.
The intrinsic value of stock options exercised during the nine months ended September 30, 2005 was $469,826. The intrinsic value of stock options exercised during the nine months ended September 30, 2006 was $951,814.
Note 5 — Stock Split
Effective August 15, 2006 the Company’s Board of Directors approved a6.1429-for-1 common stock split for shareholders of record on August 15, 2006. All share and per share information has been retroactively adjusted to reflect this stock split. The Board of Directors also approved an amendment to the Articles of Incorporation increasing the authorized shares from 2,500,000 to 15,357,250.
Note 6 — Commitments
In August 2006, the Company entered into employment agreements with its executive officers. The agreements provide for a base salary set by the Board of Directors and for potential annual bonuses at the discretion of the Compensation Committee. Upon a change in control the agreements provide for change in control payments ranging from the executive’s base salary to two times base salary. The agreements are for an indefinite term, until terminated by the executive or the Company.
F-15
Table of Contents
REPORT OF INDEPENDENT REGISTERED PUBLIC ACCOUNTING FIRM
To the Board of Directors and Shareholders
WSB Financial Group, Inc.
We have audited the accompanying consolidated statement of financial condition of WSB Financial Group, Inc. and Subsidiaries (Company) as of December 31, 2005 and 2004, and the related consolidated statements of income, changes in stockholders’ equity, and cash flows for the years then ended. These consolidated financial statements are the responsibility of the Company’s management. Our responsibility is to express an opinion on these consolidated financial statements based on our audits.
We conducted our audits with the standards of the Public Company Accounting Oversight Board (United States). Those standards require that we plan and perform the audits to obtain reasonable assurance about whether the consolidated financial statements are free of material misstatement. An audit includes consideration of internal control over financial reporting as a basis for designing audit procedures that are appropriate in the circumstances, but not for the purpose of expressing an opinion on the effectiveness of the Company’s internal control over financial reporting. Accordingly, we express no such opinion. An audit includes examining, on a test basis, evidence supporting the amounts and disclosures in the financial statements. An audit also includes assessing the accounting principles used and significant estimates made by management, as well as evaluating the overall consolidated financial statement presentation. We believe that our audits provide a reasonable basis for our opinion.
In our opinion, the consolidated financial statements referred to above present fairly, in all material respects, the consolidated financial position of WSB Financial Group, Inc. and Subsidiaries as of December 31, 2005 and 2004, and the results of their operations and their cash flows for the years then ended, in conformity with accounting principles generally accepted in the United States of America.
/s/ Moss Adams LLP
Everett, Washington
February 24, 2006, except for Note 16 as to which is dated August 29, 2006
F-16
Table of Contents
Ball and Treger, LLP
CERTIFIED PUBLIC ACCOUNTANTS
A Professional Limited Liability Partnership
| 400 Warren Avenue • Suite 430 • Bremerton, Washington 98337-1408 FAX: (360) 377-7089 | (360) 479-6868 |
INDEPENDENT AUDITOR’S REPORT
February 24, 2004
Board of Directors and
Stockholders of Westsound Bank
We have audited the accompanying statements of financial condition of Westsound Bank as of December 31, 2003 and the related statements of income, changes in stockholders’ equity, and cash flows for the year then ended. These financial statements are the responsibility of Westsound Bank’s management. Our responsibility is to express an opinion on these financial statements based on our audits.
We conducted the audit in accordance with auditing standards generally accepted in the United States of America. Those standards require that we plan and perform the audit to obtain reasonable assurance about whether the financial statements are free of material misstatement. An audit includes examining on a test basis, evidence supporting the amounts and disclosures in the financial statements. An audit also includes assessing the accounting principles used and significant estimates made by management, as well as evaluating the overall financial statement presentation. We believe that our audits provide a reasonable basis for our opinion.
In our opinion, the financial statements referred to above present fairly, in all material respects, the financial position of Westsound Bank as of December 31, 2003, and the results of its operations and cash flows for the year then ended in conformity with accounting principles generally accepted in the United States of America.
| BALL & TREGER, LLP |
F-17
Table of Contents
WSB FINANCIAL GROUP, INC. AND SUBSIDIARIES
CONSOLIDATED STATEMENT OF FINANCIAL CONDITION
| December 31, | ||||||||||
| 2005 | 2004 | |||||||||
| ASSETS | ||||||||||
| CASH AND CASH EQUIVALENTS | ||||||||||
| Cash and due from banks | $ | 8,157,828 | $ | 2,534,416 | ||||||
| Federal funds sold | 18,400,000 | 8,650,000 | ||||||||
| Total cash and cash equivalents | 26,557,828 | 11,184,416 | ||||||||
| INVESTMENT SECURITIES AVAILABLE FOR SALE, at fair value | 8,235,191 | 4,558,205 | ||||||||
| FEDERAL HOME LOAN BANK STOCK | 234,200 | 101,200 | ||||||||
| LOANS HELD FOR SALE | 8,731,863 | 2,019,111 | ||||||||
| LOANS | 200,960,273 | 116,793,046 | ||||||||
| Less allowance for loan losses | $ | (2,520,323 | ) | (1,188,939 | ) | |||||
| Total loans, net | 198,439,950 | 115,604,107 | ||||||||
| PREMISES AND EQUIPMENT, net | 6,016,723 | 2,552,339 | ||||||||
| ACCRUED INTEREST RECEIVABLE | 999,022 | 442,750 | ||||||||
| OTHER ASSETS | 783,300 | 953,432 | ||||||||
| Total assets | $ | 249,998,077 | $ | 137,415,560 | ||||||
| LIABILITIES AND STOCKHOLDERS’ EQUITY | ||||||||||
| DEPOSITS | ||||||||||
| Non-interest-bearing deposits | $ | 21,789,810 | $ | 14,723,933 | ||||||
| Interest-bearing deposits | 202,376,963 | 108,868,859 | ||||||||
| Total deposits | 224,166,773 | 123,592,792 | ||||||||
| ACCRUED INTEREST PAYABLE | 234,174 | 126,804 | ||||||||
| OTHER LIABILITIES | 1,343,372 | 784,402 | ||||||||
| JUNIOR SUBORDINATED DEBENTURES PAYABLE | 8,248,000 | — | ||||||||
| Total liabilities | $ | 233,992,319 | $ | 124,503,998 | ||||||
| STOCKHOLDERS’ EQUITY | ||||||||||
| Common stock, $1 par value; 15,357,250 shares authorized; 2,722,048 and 2,594,485 shares issued and outstanding at December 31, 2005 and 2004, respectively | 2,722,048 | 2,594,485 | ||||||||
| Additional paid-in capital | 9,052,658 | 8,441,366 | ||||||||
| Retained earnings | 4,295,429 | 1,883,859 | ||||||||
| Accumulated other comprehensive loss | (64,377 | ) | (8,148 | ) | ||||||
| Total stockholders’ equity | 16,005,758 | 12,911,562 | ||||||||
| Total liabilities and stockholders’ equity | $ | 249,998,077 | $ | 137,415,560 | ||||||
See accompanying notes.
F-18
Table of Contents
WSB FINANCIAL GROUP, INC. AND SUBSIDIARIES
CONSOLIDATED STATEMENT OF INCOME
| Year Ended December 31, | ||||||||||||||
| 2005 | 2004 | 2003 | ||||||||||||
| INTEREST INCOME | ||||||||||||||
| Interest and fees on loans | $ | 15,088,071 | $ | 7,725,300 | $ | 4,180,997 | ||||||||
| Interest and dividends on investments | 309,566 | 162,236 | 183,414 | |||||||||||
| Interest income on federal funds sold | 295,224 | 56,031 | 32,225 | |||||||||||
| Total interest income | 15,692,861 | 7,943,567 | 4,396,636 | |||||||||||
| INTEREST EXPENSE | ||||||||||||||
| Deposits | 5,002,949 | 1,705,493 | 1,110,608 | |||||||||||
| Junior subordinated debentures payable | 178,529 | — | — | |||||||||||
| Total interest expense | 5,181,478 | 1,705,493 | 1,110,608 | |||||||||||
| NET INTEREST INCOME | 10,511,383 | 6,238,074 | 3,286,028 | |||||||||||
| PROVISION FOR LOAN LOSSES | 1,351,814 | 653,735 | 231,109 | |||||||||||
| Net interest income after provision for loan losses | 9,159,569 | 5,584,339 | 3,054,919 | |||||||||||
| NONINTEREST INCOME | ||||||||||||||
| Service charges on deposit accounts | 178,651 | 154,509 | 123,739 | |||||||||||
| Other customer fees | 605,984 | 284,675 | 120,626 | |||||||||||
| Net gain on sale of loans | 4,383,487 | 2,361,811 | — | |||||||||||
| Gain on sale of investments | — | — | 1,672 | |||||||||||
| Rental income | 31,753 | — | 33,750 | |||||||||||
| Other income | 40,921 | 4,452 | 13,018 | |||||||||||
| Total other income | 5,240,796 | 2,805,447 | 292,805 | |||||||||||
See accompanying notes.
F-19
Table of Contents
WSB FINANCIAL GROUP, INC. AND SUBSIDIARIES
CONSOLIDATED STATEMENT OF INCOME — (Continued)
| Year Ended December 31, | ||||||||||||||
| 2005 | 2004 | 2003 | ||||||||||||
| NONINTEREST EXPENSE | ||||||||||||||
| Salaries and employee benefits | 7,264,567 | 4,096,778 | 1,136,337 | |||||||||||
| Occupancy | 489,202 | 346,594 | 155,953 | |||||||||||
| Depreciation | 371,273 | 257,566 | 146,790 | |||||||||||
| Equipment expenses | 254,113 | 179,100 | 108,318 | |||||||||||
| Deposit insurance | 18,999 | 15,518 | 16,921 | |||||||||||
| Professional fees | 440,991 | 236,465 | 118,633 | |||||||||||
| Printing and office supplies | 264,793 | 175,918 | 92,772 | |||||||||||
| Postage and freight | 108,799 | 79,762 | 46,012 | |||||||||||
| Advertising | 183,163 | 135,768 | 61,913 | |||||||||||
| Telephone | 77,589 | 53,650 | 25,705 | |||||||||||
| Debit and credit cards | 100,860 | 81,765 | 57,569 | |||||||||||
| Business development and travel | 103,528 | 74,185 | 30,322 | |||||||||||
| EDP expense | 362,544 | 255,933 | 207,098 | |||||||||||
| Dues and subscriptions | 30,763 | 32,185 | 17,103 | |||||||||||
| Business taxes | 202,017 | 142,899 | 61,044 | |||||||||||
| Services charges | 67,599 | 51,659 | 33,282 | |||||||||||
| Other expenses | 351,437 | 153,907 | 68,118 | |||||||||||
| Total other expenses | 10,692,237 | 6,369,652 | 2,383,890 | |||||||||||
| INCOME BEFORE PROVISION FOR INCOME TAXES | 3,708,128 | 2,020,134 | 963,834 | |||||||||||
| PROVISION FOR INCOME TAXES | 1,296,558 | 680,173 | 332,928 | |||||||||||
| NET INCOME | $ | 2,411,570 | $ | 1,339,961 | $ | 630,906 | ||||||||
| EARNINGS PER SHARE | ||||||||||||||
| Basic | $ | 0.91 | $ | 0.59 | $ | 0.36 | ||||||||
| Diluted | $ | 0.82 | $ | 0.55 | $ | 0.35 | ||||||||
See accompanying notes.
F-20
Table of Contents
WSB FINANCIAL GROUP, INC. AND SUBSIDIARIES
CONSOLIDATED STATEMENT OF CHANGES IN STOCKHOLDERS’ EQUITY
| Common Stock | Accumulated | |||||||||||||||||||||||||
| Additional | Retained | Other | ||||||||||||||||||||||||
| Number of | Paid-In | Earnings | Comprehensive | |||||||||||||||||||||||
| Shares | Amount | Capital | (Deficit) | Loss | Total | |||||||||||||||||||||
| BALANCE, December 31, 2002 | 1,505,318 | $ | 1,505,318 | $ | 3,186,128 | $ | (87,008 | ) | $ | 14,920 | $ | 4,619,358 | ||||||||||||||
| Net income | 630,906 | 630,906 | ||||||||||||||||||||||||
| Other comprehensive income, net of tax | (19,394 | ) | (19,394 | ) | ||||||||||||||||||||||
| Total comprehensive income | 611,512 | |||||||||||||||||||||||||
| Stock issued for directors fees | 10,258 | 10,258 | 57,540 | 67,798 | ||||||||||||||||||||||
| Stock transactions | 503,595 | 503,595 | 2,098,775 | 2,602,370 | ||||||||||||||||||||||
| BALANCE, December 31, 2003 | 2,019,171 | 2,019,171 | 5,342,443 | 543,898 | (4,474 | ) | 7,901,038 | |||||||||||||||||||
| Net income | 1,339,961 | 1,339,961 | ||||||||||||||||||||||||
| Other comprehensive loss net of tax | (3,674 | ) | (3,674 | ) | ||||||||||||||||||||||
| Total comprehensive income | 1,336,287 | |||||||||||||||||||||||||
| Stock issued for directors fees | 18,515 | 18,515 | 106,917 | 125,432 | ||||||||||||||||||||||
| Stock transactions | 556,799 | 556,799 | 2,992,006 | 3,548,805 | ||||||||||||||||||||||
| BALANCE, December 31, 2004 | 2,594,485 | 2,594,485 | 8,441,366 | 1,883,859 | (8,148 | ) | 12,911,562 | |||||||||||||||||||
| Net income | 2,411,570 | 2,411,570 | ||||||||||||||||||||||||
| Other comprehensive loss net of tax | (56,229 | ) | (56,229 | ) | ||||||||||||||||||||||
| Total comprehensive income | 2,355,341 | |||||||||||||||||||||||||
| Tax benefit of stock options exercised | 42,670 | 42,670 | ||||||||||||||||||||||||
| Stock issued for directors fees | 16,530 | 16,530 | 135,805 | 152,335 | ||||||||||||||||||||||
| Stock options exercised | 84,772 | 84,772 | 245,528 | 330,300 | ||||||||||||||||||||||
| Issuance of stock | 26,261 | 26,261 | 187,289 | 213,550 | ||||||||||||||||||||||
| BALANCE, December 31, 2005 | 2,722,048 | $ | 2,722,048 | $ | 9,052,658 | $ | 4,295,429 | $ | (64,377 | ) | $ | 16,005,758 | ||||||||||||||
See accompanying notes.
F-21
Table of Contents
WSB FINANCIAL GROUP, INC. AND SUBSIDIARIES
CONSOLIDATED STATEMENT OF CASH FLOWS
| Year Ended December 31, | |||||||||||||||
| 2005 | 2004 | 2003 | |||||||||||||
| CASH FLOWS FROM OPERATING ACTIVITIES | |||||||||||||||
| Net income | $ | 2,411,570 | $ | 1,339,961 | $ | 630,906 | |||||||||
| Adjustments to reconcile net income to net cash from operating activities | |||||||||||||||
| Provision for loan losses | 1,351,814 | 653,735 | 231,109 | ||||||||||||
| Depreciation | 371,273 | 257,566 | 146,790 | ||||||||||||
| Amortization of premiums | 10,288 | 48,465 | — | ||||||||||||
| Director fees paid by stock in lieu of cash | 152,335 | 125,432 | 67,798 | ||||||||||||
| Tax benefit of stock options exercised | 42,670 | — | — | ||||||||||||
| Loss on sale of premises and equipment | — | 5,077 | — | ||||||||||||
| Gain on sale of loans | (4,388,487 | ) | (2,361,811 | ) | — | ||||||||||
| FHLB stock dividend | — | (2,700 | ) | (5,577 | ) | ||||||||||
| Deferred income taxes | (511,058 | ) | 410,871 | 142,482 | |||||||||||
| Net change in | |||||||||||||||
| Accrued interest receivable | (556,272 | ) | (143,194 | ) | (57,767 | ) | |||||||||
| Other assets | 156,596 | (718,511 | ) | (27,184 | ) | ||||||||||
| Loans held for sale | (2,324,265 | ) | (2,019,111 | ) | — | ||||||||||
| Accrued interest payable | 107,370 | 74,390 | — | ||||||||||||
| Other liabilities | 1,091,667 | 295,609 | (10,093 | ) | |||||||||||
| Net cash from operating activities | (2,084,499 | ) | (2,034,221 | ) | 1,118,464 | ||||||||||
| CASH FLOWS FROM INVESTING ACTIVITIES | |||||||||||||||
| Net change in loans | (84,167,657 | ) | (55,651,579 | ) | (18,676,019 | ) | |||||||||
| Purchases of investments available-for-sale | (3,841,294 | ) | (1,125,000 | ) | (8,418,013 | ) | |||||||||
| Proceeds from calls and maturities of investments available-for-sale | — | 2,300,000 | 7,483,178 | ||||||||||||
| Principal repayments of mortgage-backed securities | 69,688 | 288,035 | — | ||||||||||||
| Purchases of investments held to maturity | (100,000 | ) | |||||||||||||
| Proceeds from investments held to maturity | — | 200,000 | — | ||||||||||||
| Purchase of FHLB stock | (133,000 | ) | (9,800 | ) | (23,000 | ) | |||||||||
| Purchases of premises and equipment | (3,835,657 | ) | (1,277,012 | ) | (304,179 | ) | |||||||||
| Proceeds from the sale of premises and equipment | — | 2,706 | — | ||||||||||||
| Net cash from investing activities | (91,907,920 | ) | (55,272,650 | ) | (20,038,033 | ) | |||||||||
| CASH FLOWS FROM FINANCING ACTIVITIES | |||||||||||||||
| Net change in non-interest-bearing deposits | 7,065,877 | 6,510,226 | 3,370,000 | ||||||||||||
| Net change in interest-bearing deposits | 93,508,104 | 49,079,879 | 16,615,732 | ||||||||||||
| Proceeds from the issuance of junior subordinated debentures payable | 8,248,000 | — | — | ||||||||||||
| Proceeds from sale of stock and the exercise of stock options | 543,850 | 3,548,805 | 2,602,370 | ||||||||||||
| Net cash from financing activities | 109,365,831 | 59,138,910 | 22,588,102 | ||||||||||||
| NET INCREASE IN CASH AND CASH EQUIVALENTS | 15,373,412 | 1,832,039 | 3,668,533 | ||||||||||||
| CASH AND CASH EQUIVALENTS, beginning of year | 11,184,416 | 9,352,377 | 5,683,844 | ||||||||||||
| CASH AND CASH EQUIVALENTS, end of year | $ | 26,557,828 | $ | 11,184,416 | $ | 9,352,377 | |||||||||
| SUPPLEMENTAL DISCLOSURES OF CASH FLOW INFORMATION | |||||||||||||||
| Cash paid for interest | $ | 5,074,108 | $ | 1,631,103 | $ | 1,110,853 | |||||||||
| Income taxes paid | $ | 555,000 | $ | 727,900 | $ | 190,446 | |||||||||
See accompanying notes.
F-22
Table of Contents
WSB FINANCIAL GROUP, INC. AND SUBSIDIARIES
NOTES TO CONSOLIDATED FINANCIAL STATEMENTS
Note 1 — Summary of Significant Accounting Policies
Nature of operations and basis of consolidation — On March 12, 1999, Westsound Bank (the Bank) was granted a state charter as a commercial bank whose principal activity is to engage in general commercial banking business in the Bremerton area of Kitsap County, Washington. The Bank generates commercial, mortgage and consumer loans and receives deposits from customers located primarily in Bremerton, Washington. As a Washington State chartered financial institution, the Bank is subject to regulations by the Washington State Banking Department of Financial Institutions and the Federal Deposit Insurance Corporation. Westsound Bank has branches and/or loan production offices in Bremerton, Silverdale, Port Angeles, Port Orchard, Sequim, Gig Harbor, and Federal Way, Washington.
The Bank is located in an area that has a significant U.S. Department of Defense presence. Closure or downsizing of one of the two large bases could affect operating results adversely. No such indication of closure or downsizing has been made in Department of Defense plans as indicated in budgets.
In July, 2005, WSB Financial Group, Inc. (the Company), a bank holding company, was issued a certificate of incorporation as a Washington Profit Corporation. During 2005, the Federal Reserve Bank of San Francisco granted authority to WSB Financial Group, Inc. to become a bank holding company through a reorganization of the ownership interests of Westsound Bank.
WSB Financial Group Trust (Trust), a subsidiary of WSB Financial Group, Inc., was formed in July 2005 for the exclusive purpose of issuing Trust Preferred Securities and common securities and using the $8 million in proceeds from the issuance to acquire junior subordinated debentures issued by WSB Financial Group, Inc. In accordance with Interpretation No. 46,Consolidation of Variable Interest Entities, the Trust is not consolidated in the Company’s financial statements.
The consolidated financial statements include the accounts of WSB Financial Group, Inc. and its wholly owned subsidiaries, excluding the Trust, after eliminating all inter-company transactions.
Use of estimates — The preparation of financial statements in conformity with accounting principles generally accepted in the United States of America requires management to make estimates and assumptions that affect the reporting amounts of assets and liabilities and disclosure of contingent assets and liabilities at the date of the financial statements and the reported amounts of revenues and expenses during the reporting period. Actual results could differ from those estimates. A material estimate that is particularly susceptible to significant change relates to the determination of the allowance for loan losses.
Cash and cash equivalents — For purposes of reporting cash flows, cash and cash equivalents are cash on hand, amounts due from banks, and federal funds sold, and have maturities of three months or less. The Bank places its cash with high credit quality institutions. The amounts on deposit fluctuate and, at times, exceed the insured limit by the U.S. Federal Deposit Insurance Corporation, which potentially subjects the Bank to credit risk. Generally, federal funds are purchased and sold for one-day periods.
Investment securities — Investment securities are classified into one of three categories: (1) held-to-maturity, (2) available-for-sale, or (3) trading. Investment securities are categorized asheld-to-maturity when the Bank has the positive intent and ability to hold those securities to maturity. Securities which areheld-to-maturity are stated at cost and adjusted for amortization of premiums and accretion of discounts, which are recognized as adjustments to interest income. The Bank had no securities classified asheld-to-maturity as of December 31, 2005 and 2004. The Bank had no trading securities as of December 31, 2005 and 2004.
Investment securities categorized as available-for-sale are generally held for investment purposes (to maturity), although unanticipated future events may result in the sale of some securities. Available-for-sale securities are recorded at estimated fair value, with the net unrealized gain or loss included in comprehensive income, net of the related tax effect. Realized gains or losses on dispositions are based on
F-23
Table of Contents
WSB FINANCIAL GROUP, INC. AND SUBSIDIARIES
NOTES TO CONSOLIDATED FINANCIAL STATEMENTS — (Continued)
the net proceeds and the adjusted carrying amount of securities sold, using the specific identification method.
Declines in the fair value of individualheld-to-maturity, and available-for-sale securities below their cost that are other than temporary are recognized by write-downs of the individual securities to their fair value. Such write-downs would be included in earnings as realized losses. In estimating other-than-temporary impairment losses, management considers (1) the length of time and the extent to which the fair value has been less than cost, (2) the financial condition and near-term prospects of the issuer, and (3) the intent and ability of the Bank to retain its investment in the issuer for a period of time sufficient to allow for any anticipated recovery in fair value. Gains and losses on the sale of securities are recorded on the trade date and are determined using the specific identification method.
Premiums and discounts are recognized in interest income using the interest method over the period to maturity.
Federal Home Loan Bank stock — The Bank’s investment in Federal Home Loan Bank (the FHLB) stock is carried at par value ($100 per share), which reasonably approximates its fair value. As a member of the FHLB system, the Bank is required to maintain a minimum level of investment in FHLB stock based on specified percentages of its outstanding FHLB advances. The Bank may request redemption at par value of any stock in excess of the amount the Bank is required to hold. Stock redemptions are at the discretion of the FHLB.
Loans held for sale — Loans originated and intended for sale in the secondary market are carried at the lower of aggregate cost or fair value, as determined by aggregate outstanding commitments from investors or current investor yield requirements. Net unrealized losses are recognized through a valuation allowance by charges to income.
Mortgage loans held for sale are generally sold with the mortgage servicing rights released by the Bank. Gains or losses on sales of mortgage loans are recognized based on the difference between the selling price and the carrying value of the related mortgage loans sold.
Accounting for derivatives — The Company is engaged in the production of loans for sale to buyers and investors in the secondary mortgage market. These loan production activities expose the Company to risk that a loan’s market value may decline between the date the Company enters into an interest rate lock commitment with a borrower to fund a loan, or with a seller to purchase a loan, and the loan’s ultimate sale into the secondary market. The Company reduces its exposure to this risk by entering into contracts to sell loans to buyers at specified prices to hedge against the economic risk of market value declines. The Company considers its commitments to extend secondary market qualifying loans (the pipeline) with interest rate lock commitments to be derivatives, as well as its firm commitments to deliver loans, all of which are recognized at their estimated fair values. The fair value and notional amount of interest rate locked loan commitments was approximately $(132,000) and $15,000,000, respectively, at December 31, 2005. The fair value and notional amount of forward sale commitments was approximately $132,000 and $15,000,000, respectively, at December 31, 2005.
Loans and allowances for loan losses — Loans that management has the intent and ability to hold for the foreseeable future or until maturity or pay-off are reported at their outstanding principal adjusted for any charge-offs, the allowance for loan losses, any deferred fees or costs on originated loans and unamortized premiums or discounts on purchased loans. Interest income is accrued on the unpaid principal balance. Loan origination fees, net of certain direct origination costs, are deferred and recognized as an adjustment of the related loan yield using the interest method.
The Bank considers loans impaired when it is probable the Bank will be unable to collect all amounts as scheduled under the loan agreement. Impaired loans are measured based on the present value of
F-24
Table of Contents
WSB FINANCIAL GROUP, INC. AND SUBSIDIARIES
NOTES TO CONSOLIDATED FINANCIAL STATEMENTS — (Continued)
expected future cash flows discounted at the loan’s effective interest rate, or, as a practical expedient, at the loan’s observable market price or the fair value of the collateral, if the loan is collateral dependent. Changes in these values will be reflected in income and as adjustments to the allowance for possible credit losses.
The accrual of interest on impaired loans is discontinued at the time the loan is 90 days past due or when, in management’s opinion, the borrower may be unable to meet payments as they become due. Factors considered by management in determining impairment include payment status, collateral value and the probability of collecting scheduled principal and interest payments when due. Loans that experience insignificant payment delays and payment shortfalls generally are not classified as impaired. Management determines the significance of payment delays and payment shortfalls on a case-by-case basis, taking into consideration all of the circumstances surrounding the loan and the borrower, including the length of the delay, the reasons for the delay, the borrower’s prior payment record and the amount of the shortfall in relation to the principal and interest owed. When interest accrual is discontinued, all unpaid accrued interest is reversed. Interest income is subsequently recognized only to the extent cash payments are received, or payment is considered certain. Loans are returned to accrual status when all the principal and interest amounts contractually due are brought current and future payments are reasonably assured.
The allowance is based on a continuing review of loans which includes consideration of actual loss experience, changes in the size and character of the portfolio, identification of individual problem situations which may affect the borrower’s ability to repay, and evaluations of the prevailing and anticipated economic conditions. This evaluation is inherently subjective, as it requires estimates that are susceptible to significant revision, as more information becomes available.
The allowance for loan losses is increased by charges to income and decreased by charge-offs (net of recoveries). While management uses available information to recognize losses on loans, changes in economic conditions may necessitate revision of the estimate in future years. In addition, various regulatory agencies, as an integral part of their examination processes, periodically review the Bank’s allowance for loan losses. Such agencies may require the Bank to recognize additional losses based on their judgment using information available to them at the time of their examination.
The allowance consists of specific, general and unallocated components. The specific component relates to loans that are classified as doubtful, substandard or special mention. For such loans that are also classified as impaired, an allowance is established when the discounted cash flows (or collateral value or observable market price) of the impaired loan are lower than the carrying value of that loan. The general component covers non-classified loans and is based on historical loss experience adjusted for qualitative factors. An unallocated component is maintained to cover uncertainties that could affect management’s estimate of probable losses. The unallocated component of the allowance reflects the margin of imprecision inherent in the underlying assumptions used in the methodologies for estimating specific and general losses in the portfolio.
Large groups of smaller balance homogeneous loans are collectively evaluated for impairment. Accordingly, the Bank does not separately identify individual consumer and residential loans for impairment disclosures, unless such loans are the subject of a restructuring agreement.
Transfers of financial assets — Transfers of financial assets are accounted for as sales, when control over the assets has been surrendered. Control over transferred assets is deemed to be surrendered when (1) the assets have been isolated from the Bank, (2) the transferee obtains the right (free of conditions that constrain it from taking advantage of that right) to pledge or exchange the transferred assets, and (3) the Bank does not maintain effective control over the transferred assets through an agreement to repurchase them before their maturity.
F-25
Table of Contents
WSB FINANCIAL GROUP, INC. AND SUBSIDIARIES
NOTES TO CONSOLIDATED FINANCIAL STATEMENTS — (Continued)
Premises and equipment — Land is carried at cost. Other premises and equipment are carried at cost net of accumulated depreciation. Depreciation is computed using the straight-line method based on the estimated useful lives of the related assets, ranging from 3 to 25 years. Maintenance and repairs are expensed as incurred while major additions and improvements are capitalized. Leasehold improvements are amortized over the life of the building lease.
Foreclosed assets — Assets acquired through, or in lieu of, loan foreclosure are held for sale and are initially recorded at fair value at the date of foreclosure, establishing a new cost basis. Subsequent to foreclosure, valuations are periodically performed by management and the assets are carried at the lower of carrying amount or fair value less cost to sell. Revenue and expenses from operations and changes in the valuation allowance are included in net expenses from foreclosed assets.
Income taxes — Income taxes are provided for the tax effects of the transactions reported in the financial statements and consist of taxes currently due plus deferred taxes related primarily to differences between the basis of the allowance for loan losses, organization costs, depreciation, and benefit associated with net operating losses. The deferred tax assets and liabilities are determined using the liability method and represent the future tax return consequences of those differences, which will either be taxable or deductible when the assets and liabilities are recovered or settle. Deferred tax assets and liabilities are reflected at income tax rates applicable to the period in which the deferred tax assets or liabilities are expected to be realized or settle. As changes in the tax laws or rates are enacted, deferred tax assets and liabilities are adjusted through the provision for income taxes.
Off-balance sheet credit related financial instruments — In the ordinary course of business, the Bank has entered into commitments to extend credit, including commitments under credit card arrangements, commercial letters of credit, and standby letters of credit. Such financial instruments are recorded when they are funded.
Stock option plans — The Bank recognizes the financial effects of stock-based employee compensation based on the intrinsic value method of accounting prescribed by Accounting Principles Board Opinion No. 25,Accounting for Stock Issued to Employees(APB 25). Generally, stock options are issued at a price equal to the fair value of the Bank’s stock as of the grant date. Under APB 25, options issued in this manner do not result in the recognition of employee compensation in the Bank’s financial statements. Additional disclosures required by Statement of Financial Accounting Standards (SFAS) No. 123,Accounting for Stock-Based Compensation, as amended, are found in Note 11.
The pro forma effect on the Bank’s earnings as a result of option issuances (determined using the minimum value method) for the years ended December 31, 2005 and 2004 was as follows:
| 2005 | 2004 | ||||||||
| Net income as reported | $ | 2,411,570 | $ | 1,339,961 | |||||
| Additional compensation for fair value of stock options, net of tax | (501,686 | ) | (296,133 | ) | |||||
| Pro forma net income | $ | 1,909,884 | $ | 1,043,828 | |||||
| Basic earnings per share | |||||||||
| As reported | $ | 0.91 | $ | 0.59 | |||||
| Pro forma | $ | 0.72 | $ | 0.46 | |||||
| Diluted earnings per share | |||||||||
| As reported | $ | 0.82 | $ | 0.55 | |||||
| Pro forma | $ | 0.65 | $ | 0.43 | |||||
In December 2004, the Financial Accounting Standards Board (FASB) issued Statement of Financial Accounting Standards No. 123(R),Share-Based Payment, which is a revision of FASB Statement
F-26
Table of Contents
WSB FINANCIAL GROUP, INC. AND SUBSIDIARIES
NOTES TO CONSOLIDATED FINANCIAL STATEMENTS — (Continued)
No. 123,Accounting for Stock-Based Compensation. Statement 123(R) supersedes Accounting Principles Board Opinion No. 25,Accounting for Stock Issued to Employees, and amends FASB Statement No. 95,Statement of Cash Flows. Generally, the approach in Statement 123(R) is similar to the approach described in Statement 123. However, Statement 123(R) requires all share-based payments to employees, including grants of employee stock options, to be recognized in the income statement based on their fair values. Pro forma disclosure is no longer an alternative. This statement will be adopted on January 1, 2006.
As permitted by Statement 123, the Company currently accounts for share-based payments to employees using Opinion 25’s intrinsic value method and, as such, generally recognizes no compensation cost for employee stock options. The impact of adoption of Statement 123(R) cannot be fully predicted at this time because it will depend on levels of share-based payments granted in the future. Statement 123(R) also requires the benefits of tax deductions in excess of recognized compensation cost to be reported as a financing cash flow, rather than as an operating cash flow as required under current literature. This requirement will reduce net operating cash flows and increase net financing cash flows in periods after adoption.
Earnings per common share — Basic earnings per share represents income available to common stockholders divided by the weighted-average number of common shares outstanding during the period. Diluted earnings per share reflect additional common shares that would have been outstanding if dilutive potential common shares had been issued, as well as any adjustment to income that would result from the assumed issuance. Potential common shares that may be issued by the Company relate solely to outstanding stock options, and are determined using the treasury stock method.
Earnings per common share have been computed based on the following:
| 2005 | 2004 | 2003 | |||||||||||
| Numerator | |||||||||||||
| Net income | $ | 2,411,570 | $ | 1,339,961 | $ | 630,906 | |||||||
| Denominator | |||||||||||||
| Weighted-average number of common shares outstanding | 2,642,628 | 2,270,211 | 1,734,434 | ||||||||||
| Incremental shares assumed for stock options | 282,464 | 159,366 | 67,233 | ||||||||||
| Weighted-average number of dilutive shares outstanding | 2,925,092 | 2,429,577 | 1,801,667 | ||||||||||
| Basic earnings per common share | $ | 0.91 | $ | 0.59 | $ | 0.36 | |||||||
| Diluted earnings per common share | $ | 0.82 | $ | 0.55 | $ | 0.35 | |||||||
There were no anti-dilutive options at December 31, 2005, 2004 or 2003.
Comprehensive income — Accounting principles generally require that recognized revenue, expenses, gains and losses be included in net income. Although certain changes in assets and liabilities, such as unrealized gains and losses on available-for-sale securities, are reported as a separate component of the equity section of the balance sheet, such items, along with net income, are components of comprehensive income.
F-27
Table of Contents
WSB FINANCIAL GROUP, INC. AND SUBSIDIARIES
NOTES TO CONSOLIDATED FINANCIAL STATEMENTS — (Continued)
The components of other comprehensive income (loss) and related tax effects are as follows:
| 2005 | 2004 | 2003 | |||||||||||
| Unrealized holding (loss) on available-for-sale securities | $ | (84,393 | ) | $ | (7,871 | ) | $ | (19,394 | ) | ||||
| Tax benefit | 28,164 | 4,197 | — | ||||||||||
| Net-of-tax-amount | $ | (56,229 | ) | $ | (3,674 | ) | $ | (19,394 | ) | ||||
The components of accumulated other comprehensive income (loss), included in stockholders’ equity are as follows:
| 2005 | 2004 | 2003 | |||||||||||
| Net unrealized (loss) on available-for-sale securities | $ | (96,737 | ) | $ | (12,345 | ) | $ | (4,474 | ) | ||||
| Tax benefit | 32,360 | 4,197 | — | ||||||||||
| Net-of-tax-amount | $ | (64,377 | ) | $ | (8,148 | ) | $ | (4,474 | ) | ||||
Lease income and expense — The Bank enters into agreements to lease property to or from third parties under operating lease agreements. Income and expense related to these agreements is recorded straight line over the life of the agreements. Lease income is recorded on the statement of income under the description “rental income”. Lease expense is included in occupancy.
Advertising costs — Advertising costs are expensed when incurred. Total advertising expenses were $183,163, $135,768 and $61,913 in 2005, 2004 and 2003, respectively.
Recent accounting pronouncements — In July 2006, the FASB issued Interpretation No. 48,“Accounting for Uncertainty in Income Taxes”(FIN No. 48). This pronouncement requires a certain methodology for measuring and reporting uncertain tax positions, as well as disclosures. Adoption may result in a cumulative adjustment to income tax liabilities and retained earnings, if applicable. This statement will be effective as of January 1, 2007, and is not expected to have a material effect on the Company.
In March 2006, the FASB issued SFAS No. 156,“Accounting for Servicing of Financial Assets, an amendment of SFAS No. 140”(SFAS No. 156). This pronouncement requires the recognition of a servicing asset or liability under specified circumstances, and if practicable, all separately recognized servicing assets and liabilities to be initially measured at fair value. Additionally, the pronouncement allows an entity to choose one of two methods when subsequently measuring its servicing assets and liabilities: the amortization method or the fair value method. The amortization method provided under SFAS No. 140, employs lower of cost or market (locom) valuation. The new fair value method allows mark ups, in addition to the mark downs under locom. SFAS No. 156 permits a one-time reclassification of available-for-sale securities to the trading classification. SFAS No. 156 is not expected to have a material effect on the Company.
In February 2006, the FASB issued SFAS No. 155,“Accounting for Certain Hybrid Financial Instruments,”an amendment of SFAS No. 133 and SFAS No. 140. This statement addresses the accounting for certain hybrid financial instruments (a financial instrument with an embedded derivative) and also clarifies which interest-only strips and principal-only strips are not subject to the requirements of SFAS No. 133. SFAS No. 155 allows combined valuation and accounting. This statement will be effective as of January 1, 2007. SFAS No. 155 is not expected to have a material effect on the Company.
Reclassifications — Certain amounts in the prior years’ financial statements have been reclassified to conform to the current year’s presentation.
F-28
Table of Contents
WSB FINANCIAL GROUP, INC. AND SUBSIDIARIES
NOTES TO CONSOLIDATED FINANCIAL STATEMENTS — (Continued)
Note 2 — Investment Securities
Amortized cost and approximate fair values of investment securities at December 31, 2005 and 2004 are summarized as follows:
| Gross Unrealized Losses | |||||||||||||||||||||
| Gross | |||||||||||||||||||||
| Amortized | Unrealized | Less Than | 12 Months | ||||||||||||||||||
| Cost | Gain | 12 Months | or Longer | Fair Value | |||||||||||||||||
December 31, 2005 | |||||||||||||||||||||
| Available for sale | |||||||||||||||||||||
| Municipal securities | $ | 1,826,974 | $ | 9,757 | $ | — | $ | (11,839 | ) | $ | 1,824,892 | ||||||||||
| Mortgage-backed | 83,870 | — | (1,191 | ) | — | 82,679 | |||||||||||||||
| Federal agencies | 6,421,084 | — | (59,052 | ) | (34,412 | ) | 6,327,620 | ||||||||||||||
| $ | 8,331,928 | $ | 9,757 | $ | (60,243 | ) | $ | (46,251 | ) | $ | 8,235,191 | ||||||||||
December 31, 2004 | |||||||||||||||||||||
| Available for sale | |||||||||||||||||||||
| Municipal securities | $ | 1,289,232 | $ | 21,515 | $ | (970 | ) | $ | — | $ | 1,309,777 | ||||||||||
| Mortgage-backed | 156,317 | 1,181 | — | — | 157,498 | ||||||||||||||||
| Federal agencies | 3,125,000 | 343 | (7,629 | ) | (26,784 | ) | 3,090,930 | ||||||||||||||
| $ | 4,570,549 | $ | 23,039 | $ | (8,599 | ) | $ | (26,784 | ) | $ | 4,558,205 | ||||||||||
The amortized cost and estimated fair value of investment securities available for sale at December 31, 2005, by contractual maturity, are as follows:
| Available-for-sale | |||||||||
| Amortized | |||||||||
| Cost | Fair Value | ||||||||
| Accounts maturing in | |||||||||
| One year or less | $ | 20,466 | $ | 20,442 | |||||
| After one year through five years | 5,730,045 | 5,655,013 | |||||||
| After five years through ten years | 1,396,645 | 1,381,752 | |||||||
| After ten years | 1,184,772 | 1,177,984 | |||||||
| $ | 8,331,928 | $ | 8,235,191 | ||||||
Expected maturities will differ from contractual maturities because issuers may have the right to call obligation with or without penalties.
For the years ended December 31, 2005, 2004 and 2003, proceeds from sales of securities available for sale amounted to $0. Gross realized gains amounted to $0. Gross realized losses amounted to $0.
Investment securities valued at $2,262,823 and $2,307,282 have been pledged at December 31, 2005 and 2004, respectively, to secure certain deposits.
Management evaluates securities for other-than-temporary impairment at least on an annual basis, and more frequently when economic or market concerns warrant such evaluation. Consideration is given to (1) the length of time and the extent to which the fair value has been less than cost, (2) the financial condition and near-term prospects of the issuer, and (3) the intent and ability of the Bank to retain its investment in the issuer for a period of time sufficient to allow for any anticipated recovery in fair value.
F-29
Table of Contents
WSB FINANCIAL GROUP, INC. AND SUBSIDIARIES
NOTES TO CONSOLIDATED FINANCIAL STATEMENTS — (Continued)
At December 31, 2005, 14 investment securities have fair values less than amortized cost and therefore contain unrealized losses. The Bank has evaluated these securities and has determined that the decline in value is temporary, and is related to the change in market interest rates since purchase. The decline in value is not related to any company or industry specific event. The Bank anticipates full recovery of amortized cost with respect to these securities at maturity or sooner in the event of a more favorable market interest rate environment.
Note 3 — Loans and Allowance for Loan Losses
Loans at December 31, 2005 and 2004 are summarized as follows:
| 2005 | 2004 | |||||||
| Real estate loans | $ | 185,352,741 | $ | 100,041,266 | ||||
| Commercial and industrial loans | 13,123,344 | 14,549,312 | ||||||
| Individual loans for household and other personal expenditures | 1,712,179 | 1,532,642 | ||||||
| Other loans | 772,009 | 669,826 | ||||||
| $ | 200,960,273 | $ | 116,793,046 | |||||
| 2005 | 2004 | 2003 | |||||||||||
| Allowance for loan losses | |||||||||||||
| Balances, beginning of year | $ | 1,188,939 | $ | 578,298 | $ | 350,633 | |||||||
| Provision for losses | 1,351,814 | 653,735 | 231,109 | ||||||||||
| Recoveries | 524 | 650 | 24,949 | ||||||||||
| Loans charged off | (954 | ) | (21,744 | ) | (20,393 | ) | |||||||
| Reclassification of allowance for unfunded credit commitments to other liabilities | (20,000 | ) | (22,000 | ) | (8,000 | ) | |||||||
| Balances, end of year | $ | 2,520,323 | $ | 1,188,939 | $ | 578,298 | |||||||
At December 31, 2005 and 2004, the Bank had no impaired loans. The average balance of impaired loans for the years ended December 31, 2005 and 2004 was $0. There was no interest income accrued or collected on impaired loans in 2005, 2004 and 2003. A summary of past due and nonaccrual loans is as follows:
| 2005 | 2004 | |||||||
| Total nonaccrual loans | $ | 127,990 | $ | 99,939 | ||||
| Total loans 90 days or more past-due and still accruing | $ | — | $ | — | ||||
The Bank has entered into transactions with certain directors and executive officers. Such transactions were made in the ordinary course of business on substantially the same terms and conditions, including interest rates and collateral, as those prevailing at the same time for comparable transactions with other customers, and did not, in the opinion of management, involve more than normal credit risk or present other unfavorable features. The aggregate amount of loans to such related parties at December 31, 2005 and 2004 was $3,774,000 and $4,954,743, respectively.
At December 31, 2005, the Bank held in the loan portfolio approximately $140,000,000 in interest-only loans. These loans consist primarily of short-term real estate construction loans and land development loans.
F-30
Table of Contents
WSB FINANCIAL GROUP, INC. AND SUBSIDIARIES
NOTES TO CONSOLIDATED FINANCIAL STATEMENTS — (Continued)
Note 4 — Premises and Equipment
A summary of premises and equipment at December 31, 2005 and 2004 is as follows:
| 2005 | 2004 | |||||||
| Leasehold improvements | $ | 382,840 | $ | 316,198 | ||||
| Equipment, furniture, and software | 1,680,444 | 939,416 | ||||||
| Land and buildings | 4,931,038 | 1,908,298 | ||||||
| 6,994,322 | 3,163,912 | |||||||
| Accumulated depreciation | (977,599 | ) | (611,573 | ) | ||||
| $ | 6,016,723 | $ | 2,552,339 | |||||
Depreciation expense was $371,273, $257,566 and $146,790 in 2005, 2004 and 2003, respectively.
Note 5 — Deposits
Deposit account balances at December 31, 2005 and 2004 are summarized as follows:
| Non-interest-bearing | $ | 21,789,810 | $ | 14,723,933 | ||||
| Interest-bearing demand | 16,586,348 | 7,133,530 | ||||||
| Money market accounts | 115,006,053 | 37,626,172 | ||||||
| Savings deposits | 4,394,654 | 4,844,109 | ||||||
| Certificates of deposit exceeding $100,000 | 24,142,814 | 22,089,326 | ||||||
| Certificates of deposit less than $100,000 | 42,247,094 | 37,175,722 | ||||||
| $ | 224,166,773 | $ | 123,592,792 | |||||
Scheduled maturities of certificates are as follows for the years ending December 31:
| 2006 | $ | 19,738,460 | ||
| 2007 | 22,330,735 | |||
| 2008 | 16,368,807 | |||
| 2009 | 1,468,967 | |||
| 2010 | 6,482,939 | |||
| $ | 66,389,908 | |||
The Bank held related party deposits of $4,224,642 and $2,831,841 at December 31, 2005 and 2004, respectively.
Note 6 — Advances and Junior Subordinated Debentures Payable
At December 31, 2005, a committed line of credit arrangement totaling $4,000,000 was available to the Bank from an unaffiliated bank with a maturity date of September 30, 2006. The line provides for interest at the then existing federal funds rate. There were no borrowings outstanding under this credit arrangement at December 31, 2005 or 2004.
At December 31, 2005, a committed line of credit arrangement totaling $3,000,000 was available to the Bank from an unaffiliated bank with a maturity date of September 30, 2006. The line provides for interest at the then existing federal funds rate. There were no borrowings outstanding under this credit arrangement at December 31, 2005 or 2004.
F-31
Table of Contents
WSB FINANCIAL GROUP, INC. AND SUBSIDIARIES
NOTES TO CONSOLIDATED FINANCIAL STATEMENTS — (Continued)
The Bank is a member of the FHLB of Seattle and, as such, has a committed credit line up to 10% of total eligible assets. Borrowings generally provide for interest at the then current published rates. There were no borrowings outstanding under this credit line at December 31, 2005 or 2004.
WSB Financial Group Trust I (the Trust) is a statutory business trust created for the exclusive purpose of issuing and selling capital securities and utilizing sale proceeds to acquire junior subordinated debentures debt issued by the Company. The Trust is a finance subsidiary 100% owned by the Company and the Company has fully and unconditionally guaranteed the securities. In July 2005, the Trust issued $8 million of trust preferred securities with a30-year maturity, callable after the fifth year by the Company. The rate adjusts quarterly based on the3-Month LIBOR plus 1.73%. These securities are considered capital for the purposes of regulatory capital requirements, subject to regulatory limitations. Accordingly, the junior subordinated debentures are the sole assets of the Trust, and payments under the junior subordinated debentures will be the sole revenues of the Trust.
Note 7 — Income Taxes
The components of the provision for income taxes for 2005, 2004 and 2003 are as follows:
| 2005 | 2004 | 2003 | ||||||||||
| Current | $ | 1,807,616 | $ | 269,302 | $ | 190,446 | ||||||
| Deferred | (511,058 | ) | 410,871 | 142,482 | ||||||||
| Income tax expense | $ | 1,296,558 | $ | 680,173 | $ | 332,928 | ||||||
There are no significant differences between the Company’s effective tax rate and income taxes determined using statutory tax rates.
The nature and components of the Bank’s net deferred tax asset (liability), established at a tax rate of 34% is as follows:
| 2005 | 2004 | ||||||||
| Deferred tax assets | |||||||||
| Allowance for loan losses | $ | 856,678 | $ | 409,038 | |||||
| Unrealized loss on securities | 32,360 | — | |||||||
| Other | — | 59 | |||||||
| 889,038 | 409,097 | ||||||||
| Deferred tax liabilities | |||||||||
| Deferred loan fees and costs | 602,974 | 689,451 | |||||||
| Depreciation | 74,975 | 93,811 | |||||||
| Unrealized gain on securities | — | 9,279 | |||||||
| Other | 41,836 | — | |||||||
| 719,785 | 792,541 | ||||||||
| Net deferred tax asset (liability) | $ | 169,253 | $ | (383,444 | ) | ||||
The Bank believes, based upon available information, that the net deferred asset will be realized in the normal course of operations.
F-32
Table of Contents
WSB FINANCIAL GROUP, INC. AND SUBSIDIARIES
NOTES TO CONSOLIDATED FINANCIAL STATEMENTS — (Continued)
Note 8 — Financial Instruments with Off-Balance-Sheet Risk
In the normal course of business, the Bank has outstanding commitments and contingent liabilities, such as commitments to extend credit and unused credit card lines, which are not included in the accompanying financial statements. The Bank’s exposure to credit loss in the event of nonperformance by other parties to the financial instruments for commitments to extend credit and unused credit card lines is represented by the contractual or notional amount of those instruments. The Bank uses the same credit policies in making such commitments as it does for instruments that are included in the balance sheet.
Financial instruments whose contract amount represents credit risk were as follows:
| 2005 | 2004 | |||||||
| Commitments to extend credit | $ | 55,155,516 | $ | 33,157,239 | ||||
| Unused credit card lines | $ | 3,162,232 | $ | 1,768,211 | ||||
Commitments to extend credit are agreements to lend to a customer as long as there is no violation of any condition established in the contract. Commitments generally have fixed expiration dates or other termination clauses and may require payment of a fee. The commitments for equity lines of credit may expire without being drawn upon. Therefore, the total commitment amounts do not necessarily represent future cash requirements. The amount of collateral obtained, if it is deemed necessary by the Bank, is based on management’s credit evaluation of the customer.
Unused credit card lines are commitments for possible future extensions of credit to existing customers. Theselines-of-credit are uncollateralized and usually do not contain a specified maturity date and may not be drawn upon to the total extent to which the Bank is committed.
In the ordinary course of business, the Bank sells loans without recourse that may have to be subsequently repurchased due to defects that occurred during the origination of the loan. The defects are categorized as documentation errors, underwriting errors, early payment defaults and fraud. When a loan sold to an investor without recourse fails to perform, the investor will typically review the loan file to determine whether defects in the origination process occurred. If a defect is identified, the Bank may be required to either repurchase the loan or indemnify the investor for losses sustained. If there are no defects, the Bank has no commitment to repurchase the loan.
Note 9 — Stockholder’s Equity and Regulatory Matters
The Bank is subject to various regulatory capital requirements administered by its primary federal regulator, the Federal Deposit Insurance Corporation (FDIC). Failure to meet the minimum regulatory capital requirements can initiate certain mandatory and possible additional discretionary actions by regulators that if undertaken, could have a direct material effect on the Bank and the financial statements. Under the regulatory capital adequacy guidelines and regulatory framework for prompt corrective action, the Bank must meet specific capital guidelines involving quantitative measures of the Bank’s assets, liabilities, and certain off-balance-sheet items as calculated under regulatory accounting practices. The Bank’s capital amounts and classification under the prompt corrective action guidelines are also subject to qualitative judgments by the regulators about components, risk weightings, and other factors.
Quantitative measures established by regulation to ensure capital adequacy require the Bank to maintain minimum amounts and ratios of total risk-based capital and Tier 1 capital to risk-weighted assets (as defined in the regulations), and Tier 1 capital to adjusted total assets (as defined). Management believes, as of December 31, 2005 that the Bank meets all the capital adequacy requirements to which it is subject.
F-33
Table of Contents
WSB FINANCIAL GROUP, INC. AND SUBSIDIARIES
NOTES TO CONSOLIDATED FINANCIAL STATEMENTS — (Continued)
At December 31, 2005, the most recent notification from the FDIC, the Bank was categorized as well capitalized under the regulatory framework for prompt corrective action. To be categorized as well capitalized, an institution must maintain minimum total risk-based, Tier 1 risk-based, and Tier 1 leverage ratios as disclosed in the table below.
The Bank’s actual and required capital amounts and ratios are as follows (dollars in thousands):
| To Be | |||||||||||||||||||||||||||||
| Well Capitalized | |||||||||||||||||||||||||||||
| Under the Prompt | |||||||||||||||||||||||||||||
| For Capital | Corrective Action | ||||||||||||||||||||||||||||
| Actual | Adequacy Purposes | Provisions | |||||||||||||||||||||||||||
| Amount | Ratio | Amount | Ratio | Amount | Ratio | ||||||||||||||||||||||||
As of December 31, 2005 | |||||||||||||||||||||||||||||
| Total Risk-Based Capital (to Risk-Weighted Assets) | |||||||||||||||||||||||||||||
| Consolidated | $ | 26,851 | 12.8 | % | $ | 16,782 | ³ | 8.0% | NA | NA | |||||||||||||||||||
| Westsound Bank | $ | 26,316 | 12.5 | % | $ | 16,842 | ³ | 8.0% | $ | 21,053 | ³ | 10.0 | % | ||||||||||||||||
| Tier 1 Capital (to Risk-Weighted Assets) | |||||||||||||||||||||||||||||
| Consolidated | $ | 21,295 | 10.2 | % | $ | 16,702 | ³ | 8.0% | NA | NA | |||||||||||||||||||
| Westsound Bank | $ | 23,740 | 11.3 | % | $ | 8,404 | ³ | 4.0% | $ | 12,605 | ³ | 6.0 | % | ||||||||||||||||
| Tier 1 Capital (to Average Assets) | |||||||||||||||||||||||||||||
| Consolidated | $ | 21,295 | 9.3 | % | $ | 18,318 | ³ | 8.0% | NA | NA | |||||||||||||||||||
| Westsound Bank | $ | 23,740 | 10.4 | % | $ | 9,131 | ³ | 4.0% | $ | 11,413 | ³ | 5.0 | % | ||||||||||||||||
As of December 31, 2004 | |||||||||||||||||||||||||||||
| Total Risk-Based Capital (to Risk-Weighted Assets) | $ | 14,085 | 12.2 | % | $ | 9,246 | 8.0% | $ | 11,558 | 10.0 | % | ||||||||||||||||||
| Tier 1 Capital (to Risk-Weighted Assets) | $ | 12,919 | 11.2 | % | $ | 4,623 | 4.0% | $ | 6,935 | 6.0 | % | ||||||||||||||||||
| Tier 1 Capital (to Average Assets) | $ | 12,919 | 10.6 | % | $ | 4,874 | 4.0% | $ | 6,094 | 5.0 | % | ||||||||||||||||||
Federal Reserve Board Regulations require maintenance of certain minimum reserve balances on deposit with the Federal Reserve Bank. The minimum reserve requirement at December 31, 2005 and 2004 was $779,000 and $25,000, respectively. Also, under Washington State law, approval from the state banking regulators is required prior to declaring cash dividends.
Note 10 — Commitments
The Bank leases space for branches and operations. These leases run for a period ranging from two to ten years and allow for established rent increases each year. All leases require the Bank to pay all taxes, maintenance and utility costs, as well as maintain certain types of insurance.
F-34
Table of Contents
WSB FINANCIAL GROUP, INC. AND SUBSIDIARIES
NOTES TO CONSOLIDATED FINANCIAL STATEMENTS — (Continued)
The minimum lease payments for each of the next five years are as follows:
| 2006 | $ | 323,027 | ||
| 2007 | 343,489 | |||
| 2008 | 358,197 | |||
| 2009 | 377,511 | |||
| 2010 | 249,661 |
Rent expense for 2005, 2004, and 2003 was $246,224, $200,604 and, $73,038 respectively. Rental income for 2005, 2004 and 2003 was $31,753, $0 and $33,750, respectively.
The Silverdale branch and adjacent mortgage office is leased from a Director. The lease is for ten years and commenced on October 1, 2001. The lease contains two five-year renewal options. Monthly rent expense for the Silverdale branch is approximately $11,000 per month. In 2005, the Bank paid a director $37,500 to provide consulting services related to new branch locations.
Note 11 — Employee Benefits
Incentive stock option plan — The Bank’s stockholders approved an Incentive Stock Option Plan on May 19, 1999. The purpose of the plan is to increase ownership interest in the Bank by employees and directors of the Bank, and to provide an incentive to serve as an employee and/or director of the Bank. The stockholders originally approved 184,287 shares of common stock to the Plan. In 2002, the stockholders approved an additional allocation of 184,287 shares. The stockholders approved additional allocations of 614,290 shares in 2005, 614,290 shares in 2004 and 184,287 shares in 2003. The maximum term of a stock option granted under the plan is ten years. Incentive stock options generally vest over a five year period while non-qualified stock options generally vest immediately.
Pro forma information regarding net income and earnings per share is required by SFAS No. 123,Accounting for Stock-Based Compensation. The pro forma information recognizes as compensation, the value of stock options granted using an option valuation model known as the Black-Scholes model. The value of options issued in 2005, 2004 and 2003 were estimated at $969,000, $529,000 and 84,000, respectively.
The following assumptions were used to estimate the value of the options granted, which management estimated using the minimum value approach:
| 2005 | 2004 | |||||||
| Risk-free interest rate | 4.31 | % | 3.65 | % | ||||
| Dividend yield rate | 0.00 | % | 0.00 | % | ||||
| Weighted average expected life of | 5 years | 7 years | ||||||
Management believes that the assumptions used in the option pricing model are highly subjective and represent only one estimate of possible value as there is no active market for the options granted. The value of the options granted is allocated to pro forma earnings over the vesting period of the options.
The remaining unrecognized compensation for value of stock options was $299,785 at December 31, 2005.
F-35
Table of Contents
WSB FINANCIAL GROUP, INC. AND SUBSIDIARIES
NOTES TO CONSOLIDATED FINANCIAL STATEMENTS — (Continued)
Stock option transactions are summarized in the following table. Amounts have been adjusted to reflect6.1429-for-1 common stock split:
| Weighted | |||||||||||||||||
| Average Fair | |||||||||||||||||
| Options | Weighted | Value of | |||||||||||||||
| Options | Granted for | Average | Options | ||||||||||||||
| Available | Common | Exercise | Granted Per | ||||||||||||||
| for Grant | Stock | Price | Share | ||||||||||||||
| Balance, December 31, 2003 | 18,429 | 350,145 | 4.10 | ||||||||||||||
| Authorized | 614,290 | — | — | ||||||||||||||
| Granted | (354,138 | ) | 354,138 | 6.84 | 1.53 | ||||||||||||
| Exercised | — | (24,572 | ) | 4.34 | |||||||||||||
| Forfeited | 3,071 | (3,071 | ) | 5.21 | |||||||||||||
| Balance, December 31, 2004 | 281,652 | 676,640 | 4.10 | ||||||||||||||
| Authorized | 614,290 | — | — | ||||||||||||||
| Granted | (537,504 | ) | 537,504 | 9.26 | 1.80 | ||||||||||||
| Exercised | — | (84,772 | ) | 3.90 | |||||||||||||
| Forfeited | 3,686 | (3,686 | ) | 5.21 | |||||||||||||
| Balance, December 31, 2005 | 362,124 | 1,125,686 | 7.43 | ||||||||||||||
| Options Outstanding | Options Exercisable | |||||||||||||||||||||
| Weighted Average | ||||||||||||||||||||||
| Range of | Number | Remaining | Weighted Average | Number | Weighted Average | |||||||||||||||||
| Exercise Prices | Outstanding | Contractual Life | Exercise Price | Exercisable | Exercise Price | |||||||||||||||||
| $ | 3.26 | 86,001 | 5.75 | $ | 3.26 | 67,572 | $ | 3.26 | ||||||||||||||
| $ | 4.44 | 93,372 | 6.58 | $ | 4.44 | 88,458 | $ | 4.44 | ||||||||||||||
| $ | 5.21 | 62,658 | 7.42 | $ | 5.21 | 51,600 | $ | 5.21 | ||||||||||||||
| $ | 6.84 | 346,152 | 8.04 | $ | 6.84 | 263,838 | $ | 6.84 | ||||||||||||||
| $ | 7.57 | 254,930 | 8.98 | $ | 7.57 | 196,573 | $ | 7.57 | ||||||||||||||
| $ | 10.78 | 282,573 | 9.71 | $ | 10.78 | 196,573 | $ | 10.78 | ||||||||||||||
401(k) Plan — The Bank established a retirement savings 401(k) plan in 2002 in which all employees may participate after attaining the age of 18. The Bank may, at its sole discretion, contribute and allocate to each eligible participant’s account, a percentage of the participant’s elective deferral or it may make non-elective contributions to the participant’s accounts The Bank made contributions of $46,000, $0 and $0 in 2005, 2004 and 2003, respectively.
Stock issued for directors fees — On a quarterly basis, the Company obtains a valuation from an independent valuation consultant to determine the value of the Company’s shares on a contemporaneous basis. The valuation methodologies utilize the market and income approach. Shares issued for director fees are valued using this third party valuation.
Note 12 — Fair Value of Financial Instruments
SFAS No. 107,Disclosures about Fair Value of Financial Instruments, requires disclosure of fair value information about financial instruments for which it is practicable to estimate fair value. As defined by SFAS No. 107, financial instruments include the categories listed below. It does not include the value of premises and equipment, and intangible assets such as customer relationships and core deposit intangibles. Fair values of off-statement condition lending commitments standby letters of credit and
F-36
Table of Contents
WSB FINANCIAL GROUP, INC. AND SUBSIDIARIES
NOTES TO CONSOLIDATED FINANCIAL STATEMENTS — (Continued)
guarantees are based on fees currently charged to enter into similar agreements, taking into account the remaining terms of the agreements and the counter parties’ credit standing. The fair value of the fees at December 31, 2005, was insignificant. See Note 8 for the notional amount of the commitments to extend credit.
The following table summarizes carrying amounts, estimated fair values and assumptions used by the Bank to estimate fair value as of December 31, 2005 and 2004:
| Carrying | Estimated Fair | ||||||||
| Amount | Value | ||||||||
2005 | |||||||||
| Assets | |||||||||
| Cash and cash equivalents | $ | 26,557,828 | $ | 26,557,828 | |||||
| Securities available for sale | $ | 8,235,191 | $ | 8,235,191 | |||||
| Loans receivable | $ | 200,960,273 | $ | 199,882,950 | |||||
| Loans held for sale | $ | 8,731,863 | $ | 8,731,863 | |||||
| Accrued interest receivable | $ | 999,022 | $ | 999,022 | |||||
| FHLB Stock | $ | 234,200 | $ | 234,200 | |||||
| Liabilities | |||||||||
| Checking, passbook and money market | $ | 157,776,865 | $ | 157,776,865 | |||||
| Certificates of deposit | $ | 66,389,908 | $ | 66,748,110 | |||||
| Accrued interest payable | $ | 234,174 | $ | 234,174 | |||||
| Junior subordinated debentures payable | $ | 8,248,000 | $ | 8,248,000 | |||||
2004 | |||||||||
| Assets | |||||||||
| Cash and cash equivalents | $ | 11,184,416 | $ | 11,184,416 | |||||
| Securities available for sale | $ | 4,558,205 | $ | 4,558,205 | |||||
| Loans receivable | $ | 116,793,046 | $ | 116,044,339 | |||||
| Loans held for sale | $ | 2,019,111 | $ | 2,019,111 | |||||
| Accrued interest receivable | $ | 442,750 | $ | 442,750 | |||||
| FHLB Stock | $ | 101,200 | $ | 101,200 | |||||
| Liabilities | |||||||||
| Checking, passbook and money market | $ | 64,327,744 | $ | 64,327,744 | |||||
| Certificates of deposit | $ | 59,265,048 | $ | 60,046,808 | |||||
| Accrued interest payable | $ | 126,804 | $ | 126,804 | |||||
The following methods and assumptions were used to estimate the fair value of financial instruments:
Cash and cash equivalents — The carrying amount of these items is a reasonable estimate of their fair value.
Investment securities available for sale — The fair value of investment securities is based on quoted market prices, if available. If quoted market prices are not available, the fair value is based on a matrix pricing model provided by an outside independent source.
Loans receivable — The fair value is estimated by discounting the future cash flows and estimated prepayments using the current rates at which similar loans would be made to borrowers with similar credit
F-37
Table of Contents
WSB FINANCIAL GROUP, INC. AND SUBSIDIARIES
NOTES TO CONSOLIDATED FINANCIAL STATEMENTS — (Continued)
ratings and for the same remaining term. Some loan types were valued at carrying value because of their floating rate or expected maturity characteristics.
Loans held for sale — The carrying amount of these items is a reasonable estimate of their fair value.
FHLB stock — The fair value is based upon the redemption value of the stock, which equates to its carrying value.
Customer accounts — The fair value of demand deposits, savings accounts, and money market accounts is the amount payable on demand at the reporting date. The fair value of fixed-maturity certificates is estimated by discounting the estimated future cash flows using the rates currently offered for deposits with similar remaining maturities.
Accrued interest receivable and payable — The carrying amounts reported in the consolidated financial statement for accrued interest receivable and payable approximate their fair value.
Junior subordinated debentures payable — The carrying amount of junior subordinated debentures payable is a reasonable estimate of the fair value.
Note 13 — Significant Concentrations of Credit Risk
The Bank has concentrated credit risk exposure, including off-balance-sheet credit risk exposure, related to real estate loans as disclosed in Notes 3 and 8. The ultimate collectibility of a substantial portion of the loan portfolio is susceptible to changes in economic and market conditions in the region. The Bank generally requires collateral on all real estate lending arrangements and typically maintainsloan-to-value ratios of no greater than 80%.
Investments in state and municipal securities generally involve governmental entities within Washington State. Loans are generally limited, by state banking regulation, to 20% of the Bank’s stockholder’s equity, excluding accumulated other comprehensive income (loss). The Bank, as a matter of practice, generally does not extend credit to any single borrower or group of related borrowers in excess of $2,500,000.
The contractual amounts of credit-related financial instruments such as commitments to extend credit and credit-card arrangements represent the amounts of potential accounting loss should the contract be fully drawn upon, the customer defaults, and the value of any existing collateral becomes worthless.
Note 14 — Restrictions on Dividends, Loans and Advances
Federal and state banking regulations place certain restrictions on dividends paid and loans or advances made by the Bank to the holding company. The total amount of dividends which may be paid at any date is generally limited to the retained earnings of the Bank, and loans or advances are limited to 10 percent of the Bank’s capital stock and surplus on a secured basis.
At December 31, 2005, the Bank’s retained earnings available for the payment of dividends was $4,480,000. Accordingly, $19,196,000 of the Corporation’s equity in the net assets of the Bank was restricted at December 31, 2005. Funds available for loans or advances by the Bank to the holding company amounted to $4,735,000.
In addition, dividends paid by the Bank to the holding company would be prohibited if the effect thereof would cause the Bank’s capital to be reduced below applicable minimum capital requirements.
F-38
Table of Contents
WSB FINANCIAL GROUP, INC. AND SUBSIDIARIES
NOTES TO CONSOLIDATED FINANCIAL STATEMENTS — (Continued)
Note 15 — Condensed Financial Statements of Parent Company
Financial information pertaining only to WSB Financial Group, Inc. is as follows:
| December 31, | ||||||
| 2005 | ||||||
Statement of Financial Condition | ||||||
| Assets | ||||||
| Cash and due from banks | $ | 134,434 | ||||
| Investment in common stock of Westsound Bank | 23,614,319 | |||||
| Other assets | 505,005 | |||||
| Total assets | $ | 24,253,758 | ||||
| Liabilities and stockholders’ equity | ||||||
| Junior subordinated debentures payable | $ | 8,248,000 | ||||
| Stockholders’ equity | 16,005,758 | |||||
| Total liabilities and stockholders’ equity | $ | 24,253,758 | ||||
| For the period | |||||||
| from inception | |||||||
| (July 25, 2005) | |||||||
| to December 31, | |||||||
| 2005 | |||||||
Statement of Income | |||||||
| Income | |||||||
| Interest income | 5,368 | ||||||
| Total income | 5,368 | ||||||
| Operating expenses | |||||||
| Interest expense | 178,529 | ||||||
| Other expense | 11,256 | ||||||
| Total Operating expenses | 189,785 | ||||||
| Loss before equity in undistributed net income of Westsound Bank | (184,417 | ) | |||||
| Income tax benefit | 62,000 | ||||||
| (122,417 | ) | ||||||
| Equity in undistributed net income of Westsound Bank | 810,100 | ||||||
| Net income | $ | 687,683 | |||||
Statement of Cash Flows | |||||||
| Cash flows from operating activities | |||||||
| Net income | $ | 687,683 | |||||
| Adjustments to reconcile net income to net cash from operating activities Equity in undistributed net income of Westsound Bank | (810,100 | ) | |||||
| Decrease (increase) in other assets | (214,335 | ) | |||||
| Net cash from operating activities | (336,752 | ) | |||||
| Cash Flows from Investing Activities | |||||||
| Capital infusion to Westsound Bank | (7,900,000 | ) | |||||
F-39
Table of Contents
WSB FINANCIAL GROUP, INC. AND SUBSIDIARIES
NOTES TO CONSOLIDATED FINANCIAL STATEMENTS — (Continued)
| For the period from | ||||||
| inception (July 25, 2005) | ||||||
| to December 31, 2005 | ||||||
| Cash flows from financing activities | ||||||
| Proceeds from issuance of junior subordinated debentures payable | 8,000,000 | |||||
| Proceeds from exercise of stock options and issuance of stock | 371,186 | |||||
| Net cash from financing activities | 8,371,186 | |||||
| Net increase (decrease) in cash and cash equivalents | 134,434 | |||||
| Cash and cash equivalents, beginning of year | — | |||||
| Cash and cash equivalents, end of year | $ | 134,434 | ||||
| Supplemental disclosure of cash flow information Non-cash investment in WSB Financial Group Trust | $ | 248,000 | ||||
Note 16 — Stock Split
Effective August 15, 2006 the Company’s Board of Directors approved a6.1429-for-1 common stock split for shareholders of record on August 15, 2006. All share and per share information has been retroactively adjusted to reflect this stock split. The Board of Directors also approved an amendment to the Articles of Incorporation increasing the authorized shares from 2,500,000 to 15,357,250.
F-40
Table of Contents
Shares
PROSPECTUS
D.A. Davidson & Co.
Table of Contents
PART II
INFORMATION NOT REQUIRED IN PROSPECTUS
| Item 13. | Other Expenses of Issuance and Distribution |
The Registrant estimates that the expenses payable by it in connection with this offering, as described in this Registration Statement, will be as follows:
| SEC registration fee | $ | 4,528 | ||
| NASDAQ listing application fee | 100,000 | |||
| NASD filing fee | 4,732 | |||
| Legal fees and expenses | 195,000 | |||
| Accounting fees and expenses | 195,000 | |||
| Printing and engraving expenses | 75,000 | |||
| Transfer agent and registrar fees | 10,000 | |||
| Miscellaneous | 10,000 | |||
| Total Offering Expenses | $ | 594,260 | ||
| Item 14. | Indemnification of Directors and Officers |
Pursuant to our bylaws, we will, to the fullest extent permitted by the WBCA, indemnify our directors and officers with respect to expenses, settlements, judgments and fines in suits (including actions brought against a director or officer in the name of the corporation commonly referred to as a derivative action) in which such person was made a party by reason of the fact that he or she is or was a director or officer, or being or having been such a director or officer, such person was serving as a director, officer, employee or other agent (i) for an enterprise of which we hold the majority of shares entitled to vote in the election of its directors (such as Westsound Bank), or (ii) at our request for another enterprise. No such indemnification may be given if the acts or omissions of the person are finally adjudged to be intentional misconduct or a knowing violation of law, if such person is liable to the corporation for an unlawful distribution, or if such person personally received a benefit to which he or she was not entitled. In addition, our articles of incorporation provide that the directors of the corporation shall not be personally liable for monetary damages to the corporation for conduct as directors, except for liabilities that involve intentional misconduct by the directors, the authorization or illegal distributions to shareholders or loans to directors or receipt of an improper personal benefit from their actions as directors. This provision might, in certain instances, discourage or deter shareholders or management from bringing a lawsuit against directors for a breach of their duties.
We have a directors’ and officers’ liability insurance policy that provides coverage sufficiently broad to permit indemnification under certain circumstances for liabilities (including reimbursement for expenses incurred) arising under the Securities Act of 1933, as amended, or the Securities Act.
| Item 15. | Recent Sales of Unregistered Securities |
The following sets forth information regarding all unregistered securities sold by the registrant and its predecessor, Westsound Bank, within the past three years, after giving effect to the 6.1429-for-1 stock split in August 2006.
(a) Securities Issued Upon Exercise of Stock Options.
The following shares of common stock were issued within the past three years pursuant to the exercise of stock options under the 1999 Incentive Stock Option Plan (the “Plan”):
| 1. In 2004, Westsound Bank issued 6,143 shares to a director in March and 18,429 shares to the director in September, for an aggregate purchase price of $106,520. |
II-1
Table of Contents
| 2. In 2005, the registrant issued 60,200 shares to an employee in July and 24,572 shares to a director in August, for an aggregate purchase price of approximately $330,421. | |
| 3. In 2006, the registrant issued 1,842 shares to an employee in January, 12,285 shares to a director in February, 6,143 shares to a director in June, and 7,371 shares to an employee in July, 104,429 shares to a former director and 19,657 shares to an executive officer in September, for an aggregate purchase price of $976,399. |
Such shares of common stock were issued pursuant to a written compensatory benefit plan under circumstances that comply with the requirements of Rule 701 promulgated under the Securities Act, and are thus exempted from the registration requirements of the Securities Act by virtue of Rule 701.
(b) Securities Issued as Directors’ Fees.
| 1. In 2003, Westsound Bank issued an aggregate of 10,259 shares of common stock to its directors in payment of their directors’ fees, for an aggregate purchase price of $67,798. The number of shares paid was based on independent valuations of our shares for 2003 at $40.60 per share. | |
| 2. In 2004, Westsound Bank issued an aggregate of 18,515 shares of common stock to its directors in payment of their directors’ fees, for an aggregate purchase price of $125,432. The number of shares paid was based on independent valuations of our shares for 2004 at $41.62 per share. | |
| 3. In 2005, Westsound Bank and the registrant issued an aggregate of 16,531 shares of common stock to its directors in payment of their directors’ fees, for an aggregate purchase price of $152,335. The number of shares paid was based on independent valuations of our shares for 2005 at $56.61 per share. | |
| 4. In August 2006, the registrant issued an aggregate of 10,474 shares of common stock to seven directors and a former director in payment of their directors’ fees accrued through June 30, 2006, for an aggregate purchase price of $123,934. The number of shares paid was based on independent valuations of our shares as of December 31, 2005 and March 31, 2006 at an average price of $11.83 per share. |
Such transactions by the registrant did not involve a public offering. The registrant relied on the exemption provided by Section 4(2) of the Securities Act of 1933.
(c) Securities Issued upon Completion of Holding Company Reorganization.
Effective July 25, 2005, WSB Financial Group completed a holding company reorganization in which each of the 2,601,242 then issued and outstanding shares of Westsound Bank common stock was exchanged for a share of WSB Financial Group. Such shares of common stock of WSB Financial Group were issued pursuant to Section 3(a)(12) of the Securities Act of 1933, and are thus exempted from the registration requirements of the Securities Act.
(d) Securities issued by WSB Financial Trust I.
On July 27, 2005, our wholly-owned subsidiary, WSB Financial Trust I, issued trust preferred securities to Merrill Lynch International for an aggregate purchase price of $8.0 million. Such securities were issued pursuant to Regulation D promulgated under the Securities Act, and are thus exempted from the registration requirements of the Securities Act.
| Item 16. | Exhibits and Financial Statement Schedules |
(a) Exhibits. See Exhibit Index on page II-6.
(b) Financial Statement Schedules. All financial schedules for which provision is made in the applicable accounting regulation of the SEC are either included in the financial information set forth in the prospectus or are inapplicable and therefore have been omitted.
II-2
Table of Contents
| Item 17. | Undertakings |
(a) The undersigned registrant hereby undertakes to provide to the underwriter at the closing specified in the underwriting agreement, certificates in such denominations and registered in such names as required by the underwriter to permit prompt delivery to each purchaser.
(b) The undersigned registrant hereby undertakes that:
| 1. For purposes of determining any liability under the Securities Act, the information omitted from the form of prospectus filed as part of this registration statement in reliance upon Rule 430A and contained in a form of prospectus filed by the registrant pursuant to Rule 424(b)(1) or (4) or 497(h) under the Securities Act shall be deemed to be part of this registration statement as of the time it was declared effective. | |
| 2. For the purpose of determining any liability under the Securities Act, each post-effective amendment that contains a form of prospectus shall be deemed to be a new registration statement relating to the securities offered therein, and the offering of such securities at that time shall be deemed to be the initialbona fideoffering thereof. That, for the purpose of determining liability under the Act, each post-effective amendment shall be deemed to be a new registration statement relating to the securities offered, and the offering of such securities at that time shall be deemed to be the initial bona fide offering thereof. |
(c) Insofar as indemnification for liabilities arising under the Act may be permitted to directors, officers and controlling persons of the registrant pursuant to the foregoing provisions, or otherwise, the registrant has been advised that in the opinion of the Securities and Exchange Commission, such indemnification is against public policy as expressed in the Act and is, therefore, unenforceable. In the event that a claim for indemnification against such liabilities (other than the payment by the registrant of expenses incurred or paid by a director, officer or controlling person of the registrant in the successful defense of any action, suit or proceeding) is asserted by such director, officer or controlling person in connection with the securities being registered, the registrant will, unless in the opinion of its counsel the matter has been settled by controlling precedent, submit to a court of appropriate jurisdiction the question whether such indemnification by it is against public policy as expressed in the Securities Act of 1933, as amended, and will be governed by the final adjudication of such issue.
II-3
Table of Contents
SIGNATURES
In accordance with the requirements of the Securities Act of 1933, the registrant has duly caused this Amendment No. 3 to the registration statement to be signed on its behalf by the undersigned, thereunto duly authorized in the City of Bremerton, State of Washington, on November 14, 2006.
| WSB FINANCIAL GROUP, INC. |
| By: | /s/David K. Johnson |
| David K. Johnson | |
| President, Chief Executive Officer and Director |
In accordance with the requirements of the Securities Act of 1933, this Amendment No. 3 to the Registration Statement has been signed by the following persons in the capacities indicated on November 14, 2006.
| Signature | Capacity | |||
| /s/David K. Johnson | President, Chief Executive Officer and Director (Principal Executive Officer) | |||
| /s/Mark D. Freeman | Executive Vice President of Finance and Operations and Chief Financial Officer (Principal Financial and Accounting Officer) | |||
| /s/Louis J. Weir* | Director, Chairman of the Board | |||
| /s/Larry C. Westfall* | Vice Chairman of the Board | |||
| /s/Richard N. Christopherson* | Director | |||
| /s/James H. Lamb* | Director | |||
| /s/Brian B. McLellan* | Director | |||
| /s/Dean Reynolds* | Director | |||
| /s/Donald H. Tucker* | Director | |||
| *By | /s/David K. Johnson pursuant to power of attorney | |||
II-4
Table of Contents
EXHIBIT INDEX
| Exhibit | ||||
| Number | Description | |||
| 1 | .1 | Form of Underwriting Agreement | ||
| 3 | .1+ | Articles of Incorporation of WSB Financial Group, Inc. | ||
| 3 | .2+ | Articles of Amendment. | ||
| 3 | .3+ | Bylaws of WSB Financial Group, Inc. | ||
| 3 | .4+ | Amendment to Bylaws. | ||
| 4 | .1 | Specimen common stock certificate. | ||
| 5 | .1 | Opinion of Keller Rohrback L.L.P. regarding legality of the securities covered by the registration statement. | ||
| 10 | .1**+ | 1999 Stock Option Plan. | ||
| 10 | .2**+ | Forms of 1999 Incentive Stock Option Plan Agreements. | ||
| (a)+ | Directors. | |||
| (b)+ | Employees. | |||
| 10 | .3+ | Lease for Port Orchard branch, dated May 28, 2001. | ||
| 10 | .4+ | Lease for Silverdale branch, dated October 1, 2001 and October 1, 2003. | ||
| 10 | .5+ | Lease for Gig Harbor branch, dated March 2, 2004. | ||
| 10 | .6+ | Lease for Federal Way LPO, dated March 30, 2005. | ||
| 10 | .7+ | Lease for Belfair LPO, dated December 13, 2005. | ||
| 10 | .8+ | Lease for Port Townsend LPO, dated August 18, 2006. | ||
| 10 | .9†+ | Agreement between Westsound Bank and Fiserv Solutions Inc. dated August 11, 2006. | ||
| 10 | .10**+ | Westsound Bank 401(k) Profit Sharing Plan. | ||
| 10 | .11+ | Placement Agreement among the registrant, WSB Financial Group Trust I and Cohen Bros. & Company dated July 25, 2005. | ||
| 10 | .12+ | Indenture by and between the registrant and JPMorgan Chase Bank, National Association, dated July 27, 2005. | ||
| 10 | .13+ | Guarantee Agreement by and between the registrant and JPMorgan Chase bank, National Association, dated July 27, 2005. | ||
| 10 | .14**+ | Employment Agreement with David K. Johnson. | ||
| 10 | .15**+ | Employment Agreement with Mark D. Freeman. | ||
| 10 | .16**+ | Form of Employment Agreement with other executive officers. | ||
| 10 | .17+ | Form of Indemnification Agreement with directors. | ||
| 10 | .18+ | Audit Committee Charter. | ||
| 10 | .19+ | Compensation Committee Charter. | ||
| 10 | .20+ | Corporate Governance/ Nominating Committee Charter. | ||
| 16 | .1 | Letter re change in certifying accountant. | ||
| 21 | .1+ | Subsidiaries of the registrant. | ||
| 23 | .1 | Consent of Independent Registered Public Accounting Firm, Moss Adams LLP. | ||
| 23 | .2 | Consent of Independent Public Accounting Firm, Ball & Treger, LLP. | ||
| 23 | .3 | Consent of Legal Counsel (included in legal opinion — filed as Exhibit 5.1). | ||
| 23 | .4 | Consent of Independent Financial Consultant, LC Financial Advisors LLC. | ||
| 24 | .1+ | A power of attorney is set forth on the signature page of this registration statement. | ||
| * | To be filed by amendment |
| ** | Compensatory plan or arrangement |
| † | Confidential treatment has been requested with respect to certain portions of this exhibit. Omitted portions have been filed separately with the Securities and Exchange Commission. |
| + | Previously filed |