Exhibit 99.2 2022 Q1 Earnings Presentation May 11, 2022

Important Information Cautionary Statement Regarding Forward-Looking Statements This presentation contains forward-looking statements. The matters discussed in this presentation, as well as in future oral and written statements by management of Portman Ridge Finance Corporation (“PTMN”, “Portman Ridge” or the “Company”), that are forward-looking statements are based on current management expectations that involve substantial risks and uncertainties which could cause actual results to differ materially from the results expressed in, or implied by, these forward-looking statements. Forward-looking statements relate to future events or our future financial performance and include, but are not limited to, projected financial performance, expected development of the business, plans and expectations about future investments, our contractual arrangements and relationships with third parties, the ability of our portfolio companies to achieve their objectives, the ability of the Company’s investment adviser to attract and retain highly talented professionals, our ability to maintain our qualification as a regulated investment company and as a business development company, our compliance with covenants under our borrowing arrangements, and the future liquidity of the Company. We generally identify forward-looking statements by terminology such as may, will, should, expects, plans, anticipates, could, intends, target, projects, “outlook”, contemplates, believes, estimates, predicts, potential or continue or the negative of these terms or other similar words. Forward-looking statements are based upon current plans, estimates and expectations that are subject to risks, uncertainties and assumptions. Should one or more of these risks or uncertainties materialize, or should underlying assumptions prove to be incorrect, actual results may vary materially from those indicated or anticipated by such forward-looking statements. Forward-looking statements are subject to change at any time based upon economic, market or other conditions, including with respect to the impact of the COVID-19 pandemic and its effects on the Company and its portfolio companies’ results of operations and financial condition. More information on these risks and other potential factors that could affect the Company’s financial results, including important factors that could cause actual results to differ materially from plans, estimates or expectations included herein, is included in the Company’s filings with the Securities and Exchange Commission (the “SEC”), including in the “Risk Factors” and “Management's Discussion and Analysis of Financial Condition and Results of Operations” sections of the Company’s most recently filed quarterly report on Form 10-Q and annual report on Form 10-K, as well as in subsequent filings. In light of these and other uncertainties, the inclusion of a projection or forward-looking statement in this presentation should not be regarded as a representation by us that our plans and objectives will be achieved. We do not undertake to publicly update or revise any forward-looking statements, whether as a result of new information, future events or otherwise, except as required to be reported under the rules and regulations of the SEC. 2
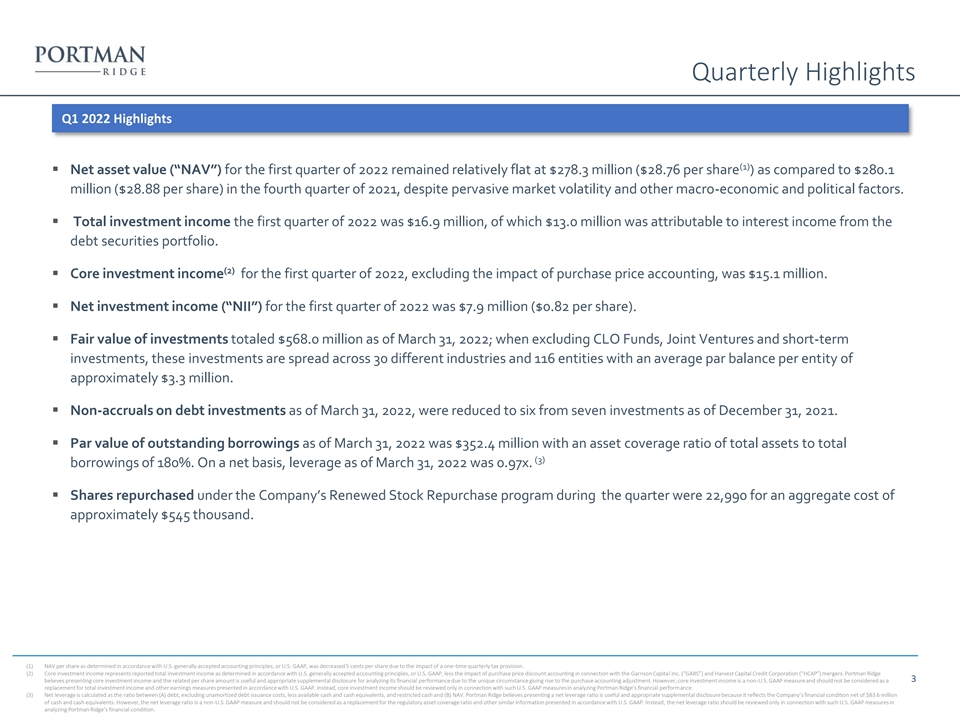
Quarterly Highlights Q1 2022 Highlights (1) ▪ Net asset value (“NAV”) for the first quarter of 2022 remained relatively flat at $278.3 million ($28.76 per share ) as compared to $280.1 million ($28.88 per share) in the fourth quarter of 2021, despite pervasive market volatility and other macro-economic and political factors. ▪ Total investment income the first quarter of 2022 was $16.9 million, of which $13.0 million was attributable to interest income from the debt securities portfolio. (2) ▪ Core investment income for the first quarter of 2022, excluding the impact of purchase price accounting, was $15.1 million. ▪ Net investment income (“NII”) for the first quarter of 2022 was $7.9 million ($0.82 per share). ▪ Fair value of investments totaled $568.0 million as of March 31, 2022; when excluding CLO Funds, Joint Ventures and short-term investments, these investments are spread across 30 different industries and 116 entities with an average par balance per entity of approximately $3.3 million. ▪ Non-accruals on debt investments as of March 31, 2022, were reduced to six from seven investments as of December 31, 2021. ▪ Par value of outstanding borrowings as of March 31, 2022 was $352.4 million with an asset coverage ratio of total assets to total (3) borrowings of 180%. On a net basis, leverage as of March 31, 2022 was 0.97x. ▪ Shares repurchased under the Company’s Renewed Stock Repurchase program during the quarter were 22,990 for an aggregate cost of approximately $545 thousand. (1) NAV per share as determined in accordance with U.S. generally accepted accounting principles, or U.S. GAAP, was decreased 5 cents per share due to the impact of a one-time quarterly tax provision. (2) Core investment income represents reported total investment income as determined in accordance with U.S. generally accepted accounting principles, or U.S. GAAP, less the impact of purchase price discount accounting in connection with the Garrison Capital Inc. (“GARS”) and Harvest Capital Credit Corporation (“HCAP”) mergers. Portman Ridge believes presenting core investment income and the related per share amount is useful and appropriate supplemental disclosure for analyzing its financial performance due to the unique circumstance giving rise to the purchase accounting adjustment. However, core investment income is a non-U.S. GAAP measure and should not be considered as a 3 replacement for total investment income and other earnings measures presented in accordance with U.S. GAAP. Instead, core investment income should be reviewed only in connection with such U.S. GAAP measures in analyzing Portman Ridge’s financial performance. (3) Net leverage is calculated as the ratio between (A) debt, excluding unamortized debt issuance costs, less available cash and cash equivalents, and restricted cash and (B) NAV. Portman Ridge believes presenting a net leverage ratio is useful and appropriate supplemental disclosure because it reflects the Company’s financial condition net of $83.6 million of cash and cash equivalents. However, the net leverage ratio is a non-U.S. GAAP measure and should not be considered as a replacement for the regulatory asset coverage ratio and other similar information presented in accordance with U.S. GAAP. Instead, the net leverage ratio should be reviewed only in connection with such U.S. GAAP measures in analyzing Portman Ridge’s financial condition.
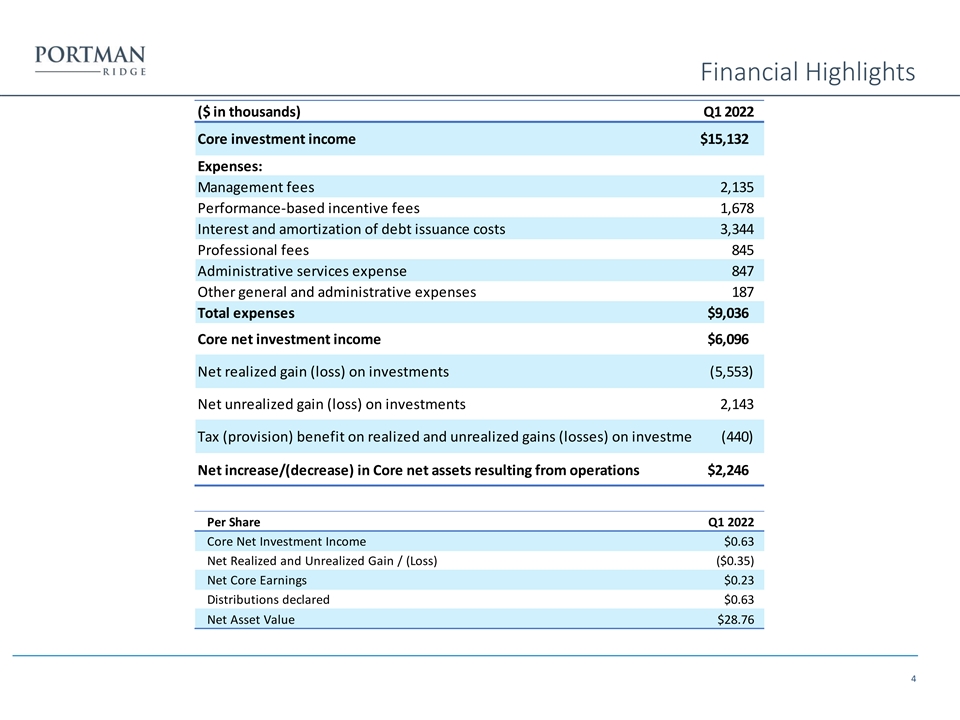
Financial Highlights ($ in thousands) Q1 2022 Core investment income $15,132 Expenses: Management fees 2,135 Performance-based incentive fees 1,678 Interest and amortization of debt issuance costs 3,344 Professional fees 845 Administrative services expense 847 Other general and administrative expenses 187 Total expenses $9,036 Core net investment income $6,096 Net realized gain (loss) on investments (5,553) Net unrealized gain (loss) on investments 2,143 Tax (provision) benefit on realized and unrealized gains (losses) on investments (440) Net increase/(decrease) in Core net assets resulting from operations $2,246 Per Share Q1 2022 Core Net Investment Income $0.63 Net Realized and Unrealized Gain / (Loss) ($0.35) Net Core Earnings $0.23 Distributions declared $0.63 Net Asset Value $28.76 4
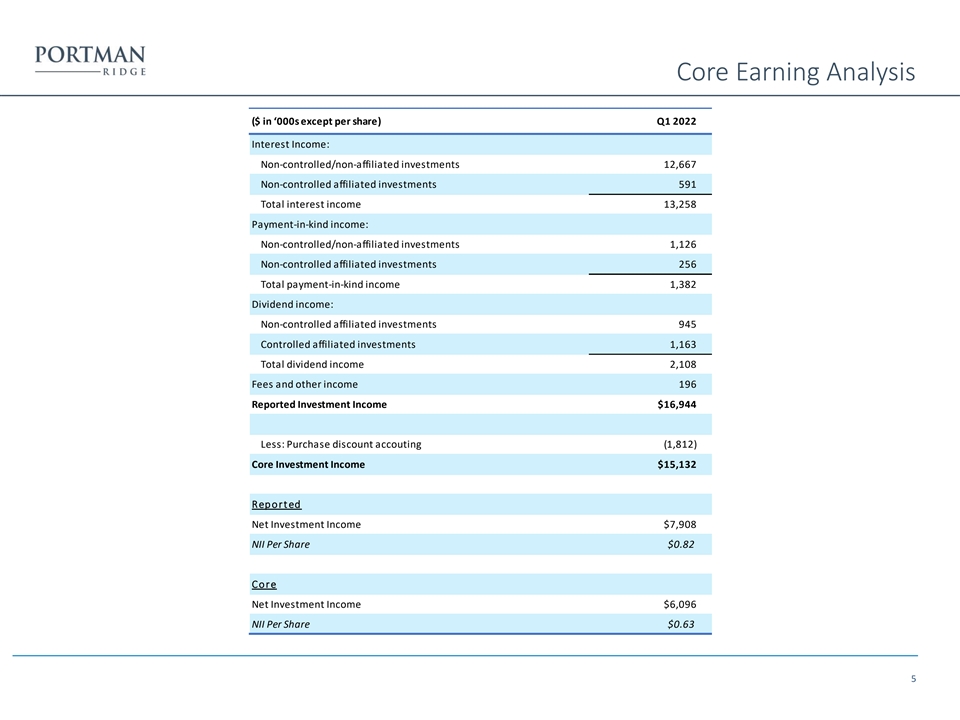
Core Earning Analysis ($ in ‘000s except per share) Q1 2022 Interest Income: Non-controlled/non-affiliated investments 12,667 Non-controlled affiliated investments 591 Total interest income 13,258 Payment-in-kind income: Non-controlled/non-affiliated investments 1,126 Non-controlled affiliated investments 256 Total payment-in-kind income 1,382 Dividend income: Non-controlled affiliated investments 945 Controlled affiliated investments 1,163 Total dividend income 2,108 Fees and other income 196 Reported Investment Income $16,944 Less: Purchase discount accouting (1,812) Core Investment Income $15,132 Report ed Net Investment Income $7,908 NII Per Share $0.82 Core Net Investment Income $6,096 NII Per Share $0.63 5
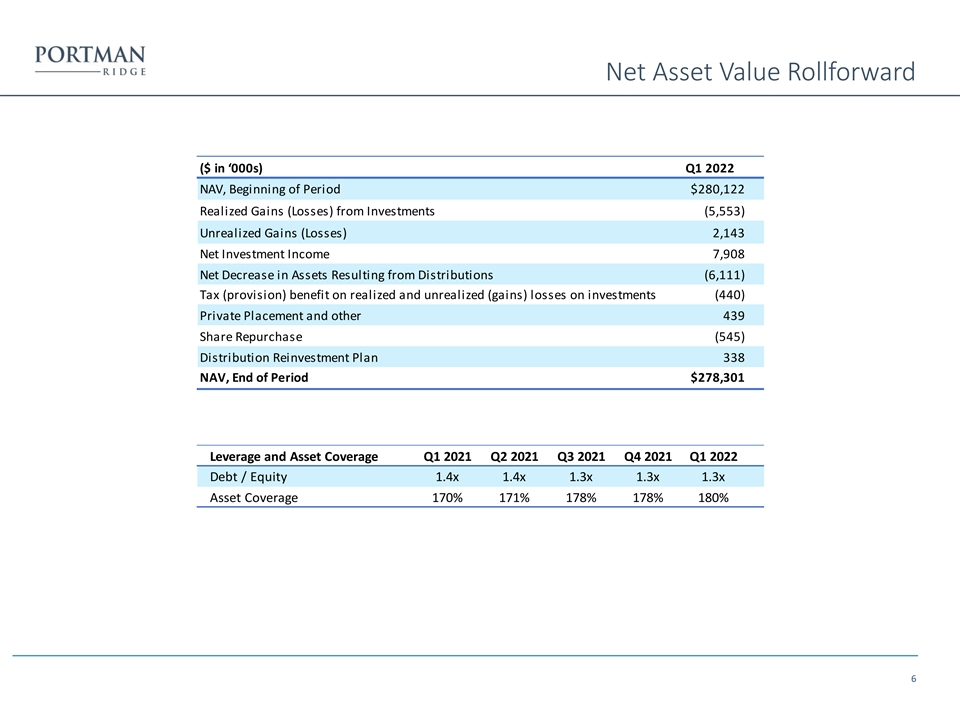
Net Asset Value Rollforward ($ in ‘000s) Q1 2022 NAV, Beginning of Period $280,122 Realized Gains (Losses) from Investments (5,553) Unrealized Gains (Losses) 2,143 Net Investment Income 7,908 Net Decrease in Assets Resulting from Distributions (6,111) Tax (provision) benefit on realized and unrealized (gains) losses on investments (440) Private Placement and other 439 Share Repurchase (545) Distribution Reinvestment Plan 338 NAV, End of Period $278,301 Leverage and Asset Coverage Q1 2021 Q2 2021 Q3 2021 Q4 2021 Q1 2022 Debt / Equity 1.4x 1.4x 1.3x 1.3x 1.3x Asset Coverage 170% 171% 178% 178% 180% 6
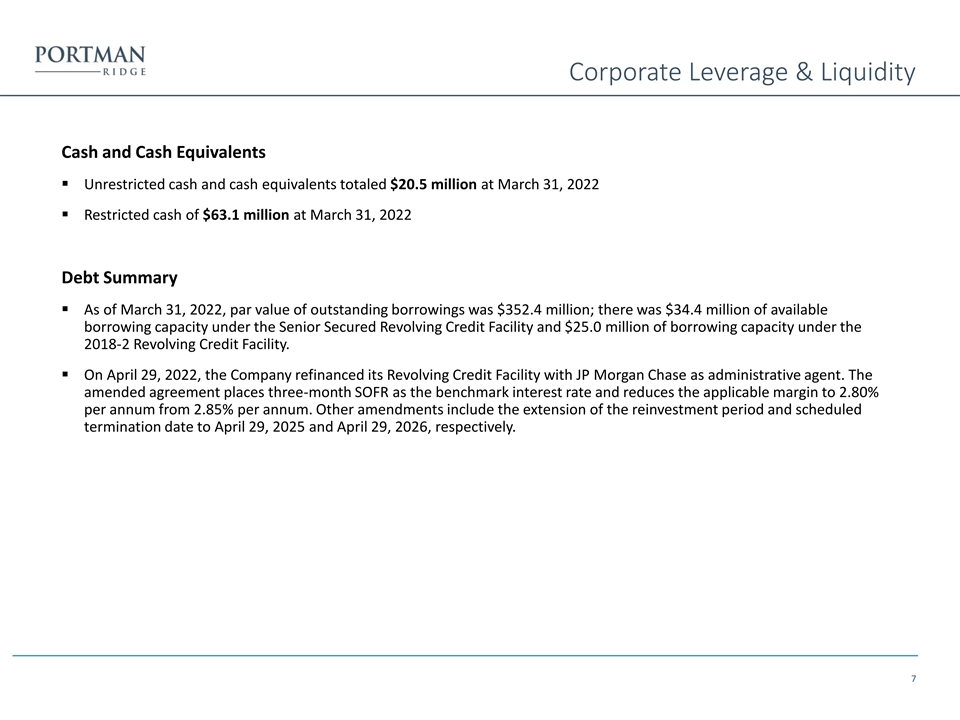
Corporate Leverage & Liquidity Cash and Cash Equivalents ▪ Unrestricted cash and cash equivalents totaled $20.5 million at March 31, 2022 ▪ Restricted cash of $63.1 million at March 31, 2022 Debt Summary ▪ As of March 31, 2022, par value of outstanding borrowings was $352.4 million; there was $34.4 million of available borrowing capacity under the Senior Secured Revolving Credit Facility and $25.0 million of borrowing capacity under the 2018-2 Revolving Credit Facility. ▪ On April 29, 2022, the Company refinanced its Revolving Credit Facility with JP Morgan Chase as administrative agent. The amended agreement places three-month SOFR as the benchmark interest rate and reduces the applicable margin to 2.80% per annum from 2.85% per annum. Other amendments include the extension of the reinvestment period and scheduled termination date to April 29, 2025 and April 29, 2026, respectively. 7
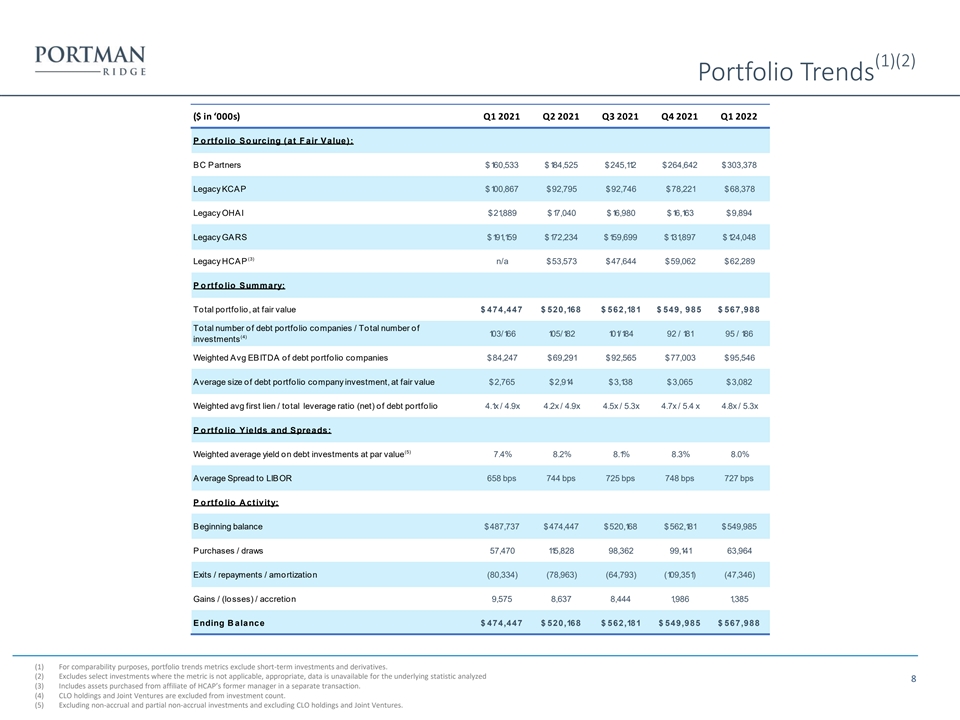
(1)(2) Portfolio Trends ($ in ‘000s) Q1 2021 Q2 2021 Q3 2021 Q4 2021 Q1 2022 P o rtfo lio So urcing (at F air Value): BC Partners $160,533 $184,525 $245,112 $264,642 $303,378 Legacy KCAP $100,867 $92,795 $92,746 $78,221 $68,378 Legacy OHAI $21,889 $17,040 $16,980 $16,163 $9,894 Legacy GARS $191,159 $172,234 $159,699 $131,897 $124,048 (3) Legacy HCAP n/a $53,573 $47,644 $59,062 $62,289 P o rtfo lio Summary: Total portfolio, at fair value $ 474,447 $ 520,168 $ 562,181 $ 549, 985 $ 567,988 Total number of debt portfolio companies / Total number of 103/166 105/182 101/184 92 / 181 95 / 186 (4) investments Weighted Avg EBITDA of debt portfolio companies $84,247 $69,291 $92,565 $77,003 $95,546 Average size of debt portfolio company investment, at fair value $2,765 $2,914 $3,138 $3,065 $3,082 Weighted avg first lien / total leverage ratio (net) of debt portfolio 4.1x / 4.9x 4.2x / 4.9x 4.5x / 5.3x 4.7x / 5.4 x 4.8x / 5.3x P o rtfo lio Yields and Spreads: (5) Weighted average yield on debt investments at par value 7.4% 8.2% 8.1% 8.3% 8.0% Average Spread to LIBOR 658 bps 744 bps 725 bps 748 bps 727 bps P o rtfo lio A ctivity: Beginning balance $487,737 $474,447 $520,168 $562,181 $549,985 Purchases / draws 57,470 115,828 98,362 99,141 63,964 Exits / repayments / amortization (80,334) (78,963) (64,793) (109,351) (47,346) Gains / (losses) / accretion 9,575 8,637 8,444 1,986 1,385 Ending B alance $ 474,447 $ 520,168 $ 562,181 $ 549,985 $ 567,988 (1) For comparability purposes, portfolio trends metrics exclude short-term investments and derivatives. (2) Excludes select investments where the metric is not applicable, appropriate, data is unavailable for the underlying statistic analyzed 8 (3) Includes assets purchased from affiliate of HCAP’s former manager in a separate transaction. (4) CLO holdings and Joint Ventures are excluded from investment count. (5) Excluding non-accrual and partial non-accrual investments and excluding CLO holdings and Joint Ventures.
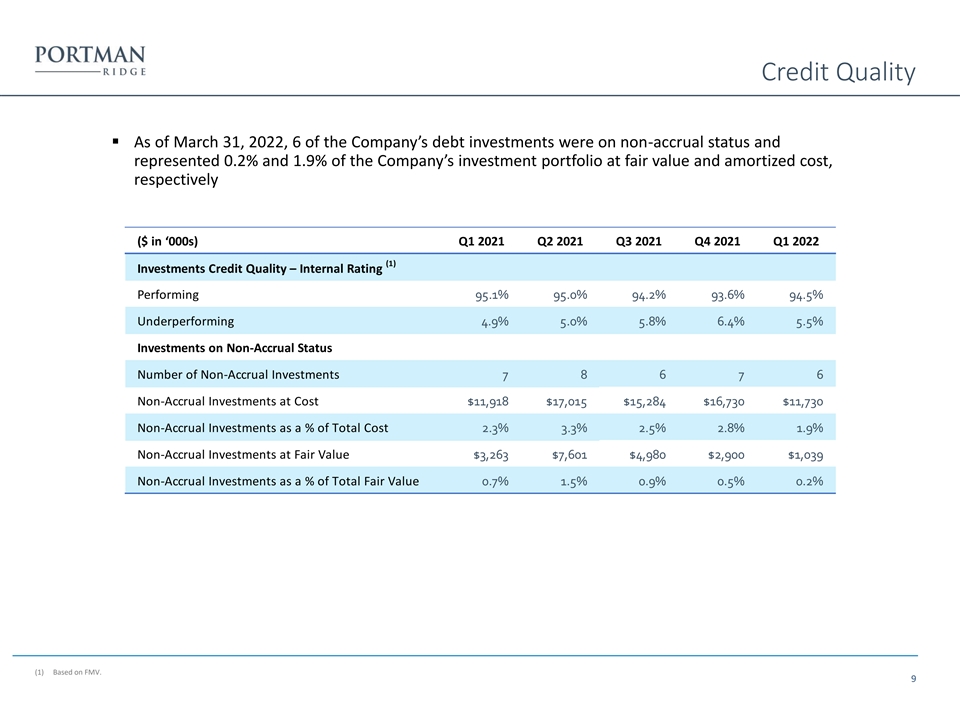
Credit Quality ▪ As of March 31, 2022, 6 of the Company’s debt investments were on non-accrual status and represented 0.2% and 1.9% of the Company’s investment portfolio at fair value and amortized cost, respectively ($ in ‘000s) Q1 2021 Q2 2021 Q3 2021 Q4 2021 Q1 2022 (1) Investments Credit Quality – Internal Rating Performing 95.1% 95.0% 94.2% 93.6% 94.5% Underperforming 4.9% 5.0% 5.8% 6.4% 5.5% Investments on Non-Accrual Status Number of Non-Accrual Investments 7 8 6 7 6 Non-Accrual Investments at Cost $11,918 $17,015 $15,284 $16,730 $11,730 Non-Accrual Investments as a % of Total Cost 2.3% 3.3% 2.5% 2.8% 1.9% Non-Accrual Investments at Fair Value $3,263 $7,601 $4,980 $2,900 $1,039 Non-Accrual Investments as a % of Total Fair Value 0.7% 1.5% 0.9% 0.5% 0.2% (1) Based on FMV. 9
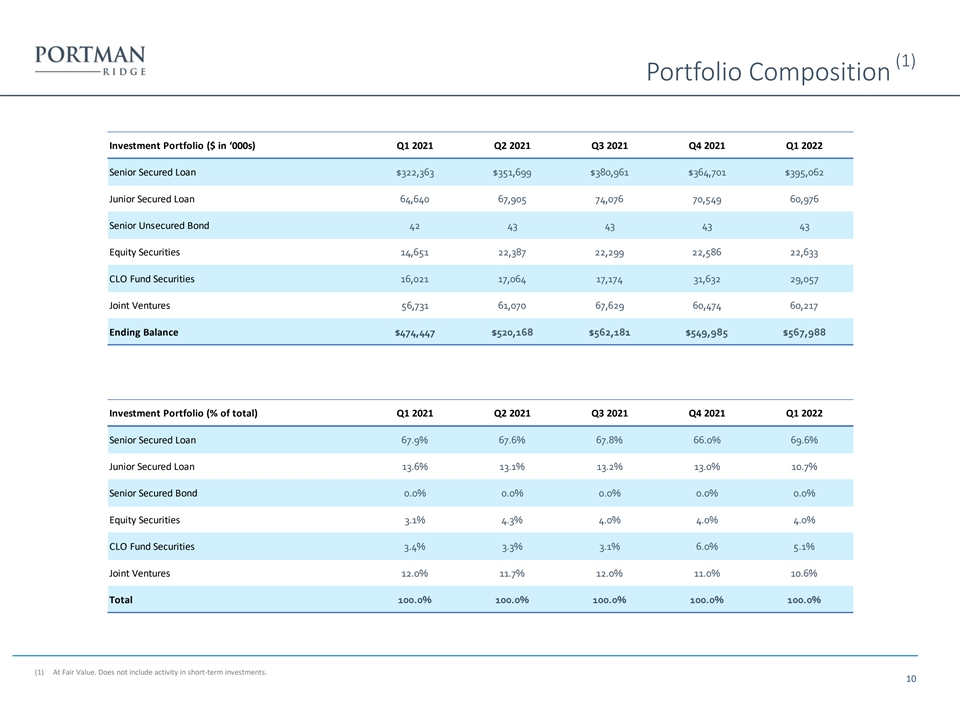
(1) Portfolio Composition Investment Portfolio ($ in ‘000s) Q1 2021 Q2 2021 Q3 2021 Q4 2021 Q1 2022 Senior Secured Loan $322,363 $351,699 $380,961 $364,701 $395,062 Junior Secured Loan 64,640 67,905 74,076 70,549 60,976 Senior Unsecured Bond 42 43 43 43 43 Equity Securities 14,651 22,387 22,299 22,586 22,633 CLO Fund Securities 16,021 17,064 17,174 31,632 29,057 Joint Ventures 56,731 61,070 67,629 60,474 60,217 Ending Balance $474,447 $520,168 $562,181 $549,985 $567,988 Investment Portfolio (% of total) Q1 2021 Q2 2021 Q3 2021 Q4 2021 Q1 2022 Senior Secured Loan 67.9% 67.6% 67.8% 66.0% 69.6% Junior Secured Loan 13.6% 13.1% 13.2% 13.0% 10.7% Senior Secured Bond 0.0% 0.0% 0.0% 0.0% 0.0% Equity Securities 3.1% 4.3% 4.0% 4.0% 4.0% CLO Fund Securities 3.4% 3.3% 3.1% 6.0% 5.1% Joint Ventures 12.0% 11.7% 12.0% 11.0% 10.6% Total 100.0% 100.0% 100.0% 100.0% 100.0% (1) At Fair Value. Does not include activity in short-term investments. 10
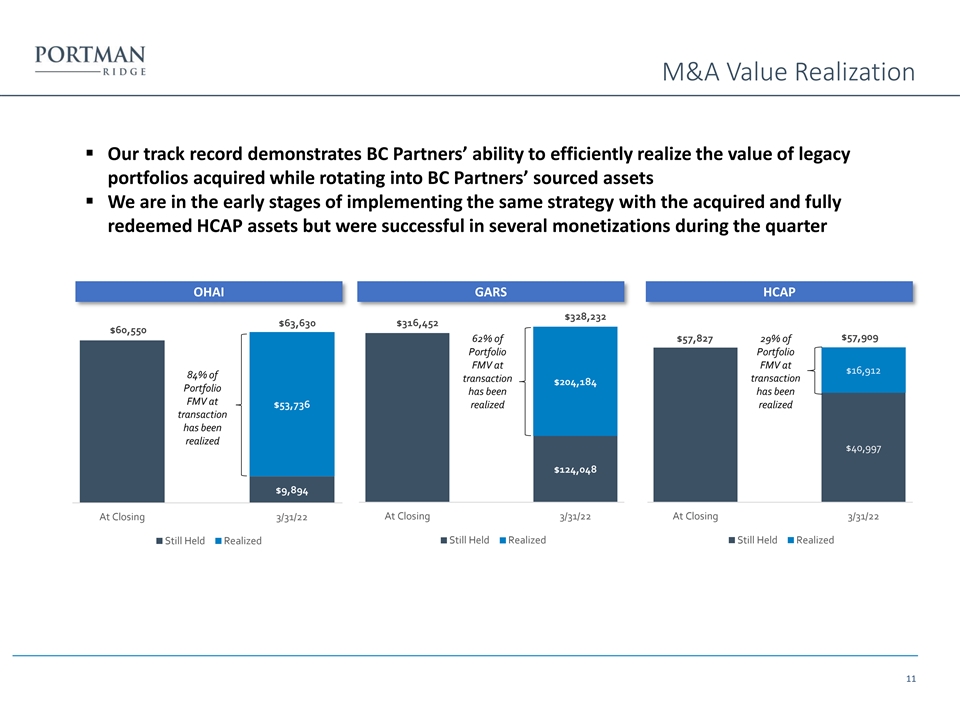
M&A Value Realization ▪ Our track record demonstrates BC Partners’ ability to efficiently realize the value of legacy portfolios acquired while rotating into BC Partners’ sourced assets ▪ We are in the early stages of implementing the same strategy with the acquired and fully redeemed HCAP assets but were successful in several monetizations during the quarter OHAI GARS HCAP $328,232 $63,630 $316,452 $60,550 $57,909 $57,827 62% of 29% of Portfolio Portfolio FMV at FMV at $16,912 84% of transaction transaction $204,184 Portfolio has been has been FMV at $53,736 realized realized transaction has been realized $40,997 $124,048 $9,894 At Closing 3/31/22 At Closing 3/31/22 At Closing 3/31/22 Still Held Realized Still Held Realized Still Held Realized 11

Appendix
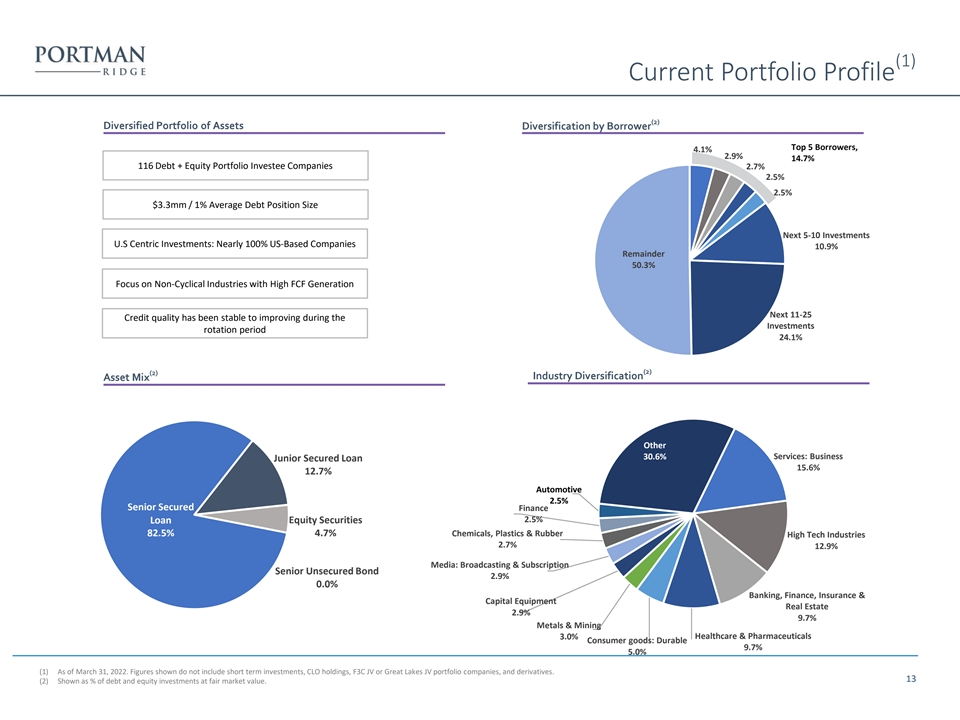
(1) Current Portfolio Profile (2) Diversified Portfolio of Assets Diversification by Borrower Top 5 Borrowers, 4.1% 2.9% 14.7% 116 Debt + Equity Portfolio Investee Companies 2.7% 2.5% 2.5% $3.3mm / 1% Average Debt Position Size Next 5-10 Investments U.S Centric Investments: Nearly 100% US-Based Companies 10.9% Remainder 50.3% Focus on Non-Cyclical Industries with High FCF Generation Next 11-25 Credit quality has been stable to improving during the Investments rotation period 24.1% (2) (2) Industry Diversification Asset Mix Other 30.6% Services: Business Junior Secured Loan 15.6% 12.7% Automotive 2.5% Senior Secured Finance 2.5% Loan Equity Securities 4.7% Chemicals, Plastics & Rubber 82.5% High Tech Industries 2.7% 12.9% Media: Broadcasting & Subscription Senior Unsecured Bond 2.9% 0.0% Banking, Finance, Insurance & Capital Equipment Real Estate 2.9% 9.7% Metals & Mining Healthcare & Pharmaceuticals 3.0% Consumer goods: Durable 9.7% 5.0% (1) As of March 31, 2022. Figures shown do not include short term investments, CLO holdings, F3C JV or Great Lakes JV portfolio companies, and derivatives. 13 (2) Shown as % of debt and equity investments at fair market value.
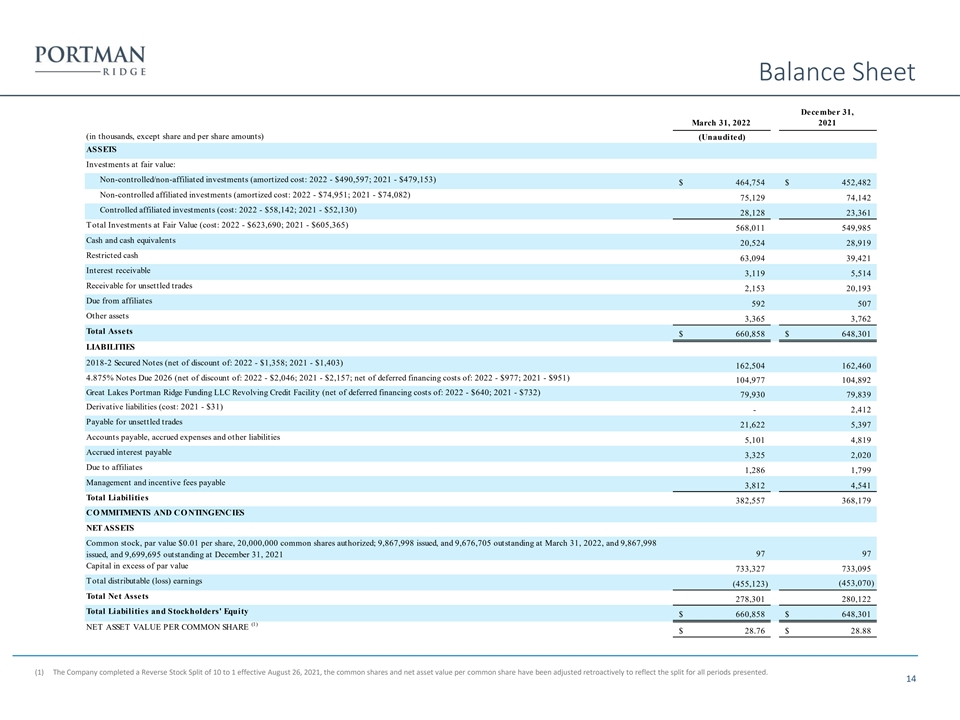
Balance Sheet December 31, March 31, 2022 2021 (in thousands, except share and per share amounts) (Unaudited) ASSETS Investments at fair value: Non-controlled/non-affiliated investments (amortized cost: 2022 - $490,597; 2021 - $479,153) $ 4 64,754 $ 452,482 Non-controlled affiliated investments (amortized cost: 2022 - $74,951; 2021 - $74,082) 75,129 7 4,142 Controlled affiliated investments (cost: 2022 - $58,142; 2021 - $52,130) 28,128 23,361 Total Investments at Fair Value (cost: 2022 - $623,690; 2021 - $605,365) 568,011 5 49,985 Cash and cash equivalents 20,524 28,919 Restricted cash 63,094 39,421 Interest receivable 3,119 5 ,514 Receivable for unsettled trades 2 ,153 2 0,193 Due from affiliates 592 507 Other assets 3,365 3,762 Total Assets $ 6 60,858 $ 648,301 LIABILITIES 2018-2 Secured Notes (net of discount of: 2022 - $1,358; 2021 - $1,403) 1 62,504 162,460 4.875% Notes Due 2026 (net of discount of: 2022 - $2,046; 2021 - $2,157; net of deferred financing costs of: 2022 - $977; 2021 - $951) 104,977 1 04,892 Great Lakes Portman Ridge Funding LLC Revolving Credit Facility (net of deferred financing costs of: 2022 - $640; 2021 - $732) 79,930 79,839 Derivative liabilities (cost: 2021 - $31) - 2 ,412 Payable for unsettled trades 21,622 5,397 Accounts payable, accrued expenses and other liabilities 5,101 4,819 Accrued interest payable 3,325 2 ,020 Due to affiliates 1 ,286 1 ,799 Management and incentive fees payable 3,812 4 ,541 Total Liabilities 382,557 3 68,179 CO MMITMENTS AND CO NTINGENCIES NET ASSETS Common stock, par value $0.01 per share, 20,000,000 common shares authorized; 9,867,998 issued, and 9,676,705 outstanding at March 31, 2022, and 9,867,998 97 97 issued, and 9,699,695 outstanding at December 31, 2021 Capital in excess of par value 7 33,327 7 33,095 Total distributable (loss) earnings ( 455,123) (453,070) Total Net Assets 278,301 2 80,122 Total Liabilities and Stockholders' Equity $ 660,858 $ 648,301 (1) NET ASSET VALUE PER COMMON SHARE $ 2 8.76 $ 2 8.88 (1) The Company completed a Reverse Stock Split of 10 to 1 effective August 26, 2021, the common shares and net asset value per common share have been adjusted retroactively to reflect the split for all periods presented. 14

Income Statement (Unaudited) (in thousands, except share and per share amounts) For the Three Months Ended March 31, 2022 2021 INVESTMENT INCO ME Interest income: Non-controlled/non-affiliated investments $ 12,667 $ 14,470 Non-controlled affiliated investments 591 233 Total interest income 13,258 1 4,703 Payment-in-kind income: Non-controlled/non-affiliated investments 1 ,126 1,132 Non-controlled affiliated investments 256 - Total payment-in-kind income 1 ,382 1,132 Dividend income: Non-controlled affiliated investments 945 814 Controlled affiliated investments 1 ,163 1 ,226 Total dividend income 2,108 2,040 Fees and other income 196 430 Total investment income 1 6,944 1 8,305 EXPENSES Management fees 2 ,135 1,793 Performance-based incentive fees 1 ,678 2,094 Interest and amortization of debt issuance costs 3,344 3 ,380 Professional fees 845 1 ,494 Administrative services expense 847 613 Other general and administrative expenses 187 718 Total expenses 9 ,036 1 0,092 NET INVESTMENT INCO ME 7 ,908 8,213 REALIZED AND UNREALIZED GAINS (LO SSES) O N INVESTMENTS Net realized gains (losses) from investment transactions: Non-controlled/non-affiliated investments (3,670) (5,195) Non-controlled affiliated investments 212 109 Derivatives (2,095) - Net realized gain (loss) on investments (5,553) ( 5,086) Net change in unrealized appreciation (depreciation) on: Non-controlled/non-affiliated investments 829 6 ,263 Non-controlled affiliated investments 117 331 Controlled affiliated investments ( 1,245) 625 Derivatives 2,442 ( 474) Net unrealized gain (loss) on investments 2,143 6,745 Tax (provision) benefit on realized and unrealized gains (losses) on investments (440) - Net realized and unrealized appreciation (depreciation) on investments, net of taxes (3,850) 1,659 Realized gains (losses) on extinguishments of debt - (1,835) NET INCREASE (DECREASE) IN NET ASSETS RESULTING FRO M O PERATIO NS $ 4,058 $ 8,037 Net Increase (Decrease) In Stockholders' Equity Resulting from Operations per Common (1) Share : Basic and Diluted: $ 0.42 $ 1 .07 (1) Net Investment Income Per Common Share : Basic and Diluted: $ 0 .82 $ 1.09 (1) Weighted Average Shares of Common Stock Outstanding—Basic and Diluted 9 ,698,099 7 ,517,453 (1) The Company completed a Reverse Stock Split of 10 to 1 effective August 26, 2021, the weighted average shares outstanding and per share values have been adjusted retroactively to reflect the split for all periods presented. 15

(1) Regular Distribution Information Date Declared Record Date Payment Date Distribution per Share 5/10/2022 5/24/2022 6/7/2022 $0.63 3/10/2022 3/21/2022 3/30/2022 $0.63 11/3/2021 11/15/2021 11/30/2021 $0.62 8/4/2021 1 for 10 Reverse Stock Split effective 8/26/21 8/4/2021 8/17/2021 8/31/2021 $0.60 5/6/2021 5/19/2021 6/1/2021 $0.60 2/12/2021 2/22/2021 3/2/2021 $0.60 10/16/2020 10/26/2020 11/27/2020 $0.60 8/5/2020 8/17/2020 8/28/2020 $0.60 3/17/2020 5/7/2020 5/27/2020 $0.60 2/5/2020 2/18/2020 2/28/2020 $0.60 11/5/2019 11/15/2019 11/29/2019 $0.60 8/5/2019 8/12/2019 8/29/2019 $0.60 (1) The Company completed a Reverse Stock Split of 10 to 1 effective August 26, 2021, the distribution per share amounts have been adjusted retroactively to reflect the split for all periods presented. 16