Exhibit (c)-(3)
Project Apollo FINANCIAL ANALYSIS DISCUSSION MATERIALS NOVEMBER 2015 CONFIDENTIAL
Disclaimer PROJECT APOLLO CONFIDENTIAL This document has been prepared by Lazard based upon information provided to it by Mindray Medical International Limited (“ Mindray ”) and publicly available information, and portions of the information herein may be based upon certain statements, estimates and forecasts with respect to the anticipated future performance of Mindray . We have relied upon the accuracy and completeness of the foregoing information, and have not assumed any responsibility for any independent verification of such information or any independent valuation or appraisal of any of the assets or liabilities (contingent or otherwise) of Mindray or any other entity, or concerning solvency or fair value of Mindray or any other entity . To the fullest extent permitted by law, Lazard disclaims any responsibility for the information herein and for any omissions from such information . With respect to financial forecasts, we have assumed that they have been reasonably prepared on bases reflecting the best currently available estimates and judgments as to future financial performance of Mindray . We assume no responsibility for and express no view as to such forecasts or the assumptions on which they are based . The information set forth herein is based upon economic, monetary, market and other conditions as in effect on, and the information made available to us as of, the date hereof, unless indicated otherwise . While any subsequent changes in the circumstances may affect the information herein, we assume no responsibility to update or supplement the information set forth herein . These materials and the information contained herein are confidential and may not be disclosed publicly or made available to third parties without the prior written consent of Lazard . These materials shall not be used for any purpose other than that for which they were provided . These materials do not constitute tax, accounting, actuarial, legal or other specialist advice, and Lazard shall have no duties or obligations to you in respect of these materials or other advice provided to you, except to the extent specifically set forth in an engagement or other written agreement, if any, that is entered into by Lazard and you . Lazard only acts for those entities and persons whom it has identified as its client and no - one else and will not be responsible to anyone other than such clients for providing the protections afforded to clients of Lazard nor for providing advice .
Table of Contents PROJECT APOLLO CONFIDENTIAL I TRANSACTION OVERVIEW 1 II REVIEW OF MANAGEMENT PROJECTIONS 4 III FINANCIAL ANALYSIS 5 APPENDICES A Additional Apollo Information 8 B Additional Valuation Materials 9 C WACC Analysis 11 D Premium Paid Analysis 12
I Transaction Overview PROJECT APOLLO
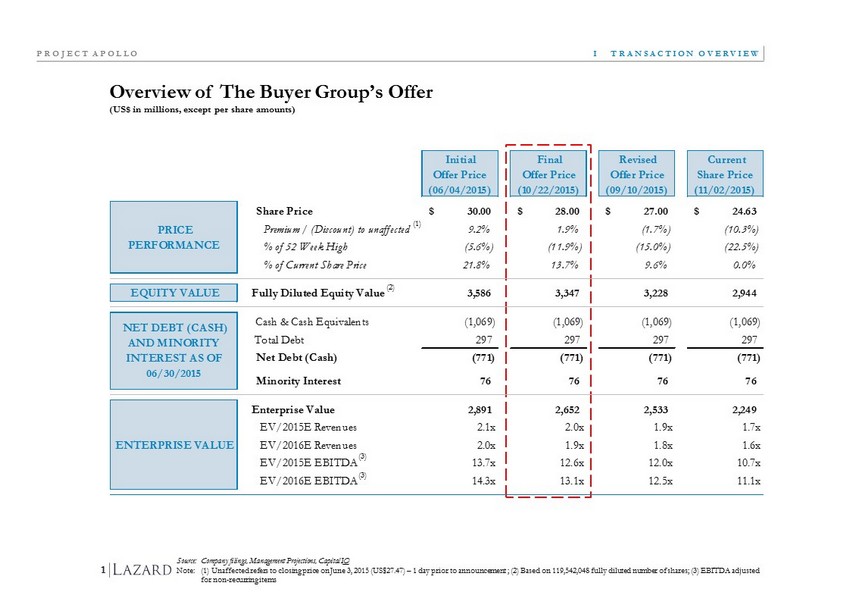
Overview of The Buyer Group’s Offer (US$ in millions, except per share amounts) I TRANSACTION OVERVIEW PROJECT APOLLO 1 Source: Company filings, Management Projections, Capital IQ Note: (1) Unaffected refers to closing price on June 3, 2015 (US$27.47) – 1 day prior to announcement ; (2 ) Based on 119,542,048 fully diluted number of shares ; (3) EBITDA adjusted for non - recurring items (1) (3) (2) (3) Initial Offer Price (06/04/2015) Final Offer Price (10/22/2015) Revised Offer Price (09/10/2015) Current Share Price (11/02/2015) Share Price 30.00$ 28.00$ 27.00$ 24.63$ Premium / (Discount) to unaffected 9.2% 1.9% (1.7%) (10.3%) % of 52 Week High (5.6%) (11.9%) (15.0%) (22.5%) % of Current Share Price 21.8% 13.7% 9.6% 0.0% EQUITY VALUE Fully Diluted Equity Value 3,586 3,347 3,228 2,944 Cash & Cash Equivalents (1,069) (1,069) (1,069) (1,069) Total Debt 297 297 297 297 Net Debt (Cash) (771) (771) (771) (771) Minority Interest 76 76 76 76 Enterprise Value 2,891 2,652 2,533 2,249 EV/2015E Revenues 2.1x 2.0x 1.9x 1.7x EV/2016E Revenues 2.0x 1.9x 1.8x 1.6x EV/2015E EBITDA 13.7x 12.6x 12.0x 10.7x EV/2016E EBITDA 14.3x 13.1x 12.5x 11.1x PRICE PERFORMANCE NET DEBT (CASH) AND MINORITY INTEREST AS OF 06/30/2015 ENTERPRISE VALUE
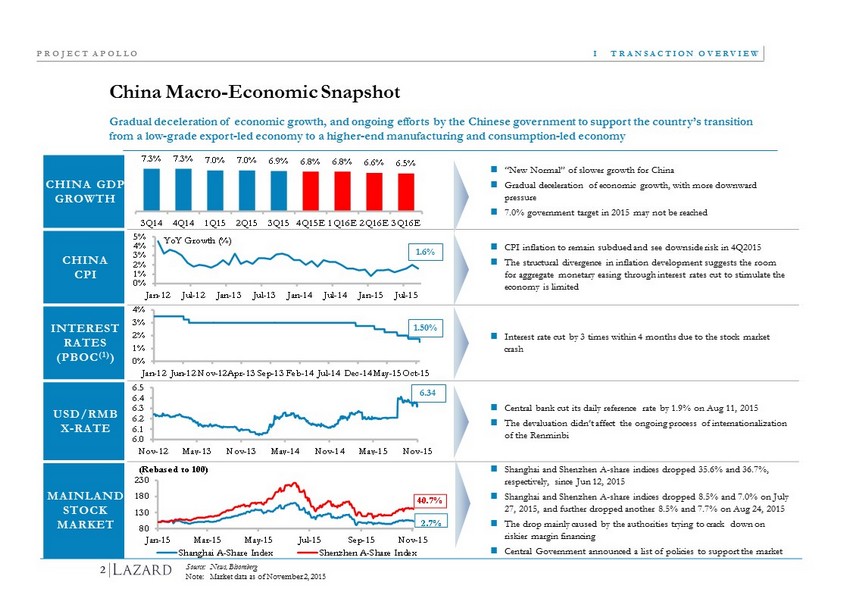
6.0 6.1 6.2 6.3 6.4 6.5 Nov-12 May-13 Nov-13 May-14 Nov-14 May-15 Nov-15 CHINA GDP GROWTH “New Normal” of slower growth for China Gradual deceleration of economic growth, with more downward pressure 7.0% government target in 2015 may not be reached CHINA CPI CPI inflation to remain subdued and see downside risk in 4Q2015 The structural divergence in inflation development suggests the room for aggregate monetary easing through interest rates cut to stimulate the economy is limited INTEREST RATES (PBOC (1) ) Interest rate cut by 3 times within 4 months due to the stock market crash USD/ RMB X - RATE Central bank cut its daily reference rate by 1.9% on Aug 11, 2015 The devaluation didn’t affect the ongoing process of internationalization of the Renminbi MAINLAND STOCK MARKET Shanghai and Shenzhen A - share indices dropped 35.6% and 36.7%, respectively, since Jun 12, 2015 Shanghai and Shenzhen A - share indices dropped 8.5% and 7.0% on July 27, 2015, and further dropped another 8.5% and 7.7% on Aug 24, 2015 The drop mainly caused by the authorities trying to crack down on riskier margin financing Central Government announced a list of policies to support the market 0% 1% 2% 3% 4% Jan-12 Jun-12 Nov-12 Apr-13 Sep-13 Feb-14 Jul-14 Dec-14 May-15 Oct-15 China Macro - Economic Snapshot I TRANSACTION OVERVIEW PROJECT APOLLO 2 Source: News, Bloomberg Note: Market data as of N ovember 2 , 2015 Gradual deceleration of economic growth, and ongoing efforts by the Chinese government to support the country’s transition from a low - grade export - led economy to a higher - end manufacturing and consumption - led economy 1.6% 1.50% 6.34 0% 1% 2% 3% 4% 5% Jan-12 Jul-12 Jan-13 Jul-13 Jan-14 Jul-14 Jan-15 Jul-15 YoY Growth ( %) 7.3% 7.3% 7.0% 7.0% 6.9% 6.8% 6.8% 6.6% 6.5% 3Q14 4Q14 1Q15 2Q15 3Q15 4Q15E 1Q16E 2Q16E 3Q16E 80 130 180 230 Jan-15 Mar-15 May-15 Jul-15 Sep-15 Nov-15 Shanghai A-Share Index Shenzhen A-Share Index 40.7% 2.7% (Rebased to 100)
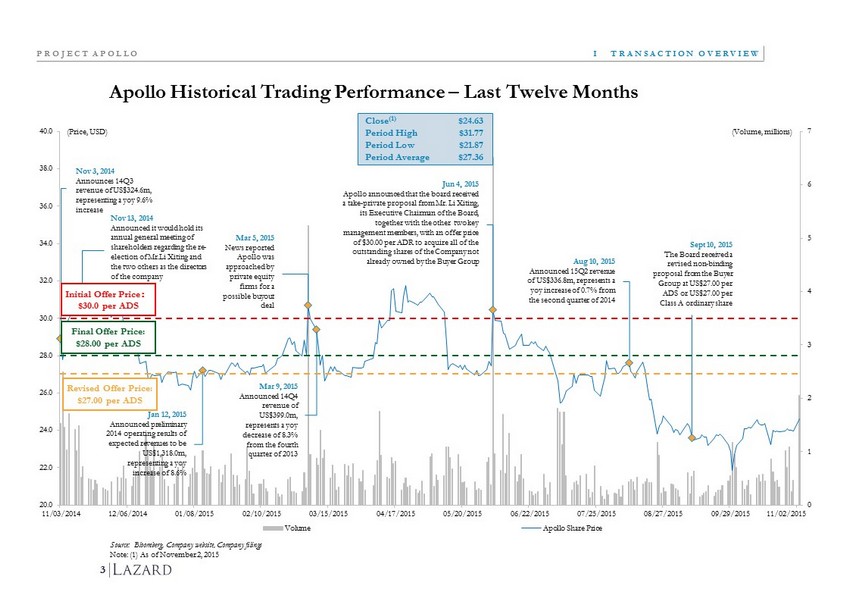
0 1 2 3 4 5 6 7 20.0 22.0 24.0 26.0 28.0 30.0 32.0 34.0 36.0 38.0 40.0 11/03/2014 12/06/2014 01/08/2015 02/10/2015 03/15/2015 04/17/2015 05/20/2015 06/22/2015 07/25/2015 08/27/2015 09/29/2015 11/01/2015 Volume Apollo Share Price (Volume, millions) (Price, USD) 11/02/2015 Offer Price $ 30.0 per ADS Apollo Historical Trading Performance – Last Twelve Months I TRANSACTION OVERVIEW PROJECT APOLLO 3 Source: Bloomberg, Company website, Company filings Note: (1) As of November 2, 2015 Mar 9, 2015 Announced 14Q4 revenue of US$399.0m, represents a yoy decrease of 8.3% from the fourth quarter of 2013 Jun 4, 2015 Apollo announced that the board received a take - private proposal from Mr. Li Xiting , its Executive Chairman of the Board, together with the other two key management members, with an offer price of $ 30.00 per ADR to acquire all of the outstanding shares of the Company not already owned by the Buyer Group Close (1) $ 24.63 Period High $ 31.77 Period Low $ 21.87 Period Average $ 27.36 Jan 12, 2015 Announced p reliminary 2014 operating results of expected revenues to be US$1,318.0m, representing a yoy increase of 8.6 % Mar 5, 2015 News reported Apollo was approached by private equity firms for a possible buyout deal Aug 10, 2015 Announced 15Q2 revenue of US$336.8m, represents a yoy increase of 0.7% from the second quarter of 2014 Revised Offer Price: $27.00 per ADS Sept 10, 2015 The Board received a revised non - binding proposal from the Buyer Group at US$27.00 per ADS or US$27.00 per Class A ordinary share Nov 3, 2014 Announces 14Q3 revenue of US$324.6m, representing a yoy 9.6% increase Nov 13, 2014 Announced it would hold its annual general meeting of shareholders regarding the re - election of Mr.Li Xiting and the two others as the directors of the company Final Offer Price: $28.00 per ADS Initial Offer Price $ 30.0 per ADS
II Review of Management Projections PROJECT APOLLO

II REVIEW OF MANAGEMENT PROJECTIONS PROJECT APOLLO 4 Management Projections Source: Company, GAAP financials Note: (1) EBITDA includes O ther I ncome and Minority I nterest Historical Management Projections 2015E-2020E (US$ millions) 2012A 2013A 2014A 2015E 2016E 2017E 2018E 2019E 2020E CAGR Income Statement Net Revenue 1,060.1 1,214.0 1,322.8 1,349.3 1,423.5 1,530.2 1,637.4 1,735.6 1,823.1 6.2% % Growth 20.4% 14.5% 9.0% 2.0% 5.5% 7.5% 7.0% 6.0% 5.0% Cost of Revenue (459.2) (527.8) (584.3) (616.6) (660.8) (719.4) (773.5) (824.1) (878.1) Gross Profit 600.8 686.2 738.5 732.7 762.7 810.8 863.9 911.5 945.0 5.2% % Gross Margin 56.7% 56.5% 55.8% 54.3% 53.6% 53.0% 52.8% 52.5% 51.8% Expenses Selling and Marketing (188.8) (220.6) (262.0) (280.8) (301.2) (329.2) (344.7) (360.2) (375.2) 6.0% % of Net Revenue 17.8% 18.2% 19.8% 20.8% 21.2% 21.5% 21.1% 20.8% 20.6% General and Administrative (116.2) (128.3) (137.0) (154.0) (156.6) (172.0) (174.1) (175.2) (177.2) 2.8% % of Net Revenue 11.0% 10.6% 10.4% 11.4% 11.0% 11.2% 10.6% 10.1% 9.7% Research and Development (104.3) (127.5) (147.0) (163.3) (175.2) (191.6) (198.2) (204.5) (211.3) 5.3% % of Net Revenue 9.8% 10.5% 11.1% 12.1% 12.3% 12.5% 12.1% 11.8% 11.6% Operating Income 191.5 209.8 192.5 134.6 129.7 118.1 146.9 171.7 181.3 6.1% % of Net Revenue 18.1% 17.3% 14.6% 10.0% 9.1% 7.7% 9.0% 9.9% 9.9% Effective Tax Rate 17.0% 5.8% 15.1% 17.4% 17.4% 17.4% 17.4% 17.4% 25.0% Net Income (Loss) 180.4 224.3 193.3 127.7 128.0 120.1 145.6 167.1 159.1 4.5% % Net Margin 17.0% 18.5% 14.6% 9.5% 9.0% 7.9% 8.9% 9.6% 8.7% D&A 42.4 54.6 58.7 62.0 69.4 77.4 84.4 91.2 97.5 EBITDA (1) 235.5 268.3 260.5 199.7 202.1 198.5 234.3 265.9 281.8 7.1% % EBITDA Margin 22.2% 22.1% 19.7% 14.8% 14.2% 13.0% 14.3% 15.3% 15.5%
III Financial Analysis PROJECT APOLLO
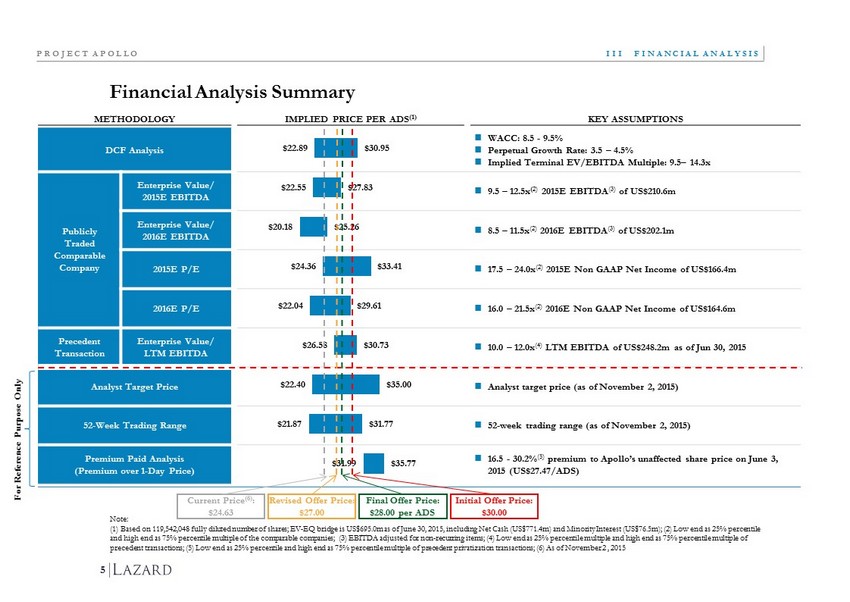
$22.89 $22.55 $20.18 $24.36 $22.04 $26.58 $22.40 $21.87 $31.99 $30.95 $27.83 $25.26 $33.41 $29.61 $30.73 $35.00 $31.77 $35.77 METHODOLOGY IMPLIED PRICE PER ADS (1) KEY ASSUMPTIONS DCF Analysis WACC: 8.5 - 9.5% Perpetual Growth Rate: 3.5 – 4.5% Implied Terminal EV/EBITDA Multiple: 9.5 – 14.3x Publicly Traded Comparable Company Enterprise Value/ 2015E EBITDA 9.5 – 12.5x ( 2) 2015E EBITDA (3) of US$210.6m Enterprise Value/ 2016E EBITDA 8.5 – 11.5x (2) 2016E EBITDA (3) of US$202.1m 2015E P/E 17.5 – 24.0x (2) 2015E Non GAAP Net Income of US$166.4m 2016E P/E 16.0 – 21.5x (2) 2016E Non GAAP Net Income of US$164.6m Precedent Transaction Enterprise Value/ LTM EBITDA 10.0 – 12.0x (4) LTM EBITDA of US$248.2m as of Jun 30, 2015 Analyst Target Price Analyst target price (as of November 2, 2015) 52 - Week Trading Range 52 - week trading range (as of November 2, 2015) Premium Paid Analysis (Premium over 1 - Day Price) 16.5 - 30.2% (5) premium to Apollo’s unaffected share price on June 3, 2015 (US$27.47/ADS) Financial Analysis Summary III FINANCIAL ANALYSIS PROJECT APOLLO 5 Current Price (6) : $24.63 Initial Offer Price: $30.00 For Reference Purpose Only Note: (1) Based on 119,542,048 fully diluted number of shares; EV - EQ bridge is US$695.0m as of June 30, 2015, including Net Cash (US$771 .4m ) and Minority Interest (US$76.5m); (2 ) Low end as 25% percentile and high end as 75% percentile multiple of the comparable companies; (3) EBITDA adjusted for non - recurring items ; (4) Low end as 25% percentile multiple and high end as 75% percentile multiple of precedent transactions; (5) Low end as 25% percentile and high end as 75% percentile multiple of precedent privatization tran sac tions; (6) As of November 2 , 2015 Revised Offer Price: $27.00 Final Offer Price: $28.00 per ADS
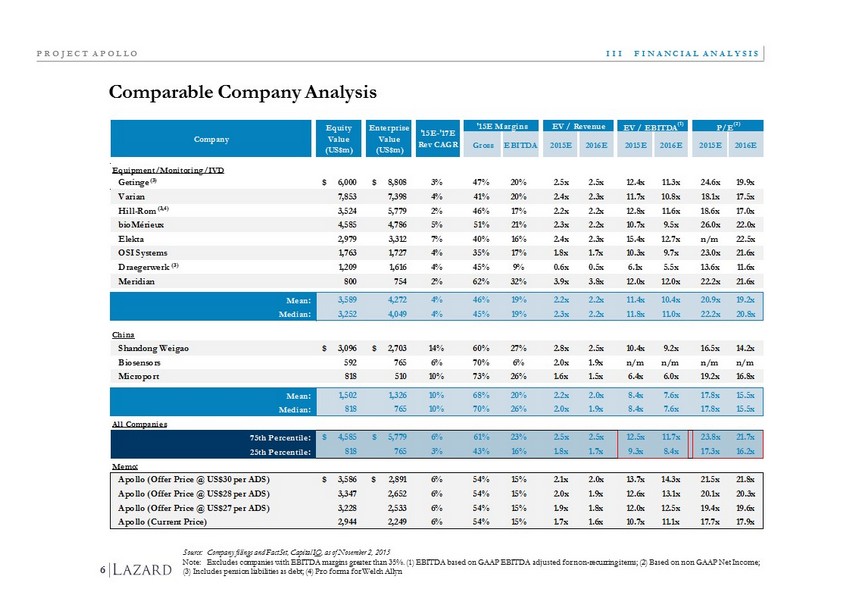
Comparable Company Analysis Source: Company filings and FactSet , Capital IQ, as of November 2, 2015 Note: Excludes companies with EBITDA margins greater than 35%. (1) EBITDA based on GAAP EBITDA a djusted for non - recurring items; (2) Based on non GAAP Net I ncome; (3) Includes pension liabilities as debt; (4) Pro forma for Welch Allyn 6 III FINANCIAL ANALYSIS PROJECT APOLLO '15E Margins EV / Revenue EV / EBITDA (1) P/E (2) Gross EBITDA 2015E 2016E 2015E 2016E 2015E 2016E Equipment/Monitoring/IVD Getinge 6,000$ 8,808$ 3% 47% 20% 2.5x 2.5x 12.4x 11.3x 24.6x 19.9x Varian 7,853 7,398 4% 41% 20% 2.4x 2.3x 11.7x 10.8x 18.1x 17.5x Hill-Rom 3,524 5,779 2% 46% 17% 2.2x 2.2x 12.8x 11.6x 18.6x 17.0x bioMérieux 4,585 4,786 5% 51% 21% 2.3x 2.2x 10.7x 9.5x 26.0x 22.0x Elekta 2,979 3,312 7% 40% 16% 2.4x 2.3x 15.4x 12.7x n/m 22.5x OSI Systems 1,763 1,727 4% 35% 17% 1.8x 1.7x 10.3x 9.7x 23.0x 21.6x Draegerwerk 1,209 1,616 4% 45% 9% 0.6x 0.5x 6.1x 5.5x 13.6x 11.6x Meridian 800 754 2% 62% 32% 3.9x 3.8x 12.0x 12.0x 22.2x 21.6x Mean: 3,589 4,272 4% 46% 19% 2.2x 2.2x 11.4x 10.4x 20.9x 19.2x Median: 3,252 4,049 4% 45% 19% 2.3x 2.2x 11.8x 11.0x 22.2x 20.8x China Shandong Weigao 3,096$ 2,703$ 14% 60% 27% 2.8x 2.5x 10.4x 9.2x 16.5x 14.2x Biosensors 592 765 6% 70% 6% 2.0x 1.9x n/m n/m n/m n/m Microport 818 510 10% 73% 26% 1.6x 1.5x 6.4x 6.0x 19.2x 16.8x Mean: 1,502 1,326 10% 68% 20% 2.2x 2.0x 8.4x 7.6x 17.8x 15.5x Median: 818 765 10% 70% 26% 2.0x 1.9x 8.4x 7.6x 17.8x 15.5x All Companies 75th Percentile: 4,585$ 5,779$ 6% 61% 23% 2.5x 2.5x 12.5x 11.7x 23.8x 21.7x 25th Percentile: 818 765 3% 43% 16% 1.8x 1.7x 9.3x 8.4x 17.3x 16.2x Memo: Apollo (Offer Price @ US$30 per ADS) 3,586$ 2,891$ 6% 54% 15% 2.1x 2.0x 13.7x 14.3x 21.5x 21.8x Apollo (Offer Price @ US$28 per ADS) 3,347 2,652 6% 54% 15% 2.0x 1.9x 12.6x 13.1x 20.1x 20.3x Apollo (Offer Price @ US$27 per ADS) 3,228 2,533 6% 54% 15% 1.9x 1.8x 12.0x 12.5x 19.4x 19.6x Apollo (Current Price) 2,944 2,249 6% 54% 15% 1.7x 1.6x 10.7x 11.1x 17.7x 17.9x Company Equity Value (US$m) Enterprise Value (US$m) '15E-'17E Rev CAGR (3,4) (3) (3)
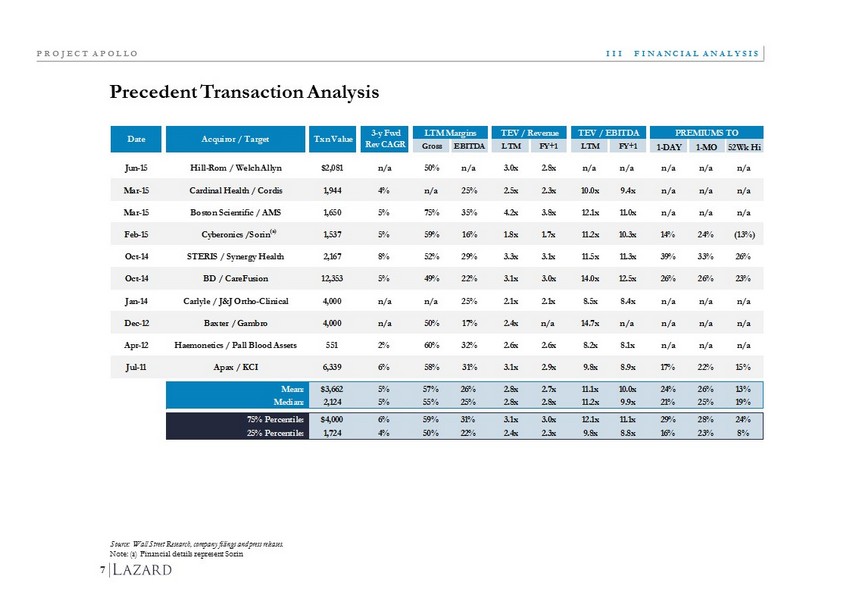
Precedent Transaction Analysis 7 III FINANCIAL ANALYSIS PROJECT APOLLO Source: Wall Street Research, company filings and press releases. Note: (a) Financial details represent Sorin LTM Margins TEV / Revenue TEV / EBITDA PREMIUMS TO Gross EBITDA LTM FY+1 LTM FY+1 1-DAY 1-MO 52Wk Hi Jun-15 Hill-Rom / Welch Allyn $2,081 n/a 50% n/a 3.0x 2.8x n/a n/a n/a n/a n/a Mar-15 Cardinal Health / Cordis 1,944 4% n/a 25% 2.5x 2.3x 10.0x 9.4x n/a n/a n/a Mar-15 Boston Scientific / AMS 1,650 5% 75% 35% 4.2x 3.8x 12.1x 11.0x n/a n/a n/a Feb-15 Cyberonics /Sorin 1,537 5% 59% 16% 1.8x 1.7x 11.2x 10.3x 14% 24% (13%) Oct-14 STERIS / Synergy Health 2,167 8% 52% 29% 3.3x 3.1x 11.5x 11.3x 39% 33% 26% Oct-14 BD / CareFusion 12,353 5% 49% 22% 3.1x 3.0x 14.0x 12.5x 26% 26% 23% Jan-14 Carlyle / J&J Ortho-Clinical 4,000 n/a n/a 25% 2.1x 2.1x 8.5x 8.4x n/a n/a n/a Dec-12 Baxter / Gambro 4,000 n/a 50% 17% 2.4x n/a 14.7x n/a n/a n/a n/a Apr-12 Haemonetics / Pall Blood Assets 551 2% 60% 32% 2.6x 2.6x 8.2x 8.1x n/a n/a n/a Jul-11 Apax / KCI 6,339 6% 58% 31% 3.1x 2.9x 9.8x 8.9x 17% 22% 15% Mean: $3,662 5% 57% 26% 2.8x 2.7x 11.1x 10.0x 24% 26% 13% Median: 2,124 5% 55% 25% 2.8x 2.8x 11.2x 9.9x 21% 25% 19% 75% Percentile: $4,000 6% 59% 31% 3.1x 3.0x 12.1x 11.1x 29% 28% 24% 25% Percentile: 1,724 4% 50% 22% 2.4x 2.3x 9.8x 8.8x 16% 23% 8% Date Acquiror / Target Txn Value 3-y Fwd Rev CAGR (a)
Appendices PROJECT APOLLO
A Additional Apollo Information PROJECT APOLLO
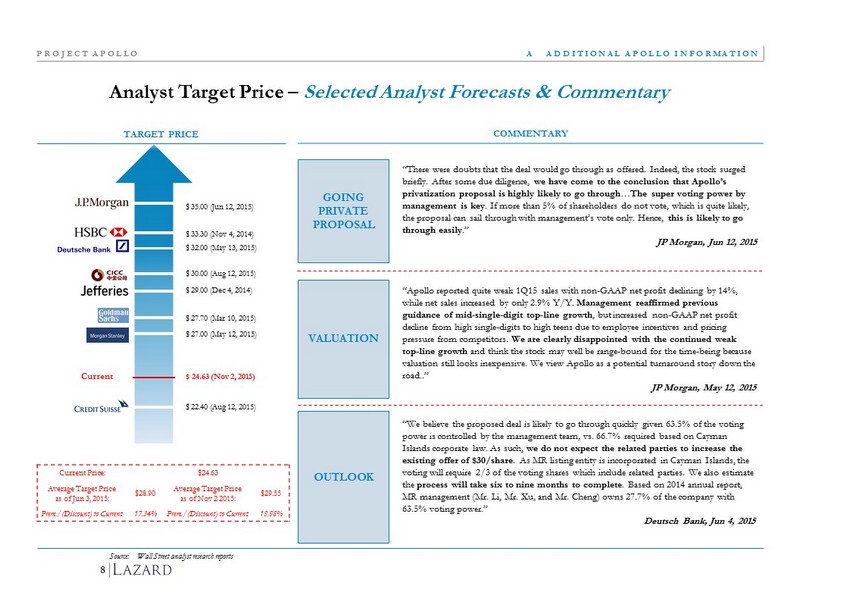
A ADDITIONAL APOLLO INFORMATION 8 Analyst Target Price – Selected Analyst Forecasts & Commentary Source: Wall Street analyst research reports COMMENTARY “There were doubts that the deal would go through as offered. Indeed, the stock surged briefly. After some due diligence, we have come to the conclusion that Apollo’s privatization proposal is highly likely to go through … The super voting power by management is key . If more than 5% of shareholders do not vote, which is quite likely, the proposal can sail through with management’s vote only. Hence, this is likely to go through easily . ” JP Morgan, Jun 12, 2015 “Apollo reported quite weak 1Q15 sales with non - GAAP net profit declining by 14%, while net sales increased by only 2.9% Y/Y. Management reaffirmed previous guidance of mid - single - digit top - line growth , but increased non - GAAP net profit decline from high single - digits to high teens due to employee incentives and pricing pressure from competitors. We are clearly disappointed with the continued weak top - line growth and think the stock may well be range - bound for the time - being because valuation still looks inexpensive. We view Apollo as a potential turnaround story down the road..” JP Morgan, May 12, 2015 “We believe the proposed deal is likely to go through quickly given 63.5% of the voting power is controlled by the management team, vs. 66.7% required based on Cayman Islands corporate law. As such, we do not expect the related parties to increase the existing offer of $30/share . As MR listing entity is incorporated in Cayman Islands, the voting will require 2/3 of the voting shares which include related parties. We also estimate the process will take six to nine months to complete . Based on 2014 annual report, MR management (Mr. Li, Mr. Xu, and Mr. Cheng) owns 27.7% of the company with 63.5% voting power.” Deutsch Bank, Jun 4, 2015 GOING PRIVATE PROPOSAL VALUATION OUTLOOK TARGET PRICE Current Price: $24.63 Average Target Price as of Jun 3, 2015: $28.90 Average Target Price as of Nov 2 2015: $29.55 Prem./(Discount) to Current: 17.34% Prem./(Discount) to Current: 19.98% PROJECT APOLLO $ 27.00 (May 12, 2015) $ 35.00 (Jun 12, 2015) $ 24.63 (Nov 2, 2015) $ 30.00 (Aug 12, 2015) $ 27.70 (Mar 10, 2015) $ 22.40 (Aug 12, 2015) $ 29.00 (Dec 4, 2014) $ 33.30 (Nov 4, 2014) Current $ 32.00 (May 13, 2015)
B Additional Valuation Materials PROJECT APOLLO
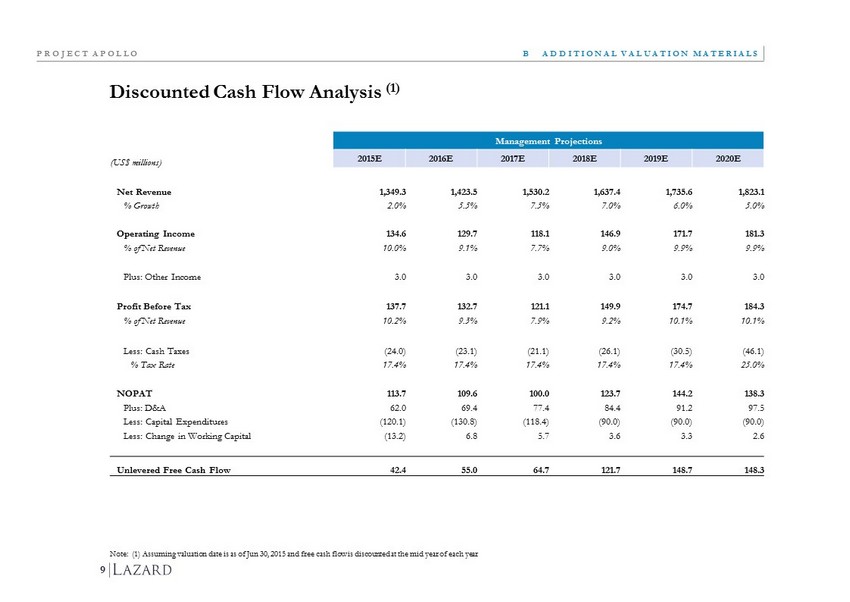
9 Discounted Cash Flow Analysis (1) B ADDITIONAL VALUATION MATERIALS PROJECT APOLLO Note: (1) Assuming valuation date is as of Jun 30, 2015 and free cash flow is discounted at the mid year of each year Management Projections (US$ millions) 2015E 2016E 2017E 2018E 2019E 2020E Net Revenue 1,349.3 1,423.5 1,530.2 1,637.4 1,735.6 1,823.1 % Growth 2.0% 5.5% 7.5% 7.0% 6.0% 5.0% Operating Income 134.6 129.7 118.1 146.9 171.7 181.3 % of Net Revenue 10.0% 9.1% 7.7% 9.0% 9.9% 9.9% Plus: Other Income 3.0 3.0 3.0 3.0 3.0 3.0 Profit Before Tax 137.7 132.7 121.1 149.9 174.7 184.3 % of Net Revenue 10.2% 9.3% 7.9% 9.2% 10.1% 10.1% Less: Cash Taxes (24.0) (23.1) (21.1) (26.1) (30.5) (46.1) % Tax Rate 17.4% 17.4% 17.4% 17.4% 17.4% 25.0% NOPAT 113.7 109.6 100.0 123.7 144.2 138.3 Plus: D&A 62.0 69.4 77.4 84.4 91.2 97.5 Less: Capital Expenditures (120.1) (130.8) (118.4) (90.0) (90.0) (90.0) Less: Change in Working Capital (13.2) 6.8 5.7 3.6 3.3 2.6 Unlevered Free Cash Flow 42.4 55.0 64.7 121.7 148.7 148.3
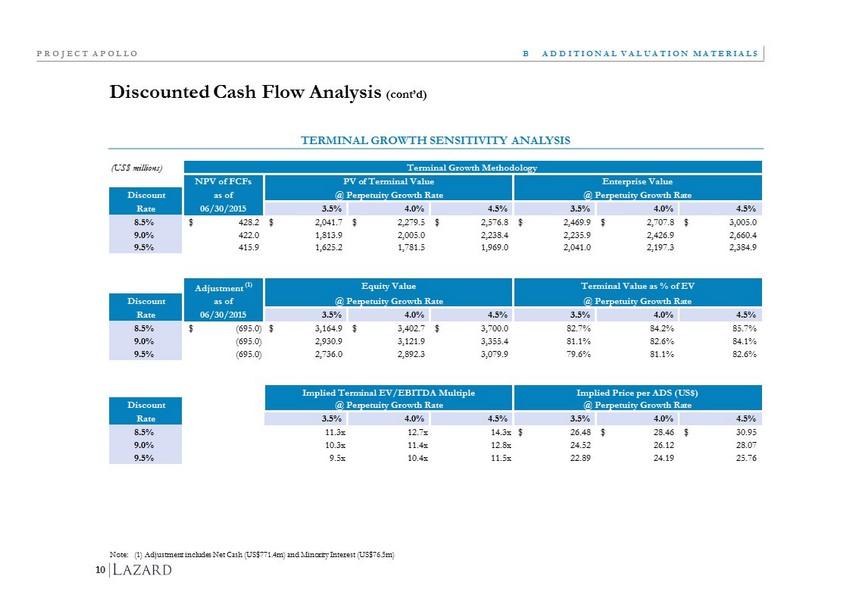
Discounted Cash Flow Analysis (cont’d) PROJECT APOLLO 10 B ADDITIONAL VALUATION MATERIALS TERMINAL GROWTH SENSITIVITY ANALYSIS Note: (1) Adjustment includes Net Cash ( US$771 .4m ) and Minority Interest ( US$76.5m ) (US$ millions) Terminal Growth Methodology NPV of FCFs PV of Terminal Value Enterprise Value Discount as of @ Perpetuity Growth Rate @ Perpetuity Growth Rate Rate 06/30/2015 3.5% 4.0% 4.5% 3.5% 4.0% 4.5% 8.5% 428.2$ 2,041.7$ 2,279.5$ 2,576.8$ 2,469.9$ 2,707.8$ 3,005.0$ 9.0% 422.0 1,813.9 2,005.0 2,238.4 2,235.9 2,426.9 2,660.4 9.5% 415.9 1,625.2 1,781.5 1,969.0 2,041.0 2,197.3 2,384.9 Adjustment (1) Equity Value Terminal Value as % of EV Discount as of @ Perpetuity Growth Rate @ Perpetuity Growth Rate Rate 06/30/2015 3.5% 4.0% 4.5% 3.5% 4.0% 4.5% 8.5% (695.0)$ 3,164.9$ 3,402.7$ 3,700.0$ 82.7% 84.2% 85.7% 9.0% (695.0) 2,930.9 3,121.9 3,355.4 81.1% 82.6% 84.1% 9.5% (695.0) 2,736.0 2,892.3 3,079.9 79.6% 81.1% 82.6% Implied Terminal EV/EBITDA Multiple Implied Price per ADS (US$) Discount @ Perpetuity Growth Rate @ Perpetuity Growth Rate Rate 3.5% 4.0% 4.5% 3.5% 4.0% 4.5% 8.5% 11.3x 12.7x 14.3x 26.48$ 28.46$ 30.95$ 9.0% 10.3x 11.4x 12.8x 24.52 26.12 28.07 9.5% 9.5x 10.4x 11.5x 22.89 24.19 25.76
C WACC Analysis PROJECT APOLLO
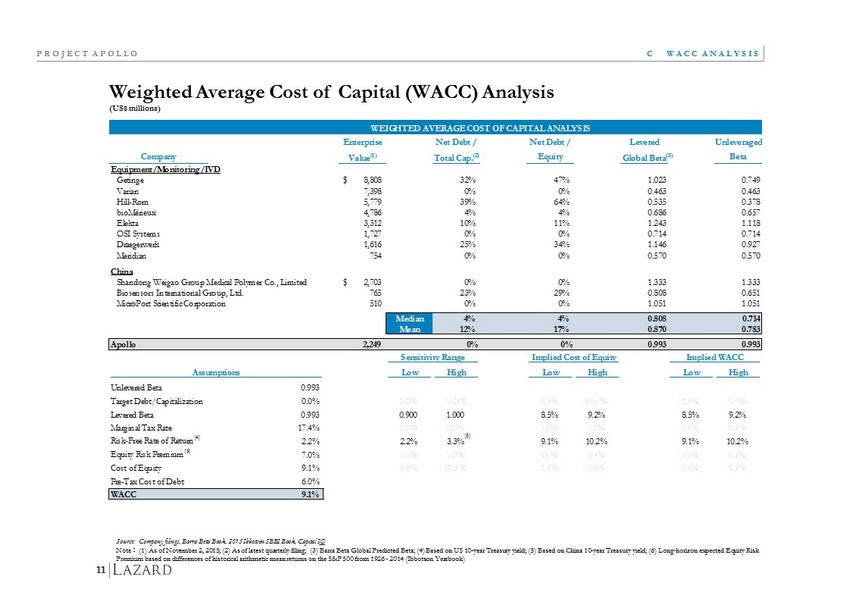
WEIGHTED AVERAGE COST OF CAPITAL ANALYSIS Enterprise Net Debt / Net Debt / Levered Unleveraged Company Value (1) Total Cap. (2) Equity Global Beta (3) Beta Equipment/Monitoring/IVD Getinge 8,808$ 32% 47% 1.023 0.749 Varian 7,398 0% 0% 0.463 0.463 Hill-Rom 5,779 39% 64% 0.535 0.378 bioMérieux 4,786 4% 4% 0.686 0.657 Elekta 3,312 10% 11% 1.243 1.118 OSI Systems 1,727 0% 0% 0.714 0.714 Draegerwerk 1,616 25% 34% 1.146 0.927 Meridian 754 0% 0% 0.570 0.570 China Shandong Weigao Group Medical Polymer Co., Limited 2,703$ 0% 0% 1.333 1.333 Biosensors International Group, Ltd. 765 23% 29% 0.808 0.651 MicroPort Scientific Corporation 510 0% 0% 1.051 1.051 Median 4% 4% 0.808 0.714 Mean 12% 17% 0.870 0.783 Apollo 2,249 0% 0% 0.993 0.993 Sensitivity Range Implied Cost of Equity Implied WACC Assumptions Low High Low High Low High Unlevered Beta 0.993 Target Debt/Capitalization 0.0% 0.0% 20.0% 9.1% 10.6% 9.1% 9.4% Levered Beta 0.993 0.900 1.000 8.5% 9.2% 8.5% 9.2% Marginal Tax Rate 17.4% 0.0% 0.0% 7.0% 7.0% 9.1% 9.1% Risk-Free Rate of Return (4) 2.2% 2.2% 3.3% 9.1% 10.2% 9.1% 10.2% Equity Risk Premium (6) 7.0% 5.5% 7.0% 7.6% 9.1% 7.6% 9.1% Cost of Equity 9.1% 8.1% 10.1% 9.1% 9.1% 9.1% 9.1% Pre-Tax Cost of Debt 6.0% WACC 9.1% 11 Weighted Average Cost of Capital (WACC) Analysis (US$ millions ) C WACC ANALYSIS PROJECT APOLLO Source: Company filings, Barra Beta Book, 2015 Ibbotson SBBI Book, Capital IQ N ote (1 ) As of November 2, 2015; ( 2) As of latest quarterly filing; ( 3 ) Barra Beta Global Predicted Beta ; ( 4 ) Based on US 10 - year Treasury yield; (5) Based on China 10 - year Treasury yield; (6 ) Long - horizon expected Equity Risk Premium based on differences of historical arithmetic mean returns on the S&P 500 from 1926 - 2014 (Ibbotson Yearbook ) (5)
D Premium Paid Analysis PROJECT APOLLO
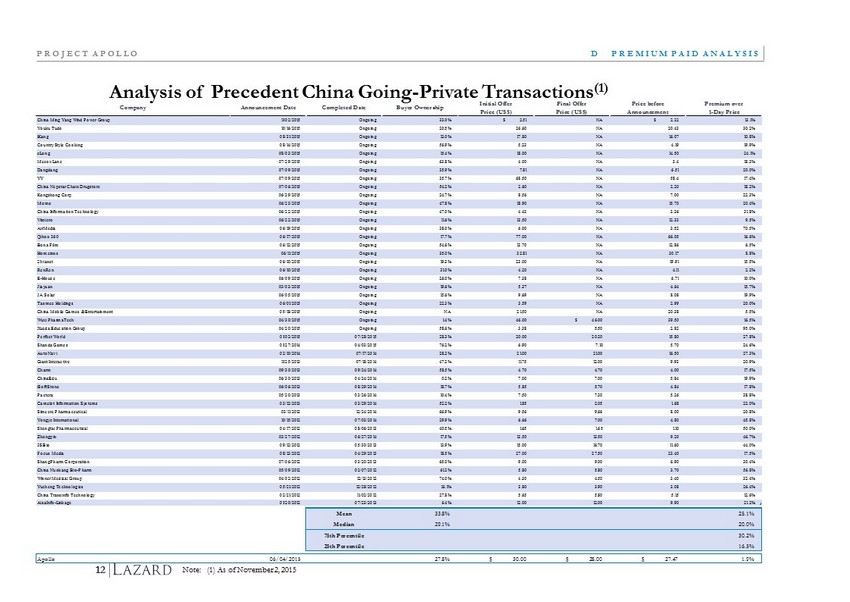
12 D PREMIUM PAID ANALYSIS PROJECT APOLLO Note: (1) As of November 2, 2015 Analysis of Precedent China Going - Private Transactions (1) Premium over 1-Day Price China Ming Yang Wind Power Group 11/02/2015 Ongoing 33.0% $ 2.51 NA $ 2.22 13.1% Youku Tudo 10/16/2015 Ongoing 20.5% 26.60 NA 20.43 30.2% iKang 08/31/2015 Ongoing 13.0% 17.80 NA 16.07 10.8% Country Style Cooking 08/14/2015 Ongoing 56.9% 5.23 NA 4.19 19.9% eLong 08/03/2015 Ongoing 15.4% 18.00 NA 14.50 24.1% Mecox Lane 07/29/2015 Ongoing 63.8% 4.00 NA 3.4 18.3% Dangdang 07/09/2015 Ongoing 35.9% 7.81 NA 6.51 20.0% YY 07/09/2015 Ongoing 35.7% 68.50 NA 58.4 17.4% China Nepstar Chain Drugstore 07/06/2015 Ongoing 54.2% 2.60 NA 2.20 18.2% Kongzhong Corp 06/29/2015 Ongoing 24.7% 8.56 NA 7.00 22.3% Momo 06/23/2015 Ongoing 47.8% 18.90 NA 15.70 20.4% China Information Technology 06/22/2015 Ongoing 47.0% 4.43 NA 3.36 31.8% Vimicro 06/22/2015 Ongoing 11.6% 13.50 NA 12.33 9.5% AirMedia 06/19/2015 Ongoing 38.0% 6.00 NA 3.52 70.5% Qihoo 360 06/17/2015 Ongoing 17.7% 77.00 NA 66.05 16.6% Bona Film 06/12/2015 Ongoing 54.6% 13.70 NA 12.86 6.5% Homeinns 06/11/2015 Ongoing 35.0% 32.81 NA 30.17 8.8% 21vianet 06/10/2015 Ongoing 19.3% 23.00 NA 19.91 15.5% RenRen 06/10/2015 Ongoing 31.0% 4.20 NA 4.11 2.2% E-House 06/09/2015 Ongoing 26.0% 7.38 NA 6.71 10.0% Jiayuan 03/03/2015 Ongoing 19.6% 5.37 NA 4.64 15.7% JA Solar 06/05/2015 Ongoing 15.6% 9.69 NA 8.08 19.9% Taomee Holdings 06/01/2015 Ongoing 22.3% 3.59 NA 2.99 20.0% China Mobile Games & Entertainment 05/18/2015 Ongoing NA 21.50 NA 20.38 5.5% Wuxi PharmaTech 04/30/2015 Ongoing 1.4% 46.00 $ 46.00 39.50 16.5% Xueda Education Group 04/20/2015 Ongoing 58.6% 3.38 5.50 2.82 95.0% Perfect World 01/02/2015 07/28/2015 28.3% 20.00 20.20 15.80 27.8% Shanda Games 01/27/2014 04/03/2015 76.2% 6.90 7.10 5.70 24.6% AutoNavi 02/10/2014 07/17/2014 28.2% 21.00 21.00 16.50 27.3% Giant Interactive 11/25/2013 07/18/2014 47.2% 11.75 12.00 9.93 20.9% Charm 09/30/2013 09/24/2014 58.5% 4.70 4.70 4.00 17.5% ChinaEdu 06/30/2013 04/24/2014 0.2% 7.00 7.00 5.84 19.9% iSoftStone 06/06/2013 08/29/2014 18.7% 5.85 5.70 4.84 17.8% Pactera 05/20/2013 03/26/2014 10.4% 7.50 7.30 5.26 38.8% Camelot Information Systems 03/12/2013 03/29/2014 52.2% 1.85 2.05 1.68 22.0% Simcere Pharmaceutical 03/11/2013 12/24/2014 66.9% 9.56 9.66 8.00 20.8% Yongye International 10/15/2012 07/03/2014 29.9% 6.66 7.00 4.80 45.8% Shengtai Pharmaceutical 04/17/2012 08/06/2013 40.5% 1.65 1.65 1.10 50.0% Zhongpin 03/27/2012 06/27/2014 17.5% 13.50 13.50 9.20 46.7% 3SBio 09/12/2012 05/30/2013 13.9% 15.00 16.70 11.60 44.0% Focus Media 08/13/2012 04/29/2013 18.5% 27.00 27.50 23.40 17.5% ShangPharm Corporation 07/06/2012 03/20/2013 65.0% 9.00 9.00 6.90 30.4% China Nuokang Bio-Pharm 05/09/2012 02/07/2012 61.2% 5.80 5.80 3.70 56.8% Winner Medical Group 04/02/2012 12/13/2012 74.0% 4.30 4.50 3.40 32.4% Yucheng Technologies 05/21/2012 12/28/2012 16.1% 3.80 3.90 3.08 26.4% China Transinfo Technology 02/21/2012 11/02/2012 27.8% 5.65 5.80 5.15 12.6% AisaInfo-Linkage 01/20/2012 07/23/2013 6.4% 12.00 12.00 9.90 21.2% Mean 33.8% 25.1% Median 29.1% 20.0% 75th Percentile 30.2% 25th Percentile 16.5% Apollo 06/04/2015 27.8% $ 30.00 $ 28.00 $ 27.47 1.9% Company Announcement Date Completed Date Buyer Ownership Initial Offer Price (US$) Final Offer Price (US$) Price before Announcement