 FIRST CAPITAL BANCORPANNUAL SHAREHOLDERS
MEETING MAY 20, 2015  FORWARD LOOKING STATEMENTS Readers are cautioned that this presentation contains forward-looking statements made pursuant to safe harbor provisions of the Private Securities Litigation Reform Act of 1995. Such forward-looking statements are based on management’s current knowledge, assumptions, and analyses, which it believes are appropriate in the circumstances regarding future events, and may address issues that involve significant risks including, but not limited to: changes in interest rates; changes in accounting principles, policies, or guidelines; significant changes in general economic, competitive, and business conditions; significant changes in or additions to laws and regulatory requirements; and significant changes in securities markets. Additionally, such aforementioned uncertainties, assumptions, and estimates may cause actual results to differ materially from the anticipated results or other expectations expressed in the forward-looking statements.
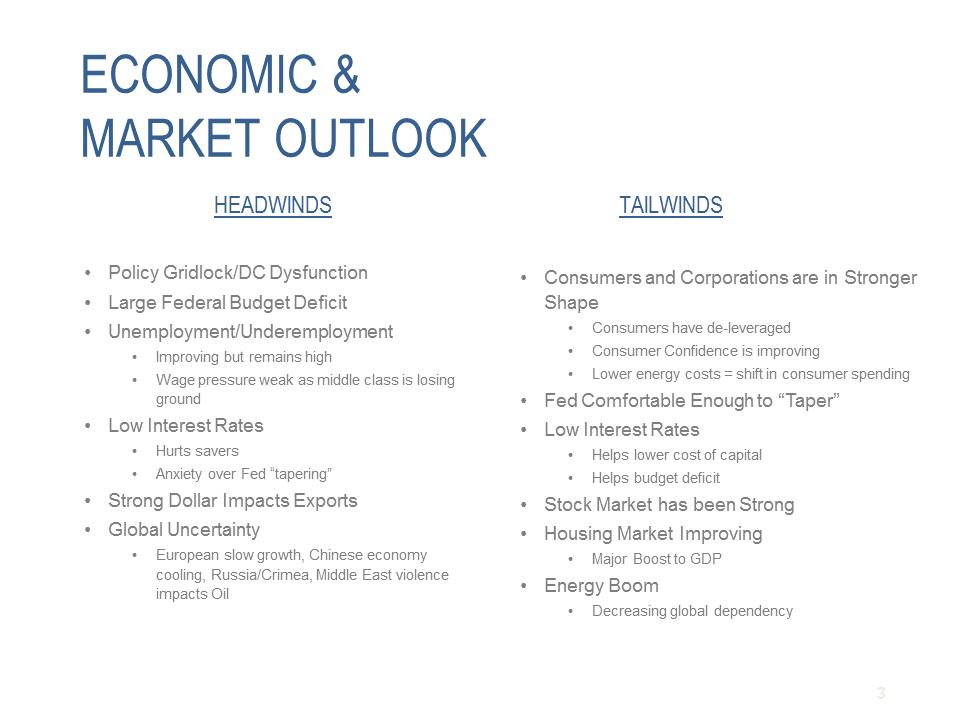 HEADWINDS TAILWINDS 3 •Consumers and Corporations are in Stronger Shape •Consumers have de-leveraged •Consumer Confidence is improving •Lower energy costs = shift in consumer spending •Fed Comfortable Enough to “Taper” •Low Interest Rates •Helps lower cost of capital •Helps budget deficit •Stock Market has been Strong •Housing Market Improving •Major Boost to GDP •Energy Boom •Decreasing global dependency ECONOMIC & MARKET OUTLOOK •Policy Gridlock/DC Dysfunction •Large Federal Budget Deficit •Unemployment/Underemployment •Improving but remains high •Wage pressure weak as middle class is losing ground •Low Interest Rates •Hurts savers •Anxiety over Fed “tapering” •Strong Dollar Impacts Exports •Global Uncertainty •European slow growth, Chinese economy cooling, Russia/Crimea, Middle East violence impacts Oil
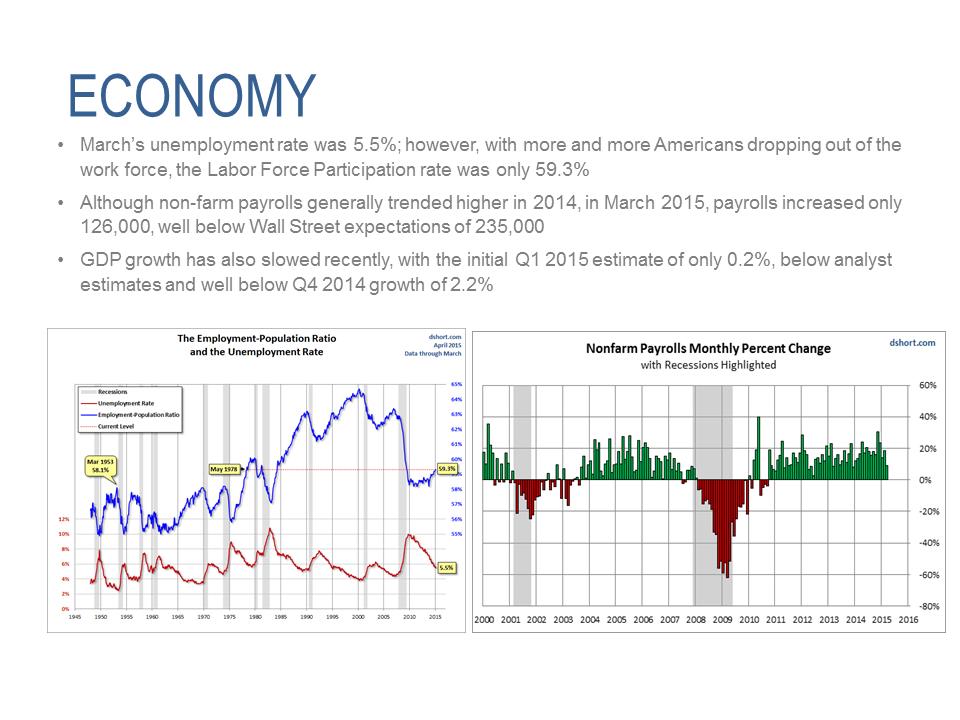 ECONOMY •March’s unemployment rate was 5.5%; however, with more and more Americans dropping out of the work force, the Labor Force Participation rate was only 59.3% •Although non-farm payrolls generally trended higher in 2014, in March 2015, payrolls increased only 126,000, well below Wall Street expectations of 235,000 •GDP growth has also slowed recently, with the initial Q1 2015 estimate of only 0.2%, below analyst estimates and well below Q4 2014 growth of 2.2%
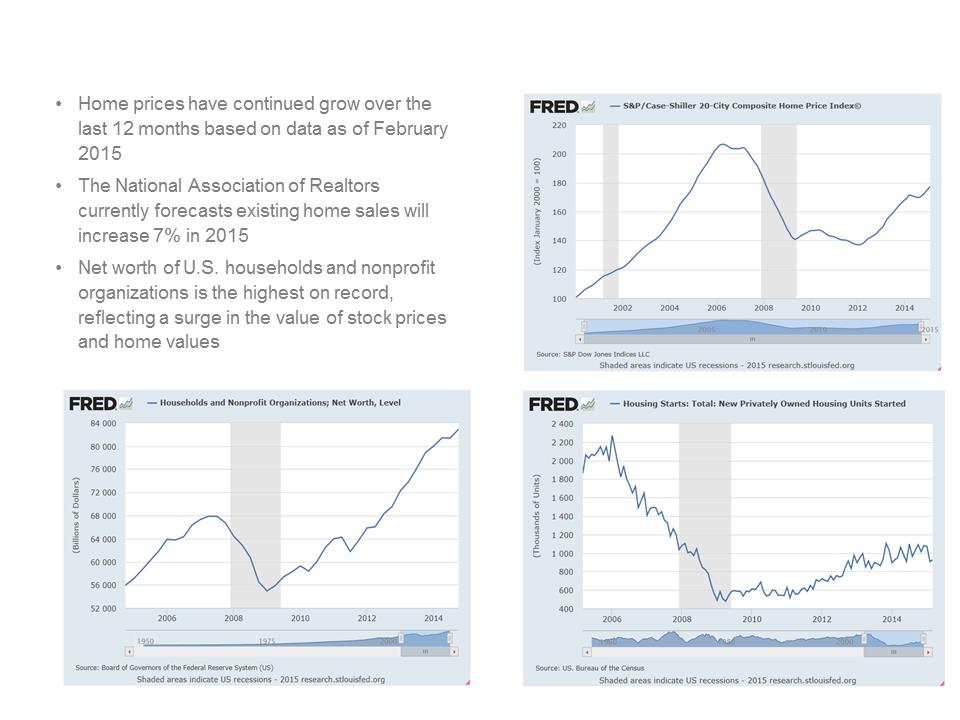 •Home prices have continued grow over the last 12 months based on data as of February 2015 •The National Association of Realtors currently forecasts existing home sales will increase 7% in 2015 •Net worth of U.S. households and nonprofit organizations is the highest on record, reflecting a surge in the value of stock prices and home values
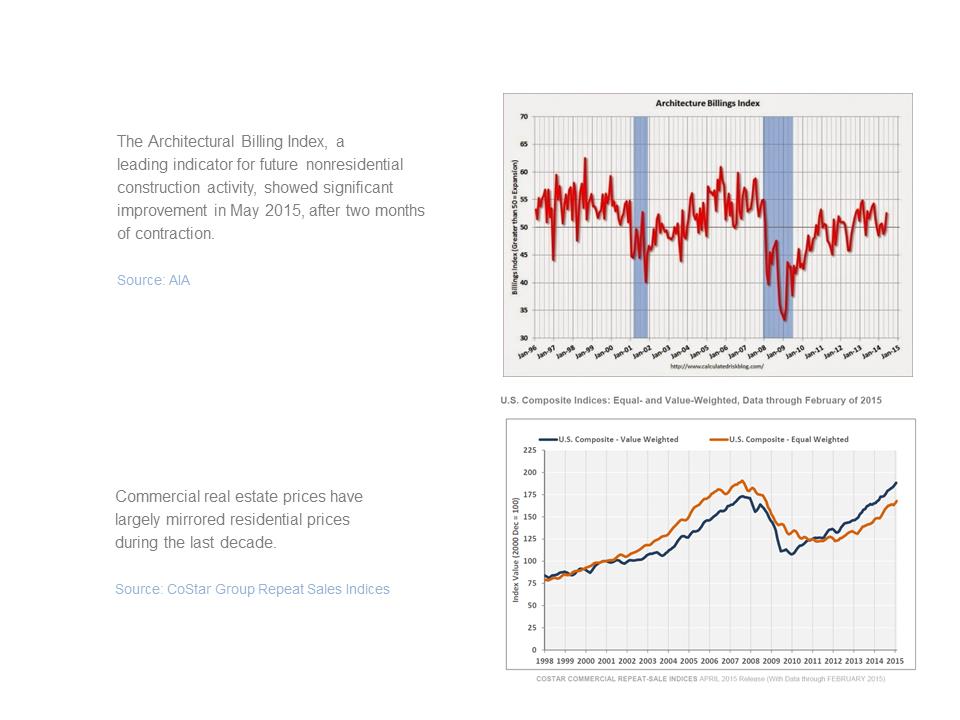 The Architectural Billing Index, a leading indicator for future nonresidential construction activity, showed significant improvement in May 2015, after two months of contraction. Source: AIA Commercial real estate prices have largely mirrored residential prices during the last decade. Source: CoStar Group Repeat Sales Indices
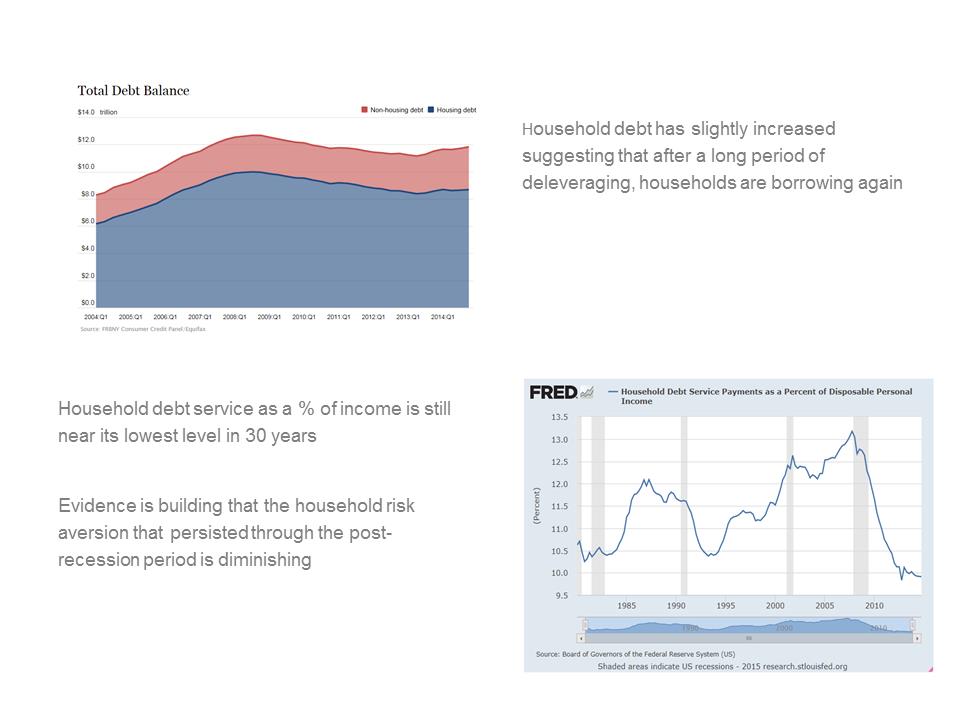 Household debt has slightly increased suggesting that after a long period of deleveraging, households are borrowing again Household debt service as a % of income is still near its lowest level in 30 years Evidence is building that the household risk aversion that persisted through the post-recession period is diminishing
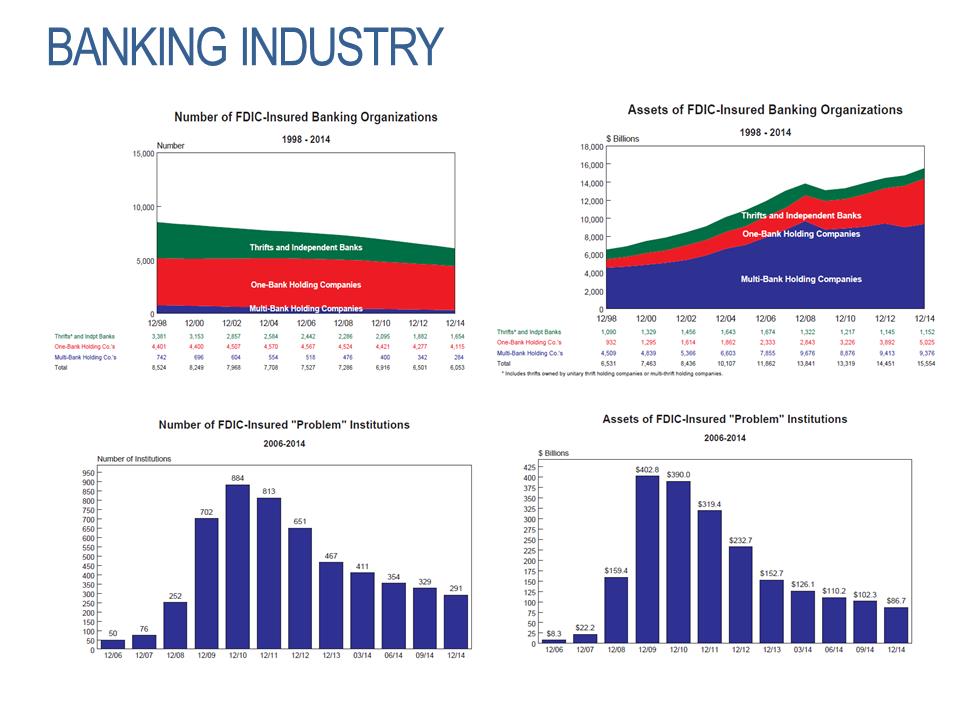
BANKING INDUSTRY 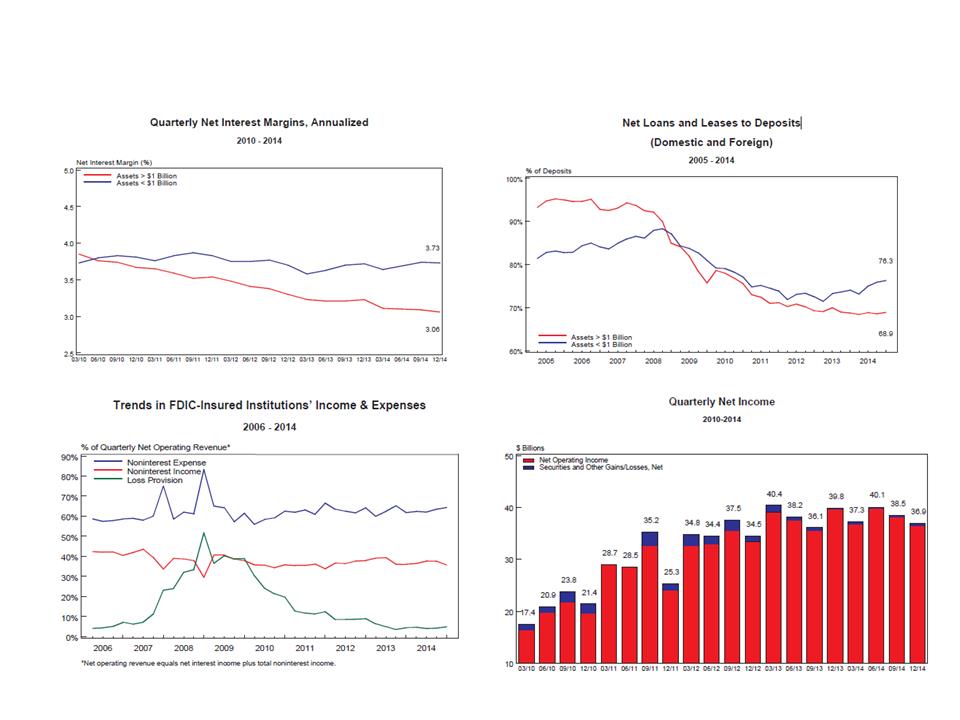
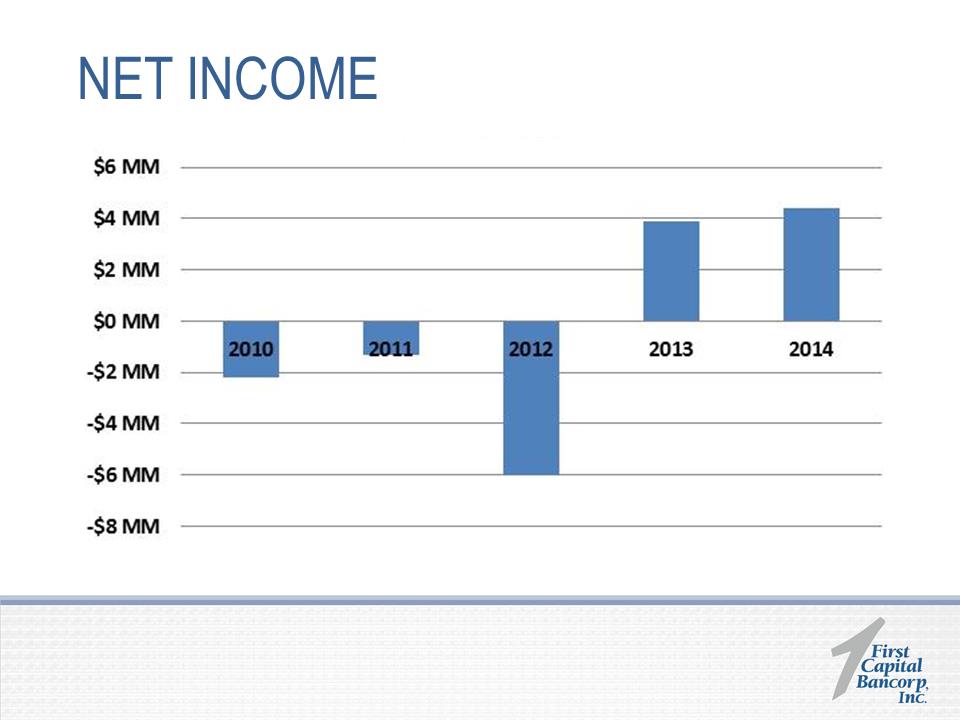
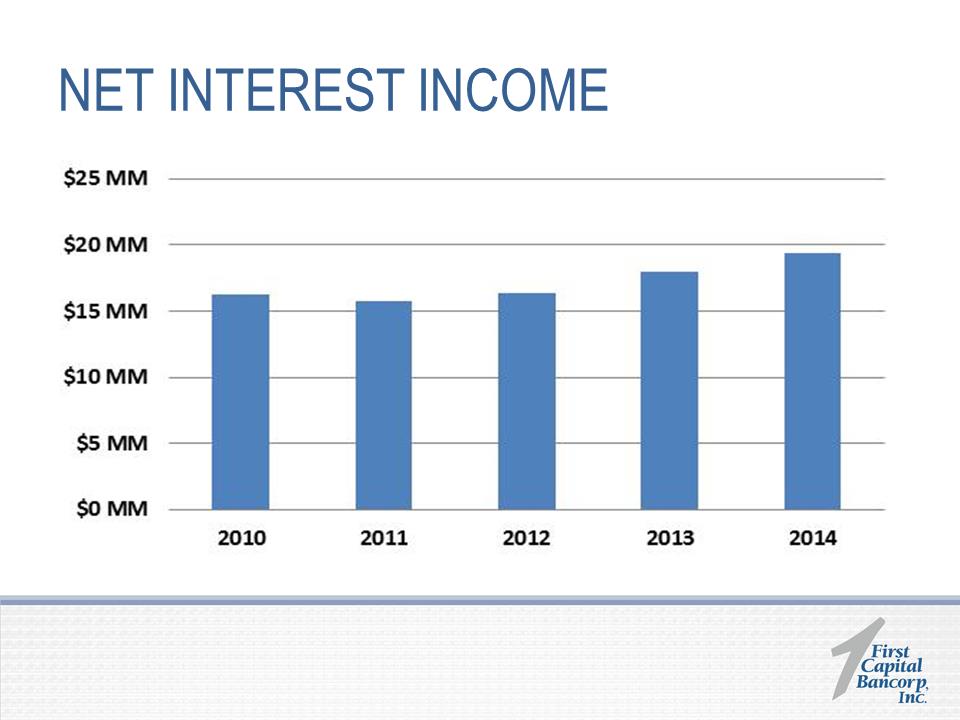
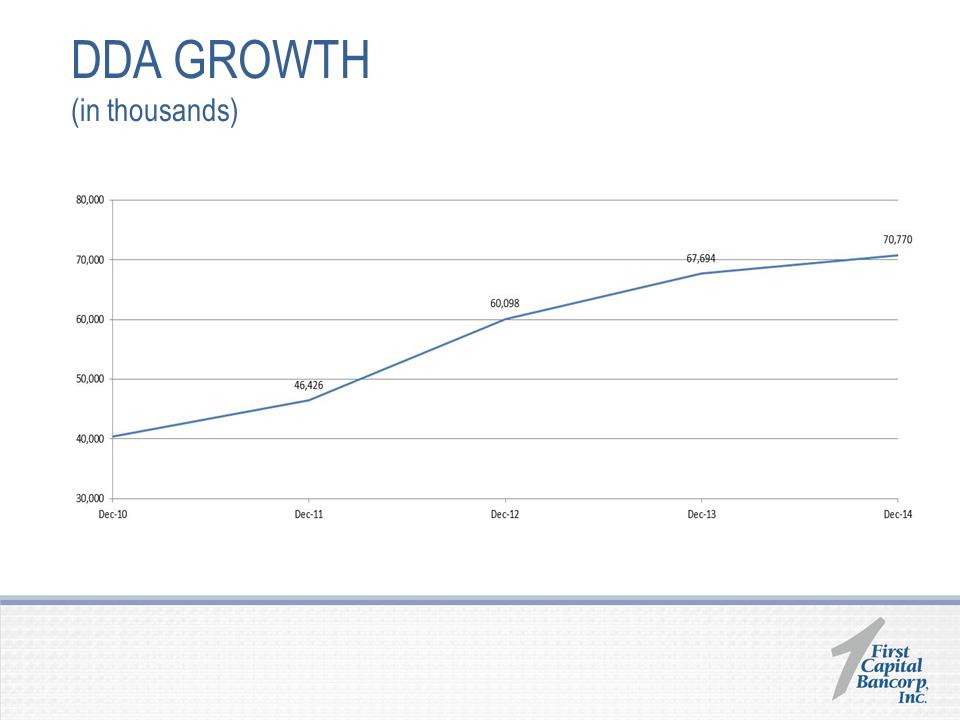
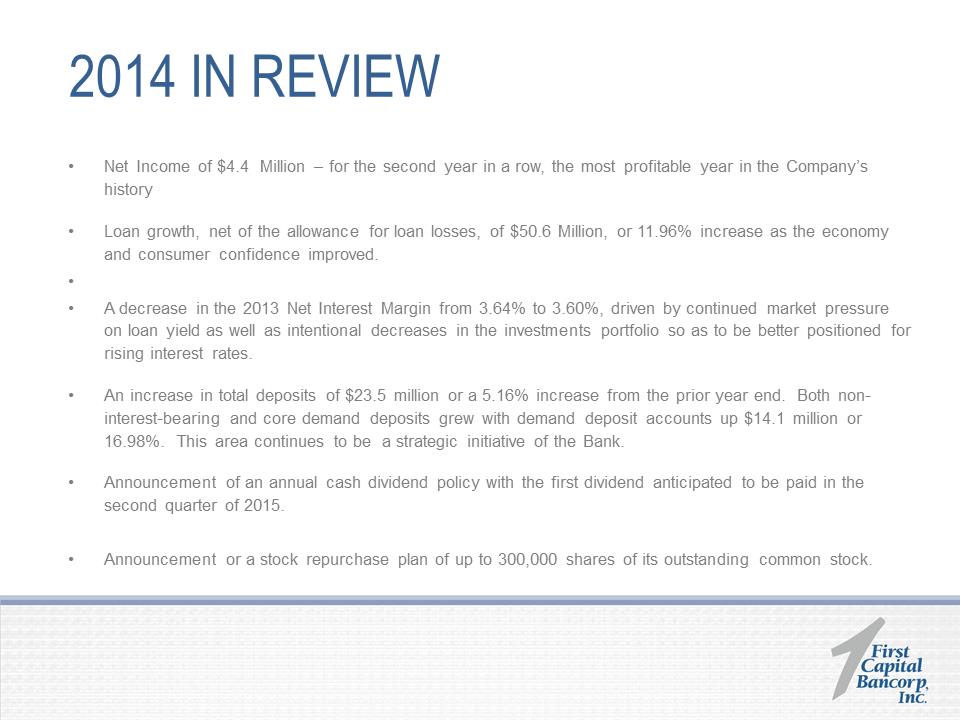 2014 IN REVIEW •Net Income of $4.4 Million –for the second year in a row, the most profitable year in the Company’s history •Loan growth, net of the allowance for loan losses, of $50.6 Million, or 11.96% increase as the economy and consumer confidence improved. • •A decrease in the 2013 Net Interest Margin from 3.64%to 3.60%, driven by continued market pressure on loan yield as well as intentional decreases in the investments portfolio so as to be better positioned for rising interest rates. •An increase in total deposits of $23.5 million or a 5.16% increase from the prior year end. Both non-interest-bearing and core demand deposits grew with demand deposit accounts up $14.1 million or 16.98%. This area continues to be a strategic initiative of the Bank. •Announcement of an annual cash dividend policy with the first dividend anticipated to be paid in the second quarter of 2015. •Announcement or a stock repurchase plan of up to 300,000 shares of its outstanding common stock.
 EARNINGS Another transformational year for the Company: 2012:Rights Offering and Capital Raise 2012/13: Implementation of the Company’s Asset Resolution Plan 2014: Ability to Grow and Expand Our Business Net income available to common shareholders was $4.4 million, or $0.30 per diluted share for the year ended December 31, 2014. This represents an increase of $835 thousand, or 23.66% over the prior year end.
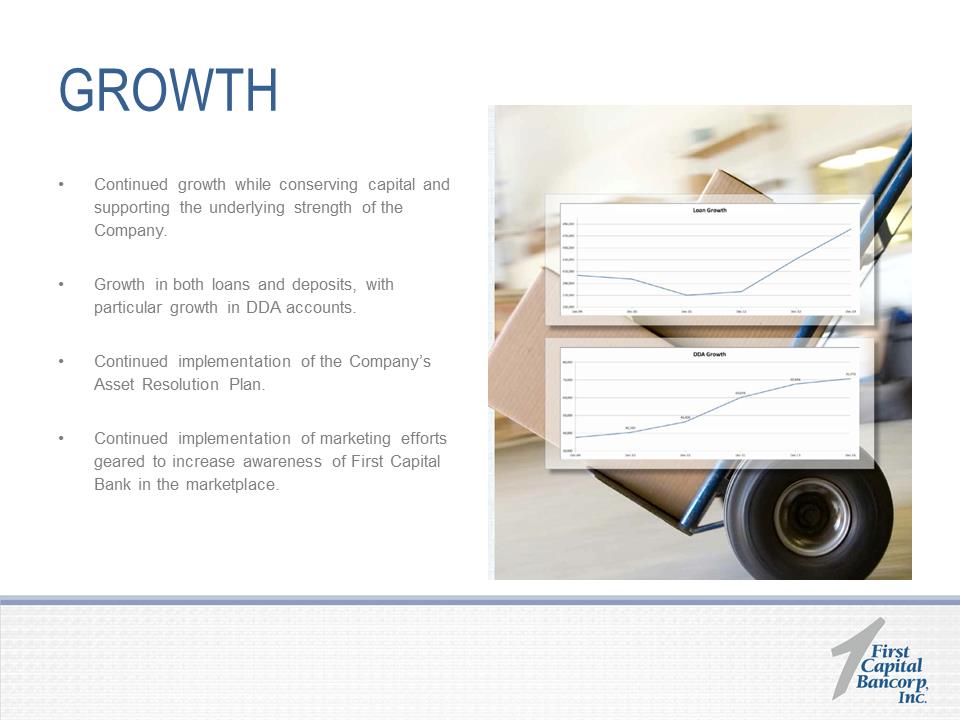 GROWTH •Continued growth while conserving capital and supporting the underlying strength of the Company. •Growth in both loans and deposits, with particular growth in DDA accounts. •Continued implementation of the Company’s Asset Resolution Plan. •Continued implementation of marketing efforts geared to increase awareness of First Capital Bank in the marketplace.
 STRATEGIC PRIORITIES AREAS OF CONTINUED FOCUS 1.Balance Sheet Management 2.Capital Strategy/Management 3.Management of Loan and Deposit Mix 4.Increasing Deposits to Fund Continued Loan Growth 5.Improving Efficiency Ratio 6.Maintaining Positioning with Increased “Community” Bank Competition
 NET INCOME
NET INTEREST INCOME 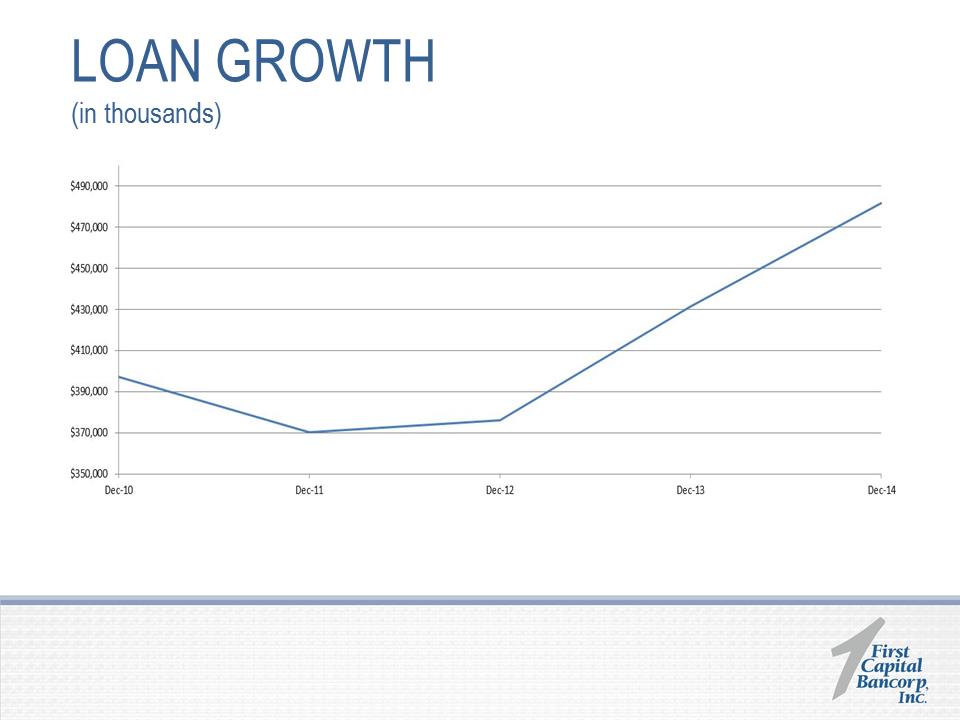 LOAN GROWTH (in thousands)
 DDA GROWTH (in thousands)
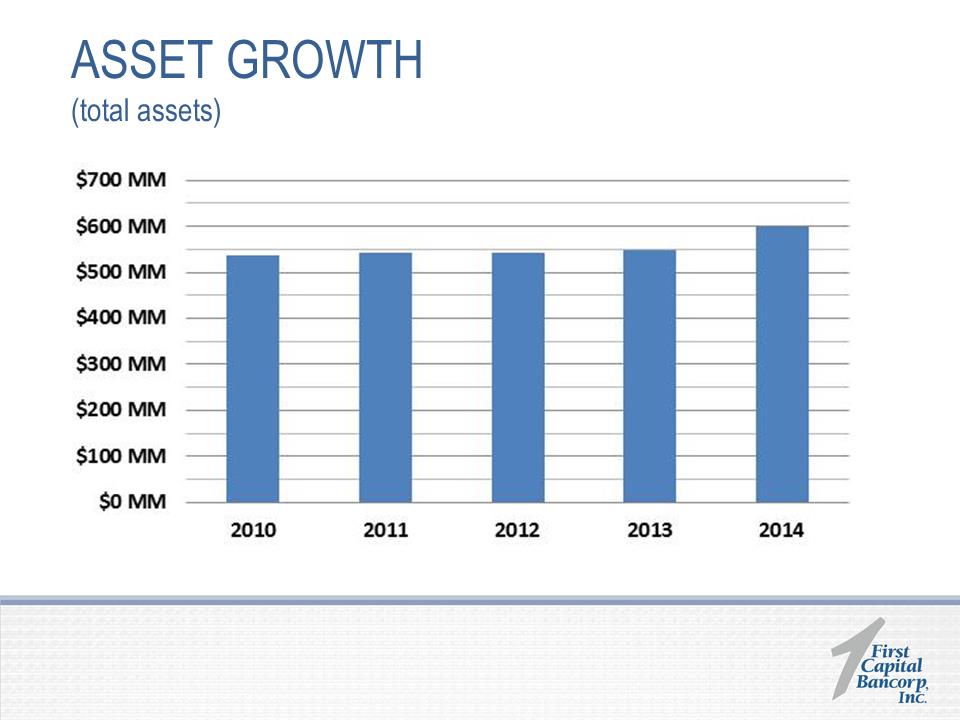 ASSET GROWTH (total assets)
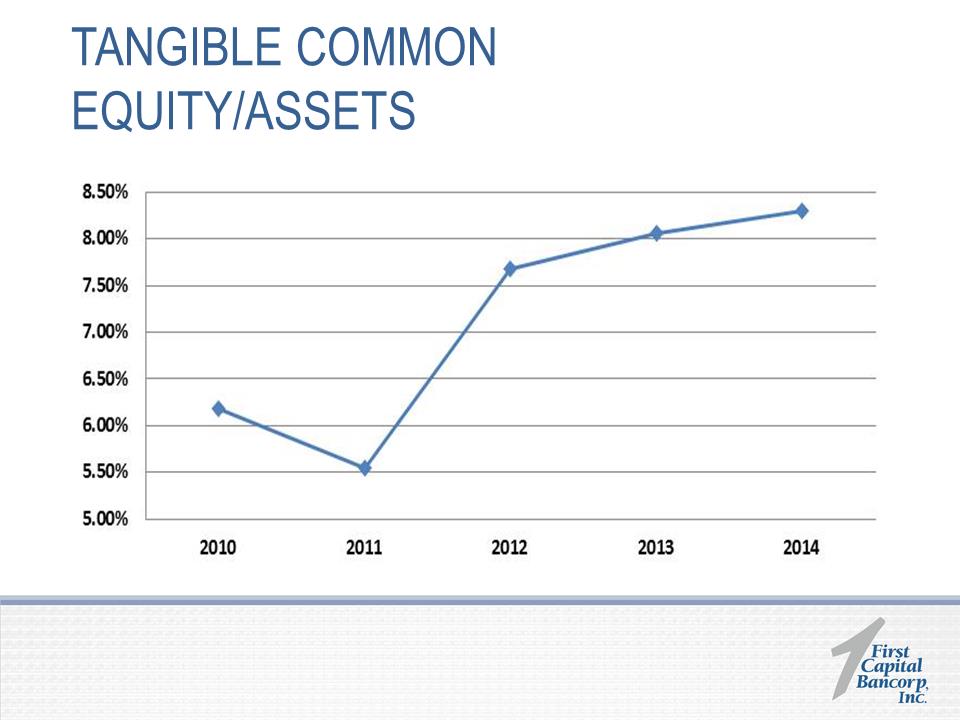 TANGIBLE COMMON EQUITY/ASSETS
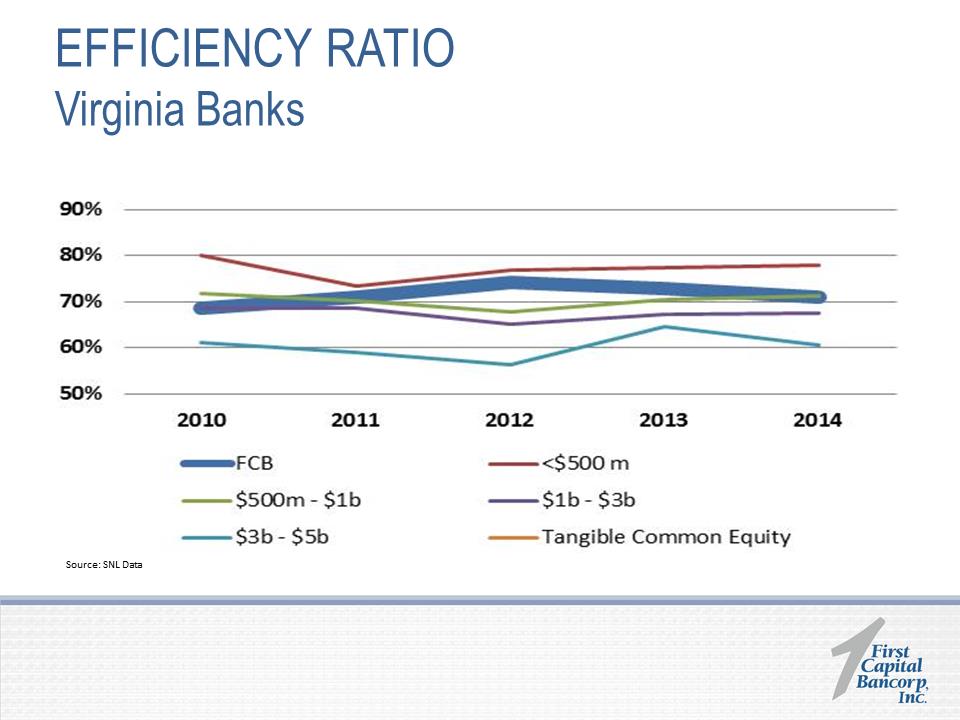 EFFICIENCY RATIO Virginia Banks Source: SNL
Data 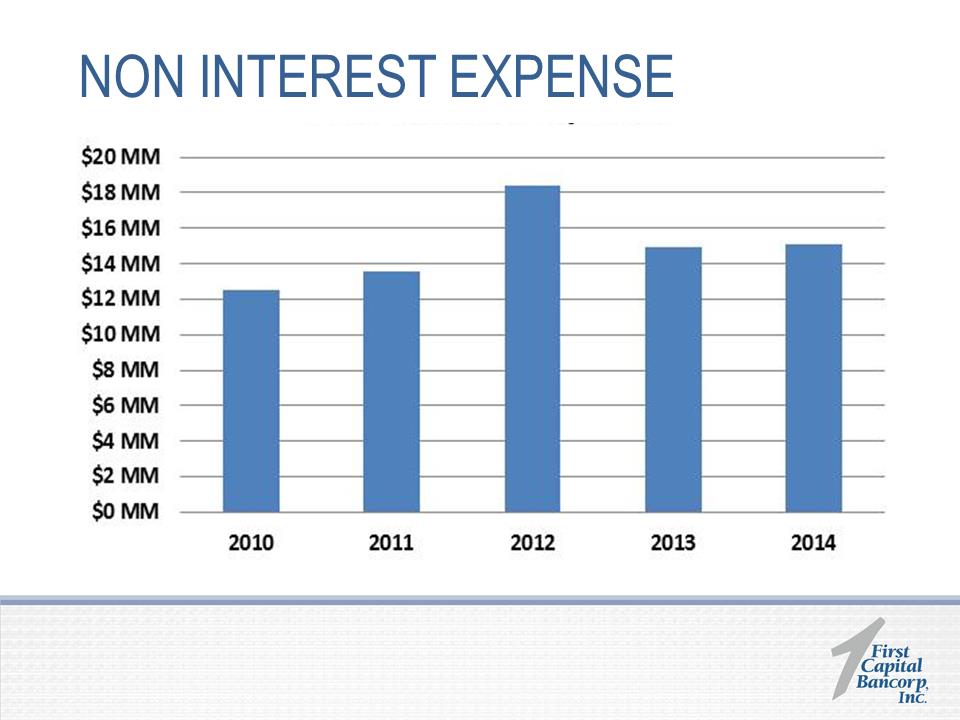 NON INTEREST EXPENSE
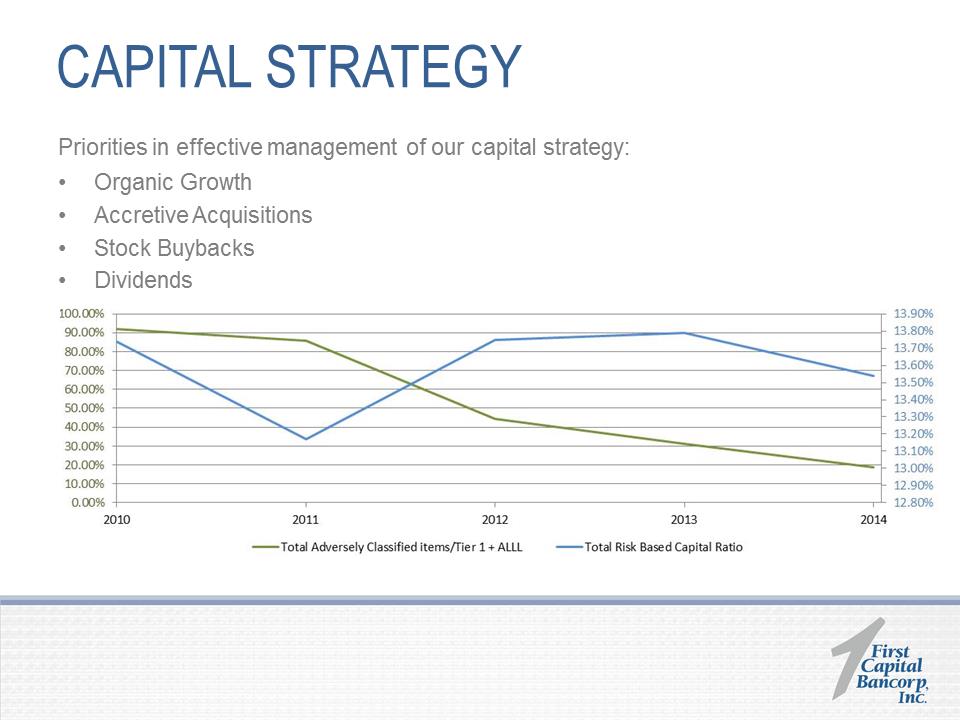 CAPITAL STRATEGY Priorities in effective
management of our capital strategy: •Organic Growth •Accretive Acquisitions •Stock Buybacks •Dividends 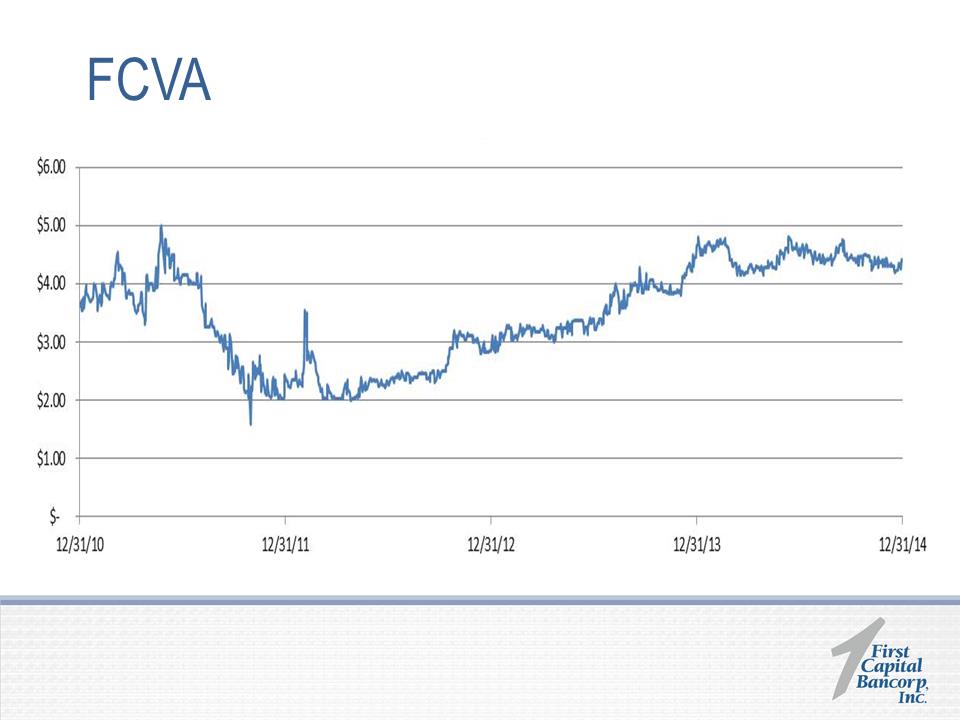 FCVA
FCVA
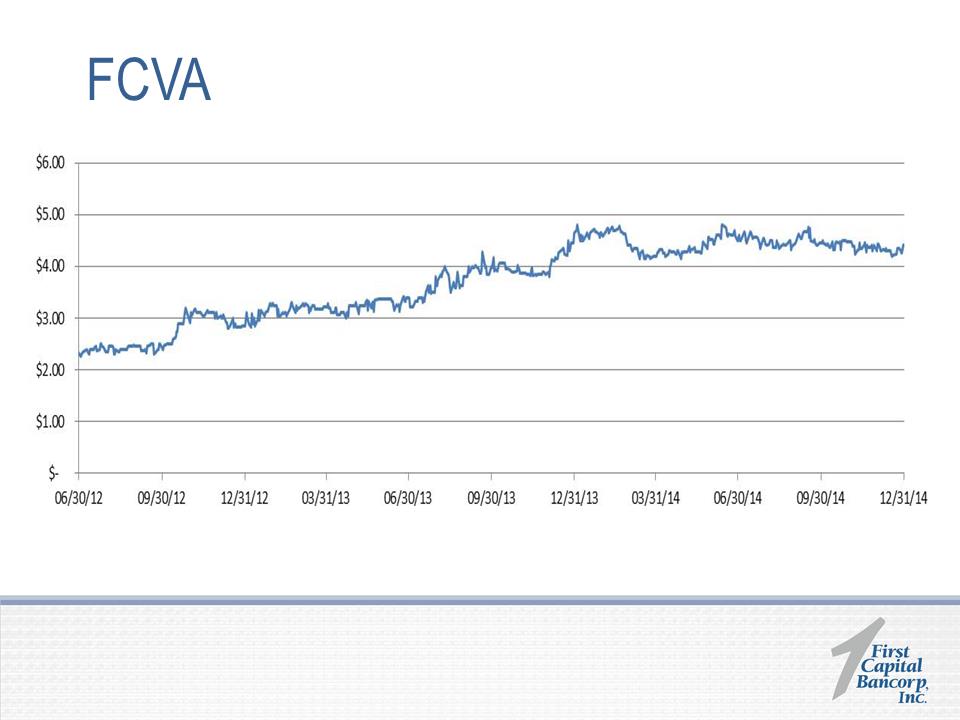 FCVA
FCVA
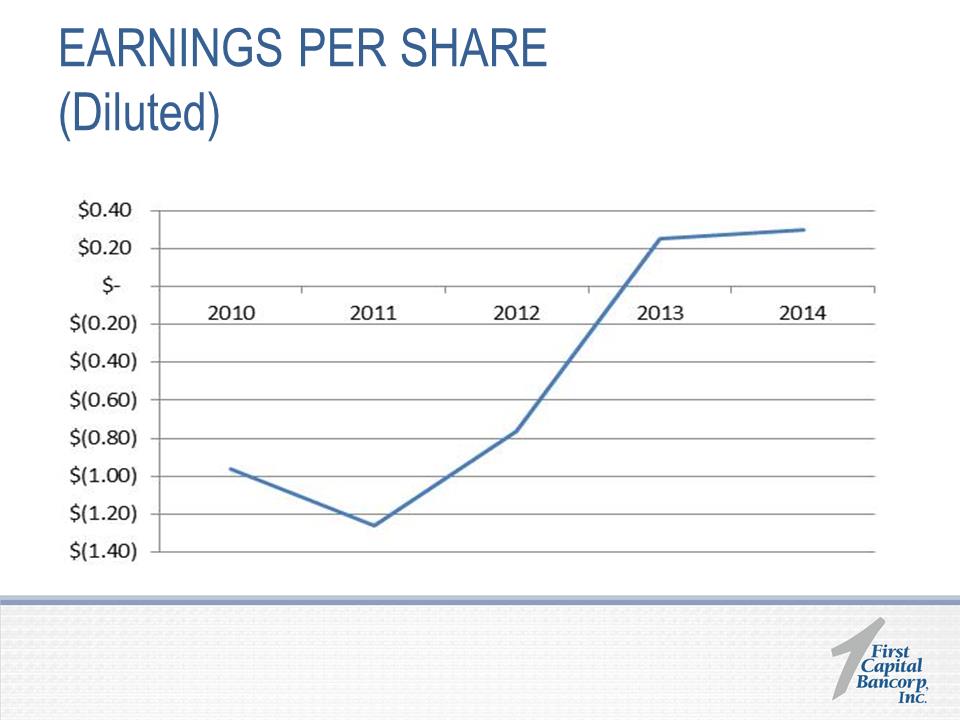 EARNINGS PER SHARE (Diluted)
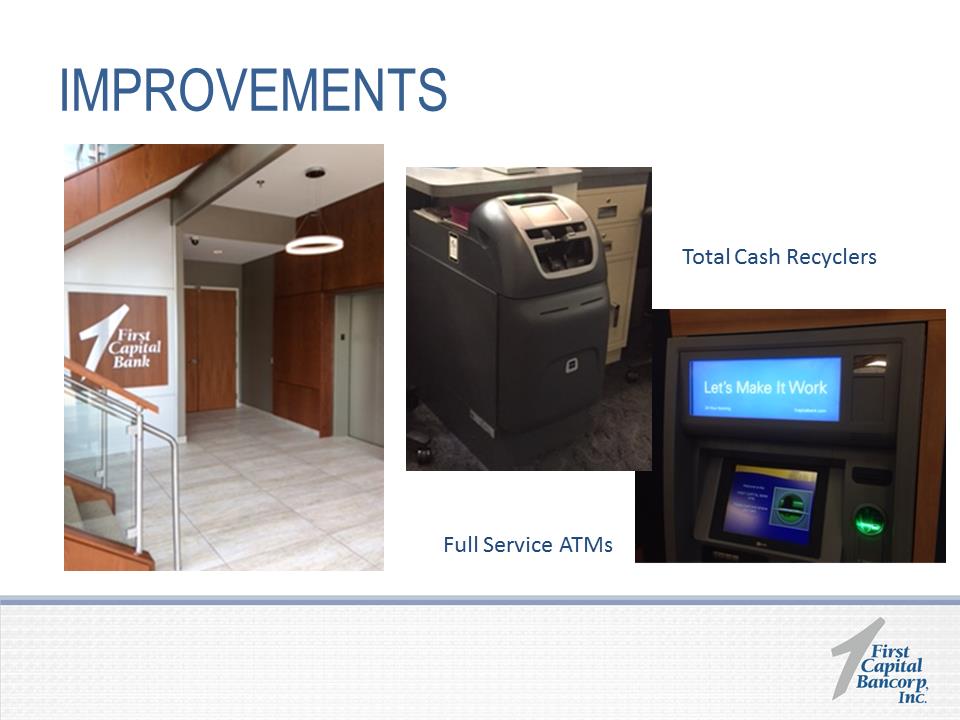 IMPROVEMENTS Full Service ATMs Total Cash
Recyclers 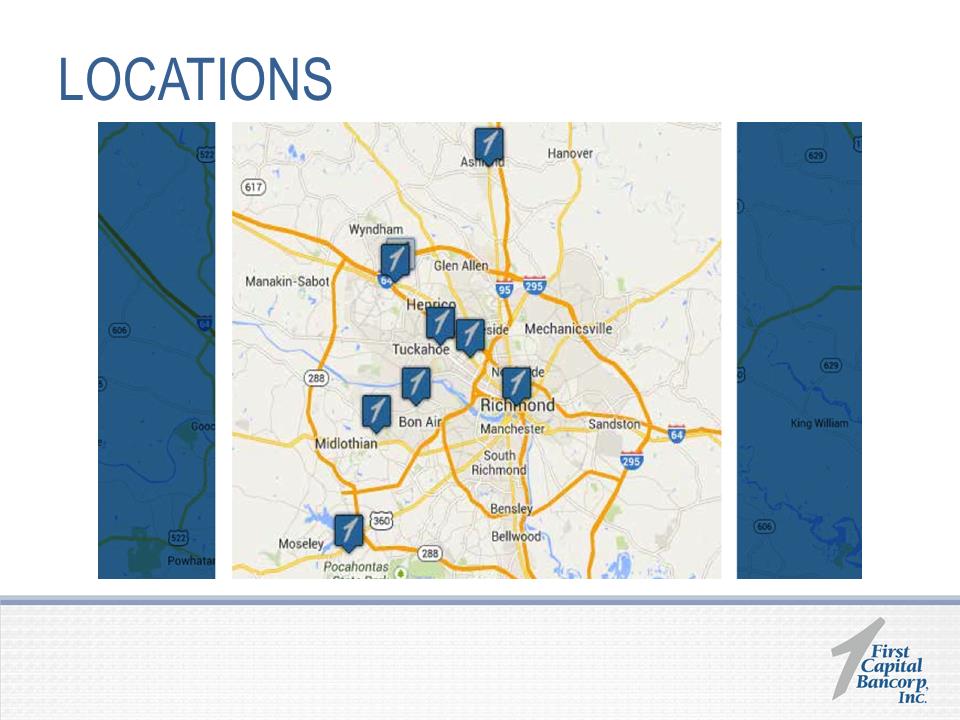 LOCATIONS
 MARKETING & ADVERTISING
 BRANCH ADVERTISING
 WEB
WEB