Exhibit 99.2 GREEN BRICK PARTNERS Q2 2018 INVESTOR CALL PRESENTATION AUGUST 6, 2018 1
FORWARD LOOKING STATEMENTS This presentation and the oral statements made by representatives of the Company during the course of this presentation that are not historical facts are forward-looking statements. These statements are often, but not always, made through the use of words or phrases such as “may,” “will,” “should,” “could,” “would,” “predicts,” “potential,” “continue,” “expects,” “anticipates,” “future,” “outlook,” “strategy,” “positioned,” “intends,” “plans,” “believes,” “projects,” “estimates” and similar expressions, as well as statements in the future tense. Although the Company believes that the assumptions underlying these statements are reasonable, individuals considering such statements for any purpose are cautioned that such forward- looking statements are inherently uncertain and necessarily involve risks that may affect the Company’s business prospects and performance, causing actual results to differ from those discussed during the presentation, and any such difference may be material. Factors that could cause actual results to differ from those anticipated are discussed in the Company’s annual and quarterly reports filed with the SEC. Any forward-looking statements made are subject to risks and uncertainties, many of which are beyond management’s control. These risks include the risks described in the Company’s filings with the SEC. Should one or more of these risks or uncertainties occur, or should underlying assumptions prove incorrect, the Company’s actual results and plans could differ materially from those expressed in any forward-looking statements. Given these risks and uncertainties, you are cautioned not to place undue reliance on such forward-looking statements. These forward-looking statements are made only as of the date hereof. The Company undertakes no obligation to publicly update any forward-looking statements, whether as a result of new information or future events. The Company presents Basic Adjusted EPS, Diluted Adjusted EPS, Basic and Diluted Adjusted weighted-average number of shares outstanding, GRBK Pre-tax Income and Adjusted Homebuilding Gross Margin. The Company believes these and similar measures are useful to management and investors in evaluating its operating performance and financing structure. The Company also believes these measures facilitate the comparison of their operating performance and financing structure with other companies in the industry. Because these measures are not calculated in accordance with Generally Accepted Accounting Principles (“GAAP”), they may not be comparable to other similarly titled measures of other companies and should not be considered in isolation or as a substitute for, or superior to, financial measures prepared in accordance with GAAP. 2
MANAGEMENT PRESENTERS Jim Brickman Rick Costello Chief Executive Officer Chief Financial Officer • Over 40 years in real estate development and • Over 26 years of financial and operating experience in homebuilding. all aspects of real estate management. • Co-founded JBGL with Greenlight Capital in 2008. JBGL • Previously served as CFO and COO of GL Homes, as was merged into Green Brick in 2014. AVP of finance of Paragon Group and as an auditor for • Previously served as Chairman and CEO of Princeton KPMG. Homes and Princeton Realty Corp. • Received his M.B.A from Northwestern University’s Kellogg School. Jed Dolson Summer Loveland President of Texas Region Chief Accounting Officer • Over 15 years of land development and property • Over 20 years of experience in the accounting and acquisition. financial reporting services industry. • Head of GRBK land acquisitions since 2010. • Previously served as Chief Financial Officer of the Dallas • Masters Degree in Engineering, Stanford University, and Police and Fire Pension System Registered Engineer, State of Texas. • Certified Public Accountant licensed in the states of Texas and California. 3
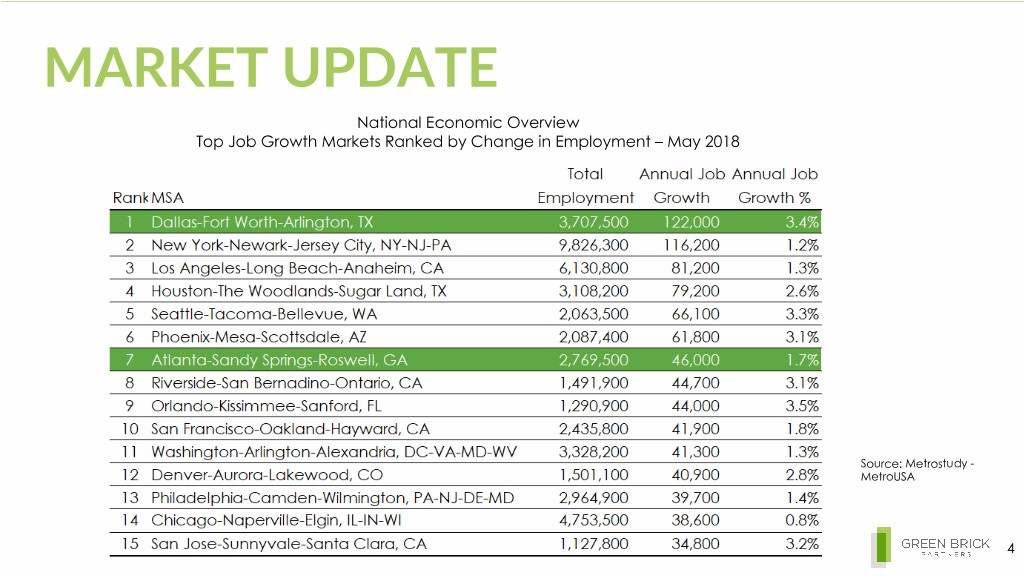
MARKET UPDATE National Economic Overview Top Job Growth Markets Ranked by Change in Employment – May 2018 Source: Metrostudy - MetroUSA 4
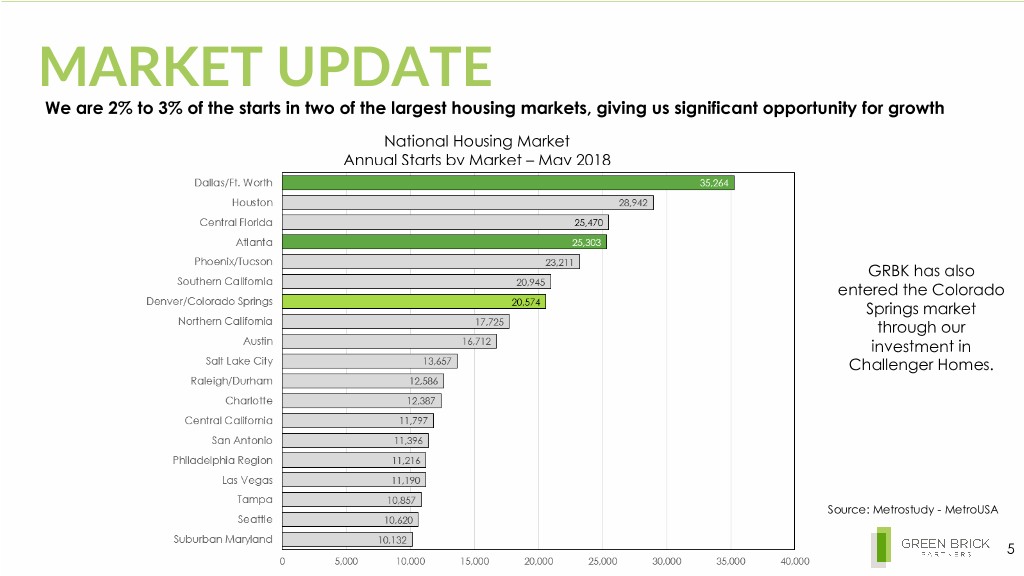
MARKET UPDATE We are 2% to 3% of the starts in two of the largest housing markets, giving us significant opportunity for growth National Housing Market Annual Starts by Market – May 2018 GRBK has also entered the Colorado Springs market through our investment in Challenger Homes. Source: Metrostudy - MetroUSA 5
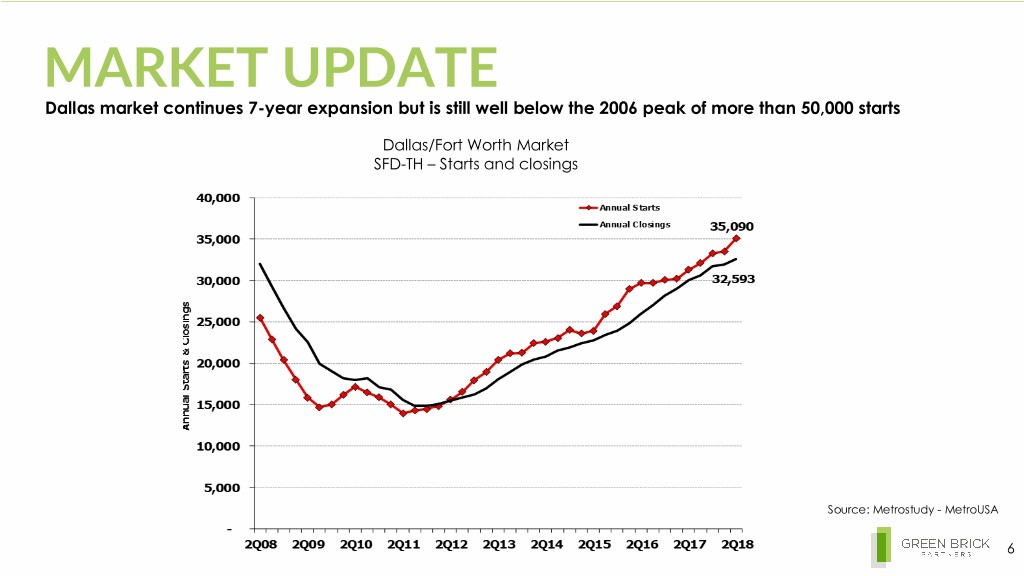
MARKET UPDATE Dallas market continues 7-year expansion but is still well below the 2006 peak of more than 50,000 starts Dallas/Fort Worth Market SFD-TH – Starts and closings Source: Metrostudy - MetroUSA 6
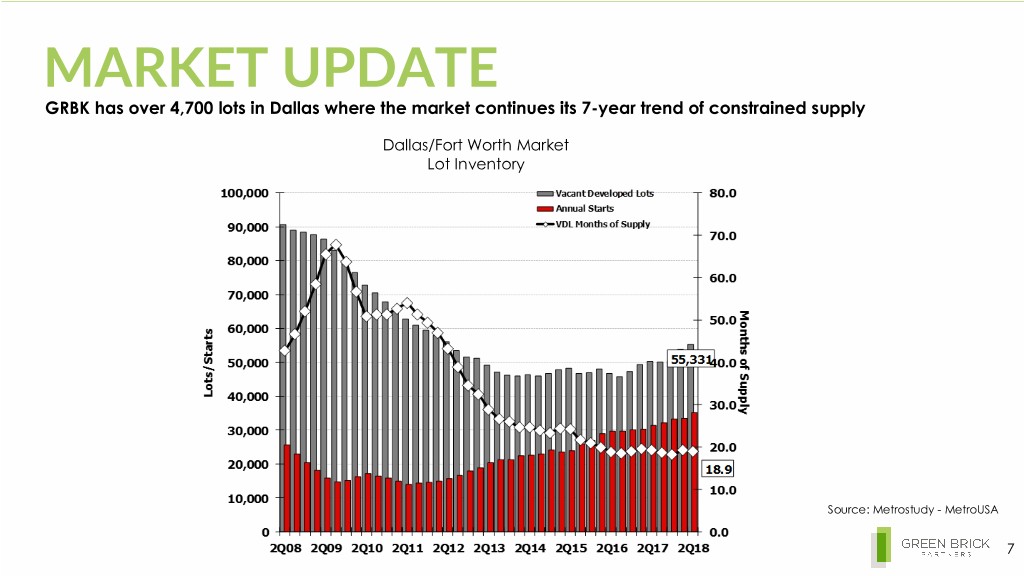
MARKET UPDATE GRBK has over 4,700 lots in Dallas where the market continues its 7-year trend of constrained supply Dallas/Fort Worth Market Lot Inventory Source: Metrostudy - MetroUSA 7
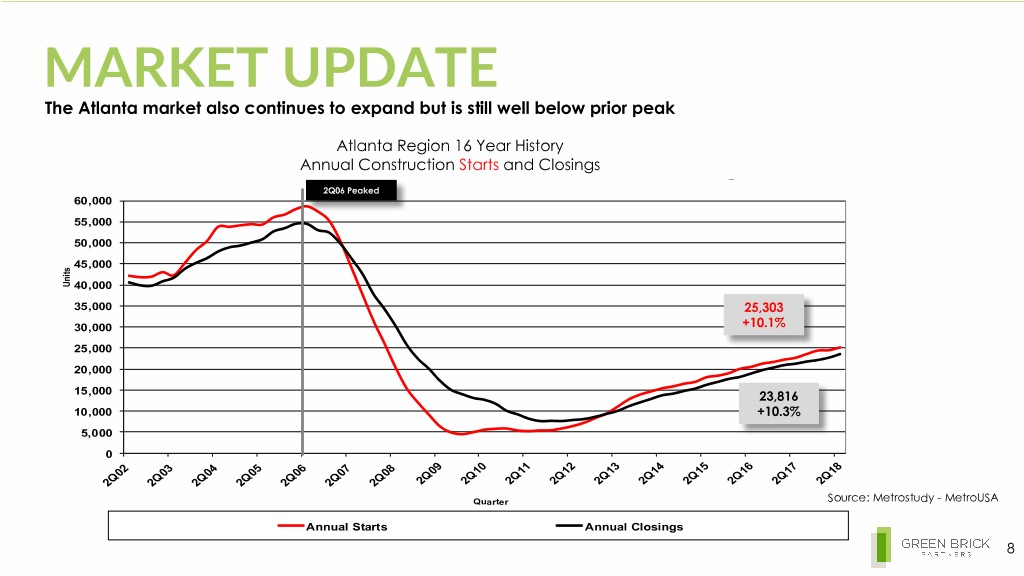
MARKET UPDATE The Atlanta market also continues to expand but is still well below prior peak AtlantaAtlanta Region Region 16 Year 16 History Year History AnnualAnnual Construction Construction Starts Startsand Closingsand Closings 2Q062Q06 Peaked Peaked 60,000 55,000 50,000 45,000 Units 40,000 35,000 25,303 30,000 +10.1% 25,000 20,000 15,000 23,816 10,000 +10.3% 5,000 0 Quarter Source: Metrostudy - MetroUSA Annual Starts Annual Closings 8
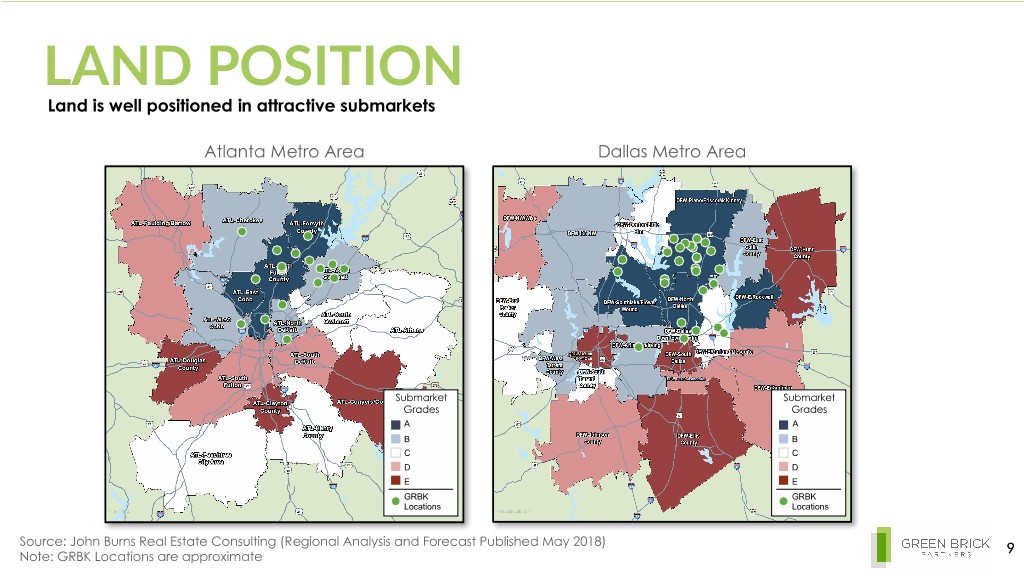
LAND POSITION Land is well positioned in attractive submarkets Atlanta Metro Area Dallas Metro Area Submarket Submarket Grades Grades A A B B C C D D E E GRBK GRBK Locations Locations Source: John Burns Real Estate Consulting (Regional Analysis and Forecast Published May 2018) 9 Note: GRBK Locations are approximate
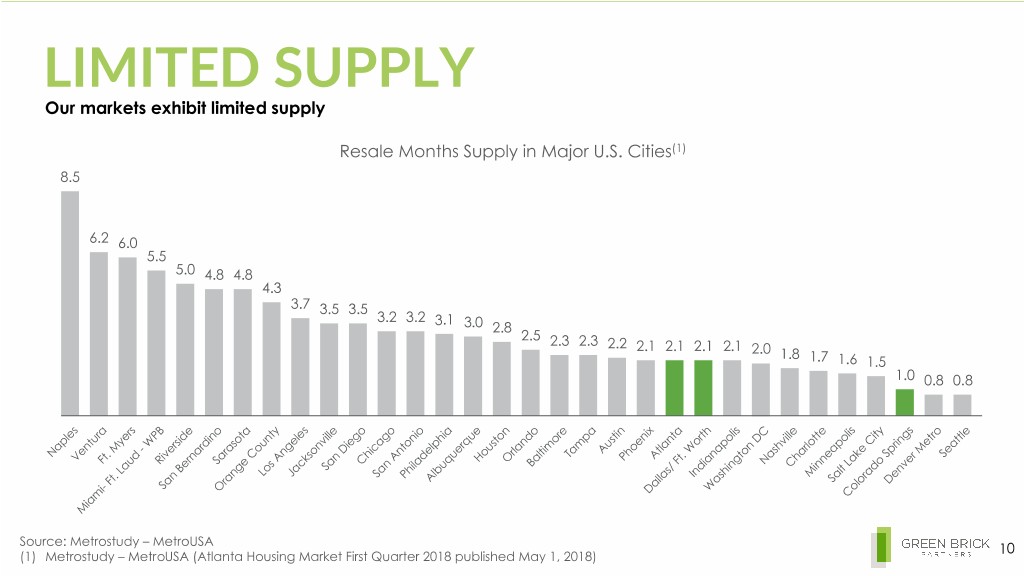
LIMITED SUPPLY Our markets exhibit limited supply Resale Months Supply in Major U.S. Cities(1) 8.5 6.2 6.0 5.5 5.0 4.8 4.8 4.3 3.7 3.5 3.5 3.2 3.2 3.1 3.0 2.8 2.5 2.3 2.3 2.2 2.1 2.1 2.1 2.1 2.0 1.8 1.7 1.6 1.5 1.0 0.8 0.8 Source: Metrostudy – MetroUSA 10 (1) Metrostudy – MetroUSA (Atlanta Housing Market First Quarter 2018 published May 1, 2018)
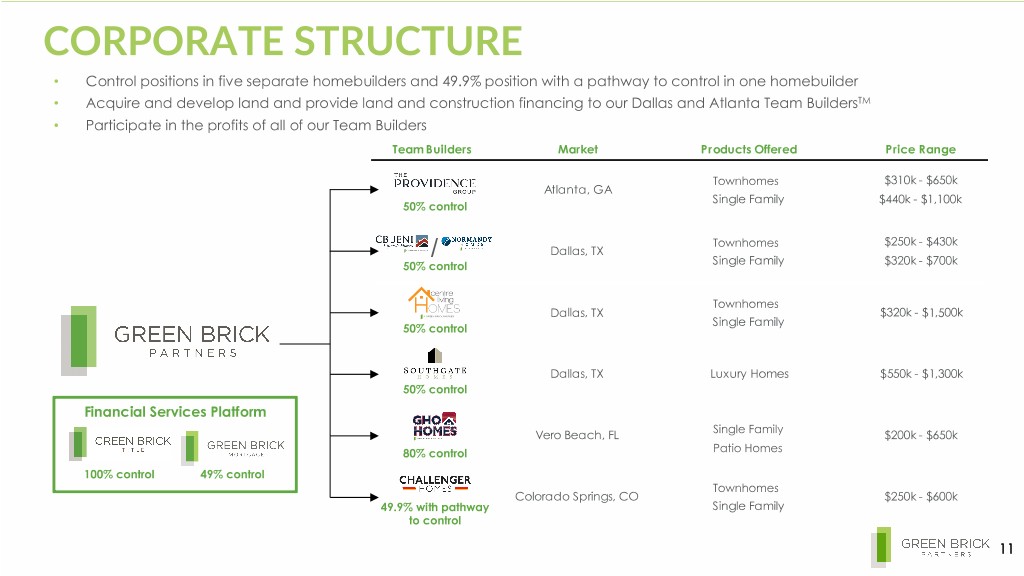
CORPORATE STRUCTURE • Control positions in five separate homebuilders and 49.9% position with a pathway to control in one homebuilder • Acquire and develop land and provide land and construction financing to our Dallas and Atlanta Team BuildersTM • Participate in the profits of all of our Team Builders Team Builders Market Products Offered Price Range TownhomesTownhomes $310k - $650k Atla nta , G A Single Family $440k - $1,100k 50% control TownhomesTownhomes $250k - $430k / Dallas, TX 50% control Single Family $320k - $700k TownhomesTownhomes Dallas, TX $320k - $1,500k Single Family 50% control Dallas, TX Luxury Homes $550k - $1,300k 50% control Financial Services Platform Single Family Vero Beach, FL Retiree Homes $200k - $650k 80% control Patio Homes 100% control 49% control TownhomesTownhomes Colorado Springs, CO $250k - $600k 49.9% with pathway Single Family to control 11
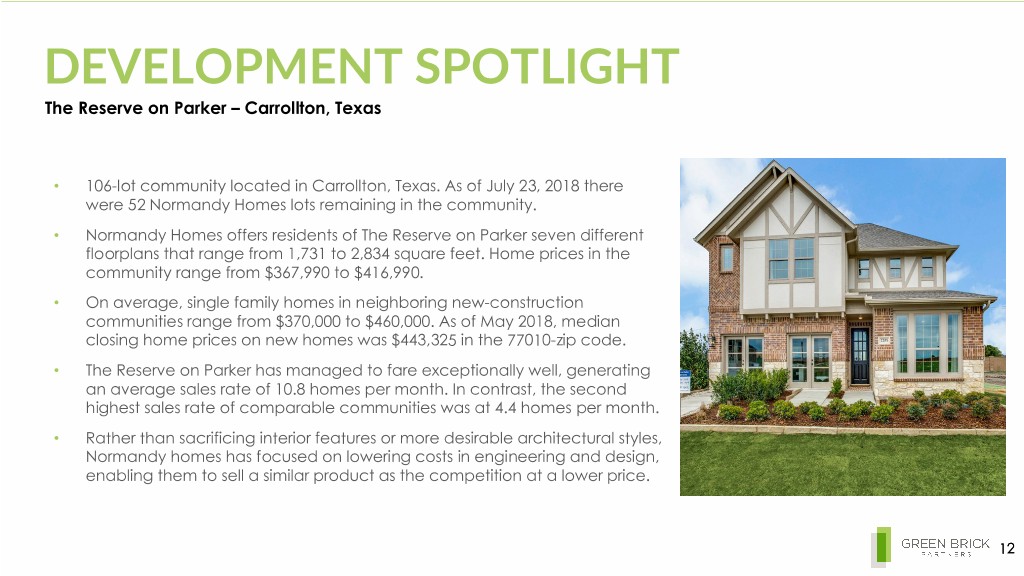
DEVELOPMENT SPOTLIGHT The Reserve on Parker – Carrollton, Texas • 106-lot community located in Carrollton, Texas. As of July 23, 2018 there were 52 Normandy Homes lots remaining in the community. • Normandy Homes offers residents of The Reserve on Parker seven different floorplans that range from 1,731 to 2,834 square feet. Home prices in the community range from $367,990 to $416,990. • On average, single family homes in neighboring new-construction communities range from $370,000 to $460,000. As of May 2018, median closing home prices on new homes was $443,325 in the 77010-zip code. • The Reserve on Parker has managed to fare exceptionally well, generating an average sales rate of 10.8 homes per month. In contrast, the second highest sales rate of comparable communities was at 4.4 homes per month. • Rather than sacrificing interior features or more desirable architectural styles, Normandy homes has focused on lowering costs in engineering and design, enabling them to sell a similar product as the competition at a lower price. 12
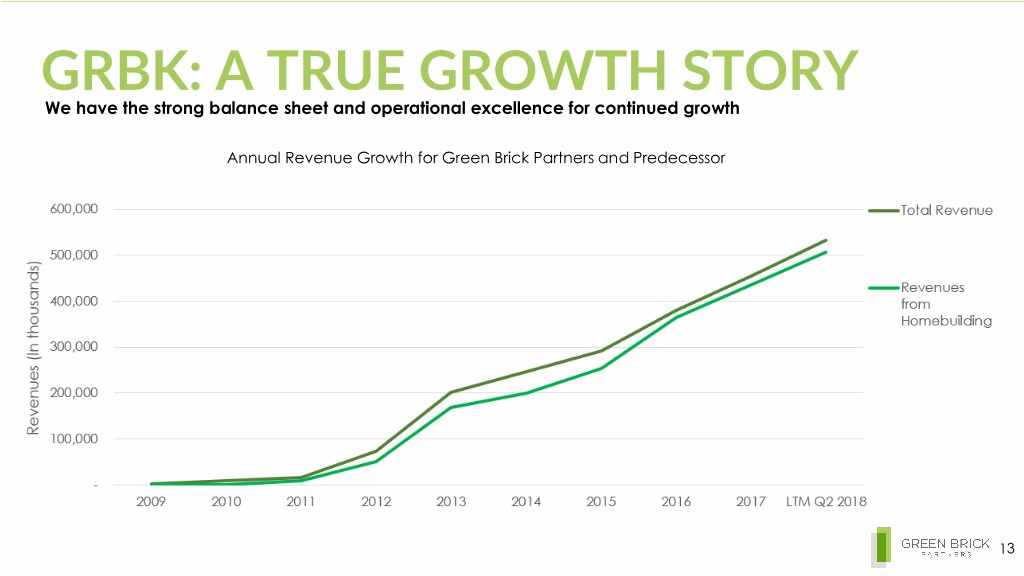
GRBK: A TRUE GROWTH STORY We have the strong balance sheet and operational excellence for continued growth Annual Revenue Growth for Green Brick Partners and Predecessor 13
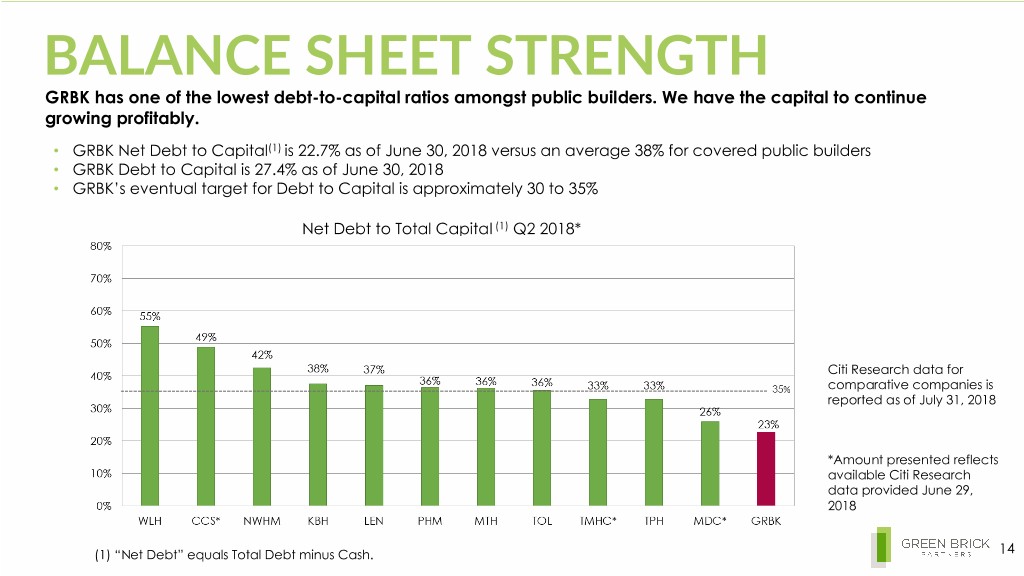
BALANCE SHEET STRENGTH GRBK has one of the lowest debt-to-capital ratios amongst public builders. We have the capital to continue growing profitably. • GRBK Net Debt to Capital(1) is 22.7% as of June 30, 2018 versus an average 38% for covered public builders • GRBK Debt to Capital is 27.4% as of June 30, 2018 • GRBK’s eventual target for Debt to Capital is approximately 30 to 35% Net Debt to Total Capital (1) Q2 2018* Citi Research data for comparative companies is reported as of July 31, 2018 *Amount presented reflects available Citi Research data provided June 29, 2018 (1) “Net Debt” equals Total Debt minus Cash. 14
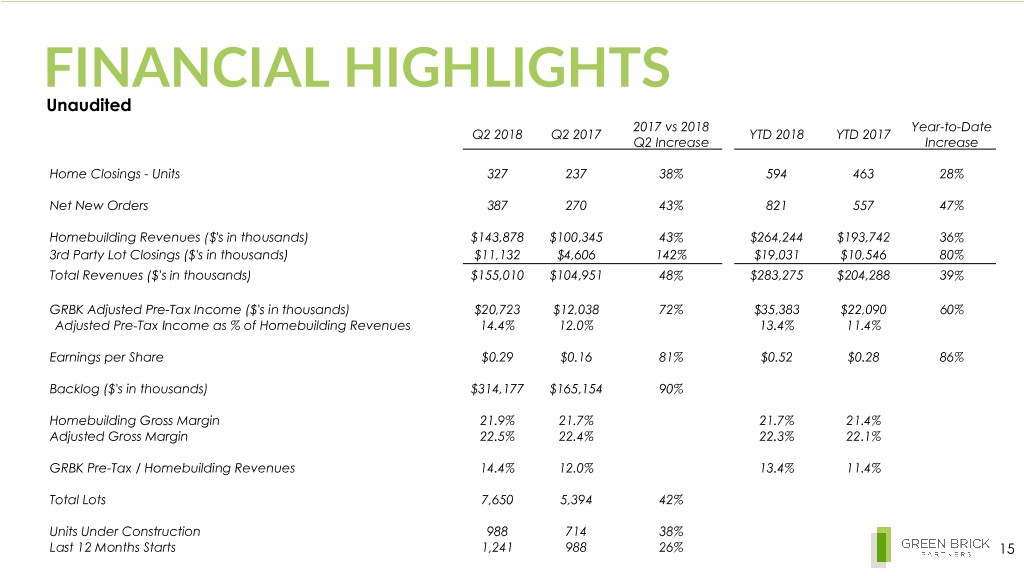
FINANCIAL HIGHLIGHTS Unaudited 2017 vs 2018 Year-to-Date Q2 2018 Q2 2017 YTD 2018 YTD 2017 Q2 Increase Increase Home Closings - Units 327 237 38% 594 463 28% Net New Orders 387 270 43% 821 557 47% Homebuilding Revenues ($'s in thousands) $143,878 $100,345 43% $264,244 $193,742 36% 3rd Party Lot Closings ($'s in thousands) $11,132 $4,606 142% $19,031 $10,546 80% Total Revenues ($'s in thousands) $155,010 $104,951 48% $283,275 $204,288 39% GRBK Adjusted Pre-Tax Income ($'s in thousands) $20,723 $12,038 72% $35,383 $22,090 60% Adjusted Pre-Tax Income as % of Homebuilding Revenues 14.4% 12.0% 13.4% 11.4% Earnings per Share $0.29 $0.16 81% $0.52 $0.28 86% Backlog ($'s in thousands) $314,177 $165,154 90% Homebuilding Gross Margin 21.9% 21.7% 21.7% 21.4% Adjusted Gross Margin 22.5% 22.4% 22.3% 22.1% GRBK Pre-Tax / Homebuilding Revenues 14.4% 12.0% 13.4% 11.4% Total Lots 7,650 5,394 42% Units Under Construction 988 714 38% Last 12 Months Starts 1,241 988 26% 15
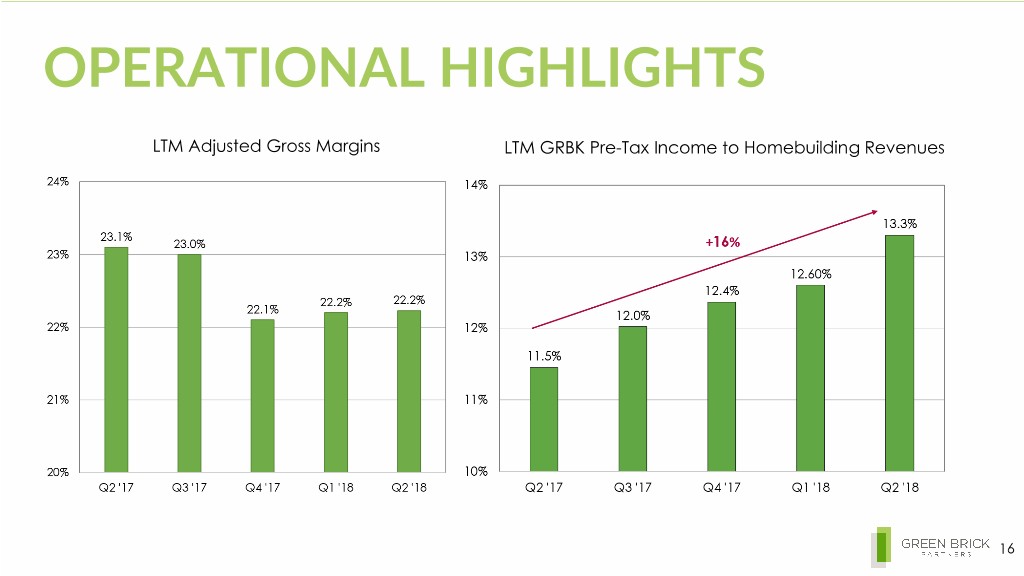
OPERATIONAL HIGHLIGHTS LTM Adjusted Gross Margins LTM GRBK Pre-Tax Income to Homebuilding Revenues 16
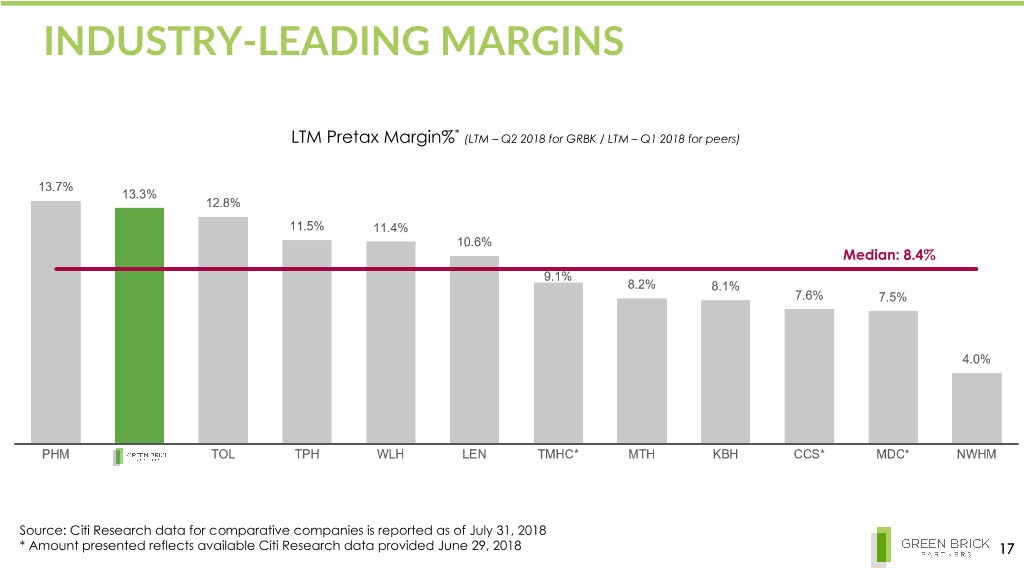
INDUSTRY-LEADING MARGINS LTM Pretax Margin%* (LTM – Q2 2018 for GRBK / LTM – Q1 2018 for peers) Median: 8.4% Source: Citi Research data for comparative companies is reported as of July 31, 2018 * Amount presented reflects available Citi Research data provided June 29, 2018 17
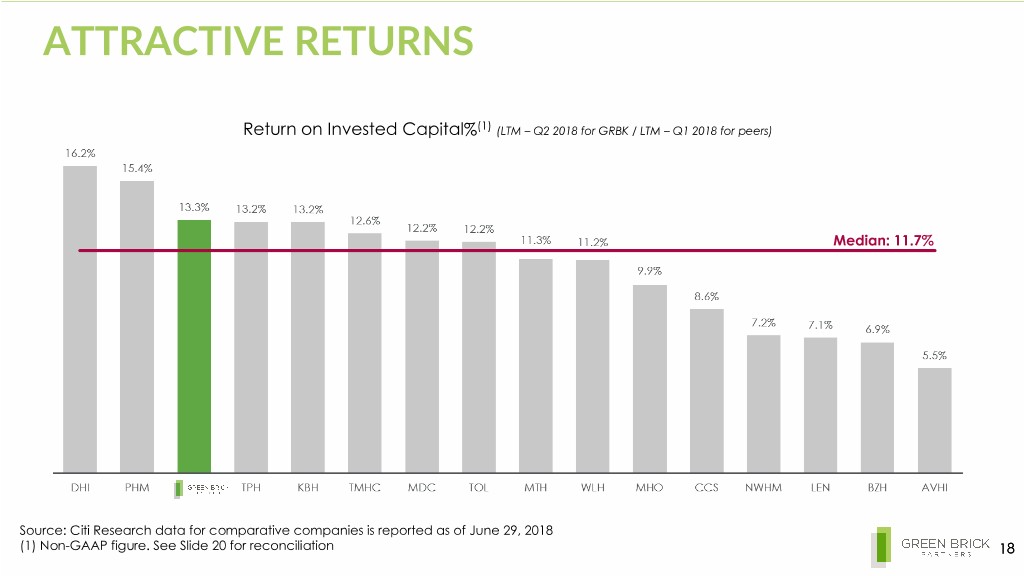
ATTRACTIVE RETURNS Return on Invested Capital%(1) (LTM – Q2 2018 for GRBK / LTM – Q1 2018 for peers) Median: 11.7% Source: Citi Research data for comparative companies is reported as of June 29, 2018 (1) Non-GAAP figure. See Slide 20 for reconciliation 18
APPENDIX 19
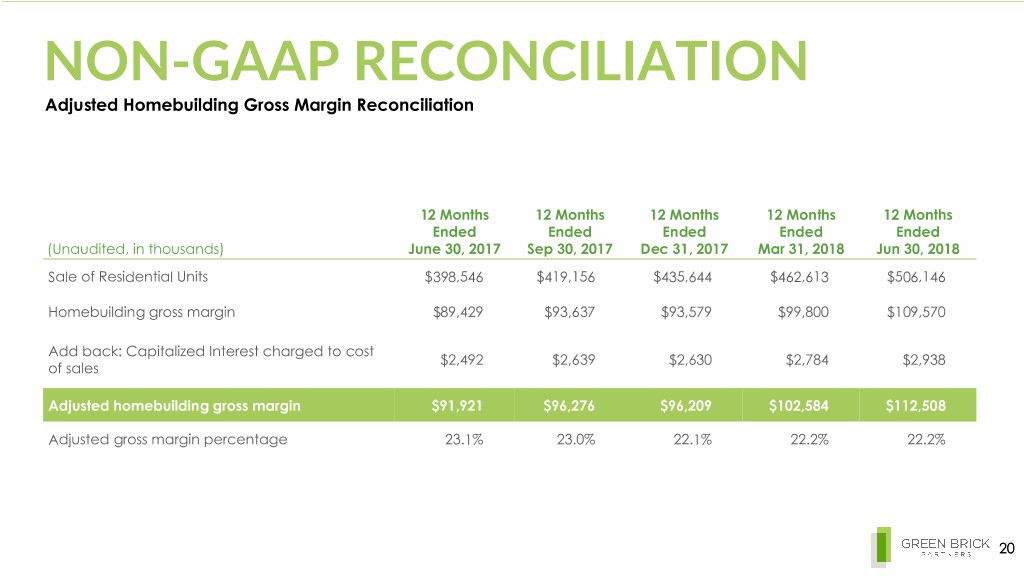
NON-GAAP RECONCILIATION Adjusted Homebuilding Gross Margin Reconciliation 12 Months 12 Months 12 Months 12 Months 12 Months Ended Ended Ended Ended Ended (Unaudited, in thousands) June 30, 2017 Sep 30, 2017 Dec 31, 2017 Mar 31, 2018 Jun 30, 2018 Sale of Residential Units $398,546 $419,156 $435,644 $462,613 $506,146 Homebuilding gross margin $89,429 $93,637 $93,579 $99,800 $109,570 Add back: Capitalized Interest charged to cost $2,492 $2,639 $2,630 $2,784 $2,938 of sales Adjusted homebuilding gross margin $91,921 $96,276 $96,209 $102,584 $112,508 Adjusted gross margin percentage 23.1% 23.0% 22.1% 22.2% 22.2% 20
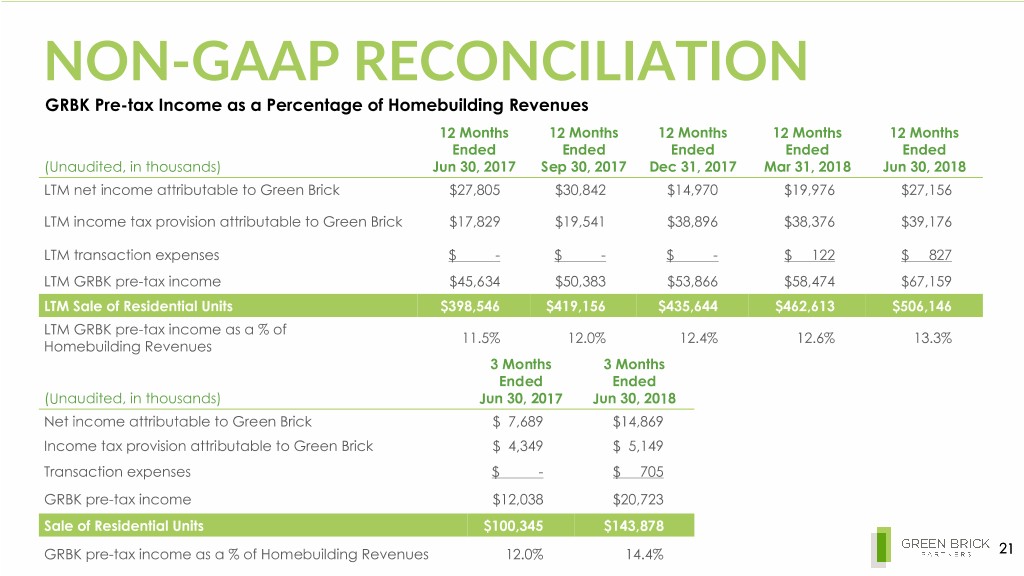
NON-GAAP RECONCILIATION GRBK Pre-tax Income as a Percentage of Homebuilding Revenues 12 Months 12 Months 12 Months 12 Months 12 Months Ended Ended Ended Ended Ended (Unaudited, in thousands) Jun 30, 2017 Sep 30, 2017 Dec 31, 2017 Mar 31, 2018 Jun 30, 2018 LTM net income attributable to Green Brick $27,805 $30,842 $14,970 $19,976 $27,156 LTM income tax provision attributable to Green Brick $17,829 $19,541 $38,896 $38,376 $39,176 LTM transaction expenses $ - $ - $ - $ 122 $ 827 LTM GRBK pre-tax income $45,634 $50,383 $53,866 $58,474 $67,159 LTM Sale of Residential Units $398,546 $419,156 $435,644 $462,613 $506,146 LTM GRBK pre-tax income as a % of 11.5% 12.0% 12.4% 12.6% 13.3% Homebuilding Revenues 3 Months 3 Months Ended Ended (Unaudited, in thousands) Jun 30, 2017 Jun 30, 2018 Net income attributable to Green Brick $ 7,689 $14,869 Income tax provision attributable to Green Brick $ 4,349 $ 5,149 Transaction expenses $ - $ 705 GRBK pre-tax income $12,038 $20,723 Sale of Residential Units $100,345 $143,878 GRBK pre-tax income as a % of Homebuilding Revenues 12.0% 14.4% 21
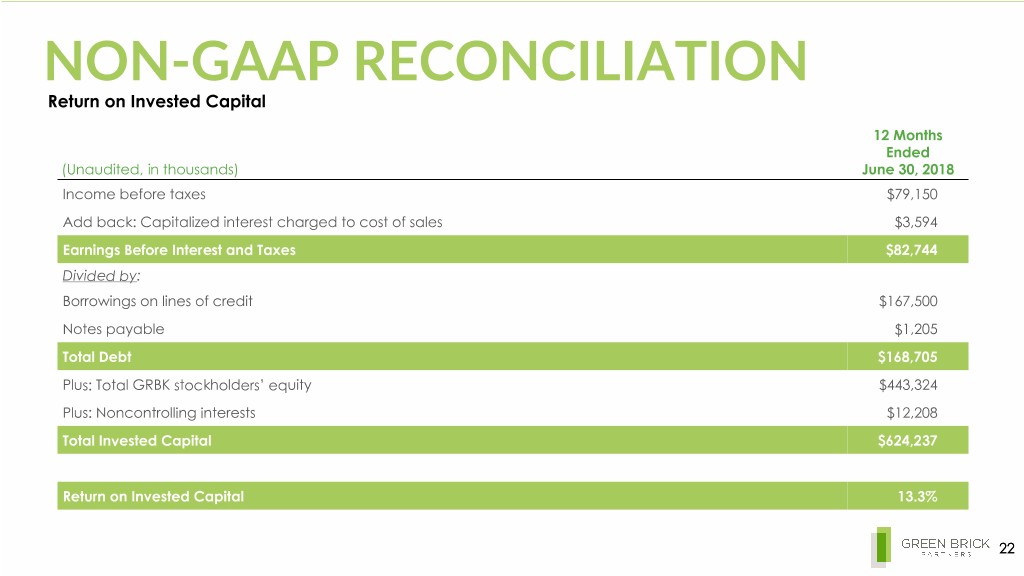
NON-GAAP RECONCILIATION Return on Invested Capital 12 Months Ended (Unaudited, in thousands) June 30, 2018 Income before taxes $79,150 Add back: Capitalized interest charged to cost of sales $3,594 Earnings Before Interest and Taxes $82,744 Divided by: Borrowings on lines of credit $167,500 Notes payable $1,205 Total Debt $168,705 Plus: Total GRBK stockholders’ equity $443,324 Plus: Noncontrolling interests $12,208 Total Invested Capital $624,237 Return on Invested Capital 13.3% 22

2805 Dallas Parkway, Suite 400 Plano, TX 75093 www.greenbrickpartners.com 23


