
Exhibit 99.1 INVESTOR PRESENTATION AUGUST 2018

FORWARD LOOKING STATEMENTS This presentation and the oral statements made by representatives of the Company during the course of this presentation that are not historical facts are forward-looking statements. These statements are often, but not always, made through the use of words or phrases such as “may,” “will,” “should,” “could,” “would,” “predicts,” “potential,” “continue,” “expects,” “anticipates,” “future,” “outlook,” “strategy,” “positioned,” “intends,” “plans,” “believes,” “projects,” “estimates” and similar expressions, as well as statements in the future tense. Although the Company believes that the assumptions underlying these statements are reasonable, individuals considering such statements for any purpose are cautioned that such forward-looking statements are inherently uncertain and necessarily involve risks that may affect the Company’s business prospects and performance, causing actual results to differ from those discussed during the presentation, and any such difference may be material. Factors that could cause actual results to differ from those anticipated are discussed in the Company’s annual and quarterly reports filed with the SEC. Any forward-looking statements made are subject to risks and uncertainties, many of which are beyond management’s control. These risks include the risks described in the Company’s filings with the SEC and the prospectus supplement to which this presentation relates. Should one or more of these risks or uncertainties occur, or should underlying assumptions prove incorrect, the Company’s actual results and plans could differ materially from those expressed in any forward-looking statements. Given these risks and uncertainties, you are cautioned not to place undue reliance on such forward-looking statements. These forward- looking statements are made only as of the date hereof. The Company undertakes no obligation to publicly update any forward-looking statements, whether as a result of new information or future events. The Company presents Adjusted Pretax Income, Return on Invested Capital, and Adjusted Homebuilding Gross Margin. The Company believes these and similar measures are useful to management and investors in evaluating its operating performance and financing structure. The Company also believes these measures facilitate the comparison of their operating performance and financing structure with other companies in the industry. Because these measures are not calculated in accordance with Generally Accepted Accounting Principles (“GAAP”), they may not be comparable to other similarly titled measures of other companies and should not be considered in isolation or as a substitute for, or superior to, financial measures prepared in accordance with GAAP. 2
MANAGEMENT PRESENTERS Rick Costello Chief Financial Officer • Over 26 years of financial and operating experience in all aspects of real estate management • Previously served as CFO and COO of GL Homes, as AVP of finance of Paragon Group and as an auditor at KPMG • Received M.B.A. degree from Kellogg School of Management at Northwestern University Jed Dolson President of Texas Region • Over 15 years of land development and property acquisition • Head of GRBK land acquisitions since 2010 • Masters degree in Engineering from Stanford University • Registered Engineer in the State of Texas 3

COMPANY OVERVIEW 4
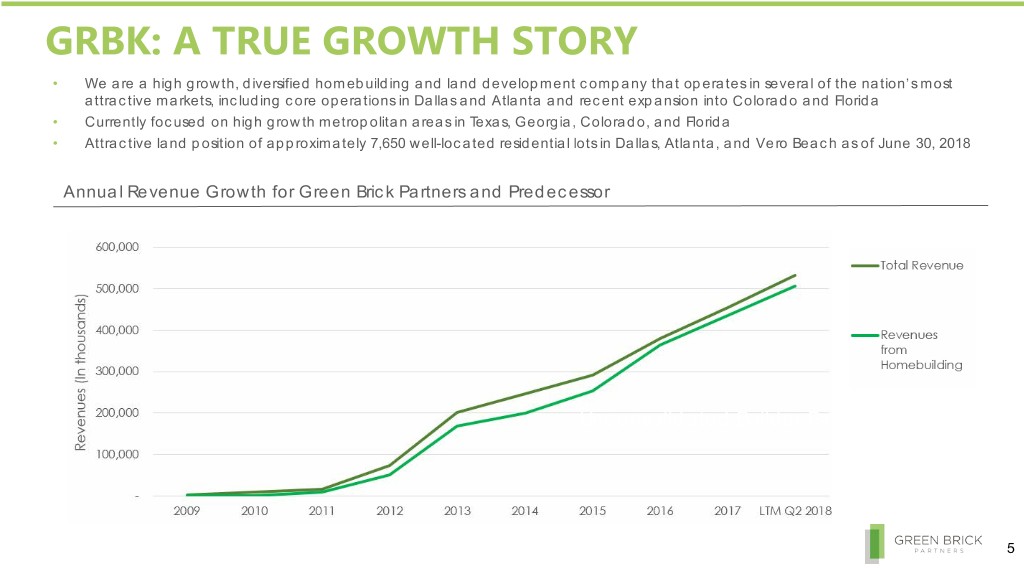
GRBK: A TRUE GROWTH STORY • We are a high growth, diversified homebuilding and land development company that operates in several of the nation’s most attractive markets, including core operations in Dallas and Atlanta and recent expansion into Colorado and Florida • Currently focused on high growth metropolitan areas in Texas, Georgia, Colorado, and Florida • Attractive land position of approximately 7,650 well-located residential lots in Dallas, Atlanta, and Vero Beach as of June 30, 2018 Annual Revenue Growth for Green Brick Partners and Predecessor Unconsolidated Builder Partners 5
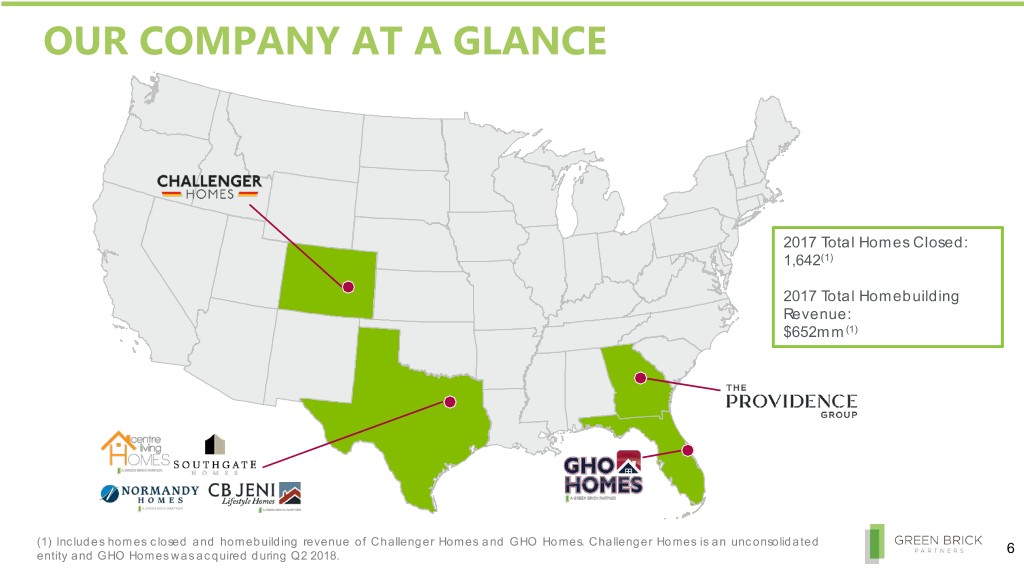
OUR COMPANY AT A GLANCE 2017 Total Homes Closed: 1,642(1) 2017 Total Homebuilding Revenue: $652mm(1) Unconsolidated Builder Partners (1) Includes homes closed and homebuilding revenue of Challenger Homes and GHO Homes. Challenger Homes is an unconsolidated entity and GHO Homes was acquired during Q2 2018. 6
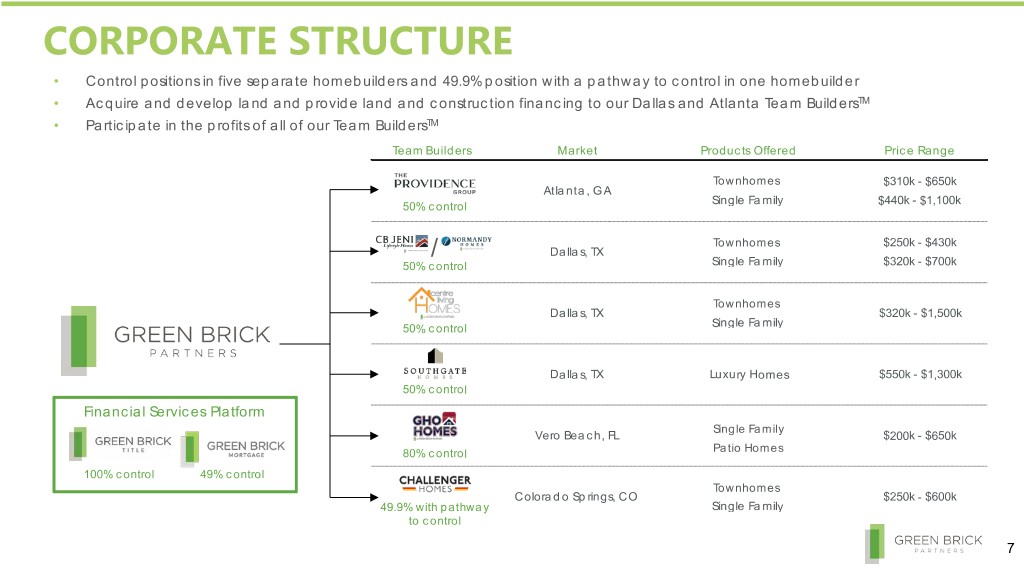
CORPORATE STRUCTURE • Control positions in five separate homebuilders and 49.9% position with a pathway to control in one homebuilder • Acquire and develop land and provide land and construction financing to our Dallas and Atlanta Team BuildersTM • Participate in the profits of all of our Team BuildersTM Team Builders Market Products Offered Price Range Townhomes $310k - $650k Atlanta, GA Single Family $440k - $1,100k 50% control Townhomes $250k - $430k / Dallas, TX 50% control Single Family $320k - $700k Townhomes Dallas, TX $320k - $1,500k Single Family 50% control Dallas, TX Luxury Homes $550k - $1,300k 50% control Financial Services Platform Single Family Vero Beach, FL Retiree Homes $200k - $650k 80% control Patio Homes 100% control 49% control Townhomes Colorado Springs, CO $250k - $600k 49.9% with pathway Single Family to control 7
PROGRESSION OF OUR BUSINESS MODEL Nimble and responsive to shifts in the homebuilding landscape, we continue to evaluate opportunities to grow our platform and deliver industry leading growth and attractive risk-adjusted returns Foundation of Business Model Levers for Additional Growth • Formed in 2008 to capitalize on • Seek to establish GRBK-controlled “partnerships” TM opportunities that arose from the housing with additional Team Builders in new markets crisis • Have created minority side-by-side • Combined our capital with local land investments with selling builders development and homebuilding • Can create “Shadow equity” with expertise management to facilitate liquidity and • Provided land and capital to builders succession for founders/ owners who were constrained • Our acquisitions of interests in GHO Homes and Challenger Homes are • Acquired controlling interests in Team great examples BuildersTM • Recently formed mortgage joint venture • All financing extended was secured by complements existing homebuilding operations first lien loans and captures incremental profit • Model provided high IRRs on selling lots • National accounts purchasing system could and high lending rates, plus upside generate substantial savings by centralizing through equity ownership functions under one GRBK Purchasing Manager 8
RECENT STRATEGIC INITIATIVES Acquisitions of dominant local builders and strategic activity complement continued organic growth in our core operations Challenger Acquisition GHO Acquisition Mortgage JV • Acquired a 49.9% stake in the • Acquired an 80% stake in April 2018 • Announced a 49%/51% mortgage JV Colorado Springs Builder in August 2017 with PrimeLending, a nationwide • Expanded presence into Florida’s mortgage originator, in June 2018 • Dominant local builder Treasure Coast • Position has a pathway to • PrimeLending is a top 10 mortgage control position(1) • Local leadership expertise with Bill lender in the nation in purchase units Handler continuing to serve as • Brian Bahr, who has 20+ years of President • We will fund the JV with a $735,000 experience, will continue serving as • 20+ years of experience initial contribution CEO • Owns the remaining 20% • Expected to be operational by Q318 in • Forbes declared Colorado Springs as Dallas, with subsequent roll-out to other one of the “10 Hottest Real Estate • High return on invested capital with no markets Q2 2019 Markets to Watch” subsidiary debt at closing • Provides additional revenue • Primarily focused on entry-level and • Large backlog opportunities and value proposition to TM move-down homebuyer • 2017 Key Statistics Team Builders • 2017 Key Statistics • Closings: 242 • Closings: 410 • Total Revenue: $85mm • Total Revenue: $131mm (1) Under the terms of our purchase agreement to acquire an interest in Challenger Homes, we have the opportunity to acquire an additional 20.1% interest in Challenger Homes or, in certain circumstances, the remaining 50.1% interest in Challenger Homes that we do not already own, 9 after the third anniversary of the acquisition date, if the counterparties to the purchase agreement, in their discretion, offer us such interests.

INVESTMENT HIGHLIGHTS 10

KEYS TO OUR SUCCESS Seasoned management team with track record of execution across cycles Differentiated business model drives industry-leading profitability and attractive returns Industry-leading growth profile and established track record of market share gains High quality land positions in leading growth markets with ample runway for expansion Recognized for award-winning homes and communities Disciplined approach and common values Strong balance sheet and conservative operating philosophy with 36 straight quarters of positive operating profit since inception(1) (1) Includes predecessor company, JBGL Capital. 11
SEASONED AND ALIGNED MANAGEMENT TEAM • Our management team is comprised of building and finance veterans with decades of experience in our markets • Significant expertise in capital allocation, land acquisition, entitlement, development, construction, marketing and home sales • Strong institutional partnership with Greenlight Capital since inception Jim Brickman Founder, CEO, and Director Significant equity holder 40+ years of experience Rick Costello Jed Dolson Summer Loveland, CPA CFO President of Texas Region CAO 26+ years of experience 15+ years of experience 20+ years of experience Team BuildersTM Bill Handler Warren Jolly Bruno Pasquinelli Jay Hankla Trevor Brickman Brian Bahr President President President President President President 20+ years of 30+ years of 30+ years of 20+ years of 10+ years of 20+ years of experience experience experience experience experience experience 12
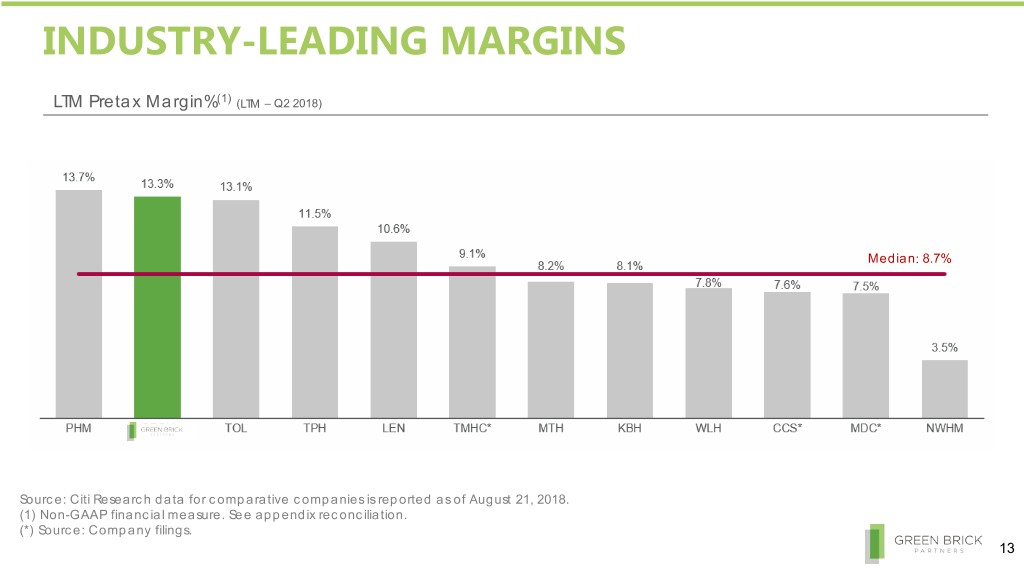
INDUSTRY-LEADING MARGINS LTM Pretax Margin%(1) (LTM – Q2 2018) Median: 8.7% Source: Citi Research data for comparative companies is reported as of August 21, 2018. (1) Non-GAAP financial measure. See appendix reconciliation. (*) Source: Company filings. 13
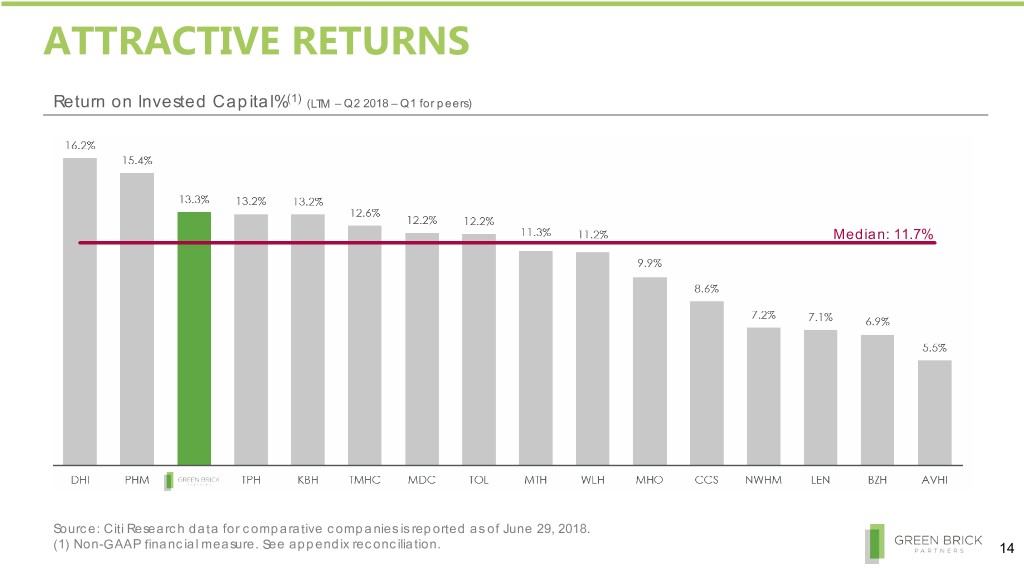
ATTRACTIVE RETURNS Return on Invested Capital%(1) (LTM – Q2 2018 – Q1 for peers) Median: 11.7% Source: Citi Research data for comparative companies is reported as of June 29, 2018. (1) Non-GAAP financial measure. See appendix reconciliation. 14
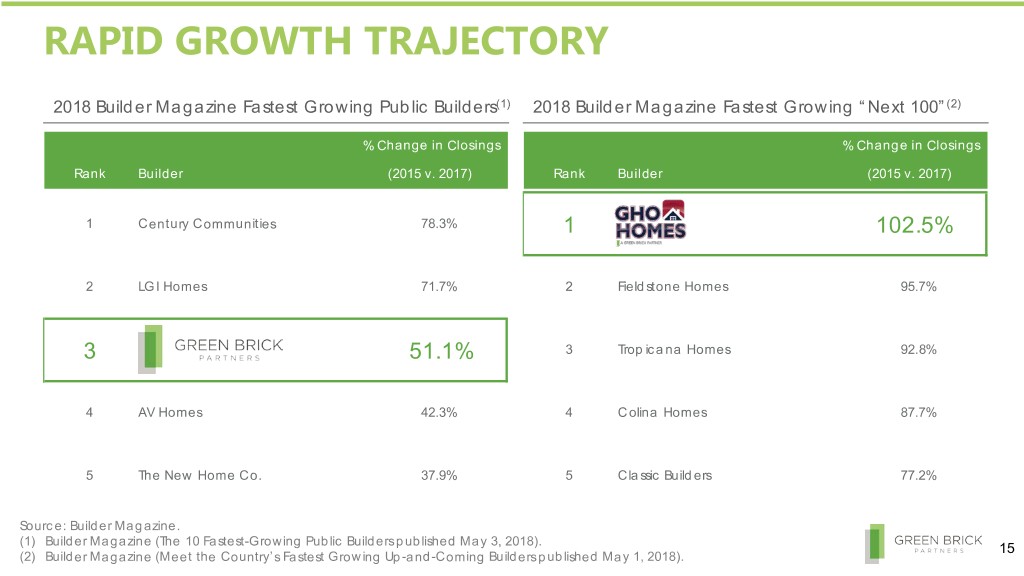
RAPID GROWTH TRAJECTORY 2018 Builder Magazine Fastest Growing Public Builders(1) 2018 Builder Magazine Fastest Growing “Next 100”(2) % Change in Closings % Change in Closings Rank Builder (2015 v. 2017) Rank Builder (2015 v. 2017) 1 Century Communities 78.3% 1 102.5% 2 LGI Homes 71.7% 2 Fieldstone Homes 95.7% 3 51.1% 3 Tropicana Homes 92.8% 4 AV H omes 42.3% 4 Colina Homes 87.7% 5 The New Home Co. 37.9% 5 Classic Builders 77.2% Source: Builder Magazine. (1) Builder Magazine (The 10 Fastest-Growing Public Builders published May 3, 2018). 15 (2) Builder Magazine (Meet the Country’s Fastest Growing Up-and-Coming Builders published May 1, 2018).
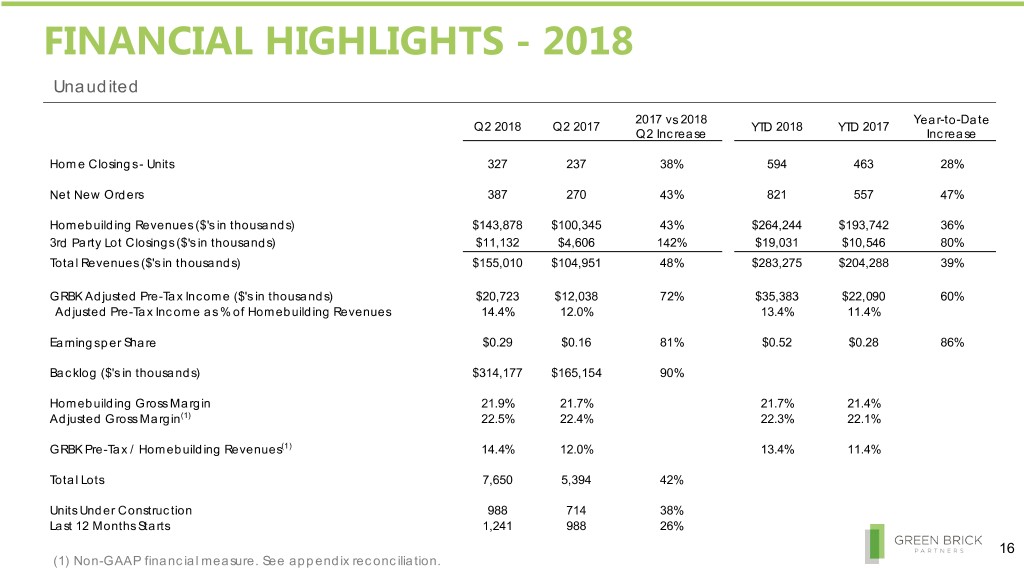
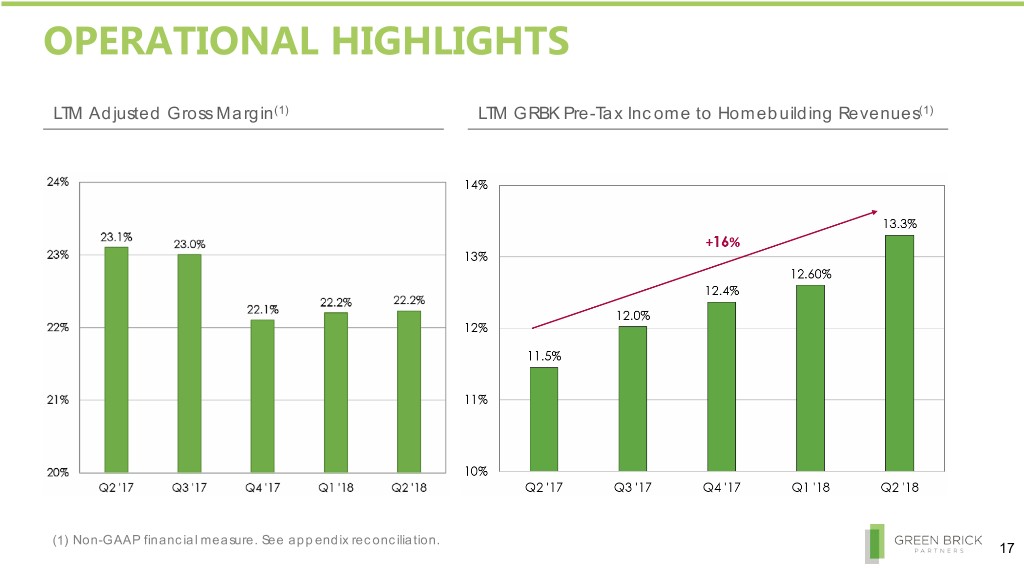
FINANCIAL HIGHLIGHTS - 2018 Unaudited 2017 vs 2018 Year-to-Date Q2 2018 Q2 2017 YTD 2018 YTD 2017 Q2 Increase Increase Home Closings - Units 327 237 38% 594 463 28% Net New Orders 387 270 43% 821 557 47% Homebuilding Revenues ($'s in thousands) $143,878 $100,345 43% $264,244 $193,742 36% 3rd Party Lot Closings ($'s in thousands) $11,132 $4,606 142% $19,031 $10,546 80% Total Revenues ($'s in thousands) $155,010 $104,951 48% $283,275 $204,288 39% GRBK Adjusted Pre-Tax Income ($'s in thousands) $20,723 $12,038 72% $35,383 $22,090 60% Adjusted Pre-Tax Income as % of Homebuilding Revenues 14.4% 12.0% 13.4% 11.4% Earnings per Share $0.29 $0.16 81% $0.52 $0.28 86% Backlog ($'s in thousands) $314,177 $165,154 90% Homebuilding Gross Margin 21.9% 21.7% 21.7% 21.4% Adjusted Gross Margin(1) 22.5% 22.4% 22.3% 22.1% GRBK Pre-Tax / Homebuilding Revenues(1) 14.4% 12.0% 13.4% 11.4% Total Lots 7,650 5,394 42% Units Under Construction 988 714 38% Last 12 Months Starts 1,241 988 26% 16 (1) Non-GAAP financial measure. See appendix reconciliation.
OPERATIONAL HIGHLIGHTS LTM Adjusted Gross Margin(1) LTM GRBK Pre-Tax Income to Homebuilding Revenues(1) (1) Non-GAAP financial measure. See appendix reconciliation. 17
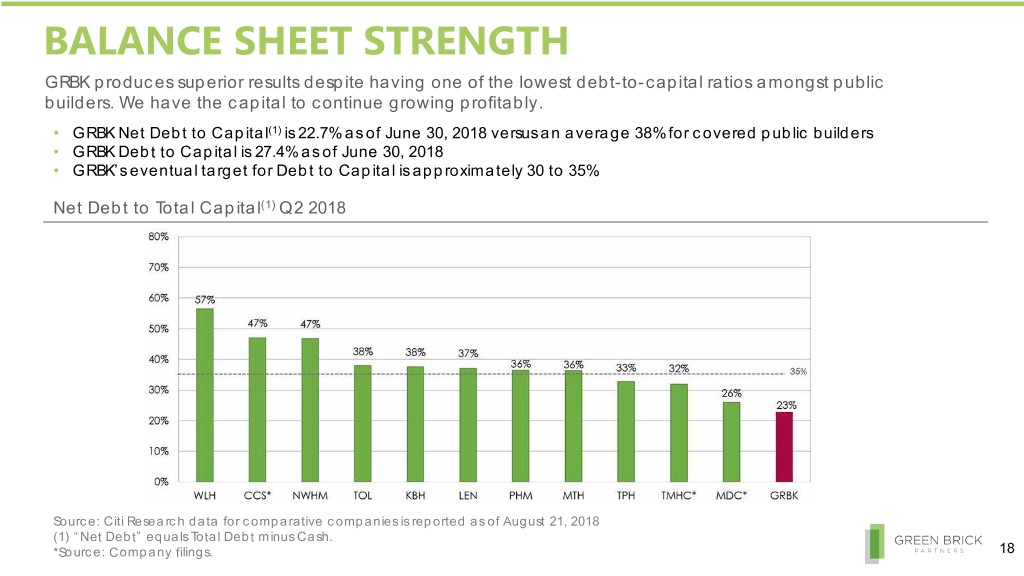
BALANCE SHEET STRENGTH GRBK produces superior results despite having one of the lowest debt-to-capital ratios amongst public builders. We have the capital to continue growing profitably. • GRBK Net Debt to Capital(1) is 22.7% as of June 30, 2018 versus an average 38% for covered public builders • GRBK Debt to Capital is 27.4% as of June 30, 2018 • GRBK’s eventual target for Debt to Capital is approximately 30 to 35% Net Debt to Total Capital(1) Q2 2018 Source: Citi Research data for comparative companies is reported as of August 21, 2018 (1) “Net Debt” equals Total Debt minus Cash. *Source: Company filings. 18
MARKET UPDATE National Economic Overview – Top Job Growth Markets Ranked by Change in Employment – May 2018 Source: Metrostudy – MetroUSA. 19

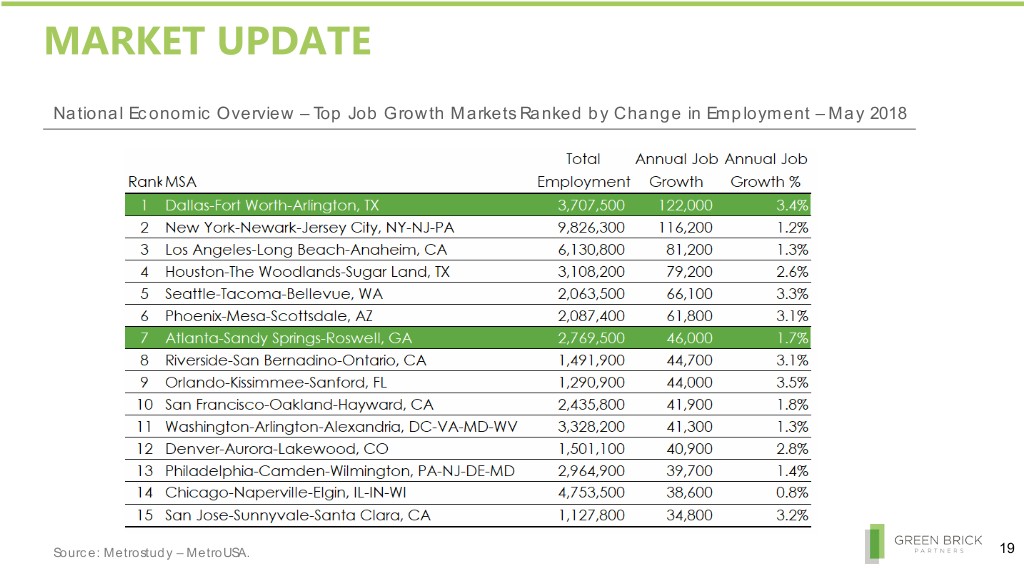
MARKET UPDATE We are 2% to 3% of the starts in two of the largest housing markets, giving us significant opportunity for growth National Housing Market – Annual Starts by Market – May 2018 GRBK has also entered the Colorado Springs market through our investment in Challenger Homes. Source: Metrostudy – MetroUSA. 20
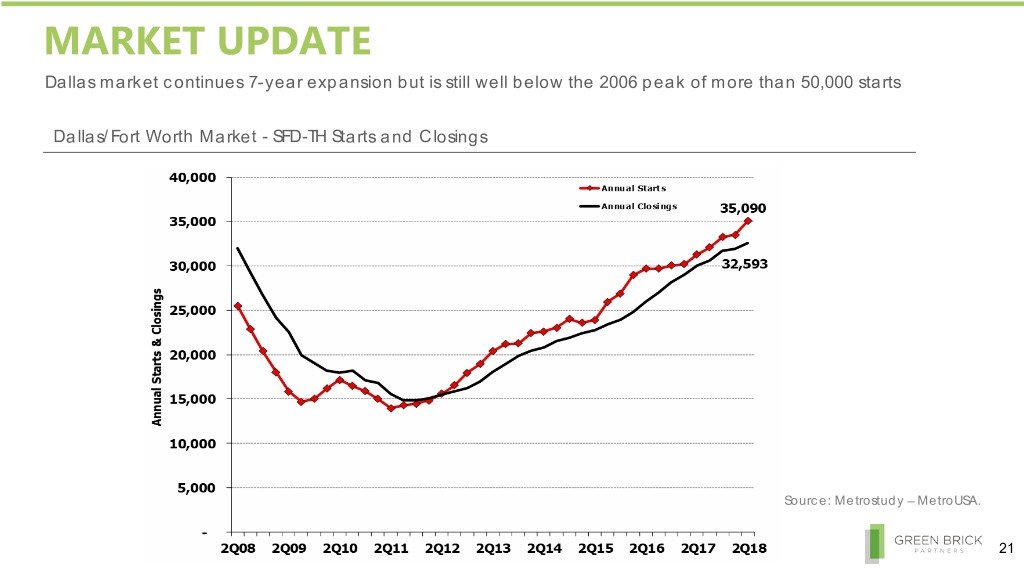
MARKET UPDATE Dallas market continues 7-year expansion but is still well below the 2006 peak of more than 50,000 starts Dallas/Fort Worth Market - SFD-TH Starts and Closings Source: Metrostudy – MetroUSA. 21
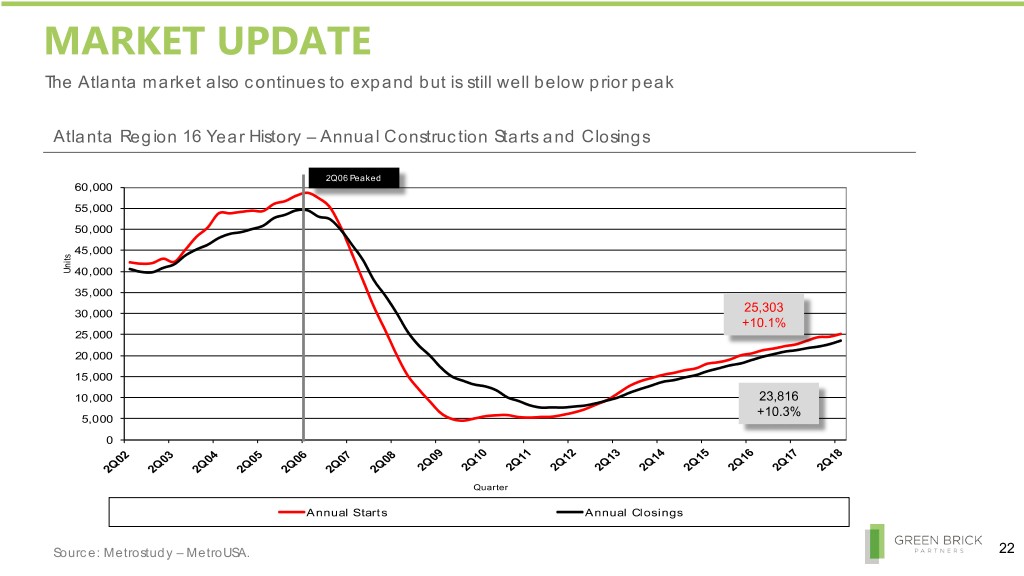
MARKET UPDATE The Atlanta market also continues to expand but is still well below prior peak Atlanta Region 16 Year History – Annual Construction Starts and Closings g 2Q062Q06 Peaked Peaked 60,000 55,000 50,000 45,000 Units 40,000 35,000 25,303 30,000 +10.1% 25,000 20,000 15,000 10,000 23,816 +10.3% 5,000 0 Quarter Annual Starts Annual Closings Source: Metrostudy – MetroUSA. 22
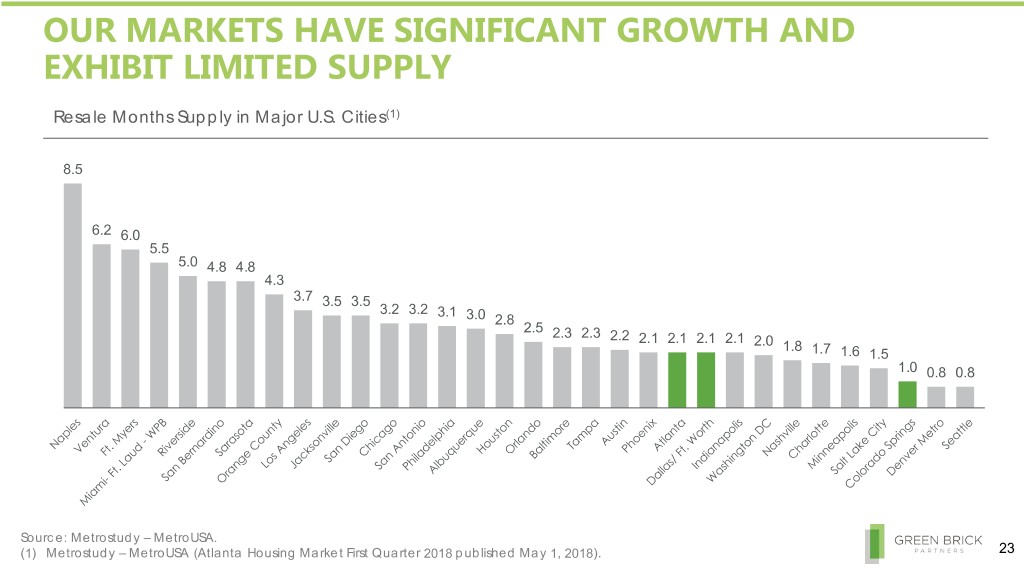
OUR MARKETS HAVE SIGNIFICANT GROWTH AND EXHIBIT LIMITED SUPPLY Resale Months Supply in Major U.S. Cities(1) 8.5 6.2 6.0 5.5 5.0 4.8 4.8 4.3 3.7 3.5 3.5 3.2 3.2 3.1 3.0 2.8 2.5 2.3 2.3 2.2 2.1 2.1 2.1 2.1 2.0 1.8 1.7 1.6 1.5 1.0 0.8 0.8 Source: Metrostudy – MetroUSA. (1) Metrostudy – MetroUSA (Atlanta Housing Market First Quarter 2018 published May 1, 2018). 23
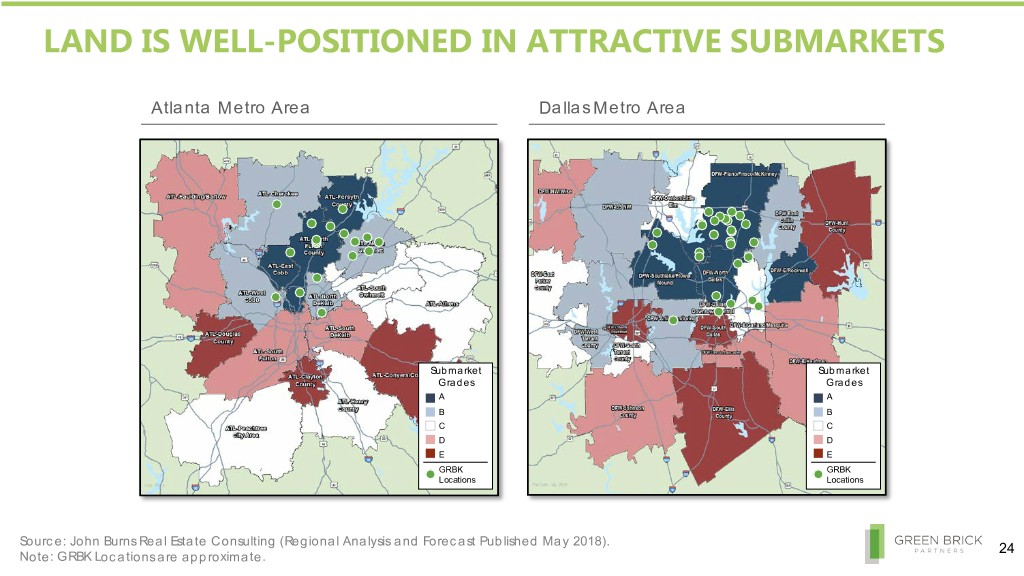
LAND IS WELL-POSITIONED IN ATTRACTIVE SUBMARKETS Atlanta Metro Area Dallas Metro Area Submarket Submarket Grades Grades A A B B C C D D E E GRBK GRBK Locations Locations Source: John Burns Real Estate Consulting (Regional Analysis and Forecast Published May 2018). 24 Note: GRBK Locations are approximate.
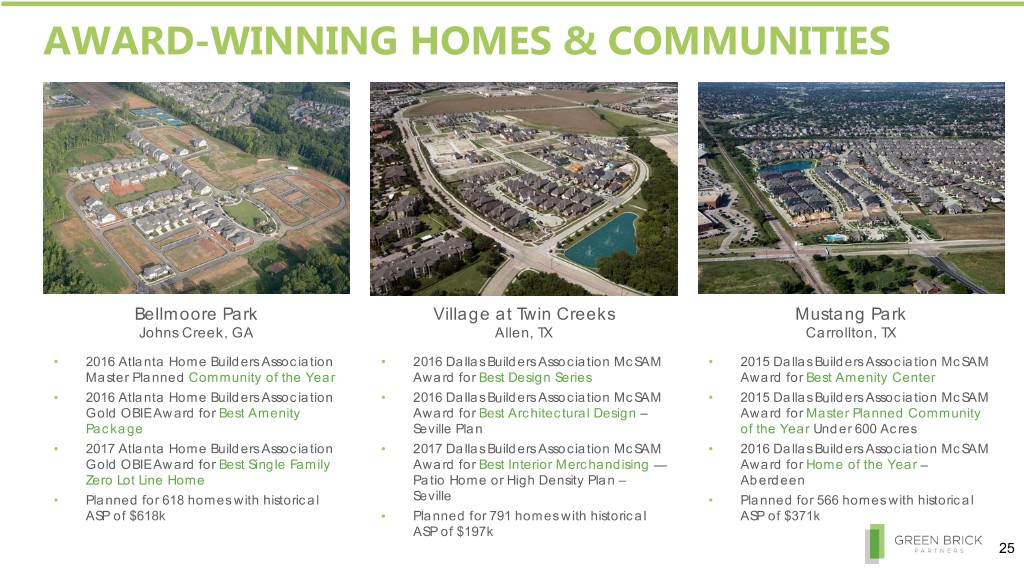
AWARD-WINNING HOMES & COMMUNITIES Bellmoore Park Village at Twin Creeks Mustang Park Johns Creek, GA Allen, TX Carrollton, TX • 2016 Atlanta Home Builders Association • 2016 Dallas Builders Association McSAM • 2015 Dallas Builders Association McSAM Master Planned Community of the Year Award for Best Design Series Award for Best Amenity Center • 2016 Atlanta Home Builders Association • 2016 Dallas Builders Association McSAM • 2015 Dallas Builders Association McSAM Gold OBIE Award for Best Amenity Award for Best Architectural Design – Award for Master Planned Community Package Seville Plan of the Year Under 600 Acres • 2017 Atlanta Home Builders Association • 2017 Dallas Builders Association McSAM • 2016 Dallas Builders Association McSAM Gold OBIE Award for Best Single Family Award for Best Interior Merchandising — Award for Home of the Year – Zero Lot Line Home Patio Home or High Density Plan – Aberdeen • Planned for 618 homes with historical Seville • Planned for 566 homes with historical ASP of $618k • Planned for 791 homes with historical ASP of $371k ASP of $197k 25

AWARD-WINNING HOMES & COMMUNITIES (cont’d) The Montgomery at 5T Ranch Seville Plan at Village at The Matthews Model Home at Argyle, TX Twin Creeks Bellmoore Park Allen, TX Johns Creek, GA • 2018 Dallas Builders Association McSAM Award for Home of the Year • 2016 Dallas Builders Association • 2017 Atlanta Home Builders Association • 2018 Dallas Builders Association McSAM Award for Best Architectural OBIE Award for Best Building Design of McSAM Award for Best Architectural Design a Detached Home Design • 2017 Dallas Builders Association • 2017 Atlanta Home Builders Association • 2018 Dallas Builders Association McSAM Award for Best Interior OBIE Award for Best Merchandising of McSAM Award for Best Design Series – Merchandising a Detached Home 5T Ranch Community • Offering homes currently priced from • Offering homes currently priced from • Offering homes currently priced from $350k to $950k with square footage $440k to $900k with square footage $559k to $678k with square footage 1,800 to 3,944 2,300 to 4,600 3,238 to 4,241 26
APPENDIX 27
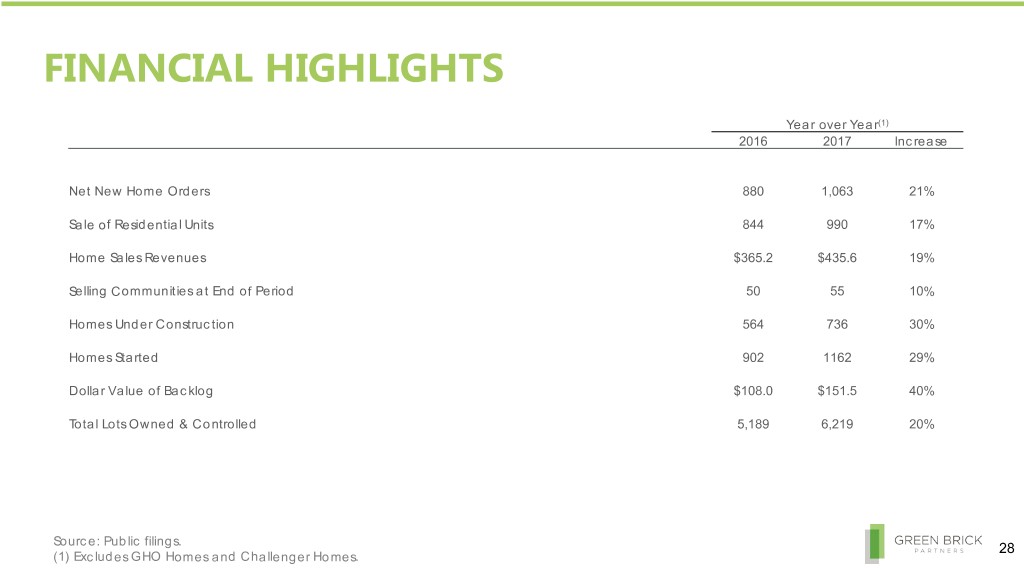
FINANCIAL HIGHLIGHTS Year over Year(1) 2016 2017 Increase Net New Home Orders 880 1,063 21% Sale of Residential Units 844 990 17% Home Sales Revenues $365.2 $435.6 19% Selling Communities at End of Period 50 55 10% Homes Under Construction 564 736 30% Homes Started 902 1162 29% Dollar Value of Backlog $108.0 $151.5 40% Total Lots Owned & Controlled 5,189 6,219 20% Source: Public filings. 28 (1) Excludes GHO Homes and Challenger Homes.
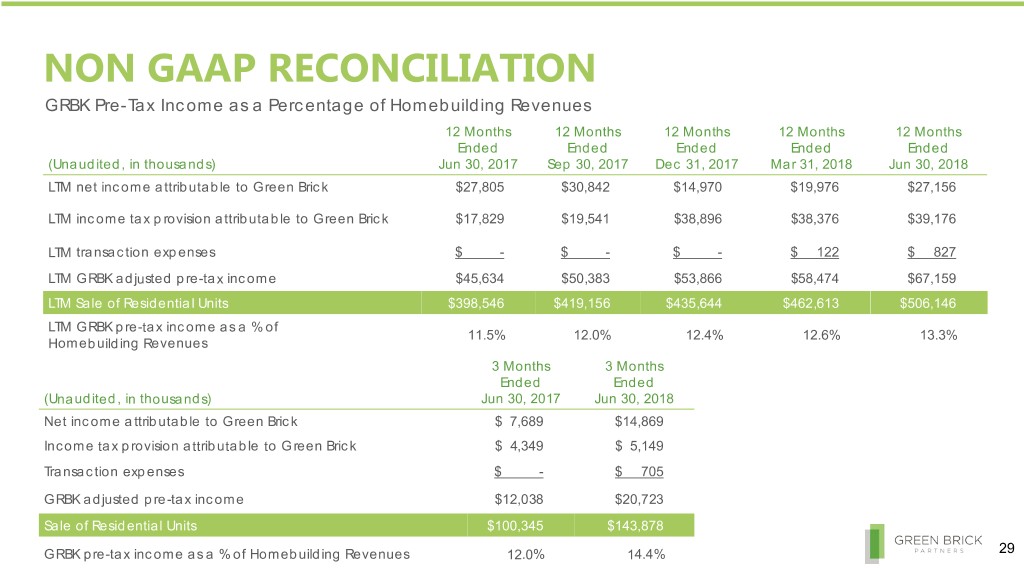
NON GAAP RECONCILIATION GRBK Pre-Tax Income as a Percentage of Homebuilding Revenues 12 Months 12 Months 12 Months 12 Months 12 Months Ended Ended Ended Ended Ended (Unaudited, in thousands) Jun 30, 2017 Sep 30, 2017 Dec 31, 2017 Mar 31, 2018 Jun 30, 2018 LTM net income attributable to Green Brick $27,805 $30,842 $14,970 $19,976 $27,156 LTM income tax provision attributable to Green Brick $17,829 $19,541 $38,896 $38,376 $39,176 LTM transaction expenses $ - $ - $ - $ 122 $ 827 LTM GRBK adjusted pre-tax income $45,634 $50,383 $53,866 $58,474 $67,159 LTM Sale of Residential Units $398,546 $419,156 $435,644 $462,613 $506,146 LTM GRBK pre-tax income as a % of 11.5% 12.0% 12.4% 12.6% 13.3% Homebuilding Revenues 3 Months 3 Months Ended Ended (Unaudited, in thousands) Jun 30, 2017 Jun 30, 2018 Net income attributable to Green Brick $ 7,689 $14,869 Income tax provision attributable to Green Brick $ 4,349 $ 5,149 Transaction expenses $ - $ 705 GRBK adjusted pre-tax income $12,038 $20,723 Sale of Residential Units $100,345 $143,878 GRBK pre-tax income as a % of Homebuilding Revenues 12.0% 14.4% 29
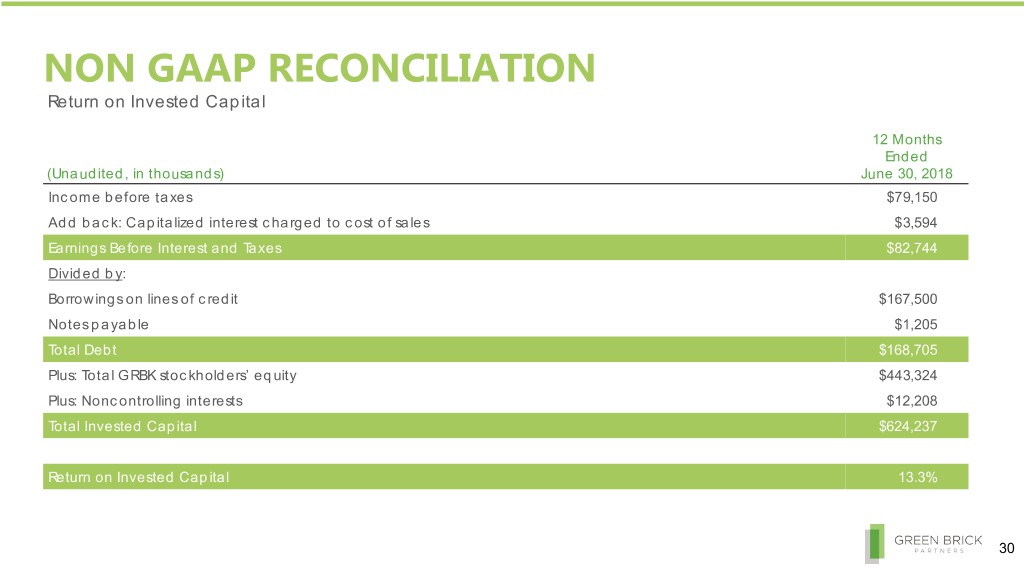
NON GAAP RECONCILIATION Return on Invested Capital 12 Months Ended (Unaudited, in thousands) June 30, 2018 Income before taxes $79,150 Add back: Capitalized interest charged to cost of sales $3,594 Earnings Before Interest and Taxes $82,744 Divided by: Borrowings on lines of credit $167,500 Notes payable $1,205 Total Debt $168,705 Plus: Total GRBK stockholders’ equity $443,324 Plus: Noncontrolling interests $12,208 Total Invested Capital $624,237 Return on Invested Capital 13.3% 30
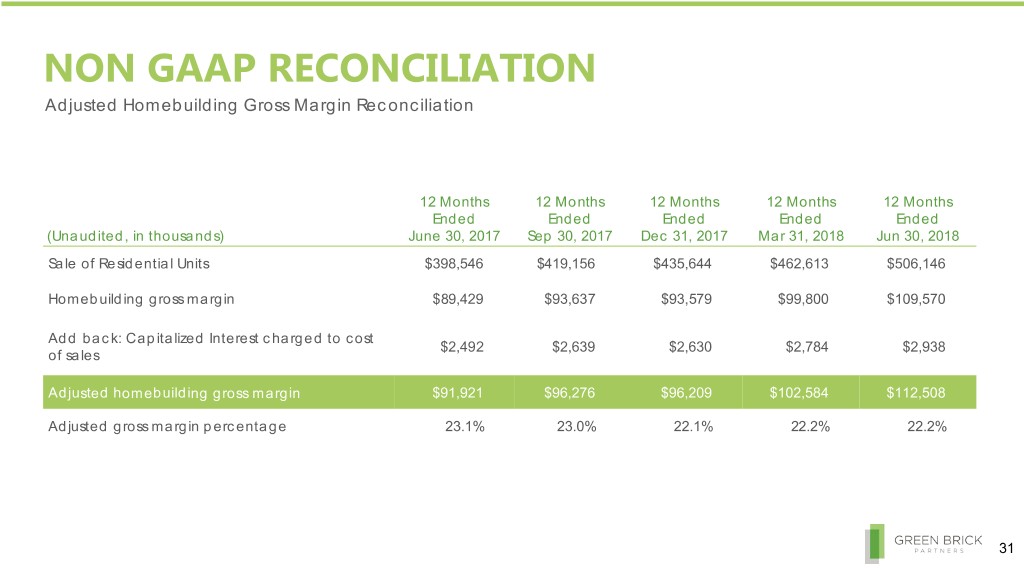
NON GAAP RECONCILIATION Adjusted Homebuilding Gross Margin Reconciliation 12 Months 12 Months 12 Months 12 Months 12 Months Ended Ended Ended Ended Ended (Unaudited, in thousands) June 30, 2017 Sep 30, 2017 Dec 31, 2017 Mar 31, 2018 Jun 30, 2018 Sale of Residential Units $398,546 $419,156 $435,644 $462,613 $506,146 Homebuilding gross margin $89,429 $93,637 $93,579 $99,800 $109,570 Add back: Capitalized Interest charged to cost $2,492 $2,639 $2,630 $2,784 $2,938 of sales Adjusted homebuilding gross margin $91,921 $96,276 $96,209 $102,584 $112,508 Adjusted gross margin percentage 23.1% 23.0% 22.1% 22.2% 22.2% 31

2805 North Dallas Parkway, Suite 400 Plano, TX 75093 www.greenbrickpartners.com 32


