UNITED STATES
SECURITIES AND EXCHANGE COMMISSION
Washington, D.C. 20549
FORM 10-K
| | | | | |
| ☒ | Annual Report pursuant to Section 13 or 15(d) of the Securities Exchange Act of 1934 |
For the fiscal year ended December 31, 2024
OR
| | | | | |
| ☐ | Transition report pursuant to Section 13 or 15(d) of the Securities Exchange Act of 1934 |
Commission File Number: 001-35580
SERVICENOW, INC.
(Exact name of registrant as specified in its charter)
| | | | | | | | |
| Delaware | | 20-2056195 |
(State or other jurisdiction of
incorporation or organization) | | (I.R.S. Employer
Identification Number) |
ServiceNow, Inc.
2225 Lawson Lane
Santa Clara, California 95054
(408) 501-8550
(Address, including zip code, and telephone number, including area code, of registrant’s principal executive offices)
Securities registered pursuant to Section 12(b) of the Act:
| | | | | | | | | | | | | | |
| Title of each class | | Trading Symbol | | Name of each exchange on which registered |
| Common stock, par value $0.001 per share | | NOW | | The New York Stock Exchange |
Securities registered pursuant to Section 12(g) of the Act:
Not applicable
__________________________
Indicate by check mark if the registrant is a well-known seasoned issuer, as defined in Rule 405 of the Securities Act. Yes ☒ No ☐
Indicate by check mark if the registrant is not required to file reports pursuant to Section 13 or Section 15(d) of Act. Yes ☐ No ☒
Indicate by check mark whether the registrant (1) has filed all reports required to be filed by Section 13 or 15(d) of the Securities Exchange Act of 1934 during the preceding 12 months (or for such shorter period that the registrant was required to file such reports), and (2) has been subject to such filing requirements for the past 90 days: Yes ☒ No ☐
Indicate by check mark whether the registrant has submitted electronically every Interactive Data File required to be submitted pursuant to Rule 405 of Regulation S-T (§232.405 of this chapter) during the preceding 12 months (or for such shorter period that the registrant was required to submit such files). Yes ☒ No ☐
Indicate by check mark whether the registrant is a large accelerated filer, an accelerated filer, a non-accelerated filer, a smaller reporting company or an emerging growth company. See the definitions of “large accelerated filer,” “accelerated filer,” “smaller reporting company” and “emerging growth company” in Rule 12b-2 of the Exchange Act.
| | | | | | | | | | | |
| Large Accelerated Filer | ☒ | Accelerated Filer | ☐ |
| Non-Accelerated Filer | ☐ | Smaller Reporting Company | ☐ |
| | Emerging Growth Company | ☐ |
If an emerging growth company, indicate by check mark if the registrant has elected not to use the extended transition period for complying with any new or revised financial accounting standards provided pursuant to Section 13(a) of the Exchange Act. ☐
Indicate by check mark whether the registrant has filed a report on and attestation to its management’s assessment of the effectiveness of its internal control over financial reporting under Section 404(b) of the Sarbanes-Oxley Act (15 U.S.C. 7262(b)) by the registered public accounting firm that prepared or issued its audit report. ☒
If securities are registered pursuant to Section 12(b) of the Act, indicate by check mark whether the financial statements of the registrant included in the filing reflect the correction of an error to previously issued financial statements. ☐
Indicate by check mark whether any of those error corrections are restatements that required a recovery analysis of incentive-based compensation received by any of the registrant’s executive officers during the relevant recovery period pursuant to §240.10D-1(b). ☐
Indicate by check mark whether the registrant is a shell company (as defined in Rule 12b-2 of the Act). Yes ☐ No ☒
Based on the closing price of the registrant’s Common Stock on the last business day of the registrant’s most recently completed second fiscal quarter, which was June 30, 2024, the aggregate market value of its shares (based on a closing price of $786.67 per share on June 30, 2024 as reported on the New York Stock Exchange) held by non-affiliates was approximately $135.0 billion.
As of January 23, 2025, there were approximately 206 million shares of the registrant’s Common Stock outstanding.
DOCUMENTS INCORPORATED BY REFERENCE
Portions of the registrant’s definitive proxy statement for its 2025 Annual Meeting of Stockholders (Proxy Statement) to be filed within 120 days of the registrant’s fiscal year ended December 31, 2024, are incorporated by reference in Part III of this Report on Form 10-K. Except with respect to information specifically incorporated by reference in this Form 10-K, the Proxy Statement is not deemed to be filed as part of this Form 10-K.
TABLE OF CONTENTS
| | | | | | | | |
| | Page |
| | |
| Item 1 | | |
| Item 1A | | |
| Item 1B | | |
| Item 1C | | |
| Item 2 | | |
| Item 3 | | |
| Item 4 | | |
| | |
| | |
| Item 5 | | |
| Item 6 | | |
| Item 7 | | |
| Item 7A | | |
| Item 8 | | |
| Item 9 | | |
| Item 9A | | |
| Item 9B | | |
| Item 9C | | |
| | |
| | |
| Item 10 | | |
| Item 11 | | |
| Item 12 | | |
| Item 13 | | |
| Item 14 | | |
| | |
| | |
| Item 15 | | |
| Item 16 | | |
| | |
| | |
| | |
PART I
FORWARD-LOOKING STATEMENTS
This Annual Report on Form 10-K contains forward-looking statements regarding future events and our future results that are based on our current expectations, estimates, forecasts and projections about our business, our results of operations, the industry in which we operate and the beliefs and assumptions of our management. Words such as “believe,” “may,” “will,” “estimate,” “continue,” “anticipate,” “would,” “could,” “should,” “intend” and “expect,” as well as variations of these words and similar expressions, are intended to identify those forward-looking statements. Forward-looking statements are only predictions and are subject to risks, uncertainties, assumptions and other factors that are difficult to predict. Therefore, actual results may differ materially and adversely from those expressed in any forward-looking statements. Factors that might cause or contribute to such differences include, but are not limited to, those discussed in this Annual Report under “Risk Factors” in Item 1A of Part I and elsewhere herein and in other reports we file with the Securities and Exchange Commission (“SEC”). While forward-looking statements are based on our management’s reasonable expectations at the time that they are made, you should not rely on those statements. We undertake no obligation to revise or update publicly any forward-looking statements for any reason, whether as a result of new information, future events or otherwise, except as may be required by law.
ServiceNow was founded on a simple premise: to make work flow better. Our intelligent platform—the Now Platform—is a cloud-based solution that helps enterprises and organizations across public and private sectors digitize workflows, in line with our purpose of making the world work better for everyone. Organizations are increasingly turning to digital investments to streamline business-critical processes, drive deeper collaboration, increase employee productivity and power better customer experiences. The Now Platform helps business leaders realize value from these investments by incorporating advanced technology into the flow of work, end-to-end across the enterprise, for every department and persona.
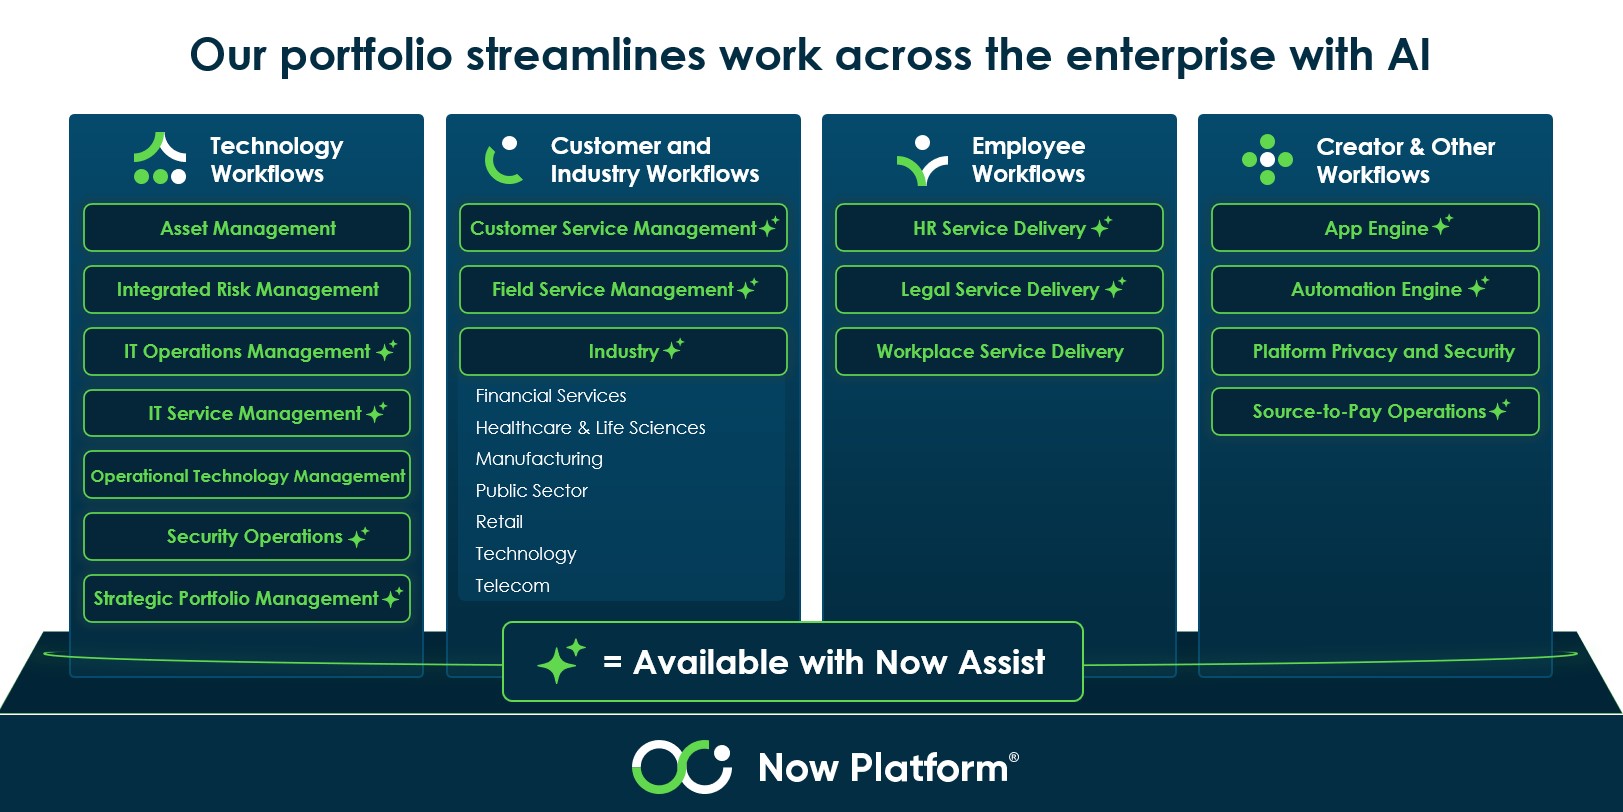
The workflow applications built on the Now Platform are organized in four primary areas: Technology, Customer and Industry, Employee and Creator. Our Technology Workflows empower Information Technology (“IT”) departments to plan, build, operate and service the IT needs of the business enterprise. Our Customer and Industry Workflows help organizations reimagine their customer experience by empowering their customers with personalized self-service and providing organizations with greater ability to anticipate their customer needs by providing real-time insights. Our Employee Workflows help customers simplify how their employees access services they need, creating a consumer-like experience. Our Creator Workflows enable customers to automate processes by quickly creating their own custom workflows on the Now Platform.
Artificial Intelligence (“AI”), particularly Generative AI (“GenAI”) and agentic AI, is driving a new wave of technology transformation. We are an early leader in applying AI to enterprise workflows and are working to remain at the forefront of AI as we continue to execute our product roadmap. As an AI platform for business transformation, the Now Platform has embedded Now Assist, our AI solution available for certain products at an additional cost, to help enhance user productivity and efficiency, thereby accelerating our customers’ return on investment in the Now Platform. For example, with Now Assist, customer service agents can solve customers’ problems quickly with AI-produced case summaries and next step suggestions; employees can obtain faster and more accurate answers using AI-powered self-service, increasing their productivity and engagement; customers can receive enhanced self-service options and improved experiences from live support agents; and developers can generate code and create apps, saving time to focus on more complex matters. We believe that with Now Assist, even customers with limited technical background can leverage AI to meaningfully contribute to their businesses’ digital transformation. Our customers have given us feedback that these enhanced products significantly improve the efficiency and fidelity of their workflows.
Agentic AI, the next evolution of GenAI, involves AI agents that act and interact in smart and autonomous ways with humans providing oversight and guardrails. With agentic AI, humans can be supported by multiple AI agents trained to perform specific tasks, rather than, for example, a single AI assistant or chatbot relying on a human’s specific prompts or queries. Agentic AI is available to our customers as a Now Assist feature, where they can easily create agentic skills tailored to their unique needs. AI agents can use these skills to work together with humans to help augment and accelerate workflow outcomes by performing and completing actions on the human’s behalf.
The Now Platform, utilized by over 85% of the Fortune 500 and nearly 60% of the Global 2000, is a platform of consequence that puts AI to work for people, delivering tangible results while upholding a trustworthy, human‑centered approach to deploying products and services at scale. Many of our customers recognize the advantages of the Now Platform and have developed multi-year digital transformation plans that expand over time the use of ServiceNow products and services for their business. As we gain our customers’ trust by delivering products that provide great experiences and value across our customers’ entire enterprise, we feel immensely proud that “The World Works with ServiceNow.”
Our Products
ServiceNow’s product portfolio—which spans our Technology, Customer and Industry, Employee, Creator and other Workflows—is delivered on the Now Platform. Each year, two major platform upgrades are released, delivering new standard functionality and standalone products to further simplify the way our customers work and enhance productivity. Since launching AI-powered versions of our products, we have continued to expand the Now Assist product portfolio and plan to continue to embed AI capabilities in our portfolio in the future.
The Now Platform
The Now Platform is the AI platform for digital transformation. We help customers leverage emerging AI-based technologies to improve enterprise workflows. We believe AI-enabled workflows allow our customers to enhance their digital transformation and business impact. Transformations enabled by the Now Platform rapidly automate business processes across an entire enterprise by seamlessly connecting disparate departments, systems and silos to unlock productivity and improve experiences for both employees and customers. As the foundation for how we deliver our cross-enterprise digital workflows, the Now Platform orchestrates work across our customers’ cloud platforms and systems of choice, allowing them to get work done regardless of their current and future systems of record and collaboration platforms, across any data and system.
Our one platform, one architecture and one data model approach can provide a “single pane of glass” that connects people, processes, data and devices. It offers a one-stop shop for automation and simplification of manual processes and is highly flexible, scalable and extensible. Enterprises can leverage our platform’s consumer-like user interface to help them deliver seamless experiences. For example, the Now Platform empowers users to independently resolve issues and seek answers through intelligent self-service portals. To illustrate, a customer may need to reset a password or update a shipping address, or an employee may want to know how many vacation days she has remaining. Because the Now Platform contains access to all of this information and the context of the user’s request in a single environment, users can easily access the information or services they need and find their own customized answers without outside help or even knowing which system or department has the answer they need. We believe better service, end-user experience and organizational agility are the ultimate desired outcomes of digital transformation.
The Now Platform is uniquely positioned to bring the full potential of GenAI and agentic AI to the enterprise. With our recent software releases, we have combined the power of the Now Platform with new GenAI and agentic AI features, offered through Now Assist, to provide intelligent workflows throughout our customers’ businesses. Customers have the flexibility to tailor their AI transformation to their unique needs and expand the value of their workflows by using ServiceNow’s large language models (“LLMs”), which include models that can process different types of data, such as text, images, audio and video, and they can incorporate third-party LLMs and their own LLMs. We regularly test these models on platform-representative data to give customers confidence that the models deliver optimal performance for their intended use cases on the Now Platform. We also provide AI governance tools, including built-in monitoring and guardrails, dataset creation management and benchmarking capabilities, and visibility into adoption, usage and performance analytics. These tools are designed to allow customers to securely and responsibly build, test and deploy new use cases and applications leveraging these models. With a single data model and integrated data layer, the Now Platform enables customers to operationalize their AI strategy and transform their business with speed, scale and security. This flexibility helps create more intuitive, efficient and seamless workflows aligned to our customers’ needs. In addition to AI, business process automation on the Now Platform can be further enhanced by other functionality, including machine learning, robotic process automation, process mining, analytics and low-code/no-code development tools.
Technology Workflows
Technology Workflows enable IT departments to serve their customers, manage their IT infrastructure, identify and remediate security vulnerabilities and threats, gain visibility across their IT resources and asset lifecycles, optimize IT costs and reduce time spent on administrative tasks. Our Technology products help companies unite IT, technology, risk management and security operations on a single platform to deliver modern and resilient digital services aligned to our customers’ priorities. These products also drive enterprise-wide outcomes, as well as power our Customer and Industry and Employee Workflows.
Asset Management
Our Asset Management product suite includes IT Asset Management and Enterprise Asset Management. IT Asset Management inventories and automates customers’ software, hardware and cloud asset lifecycles with workflows and analytics to track the financial, contractual and inventory details of these IT assets from end-to-end. Enterprise Asset Management inventories and automates processes across the lifecycle of a customer’s physical business assets from planning, deployment, inventory management and maintenance through retirement.
Integrated Risk Management
Our Integrated Risk Management (“IRM”) product capabilities include policy and compliance management, regulatory change management, compliance case management, IT and operational risk management and audit management. IRM helps customers manage risk and resilience in real time. IRM also includes ESG Management, which helps customers more effectively administer their environmental, social and governance (“ESG”) programs. For example, it can streamline data collection, provide on-demand progress monitoring against key goals and automate reporting.
IT Operations Management
Our IT Operations Management (“ITOM”) product identifies, monitors and manages a customer’s physical and cloud-based IT infrastructure. The ITOM product’s ability to identify a customer’s IT infrastructure (e.g., physical servers) and digital components (e.g., email) allows it to detect whether issues occurring on one or more of those assets
may interfere with business services. It also maintains a single data record for all IT configurable items, allowing our customers to exercise control over their on-premises or cloud-based infrastructures, while orchestrating key processes and tasks. ITOM also includes Cloud Observability, which provides real-time visibility into cloud-native and monolithic environments that power our customers’ internal- and external-facing products and services.
Now Assist for ITOM, our AI solution, simplifies complex technical language into easy-to-understand descriptions and provides quick resolution recommendations to IT operations issues. By doing so, this solution lowers the risk of outages, enhances customer productivity and increases overall service reliability.
IT Service Management
Our IT Service Management (“ITSM”) product is capable of, among others, predictive intelligence, incident management and response, routine task and request automation, performance analytics and process optimization. It also provides a Virtual Agent feature, a chatbot that can answer common questions. ITSM intelligently delivers resilient IT services, reduces costs, boosts IT productivity and provides exceptional experiences to employees, customers and partners.
Now Assist for ITSM, our AI solution, can summarize change requests or enable natural language Virtual Agent interactions and incident history summaries so customer service agents can efficiently resolve incidents. For example, upon incident closure, solution notes or knowledge-based articles can be generated to speed wrap times and adhere to incident management best practices, thereby improving agent productivity and employee experience with faster, more seamless resolutions.
Operational Technology Management
Our Operational Technology (“OT”) Management product suite provides visibility and context into connected devices and technology assets deployed for operational purposes. It enables industrial companies to prioritize, remediate and patch OT vulnerabilities, respond to issues with OT service management capabilities and automate OT asset management throughout the full device lifecycle. For example, when an OT issue is discovered, this product suite provides operators with the business context needed to strategically prioritize its criticality. OT Management will trigger an incident management process that ensures the issue is handled by the appropriate team at the right time.
Security Operations
Our Security Operations product suite connects an organization’s security function with the rest of the enterprise, integrating internal and third-party security and vulnerability data to quickly respond to security incidents and vulnerabilities, prioritized according to their potential impact on a customer’s business. It simplifies and automates threat and vulnerability management and response, while reducing risks to our customers’ organizations.
Now Assist for Security Operations, our AI solution, enhances security operations by providing AI-generated insights through automated workflows. It boosts security analysts’ productivity, accelerates issue resolution and equips chief information security officers and other security leaders with valuable insights for transforming their security operations.
Strategic Portfolio Management
Our Strategic Portfolio Management (“SPM”) product helps customers plan, visualize and track value realization across their portfolio of projects, initiatives and digital products, all on one platform. It enables customers to drive business outcomes by aligning their strategy with investments and execution.
Now Assist for SPM, our AI solution, helps ensure that business demands, related task documentations and feedback, are communicated clearly, efficiently and effectively.
Customer and Industry Workflows
Customer and Industry Workflows help organizations integrate front-end customer service capabilities with operations, order fulfillment and field service resources and can deliver industry-specific use cases. Customer and Industry Workflows help customers create a seamless customer experience from request to resolution by connecting
digital workflows that deliver fast support on a customer’s channel of choice, reducing costs, and modernizing customer experiences. Organizations can elevate their customer service with enhanced resolution efficiency and improved service quality made possible with workflows, automation, AI and task management. Customer service departments no longer need to rely on agents searching multiple systems to find a single resolution to customer requests.
Customer Service Management
Our Customer Service Management (“CSM”) product allows companies to route work to the right agent based on priority and category, which decreases errors by leveraging recommended solutions from prior cases and interactions. It optimizes customer service experiences with workflows that help organizations accelerate customer self-service, boost agent productivity and speed up resolution time. For example, CSM can automate the routing of customer requests to appropriate departments, provide self-service options for customers to troubleshoot common issues, empower agents with access to comprehensive customer data for efficient problem-solving and facilitate timely follow-ups to ensure quick resolution. As a result, organizations can shorten resolution times and increase customer satisfaction—all while reducing costs.
Now Assist for CSM, our AI solution, rapidly generates summaries for cases and chats, reduces manual work and allows agents to resolve customer issues faster. This solution helps accelerate time to resolution, reduce case volume and personalize service, which reduces the effort required by customers.
Field Service Management
Our Field Service Management (“FSM”) product provides work planning, scheduling, resource management and job execution capabilities all in one, which allows field service agents to be assigned and dispatched on the same underlying customer service management platform that created and managed the customer incident. It streamlines field service processes with automation to increase technician productivity, improve first time fix rates and optimize scheduling and dispatching. Organizations can use data-driven insights to enhance operations, identify trends and remove service bottlenecks to maximize efficiency and effectiveness, while also creating great customer and employee experiences.
Now Assist for FSM, our AI solution, helps customers quickly summarize key takeaways for pre-work triage and job completion, minimizing time spent searching through conversation histories. It accelerates productivity by simplifying work order task summarization and knowledge generation.
Industry
We offer industry solutions to better address the unique needs for specific industries, including, for example, financial services, healthcare and life sciences, manufacturing, public sector, retail, technology and telecommunications. We expect the number of industry-specific solutions to grow as we gain adoption in new industries.
| | | | | |
Financial Services | Financial Services Operations allows banking and insurance institutions to reduce contact center volumes with Now Assist. It provides frictionless service experiences that use AI across teams and systems and ensures compliance with embedded controls. |
Healthcare and Life Sciences | Healthcare and Life Sciences Service Management uses Now Assist to allow organizations to enhance patient care, unlock productivity and streamline operations. Clinical Device Management provides a single dashboard from which healthcare providers may efficiently manage and service clinical devices, while also improving their ability to meet compliance requirements. |
Manufacturing | Manufacturing Commercial Operations uses Now Assist and automated workflows to streamline sales, support and service processes, accelerate order fulfillment, optimize customer experiences and drive revenue growth for manufacturers. |
Public Sector | Public Sector Digital Services uses Now Assist to empower governments of all sizes to build seamless experiences at scale. Agencies can share a single instance to facilitate complete collaboration, thereby increasing the speed of service delivery and adding transparency. |
Retail | Retail Operations and Retail Service Management leverages Now Assist and automated workflows to streamline retail store operations by simplifying store tasks and day-to-day activities, while providing headquarters with visibility into in-store performance. These solutions improve employee and customer experiences and reduce costs. |
Technology | Technology Product Service Management with Now Assist and Sales & Order Management for Technology Providers brings customer service, service delivery and customer operations together on a single, intelligent system of action and enables technology providers to reduce time to market and increase customer satisfaction at reduced operational cost. |
Telecom | Telecom Service Management, Sales & Order Management for Telecom, Network Inventory Management and Telecom Service Operations Management offer communication service providers the ability to leverage automation and AI to streamline the end-to-end service experience and accelerate growth while reducing costs. Workflows use Now Assist to help maximize technology investments, scale sales and order management processes, launch telecom services quickly, enhance customer care, automate service assurance and optimize network management on a single platform. |
Employee Workflows
Employee Workflows help organizations transform the employee experience, improve productivity, increase employee satisfaction and fuel business growth. ServiceNow makes it easy for employees to answer their own questions, while automating mundane tasks for agents. With the Now Platform, organizations can empower career growth, make smarter talent decisions, modernize workplace management and experiences to create more collaborative in-office spaces, and streamline contract management and legal operations.
HR Service Delivery
Our HR Service Delivery (“HRSD”) product helps organizations transform the employee experience by providing a portal that makes it easy for employees to conveniently access answers, actions and guidance. It helps employees navigate key career milestones and life events with step-by-step guidance.
Now Assist for HRSD, our AI solution, enables employees to quickly obtain answers to common HR questions and take action directly through Virtual Agent, while also reducing redundant manual tasks for service agents, thereby helping HR leaders drive productivity and operational efficiency. From payroll discrepancies to employee information updates, service agents can resolve issues faster with instant summaries of case topics, chat history, Virtual Agent interactions and previous resolutions. With Now Assist and prompts that use AI, organizations can quickly generate knowledge-based articles to deflect similar cases in the future and drive proactive employee behavior such as reminders, tasks and approvals.
Legal Service Delivery
Our Legal Service Delivery (“LSD”) product suite replaces individual legal requests received through email with automated workflows that not only allow practitioners to keep track of the status of requests but also provide them visibility into interconnected legal requests. In addition, LSD’s Virtual Agent feature can automate responses to common questions. Using LSD real-time reports and dashboards, organizations can make data-driven decisions, anticipate demand for legal services, and drive continuous improvement for a company’s legal department. LSD helps organizations increase practitioner productivity, reduce risk and accelerate business outcomes through more efficient legal operations. For example, the LSD product suite includes Contract Management Pro, which helps legal, procurement, sales and IT teams streamline contract lifecycle management through a self-service portal for contract intake requests, driving operational efficiency and reducing risk.
Now Assist for LSD, our AI solution, provides practitioners with auto-generated summaries of their legal requests and matters, thereby allowing them to more easily track and manage these workstreams.
Workplace Service Delivery
Our Workplace Service Delivery product helps organizations manage workplace services, facilities and real estate. With Workplace Service Delivery, companies can optimize their workspace with real-time analytics and indoor mapping capabilities, and can automate workplace requests, reservations and repairs, and track health and safety incidents to keep workplaces running smoothly.
Creator & Other Workflows
Creator Workflows help customers quickly build and manage cross-enterprise workflows with a low-code development experience that safely delivers agile services at scale and with features that allow customers to manage security and storage. As organizations digitally transform, they need to adapt faster with new processes and business models. This requires fast and agile execution with more automation delivered throughout an organization’s business processes. With Creator Workflows, citizen developers have access to pre-built templates, low-code tools and modular building blocks created by professional developers. We enable Creator Workflows through App Engine and Automation Engine, among other products.
App Engine
Our App Engine product empowers our customers’ employees to create enterprise-class workflows using low-code and no-code development tooling and does not require formal coding experience. App Engine delivers intuitive and intelligent development experiences, designed for speed, security and scale. Examples of the types of workflows our customers have developed using App Engine include applications for:
•a healthcare institution to streamline health research for providers and patients to share and track health data in a private and secure manner;
•a retailer to manage the workflow for loss prevention, fraud protection and asset protection in retail locations;
•the management of licensing, contracting and compliance examinations and financial reviews, replacing a months-long, manual process with a 30-minute automated process; and
•providing overnight loans in different currencies for central banks.
App Engine can also be used in conjunction with Now Assist for Creator, our AI solution, to quickly create and scale apps on the Now Platform. Trained on code from ServiceNow engineering, results generated with Now Assist for Creator are generally higher quality and more scalable and secure than other code generation technology. This solution includes text-to-code, which converts natural language text into high-quality code suggestions, and in some cases into complete code, enabling faster development and increased productivity.
Automation Engine
Our Automation Engine product helps workflows integrate by connecting or automating systems, documents or tasks with minimal code. Integration to data in third-party systems is executed and secured using application programming interfaces (or “APIs”), while manual work can be eliminated by leveraging robotic process automation and intelligent document processing capabilities. Automation Engine includes process mining capabilities that can uncover trends and patterns in business processes and help eliminate redundancies and drive process optimization along with cost and productivity efficiencies.
Automation Engine can also be used in conjunction with Now Assist for Creator, our AI solution, to automate essential functions, including flow generation, code generation and app generation, allowing developers to create complex workflows and applications using natural language prompts. This automation can significantly boost productivity by reducing development time and enabling both novice and experienced developers to build more reliable applications.
To help customers in key business functions, we also enable other workflows through Platform Privacy and Security and Source-to-Pay Operations, among other products.
Platform Privacy and Security
Our Platform Privacy and Security products provide premium security, privacy and encryption controls to help our customers protect and control their sensitive data in the cloud.
Source-to-Pay Operations
Our Source-to-Pay Operations suite connects to customers’ existing enterprise resource planning and procurement systems, delivering a guided experience and highly automated processes that reduce cycle time and cuts costs across procurement, supplier management and accounts payable processes.
Now Assist for Source-to-Pay Operations, our AI solution, delivers simple experiences that can turn conversations into requisitions, making it easy for new or occasional users to follow the right process and reduce rogue spend.
Customer Support, Professional Services and ServiceNow Impact
Customer Support
We offer our customers standard and enhanced support, from technical resources located around the globe, on a subscription-based model, as well as self-service technical support through our support portal, which provides access to documentation, knowledge-based articles, online training, online support forums and online case creation.
Professional Services
Our Professional Services, offered by ServiceNow directly and through our network of partners, include process design, implementation, configuration, architecture and optimization services that help our customers maximize the value of their ServiceNow investment. With a strong implementation methodology at the core of its foundation, our Professional Services help customers succeed by giving them access to ServiceNow product experts and technical best practices. Our training services include programs for all our products.
ServiceNow Impact
ServiceNow Impact helps our customers accelerate the value they realize with our products and solutions. Through our subscription-based model, we offer our customers software tools and AI-driven recommendations that help increase adoption of ServiceNow solutions within their organizations, as well as with their customers. It also proactively monitors platform health, and tracks and reports on key platform metrics. In addition, ServiceNow Impact customers have access to designated experts, on-demand training, technical support and other services.
Our Technology and Operations
We operate a multi-instance architecture that provides each customer with its own dedicated application logic and databases. This architecture is designed to deliver high-availability, scalability, performance, security and control. Our cloud infrastructure primarily consists of industry-standard servers, networks and storage components. We host our full software-as-a-service (“SaaS”) experience on our own private cloud or customers may elect to use public cloud service providers.
Our data centers operate in paired configurations to enable replication for high-availability and redundancy. We currently operate data centers in North America, South America, Europe, Asia and Australia, and we continuously evaluate our data center operations and capacity in existing and new geographies.
We offer customers the option to deploy our services on dedicated hardware in our data centers. Our architecture also gives us the added flexibility to allow customers to deploy our services internally in their own data centers, with public cloud service providers, or with a third party to support unique regulatory or security requirements. While there are some limitations on agility and flexibility as compared to our cloud offering, a minority of our customers have elected the third-party alternative. The standard and enhanced customer support we provide to customers that deploy our services outside of our data centers is similar to the support we provide to customers deployed in our managed data centers.
Sales and Marketing
We market and sell our products and services to enterprises across a wide variety of industries. We sell our product offerings and services through subscription services primarily through our global direct sales organization. We also sell services through managed service providers and resale partners.
Our marketing efforts and lead generation activities consist primarily of customer referrals, digital advertising (including via our website), trade shows, industry events, brand campaigns and press releases. We also host our annual Knowledge user conference, webinars and other user forums, including regional forums, which we call World Forums, where customers and partners both participate in and present on a variety of programs designed to educate them on industry best practices and help accelerate their success.
We continue to expand our sales capabilities in new geographies, including through investments in direct and indirect sales channels, professional services capabilities, customer support resources, post-sales customer support resources, strategic alliances and partnerships, implementation partners and advisory councils. We also plan to increase our investment in our existing locations in order to achieve scale efficiencies in our sales and marketing efforts.
Partner Ecosystem
In addition to our global direct sales organization, we have a strong and growing ecosystem of partners that helps accelerate our customers’ digital transformation initiatives and deliver customer value at scale. They play a critical role in helping companies digitally transform their businesses. We have reimagined our program to include more flexibility and choice and are empowering partners worldwide to help us reach new markets and industries while innovating faster and together. Our industry and workflow capabilities paired with our partners’ industry and functional domain expertise help customers of all sizes. Together with our partners, we offer industry and domain-focused solutions at scale and are accelerating digital transformation as we help companies drive new approaches in engaging their end users and employees.
We are seeing continued momentum across the partner ecosystem. For example, we have expanded our relationships with a number of technology companies to enhance enterprise AI capabilities. Our latest initiative with NVIDIA, for example, focuses on co-developing native AI agents on the Now Platform, using NVIDIA Agent Blueprints, which are AI
workflow templates built on NVIDIA NIM microservices software, tailored for specific use cases. We have also expanded our relationships with cloud providers to enhance cloud capabilities. For example, our security incident response product can integrate with Amazon Web Service’s Security Hub to automate the creation of security incident records. Additionally, Now Assist and Microsoft 365 Copilot can be integrated such that both agents provide an elevated AI experience for our joint customers. Through these relationships, users can leverage their existing spending commitments with cloud providers to procure ServiceNow products. Further, our relationships with global system integrators such Accenture, Cognizant, Deloitte, EY and KPMG continue to help us expand our business by offering ServiceNow solutions to their customers.
Customers
We primarily sell our services to large enterprise customers, and we host and support large, enterprise-wide deployments for our customers. As of December 31, 2024, we had approximately 8,400 customers. Our customers operate in a wide variety of industries. The portion of our revenues generated by sales to government customers has also increased over time. See “Risk Factors—Doing business with the public sector and heavily-regulated entities subjects us to risks related to the government procurement process, regulations, and contracting requirements” for additional information about our sales to government customers.
Research and Development
Our research and development organization is responsible for the design, development, testing and validation of our solutions. We focus on innovating and developing new services and core technologies and further enhancing the functionality, reliability and performance of our existing solutions. Using emerging technologies, we can anticipate customer demands and then bring new services and new versions of existing services to market quickly in order to remain competitive in the marketplace. We have made, and will continue to make, significant investments in research and development to broaden our platform capabilities, strengthen our existing applications, expand the number of applications on our platform, enhance our user experience and develop additional mobile, automation, AI and machine intelligence technologies.
Acquisitions and Investments
We have acquired and invested in companies and technologies as part of our business strategy and will continue to evaluate and enter into potential strategic transactions, including, among other things, acquisitions of or investments in businesses, technologies, services, products and other assets. These transactions are intended to, among other things, expand or improve our service offerings and functionality, go-to-market and sales efforts, our operations or our ability to source necessary expertise and provide services in international locations.
Competition
Our business is highly competitive, rapidly evolving and fragmented, and subject to disruptive technologies with low barriers to entry, to shifting customer needs and to frequent introductions of new products and services. As our business expands and the industries in which we operate evolve, we increasingly find ourselves in competition with solutions and alternative approaches to solving customer needs, including, among others:
•enterprise application software vendors (including cloud-based and traditional on-premises vendors) such as Oracle, SAP, Salesforce and Workday;
•new technologies and entrants (including both point-solutions and platform solutions covering a wide range of functionalities);
•custom development and in-house solutions;
•technology consultants;
•systems integrators; and
•software resellers.
For additional information about competition, see “Risk Factors—A failure to innovate in response to rapidly evolving technological changes and in the midst of an intensely competitive market may harm our competitive position and business prospects.”
Intellectual Property
We rely upon a combination of U.S. and international copyright, trade secret, patent and trademark laws and confidentiality procedures and contractual rights and restrictions to establish, protect and grow our intellectual property (“IP”) rights. We enter into confidentiality and proprietary rights agreements with our employees, partners, vendors, consultants and other third parties and limit access to our IP and other proprietary information. We also purchase or license IP and technology that we incorporate into our products or services.
We continue to grow our global patent portfolio and IP rights that relate to our business. Our success depends in part upon our ability to protect our core technology and IP. As of December 31, 2024, we had over 2,000 U.S. and foreign patents, including patents acquired from third parties, and over 600 pending patent applications. We do not believe that our proprietary technology is dependent on any single patent or group of related patents. See “Risk Factors—We may not be able to protect or enforce our intellectual property rights.”
Our Ambition, Values and Corporate Purpose
Our ambition to become the defining enterprise software company of the 21st century is the driving force behind our overall business strategy and is guided by our values:
•Wow our customers: Customers are the center of our world. We strive to deliver the best customer experiences and innovations.
•Win as a team: We share the same goals and have clear roles in achieving them. We deliver results as a team and enjoy the journey.
•Create belonging: We lead with empathy, which means listening and acting to make everyone feel they belong with ServiceNow.
•Stay hungry and humble: We do not take success for granted. We are always ready to learn and evolve. We grow together, bringing fresh ideas and new perspectives.
These values have endured even as our headcount has rapidly increased over the years and we have continued to grow our business. By prioritizing these values, we are able to gain the trust of our employees and customers and work towards fulfilling our corporate purpose to “make the world work better for everyone.”
Environmental, Social and Governance
Our ESG strategy is aligned to our corporate purpose. We continue to build on our commitments and capabilities to sustain our planet (environmental), create equitable opportunities (social) and act with integrity (governance). Our year-over-year progress is included in our annual Global Impact Report, which details our ESG strategy, initiatives and performance. Our Global Impact Report is aligned with globally-recognized ESG reporting standards.
Human Capital Management
Our People Pact
Our People Pact is pivotal to our ability to fulfill our corporate purpose and is a commitment to helping each other live our best lives, do our best work and fulfill our purpose together. To deliver on this promise, we follow a Global People Strategy that serves as the foundation for how we plan and deliver on employee programming and experiences:
| | | | | | | | | | | | | | | | | | | | |
| People Led | | Data Driven | | AI Powered |
| | | | |
| Deliver on the People Pact through a product mindset that puts the user at the center of all program, process, and service delivery design | | Recruit and retain an inclusive and agile workforce through data use that accelerates growth and mitigates bias | | Make it easy to create and use AI to maximize talent impact and value |
Culture and Inclusion
Our culture is grounded in our values. We live our culture by regularly listening to our people and gathering feedback directly from our workforce to inform our programs and meet employee needs globally. Our Employee Voice Survey (“EVS”) measures and analyzes employee engagement, including inclusion and belonging, learning and development, recognition, compensation and wellbeing. EVS insights are used to create action plans at all levels of the organization and inform the assessment of our human capital management approach and its alignment with our purpose and business strategy.
“Create Belonging” is one of our four company values that guides our ambition. We aim to create a safe, seen, heard and connected workplace for our employees of all backgrounds and experiences so that they can work together to create better products and services that serve our equally diverse and global customer base and ultimately better business outcomes for ServiceNow. To build a strong culture, we have implemented initiatives that weave inclusion throughout the employee experience - from hiring, to learning and development and career advancement. Our global inclusion framework focuses on three key areas:
| | | | | | | | | | | | | | |
| Business | | Community | | Strategic Partnerships |
| | | | |
| Enable each function to build the most innovative teams possible through a global and data-driven approach that drives structural inclusion and improves equitable outcomes for all | | Strengthen and expand our inclusive culture throughout the industry through RiseUp with ServiceNow | | Engage strategic partners to provide a wide variety of development opportunities that meet the evolving needs and skills of our employees and the communities we reach |
As a technology leader, we believe in broadening our reach to underserved communities, providing them with access to technology and training, helping them unlock new opportunities. To help achieve this objective, we created RiseUp with ServiceNow – a training, certification, upskilling and career placement program. This initiative reflects our commitment to building career pathways for non-traditional tech talent by removing barriers and improving access to technology, knowledge and opportunity.
Learning and Development
Our global learning and development programs, under the ServiceNow University (“SNU”) umbrella, deliver skilling tools and processes, and technical AI, industry, professional and leadership programs. SNU empowers employees, customers, partners and future talent with advanced skills. SNU combines education and experience, leveraging the Now Platform to fuel continuous growth in talent.
Total Rewards and Pay Equity
Our total rewards are designed to help us attract and retain the best talent. We believe that our rewards should be competitive and equitable, and we are committed to recognizing exceptional performance. In support of this, all our employees are eligible to participate in our annual cash bonus plan or, for those in quota-carrying roles, our sales commission plan, in addition to their base pay. We also have a broad-based discretionary equity incentive program and an employee stock purchase plan, which enable employees to share in our success.
We understand that our employees perform their best when they have the resources they need to feel healthy, supported and secure. To support this, we offer a comprehensive range of benefits and wellbeing programs that cover physical, emotional, social and financial wellbeing. Additionally, we provide our employees with additional time away through “Wellbeing Days” to pause, recharge and further support their health and wellbeing.
We continue to maintain systematic gender pay equity for our employees across the globe and, in the U.S., on the basis of race, ethnicity, as well as gender. Every year, we partner with an independent third-party expert to examine whether any statistically significant differences in compensation exist after considering factors such as experience, role, location and performance and make adjustments, as warranted.
Ways of Working
While we value in-person activities, we are committed to embracing ways of working that promote flexibility and inclusion, support employee wellbeing and drive innovation. A substantial portion of our employees work partially or fully remote. We believe such an environment will only serve to strengthen our company.
Workforce Metrics
As of December 31, 2024, we employed 26,293 people on a full-time basis, 13,193 in the United States and 13,100 internationally. None of our U.S. employees are represented by a labor union. Employees in certain countries are represented by workers’ councils or employee representatives or have the benefits of collective bargaining arrangements at the national and/or sector level. We have not experienced interruptions of operations or work stoppages due to labor disagreements.
Available Information
You can obtain copies of our Annual Report on Form 10-K, Quarterly Reports on Form 10-Q, Current Reports on Form 8-K, and other filings with the SEC, and all amendments to these filings, free of charge from our website at www.servicenow.com/company/investor-relations/sec-filings.html as soon as reasonably practicable after we file or furnish them with the SEC. The SEC maintains an Internet site that contains reports, proxy and information statements and other information regarding issuers that file electronically with the SEC at www.sec.gov. The contents of, or accessible through, these websites are not incorporated into this filing. Our references to the URLs for these websites are intended to be inactive textual references only.
Investors and others should note that we announce material financial information to our investors using our investor relations website (https://www.servicenow.com/company/investor-relations.html), SEC filings, press releases, public conference calls, webcasts and social media. We use these channels, including our website and social media, to communicate with our investors and the public about our company, our products and solutions and other issues. It is possible that the information we post on social media could be deemed to be material information. Therefore, we encourage investors, the media and others interested in our company to review the information we make available on our website and the social media channels listed on our website.
Investing in our securities involves risks. You should carefully consider the risks and uncertainties described below, together with the other information in this Annual Report on Form 10-K, before making an investment decision. The occurrence of any of the following risks, or additional risks and uncertainties not presently known to us or that we currently believe to be immaterial, could materially and adversely affect our business, financial condition, results of operations, stock price or reputation. The following risks have been grouped by categories and are not in order of significance or probability of occurrence.
Risk Factors Summary
This summary provides an overview of the risks we face and should not be considered a substitute for the more fulsome risk factors discussed immediately following this summary.
•Risks Related to Our Ability to Grow Our Business
•Laws, regulations and customer expectations regarding the use, storage and movement of data may restrict our ability to continue to optimize our platform.
•A failure to innovate in response to rapidly evolving technological changes and in the midst of an intensely competitive market may harm our competitive position and business prospects.
•We may not successfully increase our penetration of international markets or manage risks associated with foreign markets.
•Incorporating AI technology into our offerings may result in operational, legal, regulatory, ethical and other challenges.
•We rely on our network of partners for an increasing portion of our revenues, and if these partners fail to perform, our business may be harmed.
•Doing business with the public sector and heavily-regulated entities subjects us to risks related to government procurement processes, regulations and contracting requirements.
•If we fail to comply with applicable anti-corruption and anti-bribery laws, export control laws, economic and trade sanctions laws, or other global trade laws, we could be subject to penalties and civil and/or criminal sanctions and our business could be materially adversely affected.
•Our customer deals are becoming more complex, which tend to involve longer and more expensive sales cycles, increased pricing pressure and implementation and configuration challenges.
•As we acquire or invest in companies and technologies, we may not realize the expected business or financial benefits and the acquisitions and investments may divert our management’s attention and result in additional shareholder dilution or costs.
•Risks Related to the Operation of Our Business
•Actual or perceived cybersecurity events experienced by us or our third-party service providers may create the perception that our platform is not secure, and we may lose customers or incur significant liabilities.
•We may lose key members of our management team or qualified employees or may not be able to attract and retain employees we need.
•Delays in the release of, or actual or perceived defects in, our products may slow the adoption of our latest technologies, reduce our ability to efficiently provide services, decrease customer satisfaction, and adversely impact future product sales.
•Disruptions or defects in our services could damage our customers’ businesses, subject us to substantial liability and harm our business.
•Delays in improving our information systems and processes could interfere with our ability to support our existing and growing customer and employee base as we scale.
•We may not be able to protect or enforce our intellectual property rights.
•Our use of open-source software could harm our ability to sell our products and services and subject us to possible litigation.
•Various factors, including our customers’ business, integration, migration, compliance and security requirements, or errors by us, our partners, or our customers, may cause implementations of our products to be delayed, inefficient or otherwise unsuccessful.
•Our failure or perceived failure to achieve our ESG goals or maintain ESG practices that meet evolving stakeholder expectations could adversely affect us.
•We may face natural disasters, including climate change, and other events beyond our control.
•Risks Related to the Financial Performance or Financial Position of Our Business
•Because we generally recognize revenues from our subscription service over the subscription term, a decrease in new subscriptions or renewals may not be immediately reflected in our operating results.
•As our business grows, we expect our revenue growth rate to decline over the long term.
•Changes in our effective tax rate or disallowance of our tax positions may adversely affect our business.
•We may be adversely affected by our debt service obligations.
•Risks Related to General Economic Conditions
•Our industry and business may be harmed by global economic conditions.
•We may be harmed by foreign currency exchange rate fluctuations.
•Risks Related to Ownership of Our Common Stock
•Our stock price is likely to continue to be volatile.
•Provisions in our governing documents or Delaware law might discourage, delay or prevent a change of control or changes in our management and, therefore, depress our stock price.
Risks Related to Our Ability to Grow Our Business
Laws, regulations and customer expectations regarding the use, storage and movement of data may restrict our ability to continue to optimize our platform.
Governments have adopted, and likely will continue to adopt, laws and regulations affecting the use, storage and movement of data, including laws related to data privacy and security, the use of machine learning and artificial intelligence (“AI”), and data sovereignty or residency requirements. Changing laws, regulations and standards applying to the collection, storage, use, sharing, portability, transfer or other control or processing of data, including personal data, could affect our ability to efficiently and cost-effectively offer our services and to develop our products and services for maximum utility, as well as our customers’ ability to use data or share data. Such changes may restrict our ability to use, store or otherwise process customer data in connection with providing services and could alter or increase our compliance requirements. In some cases, this could impact our ability to offer our services in certain locations or our customers’ ability to deploy our services globally. For example, the EU Data Act has significant requirements regarding data portability, interoperability and accessibility and unclear data transfer restrictions, any of which could impact our operations. In addition, the relatively new Trans-Atlantic Data Privacy Framework, which facilitates the transfer of data between the United States (“U.S.”) and European Union (“EU”), may be subject to legal challenges and regulatory interpretations that could create uncertainties and impact our operations and compliance obligations.
We offer region-specific services, by which customer data is hosted locally and customers may elect to receive support from locally-based ServiceNow teams. Setting up and maintaining these region-specific services require significant investment, including to comply with applicable laws and regulations. Actual or perceived non-compliance with those laws and regulations could result in proceedings or investigations against us by regulatory authorities or others, lead to significant fines, damages, orders, litigation or reputational harm and may otherwise adversely impact our business.
We will also need to continually adapt to customer privacy and security requirements as they change over time. For example, as customers increasingly adopt a hybrid (on-premises and off-premises/hyperscale cloud) approach for their IT workloads, our cloud services may fail to address evolving customer requirements, including data localization. Further, due to heightened concerns relating to privacy and security regulatory matters, our customers may request certain certifications and failure to obtain, or consistently maintain, those certifications may adversely impact our reputation and business.
A failure to innovate in response to rapidly evolving technological changes and in the midst of an intensely competitive market may harm our competitive position and business prospects.
We compete in markets that evolve rapidly. The pace of innovation will continue to accelerate as customers recognize the advantages of acquiring leading digital technologies and adopting modern cloud-based infrastructure. Cutting-edge capabilities such as AI, machine learning, hyper automation, low-code/no-code application development, system observability and predictive insights become increasingly relevant to the customer’s evolving needs. With this rapid evolution, we are increasingly competing with alternative solutions and approaches to solve customer needs, and we expect additional competition as we shift our products and services to compete with providers in new and adjacent markets.
Competitors, regardless of their size, may be able to respond more quickly and effectively to new or changing opportunities, technologies, standards, customer requirements and buying practices. They may introduce new technology, solve similar problems in different ways or more effectively utilize existing technology that reduces demand for our services. They may utilize acquisitions, integrations or consolidations to offer integrated or bundled products, enhanced
functionality or other advantages. Some of our existing competitors and potential competitors are larger and have greater name recognition, the ability to more efficiently scale their business, more established operations and customer relationships, and greater financial and technical resources than we do. “Systems of record” operators may attempt to create technology solutions or other mechanisms that would prevent our systems from integrating with theirs. They may create pricing pressures by reducing the price of competing products, services or subscriptions or bundling their offerings causing our offerings to appear relatively more expensive. Competition from cloud-based vendors may increase as they build business applications or AI powered automation solutions that compete with our products and services. We may also encounter customer reluctance or unwillingness to migrate away from their current solutions.
If we are not able to compete successfully, we could experience reduced sales and margins, losses or failure of our products to achieve or maintain market acceptance. Accordingly, to compete effectively, we must:
•identify and innovate in the right technologies;
•keep pace with rapidly changing technological developments, such as AI, which may disrupt resource and talent needs and the enterprise software marketplace;
•accurately predict and meet our customers’ changing digital transformation needs, priorities and adoption practices, including their technology infrastructures and buying and budgetary practices;
•invest in and continually optimize our own technology platform so that we continue to meet the very high-performance expectations of our customers;
•successfully deliver and promote new, scalable technologies and products to meet customer needs and priorities;
•efficiently integrate with technologies within our customers’ digital environments;
•expand our offerings into new and adjacent industries and comply with regulations in such industries;
•successfully sell to buyers who are not familiar with our offerings;
•profitably and efficiently market and sell our new and existing products;
•effectively scale our business processes and operations as we grow;
•successfully adapt new pricing models;
•promote ongoing customer relationships and customer value realization;
•effectively secure our platform, data and customers’ data; and
•effectively deliver, directly or through our partner ecosystem, the digital transformation process planning, IT systems architecture planning, and product implementation services that our customers require to be successful.
Further, in response to evolving customer needs, we may make significant investments in changing how we offer our products or services, such as bundling offerings or shifting to consumption-based pricing for support services or how our services are delivered or priced. However, customers may not be satisfied with these changes and, therefore, may not grow or maintain their business with us.
We may not successfully increase our penetration of international markets or manage risks associated with foreign markets.
Sales outside of North America represented 37% and 36% of our total revenues for the years ended December 31, 2024 and 2023, respectively. The growth of our business depends on our ability to increase our sales outside of the U.S. as a percentage of our total revenues. Additionally, operating in international markets requires significant investment and management attention and subjects us to varying regulatory, political and economic risks. We have made, and will continue to make, substantial investments in data centers, geographic-specific service delivery models, advisory councils, cloud computing infrastructure, sales, marketing, partnership arrangements, personnel and facilities in new geographic markets. When we make these investments, it is typically unclear when we will see a return on our investment, and we may significantly underestimate the level of investment and time required to be successful. Our rate of acquisition of new large enterprise customers, a factor affecting our growth, has been generally lower in territories where we are less established and where there may be heightened or evolving regulations and operational and IP risks. We have experienced, and may continue to experience, difficulties in new geographic markets, including hiring qualified sales management personnel, penetrating the target market, and managing local operations. Risks associated with making our products and services available in international markets include, for example:
•compliance with multiple, conflicting and changing governmental laws and regulations;
•requirements to have local partner(s), local entity ownership limitations or technology transfer or sharing requirements, or to comply with data residency and transfer laws and regulations, privacy and data protection laws and regulations, which may increase operational costs and restrictions;
•the possibility that illegal or unethical activities of our local employees or business partners will be attributed to us or cause us harm;
•longer and potentially more complex sales and payment receipt cycles and other collection difficulties;
•different pricing and distribution environments;
•potential changes in international trade policies, tariffs, agreements and practices, including the adoption and expansion of formal or informal trade restrictions or regulatory frameworks that may favor local competitors;
•governmental direction, business practices and/or cultural norms that may favor local competitors;
•more prevalent cybersecurity, intellectual property and AI risks; and
•localization of our services, including translation into foreign languages and associated expenses.
If we are unable to manage these risks, our business will be adversely affected.
Incorporating AI technology into our offerings may result in operational, legal, regulatory, ethical and other challenges.
We are increasingly innovating and expanding offerings on our platform by integrating AI technology. We expect AI to be an increasingly important driver of future growth, although, like many innovations, it presents risks and uncertainties that may impact our ability to realize its desired or anticipated benefits for our business.
AI technology is rapidly evolving and to remain competitive, we will need to make significant investments to continue to successfully develop and incorporate the technology into our products. Our ability to incorporate AI technology into our products depends on the availability and pricing of third-party hardware and software equipment and technical infrastructure. Our competitors or other third parties may develop or incorporate AI into their products more quickly or successfully than us. Other companies may also have or in the future may obtain intellectual proprietary rights that would prevent, limit, or interfere with our ability to make, use, or sell our AI products. For these reasons, among others, we may not be able to compete effectively in the evolving AI market.
Our business model may be affected by global trends and laws that govern the use of AI and machine learning. For example, the EU AI Act places new requirements on providers of AI technologies that will need to be addressed in alignment with various deadlines in the coming years. These and other laws or regulations may cause us to modify our data handling and compliance practices, which could be costly or disruptive to our operations, and may also impact our ability to use certain data to support our products or our product development efforts or hinder our customers’ ability to adopt or continue to use our products.
We may face new or heightened legal, ethical and other challenges arising out of the perceived or actual impact of AI on human rights, intellectual property, privacy and employment, among other areas. For example, our use of AI could lead to copyright infringement or other intellectual property claims, potentially requiring us to pay compensation or licensing fees to third parties. Additionally, social and ethical concerns surrounding the use of AI in our offerings could harm our brand and may cause us to incur additional costs. Failure by us or others in our industry to adequately address these concerns could erode public confidence in AI and slow adoption of AI in our products.
We rely on our network of partners for an increasing portion of our revenues, and if these partners fail to perform, our business may be harmed.
An increasing portion of our revenues is generated by sales through our network of partners, including resellers, distributors and managed service providers. Increasingly, we and our customers rely on our partners to provide professional services, including custom implementations, and there may be insufficient qualified implementation partners available to meet customer demand. While we provide our partners with training and programs, including accreditations and certifications, these programs may not be effective or utilized consistently by partners. In addition, new partners may require extensive training and/or significant time and resources to become productive. Additionally, our relationships with partners may require us, along with our partners, to comply with complex regulations, contractual requirements and government procurement rules. Failure to adhere to these requirements could result in the loss of business opportunities, potential liabilities or penalties. For example, our partners could misrepresent to our customers the functionality of our platform or products, fail to perform services to our customers’ expectations, or violate laws or our corporate policies. Further, changes to our direct go-to-market models may cause friction with our partners. Our partners may also use our platform to develop products and services that compete with our products and services, which could raise IP ownership concerns and strain these partnerships. If we fail to effectively manage and grow our network of partners, our ability to sell our products and efficiently provide our services may be impacted and our business may be harmed.
Doing business with the public sector and heavily-regulated entities subjects us to risks related to government procurement processes, regulations and contracting requirements.
We provide products and services to governmental and heavily-regulated entities directly and through our partners. We have made, and may continue to make, significant investments to support our efforts to sell to those entities. Processes to obtain authorizations and certifications required for us to provide our products and services to those entities often are lengthy and encounter delays, and we may not be able to satisfy, or maintain compliance with, the associated requirements.
A substantial majority of our sales to government entities in the U.S. have been made indirectly through our distributors, resellers or service provider partners. Doing business with government entities presents a variety of risks. The procurement process for governments and their agencies is highly competitive and time-consuming, may be subject to political influence and may involve different rules and conditions on the offering or pricing of products and services. We incur significant up-front time and expense without any assurance that we (or a third-party distributor, reseller or service provider) will win a contract. Beyond this, demand for our products and services may be adversely impacted by public sector budgetary cycles and funding availability that in any given fiscal cycle may be reduced or delayed, including in connection with an extended federal government shutdown, partisan gridlock or changes to government policy. Further, if we or our partners are successful in receiving a contract award, that award could be challenged during a bid protest process. Bid protests may result in an increase in expenses related to obtaining contract awards or an unfavorable modification or loss of an award. Even if a bid protest were unsuccessful, the delay in the startup and funding of the work under these contracts may cause our actual results to differ materially and adversely from those anticipated.
Our customers also include non-U.S. governments, to which government procurement risks similar to those present in U.S. government contracting and regulatory compliance also apply, particularly in certain emerging markets where our customer base is less established. Across the globe, we have seen political volatility increase, with rapid changes in governments and increased partisanship affecting many aspects of government, including the ability to approve budgets and make commitments. This can significantly delay or impair a government’s ability to contract for software and services such as ours. We have also seen challenges to successful awards through bid protest procedures in jurisdictions outside the U.S. As our non-U.S. government business grows, we may see an increase in bid protests as part of the standard government procurement legal procedures that exist in many jurisdictions. In addition, compliance with complex regulations and contracting provisions in a variety of jurisdictions can be expensive and consume significant management resources. In certain jurisdictions, our ability to win business may be constrained by political and other factors unrelated to our competitive position in the market.
Our public sector customers may have contractual, statutory or regulatory rights to terminate current contracts with us or our third-party distributors or resellers for convenience or due to a default, though such risk may be assumed by such third-party distributor or reseller. If a contract is terminated for convenience, we may only be able to collect fees for products or services delivered prior to termination and settlement expenses. If a contract is terminated due to a default, we may be liable for excess costs incurred by the customer for procuring alternative products or services or be precluded from doing further business with governmental entities. Further, we are required to comply with a variety of complex laws, regulations, and contractual provisions relating to the formation, administration, or performance of government contracts that give public sector customers substantial rights and remedies, many of which are not typically found in commercial contracts. These may also include rights with respect to price protection, refund and setoff, performance of services in languages other than English, the accuracy of information provided to the government, contractor compliance with supplier diversity policies, constraints on sales practices and other obligations that are particular to government contracts. These obligations may apply to us and/or our third-party resellers or distributors whose practices we may not control. Such parties’ non-compliance could create legal, contractual and customer satisfaction issues.
We and governments routinely investigate and audit compliance with contractual and regulatory requirements. For example, as disclosed in Note 17 in the notes to our consolidated financial statements, the Company informed certain U.S. government agencies of an internal investigation and preliminary findings and is cooperating with, among others, the Department of Justice, which commenced its own investigation into the matters. If it is determined that we or our third-party distributors, resellers or service providers have failed to comply with applicable contractual or regulatory requirements, we may be subject to civil and criminal penalties and administrative sanctions, including termination of contracts, forfeiture of profits, cost associated with the triggering of price reduction clauses, fines, and suspensions or debarment from future government business, among others, all of which may adversely affect our business. In the United States, our federal business has been concentrated with a small number of third-party distributors, resellers or service providers. If one of those third parties is limited in its ability to do business with the government due to a regulatory or legal issue arising from their own conduct and we are not able to move our business to another third party, our business could be negatively impacted.
Further, we are increasingly doing business in heavily regulated industries, such as financial services, telecommunication, media and television, and health care. Current and prospective customers in those industries may be required to comply with more stringent regulations to subscribe to and/or implement our services. In addition, regulatory agencies may impose requirements on third-party vendors that we may not meet. Customers in these heavily-regulated industries often have a right to conduct audits of our systems, products and practices, and in some cases the regulators of customers in heavily-regulated industries may directly examine vendors that provide outsourced services to such customers. If one or more customers and/or regulators determine that some aspect of our business does not meet regulatory requirements, our ability to continue or expand our business with those customers may be restricted.
If we fail to comply with applicable anti-corruption and anti-bribery laws, export control laws, economic and trade sanctions laws, or other global trade laws, we could be subject to penalties and civil and/or criminal sanctions and our business could be materially adversely affected.
As we continue to expand our business internationally, we will inevitably do more business with large private enterprises and the public sector in countries outside of the U.S. Increased business in countries with heightened levels of corruption subjects us and our officers and directors to increased scrutiny and potential liability from our business operations. We have an established compliance program, but there is a risk that our employees, partners, vendors, customers and agents, as well as those companies to which we outsource certain of our business operations, could violate our policies and applicable law, exposing us to additional scrutiny and potential liability. We have experienced this in the past and may experience it again in the future. In addition, we are subject to customs laws that may impose tariffs on us, directly or indirectly. Higher tariffs on imports related to our operations could increase our operating costs. We are also subject to global trade laws that apply to our worldwide operations, including prohibitions or restrictions on conducting business in certain geographies or involving certain counterparties, end-users or end-use cases. As a result of the Russia-Ukraine conflict, for example, the U.S. and other jurisdictions have imposed economic and trade sanctions and export control restrictions against Russia and Belarus, as well as certain persons, assets and interests associated with those countries. If this conflict continues or if serious conflict arises elsewhere, the U.S. and other jurisdictions could impose wider economic and trade sanctions as well as export restrictions, which could impact our business opportunities and operations. Any violation of the U.S. Foreign Corrupt Practices Act of 1977, as amended, the UK Bribery Act, other applicable anti-corruption and anti-bribery laws, or applicable export control or economic and trade sanctions laws by our employees or third-party intermediaries could subject us to significant risks such as adverse media coverage and/or severe criminal or civil sanctions, which could materially adversely affect our reputation and business.
Our customer deals are becoming more complex, which tend to involve longer and more expensive sales cycles, increased pricing pressure and implementation and configuration challenges.
The customer deals we pursue are becoming more complex as we engage with increasingly larger enterprise customers with multiple workflow products that span the enterprise. These deals can lead to increased costs, longer sales cycles, greater competition and less predictability in our ability to close sales. These customers tend to require considerable time evaluating our portfolio of products and testing our platform prior to making a purchasing decision, require multiple levels of review and approval from a broader set of buyers and stakeholders, and demand more configuration, integration services and features, particularly when switching from legacy on-premises solutions. As a result, these sales opportunities may require us to devote significant sales support and professional services to a smaller number of transactions, diverting those resources from other sales opportunities. If we fail to effectively manage these risks, our business may be negatively affected.
As we acquire or invest in companies and technologies, we may not realize the expected business or financial benefits and the acquisitions and investments may divert our management’s attention and result in additional shareholder dilution or costs.
We have acquired and invested in companies and technologies as part of our business strategy and will continue to evaluate and enter into potential strategic transactions, including, among other things, acquisitions of or investments in businesses, technologies, services, products and other assets. These transactions are intended to, among other things, expand or improve our service offerings and functionality, go-to-market and sales efforts, our operations or our ability to source necessary expertise and provide services in international locations. Although we conduct due diligence regarding these businesses and assets, our efforts may not reveal every material issue. Strategic transactions involve numerous risks, including:
•difficulties assimilating or integrating the businesses, technologies, products, personnel or operations of the acquired companies;
•failing to achieve the expected benefits of the acquisition or investment;
•potential loss of employees of the acquired company;
•inability to maintain relationships with customers, suppliers and partners of the acquired business;
•introducing vulnerabilities or threats by integrating acquired technologies or businesses;
•introducing increased complexity and burden to maintain the technology platform;
•potential adverse tax consequences;
•disruption to our business and diversion of management attention and other resources;
•potential financial, credit or regulatory risks associated with acquired customers, suppliers and partners of the acquired business;
•dependence on acquired technologies or licenses for which alternatives may not be available to us or which may involve significant cost or complexity;
•in the case of foreign acquisitions, the challenges associated with integrating operations across different cultures, languages, and legal regimes and any currency and regulatory risks associated with specific countries;
•data security or privacy risks, compliance requirements, or integration costs from the acquired technology or company;
•impairment of our investments or the possibility our investees will be unable to obtain future funding on favorable terms or at all; and
•potential unknown liabilities or disputes associated with the acquired businesses.
In addition, the amount or form of consideration we pay for acquisitions could adversely affect our financial condition or stock price. For example, if we finance an acquisition by issuing equity or convertible debt securities or loans, our existing shareholders may be diluted, or we could face constraints related to the terms of those securities or indebtedness.
Risks Related to the Operation of Our Business
Actual or perceived cybersecurity events experienced by us or our third-party service providers may create the perception that our platform is not secure, and we may lose customers or incur significant liabilities.
In the ordinary course of our business, we store, transmit, generate, and process our and our customers’ confidential, proprietary and sensitive data. As our business expands across the globe, the number of employees, contractors, vendors and other third parties remotely accessing our systems continues to grow. Our growing business operations increase our exposure to cyberattacks by a range of actors, who have used and will continue to use assorted tactics, techniques, and procedures, including malicious code, ransomware, social engineering, business email compromises, supply chain attacks, denial of service attacks and similar internet-enabled, fraudulent activity, and the frequency of those attacks have become more common. Further, during times of war and other major conflicts, we and our third-party providers may be vulnerable to a heightened risk of geopolitically motivated attacks, including cyberattacks, that could materially disrupt our systems and operations, supply chain and ability to provide our services.
Cybersecurity threats are not limited to actors operating in the systems we control directly. Our increasing reliance on third-party providers and public cloud infrastructure introduces new cybersecurity risks to our business operations. Third-party security incidents have occurred in the past and are likely to continue, as we rely on third-party service providers and technologies to operate business systems in a variety of contexts. Supply chain attacks have also increased in frequency and severity. We cannot guarantee that our third-party service providers or our supply chain infrastructure have not been compromised or that they do not contain exploitable defects or bugs that could result in a breach of or disruption to our platform, systems and network or the systems and networks of third parties that support us and our business. Our ability to monitor the data security measures of our third-party providers is limited, and we necessarily depend in part on our providers to have in place and maintain adequate security measures to protect against unauthorized access, cyberattacks and the mishandling of data. Further, employee error or malfeasance in configuring, maintaining and using these services could impact our ability to monitor and secure them effectively.
We have identified vulnerabilities in our products and services in the past and expect to continue to do so in the future. We cannot be certain that we will be able to identify all vulnerabilities or address the vulnerabilities of which we become aware. There have been delays and may continue to be delays in developing patches that can be effectively deployed to address vulnerabilities. Further, security researchers and other individuals have in the past actively searched for, published and/or exploited actual and potential vulnerabilities in our products or services and will likely continue to do so in the future. Also, certain persons, including researchers, have in the past not abided by, and may in the future not abide by, our responsible disclosure program, which has resulted in, and could in the future result in the compromise of our systems or our or our customers’ data. Moreover, the incorporation of third-party or open-source software code into our or our customers’ systems increases the risk of exploitation of vulnerabilities. We also have inherited and may in the future inherit additional security risks from acquiring or partnering with other companies.
In most instances, our customers are responsible for administering access to the data held in their particular instance for their employees and service providers. While our software is delivered with certain preset configurations, we
understand that our customers require flexibility to configure the Now Platform to their specific business needs. We work closely with our customers to help them evaluate their security configurations, including providing guidance to align configuration settings with their business needs. Yet, in configuring our platform, both our employees and customers have made errors in the past and may do so again in the future. We are aware that, on occasion, both our customers and ServiceNow have configured certain settings on our platform, or retained preset configurations, in ways that may not align with preferred or recommended security levels, which can result in, and has resulted in, information being made more widely accessible than intended. Such misconfigurations can be, and have been, identified publicly, increasing the risk of data being exposed unintentionally. In certain cases, customers may misconfigure their systems and claim that they were not properly informed of the risks to their configuration.
Our data security system and data governance framework, designed to protect our and our customers’ information and prevent data loss, may not be effective at preventing material breaches caused by intentional or unintentional actions or inactions by employees, contractors or third parties. Techniques used to sabotage or to obtain unauthorized access to systems are constantly evolving and may go undetected until a successful attack occurs. Moreover, we have experienced security incidents, which may reoccur in the future, that resulted in unauthorized access to, loss, or inadvertent disclosure of confidential, proprietary and sensitive information. We have observed attempts by third parties to induce or deceive our employees, contractors or users to fraudulently obtain access to our or our customers’ data or assets. In addition, our employees have fallen victim to phishing attacks in the past and are likely to again in the future. Further, despite our security measures, employees, contractors and other individuals (some of whom are supported by nation states) have gained, and in the future may gain, access to our systems to search for and exploit actual or potential vulnerabilities in our products or services or inflict other harms, such as deploying malware or stealing data.
An actual or perceived security breach or compromise can have a material effect on ServiceNow’s operations, finances and reputation. The adverse consequences can include accidental or unlawful destruction, loss, alteration, unauthorized disclosure of or access to data; disruptions to our services; diversion of funds; litigation; indemnification and other contractual obligations; regulatory investigations; government fines and penalties; reputational damage; negative publicity; business and operational interruptions; loss of sales, customers, and partners; mitigation and remediation expenses; and other material costs and liabilities. In addition, the assessment and response to security incidents, as well as implementation of appropriate safeguards to protect against future incidents, can lead to material economic and operational consequences. These consequences can result regardless of whether the incident is suffered by us, affects our third-party service providers or stems from customers’ action or inaction. Moreover, even if a breach is unrelated to our security programs or practices, it could still cause us reputational harm and require us to undertake significant efforts to assess and respond to the breach, including further protecting our customers from their own vulnerabilities. There can be no assurance that any limitations of liability provisions in our subscription agreements, terms of use or other agreements would be enforceable or adequate or would otherwise protect us from any such liabilities or damages with respect to any particular claim. In addition, while we maintain insurance coverage to cover potential financial losses, we cannot be certain that such coverage will continue to be available on acceptable terms or in sufficient amounts to cover potential financial losses from a security incident or that an insurer will not deny coverage as to any future claim.
We may lose key members of our management team or qualified employees or may not be able to attract and retain the employees we need.
There is increasingly intense competition for talent in the technology industry. Our success depends substantially upon the continued services of our management team, particularly our chief executive officer, chief operating officer and the other members of our executive staff. From time to time in the ordinary course of business, there have been and may continue to be changes in our management team. While we seek to manage these transitions carefully, such changes may result in a loss of institutional knowledge and negatively affect our business.
In the highly competitive technology industry, we face ongoing challenges in attracting and retaining top talent across various roles, such as product development and engineering (particularly with AI and machine learning backgrounds), sales, operations and cybersecurity. These key individual contributors are critical to our success, can command very significant compensation in the market and are actively recruited by our key competitors. Our ability to achieve significant revenue growth may depend on our success in recruiting, training and retaining sufficient qualified personnel to support our growth. We have faced and may continue to face difficulties attracting, hiring and retaining highly-skilled, qualified personnel and may not be able to fill positions in desired geographic areas or at all. Further, as we continue to grow and expand our workforce globally, we may face operational and workplace culture challenges that could negatively impact our ability to maintain the effectiveness of our business execution and the beneficial aspects of our corporate culture. While our work model, where a substantial portion of our employees work partially or fully remote, increased our access to talent, we may not be able to take advantage of a broader talent pool if our competitors offer the same work model or if we continue to rely on our primary operating locations for talent. We are continually evaluating and, as appropriate, enhancing the attractiveness of our compensation packages and benefit programs. As a result, we have experienced and may continue to
experience increased costs that may not be offset by either improved productivity or higher sales, potentially resulting in a reduction in our profitability. In addition, we grant equity awards to our employees and sustained declines in our stock price or lower stock price performance relative to our competitors reduces the retention value of such awards, which can impact the competitiveness of our compensation. Many of our employees, including all of our executive officers, are employed “at-will” and may terminate their employment with us at any time. If we fail to attract qualified, new personnel or fail to retain and motivate our current personnel, our business and future growth prospects could be adversely affected.
Delays in the release of, or actual or perceived defects in, our products may slow the adoption of our latest technologies, reduce our ability to efficiently provide services, decrease customer satisfaction, and adversely impact future product sales.
We must successfully continue to release new products and updates to existing products. The success of any release depends on a number of factors, including our ability to manage the risks associated with actual or perceived quality or other defects or deficiencies, delays in the timing of releases or the adoption of releases by customers, and other complications that may arise during the early stages of introducing our products. If releases are delayed or if customers perceive that our releases contain bugs or other defects or are difficult to implement, customer adoption of our new products or updates may be adversely impacted, customer satisfaction may decrease, our ability to efficiently provide our services may be reduced, and our growth prospects may be harmed.
Disruptions or defects in our services could damage our customers’ businesses, subject us to substantial liability and harm our business.
Our business depends on our platform to be available without disruption. From time to time, we have experienced and expect to continue to experience defects, disruptions, outages and other performance and quality problems with our platform. New defects may be detected in the future and may arise from our increasing use of the public cloud. For example, we provide regular updates to our services, which can contain undetected defects. Defects may also be introduced by our use of third-party software, including open-source software. Disruptions may result from errors we make in developing, delivering, configuring or hosting our services, or designing, installing, expanding or maintaining our cloud infrastructure. Disruptions in service can also result from incidents outside of our control, including third-party incidents or denial of service or ransomware attacks, among others. We currently serve our customers primarily using equipment managed by us and co-located in third-party data centers operated by several different providers located around the world, and we serve certain of our customers using data center facilities operated by public cloud service providers. These data centers are vulnerable to damage or interruption from earthquakes, hurricanes, floods, fires, power failures and similar events. They may also be subject to break-ins, sabotage, intentional acts of vandalism and similar misconduct, equipment failure and adverse events caused by operator error or negligence. In addition, an increased use of the public cloud increases our vulnerability to cyberattacks. Despite precautions taken at these centers, problems at these centers have occurred, resulting in interruptions in our services. Such problems could occur again and result in similar or lengthier service interruptions and the loss of customer data. In addition, our customers may use our services in ways that cause disruptions in service for other customers. In addition to data center providers, we also have a large ecosystem of vendors and service providers that we use for our products. If there is a compromise to data, supply chain issue or other incident with our critical service providers, it may impact our ability to provide our services and reduce our productivity. Our customers use our services to manage important aspects of their businesses, and our reputation and business will be adversely affected if our customers and potential customers believe our services are unreliable. Disruptions or defects in our services may reduce our revenues, cause us to issue credits or pay penalties, subject us to claims and litigation, cause our customers to delay payment or terminate or fail to renew their subscriptions, and adversely affect our ability to attract new customers. Similarly, customers may have unique requirements for system resiliency and performance depending on their business models and customers in highly regulated markets may have more demanding requirements that we may not be able to, or may not choose to, meet. The occurrence of payment delays, service credit, warranty or termination for material breach or other claims against us could result in an increase in our bad debt expense, an increase in collection cycles, an increase to our service level credit accruals, other increased expenses or risks of litigation. We may not have insurance sufficient to compensate us for potentially significant losses that may result from claims arising from disruptions to our services.
Delays in improving our information systems and processes could interfere with our ability to support our existing and growing customer and employee base as we scale.
We rely on our information systems and those of third parties to operate and scale our business. As the information we rely on for our business evolves, including as a result of implementing AI technologies, our information systems, including their infrastructure needs, network capacity and computing power, may need to expand. We have made and continue to make investments to improve our information systems to support the needs of our growing customer and employee base, increase productivity, develop and enhance our services, expand into new geographic areas, and scale with
our overall growth. Such improvements are often complex, costly, and time consuming. If implementation of these improvements is delayed, or if we encounter unforeseen problems when migrating away from our existing systems and processes, our operations and our ability to manage our business could be negatively impacted. This might lead to disruptions to our operations, loss of customers, loss of revenue, or damage to our reputation, all of which could harm our business plan to successfully scale our operations and enhance productivity.
We may not be able to protect or enforce our intellectual property rights.
Our success depends significantly on our ability to protect our proprietary technology and our brand under patent, copyright, trademark, trade secret and other IP protections in the U.S. and other jurisdictions. The IP protection we have for our technology may be insufficient, and any IP acquired in the future may not provide competitive advantages or other value. In addition, our IP may be contested, circumvented, found unenforceable or invalidated, and we may not be able to prevent third parties from infringing upon them. Further, legal standards relating to the validity, enforceability and scope of protection of IP rights vary.
Despite our efforts to protect our proprietary rights, policing unauthorized use of our IP and technology is difficult, and we may be required to spend significant resources to monitor and protect our IP rights. Unauthorized parties may attempt to copy or obtain and use, or may have copied or obtained and used, our technology to develop products and services that provide features and functionality similar to ours. Our competitors could also independently develop services equivalent to ours, and our IP rights may not be broad enough for us to prevent competitors from utilizing their developments to compete with us. Reverse engineering, unauthorized copying or other misappropriation of our proprietary technology could enable third parties to benefit from our technology without paying us for it. We may initiate claims or litigation against third parties for infringement or misappropriation of our proprietary rights or to establish the validity of our proprietary rights. However, we may be adversely affected if we are unable to prevent third parties from infringing upon or misappropriating our IP rights or are required to incur substantial costs defending our IP rights.
Third parties may challenge or invalidate our IP rights through administrative proceedings, litigation or allowing contractual rights to expire. There is considerable patent and other IP development activity and claims and related litigation regarding patent and IP rights in our industry. Our competitors, other third parties, including practicing entities and non-practicing entities, own large numbers of patents, copyrights, trademarks and trade secrets, which they may use and have used to assert claims of infringement, misappropriation or other violations of IP rights against us. Moreover, the patent portfolios of many of our competitors and other third parties may be larger than ours. This disparity may increase the risk that our competitors or other third parties may sue us for patent infringement and may limit our ability to counterclaim for patent infringement or settle through patent cross-licenses. We have recorded material charges for legal settlements of such claims in the past. Further, upon expiration of any agreements that allow us to use third-party IP, we may be unable to renew such agreements on favorable terms, if at all, in which case we may face IP litigation or may need to cease offering or to modify our products and services to remove such components. In addition, our subscription agreements generally require us to defend our customers against claims that our technology infringes the intellectual property rights of third parties.
Any claim or litigation, whether or not resolved in our favor, could result in significant expense to us, divert the efforts of our personnel and may result in counterclaims against us. If claims are successfully asserted against us and we are found to be infringing upon, misappropriating or otherwise violating the IP rights of others, we could be required to pay substantial damages and/or make substantial ongoing royalty payments; comply with an injunction and cease offering or modify our products and services; comply with other unfavorable terms, including settlement terms; and indemnify our customers and business partners, obtain costly licenses on their behalf, and/or refund fees or other payments previously paid to us. Further, the mere existence of any lawsuit, or any interim or final outcomes, and the public statements related to it (or absence of such statements) by the press, analysts and litigants could be unsettling to our customers and prospective customers. This could adversely impact our customer satisfaction and related renewal rates, cause us to lose potential sales, and could also be unsettling to investors or prospective investors and cause a substantial decline in our stock price.
Effective patent, trademark, copyright and trade secret protection may not be available in every country in which we offer services. The laws of some foreign countries may not offer effective protection for, or be as protective of, IP rights as those in the U.S., and mechanisms for enforcement of IP rights or available remedies may be inadequate, ineffective or scarce. Additionally, the IP ownership and license rights of new technologies and the use of outputs therefrom, such as AI, which we are increasingly building into our product offerings, have not been fully addressed by U.S. courts interpreting current and new laws or regulations, and the use or adoption of such technologies in our products and services may expose us to potential intellectual property claims; breach of a data license, software license, or website terms of service allegations; claimed violations of privacy rights; and other tort claims. If such laws or regulations require increased transparency, it may impair protection of our trade secrets or other IP.
Our use of open-source software could harm our ability to sell our products and services and subject us to possible litigation.
Our products incorporate software licensed to us by third-party authors under open-source licenses, and we expect to continue to incorporate open-source software into our products and services in the future. We monitor our use of open-source software to avoid subjecting our products and services to adverse licensing conditions. However, there can be no assurance that our efforts have been or will be successful. There is little or no legal precedent governing the interpretation of the terms of open-source licenses, and therefore the potential impact of these terms on our business is uncertain and enforcement of these terms may result in unanticipated obligations regarding our products and services. For example, depending on which open-source license governs certain open-source software included within our products and services, we may be subjected to conditions requiring us to offer our products and services to users at no cost; make available the source code for modifications and derivative works based upon, incorporating or using such open-source software; and license such modifications or derivative works under the terms of the particular open-source license. Moreover, if an author or other third party that distributes such open-source software were to allege that we had not complied with the conditions of one or more of these licenses, we could be required to incur significant legal costs defending ourselves against such allegations, be subject to significant damages or be enjoined from distributing our products and services.
Various factors, including our customers’ business, integration, migration, compliance and security requirements, or errors by us, our partners, or our customers, may cause implementations of our products to be delayed, inefficient or otherwise unsuccessful.
Our business depends upon the successful implementation of our products by our customers either through us or our partners. Further, our customers’ business, integration, migration, compliance and security requirements, or errors by us, our partners, or our customers, or other factors may cause implementations to be delayed, inefficient or otherwise unsuccessful. As a result of these and other risks, we or our customers may incur significant implementation costs in connection with the purchase, implementation and enablement of our products. Some customer implementations may take longer than planned, delay our ability to sell additional products or fail to meet our customers’ expectations, resulting in customers canceling or failing to renew their subscriptions before our products have been fully implemented. Some customers may lack the internal resources to manage a digital transformation such as our offering and, as a consequence, may be unable to see the benefits of our products. Unsuccessful, lengthy, or costly implementations and integrations could result in claims from customers, reputational harm, and opportunities for competitors to displace our products.
Our failure or perceived failure to achieve our ESG goals or maintain ESG practices that meet evolving stakeholder expectations could adversely affect us.
Our ability to achieve published environmental, social, and governance (“ESG”) initiatives, goals and commitments is subject to numerous factors both within and outside of our control. Our failure or perceived failure to achieve our ESG goals or maintain ESG practices that meet evolving stakeholder expectations or regulatory requirements could harm our reputation, adversely impact our ability to attract and retain employees or customers and expose us to increased scrutiny from the investment community, regulatory authorities and others or subject us to liability. Our reputation also may be harmed by the perceptions that our customers, employees and other stakeholders have about our action or inaction on ESG issues. Damage to our reputation and loss of brand equity may reduce demand for our products and services.
We may face natural disasters, including climate change, and other events beyond our control.
Natural disasters or other catastrophic events may damage or disrupt our operations, international commerce and the global economy, and thus could have a negative effect on our business. Our business operations are subject to interruption by natural disasters, flooding, fire, extreme heat, power shortages, pandemics, terrorism, political unrest, telecommunications failure, vandalism, cyberattacks, geopolitical instability, war, the effects of climate change and other events beyond our control. While we maintain crisis management and disaster response plans, such planning may not account for all possible events and the occurrence of such events could make it difficult or impossible for us to deliver our services to our customers, could decrease demand for our services, and could cause us to incur substantial expense. Our insurance may not be sufficient to cover losses or additional expenses we may sustain. In the event of major natural disasters or catastrophic events, our backup systems could fail, customer data could be lost, and resumption of operations could require significant time.
We may be subject to increased costs, regulations, reporting requirements, standards or expectations regarding climate change-driven impacts on our business. While we seek to mitigate our business risks associated with climate change by establishing robust environmental programs as part of our ESG strategy, certain of those risks are inherent wherever business is conducted. Any of our primary locations may be vulnerable to the adverse effects of climate change. For example, our California headquarters have experienced, and may continue to experience, climate-related events at an
increasing frequency and severity, including drought, water scarcity, heat waves, wildfires and air quality impacts and power shutoffs associated with wildfires. Changing market dynamics, global policy developments and increasing frequency and impact of extreme weather events on critical infrastructure in the U.S. and elsewhere have the potential to disrupt our business, the business of our customers and third-party suppliers and may cause us to experience higher attrition, losses and additional costs to maintain or resume operations.
Risks Related to the Financial Performance or Financial Position of Our Business
Because we generally recognize revenues from our subscription service over the subscription term, a decrease in new subscriptions or renewals may not be immediately reflected in our operating results.
We generally recognize revenues from customers ratably over the terms of their subscriptions. Net new annual contract value from new subscriptions and expansion contracts entered into during a period can generally be expected to generate revenues for the duration of the subscription term. As a result, a significant portion of the revenues we report in each period are derived from the recognition of deferred revenues relating to subscriptions entered into during previous periods. Consequently, a decrease in new or renewed subscriptions, expansion contracts in any single reporting period will have a limited impact on our revenues for that period, but they will negatively affect our operating results in future periods. Our subscription model also makes it difficult for us to rapidly increase our revenues through additional sales in any period, as revenues from new customers are generally recognized over the applicable subscription term. Also, our ability to adjust our cost structure in the event of a decrease in new or renewed subscriptions may be limited.
As our business grows, we expect our revenue growth rate to decline over the long term.
You should not rely on our prior revenue growth rate as an indication of our future revenue growth rate. While we have experienced significant revenue growth in prior periods, we expect the growth rate to decline over the long term due to increasing competition, a decrease in the growth rate of our overall market or other reasons. We also expect our costs to increase in future periods as we continue to invest in our strategic priorities, which may not result in a corresponding increase in revenues or growth in our business.
Changes in our effective tax rate or disallowance of our tax positions may adversely affect our business.
We are subject to income taxes in the U.S. and various foreign jurisdictions. We believe that our provision for income taxes is reasonable, but the ultimate tax outcome may differ from the amounts recorded in our consolidated financial statements and may materially affect our financial results in the period or periods in which such outcome is determined. Our effective tax rate could be adversely affected by changes in statutory tax rates, changes in the mix of earnings and losses in countries with differing statutory tax rates, certain non-deductible expenses, the valuation of deferred tax assets and liabilities and the effects of acquisitions. Increases in our effective tax rate would reduce our profitability or in some cases increase our losses.
Additionally, our future effective tax rate could be impacted by changes in accounting principles or changes in federal, state or international tax laws or tax rulings and these changes may have a retroactive effect. The U.S. Department of Treasury has broad authority to issue regulations and interpretative guidance that may significantly impact how we will comply with the law, which could affect our results of operations in the period issued. Many countries are actively considering or have proposed or enacted changes to their tax laws based on the model rules adopted by the Organisation for Economic Co-operation and Development (“OECD”) defining a 15% global minimum tax (commonly referred to as Pillar 2). Pillar 2 rules are at varying stages of adoption across jurisdictions where we operate. The timeline to implement these rules and the specific rules vary by jurisdiction. The adoption of Pillar 2 rules may affect our effective tax rate and current tax obligations and liabilities. While we do not currently anticipate Pillar 2 rules to have a material impact on our consolidated financial statements, we are monitoring developments from the OECD, governmental bodies, such as the EU, and intergovernmental economic organizations, to evaluate the impact of changing global tax laws. Global tax developments applicable to multinational businesses and increased scrutiny under tax examinations, as well as changes in federal, state or international tax laws or rulings that may increase our worldwide effective tax rate, could have a material impact on our business.
In addition, we may be subject to income tax audits by tax jurisdictions throughout the world, many of which have not established clear guidance on the tax treatment of cloud computing companies. Although we believe our income tax liabilities are reasonably estimated and accounted for in accordance with applicable laws and principles, an adverse resolution of one or more uncertain tax positions in any period could have a material impact on our results of operations for that period. Further, many of our most important intangible assets are held outside the U.S. and are subject to inter-company agreements regarding the development and distribution of those assets to other jurisdictions with potential challenge under permanent establishment or transfer pricing principles. While we believe that our position is appropriate
and well founded, if our position were successfully challenged by taxing authorities in other jurisdictions, we may become subject to significant tax liabilities.
We may be adversely affected by our debt service obligations.
Our ability to make payments on, repay or refinance the 2030 Notes in the future will depend on our future performance which is subject to a variety of risks and uncertainties, many of which are beyond our control. If we decide to refinance the 2030 Notes, we may be required to do so on different or less favorable terms or we may be unable to refinance the 2030 Notes at all, both of which may adversely affect our financial condition. Maintenance of our indebtedness, contractual restrictions, and additional issuances of indebtedness could:
•cause us to dedicate a substantial portion of our cash flows towards debt service obligations and principal repayments;
•increase our vulnerability to adverse changes in general economic, industry and competitive conditions;
•limit our flexibility in planning for, or reacting to, changes in our business and our industry;
•impair our ability to obtain future financing for working capital, capital expenditures, acquisitions, general corporate or other purposes; and
•due to limitations within the debt instruments, restrict our ability to grant liens on property, enter into certain mergers, dispose of all or substantially all of our or our subsidiaries’ assets, taken as a whole, materially change our business or incur subsidiary indebtedness, subject to customary exceptions.
We are required to comply with the covenants set forth in the indentures governing the 2030 Notes. Our ability to comply with these covenants may be affected by events beyond our control. If we breach any of the covenants and do not obtain a waiver from the note holders or lenders, then, subject to applicable cure periods, any outstanding indebtedness may be declared immediately due and payable. In addition, changes by any rating agency to our credit rating may negatively impact the value and liquidity of our securities. Downgrades in our credit ratings could restrict our ability to obtain additional financing in the future and could affect the terms of any such financing.
Risks Related to General Economic and Political Conditions
Our industry and business may be harmed by global economic and political conditions.
We operate globally and as a result, our business, revenues and profitability are impacted by global macroeconomic and political conditions. The success of our activities is affected by general economic and market conditions, including, among others, inflation, interest rates, tax rates, foreign exchange rates, economic downturns, recession, economic uncertainty, political instability, warfare, changes in laws, trade barriers, supply chain disruptions and economic and trade sanctions. The U.S. capital markets experienced and continue to experience extreme volatility and disruption. Furthermore, inflation rates in the U.S. and other key markets have recently increased to levels not seen in decades resulting in federal action to increase interest rates, affecting capital markets. Such economic volatility could adversely affect our business, financial condition, results of operations and cash flows, and future market disruptions could negatively impact us. These unfavorable economic conditions could increase our operating costs and, because our typical contracts with customers lock in our price for a few years, our profitability could be negatively affected. Geopolitical destabilization and warfare have impacted and may continue to impact global currency exchange rates, commodity prices, energy markets, trade and movement of resources, which may adversely affect the buying power of our customers, our access to and cost of resources from our suppliers, and ability to operate or grow our business. In addition, from time to time, the U.S. and other key international economies have been impacted and may continue to be impacted by geopolitical and economic instability, high levels of credit defaults, international trade disputes, changes in demand for various goods and services, high levels of persistent unemployment, wage and income stagnation, restricted credit, poor liquidity, reduced corporate profitability, volatility in credit, equity and foreign exchange markets, inflation, bankruptcies, international trade agreements, export controls, economic and trade sanctions, health crises and overall economic uncertainty. These conditions can arise suddenly and affect the rate of digital transformation spending and could adversely affect our customers’ or prospective customers’ ability or willingness to purchase our services, delay purchasing decisions, reduce the value or duration of their subscriptions, or affect renewal rates.
We may be harmed by foreign currency exchange rate fluctuations.
We conduct significant transactions, including revenue transactions and intercompany transactions, in currencies other than the U.S. Dollar or the functional operating currency of the transactional entities. In addition, our international subsidiaries maintain significant net assets that are denominated in the functional operating currencies of these entities. Accordingly, changes in the value of currencies relative to the U.S. Dollar have impacted and may continue to impact our consolidated revenues and operating results due to transactional and translational remeasurement that is reflected in our earnings. It is particularly difficult to forecast any impact from exchange rate movements. Unanticipated currency
fluctuations have adversely affected and could continue to adversely affect our financial results or cause our results to differ from investor expectations or our own guidance in any future periods. Volatility in foreign currency exchange rates and global financial markets is expected to continue due to political and economic uncertainty globally.
We use derivative instruments, such as foreign currency forward contracts, to hedge exposures that certain of our balance sheet and income statement items have to changes in foreign currency exchange rates. These hedging contracts have reduced and may continue to reduce, but they have not and cannot entirely eliminate, the impact of adverse foreign currency exchange rate movements. To the extent that the counterparties of our hedging contracts fail to perform or fulfill their obligations, we may not receive the anticipated benefit of those arrangements. Further, unanticipated changes in foreign currency exchange rates may result in poorer overall financial performance than if we had not engaged in any hedging transactions, as the hedging instrument we use may not be aligned with the exposures being hedged.
Risks Related to Ownership of Our Common Stock
Our stock price is likely to continue to be volatile.
Our stock price is likely to continue to be volatile and subject to wide fluctuations. In addition, technology companies in general have highly volatile stock prices, and the volatility in stock price and trading volume of securities is often unrelated or disproportionate to the financial performance of the companies issuing the securities. Factors affecting our stock price, some of which are beyond our control, include, among other factors:
•changes in the estimates of our operating results, revenue growth, or changes in recommendations by securities analysts;
•changes in the average contract term of our customer agreements, timing of renewals and renewal rates;
•our ability to meet our financial guidance or financial performance expectations of the securities analysts or investors;
•announcements of new products, services or technologies, new applications or enhancements to services, strategic alliances, acquisitions, or other significant events by us or by our competitors;
•fluctuations in company valuations, such as high-growth or cloud companies, perceived to be comparable to us;
•changes to our management team;
•trading activity by directors, executive officers and significant shareholders, or the market’s perception that large shareholders intend to sell their shares;
•the inclusion, exclusion, or removal of our stock from any major trading indices;
•the size of our market float;
•the trading volume of our common stock, including sales following the exercise of outstanding options or vesting of equity awards;
•our issuance or repurchase of shares of our common stock;
•changes in laws or regulations impacting the delivery of our services;
•significant litigation or regulatory actions;
•the amount and timing of customer payments, payment defaults, operating costs and capital expenditures
•the amount and timing of equity awards and the related financial statement expenses;
•the impact of new accounting pronouncements;
•the inability to conclude that our internal controls over financial reporting are effective;
•our ability to accurately estimate the total addressable market for our products and services; and
•overall performance of the equity markets.
Following periods of volatility in the market price of a company’s securities, securities class action litigation has often been brought against that company. Securities litigation could result in substantial costs and divert management’s attention and resources from our business.
Provisions in our governing documents or Delaware law might discourage, delay or prevent a change of control or changes in our management and, therefore, depress our stock price.
Our certificate of incorporation and bylaws contain provisions that could depress our stock price by acting to discourage, delay or prevent a change in control or changes in our management that our shareholders may deem advantageous. These provisions, among other things:
•permit our board to establish the number of directors;
•require super-majority voting to amend certain provisions in our certificate of incorporation and bylaws;
•authorize issuance of “blank check” preferred stock that our board could use to implement a shareholder rights plan;
•prohibit shareholder action by written consent, which requires all shareholder actions to be taken at a meeting;
•permit our board to make, alter or repeal our bylaws; and
•require advance notice for shareholders to submit director nominations or other business at annual shareholders meetings (although our bylaws permit shareholders proxy access).
Further, Section 203 of the Delaware General Corporation Law may discourage, delay or prevent a change in control of our company. Section 203 imposes certain restrictions on merger, business combinations and other transactions between us and certain shareholders.
| | | | | |
| ITEM 1B. | UNRESOLVED STAFF COMMENTS |
None.
We take a comprehensive approach to cybersecurity risk management. While securing the data customers and other stakeholders entrust to us is a top priority, we, like all companies, are subject to threats of breaches of our cybersecurity programs. Our board of directors (the “Board”) and our management are actively involved in the oversight of our risk management program, of which cybersecurity represents an important component. As described in more detail below, we have established policies, standards, processes and practices for assessing, identifying, and managing material risks from cybersecurity threats. We have devoted significant financial and personnel resources to implement and maintain security measures to meet regulatory requirements and customer expectations, and we intend to continue to make significant investments in our data and cybersecurity infrastructure. There can be no guarantee that our policies and procedures will be properly followed in every instance or that those policies and procedures will be effective as cyber criminals are becoming more sophisticated and effective every day and increasingly targeting enterprise software companies. Although our Risk Factors include further detail about the material cybersecurity risks we face, we believe that risks from prior cybersecurity threats, including as a result of any previous cybersecurity incidents, have not materially affected our business to date. We can provide no assurance that there will not be incidents in the future or that they will not materially affect us, including our business strategy, results of operations, or financial condition.
Risk Management and Strategy
Our policies, standards, processes and practices for assessing, identifying, and managing material risks from cybersecurity threats are integrated into our overall risk management program and are based on frameworks established by the National Institute of Standards and Technology (“NIST”), the International Organization for Standardization and other applicable industry standards. Our cybersecurity program in particular focuses on the following key areas:
Collaboration
Our cybersecurity risks are identified and addressed through a comprehensive, cross-functional approach. Key security, risk, and compliance stakeholders meet regularly to develop strategies for preserving the confidentiality, integrity and availability of Company and customer information, identifying, preventing and mitigating cybersecurity threats, and effectively responding to cybersecurity incidents. We maintain controls and procedures that are designed to ensure prompt escalation of certain cybersecurity incidents so that decisions regarding public disclosure and reporting of such incidents can be made by management and the Board in a timely manner.
Risk Assessment
At least annually, we conduct a cybersecurity risk assessment that takes into account information from internal stakeholders, known information security vulnerabilities, and information from external sources (e.g., reported security incidents that have impacted other companies, industry trends, and evaluations by third parties and consultants). The results of the assessment are used to drive alignment on, and prioritization of, initiatives to enhance our security controls, make recommendations to improve processes, and inform a broader enterprise-level risk assessment that is presented to our Board, Audit Committee and members of management.
Technical Safeguards
We regularly assess and deploy technical safeguards designed to protect our information systems from cybersecurity threats. Such safeguards are regularly evaluated and improved based on vulnerability assessments, cybersecurity threat intelligence and incident response experience.
Incident Response and Recovery Planning
We have established comprehensive incident response and recovery plans and continue to regularly test and evaluate the effectiveness of those plans. Our incident response and recovery plans address — and guide our employees, management and the Board on — our response to a cybersecurity incident.
Third-Party Risk Management
We have implemented controls designed to identify and mitigate cybersecurity threats associated with our use of third-party service providers. Such providers are subject to security risk assessments at the time of onboarding, contract renewal, and upon detection of an increase in risk profile. We use a variety of inputs in such risk assessments, including information supplied by providers and third parties. In addition, we require our providers to meet appropriate security requirements, controls and responsibilities and investigate security incidents that have impacted our third-party providers, as appropriate.
Education and Awareness
Our policies require each of our employees to contribute to our data security efforts. We regularly remind employees of the importance of handling and protecting customer and employee data, including through annual privacy and security training to enhance employee awareness of how to detect and respond to cybersecurity threats.
External Assessments
Our cybersecurity policies, standards, processes and practices are regularly assessed by consultants and external auditors. These assessments include a variety of activities including information security maturity assessments, audits and independent reviews of our information security control environment and operating effectiveness. For example, in 2022, 2023 and 2024 we conducted independent cyber maturity assessments to review our controls against the NIST Cybersecurity Framework. The results of significant assessments are reported to management, the Board and Audit Committee. Cybersecurity processes are adjusted, as appropriate, based on the information provided from these assessments. We have also obtained industry certifications and attestations that demonstrate our dedication to protecting the data our customers entrust to us.
Governance
Board Oversight
Our Board, in coordination with the Audit Committee, oversees our management of cybersecurity risk. They receive regular reports from management about the prevention, detection, mitigation, and remediation of material information security risks, including cybersecurity incidents and vulnerabilities. Our Audit Committee is responsible for overseeing our cybersecurity program. The Audit Committee receives regular updates from management on cybersecurity risk resulting from risk assessments, progress of risk reduction initiatives, third-party compliance certifications, control maturity assessments, and relevant ServiceNow, customer and industry cybersecurity incidents.
Management’s Role
The following individuals have primary responsibility for assessing and managing cybersecurity risks:
•Chief customer officer (“CCO”), who oversees the digital transformation, digital technology and security functions
•Chief digital information officer (“CDIO”), who oversees enterprise-wide digital transformation
•Chief information security officer (“CISO”), who oversees the security function and reports to the CCO
•Chief technology officer (“CTO”), who oversees product engineering and advanced technologies
•General Counsel, who oversees the legal and compliance functions
These individuals, among others, also serve as members of management’s Security Steering Committee (the “Security Committee”), which is a governing body that drives alignment on security decisions across the Company. The Security Committee meets quarterly to review security performance metrics, identify security risks, and assess the status of approved security enhancements. The Security Committee also considers and makes recommendations on security policies and procedures, security service requirements, and risk mitigation strategies.
Our CCO has served in various roles in information technology and information security for over 20 years, including serving as our Chief Information Officer (“CIO”) and either the Chief Technology Officer or CIO of three other public companies. He holds an undergraduate degree in computer engineering. Our CDIO has served in various roles in information technology for over 20 years, including serving as our Senior Vice President of Digital Technology Experience and in similar senior roles at two other public companies. Our CISO has served in various roles in information technology
and information security for almost 20 years, including serving as the Chief Information Security Officer or Chief Security Officer at two other large public companies. He holds an undergraduate and master’s degree in computer science. Our CTO has served in various roles in information technology for over 25 years and has been with us since 2011. Our General Counsel has over 20 years of experience managing risks, including risks arising from cybersecurity threats, at several large public technology companies.
Our principal office is located in Santa Clara, California, where we lease approximately 972,000 square feet of space under lease agreements for our business operations and product development. We also maintain offices globally. All of our properties are currently leased. We believe our existing facilities are adequate to meet our current requirements. Refer to Note 17 in the notes to our consolidated financial statements included elsewhere in this Annual Report on Form 10-K for more information about our lease commitments.
We are party to certain litigation and other legal proceedings. While legal proceedings are inherently unpredictable and subject to uncertainties, we do not believe that the ultimate resolution of any such proceedings, whether taken individually or in the aggregate, is likely to have a material adverse effect on our business, financial position, results of operations or cash flows.
For additional information regarding legal proceedings, refer to Note 17 in the notes to our consolidated financial statements in this Annual Report on Form 10-K.
| | | | | |
| ITEM 4. | MINE SAFETY DISCLOSURES |
Not applicable.
PART II
| | | | | |
| ITEM 5. | MARKET FOR REGISTRANT’S COMMON EQUITY, RELATED STOCKHOLDER MATTERS AND ISSUER PURCHASES OF EQUITY SECURITIES |
Market Information for Common Stock
Our common stock is listed on the New York Stock Exchange under the symbol “NOW.”
Dividends
Our board of directors currently intends to retain any future earnings to support operations and to finance the growth and development of our business, and therefore does not intend to pay cash dividends on our common stock for the foreseeable future.
Stockholders
As of December 31, 2024, there were 13 registered stockholders of record (not including an indeterminate number of beneficial holders of stock held in street name through brokers and other intermediaries) of our common stock.
Securities Authorized for Issuance under Equity Compensation Plans
The information required by this item will be incorporated by reference from our definitive proxy statement to be filed with the SEC pursuant to Regulation 14A.
Stock Performance Graph
This performance graph shall not be deemed “soliciting material” or to be “filed” with the SEC, for purposes of Section 18 of the Securities Exchange Act of 1934, as amended (the “Exchange Act”), or otherwise subject to the liabilities under that section, and shall not be deemed incorporated by reference into any of our other filings under the Securities Act of 1933, (the “Securities Act”) or the Exchange Act except to the extent we specifically incorporate it by reference into such filing.
The graph below compares the cumulative total stockholder return on our common stock with the cumulative total return on the S&P 500 Index, NYSE Composite Index and the Standard & Poor Systems Software Index for each of the last five fiscal years ended December 31, 2020 through December 31, 2024, assuming an initial investment of $100. Data for the S&P 500 Index, NYSE Composite Index and the Standard & Poor Systems Software Index assume reinvestment of dividends.
The comparisons in the graph below are based upon historical data and are not indicative of, nor intended to forecast, future performance of our common stock.
| | | | | | | | | | | | | | | | | | | | | | | | | | | | | | | | | | | | | |
| | | Base Period | | | | | | | | | | |
| | | Dec 31, 2019 | | Dec 31, 2020 | | Dec 31, 2021 | | Dec 31, 2022 | | Dec 31, 2023 | | Dec 31, 2024 |
| ServiceNow, Inc. | | | 100.00 | | 194.97 | | | 229.92 | | | 137.53 | | | 250.24 | | | 375.50 | |
| NYSE Composite | | | 100.00 | | 106.99 | | | 129.11 | | | 117.04 | | | 133.16 | | | 154.19 | |
| S&P 500 | | | 100.00 | | 118.40 | | | 152.39 | | | 124.79 | | | 157.59 | | | 197.02 | |
| S&P Systems Software | | | 100.00 | | 143.08 | | | 215.33 | | | 156.16 | | | 245.01 | | | 288.35 | |
Unregistered Sales of Equity Securities
None
Issuer Purchases of Equity Securities
Share repurchases of our common stock for the three months ended December 31, 2024 were as follows:
| | | | | | | | | | | | | | | | | | | | | | | | | | |
| Issuer Purchases of Equity Securities | | | | Total Number of Shares Purchased as Part of Publicly Announced Program
(in thousands) | | Approximate Dollar Value of Shares that May Yet Be Purchased Under the Program(1) (in millions) |
| Period | | Total Number of Shares Purchased (in thousands) | | Average Price Paid Per Share | | |
| October 1 - 31 | | 86 | | | $ | 927.22 | | | 86 | | | $ | 482 | |
| November 1 - 30 | | 162 | | | 1,022.16 | | | 162 | | | 316 | |
| December 1 - 31 | | 45 | | | 1,106.67 | | | 45 | | | 266 | |
| Fourth Quarter 2024 | | 293 | | | $ | 1,007.28 | | | 293 | | | $ | 266 | |
(1) On May 16, 2023, our board of directors authorized a program to repurchase up to $1.5 billion of our common stock. As of December 31, 2024, approximately $266 million remained available for future repurchases under the share repurchase program. In January 2025, our board of directors authorized an additional $3.0 billion in repurchases under the share repurchase program. Refer to Note 13 “Stockholders’ Equity” in the notes to the consolidated financial statements included in Part II, Item 8 of this Annual Report for additional information.
| | | | | |
| ITEM 6. | SELECTED CONSOLIDATED FINANCIAL DATA |
Part II, Item 6 is no longer required as we have adopted certain provisions within the amendments to Regulation S-K that eliminate Item 301.
| | | | | |
| ITEM 7. | MANAGEMENT’S DISCUSSION AND ANALYSIS OF FINANCIAL CONDITION AND RESULTS OF OPERATIONS |
This section of our Annual Report on Form 10-K discusses our financial condition and results of operations for the fiscal years ended December 31, 2024 and 2023, and year-to-year comparisons between fiscal 2024 and fiscal 2023 in accordance with U.S. Generally Accepted Accounting Principles (“GAAP”). A discussion of our financial condition and results of operations for the fiscal year ended December 31, 2022 and year-to-year comparisons between fiscal 2023 and fiscal 2022 that is not included in this Annual Report on Form 10-K can be found in “Management’s Discussion and Analysis of Financial Condition and Results of Operations” in Part II, Item 7 of our Annual Report on Form 10-K for the fiscal year ended December 31, 2023, filed on January 25, 2024.
Our free cash flow and non-GAAP consolidated income from operations measures included in the section entitled “—Key Business Metrics—Free Cash Flow” and “—Key Business Metrics—Non-GAAP Consolidated Income from Operations” are not in accordance with GAAP. These non-GAAP financial measures are not intended to be considered in isolation or as a substitute for, or superior to, financial information prepared and presented in accordance with GAAP. These measures may be different from non-GAAP financial measures used by other companies, limiting their usefulness for comparison purposes. We encourage investors to carefully consider our results under GAAP, as well as our supplemental non-GAAP results, to more fully understand our business.
Overview
ServiceNow was founded on a simple premise: to make work flow better. Our intelligent platform, the Now Platform, is a cloud-based solution that helps enterprises and organizations across public and private sectors digitize workflows, in line with our purpose of making the world work better for everyone. Our workflow applications built on the Now Platform are organized along four primary areas: Technology, Customer and Industry, Employee and Creator. The Now Platform is the AI platform for digital transformation. Transformations enabled by the Now Platform rapidly automate business processes across an entire enterprise by seamlessly connecting disparate departments, systems and silos to unlock productivity and improve experiences for both employees and customers.
We are closely monitoring the ongoing conflicts in Russia/Ukraine and the Middle East. While these events are still evolving and the outcomes remain highly uncertain, we do not believe these conflicts will have a material impact on our business and results of operations. However, if the conflicts continue or worsen, leading to greater global economic disruptions and uncertainty, our business and results of operations could be materially impacted. Our customers in these regions represented an immaterial portion of our net assets and total consolidated revenues both as of and for the years ended December 31, 2024 and December 31, 2023.
Additionally, other macroeconomic events, including higher interest rates, global inflation and bank failures, have led to economic uncertainty in the global economy. To mitigate risk, our cash and cash equivalents are distributed across several large financial institutions and are not concentrated in one financial institution. We have not experienced any impact to our liquidity or to our current and projected business operations and financial condition due to recent macroeconomic events. Further, we have policy restrictions on the types of securities that can be purchased as part of our available-for-sale debt securities portfolio. These restrictions take industry and company concentration limits into consideration among other things. Furthermore, the majority of our non-marketable equity investments do not have material relationships with any one financial institution, and therefore, we believe that our exposure to loss as a result of bank failure is immaterial. We will continue to monitor the direct and indirect impact of macroeconomic events on our business and financial results.
See the “Risk Factors” section in Part I, Item 1A of this Annual Report for further discussion of the possible impact of conflicts and macroeconomic events on our business and financial results.
Key Business Metrics
Remaining performance obligations. Transaction price allocated to remaining performance obligations (“RPO”) represents contracted revenue that has not yet been recognized, which includes deferred revenue and non-cancellable amounts that will be invoiced and recognized as revenue in future periods. RPO excludes contracts that are billed in arrears, such as certain time and materials contracts, as we apply the “right to invoice” practical expedient under relevant accounting guidance. Current remaining performance obligations (“cRPO”) represents RPO that will be recognized as revenue in the next 12 months.
As of December 31, 2024, our RPO was $22.3 billion, of which 46% represented cRPO. RPO and cRPO increased by 23% and 19%, respectively, compared to December 31, 2023. Factors that may cause our RPO to vary from period to period include the following:
•Foreign currency exchange rates. While a majority of our contracts have historically been in U.S. Dollars, an increasing percentage of our contracts in recent periods has been in foreign currencies, particularly the Euro and British Pound Sterling. Fluctuations in foreign currency exchange rates as of the balance sheet date will cause variability in our RPO.
•Mix of offerings. In a minority of cases, we allow our customers to host our software by themselves or through a third-party service provider. In self-hosted offerings, we recognize a portion of the revenue upfront upon the delivery of the software and as a result, such revenue is excluded from RPO.
•Subscription start date. From time to time, we enter into contracts with a subscription start date in the future and these amounts are included in RPO if such contracts are signed by the balance sheet date.
•Timing of contract renewals. While customers typically renew their contracts at the end of the contract term, from time to time, customers may do so either before or after the scheduled expiration date. For example, in cases where we are successful in selling additional products or services to an existing customer, a customer may decide to renew its existing contract early to ensure that all its contracts expire on the same date. In other cases, prolonged negotiations or other factors may result in a contract not being renewed until after it has expired.
•Contract duration. While we typically enter into multi-year subscription services, the duration of our contracts varies. Further, we continue to see an increase in the number of 12-month agreements entered into with the U.S. federal government throughout the year, with the highest number of agreements entered into in the quarter ended September 30, driven primarily by timing of their annual budget expenditures. We sometimes also enter into contracts with durations that have a 12-month or shorter term to enable the contracts to co-terminate with the existing contract. The contract duration will cause variability in our RPO.
Number of customers with ACV greater than $1 million. We count the total number of customers with annual contract value (“ACV”) greater than $1 million as of the end of the period. We had 2,109, 1,885, and 1,626 customers with ACV greater than $1 million as of December 31, 2024, 2023 and 2022, respectively. For purposes of customer count, a customer is defined as an entity that has a unique Dunn & Bradstreet Global Ultimate (“GULT”) Data Universal Numbering System (“DUNS”) number and an active subscription contract as of the measurement date. The DUNS number is a global standard for business identification and tracking. We make exceptions for holding companies, government entities and other organizations for which the GULT, in our judgment, does not accurately represent the ServiceNow customer. For example, while all U.S. government agencies roll up to “Government of the United States” under the GULT, we count each government agency that we contract with as a separate customer. Our customer count is subject to adjustments for acquisitions, spin-offs and other market activity; accordingly, we restate previously disclosed number of customers with ACV greater than $1 million calculations to allow for comparability. ACV is calculated based on the foreign exchange rate in effect at the time the contract was signed. Foreign exchange rate fluctuations could cause some variability in the number of customers with ACV greater than $1 million. We believe information regarding the total number of customers with ACV greater than $1 million provides useful information to investors because it is an indicator of our growing customer base and demonstrates the value customers are receiving from the Now Platform.
Free cash flow. We define free cash flow, a non-GAAP financial measure, as GAAP net cash provided by operating activities plus cash outflows for legal settlements, repayments of convertible senior notes attributable to debt discount and business combination and other related costs including compensation expense, reduced by purchases of property and equipment. Purchases of property and equipment are otherwise included in cash used in investing activities under GAAP. We believe information regarding free cash flow provides useful information to investors because it is an indicator of the strength and performance of our business operations. However, our calculation of free cash flow may not be comparable to similar measures used by other companies. A calculation of free cash flow is provided below:
| | | | | | | | | | | | | | | | | |
| | Year Ended December 31, |
| | 2024 | | 2023 | | 2022 |
| | | | | |
| (in millions) |
| Free cash flow: | | | | | |
| Net cash provided by operating activities | $ | 4,267 | | | $ | 3,398 | | | $ | 2,723 | |
| Purchases of property and equipment | (852) | | | (694) | | | (550) | |
| Business combination and other related costs | 23 | | | 24 | | | 7 | |
| Legal settlements | 17 | | | — | | | — | |
| Free cash flow | $ | 3,455 | | | $ | 2,728 | | | $ | 2,180 | |
We have historically seen higher collections in the quarter ended March 31 due to seasonality in timing of entering into customer contracts, which is significantly higher in the quarter ended December 31. Additionally, we have historically seen higher disbursements in the quarters ended March 31 and September 30 due to payouts under our annual commission plans, purchases under our employee stock purchase plan, payouts under our bonus plans and coupon payments related to our 2030 Notes.
Non-GAAP consolidated income from operations. Non-GAAP consolidated income from operations is identified as an additional measure of profit or loss. This non-GAAP measure is used by the chief operating decision maker to allocate resources and assess performance. We define non-GAAP consolidated income from operations as income from operations excluding certain non-cash or non-recurring items, including stock-based compensation expense, amortization of purchased intangibles, legal settlements and business combination and other related costs. We believe these adjustments provide useful supplemental information to investors and facilitate the analysis of our operating results and comparison of those results across reporting periods. The following table shows the reconciliation of our reported consolidated income from operations to non-GAAP consolidated income from operations.
| | | | | | | | | | | | | | | | | |
| Year Ended December 31, |
| 2024 | | 2023 | | 2022 |
| (in millions) |
| GAAP income from operations | $ | 1,364 | | | $ | 762 | | | $ | 355 | |
| Stock-based compensation | 1,746 | | | 1,604 | | | 1,401 | |
| Amortization of purchased intangibles | 94 | | | 85 | | | 80 | |
| Business combination and other related costs | 33 | | | 38 | | | 24 | |
| Legal settlements | 17 | | | — | | | — | |
| Non-GAAP income from operations | $ | 3,254 | | | $ | 2,489 | | | $ | 1,860 | |
| | | | | |
Renewal rate. We calculate our renewal rate by subtracting our attrition rate from 100%. Our attrition rate for a period is equal to the ACV from customers lost during the period, divided by the sum of (i) the total ACV from all customers that renewed during the period, excluding changes in price or users, and (ii) the total ACV from all customers lost during the period. Accordingly, our renewal rate is calculated based on ACV and is not based on the number of customers that have renewed. Further, our renewal rate does not reflect increased or decreased purchases from our customers to the extent such customers are not lost customers or lapsed renewals. A lost customer is a customer that did not renew an expiring contract and that, in our judgment, will not be renewed. Typically, a customer that reduces its subscription upon renewal is not considered a lost customer. However, in instances where the subscription decrease represents the majority of the customer’s ACV, we may deem the renewal as a lost customer. For our renewal rate calculation, we define a customer as an entity with a separate production instance of our service and an active subscription contract as of the measurement date, instead of an entity with a unique GULT or DUNS number. We adjust our renewal rate for acquisitions, consolidations and other customer events that cause the merging of two or more accounts occurring at the time of renewal. Our renewal rate was 98% for each of the years ended December 31, 2024, 2023 and 2022. As our renewal rate is impacted by the timing of renewals, which could occur in advance of, or subsequent to the original contract end date, period-to-period comparison of renewal rates may not be meaningful.
Critical Accounting Policies and Significant Judgments and Estimates
Our management’s discussion and analysis of financial condition and results of operations is based on our consolidated financial statements, which have been prepared in accordance with GAAP. The preparation of these consolidated financial statements requires us to make estimates and assumptions that affect the reported amounts of assets and liabilities and the disclosure of contingent assets and liabilities at the date of the consolidated financial statements, as well as the reported revenues and expenses during the reporting periods. These items are monitored and analyzed by us for changes in facts and circumstances, and material changes in these estimates could occur in the future. We base our estimates on historical experience and on various other factors that we believe are reasonable under the circumstances, the results of which form the basis for making judgments about the carrying value of assets and liabilities that are not readily apparent from other sources. Changes in estimates are reflected in reported results for the period in which they become known. Actual results may differ from these estimates under different assumptions or conditions and such differences could be material.
While our significant accounting policies are more fully described in Note 2 in the notes to our consolidated financial statements included elsewhere in this Annual Report on Form 10-K, we believe that the following accounting policies are critical to the process of making significant judgments and estimates in the preparation of our audited consolidated financial statements.
Revenue Recognition
We derive our revenues predominately from subscription revenues, which are primarily comprised of subscription fees that give customers access to the ordered subscription service, related support and updates, if any, to the subscribed service during the subscription term. For our cloud services, we recognize subscription revenues ratably over the contract term beginning on the commencement date of each contract, the date we make our services available to our customers. Our contracts with customers typically include a fixed amount of consideration and are generally non-cancellable and without any refund-type provisions.
Subscription revenues also include revenues from self-hosted offerings in which customers deploy, or we grant customers the option to deploy without significant penalty, our subscription service internally or contract with a third party to host the software. For these contracts, we account for the software element separately from the related support and updates as they are distinct performance obligations. The transaction price is allocated to separate performance obligations on a relative standalone selling price (“SSP”) basis. The transaction price allocated to the software element is recognized when transfer of control of the software to the customer is complete. The transaction price allocated to the related support and updates are recognized ratably over the contract term.
We enter into contracts that can include various combinations of products and services, which are generally capable of being distinct and accounted for as separate performance obligations. For these contracts, the transaction price is allocated to the separate performance obligations on a relative SSP basis. Evaluating the terms and conditions included within our customer contracts for appropriate revenue recognition and determining whether products and services are considered distinct performance obligations that should be accounted for separately versus together may require significant judgment.
Deferred Commissions
Deferred commissions are the incremental selling costs that are associated with acquiring customer contracts and consist primarily of sales commissions paid to our sales organization and referral fees paid to independent third parties. Commissions and referral fees earned upon the execution of initial and expansion contracts are primarily deferred and amortized over a period of benefit that we have determined to be five years consistent with prior year. Commissions earned upon the renewal of customer contracts are deferred and amortized over the average renewal term. Additionally, for self-hosted offerings, consistent with the recognition of subscription revenues for self-hosted offerings, a portion of the commission cost is expensed upfront when the self-hosted offering is made available. Determining the period of benefit, including average renewal term, requires judgment for which we take into consideration our customer contracts, our technology life cycle and other factors.
Business Combinations
The allocation of the purchase price in a business combination requires management to make significant estimates in determining the fair value of acquired assets and assumed liabilities, especially with respect to intangible assets. The excess of the purchase price in a business combination over the fair value of these tangible and intangible assets acquired and liabilities assumed is recorded as goodwill. Critical estimates in valuing certain intangible assets include, but are not limited to, future expected cash flows, discount rates, revenue growth rates, the time and expense to recreate the assets and profit margin a market participant would receive. These estimates are inherently uncertain and unpredictable and, as a result, actual results may differ from estimates. We evaluate these estimates and assumptions as new information is obtained and may record adjustments to the fair value of the tangible and intangible assets acquired and liabilities assumed but not later than one year from the acquisition date.
Income Taxes
Our annual tax rate is based on our income, statutory tax rates and tax planning opportunities available to us in the various jurisdictions in which we operate. Tax laws are complex and subject to different interpretations by the taxpayer and respective government taxing authorities. Significant judgment is required in determining our tax expense (benefit) and in evaluating our tax positions, including evaluating uncertainties and the complexity of taxes on foreign earnings. We review our tax positions quarterly and adjust the balances as new information becomes available.
Deferred tax assets represent amounts available to reduce income taxes payable on taxable income in future years. Such assets arise because of temporary differences between the financial reporting and tax bases of assets and liabilities, as well as from net operating loss and tax credit carryforwards. We evaluate the recoverability of these future tax deductions and credits by assessing the adequacy of future expected taxable income from all sources, including future growth, forecasted earnings, future taxable income, the mix of earnings in the jurisdictions in which we operate, historical earnings, taxable income in prior years, if carryback is permitted under the law, carryforward periods and prudent and feasible tax planning strategies. A valuation allowance is established if it is more likely than not that all or a portion of the deferred tax asset will not be realized. To the extent sufficient positive evidence becomes available, we may release all or a portion of our valuation allowance in one or more future periods. A release of the valuation allowance, if any, would result in the recognition of certain deferred tax assets and a material income tax benefit for the period in which such release is recorded.
We regularly assess the need for a valuation allowance against our deferred tax assets. In making that assessment, we consider both positive and negative evidence related to the likelihood of realization of the deferred tax assets to determine, based on the weight of available evidence, whether it is more likely than not that some or all of the deferred tax assets will not be realized. As of June 30, 2023, we achieved cumulative U.S. income during the prior twelve quarters when considering pre-tax income adjusted for permanent differences and other comprehensive losses. Based on all available positive and negative evidence, having demonstrated sustained profitability which is objective and verifiable, and taking into account anticipated future earnings, we concluded it is more likely than not that our U.S. federal and state deferred tax assets will be realizable, with the exception of California. We released $1.05 billion of our valuation allowance during the year ended December 31, 2023. As of December 31, 2024 and 2023, we maintained a valuation allowance of $220 million and $196 million, respectively, against our California deferred tax assets due to the uncertainty regarding realizability of these deferred tax assets as they have not met the “more likely than not” realization criteria, particularly as we expect research and development tax credit generation to exceed our ability to use the credits in future years. We will continue to monitor the need for a valuation allowance against our deferred tax assets on a quarterly basis. Refer to Note 16 “Provision for (Benefit from) Income Taxes,” in the notes to our consolidated financial statements included elsewhere in this Annual Report on Form 10-K for additional information on our valuation allowance.
Our tax positions are subject to income tax audits by multiple tax jurisdictions throughout the world. We recognize the tax benefit of an uncertain tax position only if it is more likely than not the position is sustainable upon examination by the taxing authority based on the technical merits. We measure the tax benefit recognized as the largest amount of benefit which is more likely than not to be realized upon settlement with the taxing authority. We recognize interest accrued and penalties related to unrecognized tax benefits in our tax provision. Significant judgment is required to evaluate uncertain tax positions. Our evaluations are based upon a number of factors, including changes in facts or circumstances, changes in tax law or guidance, correspondence with tax authorities during the course of audits and effective settlement of audit issues. Changes in the recognition or measurement of uncertain tax positions could result in material increases or decreases in our income tax expense in the period in which we make the change, which could have a material impact on our effective tax rate and operating results.
We calculate the current and deferred income tax provision based on estimates and assumptions that could differ from the actual results reflected in income tax returns filed in subsequent years and record adjustments based on filed income tax returns when identified. The amount of income taxes paid is subject to examination by U.S. federal, state and foreign tax authorities. The estimate of the potential outcome of any uncertain tax issue is subject to management’s assessment of relevant risks, facts and circumstances existing at that time. To the extent the assessment of such tax position changes, we record the change in estimate in the period in which we make the determination.
Change in Accounting Estimate
In January 2024, we completed an assessment of the useful life of our data center equipment and determined we should increase the estimated useful life of data center equipment from four to five years. This change in accounting estimate was effective beginning fiscal year 2024. Refer to Note 2 “Summary of Significant Accounting Policies,” in the notes to our consolidated financial statements included elsewhere in this Annual Report on Form 10-K for additional information on our change in estimated useful life of our data center equipment during 2024.
Components of Results of Operations
Revenues
Subscription revenues. Subscription revenues are primarily comprised of fees that give customers access to the ordered subscription service for both self-hosted offerings and cloud-based subscription offerings, and related standard and enhanced support and updates, if any, to the subscription service during the subscription term. For our cloud-based offerings, we recognize revenue ratably over the subscription term. For self-hosted offerings, a substantial portion of the sales price is recognized upon delivery of the software, which may cause greater variability in our subscription revenues and subscription gross margin. Pricing includes multiple instances, hosting and support services, data backup and disaster recovery services, as well as future updates, when and if available, offered during the subscription term. We typically invoice our customers for subscription fees in annual increments upon execution of the initial contract or subsequent renewal. Our contracts are generally non-cancellable during the subscription term, though a customer can terminate for breach if we materially fail to perform.
Professional services and other revenues. Our arrangements for professional services are primarily on a time-and-materials basis, and we generally invoice our customers monthly in arrears for the professional services based on actual hours and expenses incurred. Some of our professional services arrangements are on a fixed-fee basis. Professional services revenues are recognized as services are delivered. Other revenues primarily consist of fees from customer training delivered on-site or through publicly available classes. Typical payment terms require our customers to pay us within 30 days of invoice.
We sell our subscription services primarily through our direct sales organization. We also sell services through managed service providers and resale partners. We also generate revenues from certain professional services and from training of customers and partner personnel, through both our direct team and indirect sales channel. Revenues from our direct sales organization represented 78% of our total revenues for the year ended December 31, 2024 and 79% of our total revenues for each of the years ended December 31, 2023 and 2022. For purposes of calculating revenues from our direct sales organization, revenues from systems integrators and managed services providers are included as part of the direct sales organization.
Seasonality. We have historically experienced seasonality in terms of when we enter into customer agreements. We sign a significantly higher percentage of agreements with new customers, as well as expansion with existing customers, in the fourth quarter of each year. The increase in customer agreements for the fourth quarter is primarily a result of both large enterprise account buying patterns typical in the software industry, which are driven primarily by the expiration of annual authorized budgeted expenditures, and the terms of our commission plans, which incentivize our direct sales organization to meet their annual quotas by December 31. Furthermore, we usually sign a significant portion of these agreements during the last month, and often the last two weeks, of each quarter. This seasonality of entering into customer agreements is sometimes not immediately apparent in our revenues, due to the fact that we recognize subscription revenues from our cloud offering contracts over the term of the subscription agreement, which is generally 12 to 36 months. In addition, we continue to see an increase in the number of 12-month agreements entered into with the U.S. federal government throughout the year, with the highest number of agreements entered into in the third quarter, driven primarily by the timing of their annual budget expenditures. This larger mix of contracts with 12-month renewal terms in the third quarter will generally cause variability in our RPO and cRPO in subsequent quarters until they are renewed. Although these seasonal factors may be common in the technology industry, historical patterns should not be considered a reliable indicator of our future sales activity or performance.
Cost of Revenues
Cost of subscription revenues. Cost of subscription revenues consists primarily of expenses related to hosting our services and providing support to our customers. These expenses are comprised of data center capacity costs, which include colocation costs associated with our data centers as well as interconnectivity between data centers, depreciation related to our infrastructure hardware equipment dedicated for customer use, amortization of intangible assets, expenses associated with software, public cloud service costs, IT services and dedicated customer support, personnel-related costs directly associated with data center operations and customer support, including salaries, benefits, bonuses, stock-based compensation and allocated overhead.
Cost of professional services and other revenues. Cost of professional services and other revenues consists primarily of personnel-related costs directly associated with our professional services and training departments, including salaries, benefits, bonuses and stock-based compensation, the costs of contracted third-party partners, travel expenses and allocated overhead.
Professional services are performed directly by our services team, as well as by contracted third-party partners. Fees paid by us to third-party partners are primarily recognized as cost of revenues as the professional services are delivered. Cost of revenues associated with our professional services engagements contracted with third-party partners as a percentage of professional services and other revenues was 24%, 10% and 12% for the years ended December 31, 2024, 2023 and 2022, respectively.
Sales and Marketing
Sales and marketing expenses consist primarily of personnel-related expenses directly associated with our sales and marketing staff, including salaries, benefits, bonuses and stock-based compensation. Sales and marketing expenses also include the amortization of commissions paid to our sales employees, including related payroll taxes and fringe benefits. In addition, sales and marketing expenses include branding expenses, marketing program expenses, which include events such as Knowledge, and costs associated with purchasing advertising and marketing data, software and subscription services dedicated for sales and marketing use and allocated overhead.
Research and Development
Research and development expenses consist primarily of personnel-related expenses directly associated with our research and development staff, including salaries, benefits, bonuses, stock-based compensation and allocated overhead. Research and development expenses also include data center capacity costs, costs associated with outside services contracted for research and development purposes and depreciation of infrastructure hardware equipment that is used solely for research and development purposes.
General and Administrative
General and administrative expenses consist primarily of personnel-related expenses for our executive, finance, legal, human resources, facilities and administrative personnel, including salaries, benefits, bonuses, stock-based compensation, external legal, accounting and other professional services fees, other corporate expenses, amortization of intangible assets and allocated overhead.
Provision for (Benefit from) Income Taxes
Provision for (benefit from) income taxes consists of federal, state and foreign income taxes. Our income tax provision for the year ended December 31, 2024 is primarily attributable to the mix of earnings and losses in countries with differing statutory tax rates, offset by excess tax benefits of stock-based compensation. We continue to maintain a valuation allowance against our California deferred tax assets due to the uncertainty regarding realizability of these deferred tax assets as they have not met the “more likely than not” realization criteria, particularly as we expect research and development tax credit generation to exceed our ability to use the credits in future years.
Comparison of the years ended December 31, 2024 and 2023
Revenues
| | | | | | | | | | | | | | | | | |
| | Year Ended December 31, | | % Change |
| | 2024 | | 2023 | |
| | | | | |
| (dollars in millions) | | |
| Revenues: | | | | | |
| Subscription | $ | 10,646 | | | $ | 8,680 | | | 23 | % |
| Professional services and other | 338 | | | 291 | | | 16 | % |
| Total revenues | $ | 10,984 | | | $ | 8,971 | | | 22 | % |
| Percentage of revenues: | | | | | |
| Subscription | 97 | % | | 97 | % | | |
| Professional services and other | 3 | % | | 3 | % | | |
| Total | 100 | % | | 100 | % | | |
Subscription revenues increased by $2.0 billion for the year ended December 31, 2024, compared to the prior year, primarily driven by increased purchases by new and existing customers. Included in subscription revenues is $409 million and $322 million of revenues recognized upfront from the delivery of software associated with self-hosted offerings during the years ended December 31, 2024 and 2023, respectively.
We expect subscription revenues for the year ending December 31, 2025 to increase in absolute dollars and remain relatively flat as a percentage of revenue as we continue to add new customers and existing customers increase their usage of our products compared to the year ended December 31, 2024.
Our expectations for revenues, cost of revenues and operating expenses for the year ending December 31, 2025 are based on the 31-day average of foreign exchange rates for December 31, 2024.
Subscription revenues consist of the following:
| | | | | | | | | | | | | | | | | |
| Year Ended December 31, | | % Change |
| 2024 | | 2023 | |
| | | | | |
| (dollars in millions) | | |
| Digital workflow products | $ | 9,422 | | | $ | 7,679 | | | 23 | % |
| ITOM products | 1,224 | | | 1,001 | | | 22 | % |
| Total subscription revenues | $ | 10,646 | | | $ | 8,680 | | | 23 | % |
Our digital workflow products include most of our product offerings and are generally priced on a per user basis. Our remaining product offerings, primarily comprised of our IT Operations Management (“ITOM”) products, are predominantly priced on a subscription unit basis.
Professional services and other revenues increased by $47 million for the year ended December 31, 2024, compared to the prior year, due to an increase in services and trainings provided to new and existing customers.
We expect professional services and other revenues for the year ending December 31, 2025 to remain relatively flat both in absolute dollars and as a percentage of revenue compared to the year ended December 31, 2024.
Cost of Revenues and Gross Profit Percentage
| | | | | | | | | | | | | | | | | |
| | Year Ended December 31, | | % Change |
| | 2024 | | 2023 | |
| | | | | |
| | (dollars in millions) | | |
| Cost of revenues: | | | | | |
| Subscription | $ | 1,942 | | | $ | 1,606 | | | 21 | % |
| Professional services and other | 345 | | | 315 | | | 10 | % |
| Total cost of revenues | $ | 2,287 | | | $ | 1,921 | | | 19 | % |
| Gross profit (loss) percentage: | | | | | |
| Subscription | 82 | % | | 82 | % | | |
| Professional services and other | (2 | %) | | (8 | %) | | |
| Total gross profit percentage | 79 | % | | 79 | % | | |
| | | | | |
| Gross profit: | $ | 8,697 | | | $ | 7,050 | | | 23 | % |
| | | | | |
| | | | | |
| | | | | |
| | | | | |
Cost of subscription revenues increased by $336 million for the year ended December 31, 2024, compared to the prior year, primarily due to increased headcount and increased costs to support the growth of our subscription offerings including costs to support customers in regulated markets. Personnel-related costs, including stock-based compensation and overhead expenses, increased by $230 million as compared to prior year. Expenses associated with software, maintenance, and other costs to support the expansion of our data center capacity increased by $85 million for the year ended December 31, 2024, as compared to prior year.
We expect our cost of subscription revenues for the year ending December 31, 2025 to increase in absolute dollars as we provide subscription services to more customers and increase usage within our customer instances and increase slightly as a percentage of revenue compared to the year ended December 31, 2024. We will continue to incur incremental costs to attract customers in regulated markets by adopting public cloud offerings as well as increased support for customers impacted by new and evolving data residency requirements. To the extent future acquisitions are consummated, our cost of subscription revenues may increase due to additional non-cash charges associated with the amortization of intangible assets acquired.
Our subscription gross profit percentage was 82% for each of the years ended December 31, 2024 and 2023. We expect our subscription gross profit percentage to decrease slightly for the year ended December 31, 2025 compared to the year ended December 31, 2024.
Cost of professional services and other revenues increased by $30 million for the year ended December 31, 2024 as compared to the prior year, primarily due to an increase in partner ecosystem investments to further accelerate customer value realization, partially offset by a decrease in fixed personnel-related costs, including stock-based compensation, due to decreased internal headcount.
Our professional services and other gross loss percentage improved to 2% for the year ended December 31, 2024, compared to 8% in the prior year, primarily due to an increase in revenue and a decrease in fixed personnel-related costs, including stock-based compensation, as we execute our strategy to shift a portion of professional services to variable spending with strategic third-party partners. We expect our professional services and other gross loss percentage to increase for the year ending December 31, 2025 compared to the year ended December 31, 2024.
Sales and Marketing
| | | | | | | | | | | | | | | | | |
| | Year Ended December 31, | | % Change |
| | 2024 | | 2023 | |
| | | | | |
| | (dollars in millions) | | |
| Sales and marketing | $ | 3,854 | | | $ | 3,301 | | | 17 | % |
| Percentage of revenues | 35 | % | | 37 | % | | |
| | | | | |
Sales and marketing expenses increased by $553 million for the year ended December 31, 2024, compared to the prior year, primarily due to increased headcount resulting in an increase in personnel-related costs including stock-based compensation and overhead expenses of $330 million, compared to the prior year. Amortization expenses associated with deferred commissions increased by $90 million, compared to the prior year, due to an increase in contracts with new customers, expansion and renewal contracts. Other sales and marketing program expenses, which include branding, costs associated with purchasing advertising, marketing events and market data, increased by $95 million compared to the prior year, primarily due to increased program costs and travel for our annual Sales Kickoff and Knowledge user conference.
We expect sales and marketing expenses for the year ending December 31, 2025 to increase in absolute dollars and to decrease slightly as a percentage of revenue compared to the year ended December 31, 2024, as we continue to see leverage from increased sales productivity and marketing efficiencies.
Research and Development | | | | | | | | | | | | | | | | | |
| | Year Ended December 31, | | % Change |
| | 2024 | | 2023 | |
| | | | | |
| | (dollars in millions) | | |
| Research and development | $ | 2,543 | | | $ | 2,124 | | | 20 | % |
| Percentage of revenues | 23 | % | | 24 | % | | |
| | | | | |
Research and development expenses (“R&D”) increased by $419 million during the year ended December 31, 2024, compared to the prior year, primarily due to increased headcount resulting in an increase in personnel-related costs including stock-based compensation and overhead expenses of $350 million compared to prior year. Outside services increased by $48 million during the year ended December 31, 2024, compared to the prior year. The remaining increase was primarily due to expenses associated with software, maintenance and other costs to support the expansion of our data center capacity of $27 million for the year ended December 31, 2024, compared to the prior year. These costs were partially offset by a decrease in program spend of $12 million for the year ended December 31, 2024, compared to the prior year.
We expect R&D expenses for the year ending December 31, 2025 to increase in absolute dollars but remain relatively flat as a percentage of revenue compared to the year ended December 31, 2024, as we continue to improve the existing functionality of our services, develop new applications to fill market needs and enhance our core platform.
General and Administrative
| | | | | | | | | | | | | | | | | |
| | Year Ended December 31, | | % Change |
| | 2024 | | 2023 | |
| | | | | |
| | (dollars in millions) | | |
| General and administrative | $ | 936 | | | $ | 863 | | | 8 | % |
| Percentage of revenues | 9 | % | | 10% | | | |
| | | | | |
General and administrative expenses (“G&A”) increased by $73 million during the year ended December 31, 2024, compared to the prior year, primarily due to increased headcount resulting in an increase in personnel-related costs, excluding stock-based compensation, of $37 million. The remaining increase was primarily due to an increase in other corporate expenses and outside services of $67 million for the year ended December 31, 2024, compared to the prior year. These costs were partially offset by a decrease in stock-based compensation of $36 million for the year ended December 31, 2024, compared to the prior year, primarily due to the requisite service period of certain performance awards being met.
We expect G&A expenses for the year ending December 31, 2025 to increase in absolute dollars but remain relatively flat as a percentage of revenue compared to the year ended December 31, 2024, as we continue to see leverage from continued G&A productivity.
Stock-based Compensation
| | | | | | | | | | | | | | | | | |
| | Year Ended December 31, | | % Change |
| | 2024 | | 2023 | |
| | | | | |
| | (dollars in millions) | | |
| Cost of revenues: | | | | | |
| Subscription | $ | 250 | | | $ | 202 | | | 24 | % |
| Professional services and other | 46 | | | 52 | | | (12 | %) |
| Operating expenses: | | | | | |
| Sales and marketing | 565 | | | 505 | | | 12 | % |
| Research and development | 655 | | | 579 | | | 13 | % |
| General and administrative | 230 | | | 266 | | | (14 | %) |
| Total stock-based compensation | $ | 1,746 | | | $ | 1,604 | | | 9 | % |
| Percentage of revenues | 16 | % | | 18 | % | | |
Stock-based compensation increased by $142 million during the year ended December 31, 2024, compared to the prior year, primarily due to additional grants to current and new employees.
Stock-based compensation is inherently difficult to forecast due to fluctuations in our stock price. Based upon our stock price as of December 31, 2024, we expect stock-based compensation to continue to increase in absolute dollars for the year ending December 31, 2025 as we continue to issue stock-based awards to our employees but remain relatively flat as a percentage of revenue compared to the year ended December 31, 2024. We expect stock-based compensation as a percentage of revenue to decline over time as we continue to grow.
Foreign Currency Exchange
Our international operations have provided and will continue to provide a significant portion of our total revenues. Revenues outside North America represented 37% and 36% of total revenues for the years ended December 31, 2024 and 2023, respectively.
We primarily transact in certain foreign currencies for sales outside of the United States. The movement of the U.S. Dollar had an immaterial impact on our revenues for the year ended December 31, 2024.
In addition, we primarily transact in several foreign currencies for cost of revenues and operating expenses outside of the United States. The movement of the U.S. Dollar had an immaterial impact on our expenses for the year ended December 31, 2024.
Interest Income
| | | | | | | | | | | | | | | | | |
| Year Ended December 31, | | % Change |
| 2024 | | 2023 | |
| | | | | |
| (dollars in millions) | | |
| Interest income | $ | 419 | | | $ | 302 | | | 39 | % |
| Percentage of revenues | 4 | % | | 3 | % | | |
Interest income increased during the year ended December 31, 2024, compared to the prior year, primarily driven by an increase in investment income from our managed portfolio resulting from higher portfolio balances with higher interest rates.
Other Expense, net
| | | | | | | | | | | | | | | | | |
| | Year Ended December 31, | | % Change |
| | 2024 | | 2023 | |
| | | | | |
| | (dollars in millions) | | |
| Interest expense | $ | (23) | | | $ | (24) | | | (4 | %) |
| | | | | |
| | | | | |
| Other | (22) | | | (32) | | | (31 | %) |
| Other expense, net | $ | (45) | | | $ | (56) | | | (20 | %) |
| Percentage of revenues | — | % | | (1%) | | | |
| | | | | |
Other expense, net decreased by $11 million during the year ended December 31, 2024, compared to the prior year, primarily due to a decrease in net losses on equity investments.
To mitigate our risks associated with fluctuations in foreign currency exchange rates, we enter into foreign currency forward contracts with maturities of 12 months or less to hedge a portion of our net outstanding monetary assets and liabilities. These hedging contracts may reduce, but cannot entirely eliminate, the impact of adverse currency exchange rate movements. The gains (losses) recognized for these foreign currency forward contracts in other expense, net, were immaterial for each of the years ended December 31, 2024 and 2023.
Provision for (benefit from) Income Taxes
| | | | | | | | | | | | | | | | | |
| | Year Ended December 31, | | % Change |
| | 2024 | | 2023 | |
| | | | | |
| | (dollars in millions) | | |
| Income before income taxes | $ | 1,738 | | | $ | 1,008 | | | 72 | % |
| Provision for (benefit from) income taxes | 313 | | | (723) | | | NM |
| Effective tax rate | 18 | % | | (72 | %) | | NM |
NM - Not meaningful
The income tax provision was $313 million for the year ended December 31, 2024. The income tax provision was primarily attributable to the mix of earnings and losses in countries with differing statutory tax rates, offset by excess tax benefits of stock-based compensation.
The income tax benefit was $723 million for the year ended December 31, 2023. The income tax benefit was primarily attributable to the release of the valuation allowance of certain U.S. federal and state deferred tax assets. We regularly assess the need for a valuation allowance against our deferred tax assets. In making that assessment, we consider both positive and negative evidence related to the likelihood of realization of the deferred tax assets to determine, based on the weight of available evidence, whether it is more likely than not that some or all of the deferred tax assets will not be realized. As of June 30, 2023, we achieved cumulative U.S. income during the prior twelve quarters when considering pre-tax income adjusted for permanent differences and other comprehensive losses. Based on all available positive and negative evidence, having demonstrated sustained profitability which is objective and verifiable, and taking into account anticipated future earnings, we concluded it is more likely than not that our U.S. federal and state deferred tax assets will be realizable, with the exception of California. We released $1.05 billion of our valuation allowance during the year ended December 31, 2023. As of December 31, 2024, we continue to maintain a valuation allowance against our California deferred tax assets due to the uncertainty regarding realizability of these deferred tax assets as they have not met the “more likely than not” realization criteria, particularly as we expect research and development tax credit generation to exceed our ability to use the credits in future years. We will continue to monitor the need for a valuation allowance against our deferred tax assets on a quarterly basis.
Liquidity and Capital Resources
We generate cash inflows from operations primarily from selling subscription services which are generally paid in advance of provisioning services, and expend cash outflows to develop new services and core technologies that further enhance the Now Platform, engage our customers and enhance their experience, and enable and transform our business operations. Subscription services arrangements typically have a three-year duration, and we have experienced a renewal rate of 98% for each of the years ended December 31, 2024, 2023 and 2022. Cash outflows from operations are principally comprised of the salaries, bonuses, commissions, and benefits for our workforce, licenses and services arrangements that are integral to our business operations and data centers and operating lease arrangements that underlie our facilities. We have generated positive operating cash flows for more than ten years as we continue to grow our business in pursuit of our business strategy, and we expect to grow our business and generate positive cash flows from operations during 2025. When assessing sources of liquidity, we also include cash and cash equivalents, short-term investments and long-term investments totaling $9.9 billion as of December 31, 2024.
Our capital requirements are principally comprised of capital expenditures to support data center capacity expansion, non-contract workforce salaries, bonuses, commissions, and benefits and, to a lesser extent, cancellable and non-cancellable licenses, operating leases and services arrangements that are integral to our business operations. We also acquire technology and businesses to expand our service offerings and functionality. Our capital expenditures are under cancellable and non-cancellable arrangements. Non-cancellable purchase commitments for business operations total $4.1 billion as of December 31, 2024, due primarily over the next five years. Operating lease obligations totaling $924 million are principally associated with leased facilities and have varying maturities with $558 million due over the next five years.
We may repurchase our shares of common stock in the open market, in privately negotiated transactions or by other means, with the objective to return value to our stockholders and manage the dilution from future employee equity grants and employee stock purchase programs. In May 2023, our board of directors authorized a program to repurchase up to $1.5 billion of our common stock. During the year ended December 31, 2024, the Company repurchased 0.8 million shares of our common stock for $696 million. All repurchases were made in open market transactions. Repurchases of common stock are recognized as treasury stock and held for future issuance. As of December 31, 2024, approximately $266 million of the originally authorized amount under the share repurchase program remained available for future repurchases. In January 2025, our board of directors authorized an additional $3.0 billion in repurchases under the share repurchase program. Refer to Note 13 “Stockholders’ Equity” to our consolidated financial statements included in this Annual Report on Form 10-K for additional information.
We have also issued long-term debt to finance our business. In August 2020, we issued 1.40% fixed rate ten-year notes with an aggregate principal amount of $1.5 billion due on September 1, 2030 (the “2030 Notes”).
Our free cash flows, together with our other sources of liquidity, are available to service our liabilities as well as our cancellable and non-cancellable arrangements. We anticipate cash flows generated from operations, cash, cash equivalents and investments will be sufficient to meet our liquidity needs for at least the next 12 months. As we look beyond the next 12 months, we seek to continue to grow free cash flows necessary to fund our operations and grow our business. If we require additional capital resources, we may seek to finance our operations from the current funds available or additional equity or debt financing.
| | | | | | | | | | | |
| | Year Ended December 31, |
| | 2024 | | 2023 |
| | | |
| | (dollars in millions) |
| Net cash provided by operating activities | $ | 4,267 | | | $ | 3,398 | |
| Net cash used in investing activities | (2,501) | | | (2,167) | |
| Net cash used in financing activities | (1,343) | | | (803) | |
| Net increase in cash, cash equivalents and restricted cash | 406 | | | 429 | |
Operating Activities
Net cash provided by operating activities was $4.3 billion for the year ended December 31, 2024 compared to $3.4 billion for the prior year. The net increase in operating cash flows was primarily due to higher collections driven by revenue growth.
Investing Activities
Net cash used in investing activities for the year ended December 31, 2024 was $2.5 billion compared to $2.2 billion for the prior year. The net increase in cash used in investing activities was primarily due to a $167 million increase in net purchases of investments, a $158 million increase in purchases of property and equipment, a $106 million increase in purchases of non-marketable investments and a $37 million increase in purchases of other intangible assets, partially offset by a $166 million decrease in cash used in business combinations.
Financing Activities
Net cash used in financing activities for the year ended December 31, 2024 was $1,343 million compared to $803 million for the prior year. The net increase in cash used in financing activities is primarily due to a $241 million increase in taxes paid related to net share settlement of equity awards, a $184 million increase in business combination related to the second installment payment in the acquisition of G2K Group GmbH and a $158 million increase in repurchases of common stock, offset by a $43 million increase in proceeds from employee stock plans.
Contractual Obligations and Commitments
Our estimated future obligations consist of leases, various non-cancellable agreements with cloud service providers and an information technology equipment provider, purchase obligations, debt and unrecognized tax benefits as of December 31, 2024. Refer to Note 17 “Commitments and Contingencies,” and Note 16 “Provision for (Benefit from) Income Taxes” to our consolidated financial statements included in this Annual Report on Form 10-K for more information.
| | | | | |
| ITEM 7A. | QUALITATIVE AND QUANTITATIVE DISCLOSURES ABOUT MARKET RISK
|
Foreign Currency Exchange Risk
We have foreign currency risks related to our revenue and operating expenses denominated in currencies other than the U.S. Dollar, primarily the Euro and British Pound Sterling. We are a net receiver of Euro and British Pound Sterling, and therefore benefit from a weakening of the U.S. Dollar relative to these currencies and, conversely, are adversely affected by a strengthening of the U.S. Dollar relative to these currencies. Revenues denominated in U.S. Dollar as a percentage of total revenues were 71% for each of the years ended December 31, 2024 and 2023 and 72% for the year ended December 31, 2022.
A hypothetical 10% increase in the U.S. Dollar against other currencies would have resulted in a decrease in operating income of $150 million, $107 million and $75 million for the years ended December 31, 2024, 2023 and 2022, respectively. This analysis disregards the impact from the Company’s cash flow hedging program and possibilities that rates can move in opposite directions and that losses from one geographic area may be offset by gains from another geographic area.
To mitigate our risks associated with fluctuations in foreign currency exchange rates, we enter into foreign currency forward contracts to hedge a portion of our net outstanding monetary assets, liabilities and forecasted foreign currency denominated revenues. These foreign currency forward contracts are intended to offset gains or losses related to remeasuring monetary assets and liabilities and to reduce foreign exchange impact on our forecasted revenues. Derivative contracts related to hedging of forecasted revenues are designated as cash flow hedges for accounting purposes. For contracts qualifying as cash flow hedges, the derivative’s gain or loss is initially reported as a component of accumulated other comprehensive income (loss) and subsequently reclassified into earnings in the same period the forecasted transaction affects earnings. For contracts not designated as cash flow hedges for accounting purposes, the derivative’s gain or loss is recognized immediately in earnings within our consolidated statements of comprehensive income.
A sensitivity analysis performed on our cash flow hedge portfolio as of December 31, 2024 indicated that a hypothetical 10% depreciation of the U.S. Dollar from its value as of December 31, 2024 would decrease the fair value of our foreign currency contracts by $164 million.
These foreign currency forward contracts expose us to credit risk to the extent that the counterparties may be unable to meet the terms of the arrangement. We mitigate this credit risk by transacting with major financial institutions with high credit ratings. While the contract or notional amount is often used to express the volume of foreign currency derivative contracts, the amounts potentially subject to credit risk are generally limited to the amounts, if any, by which the counterparties’ obligations under the agreements exceed our obligations to the counterparties. We are not required to pledge, and are not entitled to receive, cash collateral related to these derivative instruments. We do not enter into derivative contracts for trading or speculative purposes. Refer to Note 8 in the notes to our consolidated financial statements included elsewhere in this Annual Report on Form 10-K for additional information.
Interest Rate Sensitivity
We had an aggregate of $9.9 billion in cash, cash equivalents, short-term investments and long-term investments as of December 31, 2024. This amount was invested primarily in money market funds, certificates of deposit, corporate notes and bonds, government and agency securities and other debt securities with a minimum rating of BBB by Standard & Poor’s, Baa2 by Moody’s or BBB by Fitch. The primary objectives of our investment activities are the preservation of capital and support of our liquidity requirements. Our investments are exposed to market risk due to fluctuations in interest rates, which may affect our interest income and the fair market value of our investments.
As of December 31, 2024, a hypothetical 100 basis point increase in interest rates would have resulted in an approximate $78 million decline of the fair value of our available-for-sale debt securities. This estimate is based on a sensitivity model that measures market value changes when changes in interest rates occur.
As of December 31, 2023, we had an aggregate of $8.1 billion in cash, cash equivalents, short-term investments and long-term investments, and a hypothetical 100 basis point increase in interest rates would have resulted in an approximate $60 million decline of the fair value of our available-for-sale debt securities.
Market Risk
In August 2020, we issued 1.40% fixed rate ten-year notes with an aggregate principal amount of $1.5 billion due on September 1, 2030. The 2030 Notes were issued at 99.63% of principal and we incurred approximately $13 million of debt issuance costs. Interest is payable semi-annually in arrears on March 1 and September 1 of each year, beginning on March 1, 2021, and the entire outstanding principal amount is due at maturity on September 1, 2030. The 2030 Notes are unsecured obligations and the indentures governing the 2030 Notes contain customary events of default and covenants that, among others and subject to exceptions, restrict our ability to incur or guarantee debt secured by liens on specified assets or enter into sale and lease-back transactions with respect to specified properties.
We hold cash balances with multiple financial institutions in various countries and these balances routinely exceed deposit insurance limits.
As of December 31, 2024 and 2023, we had $469 million and $268 million, respectively, of non-marketable equity investments in privately held companies. Our non-marketable equity investments are primarily accounted for using: (i) measurement alternative which measures the investments at cost minus impairment, if any, and adjusted for observable transactions for the same or similar investments of the same issuer and (ii) equity method which measures the investment at cost minus impairment, plus or minus our share of equity method investee income or loss. For those non-marketable equity investments using measurement alternative, recording upward and downward adjustments to the carrying value of these non-marketable equity investments requires quantitative assessments of the fair value of our non-marketable equity investments using various valuation methodologies and involves the use of estimates. The timing and amount of observable price changes are influenced by market dynamics that can impact the valuation of our non-marketable equity investments. These changes could be material based on market conditions and events. All of our non-marketable equity investments in privately held companies are subject to a risk of partial or total loss of invested capital.
| | | | | |
| ITEM 8. | CONSOLIDATED FINANCIAL STATEMENTS AND SUPPLEMENTARY DATA |
SERVICENOW, INC.
INDEX TO CONSOLIDATED FINANCIAL STATEMENTS
| | | | | |
| | Page |
| |
| |
| Consolidated Financial Statements | |
| |
| |
| |
| |
| |
| |
| |
| |
| |
| |
Report of Independent Registered Public Accounting Firm
To the Board of Directors and Stockholders of ServiceNow, Inc.
Opinions on the Financial Statements and Internal Control over Financial Reporting
We have audited the accompanying consolidated balance sheets of ServiceNow, Inc. and its subsidiaries (the “Company”) as of December 31, 2024 and 2023, and the related consolidated statements of comprehensive income, of stockholders’ equity and of cash flows for each of the three years in the period ended December 31, 2024, including the related notes (collectively referred to as the “consolidated financial statements”). We also have audited the Company's internal control over financial reporting as of December 31, 2024, based on criteria established in Internal Control - Integrated Framework (2013) issued by the Committee of Sponsoring Organizations of the Treadway Commission (COSO).
In our opinion, the consolidated financial statements referred to above present fairly, in all material respects, the financial position of the Company as of December 31, 2024 and 2023, and the results of its operations and its cash flows for each of the three years in the period ended December 31, 2024 in conformity with accounting principles generally accepted in the United States of America. Also in our opinion, the Company maintained, in all material respects, effective internal control over financial reporting as of December 31, 2024, based on criteria established in Internal Control - Integrated Framework (2013) issued by the COSO.
Basis for Opinions
The Company's management is responsible for these consolidated financial statements, for maintaining effective internal control over financial reporting, and for its assessment of the effectiveness of internal control over financial reporting, included in Management's Report on Internal Control over Financial Reporting appearing under Item 9A. Our responsibility is to express opinions on the Company’s consolidated financial statements and on the Company's internal control over financial reporting based on our audits. We are a public accounting firm registered with the Public Company Accounting Oversight Board (United States) (PCAOB) and are required to be independent with respect to the Company in accordance with the U.S. federal securities laws and the applicable rules and regulations of the Securities and Exchange Commission and the PCAOB.
We conducted our audits in accordance with the standards of the PCAOB. Those standards require that we plan and perform the audits to obtain reasonable assurance about whether the consolidated financial statements are free of material misstatement, whether due to error or fraud, and whether effective internal control over financial reporting was maintained in all material respects.
Our audits of the consolidated financial statements included performing procedures to assess the risks of material misstatement of the consolidated financial statements, whether due to error or fraud, and performing procedures that respond to those risks. Such procedures included examining, on a test basis, evidence regarding the amounts and disclosures in the consolidated financial statements. Our audits also included evaluating the accounting principles used and significant estimates made by management, as well as evaluating the overall presentation of the consolidated financial statements. Our audit of internal control over financial reporting included obtaining an understanding of internal control over financial reporting, assessing the risk that a material weakness exists, and testing and evaluating the design and operating effectiveness of internal control based on the assessed risk. Our audits also included performing such other procedures as we considered necessary in the circumstances. We believe that our audits provide a reasonable basis for our opinions.
Definition and Limitations of Internal Control over Financial Reporting
A company’s internal control over financial reporting is a process designed to provide reasonable assurance regarding the reliability of financial reporting and the preparation of financial statements for external purposes in accordance with generally accepted accounting principles. A company’s internal control over financial reporting includes those policies and procedures that (i) pertain to the maintenance of records that, in reasonable detail, accurately and fairly reflect the transactions and dispositions of the assets of the company; (ii) provide reasonable assurance that transactions are recorded as necessary to permit preparation of financial statements in accordance with generally accepted accounting principles, and that receipts and expenditures of the company are being made only in accordance with authorizations of management and directors of the company; and (iii) provide reasonable assurance regarding prevention or timely detection of unauthorized acquisition, use, or disposition of the company’s assets that could have a material effect on the financial statements.
Because of its inherent limitations, internal control over financial reporting may not prevent or detect misstatements. Also, projections of any evaluation of effectiveness to future periods are subject to the risk that controls may become inadequate because of changes in conditions, or that the degree of compliance with the policies or procedures may deteriorate.
Critical Audit Matters
The critical audit matter communicated below is a matter arising from the current period audit of the consolidated financial statements that was communicated or required to be communicated to the audit committee and that (i) relates to accounts or disclosures that are material to the consolidated financial statements and (ii) involved our especially challenging, subjective, or complex judgments. The communication of critical audit matters does not alter in any way our opinion on the consolidated financial statements, taken as a whole, and we are not, by communicating the critical audit matter below, providing a separate opinion on the critical audit matter or on the accounts or disclosures to which it relates.
Revenue Recognition – Subscription Revenue
As described in Note 2 to the consolidated financial statements, subscription revenues are primarily comprised of subscription fees that give customers access to the ordered subscription service, related support and updates, if any, to the subscribed service during the subscription term. The Company recognizes subscription revenues ratably over the contract term beginning on the commencement date of each contract, which is the date the Company makes their services available to their customers. The Company’s contracts with customers typically include a fixed amount of consideration and are generally non-cancellable and without any refund-type provisions. The Company recognized subscription revenues of $10.6 billion for the year ended December 31, 2024.
The principal considerations for our determination that performing procedures relating to revenue recognition for subscription revenue is a critical audit matter are a high degree of auditor effort in performing procedures and evaluating audit evidence related to the Company’s subscription revenue recognition.
Addressing the matter involved performing procedures and evaluating audit evidence in connection with forming our overall opinion on the consolidated financial statements. These procedures included testing the effectiveness of controls relating to the revenue recognition process for subscription revenue. These procedures also included, among others (i) testing subscription revenue transactions, on a sample basis, by obtaining and inspecting source documents, such as contracts, invoices and cash receipts, and recalculating revenue recognized and (ii) testing outstanding customer invoice balances as of December 31, 2024, on a sample basis, by obtaining and inspecting source documents, such as contracts and subsequent cash receipts.
/s/ PricewaterhouseCoopers LLP
San Jose, California
January 29, 2025
We have served as the Company’s auditor since 2011.
SERVICENOW, INC.
CONSOLIDATED BALANCE SHEETS
(in millions, except number of shares which are reflected in thousands and per share data)
| | | | | | | | | | | |
| December 31, |
| | 2024 | | 2023 |
| Assets | | | |
| Current assets: | | | |
| Cash and cash equivalents | $ | 2,304 | | | $ | 1,897 | |
| Short-term investments | 3,458 | | | 2,980 | |
| Accounts receivable, net | 2,240 | | | 2,036 | |
| Current portion of deferred commissions | 517 | | | 461 | |
| Prepaid expenses and other current assets | 668 | | | 403 | |
| | | |
| Total current assets | 9,187 | | | 7,777 | |
| Deferred commissions, less current portion | 999 | | | 919 | |
| Long-term investments | 4,111 | | | 3,203 | |
| Property and equipment, net | 1,763 | | | 1,358 | |
| Operating lease right-of-use assets | 693 | | | 715 | |
| Intangible assets, net | 209 | | | 224 | |
| Goodwill | 1,273 | | | 1,231 | |
| Deferred tax assets | 1,385 | | | 1,508 | |
| Other assets | 763 | | | 452 | |
| Total assets | $ | 20,383 | | | $ | 17,387 | |
| Liabilities and Stockholders’ Equity | | | |
| Current liabilities: | | | |
| Accounts payable | $ | 68 | | | $ | 126 | |
| Accrued expenses and other current liabilities | 1,369 | | | 1,365 | |
| Current portion of deferred revenue | 6,819 | | | 5,785 | |
| Current portion of operating lease liabilities | 102 | | | 89 | |
| | | |
| | | |
| Total current liabilities | 8,358 | | | 7,365 | |
| Deferred revenue, less current portion | 95 | | | 81 | |
| | | |
| Operating lease liabilities, less current portion | 687 | | | 707 | |
| Long-term debt, net | 1,489 | | | 1,488 | |
| Other long-term liabilities | 145 | | | 118 | |
| Total liabilities | 10,774 | | | 9,759 | |
| Commitments and contingencies | | | |
| Stockholders’ equity: | | | |
| Preferred stock, $0.001 par value; 10,000 shares authorized; no shares issued or outstanding | — | | | — | |
| Common stock, $0.001 par value; shares authorized: 600,000; shares issued: 208,151 and 205,619; shares outstanding: 206,487 and 204,724 | — | | | — | |
| Treasury stock, at cost (shares held: 1,664 and 895) | (1,219) | | | (535) | |
| Additional paid-in capital | 7,402 | | | 6,131 | |
| Accumulated other comprehensive loss | (68) | | | (37) | |
| Retained earnings | 3,494 | | | 2,069 | |
| Total stockholders’ equity | 9,609 | | | 7,628 | |
| Total liabilities and stockholders’ equity | $ | 20,383 | | | $ | 17,387 | |
See accompanying notes to consolidated financial statements
SERVICENOW, INC.
CONSOLIDATED STATEMENTS OF COMPREHENSIVE INCOME
(in millions, except number of shares which are reflected in thousands and per share data)
| | | | | | | | | | | | | | | | | |
| | Year Ended December 31, |
| | 2024 | | 2023 | | 2022 |
| Revenues: | | | | | |
| Subscription | $ | 10,646 | | | $ | 8,680 | | | $ | 6,891 | |
| Professional services and other | 338 | | | 291 | | | 354 | |
| Total revenues | 10,984 | | | 8,971 | | | 7,245 | |
Cost of revenues (1): | | | | | |
| Subscription | 1,942 | | | 1,606 | | | 1,187 | |
| Professional services and other | 345 | | | 315 | | | 386 | |
| Total cost of revenues | 2,287 | | | 1,921 | | | 1,573 | |
| Gross profit | 8,697 | | | 7,050 | | | 5,672 | |
Operating expenses (1): | | | | | |
| Sales and marketing | 3,854 | | | 3,301 | | | 2,814 | |
| Research and development | 2,543 | | | 2,124 | | | 1,768 | |
| General and administrative | 936 | | | 863 | | | 735 | |
| | | | | |
| Total operating expenses | 7,333 | | | 6,288 | | | 5,317 | |
| Income from operations | 1,364 | | | 762 | | | 355 | |
| Interest income | 419 | | | 302 | | | 82 | |
| Other expense, net | (45) | | | (56) | | | (38) | |
| Income before income taxes | 1,738 | | | 1,008 | | | 399 | |
| Provision for (benefit from) income taxes | 313 | | | (723) | | | 74 | |
| Net income | $ | 1,425 | | | $ | 1,731 | | | $ | 325 | |
| Net income per share - basic | $ | 6.92 | | | $ | 8.48 | | | $ | 1.61 | |
| Net income per share - diluted | $ | 6.84 | | | $ | 8.42 | | | $ | 1.60 | |
| Weighted-average shares used to compute net income per share - basic | 205,834 | | | 204,137 | | | 201,430 | |
| Weighted-average shares used to compute net income per share - diluted | 208,423 | | | 205,591 | | | 203,535 | |
| Other comprehensive (loss) income: | | | | | |
| Foreign currency translation adjustments | $ | (93) | | | $ | 27 | | | $ | (70) | |
| Unrealized gains (losses) on investments, net of tax | 12 | | | 38 | | | (66) | |
| Unrealized gains (losses) on derivative instruments, net of tax | 50 | | | — | | | — | |
| Other comprehensive (loss) income | (31) | | | 65 | | | (136) | |
| Comprehensive income | $ | 1,394 | | | $ | 1,796 | | | $ | 189 | |
(1)Includes stock-based compensation as follows:
| | | | | | | | | | | | | | | | | |
| | Year Ended December 31, |
| | 2024 | | 2023 | | 2022 |
| Cost of revenues: | | | | | |
| Subscription | $ | 250 | | | $ | 202 | | | $ | 157 | |
| Professional services and other | 46 | | | 52 | | | 67 | |
| Operating expenses: | | | | | |
| Sales and marketing | 565 | | | 505 | | | 459 | |
| Research and development | 655 | | | 579 | | | 495 | |
| General and administrative | 230 | | | 266 | | | 223 | |
See accompanying notes to consolidated financial statements
SERVICENOW, INC.
CONSOLIDATED STATEMENTS OF STOCKHOLDERS’ EQUITY
(in millions, except number of shares which are reflected in thousands)
| | | | | | | | | | | | | | | | | | | | | | | | | | | | | | | | | | | | | | | | | | | | | | | |
| | Common Stock | | Treasury Stock | | Additional
Paid-in
Capital | | Retained Earnings (Accumulated Deficit) | | Accumulated
Other
Comprehensive Income (Loss) | | Total
Stockholders’
Equity |
| | Shares | | Amount | | Shares | | Amount | |
| Balance as of December 31, 2021 | 199,608 | | | $ | — | | | — | | | $ | — | | | $ | 3,665 | | | $ | (4) | | | $ | 34 | | | $ | 3,695 | |
| Cumulative effect adjustment from adoption of Accounting Standards Update (ASU) 2020-06 | — | | | — | | | — | | | — | | | (19) | | | 17 | | | — | | | (2) | |
| Common stock issued under employee stock plans | 2,671 | | | — | | | — | | | — | | | 177 | | | — | | | — | | | 177 | |
| Taxes paid related to net share settlement of equity awards | — | | | — | | | — | | | — | | | (427) | | | — | | | — | | | (427) | |
| Stock-based compensation | — | | | — | | | — | | | — | | | 1,400 | | | — | | | — | | | 1,400 | |
| Settlement of 2022 Warrants | 603 | | | — | | | — | | | — | | | — | | | — | | | — | | | — | |
| Settlement of 2022 Notes conversion feature | — | | | — | | | — | | | — | | | (233) | | | — | | | — | | | (233) | |
| Benefit from exercise of 2022 Note Hedge | — | | | — | | | — | | | — | | | 233 | | | — | | | — | | | 233 | |
| Other comprehensive loss, net of tax | — | | | — | | | — | | | — | | | — | | | — | | | (136) | | | (136) | |
| Net income | — | | | — | | | — | | | — | | | — | | | 325 | | | — | | | 325 | |
| Balance as of December 31, 2022 | 202,882 | | | $ | — | | | — | | | $ | — | | | $ | 4,796 | | | $ | 338 | | | $ | (102) | | | $ | 5,032 | |
| Common stock and Treasury stock issued under employee stock plans | 2,737 | | | — | | | 5 | | | 3 | | | 190 | | | — | | | — | | | 193 | |
| Common stock repurchased | — | | | — | | | (900) | | | (538) | | | — | | | — | | | — | | | (538) | |
| Taxes paid related to net share settlement of equity awards | — | | | — | | | — | | | — | | | (459) | | | — | | | — | | | (459) | |
| Stock-based compensation | — | | | — | | | — | | | — | | | 1,604 | | | — | | | — | | | 1,604 | |
| Other comprehensive income, net of tax | — | | | — | | | — | | | — | | | — | | | — | | | 65 | | | 65 | |
| Net income | — | | | — | | | — | | | — | | | — | | | 1,731 | | | — | | | 1,731 | |
| Balance as of December 31, 2023 | 205,619 | | | $ | — | | | (895) | | | $ | (535) | | | $ | 6,131 | | | $ | 2,069 | | | $ | (37) | | | $ | 7,628 | |
| Common stock and Treasury stock issued under employee stock plans | 2,532 | | | — | | | 21 | | | 12 | | | 225 | | | — | | | — | | | 237 | |
| Common stock repurchased | — | | | — | | | (790) | | | (696) | | | — | | | — | | | — | | | (696) | |
| Taxes paid related to net share settlement of equity awards | — | | | — | | | — | | | — | | | (700) | | | — | | | — | | | (700) | |
| Stock-based compensation | — | | | — | | | — | | | — | | | 1,746 | | | — | | | — | | | 1,746 | |
| | | | | | | | | | | | | | | |
| Other comprehensive loss, net of tax | — | | | — | | | — | | | — | | | — | | | — | | | (31) | | | (31) | |
| Net income | — | | | — | | | — | | | — | | | — | | | 1,425 | | | — | | | 1,425 | |
| Balance as of December 31, 2024 | 208,151 | | | $ | — | | | (1,664) | | | $ | (1,219) | | | $ | 7,402 | | | $ | 3,494 | | | $ | (68) | | | $ | 9,609 | |
See accompanying notes to consolidated financial statements
SERVICENOW, INC.
CONSOLIDATED STATEMENTS OF CASH FLOWS
(in millions)
| | | | | | | | | | | | | | | | | |
| | Year Ended December 31, |
| | 2024 | | 2023 | | 2022 |
| Cash flows from operating activities: | | | | | |
| Net income | $ | 1,425 | | | $ | 1,731 | | | $ | 325 | |
| Adjustments to reconcile net income to net cash provided by operating activities: | | | | | |
| Depreciation and amortization | 564 | | | 562 | | | 433 | |
| Amortization of deferred commissions | 550 | | | 459 | | | 358 | |
| | | | | |
| Stock-based compensation | 1,746 | | | 1,604 | | | 1,401 | |
| Deferred income taxes | 98 | | | (857) | | | 15 | |
| | | | | |
| | | | | |
| | | | | |
| | | | | |
| | | | | |
| | | | | |
| | | | | |
| Other | (51) | | | — | | | 17 | |
| Changes in operating assets and liabilities, net of effect of business combinations: | | | | | |
| Accounts receivable | (254) | | | (300) | | | (340) | |
| Deferred commissions | (713) | | | (717) | | | (566) | |
| Prepaid expenses and other assets | (332) | | | (203) | | | (39) | |
| Accounts payable | (52) | | | (142) | | | 172 | |
| Deferred revenue | 1,179 | | | 1,085 | | | 904 | |
| Accrued expenses and other liabilities | 107 | | | 176 | | | 43 | |
| Net cash provided by operating activities | 4,267 | | | 3,398 | | | 2,723 | |
| Cash flows from investing activities: | | | | | |
| Purchases of property and equipment | (852) | | | (694) | | | (550) | |
| Business combinations, net of cash acquired | (113) | | | (279) | | | (91) | |
| Purchases of other intangibles | (40) | | | (3) | | | — | |
| Purchases of investments | (5,031) | | | (4,634) | | | (4,038) | |
| Purchases of non-marketable investments | (181) | | | (75) | | | (167) | |
| Sales and maturities of investments | 3,752 | | | 3,522 | | | 2,245 | |
| Other | (36) | | | (4) | | | 18 | |
| Net cash used in investing activities | (2,501) | | | (2,167) | | | (2,583) | |
| Cash flows from financing activities: | | | | | |
| Repayments of convertible senior notes attributable to principal | — | | | — | | | (94) | |
| Proceeds from employee stock plans | 237 | | | 194 | | | 177 | |
| Repurchases of common stock | (696) | | | (538) | | | — | |
| Taxes paid related to net share settlement of equity awards | (700) | | | (459) | | | (427) | |
| Business combination | (184) | | | — | | | — | |
| | | | | |
| Net cash used in financing activities | (1,343) | | | (803) | | | (344) | |
| Foreign currency effect on cash, cash equivalents and restricted cash | (17) | | | 1 | | | (53) | |
| Net change in cash, cash equivalents and restricted cash | 406 | | | 429 | | | (257) | |
| Cash, cash equivalents and restricted cash at beginning of period | 1,904 | | | 1,475 | | | 1,732 | |
| Cash, cash equivalents and restricted cash at end of period | $ | 2,310 | | | $ | 1,904 | | | $ | 1,475 | |
| Cash, cash equivalents and restricted cash at end of period: | | | | | |
| Cash and cash equivalents | $ | 2,304 | | | $ | 1,897 | | | $ | 1,470 | |
| Restricted cash included in prepaid expenses and other current assets | 6 | | | 7 | | | 5 | |
| Total cash, cash equivalents and restricted cash shown in the consolidated statements of cash flows | $ | 2,310 | | | $ | 1,904 | | | $ | 1,475 | |
| Supplemental disclosures of other cash flow information: | | | | | |
| Interest paid | $ | 23 | | | $ | 23 | | | $ | 24 | |
| Income taxes paid, net of refunds | 230 | | | 127 | | | 45 | |
| Non-cash investing and financing activities: | | | | | |
| | | | | |
| | | | | |
| Settlement of 2022 Notes conversion feature | — | | | — | | | 233 | |
| Benefit from exercise of 2022 Note Hedge | — | | | — | | | 233 | |
| Property and equipment included in accounts payable, accrued expenses and other liabilities | 55 | | | 44 | | | 74 | |
| | | | | |
| | | | | |
| | | | | |
See accompanying notes to consolidated financial statements
SERVICENOW, INC.
NOTES TO CONSOLIDATED FINANCIAL STATEMENTS
Unless the context requires otherwise, references in this report to “ServiceNow,” the “Company,” “we,” “us” and “our” refer to ServiceNow, Inc. and its consolidated subsidiaries.
(1) Description of the Business
ServiceNow was founded on a simple premise: to make work flow better. Our intelligent platform, the Now Platform, is a cloud-based solution that helps enterprises and organizations across public and private sectors digitize workflows, in line with our purpose of making the world work better for everyone. Our workflow applications built on the Now Platform are organized along four primary areas: Technology, Customer and Industry, Employee and Creator. The products under each of our workflows help customers connect, automate and empower work across systems and silos to enable great outcomes for businesses and great experiences for people. The Now Platform is the AI platform for digital transformation. As the foundation for how we deliver our cross-enterprise digital workflows, the Now Platform orchestrates work across our customers’ cloud platforms and systems of choice, allowing them to get work done regardless of their current and future preferred systems of record and collaboration platforms.
(2) Summary of Significant Accounting Policies
Principles of Consolidation
The accompanying consolidated financial statements have been prepared in conformity with U.S. Generally Accepted Accounting Principles (“GAAP”) and include our accounts and the accounts of our wholly-owned subsidiaries. All intercompany transactions and balances have been eliminated upon consolidation.
Use of Estimates
The preparation of consolidated financial statements in conformity with GAAP requires management to make certain estimates and assumptions. These estimates and assumptions affect the reported amounts of assets and liabilities and disclosure of contingent assets and liabilities at the date of the consolidated financial statements, as well as reported amounts of revenues and expenses during the reporting period. Such management estimates and assumptions include, but are not limited to, standalone selling price (“SSP”) for each distinct performance obligation included in customer contracts with multiple performance obligations, the period of benefit for deferred commissions, valuation of intangible assets, the useful life of property and equipment and identifiable intangible assets, stock-based compensation expense and income taxes. Actual results could differ from those estimates.
In January 2024, we completed an assessment of the useful life of our data center equipment and determined we should increase the estimated useful life of data center equipment from four to five years. This change in accounting estimate was effective beginning fiscal year 2024. Based on the carrying amount of data center equipment included in property and equipment, net as of December 31, 2023, the effect of this change in estimate for the year ended December 31, 2024, was a reduction in depreciation expense of $101 million and an increase in net income of $81 million, or $0.39 per share basic and $0.39 per share diluted.
Segments
Our chief operating decision maker (“CODM”), the Chief Executive Officer, manages the Company’s business activities as a single operating and reportable segment at the consolidated level. Accordingly, our CODM uses consolidated net income to measure segment profit or loss, allocate resources and assess performance. Further, the CODM reviews and utilizes functional expenses (cost of revenues, sales and marketing, research and development, and general and administrative) at the consolidated level to manage the Company’s operations. Other segment items included in consolidated net income are interest income, other expense, net and the provision for (benefit from) income taxes, which are reflected in the consolidated statements of comprehensive income.
Foreign Currency Translation and Transactions
The functional currency for most of our foreign subsidiaries is their respective local currency. Assets and liabilities of the wholly-owned non-U.S. Dollar functional currency subsidiaries are translated into U.S. Dollars at exchange rates in effect at each period end. Amounts classified in stockholders’ equity are translated at historical exchange rates. Revenues and expenses are translated at the average exchange rates during the period. The resulting translation adjustments are recorded in accumulated other comprehensive income (loss) as a component of stockholders’ equity. Foreign currency transaction gains and losses are included in other expense, net within the consolidated statements of comprehensive income, and were immaterial for all periods presented.
Revenue Recognition
Revenues are recognized when control of services is transferred to our customers, in an amount that reflects the consideration we expect to be entitled to in exchange for those services.
Subscription revenues
Subscription revenues are primarily comprised of subscription fees that give customers access to the ordered subscription service, related support and updates, if any, to the subscribed service during the subscription term. We recognize subscription revenues ratably over the contract term beginning on the commencement date of each contract, which is the date we make our services available to our customers. Our contracts with customers typically include a fixed amount of consideration and are generally non-cancellable and without any refund-type provisions. We typically invoice our customers annually in advance for our subscription services upon execution of the initial contract or subsequent renewal, and our invoices are typically due within 30 days from the invoice date.
Subscription revenues also include revenues from self-hosted offerings in which customers deploy, or we grant customers the option to deploy without significant penalty, our subscription service internally or contract with a third party to host the software. For these contracts, we account for the software element separately from the related support and updates as they are distinct performance obligations. Refer to the discussion below related to contracts with multiple performance obligations for further details. The transaction price is allocated to separate performance obligations on a relative SSP basis. The transaction price allocated to the software element is recognized when transfer of control of the software to the customer is complete. The transaction price allocated to the related support and updates are recognized ratably over the contract term.
Professional services and other revenues
Our professional services arrangements are primarily on a time-and-materials basis, and we generally invoice our customers monthly in arrears for these professional services based on actual hours and expenses incurred. Some of our professional services arrangements are on a fixed-fee basis. Professional services revenues are recognized as services are delivered. Other revenues mainly consist of fees from customer training delivered on-site or through publicly available classes. Typical payment terms require our customers to pay us within 30 days from the invoice date.
Contracts with multiple performance obligations
We enter into contracts that can include various combinations of products and services, which are generally capable of being distinct and accounted for as separate performance obligations. We evaluate the terms and conditions included within our customer contracts to ensure appropriate revenue recognition, including whether products and services are considered distinct performance obligations that should be accounted for separately versus together. For contracts with multiple performance obligations, the transaction price is allocated to the separate performance obligations on a relative SSP basis. We determine SSP by considering the historical selling price of these performance obligations in similar transactions as well as other factors, including, but not limited to, competitive pricing of similar products, other software vendor pricing, industry publications and current pricing practices.
Contract balances
Deferred revenue consists primarily of payments received related to unsatisfied performance obligations at the end of the period. Once our services are available to customers, we record amounts due in accounts receivable and in deferred revenue. To the extent we bill customers in advance of the billing period commencement date, the accounts receivable and corresponding deferred revenue amounts are netted to zero on our consolidated balance sheets, unless such amounts have been paid as of the balance sheet date.
Deferred Commissions
Deferred commissions are the incremental selling costs that are associated with acquiring customer contracts and consist primarily of sales commissions paid to our sales organization and referral fees paid to independent third parties. Deferred commissions also include the associated payroll taxes and fringe benefit costs associated with payments to our sales employees to the extent they are incremental. Commissions and referral fees earned upon the execution of initial and expansion contracts are primarily deferred and amortized over a period of benefit that we have determined to be five years. Commissions earned upon the renewal of customer contracts are deferred and amortized over the average renewal term. Additionally, for self-hosted offerings, consistent with the recognition of subscription revenue for self-hosted offerings, a portion of the commission cost is expensed upfront when the self-hosted offering is made available, and the remaining portion of the commission cost is expensed over the period of benefit. We determine the period of benefit by taking into consideration our customer contracts, our technology life cycle and other factors. The amortization of deferred commissions is included in sales and marketing expense in our consolidated statements of comprehensive income. There was no impairment loss in relation to the incremental selling costs capitalized for all periods presented.
Fair Value Measurements
Fair value is defined as the exchange price that would be received for an asset or paid to transfer a liability in the principal or most advantageous market for the asset or liability in an orderly transaction between market participants on the measurement date. We use a fair value hierarchy that is based on three levels of inputs, of which the first two are considered observable and the last unobservable. The three levels of the fair value hierarchy are as follows:
Level 1—Quoted prices (unadjusted) in active markets for identical assets or liabilities;
Level 2—Other inputs that are directly or indirectly observable in the marketplace; and
Level 3— Significant unobservable inputs that are supported by little or no market activity.
Cash and Cash Equivalents
Cash and cash equivalents consist of highly liquid investments with original or remaining maturities of three months or less at the date of purchase.
Accounts Receivable, net
We record trade accounts receivable at the net invoice value and such receivables are non-interest bearing. We consider receivables past due based on the contractual payment terms. We reserve for specific amounts if collectability is no longer reasonably assured based on an assessment of various factors including historical loss rates and expectations of forward-looking loss estimates. Individual accounts receivable are written off when we become aware of a specific customer’s inability to meet its financial obligation, and all collection efforts are exhausted.
Investments
Investments consist of commercial paper, corporate notes and bonds, certificates of deposit, U.S. government and agency securities and mortgage-backed and asset-backed securities. We classify investments in debt securities as available-for-sale at the time of purchase. All investments are recorded at estimated fair value, and investments with original maturities of less than one year at time of purchase are classified as short-term. Unrealized gains and losses are included in accumulated other comprehensive income (loss), net of tax, a component of stockholders’ equity, except for credit-related impairment losses for available-for-sale debt securities.
For all our available-for-sale debt securities with unrealized loss positions we have determined it is more likely than not we will hold the securities until maturity or a recovery of the cost basis. Available-for-sale securities in an unrealized loss position are written down to its fair value with the corresponding charge recorded in other expense, net in our consolidated statements of comprehensive income, if it is more likely than not that we will be required to sell the security before recovery of its amortized cost basis, or we have the intention to sell the security. Credit-related impairment losses, not to exceed the amount that fair value is less than the amortized cost basis, are recognized through an allowance for credit losses with changes in the allowance for credit losses recorded in other expense, net in the consolidated statements of comprehensive income. For purposes of identifying and measuring impairment, the policy election was made to exclude the applicable accrued interest from both the fair value and amortized cost basis. Applicable accrued interest, net of the allowance for credit losses (if any) of $79 million and $51 million, is recorded in prepaid expenses and other current assets on the consolidated balance sheets as of December 31, 2024 and 2023, respectively.
Realized gains and losses from the sales of available-for-sale debt securities are determined based on the specific identification method and are reported in other expense, net in the consolidated statements of comprehensive income.
Strategic Investments
Strategic investments consist of debt and non-marketable equity investments in privately held companies in which we do not have a controlling interest. Privately held equity securities in which we do not have a controlling financial interest in but exercise significant influence over the investee are accounted for under equity method accounting. These investments are measured at cost less any impairment, plus or minus our share of equity method investee income or loss. For those privately held equity securities that do not have readily determinable fair values and for which we do not have a controlling financial interest or exercise significant influence, we have elected to apply the measurement alternative, measuring them at cost, less any impairment, plus or minus adjustments resulting from observable price changes in orderly transactions for the identical or a similar investment of the same issuer. An impairment loss is recorded when an event or circumstance indicates a decline in value has occurred. We include these strategic investments in other assets on our consolidated balance sheets.
Derivative Financial Instruments
Derivatives Designated as Hedging Instruments
We record derivatives at fair value as either assets or liabilities on our consolidated balance sheets. For derivative contracts entered into to hedge a portion of our forecasted foreign currency denominated revenues that are designated and qualify as cash flow hedges, the unrealized gain or loss on the derivative instrument is reported as a component of accumulated other comprehensive income (loss) and reclassified into earnings as subscription revenues when the hedged transaction affects earnings.
The Company formally documents all relationships between hedging instruments and hedged items, as well as its risk management objective and strategy for undertaking various hedge transactions. We also formally assess, both at the inception of the hedge, and on an ongoing basis, whether each derivative is highly effective in offsetting changes in cash flows of the hedged item. Fluctuations in the value of the derivative instruments are generally offset by changes in the hedged item; however, if it is determined that a derivative is not highly effective as a hedge or if a derivative ceases to be a highly effective hedge, the Company will discontinue hedge accounting prospectively for the affected derivative.
Derivatives not Designated as Hedging Instruments
Derivative contracts not designated as hedging instruments consist of foreign currency forward contracts that we primarily use to hedge monetary assets and liabilities denominated in non-functional currencies. These foreign currency forward contracts are recorded at fair value and have maturities of 12 months or less. The changes in the fair value of these contracts are recorded in other expense, net on the consolidated statements of comprehensive income. Outstanding foreign currency forward contracts are recorded at gross fair value as prepaid expenses and other current assets as well as accrued expenses and other current liabilities on the consolidated balance sheets.
Property and Equipment, net
Property and equipment are stated at cost net of accumulated depreciation. Depreciation is calculated using the straight-line method over the estimated useful lives of the assets as follows:
| | | | | | | | |
| | |
| Computer equipment and software | | 3-5 years |
| Furniture and fixtures | | 3-7 years |
| Leasehold and other improvements | | shorter of the lease term or estimated useful life |
Capitalized Software Development Costs
Software development costs for software to be sold, leased or otherwise marketed are expensed as incurred until the establishment of technological feasibility, at which time those costs are capitalized until the product is available for general release to customers and amortized over the estimated life of the product. Costs and time incurred between the establishment of technological feasibility and product release have not been material, and all software development costs have been charged to research and development expense in our consolidated statements of comprehensive income.
Leases
We determine if an arrangement is or contains a lease at inception. Operating lease right-of-use assets and liabilities are recognized at the lease commencement date based on the present value of lease payments over the lease term. Lease payments consist primarily of the fixed payments under the arrangement, less any lease incentives. We generally use an incremental borrowing rate estimated based on the information available at the lease commencement date to determine the present value of lease payments, unless the implicit rate is readily determinable. Lease expense for lease payments is recognized on a straight-line basis over the lease term.
We account for lease and non-lease components as a single lease component for office leases. Lease and non-lease components for all other leases are generally accounted for separately. Additionally, we do not record leases on the balance sheet that, at the lease commencement date, have a lease term of 12 months or less.
Operating leases are included in operating lease right-of-use assets, current portion of operating lease liabilities, and operating lease liabilities, less current portion in our consolidated balance sheets. We did not have any financing leases in any of the periods presented.
Business Combinations
We allocate the acquisition purchase price to the tangible and intangible assets acquired and liabilities assumed, based on their estimated fair values. The excess of the purchase price over the fair value of these assets acquired and liabilities assumed is recorded as goodwill. Allocation of the purchase price requires significant estimates in determining the fair value of acquired assets and assumed liabilities, especially with respect to intangible assets. Critical estimates include, but are not limited to, future expected cash flows, discount rates, revenue growth rates, the time and expense to recreate the assets and profit margin a market participant would receive. These estimates are inherently uncertain and unpredictable and, as a result, actual results may differ from estimates. During the measurement period, which may not be later than one year from the acquisition date, the Company may record adjustments to the fair value of these tangible and intangible assets acquired and liabilities assumed, with the corresponding offset to goodwill.
Goodwill and Intangible Assets
Goodwill is evaluated for impairment at least annually or more frequently if circumstances indicate that goodwill may not be recoverable. A qualitative assessment is performed to determine whether it is more likely than not that the fair value of its reporting unit is less than its carrying amount. If the reporting unit does not pass the qualitative assessment, the carrying amount of the reporting unit, including goodwill, is compared to fair value and goodwill is considered impaired if the carrying value of the reporting unit exceeds its fair value. Any excess of the carrying value of the goodwill above its fair value is recognized as an impairment loss.
Intangible assets consist of developed technologies and other intangible assets, including patents and contractual agreements. Intangible assets are amortized over the period of estimated benefit using the straight-line method and estimated useful lives ranging from three to twelve years.
Impairment of Long-Lived Assets
We evaluate long-lived assets, including purchased intangible assets, for impairment whenever events or changes in circumstances indicate that the carrying amount of the assets may not be recoverable. Recoverability is measured by comparing the carrying amount to the future undiscounted cash flows we expect the asset to generate. Any excess of the carrying value of the asset above its fair value is recognized as an impairment loss.
Advertising Costs
Advertising costs, excluding costs related to our annual Knowledge user conference and other user forums, are expensed as incurred and are included in sales and marketing expense. These costs for the years ended December 31, 2024, 2023 and 2022 were $295 million, $221 million and $201 million, respectively.
Stock-based Compensation
We recognize compensation expense related to stock options and restricted stock units (“RSUs”) with only service conditions on a straight-line basis over the requisite service period. For stock options and RSUs with service, performance and market conditions (performance-based RSUs (“PRSUs”)), expenses are recognized on a graded vesting basis over the requisite service period and for awards with performance conditions, when it is probable that the performance condition will be achieved. The probability of achievement is assessed periodically to determine whether the performance metric continues to be probable. When there is a change in the probability of achievement, any cumulative effect of the change is recognized in the period of the change and the remaining unrecognized compensation will be amortized prospectively over the respective vesting period. We recognize compensation expense related to shares issued pursuant to the employee stock purchase plan (“ESPP”) on a straight-line basis over the six-month offering period. We recognize compensation expense net of estimated forfeiture activity. Amounts withheld related to the minimum statutory tax withholding requirements paid by us on behalf of our employees are recorded as a liability and a reduction to additional paid-in capital when paid and are included as a reduction of cash flows from financing activities.
We estimate the fair value of stock options with only service conditions and shares issued pursuant to the ESPP using the Black-Scholes options pricing model and the fair value of RSU awards (including PRSUs) using the fair value of our common stock on the date of grant. For stock options and PRSUs with service, performance and market conditions, we estimate the fair value of the options granted and the corresponding derived service periods using the Monte Carlo simulation, which requires the use of various assumptions, including the stock price volatility and risk-free interest rate as of the valuation date corresponding to the length of time remaining in the performance period.
Concentration of Credit Risk and Significant Customers
Financial instruments potentially exposing us to credit risk consist primarily of cash, cash equivalents, derivative contracts, investments and accounts receivable. We hold cash at financial institutions that management believes are high credit quality financial institutions and invest in investment-grade debt securities. Our derivative contracts expose us to credit risk to the extent that the counterparties may be unable to meet the terms of the arrangement. We mitigate this credit risk by transacting with major financial institutions with high credit ratings and entering into master netting arrangements, which permit net settlement of transactions with the same counterparty. We are not required to pledge, and are not entitled to receive, cash collateral related to these derivative instruments.
Credit risk arising from accounts receivable is mitigated to a certain extent due to our large number of customers and their dispersion across various industries and geographies. We had one customer, a U.S. federal channel partner and systems integrator, that represented 12% of our accounts receivable balance as of December 31, 2024 and 11% of our total revenues for the year ended December 31, 2024. Based on our periodic credit evaluations, there have been no historical collection concerns with this customer. There were no customers that individually exceeded 10% of our accounts receivable balance as of December 31, 2023 or our total revenues for the year ended December 31, 2023. For purposes of assessing concentration of credit risk and significant customers, a group of customers under common control or customers that are affiliates of each other are regarded as a single customer. The allowance for credit losses and write offs were not material for each of the periods ending December 31, 2024, 2023 and 2022.
Income Taxes
We use the asset and liability method of accounting for income taxes, in which deferred tax assets and liabilities are recognized for the future tax consequences attributable to differences between the consolidated financial statement carrying amounts of existing assets and liabilities and their respective tax bases. We measure deferred tax assets and liabilities using enacted tax rates expected to apply to taxable income in the years in which those temporary differences are expected to be reversed. We recognize the effect on deferred tax assets and liabilities of a change in tax rates within the provision for income taxes as income and expense in the period that includes the enactment date. A valuation allowance is established if it is more likely than not that all or a portion of the deferred tax asset will not be realized. In determining the need for a valuation allowance, we consider future growth, forecasted earnings, forecasted taxable income, the mix of earnings in the jurisdictions in which we operate, historical earnings, taxable income in prior years, if carryback is permitted under the law, carryforward periods and prudent and feasible tax planning strategies.
Our tax positions are subject to income tax audits by multiple tax jurisdictions throughout the world. We recognize the tax benefit of an uncertain tax position only if it is more likely than not the position is sustainable upon examination by the taxing authority, based on the technical merits. We measure the tax benefit recognized as the largest amount of benefit which is more likely than not to be realized upon settlement with the taxing authority. We recognize interest accrued and penalties related to unrecognized tax benefits in our tax provision.
We calculate the current and deferred income tax provision based on estimates and assumptions that could differ from the actual results reflected in income tax returns filed in subsequent years and record adjustments based on filed income tax returns when identified. The amount of income taxes paid is subject to examination by U.S. federal, state and foreign tax authorities. The estimate of the potential outcome of any uncertain tax issue is subject to management’s assessment of relevant risks, facts and circumstances existing at that time. To the extent the assessment of such tax position changes, we record the change in estimate in the period in which we make the determination.
Prior Period Reclassifications
Certain prior period amounts have been reclassified to conform to the current period presentation. These reclassifications did not result in a restatement of prior period consolidated financial statements.
Revision of Prior Period Financial Statements
During the quarter ended June 30, 2024, the Company identified an immaterial error in the condensed consolidated statements of cash flows for the period ended March 31, 2024 relating to a misclassification between investing cash outflows and financing cash outflows. The second installment payment for a business combination completed during the quarter ended September 30, 2023, totaling $184 million, was incorrectly classified as an investing cash outflow instead of a financing cash outflow. The Company determined that the error was not material to any previously issued financial statements and will revise such error in its Quarterly Report on Form 10-Q for the three months ending March 31, 2025.
Recently Issued Accounting Pronouncement Adopted
In November 2023, the Financial Accounting Standards Board (“FASB”) issued Accounting Standards Update (“ASU”) 2023-07, “Segment Reporting (Topic 280): Improvements to Reportable Segment Disclosures,” which expands annual and interim disclosure requirements for reportable segments, primarily through enhanced disclosures about significant segment expenses. We adopted this standard effective January 1, 2024 using a retrospective method. For further information, refer to the Segments section in Note 2 “Summary of Significant Accounting Policies.”
Recently Issued Accounting Pronouncements Pending Adoption
In November 2024, the FASB issued ASU 2024-03, “Income Statement - Reporting Comprehensive Income - Expense Disaggregation Disclosures: Disaggregation of Income Statement Expenses,” which requires disclosure of disaggregated information about specific categories underlying certain income statement expense line items in the footnotes to the financial statements for both annual and interim periods. This ASU is effective for fiscal years beginning after December 15, 2026, and interim reporting periods beginning after December 15, 2027. Early adoption is permitted. We are currently evaluating the impact of the adoption of this standard.
In December 2023, the FASB issued ASU 2023-09, “Income Taxes - Improvements to Income Tax Disclosures,” which requires enhancement and further transparency to certain income tax disclosures, most notably the tax rate reconciliation and income taxes paid. This ASU is effective for fiscal years beginning after December 15, 2024 on either a prospective or retrospective basis, with early adoption permitted. We are currently evaluating the impact of the adoption of this standard.
(3) Investments
Marketable Debt Securities
The following is a summary of our available-for-sale debt securities recorded within short-term and long-term investments on the consolidated balance sheets (in millions):
| | | | | | | | | | | | | | | | | | | | | | | |
| | December 31, 2024 |
| Amortized
Cost | | Gross
Unrealized
Gains | | Gross
Unrealized
Losses | | Estimated
Fair Value |
| Available-for-sale debt securities: | | | | | | | |
| Commercial paper | $ | 336 | | | $ | — | | | $ | — | | | $ | 336 | |
| Corporate notes and bonds | 4,966 | | | 15 | | | (5) | | | 4,976 | |
| Certificates of deposit | 67 | | | — | | | — | | | 67 | |
| U.S. government and agency securities | 2,103 | | | 3 | | | (2) | | | 2,104 | |
| Mortgage-backed and asset-backed securities | 104 | | | — | | | (18) | | | 86 | |
| Total available-for-sale debt securities | $ | 7,576 | | | $ | 18 | | | $ | (25) | | | $ | 7,569 | |
| | | | | | | | | | | | | | | | | | | | | | | |
| December 31, 2023 |
| Amortized
Cost | | Gross
Unrealized
Gains | | Gross
Unrealized
Losses | | Estimated
Fair Value |
| Available-for-sale debt securities: | | | | | | | |
| Commercial paper | $ | 349 | | | $ | — | | | $ | — | | | $ | 349 | |
| Corporate notes and bonds | 3,579 | | | 10 | | | (13) | | | 3,576 | |
| Certificates of deposit | 94 | | | — | | | — | | | 94 | |
| U.S. government and agency securities | 2,081 | | | 3 | | | (6) | | | 2,078 | |
| Mortgage-backed and asset-backed securities | 102 | | | — | | | (16) | | | 86 | |
| Total available-for-sale debt securities | $ | 6,205 | | | $ | 13 | | | $ | (35) | | | $ | 6,183 | |
As of December 31, 2024, the contractual maturities of our available-for-sale debt securities, excluding those securities classified within cash and cash equivalents on the consolidated balance sheet and mortgage-backed and asset-backed securities that do not have a single maturity, did not exceed 37 months. The fair values of available-for-sale debt securities, by remaining contractual maturity, are as follows (in millions):
| | | | | |
| December 31, 2024 |
| Due within 1 year | $ | 3,458 | |
| Due in 1 year through 5 years | 4,025 | |
| Instruments not due in single maturity | 86 | |
| Total | $ | 7,569 | |
As of December 31, 2024, unrealized losses of $18 million from available-for-sale debt securities are from securities in a continuous unrealized loss position greater than 12 months. As of December 31, 2024, the fair value of available-for-sale debt securities in a continuous unrealized loss position totaled $2,419 million, the majority of which has been in a continuous unrealized loss position for less than 12 months. As of December 31, 2023, the fair value of available-for-sale debt securities in a continuous unrealized loss position totaled $3,731 million and unrealized losses of $26 million from available-for-sale debt securities are from securities in a continuous unrealized loss position greater than 12 months.
For all available-for-sale debt securities that were in unrealized loss positions, we have determined that it is more likely than not we will hold the securities until maturity or a recovery of the cost basis. Unrealized losses on available-for-sale debt securities were due primarily to changes in market interest rates, and credit-related impairment losses were immaterial as of December 31, 2024.
Non-Marketable Equity Investments
As of December 31, 2024 and 2023, the total amount of non-marketable equity investments in privately held companies included in other assets on our consolidated balance sheets was $469 million and $268 million, respectively. Our non-marketable equity investments are primarily accounted for using the measurement alternative, which measures the investments at cost minus impairment, if any, plus or minus changes resulting from qualifying observable price changes resulting from the issuance of similar or identical securities in an orderly transaction by the same issuer. Determining whether an observed transaction is similar to a security within our portfolio requires judgment based on the rights and preferences of the securities. Recording upward and downward adjustments to the carrying value of our non-marketable equity investments as a result of observable price changes requires quantitative assessments of the fair value of our non-marketable equity investments using various valuation methodologies and involves the use of estimates. The adjustments made during the years ended December 31, 2024, 2023 and 2022 were immaterial. We classify these fair value measurements as Level 3 within the fair value hierarchy.
(4) Fair Value Measurements
The following table presents our fair value hierarchy for our assets measured at fair value on a recurring basis as of December 31, 2024 (in millions):
| | | | | | | | | | | | | | | | | |
| Level 1 | | Level 2 | | Total |
| Cash equivalents: | | | | | |
| Money market funds | $ | 1,357 | | | $ | — | | | $ | 1,357 | |
| Commercial paper | — | | | 23 | | | 23 | |
| Corporate notes and bonds | — | | | 4 | | | 4 | |
| | | | | |
| Deposits | 391 | | | — | | | 391 | |
| U.S. government and agency securities | — | | | 14 | | | 14 | |
| Marketable securities: | | | | | |
| Commercial paper | — | | | 336 | | | 336 | |
| Corporate notes and bonds | — | | | 4,976 | | | 4,976 | |
| Certificates of deposit | — | | | 67 | | | 67 | |
| U.S. government and agency securities | — | | | 2,104 | | | 2,104 | |
| Mortgage-backed and asset-backed securities | — | | | 86 | | | 86 | |
| | | | | |
| Total | $ | 1,748 | | | $ | 7,610 | | | $ | 9,358 | |
The following table presents our fair value hierarchy for our assets measured at fair value on a recurring basis as of December 31, 2023 (in millions):
| | | | | | | | | | | | | | | | | |
| Level 1 | | Level 2 | | Total |
| Cash equivalents: | | | | | |
| Money market funds | $ | 1,215 | | | $ | — | | | $ | 1,215 | |
| Commercial paper | — | | | 79 | | | 79 | |
| Corporate notes and bonds | — | | | 2 | | | 2 | |
| | | | | |
| Deposits | 295 | | | — | | | 295 | |
| U.S. government and agency securities | — | | | 4 | | | 4 | |
| Marketable securities: | | | | | |
| Commercial paper | — | | | 349 | | | 349 | |
| Corporate notes and bonds | — | | | 3,576 | | | 3,576 | |
| Certificates of deposit | — | | | 94 | | | 94 | |
| U.S. government and agency securities | — | | | 2,078 | | | 2,078 | |
| Mortgage-backed and asset-backed securities | — | | | 86 | | | 86 | |
| Total | $ | 1,510 | | | $ | 6,268 | | | $ | 7,778 | |
We determine the fair value of our security holdings based on pricing from our service providers and market prices from industry-standard independent data providers. Such market prices may be quoted prices in active markets for identical assets (Level 1 inputs), pricing determined using inputs other than quoted prices that are observable either directly or indirectly (Level 2 inputs) or using unobservable inputs that are supported by little or no market activity (Level 3 inputs). Our non-marketable equity investments are not included in the table above and are discussed in Note 3. Refer to Note 8 for the fair value measurement of our derivative contracts and Note 11 for the fair value measurement of our long-term debt, which are also not included in the table above. Our marketable equity investments are classified within Level 1 and were immaterial as of December 31, 2024 and 2023.
(5) Business Combinations
2024 Business Combinations
During the year ended December 31, 2024, we completed certain acquisitions for total purchase consideration of $112 million primarily to enhance our products with the acquired technology and engineering workforce. The acquisitions were not material to our consolidated financial statements, either individually or in the aggregate.
2023 Business Combinations
On July 17, 2023, we acquired all outstanding shares of G2K Group GmbH, an artificial intelligence powered platform, for $465 million in a cash transaction. The consideration was paid in two installments, with the first payment made in July 2023 and the second payment made in February 2024. The acquisition is intended to enhance our Now Platform with the acquired smart Internet of Things technology, enabling businesses to intelligently action digital and in-store data with enterprise-grade workflows.
The purchase price was allocated based on the fair value of the developed technology intangible asset of $75 million (six-year estimated useful life), net tangible liabilities of $1 million, deferred tax liabilities of $23 million and goodwill of $414 million, which is not deductible for income tax purposes.
Goodwill is primarily attributed to the value expected from synergies resulting from the business combination. The fair values assigned to tangible and intangible assets acquired, liabilities assumed and income taxes payable and deferred taxes are based on management’s estimates and assumptions.
2022 Business Combinations
During the year ended December 31, 2022, we completed certain acquisitions for total purchase consideration of $92 million primarily to enhance our products with the acquired technology and engineering workforce. The acquisitions were not material to our consolidated financial statements, either individually or in the aggregate.
We have included the financial results of business combinations in the consolidated financial statements from the respective dates of acquisition, which were not material. Aggregate acquisition-related costs associated with business combinations were not material for each of the years ended December 31, 2024, 2023 and 2022, respectively, and were included in general and administrative expenses in our consolidated statements of comprehensive income as incurred.
(6) Goodwill and Intangible Assets
The changes in the carrying amounts of goodwill were as follows (in millions):
| | | | | | | | | | | | | | | | | |
| | Carrying Amount |
| Balance as of December 31, 2022 | | $ | 824 | |
| Goodwill acquired | | 413 | |
| Foreign currency translation adjustments | | (6) | |
| Balance as of December 31, 2023 | | $ | 1,231 | |
| Goodwill acquired | | 75 | |
| Foreign currency translation adjustments | | (33) | |
| Balance as of December 31, 2024 | | $ | 1,273 | |
Intangible assets, net consists of the following (in millions):
| | | | | | | | | | | |
| | December 31, 2024 | | December 31, 2023 |
| Developed technology | $ | 581 | | | $ | 516 | |
| Patents | 83 | | | 72 | |
| Other | 11 | | | 11 | |
| Intangible assets, gross | $ | 675 | | | $ | 599 | |
| Less: accumulated amortization | (466) | | | (375) | |
| Intangible assets, net | $ | 209 | | | $ | 224 | |
The weighted-average useful life of the acquired developed technology for each of the years ended December 31, 2024 and 2023 was approximately five years. Amortization expense for intangible assets was approximately $94 million, $85 million and $81 million for the years ended December 31, 2024, 2023 and 2022, respectively.
The following table presents the estimated future amortization expense related to intangible assets held as of December 31, 2024 (in millions):
| | | | | | | | | | | | | | | | | |
| Years Ending December 31, |
| 2025 | | $ | 80 | |
| 2026 | | 50 | |
| 2027 | | 36 | |
| 2028 | | 28 | |
| 2029 | | 13 | |
| Thereafter | | 2 | |
| Total future amortization expense | | $ | 209 | |
(7) Property and Equipment
Property and equipment, net consists of the following (in millions):
| | | | | | | | | | | |
| | December 31, |
| | 2024 | | 2023 |
| Computer equipment | $ | 2,697 | | | $ | 2,136 | |
| Computer software | 106 | | | 96 | |
| Leasehold and other improvements | 320 | | | 292 | |
| Furniture and fixtures | 85 | | | 86 | |
| | | |
| Construction in progress | 63 | | | 33 | |
| Property and equipment, gross | 3,271 | | | 2,643 | |
| Less: Accumulated depreciation | (1,508) | | | (1,285) | |
| Property and equipment, net | $ | 1,763 | | | $ | 1,358 | |
Construction in progress consists of costs primarily related to leasehold and other improvements. Depreciation expense was $371 million, $372 million and $261 million for the years ended December 31, 2024, 2023 and 2022, respectively.
(8) Derivative Contracts
Derivatives Designated as Hedging Instruments
We entered into forward contracts to hedge a portion of our forecasted foreign currency denominated revenues during the year ended December 31, 2024. These forward contracts are recorded at fair value and have maturities of up to 34 months. As of December 31, 2024, we had outstanding cash flow hedges with total notional values of $1.7 billion. We classify cash flows related to our cash flow hedges as operating activities in our consolidated statements of cash flows.
The total gross fair values of derivatives designated as hedging instruments recorded within the consolidated balance sheets were as follows (in millions):
| | | | | | | | | | | |
| | December 31, 2024 | |
| Consolidated Balance Sheets Location | | |
| Prepaid expenses and other current assets | | $ | 55 | | |
| Other assets | | $ | 10 | | |
| | | |
| Accrued expenses and other current liabilities | | $ | (1) | | |
| Other long-term liabilities | | $ | — | | |
As of December 31, 2024, approximately $54 million of the pre-tax derivative gains from accumulated other comprehensive income (loss) is expected to be recognized in subscription revenues within the next 12 months.
All hedging relationships are formally documented at the inception of the hedge and the hedges must be highly effective in offsetting changes to future cash flows on hedged transactions. We evaluate hedge effectiveness at the inception of the hedge prospectively, and on an ongoing basis both retrospectively and prospectively. We report changes in fair value of these cash flow hedges as a component of accumulated other comprehensive income (loss) and subsequently reclassify into earnings in the same period the forecasted transaction affects earnings. Amounts reclassified to subscription revenues were a gain of $14 million for the year ended December 31, 2024. There was no ineffectiveness in the Company’s cash flow hedging program for the year ended December 31, 2024.
Derivatives not Designated as Hedging Instruments
Our derivatives not designated as hedging instruments consist of foreign currency forward contracts that we primarily use to hedge monetary assets and liabilities denominated in non-functional currencies. These foreign currency forward contracts are recorded at fair value and have maturities of 12 months or less. The changes in the fair value of these contracts are recorded in other expense, net on the consolidated statements of comprehensive income. As of December 31, 2024 and 2023, we had foreign currency forward contracts with total notional values of $2.2 billion and $1.7 billion, respectively, which were not designated as hedging instruments. The gross fair value of these foreign currency forward contracts was immaterial as of December 31, 2024 and 2023. The gains (losses) recognized for foreign currency forward contracts from derivatives not designated as hedging instruments were immaterial for the years ended December 31, 2024, 2023 and 2022. Realized gains (losses) from settlement of the derivative assets and liabilities are classified as investing activities in the consolidated statements of cash flows.
All foreign currency forward contracts, both designated and not designated as hedging instruments, are classified within Level 2 as the valuation inputs are based on quoted prices and market observable data of similar instruments in active markets, such as currency spot and forward rates.
(9) Deferred Revenue and Performance Obligations
Revenues recognized from beginning period deferred revenue during the years ended December 31, 2024 and 2023 were $5.7 billion and $4.6 billion, respectively.
Remaining Performance Obligations
Transaction price allocated to remaining performance obligations (“RPO”) represents contracted revenue that has not yet been recognized, which includes deferred revenue and non-cancellable amounts that will be invoiced and recognized as revenues in future periods. RPO excludes contracts that are billed in arrears, such as certain time and materials contracts, as we apply the “right to invoice” practical expedient under relevant accounting guidance.
As of December 31, 2024, the total non-cancellable RPO under our contracts with customers was $22.3 billion, and we expect to recognize revenues on approximately 46% of these RPO over the following 12 months. The majority of the non-current RPO will be recognized over the next 13 to 36 months.
(10) Accrued Expenses and Other Current Liabilities
Accrued expenses and other current liabilities consist of the following (in millions):
| | | | | | | | | | | |
| | December 31, |
| | 2024 | | 2023 |
| Accrued payroll | $ | 700 | | | $ | 650 | |
| Taxes payable | 162 | | | 123 | |
| Other employee-related liabilities | 196 | | | 167 | |
| Other | 311 | | | 425 | |
| Total accrued expenses and other current liabilities | $ | 1,369 | | | $ | 1,365 | |
(11) Debt
For the periods ended December 31, 2024 and 2023, the carrying value of our outstanding debt was $1,489 million and $1,488 million, respectively, net of unamortized debt discount and issuance costs of $11 million and $12 million, respectively.
We consider the fair value of the 2030 Notes at December 31, 2024 and December 31, 2023 to be a Level 2 measurement. The estimated fair value of the 2030 Notes based on the closing trading price per $100, was $1,247 million and $1,236 million at December 31, 2024 and December 31, 2023, respectively.
2030 Notes
In August 2020, we issued 1.40% fixed rate ten-year notes with an aggregate principal amount of $1.5 billion due on September 1, 2030 (the “2030 Notes”). The 2030 Notes were issued at 99.63% of principal and we incurred $13 million for debt issuance costs. The effective interest rate for the 2030 Notes was 1.53% and included interest payable, amortization of debt issuance cost and amortization of debt discount. Interest is payable semi-annually in arrears on March 1 and September 1 of each year, beginning on March 1, 2021, and the entire outstanding principal amount is due at maturity on September 1, 2030. The 2030 Notes are unsecured obligations and the indentures governing the 2030 Notes contain customary events of default and covenants that, among others and subject to exceptions, restrict our ability to incur or guarantee debt secured by liens on specified assets or enter into sale and lease-back transactions with respect to specified properties.
2022 Notes, Note Hedge and Warrants
In May and June 2017, we issued an aggregate of $782.5 million of 0% convertible senior notes (the “2022 Notes”), which were converted prior to or settled on June 1, 2022, in accordance with their terms.
To minimize the impact of potential economic dilution upon conversion of the 2022 Notes, we entered into convertible note hedge transactions (the “2022 Note Hedge”) with certain investment banks to purchase 6 million shares for $128 million with respect to our common stock concurrently with the issuance of the 2022 Notes. The 2022 Note Hedge expired upon the maturity date of the 2022 Notes, which was on June 1, 2022.
Separately, we entered into warrant transactions with certain investment banks, whereby we sold warrants to acquire 6 million shares of our common stock with aggregate proceeds of $54 million (the “2022 Warrants”). The 2022 Warrants were not part of the 2022 Notes or 2022 Note Hedge. The 2022 Warrants were settled during the quarter ended June 30, 2022 and are no longer outstanding.
(12) Accumulated Other Comprehensive Income (Loss)
The following tables show the components of accumulated other comprehensive income (loss), net of tax, in the stockholders’ equity section of our consolidated balance sheets (in millions):
| | | | | | | | | | | | | | | | | | | | | | | | |
| | Unrealized Gains (Losses) on Derivative Instruments | | Unrealized Gains (Losses) on Investments | | Foreign Currency Translation Adjustment | | | Total |
| | | | | | | | |
| Balance as of December 31, 2023 | $ | — | | | $ | (39) | | | $ | 2 | | | | $ | (37) | |
| Other comprehensive income (loss) before reclassifications | 64 | | | 12 | | | (93) | | | | (17) | |
| Amounts reclassified from accumulated other comprehensive loss | (14) | | | — | | | — | | | | (14) | |
| Net current period other comprehensive income (loss) | 50 | | | 12 | | | (93) | | | | (31) | |
| Balance as of December 31, 2024 | $ | 50 | | | $ | (27) | | | $ | (91) | | | | $ | (68) | |
| | | | | | | | | | | | | | | | | | | | | | | | |
| | Unrealized Gains (Losses) on Derivative Instruments | | Unrealized Gains (Losses) on Investments | | Foreign Currency Translation Adjustment | | | Total |
| | | | | | | | |
| Balance as of December 31, 2022 | $ | — | | | $ | (77) | | | $ | (25) | | | | $ | (102) | |
| Other comprehensive income (loss) before reclassifications | — | | | 38 | | | 27 | | | | 65 | |
| Amounts reclassified from accumulated other comprehensive loss | — | | | — | | | — | | | | — | |
| Net current period other comprehensive income (loss) | — | | | 38 | | | 27 | | | | 65 | |
| Balance as of December 31, 2023 | $ | — | | | $ | (39) | | | $ | 2 | | | | $ | (37) | |
(13) Stockholders' Equity
Common Stock
We are authorized to issue a total of 600 million shares of common stock as of December 31, 2024. Holders of our common stock are not entitled to receive dividends unless declared by our board of directors. As of December 31, 2024, we had 206.5 million shares of common stock, net of treasury stock, outstanding and had reserved shares of common stock for future issuance as follows (in thousands): | | | | | | | | | | | |
| | | December 31, 2024 |
| Stock plans: | | |
| Options outstanding | | 948 | |
RSUs (1) | | 5,788 | |
| Shares of common stock available for future grants: | | |
Amended and Restated 2021 Equity Incentive Plan (2) | | 9,499 | |
Amended and Restated 2012 Employee Stock Purchase Plan (2) | | 8,119 | |
| | |
| Total shares of common stock reserved for future issuance | | 24,354 | |
(1)Represents the number of shares issuable upon settlement of outstanding restricted stock units (“RSUs”) and performance-based RSUs (“PRSUs”), as discussed in Note 14.
(2)Refer to Note 14 for a description of these plans.
During the years ended December 31, 2024 and 2023, we issued a total of 2.6 million and 2.7 million shares, respectively, from stock option exercises, vesting of RSUs, net of employee payroll taxes, and purchases from the employee stock purchase plan (“ESPP”).
Treasury Stock
In May 2023, our board of directors authorized a program to repurchase up to $1.5 billion of our common stock (the “Share Repurchase Program”). Under the program, we may repurchase our common stock from time to time through open market purchases, in privately negotiated transactions, or by other means, including through the use of trading plans intended to qualify under Rule 10b5-1 under the Securities Exchange Act of 1934, as amended, in accordance with applicable securities laws and other restrictions. The Share Repurchase Program does not have a fixed expiration date, may be suspended or discontinued at any time, and does not obligate us to acquire any amount of common stock. The timing, manner, price, and amount of any repurchases will be determined by us at our discretion and will depend on a variety of factors, including business, economic and market conditions, prevailing stock prices, corporate and regulatory requirements, and other considerations.
During the year ended December 31, 2024, the Company repurchased 0.8 million shares of its common stock for $696 million. During the year ended December 31, 2023, the Company repurchased 0.9 million shares of its common stock for $538 million. All repurchases were made in open market transactions. Repurchases of common stock are recognized as treasury stock and held for future issuance. As of December 31, 2024, $266 million of the originally authorized amount under the Share Repurchase Program remained available for future repurchases. In January 2025, our board of directors authorized an additional $3.0 billion in repurchases under the Share Repurchase Program.
Preferred Stock
Our board of directors has the authority, without further action by stockholders, to issue up to 10 million shares of preferred stock in one or more series. Our board of directors may designate the rights, preferences, privileges and restrictions of the preferred stock, including dividend rights, conversion rights, voting rights, terms of redemption, liquidation preference and number of shares constituting any series or the designation of any series. The issuance of preferred stock could have the effect of restricting dividends on our common stock, diluting the voting power of our common stock, impairing the liquidation rights of our common stock or delaying or preventing a change in control. As of December 31, 2024 and 2023, no shares of preferred stock were outstanding.
(14) Equity Awards
We have three equity incentive plans: 2012 Equity Incentive Plan (the “2012 Plan”), amended and restated 2021 Equity Incentive Plan (the “2021 Plan”) and 2022 New-Hire Equity Incentive Plan (the “2022 Plan”). The 2012 Plan was terminated in connection with the initial approval of the 2021 Plan on June 7, 2021 but continues to govern the terms of outstanding equity awards that were granted prior to the termination of the 2012 Plan. As of June 7, 2021, we no longer grant equity awards pursuant to the 2012 Plan. The 2021 Plan, as amended and restated, was approved by the shareholders on June 1, 2023 to increase shares available for future grants by approximately 10 million shares. Upon effectiveness of the 2021 Plan, as amended and restated, the 2022 Plan was terminated, and no additional awards under the 2022 Plan have been made since the amendment and restatement of the 2021 Plan. Outstanding equity awards under the 2022 Plan continue to be subject to the terms and conditions of the 2022 Plan.
The 2021 Plan and the 2012 Plan provide for the grant of incentive stock options, nonqualified stock options, stock appreciation rights, RSUs, performance-based stock awards and other forms of equity compensation (collectively, “equity awards”). The 2022 Plan permits the grant of any of the foregoing awards with the exception of incentive stock options. In addition, the 2022 Plan, the 2021 Plan and the 2012 Plan provide for the grant of performance cash awards. Incentive stock options may be granted only to employees. All other equity awards may be granted to employees, including officers, as well as directors and consultants.
Our Amended and Restated 2012 Employee Stock Purchase Plan (the “2012 ESPP”) authorizes the issuance of shares of common stock pursuant to purchase rights granted to our employees. The price at which common stock is purchased under the 2012 ESPP is equal to 85% of the fair market value of our common stock on the first or last day of the offering period, whichever is lower. Offering periods are six months long and begin on February 1 and August 1 of each year. The number of shares of common stock reserved for issuance will not be increased without shareholder approval.
Stock Options
Stock options are exercisable at a price equal to the market value of the underlying shares of common stock on the date of the grant as determined by the closing price of our common stock as reported on the New York Stock Exchange on the date of grant. Stock options granted under the 2012 Plan to new employees generally vest 25% one year from the date the requisite service period begins and continue to vest monthly for each month of continued employment over the remaining three years. Options granted generally are exercisable for a period of up to ten years contingent on each holder’s continuous status as a service provider.
A summary of stock option activity for the year ended December 31, 2024 was as follows:
| | | | | | | | | | | | | | | | | | | | | | | |
| Number of
Shares | | Weighted-
Average
Exercise
Price Per Share | | Weighted-
Average
Remaining
Contractual
Term | | Aggregate
Intrinsic Value |
| (in thousands) | | | | (in years) | | (in millions) |
| Outstanding as of December 31, 2023 | 1,150 | | | $ | 603.30 | | | | | |
| | | | | | | |
| Exercised | (74) | | | $ | 324.80 | | | | | $ | 35 | |
| Forfeited | (128) | | | $ | 645.02 | | | | | |
| Outstanding as of December 31, 2024 | 948 | | | $ | 619.43 | | | 6.6 | | $ | 418 | |
| Vested and expected to vest as of December 31, 2024 | 878 | | | $ | 614.17 | | | 6.5 | | $ | 391 | |
| Vested and exercisable as of December 31, 2024 | 444 | | | $ | 545.37 | | | 6.2 | | $ | 229 | |
Aggregate intrinsic value represents the difference between the estimated fair value of our common stock and the exercise price of outstanding, in-the-money options. The total intrinsic value for stock options exercised for the years ended December 31, 2024, 2023 and 2022, was $35 million, $15 million and $40 million, respectively.
The total fair value of shares vested was $98 million, $7 million and $11 million for the years ended December 31, 2024, 2023 and 2022, respectively. No stock options were granted during the years ended December 31, 2024 and December 31, 2023. The weighted-average grant-date fair value of stock options granted was $273.63 per share for the year ended December 31, 2022.
During the year ended December 31, 2021, a one-time long-term performance-based option award was granted to the Chief Executive Officer (“2021 CEO Performance Award”) and to certain executives (collectively “2021 Performance Awards”) under the 2021 Plan at a total grant date fair value of $232 million. The 2021 Performance Awards will vest in eight equal tranches based on service and achievement of both performance and market conditions, subject to continued employment and specifically for the 2021 CEO Performance Award, as CEO or Executive Chairman of the Company, through each vesting date. The performance and market conditions for a particular tranche may be achieved at different points in time and in any order but will become eligible to vest only when all service, performance and market conditions for the respective tranche are met but no earlier than two years from date of grant. The performance and market conditions must be achieved by September 30, 2026 (the “Performance Period”). The stock price metric will be achieved when both the 180-day volume weighted-average price (“VWAP”) and the 30-day VWAP equal or exceed the respective tranche stock price metric on any day during the Performance Period. The performance metric is achieved when the trailing four- quarter cumulative GAAP subscription revenues equal or exceed the respective tranche performance target. Shares acquired upon exercise of the options cannot be sold, transferred or disposed until after the end of the Performance Period and the 2021 Performance Awards will expire ten years from the respective date of grant. As of December 31, 2024, the first three tranches were vested based on achievement of both the performance and market conditions.
The fair value of the 2021 Performance Awards and the corresponding derived service periods were estimated using the Monte Carlo simulation. Stock-based compensation expense is recognized on a graded vesting basis over the requisite service period for each respective tranche, but not shorter than the two-year minimum service period, and includes an assessment of when it is probable the performance condition will be achieved, which involves a subjective assessment of our future financial projections.
As of December 31, 2024, total unrecognized compensation cost, adjusted for estimated forfeitures, related to unvested stock options was approximately $7 million. The weighted-average remaining vesting period of unvested stock options as of December 31, 2024 was approximately one year.
RSUs
A summary of RSU activity for the year ended December 31, 2024 was as follows:
| | | | | | | | | | | |
| Number of
Shares | | Weighted-Average Grant-Date Fair Value Per Share |
| (in thousands) | | |
| Outstanding as of December 31, 2023 | 6,262 | | | $ | 506.77 | |
| Granted | 3,031 | | | $ | 791.14 | |
| Vested | (2,944) | | | $ | 545.45 | |
| Forfeited | (561) | | | $ | 567.81 | |
| Outstanding as of December 31, 2024 | 5,788 | | | $ | 630.10 | |
| Expected to vest as of December 31, 2024 | 5,233 | | | |
RSUs outstanding as of December 31, 2024 were comprised of 5.3 million RSUs with only service conditions and 0.5 million RSUs with both service conditions and performance conditions, including certain RSUs with additional market conditions. The total intrinsic value of the RSUs vested was $2.4 billion, $1.6 billion and $1.5 billion for the years ended December 31, 2024, 2023 and 2022, respectively. As of December 31, 2024, the aggregate intrinsic value of RSUs outstanding was $6.1 billion and RSUs expected to vest was $5.5 billion. The weighted-average grant-date fair value of RSUs granted was $791.14, $479.18 and $541.24 per share for the years ended December 31, 2024, 2023 and 2022, respectively.
PRSUs have service, performance and market vesting conditions. The ultimate number of shares eligible to vest range from 0% to 200%, subject to our board of directors compensation committee’s approval of performance metrics achievement and, for certain PRSUs, total shareholder return relative to that of the S&P 500 index. The eligible shares subject to PRSUs granted during the year ended December 31, 2024 will vest in one to three years contingent on each holder’s continuous status as an employee on the applicable vesting dates. The number of PRSUs granted included in the table above reflects the shares that could be eligible to vest at 100% of target for PRSUs and includes adjustments for over or under achievement for PRSUs granted in the prior year.
We recognized $147 million, $145 million and $121 million of stock-based compensation expense, net of actual and estimated forfeitures, associated with PRSUs on a graded vesting basis during the years ended December 31, 2024, 2023 and 2022, respectively.
As of December 31, 2024, total unrecognized compensation cost, adjusted for estimated forfeitures, related to unvested RSUs was $2.9 billion and the weighted-average remaining vesting period was approximately three years.
Total stock-based compensation expense for the years ended December 31, 2024, 2023 and 2022 was $1,746 million, $1,604 million and $1,401 million, respectively. For the years ended December 31, 2024 and 2023, we recorded $340 million and $296 million, respectively, of tax benefits on total stock-based compensation expense, which are reflected in the provision for (benefit from) income taxes in the consolidated statements of comprehensive income. Tax benefits on stock-based compensation for the year ended December 31, 2022 was immaterial.
Valuation Assumptions
The following assumptions were used in the Black-Scholes options pricing model and the Monte Carlo simulation model, to estimate our stock-based compensation on the date of grant for ESPP, stock options and PRSUs, respectively, as applicable.
| | | | | | | | | | | | | | | | | |
| | Year Ended December 31, |
| 2024 | | 2023 | | 2022 |
| Risk-Free Interest Rate | | | | | |
| ESPP | 4.96% - 5.39% | | 2.96% - 5.39% | | 0.06% - 2.96% |
| Stock Options | * | | * | | 2.04% |
| PRSU | 3.97% - 4.56% | | 4.34% | | 1.76% |
| Expected Term (in years) | | | | | |
| ESPP | 0.5 | | 0.5 | | 0.5 |
| Stock Options | * | | * | | 10 |
| Expected Volatility | | | | | |
| ESPP | 25% - 40% | | 33% - 59% | | 35% - 59% |
| Stock Options | * | | * | | 40% |
| PRSU | 33% - 42% | | 45% | | 42% |
* There were no stock option grants in 2024 and 2023.
Expected volatility. The expected volatility is based on the historical volatility of our common stock for a period similar to our expected term.
Expected term. We determine the expected term based on historical experience of similar awards, giving consideration to the contractual terms of the stock-based awards, vesting schedules and expectations of future employee behavior. We estimate the expected term for ESPP using the purchase period.
Risk-free interest rate. The risk-free interest rate is based on the U.S. Treasury yield curve in effect at the time of grant for the expected term of the stock-based award.
Expected dividend yield. Our expected dividend yield is zero, as we have not and do not currently intend to declare dividends in the foreseeable future.
(15) Net Income Per Share
Basic net income per share attributable to common stockholders is computed by dividing net income attributable to common stockholders by the weighted-average number of shares of common stock outstanding during the period. Diluted net income per share is computed by dividing net income attributable to common stockholders by the weighted-average number of shares of common stock outstanding during the period, adjusted for the effects of dilutive shares of common stock, which are comprised of outstanding stock options, RSUs, ESPP obligations, the 2022 Notes and the 2022 Warrants. Stock awards with performance or market conditions are included in dilutive shares to the extent all conditions are met. The potentially dilutive shares of common stock are computed using the treasury stock method or the as-if converted method, as applicable. The effects of outstanding stock options, RSUs, ESPP obligations, 2022 Notes and 2022 Warrants are excluded from the computation of diluted net income per share in periods in which the effect would be antidilutive.
The following table presents the calculation of basic and diluted net income per share attributable to common stockholders (in millions, except for number of shares reflected in thousands and per share data):
| | | | | | | | | | | | | | | | | |
| | Year Ended December 31, |
| | 2024 | | 2023 | | 2022 |
| Numerator: | | | | | |
| Net income | $ | 1,425 | | | $ | 1,731 | | | $ | 325 | |
| Denominator: | | | | | |
| Weighted-average shares outstanding - basic | 205,834 | | | 204,137 | | | 201,430 | |
| Weighted-average effect of potentially dilutive securities: | | | | | |
| | | | | |
| | | | | |
| | | | | |
| Common stock options, RSUs and ESPP obligations | 2,589 | | | 1,454 | | | 1,672 | |
| 2022 Notes settlements | — | | | — | | | 280 | |
| Settlement of 2022 Warrants | — | | | — | | | 153 | |
| Weighted-average shares outstanding - diluted | 208,423 | | | 205,591 | | | 203,535 | |
| Net income per share - basic | $ | 6.92 | | | $ | 8.48 | | | $ | 1.61 | |
| Net income per share - diluted | $ | 6.84 | | | $ | 8.42 | | | $ | 1.60 | |
| Common stock options, RSUs and ESPP obligations excluded from diluted net income per share because their effect would have been anti-dilutive | 711 | | | 3,191 | | | 4,658 | |
(16) Provision for (Benefit from) Income Taxes
The components of income before income taxes by U.S. and foreign jurisdictions were as follows (in millions):
| | | | | | | | | | | | | | | | | |
| | Year Ended December 31, |
| | 2024 | | 2023 | | 2022 |
| United States | $ | 1,055 | | | $ | 523 | | | $ | 173 | |
| Foreign | 683 | | | 485 | | | 226 | |
| Total | $ | 1,738 | | | $ | 1,008 | | | $ | 399 | |
The provision for (benefit from) income taxes consists of the following (in millions):
| | | | | | | | | | | | | | | | | |
| | Year Ended December 31, |
| | 2024 | | 2023 | | 2022 |
| Current provision: | | | | | |
| Federal | $ | 36 | | | $ | 2 | | | $ | — | |
| State | 49 | | | 31 | | | 13 | |
| Foreign | 130 | | | 101 | | | 46 | |
| 215 | | | 134 | | | 59 | |
| Deferred provision: | | | | | |
| Federal | 51 | | | (750) | | | (1) | |
| State | (5) | | | (135) | | | (1) | |
| Foreign | 52 | | | 28 | | | 17 | |
| 98 | | | (857) | | | 15 | |
| Provision for (benefit from) income taxes | $ | 313 | | | $ | (723) | | | $ | 74 | |
The effective income tax rate differs from the federal statutory income tax rate applied to the income before income taxes due to the following (in millions):
| | | | | | | | | | | | | | | | | |
| | Year Ended December 31, |
| | 2024 | | 2023 | | 2022 |
| | | | | |
| Tax computed at U.S. federal statutory rate | $ | 365 | | | $ | 212 | | | $ | 84 | |
| State taxes, net of federal benefit | 42 | | | 47 | | | 10 | |
| U.S. tax on foreign earnings | (7) | | | 42 | | | 96 | |
| Tax rate differential for international subsidiaries | 24 | | | 29 | | | 18 | |
| Stock-based compensation | (78) | | | 25 | | | 7 | |
| Executive compensation | 28 | | | 32 | | | 22 | |
| Tax credits | (98) | | | (93) | | | (70) | |
| | | | | |
| | | | | |
| Other | 12 | | | 15 | | | 7 | |
| Valuation allowance | 25 | | | (1,032) | | | (100) | |
| Provision for (benefit from) income taxes | $ | 313 | | | $ | (723) | | | $ | 74 | |
Significant components of our deferred tax assets are shown below (in millions). A valuation allowance has been recognized to offset our deferred tax assets, as necessary, by the amount of any tax benefits that, based on evidence, are not expected to be realized.
| | | | | | | | | | | |
| | December 31, |
| | 2024 | | 2023 |
| Deferred tax assets: | | | |
| Net operating loss carryforwards | $ | 138 | | | $ | 257 | |
| | | |
| Credit carryforwards | 458 | | | 476 | |
| Lease liability | 171 | | | 184 | |
| Capitalized research and development | 434 | | | 324 | |
| Depreciation and amortization | 514 | | | 552 | |
| Other | 168 | | | 167 | |
| Total deferred tax assets | 1,883 | | | 1,960 | |
| Less: valuation allowance | (220) | | | (196) | |
| 1,663 | | | 1,764 | |
| Deferred tax liabilities: | | | |
| Right of use asset | (150) | | | (165) | |
| Depreciation and amortization | (113) | | | (90) | |
| Other | (61) | | | (41) | |
| Net deferred tax assets | $ | 1,339 | | | $ | 1,468 | |
As of December 31, 2024, we had no unremitted earnings when evaluating our outside basis difference relating to our U.S. investment in foreign subsidiaries. However, there could be local withholding taxes due to various foreign countries and/or U.S. state taxes if certain lower tier earnings are distributed. During 2024, a decision was made to change our indefinite reinvestment assertion such that we no longer permanently reinvest all foreign earnings. Foreign withholding taxes after U.S. foreign tax credit and/or state taxes that would be payable upon remittance of these lower tier earnings are currently estimated to be immaterial.
As of December 31, 2024, we had U.S. federal net operating loss and federal tax credit carryforwards of $46 million and $376 million, respectively, as reported on our tax returns. The federal tax credits will begin to expire in 2039 if not utilized. In addition, as of December 31, 2024, we had state net operating loss and state tax credit carryforwards of approximately $0.8 billion and $313 million, respectively, as reported on our tax returns. The state net operating loss will begin to expire in 2032 if not utilized. State tax credits and a portion of the federal net operating loss carryforwards can be carried forward indefinitely. Utilization of our net operating loss and credit carryforwards may be subject to annual limitation due to the ownership change limitations provided by the Internal Revenue Code and similar state provisions. Such an annual limitation could result in the expiration of the net operating loss and tax credit carryforwards before utilization.
As of December 31, 2024, we had Canada net operating loss and tax credit carryforwards of $150 million and $12 million, respectively, as reported on our tax returns. The Canada net operating loss and tax credits will begin to expire in 2039 and 2037, respectively, if not utilized. In addition, as of December 31, 2024, we had United Kingdom net operating loss carryforwards of $147 million, as reported on our tax returns. The United Kingdom net operating loss can be carried forward indefinitely.
The increase in the 2024 valuation allowance of $24 million was primarily attributable to California tax credit generation. The decrease in the 2023 valuation allowance of $1.03 billion was primarily attributable to the $1.05 billion release of certain U.S. federal and state valuation allowances offset by approximately a $20 million increase in the California valuation allowance.
The income tax benefit was $723 million for the year ended December 31, 2023. The income tax benefit was primarily attributable to the release of the valuation allowance of certain U.S. federal and state deferred tax assets. We regularly assess the need for a valuation allowance against our deferred tax assets. In making that assessment, we consider both positive and negative evidence related to the likelihood of realization of the deferred tax assets to determine, based on the weight of available evidence, whether it is more likely than not that some or all of the deferred tax assets will not be realized. As of June 30, 2023, we achieved cumulative U.S. income during the prior twelve quarters when considering pre-tax income adjusted for permanent differences and other comprehensive losses. Based on all available positive and negative evidence, having demonstrated sustained profitability which is objective and verifiable, and taking into account anticipated future earnings, we concluded it is more likely than not that our U.S. federal and state deferred tax assets will be realizable, with the exception of California. We released $1.05 billion of our valuation allowance during the year ended December 31, 2023. As of December 31, 2024 and 2023, we maintained a valuation allowance of $220 million and $196 million, respectively, against our California deferred tax assets due to the uncertainty regarding realizability of these deferred tax assets as they have not met the “more likely than not” realization criteria, particularly as we expect research and development tax credit generation to exceed our ability to use the credits in future years. We will continue to monitor the need for a valuation allowance against our deferred tax assets on a quarterly basis.
The $98 million decrease in the 2022 valuation allowance was primarily attributable to a decrease in deferred tax assets related to the utilization of net operating losses.
A reconciliation of the beginning and ending balance of total unrecognized tax benefits is as follows (in millions):
| | | | | | | | | | | | | | | | | |
| | Year Ended December 31, |
| | 2024 | | 2023 | | 2022 |
| Balance, beginning period | $ | 221 | | | $ | 159 | | | $ | 124 | |
| Tax positions taken in prior period: | | | | | |
| Gross increases | 2 | | | — | | | — | |
| Gross decreases | (2) | | | — | | | (1) | |
| Tax positions taken in current period: | | | | | |
| Gross increases | 73 | | | 63 | | | 38 | |
| | | | | |
| | | | | |
| Settlements | (3) | | | (1) | | | (2) | |
| Balance, end of period | $ | 291 | | | $ | 221 | | | $ | 159 | |
As of December 31, 2024, we had gross unrecognized tax benefits of approximately $291 million, of which $210 million would impact the effective tax rate, if recognized. We recognize accrued interest and penalties related to unrecognized tax benefits as income tax expense. Accrued interest and penalties included in our liability related to unrecognized tax benefits were $9 million and $6 million as of December 31, 2024 and 2023, respectively. The amount of unrecognized tax benefits could be reduced upon expiration of the applicable statutes of limitations. The potential reduction in unrecognized tax benefits during the next 12 months is not expected to be material. Interest and penalties accrued on these uncertain tax positions are recognized as income tax expense and will be released upon the expiration of the statutes of limitations. These amounts are also not material for any periods presented. Further, $68 million and $51 million of unrecognized tax benefits have been recorded as liabilities as of December 31, 2024 and 2023, respectively.
We are subject to taxation in the United States and foreign jurisdictions. As of December 31, 2024, our tax years 2004 to 2024 remain subject to examination in most jurisdictions.
Due to differing interpretations of tax laws and regulations, tax authorities may dispute our tax filing positions. We periodically evaluate our exposures associated with our tax filing positions and believe that adequate amounts have been reserved for adjustments that may result from tax examinations.
(17) Commitments and Contingencies
Operating Leases
For some of our offices and data centers, we have entered into non-cancellable operating lease agreements with various expiration dates through 2035. Certain lease agreements include options to renew or terminate the lease, which are not reasonably certain to be exercised and therefore are not factored into our determination of lease payments.
Total operating lease costs were $130 million, $129 million and $112 million for each of the years ended December 31, 2024, 2023 and 2022, respectively.
For the years ended December 31, 2024 and 2023, total cash paid for amounts included in the measurement of operating lease liabilities was $85 million and $82 million, respectively. Operating lease liabilities arising from obtaining operating right-of-use assets totaled $84 million and $130 million for the years ended December 31, 2024 and 2023, respectively.
As of December 31, 2024, the weighted-average remaining lease term is approximately eight years, and the weighted-average discount rate is 4%.
Maturities of operating lease liabilities as of December 31, 2024 are presented in the table below (in millions):
| | | | | | | | | | | | | | | | | |
| Years Ending December 31, |
| 2025 | | $ | 130 | |
| 2026 | | 114 | |
| 2027 | | 111 | |
| 2028 | | 106 | |
| 2029 | | 97 | |
| Thereafter | | 366 | |
| Total operating lease payments | | 924 | |
| Less: imputed interest | | (135) | |
| Present value of operating lease liabilities | | $ | 789 | |
In addition to the amounts above, as of December 31, 2024, we have operating leases, primarily for offices, that have not yet commenced with undiscounted cash flows of $157 million. These operating leases are expected to commence in 2025 with lease terms of ten to eleven years.
Other Commitments
Other contractual commitments primarily consist of data center and IT operations, cloud services and sales and marketing activities related to our daily business operations. Future minimum payments under our non-cancellable purchase commitments as of December 31, 2024 are presented in the table below (in millions):
| | | | | | | | | | | | | | | | | |
| | Purchase Obligations (1) |
| Years Ending December 31, | | |
| 2025 | | $ | 536 | |
| 2026 | | 590 | |
| 2027 | | 756 | |
| 2028 | | 1,886 | |
| 2029 | | 121 | |
| Thereafter | | 213 | |
| Total | | $ | 4,102 | |
(1)Not included in the table above are certain purchase commitments related to our future annual Knowledge user conferences and other customer or sales conferences to be held in 2025 and future years. If we had canceled these contractual commitments as of December 31, 2024, we would have been obligated to pay cancellation penalties of approximately $56 million in aggregate.
We have entered into various non-cancellable agreements with cloud service providers, under which we have committed to spend an aggregate of $805 million through 2029 on cloud services. In addition, we have entered into a non-cancellable agreement with an information technology equipment provider, under which we have committed to spend $1.9 billion through 2028 on capital expenditures to expand our data centers. The unutilized amounts are included within the table above.
In addition to the amounts above, the repayment of our 2030 Notes with an aggregate principal amount of $1.5 billion is due on September 1, 2030. Refer to Note 11 for further information regarding our 2030 Notes.
Legal Proceedings
We are party to certain litigation and other legal proceedings. While legal proceedings are inherently unpredictable and subject to uncertainties, we do not believe the ultimate resolution of any such proceedings is likely to result in a material loss. We accrue for loss contingencies when it is both probable that we will incur the loss and when we can reasonably estimate the amount of the loss or range of loss.
On July 5, 2022, InQuisient Inc. (“Plaintiff”) filed a complaint against ServiceNow, Inc. in the U.S. District Court for the District of Delaware, alleging the Now Platform’s use of relational databases infringes three of Plaintiff’s patents and seeking injunctive relief and unspecified damages. The Company denied Plaintiff’s allegations and asserted Plaintiff’s patents were, among other things, invalid, not infringed and otherwise unenforceable. In December 2024, the parties entered into a confidential settlement agreement resolving the matter for an immaterial amount.
Any adverse determination related to intellectual property claims or other litigation could prevent us from offering our services and adversely affect our financial condition and results of operations. For additional information regarding intellectual property litigation, see “Risk Factors—We may not be able to protect or enforce our intellectual property rights.”
Other
As previously disclosed, through its internal processes, the Company received a complaint that raised potential compliance issues related to one of its government contracts. The Company initiated an internal investigation, with the assistance of outside legal counsel, into the validity of these claims that concern the hiring of the Chief Information Officer of the U.S. Army as the Company’s Head of Global Public Sector in March 2023. As a result of the investigation, the Company’s board of directors determined that the Company’s President and Chief Operating Officer and the hired individual violated Company policy regarding a possible conflict relating to such individual’s hiring. On July 24, 2024, the Company and its President and Chief Operating Officer came to a mutual agreement that he would resign from all positions
with the Company, effective immediately. The other individual also has departed the Company. The Company has informed the Department of Justice, the Department of Defense Office of Inspector General and the Army Suspension and Debarment Office of the investigation and is continuing to cooperate with the Department of Justice, which has commenced its own investigation into these matters. The Company cannot predict the timing, outcome or possible impact of the investigation.
Indemnification Provisions
Our agreements include provisions indemnifying customers against intellectual property and other third-party claims. In addition, we have entered into indemnification agreements with our directors, executive officers and certain other officers that will require us, among other things, to indemnify them against certain liabilities that may arise as a result of their affiliation with us. We have not incurred any costs as a result of such indemnification obligations and have not recorded any liabilities related to such obligations in the consolidated financial statements.
(18) Information about Geographic Areas and Products
Revenues by geographic area, based on the location of our users, were as follows for the periods presented (in millions):
| | | | | | | | | | | | | | | | | |
| | Year Ended December 31, |
| | 2024 | | 2023 | | 2022 |
North America (1) | $ | 6,909 | | | $ | 5,702 | | | $ | 4,723 | |
EMEA (2) | 2,834 | | | 2,298 | | | 1,778 | |
| Asia Pacific and other | 1,241 | | | 971 | | | 744 | |
| Total revenues | $ | 10,984 | | | $ | 8,971 | | | $ | 7,245 | |
Property and equipment, net by geographic area were as follows (in millions):
| | | | | | | | | | | |
| | December 31, |
| 2024 | | 2023 |
| Property and equipment, net: | | | |
North America (3) | $ | 1,144 | | | $ | 871 | |
EMEA (2) | 428 | | | 312 | |
| Asia Pacific and other | 191 | | | 175 | |
| Total property and equipment, net | $ | 1,763 | | | $ | 1,358 | |
(1)Revenues attributed to the United States were 94% of North America revenues for each of the years ended December 31, 2024, 2023, and 2022.
(2)Europe, the Middle East and Africa (“EMEA”).
(3)Property and equipment, net attributed to the United States were 79% of property and equipment, net attributable to North America as of December 31, 2024 and 2023, respectively.
Subscription revenues consist of the following (in millions):
| | | | | | | | | | | | | | | | | |
| Year Ended December 31, |
| 2024 | | 2023 | | 2022 |
| Digital workflow products | $ | 9,422 | | | $ | 7,679 | | | $ | 6,077 | |
| ITOM products | 1,224 | | | 1,001 | | | 814 | |
| Total subscription revenues | $ | 10,646 | | | $ | 8,680 | | | $ | 6,891 | |
Our digital workflow products include most of our product offerings and are generally priced on a per user basis. Our remaining product offerings, primarily comprised of our IT Operations Management (“ITOM”) products, are generally priced on a subscription unit basis.
(19) Subsequent Event
In January 2025, our board of directors authorized an additional $3.0 billion in repurchases under the Share Repurchase Program. Refer to Note 13 “Stockholders’ Equity” for additional information about the Share Repurchase Program.
| | | | | |
| ITEM 9. | CHANGES IN AND DISAGREEMENTS WITH ACCOUNTANTS ON ACCOUNTING AND FINANCIAL DISCLOSURE |
None.
| | | | | |
| ITEM 9A. | CONTROLS AND PROCEDURES
|
(a) Evaluation of Disclosure Controls and Procedures
Regulations under the Exchange Act require public companies, including our Company, to maintain “disclosure controls and procedures,” which are defined in Rule 13a-15(e) and Rule 15d-15(e) to mean a company’s controls and other procedures that are designed to ensure that information required to be disclosed in the reports that it files or submits under the Exchange Act is recorded, processed, summarized and reported, within the time periods specified in the SEC’s rules and forms. Disclosure controls and procedures include, without limitation, controls and procedures designed to ensure that information required to be disclosed in our reports filed or submitted under the Exchange Act is accumulated and communicated to management, including our principal executive officer and principal financial officer, or persons performing similar functions, as appropriate, to allow timely decisions regarding required or necessary disclosures. In designing and evaluating our disclosure controls and procedures, management recognizes that disclosure controls and procedures, no matter how well conceived and operated, can provide only reasonable, not absolute, assurance that the objectives of the disclosure controls and procedures are met. Additionally, in designing disclosure controls and procedures, our management necessarily was required to apply its judgment in evaluating the cost-benefit relationship of possible disclosure controls and procedures. Our Chief Executive Officer and Chief Financial Officer have concluded, based on the evaluation of the effectiveness of the disclosure controls and procedures by our management as of December 31, 2024, that our disclosure controls and procedures were effective at the reasonable assurance level for this purpose.
(b) Management’s Report on Internal Control Over Financial Reporting
Our management is responsible for establishing and maintaining adequate internal control over financial reporting (as defined in Rules 13a-15(f) and 15d-15(f) under the Exchange Act) to provide reasonable assurance regarding the reliability of our financial reporting and the preparation of consolidated financial statements for external purposes in accordance with generally accepted accounting principles.
Our management, under the supervision of our Chief Executive Officer and Chief Financial Officer, conducted an evaluation of the effectiveness of our internal control over financial reporting based on the framework in Internal Control—Integrated Framework (2013), issued by the Committee of Sponsoring Organizations of the Treadway Commission. Based on this evaluation, management concluded that our internal control over financial reporting was effective as of December 31, 2024.
The effectiveness of our internal control over financial reporting as of December 31, 2024 has been audited by PricewaterhouseCoopers LLP, an independent registered public accounting firm, as stated in their report, which is included in Item 8 of this Annual Report on Form 10-K.
(c) Changes in Internal Control over Financial Reporting
There were no changes to our internal control over financial reporting (as such term is defined in Rules 13a-15(f) and 15d-15(f) under the Exchange Act) that occurred during the quarter ended December 31, 2024 that have materially affected, or is reasonably likely to materially affect, our internal control over financial reporting.
| | | | | |
| ITEM 9B. | OTHER INFORMATION |
Rule 10b5-1 Trading Plans
During the quarter ended December 31, 2024, the following directors and Section 16 officers adopted trading arrangements intended to satisfy the affirmative defense of Rule 10b5-1(c):
•Larry Quinlan, a member of our board of directors, adopted a trading plan on November 1, 2024. The plan, which expires April 30, 2025, provides for the sale of 830 shares of our common stock during the plan period.
•Gina Mastantuono, our Chief Financial Officer, adopted a trading plan on November 22, 2024. The plan, which expires October 31, 2025, provides for the sale of (i) up to 352 shares of our common stock and (ii) up to 80% of the net vested shares resulting from the vesting of 14,467 restricted stock units and performance-based restricted stock units during the plan period, subject to certain vesting conditions. Net vested shares are net of tax withholding.
•Frederic Luddy, a member of our board of directors, adopted a trading plan on November 26, 2024. The plan, which expires May 30, 2025, provides for the sale of 100% of the net vested shares resulting from the vesting of 428 restricted stock units during the plan period, subject to certain vesting conditions.
| | | | | |
| ITEM 9C. | DISCLOSURES REGARDING FOREIGN JURISDICTION THAT PREVENT INSPECTIONS |
Not Applicable.
PART III
| | | | | |
| ITEM 10. | DIRECTORS, EXECUTIVE OFFICERS AND CORPORATE GOVERNANCE |
The information required by this item will be incorporated by reference from our definitive proxy statement to be filed pursuant to Regulation 14A.
| | | | | |
| ITEM 11. | EXECUTIVE COMPENSATION |
The information required by this item will be incorporated by reference from our definitive proxy statement to be filed pursuant to Regulation 14A.
| | | | | |
| ITEM 12. | SECURITY OWNERSHIP OF CERTAIN BENEFICIAL OWNERS AND MANAGEMENT AND RELATED STOCKHOLDER MATTERS |
The information required by this item will be incorporated by reference from our definitive proxy statement to be filed pursuant to Regulation 14A.
| | | | | |
| ITEM 13. | CERTAIN RELATIONSHIPS AND RELATED TRANSACTIONS AND DIRECTOR INDEPENDENCE |
The information required by this item will be incorporated by reference from our definitive proxy statement to be filed pursuant to Regulation 14A.
| | | | | |
| ITEM 14. | PRINCIPAL ACCOUNTANT FEES AND SERVICES
|
The information required by this item will be incorporated by reference from our definitive proxy statement to be filed pursuant to Regulation 14A.
PART IV
| | | | | |
| ITEM 15. | EXHIBITS AND FINANCIAL STATEMENT SCHEDULES |
The following documents are filed as a part of this Annual Report on Form 10-K:
(a) Financial Statements
The information concerning our financial statements, and Report of Independent Registered Public Accounting Firm required by this Item is incorporated by reference herein to the section of this Annual Report on Form 10-K in Item 8, entitled “Consolidated Financial Statements and Supplementary Data.”
(b) Financial Statement Schedules
All schedules have been omitted because the required information is not present or not present in amounts sufficient to require submission of the schedules, or because the information required is included in Item 8, entitled the “Consolidated Financial Statements and Supplementary Data.”
(c) Exhibits
The list of exhibits filed with this report is set forth in the Exhibit Index following the signature pages and is incorporated herein by reference.
| | | | | |
| ITEM 16. | FORM 10-K SUMMARY |
None.
EXHIBIT INDEX
| | | | | | | | | | | | | | | | | | | | | | | | | | | | | | | | | | | |
Exhibit Number | Description of Document | | Incorporated by Reference | | Filed
Herewith |
| Form | | File No. | | Exhibit | | Filing Date | |
| | | 8-K | | 001-35580 | | 3.1 | | 6/9/2021 | | |
| | | 8-K | | 001-35580 | | 3.2 | | 6/9/2021 | | |
| | | S-1/A | | 333-180486 | | 4.1 | | 6/19/2012 | | |
| | | 8-K | | 001-35580 | | 4.1 | | 8/11/2020 | | |
| | | 8-K | | 001-35580 | | 4.2 | | 8/11/2020 | | |
| | | 10-K | | 001-35580 | | 4.5 | | 2/3/2022 | | |
| | | 10-K | | 001-35580 | | 10.1 | | 2/27/2015 | | |
| | | 10-K | | 001-35580 | | 10.3 | | 2/27/2019 | | |
| | | 10-Q | | 001-35580 | | 10.1 | | 7/30/2020 | | |
| | | 10-Q | | 001-35580 | | 10.2 | | 7/30/2020 | | |
| | | 8-K | | 001-35580 | | 10.1 | | 6/2/2023 | | |
| | | 10-Q | | 001-35580 | | 10.1 | | 7/28/2022 | | |
| | | 8-K | | 001-35580 | | 10.2 | | 6/9/2021 | | |
| | | 10-Q | | 001-35580 | | 10.2 | | 7/28/2022 | | |
| | | 8-K | | 001-35580 | | 10.2 | | 12/27/2024 | |
|
| | | S-8 | | 333-268298 | | 4.4 | | 11/10/2022 | | |
| | | | | | | | | | | | | | | | | | | | | | | | | | | | | | | | | | | |
Exhibit Number | Description of Document | | Incorporated by Reference | | Filed
Herewith |
| Form | | File No. | | Exhibit | | Filing Date | |
| | | 8-K | | 001-35580 | | 10.1 | | 10/23/2019 | | |
| | | 8-K | | 001-35580 | | 10.1 | | 3/27/2020 | | |
| | | 8-K | | 001-35580 | | 10.1 | | 11/18/2019 | | |
| | | 10-Q | | 001-35580 | | 10.1 | | 11/6/2017 | | |
| | | 10-Q | | 001-35580 | | 10.1 | | 10/26/2023 | | |
| | | 10-Q | | 001-35580 | | 10.1 | | 7/25/2024 | | |
| | | 10-Q | | 001-35580 | | 10.1 | | 10/24/2024 | | |
| | | 8-K | | 001-35580 | | 10.1 | | 4/16/2021 | | |
| | | 10-Q | | 001-35580 | | 10.1 | | 10/28/2021 | | |
| | | 10-Q | | 001-35580 | | 10.3 | | 4/28/2022 | | |
| | | 10-Q | | 001-35580 | | 10.2 | | 7/25/2024 | | |
| | | | | | | | | | | X |
| | | 8-K | | 001-35580 | | 10.1 | | 10/23/2024 | |
|
| | | 8-K | | 001-35580 | | 10.1 | | 12/27/2024 | |
|
| | | | | | | | | | | X |
| | | | | | | | | | | X |
| | | | | | | | | | | | | | | | | | | | | | | | | | | | | | | | | | | |
Exhibit Number | Description of Document | | Incorporated by Reference | | Filed
Herewith |
| Form | | File No. | | Exhibit | | Filing Date | |
| | | | | | | | | | | X |
| | | | | | | | | | | X |
| | | | | | | | | | | X |
| | | | | | | | | | | X |
| | | | | | | | | | | X |
| | | | | | | | | | | X |
| | | 10-K | | 001-35580 | | 97 | | 1/25/2024 | |
|
| 101.INS | XBRL Instance Document - the instance document does not appear in the Interactive Data File because its XBRL tags are embedded within the Inline XBRL document | | | | | | | | | | X |
| 101.SCH | Inline XBRL Taxonomy Extension Schema Document | | | | | | | | | | X |
| 101.CAL | Inline XBRL Taxonomy Extension Calculation Linkbase Document | | | | | | | | | | X |
| 101.DEF | Inline XBRL Taxonomy Extension Definition Linkbase Document | | | | | | | | | | X |
| 101.LAB | Inline XBRL Taxonomy Extension Label Linkbase Document | | | | | | | | | | X |
| 101.PRE | Inline XBRL Taxonomy Extension Presentation Linkbase Document | | | | | | | | | | X |
| 104 | Cover Page Interactive Data File (formatted as inline XBRL and contained in Exhibit 101) | | | | | | | | | | X |
| | | | | | | | | | | |
| | | | | | | | | | | |
* Indicates a management contract, compensatory plan or arrangement.
** The certifications on Exhibit 32 hereto are deemed not “filed” for purposes of Section 18 of the Securities and Exchange Act of 1934, as amended, or otherwise subject to the liability of that Section. Such certifications will not be deemed incorporated by reference into any filing under the Securities Act or the Exchange Act.
SIGNATURES
Pursuant to the requirements of Section 13 or 15(d) of the Securities Exchange Act of 1934, the registrant has duly caused this report to be signed on its behalf by the undersigned thereunto duly authorized.
Dated: January 29, 2025
| | | | | | | | | | | |
| SERVICENOW, INC. |
| | | |
| By: | | /s/ William R. McDermott |
| | | William R. McDermott
Chief Executive Officer |
POWER OF ATTORNEY
KNOW ALL BY THESE PRESENTS, that each person whose signature appears below constitutes and appoints William R. McDermott and Gina Mastantuono, and each of them, as his or her true and lawful attorneys-in-fact and agents, each with the full power of substitution, for him or her and in his or her name, place or stead, in any and all capacities, to sign any and all amendments to this report, and to file the same, with exhibits thereto and other documents in connection therewith, with the Securities and Exchange Commission, granting unto said attorneys-in-fact and agents, and each of them, full power and authority to do and perform each and every act and thing requisite and necessary to be done in and about the premises, as fully to all intents and purposes as he might or could do in person, hereby ratifying and confirming all that said attorneys-in-fact and agents, or their or his substitute or substitutes, may lawfully do or cause to be done by virtue hereof.
Pursuant to the requirements of the Securities Exchange Act of 1934, this report has been signed by the following persons in the capacities and on the dates indicated.
| | | | | | | | | | | | | | |
| Signature | | Title | | Date |
| | | | |
| /s/ William R. McDermott | | Chairman and Chief Executive Officer (Principal Executive Officer) | | January 29, 2025 |
| William R. McDermott | | | |
| | | | |
| /s/ Gina Mastantuono | | President and Chief Financial Officer (Principal Financial Officer) | | January 29, 2025 |
| Gina Mastantuono | | | |
| | | | |
| /s/ Kevin T. McBride | | Chief Accounting Officer (Principal Accounting Officer) | | January 29, 2025 |
| Kevin T. McBride | | | |
| | | | |
| /s/ Frederic B. Luddy | | Director | | January 29, 2025 |
| Frederic B. Luddy | | | | |
| | | | |
| /s/ Deborah Black | | Director | | January 29, 2025 |
| Deborah Black | | | | |
| | | | |
| /s/ Susan L. Bostrom | | Director | | January 29, 2025 |
| Susan L. Bostrom | | | | |
| | | | |
| /s/ Teresa Briggs | | Director | | January 29, 2025 |
| Teresa Briggs | | | | |
| | | | |
| /s/ Jonathan C. Chadwick | | Director | | January 29, 2025 |
| Jonathan C. Chadwick | | | | |
| | | | |
| /s/ Paul E. Chamberlain | | Director | | January 29, 2025 |
| Paul E. Chamberlain | | | | |
| /s/ Lawrence J. Jackson, Jr. | | Director | | January 29, 2025 |
| Lawrence J. Jackson, Jr. | | | | |
| /s/ Jeffrey A. Miller | | Director | | January 29, 2025 |
| Jeffrey A. Miller | | | | |
| /s/ Joseph M. Quinlan | | Director | | January 29, 2025 |
| Joseph M. Quinlan | | | | |
| /s/ Anita M. Sands | | Director | | January 29, 2025 |
| Anita M. Sands | | | | |