Importance Notice
This document does not constitute an offer to sell or a solicitation of an offer to buy any securities . It is an outline of matters for discussion only.
Some of the statements in this presentation and other written and oral statements made from time to time by the Company and its representatives are “forward -looking statements” within the meaning of Section 27A of the Securities Act of 1933, as amended, and Section 21E of the Securities Exchange Act of 1934, as amended . These statements include statements regarding the intent and belief or current expectations of Essex and its management team and may be identified by the use of words like "anticipate", "believe", "estimate", "expect", "intend", "may", "plan", "will", "should", "seek", the negative of these terms or other comparable terminology . Investors are cautioned that any such forward -looking statements are not guarantees of future performance and involve risks and uncertainties, and that actual results may differ materially from those projected in the forward -looking statements . Important factors that could cause actual results to differ materially from Essex’s expectations include, without limitation, the continued ability of Essex to successfully execute its business plan, the possibility of a change in demand for the products and services that Essex provides (through its subsidiary, Essex Crane), intense competition which may require us to lower prices or offer more favorable terms of sale, our reliance on third party suppliers, our indebtedness which could limit our operational and financial flexibility, global economic factors including interest rates, general economic conditions, geopolitical events and regulatory changes, our dependence on our management team and key personnel, as well as other relevant risks detailed in our Annual Report on Form 10-K/A and subsequent periodic reports filed with the Securities and Exchange Commission and available on our website, www.essexrentalcorp .com. The factors listed here are not exhaustive . Many of these uncertainties and risks are difficult to predict and beyond management’s control. Forward -looking statements are not guarantees of future performance, results or events. Essex assumes no obligation to update or supplement forward -looking information in this presentation whether to reflect changed assumptions, the occurrence of unanticipated events or changes in future operating results or financial conditions, or otherwise .
This presentation contains unaudited non-GAAP financial measures, including Total EBITDA, and Rental EBITDA . Management believes that the presentation of these non-GAAP financial measures serves to enhance understanding of Essex’s individual operating and financial performance . These non-GAAP financial measures should be considered in addition to, but not as substitutes for, the most directly comparable U.S. GAAP measures . A reconciliation of Total EBITDA and Rental EBITDA to income from operations for the three months ended March 31, 2011 can be found in Essex’s Current Report on Form 8-K filed with the Securities and Exchange Commission (the “SEC”) on May 10, 2011.
We believe the non-Company information provided herein is reliable, as of the date hereof, but do not warrant its accuracy or completeness . In preparing these materials, we have relied upon and assumed, without independent verification, the accuracy and completeness of all information available from public sources . Except as required by law, the Company, Essex and their respective directors, officers, employees, agents and consultants make no representation or warranty as to the accuracy or completeness of the non-Company information contained in this document, and take no responsibility under any circumstances for any loss or damage suffered as a result of any omission, inadequacy, or inaccuracy in this document . Neither the Company nor Essex Crane guarantees the performance or return of capital from investments .
©2011 Essex Rental Corp.
1
Introduction
Ron Schad
President & Chief Executive Officer
Marty Kroll
Chief Financial Officer & Senior Vice President
Senior Management
| • | President & CEO of Essex Crane since 2000 |
| • | 15 years with Manitowoc Crane Group, including Executive Vice President and General Manager of the Crane Group responsible for over $350 million in sales |
| • | Graduated from the University of Wisconsin-Madison with a BS in Engineering |
| • | Active Industry Leader, including current board member of NCCCO and SC&RA |
| • | CFO & Senior Vice President of Essex Crane since May 2001 |
| • | Former President and Chief Financial Officer of US Holding Company of Outokumpu Copper Group |
| • | Director of Finance at American Brass Company |
| • | 8 years with PricewaterhouseCoopers LLP |
| • | Certified Public Accountant |
Essex Rental Corp.
| | Leading provider of heavy lifting equipment solutions to the infrastructure and construction industry |
| | Acquisition of Coast Crane Company in November 2010 dramatically increased the Company’s geographic footprint, product offerings and lines of business and diversified its earnings stream |
| | Focused on bare rental of heavy construction lifting equipment with over 1,000 pieces of equipment and attachments |
| | Integrated full-service approach provides the Company with multiple points of customer contact, enabling it to maintain a high quality rental fleet, as well as an effective distribution channel for fleet rotation and provides cross-selling opportunities among its new and used equipment sales, rental, parts sales and service operations |
| | Over $350 million appraised value of the fleet as of 3/31/11 |
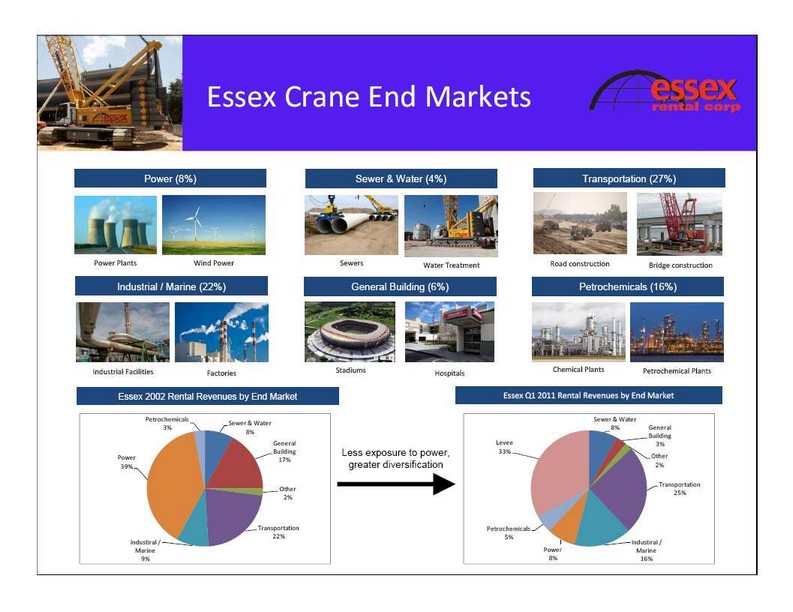
| | Highly diversified end markets served across a national footprint |
| | Over 30% of common stock is owned by management and members of the Board of Directors . |
Investment Highlights
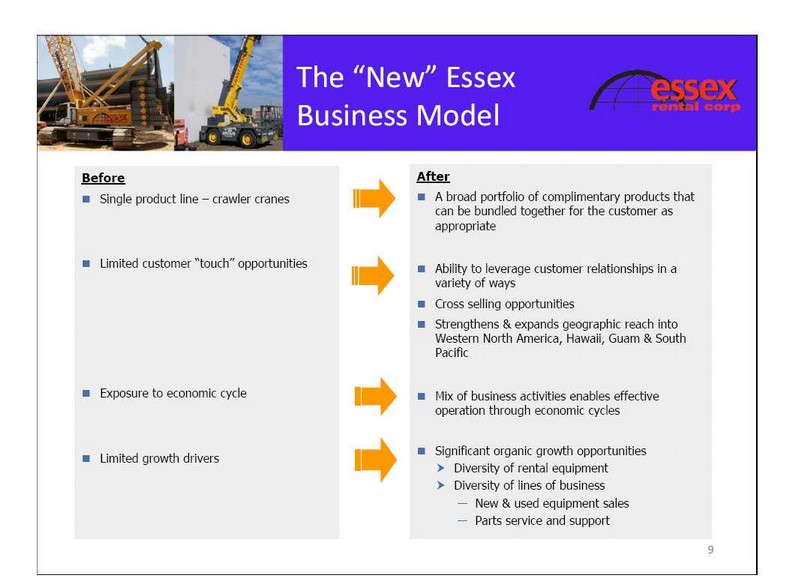
Integrated Business Model
Geographic & End Market Diversity
Significant Asset Value
Return on Capital Business Model
| — | Rental | — | Multi–faceted offering of diverse lifting needs |
| — | New and Used Sales | — | Multiple lines of business driving growth |
| — | Parts and Service | — | Cyclical “earnings smoothing” |
| — | 25 locations in 14 states | | |
| • | Serve a broad array of end markets, with no exposure to a single industry or geography |
| • | Significant focus on infrastructure and energy-related end markets |
| • | Appraised fleet value of $350 million as of 3/31/11 |
| • | Replacement value of approximately $600 million |
| • | Focus on long economic lived assets |
| • | High residual value relative to original cost |
| • | Attractive ROIC business model due to efficient conversion of EBITDA to free cash flow |
| • | New and used equipment sales |
| • | Parts and services support |
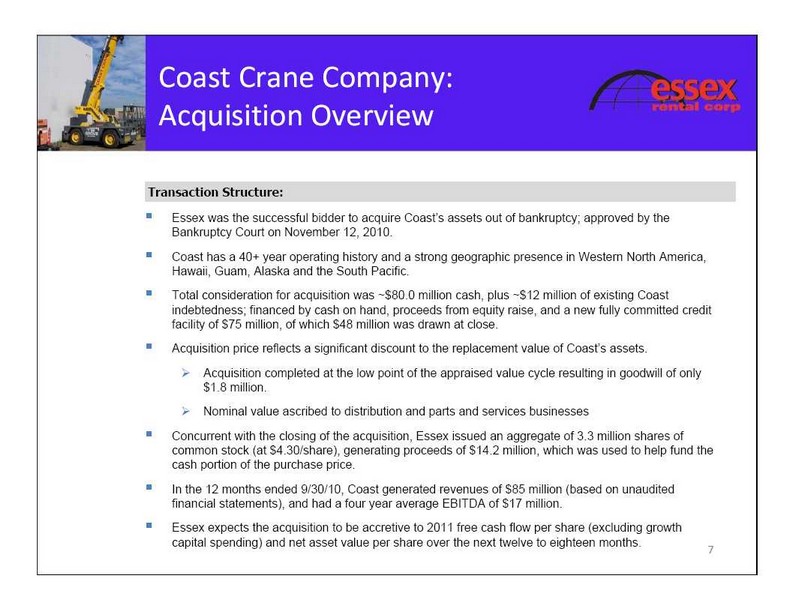
Coast Crane Company: Acquisition Overview
Transaction Structure:
| • | Essex was the successful bidder to acquire Coast’s assets out of bankruptcy; approved by the Bankruptcy Court on November 12, 2010. |
| • | Coast has a 40+ year operating history and a strong geographic presence in Western North America, Hawaii, Guam, Alaska and the South Pacific. |
| • | Total consideration for acquisition was ~$80.0 million cash, plus ~$12 million of existing Coast indebtedness; financed by cash on hand, proceeds from equity raise, and a new fully committed credit facility of $75 million, of which $48 million was drawn at close. |
| • | Acquisition price reflects a significant discount to the replacement value of Coast’s assets. |
| • | Acquisition completed at the low point of the appraised value cycle resulting in goodwill of only $1.8 million. |
| • | Nominal value ascribed to distribution and parts and services businesses |
| • | Concurrent with the closing of the acquisition, Essex issued an aggregate of 3.3 million shares of common stock (at $4.30/share), generating proceeds of $14.2 million, which was used to help fund the cash portion of the purchase price. |
| • | In the 12 months ended 9/30/10, Coast generated revenues of $85 million (based on unaudited financial statements), and had a four year average EBITDA of $17 million. |
| • | Essex expects the acquisition to be accretive to 2011 free cash flow per share (excluding growth |
capital spending) and net asset value per share over the next twelve to eighteen months .
Coast Crane Company
Summary
| • | No asset overlap; Coast’s assets are contiguous and complementary to Essex’s existing crawler crane fleet |
| • | Largest fleet in west coast: young, modern fleet with long asset lives of 10-30+ years and shorter payback periods |
| • | Tower and rough terrain crane rental agreements may have durations in excess of 18 months and boom trucks and other smaller equipment may be rented as frequently as daily. |
| • | Low maintenance capital expenditure requirements for most long lived nature of assets |
| • | Rental fleet can be used as a rent-to-sell distribution model to create additional market opportunities with customers not prepared to buy new |
| - | Types: Self Erector, City Cranes & T-top Cranes |
| - | Fleet focus on mid-to-large capacity |
| - | Heavy lift capacity multi-axel boom trucks |
Q1’11 total revenues of $13.2 million
Business Strategy
| | Essex’s three pronged strategy for creating shareholder value: |
Rental Equipment
| h | Keen focus on return on capital equipment with medium to long duration rentals |
| h | Leverage customer relationships by offering bundled equipment solutions to drive increased utilization |
| h | Organic growth through increasing fleet size |
New and Used Equipment Sales
| h | Aggressive push to add new manufacturers in existing and new territories |
| h | Continue to evolve into a broad line dealer by providing exceptional service and support |
| h | Leverages rental equipment customer relationships |
Parts and Service Support
| h | Predictable, high margin, counter cycle |
| h | Proactively market our expertise to drive growth |
| h | Provides opportunity to differentiate offering and sets customers up for a future rental or sale. |
Provides multi-faceted offering to service our customers’ varied equipment needs

Essex Rental Fleet
Essex Now Employs All of the Cranes Below in its Fleet
| | | Crane Type | | Crawler | | | Rough Terrain (RTs) | | | Tower | | | Boom Truck | | |
| Max. Lift Cap. (tons) | | 3,000 | + | | 150 | | | 80 | | | 50 | + | |
| Max. Reach Cap. (ft.) | | 700 | + | | 250 | | | 350 | | | 200 | | |
| Price New ($ ‘000) | $ | 800 - $5,000 (2) | | $ | 250 - $1,500 | | $ | 300 - $1,000 | | $ | 100 - $600 | | |
| Avg. Life (years) | | 50 | + | | 20 | + | | 30 | + | | 15 | + | |
| Rental Duration | | Long-term | | | Short-term | | | Long-term | | | Short-term | | |
| Key End Markets | | Highways, large bridges, | | | Highways, large | | | Nuclear power | | | Petrochemical | | |
| | | | | railroads | | | bridges, railroads | | | Sewer / water | | | Oil & Gas | | |
| | | | | Public infrastructure | | | Public infrastructure | | | treatment | | | Railroads | | |
| | | | | (stadiums, garages) | | | (stadiums, garages) | | | | | | | | |
| | | | | | | | | | | High rise (>10 | | | Highways | | |
| | | | | Power generation | | | Power generation | | | story) | | | | | |
| | | | | | | | | | | | | | Public Utilities | | |
| | | | | Sewer / water treatment | | | Sewer / water treatment | | | Office Towers | | | | | |
| | | | | | | | | | | | | | Condominiums | | |
| | | | | Petrochemicals | | | Petrochemicals | | | Condominiums | | | | | |
| | | | | | | | | | | | | | Apartment Buildings | | |
| | | | | Industrial / marine | | | Industrial / marine | | | Apartment | | | | | |
| | | | | | | | | | | Buildings | | | Other Residential | | |
| | | | | | | | Commercial & | | | | | | | | |
| | | | | | | | Residential | | | | | | | | |
Owned By | | Essex Crane | | | | | | Coast Crane | | | | | |
| Notes: | | | | | | | | | | | | | |
| 1 | . | Source: Manufacturer reports and Essex management estimates | | | | | | | | | | | |
| 2 | . | Crawler crane prices reflect models in Essex’s heavy‐lift niche. Light and super heavy‐lift crawler cranes can range from $0.5 million to over $35 million | | |
| | | | | | | | | | | | | | | | 12 |
National Footprint
| • | Continue to leverage the Essex and Coast brands in the territories in which they are strongest, yet achieve the benefits of geographic and product diversity |
New & Used
Equipment Sales
New Equipment Sales
| • | Continue to represent Potain Tower Crane line with future opportunity as commercial & residential markets recover |
| • | Freedom from a restrictive dealer relationship with Manitowoc for Grove, Manitowoc & National Cranes allows Essex to: |
| • | Expand our geographic footprint with rental opportunities outside of our Coast distribution geography |
| • | Pursue additional opportunities to expand our crane sales offering |
| • | Leverage existing relationships with crane suppliers familiar with Coast/Essex Crane sales and rental capabilities |
| • | Develop full-line mobile crane offering by adding distribution of other leading manufacturers’ products. |
| • | Distribution agreements signed with Terex, Manitex, Broderson, Mantis and Tadano in Q1’11: |
| • | Each agreement includes distribution to several states, British Columbia, the Yukon, Guam and Republic of the Marshall Islands. |
| • | In conjunction with new distribution agreements, Coast Crane ordered new cranes to sell or rent to its customer base from Terex, Tadano, Manitex and Broderson. |
Used Equipment Sales
| • | Continue to rebalance the Essex crawler crane fleet by selling $20M of smaller, older underutilized cranes |
| • | Leverage rent-to-own model relating to boom truck and rough terrain |
| • | Reinvigorate rent-to-sell model by selecting appropriate time and equipment to create a used crane offering for customers desiring like-new used cranes |

Current Market Conditions
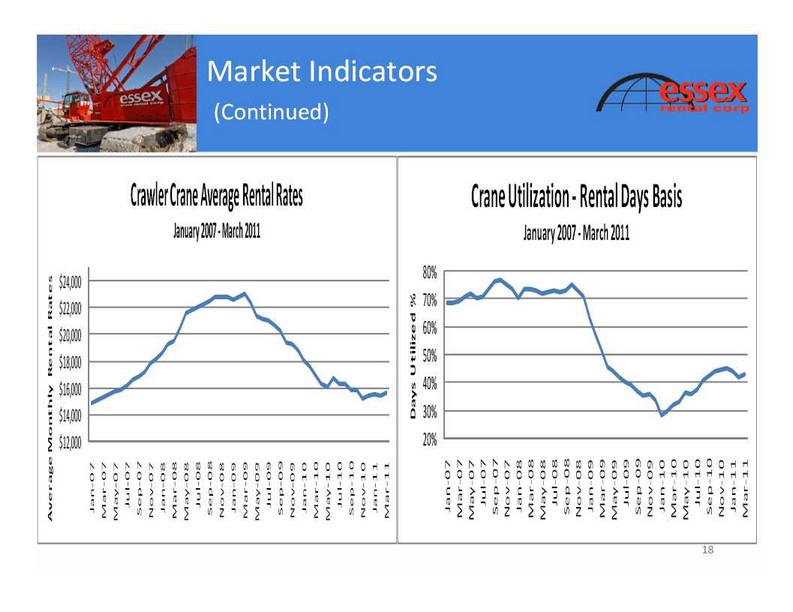
| • | Experienced 3rd consecutive quarter of year-over-year improvement in utilization rates of Essex Crane crawler crane rental fleet. |
| • | Experienced the 1st sequential increase in rental rates in Q1’11 which hasn’t occurred since Q4‘08. Improved rental activity also points to a recovery in Essex’s rental businesses. |
| • | Since January, customers requesting crawler crane rental quotations are noting that confirmed projects are 40% higher in revenue than the comparable period last year. |
| • | Increased economic indicators/measurements including ABI index and Rouse appraisal data regarding construction equipment values are consistent with a construction recovery. |
| • | Recent auction results for rough terrain cranes yielded higher than expected prices indicating market demand improvement which will support increased rental rates in the future. |
| • | Public rental companies providing lighter rental equipment are reporting much improved market conditions. Light construction equipment is considered early stage recovery equipment and is consistent with our belief that the medium to heavy construction (larger projects) are recovering and demand is increasing. |
| • | Crane manufacturers are reporting increased demand for new crane purchases by owners and contractors that prefer to own equipment rather the rent. |
Market Indicators
ArchitectureBillingIndex(ABI)
January2007 ‐ March2011
70
60
50
40
30
2011 Outlook
| • | We expect an improved environment in 2011 due to: |
| • | Belief that 2010 the was bottom of the cycle for Essex’s sector |
| • | Lifting Equipment tends to be later stage recovery – 6 to 12 months after the earth moving equipment/light equipment |
| • | Sequential improvement expected in utilization in rental business throughout the year |
| • | Rental rates expected to remain relatively flat until utilization reaches about 60% – no longer under pressure |
| • | Rental activity for tower cranes, the Company’s lowest utilized assets, has been steadily improving |
| • | Rental activity for larger lift capacity rough terrain cranes continues to be robust and the Company is adding to this asset class via purchase of new rental fleet assets throughout 2011. |
| • | Transitioning new equipment distribution to deeper relationship with a broader number of manufacturers as previously mentioned in slide 15 |
| • | Continue to integrate Coast Crane into Essex Rental without sacrificing brand, customer relationships and product expertise — creation of “One Company / One Culture” with diverse product and service offering |
| • | Opportunity for process improvements at Coast through introduction of Essex’s existing IT platform resulting in meaningful cost and working capital reductions and greater visibility to drive earnings |
| • | Opportunity for significant sequential growth in second half 2011 and beyond |
| • | Limited capital expenditures, primarily related to rough terrain products, hoist equipment and boom trucks to meet high customer demand |
| • | Capital investment of over $20 million (net of rental equipment sales) in new equipment for Coast Crane’s rental fleet in 2011 |
| • | Strong balance sheet and solid capital structure |
| | Pro Forma Capitalization & | | |
| | US Credit Facility Snapshot | | |
| Pro Forma Capitalization ($ in millions) | | | | | | | | | | | | |
| Revolving Credit Facilities | $ | 212.5 | | | | | |
| Other debt | | 7.9 | $ | 200.0 | | $ | 5.2 | | | | | |
| | | | $ | 180.0 | | $ | 28.5 | | | | | |
| Shareholders' equity | | 94.2 | $3.5 | |
| | | | $ | 160.0 | | | | | | | | |
| Total capitalization as of March 31, 2011 | $ | 314.6 | $ | 140.0 | | | | | | | | |
| | | | $ | 120.0 | | | | | | | | Suppressed collateral |
| Market equity value as of 5/18/2011 | $ | 172.2 | $ | 100.0 | | | | | | | | Availability |
| | | | | | | $ | 158.0 | | | | | |
| | | | $ | 80.0 | | | | | $ | 11.5 | | Reserves |
| | | | $ | 60.0 | | | | | $ | 4.7 | | |
| Note 1: Received $19.8 million in proceeds related to the | | | | | | | | | | Amount drawn |
| | | | $ | 40.0 | | | | | | | | |
| exercise of approximately 4 million warrants in the first | | | | | | | $ | 52.0 | | |
| quarter of 2011. | | | $ | 20.0 | | | | | | | | |
| | | | | $‐ | | | | | | | | |
| Note 2: Appraised value of rental equipment assets in excess | | | | | | | | | | |
| | | | | | | | Essex Crane | | | Coast Crane | | |
| of $350 million. | | | | | | | Subsidiary | | | Subsidiary | | |
| | | | | | | | ($190 million) | | | ($75 million) | | |
Debt Summary
| • | Essex Crane Rental Corp. |
| • | Total Debt outstanding (3/31/11): $158.0 million |
| • | Revolving Credit Facility: |
| • | $158.0 million outstanding as of March 31, 2011 |
| • | $190 million facility size |
| • | 2 financial covenants (only become effective if availability is below $20 million) |
| • | Availability under facility of $28.5 million as of March 31, 2011 |
| • | Total Debt outstanding (3/31/11): $57.5 million |
| • | U.S. Revolving Credit Facility: |
| • | $52 million outstanding as of March 31, 2011 |
| • | $75 million facility size |
| • | Libor plus 375 bps (Libor floor of 150 bps) |
| • | Availability under facility of $11.5 million as of March 31, 2011 |
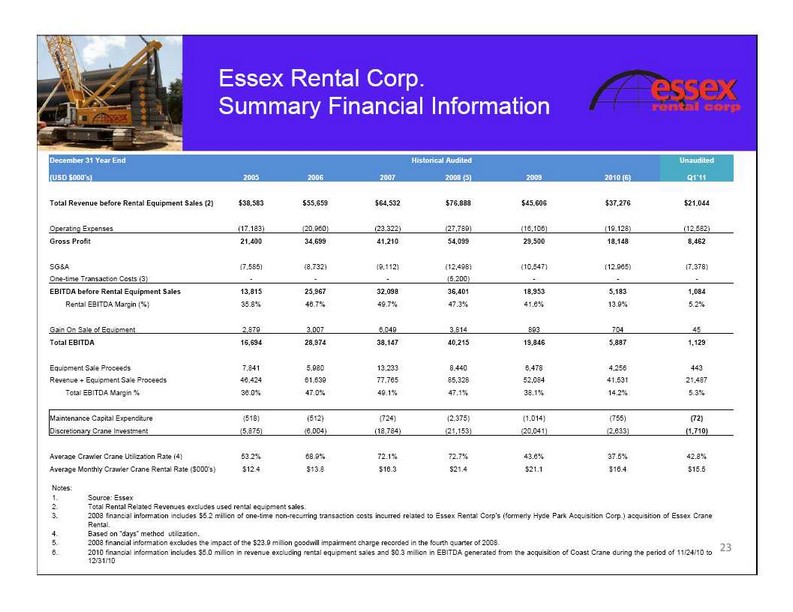
Essex Rental Corp.
Summary Financial Information
| December 31 Year End | | | | | | | | | | | Historical Audited | | | | | | | | | Unaudited | |
| (USD $000's) | | 2005 | | | 2006 | | | 2007 | | | 2008 | (5) | | 2009 | | | 2010 | (6) | Q1’ | 11 | |
| Total Revenue before Rental Equipment Sales (2) | $ | 38,583 | | $ | 55,659 | | $ | 64,532 | | $ | 76,888 | | $ | 45,606 | | $ | 37,276 | | $ | 21,044 | |
| Operating Expenses | | (17,183 | ) | | (20,960 | ) | | (23,322 | ) | | (27,789 | ) | | (16,106 | ) | | (19,128 | ) | | (12,582 | ) |
| Gross Profit | | 21,400 | | | 34,699 | | | 41,210 | | | 54,099 | | | 29,500 | | | 18,148 | | | 8,462 | |
| SG&A | | (7,585 | ) | | (8,732 | ) | | (9,112 | ) | | (12,498 | ) | | (10,547 | ) | | (12,965 | ) | | (7,378 | ) |
| One-time Transaction Costs (3) | | - | | | - | | | - | | | (5,200 | ) | | - | | | - | | | - | |
| EBITDA before Rental Equipment Sales | | 13,815 | | | 25,967 | | | 32,098 | | | 36,401 | | | 18,953 | | | 5,183 | | | 1,084 | |
Rental EBITDA Margin (%) | | 35.8 | % | | 46.7 | % | | 49.7 | % | | 47.3 | % | | 41.6 | % | | 13.9 | % | | 5.2 | % |
| Gain On Sale of Equipment | | 2,879 | | | 3,007 | | | 6,049 | | | 3,814 | | | 893 | | | 704 | | | 45 | |
| Total EBITDA | | 16,694 | | | 28,974 | | | 38,147 | | | 40,215 | | | 19,846 | | | 5,887 | | | 1,129 | |
| Equipment Sale Proceeds | | 7,841 | | | 5,980 | | | 13,233 | | | 8,440 | | | 6,478 | | | 4,256 | | | 443 | |
| Revenue + Equipment Sale Proceeds | | 46,424 | | | 61,639 | | | 77,765 | | | 85,328 | | | 52,084 | | | 41,531 | | | 21,487 | |
Total EBITDA Margin % | | 36.0 | % | | 47.0 | % | | 49.1 | % | | 47.1 | % | | 38.1 | % | | 14.2 | % | | 5.3 | % |
| Maintenance Capital Expenditure | | (518 | ) | | (512 | ) | | (724 | ) | | (2,375 | ) | | (1,014 | ) | | (755 | ) | | (72 | ) |
| Discretionary Crane Investment | | (5,875 | ) | | (6,004 | ) | | (18,784 | ) | | (21,153 | ) | | (20,041 | ) | | (2,633 | ) | | (1,710 | ) |
| Average Crawler Crane Utilization Rate (4) | | 53.2 | % | | 68.9 | % | | 72.1 | % | | 72.7 | % | | 43.6 | % | | 37.5 | % | | 42.8 | % |
| Average Monthly Crawler Crane Rental Rate ($000's) | $ | 12.4 | | $ | 13.8 | | $ | 16.3 | | $ | 21.4 | | $ | 21.1 | | $ | 16.4 | | $ | 15.5 | |
Notes:
| 2. | Total Rental Related Revenues excludes used rental equipment sales. |
| 3. | 2008 financial information includes $5.2 million of one-time non-recurring transaction costs incurred related to Essex Rental Corp’s (formerly Hyde Park Acquisition Corp.) acquisition of Essex Crane Rental. |
| 4. | Based on “days” method utilization. |
| 5. 2008 financial information excludes the impact of the $23.9 million goodwill impairment charge recorded in the fourth quarter of 2008. | 23 |
| 6. 2010 financial information includes $5.0 million in revenue excluding rental equipment sales and $0.3 million in EBITDA generated from the acquisition of Coast Crane during the period of 11/24/10 to | |
12/31/10 | |
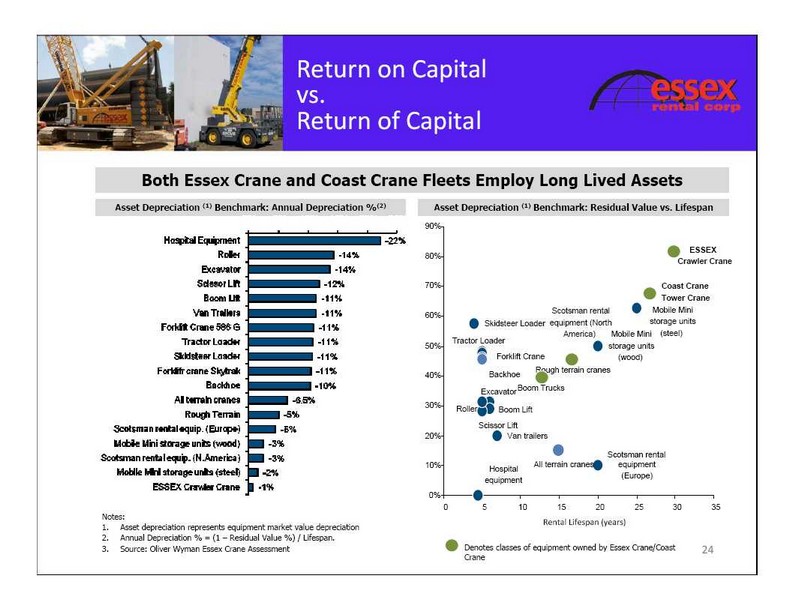
Return on Capital
vs.
Return of Capital
Both Essex Crane and Coast Crane Fleets Employ Long Lived Assets
Asset Depreciation (1) Benchmark: Annual Depreciation %(2)
Asset Depreciation (1) Benchmark: Residual Value vs. Lifespan
90%
Notes:
| 1. | Asset depreciation represents equipment market value depreciation |
| 2. | Annual Depreciation % = (1 – Residual Value %) / Lifespan. |
| 3. | Source: Oliver Wyman Essex Crane Assessment |
Investment
Summary
Essex is considered to be an attractive investment opportunity for the following reasons:
| • | Market leader with a long industry heritage able to leverage scale |
| • | Committed management team; management and Board of Directors represent ownership in excess of 30% of common shares outstanding |
| • | Strong free cash flow generation potential |
| • | Poised to participate in growing infrastructure & energy related markets as economy recovers and as capacity demands updating |
| • | Numerous organic and strategic growth opportunities |
| • | Sound capital structure including attractive, flexible and committed debt facilities |
| • | Utilization has shown growth and rental rates have bottomed |