Filing under Rule 425 under the U.S. Securities Act of 1933 Filing by: Mitsubishi UFJ Securities Co., Ltd. Subject Company: Mitsubishi UFJ Securities Co., Ltd. SEC File No. 132-02600 |

| Interim Consolidated Financial Summary for the Fiscal Year Ending March 31, 2007 | Date : October 25, 2006 |
| Company name | Mitsubishi UFJ Securities Co., Ltd. | Stock exchange listings: | Tokyo, Osaka, Nagoya | |||
| Code number | 8615 | Head office: | Tokyo | |||
| (URL http://www.sc.mufg.jp/) | ||||||
Representative: | Hirohisa Aoki, President | |||||
For inquiry: | Harutoshi Tsuji, General Manager of Accounting Division Phone: | (03) 6213 – 6900 | ||||
| Date of Board of directors with respect to the interim operating result: October 25, 2006 | ||||||
| Parent company | Mitsubishi UFJ Financial Group, Inc. | The percentage of voting rights held by the parent company: 62.8% | ||||
| (Code number: 8306) | ||||||
| Application of US GAAP: No | ||||||
1. Consolidated financial data for the six months ended September 30, 2006
| (1) Consolidated operating results | Note : Figures under million yen are rounded down. |
| Operating revenue | Net operating revenue | Operating income | Ordinary income | |||||||||||||||||
| Million yen | % | Million yen | % | Million yen | % | Million yen | % | |||||||||||||
For the six months ended September 30, 2006 | 179,240 | (80.8 | ) | 130,418 | (64.7 | ) | 22,063 | (19.1 | ) | 29,516 | (44.6 | ) | ||||||||
For the six months ended September 30, 2005 | 99,156 | (47.2 | ) | 79,172 | (32.5 | ) | 18,524 | (109.9 | ) | 20,407 | (90.1 | ) | ||||||||
For the year ended March 31, 2006 | 309,621 | 256,439 | 91,439 | 96,842 | ||||||||||||||||
<<Reference>> Ex-UFJ Tsubasa Securities | ||||||||||||||||||||
For the six months ended September 30, 2005 | 47,849 | 46,597 | 10,545 | 11,300 | ||||||||||||||||
| Net income | Basic net income per share | Diluted net income per share | ||||||||||||||||||
| Million yen | % | Yen | Sen | Yen | Sen | |||||||||||||||
For the six months ended September 30, 2006 | 18,280 | (16.0 | ) | 25 | 49 | 24 | 55 | |||||||||||||
For the six months ended September 30, 2005 | 15,761 | (37.8 | ) | 33 | 80 | 31 | 93 | |||||||||||||
For the year ended March 31, 2006 | 61,188 | 103 | 22 | 98 | 54 | |||||||||||||||
<<Reference>> Ex-UFJ Tsubasa Securities | ||||||||||||||||||||
For the six months ended September 30, 2005 | 5,071 | 8 | 54 | — | — | |||||||||||||||
Notes 1. Equity in income of affiliates: | ||
For the six months ended September 30, 2006 | 5,245 million yen | |
For the six months ended September 30, 2005 | 1,692 million yen | |
For the year ended March 31, 2006 | 3,947 million yen | |
<<Reference>> Ex-UFJ Tsubasa Securities | ||
For the six months ended September 30, 2005 | D 9 million yen | |
2. Average number of shares outstanding: | ||
For the six months ended September 30, 2006 | 717,086,987 shares | |
For the six months ended September 30, 2005 | 466,184,336 shares | |
For the year ended March 31, 2006 | 590,827,677 shares | |
<<Reference>> Ex-UFJ Tsubasa Securities | ||
For the six months ended September 30, 2005 | 593,744,852 shares | |
| 3. | Change in accounting policy No |
| 4. | The percentage noted in Operating revenue and others are the rate of the increase or decrease compared to the same period in the previous year. |
| 5. | The percentage for the six months ended September 30, 2006 represents the comparison with the results of ex-Mitsubishi Securities Co. Ltd. for the six months ended September 30, 2005. The results for the year ended March 31, 2006 are calculated as a total of the results of ex-Mitsubishi Securities Co. Ltd. for the period from April 2005 to September 2005 and the results of Mitsubishi UFJ Securities Co., Ltd. for the period from October 2005 to March 2006. |
(2) Consolidated Financial Conditions
| Total assets | Net assets | Equity ratio | Net assets per share | |||||||
| Million yen | Million yen | % | Yen | Sen | ||||||
As of September 30, 2006 | 13,284,417 | 703,808 | 5.2 | 971 | 00 | |||||
As of September 30, 2005 | 9,235,711 | 395,622 | 4.3 | 849 | 89 | |||||
As of March 31, 2006 | 9,874,474 | 698,763 | 7.1 | 974 | 30 | |||||
<<Reference>>Ex-UFJ Tsubasa Securities | ||||||||||
As of September 30, 2005 | 1,973,336 | 243,824 | 12.4 | 410 | 71 | |||||
Notes 1. Number of shares outstanding as of: | ||
September 30, 2006 | 717,101,311 shares | |
September 30, 2005 | 465,493,108 shares | |
March 31, 2006 | 716,990,078 shares | |
<<Reference>> Ex-UFJ Tsubasa Securities | ||
September 30, 2005 | 593,663,301 shares |
2. The figures as of September 30, 2005 and March 31, 2006 previously stated as Shareholders’ equity, Shareholders’ ratio and Shareholders’ equity per share are stated as Net assets, Equity Ratio and Net assets per share, respectively.
– 1 –
| (3) | Cash flows |
Cash flows from operating activities | Cash flows from investing activities | Cash flows from financing activities | Cash and cash equivalents period/fiscal year | |||||
| Million yen | Million yen | Million yen | Million yen | |||||
For the six months ended September 30, 2006 | D337,806 | D19,367 | 292,189 | 56,131 | ||||
For the six months ended September 30, 2005 | 149,443 | D3,742 | D53,102 | 153,590 | ||||
For the year ended March 31, 2006 | 20,906 | 24,815 | D28,876 | 112,647 | ||||
<<Reference>>Ex-UFJ Tsubasa Securities | ||||||||
For the six months ended September 30, 2005 | 494,466 | D4,213 | D450,735 | 71,673 | ||||
| (4) | Scope of consolidation and application of the equity method |
Consolidated subsidiaries | 26 | |
Non-consolidated subsidiaries accounted for by the equity method: | — | |
Affiliated companies accounted for by the equity method: | 6 |
| (5) | Change in the scope of consolidation and application of the equity method |
Consolidation | Equity Method | |||||
Newly consolidated: | 9 | Newly applied: | 1 | |||
Excluded: | 1 | Ceased: | — | |||
<<Reference>> | ||||||
It is difficult to estimate operating result because the Company’s principal business is securities business, of which performance is highly influenced by the economic situation and market condition. However, the Company will provide its forecast for the interim period and year end when reasonably estimated, in order to promote disclosure for investors.
– 2 –
Mitsubishi UFJ Securities Co., Ltd.
Information on Group Companies
1. Outline of group companies
Mitsubishi UFJ Securities Co., Ltd. (the “Company”) and its affiliates (including 26 consolidated subsidiaries and 6 companies accounted for using the equity method), collectively as a member of Mitsubishi UFJ Financial Group, Inc. and hereinafter referred to as the “Companies”, are mainly engaged in the business such as trading of securities, brokerage of securities, underwriting and selling of securities, subscription and distribution of securities, private placements of securities, and other financial services, providing customers with a wide range of services for both funding and investments.
2. Diagram of group companies
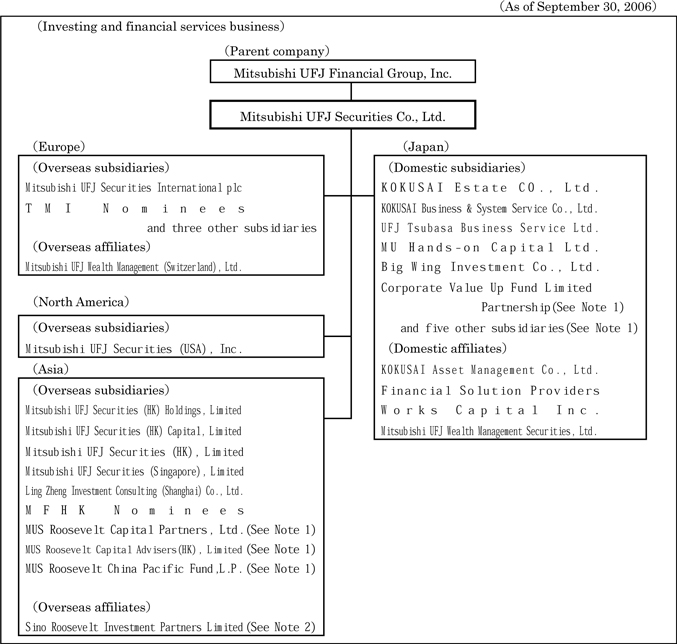
Note:
1. These companies were newly added to the scope of consolidation in this interim fiscal period.
2. This company was newly added to the scope of the equity method of accounting in this interim fiscal period.
– 3 –
Management Policies
1. Basic Management Policies
As the core securities company of Mitsubishi UFJ Financial Group (MUFG; the Group), we at Mitsubishi UFJ Securities aim to expand our business base, increase shareholder value and realize the following:
| • | Fully leverage the Group’s financial capabilities and network, create a business model that best fits financial deregulation, and actively play a leading role in creating new initiatives in the financial services industry. |
| • | Create an optimal sales and marketing structure to meet the needs of our customers while talking steps to solidify our presence as MUFG’s core securities company. |
| • | As the Group’s core securities company, establish an effective structure to deliver products and services that match a broad array of customer needs. |
2. Key Issues
Broad-ranging reforms of Japan’s securities and financial markets are being pursued in accordance with Program for Further Financial Reform, announced in December 2004. The reforms aim to create a dynamic financial system, accelerating the flow of funds from savings to investment. One example is that Japan’s Financial Instruments and Exchange Law, which aims to provide an industry-wide legal framework corresponding to the increasingly integrated provision of financial services, was enacted in June 2006 and is expected to be implemented in the summer of 2007. Furthermore, with the aim of improving the functionality and trustworthiness of securities markets, the strengthening of internal control systems related to financial reporting and quarterly disclosure are expected to become legal requirements from fiscal 2008. Furthermore, as internationalization and structural change in the financial sector continue, legal reforms related to financial conglomerates are being pursued.
In this environment, while making full use of the financial capabilities and network of the Group, enhancing our corporate governance and creating a competitive and efficient operational base, we recognize that we must focus on our customers, providing them with high-quality, innovative products and services that match their needs.
On August 29, 2006, Mitsubishi UFJ Financial Group, Inc. (MUFG, Inc.) and Mitsubishi UFJ Securities announced the signing of a basic agreement to make Mitsubishi UFJ Securities a wholly-owned subsidiary of MUFG, Inc. We are now making preparations for the share exchange that is expected to take place on March 31, 2007, subject to approval by our shareholders and the relevant authorities. We believe that through the proposed share exchange we can further strengthen our securities and investment banking business and maximize synergies among MUFG’s bank, trust bank and securities company by accelerating the exchange of personnel, utilizing the Group’s customer base and collaborating within the Group network. We will continue to make every effort to provide integrated, high-quality services in a comprehensive and timely manner to meet the increasingly diverse and sophisticated needs of our customers at home and abroad. Through these efforts, we aim to enhance the corporate value of the whole Group for all its stakeholders, including our shareholders receiving MUFG shares in the proposed share exchange.
– 4 –
3. Medium-term Corporate Strategy
(1) Increase Customer Assets
We recognize that one of our key challenges is to increase customer assets under management. To achieve this, it is essential that we expand our customer base by strengthening our own sales organization while also developing the securities intermediary business within the Group. In our own sales organization, we aim to provide service efficiently while enhancing sales activities by strengthening both online and in-person channels. For example, as regards online channels, we will improve our capabilities in areas such as internet trading and telephone trading. Further, through reforms of our branch operations, we are centralizing and standardizing our sales operations, whereby we will be able to enhance the quality of operations and services, and provide a more uniform offering of products and services. This will also enable us to effectively utilize our human resources to cultivate customer relationships through our in-person sales activities with the aim of strengthening sales of investment trusts and other products. In addition, we are utilizing Group customer contacts to focus on the securities intermediary business through Group companies and provide customers with a diverse array of products and services. In these ways, we aim to expand our base of securities business customers.
(2) Strengthen Secondary Market Equity Business
In order to expand our secondary market equity business we are working to increase business with a broad range of customers in Japan and overseas. Specifically, we intend to strengthen domestic and overseas sales and improve our infrastructure for risk management, research, and settlement support functions. We also aim to enhance our market presence by providing comprehensive solutions that link the secondary market business, underwriting, research and other aspects of our capabilities.
(3) Reinforce Investment Banking Business
In our investment banking business, we aim to provide specific solutions to our customers’ issues through a sector-based customer coverage system, precisely identifying customer needs and providing proposals that deal with their issues. To more effectively leverage the Group’s customer base we will also strengthen cooperation within the Group as regards business with large corporations and actively address our capital markets business with banking customers, which combines banking and securities functions.
– 5 –
4. Targets
By fiscal 2008 we aim to secure a steady Return on Equity (ROE) of 10%.
5. Basic Dividend Policy
Our basic dividend policy is to provide appropriate and sustainable returns to shareholders while striving to strengthen our financial base in order to withstand market fluctuations and also to retain sufficient internal reserves for future business expansion. In order to further strengthen our operational base, we will strive to use shareholders’ funds effectively and aim to maximize shareholder value.
6. Other Important Management Matters
None.
– 6 –
Operating Results and Financial Position
1. Summary of the Interim Period
In the interim period under review (the six-month period from April 2006 to September 2006), the recovery of the Japanese economy continued, led by a steady increase in private sector demand and a strong performance from exports. Capital expenditure increased, reflecting an increase in the expected economic growth rate, and despite negative factors such as unseasonable weather, consumer spending was resilient as a result of an improved supply/demand balance in the labor market and increased employees’ income. Exports, mainly those to the U.S. and Asia, increased, and production increased across a wide range of sectors. However, information technology-related inventory backlogs have reached high levels and inventory adjustments have become a cause for concern. Furthermore, the slowdown of the U.S. economy has led to some uncertainty in the economic outlook.
In the stock market, the Nikkei Stock Average traded at a high level at the beginning of the fiscal period and reached a high for the period of 17,563.37 yen on April 7. However, fears of a slowdown in the U.S. economy and predictions of a progressive weakening of stock prices globally resulted in a declining trend and the Nikkei Stock Average reached a low of 14,218.60 yen on June 13. Following this, overseas stock markets improved and with the upswing in the domestic business climate, Japanese stock prices improved and the Nikkei Stock Average reached 16,385.96 yen on September 5. Following a temporary decline due to concerns over the economic slowdown in the U.S. and Japan, the Nikkei Stock Average at the end of September was 16,127.58 yen.
In the bond market, following the ending of quantitative easing measures by the Bank of Japan, long-term interest rates trended upwards and in mid-May the ten-year Japanese government bond (JGB) yield rose above 2.0%. However, against a background of receding expectations of an early rise in interest rates as well as capital flows resulting from a decline in the stock market, the ten-year JGB yield fell to the 1.7% level in mid-June. After this, and prior to the ending of the zero interest policy in July, long-term interest rates increased but then declined again from mid-July as the perception that further increases in interest rates would be gradual gained strength. Furthermore, after revisions to the calculation of Japan’s Consumer Price Index (CPI) led in the latter half of August to CPI figures that were lower than market expectations, predictions of further interest rate rises in 2006 significantly lessened and at the end of September the ten-year JGB yield declined to the 1.6% level.
(1) Business Performance
Under the above-mentioned circumstances, consolidated operating revenue for the first half of the fiscal year was 179.240 billion yen (180.8% of the amount in the first half of the previous fiscal year) and consolidated recurring income for the period was 29.516 billion yen (144.6% of the amount in the first half of the previous fiscal year). Consolidated net income for the period was 18.280 billion yen (116.0% of the amount in the first half of the previous fiscal year).
Note: Comparisons with the interim period of the previous fiscal year are comparisons with the results of the former Mitsubishi Securities Co., Ltd. for the interim period of the previous fiscal year.
– 7 –
The following is an outline of the main consolidated revenue and expense items for the interim period under review.
| | Commissions |
Total commissions in the interim period were 68.081 billion yen (168.4% of the amount in the first half of the previous fiscal year). The breakdown is as follows:
| a. | Brokerage Commissions |
The average daily trading volume on the Tokyo Stock Exchange during the interim period (total of domestic common shares) for the interim period was 1.915 billion shares (92.9% of the amount in the first half of the previous fiscal year), and the average daily trading amount was 2.5767 trillion yen (152.3% of the amount in the first half of the previous fiscal year). Our equity brokerage commissions were 24.563 billion yen (135.5% of the amount in the first half of the previous fiscal year) and bond brokerage commissions were 99 million yen (141.6% of the amount in the first half of the previous fiscal year).
| b. | Underwriting and Selling Commissions |
In the equity primary market, despite the downturn in the stock market after April, financing for publicly traded companies was buoyed by several large transactions and expanded compared to the interim period of the previous fiscal year. In Japan, Mitsubishi UFJ Securities was the lead manager in two transactions, one public offering and sale and one J-REIT. Further, the initial public offering (IPO) market continued to be active and we were lead manager on a total of eight IPOs in Japan, seven regular IPOs and one J-REIT.
In the bond primary market, the market for domestic corporate straight bonds and FILP (Fiscal Investment and Loan Program) agency bonds declined in scale during the interim period under review. In Japan, Mitsubishi UFJ Securities was lead manager for 44 corporate straight bond issues, 12 FILP agency bonds and four municipal bonds.
As a result of the above factors, underwriting and selling commissions for the interim period were 5.826 billion yen (105.5% of the amount in the first half of the previous fiscal year).
| c. | Subscription and Distribution Commissions |
The majority of subscription and distribution commissions were received from handling commissions on the subscription for and distribution of investment trusts. In the interim period, we launched such products as the Man IP 220 International Principal Protected Fund 2, which carries out alternative investment management, and the Kokusai Japan Medium & Small Cap Stock Target Fund II and the Mitsubishi UFJ Japan Active Plus fund, which mainly invest in Japanese equity. We also focused on continuing to offer monthly dividend funds such as Global Sovereign Open (Monthly Settlement Type) and the Global Property Three Asset Class Fund (Monthly Settlement Type). Further, to respond to the diverse needs of corporate customers, we also focused on continuing to offer privately-placed investment funds.
– 8 –
As a result of the above factors, in the interim period we handled the subscription and distribution of 2.6648 trillion yen of investment trusts (223.5% of the amount in the first half of the previous fiscal year), and subscription and distribution commissions were 14.659 billion yen (348.0% of the amount in the first half of the previous fiscal year). In addition, on an issued amount basis, the outstanding balance of investment trusts (including foreign investment trusts) at the end of the interim period was 3.9581 trillion yen (104.5% of the amount in the first half of the previous fiscal year).
| d. | Other Commissions |
Other commissions included agency fees from investment trusts, commissions related to our securitization and real estate financing business, commissions from our mergers and acquisitions (M&A) business and financial advisory business, and sales commissions for investment annuities. Regarding securitization, we were the lead agent in private placements of five securitized products backed by loans, two securitized products backed by leases, and one securitized products backed by installment payments, as well as carrying out 39 arrangements in our real estate securitization business. In M&A, we utilized our domestic and overseas M&A network and close alliance with Group banks to achieve good results in meeting customer demand related to industry and business reorganization, business succession, business revitalization and cross-border M&A. In investment annuities, we focused on the offering of a Dai-Ichi Mutual Life Insurance Company’s fixed amount investment annuity in addition to existing products (investment-type insurance annuities).
As a result of the above factors, other commissions for the interim period were 22.862 billion yen (185.0% of the amount in the first half of the previous fiscal year).
| ‚ | Net Gains (Losses) on Trading |
In equities, we continued to employ a range of domestic equity trading methods. However, as a result of the sudden drop in stock prices in May and June, the flow of transactions from customers declined. After July, the stock market began to recover but the recovery was sluggish and the trading environment was difficult. In overseas equities, U.S. real estate market conditions entered a period of adjustment amid apprehension over a slowdown, and as a result, trading volumes in U.S. equities were flat.
In bonds, following large fluctuations in long-term interest rates from the beginning of the period, the market showed a rapid decline. However, we steadily accumulated revenue from over-the-counter trading. As well as actively participating in bidding for government issued bonds, we also focused on sales of inflation-indexed JGBs and JGBs for individual Investors as these grew in popularity along with economic recovery. Further, in our derivatives business, through swap transactions and others aimed at enhancing yields, trading continued to produce steady revenues through the provision of a range of transactions matched to customer requirements. By making efforts to improve our new product line-up in our structuring business, including alternative investment products, we have strengthened our ability to offer solutions tailored to customer requirements.
As a result of the above factors, net gains on trading for the interim period were 0.435 billion yen in equities (5.9% of the amount in the first half of the previous fiscal year), 33.910 billion yen in bonds (116.2% of the amount in the first half of the previous fiscal year), and 22.709 billion yen in other trading (0.644 billion yen for the first half of the previous fiscal year). As a result, total net gains on trading were 57.056 billion yen (153.4% compared to the first half of the previous fiscal year).
– 9 –
| ƒ | Net Financial Revenues |
Financial revenues in the first half of the fiscal year were 50.854 billion yen (236.3% of the amount in the first half of the previous fiscal year) and financial expenses in the first half of the fiscal year were 48.822 billion yen (244.3% of the amount in the first half of the previous fiscal year). As a result, net financial revenues in the first half of the fiscal year were 2.032 billion yen (132.1% of the amount in the first half of the previous fiscal year).
| „ | Selling, General, and Administrative Expenses |
Due to the merger and subsequent addition of new consolidated subsidiaries, as well as the expansion of business collaborations and vigorous advertising activities, selling, general and administrative expenses in the first half of the fiscal year were 108.354 billion yen (178.7% of the amount in the first half of the previous fiscal year).
2. Financial Position
(1) Results of Cash Flows
Regarding the results of cash flows, net cash provided by operating activities amounted to 337.806 billion yen partly due to the increase in the long position in trading assets. Net cash used in investing activities was 19.367 billion yen, reflecting the acquisition of software for system upgrades and the increase in call loans. Net cash used in financing activities totaled 292.189 billion yen partly due to the increase in short-term borrowings and commercial papers, as well as the issuance of bonds by the subsidiaries. As a result, at the end of the first half of the fiscal year, the balance of cash and cash equivalents decreased to 56.131 billion yen, compared with the balance as of the end of the previous fiscal year, which was 56.515 billion yen.
In addition, we have continuously strived for efficient financial management by utilizing our flexible and solid financial base; for instance, we have obtained funding from regional banks and also concluded a subordinated loan agreement for which the Bank of Tokyo-Mitsubishi UFJ, Ltd. acts as the syndication arranger.
– 10 –
Operating Results and Financial Position
3. Risk Factors
We have identified the following as risk factors pertaining to our business and financial condition that may have the potential to significantly impact investors’ decisions. In the interests of active disclosure to our investors, we have included below matters we consider significant for investment decisions though they may not necessarily fall under the risk factors category. Based on our awareness of the following risks, we make every effort to avoid them and to respond to them should they be realized. However, we cannot guarantee that we will always successfully avoid risks or respond to the realization of risks sufficiently.
(1) Position as the Core Securities Company of the Group
Mitsubishi UFJ Securities is a consolidated subsidiary of MUFG, Inc., and through MUFG’s integrated business group system we conduct our business in close cooperation with the integrated business groups. Our principal businesses are: (i) trading in securities, acting as agent, broker or intermediary in such transactions; (ii) underwriting and distributing securities; (iii) the subscription, distribution and private placement of securities; (iv) trading in derivatives; and (v) providing advisory services regarding mergers and acquisitions and asset securitization. We also engage in the consignment of the securities intermediary business and the capital markets business with banking customers to financial institutions and other parties. Through related companies, we also engage in businesses such as investment trust management and asset management.
Mitsubishi UFJ Securities concluded a management alliance agreement with MUFG, Inc. as well as various business alliance agreements with Bank of Tokyo-Mitsubishi UFJ and Mitsubishi UFJ Trust and Banking Corporation, all with the aim of realizing maximum Group synergies. Under the management alliance agreement, MUFG, Inc. advises and consults* on matters, including risk management, where necessary to ensure the sound and proper business operations of the Group and the continued business development of Mitsubishi UFJ Securities. Under the business alliance agreements, Mitsubishi UFJ Securities offers its products and services in collaboration with Bank of Tokyo-Mitsubishi UFJ and Mitsubishi UFJ Trust and Banking Corporation and provides advice in a broad range of areas. Ultimately, each agreement is designed to ensure profit growth at Mitsubishi UFJ Securities as well as the Group as a whole. Guided by the aforementioned agreements, we aim to augment our management structure and Group collaboration from a consolidated perspective.
On August 29, 2006, MUFG, Inc. and Mitsubishi UFJ Securities announced the signing of a basic agreement to make Mitsubishi UFJ Securities a wholly-owned subsidiary of MUFG, Inc. We are now making preparations for the share exchange that is expected to take place on March 31, 2007, subject to approval by our shareholders and the relevant authorities. We believe that through the proposed share exchange we can further strengthen our securities and investment banking business and maximize synergies among MUFG’s bank, trust bank and securities company by accelerating the exchange of personnel, utilizing the Group’s customer base and collaborating within the Group network. We will continue to make every effort to provide integrated, high-quality services in a comprehensive and timely manner to meet the increasingly diverse and sophisticated needs of our customers at home and abroad. Through these efforts, we aim to enhance the corporate value of the whole Group for all its stakeholders, including our shareholders receiving MUFG shares in the proposed share exchange.
If we are unable to complete the share exchange and in the future the Group’s policies or the terms of our agreements with other Group companies change significantly, our business operations and financial performance could be significantly affected.
– 11 –
(2) Changes in Financial Position and Results of Operations / Risk Management and Compliance
1) Changes in Financial Position and Results of Operations
Our securities and investment banking businesses are affected by domestic and overseas economic conditions and market trends, and commissions received and net gains (losses) on trading are highly susceptible to change. To the extent possible, we aim to establish a revenue structure that is resilient to the effects of changes in economic conditions or market trends. To achieve this, we aim to: diversify our sources of income in the corporate and wholesale businesses; strengthen our business base in the retail business; manage the various types of risk described in subsection (2), “Risk management and compliance”; work to achieve a thorough reduction in costs; and develop systems for close cooperation with the Group.
Despite the policies we adopt in this regard, the nature of our business (including the nature of our business as compared to other industries) means that economic conditions and market trends will have some unavoidable effect on our financial position and results of operations. Consequently, we cannot guarantee that we will avoid changes in commission amounts received and in net gains (losses) on trading, or that the diversification of our sources of income will proceed favorably.
In addition, our results may be directly or indirectly affected by changes in laws, regulations and ordinances, unpredictable and uncontrollable damage to infrastructure, disasters, war, terrorism, and similar factors.
2) Risk Management and Compliance
We have established a Risk Management Meeting composed of Company directors to handle risk management associated with our business operations. Our board of directors has given the Risk Management Meeting the mandate to make decisions on important matters pertaining to risk management, receive reports on the status of market risk, credit risk and liquidity risk from each major risk management department, and develop the systems required to carry out appropriate risk management.
– 12 –
We have established, as advisory bodies to the Risk Management Meeting, (i) a Market-related Risk Management Committee, which conducts cross-divisional deliberations on risk management status and other matters, (ii) an Information Security Committee, which develops and maintains information security systems and works to protect personal information, and (iii) an Operating Risk Management Committee, which engages in comprehensive detection of operating risks and develops effective improvement measures.
Each major risk management department is independent of the sales and product sections for the relative risk, and adopts a management system with checks and balances. When handling a new product or starting a business, the Risk Management Meeting decides whether to approve or reject a proposed product or business after deliberations on risk are conducted by each major risk management department.
For the Group’s overall risk management, we engage in consultations with MUFG based on our management alliance agreement. In addition, Mitsubishi UFJ Securities International plc and our other overseas subsidiaries are working to develop their risk management systems under our direction. Through such measures, we are undertaking management of the following major risks, but we cannot guarantee that we will be able to completely avoid the effects of these risks on our business.
a. Trading Risk
We engage in trading with the objective of providing products and services through the securities markets that respond to diverse customer needs. Various trading positions occur as a result. The major risks materializing in the course of trading that may have a significant impact on our financial position include: (i) market risk, which is the risk that we will incur losses due to changes in the market value (the market price and volatility of equities, interest rates, foreign exchange and commodities) of the financial products that we hold; and (ii) credit risk, which is the risk that we will incur losses due to a worsening of the financial position of borrowers, securities issuers, counterparties in market trades, counterparties to agreements and other relevant parties as well as the nonperformance of agreements and additional factors.
The Risk Management Meeting manages market risk by setting, every six months, an upper limit for the acceptable total amount of market risk and amount of losses. The Risk Management Meeting formulates a method for managing credit risk, issuer risk and country risk. Credit risk is managed on an individual trade basis with the Risk Management Meeting determining whether to provide credit. For issuer risk, our fundamental principle is the use of portfolio management with the objective of avoiding concentrations of risk. For the securities that we hold, the Risk Management Meeting manages risk by setting limits based on the credit rating of the issuer. The Risk Management Meeting manages country risk by establishing limits based on the amount of country risk each issuer is exposed to.
Through management of these risks, we aim to identify, control and avoid the risks inherent in trading, but we cannot guarantee that we will be able to sufficiently avoid large losses in the course of our trading business.
– 13 –
b. Brokerage Business Risk (broker, intermediary and agency functions)
In our brokerage business, profits may decrease substantially if investors’ demand for investments declines due to market downturns or other factors. Our brokerage business requires a large amount of fixed expenses (personnel costs, real estate costs, depreciation, etc.) in order to develop and maintain the infrastructure necessary to conduct business. We are continuously implementing measures to improve our brokerage business efficiency, and in the future we will continue to strive to achieve cost reductions.
We may experience a substantial decrease in our brokerage business profits in the future due to changes in the market environment such as market downturns. Additionally, we may experience a major deterioration of our profits regardless of efforts to reduce costs.
c. Investment Banking Business Risk
Our investment banking business consists mainly of: (i) the underwriting, subscription and distribution of publicly-traded companies’ securities, (ii) initial public offerings, (iii) advisory services relating to investor relations, (iv) advisory services regarding the securitization of various types of assets, and the underwriting, subscription and distribution of securitized products, and (v) advisory services relating to mergers and acquisitions.
Our business in this sector is naturally affected by economic conditions and market trends, and therefore fee income is highly susceptible to change. Furthermore, if we are unable to sell underwritten securities smoothly due to market declines or other circumstances, there is a risk that we will incur losses.
We also engage in medium- to long-term investment, using our own capital, which targets companies not yet publicly traded and securitization-related products. In such cases, we engage in investment with the intention of receiving investment profit through profit distribution from the investment or resale after an increase in the value of the investment. However, long periods may be required to recoup such investment or we may incur losses due to factors such as low liquidity of the investment and/or the uncertainty of investment profits.
d. Liquidity Risk
The securities business, our major business, requires a large amount of funds and as such necessitates the procurement of funds in a flexible and stable manner. Liquidity risk is the risk of incurring losses by not being able to trade at an appropriate level as a result of factors such as market conditions or credit position. Liquidity risk is comprised of: (i) funding liquidity risk (financing risk), the risk that we will incur losses as a result of not being able to procure, at an appropriate price, the necessary funds to execute trades or other business; and (ii) product liquidity risk, the risk that we will incur losses as a result of not being able to trade the volume required at an appropriate level.
– 14 –
Of the liquidity risks, funding liquidity risk is in particular a difficult risk to avoid for market participants. When carrying out transactions, we manage our cash position by analyzing the characteristics of cash flows, such as the degree of certainty of cash flows and their timing, and develop contingency plans for financing methods in times of emergency. These contingency plans consisting of alternative financing methods such as secured financing or the sale of highly liquid assets. The Risk Management Meeting manages product liquidity risk by taking into account the market size (depth) of the trade and other factors, and when necessary, establishing a product liquidity framework and striving to minimize the normally assumable risk. Nevertheless, in the event that a funding liquidity risk materializes and there is a marked deterioration in financing conditions, or in the event that there is a marked deterioration in the liquidity of the financial products we hold, there may be constraints on our ability to smoothly execute our business.
Additionally, we are working to maintain and improve our credit rating, but if our credit rating falls, it may become difficult to smoothly fund or re-fund debt, and there is therefore a risk of constraints on our business. To respond to this, we have concluded Keep Well Agreements for credit enhancement with MUFG, Inc. and the Bank of Tokyo-Mitsubishi UFJ. Through these measures we are maintaining a high credit rating and developing a flexible and stable financing base.
e. Information Asset Risk and Other Operational Risks
Information asset risk is the risk that we will incur losses through the loss, falsification, improper use or disclosure to external parties of information or the failure, stoppage, malfunction or improper use of information technology systems.
We have established the Information Security Committee as an advisory body to the Risk Management Meeting, and are working to develop and maintain our information security systems, but we cannot guarantee that we will always be able to sufficiently avoid being affected by information asset risk.
We have made a significant investment in our computer systems. However, the related depreciation costs and maintenance and operating costs may also affect our financial position and results of operations.
Other operational risks include:
| Operating Risk: | The risk that we will incur losses due to a failure to conduct internal processes properly, or due to accidents or improprieties occurring in the course of internal (transaction management) processes. |
– 15 –
| Legal Risk: | The risk that we will incur losses due to insufficient consideration of and response to laws and regulations in respect of transactions and contracts (including the risk that we will incur losses due to insufficient response to changes in laws and regulations). | |
| Reputational Risk: | The risk that we will incur losses (or fail to realize potential gains) as a result of damage to our reputation caused by the materialization of risks, problems with customers, the occurrence of misconduct and other circumstances (including the risk that our reputation will be damaged and we will incur losses due to the spreading of rumors and information by third parties, regardless of whether such rumors and information have any factual basis). | |
As regards operating risk, we have established the Operating Risk Management Committee, an advisory body to the Risk Management Meeting, in order to engage in comprehensive detection of operating risks and to develop effective improvement measures. For legal risk, we are working to ensure processes able to sufficiently consider, as necessary, the opinions of legal experts from both inside and outside the Company. Regarding reputational risk, we are fully aware that trust and reliability are key pillars of our business, and are striving to ensure that at all times we engage in appropriate conduct in our transactions with customers, prevent unfair trading, and the like, through the use of various regulations, procedures and other systems.
We are striving to accomplish the following as the basis of our overall operational risk management: (i) ensure precision and reliability in our operations; (ii) clarify the procedures and means of authorization within our business; and (iii) ensure functional internal controls. Furthermore, we have introduced Control Self Assessment (CSA), under which risk is managed through a process of self-evaluation by business managers. However, we cannot guarantee that as a result of these measures we will always be able to sufficiently avoid being affected by the risks noted above.
f. Compliance with Laws and Regulations
Securities companies and officers and employees of securities companies must, in the course of engaging in the securities business, comply with a variety of laws, regulations and ordinances such as Japan’s Securities and Exchange Law. A violation of the applicable laws could lead, depending on the nature of the violation, to punishment or orders from the relevant authorities as well as to damage to our reputation. Furthermore, litigation may be commenced against us and we may be required to pay large amounts in compensation for damages. Such situations may cause us to incur losses (or fail to realize potential gains) and our financial position and results of operations may be affected.
In response to these risks, we have identified the development of a compliance system as one of our most important management tasks, and we are striving to enhance this system. However, we cannot guarantee that as a result of measures such as this we will always be able to sufficiently avoid being affected by risks pertaining to compliance.
– 16 –
As a Personal Information Handling Enterprise we are subject to the provisions of the Japan’s Personal Information Protection Law as regards the protection of personal information. The objective of the Personal Information Protection Law is the protection of individuals’ rights and interests, and it establishes obligations for the appropriate handling of personal information by Personal Information Handling Enterprises. In the event of an irregularity in the handling of personal information, the competent minister may impose an administrative disposition such as a recommendation or order. Violation of an order from the competent minister is punishable under criminal law. Under the Personal Information Protection Law, the competent minister may request a report from any Personal Information Handling Enterprise. Criminal punishment may be imposed in the event that such a report is not forthcoming or contains falsities. In addition, customers may request compensation for damages if their personal information is disclosed. In such circumstances, we may suffer damage to our credibility.
3) Competition
The Japanese financial and securities markets are seeing increased deregulation, the spread of online securities trading, the expansion of business within Japan by foreign investment banks, new entries into the securities business from other industries, and other changes. Financial deregulation and the spread of online trading have resulted in growing business opportunities for us, but competition is intensifying as new competitors enter the securities business. Specifically, price competition has emerged as a result of the downward pressure on commissions and other income generating opportunities due to the rapid spread of commission-based services offered by online securities companies. Furthermore, competition with foreign securities companies is increasing as they expand their operations in the underwriting and corporate advisory services fields of the Japanese market. Additionally, the substantial consolidation occurring in Japan’s financial industry has resulted in the emergence of competing comprehensive financial institutions offering a broad range of financial services. In the event that we are unable to adequately compete in an operating environment rendered more competitive due to deregulation, our financial position or results of operations may be affected.
4) Legal Regulations
In order to manage the various risks inherent to Japanese securities companies, such as changes in the price of the securities we hold, we are required by the Securities and Exchange Law to maintain a regulatory capital adequacy ratio of 120%. In the event that we are unable to maintain this level, we would be subject to a range of orders including an order to change our business methods. As of the end of September 2006, our regulatory capital adequacy ratio was 501.5%.
– 17 –
Furthermore, in order to protect customer assets, securities companies are required by Japan’s Securities and Exchange Law to clearly separate any securities or cash in their possession that relates to customers’ trades, and any securities or cash held by the securities company itself. The status of this separation is periodically reviewed through inspections by the Financial Services Agency (FSA), the regulatory body for securities companies, audits by the Japan Securities Dealers Association, and internal audits. In addition, companies are required to undergo a yearly audit by an auditing firm or certified public accountant.
Securities companies must comply with a range of other regulations, and in the event that any such regulations with which we must comply are changed or new such regulations are added, it may affect our operations. Furthermore, when we engage in the securities business through overseas subsidiaries (see subsection 5), “Overseas Business”), we must comply with the various legal regulations of the countries in question. In the event that those legal regulations change as a result of the policy of a foreign government, our overseas operations may be affected.
5) Overseas Business
Mitsubishi UFJ Securities’ main overseas bases are made up of seven overseas subsidiaries and one representative office (Beijing). The subsidiaries are: Mitsubishi UFJ Securities International plc in the United Kingdom; Mitsubishi UFJ Securities (USA), Inc. in the United States; Mitsubishi UFJ Securities (HK) Holdings, Limited and its two subsidiaries (Mitsubishi UFJ Securities (HK) Capital, Limited and Mitsubishi UFJ Securities (HK), Limited) in Hong Kong; Mitsubishi UFJ Securities (Singapore), Limited, in Singapore; and Ling Zheng Investment Consulting (Shanghai) Co., Ltd., a subsidiary of Mitsubishi UFJ Securities (HK) Holdings, Limited in Shanghai.
Through collaboration in Japan and overseas, the securities and other business conducted in these overseas subsidiaries fulfill an important role in the provision of better products and services to our customers. However, changes in the business environment in economies and markets in Japan and overseas may affect the business of these overseas bases. Furthermore, changes in local laws and regulations may affect the business of our overseas subsidiaries. In respect of our overseas operations, as with the risks confronting our domestic operations, we are striving to develop and improve systems for the avoidance of business and legal risk and for risk management.
– 18 –
6) Uncertainty in Accounting Estimates
With respect to the following accounting items recorded in our consolidated financial statements, we conduct our accounting by adopting the best and most rational method from the available estimation methods and procedures and calculate amounts based on reasonable assumptions and the most objective information available. However, due to the inherent uncertainty of estimates and due to changes in the environment and other factors in the period leading up to finalization of the estimates, errors may arise in estimations based on assumptions and information established earlier. This may have an effect on our financial position and results of operations from the subsequent accounting period onward. Where an event that arises after the accounting period ends (a post-balance sheet event) for which the material cause already existed as of the accounting date, and it is determined that additional or more objective evidence should be provided, the financial statements for the term in question will be revised.
| (1) | Trading assets |
| (2) | Operating investment securities / Securities and investment securities (other securities) |
| (3) | Tangible fixed assets / intangible fixed assets |
| (4) | Allowance for doubtful accounts |
| (5) | Deferred tax assets |
| (6) | Accounting for pension benefits |
– 19 –
(Mitsubishi UFJ Securities Co., Ltd.)
CONSOLIDATED STATEMENT OF FINANCIAL CONDITION
(Millions of yen)
ASSETS
| |||||||||||||||
Description | As of September 30, 2006 (A) | As of September 30, 2005 (B) | Variance (A) - (B) | As of March 31, 2006 | <<Reference>> Ex-UFJ Tsubasa Securities | ||||||||||
As of September 30, 2005 | |||||||||||||||
Current assets | 13,134,351 | 9,139,938 | 3,994,412 | 9,715,916 | 1,907,074 | ||||||||||
Cash and bank deposits | 161,906 | 277,767 | D | 115,861 | 215,847 | 71,713 | |||||||||
Cash segregated for customers and others | 115,663 | 57,308 | 58,354 | 113,860 | 45,495 | ||||||||||
Trading assets | 5,671,157 | 3,569,125 | 2,102,031 | 4,386,941 | 719,908 | ||||||||||
Trading securities | 5,236,192 | 3,282,906 | 1,953,286 | 4,010,545 | 705,312 | ||||||||||
Derivatives | 434,964 | 286,219 | 148,744 | 376,395 | 14,596 | ||||||||||
Trading receivable | 83,815 | — | 83,815 | 294,343 | 7,070 | ||||||||||
Operating investment securities | 33,701 | — | 33,701 | 33,862 | 635 | ||||||||||
Operating loans receivable | 1,950 | — | 1,950 | 9,041 | 2,939 | ||||||||||
Margin account receivables | 163,820 | 90,969 | 72,851 | 205,820 | 61,307 | ||||||||||
Loans on margin transactions | 139,276 | 56,511 | 82,765 | 177,184 | 59,374 | ||||||||||
Cash collateral pledged for securities borrowing on margin | 24,544 | 34,458 | D | 9,914 | 28,635 | 1,933 | |||||||||
Loan secured by securities | 6,685,855 | 4,933,926 | 1,751,928 | 4,305,342 | 942,357 | ||||||||||
Cash collateral pledged for securities borrowing | 6,685,855 | 4,933,926 | 1,751,928 | 4,305,342 | 942,357 | ||||||||||
Advance payments | 1,152 | 7,421 | D | 6,269 | 2,026 | 4,070 | |||||||||
Payments for subscription | — | 8 | D | 8 | — | — | |||||||||
Short-term guarantee deposits | 100,943 | 100,943 | 75,897 | 24,033 | |||||||||||
Short-term loans | 12,105 | 2,225 | 9,880 | 1,314 | 1,459 | ||||||||||
Parent company stock | 930 | 907 | 22 | 1,095 | — | ||||||||||
Securities | 600 | 22,126 | D | 21,525 | 1,342 | — | |||||||||
Deferred tax assets | 10,349 | 9,778 | 571 | 13,382 | 1,844 | ||||||||||
Other current assets | 90,519 | 168,416 | D | 77,896 | 55,982 | 24,324 | |||||||||
Allowance for doubtful accounts | D | 121 | D | 44 | D | 77 | D | 184 | D | 87 | |||||
Non-current assets | 150,066 | 95,773 | 54,293 | 158,558 | 66,262 | ||||||||||
Tangible fixed assets | 32,825 | 22,594 | 10,230 | 32,927 | 10,679 | ||||||||||
Intangible fixed assets | 21,097 | 11,231 | 9,866 | 20,163 | 8,852 | ||||||||||
Investment and others | 96,142 | 61,947 | 34,195 | 105,466 | 46,729 | ||||||||||
Investment securities | 78,446 | 48,205 | 30,241 | 86,442 | 40,197 | ||||||||||
Long-term loans | 725 | 755 | D | 30 | 769 | 86 | |||||||||
Long-term guarantee deposits | 14,732 | 11,240 | 3,491 | 15,431 | 4,733 | ||||||||||
Deferred tax assets | 341 | 829 | D | 488 | 786 | — | |||||||||
Other investments | 4,035 | 2,662 | 1,373 | 4,189 | 2,011 | ||||||||||
Allowance for doubtful accounts | D | 2,137 | D | 1,745 | D | 392 | D | 2,152 | D | 299 | |||||
Total assets | 13,284,417 | 9,235,711 | 4,048,705 | 9,874,474 | 1,973,336 | ||||||||||
– 20 –
(Mitsubishi UFJ Securities Co., Ltd.)
(Millions of Yen)
LIABILITIES
| |||||||||||
Description | As of September 30, 2006 (A) | As of September 30, 2005 (B) | Variance (A) - (B) | As of March 31, 2006 | <<Reference>> Ex-UFJ Tsubasa | ||||||
As of 2005 | |||||||||||
Current liabilities | 11,862,836 | 8,211,856 | 3,650,979 | 8,426,782 | 1,696,355 | ||||||
Trading liabilities | 4,086,733 | 2,256,749 | 1,829,984 | 3,405,616 | 662,943 | ||||||
Trading securities | 3,663,070 | 1,950,538 | 1,712,532 | 3,026,768 | 647,930 | ||||||
Derivatives | 423,662 | 306,210 | 117,452 | 378,847 | 15,012 | ||||||
Trading payables | — | 63,039 | D | 63,039 | — | — | |||||
Margin account payables | 37,195 | 14,123 | 23,071 | 50,421 | 25,011 | ||||||
Borrowing on margin transactions | 24,456 | 1,737 | 22,718 | 32,535 | 18,061 | ||||||
Cash received for securities lending on margin transaction | 12,738 | 12,386 | 352 | 17,886 | 6,949 | ||||||
Borrowing pledged by securities | 6,082,246 | 4,929,845 | 1,152,401 | 3,695,401 | 646,654 | ||||||
Cash collateral received for securities lending | 4,719,160 | 4,633,047 | 86,113 | 3,397,398 | 646,654 | ||||||
Borrowing on Gensaki transaction | 1,363,085 | 296,797 | 1,066,287 | 298,002 | — | ||||||
Deposits received | 108,581 | 46,900 | 61,680 | 94,216 | 43,366 | ||||||
Guarantee deposits received | 198,155 | 127,224 | 70,930 | 133,835 | 13,223 | ||||||
Short-term borrowings | 901,131 | 422,904 | 478,226 | 826,489 | 255,148 | ||||||
Current portion of long-term borrowings | 145,632 | 76,179 | 69,452 | 25,494 | — | ||||||
Commercial paper | 211,800 | 219,800 | D | 8,000 | 104,800 | 35,000 | |||||
Current portion of corporate debts | 23,094 | 9,773 | 13,320 | 14,851 | — | ||||||
Income tax payables | 6,827 | 798 | 6,028 | 21,051 | 4,261 | ||||||
Other current liabilities | 61,437 | 44,516 | 16,921 | 54,601 | 10,745 | ||||||
Non-current liabilities | 715,607 | 625,112 | 90,495 | 745,058 | 31,952 | ||||||
Corporate debts | 353,298 | 200,405 | 152,893 | 255,665 | — | ||||||
Convertible corporate debts | 49,689 | 49,165 | 524 | 49,165 | — | ||||||
Long-term borrowings | 279,882 | 355,901 | D | 76,019 | 400,735 | 18,000 | |||||
Deferred tax liabilities | 16,825 | 5,248 | 11,576 | 21,984 | 8,099 | ||||||
Accrued pension benefits | 15,202 | 13,675 | 1,526 | 16,355 | 5,683 | ||||||
Other non-current liabilities | 708 | 715 | D | 6 | 1,152 | 169 | |||||
Statutory reserves | 2,165 | 1,574 | 591 | 2,027 | 433 | ||||||
Reserve for securities transaction liabilities | 2,165 | 1,574 | 591 | 2,027 | 433 | ||||||
Total liabilities | 12,580,609 | 8,838,543 | 3,742,066 | 9,173,867 | 1,728,741 | ||||||
Minority interests | — | 1,546 | — | 1,843 | 770 | ||||||
– 21 –
(Mitsubishi UFJ Securities Co., Ltd.)
(Millions of Yen)
SHAREHOLDERS’ EQUITY
| ||||||||||||||
Description | As of September 30, 2006 (A) | As of September 30, 2005 (B) | Variance (A) - (B) | As of March 31, 2006 | <<Reference>> Ex-UFJ Tsubasa | |||||||||
As of September 30, 2005 | ||||||||||||||
Common stock | — | 65,518 | — | 65,518 | 25,107 | |||||||||
Additional paid in capital | — | 228,548 | — | 417,513 | 154,072 | |||||||||
Retained earning | — | 101,971 | — | 202,592 | 55,399 | |||||||||
Net unrealized gain on investment securities | — | 8,505 | — | 21,203 | 12,615 | |||||||||
Cumulative currency translation adjustment | — | D | 1,032 | — | 1,056 | — | ||||||||
Treasury stock | — | D | 7,890 | — | D | 9,121 | D | 3,369 | ||||||
Total shareholders’ equity | — | 395,622 | — | 698,763 | 243,824 | |||||||||
Total liabilities, minority interests and shareholders’ equity | — | 9,235,711 | — | 9,874,474 | 1,973,336 | |||||||||
| NET ASSETS | ||||||||||||||
Owners’ equity | 680,272 | — | — | — | — | |||||||||
Common stock | 65,518 | — | — | — | — | |||||||||
Additional paid in capital | 417,452 | — | — | — | — | |||||||||
Retained earning | 206,331 | — | — | — | — | |||||||||
Treasury stock | D | 9,030 | — | — | — | — | ||||||||
Valuation and translation adjustments | 16,036 | — | — | — | — | |||||||||
Net unrealized gain on investment securities | 12,370 | — | — | — | — | |||||||||
Cumulative currency translation adjustment | 3,665 | — | — | — | — | |||||||||
Subscription rights to shares | 0 | — | — | — | — | |||||||||
Minority interests | 7,499 | — | — | — | — | |||||||||
Total net assets | 703,808 | — | — | — | — | |||||||||
Total liabilities and net assets | 13,284,417 | — | — | — | — | |||||||||
– 22 –
(Mitsubishi UFJ Securities Co., Ltd.)
CONSOLIDATED STATEMENT OF OPERATIONS
(Millions of yen)
Description | For the six months ended September 30, 2006 (18.4.1~18.9.30) (A) | For the six months ended September 30, 2005 (17.4.1~17.9.30) (B) | Ratio (A) / (B) | For the year ended March 31, 2006 (17.4.1~18.3.31) | <<Reference>> Ex-UFJ Tsubasa Securities | |||||||||
For the six months September 30, 2005 (17.4.1~17.9.30) | ||||||||||||||
| % | ||||||||||||||
Operating revenue | 179,240 | 99,156 | 180.8 | 309,621 | 47,849 | |||||||||
Commissions | 68,081 | 40,437 | 168.4 | 135,328 | 27,349 | |||||||||
Net gain on trading | 57,056 | 37,196 | 153.4 | 113,693 | 16,936 | |||||||||
Net gain on operating investment securities | 3,248 | — | — | 2,541 | 11 | |||||||||
Net gain on other trading | 0 | 0 | 189.9 | D | 2 | 1,203 | ||||||||
Interest and dividend income | 50,854 | 21,522 | 236.3 | 58,060 | 2,349 | |||||||||
Interest expense | 48,822 | 19,984 | 244.3 | 53,182 | 1,252 | |||||||||
Net operating revenue | 130,418 | 79,172 | 164.7 | 256,439 | 46,597 | |||||||||
Selling, general and administrative expense | 108,354 | 60,648 | 178.7 | 164,999 | 36,052 | |||||||||
Transaction related costs | 33,682 | 15,617 | 215.7 | 41,196 | 7,393 | |||||||||
Employee compensation and benefits | 45,075 | 26,285 | 171.5 | 73,169 | 15,981 | |||||||||
Occupancy and equipment | 11,895 | 5,423 | 219.3 | 17,833 | 6,244 | |||||||||
Data processing and other services | 8,652 | 5,212 | 166.0 | 13,265 | 3,122 | |||||||||
Depreciation and amortization | 5,054 | 5,700 | 88.7 | 13,332 | 1,815 | |||||||||
Taxes, other than income taxes | 1,198 | 883 | 135.6 | 2,106 | 479 | |||||||||
Others | 2,796 | 1,524 | 183.4 | 4,095 | 1,015 | |||||||||
Operating income | 22,063 | 18,524 | 119.1 | 91,439 | 10,545 | |||||||||
Non-operating revenue | 7,852 | 2,807 | 279.7 | 6,720 | 1,279 | |||||||||
Equity in income of affiliated companies | 5,245 | 1,692 | 310.0 | 3,947 | — | |||||||||
Others | 2,606 | 1,115 | 233.7 | 2,773 | 1,279 | |||||||||
Non-operating expense | 399 | 924 | 43.2 | 1,317 | 523 | |||||||||
Equity in loss of affiliated companies | — | — | — | — | 9 | |||||||||
Others | 399 | 924 | 43.2 | 1,317 | 514 | |||||||||
Ordinary income | 29,516 | 20,407 | 144.6 | 96,842 | 11,300 | |||||||||
Extraordinary gain | 215 | 90 | 236.8 | 771 | 469 | |||||||||
Gain on sales of investment securities | 128 | 90 | 141.3 | 771 | 373 | |||||||||
Reversal of allowance for doubtful accounts | 86 | — | — | — | 56 | |||||||||
Others | — | — | — | — | 39 | |||||||||
Extraordinary loss | 1,589 | 2,851 | 55.7 | 15,821 | 2,873 | |||||||||
Loss on sales of investment securities | — | 9 | — | 51 | 17 | |||||||||
Loss on revaluation of investment securities | — | 130 | — | 261 | 0 | |||||||||
Provision for securities transaction liabilities | 138 | 148 | 93.3 | 307 | 111 | |||||||||
Loss on sales of fixed assets | 54 | 34 | 159.5 | 34 | 29 | |||||||||
Impairment loss | 14 | — | — | 190 | 637 | |||||||||
Restructuring cost for branches | 1,381 | — | — | 2,041 | — | |||||||||
Merger cost | — | 2,529 | — | 12,934 | 1,007 | |||||||||
Others | — | — | — | — | 1,070 | |||||||||
Income before income taxes | 28,142 | 17,646 | 159.5 | 81,792 | 8,896 | |||||||||
Income taxes-current | 6,392 | 368 | — | 20,534 | 4,084 | |||||||||
Income taxes-deferred | 3,515 | 1,786 | 196.8 | 364 | D | 267 | ||||||||
Minority interests | D | 46 | D | 269 | — | D | 295 | 7 | ||||||
Net income | 18,280 | 15,761 | 116.0 | 61,188 | 5,071 | |||||||||
– 23 –
(Mitsubishi UFJ Securities Co., Ltd.)
CONSOLIDATED STATEMENT OF CHANGE IN NET ASSETS
For the six months ended September 30, 2006
(Millions of yen)
| Owners’ equity | Valuation and translation adjustment | ||||||||||||||||||||||||||||
Common stock | Capital Surplus | Retained earnings | Treasury stock | Total owners’ equity | Net unrealized gain on securities | Cumulative currency translation adjustments | Total valuation and translation adjustments | Subscription rights to shares | Minority interests | Total net assets | |||||||||||||||||||
Balance as of March 31, 2006 | 65,518 | 417,513 | 202,592 | D | 9,121 | 676,503 | 21,203 | 1,056 | 22,259 | 0 | 1,843 | 700,607 | |||||||||||||||||
Changes for the six months ended September 30, 2006 | |||||||||||||||||||||||||||||
Dividends (*) | D | 14,340 | D | 14,340 | D | 14,340 | |||||||||||||||||||||||
Bonus to directors (*) | D | 201 | D | 201 | D | 201 | |||||||||||||||||||||||
Net income | 18,280 | 18,280 | 18,280 | ||||||||||||||||||||||||||
Acquisition of treasury stock | D | 145 | D | 145 | D | 145 | |||||||||||||||||||||||
Sales of treasury stock | D | 60 | 241 | 181 | 181 | ||||||||||||||||||||||||
Changes by increasing equity interest of affiliated companies | D | 5 | D | 5 | D | 5 | |||||||||||||||||||||||
Net changes of items other than owners’ equity | D | 8,833 | 2,609 | D | 6,223 | — | 5,655 | D | 567 | ||||||||||||||||||||
Total changes for the six months ended September 30, 2006 | — | D | 60 | 3,738 | 90 | 3,768 | D | 8,833 | 2,609 | D | 6,223 | — | 5,655 | 3,201 | |||||||||||||||
Balance as of September 30, 2006 | 65,518 | 417,452 | 206,331 | D | 9,030 | 680,272 | 12,370 | 3,665 | 16,036 | 0 | 7,499 | 703,808 | |||||||||||||||||
| (*) | Resolved at general shareholders’ meeting in June 2006. |
– 24 –
(Mitsubishi UFJ Securities Co., Ltd.)
CONSOLIDATED STATEMENT OF RETAINED EARNINGS
(Millions of yen)
Description | For the six months ended September 30, 2006 (18.4.1~18.9.30) (A) | For the six months ended September 30, 2005 (17.4.1~17.9.30) (B) | For the year ended March 31, 2006 (17.4.1~18.3.31) | <<Reference>> Ex-UFJ Tsubasa | ||||
For the six months ended 2005 (17.4.1~17.9.30) | ||||||||
<Additional paid-in capital> | ||||||||
Additional paid-in capital at the beginning of the period | — | 228,548 | 228,548 | 154,072 | ||||
Increase in additional paid-in capital | — | — | 188,964 | 0 | ||||
Increase due to the merger | — | — | 188,399 | — | ||||
Net gain on sales of treasury stock | — | — | 564 | 0 | ||||
Additional paid-in capital at the end of the period | — | 228,548 | 417,513 | 154,072 | ||||
<Retained earnings> | ||||||||
Retained earnings at the beginning of the period | — | 98,788 | 98,788 | 53,890 | ||||
Increase in retained earnings | — | 15,761 | 117,536 | 5,071 | ||||
Increase due to the merger | — | — | 55,399 | — | ||||
Increase due to exclusion from consolidation | — | — | 947 | — | ||||
Net income | — | 15,761 | 61,188 | 5,071 | ||||
Decrease in retained earnings | — | 12,578 | 13,732 | 3,562 | ||||
Dividends paid | — | 4,199 | 4,199 | 3,562 | ||||
Bonus to directors | — | 88 | 88 | — | ||||
Net loss on sales of treasury stock | — | 27 | — | — | ||||
Decrease due to the change in accounting policy of consolidated overseas subsidiaries | — | 8,262 | 8,262 | — | ||||
Actuarial gain or loss based on the accounting standard for retirement benefits under United Kingdom | — | — | 1,181 | — | ||||
Retained earnings at the end of the period | — | 101,971 | 202,592 | 55,399 | ||||
– 25 –
(Mitsubishi UFJ Securities Co., Ltd.)
Consolidated Statement of Cash Flows
(Millions of yen)
For the six months ended September 30, 2006 (18.4.1~18.9.30) | For the six months ended September 30, 2005 (17.4.1~17.9.30) | For the year ended March 31, 2006 (17.4.1~18.3.31) | <<Reference>> Ex-UFJ Tsubasa Securities | |||||||||||
For the six months ended September 30, 2005 (17.4.1~17.9.30) | ||||||||||||||
I | Cash flows from operating activities: | |||||||||||||
Income before income taxes | 28,142 | 17,646 | 81,792 | 8,896 | ||||||||||
Depreciation and amortization | 5,054 | 5,700 | 13,332 | 1,815 | ||||||||||
Amortization on consolidation difference | — | — | 41 | 13 | ||||||||||
Amortization on goodwill | D | 694 | — | — | — | |||||||||
Decrease in accrued pension benefits | D | 1,193 | D | 750 | D | 5,623 | 531 | |||||||
Decrease in allowance for doubtful accounts | D | 78 | D | 183 | D | 121 | D | 434 | ||||||
Interest and dividend income | D | 51,406 | D | 22,262 | D | 58,742 | D | 2,349 | ||||||
Interest expense | 48,844 | 20,012 | 53,239 | 1,252 | ||||||||||
Adjustment for non-operating revenue and expense | ||||||||||||||
Equity in income of affiliated companies | D | 5,245 | D | 1,692 | D | 3,947 | 9 | |||||||
Others | 244 | D | 243 | 779 | D | 747 | ||||||||
Adjustment for extraordinary gain and loss | ||||||||||||||
Provision for securities transaction liabilities | 138 | 148 | 307 | 111 | ||||||||||
Gain on sales of investment securities | D | 128 | D | 90 | D | 771 | D | 373 | ||||||
Loss on sales of investment securities | — | 9 | 51 | 17 | ||||||||||
Loss on revaluation of investment securities | — | 130 | 261 | 0 | ||||||||||
Loss on sales of fixed assets | 54 | 34 | 34 | 29 | ||||||||||
Impairment loss | 14 | — | 190 | 637 | ||||||||||
Loss on disposal of fixed assets | — | — | — | 572 | ||||||||||
Restructuring cost for branches | 109 | — | 411 | — | ||||||||||
Merger cost | — | — | 2,634 | — | ||||||||||
Decrease (increase) in assets and liabilities | ||||||||||||||
Cash segregated for customers and payable | D | 1,975 | D | 10,146 | D | 30,405 | 1,265 | |||||||
Trading assets and liabilities | D | 597,875 | D | 534,428 | D | 128,840 | 546,118 | |||||||
Trading receivable, net of payables | 211,734 | 143,014 | D | 206,934 | 52,685 | |||||||||
Margin account receivable and payables | 28,754 | D | 1,431 | D | 42,313 | 16,069 | ||||||||
Loan secured by securities and borrowing pledged by securities | 12,459 | 522,019 | 213,320 | D | 135,371 | |||||||||
Advance payments and deposit received | 15,442 | D | 6,334 | 46,857 | 6,830 | |||||||||
Guarantee deposits | 62,293 | 60,295 | 61,470 | 219 | ||||||||||
Others | D | 72,920 | D | 44,520 | 23,271 | 1,410 | ||||||||
Subtotal | D | 318,230 | 146,926 | 20,296 | 499,207 | |||||||||
Interest and dividend income received | 48,369 | 23,338 | 57,302 | 2,775 | ||||||||||
Interest paid | D | 47,305 | D | 20,784 | D | 52,085 | D | 1,300 | ||||||
Income tax paid | D | 20,640 | D | 38 | D | 4,607 | D | 6,216 | ||||||
Net cash flows from operating activities | D | 337,806 | 149,443 | 20,906 | 494,466 | |||||||||
– 26 –
(Mitsubishi UFJ Securities Co., Ltd.)
(Millions of yen)
For the six months ended September 30, 2006 (18.4.1~18.9.30) | For the six months ended September 30, 2005 (17.4.1~17.9.30) | For the year ended March 31, 2006 (17.4.1~18.3.31) | <<Reference>> Ex-UFJ Tsubasa Securities | |||||||||||
For the six months ended September 30, 2005 (17.4.1~17.9.30) | ||||||||||||||
II | Cash flows from investing activities: | |||||||||||||
Decrease (increase) of time deposits | D | 1,230 | 1,799 | 20,656 | 0 | |||||||||
Decrease (increase) in securities | 742 | D | 663 | 18,848 | — | |||||||||
Purchases of investment securities | D | 3,420 | D | 6,609 | D | 5,953 | D | 1,231 | ||||||
Proceeds from sales or redemption of investment securities | 1,015 | 4,283 | 5,753 | 438 | ||||||||||
Purchases of tangible fixed assets | D | 2,032 | D | 872 | D | 5,285 | D | 1,186 | ||||||
Proceeds from sales of tangible fixed assets | 52 | 19 | 20 | 57 | ||||||||||
Purchases of intangible fixed assets | D | 4,246 | D | 1,124 | D | 10,475 | D | 315 | ||||||
Proceeds from sales of intangible fixed assets | — | 107 | — | — | ||||||||||
Decrease (increase) in loans | D | 10,306 | D | 682 | 1,947 | 188 | ||||||||
Decrease (increase) in investments | — | 1 | — | — | ||||||||||
Others | 58 | — | D | 696 | D | 2,165 | ||||||||
Net cash flows from investing activities | D | 19,367 | D | 3,742 | 24,815 | D | 4,213 | |||||||
III | Cash flows from financing activities: | |||||||||||||
Increase (decrease) in short-term borrowings | 75,871 | D | 179,443 | D | 29,335 | D | 448,125 | |||||||
Increase (decrease) in commercial paper | 107,000 | 29,300 | D | 120,700 | — | |||||||||
Proceeds from long-term borrowings | 31,401 | 146,232 | 243,267 | 1,000 | ||||||||||
Repayment of long-term borrowings | D | 32,341 | D | 369 | D | 118,744 | — | |||||||
Issuance of corporate debts | 162,759 | 69,074 | 150,402 | — | ||||||||||
Redemption of corporate debts | D | 37,473 | D | 112,587 | D | 151,188 | — | |||||||
Payment of dividends | D | 14,340 | D | 4,199 | D | 4,199 | D | 3,562 | ||||||
Proceeds from sales of treasury stock | 181 | — | 3,112 | 0 | ||||||||||
Purchases of treasury stock | D | 145 | — | D | 1,491 | D | 47 | |||||||
Others | D | 723 | D | 1,110 | — | — | ||||||||
Net cash flows from financing activities | 292,189 | D | 53,102 | D | 28,876 | D | 450,735 | |||||||
IV | Effect of exchange rate changes on cash and cash equivalents | 962 | 882 | D | 724 | — | ||||||||
V | Net increase (decrease) in cash and cash equivalents | D | 64,022 | 93,479 | 16,121 | 39,517 | ||||||||
VI | Cash and cash equivalents at beginning of period | 112,647 | 60,110 | 60,110 | 32,155 | |||||||||
VII | Net increase in cash and cash equivalents due to the merger | — | — | 70,068 | — | |||||||||
VIII | Increase in cash and cash equivalents due to newly consolidated subsidiaries | 7,506 | — | 1,618 | — | |||||||||
IX | Decrease in cash and cash equivalents due to exclusion of a subsidiary from consolidation | — | — | D | 35,271 | — | ||||||||
X | Cash and cash equivalents at end of period | 56,131 | 153,590 | 112,647 | 71,673 | |||||||||
– 27 –
Mitsubishi UFJ Securities Co., Ltd.
Notes to interim consolidated financial statements
The interim consolidated financial statements of the Companies have been prepared in accordance with “Regulations of Interim Consolidated Financial Statements” (MOF Ordinance No. 24, 1999) as well as with the “Cabinet Office Ordinance Concerning Securities Companies”( Prime Minister’s Office Ordinance and MOF Ordinance No. 32, 1998) and the “Uniform Accounting Standard for Broker Dealers” (approved by the board of directors of the Japan Securities Dealers Association, November 14, 1974), in accordance with and the provisions of Article 48 and Article 69 of the same regulations.
The Companies’ interim consolidated financial statements for the 6 months ended September 30, 2005 are prepared in accordance with the old “Regulations of Interim Consolidated Financial Statements” and the Companies’ interim consolidated financial statements for the six months ended September 30, 2006 are prepared in accordance with the revised “Regulations of Interim Consolidated Financial Statements”.
Basis of interim consolidated financial statements
1. Scope of consolidation
| (1) | Twenty-six companies (eighteen companies in prior fiscal year) are the consolidated subsidiaries. |
Major consolidated subsidiaries
KOKUSAI Estate CO., Ltd.
KOKUSAI Business & System Service Co., Ltd.
UFJ Tsubasa Business Service Ltd.
MU Hands-on Capital Ltd.
Big Wing Investment Co., Ltd.
Mitsubishi UFJ Securities International plc
Mitsubishi UFJ Securities (USA), Inc.
Mitsubishi UFJ Securities (HK) Holdings, Limited
Mitsubishi UFJ Securities (HK) Capital, Limited
Mitsubishi UFJ Securities (HK), Limited
Mitsubishi UFJ Securities (Singapore), Limited
Ling Zheng Investment Consulting (Shanghai) Co., Ltd.
TMI Nominees
MFHK Nominees
MUS Roosevelt Capital Partners, Ltd.
MUS Roosevelt Capital Advisers (HK), Limited
MUS Roosevelt China Pacific Fund, L.P.
Corporate Value Up Fund Limited Partnership
THC Millennium Venture Capital Investment Limited Partnership
THC Phoenix Japan Investment Limited Partnership
Hands-On First Investment Limited Partnership
Hands-On First/Second Investment Limited Partnership
“DAIKO First” Investment Partnership
and three other subsidiaries
(Addition)
MUS Roosevelt Capital Partners, Ltd.
MUS Roosevelt Capital Advisers (HK), Limited
MUS Roosevelt China Pacific Fund, L.P.
These companies above were newly established, and added to the scope of consolidation.
– 28 –
Mitsubishi UFJ Securities Co., Ltd.
Corporate Value Up Fund Limited Partnership
THC Millennium Venture Capital Investment Limited Partnership
THC Phoenix Japan Investment Limited Partnership
Hands-On First Investment Limited Partnership
Hands-On First/Second Investment Limited Partnership
“DAIKO First” Investment Partnership
These companies above are included in the scope of consolidation in accordance with the Practical Solution on Application of Control Criteria and Influence Criteria to Investment Associations (Accounting Standards Board of Japan PITF No. 20, September 8, 2006).
(Exclusion)
UFJ Tsubasa Research Institute, Ltd.
The company was absorbed through the merger, and excluded from the scope of consolidation.
(2) Scope of consolidation
Names of companies in which the Company holds more than 50% of the voting rights (power of execution), but does not own as subsidiaries are as follows:
THC AP Investment Limited Partnership
SHOUNAN Academic-Industrial Alliance Fund Investment Limited Partnership
Gunma Challenge Fund Investment Limited Partnership
(Reason of not being subsidiaries)
In any case, subsidiaries of the Company which operate venture capital businesses, have positions of unlimited liability partners to operate their quasi-administrative activities as a principal business, thus those companies are not treated as subsidiaries.
2. Application of the equity method
Six affiliates (five affiliates in prior fiscal year) are accounted for under the equity method.
Affiliates
KOKUSAI Asset Management Co., Ltd.
Financial Solution Providers Co., Ltd.
Works Capital Inc.
Mitsubishi UFJ Wealth Management Securities, Ltd.
Mitsubishi UFJ Wealth Management (Switzerland), Ltd.
Sino Roosevelt Investment Partners Limited
(Addition)
Sino Roosevelt Investment Partners Limited
The company above was newly established, and added to the scope of the equity method of accounting.
3. Interim fiscal period ends of consolidated subsidiaries
Interim fiscal period end of each consolidated subsidiaries was as follow.
End of April | 1 | subsidiary | ||
End of June | 20 | subsidiaries | ||
End of August | 1 | subsidiary | ||
End of September | 4 | subsidiaries |
For twenty-one subsidiaries, which have an interim fiscal period end different from the interim fiscal period end for consolidation by three months or less, the financial statements of those companies for the relevant interim fiscal period are consolidated with adjusting material transactions during the period between those dates. For one subsidiary, which has an interim fiscal period end different from the interim fiscal period end for consolidation by more than three months, the provisional settlement of accounts will be made as of the date of the consolidated fiscal closing date.
– 29 –
Mitsubishi UFJ Securities Co., Ltd.
4. Accounting policies
| (1) | Valuation of financial instruments held for trading purposes |
Trading assets and liabilities held by the Companies, securities held for trading purpose (trading securities) by consolidated subsidiaries and all derivatives are recorded at fair value.
| (2) | Valuation of financial instruments held for non-trading purposes |
| (i) | Bonds held to maturities |
Recorded at amortized cost using the straight-line method.
| (ii) | Other securities |
| a. | Securities with market value: |
Recorded at market value. (The difference between the cost and the market value is recorded in Net assets and cost of sales is determined using the moving average method.)
| b. | Securities without market value: |
Recorded at cost using the moving average method.
| (iii) | Investments in limited liability partnership funds |
Investments in limited liability partnership funds and other similar partnerships (recognized as securities in accordance with Item 2, Article 2 of Securities and Exchange Law) are recorded at net asset values based on their latest available financial statements in proportion to the Companies’ interests.
| (3) | Depreciation and amortization of tangible fixed assets |
The declining-balance method is applied as the depreciation method for most depreciable assets.
However, the straight-line method is applied as the depreciation method for buildings acquired after April 1, 1998 (excluding facilities attached to buildings).
| (4) | Depreciation and amortization of intangible fixed assets |
Intangible fixed assets are amortized using the straight-line method.
Internal use software is amortized using the straight-line method over internally estimated useful life (5 years).
| (5) | Accounting policies for provisions |
| (i) | Allowance for doubtful accounts |
To provide for possible losses from loans, provisions are estimated for performing loans with an expected loss rate based on historical loss experiences, and estimated for non-performing loans by assessing the probability of losses specifically.
| (ii) | Accrued bonuses |
To provide for employees’ bonus payments, estimated bonuses are provided based on prescribed calculation methods.
| (iii) | Allowance for directors’ bonuses |
To provide for directors’ bonus payments, the portion of estimated bonuses applicable to the interim period is provided.
| (iv) | Accrued pension benefits |
To provide for the payment of employees’ retirement benefits, accrued pension benefits are estimated from the present value of estimated future obligations and the fair value of plan assets at fiscal year end, and recorded for the interim fiscal period end.
The net retirement benefit obligation at transition was charged to income in the period of transition.
Prior service cost is amortized by the straight-line method over periods (12 years) which are shorter than the average remaining years of service of the employees.
Actuarial gain or loss is amortized from the following year, when the gain or loss is recognized, by the straight-line method over periods (mainly 12 years) which are shorter than the average remaining years of service of the employees.
– 30 –
Mitsubishi UFJ Securities Co., Ltd.
| (6) | Accounting for lease transactions |
Financing leases other than those for which the ownership of the leased property transfers to the lessee are accounted for as operating lease transactions.
| (7) | Accounting for hedging activities |
| (i) | Hedge accounting |
Fair value hedge is applied for currency swaps and foreign exchange forwards (foreign exchange swaps) which are designated as hedging instruments. In addition, certain eligible interest rate swaps designated as hedging instruments are accounted for under accrual method without mark-to-marketed.
| (ii) | Hedging instruments and hedged items |
| a. | Foreign exchange risk |
Hedging instruments: Currency swaps and foreign exchange forwards (foreign exchange swaps)
Hedged items: Financial assets denominated in foreign currencies (Other securities)
| b. | Interest rate risk |
Hedging instruments: Interest rate swaps
Hedged items: Borrowings
| (iii) | Hedging policy |
To hedge foreign exchange risk from certain financial assets denominated in foreign currencies, currency swaps or foreign exchange forward (foreign exchange swap) transactions are used. In addition, to hedge interest rate risks from certain borrowings, interest rate swap transactions are used. Hedged items are identified on deal by deal basis.
| (iv) | Assessment of hedge effectiveness |
Hedge effectiveness for foreign exchange risk hedge is assessed periodically. Hedge effectiveness for hedge using certain eligible interest rate swap transactions is omitted to assess.
| (8) | Accounting for consumption taxes |
Consumption taxes are excluded from transaction amounts.
| (9) | Accounting policies adopted by overseas consolidated subsidiaries |
Consolidated subsidiaries in United Kingdom recognize an actuarial gain or loss on their financial statements at its occurrence in accordance with FRS 17, accounting standard of United Kingdom. In addition, unrealized gains/losses of certain derivatives at their inceptions are deferred in accordance with FRS 26.
| 5. | Scope of “Cash and cash equivalents” in the interim consolidated statement of cash flows |
“Cash and cash equivalents” in the interim consolidated statement of cash flows consists of cash in hand, current deposits, and deposits on demand such as ordinary deposits. (Time deposits due in more than three months are not included.)
Change in the basis of consolidated financial statements
1. Accounting Standard for Presentation of Net Assets in the Balance Sheet
The Companies’ interim consolidated financial statements are prepared in accordance with “Accounting Standard for Presentation of Net Assets in the Balance Sheet” (Accounting Standards Board of Japan Statement No.5, December 9, 2005) and “Guidance on Accounting Standard for Presentation of Net Assets in the Balance Sheet” (Accounting Standards Boards of Japan Guidance No.8, December 9, 2005).
The amount of shareholders’ equity, used in the past, would be 696,308 million yen.
Net Assets in the interim consolidated statement of financial condition are prepared in accordance with revised “Regulations of Interim Consolidated Financial Statements”.
2. Accounting standard for directors’ bonus
From this interim fiscal period, the Companies applied “Accounting Standard for Directors’ Bonus” (ASBJ Statement No. 4, November 29, 2005). The adoption of this accounting standard had no material impact on operating income, ordinary income and income before income taxes.
– 31 –
Mitsubishi UFJ Securities Co., Ltd.
3. Accounting standard for financial instruments
From this interim fiscal period, the Companies applied “Accounting standard for Financial Instruments” (ASBJ Statement No. 10, August 11, 2006). The adoption of this accounting standard had no impact on net income.
4. Application of Practical Solution on Application of Control Criteria and Influence Criteria to Investment Associations
The Companies applied the Practical Solution on Application of Control Criteria and Influence Criteria to Investment Associations (ASBJ PITF No. 20, September 8, 2006) to its holding investment associations from this interim fiscal period. The adoption of this accounting standard had no material impact on operating income, ordinary income, income before income taxes, and assets.
5. Reclassification of operating investment securities
Revenue and expense arising from investments in limited-liability partnership funds as part of investment banking business were reclassified from “Non-operating revenue”/“Non-operating expense” to “Net gain on operating investment securities” since prior fiscal year, except for the investments recorded in “Other current assets”.
In relation to this change, investments in limited liability partnership funds are reclassified from “Investment securities” in non-current assets to “Operating investment securities” in current assets. As those were recorded as “Non-operating revenue”/“Non-operating expense” at prior interim fiscal period, operating income for the prior interim fiscal period was lowered by 511 million yen, and there was no impact on ordinary income or income before income tax. In addition, compared with presentation applied this interim fiscal period, current assets at prior interim fiscal period end were lower by 15,315 million yen, and non-current assets were higher by the corresponding amount.
Change in presentation
(Interim Consolidated Balance Sheet)
“Short-term guarantee deposits” previously included in “Other current assets” within current assets started to be stated separately for disclosure purposes from this interim fiscal period. The amounts of short-term guarantee deposits included in “Other current assets” within current assets as of September 30, 2005 were 83,500 million yen.
(Interim Consolidated Statement of Cash Flows)
The account previously titled “Amortization of consolidation difference” started to be stated as “Amortization of goodwill” from this interim fiscal period.
Notes to interim consolidated statement of financial condition
| 1. | Accumulated depreciation of tangible fixed assets |
As of September 30, 2006 | As of September 30, 2005 | As of March 31, 2006 | ||
27,900 million yen | 26,804 million yen | 29,221 million yen | ||
<<Reference>> Ex-UFJ Tsubasa Securities As of September 30, 2005 | ||||
| 8,325 million yen | ||||
| 2. | Debt guarantees |
As of September 30, 2006 | As of September 30, 2005 | As of March 31, 2006 | ||
178 million yen | 192 million yen | 230 million yen | ||
<<Reference>> Ex-UFJ Tsubasa Securities As of September 30, 2005 | ||||
| 33 million yen | ||||
| 3. | Subordinated borrowings |
Current portion of long-term borrowings and Long-term borrowings include subordinated borrowings provided in Article 2 of the “Cabinet Office Ordinance on the Capital Adequacy Rule for Securities Companies” (the Prime Ministers Office Ordinance No. 23, 2001), and the amounts were as follows.
– 32 –
Mitsubishi UFJ Securities Co., Ltd.
As of September 30, 2006 | As of September 30, 2005 | As of March 31, 2006 | ||||
Current portion of long-term borrowings | 106,000 million yen | 40,000 million yen | — million yen | |||
Long-term borrowings | 140,500 million yen | 246,500 million yen | 246,500 million yen | |||
<<Reference>> Ex-UFJ Tsubasa Securities
Not applicable.
Notes to interim consolidated statement of operations
| 1. | Restructuring cost for branches |
The cost incurred for restructuring the network of branches relating to the merger with ex-UFJ Tsubasa Securities.
Notes to interim consolidated statement of changes in net assets
| 1. | Shares outstanding |
Type | March 31, 2006 | Increase | Decrease | September 30, 2006 | ||||
Common stocks (in thousand shares) | 716,990 | 213 | 102 | 717,101 |
(Reason for changes)
Increase due to a decrease of treasury stocks | 213 thousand shares | |
Decrease due to an increase of treasury stocks | 102 thousand shares |
| 2. | Treasury stocks |
Type | March 31, 2006 | Increase | Decrease | September 30, 2006 | ||||
Common stocks (in thousand shares) | 9,033 | 102 | 213 | 8,921 |
(Reason for changes)
Increase due to repurchase of odd lots | 92 thousand shares | |
Increase due to change in equity in the affiliates | 9 thousand shares | |
Decrease due to exercise of stock options | 202 thousand shares | |
Decrease due to resale of odd lots | 11 thousand shares |
| 3. | Share Warrants |
Category | September 30, 2006 | |
Consolidated Subsidiaries | 0 |
| 4. | Dividends paid |
| (1) | Cash payments on dividends |
Resolution | Type | Amount (in million yen) | Dividend per share (in yen) | Base date | Effective date | |||||
June 29, 2006 General shareholders’ meeting | Common stocks | 14,340 | 20.00 | March 31, 2006 | June 29, 2006 |
| (2) | Dividend whose record dates are in the current fiscal year but whose effective dates are in the following fiscal year |
None
– 33 –
Mitsubishi UFJ Securities Co., Ltd.
Notes to interim consolidated statement of cash flow
| 1. | Reconciliation between “Cash and cash equivalents” and those on the consolidated statement of financial condition |
(in million yen)
As of September 30, 2006 | As of September 30, 2005 | As of March 31, 2006 | |||||||
Cash and bank deposits | 161,906 | 277,767 | 215,847 | ||||||
Time deposits due in more than three months | D | 105,774 | D | 124,177 | D | 103,199 | |||
Cash and cash equivalents | 56,131 | 153,590 | 112,647 | ||||||
<<Reference>> Ex-UFJ Tsubasa Securities
As of September 30, 2005 | |||
Cash and bank deposits | 71,713 | ||
Time deposits due in more than three months | D | 40 | |
Cash and cash equivalents | 71,673 | ||
– 34 –
Mitsubishi UFJ Securities Co., Ltd.
Segment Information
| 1. | Business segment information |
The Company is engaged in securities business such as trading of securities, brokerage of securities, underwriting and selling of securities, subscription and distribution of securities, and private placements of securities. These operating activities involve financial and other rendering of service, and the Company makes profits by the operating activities including other rendering of service. Therefore, the Company’s entire business segment belongs to a single industry segment, “Investment and financial services”.
| 2. | Geographic segment information |
<For the six months ended September 30, 2006>
Geographic segment information of net operating revenue, selling, general and administrative expense, and operating income are as follows:
| (in million yen) | |||||||||||||||||||
| Japan | Europe | Asia | North America | Total | (Elimination) | Consolidated | |||||||||||||
I | Net operating revenue and operating income | ||||||||||||||||||
Net operating revenue | |||||||||||||||||||
Net operating revenue from customers | 111,940 | 16,495 | 988 | 994 | 130,418 | — | 130,418 | ||||||||||||
Internal net operating revenue among segments | 4,236 | 3,761 | 182 | 1,473 | 9,653 | (9,653 | ) | — | |||||||||||
Total | 116,176 | 20,257 | 1,170 | 2,467 | 140,072 | (9,653 | ) | 130,418 | |||||||||||
Selling, general and administrative expense | 92,531 | 21,519 | 1,280 | 2,047 | 117,378 | (9,023 | ) | 108,354 | |||||||||||
Operating income or loss | 23,644 | (1,261 | ) | (109 | ) | 420 | 22,693 | (630 | ) | 22,063 | |||||||||
(Note) Method of segmentation by geographic area and main countries and areas for each geographic segment
| (1) | Method of segmentation is based on geographic adjacency. |
| (2) | Main countries and areas for each geographic segment |
Europe: United Kingdom, Switzerland
Asia: China (Hong Kong, Shanghai), Singapore
North America: United States of America
– 35 –
Mitsubishi UFJ Securities Co., Ltd.
<For the six months ended September 30, 2005>
Geographic segment information of net operating revenue, selling, general and administrative expense, and operating income:
| (in million yen) | ||||||||||||||||||
| Japan | Europe | Asia | North America | Total | (Elimination) | Consolidated | ||||||||||||
I | Net operating revenue and operating income | |||||||||||||||||
Net operating revenue | ||||||||||||||||||
Net operating revenue from customers | 69,091 | 8,766 | 271 | 1,044 | 79,172 | — | 79,172 | |||||||||||
Internal net operating revenue among segments | 2,077 | 1,621 | 143 | 418 | 4,260 | (4,260 | ) | — | ||||||||||
Total | 71,168 | 10,387 | 415 | 1,462 | 83,433 | (4,260 | ) | 79,172 | ||||||||||
Selling, general and administrative expense | 53,055 | 10,152 | 512 | 1,354 | 65,075 | (4,427 | ) | 60,648 | ||||||||||
Operating income or loss | 18,112 | 234 | (97 | ) | 107 | 18,358 | 166 | 18,524 | ||||||||||
(Note) Method of segmentation by geographic area and main countries and areas for each geographic segment
| (1) | Method of segmentation is based on geographic adjacency. |
| (2) | Main countries and areas for each geographic segment |
Europe: United Kingdom, Switzerland
Asia: China (Hong Kong, Shanghai), Singapore
North America: United States of America
– 36 –
Mitsubishi UFJ Securities Co., Ltd.
<For the year ended March 31, 2006>
Geographic segment information of net operating revenue, selling, general and administrative expense, operating income and assets are as follows:
| (in million yen) | ||||||||||||||||||
| Japan | Europe | Asia | North America | Total | (Elimination) | Consolidated | ||||||||||||
I | Net operating revenue and operating income | |||||||||||||||||
Net operating revenue | ||||||||||||||||||
Net operating revenue from customers | 230,529 | 22,726 | 1,205 | 1,977 | 256,439 | — | 256,439 | |||||||||||
Internal net operating revenue among segments | 5,276 | 4,493 | 387 | 1,390 | 11,547 | (11,547 | ) | — | ||||||||||
Total | 235,805 | 27,220 | 1,593 | 3,367 | 267,986 | (11,547 | ) | 256,439 | ||||||||||
Selling, general and administrative expense | 147,502 | 24,231 | 1,903 | 2,660 | 176,297 | (11,298 | ) | 164,999 | ||||||||||
Operating income or loss | 88,303 | 2,988 | (310 | ) | 706 | 91,688 | (249 | ) | 91,439 | |||||||||
II | Assets | 8,156,657 | 1,583,524 | 67,216 | 494,467 | 10,301,866 | (427,391 | ) | 9,874,474 | |||||||||
(Note) Method of segmentation by geographic area and main countries and areas for each geographic segment
| (1) | Method of segmentation is based on geographic adjacency. |
| (2) | Main countries and areas for each geographic segment |
Europe: United Kingdom, Switzerland
Asia: China (Hong Kong, Shanghai), Singapore
North America: United States of America
«Reference» Ex-UFJ Tsubasa Securities
<For the year ended March 31, 2006>
Operating revenue of consolidated subsidiaries from the regions other than Japan was less than 10% of consolidated operating income. Therefore, disclosure for operating income from overseas operations was omitted.
– 37 –
Mitsubishi UFJ Securities Co., Ltd.
| 3. | Net operating revenue from overseas operations |
<For the period ended September 30, 2006>
Net operating revenue (excluding internal revenue) of the Company from the regions other than Japan was as follows:
(in million yen)
| Europe | Other Area | Total | |||||||||
I | Overseas Sales (Net Operating Revenue) | 15,153 | 1,575 | 16,729 | |||||||
II | Consolidated Net Operating Revenue | 130,418 | |||||||||
III | Overseas Sales Ratio to Consolidated Net Operating Revenue | 11.6 | % | 1.2 | % | 12.8 | % |
(Note) Method of segmentation by geographic area and main countries and areas for each geographic segment
| (1) | Method of segmentation is based on geographic adjacency. |
| (2) | Main countries and areas for each geographic segment |
Europe: United Kingdom, Switzerland
Other Area: China (Hong Kong, Shanghai), Singapore, United States of America
<For the period ended September 30, 2005>
Net operating revenue (excluding internal revenue) of the Company from the regions other than Japan was as follows:
(in million yen)
| Europe | Other Area | Total | |||||||||
I | Overseas Sales (Net Operating Revenue) | 7,735 | 1,142 | 8,877 | |||||||
II | Consolidated Net Operating Revenue | 79,172 | |||||||||
III | Overseas Sales Ratio to Consolidated Net Operating Revenue | 9.8 | % | 1.4 | % | 11.2 | % |
(Note) Method of segmentation by geographic area and main countries and areas for each geographic segment
| (1) | Method of segmentation is based on geographic adjacency. |
| (2) | Main countries and areas for each geographic segment |
Europe: United Kingdom, Switzerland
Other Area: China (Hong Kong, Shanghai), Singapore, United States of America
<For the period ended March 31, 2006>
Operating revenue (excluding internal revenue) of the Company from the regions other than Japan was less than 10% of operating revenue on the consolidated statement of operations. Therefore, disclosure for operating income from overseas operations was omitted.
– 38 –
Mitsubishi UFJ Securities Co., Ltd.
«Reference» Ex-UFJ Tsubasa Securities
<For the year ended March 31, 2006>
Operating revenue (excluding internal revenue) of the Company from the regions other than Japan was less than 10% of operating revenue on the consolidated statement of operations. Therefore, disclosure for operating income from overseas operations was omitted.
– 39 –
(Mitsubishi UFJ Securities Co., Ltd.)
Fair value of securities and derivative transaction
(As of September 30, 2006)
| 1. | Held for trading purpose |
(1) Fair value of securities
(Millions of yen)
| As of September 30, 2006 | ||||
Type | Assets | Liabilities | ||
Stocks - warrants | 393,730 | 33,300 | ||
Bonds | 4,769,964 | 3,629,410 | ||
Commercial paper and certificates of deposit | 4,357 | — | ||
Investment trusts | 68,140 | 359 | ||
| (Note) | Unrealized gains and losses included in consolidated statement of operations areD6,024 million yen for the six months ended September 30, 2006. |
(2) Derivative transaction
(Millions of yen)
Type | As of September 30, 2006 | |||||||
| Assets | Liabilities | |||||||
| Notional amount | Fair value | Notional amount | Fair value | |||||
Options | 13,830,497 | 141,333 | 15,665,441 | 116,289 | ||||
Foreign exchange forwards | 701,610 | 8,896 | 1,042,520 | 36,919 | ||||
Futures | 3,951,533 | 3,670 | 3,956,775 | 2,020 | ||||
Swaps | 138,734,314 | 281,064 | 136,899,112 | 268,433 | ||||
| (Note) | Disclosure of unrealized gains and losses on the above table is omitted because all derivative transactions are stated at fair values on the consolidated statement of financial condition. |
– 40 –
(Mitsubishi UFJ Securities Co., Ltd.)
| 2. | Held for non-trading purpose |
(1) Securities held to maturity, with market value
Not applicable.
(2) Other securities with market value
| (Millions of yen | ) | |||||||
Type | Cost | Balance sheet amount | Differences | |||||
Current assets | ||||||||
Securities with unrealized gains | 952 | 1,608 | 655 | |||||
Equity | 352 | 1,007 | 655 | |||||
Bond (Domestic) | 299 | 299 | 0 | |||||
Others (Investment trusts) | 300 | 300 | 0 | |||||
Securities with unrealized loss | 10 | 6 | D | 3 | ||||
Equity | 10 | 6 | D | 3 | ||||
Non-current assets | ||||||||
Securities with unrealized gains | 30,065 | 47,806 | 17,741 | |||||
Equity | 30,065 | 47,806 | 17,741 | |||||
Securities with unrealized loss | 3,002 | 2,743 | D | 259 | ||||
Equity | 3,002 | 2,743 | D | 259 | ||||
(Note)
There are no other securities which are written off.
(3) Securities not stated at market value and those of balance sheet amounts
| (Millions of yen) | ||
Type | Balance sheet amount | |
Other securities | ||
Current assets | 10,564 | |
Equity (Unlisted) | 5,649 | |
Bond (Domestic) | 2 | |
Others (Investment trusts) | 4,911 | |
Non-current assets | 8,022 | |
Equity (Unlisted) | 8,022 | |
Investments in limited liabilities partnership funds | ||
Current assets | 23,053 | |
Tokumei-kumiai investments | 23,053 | |
Non-current assets | 3,518 | |
Others | 3,518 | |
– 41 –
(Mitsubishi UFJ Securities Co., Ltd.)
(As of September 30, 2005)
| 1. | Held for trading purpose |
(1) Fair value of securities
(Millions of yen)
| As of September 30, 2005 | ||||
Type | Assets | Liabilities | ||
Stocks - warrants | 166,297 | 47,538 | ||
Bonds | 3,044,530 | 1,902,999 | ||
Commercial paper and certificates of deposit | 41,993 | — | ||
Investment trusts | 30,084 | — | ||
| (Note) | Unrealized gains and losses included in consolidated statement of operations are 18,327 million yen for the six months ended September 30, 2006. |
(2) Derivative transaction
(Millions of yen)
| As of September 30, 2005 | ||||||||
| Assets | Liabilities | |||||||
Type | Notional amount | Fair value | Notional amount | Fair value | ||||
Options | 7, 806,267 | 63,105 | 9, 090,165 | 77,226 | ||||
Foreign exchange forwards | 429,966 | 4,175 | 539,481 | 10,114 | ||||
Futures | 1,467,646 | 1,668 | 2,372,913 | 18,067 | ||||
Swaps | 81,915,295 | 217,270 | 81,466,394 | 200,801 | ||||
| (Note) | Disclosure of unrealized gains and losses on the above table is omitted because all derivative transactions are stated at fair values on the consolidated statement of financial condition. |
– 42 –
(Mitsubishi UFJ Securities Co., Ltd.)
| 2. | Held for non-trading purpose |
(1) Securities held to maturity, with market value
Not applicable.
(2) Other securities with market value
(Millions of yen)
Type | Cost | Balance sheet amount | Differences | ||||
Current assets | |||||||
Securities with unrealized gains | 310 | 907 | 596 | ||||
Equity | 310 | 907 | 596 | ||||
Non-current assets | |||||||
Securities with unrealized gains | 7,148 | 19,497 | 12,349 | ||||
Equity | 6,385 | 18,723 | 12,338 | ||||
Bond | 762 | 774 | 11 | ||||
Securities with unrealized loss | 3,776 | 3,589 | D | 177 | |||
Equity | 642 | 557 | D | 84 | |||
Bond | 3,123 | 3,031 | D | 92 | |||
| (Note) | There are no other securities which are written off. |
(3) Securities not stated at market value and those of balance sheet amounts
(Millions of yen)
Type | Balance sheet amount | |
Other securities | ||
Current assets | 22,126 | |
Equity (Unlisted) | 27 | |
Others (Investment trusts) | 22,099 | |
Non-current assets | 2,535 | |
Equity (Unlisted) | 2,535 | |
Investments in limited liabilities partnership funds | ||
Non-current assets | 15,417 | |
Tokumei-kumiai investments | 15,417 |
– 43 –
(Mitsubishi UFJ Securities Co., Ltd.)
(As of March 31, 2006)
| 1. | Held for trading purpose |
(l) Fair value of securities
(Millions of yen)
Type | As of March 31, 2006 | |||
| Assets | Liabilities | |||
Stocks - warrants | 270,114 | 34,584 | ||
Bonds | 3,631,670 | 2,990,742 | ||
Commercial paper and certificates of deposit | 66,016 | — | ||
Investment trusts | 42,744 | 1,441 | ||
| (Note) | Unrealized gains and losses included in consolidated statement of operations are 29,411 million yen for the six months ended September 30, 2006. |
(2) Derivative transaction
(Millions of yen)
Type | As of March 31, 2006 | |||||||
| Assets | Liabilities | |||||||
| Notional amount | Fair value | Notional amount | Fair value | |||||
Options | 11,576,544 | 103,773 | 13,242,831 | 132,801 | ||||
Foreign exchange forwards | 497,400 | 3,128 | 855,598 | 32,570 | ||||
Futures | 2,395,376 | 2,290 | 2,371,458 | 16,668 | ||||
Swaps | 107,042,201 | 267,201 | 105,346,870 | 196,807 | ||||
| (Note) | Disclosure of unrealized gains and losses on the above table is omitted because all derivative transactions are stated at fair values on the consolidated statement of financial condition. |
– 44 –
(Mitsubishi UFJ Securities Co., Ltd.)
| 2. | Held for non-trading purpose |
(1) Securities held to maturity, with market value
Not applicable.
(2) Other securities with market value
(Millions of yen)
Type | Cost | Balance sheet amount | Differences | ||||
Current assets | |||||||
Securities with unrealized gains | 310 | 1,095 | 785 | ||||
Equity | 310 | 1,095 | 785 | ||||
Non-current assets | |||||||
Securities with unrealized gains | 31,236 | 62,486 | 31,249 | ||||
Equity | 31,236 | 62,486 | 31,249 | ||||
Securities with unrealized loss | 3,769 | 3,742 | D | 27 | |||
Equity | 3,769 | 3,742 | D | 27 | |||
(Note)
There are no other securities which are written off.
(3) Securities not stated at market value and those of balance sheet amounts
(Millions of yen)
Type | Balance sheet amount | |
Other securities | ||
Current assets | 3,679 | |
Equity (Unlisted) | 145 | |
Others (Investment trusts) | 3,533 | |
Non-current assets | 6,293 | |
Equity (Unlisted) | 6,293 | |
Investments in limited liabilities partnership funds | ||
Current assets | 31,526 | |
Tokumei-kumiai investments | 31,526 | |
Non-current assets | 3,283 | |
Others | 3,283 |
– 45 –
(Mitsubishi UFJ Securities Co., Ltd.)
«Reference» Ex–UFJ Tsubasa Securities
(As of September 30, 2005)
| 1. | Held for trading purpose |
(1) Fair value of securities
(Millions of yen)
Type | As of September 30, 2005 | |||
| Assets | Liabilities | |||
Stocks - warrants | 71,493 | 1,036 | ||
Bonds | 623,639 | 646,893 | ||
Commercial paper and certificates of deposit | — | — | ||
Investment trusts | 2,039 | — | ||
Others | 8,140 | — | ||
| (Note) | Unrealized gains and losses included in consolidated statement of operations are 8,356 million yen for the six months ended September 30, 2005. |
(2) Derivative transaction
(Millions of yen)
Type | As of September 30, 2005 | |||||||
| Assets | Liabilities | |||||||
| Notional amount | Fair value | Notional amount | Fair value | |||||
Options | 316,532 | 8,709 | 341,725 | 9,910 | ||||
Foreign exchange forwards | 13,743 | 83 | 34,180 | 584 | ||||
Futures | 5,362 | 679 | 86,893 | 3,006 | ||||
Swaps | 148,233 | 5,123 | 162,316 | 1,510 | ||||
| (Note) | Disclosure of unrealized gains and losses on the above table is omitted because all derivative transactions are stated at fair values on the consolidated statement of financial condition. |
– 46 –
(Mitsubishi UFJ Securities Co., Ltd.)
«Reference» Ex-UFJ Tsubasa Securities
| 2. | Held for non-trading purpose |
(1) Securities held to maturity, with market value
Not applicable.
(2) Other securities with market value
(Millions of yen)
Type | Cost | Balance sheet amount | Differences | ||||
Current assets | |||||||
Securities with unrealized gains | — | — | — | ||||
Equity | — | — | — | ||||
Non-current assets | |||||||
Securities with unrealized gains | 1,710 | 22,209 | 20,499 | ||||
Equity | 1,710 | 22,209 | 20,499 | ||||
Bond | — | — | — | ||||
Securities with unrealized loss | 177 | 154 | D | 23 | |||
Equity | 177 | 154 | D | 23 | |||
Bond | — | — | — | ||||
(3) Securities not stated at market value and those of balance sheet amounts
(Millions of yen)
Type | Balance sheet amount | |
Other securities | ||
Current assets | 635 | |
Equity (Unlisted) | 13 | |
Others | 622 | |
Non-current assets | 4,092 | |
Equity (Unlisted) | 3,861 | |
Others | 231 | |
Investments in limited liabilities partnership funds | ||
Non current assets | 13,740 | |
Tokumei-kumiai investments | 13,740 | |
– 47 –
(Mitsubishi UFJ Securities Co., Ltd.)
Interim financial data for the Fiscal Year Ending March 31, 2007
| 1. | Commissions |
(1) Breakdown by account
(Millions of yen)
For the six months ended September 30, 2006 (18.4.1~18.9.30) (A) | For the six months ended September 30, 2005 (17.4.1~17. 9. 30) (B) | Ratio (A)/(B) | For the year ended March 31, 2006 (17.4.1~18.3.31) | «Reference» Ex-UFJ Tsubasa Securities | |||||||||||
For the six months ended September 30, 2005 (17.4.1~17.9. 30) | |||||||||||||||
| % | |||||||||||||||
Brokerage commissions | 24,731 | 18,347 | 134.8 | 68,415 | 15,764 | ||||||||||
(Equities) | (24,563 | ) | (18,123 | ) | (135.5 | ) | (67,975 | ) | (15,721 | ) | |||||
(Bonds) | (99 | ) | (70 | ) | (141.6 | ) | (204 | ) | (30 | ) | |||||
Underwriting & selling | 5,826 | 5,522 | 105.5 | 16,634 | 2,271 | ||||||||||
(Equities) | (3,469 | ) | (2,564 | ) | (135.3 | ) | (10,225 | ) | (1,576 | ) | |||||
(Bonds) | (2,356 | ) | (2,956 | ) | (79.7 | ) | (6,377 | ) | (694 | ) | |||||
Subscription & distribution commissions | 14,659 | 4,212 | 348.0 | 17,410 | 2,900 | ||||||||||
(Investment trusts) | (12,219 | ) | (4,090 | ) | (298.7 | ) | (16,334 | ) | (2,793 | ) | |||||
Other commissions | 22,862 | 12,355 | 185.0 | 32,867 | 6,412 | ||||||||||
(Investment trusts) | (7,889 | ) | (3,260 | ) | (242.0 | ) | (9,803 | ) | (2,162 | ) | |||||
Total | 68,081 | 40,437 | 168.4 | 135,328 | 27,349 | ||||||||||
(2) Breakdown by Products
(Millions of yen)
For the six months ended September 30, 2006 (18.4.1~18.9.30) (A) | For the six months ended September 30, 2005 (17.4.1~17.9.30) (B) | Ratio (A)/(B) | For the year ended March 31, 2006 (17.4.1~18.3.31) | «Reference» Ex-UFJ Tsubasa Securities | ||||||
For the six months ended September 30, 2005 (17.4.1~17.9.30) | ||||||||||
| % | ||||||||||
Equities | 28,640 | 20,776 | 137.9 | 78,524 | 17,408 | |||||
Bonds | 5,071 | 3,680 | 137.8 | 8,730 | 1,060 | |||||
Investment trusts | 20,165 | 7,400 | 272.5 | 26,241 | 4,969 | |||||
Others | 14,203 | 8,579 | 165.5 | 21,832 | 3,910 | |||||
Total | 68,081 | 40,437 | 168.4 | 135,328 | 27,349 | |||||
| 2. | Net gain (loss) on trading |
(Millions of yen)
For the six months ended September 30, 2006 (18.4.1~18.9.30) (A) | For the six months ended (17.4.1~17.9.30) (B) | Ratio (A)/(B) | For the year ended March 31, 2006 (17.4.1~18.3.31) | «Reference» Ex-UFJ Tsubasa Securities | |||||||
For the six months ended September 30, 2005 (17.4.1~17.9.30) | |||||||||||
| % | |||||||||||
Equities | 435 | 7,374 | 5.9 | 28,386 | 4,478 | ||||||
Bonds | 33,910 | 29,177 | 116.2 | 60,316 | 13,104 | ||||||
Others | 22,709 | 644 | — | 24,990 | D | 647 | |||||
Total | 57,056 | 37,196 | 153.4 | 113,693 | 16,936 | ||||||
– 48 –
(Mitsubishi UFJ Securities Co., Ltd.)
(Reference)
QUARTERLY CONSOLIDATED STATEMENT OF OPERATIONS
(Millions of yen)
Description | FY 2005 2Q [2005.7.l] [2005.9.30] | FY 2005 3Q [2005.10.1] | FY 2005 4Q [2006.1.l] [2006.3.3l] | FY 2006 1Q [2006.4.1] [2006.6.30] | FY 2006 2Q [2006.7.1] [2006.9.30] | «Reference» Ex-UFJ Tsubasa Securities | ||||||||||||||||||
FY 2005 2Q [2005.7.1] | ||||||||||||||||||||||||
Operating revenue | 54,552 | 104,911 | 105,553 | 83,956 | 95,284 | 28,672 | ||||||||||||||||||
Commissions | 20,595 | 45,035 | 49,855 | 34,248 | 33,832 | 16,616 | ||||||||||||||||||
Brokerage commissions | 10,452 | 26,717 | 23,350 | 14,546 | 10,185 | 9,349 | ||||||||||||||||||
(Equities) | (10,319 | ) | (26,600 | ) | (23,251 | ) | (14,453 | ) | (10,110 | ) | (9,326 | ) | ||||||||||||
(Bonds) | (34 | ) | (61 | ) | (72 | ) | (44 | ) | (55 | ) | (15 | ) | ||||||||||||
Underwriting & selling commissions | 2,701 | 6,318 | 4,794 | 2,407 | 3,419 | 1,523 | ||||||||||||||||||
(Equities) | (1,203 | ) | (4,481 | ) | (3,180 | ) | (1,145 | ) | (2,324 | ) | (1,032 | ) | ||||||||||||
(Bonds) | (1,497 | ) | (1,804 | ) | (1,616 | ) | (1,261 | ) | (1,095 | ) | (491 | ) | ||||||||||||
Subscription & distribution commissions | 2,441 | 4,189 | 9,008 | 7,955 | 6,704 | 1,528 | ||||||||||||||||||
(Investment trusts) | (2,389 | ) | (3,991 | ) | (8,262 | ) | (6,462 | ) | (5,756 | ) | (1,497 | ) | ||||||||||||
Other commissions | 4,999 | 7,809 | 12,702 | 9,338 | 13,523 | 4,214 | ||||||||||||||||||
(Investment trusts) | (1,694 | ) | (3,151 | ) | (3,390 | ) | (3,765 | ) | (4,123 | ) | (1,131 | ) | ||||||||||||
Net gain (loss) on trading | 21,601 | 41,835 | 34,660 | 26,623 | 30,432 | 9,545 | ||||||||||||||||||
Equities | 4,130 | 12,595 | 8,416 | D | 248 | 684 | 2,324 | |||||||||||||||||
Bonds | 12,292 | 15,878 | 15,261 | 14,077 | 19,833 | 7,297 | ||||||||||||||||||
Others | 5,178 | 13,362 | 10,983 | 12,794 | 9,914 | D | 76 | |||||||||||||||||
Net gain(loss) on operating investment securities | — | 11 | 2,530 | 1,405 | 1,843 | 11 | ||||||||||||||||||
Net gain(loss) on other trading | 0 | 28 | D | 30 | 0 | 0 | 1,071 | |||||||||||||||||
Interest and dividend income | 12,355 | 17,999 | 18,538 | 21,679 | 29,175 | 1,427 | ||||||||||||||||||
Interest expense | 11,170 | 15,554 | 17,643 | 21,595 | 27,227 | 655 | ||||||||||||||||||
Net operating income | 43,381 | 89,356 | 87,909 | 62,361 | 68,057 | 28,016 | ||||||||||||||||||
Selling, general and administrative expense | 28,752 | 44,855 | 59,495 | 50,817 | 57,537 | 19,818 | ||||||||||||||||||
Transaction related cost | 6,625 | 9,774 | 15,804 | 13,903 | 19,778 | 4,383 | ||||||||||||||||||
Employee compensation and benefits | 12,744 | 20,158 | 26,724 | 23,024 | 22,050 | 8,809 | ||||||||||||||||||
Occupancy and equipment | 2,683 | 5,643 | 6,766 | 5,571 | 6,324 | 3,074 | ||||||||||||||||||
Data processing and other services | 2,613 | 3,558 | 4,494 | 3,993 | 4,658 | 1,791 | ||||||||||||||||||
Depreciation and amortization | 2,858 | 4,172 | 3,459 | 2,468 | 2,586 | 892 | ||||||||||||||||||
Taxes, other than income taxes | 344 | 664 | 558 | 769 | 428 | 176 | ||||||||||||||||||
Others | 883 | 882 | 1,687 | 1,085 | 1,710 | 689 | ||||||||||||||||||
Operating income | 14,629 | 44,500 | 28,414 | 11,543 | 10,520 | 8,198 | ||||||||||||||||||
Non-operating revenue | 1,714 | 2,222 | 1,690 | 2,296 | 5,555 | 571 | ||||||||||||||||||
Equity in income of affiliated companies | 910 | 1,246 | 1,009 | 1,165 | 4,079 | 342 | ||||||||||||||||||
Others | 804 | 976 | 680 | 1,131 | 1,475 | D | 1 | |||||||||||||||||
Non-operating expense | 592 | 104 | 288 | 329 | 69 | 343 | ||||||||||||||||||
Ordinary income | 15,751 | 46,618 | 29,816 | 13,511 | 16,005 | 8,427 | ||||||||||||||||||
Extraordinary gain | 74 | 422 | 258 | 61 | 153 | 95 | ||||||||||||||||||
Extraordinary loss | 2,548 | 6,722 | 6,246 | 858 | 730 | 2,400 | ||||||||||||||||||
Income before income tax | 13,277 | 40,318 | 23,827 | 12,713 | 15,428 | 6,122 | ||||||||||||||||||
Income taxes-current | 181 | 7,840 | 12,325 | 306 | 6,085 | 3,641 | ||||||||||||||||||
Income taxes-deferred | 1,663 | 6,463 | D | 7,885 | 5,081 | D | 1,565 | D | 1,260 | |||||||||||||||
Minority interests | D | 115 | D | 8 | D | 16 | 165 | D | 211 | 5 | ||||||||||||||
Net income | 11,547 | 26,023 | 19,404 | 7,161 | 11,119 | 3,735 | ||||||||||||||||||
– 49 –
| Interim Summary Report for the Fiscal Year Ending March 31, 2007 | Date: October 25, 2006 |
Company nameMitsubishi UFJ Securities Co., Ltd. | Stock exchange listings: | Tokyo, Osaka, Nagoya | ||
Code number 8615 | Head office: | Tokyo | ||
(URLhttp://www.sc.mufg.jp/) |
Representative: | Hirohisa Aoki, President | |||
For inquiry: | Harutoshi Tsuji, General Manager of Accounting Division | Phone: (03) 6213-6900 | ||
Date of Board of directors with respect to the interim operating result: October 25, 2006 | Start date of payments of dividend: – | |||
Application of unit stock Yes (1,000 shares) | ||||
| 1. | Financial data for the six months ended September 30, 2006 |
(1) Operating results
Note: Figures under million yen are rounded down.
| Operating revenue | Net operating revenue | Operating income | Ordinary income | |||||||||||||||||
| Million yen | % | Million yen | % | Million yen | % | Million yen | % | |||||||||||||
For the six months ended September 30, 2006 | 122,379 | (68.7 | ) | 115,365 | (64.9 | ) | 23,799 | (32.6 | ) | 24,538 | (28.1 | ) | ||||||||
For the six months ended September 30, 2005 | 72,528 | (17.9 | ) | 69,959 | (21.6 | ) | 17,942 | (102.6 | ) | 19,155 | (90.9 | ) | ||||||||
For the year ended March 31, 2006 | 239,686 | 233,366 | 87,016 | 88,292 | ||||||||||||||||
«Reference» Ex-UFJ Tsubasa Securities | ||||||||||||||||||||
For the six months ended September 30, 2005 | 47,502 | 46,257 | 10,510 | 11,242 | ||||||||||||||||
| Net income | Basic net income per share | Diluted net income per share | |||||||||||
| Million yen | % | Yen | Sen | Yen | Sen | ||||||||
For the six months ended September 30, 2006 | 13,980 | (D2.7 | ) | 19 | 49 | 18 | 78 | ||||||
For the six months ended September 30, 2005 | 14,371 | (30.2 | ) | 30 | 82 | 29 | 11 | ||||||
For the year ended March 31, 2006 | 53,555 | 90 | 30 | 86 | 21 | ||||||||
«Reference» Ex-UFJ Tsubasa Securities | |||||||||||||
For the six months ended September 30, 2005 | 5,059 | 8 | 52 | — | — | ||||||||
Notes 1. | Average number of shares outstanding: |
For the six months ended September 30, 2006 | 717,124,140 shares | |
For the six months ended September 30, 2005 | 466,215,975 shares | |
For the year ended March 31, 2006 | 590,859,714 shares | |
«Reference» Ex-UFJ Tsubasa securities | ||
For the six months ended September 30, 2005 | 593,744,852 shares | |
| 2. | Change in accounting policy: No | |
| 3. | The percentage noted in Operating revenue and others are the rate of the increase or decrease compared to the same period in the previous year. | |
| 4. | The percentage for the six months ended September 30, 2006 represents the comparison with the results of ex-Mitsubishi Securities Co. Ltd. for the six months ended September 30, 2005. The results for the year ended March 31, 2006 are calculated as a total of the results of ex-Mitsubishi Securities Co. Ltd. for the period from April, 2005 to September 2005 and the results of Mitsubishi UFJ Securities Co., Ltd. for the period from October 2005 to March 2006. | |
| (2) | Financial conditions |
| Total assets | Net assets | Equity ratio | Net assets per share | Capital adequacy ratio | ||||||||
| Million yen | Million yen | % | Yen | Sen | % | |||||||
As of September 30, 2006 | 9,504,093 | 693,514 | 7.3 | 967 | 05 | 501.5 | ||||||
As of September 30, 2005 | 7,385,743 | 407,563 | 5.5 | 875 | 49 | 457.0 | ||||||
As of March 31, 2006 | 8,234,259 | 702,762 | 8.5 | 979 | 83 | 564.1 | ||||||
«Reference» Ex-UFJ Tsubasa Securities | ||||||||||||
As of September 30, 2005 | 1,969,255 | 244,079 | 12.4 | 411 | 14 | 515.8 | ||||||
Notes 1. Number of shares outstanding as of:
September 30, 2006 | 717,143,287 shares | |
September 30, 2005 | 465,524,747 shares | |
March 31, 2006 | 717,022,514 shares |
– 50 –
«Reference» Ex-UFJ Tsubasa securities
September 30, 2005 | 593,663,301 | shares | ||
2. Number of shares held as treasury stock: | ||||
For the six months ended September 30, 2006 | 8,880,005 | shares | ||
For the six months ended September 30, 2005 | 7,136,448 | shares | ||
For the year ended March 31, 2006 | 9,000,778 | shares | ||
«Reference» Ex-UFJ Tsubasa Securities | ||||
For the six months ended September 30, 2005 | 9,579,788 | shares | ||
3. The figures as of September 30, 2005 and March 31, 2006 previously stated as Shareholders’ equity, Shareholders’ ratio and Shareholders’ equity per share are stated as Net assets, Equity Ratio and Net assets per share, respectively.
| 2. | Dividends |
| Dividend per share (yen) | ||||
Cash payments on dividends | Year end | Annual total | ||
For the year ended March 31, 2006 | 20.00 | 20.00 | ||
For the year ended March 31, 2007 (Actual) | — | To be decided | ||
For the year ended March 31, 2007 (Estimated) | — | |||
«Reference»
It is difficult to estimate operating results because the company’s performance is highly influenced by the economic situation and market condition. However, the company will provide its forecast for the interim period and year end when reasonably estimated, in order to promote disclosure for investors.
– 51 –
(Mitsubishi UFJ Securities Co., Ltd.)
STATEMENT OF FINANCIAL CONDITION
(Millions of yen)
ASSETS
| As of September 30, 2006 (A) | As of September 30, 2005 (B) | Variance (A) – (B) | As of March 31, 2006 | «Reference» Ex-UFJ Tsubasa Securities | |||||||||||
Description | As of September 30, | ||||||||||||||
Current assets | 9,228,903 | 7,175,031 | 2,053,872 | 7,961,361 | 1,901,925 | ||||||||||
Cash and bank deposits | 37,706 | 116,058 | D | 78,352 | 79,749 | 70,108 | |||||||||
Cash segregated for customers and others | 112,584 | 48,590 | 63,994 | 110,200 | 42,508 | ||||||||||
Trading assets | 4,311,859 | 2,918,549 | 1,393,309 | 3,786,186 | 719,908 | ||||||||||
Trading securities | 4,108,691 | 2,832,912 | 1,275,778 | 3,616,735 | 705,312 | ||||||||||
Derivatives | 203,167 | 85,636 | 117,531 | 169,450 | 14,596 | ||||||||||
Trading receivable | — | 138,933 | D | 138,933 | 273,249 | 7,070 | |||||||||
Operating investment securities | 37,946 | — | 37,946 | 35,774 | — | ||||||||||
Operating loans receivable | — | — | — | 7,000 | — | ||||||||||
Margin account receivables | 162,716 | 90,969 | 71,746 | 205,090 | 61,307 | ||||||||||
Loans on margin transactions | 138,171 | 56,511 | 81,660 | 176,455 | 59,374 | ||||||||||
Cash collateral pledged for securities borrowing on margin transaction | 24,544 | 34,458 | D | 9,914 | 28,635 | 1,933 | |||||||||
Loan secured by securities | 4,481,638 | 3,754,742 | 726,896 | 3,381,360 | 942,357 | ||||||||||
Cash collateral pledged for securities borrowing | 3,811,921 | 3,594,175 | 217,745 | 3,155,278 | 942,357 | ||||||||||
Loans on Gensaki transaction | 669,716 | 160,566 | 509,150 | 226,082 | — | ||||||||||
Advance payments | 327 | 6,635 | D | 6,307 | 1,652 | 4,063 | |||||||||
Short-term guarantee deposits | 33,849 | — | 33,849 | 27,069 | 24,029 | ||||||||||
Short-term loans | 13,816 | 1,035 | 12,781 | 4,335 | 4,550 | ||||||||||
Parent company stock | 930 | 907 | 22 | 1,095 | — | ||||||||||
Securities | — | 22,126 | D | 22,126 | 1,342 | — | |||||||||
Deferred tax assets | 10,159 | 9,704 | 455 | 13,260 | 1,822 | ||||||||||
Other current assets | 25,444 | 66,797 | D | 41,353 | 34,131 | 24,291 | |||||||||
Allowance for doubtful accounts | D | 73 | D | 18 | D | 55 | D | 138 | D | 93 | |||||
Non-current assets | 275,189 | 210,711 | 64,477 | 272,897 | 67,330 | ||||||||||
Tangible fixed assets | 20,863 | 16,261 | 4,602 | 21,221 | 5,337 | ||||||||||
Intangible fixed assets | 20,990 | 11,063 | 9,927 | 20,293 | 8,806 | ||||||||||
Investment and others | 233,335 | 183,387 | 49,947 | 231,382 | 53,185 | ||||||||||
Investment securities | 59,639 | 36,602 | 23,036 | 73,603 | 40,129 | ||||||||||
Investments in subsidiaries and affiliated companies | 116,777 | 99,956 | 16,821 | 105,463 | 3,135 | ||||||||||
Other securities issued by subsidiaries and affiliated companies | 2,280 | — | 2,280 | — | 2,987 | ||||||||||
Long-term loans | 37,606 | 34,291 | 3,315 | 33,982 | 86 | ||||||||||
Long-term guarantee deposits | 15,191 | 11,862 | 3,329 | 16,353 | 5,136 | ||||||||||
Other investments | 3,981 | 2,272 | 1,708 | 4,144 | 2,009 | ||||||||||
Allowance for doubtful accounts | D | 2,142 | D | 1,597 | D | 544 | D | 2,164 | D | 299 | |||||
Total assets | 9,504,093 | 7,385,743 | 2,118,350 | 8,234,259 | 1,969,255 | ||||||||||
– 52 –
(Mitsubishi UFJ Securities Co., Ltd.)
(Millions of yen)
LIABILITIES
Description | As of (A) | As of (B) | Variance (A) - (B) | As of | «Reference» Ex-UFJ Tsubasa Securities | ||||||
| As of September 30, 2005 | |||||||||||
Current liabilities | 8,481,972 | 6,611,013 | 1,870,958 | 7,103,471 | 1,692,907 | ||||||
Trading liabilities | 3,186,853 | 1,808,149 | 1,378,704 | 2,974,209 | 662,943 | ||||||
Trading securities | 3,080,119 | 1,739,108 | 1,341,011 | 2,847,645 | 647,930 | ||||||
Derivatives | 106,734 | 69,041 | 37,692 | 126,563 | 15,012 | ||||||
Trading payables | 64,552 | — | 64,552 | — | — | ||||||
Margin account payables | 37,195 | 14,123 | 23,071 | 50,421 | 25,011 | ||||||
Borrowing on margin transactions | 24,456 | 1,737 | 22,718 | 32,535 | 18,061 | ||||||
Cash received for securities lending on margin transaction | 12,738 | 12,386 | 352 | 17,886 | 6,949 | ||||||
Borrowing pledged by securities | 3,754,776 | 4,074,723 | D | 319,946 | 2,976,805 | 646,654 | |||||
Cash collateral received for securities lending | 2,462,661 | 3,633,821 | D | 1,171,159 | 2,496,014 | 646,654 | |||||
Borrowing on Gensaki transaction | 1,292,114 | 440,902 | 851,212 | 480,791 | — | ||||||
Deposits received | 105,452 | 45,760 | 59,692 | 90,709 | 40,398 | ||||||
Guarantee deposits received | 115,719 | 26,461 | 89,257 | 75,776 | 13,002 | ||||||
Short-term borrowings | 860,700 | 366,200 | 494,500 | 777,400 | 255,040 | ||||||
Current portion of long-term borrowings | 106,000 | 40,000 | 66,000 | — | — | ||||||
Commercial paper | 211,800 | 219,800 | D | 8,000 | 104,800 | 35,000 | |||||
Income tax payables | 6,745 | 455 | 6,290 | 20,492 | 4,207 | ||||||
Other current liabilities | 32,177 | 15,340 | 16,837 | 32,856 | 10,649 | ||||||
Non-current liabilities | 326,440 | 365,708 | D | 39,268 | 425,998 | 31,836 | |||||
Convertible corporate debts | 49,689 | 49,165 | 524 | 49,165 | — | ||||||
Long-term borrowings | 248,000 | 303,000 | D | 55,000 | 340,500 | 18,000 | |||||
Deferred tax liabilities | 14,650 | 4,203 | 10,446 | 20,494 | 8,100 | ||||||
Accrued pension benefits | 13,764 | 8,717 | 5,047 | 14,847 | 5,613 | ||||||
Other non-current liabilities | 335 | 622 | D | 286 | 991 | 122 | |||||
Statutory reserves | 2,165 | 1,457 | 708 | 2,027 | 433 | ||||||
Reserve for securities transaction liabilities | 2,165 | 1,457 | 708 | 2,027 | 433 | ||||||
Total liabilities | 8,810,578 | 6,978,179 | 1,832,399 | 7,531,497 | 1,725,176 | ||||||
– 53 –
(Mitsubishi UFJ Securities Co., Ltd.)
(Millions of yen)
SHAREHOLDERS’ EQUITY
As of | As of | Variance | As of | «Reference» Ex-UFJ Tsubasa Securities | |||||||||||||||
Description | As of September 30, 2005 | ||||||||||||||||||
Common stock | — | 65,518 | — | 65,518 | 25,107 | ||||||||||||||
Additional paid in capital | — | 228,548 | — | 417,508 | 154,072 | ||||||||||||||
Capital surplus reserve | — | 228,548 | — | 416,944 | 153,946 | ||||||||||||||
Other capital surplus | — | — | — | 564 | 125 | ||||||||||||||
Retained earning | — | 112,899 | — | 207,769 | 55,658 | ||||||||||||||
Earned surplus reserve | — | 8,135 | — | 12,208 | 4,073 | ||||||||||||||
Special purpose reserve | — | 49,611 | — | 74,553 | 24,941 | ||||||||||||||
Unappropriated retained earnings | — | 55,152 | — | 121,008 | 26,643 | ||||||||||||||
(Net income) | (— | ) | (14,371 | ) | (— | ) | (53,555 | ) | (5,059 | ) | |||||||||
Net unrealized gain on investment securities | — | 8,465 | — | 21,063 | 12,610 | ||||||||||||||
Treasury stock | — | D | 7,868 | — | D | 9,098 | D | 3,369 | |||||||||||
Total shareholders’ equity | — | 407,563 | — | 702,762 | 244,079 | ||||||||||||||
Total liabilities and shareholders’ equity | — | 7,385,743 | — | 8,234,259 | 1,969,255 | ||||||||||||||
| NET ASSETS | |||||||||||||||||||
Owners’ equity | 681,172 | — | — | — | — | ||||||||||||||
Common stock | 65,518 | — | — | — | — | ||||||||||||||
Additional paid in capital | 417,447 | — | — | — | — | ||||||||||||||
Capital surplus reserve | 416,944 | — | — | — | — | ||||||||||||||
Other capital surplus | 503 | — | — | — | — | ||||||||||||||
Retained earnings | 207,207 | — | — | — | — | ||||||||||||||
Earned surplus reserve | 12,208 | — | — | — | — | ||||||||||||||
Other retained earnings | 194,999 | — | — | — | — | ||||||||||||||
Special reserve | 74,553 | — | — | — | — | ||||||||||||||
Unappropriated retained earnings | 120,446 | — | — | — | — | ||||||||||||||
Treasury stock | D | 9,002 | — | — | — | — | |||||||||||||
Valuation and translation adjustments | 12,342 | — | — | — | — | ||||||||||||||
Net unrealized gain on investment securities | 12,342 | — | — | — | — | ||||||||||||||
Total net assets | 693,514 | — | — | — | — | ||||||||||||||
Total liabilities and net assets | 9,504,093 | — | — | — | — | ||||||||||||||
– 54 –
(Mitsubishi UFJ Securities Co., Ltd.)
STATEMENT OF OPERATIONS
(Millions of yen)
For the six months September 30, 2006 | For the six months September 30, 2005 | Ratio (A) / (B) | For the year ended 2006 | «Reference» Ex-UFJ Tsubasa Securities | ||||||||||
Description | For the six months ended September 30, 2005 | |||||||||||||
Operating revenue | 122,379 | 72,528 | 168.7 | % | 239,686 | 47,502 | ||||||||
Commissions | 65,120 | 38,216 | 170.4 | 129,997 | 27,027 | |||||||||
Net gain on trading | 45,189 | 30,398 | 148.7 | 95,528 | 16,933 | |||||||||
Net gain on operating investment securities | 2,893 | — | — | 2,520 | — | |||||||||
Net gain on other trading | 0 | 0 | 189.9 | D | 2 | 1,203 | ||||||||
Interest and dividend income | 9,175 | 3,913 | 234.5 | 11,642 | 2,338 | |||||||||
Interest expense | 7,013 | 2,568 | 273.0 | 6,320 | 1,245 | |||||||||
Net operating revenue | 115,365 | 69,959 | 164.9 | 233,366 | 46,257 | |||||||||
Selling, general and administrative expense | 91,565 | 52,016 | 176.0 | 146,350 | 35,747 | |||||||||
Transaction related costs | 29,527 | 15,014 | 196.7 | 40,853 | 7,277 | |||||||||
Employee compensation and benefits | 33,647 | 20,107 | 167.3 | 57,679 | 15,205 | |||||||||
Occupancy and equipment | 11,072 | 4,394 | 251.9 | 15,887 | 6,361 | |||||||||
Data processing and other services | 9,471 | 5,275 | 179.5 | 14,403 | 3,755 | |||||||||
Depreciation and amortization | 4,706 | 5,274 | 89.2 | 12,457 | 1,768 | |||||||||
Taxes, other than income taxes | 1,070 | 811 | 131.9 | 1,967 | 408 | |||||||||
Others | 2,069 | 1,138 | 181.8 | 3,101 | 969 | |||||||||
Operating income | 23,799 | 17,942 | 132.6 | 87,016 | 10,510 | |||||||||
Non-operating revenue | 1,459 | 1,322 | 110.3 | 2,320 | 1,224 | |||||||||
Non-operating expense | 720 | 110 | 654.5 | 1,043 | 492 | |||||||||
Ordinary income | 24,538 | 19,155 | 128.1 | 88,292 | 11,242 | |||||||||
Extraordinary gain | 215 | 74 | 289.9 | 753 | 472 | |||||||||
Gain on sales of investment securities | 128 | 74 | 172.9 | 753 | 373 | |||||||||
Reversal of allowance for doubtful accounts | 86 | — | — | — | 59 | |||||||||
Others | — | — | — | — | 39 | |||||||||
Extraordinary loss | 1,573 | 3,313 | 47.5 | 16,199 | 2,873 | |||||||||
Loss on sales of investment securities | — | — | — | 2 | 8 | |||||||||
Loss on revaluation of investment securities | — | 690 | — | 819 | 0 | |||||||||
Provision for securities transaction liabilities | 138 | 114 | 121.0 | 251 | 111 | |||||||||
Loss on sales of fixed assets | 38 | 27 | 139.7 | 27 | 29 | |||||||||
Impairment loss | 14 | — | — | 190 | 637 | |||||||||
Restructuring cost for branches | 1,381 | — | — | 2,041 | — | |||||||||
Merger cost | — | 2,480 | — | 12,867 | 1,007 | |||||||||
Others | — | — | — | — | 1,079 | |||||||||
Income before income taxes | 23,180 | 15,916 | 145.6 | 72,846 | 8,841 | |||||||||
Income taxes-current | 6,099 | 61 | — | 19,701 | 4,037 | |||||||||
Income taxes-deferred | 3,101 | 1,484 | 209.0 | D | 409 | D | 254 | |||||||
Net income | 13,980 | 14,371 | 97.3 | 53,555 | 5,059 | |||||||||
Unappropriated retained earnings brought forwarded | — | 40,809 | — | 40,809 | 21,584 | |||||||||
Increase due to the merger | — | — | — | 26,643 | — | |||||||||
Net loss on sales of treasury stock | — | D | 27 | — | — | — | ||||||||
Unappropriated retained earnings at the end of the period | — | 55,152 | — | 121,008 | 26,643 | |||||||||
– 55 –
(Mitsubishi UFJ Securities Co., Ltd.)
STATEMENT OF CHANGE IN NET ASSETS
For the six months ended September 30, 2006 | (Millions of yen) |
| Owners’ equity | ||||||||||||||||||||||||||
| Common stock | Capital surplus | Retained earnings | Treasury stock | Total owners’ equity | ||||||||||||||||||||||
| Capital surplus reserve | Other capital surplus | Total capital surplus | Earned surplus reserve | Other retained earnings | Total retained earnings | |||||||||||||||||||||
| Voluntary reserve | Unappropriated retained earnings | |||||||||||||||||||||||||
Balance as of March 31, 2006 | 65,518 | 416,944 | 564 | 417,508 | 12,208 | 74,553 | 121,008 | 207,769 | D | 9,098 | 681,698 | |||||||||||||||
Changes for the six months ended September 30, 2006 | ||||||||||||||||||||||||||
Dividends (*) | D | 14, 340 | D | 14, 340 | D | 14, 340 | ||||||||||||||||||||
Bonuses to directors (*) | D | 201 | D | 201 | D | 201 | ||||||||||||||||||||
Net income | 13,980 | 13,980 | 13,980 | |||||||||||||||||||||||
Acquisition of treasury stock | D | 145 | D | 145 | ||||||||||||||||||||||
Sales of treasury stock | D | 60 | D | 60 | 241 | 181 | ||||||||||||||||||||
Net changes of items other than owners’ equity | ||||||||||||||||||||||||||
Total change for the six months ended September 30, 2006 | — | — | D | 60 | D | 60 | — | — | D | 561 | D | 561 | 96 | D | 526 | |||||||||||
Balance as of September 30, 2006 | 65,518 | 416,944 | 503 | 417,447 | 12,208 | 74,553 | 120,446 | 207,207 | D | 9,002 | 681,172 | |||||||||||||||
| Valuation and translation adjustments | Total net assets | ||||||||
| Net unrealized gain on investment securities | Valuation and translation adjustment | ||||||||
Balance as of March 31, 2006 | 21,063 | 21,063 | 702,762 | ||||||
Changes for the six months ended September 30, 2006 | |||||||||
Dividends (*) | D | 14,340 | |||||||
Bonuses to directors (*) | D | 201 | |||||||
Net income | 13,980 | ||||||||
Acquisition of treasury stock | D | 145 | |||||||
Sales of treasury stock | 181 | ||||||||
Net changes of items other than owners’ equity | D | 8,720 | D | 8,720 | D | 8,720 | |||
Total changes for the six months ended September 30, 2006 | D | 8,720 | D | 8,720 | D | 9,247 | |||
Balance as of September 30, 2006 | 12,342 | 12,342 | 693,514 | ||||||
| (*) | Resolved at the general shareholders’ meeting in June 2006. |
– 56 –
Mitsubishi UFJ Securities Co., Ltd.
Notes to interim financial statements
The company’s interim financial statements have been prepared in accordance with “Regulations of Interim Financial Statements” (MOF Ordinance No.38, 1977) as well as with the “Cabinet Office Ordinance Concerning Securities Companies” (Prime Minister’s Office Ordinance and MOF Ordinance No.32, 1998) and the “Uniform Accounting Standard for Broker Dealers” (approved by the board of directors of the Japan Securities Dealers Association, November 14, 1974), in accordance with and the provisions of Article 38 and Article 57 of the same regulations.
The Company’s interim financial statements for the 6 months ended September 30, 2005 are prepared in accordance with the old “Regulations of Interim Financial Statements” and the Company’s interim financial statements for the six months ended September 30, 2006 are prepared in accordance with the revised “Regulations of Interim Financial Statements”.
Basis of interim financial statements
(1) Valuation of trading assets and liabilities
Securities held for trading purposes (trading securities) and all derivatives are recorded at fair value.
(2) Valuation of financial instruments other than trading assets and liabilities
| (i) | Bonds held to maturities |
Recorded at amortized cost using the straight-line method.
| (ii) | Investments in subsidiaries and affiliated companies |
Recorded at cost using the moving average method.
| (iii) | Other securities |
| a. | Securities with market value: |
Recorded at market value. (The difference between the cost and the market value is recorded in Net assets and cost of sales is determined at moving average method.)
| b. | Securities without market value: |
Recorded at cost using the moving average method.
| (iv) | Investments in limited liability partnership funds |
Investments in limited liability partnership funds and other similar partnerships (recognized as securities in accordance with Item 2, Article 2 of Securities and exchange Law) are recorded at net asset values based on its latest available financial statements in proportion to the company’s interests.
(3) Depreciation and amortization of fixed assets
| (i) | Tangible fixed assets |
The declining-balance method is applied as the depreciation method for most depreciable assets. However, the straight-line method is applied as the depreciation method for buildings acquired after April 1, 1998 (excluding facilities attached to buildings).
| (ii) | Intangible fixed assets, and investment and others |
The straight-line method is applied as the amortization method. Internal use software is amortized on the straight-line method over internally estimated useful lives (5 years).
(4) Accounting policies for provisions
| (i) | Allowance for doubtful accounts |
To provide for possible losses from loans, provisions are estimated for performing loans with an expected loss rate based on historical loss experiences, and estimated for non-performing loans by assessing the probability of losses specifically.
| (ii) | Accrued bonuses |
To provide for employees’ bonus payments, estimated bonuses are provided based on prescribed calculation methods.
– 57 –
Mitsubishi UFJ Securities Co., Ltd.
| (iii) | Allowance for directors’ bonuses |
To provide for directors’ bonus payments, the portion of estimated bonuses applicable to the interim period is provided.
| (iv) | Accrued pension benefits |
To provide for the payment of employees’ retirement benefits, accrued pension benefits are estimated from the present value of estimated future obligations and the fair value of plan assets at fiscal year end. The net retirement benefit obligation at transition was charged to income in the period of transition. Prior service cost is amortized by the straight-line method over periods (12 years) which are shorter than the average remaining years of service of the employees.
Actuarial gain or loss is amortized from the following year, when the gain or loss is recognized, by the straight-line method over periods (12 years) which are shorter than the average remaining years of service of the employees.
(5) Accounting for lease transactions
Financing leases other than those for which the ownership of the leased property transfers to the lessee are accounted for as operating lease transactions.
| (6) | Accounting for hedging activities |
| (i) | Hedge accounting |
Fair value hedge is applied for currency swaps and foreign exchange forwards (foreign exchange swaps) which are designated as hedging instruments. In addition, certain eligible interest rate swaps designated as hedging instruments are accounted for under accrual method without mark-to-marketed.
| (ii) | Hedging instruments and hedged items |
| a. | Foreign exchange risk |
Hedging instruments: Currency swaps and foreign exchange forwards (foreign exchange swaps)
Hedged items: Financial assets denominated in foreign currencies (Other securities)
| b. | Interest rate risk |
Hedging instruments: Interest rate swaps
Hedged items: Borrowings
| (iii) | Hedging policy |
To hedge foreign exchange risk from certain financial assets denominated in foreign currencies, currency swaps or foreign exchange forward (foreign exchange swap) transactions are used. In addition, to hedge interest rate risks from certain borrowings, interest rate swap transactions are used. Hedged items are identified on deal by deal basis.
| (iv) | Assessment of hedge effectiveness |
Hedge effectiveness for foreign exchange risk hedge is assessed periodically. Hedge effectiveness for hedge using certain eligible interest rate swap transactions is omitted to assess.
(7) Accounting for consumption taxes
Consumption taxes are excluded from transaction amounts.
Change in the basis of financial statements
| 1. | Accounting Standard for Presentation of Net Assets in the Balance Sheet |
The Company’s interim financial statements are prepared in accordance with “Accounting Standard for Presentation of Net Assets in the Balance Sheet” (Accounting Standards Board of Japan Statement No. 5, December 9, 2005) and “Guidance on Accounting Standard for Presentation of Net Assets in the Balance Sheet” (Accounting Standards Boards of Japan Guidance No. 8, December 9, 2005).
The amount of shareholders’ equity, used in the past, would be 693,514 million yen.
Net Assets in the interim statement of financial condition are prepared in accordance with revised “Regulations of Interim Financial Statements”.
– 58 –
Mitsubishi UFJ Securities Co., Ltd.
| 2. | Accounting standard for directors’ bonus |
From this interim fiscal period, the Company applied “Accounting Standard for Directors’ Bonus” (ASBJ Statement No. 4, November 29, 2005). The adoption of this new accounting standard had no material impact on operating income, ordinary income and income before income taxes.
| 3. | Accounting standard for financial instruments |
From this interim fiscal period, the Company applied “Accounting standard for Financial Instruments” (ASBJ Statement No. 10, August 11, 2006). As a result of this adoption, issuance premiums of corporate debts previously included in “Other non-current liabilities” were started to be included in “Convertible corporate debts.” The adoption of this standard had no impact on net income.
| 4. | Reclassification of operating investment securities |
Revenue and expense arising from investments in limited-liability partnership funds as part of merchant banking business were reclassified from “Non-operating revenue”/“Non-operating expense” to “Net gain on operating investment securities” since prior fiscal year, except for the investments recorded in “Other current assets”. In relation to this change, investments in limited liability partnership funds are reclassified from “Investment securities” in non-current assets to “Operating investment securities” in current assets. As those were recorded as “Non-operating revenue”/“Non-operating expense” at prior interim period, operating income for the prior interim period was lowered by 511 million yen, and there was no impact on ordinary income or income before income tax. In addition, compared with presentation applied this interim period, current assets at prior interim period end were lower by 15,315 million yen.
Change in presentation
(Interim Balance Sheet)
“Short-term guarantee deposits” previously included in “Other current assets” within current assets started to be stated separately for disclosure purposes from this interim fiscal period. The amounts of short-term guarantee deposits included in “Other current assets” within current assets as of September 30, 2005 were 34,753 million yen.
Notes to statement of financial condition
| 1. | Accumulated depreciation of tangible fixed assets |
As of | As of | As of | ||
21,913 Million yen | 22,559 Million yen | 23,563 Million yen | ||
| «Reference» Ex-UFJ Tsubasa Securities | ||||
As of | ||||
| 7,075 Million yen | ||||
| 2. | Debt guarantee |
As of | As of September 30, 2005 | As of | ||
655 Million yen | — Million yen | 29 Million yen | ||
| «Reference» Ex-UFJ Tsubasa Securities | ||||
As of | ||||
| 33 Million yen | ||||
| 3. | Subordinated borrowings |
Current portion of long-term borrowings and Long-term borrowings include subordinated borrowings provided in Article 2 of the “Cabinet Office Ordinance on the Capital Adequacy Rule for Securities Companies” (the Prime Ministers Office Ordinance No. 23, 2001), and the amounts were as follows.
| As of September 30, 2006 | As of September 30, 2005 | As of March 31, 2006 | ||||
Current portion of long-term borrowings | 106,000 Million yen | 40,000 Million yen | — Million yen | |||
Long-term borrowings | 140,500 Million yen | 246,500 Million yen | 246,500 Million yen |
– 59 –
Mitsubishi UFJ Securities Co., Ltd.
«Reference» ex-UFJ Tsubasa Securities
Not applicable
Notes to statement of operations
| 1. | Restructuring cost for branches |
The cost incurred for restructuring the network of branches relating to the merger with ex-UFJ Tsubasa Securities.
Notes to statement of changes in net assets
Treasury stocks
Type | March 31, 2006 | Increase | Decrease | September 30, 2006 | ||||
Common stocks (in thousand shares) | 9,000 | 92 | 213 | 8,880 |
(Reason for changes)
Increase due to repurchase of odd lots | 92 | thousand shares | ||
Decrease due to exercise of stock options | 202 | thousand shares | ||
Decrease due to resale of odd lots | 11 | thousand shares |
– 60 –
(Mitsubishi UFJ Securities Co., Ltd.)
Interim financial data for the Fiscal Year Ending March 31, 2007
| 1. | Commissions |
(1) Breakdown by account
| (Millions of yen) | |||||||||||||||
For the six months September 30, | For the six months September 30, | Ratio (A) / (B) | For the year ended 2006 | «Reference» Ex-UFJ Tsubasa Securities | |||||||||||
For the six months September 30, | |||||||||||||||
| % | |||||||||||||||
Brokerage commissions | 23,802 | 17,460 | 136.3 | 66,109 | 15,600 | ||||||||||
(Equities) | (23,628 | ) | (17,338 | ) | (136.3 | ) | (65,783 | ) | (15,557 | ) | |||||
(Bonds) | (101 | ) | (72 | ) | (140.8 | ) | (207 | ) | (30 | ) | |||||
Underwriting & selling | 4,871 | 4,765 | 102.2 | 14,833 | 2,271 | ||||||||||
(Equities) | (3,470 | ) | (2,564 | ) | (135.3 | ) | (10,352 | ) | (1,576 | ) | |||||
(Bonds) | (1,401 | ) | (2,201 | ) | (63.7 | ) | (4,480 | ) | (694 | ) | |||||
Subscription & distribution commissions | 14,659 | 4,208 | 348.3 | 17,403 | 2,900 | ||||||||||
(Investment trusts) | (12,219 | ) | (4,086 | ) | (299.0 | ) | (16,337 | ) | (2,793 | ) | |||||
Other commissions | 21,786 | 11,782 | 184.9 | 31,650 | 6,255 | ||||||||||
(Investment trusts) | (7,889 | ) | (3,256 | ) | (242,2 | ) | (9,797 | ) | (2,162 | ) | |||||
Total | 65,120 | 38,216 | 170.4 | 129,997 | 27,027 | ||||||||||
| (2) | Breakdown by Products |
| (Millions of yen) | ||||||||||
For the six months September 30, | For the six months September 30, | Ratio (A) / (B) | For the year ended 2006 | «Reference» Ex-UFJ Tsubasa Securities | ||||||
For the six months September 30, | ||||||||||
| % | ||||||||||
Equities | 27,794 | 20,296 | 136.9 | 76,919 | 17,243 | |||||
Bonds | 4,224 | 3,010 | 140.3 | 7,222 | 1,060 | |||||
Investment trusts | 20,180 | 7,393 | 272.9 | 26,254 | 4,969 | |||||
Others | 12,920 | 7,515 | 171.9 | 19,600 | 3,753 | |||||
Total | 65,120 | 38,216 | 170.4 | 129,997 | 27,027 | |||||
| 2. | Net gain (loss) on Trading |
| (Millions of yen) | |||||||||||||
For the six months September 30, | For the six months September 30, | Ratio (A) / (B) | For the year ended 2006 | «Reference» Ex-UFJ Tsubasa Securities | |||||||||
For the six months September 30, | |||||||||||||
| % | |||||||||||||
Equities | 639 | 6,874 | 9.3 | 23,445 | 4,478 | ||||||||
Bonds | 45,484 | 24,021 | 189.4 | 64,608 | 13,101 | ||||||||
Others | D | 933 | D | 497 | — | 7,474 | D | 647 | |||||
Total | 45,189 | 30,398 | 148.7 | 95,528 | 16,933 | ||||||||
– 61 –
(Mitsubishi UFJ Securities Co., Ltd.)
| 3. | Equity Trading Activity (excluding futures) |
(Unit: Millions of shares, Millions of yen)
| For the six months ended September 30, 2006 (18.4.1~18.9.30) | For the six months ended September 30, 2005 (17.4.1~17.9.30) | Period-to-Period comparison (%) | For the year ended March 31, 2006 | (Reference) Ex-UFJ Tsubasa | ||||||||||||||||||||||||||
| For the six months ended September 30, 2005 (17.4.1~17.9.30) | ||||||||||||||||||||||||||||||
| No. of shares | Amount | No. of shares | Amount | No. of shares | Amount | No. of shares | Amount | No. of shares | Amount | |||||||||||||||||||||
Total | 10,462 | 14,160,443 | 11,112 | 10,372,350 | 94.1 | % | 136.5 | % | 30,971 | 33,469,604 | 7,454 | 6,563,160 | ||||||||||||||||||
(Proprietary) | (4,063 | ) | (4,986,686 | ) | (4,061 | ) | (3,712,320 | ) | (100.0 | %) | (134.3 | %) | (10,729 | ) | (11,024,429 | ) | (2,377 | ) | (2,338,834 | ) | ||||||||||
(Brokerage) | (6,398 | ) | (9,173,756 | ) | (7,050 | ) | (6,660,029 | ) | (90.8 | %) | (137.7 | %) | (20,241 | ) | (22,445,175 | ) | (5,077 | ) | (4,224,325 | ) | ||||||||||
Agent ratio | 61.2 | % | 64.8 | % | 63.4 | % | 64.2 | % | 65.4 | % | 67.1 | % | 68.1 | % | 64.4 | % | ||||||||||||||
TSE share | 1.90 | % | 1.93 | % | 1.82 | % | 1.95 | % | 2.22 | % | 2.39 | % | 1.27 | % | 1.27 | % | ||||||||||||||
| 4. | Underwriting, subscription and distribution |
(Unit: Millions of shares, Millions of yen)
For the six ended | For the six ended | Period-to-Period comparison (%) | For the year 2006 | (Reference) EX-UFJ Tsubasa | |||||||||||
For the six months September 30, | |||||||||||||||
Underwriting | Equities | (No. of shares) | 39 | 14 | 281.5 | % | 91 | 25 | |||||||
| Equities | (Amount) | 69,543 | 80,602 | 86.3 | 254,554 | 45,376 | |||||||||
| Bonds | (Face value) | 1,615,991 | 2,035,972 | 79.4 | 4,664,882 | 1,090,621 | |||||||||
| Commercial paper and foreign certificates | (Face value) | 6,600 | — | — | 46,900 | 16,400 | |||||||||
Subscription and distribution | Equities | (No. of shares) | 29 | 13 | 224.7 | 92 | 23 | ||||||||
| Equities | (Amount) | 144,701 | 77,226 | 187.4 | 248,034 | 44,885 | |||||||||
| Bonds | (Face value) | 656,286 | 869,016 | 75.5 | 1,594,318 | 177,785 | |||||||||
| Investment trusts | (Face value) | 2,664,867 | 1,192,141 | 223.5 | 4,538,833 | 1,000,868 | |||||||||
| Commercial paper and foreign certificates | (Face value) | 6,600 | — | — | 46,900 | 16,400 | |||||||||
| * | Including selling and distribution of private placement. |
| 5. | Capital adequacy ratio |
(Millions of yen)
| As of Sep. 30, 2006 | As of Sep. 30, 2005 | As of March 31, 2006 | (Reference) EX-UFJ Tsubasa | |||||||||||||
| As of Sep. 30, 2005 | ||||||||||||||||
Basic items | (A) | 681,172 | 399,098 | 667,156 | 231,468 | |||||||||||
Supplementary item | Net unrealized gains on investment securities | 12,342 | 8,465 | 21,063 | 12,610 | |||||||||||
Statutory reserves | 2,165 | 1,457 | 2,027 | 433 | ||||||||||||
Allowance for doubtful accounts | 73 | 18 | 138 | 93 | ||||||||||||
Short-term subordinated debt | 246,500 | 286,500 | 246,500 | — | ||||||||||||
Total | (B) | 261,082 | 296,440 | 269,728 | 13,136 | |||||||||||
Deductible assets | (C) | 272,705 | 193,300 | 256,516 | 50,729 | |||||||||||
Net capital | (A) + (B) - (C) | (D) | 669,548 | 502,238 | 680,368 | 193,875 | ||||||||||
Total risk | Market risk | 67,979 | 74,433 | 60,179 | 15,569 | |||||||||||
Counterparty risk | 20,532 | 12,248 | 19,281 | 5,752 | ||||||||||||
Basic risk | 44,987 | 23,206 | 41,143 | 16,264 | ||||||||||||
Total | (E) | 133,498 | 109,887 | 120,603 | 37,586 | |||||||||||
Capital adequacy Ratio | (D) / (E) x 100 | 501.5 | % | 457.0 | % | 564.1 | % | 515.8 | % | |||||||
| 6. | Number of employees |
(unit: person)
| As of Sep. 30, 2006 | As of Sep. 30, 2005 | As of Mar. 31, 2006 | «Reference» EX-UFJ Tsubasa Securities | |||||
| As of Sep. 30, 2006 | ||||||||
Director | 20 | 13 | 19 | 8 | ||||
Employee | 6,024 | 3,471 | 6,244 | 3,012 |
(Note) Number of employees includes following executive officers.
As of Sep. 30, 2006 | 25 | |||||||
As of Sep. 30, 2005 | 26 | |||||||
As of Mar. 31, 2006 | 33 | |||||||
«Reference» Ex-UFJ Tsubasa Securities | ||||||||
As of Sep. 30, 2005 | 14 | |||||||
– 62 –
(Mitsubishi UFJ Securities Co., Ltd.)
(Reference)
QUARTERLY STATEMENT OF OPERATIONS
(Millions of yen)
| «Reference» Ex-UFJ Tsubasa Securities | ||||||||||||||||||||||
Description | FY 2005 2Q [2005. 7. 1] [2005. 9. 30] | FY 2005 3Q [2005. 10. 1] [2005. 12. 31] | FY 2005 4Q [2006. 1.1] [2006. 3. 31] | FY 2006 1Q [2006. 4. 1] [2006. 6. 30] | FY 2006 2Q [2006. 7. 1] [2006. 9. 30] | FY 2005 2Q [2005. 9. 30] | ||||||||||||||||
Operating revenue | 42,512 | 85,105 | 82,053 | 56,589 | 65,789 | 28,502 | ||||||||||||||||
Commissions | 21,779 | 44,042 | 47,738 | 32,488 | 32,631 | 16,460 | ||||||||||||||||
Brokerage commissions | 10,088 | 26,774 | 21,874 | 14,059 | 9,743 | 9,277 | ||||||||||||||||
(Equities) | (10,025 | ) | (26,682 | ) | (21,762 | ) | (13,966 | ) | (9,661 | ) | (9,254 | ) | ||||||||||
(Bonds) | (35 | ) | (62 | ) | (73 | ) | (44 | ) | (57 | ) | (15 | ) | ||||||||||
Underwriting & selling commissions | 2,516 | 5,981 | 4,086 | 2,036 | 2,834 | 1,523 | ||||||||||||||||
(Equities) | (1,203 | ) | (4,481 | ) | (3,307 | ) | (1,145 | ) | (2,324 | ) | (1,032 | ) | ||||||||||
(Bonds) | (1,313 | ) | (1,500 | ) | (779 | ) | (891 | ) | (510 | ) | (491 | ) | ||||||||||
Subscription & distribution commissions | 2,439 | 4,186 | 9,008 | 7,955 | 6,704 | 1,528 | ||||||||||||||||
(Investment trusts) | (2,387 | ) | (3,988 | ) | (8,262 | ) | (6,462 | ) | (5,756 | ) | (1,497 | ) | ||||||||||
Other commissions | 6,734 | 7,100 | 12,768 | 8,437 | 13,349 | 4,130 | ||||||||||||||||
(Investment trusts) | (1,692 | ) | (3,150 | ) | (3,390 | ) | (3,765 | ) | (4,123 | ) | (1,131 | ) | ||||||||||
Net gain (loss) on trading | 18,154 | 37,062 | 28,067 | 19,575 | 25,614 | 9,546 | ||||||||||||||||
Equities | 3,388 | 11,586 | 4,984 | D | 191 | 830 | 2,324 | |||||||||||||||
Bonds | 10,729 | 22,657 | 17,929 | 20,010 | 25,474 | 7,298 | ||||||||||||||||
Others | 4,036 | 2,818 | 5,153 | D | 243 | D | 690 | D | 76 | |||||||||||||
Net gain (loss) on operating investment securities | — | 2,520 | 1,405 | 1,487 | — | |||||||||||||||||
Net gain (loss) on other trading | 0 | 28 | D | 30 | 0 | 0 | 1,071 | |||||||||||||||
Interest and dividend income | 2,579 | 3,971 | 3,756 | 3,119 | 6,056 | 1,423 | ||||||||||||||||
Interest expense | 1,252 | 1,591 | 2,159 | 2,716 | 4,297 | 652 | ||||||||||||||||
Net operating income | 41,259 | 83,514 | 79,893 | 53,873 | 61,492 | 27,849 | ||||||||||||||||
Selling, general and administrative expense | 26,670 | 41,489 | 52,844 | 44,180 | 47,384 | 19,715 | ||||||||||||||||
Transaction related costs | 8,337 | 10,601 | 15,237 | 13,181 | 16,345 | 4,329 | ||||||||||||||||
Employee compensation and benefits | 9,760 | 16,412 | 21,159 | 17,343 | 16,303 | 8,410 | ||||||||||||||||
Occupancy and equipment | 2,182 | 5,284 | 6,208 | 5,210 | 5,862 | 3,121 | ||||||||||||||||
Data processing and other services | 2,736 | 3,975 | 5,152 | 4,663 | 4,808 | 2,149 | ||||||||||||||||
Depreciation and amortization | 2,638 | 3,952 | 3,230 | 2,304 | 2,401 | 868 | ||||||||||||||||
Taxes, other than income taxes | 310 | 627 | 528 | 678 | 391 | 172 | ||||||||||||||||
Others | 704 | 635 | 1,327 | 797 | 1,271 | 664 | ||||||||||||||||
Operating income | 14,589 | 42,024 | 27,048 | 9,692 | 14,107 | 8,134 | ||||||||||||||||
Non-operating revenue | 864 | 1,089 | D | 91 | 781 | 677 | 526 | |||||||||||||||
Non-operating expense | 70 | 70 | 863 | 150 | 569 | 326 | ||||||||||||||||
Ordinary income | 15,384 | 43,043 | 26,093 | 10,323 | 14,215 | 8,334 | ||||||||||||||||
Extraordinary gain | 74 | 418 | 260 | 61 | 153 | 98 | ||||||||||||||||
Extraordinary loss | 3,031 | 6,678 | 6,207 | 858 | 714 | 2,401 | ||||||||||||||||
Income before income tax | 12,427 | 36,784 | 20,145 | 9,526 | 13,654 | 6,031 | ||||||||||||||||
Income taxes-current | 45 | 7,554 | 12,085 | 30 | 6,069 | 3,597 | ||||||||||||||||
Income taxes-deferred | 1,484 | 6,212 | D | 8,106 | 4,927 | D | 1,826 | D | 1,247 | |||||||||||||
Net income | 10,898 | 23,017 | 16,166 | 4,569 | 9,411 | 3,681 | ||||||||||||||||
– 63 –
Filings with the U.S. SEC
Mitsubishi UFJ Financial Group, Inc. (“MUFG”) filed a registration statement on Form F-4 (“Form F-4”) with the U.S. SEC in connection with the proposed stock-for-stock exchange transaction to make Mitsubishi UFJ Securities Co., Ltd. (“MUS”) a wholly-owned subsidiary of MUFG. The Form F-4 contains a prospectus and other documents. After the Form F-4 is declared effective, MUS plans to mail the prospectus contained in the Form F-4 to its U.S. shareholders prior to the shareholders meeting at which the proposed transaction will be voted upon. The Form F-4 and prospectus contains important information about MUFG, MUS, the stock-for-stock exchange transaction and related matters. U.S. shareholders of MUS are urged to read the Form F-4, the prospectus and the other documents that are filed with the U.S. SEC in connection with the stock-for-stock exchange transaction carefully before they make any decision at the MUS shareholders meeting with respect to the proposed stock-for-stock exchange transaction. The Form F-4, the prospectus and all other documents filed with the U.S. SEC in connection with the stock-for-stock exchange transaction will be available when filed, free of charge, on the U.S. SEC’s web site at www.sec.gov. In addition, the prospectus and all other documents filed with the U.S. SEC in connection with the stock-for-stock exchange transaction will be made available to shareholders, free of charge, by calling, writing or e-mailing:
| MUFG Contact: | MUS Contact: | |
Mr. Hitoshi Shimamura 2-7-1, Marunouchi, Chiyoda-ku Tokyo 100-8330 Japan Telephone: 81-3-3240-6608 Email: Hitoshi_Shimamura@hd.mufg.jp | Mr. Hiroshi Kutose 2-5-2, Marunouchi, Chiyoda-ku Tokyo 100-0005 Japan Telephone 81-3-6213-6584 Email: kutose-hiroshi@sc.mufg.jp | |
In addition to the Form F-4, the prospectus and the other documents filed with the U.S. SEC in connection with the stock-for-stock exchange transaction, MUFG is obligated to file annual reports with, and submit other information to, the U.S. SEC. You may read and copy any reports and other information filed with, or submitted to, the U.S. SEC at the U.S. SEC’s public reference rooms at 100 F Street, N.E., Room 1580, Washington, D.C. 20549. Please call the U.S. SEC at 1-202-551-8090 for further information on public reference rooms. Filings with the U.S. SEC also are available to the public from commercial document retrieval services and at the web site maintained by the U.S. SEC at http://www.sec.gov.
Forward-Looking Statements
This communication contains forward-looking information and statements about MUFG, MUS and their businesses after completion of the transaction. Forward-looking statements are statements that are not historical facts. These statements include financial projections and estimates and their underlying assumptions, statements regarding plans, objectives and expectations with respect to future operations, products and services, and statements regarding future performance. Forward-looking statements are generally identified by the words “expect,” “anticipates,” “believes,” “intends,” “estimates” and similar expressions. Although MUFG’s and MUS’s management believe that the expectations reflected in such forward-looking statements are reasonable, investors and holders of MUS securities are cautioned that forward-looking information and statements are subject to various risks and uncertainties, many of which are difficult to predict and generally beyond the control of MUFG and MUS, that could cause actual results and developments to differ materially from those expressed in, or implied or projected by, the forward-looking information and statements. These risks and uncertainties include those discussed or identified in the public filings with the SEC and the local filings made by MUFG and MUS, including those listed under “Cautionary Statement Concerning Forward-Looking Statements” and “Risk Factors” in the prospectus included in the registration statement on Form F-4 that MUFG filed with the U.S. SEC. Other than as required by applicable law, MUFG and MUS do not undertake any obligation to update or revise any forward-looking information or statements.