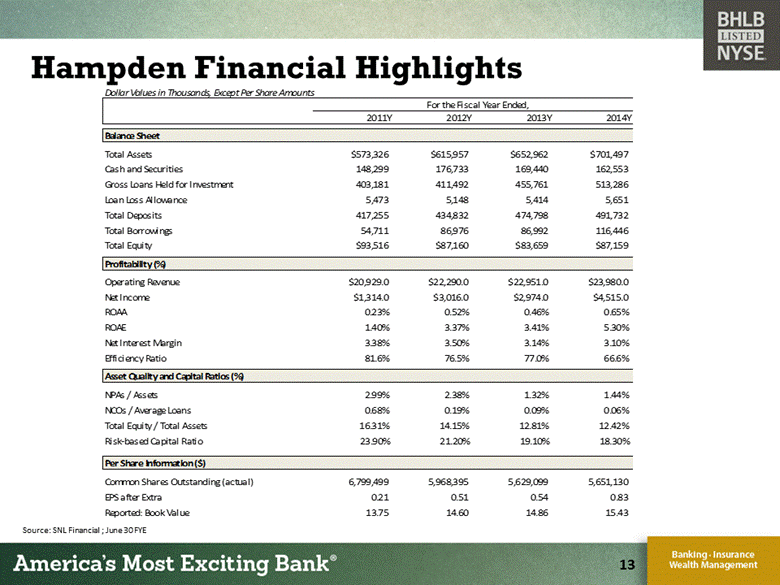
| Hampden Financial Highlights Source: SNL Financial ; June 30 FYE 13 Dollar Values in Thousands, Except Per Share Amounts For the Fiscal Year Ended, 2011Y 2012Y 2013Y 2014Y Balance Sheet Total Assets $573,326 $615,957 $652,962 $701,497 Cash and Securities 148,299 176,733 169,440 162,553 Gross Loans Held for Investment 403,181 411,492 455,761 513,286 Loan Loss Allowance 5,473 5,148 5,414 5,651 Total Deposits 417,255 434,832 474,798 491,732 Total Borrowings 54,711 86,976 86,992 116,446 Total Equity $93,516 $87,160 $83,659 $87,159 Profitability (%) Operating Revenue $20,929.0 $22,290.0 $22,951.0 $23,980.0 Net Income $1,314.0 $3,016.0 $2,974.0 $4,515.0 ROAA 0.23% 0.52% 0.46% 0.65% ROAE 1.40% 3.37% 3.41% 5.30% Net Interest Margin 3.38% 3.50% 3.14% 3.10% Efficiency Ratio 81.6% 76.5% 77.0% 66.6% Asset Quality and Capital Ratios (%) NPAs / Assets 2.99% 2.38% 1.32% 1.44% NCOs / Average Loans 0.68% 0.19% 0.09% 0.06% Total Equity / Total Assets 16.31% 14.15% 12.81% 12.42% Risk-based Capital Ratio 23.90% 21.20% 19.10% 18.30% Per Share Information ($) Common Shares Outstanding (actual) 6,799,499 5,968,395 5,629,099 5,651,130 EPS after Extra 0.21 0.51 0.54 0.83 Reported: Book Value 13.75 14.60 14.86 15.43 |

