Glenn S. Welch President/Chief Executive Officer October 2013
IMPORTANT INFORMATION This material may be deemed to be solicitation material in respect of the solicitation of proxies from the Company’s shareholders in connection with the Company’s 2013 Annual Meeting of the Stockholders (the “Annual Meeting”). On October 2, 2013, the Company filed with the Securities and Exchange Commission (the “SEC”) and mailed to its shareholders a proxy statement in connection with the Annual Meeting (the “Proxy Statement”), and advises its shareholders to read the Proxy Statement and any and all supplements and amendments thereto because they contain important information. Shareholders may obtain a free copy of the Proxy Statement and other documents that the Company files with the SEC at the SEC’s website at www.sec.gov. The Proxy Statement and these other documents may also be obtained upon request addressed to the Secretary of the Company at Hampden Bancorp, Inc., 19 Harrison Avenue, Springfield MA 01102, or our proxy solicitor, D.F. King & Co. at 48 Wall Street, New York, NY 10005; telephone: 212-269-5550 (banks and brokers), 1-800-735-3591 (shareholders); Email: info@dfking.com. 2
This material may be deemed to be solicitation material in respect of the solicitation of proxies from the Company’s shareholders in connection with the Company’s 2013 Annual Meeting of the Stockholders (the “Annual Meeting”). On October 2, 2013, the Company filed with the Securities and Exchange Commission (the “SEC”) and mailed to its shareholders a proxy statement in connection with the Annual Meeting (the “Proxy Statement”), and advises its shareholders to read the Proxy Statement and any and all supplements and amendments thereto because they contain important information. Shareholders may obtain a free copy of the Proxy Statement and other documents that the Company files with the SEC at the SEC’s website at www.sec.gov. The Proxy Statement and these other documents may also be obtained upon request addressed to the Secretary of the Company at Hampden Bancorp, Inc., 19 Harrison Avenue, Springfield MA 01102, or our proxy solicitor, D.F. King & Co. at 48 Wall Street, New York, NY 10005; telephone: 212‐269‐5550 (banks and brokers), 1‐800‐735‐ 3591 (shareholders); Email: info@dfking.com. 2 IMPORTANT INFORMATION CERTAIN INFORMATION CONCERNING PARTICIPANTS The Company, its directors and its executive officers may be deemed to be participants in the solicitation of the Company’s shareholders in connection with the Annual Meeting. Shareholders may obtain information regarding the names, affiliations and interests of such individuals in the Company’s proxy statement related to its 2013 Annual Meeting of Stockholders, filed with the SEC on October 2, 2013.
Forward Looking Statements Certain statements contained herein and presented orally at the shareholders meeting constitute “forward‐looking statements” within the meaning of the Private Securities Litigation Reform Act of 1995. These statements are based on the beliefs and expectations of management, as well as the assumptions made using information currently available to management. Because these statements reflect the views of management concerning future events, these statements involve risks, uncertainties and assumptions. As a result, actual results may differ from those contemplated by these statements. Forward‐looking statements can be identified by the fact that they do not relate strictly to historical or current facts. They often include words like “believe”, “expect”, “anticipate”, “estimate”, and “intend” or future or conditional verbs such as “will”, “would”, “should”, “could”, or “may.” Certain factors that could have a material adverse affect on the operations of the Bank include, but are not limited to, increased competitive pressure among financial service companies, national and regional economic conditions, changes in interest rates, changes in consumer spending, borrowing and savings habits, legislative and regulatory changes, adverse changes in the securities markets, inability of key third‐party providers to perform their obligations to Hampden Bank, changes in relevant accounting principles and guidelines. Additionally, other risks and uncertainties are described in the Company’s Annual Report on Form 10‐K filed with the Securities and Exchange Commission (the “SEC”) which is available through the SEC’s website at www.sec.gov. These risks and uncertainties should be considered in evaluating forward‐looking statements and undue reliance should not be placed on such statements. Readers are cautioned not to place undue reliance on these forward‐looking statements, which speak only as of the date of this report. The Company disclaims any intent or obligation to update any forward‐looking statements, whether in response to new information, future events or otherwise. 3
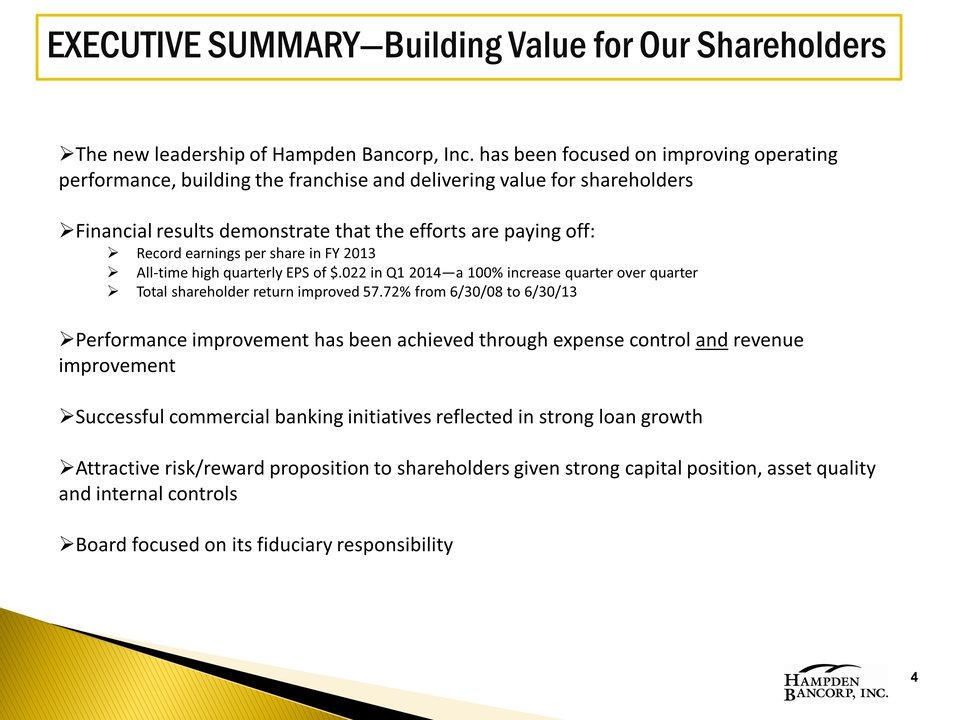
EXECUTIVE SUMMARY—Building Value for Our Shareholders The new leadership of Hampden Bancorp, Inc. has been focused on improving operating performance, building the franchise and delivering value for shareholders Financial results demonstrate that the efforts are paying off: Record earnings per share in FY 2013 All‐time high quarterly EPS of $.022 in Q1 2014—a 100% increase quarter over quarter Total shareholder return improved 57.72% from 6/30/08 to 6/30/13 Performance improvement has been achieved through expense control and revenue improvement Successful commercial banking initiatives reflected in strong loan growth Attractive risk/reward proposition to shareholders given strong capital position, asset quality and internal controls Board focused on its fiduciary responsibility 4
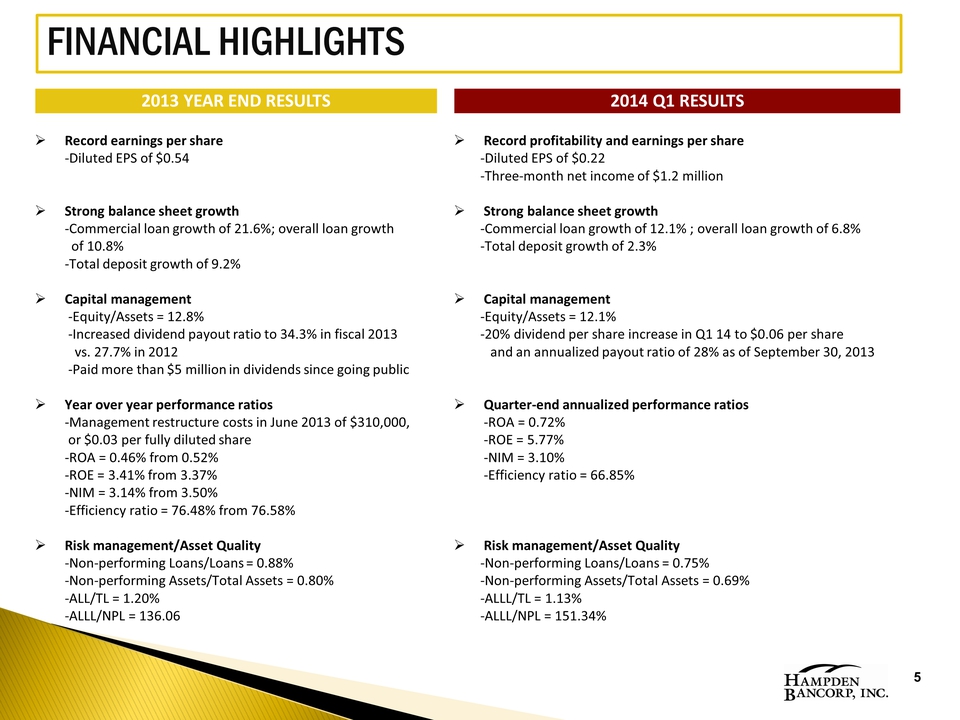
FINANCIAL HIGHLIGHTS 2013 YEAR END RESULTS Record earnings per share ‐Diluted EPS of $0.54 Strong balance sheet growth ‐Commercial loan growth of 21.6%; overall loan growth of 10.8% ‐Total deposit growth of 9.2% Capital management ‐Equity/Assets = 12.8% ‐Increased dividend payout ratio to 34.3% in fiscal 2013 vs. 27.7% in 2012 ‐Paid more than $5 million in dividends since going public Year over year performance ratios ‐Management restructure costs in June 2013 of $310,000, or $0.03 per fully diluted share ‐ROA = 0.46% from 0.52% ‐ROE = 3.41% from 3.37% ‐NIM = 3.14% from 3.50% ‐Efficiency ratio = 76.48% from 76.58% Risk management/Asset Quality ‐Non‐performing Loans/Loans = 0.88% ‐Non‐performing Assets/Total Assets = 0.80% ‐ALL/TL = 1.20% ‐ALLL/NPL = 136.06 2014 Q1 RESULTS Record profitability and earnings per share ‐Diluted EPS of $0.22 ‐Three‐month net income of $1.2 million Strong balance sheet growth ‐Commercial loan growth of 12.1% ; overall loan growth of 6.8% ‐Total deposit growth of 2.3% Capital management ‐Equity/Assets = 12.1% ‐20% dividend per share increase in Q1 14 to $0.06 per share and an annualized payout ratio of 28% as of September 30, 2013 Quarter‐end annualized performance ratios ‐ROA = 0.72% ‐ROE = 5.77% ‐NIM = 3.10% ‐Efficiency ratio = 66.85% Risk management/Asset Quality ‐Non‐performing Loans/Loans = 0.72% ‐Non‐performing Assets/Total Assets = 0.69% ‐ALLL/TL = 1.13% ‐ALLL/NPL = 151.34% 5

FRANCHISE OVERVIEW – WHO WE ARE Hampden Bancorp, Inc. – NASDAQ: HBNK Headquarters located in Springfield, MA with branches in surrounding suburbs 10 branch offices; average branch size $47 million as of June 30, 2013 Strategic plan in place to increase market share of each branch Strong credit culture throughout the organization 6
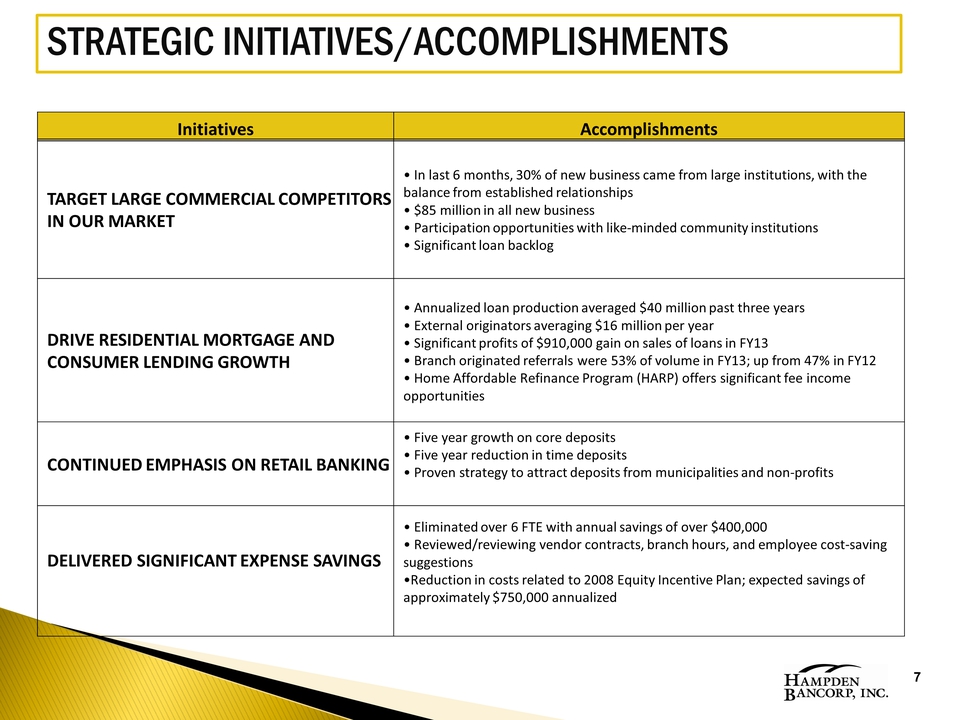
STRATEGIC INITIATIVES/ACCOMPLISHMENTS Initiatives Accomplishments TARGET LARGE MARKET COMMERCIAL COMPETITORS In last 6 months, 30% of new business came from large institutions, with the balance from established relationships $85 million new business Participation opportunities with like‐minded community institutions Significant loan backlog RESIDENTIAL MORTGAGE AND CONSUMER LENDING Annualized loan production averaged $40 million past three years External originators averaging $16 million per year Significant profits of $892 million on loan sales of $23 million Branch originated referrals were 53% of volume in FY13; up from 47% in FY12 Home Affordable Refinance Program (HARP) offers significant fee income RETAIL BANKING Five year CAGR on core deposits = 16.85% Five year reduction in time deposits Proven strategy to attract deposits from municipalities and non‐profits SIGNIFICANT EXPENSE SAVINGS Eliminated 6.16 FTE with savings of medium six figures Reviewed/reviewing vendor contracts, branch hours, and employee cost‐saving suggestions Reduction in costs related to 2008 Equity Incentive Plan; expected savings of approximately $750,000 annualized 7

STRATEGIC INITIATIVES/ACCOMPLISHMENTS (CONT) Initiatives Accomplishments STRATEGIC REVIEW The Board of Directors (“BOD”) is committed to its duty to review means to maximize shareholder value, including strategic options such as acquisition or sale opportunities, on an ongoing basis, both internally and with its external financial advisors on an annual basis As a result of last year’s non‐binding shareholder proposal, which the BOD took very seriously, it continued it’s annual review of strategic options BOD continues to focus on building long‐term value and will continue to evaluate means of maximizing shareholder value, including strategic options COMPENSATION REVIEW Compensation Committee retained an independent consultant to do annual executive compensation review targeting 50th percentile of consultant’s peer group compensation Cash bonuses tied to company financial performance goals set annually After IPO, the company and shareholders approved an equity compensation plan pursuant to which equity awards were made to executives and other employees in order to bring them in line with other peer public banking institutions SIGNIFICANT EXPENSE SAVINGS Eliminated 6.16 FTE with savings of medium six figures Reviewed/reviewing vendor contracts, branch hours, and employee cost‐saving suggestions Reduction in costs related to 2008 Equity Incentive Plan; expected savings of approximately $750,000 annualized IMPLEMENTED STRATEGY TO OFFSET COMPRESSED NET INTEREST MARGINS Delivered core relationship‐based balance sheet growth Focus on commercial loan growth with greater yields Enhanced fee structure to increase net interest margin 8
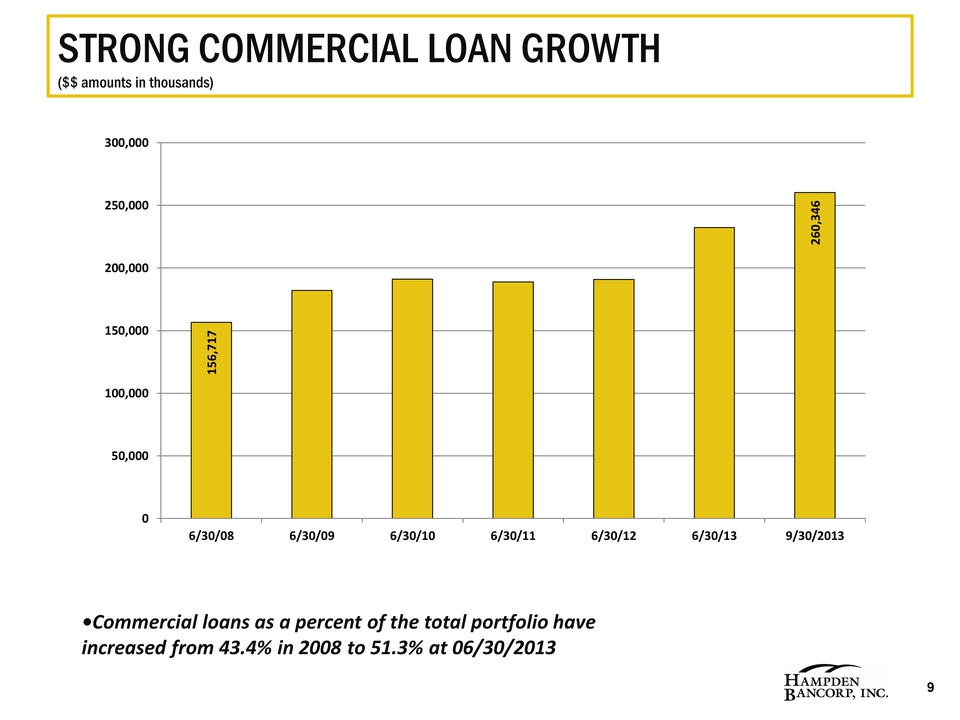
STRONG COMMERCIAL LOAN GROWTH ($$ amounts in thousands) Commercial loans as a percent of the total portfolio have increased from 43.4% in 2008 to 51.3% at 06/30/2013 156,717 260,346 6/30/08 6/30/09 6/30/10 6/30/11 6/30/12 6/30/13 9/30/2013 9
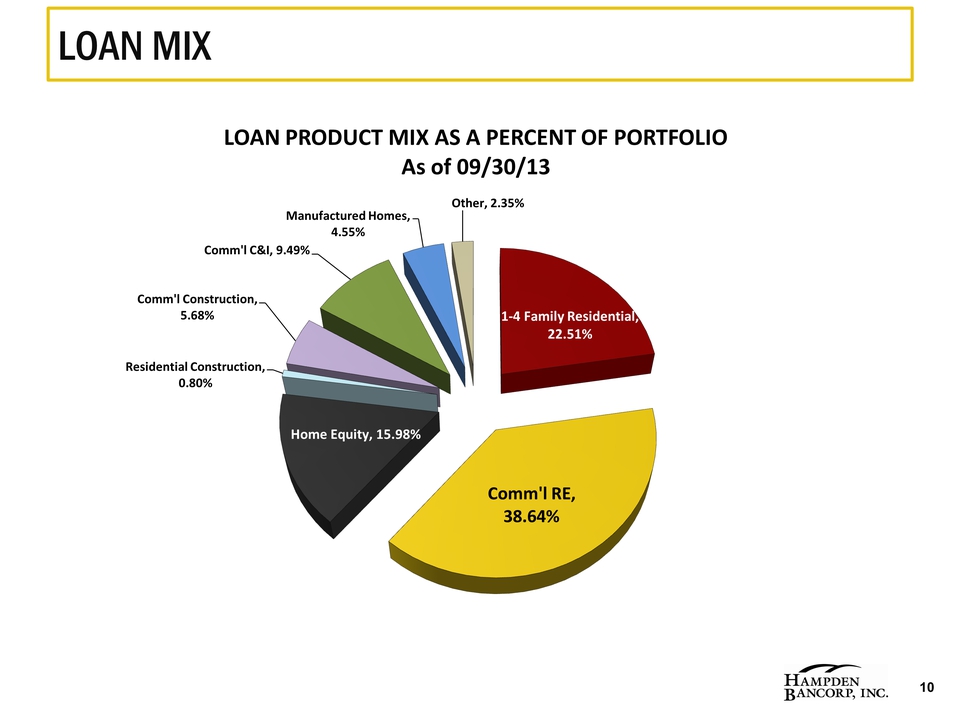
LOAN MIX LOAN PRODUCT MIX AS A PERCENT OF PORTFOLIO As of 09/30/13 Comm'l RE, 38.64% 1‐4 Family Residential, 22.51% Home Equity, 15.98% Comm'l C&I, 9.49% Comm'l Construction, 5.68% Manufactured Homes, 4.55% Other, 2.35% Residential Construction, 0.80% 10
DEPOSIT MIX ($$ amounts in thousands) Core deposits as a percent of total deposits have increased from 46.9% in 2008 to 65.2% at 06/30/13 142,046 320,366 189,422 165,303 Total Core Deposits Total Time Deposits 6/30/2008 6/30/2009 6/30/2010 6/30/2011 6/30/2012 6/30/2013 9/30/2013 11
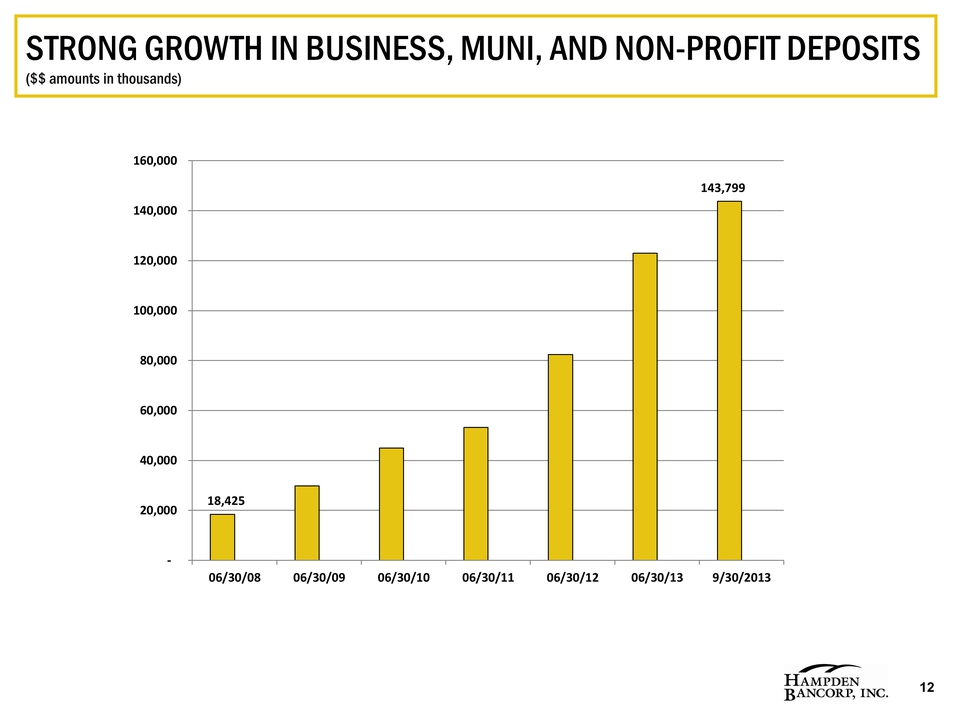
STRONG GROWTH IN BUSINESS, MUNI, AND NON-PROFIT DEPOSITS ($$ amounts in thousands) 18,425 143,799 06/30/08 06/30/09 06/30/10 06/30/11 06/30/12 06/30/13 9/30/2013 11
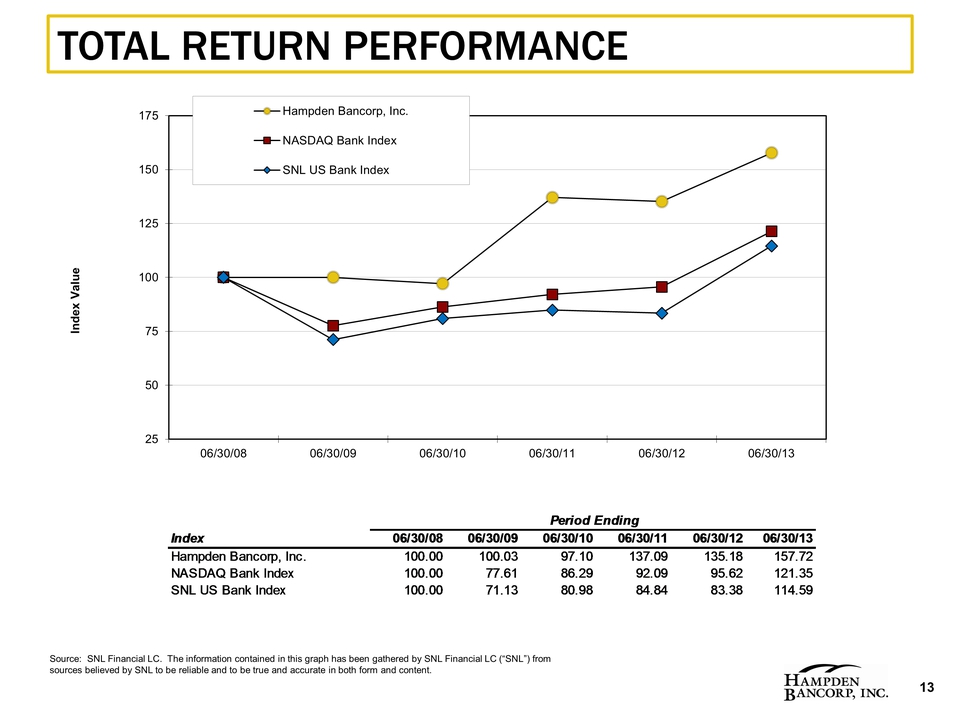
TOTAL RETURN PERFORMANCE Index Value Hampden Bancorp, Inc. NASDAQ Bank Index SNL US Bank Index 06/30/08 06/30/09 06/30/10 06/30/11 06/30/12 06/30/13 Source: SNL Financial LC. The information contained in this graph has been gathered by SNL Financial LC (“SNL”) from sources believed by SNL to be reliable and to be true and accurate in both form and content. Period Ending Index 06/30/08 06/30/09 06/30/10 06/30/11 06/30/12 06/30/13 Hampden Bancorp, Inc. 100.00 100.03 97.10 137.09 135.18 157.72 NASDAQ Bank Index 100.00 77.61 86.29 92.09 95.62 121.35 SNL US Bank Index 100.00 71.13 80.98 84.84 83.38 114.59 13
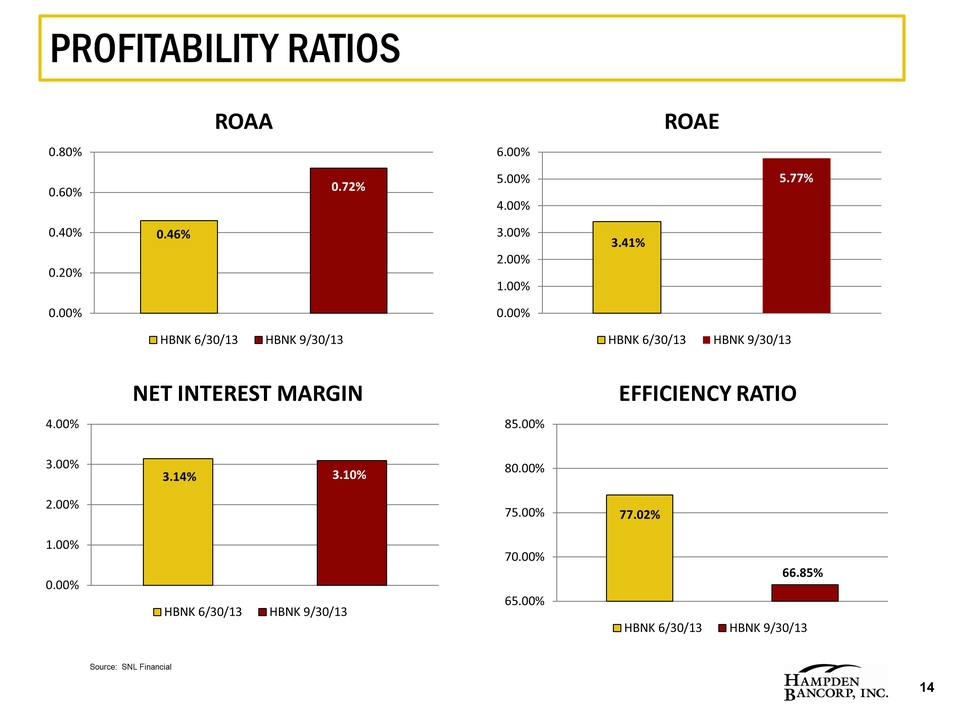
PROFITABILITY RATIOS ROAA 0.46% 0.72% HBNK 6/30/13 HBNK 9/30/13 ROAE 3.41% 5.77% HBNK 6/30/13 HBNK 9/30/13 NET INTEREST MARGIN 3.14% 3.10% HBNK 6/30/13 HBNK 9/30/13 EFFICIENCY RATIO 77.02% 66.85% HBNK 6/30/13 HBNK 9/30/13 Source: SNL Financial 14
WHY INVEST IN US Strategically positioned franchise Energized management team committed to strong operating performance Scalable platform built for long‐term growth Successfully executing Strategic Plan Disciplined capital management 15

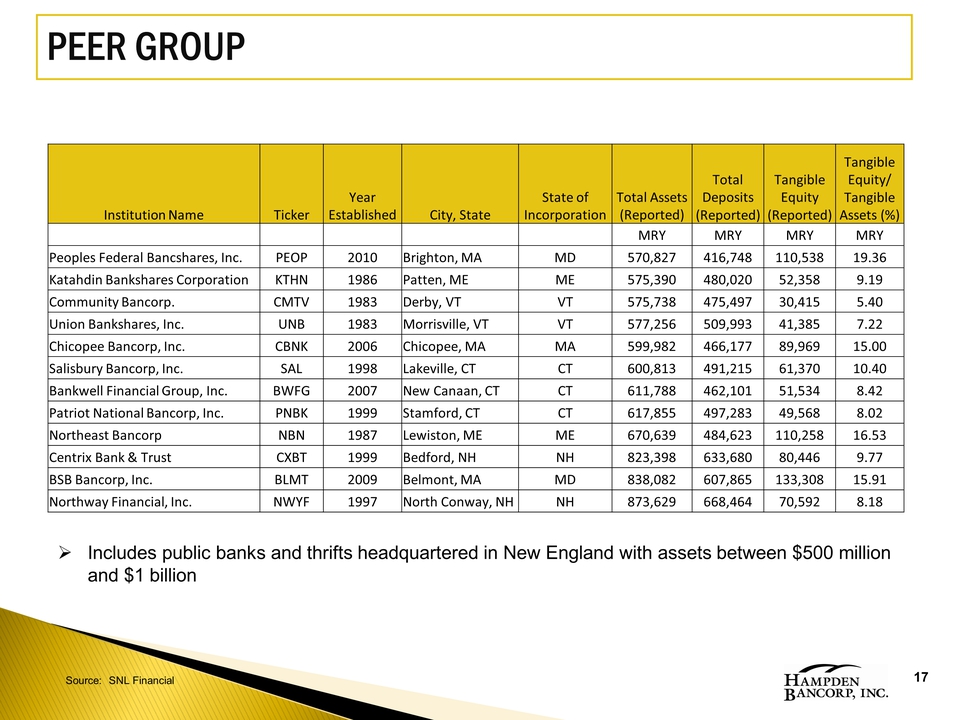
PEER GROUP Includes public banks and thrifts headquartered in New England with assets between $500 million and $1 billion Institution Name Ticker Year Established City, State State of Incorporation Total Assets (Reported) Total Deposits (Reported) Tangible Equity (Reported) Tangible Equity/ Tangible Assets (%) MRY MRY MRY MRY Peoples Federal Bancshares, Inc. PEOP 2010 Brighton, MA MD 570,827 416,748 110,538 19.36 Katahdin Bankshares Corporation KTHN 1986 Patten, ME ME 575,390 480,020 52,358 9.19 Community Bancorp. CMTV 1983 Derby, VT VT 575,738 475,497 30,415 5.40 Union Bankshares, Inc. UNB 1983 Morrisville, VT VT 577,256 509,993 41,385 7.22 Chicopee Bancorp, Inc. CBNK 2006 Chicopee, MA MA 599,982 466,177 89,969 15.00 Salisbury Bancorp, Inc. SAL 1998 Lakeville, CT CT 600,813 491,215 61,370 10.40 Bankwell Financial Group, Inc. BWFG 2007 New Canaan, CT CT 611,788 462,101 51,534 8.42 Patriot National Bancorp, Inc. PNBK 1999 Stamford, CT CT 617,855 497,283 49,568 8.02 Northeast Bancorp NBN 1987 Lewiston, ME ME 670,639 484,623 110,258 16.53 Centrix Bank & Trust CXBT 1999 Bedford, NH NH 823,398 633,680 80,446 9.77 BSB Bancorp, Inc. BLMT 2009 Belmont, MA MD 838,082 607,865 133,308 15.91 Northway Financial, Inc. NWYF 1997 North Conway, NH NH 873,629 668,464 70,592 8.18 Source: SNL Financial 17