UNITED STATES
SECURITIES AND EXCHANGE COMMISSION
Washington, D.C. 20549
FORM N-CSR
CERTIFIED SHAREHOLDER REPORT OF REGISTERED
MANAGEMENT INVESTMENT COMPANIES
Investment Company Act File Number: 811-21948
Cohen & Steers Closed-End Opportunity Fund, Inc.
(Exact name of registrant as specified in charter)
280 Park Avenue, New York, NY 10017
(Address of principal executive offices) (Zip code)
Dana A. DeVivo
Cohen & Steers Capital Management, Inc.
280 Park Avenue
New York, New York 10017
(Name and address of agent for service)
Registrant’s telephone number, including area code: (212) 832-3232
Date of fiscal year end: December 31
Date of reporting period: June 30, 2022
Item 1. Reports to Stockholders.
COHEN & STEERS CLOSED-END OPPORTUNITY FUND, INC.
To Our Shareholders:
We would like to share with you our report for the six months ended June 30, 2022. The total returns for Cohen & Steers Closed-End Opportunity Fund, Inc. (the Fund) and its comparative benchmarks were:
| | | | |
| | | Six Months Ended
June 30, 2022 | |
Cohen & Steers Closed-End Opportunity Fund at Net Asset Valuea | | | –18.67 | % |
Cohen & Steers Closed-End Opportunity Fund at Market Valuea | | | –24.60 | % |
S-Network All Taxable ex-Foreign Plus Capped Municipal CEF Indexb | | | –18.52 | % |
S&P 500 Indexb | | | –19.96 | % |
The performance data quoted represent past performance. Past performance is no guarantee of future results. The investment return and the principal value of an investment will fluctuate and shares, if sold, may be worth more or less than their original cost. Current performance may be lower or higher than the performance data quoted. Current total returns of the Fund can be obtained by visiting our website at cohenandsteers.com. The Fund’s returns assume the reinvestment of all dividends and distributions at prices obtained under the Fund’s dividend reinvestment plan. Net asset value (NAV) returns reflect fee waivers and/or expense reimbursements, without which the returns would be lower. Index performance does not reflect the deduction of any fees, taxes or expenses. An investor cannot invest directly in an index. Performance figures for periods shorter than one year are not annualized.
Managed Distribution Policy
The Fund, acting in accordance with an exemptive order received from the U.S. Securities and Exchange Commission (SEC) and with approval of its Board of Directors (the Board), adopted a managed distribution policy under which the Fund intends to include long-term capital gains, where applicable, as part of the regular monthly cash distributions to its shareholders (the Plan). The Plan gives the Fund greater flexibility to realize long-term capital gains and to distribute those gains on a regular monthly basis. In accordance with the Plan, the Fund currently distributes $0.087 per share on a monthly basis.
The Fund may pay distributions in excess of the Fund’s investment company taxable income and net realized gains. This excess would be a return of capital distributed from the Fund’s assets. Distributions of capital decrease the Fund’s total assets and, therefore, could have the effect of increasing the Fund’s expense ratio. In addition, in order to make these distributions, the Fund may have to sell portfolio securities at a less than opportune time.
| a | As a closed-end investment company, the price of the Fund’s exchange-traded shares will be set by market forces and can deviate from the net asset value (NAV) per share of the Fund. |
| b | The S-Network All Taxable ex-Foreign plus Capped Municipal CEF Index is a market capitalization-weighted index comprising all taxable closed-end funds and diversified municipal bond funds, except for single-country funds and region-specific equity funds. The index reconstitutes and rebalances quarterly. The S&P 500 Index is an unmanaged index of 500 large-capitalization stocks that is frequently used as a general measure of U.S. stock market performance. |
1
COHEN & STEERS CLOSED-END OPPORTUNITY FUND, INC.
Shareholders should not draw any conclusions about the Fund’s investment performance from the amount of these distributions or from the terms of the Fund’s Plan. The Fund’s total return based on NAV is presented in the table above as well as in the Financial Highlights table.
The Plan provides that the Board may amend or terminate the Plan at any time without prior notice to Fund shareholders; however, at this time, there are no reasonably foreseeable circumstances that might cause the termination. The termination of the Plan could have the effect of creating a trading discount (if the Fund’s stock is trading at or above NAV) or widening an existing trading discount.
Market Review
Closed-end funds declined in the six months ended June 30, 2022, hit by rising interest rates and capital market volatility stemming from Russia’s war with Ukraine. The period featured inflation readings at 40-year highs, as the war led to a pronounced increase in prices for energy and other commodities. In response, most major central banks began to aggressively raise interest rates to slow demand. The Federal Reserve increased its key interest rate by 50 basis points in early May, followed by a 75 basis-point hike in June, the sharpest individual hikes in decades. The Fed’s actions raised fears that the economy, already showing signs of slowing, would tip into recession, helping to send prices of stocks and bonds lower. Volatility was high throughout the period as bond yields rose sharply before backing off slightly by the end of the period.
Discounts to net asset value (NAV) expanded during the first half but ended the period down from their widest levels. Taxable fixed-income funds traded at an average 3.3% discount to NAV at period end, compared to a 0.7% premium at the start of the year; in June, the discount for the group topped 7% before backing off. Their long-term average discount is 3.3%. National municipal funds’ average discount widened to 5.7% from a 0.4% discount, compared with their long-term average discount of 3.9%. The average discount on equity funds reached 3.6%, up from 1.3% at the start of the year but below their long-term average of 5.3%.
The closed-end fund IPO window, which was open throughout 2021 (averaging one new deal per month), was effectively closed. A few IPOs came to market early in the period, but the spike in equity market volatility—and the decline in stocks that began in late February—cooled investor appetite. Plans for several offerings were subsequently shelved.
Fund Performance
The portfolio had a negative total return in the six months ended June 30, 2022, and trailed its benchmark on both a market price and net asset value basis.
Amid considerable stock market volatility globally, closed-end equity funds, on average, declined 15.7% in market price and 14.1% in NAV. Within this segment, U.S. general equity funds, U.S. hybrid and option income funds were among the biggest decliners. Global equity and global hybrid funds also trailed other equity fund categories. The Fund’s underweight allocation and selection in global equity and U.S. hybrid funds contributed to relative performance. Our selection and overweight allocation in U.S. general equity funds detracted from relative performance. Selection in option income funds also detracted from relative performance, although this was partially offset by a favorable underweight allocation in the category.
2
COHEN & STEERS CLOSED-END OPPORTUNITY FUND, INC.
While real estate fundamentals generally remained sound, slower growth and higher inflation clouded the outlook for REITs (and real estate funds). Utilities, which are often viewed as rate-sensitive, nevertheless outperformed as investors generally favored more-defensive stocks in the period. The Fund’s underweight allocation in utilities funds detracted from relative performance. However, this negative was partially offset by favorable security selection in the sector.
Global demand for commodities generally remained strong despite a weakening consumer and COVID-related activity restrictions in China. Meanwhile, energy supply has remained tight as Russian crude oil exports have diminished and skepticism surrounds OPEC’s ability to increase production. MLP funds rose as high oil and gas prices and strong midstream energy throughput volumes were supportive of the earnings of the underlying companies. The Fund’s overweight in MLP funds aided relative performance. In contrast, our non-investment in diversified commodity funds and underweight in single commodity funds detracted from the Fund’s relative performance.
Against a backdrop of rising interest rates, taxable fixed income closed-end funds overall lost 18.9% in market price and 15.4% on a NAV basis. Municipal bond funds, which tend to hold securities with longer durations, fared slightly worse. The Fund’s non-investment in taxable municipal bond funds and underweight and selection in diversified municipal bond funds modestly contributed to relative performance.
Bank loan funds and U.S. sector bond funds, both of which tend to hold relatively short-duration securities, were the top-performing bond fund categories. The Fund’s non-investment in U.S. sector bond funds modestly hindered relative performance.
The more equity-like bond funds, including convertible bonds and high-yield bonds, underperformed. The Fund’s underweight in convertible bond funds aided relative performance, while our selection in U.S. high-yield funds detracted.
Sincerely,
| | |

| | 
|
| DOUGLAS R. BOND | | JEFFREY PALMA |
| Portfolio Manager | | Portfolio Manager |
The views and opinions in the preceding commentary are subject to change without notice and are as of the date of the report. There is no guarantee that any market forecast set forth in the commentary will be realized. This material represents an assessment of the market environment at a specific point in time, should not be relied upon as investment advice and is not intended to predict or depict performance of any investment.
3
COHEN & STEERS CLOSED-END OPPORTUNITY FUND, INC.
Visit Cohen & Steers online at cohenandsteers.com
For more information about the Cohen & Steers family of mutual funds, visit cohenandsteers.com. Here you will find fund net asset values, fund fact sheets and portfolio highlights, as well as educational resources and timely market updates.
Our website also provides comprehensive information about Cohen & Steers, including our most recent press releases, profiles of our senior investment professionals and their investment approach to each asset class. The Cohen & Steers family of mutual funds specializes in liquid real assets, including real estate securities, listed infrastructure and natural resource equities, as well as preferred securities and other income solutions.
4
COHEN & STEERS CLOSED-END OPPORTUNITY FUND, INC.
Performance Review (Unaudited)
Average Annual Total Returns—For Periods Ended June 30, 2022
| | | | | | | | | | | | | | | | |
| | | 1 Year | | | 5 Years | | | 10 Years | | | Since Inceptiona | |
Fund at NAV | | | –15.48 | % | | | 3.99 | % | | | 6.71 | % | | | 5.08 | % |
Fund at Market Value | | | –20.41 | % | | | 4.48 | % | | | 7.23 | % | | | 4.63 | % |
The performance data quoted represent past performance. Past performance is no guarantee of future results. The investment return and principal value of an investment will fluctuate and shares, if redeemed, may be worth more or less than their original cost. Current performance may be lower or higher than the performance data quoted. Performance information current to the most recent month end can be obtained by visiting our website at cohenandsteers.com. Total return assumes the reinvestment of all dividends and distributions at prices obtained under the Fund’s dividend reinvestment plan. NAV returns reflect fee waivers and/or expense reimbursements, without which the returns would be lower. The performance table does not reflect the deduction of taxes that a shareholder would pay on Fund distributions or the sale of Fund shares.
| a | Commencement of investment operations was November 24, 2006. |
5
COHEN & STEERS CLOSED-END OPPORTUNITY FUND, INC.
June 30, 2022
Top Ten Holdingsa
(Unaudited)
| | | | | | | | |
Security | | Value | | | % of
Net
Assets | |
| | |
Pimco Dynamic Income Fund | | $ | 18,101,135 | | | | 6.0 | |
Adams Diversified Equity Fund, Inc. | | | 14,777,605 | | | | 4.9 | |
PIMCO Dynamic Income Opportunities Fund | | | 11,526,940 | | | | 3.8 | |
Gabelli Dividend & Income Trust | | | 9,577,267 | | | | 3.2 | |
Sprott Physical Gold and Silver Trust | | | 7,752,001 | | | | 2.6 | |
Eaton Vance Tax-Advantaged Global Dividend Income Fund | | | 7,622,607 | | | | 2.5 | |
DNP Select Income Fund, Inc. | | | 7,577,225 | | | | 2.5 | |
SPDR Gold Shares | | | 7,548,524 | | | | 2.5 | |
Eaton Vance Tax-Managed Global Diversified Equity Income Fund | | | 7,279,635 | | | | 2.4 | |
DoubleLine Income Solutions Fund | | | 5,892,560 | | | | 1.9 | |
| a | Top ten holdings (excluding short-term investments) are determined on the basis of the value of individual securities held. The Fund may also hold positions in other securities issued by the companies listed above. See the Schedule of Investments for additional details on such other positions. |
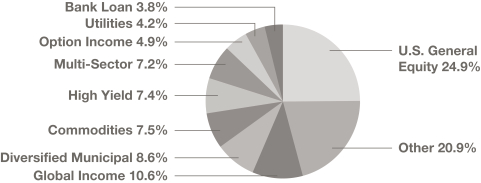
Sector Breakdown
(Based on Net Assets)
(Unaudited)
6
COHEN & STEERS CLOSED-END OPPORTUNITY FUND, INC.
SCHEDULE OF INVESTMENTS
June 30, 2022 (Unaudited)
| | | | | | | | | | | | |
| | | | | | Shares | | | Value | |
CLOSED-END FUNDS | | | 84.9% | | | | | | | | | |
BANK LOAN | | | 3.8% | | | | | | | | | |
Ares Dynamic Credit Allocation Fund, Inc. | | | | 156,132 | | | $ | 1,904,810 | |
BlackRock Debt Strategies Fund, Inc. | | | | 36,029 | | | | 329,305 | |
BlackRock Floating Rate Income Trust Fund, Inc. | | | | 83,871 | | | | 924,258 | |
Blackstone Long-Short Credit Income Fund | | | | 244,441 | | | | 2,811,071 | |
Eaton Vance Senior Floating-Rate Trust | | | | 71,684 | | | | 879,563 | |
Invesco Dynamic Credit Opportunity Funda | | | | 172,351 | | | | 1,935,498 | |
Invesco Senior Income Trust | | | | 480,577 | | | | 1,869,445 | |
Nuveen Credit Strategies Income Fund | | | | 171,033 | | | | 889,372 | |
| | | | | | | | | | | | |
| | | | | | | | 11,543,322 | |
| | | | | | | | | | | | |
COMMODITIES—FOREIGN | | | 4.5% | | | | | | | | | |
Sprott Physical Gold and Silver Trust (Canada)b | | | | 460,880 | | | | 7,752,001 | |
Sprott Physical Gold Trust (Canada)b | | | | 174,109 | | | | 2,468,866 | |
Sprott Physical Platinum & Palladium Trust (Canada)b | | | | 68,522 | | | | 905,861 | |
Sprott Physical Silver Trust (Canada)b | | | | 342,012 | | | | 2,359,883 | |
| | | | | | | | | | | | |
| | | | | | | | 13,486,611 | |
| | | | | | | | | | | | |
CONVERTIBLE | | | 0.3% | | | | | | | | | |
Virtus AllianzGI Convertible & Income Fund | | | | 66,709 | | | | 245,489 | |
Virtus AllianzGI Convertible & Income Fund II | | | | 237,809 | | | | 751,476 | |
| | | | | | | | | | | | |
| | | | | | | | 996,965 | |
| | | | | | | | | | | | |
DIVERSIFIED EMERGING MARKETS EQUITY | | | 0.1% | | | | | | | | | |
Templeton Emerging Markets Fund | | | | 37,645 | | | | 450,987 | |
| | | | | | | | | | | | |
DIVERSIFIED EMERGING MARKETS EQUITY—FOREIGN | | | 0.1% | | | | | | | | | |
Templeton Emerging Markets Investment Trust PLC (United Kingdom) | | | | 237,712 | | | | 430,732 | |
| | | | | | | | | | | | |
DIVERSIFIED MUNICIPAL | | | 8.6% | | | | | | | | | |
BlackRock MuniHoldings Fund, Inc. | | | | 109,873 | | | | 1,394,288 | |
BlackRock MuniHoldings Quality Fund II, Inc. | | | | 32,996 | | | | 363,616 | |
BlackRock MuniVest Fund, Inc. | | | | 213,857 | | | | 1,593,235 | |
BlackRock MuniYield Quality Fund II, Inc. | | | | 21,578 | | | | 247,284 | |
BlackRock MuniYield Quality Fund III, Inc. | | | | 215,160 | | | | 2,508,766 | |
BlackRock MuniYield Quality Fund, Inc. | | | | 75,367 | | | | 956,407 | |
Eaton Vance Municipal Income Trust | | | | 51,258 | | | | 560,763 | |
MainStay MacKay DefinedTerm Municipal Opportunities Fund | | | | 22,673 | | | | 411,288 | |
See accompanying notes to financial statements.
7
COHEN & STEERS CLOSED-END OPPORTUNITY FUND, INC.
SCHEDULE OF INVESTMENTS—(Continued)
June 30, 2022 (Unaudited)
| | | | | | | | | | | | |
| | | | | | Shares | | | Value | |
Nuveen AMT-Free Municipal Credit Income Fund | | | | 122,054 | | | $ | 1,600,128 | |
Nuveen AMT-Free Quality Municipal Income Fund | | | | 243,424 | | | | 2,860,232 | |
Nuveen Dynamic Municipal Opportunities Fund | | | | 67,264 | | | | 747,976 | |
Nuveen Municipal Credit Income Fund | | | | 167,599 | | | | 2,105,043 | |
Nuveen Municipal Credit Opportunities Fund | | | | 195,251 | | | | 2,389,872 | |
Nuveen Municipal Value Fund, Inc. | | | | 221,118 | | | | 1,974,584 | |
Nuveen Quality Municipal Income Fund | | | | 253,159 | | | | 3,156,893 | |
PIMCO Municipal Income Fund | | | | 79,460 | | | | 915,379 | |
PIMCO Municipal Income Fund III | | | | 94,215 | | | | 868,662 | |
Putnam Managed Municipal Income Trust | | | | 89,542 | | | | 592,768 | |
Putnam Municipal Opportunities Trust | | | | 50,786 | | | | 598,767 | |
Western Asset Municipal Partners Fund, Inc. | | | | 16,875 | | | | 211,106 | |
| | | | | | | | | | | | |
| | | | | | | | | | | 26,057,057 | |
| | | | | | | | | | | | |
GLOBAL EQUITY | | | 1.1% | | | | | | | | | |
Aberdeen Total Dynamic Dividend Fund | | | | 417,314 | | | | 3,371,897 | |
| | | | | | | | | | | | |
GLOBAL HYBRID | | | 3.1% | | | | | | | | | |
Blackrock Capital Allocation Trust | | | | 326,007 | | | | 4,776,002 | |
Blackrock ESG Capital Allocation Trust | | | | 232,393 | | | | 3,325,544 | |
Thornburg Income Builder Opportunities Trust | | | | 93,893 | | | | 1,362,387 | |
| | | | | | | | | | | | |
| | | | | | | | | | | 9,463,933 | |
| | | | | | | | | | | | |
GLOBAL INCOME | | | 10.6% | | | | | | | | | |
Pimco Dynamic Income Fund | | | | 867,328 | | | | 18,101,135 | |
PIMCO Dynamic Income Opportunities Fund | | | | 832,270 | | | | 11,526,940 | |
Western Asset Diversified Income Fund | | | | 145,412 | | | | 2,015,410 | |
Western Asset Global High Income Fund, Inc. | | | | 70,333 | | | | 495,848 | |
| | | | | | | | | | | | |
| | | | | | | | | | | 32,139,333 | |
| | | | | | | | | | | | |
HIGH YIELD | | | 7.2% | | | | | | | | | |
Allspring Income Opportunities | | | | 729,233 | | | | 4,732,722 | |
Apollo Tactical Income Fund, Inc. | | | | 103,255 | | | | 1,243,190 | |
Barings Global Short Duration High Yield Fund | | | | 104,121 | | | | 1,354,614 | |
BlackRock Corporate High Yield Fund, Inc. | | | | 64,964 | | | | 619,107 | |
DoubleLine Yield Opportunities Fund | | | | 114,849 | | | | 1,646,935 | |
KKR Income Opportunities Fund | | | | 141,567 | | | | 1,647,840 | |
PGIM Global High Yield Fund, Inc. | | | | 304,751 | | | | 3,495,494 | |
PGIM High Yield Bond Fund, Inc. | | | | 322,912 | | | | 3,975,047 | |
PGIM Short Duration High Yield Opportunities Fund | | | | 83,445 | | | | 1,244,165 | |
See accompanying notes to financial statements.
8
COHEN & STEERS CLOSED-END OPPORTUNITY FUND, INC.
SCHEDULE OF INVESTMENTS—(Continued)
June 30, 2022 (Unaudited)
| | | | | | | | | | | | |
| | | | | | Shares | | | Value | |
Pioneer Diversified High Income Fund, Inc. | | | | 87,051 | | | $ | 943,633 | |
Pioneer High Income Fund, Inc. | | | | 111,696 | | | | 788,574 | |
| | | | | | | | | | | | |
| | | | | | | | | | | 21,691,321 | |
| | | | | | | | | | | | |
MASTER LIMITED PARTNERSHIPS | | | 3.1% | | | | | | | | | |
First Trust Energy Infrastructure Fund | | | | 271,837 | | | | 3,892,706 | |
First Trust MLP and Energy Income Fund | | | | 436,173 | | | | 3,354,170 | |
First Trust New Opportunities MLP & Energy Fund | | | | 365,981 | | | | 2,115,370 | |
| | | | | | | | | | | | |
| | | | | | | | | | | 9,362,246 | |
| | | | | | | | | | | | |
MULTI-SECTOR | | | 7.2% | | | | | | | | | |
BlackRock Credit Allocation Income Trust IV | | | | 22,902 | | | | 249,403 | |
BlackRock Multi-Sector Income Trust | | | | 17,463 | | | | 248,149 | |
DoubleLine Income Solutions Fund | | | | 485,784 | | | | 5,892,560 | |
Guggenheim Active Allocation Fund/DE | | | | 232,194 | | | | 3,297,155 | |
Guggenheim Strategic Opportunities Fund | | | | 307,498 | | | | 4,947,643 | |
PIMCO Global StocksPLUS & Income Fund | | | | 190,795 | | | | 1,505,373 | |
PIMCO High Income Fund | | | | 813,408 | | | | 4,205,319 | |
PIMCO Income Strategy Fund II | | | | 164,500 | | | | 1,302,840 | |
| | | | | | | | | | | | |
| | | | | | | | | | | 21,648,442 | |
| | | | | | | | | | | | |
OPTION INCOME | | | 4.9% | | | | | | | | | |
BlackRock Enhanced Capital and Income Fund, Inc. | | | | 8,626 | | | | 151,645 | |
BlackRock Science & Technology Trust | | | | 52,827 | | | | 1,716,349 | |
Eaton Vance Enhanced Equity Income Fund II | | | | 68,798 | | | | 1,113,840 | |
Eaton Vance Tax-Managed Buy-Write Opportunities Fund | | | | 22,753 | | | | 307,393 | |
Eaton Vance Tax-Managed Diversified Equity Income Fund | | | | 384,084 | | | | 4,351,672 | |
Eaton Vance Tax-Managed Global Diversified Equity Income Fund | | | | 944,181 | | | | 7,279,635 | |
| | | | | | | | | | | | |
| | | | | | | | | | | 14,920,534 | |
| | | | | | | | | | | | |
PREFERRED | | | 1.9% | | | | | | | | | |
Flaherty & Crumrine Preferred and Income Securities Fund, Inc. | | | | 14,515 | | | | 243,416 | |
John Hancock Preferred Income Fund | | | | 38,135 | | | | 667,744 | |
John Hancock Preferred Income Fund III | | | | 33,788 | | | | 532,837 | |
Nuveen Preferred & Income Opportunities Fund | | | | 283,303 | | | | 2,167,268 | |
Nuveen Preferred & Income Securities Fund | | | | 292,207 | | | | 2,121,423 | |
| | | | | | | | | | | | |
| | | | | | | | | | | 5,732,688 | |
| | | | | | | | | | | | |
See accompanying notes to financial statements.
9
COHEN & STEERS CLOSED-END OPPORTUNITY FUND, INC.
SCHEDULE OF INVESTMENTS—(Continued)
June 30, 2022 (Unaudited)
| | | | | | | | | | | | |
| | | | | | Shares | | | Value | |
REAL ESTATE | | | 2.5% | | | | | | | | | |
Aberdeen Global Premier Properties Fund | | | | 262,052 | | | $ | 1,286,675 | |
CBRE Global Real Estate Income Fund | | | | 224,208 | | | | 1,627,750 | |
Nuveen Real Asset Income and Growth Fund | | | | 172,921 | | | | 2,260,078 | |
Nuveen Real Estate Income Fund | | | | 242,700 | | | | 2,281,380 | |
| | | | | | | | | | | | |
| | | | | | | | | | | 7,455,883 | |
| | | | | | | | | | | | |
SECTOR EQUITY | | | 1.7% | | | | | | | | | |
BlackRock Health Sciences Trust II | | | | 36,363 | | | | 597,444 | |
Tekla Healthcare Investors | | | | 124,562 | | | | 2,328,064 | |
Tekla Healthcare Opportunities Fund | | | | 69,045 | | | | 1,376,757 | |
Tekla Life Sciences Investors | | | | 55,489 | | | | 789,609 | |
| | | | | | | | | | | | |
| | | | | | | | | | | 5,091,874 | |
| | | | | | | | | | | | |
SECTOR EQUITY—FOREIGN | | | 0.4% | | | | | | | | | |
Hipgnosis Songs Fund Ltd./The Fund (United Kingdom) | | | | 973,447 | | | | 1,301,659 | |
| | | | | | | | | | | | |
SHORT DURATION | | | 1.4% | | | | | | | | | |
BlackRock Limited Duration Income Trust | | | | 316,920 | | | | 4,009,038 | |
Eaton Vance Limited Duration Income Fund | | | | 30,209 | | | | 312,059 | |
| | | | | | | | | | | | |
| | | | | | | | | | | 4,321,097 | |
| | | | | | | | | | | | |
U.S. GENERAL EQUITY | | | 16.9% | | | | | | | | | |
Adams Diversified Equity Fund, Inc. | | | | 963,338 | | | | 14,777,605 | |
Boulder Growth & Income Fund, Inc. | | | | 396,251 | | | | 4,735,199 | |
Eaton Vance Tax-Advantaged Dividend Income Fund | | | | 200,940 | | | | 4,796,438 | |
Eaton Vance Tax-Advantaged Global Dividend Income Fund | | | | 473,160 | | | | 7,622,607 | |
Gabelli Dividend & Income Trust | | | | 468,326 | | | | 9,577,267 | |
General American Investors Co., Inc. | | | | 73,966 | | | | 2,615,438 | |
Liberty All-Star Equity Fund | | | | 283,945 | | | | 1,783,175 | |
Liberty All-Star Growth Fund, Inc. | | | | 34,070 | | | | 198,628 | |
Nuveen Core Equity Alpha Fund | | | | 76,928 | | | | 1,026,989 | |
Royce Value Trust, Inc. | | | | 290,360 | | | | 4,056,329 | |
| | | | | | | | | | | | |
| | | | | | | | | | | 51,189,675 | |
| | | | | | | | | | | | |
U.S. GENERAL EQUITY—FOREIGN | | | 0.4% | | | | | | | | | |
Baillie Gifford US Growth Trust PLC (United Kingdom)b | | | | 610,373 | | | | 1,116,983 | |
| | | | | | | | | | | | |
U.S. HYBRID | | | 0.9% | | | | | | | | | |
PIMCO Energy & Tactical Credit Opportunities Fund | | | | 134,891 | | | | 1,732,000 | |
Virtus AllianzGI Equity & Convertible Income Fund | | | | 43,778 | | | | 908,394 | |
| | | | | | | | | | | | |
| | | | | | | | | | | 2,640,394 | |
| | | | | | | | | | | | |
See accompanying notes to financial statements.
10
COHEN & STEERS CLOSED-END OPPORTUNITY FUND, INC.
SCHEDULE OF INVESTMENTS—(Continued)
June 30, 2022 (Unaudited)
| | | | | | | | | | | | |
| | | | | | Shares | | | Value | |
UTILITIES | | | 4.2% | | | | | | | | | |
DNP Select Income Fund, Inc. | | | | 699,006 | | | $ | 7,577,225 | |
Macquarie Global Infrastructure Total Return Fund, Inc. | | | | 130,836 | | | | 3,035,395 | |
MainStay CBRE Global Infrastructure Megatrends Fund | | | | 99,012 | | | | 1,573,301 | |
Reaves Utility Income Fund | | | | 15,285 | | | | 473,835 | |
| | | | | | | | | | | | |
| | | | | | | | | | | 12,659,756 | |
| | | | | | | | | | | | |
TOTAL CLOSED-END FUNDS
(Identified cost—$288,915,387) | | | | | | | | 257,073,389 | |
| | | | | | | | | | | | |
EXCHANGE-TRADED FUNDS | | | 13.7% | | | | | | | | | |
COMMODITIES | | | 3.0% | | | | | |
iShares Silver Trustb | | | | 86,983 | | | | 1,621,363 | |
SPDR Gold Sharesb | | | | 44,809 | | | | 7,548,524 | |
| | | | | | | | | | | | |
| | | | | | | | | | | 9,169,887 | |
| | | | | | | | | | | | |
PREFERRED | | | 0.3% | | | | | | | | | |
iShares Preferred & Income Securities ETF | | | | 23,145 | | | | 761,008 | |
| | | | | | | | | | | | |
HIGH YIELD | | | 0.2% | | | | | | | | | |
iShares iBoxx High Yield Corporate Bond ETF | | | | 6,349 | | | | 467,350 | |
| | | | | | | | | | | | |
REAL ESTATE | | | 1.3% | | | | | | | | | |
Vanguard Real Estate ETF | | | | 44,303 | | | | 4,036,446 | |
| | | | | | | | | | | | |
SECTOR EQUITY | | | 0.9% | | | | | | | | | |
Energy Select Sector SPDR Fund | | | | 5,253 | | | | 375,642 | |
iShares Biotechnology ETF | | | | 14,773 | | | | 1,737,748 | |
VanEck Pharmaceutical ETF | | | | 9,855 | | | | 757,258 | |
| | | | | | | | | | | | |
| | | | | | | | | | | 2,870,648 | |
| | | | | | | | | | | | |
U.S. GENERAL EQUITY | | | 7.6% | | | | | | | | | |
Consumer Discretionary Select Sector SPDR ETF | | | | 16,450 | | | | 2,261,546 | |
Invesco S&P 500 Equal Weight Consumer Discretionary ETF | | | | 21,135 | | | | 2,263,136 | |
Invesco S&P 500 Equal Weight ETF | | | | 20,405 | | | | 2,738,963 | |
iShares Russell 2000 ETF | | | | 18,006 | | | | 3,049,496 | |
iShares Russell 2000 Value ETF | | | | 8,113 | | | | 1,104,585 | |
SPDR S&P 500 ETF Trust | | | | 15,008 | | | | 5,661,768 | |
Vanguard S&P 500 ETF | | | | 16,815 | | | | 5,832,787 | |
| | | | | | | | | | | | |
| | | | | | | | | | | 22,912,281 | |
| | | | | | | | | | | | |
See accompanying notes to financial statements.
11
COHEN & STEERS CLOSED-END OPPORTUNITY FUND, INC.
SCHEDULE OF INVESTMENTS—(Continued)
June 30, 2022 (Unaudited)
| | | | | | | | | | | | |
| | | | | | Shares | | | Value | |
U.S. GOVERNMENT BOND | | | 0.4% | | | | | | | | | |
iShares 20+ Year Treasury Bond ETF | | | | 11,019 | | | $ | 1,265,753 | |
| | | | | | | | | | | | |
TOTAL EXCHANGE-TRADED FUNDS
(Identified cost—$38,965,906) | | | | | | | | 41,483,373 | |
| | | | | | | | | | | | |
COMMON STOCK—FINANCIAL | | | 0.8% | | | | | | | | | |
Berkshire Hathaway, Inc., Class Bb | | | | 8,739 | | | | 2,385,922 | |
| | | | | | | | | | | | |
TOTAL COMMON STOCK
(Identified cost—$2,324,900) | | | | | | | | 2,385,922 | |
| | | | | | | | | | | | |
SHORT-TERM INVESTMENTS | | | 0.1% | | | | | | | | | |
MONEY MARKET FUNDS | | | | | | | | | |
State Street Institutional Treasury Money Market Fund, Premier Class, 1.04%c | | | | 288,266 | | | | 288,266 | |
| | | | | | | | | | | | |
TOTAL SHORT-TERM INVESTMENTS
(Identified cost—$288,266) | | | | | | | | 288,266 | |
| | | | | | | | | | | | |
TOTAL INVESTMENTSIN SECURITIES
(Identified cost—$330,494,459) | | | 99.5% | | | | | | | | 301,230,950 | |
OTHER ASSETSIN EXCESSOF LIABILITIES | | | 0.5 | | | | | | | | 1,433,289 | |
| | | | | | | | | | | | |
NET ASSETS (Equivalent to $11.06 per share based on 27,367,864 shares of common stock outstanding) | | | 100.0% | | | | | | | $ | 302,664,239 | |
| | | | | | | | | | | | |
Glossary of Portfolio Abbreviations
| | | | |
ETF | | Exchange-Traded Fund |
MLP | | Master Limited Partnership |
SPDR | | Standard & Poor’s Depositary Receipt |
Note: Percentages indicated are based on the net assets of the Fund.
a Investment valued using NAV as the practical expedient and has been excluded from the fair value hierarchy. The investment fund provides liquidity through quarterly repurchase offers.
b Non-income producing security.
c Rate quoted represents the annualized seven-day yield.
See accompanying notes to financial statements.
12
COHEN & STEERS CLOSED-END OPPORTUNITY FUND, INC.
STATEMENT OF ASSETS AND LIABILITIES
June 30, 2022 (Unaudited)
| | | | |
ASSETS: | |
Investments in securities, at value (Identified cost—$330,494,459) | | $ | 301,230,950 | |
Cash | | | 133,580 | |
Foreign currency, at value (Identified cost—$11,746) | | | 11,718 | |
Receivable for: | | | | |
Investment securities sold | | | 2,644,085 | |
Dividends and interest | | | 855,537 | |
Other assets | | | 788 | |
| | | | |
Total Assets | | | 304,876,658 | |
| | | | |
LIABILITIES: | |
Payable for: | | | | |
Investment securities purchased | | | 1,843,511 | |
Investment management fees | | | 242,354 | |
Dividends declared | | | 123,084 | |
Directors’ fees | | | 380 | |
Other liabilities | | | 3,090 | |
| | | | |
Total Liabilities | | | 2,212,419 | |
| | | | |
NET ASSETS | | $ | 302,664,239 | |
| | | | |
NET ASSETS consist of: | |
Paid-in capital | | $ | 336,601,189 | |
Total distributable earnings/(accumulated loss) | | | (33,936,950 | ) |
| | | | |
| | $ | 302,664,239 | |
| | | | |
NET ASSET VALUE PER SHARE: | |
($302,664,239 ÷ 27,367,864 shares outstanding) | | $ | 11.06 | |
| | | | |
MARKET PRICE PER SHARE | | $ | 10.68 | |
| | | | |
MARKET PRICE PREMIUM (DISCOUNT) TO NET ASSET VALUE PER SHARE | | | (3.44 | )% |
| | | | |
See accompanying notes to financial statements.
13
COHEN & STEERS CLOSED-END OPPORTUNITY FUND, INC.
STATEMENT OF OPERATIONS
For the Six Months Ended June 30, 2022 (Unaudited)
| | | | |
Investment Income: | |
Dividend income | | $ | 6,940,363 | |
| | | | |
Expenses: | |
Investment management fees | | | 1,628,623 | |
Directors’ fees and expenses | | | 5,575 | |
Miscellaneous | | | 1,181 | |
| | | | |
Total Expenses | | | 1,635,379 | |
Reduction of Expenses (See Note 2) | | | (6,756 | ) |
| | | | |
Net Expenses | | | 1,628,623 | |
| | | | |
Net Investment Income (Loss) | | | 5,311,740 | |
| | | | |
Net Realized and Unrealized Gain (Loss): | |
Net realized gain (loss) on: | |
Investments in securities | | | 2,187,872 | |
Foreign currency transactions | | | (1,581 | ) |
| | | | |
Net realized gain (loss) | | | 2,186,291 | |
| | | | |
Net change in unrealized appreciation (depreciation) on: | |
Investments in securities | | | (78,908,960 | ) |
Foreign currency translations | | | (94 | ) |
| | | | |
Net change in unrealized appreciation (depreciation) | | | (78,909,054 | ) |
| | | | |
Net Realized and Unrealized Gain (Loss) | | | (76,722,763 | ) |
| | | | |
Net Increase (Decrease) in Net Assets Resulting from Operations | | $ | (71,411,023 | ) |
| | | | |
See accompanying notes to financial statements.
14
COHEN & STEERS CLOSED-END OPPORTUNITY FUND, INC.
STATEMENT OF CHANGES IN NET ASSETS (Unaudited)
| | | | | | | | |
| | | For the
Six Months Ended
June 30, 2022 | | | For the
Year Ended
December 31, 2021 | |
Change in Net Assets: | |
From Operations: | | | | | | | | |
Net investment income (loss) | | $ | 5,311,740 | | | $ | 8,682,730 | |
Net realized gain (loss) | | | 2,186,291 | | | | 41,744,400 | |
Net change in unrealized appreciation (depreciation) | | | (78,909,054 | ) | | | 15,535,645 | |
| | | | | | | | |
Net increase (decrease) in net assets
resulting from operations | | | (71,411,023 | ) | | | 65,962,775 | |
| | | | | | | | |
Distributions to Shareholders | | | (14,283,276 | ) | | | (28,492,145 | ) |
| | | | | | | | |
Capital Stock Transactions: | | | | | | | | |
Increase (decrease) in net assets from Fund share transactions | | | 279,242 | | | | 1,479,521 | |
| | | | | | | | |
Total increase (decrease) in net assets | | | (85,415,057 | ) | | | 38,950,151 | |
Net Assets: | | | | | | | | |
Beginning of period | | | 388,079,296 | | | | 349,129,145 | |
| | | | | | | | |
End of period | | $ | 302,664,239 | | | $ | 388,079,296 | |
| | | | | | | | |
See accompanying notes to financial statements.
15
COHEN & STEERS CLOSED-END OPPORTUNITY FUND, INC.
FINANCIAL HIGHLIGHTS (Unaudited)
The following table includes selected data for a share outstanding throughout each period and other performance information derived from the financial statements. It should be read in conjunction with the financial statements and notes thereto.
| | | | | | | | | | | | | | | | | | | | | | | | |
| | | For the Six
Months Ended
June 30, 2022 | | | For the Year Ended December 31, | |
Per Share Operating Data: | | 2021 | | | 2020 | | | 2019 | | | 2018 | | | 2017 | |
Net asset value, beginning of period | | | $14.19 | | | | $12.82 | | | | $13.70 | | | | $11.71 | | | | $14.02 | | | | $13.02 | |
| | | | | | | | | | | | | | | | | | | | | | | | |
Income (loss) from investment operations: | |
| | | | | | |
Net investment income (loss)a,b | | | 0.19 | | | | 0.32 | | | | 0.31 | | | | 0.36 | | | | 0.44 | | | | 0.44 | |
| | | | | | |
Net realized and unrealized gain (loss) | | | (2.80 | ) | | | 2.09 | | | | (0.15 | ) | | | 2.67 | | | | (1.71 | ) | | | 1.60 | |
| | | | | | | | | | | | | | | | | | | | | | | | |
Total from investment operations | | | (2.61 | ) | | | 2.41 | | | | 0.16 | | | | 3.03 | | | | (1.27 | ) | | | 2.04 | |
| | | | | | | | | | | | | | | | | | | | | | | | |
Less dividends and distributions to shareholders from: | | | | | | | | | | | | | | | | | | | | | | | | |
| | | | | | |
Net investment income | | | (0.52 | ) | | | (0.37 | ) | | | (0.29 | ) | | | (0.45 | ) | | | (0.87 | ) | | | (1.04 | ) |
| | | | | | |
Net realized gain | | | — | | | | (0.67 | ) | | | — | | | | (0.08 | ) | | | — | | | | — | |
| | | | | | |
Tax return of capital | | | — | | | | — | | | | (0.75 | ) | | | (0.51 | ) | | | (0.17 | ) | | | — | |
| | | | | | | | | | | | | | | | | | | | | | | | |
Total dividends and distributions to shareholders | | | (0.52 | ) | | | (1.04 | ) | | | (1.04 | ) | | | (1.04 | ) | | | (1.04 | ) | | | (1.04 | ) |
| | | | | | | | | | | | | | | | | | | | | | | | |
Net increase (decrease) in net asset value | | | (3.13 | ) | | | 1.37 | | | | (0.88 | ) | | | 1.99 | | | | (2.31 | ) | | | 1.00 | |
| | | | | | | | | | | | | | | | | | | | | | | | |
Net asset value, end of period | | | $11.06 | | | | $14.19 | | | | $12.82 | | | | $13.70 | | | | $11.71 | | | | $14.02 | |
| | | | | | | | | | | | | | | | | | | | | | | | |
Market value, end of period | | | $10.68 | | | | $14.78 | | | | $12.42 | | | | $13.42 | | | | $11.09 | | | | $13.31 | |
| | | | | | | | | | | | | | | | | | | | | | | | |
| | | | | | |
| | | | | | | | | | | | | | | | | | | | | | | | | |
Total net asset value returnc | | | –18.67 | %d | | | 19.38 | % | | | 2.69 | % | | | 26.89 | % | | | –9.24 | % | | | 16.67 | % |
| | | | | | | | | | | | | | | | | | | | | | | | |
Total market value returnc | | | –24.60 | %d | | | 28.35 | % | | | 1.56 | % | | | 31.25 | % | | | –9.46 | % | | | 23.26 | % |
| | | | | | | | | | | | | | | | | | | | | | | | |
| | | | | | |
| | | | | | | | | | | | | | | | | | | | | | | | | |
See accompanying notes to financial statements.
16
COHEN & STEERS CLOSED-END OPPORTUNITY FUND, INC.
FINANCIAL HIGHLIGHTS (Unaudited)—(Continued)
| | | | | | | | | | | | | | | | | | | | | | | | |
| | | For the Six
Months Ended
June 30, 2022 | | | For the Year Ended December 31, | |
Ratios/Supplemental Data: | | 2021 | | | 2020 | | | 2019 | | | 2018 | | | 2017 | |
Net assets, end of period (in millions) | | $ | 302.7 | | | $ | 388.1 | | | $ | 349.1 | | | $ | 373.0 | | | $ | 318.5 | | | $ | 381.4 | |
| | | | | | | | | | | | | | | | | | | | | | | | |
Ratios to average daily net assets: | | | | | | | | | | | | | | | | | | | | | | | | |
| | | | | | |
Expenses (before expense reduction)e | | | 0.95 | %f | | | 0.95 | % | | | 0.96 | % | | | 0.96 | % | | | 0.96 | % | | | 0.96 | % |
| | | | | | | | | | | | | | | | | | | | | | | | |
Expenses (net of expense reduction)e | | | 0.95 | %f | | | 0.95 | % | | | 0.95 | % | | | 0.95 | % | | | 0.95 | % | | | 0.95 | % |
| | | | | | | | | | | | | | | | | | | | | | | | |
Net investment income (loss) (before expense reduction)b,e | | | 3.10 | %f | | | 2.31 | % | | | 2.63 | % | | | 2.76 | % | | | 3.28 | % | | | 3.19 | % |
| | | | | | | | | | | | | | | | | | | | | | | | |
Net investment income (loss) (net of expense reduction)b,e | | | 3.10 | %f | | | 2.31 | % | | | 2.64 | % | | | 2.77 | % | | | 3.29 | % | | | 3.20 | % |
| | | | | | | | | | | | | | | | | | | | | | | | |
Portfolio turnover rate | | | 25 | %d | | | 60 | % | | | 54 | % | | | 53 | % | | | 37 | % | | | 80 | % |
| | | | | | | | | | | | | | | | | | | | | | | | |
| a | Calculation based on average shares outstanding. |
| b | Net investment income (loss) is affected by the timing of distributions of the underlying funds in which the Fund invests. |
| c | Total net asset value return measures the change in net asset value per share over the period indicated. Total market value return is computed based upon the Fund’s market price per share and excludes the effects of brokerage commissions. Dividends and distributions are assumed, for purposes of these calculations, to be reinvested at prices obtained under the Fund’s dividend reinvestment plan. |
| e | Does not include expenses incurred by the underlying funds in which the Fund invests. |
See accompanying notes to financial statements.
17
COHEN & STEERS CLOSED-END OPPORTUNITY FUND, INC.
NOTES TO FINANCIAL STATEMENTS (Unaudited)
Note 1. Organization and Significant Accounting Policies
Cohen & Steers Closed-End Opportunity Fund, Inc. (the Fund) was incorporated under the laws of the State of Maryland on September 14, 2006 and is registered under the Investment Company Act of 1940 (the 1940 Act) as a diversified, closed-end management investment company. The Fund’s investment objective is to achieve total return, consisting of high current income and potential capital appreciation.
The following is a summary of significant accounting policies consistently followed by the Fund in the preparation of its financial statements. The Fund is an investment company and, accordingly, follows the investment company accounting and reporting guidance of the Financial Accounting Standards Board Accounting Standards Codification (ASC) Topic 946—Investment Companies. The accounting policies of the Fund are in conformity with accounting principles generally accepted in the United States of America (GAAP). The preparation of the financial statements in accordance with GAAP requires management to make estimates and assumptions that affect the reported amounts of assets and liabilities at the date of the financial statements and the reported amounts of income and expenses during the reporting period. Actual results could differ from those estimates.
Portfolio Valuation: Investments in securities that are listed on the New York Stock Exchange (NYSE) are valued, except as indicated below, at the last sale price reflected at the close of the NYSE on the business day as of which such value is being determined. If there has been no sale on such day, the securities are valued at the mean of the closing bid and ask prices on such day or, if no ask price is available, at the bid price.
Securities not listed on the NYSE but listed on other domestic or foreign securities exchanges (including NASDAQ) are valued in a similar manner. Securities traded on more than one securities exchange are valued at the last sale price reflected at the close of the exchange representing the principal market for such securities on the business day as of which such value is being determined. If after the close of a foreign market, but prior to the close of business on the day the securities are being valued, market conditions change significantly, certain non-U.S. equity holdings may be fair valued pursuant to procedures established by the Board of Directors.
Readily marketable securities traded in the OTC market, including listed securities whose primary market is believed by Cohen & Steers Capital Management, Inc. (the investment manager) to be OTC, are valued on the basis of prices provided by a third-party pricing service or third-party broker-dealers when such prices are believed by the investment manager, pursuant to delegation by the Board of Directors, to reflect the fair value of such securities.
Short-term debt securities with a maturity date of 60 days or less are valued at amortized cost, which approximates fair value. Investments in open-end mutual funds and closed-end interval funds are valued at net asset value (NAV).
The policies and procedures approved by the Fund’s Board of Directors delegate authority to make fair value determinations to the investment manager, subject to the oversight of the Board of Directors. The investment manager has established a valuation committee (Valuation Committee) to administer, implement and oversee the fair valuation process according to the policies and procedures approved annually by the Board of Directors. Among other things, these procedures allow the Fund to
18
COHEN & STEERS CLOSED-END OPPORTUNITY FUND, INC.
NOTES TO FINANCIAL STATEMENTS (Unaudited)—(Continued)
utilize independent pricing services, quotations from securities and financial instrument dealers and other market sources to determine fair value.
Securities for which market prices are unavailable, or securities for which the investment manager determines that the bid and/or ask price or a counterparty valuation does not reflect market value, will be valued at fair value, as determined in good faith by the Valuation Committee, pursuant to procedures approved by the Fund’s Board of Directors. Circumstances in which market prices may be unavailable include, but are not limited to, when trading in a security is suspended, the exchange on which the security is traded is subject to an unscheduled close or disruption or material events occur after the close of the exchange on which the security is principally traded. In these circumstances, the Fund determines fair value in a manner that fairly reflects the market value of the security on the valuation date based on consideration of any information or factors it deems appropriate. These may include, but are not limited to, recent transactions in comparable securities, information relating to the specific security and developments in the markets.
Foreign equity fair value pricing procedures utilized by the Fund may cause certain non-U.S. equity holdings to be fair valued on the basis of fair value factors provided by a pricing service to reflect any significant market movements between the time the Fund values such securities and the earlier closing of foreign markets.
The Fund’s use of fair value pricing may cause the NAV of Fund shares to differ from the NAV that would be calculated using market quotations. Fair value pricing involves subjective judgments and it is possible that the fair value determined for a security may be materially different than the value that could be realized upon the sale of that security.
Fair value is defined as the price that the Fund would expect to receive upon the sale of an investment or expect to pay to transfer a liability in an orderly transaction with an independent buyer in the principal market or, in the absence of a principal market, the most advantageous market for the investment or liability. The hierarchy of inputs that are used in determining the fair value of the Fund’s investments is summarized below.
| | • | | Level 1—quoted prices in active markets for identical investments |
| | • | | Level 2—other significant observable inputs (including quoted prices for similar investments, interest rates, credit risk, etc.) |
| | • | | Level 3—significant unobservable inputs (including the Fund’s own assumptions in determining the fair value of investments) |
The inputs or methodology used for valuing investments may or may not be an indication of the risk associated with those investments. Changes in valuation techniques may result in transfers into or out of an assigned level within the disclosure hierarchy.
19
COHEN & STEERS CLOSED-END OPPORTUNITY FUND, INC.
NOTES TO FINANCIAL STATEMENTS (Unaudited)—(Continued)
The following is a summary of the inputs used as of June 30, 2022 in valuing the Fund’s investments carried at value:
| | | | | | | | | | | | | | | | |
| | | Quoted Prices
in Active
Markets for
Identical
Investments
(Level 1) | | | Other
Significant
Observable
Inputs
(Level 2) | | | Significant
Unobservable
Inputs
(Level 3) | | | Total | |
Closed-End Funds: | | | | | | | | | | | | | | | | |
Diversified Emerging Markets Equity—Foreign | | $ | — | | | $ | 430,732 | | | $ | — | | | $ | 430,732 | |
Sector Equity—Foreign | | | — | | | | 1,301,659 | | | | — | | | | 1,301,659 | |
U.S. General Equity—Foreign | | | — | | | | 1,116,983 | | | | — | | | | 1,116,983 | |
Other Industries | | | 252,288,517 | | | | — | | | | — | | | | 252,288,517 | |
Exchange-Traded Funds | | | 41,483,373 | | | | — | | | | — | | | | 41,483,373 | |
Common Stock | | | 2,385,922 | | | | — | | | | — | | | | 2,385,922 | |
Short-Term Investments | | | — | | | | 288,266 | | | | — | | | | 288,266 | |
| | | | | | | | | | | | | | | | |
Subtotala | | | 296,157,812 | | | | 3,137,640 | | | | — | | | | 299,295,452 | |
| | | | | | | | | | | | | | | | |
Investments Valued at NAVb | | | — | | | | — | | | | — | | | | 1,935,498 | |
| | | | | | | | | | | | | | | | |
Total Investments in Securitiesa | | $ | 296,157,812 | | | $ | 3,137,640 | | | $ | — | | | $ | 301,230,950 | |
| | | | | | | | | | | | | | | | |
| a | Portfolio holdings are disclosed individually on the Schedule of Investments. |
| b | As of June 30, 2022, one of the Fund’s investments was valued using NAV per unit as a practical expedient and has been excluded from the fair value hierarchy. The fair value amounts presented in this table are intended to permit reconciliation of the fair value hierarchy to the amounts presented within the Schedule of Investments. |
Security Transactions and Investment Income: Security transactions are recorded on trade date. Realized gains and losses on investments sold are recorded on the basis of identified cost. Interest income, which includes the amortization of premiums and accretion of discounts, is recorded on the accrual basis. Dividend income is recorded on the ex-dividend date, except for certain dividends on foreign securities, which are recorded as soon as the Fund is informed after the ex-dividend date. Distributions from closed-end funds (CEFs) and exchange-traded funds (ETFs) are recorded as ordinary income, net realized capital gain or return of capital based on information reported by the CEFs and ETFs and management’s estimates of such amounts based on historical information. These estimates are adjusted when the actual source of distributions is disclosed by the CEFs and ETFs and may differ from the estimated amounts.
Foreign Currency Translation: The books and records of the Fund are maintained in U.S. dollars. Investment securities and other assets and liabilities denominated in foreign currencies are translated into U.S. dollars based upon prevailing exchange rates on the date of valuation. Purchases and sales of investment securities and income and expense items denominated in foreign currencies are translated into U.S. dollars based upon prevailing exchange rates on the respective dates of such transactions.
20
COHEN & STEERS CLOSED-END OPPORTUNITY FUND, INC.
NOTES TO FINANCIAL STATEMENTS (Unaudited)—(Continued)
The Fund does not isolate that portion of the results of operations resulting from fluctuations in foreign exchange rates on investments from the fluctuations arising from changes in market prices of securities held. Such fluctuations are included with the net realized and unrealized gain or loss on investments.
Net realized foreign currency transaction gains or losses arise from sales of foreign currencies, (excluding gains and losses on forward foreign currency exchange contracts, which are presented separately, if any), currency gains or losses realized between the trade and settlement dates on securities transactions, and the difference between the amounts of dividends, interest, and foreign withholding taxes recorded on the Fund’s books and the U.S. dollar equivalent of the amounts actually received or paid. Net unrealized foreign currency translation gains and losses arise from changes in the values of assets and liabilities, other than investments in securities, on the date of valuation, resulting from changes in exchange rates. Pursuant to U.S. federal income tax regulations, certain foreign currency gains/losses included in realized and unrealized gains/losses are included in or are a reduction of ordinary income for federal income tax purposes.
Dividends and Distributions to Shareholders: Dividends from net investment income and capital gain distributions are determined in accordance with U.S. federal income tax regulations, which may differ from GAAP. Dividends from net investment income, if any, are typically declared quarterly and paid monthly. Net realized capital gains, unless offset by any available capital loss carryforward, are typically distributed to shareholders at least annually. Dividends and distributions to shareholders are recorded on the ex-dividend date and are automatically reinvested in full and fractional shares of the Fund in accordance with the Fund’s Reinvestment Plan, unless the shareholder has elected to have them paid in cash.
The Fund has a managed distribution policy in accordance with exemptive relief issued by the U.S. Securities and Exchange Commission (SEC). The Plan gives the Fund greater flexibility to realize long-term capital gains throughout the year and to distribute those gains on a more regular basis to shareholders. Therefore, regular monthly distributions throughout the year may include a portion of estimated realized long-term capital gains, along with net investment income, short-term capital gains and return of capital, which is not taxable. In accordance with the Plan, the Fund is required to adhere to certain conditions in order to distribute long-term capital gains during the year.
Dividends from net investment income are subject to recharacterization for tax purposes. Based upon the results of operations for the six months ended June 30, 2022, the investment manager considers it likely that a portion of the dividends will be reclassified to distributions from net realized gain and/or tax return of capital upon the final determination of the Fund’s taxable income after December 31, 2022, the Fund’s fiscal year end.
Distributions Subsequent to June 30, 2022: The following distributions have been declared by the Fund’s Board of Directors and are payable subsequent to the period end of this report.
| | | | | | | | | | | | | | |
| Ex-Date | | | Record Date | | | Payable Date | | | Amount | |
| | 7/12/22 | | | | 7/13/22 | | | | 7/29/22 | | | $ | 0.087 | |
| | 8/16/22 | | | | 8/17/22 | | | | 8/31/22 | | | $ | 0.087 | |
| | 9/13/22 | | | | 9/14/22 | | | | 9/30/22 | | | $ | 0.087 | |
Income Taxes: It is the policy of the Fund to continue to qualify as a regulated investment company (RIC), if such qualification is in the best interest of the shareholders, by complying with the
21
COHEN & STEERS CLOSED-END OPPORTUNITY FUND, INC.
NOTES TO FINANCIAL STATEMENTS (Unaudited)—(Continued)
requirements of Subchapter M of the Internal Revenue Code applicable to RICs, and by distributing substantially all of its taxable earnings to its shareholders. Also, in order to avoid the payment of any federal excise taxes, the Fund will distribute substantially all of its net investment income and net realized gains on a calendar year basis. Accordingly, no provision for federal income or excise tax is necessary. Management has analyzed the Fund’s tax positions taken on federal and applicable state income tax returns as well as its tax positions in non-U.S. jurisdictions in which it trades for all open tax years and has concluded that as of June 30, 2022, no additional provisions for income tax are required in the Fund’s financial statements. The Fund’s tax positions for the tax years for which the applicable statutes of limitations have not expired are subject to examination by the Internal Revenue Service, state departments of revenue and by foreign tax authorities.
Note 2. Investment Management Fees and Other Transactions with Affiliates
Investment Management Fees: Cohen & Steers Capital Management, Inc. serves as the Fund’s investment manager pursuant to an investment management agreement (the investment management agreement). Under the terms of the investment management agreement, the investment manager provides the Fund with day-to-day investment decisions and generally manages the Fund’s investments in accordance with the stated policies of the Fund, subject to the supervision of the Board of Directors.
For the services provided to the Fund, the investment manager receives a fee, accrued daily and paid monthly, at the annual rate of 0.95% of the average daily net assets of the Fund.
The investment manager is also responsible, under the investment management agreement, for the performance of certain administrative functions for the Fund. Additionally, the investment manager pays certain expenses of the Fund, including, but not limited to, administrative and custody fees, transfer agent fees, professional fees, and reports to shareholders.
The investment manager has contractually agreed to reimburse the Fund so that its total annual operating expenses (exclusive of brokerage fees and commissions, taxes, and upon approval of the Board of Directors, extraordinary expenses do not exceed 0.95% of the Fund’s average daily net assets of the Fund. This commitment is currently expected to remain in place for the life of the Fund, can only be amended or terminated by agreement of the Fund’s Board of Directors and the investment manager and will terminate automatically in the event of termination of the investment management agreement between the investment manager and the Fund. For the six months ended June 30, 2022, fees waived and/or expenses reimbursed totaled $6,756.
Directors’ and Officers’ Fees: Certain directors and officers of the Fund are also directors, officers, and/or employees of the investment manager. The Fund does not pay compensation to directors and officers affiliated with the investment manager except for the Chief Compliance Officer, who received compensation from the investment manager, which was reimbursed by the Fund, in the amount of $4,840 for the six months ended June 30, 2022.
Note 3. Purchases and Sales of Securities
Purchases and sales of securities, excluding short-term investments, for the six months ended June 30, 2022, totaled $87,492,389 and $91,550,315, respectively.
22
COHEN & STEERS CLOSED-END OPPORTUNITY FUND, INC.
NOTES TO FINANCIAL STATEMENTS (Unaudited)—(Continued)
Note 4. Income Tax Information
As of June 30, 2022, the federal tax cost and net unrealized appreciation (depreciation) in value of investments held were as follows:
| | | | |
Cost of investments in securities for federal income tax purposes | | $ | 330,494,459 | |
| | | | |
Gross unrealized appreciation on investments | | $ | 10,492,246 | |
Gross unrealized depreciation on investments | | | (39,755,777 | ) |
| | | | |
Net unrealized appreciation (depreciation) on investments | | $ | (29,263,531 | ) |
| | | | |
Note 5. Capital Stock
The Fund is authorized to issue 100 million shares of common stock at a par value of $0.001 per share.
During the six months ended June 30, 2022, the Fund issued 21,136 shares of common stock at $279,242 for the reinvestment of dividends. During the year ended December 31, 2021, the Fund issued 107,334 shares of common stock at $1,479,521 for the reinvestment of dividends.
On December 7, 2021, the Board of Directors approved the continuation of the delegation of its authority to management to effect repurchases, pursuant to management’s discretion and subject to market conditions and investment considerations, of up to 10% of the Fund’s common shares outstanding (Share Repurchase Program) as of January 1, 2022 through December 31, 2022.
During the six months ended June 30, 2022 and the year ended December 31, 2021, the Fund did not effect any repurchases.
Note 6. Other Risks
Market Price Discount from Net Asset Value Risk: Shares of closed-end investment companies frequently trade at a discount from their NAV. This characteristic is a risk separate and distinct from the risk that NAV could decrease as a result of investment activities. Whether investors will realize gains or losses upon the sale of the shares will depend not upon the Fund’s NAV but entirely upon whether the market price of the shares at the time of sale is above or below the investor’s purchase price for the shares. Because the market price of the shares is determined by factors such as relative supply of and demand for shares in the market, general market and economic conditions, and other factors beyond the control of the Fund, the shares may trade at, above or below NAV.
Investing in Other Investment Companies Risk: Since the Fund concentrates its assets in closed-end management investment companies, risks of investing in the Fund include the risks associated with the purchased closed-end investment companies’ portfolio securities, and a shareholder in the Fund will bear not only his or her proportionate share of the Fund’s expenses, but also indirectly the expenses of the purchased closed-end investment companies (“Portfolio Funds”). Shareholders will therefore be subject to duplicative expenses to the extent the Fund invests in other
23
COHEN & STEERS CLOSED-END OPPORTUNITY FUND, INC.
NOTES TO FINANCIAL STATEMENTS (Unaudited)—(Continued)
investment companies. Risks associated with investments in closed-end funds generally include market risk, leverage risk, risk of market price discount from NAV, risk of anti-takeover provisions and non-diversification.
To the extent the Fund invests a portion of its assets in other investment companies, including open-end funds, exchange-traded funds and other types of pooled investment funds, those assets will be subject to the risks of the purchased investment fund’s portfolio securities, and a shareholder in the Fund will bear not only his or her proportionate share of the Fund’s expenses, but also indirectly the expenses of the purchased investment funds. In addition, restrictions under the 1940 Act may limit the Fund’s ability to invest in other investment companies to the extent desired.
Sector Concentration Risk: Some Portfolio Funds invest substantially, or even exclusively, in one sector or industry group and therefore carry risk of the particular sector or industry group. To the extent a Portfolio Fund focuses its investments in a specific sector, such as real estate, energy or utilities, the Portfolio Fund will be susceptible to adverse conditions and economic or regulatory occurrences affecting the sector or industry group, which tends to increase volatility and result in higher risk.
Covered Call Writing Risk: The Fund may invest in Portfolio Funds that engage in a strategy known as “covered call option writing,” which is designed to produce income from option premiums and offset a portion of a market decline in the underlying security. The writer (seller) of a covered call option forgoes, during the option’s life, the opportunity to profit from increases in the market value of the security covering the call option above the sum of the premium and the strike price of the call, but has retained the risk of loss should the price of the underlying security decline. The writer of an option has no control over the time when it may be required to fulfill its obligation as a writer of the option. Once an option writer has received an exercise notice, it cannot effect a closing purchase transaction in order to terminate its obligation under the option and must deliver the underlying security at the exercise price.
Municipal Bond Risk: The Fund may invest in Portfolio Funds that invest in municipal bonds. Municipal bonds are debt obligations issued by states or by political subdivisions or authorities of states. Municipal bonds are typically designated as general obligation bonds, which are general obligations of a governmental entity that are backed by the taxing power of such entity, or revenue bonds, which are payable from the income of a specific project or authority and are not supported by the issuer’s power to levy taxes. Municipal bonds are long-term fixed rate debt obligations that generally decline in value with increases in interest rates, when an issuer��s financial condition worsens or when the rating on a bond is decreased. Many municipal bonds may be called or redeemed prior to their stated maturity. Lower quality revenue bonds and other credit-sensitive municipal securities carry higher risks of default than general obligation bonds.
Master Limited Partnership Risk: The Fund may invest in Portfolio Funds that invest in master limited partnerships (MLPs). An investment in MLP units involves some risks that differ from an investment in the common stock of a corporation. Holders of MLP units have limited control on matters affecting the partnership. Investing in MLPs involves certain risks related to investing in the underlying assets of the MLPs and risks associated with pooled investment vehicles. MLPs holding credit-related investments are subject to interest rate risk and the risk of default on payment obligations by debt issuers. MLPs that concentrate in a particular industry or a particular geographic region are subject to risks associated with such industry or region. The benefit derived from the Fund’s investment in MLPs is
24
COHEN & STEERS CLOSED-END OPPORTUNITY FUND, INC.
NOTES TO FINANCIAL STATEMENTS (Unaudited)—(Continued)
largely dependent on the MLPs being treated as partnerships for federal income tax purposes. Weakening energy market fundamentals may increase counterparty risk and impact MLP profitability. Specifically, energy companies suffering financial distress may be able to abrogate contracts with MLPs, decreasing or eliminating sources of revenue.
Senior Loans Risk: The Fund may invest in Portfolio Funds that invest in senior loans. The risks associated with senior loans are similar to the risks of junk bonds, although senior loans are typically senior and secured, whereas junk bonds are often subordinated and unsecured. Investments in senior loans are typically below investment grade and are considered speculative because of the credit risk of their issuers. Such companies are more likely to default on their payments of interest and principal owed, and such defaults could reduce a Portfolio Fund’s NAV and income distributions. An economic downturn generally leads to a higher non-payment rate, and a senior loan may lose significant value before a default occurs. There is no assurance that the liquidation of the collateral would satisfy the claims of the borrower’s obligations in the event of the nonpayment of scheduled interest or principal, or that the collateral could be readily liquidated. Economic and other events (whether real or perceived) can reduce the demand for certain senior loans or senior loans generally, which may reduce market prices. Senior loans and other debt securities are also subject to the risk of price declines and to increases in prevailing interest rates, although floating-rate debt instruments such as senior loans in which certain Portfolio Funds may be expected to invest are substantially less exposed to this risk than fixed-rate debt instruments.
Preferred Securities Risk: The Fund may invest in Portfolio Funds that invest in preferred securities. Preferred securities are subject to credit risk, which is the risk that a security will decline in price, or the issuer of the security will fail to make dividend, interest or principal payments when due, because the issuer experiences a decline in its financial status. Preferred securities are also subject to interest rate risk and may decline in value because of changes in market interest rates. The Fund may be subject to a greater risk of rising interest rates than would normally be the case in an environment of low interest rates and the effect of potential government fiscal policy initiatives and resulting market reaction to those initiatives. In addition, an issuer may be permitted to defer or omit distributions. Preferred securities are also generally subordinated to bonds and other debt instruments in a company’s capital structure. During periods of declining interest rates, an issuer may be able to exercise an option to redeem (call) its issue at par earlier than scheduled, and the Fund may be forced to reinvest in lower yielding securities. Certain preferred securities may be substantially less liquid than many other securities, such as common stocks. Generally, preferred security holders have no voting rights with respect to the issuing company unless certain events occur. Certain preferred securities may give the issuers special redemption rights allowing the securities to be redeemed prior to a specified date if certain events occur, such as changes to tax or securities laws.
Leverage Risk: Portfolio Funds may employ the use of leverage. The use of leverage is a speculative technique and there are special risks and costs associated with leverage. The NAV of the Portfolio Fund’s shares may be reduced by the issuance and ongoing costs of leverage. So long as the Portfolio Fund is able to invest in securities that produce an investment yield that is greater than the total cost of leverage, the leverage strategy will produce higher current net investment income for the shareholders, including the Fund. On the other hand, to the extent that the total cost of leverage
25
COHEN & STEERS CLOSED-END OPPORTUNITY FUND, INC.
NOTES TO FINANCIAL STATEMENTS (Unaudited)—(Continued)
exceeds the incremental income gained from employing such leverage, shareholders, including the Fund, would realize lower net investment income. In addition to the impact on net income, the use of leverage will have an effect of magnifying capital appreciation or depreciation for shareholders. Specifically, in an up market, leverage will typically generate greater capital appreciation than if the Portfolio Fund were not employing leverage. Conversely, in down markets, the use of leverage will generally result in greater capital depreciation than if the Portfolio Fund had been unlevered. To the extent that the Portfolio Fund is required or elects to reduce its leverage, the Portfolio Fund may need to liquidate investments, including under adverse economic conditions which may result in capital losses potentially reducing returns to shareholders. The use of leverage also results in the investment management fees payable to the investment manager being higher than if the Fund did not use leverage and can increase operating costs, which may reduce total return. There can be no assurance that a leveraging strategy will be successful during any period in which it is employed.
Foreign (Non-U.S.) Securities Risk: Some of the securities held by certain of the Portfolio Funds may be issued by foreign issuers. Risks of investing in foreign securities include currency risks, future political and economic developments and possible imposition of foreign withholding taxes on income or proceeds payable on the securities. In addition, there may be less publicly available information about a foreign issuer than about a domestic issuer, and foreign issuers may not be subject to the same accounting, auditing and financial recordkeeping standards and requirements as domestic issuers. Moreover, securities of many foreign issuers and their markets may be less liquid and their prices more volatile than securities of comparable U.S. issuers.
Investing in securities of companies in emerging markets may entail special risks relating to potential economic, political or social instability and the risks of expropriation, nationalization, confiscation, trade sanctions or embargoes or the imposition of restrictions on foreign investment, the lack of hedging instruments, and repatriation of capital invested. The securities and real estate markets of some emerging market countries have in the past experienced substantial market disruptions and may do so in the future.
Geopolitical Risk: Occurrence of global events similar to those in recent years, such as war (including Russia’s military invasion of Ukraine), terrorist attacks, natural or environmental disasters, country instability, infectious disease epidemics, such as that caused by COVID-19, market instability, debt crises and downgrades, embargoes, tariffs, sanctions and other trade barriers and other governmental trade or market control programs, the potential exit of a country from its respective union and related geopolitical events, may result in market volatility and may have long-lasting impacts on both the U.S. and global financial markets. Events occurring in one region of the world may negatively impact industries and regions that are not otherwise directly impacted by the events. Additionally, those events, as well as other changes in foreign and domestic political and economic conditions, could adversely affect individual issuers or related groups of issuers, securities markets, interest rates, secondary trading, credit ratings, inflation, investor sentiment and other factors affecting the value of the Fund’s investments.
Although the long-term economic fallout of COVID-19 is difficult to predict, it has contributed to, and may continue to contribute to, market volatility, inflation and systemic economic weakness. In
26
COHEN & STEERS CLOSED-END OPPORTUNITY FUND, INC.
NOTES TO FINANCIAL STATEMENTS (Unaudited)—(Continued)
addition, the U.S. government and other central banks across Europe, Asia, and elsewhere announced and/or adopted economic relief packages in response to COVID-19. The end of any such program could cause market downturns, disruptions and volatility, particularly if markets view the ending as premature. The COVID-19 pandemic and its effects are expected to continue, and therefore the economic outlook, particularly for certain industries and businesses, remains inherently uncertain.
On January 31, 2020, the United Kingdom (UK) withdrew from the European Union (EU) (referred to as Brexit), commencing a transition period that ended on December 31, 2020. The EU-UK Trade and Cooperation Agreement, a bilateral trade and cooperation deal governing the future relationship between the UK and the EU (TCA), provisionally went into effect on January 1, 2021, and entered into force officially on May 1, 2021. Notwithstanding the TCA, following the transition period, there is likely to be considerable uncertainty as to the UK’s post-transition framework, including how the financial markets will react. As this process unfolds, markets may be further disrupted. Given the size and importance of the UK’s economy, uncertainty about its legal, political and economic relationship with the remaining member states of the EU may continue to be a source of instability.
On February 24, 2022, Russia launched a large-scale invasion of Ukraine significantly amplifying already existing geopolitical tensions. The United States and many other countries have instituted various economic sanctions against Russian individuals and entities. The extent and duration of the military action, sanctions imposed and other punitive actions taken and resulting future market disruptions in Europe and globally cannot be easily predicted, but could be significant and have a severe adverse effect on the global economy, securities markets and commodities markets globally. To the extent the Fund has exposure to the energy sector, the Fund may be especially susceptible to these risks. These disruptions may also make it difficult to value the Fund’s portfolio investments and cause certain of the Fund’s investments to become illiquid. The strengthening or weakening of the U.S. dollar relative to other currencies may, among other things, adversely affect the Fund’s investments denominated in non-U.S. dollar currencies. It is difficult to predict when similar events affecting the U.S. or global financial markets may occur, the effects that such events may have, and the duration of those effects.
Regulatory Risk: The U.S. government has proposed and adopted multiple regulations that could have a long-lasting impact on the Fund and on the mutual fund industry in general. The U.S. Securities and Exchange Commission (SEC)’s final rules, related requirements and amendments to modernize reporting and disclosure, along with other potential upcoming regulations, could, among other things, restrict the Fund’s ability to engage in transactions, and/or increase overall expenses of the Fund. In addition to recently adopted Rule 18f-4, which governs the way derivatives are used by registered investment companies, the SEC, Congress, various exchanges and regulatory and self-regulatory authorities, both domestic and foreign, have undertaken reviews of the use of derivatives by registered investment companies, which could affect the nature and extent of instruments used by the Fund. While the full extent of all of these regulations is still unclear, these regulations and actions may adversely affect both the Fund and the instruments in which the Fund invests and its ability to execute its investment strategy. Similarly, regulatory developments in other countries may have an unpredictable and adverse impact on the Fund.
27
COHEN & STEERS CLOSED-END OPPORTUNITY FUND, INC.
NOTES TO FINANCIAL STATEMENTS (Unaudited)—(Continued)
Note 7. Other
In the normal course of business, the Fund enters into contracts that provide general indemnifications. The Fund’s maximum exposure under these arrangements is dependent on claims that may be made against the Fund in the future and, therefore, cannot be estimated; however, based on experience, the risk of material loss from such claims is considered remote.
Note 8. Subsequent Events
Management has evaluated events and transactions occurring after June 30, 2022 through the date that the financial statements were issued, and has determined that no additional disclosure in the financial statements is required.
28
COHEN & STEERS CLOSED-END OPPORTUNITY FUND, INC.
PROXY RESULTS (Unaudited)
Cohen & Steers Closed-End Opportunity Fund, Inc. shareholders voted on the following proposals at the annual meeting held on April 27, 2022. The description of each proposal and number of shares voted are as follows:
| | | | | | | | |
| Common Shares | | Shares Voted
For | | | Authority
Withheld | |
To elect Directors: | | | | | | | | |
| | |
Joseph M. Harvey | | | 20,415,361 | | | | 629,454 | |
Gerald J. Maginnis | | | 20,502,721 | | | | 542,094 | |
Daphne L. Richards | | | 20,397,155 | | | | 647,660 | |
29
COHEN & STEERS CLOSED-END OPPORTUNITY FUND, INC.
(The following pages are unaudited)
REINVESTMENT PLAN
We urge shareholders who want to take advantage of this plan and whose shares are held in Street Name’ to consult your broker as soon as possible to determine if you must change registration into your own name to participate.
OTHER INFORMATION
A description of the policies and procedures that the Fund uses to determine how to vote proxies relating to portfolio securities is available (i) without charge, upon request, by calling 866-227-0757, (ii) on our website at cohenandsteers.com or (iii) on the U.S. Securities and Exchange Commission’s (SEC) website at http://www.sec.gov. In addition, the Fund’s proxy voting record for the most recent 12-month period ended June 30 is available by August 31 of each year (i) without charge, upon request, by calling 866-227-0757 or (ii) on the SEC’s website at http://www.sec.gov.
Disclosures of the Fund’s complete holdings are required to be made monthly on Form N-PORT, with every third month made available to the public by the SEC 60 days after the end of the Fund’s fiscal quarter. The Fund’s Form N-PORT is available (i) without charge, upon request, by calling 866-227-0757 or (ii) on the SEC’s website at http://www.sec.gov.
Please note that distributions paid by the Fund to shareholders are subject to recharacterization for tax purposes and are taxable up to the amount of the Fund’s investment company taxable income and net realized gains. Distributions in excess of the Fund’s net investment company taxable income and realized gains are a return of capital distributed from the Fund’s assets. To the extent this occurs, the Fund’s shareholders of record will be notified of the estimated amount of capital returned to shareholders for each such distribution and this information will also be available at cohenandsteers.com. The final tax treatment of all distributions is reported to shareholders on their 1099-DIV forms, which are mailed after the close of each calendar year. Distributions of capital decrease the Fund’s total assets and, therefore, could have the effect of increasing the Fund’s expense ratio. In addition, in order to make these Paige distributions, the Fund may have to sell portfolio securities at a less than opportune time.
Notice is hereby given in accordance with Rule 23c-1 under the 1940 Act that the Fund may purchase, from time to time, shares of its common stock in the open market.
30
COHEN & STEERS CLOSED-END OPPORTUNITY FUND, INC.
The following information in this semi-annual shareholder report is a summary of certain changes since the Fund’s most recent annual shareholder report. This information may not reflect all of the changes that have occurred since you purchased the Fund.
Addition to Portfolio Management Team
Effective April 29, 2022, Mr. Jeffrey Palma was added as a portfolio manager of the Fund. Mr. Palma joined the investment manager in 2021 and currently serves as Senior Vice President of the investment manager.
APPROVAL OF INVESTMENT MANAGEMENT AGREEMENT
The Board of Directors of the Fund, including a majority of the directors who are not parties to the Fund’s investment management agreement (the Management Agreement), or interested persons of any such party (the Independent Directors), has the responsibility under the Investment Company Act of
1940 to approve the Fund’s Management Agreement for its initial two year term and its continuation annually thereafter at a meeting of the Board of Directors called for the purpose of voting on the approval or continuation. The Management Agreement was discussed at a meeting of the Independent Directors, in their capacity as the Contract Review Committee, held on June 7, 2022 and at meetings of the full Board of Directors held on March 15, 2022 and June 14, 2022. The Independent Directors, in their capacity as the Contract Review Committee, also discussed the Management Agreement in executive session on June 14, 2022. At the meeting of the full Board of Directors on June 14, 2022, the Management Agreement was unanimously continued for a term ending June 30, 2023 by the Fund’s Board of Directors, including the Independent Directors. The Independent Directors were represented by independent counsel who assisted them in their deliberations during the meetings and executive session.
In considering whether to continue the Management Agreement, the Board of Directors reviewed materials provided by an independent data provider, which included, among other items, fee, expense and performance information compared to peer funds (the Peer Funds and, collectively with the Fund, the Peer Group) and performance comparisons to a larger category universe; summary information prepared by the Fund’s investment manager (the Investment Manager); and a memorandum from counsel to the Independent Directors outlining the legal duties of the Board of Directors. The Board of Directors also considered a supplemental peer group compiled by the Investment Manager when evaluating the Fund’s performance and fees and expenses; because the Peer Funds consist of a mix of non-leveraged closed-end funds across various classifications, the Investment Manager believes the supplemental peer group is more representative of the Fund’s investment strategy. The Board of Directors also spoke directly with representatives of the independent data provider and met with investment management personnel. In addition, the Board of Directors considered information provided from time to time by the Investment Manager throughout the year at meetings of the Board of Directors, including presentations by portfolio managers relating to the investment performance of the Fund and the investment strategies used in pursuing the Fund’s objective. The Board of Directors also considered information provided by the Investment Advisor in response to a request for information submitted by counsel to the Independent Directors, on behalf of the Independent Directors, as well as information provided by the Investment Advisor in response to a supplemental request. Additionally, the Independent Directors noted that in connection with their considerations, that they had received information from the Investment Manager about, and discussed with the Investment Manager, the
31
COHEN & STEERS CLOSED-END OPPORTUNITY FUND, INC.
operations of its business continuity plan and related matters and the operations of third party service providers during the COVID-19 pandemic. In particular, the Board of Directors considered the following:
(i) The nature, extent and quality of services to be provided by the Investment Manager: The Board of Directors reviewed the services that the Investment Manager provides to the Fund, including, but not limited to, making the day-to-day investment decisions for the Fund, placing orders for the investment and reinvestment of the Fund’s assets, furnishing information to the Board of Directors of the Fund regarding the Fund’s portfolio, providing individuals to serve as Fund officers, and generally managing the Fund’s investments in accordance with the stated policies of the Fund. The Board of Directors also discussed with officers and portfolio managers of the Fund the types of transactions conducted on behalf of the Fund. Additionally, the Board of Directors took into account the services provided by the Investment Manager to its other funds and accounts, including those that have investment objectives and strategies similar to those of the Fund. The Board of Directors also considered the education, background and experience of the Investment Manager’s personnel, particularly noting the potential benefit that the portfolio managers’ work experience and favorable reputation can have on the Fund. The Board of Directors further noted the Investment Manager’s ability to attract qualified and experienced personnel. The Board of Directors also considered the administrative services provided by the Investment Manager, including compliance and accounting services. After consideration of the above factors, among others, the Board of Directors concluded that the nature, extent and quality of services provided by the Investment Manager are satisfactory and appropriate.
(ii) Investment performance of the Fund and the Investment Manager: The Board of Directors considered the investment performance of the Fund compared to Peer Funds and compared to a relevant linked blended benchmark. The Board of Directors noted that the Fund underperformed the Peer Group median for the one-, three-, five- and ten- year periods ended March 31, 2022, ranking the Fund in the third, fifth, fifth and fifth quintiles, respectively. The Fund outperformed its linked blended benchmark for the one-, three-, five- and ten-year periods ended March 31, 2022. The Board of Directors also considered the Fund’s performance compared to a supplemental peer group compiled by the Investment Manager, and noted that the Fund outperformed the supplemental peer group median for the one-year period ended March 31, 2022, ranking three out of eight peers, and underperformed the supplemental peer group median for the three-, five- and ten-year periods ended March 31, 2022, ranking six out of eight, six out of eight and three out of three peers, respectively. The Board of Directors considered that due to the unique nature of the Fund, it is difficult to make quantitative comparisons of the Fund’s performance among any peer group. The Board of Directors engaged in discussions with the Investment Manager regarding the contributors to and detractors from the Fund’s performance during the period, including the relevant implications of the continuing COVID-19 pandemic. The Board of Directors also considered additional supplemental information provided by the Investment Manager, including a narrative summary of various factors affecting performance and the Investment Manager’s performance in managing similarly managed funds and accounts. The Board of Directors determined that Fund performance, in light of all considerations noted above, supported the continuation of the Management Agreement.
(iii) Cost of the services to be provided and profits to be realized by the Investment Manager from the relationship with the Fund: The Board of Directors considered the contractual and actual management fees paid by the Fund, as well as the Fund’s total expense ratio. As part of its analysis, the Board of Directors gave consideration to the fee and expense analyses provided by the independent data provider. The Board of Directors noted that the Fund’s actual management fee and total expense
32
COHEN & STEERS CLOSED-END OPPORTUNITY FUND, INC.
ratio are lower than the Peer Group medians, ranking in the third quintile for each. The Board of Directors also considered the Fund’s actual management fee and total expense ratio compared to the supplemental peer group compiled by the Investment Manager, and noted that each were lower than the supplemental peer group’s median, ranking three out of eight peers and two out of eight peers, respectively. In light of the considerations above, the Board of Directors concluded that the Fund’s current expense structure was satisfactory.
The Board of Directors also reviewed information regarding the profitability to the Investment Manager of its relationship with the Fund. The Board of Directors considered the level of the Investment Manager’s profits and whether the profits were reasonable for the Investment Manager. The Board of Directors took into consideration other benefits to be derived by the Investment Manager in connection with the Management Agreement, noting particularly the research and related services, within the meaning of Section 28(e) of the Securities Exchange Act of 1934, which the Investment Manager receives by allocating the Fund’s brokerage transactions. The Board of Directors further considered that the Investment Manager continues to reinvest profits back in the business, including upgrading and/or implementing new trading, compliance and accounting systems, and by adding investment personnel to the portfolio management teams. The Board of Directors concluded that the profits realized by the Investment Manager from its relationship with the Fund were reasonable and consistent with the Investment Manager’s fiduciary duties.
(iv) The extent to which economies of scale would be realized as the Fund grows and whether fee levels would reflect such economies of scale: The Board of Directors considered that, as a closed-end fund, the Fund would not be expected to have inflows of capital that might produce increasing economies of scale. The Board of Directors determined that, given the Fund’s closed-end structure, there were no significant economies of scale that were not already being shared with shareholders. In considering economies of scale, the Board of Directors also noted, as discussed above in (iii), that the Investment Manager continues to reinvest profits back in the business.
(v) Comparison of services to be rendered and fees to be paid to those under other investment management contracts, such as contracts of the same and other investment advisors or other clients: As discussed above in (iii), the Board of Directors compared the fees paid under the Management Agreement to those under other investment management contracts of other investment advisors managing Peer Funds. The Board of Directors also compared the services rendered and fees paid under the Management Agreement to fees paid, including the ranges of such fees, under the Investment Manager’s other fund management agreements and advisory contracts with institutional and other clients with similar investment mandates, noting that the Investment Manager provides more services to the Fund than it does for institutional or subadvised accounts. The Board of Directors also considered the entrepreneurial risk and financial exposure assumed by the Investment Manager in developing and managing the Fund that the Investment Manager does not have with institutional and other clients and other differences in the management of registered investment companies and institutional accounts. The Board of Directors determined that on a comparative basis the fees under the Management Agreement were reasonable in relation to the services provided.
No single factor was cited as determinative to the decision of the Board of Directors, and each Director may have assigned different weights to the various factors. Rather, after weighing all of the considerations and conclusions discussed above, the Board of Directors, including the Independent Directors, unanimously approved the continuation of the Management Agreement.
33
COHEN & STEERS CLOSED-END OPPORTUNITY FUND, INC.
Cohen & Steers Privacy Policy
| | |
| | |
| Facts | | What Does Cohen & Steers Do With Your Personal Information? |
| |
| Why? | | Financial companies choose how they share your personal information. Federal law gives consumers the right to limit some but not all sharing. Federal law also requires us to tell you how we collect, share, and protect your personal information. Please read this notice carefully to understand what we do. |
| |
| What? | | The types of personal information we collect and share depend on the product or service you have with us. This information can include: • Social Security number and account balances • Transaction history and account transactions • Purchase history and wire transfer instructions |
| |
| How? | | All financial companies need to share customers’ personal information to run their everyday business. In the section below, we list the reasons financial companies can share their customers’ personal information; the reasons Cohen & Steers chooses to share; and whether you can limit this sharing. |
| | | | |
| Reasons we can share your personal information | | Does Cohen & Steers
share? | | Can you limit this
sharing? |
| | |
For our everyday business purposes— such as to process your transactions, maintain your account(s), respond to court orders and legal investigations, or reports to credit bureaus | | Yes | | No |
| | |
For our marketing purposes— to offer our products and services to you | | Yes | | No |
| | |
| For joint marketing with other financial companies— | | No | | We don’t share |
| | |
For our affiliates’ everyday business purposes— information about your transactions and experiences | | No | | We don’t share |
| | |
For our affiliates’ everyday business purposes— information about your creditworthiness | | No | | We don’t share |
| | |
| For our affiliates to market to you— | | No | | We don’t share |
| | |
| For non-affiliates to market to you— | | No | | We don’t share |
| | |
| | | | |
| | | |
| Questions? Call 800.330.7348 | | | | |
34
COHEN & STEERS CLOSED-END OPPORTUNITY FUND, INC.
Cohen & Steers Privacy Policy—(Continued)
| | |
| | |
| Who we are | | |
| |
| Who is providing this notice? | | Cohen & Steers Capital Management, Inc., Cohen & Steers Asia Limited, Cohen & Steers Japan Limited, Cohen & Steers UK Limited, Cohen & Steers Ireland Limited, Cohen & Steers Securities, LLC, Cohen & Steers Private Funds and Cohen & Steers Open and Closed-End Funds (collectively, Cohen & Steers). |
| |
| What we do | | |
| |
| How does Cohen & Steers protect my personal information? | | To protect your personal information from unauthorized access and use, we use security measures that comply with federal law. These measures include computer safeguards and secured files and buildings. We restrict access to your information to those employees who need it to perform their jobs, and also require companies that provide services on our behalf to protect your information. |
| |
| How does Cohen & Steers collect my personal information? | | We collect your personal information, for example, when you: • Open an account or buy securities from us • Provide account information or give us your contact information • Make deposits or withdrawals from your account We also collect your personal information from other companies. |
| |
| Why can’t I limit all sharing? | | Federal law gives you the right to limit only: • sharing for affiliates’ everyday business purposes—information about your creditworthiness • affiliates from using your information to market to you • sharing for non-affiliates to market to you State law and individual companies may give you additional rights to limit sharing. |
| |
| Definitions | | |
| |
| Affiliates | | Companies related by common ownership or control. They can be financial and nonfinancial companies. • Cohen & Steers does not share with affiliates. |
| |
| Non-affiliates | | Companies not related by common ownership or control. They can be financial and nonfinancial companies. • Cohen & Steers does not share with non-affiliates. |
| |
| Joint marketing | | A formal agreement between non-affiliated financial companies that together market financial products or services to you. • Cohen & Steers does not jointly market. |
35
COHEN & STEERS CLOSED-END OPPORTUNITY FUND, INC.
Cohen & Steers Open-End Mutual Funds
COHEN & STEERS REALTY SHARES
| • | | Designed for investors seeking total return, investing primarily in U.S. real estate securities |
| • | | Symbols: CSJAX, CSJCX, CSJIX, CSRSX, CSJRX, CSJZX |
COHEN & STEERS REAL ESTATE SECURITIES FUND
| • | | Designed for investors seeking total return, investing primarily in U.S. real estate securities |
| • | | Symbols: CSEIX, CSCIX, CREFX, CSDIX, CIRRX, CSZIX |
COHEN & STEERS INSTITUTIONAL REALTY SHARES
| • | | Designed for institutional investors seeking total return, investing primarily in U.S. real estate securities |
COHEN & STEERS GLOBAL REALTY SHARES
| • | | Designed for investors seeking total return, investing primarily in global real estate equity securities |
| • | | Symbols: CSFAX, CSFCX, CSSPX, GRSRX, CSFZX |
COHEN & STEERS INTERNATIONAL REALTY FUND
| • | | Designed for investors seeking total return, investing primarily in international (non-U.S.) real estate securities |
| • | | Symbols: IRFAX, IRFCX, IRFIX, IRFRX, IRFZX |
COHEN & STEERS REAL ASSETS FUND
| • | | Designed for investors seeking total return and the maximization of real returns during inflationary environments by investing primarily in real assets |
| • | | Symbols: RAPAX, RAPCX, RAPIX, RAPRX, RAPZX |
COHEN & STEERS PREFERRED SECURITIES
AND INCOME FUND
| • | | Designed for investors seeking total return (high current income and capital appreciation), investing primarily in preferred and debt securities issued by U.S. and non-U.S. companies |
| • | | Symbols: CPXAX, CPXCX, CPXFX, CPXIX, CPRRX, CPXZX |
COHEN & STEERS LOW DURATION PREFERRED
AND INCOME FUND
| • | | Designed for investors seeking high current income and capital preservation by investing in low-duration preferred and other income securities issued by U.S. and non-U.S. companies |
| • | | Symbols: LPXAX, LPXCX, LPXFX, LPXIX, LPXRX, LPXZX |
COHEN & STEERS MLP & ENERGY OPPORTUNITY FUND
| • | | Designed for investors seeking total return, investing primarily in midstream energy master limited partnership (MLP) units and related stocks |
| • | | Symbols: MLOAX, MLOCX, MLOIX, MLORX, MLOZX |
COHEN & STEERS GLOBAL INFRASTRUCTURE FUND
| • | | Designed for investors seeking total return, investing primarily in global infrastructure securities |
| • | | Symbols: CSUAX, CSUCX, CSUIX, CSURX, CSUZX |
COHEN & STEERS ALTERNATIVE INCOME FUND
| • | | Designed for investors seeking high current income and capital appreciation, investing in equity, preferred and debt securities, focused on real assets and alternative income strategies |
| • | | Symbols: DVFAX, DVFCX, DVFIX, DVFRX, DVFZX |
Distributed by Cohen & Steers Securities, LLC.
Please consider the investment objectives, risks, charges and expenses of any Cohen & Steers U.S. registered open-end fund carefully before investing. A summary prospectus and prospectus containing this and other information can be obtained by calling 800-330-7348 or by visiting cohenandsteers.com. Please read the summary prospectus and prospectus carefully before investing.
36
COHEN & STEERS CLOSED-END OPPORTUNITY FUND, INC.
OFFICERS AND DIRECTORS
Joseph M. Harvey
Director, Chairman and Vice President
Adam M. Derechin
Director
Michael G. Clark
Director
George Grossman
Director
Dean A. Junkans
Director
Gerald J. Maginnis
Director
Jane F. Magpiong
Director
Daphne L. Richards
Director
Ramona Rogers-Windsor
Director
James Giallanza
President and Chief Executive Officer
Albert Laskaj
Treasurer and Chief Financial Officer
Dana A. DeVivo
Secretary and Chief Legal Officer
Stephen Murphy
Chief Compliance Officer
and Vice President
Douglas R. Bond
Vice President
Yigal D. Jhirad
Vice President
KEY INFORMATION
Investment Manager and Administrator
Cohen & Steers Capital Management, Inc.
280 Park Avenue
New York, NY 10017
(212) 832-3232
Co-administrator and Custodian
State Street Bank and Trust Company
One Lincoln Street
Boston, MA 02111
Transfer Agent
Computershare
150 Royall Street
Canton, MA 02021
(866) 227-0757
Legal Counsel
Ropes & Gray LLP
1211 Avenue of the Americas
New York, NY 10036
| | |
| New York Stock Exchange Symbol: | | FOF |
Website: cohenandsteers.com
This report is for shareholder information. This is not a prospectus intended for use in the purchase or sale of Fund shares. Performance data quoted represent past performance. Past performance is no guarantee of future results and your investment may be worth more or less at the time you sell your shares.
37
eDelivery AVAILABLE
Stop traditional mail delivery;
receive your shareholder reports
and prospectus online.
Sign up at cohenandsteers.com

Cohen & Steers
Closed-End
Opportunity
Fund (FOF)
Semiannual Report June 30, 2022
As permitted by regulations adopted by the U.S. Securities and Exchange Commission, paper copies of the Fund’s annual and semi-annual shareholder reports are no longer sent by mail, unless you specifically requested paper copies of the reports. Instead, the reports are made available on the Fund’s website at www.cohenandsteers.com, and you will be notified by mail each time a report is posted and provided with a website link to access the report.
If you have already elected to receive shareholder reports electronically, you will not be affected by this change and you need not take any action. You may elect to receive shareholder reports and other communications from a Fund electronically anytime by contacting your financial intermediary or, if you are a direct investor, by signing up at www.cohenandsteers.com.
You may elect to receive all future reports in paper, free of charge, at any time. If you invest through a financial intermediary, you can contact your financial intermediary or, if you are a direct investor, you can call (866) 227-0757 to let the Fund know you wish to continue receiving paper copies of your shareholder reports. Your election to receive reports in paper will apply to all Funds held in your account if you invest through your financial intermediary or all Funds held within the fund complex if you invest directly with the Fund.
FOFSAR
Item 2. Code of Ethics.
Not applicable.
Item 3. Audit Committee Financial Expert.
Not applicable.
Item 4. Principal Accountant Fees and Services.
Not applicable.
Item 5. Audit Committee of Listed Registrants.
Not applicable.
Item 6. Schedule of Investments.
Included in Item 1 above.
Item 7. Disclosure of Proxy Voting Policies and Procedures for Closed-End Management Investment Companies.
Not applicable.
Item 8. Portfolio Managers of Closed-End Investment Companies.
Information pertaining to the portfolio managers of the registrant, as of September 7, 2022, is set forth below.
| | |
Douglas R. Bond • Vice President • Portfolio manager since inception | | Executive Vice President of C&S since 2004. |
| |
Jeffrey Palma • Vice President • Portfolio manager since April 2022 | | Senior Vice President of C&S since 2021. |
C&S utilizes a team-based approach in managing the registrant. Effective April 29, 2022, Jeffrey Palma was added as portfolio manager of the Fund. Douglas Bond continues to serve as portfolio manager of the Fund. Mr. Bond and Mr. Palma direct and supervise the execution of the registrant’s investment strategy, and lead and guide the other members of the team.
Each portfolio manager listed above manages other investment companies and/or investment vehicles and accounts in addition to the registrant. The following tables show, as of June 30, 2022, the number of other accounts the portfolio managers managed in each of the listed categories and the total assets in the accounts managed within each category. The portfolio managers do not receive performance-based fees with respect to any of the registered investment companies, other pooled investment vehicles or other accounts that they manage.
| | | | | | |
| Douglas Bond | | Number of accounts | | Total assets | |
| | |
• Registered investment companies | | 0 | | $ | 0 | |
| | |
• Other pooled investment vehicles | | 0 | | $ | 0 | |
| | |
• Other accounts | | 2 | | $ | 206,710,882 | |
| | |
| Jeffrey Palma | | Number of accounts | | Total assets | |
| | |
• Registered investment companies | | 1 | | $ | 588,885,842 | |
| | |
• Other pooled investment vehicles | | 1 | | $ | 113,954,096 | |
| | |
• Other accounts | | 2 | | $ | 390,939,432 | |
Share Ownership. The following table indicates the dollar range of securities of the registrant owned by the registrant’s portfolio managers as of June 30, 2022:
| | |
| | | Dollar Range of Securities Owned |
Douglas R. Bond | | $100,001–$500,000 |
Jeffrey Palma | | None |
Conflicts of Interest. It is possible that conflicts of interest may arise in connection with the portfolio manager’s management of the registrant’s investments on the one hand and the investments of other accounts or vehicles for which the portfolio managers are responsible on the other. For example, a portfolio manager may have conflicts of interest in allocating management time, resources and investment opportunities among the registrant and the other accounts or vehicles he advises. In addition, due to differences in the investment strategies or restrictions among the registrant and the other accounts, a portfolio manager may take action with respect to another account that differs from the action taken with respect to the registrant.
In some cases, another account managed by a portfolio manager may provide more revenue to the registrant’s investment advisor. While this may appear to create additional conflicts of interest for the portfolio manager in the allocation of management time, resources and investment opportunities, the investment advisor strives to ensure that portfolio managers endeavor to exercise their discretion in a manner that is equitable to all interested persons. In this regard, in the absence of specific account-related impediments (such as client-imposed restrictions or lack of available cash), it is the policy of the investment advisor to allocate investment ideas pro rata to all accounts with the same primary investment objective.
In addition, certain of the portfolio managers may from time to time manage one or more accounts on behalf of the registrant’s investment advisor and its affiliated companies (the “CNS Accounts”). Certain securities held and traded in the CNS Accounts also may be held and traded in one or more client accounts. It is the policy of the investment advisor however not to put the interests of the CNS Accounts ahead of the interests of client accounts. The investment advisor may aggregate orders of client accounts with those of the CNS Accounts; however, under no circumstances will preferential treatment be given to the CNS Accounts. For all orders involving the CNS Accounts, purchases or sales will be allocated prior to trade placement, and orders that are only partially filled will be allocated across all accounts in proportion to the shares each account, including the CNS Accounts, was designated to receive prior to trading. As a result, it is expected that the CNS Accounts will receive the same average price as other accounts included in the aggregated order. Shares will not be allocated or re-allocated to the CNS Accounts after trade execution or after the average price is known. In the event so few shares of an order are executed that a pro-rata allocation is not practical, a rotational system of allocation may be used; however, the CNS Accounts will never be part of that rotation or receive shares of a partially filled order other than on a pro-rata basis.
Because certain CNS Accounts are managed with a cash management objective, it is possible that a security will be sold out of the CNS Accounts but continue to be held for one or more client accounts. In situations when this occurs, such security will remain in a client account only if the portfolio manager, acting in its reasonable judgment and consistent with its fiduciary duties, believes this is appropriate for, and consistent with the objectives and profile of, the client account.
Advisor Compensation Structure. Compensation of the investment advisor’s portfolio managers and other investment professionals has three primary components: (1) a base salary, (2) an annual cash bonus and (3) long-term stock-based compensation consisting generally of restricted stock units of the investment advisor’s parent, CNS. The investment advisor’s investment professionals, including the portfolio managers, also receive certain retirement, insurance and other benefits that are broadly available to all of its employees. Compensation of the investment advisor’s investment professionals is reviewed primarily on an annual basis. Cash bonuses, stock-based compensation awards, and adjustments in base salary are typically paid or put into effect in the January following the fiscal year-end of CNS.
Method to Determine Compensation. The registrant’s investment advisor compensates its portfolio managers based primarily on the total return performance of funds and accounts managed by the portfolio manager versus appropriate peer groups or benchmarks. C&S uses a variety of benchmarks to evaluate each portfolio managers’ performance for compensation purposes, including the Morningstar U.S. All Taxable Ex-Foreign Equity Index and other broad based indexes based on the asset classes managed by each portfolio manager. In evaluating the performance of a portfolio manager, primary emphasis is normally placed on one- and three-year performance, with secondary consideration of performance over longer periods of time. Performance is evaluated on a pre-tax and pre-expense basis. In addition to rankings within peer groups of funds on the basis of absolute performance, consideration may also be given to risk-adjusted performance. For funds and accounts with a primary investment objective of high
current income, consideration will also be given to the fund’s and account’s success in achieving this objective. For portfolio managers responsible for multiple funds and accounts, investment performance is evaluated on an aggregate basis. The investment advisor has three funds or accounts with performance-based advisory fees. Portfolio managers are also evaluated on the basis of their success in managing their dedicated team of analysts. Base compensation for portfolio managers of the Advisor varies in line with the portfolio manager’s seniority and position with the firm.
Salaries, bonuses and stock-based compensation are also influenced by the operating performance of the registrant’s investment advisor and CNS. While the annual salaries of the Advisor’s portfolio managers are fixed, cash bonuses and stock based compensation may fluctuate significantly from year to year, based on changes in manager performance and other factors.
Item 9. Purchases of Equity Securities by Closed-End Management Investment Company and Affiliated Purchasers.
None.
Item 10. Submission of Matters to a Vote of Security Holders.
None.
Item 11. Controls and Procedures.
| (a) | The registrant’s principal executive officer and principal financial officer have concluded that the registrant’s disclosure controls and procedures are reasonably designed to ensure that information required to be disclosed by the registrant in this Form N-CSR was recorded, processed, summarized and reported within the time periods specified in the Securities and Exchange Commission’s rules and forms, based upon such officers’ evaluation of these controls and procedures as of a date within 90 days of the filing date of this report. |
| (b) | There were no changes in the registrant’s internal control over financial reporting that occurred during the period covered by this report that have materially affected, or are reasonably likely to materially affect, the registrant’s internal control over financial reporting. |
Item 12. Disclosure of Securities Lending Activities for Closed-End Management Investment Companies.
| (a) | The Fund did not engage in any securities lending activity during the fiscal year ended December 31, 2021. |
| (b) | The Fund did not engage in any securities lending activity and did not engage a securities lending agent during the fiscal year ended December 31, 2021. |
Item 13. Exhibits.
(a)(1) Not applicable.
(a) (2) Certifications of principal executive officer and principal financial officer as required by Rule 30a-2(a) under the Investment Company Act of 1940.
(a)(3) Not applicable.
(a)(4) Not applicable.
(b) Certifications of principal executive officer and principal financial officer as required by Rule 30a-2(b) under the Investment Company Act of 1940.
(c) Registrant’s notices to shareholders pursuant to registrant’s exemptive order granting an exemption from Section 19(b) of the 1940 Act and Rule 19b-1 thereunder regarding distributions pursuant to the registrant’s Managed Distribution Plan.
SIGNATURES
Pursuant to the requirements of the Securities Exchange Act of 1934 and the Investment Company Act of 1940, the registrant has duly caused this report to be signed on its behalf by the undersigned, thereunto duly authorized.
COHEN & STEERS CLOSED-END OPPORTUNITY FUND, INC.
| | | | |
| | |
| | By: | | /s/ James Giallanza |
| | | | Name: James Giallanza Title: Principal Executive Officer (President and Chief Executive Officer) |
| | |
| | Date: | | September 7, 2022 |
Pursuant to the requirements of the Securities Exchange Act of 1934 and the Investment Company Act of 1940, this report has been signed below by the following persons on behalf of the registrant and in the capacities and on the dates indicated.
| | | | |
| | |
| | By: | | /s/ James Giallanza |
| | | | Name: James Giallanza Title: Principal Executive Officer (President and Chief Executive Officer) |
| | |
| | By: | | /s/ Albert Laskaj |
| | | | Name: Albert Laskaj Title: Principal Financial Officer (Treasurer and Chief Financial Officer) |
| |
| | Date: September 7, 2022 |