WASHINGTON, D.C. 20549
Item #1. Reports to Stockholders.
Dalton, Greiner, Hartman, Maher & Co., LLC
A Boston Private Wealth Management Company
DGHM INVESTMENT TRUST
Semi-Annual Report to Shareholders
(unaudited)
DGHM ALL-CAP VALUE FUND
DGHM V2000 SMALLCAP
VALUE FUND
For the six months ended August 31,2011
DGHM INVESTMENT TRUST
TABLE OF CONTENTS
| | PAGE |
Schedule of Investments – DGHM All-Cap Value Fund | 1 |
| DGHM V2000 SmallCap Value Fund | 5 |
| Statements of Assets and Liabilities | 10 |
| Statements of Operations | 11 |
| Statements of Changes In Net Assets | 12 |
Financial Highlights – DGHM All-Cap Value Fund | 13 |
| DGHM V2000 SmallCap Value Fund | 16 |
| Notes to Financial Statements | 18 |
| Supplemental Information | 27 |
| About Your Funds’ Expenses | 28 |
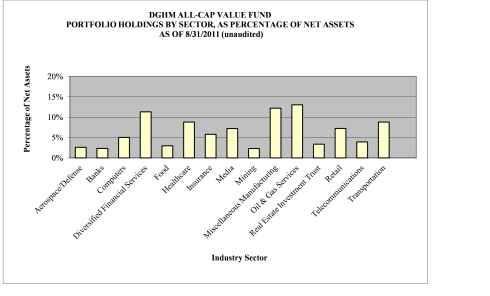
DGHM ALL-CAP VALUE FUND SCHEDULE OF INVESTMENTS August 31, 2011 (unaudited) |
| Number of Shares | | Security Description | | % of Net Assets | | Fair Value |
| | | | | | | |
| | | COMMON STOCKS | | 97.03% | | |
| | | | | | | |
| | | AEROSPACE/DEFENSE | | 2.60% | | |
| 49,076 | | General Dynamics Corporation | | | | $ 3,144,790 |
| | | | | | | |
| | | BANKS | | 2.35% | | |
| 142,837 | | SunTrust Banks, Inc. | | | | 2,842,456 |
| | | | | | | |
| | | COMPUTERS | | 5.04% | | |
| 19,299 | | International Business Machines Corporation | | 3,317,691 |
| 53,167 | | Teradata Corporation* | | | | 2,783,824 |
| | | | | | | 6,101,515 |
| | | DIVERSIFIED FINANCIAL SERVICES | | 11.33% | | |
| 254,800 | | Fifth Third Bancorp | | | | 2,705,976 |
| 35,853 | | Franklin Resources, Inc. | | | | 4,299,492 |
| 112,854 | | JPMorgan Chase & Co. | | | | 4,238,796 |
| 545,400 | | Regions Financial Corp. | | | | 2,476,116 |
| | | | | | | 13,720,380 |
| | | FOOD | | 2.99% | | |
| 68,825 | | H.J. Heinz Company | | | | 3,622,948 |
| | | | | | | |
| | | HEALTHCARE | | 8.80% | | |
| 61,260 | | Baxter International Inc. | | | | 3,429,335 |
| 133,760 | | Pharmaceutical Product Development, Inc. | | 4,210,765 |
| 61,635 | | Stryker Corp. | | | | 3,010,253 |
| | | | | | | 10,650,353 |
| | | INSURANCE | | 5.81% | | |
| 65,182 | | ACE Limited | | | | 4,209,454 |
| 148,780 | | Protective Life Corp. | | | | 2,825,332 |
| | | | | | | 7,034,786 |
DGHM ALL-CAP VALUE FUND SCHEDULE OF INVESTMENTS August 31, 2011 (unaudited) | |
| Number of Shares | | Security Description | | % of Net Assets | | Fair Value | |
| | | MEDIA | | 7.22% | | | |
| 63,814 | | The DIRECTV Group, Inc. Class A* | | $ 2,805,902 | |
| 71,051 | | Omnicom Group, Inc. | | | | 2,881,118 | |
| 63,406 | | Viacom, Inc."B" | | | | 3,058,705 | |
| | | | | | | 8,745,725 | |
| | | MINING | | 2.31% | | | |
| 59,400 | | Freeport-McMoRan Copper & Gold Inc. | | 2,800,116 | |
| | | | | | | | |
| | | MISCELLANEOUS MANUFACTURING | | 12.21% | | | |
| 35,732 | | 3M Company | | | | 2,965,041 | |
| 100,960 | | Analog Devices, Inc. | | | | 3,333,699 | |
| 35,887 | | Becton, Dickinson and Co. | | | | 2,920,484 | |
| 60,340 | | Mueller Industries, Inc. | | | | 2,844,428 | |
| 53,213 | | Rockwood Holdings Inc.* | | | | 2,713,863 | |
| | | | | | | 14,777,515 | |
| | | OIL & GAS SERVICES | | 13.04% | | | |
| 50,620 | | Devon Energy Corp. | | | | 3,433,555 | |
| 142,630 | | Piedmont Natural Gas Co. Inc. | | | | 4,407,267 | |
| 47,387 | | Pioneer Natural Resources Co. | | | | 3,704,242 | |
| 154,770 | | Vectren Corp. | | | | 4,236,055 | |
| . | | | | | | 15,781,119 | |
| | | REAL ESTATE INVESTMENT TRUST | | 3.37% | | | |
| 49,781 | | Alexandria Real Estate Equities, Inc. | | 3,624,555 | |
| 30,370 | | CB Richard Ellis Group, Inc.* | | | | 460,409 | |
| | | | | | | 4,084,964 | |
| | | RETAIL | | 7.23% | | | |
| 57,500 | | Kohls Corp. | | | | 2,664,550 | |
| 171,770 | | Safeway Inc. | | | | 3,148,544 | |
| 55,350 | | Wal-Mart Stores, Inc. | | | | 2,945,174 | |
| | | | | | | 8,758,268 | |
| | | | | | | | |
| | | | | | | | |
| | | | | | | | |
DGHM ALL-CAP VALUE FUND SCHEDULE OF INVESTMENTS August 31, 2011 (unaudited) | |
| Number of Shares | | Security Description | | % of Net Assets | | Fair Value | |
| | | TELECOMMUNICATIONS | | 3.92% | | | |
| 166,830 | | AT&T Inc. | | | | $ 4,751,318 | |
| | | | | | | | |
| | | TRANSPORTATION | | 8.81% | | | |
| 76,962 | | Tidewater Inc. | | | | 4,125,163 | |
| 47,750 | | United Parcel Service, Inc. "B" | | | | 3,217,873 | |
| 65,190 | | Visteon Corp.* | | | | 3,329,905 | |
| | | | | | | 10,672,941 | |
| | | | | | | | |
| | | TOTAL COMMON STOCKS | | 97.03% | | 117,489,194 | |
| | | (Cost: $118,287,952) | | | | | |
| | | | | | | | |
| | | INVESTMENT COMPANIES | | 2.87% | | | |
| 3,471,159 | | WFA Treasury Plus Money Market Fund 0.1%** | | 3,471,159 | |
| | | (Cost: $3,471,159) | | | | | |
| | | | | | | | |
| | | TOTAL INVESTMENTS: | | | | | |
| | | (Cost: $121,759,111) | | 99.90% | | 120,960,353 | |
| | | Other assets, net of liabilities | | 0.10% | | 115,516 | |
| | | NET ASSETS | | 100.00% | | $121,075,869 | |
| | | | | | | | |
| | | | | | | | |
| | | | | | | | |
| *Non-income producing (security is considered non-income producing if at least one dividend has not been paid during the last year preceding the date of the Fund's related balance sheet). | |
| | | | | | | | |
| **Effective 7 day yield as of August 31, 2011 |
| See Notes to Financial Statements |
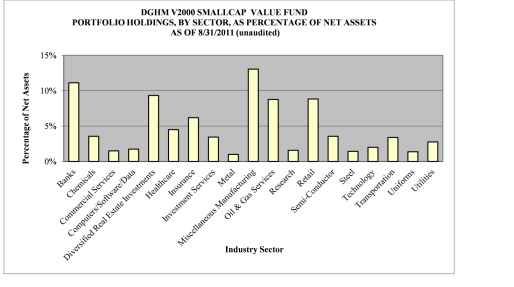
DGHM V2000 SMALLCAP VALUE FUND SCHEDULE OF INVESTMENTS August 31, 2011 (unaudited) |
Number of Shares | | Security Description | | % of Net Assets | | Fair Value |
| | | COMMON STOCKS | | 89.17% | | |
| | | | | | | |
| | | BANKS | | 11.12% | | |
| 335 | | Colony Financial Inc. | | | | $ 5,169 |
| 194 | | Community Trust Bancorp, Inc. | | | | 4,898 |
| 320 | | First Commonwealth Financial Corp. | | | | 1,440 |
| 690 | | National Penn Banchsares, Inc. | | | | 5,002 |
| 687 | | Old National Bancorp | | | | 6,739 |
| 513 | | Provident Financial Services | | | | 6,443 |
| 313 | | United Financial Bancorp, Inc. | | | | 4,826 |
| 226 | | Webster Financial Corp. | | | | 4,091 |
| 246 | | WesBanco, Inc. | | | | 4,767 |
| | | | | | | 43,375 |
| | | CHEMICALS | | 3.57% | | |
| 123 | | Ashland Inc. | | | | 6,520 |
| 585 | | PolyOne Corp. | | | | 7,388 |
| | | | | | | 13,908 |
| | | COMMERCIAL SERVICES | | 1.51% | | |
| 149 | | Steiner Leisure Ltd.* | | | | 5,944 |
| | | | | | | |
| | | COMPUTERS/SOFTWARE/DATA | | 1.75% | | |
| 435 | | Sykes Enterprise, Inc.* | | | | 6,808 |
| | | | | | | |
| | | DIVERSIFIED REAL ESTATE INVESTMENTS | 9.33% | | |
| 311 | | BioMed Realty Trust, Inc. | | | | 5,688 |
| 404 | | CBL & Associates Properties, Inc. | | | | 5,943 |
| 279 | | Colonial Properties Trust | | | | 5,865 |
| 744 | | Cousins Properties, Inc. | | | | 5,372 |
| 210 | | Gaylord Entertainment Co.* | | | | 5,279 |
| 1,120 | | Hersha Hospitality Trust | | | | 4,155 |
| 325 | | Redwood Trust, Inc. | | | | 4,082 |
| | | | | | | 36,384 |
DGHM V2000 SMALLCAP VALUE FUND SCHEDULE OF INVESTMENTS August 31, 2011 (unaudited) |
Number of Shares | | Security Description | | % of Net Assets | | Fair Value |
| | | HEALTHCARE | | 4.50% | | |
| 57 | | Bio-Rad Laboratories, Inc.* | | | | $ 5,719 |
| 150 | | ICU Medical, Inc.* | | | | 6,180 |
| 142 | | Integra LifeSciences Holding* | | | | 5,663 |
| | | | | | | 17,562 |
| | | INSURANCE | | 6.19% | | |
| 360 | | Alterra Capital Holdings Ltd. | | | | 7,344 |
| 480 | | First American Financial Corp. | | | | 7,320 |
| 510 | | Maiden Holdings Ltd. | | | | 4,345 |
| 270 | | Protective Life Corp. | | | | 5,127 |
| | | | | | | 24,136 |
| | | INVESTMENT SERVICES | | 3.45% | | |
| 108 | | GAMCO Investors, Inc. | | | | 5,273 |
| 330 | | Walter Investment Management Corp. | | | | 8,201 |
| | | | | | | 13,474 |
| | | METAL | | 1.00% | | |
| 160 | | L. B. Foster Company Class A | | | | 3,920 |
| | | | | | | |
| | | MISCELLANEOUS MANUFACTURING | 13.06% | | |
| 290 | | Beacon Roofing Supply, Inc.* | | | | 5,382 |
| 165 | | Bemis Company, Inc. | | | | 5,125 |
| 136 | | Brady Corp. Class A | | | | 3,740 |
| 315 | | Elecro Scientific Industries, Inc.* | | | | 4,763 |
| 272 | | Herman Miller, Inc. | | | | 5,405 |
| 121 | | Mueller Industries, Inc. | | | | 5,704 |
| 56 | | NACCO Industries, Inc. Class A | | | | 4,296 |
| 704 | | Photronics, Inc.* | | | | 4,562 |
| 57 | | Polaris Industries Inc. | | | | 6,263 |
| 220 | | Pool Corp | | | | 5,705 |
| | | | | | | 50,945 |
| | | OIL & GAS SERVICES | | 8.78% | | |
| 193 | | Atmos Energy Corp. | | | | 6,473 |
| 124 | | Berry Petroleum Co. Class A | | | | 6,080 |
| 310 | | Goodrich Petroleum Corp.* | | | | 4,966 |
| 112 | | Nicor Inc. | | | | 6,227 |
DGHM V2000 SMALLCAP VALUE FUND SCHEDULE OF INVESTMENTS August 31, 2011 (unaudited) |
Number of Shares | | Security Description | | % of Net Assets | | Fair Value |
| 190 | | Piedmont Natural Gas Co., Inc. | | | | $ 5,871 |
| 150 | | Swift Energy Co.* | | | | 4,628 |
| . | | | | | | 34,245 |
| | | RESEARCH | | 1.57% | | |
| 301 | | Parexel International Corp.* | | | | 6,134 |
| | | | | | | |
| | | RETAIL | | 8.82% | | |
| 500 | | Chico's FAS, Inc. | | | | 6,960 |
| 131 | | Genesco Inc.* | | | | 6,946 |
| 264 | | Papa John's International, Inc.* | | | | 7,854 |
| 110 | | Snap-on Inc. | | | | 5,820 |
| 175 | | Weis Markets, Inc. | | | | 6,843 |
| | | | | | | 34,423 |
| | | SEMICONDUCTOR | | 3.56% | | |
| 650 | | GT Advanced Technologies Inc.* | | | | 7,937 |
| 1,060 | | Lattice Semiconductor Corp.* | | | | 5,968 |
| | | | | | | 13,905 |
| | | STEEL | | 1.43% | | |
| 135 | | Reliance Steel & Aluminum Co. | | | | 5,594 |
| | | | | | | |
| | | TECHNOLOGY | | 2.00% | | |
| 132 | | Anixter International Inc. | | | | 7,789 |
| | | | | | | |
| | | TRANSPORTATION | | 3.40% | | |
| 480 | | Heartland Express, Inc. | | | | 7,296 |
| 256 | | Werner Enterprises, Inc. | | | | 5,960 |
| | | | | | | 13,256 |
| | | UNIFORMS | | 1.37% | | |
| 103 | | UniFirst Corp. | | | | 5,333 |
| | | | | | | |
| | | UTILITIES | | 2.76% | | |
| 134 | | Pinnacle West Capital Corp. | | | | 5,928 |
| 200 | | Portland General Electric Co. | | | | 4,824 |
| | | | | | | 10,752 |
| | | | | | | |
DGHM V2000 SMALLCAP VALUE FUND SCHEDULE OF INVESTMENTS August 31, 2011 (unaudited) |
Number of Shares | | Security Description | | % of Net Assets | | Fair Value |
| | | TOTAL COMMON STOCKS | | 89.17% | | $ 347,887 |
| | | (Cost: $369,370) | | | | |
| | | | | | | |
| | | | | | | |
| | | INVESTMENT COMPANIES | | 1.49% | | |
| 5,807 | | WFA Treasury Plus Money Market Fund 0.1%** | | 5,807 |
| | | (Cost: $5,807) | | | | |
| | | | | | | |
| | | TOTAL INVESTMENTS: | | | | |
| | | (Cost: $375,177) | | 90.66% | | 353,694 |
| | | Other assets, net of liabilities | | 9.34% | | 36,458 |
| | | NET ASSETS | | 100.00% | | $ 390,152 |
| | | | | | | |
| | | | | | | |
| *Non-income producing (security is considered non-income producing if at least one dividend has not been paid during the last year preceding the date of the Fund's related balance sheet). |
| | | | | | | |
| **Effective 7 day yield as of August 31, 2011 |
| | | | | | | |
| See Notes to Financial Statements |
STATEMENTS OF ASSETS AND LIABILITIES At August 31, 2011 (unaudited) |
| | | | DGHM All-Cap Value Fund | | DGHM V2000 SmallCap Value Fund |
| ASSETS | | | |
| | Investments at fair value (identified cost of $121,759,111 and $375,177, respectively) (Note 1) | $ 120,960,353 | | $ 353,694 |
| | Receivable for investments sold | 1,353,487 | | 6,505 |
| | Receivable for capital stock sold | 932,332 | | - |
| | Dividends receivable | 187,748 | | 375 |
| | Interest receivable | 23 | | - |
| | Due from advisor | - | | 17,591 |
| | Prepaid expenses | 56,279 | | 20,362 |
| | | TOTAL ASSETS | 123,490,222 | | 398,527 |
| LIABILITIES | | | |
| | Payable for securities purchased | 2,279,583 | | - |
| | Payable for capital stock redeemed | 40,070 | | - |
| | Accrued investment management fees | 63,856 | | - |
| | Accrued 12b-1 fees | 9,063 | | - |
| | Accrued administration, accounting andtransfer agent fees | 10,419 | | 2,565 |
| | Other accrued expenses | 11,362 | | 5,810 |
| | | TOTAL LIABILITIES | 2,414,353 | | 8,375 |
| NET ASSETS | $ 121,075,869 | | $ 390,152 |
| Net Assets Consist of: | | | |
| | Paid-in-capital applicable to 11,555,175 and 33,484 no par value shares of beneficial interest outstanding, respectively | $ 118,842,766 | | $ 263,516 |
| | Accumulated net investment income (loss) | 353,464 | | (250) |
| | Accumulated net realized gain (loss) on investments | 2,678,397 | | 148,369 |
| | Net unrealized appreciation (depreciation) ofinvestments | (798,758) | | (21,483) |
| | Net Assets | $ 121,075,869 | | $ 390,152 |
| NET ASSET VALUE, OFFERING AND REDEMPTION PRICE PER SHARE |
Investor Class ($71,386,995 / 6,808,061 shares outstanding and $64,494 / 5,575 shares outstanding, respectively) | $ 10.49 | | $ 11.57 |
Class C (a) ($4,565,846 / 446,510 shares outstanding) | $ 10.23 | | N/A |
Institutional Class ($45,123,028 / 4,300,604 shares outstanding and $325,658 / 27,909 shares outstanding, respectively) | $ 10.49 | | $ 11.67 |
(a) May be subject to a contingent deferred sales charge if redeemed within one year of purchase (see Note 1) |
| | | | | | |
| See Notes to Financial Statements | | | |
STATEMENT OF OPERATIONS |
| | | | DGHM All-Cap Value Fund | | DGHM V2000 SmallCap Value Fund |
| | | | For the six months ended August 31, 2011 (unaudited) | | For the six months ended August 31, 2011 (unaudited) |
| INVESTMENT INCOME | | | |
| | Dividend (net of foreign tax withheld of $1,893 and$ - , respectively) | $ 1,073,372 | | $ 5,136 |
| | Interest | 167 | | 1 |
| | | Total investment income | 1,073,539 | | 5,137 |
| EXPENSES | | | |
| | Investment management fees (Note 2) | 373,533 | | 2,387 |
| | 12b-1 fees (Note 2) | | | |
| | | Investor Class | 92,834 | | 244 |
| | | Class C | 24,491 | | - |
| | Recordkeeping and administrative services (Note 2) | 51,550 | | 10,055 |
| | Accounting fees (Note 2) | 28,733 | | 10,055 |
| | Custodian fees | 8,924 | | 3,112 |
| | Transfer agent fees (Note 2) | - | | 7,905 |
| | | Investor Class | 21,920 | | - |
| | | Class C | 1,582 | | - |
| | | Institutional Class | 5,365 | | - |
| | Professional fees | 19,306 | | 12,472 |
| | Filing and registration fees | 29,061 | | 4,203 |
| | Trustee fees | 5,152 | | 2,887 |
| | Compliance fees | 8,543 | | 3,228 |
| | Shareholder servicing and reports | | | |
| | | Investor Class | 8,761 | | 5,913 |
| | | Class C | 791 | | - |
| | | Institutional Class | 261 | | 1,257 |
| | Other | 39,268 | | 13,124 |
| | | Total expenses | 720,075 | | 76,842 |
| | | Fee waivers and reimbursed expenses (Note 2) | - | | (71,455) |
| | | Net Expenses | 720,075 | | 5,387 |
| | | Net investment income (loss) | 353,464 | | (250) |
| REALIZED AND UNREALIZED GAIN (LOSS) ON INVESTMENTS |
| | Net realized gain (loss) on investments | 3,836,998 | | 135,599 |
| | Net increase (decrease) in unrealizedappreciation (depreciation) of investments | (16,122,753) | | (180,074) |
| | Net realized and unrealized gain (loss) oninvestments | (12,285,755) | | (44,475) |
| | INCREASE (DECREASE) IN NET ASSETS FROM OPERATIONS | $ (11,932,291) | | $ (44,725) |
| | | | |
| See Notes to Financial Statements | | | |
STATEMENTS OF CHANGES IN NET ASSETS |
| | | | | DGHM All-Cap Value Fund | | DGHM V2000 SmallCap Value Fund |
| | | | | For the six months ended August 31, 2011 (unaudited) | | For the Year ended February 28, 2011 | | For the six months ended August 31, 2011 (unaudited) | | For the period June 30, 2010* to February 28, 2011 |
| | | |
| | | |
| | | |
| Increase (decrease) in Net Assets | | | | | | |
| OPERATIONS | | | | | | | | |
| | Net investmentincome (loss) | | $ 353,464 | | $ 15,598 | | $ (250) | | $ 1,454 |
| | Net realized gain(loss) oninvestments | | 3,836,998 | | 4,392,997 | | 135,599 | | 29,173 |
| | Change in netunrealizedappreciation (depreciation) oninvestments | | (16,122,753) | | 9,236,856 | | (180,074) | | 158,591 |
| |
| | Increase (decrease) innet assets from operations | | (11,932,291) | | 13,645,451 | | (44,725) | | 189,218 |
| |
| DISTRIBUTIONS TO SHAREHOLDERS | | | | | | |
| | Net investment income | | | | | | |
| | | Investor Class | | - | | (6,897) | | - | | - |
| | | Institutional Class | - | | (17,360) | | - | | (2,118) |
| Net realized gain | | | | | | | | |
| | | Investor Class | | - | | - | | - | | (2,978) |
| | | Institutional Class | - | | - | | - | | (13,425) |
| | Decrease in net assets from distributions | | - | | (24,257) | | - | | (18,521) |
| CAPITAL STOCK TRANSACTIONS (Note 5) | | | | | |
| | Shares sold | | | | | | | | |
| | | Investor Class | | 19,616,651 | | 28,507,623 | | 23,753 | | 232,768 |
| | | Class C | | 1,116,369 | | 2,171,909 | | - | | - |
| | | Institutional Class | 33,056,898 | | 16,440,096 | | 127,745 | | 853,949 |
| | Distributions reinvested | | | | | | | |
| | | Investor Class | | - | | 5,805 | | - | | 2,978 |
| | | Institutional Class | - | | 8,893 | | - | | 12,280 |
| | Shares redeemed | | | | | | | | |
| | | Investor Class | | (11,657,341) | | (12,887,434) | | (210,858) | | (14,134) |
| | | Class C | | (763,934) | | (466,156) | | - | | - |
| | | Institutional Class | (1,682,901) | | (53,325) | | (764,301) | | - |
| | Increase (decrease) innet assets fromcapital stocktransactions | | 39,685,742 | | 33,727,411 | | (823,661) | | 1,087,841 |
| |
| NET ASSETS | | | | | | | | |
| | Increase (decrease)during period | | 27,753,451 | | 47,348,605 | | (868,386) | | 1,258,538 |
| | Beginning of period | | 93,322,418 | | 45,973,813 | | 1,258,538 | | - |
| | End of period (includingundistributed netinvestment income(loss) of $353,464, $ -,$(250) and $ - ,respectively) | $121,075,869 | | $ 93,322,418 | | $ 390,152 | | $1,258,538 |
| *Commencement of operations. |
| See Notes to Financial Statements |
FINANCIAL HIGHLIGHTS SELECTED PER SHARE DATA FOR A SHARE OUTSTANDING THROUGHOUT EACH PERIOD | | |
| | | | Investor Class Shares | | |
| | | | Six months ended August 31, 2011 (unaudited) | Year ended February 28, | | Period June 20, 2007* to February 29, 2008 | | | |
| | | | | | | | | | | | | |
| | | | | 2011 | | 2010 | | 2009 | | | | |
| Net asset value, beginning of period | | $ 11.60 | | $ 9.44 | | $ 6.26 | | $ 9.26 | | $ 10.00 | | |
| Investment activities | | | | | | | | | | | | |
| | Net investment income (loss) | | 0.03 | (C) | - | (B) (C) | 0.01 | | 0.02 | | 0.01 | | |
| | Net realized and unrealized gain | | | | | | | | | | | | |
| | | (loss) on investments | | (1.14) | | 2.16 | | 3.19 | | (3.01) | | (0.75) | | |
| | Total from investment activities | | (1.11) | | 2.16 | | 3.20 | | (2.99) | | (0.74) | | |
| Distributions | | | | | | | | | | | | |
| | Net investment income | | - | | - | (B) | (0.02) | | (0.01) | | - | | |
| | Total distributions | | - | | - | | (0.02) | | (0.01) | | - | | |
| Net asset value, end of period | | $ 10.49 | | $ 11.60 | | $ 9.44 | | $ 6.26 | | $ 9.26 | | |
| Total Return | | (9.57%) | *** | 22.89% | | 51.17% | | (32.26%) | | (7.40%) | *** | |
| Ratios/Supplemental Data | | | | | | | | | | | | |
| Ratio to average net assets | | | | | | | | | | | | |
| | Expenses, net | | 1.32% | ** | 1.47% | | 1.71% | | 1.75% | | 1.75% | **(A) | |
| | Net investment income (loss) | | 0.55% | ** | 0.04% | | 0.19% | | 0.71% | | 0.20% | **(A) | |
| Portfolio turnover rate | | 22.04% | *** | 53.05% | | 101.89% | | 90.97% | | 80.71% | *** | |
| Net assets, end of period (000's) | | $ 71,387 | | $ 71,124 | | $ 43,669 | | $ 32,223 | | $ 2,066 | | |
| | | | | | | | | | | | |
*Commencement of operations | | | | | | | | | | | |
** Annualized | | | | | | | | | | | |
*** Not annualized | | | | | | | | | | | |
(A) Management fee waivers and reimbursement of expenses reduced the expense ratio and increased net investment income ratio by 0.72% for the year ended February 28, 2009 and by 6.77% for the period June 20, 2007 to February 29, 2008. The ratios reflect the effect of the management fee waivers and reimbursement of expenses. |
(B) Less than $0.01 per share. | | | | | |
(C) Per share amounts calculated using the average number of shares outstanding. | | | | | | | |
| | | | | | | | | | | | | | |
| See Notes to Financial Statements | | | | | | | | | | | |
FINANCIAL HIGHLIGHTS SELECTED PER SHARE DATA FOR A SHARE OUTSTANDING THROUGHOUT EACH PERIOD | | |
| | | | Class C Shares | | |
| | | | Six months ended August 31, 2011 (unaudited) | Year ended February 28 | Period June 20, 2007* to February 29, 2008 | | | |
| | | | | | | | | | | | | |
| | | | | 2011 | | 2010 | | 2009 | | | | |
| Net asset value, beginning of period | | $ 11.36 | | $ 9.31 | | $ 6.20 | | $ 9.22 | | $ 10.00 | | | |
| Investment activities | | | | | | | | | | | | | |
| | Net investment income (loss) | | (0.01) | (C) | (0.07) | (C) | (0.04) | | - | (B) | (0.03) | | | |
| | Net realized and unrealized gain | | | | | | | | | | | | | |
| | | (loss) on investments | | (1.12) | | 2.12 | | 3.15 | | (3.02) | | (0.75) | | | |
| | Total from investment activities | | (1.13) | | 2.05 | | 3.11 | | (3.02) | | (0.78) | | | |
| Distributions | | | | | | | | | | | | | |
| | Net investment income | | - | | - | | - | | - | | - | | | |
| | Total distributions | | - | | - | | - | | - | | - | | | |
| Net asset value, end of period | | $ 10.23 | | $ 11.36 | | $ 9.31 | | $ 6.20 | | $ 9.22 | | | |
| Total Return | | (9.95%) | *** | 22.02% | | 50.16% | | (32.75%) | | (7.80%) | *** | | |
| Ratios/Supplemental Data | | | | | | | | | | | | | |
| Ratio to average net assets | | | | | | | | | | | | | |
| | Expenses, net | | 2.08% | ** | 2.23% | | 2.46% | | 2.50% | (A) | 2.50% | **(A) | | |
| | Net investment income (loss) | | (0.21%) | ** | (0.69%) | | (0.56%) | | (0.04%) | (A) | (0.55%) | **(A) | | |
| Portfolio turnover rate | | 22.04% | *** | 53.05% | | 101.89% | | 90.97% | | 80.71% | *** | | |
| Net assets, end of period (000's) | | $ 4,566 | | $ 4,713 | | $ 2,304 | | $ 1,446 | | $ 2,038 | | | |
*Commencement of operations | | | | | | | | | | | | | |
** Annualized | | | | | | | | | | | | | |
*** Not annualized | | | | | | | | | | | | | |
(A) Management fee waivers and reimbursement of expenses reduced the expense ratio and increased net investment income ratio by 0.72 % for the year ended February 28, 2009 and by 6.77% for the period June 20, 2007 to February 29, 2008. The ratios reflect the effect of the management fee waivers and reimbursement of expenses. | | |
(B) Less than $0.01 per share. | | | | | | | | | | | |
(C) Per share amounts calculated using the average number of shares outstanding. | | | | | |
| | | | | | | | | | | | | | |
| See Notes to Financial Statements | | | | | | | | | | | |
DGHM ALL-CAP VALUE FUND FINANCIAL HIGHLIGHTS SELECTED PER SHARE DATA FOR A SHARE OUTSTANDING THROUGHOUT THE PERIOD |
| | | | Institutional Class Shares |
| | | | | Six months ended August 31, 2011 (unaudited) | | | Period July 19, 2010* to February 28, 2011 | |
| | | | | | | |
| | | | | | | |
| Net asset value, beginning of period | | $ 11.59 | | | $ 9.33 | |
| Investment activities | | | | | | |
| | Net investment income (loss) | | 0.05 | (A) | | 0.03 | (A) |
| | Net realized and unrealized gain (loss) on investments | | (1.15) | | | 2.26 | |
| | Total from investment activities | | (1.10) | | | 2.29 | |
| Distributions | | - | | | | |
| | Net investment income | | - | | | (0.03) | |
| | Total distributions | | - | | | (0.03) | |
| Net asset value, end of period | | $ 10.49 | | | $ 11.59 | |
| Total Return | | (9.49%) | *** | | 24.55% | *** |
| Ratios/Supplemental Data | | | | | | |
| Ratio to average net assets | | | | | | |
| | Expenses, net | | 1.01% | ** | | 1.11% | ** |
| | Net investment income (loss) | | 0.86% | ** | | 0.46% | ** |
| Portfolio turnover rate | | 22.04% | *** | | 53.05% | *** |
| Net assets, end of period (000's) | | $ 45,123 | | | $ 17,486 | |
| | | | | | | | | |
* Commencement of operations | | | | | | |
** Annualized | | | | | | |
*** Not annualized | | | | | | |
(A) Per share amounts calculated using the average number of shares outstanding. |
| | | | | | | | | |
| See Notes to Financial Statements | | | | | | |
DGHM V2000 SMALLCAP VALUE FUND FINANCIAL HIGHLIGHTS SELECTED PER SHARE DATA FOR A SHARE OUTSTANDING THROUGHOUT THE PERIOD | |
| | | | Investor Class Shares | |
| | | | | Six months ended August 31, 2011 (unaudited) | | | Period June 30, 2010* to February 28, 2011 | | | |
| | | | | | | | | |
| | | | | | | | | |
| Net asset value, beginning of period | | $ 12.92 | | | $ 10.00 | | | |
| Investment activities | | | | | | | | |
| | Net investment income (loss) | | (0.24) | (1) | | - | (1) (B) | | |
| | Net realized and unrealized gain | | | | | | | | |
| | | (loss) on investments | | (1.11) | | | 3.10 | | | |
| | Total from investment activities | | (1.35) | | | 3.10 | | | |
| Distributions | | | | | | | | |
| | Net investment income | | - | | | - | | | |
| | Realized gains | | - | | | (0.18) | | | |
| | Total distributions | | - | | | (0.18) | | | |
| Net asset value, end of period | | $ 11.57 | | | $ 12.92 | | | |
| Total Return | | (10.47%) | *** | | 31.05% | *** | | |
| Ratios/Supplemental Data | | | | | | | | |
| Ratio to average net assets | | | | | | | | |
| | Expenses, gross | | 29.60% | ** | | 15.71% | ** | | |
| | Expenses, net (A) | | 1.90% | ** | | 1.90% | ** | | |
| | Net investment income (loss) | | (3.68)% | ** | | 0.07% | ** | | |
| Portfolio turnover rate | | 30.32% | ** | | 33.60% | *** | | |
| Net assets, end of period (000's) | | $ 64 | | | $ 260 | | | |
| | | | | | | | | | | |
*Commencement of operations | | | | | | | | |
** Annualized | | | | | | | | |
*** Not annualized | | | | | | | | |
(A) Management fee waivers and reimbursement of expenses reduced the expense ratio and increased net investment income ratio by 27.70% for the six months ended August 31, 2011 and by 13.81% for the period June 30, 2010 to February 28, 2011. The ratios reflect the effect of the management fee waivers and reimbursement of expenses. | |
(B) Less than $0.01 per share. |
(1) Per share amounts calculated using the average number of shares outstanding. |
| See Notes to Financial Statements | | | | | | |
DGHM V2000 SMALLCAP VALUE FUND FINANCIAL HIGHLIGHTS SELECTED PER SHARE DATA FOR A SHARE OUTSTANDING THROUGHOUT THE PERIOD | | |
| | | | Institutional Class Shares | | |
| | | | | Six months ended August 31, 2011 (unaudited) | | | | Period June 30, 2010* to February 28, 2011 | | |
| | | | | | | | | |
| | | | | | | | | |
| Net asset value, beginning of period | | $ 13.01 | | | | $ 10.00 | | |
| Investment activities | | | | | | | | |
| | Net investment income (loss) | | 0.12 | (1) | | | 0.02 | (1) | |
| | Net realized and unrealized gain | | | | | | | | |
| | | (loss) on investments | | (1.49) | | | | 3.20 | | |
| | Total from investment activities | | (1.37) | | | | 3.22 | | |
| Distributions | | | | | | | | |
| | Net investment income | | - | | | | (0.03) | | |
| | Realized gains | | - | | | | (0.18) | | |
| | Total distributions | | - | | | | (0.21) | | |
| Net asset value, end of period | | $ 11.64 | | | | $ 13.01 | | |
| Total Return | | (10.47%) | *** | | | 32.24% | *** | |
| Ratios/Supplemental Data | | | | | | | | |
| Ratio to average net assets | | | | | | | | |
| | Expenses, gross | | 23.91% | ** | | | 15.46% | ** | |
| | Expenses, net (A) | | 1.65% | ** | | | 1.65% | ** | |
| | Net investment income (loss) | | 1.91% | ** | | | 0.32% | ** | |
| Portfolio turnover rate | | 30.32% | *** | | | 33.60% | *** | |
| Net assets, end of period (000's) | | $ 28 | | | | $ 998 | | |
| | | | | | | | | | | |
*Commencement of operations |
** Annualized |
*** Not annualized |
(A) Management fee waivers and reimbursement of expenses reduced the expense ratio and increased net investment income ratio by 27.70% for the six months ended August 31, 2011 and by 13.81% for the period June 30, 2010 to February 28, 2011. The ratios reflect the effect of the management fee waivers and reimbursement of expenses. |
(1)Per share amounts calculated using the average number of shares outstanding. |
| See Notes to Financial Statements |
DGHM INVESTMENT TRUST
NOTES TO FINANCIAL STATEMENTS
August 31, 2011 (unaudited)
NOTE 1-ORGANIZATION AND SIGNIFICANT ACCOUNTING POLICIES
The DGHM All-Cap Value Fund and the DGHM V2000 SmallCap Value Fund (the "Funds") are series of the DGHM Investment Trust (the "Trust"). The Trust was organized as a Delaware statutory trust and is registered under the Investment Company Act of 1940, as amended (the “1940 Act”), as a diversified open-end management company. The DGHM All-Cap Value (“All-Cap Fund”) and DGHM V2000 SmallCap Value (“SmallCap Fund”) Funds commenced operations on June 20, 2007 and June 30, 2010, respectively.
The investment objectives of the Funds are to provide long-term capital appreciation through investments that Dalton, Greiner, Hartman, Maher & Co., LLC, the Funds’ investment advisor (“Advisor”), believes are undervalued.
The following is a summary of significant accounting policies consistently followed by the Funds. The policies are in conformity with accounting principles generally accepted in the United States of America (“GAAP”).
Security Valuation
The Funds’ securities are valued at current market prices. Investments traded on a principal exchange (U.S. or foreign) or included in the NASDAQ National Market System are valued at the last reported sales price on the exchange on which the securities are traded as of the close of business on the last day of the period or, lacking any sales, at the last available bid price. In cases where securities are traded on more than one exchange, the securities are valued on the exchange designated by or under the authority of the Funds’ Board of Trustees (the “Trustees”). Short-term debt securities (less than 60 days to maturity) are valued at their fair market value using amortized cost. Securities traded in the over-the-counter market are valued at the last available sale price in the over-the-counter market prior to time of valuation. Securities traded in the over-the-counter market and listed securities for which no sale was reported on that date are valued at the most recent bid price. Securities for which market quotations are not readily available are valued on a consistent basis at fair value as determined in good faith under procedures approved by the Funds’ Trustees. Fair value pricing may be used, for example, in situations where (i) a portfolio security is so thinly traded that there have been no transactions for that security over an extended period of time; (ii) the exchange on which the portfolio security is principally traded closes early; or (iii) trading of the portfolio security is halted during the day and does not resume prior to the Fund’s net asset value calculation. A portfolio security’s “fair value” price may differ from the price next available for that portfolio security using the Funds’ normal pricing procedures. Investment companies are valued at net asset value. If values of foreign securities have been materially affected by events occurring after the close of a foreign market, foreign securities may be valued by another method that the Trustees believe reflects fair value. Generally, trading in corporate bonds, U.S. government securities and money market instruments is substantially completed each day at various times before the scheduled close of the New York Stock Exchange. The value of these securities used in computing the Funds’ net asset value is determined as of such times.
In accordance with GAAP, “fair value” is defined as the price that a fund would receive upon selling an investment in an orderly transaction to an independent buyer in the principal or most advantageous market for the investment. Various inputs are used in determining the value of a fund’s investments. GAAP established a three-tier hierarchy of inputs to establish a classification of fair value measurements for disclosure purposes. Level 1 includes quoted prices in active markets for identical securities. Level 2 includes other significant observable market-based inputs (including quoted prices for similar securities, interest rates, prepayment speeds, credit risk, etc.). Level 3 includes significant unobservable inputs (including the Fund’s own assumptions in determining fair value of investments).
The inputs or methodology used for valuing securities are not necessarily an indication of the risk associated with investing in those securities.
The following is a summary of the inputs used to value the Funds’ investments as of August 31, 2011:
| | Level 1 Quoted Prices | Level 2 Other Significant Observable Inputs | Level 3 Significant Unobservable Inputs | Total |
| All-Cap Fund | | | | |
| Common Stocks | $117,489,194 | $ - | $ - | $117,489,194 |
| Investment Companies | 3,471,159 | - | - | 3,471,159 |
| | $120,960,353 | $ - | $ - | $120,960,353 |
| SmallCap Fund | | | | |
| Common Stocks | $347,887 | $ - | $ - | $347,887 |
| Investment Companies | 5,807 | - | - | 5,807 |
| | $ 353,694 | $ - | $ - | $ 353,694 |
Refer to the Funds’ Schedules of Investments for a listing of securities by security type and industry. The Funds held no Level 3 securities at any time during the period. There were no transfers between levels during the six months ended August 31, 2011.
DGHM INVESTMENT TRUST
NOTES TO FINANCIAL STATEMENTS
August 31, 2011 (unaudited)
Security Transactions and Income
Security transactions are accounted for on the trade date. The cost of securities sold is determined generally on a specific identification basis. Dividends are recorded on the ex-dividend date. Interest income is recorded on an accrual basis and includes amortization of discounts and premiums.
Cash and Cash Equivalents
Cash and cash equivalents, if any, consist of overnight deposits with the custodian bank which earn interest at the current market rate.
Accounting Estimates
In preparing financial statements in conformity with GAAP, management makes estimates and assumptions that affect the reported amounts of assets and liabilities and disclosure of contingent assets and liabilities at the date of the financial statements, and the reported amounts of increases and decreases in the net assets during the reporting period. Actual results could differ from those estimates.
Federal Income Taxes
The Funds intend to comply with the requirements of the Internal Revenue Code applicable to regulated investment companies and to distribute all of its taxable income to its shareholders. The Funds also intend to distribute sufficient net investment income and net capital gains, if any, so that they will not be subject to excise tax on undistributed income and gains. Therefore, no federal income tax or excise provision is required.
The Funds recognize tax benefits on certain tax positions only where the position is “more likely than not” to be sustained assuming investigation from tax authorities. Management has reviewed the Funds’ tax positions and has concluded that no liability for unrecognized tax benefits should be recorded related to uncertain tax positions expected to be taken in the Funds’ 2011 tax returns. The Funds have no examinations in progress and management is not aware of any tax positions for which it is reasonably possible that the total amounts of unrecognized tax benefits will significantly change in the next twelve months. The All-Cap Fund’s Federal tax returns filed in the three-year period ended February 28, 2011 remain subject to examination by the Internal Revenue Service. Interest and penalties, if any, associated with any federal or state income tax obligations, are recorded as income tax expense.
Reclassification of Capital Accounts
GAAP requires that certain components of net assets relating to permanent differences be reclassified between financial and tax reporting. These reclassifications have no effect on net assets or net asset value per share. As of August 31, 2011, there were no such reclassifications.
Class Net Asset Values and Expenses
Each Fund can offer three classes of shares: Investor Shares, Class C and Institutional Class shares. Each class of shares has equal rights as to assets of the Funds, and the classes are identical except for differences in their sales charge structures, ongoing distribution and service fees, shareholder servicing and reports fees and transfer agent fees. Income, expenses (other than distribution and service fees, shareholder servicing and reports fees and transfer agent fees), and realized and unrealized gains or losses on investments are allocated to each class of shares based upon its relative net assets. All classes have equal voting privileges, except where otherwise required by law or when the Board of Trustees determines that the matter to be voted on affects only the interests of the shareholders of a particular class. The Class C shares are subject to a 1% contingent deferred sales charge on proceeds that are redeemed within one year of the purchase date. The contingent deferred sales charge is payable to the Distributor of the Trust. Class C shares automatically convert into Investor Shares after seven years. Effective February 25, 2010, Class A Shares of the All-Cap Fund were re-designated as Investor Shares. As of August 31, 2011, there were no Class C shares of SmallCap Fund outstanding.
NOTE 2-INVESTMENT ADVISORY AND DISTRIBUTION AGREEMENTS AND OTHER TRANSACTIONS WITH AFFILIATES
Pursuant to Investment Advisory Agreements, the Advisor provides investment advisory services for an annual fee of 0.65% on the average daily net assets of the All-Cap Fund and 0.80% on the average daily net assets of the SmallCap Fund. For the six months ended August 31, 2011, the Advisor earned $373,533 in advisory fees from the All-Cap Fund. As of August 31, 2011, the Advisor was due $63,856 from the All-Cap Fund. For the six months ended August 31, 2011, the Advisor earned and waived $2,387 in advisory fees from the SmallCap Fund.
In the interest of limiting the operating expenses of the Funds, the Advisor has contractually agreed to waive or reduce its fees and to assume other expenses of the Funds through June 30, 2012, if necessary, in amounts that limit the Funds’ total operating expenses to 1.50% and 1.65% of average daily net assets of the All-Cap Fund and the SmallCap Fund, respectively. The limit does not apply to interest, taxes, brokerage commissions, other expenditures capitalized in accordance with GAAP, other extraordinary expenses not incurred in the ordinary course of the Fund’s business, dividend expense on short sales and amounts, if any, payable pursuant to a plan adopted in accordance with Rule 12b-1 of the 1940 Act. In determining each Fund’s total operating expenses, expenses that the Fund would have incurred but did not actually pay because of expense offset or brokerage/services arrangements shall be added to the aggregate expenses so as not to benefit the Advisor. Additionally, fees reimbursed to the Funds relating to brokerage/services arrangements shall not be taken into account in determining the Funds’ total operating expenses so as to benefit the Advisor. Finally, these expense limitation arrangements exclude any “acquired fund fees and expenses” as that term is described in the prospectus of the Funds. In addition, the Advisor may be entitled to reimbursement of fees waived or remitted by the Advisor to the Funds after March 1, 2009. The total amount of reimbursement shall be the sum of all fees previously waived or reduced by the Advisor and all other payments remitted by the Advisor to the Funds during any of the previous three fiscal years (beginning March 1, 2009), less any reimbursement previously paid by the Funds to the Advisor with respect to such waivers, reductions and payments. Amounts reimbursed may not cause the Funds to exceed expense limits that were in place at the time such fees and expenses were waived and/or reimbursed. As of August 31, 2011, there were no fee waivers or reimbursements eligible for reimbursement to the Advisor pertaining to the All-Cap Fund. For the six months ended August 31, 2011, the Advisor earned and waived $2,387 in advisory fees and reimbursed expenses of $69,068 for the SmallCap Fund. The total amount of recoverable reimbursements as of August 31, 2011 was $147,218 and expires as follows:
2014 $ 75,763
2015 71,455
$147,218
The Funds have adopted plans of distribution in accordance with Rule 12b-1 under the 1940 Act (each a “Plan” and collectively, the “Plans”). Pursuant to the Plans, the Funds compensate the Funds’ principal underwriter for services rendered and expenses borne in connection with activities primarily intended to result in the sale of the Funds’ shares. The Plans provide that the Funds will pay the annual rate of up to 0.25% of the average daily net assets of the Funds’ Investor Shares and up to 1.00% of the average daily net assets of the Funds’ Class C Shares for activities primarily intended to result in the sale of those shares. These activities include reimbursement to entities for providing distribution and shareholder servicing with respect to the Funds’ shares. The 0.25% fee for the Investor Shares is a service fee. The 1.00% fee for the Class C Shares is comprised of a 0.25% service fee and a 0.75% distribution fee. The All-Cap Fund incurred $92,834 and $24,491, in 12b-1 fees under the Plans with respect to Investor Shares and Class C Shares, respectively, for the six months ended August 31, 2011. The SmallCap Fund incurred $244 in 12b-1 fees under the Plans with respect to Investor Shares for the six months ended August 31, 2011.
First Dominion Capital Corporation (the “FDCC”) acts as the Funds’ principal underwriter and distributor. For the six months ended August 31, 2011, FDCC received no commissions or underwriting fees from the sale of the Funds’ shares. In addition, FDCC receives a contingent deferred sales charge (“CDSC”) of 1% of Class C share redemptions occurring within one year of purchase. Shares redeemed subject to a CDSC will receive a lower redemption value per share. For the six months ended August 31, 2011, FDCC received no CDSC fees.
Commonwealth Shareholder Services, Inc. (“CSS”) provides shareholder, recordkeeping, administrative and blue-sky filing services as the administrative agent for the Funds. For such administrative services, CSS receives 0.10% per annum of average daily net assets of the Funds on the first $75 million and 0.07% per annum of the average daily net assets over $75 million. For the six months ended August 31, 2011, CSS earned $51,550 for its services and at August 31, 2011, was due $4,372 from the All-Cap Fund. For the six months ended August 31, 2011, CSS earned $10,055 for its services and at August 31, 2011, was due $821 from the SmallCap Fund.
Commonwealth Fund Services, Inc. (“CFSI”) is the Funds’ transfer and dividend disbursing agent. For such services, CFSI receives the greater of a basis point charge or a per-account charge, subject to a $10,000 minimum per year. CFSI earned $28,867 for its services for the six months ended August 31, 2011 and at August 31, 2011, was due $3,448 from the All-Cap Fund. CFSI earned $7,905 for its services for the six months ended August 31, 2011 and at August 31, 2011, was due $1,028 from the SmallCap Fund.
Commonwealth Fund Accounting (“CFA”) is the Funds’ pricing agent. CFA earned $28,867 for its services for the six months ended August 31, 2011 and at August 31, 2011, was due $2,599 from the All-Cap Fund. CFA earned $10,055 for its services for the period June 30, 2010 (commencement of operations of the Fund) to August 31, 2011 and at August 31, 2011, was due $716 from the SmallCap Fund.
One Trustee and officers of the Trust are also officers of the Advisor. One officer of the Fund is also an officer and/or director of FDCC, CSS, CFA and CFSI.
NOTE 3 - INVESTMENTS
The cost of purchases and proceeds from the sales of securities other than short-term notes for the six months ended August 31, 2011, were $64,305,022 and $24,574,357, respectively for the All-Cap Fund. The cost of purchases and proceeds from the sales of securities other than short-term notes for the six months ended August 31, 2011, were $178,315 and $998,093, respectively for the SmallCap Fund.
NOTE 4 – DISTRIBUTIONS TO SHAREHOLDERS AND TAX COMPONENTS OF CAPITAL
Distributions from net investment income and realized gains, if any, are recorded on the ex-dividend date. Income distributions and capital gain distributions are determined in accordance with income tax regulations, which may differ from GAAP.
The tax character of distributions during the period ended August 31, 2011 and the year ended February 28, 2011 were as follows:
| | All-Cap Fund | | SmallCap Fund |
| | Six months Ended August 31, 2011 (unaudited) | | | Six months Ended August 31, 2011 (unaudited) | |
| | Year ended February 28, 2011 | | June 30, 2010* to February 28, 2011 |
| Distributions paid from: | | | | | |
Ordinary income | $ - | $24,257 | | $ - | $ 18,521 |
| | | | | | |
| | | | | | |
* commencement of operations
As of August 31, 2011, the components of distributable earnings on a tax basis were as follows:
| | All-Cap Fund | | SmallCap Fund |
| Accumulated net investment income (loss) | $ 353,464 | | $ (250) |
Accumulated net realized gain (loss) on investments | 2,082,386 | | 148,415 |
Unrealized appreciation (depreciation) | (202,747) | | (21,529) |
| | $ 2,233,103 | | $ 126,636 |
| | | | |
As of August 31, 2011, the All-Cap Fund has a capital loss carryforward of $824,277 available to offset future gains, if any. To the extent that these carryforwards are used to offset future capital gains, it is probable that the amount, which is offset, will not be distributed to shareholders. The capital loss carryforward expires on February 28, 2018.
Cost of securities for Federal Income tax purpose is $121,163,100 for All-Cap Fund and $375,223 for SmallCap Fund and the related tax-based net unrealized appreciation (depreciation) consists of:
| | All-Cap Fund | | SmallCap Fund |
| | | | |
| Gross unrealized appreciation | $ 8,310,816 | | $ 16,626 |
| Gross unrealized depreciation | (8,513,563) | | (38,155) |
Net unrealized appreciation (depreciation) | $ (202,747) | | $ (21,529) |
| | | | |
NOTE 5 – CAPITAL STOCK TRANSACTIONS
Capital stock transactions for the Funds were:
| | All-Cap Fund |
| | Six months ended August 31, 2011 (unaudited) |
| | Investor Class | | Class C | | Institutional Class |
| | Shares | Amount | | Shares | Amount | | Shares | Amount |
| Shares sold | 1,730,730 | $19,616,651 | | 101,768 | $1,116,369 | | 2,946,197 | $33,056,898 |
| Shares reinvested | - | - | | - | - | | - | - |
| Shares redeemed | (1,052,638) | (11,657,341) | | (70,157) | (763,934) | | (153,797) | (1,682,901) |
| Net increase (decrease) | 678,092 | $7,959,310 | | 31,611 | $352,435 | | 2,792,400 | $31,373,997 |
*Commencement of operations.
| | All-Cap Fund |
| | Year ended February 28, 2011 | | Period July 19, 2010* to February 28, 2011 |
| | Investor Class | | Class C | | Institutional Class |
| | Shares | Amount | | Shares | Amount | | Shares | Amount |
| Shares sold | 2,753,934 | $ 28,507,623 | | 213,812 | $2,171,909 | | 1,512,293 | $16,440,096 |
| Shares reinvested | 529 | 5,805 | | - | - | | 773 | 8,893 |
| Shares redeemed | (1,252,746) | (12,887,434) | | (46,505) | (466,156) | | (4,862) | (53,325) |
| Net increase (decrease) | 1,501,717 | $15,625,994 | | 167,307 | $1,705,753 | | 1,508,204 | $16,395,664 |
| | SmallCap Fund |
| | Six months ended August 31, 2011 (unaudited) |
| | Investor Class | | Institutional Class |
| | Shares | Amount | | Shares | Amount |
| Shares sold | 1,908 | $ 23,753 | | 9,834 | $ 127,745 |
| Shares reinvested | - | - | | - | - |
| Shares redeemed | (16,486) | (210,858) | | (58,665) | (764,301) |
| Net increase (decrease) | (14,578) | $ (187,105) | | (48,831) | $ (636,555) |
| | SmallCap Fund |
| | Period June 30, 2010* to February 28, 2011 |
| | Investor Class | | Institutional Class |
| | Shares | Amount | | Shares | Amount |
| Shares sold | 21,029 | $ 232,768 | | 75,769 | $ 853,949 |
| Shares reinvested | 237 | 2,978 | | 971 | 12,280 |
| Shares redeemed | (1,113) | (14,134) | | - | - |
| Net increase (decrease) | 20,153 | $ 221,612 | | 76,740 | $ 866,229 |
*Commencement of operations.
NOTE 6 – COMMITMENTS AND CONTINGENCIES
Under the Trust’s organizational documents, its officers and Trustees are indemnified against certain liabilities arising out of the performance of their duties to the Funds. In addition, in the normal course of business, the Trust entered into contracts with its vendors, on behalf of the Funds, and others that provide for general indemnifications. The Funds’ maximum exposure under these arrangements is unknown, as this would involve future claims that may be made against the Funds. The Funds expects that risk of loss to be remote.
NOTE 7 - SUBSEQUENT EVENTS
Management has evaluated all transactions and events subsequent to the date of the balance sheet through the date these financial statements were issued. Except as already included in the notes to these financial statements, no additional items require disclosure.
DGHM INVESTMENT TRUST (the “Trust”)
SUPPLEMENTAL INFORMATION (unaudited)
VOTING PROXIES ON FUND PORTFOLIO SECURITIES
A copy of the Trust’s Proxy Voting and Disclosure Policy and the Advisor’s Proxy Voting and Disclosure Policy are included as Appendix B to the Fund’s Statement of Additional Information and is available, without charge, (1) upon request, by calling 1-800-653-2839 and (2) on the SEC’s website at http://www.sec.gov. Information regarding how the Funds voted proxies relating to portfolio securities during the most recent 12-month period ended June 30 is available without charge, (1) upon request, by calling the Funds at the number above and (2) on the SEC’s website at http://www.sec.gov.
QUARTERLY PORTFOLIO HOLDINGS
The Funds file with the SEC a complete schedule of its portfolio holdings, as of the close of the first and third quarters of its fiscal year, on “Form N-Q”. These filings are available on the SEC’s website at www.sec.gov. The Funds’ Forms N-Q may be reviewed and copied at the SEC’s Public Reference Room in Washington, D.C. Information on the operation of the Public Reference Room may be obtained by calling 1-800-SEC-0330.
DGHM INVESTMENT TRUST
FUND EXPENSES (unaudited)
Fund Expenses Example
As a shareholder of the Fund, you incur two types of costs: (1) transaction costs, including deferred sales charges on certain redemptions made within one year of purchase (Class C shares in DGHM All-Cap Value Fund) and (2) ongoing costs, including management fees, distribution (12b-1) fees and other Fund expenses. This example is intended to help you understand your ongoing costs (in dollars) of investing in the Fund and to compare these costs with the ongoing costs of investing in other mutual funds. The example is based on an investment of $1,000 invested at the beginning of the period, March 1, 2011, and held for the six months ended August 31, 2011.
Actual Expenses Example
The first line of the table below provides information about actual account values and actual expenses. You may use the information in this line, together with the amount you invested, to estimate the expenses that you paid over the period. Simply divide your account value by $1,000 (for example, an $8,600 account value divided by $1,000= 8.6), then multiply the result by the number in the first line under the heading entitled “Expenses Paid During Period” to estimate the expenses you paid on your account during this period.
Hypothetical Example for Comparison Purposes
The second line of the table below provides information about hypothetical account values and hypothetical expenses based on the Fund’s actual expense ratio and an assumed rate of return of 5% per year before expenses, which is not the Fund’s actual return. The hypothetical account values and expenses may not be used to estimate the actual ending account balance or expenses you paid for the period. You may use this information to compare the ongoing costs of investing in the Fund and other funds. To do so, compare this 5% hypothetical example with the 5% hypothetical examples that appear in the shareholder reports of the other funds.
Please note that the expenses shown in the table are meant to highlight your ongoing costs only and do not reflect any transactional costs, such as contingent deferred sales charges on certain redemptions. Therefore, the second line of the table is useful in comparing ongoing costs only, and will not help you determine the relative total costs of owning different funds. In addition, if these transactional costs were included, your costs would have been higher.
DGHM ALL-CAP VALUE FUND
INVESTOR CLASS | Beginning Account Value March 1, 2011 | Ending Account Value August 31, 2011 | Expenses Paid During Period* March 1, 2011 through August 31, 2011 |
| Actual | $1,000.00 | $904.31 | $6.34 |
| Hypothetical (5% return before expenses) | $1,000.00 | $1,018.40 | $6.72 |
CLASS C | Beginning Account Value March 1, 2011 | Ending Account Value August 31, 2011 | Expenses Paid During Period* March 1, 2011 through August 31, 2011 |
| Actual | $1,000.00 | $900.53 | $9.96 |
| Hypothetical (5% return before expenses) | $1,000.00 | $1,014.60 | $10.56 |
INSTITUTIONAL CLASS | Beginning Account Value March 1, 2011 | Ending Account Value August 31, 2011 | Expenses Paid During Period* March 1, 2011 through August 31, 2011 |
| Actual | $1,000.00 | $905.09 | $4.85 |
| Hypothetical (5% return before expenses) | $1,000.00 | $1,019.85 | $5.14 |
* - Expenses are equal to the Fund’s annualized expense ratio of 1.32% for Investor Class, 2.08% for Class C and 1.01% for Institutional Class, multiplied by the average account value for the period, multiplied by 184 days in the most recent fiscal half year divided by 366 days in the current year.
DGHM V2000 SMALLCAP VALUE FUND
INVESTOR CLASS | Beginning Account Value March 1, 2011 | Ending Account Value August 31, 2011 | Expenses Paid During Period* March 1, 2011 through August 31, 2011 |
| Actual | $1,000.00 | $895.27 | $8.58 |
| Hypothetical (5% return before expenses) | $1,000.00 | $1,016.00 | $9.12 |
INSTITUTIONAL CLASS | Beginning Account Value March 1, 2011 | Ending Account Value August 31, 2011 | Expenses Paid During Period* March 1, 2011 through August 31, 2011 |
| Actual | $1,000.00 | $896.07 | $7.39 |
| Hypothetical (5% return before expenses) | $1,000.00 | $1,017.25 | $7.86 |
* - Expenses are equal to the Fund’s annualized expense ratio of 1.90% for Investor Class and 1.65% for Institutional Class, multiplied by the average account value for the period, multiplied by 184 days in the most recent fiscal half year divided by 366 days in the current year.
Investment Adviser:
Dalton, Greiner, Hartman, Maher & Co., LLC
565 Fifth Avenue, Suite 2101
New York, New York 10017-2413
Distributor:
First Dominion Capital Corp.
8730 Stony Point Parkway, Suite 205
Richmond, Virginia 23235
Independent Registered Public Accounting Firm:
BBD, LLP
1835 Market Street, 26th Floor
Philadelphia, Pennsylvania 19103
Legal Counsel:
The Law Offices of John H. Lively & Associates, Inc.
A member firm of The 1940 Act Law Group
2041 West 141st Terrace, Suite 119
Leakwood, Missouri 66224
Transfer Agent:
For account information, wire purchase or redemptions, call or write to DGHM Investment Trust’s Transfer Agent:
Commonwealth Fund Services, Inc.
8730 Stony Point Parkway, Suite 205
Richmond, Virginia 23235
(800) 653-2839 (Toll Free)
