Exhibit 99.2 Q3 2024 Results Conference Call October 30, 2024
Disclaimer & Cautionary Statements This presentation includes forward-looking statements. Forward-looking statements are subject to risks and uncertainties, and the Company cautions investors against placing undue reliance on such statements. Actual results may differ materially from those set forth in the forward- looking statements. Such forward-looking statements include statements regarding: • Future sales, sales growth, profitability and Adjusted EBITDA margins; • Estimates of potential market size and demand for the Company’s current and future products; • Plans for expansion outside of the U.S.; • The effectiveness of amniotic tissue as a therapy for any particular indication or condition; • Expected spending on research and development, including to innovate and diversify our product portfolio; • Investments in data; • Expectations regarding the reimbursement environment for the Company’s products, including Medicare Spending; • Manner of LCD implementation; • Expectations regarding plans to reduce customer churn and enhancing customer relationships; • Expectations that HELIOGEN will be a meaningful contributor to our financial performance in 2025; • The stage of development of the placental-derived products market; • The Company’s long-term strategy and goals for value creation, the status of its pipeline products, expectations for future products, and expectations for future growth and profitability 2
Disclaimer & Cautionary Statements Additional forward-looking statements may be identified by words such as believe, expect, may, plan, potential, will, preliminary, and similar expressions, and are based on management's current beliefs and expectations. Forward-looking statements are subject to risks and uncertainties, and the Company cautions investors against placing undue reliance on such statements. Actual results may differ materially from those set forth in the forward-looking statements. Factors that could cause actual results to differ from expectations include: • Future sales are uncertain and are affected by competition, access to customers, patient access to hospitals and healthcare providers, the reimbursement environment and many other factors; • The future market for the Company’s products can depend on regulatory approval of such products, which might not occur at all or when expected, and is based in part on assumptions regarding the number of patients who elect less acute and more acute treatment than the Company’s products, market acceptance of the Company’s products, and adequate reimbursement for such therapies; • The process of obtaining regulatory clearances or approvals to market a biological product or medical device from the FDA or similar regulatory authorities outside of the U.S. is costly and time consuming, and such clearances or approvals may not be granted on a timely basis, or at all, and the ability to obtain the rights to market additional, suitable products depends on negotiations with third parties which may not be forthcoming; and • The Company describes additional risks and uncertainties in the Risk Factors section of its most recent annual report and quarterly reports filed with the Securities and Exchange Commission. Any forward-looking statements speak only as of the date of this presentation and the Company assumes no obligation to update any forward- looking statement. 3
Joe Capper Chief Executive Officer helping humans heal.
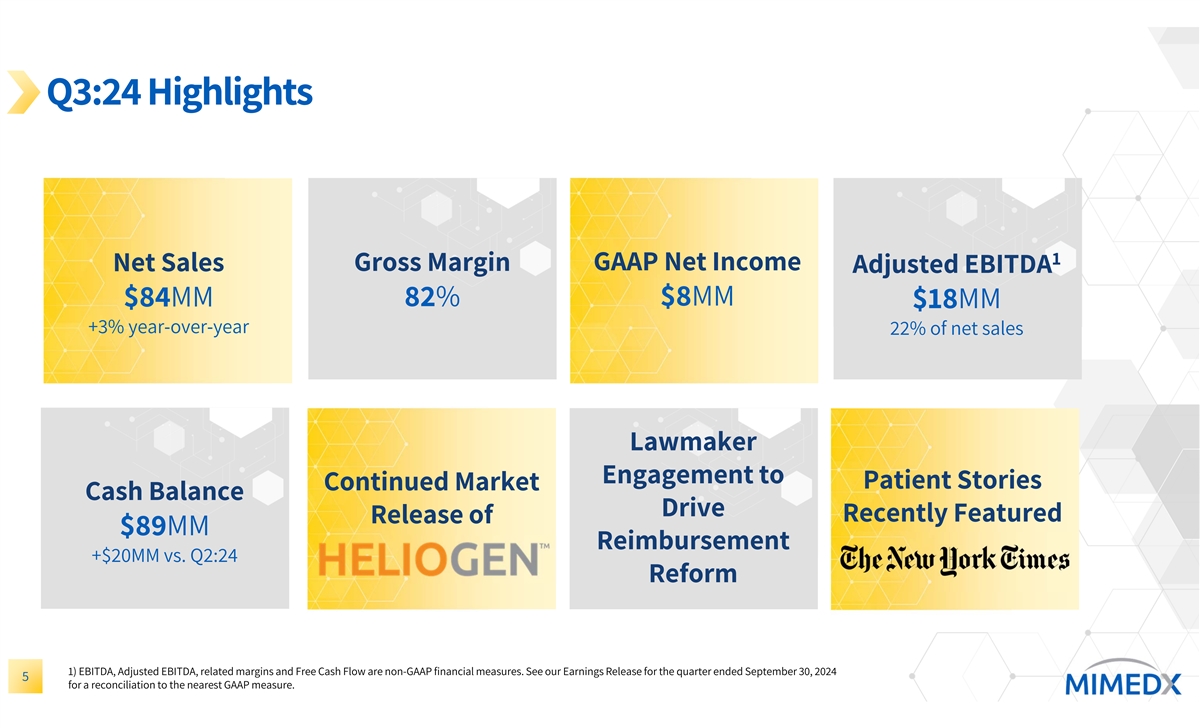
Q3:24 Highlights 1 GAAP Net Income Net Sales Gross Margin Adjusted EBITDA $8MM $84MM 82% $18MM +3% year-over-year 22% of net sales Lawmaker Engagement to Patient Stories Continued Market Cash Balance Drive Recently Featured Release of $89MM Reimbursement +$20MM vs. Q2:24 Reform 1) EBITDA, Adjusted EBITDA, related margins and Free Cash Flow are non-GAAP financial measures. See our Earnings Release for the quarter ended September 30, 2024 5 for a reconciliation to the nearest GAAP measure.
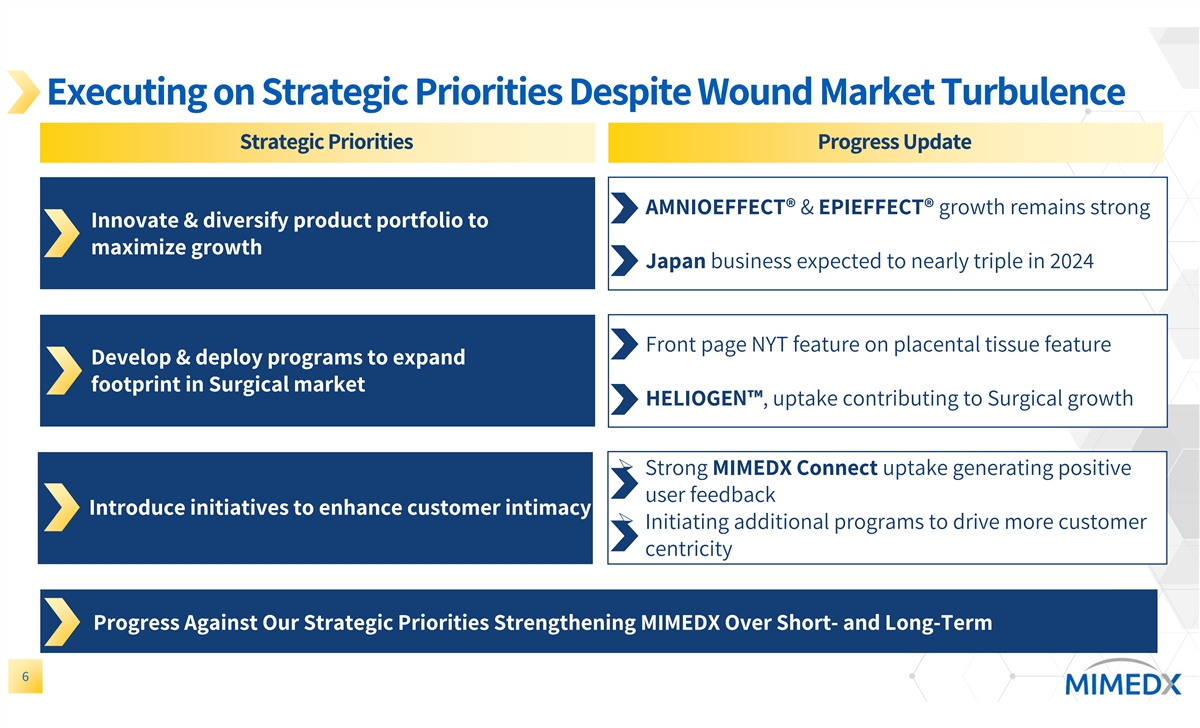
Executing on Strategic Priorities Despite Wound Market Turbulence Strategic Priorities Progress Update Ø AMNIOEFFECT® & EPIEFFECT® growth remains strong Innovate & diversify product portfolio to maximize growth Ø Japan business expected to nearly triple in 2024 Ø Front page NYT feature on placental tissue feature Develop & deploy programs to expand footprint in Surgical market Ø HELIOGEN , uptake contributing to Surgical growth Ø Strong MIMEDX Connect uptake generating positive user feedback Introduce initiatives to enhance customer intimacy Ø Initiating additional programs to drive more customer centricity Progress Against Our Strategic Priorities Strengthening MIMEDX Over Short- and Long-Term 6
Doug Rice Chief Financial Officer helping humans heal.
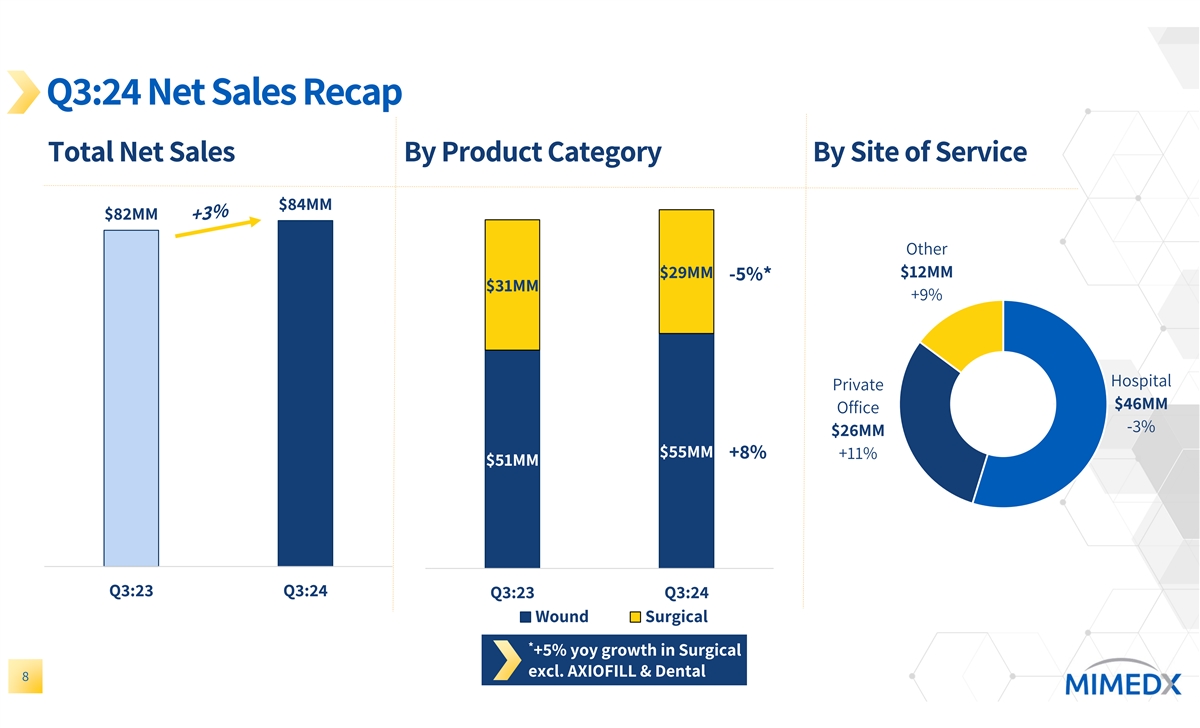
Q3:24 Net Sales Recap Total Net Sales By Product Category By Site of Service $84MM $82MM Other $12MM $29MM -5%* $31MM +9% Hospital Private $46MM Office -3% $26MM $55MM +8% +11% $51MM Q3:23 Q3:24 Q3:23 Q3:24 Wound Surgical * +5% yoy growth in Surgical excl. AXIOFILL & Dental 8
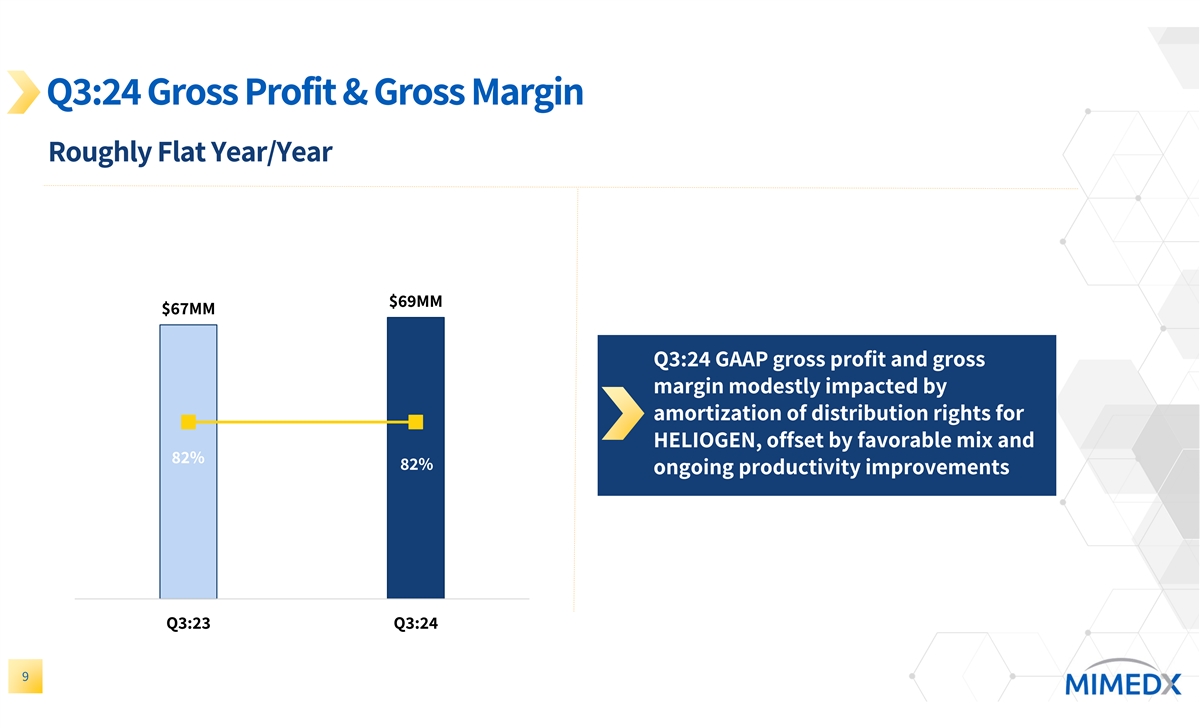
Q3:24 Gross Profit & Gross Margin Roughly Flat Year/Year 80 $69MM $67MM Q3:24 GAAP gross profit and gross margin modestly impacted by amortization of distribution rights for HELIOGEN, offset by favorable mix and 82% 82% ongoing productivity improvements 0 Q3:23 Q3:24 9
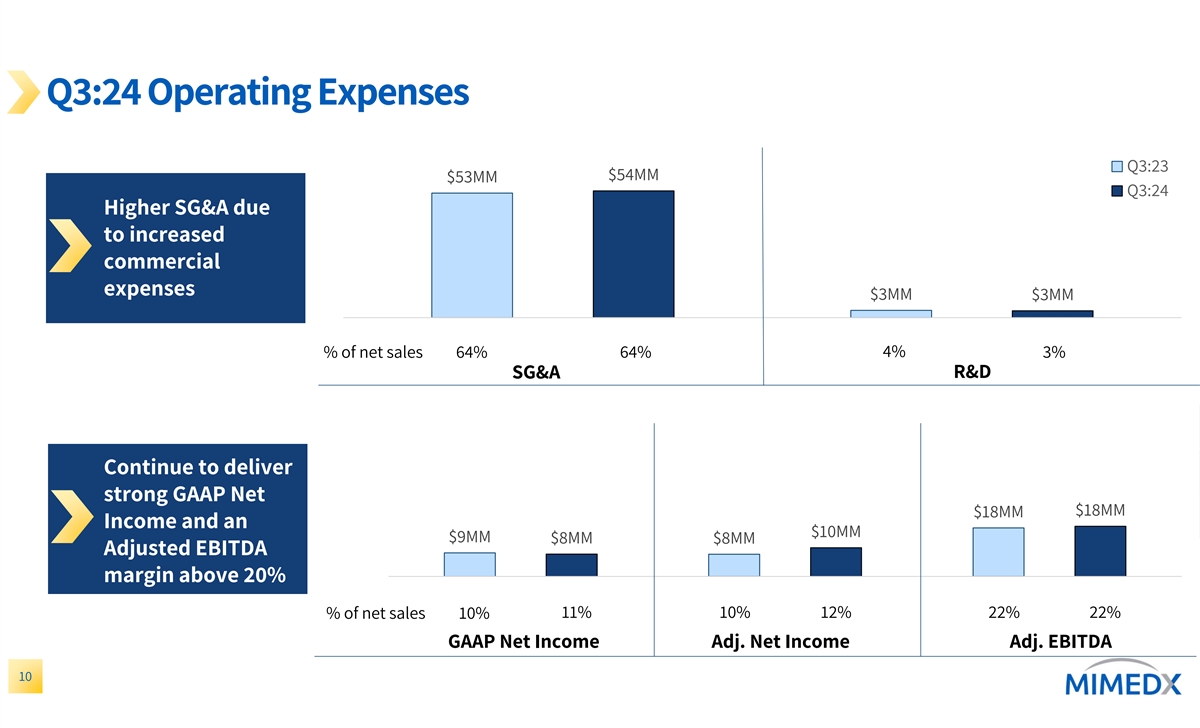
Q3:24 Operating Expenses Q3:23 $54MM $53MM Q3:24 Higher SG&A due to increased commercial expenses $3MM $3MM 4% % of net sales 64% 64% 3% SG&A R&D Continue to deliver strong GAAP Net $18MM $18MM Income and an $10MM $9MM $8MM $8MM Adjusted EBITDA margin above 20% % of net sales 10% 11% 10% 12% 22% 22% GAAP Net Income Adj. Net Income Adj. EBITDA 10
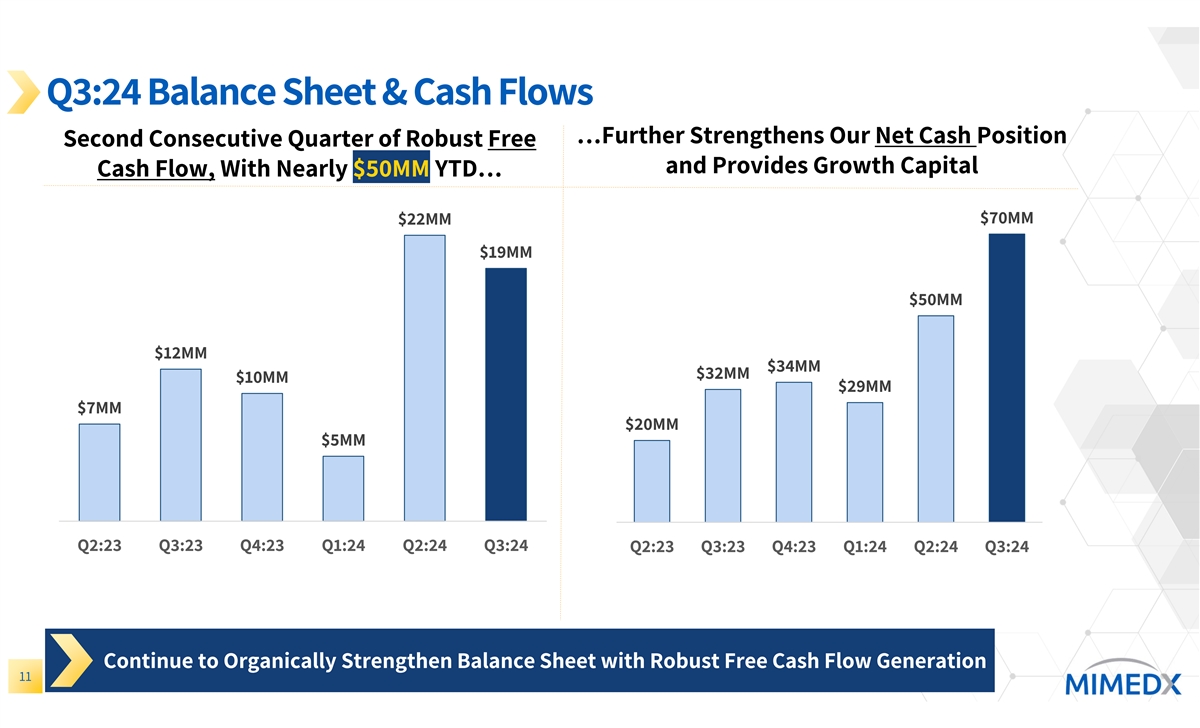
Q3:24 Balance Sheet & Cash Flows …Further Strengthens Our Net Cash Position Second Consecutive Quarter of Robust Free and Provides Growth Capital Cash Flow, With Nearly $50MM YTD… $70MM $22MM $19MM $50MM $12MM $34MM $32MM $10MM $29MM $7MM $20MM $5MM Q2:23 Q3:23 Q4:23 Q1:24 Q2:24 Q3:24 Q2:23 Q3:23 Q4:23 Q1:24 Q2:24 Q3:24 Continue to Organically Strengthen Balance Sheet with Robust Free Cash Flow Generation 11

Joe Capper Chief Executive Officer helping humans heal.
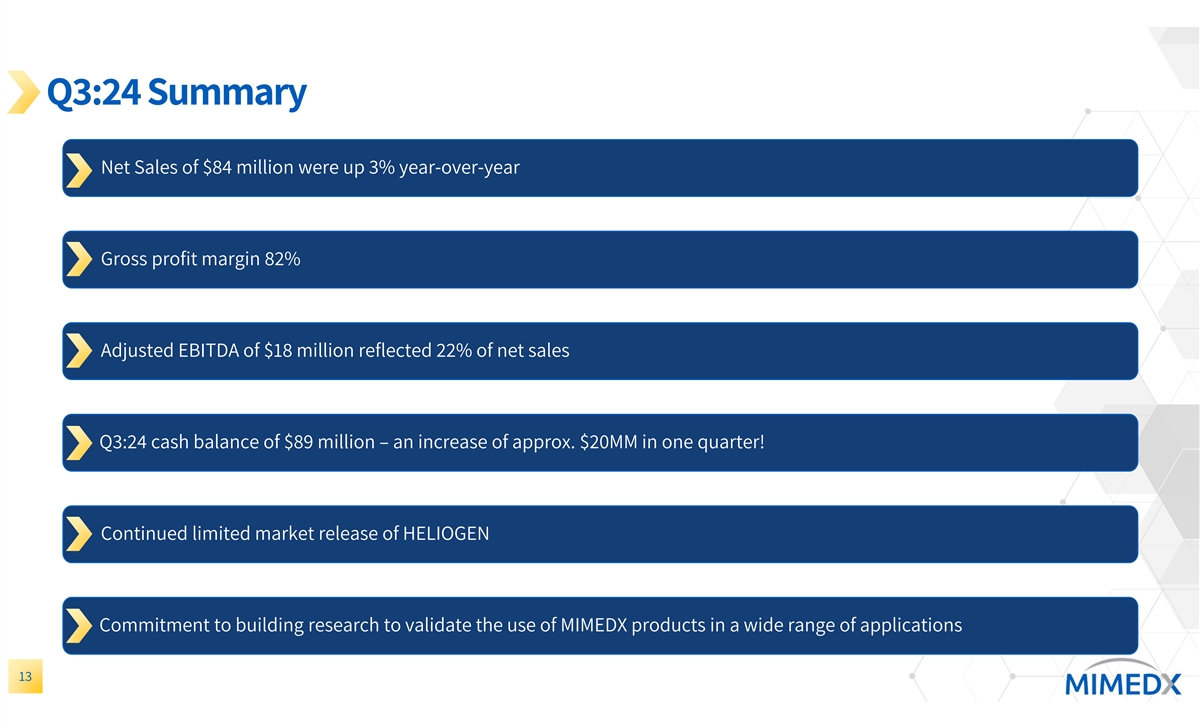
Q3:24 Summary Net Sales of $84 million were up 3% year-over-year Gross profit margin 82% Adjusted EBITDA of $18 million reflected 22% of net sales Q3:24 cash balance of $89 million – an increase of approx. $20MM in one quarter! Continued limited market release of HELIOGEN Commitment to building research to validate the use of MIMEDX products in a wide range of applications 13
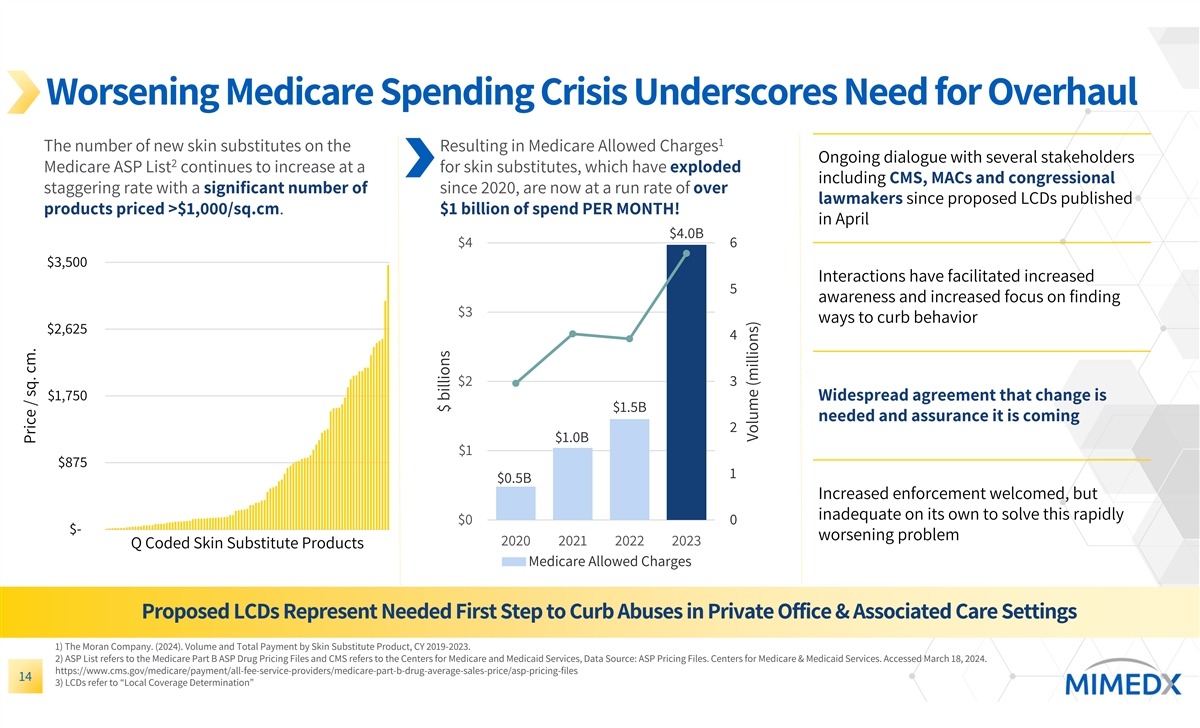
Worsening Medicare Spending Crisis Underscores Need for Overhaul 1 The number of new skin substitutes on the Resulting in Medicare Allowed Charges Ongoing dialogue with several stakeholders 2 Medicare ASP List continues to increase at a for skin substitutes, which have exploded including CMS, MACs and congressional staggering rate with a significant number of since 2020, are now at a run rate of over lawmakers since proposed LCDs published products priced >$1,000/sq.cm. $1 billion of spend PER MONTH! in April $4.0B $4 6 $3,500 Interactions have facilitated increased 5 awareness and increased focus on finding $3 ways to curb behavior $2,625 4 $2 3 $1,750 Widespread agreement that change is $1.5B needed and assurance it is coming 2 $1.0B $1 $875 1 $0.5B Increased enforcement welcomed, but inadequate on its own to solve this rapidly $0 0 $- worsening problem 2020 2021 2022 2023 Q Coded Skin Substitute Products Medicare Allowed Charges Proposed LCDs Represent Needed First Step to Curb Abuses in Private Office & Associated Care Settings 1) The Moran Company. (2024). Volume and Total Payment by Skin Substitute Product, CY 2019-2023. 2) ASP List refers to the Medicare Part B ASP Drug Pricing Files and CMS refers to the Centers for Medicare and Medicaid Services, Data Source: ASP Pricing Files. Centers for Medicare & Medicaid Services. Accessed March 18, 2024. https://www.cms.gov/medicare/payment/all-fee-service-providers/medicare-part-b-drug-average-sales-price/asp-pricing-files 14 3) LCDs refer to “Local Coverage Determination” Price / sq. cm. $ billions Volume (millions)
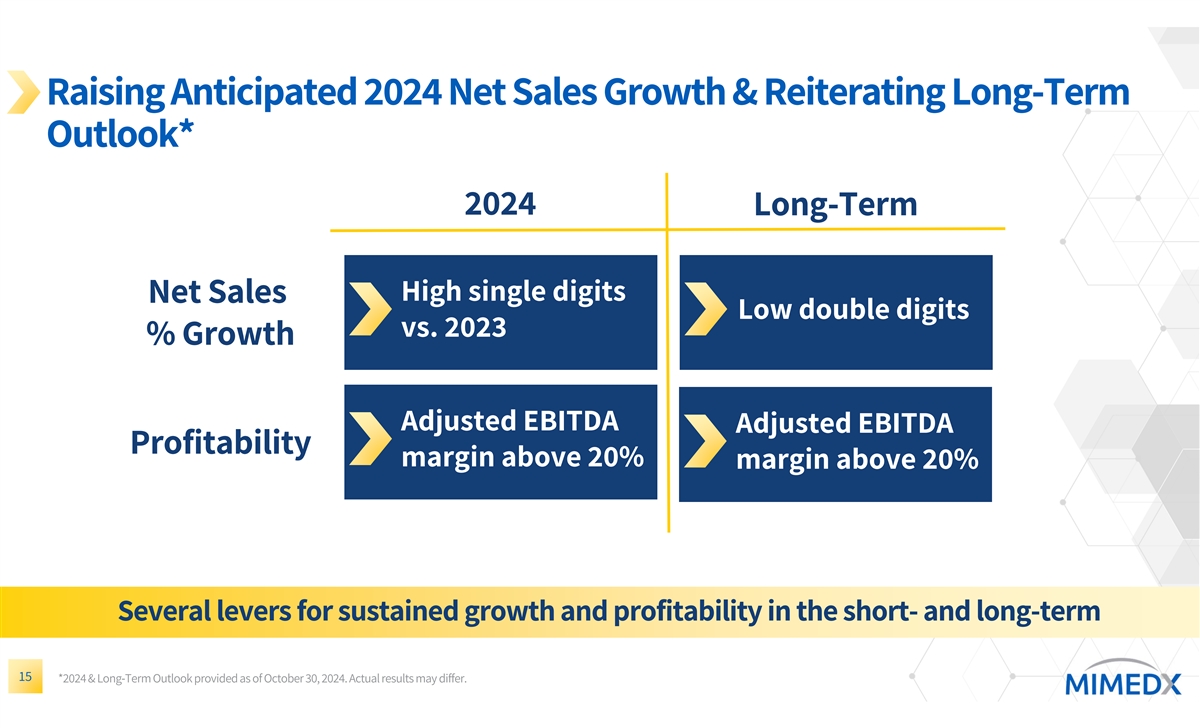
Raising Anticipated 2024 Net Sales Growth & Reiterating Long-Term Outlook* 2024 Long-Term High single digits Net Sales Low double digits vs. 2023 % Growth Adjusted EBITDA Adjusted EBITDA Profitability margin above 20% margin above 20% Several levers for sustained growth and profitability in the short- and long-term 15 *2024 & Long-Term Outlook provided as of October 30, 2024. Actual results may differ.
Closing Remarks, Q&A