
1 A TRANSFORMATIONAL PLACENTAL BIOLOGICS COMPANY 40th Annual J.P. Morgan Healthcare Conference January 2022 EXHIBIT 99.1
2 DISCLAIMER & CAUTIONARY STATEMENTS This presentation includes forward-looking statements. Forward-looking statements are subject to risks and uncertainties, and the Company cautions investors against placing undue reliance on such statements. Actual results may differ materially from those set forth in the forward-looking statements. Such forward-looking statements include statements regarding: • future sales or sales growth; • the Company’s expectations regarding its mdHACM product’s potential use as a safe and effective treatment option, and that it may be an effective treatment for persons battling inflammatory conditions; the Company’s plans for meetings with the U.S. Food & Drug Administration (FDA), and planned biologics license application (BLA) submissions to the FDA, and their timing; plans for future clinical trials, including the Company’s decision to pursue or not pursue, and their timing; • the effectiveness of amniotic tissue as a therapy for any particular indication or condition; • estimates of potential market size for the Company’s current and future products; • plans for expansion outside of the U.S.; • expected spending on clinical trials and research and development; • the Company’s long-term strategy for value creation, the status of its pipeline products, expectations for future products, and expectations for future growth;
3 DISCLAIMER & CAUTIONARY STATEMENTS Additional forward-looking statements may be identified by words such as "believe," "expect," "may," "plan," "potential," "will," "preliminary," and similar expressions, and are based on management's current beliefs and expectations. Forward-looking statements are subject to risks and uncertainties, and the Company cautions investors against placing undue reliance on such statements. Actual results may differ materially from those set forth in the forward-looking statements. Factors that could cause actual results to differ from expectations include: • future sales are uncertain and are affected by competition, access to customers, patient access to healthcare providers, and many other factors; • the results of a clinical trial or trials may not demonstrate that the product is safe or effective, or may have little or no statistical value; the Company may change its plans due to unforeseen circumstances, and delay or alter the timeline for future trials, analyses, or public announcements; the timing of any meeting with the FDA depends on many factors and is outside of the Company’s control, and the results from any meeting are uncertain; a BLA submission requires a number of prerequisites, including favorable study results and statistical support, and completion of a satisfactory FDA inspection of the Company’s manufacturing facility or facilities; plans for future clinical trials depend on the results of pending clinical trials, discussion with the FDA, and other factors; and conducting clinical trials is a time-consuming, expensive, and uncertain process; • the future market for the Company’s products can depend on regulatory approval of such products, which might not occur at all or when expected, and is based in part on assumptions regarding the number of patients who elect less acute and more acute treatment than the Company’s products, market acceptance of the Company’s products, and adequate reimbursement for such therapies; • the process of obtaining regulatory clearances or approvals to market a biological product or medical device from the FDA or similar regulatory authorities outside of the U.S. is costly and time consuming, and such clearances or approvals may not be granted on a timely basis, or at all, and the ability to obtain the rights to market additional, suitable products depends on negotiations with third parties which may not be forthcoming; • whether there is full access to hospitals and healthcare provider facilities, as a continuation or escalation of access restrictions or lockdown orders resulting from the ongoing COVID-19 pandemic; and • expected spending can depend in part on the results of pending clinical trials; The Company describes additional risks and uncertainties in the Risk Factors section of its most recent annual report and quarterly reports filed with the Securities and Exchange Commission. Any forward-looking statements speak only as of the date of this press release and the Company assumes no obligation to update any forward-looking statement.

4 OUR PLACENTAL BIOLOGICS ARE TRANSFORMING MEDICINE AND PATIENTS’ LIVES
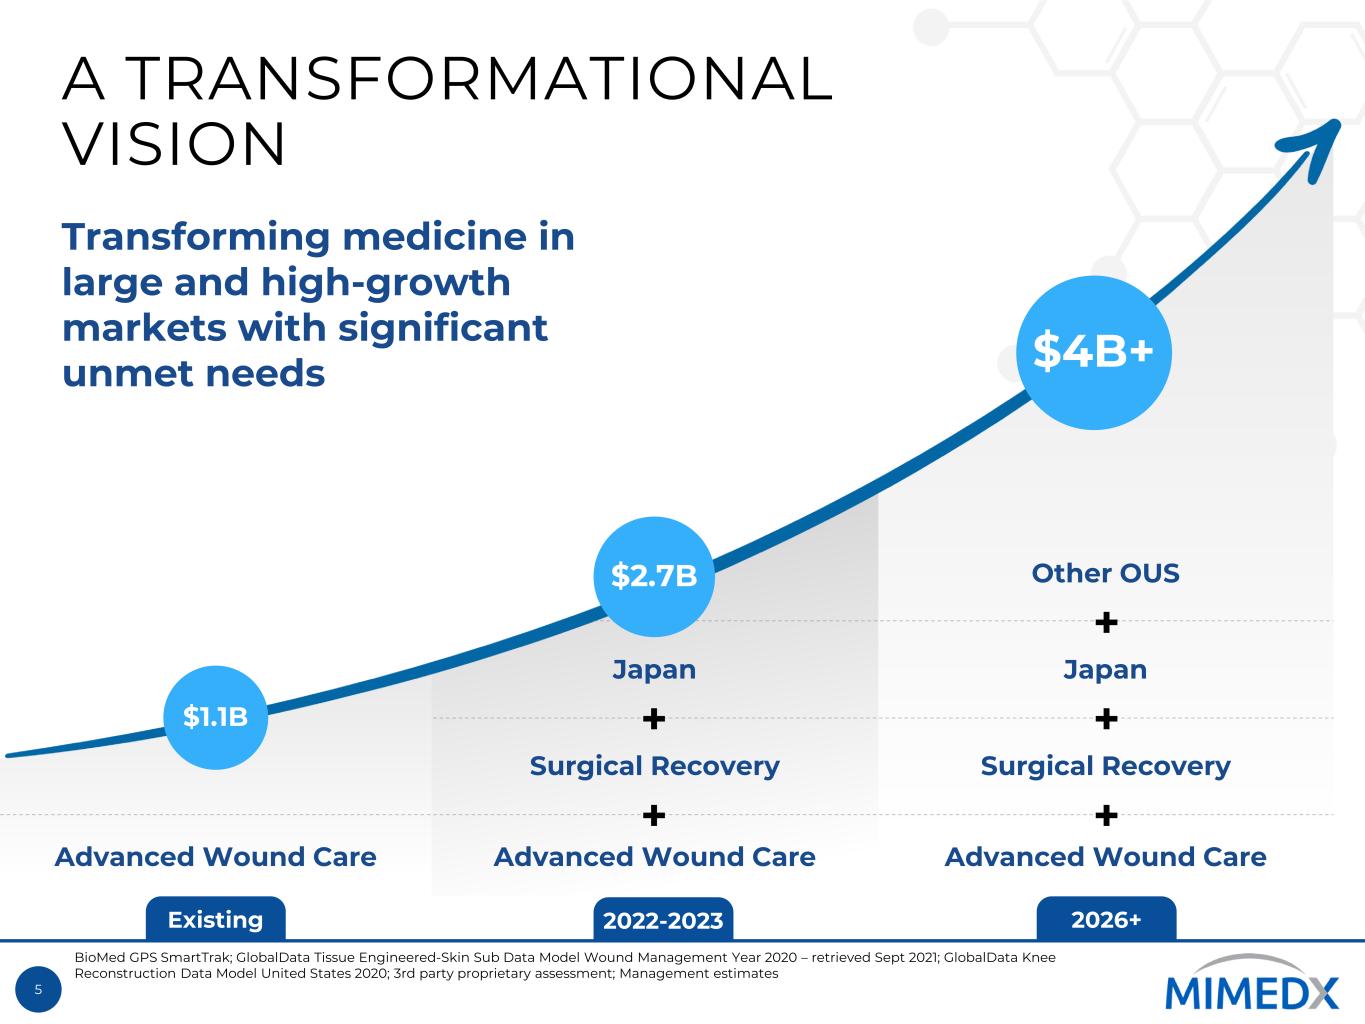
5 Existing 2022-2023 2026+ A TRANSFORMATIONAL VISION $1.1B $4B+ Transforming medicine in large and high-growth markets with significant unmet needs Advanced Wound Care Advanced Wound Care Surgical Recovery Japan Advanced Wound Care Surgical Recovery Japan + + + + + Other OUS$2.7B BioMed GPS SmartTrak; GlobalData Tissue Engineered-Skin Sub Data Model Wound Management Year 2020 – retrieved Sept 2021; GlobalData Knee Reconstruction Data Model United States 2020; 3rd party proprietary assessment; Management estimates
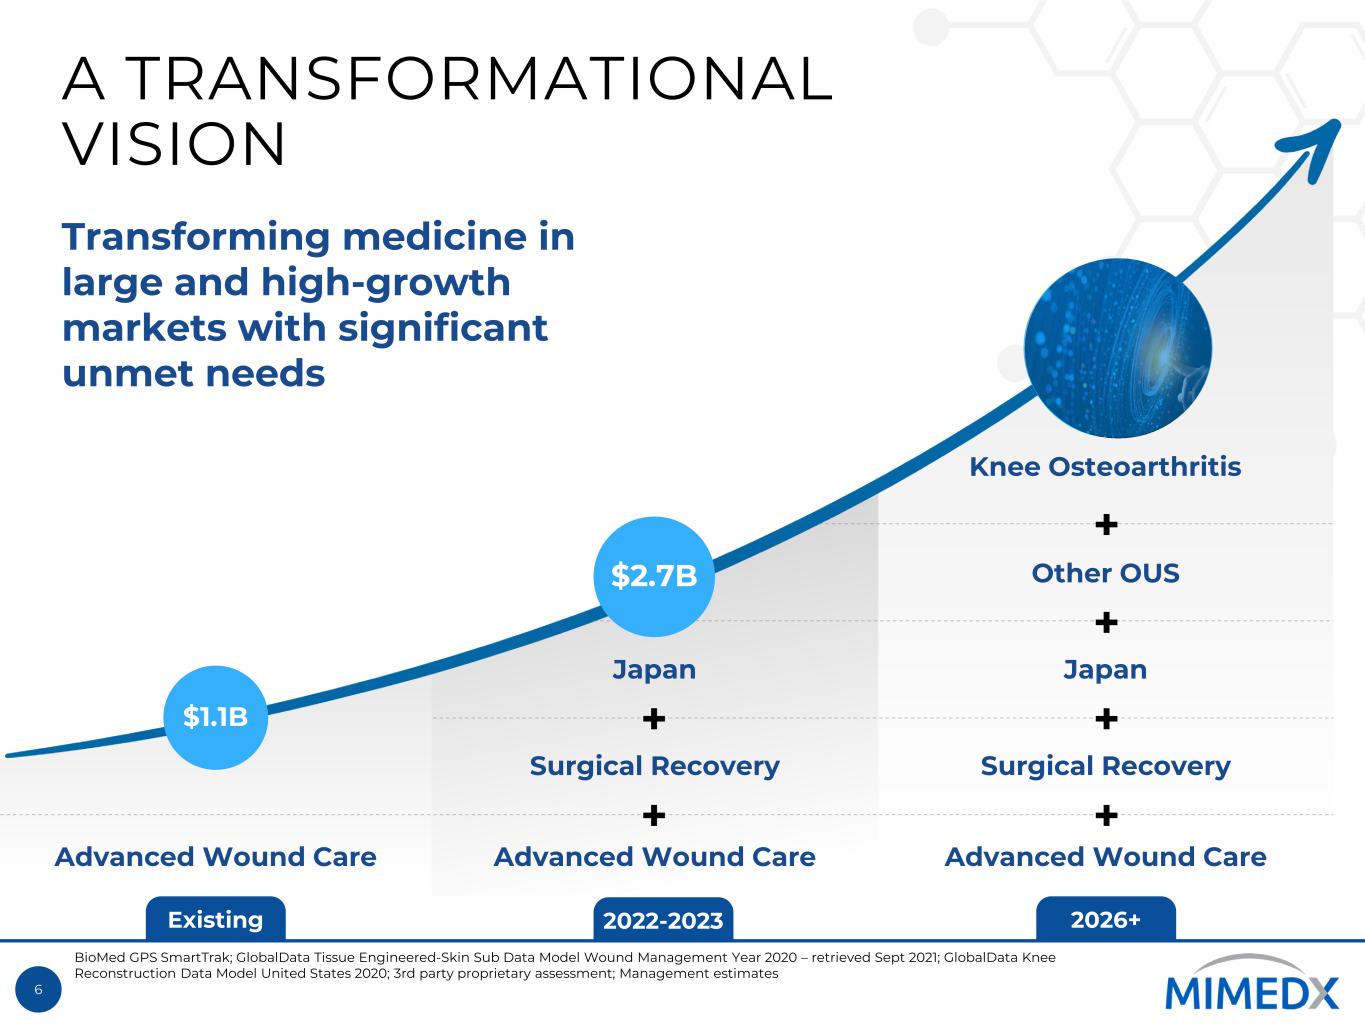
6 Existing 2022-2023 2026+ A TRANSFORMATIONAL VISION $1.1B Transforming medicine in large and high-growth markets with significant unmet needs Advanced Wound Care Advanced Wound Care Surgical Recovery Japan Knee Osteoarthritis + + $2.7B Advanced Wound Care Surgical Recovery Japan + + + Other OUS + BioMed GPS SmartTrak; GlobalData Tissue Engineered-Skin Sub Data Model Wound Management Year 2020 – retrieved Sept 2021; GlobalData Knee Reconstruction Data Model United States 2020; 3rd party proprietary assessment; Management estimates

7 Existing 2022-2023 2026+ THE TRANSFORMATIONAL POTENTIAL Advanced Wound Care Advanced Wound Care Surgical Recovery Japan + + Advanced Wound Care Surgical Recovery Japan + + + Other OUS + $1.1B $2.7B Knee Osteoarthritis DMOAD BioMed GPS SmartTrak; GlobalData Tissue Engineered-Skin Sub Data Model Wound Management Year 2020 – retrieved Sept 2021; GlobalData Knee Reconstruction Data Model United States 2020; 3rd party proprietary assessment; Management estimates; DMOAD = Disease Modifying Osteoarthritis Drug
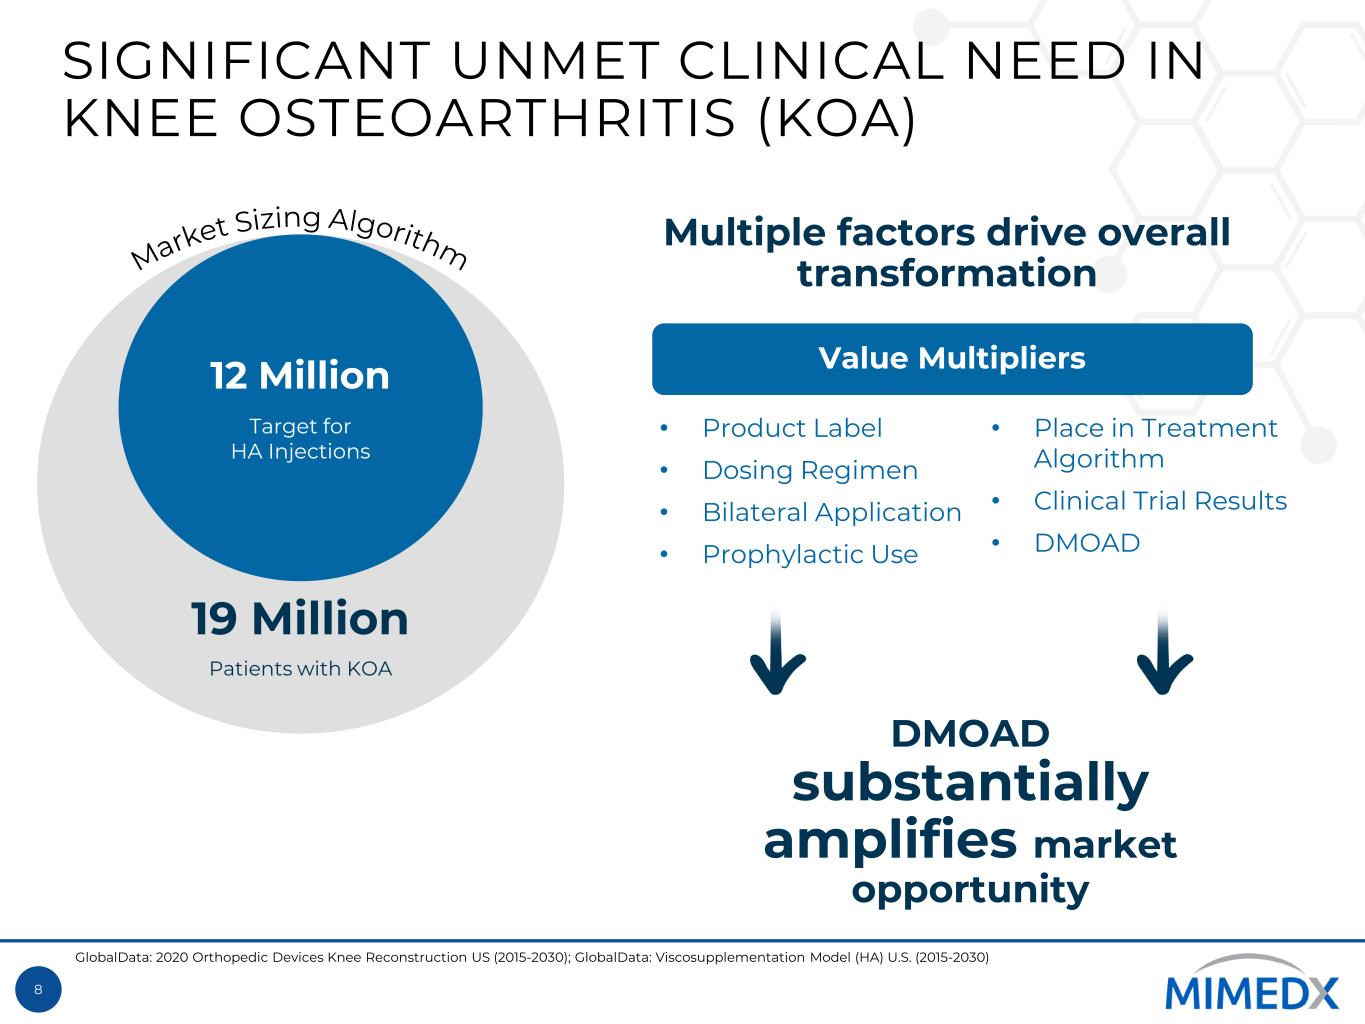
8 SIGNIFICANT UNMET CLINICAL NEED IN KNEE OSTEOARTHRITIS (KOA) 19 Million Patients with KOA 12 Million Target for HA Injections Value Multipliers DMOAD substantially amplifies market opportunity • Product Label • Dosing Regimen • Bilateral Application • Prophylactic Use • Place in Treatment Algorithm • Clinical Trial Results • DMOAD Multiple factors drive overall transformation GlobalData: 2020 Orthopedic Devices Knee Reconstruction US (2015-2030); GlobalData: Viscosupplementation Model (HA) U.S. (2015-2030)
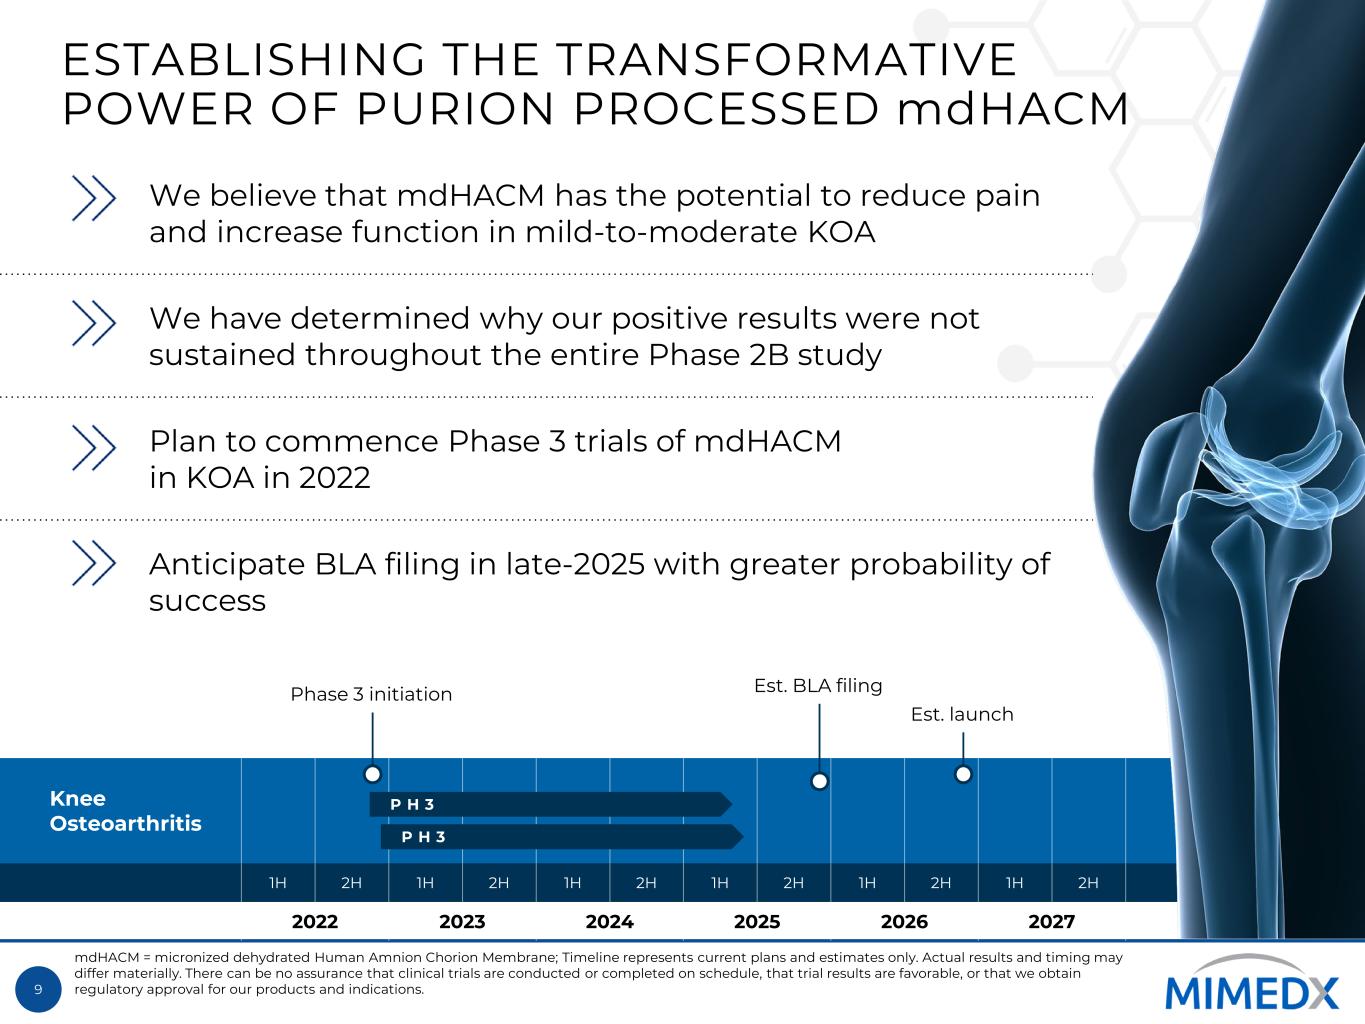
9 Knee Osteoarthritis 1H 2H 1H 2H 1H 2H 1H 2H 1H 2H 1H 2H 2022 2023 2024 2025 2026 2027 ESTABLISHING THE TRANSFORMATIVE POWER OF PURION PROCESSED mdHACM We believe that mdHACM has the potential to reduce pain and increase function in mild-to-moderate KOA We have determined why our positive results were not sustained throughout the entire Phase 2B study Plan to commence Phase 3 trials of mdHACM in KOA in 2022 Anticipate BLA filing in late-2025 with greater probability of success mdHACM = micronized dehydrated Human Amnion Chorion Membrane; Timeline represents current plans and estimates only. Actual results and timing may differ materially. There can be no assurance that clinical trials are conducted or completed on schedule, that trial results are favorable, or that we obtain regulatory approval for our products and indications. Phase 3 initiation Est. launch P H 3 Est. BLA filing P H 3
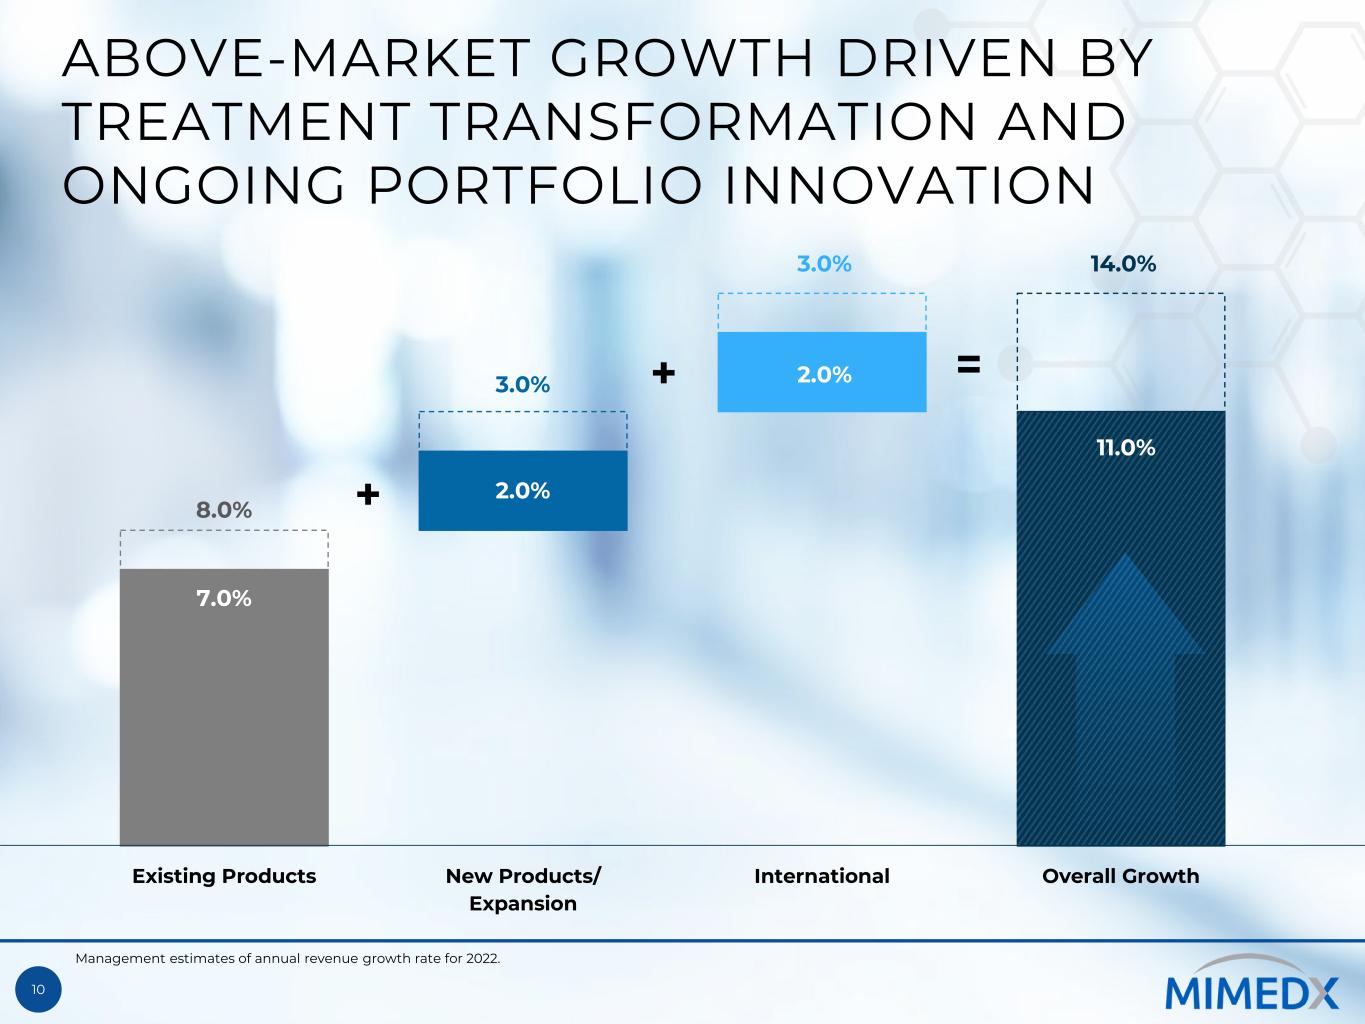
10 ABOVE-MARKET GROWTH DRIVEN BY TREATMENT TRANSFORMATION AND ONGOING PORTFOLIO INNOVATION 7.0% 11.0% 8.0% 2.0% 2.0% 14.0% 3.0% 3.0% Existing Products New Products/ Expansion International Overall Growth + + = Management estimates of annual revenue growth rate for 2022.
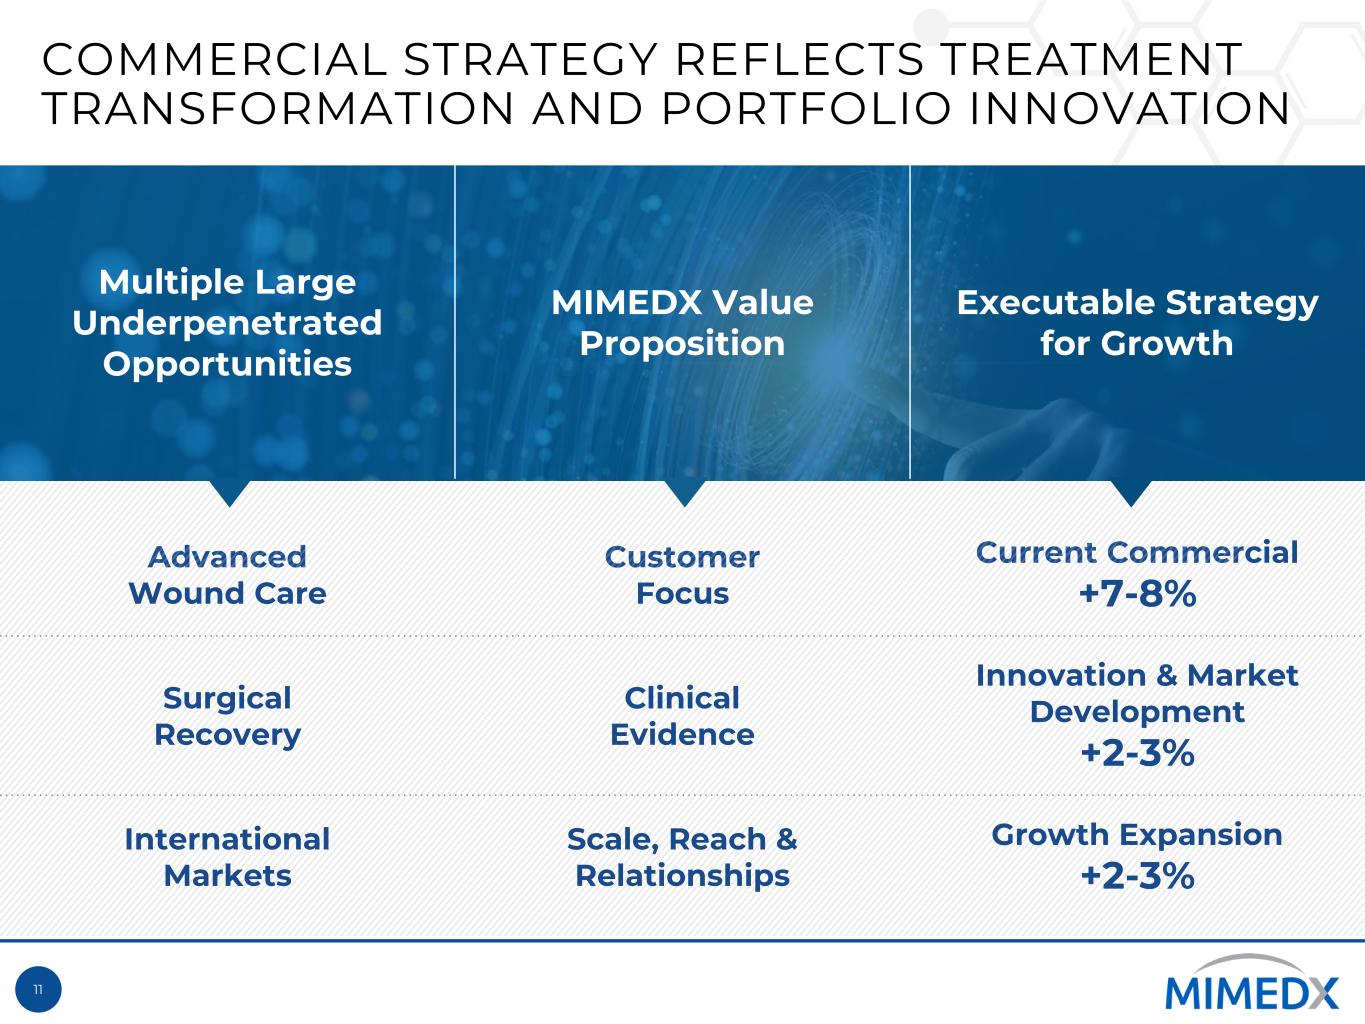
11 COMMERCIAL STRATEGY REFLECTS TREATMENT TRANSFORMATION AND PORTFOLIO INNOVATION Multiple Large Underpenetrated Opportunities MIMEDX Value Proposition Executable Strategy for Growth Advanced Wound Care Customer Focus Current Commercial +7-8% Surgical Recovery Clinical Evidence Innovation & Market Development +2-3% International Markets Scale, Reach & Relationships Growth Expansion +2-3%
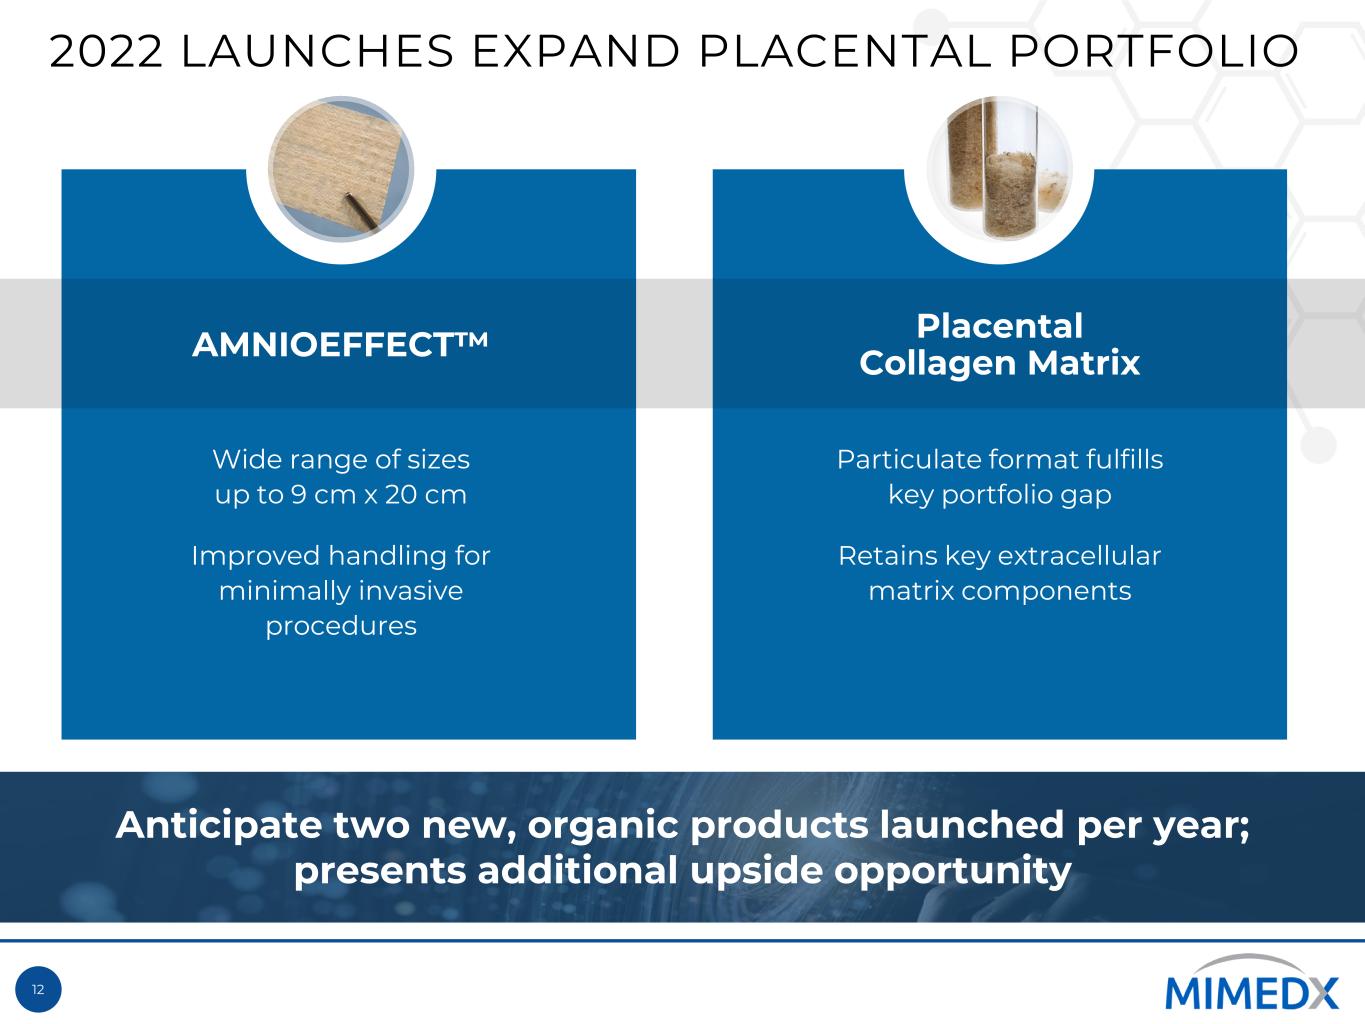
12 2022 LAUNCHES EXPAND PLACENTAL PORTFOLIO AMNIOEFFECT™ Placental Collagen Matrix Particulate format fulfills key portfolio gap Retains key extracellular matrix components Wide range of sizes up to 9 cm x 20 cm Improved handling for minimally invasive procedures Anticipate two new, organic products launched per year; presents additional upside opportunity
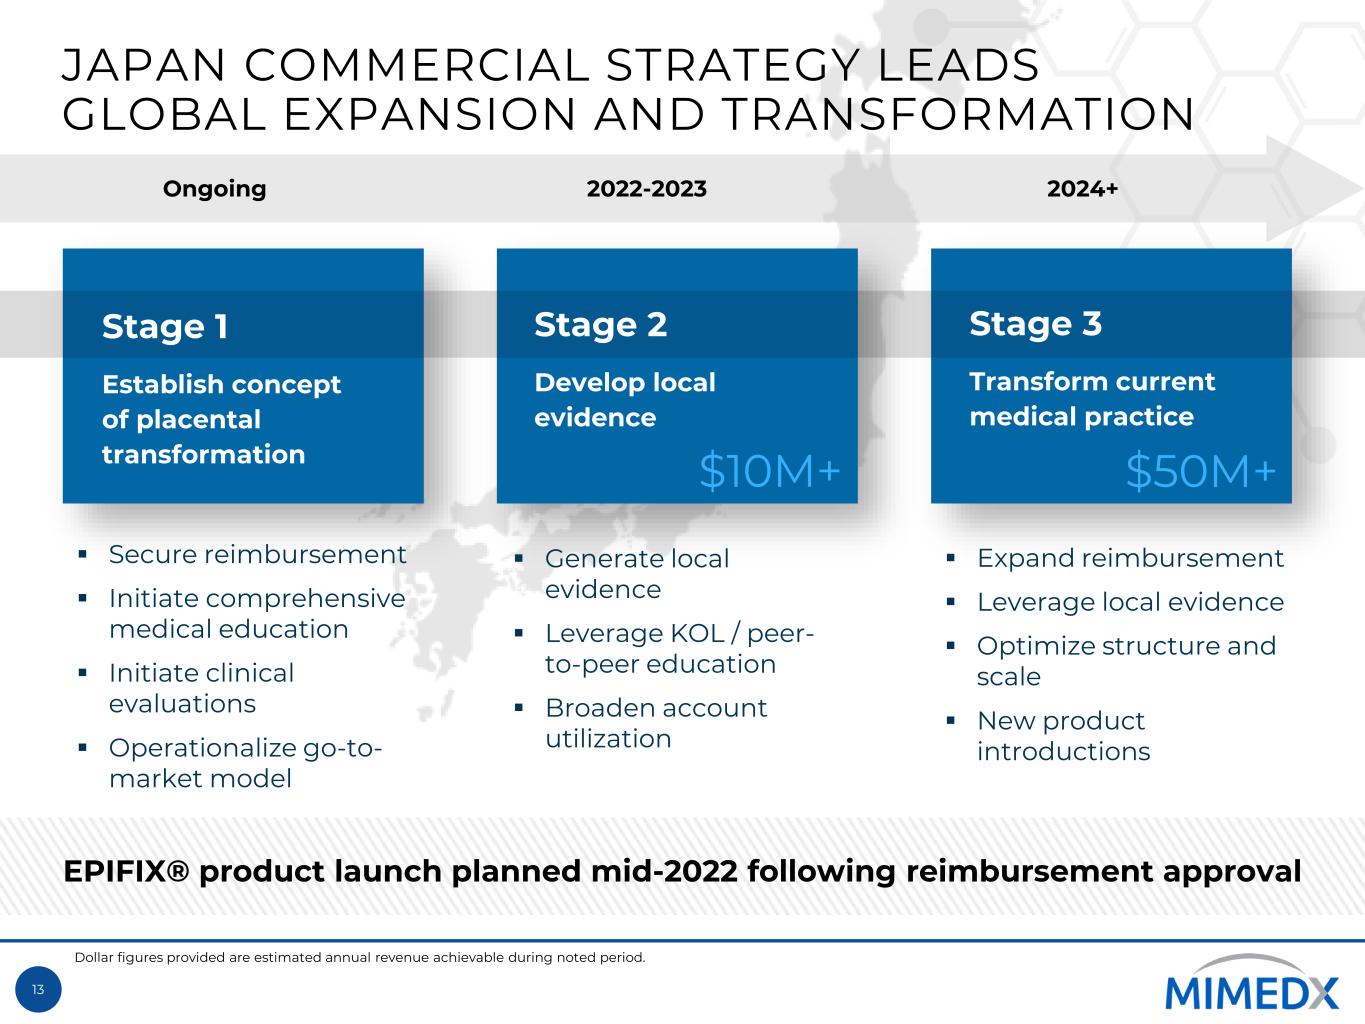
13 JAPAN COMMERCIAL STRATEGY LEADS GLOBAL EXPANSION AND TRANSFORMATION Ongoing 2022-2023 2024+ Stage 1 Establish concept of placental transformation Stage 3 Transform current medical practice Stage 2 Develop local evidence Secure reimbursement Initiate comprehensive medical education Initiate clinical evaluations Operationalize go-to- market model Generate local evidence Leverage KOL / peer- to-peer education Broaden account utilization Expand reimbursement Leverage local evidence Optimize structure and scale New product introductions $10M+ $50M+ Dollar figures provided are estimated annual revenue achievable during noted period. EPIFIX® product launch planned mid-2022 following reimbursement approval
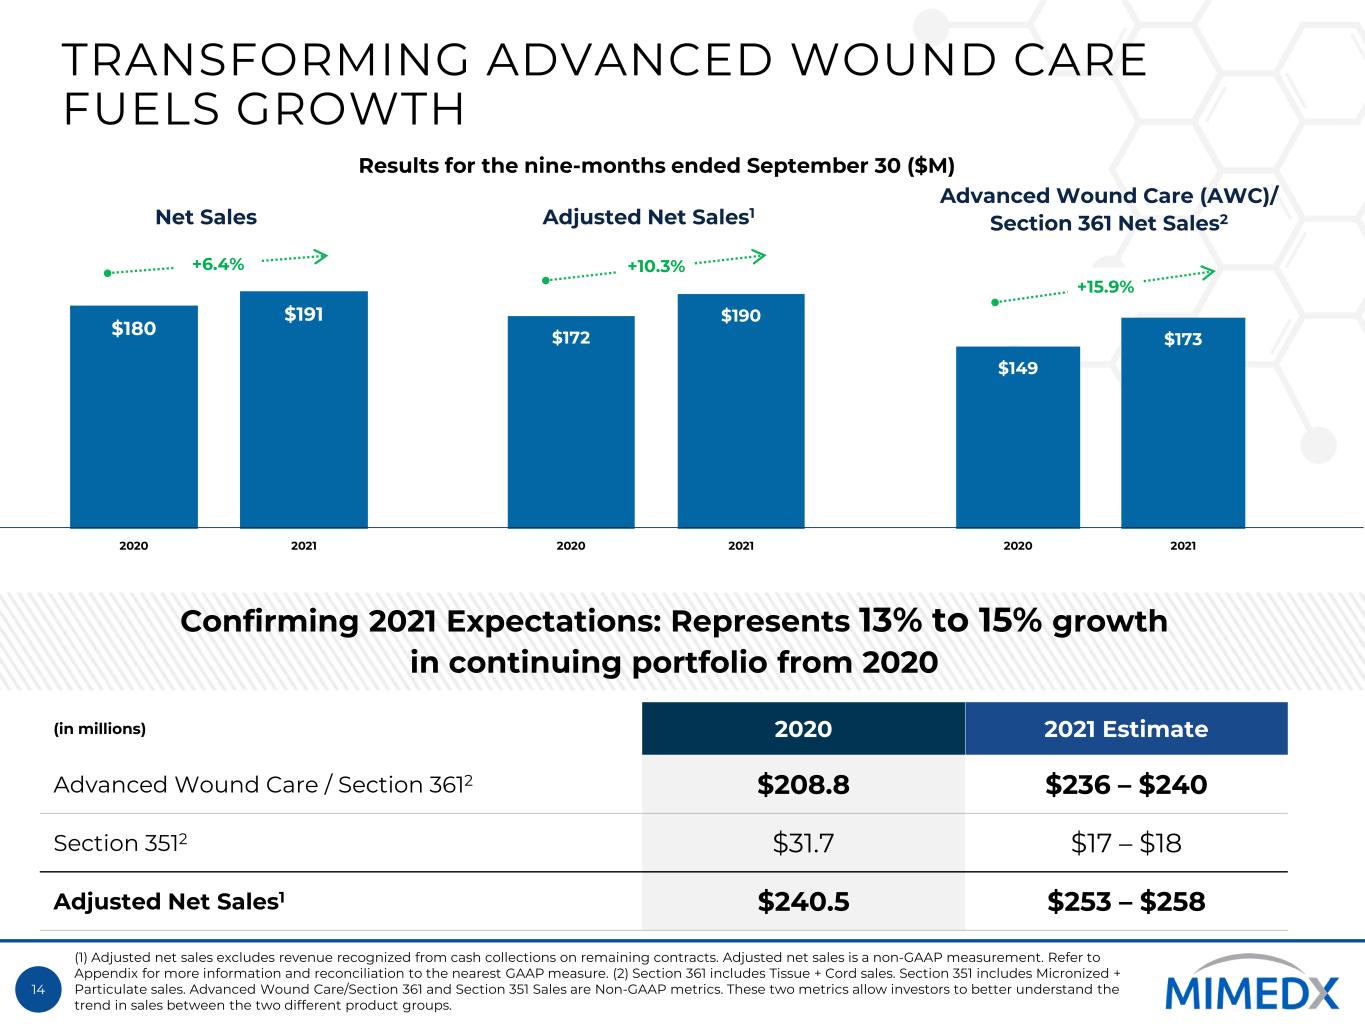
14 TRANSFORMING ADVANCED WOUND CARE FUELS GROWTH $180 $191 2020 2021 $172 $190 2020 2021 $149 $173 2020 2021 +6.4% +10.3% Confirming 2021 Expectations: Represents 13% to 15% growth in continuing portfolio from 2020 (in millions) 2020 2021 Estimate Advanced Wound Care / Section 3612 $208.8 $236 – $240 Section 3512 $31.7 $17 – $18 Adjusted Net Sales1 $240.5 $253 – $258 Adjusted Net Sales1Net Sales +15.9% Advanced Wound Care (AWC)/ Section 361 Net Sales2 Results for the nine-months ended September 30 ($M) (1) Adjusted net sales excludes revenue recognized from cash collections on remaining contracts. Adjusted net sales is a non-GAAP measurement. Refer to Appendix for more information and reconciliation to the nearest GAAP measure. (2) Section 361 includes Tissue + Cord sales. Section 351 includes Micronized + Particulate sales. Advanced Wound Care/Section 361 and Section 351 Sales are Non-GAAP metrics. These two metrics allow investors to better understand the trend in sales between the two different product groups.
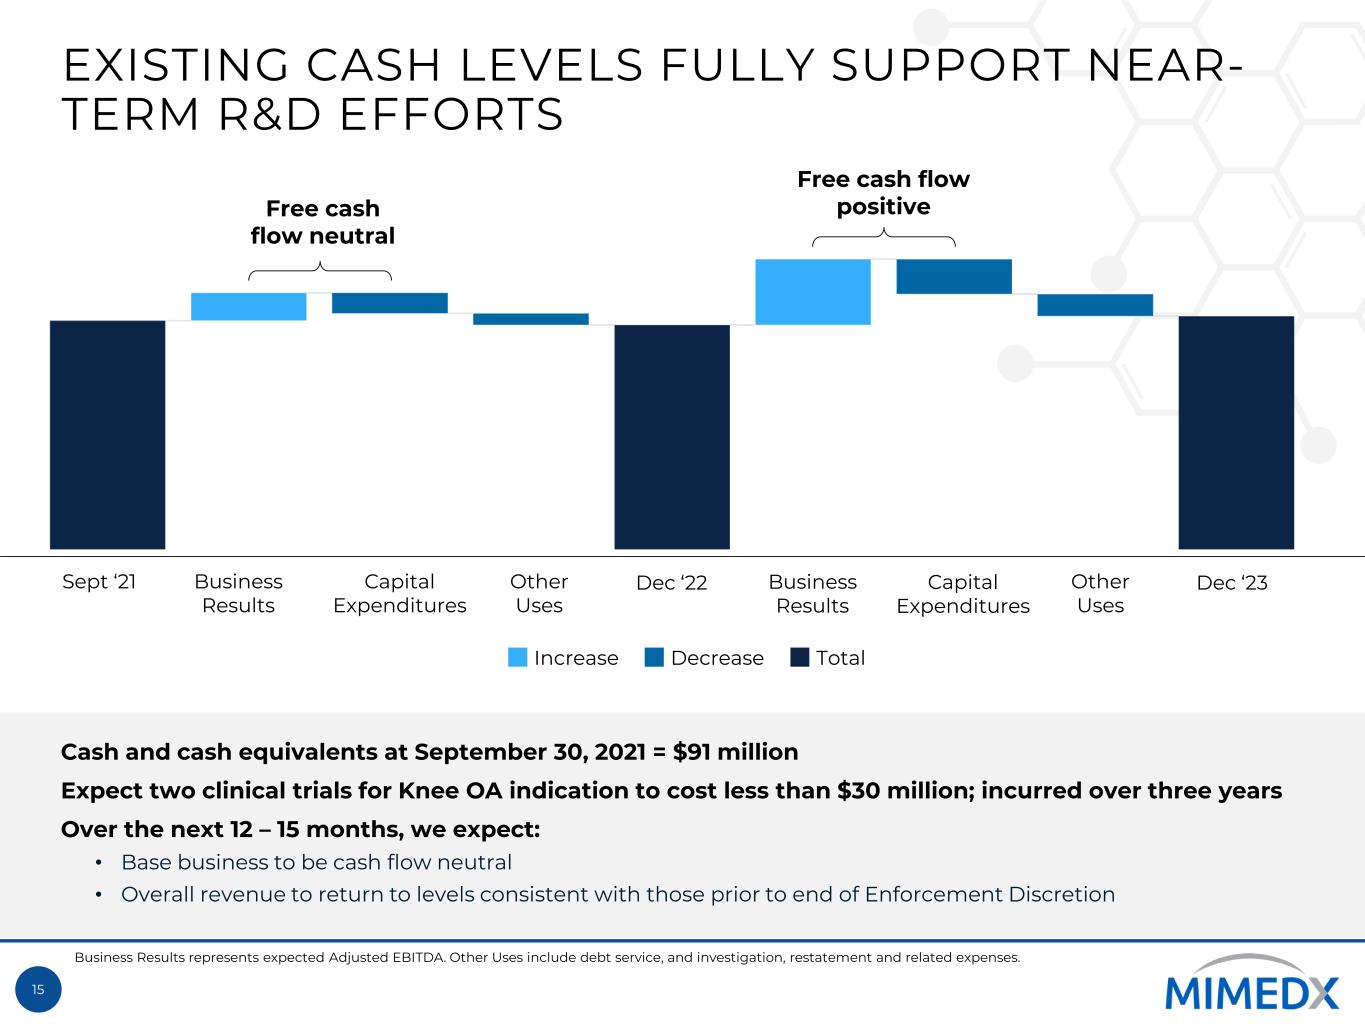
15 EXISTING CASH LEVELS FULLY SUPPORT NEAR- TERM R&D EFFORTS Free cash flow neutral Free cash flow positive Cash and cash equivalents at September 30, 2021 = $91 million Expect two clinical trials for Knee OA indication to cost less than $30 million; incurred over three years Over the next 12 – 15 months, we expect: • Base business to be cash flow neutral • Overall revenue to return to levels consistent with those prior to end of Enforcement Discretion Increase Decrease Total Business Results represents expected Adjusted EBITDA. Other Uses include debt service, and investigation, restatement and related expenses. Sept ‘21 Business Results Business Results Capital Expenditures Capital Expenditures Other Uses Other Uses Dec ‘22 Dec ‘23
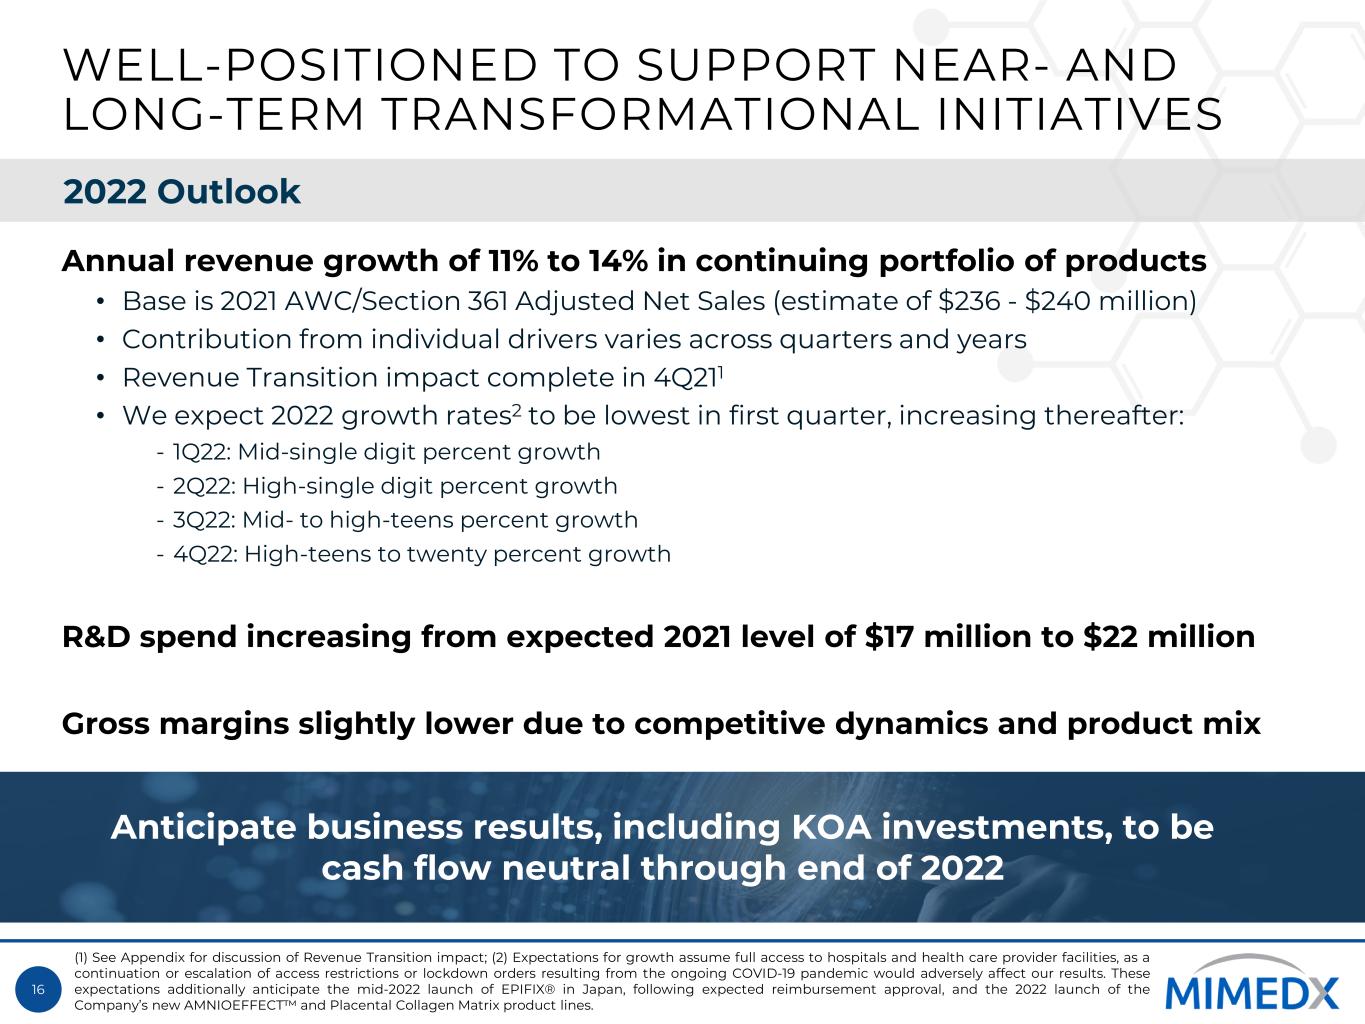
16 WELL-POSITIONED TO SUPPORT NEAR- AND LONG-TERM TRANSFORMATIONAL INITIATIVES Annual revenue growth of 11% to 14% in continuing portfolio of products • Base is 2021 AWC/Section 361 Adjusted Net Sales (estimate of $236 - $240 million) • Contribution from individual drivers varies across quarters and years • Revenue Transition impact complete in 4Q211 • We expect 2022 growth rates2 to be lowest in first quarter, increasing thereafter: - 1Q22: Mid-single digit percent growth - 2Q22: High-single digit percent growth - 3Q22: Mid- to high-teens percent growth - 4Q22: High-teens to twenty percent growth R&D spend increasing from expected 2021 level of $17 million to $22 million Gross margins slightly lower due to competitive dynamics and product mix Anticipate business results, including KOA investments, to be cash flow neutral through end of 2022 (1) See Appendix for discussion of Revenue Transition impact; (2) Expectations for growth assume full access to hospitals and health care provider facilities, as a continuation or escalation of access restrictions or lockdown orders resulting from the ongoing COVID-19 pandemic would adversely affect our results. These expectations additionally anticipate the mid-2022 launch of EPIFIX® in Japan, following expected reimbursement approval, and the 2022 launch of the Company’s new AMNIOEFFECT™ and Placental Collagen Matrix product lines. 2022 Outlook
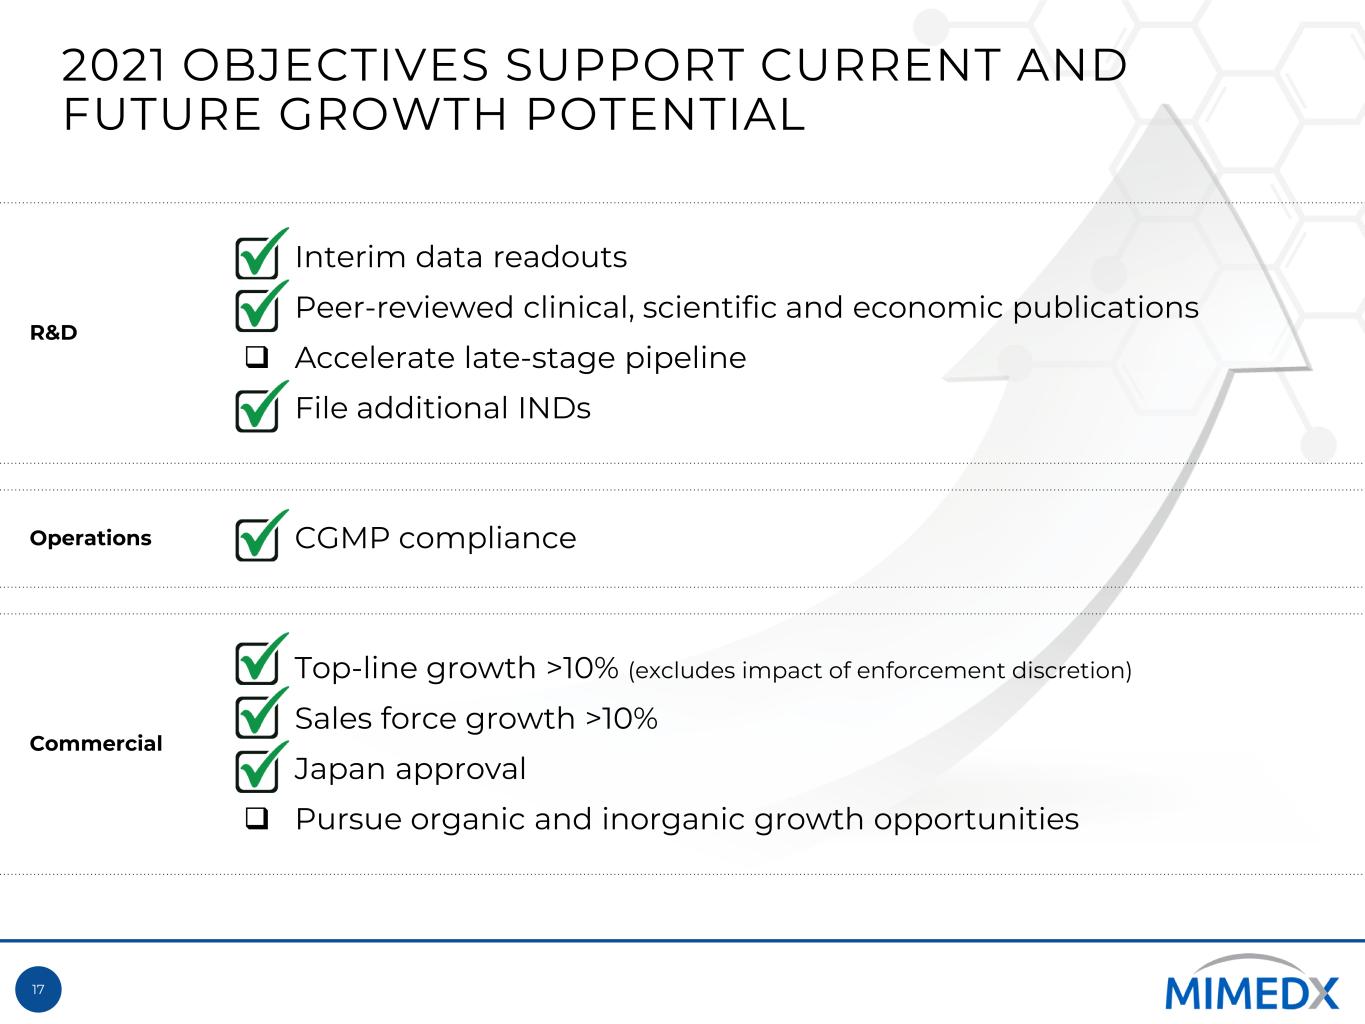
17 2021 OBJECTIVES SUPPORT CURRENT AND FUTURE GROWTH POTENTIAL R&D Interim data readouts Peer-reviewed clinical, scientific and economic publications Accelerate late-stage pipeline File additional INDs Operations CGMP compliance Commercial Top-line growth >10% (excludes impact of enforcement discretion) Sales force growth >10% Japan approval Pursue organic and inorganic growth opportunities
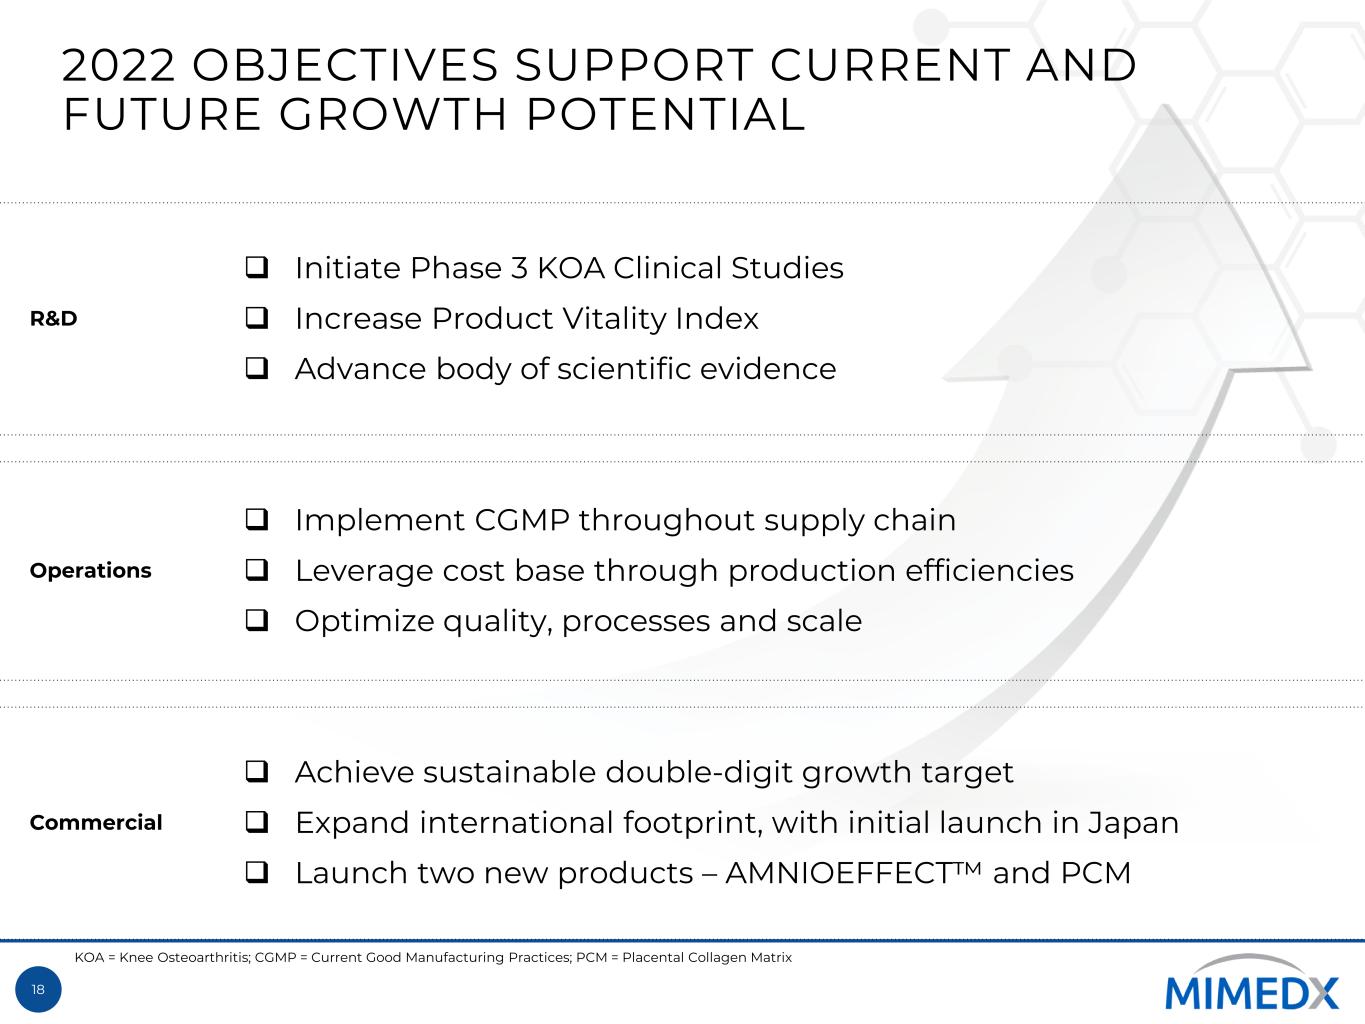
18 2022 OBJECTIVES SUPPORT CURRENT AND FUTURE GROWTH POTENTIAL R&D Initiate Phase 3 KOA Clinical Studies Increase Product Vitality Index Advance body of scientific evidence Operations Implement CGMP throughout supply chain Leverage cost base through production efficiencies Optimize quality, processes and scale Commercial Achieve sustainable double-digit growth target Expand international footprint, with initial launch in Japan Launch two new products – AMNIOEFFECT™ and PCM KOA = Knee Osteoarthritis; CGMP = Current Good Manufacturing Practices; PCM = Placental Collagen Matrix
DIFFERENTIATED VALUE PROPOSITION OF TRANSFORMATION DRIVES GROWTH 19 Sustainable above-market growth from commercial business in multiple therapeutic areas with significant unmet need Native & multimodal therapeutic properties of placental tissue provide unlimited range of organic product innovation KOA indication represents blockbuster biologic opportunity Underlying mechanism of action and proprietary tissue engineering offer new insights into disease modifying potential Talented, skilled and seasoned leadership team in place

20 TRANSFORMING THE LIVES OF PATIENTS IS WHY WE ARE HERE

21 APPENDIX
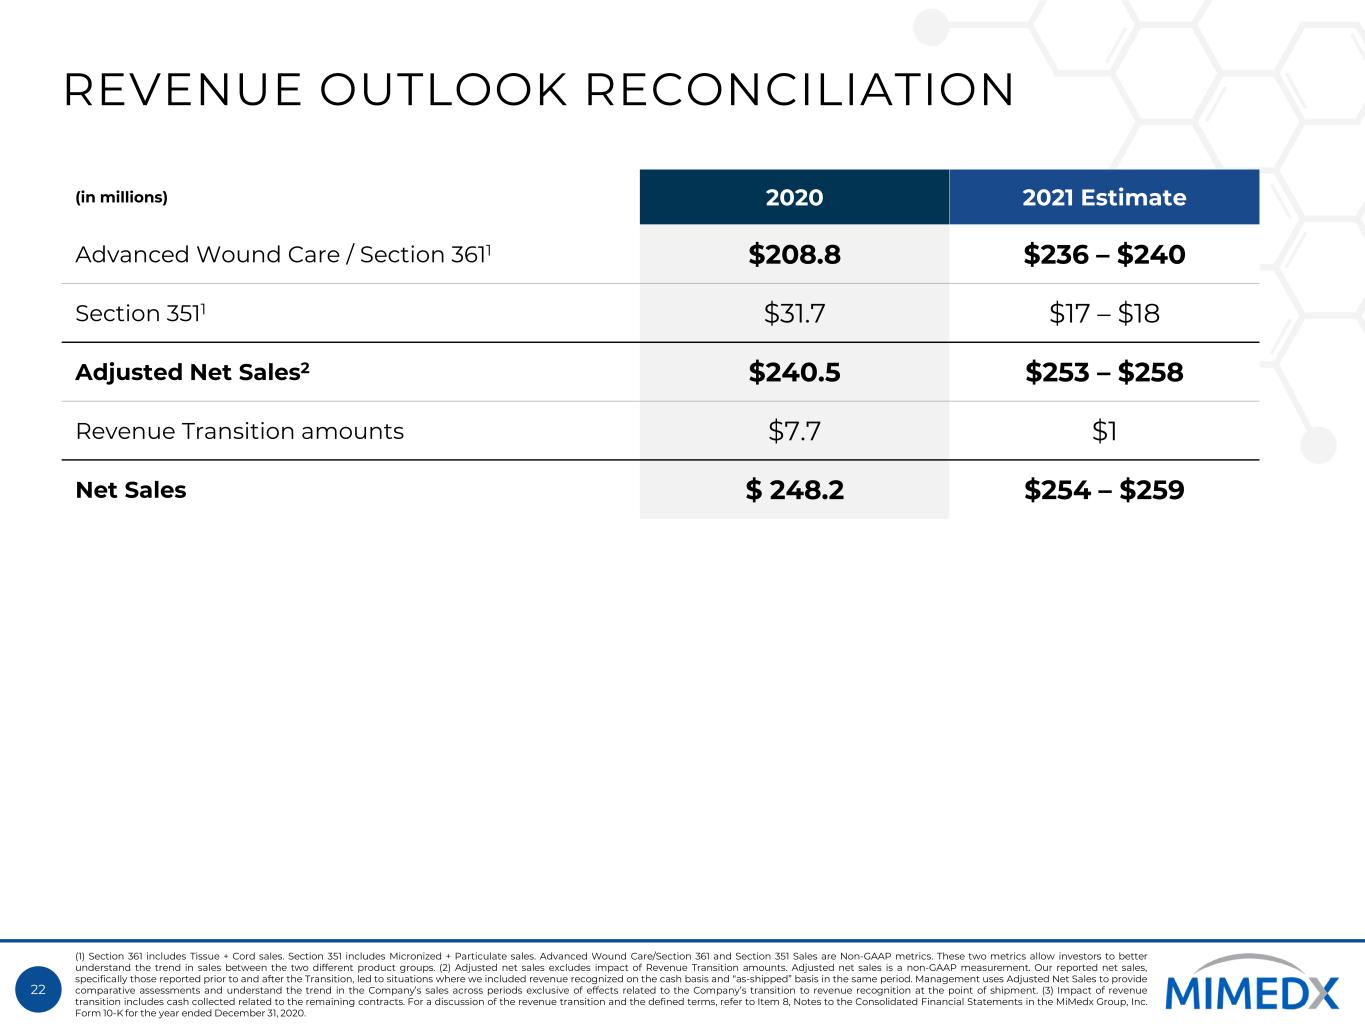
22 REVENUE OUTLOOK RECONCILIATION (in millions) 2020 2021 Estimate Advanced Wound Care / Section 3611 $208.8 $236 – $240 Section 3511 $31.7 $17 – $18 Adjusted Net Sales2 $240.5 $253 – $258 Revenue Transition amounts $7.7 $1 Net Sales $ 248.2 $254 – $259 (1) Section 361 includes Tissue + Cord sales. Section 351 includes Micronized + Particulate sales. Advanced Wound Care/Section 361 and Section 351 Sales are Non-GAAP metrics. These two metrics allow investors to better understand the trend in sales between the two different product groups. (2) Adjusted net sales excludes impact of Revenue Transition amounts. Adjusted net sales is a non-GAAP measurement. Our reported net sales, specifically those reported prior to and after the Transition, led to situations where we included revenue recognized on the cash basis and “as-shipped” basis in the same period. Management uses Adjusted Net Sales to provide comparative assessments and understand the trend in the Company’s sales across periods exclusive of effects related to the Company’s transition to revenue recognition at the point of shipment. (3) Impact of revenue transition includes cash collected related to the remaining contracts. For a discussion of the revenue transition and the defined terms, refer to Item 8, Notes to the Consolidated Financial Statements in the MiMedx Group, Inc. Form 10-K for the year ended December 31, 2020.
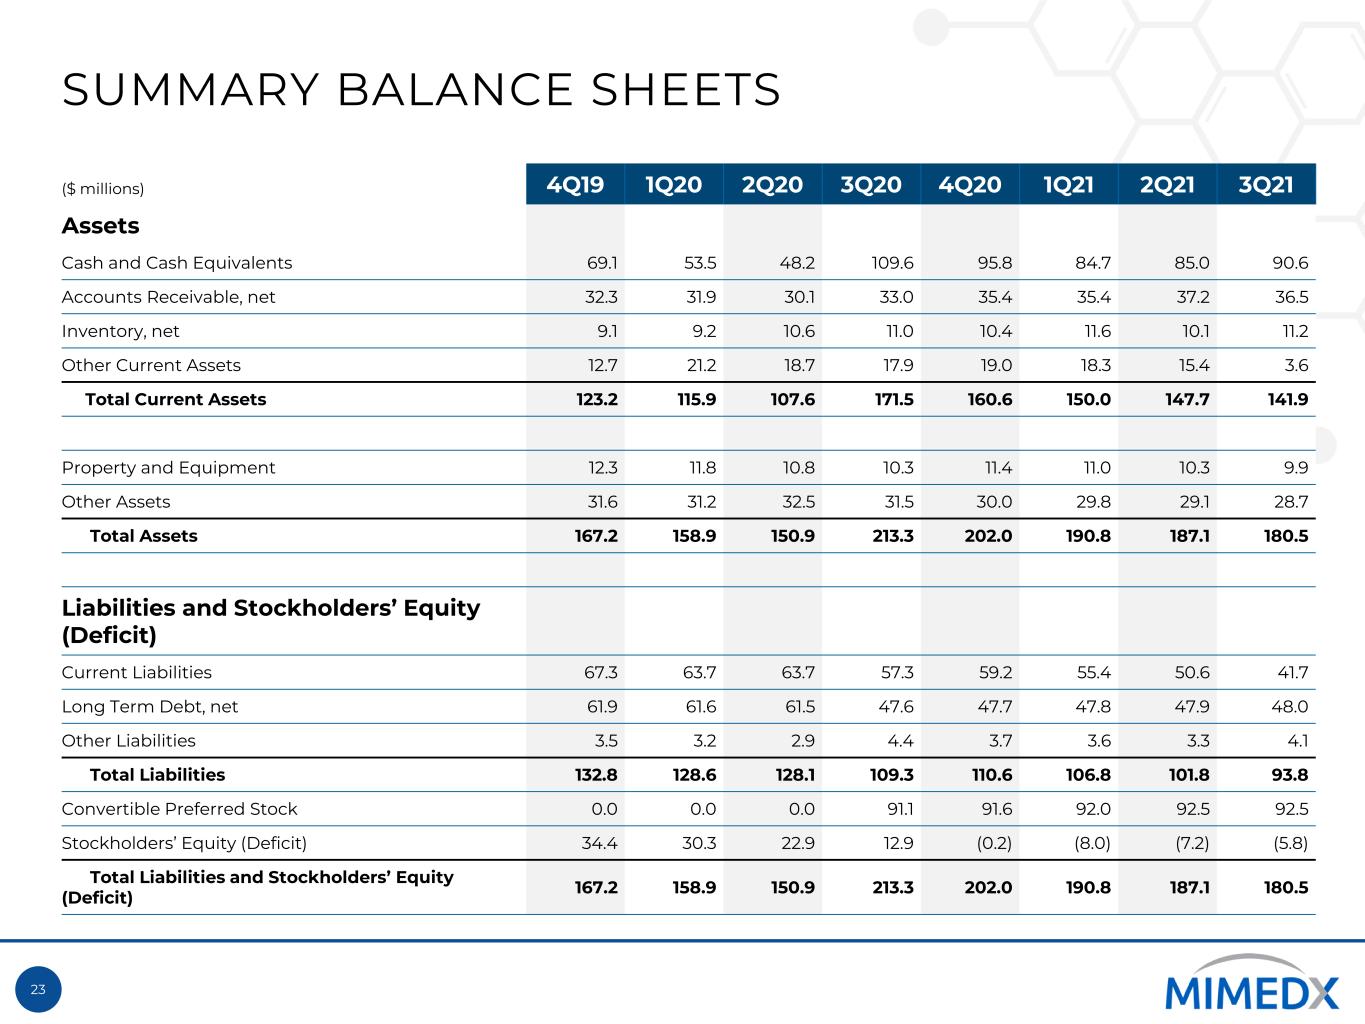
23 SUMMARY BALANCE SHEETS ($ millions) 4Q19 1Q20 2Q20 3Q20 4Q20 1Q21 2Q21 3Q21 Assets Cash and Cash Equivalents 69.1 53.5 48.2 109.6 95.8 84.7 85.0 90.6 Accounts Receivable, net 32.3 31.9 30.1 33.0 35.4 35.4 37.2 36.5 Inventory, net 9.1 9.2 10.6 11.0 10.4 11.6 10.1 11.2 Other Current Assets 12.7 21.2 18.7 17.9 19.0 18.3 15.4 3.6 Total Current Assets 123.2 115.9 107.6 171.5 160.6 150.0 147.7 141.9 Property and Equipment 12.3 11.8 10.8 10.3 11.4 11.0 10.3 9.9 Other Assets 31.6 31.2 32.5 31.5 30.0 29.8 29.1 28.7 Total Assets 167.2 158.9 150.9 213.3 202.0 190.8 187.1 180.5 Liabilities and Stockholders’ Equity (Deficit) Current Liabilities 67.3 63.7 63.7 57.3 59.2 55.4 50.6 41.7 Long Term Debt, net 61.9 61.6 61.5 47.6 47.7 47.8 47.9 48.0 Other Liabilities 3.5 3.2 2.9 4.4 3.7 3.6 3.3 4.1 Total Liabilities 132.8 128.6 128.1 109.3 110.6 106.8 101.8 93.8 Convertible Preferred Stock 0.0 0.0 0.0 91.1 91.6 92.0 92.5 92.5 Stockholders’ Equity (Deficit) 34.4 30.3 22.9 12.9 (0.2) (8.0) (7.2) (5.8) Total Liabilities and Stockholders’ Equity (Deficit) 167.2 158.9 150.9 213.3 202.0 190.8 187.1 180.5
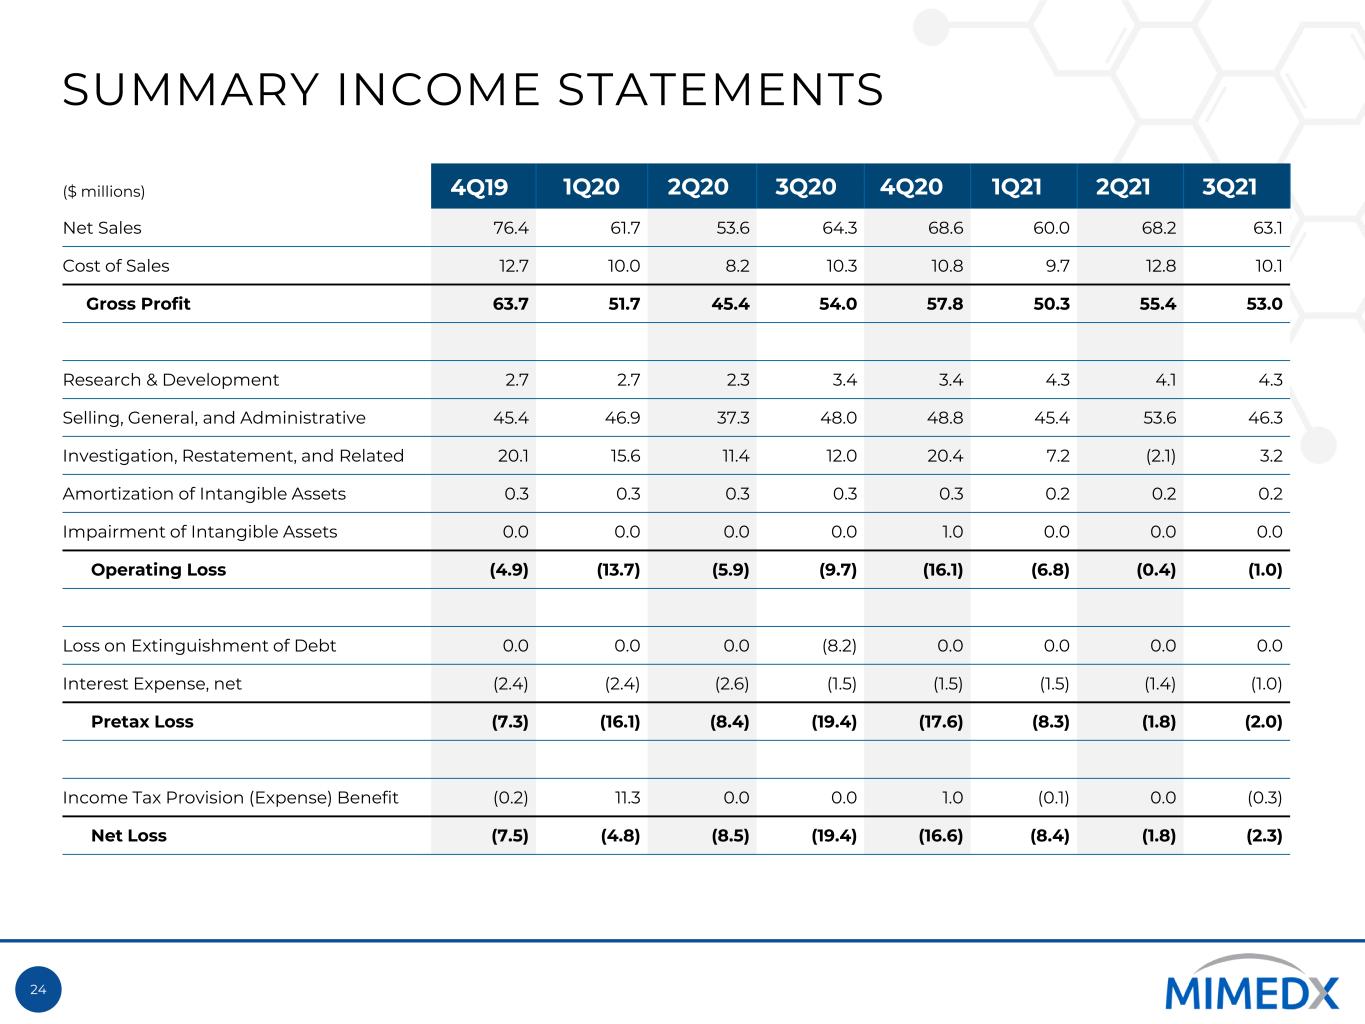
24 SUMMARY INCOME STATEMENTS ($ millions) 4Q19 1Q20 2Q20 3Q20 4Q20 1Q21 2Q21 3Q21 Net Sales 76.4 61.7 53.6 64.3 68.6 60.0 68.2 63.1 Cost of Sales 12.7 10.0 8.2 10.3 10.8 9.7 12.8 10.1 Gross Profit 63.7 51.7 45.4 54.0 57.8 50.3 55.4 53.0 Research & Development 2.7 2.7 2.3 3.4 3.4 4.3 4.1 4.3 Selling, General, and Administrative 45.4 46.9 37.3 48.0 48.8 45.4 53.6 46.3 Investigation, Restatement, and Related 20.1 15.6 11.4 12.0 20.4 7.2 (2.1) 3.2 Amortization of Intangible Assets 0.3 0.3 0.3 0.3 0.3 0.2 0.2 0.2 Impairment of Intangible Assets 0.0 0.0 0.0 0.0 1.0 0.0 0.0 0.0 Operating Loss (4.9) (13.7) (5.9) (9.7) (16.1) (6.8) (0.4) (1.0) Loss on Extinguishment of Debt 0.0 0.0 0.0 (8.2) 0.0 0.0 0.0 0.0 Interest Expense, net (2.4) (2.4) (2.6) (1.5) (1.5) (1.5) (1.4) (1.0) Pretax Loss (7.3) (16.1) (8.4) (19.4) (17.6) (8.3) (1.8) (2.0) Income Tax Provision (Expense) Benefit (0.2) 11.3 0.0 0.0 1.0 (0.1) 0.0 (0.3) Net Loss (7.5) (4.8) (8.5) (19.4) (16.6) (8.4) (1.8) (2.3)
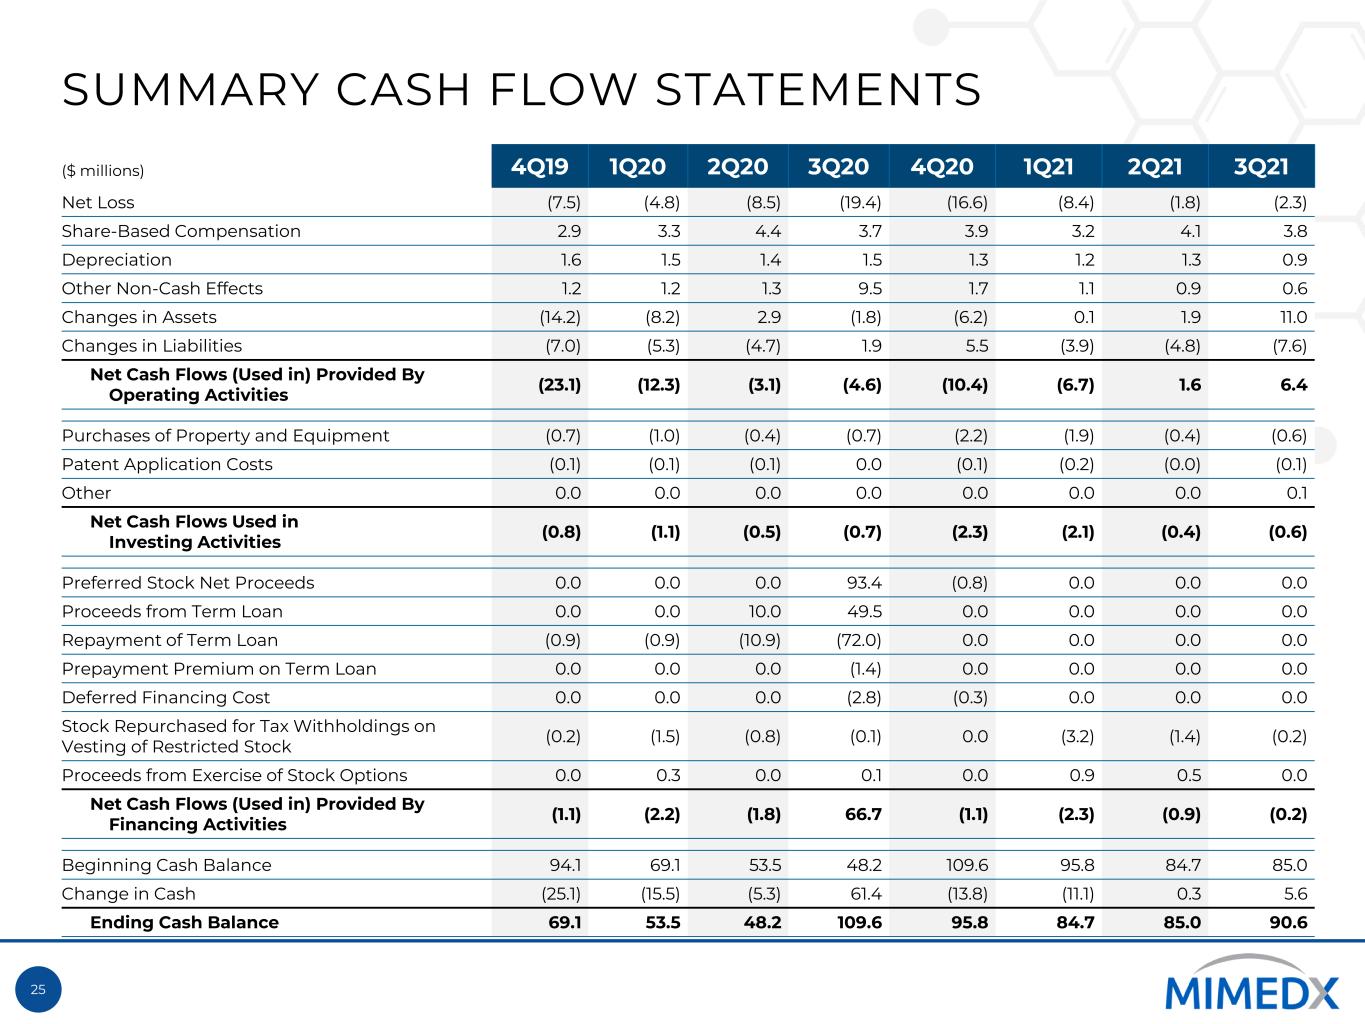
25 SUMMARY CASH FLOW STATEMENTS ($ millions) 4Q19 1Q20 2Q20 3Q20 4Q20 1Q21 2Q21 3Q21 Net Loss (7.5) (4.8) (8.5) (19.4) (16.6) (8.4) (1.8) (2.3) Share-Based Compensation 2.9 3.3 4.4 3.7 3.9 3.2 4.1 3.8 Depreciation 1.6 1.5 1.4 1.5 1.3 1.2 1.3 0.9 Other Non-Cash Effects 1.2 1.2 1.3 9.5 1.7 1.1 0.9 0.6 Changes in Assets (14.2) (8.2) 2.9 (1.8) (6.2) 0.1 1.9 11.0 Changes in Liabilities (7.0) (5.3) (4.7) 1.9 5.5 (3.9) (4.8) (7.6) Net Cash Flows (Used in) Provided By Operating Activities (23.1) (12.3) (3.1) (4.6) (10.4) (6.7) 1.6 6.4 Purchases of Property and Equipment (0.7) (1.0) (0.4) (0.7) (2.2) (1.9) (0.4) (0.6) Patent Application Costs (0.1) (0.1) (0.1) 0.0 (0.1) (0.2) (0.0) (0.1) Other 0.0 0.0 0.0 0.0 0.0 0.0 0.0 0.1 Net Cash Flows Used in Investing Activities (0.8) (1.1) (0.5) (0.7) (2.3) (2.1) (0.4) (0.6) Preferred Stock Net Proceeds 0.0 0.0 0.0 93.4 (0.8) 0.0 0.0 0.0 Proceeds from Term Loan 0.0 0.0 10.0 49.5 0.0 0.0 0.0 0.0 Repayment of Term Loan (0.9) (0.9) (10.9) (72.0) 0.0 0.0 0.0 0.0 Prepayment Premium on Term Loan 0.0 0.0 0.0 (1.4) 0.0 0.0 0.0 0.0 Deferred Financing Cost 0.0 0.0 0.0 (2.8) (0.3) 0.0 0.0 0.0 Stock Repurchased for Tax Withholdings on Vesting of Restricted Stock (0.2) (1.5) (0.8) (0.1) 0.0 (3.2) (1.4) (0.2) Proceeds from Exercise of Stock Options 0.0 0.3 0.0 0.1 0.0 0.9 0.5 0.0 Net Cash Flows (Used in) Provided By Financing Activities (1.1) (2.2) (1.8) 66.7 (1.1) (2.3) (0.9) (0.2) Beginning Cash Balance 94.1 69.1 53.5 48.2 109.6 95.8 84.7 85.0 Change in Cash (25.1) (15.5) (5.3) 61.4 (13.8) (11.1) 0.3 5.6 Ending Cash Balance 69.1 53.5 48.2 109.6 95.8 84.7 85.0 90.6
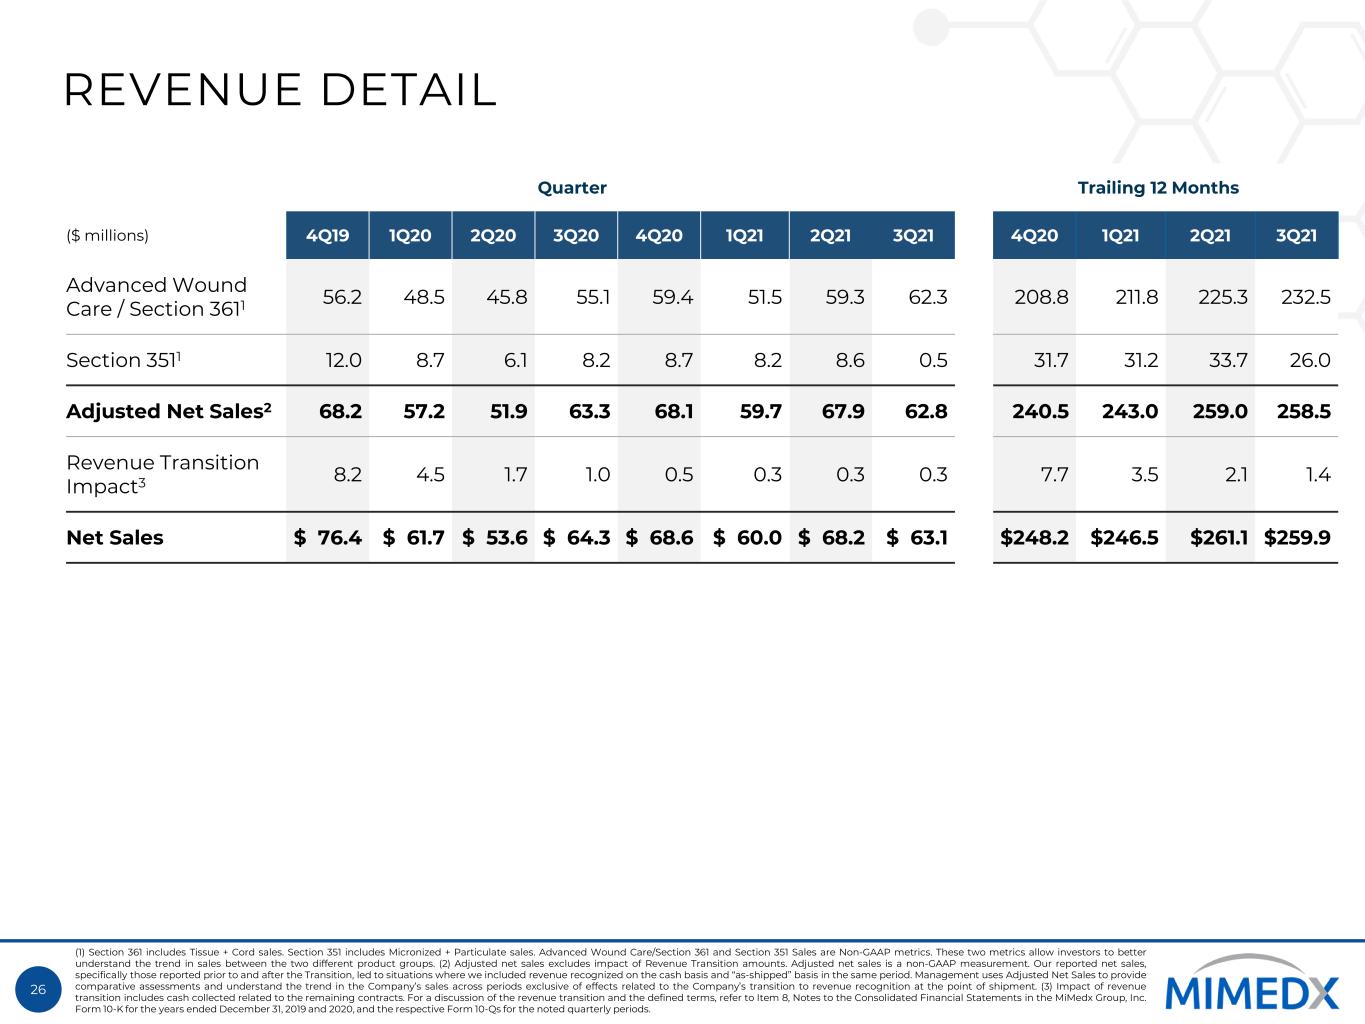
26 REVENUE DETAIL Quarter Trailing 12 Months ($ millions) 4Q19 1Q20 2Q20 3Q20 4Q20 1Q21 2Q21 3Q21 4Q20 1Q21 2Q21 3Q21 Advanced Wound Care / Section 3611 56.2 48.5 45.8 55.1 59.4 51.5 59.3 62.3 208.8 211.8 225.3 232.5 Section 3511 12.0 8.7 6.1 8.2 8.7 8.2 8.6 0.5 31.7 31.2 33.7 26.0 Adjusted Net Sales2 68.2 57.2 51.9 63.3 68.1 59.7 67.9 62.8 240.5 243.0 259.0 258.5 Revenue Transition Impact3 8.2 4.5 1.7 1.0 0.5 0.3 0.3 0.3 7.7 3.5 2.1 1.4 Net Sales $ 76.4 $ 61.7 $ 53.6 $ 64.3 $ 68.6 $ 60.0 $ 68.2 $ 63.1 $248.2 $246.5 $261.1 $259.9 (1) Section 361 includes Tissue + Cord sales. Section 351 includes Micronized + Particulate sales. Advanced Wound Care/Section 361 and Section 351 Sales are Non-GAAP metrics. These two metrics allow investors to better understand the trend in sales between the two different product groups. (2) Adjusted net sales excludes impact of Revenue Transition amounts. Adjusted net sales is a non-GAAP measurement. Our reported net sales, specifically those reported prior to and after the Transition, led to situations where we included revenue recognized on the cash basis and “as-shipped” basis in the same period. Management uses Adjusted Net Sales to provide comparative assessments and understand the trend in the Company’s sales across periods exclusive of effects related to the Company’s transition to revenue recognition at the point of shipment. (3) Impact of revenue transition includes cash collected related to the remaining contracts. For a discussion of the revenue transition and the defined terms, refer to Item 8, Notes to the Consolidated Financial Statements in the MiMedx Group, Inc. Form 10-K for the years ended December 31, 2019 and 2020, and the respective Form 10-Qs for the noted quarterly periods.
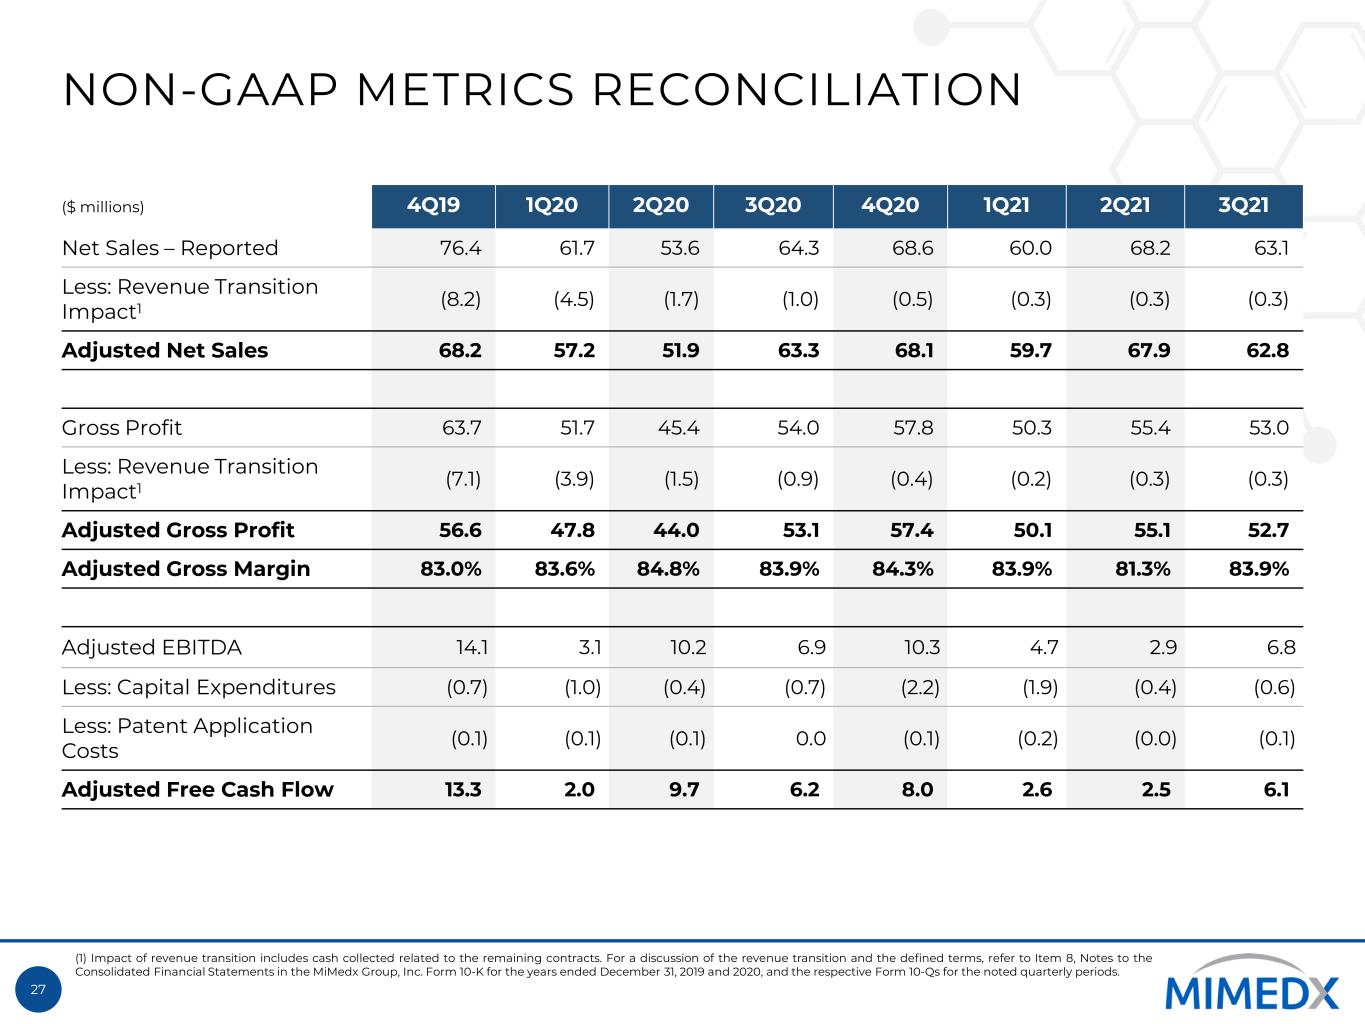
27 NON-GAAP METRICS RECONCILIATION ($ millions) 4Q19 1Q20 2Q20 3Q20 4Q20 1Q21 2Q21 3Q21 Net Sales – Reported 76.4 61.7 53.6 64.3 68.6 60.0 68.2 63.1 Less: Revenue Transition Impact1 (8.2) (4.5) (1.7) (1.0) (0.5) (0.3) (0.3) (0.3) Adjusted Net Sales 68.2 57.2 51.9 63.3 68.1 59.7 67.9 62.8 Gross Profit 63.7 51.7 45.4 54.0 57.8 50.3 55.4 53.0 Less: Revenue Transition Impact1 (7.1) (3.9) (1.5) (0.9) (0.4) (0.2) (0.3) (0.3) Adjusted Gross Profit 56.6 47.8 44.0 53.1 57.4 50.1 55.1 52.7 Adjusted Gross Margin 83.0% 83.6% 84.8% 83.9% 84.3% 83.9% 81.3% 83.9% Adjusted EBITDA 14.1 3.1 10.2 6.9 10.3 4.7 2.9 6.8 Less: Capital Expenditures (0.7) (1.0) (0.4) (0.7) (2.2) (1.9) (0.4) (0.6) Less: Patent Application Costs (0.1) (0.1) (0.1) 0.0 (0.1) (0.2) (0.0) (0.1) Adjusted Free Cash Flow 13.3 2.0 9.7 6.2 8.0 2.6 2.5 6.1 (1) Impact of revenue transition includes cash collected related to the remaining contracts. For a discussion of the revenue transition and the defined terms, refer to Item 8, Notes to the Consolidated Financial Statements in the MiMedx Group, Inc. Form 10-K for the years ended December 31, 2019 and 2020, and the respective Form 10-Qs for the noted quarterly periods.
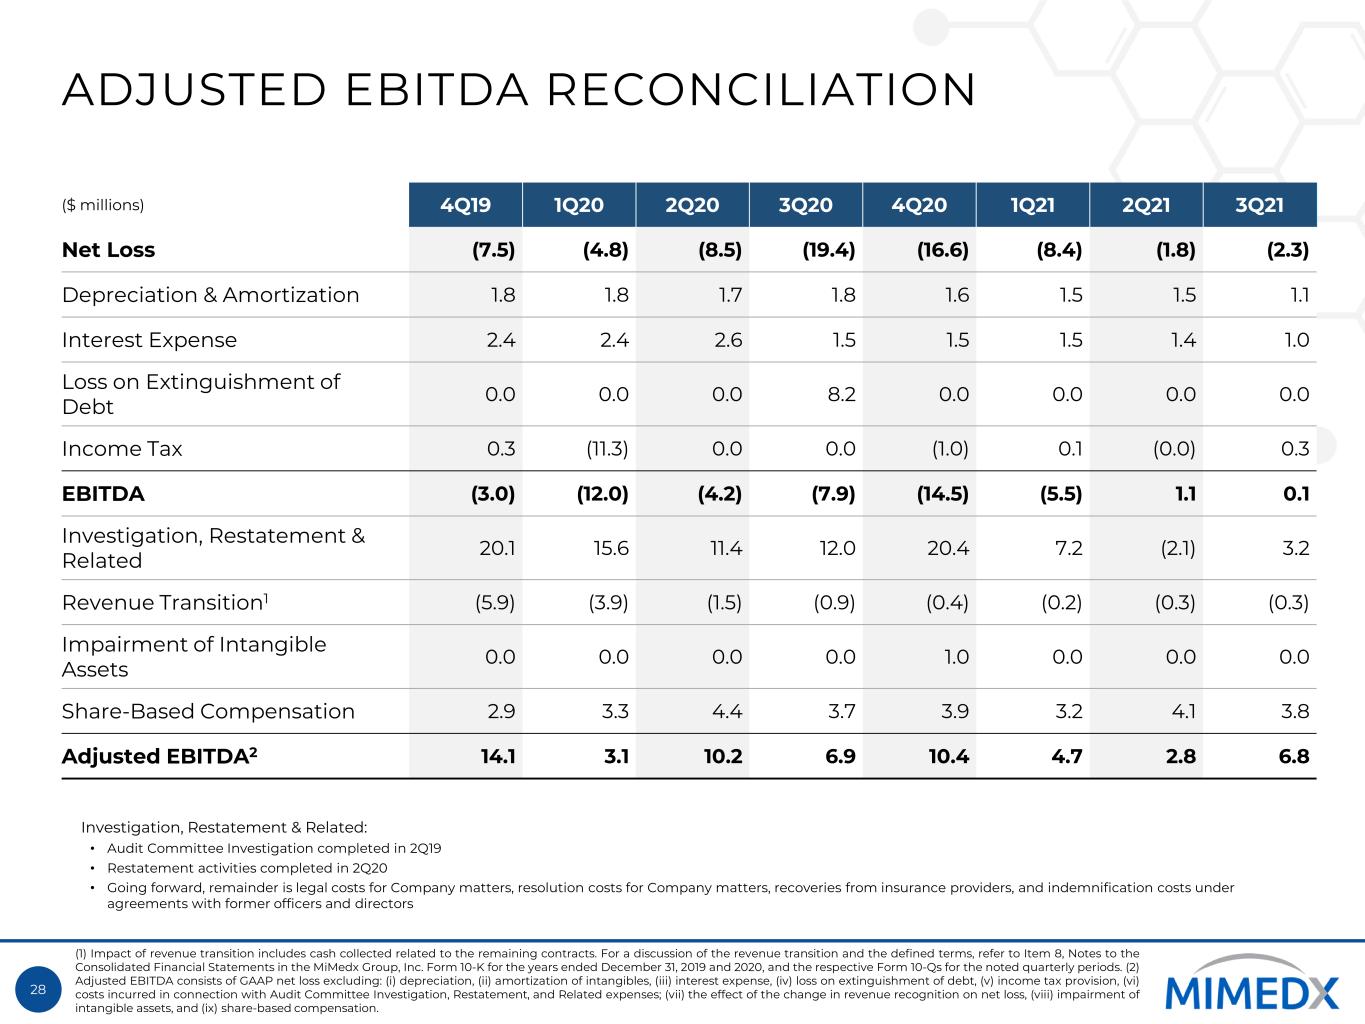
28 ADJUSTED EBITDA RECONCILIATION ($ millions) 4Q19 1Q20 2Q20 3Q20 4Q20 1Q21 2Q21 3Q21 Net Loss (7.5) (4.8) (8.5) (19.4) (16.6) (8.4) (1.8) (2.3) Depreciation & Amortization 1.8 1.8 1.7 1.8 1.6 1.5 1.5 1.1 Interest Expense 2.4 2.4 2.6 1.5 1.5 1.5 1.4 1.0 Loss on Extinguishment of Debt 0.0 0.0 0.0 8.2 0.0 0.0 0.0 0.0 Income Tax 0.3 (11.3) 0.0 0.0 (1.0) 0.1 (0.0) 0.3 EBITDA (3.0) (12.0) (4.2) (7.9) (14.5) (5.5) 1.1 0.1 Investigation, Restatement & Related 20.1 15.6 11.4 12.0 20.4 7.2 (2.1) 3.2 Revenue Transition1 (5.9) (3.9) (1.5) (0.9) (0.4) (0.2) (0.3) (0.3) Impairment of Intangible Assets 0.0 0.0 0.0 0.0 1.0 0.0 0.0 0.0 Share-Based Compensation 2.9 3.3 4.4 3.7 3.9 3.2 4.1 3.8 Adjusted EBITDA2 14.1 3.1 10.2 6.9 10.4 4.7 2.8 6.8 (1) Impact of revenue transition includes cash collected related to the remaining contracts. For a discussion of the revenue transition and the defined terms, refer to Item 8, Notes to the Consolidated Financial Statements in the MiMedx Group, Inc. Form 10-K for the years ended December 31, 2019 and 2020, and the respective Form 10-Qs for the noted quarterly periods. (2) Adjusted EBITDA consists of GAAP net loss excluding: (i) depreciation, (ii) amortization of intangibles, (iii) interest expense, (iv) loss on extinguishment of debt, (v) income tax provision, (vi) costs incurred in connection with Audit Committee Investigation, Restatement, and Related expenses; (vii) the effect of the change in revenue recognition on net loss, (viii) impairment of intangible assets, and (ix) share-based compensation. Investigation, Restatement & Related: • Audit Committee Investigation completed in 2Q19 • Restatement activities completed in 2Q20 • Going forward, remainder is legal costs for Company matters, resolution costs for Company matters, recoveries from insurance providers, and indemnification costs under agreements with former officers and directors


