UNITED STATES
SECURITIES AND EXCHANGE COMMISSION
Washington, D.C. 20549
FORM 10-K
(Mark One)
|
| |
| x | ANNUAL REPORT PURSUANT TO SECTION 13 OR 15(d) OF THE SECURITIES EXCHANGE ACT OF 1934 |
For the fiscal year ended December 31, 2013
OR
|
| |
| o | TRANSITION REPORT PURSUANT TO SECTION 13 OR 15(d) OF THE SECURITIES EXCHANGE ACT OF 1934 |
For the transition period from ________ to
Commission file number: 1-33119
ALLIED NEVADA GOLD CORP.
(Exact name of registrant as specified in its charter)
|
| | |
| Delaware | | 20-5597115 |
(State or other jurisdiction of incorporation or organization) | | (IRS Employer Identification No.) |
| | | |
9790 Gateway Drive, Suite 200 Reno, NV | | 89521 |
| (Address of principal executive offices) | | (Zip Code) |
(775) 358-4455
(Registrant’s telephone number, including area code)
|
| | |
| Securities registered pursuant to Section 12(b) of the Act: |
| Title of each class | | Name of exchange on which registered |
| Common Stock, $0.001 Par Value | | NYSE MKT LLC / Toronto Stock Exchange |
| | | |
| Securities registered pursuant to Section 12(g) of the Act: None |
Indicate by check mark if the registrant is a well-known seasoned issuer, as defined in Rule 405 of the Securities Act. Yes x No o
Indicate by check mark if the registrant is not required to file reports pursuant to Section 13 or Section 15(d) of the Act. Yes o No x
Indicate by check mark whether the registrant (1) has filed all reports required to be filed by Section 13 or 15(d) of the Securities Exchange Act of 1934 during the preceding 12 months (or for such shorter period that the registrant was required to file such reports), and (2) has been subject to such filing requirements for the past 90 days. Yes x No o
Indicate by check mark whether the registrant has submitted electronically and posted on its corporate Web site, if any, every Interactive Data File required to be submitted and posted pursuant to Rule 405 of Regulation S-T (§232.405 of this chapter) during the preceding 12 months (or for such shorter period that the registrant was required to submit and post such files). Yes x No o
Indicate by check mark if disclosure of delinquent filers pursuant to Item 405 of Regulation S-K (§229.405) is not contained herein, and will not be contained, to the best of registrant’s knowledge, in definitive proxy or information statements incorporated by reference in Part III of this Form 10-K or any amendment to this Form 10-K. x
Indicate by check mark whether the registrant is a large accelerated filer, an accelerated filer, a non-accelerated filer, or a smaller reporting company. See the definitions of “large accelerated filer,” “accelerated filer,” and “smaller reporting company” in Rule 12b-2 of the Exchange Act. (Check one):
|
| | | | | | |
| Large accelerated filer | | x | | Accelerated filer | | o |
| | | | |
| Non-accelerated filer | | o (Do not check if a smaller reporting company) | | Smaller reporting company | | o |
Indicate by check mark whether the registrant is a shell company (as defined in Rule 12b-2 of the Act). Yes o No x
The aggregate market value of common stock held by non-affiliates of the registrant was $631.5 million on June 28, 2013. On February 21, 2014, there were 104,043,169 shares of the registrant’s common stock, par value $0.001 per share, outstanding.
Documents Incorporated by Reference
To the extent specifically referenced in Part III, portions of the registrant’s definitive Proxy Statement on Schedule 14A to be filed with the Securities and Exchange Commission in connection with the 2014 Annual Meeting of Stockholders are hereby incorporated by reference into this report.
ALLIED NEVADA GOLD CORP.
FORM 10-K
For the Year Ended December 31, 2013
TABLE OF CONTENTS
|
| | | | |
| | | | | Page |
| | | | | |
| | | | | |
| | | | | |
| | | PART I | | |
| Item 1. | | | | |
| Item 1A. | | | | |
| Item 1B. | | | | |
| Item 2. | | | | |
| Item 3. | | | | |
| Item 4. | | | | |
| | | | | |
| | | PART II | | |
| Item 5. | | | | |
| Item 6. | | | | |
| Item 7. | | | | |
| Item 7A. | | | | |
| Item 8. | | | | |
| Item 9. | | | | |
| Item 9A. | | | | |
| Item 9B. | | | | |
| | | | | |
| | | PART III | | |
| Item 10. | | | | |
| Item 11. | | | | |
| Item 12. | | | | |
| Item 13. | | | | |
| Item 14. | | | | |
| | | | | |
| | | PART IV | | |
| Item 15. | | | | |
| | | | | |
Cautionary Statement Regarding Forward-Looking Statements
In addition to historical information, this Form 10-K contains forward-looking statements within the meaning of Section 27A of the Securities Act of 1933, as amended (the “Securities Act”), Section 21E of the Securities Exchange Act of 1934, as amended (the “Exchange Act”), and the Private Securities Litigation Reform Act of 1995 (the “PSLRA”) or in releases made by the U.S. Securities and Exchange Commission (the “SEC”), all as may be amended from time to time. All statements, other than statements of historical fact, included herein or incorporated by reference, that address activities, events or developments that we expect or anticipate will or may occur in the future, are forward-looking statements, including but not limited to such things as:
| |
| • | our future business strategy, plans and goals; |
| |
| • | future gold and silver prices; |
| |
| • | our estimated future capital expenditures, construction, and other cash needs and expectations as to the funding or timing thereof; |
| |
| • | our anticipated cash flows, cash operating costs and adjusted cash costs1; |
| |
| • | the availability, terms and costs related to future borrowing, debt repayment, and equity funding |
| |
| • | our expectations regarding the growth of our business and our estimates of mineral reserves and other mineralized material; |
| |
| • | the economic potential of the sulfide mineralization and milling project at the Hycroft Mine; |
| |
| • | the anticipated results of the exploration drilling programs at our properties; |
| |
| • | the projected amounts of our future costs and expenses; |
| |
| • | our expectations regarding gold and silver recovery; |
| |
| • | our estimated future production, cost of production, sales and cost of sales; |
| |
| • | our plans and expectations regarding the development of our properties, including with respect to the Hycroft Mine; and |
| |
| • | our plans and expectations regarding the sale of certain assets, including with respect to the Hasbrouck/Three Hills properties and certain assets held for sale. |
These statements can be found under Part I-Item 1. Business, Part I-Item 1A. Risk Factors, Part I-Item 2. Properties, Part II-Item 7. Management’s Discussion and Analysis of Financial Condition and Results of Operations and elsewhere throughout this Annual Report on Form 10-K. The words “estimate”, “plan”, “anticipate”, “expect”, “intend”, “believe”, “project”, “target”, “budget”, “may”, “will”, “would”, “could”, “seeks”, or “scheduled to”, or other similar words, or negatives of these terms or other variations of these terms or comparable language or any discussion of strategy or intentions identify forward-looking statements. These cautionary statements are being made pursuant to the Securities Act, the Exchange Act and the PSLRA with the intention of obtaining the benefit of the “safe harbor” provisions of such laws. These statements involve known and unknown risks, uncertainties, assumptions and other factors which may cause our actual results, performance or achievements to be materially different from any results, performance or achievements expressed or implied by such forward-looking statements. Forward-looking statements are based on current expectations. Important factors that could cause actual results, performance or achievements to differ materially from those in the forward-looking statements include, but are not limited to:
| |
| • | volatile market prices of gold and silver; |
| |
| • | our current intention not to use forward-sale arrangements; |
| |
| • | our ability to raise additional capital on favorable terms or at all; |
| |
| • | risks associated with our substantial level of indebtedness; |
| |
| • | risks related to the heap leaching process at the Hycroft Mine, including but not limited to gold recovery rates, gold extraction rates, leach pad remediation processes, and the grades of ore placed on our leach pads; |
| |
| • | an increase in the cost or timing of new projects; |
| |
| • | uncertainties concerning estimates of mineral reserves and mineralized material, and grading; |
| |
| • | our ability to achieve our estimated production rates and stay within our estimated operating costs; |
| |
| • | our ability to attract and retain personnel; |
| |
| • | availability of equipment or supplies; |
| |
| • | intense competition within the mining industry; |
| |
| • | the commercial success of our exploration and development activities; |
| |
| • | uncertainties related to our ability to find and acquire new mineral properties; |
| |
| • | risks associated with the expansion of our operations, including those associated with any future acquisitions or joint ventures; |
| |
| • | cost of compliance with current and future government regulations, including those related to environmental protection, mining, health and safety, corporate governance and public disclosure; |
| |
| • | uncertainties relating to obtaining or retaining approvals and permits from governmental regulatory authorities; |
|
| | | |
| | | |
1 |
| The term “adjusted cash costs” is a non-GAAP financial measure. See the section titled “Non-GAAP Financial Measures” in Part II – Item 7 Management’s Discussion and Analysis of Financial Condition and Results of Operations. |
| |
| • | potential operational and financial effects of current and proposed federal and state regulations related to environmental protection and mining, and the exposure to potential liability created by such regulations; |
| |
| • | the inherently hazardous nature of mining activities, including operational, geotechnical and environmental risks; |
| |
| • | potential challenges to title in our mineral properties; and |
| |
| • | potential conflicts of interests that may arise through some of our directors’ involvement with other natural resources companies. |
For a more detailed discussion of such risks and other important factors that could cause actual results, performance or achievements to differ materially from those in our forward-looking statements, please see the risk factors discussed in “Part I-Item 1A. Risk Factors” of this Annual Report on Form 10-K and our other filings with the SEC. Although we have attempted to identify important factors that could cause actual results to differ materially from those described in forward-looking statements, there may be other factors that cause results not to be as anticipated, estimated or intended. Although we base these forward-looking statements on assumptions that we believe are reasonable when made, we caution you that forward-looking statements are not guarantees of future performance and that our actual results, performance or achievements may differ materially from those made in or suggested by the forward-looking statements contained in this Form 10-K. In addition, even if our results, performance or achievements are consistent with the forward-looking statements contained in this Form 10-K, those results, performance or achievements may not be indicative of results, performance or achievements in subsequent periods.
Given these risks and uncertainties, you are cautioned not to place undue reliance on these forward-looking statements. Any forward-looking statements that we make in this Form 10-K speak only as of the date of those statements, and we undertake no obligation to update those statements or to publicly announce the results of any revisions to any of those statements to reflect future events or developments. Comparisons of results for current and any prior periods are not intended to express any future trends or indications of future performance, unless expressed as such, and should only be viewed as historical data.
Cautionary Note Regarding Mineralized Material
Allied Nevada has reported reserve and mineralized material estimates in accordance with SEC Industry Guide 7. In accordance with SEC Industry Guide 7, resources have been reported as “mineralized material”. Canadian investors are cautioned that estimates of mineralized materials may differ from mineral resource estimates prepared in accordance with the standards of the Canadian Institute of Mining, Metallurgy and Petroleum referred to in Canadian National Instrument 43-101 - Standards of Disclosure for Mineral Projects (“NI 43-101”). Canadian investors should review the mineral resource estimates prepared in accordance with NI 43-101 contained in the mineral proven and probable ore reserves table.
Glossary
“Assay” means to test minerals by chemical or other methods for the purpose of determining the amount of metals contained therein.
“Claim” means a mining interest giving its holder the right to prospect, explore for and exploit minerals within a defined area.
“Feasibility study” means a comprehensive study undertaken to determine the economic feasibility of a project; the conclusion of which will be used to determine if a construction and/or production decision can be made.
“Grade” means the amount of metal in each ton of ore, expressed as troy ounces per ton for precious metals.
“Heap leaching” means a process whereby gold is extracted by "heaping" crushed ore on impermeable leach pads and continually applying a weak cyanide solution that dissolves the gold from the ore. The gold-laden solution is then collected for gold recovery.
“gpm” means gallons per minute.
“Mill” means a processing facility where ore is finely ground and thereafter undergoes physical or chemical treatments to extract the valuable metals.
“Mineralized material” is a body that contains mineralization which has been delineated by appropriately spaced drilling and/or underground sampling to estimate a sufficient tonnage and average grade of metal(s). Such a deposit does not qualify as a reserve until a comprehensive evaluation based upon unit cost, grade, recoveries, and other material factors conclude legal and economic feasibility of extraction at the time of reserve determination.
“Mining Rate” means tons of ore mined per day or specified time period.
“NI 43-101” means “National Instrument 43-101—Standards of Disclosure for Mineral Projects of the Canadian Securities Administrators.”
“NSR” means net smelter return royalty.
“opt” or “oz/ton” means ounces per ton.
“Ore” means material within a mineral deposit that can be economically extracted by the use of mining methods. Ore is processed or stockpiled.
“Ounce” means a troy ounce.
“Oxide” means ore in which some of the minerals have been oxidized (i.e., combined with oxygen through exposure to air or water) from surface exposure, fracturing, faulting, or exposure to high temperatures. Oxidation tends to make the ore more porous and permits a more complete permeation of cyanide solutions so that minute particles of gold in the interior of the minerals will be more readily dissolved. Oxide ore is generally processed using a heap leach method.
“Probable reserves” means reserves for which quantity and grade and/or quality are computed from information similar to that used for proven (measured) reserves, but the sites for inspection, sampling and measurement are farther apart or are otherwise less adequately spaced. The degree of assurance, although lower than that for proven (measured) reserves, is high enough to assume continuity between points of observation.
“Proven reserves” means reserves for which (a) quantity is computed from dimensions revealed in outcrops, trenches, workings or drill holes; grade and/or quality are computed from the results of detailed sampling and (b) the sites for inspection, sampling and measurement are spaced so closely and the geologic character is so well defined that size, shape, depth, and mineral content of reserves are well-established.
“Recovery” means that portion of the metal contained in the ore that is successfully extracted by processing, can also be expressed as a percentage.
“Reserves” or “ore reserves” mean that part of a mineral deposit, which could be economically and legally extracted or produced at the time of the reserve determination.
“Stripping ratio” or “strip ratio” means the ratio of waste tons to ore tons mined in an open pit mine.
“Sulfide” means a compound of sulfur and a metallic element. Sulfide ore is generally processed using a mill method.
“Ton” means a short ton (2,000 pounds).
“Transitional” means a material that has been incompletely oxidized. Transitional ore is generally processed using a mill or heap leach method.
“Waste” means rock or other material lacking sufficient grade and/or other characteristics to be economically processed or stockpiled as ore. To access an ore deposit it is often necessary to remove waste.
PART I
Item 1. Business
About the Company
We are a U.S.-based primary gold producer focused on mining, developing, and exploring properties in the state of Nevada in a safe, environmentally responsible, and cost-effective manner. We were incorporated under the laws of the state of Delaware on September 14, 2006. In this report, “we”, “us”, “our”, the “Company”, and “Allied Nevada” refer to Allied Nevada Gold Corp. and its subsidiaries.
Our operating mine, the Hycroft Mine (“Hycroft”), is an open-pit heap leach operation located approximately 54 miles west of Winnemucca, Nevada. Hycroft was restarted in 2008 and during the year ended December 31, 2013 we sold 181,941 ounces of gold and 858,073 ounces of silver produced at Hycroft. We expect our 2014 sales from Hycroft to increase to approximately 230,000 to 250,000 ounces of gold and 1.7 million to 2.0 million ounces of silver. As of December 31, 2013, the Hycroft Mine had proven and probable mineral reserves of 11.3 million ounces of gold and 497.1 million ounces of silver, which are contained in oxide (heap leach) and sulfide (mill) ores. We currently recover metals contained in oxide ores through our recently expanded heap leach operations and are in the process of updating our feasibility study to develop an optimized plan for our previously commenced (and subsequently deferred) mill expansion, the construction of which would allow us to recover metals contained in sulfide ores. We are working with an independent engineering firm to update our previous feasibility study of the mill expansion to incorporate onsite oxidation of our sulfide concentrates. We anticipate the feasibility study will be completed by the end of the third quarter of 2014.
In addition to the Hycroft Mine, we have six properties which have reported other mineralized material and approximately 73 other early stage exploration properties. On January 24, 2014, we entered into a Letter Agreement to sell two (Hasbrouck and Three Hills) of our mineral properties having reported mineralized material. See Note 25 - Subsequent Events to our Consolidated Financial Statements for additional information. On an ongoing basis, we evaluate our exploration portfolio to determine ways to increase the value of these properties.
The Hycroft Mine, all of our mineral properties, and our corporate office are located in the state of Nevada. Allied Nevada’s corporate headquarters is located at 9790 Gateway Drive, Suite 200, Reno, Nevada 89521.
Segment Information
Our segments include the Hycroft Mine, Exploration, and Corporate and Other. The Hycroft Mine segment includes the operations, development, and exploration activities of Hycroft and contains 100% of our revenues and production costs. The Exploration segment includes all costs related to the exploration and development of our properties outside of the Hycroft Mine and gains and losses resulting from the disposition or sale of mineral properties. The Corporate and Other segment includes corporate general and administrative costs of the Company. See Note 21 - Segment Information to our Consolidated Financial Statements for additional information on our segments.
Principal Products, Revenues, and Market Overview
Our principal products are produced at our Hycroft Mine and consist of unrefined gold bars (doré) and in-process inventories (metal-laden carbon), both of which are sent to third party refineries before being sold, generally at prevailing spot prices, to precious metals traders or financial institutions. Doré bars and metal-laden carbon are sent to refineries to produce bullion that meets the required market standards of 99.95% pure gold and 99.90% pure silver. Under the terms of our refining agreements, doré bars and metal-laden carbon are refined for a fee, and our share of the refined gold and the separately-recovered silver are credited to our account or delivered to our buyers.
Product Revenues and Customers
In 2013, revenues from gold and silver made up 93% and 7%, respectively, of our total revenue and, as such, we consider gold our principal product. We expect gold and silver sales to be our only source of future revenues. In 2013, all of our revenues were derived from metal sales to four customers; however, we do not believe we have any dependencies on these customers due to the liquidity of the metal markets and the availability of other metal traders and financial institutions.
Gold Uses
Gold has two main categories of use: fabrication and investment. Fabricated gold has a variety of end uses, including jewelry, electronics, dentistry, industrial and decorative uses, medals, medallions and coins. Gold investors buy gold bullion, coins and jewelry.
Gold Supply and Demand
The supply of gold consists of a combination of current production from mining and metal recycling and the draw-down of existing stocks of gold held by governments, financial institutions, industrial organizations and private individuals. Based on publicly available information, gold production from mines increased 5% during 2013 to a total of approximately 3,272.2 tons (or 95.4 million ounces). Annual gold production from mines represented approximately 68% of the 2013 gold supply. Gold demand in 2013 was approximately 4,140.3 tons (or 120.8 million ounces) and totaled approximately $170.4 billion in value. In 2013, gold demand by sector was comprised of jewelry (59%), bar and coin (44%), technology (11%), central bank purchases (9%), and ETF investments (-23%).
Gold Prices
The price of gold is volatile and is affected by many factors beyond our control, such as the sale or purchase of gold by central banks and financial institutions, inflation or deflation and monetary policies, fluctuation in the value of the US dollar and foreign currencies, global and regional demand, and the political and economic conditions of major gold producing countries throughout the world. The following table presents the annual high, low, and average afternoon fixing prices for gold over the past ten years on the London Bullion Market (in US dollars per ounce).
|
| | | | | | | | | | | | |
| Year | | High | | Low | | Average |
| 2004 | | $ | 454 |
| | $ | 375 |
| | $ | 410 |
|
| 2005 | | 536 |
| | 411 |
| | 444 |
|
| 2006 | | 725 |
| | 525 |
| | 604 |
|
| 2007 | | 841 |
| | 608 |
| | 695 |
|
| 2008 | | 1,011 |
| | 713 |
| | 872 |
|
| 2009 | | 1,213 |
| | 810 |
| | 972 |
|
| 2010 | | 1,421 |
| | 1,058 |
| | 1,225 |
|
| 2011 | | 1,895 |
| | 1,319 |
| | 1,572 |
|
| 2012 | | 1,792 |
| | 1,540 |
| | 1,669 |
|
| 2013 | | 1,694 |
| | 1,192 |
| | 1,411 |
|
On February 24, 2014, the afternoon fixing price for gold on the London Bullion Market was $1,335 per ounce.
Employees
At December 31, 2013, we had approximately 428 employees, of which 404 were employed at the Hycroft Mine. None of our employees are represented by unions.
Competition
We compete with other mining companies that operate within a general proximity to our Hycroft Mine for skilled employees as the nearby population in Winnemucca, NV is small. Shortages of skilled employees could lead to production inefficiencies and/or additional costs. To date, we have not experienced any material shortages in staffing our Hycroft Mine with skilled employees.
From time-to-time certain production inputs have been in short supply. Shortages of production supplies rarely lead to operational issues, but would require us to either substitute with lower quality supplies or to ship these supplies from longer distances. These substitutions and changes could result in minor production inefficiencies and/or additional costs. To date, we have not experienced any material shortages in production inputs.
Government Regulation of Mining-Related Activities
Government Regulation
Mining operations and exploration activities are subject to various federal, state and local laws and regulations in the United States, which govern prospecting, development, mining, production, exports, taxes, labor standards, occupational health, waste disposal, protection of the environment, mine safety, hazardous substances and other matters. We have obtained or have pending applications for those licenses, permits or other authorizations currently required to conduct our mining, exploration and other programs. We believe that we are in compliance in all material respects with applicable mining, health, safety and environmental statutes and the regulations passed thereunder in Nevada and the United States. Although we are not aware of any current claims, orders or directions relating to our business with respect to the foregoing laws and regulations, changes to, or more stringent application or interpretation of, such laws and regulations in Nevada, or in jurisdictions where we may operate in the future, could require additional capital expenditures and increased operating and/or reclamation costs, which could adversely impact the profitability levels of our projects.
Environmental Regulation
Our mining projects are subject to various federal and state laws and regulations governing protection of the environment. These laws and regulations are continually changing and, in general, are becoming more restrictive. They, among other things, impose strict, joint and several liability on current and former owners and operators of sites and on persons who disposed of or arranged for the disposal of hazardous substances found at such sites (the Comprehensive Environmental Response, Compensation, and Liability Act); govern the generation, treatment, storage and disposal of solid waste and hazardous waste (the Federal Resource Conservation and Recovery Act); restrict the emission of air pollutants from many sources, including mining and processing activities (the Clean Air Act); require federal agencies to integrate environmental considerations into their decision-making processes by evaluating the environmental impacts of their proposed actions, including the issuance of permits to mining facilities and assessing alternatives to these actions (the National Environmental Policy Act); regulate the use of federal public lands to prevent undue and unnecessary degradation of the public lands (the Federal Land Policy and Management Act of 1976 ); restrict and control the discharge of pollutants and dredged and fill materials into waters of the United States (the Clean Water Act); and regulate the drilling of subsurface injection wells (the Safe Drinking Water Act and the Underground Injection Control program promulgated thereunder). At the state level, mining operations in Nevada are regulated by the Nevada Department of Conservation and Natural Resources, Division of Environmental Protection, which has the authority to implement and enforce many of the federal regulatory programs described above as well as state environmental laws and regulations. Compliance with these and other federal and state laws and regulations could result in delays in obtaining, or failure to obtain, government permits and approvals, delays in beginning or expanding operations, limitations on production levels, incurring additional costs for investigation or cleanup of hazardous substances, payment of fines, penalties or remediation costs for non-compliance, and post-mining closure, reclamation and bonding.
It is our policy to conduct business in a way that safeguards public health and the environment. We believe that our operations are, and will be, conducted in material compliance with applicable laws and regulations. However, our past and future activities in the United States may cause us to be subject to liability under such laws and regulations. For information about the risks to our business related to environmental regulation, see the following risk factors in Item 1A - Risk Factors:
| |
| • | Our operations are subject to numerous governmental permits that are difficult to obtain and we may not be able to obtain or renew all of the permits we require, or such permits may not be timely obtained or renewed; |
| |
| • | Changes in environmental regulations could adversely affect our cost of operations or result in operations delays; |
| |
| • | Environmental regulations could require us to make significant expenditures or expose us to potential liability; and |
| |
| • | Our exploration and development operations are subject to extensive environmental regulations, which could result in the incurrence of additional costs and operational delays. |
During 2013, 2012 and 2011, there were no material environmental incidents or non-compliance with any applicable environmental regulations on the properties now held by us. We did not incur material capital expenditures for environmental control facilities during 2013, 2012 or 2011 and do not expect to incur any material expenditures in 2014 for such environmental control facilities.
Reclamation
We are required to mitigate long-term environmental impacts by stabilizing, contouring, re-sloping and re-vegetating various portions of a site after mining and mineral processing operations are completed. These reclamation efforts will be conducted in accordance with detailed plans, which must be reviewed and approved by the appropriate regulatory agencies. Our principal reclamation liability is at the Hycroft Mine and is fully secured by surface management surety bonds that meet the financial bonding requirements of the Bureau of Land Management (the “BLM”). Our most recent reclamation cost estimate was approved by the BLM in their December 2013 decision letter and totals $58.3 million. At December 31, 2013, our surface management surety bonds totaled $61.5 million, which were partially collateralized by restricted cash of $41.2 million. If we were to carry out unanticipated reclamation work in the future, our financial position could be adversely affected or our posted bonds may be insufficient. For financial information about our estimated future reclamation costs refer to Note 11 - Asset Retirement Obligation to our Notes to Consolidated Financial Statements.
Mine Safety and Health Administration Regulations
Safety and health is our highest priority which is why we have a mandatory mine safety and health program that includes employee and contractor training, risk management, workplace inspection, emergency response, accident investigation and program auditing. We consider this program to be essential at all levels to ensure that our employees, contractors, and visitors are always in an environment that is safe and healthy.
Our operations and exploration properties are subject to regulation by the Federal Mine Safety and Health Administration (“MSHA”) under the Federal Mine Safety and Health Act of 1977 (the “Mine Act”). MSHA inspects our mines on a regular basis and issues various citations and orders when it believes a violation has occurred under the Mine Act. The number of citations and orders charged against mining operations, and the dollar penalties assessed for such citations, have generally increased in recent years. The Dodd-Frank Wall Street Reform and Consumer Protection Act (the “Dodd-Frank Act”) requires us to provide a mine safety disclosure, which we have done in Part I - Item 4B of this Form 10-K.
Property Interests and Mining Claims
Our exploration activities are conducted in the State of Nevada. Mineral interests may be owned in Nevada by the United States, Nevada, or private parties. Where prospective mineral properties are held by the United States, mineral rights may be acquired through the location of unpatented mineral claims upon unappropriated federal land. Where prospective mineral properties are owned by Nevada or private parties, some type of property acquisition agreement is necessary in order for us to explore or develop such property. Mining claims are subject to the same risk of defective title that is common to all real property interests. Additionally, mining claims are self-initiated and self-maintained and, therefore, possess some unique vulnerabilities not associated with other types of property interests. It is impossible to ascertain the validity of unpatented mining claims solely from an examination of the public real estate records and, therefore, it can be difficult or impossible to confirm that all of the requisite steps have been followed for location and maintenance of a claim. For general information about our mineral properties and mining claims refer to Item 2 - Properties. For information about the risks to our business related to our property interests and mining claims, see the following risk factors in Item 1A - Risk Factors:
| |
| • | There are uncertainties as to title matters in the mining industry. Any defects in such title could cause us to lose our rights in mineral properties and jeopardize our business operations; and |
| |
| • | Legislation has been proposed that could, if enacted, significantly affect the cost of our operations on our unpatented mining claims. |
Available Information
We maintain an internet web site at www.alliednevada.com. Through the Investor section of the web site, we make available, free of charge, our Annual Reports on Form 10-K, Quarterly Reports on Form 10-Q, Proxy Statements, Current Reports on Form 8-K filed or furnished pursuant to Section 13(a) or 15(d) of the Exchange Act, and all amendments to those reports, as soon as reasonably practical after such material is electronically filed or furnished with the SEC. Our website also contains Interactive Data Files filed or furnished pursuant to Rule 405 of Regulation S-T. In addition, our Corporate Governance Guidelines, the charters of key committees of our Board of Directors, and our Code of Ethics are also available on our web site.
You may also read and copy any materials we file with the SEC at the SEC’s Public Reference Room at 100 F Street, NE, Washington, D.C. 20549. Copies of such materials also can be obtained free of charge at the SEC’s website, www.sec.gov, or by mail from the Public Reference Room of the SEC, at prescribed rates. Please call the SEC at 1-800-SEC-0330 for further information on the operation of the Public Reference Room.
Item 1A. Risk Factors
Any investment in Allied Nevada involves a high degree of risk. You should carefully consider the risks described below and the other information contained in this Form 10-K. The risks and uncertainties described below are not the only risks and uncertainties that we face. Additional risks and uncertainties not presently known to us or that we currently deem immaterial may also impair our business operations. If any of those risks actually occur, our business, financial condition and results of operations would suffer. The risks discussed below also include forward-looking statements, and our actual results may differ substantially from those discussed in these forward-looking statements. See also “Cautionary Statement Regarding Forward-Looking Statements” above.
The risk factors discussed below are grouped into the following categories: Financial Risks; Operational and Development Risks; Environmental, Compliance, and Regulatory Risks; Market Risks; and General and Other Risks.
Financial Risks
The market prices of gold and silver are volatile. A decline in gold and silver prices could result in decreased revenues, decreased net income, increased losses, and decreased cash flows, and may negatively affect our business.
Gold and silver are commodities. Their prices fluctuate and are affected by many factors beyond our control, including interest rates, expectations regarding inflation, speculation, currency values, central bank activities, governmental decisions regarding the disposal of precious metals stockpiles, global and regional demand and production, political and economic conditions and other factors. The prices of gold and silver, as quoted by The London Bullion Market Association on December 31, 2013 and 2012, were $1,201.50 and $1,664.00 per ounce for gold, respectively, and $19.50 and $29.95 per ounce for silver, respectively. The prices of gold and silver may decline in the future. A substantial or extended decline in gold or silver prices would adversely impact our financial position, revenues, net income and cash flows, particularly in light of our current strategy of not engaging in hedging transactions with respect to gold or silver. In addition, sustained lower gold or silver prices may:
| |
| • | reduce revenues further through production declines due to cessation of the mining of deposits, or portions of deposits, that have become uneconomic at the then-prevailing gold or silver price; |
| |
| • | reduce or eliminate the profit, if any, that we currently expect from ore stockpiles and ore on leach pads; |
| |
| • | halt, delay, modify, or cancel plans for the construction of a mill for the sulfide ores or the development of new and existing projects; |
| |
| • | make it more difficult for us to satisfy and/or service our debt obligations; |
| |
| • | reduce existing reserves by removing ores from reserves that can no longer be economically processed at prevailing prices; |
| |
| • | cause us to recognize an impairment to the carrying values of mineral properties and long-lived assets; and |
| |
| • | reduce funds available for exploration with the result that depleted reserves may not be replaced. |
We do not currently use forward sale or other significant hedging arrangements to protect against gold and silver prices and commodity prices (other than related to a portion of our diesel costs from time to time) and, as a result, our operating results are exposed to the impact of any significant decrease in the price of gold or silver or any significant increase in commodity prices.
We do not currently enter into forward sales or other significant hedging arrangements to reduce the risk of exposure to volatility in metal and commodity prices. Accordingly, our future operations are exposed to the impact of any significant decrease in gold or silver prices and any significant increase in commodity prices. If such prices change significantly, we will realize reduced revenues and increased costs. While it is not our current intention to enter into forward sales or other significant hedging arrangements, we are not restricted from entering into such arrangements at a future date.
We may be unable to raise additional capital on favorable terms or at all.
The exploration and development of our properties, including the advancement of the Hycroft Mine mill expansion project and the development of any of our exploration properties, as well as any acquisitions we may make, will require significant capital investment. Failure to obtain sufficient financing may result in the delay or indefinite postponement of exploration activity, development or production on any of our properties or consummation of any acquisitions. Any downgrades to our credit ratings could significantly limit our ability to secure new or additional credit facilities, increase our cots of borrowing, reduce the market value of our senior notes, and make it difficult or impossible to raise additional capital on favorable terms or at all. We can provide no assurance that additional financing will be available at all or on terms we consider acceptable.
Our substantial indebtedness could adversely affect our financial condition.
We have a significant amount of indebtedness. As of December 31, 2013, we had indebtedness of $599.2 million, including CDN $400.0 million aggregate principal of 8.75% Senior Unsecured Notes due 2019 (“Notes”) (which have been swapped to $400.4 million at 8.375% through a currency swap agreement) and the remaining being attributed to capital lease and term loan obligations for mobile equipment and security deposit advances for an electric rope shovel. We also have $40.0 million of unused commitments under our revolving credit facility (the “Revolver”) as of December 31, 2013. Subject to the limits contained in the credit agreement governing our Revolver, the indenture governing our Notes and our other debt instruments, we may be able to incur substantial additional debt from time to time to finance working capital, capital expenditures, investments or acquisitions, or for other purposes. If we do so, the risks related to our high level of debt could intensify. Our high level of debt could:
| |
| • | make it more difficult for us to satisfy our obligations with respect to our outstanding debt; |
| |
| • | require a substantial portion of our cash flows to be dedicated to debt service payments instead of other purposes, thereby reducing the amount of cash flows available for working capital, capital expenditures, acquisitions and other general corporate purposes; |
| |
| • | limit our ability to obtain additional financing to fund future working capital, capital expenditures, acquisitions or other general corporate requirements; |
| |
| • | increase our vulnerability to general adverse economic and industry conditions; |
| |
| • | expose us to the risk of increased interest rates as certain of our borrowings are at variable rates of interest; |
| |
| • | limit our flexibility in planning for and reacting to changes in the industry in which we compete; |
| |
| • | place us at a disadvantage compared to other, less leveraged competitors; and |
| |
| • | increase our cost of borrowing. |
Any of the above-listed factors could have an adverse effect on our business, financial condition and results of operations and our ability to meet our payment obligations under our debt, and the price of our common stock.
In addition to the indenture governing our Notes, certain of our capital lease obligations and our Revolver contain restrictive covenants that limit our ability to engage in activities that may be in our long-term best interest. Our failure to comply with those covenants could result in an event of default which, if not cured or waived, could result in the acceleration of nearly all of our debt.
We may not be able to generate sufficient cash to service all of our indebtedness, and may be forced to take other actions to satisfy our obligations under our indebtedness, which may not be successful.
Our ability to make scheduled payments on or refinance our debt obligations (if necessary) depends on our financial condition and operating performance, which are subject to prevailing economic and competitive conditions and to certain financial, business, legislative, regulatory and other factors beyond our control. We may be unable to maintain a level of cash flow from operating activities sufficient to permit us to pay the principal, premium, if any, and interest on our indebtedness.
If our cash flows and capital resources are insufficient to fund our debt service obligations, we could face substantial liquidity problems and could be forced to reduce or delay investments and capital expenditures or to dispose of material assets or operations, seek additional debt or equity capital or restructure or refinance our indebtedness. We may not be able to effect any such alternative measures, if necessary, on commercially reasonable terms or at all and, even if successful, those alternative actions may not allow us to meet our scheduled debt service obligations. The credit agreement governing our Revolver and the indenture governing our Notes restrict our ability to dispose of assets and use the proceeds from those dispositions and may also restrict our ability to raise debt to be used to repay other indebtedness when it becomes due. We may not be able to consummate those dispositions or to obtain proceeds in an amount sufficient to meet any debt service obligations then due.
In addition, we conduct a substantial portion of our operations through our subsidiaries, certain of which in the future may not be guarantors of our indebtedness. Accordingly, repayment of our indebtedness is dependent on the generation of cash flow by our subsidiaries and their ability to make such cash available to us, by dividend, debt repayment or otherwise. Unless they are guarantors of our indebtedness, our subsidiaries do not have any obligation to pay amounts due on our indebtedness or to make funds available for that purpose. Our subsidiaries may not be able to, or may not be permitted to, make distributions to enable us to make payments in respect of our indebtedness. Each subsidiary is a distinct legal entity, and, under certain circumstances, legal and contractual restrictions may limit our ability to obtain cash from our subsidiaries. While the indenture governing our Notes limits the ability of our subsidiaries to incur consensual restrictions on their ability to pay dividends or make other intercompany payments to us, these limitations are subject to qualifications and exceptions. In the event that we do not receive distributions from our subsidiaries, we may be unable to make required principal and interest payments on our indebtedness.
Our inability to generate sufficient cash flows to satisfy our debt obligations, or to refinance our indebtedness on commercially reasonable terms or at all, would materially and adversely affect our financial position and results of operations and our ability to satisfy our obligations.
If we cannot make scheduled payments on our debt, we will be in default and holders of our Notes could declare all outstanding principal and interest to be due and payable, the lenders under our Revolver and capital leases could terminate their commitments to loan money, the lenders could foreclose against the assets securing their borrowings and we could be forced into bankruptcy or liquidation.
The terms of the indenture governing our Notes and the credit agreement governing our Revolver will restrict our current and future operations, particularly our ability to respond to changes or to take certain actions.
The indenture governing our Notes and the credit agreement governing our Revolver contain a number of restrictive covenants that impose significant operating and financial restrictions on us and may limit our ability to engage in acts that may be in our long-term best interest, including restrictions on our ability to:
| |
| • | incur additional indebtedness and guarantee indebtedness; |
| |
| • | pay dividends or make other distributions or repurchase or redeem capital stock; |
| |
| • | issue certain preferred stock or similar equity securities; |
| |
| • | make loans and investments; |
| |
| • | enter into transactions with affiliates; |
| |
| • | make capital expenditures for the mill expansion; |
| |
| • | enter into agreements restricting our subsidiaries’ ability to pay dividends; and |
| |
| • | consolidate, merge or sell all or substantially all of our assets. |
In addition, the restrictive covenants in the credit agreement governing our Revolver require us to maintain specified financial ratios and satisfy other financial condition tests. Our ability to meet those financial ratios and tests can be affected by events beyond our control, and we may be unable to meet them.
A breach of the covenants or restrictions under the indenture governing our Notes or under the credit agreement governing our Revolver could result in an event of default under the applicable indebtedness. Such a default may allow the creditors to accelerate the related debt and may result in the acceleration of any other debt to which a cross-acceleration or cross-default provision applies, including our capital lease obligations and any amounts owed pursuant to the cross currency swaps. In addition, an event of default under the credit agreement governing our Revolver would permit the lenders under our Revolver to terminate all commitments to extend further credit under that facility. Furthermore, if we were unable to repay the amounts due and payable under our Revolver, those lenders could proceed against the collateral granted to them to secure that indebtedness and any amounts owed pursuant to the cross currency swaps. In the event our lenders or noteholders accelerate the repayment of our borrowings, we and our subsidiaries may not have sufficient assets to repay that indebtedness. As a result of these restrictions, we may be:
| |
| • | limited in how we conduct our business; |
| |
| • | unable to raise additional debt or equity financing to operate during general economic or business downturns; or |
| |
| • | unable to compete effectively or to take advantage of new business opportunities. |
These restrictions may affect our ability to grow in accordance with our strategy. In addition, our financial results, our substantial indebtedness and our credit ratings could adversely affect the availability and terms of our financing.
Our liquidity and financial position may be negatively impacted by movements in foreign exchange rates.
In January of 2014 we began being required to collateralize $90.0 million of the total notional amount of the Notes cross currency swap with cash, letters of credit, or a combination of the two. Fluctuations in the Canadian dollar to U.S. dollar exchange rate could reduce the capacity we have available under our Revolver if collateral is posted with letters of credit or reduce our liquid assets if collateral is posted with cash and cash equivalents. Refer to Note 25 - Subsequent Events for additional information.
Operational and Development Risks
Cost estimates and timing of our Hycroft Mine expansion project and new projects is uncertain, which may adversely affect our expected production and profitability.
The capital expenditures and time required to develop and explore our properties, including the Hycroft Mine and any of our exploration properties, are considerable and changes in costs, construction schedules or both, can adversely affect project economics and expected production and profitability. There are a number of factors that can affect costs and construction schedules, including, among others:
| |
| • | changes in input commodity prices and labor costs; |
| |
| • | availability and terms of financing; |
| |
| • | availability of labor, energy, transportation, equipment, and infrastructure; |
| |
| • | fluctuations in currency exchange rates; |
| |
| • | changes in anticipated tonnage, grade and metallurgical characteristics of the ore to be mined and processed; |
| |
| • | recovery rates of gold and other metals from the ore; |
| |
| • | difficulty of estimating construction costs over a period of years; |
| |
| • | delays in completing any environmental review or in obtaining environmental or other government permits; |
| |
| • | weather and severe climate impacts; and |
| |
| • | potential delays related to social and community issues. |
We currently recover gold and silver from oxide and transitional ores at the Hycroft Mine. We are working on an updated Hycroft mill feasibility study, which relates to the economic potential of recovering metals from the sulfide mineralization at the Hycroft property, that we believe will be completed during the third quarter of 2014. The results of the feasibility study work, in terms of project costs, timing, the success of onsite oxidation of the sulfide concentrate, and overall economics, could largely determine when (if ever) we will resume the mill expansion project and gain the capabilities of processing sulfide ores. The processing of sulfide ore, if it is to occur, is uncertain and, therefore, the costs and timing of the commencement of sulfide operations at the Hycroft Mine could vary greatly from our estimates.
The estimation of the ultimate recovery of gold and silver from the Hycroft Mine, although based on standard industry sampling and estimating methods, is subjective. The Company’s results of operations, liquidity, and financial position may be negatively impacted if actual recoveries are lower than initial estimations.
Our Hycroft Mine utilizes the heap leach process to extract gold and silver from ore. The heap leach process extracts gold and silver by placing ore on an impermeable pad and applying a dilute cyanide solution that dissolves a portion of the contained gold and silver, which are then recovered in metallurgical processes. We use several integrated steps in the process of extracting gold and silver to estimate the metal content of ore placed on the leach pad. Although we refine our estimates as appropriate at each step in the process, the final amounts are not determined until a third-party smelter refines the doré and/or metal-laden carbon and determines the final ounces of gold and silver available for sale. We then review this end result and reconcile it to the estimates we developed and used throughout the production process. Based on this review, we adjust our estimation procedures when appropriate. Due to the complexity of the estimation process and the number of steps involved, among other things, actual recoveries can vary from estimates, and the amount of the variation could be significant and could have a material adverse impact on our financial condition and results of operations.
Each of these factors not only applies to our current and future operations at the Hycroft Mine, but also will apply to any future development of other properties not yet in production. In the case of mines that we may develop in the future, we will not have the benefit of actual experience in our estimates with respect to those mines, and there is a greater likelihood that actual results will vary from the estimates.
Reserve and other mineralized material calculations are estimates only, and are subject to uncertainty due to factors including metal prices, inherent variability of the ore and recoverability of metal in the mining process.
The calculation of mineral reserves, other mineralized material and grading are estimates and depend upon geological interpretation and statistical inferences or assumptions drawn from drilling and sampling analysis, which may prove to be unpredictable. There is a degree of uncertainty attributable to the calculation of mineral reserves and corresponding grades. Until mineral reserves and other mineralized materials are actually mined and processed, the quantity of ore and grades must be considered as an estimate only. In addition, the quantity of mineral reserves and other mineralized materials and ore may vary depending on metal prices, which largely determine whether mineral reserves and other mineralized materials are classified as ore (economic to mine) or waste (uneconomic to mine). A decline in metal prices may result in previously reported mineral reserves (ore) becoming uneconomic to mine (waste). Any material change in the quantity of mineral reserves, other mineralized materials, mineralization, grade or stripping ratio may affect the economic viability of our properties. In addition, we can provide no assurance that gold recoveries or other metal recoveries experienced in small-scale laboratory tests will be duplicated in larger scale tests under on-site conditions or during production.
We may not achieve our production and/or sales estimates and our costs may be higher than our estimates, thereby reducing our cash flows and negatively impacting our results of operations.
We prepare estimates of future production, sales, and costs for our operations. We develop our estimates based on, among other things, mining experience, reserve and other mineralized material estimates, assumptions regarding ground conditions and physical characteristics of ores (such as hardness and presence or absence of certain metallurgical characteristics) and estimated rates and costs of mining and processing. All of our estimates are subject to numerous uncertainties, many of which are beyond our control. Our actual production and/or sales may be lower than our estimates and our actual costs may be higher than our estimates, which could negatively impact our cash flows and results of operations. While we believe that our estimates are reasonable at the time they are made, actual results will vary and such variations may be material. These estimates are necessarily speculative in nature, and it may be the case that one or more of the assumptions underlying such projections and estimates may not materialize. Investors in our common stock are cautioned not to place undue reliance on the projections and estimates set forth in this Form 10-K.
Our gold and silver production may decline, reducing our revenues and negatively impacting our business.
Our future gold and silver production may decline as a result of an exhaustion of reserves, the inability to process existing sulfide ores, and possible closure of mines. It is our business strategy to conduct gold and silver exploratory activities at the Hycroft Mine; however, if we cannot expand and/or replace oxide ore reserves or complete expansion projects that would allow us to process sulfide reserves, our revenues from the sale of gold and silver may decline, negatively affecting our results of operations or the duration in which we are able to operate. We can provide no assurance that our gold and silver production in the future will not decline.
A shortage of equipment and supplies and/or the time it takes such items to arrive at our Hycroft Mine could adversely affect our ability to operate our business.
We are dependent on various supplies and equipment to carry out our mining, exploration, and development operations. The shortage of such supplies, equipment and parts and/or the time it takes such items to arrive at our Hycroft Mine could have a material adverse effect on our ability to carry out our operations, develop our properties, and complete expansion projects and therefore limit or increase the cost of production. Such shortages could also result in increased construction costs and cause delays in expansion projects.
Changes in the cost or supply of energy or commodities used in operations may adversely affect the profitability of our operations and our financial condition.
Our mining operations and exploration activities are intensive users of energy. Our principal energy sources are electricity and diesel fuel. We rely upon third parties for our supply of energy resources consumed in our mining and exploration activities. Energy prices can be affected by numerous factors beyond our control, including global and regional supply and demand, political and economic conditions, and applicable regulatory regimes. The prices of various sources of energy may increase significantly from current levels. An increase in energy prices could materially and adversely affect our results of operations and financial condition.
Disruptions in the supply of our energy resources could temporarily impair our ability to produce gold and silver or delay any expansion projects or plans. Some of our mining operations and exploration projects are in remote locations requiring the building of power lines and long distance transmission of power. A disruption in the transmission of energy, inadequate energy transmission infrastructure or the termination of any of our energy supply contracts could interrupt our energy supply and adversely affect our operations or expansion projects.
Our production costs are also affected by the prices of commodities we consume or use in our operations, such as diesel fuel, lime, sodium cyanide and explosives. The prices of such commodities are influenced by supply and demand trends affecting the mining industry in general and other factors outside our control. Increases in the price for materials consumed in our mining and production activities could materially and adversely affect our results of operations and financial condition.
We face intense competition in the mining industry.
The mining industry is intensely competitive. As a result of this competition, some of which is with large established mining companies with substantial capabilities and with greater financial and technical resources than ours, we may be unable to acquire additional attractive mining claims or financing on terms we consider acceptable, which may adversely impact our growth and development. This, in turn, may adversely affect our financial condition and results of operations. We also compete with other mining companies in the recruitment and retention of qualified managerial and technical employees. If we are unable to successfully attract and retain qualified employees, our exploration and development programs may be slowed down or suspended.
Our reliance on third party contractors and consultants to conduct a significant portion of our operations and construction projects exposes us to risks.
We contract and engage third party contractors and consultants for a portion of our operations and for our construction projects, including the crushing facility and the mill expansion project, and other ongoing expansion projects at the Hycroft Mine. As a result, our operations and construction projects are subject to a number of risks, some of which are outside our control, including:
| |
| • | negotiating agreements with contractors and consultants on acceptable terms; |
| |
| • | the inability to replace a contractor or consultant and their operating equipment in the event that either party terminates the agreement; |
| |
| • | reduced control over those aspects of operations which are the responsibility of the contractor or consultant; |
| |
| • | failure of a contractor or consultant to perform under their agreement or disputes relative to their performance; |
| |
| • | interruption of operations or increased costs in the event that a contractor or consultant ceases their business due to insolvency or other unforeseen events; |
| |
| • | failure of a contractor or consultant to comply with applicable legal and regulatory requirements, to the extent they are responsible for such compliance; and |
| |
| • | problems of a contractor or consultant with managing their workforce, labor unrest or other employment issues. |
In addition, we may incur liability to third parties as a result of the actions of our contractors or consultants. The occurrence of one or more of these risks could decrease our gold and silver production, increase our costs, delay expansion projects, and adversely affect our results of operations and financial position.
We cannot be certain that our future exploration and development activities will be commercially successful.
Substantial expenditures are required to further explore our Hycroft Mine and any of our exploration properties, to establish reserves and other mineralized material through drilling and analysis, to develop metallurgical processes to extract metal from the ore and, in the case of new properties or the expansion of our existing projects, to develop the mining and processing facilities and infrastructure at any site chosen for mining. We cannot provide assurance that any reserves or other mineralized material discovered will be in sufficient quantities to justify commercial operations or that the funds required for development can be obtained on a timely basis. A number of factors, including costs, actual mineralization, consistency and reliability of ore grades and commodity prices, affect successful project development. The efficient operation of processing facilities, the existence of competent operational management, as well as the availability and reliability of appropriately skilled and experienced consultants also can affect successful project development. There can be no assurance that our exploration and development programs, including the advancement of the Hycroft Mine oxide operation and the updated Hycroft milling feasibility study for the mill expansion project, will result in economically viable mining operations or yield new mineral reserves or other mineralized material.
Our ability to find and acquire new mineral properties and our prospects for the future growth of our business are uncertain. The sale of our mineral properties may greatly limit our ability to generate new reserves or identify other mineralized materials.
Because mines have limited lives based on proven and probable ore reserves, we are continually seeking to replace and expand our ore reserves. Identifying promising mining properties is difficult and speculative. We encounter strong competition from other mining companies in connection with the acquisition of properties producing or capable of producing gold and silver. Many of these companies have greater financial resources than we do. Consequently, we may be unable to replace and expand current ore reserves through the acquisition of new mining properties or interests therein on terms we consider acceptable. Further, from time to time we may sell mineral properties we own which greatly limits our ability to develop or grow our reserves or identify other mineralized materials (as discussed in Note 25 - Subsequent Events to our Consolidated Financial Statements, on January 24, 2014, the Company entered into a letter agreement for the sale of Hasbrouck and Three Hills). As a result, our revenues from the future sale of gold and silver may decline, resulting in lower income and reduced growth.
Mining development, exploration, and processing operations pose risks and costs that may negatively impact our business.
Mining development, exploration, and processing operations involve many hazards and uncertainties, including, among others:
| |
| • | unusual and unexpected rock formations or water conditions; |
| |
| • | metallurgical or other processing problems; |
| |
| • | ground or slope failures; |
| |
| • | environmental contamination or leakage; |
| |
| • | flooding and periodic interruptions due to inclement or hazardous weather conditions or other acts of nature; |
| |
| • | organized labor disputes or work slow-downs; |
| |
| • | mechanical equipment failure and facility performance problems; and |
| |
| • | the availability of critical materials, equipment and skilled labor. |
These occurrences could result in damage to, or destruction of, our properties or production facilities, personal injury or death, environmental damage, delays in mining or processing, increased production costs, asset write downs, monetary losses and legal liability, any of which could have an adverse effect on our results of operations and financial condition and adversely affect our projected development and production estimates.
We may be adversely affected by challenges relating to slope stability.
Our open pit mines get deeper as we mine them, presenting certain geotechnical challenges including the possibility of slope failure. If we are required to decrease pit slope angles or provide additional road access to prevent such a failure, our stated reserves could be negatively affected. Further, hydrological conditions relating to pit slopes, renewal of material displaced by slope failures and increased stripping requirements could also negatively affect our stated reserves. We have taken actions in order to maintain slope stability, but we cannot provide any assurances that we will not have to take additional action in the future or that our actions taken to date will be sufficient. Unexpected failure or additional requirements to prevent slope failure may negatively affect our results of operations and financial condition, as well as have the effect of diminishing our stated ore reserves.
Our insurance may not cover all of the risks associated with our business.
The mining business is subject to risks and hazards, including construction risks, environmental hazards, industrial accidents, the encountering of unusual or unexpected geological formations, slide-ins, flooding, earthquakes and periodic interruptions due to inclement or hazardous weather conditions. These occurrences could result in damage to, or destruction of, mineral properties or production facilities, personal injury or death, environmental damage, reduced production and delays in mining, asset write-downs, monetary losses and possible legal liability. Insurance fully covering many of these risks is not generally available to us and if it is, we may elect not to obtain it because of the high premium costs or commercial impracticality. We do not currently carry business interruption insurance and have no plans to obtain such insurance in the future. Any liabilities that the we incur for these risks and hazards could be significant and could adversely affect results of operation, cash flows and financial condition.
Environmental, Compliance, and Regulatory Risks
Environmental regulations could require us to make significant expenditures or expose us to potential liability.
To the extent we become subject to environmental liabilities, the payment of such liabilities or the costs that we may incur, including costs to remedy environmental pollution, would reduce funds otherwise available to us and could have a material adverse effect on our financial condition, results of operations, and liquidity. If we are unable to fully remedy an environmental violation or release of hazardous substances, we might be required to suspend operations or enter into interim compliance measures pending completion of the required remedy or corrective action. The environmental standards that may ultimately be imposed at a mine site can vary and may impact the cost of remediation. Actual remedial costs may exceed the financial accruals that have been made for such remediation. The potential exposure may be significant and could have a material adverse effect on our financial condition and results of operations.
Moreover, governmental authorities and private parties may bring lawsuits based upon damage to property or natural resources and injury to persons resulting from the environmental, health and safety impacts of our past and current operations, which could lead to the imposition of substantial fines, remediation costs, penalties, injunctive relief and other civil and criminal sanctions. Substantial costs and liabilities, including those required to restore the environment after the closure of mines, are inherent in our operations. Although we believe that we are in substantial compliance with applicable laws and regulations, we cannot provide any assurance that any such law, regulation, enforcement or private claim will not have a negative effect on our business, financial condition or results of operations.
Our exploration and development operations are subject to extensive environmental regulations, which could result in the incurrence of additional costs and operational delays.
All phases of our operations are subject to extensive federal and state environmental regulation, including those enacted under the following laws:
| |
| • | Comprehensive Environmental Response, Compensation, and Liability Act; |
| |
| • | The Resource Conservation and Recovery Act; |
| |
| • | The National Environmental Policy Act; |
| |
| • | The Clean Water Act; and |
| |
| • | The Safe Drinking Water Act. |
These environmental regulations require us to obtain various operating permits, approvals and licenses and also impose standards and controls relating to exploration, development and production activities. For instance, we are required to hold a Nevada Reclamation Permit with respect to the Hycroft Mine. This permit mandates concurrent and post-mining reclamation of mines and requires the posting of reclamation bonds sufficient to guarantee the cost of mine reclamation. We have set up a provision for our reclamation bond at the Hycroft Mine. Compliance with this and other federal and state regulations could result in delays in beginning or expanding operations, incurring additional costs for investigation or cleanup of hazardous substances, payment of penalties for non-compliance or discharge of pollutants, and post-mining closure, reclamation and bonding, all of which could have an adverse impact on our financial performance and results of operations.
Our operations are subject to numerous governmental permits that are difficult to obtain and we may not be able to obtain or renew all of the permits we require, or such permits may not be timely obtained or renewed.
In the ordinary course of business we are required to obtain and renew governmental permits for our operations, including in connection with our mining and exploration plans at the Hycroft Mine and our exploration properties. We also need additional governmental permits in order to complete our expansion of the Hycroft Mine operations, including without limitation, permits to construct the tailings impoundment and allow mining below the water table. Obtaining or renewing the necessary governmental permits is a complex and time-consuming process involving costly undertakings by us. The duration and success of our efforts to obtain and renew permits are contingent upon many variables not within our control, including the interpretation of applicable requirements implemented by the permitting authority and intervention by third parties in any required environmental review. We may not be able to obtain or renew permits that are necessary to our operations on a timely basis or at all, and the cost to obtain or renew permits may exceed our estimates. Failure to comply with the terms of our permits may result in injunctions, fines, suspension or revocation of permits and other penalties. We can provide no assurance that we have been, or will at all times, be in full compliance with all of the terms of our permits or that we have all required permits. The costs and delays associated with compliance with these permits and with the permitting process could delay or stop us from executing our Hycroft Mine expansion project, proceeding with the operation or development of a property or increase the costs of development or production and may materially adversely affect our business, results of operations or financial condition.
Compliance with current and future government regulations may cause us to incur significant costs.
Our operations are subject to extensive federal and state legislation governing matters such as mine safety, occupational health, labor standards, prospecting, exploration, production, exports, toxic and hazardous substances, explosives, management of natural resources, price controls, land use, water use, air emissions, waste disposal, environmental review and taxes. Compliance with this and other legislation could require us to make significant financial outlays. The enactment of new legislation or more stringent enforcement of current legislation may increase costs, which could have a negative effect on our financial position, results of operations, and liquidity. We cannot make assurances that we will be able to adapt to these regulatory developments on a timely or cost-effective basis. Violations of these laws, regulations and other regulatory requirements could lead to substantial fines, penalties or other sanctions, including possible shut-downs of the Hycroft Mine or future operations, as applicable.
Changes in environmental regulations could adversely affect our cost of operations or result in operational delays.
The regulatory environment in which we operate is evolving in a manner that will require stricter standards and enforcement, increased fines and penalties for non-compliance, more stringent environmental assessments of proposed projects and a heightened degree of responsibility for companies and their officers, directors and employees. New environmental laws and regulations or changes in existing environmental laws and regulations could have a negative effect on exploration activities, operations, production levels and methods of production. We can provide no assurance that future changes in environmental laws and regulations will not adversely affect our current operations or future projects. Any changes to these laws and regulations could have an adverse impact on our financial performance and results of operations by, for example, requiring changes to operating constraints, technical criteria, fees or surety requirements.
There are uncertainties as to title matters in the mining industry. Any defects in such title could cause us to lose our rights in mineral properties and jeopardize our business operations.
Our mineral properties consist of private mineral rights, leases covering private lands, leases of patented mining claims and unpatented mining claims. Many of our mining properties in the United States are unpatented mining claims located on lands administered by the U.S. Bureau of Land Management (“BLM”), Nevada State Office to which we have only possessory title. Because title to unpatented mining claims is subject to inherent uncertainties, it is difficult to determine conclusively ownership of such claims. These uncertainties relate to such things as sufficiency of mineral discovery, proper location and posting and marking of boundaries, and possible conflicts with other claims not determinable from descriptions of record. We believe a substantial portion of all mineral exploration, development and mining in the United States now occurs on unpatented mining claims, and this uncertainty is inherent in the mining industry.
The present status of our unpatented mining claims located on public lands allows us the right to mine and remove valuable minerals, such as precious and base metals, from the claims conditioned upon applicable environmental reviews and permitting programs. We also are generally allowed to use the surface of the land solely for purposes related to mining and processing the mineral-bearing ores. However, legal ownership of the land remains with the United States. We remain at risk that the mining claims may be forfeited either to the United States or to rival private claimants due to failure to comply with statutory requirements. Prior to 1994, a mining claim locator who was able to prove the discovery of valuable, locatable minerals on a mining claim, and to meet all other applicable federal and state requirements and procedures pertaining to the location and maintenance of federal unpatented mining claims, had the right to prosecute a patent application to secure fee title to the mining claim from the Federal government. The right to pursue a patent, however, has been subject to a moratorium since October 1994, through federal legislation restricting the BLM from accepting any new mineral patent applications. If we do not obtain fee title to our unpatented mining claims, we can provide no assurance that we will be able to obtain compensation in connection with the forfeiture of such claims.
There may be challenges to title to the mineral properties in which we hold a material interest. If there are title defects with respect to any properties, we might be required to compensate other persons or perhaps reduce our interest in the affected property. Also, in any such case, the investigation and resolution of title issues would divert our management’s time from ongoing production, exploration and development programs.
Legislation has been proposed that could, if enacted, significantly affect the cost of our operations on our unpatented mining claims or the amount of Net Proceeds of Mineral Tax we pay to the state of Nevada.
Members of the U.S. Congress have repeatedly introduced bills which would supplant or alter the provisions of the Mining Law of 1872. Such bills have proposed, among other things, to either eliminate or greatly limit the right to a mineral patent and to impose a federal royalty on production from unpatented mining claims. Such proposed legislation could change the cost of holding unpatented mining claims and could significantly impact our ability to develop mineralized material on unpatented mining claims. A majority of our mining claims are on unpatented claims. Although we cannot predict what legislated royalties might be, the enactment of these proposed bills could adversely affect the potential for development of our unpatented mining claims and the economics of our existing operating mines on federal unpatented mining claims. Passage of such legislation could adversely affect our financial performance.
We pay Net Proceeds of Mineral Tax (“NPT”) to the state of Nevada on up to 5% of net proceeds generated from our Hycroft Mine. Net proceeds are calculated as the excess of gross yield over direct costs. Gross yield is determined as the value received when minerals are sold, exchanged for anything of value or removed from the state. Direct costs generally include the costs to develop, extract, produce, transport and refine minerals. From time to time Nevada legislators introduce bills which aim to increase the amount of NPT mining companies operating in the state pay. If legislation is passed that increases the NPT we pay to the state of Nevada our business, results of operations, and cash flows could be negatively impacted.
Regulations and pending legislation governing issues involving climate change could result in increased operating costs, which could have a material adverse effect on our business.
A number of governments or governmental bodies have introduced or are contemplating regulatory changes in response to various climate change interest groups and the potential impact of climate change. Legislation and increased regulation regarding climate change could impose significant costs on us, our venture partners and our suppliers, including costs related to increased energy requirements, capital equipment, environmental monitoring and reporting and other costs to comply with such regulations. Any adopted future climate change regulations could also negatively impact our ability to compete with companies situated in areas not subject to such regulations. Given the emotion, political significance and uncertainty around the impact of climate change and how it should be dealt with, we cannot predict how legislation and regulation will affect our financial condition, operating performance and ability to compete. Furthermore, even without such regulation, increased awareness and any adverse publicity in the global marketplace about potential impacts on climate change by us or other companies in our industry could harm our reputation.
Climate change could have an adverse impact on our cost of operations.
The potential physical impacts of climate change on our operations are highly uncertain and would be particular to the geographic circumstances in areas in which we operate. These climate changes may include changes in rainfall and storm patterns and intensities, water shortages, changing sea levels and changing temperatures. These changes in climate could have an impact on the cost of production at our mines and adversely affect the financial performance of our operations.
Market Risks
The market price of our shares may fluctuate widely.
During the year ended December 31, 2013, our common stock price per share closed as high as $30.71 and as low as $3.05. We cannot predict the prices at which our common stock may trade. The market price of our common stock may fluctuate widely, depending upon many factors, some of which may be beyond our control including, but not limited to: fluctuations in the price of gold and silver; announcements by us or competitors of significant acquisitions or dispositions; changes in earnings estimates or recommendations by research analysts who track our common stock or the shares of other companies in the resource sector; changes in general economic and/or political conditions; the arrival or departure of key personnel; decreases in production and/or sales; delays in or the deferring of construction or expansion projects; and overall market fluctuations and general economic conditions. Stock markets in general have experienced volatility that has often been unrelated to the operating performance of a particular company. These broad market fluctuations may adversely affect the trading price of our common stock.
Future sales of our common stock in the public or private markets could adversely affect the trading price of our common stock, our ability to raise funds in new stock offerings, or the dilution of our already issued and outstanding common stock.
Future sales of substantial amounts of our common stock or equity-related securities in the public or private markets, or the perception that such sales could occur, could adversely affect prevailing trading prices of our common stock and could impair our ability to raise capital through future offerings of equity or equity-related securities. As of December 31, 2013, 104,043,169 shares of our common stock were outstanding. We cannot predict the effect, if any, that future sales of our common stock, or the perception that such sales could occur, will have on the trading price of our common stock. Further, the issuance of additional equity securities or securities convertible into equity securities would result in dilution to our existing shareholders’ equity ownership.
We do not intend to pay dividends for the foreseeable future.
We have never declared or paid any dividends on our common stock and, subject to certain exceptions, we have agreed to restrictions against paying dividends in the indenture governing our Notes and in our credit agreement governing the Revolver. We intend to retain all of our earnings for the foreseeable future to finance the operation and expansion of our business, and we do not anticipate paying any cash dividends in the future. As a result, you may only receive a return on your investment in our common stock if the market price of our common stock increases. Our board of directors retains the discretion to change this policy.
Anti-takeover provisions in our organizational documents and under Delaware law could make a third party acquisition of us difficult.
Our amended and restated certificate of incorporation and bylaws contain provisions that may discourage unsolicited takeover proposals that stockholders may consider to be in their best interests. These provisions include the ability of our board of directors to designate the terms of and issue new series of preferred stock and the ability of our board of directors to amend the bylaws without stockholder approval. In addition, as a Delaware corporation, we are subject to Section 203 of the Delaware General Corporation Law, which generally prohibits a Delaware corporation from engaging in any business combination with any interested stockholder for a period of three years following the date that the stockholder became an interested stockholder, unless certain specific requirements are met as set forth in Section 203. Collectively, these provisions could make a third party acquisition of us difficult or could discourage transactions that otherwise could involve payment of a premium over prevailing market prices for our securities.
General and Other Risks
If we lose key personnel or are unable to attract and retain additional personnel, we may be unable to develop our business.
Our development in the future will be highly dependent on the efforts of key management employees, specifically, Robert Buchan, our Executive Chairman, Randy Buffington, our Chief Executive Officer, Stephen Jones, our Executive Vice President and Chief Financial Officer, and other key employees that we may hire in the future. Although we have entered into employment agreements with Mr. Buffington and Mr. Jones, we do not have and currently have no plans to obtain key man insurance with respect to any of our key employees. As well, we will need to recruit and retain other qualified managerial and technical employees to build and maintain our operations. If we are unable to successfully recruit and retain such persons, our development and growth could be significantly curtailed.
Some of our directors may have conflicts of interest as a result of their involvement with other natural resource companies.
Some of our directors are directors or officers of other natural resource or mining-related companies, or may be involved in related pursuits that could present conflicts of interest with their roles at Allied Nevada. In the event that any such conflict of interest arises, a director who has such a conflict is required to disclose the conflict to our board of directors (and any applicable committees), should abstain from voting on the matter and, in most cases, should leave the meeting while the remaining directors discuss and vote on such matter. In appropriate cases, we will establish a special committee of independent directors to review a matter in which directors, or management, may have a conflict.
Joint ventures and other partnerships may expose us to risks.
In the future, we may enter into joint ventures or other partnership arrangements with other parties in relation to the exploration, development and production of certain of the properties in which we have an interest. Joint ventures can often require unanimous approval of the parties to the joint venture or their representatives for certain fundamental decisions such as an increase or reduction of registered capital, merger, division, dissolution, amendments of constituting documents, and the pledge of joint venture assets, which means that each joint venture party may have a veto right with respect to such decisions which could lead to a deadlock in the operations of the joint venture or partnership. Further, we may be unable to exert control over strategic decisions made in respect of such properties, including our existing joint venture at our Maverick Springs property where we are a minority (45%) owner or any future joint ventures which we may become party to (as discussed in Note 25 - Subsequent Events to our Consolidated Financial Statements, on January 24, 2014, the Company entered into a letter agreement for the sale of Hasbrouck and Three Hills, which could result in the Company retaining a 25% joint venture interest). Any failure of such other companies to meet their obligations to us or to third parties, or any disputes with respect to the parties’ respective rights and obligations, could have a material adverse effect on the joint ventures or their properties and therefore could have a material adverse effect on our results of operations, financial performance, and cash flows.
Security breaches and other disruptions could compromise our information and expose us to liability, which would cause our business and reputation to suffer.
We collect and store sensitive data, including intellectual property, our proprietary business information and personally identifiable information of our employees, on our networks. The secure processing, maintenance and transmission of this information is critical to our operations. Despite our security measures, our information technology and infrastructure may be vulnerable to attacks by hackers or breached due to employee error, malfeasance or other disruptions. Any such breach could compromise our networks and the information stored there could be accessed, publicly disclosed, lost or stolen. Any such access, disclosure or other loss of information could result in legal claims or proceedings, liability under laws that protect the privacy of personal information, and regulatory penalties, disrupt our operations, and damage our reputation, which could adversely affect our business.
Item 1B. Unresolved Staff Comments
None.
Item 2. Properties
We classify our mineral properties into three categories: “Operating Properties”, “Advanced Exploration Properties”, and “Other Exploration Properties”. Operating Properties are properties in which we operate a producing mine. The Hycroft Mine, as described below, is our only Operating Property and makes up the “Hycroft Mine” segment in our Consolidated Financial Statements. Advanced Exploration Properties are properties where we retain a significant controlling interest or joint venture and there has been sufficient historical drilling and analysis completed to identify and report reserves or other mineralized material. Other Exploration Properties are those for which insufficient drilling and geologic investigations have been completed to define mineralized materials. In our Consolidated Financial Statements, the “Exploration” segment includes all costs, expenses, gains, and losses attributable to our Advanced and Other Exploration Properties.
Operating Property
Hycroft Mine
For a detailed discussion of the Hycroft Mine’s operating and production data, see Part II - Item 7 Management’s Discussion and Analysis of Financial Condition and Results of Operations - Hycroft Mine.
The following shows where our Hycroft Mine and Advanced Exploration Properties are located as well as areas of the Hycroft Mine:
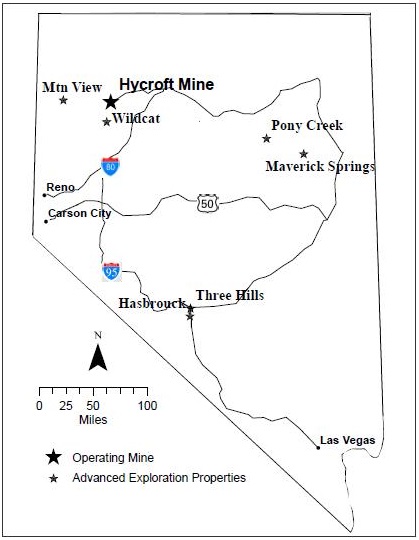 --------
We currently have one Operating Property, the Hycroft Mine which is located 54 miles west of Winnemucca, NV. Winnemucca, a city with a population of 7,700, is a commercial community on Interstate 80, 164 miles northeast of Reno. The town is served by a transcontinental railroad and has a municipal airport. Access to the Hycroft Mine from Winnemucca is by State Road No. 49 (Jungo Road), a good-quality, unpaved road, and a short access road to the main entrance of the mine. Well-maintained mine and exploration roads provide access throughout the property. Access is also possible from Imlay, Gerlach, and Lovelock by unpaved roads intersecting Interstate 80 and Nevada State Route 447. The majority of our employees live in the Winnemucca area. The site receives electrical power provided by NV Energy from the northwestern Nevada power grid. The Hycroft Mine currently has water rights which are adequate to support our current and planned future oxide heap leach and sulfide operations.
We hold 27 private patented claims and 3,064 unpatented mining claims that constitute our Hycroft Mine Operating Property. The total acreage covered by unpatented claims is approximately 64,986 acres and an additional 1,814 acres is covered by patented claims. Combining the patented and unpatented claims, total claims cover approximately 66,800 acres. Our Hycroft Mine patented claims occupy private lands and our unpatented claims occupy public lands, administered by the BLM. These claims are governed by the laws and regulations of the U.S. federal government and the state of Nevada. To maintain the patented claims in good standing, we must pay the annual property tax payments to the county in which the claims are held. To maintain the unpatented claims in good standing, we must file a notice of intent to maintain the claims within the county and pay the annual mineral claim filing fees to the BLM. A portion of the Hycroft Mine is subject to a mining lease requiring a 4% net profit royalty payable to the owner of certain patented and unpatented mining claims, subject to a maximum of $7.6 million, of which $1.9 million had been paid as of December 31, 2013. There is no expiration date on the net profit royalty.
The Hycroft Mine was formerly known as the Crofoot-Lewis open pit mine, which was a small heap leaching operation that commenced in 1983. Vista Gold Corp., a corporation incorporated under the laws of the Yukon Territory (“Vista”), acquired the Crofoot-Lewis claims and mine in 1987 and 1988. During this first operating period the mine produced over one million ounces of gold and two and one-half million ounces of silver. The mine production continued until it was placed on a care and maintenance program in December 1998 due to low gold prices. We acquired the Hycroft Mine in 2007 pursuant to an arrangement agreement where Vista transferred to us its Nevada mining properties. We completed our first year of mining operations in 2009.
Exploration and Development
We have recently expanded our heap leach operations and are in the process of updating our feasibility study to develop an optimized plan for our previously commenced (and subsequently deferred) mill expansion. For a detailed discussion on expansion and development projects that occurred at our Hycroft Mine during 2013, see Part II - Item 7 Management’s Discussion and Analysis of Financial Condition and Results of Operations - Hycroft Mine - Hycroft Expansion Projects.
In 2013, we drilled 232 holes, representing approximately 119,185 feet, with a focus on metallurgical drilling at Lewis Pad, Central, and Brimstone, geotechnical and hydrology drilling in support of construction activities, step out drilling at Bay, Central and Brimstone, and targeting oxide ore proximal to current reserves. The drilling results have been utilized to update the corresponding engineering models. The 2013 drill program was directed towards the following items: 15% hydrology; 5% facility design and geotechnical, 21% production support, 5% oxide targets, and 54% infill, step-out, and metallurgy.
A 100,000 foot development program has been designed for 2014 with a focus on facility condemnation, core drilling in support of metallurgical and geotechnical studies, and targeting oxide material for heap leaching.
At December 31, 2013, the book cost of the Hycroft property totaled $3.5 million and its associated plant, equipment, and mine development totaled $1,021.5 million.
Geology
The Hycroft Mine is located on the western flank of the Kamma Mountains. The deposit is hosted in a volcanic eruptive breccia and conglomerates associated with the Tertiary Kamma Mountain volcanics. The volcanics are mainly acidic to intermediate tuffs, flows and coarse volcaniclastic rocks. Volcanic rocks have been block-faulted by dominant north-trending structures, which have affected the distribution of alteration and mineralization. The Central Fault and East Fault control the distribution of mineralization and subsequent oxidation. A post-mineral range-front fault separates the ore body from the adjacent Pleistocene Lahontan Lake sediments in the Black Rock Desert.
The known gold mineralization within the Hycroft Mine extends for a distance of three miles in a north-south direction by 1.5 miles in an east-west direction. Mineralization extends to a depth of less than 330 feet in the outcropping to near-outcropping portion of the deposit on the northwest side to over 2,500 feet in the Vortex deposit to the east. The mineralization is oxide from the surface down to a depth of approximately 300 feet and sulfide mineralization occurs at this depth. The transitional mineralization occurs at the boundary region where original sulfide mineralization has been partially oxidized.
Mineral Proven and Probable Ore Reserves
Our reserve estimates are calculated in accordance with Industry Guide 7 of the Exchange Act. Proven and probable reserves may not be comparable to similar information regarding mineral reserves disclosed in accordance with the guidance of other countries. We conduct ongoing studies of our ore bodies to optimize economic values and to manage risk. We revise our mine plans and estimates of proven and probable mineral reserves as required and in accordance with the latest available studies. Our estimates of proven and probable reserves are prepared by and are the responsibility of our employees, and a majority of these estimates are reviewed and verified by independent experts in mining, geology and reserve determination.
Our most recent reserve estimate was completed on March 6, 2013, which estimated proven and probable reserves as of December 31, 2012, using prices of $800 per ounce for gold and $14 per ounce for silver. The average London Bullion Market spot metal prices for the past three years is approximately $1,551 per ounce for gold and $30 per ounce for silver. Below is a summary of our estimated proven and probable ore reserves as of December 31, 2013, which are based on our estimated proven and probable reserves as of December 31, 2012 reduced for mining activities that occurred during 2013.
|
| | | | | | | | | | | | | | | | | | | | |
| | Ore Tons (000’s) | | Gold | | Silver | | | | Strip Ratio |
| Category | oz/ton | | Contained Ounces (000’s) | | oz/ton | | Contained Ounces (000’s) | | Waste Tons (000’s) | |
| Proven reserves | 854,286 |
| | 0.011 |
| | 9,306 |
| | 0.48 |
| | 411,966 |
| | | | |
| Probable reserves | 201,367 |
| | 0.010 |
| | 2,036 |
| | 0.42 |
| | 85,160 |
| | | | |
| Proven and probable reserves | 1,055,653 |
| | 0.011 |
| | 11,342 |
| | 0.47 |
| | 497,126 |
| | 1,267,251 |
| | 1.20 |
|
Advanced Exploration Properties
Advanced Exploration Properties are both those properties where we retain a significant controlling interest or joint venture and where there has been sufficient drilling and analysis completed to identify and report reserves or other mineralized material. Allied Nevada currently has six properties on which mineralized material has been identified: Maverick Springs (a 45% joint venture with Silver Standard), Mountain View, Hasbrouck, Three Hills, Wildcat and Pony Creek/Elliot Dome. None of these properties currently have proven or probable reserves as defined by Industry Guide 7 of the Exchange Act. At the end of 2013, these six properties contained 2,360 unpatented mining claims, covering approximately 48,758 acres. We continually evaluate our properties to determine how to best advance them by increasing the identified mineralized materials, improving the quality of these mineralized materials, and/or conducting engineering studies. We do not currently have any plans to perform significant exploration activities at our Advanced Exploration Properties in 2014.
Over the past three years, our most significant exploration campaigns have taken place at Hasbrouck and Three Hills and in 2012 we completed a preliminary economic assessment for these properties, which is why we have described them in greater detail below. Additional information can be found on any of our Advanced Exploration Properties by visiting our website at www.alliednevada.com.
Agreement to Sell Mineral Properties
On January 24, 2014, we entered into a letter agreement for the sale of our Hasbrouck, Three Hills, and Esmeralda County Exploration Properties. Refer to Note 25 - Subsequent Events to our Consolidated Financial Statements for additional information.
Hasbrouck
The Hasbrouck property is located in southwestern Nevada about 5 miles south-southwest of the town of Tonopah in Esmeralda County, Nevada, adjacent to U.S. Highway 95 and approximately half-way between Reno and Las Vegas and approximately 4.5 miles from the Three Hills property described below. The property is accessed from Tonopah by traveling south along US Highway 95, which transects the claim block. The project is accessed by a gravel road off of U.S. Highway 95 that connects to a network of dirt drill roads that traverse Hasbrouck. Nearby power lines traverse the Hasbrouck property.
Hasbrouck consists of 28 patented mining claims and 583 unpatented mining claims, which combined cover an area of approximately 12,660 acres within Esmeralda County, Nevada. Seventeen of the patented mining claims and three of the unpatented mining claims are subject to a mineral production royalty of 4% of the net smelter returns (“NSRs”). The remaining 11 patented mining claims and 263 of the unpatented mining claims are subject to a mineral production royalty of 2% of the NSRs. The remaining 317 unpatented mining claims are not subject to a royalty.
Exploration
The Company commenced drilling activities on Hasbrouck in 2010, and continued drilling until November of 2012, in order to further identify and delineate the gold mineralization previously identified at the property. No further drilling was completed in 2013.
Geology
We prepared an estimate of mineralized material for Hasbrouck in 2012. Multiple zones of higher grade mineralization are presently defined. The Saddle Zone consists of a structurally and stratigraphically controlled higher grade mineral body, with the highest grade mineralization hosted in hydrothermal breccia bodies. The Crossroads Zone is east of and adjacent to the Saddle Zone, consisting of higher than average grade disseminated mineralization interspersed with higher grade veins. The Franco Zone is adjacent to the east with the Crossroads Zone, and hosts mineralization similar to Crossroads, with higher grade mineralization in veins. Mineralization is continuous between the three zones. These zones are surrounded by lower grade mineralized material.
Three Hills
The Three Hills deposit is located in southwestern Nevada about 1 mile west of the town of Tonopah in Esmeralda and Nye Counties, Nevada, and about 4.5 miles northwest of the Hasbrouck property described above. Access to the site is via county-maintained gravel roads from the northwest end of town. Since Three Hills is near the town of Tonopah, power lines are close to the property.
Three Hills consists of 100 unpatented lode claims and 6 patented claims totaling approximately 2,186 acres. In 2013, we staked 24 unpatented claims and purchased 3 patented claims. All of the unpatented mining claims and the two patented mining claims are subject to a 2% NSR.
Exploration
In 2013, we completed 8 core drill holes (3,509 feet) at Three Hills, focused on metallurgical core within the known deposit footprint.
Geology
Three Hills is located in the Walker Lane structural domain of the Basin and Range physiographic province. It is in an area of structural disruption resulting from a series of orogenic events occurring in Paleozoic, Mesozoic and Cenozoic times. Basin and Range high-angle normal faults control the mineralization at Three Hills, where they cut the Siebert Formation. Gold mineralization occurs in a zone of pervasive silicification in the Siebert Formation and the upper 10 to 30 feet of the underlying Fraction Tuff. The contact between these two units contains consistently higher grades of gold and is more commonly argillized than silicified.
Other Exploration Properties
In general, Other Exploration Properties consist of those properties for which insufficient drilling and geologic investigations have been completed to define mineralized materials or may include properties in which we do not have a significant controlling interest. Allied Nevada has approximately 73 Other Exploration Properties. Certain of these exploration properties have been optioned and leased to other exploration companies in return for production royalties averaging approximately 3.0%. We intend to continue to pursue strategic options for our Other Exploration Properties through exploration programs, joint ventures, royalty agreements, or the sale or release of the mineral property.
During the year ended December 31, 2013, we completed a review of our Other Exploration Properties and as a result abandoned 12 mineral properties. During 2013 we also discontinued leasing all of our (eight) geothermal leases totaling 27,555 acres.
Item 3. Legal Proceedings
From time to time, we are party to litigation and proceedings that are considered part of the ordinary course of our business. We are not aware of any material current, pending, or threatened litigation.
Item 4. Mine Safety Disclosure
Safety and health is our highest priority, which is why we have a mandatory mine safety and health program that includes employee and contractor training, risk management, workplace inspection, emergency response, accident investigation and program auditing. We consider this program to be essential at all levels to ensure that our employees, contractors, and visitors are always in an environment that is safe and healthy.
The information concerning mine safety violations or other regulatory matters required by Section 1503(a) of the Dodd-Frank Wall Street Reform and Consumer Protection Act and Item 104 of Regulation S-K is included in Exhibit 95.1 to this Form 10-K.
PART II - FINANCIAL INFORMATION
Item 5. Market for Registrant’s Common Equity, Related Stockholder Matters and Issuer Purchases of Equity Securities
Our common stock is listed on the NYSE MKT and the Toronto Stock Exchange (“TSX”) under the symbol “ANV”. We commenced trading on each of these exchanges on May 10, 2007. The following table sets out the reported high and low sale prices as reported by the exchanges:
|
| | | | | | | | | | | | |
| | | NYSE MKT ($) | | Toronto Stock Exchange (CDN$) |
| | | High | | Low | | High | | Low |
| 2013 | 1st quarter | 31.31 |
| | 15.65 |
| | 31.00 |
| | 15.91 |
|
| | 2nd quarter | 16.65 |
| | 5.40 |
| | 16.77 |
| | 5.66 |
|
| | 3rd quarter | 7.50 |
| | 3.54 |
| | 7.58 |
| | 3.66 |
|
| | 4th quarter | 5.09 |
| | 3.01 |
| | 5.25 |
| | 3.20 |
|
| 2012 | 1st quarter | 38.62 |
| | 29.93 |
| | 38.50 |
| | 29.71 |
|
| | 2nd quarter | 33.91 |
| | 23.69 |
| | 33.68 |
| | 23.96 |
|
| | 3rd quarter | 39.93 |
| | 24.70 |
| | 39.14 |
| | 25.01 |
|
| | 4th quarter | 41.02 |
| | 28.00 |
| | 40.15 |
| | 28.16 |
|
On February 24, 2014, the last reported sale price of our common stock on the NYSE MKT was $5.80 and on the TSX was CDN $6.44. As of February 21, 2014, there were 104,043,169 shares of our common stock issued and outstanding, and we had 196 registered shareholders of record.
We have never paid dividends or repurchased shares of our common stock and currently have no intention to do so. Our senior notes, line of credit, and certain capital lease agreements, contain provisions that restrict our ability to pay dividends and repurchase or redeem capital stock. For additional information on these restrictions, please see Part II – Item 7 Management’s Discussion and Analysis of Financial Condition and Results of Operations – Debt Covenants and Note 10 - Debt to our Consolidated Financial Statements.
Stock Performance Graph
The following graph and table compares the performance of our common stock to the S&P 500 Index and the PHLX Gold/Silver Sector IndexSM, assuming reinvestment of dividends on December 31 of each year indicated. The chart and table assumes $100 invested at the per share closing price on NYSE MKT in Allied Nevada and each of the indices on December 31, 2008 through December 31, 2013. The following performance graph and table is furnished and shall not be deemed “filed” for purposes of Section 18 of the Exchange Act, nor shall it be deemed incorporated by reference in any filing under the Securities Act or Exchange Act.
|
|
| Comparison of 5 Year Cumulative Total Return |
| Among Allied Nevada Gold Corp., the S&P 500 Index, and the PHLX Gold and Silver Sector Index |
|
| | | | | | | | | | | | | | | | | | | | | | | | |
| | | December 31, |
| | | 2008 | | 2009 | | 2010 | | 2011 | | 2012 | | 2013 |
| Allied Nevada Gold Corp. | | $ | 100.00 |
| | $ | 298.02 |
| | $ | 520.75 |
| | $ | 598.42 |
| | $ | 595.45 |
| | $ | 70.16 |
|
| S&P 500 Index | | 100.00 |
| | 125.92 |
| | 144.63 |
| | 147.62 |
| | 170.98 |
| | 225.93 |
|
| PHLX Gold and Silver Index | | 100.00 |
| | 135.85 |
| | 182.95 |
| | 145.85 |
| | 133.71 |
| | 67.95 |
|
Sales of Unregistered Securities
The Company had no sales of unregistered securities during the years ended December 31, 2013, 2012, and 2011.
Equity Compensation Plan Information
The following table summarizes our stockholder approved equity compensation plans:
|
| | | | | | | | | | |
| | | December 31, 2013 | |
| Plan Category | | (a) | | (b) | | (c) | |
Equity compensation plans approved by security holders | | Number of securities to be issued upon exercise of outstanding options, warrants, and rights (#) | | Weighted average exercise price or grant date fair value of outstanding options, warrants, and rights ($) | | Number of securities remaining available for future issuance under equity compensation plans (excluding securities referenced in column (a)) | |
| Allied Nevada 2007 Stock Option Plan | | 500,000 |
| | 4.35 |
| | 894,186 |
| (1) |
| Allied Nevada Restricted Share Plan | | 1,630,145 |
| | 11.85 |
| | 894,186 |
| (1) |
| Deferred Share Unit Plan | | 134,408 |
| | 14.60 |
| | 362,500 |
| |
| Deferred Phantom Unit Plan | | 248,136 |
| | 18.50 |
| | 11,597 |
| |
| | | 2,512,689 |
| | | | 1,268,283 |
| |
(1) A total of 6,900,000 shares of common stock are available for issuance under both the Allied Nevada Restricted Share Unit Plan and the 2007 Stock Option Plan. |
For additional information on our equity compensation plans refer to Note 13 - Stock-Based Compensation to our Consolidated Financial Statement.
Item 6. Selected Financial Data
The following table summarizes selected consolidated financial data and is derived from our audited Consolidated Financial Statements and should be read in conjunction with “Part II—Item 7. Management’s Discussion and Analysis of Financial Condition and Results of Operations” and “Part II—Item 8. Financial Statements and Supplementary Data.”
Selected Financial Data
U.S. dollars in thousands (except per share amounts)
|
| | | | | | | | | | | | | | | | | | | | |
| | | Years Ended December 31, |
| Results of operations | | 2013 | | 2012 | | 2011 | | 2010 | | 2009 |
| Revenue | | $ | 267,901 |
| | $ | 214,559 |
| | $ | 152,029 |
| | $ | 130,930 |
| | $ | 43,204 |
|
| Total cost of sales | | 209,156 |
| | 109,492 |
| | 63,029 |
| | 64,685 |
| | 28,798 |
|
| Net income | | 1,405 |
| | 47,727 |
| | 36,709 |
| | 34,128 |
| | 8,451 |
|
| Basic net income per share | | 0.01 |
| | 0.53 |
| | 0.41 |
| | 0.41 |
| | 0.13 |
|
| Diluted net income per share | | 0.01 |
| | 0.52 |
| | 0.40 |
| | 0.41 |
| | 0.13 |
|
|
| | | | | | | | | | | | | | | | | | | | |
| | | December 31, |
| Financial position | | 2013 | | 2012 | | 2011 | | 2010 | | 2009 |
| Cash and cash equivalents | | $ | 81,470 |
| | $ | 347,047 |
| | $ | 275,002 |
| | $ | 337,829 |
| | $ | 91,581 |
|
| Inventories | | 76,221 |
| | 55,818 |
| | 28,305 |
| | 9,978 |
| | 6,773 |
|
| Ore on leachpads, current | | 156,693 |
| | 93,088 |
| | 64,230 |
| | 49,357 |
| | 34,179 |
|
| Stockpiles and ore on leachpads, non-current | | 116,192 |
| | 38,357 |
| | 11,320 |
| | — |
| | — |
|
| Plant, equipment, and mine development, net | | 890,271 |
| | 538,037 |
| | 190,694 |
| | 84,955 |
| | 45,756 |
|
| Total assets | | 1,512,601 |
| | 1,233,224 |
| | 657,206 |
| | 567,352 |
| | 252,425 |
|
| Debt, current | | 76,780 |
| | 28,614 |
| | 10,306 |
| | 3,215 |
| | 1,298 |
|
| Debt, non-current | | 522,427 |
| | 496,578 |
| | 34,245 |
| | 11,104 |
| | 4,700 |
|
| Total liabilities | | 735,552 |
| | 613,250 |
| | 92,084 |
| | 44,598 |
| | 29,245 |
|
| Total stockholders’ equity | | 777,049 |
| | 619,974 |
| | 565,122 |
| | 522,754 |
| | 223,180 |
|
Item 7. Management’s Discussion and Analysis of Financial Condition and Results of Operations
In Management’s Discussion and Analysis of Financial Condition and Results of Operations, “we”, “us”, “our”, the “Company”, and “Allied Nevada” refer to Allied Nevada Gold Corp. and its subsidiaries. The following discussion, which has been prepared based on information available to us as of February 24, 2014, provides information that we believe is relevant to an assessment and understanding of our consolidated operating results and financial condition. The following discussion should be read in conjunction with our other reports filed with the U.S. Securities and Exchange Commission (the “SEC”). References to “$” refers to United States currency and “CDN $” to Canadian currency.
Our discussion and analysis consists of the following subsections:
| |
| • | Introduction to the Company which provides a brief discussion of our current heap leach (oxide) operations, future mill (sulfide) expansion plans, and business strategies and goals; |
| |
| • | Executive Summary which lists and discusses significant matters related to our health and safety, financial performance, operations, and expansion projects; |
| |
| • | Critical Accounting Estimates which provides a discussion of accounting estimates that we believe are critical in understanding and evaluating our reported financial results because they affect reported amounts and require significant management judgment and assumptions about highly uncertain matters; |
| |
| • | Hycroft Mine which provides a detailed discussion of our operations, expansion projects, and 2014 outlook; |
| |
| • | Results of Operations which provides a discussion and analysis of our operating results for the last three years; |
| |
| • | Liquidity and Capital Resources which provides a discussion of our cash flows (last three years), liquidity, available sources of liquidity, capital requirements, and debt covenants; and |
| |
| • | Non-GAAP Financial Measures which includes a description of our non-GAAP financial measure “adjusted cash costs”, the reasons for our use of such measure, and a three year reconciliation to our production costs and write-down of production inventories (GAAP). |
Introduction to the Company
We are a U.S.-based primary gold producer focused on mining, developing, and exploring properties in the state of Nevada in a safe, environmentally responsible, and cost-effective manner. Gold and silver sales represent 100% of our revenues and the market prices of gold and silver significantly impact our operating results and cash flows.
Our operating mine, the Hycroft Mine (“Hycroft”), is an open-pit heap leach operation and during the year ended December 31, 2013 we sold 181,941 ounces of gold and 858,073 ounces of silver produced at Hycroft. As of December 31, 2013, the Hycroft Mine had proven and probable mineral reserves of 11.3 million ounces of gold and 497.1 million ounces of silver, which are contained in oxide (heap leach) and sulfide (mill) ores. We currently recover metals contained in oxide ores through our recently expanded heap leach operations and are in the process of updating our feasibility study to develop an optimized plan for our previously commenced (and subsequently deferred) mill expansion, the construction of which would allow us to recover metals contained in sulfide (mill) ores. As an oxide (heap leach) only operation, we expect our annual production through 2020 to average 225,000 ounces of gold and 2.0 million ounces of silver.
We cannot control the prices that we receive for the sale of our products, which is why our near-term operating strategies and goals focus on sales volumes, costs, capital expenditures, and other items that we may have discretionary influence over. Our near-term operating strategies and goals, which we strive to accomplish in a safe and environmentally responsible manner, include:
| |
| • | maintain, at all times, sufficient liquid assets and access to capital resources; |
| |
| • | maximize operating cash flows by meeting projected ounces sold volumes, achieving our annual targeted mining and processing rates and cost metrics, and operating our heap leach operations to its full, steady-state capacity; |
| |
| • | manage discretionary general, administrative, and exploration related spending; and |
| |
| • | minimize our capital expenditures. |
If we are able to carry out our near-term operating strategies and goals, we believe we will be better positioned to continue working towards our long-term goal, which is the construction and operation of a mill to process our sulfide ore at the Hycroft Mine.
Executive Summary
Our 2013 highlights and significant developments included the following, which are discussed in further detail throughout this Management’s Discussion and Analysis of Financial Condition and Results of Operations:
Health and safety: We remained committed to our core values, health and safety, and operated in an environmentally responsible manner. Regrettably, there was one lost time accident at our Hycroft Mine during the third quarter; however, we have taken measures to strengthen the overall health and safety environment at our Hycroft Mine through increased training, more frequent safety meetings, and increased communications.
Ounces sold: We sold an annual record 181,941 gold ounces and 858,073 silver ounces, of which 60,460 (or 33%) gold ounces and 352,922 (or 41%) silver ounces were sold during the fourth quarter as a result of our expanded heap leach operations.
Net income: As discussed in the Results of Operations section below, net income was $1.4 million (or $0.01 per share - basic and diluted). Although we sold a record number of gold and silver ounces, we were negatively impacted by a low metal price environment, increased production costs, and significant charges for assets classified as held for sale, mineral property dispositions, separation and severance costs, and a write-down of production inventories.
Maintained sufficient liquidity: In addition to other liquid assets, we finished the year with $81.5 million of cash and cash equivalents and diligently maintained sufficient liquidity throughout the year despite a low metal price environment and significant capital expenditures. In the second quarter we proactively improved our financial position and liquidity through the completion of a public offering of our common stock for gross proceeds of $150.5 million (net proceeds of $142.0 million). During the fourth quarter we amended our revolving credit agreement, eliminating certain financial ratio covenants which were precluding us from being able to utilize the facility. Borrowing capacity available to us under the amended revolving credit agreement is $40.0 million.
Hycroft Mine - operations: We achieved our annual mining rate target and placed 45.6 million ore tons on the leach pads containing approximately 256,384 recoverable ounces of gold and approximately 1.5 million recoverable ounces of silver. During the second half of the year we decreased our per ton mining and processing costs from the first half of the year and from prior years’ costs, all while operating in a leaner, more cost-efficient structure as a result of our mine-site and corporate workforce reductions.
Hycroft Mine - heap leach expansion projects: As discussed below in the Hycroft Mine - Operations and Hycroft Expansion Projects sections, our heap leach expansion projects were successfully completed. During the year we increased our mining rate and commissioned the North leach pad, two 73 cubic-yard electric rope shovels, and a 21,500 gallons per minute (“gpm”) Merrill-Crowe plant. We also mechanically completed construction of the crushing system, which we expect to commission during the first quarter of 2014.
Hycroft Mine - mill construction deferred: As discussed below in the Hycroft Expansion Projects section, during the second quarter we deferred construction of a mill. We are working with an independent engineering firm to update our feasibility study of the mill expansion, incorporating onsite oxidation of our sulfide concentrates and reviewing the capital and operating costs.
Critical Accounting Estimates
Management’s Discussion and Analysis of Financial Condition and Results of Operations is based on our Consolidated Financial Statements, which have been prepared in accordance with generally accepted accounting principles (“GAAP”) in the United States. The preparation of these statements requires us to make assumptions, estimates, and judgments that affect the reported amounts of assets, liabilities, revenues, and expenses. We base our assumptions, estimates, and judgments on historical experience, current trends and other factors that we believe to be relevant at the time our Consolidated Financial Statements are prepared. On a regular basis, we review our accounting policies, assumptions, estimates and judgments to ensure that our financial statements are presented fairly and in accordance with GAAP. However, because future events and their effects cannot be determined with certainty, actual results could (will) differ, and such differences could be material.
We consider an accounting estimate to be critical if it requires significant management judgments and assumptions about matters that are highly uncertain at the time the estimate is made and if changes in the estimate that are reasonably possible could materially impact our financial statements. Although other estimates are used in preparing our financial statements, we believe that the following accounting estimates are the most critical to understanding and evaluating our reported financial results. For information on all of our significant accounting policies, see Note 2 - Summary of Significant Accounting Policies to our Notes to Consolidated Financial Statements.
Ore on Leach Pads and Stockpiles
Estimate Required:
The recovery of gold at the Hycroft Mine is accomplished through a heap leaching process, the nature of which limits our ability to precisely determine the recoverable gold ounces in ore on leach pads and stockpiles. We estimate the quantity of recoverable gold ounces in stockpiles and ore on leachpads using surveyed volumes of material, ore grades determined through sampling and assaying of blastholes, and estimated recovery rates based on ore type and domain. The quantity of recoverable gold ounces and recovery rates varies based on ore mineralogy, ore grade, and ore particle sizes. The estimated recoverable gold ounces stockpiled or placed on the leach pads and recovery rates are periodically reconciled by comparing the related ore to the actual gold ounces recovered (metallurgical balancing). The ultimate recoverable gold ounces or life-of-mine recovery rate is unknown until mining operations cease. A change in the recovery rate or the quantity of recoverable gold ounces in our stockpiles or ore on leach pads could materially impact our financial statements.
Impact of Change in Estimate:
Changes in recovery rate estimates or estimated recoverable gold ounces that do not result in write-downs are accounted for on a prospective basis. If a write-down is required, stockpiles and ore on leach pads would be adjusted to market values before prospectively accounting for the remaining costs and revised estimated recoverable gold ounces. We have not experienced any significant changes to estimated recovery rates or estimates of recoverable gold ounces. As discussed in Note 4 - Stockpiles and Ore On Leach Pads to our Notes to Consolidated Financial Statements, our $12.6 million write-down of ore on leach pads resulted solely from the application of our lower of cost or market accounting policy and was unrelated to our metallurgical balancing analytics or changes to recovery rates.
At December 31, 2013, if our estimate of recoverable gold ounces on the leach pad decreased by 1% or 2%, recoverable gold ounces in ore on leach pads would decrease by 2,585 ounces or 5,169 ounces, respectively, which would require a write-down of $3.0 million or $5.9 million, respectively, of our ore on leach pad costs before prospectively accounting for the remaining costs. A 1% or 2% increase to our estimate of recoverable gold ounces in ore on leach pads would increase the estimated recoverable ounces by the aforementioned amounts and reduce our weighted average cost per ounce by approximately $11 per ounce or $22 per ounce, respectively, which would be accounted for on a prospective basis.
Proven and Probable Ore Reserves
Estimate Required:
Proven and probable ore reserves are the part of a mineral deposit that can be economically and legally extracted or produced at the time of the reserve determination. Estimated recoverable gold ounces in our proven and probable reserves at the Hycroft Mine are used in units-of-production amortization calculations and are the basis for future cash flow estimates utilized in impairment calculations. When determining proven and probable reserves, we must make assumptions and estimates of future commodity prices and demand, the mining methods we use and intend to use in the future, and the related costs incurred to develop, mine, and process our reserves. Our estimates of recoverable gold ounces in proven and probable reserves are prepared by and are the responsibility of our employees and are reviewed by independent experts in mining, geology and reserve determination. Any change in estimate or assumption used to determine our proven and probable ore reserves could change our estimated recoverable gold ounces in such reserves, which may have a material impact on our financial statements.
Impact of Change in Estimate:
Our proven and probable ore reserves are periodically updated, usually on an annual basis. Resulting changes in estimates of recoverable gold ounces are used in our units-of-production calculations and impairment calculations on a prospective basis.
Estimated recoverable gold ounces used in our units-of-production amortization and impairment calculations are based on proven and probable ore reserves that were determined using gold and silver selling prices of $800 per ounce and $14 per ounce, respectively. Accordingly, based upon our most recently completed proven and probable reserve study (March 6, 2013), we do not anticipate an impairment write-down to our long-lived assets until spot market metal prices approach, or drop below, the gold and silver selling prices used in the determination of our proven and probable ore reserves. If our proven and probable ore reserves increased or decreased by 5% the effect on our 2013 amortization expense would be less than $0.1 million.
Hycroft Mine
Operations
Key operating statistics for the previous three years, together with our current 2014 projections, are as follows:
|
| | | | | | | | | | | | | | | |
| | | Projected | | Years ended December 31, |
| | | 2014 | | 2013 | | 2012 | | 2011 |
| Ore mined (000’s tons) | | 33,600 - 35,300 |
| | 45,557 |
| | 30,299 |
| | 16,638 |
|
| Ore mined and stockpiled (000’s tons) | | 4,700 - 4,900 |
| | 3,515 |
| | 3,346 |
| | — |
|
| Waste mined (000’s tons) | | 51,400 - 54,100 |
| | 32,969 |
| | 22,088 |
| | 11,393 |
|
| | | 89,700 - 94,300 |
| | 82,041 |
| | 55,733 |
| | 28,031 |
|
| Excavation mined (000’s tons) | | — |
| | 3,288 |
| | 4,945 |
| | 5,976 |
|
| Ore mined grade - gold (oz/ton) | | 0.014 |
| | 0.011 |
| | 0.012 |
| | 0.013 |
|
| Ore mined grade - silver (oz/ton) | | 0.350 |
| | 0.219 |
| | 0.211 |
| | 0.340 |
|
| Ounces produced - gold | | 230,000 - 250,000 |
| | 190,831 |
| | 136,930 |
| | 104,002 |
|
| Ounces produced - silver | | 1.7 - 2.0 million |
| | 882,225 |
| | 794,097 |
| | 479,440 |
|
| Ounces sold - gold | | 230,000 - 250,000 |
| | 181,941 |
| | 114,705 |
| | 88,191 |
|
| Ounces sold - silver | | 1.7 - 2.0 million |
| | 858,073 |
| | 696,144 |
| | 372,000 |
|
| Average realized price - gold ($/oz) | | | | $ | 1,365 |
| | $ | 1,681 |
| | $ | 1,577 |
|
| Average realized price - silver ($/oz) | | | | $ | 23 |
| | $ | 31 |
| | $ | 35 |
|
Adjusted cash costs per ounce1 | | $825 - $850 |
| | $ | 855 |
| (2) | $ | 638 |
| | $ | 488 |
|
As discussed below in the Hycroft Mine - Hycroft Expansion Projects section, our mining rate and processing capabilities were expanded during 2013, which resulted in the production and sale of a record number of gold and silver ounces. Our total tons mined during 2013 increased approximately 41% from 2012 as a result of our expanded mobile mine equipment fleet and the addition of the two electric rope shovels. Efficiencies gained with our mobile equipment dispatch system helped us achieve our 2013 target mining rate, all while operating with an approximately 24% leaner mine-site workforce following the July reductions. During 2013, we commissioned the North leach pad and a 21,500 gpm Merrill-Crowe plant and were provided with additional solution processing capacity from our carbon columns (which we expect to de-commission in 2014).
As of December 31, 2013, we had approximately 12.2 million square feet under leach, an increase of approximately 5.1 million square feet (or +72%) from December 31, 2012. The North leach pad has performed well since becoming operational in early 2013 as our overall metal recoveries and timing of such metal recoveries remained consistent with our expectations. During the second half of 2013 we continued our remediation efforts of the Lewis leach pad and received permits which allowed us to begin introducing solution into wells that have been drilled into dry areas of the pad and, to date, we are seeing positive results. The timing of the metal recoveries is dependent on the advance rate of the solution into the wells on the pad and our overall management of solution flows to the Lewis leach pad and the wells themselves. We expect metal recoveries from our remediation efforts to occur over the next two years.
Production costs were high during the first half 2013 as additional drilling, lime, and cyanide costs associated with the Lewis leach pad remediation, increased maintenance costs of older loading equipment, and inefficient utilization of the mobile fleet resulted in a significant increase to the average cost per ounce placed on the leach pads. During the second half of 2013, our average mining cost per ton and average processing cost per ore ton decreased by 22% and 12%, respectively, from the first half 2013 per ton costs. We expect such efficiencies in mining and processing costs to continue into 2014, which we believe will positively impact our future production costs and adjusted cash costs per ounce1.
During 2013, our adjusted cash costs per ounce1 increased by $217 (or +34%) from 2012. Although our second half 2013 mining and processing costs improved from previous periods, our adjusted cash costs per ounce1 for 2013 were negatively impacted by increased production costs incurred during the first half of 2013, external refining costs for carbon in-process inventories sold during the year, and $9.7 million (or $53 per ounce) in previously incurred cash production costs that were written-off (as discussed in Note 4 - Stockpiles and Ore On Leach Pads to our Notes to Consolidated Financial Statements). Further, during 2013 our average realized price per ounce of silver sold decreased by approximately $8 (or -26%) compared to 2012, thereby decreasing the benefit received from each ounce of silver sold and increasing our adjusted cash costs per ounce1 by approximately $38. |
| | | | | |
| | | | | |
1 |
| The term “adjusted cash costs per ounce” is a non-GAAP financial measure. Non-GAAP financial measures do not have any standardized meaning prescribed by GAAP and, therefore, should not be considered in isolation or as a substitute for measures of performance prepared in accordance with GAAP. See the section on “Non-GAAP Financial Measures” in this MD&A for additional information. |
2 |
| Calculation is inclusive of a $9.7 million (or $53 per ounce) write-down of previously incurred cash production costs. See Note 4 - Ore on leachpads to our Notes to Consolidated Financial Statements for additional detail. |
Operations Outlook
2014 operations projections
Ounces sold - We currently expect our sales to increase to approximately 230,000 to 250,000 ounces of gold and 1.7 million to 2.0 million ounces of silver. We are currently projecting gold ounces sold will increase approximately 26% - 37% and silver ounces sold will increase approximately 98% - 133% as leach pad expansion projects that were completed during the second half of 2013 will have a positive benefit in 2014. We currently believe our annual sales projections are attainable as we sold 60,460 ounces of gold and 352,922 ounces of silver during the the fourth quarter of 2013 when our Hycroft Mine began to operate near its steady-state, heap leach capacity.
Depreciation and amortization - We currently expect our 2014 depreciation and amortization to increase significantly to approximately $80.5 - $84.5 million (or $335 - $352 per ounce) as a result of increases to our plant and equipment placed in service from our 2013 heap leach expansion projects, which will increase the amount of non-cash expense we recognize per gold ounce sold. During 2014, plant and equipment in service will continue to increase as the crushing system is expected to be commissioned in the first quarter of 2014. Additionally, as discussed above, our projected 2014 volume increase in gold ounces sold is expected to further contribute to increased depreciation and amortization.
Exploration, development, and land holding - We currently expect our 2014 exploration, development, and land holding costs to approximate $2.5 - $3.5 million, consisting of land holding costs and minimal reserve drilling at Hycroft. Consistent with our strategy and goal to preserve liquidity by managing discretionary spending, we have planned no statewide exploration activities at any of our properties and we no longer employ a statewide exploration workforce.
Adjusted cash costs per ounce(1) - We currently expect our adjusted cash costs per ounce(1) to approximate $825 - $850 per ounce (with silver as a byproduct credit).
Capital expenditures - Consistent with our strategy and goal to preserve liquidity by minimizing capital expenditures, we currently expect our 2014 capital spending to decrease significantly from the amount spent in 2013. Non-expansion (sustaining) and expansion capital expenditures are expected be less than $15.0 million and approximately $73.8 million, respectively, in 2014.
For information about our 2014 outlook on corporate general and administrative and interest expense refer to the Results of Operations section below.
Heap leach only operations projections
Until the decision to resume construction of a mill is made, as a heap leach only operation, we currently expect to be able to mine existing heap leach reserves of approximately 2.0 million ounces of gold and 84.3 million ounces of silver for six years (starting in 2014) and process at a reduced rate through 2021. The average mining rate is currently expected to be 81.2 million total tons, including 33.5 million ore tons processed, per year. Production is currently expected to average 225,000 ounces of gold and 2.0 million ounces of silver annually, through 2020, assuming heap leach operations only. The Hycroft Mine deposit remains open to the south with the potential for further expansion which could provide additional heap leach mineralized material.
Hycroft Expansion Projects
We have previously announced and commenced projects to expand our oxide (heap leach) operations and implement sulfide mineralization processing capabilities through the construction of a mill, which would provide staged increases to production. Although not all of the following expansion projects are ongoing, as discussed below, our previously announced expansion projects at the Hycroft Mine included (1) increasing the mining rate through larger capacity haul trucks, shovels, and production drills; (2) expanding leach pad operations through increased pad size, additional solution processing capacity, and the addition of a gyratory crusher to enhance the exposure of ore to the leach process; (3) constructing a mill to process higher grade transitional and sulfide mineralization; and (4) upgrading infrastructure items to handle the milling demands, including power transmission and distribution, the construction of a railroad spur and an employee housing project.
The significant decline in gold and silver prices during the second quarter of 2013 impacted our expected cash flows from operations, resulting in our decision to defer construction of the mill and related infrastructure upgrades, further discussed in the below Mill construction and Infrastructure upgrades sections. The decision to defer the mill construction did not reduce our actual 2013 capital expenditures from our initial estimates, as spending during 2013 was largely for the expansion of our leach pad operations, mining equipment, and previously ordered tangible mill components. Our 2013 capital expenditures at the Hycroft Mine for expansion projects totaled approximately $327.6 million and as of December 31, 2013 we had $73.8 million of outstanding purchase obligations for expansion expenditures we expect to make in 2014. For additional detail about Hycroft Mine expansion spending see the Liquidity and Capital Resources section below.
|
| | | | | |
| | | | | |
1 |
| The term “adjusted cash costs per ounce” is a non-GAAP financial measure. Non-GAAP financial measures do not have any standardized meaning prescribed by GAAP and, therefore, should not be considered in isolation or as a substitute for measures of performance prepared in accordance with GAAP. See the section on “Non-GAAP Financial Measures” in this MD&A for additional information. |
The following sections provide details and status updates on the previously announced Hycroft Mine expansion projects.
Increasing the mining rate
This expansion project was completed during the third quarter of 2013. Equipment to increase the annual mining rate first began arriving on site in late 2010 and as of the end of July 2013, we had commissioned all 33 of the planned 320-ton Komatsu haul trucks and the first two (of three) 73 cubic-yard electric rope shovels. The operational benefits realized from this expansion project may be evidenced by the increase to our annual tons mined, which totaled 85.3 million total tons during 2013, an increase of 41% from the 2012 total. For additional information refer to the Hycroft Mine - Operations section above.
As part of this expansion project we had previously ordered a third electric rope shovel; however, during the third quarter of 2013, we began efforts to sell it prior to it being built. Accordingly, expenditures for the third electric rope shovel are included in assets held for sale in our Consolidated Balance Sheets as of December 31, 2013. We believe that our current mobile equipment fleet is sufficient to support our future operations, including a milling scenario, without a third electric rope shovel.
Expanding leach pad operations
This expansion project is expected to be completed during the first quarter of 2014 with the commissioning of the crushing system, but was considered largely complete by the end of 2013. To accommodate the increased mining rate we expanded our leach pad capacity and solution processing capabilities. The North leach pad, which was commissioned during the second quarter of 2013, increased our gross leach pad capacity by 80.0 million tons. We had 70.0 million tons of remaining leach capacity as of December 31, 2013, an increase of 58.0 million tons from the December 31, 2012 remaining capacity of 12.0 million tons. A new 21,500 gpm Merrill-Crowe processing plant increased our total solution processing capacity to 26,500 gpm with the existing Merrill-Crowe plant, thereby eliminating the need to use our less efficient carbon columns once we have stabilized production from both our Merrill-Crowe plants. The new Merrill-Crowe plant began processing 7,000 gpm of solution in mid-October and by the end of October was fully commissioned and capable of processing solution at the full 21,500 gpm capacity. We continue to work with our vendors to be able to sustain the full 21,500 gpm capacity of the new Merrill-Crowe plant, which we have not been able to do to date. As of December 31, 2013, we had mechanically completed construction of the crushing system, including the primary, secondary, and tertiary crushers, but were still finalizing the electrical and programmable controls. We expect to commission the crushing system in the first quarter of 2014. As discussed in the Hycroft Mine - Operations section above, the operational benefits realized from this expansion project may be evidenced by the record number of gold and silver ounces sold during 2013.
In 2014, we do not expect to add additional leach pad space. We had originally planned to complete construction a new pad, which we refer to as the “South leach pad”; however, we now believe that we can expand our leach pad capacity on the north side of the property. As part of our sustaining capital requirements we expect to add additional leach pad space in 2015.
Mill construction
To process our sulfide ore (and select higher grade oxide and transitional ores), our previously announced expansion plans included the construction of a mill, which we have decided to defer due to declining metal prices and the resultant lower than expected cash flows generated by our operations.
We are working with an independent third-party engineering firm to update our feasibility study of the mill expansion to incorporate onsite oxidation of our sulfide concentrates. As part of the update, we plan to evaluate varying mill scenarios in terms of design capacity, including a staged mill scenario in which we would start with a 75,000 tons per day plant that could be increased to 130,000 tons per day in the future once the initial phase is operating according to plan. Currently, we do not have an estimated revised time frame, scope, or capital cost for different mill scenarios nor have we determined long-term projections and estimates of annual production. We expect the feasibility study to be completed by the end of the third quarter of 2014.
Mill related capital spending during 2013 related to the mills themselves, the motors, foundation preparation, and mill-related engineering. We worked with our engineers to finalize and catalog all detailed engineering work that was previously performed so it can be quickly resumed at a future date. Mill components that we have received (and continue to receive) will be stored until the decision is made to continue construction of a mill or offer the components for sale. During 2013 we received the permits necessary to operate a mill once constructed.
Infrastructure upgrades
Our previously announced expansion plans required improvements to infrastructure at the Hycroft Mine, including the construction of a rail spur and upgrading the power transmission and distribution system to handle the demands of a mill and our electric rope shovels. Concurrently with our decision to defer construction of a mill, we decided to delay certain infrastructure improvements, including the rail spur and certain electrical upgrades, which were specific to supporting the demands of a mill. However, during 2013, we completed necessary infrastructure upgrades to support our expanded leach pad operations, including the electric rope shovels, Merill-Crowe plant, and crushing system.
Additionally, during 2013, we began building single family homes and townhouses in Winnemucca, NV for our current workforce and in anticipation of an expanded future workforce necessary to operate a mill, which we planned to rent and/or sell to our employees. Our original plans called for the completion of 39 single family homes and 50 townhouses; however, the scope of our housing needs was lowered with our decision to defer construction of a mill. Our plans are now to complete a total of 29 single family homes and 34 townhouses, which we plan to sell (or have sold) to employees and/or the general public. Accordingly, costs for single family homes and townhouses are included in assets held for sale in our Consolidated Balance Sheets as of December 31, 2013.
During 2013, we completed a temporary housing project in anticipation of lodging needs related to the construction of a mill. As of December 31, 2013, we had vacated this facility and believe it will remain available for our use if we begin construction of a mill.
Results of Operations
Revenue
Gold revenue
The table below summarizes changes in gold revenue, ounces sold, and average realized prices for the following periods:
|
| | | | | | | | | | | |
| | Years ended December 31, |
| | 2013 | | 2012 | | 2011 |
| Total gold revenue (thousands) | $ | 248,386 |
| | $ | 192,847 |
| | $ | 139,046 |
|
| Gold ounces sold | 181,941 |
| | 114,705 |
| | 88,191 |
|
| Average realized price (per ounce) | $ | 1,365 |
| | $ | 1,681 |
| | $ | 1,577 |
|
| | | | | | |
| | 2013 vs. 2012 | | 2012 vs. 2011 | | |
| The change in gold revenue was attributable to (thousands): | | | | | |
| Increase in ounces sold | $ | 113,040 |
| | $ | 41,803 |
| | |
| (Decrease) increase in average realized price | (36,252 | ) | | 9,225 |
| | |
| Effect of average realized price (decrease) increase on ounces sold increase | (21,249 | ) | | 2,773 |
| | |
| | $ | 55,539 |
| | $ | 53,801 |
| | |
During 2013 and 2012 our gold revenue increased by approximately 29% and 39%, respectively, from the preceding years due to increases in the number of gold ounces sold. Gold ounces sold in 2013 increased by 67,236 ounces (or +59%) due to our expanded mine equipment fleet, increased ore under leach and solution flows, and increased solution processing capacity created by the additional carbon columns and our 21,500 gpm Merrill-Crowe plant (commissioned during the fourth quarter). Gold ounces sold in 2012 increased by 26,514 ounces (or +30%) due to our expanded mine equipment fleet as we mined 30.3 million tons of heap leach ore, nearly double the amount of heap leach ore tons mined in 2011. During 2013 we were negatively impacted by a $316 (or -19%) decrease to the average realized price per ounce compared to 2012, whereas in 2012 we benefited from an increase of $104 (or +7%) to the average realized price per ounce compared to 2011.
2014 Projection: As discussed above in the Hycroft Mine - Operations Outlook section, we currently expect our 2014 gold ounces sold to approximate 230,000 - 250,000 ounces.
Silver revenue
The table below summarizes changes in silver revenue, ounces sold, and average realized prices for the following periods:
|
| | | | | | | | | | | |
| | Years ended December 31, |
| | 2013 | | 2012 | | 2011 |
| Total silver revenue (thousands) | $ | 19,515 |
| | $ | 21,712 |
| | $ | 12,983 |
|
| Silver ounces sold | 858,073 |
| | 696,144 |
| | 372,000 |
|
| Average realized price (per ounce) | $ | 23 |
| | $ | 31 |
| | $ | 35 |
|
| | | | | | |
| | 2013 vs. 2012 | | 2012 vs. 2011 | | |
| The change in silver revenue was attributable to (thousands): | | | | | |
| Decrease in average realized price | $ | (5,880 | ) | | $ | (1,381 | ) | | |
| Increase in ounces sold | 5,051 |
| | 11,313 |
| | |
| Effect of average realized price decrease on ounces sold increase | (1,368 | ) | | (1,203 | ) | | |
| | $ | (2,197 | ) | | $ | 8,729 |
| | |
During 2013 our silver revenue decreased by approximately 10% from 2012 as the $8 (or -26%) decrease to the average realized price per ounce negated the 161,929 ounce (or +23%) increase in silver ounces sold. During the first nine months of 2013 we sold 505,151 ounces of silver (or 59% of the annual total) as we experienced lower silver recoveries from solution processed through the carbon columns. Fourth quarter 2013 silver sales increased significantly from previous quarters to 352,922 ounces (or 41% of the annual total) due to the commissioning of the 21,500 gpm Merrill-Crowe plant, which yields higher silver recoveries and a higher concentration of silver in the doré when compared to that in the carbon. In 2012 silver ounces sold increased by 324,144 ounces (or +87%) as we nearly doubled the amount of production ore tons mined compared to 2011 and utilized additional sodium cyanide per ton of ore to improve silver recoveries.
2014 Projection: As discussed above in the Hycroft Mine - Operations Outlook section, we currently expect our 2014 silver ounces sold to approximate 1.7 to 2.0 million ounces.
Total cost of sales
Total cost of sales consists of production costs, depreciation and amortization, and write-down of production inventories. The table below summarizes changes in total cost of sales for the following periods (in thousands):
|
| | | | | | | | | | | |
| | Years ended December 31, |
| | 2013 | | 2012 | | 2011 |
| Production costs | $ | 165,478 |
| | $ | 94,898 |
| | $ | 56,045 |
|
| Depreciation and amortization | 31,092 |
| | 14,594 |
| | 6,984 |
|
| Write-down of production inventories | 12,586 |
| | — |
| | — |
|
| Total cost of sales | $ | 209,156 |
| | $ | 109,492 |
| | $ | 63,029 |
|
| | | | | | |
| | 2013 vs. 2012 | | 2012 vs. 2011 | | |
| The change in cost of sales was attributable to: | | | | | |
| Increase in gold ounces sold | $ | 64,180 |
| | $ | 18,949 |
| | |
| Increase in average cost of sales per ounce | 22,371 |
| | 21,154 |
| | |
| Effect of average cost per ounce increase on ounces sold increase | 13,113 |
| | 6,360 |
| | |
| | $ | 99,664 |
| | $ | 46,463 |
| | |
Production costs
As discussed above in the Gold Revenue section, during 2013 and 2012, we sold 59% and 30% more gold ounces, respectively, than the preceding year at higher costs.
As shown above in the Hycroft Mine – Operations table, during 2013 we experienced a comparable waste to ore strip ratio to 2012 but progressed through a lower gold ore grade phase of the mine plan. In the first half of 2013 additional drilling, lime, and cyanide costs associated with the Lewis leach pad remediation, increased maintenance costs of older loading equipment, and inefficient utilization of the mobile fleet resulted in a significant increase to the average cost per ounce placed on the leach pads. During the second half of 2013, we commissioned two electric rope shovels and a 21,500 gpm Merrill-Crowe plant and began to realize efficiencies from our mobile equipment dispatch system, all while operating with a leaner workforce subsequent to the July 2013 reduction in force. During the second half of 2013, our average mining cost per ton and average processing cost per ore ton decreased by 22% and 12%, respectively, from the first half 2013 per ton amounts. We expect such efficiencies in mining and processing costs to continue into 2014, which we believe will decrease our future production costs.
During 2012, we incurred $4.7 million of additional shipping and processing fees related to ounces sold from our in-process inventories compared to 2011 in which substantially all our sales were attributable to doré. During the first half of 2012, as we progressed through high waste zones the strip ratio was 1.4:1, which increased the average cost per ounce placed on the leach pads. Additionally, average gold grades of ore mined during 2012 decreased by approximately 8% to .012 opt from .013 opt in 2011.
Depreciation and amortization
During 2013 and 2012, as we expanded our oxide heap leach operations, the amount of plant, equipment, and mine development in service increased, resulting in increased depreciation and amortization. At the end of 2013, we had in service an additional $242.9 million (or +67%) of plant, equipment, and mine development compared to the end of 2012, including the North leach pad, two electric rope shovels, the 21,500 gpm Merrill-Crowe plant, and several haul trucks. Similarly, at the end of 2012, we had in service an additional $146.0 million (or +68%) of plant, equipment, and mine development compared to the end of 2011.
2014 Projection: As discussed above in the Hycroft Mine - Operations Outlook section, we currently expect our 2014 depreciation and amortization to increase significantly to approximately $80.5 - $84.5 million (or $335 - $352 per ounce).
Write-down of production inventories
The application of our lower of cost or market accounting policy using period-end London Bullion Market Association metal prices resulted in a $12.6 million write-down of ore on leach pads during December 2013. The 2013 write-down resulted solely from the application of our lower of cost or market accounting policy and was unrelated to any metallurgical balancing analytics or changes to recovery rates. For additional information refer to Note 4 - Stockpiles and Ore On Leach Pads to our Notes to Consolidated Financial Statements.
Exploration, development, and land holding
Exploration, development, and land holding costs totaled $3.6 million, $7.4 million, and $28.2 million during 2013, 2012, and 2011, respectively, consisting of compensation and benefit costs for our exploration employees, land holding and claim maintenance fees, and exploration campaign fees (when present). Our 2013 costs decreased from 2012 as we incurred only minimal exploration program costs during the first half of 2013. During 2012, we spent $4.4 million for drilling campaigns that took place at some of our Advanced Exploration Properties (Hasbrouck, Three Hills, and Wildcat).
During 2011, significant exploration, development, and land holding costs included $12.3 million to expand mineralized material and identify high-grade zones at Hasbrouck, $9.8 million for exploration activities that occurred outside of the then current proven and probable reserve pit at Hycroft, and $2.9 million for engineering, consulting, and metallurgy services performed on sulfide mineralized materials.
2014 Projection: As discussed above in the Hycroft Mine - Operations Outlook section, we currently expect our 2014 exploration, development, and land holding costs to approximate $2.5 - $3.5 million.
Corporate general and administrative
Corporate general and administrative costs totaled $18.9 million, $16.3 million, and $18.6 million during 2013, 2012, and 2011, respectively. The 2013 increase of $2.6 million was attributable to increased staff levels in support of our growing operations and increased stock-based compensation costs. Although we reduced our corporate workforce by approximately 40% during the third quarter of 2013, we experienced increased costs compared to 2012 as our overall workforce was larger during the majority of 2013. Stock-based compensation costs for directors increased $1.3 million during 2013 compared to 2012. In 2012, mark-to-market adjustments for outstanding shares granted under the Deferred Phantom Unit Plan (prior to its August 2012 plan modification) resulted in reductions to stock-based compensation costs. For additional information refer to Note 13 - Stock-Based Compensation to our Notes to Consolidated Financial Statements.
The 2012 decrease of $2.3 million from 2011 was attributable to reductions of $2.6 million in stock-based compensation for directors and $0.9 million in legal and accounting fees, offset by higher compensation and benefit costs from increased staff levels for the ongoing expansion projects.
2014 Projection: We currently expect our 2014 corporate general and administrative costs to approximate $17.0 - $19.0 million based upon our projected workforce levels and related benefit costs and estimates of other costs, such as, legal and accounting fees, insurance, and consulting and service provider costs.
Separation and severance
Separation and severance costs relate to the rationalizing of our employee headcount to align our operations in the most strategic and cost-efficient manner and totaled $5.9 million during 2013. During the third quarter of 2013 we reduced the Hycroft Mine workforce by approximately 24% and our corporate workforce by approximately 40%. There were no comparable costs in the 2012 and 2011 years. For additional information refer to Note 15 - Separation and Severance Costs to our Notes to Consolidated Financial Statements.
2014 Projection: We do not currently expect to incur any material separation and severance costs during 2014.
Loss (gain) on disposition or sale of mineral properties
During 2013 we completed a review of our early-stage exploration properties, which are properties having no defined mineralized material due to insufficient historical exploration activities, that resulted in the abandonment of 12 mineral properties and a $1.4 million loss on disposition. During 2011, we sold a mineral property in exchange for common shares of the purchasing company and recorded a $1.1 million gain on sale.
Loss on assets classified as held for sale
During 2013 we determined that certain of our property and equipment no longer fit into our strategic operating plans and committed to a plan to sell such identified assets, which resulted in an $11.7 million loss when these assets were adjusted to their fair values (less costs to sell). At December 31, 2013, assets held for sale included a residential housing and townhouse
development, new and used blasthole drills, used haul trucks, shovels, and graders, and the components required for one electric wire rope shovel.
Interest expense
Interest expense was $22.6 million, $17.9 million, and $0.7 million during 2013, 2012, and 2011, respectively. We issued senior notes in May of 2012 and regularly enter into additional capital lease and term loan obligations for mine equipment, both of which increased interest expense. Interest expense is reduced for amounts capitalized to our project expenditures. For additional detail on our recorded interest expense, including amounts capitalized, and increases to our debt obligations refer to Note 10 - Debt to our Notes to Consolidated Financial Statements.
2014 Projection: We currently expect our 2014 interest expense, net of amounts capitalized to our capital expenditures, to approximate $40.5 - $44.5 million, increasing from 2013 as we currently have minimal planned capital expenditures. Our projected interest expense may vary significantly if the timing and/or amount of our sustaining or expansion capital expenditures is adjusted.
Other, net
Other, net was $1.0 million of expense during 2013 and $0.3 million and $0.4 million of income during 2012 and 2011, respectively. Other, net consists of fair value changes to marketable equity securities received in a 2011 mineral property sale and foreign currency transaction gains (losses) on the senior notes, which are offset by corresponding amounts from the cross currency swap. The marketable equity securities were sold in the fourth quarter of 2013. For additional detail on our other income and expense, refer to Note 16 - Other, Net to our Notes to Consolidated Financial Statements.
Income tax benefit (expense)
Income tax benefit totaled $8.1 million during 2013 and income tax expense totaled $16.4 million and $6.3 million in 2012 and 2011, respectively. Our 2013 income tax benefit primarily consisted of a $2.3 million benefit from our loss before income taxes multiplied by the federal statutory tax rate and an $11.4 million depletion deduction benefit, offset by a $4.3 million dollar charge to increase the valuation allowance against deferred tax assets. Our 2012 income tax expense primarily consisted of a $22.5 million charge from income taxed at the statutory rate and a $6.9 million depletion deduction. Our 2011 income tax expense included a charge of $15.1 million computed at the federal statutory income tax rate, which was offset by a $7.7 million depletion deduction and a $1.0 million basis adjustment. For additional detail on our recorded income tax benefit (expense), refer to Note 8 - Income Taxes to our Notes to Consolidated Financial Statements.
Net income
For the reasons described above, we reported net income of $1.4 million, $47.7 million, and $36.7 million during 2013, 2012, and 2011, respectively.
Other comprehensive income (loss), net of tax
During 2013 and 2012 other comprehensive income (loss), net of tax totaled $7.1 million of income and $5.4 million of loss, respectively, and included fair value adjustments to our cash flow hedge instruments, settlements of such hedges, and reclassifications into earnings. For additional detail refer to Note 20 - Derivative Instruments to our Notes to Consolidated Financial Statements.
Liquidity and Capital Resources
General
One of our near-term operating strategies and goals is to maintain, at all times, sufficient liquid assets and access to capital resources. To accomplish this, we closely and actively manage our liquidity and capital resources by, among other things, (1) monitoring metal prices and the impacts (near-term and future) they have on our business; (2) achieving our projected ounces sold volumes and per ounce cost metrics; (3) controlling our working capital; (4) managing discretionary general and administrative and exploration related spending; (5) planning the timing and amounts of capital expenditures at the Hycroft Mine; and (6) reviewing our existing borrowing arrangements and availability under such arrangements. Our future liquidity and capital resources management strategy entails a disciplined approach to monitor the timing and amount of any investment in the expansion of the Hycroft Mine while continually remaining in a position that allows us to respond to changes in our business environment, such as a decrease in metal prices, and changes in other factors beyond our control. Accordingly, and as discussed above in the Hycroft Mine - Hycroft Expansion Projects section, we have deferred construction of a mill in response to declining metal prices and have focused on improving our financial position, which we believe will allow us to advance a mill project and related construction in a responsible manner at a later date.
Cash and cash equivalents and liquid assets on hand
Our principal sources of liquidity are cash and cash equivalents, as well as any cash flow from our ongoing business, which we believe will allow us to meet our needs for working capital, capital expenditures, debt service, and other liquidity requirements associated with our operations and expansion projects for at least the next 12 months.
We have placed substantially all of our cash and cash equivalents in short-term money market instruments with a single, high quality financial institution, thereby ensuring balances remain readily available. Due to the nature of our operations and the composition of our current assets, our cash and cash equivalents and accounts receivable balances represent substantially all of our liquid assets on hand. In addition to our liquid assets on hand, we have access to additional liquidity under our $40.0 million Second Amended and Restated Credit Agreement (the “Revolver”). The Revolver contains an accordion feature which permits the credit available to be increased to up to $75.0 million through the addition of additional lenders, which is discussed further in the Available sources of liquidity section below. As of December 31, 2013, we had existing cash and cash equivalents of $81.5 million, a decrease from the December 31, 2012 balance of $347.0 million due primarily to $327.6 million of cash used in our ongoing expansion projects at the Hycroft Mine and $38.6 million of cash used to repay principal on our capital lease obligations, which exceeded the $142.2 million of net proceeds generated from our May 2013 public stock offering. For additional detail on our cash and cash equivalents activity, see the Sources and uses of cash for 2013, 2012, and 2011 section below.
Additional sources of liquidity
We believe the following table provides additional insight about items as of December 31, 2013, or developments as of the date of this Management’s Discussion and Analysis of Financial Condition and Results of Operations, that we believe may provide us with additional liquidity over the next 12 months (in thousands):
|
| | | | | | | | |
| | | Date of estimated liquidity determination | | | | |
| Description | | | | | Amount |
| Cash and cash equivalents | | December 31, 2013 | | | | $ | 81,470 |
|
Revolving credit agreement(1) | | February 24, 2014 | | | | 27,800 |
|
Accounts receivable(2) | | December 31, 2013 | | | | 8,227 |
|
Inventories(3) | | December 31, 2013 | | | | 62,596 |
|
Ore on leachpads, current(3) | | December 31, 2013 | | | | 163,780 |
|
Assets held for sale(4) | | December 31, 2013 | | | | 23,282 |
|
Mineral property sale(5) | | February 24, 2014 | | | | 20,000 |
|
| | | | | | | 387,155 |
|
(1) Availability under our Revolver as of February 24, 2014 has been reduced for letters of credit issued to collateralize the cross currency swap. See Note 25 - Subsequent Events to our Notes to Consolidated Financial Statements for additional detail. |
(2) Entire Accounts receivable balance is expected to be collected during the next 12 months. |
(3) Inventories and Ore on leach pads, current contained approximately 188,411 ounces of gold which are expected to be sold within the next 12 months. Assuming a gold selling price of $1,201.50 per ounce (the December 31, 2013 P.M. fix) and excluding any proceeds from silver sales, the sale of all gold ounces estimated to be recovered from our Inventories and Ore on leach pads, current would provide us with $226.4 million of revenue during the next 12 months. |
(4) Assets held for sale in our Consolidated Balance Sheets as of December 31, 2013 totaled $47.4 million and, for the purpose of determining estimates of additional liquidity, have been reduced for any related debt that will be repaid at the time of sale. |
(5) On January 24, 2014, we entered into a letter agreement for the sale of the Hasbrouck, Three Hills, and Esmeralda County Exploration Properties with West Kirkland Mining, Inc. which may provide us with up to $20.0 million in gross proceeds during the next 12 months. See Note 25 - Subsequent Events to our Notes to Consolidated Financial Statements for additional detail. |
Revolving credit facility
In December 2013, we entered into the Revolver which amended and restated the October 2012 Amended and Restated Credit Agreement (the “Previous Revolver”). The aggregate amount available to us under the Revolver is determined by a Borrowing Base (as defined in the Revolver) that makes up to $40.0 million available (a reduction from the $120.0 million available under the Previous Revolver) to us depending upon the value of the gold and silver in our ore on leach pads, in-process, and finished goods inventories less estimated remaining processing and selling costs. As of December 31, 2013, $40.0 million was available to us as determined by the Borrowing Base. During the years ended December 31, 2013 and 2012, no amounts were borrowed under the Revolver or the Previous Revolver. For information on the Revolver’s covenants see the Debt covenants - Revolving credit facility section below.
The Revolver contains an accordion feature which permits the credit available to be increased to up to $75.0 million through the addition of additional lenders. We have expressed to the lender to the Revolver, our interest in growing the borrowing capacity through the Revolver’s accordion feature which would provide us with additional liquidity.
Future cash requirements
We expect our future net cash used in investing and financing activities during the next year will exceed any cash flows provided by operating activities during the same period. Our primary future cash requirements will be to fund our purchase obligations related to the expansion of the Hycroft Mine (as revised), discussed above in the Hycroft Mine - Hycroft Expansion Projects section, make scheduled semi-annual interest payments on the May 2012 senior notes (the “Notes”), and make scheduled principal and interest payments on our capital lease and term loan obligations. See the Contractual Obligations table below for additional detail on our future cash requirements.
As discussed in this Liquidity and Capital Resources section, we believe that we have sufficient resources to fund our operations and expansion projects for at least the next 12 months. Our liquidity and capital resources management entails a disciplined strategy that allows us to respond to changes in our business environment and other factors beyond our control. We do, however, continually evaluate financing options that may improve our current liquidity and financial condition, are attainable on favorable and reasonable terms, and are permissible under our existing debt agreements. This may include, but is not limited to, issuance of various forms of equity and/or debt securities or other instruments or arrangements such as joint ventures and the sale of assets or mineral properties. Additionally, the timing of capital expenditures for our expansion projects can be adjusted, if we feel necessary, to respond to changes in our business environment. As discussed above in the Hycroft Mine - Hycroft Expansion Projects section, we have deferred construction of a mill in response to declining metal prices and have focused on improving our financial position which we believe will allow us to advance a mill project and related construction in a responsible manner at a later date.
Sources and uses of cash for 2013, 2012, and 2011 (in thousands)
|
| | | | | | | | | | | |
| | Years ended December 31, |
| | 2013 | | 2012 | | 2011 |
| Net income | $ | 1,405 |
| | $ | 47,727 |
| | $ | 36,709 |
|
| Net non-cash adjustments | 45,495 |
| | 37,853 |
| | 16,618 |
|
| Net change in operating assets and liabilities | (79,083 | ) | | (106,691 | ) | | (35,906 | ) |
| Net cash used in operating activities | (32,183 | ) | | (21,111 | ) | | 17,421 |
|
| Net cash used in investing activities | (335,687 | ) | | (275,249 | ) | | (85,263 | ) |
| Net cash provided by financing activities | 102,293 |
| | 368,405 |
| | 5,015 |
|
| Net (decrease) increase in cash and cash equivalents | (265,577 | ) | | 72,045 |
| | (62,827 | ) |
| Cash and cash equivalents, beginning of period | 347,047 |
| | 275,002 |
| | 337,829 |
|
| Cash and cash equivalents, end of period | $ | 81,470 |
| | $ | 347,047 |
| | $ | 275,002 |
|
Cash used in operating activities
Our operating cash flows vary with prices realized from metal sales, sales volumes, production costs, mine plans, working capital changes, and non-cash amounts included in net income. Our operating cash flows are largely impacted by increases in production-related inventories as we have increased our mining rate and expanded our heap leach operations.
During 2013, 2012, and 2011, we generated $46.9 million, $85.6 million, and $53.3 million, respectively, of operating cash from net income and net non-cash adjustments which was offset by changes in working capital. As discussed in the above Results of Operations section, our non-cash depreciation and amortization expense approximately doubled in 2013 and 2012 (when compared to the preceding year) as a result of our increased sales volumes and expanded heap leach plant and equipment, which increased the capital cost amount allocated to each ounce of gold sold. In 2013, we sold a record number of gold and silver ounces as the Hycroft Mine began to operate near its steady-state, heap leach capacity; however, a low metal price environment negatively impacted our operating cash flows as gold revenue did not increase in proportion to the increase in gold ounces sold. The following chart compares the 2013 and 2012 percentage increases in ounces sold and gold revenue from the prior years:
|
|
| Comparison of Increases in Gold Ounces Sold and Gold Revenue From Prior Year |
During 2013, 2012, and 2011, we used approximately $114.7 million, $69.1 million, and $38.9 million, respectively, of cash to increase our recoverable gold ounces included in inventories, stockpiles, and ore on leach pads as we increased our mining rate and heap leach operations during each year. In 2013 and 2012, the change in our accounts receivable balance provided $47.7 million of cash and used $56.0 million of cash, respectively, as we received payment in 2013 from the 2012 sale of a significant amount of in-process inventories. In 2013, our operating cash flows were further reduced by $14.5 million invested in plant and equipment which we subsequently classified as assets held for sale.
Cash used in investing activities
The amount of cash used in investing activities increased 22% in 2013 due to the expansion projects at the Hycroft Mine. During 2013, cash additions to plant, equipment, and mine development totaled $327.6 million and included $99.3 million for the crushing facility, $59.5 million for the mill project, $53.3 million for processing upgrades, $40.6 million for mine equipment, $32.4 million for leach pad expansions, $22.9 million for mine development, and $19.6 million for other additions. Additionally, during 2013 we increased our restricted cash balances by $9.4 million to satisfy financial assurance requirements for the estimated future reclamation and remediation costs at our Hycroft Mine.
The amount of cash used in investing activities significantly increased in 2012 due to the ongoing expansion projects at the Hycroft Mine. During 2012, cash additions to plant, equipment, and mine development included $103.7 million for the mill project, $59.4 million for the crushing facility, $35.3 million for mine development, $30.1 million for leach pad expansions, $8.7 million for mine equipment, and $25.0 million for other additions. Significant additions for the mill project included initial payments for the purchase of SAG mills, ball mills, a regrind mill, and engineering costs. Significant additions for the crushing facility included the purchase of a gyratory crusher, secondary and tertiary crushers, and excavation costs. Mine development additions were related to reserve verification, condemnation drilling, and environmental and permitting costs for our Environmental Impact Statement. Additionally, during 2012 we increased our restricted cash balances by $13.0 million to satisfy financial assurance requirements for the estimated future reclamation and remediation costs at our Hycroft Mine.
During 2011, we increased our mining rate by utilizing a larger mine equipment fleet and increased our oxide ore processing capabilities through increased leach pad capacity. We also completed pre-stripping activities for the Cut-5 pit, further delineated and developed our ore bodies within proven and probable reserve regions, and performed drilling and assaying for mine planning associated with expansion projects. In 2011, cash additions to plant, equipment, and mine development included $37.3 million for mine development, $16.4 million for mobile mine equipment, $11.6 million for leach pad expansions, $7.9 million for a new truck shop, $1.5 million for power supply improvements, and $6.9 million of other additions. In 2011, we increased our restricted cash balances by $3.8 million to satisfy financial assurance requirements for the estimated future reclamation and remediation costs at our Hycroft Mine.
Cash provided by financing activities
During 2013, we completed a public offering for gross proceeds of $150.5 million and paid fees, commissions, and related offering costs of $8.5 million. Our principal repayments on capital lease and term loan obligations totaled $38.6 million, increasing from 2012 as a result of entering into additional obligations, primarily for haul trucks, the two electric wire rope shovels, and other mobile mine equipment.
During 2012, we issued senior notes for gross proceeds of $400.4 million (after the effect of the cross currency and interest rate swap), and paid related debt issuance costs of $13.3 million. An additional $2.0 million of debt issuance costs were paid for the October 2012 amendment of our revolving credit facility and capital lease financing arrangements. Our repayments on capital lease obligations increased to $16.3 million as a result of entering into additional leases, primarily for haul trucks and hydraulic shovels.
During 2011, we received $9.5 million in proceeds from a sale-leaseback agreement and made repayments of $5.6 million on our capital lease obligations.
Capital requirements
We believe that cash flows from our ongoing business, when combined with our existing cash and cash equivalents and other liquid assets, will be sufficient over at least the next twelve months to meet operational needs, make capital expenditures, invest in the business and service debt due. The following table provides our gross contractual cash obligations as of December 31, 2013, which are grouped in the same manner as they are classified in the Consolidated Statements of Cash Flows in order to provide a better understanding of the nature of the obligations and to provide a basis for comparison to historical information (in thousands):
|
| | | | | | | | | | | | | | | | | | | |
| | Total | | Payments Due by Period |
| | Less than | | 1 – 3 | | 3 – 5 | | More than |
| Contractual obligations | 1 year | | Years | | Years | | 5 Years |
| Operating activities: | | | | | | | | | |
Interest related to debt (1) | $ | 207,991 |
| | $ | 42,303 |
| | $ | 77,470 |
| | $ | 70,335 |
| | $ | 17,883 |
|
Property and claim maintenance fees (2) | 13,846 |
| | 998 |
| | 4,707 |
| | 2,398 |
| | 5,743 |
|
Remediation and reclamation expenditures (3) | 37,696 |
| | 20 |
| | — |
| | 40 |
| | 37,636 |
|
| Temporary housing and space rental costs | 4,902 |
| | 1,195 |
| | 3,707 |
| | — |
| | — |
|
| Investing activities: | | | | | | | | | |
Purchase obligations for plant and equipment(4) | 73,753 |
| | 73,753 |
| | — |
| | — |
| | — |
|
| Financing activities: | | | | | | | | | |
Repayments of principal on debt(1)(5) | 623,527 |
| | 76,780 |
| | 90,531 |
| | 41,612 |
| | 414,604 |
|
| | $ | 961,715 |
| | $ | 195,049 |
| | $ | 176,415 |
| | $ | 114,385 |
| | $ | 475,866 |
|
| |
(1) | Interest related to debt does not include amortization of debt issuance costs or Revolver standby fees. Interest and principal payments are adjusted for the effect of the cross currency swap agreement. For additional information see Note 10 - Debt to our Notes to Consolidated Financial Statements. |
| |
(2) | Includes Hycroft Mine property and county claim fees and a 4% net profits royalty on Crofoot claims at the Hycroft Mine. For additional information on our 4% net profits royalty see Note 24 - Commitments and Contingencies to our Notes to Consolidated Financial Statements. |
| |
(3) | Mining operations are subject to extensive environmental regulations in the jurisdictions in which they are conducted and we are required, upon cessation of operations, to reclaim and remediate the lands that our operations have disturbed. The estimated undiscounted cash outflows of these remediation and reclamation obligations are reflected here. For additional information see Note 11 - Asset Retirement Obligation to our Notes to Consolidated Financial Statements. |
| |
(4) | Purchase obligations are not recorded in the Consolidated Financial Statements. The amounts shown above represent certain purchase obligations which we cannot cancel. For additional information on see Note 24 - Commitments and Contingencies to our Notes to Consolidated Financial Statements. |
| |
(5) | Included in the “Less than 1 year” column is $24.1 million of debt which will be repaid concurrently with the sale of the components of the third electric rope shovel and three production drills which are classified as held for sale in our Consolidated Balance Sheets. |
Debt covenants
We were in compliance with all debt covenants as of December 31, 2013, which are discussed below in additional detail.
Senior notes
In May 2012, we issued CDN $400.0 million of uncollateralized Notes that pay interest semi-annually at the rate of 8.75% per annum and mature in June 2019. Concurrently with the issuance of the Notes, we entered into a cross currency swap agreement based upon a notional amount of $400.4 million, the gross proceeds to us from the issuance, and a fixed interest rate of 8.375%. The Notes constitute senior unsecured obligations and are guaranteed by most of our currently wholly owned subsidiaries, including Hycroft Resources & Development Inc., which owns the Hycroft Mine and conducts mining operations. We are using the net proceeds from the Notes to fund capital expenditures at the Hycroft Mine.
The indenture for the Notes may, among other things, limit our ability and the ability of our subsidiary guarantors to (i) pay dividends, or make certain other restricted payments or investments; (ii) incur additional indebtedness and issue disqualified stock; (iii) create liens on our and their assets; (iv) transfer and sell assets; (v) merge, consolidate or sell all or substantially all of our and their assets; (vi) enter into certain transactions with affiliates; (vii) create restrictions on dividends or other payments by our subsidiary guarantors and (viii) create guarantees of indebtedness by our subsidiary guarantors. These covenants are subject to a number of important limitations and exceptions that are described in the indenture for the Notes.
Upon the occurrence of a change of control triggering event specified in the indenture for the Notes, we must offer to purchase the Notes at a redemption price equal to 101% of the principal amount thereof, plus accrued and unpaid interest, if any, to the date of purchase.
The indenture for the Notes provides for customary events of default (subject in certain cases to customary grace and cure periods), which include nonpayment, breach of covenants in the indenture for the Notes, payment defaults or acceleration of other indebtedness, a failure to pay certain judgments and certain events of bankruptcy and insolvency. If an event of default occurs and is continuing, the trustee or holders of at least 25% in principal amount of the outstanding Notes may declare the principal, accrued and unpaid interest, if any, on all the Notes to be due and payable. These events of default are subject to a number of important qualifications, limitations and exceptions that are described in the indenture for the Notes.
Revolving credit facility
In December 2013, we entered into the Revolver which amended and restated the Previous Revolver. The Revolver continues to be collateralized by substantially all of our assets and matures on April 30, 2016, unless extended in accordance with the terms of Revolver. The Revolver contains financial covenants related to Tangible Net Worth, Minimum Current Ratio, and Minimum Reserve Tail, as such terms are defined in the Revolver. We are required to maintain a Tangible Net Worth of $437.0 million plus 25% of positive net income for each quarter ending after September 30, 2013 and a Minimum Current Ratio of 1.25:1.0. The Minimum Reserve Tail covenant requires that at all times the Company will maintain more than 600,000 gold equivalent recoverable ounces in its heap leach reserves after maturity of the Revolver.
Term and Security Deposit Loan Agreement
In March 2013, we entered into a Term and Security Deposit Loan Agreement (the” Loan Agreement”) related to the purchase of three electric rope shovels. Under the Loan Agreement, up to $60.0 million was made available to us for scheduled advance security deposit payments pursuant to purchase agreements for the electric rope shovels and up to $90.0 million was made available for term loan financing to fund the purchase of the electric rope shovels as they were commissioned at the Hycroft Mine. The electric rope shovels secure all amounts borrowed by us under the Loan Agreement. The Loan Agreement contains customary covenants, agreements, and events of default for loan agreements of this type.
Capital lease obligations
Certain capital lease obligations reference the covenants included in the Revolver and contain limitations on dividends.
Off-balance sheet arrangements
As of December 31, 2013, we had no off-balance sheet arrangements.
Non-GAAP Financial Measures
Adjusted Cash Costs per Ounce
Adjusted cash costs per ounce is a non-GAAP financial measure, calculated on a per ounce of gold sold basis, and includes all direct and indirect operating cash costs related to the physical activities of producing gold, including mining, processing, cash portions of production costs written-down, third party refining expenses, on-site administrative and support costs, royalties, and mining production taxes, net of revenue earned from silver sales. Because we are a primary gold producer and our operations focus on maximizing profits and cash flows from the extraction and sale of gold, we believe that silver revenue is peripheral and not material to our key performance measures or our Hycroft Mine operating segment and, as such, adjusted cash costs per ounce is reduced by the benefit received from silver sales.
Adjusted cash costs per ounce provides management and investors with a further measure, in addition to conventional measures prepared in accordance with GAAP, to assess the performance of our mining operations and ability to generate cash flows over multiple periods from the sale of gold. Non-GAAP financial measures do not have any standardized meaning prescribed by GAAP and, therefore, may not be comparable to similar measures presented by other mining companies. Accordingly, the above measures are intended to provide additional information and should not be considered in isolation or as a substitute for measures of performance prepared in accordance with GAAP.
The table below presents a reconciliation for the last three years between non-GAAP adjusted cash costs (excluding write-down), which is the numerator used to calculate non-GAAP adjusted cash costs per ounce (excluding write-down), to Production costs. Adjusted cash costs per ounce (excluding write-down) are then increased for the per ounce cash portion of previously incurred production costs that were written-down and included in Write-down of production inventories (GAAP) (in thousands, except ounces sold and per ounce amounts):
|
| | | | | | | | | | | | |
| | | Years ended December 31, |
| | | 2013 | | 2012 | | 2011 |
| Production costs | | $ | 165,478 |
| | $ | 94,898 |
| | $ | 56,045 |
|
| Less: Silver revenues - Note 14 | | (19,515 | ) | | (21,712 | ) | | (12,983 | ) |
| Adjusted cash costs, excluding write-down | | $ | 145,963 |
| | $ | 73,186 |
| | $ | 43,062 |
|
| Gold ounces sold - Note 14 | | 181,941 |
| | 114,705 |
| | 88,191 |
|
| | | | | | | |
| Adjusted cash costs per ounce, excluding write-down | | $ | 802 |
| | $ | 638 |
| | $ | 488 |
|
Write-down of production inventories per ounce(1) - Note 4 | | 53 |
| | — |
| | — |
|
| Adjusted cash costs per ounce | | $ | 855 |
| | $ | 638 |
| | $ | 488 |
|
| | | | | | | |
(1) Our $12.6 million write-down to production related inventories in 2013 consisted of $2.9 million of allocated depreciation and amortization costs and $9.7 million (or $53 per gold ounce sold) of previously incurred cash production costs (which are included in the above reconciliation). See Note 4 - Ore on leachpads to our Notes to Consolidated Financial Statements for additional detail. |
Item 7A. Quantitative and Qualitative Disclosures About Market Risk
Metal Price Risk
Our principal products are unrefined gold bars (doré) and in-process inventories (metal-laden carbon), both of which are produced at our Hycroft Mine. During 2013, 2012, and 2011, 100% of our revenues were from the sale of gold and silver. Our financial results can vary significantly as a result of fluctuations in the market prices of gold and silver. The price of gold and silver is volatile and is affected by many factors beyond our control, such as interest rates, expectations regarding inflation, speculation, currency values, central bank activities, governmental decisions regarding the disposal of precious metals stockpiles, global and regional demand and production, political and economic conditions and other factors.
We have not entered into any financial instruments to mitigate the risk of fluctuations in metal prices and therefore a substantial or extended decline in gold or silver prices would adversely impact our financial position, revenues, net income and cash flows.
Interest Rate Risk
Borrowings under our $40.0 million Revolver bear interest per annum at either LIBOR plus 450 basis points ("bps") or at an Alternate Base Rate, as defined in the Revolver, plus 350 bps.
We have not entered into any financial instruments to mitigate the risk of fluctuations in LIBOR and therefore a substantial or extended increase to LIBOR could adversely impact our financial position, revenues, net income and cash flows.
Foreign Currency Exchange Risk
As discussed in Note 25 - Subsequent Events to our Notes to Consolidated Financial Statements, in January 2014 we began being required to collateralize the mark-to-market position of 22% of the total $400.4 million notional amount of the Notes cross currency swap with cash, letters of credit, or a combination of the two. As of February 24, 2014, we had issued $12.2 million of letters of credit under the Revolver and remitted $0.2 million of cash to collateralize the mark-to-market position of 22% of the cross currency swap’s liability position.
We have not entered into any financial instruments to mitigate the risk of fluctuations in the CDN dollar to US dollar exchange rate for $90.0 million of the total $400.4 million notional amount of the cross currency swap and therefore, a substantial or extended fluctuation in the CDN dollar to US dollar exchange rate could adversely impact our financial position, revenues, net income and cash flows as we could be required to collateralize a portion of the swap.
Cash Flow Hedges
We have entered into certain derivative financial instruments classified as cash flow hedges in an effort to mitigate our exposure to foreign currency exchange risk and diesel price risk. We have not entered into any market risk sensitive financial instruments or derivatives for trading purposes. For information about our derivative instruments see Note 20 - Derivative Instruments to our Notes to Consolidated Financial Statements.
Item 8. Financial Statements and Supplementary Data
INDEX TO FINANCIAL STATEMENTS
|
| |
| | |
| | Page |
| Consolidated Financial Statements: | |
| Report of Independent Registered Public Accounting Firm | |
| Management’s Report on Internal Control over Financial Reporting | |
| Consolidated Balance Sheets at December 31, 2013 and 2012 | |
| Consolidated Statements of Income and Comprehensive Income for the Years Ended December 31, 2013, 2012, and 2011 | |
| Consolidated Statements of Cash Flows for the Years Ended December 31, 2013, 2012, and 2011 | |
| Consolidated Statements of Stockholders’ Equity for the Years Ended December 31, 2013, 2012, and 2011 | |
| Notes to Consolidated Financial Statements | |
REPORT OF INDEPENDENT REGISTERED PUBLIC ACCOUNTING FIRM
Board of Directors and Stockholders
Allied Nevada Gold Corp.
Reno, Nevada
We have audited the accompanying consolidated balance sheets of Allied Nevada Gold Corp. and subsidiaries (the “Company”) as of December 31, 2013 and 2012, and the related consolidated statements of income and comprehensive income, stockholders’ equity, and cash flows for each of the years in the three-year period ended December 31, 2013. We also have audited the Company’s internal control over financial reporting as of December 31, 2013, based on criteria established in Internal Control - Integrated Framework (1992), issued by the Committee of Sponsoring Organizations of the Treadway Commission (COSO). The Company’s management is responsible for these financial statements, for maintaining effective internal control over financial reporting, and for its assessment of the effectiveness of internal control over financial reporting included in the accompanying Management’s Report on Internal Control Over Financial Reporting. Our responsibility is to express an opinion on these financial statements and an opinion on the Company’s internal control over financial reporting based on our audits.
We conducted our audits in accordance with standards of the Public Company Accounting Oversight Board (United States). Those standards require that we plan and perform our audits to obtain reasonable assurance about whether the financial statements are free of material misstatement and whether effective internal control over financial reporting was maintained in all material respects. Our audits of the financial statements included examining, on a test basis, evidence supporting the amounts and disclosures in the financial statements, assessing the accounting principles used and significant estimates made by management, and evaluating the overall financial statement presentation. Our audit of internal control over financial reporting included obtaining an understanding of internal control over financial reporting, assessing the risk that a material weakness exists, and testing and evaluating the design and operating effectiveness of internal control, based on the assessed risk. Our audits also included performing such other procedures as we considered necessary in the circumstances. We believe that our audits provide a reasonable basis for our opinions.
A company’s internal control over financial reporting is a process designed to provide reasonable assurance regarding the reliability of financial reporting and the preparation of financial statements for external purposes in accordance with generally accepted accounting principles. A company’s internal control over financial reporting includes those policies and procedures that 1) pertain to the maintenance of records that, in reasonable detail, accurately and fairly reflect the transactions and dispositions of the assets of the company; 2) provide reasonable assurance that transactions are recorded as necessary to permit preparation of financial statements in accordance with generally accepted accounting principles, and that receipts and expenditures of the company are being made only in accordance with authorizations of management and directors of the company; and 3) provide reasonable assurance regarding prevention or timely detection of unauthorized acquisition, use, or disposition of the company’s assets that could have a material effect on the financial statements.
Because of its inherent limitations, internal control over financial reporting may not prevent or detect misstatements. Also, projections of any evaluation of effectiveness to future periods are subject to the risk that controls may become inadequate because of changes in conditions, or that the degree of compliance with the policies or procedures may deteriorate.
In our opinion, the financial statements referred to above present fairly, in all material respects, the financial position of Allied Nevada Gold Corp. and subsidiaries as of December 31, 2013 and 2012, and the results of its operations and its cash flows for each of the years in the three-year period ended December 31, 2013, in conformity with accounting principles generally accepted in the United States of America. Also, in our opinion, the Company maintained, in all material respects, effective internal control over financial reporting as of December 31, 2013, based on criteria established in Internal Control - Integrated Framework (1992) issued by the Committee of Sponsoring Organizations of the Treadway Commission (COSO).
/s/ EKS&H LLLP
February 24, 2014
Denver, Colorado
Management’s Report on Internal Control over Financial Reporting
The Company’s management is responsible for establishing and maintaining adequate internal control over financial reporting as defined in Rule 13a-15(f) under the Exchange Act. Our internal control over financial reporting is a process designed to provide reasonable assurance regarding the reliability of financial reporting and the preparation of financial statements for external purposes in accordance with accounting principles generally accepted in the United States of America. Because of its inherent limitations, internal control over financial reporting may not prevent or detect misstatements. Also, projections of any evaluation of effectiveness to future periods are subject to the risk that controls may become inadequate because of changes in conditions, or that the degree of compliance with the policies or procedures may deteriorate.
The Company’s management, with the participation of the Company’s Chief Executive Officer and Chief Financial Officer, assessed the effectiveness of the Company’s internal control over financial reporting as of December 31, 2013. In making the assessment, the Company’s management, with the participation of the Company’s Chief Executive Officer and Chief Financial Officer, used the criteria set forth by the Committee of Sponsoring Organizations of the Treadway Commission in “Internal Control-Integrated Framework.” Based on that assessment, the Company’s management, with the participation of the Company’s Chief Executive Officer and Chief Financial Officer, concluded that, as of December 31, 2013, the Company’s internal control over financial reporting was effective based on such criteria.
The effectiveness of the Company’s internal control over financial reporting as of December 31, 2013 has been audited by EKS&H LLLP, an independent registered public accounting firm, as stated in their report, which is included herein.
|
| | |
| | | |
| /s/ Randy E. Buffington | | /s/ Stephen M. Jones |
| Randy E. Buffington | | Stephen M. Jones |
| President and Chief Executive Officer | | Executive Vice President and Chief Financial Officer |
| February 24, 2014 | | |
ALLIED NEVADA GOLD CORP.
CONSOLIDATED BALANCE SHEETS
(US dollars in thousands)
|
| | | | | | | |
| | December 31, |
| | 2013 | | 2012 |
| Assets: | | | |
| Cash and cash equivalents | $ | 81,470 |
| | $ | 347,047 |
|
| Accounts receivable | 8,227 |
| | 55,976 |
|
| Inventories - Note 3 | 76,221 |
| | 55,818 |
|
| Ore on leachpads, current - Note 4 | 156,693 |
| | 93,088 |
|
| Prepaids and other - Note 5 | 10,857 |
| | 12,084 |
|
| Assets held for sale | 47,357 |
| | — |
|
| Deferred tax assets, current - Note 8 | 22,943 |
| | — |
|
| Current assets | 403,768 |
| | 564,013 |
|
| Restricted cash - Note 11 | 41,215 |
| | 31,837 |
|
| Stockpiles and ore on leachpads, non-current - Note 4 | 116,192 |
| | 38,357 |
|
| Other assets, non-current - Note 5 | 12,682 |
| | 16,364 |
|
| Plant, equipment, and mine development, net - Note 6 | 890,271 |
| | 538,037 |
|
| Mineral properties, net - Note 7 | 48,473 |
| | 44,616 |
|
| Total assets | $ | 1,512,601 |
| | $ | 1,233,224 |
|
| Liabilities: | | | |
| Accounts payable | $ | 67,958 |
| | $ | 60,292 |
|
| Interest payable | 2,848 |
| | 2,756 |
|
| Other liabilities, current - Note 9 | 8,512 |
| | 5,259 |
|
| Debt, current - Note 10 | 76,780 |
| | 28,614 |
|
| Asset retirement obligation, current - Note 11 | 20 |
| | 331 |
|
| Deferred tax liabilities, current - Note 8 | — |
| | 76 |
|
| Current liabilities | 156,118 |
| | 97,328 |
|
| Other liabilities, non-current - Note 9 | 22,735 |
| | 10,223 |
|
| Debt, non-current - Note 10 | 522,427 |
| | 496,578 |
|
| Asset retirement obligation, non-current - Note 11 | 15,344 |
| | 8,726 |
|
| Deferred tax liabilities, non-current - Note 8 | 18,928 |
| | 395 |
|
| Total liabilities | 735,552 |
| | 613,250 |
|
| Commitments and Contingencies - Note 24 |
| |
|
| Stockholders’ Equity: - Note 12 | | | |
| Common stock, $0.001 par value | | | |
| Shares authorized: 200,000,000 | | | |
| Shares issued and outstanding: 104,043,169 and 89,734,112, respectively | 104 |
| | 90 |
|
| Additional paid-in capital | 750,119 |
| | 601,553 |
|
| Accumulated other comprehensive income (loss) - Note 20 | 1,674 |
| | (5,416 | ) |
| Retained earnings | 25,152 |
| | 23,747 |
|
| Total stockholders’ equity | 777,049 |
| | 619,974 |
|
| Total liabilities and stockholders’ equity | $ | 1,512,601 |
| | $ | 1,233,224 |
|
The accompanying notes are an integral part of these statements.
ALLIED NEVADA GOLD CORP.
CONSOLIDATED STATEMENTS OF INCOME AND COMPREHENSIVE INCOME
(US dollars in thousands, except per share amounts)
|
| | | | | | | | | | | |
| | Years ended December 31, |
| | 2013 | | 2012 | | 2011 |
Revenue - Note 14 | $ | 267,901 |
| | $ | 214,559 |
| | $ | 152,029 |
|
| Operating expenses: | | | | | |
| Production costs | 165,478 |
| | 94,898 |
| | 56,045 |
|
| Depreciation and amortization | 31,092 |
| | 14,594 |
| | 6,984 |
|
| Write-down of production inventories - Note 4 | 12,586 |
| | — |
| | — |
|
| Total cost of sales | 209,156 |
| | 109,492 |
| | 63,029 |
|
| Exploration, development, and land holding | 3,586 |
| | 7,367 |
| | 28,174 |
|
| Accretion - Note 11 | 659 |
| | 564 |
| | 450 |
|
| Corporate general and administrative | 18,893 |
| | 16,269 |
| | 18,593 |
|
| Separation and severance - Note 15 | 5,933 |
| | — |
| | — |
|
| Loss (gain) on disposition or sale of mineral properties - Note 7 | 1,394 |
| | — |
| | (1,097 | ) |
| Loss on assets classified as held for sale | 11,727 |
| | — |
| | — |
|
| Income from operations | 16,553 |
| | 80,867 |
| | 42,880 |
|
| Other income (expense): | | | | | |
| Interest income | 346 |
| | 899 |
| | 473 |
|
| Interest expense - Note 10 | (22,560 | ) | | (17,908 | ) | | (712 | ) |
| Other, net - Note 16 | (1,002 | ) | | 292 |
| | 417 |
|
| (Loss) income before income taxes | (6,663 | ) | | 64,150 |
| | 43,058 |
|
| Income tax benefit (expense) - Note 8 | 8,068 |
| | (16,423 | ) | | (6,349 | ) |
| Net income | 1,405 |
| | 47,727 |
| | 36,709 |
|
| Other comprehensive income (loss), net of tax | | | | | |
| Change in fair value of effective portion of cash flow hedge instruments, net of tax - Note 20 | 7,188 |
| | (5,940 | ) | | — |
|
| Settlements of cash flow hedges, net of tax - Note 20 | (16,594 | ) | | 2,297 |
| | — |
|
| Reclassifications into earnings, net of tax - Note 20 | 16,496 |
| | (1,773 | ) | | — |
|
| Other comprehensive income (loss), net of tax | 7,090 |
| | (5,416 | ) | | — |
|
| Comprehensive income | $ | 8,495 |
| | $ | 42,311 |
| | $ | 36,709 |
|
| Income per share: | | | | | |
| Basic - Note 17 | $ | 0.01 |
| | $ | 0.53 |
| | $ | 0.41 |
|
| Diluted - Note 17 | $ | 0.01 |
| | $ | 0.52 |
| | $ | 0.40 |
|
The accompanying notes are an integral part of these statements.
ALLIED NEVADA GOLD CORP.
CONSOLIDATED STATEMENTS OF CASH FLOWS
(US dollars in thousands)
|
| | | | | | | | | | | |
| | Years ended December 31, |
| | 2013 | | 2012 | | 2011 |
| Cash flows from operating activities: | | | | | |
| Net income | $ | 1,405 |
| | $ | 47,727 |
| | $ | 36,709 |
|
| Adjustments to reconcile net income for the period to net cash (used in) provided by operating activities: | | | | | |
| Depreciation and amortization | 31,092 |
| | 14,594 |
| | 6,984 |
|
| Accretion - Note 11 | 659 |
| | 564 |
| | 450 |
|
| Stock-based compensation - Note 13 | 6,052 |
| | 4,339 |
| | 6,562 |
|
| Deferred taxes - Note 8 | (8,304 | ) | | 18,656 |
| | 4,116 |
|
| Write-down of production inventories - Note 4 | 2,875 |
| | — |
| | — |
|
| Loss (gain) on disposition or sale of mineral properties - Note 7 | 1,394 |
| | — |
| | (1,097 | ) |
| Loss on assets classified as held for sale | 11,727 |
| | — |
| | — |
|
| Other non-cash items | — |
| | (300 | ) | | (397 | ) |
| Changes in operating assets and liabilities: | | | | | |
| Accounts receivable | 47,749 |
| | (55,976 | ) | | — |
|
| Inventories | (15,065 | ) | | (23,849 | ) | | (16,843 | ) |
| Stockpiles and ore on leach pads | (99,659 | ) | | (45,235 | ) | | (22,074 | ) |
| Prepaids and other | 3,954 |
| | (2,228 | ) | | 1,194 |
|
| Assets held for sale | (14,466 | ) | | — |
| | — |
|
| Accounts payable | (4,722 | ) | | 16,285 |
| | 1,310 |
|
| Interest payable | 92 |
| | 2,756 |
| | — |
|
| Asset retirement obligation | (47 | ) | | (540 | ) | | (775 | ) |
| Other liabilities | 3,081 |
| | 2,096 |
| | 1,282 |
|
| Net cash (used in) provided by operating activities | (32,183 | ) | | (21,111 | ) | | 17,421 |
|
| Cash flows from investing activities: | | | | | |
| Additions to plant, equipment, and mine development | (327,633 | ) | | (262,216 | ) | | (81,554 | ) |
| Additions to mineral properties | (51 | ) | | (130 | ) | | (114 | ) |
| Increases in restricted cash | (9,378 | ) | | (13,039 | ) | | (3,778 | ) |
| Proceeds from other investing activities | 1,375 |
| | 136 |
| | 183 |
|
| Net cash used in investing activities | (335,687 | ) | | (275,249 | ) | | (85,263 | ) |
| Cash flows from financing activities: | | | | | |
| Proceeds from issuance of common stock | 151,071 |
| | 464 |
| | 815 |
|
| Payments of share issuance costs | (8,543 | ) | | — |
| | — |
|
| Proceeds from debt issuance | — |
| | 400,400 |
| | — |
|
| Payments of debt issuance costs | (1,668 | ) | | (15,340 | ) | | (476 | ) |
| Proceeds from sale-leaseback agreement | — |
| | — |
| | 9,471 |
|
| Repayments of principal on capital lease obligations | (38,567 | ) | | (16,323 | ) | | (5,591 | ) |
| Excess tax benefit from stock-based awards | — |
| | (796 | ) | | 796 |
|
| Net cash provided by financing activities | 102,293 |
| | 368,405 |
| | 5,015 |
|
| Net (decrease) increase in cash and cash equivalents | (265,577 | ) | | 72,045 |
| | (62,827 | ) |
| Cash and cash equivalents, beginning of period | 347,047 |
| | 275,002 |
| | 337,829 |
|
| Cash and cash equivalents, end of period | $ | 81,470 |
| | $ | 347,047 |
| | $ | 275,002 |
|
The accompanying notes are an integral part of these statements.
ALLIED NEVADA GOLD CORP.
CONSOLIDATED STATEMENTS OF CASH FLOWS - (Continued)
(US dollars in thousands)
|
| | | | | | | | | | | |
| | Years ended December 31, |
| | 2013 | | 2012 | | 2011 |
| Supplemental cash flow disclosures: | | | | | |
| Cash paid for interest | $ | 43,839 |
| | $ | 21,367 |
| | $ | 1,167 |
|
| Cash paid for income taxes | — |
| | 3,950 |
| | — |
|
| Significant non-cash financing and investing activities: | | | | | |
| Mining equipment acquired through debt financing | 111,731 |
| | 84,877 |
| | 35,823 |
|
| Plant and equipment additions through accounts payable increase | 40,128 |
| | 27,740 |
| | 10,047 |
|
| Assets held for sale acquired through debt financing | 23,697 |
| | — |
| | — |
|
| Mineral property addition through asset retirement obligation increase | 5,695 |
| | 307 |
| | 2,323 |
|
| Accounts payable reduction through capital lease | 2,560 |
| | 10,047 |
| | — |
|
| Additional paid in capital increase from award modification and settlement of outstanding DPU liability | — |
| | 7,453 |
| | — |
|
| Mineral properties increase from deferred tax adjustment | — |
| | — |
| | 5,611 |
|
The accompanying notes are an integral part of these statements.
ALLIED NEVADA GOLD CORP.
CONSOLIDATED STATEMENTS OF STOCKHOLDERS’ EQUITY
(US dollars in thousands, except shares)
|
| | | | | | | | | | | | | | | | | | | | | | |
| | Common Stock | | Additional Paid-in Capital | | Accumulated Other Comprehensive Income (Loss) | | Retained Earnings (Accumulated Deficit) | | Total Stockholders’ Equity |
| | Shares | | Amount | |
| Balance, January 1, 2011 | 88,958,989 |
| | $ | 89 |
| | $ | 583,354 |
| | $ | — |
| | $ | (60,689 | ) | | $ | 522,754 |
|
| Shares issued under stock option plans | 177,541 |
| | — |
| | 815 |
| | — |
| | — |
| | 815 |
|
| Stock-based compensation and share issuances under RSU Plan | 510,458 |
| | 1 |
| | 4,047 |
| | — |
| | — |
| | 4,048 |
|
| Utilization of excess tax benefits | — |
| | — |
| | 796 |
| | — |
| | — |
| | 796 |
|
| Net income | — |
| | — |
| | — |
| | — |
| | 36,709 |
| | 36,709 |
|
| Balance, December 31, 2011 | 89,646,988 |
| | $ | 90 |
| | $ | 589,012 |
| | $ | — |
| | $ | (23,980 | ) | | $ | 565,122 |
|
| Shares issued under stock option plans | 92,442 |
| | — |
| | 464 |
| | — |
| | — |
| | 464 |
|
| Stock-based compensation and share issuances under RSU Plan | 231,323 |
| | 1 |
| | 4,632 |
| | — |
| | — |
| | 4,633 |
|
| Stock-based compensation and share issuances under DSU Plan | 3,092 |
| | — |
| | 787 |
| | — |
| | — |
| | 787 |
|
| Correction of reporting issuance by RSU stock plan administrator | (280,000 | ) | | (1 | ) | | 1 |
| | — |
| | — |
| | — |
|
| Modification of the DPU Plan - Note 13 | — |
| | — |
| | 7,453 |
| | — |
| | — |
| | 7,453 |
|
| Shares issued under the DPU Plan | 40,267 |
| | — |
| | — |
| | — |
| | — |
| | — |
|
| Change to previous utilization of excess tax benefits | — |
| | — |
| | (796 | ) | | — |
| | — |
| | (796 | ) |
| Other comprehensive loss - Note 20 | — |
| | — |
| | — |
| | (5,416 | ) | | — |
| | (5,416 | ) |
| Net income | — |
| | — |
| | — |
| | | | 47,727 |
| | 47,727 |
|
| Balance, December 31, 2012 | 89,734,112 |
| | $ | 90 |
| | $ | 601,553 |
| | $ | (5,416 | ) | | $ | 23,747 |
| | $ | 619,974 |
|
| Shares issued under 2007 Stock Option Plan | 90,000 |
| | — |
| | 571 |
| | — |
| | — |
| | 571 |
|
| Stock-based compensation and share issuances under RSU Plan | 219,057 |
| | — |
| | 5,052 |
| | — |
| | — |
| | 5,052 |
|
| Stock-based compensation under DSU Plan | — |
| | — |
| | 1,000 |
| | — |
| | — |
| | 1,000 |
|
| Shares issued in public offering | 14,000,000 |
| | 14 |
| | 150,486 |
| | — |
| | — |
| | 150,500 |
|
| Share issuance costs | — |
| | — |
| | (8,543 | ) | | — |
| | — |
| | (8,543 | ) |
| Other comprehensive income - Note 20 | — |
| | — |
| | — |
| | 7,090 |
| | — |
| | 7,090 |
|
| Net income | — |
| | — |
| | — |
| | — |
| | 1,405 |
| | 1,405 |
|
| Balance, December 31, 2013 | 104,043,169 |
| | $ | 104 |
| | $ | 750,119 |
| | $ | 1,674 |
| | $ | 25,152 |
| | $ | 777,049 |
|
The accompanying notes are an integral part of these statements.
ALLIED NEVADA GOLD CORP.
Notes to Consolidated Financial Statements
1. Nature of Operations
Allied Nevada Gold Corp. and its subsidiaries (collectively, “Allied Nevada” or the “Company”) is a U.S. based gold producer focused on mining, developing, and exploring properties in the state of Nevada. Allied Nevada’s operating property, the Hycroft Mine, and its advanced exploration and other exploration properties are all located in the State of Nevada.
2. Summary of Significant Accounting Policies
Basis of Presentation
The Consolidated Financial Statements of the Company have been prepared in accordance with generally accepted accounting principles (“GAAP”) in the United States. The results of operations are not necessarily indicative of the results that may be expected for future years. References to “$” refers to United States currency and “CDN $” to Canadian currency.
Use of Estimates
The preparation of the Company’s Consolidated Financial Statements requires management to make estimates and assumptions that affect amounts reported in these financial statements and accompanying notes. The more significant areas requiring the use of management estimates and assumptions relate to mineral reserves that are the basis for future cash flow estimates utilized in impairment calculations and units of production amortization calculations; estimates of recoverable gold and silver in stockpiles, ore on leach pads, and in-process inventories; the classification of current and non-current stockpiles and ore leach pads inventories; net realizable value of stockpiles, ore on leach pads, and in-process inventories; the useful lives of long-lived assets, environmental reclamation and closure costs; deferred taxes and related valuation allowances; and estimates of fair value for asset impairments, financial instruments, and assets held for sale. The Company bases its estimates on historical experience and various assumptions that are believed to be reasonable at the time the estimate is made. Accordingly, actual results may differ from amounts estimated in these Consolidated Financial Statements and such differences could be material.
Principles of Consolidation
The Consolidated Financial Statements include the accounts of Allied Nevada Gold Corp. and its wholly-owned subsidiaries. All significant intercompany balances and transactions have been eliminated.
Reclassifications
Certain reclassifications have been made to the prior period Consolidated Financial Statements to conform to the current period presentation. The Company reclassified its advance payments for plant and equipment from Other assets, non-current to Plant, equipment, and mine development, net in the Consolidated Balance Sheets as of December 31, 2012. The Company also reclassified refining and processing fees from Other liabilities, current to Accounts receivable in the Consolidated Balance Sheets as of December 31, 2012 and made conforming changes to the Consolidated Statements of Cash Flows for the year ended December 31, 2012. These reclassifications decreased total assets and total liabilities each by $4.5 million and had no effect on previously reported net cash flows or net income.
Cash and Cash Equivalents
Cash and cash equivalents consist of all cash balances and highly liquid investments with an original maturity of three months or less. Cash and cash equivalents are invested in highly liquid money market funds with high quality financial institutions. The Company has not experienced any losses on cash balances and believes that no significant risk of loss exists with respect to its cash and cash equivalents. Restricted cash is excluded from cash and cash equivalents and is listed separately on the Consolidated Balance Sheets.
Accounts Receivable
Accounts receivable consist of amounts due from customers for gold and silver sales. The Company has evaluated the customers credit risk and financial condition and determined that no allowance for doubtful accounts is necessary. The entire accounts receivable balance is expected to be collected during the next 12 months.
ALLIED NEVADA GOLD CORP.
Notes to Consolidated Financial Statements
Stockpiles, Ore on Leach Pads, and Inventories
The Company’s production-related inventories include: ore on leach pads; stockpiles; in-process inventories; and precious metals inventory. Production-related inventories are carried at the lower of average cost or market. Cost includes mining (ore and waste), processing, and refining costs incurred during production stages, including mine site overhead and depreciation and amortization relating to mining and processing operations. Market is computed using the London Bullion Market Association’s (“LBMA”) quoted period-end metal prices reduced for any further estimated mining, processing, refining, and selling costs. Losses that result from the application of the lower of cost or market are recorded to Write-down of production inventories on the Consolidated Statements of Income and Comprehensive Income. Refer to Note 4 - Stockpiles and Ore On Leach Pads for additional information.
The recovery of gold at the Hycroft Mine is accomplished through a heap leaching process, the nature of which limits the Company’s ability to precisely determine the recoverable gold ounces in stockpiles and ore on leach pads. The Company estimates the quantity of recoverable gold ounces in stockpiles and ore on leachpads using surveyed volumes of material, ore grades determined through sampling and assaying of blastholes, and estimated recovery percentages based on ore type and domain. The estimated recoverable gold ounces stockpiled or placed on the leach pads is periodically reconciled by comparing the related ore to the actual gold ounces recovered (metallurgical balancing). Changes in recovery rate estimates from metallurgical balancing that do not result in write-downs are accounted for on a prospective basis. If a write-down is required, production-related inventories would be adjusted to market values before prospectively accounting for the remaining costs and revised estimated recoverable ounces. The Company has not incurred any write-downs of production-related inventories as a result of metallurgical balancing analytics.
Stockpiles
Stockpiles represent ore that has been extracted from the mine and is available for further processing. Costs are transferred from stockpiles to other production-related inventories at an average cost per estimated recoverable ounce of gold.
Ore on leach pads
Ore on leach pads represents ore that is being treated with a chemical solution to dissolve the contained gold. Costs are transferred from ore on leach pads at an average cost per estimated recoverable ounce of gold to in-process inventories as the gold-bearing materials are further processed.
In-process Inventories
In-process inventories represent gold-bearing concentrated materials that are in the process of being converted to a saleable product using a Merrill-Crowe or carbon in column processing method. Costs are transferred from in-process inventories at an average cost per ounce of gold to precious metals inventory as gold ounces are recovered.
Precious Metals Inventory
Precious metals inventory consist of doré containing both gold and silver. Costs of precious metals inventory are recognized in Total costs of sales as gold ounces are sold.
Materials and Supplies
Materials and supplies are valued at the lower of average cost or net realizable value. Cost includes applicable taxes and freight.
Assets Held for Sale
From time to time the Company may determine that certain of its property and equipment no longer fit into its strategic operating plans and commit to a plan to sell such identified assets. Assets held for sale are actively marketed at prices that are equal to, or less than, their current fair values which the Company believes will result in their sale within the next twelve months. Assets held for sale are carried at the lower of their carrying amount or fair value less costs to sell. Liabilities related to assets held for sale, including outstanding debt, are classified as current liabilities on the Consolidated Balance Sheets. The Company ceases depreciation on assets classified as held for sale. Losses resulting from adjusting an asset held for sale to fair value less costs to sell are recorded to Loss on assets classified as held for sale on the Consolidated Statements of Income and Comprehensive Income.
At December 31, 2013, assets held for sale included a residential housing and townhouse development, new and used blasthole drills, used haul trucks, shovels, and graders, and the components required for one electric wire rope shovel.
ALLIED NEVADA GOLD CORP.
Notes to Consolidated Financial Statements
Plant, Equipment, and Mine Development
Expenditures for new facilities or equipment and expenditures that extend the useful lives or expand the production capacity of existing facilities or equipment are capitalized and recorded at cost. Such costs are depreciated using the straight-line or units-of-production methods at rates sufficient to depreciate such costs over the estimated productive lives of such assets or estimated proven and probable reserves as gold ounces are recovered. Refer to Note 6 - Plant, Equipment, and Mine Development, Net for additional information.
Mine Development
Mine development costs include the cost of engineering and metallurgical studies, drilling and assaying costs to delineate an ore body, environmental costs, the building of infrastructure, and the removal of overburden to initially expose an ore body at an open pit mine within a mining complex. Additionally, interest is capitalized to mine development until such assets are ready for their intended use. Any of the above costs incurred before mineralization is classified as proven and probable reserves are expensed.
Drilling, engineering, metallurgical, and other related costs are capitalized for an ore body where proven and probable reserves exist and the activities are directed at obtaining additional information on the ore body, converting non-reserve mineralization to proven and probable reserves, infrastructure planning, or supporting the environmental impact statement. All other drilling costs are expensed as incurred. Drilling costs incurred during the production phase for operational ore control are allocated to inventory costs to be included as a component of Total cost of sales.
The cost of removing overburden and waste materials to access proven and probable reserves prior to the production phase of a mine are referred to as “pre-production stripping costs” and are capitalized during the development of an open pit mine. Where multiple open pit mines exist at a mining complex using common processing facilities, pre-production stripping costs are capitalized at each pit determined to be a separate and distinct mining area or operation. The Company’s definition of a mine and accounting treatment of pre-production stripping costs may differ from that of other companies in the mining industry. The production phase of an open pit mine commences when the Company has extracted (produced) more than a de-minimus amount of saleable gold. Mining costs incurred in production phase pits are included as a component of Stockpiles and Ore on leach pads to be recognized in Production costs in the same period as the revenue from the sale of inventory.
Mine development costs are amortized using the units-of-production method based upon estimated recoverable ounces in proven and probable reserves. To the extent such capitalized costs benefit an entire ore body, they are amortized over the estimated life of that ore body. Capitalized costs that benefit specific ore blocks or areas are amortized over the estimated life of that specific ore block or area. Recoverable ounces are determined by the Company based upon its proven and probable reserves and estimated metal recoveries associated with those reserves.
Mineral Properties
Mineral properties are tangible assets recorded at cost for royalty interests and land and mineral rights to explore and extract minerals from properties. Once a property is in the production phase, mineral property costs are amortized using the units-of-production method based upon estimated recoverable gold ounces from proven and probable reserves at such properties. Currently, the Company is amortizing mineral property costs associated with its only operating property, the Hycroft Mine. Costs to maintain mineral properties are expensed in the period they are incurred. Gains and losses from the sale or disposal of mineral properties are recorded to Loss (gain) on disposition or sale of mineral properties on the Consolidated Statements of Income and Comprehensive Income. Refer to Note 7 - Mineral Properties, Net for additional information.
Impairment of Long-lived Assets
The Company reviews and evaluates its long-lived assets for impairment annually and at interim periods if events or changes in circumstances indicate that the related carrying amounts may not be recoverable. An impairment is determined to exist if the total estimated future cash flows on an undiscounted basis are less than the carrying amount of the assets. An impairment loss is measured and recorded based on the excess carrying value of the impaired asset over fair value. Future cash flows are estimated based on quantities of recoverable minerals, expected gold and other commodity prices (considering current and historical prices, price trends and related factors), production levels and operating costs of production and capital costs, all based on life-of-mine plans. The term “recoverable minerals” refers to the estimated amount of gold and silver that will be obtained after taking into account losses during ore processing and treatment. In estimating future cash flows, assets are grouped at the lowest level for which there are identifiable cash flows that are largely independent of future cash flows from other asset groups. The Company’s estimates of future cash flows are based on numerous assumptions and actual future cash flows may be significantly different than the estimates, as actual future quantities of recoverable minerals, gold and other commodity prices, production levels and operating costs of production and capital costs are each subject to significant risks and uncertainties. The Company had no impairments during the years ended December 31, 2013, 2012, or 2011.
ALLIED NEVADA GOLD CORP.
Notes to Consolidated Financial Statements
Asset Retirement Obligations
Asset retirement obligations, consisting primarily of estimated mine reclamation and closure costs at the Company’s Hycroft Mine, are recognized in the period incurred and recorded as liabilities at fair value. Such obligations, which are initially estimated based on discounted cash flow estimates, are accreted to full value over time through charges to Accretion expense. Asset retirement cost assets are depreciated on a units-of-production method over the related long-lived asset’s useful life. Asset retirement obligations are periodically adjusted to reflect changes in the estimated present value resulting from revisions to the estimated timing or amount of reclamation and closure costs. The Company reviews and evaluates its asset retirement obligations annually or more frequently at interim periods if deemed necessary. Refer to Note 11 - Asset Retirement Obligation for additional information.
Derivative Instruments
The Company has a cross currency swap agreement in place to hedge against changes in foreign exchange and interest rates and from time to time has previously entered into diesel swap agreements to hedge against changes in diesel prices. Certain of the Company’s provisionally priced sales agreements contain embedded derivatives (as discussed below in Revenue Recognition). While derivative instruments may enhance the predictability of certain cash flows, they may also curtail benefits from future decreases in diesel prices and changes in the CDN dollar to U.S. dollar exchange rate. The Company does not hold derivative instruments for trading purposes.
The fair value of the Company’s derivative instruments are reflected as assets or liabilities on the Consolidated Balance Sheets. The Company designated the cross currency swap and diesel swaps as cash flows hedges and, as such, the effective portion of changes in the fair value of these derivative instruments, together with settlement gains and losses, are deferred in Accumulated other comprehensive income (loss) and reclassified into earnings when the hedged transaction affects earnings. Transactions related to the Company’s derivative instruments accounted for as hedges are classified in the same category as the hedged item in the Consolidated Statements of Cash Flows. Refer to Note 19 - Fair Value Measurements and Note 20 - Derivative Instruments for additional information.
For derivatives designated as hedges the Company assesses, both at the hedge’s inception and on an ongoing basis (quarterly), whether the derivatives are highly effective in offsetting cash flows of hedged items. The ineffective portions of a derivative’s gain or loss, if any, are recorded to Other, net. In addition, if a derivative is not expected to be highly effective in the future, the Company will stop hedge accounting and previously deferred gains or losses in Accumulated other comprehensive income (loss) will be reclassified into earnings when the hedged transaction impacts earnings. The Company has not experienced any ineffectiveness with its derivatives.
Revenue Recognition
The Company recognizes revenue on gold and silver sales when persuasive evidence of an arrangement exists, the price is fixed or determinable, the title or risk of loss has been transferred to the customer, and collectability is reasonably assured.
For the years ended December 31, 2013, 2012, and 2011, approximately 93%, 90%, and 91%, respectively, of the Company’s sales were attributable to gold. A significant and sustained decrease in the price of gold and/or silver from current levels could have a material and negative impact on the Company’s business, financial condition, and results of operations. Refer to Note 14 - Revenue for additional information.
Provisionally Priced Sales
Revenues from the Company’s provisionally priced, carbon in-process inventory sales are recorded at the time of shipment based on forward prices and estimates of recoverable gold and silver ounces. The sales agreements, in general, provide for a provisional payment to the Company on the shipment date based upon provisional assays and quoted metal prices. Provisionally priced sales are settled at future dates using then current metal prices. When final settlement occurs, changes in metal prices from the shipment date and/or metal quantities from updated assay information result in adjustments to previously recorded revenues and accounts receivable. Final settlements generally occur within one to five months from the shipment date. The Company does not provisionally price its finished goods (doré), which is sold at quoted spot market prices.
Provisionally priced sales agreements contain an embedded derivative that is required to be separated from the host contract for accounting purposes. The host contract is the receivable from the sale of metals at forward prices. The embedded derivative, which does not qualify for hedge accounting, is adjusted to fair value through earnings (Revenues) each period, using period-end forward prices, through the date of final settlement. Embedded derivatives are recorded as assets in Prepaids and other or as liabilities in Other liabilities, current. As of December 31, 2013 and 2012 the Company had no provisionally priced sales.
ALLIED NEVADA GOLD CORP.
Notes to Consolidated Financial Statements
Separation and Severance Costs
Separation and severance costs result(ed) from rationalizing the Company’s overall employee headcount to align its operations in the most strategic and cost-efficient structure. Separation and severance costs are considered those costs associated with (1) a substantial re-alignment of the Company’s management structure and (2) substantial reductions to the Company’s existing workforce. Separation and severance costs are comprised of one-time, cash payments to employees who are involuntarily terminated and additional benefits pursuant to severance and/or settlement agreements, such as stock-based compensation costs resulting from the continued vesting of outstanding restricted share unit awards. Liabilities for separation and severance costs are recorded at fair value in the period in which they are incurred and included in Other liabilities, current prior to payment. Refer to Note 15 - Separation and Severance Costs for additional information.
Stock-Based Compensation
Stock-based compensation costs for eligible employees and directors are measured at fair value on the date of grant and charged to expense over the requisite service period. The fair value of awards is determined using the stock price on either the date of grant (if subject only to service conditions) or the date that the Compensation Committee of the Board of Directors establishes applicable performance targets (if subject to performance conditions). The Company estimates forfeitures at the time of grant and revises those estimates in subsequent periods through the final vesting date. Refer to Note 13 - Stock-Based Compensation for additional information.
Income Taxes
Considerable judgment is required in determining the Company’s provision for income taxes and evaluating its uncertain tax positions. The Company accounts for income taxes using the liability method, recognizing certain temporary differences between the financial reporting basis of the Company’s liabilities and assets and the related income tax basis for such liabilities and assets. This method generates either a net deferred income tax liability or asset for the Company, as measured by the statutory tax rates in effect. The Company derives its deferred income tax provision or benefit by recording the change in either the net deferred income tax liability or asset balance for the year. Refer to Note 8 - Income Taxes for additional information.
The Company’s deferred income tax assets include certain future tax benefits. The Company records a valuation allowance against any portion of those deferred income tax assets when it believes, based on the weight of available evidence, it is more likely than not that some portion or all of the deferred income tax asset will not be realized. Evidence evaluated includes past operating results, forecasted earnings, estimated future taxable income, and prudent and feasible tax planning strategies. The assumptions utilized in determining future taxable income require significant judgment and are consistent with the plans and estimates used to manage the underlying business.
As necessary, the Company also provides reserves against the benefits of uncertain tax positions taken on its tax filings. The necessity for and amount of a reserve is established by determining, based on the weight of available evidence, the amount of benefit which is more likely than not to be sustained upon audit for each uncertain tax position. The difference, if any, between the full benefit recorded on the tax return and the amount more likely than not to be sustained is recorded as a liability.
New Accounting Pronouncements
Recently Adopted
In January 2013, the Financial Accounting Standards Board (“FASB”) issued ASU No. 2013-1, “Clarifying the Scope of Disclosures about Offsetting Assets and Liabilities.” ASU 2013-1 states the intended scope of disclosures required by ASU No. 2011-11 “Balance Sheet (Topic 210): Disclosures about Offsetting Assets and Liabilities” apply to derivatives and hedging transactions. This pronouncement was effective for fiscal years, and interim periods within those years, beginning on or after January 1, 2013. The adoption of this guidance did not have an effect on the Company’s consolidated financial position, results of operations, or cash flows.
In February 2013, FASB issued ASU No. 2013-2, “Reporting of Amounts Reclassified Out of Accumulated Other Comprehensive Income.” ASU 2013-2 improves the reporting of reclassifications out of accumulated other comprehensive income by requiring an entity to report their corresponding effect(s) on net income. This pronouncement was effective for fiscal years, and interim periods within those years, beginning on or after December 15, 2012. Other than the additional disclosure requirements, the adoption of this guidance did not have an effect on the Company’s consolidated financial position, results of operations, or cash flows.
ALLIED NEVADA GOLD CORP.
Notes to Consolidated Financial Statements
Recently Issued
In July 2013, FASB issued ASU No. 2013-11, “Presentation of an Unrecognized Tax Benefit When a Net Operating Loss (“NOL”) Carryforward, a Similar Tax Loss, or a Tax Credit Carryforward Exists.” ASU 2013-11 improves the reporting of unrecognized tax benefits when an NOL carryforward, a similar tax loss, or a tax credit carryforward exists, by eliminating diversity in practice. This pronouncement is effective for fiscal years, and interim periods within those years, beginning on or after December 15, 2013. Other than the additional disclosure requirements, the adoption of this guidance is not expected to have an effect on the Company’s consolidated financial position, results of operations, or cash flows.
3. Inventories
The following table provides the components of inventories and the estimated recoverable gold ounces therein (in thousands, except ounces):
|
| | | | | | | | | | | | | |
| | December 31, 2013 | | December 31, 2012 |
| | Amount | | Gold ounces | | Amount | | Gold ounces |
| Materials and supplies | $ | 18,002 |
| | | | $ | 11,637 |
| | |
| In-process | 56,133 |
| | 50,268 |
| | 42,479 |
| | 46,754 |
|
| Carbon in-process | 859 |
| | 724 |
| | 1,281 |
| | 1,474 |
|
| Precious metals | 1,227 |
| | 1,106 |
| | 421 |
| | 463 |
|
| | $ | 76,221 |
| | 52,098 |
| | $ | 55,818 |
| | 48,691 |
|
4. Stockpiles and Ore On Leach Pads
The following table summarizes stockpiles and ore on leach pads and the estimated recoverable gold ounces therein (in thousands, except ounces):
|
| | | | | | | | | | | | | |
| | December 31, 2013 | | December 31, 2012 |
| | Amount | | Gold ounces | | Amount | | Gold ounces |
| Current: | | | | | | | |
| Ore on leach pads | $ | 156,693 |
| | 136,313 |
| | $ | 93,088 |
| | 114,252 |
|
| Non-current: | | | | | | | |
| Ore on leach pads | $ | 88,501 |
| | 77,537 |
| | $ | 23,272 |
| | 28,563 |
|
| Stockpiles | 27,691 |
| | 61,771 |
| | 15,085 |
| | 32,074 |
|
| | $ | 116,192 |
| | 139,308 |
| | $ | 38,357 |
| | 60,637 |
|
As discussed in Note 2 - Summary of Significant Accounting Policies, the market value of the Company’s production-related inventories is determined in part by using period-end LBMA prices per gold and silver ounce and is highly sensitive to these inputs. At December 31, 2013, the period-end LBMA price per gold ounce was $1,201.50 and the price per silver ounce was $19.50. The Company’s application of its lower of cost or market accounting policy using these period-end LBMA metal prices resulted in a $12.6 million write-down of Ore on leach pads during the year ended December 31, 2013. The Company does not believe the December 31, 2013 LBMA metal prices represent a temporary or unusual decline as there is a general consensus among market analysts and financial institutions that 2014 gold and silver prices could remain at levels comparable to those at year end. If metal prices decline further during the year ending December 31, 2014, the Company could be required to record additional write-downs to its production-related inventories. The Company’s $12.6 million write-down of Ore on leach pads consisted of $2.9 million of allocated depreciation and amortization costs and $9.7 million of previously incurred cash production costs. The write-down during the year ended December 31, 2013 resulted solely from the Company’s application of its lower of cost or market accounting policy and was unrelated to any metallurgical balancing analytics or changes to recovery rates.
The Company did not write-down any production-related inventories during the years ended December 31, 2012 or 2011.
ALLIED NEVADA GOLD CORP.
Notes to Consolidated Financial Statements
5. Prepaids and Other Assets
The following table provides the components of prepaids and other assets (in thousands):
|
| | | | | | | |
| | December 31, |
| | 2013 | | 2012 |
| Prepaids and other | | | |
| Prepaids | $ | 6,083 |
| | $ | 6,185 |
|
| Federal income taxes receivable | 2,914 |
| | 3,150 |
|
| Deposits | 1,685 |
| | 661 |
|
| Derivative instruments - Note 20 | — |
| | 1,826 |
|
| Other | 175 |
| | 262 |
|
| | $ | 10,857 |
| | $ | 12,084 |
|
| Other assets, non-current | | | |
| Debt issuance costs, net | $ | 12,208 |
| | $ | 13,947 |
|
| Marketable equity securities | — |
| | 1,774 |
|
| Reclamation policy premium, net | 474 |
| | 593 |
|
| Other | — |
| | 50 |
|
| | $ | 12,682 |
| | $ | 16,364 |
|
6. Plant, Equipment, and Mine Development, Net
The following table provides the components of plant, equipment, and mine development, net (in thousands):
|
| | | | | | | | | |
| | Depreciable life or method | | December 31, |
| | | 2013 | | 2012 |
| Mine equipment | 3 - 10 years | | $ | 312,425 |
| | $ | 188,499 |
|
| Mine development | Units-of-production | | 120,038 |
| | 96,406 |
|
| Leach pads | Units-of-production | | 78,737 |
| | 38,700 |
|
| Process equipment | Units-of-production | | 60,875 |
| | 11,947 |
|
| Buildings and leasehold improvements | 3 - 10 years | | 25,083 |
| | 19,798 |
|
| Furniture, fixtures, and office equipment | 2 - 3 years | | 4,236 |
| | 3,769 |
|
| Vehicles | 3 - 5 years | | 2,943 |
| | 2,332 |
|
| Construction in progress and other | | | 421,117 |
| | 247,262 |
|
| | | | 1,025,454 |
| | 608,713 |
|
| Less: accumulated depreciation and amortization | | | (135,183 | ) | | (70,676 | ) |
| | | | $ | 890,271 |
| | $ | 538,037 |
|
Mine equipment included $261.8 million and $147.9 million at December 31, 2013 and 2012, respectively, for the gross amount of assets acquired under outstanding capital lease and term loan obligations. Accumulated depreciation on such mine equipment totaled $49.3 million and $19.0 million at December 31, 2013 and 2012, respectively.
The Company records advance payments for plant and equipment in construction in progress and other. Construction in progress at December 31, 2013 consisted of $228.9 million related to the mill expansion, $173.1 million for the crushing system, $8.5 million for the South leach pad expansion, and $10.6 million for other capital items.
ALLIED NEVADA GOLD CORP.
Notes to Consolidated Financial Statements
7. Mineral Properties, Net
The following table summarizes changes in the Company’s mineral properties, net (in thousands):
|
| | | | | | | |
| | Years ended December 31, |
| | 2013 | | 2012 |
| Balance, beginning of year | $ | 44,616 |
| | $ | 44,706 |
|
| Asset retirement cost asset increase | 5,695 |
| | 307 |
|
| Property additions | 51 |
| | 130 |
|
| Property dispositions | (1,441 | ) | | — |
|
| Amortization of royalty rights | (339 | ) | | (205 | ) |
| Amortization of asset retirement cost asset | (109 | ) | | (322 | ) |
| Balance, end of year | $ | 48,473 |
| | $ | 44,616 |
|
As of December 31, 2013, Mineral properties, net included royalty rights of $3.5 million and an asset retirement cost asset of $10.1 million that were being amortized using the units-of-production method based upon proven and probable reserves at the Company’s only operating property, the Hycroft Mine. Asset retirement cost asset increases are related to upward revisions of cash flow estimates for the Company’s asset retirement obligation. Refer to Note 11 - Asset Retirement Obligation for additional information.
During the year ended December 31, 2013, the Company completed a review of its early-stage exploration properties, which are properties having no defined mineralized material due to insufficient historical exploration activities. As a result of this review, the Company abandoned 12 mineral properties and recorded a $1.4 million loss on disposition.
8. Income Taxes
The Company’s income (loss) before income taxes was attributable solely to domestic operations in the United States. The components of the Company’s income tax (benefit) expense are as follows (in thousands):
|
| | | | | | | | | | | |
| | Years ended December 31, |
| | 2013 | | 2012 | | 2011 |
| Current: | | | | | |
| Federal | $ | 236 |
| | $ | (2,233 | ) | | $ | 2,233 |
|
| Deferred: | | | | | |
| Federal | (12,653 | ) | | 18,920 |
| | 4,116 |
|
| Change in valuation allowance | 4,349 |
| | (264 | ) | | — |
|
| Income tax (benefit) expense | $ | (8,068 | ) | | $ | 16,423 |
| | $ | 6,349 |
|
The following table provides a reconciliation of income taxes computed at the United States federal statutory tax rate of 35% to income tax provision (benefit) (in thousands):
|
| | | | | | | | | | | |
| | Years ended December 31, |
| | 2013 | | 2012 | | 2011 |
| (Loss) income before income taxes | $ | (6,663 | ) | | $ | 64,150 |
| | $ | 43,058 |
|
| United States statutory income tax rate | 35 | % | | 35 | % | | 35 | % |
| Income tax (benefit) expense at United States statutory income tax rate | (2,332 | ) | | 22,452 |
| | 15,071 |
|
| Percentage depletion | (11,438 | ) | | (6,933 | ) | | (7,688 | ) |
| Change in valuation allowance | 4,349 |
| | (264 | ) | | — |
|
| Basis adjustment | 831 |
| | — |
| | (1,077 | ) |
| Stock-based compensation shortfall | 498 |
| | — |
| | — |
|
| Other | 24 |
| | 1,168 |
| | 43 |
|
| Income tax (benefit) expense | $ | (8,068 | ) | | $ | 16,423 |
| | $ | 6,349 |
|
ALLIED NEVADA GOLD CORP.
Notes to Consolidated Financial Statements
The components of the Company’s deferred tax assets and liabilities are as follows (in thousands):
|
| | | | | | | |
| | December 31, |
| | 2013 | | 2012 |
| Current deferred tax assets (liabilities) | | | |
| Inventories | $ | 18,574 |
| | $ | (15,728 | ) |
| Assets held for sale | 3,842 |
| | — |
|
| Other liabilities | 2,842 |
| | 837 |
|
| Net operating loss | — |
| | 15,837 |
|
| Diesel and currency swaps | (249 | ) | | (1,022 | ) |
| Valuation allowance | (2,066 | ) | | — |
|
| Net current deferred tax assets (liabilities) | $ | 22,943 |
| | $ | (76 | ) |
| Non-current deferred tax assets (liabilities) | | | |
| Plant, equipment, and mine development | $ | (50,727 | ) | | $ | (13,964 | ) |
| Net operating loss | 16,475 |
| | — |
|
| Inventories | 6,822 |
| | — |
|
| Stock-based compensation | 5,776 |
| | 6,461 |
|
| Asset retirement obligation | 5,377 |
| | 3,170 |
|
| Currency swap | (653 | ) | | 3,938 |
|
| Credits and other | 285 |
| | — |
|
| Valuation allowance | (2,283 | ) | | — |
|
| Net non-current deferred tax liabilities | $ | (18,928 | ) | | $ | (395 | ) |
| Total net deferred tax assets (liabilities) | $ | 4,015 |
| | $ | (471 | ) |
The ultimate realization of deferred tax assets is dependent upon the generation of future taxable income during the periods in which those temporary differences become deductible. Management considers the scheduled reversal of deferred tax liabilities, available taxes in carryback periods, projected future taxable income projections and tax planning strategies in assessing whether deferred tax assets will be realized. As of December 31, 2013, the Company believed it will be subject to alternative minimum tax (“AMT”) for the foreseeable future and has recorded a valuation allowance of $4.3 million to reflect the expected realizable value of its net deferred tax assets, including a full valuation allowance against $0.2 million of AMT credit carry forward.
The Company had net operating loss carryovers as of December 31, 2013 of $89.9 million for federal income tax purposes and $47.1 million for financial statement purposes. The difference of $42.8 million related to excess stock-based compensation tax deductions reported for tax purposes over deductions reported for financial statement purposes. The benefit of the excess tax deductions will not be recognized for financial statement purposes until the related deductions reduce income taxes payable. The net operating loss carryovers may be carried back 2 years and forward 20 years from the year the net operating loss was generated and expire in varying amounts from 2019 to 2033.
The Company believes that the benefits of uncertain tax positions recorded in the calculation of the current year income tax benefit and on prior year tax returns do not exceed benefits calculated using the more likely than not threshold. As a result, the Company has not recorded any income tax reserves or related interest or penalties for the year ended December 31, 2013. The Company is not currently under audit by any taxing jurisdiction and, with limited exception, the Company is no longer subject to U.S. federal income tax audits by taxing authorities for tax years 2009 and prior.
ALLIED NEVADA GOLD CORP.
Notes to Consolidated Financial Statements
9. Other Liabilities
The following table summarizes the components of other liabilities, current and non-current (in thousands):
|
| | | | | | | |
| | December 31, |
| | 2013 | | 2012 |
| Other liabilities, current | | | |
| Capital expenditure retentions | $ | 4,256 |
| | $ | 977 |
|
| Accrued compensation | 3,587 |
| | 4,282 |
|
| Derivative instruments - Note 20 | 669 |
| | — |
|
| | $ | 8,512 |
| | $ | 5,259 |
|
| Other liabilities, non-current | | | |
| Derivative instruments - Note 20 | $ | 21,730 |
| | $ | 9,324 |
|
| Deferred royalty income | 953 |
| | 790 |
|
| Other | 52 |
| | 109 |
|
| | $ | 22,735 |
| | $ | 10,223 |
|
10. Debt
The following table summarizes the components of debt (in thousands):
|
| | | | | | | | |
| | | December 31, |
| | | 2013 | | 2012 |
| Debt, current: | | | | |
Capital lease and term loan obligations (1) | | $ | 58,435 |
| | $ | 28,614 |
|
Term and Security Deposit loan(2) | | 18,345 |
| | — |
|
| | | $ | 76,780 |
| | $ | 28,614 |
|
| Debt, non-current: | | | | |
| Capital lease and term loan obligations | | $ | 146,347 |
| | $ | 94,538 |
|
8.75% Senior Notes due June 2019 (3) | | 376,080 |
| | 402,040 |
|
| | | $ | 522,427 |
| | $ | 496,578 |
|
(1) Includes borrowings of $5.7 million for mine equipment included in Assets held for sale. | | | |
(2) Entire borrowing is attributable to the third rope shovel which is included in Assets held for sale. | | | |
(3) Effective interest rate of 8.375% after cross currency swap. | | | |
Senior Notes
In May 2012, the Company issued CDN $400.0 million of uncollateralized senior notes (the “Notes”). The Notes are denominated in Canadian dollars, pay interest semi-annually at the rate of 8.75% per annum, and mature in June 2019. Concurrently with the issuance of the Notes, the Company entered into a cross currency swap agreement based upon a notional amount of $400.4 million (the gross proceeds from the issuance) which fixed the interest rate at 8.375%, as further described in Note 20 - Derivative Instruments. The Notes balance was $376.1 million based upon the Canadian dollar to U.S. dollar exchange rate on December 31, 2013. The Notes are guaranteed by most of the Company’s currently wholly-owned subsidiaries, including Hycroft Resources & Development Inc., which owns the Company’s Hycroft Mine.
The Company may redeem up to 35% of the Notes outstanding prior to June 2015 at a redemption price of 108.75% of the Notes redeemed plus accrued interest with the net cash proceeds of an equity offering. Prior to June 2016, the Company may redeem all or part of the Notes at a redemption price equal to the greater of i) the Canada Yield Price as defined in the indenture governing the Notes or ii) 101% of the principal amount plus accrued interest. On or after June 2016, the Company may redeem all of the Notes at a redemption price ranging from 104.375% to 100% depending upon the year redeemed plus accrued interest.
ALLIED NEVADA GOLD CORP.
Notes to Consolidated Financial Statements
Capital Lease and Term Loan Obligations
The Company’s capital lease and term loan obligations are for the purchase of mining equipment, bear interest at rates between 4% - 7% per annum, and primarily carry 60 - 84-month terms. The following is a summary of the future minimum payments under the Company’s capital lease and term loan obligations as of December 31, 2013 (in thousands):
|
| | | | | |
| Fiscal Year | | | Minimum Lease Payments |
2014 (1) | | | $ | 67,203 |
|
| 2015 | | | 53,195 |
|
| 2016 | | | 47,694 |
|
| 2017 | | | 33,096 |
|
| 2018 | | | 11,784 |
|
| Thereafter | | | 14,966 |
|
| Less: interest | | | (23,156 | ) |
| Net minimum capital lease payments | | | 204,782 |
|
| Less: current portion | | | (58,435 | ) |
| Non-current portion | | | $ | 146,347 |
|
(1) Includes borrowings of $5.7 million for mine equipment included in Assets held for sale. | |
Term and Security Deposit Loan Agreement
In March 2013, the Company entered into a Term and Security Deposit Loan Agreement (the “Loan Agreement”) related to the purchase of three electric rope shovels. Under the Loan Agreement, the Company was made available up to $60.0 million ($20.0 million for each shovel) for scheduled advance security deposit payments pursuant to purchase agreements for the electric rope shovels and up to $90.0 million ($30.0 million for each shovel) in term loan financing to fund the purchase of the electric rope shovels once commissioned at the Hycroft Mine. Under the Loan Agreement, as electric rope shovels were commissioned, amounts previously advanced to the Company for security deposits, together with the remaining purchase price of each electric rope shovel, were converted to term loan obligations. The electric rope shovels secure all amounts borrowed by the Company under the Loan Agreement.
As of December 31, 2013, the Company had previously commissioned two (of the three) electric rope shovels and, as such, amounts borrowed for these two shovels were included in capital lease and term loan obligations. Costs for the third electric rope shovel were included in Assets held for sale at December 31, 2013 and, as such, related amounts borrowed under the Loan Agreement were included in Debt, current as repayment will occur when the components of the third shovel are sold, which the Company believes will happen within the next twelve months. Advances for security deposits under the Loan Agreement bear an interest rate determined by an applicable rate plus the three month LIBOR, which approximated 4.8% at December 31, 2013. The two executed term loan obligations for the commissioned shovels carry seven year terms and bear interest at a fixed rate of approximately 6%.
Revolving Credit Agreement
In December 2013, the Company entered into a Second Amended and Restated Credit Agreement (the “Revolver”) which amended and restated the October 2012 Amended and Restated Credit Agreement (the “Previous Revolver”). The aggregate amount available to the Company under the Revolver is determined by a Borrowing Base (as defined in the Revolver) that makes up to $40.0 million available (a reduction from the $120.0 million available under the Previous Revolver) to the Company depending upon the value of the gold and silver in the Company’s ore on leach pads, in-process, and finished goods inventories less estimated remaining processing and selling costs. As of December 31, 2013, $40.0 million was available to the Company as determined by the Borrowing Base. During the years ended December 31, 2013 and 2012, no amounts were borrowed under the Revolver or the Previous Revolver.
Borrowings under the Revolver bear interest per annum at either LIBOR plus 450 basis points (“bps”) or at an Alternate Base Rate, as defined in the Revolver, plus 350 bps. Financial letters of credit and non-financial letters of credit bear interest per annum at 4.50% and 2.70%, respectively. The Revolver continues to be collateralized by substantially all of the Company’s assets and matures on April 30, 2016, unless extended in accordance with the terms of Revolver. The Revolver contains an accordion feature which permits the credit available to be increased to up to $75.0 million through the addition of additional lenders.
ALLIED NEVADA GOLD CORP.
Notes to Consolidated Financial Statements
As discussed in Note 20 - Derivative Instruments and Note 25 - Subsequent Events, as a result of entering into the Revolver, beginning in January 2014 the Company will be required to collateralize the mark-to-market position of 22% of the total $400.4 million notional amount of the cross currency swap for the Notes. As of February 24, 2014, the Company had issued $12.2 million of letters of credit under the Revolver and remitted $0.2 million of cash to collateralize the mark-to-market position of 22% of the cross currency swap’s liability position.
Debt Covenants
The Company’s debt agreements contain representations and warranties, events of default, and covenants that are customary for agreements of these types. The Company’s Notes contain provisions that, among other things, restrict or limit the ability of the Company to redeem the Notes, incur or guarantee additional debt, pay dividends, and consolidate, merge or sell all or substantially all of the Company’s assets. The Company’s Revolver and certain capital lease obligations contain financial covenants related to Tangible Net Worth, Minimum Current Ratio, and Minimum Reserve Tail, as such terms are defined in the Revolver. The Company was in compliance with all debt covenants as of December 31, 2013.
Interest Expense
The following table summarizes the components of interest expense (in thousands):
|
| | | | | | | | | | | | |
| | | Years ended December 31, |
| | | 2013 | | 2012 | | 2011 |
8.75% Senior Notes due June 2019 (1) | | $ | 33,534 |
| | $ | 20,166 |
| | $ | — |
|
| Capital lease and term loan obligations | | 8,979 |
| | 3,957 |
| | 1,434 |
|
| Amortization of debt issuance costs | | 3,408 |
| | 1,294 |
| | 99 |
|
| Term and Security Deposit loan | | 1,325 |
| | — |
| | — |
|
| Revolving credit facility standby fees | | 1,590 |
| | 443 |
| | 183 |
|
| Other interest expense | | 548 |
| | — |
| | — |
|
| Capitalized interest | | (26,824 | ) | | (7,952 | ) | | (1,004 | ) |
| | | $ | 22,560 |
| | $ | 17,908 |
| | $ | 712 |
|
(1) Effective interest rate of 8.375% after cross currency swap. | | | | |
11. Asset Retirement Obligation
The Company’s mining and exploration activities are subject to various federal and state laws and regulations governing the protection of the environment. Asset retirement obligation (“ARO”) and future reclamation expenditures may increase or decrease significantly in the future as a result of changes in regulations, mine plans, estimates, or other factors. The Company’s ARO relates to its operating property, the Hycroft Mine.
Changes to the Company’s ARO are summarized below (in thousands): |
| | | | | | | |
| | December 31, |
| | 2013 | | 2012 |
| Balance, beginning of year | $ | 9,057 |
| | $ | 8,726 |
|
| Accretion | 659 |
| | 564 |
|
| Reclamation expenditures | (47 | ) | | (540 | ) |
| Additions and changes in estimates | 5,695 |
| | 307 |
|
| Balance, end of year | 15,364 |
| | 9,057 |
|
| Less: current portion | (20 | ) | | (331 | ) |
| Non-current portion | $ | 15,344 |
| | $ | 8,726 |
|
Additions and changes in estimates during the year ended December 31, 2013 were primarily related to updated reclamation expenditure estimates that incorporated the North Leach Pad and 21,500 gallon per minute Merrill-Crowe plant, both of which were constructed during 2013. As of December 31, 2013, the Company estimates that approximately 96% of its total undiscounted reclamation expenditures will occur during the years 2025 - 2035. As of December 31, 2013, the Company’s ARO was fully secured by surety bonds totaling $61.5 million, which were partially collateralized with restricted cash totaling $41.2 million.
ALLIED NEVADA GOLD CORP.
Notes to Consolidated Financial Statements
12. Stockholders' Equity
Preferred Stock
In addition to common stock, the authorized share capital of the Company includes 10,000,000 shares of undesignated preferred stock with a par value of $0.001 per share, none of which has been issued.
Dividend Policy
The Company has never paid dividends and has no intention to do so. The Company’s Notes, Revolver, and certain capital lease agreements, contain provisions that restrict its ability to pay dividends. For additional information refer to Note 10 - Debt.
13. Stock-Based Compensation
The Company has stock-based compensation plans to attract, retain, and motivate employees and directors while directly linking incentives to increases in stockholder value. The following table summarizes the common shares authorized for issuance and available for future issuance under the Deferred Phantom Unit Plan (the “DPU Plan”), the Deferred Share Unit Plan (the “DSU Plan”), the 2007 Stock Option Plan, and the Restricted Share Unit Plan (the “RSU Plan”) as of December 31, 2013.
|
| | | | | | | |
| | | | Stock-based Compensation Plan |
| | | | RSU Plan and 2007 Stock Option Plan | | DSU Plan | | DPU Plan |
| Common shares authorized for issuance | | | 6,900,000 | (1) | 500,000 | | 300,000 |
| Common shares remaining for future grants | | | 894,186 | | 362,500 | | 11,597 |
(1) A total of 6,900,000 shares of common stock are available for issuance under both the RSU Plan and the 2007 Stock Option Plan. |
The following tables summarize the Company’s stock-based compensation cost and unrecognized stock-based compensation cost by plan (in thousands):
|
| | | | | | | | | | | |
| | Years ended December 31, |
| Stock-based compensation cost | 2013 | | 2012 | | 2011 |
| Restricted Share Unit | $ | 5,052 |
| | $ | 4,632 |
| | $ | 4,004 |
|
| Deferred Share Unit | 1,000 |
| | 787 |
| | — |
|
| Deferred Phantom Unit | — |
| | (1,080 | ) | | 2,515 |
|
| 2007 Stock Option | — |
| | — |
| | 43 |
|
| | $ | 6,052 |
| | $ | 4,339 |
| | $ | 6,562 |
|
| Capitalized as part of an asset cost | $ | 529 |
| | $ | 342 |
| | $ | 487 |
|
|
| | | | | | | | | | | |
| | December 31, |
| Unrecognized stock-based compensation cost | 2013 | | 2012 | | 2011 |
| Restricted Share Unit | $ | 9,024 |
| | $ | 10,703 |
| | $ | 7,224 |
|
| Deferred Share Unit | 262 |
| | 262 |
| | — |
|
| | $ | 9,286 |
| | $ | 10,965 |
| | $ | 7,224 |
|
Restricted Share Unit Plan
The RSU Plan was adopted by the Company in July 2007, primarily to compensate employees of the Company. RSUs granted without performance based vesting criteria typically vest in equal semi-annual or annual installments over two to three years and RSUs granted with performance based vesting criteria typically vest in annual installments over three years subject to the achievement of certain financial and operating results of the Company, which are established annually by the Compensation Committee of the Board of Directors. Upon vesting, one share of Allied Nevada common stock is automatically issued for no additional consideration, except in the case of Canadian residents, where an election may be made to defer the issuance date.
ALLIED NEVADA GOLD CORP.
Notes to Consolidated Financial Statements
The following table summarizes activity of the Company’s RSU Plan:
|
| | | | | | | | | | | | | | | | | | | | |
| | Years ended December 31, |
| | 2013 | | 2012 | | 2011 |
| | Number of RSUs | | Weighted Average Grant-Date Fair Value | | Number of RSUs | | Weighted Average Grant-Date Fair Value | | Number of RSUs | | Weighted Average Grant-Date Fair Value |
| Outstanding, beginning of year | 849,482 |
| | $ | 19.59 |
| | 568,787 |
| | $ | 18.59 |
| | 957,901 |
| | $ | 10.42 |
|
| Correction of reporting issuance by plan administrator | — |
| | — |
| | 280,000 |
| | 4.35 |
| | — |
| | — |
|
| Granted | 1,427,395 |
| | 11.76 |
| | 293,289 |
| | 33.22 |
| | 245,962 |
| | 30.19 |
|
| Vested/issued | (219,057 | ) | | 18.35 |
| | (231,323 | ) | | 14.72 |
| | (510,458 | ) | | 6.99 |
|
| Canceled/forfeited | (427,675 | ) | | 23.62 |
| | (61,271 | ) | | 24.33 |
| | (124,618 | ) | | 26.18 |
|
| Outstanding, end of year | 1,630,145 |
| | 11.85 |
| | 849,482 |
| | 19.59 |
| | 568,787 |
| | 18.59 |
|
| Vested and unissued, end of year | 495,116 |
| | 9.17 |
| | 380,000 |
| | 8.15 |
| | 50,000 |
| | 18.80 |
|
At December 31, 2013, there were 205,669 RSUs outstanding that are subject to performance based vesting criteria.
The following table provides additional detail for grants made under the RSU Plan:
|
| | | | | | | | | | | |
| | December 31, |
| | 2013 | | 2012 | | 2011 |
| Weighted-average contractual vesting period of RSUs granted | 2.2 years |
| | 3.0 years |
| | 3.7 years |
|
| Weighted-average remaining vesting period of unvested RSUs | 1.7 years |
| | 1.6 years |
| | 1.4 years |
|
| Weighted-average estimated forfeiture rate of RSUs granted | 6.97 | % | | 11.84 | % | | 16.97 | % |
| Fair value of RSUs vested (millions) | $ | 3.0 |
| | $ | 8.9 |
| | $ | 7.5 |
|
| Intrinsic value of RSUs exercised (millions) | 2.3 |
| | 7.5 |
| | 8.4 |
|
| Intrinsic value of RSUs outstanding (millions) | 5.8 |
| | 25.6 |
| | 25.7 |
|
| Intrinsic value of RSUs vested and outstanding (millions) | 1.8 |
| | 11.5 |
| | 10.0 |
|
Deferred Phantom Unit Plan and Deferred Share Unit Plan
The DPU Plan was adopted by the Company in April 2009 to compensate non-employee directors. DPUs are fully vested at the time of grant, have the value of one share of Allied Nevada common stock, and are to be issued when a director leaves the Board. In August 2012, the Company’s Board of Directors approved a resolution requiring all DPUs to be settled in shares of the Company’s common stock, which modified the then current classification of outstanding DPUs from liability instruments to equity instruments and increased Additional paid-in capital by $7.5 million.
The DSU Plan, an equity-based compensation plan for non-employee directors, was approved by the Company’s stockholders in October 2011 and adopted by the Company in June 2012. Under the DSU Plan, annual awards are granted to each non-employee director and vest over directors’ one year service periods. Each DSU has the value of one share of Allied Nevada common stock to be issued when a director leaves the Board.
ALLIED NEVADA GOLD CORP.
Notes to Consolidated Financial Statements
The following table summarizes activity of the Company’s DPU Plan and DSU Plan:
|
| | | | | | | | | | | | | | | | | | | | | | |
| | Years ended December 31, |
| | 2013 | | 2012 | | 2011 |
| | Number of DSUs | | Weighted Average Grant-Date Fair Value of DSUs | | Number of DPUs | | Number of DSUs | | Weighted Average Grant-Date Fair Value of DSUs | | Number of DPUs | | Number of DPUs |
| Outstanding, beginning of year | 34,008 |
| | $ | 28.3 |
| | 248,136 |
| | — |
| | $ | — |
| | 281,869 |
| | 238,000 |
|
| Granted | 100,400 |
| | 9.96 |
| | — |
| | 39,308 |
| | 28.30 |
| | 6,534 |
| | 43,869 |
|
| Issued | — |
| | — |
| | — |
| | (3,092 | ) | | 28.30 |
| | (40,267 | ) | | — |
|
| Canceled/forfeited | — |
| | — |
| | — |
| | (2,208 | ) | | 28.30 |
| | — |
| | — |
|
| Outstanding, end of year | 134,408 |
| | 14.60 |
| | 248,136 |
| | 34,008 |
| | 28.30 |
| | 248,136 |
| | 281,869 |
|
| Vested and unissued, end of year | 108,053 |
| | 15.73 |
| | 248,136 |
| | 24,733 |
| | 28.30 |
| | 248,136 |
| | 281,869 |
|
The following table provides additional detail for grants made under the DSU Plan:
|
| | | | | | | |
| | December 31, |
| | 2013 | | 2012 |
| Weighted-average contractual vesting period of DSUs granted | 1.0 year |
| | 1.0 year |
|
| Weighted-average remaining vesting period of unvested DSUs | 0.3 years |
| | 0.3 years |
|
| Weighted-average estimated forfeiture rate of DSUs granted | — | % | | — | % |
| Fair value of DSUs vested (millions) | $ | 1.0 |
| | $ | 0.8 |
|
| Intrinsic value of DSUs exercised (millions) | — |
| | 0.1 |
|
| Intrinsic value of DSUs outstanding (millions) | 0.5 |
| | 1.0 |
|
| Intrinsic value of DSUs vested and outstanding (millions) | 0.4 |
| | 0.8 |
|
The intrinsic value of outstanding DPUs at December 31, 2013 and 2012 was $0.9 million and $7.5 million, respectively.
Allied Nevada’s 2007 Stock Option Plan
The Company’s 2007 Stock Option Plan was adopted in February 2007 to compensate directors, officers, employees, and consultants of the Company. The Company has not granted any options under the 2007 Stock Option Plan during the years ended December 31, 2013, 2012, or 2011.
The following table summarizes activity of the 2007 Stock Option Plan:
|
| | | | | | | | | | | | | | | | | | | | |
| | Years ended December 31, |
| | 2013 | | 2012 | | 2011 |
| | Number of Stock Options | | Weighted Average Exercise Price | | Number of Stock Options | | Weighted Average Exercise Price | | Number of Stock Options | | Weighted Average Exercise Price |
| Outstanding, beginning of year | 640,000 |
| | $ | 4.79 |
| | 775,776 |
| | $ | 4.79 |
| | 931,930 |
| | $ | 4.71 |
|
| Canceled/forfeited | (50,000 | ) | | 6.34 |
| | (43,334 | ) | | 4.35 |
| | (2,000 | ) | | 2.43 |
|
| Exercised | (90,000 | ) | | 6.34 |
| | (92,442 | ) | | 5.01 |
| | (154,154 | ) | | 4.48 |
|
| Outstanding, end of year | 500,000 |
| | 4.35 |
| | 640,000 |
| | 4.79 |
| | 775,776 |
| | 4.79 |
|
| Vested and exercisable, end of year | 500,000 |
| | 4.35 |
| | 640,000 |
| | 4.79 |
| | 775,776 |
| | 4.79 |
|
ALLIED NEVADA GOLD CORP.
Notes to Consolidated Financial Statements
The following table provides additional detail for grants made under the 2007 Stock Option Plan:
|
| | | | | | | | | | | |
| | December 31, |
| | 2013 | | 2012 | | 2011 |
| Weighted-average remaining contractual period of outstanding options | 3.5 years |
| | 3.6 years |
| | 4.4 years |
|
| Weighted-average remaining contractual period of vested options | 3.5 years |
| | 3.6 years |
| | 4.4 years |
|
| Intrinsic value of options exercised (millions) | $ | 0.5 |
| | $ | 2.3 |
| | $ | 4.6 |
|
| Fair value of options vested (millions) | — |
| | — |
| | 1.8 |
|
| Intrinsic value of options vested and outstanding (millions) | — |
| | 16.2 |
| | 19.8 |
|
| Intrinsic value of options outstanding (millions) | — |
| | 16.2 |
| | 19.8 |
|
14. Revenue
The table below is a summary of the Company’s gold and silver revenue (in thousands, except ounces sold):
|
| | | | | | | | | | | | | | | | | | | | |
| | Years ended December 31, |
| | 2013 | | 2012 | | 2011 |
| | Amount | | Ounces sold | | Amount | | Ounces sold | | Amount | | Ounces sold |
| Gold revenue | $ | 248,386 |
| | 181,941 |
| | $ | 192,847 |
| | 114,705 |
| | $ | 139,046 |
| | 88,191 |
|
| Silver revenue | 19,515 |
| | 858,073 |
| | 21,712 |
| | 696,144 |
| | 12,983 |
| | 372,000 |
|
| | $ | 267,901 |
| | | | $ | 214,559 |
| | | | $ | 152,029 |
| | |
15. Separation and Severance Costs
The tables below summarize the Company’s separation and severance costs by type of cost and by the reportable segment to which they relate (in thousands):
|
| | | | | | | | | | | |
| | Years ended December 31, |
| Type of cost | 2013 | | 2012 | | 2011 |
| One time, cash payments | $ | 4,809 |
| | $ | — |
| | $ | — |
|
| Stock-based compensation costs from continued vesting | 1,124 |
| | — |
| | — |
|
| | $ | 5,933 |
| | $ | — |
| | $ | — |
|
| Reportable segment | | | | | |
| Hycroft Mine | $ | 1,860 |
| | $ | — |
| | $ | — |
|
| Exploration | 405 |
| | — |
| | — |
|
| Corporate and Other | 3,668 |
| | — |
| | — |
|
| | $ | 5,933 |
| | $ | — |
| | $ | — |
|
16. Other, Net
The table below is a summary of the Company’s other income and expense (in thousands):
|
| | | | | | | | | | | |
| | Years ended December 31, |
| | 2013 | | 2012 | | 2011 |
| (Loss) gain on marketable equity securities | $ | (1,120 | ) | | $ | 290 |
| | $ | 387 |
|
| Foreign currency transaction gain (loss) on Notes - Note 20 | 25,960 |
| | (1,640 | ) | | — |
|
Reclassification of (loss) gain from Accumulated other comprehensive income (loss) for cross currency swap - Note 20 | (25,960 | ) | | 1,640 |
| | — |
|
| Other, net | 118 |
| | 2 |
| | 30 |
|
| | $ | (1,002 | ) | | $ | 292 |
| | $ | 417 |
|
17. Income Per Share
Basic income per share is computed by dividing Net income by the weighted-average number of common shares outstanding during the year. Diluted income per share is computed in the same manner except that the weighted average common shares outstanding is increased to include the number of additional shares that would have been outstanding if potentially dilutive shares had been issued.
ALLIED NEVADA GOLD CORP.
Notes to Consolidated Financial Statements
The following table sets forth the computation of basic and diluted income per share (in thousands, except per share amounts):
|
| | | | | | | | | | | |
| | Years ended December 31, |
| | 2013 | | 2012 | | 2011 |
| Net income available to common stockholders: | $ | 1,405 |
| | $ | 47,727 |
| | $ | 36,709 |
|
| Weighted average common shares: | | | | | |
| Basic | 99,105 |
| | 89,945 |
| | 89,553 |
|
| Effect of shares granted under the: | | | | | |
| Restricted Share Unit Plan | 1,089 |
| | 532 |
| | 654 |
|
| Deferred Phantom Unit Plan | 248 |
| | 119 |
| | 55 |
|
| 2007 Stock Option Plan | 281 |
| | 407 |
| | 668 |
|
| Deferred Share Unit Plan | 106 |
| | 27 |
| | — |
|
| Special Stock Option Plan | — |
| | — |
| | 2 |
|
| Diluted | 100,829 |
| | 91,030 |
| | 90,932 |
|
| Income per share: | | | | | |
| Basic | $ | 0.01 |
| | $ | 0.53 |
| | $ | 0.41 |
|
| Diluted | $ | 0.01 |
| | $ | 0.52 |
| | $ | 0.40 |
|
18. Quarterly Financial Information (Unaudited)
Summarized quarterly results for the years ended December 31, 2013, 2012, and 2011 are as follows (in thousands, except per share amounts):
|
| | | | | | | | | | | | | | | | | | | | |
| | | Quarters | | |
| 2013 | | First | | Second | | Third | | Fourth | | Year |
| Revenue | | $ | 49,190 |
| | $ | 58,998 |
| | $ | 76,741 |
| | $ | 82,972 |
| | $ | 267,901 |
|
| Total cost of sales | | 25,648 |
| | 40,977 |
| | 61,382 |
| | 81,149 |
| (1) | 209,156 |
|
Gross profit (2) | | 23,542 |
| | 18,021 |
| | 15,359 |
| | 1,823 |
| | 58,745 |
|
| Net income (loss) | | 8,818 |
| | 4,230 |
| | 4,971 |
| | (16,614 | ) | | 1,405 |
|
| Basic income (loss) per share | | 0.10 |
| | 0.04 |
| | 0.05 |
| | (0.18 | ) | | 0.01 |
|
| Diluted income (loss) per share | | 0.10 |
| | 0.04 |
| | 0.05 |
| | (0.18 | ) | | 0.01 |
|
| 2012 | | | | | | | | | | |
| Revenue | | $ | 39,225 |
| | $ | 33,666 |
| | $ | 64,829 |
| | $ | 76,839 |
| | $ | 214,559 |
|
| Total cost of sales | | 17,139 |
| | 16,539 |
| | 33,291 |
| | 42,523 |
| | 109,492 |
|
Gross profit (2) | | 22,086 |
| | 17,127 |
| | 31,538 |
| | 34,316 |
| | 105,067 |
|
| Net income | | 12,068 |
| | 6,142 |
| | 13,402 |
| | 16,115 |
| | 47,727 |
|
| Basic income per share | | 0.13 |
| | 0.07 |
| | 0.15 |
| | 0.18 |
| | 0.53 |
|
| Diluted income per share | | 0.13 |
| | 0.07 |
| | 0.15 |
| | 0.17 |
| | 0.52 |
|
| 2011 | | | | | | | | | | |
| Revenue | | $ | 31,926 |
| | $ | 33,580 |
| | $ | 49,644 |
| | $ | 36,879 |
| | $ | 152,029 |
|
| Total cost of sales | | 14,695 |
| | 13,929 |
| | 19,312 |
| | 15,093 |
| | 63,029 |
|
Gross profit (2) | | 17,231 |
| | 19,651 |
| | 30,332 |
| | 21,786 |
| | 89,000 |
|
| Net income | | 181 |
| | 3,636 |
| | 14,672 |
| | 18,220 |
| | 36,709 |
|
| Basic income per share | | — |
| | 0.04 |
| | 0.16 |
| | 0.21 |
| | 0.41 |
|
| Diluted income per share | | — |
| | 0.04 |
| | 0.16 |
| | 0.20 |
| | 0.40 |
|
(1) Includes a $12.6 million write-down of production inventories. See Note 4 - Stockpiles and Ore On Leachpads for detail. |
(2) Calculated as revenue less total cost of sales. | | | | | | | | |
ALLIED NEVADA GOLD CORP.
Notes to Consolidated Financial Statements
19. Fair Value Measurements
Fair value accounting establishes a fair value hierarchy that prioritizes the inputs to valuation techniques used to measure fair value. The hierarchy gives the highest priority to unadjusted quoted prices in active markets for identical assets or liabilities (Level 1 measurements) and the lowest priority to unobservable inputs (Level 3 measurements). The three levels of the fair value hierarchy are described below:
Level 1 – Unadjusted quoted prices in active markets that are accessible at the measurement date for identical, unrestricted assets or liabilities. Active markets are those in which transactions for the asset or liability occur in sufficient frequency and volume to provide pricing information on an ongoing basis;
Level 2 – Quoted prices in markets that are not active, or inputs that are observable, either directly or indirectly, for substantially the full term of the asset or liability; and
Level 3 – Prices or valuation techniques that require inputs that are both significant to the fair value measurement and unobservable (supported by little or no market activity).
Assets and liabilities are classified in their entirety based on the lowest level of input that is significant to the fair value measurement. Certain financial instruments, including cash and equivalents, accounts receivable, prepaids and other, accounts payable, and other liabilities, are carried at cost, which approximates fair value due to the short-term nature of these instruments. There were no changes to the Company’s valuation techniques and no transfers in or out of Levels 1 or 2 during the year ended December 31, 2013.
The following table sets forth by level, within the fair value hierarchy, the Company’s assets and liabilities measured at fair value on a recurring basis (in thousands).
|
| | | | | | | | | |
| | December 31, | | Input Hierarchy Level |
| Assets | 2013 | | 2012 | |
| Available-for-sale securities: | | | | | |
| Marketable equity securities | $ | — |
| | $ | 1,774 |
| | Level 1 |
| Derivative instruments: | | | | | |
| Diesel swap agreements - Note 20 | $ | — |
| | $ | 435 |
| | Level 2 |
| Cross currency swap - Note 20 | — |
| | 1,391 |
| | Level 2 |
| | $ | — |
| | $ | 1,826 |
| | |
| Assets held for sale | $ | 47,357 |
| | $ | — |
| | Level 2 |
| | | | | | |
| Liabilities | | | | | |
| Derivative instruments: | | | | | |
| Cross currency swap - Note 20 | $ | 22,399 |
| | $ | 9,324 |
| | Level 2 |
| | $ | 22,399 |
| | $ | 9,324 |
| | |
The Company’s marketable equity securities are valued using quoted market prices in active markets and, as such, are classified within Level 1 of the fair value hierarchy. The fair value of the marketable equity securities is calculated as the quoted price of the marketable equity security multiplied by the quantity of shares held by the Company. Available-for-sale equity securities are classified as Other assets, non-current with periodic changes in fair value included in Other, net. In November 2013 the Company sold its marketable equity securities.
The Company’s derivative instruments are valued using models which require a variety of inputs, including contractual terms, market prices, yield curves, credit spreads, and correlations of such inputs. Some of the model inputs used in valuing the derivative instruments trade in liquid markets and, as such, model inputs can generally be verified and do not involve significant management judgment. Derivative instruments are classified within Level 2 of the fair value hierarchy and are included in Prepaids and other and Other liabilities, current and non-current. As of December 31, 2013, the Company had no outstanding diesel swap agreements.
The Company’s assets held for sale are valued using a market approach for each item of property and equipment held for sale. Inputs include quoted market prices for identical or similar assets in markets that are not active and, as such, property and equipment held for sale is classified within Level 2 of the fair value hierarchy. Periodic changes in fair value (less costs to sell) to assets held for sale are included in Loss on assets classified as held for sale.
ALLIED NEVADA GOLD CORP.
Notes to Consolidated Financial Statements
Items Disclosed at Fair Value
Using prevailing interest rates on similar debt issuances, credit spreads, and foreign currency forward rates, the estimated fair value of the Notes was $328.6 million at December 31, 2013. The fair value estimate of the Notes was prepared with the assistance of an independent third party and does not reflect the Notes actual trading value or the carrying value of the Notes in the Company’s consolidated financial statements.
20. Derivative Instruments
Derivative Instrument Fair Values
The following table is a summary of the fair values of the Company’s derivative instruments (in thousands):
|
| | | | | | | | | | | | | | | |
| | December 31, 2013 | | December 31, 2012 |
| | Other liabilities, current | | Other liabilities, non-current | | Prepaids and other | | Other liabilities, non-current |
| Cross currency swap | $ | 669 |
| | $ | 21,730 |
| | $ | 1,391 |
| | $ | 9,324 |
|
| Diesel swap agreements | — |
| | — |
| | 435 |
| | — |
|
| | $ | 669 |
| | $ | 21,730 |
| | $ | 1,826 |
| | $ | 9,324 |
|
Derivative Instruments Designated as Hedges – Cash Flow Hedges
Diesel Swap Agreements
As of December 31, 2013, the Company had no outstanding diesel swaps. The net gain remaining in Accumulated other comprehensive income (loss) from previously settled diesel swaps will be reclassified into earnings when the hedged transaction impacts earnings (as specific gold ounces are sold).
Cross Currency Swap
In May 2012, the Company entered into a cross currency swap concurrent with the issuance of the Notes. The notional value of the cross currency swap was $400.4 million and the interest rate was fixed at 8.375%. The Company makes interest payments ($400.4 million at 8.375%) to the counterparty in exchange for the Canadian dollars required to service the Notes (CDN$400.0 million at 8.75%). Upon maturity the Company will pay $400.4 million to the counterparty and receive CDN $400.0 million, which will be used to satisfy the face amount of the issuance.
The cross currency swap agreement contains a mutual put provision that can be exercised by either party to the agreement in June 2016. The amount to be received or paid by the Company would be equal to the mark-to-market value as defined in the agreement. At this time, the Company does not intend to exercise the above put provision and does not believe the counterparties to the swap agreement intend to exercise the put provision.
As discussed in Note 10 - Debt, in December 2013 the Company entered into the Revolver which amended and restated the Previous Revolver and changed the lenders thereto. Certain lenders to the Previous Revolver held (and continue to hold) portions of the cross currency swap, which is no longer collateralized by the security granted to them under the Previous Revolver. In connection with entering into the Revolver, which changed the lender composition from the Previous Revolver, the Company entered into an Amendment Agreement and Credit Support Annex to the ISDA Master Agreement with the lenders to the Previous Revolver. As a result, beginning in January 2014 the Company will be required to collateralize the mark-to-market position of 22% of the $400.4 million total notional amount of the cross currency swap with cash, letters of credit, or a combination of the two. As of February 24, 2014, the Company had issued $12.2 million of letters of credit under the Revolver and remitted $0.2 million of cash to collateralize the mark-to-market position of 22% of the cross currency swap’s liability position. See Note 25 - Subsequent Events for additional information.
ALLIED NEVADA GOLD CORP.
Notes to Consolidated Financial Statements
Accumulated Other Comprehensive Income (Loss)
The following table sets forth changes in Accumulated other comprehensive income (loss) and the effect cash flow hedges had on the Company’s earnings (in thousands):
|
| | | | | | | | | | | | | | | |
| | Years ended December 31, 2013 |
| | Cross Currency Swap | | Diesel Swap Agreements | | Tax Effects | | Total |
| Balance, beginning of period | $ | (9,574 | ) | | $ | 1,241 |
| | $ | 2,917 |
| | $ | (5,416 | ) |
| Gain (loss) recognized in other comprehensive income (loss) for effective portion of unsettled cash flow hedges | 11,494 |
| | (435 | ) | | (3,871 | ) | | 7,188 |
|
| Settlements of cash flow hedges | (26,247 | ) | | 717 |
| | 8,936 |
| | (16,594 | ) |
| Reclassifications into earnings when underlying hedged transactions impacted earnings: | | | | | | | |
Reclassified to Interest expense | 287 |
| | — |
| | (100 | ) | | 187 |
|
Reclassified to Other, net | 25,960 |
| | — |
| | (9,086 | ) | | 16,874 |
|
Reclassified to Production costs | — |
| | (870 | ) | | 305 |
| | (565 | ) |
| Balance, end of period | $ | 1,920 |
| | $ | 653 |
| | $ | (899 | ) | | $ | 1,674 |
|
|
| | | | | | | | | | | | | | | |
| | Years ended December 31, 2012 |
| | Cross Currency Swap | | Diesel Swap Agreements | | Tax Effects | | Total |
| Balance, beginning of period | $ | — |
| | $ | — |
| | $ | — |
| | $ | — |
|
| Gain (loss) recognized in other comprehensive income (loss) for effective portion of unsettled cash flow hedges | (9,574 | ) | | 435 |
| | 3,199 |
| | (5,940 | ) |
| Settlements of cash flow hedges | 2,660 |
| | 874 |
| | (1,237 | ) | | 2,297 |
|
| Reclassifications into earnings when underlying hedged transactions impacted earnings: | | | | | | | |
Reclassified to Interest expense | (1,020 | ) | | — |
| | 357 |
| | (663 | ) |
Reclassified to Other, net | (1,640 | ) | | — |
| | 574 |
| | (1,066 | ) |
Reclassified to Production costs | — |
| | (68 | ) | | 24 |
| | (44 | ) |
| Balance, end of period | $ | (9,574 | ) | | $ | 1,241 |
| | $ | 2,917 |
| | $ | (5,416 | ) |
During the year ended December 31, 2013, a foreign currency transaction gain of $26.0 million decreased the outstanding Notes balance and was included in Other, net. As a result of the cross currency swap, the transaction gain was offset by a corresponding loss included in Other, net, resulting in no impact to Net income. Similarly, any future foreign currency transaction gain (loss) attributable to the Notes and included in Other, net will be offset due to the currency swap, resulting in no impact to Net income.
As a result of the cross currency swap, during the year ended December 31, 2013, the Company recorded a $0.3 million reduction to Interest expense, representing the difference in interest expense between the swapped amount and rate ($400.4 million at 8.375%) and the interest expense on the issued amount and stated rate (CDN $400.0 million at 8.75%) translated to US dollars. The Company estimates that $0.4 million (net of tax) related to the currency swap will be reclassified from Accumulated other comprehensive income (loss) into earnings during the next 12 months.
During the year ended December 31, 2013, as certain gold ounces were sold, a $0.9 million reduction to Production costs resulted from reclassifying amounts from previously settled diesel swap agreements into earnings. The Company estimates that $0.3 million (net of tax) will be reclassified from Accumulated other comprehensive income (loss) into earnings during the next 12 months for previously settled diesel swap agreements.
21. Segment Information
The Company is engaged in the operation of the Hycroft Mine and the evaluation, acquisition, exploration, and advancement of gold exploration and development projects in Nevada. Segments are defined as components of the Company for which separate financial information is available that is evaluated regularly by the executive decision-making group in assessing performance, establishing operating plans and budgets, and deciding how to allocate resources. Segment information as of and for the years ended December 31, 2013, 2012, and 2011 is as follows (in thousands):
ALLIED NEVADA GOLD CORP.
Notes to Consolidated Financial Statements
|
| | | | | | | | | | | | | | | | |
| Years ended December 31, | | Hycroft Mine | | Exploration | | Corporate and Other | | Total |
| 2013 | | | | | | | | |
| Revenue - Note 14 | | $ | 267,901 |
| | $ | — |
| | $ | — |
| | $ | 267,901 |
|
| Depreciation and amortization | | 30,041 |
| | — |
| | 1,051 |
| | 31,092 |
|
| Income (loss) from operations | | 45,551 |
| | (4,980 | ) | | (24,018 | ) | | 16,553 |
|
| Interest income | | 12 |
| | — |
| | 334 |
| | 346 |
|
| Interest expense - Note 10 | | (10,759 | ) | | — |
| | (11,801 | ) | | (22,560 | ) |
| Other, net - Note 16 | | 132 |
| | — |
| | (1,134 | ) | | (1,002 | ) |
| Income (loss) before income taxes | | 34,936 |
| | (4,980 | ) | | (36,619 | ) | | (6,663 | ) |
| Total assets | | 1,368,204 |
| | 38,435 |
| | 105,962 |
| | 1,512,601 |
|
| Capital expenditures | | $ | 439,279 |
| | $ | — |
| | $ | 85 |
| | $ | 439,364 |
|
| 2012 | | | | | | | | |
| Revenue - Note 14 | | $ | 214,559 |
| | $ | — |
| | $ | — |
| | $ | 214,559 |
|
| Depreciation and amortization | | 13,858 |
| | — |
| | 736 |
| | 14,594 |
|
| Income (loss) from operations | | 105,240 |
| | (7,367 | ) | | (17,006 | ) | | 80,867 |
|
| Interest income | | 21 |
| | — |
| | 878 |
| | 899 |
|
| Interest expense - Note 10 | | (3,045 | ) | | — |
| | (14,863 | ) | | (17,908 | ) |
| Other, net - Note 16 | | (7 | ) | | — |
| | 299 |
| | 292 |
|
| Income (loss) before income taxes | | 102,209 |
| | (7,367 | ) | | (30,692 | ) | | 64,150 |
|
| Total assets | | 840,598 |
| | 39,944 |
| | 352,682 |
| | 1,233,224 |
|
| Capital expenditures | | $ | 372,557 |
| | $ | 2 |
| | $ | 2,274 |
| | $ | 374,833 |
|
| 2011 | | | | | | | | |
| Revenue - Note 14 | | $ | 152,029 |
| | $ | — |
| | $ | — |
| | $ | 152,029 |
|
| Depreciation and amortization | | 6,738 |
| | — |
| | 246 |
| | 6,984 |
|
| Income (loss) from operations | | 88,796 |
| | (24,178 | ) | | (21,738 | ) | | 42,880 |
|
| Interest income | | 24 |
| | — |
| | 449 |
| | 473 |
|
| Interest expense - Note 10 | | (429 | ) | | — |
| | (283 | ) | | (712 | ) |
| Other, net - Note 16 | | 5 |
| | — |
| | 412 |
| | 417 |
|
| Income (loss) before income taxes | | 88,396 |
| | (24,178 | ) | | (21,160 | ) | | 43,058 |
|
| Total assets | | 342,383 |
| | 34,819 |
| | 280,004 |
| | 657,206 |
|
| Capital expenditures | | $ | 126,689 |
| | $ | 62 |
| | $ | 787 |
| | $ | 127,538 |
|
22. Related Party Transactions
Legal Services
Cameron Mingay, who has been an Allied Nevada Director since March 2007, is a partner at Cassels Brock & Blackwell LLP (“Cassels Brock”) of Toronto, Ontario, Canada, which since June 2007 has served as outside counsel to Allied Nevada in connection with Canadian corporate and securities law matters. The Company has paid Cassels Brock an aggregate of approximately $0.5 million, $0.7 million, and $0.6 million for legal services rendered during the years ended December 31, 2013, 2012, and 2011, respectively. In addition, approximately $46,000 was owed to Cassels Brock at December 31, 2013.
Air Travel
From time to time, the Company uses a private aircraft owned by Angus Aviation LP (“Angus”), which is controlled by Robert Buchan, the Chairman of the Board of Directors. The Company pays Angus based on an hourly rate and certain additional charges including landing fees. For each of the years ended December 31, 2013, 2012, and 2011, the Company incurred travel expenses of approximately CDN $0.4 million, CDN $0.1 million, and CDN $0.1 million, respectively, all of which were paid during such years.
Office Rent
The Company maintains an office in Toronto, Ontario which is primarily utilized by Robert Buchan, the Chairman of the Board of Directors. Rental expense of CDN $18,000 per month is paid by Robert Buchan on a month to month basis. The
ALLIED NEVADA GOLD CORP.
Notes to Consolidated Financial Statements
Company reimbursed Robert Buchan CDN $0.2 million in each of the years ended December 31, 2013, 2012, and 2011 for office rent expenses.
Environmental Consulting
The Company often uses SRK Consulting for various environmental matters such as permitting, engineering studies, and reclamation estimates. During the years ended December 31, 2012 and 2011, one of our Vice President’s spouse was a principal at SRK Consulting and often contributed to services received by the Company. During the years ended December 31, 2012 and 2011, the Company paid SRK Consulting $1.2 million in each year. At December 31, 2012 no amounts were owed to SRK Consulting.
23. Employee Benefit Plans
401(k) Plan
The Allied Nevada Gold Corp. 401(k) Plan (the “401(k) Plan”) is a defined contribution plan that is available to all employees of the Company upon their date of hire. The 401(k) Plan is subject to the provisions of the Employee Retirement Income Security Act of 1974, as amended, and Section 401(k) of the Internal Revenue Code. Administrative fees of the 401(k) Plan are paid by the Company. The assets of the 401(k) Plan are held and the related investments are executed by the 401(k) Plan’s trustee.
Participants in the 401(k) Plan exercise control and direct the investment of their contributions and account balances among various investment alternatives. The Company matches a percentage of employee deferrals to the 401(k) Plan up to certain limits. For the years ended December 31, 2013, 2012, and 2011, the Company’s matching contributions totaled $1.7 million, $1.0 million, and $0.7 million, respectively.
Supplemental Executive Retirement Plan
The Allied Nevada Gold Corp. Supplemental Executive Retirement Plan (“Supplemental Plan”) is an unfunded top-hat deferred compensation arrangement designed to provide additional benefits to certain executives of the Company whose pre-tax deferrals to the Company’s 401(k) Plan are limited by the Internal Revenue Code. Benefits earned under the Supplemental Plan will be distributed upon an executive’s separation from the Company, death or disability, or change in control. The Company had an accrued liability of approximately $0.1 million and $0.1 million as of December 31, 2013 and 2012, respectively, for benefits earned under the Supplemental Plan.
24. Commitments and Contingencies
The Company is involved from time to time in various legal proceedings related to its business. Management does not believe that adverse decisions are likely in any pending or threatened proceeding, or that amounts that may be required to be paid will have a material adverse effect on the Company’s financial condition, results of operations, or cash flows.
Financial Commitments Not Recorded in the Consolidated Financial Statements
Purchase Obligations
At December 31, 2013, the Company had purchase obligations not recorded in the consolidated financial statements totaling $73.8 million for the purchase of mill components and capital items associated with the expansion projects of the Hycroft Mine. The capital items included crusher components, mills and motors, electrical upgrades, and installation and commissioning costs. During 2014, the Company expects purchase obligations to be satisfied through cash payments.
Temporary Housing Space Rental and Service Agreement
The Company leases a temporary housing complex in Winnemucca, NV to provide lodging for employees, contractors, and consultants. The temporary housing complex is leased from a third party who maintains the property and grounds. The Company estimates the remaining payments due under the temporary housing space rental and service agreement will approximate $1.2 million in 2014, $3.6 million in 2015, and $0.2 million in 2016.
Net Profit Royalty
A portion of the Hycroft Mine is subject to a mining lease that requires a 4% net profit royalty be paid to the owner of certain patented and unpatented mining claims. The mining lease also requires an annual advance payment of $120,000 every year mining occurs on the leased claims. All advance annual payments are credited against the future payments due under the 4% net profit royalty. The total payments due under the mining lease are capped at $7.6 million, of which the Company has paid approximately $1.9 million through December 31, 2013. The Company estimates the remaining payments due under the mining lease will approximate $0.5 million in 2014, $1.7 million in 2015, $2.1 million in 2016, and $1.4 million in 2017.
ALLIED NEVADA GOLD CORP.
Notes to Consolidated Financial Statements
25. Subsequent Events
Collateralization of a Portion of the Cross Currency Swap
As discussed in Note 20 - Derivative Instruments, in January 2014 the Company began to collateralize a portion of the cross currency swap for the Notes. As of February 24, 2014, the Company had issued $12.2 million of letters of credit under the Revolver and remitted $0.2 million of cash to collateralize the mark-to-market position of 22% of the cross currency swap’s liability position.
Agreement to Sell Mineral Properties
On January 24, 2014, the Company entered into a letter agreement (the “Letter Agreement”) for the sale of the Hasbrouck, Three Hills, and Esmeralda County Exploration Properties (the “Properties”) with West Kirkland Mining, Inc. (“WKM”) for $30.0 million. As part of the Letter Agreement, the Company granted WKM a 90-day exclusive right from the date of the Letter Agreement to complete the purchase of the Properties. Upon entering into the Letter Agreement, WKM paid the Company a $0.5 million non-refundable deposit. To complete the purchase, WKM must make an additional payment of $19.5 million to the Company on the date the transaction is closed. The final $10.0 million is to be paid to the Company within 30 months after the closing date, subject to the Company’s option to retain an interest in the Properties. In the event WKM does not meet its final $10.0 million commitment to the Company, or if the Company elects to decline the final payment and retain an interest in the Properties, the Properties will be placed into a joint venture with WKM holding a 75% interest and the Company retaining a 25% interest.
The sale is subject to WKM’s ability to secure financing and the execution of a definitive agreement containing customary closing conditions and regulatory approvals.
Item 9. Changes in and Disagreements With Accountants on Accounting and Financial Disclosure
None.
Item 9A. Controls and Procedures
A. Evaluation of Disclosure Controls and Procedures
The principal executive officer and principal financial officer, with the supervision and participation of management, have evaluated the effectiveness of Allied Nevada’s disclosure controls and procedures (as defined in Rule 13a-15(e) under the Exchange Act) as of December 31, 2013. Based on the evaluation, the principal executive officer and principal financial officer concluded that the disclosure controls and procedures in place are effective to ensure that information required to be disclosed by Allied Nevada, including consolidated subsidiaries, in reports that Allied Nevada files or submits under the Exchange Act, is recorded, processed, summarized and reported in accordance with applicable time periods specified by the Securities and Exchange Commission rules and forms. Disclosure controls and procedures include, without limitation, controls and procedures designed to ensure that information required to be disclosed by the Company in reports that it files or submits under the Exchange Act is accumulated and communicated to the Company’s management, including its principal executive and financial officers, or persons performing similar functions, as appropriate, to allow timely decisions regarding required disclosure.
B. Management’s Annual Report on Internal Control over Financial Reporting
Allied Nevada’s management is responsible for establishing and maintaining adequate internal control over financial reporting. Internal control over financial reporting is defined in Rule 13a-15(f) and Rule 15d-15(f) promulgated under the Exchange Act as a process designed by, or under the supervision of, the Company’s principal executive and principal financial officers, or persons performing similar functions, and effected by the Company’s Board of Directors, management and other personnel, to provide reasonable assurance regarding the reliability of financial reporting and the preparation of financial statements for external purposes in accordance with generally accepted accounting principles. The Company’s internal control over financial reporting includes those policies and procedures that:
| |
| • | pertain to the maintenance of records that, in reasonable detail, accurately and fairly reflect the transactions and dispositions of the assets of the Company; |
| |
| • | provide reasonable assurance that transactions are recorded as necessary to permit preparation of financial statements in accordance with generally accepted accounting principles, and that receipts and expenditures of the Company are being made only in accordance with authorizations of management and directors of the Company; and |
| |
| • | provide reasonable assurance regarding prevention or timely detection of unauthorized acquisition, use or disposition of the Company’s assets that could have a material effect on the financial statements. |
The Company’s management, with the participation of the Company’s principal executive officer and principal financial officer, assessed the effectiveness of the Company’s internal control over financial reporting as of December 31, 2013. In making this assessment, it used the criteria set forth in the Internal Control-Integrated Framework issued by the Committee of Sponsoring Organizations of the Treadway Commission (“COSO”). Based on such assessment, the Company’s management, with the participation of the Company’s principal executive officer and principal financial officer, concluded that, as of December 31, 2013, the Company’s internal control over financial reporting was effective based on such criteria. The Company’s independent registered public accounting firm has issued an attestation report on the Company’s internal control over financial reporting as of December 31, 2013, which is included in Part II - Item 8 of this Form 10-K.
C. Changes in Internal Controls
There has been no change in Allied Nevada’s internal control over financial reporting during the year ended December 31, 2013 that has materially affected, or is reasonably likely to materially affect, Allied Nevada’s internal control over financial reporting.
Item 9B. Other Information
None.
PART III
Item 10. Directors, Executive Officers and Corporate Governance
The information required by Items 401, 405, 406, and 407(c)(3), (d)(4) and (d)(5) of Regulation S-K will be contained in the Company’s 2014 Proxy Statement, to be filed with the SEC within 120 days following the end of the Company’s fiscal year ended December 31, 2013 (the “2013 Proxy Statement”) and is hereby incorporated by reference thereto.
The Company has adopted a Code of Business Conduct and Ethics that applies to all directors, officers and employees of the Company, including our CEO and CFO and other finance professionals. The Code of Business Conduct and Ethics reaffirms the Company’s high standards of business conduct. The Code of Business Conduct and Ethics is part of the Company’s continuing effort to ensure that it complies with all applicable laws, has an effective program to prevent and detect violations of law, and conducts its business with fairness, honesty and integrity. In the event of a waiver, any such waivers of this code for directors or officers will be approved by the Audit Committee and such waiver will be promptly disclosed to stockholders as required by law. The Code of Business Conduct and Ethics is located on the Company’s internet website at http://www.alliednevada.com. The Company is not including the information contained on or available through its website as a part of, or incorporating such information by reference into, this report.
As required by applicable U.S. federal securities laws, all senior financial officers are subject to the Code of Conduct and Ethics for Senior Financial Officers setting forth various restrictions and obligations for our senior financial officers.
Item 11. Executive Compensation
The information required by Item 402 and paragraph (e)(4) and (e)(5) of Item 407 of Regulation S-K will be contained in the Company’s 2014 Proxy Statement, to be filed with the SEC within 120 days following the end of the Company’s fiscal year ended December 31, 2013 and is hereby incorporated by reference thereto.
Item 12. Security Ownership of Certain Beneficial Owners and Management and Related Stockholder Matters
The information required by Item 201(d) and Item 403 of Regulation S-K will be contained in the Company’s 2014 Proxy Statement, to be filed with the SEC within 120 days following the end of the Company’s fiscal year ended December 31, 2013 and is hereby incorporated by reference thereto.
Item 13. Certain Relationships and Related Transactions, and Director Independence
The information required by Item 404 and Item 407(a) of Regulation S-K will be contained in the Company’s 2014 Proxy Statement, to be filed with the SEC within 120 days following the end of the Company’s fiscal year ended December 31, 2013 and is hereby incorporated by reference thereto.
Item 14. Principal Accountant Fees and Services
The information required by Item 9(e) of Schedule 14A will be contained in the Company’s 2014 Proxy Statement, to be filed with the SEC within 120 days following the end of the Company’s fiscal year ended December 31, 2013 and is hereby incorporated by reference thereto.
PART IV
Item 15. Exhibits
(a) Documents filed as a part of this report:
(1) Financial Statements – Included in Part II, Item 8, Financial Statements and Supplementary Data
|
| | |
| | | Page |
| Report of Independent Registered Public Accounting Firm | | |
| Management’s Report on Internal Control over Financial Reporting | | |
| Consolidated Balance Sheets at December 31, 2013 and 2012 | | |
| Consolidated Statements of Income and Comprehensive Income for the Years Ended December 31, 2013, 2012, and 2011 | | |
| Consolidated Statements of Cash Flows for the Years Ended December 31, 2013, 2012, and 2011 | | |
| Consolidated Statements of Stockholders’ Equity for the Years Ended December 31, 2013, 2012, and 2011 | | |
| Notes to Consolidated Financial Statements | | |
(2) Financial Statement Schedules – Not applicable
(3) Exhibits – Set forth on the Exhibit Index that follows the signatures page of this report.
SIGNATURES
Pursuant to the requirements of Section 13 or 15(d) of the Securities Exchange Act of 1934, the registrant has duly caused this report to be signed on its behalf by the undersigned, thereunto duly authorized.
|
| | | | |
| | | | ALLIED NEVADA GOLD CORP. |
| | | | Registrant |
| Date: | February 24, 2014 | | By: | /s/ Randy E. Buffington |
| | | | | Randy E. Buffington |
| | | | | President and Chief Executive Officer |
Pursuant to the requirements of the Securities Exchange Act of 1934, this report has been signed below by the following persons on behalf of the registrant and in the capacities and on the dates indicated.
|
| | | | |
| Signature | | Title | | Date |
| | | | | |
| /s/ Randy E. Buffington | | President, Chief Executive Officer and Director (Principal Executive Officer) | | February 24, 2014 |
| Randy E. Buffington | |
| | | | | |
| /s/ Stephen M. Jones | | Executive Vice President and Chief Financial Officer (Principal Financial and Accounting Officer) | | February 24, 2014 |
| Stephen M. Jones | |
| | | | | |
| /s/ Robert M. Buchan | | Executive Chairman and Director | | February 24, 2014 |
Robert M. Buchan | |
| | | | | |
| /s/ John W. Ivany | | Director | | February 24, 2014 |
| John W. Ivany | |
| | | | | |
| /s/ Stephen A. Lang | | Director | | February 24, 2014 |
| Stephen A. Lang | |
| | | | | |
| /s/ Cameron A. Mingay | | Director | | February 24, 2014 |
| Cameron A. Mingay | |
| | | | | |
| /s/ Terry M. Palmer | | Director | | February 24, 2014 |
| Terry M. Palmer | |
| | | | | |
| /s/ Carl Pescio | | Director | | February 24, 2014 |
| Carl Pescio | |
| | | | | |
| /s/ A. Murray Sinclair | | Director | | February 24, 2014 |
| A. Murray Sinclair | |
| | | | | |
| /s/ Robert G. Wardell | | Director | | February 24, 2014 |
| Robert G. Wardell | |
| | | | | |
EXHBIT INDEX
|
| |
Exhibit Number | Description of Document |
| | |
| Underwriting Agreement. |
| 1.1† | Underwriting Agreement, dated as of May 2, 2013, among Allied Nevada Gold Corp., Dundee Securities Ltd. and Cormark Securities Inc. (incorporated herein by reference to Exhibit 1.2 of Allied Nevada Gold Corp.’s Current Report on Form 8-K dated May 2, 2013 filed with the SEC on May 3, 2013). |
| | |
| Plan of Acquisition, Reorganization, Arrangement, Liquidation or Succession. |
| 2.1† | Arrangement and Merger Agreement, dated as of September 22, 2006, between Vista Gold Corp., Allied Nevada Gold Corp., Carl Pescio and Janet Pescio (incorporated herein by reference to Exhibit 10.1 of Allied Nevada Gold Corp.’s Registration Statement on Form 10 filed with the SEC on January 12, 2007). |
| 2.2† | Amendment to Arrangement and Merger Agreement, dated as of May 8, 2007, among Vista Gold Corp., Allied Nevada Gold Corp., Carl Pescio and Janet Pescio (incorporated herein by reference to Exhibit 10.1 of Allied Nevada Gold Corp.’s Current Report on Form 8-K dated May 10, 2007 filed with the SEC on May 16, 2007). |
| | |
| Articles of Incorporation and By-laws. |
| 3.1† | First Amended and Restated Certificate of Incorporation of Allied Nevada Gold Corp. (incorporated herein by reference to Exhibit 3.1 of Allied Nevada Gold Corp.’s Quarterly Report on Form 10-Q for the quarterly period ended September 30, 2011 filed with the SEC on November 7, 2011). |
| 3.2† | By-laws of Allied Nevada Gold Corp., as amended October 31, 2013 (incorporated herein by reference to Exhibit 3.2 of Allied Nevada Gold Corp.’s Quarterly Report on Form 10-Q for the quarterly period ended September 30, 2013 filed with the SEC on November 5, 2013). |
| | |
| Instruments Defining the Rights of Security Holders, Including Indentures. |
| 4.1† | Indenture, dated as of May 25, 2012, between Allied Nevada Gold Corp. and Computershare Trust Company of Canada, as trustee (incorporated herein by reference to Exhibit 4.1 of Allied Nevada Gold Corp.’s Current Report on Form 8-K dated May 22, 2012 and filed with the SEC on March 29, 2012). |
| 4.2† | Guaranty, dated May 25, 2012, by Allied Nevada Gold Holdings LLC, Allied VGH Inc., Allied VNC Inc., Hycroft Resources & Development, Inc., Victory Exploration Inc., Victory Gold Inc., ANG Central LLC, ANG Cortez LLC, ANG Eureka LLC, ANG North LLC, ANG Northeast LLC, and ANG Pony LLC (incorporated herein by reference to Exhibit 4.1 of Allied Nevada Gold Corp.’s Current Report on Form 8-K dated May 22, 2012 and filed with the SEC on March 29, 2012). |
| | |
| Material Contracts. |
| 10.1† | Form of Allied Nevada Gold Corp. Indemnification Agreement, entered into with each of the following: Scott A. Caldwell, W. Durrand Eppler, John W. Ivany, Hal D. Kirby, Cameron A. Mingay, Terry M. Palmer, Carl Pescio, Michael B. Richings and Robert W. Wardell (incorporated herein by reference to Exhibit 10.8 of Amendment No. 1 to Allied Nevada Gold Corp.’s Registration Statement on Form 10 filed with the SEC on February 20, 2007). |
| 10.2 | Form of Allied Nevada Gold Corp. Amended and Restated Indemnification Agreement, entered into with each of the following: Robert M. Buchan, Randy E. Buffington, Joseph Doherty, John W. Ivany, Stephen M. Jones, Stephen A. Lang, Deborah Lassiter, Cameron A. Mingay, Michael Murphy, Terry M. Palmer, Carl Pescio, Rebecca Rivenbark, A. Murray Sinclair, Tracey Thom, Carl Waggoner, Robert W. Wardell and Warren Woods. |
| 10.3†* | Allied Nevada Gold Corp. Special Stock Option Plan, dated February 7, 2007, and Form of Special Stock Option Agreement (incorporated herein by reference to Exhibit 10.6 of Amendment No. 1 to Allied Nevada Gold Corp.’s Registration Statement on Form 10 filed with the SEC on February 20, 2007). |
| 10.4†* | Allied Nevada Gold Corp. 2007 Stock Option Plan, as amended, and Form of Stock Option Agreement (incorporated herein by reference to Appendix B to Allied Nevada Gold Corp.’s 2009 Definitive Proxy Statement on Form DEF 14A filed with the SEC on May 15, 2009). |
| 10.5* | Allied Nevada Gold Corp. Restricted Share Plan, as amended, and Form of Restricted Share Right Grant. |
| 10.6†* | Allied Nevada Gold Corp. Deferred Phantom Unit Plan, as amended (incorporated herein by reference to Appendix C to Allied Nevada Gold Corp.’s 2011 Definitive Proxy Statement on Form DEF 14A filed with the SEC on September 26, 2011). |
| 10.7†* | Form of Deferred Phantom Unit Grant Letter under the Allied Nevada Gold Corp. Deferred Phantom Unit Plan (incorporated herein by reference to Exhibit 10.7 of Allied Nevada Gold Corp.’s Annual Report on Form 10-K for the fiscal year ended December 31, 2011 filed with the SEC on February 27, 2012). |
| 10.8†* | Allied Nevada Gold Corp. Deferred Share Unit Plan, dated March 7, 2012 (incorporated herein by reference to Exhibit 10.1 of Allied Nevada Gold Corp.’s Quarterly Report on Form 10-Q for the quarterly period ended September 30, 2012 filed with the SEC on November 5, 2012). |
| 10.9†* | Form of Deferred Share Unit Grant Letter under the Allied Nevada Gold Corp. Deferred Share Unit Plan (incorporated herein by reference to Exhibit 10.8 of Allied Nevada Gold Corp.’s Annual Report on Form 10-K for the fiscal year ended December 31, 2012 filed with the SEC on February 25, 2013). |
| 10.10* | Allied Nevada Gold Corp. Supplemental Executive Retirement Plan, effective February 2, 2012. |
|
| |
| 10.11†* | Employment Agreement, dated as of January 11, 2008, between Allied Nevada Gold Corp. and Scott A. Caldwell (incorporated herein by reference to Exhibit 10.1 of Allied Nevada Gold Corp.’s Current Report on Form 8-K dated January 11, 2008 filed with the SEC on January 15, 2008). |
| 10.12†* | Addendum No. 1 to Employment Agreement between Allied Nevada Gold Corp. and Scott A. Caldwell, dated December 29, 2008 (incorporated herein by reference to Exhibit 10.1 of Allied Nevada Gold Corp.’s Current Report on Form 8-K dated December 29, 2008 filed with the SEC on December 31, 2008). |
| 10.13†* | Separation and Settlement Agreement, dated as of May 29, 2013, by and between Allied Nevada Gold Corp. and Scott Caldwell (incorporated herein by reference to Exhibit 10.1 of Allied Nevada Gold Corp.’s Current Report on Form 8-K dated May 29, 2013 filed with the SEC on June 4, 2013). |
| 10.14†* | Employment Agreement, dated as of October 15, 2010, between Allied Nevada Gold Corp. and David Hill (incorporated herein by reference to Exhibit 10.10 of Allied Nevada Gold Corp.’s Annual Report on Form 10-K for the fiscal year ended December 31, 2010 filed with the SEC on February 28, 2011). |
| 10.15†* | Employment Agreement, dated as of March 16, 2009, between Allied Nevada Gold Corp. and Warren Woods (incorporated herein by reference to Exhibit 10.23 of Allied Nevada Gold Corp.’s Quarterly Report on Form 10-Q for the quarterly period ended March 31, 2010 filed with the SEC on May 10, 2010). |
| 10.16†* | Amended and Restated Employment Agreement, dated as of December 20, 2013, between Allied Nevada Gold Corp. and Stephen M. Jones (incorporated herein by reference to Exhibit 10.2 of Allied Nevada Gold Corp.’s Current Report on Form 8-K dated December 19, 2013 filed with the SEC on January 23, 2014). |
| 10.17†* | Employment Agreement, dated as of February 13, 2012, between Allied Nevada Gold Corp. and Gary W. Banbury (incorporated herein by reference to Exhibit 10.1 of Allied Nevada Gold Corp.’s Quarterly Report on Form 10-Q for the quarterly period ended March 31, 2012 filed with the SEC on May 7, 2012). |
| 10.18†* | Release of All Claims, dated June 3, 2013, between Allied Nevada Gold Corp. and Gary W. Banbury (incorporated herein by reference to Exhibit 10.1 of Allied Nevada Gold Corp.’s Current Report on Form 8-K dated June 3, 2013 filed with the SEC on June 6, 2013). |
| 10.19†* | Amended and Restated Employment Agreement, dated as of December 19, 2013, between Allied Nevada Gold Corp. and Randy Buffington (incorporated herein by reference to Exhibit 10.1 of Allied Nevada Gold Corp.’s Current Report on Form 8-K dated December 19, 2013 filed with the SEC on January 23, 2014). |
| 10.20† | Letter Agreement, dated May 15, 2012, by and among Allied Nevada Gold Corp., Scotia Capital Inc. and GMP Securities L.P. (incorporated herein by reference to Exhibit 10.1 of Allied Nevada Gold Corp.’s Current Report on Form 8-K dated May 15, 2012 and filed with the SEC on May 18, 2012). |
| 10.21† | Amended and Restated Credit Agreement, dated as of October 31, 2012, between Allied Nevada Gold Corp., The Bank of Nova Scotia, Commonwealth Bank of Australia, National Bank of Canada and Société Générale (Canada Branch) (incorporated herein by reference to Exhibit 10.2 of Allied Nevada Gold Corp.’s Quarterly Report on Form 10-Q for the quarterly period ended September 30, 2012 filed with the SEC on November 5, 2012). |
| 10.22† | First Amendment to Amended and Restated Credit Agreement, dated as of March 26, 2013, between Allied Nevada Gold Corp., The Bank of Nova Scotia, Commonwealth Bank of Australia, National Bank of Canada and Société Générale (Canada Branch) (incorporated herein by reference to Exhibit 10.1 of Allied Nevada Gold Corp.’s Current Report on Form 8-K dated March 26, 2013 filed with the SEC on March 29, 2013). |
| 10.23† | Second Amendment to Amended and Restated Credit Agreement, dated as of June 27, 2013, between Allied Nevada Gold Corp., The Bank of Nova Scotia, Commonwealth Bank of Australia, National Bank of Canada and Société Générale (Canada Branch) (incorporated herein by reference to Exhibit 10.1 of Allied Nevada Gold Corp.’s Current Report on Form 8-K dated June 27, 2013 filed with the SEC on June 28, 2013). |
| 10.24† | Third Amendment to Amended and Restated Credit Agreement, dated as of September 30, 2013, between Allied Nevada Gold Corp., The Bank of Nova Scotia, Commonwealth Bank of Australia, National Bank of Canada and Société Générale (Canada Branch) (incorporated herein by reference to Exhibit 10.1 of Allied Nevada Gold Corp.’s Current Report on Form 8-K dated September 30, 2013 filed with the SEC on October 1, 2013). |
| 10.25† | Second Amended and Restated Credit Agreement, dated as of December 27, 2013, between Allied Nevada Gold Corp. and The Bank of Nova Scotia (incorporated herein by reference to Exhibit 10.1 of Allied Nevada Gold Corp.’s Current Report on Form 8-K dated December 27, 2013 filed with the SEC on December 30, 2013). |
| 10.26† | Confirmation of Cross Currency Swap Transaction, dated June 18, 2012, between Allied Nevada Gold Corp. and The Bank of Nova Scotia (incorporated herein by reference to Exhibit 10.3 of Allied Nevada Gold Corp.’s Quarterly Report on Form 10-Q for the quarterly period ended June 30, 2012 filed with the SEC on August 7, 2012). |
| 10.27† | Term and Security Deposit Loan Agreement, dated March 27, 2013, between Hycroft Resources & Development, Inc. and Caterpillar Financial Services corporation (incorporated herein by reference to Exhibit 10.2 of Allied Nevada Gold Corp.’s Current Report on Form 8-K dated March 26 2013 filed with the SEC on March 29, 2013). |
| 10.28† | Guaranty of Indebtedness by Allied Nevada Gold Corp. (incorporated herein by reference to Exhibit 10.3 of Allied Nevada Gold Corp.’s Current Report on Form 8-K dated March 26, 2013 filed with the SEC on March 29, 2013). |
| 10.29† | Letter Agreement, dated January 24, 2014, between Allied Nevada Gold Corp. and West Kirkland Mining Inc. (incorporated herein by reference to Exhibit 10.1 of Allied Nevada Gold Corp.’s Current Report on Form 8-K dated January 28, 2014 filed with the SEC on January 28, 2014). |
| | |
| Subsidiaries of the Registrant. |
| 21.1 | Subsidiaries of the Registrant |
| | |
| Consents of Experts and Counsel. |
|
| |
| 23.1 | Consent of EKS&H LLLP, independent registered public accounting firm |
| | |
| Rule 13a-14(a)/15d-14(a) Certifications. |
| 31.1 | Certification of Chief Executive Officer pursuant to Rule 13a-14(a) under the Securities Exchange Act of 1934, as amended |
| 31.2 | Certification of Chief Financial Officer pursuant to Rule 13a-14(a) under the Securities Exchange Act of 1934, as amended |
| | |
| Section 1350 Certifications. |
| 32.1 | Certification of Chief Executive Officer pursuant to 18 U.S.C. Section 1350, as adopted pursuant to Section 906 of the Sarbanes-Oxley Act of 2002 |
| 32.2 | Certification of Chief Financial Officer pursuant to 18 U.S.C. Section 1350, as adopted pursuant to Section 906 of the Sarbanes-Oxley Act of 2002 |
| | |
| Mine Safety Disclosure Exhibits. |
| 95.1 | Mine Safety Disclosures |
| | |
| Interactive Data File. |
| 101.INS | XBRL Instance Document |
| 101.SCH | XBRL Taxonomy Extension Schema Document |
| 101.CAL | XBRL Taxonomy Calculation Linkbase Document |
| 101.DEF | XBRL Taxonomy Extension Definition Linkbase Document |
| 101.LAB | XBRL Taxonomy Label Linkbase Document |
| 101.PRE | XBRL Taxonomy Presentation Linkbase Document |
† Not filed herewith, but incorporated herein by reference.
* Management contract or compensatory plan or arrangement.