UNITED STATES
SECURITIES AND EXCHANGE COMMISSION
Washington, D.C. 20549
FORM 20-F
(Mark One)
| ¨ | REGISTRATION STATEMENT PURSUANT TO SECTION 12(b) OR 12(g) OF THE SECURITIES EXCHANGE ACT OF 1934 |
OR
| x | ANNUAL REPORT PURSUANT TO SECTION 13 OR 15(d) OF THE SECURITIES EXCHANGE ACT OF 1934 |
For the fiscal year ended December 31, 2012.
OR
| ¨ | TRANSITION REPORT PURSUANT TO SECTION 13 OR 15(d) OF THE SECURITIES EXCHANGE ACT OF 1934 |
For the transition period from to
OR
| ¨ | SHELL COMPANY REPORT PURSUANT TO SECTION 13 OR 15(d) OF THE SECURITIES EXCHANGE ACT OF 1934 |
Date of event requiring this shell company report
Commission file number: 001-33082
HOME INNS & HOTELS MANAGEMENT INC.
(Exact Name of Registrant as Specified in Its Charter)
N/A
(Translation of Registrant’s Name Into English)
Cayman Islands
(Jurisdiction of Incorporation or Organization)
No. 124 Caobao Road
Xuhui District
Shanghai 200235
People’s Republic of China
(Address of Principal Executive Offices)
David Jian Sun, Chief Executive Officer
No. 124 Caobao Road
Xuhui District
Shanghai 200235
People’s Republic of China
Phone: +86 21 3337 3333
Fax: +86 21 6483 5661
(Name, Telephone, E-mail and/or Facsimile number and Address of Company Contact Person)
Securities registered or to be registered pursuant to Section 12(b) of the Act:
| | |
Title of Each Class | | Name of Each Exchange On Which Registered |
| American Depositary Shares, each representing two ordinary shares, par value $0.005 per share | | Nasdaq Global Market |
Securities registered or to be registered pursuant to Section 12(g) of the Act:
None
(Title of Class)
Securities for which there is a reporting obligation pursuant to Section 15(d) of the Act:
None
(Title of Class)
Indicate the number of outstanding shares of each of the issuer’s classes of capital or common stock as of the close of the period covered by the annual report.91,672,320 ordinary shares, par value US$0.005 per share, as of December 31, 2012.
Indicate by check mark if the registrant is a well-known seasoned issuer, as defined in Rule 405 of the Securities Act. Yes x No ¨
If this report is an annual or transition report, indicate by check mark if the registrant is not required to file reports pursuant to Section 13 or 15(d) of the Securities Exchange Act of 1934. Yes ¨ No x
Indicate by check mark whether the registrant: (1) has filed all reports required to be filed by Section 13 or 15(d) of the Securities Exchange Act of 1934 during the preceding 12 months (or for such shorter period that the registrant was required to file such reports), and (2) has been subject to such filing requirements for the past 90 days. Yes x No ¨
Indicate by check mark whether the registrant has submitted electronically and posted on its corporate Web site, if any, every Interactive Data File required to be submitted and posted pursuant to Rule 405 of Regulation S-T during the preceding 12 months (or for such shorter period that the registrant was required to submit and post such files). Yes x No ¨
Indicate by check mark whether the registrant is a large accelerated filer, an accelerated filer, or a non-accelerated filer. See definition of “accelerated filer and large accelerated filer” in Rule 12b-2 of the Exchange Act. (Check one):
Large accelerated filer x Accelerated filer ¨ Non-accelerated ¨
Indicate by check mark which basis of accounting the registrant has used to prepare the financial statements included in this filing:
| | | | |
U.S. GAAP x | | International Financial Reporting Standards as issued by the International Accounting Standards Board¨ | | Other ¨ |
If “Other” has been checked in response to the previous question, indicate by check mark which financial statement item the registrant has elected to follow. Item 17 ¨ Item 18 ¨
If this is an annual report, indicate by check mark whether the registrant is a shell company (as defined in Rule 12b-2 of the Exchange Act). Yes ¨ No x
(APPLICABLE ONLY TO ISSUERS INVOLVED IN BANKRUPTCY PROCEEDINGS DURING THE PAST FIVE YEARS)
Indicate by check mark whether the registrant has filed all documents and reports required to be filed by Sections 12, 13 or 15(d) of the Securities Exchange Act of 1934 subsequent to the distribution of securities under a plan confirmed by a court. Yes ¨ No ¨
TABLE OF CONTENTS
INTRODUCTION
Unless otherwise indicated and except where the context otherwise requires, references in this annual report on Form 20-F to:
| | • | | “we,” “us,” “our company” and “our” refer to Home Inns & Hotels Management Inc., a Cayman Islands company, and its predecessor entities and subsidiaries; |
| | • | | “China” or “PRC” refers to the People’s Republic of China, excluding solely for the purposes of this report Taiwan, Hong Kong and Macau; |
| | • | | “Motel 168” refers to Motel 168 International Holdings Limited and its subsidiaries, which we acquired in 2011; |
| | • | | “our hotels” refers, collectively, to our leased-and-operated and franchised-and-managed hotels; |
| | • | | “mature hotels” refers to hotels that have been in operation for 18 months or more; |
| | • | | “ramp-up stage hotels” refers to hotels that have been in operation for 6 months or less; |
| | • | | “average daily rate” refers to total hotel room revenues divided by the total number of occupied rooms in a given period; |
| | • | | “occupancy rate” refers to the total number of occupied rooms divided by the total number of available rooms in a given period; |
| | • | | “RevPAR” represents revenue per available room, which is calculated by dividing total hotel room revenues by the total number of available rooms in a given period, or by multiplying average daily rates and occupancy rates in a given period; |
| | • | | “shares” or “ordinary shares” refers to our ordinary shares; |
| | • | | “outstanding ordinary shares” and “ordinary shares outstanding” refer to our outstanding ordinary shares, excluding ordinary shares that have been issued to The Bank of New York Mellon but are reserved in anticipation of the exercise of options and vesting of restricted shares under the share incentive plan we adopted in 2006; |
| | • | | “ADSs” refers to our American depositary shares, each of which represents two ordinary shares; |
| | • | | “convertible bonds” refer to our US$ settled zero coupon convertible senior bonds due 2012 that we issued in December 2007; |
| | • | | “convertible notes” refer to our 2.00% convertible senior notes due 2015 that we issued in December 2010; and |
| | • | | “RMB” or “Renminbi” refers to the legal currency of China; “$,” “dollars,” “US$” or “U.S. dollars” refers to the legal currency of the United States; and “HK$” refers to the legal currency of Hong Kong. |
This annual report on Form 20-F includes our audited consolidated financial statements including the statement of operations for the years ended December 31, 2010, 2011 and 2012 and the consolidated balance sheet as of December 31, 2011 and 2012.
1
PART I.
| ITEM 1. | IDENTITY OF DIRECTORS, SENIOR MANAGEMENT AND ADVISERS |
Not applicable.
| ITEM 2. | OFFER STATISTICS AND EXPECTED TIMETABLE |
Not applicable.
A.Selected Financial Data
Our Selected Consolidated Financial Data
The following table presents our selected consolidated financial information. The selected consolidated statement of operations data for the years ended December 31, 2010, 2011 and 2012 and the consolidated balance sheet data as of December 31, 2011 and 2012 have been derived from our audited consolidated financial statements included elsewhere in this annual report. Our selected consolidated statement of operations data for the years ended December 31, 2008 and 2009 and our consolidated balance sheet data as of December 31, 2008, 2009 and 2010 have been derived from our audited consolidated financial statements not included in this annual report. Our consolidated financial statements are prepared and presented in accordance with U.S. GAAP.
Our historical results do not necessarily indicate our results expected for any future periods. You should read the following information in conjunction with our consolidated financial statements and related notes included elsewhere in this annual report.
| | | | | | | | | | | | | | | | | | | | | | | | |
| | | For the Year Ended December 31, | |
| | | 2008 | | | 2009 | | | 2010 | | | 2011 | | | 2012 | |
| | | RMB | | | RMB | | | RMB | | | RMB | | | RMB | | | US$ | |
| | | (in thousands) | |
Consolidated Statement of Operations Data | | | | | | | | | | | | | | | | | | | | | | | | |
Revenues: | | | | | | | | | | | | | | | | | | | | | | | | |
Leased-and-operated hotels | | | 1,771,762 | | | | 2,453,105 | | | | 2,910,458 | | | | 3,559,740 | | | | 5,164,799 | | | | 829,007 | |
Franchised-and-managed hotels | | | 99,779 | | | | 147,535 | | | | 256,799 | | | | 399,986 | | | | 604,936 | | | | 97,099 | |
| | | | | | | | | | | | | | | | | | | | | | | | |
Total revenues | | | 1,871,541 | | | | 2,600,640 | | | | 3,167,257 | | | | 3,959,726 | | | | 5,769,735 | | | | 926,106 | |
Less: Business tax and related surcharges | | | (111,870 | ) | | | (158,975 | ) | | | (191,232 | ) | | | (249,274 | ) | | | (353,418 | ) | | | (56,728 | ) |
| | | | | | | | | | | | | | | | | | | | | | | | |
Net revenues | | | 1,759,671 | | | | 2,441,665 | | | | 2,976,025 | | | | 3,710,452 | | | | 5,416,317 | | | | 869,378 | |
Operating costs and expenses (1): | | | | | | | | | | | | | | | | | | | | | | | | |
Leased-and-operated hotel costs: | | | | | | | | | | | | | | | | | | | | | | | | |
Rents and utilities | | | (643,694 | ) | | | (797,944 | ) | | | (875,510 | ) | | | (1,232,662 | ) | | | (1,953,243 | ) | | | (313,517 | ) |
Personnel costs | | | (337,837 | ) | | | (461,949 | ) | | | (506,406 | ) | | | (657,155 | ) | | | (1,037,371 | ) | | | (166,510 | ) |
Depreciation and amortization | | | (190,698 | ) | | | (281,543 | ) | | | (308,888 | ) | | | (398,914 | ) | | | (612,789 | ) | | | (98,359 | ) |
Consumables, food and beverage | | | (143,555 | ) | | | (172,467 | ) | | | (173,256 | ) | | | (258,120 | ) | | | (351,338 | ) | | | (56,394 | ) |
Others | | | (182,284 | ) | | | (275,186 | ) | | | (310,705 | ) | | | (413,815 | ) | | | (687,254 | ) | | | (110,312 | ) |
| | | | | | | | | | | | | | | | | | | | | | | | |
Total leased-and-operated hotel costs | | | (1,498,068 | ) | | | (1,989,089 | ) | | | (2,174,765 | ) | | | (2,960,666 | ) | | | (4,641,995 | ) | | | (745,092 | ) |
Personnel costs of franchised-and-managed hotels(1) | | | (14,293 | ) | | | (24,874 | ) | | | (44,128 | ) | | | (72,009 | ) | | | (125,031 | ) | | | (20,069 | ) |
Sales and marketing expenses(1) | | | (27,161 | ) | | | (30,462 | ) | | | (33,257 | ) | | | (44,451 | ) | | | (76,878 | ) | | | (12,340 | ) |
General and administrative expenses(1) | | | (138,355 | ) | | | (155,606 | ) | | | (193,482 | ) | | | (335,888 | ) | | | (315,235 | ) | | | (50,599 | ) |
| | | | | | | | | | | | | | | | | | | | | | | | |
Total operating costs and expenses | | | (1,677,877 | ) | | | (2,200,031 | ) | | | (2,445,632 | ) | | | (3,413,014 | ) | | | (5,159,139 | ) | | | (828,100 | ) |
Other income | | | — | | | | — | | | | — | | | | — | | | | 16,558 | | | | 2,658 | |
| | | | | | | | | | | | | | | | | | | | | | | | |
Income from operations | | | 81,794 | | | | 241,634 | | | | 530,393 | | | | 297,438 | | | | 273,736 | | | | 43,936 | |
| | | | | | | | | | | | | | | | | | | | | | | | |
2
| | | | | | | | | | | | | | | | | | | | | | | | |
| | | For the Year Ended December 31, | |
| | | 2008 | | | 2009 | | | 2010 | | | 2011 | | | 2012 | |
| | | RMB | | | RMB | | | RMB | | | RMB | | | RMB | | | US$ | |
| | | (in thousands) | |
Interest income | | | 32,023 | | | | 6,686 | | | | 9,454 | | | | 31,996 | | | | 11,874 | | | | 1,906 | |
Interest expense | | | (28,136 | ) | | | (10,983 | ) | | | (2,024 | ) | | | (46,868 | ) | | | (119,416 | ) | | | (19,168 | ) |
Issuance costs for convertible notes | | | — | | | | — | | | | (42,559 | ) | | | — | | | | — | | | | — | |
Loss from equity investment | | | — | | | | — | | | | — | | | | — | | | | (2,305 | ) | | | (370 | ) |
(Loss)/gain on change in fair value of convertible notes | | | — | | | | — | | | | (9,040 | ) | | | 198,547 | | | | (87,099 | ) | | | (13,980 | ) |
Gain on buy-back of convertible bond | | | 103,291 | | | | 69,327 | | | | 2,480 | | | | 1,521 | | | | — | | | | — | |
Other non-operating income | | | 10,971 | | | | 16,248 | | | | 22,223 | | | | 35,899 | | | | 43,248 | | | | 6,942 | |
Non-operating expenses | | | — | | | | — | | | | — | | | | (7,315 | ) | | | (6,665 | ) | | | (1,070 | ) |
Foreign exchange (loss)/gain, net | | | (65,524 | ) | | | (286 | ) | | | (4,350 | ) | | | 15,849 | | | | 217 | | | | 35 | |
| | | | | | | | | | | | | | | | | | | | | | | | |
Income before income tax expense and noncontrolling interests | | | 134,419 | | | | 322,626 | | | | 506,577 | | | | 527,067 | | | | 113,590 | | | | 18,231 | |
Income tax expense | | | (28,107 | ) | | | (62,166 | ) | | | (139,969 | ) | | | (169,442 | ) | | | (136,305 | ) | | | (21,878 | ) |
| | | | | | | | | | | | | | | | | | | | | | | | |
Net income/(loss)(2) | | | 106,312 | | | | 260,460 | | | | 366,608 | | | | 357,625 | | | | (22,715 | ) | | | (3,647 | ) |
| | | | | | | | | | | | | | | | | | | | | | | | |
Less: Net income attributable to noncontrolling interests | | | (5,087 | ) | | | (4,457 | ) | | | (7,109 | ) | | | (6,094 | ) | | | (4,061 | ) | | | (652 | ) |
| | | | | | | | | | | | | | | | | | | | | | | | |
Net income/(loss) attributable to Home Inns’ shareholders | | | 101,225 | | | | 256,003 | | | | 359,499 | | | | 351,531 | | | | (26,776 | ) | | | (4,299 | ) |
| | | | | | | | | | | | | | | | | | | | | | | | |
Earning per share: | | | | | | | | | | | | | | | | | | | | | | | | |
Basic | | | 1.43 | | | | 3.37 | | | | 4.45 | | | | 4.17 | | | | (0.29 | ) | | | (0.05 | ) |
Diluted | | | 0.04 | | | | 2.34 | | | | 4.23 | | | | 1.26 | | | | (0.29 | ) | | | (0.05 | ) |
Earnings per ADS (3): | | | | | | | | | | | | | | | | | | | | | | | | |
Basic | | | 2.86 | | | | 6.74 | | | | 8.89 | | | | 8.35 | | | | (0.59 | ) | | | (0.09 | ) |
Diluted | | | 0.09 | | | | 4.69 | | | | 8.45 | | | | 2.51 | | | | (0.59 | ) | | | (0.09 | ) |
Weighted average ordinary shares outstanding: | | | | | | | | | | | | | | | | | | | | | | | | |
Basic | | | 70,863,336 | | | | 75,922,589 | | | | 80,846,617 | | | | 84,221,665 | | | | 90,804,777 | | | | 90,804,777 | |
Diluted | | | 78,037,433 | | | | 80,895,112 | | | | 84,747,102 | | | | 94,299,393 | | | | 90,804,777 | | | | 90,804,777 | |
(1) Share-based compensation expenses are included in the consolidated statement of operations data as follows: | |
| | | For the Year Ended December 31, | |
| | | 2008 | | | 2009 | | | 2010 | | | 2011 | | | 2012 | |
| | | RMB | | | RMB | | | RMB | | | RMB | | | RMB | | | US$ | |
| | | (in thousands) | |
Leased-and-operated hotel costs—personnel costs | | | 11 | | | | — | | | | — | | | | 3,283 | | | | 8,199 | | | | 1,316 | |
Personnel costs of franchised-and-managed hotels | | | — | | | | — | | | | — | | | | 3,369 | | | | 9,578 | | | | 1,537 | |
Sales and marketing expenses | | | — | | | | — | | | | — | | | | 656 | | | | 1,535 | | | | 246 | |
General and administrative expenses | | | 24,833 | | | | 32,009 | | | | 53,272 | | | | 69,227 | | | | 74,064 | | | | 11,888 | |
| | | | | | | | | | | | | | | | | | | | | | | | |
Total share-based compensation expenses | | | 24,844 | | | | 32,009 | | | | 53,272 | | | | 76,535 | | | | 93,376 | | | | 14,987 | |
| (2) | Data in 2008 were retrospectively adjusted to reflect the adoption of ASC 810. |
| (3) | Each ADS represents two ordinary shares. |
3
The following table presents a summary of our consolidated balance sheet data as of December 31, 2008, 2009, 2010, 2011 and 2012:
| | | | | | | | | | | | | | | | | | | | | | | | |
| | | As of December 31, | |
| | | 2008 | | | 2009 | | | 2010 | | | 2011 | | | 2012 | |
| | | RMB | | | RMB | | | RMB | | | RMB | | | RMB | | | US$ | |
| | | (in thousands) | |
Consolidated Balance Sheet Data | | | | | | | | | | | | | | | | |
Cash and cash equivalents | | | 608,445 | | | | 829,592 | | | | 2,382,643 | | | | 1,786,038 | | | | 663,156 | | | | 106,444 | |
Total assets | | | 3,363,454 | | | | 3,454,948 | | | | 5,286,145 | | | | 9,549,836 | | | | 8,954,014 | | | | 1,437,217 | |
Convertible bonds, current | | | — | | | | 363,506 | | | | — | | | | 113,051 | | | | — | | | | — | |
Current portion of term loans | | | — | | | | — | | | | — | | | | 346,550 | | | | 12,571 | | | | 2,018 | |
Total current liabilities | | | 639,518 | | | | 925,630 | | | | 838,576 | | | | 2,089,315 | | | | 1,742,899 | | | | 279,752 | |
Deferred rental | | | 136,825 | | | | 155,612 | | | | 191,034 | | | | 593,955 | | | | 631,618 | | | | 101,382 | |
Term loans | | | — | | | | — | | | | — | | | | 1,165,666 | | | | 735,404 | | | | 118,040 | |
Convertible bonds, non-current | | | 895,696 | | | | — | | | | 159,402 | | | | — | | | | — | | | | — | |
Financial liability (convertible notes measured at fair value) | | | — | | | | — | | | | 1,227,577 | | | | 979,008 | | | | 1,066,771 | | | | 171,229 | |
Ordinary shares | | | 2,899 | | | | 3,209 | | | | 3,257 | | | | 3,542 | | | | 3,574 | | | | 574 | |
Additional paid-in capital | | | 1,393,903 | | | | 1,798,086 | | | | 1,913,734 | | | | 2,683,923 | | | | 2,802,905 | | | | 449,897 | |
Total Home Inns shareholders’ equity | | | 1,607,608 | | | | 2,268,104 | | | | 2,743,299 | | | | 3,865,304 | | | | 3,957,401 | | | | 635,207 | |
| | | | | | | | | | | | | | | | | | | | | | | | |
Exchange Rate Information
This annual report contains translations of RMB amounts into U.S. dollars at specific rates solely for the convenience of the reader. The conversion of RMB into U.S. dollars in this annual report is based on the noon buying rate published by the Federal Reserve Board. Unless otherwise noted, all translations of financial data from RMB to U.S. dollars in this annual report were made at a rate of RMB 6.2301 to US$1.00, the certified exchange rate in effect as of December 31, 2012. We make no representation that any RMB or U.S. dollar amounts could have been, or could be, converted into U.S. dollars or RMB, as the case may be, at any particular rate, the rates stated below, or at all. The PRC government imposes control over its foreign currency reserves in part through direct regulation of the conversion of RMB into foreign exchange and through restrictions on foreign trade. On April 12, 2013, the noon buying rate was RMB 6.1914 to US$1.00.
The following table sets forth information concerning exchange rates between the RMB and the U.S. dollar for the periods indicated. These rates are provided solely for your convenience and are not necessarily the exchange rates that we used in this annual report or will use in the preparation of our periodic reports or any other information to be provided to you. The source of these rates is the Federal Reserve Board.
| | | | | | | | | | | | | | | | |
| | | Noon Buying Rate | |
| | | Period End | | | Average(1) | | | Low | | | High | |
Period | | | | | | | | | | | | | | | | |
2008 | | | 6.8225 | | | | 6.9193 | | | | 7.2946 | | | | 6.7800 | |
2009 | | | 6.8259 | | | | 6.8295 | | | | 6.8470 | | | | 6.8176 | |
2010 | | | 6.6000 | | | | 6.6497 | | | | 6.6745 | | | | 6.6000 | |
2011 | | | 6.2939 | | | | 6.4630 | | | | 6.6364 | | | | 6.2939 | |
2012 | | | 6.2301 | | | | 6.2990 | | | | 6.3879 | | | | 6.2221 | |
October | | | 6.2372 | | | | 6.2627 | | | | 6.2877 | | | | 6.2372 | |
November | | | 6.2265 | | | | 6.2338 | | | | 6.2454 | | | | 6.2221 | |
December | | | 6.2301 | | | | 6.2328 | | | | 6.2502 | | | | 6.2251 | |
2013 | | | | | | | | | | | | | | | | |
January | | | 6.2186 | | | | 6.2215 | | | | 6.2303 | | | | 6.2134 | |
February | | | 6.2213 | | | | 6.2323 | | | | 6.2438 | | | | 6.2213 | |
March | | | 6.2108 | | | | 6.2154 | | | | 6.2246 | | | | 6.2105 | |
April (through April 12, 2013) | | | 6.1914 | | | | 6.1991 | | | | 6.2078 | | | | 6.1914 | |
| (1) | Annual averages are calculated from month-end rates. Monthly averages are calculated using the average of the daily rates during the relevant period. |
4
B.Capitalization and Indebtedness
Not applicable.
C.Reasons for the Offer and Use of Proceeds
Not applicable.
D.Risk Factors
Risks Related to Our Business
Our operating results are subject to conditions typically affecting the lodging industry.
Our operating results are subject to conditions typically affecting the lodging industry, including the following:
| | • | | changes in national, regional or local economic conditions; |
| | • | | severe weather conditions, natural disasters or travelers’ fears of exposure to serious contagious diseases; |
| | • | | competition from other hotels, the attractiveness of our hotels to customers, and our ability to maintain and increase sales to existing customers and attract new customers; |
| | • | | local market conditions such as an oversupply of, or a reduction in demand for, hotel rooms; |
| | • | | the quality and performance of managerial and other employees of our hotels; |
| | • | | increases in operating costs and expenses due to inflation and other factors; |
| | • | | the availability and cost of capital to allow us and our franchisees to fund construction and renovation of, and make other investments in, our hotels; |
| | • | | seasonality of the lodging business and occurrence of major national or regional events; and |
| | • | | the risk that leased properties may be subject to challenges as to their compliance with relevant government regulations or their compatibility with government planning and re-zoning. |
Changes in any of these conditions could adversely affect our occupancy rates, average daily rates and RevPAR or otherwise adversely affect our results of operations and financial condition.
We may not be able to manage our expected expansion, which could materially and adversely affect our operating results.
Since our inception, we have experienced substantial growth in our hotel network. We have increased the number of our hotels in operation in China from 5 in 2002 to 1,772 (with another 241 hotels contracted or under construction) as of December 31, 2012. We intend to continue to develop additional hotels in different geographic locations in China and increase our number of hotels in operation. In November 2010, we launched a new hotel brand for the midscale to upscale market, Yitel (orHeyi in Chinese). By the end of 2012 we had 7 Yitel hotels in operation and 4 other Yitel hotels contracted or under construction. Effective October 1, 2011, we completed the acquisition of a 100% ownership interest in Motel 168 International Holdings Limited, or Motel 168, and we have retained the Motel 168 brand. As of December 31, 2012, we had 334 hotels in operation under the Motel 168 brand and another 26 contracted or under construction. We plan to continue to open new hotels under each of these brands in the foreseeable future.
Our expansion has placed, and will continue to place, substantial demands on our managerial, operational, technological and other resources. Our planned expansion will also require us to maintain the consistency of each of our products and the quality of our services to ensure that our brands do not suffer as a result of any deviations, whether actual or perceived, in the consistency of each of our products and the quality of our services. In order to manage and support our growth, we must continue to improve our existing operational, administrative and technological systems and our financial and management controls, and recruit, train and retain qualified hotel management personnel as well as other administrative and sales and marketing personnel, particularly as we expand into new markets. We cannot guarantee that we will be able to effectively and efficiently manage the growth of our operations, recruit and retain qualified personnel and integrate new hotels into our operations. Any failure to effectively and efficiently manage our expansion may materially and adversely affect our ability to capitalize on new business opportunities, which in turn may have a material adverse effect on our results of operation.
5
Expansion into new geographic markets and addition of new hotel products for which we have limited operating experience and brand recognition may present operating and marketing challenges that are different from those that we currently encounter in existing markets for our hotels. In addition, our expansion within existing markets may adversely affect the financial performance of our existing hotels in those markets and, as a result, negatively affect our overall results of operations. Inability to anticipate the changing demands that expanding our operations will impose on our management and information and operational systems, or failure to quickly adapt our systems and procedures to the new markets, could result in revenue decline and increased expenses and otherwise harm our results of operations and financial condition.
We have committed significant resources to the acquisition of Motel 168, and if we cannot successfully integrate Motel 168’s operations and personnel with our own, our results of operations and return on capital may be materially adversely affected.
We acquired the Motel 168 hotel chain effective October 1, 2011. The addition of Motel 168’s hotels expanded our holding by an additional 297 hotels in operation, including 144 leased-and-operated hotels and 153 franchised-and-managed hotels, with about 47,099 rooms located in 85 cities across China. The base acquisition price was US$470.0 million, consisting of US$305.5 million in cash and 8,149,616 ordinary shares priced at US$40.37 per ADS or US$20.185 per ordinary share at the closing of the transaction. The cash portion was funded with cash on hand and a four-year term loan facility of US$240.0 million with an interest rate at 390 basis points over LIBOR. Following the acquisition, we spent approximately US$17.4 million through December 31, 2012 on renovating our Motel 168 hotels and implementing new marketing initiatives and operational best practices, and we expect that our expenditures for these purposes will total between $20 million and $25 million by the time major work under the integration plan is completed. The acquisition of Motel 168 exposes us to potential risks, including risks associated with unforeseen or hidden liabilities, the diversion of management attention and resources from our existing business and the inability to generate sufficient revenues to offset the costs and expenses of the acquisition.
Historically, Motel 168 did not consistently generate positive net income on a consolidated basis. As a consequence, the consolidation of Motel 168 with our financial results had a negative impact on our results of operations for the quarter and year ended December 31, 2011. Despite the continued operational improvements during 2012, financial results of Motel 168 impacted our results of operations negatively on an annual basis in 2012, and the improvements were limited by the slowdown in the Chinese economy in 2013. Motel 168 may have a negative impact on our results of operations in 2013 without meaningful improvement in the economy and this could delay the achievement of our final integration targets.
If we are presented with appropriate opportunities in the future, we may acquire additional businesses or assets that are complementary to our business. Difficulties encountered in the acquisition and integration process may have an adverse effect on our ability to manage our business.
We may not be able to comply with the financial covenants contained in the credit agreement relating to our secured loan facility, which would give the lenders under that facility certain rights to accelerate our obligation to repay the outstanding balance. Any involuntary acceleration of the loan would have an adverse effect on our financial condition. Furthermore, in the event of a default under the secured loan facility, including failure to comply with all financial covenants, the lenders could proceed against the collateral that we have granted to secure our indebtedness, which includes substantially all of our assets.
In September 2011, we obtained a secured loan facility from a consortium of lenders in connection with our acquisition of Motel 168. As of the date of this annual report, the outstanding principal amount under the secured loan facility is US$117.0 million, which we are required to repay in two more installments on July 31, 2014 and September 15, 2015. The related credit agreement dated as of September 26, 2011 contains financial covenants relating to our business, including a maximum consolidated total debt to consolidated capitalization ratio, a minimum debt service coverage ratio and a maximum leverage ratio as of each quarter end and a maximum consolidated capital expenditures limit for each fiscal year. It also requires us to maintain certain cash balances in bank accounts outside of China, including cash balances in accounts pledged as security to the lenders to be maintained for the payment of interest and principal on the term loans. See “Item 5. Operating and Financial Review and Prospects—B. Liquidity and Capital Resources.”
Upon the occurrence of any default under the secured loan facility, including failure to comply with all financial covenants, the lenders could elect to declare all borrowings outstanding, together with accrued and unpaid interest and fees, to be due and payable, or could require us to apply all of our available cash to repay these borrowings up to the amount of our legally distributable earnings. If we cannot repay these amounts, the lenders could proceed against the collateral granted to them to secure our indebtedness. We have pledged substantially all of our assets as collateral under the secured loan facility. If the lenders accelerate the repayment of our borrowings, we may not have sufficient assets to repay the loans under the secured loan facility and any other indebtedness that defaults as a result, or be able to borrow sufficient funds to refinance such indebtedness. Even if we are able to obtain new financing, it may not be on commercially reasonable terms, or terms that are acceptable to us.
6
We cannot guarantee that we will be able to comply with the covenants contained in the secured convertible loan facility in the future, and if we breach the covenants, we cannot guarantee that we would be able to obtain any amendments to or waivers of the covenants contained in the secured loan facility. In addition, any amendment to or waiver of the covenants may involve upfront fees, higher annual interest costs and other terms less favorable to us than those currently offered by the secured convertible loan facility.
If the value of our brands or image diminishes, it could have a material and adverse effect on our business and results of operations.
Our “Home Inn” and “Motel 168” brands are associated with cleanliness, convenience and comfort with consistent, high-quality service among value-conscious individual business and leisure travelers in China. The “Home Inn” brand tends to attract a higher proportion of business travelers, while “Motel 168” tends to cater more to younger leisure travelers. Our continued success in maintaining and enhancing our brands and image depends, to a large extent, on our ability to satisfy customer needs by further developing and maintaining our innovative and distinctive products and maintaining consistent quality of services across our hotel chain, as well as our ability to respond to competitive pressures. If we are unable to do so, our occupancy rates may decline, which could in turn adversely affect our results of operations. Our business may also be adversely affected if our public image or reputation were to be diminished by the operations of any of our hotels, whether due to unsatisfactory service, accidents and injuries or otherwise. Our brands are integral to our sales and marketing efforts. If our brands do not continue to be attractive to customers and if the value of our brands is diminished, our business and results of operations may be materially and adversely affected.
If we are not able to hire, train and retain qualified managerial and other employees for our hotel operations, our brand and our business may be materially and adversely affected.
Our managerial and other employees manage our hotels and interact with our customers on a daily basis. They are critical to maintaining the quality and consistency of our services as well as our established brand and reputation. It is important for us to attract qualified managerial and other employees who have experience in lodging or other consumer-service industries and are committed to our “customer-first” approach. There may be a limited supply of such qualified individuals in some of the cities in China where we have operations and other cities into which we intend to expand. In addition, characteristics such as dedication are difficult to assess during the recruitment process. We must hire and train qualified managerial and other employees on a timely basis to keep pace with our growth while maintaining consistent quality of services across our hotels in various geographic locations. We must also provide continuous training to our managerial and other employees so that they are equipped with up-to-date knowledge of various aspects of our hotel operations and can meet our demand for high-quality services. If we fail to do so, the quality of our services may decrease in one or more of the markets where we operate, which in turn may have a material and adverse effect on our brand and our business.
We may not be able to successfully identify and secure additional hotel properties.
We plan to open more hotels in targeted markets to further grow our business. We may not be successful in identifying and leasing or franchising additional hotel properties at desirable locations and on commercially reasonable terms or at all. Some cities in China have undergone economic development and expansion for several decades while others are still in early stages of development. In more developed cities, it may be difficult to increase the number of hotels if we or our competitors already have substantial operations in such cities. In less developed cities, demand for our hotels may not increase as rapidly as we expect. Even if we are able to successfully identify and acquire new hotel properties via lease or franchise arrangements, new hotels may not generate the returns we expect. We also may incur costs in connection with evaluating hotel properties and negotiating with property owners, including properties that we are subsequently unable to lease or franchise. If we fail to successfully identify or compete for additional hotel properties, our ability to execute our growth strategy could be impaired and our business and prospects may be materially and adversely affected.
The covenants contained in the credit agreement relating to our secured loan facility restrict our ability to expand our business.
In September 2011, we obtained a secured loan facility from a syndicate of lenders in connection with our acquisition of Motel 168. As of the date of this annual report, the outstanding principal amount under the secured loan facility is US$117.0 million, which we are required to repay in two more installments on July 31, 2014 and September 15, 2015. The related credit agreement dated as of September 26, 2011 imposes certain limitations on our business expansion beyond our current projection absent consent from the lenders. In particular, before the loan facility is repaid, we may only acquire assets or equity interests of any ongoing business or invest in a non-controlled joint venture through any of our entities outside of China with proceeds raised from an equity issuance made specifically for that purpose, subject to certain exceptions. In addition, investments in non-controlled joint ventures through any of our entities in China are limited to a maximum of US$36 million in 2013 and US$44.25 million in 2014 or thereafter. The credit agreement also contains certain other restrictions on our ability to conduct mergers or corporate restructurings, dispose of assets, extend loans or guarantees or incur indebtedness. Furthermore, each year we are required under the credit agreement to cause our subsidiaries in China to declare and pay the maximum legally distributable earnings of the most recently ended calendar year as dividends to our entities outside of China to service the debt, except that we may maintain a cash balance of up to RMB500 million in China to continue on-going operation and expansion according to a prescribed budget and forecast. In 2012, we distributed RMB 336.4 million in onshore earnings to offshore subsidiaries pursuant to this requirement. Without lender consent to waivers or amendments, these restrictions and requirements may limit our ability to expand our business and prevent us from taking advantage of favorable growth opportunities.
7
We may need additional capital. To the extent permitted under the terms of our existing indebtedness, the sale of additional ADSs or other equity securities could result in additional dilution to our shareholders, and the incurrence of additional indebtedness would result in increased debt service obligations and could restrict our operations.
We believe that our current cash and cash equivalents, anticipated cash flow from operations and the proceeds from our past capital markets fundraising activities, and undrawn bank credit facilities available to us will be sufficient to meet our anticipated cash needs for the foreseeable future. We may, however, require additional cash resources due to changed business conditions, strategic acquisitions or other future developments, including any re-financing needs or any investments or acquisitions we may decide to pursue. If these resources are insufficient to satisfy our cash requirements, we may seek to sell additional equity or debt securities or obtain additional credit facilities, to the extent permitted under the terms of our existing indebtedness. The sale of additional equity securities could result in additional dilution to our shareholders. The incurrence of indebtedness would result in increased debt service obligations and could result in operating and financing covenants that would restrict our operations. We cannot guarantee that financing will be available in amounts or on terms acceptable to us, if at all, particularly in light of current global economic conditions, or that the operating and financing covenants in our existing indebtedness will allow us to raise the additional capital that we might need.
We may not be able to develop hotel properties on a timely or cost-efficient basis, which may adversely affect our growth strategy and business.
We develop almost all of our leased-and-operated hotels directly. Our involvement in the development of properties presents a number of risks, including construction delays or cost overruns, which may result in increased project costs or forgone revenue. We may be unable to recover development costs we incur for projects that do not reach completion. Properties that we develop could become less attractive due to market saturation or oversupply, and as a result we may not be able to recover development costs at the expected rate, or at all. If we are unable to successfully manage our hotel development to minimize these risks, our growth strategy and business prospects may be adversely affected.
If we are unable to maintain our hotels’ good condition and attractive appearance, our hotel occupancy rates may decline.
In order to maintain our hotels’ good condition and attractive appearance, our hotels require ongoing repairs, maintenance, renovations and other leasehold improvements, including periodic replacement of certain furniture, fixtures and equipment. If we and our franchisees do not make needed leasehold investments and improvements, our hotel occupancy rates may decline and we could lose market share.
Our costs and expenses may remain constant or increase even if our revenues decline.
A significant portion of our operating costs, including rent, is fixed. Accordingly, a decrease in our revenues could result in a disproportionately higher decrease in our earnings because our operating costs and expenses are unlikely to decrease proportionately. For example, the period during which China’s Spring Festival holiday occurs generally accounts for a lower portion of our annual revenues than other periods, but our expenses do not vary as significantly as changes in occupancy and revenues, since we need to continue to pay rent and salary, make regular repairs, maintenance and renovations and invest in other capital improvements throughout the year to maintain the attractiveness of our hotels. Our property development and renovation costs may increase as a result of increasing costs of materials. However, we have a limited ability to pass increased costs to customers through room rate increases. Therefore, our costs and expenses may remain constant or increase even if our revenues decline.
In addition, our leased-and-operated hotels typically incur significant pre-opening costs during the conversion stage, and may incur losses during the ramp-up stage before revenues exceed operating costs, which are largely fixed. Should there be delays in conversion process or if the ramp-up is slower than expected, our financial performance can be materially and adversely impacted.
Our effort in developing our new hotel brand, Yitel (or Heyi in Chinese), may divert management attention and resources from our existing business, and if the new product is not well received by the market, we may not be able to generate sufficient revenue to offset the costs and expenses, and our overall financial performance and condition may be adversely affected.
We currently operate seven hotels under the Yitel (or Heyi in Chinese) brand, which is a mid to upscale brand concept targeting individual business and leisure travelers who have a higher travel budget than the customers of economy hotels, but a lower travel budget than the customers of high star-rated hotels. We started the initiative to enter this market segment in late 2008, when we opened the first hotel under the H Hotel name. After efforts to refine the design concept of this product, service offering and other features and standards, we opened the second hotel in this segment under the Yitel name in September 2011. Subsequently, the H Hotel was re-named Yitel, and we opened two other Yitel hotels in late 2011 and three more in 2012. We currently have four other Yitel hotels contracted and under development, and we target to have a total of more than 50 Yitel hotels within the next three years. We have limited operating experience in developing and operating hotels in the mid to upscale market. If the new product is not well received by the market, we may not be able to generate sufficient revenue to offset the costs and expenses, and our overall financial performance and condition may be adversely affected.
8
Our business is sensitive to global economic conditions. A severe or prolonged downturn in the global or Chinese economy could materially and adversely affect our business and our financial condition.
The global financial markets experienced significant disruptions in 2008 and the United States, Europe and other economies went into recession. The recovery from the lows of 2008 and 2009 was uneven and it is facing new challenges, including the escalation of the European sovereign debt crisis since 2011 and the slowdown of the Chinese economy in 2012. It is unclear whether the European sovereign debt crisis will be contained and whether the Chinese economy will resume its high growth rate. There is considerable uncertainty over the long term effects of the expansionary monetary and fiscal policies that have been adopted by the central banks and financial authorities of some of the world’s leading economies, including China’s. There have also been concerns over unrest in the Middle East and Africa, which have resulted in volatility in oil and other markets, and over the possibility of a war involving Iran. There have also been concerns about the economic effect of the earthquake, tsunami and nuclear crisis in Japan, about tensions in the relationship between China and Japan and more recently about North Korea’s nuclear program. Economic conditions in China are sensitive to global economic conditions, and any slowdown in the Chinese economy would likely reduce the level of business and leisure travel within China, which would have a negative impact on our business, results of operations and financial condition, and continued turbulence in the international markets may adversely affect our ability to access the capital markets to meet liquidity needs.
Our financial and operating performance may be adversely affected by epidemics, severe weather conditions, natural disasters and other catastrophes.
Our financial and operating performance may be adversely affected by epidemics, severe weather conditions, natural disasters and other catastrophes, particularly in locations where we operate a large number of hotels. Losses caused by epidemics, severe weather conditions, natural disasters and other catastrophes, including H1N1 or H7N9 virus, SARS, avian flu, earthquakes and typhoons, are either uninsurable or too expensive to justify insuring against in China. In the event an uninsured loss or a loss in excess of insured limits occurs, we could lose all or a portion of the capital we have invested in a hotel, as well as the anticipated future revenue from the hotel. In that event, we might nevertheless remain obligated for any financial obligations related to the hotel. Similarly, epidemics, war (including the potential of war), terrorist activity (including threats of terrorist activity), social unrest and heightened travel security measures instituted in response and travel-related accidents, as well as geopolitical uncertainty and international conflict, will affect travel and may in turn have a material adverse effect on our business and results of operation. In addition, we may not be adequately prepared with contingency planning or recovery capability for a major incident or crisis, and as a result our operational continuity may be adversely affected and our reputation may be harmed.
The lodging industry in China is highly competitive with relatively low barriers to entry, and if we are unable to compete successfully, our financial condition and results of operations may be harmed.
The lodging industry in China is highly competitive. Competition in the industry is primarily based on room rates, quality of accommodations, brand name recognition, convenience of location, geographic coverage, service quality, range of services and guest amenities. We compete primarily with other economy hotel chains as well as various regional and local economy hotels. We also compete with two- and three-star hotels, as we offer rooms with standards comparable to many of those hotels while maintaining competitive pricing. In addition, we may also face competition from new entrants in the economy hotel segment in China. As compared to developing four- or five-star hotels, developing economy and midscale hotels does not require significant capital commitments or human resources. This relatively low barrier to entry potentially allows new competitors to enter our markets quickly to compete with our business. Furthermore, we compete with all other hotels for guests in each market in which we operate, as our typical business and leisure traveler customers may change their travel, spending and consumption patterns and choose to stay in hotels in different segments. New and existing competitors may offer competitive rates, greater convenience, services or amenities or superior facilities, which could attract customers away from our hotels, resulting in a decrease in occupancy and average daily rates for our hotels. Any of these factors may have an adverse effect on our competitive position, results of operations and financial condition.
Failure to retain our senior management could harm our business.
We place substantial reliance on the lodging and other consumer-service industry experience and the institutional knowledge of members of our senior management team. Mr. David Jian Sun, our chief executive officer, Ms. Huiping Yan, our chief financial officer, Mr. Jason Xiangxin Zong, our chief operating officer, and Ms. May Wu, our chief strategy officer, are particularly important to our future success due to their substantial experience in the lodging and other consumer service industries. We do not carry key person insurance on any of our senior management team. The loss of the services of one or more of these members of our senior management team due to their departure or otherwise could hinder our ability to effectively manage our business and implement our growth strategies. Finding suitable replacements for Mr. Sun, Ms. Yan, Mr. Zong and Ms. Wu could be difficult, and competition for such personnel of similar experience is intense. If we lose the services of any of them, our business may be adversely affected.
9
Interruption or failure of our information and operational systems could impair our ability to effectively provide our services, which could damage our reputation.
Our ability to provide consistent and high-quality services throughout our hotel chain depends on the continued operation of our proprietary information and operational systems, including our property management, central reservation, customer relationship management and management reporting systems. Any damage to, or failure of, our systems could interrupt our service. Our systems are vulnerable to damage or interruption as a result of power loss, telecommunications failures, computer viruses, fires, floods, earthquakes, interruptions in access to our toll-free numbers, hacking or other attempts to harm our systems, and similar events. Our servers, which are maintained in Shanghai, may also be vulnerable to break-ins, sabotage and vandalism. Some of our systems are not fully redundant, and our disaster recovery planning does not account for all possible scenarios. In addition, our systems and technologies may become outdated and we may not be able to replace or introduce upgraded systems as quickly as our competitors or within budgeted costs for such upgrades. If we experience frequent or persistent system failures, our quality of services and our reputation could be harmed. The steps we need to take to increase the reliability and redundancy of our systems may be costly, which could reduce our operating margin, and there can be no assurance that whatever increased reliability may be achievable in practice would justify the costs incurred.
Failure to maintain the integrity of internal or customer data could result in harm to our reputation or subject us to costs, liabilities, fines or lawsuits.
Our business involves collecting and retaining large volumes of internal and customer data, including credit card numbers and other personal information as our various information technology systems enter, process, summarize and report such data. We also maintain information about various aspects of our business operations as well as our employees. The integrity and protection of our customer, employee and company data is critical to our business. Our customers and employees expect that we will adequately protect their personal information, and the regulations applicable to security and privacy are becoming increasingly important in China. Theft, loss, fraudulent or unlawful use of customer, employee or company data could harm our reputation or result in remedial and other costs including fines and litigation liabilities.
If we fail to maintain an effective system of internal control over financial reporting, we may not be able to accurately report our financial results or prevent fraud.
We are subject to reporting obligations under the U.S. securities laws. The Securities and Exchange Commission, or the SEC, as required by Section 404 of the Sarbanes-Oxley Act of 2002, adopted rules requiring every public company to include a management report on such company’s internal control over financial reporting in its annual report, which contains management’s assessment of the effectiveness of our internal control over financial reporting. Our management has concluded that our internal control over financial reporting was effective as of December 31, 2012. See “Item 15. Controls and Procedures.” Our independent registered public accounting firm has issued an attestation report as of December 31, 2012. See “Item 15. Controls and Procedures—Attestation Report of the Registered Public Accounting Firm.” However, if we fail to maintain effective internal control over financial reporting in the future, our management and our independent registered public accounting firm may not be able to conclude that we have effective internal control over financial reporting at a reasonable assurance level. This could in turn result in the loss of investor confidence in the reliability of our financial statements and negatively impact the trading price of our ADSs. Furthermore, we have incurred and anticipate that we will continue to incur considerable costs, management time and other resources in an effort to continue to comply with Section 404 and other requirements of the Sarbanes-Oxley Act.
Any failure to protect our trademarks and other intellectual property rights could have a negative impact on our business.
We believe our brands, trade names, trademarks and other intellectual property are critical to our success. “Home Inn” and “Motel 168” are highly recognized brands in the economy hotel segment of China’s lodging industry. The success of our business depends in part upon our continued ability to use our brands, trade names and trademarks to increase brand awareness and to further develop our brand. The unauthorized reproduction of our trademarks could diminish the value of our brands and their market acceptance, competitive advantages or goodwill. In addition, our proprietary information and operational systems, which have not been patented or otherwise registered as our property, are a key component of our competitive advantage and our growth strategy.
Monitoring and preventing the unauthorized use of our intellectual property is difficult. The measures we take to protect our brands, trade names, trademarks and other intellectual property rights may not be adequate to prevent their unauthorized use by third parties. Furthermore, the application of laws governing intellectual property rights in China and abroad is evolving, and could involve substantial uncertainties to us. If we are unable to adequately protect our brands, trade names, trademarks and other intellectual property rights, we may lose these rights and our business may suffer materially.
10
The growth of on-line and other hotel reservation intermediaries and travel consolidators may adversely affect our margins and profitability.
Some of our hotel rooms are booked through travel intermediaries and consolidators to whom we pay agency fees for such services. If these intermediaries and consolidators become the primary channel through which our customers make their bookings, they may be able to negotiate higher agency fee rates, reduced room rates, or other significant concessions from us. We believe that the aim of such intermediaries and consolidators is to have consumers develop loyalties to their reservation systems rather than to our brand. A material increase in reliance on these travel intermediaries and consolidators may adversely affect our ability to control the supply and price of our room inventory, which would in turn adversely affect our margins and profitability.
Our expansion and our integration of the Motel 168 hotels requires capital. If we fail to generate sufficient cash flow from operations and/or obtain outside financing when required, we may not be able to fund our planned expansion.
We typically need to make a capital expenditure of approximately US$1.4 million to convert a leased property into an operational Home Inn brand leased-and-operated hotel. Following our acquisition of Motel 168, we spent approximately US$17.4 million through December 31, 2012 on renovating the Motel 168 hotels and implementing new marketing initiatives and operational best practices, and we expect that our expenditures for these purposes will total between $20 million and $25 million by the time major work under the integration plan is completed. Accelerated expansion of our leased-and-operated Home Inn, Motel 168 and Yitel brand hotels beyond the levels of the last two years will increase our capital expenditures. We typically incur substantial pre-opening expenses for leased-and-operated hotels during the conversion stage and incur losses during the initial ramp-up stage. In the past, we were able to fund such capital expenditures and pre-opening and other expenses from capital markets fund raising activities and cash flow generated internally from our operations. There is no assurance that we will continue to be able to access capital markets or generate sufficient cash flow internally to fund our planned expansion. In addition, the covenants contained in the credit agreement relating to our secured loan facility limit our ability to access the capital markets for the duration of that loan facility. See “—The covenants contained in the credit agreement relating to our secured loan facility restrict our ability to expand our business.”
Future acquisitions or strategic investments may have an adverse effect on our ability to manage our business and harm our financial condition and results of operations.
If we are presented with appropriate opportunities, we may acquire or invest in businesses or assets that are complementary to our business. Future acquisitions, particularly actual or potential material acquisitions, would expose us to potential risks, including risks associated with unforeseen or hidden liabilities, the diversion of management attention and resources from our existing business and the inability to generate sufficient revenues to offset the costs and expenses of acquisitions. After we acquired Top Star in 2007, our operational and financial performance was negatively impacted by the acquired hotels after we had committed substantial management and financial resources to the integration and improvement of those acquired hotels. The acquisition of Motel 168 in 2011 had a short-term negative impact on our operational and financial performance in 2012, and it may have a negative impact on our results of operations in 2013 without meaningful improvement in the economy. Any difficulties encountered in the acquisition and integration process may have an adverse effect on our ability to manage our business and near term profitability. If a strategic investment is unsuccessful, then in addition to the diversion of management attention and resources from our existing business we may lose the value of our investment, which could have a material adverse effect on our financial condition and results of operations.
Our limited operating history makes it difficult to evaluate our future prospects and results of operations.
We believe that our future success depends on our ability to increase revenue and profitability from our operations. We have a limited operating history, having commenced operations in 2002. Accordingly, you should consider our future prospects in light of the risks and challenges encountered by a company with a limited operating history. These risks and challenges include those associated with our ability to:
| | • | | continue our growth while maintaining our profitability; |
| | • | | maintain and enhance our competitive position in the economy hotel segment of the lodging industry in China; |
| | • | | offer an innovative product to attract recurring and new customers; |
| | • | | implement our strategy and modify it from time to time to respond effectively to competition and changes in customer preferences and needs; |
| | • | | increase awareness of our “Home Inn”, “Yitel” and “Motel 168” brands and continue to develop customer loyalty; |
| | • | | attract, train, retain and motivate qualified personnel; and |
| | • | | renew leases for our leased-and-operated hotels on commercially viable terms after the initial lease terms expire. |
If we are unsuccessful in addressing any of these risks or challenges, our business may be materially and adversely affected.
11
Seasonality of our business and the occurrence of national or regional major events may cause fluctuations in our revenues, cause our ADS price to decline, and adversely affect our profitability.
The lodging industry is subject to fluctuations in revenues due to seasonality and national or regional major events. The seasonality of our business may cause fluctuations in our quarterly operating results. Generally, the first quarter, in which both the New Year and Spring Festival holidays fall, accounts for a lower percentage of our annual revenues than other quarters of the year. Therefore, you should not rely on our operating results for prior quarters as an indication of our results in any future period. In addition, the occurrence of national or regional major events may affect our operating results, in particular for the hotel locations where those events are held. In 2011, our year-over-year RevPar decrease was driven by a lower occupancy rate and a lower average daily rate due to the absence of the price premium unique to the Shanghai World Expo that started on May 1, 2010 and ended on October 31, 2010. As our revenues may vary from quarter to quarter or year to year, our business is difficult to predict and our results could fall below investor expectations, which could cause our ADS price to decline. Furthermore, although it typically takes our new hotels three to six months to ramp up, the ramp-up process of some of our hotels can be delayed due to seasonality, which may negatively affect our revenues and profitability.
We are subject to various franchise, hotel industry, construction, hygiene, health and safety, and environmental laws and regulations that may subject us to liability.
Our business is subject to various compliance and operational requirements under PRC laws. For example, we are required to obtain the approval from, and file initial and annual reports with, the PRC Ministry of Commerce to engage in the hotel franchising business. Each of our hotels is required to obtain a special industry license and a fire control approval issued by the local public security bureau, to have hotel operations included in the business scope of its business license, to obtain hygiene permits and environmental impact assessment approvals, and to comply with license requirements, rules, laws and regulations with respect to construction permit, zoning, fire prevention, public and food safety and environmental protection. See “Regulation — Regulations on Hotel Operation.”
If we fail to comply with any applicable construction, hygiene, health and safety, and environmental laws and regulations related to our business, we may be subject to potentially significant monetary damages and fines or the suspension of our operations or development activities. Furthermore, new regulations could also require us to retrofit or modify our hotels or incur other significant expenses. It is also possible that new zoning plans or regulations applicable to a specific location may cause us to relocate our hotel(s) in that location, or require additional approvals and licenses that may not be granted to us promptly or at all, which may adversely affect our operating results. Any failure by us to control the use of, or to adequately restrict the discharge of, hazardous substances in our development activities, or to otherwise operate in compliance with environmental laws could also subject us to potentially significant monetary damages and fines or the suspension of our hotel development activities or hotel operations, which could materially adversely affect our financial condition and results of operations.
As of December 31, 2012, we had not yet obtained certain required approvals, licenses and permits in the PRC for 16 of our hotels, most of which had been open for less than three months. While we expect to obtain the required approvals, licenses and permits in due course, this noncompliance could result in administrative fines, suspension of operations or other penalties under applicable PRC law. We cannot guarantee that we will not be subject to any challenges or other actions with respect to such noncompliance.
Accidents or injuries in our hotels may adversely affect our reputation and subject us to liability.
There are inherent risks of accidents or injuries occurring in hotels or in connection with our hotel construction or operations. For example, in the early morning of May 1, 2011, a fire broke out in Tonghua City, Jilin Province, in the building in which one of our hotels is located. Ten people were killed and over forty were injured. It was later determined that the fire was caused by arson within the premises of another tenant in the same building. As the fire broke out between three and four o’clock in the morning, most of the victims were guests or employees of our hotel. The occurrence of one or more such accidents or injuries could adversely affect our reputation for safety among customers and potential customers, harm our brand, result in liability, and increase our costs by requiring us to implement even more comprehensive safety measures. Our current property and liability insurance policies may not provide adequate coverage and we may be unable to renew our insurance policies or obtain new insurance policies without increased premiums or decreased levels of coverage.
12
We have limited insurance coverage.
We carry property insurance that covers the assets that we own at our hotels, but not the buildings or any other assets owned by our lessors. Although we require our lessors to purchase customary insurance policies, we cannot guarantee that they will adhere to such requirements. Furthermore, those Motel 168 hotels that are still operating on leases they had signed before the acquisition generally have lower insurance coverage than our Home Inn and Yitel hotels. If we were held liable for amounts and claims exceeding the limits of our insurance coverage or outside the scope of our insurance coverage, our business, results of operations and financial condition may be materially and adversely affected. In addition, we do not have any business disruption insurance coverage for our operations to cover losses that may be caused by severe weather conditions, natural disasters or catastrophic events, such as epidemics or earthquakes. Any business disruption or natural disaster may result in our incurring substantial costs and diversion of our resources.
Our leases could be terminated early, we may not be able to renew our existing leases on commercially reasonable terms and our rents could increase substantially in the future, which could materially and adversely affect our business and results of operations.
Our lease agreements with third parties for our leased-and-operated hotels typically provide, among other things, that the lease agreements could be terminated under certain legal or factual circumstances. If our leases were terminated early, we may be entitled to liquidated damages and full or partial recovery of our investments in leasehold improvements; however, our operation of such properties may be interrupted or discontinued and we may incur costs in relocating our operations to other locations. Furthermore, we may have to pay losses and damages and incur other liabilities to our guests and other vendors due to breach or default of our contractual obligations for a particular property. As a result, our business and results of operations and financial condition may be adversely affected by early termination of our lease agreements.
We plan to renew our existing leases upon expiration. However, we may be unable to retain our leases on satisfactory terms, or at all. In particular, we may experience an increase in rent payments and loss of revenues in connection with renegotiating our leases. If a significant number of our existing leases are terminated early or are not renewed on satisfactory terms upon expiration, our costs may increase in the future. If we cannot pass the increased costs on to our guests through room rate increases, our operating margins and earnings could decrease and our results of operations could be materially and adversely affected.
Our legal right to lease certain properties could be challenged by property owners or other third parties, which could prevent us from continuing to operate the affected hotels or increase the costs associated with operating these hotels.
Except for one hotel property, we do not hold any land-use rights with respect to the land on which our hotels are located, nor do we own any of the hotel properties we operate. Instead, our business model relies on leases from third parties who either own the properties or lease the properties from the ultimate property owner. As of December 31, 2012, title certificates for 98 of the properties operated by us had not been obtained. We cannot guarantee that title to properties we currently lease or franchise will not be challenged, and such challenges, if successful, could impair the development or operations of our hotels on such properties. In addition, we are subject to the risk of potential disputes with property owners. Such disputes, whether resolved in our favor or not, may divert management attention, harm our reputation or otherwise disrupt our business.
In a few instances where our immediate lessors are not the ultimate owners of hotel properties, no consent was obtained from the owners to sublease the hotel properties to us. A lessor’s failure to duly obtain the title to the property or to receive any necessary approvals from the ultimate owner or the primary lease holder, as applicable, could potentially invalidate our lease or result in the renegotiation of such lease leading to less favorable terms. Moreover, we cannot guarantee that the building ownership or leasehold in connection with our franchised-and-managed hotels will not be subject to similar third-party challenges. Some of the properties we or our franchisees lease from third parties were subject to mortgages at the time the leases were signed. In such circumstances and where consent to the lease was not obtained from the mortgage holder, the lease may not be binding on the transferee of the property if the mortgage holders foreclose on the mortgage and transfer the property, which could in turn materially and adversely affect our ability to operate the hotel facility.
13
Our lessors’ failure to comply with lease registration and other compliance requirements under PRC law may subject these lessors or us to fines or other penalties that may negatively affect our ability to operate our hotels.
As an operator and manager of hotel properties, we, our franchisees and those from whom we lease properties are subject to a number of land- and property-related legal requirements. For instance, under PRC law, all lessors are required to register their lease agreements with the local housing bureau. Our standard lease agreement generally requires the lessor to make such registrations. However, as of December 31, 2012, most lessors of our leased-and-operated hotels had not obtained registrations of their leases from the relevant authorities as required. We continue to remind these lessors to obtain registrations under our lease agreements with them. In addition, based on the specific land use right certificates and property ownership certificates currently held by some of our lessors, certain hotel properties we lease are restricted to industrial and other uses, rather than for commercial service use. The failure of our lessors to register lease agreements as required by law or to ensure that the hotel properties are operated in compliance with their designated use may subject these lessors or us to fines or other penalties which may negatively affect our ability to operate the hotels covered under those leases.
There are uncertainties associated with our cooperation with our franchisees. Franchisees’ defaults or wrongdoings may affect our reputation, which would adversely affect the results of our operations.
Our franchised-and-managed hotels operate under our brand names. If our brands are misused by any of our franchisees, there may be an adverse impact on our business reputation and brand image. In addition, like operators in service-oriented industries, we are subject to customer complaints and we may face complaints from unsatisfied customers who are unhappy with the standard of service offered by our franchisees. Any complaints, regardless of their nature and validity, may affect our reputation, thereby adversely affecting the results of our operations. We may also have to incur additional costs in placating any customers or salvaging our reputation. If our franchisees default or commit wrongdoings, there could be situations where the franchisees are not in a position to sufficiently compensate us for losses which we may have suffered as a result thereof.
Risks Related to Doing Business in China
Changes in economic and political policies of the PRC government could have a material adverse effect on the overall economic growth of China, which could adversely affect our business.
We conduct substantially all of our business operations in China. As the travel industry is highly sensitive to business and personal discretionary spending levels, it tends to decline during general economic downturns. Accordingly, our results of operations, financial condition and prospects are influenced significantly by economic, political and legal developments in China. China’s economy differs from the economies of most developed countries in many respects, including the degree of government involvement and influence on the level of economic development, growth rate, control of foreign exchange and allocation of resources. While the PRC economy has experienced significant growth in the past 20 years, growth has been uneven across different regions and economic sectors of China. The PRC government has implemented various measures to promote economic development and direct the allocation of resources. While some of these measures benefit the overall PRC economy, they may also have a negative impact on us. For example, our financial condition and results of operations may be adversely affected by government control over capital investments or changes in tax regulations that are applicable to us. In addition, zoning requirements and other governmental mandates with respect to urban planning may change from time to time, and some of our hotels may be demolished or relocated, for which we may not receive adequate compensation.
As the PRC economy is increasingly intricately linked to the global economy, it is affected in various respects by downturns and recessions of major economies around the world, such as the recent global financial crisis. Stimulus measures designed to help China weather the global financial crisis may contribute to higher inflation, which could adversely affect our results of operations and financial condition. Whether as a result of rising standards of living or other factors, we have already felt inflationary pressure on rents, utilities and wages. Measures to control the pace of economic growth may cause a decrease in the level of economic activity in China, which in turn could adversely affect our results of operations and financial condition by reducing demand from business and leisure travelers. The PRC economy has been transitioning from a planned economy to a more market-oriented economy. Although the PRC government has implemented measures since the late 1970s emphasizing the utilization of market forces for economic reform, the reduction of state ownership of productive assets and the establishment of improved corporate governance in business enterprises, a substantial portion of productive assets in China is still owned by the PRC government. In addition, the PRC government continues to play a significant role in regulating industry development by imposing industrial policies. The PRC government also exercises significant control over China’s economic growth through the allocation of resources, controlling payment of foreign currency-denominated obligations, setting monetary policy and providing preferential treatment to selected industries or companies. We cannot guarantee that future actions and policies of the PRC government will not materially affect our liquidity and access to capital and our ability to operate our business.
14
The audit report included in this annual report is prepared by an auditor that is not inspected by the Public Company Accounting Oversight Board, and consequently you are deprived of the benefits of such inspection.
Auditors of companies that are registered with the SEC and traded publicly in the United States, including our independent registered public accounting firm, must be registered with the US Public Company Accounting Oversight Board, or PCAOB, and are required by the laws of the United States to undergo regular inspections by the PCAOB to assess their compliance with the laws of the United States and professional standards. Because our auditors are licensed to operate in the Peoples’ Republic of China, a jurisdiction where the PCAOB is currently unable to conduct inspections without the approval of the Chinese authorities, their audit procedures or quality control procedures are not currently inspected by the PCAOB.
This lack of PCAOB inspections in China prevents the PCAOB from regularly evaluating audits and quality control procedures of any auditors operating in China, including our auditors. As a result, investors may be deprived of the benefits of PCAOB inspections.
The inability of the PCAOB to conduct inspections of auditors in China makes it difficult to evaluate the effectiveness of our auditor’s audit procedures or quality control procedures as compared to auditors outside of China that are subject to PCAOB inspections. Investors may lose confidence in our reported financial information and procedures and the quality of our financial statements.
Proceedings instituted recently by the SEC against five PRC-based accounting firms, including our independent registered public accounting firm, may ultimately result in our financial statements being determined to not be in compliance with the requirements of the Securities Exchange Act of 1934.
In December 2012, the SEC instituted proceedings under Rule 102(e)(1)(iii) of the SEC’s Rules of Practice against five PRC-based accounting firms, including our independent registered public accounting firm, alleging that these firms had violated U.S. securities laws and the SEC’s rules and regulations thereunder by failing to provide to the SEC the firms’ work papers related to their audits of certain PRC-based companies that are publicly traded in the United States. Rule 102(e)(1)(iii) grants to the SEC the authority to deny to any person, temporarily or permanently, the ability to practice before the SEC if that person is found by the SEC, after notice and opportunity for a hearing, to have willfully violated, or willfully aided and abetted the violation of, any such laws or rules and regulations. While we cannot predict the outcome of the SEC’s proceedings, if our independent registered public accounting firm were denied, temporarily or permanently, the ability to practice before the SEC, our financial statements could be determined to not be in compliance with the requirements for financial statements of public companies with a class of securities registered under the Securities Exchange Act of 1934, as amended, or the Exchange Act. Such a determination could ultimately lead to the SEC’s revocation of the registration of our ordinary shares under the Exchange Act, which would cause the immediate delisting of our ADSs from the Nasdaq Global Market, and the effective termination of the trading market for our ADSs in the United States, which would be likely to have a significant adverse effect on the value of our ADSs and our ordinary shares. In addition, because the issues raised in the SEC proceedings would be likely to extend to all independent public accounting firms in the PRC, it may not be possible for us to attempt to address this issue by changing our independent registered public accounting firm.
Uncertainties with respect to the Chinese legal system could adversely affect us.
We conduct our business primarily through our subsidiaries in China. Our operations in China are governed by PRC laws and regulations. Our subsidiaries are generally subject to laws and regulations applicable to foreign investments in China and, in particular, laws applicable to foreign-invested enterprises. The PRC legal system is based on written statutes. Prior court decisions may be cited for reference but do not have binding legal effect. Since 1979, PRC legislation and regulations have significantly enhanced the protections afforded to various forms of foreign investments in China. However, China has not developed a fully integrated legal system and recently enacted laws and regulations may not sufficiently cover all aspects of economic activities in China. In particular, because these laws and regulations are relatively new, and because of the limited volume of published court decisions and their nonbinding nature, the interpretation and enforcement of these laws and regulations involve uncertainties. In addition, any litigation in China may be protracted and result in substantial costs and diversion of resources and management attention.
15
Governmental control of currency conversion may affect the value of your investment.
The PRC government imposes controls on the convertibility of RMB into foreign currencies and, in certain cases, the remittance of currency out of China. We receive substantially all of our revenues in RMB. Shortages in the availability of foreign currency may restrict the ability of our PRC subsidiaries to remit sufficient foreign currency to our offshore entities for our offshore entities to pay dividends or make other payments or otherwise to satisfy our foreign currency-dominated obligations. Under existing PRC foreign exchange regulations, payments of current account items, including profit distributions, interest payments and expenditures from trade-related transactions, can be made in foreign currencies without prior approval from the State Administration of Foreign Exchange, or SAFE, by complying with certain procedural requirements. Our PRC subsidiaries may also retain foreign currency in their current account bank accounts for use in payment of international current account transactions. However, for most capital account items, approval from or registration with appropriate government authorities is required where RMB is to be converted into foreign currency and remitted out of China to pay capital expenses such as the repayment of bank loans denominated in foreign currencies.
If we finance our PRC subsidiaries through additional capital contributions, the amount of these capital contributions must be approved by the Ministry of Commerce in China or its local counterpart. On August 29, 2008, SAFE promulgated Memorandum 142, a notice regulating the conversion by a foreign-invested company of foreign currency into RMB by restricting how the converted RMB may be used. The notice requires that RMB converted from the foreign currency-denominated capital of a foreign-invested company may only be used for purposes within the business scope approved by the applicable governmental authority and may not be used for equity investments within the PRC unless this is specifically provided for in the business scope of the foreign-invested company. In addition, SAFE strengthened its oversight of the flow and use of RMB funds converted from the foreign currency-denominated capital of a foreign-invested company. The use of such RMB may not be changed without approval from SAFE, and it may not be used to repay RMB loans if the proceeds of such loans have not yet been used for purposes within the company’s approved business scope. Violations of Memorandum 142 may result in severe penalties, including substantial fines as set forth in the Foreign Exchange Administration Regulations. We cannot guarantee you that we will be able to complete the necessary government registrations or obtain the necessary government approvals on a timely basis, if at all, with respect to future loans by us to our PRC subsidiaries or with respect to future capital contributions by us to our PRC subsidiaries. If we fail to complete such registrations or obtain such approvals, our ability to contribute additional capitals to fund our PRC operations may be negatively affected, which could adversely and materially affect our liquidity and our ability to fund and expand our business.
Fluctuation in the value of the RMB may have a material adverse effect on your investment.
Substantially all of our revenues and most of our expenses are denominated in RMB. However, we also have substantial assets and liabilities that are denominated in U.S. dollars. As of December 31, 2012, we had U.S. dollar denominated cash and cash equivalents of US$41.5 million, and we had US$184.0 million in outstanding convertible notes and US$119.0 million in outstanding term loans.
The conversion of RMB into foreign currencies, including U.S. dollars, is based on rates set by the People’s Bank of China. The PRC government allowed the RMB to appreciate by more than 20% against the U.S. dollar between July 2005 and July 2008. Between July 2008 and June 2010, this appreciation halted and the exchange rate between the RMB and the U.S. dollar remained within a narrow band. Since June 2010, the PRC government has allowed the RMB to appreciate slowly against the U.S. dollar again, though there have been periods recently when the U.S. dollar has appreciated against the Renminbi. It is difficult to predict how market forces or PRC or U.S. government policy may impact the exchange rate between the RMB and the U.S. dollar in the future.
Any significant depreciation of the RMB against the U.S. dollar may have a material adverse effect on the value of, and any dividends payable on, our ADSs and common shares. If we decide to convert our RMB into U.S. dollars for the purpose of making payments for dividends on our ordinary shares, for repayment of debt or for other business purposes, depreciation of the RMB against the U.S. dollar would reduce the U.S. dollar amount available to us. Under the terms of the credit agreement dated September 26, 2011, which we entered into in connection with our acquisition of Motel 168, we are required to cause our subsidiaries in China to declare and pay the maximum legally distributable earnings of the most recently ended calendar year as dividends to our entities outside of China to service the debt, except that we may maintain a level of RMB cash balance in China to continue on-going operation and expansion according to a prescribed budget and forecast. On the other hand, to the extent that we need to convert U.S. dollars into RMB for our operations, appreciation of the RMB against the U.S. dollar would have an adverse effect on the RMB amount we receive from the conversion. In addition, the value of your investment in our ADSs will be affected by the exchange rate between U.S. dollars and RMB because the value of our business is effectively denominated in RMB, while the ADSs will be traded in U.S. dollars. Fluctuation in the value of the RMB in either direction could have a material adverse effect on the value of our company and the value of your investment.
16
PRC regulations relating to the establishment of offshore special purpose companies by PRC residents may subject our PRC resident shareholders to personal liability and limit our ability to inject capital into our PRC subsidiaries, limit our PRC subsidiaries’ ability to distribute profits to us, or otherwise adversely affect us.
SAFE issued a public notice in October 2005 along with related procedural guidance most recently amended in 2011 requiring PRC residents to register with the local SAFE branch before establishing or gaining control of any company outside of China for the purpose of capital financing with assets or equity of PRC companies. This kind of company is referred to in the notice as an “offshore special purpose company.” Under this public notice, PRC residents who are shareholders and/or beneficial owners of such offshore special purpose companies were required to register with the local SAFE branch. We have requested our shareholders and/or beneficial owners who are subject to the registration requirements under the SAFE notice to register with the local SAFE branch. Failure of these shareholders and/or beneficial owners to register with the local SAFE branch as required by the SAFE notice or failure of future shareholders of our company who are PRC residents to comply with the registration procedures set forth in the SAFE notice may subject such shareholders and/or beneficial owners to fines and other government actions and may also limit our ability to fund our PRC subsidiaries, limit our PRC subsidiaries’ ability to distribute dividends to our company or otherwise adversely affect our business.
We rely principally on dividends and other distributions on equity paid by our subsidiaries to fund any cash and financing requirements we may have, and any limitation on the ability of our subsidiaries entities to make payments to us could have a material adverse effect on our ability to conduct our business.
We are a holding company and we rely principally on dividends and other distributions from our subsidiaries in China for our cash requirements, including any debt we may incur. Current PRC regulations permit our subsidiaries to pay dividends to us only out of their accumulated profits, if any, determined in accordance with PRC accounting standards and regulations. In addition, each of our subsidiaries in China is required to set aside at least 10% of its accumulated after-tax profits each year, if any, to fund certain statutory reserves until the aggregate amount of such statutory reserves reach 50% of its registered capital. These reserves are not distributable as cash dividends. As of December 31, 2012, aggregate net assets of RMB 3.27 billion (US$524.7 million) were not distributable in the form of dividends to us due to these PRC regulations. Furthermore, if our subsidiaries in China incur debt on their own behalf in the future, the instruments governing the debt may restrict their ability to pay dividends or make other payments to us. In addition, the PRC tax authorities may require us to adjust our taxable income under the contractual arrangements we currently have in place in a manner that would materially and adversely affect our subsidiaries’ ability to pay dividends and other distributions to us. Any limitation on the ability of our subsidiaries to distribute dividends or other payments to us could materially and adversely limit our ability to grow, make investments or acquisitions that could be beneficial to our businesses, pay dividends, or otherwise fund and conduct our business.
The PRC tax treatment of our holding company structure under the Enterprise Income Tax Law is subject to uncertainties, and if such uncertainties are resolved unfavorably to us, we may incur higher taxes than we anticipate, and our net income and ability to pay dividends could be hampered.
We are a holding company incorporated in the Cayman Islands that indirectly holds, through subsidiaries in the Cayman Islands, the British Virgin Islands, Mauritius and Hong Kong, other subsidiaries in the PRC. We conduct substantially all of our business operations in China. The Enterprise Income Tax Law and its implementation rules provide that China-sourced income of foreign enterprises, such as dividends paid by a PRC subsidiary to its non-PRC resident overseas parent, will normally be subject to PRC withholding tax at a rate of 10%, unless there are applicable treaties that reduce such rate. Under a special arrangement between China and Hong Kong, dividends paid to enterprises incorporated in Hong Kong are subject to a preferential withholding tax rate of 5% provided that a Hong Kong resident enterprise owns over 25% of the PRC enterprise distributing the dividend and can be considered as a “beneficial owner” of the dividends received from the PRC enterprise. The State Administration for Taxation promulgated Notice Regarding Interpretation and Recognition of Beneficial Owners under Tax Treaties on October 27, 2009, which provides guidance on the determination of “beneficial owners”. If our Hong Kong subsidiaries are not considered to be the “beneficial owners” of the dividends they receive from our PRC subsidiaries under this notice, any dividends paid by our PRC subsidiaries to our Hong Kong subsidiaries would be subject to withholding tax at a rate of 10%.
Under the Enterprise Income Tax Law, an enterprise established outside of China whose “de facto management body” is located in China is considered a resident enterprise for PRC tax purpose and will be subject to enterprise income tax at the rate of 25% on its worldwide income. Under the applicable implementation regulations, the “de facto management body” is defined as the organizational body that effectively exercises overall management and control over production and business operations, personnel, finance and accounting, and properties of the enterprise. It remains unclear how the PRC tax authorities will interpret such a broad definition. Substantially all of our management is currently based in China, and may remain in China in the future. If the PRC tax authorities determine that we should be classified as a resident enterprise for PRC tax purposes, our global income will be subject to income tax at a uniform rate of 25%, which may have a material adverse effect on our financial condition and results of operations. Notwithstanding the foregoing provision, the Enterprise Income Tax Law also provides that, if a resident enterprise directly invests in another resident enterprise, the dividends received by the investing resident enterprise from the invested enterprise are exempted from income tax, subject to certain conditions.
17
Our foreign ADS or ordinary share holders may be subject to PRC withholding tax on the dividends payable by us and upon gains realized on their sales of our ADSs or ordinary shares if we are classified as a PRC “resident enterprise.”
Under the Enterprise Income Tax Law and its implementation rules, any gain realized by “non-resident enterprises” is subject to 10% withholding tax to the extent such gain is sourced within the PRC if (i) such “nonresident enterprise” has no establishment or premise in the PRC, or (ii) it has an establishment or premise in the PRC but its income sourced within the PRC has no real connection with such establishment or premise, unless the withholding tax is otherwise exempted or reduced by tax treaties. The Enterprise Income Tax Law and its implementation rules are relatively new and ambiguities exist with respect to the interpretation of the provisions relating to identification of PRC-source income. If we are recognized as a PRC resident enterprise under the Enterprise Income Tax Law by the PRC tax authorities, dividends paid by us to our non-PRC resident enterprise ADS holders and ordinary shareholders may be deemed to be derived from sources within the PRC and, therefore, be subject to the 10% PRC dividend withholding tax. Similarly, any gain realized on the transfer of our ADSs or ordinary shares by our non-PRC resident enterprise ADS holders and ordinary shareholders may also be subject to the 10% PRC income tax if such gain is regarded as income derived from sources within the PRC. In such case, our foreign ADS or ordinary share holders that are “non-resident enterprises” may become subject to a 10% withholding income tax under the Enterprise Income Law, unless any such foreign ADS or ordinary share holders is qualified for a preferential withholding rate or tax exemption under a tax treaty or tax law.
If the PRC tax authorities recognize us as a PRC resident enterprise under the Enterprise Income Tax Law, our ADS holders who are not PRC tax residents and seek to enjoy preferential tax rates under relevant tax treaties will need to apply to the PRC tax authorities for recognition of eligibility for such benefits in accordance with Memorandum 124, issued by the PRC State Administration of Taxation on August 24, 2009. It is likely that eligibility will be based on a substantive analysis of the ADS holders’ tax residency and economic substance. With respect to dividends, the “beneficial owner” tests will also apply. If determined to be ineligible for treaty benefits, such an ADS holder would become subject to higher PRC tax rates on capital gains realized from sales of our ADSs and on dividends on our ADSs.
In such circumstances, the value of such foreign ADS holders’ investment in our ADSs may be materially and adversely affected.
The M&A rule sets forth complex procedures for acquisitions conducted by foreign investors which could make it more difficult to pursue growth through acquisitions.
On August 8, 2006, six PRC regulatory agencies including the PRC Ministry of Commerce and SAFE jointly adopted the Regulations on Mergers and Acquisitions of Domestic Enterprises by Foreign Investors, or the M&A Rule. The M&A Rule sets forth complex procedures and requirements that could make merger and acquisition activities by foreign investors more time-consuming and complex, including requirements in some instances that the approvals from Ministry of Commerce be obtained. We may continue to expand our business in part by acquiring complementary businesses or assets in China. Complying with the requirements of the M&A Rule to complete such transactions could be time-consuming, and any required approval processes, including obtaining approval from the Ministry of Commerce, may delay or inhibit such transactions, which could affect our ability to expand our business or maintain our market share.
Risks Related to Our ADSs
The market price for our ADSs has been and may continue to be volatile.
The market price of our ADSs has been and may continue to be subject to wide fluctuations. From our listing on October 27, 2006 to April 18, 2013, the market price of our ADSs on Nasdaq ranged from a low of US$7.00 to a high of US$54.25 per ADS, and the closing price on April 19, 2013 was US$26.58 per ADS. The market price for our ADSs has been and may continue to be volatile and subject to wide fluctuations in response to factors including the following:
| | • | | revisions to our projected financial or operational performance by ourselves or by securities research analysts; |
| | • | | actual or anticipated fluctuations in our quarterly operating results; |
| | • | | conditions in the travel and lodging industries, including regulatory developments affecting us or our competitors; |
18
| | • | | changes in the performance or market valuations of other lodging companies; |
| | • | | announcements of studies and reports relating to the quality of our services or those of our competitors; |
| | • | | announcements by us or our competitors of new products, acquisitions, strategic partnerships, expansions or capital commitments; |
| | • | | addition or departure of key personnel; |
| | • | | fluctuations of exchange rates between the RMB and U.S. dollar or other foreign currencies; |
| | • | | detrimental negative publicity about our company or our services; |
| | • | | potential litigation or administrative investigations; |
| | • | | sales or anticipated potential sales of additional shares or ADSs; |
| | • | | market and volume fluctuations in the stock market in general; and |
| | • | | general economic or political conditions in China and elsewhere. |
In addition, the market prices for companies with operations in China in particular have experienced volatility that might have been unrelated to the operating performance of such companies. The securities of some China-based companies that have listed their securities in the United States have experienced significant volatility since their initial public offerings, including, in some cases, substantial price declines in the market prices of their securities. The performance of the securities of these China-based companies after their offerings may affect the attitudes of investors toward Chinese companies listed in the United States, which consequently may impact the performance of our ADSs, regardless of our actual operating performance. In addition, any negative news or perceptions about inadequate corporate governance practices or fraudulent accounting, corporate structure or other matters in other China-based companies may also negatively affect the attitudes of investors towards China-based companies in general, including us, regardless of whether we have engaged in any inappropriate activities.
The global financial crisis and the ensuing economic recessions in many countries have contributed and may continue to contribute to extreme volatility in the global stock markets, such as the large declines in share prices in the United States, China and other jurisdictions at various times since 2008. These broad market and industry fluctuations may adversely affect the price of our ADSs, regardless of our operating performance.
Substantial future sales of our ADSs or ordinary shares in the public market, or the perception that these sales could occur, could cause the price of our ADSs to decline.
Additional sales of our ADSs or ordinary shares in the public market, or the perception that these sales could occur, could cause the market price of our ADSs to decline, particularly if a large number of previously restricted shares become registered. In some cases, we may agree to file shelf registration statements in connection with a major acquisition or securities offering. For example, we filed a shelf registration statement on Form F-3 in May 2011 after certain shareholders and holders of our convertible notes exercised their registration rights, and we filed another shelf registration statement on Form F-3 in May 2012 after the former shareholders of Motel 168 exercised their registration rights. In each case, a significant number of shares or convertible securities became freely tradable without restriction under the Securities Act. Sales of these registered shares in the public market could cause the price of our ADSs to decline.
Our corporate actions are substantially controlled by our officers, directors and principal shareholders.
As of March 31, 2013, our directors and officers beneficially owned a total of 35,303,628 of our ordinary shares, including shares that they had the right to acquire within 60 days. Beijing Tourism Group, or BTG, through its affiliate, owned 14,726,165 of our ordinary shares based on the latest information it has filed with the SEC, and it has the right to appoint, and has appointed, two directors of our company. Furthermore, Ctrip.com International, Ltd., or Ctrip, owned 14,400,765 of our ordinary shares based on the latest information it has filed with the SEC; two of Ctrip’s co-founders and directors are also our co-founders and directors. If our officers, directors and these two principal shareholders choose to act in concert, they would beneficially own 37.9% of our ordinary shares (calculated as of March 31, 2013, including shares that they had the right to acquire within 60 days) and could exert substantial influence over matters requiring approval by our shareholders, including electing directors and approving mergers or other business combination transactions. The concentration of our share ownership may discourage, delay or prevent a change in control of our company, which could deprive our shareholders of an opportunity to receive a premium for their shares as part of a sale of our company and might reduce the price of our ADSs or the value of our ordinary shares. These actions may be taken even if they are opposed by our other shareholders.
19
You may not have the same voting rights as the holders of our ordinary shares and may not receive voting materials in time to be able to exercise your right to vote.
Except as described in this annual report and in the deposit agreement, holders of our ADSs will not be able to exercise voting rights attaching to the shares represented by our ADSs directly. Holders of our ADSs may instruct the depositary or its nominee how to exercise the voting rights attaching to the shares represented by the ADSs. However, you may not receive voting materials in time to instruct the depositary to vote, and it is possible that you, or persons who hold their ADSs through brokers, dealers or other third parties, will not have the opportunity to exercise a right to vote.
You may not be able to participate in rights offerings and may experience dilution of your holdings as a result.
We may distribute rights to our shareholders from time to time, including rights to acquire our securities. Under the deposit agreement for the ADSs, the depositary will not offer those rights to ADS holders unless both the rights and the underlying securities to be distributed to ADS holders are either registered under the Securities Act or exempt from registration under the Securities Act with respect to all holders of ADSs. We are under no obligation to file a registration statement with respect to any such rights or underlying securities or to endeavor to cause such a registration statement to be declared effective. In addition, we may not be able to take advantage of any exemptions from registration under the Securities Act. Accordingly, holders of our ADSs may be unable to participate in our rights offerings and may experience dilution in their holdings as a result.
You may be subject to limitations on transfer of your ADSs.
Your ADSs are transferable on the books of the depositary. However, the depositary may close its transfer books at any time or from time to time when it deems expedient in connection with the performance of its duties. In addition, the depositary may refuse to deliver, transfer or register transfers of ADSs generally when our books or the books of the depositary are closed, or at any time if we or the depositary deem it advisable to do so because of any requirement of law or of any government or governmental body, or under any provision of the deposit agreement, or for any other reason.
You may face difficulties in protecting your interests, and your ability to protect your rights through the U.S. federal courts may be limited, because we are incorporated under Cayman Islands law, we conduct substantially all of our operations in China and the majority of our officers reside outside the United States.
We are incorporated in the Cayman Islands, and conduct substantially all of our operations in China through our wholly-owned subsidiaries in China. Most of our directors and officers reside outside the United States and some or all of the assets of those persons are located outside of the United States. As a result, it may be difficult to effect service of process within the United States or elsewhere outside China upon our directors and officers, including with respect to matters arising under U.S. federal securities laws or applicable state securities laws.
It may also be difficult or impossible for you to bring an action against us or against our directors and officers in the Cayman Islands or in China in the event that you believe that your rights have been infringed under the securities laws or otherwise. Even if you are successful in bringing an action of this kind, the laws of the Cayman Islands and of China may render you unable to enforce a judgment against our assets or the assets of our directors and officers. There is no statutory recognition in the Cayman Islands of judgments obtained in the United States, although the courts of the Cayman Islands will generally recognize and enforce a non-penal judgment of a foreign court of competent jurisdiction without retrial on the merits, provided that the judgment is final and was not obtained in a manner and is not of a kind where its enforcement would be contrary to natural justice or the public policy of the Cayman Islands. Moreover, our PRC counsel has advised us that the PRC does not have treaties with the United States or many other countries providing for the reciprocal recognition and enforcement of judgment of courts.
Our corporate affairs are governed by our memorandum and articles of association and by the Companies Law (2012 Revision) and common law of the Cayman Islands. The rights of shareholders to take legal action against our directors and us, actions by minority shareholders and the fiduciary responsibilities of our directors to us under Cayman Islands law are to a large extent governed by the common law of the Cayman Islands. The common law of the Cayman Islands is derived in part from comparatively limited judicial precedent in the Cayman Islands as well as from English common law, which has persuasive, but not binding, authority on a court in the Cayman Islands. The rights of our shareholders and the fiduciary responsibilities of our directors under Cayman Islands law are not as clearly established as they would be under statutes or judicial precedents in the United States. In particular, the Cayman Islands has a less developed body of securities laws as compared to the United States, and provides significantly less protection to investors. In addition, Cayman Islands companies may not have standing to initiate a shareholder derivative action before the federal courts of the United States.
20
As a result of all of the above, our public shareholders may have more difficulty in protecting their interests through actions against our management, directors or major shareholders than would shareholders of a corporation incorporated in a jurisdiction in the United States.
Our articles of association contain anti-takeover provisions that could have a material adverse effect on the rights of holders of our ordinary shares and ADSs.
Our articles of association contain provisions limiting the ability of others to acquire control of our company or cause us to enter into change-of-control transactions. These provisions could have the effect of depriving our shareholders of an opportunity to sell their shares at a premium over prevailing market prices by discouraging third parties from seeking to obtain control of our company in a tender offer or similar transaction. For example, our board of directors has the authority, without further action by our shareholders, to issue preferred shares in one or more series and to fix their designations, powers, preferences, privileges, and relative participating, optional or special rights and the qualifications, limitations or restrictions, including dividend rights, conversion rights, voting rights, terms of redemption and liquidation preferences, any or all of which may be greater than the rights associated with our ordinary shares, in the form of ADS or otherwise. Preferred shares could be issued quickly with terms calculated to delay or prevent a change in control of our company or make removal of management more difficult. If our board of directors decides to issue preferred shares, the price of our ADSs may fall and the voting and other rights of the holders of our ordinary shares and ADSs may be materially and adversely affected.
Provisions of our convertible notes and our secured loan facility agreement could discourage an acquisition of our company by a third party.
The indenture for our convertible notes defines a “fundamental change” to include: (1) any person or group gaining control of our company; (2) our company merging with or into another company or disposing of substantially all of its assets; (3) our ADSs ceasing to be listed on a U.S. national securities exchange; or (4) the adoption of any plan relating to the dissolution or liquidation of our company. Upon the occurrence of a fundamental change, holders of our convertible notes will have the right, at their option, to require us to repurchase all of their notes or any portion of the principal amount of such notes in integral multiples of US$1,000. In the event of a fundamental change, we may also be required to issue additional ADSs upon conversion of our convertible notes. As of December 31, 2012, the outstanding principal amount under the convertible notes was US$184.0 million.
Our secured loan facility agreement defines a “change of control” to include: (1) any person or group owning 50.1% (or, with our cooperation, 30%) of the voting equity interests of our company; (2) any person who was not a member of our management on September 26, 2011, obtaining the ability to appoint senior officers of our corporate group or a majority of the members of our board or the board of any of our subsidiaries; (3) our ADSs being delisted from Nasdaq, or ADSs representing less than 15% of our issued and outstanding shares being registered and available for trading on Nasdaq; or (4) the disposal of all or substantially all of our assets. Upon the occurrence of a change of control, all outstanding term loans become immediately due and payable. As of the date of this annual report, the outstanding principal amount under the secured loan facility is US$117.0 million.
These provisions of our convertible notes and our secured loan facility agreement could make it more difficult or more expensive for a third party to acquire us and discourage an acquisition of our company by a third party.
The depositary of our ADSs, except in limited circumstances, has granted to us a discretionary proxy to vote the ordinary shares underlying the ADSs if ADS holders do not vote at shareholders’ meetings, which could adversely affect ADS holders’ interests.
Under the deposit agreement for the ADSs, the depositary gave us a discretionary proxy to vote the ordinary shares underlying the ADSs at shareholders’ meetings if ADS holders do not vote, unless:
| | • | | we have failed to timely provide the depositary with our notice of meeting and related materials; |
| | • | | we have instructed the depositary that we do not wish a discretionary proxy to be given; |
| | • | | we have informed the depositary that there is substantial opposition as to a matter to be voted on at the meeting; |
| | • | | a matter to be voted on at the meeting would have a material adverse impact on shareholders; or |
21
| | • | | voting at the meeting is made on a show of hands. |
The effect of this discretionary proxy is that ADS holders cannot prevent ordinary shares underlying the ADSs from being voted, absent the situations described above. Holders of our ordinary shares are not subject to this discretionary proxy.
We may be classified as a passive foreign investment company, which could result in adverse United States federal income tax consequences for U.S. Holders.
Based on the price of our ADSs and ordinary shares and the composition of our income and assets, we believe that we were not a “passive foreign investment company,” or PFIC, for United States federal income tax purposes for our taxable year ended December 31, 2012. However, the application of the PFIC rules is subject to ambiguity in several aspects and we must make a separate determination each year as to whether we are a PFIC (after the close of such taxable year). Accordingly, we cannot guarantee that we will not be a PFIC for our current or any future taxable year. A non-U.S. corporation will be considered a PFIC for any taxable year if either (i) at least 75% of its gross income is passive income or (ii) at least 50% of the value of its assets (based on an average of the quarterly values of the assets during a taxable year) is attributable to assets that produce or are held for the production of passive income. The value of our assets generally will be determined by reference to the market price of our ADSs and ordinary shares, which may fluctuate considerably. In addition, the composition of our income and assets will be affected by how, and how quickly, we spend the cash we raise in any offering. In the event that we become classified as a PFIC, we do not intend to prepare or provide the information that would enable U.S. Holders to make an election to treat us as a qualified electing fund. Further, if we were treated as a PFIC for any taxable year during which a U.S. Holder held an ADS or an ordinary share, certain adverse United States federal income tax consequences could apply to the U.S. Holder. For the definition of “U.S. Holder” and a more detailed discussion of United States federal income tax consequences to U.S. Holders, see “ Item 10. Additional Information—E. Taxation—United States Federal Income Taxation—Passive Foreign Investment Company.”
| ITEM 4. | INFORMATION ON THE COMPANY |
A.History and Development of the Company
Home Inns & Hotels Management (Hong Kong) Limited, or Home Inns Hong Kong, was incorporated in Hong Kong in 2001 by its individual founders and Ctrip, a leading China-based travel consolidator. In 2002, Home Inns Hong Kong and a subsidiary of BTG entered into a joint venture agreement to form Home Inns & Hotels Management (Beijing) Limited, or Home Inns Beijing. Home Inns Hong Kong gradually increased its ownership interest in Home Inns Beijing until Home Inns Beijing became its wholly-owned subsidiary in 2007.
In May 2006, we incorporated Home Inns & Hotels Management Inc. in the Cayman Islands in preparation for our initial public offering. In June 2006, all of the then-existing shareholders of Home Inns Hong Kong exchanged their shares of Home Inns Hong Kong for an equivalent number of shares of Home Inns & Hotels Management Inc. of equivalent classes, and Home Inns Hong Kong became our wholly-owned subsidiary. We completed our initial public offering in October 2006.
In October 2007, we acquired the Top Star hotel chain, which had 26 hotels in operation at the time of the acquisition with approximately 4,200 rooms located in 18 cities across China. In October 2011, we acquired Motel 168, which had 297 hotels in operation at the time of the acquisition, including 144 leased-and-operated hotels and 153 franchised-and-managed hotels, with approximately 47,099 rooms located in 85 cities across China. We are retaining the Motel 168 brand in addition to our Home Inn and Yitel brands and will continue to have brand-specific business development and operations.
As of December 31, 2012, we had 1,772 hotels in operation, including 803 leased-and-operated hotels and 969 franchised-and-managed hotels, with approximately 214,070 rooms located in 253 cities across China, and an additional 241 hotels under development.
Our principal executive offices are located at No. 124 Caobao Road, Xuhui District, Shanghai 200235, People’s Republic of China. Our telephone number at this address is +86 21 3337 3333. Our agent for service of process in the United States is CT Corporation System, 111 Eighth Avenue, New York, New York 10011.
B.Business Overview
We are a leading economy hotel chain in China, based on the number of our hotels, the number of our hotel rooms and the geographic coverage of our hotel chain. We develop and operate economy hotels across China under our award-winning “Home Inn” brand, our new “Yitel” brand and our recently acquired “Motel 168” brand. Since we commenced operations in 2002, we have become one of the best-known economy hotel chains in China. We offer a consistent product and high-quality services to serve primarily the fast growing population of value-conscious individual business and leisure travelers who demand clean, comfortable and convenient lodging.
22
We have experienced substantial growth since 2003. Our hotels in operation grew rapidly from 10 hotels in 4 cities as of the end of 2003 to 1,772 hotels in 253 cities as of the end of 2012. Our total revenues grew from RMB 3.17 billion in 2010 to RMB 3.96 billion in 2011 and RMB 5.77 billion (US$926.1 million) in 2012. However, our net income attributable to Home Inns’ shareholders declined from RMB 359.5 million in 2010 to RMB 351.6 million in 2011 and we had a net loss attributable to Home Inns’ shareholders of RMB 26.8 million (US$4.3 million) in 2012. The reasons for the net loss in 2012 include: the softer domestic economy, which weakened demand from business and leisure travelers and prevented systematic price increases; inflationary pressures on rents, utilities and wages; net losses from Motel 168 hotels and one-time integration charges; and fair value accounting losses on convertible notes.
We operate under two business models. We either lease real estate properties with which we develop and operate hotels, or we franchise our brand and manage these franchised hotel properties. We refer to the former type of hotels as “leased-and-operated hotels” and to the latter type of hotels as “franchised-and-managed hotels.” As of December 31, 2012, our hotel chain consisted of 803 leased-and-operated hotels in operation with an additional 71 leased-and-operated hotels contracted or under construction and 969 franchised-and-managed hotels in operation and an additional 170 franchised-and-managed hotels contracted or under construction.
We have received many awards and accolades for our innovative, consistent and high-quality product and services across our hotel chain. We received the “Golden Pillow Award” for the best brand in economy hotels from the 21st Century Business Herald, a national financial and economic journal in China, every year from 2007 to 2011. In 2010, we won an “International Franchisor of the Year” award from the Singapore Franchising & Licensing Association and a “China Top 10 Hotel Brands” Award from the China Chain Store & Franchise Association. In 2011, we won the 2010 “Excellent National Brand of China Hotel Industry” from the China Hotel Association, a “China Franchise Prize” from the China Chain Store & Franchise Association, a “Global 100 Companies with Greatest Growth Potential” award from the Chinese edition ofFortune magazine and a “Best Operational Practices” award from theHarvard Business Review. In 2012, we won the “Best Chain Brand of the China Hotel Industry” award from the China Hotel Association and the “CCTV China Brand of the Year” award from CCTV, along with the “2012 China’s Most Popular Economy Chain Brand” award for our Motel 168 brand and the “2012 Best High-End Commercial Hotel” award for our Yitel brand, both from the 21st Century Business Herald.
Market Outlook
The growth in the Chinese economy hotel sector has benefited greatly from the overall growth of the Chinese economy in the past ten years. By unofficial estimates, economy hotels in China represented approximately 15% of the overall Chinese lodging market in terms of number of rooms by the end of the second quarter of 2012. The outlook for Chinese economy hotel growth continues to be positive, in our view, taking into consideration China’s continued GDP expansion and urbanization and the increasing spending capability of Chinese consumers, which are factors that tend to support a rising average daily rate for the sector over time. We believe that the Chinese economy hotel market will remain demand-driven for the next two to three years, and therefore that occupancy rates for mature hotels will continue to be around 90 percent in the foreseeable future as business activities and leisure travel exhibit steady growth. We understand that policy makers consider the travel industry to be one of the key industries in China for enhancing domestic consumption, and we are of the view that the leading branded economy hotel operators will continue to increase scale and geographic coverage for the foreseeable future. If the pace of growth continues at current levels, we believe that the economy hotel sector will increase its share of the overall lodging space to 20% or potentially more in the next eight to ten years.
Our Hotel Chain
We are a leading economy hotel chain in China offering cleanliness, convenience, comfort and value to individual business and leisure travelers. We are dedicated to providing consistent and high-quality products and services to our customers, allowing them to enjoy the comforts of home while staying at our hotels. In addition to our Home Inn brand of hotels, we launched a new hotel brand in November 2010 targeting the midscale to upscale market. We call this new brand Yitel (or Heyi in Chinese). In October 2011, we acquired Motel 168, an economy hotel chain with national scope that has been in operation since 2003. Motel 168 tends to cater more to younger leisure travelers. As of December 31, 2012, we had a total of 1,772 hotels in operation, including 1,431 hotels under the Home Inn brand, 334 hotels under the Motel 168 brand and 7 hotels under the Yitel brand, covering a total of 253 cities across China, as well as an additional 241 hotels contracted or under construction which will extend our reach to a total of 279 cities across China.
Our hotel chain currently covers most major metropolitan areas in China. We intend to further penetrate the cities and metropolitan areas where we already have a presence and also expand into additional cities in China with a population of over eight hundred thousand, an annual GDP of over RMB 7.5 billion (US$1.2 billion), or both. We believe cities meeting these criteria generally have the potential for sustainable economic growth and increasing demand for hotel accommodation services. Because we believe that our Motel 168 brand is complementary to our Home Inn brand, we may open new Motel 168 hotels in locations where we would not necessarily open additional Home Inn hotels.
23
A typical Home Inns hotel has 80 to 160 guest rooms. Our existing Motel 168 hotels vary more in size, from 80 up to 500 rooms, with an average of around 150 rooms. Each hotel has a standardized design, appearance, decor, color scheme, lighting scheme and set of guest amenities in each room, including a comfortable bedding package, free in-room broadband Internet access, a comfortable work space, air-conditioning and a supply of cold and hot drinking water. Our hotels are strategically located to provide our guests with convenient access to major business districts, ground transportation hubs, major highways, shopping centers, industrial development zones, colleges and universities, and large residential neighborhoods.
The following table sets forth a complete listing of all of our hotels as of December 31, 2012:
| | | | | | | | | | | | | | | | | | | | | | | | | | | | | | | | | | | | | | | | | | | | | | | | | | | | | | | | |
| | | | | | | | | Hotels in Operation | | | Hotels Contracted (1) | |
| | | | | | | | | Leased-and-
Operated | | | Franchised-
and-Managed | | | Leased-and-
Operated | | | Franchised-
and-Managed | |
| | | Number of
Hotels | | | Number of
Cities | | | Home
Inns | | | Motel
168 | | | Yitel | | | Home
Inns | | | Motel
168 | | | Yitel | | | Home
Inns | | | Motel
168 | | | Yitel | | | Home
Inns | | | Motel
168 | | | Yitel | |
Jiangsu | | | 302 | | | | 28 | | | | 68 | | | | 24 | | | | — | | | | 118 | | | | 62 | | | | — | | | | 6 | | | | 2 | | | | — | | | | 15 | | | | 7 | | | | — | |
Shandong | | | 215 | | | | 36 | | | | 89 | | | | 8 | | | | — | | | | 87 | | | | 4 | | | | — | | | | 7 | | | | 1 | | | | — | | | | 17 | | | | 1 | | | | 1 | |
Shanghai | | | 209 | | | | 1 | | | | 32 | | | | 46 | | | | 1 | | | | 60 | | | | 60 | | | | 1 | | | | — | | | | — | | | | 1 | | | | 7 | | | | — | | | | 1 | |
Beijing | | | 142 | | | | 1 | | | | 22 | | | | 4 | | | | 1 | | | | 99 | | | | 1 | | | | — | | | | 1 | | | | — | | | | — | | | | 13 | | | | 1 | | | | — | |
Zhejiang | | | 131 | | | | 19 | | | | 18 | | | | 10 | | | | — | | | | 75 | | | | 19 | | | | — | | | | 2 | | | | 1 | | | | — | | | | 4 | | | | 2 | | | | — | |
Guangdong | | | 122 | | | | 21 | | | | 60 | | | | 18 | | | | — | | | | 22 | | | | 1 | | | | — | | | | 13 | | | | 1 | | | | — | | | | 7 | | | | — | | | | — | |
Liaoning | | | 98 | | | | 13 | | | | 35 | | | | 5 | | | | 1 | | | | 42 | | | | 1 | | | | — | | | | — | | | | 3 | | | | — | | | | 11 | | | | — | | | | — | |
Hebei | | | 76 | | | | 11 | | | | 26 | | | | 1 | | | | — | | | | 36 | | | | 1 | | | | — | | | | 3 | | | | 1 | | | | 1 | | | | 5 | | | | 2 | | | | — | |
Shaanxi | | | 68 | | | | 7 | | | | 28 | | | | 2 | | | | 1 | | | | 22 | | | | 1 | | | | — | | | | 5 | | | | — | | | | — | | | | 9 | | | | — | | | | — | |
Anhui | | | 63 | | | | 14 | | | | 26 | | | | 4 | | | | 1 | | | | 10 | | | | 11 | | | | — | | | | 3 | | | | 1 | | | | — | | | | 7 | | | | — | | | | — | |
Tianjin | | | 61 | | | | 1 | | | | 17 | | | | 5 | | | | — | | | | 33 | | | | 2 | | | | — | | | | 2 | | | | 1 | | | | — | | | | 1 | | | | — | | | | — | |
Hubei | | | 55 | | | | 6 | | | | 23 | | | | 8 | | | | — | | | | 17 | | | | 5 | | | | — | | | | 1 | | | | — | | | | — | | | | 1 | | | | — | | | | — | |
Fujian | | | 48 | | | | 8 | | | | 9 | | | | — | | | | — | | | | 34 | | | | 1 | | | | — | | | | — | | | | — | | | | — | | | | 4 | | | | — | | | | — | |
Shanxi | | | 44 | | | | 10 | | | | 14 | | | | — | | | | 1 | | | | 19 | | | | 1 | | | | — | | | | 2 | | | | — | | | | — | | | | 7 | | | | — | | | | — | |
Heilongjiang | | | 40 | | | | 9 | | | | 21 | | | | 2 | | | | — | | | | 12 | | | | 1 | | | | — | | | | 1 | | | | 1 | | | | — | | | | 2 | | | | — | | | | — | |
Henan | | | 39 | | | | 13 | | | | 18 | | | | 1 | | | | — | | | | 13 | | | | 4 | | | | — | | | | 1 | | | | — | | | | — | | | | 2 | | | | — | | | | — | |
Sichuan | | | 38 | | | | 12 | | | | 11 | | | | 2 | | | | — | | | | 13 | | | | 2 | | | | — | | | | 2 | | | | — | | | | — | | | | 8 | | | | — | | | | — | |
Gansu | | | 31 | | | | 10 | | | | 17 | | | | — | | | | — | | | | 10 | | | | — | | | | — | | | | 2 | | | | — | | | | — | | | | 2 | | | | — | | | | — | |
Jilin | | | 26 | | | | 7 | | | | 16 | | | | 2 | | | | — | | | | 6 | | | | — | | | | — | | | | — | | | | — | | | | — | | | | 2 | | | | — | | | | — | |
Xinjiang | | | 25 | | | | 5 | | | | 13 | | | | — | | | | — | | | | 6 | | | | 1 | | | | ��� | | | | — | | | | — | | | | — | | | | 5 | | | | — | | | | — | |
Hunan | | | 23 | | | | 7 | | | | 11 | | | | 5 | | | | — | | | | 4 | | | | 1 | | | | — | | | | — | | | | — | | | | — | | | | 2 | | | | — | | | | — | |
Hainan | | | 23 | | | | 5 | | | | 9 | | | | — | | | | — | | | | 7 | | | | — | | | | — | | | | 1 | | | | — | | | | — | | | | 6 | | | | — | | | | — | |
Yunnan | | | 22 | | | | 8 | | | | 8 | | | | — | | | | — | | | | 7 | | | | — | | | | — | | | | 2 | | | | 1 | | | | — | | | | 4 | | | | — | | | | — | |
Jiangxi | | | 22 | | | | 7 | | | | 11 | | | | — | | | | — | | | | 6 | | | | 1 | | | | — | | | | 2 | | | | — | | | | — | | | | 2 | | | | — | | | | — | |
Inner Mongolia | | | 22 | | | | 7 | | | | 10 | | | | — | | | | — | | | | 7 | | | | — | | | | — | | | | — | | | | — | | | | — | | | | 5 | | | | — | | | | — | |
Guangxi | | | 22 | | | | 5 | | | | 15 | | | | — | | | | — | | | | 2 | | | | 2 | | | | — | | | | — | | | | — | | | | — | | | | 3 | | | | — | | | | — | |
Chongqing | | | 20 | | | | 1 | | | | 7 | | | | 2 | | | | — | | | | 8 | | | | 1 | | | | — | | | | — | | | | — | | | | — | | | | 2 | | | | — | | | | — | |
Guizhou | | | 13 | | | | 2 | | | | 5 | | | | 2 | | | | — | | | | 5 | | | | — | | | | — | | | | — | | | | — | | | | — | | | | 1 | | | | — | | | | — | |
Ningxia | | | 7 | | | | 3 | | | | 6 | | | | — | | | | — | | | | 1 | | | | — | | | | — | | | | — | | | | — | | | | — | | | | — | | | | — | | | | — | |
Qinghai | | | 5 | | | | 1 | | | | 1 | | | | — | | | | — | | | | 3 | | | | — | | | | — | | | | — | | | | — | | | | — | | | | 1 | | | | — | | | | — | |
Tibet | | | 1 | | | | 1 | | | | — | | | | — | | | | — | | | | 1 | | | | — | | | | — | | | | — | | | | — | | | | — | | | | — | | | | — | | | | — | |
| | | | | | | | | | | | | | | | | | | | | | | | | | | | | | | | | | | | | | | | | | | | | | | | | | | | | | | | |
Total | | | 2,013 | | | | 279 | | | | 646 | | | | 151 | | | | 6 | | | | 785 | | | | 183 | | | | 1 | | | | 56 | | | | 13 | | | | 2 | | | | 155 | | | | 13 | | | | 2 | |
| | | | | | | | | | | | | | | | | | | | | | | | | | | | | | | | | | | | | | | | | | | | | | | | | | | | | | | | |
| (1) | Contracted hotels include hotels which have not commenced operations but for which we have entered into binding leases or franchise agreements with the lessors or franchisees. |
Leased-and-operated Hotels. For our leased-and-operated hotels, we lease properties from real estate owners or lessors. We are responsible for hotel development and customization to conform to the standards of our hotel chain, as well as repairs and maintenance and operating expenses of properties over the term of the lease. We are also responsible for all aspects of hotel operations and management, including hiring, training and supervising the managers and employees required to operate our hotels as well as purchasing supplies. We typically enjoy rental holidays of three to six months and pay fixed rent on a quarterly basis for the first three or five years of the lease term, after which we may be subject to a 3% to 5% increase every three to five years. We generally have a right of first refusal to extend the lease after the initial term expires. The annual rent for each of our leased-and-operated hotels ranges from RMB 0.3 million (US$0.05 million) to RMB 12.0 million (US$1.9 million), depending on the location, size and condition of each hotel property. The terms of our leases range from 5 to 20 years, most of which are 15 to 20 years in duration. In general, upon expiration of these leases, we may dispose of the removable fixtures, equipment and appliances installed by us while leasehold improvements and fixtures may be kept by the lessor on the premises.
24
In the case of early termination of a lease due to the lessor’s default, we are generally entitled to take all removable items installed by us and may also be compensated for the amount we spent in connection with the leasehold improvements. In the case of early termination of a lease due to our default, we are generally entitled to take all removable items installed by us, the lessor is entitled to the leasehold improvements which result from our investments, and we may have to pay liquidated damages equal to a proportion or multiple of the remaining rent due.
Franchised-and-managed Hotels. For our franchised-and-managed hotels, we franchise our “Home Inn,” “Motel 168” and “Yitel” brands to franchisees who are property owners, lessors or existing hotel operators, and we are generally responsible for managing these hotels, typically including the hiring and appointing of the general managers of these hotels. Under a typical franchise agreement between us and a franchisee, the franchisee is generally required to pay us an initial franchise fee of between RMB 0.25 million and RMB 0.45 million per hotel and ongoing franchise and management fees equal to 6% of gross revenue, including an annual brand royalty fee of 3%, an annual management fee of 1.5% and an annual franchise fee of 1.5%, with the exception that the annual management fees and annual franchise fees in new Motel 168 franchise agreements are generally only 1% each while we integrate franchised-and-managed Motel 168 hotels. The franchisee is responsible for the costs of hotel development and customization to conform to the standards of our hotel chain, as well as for repairs and maintenance and operating expenses of the hotel. In general, we enter into franchise arrangements in markets where we have established leased-and-operated hotels and are able to leverage our local knowledge and experience as well as marketing and administrative resources to better assist our franchised-and-managed hotels in these localities. The typical term for our franchise agreements is eight years. Motel 168 franchise agreements that were signed before the acquisition differ in certain terms: in particular, the initial franchise fee was between RMB 0.1 million and RMB 0.4 million per hotel, the ongoing total royalty fee, management fee and fees payable by the franchisee under those agreements are typically between 3% and 4% in the first year and between 4% and 5% in later years, and the duration of the franchise agreement is typically five years.
Future franchise agreements for all brands will be based on the form we currently use for our Home Inn and Yitel franchisees.
The following table sets forth additional information about of our hotels in operation as of December 31, 2012.
| | | | | | | | | | | | | | | | | | | | |
| | | Total
Number of
Hotels | | | Number of
Hotels
Opened for
Over Six
Months | | | Number of
Hotels Opened
for No More
Than Six
Months | | | Average
Number of
Rooms per
Hotel | | | Typical
Lease or
Franchise
Term | |
Leased-and-operated Hotels | | | 803 | | | | 731 | | | | 72 | | | | 131 | | | | 15–20 years | |
Franchised-and-managed Hotels | | | 969 | | | | 837 | | | | 132 | | | | 112 | | | | 5–8 years | |
We also operate seven leased-and-operated hotels through joint ventures. We control six joint ventures through Home Inns Hotel Management (Shanghai) Co., Ltd., which owns 51% of three joint ventures, 70% of one joint venture, 75% of one joint venture and 95% of one other joint venture. We also have joint control of another joint venture through Motel 168 Hotel Management (Shanghai) Co., Ltd., which owns 50% of that entity.
We set the room rates of our hotels based on local market conditions with reference to room rates set by our competitors. As we primarily target individual business and leisure travelers, the month that includes Chinese New Year (which can fall in late January or early February) generally accounts for a lower portion of our annual revenues than other months.
Hotel Development
We follow a structured and systematic development and construction process with respect to our development of new hotel properties. Our multi-step development process starts with planning and site identification. We have staff based in Shanghai focusing on identifying potential new markets and performing comprehensive studies of each new market by conducting site visits and gathering background information such as the regional economic conditions, economic development plans and availability of existing hotel accommodation services in the prospective new markets. After the development plans are designed and market opportunities are identified, we assign our regional development staff members and the city general managers in each region to survey and select ideal hotel locations in the chosen markets. Once a site has been selected, we negotiate with the property owner while concurrently conducting due diligence with respect to a number of major legal and regulatory aspects, including the owner’s land title and relevant zoning regulations. For our leased-and-operated hotels, we lease properties from real estate owners or lessors and we convert the properties into standardized hotels. Our lease term negotiations are guided by a comprehensive set of criteria, including certain financial return requirements. All new hotel leases are subject to the final approval of four designated members of our investment committee, including our chief executive officer, David Jian Sun. As a leading branded economy hotel chain in China, we are generally able to establish credibility with property owners and secure desirable properties on reasonable terms. We commence constructing a standardized hotel after definitive agreements with the owner have been executed. A majority of the construction materials and supplies for the new hotel are purchased through our centralized procurement system. For our franchised-and-managed hotels, we assist franchisees in refurbishing, renovating or constructing their properties, and in meeting our brand specifications by providing technical expertise and cost-savings suggestions. Before completion of construction, we carry out a series of pre-opening activities, such as identifying and appointing the general manager and other members of the hotel management team, and hiring and training hotel staff in anticipation of the hotel opening. It typically takes four to six months from execution of a lease or franchise agreement to hotel opening.
25
We have incurred capital expenditures primarily in connection with leasehold improvements and investments in furniture, fixtures and equipment, technology and information and operational systems. Our capital expenditures totaled RMB 546.4 million, RMB 909.3 million and RMB 1.01 billion (US$162.4 million) in 2010, 2011 and 2012, respectively. We will continue to incur capital expenditures to meet the expected growth of our operations. We expect to meet our capital expenditure needs in the foreseeable future with cash generated from our operating activities and financing activities. We have not had any material divestiture during the past three years.
We seek to lease or franchise properties that meet the following market- and hotel-specific criteria:
General Market Criteria
Economic Growth. We focus on cities and metropolitan areas that are approaching, or have already entered into, periods of significant economic growth. Such cities and metropolitan areas generally show growth in certain business activities as measured by employment opportunities, population growth rates, tourism and convention activities, air traffic volume, local commercial real estate occupancy, and retail sales volume. Markets that exhibit growth in these metrics typically have strong demand for hotel facilities and services. Provincial capitals also have strong demand for hotel facilities and services. We have identified approximately 280 such cities in China, including cities with a population of over eight hundred thousand, annual GDP of over RMB 7.5 billion (US$1.2 billion), or both. We intend to continue focusing on these cities and metropolitan areas going forward.
Geographic Diversification. We seek to maintain a portfolio of hotels that is geographically diverse to offset the effects of regional economic cycles. We will continue to manage expansion into new urban business centers as opportunities arise that meet our carefully established and periodically updated investment criteria.
Favorable Development Environment. We seek lodging markets with favorable hotel development environments, in particular in newly emerged markets where zoning requirements are minimal, local development approval and registration processes are not complex and lengthy, and suitable property sites and local construction resources are available.
Specific Hotel Criteria
Location and Market Appeal. We seek to invest in hotels situated near both business and leisure centers that tend to generate a broad base of demand for hotel accommodations and facilities. These demand drivers include transportation hubs, convention centers, business parks, shopping centers and other retail areas, major highways, tourist destinations, major universities and cultural and entertainment centers. The proximity of business and leisure centers will enable us to attract both weekday business travelers and weekend leisure guests.
Size and Facilities. We seek to develop and operate economy hotels with 80 to 160 guest rooms, which include amenities that are attractive to key demand segments such as individual business and leisure travelers. We believe operating economy hotels with 80 to 160 rooms allows us to best leverage our competitive strengths and maximize our profitability.
Financial Return Requirements. We require our development team, marketing team and city general managers to assess the potential financial return of every proposed new hotel. We will only develop hotels that exhibit a potential for meeting our internal financial return objectives both in the near term and over the term of the lease agreement.
Hotel Management
We believe that skilled management is a critical element in maximizing revenues and profitability of our hotel operations. A majority of our senior hotel management team has extensive experience in the hospitality and other consumer-services industries. Personnel at our corporate office perform strategic planning, finance, project development, sales and marketing, training and other functions and guide, support and monitor our on-site hotel operations. Each of our headquarter departments, including hotel operations, sales and marketing, human resources, training, information technology, development, legal, and accounting and finance, is staffed by an experienced team with significant expertise in their area. These departments support each hotel and its management in day-to-day activities by providing operating statistics, accounting and budgeting services, sales and revenue management, marketing and promotion support, cost controls, property management tools and other resources that we develop, maintain and deliver efficiently and effectively using our centralized corporate office resources. Key elements of our centralized hotel management programs include the following:
Budgeting and Monitoring.Our corporate office personnel work with the general manager of each hotel to set a detailed annual budget for revenues and cost categories of the hotel. The annual budget is based on historical operating performance of the hotel, planned targeted marketing, planned renovations, operational efficiencies and local market conditions. Through the use of our online property management and management reporting systems, we are able to track each hotel’s daily occupancy, average daily rates, RevPAR and other operating data. As a result, we can effectively and timely monitor the actual performance of each hotel and adjust sales efforts and other resources in time to take advantage of changes in the market and to maximize our profitability.
26
Quality Assurance and Training. We are dedicated to providing value and consistent quality standards to our customers. We have established quality standards for all aspects of our hotel operations that cover, among other areas, housekeeping, hotel maintenance and renovation, and service offering. To ensure compliance with our quality standards, we have developed a comprehensive set of procedural manuals relating to all aspects of our hotel operations to ensure that our employees follow the same standards. We have implemented comprehensive training programs to ensure the effectiveness and uniformity of our employee training through our centralized human resources department at our corporate office as well as through our dedicated training facility, Home Inns Academy.
We monitor the compliance of our hotels with quality standards through both scheduled and unannounced visits and reviews conducted periodically at each hotel. Quality inspection scores are integrated into performance measurements. Periodically, we require most of our employees to take tests to monitor their knowledge of our quality standards. In addition, our practice of tracking customer comments through guest comment cards, and the direct solicitation of guest opinions regarding specific items, allows us to improve services and amenities at each hotel across our hotel chain.
Strategic Capital Improvements. To maintain our competitiveness and enhance our hotels’ appeal to targeted market segments, we require each of our hotels to allocate a fixed percentage of its revenue for on-going repair and maintenance, and periodic renovation and replacement of furnishings and equipment to maintain the quality and standards of our facilities. We base recommendations on capital spending decisions on customer feedback, strategic needs, and our targeted financial return on a given capital investment.
Centralized Procurement.We have implemented a centralized procurement system to allow us to obtain the best pricing available for the quality of goods sourced to our hotels in order to minimize the operating expenses of our hotels. As a leading branded economy hotel chain in China with nationwide scale, we are able to exert leverage over our suppliers of commodity goods and services.
Targeted Sales. We support each hotel’s local sales efforts with corporate office sales executives who develop and implement new marketing programs, and monitor and respond to specific market needs and preferences. We use our property management system to manage each property’s use of the various distribution channels in the lodging industry. Those channels include our central reservation system which handles internet booking and toll-free calls, third-party travel agents and other travel intermediaries, and corporate travel offices. Based on market conditions, we adjust the number of rooms allocated to each of our sales channels on a daily basis in order to optimize our profitability. Our customer relationship management programs offer incentives to individual customers in our loyalty programs, who currently represent approximately 57% of our rooms sold. Corporate contracts currently represent approximately 12% of our rooms sold. These programs and contracts contribute to our repeat customer base.
Hotel Information and Operational Systems
The principal objectives of our hotel operations are to generate higher RevPAR, control costs and increase the net operating income of our hotels while providing our customers with high-quality services and value. Our integrated information and operational systems are proprietary and were designed to differentiate us in the marketplace and to operate efficiently and cost-effectively today as well as to accommodate future growth. Our investment in our sophisticated system infrastructure delivers better customer service, ease of storage and processing of large amounts of data, support of large-scale operation and automated business administration and real-time financial and operational information from each hotel to enable strategic decision making on a timely basis.
Our key hotel information and operational systems include the following:
Property Management System.Our proprietary property management system is designed to help our hotels maximize profitability and compete more effectively by managing their room inventory, rates and reservations. The property management system synchronizes each hotel’s room inventory with our reservation system, giving our reservation agents the capability to sell available rooms at our hotels. The property management system also includes a revenue management feature that calculates and suggests optimum rates based on each hotel’s past performance and projected occupancy. These tools enhance our ability to effectively manage our hotel operations and maximize RevPAR. As of December 31, 2012, we have completed the integration of Motel 168’s property management system.
27
Central Reservation System.In 2012, approximately 12.4% of our total hotel room nights were booked through our proprietary reservation system, primarily through our toll-free telephone reservation system. As of December 31, 2012, we employed an aggregate of 310 reservation agents to serve customers who make hotel reservations by phone. Our trained reservation agents can match each caller with a hotel that meets the caller’s needs. Our central reservation system provides a data link to all of our hotels so that confirmations are transmitted automatically to the hotel for which the reservations are made. As of December 31, 2012, we have completed the integration of Motel 168’s property management system.
Customer Relationship Management System.Our proprietary customer relationship management system tracks the consumption patterns and accumulated and redeemed points of the active members of our Home Inns membership rewards program. This information enables us to analyze customer data on a company-wide basis as well as to develop a more specific and targeted marketing strategy. As of December 31, 2012, we have completed the integration of Motel 168’s members and their membership points.
Management Reporting System.We have designed a proprietary web-based management reporting system that records the daily financial and operating performance of each of our hotels in a central database for monitoring and analysis. This system allows us to track each hotel’s daily occupancy, average daily rates, RevPAR and other operating and financial data. One of our ongoing primary objectives is to maintain reliable information, management and operational systems. We have implemented performance monitoring for all key systems to enable us to respond quickly to potential problems. Our computers and servers are hosted at a facility in Shanghai. This facility provides redundant utility systems, a backup electric generator and 24-hour server support. All servers have uninterrupted power supplies and redundant file systems to maximize system and data availability. We regularly back up our data to minimize the impact of data loss due to system failure.
Sales and Marketing
Our core targeted customers consist of value-oriented individual small-and-medium-enterprise business travelers and leisure travelers seeking comfortable and convenient lodging at an affordable price. We systematically review our hotel pricing twice a year and typically adjust room rates annually based on the local market conditions of the city, the specific location of each hotel and the development plans for that local market. Under certain conditions we have also begun to adjust price at selected hotels according to seasonality and major event schedules in recent years. Our head office team and our city and hotel managers jointly develop tailored marketing plans to drive sales for each hotel and in each city. We use management and operational systems to manage each hotel’s use of the various distribution channels in the lodging industry. Those channels include our centralized reservation system and toll-free numbers, third-party travel agents and other travel intermediaries and corporate travel offices. Our access to these channels allows us to further enhance occupancy rates of our hotels on a day-to-day basis.
The following table presents the approximate percentage of room nights stayed for our hotels in 2012, by customer channel:
| | | | |
Customer Channel | | Approximate
Percentage of
Total Room Nights
Stayed in 2012 | |
Central reservation system bookings by individual members of our membership network | | | 11.2 | % |
Central reservation system bookings by non-members of our membership network | | | 1.2 | % |
Reservations made directly with hotels by individual members of our membership network | | | 44.8 | % |
Walk-ins | | | 7.9 | % |
Corporate accounts | | | 12.4 | % |
Travel agencies and consolidators | | | 8.3 | % |
Others | | | 14.4 | % |
| | | | |
Total | | | 100.0 | % |
Both of our centralized reservation centers are located in Shanghai, China and provide services 24 hours a day, seven days a week. Customers can call our nationwide toll free number for Home Inn or Motel 168 to consult with our reservation agents, receive real-time hotel information and make hotel bookings. As of December 31, 2012, we employed 310 reservation agents at our two centers, all of whom participated in a formal training program before commencing work. We believe we have sufficient capacity to meet the currently anticipated increases in call volume. If we exceed this capacity, we believe we can add, within a reasonable time and at a reasonable cost, additional phone lines, computer systems and reservation agents to handle increasing call volumes without the need to undertake system redesign to our existing systems.
28
Our corporate marketing and advertising programs are designed to enhance consumer awareness and preference for the “Home Inn” brand and the “Motel 168” brand as offering the greatest value, convenience and comfort in the economy hotel segment of the Chinese lodging industry, and to encourage customers’ use of our centralized reservation system. Marketing and advertising efforts include outdoor advertisements, distribution of flyers and other marketing materials on our hotel properties, television, internet and radio advertising, print advertising in consumer media and promotional events, special holiday promotions and joint promotional activities.
We have operated a membership reward program to attract travelers by rewarding frequent stays with points towards free hotel stays, discounts on room rates, priority in hotel reservations and other rewards. We track the number of active members, which we define as the number of membership cards as of a given date that have at least one transaction within the preceding two years. As of December 31, 2012, we had a total of 11.9 million unique active non-corporate members, including 3.5 million active members from the Motel 168 membership program, which we integrated into our Home Inns membership program in 2012. Our Home Inns brand membership reward program had 5.1 million and 3.8 million active non-corporate members as of December 31, 2011 and 2010, respectively. Our membership reward program allows us to build customer loyalty as well as conduct lower cost, more targeted marketing activities.
Employees and Training
We believe that developing and maintaining a team of capable and motivated managerial and other employees is critical to our success. Because our managerial and other employees manage our hotels and interact with our customers on a daily basis, they are critical to maintaining the quality and consistency of our services as well as our brand and reputation. We seek to hire managerial employees with background and experience in hotel and other consumer services industries with a customer-first mentality. We aim to recruit, train and retain the best talent through a multi-step recruiting and training process while offering competitive performance-linked compensation packages and career advancement opportunities.
We have implemented extensive training programs and periodic tests for managerial and other hotel-based staff primarily through our training facility, “Home Inns Academy.” New general managers of our hotels and executive assistants to general managers are required to undergo a two-month training period, during which they receive training in managing all core aspects of our hotel operations, as well as our company culture and philosophy. We also require our hotel general managers and city managers to participate in annual training programs so that they can stay abreast of changes in our hotel operations and consumer preferences and demands. In addition, all employees of a new hotel are required to undergo an approximately 25-day job training prior to commencing their duties. We also have trained on-site managers in many of our hotels to provide continuous training to our hotel staff. In addition to training, we have implemented periodic tests to assess the relevant knowledge and skills of our managerial and other employees. We have integrated the existing employees at our Motel 168 hotels into our on-the-job training programs, and all new employees at Motel 168 hotels will go through the same training as those at our other hotels.
To ensure that all of our hotels have the best possible performance, we have established an effective and clearly defined performance evaluation system based on a comprehensive set of key performance indicators that are aligned with a corresponding compensation structure. In addition, we provide capable and experienced hotel staff with opportunities to be promoted to management positions. We believe our performance-linked compensation structure, career-oriented training and career advancement opportunities are the key drivers that motivate our employees. As a result, we have experienced a very low attrition rate among our managerial staff since our inception.
Excluding employees of our franchised-and-managed hotels, we had 16,313, 26,670 and 26,429 employees as of December 31, 2010, 2011 and 2012, respectively. As of December 31, 2012, our employees consisted of 23,767 hotel-based employees, 310 reservation agents at our centralized reservation center, and 2,352 corporate staff. Approximately 23% of our employees are associated with labor unions. We consider our relations with our employees to be good.
Competition
The lodging industry in China is highly fragmented and competitive, and we expect competition to persist and intensify. Hotels in China may but are not required to apply for star ratings as approved by tourism bureaus of local governments or the National Tourist Administration based on the star rating regulations in China. This standard defines five distinct star ratings, i.e., one-star, two-star, three-star, four-star, and five-star, including platinum five-star. In order to obtain a particular star rating, a hotel must meet certain defined standards for the availability and quality of hotel facilities and public area, availability and quality of amenities in guest rooms, food and beverage facility, scope of guest services, and scope and quality of management infrastructure, etc. We have not applied for star ratings because we do not consider obtaining a star rating as necessary and our business has not been affected as we focus on meeting individual business and leisure travelers’ basic accommodation needs with affordable pricing, a comfortable lodging experience, high-quality services and standardized hotel rooms and amenities across our hotel chain.
29
We compete with other hotels for guests in each of the markets in which we operate. Competition in the industry is primarily based on room rates, quality of accommodations, brand name recognition, convenience of location, geographic coverage, service quality, range of services, and guest amenities. We compete primarily with other economy hotel chains, such as Jinjiang Star, 7 Days Inn, Han Ting, Green Tree Inn and Super 8, as well as various regional and local economy hotel chains. We also compete with two- and three-star hotels, as we offer rooms with standards comparable to many of those hotels and many of the amenities available at those hotels while maintaining competitive pricing and high-quality services tailored to individual business and leisure travelers. In addition, we may also face competition from new players in the economy hotel segment in China. As compared to four- or five-star hotels, developing an economy hotel requires a smaller commitment of capital and human resources. This relatively low barrier of entry permits new competitors to enter our markets quickly and compete with our business. Furthermore, we may face competition from all other hotels for guests in each of our markets, as our typical business and leisure traveler customers may change their travel and spending patterns and choose to stay in hotels in different segments.
Intellectual Property
Our brand, trade names, trademarks, trade secrets and other intellectual property rights distinguish and protect our technology, services and products from those of our competitors and contribute to our competitive advantage in the economy hotel segment of the lodging industry in China. To protect our brand and other intellectual property, we rely on a combination of trademark, trade secret and copyright laws as well as imposing confidentiality obligations on our employees, contractors and others. We have a total of 112 registered trademarks in China, including 如家 (for Home Inns), 莫泰 (for Motel 168) and 和颐 (for Yitel). We are applying for registration of 49 new trademarks in China. We have also registered our domain nameswww.homeinns.com, www.motel168.com andwww.yitel.comwith the Internet Corporation for Assigned Names and Numbers.
We cannot guarantee that our efforts to protect our intellectual property rights will be adequate or that third parties will not infringe or misappropriate these rights. If others are able to copy and use our proprietary information and operational system and other proprietary technology without spending time and resources to develop their own, we may not be able to maintain our competitive position. Furthermore, the application of laws governing intellectual property rights in China is uncertain and evolving and could involve substantial risks to us. If litigation is necessary to enforce our intellectual property rights or determine the scope of the proprietary rights of others, we may have to incur substantial costs or divert other resources, which could harm our business and prospects.
Insurance
Our hotels are covered by property and liability insurance policies with coverage features and insured limits that we believe are customary for similar properties in China. We carry property insurance that covers the assets that we own at our hotels, but not the buildings or any other assets owned by our lessors. Although we require our lessors to purchase customary insurance policies, we cannot guarantee that they will adhere to such requirements. If we suffer losses or are held liable for amounts and claims exceeding the limits of our insurance coverage or outside the scope of our insurance coverage, our business, results of operations and financial condition may be materially and adversely affected.
Regulation
The hotel industry in China is subject to a number of laws and regulations, including laws and regulations relating specifically to hotel operation and management and commercial franchising, as well as those relating to environmental and consumer protection. The principal regulation governing foreign ownership of hotel businesses in the PRC is the Foreign Investment Industrial Guidance Catalogue, the most recent version of which was promulgated on December 24, 2011. Under this catalogue, the hotel industry (other than the development and operation of high-end hotels) belongs to the category of permitted foreign investment industry and there is no special restriction on foreign investment in hotel businesses (other than the development and operation of high-end hotels) in China, other than regular business license and other permits that must be possessed by every lodging business in China. There are no regulatory ceilings on room rates in China. Market-based pricing is permissible for the hotel industry and room rates may be determined at the sole discretion of hotel management. Relative to other industries in China, regulation of the hotel industry in China is still developing and evolving. As a result, most legislative action has consisted of general measures such as industry standards, rules or circulars issued by different ministries rather than detailed legislation. Many of these standards, rules and circulars date from the late 1990’s, and it is expected that they may be amended, revised or expanded in the coming years as the hotel industry in China matures. This section summarizes the principal PRC regulations currently relevant to our business and operations.
30
Regulations on Hotel Operation
Under applicable PRC regulations, anyone who applies to operate a hotel is subject to examination and approval by the local public security authority and must obtain a special industry license. Hotel operators have certain security control obligations as well. For example, the hotel must examine the identification card of any guest to whom accommodation is provided and make an accurate registration. The hotel must also report to the local public security authority if it discovers anyone violating the law, behaving suspiciously or an offender wanted by the public security authority.
A hotel must obtain a public area hygiene license and pass a fire prevention safety inspection by the local public security fire-fighting department before opening for business and must obtain a food hygiene license to serve food. Hotels that provide entertainment facilities, such as discos or ballrooms, are required to obtain a license for entertainment business operations. Hotels are also subject to regulations concerning other standards relating to the operation of public facilities. The relevant administrative authorities may impose penalties and even shut down hotels that violate the provisions.
All hotels that have been in operation for over one year are eligible to apply for a star rating assessment under theRegulations on the Assessment of the Star Rating of Tourist Hotels. There are five ratings from one star to five stars for tourist hotels, assessed based on the level of facilities, management standards and quality of service. A star rating, once granted, is valid for five years.
Regulations on Consumer Protection
Under theLaw on the Protection of the Rights and Interests of Consumers, a business operator providing a commodity or service to a consumer is subject to a number of requirements, including the following:
(1) to ensure that commodities and services meet with certain safety requirements;
(2) to disclose serious defects of a commodity or a service and adopt preventive measures against damage occurrence;
(3) to provide consumers with true information and to refrain from conducting false advertising;
(4) not to set unreasonable or unfair terms for consumers or alleviate or release itself from civil liability for harming the legal rights and interests of consumers by means of standard contracts, circulars, announcements, shop notices or other means; and
(5) not to insult or slander consumers or to search the person of, or articles carried by, a consumer or to infringe upon the personal freedom of a consumer.
Business operators may be subject to civil liabilities for failing to fulfill the obligations discussed above. These liabilities include restoring the consumer’s reputation, eliminating the adverse effects suffered by the consumer, and offering an apology and compensation for any losses incurred. The following penalties may also be imposed upon business operators for the infraction of these obligations: issuance of a warning, confiscation of any illegal income, imposition of a fine, an order to cease business operations, revocation of its business license or imposition of criminal liabilities under circumstances that are specified in laws and statutory regulations.
TheInterpretation of Some Issues concerning the Application of Law for the Trial of Cases on Compensation for Personal Injuryenacted by the Supreme People’s Court further increases the liabilities of a business operator engaged in the operation of hotels, restaurants, or entertainment facilities and subjects such operators to compensatory liability for failing to fulfill their statutory obligation to a reasonable extent or to guarantee the personal safety of others.
Regulations on Environmental Protection
TheLaw on Promoting Clean Productionregulates service enterprises such as restaurants, entertainment establishments and hotels and requires them to use technologies and equipment that conserve energy and water and serve other environmental protection purposes, and to reduce or stop the use of consumer goods that waste resources or pollute the environment.
Regulations on Commercial Franchising
Franchise activities are subject to the supervision and administration of the Ministry of Commerce and its regional counterparts. Under applicable PRC regulations, franchisors must satisfy certain requirements including, among other things, having mature business models and the capacity to provide operation instruction, technical support and training to franchisees. Franchisors engaged in franchising activities without satisfying the above requirements may be subject to penalties such as the forfeit of illegal income and the imposition of monetary fines between RMB 100,000 and RMB 500,000 and may be bulletined by the Ministry of Commerce or its local counterparts. Franchise contracts shall include certain required provisions, such as terms, termination rights and payments.
31
Franchisors are generally required to file franchise contracts with the Ministry of Commerce or its local counterparts. Failure to report franchising activities may result in penalties such as fines up to RMB 100,000. Such noncompliance may also be bulletined. In the first quarter of every year, franchisors are required to report to Ministry of Commerce or its local counterparts any franchising contracts they executed, canceled, renewed or amended in the previous year.
The term of the franchising contracts shall be no less than three years unless franchisees otherwise agree. The franchisee is entitled to terminate the franchise contract at his sole discretion after a period of time.
Franchisors are also required to provide franchisees with basic information in writing and franchise contracts 30 days prior to the execution of such contracts. Failure to disclose or misrepresentation entitles the franchisee to terminate the franchise contact and may also result in fines for the franchisor of up to RMB 100,000. In addition, such noncompliance may be bulletined.
Regulations on Trademarks
PRC trademark law and regulations give protection to the holders of registered trademarks and trade names. The Trademark Office under the State Administration for Industry and Commerce handles trademark registrations and grants a term of ten years to registered trademarks. Trademark license agreement must be filed with the Trademark Office or its regional counterpart.
Regulations on Foreign Currency Exchange
Under various rules and regulations issued by SAFE and other relevant PRC government authorities, the RMB is convertible for current account items, such as trade related receipts and payments, interest and dividends. Capital account items, such as direct equity investments, loans and repatriation of investment, require the prior approval from SAFE or its local counterpart for conversion of RMB into a foreign currency, such as U.S. dollars, and remittance of the foreign currency outside the PRC.
Payments for transactions that take place within the PRC must be made in RMB. Unless otherwise approved, PRC companies must repatriate foreign currency payments received from abroad. Foreign-invested enterprises may retain foreign exchange in accounts with designated foreign exchange banks subject to a cap set by SAFE or its local counterpart. Unless otherwise approved, domestic enterprises must convert all of their foreign currency receipts into RMB.
Regulations on Dividend Distribution
Under applicable PRC regulations, wholly foreign owned enterprises and Sino-foreign equity joint ventures in the PRC may pay dividends only out of their accumulated profits, if any, determined in accordance with PRC accounting standards and regulations. Additionally, these foreign-invested enterprises are required to set aside certain amounts of their accumulated profits each year, if any, to fund certain reserve funds. These reserves are not distributable as cash dividends except in the event of liquidation and cannot be used for working capital purposes. See “Item 3. Key Information—D. Risk Factors—Risks Related to Doing Business in China—We rely principally on dividends and other distributions on equity paid by our subsidiaries to fund any cash and financing requirements we may have, and any limitation on the ability of our subsidiaries entities to make payments to us could have a material adverse effect on our ability to conduct our business.”
Regulations on Employee Stock Holding Plan or Stock Option Plan
On February 15, 2012, SAFE promulgated the Circular on Relevant Issues Concerning Foreign Exchange Administration for Domestic Individuals Participating in an Employees Share Incentive Plan of an Overseas-Listed Company, or the new Share Incentive Rule, which replaced a previous circular promulgated in 2007. Under the new Share Incentive Rule, PRC citizens who participate in a share incentive plan of an overseas publicly listed company are required to register with SAFE and complete certain other procedures. All such participants need to retain a PRC agent through the PRC subsidiary of the overseas publicly listed company to register with SAFE and handle foreign exchange matters such as opening accounts, transferring and settlement of the relevant proceeds. The Rule further requires that an offshore agent should also be designated to handle matters in connection with the exercise or sale of share options and fund transferring for the share incentive plan participants.
Regulation on Mergers and Acquisitions
In 2006, six PRC regulatory agencies jointly adopted new regulations governing mergers and acquisitions, the M&A Rule, setting forth complex procedures and requirements, including requirements in some instances that the Ministry of Commerce be notified in advance of any change-of-control transaction in which a foreign investor takes control of a PRC domestic enterprise. See “Item 3. Key Information—D. Risk Factors—Risks Related to Doing Business in China—The M&A rule sets forth complex procedures for acquisitions conducted by foreign investors which could make it more difficult to pursue growth through acquisitions.”
32
Regulation of Loans between a Foreign Company and its Chinese Subsidiary
A loan denominated in foreign currency made by foreign investors as shareholders in a foreign-invested enterprise is considered to be foreign debt in China and is subject to several Chinese laws and regulations. Under these rules and regulations, a shareholder loan in the form of foreign debt made to a Chinese entity does not require the prior approval of SAFE. However, such foreign debt must be registered with and recorded by SAFE or its local branch in accordance with relevant PRC laws and regulations. Each of our PRC subsidiaries can legally borrow foreign currency denominated loans up to its borrowing limit, which is defined as the difference between the amount of its “total investment” and “registered capital” as approved by the Ministry of Commerce or its local counterparts. Interest payments, if any, on the loans are subject to a 10% withholding tax unless any such foreign shareholder’s jurisdiction of incorporation has a tax treaty with China that provides for a different withholding arrangement. If the amount of foreign currency denominated loan of any of our PRC subsidiaries exceeds its borrowing limit, we are required to apply to the relevant Chinese authorities to increase the total investment amount and registered capital to allow the excess foreign debt to be registered with SAFE.
Tax
See “Item 5. Operating and Financial Review and Prospects—A. Operating Results—Taxation.”
C.Organizational Structure
The following two charts illustrates our company’s organizational structure.
33
Chart 1
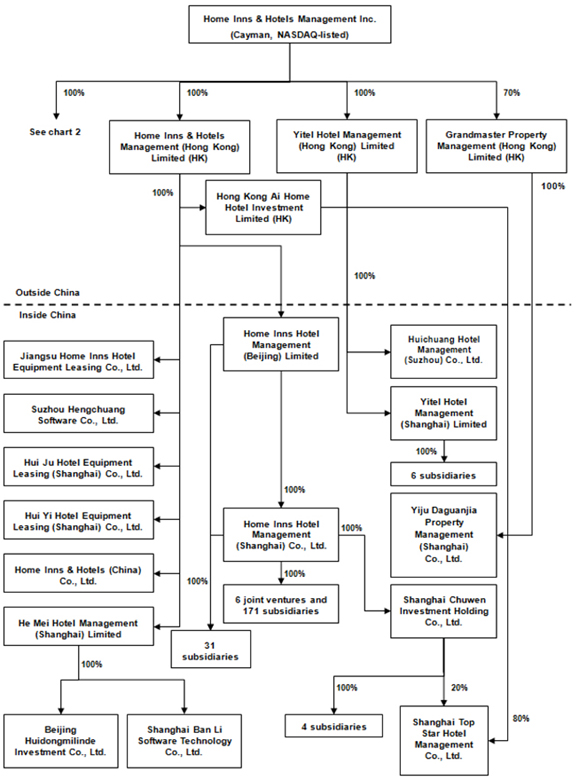
| Note: | Home Inns Hotel Management (Shanghai) Co., Ltd. owns 51% of three joint ventures, 70% of one joint venture, 75% of one joint venture and 95% of one joint venture. |
34
Chart 2
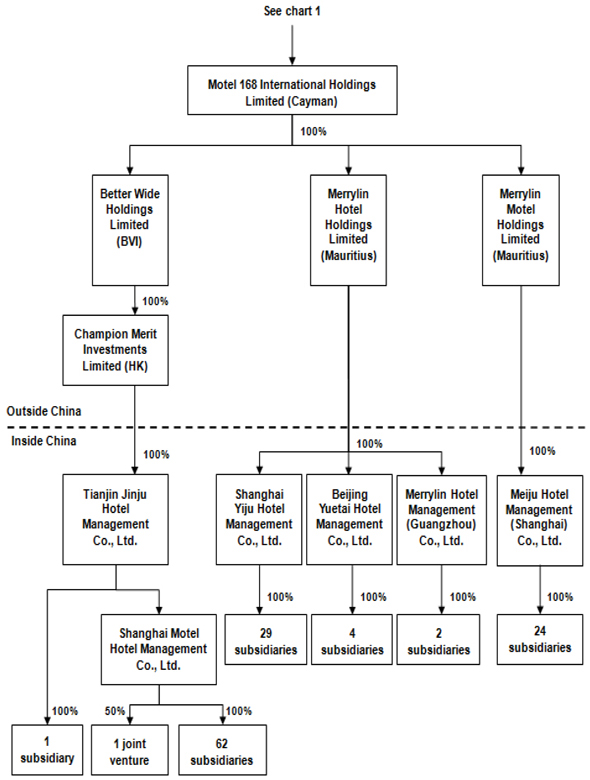
D.Property, Plant and Equipment
Our headquarters are located in Shanghai, China, where we lease approximately 5,423 square meters of office space for our headquarters and call centers. As of December 31, 2012, we leased 803 of our 1,772 hotel facilities with an aggregate size of 4.0 million square meters. For information about the locations of our hotels, see “Item 4. Information On the Company—B. Business Overview—Our Hotel Chain.”
35
| ITEM 4A. | UNRESOLVED STAFF COMMENTS |
None.
| ITEM 5. | OPERATING AND FINANCIAL REVIEW AND PROSPECTS |
You should read the following discussion and analysis of our financial condition and results of operations in conjunction with our consolidated financial statements and the related notes included elsewhere in this annual report on Form 20-F. This discussion may contain forward-looking statements based upon current expectations that involve risks and uncertainties. Our actual results may differ materially from those anticipated in these forward-looking statements as a result of various factors, including those set forth under “Item 3. Key Information—D. Risk Factors” or in other parts of this annual report on Form 20-F.
A.Operating Results
Key Performance Indicators
We utilize a set of non-financial and financial key performance indicators which our senior management reviews frequently. The review of these indicators facilitates timely evaluation of the performance of our business and effective communication of results and key decisions, allowing us to react promptly to changing customer demands and market conditions.
Our non-financial key performance indicators consist of the increase in the total number of hotels and hotel rooms in our hotel chain as well as the RevPAR achieved by our hotels. The increase in the number of hotels in our hotel chain is largely affected by the demand for our hotels in various cities and our ability to successfully identify and secure new properties and develop new hotels at desirable locations. RevPAR is a commonly used operating measure in the hospitality industry and is defined as the product of average occupancy rates and average daily rates achieved. Occupancy rates of our hotels mainly depend on the locations of our hotels, the effectiveness of our sales and brand promotion efforts, our ability to maintain the consistency and quality of our facilities and service, the performance of managerial and other employees of our hotels, and our ability to respond to competitive pressure. We set room rates of our hotels primarily based on the location of a hotel and room rates charged by our competitors within the same locality. Changes in RevPAR primarily due to changes in average occupancy rates achieved have different implications for our total revenues and profitability than changes in RevPAR primarily due to changes in average daily rates achieved. For example, increases in occupancy at our hotels would generally lead to increases in room revenues as well as additional incremental costs, such as housekeeping services, utilities and room amenity costs. However, RevPAR increases due to higher room rates generally would not result in these additional room-related costs. As a result, RevPAR increases due to higher room rates would have a greater positive effect on our profitability.
Our financial key performance indicators consist of our revenue and cost structure, which are discussed in greater details in the following paragraphs. In addition, we use EBITDA, a non-GAAP financial measure, as a key financial performance indicator to assess our operating results before the impact of interest, income taxes, depreciation and amortization. Given the significant investments that we have made in leasehold improvements, depreciation and amortization expense comprises a significant portion of our cost structure. We believe that EBITDA is widely used by other companies in the lodging industry and may be used by investors as a measure of our financial performance.
Revenues. In 2012, we generated total revenues of RMB 5.77 billion (US$926.1 million). Our revenues are significantly affected by the following operating measures, which are widely used in the hospitality industry and appear throughout this annual report:
| | • | | the total number of hotels in our hotel chain; |
| | • | | the total number of hotel rooms in our hotel chain; |
| | • | | occupancy rates achieved by our hotels; |
| | • | | average daily rates achieved by our hotels; and |
| | • | | the RevPAR achieved by our hotels, which represents the product of average daily rates and occupancy rates. |
36
Our future revenue growth will depend significantly upon our ability to expand our hotel chain in existing and new markets in China and maintain and further increase occupancy rates, average daily rates and RevPAR at existing hotels. The acquisition of Motel 168 effective October 1, 2011 has significantly increased the number of hotels in our hotel chain, in conjunction with our organic growth. As of December 31, 2012, we had entered into binding contracts with lessors of 71 properties for our leased-and-operated hotels which are currently under development or awaiting development. In addition to what we had already spent as of that date, we expect to incur an additional RMB 317.8 million (US$51.0 million) in capital expenditures in connection with the completion of the leasehold improvements of these hotels. We intend to fund this planned expansion with our operating cash flow, existing cash balance and bank credit facilities. Motel 168 historically had lower occupancy rates than Home Inns hotels, in part due to operating inefficiencies and in part due to the materially higher average number of rooms in Motel 168 hotels that were built before the time of the acquisition. We believe that we can raise the occupancy rates at existing Motel 168 hotels as we conclude its integration through improvements of operational efficiency and the conversion of hotels with a large average number of rooms to hotels of smaller scale. For the near future, RevPAR for mature hotels might reasonably be expected to be at least stable or increasing slightly year over year, on a same hotel basis, if China can maintain a stable economic growth environment. Expansion into smaller markets, where average daily rates are lower compared to those in larger or more mature and established markets, may cause overall average daily rate to experience short-term decline before rising again as these smaller markets develop. The magnitude of this type of short-term decline should decrease as the geographic profile of our hotel portfolio stabilizes.
The following table sets forth the revenues generated by our leased and-operated hotels and franchised-and-managed hotels, both in absolute amount and as a percentage of total revenues for the periods indicated.
| | | | | | | | | | | | | | | | | | | | | | | | | | | | |
| | | For the Year Ended December 31, | |
| | | 2010 | | | 2011 | | | 2012 | |
| | | RMB | | | % | | | RMB | | | % | | | RMB | | | US$ | | | % | |
| | | (in thousands, except percentages) | |
Revenues: | | | | | | | | | | | | | | | | | | | | | | | | | | | | |
Leased-and-operated hotels | | | 2,910,458 | | | | 91.9 | | | | 3,559,740 | | | | 89.9 | | | | 5,164,799 | | | | 829,007 | | | | 89.5 | |
Franchised-and-managed hotels | | | 256,799 | | | | 8.1 | | | | 399,986 | | | | 10.1 | | | | 604,936 | | | | 97,099 | | | | 10.5 | |
| | | | | | | | | | | | | | | | | | | | | | | | | | | | |
Total revenues | | | 3,167,257 | | | | 100.0 | | | | 3,959,726 | | | | 100.0 | | | | 5,769,735 | | | | 926,106 | | | | 100.0 | |
Less: Business tax and related surcharges | | | (191,232 | ) | | | (6.0 | ) | | | (249,274 | ) | | | (6.3 | ) | | | (353,418 | ) | | | (56,728 | ) | | | (6.1 | ) |
| | | | | | | | | | | | | | | | | | | | | | | | | | | | |
Net revenues | | | 2,976,025 | | | | 94.0 | | | | 3,710,452 | | | | 93.7 | | | | 5,416,317 | | | | 869,378 | | | | 93.9 | |
| | | | | | | | | | | | | | | | | | | | | | | | | | | | |
Leased-and-operated Hotels. In 2012, we generated revenues of RMB 5.16 billion (US$829.0 million) from our leased-and-operated hotels, which accounted for 89.5% of our total revenues for the year. We expect that revenues from our leased-and-operated hotels will continue to constitute a substantial majority of our total revenues in the foreseeable future.
For our leased-and-operated hotels, we lease properties from real estate owners or lessors and we are responsible for hotel development and customization to conform them to our standards, as well as for repairs and maintenance and operating costs and expenses of properties over the term of the lease. We are also responsible for all aspects of hotel operations and management, including hiring, training and supervising the managers and employees required to operate our hotels and purchasing supplies. We typically pay fixed rent on a quarterly basis for the first three or five years of the lease term, after which we are generally subject to a 3% to 5% increase every three to five years.
Revenues from our leased-and-operated hotels primarily consist of revenues from sales of room stays and, to a much lesser extent, revenues from sales of food and beverage at our hotels and other services. We recognize revenues from sales of room stays, food and beverage when our services are rendered.
Franchised-and-managed Hotels. In 2012, we generated revenues of RMB 604.9 million (US$97.1 million) from our franchised-and-managed hotels, which accounted for 10.5% of our total revenues for the year. We expect that revenues from our franchised-and-managed hotels will increase in the foreseeable future as we add more franchised-and-managed hotels to our hotel chain.
37
For our franchised-and-managed hotels, we franchise our brands to franchisees who are property owners, lessors or existing hotel operators, and we are generally responsible for managing these hotels. Under a typical franchise agreement between us and a franchisee, the franchisee is generally required to pay us an initial franchise fee between RMB 0.25 million and RMB 0.45 million per hotel, an annual brand royalty fee of 3% of the revenues of the hotel, an annual management fee of 1.5% of the revenues of the hotel and an annual franchise fee of 1.5% of the revenues of the hotel, with the exception that annual management fees and annual franchise fees in new Motel 168 franchise agreements are generally only 1% each. The franchisee is responsible for the costs of hotel development and customization to conform to the standards of our hotel chain, as well as for repairs and maintenance and operating expenses of the hotel. In general, we enter into franchise arrangements in markets where we have established leased-and-operated hotels and are able to leverage our local knowledge and experience as well as marketing and administrative resources to better assist our franchised-and-managed hotels in these localities. The typical term for our franchise agreements is eight years. Motel 168 franchise agreements that were signed before the acquisition differ in certain respects: in particular, the initial franchise fee was between RMB 0.1 million and RMB 0.4 million per hotel, the ongoing total royalty fees, management fees and franchise fees payable by the franchisee under those agreements are typically between 3% and 4% in the first year and between 4% and 5% in later years, and the duration is typically five years.
For each franchised-and-managed hotel under our standard franchise agreement, we recognize the initial franchise fee as revenue when the franchised-and-managed hotel opens for business, the fee becomes non-refundable, and we have fulfilled all our commitments and obligations associated with these initial fees. We recognize ongoing royalty fees, management fees and franchise fees as revenues when the franchised-and-managed hotel recognizes revenues from which we derive these fees. We recognize fees received from franchisees for system usage, maintenance and support as revenues when our services are rendered. The Motel 168 franchise agreements that were signed before the acquisition differ in certain respects: we recognize the initial franchise fee as deferred revenue when cash is received and recognize as revenue during the franchising period which usually is five years as the franchisees have a refund right that lapses gradually over a five-year period.
Operating Costs and Expenses. Our operating costs and expenses consist of costs for our leased-and-operated hotels, sales and marketing expenses, general and administrative expenses and other operating expenses. The following table sets forth the components of our operating costs and expenses, both in absolute amount and as a percentage of total revenues for the periods indicated.
| | | | | | | | | | | | | | | | | | | | | | | | | | | | |
| | | For the Year Ended December 31, | |
| | | 2010 | | | 2011 | | | 2012 | |
| | | RMB | | | % | | | RMB | | | % | | | RMB | | | US$ | | | % | |
| | | (in thousands, except percentages) | |
Total revenues | | | 3,167,257 | | | | 100.0 | | | | 3,959,726 | | | | 100.0 | | | | 5,769,735 | | | | 926,106 | | | | 100.0 | |
Less: Business tax and related surcharges | | | (191,232 | ) | | | (6.0 | ) | | | (249,274 | ) | | | (6.3 | ) | | | (353,418 | ) | | | (56,728 | ) | | | (6.1 | ) |
| | | | | | | | | | | | | | | | | | | | | | | | | | | | |
Net revenues | | | 2,976,025 | | | | 94.0 | | | | 3,710,452 | | | | 93.7 | | | | 5,416,317 | | | | 869,378 | | | | 93.9 | |
Operating costs and expenses: | | | | | | | | | | | | | | | | | | | | | | | | | | | | |
Leased-and-operated hotel costs: | | | | | | | | | | | | | | | | | | | | | | | | | | | | |
Rents and utilities | | | (875,510 | ) | | | (27.6 | ) | | | (1,232,662 | ) | | | (31.1 | ) | | | (1,953,243 | ) | | | (313,517 | ) | | | (33.9 | ) |
Personnel costs | | | (506,406 | ) | | | (16.0 | ) | | | (657,655 | ) | | | (16.6 | ) | | | (1,037,371 | ) | | | (166,510 | ) | | | (18.0 | ) |
Depreciation and amortization | | | (308,888 | ) | | | (9.8 | ) | | | (398,914 | ) | | | (10.1 | ) | | | (612,789 | ) | | | (98,359 | ) | | | (10.6 | ) |
Consumables, food and beverage | | | (173,256 | ) | | | (5.5 | ) | | | (258,120 | ) | | | (6.5 | ) | | | (351,338 | ) | | | (56,394 | ) | | | (6.1 | ) |
Others | | | (310,705 | ) | | | (9.8 | ) | | | (413,815 | ) | | | (10.5 | ) | | | (687,254 | ) | | | (110,312 | ) | | | (11.9 | ) |
| | | | | | | | | | | | | | | | | | | | | | | | | | | | |
Total leased-and-operated hotel costs | | | (2,174,765 | ) | | | (68.7 | ) | | | (2,960,666 | ) | | | (74.8 | ) | | | (4,641,995 | ) | | | (745,092 | ) | | | (80.5 | ) |
Personnel costs of franchised-and-managed hotels | | | (44,128 | ) | | | (1.4 | ) | | | (72,009 | ) | | | (1.8 | ) | | | (125,031 | ) | | | (20,069 | ) | | | (2.2 | ) |
Sales and marketing expenses | | | (33,257 | ) | | | (1.0 | ) | | | (44,451 | ) | | | (1.1 | ) | | | (76,878 | ) | | | (12,340 | ) | | | (1.3 | ) |
General and administrative expenses | | | (193,482 | ) | | | (6.1 | ) | | | (335,888 | ) | | | (8.5 | ) | | | (315,235 | ) | | | (50,599 | ) | | | (5.5 | ) |
| | | | | | | | | | | | | | | | | | | | | | | | | | | | |
Total operating costs and expenses | | | (2,445,632 | ) | | | (77.2 | ) | | | (3,413,014 | ) | | | (86.2 | ) | | | (5,159,139 | ) | | | (828,100 | ) | | | (89.5 | ) |
| | | | | | | | | | | | | | | | | | | | | | | | | | | | |
Leased-and-operated Hotel Costs. Our leased-and-operated hotel costs consist of costs and expenses directly attributable to our operation of leased-and-operated hotels, primarily including rental payments and utility costs for hotel properties, compensation and benefits for our hotel-based employees, costs of hotel room consumable products, depreciation and amortization of leasehold improvements, and agency fees to travel intermediaries and consolidators. We anticipate that our leased-and-operated hotel costs will increase as we continue to open new leased-and-operated hotels and hire additional hotel-based employees.
38
Sales and Marketing Expenses. Our sales and marketing expenses primarily consist of advertising expenses, production costs of marketing materials, expenses associated with our membership reward program, and compensation and benefits for our sales and marketing personnel, including personnel at our centralized reservation center. We expect that our sales and marketing expenses will increase as we promote our brands.
General and Administrative Expenses. Our general and administrative expenses primarily consist of compensation and benefits for our corporate office employees and other employees who are not sales and marketing or hotel-based employees, costs of third-party professional services, and rental payments relating to office and administrative functions. We expect that our general and administrative expenses will increase in the near term as we hire additional personnel and incur additional costs in connection with the expansion of our business.
The following table sets forth the allocation of our share-based compensation expenses both in absolute amount and as a percentage of total share-based compensation expenses, among the cost and expense items set forth below. Share-based compensation expenses are allocated among these items based on the nature of the work our employees were assigned to perform.
| | | | | | | | | | | | | | | | | | | | | | | | | | | | |
| | | For the Year Ended December 31, | |
| | | 2010 | | | 2011 | | | 2012 | |
| | | RMB | | | % | | | RMB | | | % | | | RMB | | | US$ | | | % | |
| | | (in thousands, except percentages) | |
Leased-and-operated hotel costs—personnel costs | | | — | | | | — | | | | 3,283 | | | | 4.3 | | | | 8,199 | | | | 1,316 | | | | 8.8 | |
Personnel costs of franchised-and-managed hotels | | | — | | | | — | | | | 3,369 | | | | 4.4 | | | | 9,578 | | | | 1,537 | | | | 10.3 | |
Sales and marketing expenses | | | — | | | | — | | | | 656 | | | | 0.8 | | | | 1,535 | | | | 246 | | | | 1.6 | |
General and administrative expenses | | | 53,272 | | | | 100.0 | | | | 69,227 | | | | 90.5 | | | | 74,064 | | | | 11,888 | | | | 79.3 | |
| | | | | | | | | | | | | | | | | | | | | | | | | | | | |
Total share-based compensation expense | | | 53,272 | | | | 100.0 | | | | 76,535 | | | | 100.0 | | | | 93,376 | | | | 14,987 | | | | 100.0 | |
| | | | | | | | | | | | | | | | | | | | | | | | | | | | |
Non-GAAP Financial Measures. To supplement our consolidated financial results presented in accordance with U.S. GAAP, we use two measures defined as non-GAAP financial measures in evaluating our business: EBITDA (non-GAAP) and adjusted EBITDA (non-GAAP). We define EBITDA (non-GAAP) as net income attributable to Home Inns’ shareholders before interest income, interest expenses, income tax expense, and depreciation and amortization. We define adjusted EBITDA (non-GAAP) as EBITDA (non-GAAP) further adjusted to eliminate net foreign exchange loss or gain, share-based compensation, gain on buy-back of convertible bonds, issuance costs for convertible bond, acquisition expenses and integration cost for Motel 168, loss or gain on change in fair value of interest swap transaction and loss or gain on change in fair value of convertible notes. We present non-GAAP financial measures because they are used by our management to evaluate our operating performance. We also believe that these non-GAAP financial measures provide useful information to investors and others in understanding and evaluating our consolidated results of operations in the same manner as our management and in comparing financial results across accounting periods and to those of our peer companies. The presentation of these non-GAAP financial measures is not intended to be considered in isolation or as a substitute for the financial information prepared and presented in accordance with GAAP. For more information on these non-GAAP financial measures, please see the table below.
39
| | | | | | | | | | | | | | | | |
| | | For the Year Ended December 31, | |
| | | 2010 | | | 2011 | | | 2012 | |
Reconciliation of non-GAAP financial measures | | | RMB | | | | RMB | | | | RMB | | | �� | US$ | |
Net income attributable to Home Inns’ shareholders | | | 359,499 | | | | 351,531 | | | | (26,776 | ) | | | (4,299 | ) |
Interest income | | | (9,454 | ) | | | (31,996 | ) | | | (11,874 | ) | | | (1,906 | ) |
Interest expenses | | | 2,024 | | | | 46,868 | | | | 119,416 | | | | 19,168 | |
Income tax expense | | | 139,969 | | | | 169,442 | | | | 136,305 | | | | 21,878 | |
Depreciation and amortization | | | 319,989 | | | | 413,105 | | | | 632,468 | | | | 101,518 | |
| | | | | | | | | | | | | | | | |
EBITDA (non-GAAP) | | | 812,027 | | | | 948,950 | | | | 849,539 | | | | 136,359 | |
Foreign exchange loss/(gain), net | | | 4,350 | | | | (15,849 | ) | | | (217 | ) | | | (35 | ) |
Share-based compensation | | | 53,272 | | | | 76,535 | | | | 93,376 | | | | 14,987 | |
Gain on buy-back of convertible bonds | | | (2,480 | ) | | | (1,521 | ) | | | — | | | | — | |
Issuance costs for convertible bond | | | 42,559 | | | | — | | | | — | | | | — | |
Acquisition expenses—Motel 168 | | | — | | | | 63,824 | | | | — | | | | — | |
Integration cost | | | — | | | | 19,505 | | | | 96,952 | | | | 15,562 | |
Non-operating expenses—loss on change in fair value of interest swap transaction | | | — | | | | 7,315 | | | | 6,665 | | | | 1,070 | |
(Gain)/loss on change in fair value of convertible notes | | | 9,040 | | | | (198,547 | ) | | | 87,099 | | | | 13,980 | |
| | | | | | | | | | | | | | | | |
Adjusted EBITDA (non-GAAP) | | | 918,768 | | | | 900,212 | | | | 1,133,414 | | | | 181,923 | |
| | | | | | | | | | | | | | | | |
Adjusted EBITDA (non-GAAP) as a percentage of total revenue | | | 29.0 | % | | | 22.7 | % | | | 19.6 | % | | | 19.6 | % |
Seasonality
Our business is subject to fluctuations in revenues due to seasonality, which may cause fluctuations in our quarterly operating results. Generally, the first quarter, in which both the Chinese New Year and Spring Festival holidays fall, accounts for a lower percentage of our annual revenues than other quarters of the year. Further, travel volume in second and third quarters of the year is generally higher given better weather conditions and school vacations. Therefore, you should not rely on our operating results for prior quarters as an indication of our results in any future period.
In addition, the occurrence of major events may affect our operating results, in particular for the hotel locations where those events are held. Examples of major events in recent years include the Beijing Olympics in 2008 and the Shanghai World Expo in 2010. In years where there are no comparable events, our performance may suffer by comparison. For example, the decrease in our RevPAR from 2010 to 2011 was driven by a lower occupancy rate and a lower average daily rate due to the absence of the price premium that our Shanghai hotels enjoyed during the six months of the 2010 Shanghai World Expo.
Taxation
We are incorporated in the Cayman Islands. Under Cayman Islands law, we are not subject to income or capital gains tax. In addition, dividend payments are not subject to withholding tax in the Cayman Islands. We also have two subsidiaries incorporated in the Cayman Islands.
Our subsidiaries in Hong Kong are subject to a profit tax at the rate of 16.5% on assessable profit determined under relevant Hong Kong tax regulations. To date, our subsidiaries in Hong Kong have not been required to pay profit tax as they have had no assessable profit.
Motel 168 has subsidiaries in the British Virgin Islands and the Republic of Mauritius. These subsidiaries are not subject to tax on income or capital gains. In addition, dividend payments are not subject to withholding tax in the British Virgin Islands or the Republic of Mauritius.
Our subsidiaries in China are subject to a business tax at a rate of approximately 6% on revenues generated from providing services and related surcharges by various local tax authorities. In addition, our subsidiaries in China are generally subject to the standard enterprise income tax at a rate of 25%. However, some of our subsidiaries are subject to lower enterprise income tax rates due to the preferential tax treatments granted by the local tax authorities. For example, our wholly-owned subsidiary, Suzhou Hengchuang Software Co., Ltd., was exempted from enterprise income tax rate for 2012 and 2013, because of the preferential income tax rate applicable to the software industry, and it will be taxed at a preferential rate of 12.5% for 2014, 2015 and 2016 before becoming subject to the full rate of 25% in 2017.
40
Under the Enterprise Income Tax Law and its implementation regulations, a 10% PRC income tax is applicable to dividends payable to investors that are “non-resident enterprises,” i.e., enterprises that do not have an establishment or place of business in the PRC, to the extent such dividends have their sources within the PRC. Such dividends are also subject to the 10% tax even if the recipient has an establishment or place of business in the PRC if the relevant income is not effectively connected with the establishment or place of business. Undistributed earnings generated prior to January 1, 2008 are exempt from the 10% PRC income tax. We are a holding company incorporated in the Cayman Islands that indirectly holds, through subsidiaries in the Cayman Islands, the British Virgin Islands, Mauritius and Hong Kong, other subsidiaries in the PRC. Our business operations are principally conducted through our PRC subsidiaries. Thus, dividends for earnings accumulated beginning on January 1, 2009 payable to us by our subsidiaries in China, will be subject to the 10% income tax if we are considered as “non-resident enterprises” under the Enterprise Income Tax Law.
Under a special arrangement between China and Hong Kong, dividends from our PRC subsidiaries paid to us through our Hong Kong subsidiary, which would otherwise be subject to a 10% withholding tax, may be subject to a 5% preferential withholding tax if our Hong Kong subsidiary can be considered as a “beneficial owner” of our PRC subsidiaries and is otherwise entitled to the benefits under the special arrangement. The State Administration for Taxation promulgated Notice Regarding Interpretation and Recognition of Beneficial Owners under Tax Treaties on October 27, 2009, which provides guidance on the determination of “beneficial owners”. If our Hong Kong subsidiaries are not considered to be the “beneficial owners” of our PRC subsidiaries under this notice, any dividends paid by our PRC subsidiaries to our Hong Kong subsidiaries would be subject to withholding tax at a rate of 10%. Moreover, under the Enterprise Income Tax Law, foreign ADS holders may be subject to a 10% withholding tax upon dividends payable by us and gains realized on the sale or other disposition of ADSs or ordinary shares, if such income is sourced from within the PRC.
Our effective income tax rate varies over the years and the following table sets forth a reconciliation between statutory tax rate and the effective tax rate:
| | | | | | | | | | | | |
| | | 2010 | | | 2011 | | | 2012 | |
Statutory corporate income tax rate | | | 25 | % | | | 25 | % | | | 25 | % |
Tax differential from statutory rate applicable to subsidiaries in the PRC | | | (3 | %) | | | (3 | %) | | | (1 | %) |
Tax differential for the expenses recorded by Home Inns & Hotels Management Inc. and its subsidiaries registered in the Cayman Islands, BVI and Mauritius which are not subject to tax (1) | | | 5 | % | | | 2 | % | | | 68 | % |
Permanent difference for non-deductible expenses | | | 1 | % | | | 1 | % | | | 7 | % |
Withholding tax for profit distribution from onshore subsidiaries to offshore subsidiaries | | | — | | | | 7 | % | | | 21 | % |
| | | | | | | | | | | | |
Effective corporate income tax rate | | | 28 | % | | | 32 | % | | | 120 | % |
| | | | | | | | | | | | |
| (1) | Tax differential for the expenses recorded by Home Inns & Hotels Management Inc. and its subsidiaries registered in the Cayman Islands, BVI and Mauritius which are not subject to tax primarily represents the effects of the following items being not tax deductible: (i) a rate of 21% as a result of permanent difference arising from share base compensation expenses (4% in 2011, 3% in 2010); (ii) a rate of 26% as a result of permanent differences arising from the interest expense in convertible notes and term loan (2% in 2011, nil in 2010); and (iii) a rate of 19% as a result of permanent difference in connection with loss arising from change in fair value in convertible notes (–9% in 2011, nil in 2010). |
Critical Accounting Policies
We prepare financial statements in accordance with U.S. GAAP, which requires us to make judgments, estimates and assumptions that affect the reported amounts of our assets and liabilities and the disclosure of our contingent assets and liabilities at the end of each fiscal period and the reported amounts of revenues and expenses during each fiscal period. We continually evaluate these judgments and estimates based on our own historical experience, knowledge and assessment of current business and other conditions, our expectations regarding the future based on available information and assumptions that we believe to be reasonable, which together form our basis for making judgments about matters that are not readily apparent from other sources. Since the use of estimates is an integral component of the financial reporting process, our actual results could differ from those estimates. Some of our accounting policies require a higher degree of judgment than others in their application.
41
The selection of critical accounting policies, the judgments and other uncertainties affecting application of those policies and the sensitivity of reported results to changes in conditions and assumptions are factors that should be considered when reviewing our financial statements. We believe the following accounting policies involve the most significant judgments and estimates used in the preparation of our financial statements.
Basis of Consolidation
The consolidated financial statements include the financial statements of Home Inns & Hotels Management Inc., its subsidiaries and its variable interest entities, or VIEs. All significant transactions and balances between Home Inns & Hotels Management Inc., its subsidiaries and its VIEs have been eliminated upon consolidation.
A subsidiary is an entity in which Home Inns & Hotels Management Inc., directly or indirectly, controls more than one half of the voting power, has the power to appoint or remove the majority of the members of the board of directors, has the power to cast a majority of the votes at a meeting of the board of directors or has the power to govern the financial and operating policies of the investee under a statute or agreement among the shareholders or equity holders.
ASC 810 “Consolidation”, which provides guidance on the identification of and financial reporting for entities over which control is achieved through means other than voting interests, requires certain variable interest entities to be consolidated by the primary beneficiary of the entity.
Prior to January 1, 2011, certain entities were considered variable interest entities because the equity at risk of each entity was not sufficient to finance its intended activities without additional financial support. Home Inns & Hotels Management (Shanghai) Co., Ltd. was considered the primary beneficiary of these entities because it had a controlling financial interest and was the primary beneficiary of these VIEs as it had both the power to direct the activities of the VIEs that most significantly impacted the VIEs’ economic performance and an obligation to absorb losses or the right to receive benefits that could potentially be significant to the VIEs. Accordingly, the financial statements of the following VIEs were consolidated into our financial statements from their respective date of establishment or acquisition until January 1, 2011:
| | | | |
Name of VIE | | Our ownership interest | |
Home Inns & Hotels Management (Xiamen) Co., Ltd. | | | 51 | % |
Home Inns & Hotels Management (Fuzhou) Co., Ltd. | | | 51 | % |
Home Inns & Hotels Management (Caoxi) Co., Ltd. | | | 51 | % |
Home Inns & Hotels Management (Caobao) Co., Ltd. | | | 75 | % |
Home Inns & Hotels Management (Dongguan) Co., Ltd. | | | 65 | % |
Home Inns & Hotels Kuaijie (Fuzhou) Co., Ltd. | | | 70 | % |
The total registered capital of the six VIEs was RMB 6.0 million as of December 31, 2010. The total net assets of the consolidated VIEs were RMB 26.3 million as of December 31, 2010. The total net income of the six VIEs was RMB 16.3 million in the year ended December 31, 2010. We monitor the regulatory risk associated with these contractual arrangements. There were no consolidated VIE assets that were collateral for the VIE obligations and which could only be used to settle the VIE’s obligations. Creditors of the VIEs had no recourse to the general credit of Home Inns & Hotels Management (Shanghai) Co., Ltd., which was the primary beneficiary of the VIEs.
In 2011, we determined that the six VIEs that were equity investments were no longer considered variable interest entities effective for the year ended December 31, 2011. As we have majority legal ownership in these entities, we continue to consolidate them. The reconsideration event did not have any impact on our consolidated financial statements.
We evaluate our business relationships, such as those with our franchisees, to identify potential variable interest entities. Generally, these businesses qualify for the business scope exception under the consolidation guidance. Therefore, we have concluded that consolidation of any such entities is not appropriate for the periods presented.
Allowance for Doubtful Accounts
Provision is made against receivables to the extent collection is considered to be doubtful. Accounts receivable and other receivables in the balance sheet are stated net of such provision, if any. For the years ended December 31, 2011 and 2012, the allowance for doubtful accounts was RMB 0.3 million and nil, respectively.
42
Business Combinations
U.S. GAAP requires that business combinations be accounted for under the acquisition purchase method. From January 1, 2009, we adopted ASC 805 “Business Combinations”. Following this adoption, the cost of an acquisition is measured as the aggregate of the fair values at the date of exchange of the assets given, liabilities incurred, and equity instruments issued. The costs directly attributable to the acquisition are expensed as incurred. Identifiable assets, liabilities and contingent liabilities acquired or assumed are measured separately at their fair value as of the acquisition date, irrespective of the extent of any non-controlling interests. The excess of (i) the total of cost of acquisition, the fair value of the non-controlling interests and the acquisition date fair value of any previously held equity interest in the acquiree over (ii) the fair value of the identifiable net assets of the acquiree is recorded as goodwill. If the cost of acquisition is less than the fair value of the net assets of the entity acquired, the difference is recognized directly in the statements of operations.
The determination and allocation of fair values to the identifiable assets acquired and liabilities assumed are based on various assumptions and valuation methodologies requiring considerable management judgment. The most significant variables in these valuations are discount rates, terminal values, the number of years on which to base the cash flow projections and the assumptions and estimates used to determine the cash inflows and outflows. Management determines discount rates to be used based on the risk inherent in the related activity’s current business model and industry comparisons. Terminal values are based on the expected life of assets and forecasted life cycle and forecasted cash flows over that period. Although we believe that the assumptions applied in the determinations that we have made are reasonable based on information available at the date of acquisition, actual results may differ from the forecasted amounts and the difference could be material.
Jointly Controlled Entity
Investment in a jointly controlled entity is accounted for by the equity method of accounting as we have the ability to exercise significant influence but do not own a majority equity interest. Under this method, our income or loss from investment is recognized in our consolidated statements of operations. Unrealized gains on transactions between us and the jointly controlled entity are eliminated to the extent of our interest in the jointly controlled entity, if any; unrealized losses are also eliminated unless the transaction provides evidence of an impairment of the asset transferred. When our share of losses in the jointly controlled entity equals or exceeds our interest in the jointly controlled entity, we do not recognize further losses, unless we have incurred obligations or made payments on behalf of the jointly controlled entity.
We review our investment in the jointly controlled entity to determine whether a decline in fair value below the carrying value is other than temporary at period end. The primary factors we consider in our determination are the length of time that the fair value of the investment is below our carrying value and the financial condition, operating performance and near term prospects of the investee. In addition, we consider the reason for the decline in fair value, including general market conditions, industry-specific or investee-specific reasons, changes in valuation subsequent to the balance sheet date and our intent and ability to hold the investment for a period of time sufficient to allow for a recovery in fair value. If the decline in fair value is deemed to be other than temporary, the carrying value of the security is written down to fair value. There were no impairment losses for our investment in the jointly controlled entity in the years ended December 31, 2011 and 2012.
Goodwill
Goodwill is an asset representing the future economic benefits arising from other assets acquired in a business combination that are not individually identified and separately recognized. Goodwill is not amortized, but rather is tested for impairment at least annually. The guidance requires that a two-step impairment test be performed annually or whenever events or changes in circumstances indicate that it is more likely than not that the fair value of a reporting unit is less than its carrying amount. The first step of the test for impairment compares the book value of the reporting unit under which goodwill is recorded to its estimated fair value. The second step of the goodwill impairment test, which is only required when the net book value of the reporting unit exceeds the fair value, measures the impairment as the difference between the implied fair value of goodwill and its book value. No impairment of goodwill was recognized for the years ended December 31, 2010, 2011 and 2012.
Impairment of Long-lived Assets and Definite-lived Intangible Assets
Long-lived assets and definite-lived intangible assets are reviewed for impairment whenever events or changes in circumstances indicate that carrying amount of an asset may not be recoverable. Factors considered important that could result in an impairment review include significant underperformance relative to expected historical or projected future operating results, significant changes in the manner of use of long-lived assets and definite-lived intangible assets and significant negative industry or economic trends. Impairments are recognized based on the difference between the fair value of the asset and its carrying value in the event that the carrying amount exceeds the estimated future undiscounted cash flow attributed to such assets. Fair value is generally measured based on either quoted market prices, if available, or discounted cash flow analyses. Additionally, determining fair values requires probability weighting the cash flows to reflect expectations about possible variations in their amounts or timing and the selection of an appropriate discount rate. Although cash flow estimates are based on relevant information available at the time the estimates are made, estimates of future cash flows are, by nature, highly uncertain and may vary significantly from actual results. Any write-downs would be treated as permanent reductions in the carrying amounts of the assets and an operating loss would be recognized. The impairment losses on property and equipment recognized for the years ended December 31, 2010, 2011 and 2012 were nil, RMB 1.7 million and RMB 12.6 million (US$2.0 million), respectively.
43
Accruals for Customer Reward Program
We invite our customers to participate in a customer reward program. Prior to November 14, 2004, membership was free of charge. A one-time membership fee was charged after that date for new members. Members enjoy discounts on room rates and priority in hotel reservation and accumulate membership points for their paid stays, which can be redeemed for membership upgrades, room night awards and other gifts. The estimated incremental costs to provide membership upgrades, room night awards and other gifts are accrued and recorded as accruals for customer reward program as members accumulate points and recognized as sales and marketing expenses in the statements of operations. As members redeem awards or their entitlements expire, the provision is reduced correspondingly.
Prior to the second quarter of 2011, we did not apply redemption rates to the estimation on reward cost due to the limited history of our customer reward program. With sufficient historical information and accumulated knowledge on reward point redemption and expiration, we have applied a historical redemption rate of 20% prospectively in estimating the costs of reward points since April 1, 2011. After the acquisition of Motel 168, we updated the terms under Motel 168’s customer reward program to conform to those of Home Inns’ customer reward program. We reassess the redemption rate at each period end to ensure that the estimate of redemption rate is reasonable.
As of December 31, 2010, 2011 and 2012, the accruals for customer reward program amounted to RMB 17.4 million, RMB 5.2 million and RMB 5.5 million (US$0.9 million), respectively, based on the estimated liabilities under the customer reward program.
Revenue Recognition
Revenue from leased-and-operated hotels represents primarily room rentals and food and beverage sales from the leased-and-operated hotels. We recognize such revenues when goods are delivered and services are provided.
Revenues from franchised-and-managed hotels are derived from franchise agreements where the franchisees are required to pay (i) an initial one-time franchise fee and (ii) on-going management and service fees based on a percentage of revenue, which historically have approximated 3% to 6% of the room revenues of the franchised-and-managed hotels. The franchise fee is an initial one-time fee. For franchise agreements signed under the Home Inns brand and Yitel brand and franchise agreements signed under the Motel 168 brand after our acquisition of Motel 168, the franchise fee is recognized as revenue when the franchised hotel opens for business, the franchise fee becomes non-refundable, and we have fulfilled all our commitments and obligations including assistance to the franchisees in property design, leasehold improvement construction project management, systems installation, personnel recruiting and training. For franchise agreements signed by Motel 168 prior to our acquisition of it, the franchise fee is recorded as deferred revenue when the cash is received and recognized as revenue during the franchising period which usually is five years as the franchisees have a refund right that lapses gradually over a five-year period. On-going management and service fees are recognized when the underlying service revenue is recognized by the franchisees’ operations. Other revenues generated from franchise agreements include a system maintenance and support fee and a central reservation system usage fee, which are recognized when services are provided.
Prior to the second quarter of 2011, revenue from one-time membership fees was deferred when received and was recognized when membership records showed no activity after a year. With sufficient historical information and accumulated knowledge on membership activity pattern, we estimated that the average life of memberships is approximately two years. Therefore, the change in accounting estimate is applied prospectively, and revenue from one-time membership fees has been recognized over two years on a straight line basis since April 1, 2011. For the years ended December 31, 2010, 2011 and 2012, we recognized revenues of RMB 33.8 million, RMB 79.4 million and RMB 172.1 million (US$27.6 million), from one-time membership fees.
We continue to monitor the membership activity pattern and reassess average life of memberships at each period end to ensure the revenue recognition period is reasonable.
44
Share-based Compensation
We account for share-based compensation arrangements with employees in accordance with ASC 718 “Compensation — Stock Compensation”. It requires us to measure the fair value of the stock-based award at the grant date and recognize compensation expense, net of estimated forfeitures, on a straight-line basis over the requisite service period. We use the Black-Scholes option pricing model to determine the fair value of stock options. The requisite service period is the vesting period, which is generally four years. Forfeitures are estimated at the time of grant and revised in subsequent periods if actual forfeitures differ from those estimates.
One of our subsidiaries grants share options with an exercise price denominated in U.S. dollars. We determined that this subsidiary should account for the U.S. dollar denominated share options granted to employees and directors of the subsidiary as liability awards as our functional currency is the Renminbi and the underlying shares denominated in U.S. dollars are not publicly traded. All grants of share-based awards to employees and directors classified as liability are remeasured at the end of each reporting period with an adjustment for fair value recorded to the current period expense in order to properly reflect the cumulative expense based on the current fair value of the vested rewards over the vesting periods.
Leases
We lease certain property and equipment.
Leases of property and equipment are classified as operating leases when substantially all the risks and rewards of ownership of assets remain with the lessor. Payments made under operating leases net of any incentives received from the lessor are charged to the consolidated statements of operations on a straight-line basis over the terms of the underlying lease.
Leases of property and equipment are classified as finance leases when we have substantially all the risks and rewards of ownership. Finance leases are capitalized at the lease’s commencement at the lower of the fair value of the leased property and the present value of the minimum lease payments. Each lease payment is allocated between the liability and finance charges. The corresponding rental obligations, net of finance charges, are included in finance lease liabilities. The interest element of the finance cost is charged to the statements of operations over the lease period so as to produce a constant periodic rate of interest on the remaining balance of the liability for each period. The property and equipment acquired under finance leases are depreciated over the lease term if the lease does not meet the transfer of ownership criterion or the bargain purchase option criterion. If the lease meets either the transfer of ownership criterion or the bargain purchase option criterion, then the related asset is depreciated over the useful life of the asset.
Fixed assets capitalized under finance leases are depreciated in accordance with our policy for the depreciation of fixed assets.
Taxation
The provision for income taxes is based on the income and expense amounts recorded in our consolidated statements of operations. Income tax expenses are recorded using the liability method. Deferred tax assets or liabilities are recognized for the estimated future tax effects attributable to temporary differences and tax loss carry forwards. Deferred tax assets and liabilities are recognized and measured using enacted income tax rates expected to apply to taxable income in the years in which those temporary differences are expected to be recovered or settled. The effect on deferred taxes of a change in tax rates is recognized in statements of operations in the period that includes the enactment date. A valuation allowance is recorded to reduce the amount of deferred tax assets if it is considered more likely than not that such assets will not be realized. A valuation allowance of RMB 271.1 million and RMB 223.0 million (US$35.8 million) was provided for our net deferred tax assets as of December 31, 2011 and 2012, respectively. As of December 31, 2011 and December 31, 2012, a valuation allowance of RMB 237.4 million and RMB 166.6 million (US$26.7 million) was carried forward from the acquisition of Motel 168. The valuation allowances were provided on the deferred tax assets to the extent that we believed it was more likely than not that such deferred tax assets would not have been realized in the foreseeable future. Valuation allowances were also provided because it was more likely than not that we would not be able to utilize certain tax loss carry forwards generated by certain subsidiaries. As those entities continue to have accumulated tax losses and tax planning strategies are not available to utilize those tax losses in other subsidiaries of ours, we believe it is more likely than not that such losses will not be utilized before they expire. However, certain valuation allowances were reversed in 2010, 2011 and 2012 when we generated sufficient taxable income to utilize the deferred tax assets. If events occur in the future that prevent us from realizing some or all of our deferred tax assets, an adjustment to the valuation allowances will be recognized when such events occur. In the PRC, tax loss carry forwards generally expire after five years.
In order to assess uncertain tax positions, we apply a more likely than not threshold and a two-step approach for the tax position measurement and financial statement recognition. For the two-step approach, the first step is to evaluate the tax position for recognition by determining if the weight of available evidence indicates that it is more likely than not that the position will be sustained, including resolution of related appeals or litigation processes, if any. The second step is to measure the tax benefit as the largest amount that is greater than 50% likely to be realized upon settlement. As of December 31, 2011 and 2012, there were no uncertain tax positions.
45
Recent Accounting Pronouncements
In December 2011, the FASB issued ASU 2011-11, Balance Sheet (Topic 210), “Disclosures about Offsetting Assets and Liabilities” (ASU 2011-11). This newly issued accounting standard requires an entity to disclose both gross and net information about instruments and transactions eligible for offset in the statements of financial position as well as instruments and transactions executed under a master netting or similar arrangement and was issued to enable users of financial statements to understand the effects or potential effects of those arrangements on their financial position. This ASU is required to be applied retrospectively and is effective for fiscal years, and interim periods within those years, beginning on or after January 1, 2013. As this accounting standard only requires enhanced disclosure, we do not expect the adoption of this standard to have a material impact on our financial statements.
In July 2012, the FASB issued ASU 2012-02, “Intangibles – Goodwill and Other: Testing Indefinite Lived Intangible Assets for Impairment”. The update applies to all entities, both public and nonpublic, that have indefinite-lived intangible assets, other than goodwill, reported in their financial statements. Per the update, an entity has the option first to assess qualitative factors to determine whether the existence of events and circumstances indicates that it is more likely than not that the indefinite-lived intangible asset is impaired. If, after assessing the totality of events and circumstances, an entity concludes that it is not more likely than not that the indefinite-lived intangible asset is impaired, then the entity is not required to take further action. The amendments are effective for annual and interim impairment tests performed for fiscal years beginning after September 15, 2012. Early adoption is permitted, including for annual and interim impairment tests performed as of a date before July 27, 2012, if financial statements for the most recent annual or interim period have not yet been issued. The adoption of this update beginning on December 31, 2012 is not expected to have a material impact on our consolidated financial statements.
In February 2013, the FASB issued ASU 2013-02, “Comprehensive Income: Reporting of Amounts Reclassified Out of Accumulated Other Comprehensive Income”. This update does not change the current requirements for reporting net income or other comprehensive income in financial statements. However, this update requires an entity to provide information about the amounts reclassified out of accumulated other comprehensive income by component. In addition, an entity is required to present, either on the face of the statement where net income is presented or in the notes, significant amounts reclassified out of accumulated other comprehensive income by the respective line items of net income but only if the amount reclassified is required under U.S. GAAP to be reclassified to net income in its entirety in the same reporting period. For other amounts that are not required under U.S. GAAP to be reclassified in their entirety to net income, an entity is required to cross-reference to other disclosures required under U.S. GAAP that provide additional detail about those amounts. This update is effective prospectively for reporting periods beginning after December 15, 2012 for public entities. The adoption of this update beginning on January 1, 2013 is not expected to have a material impact on our consolidated financial statements.
In February 2013, the FASB issued ASU 2013-04, “Obligations Resulting from Joint and Several Liability Arrangements for Which the Total Amount of the Obligation is Fixed at the Reporting Date”. This update provides guidance for the recognition, measurement, and disclosure of obligations resulting from joint and several liability arrangements for which the total amount of the obligation within the scope of this update is fixed at the reporting date, except for obligations addressed within existing guidance in U.S. GAAP. The guidance requires an entity to measure those obligations as the sum of the amount the reporting entity agreed to pay on the basis of its arrangement among its co-obligors and any additional amount the reporting entity expects to pay on behalf of its co-obligors. The guidance in this update also requires an entity to disclose the nature and amount of the obligation as well as other information about those obligations. This update is effective for fiscal years, and interim periods within those years, beginning after December 15, 2013. This update should be applied retrospectively to all prior periods presented for those obligations resulting from joint and several liability arrangements within the update’s scope that exist at the beginning of an entity’s fiscal year of adoption. An entity may elect to use hindsight for the comparative periods (if it changed its accounting as a result of adopting the amendments in this update) and should disclose that fact. The adoption of this update beginning on January 1, 2013 is not expected to have a material impact on our consolidated financial statements.
In March 2013, the FASB issued ASU 2013-05, “Parent’s Accounting for the Cumulative Translation Adjustment upon Derecognition of Certain Subsidiaries or Groups of Assets within a Foreign Entity or of an Investment in a Foreign Entity”. This update provides that when a reporting entity (parent) ceases to have a controlling financial interest in a subsidiary or group of assets that is a nonprofit activity or a business (other than a sale of in substance real estate or conveyance of oil and gas mineral rights) within a foreign entity, the parent is required to apply the guidance in Subtopic 830-30 to release any related cumulative translation adjustment into net income. Accordingly, the cumulative translation adjustment should be released into net income only if the sale or transfer results in the complete or substantially complete liquidation of the foreign entity in which the subsidiary or group of assets had resided. For an equity method investment that is a foreign entity, a pro rata portion of the cumulative translation adjustment should be released into net income upon a partial sale of such an equity method investment. However, this treatment does not apply to an equity method investment that is not a foreign entity. In those instances, the cumulative translation adjustment is released into net income only if the partial sale represents a complete or substantially complete liquidation of the foreign entity that contains the equity method investment. Additionally, the amendments in this update clarify that the sale of an investment in a foreign entity includes both (1) events that result in the loss of a controlling financial interest in a foreign entity (that is, irrespective of any retained investment) and (2) events that result in an acquirer obtaining control of an acquiree in which it held an equity interest immediately before the acquisition date (sometimes also referred to as a step acquisition). Accordingly, the cumulative translation adjustment should be released into net income upon the occurrence of those events. This update is effective prospectively for fiscal years (and interim reporting periods within those years) beginning after December 15, 2013. The adoption of this update beginning on January 1, 2013 is not expected to have a material impact on our consolidated financial statements.
46
Selected Operating Data
The following tables present certain selected operating data of our company as of and for the dates and periods indicated. These operating measures are widely used in the hospitality industry.
| | | | | | | | | | | | |
| | | As of and for the Year Ended
December 31, | |
| | | 2010 | | | 2011 | | | 2012 | |
Operating Data (1) | | | | | | | | | | | | |
Hotels in operation | | | | | | | | | | | | |
Leased-and-operated hotels (2) | | | 454 | | | | 698 | | | | 803 | |
Franchised-and-managed hotels (2) | | | 364 | | | | 728 | | | | 969 | |
| | | | | | | | | | | | |
Total (2) | | | 818 | | | | 1,426 | | | | 1,772 | |
Total rooms (2) | | | 93,898 | | | | 176,562 | | | | 214,070 | |
Number of cities (2) | | | 146 | | | | 212 | | | | 253 | |
Occupancy rate (as a percentage) | | | | | | | | | | | | |
All hotels | | | 93.5 | | | | 88.8 | | | | 86.1 | |
Leased-and-operated hotels | | | 92.5 | | | | 86.6 | | | | 83.0 | |
Franchised-and-managed hotels | | | 95.0 | | | | 91.3 | | | | 89.2 | |
Average daily rate (in RMB) | | | | | | | | | | | | |
All hotels | | | 175 | | | | 172 | | | | 168 | |
Leased-and-operated hotels | | | 168 | | | | 165 | | | | 161 | |
Franchised-and-managed hotels | | | 185 | | | | 179 | | | | 174 | |
RevPAR (in RMB) | | | | | | | | | | | | |
All hotels | | | 164 | | | | 152 | | | | 144 | |
Leased-and-operated hotels | | | 156 | | | | 143 | | | | 134 | |
Franchised-and-managed hotels | | | 176 | | | | 163 | | | | 155 | |
| (1) | All numbers pertain to hotels in operation and exclude hotels contracted or under construction. Data for leased-and-operated hotels includes hotels operated through joint ventures. Home Inns Hotel Management (Shanghai) Co., Ltd. currently owns 51% of three joint ventures, 70% of one joint venture, 75% of one joint venture and 95% of one other joint venture. Motel 168 Hotel Management (Shanghai) Co., Ltd. owns 50% of one joint venture. |
| (2) | As of the end of each period. |
The comparative performance of ramp-up stage hotels and mature hotels shown in the following table illustrates the materially dilutive nature of the performance of the ramp-up stage hotels, which are those hotels that have been in operation for 6 months or less. As of December 31, 2010, 2011 and 2012, there were 134, 325 and 367 hotels that had been in operation for over 6 months but less than 18 months. After the initial 6 months of operations, during which performance improves quickly, hotels will continue to increase in occupancy rate and average daily rate at a more gradual pace before becoming mature hotels. These hotels as a group have a less dilutive impact on the overall portfolio performance than do the ramp-up stage hotels.
47
| | | | | | | | | | | | |
| | | As of and for the Year Ended
December 31, | |
| | | 2010 | | | 2011 | | | 2012 | |
Mature Hotels and Ramp-up Stage Hotels(1) | | | | | | | | | | | | |
Hotels in operation | | | | | | | | | | | | |
Mature hotels(2) | | | 536 | | | | 895 | | | | 1,201 | |
Ramp-up stage hotels(2) | | | 148 | | | | 206 | | | | 204 | |
Occupancy rate (as a percentage) | | | | | | | | | | | | |
Mature hotels | | | 95.3 | | | | 91.8 | | | | 88.4 | |
Ramp-up stage hotels | | | 68.5 | | | | 62.4 | | | | 57.5 | |
Average daily rate (in RMB) | | | | | | | | | | | | |
Mature hotels | | | 176 | | | | 174 | | | | 170 | |
Ramp-up stage hotels | | | 165 | | | | 160 | | | | 157 | |
RevPAR (in RMB) | | | | | | | | | | | | |
Mature hotels | | | 168 | | | | 160 | | | | 151 | |
Ramp-up stage hotels | | | 113 | | | | 100 | | | | 90 | |
| (1) | Mature hotels are hotels that have been in operation for 18 months or more. Ramp-up stage hotels are hotels that have been in operation for 6 months or less. |
| (2) | As of the end of each period. |
Results of Operations
The following table sets forth a summary of our consolidated results of operations, both in absolute amount and as a percentage of total revenues for the periods indicated. This information should be read together with our consolidated financial statements and related notes included at the end of this annual report. Our limited operating history makes it difficult to predict future operating results. We believe that the period-to-period comparison of operating results should not be relied upon as being indicative of future performance.
| | | | | | | | | | | | | | | | | | | | | | | | | | | | |
| | | For the Year Ended December 31, | |
| | | 2010 | | | 2011 | | | 2012 | |
| | | RMB | | | % | | | RMB | | | % | | | RMB | | | US$ | | | % | |
| | | (in thousands, except percentages) | |
Consolidated Statement of Operations Data | | | | | | | | | | | | | | | | | | | | | | | | | | | | |
Revenues: | | | | | | | | | | | | | | | | | | | | | | | | | | | | |
Leased-and-operated hotels | | | 2,910,458 | | | | 91.9 | | | | 3,559,740 | | | | 89.9 | | | | 5,164,799 | | | | 829,007 | | | | 89.5 | |
Franchised-and-managed hotels | | | 256,799 | | | | 8.1 | | | | 399,986 | | | | 10.1 | | | | 604,936 | | | | 97,099 | | | | 10.5 | |
| | | | | | | | | | | | | | | | | | | | | | | | | | | | |
Total revenues | | | 3,167,257 | | | | 100.0 | | | | 3,959,726 | | | | 100.0 | | | | 5,769,735 | | | | 926,106 | | | | 100.0 | |
Less: Business tax and related surcharges | | | (191,232 | ) | | | (6.0 | ) | | | (249,274 | ) | | | (6.3 | ) | | | (353,418 | ) | | | (56,728 | ) | | | (6.1 | ) |
| | | | | | | | | | | | | | | | | | | | | | | | | | | | |
Net revenues | | | 2,976,025 | | | | 94.0 | | | | 3,710,452 | | | | 93.7 | | | | 5,416,317 | | | | 869,378 | | | | 93.9 | |
Operating costs and expenses: | | | | | | | | | | | | | | | | | | | | | | | | | | | | |
Leased-and-operated hotel costs: | | | | | | | | | | | | | | | | | | | | | | | | | | | | |
Rents and utilities | | | (875,510 | ) | | | (27.6 | ) | | | (1,232,662 | ) | | | (31.1 | ) | | | (1,953,243 | ) | | | (313,517 | ) | | | (33.9 | ) |
Personnel costs | | | (506,406 | ) | | | (16.0 | ) | | | (657,155 | ) | | | (16.6 | ) | | | (1,037,371 | ) | | | (166,510 | ) | | | (18.0 | ) |
Depreciation and amortization | | | (308,888 | ) | | | (9.8 | ) | | | (398,914 | ) | | | (10.1 | ) | | | (612,789 | ) | | | (98,359 | ) | | | (10.6 | ) |
Consumables, food and beverage | | | (173,256 | ) | | | (5.5 | ) | | | (258,120 | ) | | | (6.5 | ) | | | (351,338 | ) | | | (56,394 | ) | | | (6.1 | ) |
Others | | | (310,705 | ) | | | (9.8 | ) | | | (413,815 | ) | | | (10.5 | ) | | | (687,254 | ) | | | (110,312 | ) | | | (11.9 | ) |
| | | | | | | | | | | | | | | | | | | | | | | | | | | | |
Total leased-and-operated hotel costs | | | (2,174,765 | ) | | | (68.7 | ) | | | (2,960,666 | ) | | | (74.8 | ) | | | (4,641,995 | ) | | | (745,092 | ) | | | (80.5 | ) |
Personnel costs of franchised-and-managed hotels | | | (44,128 | ) | | | (1.4 | ) | | | (72,009 | ) | | | (1.8 | ) | | | (125,031 | ) | | | (20,069 | ) | | | (2.2 | ) |
Sales and marketing expenses | | | (33,257 | ) | | | (1.0 | ) | | | (44,451 | ) | | | (1.1 | ) | | | (76,878 | ) | | | (12,340 | ) | | | (1.3 | ) |
General and administrative expenses | | | (193,482 | ) | | | (6.1 | ) | | | (335,888 | ) | | | (8.5 | ) | | | (315,235 | ) | | | (50,599 | ) | | | (5.5 | ) |
| | | | | | | | | | | | | | | | | | | | | | | | | | | | |
Total operating costs and expenses | | | (2,445,632 | ) | | | (77.2 | ) | | | (3,413,014 | ) | | | (86.2 | ) | | | (5,159,139 | ) | | | (828,100 | ) | | | (89.5 | ) |
| | | | | | | | | | | | | | | | | | | | | | | | | | | | |
Other income | | | — | | | | — | | | | — | | | | — | | | | 16,558 | | | | 2,658 | | | | 0.3 | |
| | | | | | | | | | | | | | | | | | | | | | | | | | | | |
Income from operations | | | 530,393 | | | | 16.7 | | | | 297,438 | | | | 7.5 | | | | 273,736 | | | | 43,936 | | | | 4.7 | |
| | | | | | | | | | | | | | | | | | | | | | | | | | | | |
48
| | | | | | | | | | | | | | | | | | | | | | | | | | | | |
| | | For the Year Ended December 31, | |
| | | 2010 | | | 2011 | | | 2012 | |
| | | RMB | | | % | | | RMB | | | % | | | RMB | | | US$ | | | % | |
| | | (in thousands, except percentages) | |
Interest income | | | 9,454 | | | | 0.3 | | | | 31,996 | | | | 0.8 | | | | 11,874 | | | | 1,906 | | | | 0.2 | |
Interest expense | | | (2,024 | ) | | | (0.1 | ) | | | (46,868 | ) | | | (1.2 | ) | | | (119,416 | ) | | | (19,168 | ) | | | (2.1 | ) |
Issuance costs for convertible notes | | | (42,559 | ) | | | (1.3 | ) | | | — | | | | — | | | | — | | | | — | | | | — | |
Loss from equity investment | | | — | | | | — | | | | — | | | | — | | | | (2,305 | ) | | | (370 | ) | | | (0.0 | ) |
(Loss)/gain on change in fair value of convertible notes | | | (9,040 | ) | | | (0.3 | ) | | | 198,547 | | | | 5.0 | | | | (87,099 | ) | | | (13,980 | ) | | | (1.5 | ) |
Gain on buy-back of convertible bond | | | 2,480 | | | | 0.1 | | | | 1,521 | | | | 0.0 | | | | — | | | | — | | | | — | |
Other non-operating income | | | 22,223 | | | | 0.7 | | | | 35,899 | | | | 0.9 | | | | 43,248 | | | | 6,942 | | | | 0.7 | |
Non-operating expenses | | | — | | | | — | | | | (7,315 | ) | | | (0.2 | ) | | | (6,665 | ) | | | (1,070 | ) | | | (0.1 | ) |
Foreign exchange (loss)/gain, net | | | (4,350 | ) | | | (0.1 | ) | | | 15,849 | | | | 0.4 | | | | 217 | | | | 35 | | | | 0.0 | |
| | | | | | | | | | | | | | | | | | | | | | | | | | | | |
Income before income tax expense and noncontrolling interests | | | 506,577 | | | | 16.0 | | | | 527,067 | | | | 13.2 | | | | 113,590 | | | | 18,231 | | | | 2.0 | |
Income tax expense | | | (139,969 | ) | | | (4.4 | ) | | | (169,442 | ) | | | (4.3 | ) | | | (136,305 | ) | | | (21,878 | ) | | | (2.4 | ) |
| | | | | | | | | | | | | | | | | | | | | | | | | | | | |
Net income/(loss) | | | 366,608 | | | | 11.6 | | | | 357,625 | | | | 8.9 | | | | (22,715 | ) | | | (3,647 | ) | | | (0.4 | ) |
| | | | | | | | | | | | | | | | | | | | | | | | | | | | |
Less: Net income attributable to noncontrolling interests | | | (7,109 | ) | | | (0.2 | ) | | | (6,094 | ) | | | (0.2 | ) | | | (4,061 | ) | | | (652 | ) | | | (0.1 | ) |
| | | | | | | | | | | | | | | | | | | | | | | | | | | | |
Net income/(loss) attributable to Home Inns’ shareholders | | | 359,499 | | | | 11.4 | | | | 351,531 | | | | 8.7 | | | | (26,776 | ) | | | (4,299 | ) | | | (0.5 | ) |
| | | | | | | | | | | | | | | | | | | | | | | | | | | | |
Year Ended December 31, 2012 Compared to Year Ended December 31, 2011
Revenues. Our total revenues increased by 45.5% from RMB 3.96 billion in 2011 to RMB 5.76 billion (US$926.1 million) in 2012.
| | • | | Leased-and-operated Hotels. Revenues from our leased-and-operated hotels increased by 44.9% from RMB 3.56 billion in 2011 to RMB 5.16 billion (US$829.0 million) in 2012. This increase was primarily due to the fact that we consolidated the financial results from the Motel 168 hotels for the entire year of 2012, as opposed to only the last three months of 2011, as well as to an increase in the number of leased-and-operated hotels in operation from 698 hotels with 93,967 rooms as of December 31, 2011 to 803 hotels with 105,505 rooms as of December 31, 2012 as a result of our organic growth. Motel 168 contributed revenues of RMB 1.40 billion (US$224.4 million) from leased-and-operated hotels in 2012 as compared to RMB 351.4 million for the last three months of 2011. |
| | • | | Franchised-and-managed Hotels. Revenues from our franchised-and-managed hotels increased by 51.2% from RMB 400.0 million in 2011 to RMB 604.9 million (US$97.1 million) in 2012. This growth was primarily due to the fact that we consolidated the financial results from the Motel 168 hotels for the entire year of 2012, as opposed to only the last three months of 2011, as well as to an increase in the number of franchised-and-managed hotels in operation from 728 hotels with 82,595 rooms as of December 31, 2011 to 969 hotels with 108,565 rooms as of December 31, 2012 as a result of our organic growth. Motel 168 contributed revenues of RMB 70.8 million (US$11.4 million) from franchised-and-managed hotels in 2012 as compared to RMB 16.2 million for the last three months of 2011. |
Operating Costs and Expenses. Our total operating costs and expenses increased by 51.3% from RMB 3.41 billion in 2011 to RMB 5.16 billion (US$828.1 million) in 2012. This increase resulted from increases in all of our operating cost and expense line items as we substantially expanded our operations in 2012.
| | • | | Leased-and-operated Hotel Costs. Our leased-and-operated hotel costs increased from RMB 2.96 billion in 2011 to RMB 4.64 billion (US$745.1 million) in 2012. This increase was primarily driven by the fact that we consolidated the financial results from the Motel 168 hotels for the entire year of 2012, as opposed to only the last three months of 2011, as well as by the increased number of leased-and-operated hotels in operation from 698 hotels with 93,967 rooms as of December 31, 2011 to 803 hotels with 105,505 rooms as of December 31, 2012. Excluding integration costs, Motel 168 incurred leased-and-operated hotel operating costs of RMB 1.35 billion (US$216.1 million) in 2012 as compared to RMB 342.2 million for the last three months of 2011. We spent RMB 83.7 million (US$13.4 million) on Motel 168 integration costs in 2012 as compared to RMB 19.5 million for the last three months of 2011. |
49
| | • | | Personnel Costs of Franchised-and-managed hotels.Our personnel costs for franchised-and-managed hotels increased from RMB 72.0 million in 2011 to RMB 125.0 million (US$20.1 million) in 2012 primarily due to an increase in the number of franchised-and-managed hotels in operation from 728 hotels as of December 31, 2011 to 969 hotels as December 31, 2012, as well as the fact that we only consolidated the results from Motel 168 for the last three months of 2011. Motel 168 contributed personnel costs of RMB 21.3 million (US$3.4 million) from franchised-and-managed hotels in 2012 as compared to RMB 2.3 million for the last three months of 2011. |
| | • | | Sales and Marketing Expenses. Our sales and marketing expenses increased by 72.8% from RMB 44.5 million or 1.1% of total revenues in 2011 to RMB 76.9 million (US$12.3 million) or 1.3% of total revenues in 2012. Sales and marketing expenses were relatively low as a percentage of total revenues in 2011 due to a true-up adjustment we made to accruals for our customer reward program at the beginning of the second quarter of 2011. |
| | • | | General and Administrative Expenses. Our general and administrative expenses decreased by 6.2% from RMB 335.9 million in 2011 to RMB 315.2 million (US$50.6 million) in 2012. The decrease was mainly because we incurred RMB 63.8 million in Motel 168 acquisition expenses in 2011 while we did not have such expenses in 2012. |
Income from Operations. Our income from operations decreased by 8.0% from RMB 297.4 million in 2011 to RMB 273.7 million (US$43.9 million) in 2012. The decrease in income from operations was mainly due to the weaker operating environment and the absence of systematic price increases to offset rising hotel operating costs including utilities and personnel related costs. Consolidation of Motel 168 for the full year of 2012, with its higher cost ratio as its business was still in the process of being integrated, also contributed to the year-over-year decrease in income from operations.
Interest Expense, Net. Our net interest expense increased from RMB 14.9 million in 2011 to RMB 107.5 million (US$17.3 million) in 2012, primarily because of an increase in interest expense for the term loan that we incurred relating to the acquisition of Motel 168 in 2011.
(Loss)/Gain on Change in Fair Value of Convertible Notes. The fair value of our convertible notes is affected by changes in our share price, the volatility of our share price and market interest rates. We incurred a loss of RMB 87.1 million (US$14.0 million) on change in fair value of convertible notes in 2012 as opposed to a gain of RMB 198.5 million in 2011.
Foreign Exchange (Loss)/Gain, Net. Our net foreign exchange gain decreased from RMB 15.8 million in 2011 to RMB 0.2 million (US$0.0 million) in 2012, primarily because the RMB did not appreciate as much against the U.S. dollar in 2012 as it did in 2011.
Income Tax Expense. Our income tax expense decreased by 19.5% from RMB 169.4 million in 2011 to RMB 136.3 million (US$21.9 million) in 2012, primarily because our cost and expenses increased more than our total revenues, which lead to a decrease in our income before income tax.
Net Income/(Loss). As a cumulative result of the above factors, we had a net loss of RMB 22.7 million (US$3.6 million) in 2012 as compared to net income of RMB 357.6 million in 2011.
Noncontrolling Interests.Noncontrolling interests represent our joint venture partners’ share of the net income of the seven leased-and-operated hotels owned by the joint ventures and also of the two property management companies.
Net Income/(Loss) Attributable to Home Inns’ Shareholders. As a result of the foregoing, we had net loss attributable to Home Inns’ shareholders of RMB 26.8 million (US$4.3 million) in 2012, as compared to net income attributable to Home Inns’ shareholders of RMB 351.5 million in 2011.
Year Ended December 31, 2011 Compared to Year Ended December 31, 2010
Revenues. Our total revenues increased by 25.0% from RMB 3.17 billion in 2010 to RMB 3.96 billion (US$629.1 million) in 2011.
| | • | | Leased-and-operated Hotels. Revenues from our leased-and-operated hotels increased by 22.3% from RMB 2.91 billion in 2010 to RMB 3.56 billion (US$565.6 million) in 2011. This increase was primarily due to an increase in the number of leased-and-operated hotels in operation from 454 hotels with 53,067 rooms as of December 31, 2010 to 698 hotels with 93,967 rooms as of December 31, 2011, as a result of our organic growth and our acquisition of Motel 168 effective October 1, 2011. Motel 168 contributed revenues of RMB351.4 million from leased-and-operated hotels from October 1, 2011 through December 31, 2011. |
50
| | • | | Franchised-and-managed Hotels. Revenues from our franchised-and-managed hotels increased by 55.8% from RMB 256.8 million in 2010 to RMB 400 million (US$63.6 million) in 2011. This growth was primarily due to an increase in the number of franchised-and-managed hotels in operation from 364 hotels with 40,831 rooms as of December 31, 2010 to 728 hotels with 82,595 rooms as of December 31, 2011, as a result of our organic growth and the acquisition of Motel 168 effective October 1, 2011. |
Operating Costs and Expenses. Our total operating costs and expenses increased by 39.6% from RMB 2.45 billion in 2010 to RMB 3.41 billion (US$542.3 million) in 2011. This increase resulted from increases in all of our operating cost and expense line items as we substantially expanded our operations in 2011.
| | • | | Leased-and-operated Hotel Costs. Our leased-and-operated hotel costs increased from RMB 2.17 billion in 2010 to RMB 2.96 billion (US$470.4 million) in 2011. This increase was primarily driven by the increased number of leased-and-operated hotels in operation from 454 hotels with 53,067 rooms as of December 31, 2010 to 698 hotels with 93,967 rooms as of December 31, 2011. |
| | • | | Personnel Costs of Franchised-and-managed hotels.Our personnel costs for franchised-and-managed hotels increased from RMB 44.1 million in 2010 to RMB 72.0 million (US$11.4 million) in 2011 primarily due to an increase in the number of franchised-and-managed hotels in operation from 364 hotels as of December 31, 2010 to 728 hotels as December 31, 2011. |
| | • | | Sales and Marketing Expenses. Our sales and marketing expenses for 2011 were RMB 44.5 million (US$7.1 million), representing 1.1% of total revenue, compared with RMB 33.3 million or 1.1% of total revenue in 2010. The percentage of revenue remained stable. |
| | • | | General and Administrative Expenses. Our general and administrative expenses increased by 73.6% from RMB 193.5 million in 2010 to RMB 335.9 million (US$53.4 million) in 2011. General and administrative expenses, excluding share-based compensation and transaction expenses related with Motel 168 acquisition, were RMB 202.8 million (US$32.2 million) or 5.1% of total revenues, compared with 4.8% in 2010. |
Income from Operations. Our income from operations decreased by 43.9% from RMB 530.4 million in 2010 to RMB 297.4 million (US$47.3 million) in 2011. Income from operations excluding share-based compensation expenses and transaction expenses related with Motel 168 acquisition for 2011 was RMB 437.8 million (US$69.6 million), or 11.1% of total revenues, compared with RMB 583.7 million, or 18.4% for the previous year. This margin decline was primarily due to the loss from operations contributed by the acquired Motel 168 hotels, the absence of the one-time benefit from the 2010 Shanghai World Expo and higher pre-opening costs driven by accelerated growth while the overall cost structure of the business remained stable.
Interest Income (Expense), Net. We had net interest income of RMB 7.4 million in 2010 and net income expense of RMB14.9 million (US$2.4 million) in 2011, primarily because of an increase in interest expense for the convertible bonds and the term loan that we incurred relating to the acquisition of Motel 168 in 2011.
Issuance Cost for Convertible Notes. Our issuance cost for convertible notes decreased from RMB 42.6 million in 2010 to nil in 2011 because we did not issue convertible notes in 2011.
(Loss)/Gain on Change in Fair Value of Convertible Notes. In 2011, in conjunction with the general decline in share prices of other issuers with operations primarily in China, the volatility of our share price increased from 42% in 2010 to 53% in 2011 and the closing price of our ADSs decreased from US$40.96 per ADS on the last trading day of 2010 to US$25.80 per ADS on the last trading day of 2011, resulting in a decrease in fair value of convertible notes by RMB 198.5 million (US$31.5 million) in 2011, as compared to a loss of RMB 9.0 million from fair value change of convertible notes in 2010.
Foreign Exchange (Loss)/Gain, Net. We recognized net foreign exchange gain of RMB 15.8 million (US$2.5 million) in 2011 primarily due to the depreciation of the U.S. dollar against the RMB and our higher level of outstanding debt denominated in the U.S. dollar in 2011, including the term loan that we incurred relating to the acquisition of Motel 168 in 2011.
Income Tax Expense. Our income tax expense increased by 21% from RMB 140.0 million in 2010 to RMB 169.4 million (US$26.9 million) in 2011, primarily because our effective income tax rate increased from 2010. Our effective income tax rate was 32% in 2011 compared with 28% in 2010. The increase in our effective income tax rate was mainly due to higher overseas company expenses related to merger and acquisition activity, which are not deductible for PRC income tax purposes, and higher income taxes levied on Home Inns Hong Kong related to dividend distributions to that entity from our PRC companies.
51
Net Income. We had net income of RMB 357.6 million (US$56.8 million) in 2011, a decrease of 2.5% from net income of RMB 366.6 million in 2010, as a cumulative result of the above factors.
Noncontrolling Interests.Noncontrolling interests represent our joint venture partners’ share of the net income of the seven leased-and-operated hotels owned by the joint ventures and also of the two property management companies in 2011. In 2010, it involved seven leased-and-operated hotels. Noncontrolling interests amounted to RMB 6.1 million (US$1.0 million) in 2011 compared to RMB 7.1 million in 2010.
Net Income Attributable to Home Inns’ Shareholders. As a result of the foregoing, we had net income attributable to Home Inns’ shareholders of RMB 351.5 million (US$55.8 million) in 2011, a decrease of 2.2% from net income attributable to Home Inns’ shareholders of RMB 359.5 million in 2010.
B.Liquidity and Capital Resources
Our principal sources of liquidity have been cash generated from operating activities, our sale of ordinary shares through private placements and borrowings from third-party lenders, as well as the proceeds we received from our public offerings of ordinary shares and our offerings of convertible bonds and notes. Our cash and cash equivalents consist of cash on hand and liquid investments which are unrestricted as to withdrawal or use, and which have original maturities of three months or less that are placed with banks and other financial institutions. Our financing activities consist of issuance and sale of our shares and convertible bonds and notes to investors and related parties, borrowings from third-party lenders and our public offerings of our shares. As of the date of this annual report, we had convertible notes with an outstanding principal amount of US$184.0 million and a term loans facility with an outstanding principal of US$117.0 million, and the remaining funds available under our credit facilities in the aggregate amounted to approximately RMB 600.0 million (US$96.3 million), which are available to be drawn down if needed. As of December 31, 2012, we had entered into binding contracts with lessors of 71 properties for our leased-and-operated hotels under development. We expect to incur an additional RMB 317.8 million (US$51.0 million) in capital expenditures in connection with the completion of the leasehold improvements of these hotels. In addition, we plan to incur an additional RMB 235 million (US$37.8 million) for our Wujiang head quarter construction. We intend to fund this planned expansion and construction with our operating cash flow, our existing cash balance and bank credit facilities.
The credit agreement dated as of September 26, 2011, which we entered into in connection with our acquisition of Motel 168, contains financial covenants relating to our business, including a maximum consolidated total debt to consolidated capitalization ratio, a minimum debt service coverage ratio and a maximum leverage ratio as of each quarter end and a maximum consolidated capital expenditures limit for each fiscal year. It also requires us to maintain certain cash balances in bank accounts outside of China, including cash balances in bank accounts to be maintained for the payment of interest and principal on the term loans. We are also required to maintain at all times a cash balance equal to the aggregate amount of interest payable over the next six months on all of our outstanding indebtedness, including the term loans and the convertible notes, in an account reserved for that purpose. As of March 31, 2013, we have a restricted cash balance of US$4.8 million in this bank account. These bank accounts are held with one of the banks that is a mandated lead arranger under the credit agreement, are pledged as security to the lenders and are generally not available for any purposes other than as described above. Under the terms of the credit agreement, we are also required to cause our subsidiaries in China to declare and pay the maximum legally distributable earnings of the most recently ended calendar year as dividends to our entities outside of China to service the debt, except that we may maintain an RMB cash balance in China to continue on-going operation and expansion according to a prescribed budget and forecast. The covenants under the credit agreement also restrict our right to issue equity or incur indebtedness except under specified circumstances without the permission of the lenders.
Given our strong cash position at the end of 2011, we chose to reduce the amount outstanding under this credit agreement through additional voluntary prepayments during 2012. We repaid US$121 million of the loan in 2012 and an additional US$2 million on January 31, 2013. The remaining installments due under this agreement are US$57 million on July 31, 2014 and US$60 million on September 15, 2015.
As of December 31, 2012, our current liabilities exceeded our current assets by approximately RMB 474.5 million. As of December 31, 2012, we had credit facilities of RMB 600 million and these facilities are available to be drawn down if needed. We believe that by closely monitoring and appropriately allocating our cash resources, together with drawing down our credit facilities, if needed, we will be able to maintain a sufficient cash position and liquidity status in the foreseeable future.
52
The following table sets forth a summary of our cash flows for the periods indicated:
| | | | | | | | | | | | | | | | |
| | | For the Year Ended December 31, | |
| | | 2010 | | | 2011 | | | 2012 | |
| | | RMB | | | RMB | | | RMB | | | US$ | |
| | | (in thousands except percentages) | |
Consolidated Statement of Operations Data | | | | | | | | | | | | | | | | |
| | | | |
Net cash provided by operating activities | | | 878,694 | | | | 726,102 | | | | 747,779 | | | | 120,027 | |
Net cash used in investing activities | | | (355,962 | ) | | | (2,669,499 | ) | | | (1,001,634 | ) | | | (160,774 | ) |
Net cash provided by/(used in) financing activities | | | 1,040,250 | | | | 1,403,102 | | | | (864,284 | ) | | | (138,727 | ) |
Effect of foreign exchange rate changes on cash and cash equivalents | | | (11,195 | ) | | | (56,310 | ) | | | (4,743 | ) | | | (761 | ) |
| | | | | | | | | | | | | | | | |
Net increase/(decrease) in cash and cash equivalents | | | 1,553,051 | | | | (596,605 | ) | | | (1,122,882 | ) | | | (180,235 | ) |
Cash and cash equivalents at beginning of year | | | 829,592 | | | | 2,382,643 | | | | 1,786,038 | | | | 286,679 | |
| | | | | | | | | | | | | | | | |
Cash and cash equivalents at end of year | | | 2,382,643 | | | | 1,786,038 | | | | 663,156 | | | | 106,444 | |
| | | | | | | | | | | | | | | | |
Operating Activities
Net cash provided by operating activities amounted to RMB 747.8 million (US$120.0 million) in 2012, as compared to net loss of RMB 26.8 million (US$4.3 million). The principal working capital items accounting for the difference between our net cash provided by operating activities and net income included an increase in deferred rental and deposits of RMB 65.7 million (US$10.5 million) as a result of an increase in the number of our contracted and newly opened leased-and-operated hotels and franchised-and-managed hotels and an increase in salaries and welfare payable of RMB37.5 million (US$6.0 million) as we added more employees, partially offset by an increase in prepayments and other current assets of RMB 29.9 million (US$4.8 million) and a decrease in deferred revenues of RMB 34.1 million (US$5.5 million). However, non-cash items accounted for substantially all of the difference between our net cash provided by operating activities and our net income. The principal non-cash items were depreciation and amortization of RMB633.9 million (US$101.7 million), which is growing in line with our business, share-based compensation of RMB 93.4 million (US$15.0 million) primarily relating to share options we granted in years prior to 2012 and loss on change in fair value of convertible notes of RMB 87.1 million (US$14.0 million) relating to the convertible notes we issued in 2011, partially offset by a deferred income tax benefit of RMB 132.1 million (US$21.2 million).
Net cash provided by operating activities amounted to RMB 726.1 million in 2011, as compared to net income of RMB 357.6 million. The principal working capital items accounting for the difference between our net cash provided by operating activities and net income included an increase in deferred rental of RMB 56.6 million as a result of an increase in the number of our contracted and newly opened leased-and-operated hotels, and an increase in other payables and accruals of RMB 75.3 million mainly as a result of the increase in the number of our leased-and-operated hotels, including Motel 168 hotels. The other principal non-cash items accounting for the difference between our net cash provided by operating activities and net income were depreciation and amortization of RMB 412.7 million primarily relating to our leased-and-operated hotels and share-based compensation of RMB 76.5 million primarily relating to share options we granted in years prior to 2011, partially offset by gain on fair value change of convertible notes of RMB 198.5 million.
Net cash provided by operating activities amounted to RMB 878.7 million in 2010, as compared to net income of RMB 366.6 million. The principal working capital items accounting for the difference between our net cash provided by operating activities and net income were an increase in salaries and welfare payable of RMB 38.2 million mainly as a result of higher year-end bonuses payable to employees due to our improved annual performance, an increase in deferred rental of RMB 35.4 million as a result of an increase in the number of our contracted and newly opened leased-and-operated hotels, and an increase in deferred revenue (current and non-current) of RMB 27.7 million mainly as a result of increases in initial franchise fees received and cash received from sale of membership programs. The other principal non-cash items accounting for the difference between our net cash provided by operating activities and net income were depreciation and amortization of RMB 320.0 million primarily relating to our leased-and-operated hotels, share-based compensation of RMB 53.3 million primarily relating to share options we granted in years prior to 2010, and issuance costs for convertible notes of RMB 42.6 million relating to our issuance of convertible notes in December 2010.
Investing Activities
Net cash used in investing activities in 2012 amounted to RMB 1,001.6 million (US$160.8 million), primarily due to leasehold improvements and purchase of equipment and fixtures used in leased-and-operated hotels as well as to settle the payment for Motel 168 and other acquisitions.
53
Net cash used in investing activities in 2011 amounted to RMB 2,669.5 million, due primarily to the Motel 168 acquisition as well as to our leasehold improvements and purchase of equipment and fixtures used in leased-and-operated hotels.
Net cash used in investing activities in 2010 amounted to RMB 356.0 million, due primarily to our leasehold improvements and purchase of equipment and fixtures used in leased-and-operated hotels.
Financing Activities
Net cash used in financing activities in 2012 amounted to RMB 864.3 million (US$138.7 million), primarily consisting of RMB111.9 million (US$18.0 million) for our convertible bonds that matured in December 2012 and RMB760.9 million (US$122.1 million) to repay part of the term loan we borrowed for the Motel 168 acquisition.
Net cash provided in financing activities in 2011 amounted to RMB 1,403.1 million, primarily from the cash proceeds of RMB 1,433.6 million from the term loan we borrowed for the Motel 168 acquisition.
Net cash provided by financing activities in 2010 amounted to RMB 1.04 billion, primarily from the proceeds from our issuance of convertible notes. In December 2010, we issued and sold US$184 million aggregate principal amount of convertible notes in a private placement to qualified institutional buyers. The notes had an initial conversion price of 20.2560 ADSs per US$1,000 principal amount of notes (equal to approximately US$49.37 per ADS).
Capital Expenditures
Our capital expenditures were incurred primarily in connection with leasehold improvements, investments in furniture, fixtures and equipment, the construction of our Wujiang headquarters and the purchase and development of technology, information and operational software. Our capital expenditures totaled RMB 546.4 million, RMB 909.3 million and RMB 1.01 billion (US$162.4 million) in 2010, 2011 and 2012, respectively.
The following table sets forth the breakdown of our capital expenditures on an accrual basis for the periods indicated:
| | | | | | | | | | | | | | | | |
| | | For the Year Ended December 31, | |
| | | 2010 | | | 2011 | | | 2012 | |
| | | RMB | | | RMB | | | RMB | | | US$ | |
| | | (in thousands) | |
New hotel development | | | 534,910 | | | | 895,656 | | | | 931,422 | | | | 149,504 | |
Hotel redevelopment and renovations | | | 4,079 | | | | 5,970 | | | | 41,995 | | | | 6,741 | |
Capital expenditures for headquarters | | | 3,914 | | | | 4,622 | | | | 28,188 | | | | 4,524 | |
Others | | | 3,539 | | | | 3,040 | | | | 10,408 | | | | 1,671 | |
| | | | | | | | | | | | | | | | |
Total | | | 546,442 | | | | 909,288 | | | | 1,012,013 | | | | 162,440 | |
| | | | | | | | | | | | | | | | |
The growth in our capital expenditures from year to year has been driven primarily by our new hotel development, which is a result of our continued organic growth, and we expect our capital expenditures in the future to continue to be influenced primarily by our rate of organic growth. The substantial increase in capital expenditures for hotel redevelopment and renovations in 2012 was driven primarily by our acquisition of Motel 168, as we devoted significant resources to renovating many of the hotels we acquired.
Under the terms of the credit agreement dated as of September 26, 2011, which we entered into in connection with our acquisition of Motel 168, we may not incur cash payment for consolidated capital expenditures in excess of US$135 million in 2011, US$180 million in 2012, US$240 million in 2013 or US$295 million in 2014 or any subsequent year until the term loans are fully repaid. However, 50% of any amount under these limits unused in one year may be carried over and used in the subsequent year. For these purposes, “consolidated capital expenditures” is defined to include the aggregate of all of our expenditures that are or should be included in “purchase of property and equipment” or similar items reflected in our consolidated statement of cash flows in accordance with U.S. GAAP. It also includes any amount we use to fund joint ventures but excludes amounts used for the purchase or acquisition of any assets that constitute an ongoing business.
We will continue to make capital expenditures to meet the expected growth of our operations and expect cash generated from our operating activities and financing activities will meet our capital expenditure needs in the foreseeable future.
54
C.Research and Development, Patents and Licenses, Etc.
Intellectual Property
Our brands, trade names, trademarks, trade secrets and other intellectual property rights distinguish and protect our technology, services and products from those of our competitors and contribute to our competitive advantage in the economy hotel segment of the lodging industry in China. To protect our brand and other intellectual property, we rely on a combination of trademark, trade secret and copyright laws as well as imposing confidentiality obligations on our employees, contractors and others. We have a total of 112 registered trademarks in China, including 如家 (for Home Inns), 莫泰 (for Motel 168) and 和颐 (for Yitel). We are applying for registration of 49 new trademarks in China. We have also registered our domain nameswww.homeinns.com, www.motel168.com andwww.yitel.com with the Internet Corporation for Assigned Names and Numbers.
We cannot guarantee you that our efforts to protect our intellectual property rights will be adequate or that third parties will not infringe or misappropriate these rights. If others are able to copy and use our proprietary information and operational system and other proprietary information and operational system and other proprietary technology without spending time and resources to develop their own, we may not be able to maintain our competitive position. Furthermore, the application of laws governing intellectual property rights in China is uncertain and evolving and could involve substantial risks to us. If litigation is necessary to enforce our intellectual property rights or determine the scope of the proprietary rights of others, we may have to incur substantial costs or divert other resources, which could harm our business and prospects.
D.Trend Information
Other than as disclosed elsewhere in this annual report, we are not aware of any trends, uncertainties, demands, commitments or events since January 1, 2012 that are reasonably likely to have a material adverse effect on our net revenues, income, profitability, liquidity or capital resources, or that caused the disclosed financial information to be not necessarily indicative of future operating results or financial conditions.
E.Off-balance Sheet Arrangements
Other than operating lease obligations set forth in the table below in “Item 5. Operating and Financial Review and Prospects—F. Tabular Disclosure of Contractual Obligations,” we have not entered into any financial guarantees or other commitments to guarantee the payment obligations of any third parties. We have not entered into any derivative contracts that are indexed to our shares and classified as shareholders’ equity, or that are not reflected in our consolidated financial statements. Furthermore, we do not have any retained or contingent interest in assets transferred to an unconsolidated entity that serves as credit, liquidity or market risk support to such entity. We do not have any variable interest in any unconsolidated entity that provides financing, liquidity, market risk or credit support to us or engages in leasing, hedging or research and development services with us.
F.Tabular Disclosure of Contractual Obligations
The following table sets forth our contractual obligations as of December 31, 2012:
| | | | | | | | | | | | | | | | | | | | |
| | | Payment Due by Period | |
| | | Total | | | Less than
1 year | | | 1-3 years | | | 3-5 years | | | More than
5 years | |
| | | (in RMB millions) | |
Convertible notes with principal and interest | | | 1,225 | | | | 23 | | | | 1,202 | | | | — | | | | — | |
Term loans with principal and interest | | | 829 | | | | 50 | | | | 779 | | | | — | | | | — | |
Operating lease obligations | | | 17,722 | | | | 1,544 | | | | 3,172 | | | | 3,170 | | | | 9,836 | |
Purchase obligations | | | 553 | | | | 410 | | | | 131 | | | | 12 | | | | — | |
Financial lease obligations | | | 8 | | | | 6 | | | | 2 | | | | — | | | | — | |
| | | | | | | | | | | | | | | | | | | | |
Total | | | 20,337 | | | | 2,033 | | | | 5,286 | | | | 3,182 | | | | 9,836 | |
| | | | | | | | | | | | | | | | | | | | |
Our convertible notes will mature in December 2015, unless earlier repurchased or converted.
Our term loans relate to a senior secured credit agreement with a maximum loan amount of US$240 million and floating interest rate of 390 basis points over LIBOR which we entered into on September 26, 2011. Loans under this facility could only be used to fund the acquisition of Motel 168. As of December 31, 2011, we had drawn down the full amount of US$240 million. In 2012, we repaid US$121 million of the loan. On January 31, 2013, we repaid an additional US$2 million. The remaining installments due under this agreement are US$57 million on July 31, 2014 and US$60 million on September 15, 2015.
55
Our operating lease obligations relate to our obligations under lease agreements with lessors of our leased-and-operated hotels. Our purchase obligations primarily consisted of our contractual commitments relating to leasehold improvements and installation of equipment for our leased-and-operated hotels. Our finance leases obligations relate to finance leases for certain electronic equipment with three-year payment terms.
G.Safe Harbor
This annual report on Form 20-F contains forward-looking statements that relate to future events, including our future operating results and conditions, our prospects and our future financial performance and condition, all of which are largely based on our current expectations and projections. The forward-looking statements are contained principally in the sections entitled “Item 3. Key Information—D. Risk Factors,” “Item 4. Information on the Company” and “Item 5. Operating and Financial Review and Prospects.” These statements are made under the “safe harbor” provisions of the U.S. Private Securities Litigation Reform Act of 1995. You can identify these forward-looking statements by terminology such as “may,” “will,” “expect,” “anticipate,” “future,” “intend,” “plan,” “believe,” “estimate,” “is/are likely to” or other and similar expressions. Forward-looking statements involve inherent risks and uncertainties.
We have based these forward-looking statements largely on our current expectations and projections about future events and financial trends that we believe may affect our financial condition, results of operations, business strategy and financial needs. These forward-looking statements include:
| | • | | our anticipated growth strategies; |
| | • | | our future business development, results of operations and financial condition; |
| | • | | expected changes in our revenues and certain cost or expense items; |
| | • | | our ability to attract customers and leverage our brand; |
| | • | | trends and competition in the lodging industry; |
| | • | | our ability to integrate acquired companies into our business; and |
| | • | | our ability to develop new hotels at desirable locations in a timely and cost-effective manner. |
You should read thoroughly this annual report and the documents that we refer to in this annual report with the understanding that our actual future results may be materially different from and worse than what we expect. We qualify all of our forward-looking statements by these cautionary statements. Other sections of this annual report include additional factors which could adversely impact our business and financial performance. Moreover, we operate in an evolving environment. New risk factors and uncertainties emerge from time to time and it is not possible for our management to predict all risk factors and uncertainties, nor can we assess the impact of all factors on our business or the extent to which any factor, or combination of factors, may cause actual results to differ materially from those contained in any forward-looking statements. You should not rely upon forward-looking statements as predictions of future events. We undertake no obligation to update or revise any forward-looking statements, whether as a result of new information, future events or otherwise.
| ITEM 6. | DIRECTORS, SENIOR MANAGEMENT AND EMPLOYEES |
A.Directors and Senior Management
The following table sets forth information regarding our executive officers and directors as of January 1, 2013.
| | | | |
Name | | Age | | Position/Title |
| Yi Liu | | 52 | | Co-Chairman of the Board of Directors, Independent Director |
| Neil Nanpeng Shen | | 45 | | Co-Founder, Co-Chairman of the Board of Directors, Independent Director |
| David Jian Sun | | 48 | | Chief Executive Officer, Director |
| May Wu | | 45 | | Chief Strategy Officer |
| Huiping Yan | | 46 | | Chief Financial Officer |
| Jason Xiangxin Zong | | 48 | | Chief Operating Officer |
| Min Bao | | 53 | | Independent Director |
| James Jianzhang Liang | | 43 | | Co-Founder, Independent Director |
| Kenneth Gaw | | 42 | | Independent Director |
| Terry Yongmin Hu | | 43 | | Independent Director |
| Arthur M. Wang | | 52 | | Independent Director |
56
Yi Liu has served as our independent director since 2013. Mr. Liu has been the CEO of BTG since June 2008 and the vice chairman of BTG since April 2010. Prior to that, Mr. Liu had served as the vice-CEO of BTG and a director of BTG, each since September 2004. Mr. Liu also serves as the chairman of Beijing Summer Palace Hotel Co., Ltd., which is the owner of a high-end boutique hotel, Aman at Summer Palace. In addition, Mr. Liu also serves on the boards of several other companies, including China CYTS Tours Holding Co., Ltd., Century Securities Co., Ltd., and Poly Victory Investments Limited. Previously, Mr. Liu served as chairman of Beijing Capital Tourism Co., Ltd, a listed company on China’s A-share market, chairman of Beijing Shouqi Group Co. Ltd, and chairman of BTG International Travel & Tours. Mr. Liu graduated from the International School of Science and Tourism in Italy and received his EMBA degree from Tsinghua University in China.
Neil Nanpeng Shenis one of the co-founders of our company and has been our company’s director since our inception and our independent director since 2007. He is the founding managing partner of Sequoia Capital Advisors (Hong Kong) Limited, or Sequoia. In 1999, prior to founding Sequoia, he co-founded Ctrip.com International, Ltd., or Ctrip, a leading travel service provider in China listed on Nasdaq. Mr. Shen served as Ctrip’s chief financial officer from 2000 to 2005 and as its president from 2003 to 2005. He has been a director of Ctrip since 1999. Before founding Ctrip, Mr. Shen worked in the investment banking industry as a director at Deutsche Bank Hong Kong from 1996 to 1999, and prior to that at Chemical Bank, Lehman Brothers and Citibank in Hong Kong and the United States. In addition to the above, Mr. Shen is a director of a number of public and private companies, including: a director of E-House (China) Holdings Limited, a leading real estate service company in China listed on the New York Stock Exchange; an independent director and a member of the nominating committee of Focus Media Holding Limited, a media advertising company listed on Nasdaq; a director of Peak Sport Products, a sports products company listed on the Stock Exchange of Hong Kong; a director of Le Gaga Holdings Limited, a greenhouse vegetable producer listed on Nasdaq; the chairman of the board of Mecox Lane Limited, an online platform for apparel and accessories listed on Nasdaq; and a director and member of the compensation committee for Qihoo 360 Technology Co. Ltd., an internet company listed on the New York Stock Exchange. Mr. Shen received a bachelor’s degree from Shanghai Jiao Tong University in 1988 and a master’s degree from the School of Management at Yale University in 1992.
David Jian Sunhas served as our director and chief executive officer since 2004. Mr. Sun has over ten years of consumer industry experience. From 2003 to 2004, Mr. Sun served as a vice president of operations for B&Q (China) Ltd., a subsidiary of Kingfisher plc, the third largest home improvement retail group in the world, overseeing the operation of 15 B&Q superstores in China. From 2000 to 2003, Mr. Sun served as a vice president of marketing for B&Q (China) Ltd., leading B&Q’s market positioning and branding efforts in China. Since 2010, Mr. Sun has also has served as independent director, chairman of the compensation committee and a member of the audit committee of Mecox Lane Limited, an online platform for apparel and accessories listed on Nasdaq. Mr. Sun holds a bachelor’s degree from Shanghai Medical University in China.
May Wuhas served as our chief strategy officer since 2010. From 2010 to 2012, she also served as the chief executive officer of our Yitel brand. From 2006 to 2010, she served as our chief financial officer. Prior to joining our company, Ms. Wu was a first vice president at Schroder Investment Management North America Inc. from 2005 to 2006, and a vice president from 2003 to 2004. She was responsible for investment research and management for various funds, specializing in consumer and services sectors. Prior to that, Ms. Wu was an equity research analyst from 1998 to 2002 at J.P. Morgan Asset Management and also a vice president from 2000 to 2002. Since 2010, she has served as independent director and member of the audit committee of County Style Cooking Restaurant China Co., Ltd. , a quick service restaurant chain in China listed on the New York Stock Exchange. Since 2010, she has also served as independent director, chair of the audit committee, and member of the compensation committee and corporate governance and nominating committee of Noah Holdings, a distributor and manager of wealth management products to high net worth individuals and corporations in China listed on the New York Stock Exchange. She was an independent director and chair of the audit committee of E-House (China) Holdings Limited, a leading real estate service company based in China and listed on the New York Stock Exchange, from 2008 to 2012. Ms. Wu holds a bachelor’s degree from Fudan University in China, a master’s degree from Brooklyn College at the City University of New York and an MBA degree from the J.L. Kellogg Graduate School of Management at Northwestern University.
Huiping Yanhas served as our chief financial officer since 2010. She was our senior vice president of finance and strategy from 2009 to 2010. Prior to joining our company, Ms. Yan spent 11 years at General Electric Company (GE) in both the United States and Asia, serving in a number of key roles in corporate financial management including tax controller of GE Energy, chief financial officer and a director of GE Hydro Equipment Asia, Ltd., headquarter chief financial officer and financial planning and analysis manager of GE Energy Inspection and Repair Services, lead finance program manager of mergers, acquisitions & integrations of GE Energy Infrastructure. Ms. Yan worked at Deloitte & Touche (US) from 1992 to 1998 and advanced to the position of tax manager of international services prior to joining GE. Ms. Yan studied at Shanghai International Studies University and holds a bachelor’s degree in business administration with an accounting major from Hawaii Pacific University. Ms. Yan graduated from the GE experienced finance leadership program and is a US certified public accountant.
57
Jason Xiangxin Zonghas served as our chief operating officer since 2008. He served as our senior vice president of operations from 2006 to 2007. Mr. Zong has more than 10 years of consumer industry experience. From 2004 to 2006, Mr. Zong served as vice president of operations and east region general manager of China for B&Q (China) Ltd., a subsidiary of Kingfisher plc, the third largest home improvement retail group in the world. From 2001 to 2004, Mr. Zong served as vice president of operations for Lotus Supermarket Chain Store Co., Ltd. Mr. Zong holds a bachelor’s degree from Fudan University.
Min Baohas served as our director since 2006. Mr. Bao has served as the vice president of BTG since July. From 2007 to 2008, he was the assistant general manager of BTG. From 2006 to 2007, Mr. Bao was the general manager of BTG-International Hotel Group Co., Ltd. From 2002 to 2006, he was the general manager of Beijing Chang Fu Gong Center Co., Ltd., a holding company that owns a hotel and residential and commercial properties. Prior to that, he served as the general manager of Novotel Xin Qiao Beijing Hotel. Mr. Bao currently serves on the boards of Home Inns Beijing and Home Inns Hong Kong as well as the boards of several companies, including Poly Victory Investments Limited., BTG-International Hotel Group Co., Ltd. and Henan Xing Ya Jian Guo Hotel, all of which are China-based hotel companies.
James Jianzhang Liangis one of the co-founders of our company. He has served as our director since our inception. Mr. Liang co-founded Ctrip and has been a director of Ctrip since its inception and the chairman of its board of directors since 2003. Mr. Liang also served as Ctrip’s chief executive officer from 2000 to 2006. Prior to founding Ctrip, Mr. Liang held a number of technical and managerial positions with Oracle Corporation from 1991 to 1999 in the United States and China, including the head of the ERP consulting division of Oracle China from 1997 to 1999. Mr. Liang received his master’s and bachelor’s degrees from Georgia Institute of Technology. He also attended an undergraduate program at Fudan University in China.
Kenneth Gawhas served as our independent director since 2006. Since 1999, Mr. Gaw has been a managing director of Pioneer Global Group Limited, a company listed on the Hong Kong Stock Exchange that primarily focuses on real estate and hotel investments in Hong Kong, Macau, China and South East Asia. Mr. Gaw is also a co-founder and president of Gaw Capital Partners, a private equity fund focusing on a real estate investment and management. Mr. Gaw currently serves on the boards of several companies, including Gaw Capital Partners, Hong Kong Thailand Business Council, a non-profit organization, and Dusit Thani Public Company Limited, a company that owns and operates hotels in Thailand. Mr. Gaw received a bachelor’s degree in applied mathematics and economics from Brown University in the United States.
Terry Yongmin Huhas served as our independent director since 2006. Mr. Hu is a partner at FountainVest Partners (Asia) Limited, a China-focused private equity firm, and currently serves on the boards of Central China Real Estate Company Limited, an investment company focusing on property development, property leasing and construction, and L.K. Technology Holdings Limited, a manufacturer and designer of machinery, both of which are listed on the Hong Kong Stock Exchange. From 2005 to 2007, Mr. Hu served as a managing director of Temasek Holdings (HK) Limited, an investment company that focuses on private equity investments in China. Prior to joining Temasek Holdings in 2005, Mr. Hu was a director at Credit Suisse (HK) Limited where he was responsible for its technology, media and telecommunications investment banking efforts in China. Before joining Credit Suisse in 2004, Mr. Hu worked for a number of years at Bear Stearns Asia Limited where he last served as a vice president of investment banking and the chief representative of its Shanghai office. Mr. Hu received a bachelor’s degree in English language and literature from Fudan University in China.
Arthur M. Wanghas served as our independent director and member of the audit committee of the board of directors since 2009. Mr. Wang is the chief executive officer of 698 Capital, a private investment firm. He is also a member of the board of Linmark Group, a global sourcing firm listed on the Stock Exchange of Hong Kong, where he serves as chair of the compensation committee. Mr. Wang was the chief executive officer and a director of Gigamedia Limited, a Nasdaq-listed online entertainment and game firm, from 2003 to 2011. Mr. Wang was also the managing director of 698 Capital and an executive director of KGI Asia Limited, where he served as head of corporate finance. He has also served as an investment advisor and board member of UFJ Asia Finance Technology Fund of the UFJ Group (formerly the Sanwa Bank Group of Japan), and as a board member and director of Softbank Investment International (Strategic) Limited, the arm of Softbank Corporation listed on the Stock Exchange of Hong Kong. Mr. Wang received his Bachelor of Arts degree from the University of California, Los Angeles and his juris doctorate degree from Yale Law School. He previously practiced corporate and securities law in the New York and Hong Kong offices of Skadden, Arps, Slate, Meagher & Flom LLP.
Employment Agreements
We have entered into an employment agreement with each of our senior executive officers. We may terminate a senior executive officer’s employment for cause, at any time, without notice or remuneration, for certain acts of the officer, including, but not limited to, a conviction or plea of guilty to a felony, willful misconduct to our detriment or a failure to perform agreed duties. A senior executive officer may terminate his or her employment at any time without penalty if there is a material reduction in his or her authority, duties and responsibilities or if there is a material breach by us, provided that we are allowed to correct or cure within 30 days upon receipt of his or her written notice of intent to terminate on such basis. Furthermore, either we or an executive officer may terminate employment at any time without cause upon advance written notice to the other party. Each senior executive officer is entitled to certain benefits upon termination, including a severance pay equal to three months’ salary, if he or she resigns for certain specified good reasons or if we terminate his or her employment due to his or her incapacitation. We will indemnify an executive officer for his losses based on or related to his or her acts and decisions made in the course of his or her performance of duties within the scope of his or her employment.
58
Each senior executive officer has agreed to hold in strict confidence any trade secrets or technical secrets of our company. Each officer also agrees to comply with all material applicable laws and regulations related to his or her responsibilities at our company as well as all material written corporate and business policies and procedures of our company.
B.Compensation of Directors and Executive Officers
For the fiscal year ended December 31, 2012, we paid an aggregate of approximately RMB 7.4 million (US$1.2 million) in cash to our senior executive officers, and we did not pay any cash compensation to our non-executive directors.
Share Incentives
2003 Plan. In 2003, we adopted our Employee’s Stock Option Plan, or the 2003 Plan, to attract and retain the best available personnel, provide additional incentives to employees, directors and consultants, and promote the success of our business. Our board of directors authorized the issuance of up to 4,784,226 ordinary shares pursuant to awards under our 2003 Plan, and we granted 4,775,862 options, of which 4,506,042 were exercised. The 2003 Plan was terminated in 2006 and no grants remain outstanding under it.
2006 Plan.In 2006, our board of directors and shareholders approved our 2006 Share Incentive Plan, or the 2006 Plan, to replace the 2003 Plan. At our annual general meetings on November 3, 2009 and September 15, 2011, our shareholders approved increases in the number of ordinary shares that may be granted under the 2006 Plan. As of March 31, 2013, the maximum number of ordinary shares permitted to be issued pursuant to awards under the 2006 Plan was 15,062,194. We have granted 9,625,550 options under the 2006 Plan as of March 31, 2013, of which 2,822,802 had been exercised, 860,602 had been cancelled and 5,942,146 remained outstanding on that date. We have also granted 1,079,940 restricted share units under the 2006 Plan as of March 31, 2013, of which 213,952 have vested, 765,822 remain unvested and 100,166 have been forfeited as of that date.
Types of Awards. The types of awards we may grant under our 2006 Plan include the following:
| | • | | options to purchase our ordinary shares; |
| | • | | restricted shares, which may be subject to forfeiture, representing non-transferable ordinary shares; |
| | • | | restricted share units, which may be subject to forfeiture, representing the right to receive our ordinary shares at a specified date in the future; |
| | • | | share appreciation rights, which provide for payment to the grantee based upon increases in the price of our ordinary shares over a set base price; and |
| | • | | dividend equivalent rights, which represent the value of the dividends per share that we pay. |
Awards may be designated in the form of ADSs instead of ordinary shares. If we designate an award in the form of ADSs, the number of shares issuable under the 2006 Plan will be adjusted to reflect a ratio of one ADS to two ordinary shares.
Eligibility. We may grant awards to employees, directors and consultants of our company or any of our related entities, which include our subsidiaries or any entities in which we hold a substantial ownership interest. However, we may grant options that are intended to qualify as incentive stock options, or ISOs, only to our employees and employees of our majority-owned subsidiaries.
Plan Administration. The compensation committee of our board of directors, or a committee designated by the compensation committee, will administer the 2006 Plan. However, with respect to awards made to our independent directors and executive officers, the entire board of directors will administer the 2006 Plan. The compensation committee or the full board of directors, as appropriate, will determine the individuals who will receive grants, the types of awards to be granted and terms and conditions of each award grant, including any vesting or forfeiture restrictions.
59
Award Agreement. Awards granted under our 2006 Plan will be evidenced by an award agreement that will set forth the terms, conditions and limitations for each award. In addition, in the case of options, the award agreement will also specify whether the option constitutes an ISO or a non-qualifying stock option.
Acceleration of Awards upon Corporate Transactions. The outstanding awards will accelerate upon occurrence of a change-of-control corporate transaction where the successor entity does not assume our outstanding awards under the 2006 Plan. In such event, each outstanding award will become fully vested and immediately exercisable, and the transfer restrictions on the awards will be released and any forfeiture provisions will terminate immediately before the date of the change-of-control transaction. If the successor entity assumes our outstanding awards and later terminates the grantee’s service without cause within 12 months of the change-of-control transaction, the outstanding awards will automatically become fully vested and exercisable.
Exercise Price and Term of Awards. In general, the plan administrator determines the exercise price of an award and sets forth the price in the award agreement. The exercise price may be fixed or variable price related to the fair market value of our ordinary shares. However, ISOs may not be granted to any individual if the fair market value of the shares underlying such ISOs that are exercisable in any calendar year exceeds US$100,000 or other limitations imposed by law. Also, if we grant an ISO to an employee, who, at the time of that grant, owns shares representing more than 10% of the voting power of all classes of our share capital, the exercise price cannot be less than 110% of the fair market value of our ordinary shares on the date of that grant.
The term of each award will be stated in the award agreement. The term of an award shall not exceed 10 years from the date of the grant, except that five years is maximum term of an ISO granted to an employee who holds more than 10% of the voting power of our share capital.
Amendment and Termination. Our board of directors may at any time amend, suspend or terminate the 2006 Plan. Amendments to the 2006 Plan are subject to shareholder approval to the extent required by law, or stock exchange rules or regulations. Additionally, shareholder approval will be specifically required to increase the number of shares available for issuance under the 2006 Plan or to extend the term of an option beyond ten years. Unless terminated earlier, the 2006 Plan will expire and no further awards may be granted after the tenth anniversary of the shareholder approval of the 2006 Plan.
Amendment to the 2006 Plan. In 2009, our board of directors and shareholders approved an amendment to our 2006 Plan to increase the award pool under the 2006 Plan by that number of shares equal to 6% of our total outstanding shares as of November 3, 2009. In 2011, our board of directors and shareholders approved an additional amendment to our 2006 Plan to further increase the award pool under the 2006 Plan by that number of shares equal to 6% of our total outstanding shares as of September 15, 2011 plus 6% of the number of shares issued in connection with the completion of the Motel 168 acquisition.
The following table summarizes the grants of options and restricted shares we have made to our directors and executive officers and to other individuals as a group as of March 31, 2013, excluding options that had expired by that date but without giving effect to options that were exercised or cancelled (other than the cancellations described in the note to the table). In the case of options, “Number of Shares” refers to the number of ordinary shares that can be acquired upon exercise of the options; in the case of restricted shares, “Number of Shares” refers to the number of restricted shares and “Exercise Price” is marked as not applicable (N/A).
| | | | | | | | | | | | | | | | |
| Name | | Number of
Shares | | | Exercise
Price | | | Date of
Grant | | | Date of
Expiration | |
| | | | | | (US$/Share) | | | | | | | |
Yi Liu | | | 24,000 | | | | 14.64 | | | | 1/2/2013 | | | | 12/31/2017 | |
| | | 24,000 | | | | N/A | | | | 1/2/2013 | | | | N/A | |
Neil Nanpeng Shen | | | 46,500 | | | | 3.63 | | | | 10/27/2008 | | | | 10/26/2013 | |
| | | 20,000 | | | | 7.33 | | | | 7/14/2009 | | | | 7/13/2014 | |
| | | 24,000 | | | | 16.165 | | | | 3/19/2010 | | | | 3/18/2015 | |
| | | 24,000 | | | | 16.355 | | | | 2/24/2011 | | | | 2/23/2016 | |
| | | 6,000 | | | | 13.43 | | | | 3/12/2012 | | | | 3/12/2017 | |
| | | 6,000 | | | | N/A | | | | 3/12/2012 | | | | N/A | |
David Jian Sun | | | 170,000 | | | | 3.63 | | | | 10/27/2008 | | | | 10/26/2013 | |
| | | 100,000 | | | | 7.33 | | | | 7/14/2009 | | | | 7/13/2014 | |
| | | 96,000 | | | | 16.165 | | | | 3/19/2010 | | | | 3/18/2015 | |
| | | 120,000 | | | | 16.355 | | | | 2/24/2011 | | | | 2/23/2016 | |
| | | 60,000 | | | | 15.615 | | | | 11/9/2011 | | | | 11/8/2016 | |
| | | 24,000 | | | | 13.43 | | | | 3/12/2012 | | | | 3/12/2017 | |
| | | 24,000 | | | | N/A | | | | 3/12/2012 | | | | N/A | |
60
| | | | | | | | | | | | | | | | |
| Name | | Number of
Shares | | | Exercise
Price | | | Date of
Grant | | | Date of
Expiration | |
| | | | | | (US$/Share) | | | | | | | |
May Wu | | | 150,000 | | | | 3.63 | | | | 10/27/2008 | | | | 10/26/2013 | |
| | | 60,000 | | | | 7.33 | | | | 7/14/2009 | | | | 7/13/2014 | |
| | | 48,000 | | | | 16.165 | | | | 3/19/2010 | | | | 3/18/2015 | |
| | | 102,000 | | | | 16.355 | | | | 2/24/2011 | | | | 2/23/2016 | |
| | | 20,000 | | | | 15.615 | | | | 11/9/2011 | | | | 11/8/2016 | |
| | | 18,000 | | | | 13.43 | | | | 3/12/2012 | | | | 3/12/2017 | |
| | | 18,000 | | | | N/A | | | | 3/12/2012 | | | | N/A | |
Huiping Yan | | | 150,000 | | | | 7.33 | | | | 7/14/2009 | | | | 7/13/2014 | |
| | | 98,000 | | | | 16.165 | | | | 3/19/2010 | | | | 3/18/2015 | |
| | | 90,000 | | | | 16.355 | | | | 2/24/2011 | | | | 2/23/2016 | |
| | | 30,000 | | | | 15.615 | | | | 11/9/2011 | | | | 11/8/2016 | |
| | | 18,000 | | | | 13.43 | | | | 3/12/2012 | | | | 3/12/2017 | |
| | | 18,000 | | | | N/A | | | | 3/12/2012 | | | | N/A | |
Jason Xiangxin Zong | | | 101,500 | | | | 3.63 | | | | 10/27/2008 | | | | 10/26/2013 | |
| | | 60,000 | | | | 7.33 | | | | 7/14/2009 | | | | 7/13/2014 | |
| | | 72,000 | | | | 16.165 | | | | 3/19/2010 | | | | 3/18/2015 | |
| | | 84,000 | | | | 16.355 | | | | 2/24/2011 | | | | 2/23/2016 | |
| | | 46,000 | | | | 15.615 | | | | 11/9/2011 | | | | 11/8/2016 | |
| | | 18,000 | | | | 13.43 | | | | 3/12/2012 | | | | 3/12/2017 | |
| | | 18,000 | | | | N/A | | | | 3/12/2012 | | | | N/A | |
Min Bao | | | 24,000 | | | | 3.63 | | | | 10/27/2008 | | | | 10/26/2013 | |
| | | 10,000 | | | | 7.33 | | | | 7/14/2009 | | | | 7/13/2014 | |
| | | 12,000 | | | | 16.165 | | | | 3/19/2010 | | | | 3/18/2015 | |
| | | 12,000 | | | | 16.355 | | | | 2/24/2011 | | | | 2/23/2016 | |
| | | 3,000 | | | | 13.43 | | | | 3/12/2012 | | | | 3/12/2017 | |
| | | 3,000 | | | | N/A | | | | 3/12/2012 | | | | N/A | |
James Jianzhang Liang | | | 24,000 | | | | 3.63 | | | | 10/27/2008 | | | | 10/26/2013 | |
| | | 10,000 | | | | 7.33 | | | | 7/14/2009 | | | | 7/13/2014 | |
| | | 12,000 | | | | 16.165 | | | | 3/19/2010 | | | | 3/18/2015 | |
| | | 12,000 | | | | 16.355 | | | | 2/24/2011 | | | | 2/23/2016 | |
| | | 3,000 | | | | 13.43 | | | | 3/12/2012 | | | | 3/12/2017 | |
| | | 3,000 | | | | N/A | | | | 3/12/2012 | | | | N/A | |
Kenneth Gaw | | | 24,000 | | | | 3.63 | | | | 10/27/2008 | | | | 10/26/2013 | |
| | | 10,000 | | | | 7.33 | | | | 7/14/2009 | | | | 7/13/2014 | |
| | | 12,000 | | | | 16.165 | | | | 3/19/2010 | | | | 3/18/2015 | |
| | | 12,000 | | | | 16.355 | | | | 2/24/2011 | | | | 2/23/2016 | |
| | | 3,000 | | | | 13.43 | | | | 3/12/2012 | | | | 3/12/2017 | |
| | | 3,000 | | | | N/A | | | | 3/12/2012 | | | | N/A | |
Terry Yongmin Hu | | | 24,000 | | | | 3.63 | | | | 10/27/2008 | | | | 10/26/2013 | |
| | | 10,000 | | | | 7.33 | | | | 7/14/2009 | | | | 7/13/2014 | |
| | | 15,000 | | | | 16.165 | | | | 3/19/2010 | | | | 3/18/2015 | |
| | | 15,000 | | | | 16.355 | | | | 2/24/2011 | | | | 2/23/2016 | |
| | | 3,750 | | | | 13.43 | | | | 3/12/2012 | | | | 3/12/2017 | |
| | | 3,750 | | | | N/A | | | | 3/12/2012 | | | | N/A | |
Arthur Wang | | | 60,000 | | | | 13.29 | | | | 10/30/2009 | | | | 10/29/2014 | |
| | | 12,000 | | | | 16.165 | | | | 3/19/2010 | | | | 3/18/2015 | |
| | | 12,000 | | | | 16.355 | | | | 2/24/2011 | | | | 2/23/2016 | |
| | | 3,000 | | | | 13.43 | | | | 3/12/2012 | | | | 3/12/2017 | |
| | | 3,000 | | | | N/A | | | | 3/12/2012 | | | | N/A | |
Other individuals as a group | | | 4,353,840 | | | | | | | | | | | | | |
| Note: | On October 27, 2008, we cancelled the unvested portion of the options held by each of our option grantees and granted them new options that would entitle each of them to acquire the same number of our ordinary shares underlying the cancelled options at a new strike price, with a new vesting schedule beginning from October 27, 2008. The information in the above table gives effect to the cancellation of the unvested portion of the old options and grant of the new options to each of the directors and officers named in the table. |
61
C.Board Practices
Our board of directors currently has eight members. A director is not required to hold any shares in the company by way of qualification. A director may vote with respect to any contract, proposed contract or arrangement in which he is materially interested. A director may exercise all the powers of the company to borrow money, mortgage its undertaking, property and uncalled capital, and issue debentures or other securities whenever money is borrowed or as security for any obligation of the company or of any third party.
In 2012, our board held meetings or passed resolutions by unanimous written consent eight times.
Committees of the Board of Directors
We have established two committees under the board of directors: the audit committee and the compensation committee. We currently do not plan to establish a nominating committee. The independent directors of our company will select and recommend to the board for nomination by the board such candidates as the directors, in the exercise of their judgment, have found to be well qualified and willing and available to serve as our directors prior to each annual meeting of our shareholders at which meeting directors are to be elected or re-elected. In addition, our board of directors has resolved that director nomination be approved by a majority of the board as well as a majority of the independent directors of the board. In compliance with Rule 5605(b)(1) of the Nasdaq Marketplace Rules, all members of each of our board committees will be independent directors. We have adopted a charter for each of the board committees. Each committee’s members and functions are described below.
Audit Committee. Our audit committee consists of Messrs. Arthur M. Wang, Kenneth Gaw and Terry Yongmin Hu. We have determined that all the members of our audit committee satisfy the “independence” requirements of Rule 10A-3 under the Exchange Act and Nasdaq Marketplace Rule 5605(c)(2)(A) and all the members of our audit committee are audit committee financial experts as defined in the instructions to Item 16A of the Form 20-F. The audit committee will oversee our accounting and financial reporting processes and the audits of the financial statements of our company. The audit committee will be responsible for, among other things:
| | • | | selecting the independent auditors and pre-approving all auditing and non-auditing services permitted to be performed by the independent auditors; |
| | • | | reviewing with the independent auditors any audit problems or difficulties and management’s response; |
| | • | | reviewing and approving all proposed related party transactions, as defined in Item 404 of Regulation S-K under the Securities Act; |
| | • | | discussing the annual audited financial statements with management and the independent auditors; |
| | • | | reviewing major issues as to the adequacy of our internal control; and |
| | • | | meeting separately and periodically with management and the independent auditors. |
In 2012, our audit committee held meetings or passed resolutions by unanimous written consent four times.
Compensation Committee.Our compensation committee consists of Messrs. Neil Nanpeng Shen, Kenneth Gaw and Terry Yongmin Hu. We have determined that all the members of our compensation committee satisfy the “independence” requirements of Rule 5605(d) of Nasdaq Stock Market Marketplace Rules. The compensation committee assists the board in reviewing and approving the compensation structure, including all forms of compensation, relating to our directors and executive officers. Our chief executive officer may not be present at any committee meeting during which his compensation is deliberated. The compensation committee will be responsible for, among other things:
| | • | | reviewing and approving the total compensation package for our four most senior executives; |
| | • | | reviewing and recommending to the board with respect to the compensation of our directors; and |
| | • | | reviewing periodically and approving any long-term incentive compensation or equity plans, programs or similar arrangements, annual bonuses, employee pension and welfare benefit plans. |
In 2012, our compensation committee held meetings or passed resolutions by unanimous written consent once.
62
Duties of Directors
Under Cayman Islands law, our directors have a duty of loyalty to act honestly in good faith with a view to our best interests. Our directors also have a duty to exercise the skill they actually possess and such care and diligence that a reasonably prudent person would exercise in comparable circumstances. In fulfilling their duty of care to us, our directors must ensure compliance with our memorandum and articles of association.
Terms of Directors and Officers
Our officers are elected by and serve at the discretion of our shareholders and board of directors in accordance with our articles of association. Our directors are not subject to a term of office and hold office until such time as they are removed from office by special resolution or the unanimous written resolution of all shareholders. A director will be removed from office automatically if, among other things, the director (i) becomes bankrupt or makes any arrangement or composition with his creditors; or (ii) dies or is found by our company to be or becomes of unsound mind.
D.Employees
Excluding employees of our franchised-and-managed hotels, we had 16,313, 26,670 and 26,429 employees as of December 31, 2010, 2011 and 2012, respectively. As of December 31, 2012, our employees consisted of 23,767 hotel-based employees, 310 reservation agents at our centralized reservation center, and 2,352 corporate staff. Approximately 23% of our employees are associated with labor unions. We consider our relations with our employees to be good.
E.Share Ownership
The following table sets forth information with respect to the beneficial ownership of our ordinary shares as of March 31, 2013 by:
| | • | | each of our directors and executive officers; and |
| | • | | each person known to us to own beneficially more than 5% of our ordinary shares. |
| | | | | | | | |
| | | Shares Beneficially Owned | |
| | | Number(1) | | | Percentage (2) | |
Directors and Executive Officers: | | | | | | | | |
Neil Nanpeng Shen (3) | | | 18,957,016 | | | | 20.5 | |
James Jianzhang Liang(4) | | | 14,742,059 | | | | 16.0 | |
Yi Liu (5) | | | 14,726,165 | | | | 16.0 | |
Min Bao(6) | | | 14,771,075 | | | | 16.0 | |
David Jian Sun (7) | | | 518,336 | | | | * | |
May Wu(8) | | | 189,500 | | | | * | |
Jason Xiangxin Zong(9) | | | 89,972 | | | | * | |
Kenneth Gaw(10) | | | 113,459 | | | | * | |
Huiping Yan(11) | | | 217,850 | | | | * | |
Arthur Wang(12) | | | 61,500 | | | | * | |
Terry Yongmin Hu(13) | | | 43,626 | | | | * | |
All Directors and Executive Officers as a Group (14) | | | 35,303,628 | | | | 37.9 | |
Principal Shareholders: | | | | | | | | |
Poly Victory Investments Limited (15) | | | 14,726,165 | | | | 16.0 | |
Ctrip.com International, Ltd. (16) | | | 14,400,765 | | | | 15.6 | |
FMR LLC (17) | | | 5,550,000 | | | | 6.0 | |
Morgan Stanley (18) | | | 5,428,772 | | | | 5.9 | |
OppenheimerFunds, Inc. (19) | | | 5,060,393 | | | | 5.5 | |
| (1) | Beneficial ownership is determined in accordance with the rules of the SEC and includes voting or investment owner with respect to the securities. |
| (2) | For each person and group included in this table, percentage ownership is calculated by dividing the number of shares beneficially owned by such person or group by the sum of (i) 92,167,262, which was the number of ordinary shares outstanding as of March 31, 2013, and (ii) the number of ordinary shares underlying share options held by such person or group that are exercisable within 60 days after March 31, 2013. |
63
| (3) | Includes (i) 301,500 ordinary shares held by Mr. Shen; (ii) 3,955,389 ordinary shares held by Smart Master International Limited, or Smart Master, a British Virgin Islands company solely owned and controlled by Mr. Shen; (iii) 206,362 ordinary shares represented by ADS held by Smart Master; (iv) 93,000 ordinary shares issuable upon exercise of options held by Mr. Shen that are exercisable within 60 days after March 31, 2013 and (v) 7,514,503 ordinary shares and 6,886,262 ordinary shares represented by ADSs held by subsidiaries of Ctrip, of which Mr. Shen is a co-founder and a director. The business address of Mr. Shen is Suite 2215, Two Pacific Place, 88 Queensway, Hong Kong. |
| (4) | Includes (i) 750 ordinary shares held by Mr. Liang, (ii) 317,294 ordinary shares represented by ADS held by Ms. Lau, Mr. Liang’s wife; (ii) 23,250 ordinary shares issuable upon exercise of options held by Mr. Liang that that are exercisable within 60 days after March 31, 2013 and (iv) 7,514,503 ordinary shares and 6,886,262 ordinary shares represented by ADSs held by subsidiaries of Ctrip, of which Mr. Liang is chairman, a co-founder and a director. Mr. Liang disclaims the beneficial ownership of all the shares held by his wife. The business address of Mr. Liang is Ctrip.com International, Ltd., 99 Fu Quan Road, Shanghai 200335, People’s Republic of China. |
| (5) | Includes 13,446,959 ordinary shares and 1,279,206 ordinary shares represented by ADSs held by Poly Victory Investments Limited, of which Mr. Liu is a director. Mr. Liu is also the vice chairman and CEO of BTG, the parent company of Poly Victory Investments Limited. The business address of Mr. Liu is No.10 Yabao Road, Chaoyang District, Beijing 100020, People’s Republic of China. |
| (6) | Includes (i) 660 ordinary shares held by Mr. Bao, (ii) 5,500 ordinary shares represented by ADS, (iii) 38,750 ordinary shares issuable upon exercise of options held by Mr. Bao that are exercisable within 60 days after March 31, 2013 and (iv) 13,446,959 ordinary shares and 1,279,206 ordinary shares represented by ADSs held by Poly Victory Investments Limited, of which Mr. Bao is a director. Mr. Bao also serves on the board of BTG, the parent company of Poly Victory Investments Limited. The business address of Mr. Bao is No.10 Yabao Road, Chaoyang District, Beijing 100020, People’s Republic of China. |
| (7) | Includes (i) 14,030 ordinary shares held by Mr. Sun, (ii) 188,806 ordinary shares held by Peace Unity Investments Limited, a company solely owned and controlled him, (iii) 40,000 ordinary shares held by Mr. Sun’s daughters; and (iv) 275,500 ordinary shares issuable upon exercise of options held by Mr. Sun that are exercisable within 60 days after March 31, 2013. The business address of Mr. Sun is No. 124, Caobao Road, Xuhui District, Shanghai 200235, People’s Republic of China. |
| (8) | Includes (i) 78,000 ordinary shares held by Ms. Wu and (ii) 111,500 ordinary shares issuable upon exercise of options held by Ms. Wu that are exercisable within 60 days after March 31, 2013. The business address of Ms. Wu is No. 124, Caobao Road, Xuhui District, Shanghai 200235, People’s Republic of China. |
| (9) | Includes (i) 56,272 ordinary shares held by Mr. Zong, (ii) 10,000 ordinary shares represented by ADS and (iii) 23,700 ordinary shares issuable upon exercise of options held by Mr. Zong that are exercisable within 60 days after March 31, 2013. The business address of Mr. Zong is No. 124, Caobao Road, Xuhui District, Shanghai 200235, People’s Republic of China. |
| (10) | Includes (i) 750 ordinary shares held by Mr. Gaw, (ii) 32,800 ordinary shares represented by ADS held by Mr. Gaw, (iii) 32,659 ordinary shares held by Top Elite Company Limited, a company solely owned and controlled by Mr. Gaw, and (iv) 47,250 ordinary shares issuable upon exercise of options held by Mr. Gaw that are exercisable within 60 days after March 31, 2013. The business address of Mr. Gaw is 22nd Floor, 1 Lyndhurst Tower, No. 1 Lyndhurst Terrace, Central, Hong Kong. |
| (11) | Includes (i) 4,500 ordinary shares held by Ms. Yan and (ii) 213,350 ordinary shares are issuable upon exercise of options held by Ms. Yan that are exercisable within 60 days after March 31, 2013. The business address of Ms. Yan is No. 124, Caobao Road, Xuhui District, Shanghai 200235, People’s Republic of China. |
| (12) | Includes (i) 750 ordinary shares held by Mr. Wang and (ii) 60,750 ordinary shares are issuable upon exercise of options held by Mr. Wang that are exercisable within 60 days after March 31, 2013. The business address of Mr. Wang is the Centrium, 22/F, 60 Wyndham Street, Central, Hong Kong. |
| (13) | Includes (i) 938 ordinary shares held by Mr. Hu and (ii) 42,688 ordinary shares are issuable upon exercise of options held by Mr. Hu that are exercisable within 60 days after March 31, 2013. The business address of Mr. Hu is Suite 906 ICBC Tower, 3 Garden Road, Central, Hong Kong. |
| (14) | Includes (i) 25,636,466 ordinary shares, (ii) 9,117,424 ordinary shares represented by ADS and (iii) 929,738 ordinary shares issuable upon exercise of options that are exercisable within 60 days after March 31, 2013. |
| (15) | Based on the Schedule 13G filed with the SEC on January 18, 2012. The ordinary shares include (i) 13,446,959 ordinary shares and (ii) 1,279,206 ordinary shares represented by ADSs. Poly Victory Investments Limited, a company incorporated in the British Virgin Islands, is beneficially owned by Beijing Tourism Group, which is a state-owned enterprise in China. The principal business address of Poly Victory Investments Limited is Room 3406, Bank of America Tower, 12 Harcourt Road, Central, Hong Kong. The principal business address of Beijing Tourism Group is No. 10 Yabao Road, Chaoyang District, Beijing 100020, the People’s Republic of China. |
64
| (16) | Based on the Schedule 13D/A filed with the SEC on May 21, 2009. The ordinary shares consist of 7,514,503 ordinary shares through private placement and 3,443,131 ADSs representing 6,886,262 ordinary shares purchased by Ctrip and its wholly-owned subsidiaries. |
| (17) | Based on the Schedule 13G filed with the SEC on February 14, 2013. FMR LLC’s principal business office is 82 Devonshire Street, Boston, Massachusetts 02109. Fidelity Management & Research Company, a wholly-owned subsidiary of FMR LLC and an investment adviser registered under Section 203 of the Investment Advisers Act of 1940 whose principal business office is 82 Devonshire Street, Boston, Massachusetts 02109, is the beneficial owner of 5,550,000 ordinary shares represented by ADSs as a result of acting as investment adviser to various investment companies registered under Section 8 of the Investment Company Act of 1940. The 5,550,000 ordinary shares are held by one investment company, Fidelity Growth Company Fund, which has its principal business office is 82 Devonshire Street, Boston, Massachusetts 02109. |
| (18) | Based on the Schedule 13G filed with the SEC on February 8, 2013. Morgan Stanley’s principal business office is 1585 Broadway, New York, New York 10036. Morgan Stanley is a broker-dealer registered under section 15 of the Exchange Act. Morgan Stanley is the beneficial owner of 5,428,772 ordinary shares represented by ADSs, including 5,373,952 ordinary shares represented by ADSs that are held by related entities. |
| (19) | Based on the Schedule 13G filed with the SEC on February 13, 2013. OppenheimerFunds, Inc.’s principal business office is Two World Financial Center, 225 Liberty Street, New York, New York 10281. OppenheimerFunds, Inc. is an investment adviser in accordance with Rule 13d-1(b)(1)(ii)(E). Oppenheimer Developing Markets Fund’s principal business office is 6803 S. Tucson Way, Centennial, Colorado 80112. Oppenheimer Developing Markets Fund is an investment company registered under section 8 of the Investment Company Act of 1940. OppenheimerFunds, Inc. is the beneficial owner of 5,060,393 ordinary shares represented by ADSs, including 4,389,313 ordinary shares represented by ADSs that are held by Oppenheimer Developing Markets Fund. |
None of our existing shareholders have different voting rights from other shareholders. We are not aware of any arrangement that may, at a subsequent date, result in a change of control of our company.
As of March 31, 2013, we had 92,167,262 ordinary shares issued and outstanding. To our knowledge, we had only five record shareholders in the United States. The Bank of New York Mellon, which is the depositary of our ADS program and held approximately 74.2% of our total outstanding ordinary shares. The number of beneficial owners of our ADSs in the United States is likely to be much larger than the number of record holders of our ordinary shares in the United States.
| ITEM 7. | MAJOR SHAREHOLDERS AND RELATED PARTY TRANSACTIONS |
A.Major Shareholders
Please refer to “Item 6. Directors, Senior Management and Employees—E. Share Ownership.”
B.Related Party Transactions
Shareholders’ Agreement
In connection with our reorganization in June 2006, we and our then existing shareholders entered into a shareholders agreement, which incorporates the principal terms of the previous shareholders agreements between Home Inns Hong Kong and our shareholders. Under this agreement, these shareholders are entitled to certain registration rights, including demand registration and Form F-3 or Form S-3 registration.
Transaction with Jian Guo Inns
Jian Guo Inns Beijing Ltd., or Jian Guo Inns, is a subsidiary of BTG, which is the parent company of Poly Victory Investments Limited, one of our principal shareholders. From 2004 through the beginning of 2012, Jian Guo Inns was the lessor of three leased-and-operated hotels in our chain. One of the three property lease contracts was terminated from April 1, 2012 due to a change in the property’s ownership. In 2010, 2011 and 2012, we paid RMB 2.8 million, RMB 2.8 million and RMB 2.1 million (US$0.3 million), respectively, to Jian Guo Inns as rental payments.
65
Transactions with Ctrip
Two of Ctrip’s directors, Neil Nanpeng Shen and James Jianzhang Liang, are also our directors. Some of our customers book our hotel rooms through Ctrip and we pay agency fees to Ctrip for such bookings. The amounts paid to Ctrip as agency fees in 2010, 2011, 2012 and thus far in 2013 were RMB 18.2 million, RMB 17.7 million, RMB 35.9 million (US$5.8 million) and RMB 7.6 million (US$1.2 million), respectively.
In May 2009, we sold Ctrip 7,514,503 ordinary shares through a private placement for US$50 million in cash. The purchase price per ordinary share was set at US$6.6538, calculated as the average of the closing prices for our ADSs on Nasdaq for each trading day within the 30 calendar days preceding the date of the definitive purchase agreement. As Ctrip and its wholly-owned subsidiary had previously purchased 3,443,131 of our ADSs on the open market representing 6,886,262 ordinary shares, this transaction increased Ctrip’s ownership in us to 14,400,765 ordinary shares, representing 18.25% of our ordinary shares outstanding upon the completion of the private placement.
See “Item 10. Additional Information—C. Material Contracts” for a description of the registration rights agreement we have entered into with Ctrip.
Employment Agreements
See “Item 6. Directors, Senior Management and Employees—A. Directors and Senior Management—Employment Agreements” for a description of the employment agreements we have entered into with our senior executive officers.
Share Incentives
See “Item 6. Directors, Senior Management and Employees—B. Compensation of Directors and Executive Officers—Share Incentives” for a description of share options we have granted to our directors, officers and other individuals as a group.
C.Interests of Experts and Counsel
Not applicable.
| ITEM 8. | FINANCIAL INFORMATION |
A.Consolidated Statements and Other Financial Information
We have appended consolidated financial statements filed as part of this annual report.
Legal and Administrative Proceedings
We are subject to legal proceedings, investigations and claims incidental to the conduct of our business from time to time. We are not currently a party to, nor are we aware of, any legal proceeding, investigation or claim which, in the opinion of our management, is likely to have a material adverse effect on our business, financial condition, results of operations, liquidity or cash flows.
Dividend Policy
We have no present plan to declare and pay any dividends on our shares or ADSs in the near future. We currently intend to retain most, if not all, of our available funds and any future earnings to operate and expand our business. Under the terms of the credit agreement dated September 26, 2011, which we entered into in connection with our acquisition of Motel 168, we may not pay dividends to our shareholders until we have repaid all loans outstanding under that agreement. As of the date of this annual report, we have a principal amount of US$117 million outstanding under that agreement, which is not scheduled to be completely repaid until September 15, 2015.
We are a holding company incorporated in the Cayman Islands. We rely on dividends from our subsidiaries in China. Under the terms of the credit agreement dated September 26, 2011, which we entered into in connection with our acquisition of Motel 168, we are required to cause our subsidiaries in China to declare and pay the maximum legally distributable earnings of the most recently ended calendar year as dividends to our entities outside of China to service the debt, except that we may maintain a level of RMB cash balance in China to continue on-going operation and expansion according to a prescribed budget and forecast. Current PRC regulations permit our subsidiaries to pay dividends to us only out of their accumulated profits, if any, determined in accordance with PRC accounting standards and regulations. In addition, each of our subsidiaries in China is required to set aside a certain amount of its accumulated after-tax profits each year, if any, to fund certain statutory reserves. These reserves may not be distributed as cash dividends. Further, if our subsidiaries in China incur debt on their own behalf, the instruments governing the debt may restrict their ability to pay dividends or make other payments to us.
66
Our board of directors has complete discretion as to whether to distribute dividends, subject to the approval of our shareholders. Even if our board of directors decides to pay dividends, the form, frequency and amount will depend upon our future operations and earnings, capital requirements and surplus, general financial condition, contractual restrictions and other factors that the board of directors may deem relevant. If we pay any dividends, we will pay our ADS holders to the same extent as holders of our ordinary shares, subject to the terms of the deposit agreement, including the fees and expenses payable thereunder.
B.Significant Changes
We have not experienced any significant changes since the date of our audited consolidated financial statements included in this annual report.
| ITEM 9. | THE OFFER AND LISTING |
A.Offering and Listing Details
Market Price Information for our American Depositary Shares
Our ADSs, each representing two of our ordinary shares, have been listed on the Nasdaq Global Market since October 26, 2006. Our ADSs trade under the symbol “HMIN.”
The following table provides the high and low closing prices for our ADSs on the Nasdaq Global Market for each period indicated.
| | | | | | | | |
| | | Trading Price | |
| | | High | | | Low | |
| | | US$ | | | US$ | |
| | |
Annual Highs and Lows | | | | | | | | |
2008 | | | 36.00 | | | | 7.00 | |
2009 | | | 37.93 | | | | 7.63 | |
2010 | | | 53.66 | | | | 27.89 | |
2011 | | | 44.48 | | | | 25.00 | |
2012 | | | 32.95 | | | | 16.32 | |
| | |
Quarterly Highs and Lows | | | | | | | | |
First Quarter 2011 | | | 40.83 | | | | 32.55 | |
Second Quarter 2011 | | | 44.48 | | | | 33.62 | |
Third Quarter 2011 | | | 40.90 | | | | 25.77 | |
Fourth Quarter 2011 | | | 35.29 | | | | 25.00 | |
First Quarter 2012 | | | 32.95 | | | | 24.90 | |
Second Quarter 2012 | | | 27.41 | | | | 19.86 | |
Third Quarter 2012 | | | 25.89 | | | | 16.32 | |
Fourth Quarter 2012 | | | 29.67 | | | | 24.75 | |
First Quarter 2013 | | | 32.00 | | | | 27.60 | |
| | |
Monthly Highs and Lows | | | | | | | | |
2012 | | | | | | | | |
October | | | 29.67 | | | | 24.96 | |
November | | | 29.67 | | | | 24.88 | |
December | | | 29.27 | | | | 24.75 | |
2013 | | | | | | | | |
January | | | 32.00 | | | | 28.85 | |
February | | | 31.88 | | | | 28.00 | |
March | | | 32.00 | | | | 27.60 | |
April (through April 19, 2013) | | | 30.03 | | | | 24.25 | |
67
B.Plan of Distribution
Not applicable.
C.Markets
Our ADSs, each representing two of our ordinary shares, have been listed on the Nasdaq Global Market since October 26, 2006 under the symbol “HMIN.”
D.Selling Shareholders
Not applicable.
E.Dilution
Not applicable.
F.Expenses of the Issue
Not applicable.
| ITEM 10. | ADDITIONAL INFORMATION |
A.Share Capital
Not applicable.
B.Memorandum and Articles of Association
The following are summaries of material provisions of our amended and restated memorandum and articles of association, as well as the Companies Law (2012 Revision) insofar as they relate to the material terms of our ordinary shares.
Registered Office and Objects
Our registered office is at the offices of Maples Corporate Services Limited, PO Box 309, Ugland House, Grand Cayman KY1-1104, Cayman Islands. The objects for which our company is established are unrestricted and we have full power and authority to carry out any object not prohibited by the Companies Law (2012 Revision) or as the same may be revised from time to time, or any other law of the Cayman Islands.
Board of Directors
See “Item 6.C. Board Practices — Board of Directors.”
Ordinary Shares
General. All of our outstanding ordinary shares are fully paid and non-assessable. Certificates representing the ordinary shares are issued in registered form. Our shareholders who are non-residents of the Cayman Islands may freely hold and vote their shares.
Dividends. The holders of our ordinary shares are entitled to such dividends as may be declared by our board of directors subject to the Companies Law.
Voting Rights. Each ordinary share is entitled to one vote on all matters upon which the ordinary shares are entitled to vote. Voting at any shareholders’ meeting is by show of hands unless a poll is demanded. A poll may be demanded by one or more shareholders present in person or by proxy entitled to vote and who together held not less than 10% of the paid up voting share capital of our company.
A quorum required for a meeting of shareholders consists of shareholders present in person or by proxy or, if a corporation or other non-natural person, by its duly authorized representative, holding not less than one-third of our voting share capital. Shareholders’ meetings may be held annually and may be convened by our board of directors on its own initiative or upon a request to the directors by shareholders holding in aggregate at least one-third of our voting share capital. Advance notice of at least 14 days is required for the convening of our annual general meeting and other shareholders’ meetings.
68
An ordinary resolution to be passed by the shareholders requires the affirmative vote of a simple majority of the votes attaching to the ordinary shares cast in a general meeting, while a special resolution requires the affirmative vote of no less than two-thirds of the votes attaching to the ordinary shares cast in a general meeting. A special resolution is required for important matters such as a change of name. Holders of the ordinary shares may effect certain changes by ordinary resolution, including increase the amount of our authorized share capital, consolidate and divide all or any of our share capital into shares of larger amount than our existing share capital, and cancel any authorized but unissued shares.
Transfer of Shares. Subject to the restrictions of our memorandum and articles of association, as applicable, any of our shareholders may transfer all or any of his or her ordinary shares by an instrument of transfer in the usual or common form or any other form approved by our board.
Liquidation. On a return of capital on winding up or otherwise (other than on conversion, redemption or purchase of shares), assets available for distribution among the holders of ordinary shares shall be distributed among the holders of the ordinary shares on a pro rata basis. If our assets available for distribution are insufficient to repay all of the paid-up capital, the assets will be distributed so that the losses are borne by our shareholders proportionately.
Calls on Shares and Forfeiture of Shares. Our board of directors may from time to time make calls upon shareholders for any amounts unpaid on their shares in a notice served to such shareholders at least 14 days prior to the specified time or times of payment. The shares that have been called upon and remain unpaid on the specified time are subject to forfeiture.
Redemption of Shares. Subject to the provisions of the Companies Law, we may issue shares on terms that are subject to redemption, at our option or at the option of the holders, on such terms and in such manner as may be determined by our directors.
Variations of Rights of Shares. All or any of the special rights attached to any class of shares may, subject to the provisions of the Companies Law, be varied either with the written consent of the holders of a majority of the issued shares of that class or with the sanction of a resolution passed by at least a majority of the holders of the shares of the class present in person or by proxy at a separate general meeting of the holders of the shares of that class.
Inspection of Books and Records. Holders of our ordinary shares will have no general right under Cayman Islands law to inspect or obtain copies of our list of shareholders or our corporate records. However, we will provide our shareholders with annual audited financial statements.
C.Material Contracts
We have not entered into any material contracts other than in the ordinary course of business and other than those described in “Item 4. Information on the Company”, in this “Item 10.C. Material Contracts” or elsewhere in this annual report on Form 20-F.
Registration Rights of Certain Shareholders
Pursuant to a shareholders agreement entered into in June 2006, we have granted certain registration rights to holders of our registrable securities. Set forth below is a description of the registration rights granted under the agreement.
Demand Registration Rights. At any time, holders of at least 50% of registrable securities have the right to demand that we file a registration statement covering the offer and sale of their securities with anticipated aggregate proceeds in excess of US$5 million. We, however, are not obligated to effect a demand registration if (1) we have already effected two demand registrations, (2) during the period beginning on the 60th day prior to our good faith estimate of the filing date of, and ending on the 180th day after the effective date of, a public offering of our securities initiated by us, or (3) if the securities to be registered can be registered on Form F-3. We have the right to defer filing of a registration statement for up to 120 days if we provide the requesting holders a certificate signed by either our chief executive officer or chairman of the board of directors stating that in the good faith judgment of the board of directors that filing of a registration statement will be detrimental to us and our shareholders, but we cannot exercise the deferral right more than once in any 24-month period.
Piggyback Registration Rights. If we propose to file a registration statement for a public offering of our securities other than, among other things, relating to a stock option plan or a corporate reorganization, then we must offer holders of registrable securities an opportunity to include in the registration all or any part of their registrable securities. The underwriters of any underwritten offering will have the right to limit the number of shares having registration rights to be included in the registration statement.
Form F-3 Registration Rights. When we are eligible for use of Form F-3, holders of our registrable securities then outstanding have the right to request that we file a registration statement under Form F-3. We are not obligated to file a registration statement on Form F-3 if we have already effected one registration on Form F-3 in any six-month period or the holders propose to sell registrable securities and such other securities (if any) at an aggregate public price of less than US$500,000, net of any underwriters’ discounts or commissions.
69
Expenses of Registration. We will pay all expenses, other than underwriting discounts and commissions, relating to any demand, piggyback or F-3 registration.
Registration Rights of Ctrip
Set forth below is a description of the registration rights we granted to Ctrip in May 2009.
Demand Registration Rights. At any time, holders of at least 25% of the ordinary shares held by Ctrip and its transferees and assignees have the right to demand that we file a registration statement covering the offer and sale of their securities. We are obligated under the registration rights agreement to use our best efforts to register our ordinary shares for resale if Ctrip or its transferees and assignees make such a request. We are not obligated to affect such demand registrations on more than three occasions. If the holders of shares initiating a demand intend to distribute their shares by mean of an underwriting, the underwriters will have the right to limit the number of shares having registration rights to be included in the registration statement. We have the ability to defer the filing of a registration statement for up to 90 days if we furnish to the demanding holder or holders a certificate signed by one of our directors stating that in the good faith judgment of the board of directors, filing of a registration statement will be detrimental to us and our shareholders, but we cannot exercise the deferral right more than once in any 12-month period.
Piggyback Registration Rights. If we propose to file a registration statement with respect to a public offering of our securities for our own account or for the account of any person that is not Ctrip or its transferees and assignees, we must offer Ctrip and its transferees and assignees the opportunity to include their securities in the registration statement. If the registration statement is for an underwritten offering and the underwriters determine that marketing factors require a limitation on the number of shares to be underwritten, the number of shares included in the offering and the underwriting will be allocated first to our company, second to Ctrip and its transferees and assignees, and third to other holders.
Form F-3 Registration Rights. When we are eligible for use of Form F-3, holders of at least 25% of the ordinary shares held by Ctrip or its transferees and assignees have the right to request that we file a registration statement under Form F-3. Such requests for registrations are not counted as demand registrations. We have the ability to defer the filing of such a registration statement for up to 90 days if we furnish to the requesting holder or holders a certificate signed by one of our directors stating that in the good faith judgment of the board of directors, filing of a registration statement will be detrimental to us and our shareholders, but we cannot exercise the deferral right more than once in any 12-month period.
Expenses of Registration. We will pay all expenses, other than underwriting discounts and commissions, relating to any demand, piggyback or F-3 registration.
Registration Rights Relating to Convertible Notes
In connection with the issuance of our convertible notes in December 2010, we filed an effective shelf registration statement on May 19, 2011 for re-sales by holders of our notes and any securities into which such notes are converted, and we agreed to file certain supplements and amendments to the shelf registration statement upon requests from such holders.
The Motel 168 Acquisition
On May 27, 2011, we entered into a definitive agreement to acquire 100% of Motel 168. The base acquisition price was US$470.0 million, consisting of US$305.5 million in cash and 8,149,616 ordinary shares priced at US$40.37 per ADS or US$20.185 per ordinary share at the closing of the transaction. The cash portion was funded with cash on hand and a four-year term loan facility of US$240.0 million with an interest rate at 390 basis points over LIBOR, and we granted registration rights to the sellers in connection with our issuance of ordinary shares to them. The closing conditions were met and the acquisition became effective on October 1, 2011. Motel 168 had 297 hotels in operation, including 144 leased-and-operated hotels and 153 franchised-and-managed hotels, with about 47,099 rooms located in 85 cities across China at the time of the acquisition. We are retaining the Motel 168 brand in addition to our Home Inn and Yitel brands and we plan to continue to open new hotels under each of these brands in the foreseeable future. We have integrated most of Motel 168’s support functions into our existing corporate platform, including human resources, accounting and finance, and legal, while keeping most front-line business functions brand-specific, including business development and operations. Following the acquisition, we spent approximately US$17.4 million through December 31, 2012 on renovating our Motel 168 hotels and implementing new marketing initiatives and operational best practices, and we expect that our expenditures for these purposes will total between $20 million and $25 million by the time major work under the integration plan is completed. We plan to conclude the work in 2013.
70
Registration Rights Relating to the Motel 168 Acquisition
Pursuant to the registration rights agreement among Home Inns & Hotels Management, Inc., GSS III Monroe Holdings Limited and Merrylin International Investment Limited entered into as of September 30, 2011, we have granted certain registration rights to the selling shareholders of Motel 168 in connection with the acquisition. Set forth below is a description of the registration rights granted under the agreement.
Demand Registration Rights. At any time, holders of at least 50% of outstanding registrable securities have the right to demand that we file a registration statement covering the offer and sale of their securities. We, however, are not obligated to effect a demand registration if we have already effected two demand registrations. We have the right to defer filing of a registration statement for up to 90 days if we provide the requesting holders a certificate signed by one of our directors stating that in the good faith judgment of the board of directors that filing of a registration statement will be detrimental to us and our shareholders, but we cannot exercise the deferral right more than once in any 12-month period.
Piggyback Registration Rights. If we propose to file a registration statement for a public offering of our securities other than, among other things, relating to a stock option plan or a corporate reorganization, then we must offer holders of registrable securities an opportunity to include in the registration all or any part of their registrable securities. The underwriters of any underwritten offering will have the right to limit the number of shares having registration rights to be included in the registration statement.
Form F-3 Registration Rights. Provided that we are eligible for use of Form F-3, holders of at least 50% of the outstanding registrable ordinary shares have the right to request that we file a registration statement under Form F-3. Such requests for registrations are not counted as demand registrations. We have the ability to defer the filing of such a registration statement for up to 90 days if we furnish to the requesting holder or holders a certificate signed by one of our directors stating that in the good faith judgment of the board of directors, filing of a registration statement will be detrimental to us and our shareholders, but we cannot exercise the deferral right more than once in any 12-month period. The shareholders have already exercised this right and we have filed an automatic shelf registration statement on Form F-3 with the SEC that became effective upon filing on May 3, 2012.
Expenses of Registration. We will pay all expenses, other than underwriting discounts and commissions, relating to any demand, piggyback or F-3 registration.
D.Exchange Controls
See “Item 4. Information on the Company—B. Business Overview—Regulation—Regulations on Foreign Currency Exchange.”
E.Taxation
The following summary of the material Cayman Islands, People’s Republic of China and United States federal income tax consequences of an investment in our ADSs or ordinary shares is based upon laws and relevant interpretations thereof in effect as of the date of this annual report, all of which are subject to change. This summary does not deal with all possible tax consequences relating to an investment in our ADSs or ordinary shares, such as the tax consequences under state, local and other tax laws.
Cayman Islands Taxation
The Cayman Islands does not impose any withholding taxes on dividends paid to shareholders by a Cayman Islands corporation, nor does the Cayman Islands impose any other taxes on shareholders of a Cayman Islands corporation who are not themselves residents of the Cayman Islands. The Cayman Islands is not a party to any tax treaties that are applicable to any payments made to or by our company.
People’s Republic of China Taxation
Under the Enterprise Income Tax Law, enterprises established outside of China but whose “de facto management body” is located in China are considered “resident enterprises” for PRC tax purposes. Under the applicable implementation regulations, “de facto management body” is defined as the organizational body that effectively exercises overall management and control over production and business operations, personnel, finance and accounting, and properties of the enterprise. Substantially all of our management is currently based in China, and may remain in China in the future. If we are treated as a “resident enterprise” for PRC tax purposes, foreign enterprise holders of our ADSs or ordinary shares may be subject to a 10% PRC income tax upon dividends payable by us and on gains realized on their sales or other dispositions of our ADSs or ordinary shares. See “Item 3. Key Information—D. Risk Factors—Risks Related to Doing Business in China—Our foreign ADS holders may be subject to PRC withholding tax on the dividends payable by us and upon gains realized on their sales of our ADSs if we are classified as a PRC ‘resident enterprise.’”
71
United States Federal Income Taxation
The following discussion describes certain of the U.S. federal income tax consequences to U.S. Holders (defined below) under present U.S. federal income tax law of an investment in the ADSs or ordinary shares. This summary applies only to investors that hold the ADSs or ordinary shares as capital assets and that have the U.S. dollar as their functional currency. This discussion is based on U.S. federal income tax laws as in effect on the date of this annual report and on U.S. Treasury regulations in effect or, in some cases, proposed, as of the date of this annual report, as well as judicial and administrative interpretations thereof available on or before such date. All of the foregoing authorities are subject to change, possibly with retroactive effect.
The following discussion does not deal with the tax consequences to any particular investor or to persons in special tax situations such as:
| | • | | certain financial institutions; |
| | • | | regulated investment companies; |
| | • | | real estate investment trusts; |
| | • | | traders that elect to mark to market; |
| | • | | persons liable for alternative minimum tax; |
| | • | | persons holding an ADS or ordinary share as part of a straddle, hedging, constructive sale, conversion or integrated transaction; |
| | • | | persons that actually or constructively own 10% or more of our voting stock; |
| | • | | persons who acquired ADSs or ordinary shares pursuant to the exercise of any employee share option or otherwise as compensation; or |
| | • | | persons holding ADSs or ordinary shares through partnerships or other pass-through entities for U.S. federal income tax purposes. |
In addition, this summary does not discuss any state, local or estate or gift tax considerations and, except for the limited instances where PRC tax law and potential PRC taxes are discussed below, does not discuss any non-United States tax considerations.
PROSPECTIVE INVESTORS ARE URGED TO CONSULT THEIR TAX ADVISORS REGARDING THE APPLICATION OF THE U.S. FEDERAL TAX RULES TO THEIR PARTICULAR CIRCUMSTANCES AS WELL AS THE STATE AND LOCAL AND NON-UNITED STATES TAX CONSEQUENCES TO THEM OF THE PURCHASE, OWNERSHIP AND DISPOSITION OF ADSs OR ORDINARY SHARES.
The discussion below of the U.S. federal income tax consequences to “U.S. Holders” will apply if you are a beneficial owner of ADSs or ordinary shares and you are, for U.S. federal income tax purposes,
| | • | | an individual who is a citizen or resident of the United States; |
| | • | | a corporation (or other entity taxable as a corporation) organized under the laws of the United States, any State or the District of Columbia; |
| | • | | an estate whose income is subject to U.S. federal income taxation regardless of its source; or |
| | • | | a trust that (1) is subject to the supervision of a court within the United States and the control of one or more U.S. persons or (2) has a valid election in effect under applicable U.S. Treasury regulations to be treated as a U.S. person. |
If you are a partner in partnership or other entity treated as a partnership for U.S. federal income tax purposes that holds ADSs or ordinary shares, your tax treatment generally will depend on your status and the activities of the partnership.
72
The discussion below assumes that the representations contained in the deposit agreement are true and that the obligations in the deposit agreement and any related agreement will be complied with in accordance with their terms. If you hold ADSs, you should be treated as the holder of the underlying ordinary shares represented by those ADSs for U.S. federal income tax purposes. Accordingly, deposits or withdrawals of ordinary shares for ADSs will not be subject to U.S. federal income tax.
Taxation of Dividends and Other Distributions on the ADSs or Ordinary Shares
Subject to the passive foreign investment company rules discussed below, the gross amount of all our distributions to you with respect to the ADSs or ordinary shares generally will be included in your gross income as ordinary dividend income on the date of actual or constructive receipt by the depositary, in the case of ADSs, or by you, in the case of ordinary shares, but only to the extent that the distribution is paid out of our current or accumulated earnings and profits (as determined under U.S. federal income tax principles). As we do not maintain records of earnings and profits in accordance with U.S. Federal income tax principles, U.S. Holders should expect that the full amount of any distribution will be reported as dividend. The dividends will not be eligible for the dividends-received deduction allowed to corporations in respect of dividends received from other U.S. corporations.
With respect to non-corporate U.S. Holders including individual U.S. Holders, dividends may constitute “qualified dividend income” that is subject to tax at the lower applicable capital gains rate provided that (1) the ADSs or ordinary shares, as applicable, are readily tradable on an established securities market in the United States or we are eligible for the benefit of the income tax treaty between the United States and the PRC, (2) we are not a passive foreign investment company (as discussed below) for either our taxable year in which the dividend was paid or the preceding taxable year, and (3) certain holding period requirements are met. Under Internal Revenue Service authority, ordinary shares, or ADSs representing such shares, are considered for the purpose of clause (1) above to be readily tradable on an established securities market in the United States if they are listed on the NASDAQ Global Market, as our ADSs are (but not our ordinary shares). Thus, we do not believe that dividends that we pay on our ordinary shares that are not represented by ADSs currently meet the conditions required for these reduced tax rates. There can be no assurance that our ADSs will be considered readily tradable on an established securities market in later years. You should consult your tax advisors regarding the availability of the lower rate for dividends paid with respect to our ADSs or ordinary shares.
For United States foreign tax credit purposes, dividends will generally be treated as income from foreign sources and will constitute passive category income. Depending on your particular facts and circumstances, the you may be eligible to claim a foreign tax credit in respect of any foreign withholding taxes imposed on dividends received on our ADSs or ordinary shares. If you do not elect to claim a foreign tax credit for foreign tax withheld, you will be permitted instead to claim a deduction, for U.S. federal income tax purposes, in respect of such withholdings, but only for a year in which you elect to do so for all creditable foreign income taxes. The rules governing the foreign tax credit are complex and their outcome depends in large part on your particular facts and circumstances. Accordingly, you should consult your tax advisors regarding the availability of the foreign tax credit based on your particular circumstances.
Taxation of Disposition of ADSs or Ordinary Shares
Subject to the passive foreign investment company rules discussed below, you will recognize taxable gain or loss on any sale, exchange or other taxable disposition of an ADS or ordinary share equal to the difference, if any, between the amount realized for the ADS or ordinary share and your tax basis in the ADS or ordinary share. The gain or loss generally will be capital gain or loss. If you are a non-corporate U.S. Holder, including an individual U.S. Holder, who has held the ADS or ordinary share for more than one year, you will be eligible for reduced tax rates. The deductibility of capital losses is subject to limitations. Any such gain or loss that you recognize generally will be treated as U.S. source income or loss for foreign tax credit limitation purposes. However, in the event we are deemed to be a Chinese resident enterprise under PRC tax law, we may be eligible for the benefits of the income tax treaty between the United States and the PRC. In such event, if PRC tax were to be imposed on any gain from the disposition of the ADSs or ordinary shares, a U.S. Holder that is eligible for the benefits of the income tax treaty between the United States and the PRC may elect to treat such gain as PRC source income. U.S. Holders should consult their tax advisors regarding the creditability of any PRC tax.
Passive Foreign Investment Company
Based on the price of our ADSs and ordinary shares and the composition of our income and assets, we believe that we were not a passive foreign investment company, or PFIC, for U.S. federal income tax purposes for our taxable year that ended December 31, 2012. However, the application of the PFIC rules is subject to ambiguity in several aspects and we must make a separate determination each year as to whether we are a PFIC (after the close of such taxable year). Accordingly, we cannot guarantee you that we will not be a PFIC for our current or any future taxable year. A non-U.S. corporation is considered to be a PFIC for any taxable year if either:
| | • | | at least 75% of its gross income is passive income (the “income test”), or |
| | • | | at least 50% of the value of its assets (based on an average of the quarterly values of the assets during a taxable year) is attributable to assets that produce or are held for the production of passive income (the “asset test”). |
73
We will be treated as owning our proportionate share of the assets and earning our proportionate share of the income of any other corporation in which we own, directly or indirectly, 25% or more (by value) of the stock.
We must make a separate determination each year as to whether we are a PFIC. As a result, our PFIC status may change. In particular, because the total value of our assets for purposes of the asset test generally will be calculated using the market price of our ADSs and ordinary shares, our PFIC status will depend in large part on the market price of our ADSs and ordinary shares, which may fluctuate considerably. Accordingly, fluctuations in the market price of the ADSs and ordinary shares may result in our being a PFIC for any year. In addition, the composition of our income and assets will be affected by how, and how quickly, we spend the cash we raise in any offering. If we are a PFIC for any year during which you hold ADSs or ordinary shares, we generally will continue to be treated as a PFIC for all succeeding years during which you hold ADSs or ordinary shares. However, if we cease to be a PFIC, you may avoid some of the adverse effects of the PFIC regime by making a deemed sale election with respect to the ADSs or ordinary shares, as applicable. If we are a PFIC for any taxable year and any of our foreign subsidiaries is also a PFIC, a U.S. Holder would be treated as owning a proportionate amount (by value) of the shares of the lower-tier PFIC for purposes of the application of these rules. You are urged to consult your tax advisors about the application of the PFIC rules to any of our subsidiaries.
If we are a PFIC for any taxable year during which you hold ADSs or ordinary shares, you will be subject to special tax rules with respect to any “excess distribution” that you receive and any gain you realize from a sale or other disposition (including a pledge) of the ADSs or ordinary shares, unless you make a “mark-to-market” election as discussed below. Distributions you receive in a taxable year that are greater than 125% of the average annual distributions you received during the shorter of the three preceding taxable years or your holding period for the ADSs or ordinary shares will be treated as an excess distribution. Under these special tax rules:
| | • | | the excess distribution or gain will be allocated ratably over your holding period for the ADSs or ordinary shares, |
| | • | | the amount allocated to the current taxable year, and any taxable year prior to the first taxable year in which we became a PFIC, will be treated as ordinary income, and |
| | • | | the amount allocated to each of the other taxable years would be subject to tax at the highest rate of tax in effect for the applicable class of taxpayer for such year and would be increased by an additional tax equal to interest on the resulting tax deemed deferred with respect to each such other taxable year. |
The tax liability for amounts allocated to years prior to the year of disposition or “excess distribution” cannot be offset by any net operating losses for such years, and gains (but not losses) realized on the sale of the ADSs or ordinary shares cannot be treated as capital, even if you hold the ADSs or ordinary shares as capital assets.
If a company that is a PFIC provides certain information to U.S. Holders, a U.S. Holder can avoid certain adverse tax consequences described above by making a “qualified electing fund” election to be taxed currently on its proportionate share of the PFIC’s ordinary income and net capital gains. However, we do not intend to prepare or provide the information that would enable you to make a qualified electing fund election.
Alternatively, a U.S. Holder of “marketable stock” (as defined below) in a PFIC may make a mark-to-market election with respect to such stock to elect out of the tax treatment discussed above. If you make a valid mark-to-market election for the ADSs or ordinary shares, you will include in income each year an amount equal to the excess, if any, of the fair market value of the ADSs or ordinary shares as of the close of your taxable year over your adjusted basis in such ADSs or ordinary shares. You are allowed a deduction for the excess, if any, of the adjusted basis of the ADSs or ordinary shares over their fair market value as of the close of the taxable year. However, deductions are allowable only to the extent of any net mark-to-market gains on the ADSs or ordinary shares included in your income for prior taxable years. Amounts included in your income under a mark-to-market election, as well as gain on the actual sale or other disposition of the ADSs or ordinary shares, are treated as ordinary income. Ordinary loss treatment also applies to the deductible portion of any mark-to-market loss on the ADSs or ordinary shares, as well as to any loss realized on the actual sale or disposition of the ADSs or ordinary shares, to the extent that the amount of such loss does not exceed the net mark-to-market gains previously included for such ADSs or ordinary shares. Your basis in the ADSs or ordinary shares will be adjusted to reflect any such income or loss amounts. If you make such an election, the tax rules that apply to distributions by corporations that are not PFICs will apply to distributions by us, except that the lower applicable capital gains rate discussed above under “—Taxation of Dividends and Other Distributions on the ADSs or Ordinary Shares” will not apply.
74
The mark-to-market election is available only for “marketable stock,” which is stock that is traded in other thande minimis quantities on at least 15 days during each calendar quarter (“regularly traded”) on a qualified exchange or other market, as defined in applicable U.S. Treasury regulations. The NASDAQ Global Market is a qualified exchange and, consequently, provided that the ADSs continue to be listed on the NASDAQ Global Market and are regularly traded, if you are a holder of ADSs, the mark-to-market election would be available to you were we to be a PFIC.
Because a mark-to-market election cannot be made for any lower-tier PFICs that we may own, a U.S. Holder will continue to be subject to the PFIC rules with respect to such U.S. Holder’s indirect interest in any investments held by us that are treated as an equity interest in a PFIC for United States federal income tax purposes.
If you hold ADSs or ordinary shares in any year in which we are a PFIC, you will be required to file Internal Revenue Service Form 8621 regarding distributions received on the ADSs or ordinary shares and any gain realized on the disposition of the ADSs or ordinary shares.
You are urged to consult your tax advisor regarding the application of the PFIC rules to your investment in ADSs or ordinary shares.
Information Reporting and Backup Withholding
Pursuant to the Hiring Incentives to Restore Employment Act of 2010, individual U.S. Holders and certain entities may be required to submit to the IRS certain information with respect to his or her beneficial ownership of our ADSs or ordinary shares, if such ADSs or ordinary shares are not held on his or her behalf by a financial institution. This new law also imposes penalties if an individual U.S. Holder is required to submit such information to the IRS and fails to do so.
In addition, dividend payments with respect to ADSs or ordinary shares and proceeds from the sale, exchange or redemption of ADSs or ordinary shares may be subject to information reporting to the Internal Revenue Service and possible U.S. backup withholding at a current rate of 28%. Backup withholding will not apply, however, to a U.S. Holder who furnishes a correct taxpayer identification number and makes any other required certification or who is otherwise exempt from backup withholding. U.S. Holders who are required to establish their exempt status generally must provide such certification on Internal Revenue Service Form W-9. U.S. Holders should consult their tax advisors regarding the application of the U.S. information reporting and backup withholding rules.
Backup withholding is not an additional tax. Amounts withheld as backup withholding may be credited against your U.S. federal income tax liability, and you may obtain a refund of any excess amounts withheld under the backup withholding rules by timely filing the appropriate claim for refund with the Internal Revenue Service and furnishing any required information.
F.Dividends and Paying Agents
Not applicable.
G.Statement by Experts
Not applicable.
H.Documents on Display
We are subject to the periodic reporting and other informational requirements of the Exchange Act. Under the Exchange Act, we are required to file reports and other information with the SEC. Specifically, we are required to file annually a Form 20-F no later than four months after the close of each fiscal year. Copies of reports and other information, when so filed, may be inspected without charge and may be obtained at prescribed rates at the public reference facilities maintained by the SEC at 100 F Street, N.E., Room 1580, Washington, D.C. 20549. The public may obtain information regarding the Washington, D.C. Public Reference Room by calling the SEC at 1-800-SEC-0330. The SEC also maintains a web site atwww.sec.gov that contains reports, proxy and information statements, and other information regarding registrants that make electronic filings with the SEC using its EDGAR system. As a foreign private issuer, we are exempt from the rules under the Exchange Act prescribing the furnishing and content of quarterly reports and proxy statements, and officers, directors and principal shareholders are exempt from the reporting and short-swing profit recovery provisions contained in Section 16 of the Exchange Act.
75
We will furnish The Bank of New York, the depositary of our ADSs, with our annual reports, which will include a review of operations and annual audited consolidated financial statements prepared in conformity with U.S. GAAP, and all notices of shareholders’ meetings and other reports and communications that are made generally available to our shareholders. The depositary will make such notices, reports and communications available to holders of ADSs and, upon our request, will mail to all record holders of ADSs the information contained in any notice of a shareholders’ meeting received by the depositary from us.
I.Subsidiary Information
For a listing of our subsidiaries, see “Item 4. Information on the Company—C. Organizational Structure.”
| ITEM 11. | QUANTITATIVE AND QUALITATIVE DISCLOSURES ABOUT MARKET RISK |
Interest Rate Risk
Our exposure to interest rate risk typically relates to any interest rates for our outstanding debt and the interest income generated by excess cash invested in liquid investments with original maturities of three months or less.
In December 2010, we issued US$184 million of convertible notes. The interest rate on these convertible notes is 2% per annum, payable semi-annually in arrears. No accrued interest is payable upon conversion. The convertible notes will mature on December 15, 2015.
In September 2011, we entered into a senior secured credit agreement with a maximum loan amount of US$240 million and floating interest rate of 390 basis points over three-month U.S. dollar LIBOR. As of December 31, 2011, we had drawn down the full amount of US$240 million. In 2012, we repaid US$121 million of the loan. On January 31, 2013, we repaid an additional US$2 million. The remaining installments due under this agreement are US$57 million on July 31, 2014 and US$60 million on September 15, 2015.
Under the terms of the September 2011 intercreditor agreement that we entered into in connection with the term loan, we are required to enter into and maintain derivative financial instruments to manage our interest risk exposure in respect of notional amounts equal in the aggregate to at least 75% of the outstanding principal amount from time to time (taking into account scheduled repayments) of the term loans under that agreement at least through September 30, 2014. We entered into an interest rate swap contract for this purpose on November 28, 2011. The notional principal amount of the outstanding interest rate swap contract at December 31, 2012 was US$93 million, on which we pay a fixed rate of 1.13% and receive a floating rate of three-month U.S. dollar LIBOR. Aside from this interest rate swap, we have not used any derivative financial instruments to manage our interest risk exposure.
We had cash and cash equivalents of RMB 663.2 million (US$106.4 million) as of December 31, 2012, and interest income of RMB 11.9 million (US$1.9 million) for the year ended December 31, 2012 derived entirely from our cash and cash equivalents.
Three-month U.S. dollar LIBOR was approximately 0.3060% as of December 31, 2012, and it has generally remained within 30 basis points of that number since the summer of 2009. An increase in three-month U.S. dollar LIBOR of 30 basis points would increase our interest expense by US$78 thousand and decrease the fair value of the convertible bonds and the swap by approximately US$2.1 million. A decrease in three-month U.S. dollar LIBOR of 10 basis points would decrease our interest expense by US$26 thousand and increase the fair value of the convertible bonds and the swap by approximately US$0.6 million.
Foreign Exchange Risk
Substantially all of our revenues and most of our expenses are denominated in RMB. Our exposure to foreign exchange risk primarily relates to our cash and cash equivalent denominated in U.S. dollars, on the asset side, and our convertible notes and term loans denominated in U.S. dollars, on the liability side. As of December 31, 2012, we had cash and cash equivalents denominated in U.S. dollars of US$41.5 million, and we had US$184.0 million in outstanding convertible notes and US$119.0 million in outstanding term loans. Under the terms of the credit agreement dated September 26, 2011, which we entered into in connection with our acquisition of Motel 168, we are required to cause our subsidiaries in China to declare and pay the maximum legally distributable earnings of the most recently ended calendar year as dividends to our entities outside of China to service the debt, except that we may maintain a level of RMB cash balance in China to continue on-going operation and expansion according to a prescribed budget and forecast. We expect to convert any money that we distribute to our entities outside of China from RMB into U.S. dollars.
76
In addition, the value of your investment in our ADSs will be affected by the exchange rate between U.S. dollars and RMB because the value of our business is effectively denominated in RMB, while the ADSs will be traded in U.S. dollars.
The conversion of RMB into foreign currencies, including U.S. dollars, is based on rates set by the People’s Bank of China. The PRC government allowed the RMB to appreciate by more than 20% against the U.S. dollar between July 2005 and July 2008. Between July 2008 and June 2010, this appreciation halted and the exchange rate between the RMB and the U.S. dollar remained within a narrow band. Since June 2010, the PRC government has allowed the RMB to appreciate slowly against the U.S. dollar again, though there have been periods when the U.S. dollar has appreciated against the Renminbi as well. It is difficult to predict how market forces or PRC or U.S. government policy may impact the exchange rate between the RMB and the U.S. dollar in the future. However, the appreciation in the RMB against the U.S. dollar since June 2010 has generally been no more than 5% over any given 12-month period. We believe that any depreciation of the RMB against the U.S. dollar in the near term is significantly less likely than continued appreciation.
Depreciation of the RMB against the U.S. dollar by 1% would result in a foreign exchange loss to us of approximately RMB 15.5 million (US$2.5 million), whereas appreciation of the RMB against the U.S. dollar by 1% would result in a foreign exchange gain to us of approximately the same amount.
We have not hedged exposures denominated in foreign currencies or any other derivative financial instruments. Under the September 2011 credit agreement, if the RMB/US$ exchange rate is above 6.50 for any period of five consecutive business days then we are required to enter into and maintain derivative financial instruments to hedge our exposure to foreign currency exchange risk in respect of notional amounts equal in the aggregate to at least 50% of the outstanding principal amount from time to time (taking into account scheduled repayments) of the term loans under that agreement at least through the final maturity date of the loans, which is the earlier of September 15, 2015 and the date when the loans become due and payable in full. As of the date of this annual report, this requirement has not been triggered.
Equity Prices
The closing price of our ADSs was US$28.90 as of December 31, 2012, and it has generally been within $15 of that number for most of our history, the principal exception being the last quarter of 2008 and first quarter of 2009, when it was lower. An increase of US$15 in the market price of our ADSs from their closing price of US$28.90 as of December 30, 2012 would cause the fair value of our convertible notes to increase by US$31.9 million. A decrease of US$15 in the market price of our ADSs from their closing price of US$28.90 as of December 30, 2012 would cause the fair value of our convertible notes to decrease by US$15.1 million.
The volatility of the market price of our ADSs in 2012 was 42%. An increase of 5 percentage points in volatility would cause the fair value of our convertible notes to increase by approximately US$3.5 million, where as a decrease of 5 percentage points in volatility would cause the fair value of our convertible notes to decrease by approximately US$3.3 million.
Impact of Market Risk in 2012
The increase in the market price of our ADSs and the decrease in three-month U.S. dollar LIBOR in 2012, partially offset by the decrease in the volatility of the market price of our ADSs during the same year, were responsible for that portion of the decline in the fair value of our convertible notes that is recorded as a loss on change in fair value of our convertible notes of RMB 87.1 million (US$14.0 million) on our statement of operations for the year ended December 31, 2012.
The depreciation of the U.S. dollar against the RMB in 2012 was responsible for an increase in the fair value of our U.S. dollar-denominated debt and debt instruments and a corresponding decrease in the value of our U.S. dollar-denominated cash and cash equivalents, the net effect of which is recorded as a foreign exchange gain of RMB 0.2 million (US$0.0 million) on our income statement for the year ended December 31, 2012.
Inflation
Since our inception, inflation in China has not had a material adverse impact on our results of operations. While inflation adds pressure on hotel operating costs such as rents and personnel costs, we are also able to increase the rates we charge at our hotels during times of rising prices and absorb part or all of the impact from rising operating costs, as long as the economy is not too weak. According to the National Bureau of Statistics of China, the year-over-year percent changes in the consumer price index for December 2010, 2011 and 2012 were increases of 4.6%, 4.1% and 2.5%, respectively. While recent inflation has been associated with food and other consumption items that are not a major direct cost to us, inflationary pressure has led to increases in minimum wages in China that affect some of our hotel staff. Personnel costs represent a material part of our total operating costs and expenses. Although we have not been materially affected by inflation in the past, we may be materially affected if China experience higher rates of inflation in the future and if our ability to raise the rates we charge is constrained by overall market conditions in China.
77
| ITEM 12. | DESCRIPTION OF SECURITIES OTHER THAN EQUITY SECURITIES |
A.Debt Securities
Not applicable.
B. Warrants and Rights
Not applicable.
C.Other Securities
Not applicable.
D.American Depositary Shares
Fees and Charges Our ADS Holders May Have to Pay
The Bank of New York Mellon, the depositary of our ADS program, collects its fees for issuance and cancellation of ADSs directly from investors depositing shares or surrendering ADSs for the purpose of withdrawal or from intermediaries acting for them. The depositary also collects fees for making distributions to investors by deducting those fees from the amounts distributed or by selling a portion of distributable property to pay the fees. The depositary may collect its annual fee for depositary services by deduction from cash distributions or by directly billing investors or by charging the book-entry system accounts of participants acting for them. The depositary may generally refuse to provide fee-attracting services until its fees for those services are paid.
| | |
Persons depositing or withdrawing shares must pay: | | For: |
| US$5.00 (or less) per 100 ADSs (or portion of 100 ADSs) | | Issuance of ADSs, including issuances resulting from a distribution of shares or rights or other property |
| |
| | Cancellation of ADSs for the purpose of withdrawal, including if the deposit agreement terminates |
| |
| US$0.02 (or less) per ADS | | Any cash distribution to registered ADS holders |
| |
| A fee equivalent to the fee that would be payable if securities distributed had been shares and the shares had been deposited for issuance of ADSs | | Distribution of securities distributed to holders of deposited securities which are distributed by the depositary to registered ADS holders |
| |
| US$0.02 (or less) per ADS per calendar year | | Depositary services |
| |
| Registration or transfer fees | | Transfer and registration of shares on our share register to or from the name of the depositary or its agent when you deposit or withdraw shares |
| |
| Expenses of the depositary | | Cable, telex and facsimile transmissions (when expressly provided in the deposit agreement) |
| |
| | Converting foreign currency to U.S. dollars |
| |
| Taxes and other governmental charges the depositary or the custodian have to pay on any ADS or share underlying an ADS, for example, stock transfer taxes, stamp duty or withholding taxes | | As necessary |
| |
| Any charges incurred by the depositary or its agents for servicing the deposited securities | | As necessary |
78
Fees and Other Payments Made by the Depositary to Us
The depositary has agreed to reimburse us for expenses we incur that are related to the establishment and maintenance of the ADR program, including investor relations expenses. There are limits on the amount of expenses for which the depositary will reimburse us, but the amount of reimbursement available to us is not linked to the amounts of fees the depositary collects from investors. We were entitled to receive US$241,179 (after withholding tax) for the period between January 1, 2012 and October 31, 2012 from the depositary as reimbursement for our expenses incurred in connection with investor relationship programs related to the ADS facility. In addition, we are entitled to receive US$397,275 (including withholding tax) for the period between November 2012 and October 2013 from the depositary as the reimbursement for the same purpose. For the year ended December 31, 2012, a total of US$ 66,502 (after withholding tax) has been paid to us.
PART II.
| ITEM 13. | DEFAULTS, DIVIDEND ARREARAGES AND DELINQUENCIES |
None.
| ITEM 14. | MATERIAL MODIFICATIONS TO THE RIGHTS OF SECURITY HOLDERS AND USE OF PROCEEDS |
Not applicable.
| ITEM 15. | CONTROLS AND PROCEDURES |
Evaluation of Disclosure Controls and Procedures
Our management, with the participation of our chief executive officer and chief financial officer, has performed an evaluation of the effectiveness of our disclosure controls and procedures within the meaning of Rules 13a-15(e) and 15d-15(e) of the Exchange Act as of the end of the period covered by this report. Based on such evaluation, our management has concluded that, as of the end of the period covered by this annual report, our disclosure controls and procedures were effective.
Management’s Report on Internal Control over Financial Reporting
Our management is responsible for establishing and maintaining adequate internal control over financial reporting, as defined in Rules 13a-15(f) under the Exchange Act. Our management evaluated the effectiveness of our internal control over financial reporting based on criteria established in the framework inInternal Control-Integrated Frameworkissued by the Committee of Sponsoring Organizations of the Treadway Commission. Based on this evaluation, our management has concluded that our internal control over financial reporting was effective as of December 31, 2012.
Because of its inherent limitations, internal control over financial reporting may not prevent or detect misstatements. In addition, projections of any evaluation of effectiveness of our internal control over financial reporting to future periods are subject to the risk that controls may become inadequate because of changes in conditions, or that the degree of compliance with the policies and procedures may deteriorate.
Attestation Report of the Registered Public Accounting Firm
See the consolidated financial statements of Home Inns & Hotels Management Inc., which are included at the end of this annual report.
Changes in Internal Control
There were no significant changes in internal control for the year ended December 31, 2012.
79
| ITEM 16A. | AUDIT COMMITTEE FINANCIAL EXPERT |
Our board of directors has determined that Terry Yongmin Hu, Kenneth Gaw and Arthur M. Wang, all of whom are members of our audit committee and independent directors (under the standards set forth in Nasdaq Marketplace Rule 5605(c)(2) and Rule 10A-3 under the Exchange Act), are audit committee financial experts.
Our board of directors adopted a code of business conduct and ethics on October 2, 2006 that applies to our directors, officers, employees and agents, including certain provisions that specifically apply to our executive officers and any other persons who perform similar functions for us. We have filed our code of business conduct and ethics as an exhibit to our registration statement on Form F-1 (No. 333-137800). On March 3, 2009, our board of directors amended the code of business conduct and ethics adopted in 2006 and appointed Tanya Xiaoxian Tang, who was the head of our internal audit department, as our chief compliance officer. Tanya Xiaoxian Tang resigned from our company in July 2010, and our board of directors has not appointed her replacement. Mr. Jianfeng Geng, an employee in our internal audit department, temporarily acted as chief compliance officer for the purposes of our code of business conduct and ethics. On March 1, 2012, we hired Alex Zhenyu Wan as the head of our internal audit department, and he will act as our chief compliance officer until a permanent appointment is made. Our amended code of business conduct and ethics is filed as an exhibit to this annual report.
| ITEM 16C. | PRINCIPAL ACCOUNTANT FEES AND SERVICES |
The following table sets forth the aggregate fees by categories specified below in connection with certain professional services rendered by PricewaterhouseCoopers Zhong Tian CPAs Limited Company, our principal external auditors, for the periods indicated. We did not pay any other fees to our auditors during the periods indicated below.
| | | | | | | | |
| | | For the Year Ended December 31, | |
| | | 2011 | | | 2012 | |
| | | (in thousands of RMB) | |
Audit fees (1) | | | 9,967 | | | | 9,377 | |
Audit-related fees (2) | | | 1,470 | | | | — | |
Tax fees (3) | | | 1,750 | | | | — | |
| (1) | “Audit fees” means the aggregate fees billed for professional services rendered by our principal auditors for the audit of our annual financial statements and the review of our comparative interim financial statements. |
| (2) | “Audit-related fees” means the aggregate fees billed for professional services rendered by our principal auditors in connection with the issuance in 2011 of ordinary shares related with the Motel 168 acquisition. |
| (3) | “Tax fees” means the aggregate fees billed for the professional services rendered for tax consultation in connection with the distribution of dividends from our PRC subsidiaries to our offshore subsidiaries. |
The policy of our audit committee is to pre-approve all audit and non-audit services provided by PricewaterhouseCoopers Zhong Tian CPAs Limited Company, including audit services, audit-related services, tax services and other services as described above, other than those forde minimis services which are approved by the Audit Committee prior to the completion of the audit.
| ITEM 16D. | EXEMPTIONS FROM THE LISTING STANDARDS FOR AUDIT COMMITTEES |
Not applicable.
| ITEM 16E. | PURCHASES OF EQUITY SECURITIES BY THE ISSUER AND AFFILIATED PURCHASERS |
None.
| ITEM 16F. | CHANGE IN REGISTRANT’S CERTIFYING ACCOUNTANT |
Not applicable.
80
| ITEM 16G. | CORPORATE GOVERNANCE |
Nasdaq Marketplace Rule 5250(d)(1) requires each issuer to distribute to shareholders copies of an annual report containing audited financial statements of the company and its subsidiaries. It further requires that the report be distributed to shareholders a reasonable period of time prior to the company’s annual meeting of shareholders and that it be filed with Nasdaq at the time it is distributed to shareholders. Nasdaq Marketplace Rule 5620(a) requires each issuer to hold an annual meeting of shareholders no later than one year after the end of the issuer’s fiscal year-end. Nasdaq Marketplace Rule 5635(c) and IM-5635-1 require each issuer to seek shareholder approval for any material amendments to the issuer’s equity compensation plans or other equity compensation arrangements, including a repricing of outstanding options. However, Nasdaq Marketplace Rule 5615(a)(3) permits foreign private issuers like us to follow “home country practice” in certain corporate governance matters.
Maples and Calder, our Cayman Islands counsel, has provided a letter to the Nasdaq Stock Market certifying that under Cayman Islands law, we are not required to hold annual shareholder meetings. We did not hold an annual general meeting in 2012. We may hold annual shareholder meetings in the future if there are issues that require shareholder approval.
Maples and Calder has also provided a letter to the Nasdaq Stock Market certifying that under Cayman Islands law, we are not required to seek shareholder approval for amendments to our existing equity incentive plans or arrangements. We followed home country practice with respect to certain equity incentive arrangements with our option grantees. We previously cancelled the unvested portion of the options of each of our option grantees on October 27, 2008 and issued them new options for the same number of underlying ordinary shares, with new vesting schedules and a reduced strike price.
Nasdaq Marketplace Rule 5605(c)(2)(A) requires an audit committee to have a minimum of three members. Pursuant to Nasdaq Marketplace Rule 5615(a)(3), we followed home country practice with respect to the audit committee composition requirement. Maples and Calder has provided a letter to the Nasdaq Stock Market certifying that both the Cayman Islands laws and our articles of association permit us to have only two members serving on the audit committee. During the period from May 21, 2009 to September 22, 2009, our audit committee consisted of only two members. Since September 23, 2009, our audit committee has had three members.
Other than the above, we have followed and intend to continue to follow the applicable corporate governance standards under Nasdaq Marketplace Rules.
In accordance with Nasdaq Marketplace Rule 5250(d)(1), we will post this annual report on Form 20-F on our company websiteenglish.homeinns.com. In addition, we will provide hard copies of our annual report free of charge to shareholders and ADS holders upon request.
| ITEM 16H. | MINE SAFETY DISCLOSURE |
Not applicable.
PART III.
| ITEM 17. | FINANCIAL STATEMENTS |
We have elected to provide financial statements pursuant to Item 18.
| ITEM 18. | FINANCIAL STATEMENTS |
The consolidated financial statements of Home Inns & Hotels Management Inc. are included at the end of this annual report.
| | |
Exhibit Number | | Description of Document |
| |
| 1.1 | | Amended and Restated Memorandum and Articles of Association of the Registrant, effective November 3, 2009 (incorporated by reference to Exhibit 99.3 of Form 6-K (File No. 001-33082) filed with the SEC on November 4, 2009) |
| |
| 2.1 | | Indenture, dated December 10, 2007, constituting RMB 1,110,000,000 USD Settled Zero Coupon Convertible Senior Bonds due December 10, 2012 (incorporated by reference to Exhibit 2.1 of our annual report on Form 20-F (File No. 001-33082) filed with the SEC on April 18, 2008) |
81
| | |
Exhibit Number | | Description of Document |
| |
| 2.2 | | Indenture, dated December 21, 2010, constituting US$184,000,000 2.00% Convertible Senior Notes due December 15, 2015 (incorporated by reference to Exhibit 2.2 of our annual report on Form 20-F (File No. 001-33082) filed with the SEC on April 27, 2011) |
| |
| 2.3 | | Amendment Agreement regarding indenture, dated April 26, 2011, between the Registrant and The Bank of New York Mellon, as trustee (incorporated by reference to Exhibit 2.3 of our annual report on Form 20-F (File No. 001-33082) filed with the SEC on April 27, 2011) |
| |
| 2.4 | | Registration Rights Agreement among the Registrant, Credit Suisse Securities (USA) LLC and J.P. Morgan Securities Ltd., dated December 21, 2010 (incorporated by reference to Exhibit 2.4 of our annual report on Form 20-F (File No. 001-33082) filed with the SEC on April 27, 2011) |
| |
| 2.5 | | Registration Rights Agreement by and among the Registrant, GSS III Monroe Holdings Limited and Merrylin International Investment Limited dated as of September 30, 2011 (incorporated by reference to Exhibit 2.5 of our annual report on Form 20-F (File No. 001-33082) filed with the SEC on April 24, 2012) |
| |
| 4.1 | | Shareholders agreement, dated June 29, 2006 (incorporated by reference to Exhibit 4.8 from our F-1 registration statement (File No. 333-142190), as amended, initially filed with the SEC on April 18, 2007) |
| |
| 4.2 | | Employment Agreement between the Registrant and Jason Xiangxin Zong, dated January 1, 2007 (incorporated by reference to Exhibit 4.1 of our annual report on Form 20-F (File No. 001-33082) filed with the SEC on April 18, 2008) |
| |
| 4.3 | | Registration Rights Agreement by and among the Registrant and Ctrip.com International, Ltd. as of May 7, 2009 (incorporated by reference to Exhibit 4.5 of our annual report on Form 20-F (File No. 001-33082) filed with the SEC on April 21, 2010) |
| |
| 4.4 | | Amended and Restated 2006 Share Incentive Plan, effective November 3, 2009 (incorporated by reference to Exhibit 99.2 of Form 6-K (File No. 001-33082) filed with the SEC on November 4, 2009) |
| |
| 4.5 | | Employment Agreement between the Registrant and David Jian Sun, dated January 1, 2007 (incorporated by reference to Exhibit 10.3 of our F-1 registration statement (File No. 333-142190), as amended, initially filed with the SEC on April 18, 2007) |
| |
| 4.6 | | Employment Agreement between the Registrant and May Wu, dated January 1, 2007 (incorporated by reference to Exhibit 10.5 of our F-1 registration statement (File No. 333-142190), as amended, initially filed with the SEC on April 18, 2007) |
| |
| 4.7 | | Employment Agreement between the Registrant and Huiping Yan, dated July 13, 2009 (incorporated by reference to Exhibit 4.10 of our annual report on Form 20-F (File No. 001-33082) filed with the SEC on April 27, 2011) |
| |
| 4.8 | | Amendment to Employment Agreement between the Registrant and Jason Xiangxin Zong, effective January 1, 2008 (incorporated by reference to Exhibit 4.11 of our annual report on Form 20-F (File No. 001-33082) filed with the SEC on April 27, 2011) |
| |
| 4.9 | | Amendment to Employment Agreement between the Registrant and May Wu, effective April 22, 2010 (incorporated by reference to Exhibit 4.12 of our annual report on Form 20-F (File No. 001-33082) filed with the SEC on April 27, 2011) |
| |
| 4.10 | | Amendment to Employment Agreement between the Registrant and Huiping Yan, effective April 22, 2010 (incorporated by reference to Exhibit 4.13 of our annual report on Form 20-F (File No. 001-33082) filed with the SEC on April 27, 2011) |
| |
| 4.11 | | Share Purchase Agreement by and between the Registrant, Motel 168 International Holdings Limited, GSS III Monroe Holdings Limited and Merrylin International Investment Limited dated as of May 27, 2011 (incorporated by reference to Exhibit 4.12 of our annual report on Form 20-F (File No. 001-33082) filed with the SEC on April 24, 2012) |
| |
| 4.12 | | Credit Agreement among the Registrant and certain of its subsidiaries, BNP Parisbas Hong Kong Branch, Chinatrust Commercial Bank, Ltd., Crédit Agricole Corporate and Investment Bank, Credit Suisse AG, Singapore Branch, JPMorgan Chase Bank, N.A. acting through its Hong Kong Branch, Natixis, Hong Kong Branch, Shinhan Asia Limited, Industrial and Commercial Bank of China (Asia) Limited, and the lenders party thereto, dated as of September 26, 2011 (incorporated by reference to Exhibit 4.13 of our annual report on Form 20-F (File No. 001-33082) filed with the SEC on April 24, 2012) |
| |
| 4.13 | | Intercreditor Agreement among the Registrant and certain of its subsidiaries, BNP Parisbas Hong Kong Branch, Chinatrust Commercial Bank, Ltd., Crédit Agricole Corporate and Investment Bank, Credit Suisse AG, Singapore Branch, JPMorgan Chase Bank, N.A. acting through its Hong Kong Branch, Natixis, Hong Kong Branch, Shinhan Asia Limited, Industrial and Commercial Bank of China (Asia) Limited, and the hedge counterparties party thereto, dated as of September 29, 2011 (incorporated by reference to Exhibit 4.14 of our annual report on Form 20-F (File No. 001-33082) filed with the SEC on April 24, 2012) |
| |
| 8.1* | | Subsidiaries of the Registrant |
82
| | |
Exhibit Number | | Description of Document |
| |
| 11.1 | | Code of Business Conduct and Ethics of the Registrant, as amended on March 3, 2010 (incorporated by reference to Exhibit 11.1 of our annual report on Form 20-F (File No. 001-33082) filed with the SEC on April 21, 2010). |
| |
| 12.1* | | CEO Certification Pursuant to Section 302 of the Sarbanes-Oxley Act of 2002 |
| |
| 12.2* | | CFO Certification Pursuant to Section 302 of the Sarbanes-Oxley Act of 2002 |
| |
| 13.1* | | CEO Certification Pursuant to Section 906 of the Sarbanes-Oxley Act of 2002 |
| |
| 13.2* | | CFO Certification Pursuant to Section 906 of the Sarbanes-Oxley Act of 2002 |
| |
| 15.1* | | Consent of Maples and Calder |
| |
| 15.2* | | Consent of PricewaterhouseCoopers Zhong Tian CPAs Limited Company |
| |
| 101.INS** | | Instance Document |
| |
| 101.SCH** | | Schema Document |
| |
| 101.CAL** | | Calculation Linkbase Document |
| |
| 101.DEF** | | Definition Linkbase Document |
| |
| 101.LAB** | | Label Linkbase Document |
| |
| 101.PRE** | | Presentation Linkbase Document |
| * | Filed with this Annual Report on Form 20-F. |
| ** | XBRL (eXtensible Business Reporting Language) information is furnished and not filed or a part of a registration statement or prospectus for purposes of Sections 11 or 12 of the Securities Act of 1933, as amended, is deemed not filed for purposes of Section 18 of the Exchange Act of 1934, as amended, and otherwise is not subject to liability under these sections. |
83
SIGNATURES
The registrant hereby certifies that it meets all of the requirements for filing on Form 20-F and that it has duly caused and authorized the undersigned to sign this annual report on its behalf.
| | |
HOME INNS & HOTELS MANAGEMENT INC. |
| |
| By: | | /s/ David Jian Sun |
| Name: | | David Jian Sun |
| Title: | | Director and Chief Executive Officer |
Date: April 22, 2013
84
HOME INNS & HOTELS MANAGEMENT INC.
INDEX TO CONSOLIDATED FINANCIAL STATEMENTS
F-1

Report of Independent Registered Public Accounting Firm
2013/SH-089/HXU/AZYP
To the Board of Directors and Shareholders of Home Inns & Hotels Management Inc.:
In our opinion, the accompanying consolidated balance sheets and the related consolidated statements of operations, of changes in shareholders’ equity and of cash flows present fairly, in all material respects, the financial position of Home Inns & Hotels Management Inc. (the “Company”) and its subsidiaries as of December 31, 2012 and 2011, and the results of their operations and their cash flows for each of the three years in the period ended December 31, 2012 in conformity with accounting principles generally accepted in the United States of America. Also in our opinion, the Company maintained, in all material respects, effective internal control over financial reporting as of December 31, 2012, based on criteria established inInternal Control – Integrated Framework issued by the Committee of Sponsoring Organizations of the Treadway Commission (COSO). The Company’s management is responsible for these financial statements, for maintaining effective internal control over financial reporting and for its assessment of the effectiveness of internal control over financial reporting, included in Management’s Report on Internal Control over Financial Reporting appearing in item 15 of this Form 20-F. Our responsibility is to express opinions on these financial statements and on the Company’s internal control over financial reporting based on our integrated audits. We conducted our audits in accordance with the standards of the Public Company Accounting Oversight Board (United States). Those standards require that we plan and perform the audits to obtain reasonable assurance about whether the financial statements are free of material misstatement and whether effective internal control over financial reporting was maintained in all material respects. Our audits of the financial statements included examining, on a test basis, evidence supporting the amounts and disclosures in the financial statements, assessing the accounting principles used and significant estimates made by management, and evaluating the overall financial statement presentation. Our audit of internal control over financial reporting included obtaining an understanding of internal control over financial reporting, assessing the risk that a material weakness exists, and testing and evaluating the design and operating effectiveness of internal control based on the assessed risk. Our audits also included performing such other procedures as we considered necessary in the circumstances. We believe that our audits provide a reasonable basis for our opinions.
A company’s internal control over financial reporting is a process designed to provide reasonable assurance regarding the reliability of financial reporting and the preparation of financial statements for external purposes in accordance with generally accepted accounting principles. A company’s internal control over financial reporting includes those policies and procedures that (i) pertain to the maintenance of records that, in reasonable detail, accurately and fairly reflect the transactions and dispositions of the assets of the company; (ii) provide reasonable assurance that transactions are recorded as necessary to permit preparation of financial statements in accordance with generally accepted accounting principles, and that receipts and expenditures of the company are being made only in accordance with authorizations of management and directors of the company; and (iii) provide reasonable assurance regarding prevention or timely detection of unauthorized acquisition, use, or disposition of the company’s assets that could have a material effect on the financial statements.
Because of its inherent limitations, internal control over financial reporting may not prevent or detect misstatements. Also, projections of any evaluation of effectiveness to future periods are subject to the risk that controls may become inadequate because of changes in conditions, or that the degree of compliance with the policies or procedures may deteriorate.
/s/ PricewaterhouseCoopers Zhong Tian CPAs Limited Company
Shanghai, the People’s Republic of China
April 22, 2013

PricewaterhouseCoopers Zhong Tian CPAs Limited Company, 11/F PricewaterhouseCoopers Center
2 Corporate Avenue, 202 Hu Bin Road, Huangpu District, Shanghai 200021, PRC
T: +86 (21) 2323 8888, F: +86 (21) 2323 8800, www.pwccn.com
F-2
HOME INNS & HOTELS MANAGEMENT INC.
CONSOLIDATED STATEMENTS OF OPERATIONS
FOR THE YEARS ENDED DECEMBER 31, 2010, 2011 AND 2012
(Amounts expressed in RMB in thousands, except share and per share data and where otherwise stated)
| | | | | | | | | | | | | | | | | | |
| | | Note | | 2010 | | | 2011 | | | 2012 | | | 2012 | |
| | | | | | | | | | | | | | US$ thousands | |
| | | | | | | | | | | | | | (Note 2(d)) | |
Revenues: | | | | | | | | | | | | | | | | | | |
Leased-and-operated hotels | | | | | 2,910,458 | | | | 3,559,740 | | | | 5,164,799 | | | | 829,007 | |
Franchised-and-managed hotels | | | | | 256,799 | | | | 399,986 | | | | 604,936 | | | | 97,099 | |
| | | | | | | | | | | | | | | | | | |
Total revenues | | | | | 3,167,257 | | | | 3,959,726 | | | | 5,769,735 | | | | 926,106 | |
Less: Business tax and related surcharges | | | | | (191,232 | ) | | | (249,274 | ) | | | (353,418 | ) | | | (56,728 | ) |
| | | | | | | | | | | | | | | | | | |
Net revenues | | | | | 2,976,025 | | | | 3,710,452 | | | | 5,416,317 | | | | 869,378 | |
Operating costs and expenses: | | | | | | | | | | | | | | | | | | |
Leased-and-operated hotel costs – | | | | | | | | | | | | | | | | | | |
Rents and utilities | | | | | (875,510 | ) | | | (1,232,662 | ) | | | (1,953,243 | ) | | | (313,517 | ) |
Personnel costs | | | | | (506,406 | ) | | | (657,155 | ) | | | (1,037,371 | ) | | | (166,510 | ) |
Depreciation and amortization | | | | | (308,888 | ) | | | (398,914 | ) | | | (612,789 | ) | | | (98,359 | ) |
Consumables, food and beverage | | | | | (173,256 | ) | | | (258,120 | ) | | | (351,338 | ) | | | (56,394 | ) |
Others | | | | | (310,705 | ) | | | (413,815 | ) | | | (687,254 | ) | | | (110,312 | ) |
| | | | | | | | | | | | | | | | | | |
Total leased-and-operated hotel costs | | | | | (2,174,765 | ) | | | (2,960,666 | ) | | | (4,641,995 | ) | | | (745,092 | ) |
Personnel costs of franchised-and-managed hotels | | | | | (44,128 | ) | | | (72,009 | ) | | | (125,031 | ) | | | (20,069 | ) |
Sales and marketing expenses | | 2(w) | | | (33,257 | ) | | | (44,451 | ) | | | (76,878 | ) | | | (12,340 | ) |
General and administrative expenses | | | | | (193,482 | ) | | | (335,888 | ) | | | (315,235 | ) | | | (50,599 | ) |
| | | | | | | | | | | | | | | | | | |
Total operating costs and expenses | | | | | (2,445,632 | ) | | | (3,413,014 | ) | | | (5,159,139 | ) | | | (828,100 | ) |
| | | | | | | | | | | | | | | | | | |
Other income | | | | | — | | | | — | | | | 16,558 | | | | 2,658 | |
| | | | | | | | | | | | | | | | | | |
Income from operations | | | | | 530,393 | | | | 297,438 | | | | 273,736 | | | | 43,936 | |
| | | | | | | | | | | | | | | | | | |
Interest income | | | | | 9,454 | | | | 31,996 | | | | 11,874 | | | | 1,906 | |
Interest expense | | | | | (2,024 | ) | | | (46,868 | ) | | | (119,416 | ) | | | (19,168 | ) |
Issuance costs for convertible notes | | 12 | | | (42,559 | ) | | | — | | | | — | | | | — | |
Loss from equity investment | | | | | — | | | | — | | | | (2,305 | ) | | | (370 | ) |
(Loss)/gain on change in fair value of convertible notes | | 12 | | | (9,040 | ) | | | 198,547 | | | | (87,099 | ) | | | (13,980 | ) |
Gain on buy-back of convertible bonds | | 11 | | | 2,480 | | | | 1,521 | | | | — | | | | — | |
Non-operating income | | 2(ac) | | | 22,223 | | | | 35,899 | | | | 43,248 | | | | 6,942 | |
Non-operating expenses | | 12 | | | — | | | | (7,315 | ) | | | (6,665 | ) | | | (1,070 | ) |
Foreign exchange (loss)/gain, net | | 2(c) | | | (4,350 | ) | | | 15,849 | | | | 217 | | | | 35 | |
| | | | | | | | | | | | | | | | | | |
Income before income tax expenses and noncontrolling interests | | | | | 506,577 | | | | 527,067 | | | | 113,590 | | | | 18,231 | |
Income tax expenses | | 4 | | | (139,969 | ) | | | (169,442 | ) | | | (136,305 | ) | | | (21,878 | ) |
| | | | | | | | | | | | | | | | | | |
Net income/(loss) | | | | | 366,608 | | | | 357,625 | | | | (22,715 | ) | | | (3,647 | ) |
| | | | | |
Less: Net income attributable to noncontrolling interests | | | | | (7,109 | ) | | | (6,094 | ) | | | (4,061 | ) | | | (652 | ) |
| | | | | | | | | | | | | | | | | | |
Net income/(loss) attributable to Home Inns’ shareholders | | | | | 359,499 | | | | 351,531 | | | | (26,776 | ) | | | (4,299 | ) |
| | | | | | | | | | | | | | | | | | |
| | | | | |
Earnings per share | | 16 | | | | | | | | | | | | | | | | |
— Basic | | | | | 4.45 | | | | 4.17 | | | | (0.29 | ) | | | (0.05 | ) |
| | | | | | | | | | | | | | | | | | |
— Diluted | | | | | 4.23 | | | | 1.26 | | | | (0.29 | ) | | | (0.05 | ) |
| | | | | | | | | | | | | | | | | | |
Weighted average ordinary shares outstanding | | | | | | | | | | | | | | | | | | |
— Basic | | | | | 80,846,617 | | | | 84,221,665 | | | | 90,804,777 | | | | 90,804,777 | |
| | | | | | | | | | | | | | | | | | |
— Diluted | | | | | 84,747,102 | | | | 94,299,393 | | | | 90,804,777 | | | | 90,804,777 | |
| | | | | | | | | | | | | | | | | | |
Share-based compensation expense was included in the statement of operations as follows: | | | | | | | | | | | | | | | | | | |
Leased-and-operated hotel costs – Personnel costs | | | | | — | | | | 3,283 | | | | 8,199 | | | | 1,316 | |
Personnel costs of Franchised-and-managed hotels | | | | | — | | | | 3,369 | | | | 9,578 | | | | 1,537 | |
Sales and marketing expenses | | | | | — | | | | 656 | | | | 1,535 | | | | 246 | |
General and administrative expenses | | | | | 53,272 | | | | 69,227 | | | | 74,064 | | | | 11,888 | |
The accompanying notes are an integral part of these consolidated financial statements.
F-3
HOME INNS & HOTELS MANAGEMENT INC.
CONSOLIDATED BALANCE SHEETS
AS OF DECEMBER 31, 2011 AND 2012
(Amounts expressed in RMB in thousands, except share and per share data and where otherwise stated)
| | | | | | | | | | | | | | |
| | | Note | | 2011 | | | 2012 | | | 2012 | |
| | | | | | | | | | | US$ thousands | |
| | | | | | | | | | | (Note 2(d)) | |
ASSETS | | | | | | | | | | | | | | |
Current assets: | | | | | | | | | | | | | | |
Cash and cash equivalents | | 2(e) | | | 1,786,038 | | | | 663,156 | | | | 106,444 | |
Restricted cash | | 2(f) | | | 205,926 | | | | 205,739 | | | | 33,023 | |
Accounts receivable, net | | 2(g) | | | 91,980 | | | | 98,176 | | | | 15,758 | |
Receivables from related parties | | 17 | | | 6,379 | | | | 6,818 | | | | 1,094 | |
Consumables | | | | | 43,049 | | | | 41,600 | | | | 6,677 | |
Prepayments and other current assets | | 3,2(g) | | | 137,887 | | | | 172,534 | | | | 27,694 | |
Deferred tax assets | | 4 | | | 75,446 | | | | 80,369 | | | | 12,900 | |
| | | | | | | | | | | | | | |
Total current assets | | | | | 2,346,705 | | | | 1,268,392 | | | | 203,590 | |
| | | | | | | | | | | | | | |
Investment in a jointly controlled entity | | 5 | | | 8,301 | | | | 6,625 | | | | 1,063 | |
Property and equipment, net | | 7 | | | 3,452,846 | | | | 3,846,835 | | | | 617,460 | |
Goodwill | | 8 | | | 2,197,728 | | | | 2,254,631 | | | | 361,893 | |
Intangible assets, net | | 9 | | | 1,174,452 | | | | 1,149,419 | | | | 184,494 | |
Other assets | | | | | 170,039 | | | | 117,350 | | | | 18,836 | |
Non-current deferred tax assets | | 4 | | | 199,765 | | | | 310,762 | | | | 49,881 | |
| | | | | | | | | | | | | | |
Total assets | | | | | 9,549,836 | | | | 8,954,014 | | | | 1,437,217 | |
| | | | | | | | | | | | | | |
LIABILITIES | | | | | | | | | | | | | | |
Current liabilities: | | | | | | | | | | | | | | |
Accounts payable | | | | | 91,457 | | | | 76,825 | | | | 12,331 | |
Payables to related parties | | 17 | | | 2,797 | | | | 3,798 | | | | 610 | |
Short term loans | | 13 | | | 346,550 | | | | 12,571 | | | | 2,018 | |
Finance lease liabilities | | | | | 7,006 | | | | 6,660 | | | | 1,069 | |
Salaries and welfare payable | | | | | 178,032 | | | | 215,569 | | | | 34,601 | |
Income tax payable | | | | | 80,356 | | | | 76,382 | | | | 12,260 | |
Other taxes payable | | | | | 27,295 | | | | 27,761 | | | | 4,456 | |
Deferred revenues | | | | | 202,870 | | | | 202,874 | | | | 32,564 | |
Convertible bonds | | 11 | | | 113,051 | | | | — | | | | — | |
Other unpaid and accruals | | 10 | | | 154,498 | | | | 165,886 | | | | 26,624 | |
Other payables | | 10 | | | 847,090 | | | | 925,134 | | | | 148,494 | |
Deferred tax liability | | 4 | | | 38,313 | | | | 29,439 | | | | 4,725 | |
| | | | | | | | | | | | | | |
Total current liabilities | | | | | 2,089,315 | | | | 1,742,899 | | | | 279,752 | |
| | | | | | | | | | | | | | |
The accompanying notes are an integral part of these consolidated financial statements.
F-4
HOME INNS & HOTELS MANAGEMENT INC.
CONSOLIDATED BALANCE SHEETS (CONTINUED)
AS OF DECEMBER 31, 2011 AND 2012
(Amounts expressed in RMB in thousands, except share and per share data and where otherwise stated)
| | | | | | | | | | | | | | |
| | | Note | | 2011 | | | 2012 | | | 2012 | |
| | | | | | | | | | | US$ thousands | |
| | | | | | | | | | | (Note 2(d)) | |
Non-Current Liabilities: | | | | | | | | | | | | | | |
Long term loans | | 13 | | | 1,165,666 | | | | 735,404 | | | | 118,040 | |
Deferred rental | | | | | 593,955 | | | | 631,618 | | | | 101,382 | |
Deferred revenues | | | | | 79,202 | | | | 45,089 | | | | 7,237 | |
Finance lease liabilities | | | | | 7,750 | | | | 1,620 | | | | 260 | |
Deposits due to franchisees | | | | | 63,472 | | | | 91,462 | | | | 14,681 | |
Other long term payables | | | | | — | | | | 10,620 | | | | 1,705 | |
Unfavorable lease liabilities | | 9 | | | 396,774 | | | | 370,548 | | | | 59,477 | |
Financial liability | | 12 | | | 979,008 | | | | 1,066,771 | | | | 171,229 | |
Deferred tax liabilities | | 4 | | | 294,728 | | | | 288,321 | | | | 46,279 | |
| | | | | | | | | | | | | | |
| | | | |
Total liabilities | | | | | 5,669,870 | | | | 4,984,352 | | | | 800,042 | |
| | | | | | | | | | | | | | |
| | | | |
Commitments and contingencies | | 19 | | | | | | | | | | | | |
| | | | |
Shareholders’ equity | | | | | | | | | | | | | | |
Ordinary shares (US$ 0.005 par value; 200,000,000 shares authorized, 90,659,882 and 91,672,320 shares issued and outstanding as of December 31, 2011 and 2012, respectively) | | 14 | | | 3,542 | | | | 3,574 | | | | 574 | |
Additional paid-in capital | | | | | 2,683,923 | | | | 2,802,905 | | | | 449,897 | |
Statutory reserves | | 2(ad) | | | 125,863 | | | | 158,417 | | | | 25,428 | |
Retained earnings | | | | | 1,051,976 | | | | 992,505 | | | | 159,308 | |
| | | | | | | | | | | | | | |
Total Home Inns shareholders’ equity | | | | | 3,865,304 | | | | 3,957,401 | | | | 635,207 | |
| | | | | | | | | | | | | | |
| | | | |
Noncontrolling interests | | | | | 14,662 | | | | 12,261 | | | | 1,968 | |
| | | | | | | | | | | | | | |
| | | | |
Total shareholders’ equity | | | | | 3,879,966 | | | | 3,969,662 | | | | 637,175 | |
| | | | | | | | | | | | | | |
| | | | |
Total liabilities and shareholders’ equity | | | | | 9,549,836 | | | | 8,954,014 | | | | 1,437,217 | |
| | | | | | | | | | | | | | |
The accompanying notes are an integral part of these consolidated financial statements.
F-5
HOME INNS & HOTELS MANAGEMENT INC.
CONSOLIDATED STATEMENTS OF CHANGES IN SHAREHOLDERS’ EQUITY
FOR THE YEARS ENDED DECEMBER 31, 2010, 2011 AND 2012
(Amounts expressed in RMB in thousands, except share and per share data and where otherwise stated)
| | | | | | | | | | | | | | | | | | | | | | | | | | | | |
| | | | | | | | | Additional | | | | | | | | | | | | Total | |
| | | Ordinary shares | | | paid-in | | | Statutory | | | Retained | | | Noncontrolling | | | shareholders’ | |
| | | Shares | | | Amount | | | Capital | | | reserves | | | earnings | | | interests | | | equity | |
| | | | | | | |
Balance as of January 1, 2010 | | | 80,303,510 | | | | 3,209 | | | | 1,798,086 | | | | 67,591 | | | | 399,218 | | | | 13,465 | | | | 2,281,569 | |
| | | | | | | | | | | | | | | | | | | | | | | | | | | | |
Exercise of restricted stocks (Note 15) | | | 75,000 | | | | 3 | | | | 781 | | | | — | | | | — | | | | — | | | | 784 | |
Exercise of stock option (Note 15) | | | 1,337,574 | | | | 45 | | | | 61,595 | | | | — | | | | — | | | | — | | | | 61,640 | |
Recognition of share-based compensation costs | | | — | | | | — | | | | 53,272 | | | | — | | | | — | | | | — | | | | 53,272 | |
Dividends distributed to noncontrolling interests | | | — | | | | — | | | | — | | | | — | | | | — | | | | (9,530 | ) | | | (9,530 | ) |
Net income | | | — | | | | — | | | | — | | | | — | | | | 359,499 | | | | 7,109 | | | | 366,608 | |
Appropriations to statutory reserves | | | — | | | | — | | | | — | | | | 26,523 | | | | (26,523 | ) | | | — | | | | — | |
| | | | | | | | | | | | | | | | | | | | | | | | | | | | |
Balance as of December 31, 2010 | | | 81,716,084 | | | | 3,257 | | | | 1,913,734 | | | | 94,114 | | | | 732,194 | | | | 11,044 | | | | 2,754,343 | |
| | | | | | | | | | | | | | | | | | | | | | | | | | | | |
Exercise of stock option (Note 15) | | | 794,182 | | | | 26 | | | | 27,829 | | | | — | | | | — | | | | — | | | | 27,855 | |
Issuance of ordinary shares in the acquisition of Motel 168 (Note 6) | | | 8,149,616 | | | | 259 | | | | 667,055 | | | | — | | | | — | | | | — | | | | 667,314 | |
Recognition of share-base compensation costs | | | — | | | | — | | | | 76,535 | | | | — | | | | — | | | | — | | | | 76,535 | |
Dividends distributed to noncontrolling interests | | | — | | | | — | | | | — | | | | — | | | | — | | | | (6,998 | ) | | | (6,998 | ) |
Net income | | | — | | | | — | | | | — | | | | — | | | | 351,531 | | | | 6,094 | | | | 357,625 | |
Appropriations to statutory reserves | | | — | | | | — | | | | — | | | | 31,749 | | | | (31,749 | ) | | | — | | | | — | |
Acquisition of noncontrolling interest of a subsidiary | | | — | | | | — | | | | (1,230 | ) | | | — | | | | — | | | | 1,220 | | | | (10 | ) |
Establishment of majority owned subsidiaries | | | — | | | | — | | | | — | | | | — | | | | — | | | | 3,302 | | | | 3,302 | |
| | | | | | | | | | | | | | | | | | | | | | | | | | | | |
| | | | | | | |
Balance as of December 31, 2011 | | | 90,659,882 | | | | 3,542 | | | | 2,683,923 | | | | 125,863 | | | | 1,051,976 | | | | 14,662 | | | | 3,879,966 | |
| | | | | | | | | | | | | | | | | | | | | | | | | | | | |
The accompanying notes are an integral part of these consolidated financial statements
F-6
HOME INNS & HOTELS MANAGEMENT INC.
CONSOLIDATED STATEMENTS OF CHANGES IN SHAREHOLDERS’ EQUITY (CONTINUED)
FOR THE YEARS ENDED DECEMBER 31, 2010, 2011 AND 2012
(Amounts expressed in RMB in thousands, except share and per share data and where otherwise stated)
| | | | | | | | | | | | | | | | | | | | | | | | | | | | |
| | | | | | | | | Additional | | | | | | | | | | | | Total | |
| | | Ordinary shares | | | paid-in | | | Statutory | | | Retained | | | Noncontrolling | | | shareholders’ | |
| | | Shares | | | Amount | | | Capital | | | reserves | | | earnings | | | interests | | | Equity | |
| | | | | | | |
Balance as of December 31, 2011 | | | 90,659,882 | | | | 3,542 | | | | 2,683,923 | | | | 125,863 | | | | 1,051,976 | | | | 14,662 | | | | 3,879,966 | |
| | | | | | | | | | | | | | | | | | | | | | | | | | | | |
Exercise of stock option (Note 15) | | | 1,012,438 | | | | 32 | | | | 26,583 | | | | — | | | | — | | | | — | | | | 26,615 | |
Recognition of share-based compensation costs | | | — | | | | — | | | | 92,912 | | | | — | | | | — | | | | — | | | | 92,912 | |
Dividends distributed to noncontrolling interests | | | — | | | | — | | | | — | | | | — | | | | — | | | | (6,675 | ) | | | (6,675 | ) |
Net income / (loss) | | | — | | | | — | | | | — | | | | — | | | | (26,776 | ) | | | 4,061 | | | | (22,715 | ) |
Appropriations to statutory reserves | | | — | | | | — | | | | — | | | | 32,695 | | | | (32,695 | ) | | | — | | | | — | |
Acquisition of noncontrolling interest of a subsidiary | | | — | | | | — | | | | (513 | ) | | | — | | | | — | | | | 213 | | | | (300 | ) |
Reversal of statutory reserve due to disposal of a subsidiary | | | — | | | | — | | | | — | | | | (141 | ) | | | — | | | | — | | | | (141 | ) |
| | | | | | | | | | | | | | | | | | | | | | | | | | | | |
Balance as of December 31, 2012 | | | 91,672,320 | | | | 3,574 | | | | 2,802,905 | | | | 158,417 | | | | 992,505 | | | | 12,261 | | | | 3,969,662 | |
| | | | | | | | | | | | | | | | | | | | | | | | | | | | |
Balance as of December 31, 2012 US$ thousands (Note 2(d)) | | | 91,672,320 | | | | 574 | | | | 449,897 | | | | 25,428 | | | | 159,308 | | | | 1,968 | | | | 637,175 | |
| | | | | | | | | | | | | | | | | | | | | | | | | | | | |
The accompanying notes are an integral part of these consolidated financial statements
F-7
HOME INNS & HOTELS MANAGEMENT INC.
CONSOLIDATED STATEMENTS OF CASH FLOWS
FOR THE YEARS ENDED DECEMBER 31, 2010, 2011 AND 2012
(Amounts expressed in RMB in thousands, except share and per share data and where otherwise stated)
| | | | | | | | | | | | | | | | |
| | | 2010 | | | 2011 | | | 2012 | | | 2012 | |
| | | | | | | | | | | | US$ thousands | |
| | | | | | | | | | | | (Note 2(d)) | |
Cash flows from operating activities: | | | | | | | | | | | | | | | | |
Net income/(loss) | | | 366,608 | | | | 357,625 | | | | (22,715 | ) | | | (3,647 | ) |
Adjustments to reconcile net income to net cash provided by operating activities: | | | | | | | | | | | | | | | | |
Share-based compensation | | | 53,272 | | | | 76,535 | | | | 93,376 | | | | 14,987 | |
Depreciation and amortization | | | 319,988 | | | | 412,684 | | | | 633,855 | | | | 101,741 | |
Amortization of upfront fee of term loan | | | — | | | | 5,726 | | | | 43,060 | | | | 6,912 | |
Foreign exchange loss/(gain), net | | | 4,350 | | | | (15,849 | ) | | | (217 | ) | | | (35 | ) |
(Gain)/loss from disposal of property and equipment | | | (6,165 | ) | | | 9,859 | | | | (11,557 | ) | | | (1,855 | ) |
Impairment loss of property and equipment | | | — | | | | 1,705 | | | | 12,641 | | | | 2,029 | |
Gain on buy-back of convertible bonds | | | (2,480 | ) | | | (1,521 | ) | | | — | | | | — | |
Issuance costs for convertible notes | | | 42,559 | | | | — | | | | — | | | | — | |
Loss/(gain) on change in fair value of convertible notes | | | 9,040 | | | | (198,547 | ) | | | 87,099 | | | | 13,980 | |
Provision for doubtful accounts | | | — | | | | 295 | | | | — | | | | — | |
Deferred income tax provision/(benefit) | | | 6,789 | | | | (15,559 | ) | | | (132,057 | ) | | | (21,197 | ) |
Share of loss of a jointly controlled entity | | | — | | | | 853 | | | | 1,676 | | | | 269 | |
Loss from fair value change of interest rate swap transaction | | | — | | | | 7,315 | | | | 6,665 | | | | 1,070 | |
Change in assets and liabilities, net of effects of acquisitions: | | | | | | | | | | | | | | | | |
Increase in accounts receivable | | | (11,205 | ) | | | (14,485 | ) | | | (6,045 | ) | | | (970 | ) |
Increase in receivables from related parties | | | (2,523 | ) | | | — | | | | — | | | | — | |
(Increase)/ decrease in consumables | | | (10,140 | ) | | | (4,894 | ) | | | 2,004 | | | | 322 | |
Increase in prepayments and other current assets | | | (25,674 | ) | | | (7,077 | ) | | | (29,941 | ) | | | (4,806 | ) |
(Increase)/decrease in other assets | | | (8,813 | ) | | | (16,855 | ) | | | 9,629 | | | | 1,546 | |
Increase/(decrease) in accounts payable | | | 24,088 | | | | (19,027 | ) | | | (12,692 | ) | | | (2,037 | ) |
Increase in payables to related parties | | | 1,150 | | | | 1,136 | | | | 1,241 | | | | 199 | |
Increase in salaries and welfare payable | | | 38,172 | | | | 1,852 | | | | 37,537 | | | | 6,025 | |
(Decrease)/increase in income tax payable | | | (19,367 | ) | | | 5,648 | | | | (4,089 | ) | | | (656 | ) |
(Decrease)/increase in other taxes payable | | | (53 | ) | | | 81 | | | | 330 | | | | 53 | |
Increase/(decrease) in accruals for customer reward program | | | 4,075 | | | | (13,931 | ) | | | 288 | | | | 46 | |
Increase in other payables and accruals | | | 19,409 | | | | 75,319 | | | | 7,306 | | | | 1,174 | |
Increase/(decrease) in deferred revenues | | | 27,674 | | | | 19,780 | | | | (34,109 | ) | | | (5,475 | ) |
Increase in deferred rental | | | 35,422 | | | | 56,585 | | | | 37,663 | | | | 6,045 | |
Increase in deposits due to franchisees | | | 12,719 | | | | — | | | | 27,990 | | | | 4,493 | |
Increase/(decrease) in interest accruals for convertible bonds and financial liability | | | 1,063 | | | | 849 | | | | (1,159 | ) | | | (186 | ) |
| | | | | | | | | | | | | | | | |
Net cash provided by operating activities | | | 879,958 | | | | 726,102 | | | | 747,779 | | | | 120,027 | |
| | | | | | | | | | | | | | | | |
The accompanying notes are an integral part of these consolidated financial statements.
F-8
HOME INNS & HOTELS MANAGEMENT INC.
CONSOLIDATED STATEMENTS OF CASH FLOWS (CONTINUED)
FOR THE YEARS ENDED DECEMBER 31, 2010, 2011 AND 2012
(Amounts expressed in RMB in thousands, except share and per share data and where otherwise stated)
| | | | | | | | | | | | | | | | |
| | | 2010 | | | 2011 | | | 2012 | | | 2012 | |
| | | | | | | | | | | | US$ thousands | |
| | | | | | | | | | | | (Note 2(d)) | |
Cash flows from investing activities: | | | | | | | | | | | | | | | | |
Proceeds from sale of property and equipment | | | 21,708 | | | | 5,192 | | | | 16,032 | | | | 2,573 | |
Purchase of property and equipment | | | (373,531 | ) | | | (737,102 | ) | | | (934,193 | ) | | | (149,950 | ) |
Purchase of intangible assets | | | (3,539 | ) | | | (3,040 | ) | | | (10,408 | ) | | | (1,670 | ) |
Cash paid to restricted cash – escrow account and interest reserve account | | | — | | | | (202,323 | ) | | | (3,703 | ) | | | (594 | ) |
Cash used for the acquisition of subsidiaries, net of cash acquired | | | (600 | ) | | | (1,732,226 | ) | | | (69,362 | ) | | | (11,133 | ) |
| | | | | | | | | | | | | | | | |
Net cash used in investing activities | | | (355,962 | ) | | | (2,669,499 | ) | | | (1,001,634 | ) | | | (160,774 | ) |
| | | | | | | | | | | | | | | | |
Cash flows from financing activities: | | | | | | | | | | | | | | | | |
Proceeds from share option exercise | | | 63,644 | | | | 28,173 | | | | 26,615 | | | | 4,272 | |
Net proceeds from issuance of convertible notes | | | 1,188,823 | | | | — | | | | — | | | | — | |
Buy-back of convertible bonds | | | (202,687 | ) | | | (45,507 | ) | | | — | | | | — | |
Repayment of convertible bonds | | | — | | | | — | | | | (111,945 | ) | | | (17,968 | ) |
Payment for bond offering related issuance costs | | | — | | | | (5,874 | ) | | | — | | | | — | |
Proceeds from loans, net of upfront fee | | | 24,900 | | | | 1,433,559 | | | | — | | | | — | |
Repayment of short-term borrowings | | | (24,900 | ) | | | — | | | | (760,949 | ) | | | (122,141 | ) |
Cash paid for finance lease | | | — | | | | (1,808 | ) | | | (7,233 | ) | | | (1,161 | ) |
Dividend paid to noncontrolling interests shareholders of subsidiaries | | | (9,530 | ) | | | (8,743 | ) | | | (7,354 | ) | | | (1,180 | ) |
Cash settlement of interest swap transaction | | | — | | | | — | | | | (3,418 | ) | | | (549 | ) |
Capital contribution from a noncontrolling interests shareholders of newly established majority-owned subsidiary | | | — | | | | 3,302 | | | | — | | | | — | |
| | | | | | | | | | | | | | | | |
Net cash provided by/(used in) financing activities | | | 1,040,250 | | | | 1,403,102 | | | | (864,284 | ) | | | (138,727 | ) |
| | | | | | | | | | | | | | | | |
| | | | |
Effect of foreign exchange rate changes on cash and cash equivalents | | | (11,195 | ) | | | (56,310 | ) | | | (4,743 | ) | | | (761 | ) |
| | | | |
Net increase/(decrease) in cash and cash equivalents | | | 1,553,051 | | | | (596,605 | ) | | | (1,122,882 | ) | | | (180,235 | ) |
Cash and cash equivalents, beginning of year | | | 829,592 | | | | 2,382,643 | | | | 1,786,038 | | | | 286,679 | |
| | | | | | | | | | | | | | | | |
Cash and cash equivalents, end of year | | | 2,382,643 | | | | 1,786,038 | | | | 663,156 | | | | 106,444 | |
| | | | | | | | | | | | | | | | |
| | | | |
Supplemental disclosure of cash flow information | | | | | | | | | | | | | | | | |
Cash paid during the year for income tax and withholding tax | | | (152,547 | ) | | | (179,352 | ) | | | (272,336 | ) | | | (43,713 | ) |
Cash paid during the year for interest | | | (211 | ) | | | (39,115 | ) | | | (77,706 | ) | | | (12,473 | ) |
| | | | |
Supplemental schedule of non-cash activities: | | | | | | | | | | | | | | | | |
Unpaid consideration related to the acquisition of Motel 168 | | | — | | | | 143,728 | | | | — | | | | — | |
Unpaid consideration related to the other acquisitions | | | — | | | | — | | | | 8,108 | | | | 1,301 | |
Non-cash consideration in settlement of the seller’ payable to Motel 168 | | | — | | | | 23,222 | | | | — | | | | — | |
Accruals related to the construction costs of property and equipment | | | 169,196 | | | | 169,134 | | | | 78,030 | | | | 12,525 | |
Accruals related to the issuance costs for convertible notes | | | 5,998 | | | | — | | | | — | | | | — | |
Restricted cash related to the exercise of the employee stock option which are yet to be transmitted to the employees | | | 21,552 | | | | (17,949 | ) | | | (3,596 | ) | | | (577 | ) |
Issuance of ordinary shares related to the acquisition of Motel 168 | | | — | | | | 667,314 | | | | — | | | | — | |
The accompanying notes are an integral part of these consolidated financial statements.
F-9
HOME INNS & HOTELS MANAGEMENT INC.
NOTES TO THE CONSOLIDATED FINANCIAL STATEMENTS
(Amounts expressed in RMB in thousands, except share and per share data and where otherwise stated)
| 1. | ORGANIZATION AND NATURE OF OPERATIONS |
The accompanying consolidated financial statements include the financial statements of Home Inns & Hotels Management Inc. (“the Company”), its subsidiaries, and variable interest entities (“VIEs”) for which the Company is the primary beneficiary (“VIE subsidiary”). The Company and its consolidated subsidiaries and VIE subsidiaries are collectively referred to as the “Group”.
The Company was established in Cayman Islands on May 30, 2006. In June 2006, all the then existing shareholders of Home Inns & Hotels Management (Hong Kong) Limited (“Home Inns HK”), the Company’s predecessor, exchanged their respective shares in Home Inns HK for an equivalent number of shares in the Company. As a result, Home Inns HK became a wholly-owned subsidiary of the Company. Home Inns HK did not have any operations until April 2002 when Home Inns & Hotels Management (Beijing) Co., Ltd. (“Home Inns Beijing”), a hotel operation and management company, was established as a joint venture of Home Inns HK and Beijing Capital Travel International Hotel Group Co., Ltd. (“Beijing Capital Travel”), a subsidiary of Beijing Tourism Group (“BTG”). At inception, Home Inns HK and BTG, through Beijing Capital Travel, owned 55% and 45% interest in Home Inns Beijing, respectively. Through a series of financing activities and acquisitions, Home Inns Beijing has become a wholly-owned subsidiary in July 2007.
In October 2006, the Company completed an initial public offering of American Depositary Shares (“ADSs”). ADSs of the Company are traded from October 26, 2006 on Nasdaq Global Market under the symbol “HMIN” in the United States.
In October 2011, the Group completed the acquisition of 100% equity interest of Motel 168 International Holding Limited (“Motel 168”). The total consideration of RMB 2,869,045 included RMB 2,201,731 in cash and RMB 667,314 in share consideration of 8,149,616 Home Inns’ ordinary shares. Thereafter, Motel 168 became a wholly owned subsidiary of the Group. (Refer to Note 6).
The principal activities of the Group are to develop, lease, operate, franchise, and manage economy hotels under the Home Inn brand, Yitel brand and Motel 168 brand in the People’s Republic of China (“PRC”). The Group either leases real estate properties on which it develops and operates hotels or franchises the Home Inn brand, Yitel brand and Motel 168 brand to hotel owners and manages these hotels. The former type of hotels is referred to as “leased-and-operated hotels” and the latter type of hotels as “franchised-and-managed hotels.”
Leased-and-operated hotels
The Group leases hotel properties from property owners and develops these hotels directly, by hiring, training and supervising the managers and employees to operate the hotels. The Group is responsible for hotel development and customization to conform to the standards of the Group, as well as repairs and maintenance, operating expenses and management of properties over the term of the lease. Under the lease arrangements, the Group typically enjoys rental holiday of three to six months and pays fixed rent on a quarterly basis for the first three or five years of the lease term, after which the rental payments may be subject to an increase every three to five years.
Franchised-and-managed hotels
The Group enters into certain franchise arrangements with hotel owners for which the Group is responsible for managing the hotels, including hiring and appointment of the general manager of each franchised-and-managed hotel. Under a typical franchise agreement, the franchisee is required to pay an initial franchise fee and ongoing management service fees equal to a certain percentage of the revenues of the hotel. The franchisee is responsible for the costs of hotel development and customization and the costs of its operations. The term of the franchise agreement is typically 5 years or 8 years and is renewable only upon mutual agreement between the Group and the franchisee.
F-10
HOME INNS & HOTELS MANAGEMENT INC.
NOTES TO THE CONSOLIDATED FINANCIAL STATEMENTS (CONTINUED)
(Amounts expressed in RMB in thousands, except share and per share data and where otherwise stated)
| 2. | PRINCIPAL ACCOUNTING POLICIES |
The principal accounting policies adopted in the preparation of these consolidated financial statements are set out below:
a. Basis of presentation and use of estimates
The accompanying consolidated financial statements have been prepared in accordance with generally accepted accounting principles in the United States of America (“US GAAP”).
The preparation of financial statements in conformity with US GAAP requires management to make estimates and assumptions that affect the reported amounts of assets and liabilities, disclosures of contingent assets and liabilities at the balance sheet dates and the reported amounts of revenues and expenses during the reporting periods. Significant accounting estimates reflected in the Group’s financial statements mainly include assumptions used in the computation of share-based compensation, allowance for doubtful accounts, assumption of redemption rate utilized in customer loyalty program, assumptions and inputs used in fair value measurement of financial liabilities, assumptions used to measure impairment of long-lived assets, intangible asset with indefinite life and goodwill, useful lives of long-lived assets, determination of fair value of identifiable assets and liabilities acquired through business combinations, recognition of non-controlling interests, and valuation allowance of deferred tax assets. Such accounting policies are impacted significantly by judgments, assumptions and estimates used in the preparation of the Group’s consolidated financial statements, and actual results could differ materially from these estimates.
As of December 31, 2012, the Group’s current liabilities exceeded its current assets by approximately RMB 474.5 million. As of December 31, 2012, the Group’ credit facilities was RMB 600 million and these facilities are available to be drawn down if needed. The Group believes that by closely monitoring and appropriately allocating its cash resources, together with drawing down the above credit facilitates, if needed, it is able to maintain a sufficient cash position and liquidity status in the foreseeable future.
b. Basis of consolidation and accounting for investments
The consolidated financial statements include the financial statements of the Company, its subsidiaries and VIEs. All significant transactions and balances between the Company, its subsidiaries and VIEs have been eliminated upon consolidation.
A subsidiary is an entity in which the Company, directly or indirectly, controls more than one half of the voting power; has the power to appoint or remove the majority of the members of the board of directors; to cast a majority of votes at the meeting of the board of directors or to govern the financial and operating policies of the investee under a statute or agreement among the shareholders or equity holders.
Accounting Standards Codification (“ASC”) 810 “Consolidation”, which provides guidance on the identification of and financial reporting for entities over which control is achieved through means other than voting interests, which requires certain variable interest entities to be consolidated by the primary beneficiary of the entity.
F-11
HOME INNS & HOTELS MANAGEMENT INC.
NOTES TO THE CONSOLIDATED FINANCIAL STATEMENTS (CONTINUED)
(Amounts expressed in RMB in thousands, except share and per share data and where otherwise stated)
Prior to January 1, 2011, certain entities were considered variable interest entities because the equity at risk of each entity was not sufficient to finance its intended activities without additional financial support. The Company was considered the primary beneficiary of these entities because it had a controlling financial interest and was the primary beneficiary of these VIEs as it had both the power to direct the activities of the VIEs that most significantly impacted the VIEs’ economic performance and an obligation to absorb losses or the right to receive benefits that could potentially be significant to the VIEs. Accordingly, the financial statements of the following VIEs were consolidated into the Company’s financial statements since their respective date of establishment/acquisition prior to January 1, 2011:
| | | | |
Name of VIE | | | The Company’s ownership interest | |
Home Inns & Hotels Management (Xiamen) Co., Ltd. (“Home Inns Xiamen”) | | | 51 | % |
Home Inns & Hotels Management (Fuzhou) Co., Ltd. (“Home Inns Fuzhou”) | | | 51 | % |
Home Inns & Hotels Management (Caoxi) Co., Ltd. (“Home Inns Caoxi”) | | | 51 | % |
Home Inns & Hotels Management (Caobao) Co., Ltd. (“Home Inns Caobao”) | | | 75 | % |
Home Inns & Hotels Management (Dongguan) Co., Ltd. (“Home Inns Dongguan”) | | | 65 | % |
Home Inns & Hotels Kuaijie (Fuzhou) Co., Ltd. (“Home Inns Fuzhou Kuaijie”) | | | 70 | % |
The total registered capital of the six VIEs was RMB 6,010 as of December 31, 2010. The total net assets of the consolidated VIEs were RMB 26,262 as of December 31, 2010. The total net income of the six VIE was RMB 16,257 in the year ended December 31, 2010. Management monitors the regulatory risk associated with these contractual arrangements. There were no consolidated VIE assets that were collateral for the VIE obligations and which could only be used to settle the VIE’s obligations. Creditors of the VIE had no recourse to the general credit of Home Inns & Hotels Management (Shanghai) Co., Ltd., which was the primary beneficiary of the VIEs.
In 2011, the Company has determined that the six VIE entities were no longer considered variable interest entities effective for the year ended December 31, 2011. As the Group has majority legal ownership in these entities, it continues to consolidate these entities. The reconsideration event did not have any impact on the Company’s consolidated financial statements.
The Company evaluates its business relationships such as those with franchisees to identify potential variable interest entities. Generally, these businesses qualify for the business scope exception under the consolidation guidance. Therefore, the Company has concluded that consolidation of any such entities is not appropriate for the periods.
c. Foreign currencies
The Group’s functional currency and reporting currency is Renminbi (“RMB”). Transactions denominated in currencies other than RMB are translated into RMB at the exchange rates quoted by the People’s Bank of China (the “PBOC”) prevailing at the dates of the transactions. Monetary assets and liabilities denominated in foreign currencies are translated into RMB using the applicable exchange rates quoted by the PBOC at the balance sheet dates. All such exchange gains and losses resulting from foreign currency transactions are included in the consolidated statements of operations.
The RMB is not a freely convertible currency. The PRC State Administration for Foreign Exchange, under the authority of the People’s Bank of China, controls the conversion of RMB into foreign currencies. The value of the RMB is subject to changes in central government policies and to international economic and political developments affecting supply and demand in the China foreign exchange trading system market.
F-12
HOME INNS & HOTELS MANAGEMENT INC.
NOTES TO THE CONSOLIDATED FINANCIAL STATEMENTS (CONTINUED)
(Amounts expressed in RMB in thousands, except share and per share data and where otherwise stated)
d. Convenience translation
Translations of balances in the statements of operations, balance sheet and statement of cash flows from RMB into United States dollars (“US$”) as of and for the year ended December 31, 2012 are solely for the convenience of the reader and were calculated at the rate of US$ 1.00 = RMB 6.2301, on December 31, 2012, representing the certificated exchange rate published by the Federal Reserve Board. No representation is intended to imply that the RMB amounts could have been, or could be, converted, realized or settled into US$ at that rate on December 31, 2012, or at any other rate.
e. Cash and cash equivalents
Cash and cash equivalents comprise cash on hand and liquid investment which are unrestricted as to withdrawal or use, and which have original maturities of three months or less that are placed with banks or other financial institutions. Cash and cash equivalents balance as of December 31, 2011 included US$ 52,747 thousand and HK$ 0.1 thousand. Cash and cash equivalents balance as of December 31, 2012 included US$ 41,524 thousand and HK$ 0.1 thousand.
f. Restricted cash
Restricted cash consists of cash proceeds from the exercise of share options by the Company’s employees which are yet to be transmitted to them, cash reserved in specific interests reserve account (“IRA”) for term loans which will be repaid in 6 months, and cash deposited in an escrow account for the settlement of the outstanding purchase consideration of Motel 168 acquisition.
g. Allowance for doubtful accounts
Provision is made against receivables to the extent collection is considered to be doubtful. Accounts receivable and other receivables in the balance sheet are stated net of such provision, if any. For the years ended December 31, 2011 and 2012, the allowance for doubtful accounts was RMB 295 and nil, respectively.
h. Consumables
The Group purchases consumables for the operation of leased-and-operated hotels. Consumables include fabrics, such as towels and beddings, which need to be renewed periodically. Consumables are amortized over their useful lives, generally one year or less, from the time they are put into use and are stated at purchase price less accumulated amortization.
i. Property and equipment, net
Property and equipment are stated at cost less accumulated depreciation and amortization and impairment losses, if any. The cost of property and equipment comprises its purchase price and any directly attributable costs, including interest cost during the period the asset is brought to its working condition and location for its intended use.
Depreciation and amortization of property and equipment is provided using the straight line method over their expected useful lives. The expected useful lives are as follows:
| | |
| Buildings | | 40 years |
| Leasehold improvements | | Over the shorter of the economic useful life or the lease period |
| Machinery and equipment | | 5 to 10 years |
| Furniture, fixtures and office equipment | | 3 to 5 years |
Construction in progress represents leasehold improvements under construction or installation and is stated at cost. Cost comprises original cost of property and equipment, installation, construction and other direct costs. Construction in progress is transferred to property and equipment and depreciation commences when the asset is ready for its intended use.
Expenditures for repairs and maintenance are expensed as incurred. Gain or loss on disposal of property and equipment, if any, is recognized in the statements of operations as the difference between the net sales proceeds and the carrying amount of the underlying asset.
F-13
HOME INNS & HOTELS MANAGEMENT INC.
NOTES TO THE CONSOLIDATED FINANCIAL STATEMENTS (CONTINUED)
(Amounts expressed in RMB in thousands, except share and per share data and where otherwise stated)
j. Fair value measurement
The Company adopted Accounting Standard Codification (“ASC”) 820 “Fair value measurements and disclosures” on January 1, 2008. This guidance defines fair value as the price that would be received to sell an asset or paid to transfer a liability in an orderly transaction between market participants at the measurement date (an exit price). The guidance outlines a valuation framework and creates a fair value hierarchy in order to increase the consistency and comparability of fair value measurements and the related disclosures. Under GAAP, certain assets and liabilities must be measured at fair value, and the guidance details the disclosures that are required for items measured at fair value.
The Company measures the fair value of financial assets and liabilities using inputs from the following three levels of the fair value hierarchy. The three levels are as follows:
Level 1 inputs are unadjusted quoted prices in active markets for identical assets that the management has the ability to access at the measurement date.
Level 2 inputs include quoted prices for similar assets in active markets, quoted prices for identical or similar assets in markets that are nor active, inputs other than quoted prices that are observable for the asset (i.e., interest rates, yield curves, etc.), and inputs that are derived principally from or corroborated by observable market data by correlation or other means (market corroborated inputs).
Level 3 includes unobservable inputs that reflect the management’s assumptions about the assumptions that market participants would use in pricing the asset. The management develops these inputs based on the best information available, including their own data.
The following table presents information about the Group’s financial liabilities classified as Level 3 as of December 31, 2012 and December 31, 2011.
| | | | | | | | | | | | | | | | |
| | | Balance as of December 31, 2012 | |
| | | | | | Fair Value Measurements | |
| | | Carrying Value | | | Using Fair Value Hierarchy | |
| | | | | | Level 1 | | | Level 2 | | | Level 3 | |
| | | | |
Convertible notes measured at fair value | | | 1,056,209 | | | | — | | | | — | | | | 1,056,209 | |
Interest rate swap transaction | | | 10,562 | | | | — | | | | — | | | | 10,562 | |
| | | | | | | | | | | | | | | | |
Total financial liability, non-current | | | 1,066,771 | | | | — | | | | — | | | | 1,066,771 | |
| | | | | | | | | | | | | | | | |
| | | | | | | | | | | | | | | | |
| | | Balance as of December 31, 2011 | |
| | | | | | Fair Value Measurements | |
| | | Carrying Value | | | Using Fair Value Hierarchy | |
| | | | | | Level 1 | | | Level 2 | | | Level 3 | |
| | | | |
Convertible notes measured at fair value | | | 971,693 | | | | — | | | | — | | | | 971,693 | |
Interest rate swap transaction | | | 7,315 | | | | — | | | | — | | | | 7,315 | |
| | | | | | | | | | | | | | | | |
Total financial liability, non-current | | | 979,008 | | | | — | | | | — | | | | 979,008 | |
| | | | | | | | | | | | | | | | |
A summary of changes in Level 3 financial liabilities for the year ended December 31, 2012 was as follows:
| | | | |
Balance at December 31, 2011 | | | 979,008 | |
Add: Unrealized loss – change in fair value in convertible notes (note 12) | | | 87,099 | |
Less: foreign exchange gains in convertible notes (note 12) | | | (2,583 | ) |
Add: Loss arising from change in fair value in interest rate swap transaction (note 12) | | | 6,665 | |
Less: Cash settlement of swap transaction (note 12) | | | (3,418 | ) |
| | | | |
Balance at December 31, 2012 | | | 1,066,771 | |
| | | | |
F-14
HOME INNS & HOTELS MANAGEMENT INC.
NOTES TO THE CONSOLIDATED FINANCIAL STATEMENTS (CONTINUED)
(Amounts expressed in RMB in thousands, except share and per share data and where otherwise stated)
k. Fair value of financial instruments
Financial instruments of the Group primarily comprise of cash and cash equivalents, restricted cash, receivables, payables, accruals, term loans, convertible bonds and financial liability. Carrying values of cash and cash equivalents, restricted cash, receivables, payables, and accruals approximate their estimated fair values due to the short-term nature of these financial instruments. The carrying values of term loans approximate their fair values as all the borrowings carry variable interest rates which approximate rates currently offered by the Group’s bankers for similar debt instruments of comparable maturities. Fair value of convertible bonds is measured using Level 1 input, which is based on quotes obtained from over-the-counter trading activities (Refer to Note 11). Fair value of financial liability associated with the issuance of convertible notes in 2010 is measured using Level 3 inputs, which is measured using a binomial model. Fair value of the financial liability associated with the interest rate swap transaction in 2011 is measured using level 3 inputs, which is measured using the discounted cash flow method (Refer to Note 12).
The following table presents information about the composition of the Group’s financial instruments and the relevant fair value considerations.
| | |
Items | | Fair value consideration |
| |
| Cash and cash equivalents | | Carrying values of these items approximate their estimated fair values due to the short-term nature of these financial instruments. |
| Restricted cash | |
| Receivables | |
| Payables | |
| Accruals | |
| |
| Term loans | | The carrying values of term loans approximate their fair values as all the borrowings carry variable interest rates which approximate rates currently offered by the Group’s bankers for similar debt instruments of comparable maturities. |
| |
| Convertible bonds | | Fair value of convertible bonds is measured using Level 1 input, which is based on quotes obtained from over-the-counter trading activities (Refer to Note 11) |
| |
| Financial liability | | Fair value of financial liability associated with the issuance of convertible notes in 2010 is measured using Level 3 inputs, which is measured using a binomial model. Fair value of the financial liability associated with the interest rate swap transaction in 2011 is measured using level 3 inputs, which is measured using the discounted cash flow method (Refer to Note 12). |
l. Business combinations
U.S. GAAP requires that business combinations be accounted for under the acquisition purchase method. From January 1, 2009, the group adopted ASC 805 “Business Combinations”. Following this adoption, the cost of an acquisition is measured as the aggregate of the fair values at the date of exchange of the assets given, liabilities incurred, and equity instruments issued. The costs directly attributable to the acquisition are expensed as incurred. Identifiable assets, liabilities and contingent liabilities acquired or assumed are measured separately at their fair value as of the acquisition date, irrespective of the extent of any non-controlling interests. The excess of (i) the total of cost of acquisition, fair value of the non controlling interests and acquisition date fair value of any previously held equity interest in the acquiree over (ii) the fair value of the identifiable net assets of the acquiree is recorded as goodwill. If the cost of acquisition is less than the fair value of the net assets of the entity acquired, the difference is recognized directly in the statements of operations.
The determination and allocation of fair values to the identifiable assets acquired and liabilities assumed is based on various assumptions and valuation methodologies requiring considerable management judgment. The most significant variables in these valuations are discount rates, terminal values, the number of years on which to base the cash flow projections, as well as the assumptions and estimates used to determine the cash inflows and outflows. Management determines discount rates to be used based on the risk inherent in the related activity’s current business model and industry comparisons. Terminal values are based on the expected life of assets and forecasted life cycle and forecasted cash flows over that period. Although we believe that the assumptions applied in the determination are reasonable based on information available at the date of acquisition, actual results may differ from the forecasted amounts and the difference could be material.
F-15
HOME INNS & HOTELS MANAGEMENT INC.
NOTES TO THE CONSOLIDATED FINANCIAL STATEMENTS (CONTINUED)
(Amounts expressed in RMB in thousands, except share and per share data and where otherwise stated)
m. Jointly controlled entity
Investment in a jointly controlled entity is accounted for by the equity method of accounting as the Group has the ability to exercise significant influence but does not own a majority equity interest. Under this method, the Group’s income (loss) from investment is recognized in the consolidated statements of operations. Unrealized gains on transactions between the Group and the jointly controlled entity are eliminated to the extent of the Group’s interest in the jointly controlled entity, if any; unrealized losses are also eliminated unless the transaction provides evidence of an impairment of the asset transferred. When the Group’s share of losses in the jointly controlled entity equals or exceeds its interest in the jointly controlled entity, the Group does not recognize further losses, unless the Group has incurred obligations or made payments on behalf of the jointly controlled entity.
The Group reviews its investment in the jointly controlled entity to determine whether a decline in fair value below the carrying value is other than temporary at period end. The primary factors the Group considers in its determination are the length of time that the fair value of the investment is below the Group’s carrying value and the financial condition, operating performance and near term prospects of the investee. In addition, the Group considers the reason for the decline in fair value, including general market conditions, industry-specific or investee-specific reasons, and changes in valuation subsequent to the balance sheet date and the Group’s intent and ability to hold the investment for a period of time sufficient to allow for a recovery in fair value. If the decline in fair value is deemed to be other than temporary, the carrying value of the security is written down to fair value. There were no impairment losses for its investment in the jointly controlled entity in the years ended December 31, 2011 and 2012.
n. Goodwill
Goodwill is an asset representing the future economic benefits arising from other assets acquired in a business combination that are not individually identified and separately recognized. Goodwill is not amortized, but rather is tested for impairment at least annually. The guidance requires that a two-step impairment test be performed annually or whenever events or changes in circumstances indicate that it is more likely than not that the fair value of a reporting unit is less than its carrying amount. The first step of the test for impairment compares the book value of the Group’s reporting unit under which goodwill is recorded to its estimated fair value. The second step of the goodwill impairment test, which is only required when the net book value of the reporting unit exceeds the fair value, measures the impairment as the difference between the implied fair value of goodwill and its book value. No impairment of goodwill was recognized for the years ended December 31, 2010, 2011 and 2012.
o. Intangible assets, net
Intangible assets consist primarily of intangible assets acquired in business combinations and software purchased from third parties. Intangible assets acquired through business combinations are recognized as assets separate from goodwill if they satisfy either the “contractual-legal” or “separability” criterion. Intangible assets, including brand, favorable lease agreements and certain franchise agreements existing as of the date of acquisition, are recognized and measured at fair value upon acquisition.
Except brand, intangible assets arising from business combinations are amortized on a straight-line base over the remaining operating lease term, the franchise agreement term, or estimated life of customer relationship. The estimated useful lives of amortized intangibles are reassessed if circumstances occur that indicate the useful lives have changed.
The trademarked Motel 168 brand was registered in PRC China with remaining legal life of 6 years and can be renewed with minimal costs. Motel 168 is a well recognized brand in the economy hotel industry in PRC China. The useful life of the brand is indefinite. The Group evaluates indefinite-lived intangible asset each reporting period to determine whether events and circumstances continue to support an indefinite useful life. If an intangible asset that is not being amortized is subsequently determined to have a finite useful life, the asset is tested for impairment. ASC 350 “Intangibles – Goodwill and Other,” provides that intangible assets that have indefinite useful lives will not be amortized but rather will be tested at least annually for impairment.
Purchased software is stated at cost less accumulated amortization and impairment, if any, and is amortized on the straight-line basis over its estimated useful life of 5 years.
No impairment of intangible assets was recognized for the years ended December 31, 2010, 2011 and 2012.
F-16
HOME INNS & HOTELS MANAGEMENT INC.
NOTES TO THE CONSOLIDATED FINANCIAL STATEMENTS (CONTINUED)
(Amounts expressed in RMB in thousands, except share and per share data and where otherwise stated)
p. Impairment of long-lived assets and definite-lived intangible assets
Long-lived assets and definite-lived intangible assets are reviewed for impairment whenever events or changes in circumstances indicate that carrying amount of an asset may not be recoverable. Factors considered important that could result in an impairment review include significant underperformance relative to expected historical or projected future operating results, significant changes in the manner of use of long-lived assets and definite-lived intangible assets and significant negative industry or economic trends. Impairments are recognized based on the difference between the fair value of the asset and its carrying value in the event that the carrying amount exceeds the estimated future undiscounted cash flow attributed to such assets. Fair value is generally measured based on either quoted market prices, if available, or discounted cash flow analyses. Additionally, determining fair values requires probability weighting the cash flows to reflect expectations about possible variations in their amounts or timing and the selection of an appropriate discount rate. Although cash flow estimates are based on relevant information available at the time the estimates are made, estimates of future cash flows are, by nature, highly uncertain and may vary significantly from actual results. Any write-downs would be treated as permanent reductions in the carrying amounts of the assets and an operating loss would be recognized. The impairment losses on property and equipment recognized for the years ended December 31, 2010, 2011 and 2012 were nil, RMB 1,705 and RMB 12,641, respectively.
q. Employee benefits
The employees of the Group’s PRC subsidiaries are entitled to staff welfare benefits including medical care, housing fund, unemployment insurance and pension benefits. These entities are required to accrue for these benefits based on certain percentages of the employees’ salaries, subject to certain ceilings, in accordance with the relevant PRC regulations and make contributions to the government-sponsored plans out of the amounts accrued. Employee benefits expense was RMB 103,292, RMB 180,145 and RMB 215,251 for the years ended December 31, 2010, 2011 and 2012, respectively. Amounts accrued and included in salaries and welfare payable and other unpaid and accruals in the balance sheets were RMB 12,524 and RMB 11,913 for the years ended December 31, 2011 and 2012, respectively.
r. Accruals for customer reward program
The Group invites its customers to participate in a customer reward program. Prior to November 14, 2004, membership was free of charge. A one-time membership fee was charged after that date for new members. Members enjoy discounts on room rates, priority in hotel reservation, and accumulate membership points for their paid stays, which can be redeemed for membership upgrades, room night awards and other gifts. The estimated incremental costs to provide membership upgrades, room night awards and other gifts are accrued and recorded as accruals for customer reward program as members accumulate points and recognized as sales and marketing expenses in the statements of operations. As members redeem awards or their entitlements expire, the provision is reduced correspondingly.
Prior to the second quarter of 2011, the Group did not apply redemption rates to the estimation on reward cost due to limited history in its customer reward program. With sufficient historical information and accumulated knowledge on reward points redemption and expiration, the Group has applied a historical redemption rate of 20% prospectively in estimating the costs of reward points since April 1, 2011. After the acquisition of Motel 168, the terms under the Motel 168’s customer reward program have been updated to conform to that of Home Inns’ customer reward program. The Group reassesses the redemption rate at each period end to ensure that the estimate of redemption rate is reasonable.
As of December 31, 2011 and 2012, the accruals for customer reward program amounted to RMB 5,211 and RMB 5,499, respectively, based on the estimated liabilities under the customer reward program.
s. Deferred Revenue
Deferred revenue generally consists of advances received from customers for room stays, initial franchise fees received prior to the Group fulfilling its commitments to the franchisee, and cash received from sale of membership programs. Non-current portion of deferred revenue represents cash received from initial franchise fees and sales of membership program, which is recognized after one year from the balance sheet date.
F-17
HOME INNS & HOTELS MANAGEMENT INC.
NOTES TO THE CONSOLIDATED FINANCIAL STATEMENTS (CONTINUED)
(Amounts expressed in RMB in thousands, except share and per share data and where otherwise stated)
t. Revenue recognition
Revenues from leased-and-operated hotels represent primarily room rentals and food and beverage sales from the leased-and-operated hotels. Such revenues are recognized when goods are delivered and services are provided.
Revenues from franchised-and-managed hotels are derived from franchise agreements where the franchisees are required to pay (i) an initial franchise fee and (ii) on-going management and service fees based on a percentage of revenue which approximates 3% to 6% of the room revenues of the franchised hotels. The franchise fee is an initial one-time fee. For the franchise agreements signed under Home Inns brand, Yitel brand and Motel 168 brand after its acquisition by the Group, the franchise fee is recognized as revenue when the franchised hotel opens for business, becomes non-refundable, and the group has fulfilled all its commitments and obligations including the assistance to the franchisees in property design, leasehold improvement construction project management, systems installation, personnel recruiting and training. For the franchise agreements signed under Motel 168 brand prior to its acquisition by the Group, the franchise fee is recorded as deferred revenue when cash is received and recognized as revenue during the franchising period which usually is 5 years as the franchisees have the refund right which elapses proportionally within 5 years. On-going management and service fees are recognized when the underlying service revenue is recognized by the franchisees’ operations. Other revenues generated from franchise agreements include system maintenance and support fee and central reservation system usage fee, which are recognized when services are provided.
Prior to the second quarter of 2011, revenue from one-time membership fees was deferred when received and was recognized when membership records show no activity after a year. With sufficient historical information and accumulative knowledge on membership activity pattern, the Group estimated that average life of members is approximately two years. Therefore, the change in accounting estimate is applied prospectively, and revenue from one-time membership fees has been recognized over two years on a straight line basis since April 1, 2011. For the years ended December 31, 2010, 2011 and 2012, the Group recognized revenue of RMB 33,846, RMB 79,367 and RMB 172,148 from one-time membership fees, respectively.
The Group continues to monitor the membership activity pattern and reassess average life of members at each period end to ensure estimate of revenue recognition period is reasonable.
u. Business tax and related surcharge
The Group is subject to business tax and related surcharges on the services provided in the PRC. Such tax is levied based on turnover at a total approximate rate of 5.6% and is recorded as a reduction of revenues.
v. Leased-and-operated hotel costs
Leased-and-operated hotel costs include all direct costs incurred in the operation of the leased-and-operated hotels and consist primarily of property rentals and related expenses, utility costs, personnel compensation, amortization of guest room consumables, amortization of leasehold improvements, depreciation of equipment, amortization of consumables costs, food and beverage.
w. Sales and marketing expenses
Sales and marketing expenses consist primarily of advertising related expenses, expenses associated with the Group’s membership reward program, payroll and related compensation for the Group’s sales and marketing personnel and entertainment expenses relating to marketing activities. Advertising related expenses, including promotion expenses and production costs of marketing materials, are charged to the statements of operations as incurred and amounted to RMB 11,361, RMB 21,944 and RMB 24,068 for the years ended December 31, 2010, 2011 and 2012, respectively.
F-18
HOME INNS & HOTELS MANAGEMENT INC.
NOTES TO THE CONSOLIDATED FINANCIAL STATEMENTS (CONTINUED)
(Amounts expressed in RMB in thousands, except share and per share data and where otherwise stated)
x. Share-based compensation
The Group accounts for share-based compensation arrangements with employees in accordance with ASC 718 “Compensation – Stock Compensation”. It requires the Group to measure at the grant date the fair value of the stock-based award and recognize compensation expense, net of estimated forfeitures, on a straight-line basis, over the requisite service period. The Group uses the Black-Scholes option pricing model to determine the fair value of stock options. The requisite service period is the vesting period, which is generally 4 years. Forfeitures are estimated at the time of grant and revised in subsequent periods if actual forfeitures differ from those estimates.
A subsidiary of the Company grants share options which contained an exercise price denominated in US$. The Group determined it should account for the U.S. dollar denominated share options granted to employees and directors of the subsidiary as liability awards as the Company’s functional currency is RMB and the underlying shares denominated in U.S. dollar has not been publicly traded. All grants of share-based awards to employees and directors classified as liability are remeasured at the end of each reporting period with an adjustment for fair value recorded to the current period expense in order to properly reflect the cumulative expense based on the current fair value of the vested rewards over the vesting periods.
y. Leases
The Company leases certain property and equipment.
Leases of property and equipment are classified as operating leases when substantially all the risks and rewards of ownership of assets remain with the lessor. Payments made under operating leases net of any incentives received from the lessor are charged to the consolidated statements of operations on a straight-line basis over the terms of the underlying lease.
Leases of property and equipment are classified as finance leases when the Company has substantially all the risks and rewards of ownership. Finance leases are capitalized at the lease’s commencement at the lower of the fair value of the leased property and the present value of the minimum lease payments. Each lease payment is allocated between the liability and finance charges. The corresponding rental obligations, net of finance charges, are included in finance lease liabilities. The interest element of the finance cost is charged to the statements of operations over the lease period so as to produce a constant periodic rate of interest on the remaining balance of the liability for each period. The property and equipment acquired under finance leases are depreciated over the lease term if the lease does not meet the transfer of ownership criterion or the bargain purchase option criterion. If the lease meets either the transfer of ownership criterion or the bargain purchase option criterion, then the related assets are depreciated over the useful life of the asset.
Fixed assets capitalized under finance leases are depreciated in accordance with the Group’s policy for the depreciation of fixed assets.
z. Borrowing costs
Interests incurred in connection with term loan used for acquisition of Motel 168 are expensed as incurred. The upfront fee incurred in connection with the term loan are amortized and recorded as interest expenses over the loan period (Refer to Note 13).
Interest cost incurred on funds used to construct leasehold improvements during the active construction period is capitalized. For the years ended December 31, 2010, 2011 and 2012, there was no capitalized interest cost.
aa. Pre-operating expenditure
Pre-operating expenditure represents start-up costs, other than amounts capitalized as leasehold improvements, for leased-and-operated hotels are charged to the consolidated statements of operations in the period in which it is incurred.
ab. Taxation
The provision for income taxes is based on the income and expense amounts recorded in our consolidated statements of operations. Income tax expenses are recorded using the liability method. Deferred tax assets or liabilities are recognized for the estimated future tax effects attributable to temporary differences and tax loss carry forwards. Deferred tax assets and liabilities are recognized and measured using enacted income tax rates expected to apply to taxable income in the years in which those temporary differences are expected to be recovered or settled. The effect on deferred taxes of a change in tax rates is recognized in statements of operations in the period that includes the enactment date. A valuation allowance is recorded to reduce the amount of deferred tax assets if it is considered more likely than not that such assets will not be realized.
F-19
HOME INNS & HOTELS MANAGEMENT INC.
NOTES TO THE CONSOLIDATED FINANCIAL STATEMENTS (CONTINUED)
(Amounts expressed in RMB in thousands, except share and per share data and where otherwise stated)
In order to assess uncertain tax positions, the Group applies a more likely than not threshold and a two-step approach for the tax position measurement and financial statement recognition. For the two-step approach, the first step is to evaluate the tax position for recognition by determining if the weight of available evidence indicates that it is more likely than not that the position will be sustained, including resolution of related appeals or litigation processes, if any. The second step is to measure the tax benefit as the largest amount that is greater than 50% likely to be realized upon settlement. As of December 31, 2011 and 2012, there were no uncertain tax positions.
ac. Non-operating income
Other non-operating income primarily consists of financial subsidies received from provincial and local governments for operating a business in their jurisdictions and compliance with specific policies promoted by the local governments. During the years ended December 31, 2010, 2011 and 2012, the Group received financial subsidies of RMB 14,903, RMB 22,356 and RMB 43,248, respectively, from various local PRC government authorities. There are no defined rules and regulations to govern the criteria necessary for companies to receive such benefits, and the amount of financial subsidy is determined at the discretion of the relevant government authorities. Such amounts are recorded as other non-operating income when received as there is no additional condition attached to the subsidies.
ad. Statutory reserves
The Group’s subsidiaries incorporated in the PRC are required to set aside 10% of their net income, after offsetting accumulated losses from prior years, and before profit distributions to the investors, as reported in its statutory accounts on an annual basis to the Statutory Surplus Reserve Fund. Once the total Statutory Surplus Reserve Fund reaches 50% of the registered capital of the respective subsidiaries, further appropriations are discretionary. The Statutory Surplus Reserve Fund can be used to increase the registered capital and eliminate future losses of the respective companies under PRC regulations. The Group’s Statutory Surplus Reserve Fund is not distributable to shareholders except in the event of liquidation.
Appropriations to the Statutory Surplus Reserve Fund are accounted for as a transfer from retained earnings to statutory reserves. During the years ended December 31, 2010, 2011 and 2012, the Group made total appropriations to these statutory reserves of RMB 26,523, RMB 31,749 and RMB 32,695, respectively. During the year ended December 31, 2012, the Group made a reversal of RMB 141 from the statutory reserve to retained earnings due to disposal of a subsidiary. No reversal of the statutory reserve was made in the year ended December 31, 2011.
ae. Dividends
Dividends are recognized when declared. The Group has not declared or paid any dividends to its shareholders except for the noncontrolling interests.
Current PRC regulations permit PRC companies to pay dividends only out of their accumulated profits, if any, determined in accordance with PRC accounting standards and regulations. Additionally, the Company’s PRC subsidiaries can only distribute dividends after they have met the PRC requirements for appropriation to statutory reserves (Note 2(ad)). Restricted net assets of the Company’s PRC subsidiaries not distributable in the form of dividends to the parent as a result of the aforesaid PRC regulations were RMB 3,269,349 as of December 31, 2012. In addition to the typical statutory reserves of the Company’s PRC subsidiaries, the restricted net assets also includes RMB 3,110,933 paid in capital.
af. Earnings per share
In accordance with ASC 260 “Earnings Per Share”, basic earnings per share is computed by dividing net income attributable to ordinary shareholders by the weighted average number of ordinary shares outstanding during the year. The Company’s convertible bonds issued in 2007 and convertible notes issued in 2010 are not participating securities because the terms of the agreements do not provide any participating rights to the holders before conversion. Diluted earnings per share is calculated by dividing net income attributable to ordinary shareholders as adjusted for the monetary effect of instruments that are dilutive ordinary equivalent shares, if any, by the weighted average number of ordinary and dilutive ordinary equivalent shares outstanding during the year. Ordinary equivalent shares consist of the ordinary shares issuable upon the conversion of convertible bonds and convertible notes (using the if-converted method) the vesting of restricted stock and ordinary shares issuable upon the exercise of outstanding share options (using the treasury stock method).
F-20
HOME INNS & HOTELS MANAGEMENT INC.
NOTES TO THE CONSOLIDATED FINANCIAL STATEMENTS (CONTINUED)
(Amounts expressed in RMB in thousands, except share and per share data and where otherwise stated)
ag. Segment reporting
The Company follows “Disclosures about Segment of an Enterprise and Related Information” for its segment reporting. The Group operates and manages its business as a single segment. The Company’s chief operation decision-maker (“CODM”) reviews operating results to make decision about allocating resources and assessing performance for the entire company.
The Group primarily generates its revenues from customers in the PRC, and assets of the Group are also located in PRC. Accordingly, no geographical segments are presented.
ah. Recent accounting pronouncements
In December 2011, the FASB issued ASU 2011-11, Balance Sheet (Topic 210), “Disclosures about Offsetting Assets and Liabilities” (ASU 2011-11). This newly issued accounting standard requires an entity to disclose both gross and net information about instruments and transactions eligible for offset in the statements of financial position as well as instruments and transactions executed under a master netting or similar arrangement and was issued to enable users of financial statements to understand the effects or potential effects of those arrangements on their financial position. This ASU is required to be applied retrospectively and is effective for fiscal years, and interim periods within those years, beginning on or after January 1, 2013. As this accounting standard only requires enhanced disclosure, the Company does not expect the adoption of this standard to have a material impact on the Group’s financial statements.
In July 2012, the FASB issued ASU 2012-02, “Intangibles – Goodwill and Other: Testing Indefinite Lived Intangible Assets for Impairment”. The Update applies to all entities, both public and nonpublic, that have indefinite-lived intangible assets, other than goodwill, reported in their financial statements. Per the Update, an entity has the option first to assess qualitative factors to determine whether the existence of events and circumstances indicates that it is more likely than not that the indefinite-lived intangible asset is impaired. If, after assessing the totality of events and circumstances, an entity concludes that it is not more likely than not that the indefinite-lived intangible asset is impaired, then the entity is not required to take further action. The amendments are effective for annual and interim impairment tests performed for fiscal years beginning after September 15, 2012. Early adoption is permitted, including for annual and interim impairment tests performed as of a date before July 27, 2012, if financial statements for the most recent annual or interim period have not yet been issued. The adoption of this Update beginning on December 31, 2012 is not expected to have a material impact on the Company’s consolidated financial statements.
In February 2013, the FASB issued ASU 2013-02, “Comprehensive Income: Reporting of Amounts Reclassified Out of Accumulated Other Comprehensive Income”. This update does not change the current requirements for reporting net income or other comprehensive income in financial statements. However, this update requires an entity to provide information about the amounts reclassified out of accumulated other comprehensive income by component. In addition, an entity is required to present, either on the face of the statement where net income is presented or in the notes, significant amounts reclassified out of accumulated other comprehensive income by the respective line items of net income but only if the amount reclassified is required under U.S. GAAP to be reclassified to net income in its entirety in the same reporting period. For other amounts that are not required under U.S. GAAP to be reclassified in their entirety to net income, an entity is required to cross-reference to other disclosures required under U.S. GAAP that provide additional detail about those amounts. This update is effective prospectively for reporting periods beginning after December 15, 2012 for public entities. The adoption of this Update beginning on January 1, 2013 is not expected to have a material impact on the Company’s consolidated financial statements.
In February 2013, the FASB issued ASU 2013-04, “Obligations Resulting from Joint and Several Liability Arrangements for Which the Total Amount of the Obligation is Fixed at the Reporting Date”. This update provides guidance for the recognition, measurement, and disclosure of obligations resulting from joint and several liability arrangements for which the total amount of the obligation within the scope of this update is fixed at the reporting date, except for obligations addressed within existing guidance in U.S. GAAP. The guidance requires an entity to measure those obligations as the sum of the amount the reporting entity agreed to pay on the basis of its arrangement among its co-obligors and any additional amount the reporting entity expects to pay on behalf of its co-obligors. The guidance in this update also requires an entity to disclose the nature and amount of the obligation as well as other information about those obligations. This update is effective for fiscal years, and interim periods within those years, beginning after December 15, 2013. This update should be applied retrospectively to all prior periods presented for those obligations resulting from joint and several liability arrangements within the Update’s scope that exist at the beginning of an entity’s fiscal year of adoption. An entity may elect to use hindsight for the comparative periods (if it changed its accounting as a result of adopting the amendments in this Update) and should disclose that fact. The adoption of this Update beginning on January 1, 2013 is not expected to have a material impact on the Company’s consolidated financial statements.
F-21
HOME INNS & HOTELS MANAGEMENT INC.
NOTES TO THE CONSOLIDATED FINANCIAL STATEMENTS (CONTINUED)
(Amounts expressed in RMB in thousands, except share and per share data and where otherwise stated)
In March 2013, the FASB issued ASU 2013-05, “Parent’s Accounting for the Cumulative Translation Adjustment upon Derecognition of Certain Subsidiaries or Groups of Assets within a Foreign Entity or of an Investment in a Foreign Entity”. This update provides that when a reporting entity (parent) ceases to have a controlling financial interest in a subsidiary or group of assets that is a nonprofit activity or a business (other than a sale of in substance real estate or conveyance of oil and gas mineral rights) within a foreign entity, the parent is required to apply the guidance in Subtopic 830-30 to release any related cumulative translation adjustment into net income. Accordingly, the cumulative translation adjustment should be released into net income only if the sale or transfer results in the complete or substantially complete liquidation of the foreign entity in which the subsidiary or group of assets had resided. For an equity method investment that is a foreign entity, a pro rata portion of the cumulative translation adjustment should be released into net income upon a partial sale of such an equity method investment. However, this treatment does not apply to an equity method investment that is not a foreign entity. In those instances, the cumulative translation adjustment is released into net income only if the partial sale represents a complete or substantially complete liquidation of the foreign entity that contains the equity method investment. Additionally, the amendments in this update clarify that the sale of an investment in a foreign entity includes both (1) events that result in the loss of a controlling financial interest in a foreign entity (that is, irrespective of any retained investment) and (2) events that result in an acquirer obtaining control of an acquiree in which it held an equity interest immediately before the acquisition date (sometimes also referred to as a step acquisition). Accordingly, the cumulative translation adjustment should be released into net income upon the occurrence of those events. This update is effective prospectively for fiscal years (and interim reporting periods within those years) beginning after December 15, 2013. The adoption of this Update beginning on January 1, 2013 is not expected to have a material impact on the Company’s consolidated financial statements.
ai. Certain risks and concentration
Financial instruments that potentially subject the Company to significant concentrations of credit risk consist primarily of cash and accounts receivable. As of December 31, 2011 and 2012, substantially all of the Company’s cash was held in major financial institutions located in the PRC, Hong Kong and the United States of America, which management considers being of high credit quality. China does not have an official deposit insurance program, nor does it have an agency similar to The Federal Deposit Insurance Corporation (FDIC) in the United States. However, the Group believes that the risk of failure of any of these PRC banks is remote. Bank failure is extremely uncommon in China and the Group believes that those Chinese banks that hold the Company’s cash, cash equivalents and long term time deposit are financially sound based on public available information.
Accounts receivable are typically not collateralized and are denominated in RMB, and are derived from revenues earned from operations arising in the PRC.
No individual customer accounted for more than 10% of net revenues for the years ended December 31, 2010, 2011 and 2012. No individual customer accounted for more than 10% of accounts receivable at December 31, 2011 and 2012.
aj. Commitments and Contingencies
Liabilities for loss contingencies arising from claims, assessments, litigation, fines and penalties and other sources are recorded when it is probable that a liability has been incurred and the amount can be reasonably estimated.
| 3. | PREPAYMENTS AND OTHER CURRENT ASSETS |
Components of prepayments and other current assets as of December 31, 2011 and 2012 are as follows:
| | | | | | | | |
| | | 2011 | | | 2012 | |
Prepayment for utility and telecom expenses | | | 31,645 | | | | 47,460 | |
Prepayment for rental expenses | | | 28,748 | | | | 46,057 | |
Employee advances | | | 10,076 | | | | 11,694 | |
Proceeds receivable from disposal of a subsidiary | | | 12,418 | | | | 10,919 | |
Deposits for utility expenses | | | 9,772 | | | | 9,187 | |
Prepayment for advertisement, consultation and insurance | | | 5,778 | | | | 5,012 | |
Interest receivable | | | 7,047 | | | | 100 | |
Other current assets | | | 32,403 | | | | 42,105 | |
| | | | | | | | |
Total | | | 137,887 | | | | 172,534 | |
| | | | | | | | |
F-22
HOME INNS & HOTELS MANAGEMENT INC.
NOTES TO THE CONSOLIDATED FINANCIAL STATEMENTS (CONTINUED)
(Amounts expressed in RMB in thousands, except share and per share data and where otherwise stated)
Cayman Islands, British Virgin Islands (“BVI”) and the Republic of Mauritius (“Mauritius”)
Under the current laws of the Cayman Islands, BVI and Mauritius, the Company and its subsidiaries registered in Cayman Islands, BVI and Mauritius are not subject to tax on income or capital gain. In addition, upon payments of dividends by the Company to its shareholders, no Cayman Islands withholding tax will be imposed.
Hong Kong
Home Inns Hong Kong subsidiaries were subject to Hong Kong profit tax at a rate of 16.5% on their assessable profits. No Hong Kong profit tax has been provided as the Group did not have assessable profit that was earned in or derived from Hong Kong subsidiaries during the years presented.
PRC
The Company’s subsidiaries incorporated in the PRC are subject to PRC Corporate Income Tax (“CIT”) on the taxable income as reported in their respective statutory financial statements adjusted in accordance with relevant PRC income tax laws. Effective January 1, 2008, the Company’s subsidiaries are subject to the Corporate Income Tax Law of the People’s Republic of China (hereinafter “the new CIT Law”) as approved by the National People’s Congress on March 16, 2007, under which the corporate income tax rate applicable to most of the Group’s PRC entities adjusted from 33% to 25%. Five of the Group’s subsidiaries enjoyed a preferential income tax rate of 15% before 2008, and the income tax rate applicable to these subsidiaries is phased in at 18%, 20%, 22%, 24% and 25% in a 5 year period from 2008 to 2012. Shanghai Banli Software Technology Co., Ltd. and Suzhou Hengchuang Software Co., Ltd. were qualified software enterprises in 2008 and 2011 respectively and are exempted from income tax for the first two years and are entitled to a preferential tax rate of 12.5% for the three years from thereafter.
On February 22, 2008, the Ministry of Finance (“MOF”) and the State Administration of Taxation (“SAT”) jointly issued Cai Shui [2008] Circular 1 (“Circular 1”). According to Article 4 of Circular 1, distributions of accumulated profits earned by a Foreign Invested Enterprise (“FIE”) prior to January 1, 2008 to foreign investor(s) in 2008 or after will be exempt from withholding tax (“WHT”) while distribution of the profit earned by an FIE after January 1, 2008 to its foreign investor(s) shall be subject to WHT at a rate up to 10%. For certain jurisdictions that have signed tax treaties with the PRC, the WHT rate are 5%. No dividend was declared by PRC subsidiaries in the years ended December 31, 2009 and 2010. As the Group intended to indefinitely reinvest its earnings to further expand its businesses in PRC China, undistributed earnings as of December 31, 2009 and 2010 were considered to be indefinitely reinvested, Therefore, no deferred tax liability was recognized in the years ended December 31, 2009 and 2010.
In September 2011, in connection with the acquisition of Motel 168, the Group entered into a US$240.0 million US dollar denominated, 4-year term loan facility agreement (Refer to Note 13). In order to service the debt, after-tax profits from its PRC subsidiaries in China will be distributed to its overseas holding company borrower. The Group has recognized the relevant deferred tax liability of RMB 38,313 and RMB 29,439 as of December 31, 2011 and December 31, 2012 in connection with cumulative distributable earnings since 2008 using a 5% dividend withholding tax rate provided as a preferential rate by the tax arrangement between PRC and Hong Kong. (Note a,Reconciliation of the differences between statutory tax rate and the effective tax rate)
Composition of income tax expense
The current and deferred portion of income tax expense included in the consolidated statements of operations for the years ended December 31 is as follows:
| | | | | | | | | | | | |
| | | 2010 | | | 2011 | | | 2012 | |
Current income tax expenses | | | 133,180 | | | | 185,001 | | | | 235,594 | |
Deferred income tax provision/(benefit) | | | 6,789 | | | | (15,559 | ) | | | (99,289 | ) |
| | | | | | | | | | | | |
Income tax expenses | | | 139,969 | | | | 169,442 | | | | 136,305 | |
| | | | | | | | | | | | |
F-23
HOME INNS & HOTELS MANAGEMENT INC.
NOTES TO THE CONSOLIDATED FINANCIAL STATEMENTS (CONTINUED)
(Amounts expressed in RMB in thousands, except share and per share data and where otherwise stated)
Reconciliation of the differences between statutory tax rate and the effective tax rate
A reconciliation between the statutory CIT rate and the Group’s effective tax rate for the years ended December 31 is as follows:
| | | | | | | | | | | | |
| | | 2010 | | | 2011 | | | 2012 | |
Statutory CIT rate | | | 25% | | | | 25% | | | | 25% | |
Tax differential from statutory rate applicable to subsidiaries in the PRC | | | (3% | ) | | | (3% | ) | | | (1% | ) |
Tax differential for the expenses recorded by the Company and its subsidiaries registered in Cayman Islands, BVI and Mauritius which are not subject to tax (a) | | | 5% | | | | 2% | | | | 68% | |
Permanent difference for non-deductible expenses | | | 1% | | | | 1% | | | | 7% | |
Withholding tax on earnings no longer considered indefinitely reinvested | | | — | | | | 7% | | | | 21% | |
| | | | | | | | | | | | |
Effective CIT rate | | | 28% | | | | 32% | | | | 120% | |
| | | | | | | | | | | | |
| (a) | Tax differential for the expenses recorded by the Company and its subsidiaries registered in Cayman Islands, BVI and Mauritius which are not subject to tax primarily represents the following items which are not tax deductible: (i) a rate of 21% as a result of permanent difference arising from the share base compensation expenses (2011: 4%, 2010: 3%); (ii) a rate of 26% as a result of permanent differences arising from the interest expense in convertible notes and term loan (2011:2%, 2010: nil); (iii) a rate of 19% as a result of permanent difference in connection with loss arising from change in fair value in convertible notes (2011: (9%), 2010: nil). |
Deferred tax assets and liabilities comprised:
| | | | | | | | |
| | | 2011 | | | 2012 | |
Deferred tax assets, current: | | | | | | | | |
Tax loss carry forwards | | | 21,269 | | | | 17,547 | |
Deductible temporary differences related to: | | | | | | | | |
-rental expenses | | | 3,009 | | | | 3,888 | |
-pre-operating expenses | | | 8,886 | | | | 5,618 | |
-deferred revenue, current | | | 42,670 | | | | 43,075 | |
-accruals for customer reward program | | | 915 | | | | 1,003 | |
-others | | | 12,154 | | | | 16,411 | |
Valuation allowance | | | (13,457 | ) | | | (7,173 | ) |
| | | | | | | | |
| | | 75,446 | | | | 80,369 | |
| | | | | | | | |
Deferred tax assets, non-current: | | | | | | | | |
Tax loss carry forwards | | | 101,649 | | | | 158,124 | |
Deductible temporary differences related to: | | | | | | | | |
-rental expenses | | | 185,448 | | | | 213,389 | |
-pre-operating expenses | | | 16,100 | | | | 8,898 | |
-deferred revenue, non current | | | 15,331 | | | | 8,715 | |
-unfavorable lease related to acquisitions | | | 98,188 | | | | 91,751 | |
-Impairment loss of property and equipment | | | 39,499 | | | | 42,643 | |
-others | | | 1,190 | | | | 3,051 | |
Valuation allowance | | | (257,640 | ) | | | (215,809 | ) |
| | | | | | | | |
| | | 199,765 | | | | 310,762 | |
| | | | | | | | |
Total deferred tax assets | | | 275,211 | | | | 391,131 | |
| | | | | | | | |
| | |
Deferred tax liabilities, current: | | | | | | | | |
Withholding tax for profit distribution of previous periods (refer to Income Tax – PRC) | | | 38,313 | | | | 29,439 | |
| | | | | | | | |
| | |
Deferred tax liabilities, non-current: | | | | | | | | |
Recognition of intangible assets related to the acquisition of Motel 168 | | | 282,638 | | | | 273,986 | |
Other taxable temporary differences | | | 12,090 | | | | 14,335 | |
| | | | | | | | |
| | | 294,728 | | | | 288,321 | |
| | | | | | | | |
Total deferred tax liabilities | | | 333,041 | | | | 317,760 | |
| | | | | | | | |
F-24
HOME INNS & HOTELS MANAGEMENT INC.
NOTES TO THE CONSOLIDATED FINANCIAL STATEMENTS (CONTINUED)
(Amounts expressed in RMB in thousands, except share and per share data and where otherwise stated)
The Group had tax loss carry forward of RMB 702,684 as of December 31, 2012. The Group’s remaining tax loss carry forward will be netted against future taxable income. According to the PRC CIT regulations, the loss incurred during a tax year may be carried forward to the following years and set off against the profits of the following years, but the period shall not exceed a maximum of 5 years. These accumulated tax losses will expire on or before January 1, 2018.
A valuation allowance of RMB 271,097 and RMB 222,982 was provided for the net deferred tax assets of the Company as of December 31, 2011 and 2012, respectively. As of December 31, 2011 and December 31, 2012, a valuation allowance of RMB 237,385 and RMB 166,571 was carried forward from the acquisition of Motel 168. The valuation allowances were provided on the deferred tax assets to the extent that management believed it was more likely than not that such deferred tax assets would not have been realized in the foreseeable future. Valuation allowances were also provided because it was more likely than not that the Company will not be able to utilize certain tax loss carry forwards generated by certain subsidiaries. As those entities continue to have accumulated tax losses and tax planning strategies are not available to utilize those tax losses in other subsidiaries, management believes it is more likely than not that such losses will not be utilized before they expire. However, certain valuation allowance was reversed in 2010, 2011 and 2012 when the Company generated sufficient taxable income to utilize the deferred tax assets. If events occur in the future that prevent the Company from realizing some or all of its deferred tax assets, an adjustment to the valuation allowances will be recognized when such events occur. In the PRC, tax loss carry forwards generally expire after five years.
For the tax holidays described for certain entities in the “China” section of this Note, the aggregate amount and per share effect of the tax holidays are as follows:
| | | | | | | | | | | | |
| | | For the years ended December 31, | |
| | | 2010 | | | 2011 | | | 2012 | |
| (in thousands, except per share data) | | RMB | | | RMB | | | RMB | |
| | | |
Aggregate effect | | | 13,851 | | | | 14,505 | | | | 354 | |
Basic ordinary share effect | | | 0.17 | | | | 0.17 | | | | 0.004 | |
Diluted ordinary share effect | | | 0.16 | | | | 0.15 | | | | 0.004 | |
F-25
HOME INNS & HOTELS MANAGEMENT INC.
NOTES TO THE CONSOLIDATED FINANCIAL STATEMENTS (CONTINUED)
(Amounts expressed in RMB in thousands, except share and per share data and where otherwise stated)
| 5. | INVESTMENT IN A JOINTLY CONTROLLED ENTITY |
| | | | | | | | | | | | | | | | | | | | |
| | | Investment in a jointly
controlled entity | | | Shareholders’
loan | | | Subtotal | | | Shares of loss | | | Total | |
At October 1, 2011 | | | 500 | | | | 10,000 | | | | 10,500 | | | | (1,346 | ) | | | 9,154 | |
Share of loss | | | — | | | | — | | | | — | | | | (853 | ) | | | (853 | ) |
| | | | | | | | | | | | | | | | | | | | |
At December 31, 2011 | | | 500 | | | | 10,000 | | | | 10,500 | | | | (2,199 | ) | | | 8,301 | |
| | | | | | | | | | | | | | | | | | | | |
| | | | | |
Share of loss | | | — | | | | — | | | | — | | | | (1,676 | ) | | | (1,676 | ) |
| | | | | | | | | | | | | | | | | | | | |
At December 31, 2012 | | | 500 | | | | 10,000 | | | | 10,500 | | | | (3,875 | ) | | | 6,625 | |
| | | | | | | | | | | | | | | | | | | | |
The jointly controlled entity was originally invested by Motel 168 and Suzhou Taide Hotels Management Co., Ltd. who has 50% of equity interest, respectively. After the acquisition by Home Inns on October 1, 2011, the amount of RMB 853 recognized as ‘share of loss of a jointly controlled entity’ in the consolidated statements of operations is equal to the share of total loss of the jointly controlled entity during the three-month ended in December, 2011. It has exceeded the original cost of the Group’s investment in the entity. Before the acquisition, Motel 168 loaned RMB 10,000 to the entity without a specified repayment date. This loan has the same economic effect as a capital contribution and should be treated as being a part of the net investment in the entity. Therefore, Motel 168 treated its original investment of RMB 500, together with the loan of RMB 10,000 that in substance form part of the net investment, as the ceiling, being RMB 10,500, to pick up its share of loss of the entity. For the years ended December 31, 2011 and 2012, the Group fully picked up its share of loss of the entity of RMB 853 and RMB 1,676, and records it as a reduction to the interests in a jointly controlled entity.
| a. | Acquisition of Motel 168 |
On October 1, 2011, to further strengthen the Group’s diverse growth plans and multi-brand strategy, the Group completed the transaction to acquire 100% equity interest in Motel 168, a well-established economy hotel chain in China. The Group obtained control over Motel 168 and has consolidated its financial statements since then. The total purchase price for the transaction was approximately RMB 2,869,045, which consists of RMB 2,201,731 in cash consideration and RMB 667,314 in shares consideration of Home Inns’ 8,149,616 ordinary shares. Fair value of the ordinary shares is measured at the quoted market price of US$12.885 as of September 30, 2011, the date closest to the acquisition date. Total acquisition costs were RMB 63,824, which were expensed as incurred in the year ended December 31, 2011.
Purchase Price Allocation
The total purchase price was allocated to Motel 168’s tangible assets, identifiable intangible assets, and assumed liabilities based on their estimated fair values as set forth below. The excess of (i) the total of cost of acquisition, over (ii) the fair value of the identifiable net assets of Motel 168 is recorded as goodwill. The Group makes estimates and judgments in determining the fair value of the acquired assets and assumed liabilities, based on its experience with similar assets and liabilities in similar industries. In performing the purchase price allocation, the Group considered the analyses of historical financial performance and estimates of future performance of Motel 168’s business.
Allocation of purchase price:
| | | | |
Fair value of net tangible assets acquired | | | 559,267 | |
Intangible assets-favorable lease | | | 399,193 | |
Intangible assets-customer relationship | | | 6,990 | |
Intangible assets-franchise agreement | | | 48,770 | |
Intangible assets-brand | | | 684,300 | |
Unfavorable lease liability | | | (392,608 | ) |
Goodwill | | | 1,806,846 | |
Net deferred tax liability, non-current | | | (243,713 | ) |
| | | | |
Total purchase price | | | 2,869,045 | |
| | | | |
No significant contingencies were identified which should be valued. Motel 168 contributed net revenues of RMB 346,365 and incurred net loss of RMB 17,516 from October 1, 2011 through December 31, 2011.
F-26
HOME INNS & HOTELS MANAGEMENT INC.
NOTES TO THE CONSOLIDATED FINANCIAL STATEMENTS (CONTINUED)
(Amounts expressed in RMB in thousands, except share and per share data and where otherwise stated)
Unaudited Pro forma Financial Information
The following unaudited combined pro forma information presents information of the Group as if the acquisition above occurred on January 1, 2010.
| | | | | | | | |
(in RMB) | | 2010 | | | 2011 | |
| | | (unaudited) | | | (unaudited) | |
| | |
Net revenues | | | 4,599,322 | | | | 4,753,563 | |
Income from operations | | | 635,700 | | | | 290,302 | |
Net income | | | 306,948 | | | | 255,998 | |
| | |
Basic | | | 3.45 | | | | 2.84 | |
Diluted | | | 3.29 | | | | 0.23 | |
The unaudited pro forma financial information includes RMB 4,203 and RMB 4,203 in 2010 and 2011, respectively for the net amortization of identifiable intangible assets and unfavorable leases. The unaudited pro forma financial information for the year ended December 31, 2011 excluded the transaction costs of RMB 63,824 and the unaudited pro forma financial information for the year ended December 31, 2010 included the transaction costs of RMB 63,824. These costs were directly related to this transaction and were non-recurring. The pro forma diluted gain per share of 2011 was RMB 0.23, primarily due to fair value impact of convertible notes. The information presented above is for illustrative purposes only and does not purport to be indicative of results that would have been achieved if the acquisition had occurred as of January 1, 2010.
| b. | Acquisition of Anhui Youle Fashion Hotel Management Co., Ltd. and Anhui Meibang Hotel Management Co., Ltd. (collectively “eJia Express”) |
The Group and eJia Express entered into an equity transfer agreement in June 2012 under which the Group acquired 100% equity of eJia Express, whose primary assets included 13 leased-and-operated hotels located in Anhui province of China. Accordingly, eJia Express has been consolidated by the Group since July 1, 2012. Total purchase price for this acquisition amounted to RMB 48,214. The acquisition resulted in the recognition of goodwill, intangible assets (favorable leases) and unfavorable lease liability amounting to RMB 41,970, RMB 6,748 and RMB 6,231, respectively.
No significant contingencies were identified which should be valued. eJia Express contributed net revenues of RMB 13,472 and incurred net loss of RMB 11,180 from July 1, 2012 through December 31, 2012.
| c. | Acquisition of Anhui Shanghai Xurun Hotel Management Co., Ltd. (“Shanghai Xurun”) |
The Group and Shanghai Xurun entered into an equity transfer agreement in June 2012 under which the Group acquired 100% equity of Shanghai Xurun, whose primary assets included one leased-and-operated hotel. Accordingly, Shanghai Xurun has been consolidated by the Group since July 1, 2012. Total purchase price for this acquisition amounted to RMB 420. The acquisition resulted in the recognition of goodwill amounting to RMB 12,354.
No significant contingencies were identified which should be valued. Shanghai Xurun contributed net revenues of RMB 2,745 and incurred net loss of RMB 759 from July 1, 2012 through December 31, 2012.
| d. | Acquisition of Shanghai Junxing Hotel Management Co., Ltd. (“Shanghai Junxing”) |
The Group and Shanghai Junxing entered into an equity transfer agreement in November 2012, under which Group acquired 100% equity of Shanghai Junxing, whose primary assets included one leased-and-operated hotel. Accordingly, Shanghai Junxing has been consolidated by the Group since November 1, 2012. Total purchase price for this acquisition amounted to RMB 0. The acquisition resulted in the recognition of goodwill and intangible assets (favorable leases) amounting to RMB 2,579 and RMB 2,907, respectively.
No significant contingencies were identified which should be valued. Shanghai Junxing contributed net revenues of RMB 893 and incurred net loss of RMB 1,143 from November 1, 2012 through December 31, 2012.
As if the above acquisitions entered into in 2012 occurred on January 1, 2011, the net revenues, income from operations and net income that would contributed by the above acquisitions would not be significant to the Group.
F-27
HOME INNS & HOTELS MANAGEMENT INC.
NOTES TO THE CONSOLIDATED FINANCIAL STATEMENTS (CONTINUED)
(Amounts expressed in RMB in thousands, except share and per share data and where otherwise stated)
The components of property and equipment are as follows:
| | | | | | | | |
| | | 2011 | | | 2012 | |
Leasehold improvements | | | 3,685,489 | | | | 4,289,498 | |
Furniture, fixtures and office equipment | | | 627,588 | | | | 801,821 | |
Machinery and equipment | | | 285,921 | | | | 343,379 | |
Buildings | | | 9,310 | | | | 9,310 | |
Construction in progress | | | 159,985 | | | | 268,780 | |
| | | | | | | | |
| | | 4,768,293 | | | | 5,712,788 | |
| | |
Less: Accumulated depreciation | | | (1,315,447 | ) | | | (1,865,953 | ) |
| | | | | | | | |
Property and equipment, net | | | 3,452,846 | | | | 3,846,835 | |
| | | | | | | | |
Depreciation expenses incurred for the years ended December 31, 2010, 2011 and 2012 were RMB 314,923, RMB 404,901 and RMB 621,216, respectively. The cost of property and equipment is stated net off accumulated impairment losses of RMB 7,182 and RMB 19,823 as of December 31, 2011 and 2012.
Included in leasehold improvements was accumulated capitalized interest of RMB 3,916 as of December 31, 2011 and 2012.
The Group evaluates long-lived assets for impairment if events or changes in circumstances indicated that the carrying value of such assets may not be recoverable. The Group determined to perform a two step impairment analysis for those hotels which are in a loss position for the year ended December 31, 2012. In step one impairment analysis, the estimated future undiscounted net cash flows expected to be generated by the assets over their remaining estimated useful lives were based on certain assumptions, such as forecasts of future operating results, gross margin and expected future growth rates. The estimated undiscounted future cash flows generated by the property and equipment were less than their carrying value, which required the step two impairment test. In the step two impairment analysis, the Group estimated the fair value based on discounted cash flow analysis using market participants’ assumptions, such as forecasts of future operating results, discount rates commensurate with the risk involved, and expected future growth rates. The carrying value of the property and equipment was reduced to fair value based on the discounted cash flow analysis. This resulted in an impairment charge of RMB 19,823 recorded in the impairment loss on property and equipment as other operating expense in the Condensed Consolidated Statements of Operations in the year ended December 31, 2012. Although assumptions used in estimates of future cash flows are management best estimates, such assumptions are, by nature, highly judgmental and may vary significantly from actual results.
Components of goodwill as of December 31, 2011 and 2012 are as follows:
| | | | | | | | |
| | | 2011 | | | 2012 | |
Acquisition of Home Inns Beijing | | | 137,072 | | | | 137,072 | |
Acquisition of Top Star hotel chain | | | 191,368 | | | | 191,368 | |
Acquisition of Motel 168 | | | 1,806,846 | | | | 1,806,846 | |
Other acquisitions | | | 62,442 | | | | 119,345 | |
| | | | | | | | |
Total goodwill | | | 2,197,728 | | | | 2,254,631 | |
| | | | | | | | |
There is only one reporting unit in the Group. The goodwill arose from the acquisitions discussed in Note 6 have been allocated to this reporting unit. None of the goodwill acquired is expected to be deductible for income tax purposes.
F-28
HOME INNS & HOTELS MANAGEMENT INC.
NOTES TO THE CONSOLIDATED FINANCIAL STATEMENTS (CONTINUED)
(Amounts expressed in RMB in thousands, except share and per share data and where otherwise stated)
| 9. | INTANGIBLE ASSETS AND UNFAVORABLE LEASE |
Intangible assets and unfavorable lease as of December 31 are as follows:
| | | | | | | | |
| | | 2011 | | | 2012 | |
Intangible assets, original cost – | | | | | | | | |
Favorable lease agreements | | | 441,682 | | | | 451,337 | |
Franchise agreements | | | 49,574 | | | | 49,574 | |
Customer relationship | | | 7,073 | | | | 7,073 | |
Brand | | | 684,300 | | | | 684,300 | |
Purchased software | | | 30,246 | | | | 40,772 | |
| | | | | | | | |
| | | 1,212,875 | | | | 1,233,056 | |
| | | | | | | | |
Less: Accumulated amortization – | | | | | | | | |
Favorable lease agreements | | | (21,462 | ) | | | (51,886 | ) |
Franchise agreements | | | (2,328 | ) | | | (8,424 | ) |
Customer relationship | | | (461 | ) | | | (2,215 | ) |
Purchased software | | | (14,172 | ) | | | (21,112 | ) |
| | | | | | | | |
| | | (38,423 | ) | | | (83,637 | ) |
| | | | | | | | |
Intangible assets, net | | | 1,174,452 | | | | 1,149,419 | |
| | | | | | | | |
Unfavorable lease liability –
| | | | | | | | |
| | | 2011 | | | 2012 | |
| | |
Unfavorable lease agreements, original cost | | | 410,381 | | | | 416,612 | |
Less: Accumulated amortization | | | (13,607 | ) | | | (46,064 | ) |
| | | | | | | | |
Unfavorable lease liability, net | | | 396,774 | | | | 370,548 | |
| | | | | | | | |
Franchise agreements, and favorable and unfavorable leases agreements were acquired primarily from the acquisition of Top Star hotel chain, the purchase of minority interests in Home Inns Beijing and the acquisition of Motel 168. The value of the favorable lease agreements was determined based on the estimated present value of the amount the company has avoided paying as a result of entering into the lease agreements. Unfavorable lease agreements were determined based on the estimated present value of the acquired leases that exceed market prices and is recognized as a liability. Franchise agreements were determined at the estimated present value of net cash flows expected to be received over the remaining terms of the franchise agreements. The value of favorable and unfavorable lease agreements is amortized using the straight-line method over the remaining lease term and the amortization is recorded as operating costs at net. The value of franchise agreements is amortized using the straight-line method over the remaining terms of the franchise agreements.
Amortization expense of intangible assets for the years ended December 31, 2010, 2011 and 2012 amounted to RMB 6,439, RMB 16,828 and RMB 45,096, respectively. Amortization expense of unfavorable lease agreements for the years ended December 31, 2010, 2011 and 2012 amounted to RMB 1,374, RMB 9,045 and RMB 32,457 respectively.
The annual estimated amortization expense for intangible assets and unfavorable lease liability for the following years is as follows:
| | | | | | | | | | | | |
| | | Amortization for
Intangible Assets | | | Amortization for
Unfavourable Lease | | | Net Amortization | |
2013 | | | 43,523 | | | | (32,922 | ) | | | 10,601 | |
2014 | | | 41,987 | | | | (32,919 | ) | | | 9,068 | |
2015 | | | 40,234 | | | | (32,919 | ) | | | 7,315 | |
2016 | | | 38,658 | | | | (32,827 | ) | | | 5,831 | |
2017 | | | 35,573 | | | | (32,493 | ) | | | 3,080 | |
| | | | | | | | | | | | |
| | | 199,975 | | | | (164,080 | ) | | | 35,985 | |
| | | | | | | | | | | | |
F-29
HOME INNS & HOTELS MANAGEMENT INC.
NOTES TO THE CONSOLIDATED FINANCIAL STATEMENTS (CONTINUED)
(Amounts expressed in RMB in thousands, except share and per share data and where otherwise stated)
| 10. | OTHER PAYABLES AND ACCRUALS |
| | | | | | | | |
| | | 2011 | | | 2012 | |
Accrued expenses for utilities, rental expenses and others | | | 81,367 | | | | 109,226 | |
Accruals for professional service fees | | | 22,702 | | | | 11,593 | |
Accrued agency fees | | | 5,481 | | | | 7,531 | |
Accruals for customer reward program | | | 5,211 | | | | 5,499 | |
Others | | | 39,737 | | | | 32,037 | |
| | | | | | | | |
Other unpaid and accruals-subtotal | | | 154,498 | | | | 165,886 | |
| | | | | | | | |
Payables on construction cost of leasehold improvement | | | 524,792 | | | | 592,203 | |
Payables on the unpaid consideration related to the acquisitions | | | 219,339 | | | | 193,360 | |
Payables on repair and maintenance cost | | | 30,051 | | | | 45,964 | |
Deposit from franchised-and-managed hotels, current | | | 34,135 | | | | 41,180 | |
Payables to employees for exercised options | | | 11,713 | | | | 18,557 | |
Others | | | 27,060 | | | | 33,870 | |
| | | | | | | | |
Other payables-subtotal | | | 847,090 | | | | 925,134 | |
| | | | | | | | |
Total | | | 1,001,588 | | | | 1,091,020 | |
| | | | | | | | |
In December 2007, the Company issued RMB 1,110,000 of USD settled zero coupon convertible bonds (the “Bonds”). The Bonds matured on December 10, 2012.
Each Bond was, at the option of the holder, convertible (unless previously redeemed, converted or purchased and cancelled) on or after March 9, 2008 into fully paid ordinary shares with a par value of US$ 0.005 each of the Company at the USD equivalent of its RMB principal amount. The number of shares issuable upon conversion was a fixed amount, subject only to adjustments for dilutive events.
Unless previously redeemed, converted or purchased and cancelled, the Bonds was redeemed on December 10, 2012 at an amount equal to the USD equivalent of their RMB principal amount multiplied by 102.53%. At any time after December 10, 2010 and prior to December 10, 2012, the Company may redeem all but not a portion of the Bonds at a redemption price equal to the USD equivalent of their redemption amount (represents for the bondholder a gross yield to maturity of 0.5% per annum calculated on a semi-annual basis) on the redemption date if the closing price of the ADSs for each of 20 out of 30 consecutive trading days prior to the date upon which notice of such redemption is given, was at least 125% of the conversion price then in effect translated into RMB at the fixed exchange rate of US$ 1.00 to RMB 7.40. The Company may redeem all and not some only of the Bonds at a redemption price equal to the USD equivalent of their early redemption amount on the redemption amount if at any time at least 90% in principal amount of the Bonds has already been converted, redeemed or purchased and cancelled.
The Bonds may also be redeemed at the option of the holders at a redemption price equal to the USD equivalent of their early redemption amount upon the ADSs ceasing to be listed on the Nasdaq Global Market or the occurrence of a change of control. All and not some only of the Bonds may be redeemed at any time at a redemption price equal to the USD of their early redemption amount in the event of certain changes relating to Cayman Island or PRC taxation, subject to the non-redemption of each bondholder after the exercise by the Company of its tax redemption option.
The Company could, at the option of the holder of any Bond, redeem, in whole or in part, that holder’s Bonds on December 10, 2010 (the “Put Option Date”), at an amount equal to the USD Equivalent of its RMB principal amount, multiplied by 101.51%. To exercise such right, the holder of the relevant Bond must complete, sign and deposit at the specified office of any Paying Agent a duly completed and signed notice (the “Put Option Notice”) together with the Certificate evidencing the Bonds to be redeemed not earlier than 60 days and not later than 20 days prior to the Put Option Date. A Put Option Notice, once delivered, shall be irrevocable (and may not be withdrawn unless the Company consents to such withdrawal) and the Company shall redeem the Bonds the subject of a Put Option Notice delivered as aforesaid on the Put Option Date.
The Bonds contain embedded redemption and conversion features were not required to be bifurcated.
F-30
HOME INNS & HOTELS MANAGEMENT INC.
NOTES TO THE CONSOLIDATED FINANCIAL STATEMENTS (CONTINUED)
(Amounts expressed in RMB in thousands, except share and per share data and where otherwise stated)
The issuance costs related to the convertible bond offering was amortized within two years from December 2007. Amortization expense was included within interest expenses.
As of December 31, 2010, the fair value of the Bonds was approximately RMB 161,906 or approximately 103.13% of face value, based on quotes obtained from over-the-counter trading activities. As a result of the depressed market conditions, the Company repurchased approximately RMB 202,800 or 18% of the Bonds at approximately 99.94% of face value in early 2010, which resulted in a gain of RMB 2,480 in 2010.
As of December 31, 2011, the fair value of the Bonds was approximately RMB 106,922 or approximately 96.50% of face value, based on quotes obtained from over-the-counter trading activities. As a result of the depressed market conditions, the Company repurchased approximately RMB 46,200 or 4% of the Bonds at approximately 98.5% of face value in early 2011, which resulted in a gain of RMB 1,521 in 2011.
In December 2012, the Company has fully repaid the matured Bonds of USD 17,790K (equal to RMB 111,945) and interest expense of USD 450K (equal to RMB 2,804).
The financial liabilities consist of convertible notes and interest rate swap transaction.
(a) Convertible notes measured at fair value
The Company issued USD 184 million of convertible notes (including USD 24 million covering 30-day over-allotment option) on December 21, 2010 (the “Notes”). The Notes will mature on December 15, 2015. The interest rate is 2% per annum payable semi-annually, in arrears. Holders have the option to convert their Notes from the earlier of (i) when the registration statement becomes effective and
(ii) the first anniversary of the date on which the Notes are first issued, through to and including the business day prior to the maturity date into ADSs representing the ordinary shares initially at a conversion rate of 20.2560 ADSs per US$1,000 principal amount of Notes (equivalent to an initial conversion price of approximately US$49.37 per ADS). No accrued interest to be paid on the Notes when they are converted.
The conversion rate is subject to change on anti-dilution and upon certain fundamental changes. Fundamental changes are defined as 1) any “person” or “group” beneficially owns (directly or indirectly) 50% or more of the total voting power of all outstanding classes of Company’s shares or has the power to elect a majority of the members of the board of directors; 2) Company consolidates with, or merge with or into, another person or the Company sells, assigns, conveys, transfers, leases or otherwise disposes of all or substantially all of its assets, or any person consolidates with, or merges with or into, the Company; 3) Termination of trading of Company’s ADSs; and 4) adoption of a plan relating to our liquidation or dissolution.
The holder has the option to require the Company to repurchase the Notes, in whole or in part, in the event of a fundamental change for an amount equal to the 100% of the principal amount and any accrued and unpaid interest in the event of fundamental changes. Management assessed that the likelihood of fundamental change is remote.
While the Notes remain outstanding, the Company or its subsidiaries will not create or permit to subsist any security upon its property, assets or revenues (present or future) to secure any international investment securities or to secure any guarantee of or indemnity of any international investment securities unless the obligations under the notes and the indenture (a) are secured equally and ratably therewith, or (b) have the benefit of such other security, guarantee, indemnity or other arrangement as shall be approved by holders of a majority in aggregate principal amount of the Notes then outstanding.
The registration rights granted under the convertible notes agreement are: (i) demand registration rights, (ii) piggyback registration rights, and (iii) Form F-3 registration rights. The Company is required to use its best effort to cause a shelf registration statement to become effective within 210 days after the original issuance of the Notes with respect to register re-sales of the Notes and the issuance of ordinary shares (represented by ADSs) issuable upon conversion of the Notes. The Company will be required to pay additional interest of up to 0.50% per annum for the first year, subject to some limitations, to the holders of the notes if it fails to comply with the obligations to register the Notes and ordinary shares represented by ADSs issuable upon conversion of the Notes or the registration statement does not become effective within the specified time periods. The Form F-3 was filed on May 18, 2011. As of December 31, 2012, management assessed that the likelihood of the Company having to make any additional interest payments under the arrangement is remote.
F-31
HOME INNS & HOTELS MANAGEMENT INC.
NOTES TO THE CONSOLIDATED FINANCIAL STATEMENTS (CONTINUED)
(Amounts expressed in RMB in thousands, except share and per share data and where otherwise stated)
The Company has RMB as its functional currency, and the Notes are denominated in USD. As a result, the conversion feature is dual indexed to the Company’s stock as well as the RMB and USD exchange rate, and is considered an embedded derivative which needs to be bifurcated from the host instrument in accordance with ASC 815.
ASC 815-15-25 provides that if an entity has a hybrid financial instrument that would require bifurcation of embedded derivatives under ASC 815, the entity may irrevocably elect to initially and subsequently measure a hybrid financial instrument in its entirety at fair value with changes in fair value recognized in earnings. The fair value election can be made instrument by instrument and shall be supported by concurrent documentation or a preexisting documented policy for automatic election.
The Company elected to measure the Notes in their entirety at fair value with changes in fair value recognized as non-operating income or loss at each balance sheet date in accordance with ASC 815-15-25. Further, as the functional currency of the Company is RMB, the fair value of the Notes is translated into RMB at each balance sheet date with the difference being reported as exchange gain or loss. In addition, all issuance costs associated with the Notes offering have been expensed as incurred in the year ended December 31, 2010.
Fair value of the Notes is determined using the binomial model, one of the option pricing methods. The valuation involves complex and subjective judgment and the Company’s best estimates of the probability of occurrence of future events, such as fundamental changes, on the valuation date. Under the binomial valuation model, the Group uses a weighted risk-free and risk interest rate (the combination of the risk free rate plus the credit spread for the underlying Notes) weighted by the probability of conversion as internally solved out by binomial model in discounting its cash flows. The main inputs to this model include the underlying share price, the expected share volatility, the expected dividend yield, the risk free and risk interest rate.
The estimated fair value of financial liability amounted to approximately RMB 971,693 (US$154,386) and RMB 1,056,209 (US$ 169,533) as of December 31, 2011 and 2012, respectively. In the year ended December 31, 2010, the Company recorded foreign exchange gain of RMB 6,848, loss from fair value change of the Notes of RMB 9,040, and one-time charge of issuance costs of RMB 42,559, respectively. In the years ended December 31, 2011 and December 31, 2012, the Company recorded foreign exchange gain of RMB 57,337 and RMB 2,583, and a gain(loss) from fair value change of RMB 198,547 and RMB (87,099), respectively.
(b) Interest rate swap transaction
In connection with the acquisition of Motel 168, the Company entered into a US$ 240 million US dollar denominated, 4-year term loan facility. This term loan carries floating interest at a rate per annum equal to one-month London Interbank Offered Rate (“LIBOR”) plus 3.9%. The Company entered into an interest rate swap contract on November 28, 2011 and updated the interest rate swap contract on 31 July, 2012. The notional principal amount of the outstanding interest rate swap contract at December 31, 2011 and December 31, 2012 was US$180 million and US$ 93 million due to the repayment of term loans during the year, and the fixed interest rate was 1.13%. The floating rate was with reference to three-month US dollar LIBOR.
The Company has accounted for this derivative financial instrument at fair value with the changes in fair value recorded in the consolidated statement of operations. The Company performs valuation of the derivative at each balance sheet date and records the change in fair value as non-operating income or loss.
Fair value of the financial liabilities is determined using the discounted cash flow method. Under this method, the value of the interest rate swap equals to the present value of the net position of its future cash flows as of each settlement date. The net position of the future cash flows as of each settlement date is determined by comparing the projected fixed cash outflows with the projected variable cash inflows. The projected fixed cash outflows are calculated based on the fixed interest rate established upon consummation of the initial swap contract. The projected variable cash inflows are calculated based on the estimated swap yield curve as of the measurement date, in respect that the interest rates swap is a fix-for-floating swap from the Company’s perspective. The net position of the future cash flows is then discounted by using the estimated swap yield curve rates.
In the years ended December 31, 2011 and December 31, 2012, total loss as a result of fair value measurement is approximately RMB 7,315 and RMB 6,665. For the year ended December 31, 2012, the Company made cash settlement of RMB 3,418 for purpose of reducing the principal amount that is associated with the interest rate swap arrangement due to the repayment of term loans during the year.
The Company elected to classify the cash flows related to the SWAP transaction in the financing section of its statement of cash flows as the underlying activities subject to the interest rate SWAP are financing arrangement in nature.
F-32
HOME INNS & HOTELS MANAGEMENT INC.
NOTES TO THE CONSOLIDATED FINANCIAL STATEMENTS (CONTINUED)
(Amounts expressed in RMB in thousands, except share and per share data and where otherwise stated)
The Group’s borrowings consist of the following:
| | | | | | | | |
| | | 2011 | | | 2012 | |
Long-term debt, current portion | | | 346,550 | | | | 12,571 | |
Long-term debt | | | 1,165,666 | | | | 735,404 | |
| | | | | | | | |
Total | | | 1,512,216 | | | | 747,975 | |
| | | | | | | | |
On September 26, 2011, the Group entered into a senior secured credit facility under which the Group can borrow up to USD 240 million. The proceeds of the borrowing should only be used for the acquisition of Motel 168. As of December 31, 2011, the Company had drawn down the full amount of the credit facility.
The interest rate of this borrowing is LIBOR plus 3.90% and total upfront fee is RMB 91,617. The weighted average interest rate for the borrowings was 4.22% and 4.43% for the years ended December 31, 2011 and December 31, 2012. The upfront fee is amortized and recorded as interest expenses during the loan period, which is four years.
In 2012, the Group repaid USD 121 million of this borrowing. The remaining principal amounts of the borrowing will be repaid in consecutive installments (each, an “Installment”) on each of the dates (each, an “Amortization Date”) and in the aggregate amounts set forth in the table below:
| | | | |
| Date | | Installment | |
July 31, 2014 | | US$ | 57,000,000 | |
September 15, 2015 | | US$ | 60,000,000 | |
| | | | |
Total | | US$ | 117,000,000 | |
| | | | |
As of December 31, 2011 and 2012, the authorized share capital of the Company was US$ 1,000,000, divided into 200,000,000 ordinary shares.
In July 2006, the Company issued 2,834,037 ordinary shares in a private placement to certain individuals including certain executives and directors of the Company, for RMB 62,918 or US$ 2.77 per share, pursuant to a financing arrangement agreed amongst the shareholders and the Company’s board of directors The issuance price per ordinary share of US$ 2.77 was lower than the fair value of the Company’s ordinary shares as of the date of the agreement and the difference of RMB 9,564 was recognized as share-based compensation expenses.
On October 31, 2006, upon the completion of the initial public offering, the Company issued 5,874,237 ADSs or 11,748,474 shares, which were priced at US$ 13.8 per ADS. Each ADS represents two ordinary shares. Total proceeds, net of issuance costs paid and payable from the offering, amounted to RMB 581,252. Upon completion of the Company’s initial public offering, all convertible preferred shares were automatically converted into 22,924,886 ordinary shares. The Company’s authorized shares became 200,000,000 shares of US$ 0.005 par value per ordinary share.
In May 2007, the Company completed a secondary offering, during which it issued 1,478,155 ADSs or 2,956,310 shares, which were priced at US$ 34.27 per ADS, or US$ 17.135 per share. Total proceeds, net of issuance costs paid and payable from the offering, amounted to RMB 370,379.
On October 22, 2007, the Company issued US$ 28,252 in equity, or 655,831 ordinary shares, to selling shareholders of Top Star hotel chain. The purchase price per ordinary share was set at US$ 21.539 or US$ 43.078 per ADS. Total proceeds, net of issuance costs from the issuance, amounted to RMB 106,022.
On May 21, 2009, the Company issued US$50,000 in equity, or 7,514,503 ordinary shares, to Ctrip.com International, Ltd. through a private placement. The purchase price per ordinary share is set at US$6.6538 or US$13.3076 per ADS. Total proceeds, net of issuance costs from the issuance, amounted to RMB 341,078.
On September 30, 2011, the Company issued US$105,008 in equity, or 8,149,616 ordinary shares, to selling shareholders of Motel 168. The purchase price per ordinary share was set at US$12.885 or US$25.77 per ADS. The total value amounted to RMB 667,314 (Note 6).
F-33
HOME INNS & HOTELS MANAGEMENT INC.
NOTES TO THE CONSOLIDATED FINANCIAL STATEMENTS (CONTINUED)
(Amounts expressed in RMB in thousands, except share and per share data and where otherwise stated)
| 15. | SHARE BASED COMPENSATION |
On February 28, 2003, the Company adopted a share option plan (“2003 Option Plan”) under which the directors of the Company may, at their discretion, grant options to acquire ordinary shares to any senior executives (including directors) and employees of the Company and/or its subsidiaries. Share options vest annually over a period of 4 years and once vested can be exercised within 5 years from the date of grant. The 2003 Option Plan provides for the issuance of options of the Company’s ordinary shares in the amount of up to 5% of total ordinary and preferred shares outstanding. On May 30, 2005, the Company adopted a board resolution to increase shares reserved under the share option plan to 6% of total ordinary and preferred shares outstanding. On March 30, 2006, the Company adopted a shareholder resolution to increase shares reserved for the share options plan to 9% of total ordinary and preferred shares outstanding. This represented 4,784,226 options based on the then outstanding ordinary shares, which have been fully issued.
On October 2, 2006, the Company adopted a share incentive plan (“2006 Share Incentive Plan”) under which the directors of the Company may, at their discretion, grant awards to employees, directors and consultants of the Company or any of our related entities, which include our subsidiaries or any entities in which the Company holds a substantial ownership interest. Such awards include 1) share options; 2) restricted shares, which represent non-transferable ordinary shares, that may be subject to forfeiture; 3) restricted share units, which represent the right to receive the Company’s ordinary shares at a specified date in the future, which may be subject to forfeiture; 4) share appreciation rights, which provide for payment to the grantee based upon increases in the price of our ordinary shares over a set base price; and 5) dividend equivalent right, which represent the value of the dividends per share that the Company pay. The term of an award shall not exceed 10 years from the date of the grant, except that 10 years is the maximum term of share option granted. The term of each award will be stated in the award agreement. According to the annual general meetings on November 3, 2009 and September 15, 2011, the shareholders approved increases in the number of ordinary shares that may be granted under the 2006 Share Incentive Plan. As of December 31, 2012, the maximum number of ordinary shares permitted to be issued pursuant to awards under the 2006 Share Incentive Plan is up to 15,062,194 options. The 2006 Share Incentive Plan will expire in 2016. The characteristics of the awards granted during 2006 under this plan are similar to the awards granted under the 2003 Option Plan.
In March 2008, the Company granted 1,093,200 share options to its employees and directors under the 2006 Share Incentive Plan, which had a grant date fair value of US$ 3.1826 per option.
The Company entered into an option cancellation and replacement (“modification”) agreement for all unvested options under the 2006 Share Incentive Plan as of October 27, 2008 and adjusted the exercise price to the then current market price of US$ 3.63. The Company modified 2,443,000 share options with an incremental value of US$ 1.2415, US$ 1.2601, US$ 1.2588 and US$ 0.9830 per option for 26/12/2006 program, 20/04/2007 program, 21/12/2007 program and 27/03/2008 program, respectively. The modification had an immaterial impact on 2008 stock compensation expense and will increase stock compensation expenses by US$ 4,628 thousand from 2009 to 2012.
On October 27, 2008, the Company granted 280,000 share options to its employees under the 2006 Share Incentive Plan, which had a fair value of US$ 1.3942 per option.
On July 14, 2009 and October 30, 2009, the Company granted 1,416,000 and 220,000 share options to its employees under the 2006 Share Incentive Plan, which had a fair value of US$ 3.2313 and US$ 6.4533 per option, respectively.
On March 19, 2010, June 21, 2010 and November 10, 2010, the Company granted 1,760,500, 120,000 and 109,000 share options to its employees under the 2006 Share Incentive Plan, which had a fair value of US$ 8.1764, US$ 12.176 and US$ 11.594 per option, respectively.
On February 24, 2011 and November 9, 2011, the Company granted 1,919,000 and 317,000 share options to its employees under the 2006 Share Incentive Plan, which had a fair value of US$ 8.0297 and US$ 7.4567 per option, respectively.
F-34
HOME INNS & HOTELS MANAGEMENT INC.
NOTES TO THE CONSOLIDATED FINANCIAL STATEMENTS (CONTINUED)
(Amounts expressed in RMB in thousands, except share and per share data and where otherwise stated)
On February 15, 2012, March 1, 2012, March 12, 2012 and November 26, 2012, the Company granted 40,000, 18,000, 433,250 and 6,000 share options to its employees under the 2006 Share Incentive Plan, which had a average fair value of US$ 7.1999, US$ 7.2419, US$ 6.3474 and US$ 5.2423 per option, respectively.
The following summarizes the Company’s share option activity under the 2003 Option Plan and 2006 Share Incentive Plan as of and for the years ended December 31, 2010, 2011 and 2012:
| | | | | | | | | | | | | | | | |
| | | Options | | | Weighted
Average
Exercise Price
(US$) | | | Weighted-
average
remaining
contractual
life (years) | | | Aggregate
Intrinsic Value
(US$ millions) | |
| | | | |
Outstanding as of January 1, 2010 | | | 5,196,132 | | | US$ | 5.8839 | | | | 3.5 | | | US$ | 61.27 | |
Granted | | | 1,989,500 | | | US$ | 16.8005 | | | | | | | | | |
Exercised | | | (1,337,574 | ) | | US$ | 6.8249 | | | | | | | | | |
Forfeited | | | (79,630 | ) | | US$ | 10.2435 | | | | | | | | | |
Cancelled | | | (1,500 | ) | | US$ | 8.2183 | | | | | | | | | |
| | | | | | | | | | | | | | | | |
Outstanding as of December 31, 2010 | | | 5,766,928 | | | US$ | 9.3709 | | | | 3.3 | | | US$ | 64.06 | |
Vested and exercisable as of December 31, 2010 | | | 1,329,628 | | | US$ | 5.1184 | | | | 2.1 | | | US$ | 20.43 | |
| | | | |
Outstanding as of December 31, 2010 | | | 5,766,928 | | | US$ | 9.3709 | | | | 3.3 | | | US$ | 64.06 | |
Granted | | | 2,236,000 | | | US$ | 16.2501 | | | | | | | | | |
Exercised | | | (794,182 | ) | | US$ | 5.4085 | | | | | | | | | |
Forfeited | | | (122,076 | ) | | US$ | 13.0759 | | | | | | | | | |
Cancelled | | | (6,000 | ) | | US$ | 7.6418 | | | | | | | | | |
| | | | | | | | | | | | | | | | |
Outstanding as of December 31, 2011 | | | 7,080,670 | | | US$ | 11.9253 | | | | 3.09 | | | US$ | 6.90 | |
Vested and exercisable as of December 31, 2011 | | | 2,044,384 | | | US$ | 7.8647 | | | | 2.28 | | | US$ | 10.29 | |
| | | | |
Outstanding as of December 31, 2011 | | | 7,080,670 | | | US$ | 11.9253 | | | | 3.09 | | | US$ | 6.90 | |
Granted | | | 497,250 | | | US$ | 13.6397 | | | | | | | | | |
Exercised | | | (1,012,438 | ) | | US$ | 4.1641 | | | | | | | | | |
Forfeited | | | (191,856 | ) | | US$ | 12.5589 | | | | | | | | | |
Cancelled | | | (101,990 | ) | | US$ | 16.5634 | | | | | | | | | |
| | | | | | | | | | | | | | | | |
Outstanding as of December 31, 2012 | | | 6,271,636 | | | US$ | 13.2193 | | | | 2.45 | | | US$ | 7.72 | |
Vested and exercisable as of December 31, 2012 | | | 2,924,886 | | | US$ | 11.0185 | | | | 1.89 | | | US$ | 10.04 | |
The aggregate intrinsic value represents the total intrinsic value based on the Company’s closing stock price of US$ 20.48, US$ 12.90 and US$ 14.45 per share as of December 31, 2010, 2011 and 2012, respectively.
F-35
HOME INNS & HOTELS MANAGEMENT INC.
NOTES TO THE CONSOLIDATED FINANCIAL STATEMENTS (CONTINUED)
(Amounts expressed in RMB in thousands, except share and per share data and where otherwise stated)
The following is information relating to options outstanding as of December 31, 2012:
| | | | | | | | | | | | | | | | | | | | |
| | | | | | Outstanding | | | Exercisable | |
Exercise price | | Weighted-average
grant date fair value
of ordinary shares | | | Number of
shares | | | Weighted-
average
remaining
contractual
life (years) | | | Number of
shares | | | Weighted-
average
remaining
contractual | |
US$3.6300 | | US$ | 3.6300 | | | | 820,248 | | | | 0.82 | | | | 820,248 | | | | 0.82 | |
US$7.3300 | | US$ | 7.3300 | | | | 902,150 | | | | 1.53 | | | | 579,900 | | | | 1.53 | |
US$13.290 | | US$ | 13.290 | | | | 149,750 | | | | 1.83 | | | | 110,250 | | | | 1.83 | |
US$16.165 | | US$ | 16.165 | | | | 1,575,488 | | | | 2.21 | | | | 767,238 | | | | 2.21 | |
US$20.515 | | US$ | 22.975 | | | | 120,000 | | | | 2.86 | | | | 60,000 | | | | 2.86 | |
US$22.975 | | US$ | 22.975 | | | | 107,000 | | | | 2.86 | | | | 53,500 | | | | 2.86 | |
US$16.355 | | US$ | 16.355 | | | | 1,812,750 | | | | 3.15 | | | | 456,000 | | | | 3.15 | |
US$15.615 | | US$ | 15.615 | | | | 311,000 | | | | 3.85 | | | | 77,750 | | | | 3.85 | |
US$15.275 | | US$ | 15.275 | | | | 40,000 | | | | 4.12 | | | | — | | | | — | |
US$15.340 | | US$ | 15.340 | | | | 6,000 | | | | 4.16 | | | | — | | | | — | |
US$13.430 | | US$ | 13.430 | | | | 421,250 | | | | 4.19 | | | | — | | | | — | |
US$12.780 | | US$ | 12.780 | | | | 6,000 | | | | 4.88 | | | | — | | | | — | |
| | | | | | | | | | | | | | | | | | | | |
| | | | | | | 6,271,636 | | | | | | | | 2,924,886 | | | | | |
| | | | | | | | | | | | | | | | | | | | |
In connection with the share options granted during the years ended December 31, 2010, 2011 and 2012, the Company recognized share-based compensation expense of RMB 53,142, RMB 76,535 and RMB 79,084, respectively. As of December 31, 2012, there was RMB 112,387 of unrecognized share-based compensation cost related to unvested share options which is expected to be recognized over a weighted average period of 2.04 years.
The Company calculated the estimated fair value of share options on the date of grant using the Black-Scholes pricing model with the following assumptions:
| | | | | | |
| | | 2010 | | 2011 | | 2012 |
Risk-free interest rate(1) | | 0.795% to 1.905% | | 0.5128% to 1.4348% | | 0.4418% to 0.5960% |
Expected life (years)(2) | | 3 to 4.5 | | 3.41 to 3.56 | | 3.55 to 3.56 |
Expected dividend yield(3) | | — | | — | | — |
Expected Volatility(4) | | 67.32% to 68.92% | | 67.01% to 69.38% | | 56.50% to 66.08% |
| (1) | The risk-free interest rates are based on the US Treasury yield for a term consistent with the expected life of the awards in effect at the time of grant. |
| (2) | The expected life of share options is based on historical exercise patterns, for options granted since 2009 which the Company has historical data of and believes are representative of future behavior. |
| (3) | The Company has no history or expectation of paying dividends on its ordinary shares. |
| (4) | For the year ended December 31, 2010, the Company estimated the volatility of its ordinary shares at the date of grant based on the historical volatility and implied volatility of comparable companies and itself for a period equal to time from the grant date to the assumed exercised date of the respective options in accordance with the vesting schedule. Since 2011, expected volatility is estimated based on the Company’s historical volatility for a period equivalent to the expected term preceding the grant date. |
F-36
HOME INNS & HOTELS MANAGEMENT INC.
NOTES TO THE CONSOLIDATED FINANCIAL STATEMENTS (CONTINUED)
(Amounts expressed in RMB in thousands, except share and per share data and where otherwise stated)
In 2012, the Company granted 1,055,940 restricted share units (“RSU”) to employees under Share Incentive Plan, which vest annually over a period of 4 years since grant date. The total share-based compensation cost amounted to RMB 13,828 for the year ended December 31, 2012. As of December 31, 2012, there was RMB 66,663 unrecognized compensation cost, net of estimated forfeitures, related to unvested restricted shares, which are to be recognized over a weighted average vesting period of 3.28 years. Total unrecognized compensation cost may be adjusted for further changes in estimated forfeitures.
The following summarizes the Company’s RSU activities as of and for the year ended December 31, 2012:
| | | | | | | | | | | | |
| | | RSUs | | | Weighted Average
Exercise Price (US$) | | | Weighted-average
remaining
contractual life
(years) | |
| | | |
Outstanding as of January 1, 2012 | | | — | | | | — | | | | — | |
Granted | | | 1,055,940 | | | US$ | 13.4705 | | | | | |
Exercised | | | — | | | | — | | | | | |
Forfeited | | | (88,666 | ) | | US$ | 13.4552 | | | | | |
Cancelled | | | — | | | | — | | | | | |
| | | | | | | | | | | | |
Outstanding as of December 31, 2012 | | | 967,274 | | | US$ | 13.4510 | | | | 4.26 | |
Vested and exercisable as of December 31, 2012 | | | — | | | | — | | | | | |
The following is information relating to options outstanding as of December 31, 2012:
| | | | | | | | | | | | | | | | | | | | |
| | | | | | Outstanding | | | Exercisable | |
Grant price | | Weighted-average
grant date fair value
of ordinary shares | | | Number of
shares | | | Weighted-
average
remaining
contractual
life (years) | | | Number of
shares | | | Weighted-
average
remaining
contractual | |
US$15.275 | | US$ | 15.275 | | | | 40,000 | | | | 4.12 | | | | — | | | | — | |
US$15.340 | | US$ | 15.340 | | | | 6,000 | | | | 4.16 | | | | — | | | | — | |
US$13.430 | | US$ | 13.430 | | | | 821,350 | | | | 4.19 | | | | — | | | | — | |
US$12.780 | | US$ | 12.780 | | | | 99,924 | | | | 4.88 | | | | — | | | | — | |
| | | | | | | | | | | | | | | | | | | | |
| | | | | | | 967,274 | | | | | | | | — | | | | | |
| | | | | | | | | | | | | | | | | | | | |
In July 2012, the Board of Directors of Yitel Hotel Management (Hong Kong) Limited (“Yitel”) passed a resolution to adopt Stock Option Plan (“the Yitel Option Plan”) that provides for the granting of options to key employees of Yitel to acquire ordinary shares of Yitel at a US$ 0.1 exercise price as determined by the Administrator or the Board at the time of grant. Upon this resolution, the Board of Directors and shareholders authorized and reserved 14,862,000 ordinary shares for the issuance under the Yitel Option Plan.
The Company granted the Yitel share options containing an exercise price denominated in US$, which is not the functional currency of Yitel. Thus, those share options are accounted for as liability awards that are remeasured at fair value with changes recognized in the consolidated statements of operations. Total compensation cost in connection with Yitel hotel’s options was RMB 464 for the year ended December 31, 2012. Total liability balance associated with the awards, which was recorded as other liability, was RMB 464 as of December 31, 2012.
The weighted average fair value of each option for employees was US$0.05 and US$ 0.06 at the grant-date and as of December 31, 2012, respectively. There was no income tax benefit recognized in the statements of operations for share-based compensation plans in the year ended December 31, 2012.
F-37
HOME INNS & HOTELS MANAGEMENT INC.
NOTES TO THE CONSOLIDATED FINANCIAL STATEMENTS (CONTINUED)
(Amounts expressed in RMB in thousands, except share and per share data and where otherwise stated)
Under ASC 718, the Company applied the Black-Scholes option pricing model in determining the fair value of options granted. The assumptions used to value share-based compensation awards are presented as follows:
| | |
| | | As at grant date |
Expected volatility (%) | | 45% to 56% |
Expected dividend yield (%) | | — |
Expected term (years) | | 5.5 to 7 |
Risk-free interest rate (per annum) (%) | | 0.79% to 1.12% |
The Company calculated the estimated fair value of the liability awards at December 31, 2012 using the Black-Scholes option pricing model with the following assumptions:
| | |
| | | As at December 31, 2012 |
Expected volatility (%) | | 46% to 54% |
Expected dividend yield (%) | | — |
Expected term (years) | | 5 to 6.5 |
Risk-free interest rate (per annum) (%) | | 0.75% to 1.11% |
The Company estimated the expected volatility at the date of grant based on average annualized standard deviation of the share price of comparable listed companies. The Company has no history or expectation of paying dividends on its ordinary shares. The Company estimated the expected term based on the timing of the expected public offering, the vesting schedule and the exercise period of the options. Risk-free interest rates are based on the derived market yield of the US$ denominated Chinese Government bonds for the term approximating the expected life of award at the time of grant.
Basic earnings per share and diluted earnings per share have been calculated as follows:
| | | | | | | | | | | | |
| | | 2010 | | | 2011 | | | 2012 | |
Numerator: | | | | | | | | | | | | |
Net income/(loss) available to ordinary shareholders | | | 359,499 | | | | 351,531 | | | | (26,776 | ) |
| | | | | | | | | | | | |
Dilutive effect of issuance and buy-back of convertible bonds | | | (1,418 | ) | | | (845 | ) | | | — | |
Dilutive effect of issuance of convertible notes | | | — | | | | (232,278 | ) | | | — | |
| | | |
Net income/(loss) for diluted earnings | | | 358,081 | | | | 118,408 | | | | (26,776 | ) |
| | | | | | | | | | | | |
Denominator: | | | | | | | | | | | | |
Denominator for basic earnings per share – weighted average ordinary shares outstanding | | | 80,846,617 | | | | 84,221,665 | | | | 90,804,777 | |
Dilutive effect of share options | | | 2,847,416 | | | | 1,951,850 | | | | — | |
Dilutive effect of convertible bonds | | | 1,053,069 | | | | 671,670 | | | | — | |
| | | |
Dilutive effect of convertible notes | | | — | | | | 7,454,208 | | | | — | |
| | | | | | | | | | | | |
| | | |
Denominator for diluted earnings per share | | | 84,747,102 | | | | 94,299,393 | | | | 90,804,777 | |
| | | | | | | | | | | | |
| | | |
Basic earnings per share | | | 4.45 | | | | 4.17 | | | | (0.29 | ) |
| | | | | | | | | | | | |
| | | |
Diluted earnings per share | | | 4.23 | | | | 1.26 | | | | (0.29 | ) |
| | | | | | | | | | | | |
F-38
HOME INNS & HOTELS MANAGEMENT INC.
NOTES TO THE CONSOLIDATED FINANCIAL STATEMENTS (CONTINUED)
(Amounts expressed in RMB in thousands, except share and per share data and where otherwise stated)
For the year ended December 31, 2010, outstanding stock options of 290,914 shares and 224,647 ordinary shares issuable upon the conversion of convertible notes were excluded in the computation of diluted earnings per share due to their anti-dilutive effect.
For the year ended December 31, 2011, outstanding stock options of 1,254,933 shares were excluded in the computation of diluted earnings per share due to their anti-dilutive effect.
For the year ended December 31, 2011, dilutive effect of issuance of convertible notes included gain on change in fair value of 198,547, foreign exchange gain on convertible notes of 57,337 and related interest expenses of 23,606.
For the year ended December 31, 2012, outstanding stock options of 1,382,531 shares and 7,454,208 ordinary shares issuable upon the conversion of convertible notes were excluded in the computation of diluted earnings per share due to their anti-dilutive effect.
| 17. | RELATED PARTY TRANSACTIONS |
| | |
Nature of related parties: | | Relationship with the Company |
| BTG | | Parent company of Poly Victory Investments Limited |
| Ctrip.com International, Ltd. | | Principal shareholder of the Company, common directors |
| Jian Guo Inns | | A subsidiary of BTG |
| Shanghai Xin Zhi Trading Co., Ltd. | | Non controlling interests of subsidiary |
| Fujian Yun Tong Co., Ltd. | | Non controlling interests of subsidiary |
| Shanghai Dinuo Co., Ltd. | | Non controlling interests of subsidiary |
| Sun Yan | | Non controlling interests of subsidiary |
| Xiamen Shuiwu Co., Ltd. | | Non controlling interests of subsidiary |
Transactions with related parties:
| | | | | | | | | | | | |
| | | 2010 | | | 2011 | | | 2012 | |
Agency fees paid to Ctrip.com International, Ltd. | | | 18,191 | | | | 17,661 | | | | 35,932 | |
Rental fees paid to Jian Guo Inns | | | 2,800 | | | | 2,800 | | | | 2,050 | |
Some of our customers book our hotel rooms through Ctrip.com International, Ltd. and we pay agency fees to Ctrip.com International, Ltd. for such bookings. Agency fees paid to Ctrip.com International, Ltd. for the years ended December 31, 2010, 2011 and 2012 are presented as above.
Jian Guo Inns has been the lessor of certain leased-and-operated hotels in our chain. Total rental fees paid to Jian Guo Inns for the years ended December 31, 2010, 2011 and 2012 are presented as above.
As of December 31, significant balances with related parties are as follows:
Due from related parties:
| | | | | | | | |
| | | 2011 | | | 2012 | |
Shanghai Xin Zhi Trading Co., Ltd. | | | 2,408 | | | | 2,457 | |
Fujian Yun Tong Co., Ltd. | | | 1,596 | | | | 1,766 | |
Shanghai Dinuo Co., Ltd. | | | 1,425 | | | | 1,425 | |
Sun Yan | | | 950 | | | | 950 | |
Xiamen Shuiwu Co., Ltd. | | | — | | | | 220 | |
| | | | | | | | |
| | | 6,379 | | | | 6,818 | |
| | | | | | | | |
The amount due from all the related parities represented the advance payment for dividends.
F-39
HOME INNS & HOTELS MANAGEMENT INC.
NOTES TO THE CONSOLIDATED FINANCIAL STATEMENTS (CONTINUED)
(Amounts expressed in RMB in thousands, except share and per share data and where otherwise stated)
Due to related parties:
| | | | | | | | |
| | | 2011 | | | 2012 | |
Ctrip.com International, Ltd. | | | 2,557 | | | | 3,798 | |
Xiamen Shuiwu Co., Ltd. | | | 240 | | | | — | |
| | | | | | | | |
| | | 2,797 | | | | 3,798 | |
| | | | | | | | |
The amounts due from and due to related parties as of December 31, 2011 and 2012 mainly arose from the above transactions and payments made by the Company and related parties on behalf of each other. These amounts are not collateralized, free of interest and receivable or payable on demand.
| 18. | OBLIGATIONS UNDER FINANCE LEASES |
The Company has entered into finance leases for certain electronic equipment with 3-year payment terms. The following is an analysis of the leased property under finance lease:
| | | | |
| | | December 31, 2012 | |
Electronic equipment | | | 19,696 | |
Less: Accumulated depreciation | | | (7,112 | ) |
| | | | |
Total | | | 12,584 | |
| | | | |
The following is a schedule of future minimum lease payments under finance leases together with the present value of the net minimum lease payments as of December 31, 2012:
| | | | |
| | | December 31, 2012 | |
| |
2013 | | | 7,233 | |
2014 | | | 1,407 | |
Total minimum lease payments | | | 8,640 | |
| |
Less: Amount representing interest | | | (360 | ) |
| | | | |
Present value of net minimum lease payments | | | 8,280 | |
| | | | |
| |
Analysis as: | | | | |
Current | | | 6,660 | |
Non Current | | | 1,620 | |
| | | | |
| | | 8,280 | |
| | | | |
The above finance lease obligations are included in finance lease liabilities in the balance sheet.
F-40
HOME INNS & HOTELS MANAGEMENT INC.
NOTES TO THE CONSOLIDATED FINANCIAL STATEMENTS (CONTINUED)
(Amounts expressed in RMB in thousands, except share and per share data and where otherwise stated)
| 19. | COMMITMENTS AND CONTINGENCIES |
As of December 31, 2012, the Group’s commitments related to the construction of headquarter located in Wujiang, leasehold improvements, and installation of machinery and equipment for the hotel operations amounted to RMB 552,772.
| (b) | Commitments under operating leases |
The Group has entered into lease agreements relating to leased-and-operated hotels that are classified as operating leases.
Future minimum lease payments for non-cancelable operating leases at December 31 are as follows:
| | | | | | | | | | | | |
| | | Related party | | | Non-related party | | | Total | |
| | | |
2013 | | | 1,800 | | | | 1,542,030 | | | | 1,543,830 | |
2014 | | | 1,800 | | | | 1,578,790 | | | | 1,580,590 | |
2015 | | | 1,800 | | | | 1,589,995 | | | | 1,591,795 | |
2016 | | | 1,650 | | | | 1,588,628 | | | | 1,590,278 | |
2017 | | | 500 | | | | 1,579,378 | | | | 1,579,878 | |
Thereafter | | | — | | | | 9,836,147 | | | | 9,836,147 | |
| | | | | | | | | | | | |
Total | | | 7,550 | | | | 17,714,968 | | | | 17,722,518 | |
| | | | | | | | | | | | |
Rental expenses amounted to RMB 644,248, RMB 937,145 and RMB 1,489,333 during the years ended December 31, 2010, 2011 and 2012, respectively.
As of December 31, 2012 the Group had no significant outstanding contingencies that are likely to have a material impact on our financial condition, results of operations, liquidity or cash flows.
F-41
HOME INNS & HOTELS MANAGEMENT INC.
NOTES TO THE CONSOLIDATED FINANCIAL STATEMENTS (CONTINUED)
(Amounts expressed in RMB in thousands, except share and per share data and where otherwise stated)
| 20. | ADDITIONAL INFORMATION-FINANCIAL STATEMENTS SCHEDULE I |
The separate financial statements of the Company as presented below have been prepared in accordance Securities and Exchange Commission Regulation S-X Rule 5-04 and Rule 12-04 and present the Company’s investments in its subsidiaries under the equity method of accounting. Such investments are presented on the separate balance sheets of the Company as ‘Investments in subsidiaries.” The Company was incorporated in May 2006 and immediately became the parent company of Home Inns & Hotels Management (Hong Kong) Limited and its operating subsidiaries. The financial statements have been prepared as if the Company had been in existence since January 1, 2006. Subsidiaries income or loss is included as the Company’s “Share of income from subsidiaries” on the statements of operations. The subsidiaries did not pay any dividend to the Company for the periods presented.
The Company did not have any significant commitments or guarantees as of December 31, 2011 and 2012.
| | | | | | | | | | | | | | | | |
| | | 2010 | | | 2011 | | | 2012 | | | 2012 | |
| | | | | | | | | | | | US$ thousands (Note 2(d)) | |
Statements of operations | | | | | | | | | | | | | | | | |
| | | | |
Net revenues | | | — | | | | — | | | | — | | | | — | |
Operating expenses | | | (3,590 | ) | | | (61,783 | ) | | | (7,901 | ) | | | (1,268 | ) |
| | | | | | | | | | | | | | | | |
| | | | |
Loss from operations | | | (3,590 | ) | | | (61,783 | ) | | | (7,901 | ) | | | (1,268 | ) |
Share of income from subsidiaries | | | 416,760 | | | | 239,217 | | | | 190,404 | | | | 30,562 | |
Interest income | | | 90 | | | | 8,095 | | | | 889 | | | | 143 | |
Interest expense | | | (1,730 | ) | | | (45,945 | ) | | | (118,515 | ) | | | (19,023 | ) |
Issuance costs for convertible notes | | | (42,559 | ) | | | — | | | | — | | | | — | |
(Loss)/gain on change in fair value of convertible notes | | | (9,040 | ) | | | 198,547 | | | | (87,099 | ) | | | (13,980 | ) |
Foreign exchange (loss)/gain | | | (2,912 | ) | | | 19,194 | | | | 1,969 | | | | 316 | |
Gain on buy-back of convertible bonds | | | 2,480 | | | | 1,521 | | | | — | | | | — | |
Non-operating expenses | | | — | | | | (7,315 | ) | | | (6,665 | ) | | | (1,070 | ) |
| | | | | | | | | | | | | | | | |
Income/(loss) before income tax expense | | | 359,499 | | | | 351,531 | | | | (26,918 | ) | | | (4,320 | ) |
| | | | | | | | | | | | | | | | |
Income tax expense | | | — | | | | — | | | | — | | | | — | |
Net income/(loss) | | | 359,499 | | | | 351,531 | | | | (26,918 | ) | | | (4,320 | ) |
| | | | | | | | | | | | | | | | |
F-42
HOME INNS & HOTELS MANAGEMENT INC.
NOTES TO THE CONSOLIDATED FINANCIAL STATEMENTS (CONTINUED)
(Amounts expressed in RMB in thousands, except share and per share data and where otherwise stated)
| | | | | | | | | | | | |
| | | 2011 | | | 2012 | | | 2012 | |
| | | | | | | | | US$ thousands
(Note 2(d)) | |
Balance sheets: | | | | | | | | | | | | |
| | | |
Assets | | | | | | | | | | | | |
Current assets: | | | | | | | | | | | | |
Cash and cash equivalents | | | 181,581 | | | | 45,700 | | | | 7,335 | |
Restricted cash | | | 202,323 | | | | 205,731 | | | | 33,022 | |
Receivables from related parties | | | 241 | | | | 87 | | | | 14 | |
Prepayments and other current assets | | | 1,036 | | | | 3,786 | | | | 608 | |
| | | | | | | | | | | | |
Total current assets | | | 385,181 | | | | 255,304 | | | | 40,979 | |
| | | | | | | | | | | | |
Investments in subsidiaries (a) | | | 6,154,925 | | | | 5,639,123 | | | | 905,142 | |
Other assets | | | 85,891 | | | | 42,831 | | | | 6,875 | |
| | | | | | | | | | | | |
Total assets | | | 6,625,997 | | | | 5,937,258 | | | | 952,996 | |
| | | | | | | | | | | | |
| | | |
Liabilities | | | | | | | | | | | | |
Current liabilities | | | | | | | | | | | | |
Short-term loans | | | 346,550 | | | | 12,571 | | | | 2,018 | |
Convertible bonds | | | 113,051 | | | | — | | | | — | |
Other payables and accruals | | | 156,418 | | | | 165,111 | | | | 26,502 | |
| | | | | | | | | | | | |
Total current liabilities | | | 616,019 | | | | 177,682 | | | | 28,520 | |
| | | | | | | | | | | | |
Non-current liabilities | | | | | | | | | | | | |
Long-term loans | | | 1,165,666 | | | | 735,404 | | | | 118,040 | |
Financial liability | | | 979,008 | | | | 1,066,771 | | | | 171,229 | |
| | | | | | | | | | | | |
Total liabilities | | | 2,760,693 | | | | 1,979,857 | | | | 317,789 | |
| | | | | | | | | | | | |
| | | |
Shareholders’ equity | | | | | | | | | | | | |
Ordinary shares (US$ 0.005 par value; 200,000,000 shares authorized, 90,659,882 and 91,672,320 shares issued and outstanding as of December 31, 2011 and 2012, respectively) | | | 3,542 | | | | 3,574 | | | | 574 | |
Additional paid-in capital | | | 2,683,923 | | | | 2,802,905 | | | | 449,897 | |
Retained earnings | | | 1,177,839 | | | | 1,150,922 | | | | 184,736 | |
| | | | | | | | | | | | |
Total shareholders’ equity | | | 3,865,304 | | | | 3,957,401 | | | | 635,207 | |
| | | | | | | | | | | | |
Total liabilities and shareholders’ equity | | | 6,625,997 | | | | 5,937,258 | | | | 952,996 | |
| | | | | | | | | | | | |
| (a) | Investments in subsidiaries include the amounts contributed to Home Inns HK by the Company for Home Inns HK’s investments in PRC subsidiaries. |
F-43
HOME INNS & HOTELS MANAGEMENT INC.
NOTES TO THE CONSOLIDATED FINANCIAL STATEMENTS (CONTINUED)
(Amounts expressed in RMB in thousands, except share and per share data and where otherwise stated)
| | | | | | | | | | | | | | | | |
| | | 2010 | | | 2011 | | | 2012 | | | 2012 | |
| | | | | | | | | | | | US$ thousands (Note 2(d)) | |
Statements of Cash flows: | | | | | | | | | | | | | | | | |
| | | | |
Cash flows from operating activities: | | | | | | | | | | | | | | | | |
Net income/(loss) | | | 359,499 | | | | 351,531 | | | | (26,918 | ) | | | (4,320 | ) |
Adjustments to reconcile net income to net cash provided by (used in) operating activities: | | | | | | | | | | | | | | | | |
Amortization of upfront fee of term loan | | | — | | | | 5,726 | | | | 43,060 | | | | 6,912 | |
Share of income from subsidiaries | | | (416,760 | ) | | | (239,217 | ) | | | (190,404 | ) | | | (30,562 | ) |
Interest expense | | | 1,730 | | | | — | | | | — | | | | — | |
Foreign exchange loss/(gain) | | | 2,912 | | | | (19,194 | ) | | | (1,969 | ) | | | (316 | ) |
Gain on buy-back of convertible bonds | | | (2,480 | ) | | | (1,521 | ) | | | — | | | | — | |
Issuance costs for convertible notes | | | 42,559 | | | | — | | | | — | | | | — | |
Loss/(gain) on change in fair value of convertible notes | | | 9,040 | | | | (198,547 | ) | | | 87,099 | | | | 13,980 | |
Loss from fair value change of interest rate swap transaction | | | — | | | | 7,315 | | | | 6,665 | | | | 1,070 | |
Change in assets and liabilities, net of effects of acquisitions: | | | | | | | | | | | | | | | | |
(Increase)/decrease in receivables from related parties | | | — | | | | (241 | ) | | | 154 | | | | 25 | |
(Increase)/decrease in prepayments and other current assets | | | (205 | ) | | | 540 | | | | (2,750 | ) | | | (441 | ) |
Increase/(decrease) in payables to related parties | | | 97,248 | | | | (163,258 | ) | | | — | | | | — | |
(Decrease)/increase in other payables and accruals | | | (673 | ) | | | (4,630 | ) | | | 6,444 | | | | 1,034 | |
| | | | | | | | | | | | | | | | |
Net cash provided by/(used in) operating activities | | | 92,870 | | | | (261,496 | ) | | | (78,619 | ) | | | (12,618 | ) |
| | | | | | | | | | | | | | | | |
| | | | |
Cash flows from investing activities: | | | | | | | | | | | | | | | | |
Cash paid to restricted cash | | | | | | | | | | | | | | | | |
– escrow account and interest reserve account | | | — | | | | (202,323 | ) | | | (3,703 | ) | | | (594 | ) |
Cash paid for the acquisition of Motel 168 | | | — | | | | (2,031,421 | ) | | | — | | | | — | |
Investments in subsidiaries | | | (47,951 | ) | | | (53,319 | ) | | | — | | | | — | |
Dividend received from subsidiaries | | | — | | | | — | | | | 798,605 | | | | 128,184 | |
| | | | | | | | | | | | | | | | |
Cash flows (used in)/ provided by investing activities: | | | (47,951 | ) | | | (2,287,063 | ) | | | 794,902 | | | | 127,590 | |
| | | | | | | | | | | | | | | | |
| | | | |
Cash flows from financing activities: | | | | | | | | | | | | | | | | |
Proceeds from share option exercise | | | 63,644 | | | | 28,173 | | | | 26,615 | | | | 4,272 | |
Buy-back of convertible bonds | | | (75,687 | ) | | | (45,507 | ) | | | — | | | | — | |
Net proceeds from issuance of convertible notes | | | 1,188,823 | | | | — | | | | — | | | | — | |
Repayment of convertible bonds | | | — | | | | — | | | | (111,945 | ) | | | (17,968 | ) |
Proceeds from loans | | | — | | | | 1,525,176 | | | | — | | | | — | |
Repayment of loans | | | — | | | | — | | | | (760,949 | ) | | | (122,141 | ) |
Cash settlement of interest swap transaction | | | — | | | | — | | | | (3,418 | ) | | | (549 | ) |
Payment for upfront fee of loan | | | — | | | | (91,617 | ) | | | — | | | | — | |
| | | | | | | | | | | | | | | | |
Net cash provided by/(used in) financing activities | | | 1,176,780 | | | | 1,416,225 | | | | (849,697 | ) | | | (136,386 | ) |
| | | | | | | | | | | | | | | | |
| | | | |
Effect of foreign exchange rate changes on cash and cash equivalents | | | (9,761 | ) | | | (52,334 | ) | | | (2,467 | ) | | | (397 | ) |
| | | | | | | | | | | | | | | | |
Net increase/(decrease) in cash and cash equivalents | | | 1,211,938 | | | | (1,184,668 | ) | | | (135,881 | ) | | | (21,811 | ) |
Cash and cash equivalents, beginning of year | | | 154,311 | | | | 1,366,249 | | | | 181,581 | | | | 29,146 | |
| | | | | | | | | | | | | | | | |
Cash and cash equivalents, end of the year | | | 1,366,249 | | | | 181,581 | | | | 45,700 | | | | 7,335 | |
| | | | | | | | | | | | | | | | |
| | | | |
Supplemental disclosure of cash flow information | | | | | | | | | | | | | | | | |
Cash paid during the year for interest | | | — | | | | (33,848 | ) | | | (77,706 | ) | | | (12,473 | ) |
| | | | |
Supplemental schedule of non-cash investing activities: | | | | | | | | | | | | | | | | |
Unpaid consideration related to the acquisition of Motel 168 | | | — | | | | 143,728 | | | | — | | | | — | |
Decrease of investments in subsidiaries when Home Inns HK paid on behalf of the Company | | | 127,000 | | | | — | | | | — | | | | — | |
Issuance of ordinary shares related to the acquisition of Motel 168 | | | — | | | | 667,314 | | | | — | | | | — | |
F-44