
S U P P L E M E N T A R Y A N A L Y S I S—T O B E R E A D O N L Y I N C O N J U C T I O N W I T H S T R A T E G I C A S S E S S M E N T R E P O R T J A N U A R Y 2 0 1 4
Confidential SUPPLEMENTARY ANALYSIS—TO BE READ ONLY IN CONJUNCTION WITH STRATEGIC ASSESSMENT REPORT This document has been prepared by Lazard Frères & Co. LLC (“Lazard”) based upon information supplied by the Tennessee Valley Authority (the “TVA”) and its representatives and information supplied by the Federal Government and its representatives (including representatives of the Treasury and the Office of Management and Budget (the “OMB”)) and information provided by other sources, as well as publicly available information. Portions of the information herein may be based upon certain statements, estimates and forecasts provided by the TVA with respect to the historical or anticipated future performance of the TVA or certain TVA assets. We have relied upon the accuracy and completeness of all the foregoing information, and have not assumed any responsibility for any independent verification of such information or any independent appraisal of any of the assets or liabilities of the TVA or any other entity, or concerning solvency or fair value. With respect to financial forecasts, we have assumed that they have been reasonably prepared on bases reflecting the best currently available estimates and judgments as to the applicable future financial performance. We assume no responsibility for and express no view as to such forecasts or the assumptions on which they are based. The information set forth herein is based upon economic, monetary, market and other conditions as in effect on, and the information made available to us as of, the date hereof, unless indicated otherwise. Lazard does not have any obligation to update or otherwise revise this document. Lazard is not providing and is not responsible for any tax, accounting, actuarial, legal or other specialist advice. Accordingly, although Lazard has considered with the TVA such matters generally as they relate to possibly transferring ownership and/or operation of the TVA, this document does not incorporate analysis requiring any such specialist advice and Lazard understands that the TVA has obtained or will obtain any such advice as it deems necessary from qualified professionals. These materials are also summary in nature and do not purport to include all of the information that should be evaluated in considering alternatives for the TVA. Lazard is acting as investment banker to the TVA and any advice, recommendations, information or work product provided by Lazard is for the sole use of the TVA and the OMB. This document, and any advice, recommendations, information or work product provided by Lazard is not intended for the benefit of any third party and may not be relied upon by any third party. This document may not be disclosed publicly or made available to third parties without the prior written consent of Lazard. Financial analysis included in this report is based on market data as of November 14, 2013 unless otherwise noted. Disclaimer C O N F I D E N T I A L
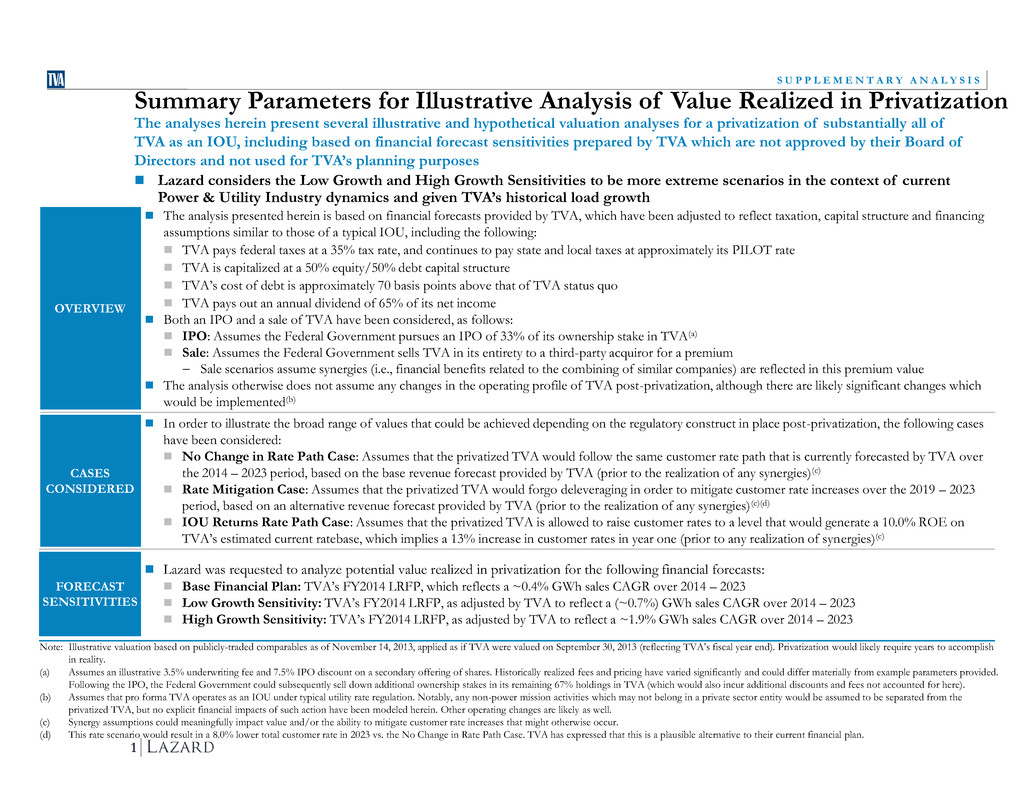
Confidential SUPPLEMENTARY ANALYSIS—TO BE READ ONLY IN CONJUNCTION WITH STRATEGIC ASSESSMENT REPORT 1 S U P P L E M E N T A R Y A N A L Y S I S Note: Illustrative valuation based on publicly-traded comparables as of November 14, 2013, applied as if TVA were valued on September 30, 2013 (reflecting TVA’s fiscal year end). Privatization would likely require years to accomplish in reality. (a) Assumes an illustrative 3.5% underwriting fee and 7.5% IPO discount on a secondary offering of shares. Historically realized fees and pricing have varied significantly and could differ materially from example parameters provided. Following the IPO, the Federal Government could subsequently sell down additional ownership stakes in its remaining 67% holdings in TVA (which would also incur additional discounts and fees not accounted for here). (b) Assumes that pro forma TVA operates as an IOU under typical utility rate regulation. Notably, any non-power mission activities which may not belong in a private sector entity would be assumed to be separated from the privatized TVA, but no explicit financial impacts of such action have been modeled herein. Other operating changes are likely as well. (c) Synergy assumptions could meaningfully impact value and/or the ability to mitigate customer rate increases that might otherwise occur. (d) This rate scenario would result in a 8.0% lower total customer rate in 2023 vs. the No Change in Rate Path Case. TVA has expressed that this is a plausible alternative to their current financial plan. Summary Parameters for Illustrative Analysis of Value Realized in Privatization The analyses herein present several illustrative and hypothetical valuation analyses for a privatization of substantially all of TVA as an IOU, including based on financial forecast sensitivities prepared by TVA which are not approved by their Board of Directors and not used for TVA’s planning purposes Lazard considers the Low Growth and High Growth Sensitivities to be more extreme scenarios in the context of current Power & Utility Industry dynamics and given TVA’s historical load growth OVERVIEW The analysis presented herein is based on financial forecasts provided by TVA, which have been adjusted to reflect taxation, capital structure and financing assumptions similar to those of a typical IOU, including the following: TVA pays federal taxes at a 35% tax rate, and continues to pay state and local taxes at approximately its PILOT rate TVA is capitalized at a 50% equity/50% debt capital structure TVA’s cost of debt is approximately 70 basis points above that of TVA status quo TVA pays out an annual dividend of 65% of its net income Both an IPO and a sale of TVA have been considered, as follows: IPO: Assumes the Federal Government pursues an IPO of 33% of its ownership stake in TVA(a) Sale: Assumes the Federal Government sells TVA in its entirety to a third-party acquiror for a premium Sale scenarios assume synergies (i.e., financial benefits related to the combining of similar companies) are reflected in this premium value The analysis otherwise does not assume any changes in the operating profile of TVA post-privatization, although there are likely significant changes which would be implemented(b) CASES CONSIDERED In order to illustrate the broad range of values that could be achieved depending on the regulatory construct in place post-privatization, the following cases have been considered: No Change in Rate Path Case: Assumes that the privatized TVA would follow the same customer rate path that is currently forecasted by TVA over the 2014 – 2023 period, based on the base revenue forecast provided by TVA (prior to the realization of any synergies)(c) Rate Mitigation Case: Assumes that the privatized TVA would forgo deleveraging in order to mitigate customer rate increases over the 2019 – 2023 period, based on an alternative revenue forecast provided by TVA (prior to the realization of any synergies)(c)(d) IOU Returns Rate Path Case: Assumes that the privatized TVA is allowed to raise customer rates to a level that would generate a 10.0% ROE on TVA’s estimated current ratebase, which implies a 13% increase in customer rates in year one (prior to any realization of synergies)(c) FORECAST SENSITIVITIES Lazard was requested to analyze potential value realized in privatization for the following financial forecasts: Base Financial Plan: TVA’s FY2014 LRFP, which reflects a ~0.4% GWh sales CAGR over 2014 – 2023 Low Growth Sensitivity: TVA’s FY2014 LRFP, as adjusted by TVA to reflect a (~0.7%) GWh sales CAGR over 2014 – 2023 High Growth Sensitivity: TVA’s FY2014 LRFP, as adjusted by TVA to reflect a ~1.9% GWh sales CAGR over 2014 – 2023
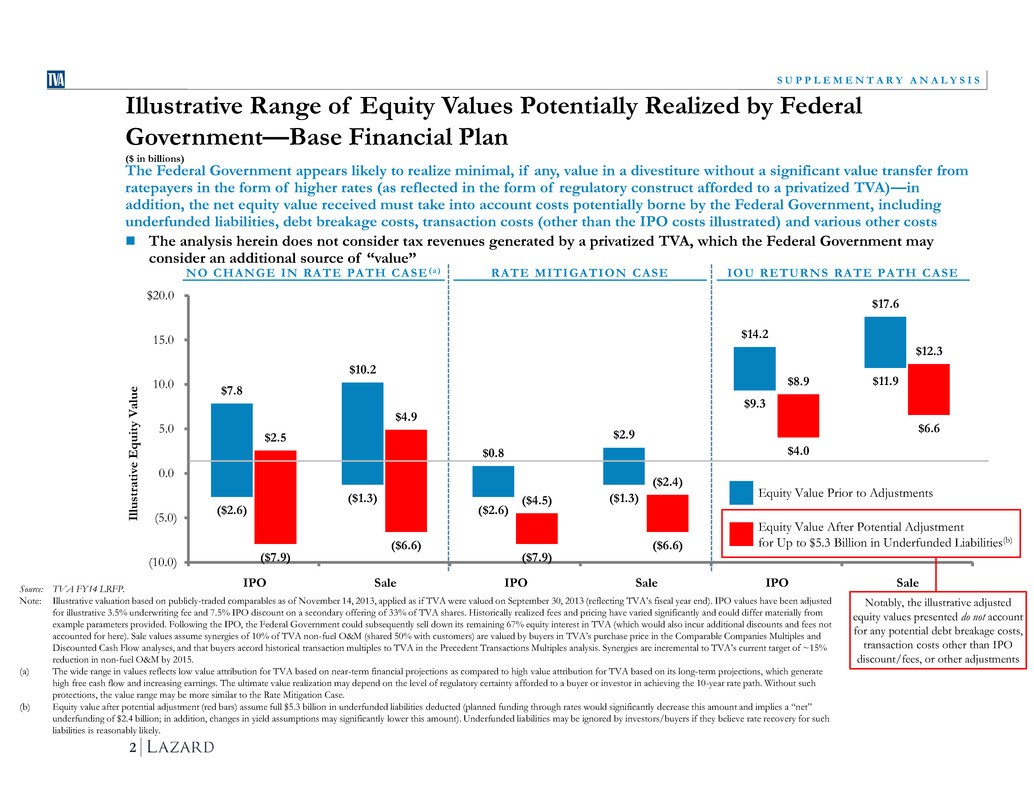
Confidential SUPPLEMENTARY ANALYSIS—TO BE READ ONLY IN CONJUNCTION WITH STRATEGIC ASSESSMENT REPORT 2 S U P P L E M E N T A R Y A N A L Y S I S Source: TVA FY14 LRFP. Note: Illustrative valuation based on publicly-traded comparables as of November 14, 2013, applied as if TVA were valued on September 30, 2013 (reflecting TVA’s fiscal year end). IPO values have been adjusted for illustrative 3.5% underwriting fee and 7.5% IPO discount on a secondary offering of 33% of TVA shares. Historically realized fees and pricing have varied significantly and could differ materially from example parameters provided. Following the IPO, the Federal Government could subsequently sell down its remaining 67% equity interest in TVA (which would also incur additional discounts and fees not accounted for here). Sale values assume synergies of 10% of TVA non-fuel O&M (shared 50% with customers) are valued by buyers in TVA’s purchase price in the Comparable Companies Multiples and Discounted Cash Flow analyses, and that buyers accord historical transaction multiples to TVA in the Precedent Transactions Multiples analysis. Synergies are incremental to TVA’s current target of ~15% reduction in non-fuel O&M by 2015. (a) The wide range in values reflects low value attribution for TVA based on near-term financial projections as compared to high value attribution for TVA based on its long-term projections, which generate high free cash flow and increasing earnings. The ultimate value realization may depend on the level of regulatory certainty afforded to a buyer or investor in achieving the 10-year rate path. Without such protections, the value range may be more similar to the Rate Mitigation Case. (b) Equity value after potential adjustment (red bars) assume full $5.3 billion in underfunded liabilities deducted (planned funding through rates would significantly decrease this amount and implies a “net” underfunding of $2.4 billion; in addition, changes in yield assumptions may significantly lower this amount). Underfunded liabilities may be ignored by investors/buyers if they believe rate recovery for such liabilities is reasonably likely. ($4.5) ($2.4) ($2.6) ($7.9) ($1.3) ($6.6) ($2.6) ($7.9) ($1.3) ($6.6) $9.3 $4.0 $11.9 $6.6 $7.8 $2.5 $10.2 $4.9 $0.8 $2.9 $14.2 $8.9 $17.6 $12.3 (10.0) (5.0) 0.0 5.0 10.0 15.0 $20.0 Il lu st ra ti ve E q uity V a lu e IPO Sale IPO Sale IPO Sale Equity Value After Potential Adjustment for Up to $5.3 Billion in Underfunded Liabilities(b) NO CHANGE IN RATE PATH CASE (a) RATE MITIGATION CASE IOU RETURNS RATE PATH CASE Equity Value Prior to Adjustments Notably, the illustrative adjusted equity values presented do not account for any potential debt breakage costs, transaction costs other than IPO discount/fees, or other adjustments Illustrative Range of Equity Values Potentially Realized by Federal Government—Base Financial Plan ($ in billions) The Federal Government appears likely to realize minimal, if any, value in a divestiture without a significant value transfer from ratepayers in the form of higher rates (as reflected in the form of regulatory construct afforded to a privatized TVA)—in addition, the net equity value received must take into account costs potentially borne by the Federal Government, including underfunded liabilities, debt breakage costs, transaction costs (other than the IPO costs illustrated) and various other costs The analysis herein does not consider tax revenues generated by a privatized TVA, which the Federal Government may consider an additional source of “value”

Confidential SUPPLEMENTARY ANALYSIS—TO BE READ ONLY IN CONJUNCTION WITH STRATEGIC ASSESSMENT REPORT 3 S U P P L E M E N T A R Y A N A L Y S I S Source: TVA FY14 LRFP. Note: Illustrative valuation based on publicly-traded comparables as of November 14, 2013, applied as if TVA were valued on September 30, 2013 (reflecting TVA’s fiscal year end). IPO values have been adjusted for illustrative 3.5% underwriting fee and 7.5% IPO discount on a secondary offering of 33% of TVA shares. Historically realized fees and pricing have varied significantly and could differ materially from example parameters provided. Following the IPO, the Federal Government could subsequently sell down its remaining 67% equity interest in TVA (which would also incur additional discounts and fees not accounted for here). Sale values assume synergies of 10% of TVA non-fuel O&M (shared 50% with customers) are valued by buyers in TVA’s purchase price in the Comparable Companies Multiples and Discounted Cash Flow analyses, and that buyers accord historical transaction multiples to TVA in the Precedent Transactions Multiples analysis. Synergies are incremental to TVA’s current target of ~15% reduction in non-fuel O&M by 2015. (a) Equity value after potential adjustment (red bars) assume full $5.3 billion in underfunded liabilities deducted (planned funding through rates would significantly decrease this amount and implies a “net” underfunding of $2.4 billion; in addition, changes in yield assumptions may significantly lower this amount). Underfunded liabilities may be ignored by investors/buyers if they believe rate recovery for such liabilities is reasonably likely. ($2.8) ($0.7) ($3.8) ($9.1) ($2.5) ($7.8) $9.3 $4.0 $11.8 $6.5 $2.5 $4.6 $13.6 $8.3 $17.0 $11.7 (10.0) (5.0) 0.0 5.0 10.0 15.0 $20.0 Il lu st ra ti ve E q uity V a lu e IPO Sale IPO Sale Equity Value After Potential Adjustment for Up to $5.3 Billion in Underfunded Liabilities(a) NO CHANGE IN RATE PATH CASE IOU RETURNS RATE PATH CASE Equity Value Prior to Adjustments Notably, the illustrative adjusted equity values presented do not account for any potential debt breakage costs, transaction costs other than IPO discount/fees, or other adjustments Illustrative Range of Equity Values Potentially Realized by Federal Government: Low Growth Sensitivity ($ in billions) The Low Growth Sensitivity implies lower value realization vs. the Base Financial Plan for the Federal Government under the No Change in Rate Path Case, due to the expected revenue reduction not being entirely offset by reduced operating expenses and capital requirements. In the IOU Returns Rate Path Case, the value realization for the Federal Government is modestly less than in the Base Financial Plan, due primarily to TVA’s modestly smaller capital spending program (and resulting earning ratebase) As in the Base Financial Plan analysis, the Federal Government also should consider value transfer issues (as reflected in the form of a privatized regulatory construct), other costs potentially borne by the Federal Government and its view on tax revenues as a potential source of “value”
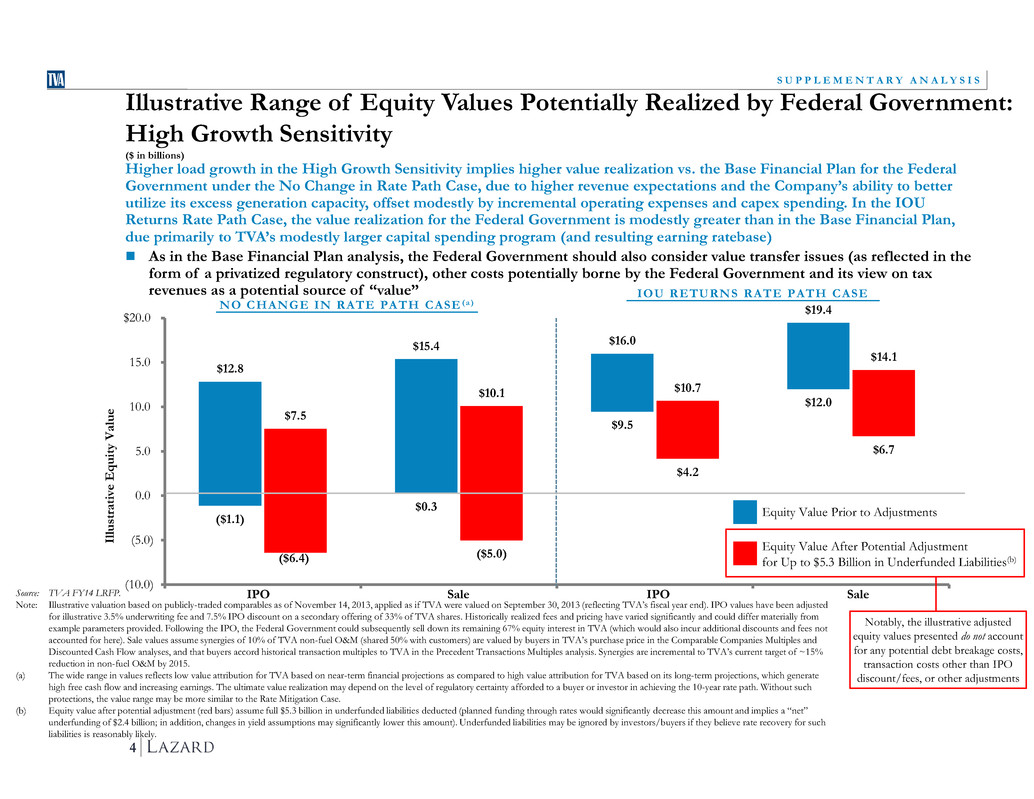
Confidential SUPPLEMENTARY ANALYSIS—TO BE READ ONLY IN CONJUNCTION WITH STRATEGIC ASSESSMENT REPORT 4 S U P P L E M E N T A R Y A N A L Y S I S Source: TVA FY14 LRFP. Note: Illustrative valuation based on publicly-traded comparables as of November 14, 2013, applied as if TVA were valued on September 30, 2013 (reflecting TVA’s fiscal year end). IPO values have been adjusted for illustrative 3.5% underwriting fee and 7.5% IPO discount on a secondary offering of 33% of TVA shares. Historically realized fees and pricing have varied significantly and could differ materially from example parameters provided. Following the IPO, the Federal Government could subsequently sell down its remaining 67% equity interest in TVA (which would also incur additional discounts and fees not accounted for here). Sale values assume synergies of 10% of TVA non-fuel O&M (shared 50% with customers) are valued by buyers in TVA’s purchase price in the Comparable Companies Multiples and Discounted Cash Flow analyses, and that buyers accord historical transaction multiples to TVA in the Precedent Transactions Multiples analysis. Synergies are incremental to TVA’s current target of ~15% reduction in non-fuel O&M by 2015. (a) The wide range in values reflects low value attribution for TVA based on near-term financial projections as compared to high value attribution for TVA based on its long-term projections, which generate high free cash flow and increasing earnings. The ultimate value realization may depend on the level of regulatory certainty afforded to a buyer or investor in achieving the 10-year rate path. Without such protections, the value range may be more similar to the Rate Mitigation Case. (b) Equity value after potential adjustment (red bars) assume full $5.3 billion in underfunded liabilities deducted (planned funding through rates would significantly decrease this amount and implies a “net” underfunding of $2.4 billion; in addition, changes in yield assumptions may significantly lower this amount). Underfunded liabilities may be ignored by investors/buyers if they believe rate recovery for such liabilities is reasonably likely. ($1.1) ($6.4) ($5.0) $0.3 $9.5 $4.2 $12.0 $6.7 $12.8 $7.5 $15.4 $10.1 $16.0 $10.7 $19.4 $14.1 (10.0) (5.0) 0.0 5.0 10.0 15.0 $20.0 Il lu st ra ti ve E q uity V a lu e IPO Sale IPO Sale Equity Value After Potential Adjustment for Up to $5.3 Billion in Underfunded Liabilities(b) NO CHANGE IN RATE PATH CASE (a) IOU RETURNS RATE PATH CASE Equity Value Prior to Adjustments Notably, the illustrative adjusted equity values presented do not account for any potential debt breakage costs, transaction costs other than IPO discount/fees, or other adjustments Illustrative Range of Equity Values Potentially Realized by Federal Government: High Growth Sensitivity ($ in billions) Higher load growth in the High Growth Sensitivity implies higher value realization vs. the Base Financial Plan for the Federal Government under the No Change in Rate Path Case, due to higher revenue expectations and the Company’s ability to better utilize its excess generation capacity, offset modestly by incremental operating expenses and capex spending. In the IOU Returns Rate Path Case, the value realization for the Federal Government is modestly greater than in the Base Financial Plan, due primarily to TVA’s modestly larger capital spending program (and resulting earning ratebase) As in the Base Financial Plan analysis, the Federal Government should also consider value transfer issues (as reflected in the form of a privatized regulatory construct), other costs potentially borne by the Federal Government and its view on tax revenues as a potential source of “value”

Confidential SUPPLEMENTARY ANALYSIS—TO BE READ ONLY IN CONJUNCTION WITH STRATEGIC ASSESSMENT REPORT Appendix
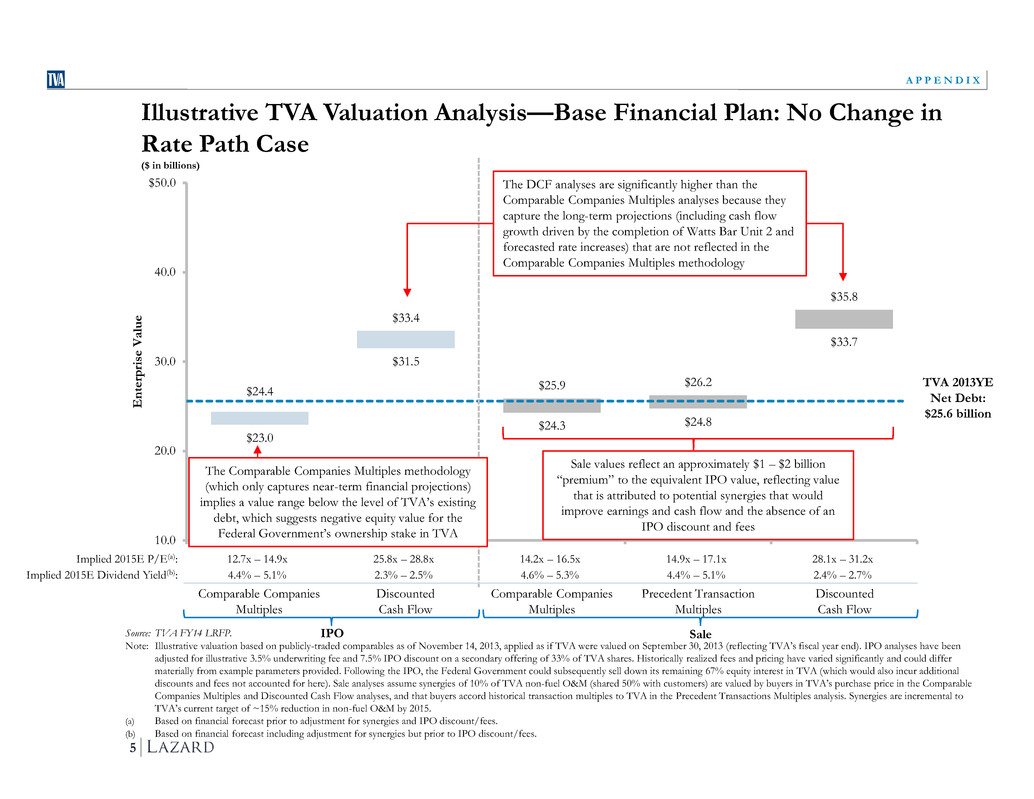
Confidential SUPPLEMENTARY ANALYSIS—TO BE READ ONLY IN CONJUNCTION WITH STRATEGIC ASSESSMENT REPORT $23.0 $31.5 $24.3 $24.8 $33.7 $24.4 $33.4 $25.9 $26.2 $35.8 10.0 20.0 30.0 40.0 $50.0 E n te rp ri se V a lu e 5 A P P E N D I X IPO Sale The Comparable Companies Multiples methodology (which only captures near-term financial projections) implies a value range below the level of TVA’s existing debt, which suggests negative equity value for the Federal Government’s ownership stake in TVA The DCF analyses are significantly higher than the Comparable Companies Multiples analyses because they capture the long-term projections (including cash flow growth driven by the completion of Watts Bar Unit 2 and forecasted rate increases) that are not reflected in the Comparable Companies Multiples methodology Illustrative TVA Valuation Analysis—Base Financial Plan: No Change in Rate Path Case ($ in billions) Implied 2015E P/E(a): 12.7x – 14.9x 25.8x – 28.8x 14.2x – 16.5x 14.9x – 17.1x 28.1x – 31.2x Implied 2015E Dividend Yield(b): 4.4% – 5.1% 2.3% – 2.5% 4.6% – 5.3% 4.4% – 5.1% 2.4% – 2.7% Comparable Companies Multiples Discounted Cash Flow Comparable Companies Multiples Precedent Transaction Multiples Discounted Cash Flow Sale values reflect an approximately $1 – $2 billion “premium” to the equivalent IPO value, reflecting value that is attributed to potential synergies that would improve earnings and cash flow and the absence of an IPO discount and fees TVA 2013YE Net Debt: $25.6 billion Source: TVA FY14 LRFP. Note: Illustrative valuation based on publicly-traded comparables as of November 14, 2013, applied as if TVA were valued on September 30, 2013 (reflecting TVA’s fiscal year end). IPO analyses have been adjusted for illustrative 3.5% underwriting fee and 7.5% IPO discount on a secondary offering of 33% of TVA shares. Historically realized fees and pricing have varied significantly and could differ materially from example parameters provided. Following the IPO, the Federal Government could subsequently sell down its remaining 67% equity interest in TVA (which would also incur additional discounts and fees not accounted for here). Sale analyses assume synergies of 10% of TVA non-fuel O&M (shared 50% with customers) are valued by buyers in TVA’s purchase price in the Comparable Companies Multiples and Discounted Cash Flow analyses, and that buyers accord historical transaction multiples to TVA in the Precedent Transactions Multiples analysis. Synergies are incremental to TVA’s current target of ~15% reduction in non-fuel O&M by 2015. (a) Based on financial forecast prior to adjustment for synergies and IPO discount/fees. (b) Based on financial forecast including adjustment for synergies but prior to IPO discount/fees.
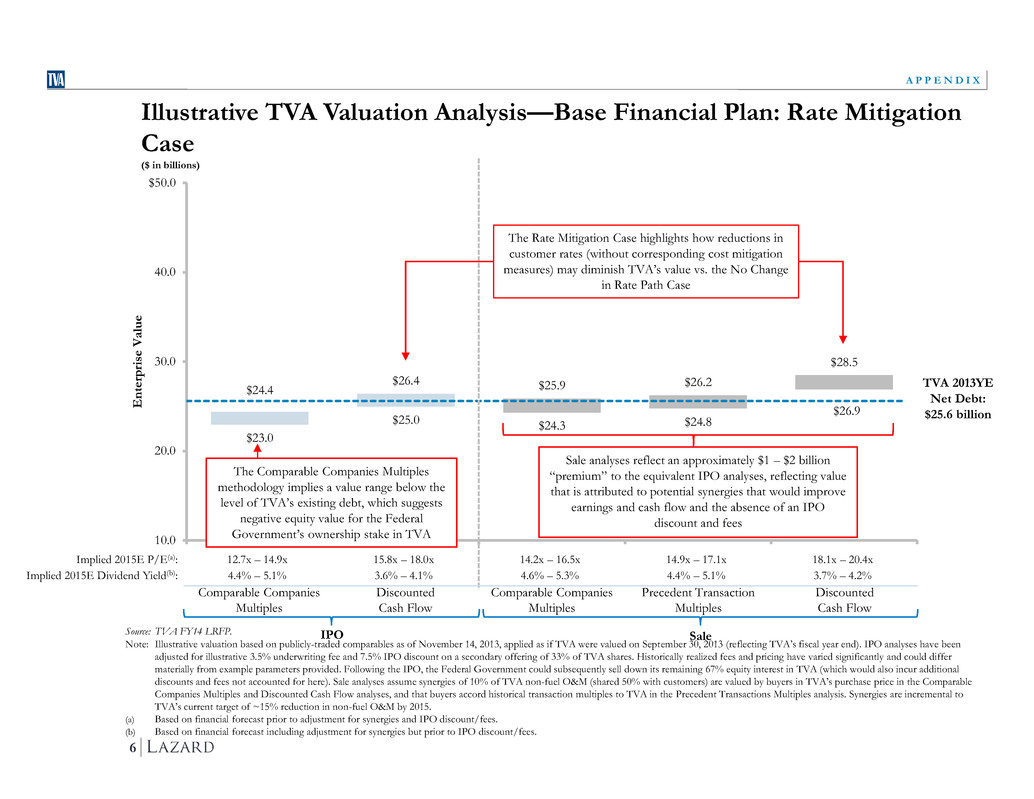
Confidential SUPPLEMENTARY ANALYSIS—TO BE READ ONLY IN CONJUNCTION WITH STRATEGIC ASSESSMENT REPORT $23.0 $25.0 $24.3 $24.8 $26.9 $24.4 $26.4 $25.9 $26.2 $28.5 10.0 20.0 30.0 40.0 $50.0 E n te rp ri se V a lu e 6 A P P E N D I X TVA 2013YE Net Debt: $25.6 billion IPO Sale The Comparable Companies Multiples methodology implies a value range below the level of TVA’s existing debt, which suggests negative equity value for the Federal Government’s ownership stake in TVA Illustrative TVA Valuation Analysis—Base Financial Plan: Rate Mitigation Case ($ in billions) Implied 2015E P/E(a): 12.7x – 14.9x 15.8x – 18.0x 14.2x – 16.5x 14.9x – 17.1x 18.1x – 20.4x Implied 2015E Dividend Yield(b): 4.4% – 5.1% 3.6% – 4.1% 4.6% – 5.3% 4.4% – 5.1% 3.7% – 4.2% Comparable Companies Multiples Discounted Cash Flow Comparable Companies Multiples Precedent Transaction Multiples Discounted Cash Flow Sale analyses reflect an approximately $1 – $2 billion “premium” to the equivalent IPO analyses, reflecting value that is attributed to potential synergies that would improve earnings and cash flow and the absence of an IPO discount and fees The Rate Mitigation Case highlights how reductions in customer rates (without corresponding cost mitigation measures) may diminish TVA’s value vs. the No Change in Rate Path Case Source: TVA FY14 LRFP. Note: Illustrative valuation based on publicly-traded comparables as of November 14, 2013, applied as if TVA were valued on September 30, 2013 (reflecting TVA’s fiscal year end). IPO analyses have been adjusted for illustrative 3.5% underwriting fee and 7.5% IPO discount on a secondary offering of 33% of TVA shares. Historically realized fees and pricing have varied significantly and could differ materially from example parameters provided. Following the IPO, the Federal Government could subsequently sell down its remaining 67% equity interest in TVA (which would also incur additional discounts and fees not accounted for here). Sale analyses assume synergies of 10% of TVA non-fuel O&M (shared 50% with customers) are valued by buyers in TVA’s purchase price in the Comparable Companies Multiples and Discounted Cash Flow analyses, and that buyers accord historical transaction multiples to TVA in the Precedent Transactions Multiples analysis. Synergies are incremental to TVA’s current target of ~15% reduction in non-fuel O&M by 2015. (a) Based on financial forecast prior to adjustment for synergies and IPO discount/fees. (b) Based on financial forecast including adjustment for synergies but prior to IPO discount/fees.
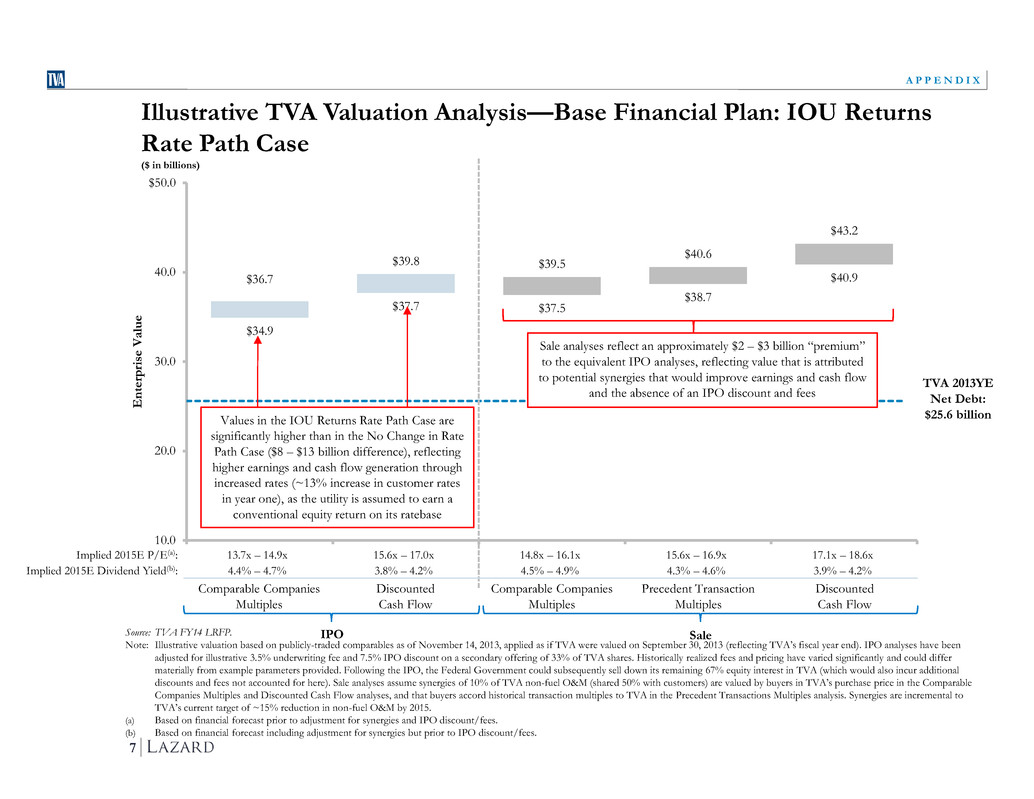
Confidential SUPPLEMENTARY ANALYSIS—TO BE READ ONLY IN CONJUNCTION WITH STRATEGIC ASSESSMENT REPORT $34.9 $37.7 $37.5 $38.7 $40.9 $36.7 $39.8 $39.5 $40.6 $43.2 10.0 20.0 30.0 40.0 $50.0 E n te rp ri se V a lu e 7 A P P E N D I X TVA 2013YE Net Debt: $25.6 billion IPO Sale Illustrative TVA Valuation Analysis—Base Financial Plan: IOU Returns Rate Path Case ($ in billions) Implied 2015E P/E(a): 13.7x – 14.9x 15.6x – 17.0x 14.8x – 16.1x 15.6x – 16.9x 17.1x – 18.6x Implied 2015E Dividend Yield(b): 4.4% – 4.7% 3.8% – 4.2% 4.5% – 4.9% 4.3% – 4.6% 3.9% – 4.2% Comparable Companies Multiples Discounted Cash Flow Comparable Companies Multiples Precedent Transaction Multiples Discounted Cash Flow Sale analyses reflect an approximately $2 – $3 billion “premium” to the equivalent IPO analyses, reflecting value that is attributed to potential synergies that would improve earnings and cash flow and the absence of an IPO discount and fees Values in the IOU Returns Rate Path Case are significantly higher than in the No Change in Rate Path Case ($8 – $13 billion difference), reflecting higher earnings and cash flow generation through increased rates (~13% increase in customer rates in year one), as the utility is assumed to earn a conventional equity return on its ratebase Source: TVA FY14 LRFP. Note: Illustrative valuation based on publicly-traded comparables as of November 14, 2013, applied as if TVA were valued on September 30, 2013 (reflecting TVA’s fiscal year end). IPO analyses have been adjusted for illustrative 3.5% underwriting fee and 7.5% IPO discount on a secondary offering of 33% of TVA shares. Historically realized fees and pricing have varied significantly and could differ materially from example parameters provided. Following the IPO, the Federal Government could subsequently sell down its remaining 67% equity interest in TVA (which would also incur additional discounts and fees not accounted for here). Sale analyses assume synergies of 10% of TVA non-fuel O&M (shared 50% with customers) are valued by buyers in TVA’s purchase price in the Comparable Companies Multiples and Discounted Cash Flow analyses, and that buyers accord historical transaction multiples to TVA in the Precedent Transactions Multiples analysis. Synergies are incremental to TVA’s current target of ~15% reduction in non-fuel O&M by 2015. (a) Based on financial forecast prior to adjustment for synergies and IPO discount/fees. (b) Based on financial forecast including adjustment for synergies but prior to IPO discount/fees.
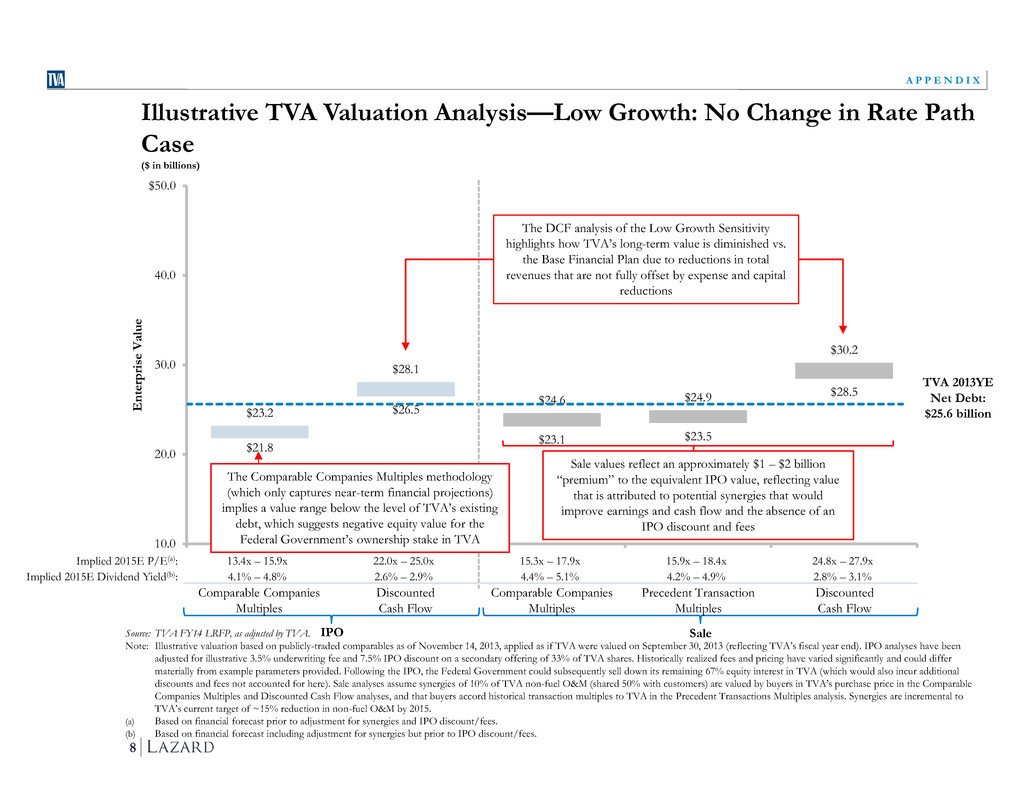
Confidential SUPPLEMENTARY ANALYSIS—TO BE READ ONLY IN CONJUNCTION WITH STRATEGIC ASSESSMENT REPORT $21.8 $26.5 $23.1 $23.5 $28.5 $23.2 $28.1 $24.6 $24.9 $30.2 10.0 20.0 30.0 40.0 $50.0 E n te rp ri se V a lu e 8 A P P E N D I X IPO Sale Illustrative TVA Valuation Analysis—Low Growth: No Change in Rate Path Case ($ in billions) Implied 2015E P/E(a): 13.4x – 15.9x 22.0x – 25.0x 15.3x – 17.9x 15.9x – 18.4x 24.8x – 27.9x Implied 2015E Dividend Yield(b): 4.1% – 4.8% 2.6% – 2.9% 4.4% – 5.1% 4.2% – 4.9% 2.8% – 3.1% Comparable Companies Multiples Discounted Cash Flow Comparable Companies Multiples Precedent Transaction Multiples Discounted Cash Flow TVA 2013YE Net Debt: $25.6 billion Source: TVA FY14 LRFP, as adjusted by TVA. Note: Illustrative valuation based on publicly-traded comparables as of November 14, 2013, applied as if TVA were valued on September 30, 2013 (reflecting TVA’s fiscal year end). IPO analyses have been adjusted for illustrative 3.5% underwriting fee and 7.5% IPO discount on a secondary offering of 33% of TVA shares. Historically realized fees and pricing have varied significantly and could differ materially from example parameters provided. Following the IPO, the Federal Government could subsequently sell down its remaining 67% equity interest in TVA (which would also incur additional discounts and fees not accounted for here). Sale analyses assume synergies of 10% of TVA non-fuel O&M (shared 50% with customers) are valued by buyers in TVA’s purchase price in the Comparable Companies Multiples and Discounted Cash Flow analyses, and that buyers accord historical transaction multiples to TVA in the Precedent Transactions Multiples analysis. Synergies are incremental to TVA’s current target of ~15% reduction in non-fuel O&M by 2015. (a) Based on financial forecast prior to adjustment for synergies and IPO discount/fees. (b) Based on financial forecast including adjustment for synergies but prior to IPO discount/fees. The DCF analysis of the Low Growth Sensitivity highlights how TVA’s long-term value is diminished vs. the Base Financial Plan due to reductions in total revenues that are not fully offset by expense and capital reductions The Comparable Companies Multiples methodology (which only captures near-term financial projections) implies a value range below the level of TVA’s existing debt, which suggests negative equity value for the Federal Government’s ownership stake in TVA Sale values reflect an approximately $1 – $2 billion “premium” to the equivalent IPO value, reflecting value that is attributed to potential synergies that would improve earnings and cash flow and the absence of an IPO discount and fees

Confidential SUPPLEMENTARY ANALYSIS—TO BE READ ONLY IN CONJUNCTION WITH STRATEGIC ASSESSMENT REPORT $34.9 $37.2 $37.4 $38.6 $40.4 $36.7 $39.2 $39.4 $40.5 $42.6 10.0 20.0 30.0 40.0 $50.0 E n te rp ri se V a lu e 9 A P P E N D I X TVA 2013YE Net Debt: $25.6 billion IPO Sale Illustrative TVA Valuation Analysis—Low Growth: IOU Returns Rate Path Case ($ in billions) Implied 2015E P/E(a): 13.7x – 14.9x 15.3x – 16.7x 14.8x – 16.1x 15.7x – 16.9x 16.8x – 18.2x Implied 2015E Dividend Yield(b): 4.4% – 4.7% 3.9% – 4.3% 4.5% – 4.9% 4.3% – 4.6% 4.0% – 4.3% Comparable Companies Multiples Discounted Cash Flow Comparable Companies Multiples Precedent Transaction Multiples Discounted Cash Flow Source: TVA FY14 LRFP, as adjusted by TVA. Note: Illustrative valuation based on publicly-traded comparables as of November 14, 2013, applied as if TVA were valued on September 30, 2013 (reflecting TVA’s fiscal year end).. IPO analyses have been adjusted for illustrative 3.5% underwriting fee and 7.5% IPO discount on a secondary offering of 33% of TVA shares. Historically realized fees and pricing have varied significantly and could differ materially from example parameters provided. Following the IPO, the Federal Government could subsequently sell down its remaining 67% equity interest in TVA (which would also incur additional discounts and fees not accounted for here). Sale analyses assume synergies of 10% of TVA non-fuel O&M (shared 50% with customers) are valued by buyers in TVA’s purchase price in the Comparable Companies Multiples and Discounted Cash Flow analyses, and that buyers accord historical transaction multiples to TVA in the Precedent Transactions Multiples analysis. Synergies are incremental to TVA’s current target of ~15% reduction in non-fuel O&M by 2015. (a) Based on financial forecast prior to adjustment for synergies and IPO discount/fees. (b) Based on financial forecast including adjustment for synergies but prior to IPO discount/fees. Values in the IOU Returns Rate Path Case are significantly higher than in the No Change in Rate Path Case ($11 – $14 billion difference), reflecting higher earnings and cash flow generation through increased rates (~14% increase in customer rates in year one), as the utility is assumed to earn a conventional equity return on its ratebase Sale analyses reflect an approximately $2 – $3 billion “premium” to the equivalent IPO analyses, reflecting value that is attributed to potential synergies that would improve earnings and cash flow and the absence of an IPO discount and fees
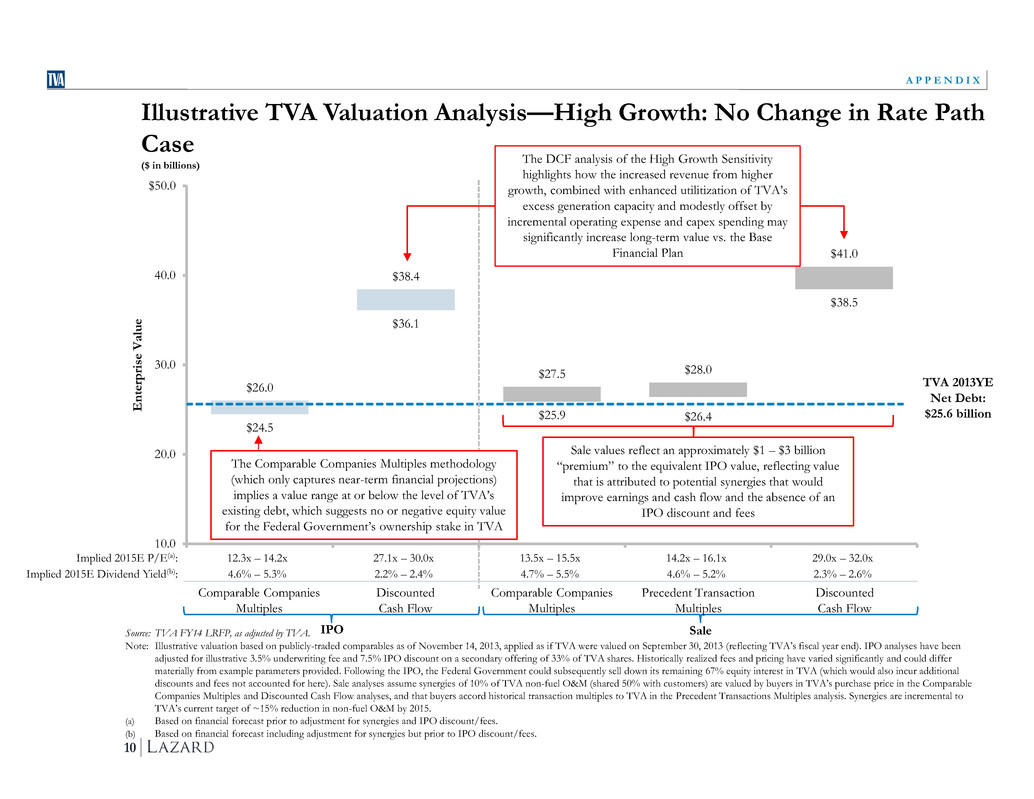
Confidential SUPPLEMENTARY ANALYSIS—TO BE READ ONLY IN CONJUNCTION WITH STRATEGIC ASSESSMENT REPORT $24.5 $36.1 $25.9 $26.4 $38.5 $26.0 $38.4 $27.5 $28.0 $41.0 10.0 20.0 30.0 40.0 $50.0 E n te rp ri se V a lu e 10 A P P E N D I X IPO Sale Illustrative TVA Valuation Analysis—High Growth: No Change in Rate Path Case ($ in billions) Implied 2015E P/E(a): 12.3x – 14.2x 27.1x – 30.0x 13.5x – 15.5x 14.2x – 16.1x 29.0x – 32.0x Implied 2015E Dividend Yield(b): 4.6% – 5.3% 2.2% – 2.4% 4.7% – 5.5% 4.6% – 5.2% 2.3% – 2.6% Comparable Companies Multiples Discounted Cash Flow Comparable Companies Multiples Precedent Transaction Multiples Discounted Cash Flow TVA 2013YE Net Debt: $25.6 billion Source: TVA FY14 LRFP, as adjusted by TVA. Note: Illustrative valuation based on publicly-traded comparables as of November 14, 2013, applied as if TVA were valued on September 30, 2013 (reflecting TVA’s fiscal year end). IPO analyses have been adjusted for illustrative 3.5% underwriting fee and 7.5% IPO discount on a secondary offering of 33% of TVA shares. Historically realized fees and pricing have varied significantly and could differ materially from example parameters provided. Following the IPO, the Federal Government could subsequently sell down its remaining 67% equity interest in TVA (which would also incur additional discounts and fees not accounted for here). Sale analyses assume synergies of 10% of TVA non-fuel O&M (shared 50% with customers) are valued by buyers in TVA’s purchase price in the Comparable Companies Multiples and Discounted Cash Flow analyses, and that buyers accord historical transaction multiples to TVA in the Precedent Transactions Multiples analysis. Synergies are incremental to TVA’s current target of ~15% reduction in non-fuel O&M by 2015. (a) Based on financial forecast prior to adjustment for synergies and IPO discount/fees. (b) Based on financial forecast including adjustment for synergies but prior to IPO discount/fees. The DCF analysis of the High Growth Sensitivity highlights how the increased revenue from higher growth, combined with enhanced utilitization of TVA’s excess generation capacity and modestly offset by incremental operating expense and capex spending may significantly increase long-term value vs. the Base Financial Plan The Comparable Companies Multiples methodology (which only captures near-term financial projections) implies a value range at or below the level of TVA’s existing debt, which suggests no or negative equity value for the Federal Government’s ownership stake in TVA Sale values reflect an approximately $1 – $3 billion “premium” to the equivalent IPO value, reflecting value that is attributed to potential synergies that would improve earnings and cash flow and the absence of an IPO discount and fees
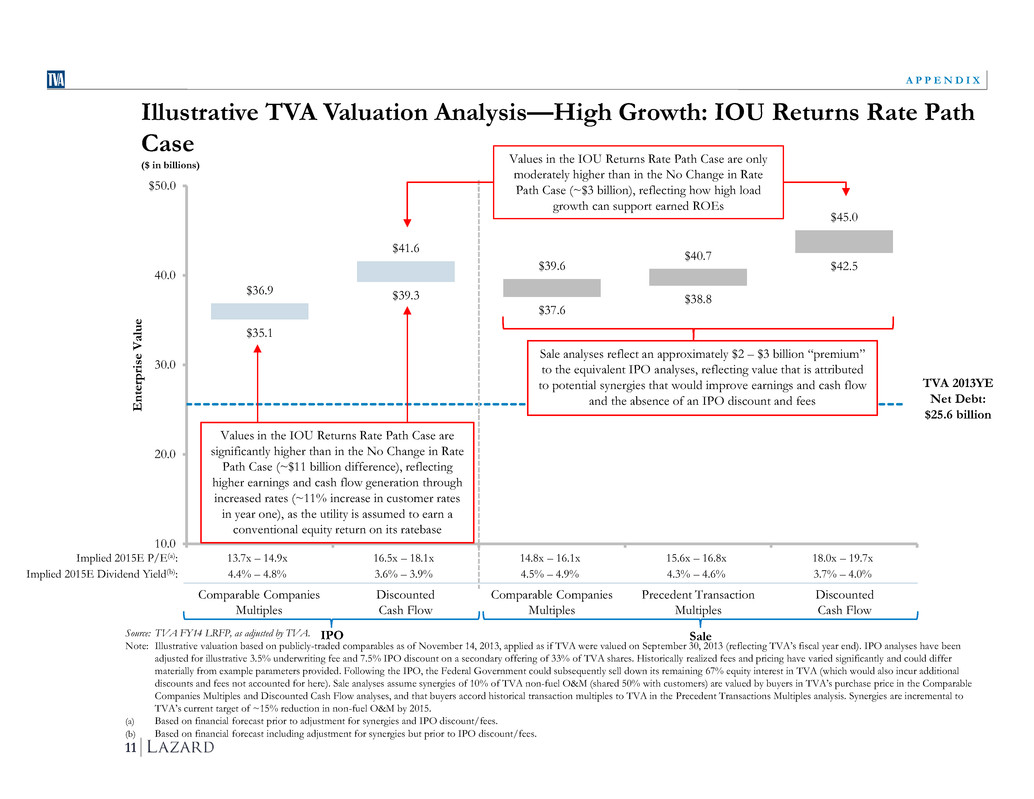
Confidential SUPPLEMENTARY ANALYSIS—TO BE READ ONLY IN CONJUNCTION WITH STRATEGIC ASSESSMENT REPORT $35.1 $39.3 $37.6 $38.8 $42.5 $36.9 $41.6 $39.6 $40.7 $45.0 10.0 20.0 30.0 40.0 $50.0 E n te rp ri se V a lu e 11 A P P E N D I X TVA 2013YE Net Debt: $25.6 billion IPO Sale Illustrative TVA Valuation Analysis—High Growth: IOU Returns Rate Path Case ($ in billions) Implied 2015E P/E(a): 13.7x – 14.9x 16.5x – 18.1x 14.8x – 16.1x 15.6x – 16.8x 18.0x – 19.7x Implied 2015E Dividend Yield(b): 4.4% – 4.8% 3.6% – 3.9% 4.5% – 4.9% 4.3% – 4.6% 3.7% – 4.0% Comparable Companies Multiples Discounted Cash Flow Comparable Companies Multiples Precedent Transaction Multiples Discounted Cash Flow Source: TVA FY14 LRFP, as adjusted by TVA. Note: Illustrative valuation based on publicly-traded comparables as of November 14, 2013, applied as if TVA were valued on September 30, 2013 (reflecting TVA’s fiscal year end). IPO analyses have been adjusted for illustrative 3.5% underwriting fee and 7.5% IPO discount on a secondary offering of 33% of TVA shares. Historically realized fees and pricing have varied significantly and could differ materially from example parameters provided. Following the IPO, the Federal Government could subsequently sell down its remaining 67% equity interest in TVA (which would also incur additional discounts and fees not accounted for here). Sale analyses assume synergies of 10% of TVA non-fuel O&M (shared 50% with customers) are valued by buyers in TVA’s purchase price in the Comparable Companies Multiples and Discounted Cash Flow analyses, and that buyers accord historical transaction multiples to TVA in the Precedent Transactions Multiples analysis. Synergies are incremental to TVA’s current target of ~15% reduction in non-fuel O&M by 2015. (a) Based on financial forecast prior to adjustment for synergies and IPO discount/fees. (b) Based on financial forecast including adjustment for synergies but prior to IPO discount/fees. Sale analyses reflect an approximately $2 – $3 billion “premium” to the equivalent IPO analyses, reflecting value that is attributed to potential synergies that would improve earnings and cash flow and the absence of an IPO discount and fees Values in the IOU Returns Rate Path Case are significantly higher than in the No Change in Rate Path Case (~$11 billion difference), reflecting higher earnings and cash flow generation through increased rates (~11% increase in customer rates in year one), as the utility is assumed to earn a conventional equity return on its ratebase Values in the IOU Returns Rate Path Case are only moderately higher than in the No Change in Rate Path Case (~$3 billion), reflecting how high load growth can support earned ROEs


