UNITED STATES
SECURITIES AND EXCHANGE COMMISSION
Washington, D.C. 20549
FORM 10-Q
(MARK ONE)
x QUARTERLY REPORT PURSUANT TO SECTION 13, 15(d), OR 37 OF THE
SECURITIES EXCHANGE ACT OF 1934
For the quarterly period ended December 31, 2024
OR
o TRANSITION REPORT PURSUANT TO SECTION 13 OR 15(d) OF
THE SECURITIES EXCHANGE ACT OF 1934
For the transition period from _____ to _____
Commission file number 000-52313
TENNESSEE VALLEY AUTHORITY
(Exact name of registrant as specified in its charter)
| | | | | | | | | | | |
A corporate agency of the United States created by an act of Congress (State or other jurisdiction of incorporation or organization) | | 62-0474417 (I.R.S. Employer Identification No.) |
| |
400 W. Summit Hill Drive Knoxville, Tennessee (Address of principal executive offices) | | 37902 (Zip Code) |
(865) 632-2101
(Registrant's telephone number, including area code)
None
(Former name, former address and former fiscal year, if changed since last report)
Securities registered pursuant to Section 12(b) of the Act
| | | | | | | | |
| Title of each class | Trading Symbol(s) | Name of each exchange on which registered |
| N/A | N/A | N/A |
Indicate by check mark whether the registrant (1) has filed all reports required to be filed by Section 13, 15(d), or 37 of the Securities Exchange Act of 1934 during the preceding 12 months (or for such shorter period that the registrant was required to file such reports), and (2) has been subject to such filing requirements for the past 90 days.
Yes x No o
Indicate by check mark whether the registrant has submitted electronically every Interactive Data File required to be submitted pursuant to Rule 405 of Regulation S-T (§ 232.405 of this chapter) during the preceding 12 months (or for such shorter period that the registrant was required to submit such files).
Yes x No o
Indicate by check mark whether the registrant is a large accelerated filer, an accelerated filer, a non-accelerated filer, a smaller reporting company, or an emerging growth company. See the definitions of "large accelerated filer," "accelerated filer," "smaller reporting company," and "emerging growth company" in Rule 12b-2 of the Exchange Act.
Large accelerated filer o Accelerated filer o
Non-accelerated filer x Smaller reporting company o
Emerging growth company o
If an emerging growth company, indicate by check mark if the registrant has elected not to use the extended transition period for complying with any new or revised financial accounting standards provided pursuant to Section 13(a) of the Exchange Act. o
Indicate by check mark whether the registrant is a shell company (as defined in Rule 12b-2 of the Exchange Act).
Yes o No x
Number of shares of common stock outstanding at February 4, 2025: N/A
| | | | | |
| Table of Contents |
| | |
| | Page |
GLOSSARY OF COMMON ACRONYMS...................................................................................................................................... | |
FORWARD-LOOKING INFORMATION......................................................................................................................................... | |
GENERAL INFORMATION............................................................................................................................................................ | |
| | |
|
| | |
ITEM 1. FINANCIAL STATEMENTS............................................................................................................................................. | |
| |
| |
| |
| |
| |
| |
| | |
| |
Executive Overview............................................................................................................................................................... | |
Results of Operations............................................................................................................................................................ | |
Liquidity and Capital Resources............................................................................................................................................ | |
| |
| |
| |
| |
Critical Accounting Estimates................................................................................................................................................ | |
| |
| |
| | |
| |
| | |
ITEM 4. CONTROLS AND PROCEDURES.................................................................................................................................. | |
| |
| |
| | |
|
| | |
ITEM 1. LEGAL PROCEEDINGS.................................................................................................................................................. | |
| |
ITEM 1A. RISK FACTORS............................................................................................................................................................ | |
| | |
| |
| |
ITEM 6. EXHIBITS........................................................................................................................................................................ | |
| | |
SIGNATURES............................................................................................................................................................................... | |
| | | | | | | | |
| GLOSSARY OF COMMON ACRONYMS |
| Following are definitions of some of the terms or acronyms that may be used in this Quarterly Report on Form 10-Q for the quarter ended December 31, 2024 (the "Quarterly Report"): |
| |
| Term or Acronym | | Definition |
| | |
| | |
| | |
| | |
| AOCI | | Accumulated other comprehensive income (loss) |
| ARO | | Asset retirement obligation |
| ART | | Asset Retirement Trust |
| Bonds | | Bonds, notes, or other evidences of indebtedness |
| CCR | | Coal combustion residuals |
| CCR Rule | | 2015 Coal Combustion Residual Rule |
| CEO | | Chief Executive Officer |
| CT | | Combustion turbine |
| | |
| | |
| | |
| CY | | Calendar year |
| | |
| DCP | | Deferred Compensation Plan |
| | |
| | |
| | |
| | |
| | |
| | |
| | |
| | |
| | |
| | |
| FHP | | Financial Hedging Program |
| | |
| GAAP | | Accounting principles generally accepted in the United States of America |
| GAC | | Grid access charge |
| GEH | | GE Hitachi Nuclear Energy |
| | |
| | |
| | |
| | |
| | |
| Holdco | | John Sevier Holdco LLC |
| JACTG | | Johnsonville Aeroderivative Combustion Turbine Generation LLC |
| JHLLC | | Johnsonville Holdco LLC |
| Johnsonville Facility | | Johnsonville Aeroderivative Combustion Turbine Facility |
| JSCCG | | John Sevier Combined Cycle Generation LLC |
| | |
| kWh | | Kilowatt hours |
| Legacy CCR Rule | | Final legacy CCR rule |
| LPCs | | Local power company customers |
| | |
| | |
| | |
| | |
| MLGW | | Memphis Light, Gas and Water Division |
| mmBtu | | Million British thermal unit(s) |
| Moody's | | Moody's Investors Service, Inc. |
| MtM | | Mark-to-market |
| | |
| | |
| NAV | | Net asset value |
| NDT | | Nuclear Decommissioning Trust |
| NEIL | | Nuclear Electric Insurance Limited |
| | |
| | |
| NES | | Nashville Electric Service |
| | |
| | |
| NRC | | Nuclear Regulatory Commission |
| | |
| | |
| | |
| | |
| | |
| | |
| | |
| | |
| | |
| PPA(s) | | Power Purchase Agreement(s) |
| | |
| | |
| | |
| | |
| | |
| RP | | Restoration Plan |
| SCCG | | Southaven Combined Cycle Generation LLC |
| | |
| SEC | | Securities and Exchange Commission |
| | |
| SERP | | Supplemental Executive Retirement Plan |
| SHLLC | | Southaven Holdco LLC |
| | |
| | |
| | |
| | |
| | |
| | |
| TVA | | Tennessee Valley Authority |
| TVA Act | | Tennessee Valley Authority Act of 1933, as amended |
| TVA Board | | TVA Board of Directors |
| | |
| | |
| U.S. Treasury | | United States Department of the Treasury |
| | |
| | |
| VIE | | Variable interest entity |
| | |
| XBRL | | eXtensible Business Reporting Language |
FORWARD-LOOKING INFORMATION
This Quarterly Report contains forward-looking statements relating to future events and future performance. All statements other than those that are purely historical may be forward-looking statements. In certain cases, forward-looking statements can be identified by the use of words such as "may," "will," "should," "expect," "anticipate," "believe," "intend," "project," "plan," "predict," "assume," "forecast," "estimate," "objective," "possible," "probably," "likely," "potential," "speculate," "aim," "aspiration," "goal," "seek," "strategy," "target," the negative of such words, or other similar expressions.
Although the Tennessee Valley Authority ("TVA") believes that the assumptions underlying any forward-looking statements are reasonable, TVA does not guarantee the accuracy of these statements. Numerous factors could cause actual results to differ materially from those in any forward-looking statements. These factors include, among other things:
•Significant additional costs for TVA to manage and operate its coal combustion residuals ("CCR") facilities;
•The cost of complying with known, anticipated, or new environmental requirements, some of which could render continued operation of many of TVA's aging coal-fired generation units not cost-effective or result in their removal from service, perhaps permanently;
•Federal legislation aimed specifically at curtailing TVA's activities, including legislation that may require the divestiture of TVA or the sale of certain of TVA's assets; restrict access to its United States Department of the Treasury ("U.S. Treasury") account; eliminate its sole authority to set rates; restrict its authority to manage the Tennessee River system; lower the debt ceiling on bonds, notes, or other evidences of indebtedness (collectively, "Bonds") specified in the Tennessee Valley Authority Act of 1933, as amended ("TVA Act"); or limit its ability to pay its Chief Executive Officer or other employees competitive salaries;
•New, existing, or amended laws, regulations, executive orders ("EOs"), or administrative orders or interpretations, including those related to climate change and other environmental matters, and the costs of complying with these laws, regulations, EOs, or administrative orders or interpretations;
•Loss of TVA's protected service territory if the Federal Energy Regulatory Commission ("FERC") were to limit the application of the anti-cherrypicking provision, or if Congress were to eliminate the anti-cherrypicking provision, without corresponding legislative modifications to the territorial limitations imposed by the fence;
•Additional federal reliability standards set forth by the North American Electric Reliability Corporation ("NERC") and approved by FERC and the costs of complying with these new standards;
•The failure of TVA's generation, transmission, navigation, flood control, and related assets and infrastructure, including CCR facilities, dams, and spent nuclear fuel storage facilities, to operate as anticipated, resulting in health, safety, or environmental problems, lost revenues, damages, or other costs that are not reflected in TVA's financial statements or projections, including due to aging, technological issues, or extreme weather conditions;
•Significant delays and additional costs, and/or inability to obtain necessary regulatory approvals, licenses, or permits, for major projects, including for assets that TVA needs to serve its existing and future load and to meet its carbon reduction aspirations;
•Risks associated with the operation of nuclear facilities or other generation and related facilities, including CCR facilities and dams;
•Events at a nuclear facility, whether or not operated by or licensed to TVA, which, among other things, could lead to increased regulation or restriction on the construction, ownership, operation, or decommissioning of nuclear facilities or on the storage of spent fuel, obligate TVA to pay retrospective insurance premiums, reduce the availability and affordability of insurance, increase the costs of operating TVA's existing nuclear units, or cause TVA to forego future construction at these or other facilities;
•The inaccuracy of certain assumptions about the future, including economic forecasts, anticipated energy and commodity prices, cost estimates, construction schedules, power demand forecasts, potential regulatory environments, and the appropriate generation mix to meet demand;
•Circumstances that cause TVA to change its determinations regarding the appropriate mix of generation assets;
•Inability to continue to operate certain assets, especially nuclear facilities, including due to the inability to obtain, or loss of, regulatory approval for the operation of assets;
•Physical attacks, threats, or other interference causing damage to TVA's facilities or interfering with TVA's operations;
•Unforeseeable occurrences negatively impacting TVA assets or their supporting infrastructure;
•Events at TVA facilities, which, among other things, could result in loss of life, damage to the environment, damage to or loss of the facility, or damage to the property of others;
•Events that negatively impact TVA's reliability, including problems at other utilities or at TVA facilities or the increase in intermittent sources of power;
•Disruption of supplies of fuel, purchased power, or other critical items or services, which may result from, among other things, economic conditions, weather conditions, physical or cyber attacks, political developments, international trade restrictions or tariffs, legal actions, mine closures or reduced mine production, increases in fuel exports, environmental regulations affecting TVA's suppliers, transportation or delivery constraints, shortages of raw materials, supply chain difficulties, labor shortages, force majeure events, forced outages, intentional defaults, strikes, inflation, or similar events and which may, among other things, hinder TVA's ability to operate its assets, complete projects on time and on budget, and meet its contractual obligations to deliver power;
•Global conflicts, terrorist activities, or military actions by the United States ("U.S.") government and its allies;
•Cyber attacks on TVA's assets or the assets of third parties upon which TVA relies, which may become more frequent and sophisticated due to advances in artificial intelligence ("AI");
•The failure of TVA's information technology systems;
•Lower future demand for electricity than TVA currently expects or is financially planning for, which would lead to unexpected revenue constraints that could negatively impact TVA's ability to meet financial obligations, including those associated with financing of projects to meet the anticipated demand;
•The need for significant future contributions associated with TVA's pension plans, other post-retirement benefit plans, or health care plans;
•Limitations on TVA's ability to borrow money, which may result from, among other things, TVA's approaching or substantially reaching the debt ceiling or TVA's losing access to the debt markets, and which may impact TVA's ability to make planned capital investments;
•Downgrades of TVA's credit ratings or the United States' sovereign credit ratings which may negatively impact TVA and the owners of TVA securities;
•Changes in technology, which, among other things, may affect relationships with customers and require TVA to change how it conducts its operations;
•Loss of competitive edge due to TVA's governmental status affecting TVA's ability to keep up with technological changes;
•Changes in the market price of commodities such as purchased power, coal, uranium, natural gas, fuel oil, crude oil, construction materials, reagents, or emission allowances;
•A limitation on the market for TVA Bonds, which may be influenced by the fact that the payment of principal and interest on TVA securities is not guaranteed by the U.S. government;
•Failure to attract or retain an appropriately qualified workforce;
•Changes in the membership of the TVA Board of Directors ("TVA Board") or TVA senior management, which may impact how TVA operates;
•Loss of quorum of the TVA Board, which may limit TVA's ability to adapt to meet changing business conditions;
•Weather conditions, including changing weather patterns, extreme weather conditions, and other events such as flooding, droughts, wildfires, heat waves, and snow or ice storms that may result from climate change, which may hamper TVA's ability to supply power, cause customers' demand for power to exceed TVA's then-present power supply, pose health, safety, or environmental risks, or otherwise negatively impact TVA's operations or financial condition;
•Events affecting the supply or quality of water from the Tennessee River system or Cumberland River system, or elsewhere, which could interfere with TVA's ability to generate power;
•Catastrophic events, such as fires, earthquakes, explosions, solar events, electromagnetic pulses, geomagnetic disturbances, droughts, floods, hurricanes, tornadoes, polar vortexes, icing events, pipeline explosions, or other casualty events, wars, national emergencies, terrorist activities, pandemics, widespread public health crises, geopolitical events, or other destructive or disruptive events;
•Ineffectiveness of TVA's financial control system to control issues and instances of fraud or to prevent or detect errors;
•Inability to use regulatory accounting for certain costs;
•Inability of TVA to implement its business strategy successfully, including due to the increased use in the public of distributed energy resources or energy-efficiency programs;
•Inability of TVA to achieve or maintain its cost reduction goals, which may require TVA to increase rates and/or issue more debt than planned;
•Failure of TVA’s organizational structure to adequately support TVA’s anticipated business needs or enable it to meet the needs of its current or potential customers;
•Inability of TVA to adapt its business model to changes in the utility industry and customer preferences and to remain cost competitive;
•Changes in commodity prices, investment prices, interest rates, currency exchange rates, or inflation rates;
•Reliability or creditworthiness of counterparties including but not limited to customers, suppliers, renewable resource providers, and financial institutions;
•Changes in the U.S. economy and volatility in financial markets;
•Ineffectiveness of TVA’s disclosure controls and procedures or its internal control over financial reporting;
•Changes in customer preferences for energy produced from cleaner generation sources;
•Increases in TVA’s financial liabilities for decommissioning its nuclear facilities and retiring other assets;
•The requirement or decision to make additional contributions to TVA’s Nuclear Decommissioning Trust (“NDT”) or Asset Retirement Trust (“ART”);
•Events or changes involving transmission lines, dams, and other facilities not operated by TVA, including those that affect the reliability of the interstate transmission grid of which TVA’s transmission system is a part and those that increase flows across TVA’s transmission grid;
•Actions taken, or inaction, by the U.S. government relating to the national debt ceiling or automatic spending cuts in government programs;
•Inability to respond quickly enough to current or potential customer demands or needs or to act solely in the interest of ratepayers;
•Addition or loss of customers by TVA or TVA’s local power company customers (“LPCs”);
•Differences between estimates of revenues and expenses and actual revenues earned and expenses incurred;
•Changes in the market price of equity securities, debt securities, or other investments;
•An increase in TVA’s cost of capital, which may result from, among other things, changes in the market for Bonds, disruptions in the banking system or financial markets, changes in the credit rating of TVA or the U.S. government, or, potentially, an increased reliance by TVA on alternative financing should TVA approach its debt limit;
•Costs or liabilities that are not anticipated in TVA’s financial statements for third-party claims, natural resource damages, environmental cleanup activities, or fines or penalties associated with unexpected events such as failures of a facility or infrastructure;
•Adverse effects from global, national, or regional health or other emergencies;
•Negative impacts on TVA's reputation; or
•Other unforeseeable events.
See also Part I, Item 1A, Risk Factors, and Part II, Item 7, Management's Discussion and Analysis of Financial Condition and Results of Operations in TVA's Annual Report on Form 10-K for the year ended September 30, 2024 (the "Annual Report"), and Part I, Item 2, Management's Discussion and Analysis of Financial Condition and Results of Operations in this Quarterly Report for a discussion of factors that could cause actual results to differ materially from those in any forward-looking statement. New factors emerge from time to time, and it is not possible for TVA to predict all such factors or to assess the extent to which any factor or combination of factors may impact TVA's business or cause results to differ materially from those contained in any forward-looking statement. TVA undertakes no obligation to update any forward-looking statement to reflect developments that occur after the statement is made, except as required by law.
GENERAL INFORMATION
Fiscal Year
References to years (2025, 2024, etc.) in this Quarterly Report are to TVA's fiscal years ending September 30. Years that are preceded by "CY" are references to calendar years.
Notes
References to "Notes" are to the Notes to Consolidated Financial Statements contained in Part I, Item 1, Financial Statements in this Quarterly Report.
Available Information
TVA files annual, quarterly, and current reports with the Securities and Exchange Commission ("SEC") under Section 37 of the Securities Exchange Act of 1934 (the "Exchange Act"). TVA's SEC filings are available to the public at www.tva.com, free of charge, as soon as reasonably practicable after such reports are electronically filed with or furnished to the SEC. Information contained on or accessible through TVA's website shall not be deemed to be incorporated into, or to be a part of, this Quarterly Report or any other report or document that TVA files with the SEC. All TVA SEC reports are available to the public without charge from the website maintained by the SEC at www.sec.gov.
PART I - FINANCIAL INFORMATION
ITEM 1. FINANCIAL STATEMENTS
TENNESSEE VALLEY AUTHORITY
CONSOLIDATED STATEMENTS OF OPERATIONS (Unaudited)
Three Months Ended December 31
(in millions)
| | | | | | | | | | | | | | | |
| | | |
| | 2024 | | 2023 | | | | |
| Operating revenues | | | | | | | |
| Revenue from sales of electricity | $ | 2,876 | | | $ | 2,731 | | | | | |
| Other revenue | 44 | | | 34 | | | | | |
| Total operating revenues | 2,920 | | | 2,765 | | | | | |
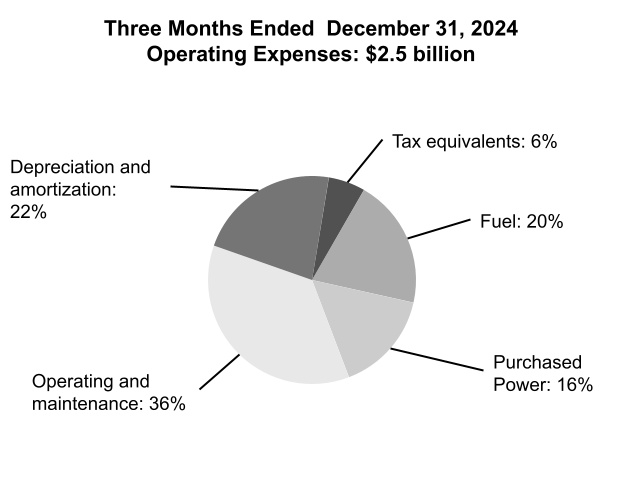
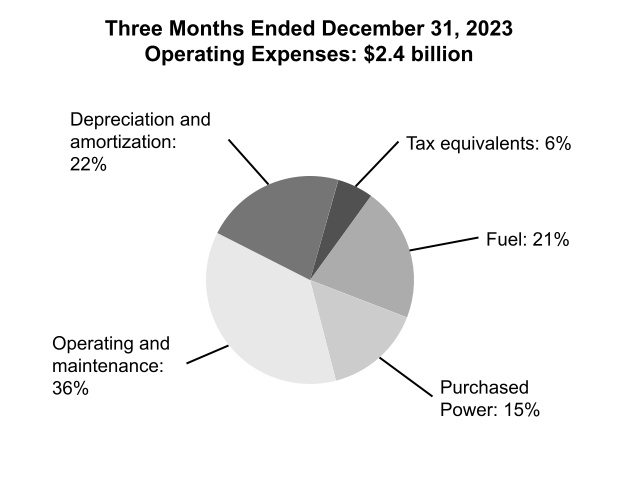
| Operating expenses | | | | | | | |
| Fuel | 505 | | | 496 | | | | | |
| Purchased power | 394 | | | 359 | | | | | |
| Operating and maintenance | 905 | | | 867 | | | | | |
| Depreciation and amortization | 557 | | | 521 | | | | | |
| Tax equivalents | 146 | | | 133 | | | | | |
| Total operating expenses | 2,507 | | | 2,376 | | | | | |
| Operating income | 413 | | | 389 | | | | | |
| Other income, net | 17 | | | 23 | | | | | |
| Other net periodic benefit cost | 25 | | | 23 | | | | | |
| Interest expense | 280 | | | 262 | | | | | |
| Net income | $ | 125 | | | $ | 127 | | | | | |
| The accompanying notes are an integral part of these consolidated financial statements. |
TENNESSEE VALLEY AUTHORITY
CONSOLIDATED STATEMENTS OF COMPREHENSIVE INCOME (LOSS) (Unaudited)
Three Months Ended December 31
(in millions)
| | | | | | | | | | | | | | | |
| | | |
| | 2024 | | 2023 | | | | |
| Net income | $ | 125 | | | $ | 127 | | | | | |
| Other comprehensive income (loss) | | | | | | | |
| Net unrealized gain (loss) on cash flow hedges | (19) | | | 20 | | | | | |
| Net unrealized (gain) loss reclassified to earnings from cash flow hedges | 37 | | | (19) | | | | | |
| Total other comprehensive income | 18 | | | 1 | | | | | |
| Total comprehensive income | $ | 143 | | | $ | 128 | | | | | |
| The accompanying notes are an integral part of these consolidated financial statements. |
TENNESSEE VALLEY AUTHORITY
CONSOLIDATED BALANCE SHEETS (Unaudited)
(in millions)
| | | | | | | | | | | |
| ASSETS |
| | December 31, 2024 | | September 30, 2024 |
| Current assets | | | |
| Cash and cash equivalents | $ | 507 | | | $ | 502 | |
| Restricted cash of variable interest entity | 25 | | | — | |
| | | |
| Accounts receivable, net | 1,709 | | | 1,801 | |
| Inventories, net | 1,198 | | | 1,155 | |
| Regulatory assets | 110 | | | 191 | |
| Other current assets | 159 | | | 120 | |
| Total current assets | 3,708 | | | 3,769 | |
| | | |
| Property, plant, and equipment | | | |
| Completed plant | 70,690 | | | 70,989 | |
| Less accumulated depreciation | (38,220) | | | (38,793) | |
| Net completed plant | 32,470 | | | 32,196 | |
| Construction in progress | 5,430 | | | 4,879 | |
| Nuclear fuel | 1,310 | | | 1,261 | |
| Finance leases | 708 | | | 729 | |
| Total property, plant, and equipment, net | 39,918 | | | 39,065 | |
| | | |
| Investment funds | 4,919 | | | 4,968 | |
| | | |
| Regulatory and other long-term assets | | | |
| Regulatory assets | 9,287 | | | 9,408 | |
| Operating lease assets, net of amortization | 157 | | | 149 | |
| Other long-term assets | 374 | | | 344 | |
| Total regulatory and other long-term assets | 9,818 | | | 9,901 | |
| | | |
| Total assets | $ | 58,363 | | | $ | 57,703 | |
| The accompanying notes are an integral part of these consolidated financial statements. |
TENNESSEE VALLEY AUTHORITY
CONSOLIDATED BALANCE SHEETS (Unaudited)
(in millions)
| | | | | | | | | | | |
| LIABILITIES AND PROPRIETARY CAPITAL |
| December 31, 2024 | | September 30, 2024 |
| Current liabilities | | | |
| Accounts payable and accrued liabilities | $ | 2,781 | | | $ | 2,910 | |
| | | |
| Accrued interest | 290 | | | 280 | |
| Asset retirement obligations | 301 | | | 283 | |
| | | |
| | | |
| Regulatory liabilities | 186 | | | 174 | |
| Short-term debt, net | 1,357 | | | 1,167 | |
| Current maturities of power bonds | 2,372 | | | 1,022 | |
| Current maturities of long-term debt of variable interest entities | 46 | | | 37 | |
| | | |
| Total current liabilities | 7,333 | | | 5,873 | |
| | | |
| Other liabilities | | | |
| Post-retirement and post-employment benefit obligations | 2,801 | | | 2,887 | |
| Asset retirement obligations | 10,521 | | | 10,523 | |
| Finance lease liabilities | 689 | | | 700 | |
| Other long-term liabilities | 1,479 | | | 1,712 | |
| | | |
| Regulatory liabilities | 78 | | | 83 | |
| Total other liabilities | 15,568 | | | 15,905 | |
| | | |
| Long-term debt, net | | | |
| Long-term power bonds, net | 16,485 | | | 17,867 | |
| Long-term debt of variable interest entities, net | 1,675 | | | 897 | |
| | | |
| Total long-term debt, net | 18,160 | | | 18,764 | |
| | | |
| Total liabilities | 41,061 | | | 40,542 | |
| | | |
| Contingencies and legal proceedings (Note 20) | | | |
| | | |
| Proprietary capital | | | |
| Power program appropriation investment | 258 | | | 258 | |
| Power program retained earnings | 16,562 | | | 16,437 | |
| Total power program proprietary capital | 16,820 | | | 16,695 | |
| Nonpower programs appropriation investment, net | 516 | | | 518 | |
| Accumulated other comprehensive loss | (34) | | | (52) | |
| Total proprietary capital | 17,302 | | | 17,161 | |
| | | |
| Total liabilities and proprietary capital | $ | 58,363 | | | $ | 57,703 | |
| The accompanying notes are an integral part of these consolidated financial statements. |
TENNESSEE VALLEY AUTHORITY
CONSOLIDATED STATEMENTS OF CASH FLOWS (Unaudited)
For the Three Months Ended December 31
(in millions)
| | | | | | | | | | | |
| | 2024 | | 2023 |
| Cash flows from operating activities | | | |
| Net income | $ | 125 | | | $ | 127 | |
| Adjustments to reconcile net income to net cash provided by operating activities | | | |
Depreciation and amortization(1) | 563 | | | 527 | |
| Amortization of nuclear fuel cost | 75 | | | 99 | |
| Non-cash retirement benefit expense | 36 | | | 33 | |
| | | |
| Other regulatory amortization and deferrals | 22 | | | 46 | |
| | | |
| | | |
| | | |
| Changes in current assets and liabilities | | | |
| Accounts receivable, net | 116 | | | 153 | |
| Inventories and other current assets, net | (68) | | | (105) | |
| Accounts payable and accrued liabilities | (234) | | | (201) | |
| Accrued interest | 12 | | | (2) | |
| | | |
| Pension contributions | (75) | | | (75) | |
| | | |
| | | |
| Settlements of asset retirement obligation | (73) | | | (88) | |
| Other, net | (49) | | | (121) | |
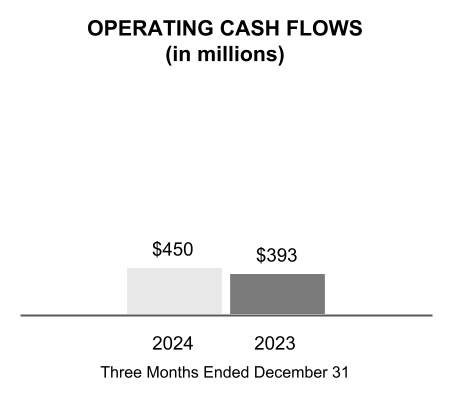
| Net cash provided by operating activities | 450 | | | 393 | |
| | | |
| Cash flows from investing activities | | | |
| Construction expenditures | (1,209) | | | (863) | |
| | | |
| Nuclear fuel expenditures | (159) | | | (146) | |
| Purchases of investments | (4) | | | (1) | |
| | | |
| Loans and other receivables | | | |
| Advances | — | | | (4) | |
| Repayments | 1 | | | 2 | |
| Other, net | (7) | | | 10 | |
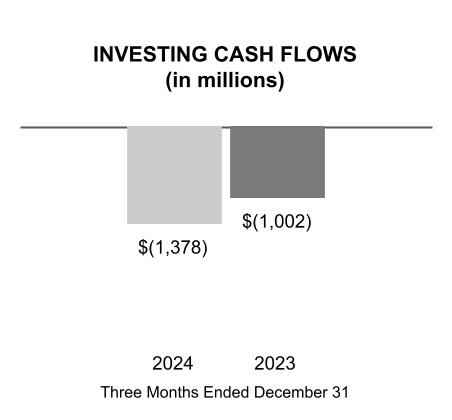
| Net cash used in investing activities | (1,378) | | | (1,002) | |
| | | |
| Cash flows from financing activities | | | |
| Long-term debt | | | |
| | | |
| Issues of variable interest entities | 800 | | | — | |
| Redemptions and repurchases of power bonds | (1) | | | (1) | |
| | | |
| | | |
| Short-term debt issues, net | 189 | | | 610 | |
| Payments on leases and leasebacks | (12) | | | (10) | |
| | | |
| Financing costs, net | (12) | | | — | |
| | | |
| | | |
| | | |
| Other, net | (6) | | | 7 | |
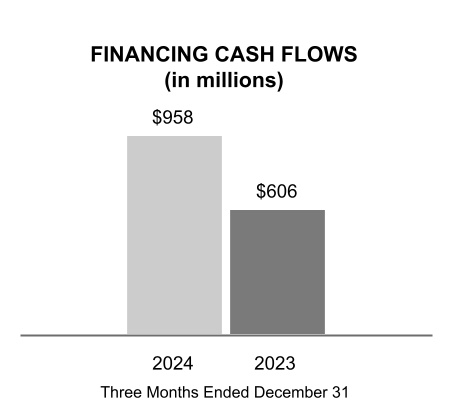
| Net cash provided by financing activities | 958 | | | 606 | |
| Net change in cash, cash equivalents, and restricted cash | 30 | | | (3) | |
| Cash, cash equivalents, and restricted cash at beginning of period | 523 | | | 521 | |
| Cash, cash equivalents, and restricted cash at end of period | $ | 553 | | | $ | 518 | |
| | | |
| | | |
| | | |
| | | |
| | | |
Note (1) Includes amortization of debt issuance costs and premiums/discounts. |
| The accompanying notes are an integral part of these consolidated financial statements. |
TENNESSEE VALLEY AUTHORITY
CONSOLIDATED STATEMENTS OF CHANGES IN PROPRIETARY CAPITAL (Unaudited)
For the Three Months Ended December 31, 2024 and 2023
| | | | | | | | | | | | | | | | | | | | | | | | | | | | | |
| | Power Program Appropriation Investment | |
Power Program Retained Earnings | | Nonpower Programs Appropriation Investment, Net | | Accumulated
Other
Comprehensive
Income (Loss) | |
Total |
| Balance at September 30, 2023 | $ | 258 | | | $ | 15,302 | | | $ | 525 | | | $ | (29) | | | $ | 16,056 | |
| Net income (loss) | — | | | 129 | | | (2) | | | — | | | 127 | |
| Total other comprehensive income | — | | | — | | | — | | | 1 | | | 1 | |
| Return on power program appropriation investment | — | | | (2) | | | — | | | — | | | (2) | |
| | | | | | | | | |
| Balance at December 31, 2023 | $ | 258 | | | $ | 15,429 | | | $ | 523 | | | $ | (28) | | | $ | 16,182 | |
| | | | | | | | | |
| Balance at September 30, 2024 | $ | 258 | | | $ | 16,437 | | | $ | 518 | | | $ | (52) | | | $ | 17,161 | |
| Net income (loss) | — | | | 127 | | | (2) | | | — | | | 125 | |
| Total other comprehensive income | — | | | — | | | — | | | 18 | | | 18 | |
| Return on power program appropriation investment | — | | | (2) | | | — | | | — | | | (2) | |
| Balance at December 31, 2024 | $ | 258 | | | $ | 16,562 | | | $ | 516 | | | $ | (34) | | | $ | 17,302 | |
The accompanying notes are an integral part of these consolidated financial statements. |
NOTES TO CONSOLIDATED FINANCIAL STATEMENTS (Unaudited)
(Dollars in millions except where noted)
| | | | | | | | | | | |
| Note | Page |
| 1 | | Summary of Significant Accounting Policies | |
| 2 | | Impact of New Accounting Standards and Interpretations | |
| 3 | | Accounts Receivable, Net | |
| 4 | | Inventories, Net | |
| 5 | | Other Current Assets | |
| 6 | | Plant Closures | |
| | | |
| 7 | | Other Long-Term Assets | |
| 8 | | Regulatory Assets and Liabilities | |
| 9 | | Variable Interest Entities | |
| 10 | | Other Long-Term Liabilities | |
| 11 | | Asset Retirement Obligations | |
| 12 | | Debt and Other Obligations | |
| | | |
| 13 | | Risk Management Activities and Derivative Transactions | |
| 14 | | Fair Value Measurements | |
| 15 | | Revenue | |
| 16 | | Other Income, Net | |
| 17 | | Supplemental Cash Flow Information | |
| 18 | | Benefit Plans | |
| 19 | | Collaborative Arrangement | |
| 20 | | Contingencies and Legal Proceedings | |
| | | |
1. Summary of Significant Accounting Policies
General
The Tennessee Valley Authority ("TVA") prepares its consolidated interim financial statements in conformity with accounting principles generally accepted in the United States of America ("GAAP") for consolidated interim financial information. Accordingly, TVA's consolidated interim financial statements do not include all of the information and notes required by GAAP for annual financial statements. As such, they should be read in conjunction with the audited financial statements for the year ended September 30, 2024, and the notes thereto, which are contained in TVA's Annual Report on Form 10-K for the year ended September 30, 2024 (the "Annual Report"). In the opinion of management, all adjustments (consisting of items of a normal recurring nature) considered necessary for fair presentation are included on the consolidated interim financial statements.
Fiscal Year
TVA's fiscal year ends September 30. Years (2025, 2024, etc.) refer to TVA's fiscal years unless they are preceded by "CY," in which case the references are to calendar years.
Basis of Presentation
The accompanying consolidated interim financial statements, which have been prepared in accordance with GAAP, include the accounts of TVA and variable interest entities ("VIEs") of which TVA is the primary beneficiary. See Note 9 — Variable Interest Entities. Intercompany balances and transactions have been eliminated in consolidation.
Use of Estimates
The preparation of financial statements requires TVA to estimate the effects of various matters that are inherently uncertain as of the date of the consolidated financial statements. Although the consolidated financial statements are prepared in conformity with GAAP, TVA is required to make estimates and assumptions that affect the reported amounts of assets and liabilities, the disclosure of contingent assets and liabilities, and the amounts of revenues and expenses, reported during the reporting period. Each of these estimates varies in regard to the level of judgment involved and its potential impact on TVA's financial results. Estimates are considered critical either when a different estimate could have reasonably been used, or where changes in the estimate are reasonably likely to occur from period to period, and such use or change would materially impact TVA's financial condition, results of operations, or cash flows.
Cash, Cash Equivalents, and Restricted Cash
Cash includes cash on hand, non-interest bearing cash, and deposit accounts. All highly liquid investments with original maturities of three months or less are considered cash equivalents. Cash and cash equivalents that are restricted, as to withdrawal or use under the terms of certain contractual agreements, are recorded in Other long-term assets on the Consolidated Balance Sheets. Restricted cash and cash equivalents include cash held in trusts that are currently restricted for TVA economic development loans and for certain TVA environmental programs in accordance with agreements related to compliance with certain environmental regulations. In addition, as of December 31, 2024, TVA had restricted cash related to variable interest entities. See Note 9 — Variable Interest Entities.
The following table provides a reconciliation of cash, cash equivalents, and restricted cash reported on the Consolidated Balance Sheets and Consolidated Statements of Cash Flows:
| | | | | | | | | | | |
Cash, Cash Equivalents, and Restricted Cash (in millions) |
| | At December 31, 2024 | | At September 30, 2024 |
| Cash and cash equivalents | $ | 507 | | | $ | 502 | |
| Restricted cash of variable interest entity | 25 | | | — | |
| Restricted cash and cash equivalents included in Other long-term assets | 21 | | | 21 | |
| Total cash, cash equivalents, and restricted cash | $ | 553 | | | $ | 523 | |
Allowance for Uncollectible Accounts
TVA recognizes an allowance that reflects the current estimate for credit losses expected to be incurred over the life of the financial assets based on historical experience, current conditions, and reasonable and supportable forecasts that affect the collectability of the reported amounts. The appropriateness of the allowance is evaluated at the end of each reporting period.
To determine the allowance for trade receivables, TVA considers historical experience and other currently available information, including events such as customer bankruptcy and/or a customer failing to fulfill payment arrangements by the due date. TVA's corporate credit department also performs an assessment of the financial condition of customers and the credit quality of the receivables. In addition, TVA reviews other reasonable and supportable forecasts to determine if the allowance for uncollectible amounts should be further adjusted in accordance with the accounting guidance for Current Expected Credit Losses.
To determine the allowance for loans receivables, TVA aggregates loans into the appropriate pools based on the existence of similar risk characteristics such as collateral types and internal assessed credit risks. In situations where a loan exhibits unique risk characteristics and is no longer expected to experience similar risks to the rest of its pool, the loan will be evaluated separately. TVA derives an annual loss rate based on historical loss and then adjusts the rate to reflect TVA's consideration of available information on current conditions and reasonable and supportable future forecasts. This information may include economic and business conditions, default trends, and other internal and external factors. For periods beyond the reasonable and supportable forecast period, TVA uses the current calculated long-term average historical loss rate for the remaining life of the loan portfolio.
The allowance for uncollectible accounts was less than $1 million at both December 31, 2024, and September 30, 2024, for trade accounts receivable. Additionally, loans receivable of $94 million and $105 million at December 31, 2024, and September 30, 2024, respectively, are included in Accounts receivable, net and Other long-term assets, for the current and long-term portions, respectively. Loans receivables are reported net of allowances for uncollectible accounts of $2 million at both December 31, 2024, and September 30, 2024.
Pre-Commercial Plant Operations
As part of the process of completing the construction of a generating unit, the electricity produced is used to serve the demands of the electric system. TVA estimates revenues earned during pre-commercial operations at the fair value of the energy delivered based on TVA's hourly incremental dispatch cost. Pre-commercial plant operations began on Paradise combustion turbine ("CT") Units 5-7 in the first quarter of 2024, and the units became operational on December 29, 2023. Estimated revenue of $3 million related to this project was capitalized to offset project costs for the three months ended December 31, 2023. TVA also capitalized related fuel costs for this project of $3 million for the three months ended December 31, 2023. Pre-commercial plant operations began on Johnsonville Aeroderivative CT Units 25-28 in the first quarter of 2025. Estimated revenue of less than $1 million related to this project was capitalized to offset project costs for the three months ended December 31, 2024. TVA also capitalized related fuel costs for this project of less than $1 million for the three months ended December 31, 2024.
Depreciation
TVA accounts for depreciation of its properties using the composite depreciation convention of accounting. Under the composite method, assets with similar economic characteristics are grouped and depreciated as one asset. Depreciation is generally computed on a straight-line basis over the estimated service lives of the various classes of assets. The estimation of asset useful lives requires management judgment, supported by external depreciation studies of historical asset retirement experience. Depreciation rates are determined based on external depreciation studies that are updated approximately every five years, with the latest study implemented during the first quarter of 2022. Depreciation expense was $471 million and $452 million for the three months ended December 31, 2024 and 2023, respectively. See Note 6 — Plant Closures for a discussion of the impact of plant closures.
2. Impact of New Accounting Standards and Interpretations
The following accounting standards or rules have been issued but as of December 31, 2024, were not effective and have not been adopted by TVA:
| | | | | |
|
| |
| |
| |
|
|
| |
| |
| |
|
|
| |
| |
| |
|
|
| |
| |
| |
|
|
| |
| |
| |
|
| Improvements to Reportable Segment Disclosures |
| Description | This guidance improves reportable segment disclosure requirements, primarily through enhanced disclosures about significant segment expenses. The amendment requires a public entity to disclose, on an annual and interim basis, significant segment expenses that are regularly provided to the chief operating decision maker and included within each reported measure of segment profit and loss. It also requires a public entity that has a single reportable segment to provide all of the disclosures required by the amendment and all existing segment disclosures. The amendment is effective for public entities for fiscal years beginning after December 15, 2023, and interim periods in fiscal years beginning after December 15, 2024. Upon adoption, a public entity should apply the amendments retrospectively to all prior periods presented in the financial statements. |
| Effective Date for TVA | Annual disclosures to be adopted for the fiscal year ending September 30, 2025 and interim period disclosures to be adopted beginning October 1, 2025. |
| Effect on the Financial Statements or Other Significant Matters | The adoption of this standard will result in TVA including the additional required disclosures, and TVA does not expect an impact on its financial condition, results of operations, or cash flows. |
|
|
| |
| |
| |
|
|
| |
| |
| |
| | | | | |
| Enhancement and Standardization of Climate-Related Disclosures for Investors |
| Description | In March 2024, the SEC adopted its climate-related final rule (SEC Release No. 34-99678, The Enhancement and Standardization of Climate-Related Disclosures for Investors), and in April 2024, the SEC voluntarily stayed the new rule as a result of pending legal challenges. The new rule, if implemented as adopted, will require registrants to provide certain climate-related information in their annual reports and registration statements and will also require the dollar impact of severe weather events and other natural conditions, as well as amounts related to carbon offsets and renewable energy credits or certificates, to be disclosed in the audited financial statements in certain circumstances. The disclosure requirements are currently expected to begin phasing in for fiscal years beginning on or after January 1, 2027 for non-accelerated filers. |
| Effective Date for TVA | Fiscal year beginning October 1, 2027. |
| Effect on the Financial Statements or Other Significant Matters | TVA is currently evaluating the impact of the rule on its disclosures. |
| |
| Disaggregation of Income Statement Expenses |
| Description | This guidance improves the disclosures about a public entity's expenses in the notes to financial statements and requires disclosure of specified information about certain costs and expenses. The amendment requires a public entity to disclose, on an annual and interim basis, purchases of inventory, employee compensation, depreciation, intangible asset amortization, and depletion for each income statement line item that contains those expenses. Specified expenses, gains, or losses that are already disclosed under existing US GAAP are required to be included in the disaggregated income statement expense line item disclosures, and any relevant remaining amounts need to be described qualitatively. Separate disclosures of total selling expenses and an entity’s definition of those expenses are also required. The amendment is effective for public entities for fiscal years beginning after December 15, 2026, and interim periods within fiscal years beginning after December 15, 2027. Upon adoption, a public entity can apply the amendments prospectively or apply them retrospectively to all prior periods presented in the financial statements. |
| Effective Date for TVA | Fiscal year beginning October 1, 2027, and interim periods beginning October 1, 2028. |
| Effect on the Financial Statements or Other Significant Matters | The adoption of this standard will result in TVA including the additional required disclosures, and TVA does not expect an impact on its financial condition, results of operations, or cash flows. |
| |
3. Accounts Receivable, Net
Accounts receivable primarily consist of amounts due from customers for power sales. The table below summarizes the types and amounts of TVA's accounts receivable:
| | | | | | | | | | | |
Accounts Receivable, Net (in millions) |
| | At December 31, 2024 | | At September 30, 2024 |
| Power receivables | $ | 1,569 | | | $ | 1,683 | |
| Other receivables | 140 | | | 118 | |
| | | |
Accounts receivable, net(1) | $ | 1,709 | | | $ | 1,801 | |
Note
(1) Allowance for uncollectible accounts was less than $1 million at both December 31, 2024, and September 30, 2024, and therefore is not represented in the table above.
4. Inventories, Net
The table below summarizes the types and amounts of TVA's inventories:
| | | | | | | | | | | |
Inventories, Net (in millions) |
| | At December 31, 2024 | | At September 30, 2024 |
| Materials and supplies inventory | $ | 954 | | | $ | 931 | |
| Fuel inventory | 310 | | | 286 | |
| Renewable energy certificates/emissions allowance inventory, net | 10 | | | 11 | |
| Allowance for inventory obsolescence | (76) | | | (73) | |
| Inventories, net | $ | 1,198 | | | $ | 1,155 | |
5. Other Current Assets
Other current assets consisted of the following:
| | | | | | | | | | | |
Other Current Assets (in millions) |
| | At December 31, 2024 | | At September 30, 2024 |
| Prepaid software maintenance | $ | 43 | | | $ | 22 | |
| Inventory work-in-progress | 42 | | | 41 | |
| Prepaid insurance | 23 | | | 19 | |
| Commodity contract derivative assets | 17 | | | 5 | |
| Current portion of prepaid long-term service agreements | 13 | | | 7 | |
| Prepaid cloud assets | 8 | | | 13 | |
| Other | 13 | | | 13 | |
| Other current assets | $ | 159 | | | $ | 120 | |
Commodity Contract Derivative Assets. See Note 13 — Risk Management Activities and Derivative Transactions — Derivatives Not Receiving Hedge Accounting Treatment — Commodity Derivatives and — Commodity Derivatives under the FHP for a discussion of TVA's commodity contract derivatives.
6. Plant Closures
Background
TVA must continuously evaluate all generating assets to ensure an optimal energy portfolio that provides safe, clean, and reliable power while maintaining flexibility and fiscal responsibility to the people of the Tennessee Valley. In January 2023, TVA issued its Record of Decision to retire the two coal-fired units at Cumberland Fossil Plant ("Cumberland") by the end of CY 2026 and CY 2028. In April 2024, TVA issued its Record of Decision to retire the nine coal-fired units at Kingston Fossil Plant ("Kingston") by CY 2027. In addition, TVA is evaluating the impact of retiring the balance of the coal-fired fleet by 2035, and that evaluation includes environmental reviews, public input, and TVA Board of Directors ("TVA Board") approval.
Financial Impact
TVA's policy is to adjust depreciation rates to reflect the most current assumptions, ensuring units will be fully depreciated by the applicable retirement dates. TVA's decision to retire the two units at Cumberland is estimated to result in approximately $16 million of additional depreciation quarterly, which does not include any potential impact from additions or retirements to net completed plant. The cumulative impact approximates $128 million of additional depreciation since January 2023, related to this decision. In addition, TVA's decision to retire the nine units at Kingston is estimated to result in approximately $9 million of additional depreciation quarterly, which does not include any potential impact from additions or retirements to net completed plant. The cumulative impact approximates $27 million of additional depreciation since April 2024, related to this decision.
7. Other Long-Term Assets
The table below summarizes the types and amounts of TVA's other long-term assets:
| | | | | | | | | | | |
Other Long-Term Assets (in millions) |
| At December 31, 2024 | | At September 30, 2024 |
| | | |
| Loans and other long-term receivables, net | $ | 85 | | | $ | 84 | |
| Cloud assets | 56 | | | 35 | |
| Prepaid capital assets | 55 | | | 29 | |
| Prepaid long-term service agreements | 54 | | | 62 | |
EnergyRight® receivables, net | 44 | | | 44 | |
| | | |
| | | |
| Commodity contract derivative assets | 1 | | | 2 | |
| | | |
| | | |
| Other | 79 | | | 88 | |
| Total other long-term assets | $ | 374 | | | $ | 344 | |
Loans and Other Long-Term Receivables. At December 31, 2024, and September 30, 2024, the carrying amount of the loans receivable, net of discount, reported in Accounts receivable, net was $9 million and $21 million, respectively. Loans receivables are reported net of allowances for uncollectible accounts. See Note 1 — Summary of Significant Accounting Policies — Allowance for Uncollectible Accounts.
The allowance components, which consist of a collective allowance and specific loans allowance, are based on the risk characteristics of TVA's loans. Loans that share similar risk characteristics are evaluated on a collective basis in measuring credit losses, while loans that do not share similar risk characteristics with other loans are evaluated on an individual basis.
| | | | | | | | | | | |
Allowance Components (in millions) |
| At December 31, 2024 | | At September 30, 2024 |
EnergyRight® loan reserve | $ | 1 | | | $ | 1 | |
| Economic development loan specific loan reserve | 1 | | | 1 | |
| | | |
| | | |
| Total allowance for loan losses | $ | 2 | | | $ | 2 | |
Cloud Assets. At December 31, 2024, and September 30, 2024, the carrying amount of the cloud assets reported in Other current assets was $8 million and $13 million, respectively.
Prepaid Long-Term Service Agreements. At December 31, 2024, and September 30, 2024, prepayments of $13 million and $7 million, respectively, were recorded in Other current assets.
EnergyRight® Receivables. In association with the EnergyRight® program, TVA's local power company customers ("LPCs") offer financing to end-use customers for the purchase of energy-efficient equipment. Depending on the nature of the energy-efficiency project, loans may have a maximum term of five years or 10 years. TVA purchases the resulting loans receivable from its LPCs. The loans receivable are then transferred to a third-party bank with which TVA has agreed to repay in full any loans receivable that have been in default for 180 days or more or that TVA has determined are uncollectible. Given this continuing involvement, TVA accounts for the transfer of the loans receivable as secured borrowings. The current and long-term portions of the loans receivable are reported in Accounts receivable, net and Other long-term assets, respectively, on TVA's Consolidated Balance Sheets. At both December 31, 2024, and September 30, 2024, the carrying amount of the loans receivable, net of discount, reported in Accounts receivable, net was $12 million. See Note 10 — Other Long-Term Liabilities for information regarding the associated financing obligation.
Commodity Contract Derivative Assets. See Note 13 — Risk Management Activities and Derivative Transactions — Derivatives Not Receiving Hedge Accounting Treatment — Commodity Derivatives and — Commodity Derivatives under the FHP for a discussion of TVA's commodity contract derivatives.
8. Regulatory Assets and Liabilities
TVA records certain assets and liabilities that result from the regulated ratemaking process that would not be recorded under GAAP for non-regulated entities. As such, certain items that would generally be reported in earnings or that would impact the Consolidated Statements of Operations are recorded as regulatory assets or regulatory liabilities. Regulatory assets generally represent incurred costs that have been deferred because such costs are probable of future recovery in customer rates. Regulatory liabilities generally represent obligations to make refunds to customers for previous collections for costs that are not likely to be incurred or deferral of gains that will be credited to customers in future periods. Components of regulatory assets and regulatory liabilities are summarized in the table below.
| | | | | | | | | | | |
Regulatory Assets and Liabilities (in millions) |
| | At December 31, 2024 | | At September 30, 2024 |
| Current regulatory assets | | | |
| Unrealized losses on commodity derivatives | $ | 55 | | | $ | 102 | |
| Unrealized losses on interest rate derivatives | 46 | | | 54 | |
| | | |
| | | |
| | | |
| Fuel cost adjustment receivable | 9 | | | 35 | |
| | | |
| Total current regulatory assets | 110 | | | 191 | |
| | | |
| Non-current regulatory assets | | | |
| Non-nuclear decommissioning costs | 6,202 | | | 6,187 | |
| Retirement benefit plans deferred costs | 1,959 | | | 1,979 | |
| | | |
| Nuclear decommissioning costs | 440 | | | 362 | |
| Unrealized losses on interest rate derivatives | 282 | | | 447 | |
| | | |
| Environmental compliance and remediation costs | 215 | | | 215 | |
| Unrealized losses on commodity derivatives | 32 | | | 64 | |
| | | |
| Other non-current regulatory assets | 157 | | | 154 | |
| Total non-current regulatory assets | 9,287 | | | 9,408 | |
| Total regulatory assets | $ | 9,397 | | | $ | 9,599 | |
| | | |
| Current regulatory liabilities | | | |
| Fuel cost adjustment tax equivalents | $ | 169 | | | $ | 169 | |
| | | |
| Unrealized gains on commodity derivatives | 17 | | | 5 | |
| Total current regulatory liabilities | 186 | | | 174 | |
| | | |
| Non-current regulatory liabilities | | | |
| Retirement benefit plans deferred credits | 77 | | | 81 | |
| Unrealized gains on commodity derivatives | 1 | | | 2 | |
| Total non-current regulatory liabilities | 78 | | | 83 | |
| Total regulatory liabilities | $ | 264 | | | $ | 257 | |
9. Variable Interest Entities
A variable interest entity ("VIE") is an entity that either (i) has insufficient equity to permit the entity to finance its activities without additional subordinated financial support or (ii) has equity investors who lack the characteristics of owning a controlling financial interest. When TVA determines that it has a variable interest in a VIE, a qualitative evaluation is performed to assess which interest holders have the power to direct the activities that most significantly impact the economic performance of the entity and have the obligation to absorb losses or receive benefits that could be significant to the entity. The evaluation considers the purpose and design of the business, the risks that the business was designed to create and pass along to other entities, the activities of the business that can be directed and which party can direct them, and the expected relative impact of those activities on the economic performance of the business through its life. TVA has the power to direct the activities of an entity when it has the ability to make key operating and financing decisions, including, but not limited to, capital investment and the issuance of debt. Based on the evaluation of these criteria, TVA has determined it is the primary beneficiary of certain entities and as such is required to account for the VIEs on a consolidated basis.
John Sevier VIEs
In 2012, TVA entered into a $1.0 billion construction management agreement and lease financing arrangement with John Sevier Combined Cycle Generation LLC ("JSCCG") for the completion and lease by TVA of the John Sevier Combined Cycle Facility ("John Sevier CCF"). JSCCG is a special single-purpose limited liability company formed in January 2012 to finance the John Sevier CCF through a $900 million secured note issuance (the "JSCCG notes") and the issuance of $100 million of membership interests subject to mandatory redemption. The membership interests were purchased by John Sevier Holdco LLC ("Holdco"). Holdco is a special single-purpose entity, also formed in January 2012, established to acquire and hold the membership interests in JSCCG. A non-controlling interest in Holdco is held by a third party through nominal membership interests, to which none of the income, expenses, and cash flows are allocated.
The membership interests held by Holdco in JSCCG were purchased with proceeds from the issuance of $100 million of secured notes (the "Holdco notes") and are subject to mandatory redemption pursuant to a schedule of amortizing, semi-annual payments due each January 15 and July 15, with a final payment due in January 2042. The payment dates for the mandatorily redeemable membership interests are the same as those of the Holdco notes. The sale of the JSCCG notes, the membership interests in JSCCG, and the Holdco notes closed in January 2012. The JSCCG notes are secured by TVA's lease payments, and the Holdco notes are secured by Holdco's investment in, and amounts receivable from, JSCCG. TVA's lease payments to JSCCG are equal to and payable on the same dates as JSCCG's and Holdco's semi-annual debt service payments. In addition to the lease payments, TVA pays administrative and miscellaneous expenses incurred by JSCCG and Holdco. Certain agreements related to this transaction contain default and acceleration provisions.
Due to its participation in the design, business activity, and credit and financial support of JSCCG and Holdco, TVA has determined that it has a variable interest in both of these entities. Based on its analysis, TVA has concluded that it is the primary beneficiary of JSCCG and Holdco and, as such, is required to account for the VIEs on a consolidated basis. Holdco's membership interests in JSCCG are eliminated in consolidation.
Southaven VIE
In 2013, TVA entered into a $400 million lease financing arrangement with Southaven Combined Cycle Generation LLC ("SCCG") for the lease by TVA of the Southaven Combined Cycle Facility ("Southaven CCF"). SCCG is a special single-purpose limited liability company formed in June 2013 to finance the Southaven CCF through a $360 million secured notes issuance (the "SCCG notes") and the issuance of $40 million of membership interests subject to mandatory redemption. The membership interests were purchased by Southaven Holdco LLC ("SHLLC"). SHLLC is a special single-purpose entity, also formed in June 2013, established to acquire and hold the membership interests in SCCG. A non-controlling interest in SHLLC is held by a third party through nominal membership interests, to which none of the income, expenses, and cash flows of SHLLC are allocated.
The membership interests held by SHLLC were purchased with proceeds from the issuance of $40 million of secured notes (the "SHLLC notes") and are subject to mandatory redemption pursuant to a schedule of amortizing, semi-annual payments due each February 15 and August 15, with a final payment due on August 15, 2033. The payment dates for the mandatorily redeemable membership interests are the same as those of the SHLLC notes, and the payment amounts are sufficient to provide returns on, as well as returns of, capital until the investment has been repaid to SHLLC in full. The rate of return on investment to SHLLC is seven percent, which is reflected as interest expense in the Consolidated Statements of Operations. SHLLC is required to pay a pre-determined portion of the return on investment to Seven States Southaven, LLC on each lease payment date as agreed in SHLLC's formation documents (the "Seven States Return"). The current and long-term portions of the Membership interests of VIE subject to mandatory redemption are included in Accounts payable and accrued liabilities and Other long-term liabilities, respectively.
The payment dates for the mandatorily redeemable membership interests are the same as those of the SHLLC notes. The SCCG notes are secured by TVA's lease payments, and the SHLLC notes are secured by SHLLC's investment in, and amounts receivable from, SCCG. TVA's lease payments to SCCG are payable on the same dates as SCCG's and SHLLC's semi-annual debt service payments and are equal to the sum of (i) the amount of SCCG's semi-annual debt service payments,
(ii) the amount of SHLLC's semi-annual debt service payments, and (iii) the amount of the Seven States Return. In addition to the lease payments, TVA pays administrative and miscellaneous expenses incurred by SCCG and SHLLC. Certain agreements related to this transaction contain default and acceleration provisions.
In the event that TVA were to choose to exercise an early buy out feature of the Southaven facility lease, in part or in whole, TVA must pay to SCCG amounts sufficient for SCCG to repay or partially repay on a pro rata basis the membership interests held by SHLLC, including any outstanding investment amount plus accrued but unpaid return. TVA also has the right, at any time and without any early redemption of the other portions of the Southaven facility lease payments due to SCCG, to fully repay SHLLC's investment, upon which repayment SHLLC will transfer the membership interests to a designee of TVA.
TVA participated in the design, business activity, and financial support of SCCG and has determined that it has a direct variable interest in SCCG resulting from risk associated with the value of the Southaven CCF at the end of the lease term. Based on its analysis, TVA has determined that it is the primary beneficiary of SCCG and, as such, is required to account for the VIE on a consolidated basis.
Johnsonville VIE
In October 2024, TVA entered into an $800 million construction management agreement and lease financing arrangement with Johnsonville Aeroderivative Combustion Turbine Generation LLC ("JACTG") for the completion and lease by TVA of the Johnsonville Aeroderivative Combustion Turbine Facility ("Johnsonville Facility"). JACTG is a special single-purpose limited liability company formed in September 2024 to finance the Johnsonville Facility through a $720 million secured note issuance (the "JACTG notes") and the issuance of $80 million of membership interests subject to mandatory redemption. The membership interests were purchased by Johnsonville Holdco LLC ("JHLLC"). JHLLC is a special single-purpose entity, also formed in September 2024, established to acquire and hold the membership interests in JACTG. A non-controlling interest in JHLLC is held by a third-party through nominal membership interests, to which none of the income, expenses, and cash flows are allocated.
The membership interests held by JHLLC in JACTG were purchased with proceeds from the issuance of $80 million of secured notes (the "JHLLC notes") and are subject to mandatory redemption pursuant to a schedule of amortizing, semi-annual payments due each April 1 and October 1, with a final payment due in October 2054. The payment dates for the mandatorily redeemable membership interests are the same as those of the JHLLC notes. The sale of the JACTG notes, the membership interests in JACTG, and the JHLLC notes closed in October 2024. The JACTG notes are secured by TVA's lease payments, and the JHLLC notes are secured by JHLLC's investment in, and amounts receivable from, JACTG. TVA's lease payments to JACTG are equal to and payable on the same dates as JACTG's and JHLLC's semi-annual debt service payments. In addition to the lease payments, TVA pays administrative and miscellaneous expenses incurred by JACTG and JHLLC. Certain agreements related to this transaction contain default and acceleration provisions.
Due to its participation in the design, business activity, and credit and financial support of JACTG and JHLLC, TVA has determined that it has a variable interest in both of these entities. Based on its analysis, TVA has concluded that it is the primary beneficiary of JACTG and JHLLC and, as such, is required to account for the VIEs on a consolidated basis. JHLLC's membership interests in JACTG are eliminated in consolidation.
Approximately $775 million of the proceeds from the secured notes issuances was paid to TVA in accordance with the terms of the head lease and the construction management agreement. JACTG deposited approximately $25 million with a lease indenture trustee to fund the payments due on April 1, 2025, in connection with the JACTG notes and JHLLC's membership interests in JACTG. The deposit is reflected as Restricted cash of variable interest entity on the Consolidated Balance Sheets. TVA intends to use the proceeds from the transaction to meet its requirements under the Tennessee Valley Authority Act of 1933, as amended ("TVA Act").
Impact on Consolidated Financial Statements
The financial statement items attributable to carrying amounts and classifications of JSCCG, Holdco, SCCG, JACTG, and JHLLC at December 31, 2024, and September 30, 2024, as reflected on the Consolidated Balance Sheets, are as follows:
| | | | | | | | | | | |
Summary of Impact of VIEs on Consolidated Balance Sheets (in millions) |
| | At December 31, 2024 | | At September 30, 2024 |
| Current assets | | | |
| Restricted cash of variable interest entity | $ | 25 | | | $ | — | |
| Total assets | $ | 25 | | | $ | — | |
| | | |
| Current liabilities | | | |
| Accrued interest | $ | 30 | | | $ | 9 | |
| Accounts payable and accrued liabilities | 1 | | | 1 | |
| Current maturities of long-term debt of variable interest entities | 46 | | | 37 | |
| Total current liabilities | 77 | | | 47 | |
| Other liabilities | | | |
| Other long-term liabilities | 16 | | | 16 | |
| Long-term debt, net | | | |
| Long-term debt of variable interest entities, net | 1,675 | | | 897 | |
| Total liabilities | $ | 1,768 | | | $ | 960 | |
Interest expense of $22 million and $12 million for the three months ended December 31, 2024 and 2023, respectively, is included in the Consolidated Statements of Operations related to debt of VIEs and membership interests of VIEs subject to mandatory redemption.
Creditors of the VIEs do not have any recourse to the general credit of TVA. TVA does not have any obligations to provide financial support to the VIEs other than as prescribed in the terms of the agreements related to these transactions.
10. Other Long-Term Liabilities
Other long-term liabilities consist primarily of liabilities related to certain derivative agreements as well as liabilities related to operating leases. The table below summarizes the types and amounts of Other long-term liabilities:
| | | | | | | | | | | |
Other Long-Term Liabilities (in millions) |
| | At December 31, 2024 | | At September 30, 2024 |
| Interest rate swap liabilities | $ | 589 | | | $ | 792 | |
| Environmental compliance and remediation costs | 210 | | | 212 | |
| Long-term project cost accruals | 160 | | | 140 | |
| Currency swap liabilities | 127 | | | 109 | |
| Operating lease liabilities | 93 | | | 88 | |
EnergyRight® financing obligation | 52 | | | 52 | |
| Long-term deferred revenue | 49 | | | 48 | |
| Long-term deferred compensation | 37 | | | 50 | |
| Commodity contract derivative liabilities | 32 | | | 64 | |
| Advances for construction | 32 | | | 55 | |
| | | |
| | | |
| | | |
| Other | 98 | | | 102 | |
| Total other long-term liabilities | $ | 1,479 | | | $ | 1,712 | |
Interest Rate Swap Liabilities. See Note 13 — Risk Management Activities and Derivative Transactions — Overview of Accounting Treatment and Derivatives Not Receiving Hedge Accounting Treatment — Interest Rate Derivatives for information regarding the interest rate swap liabilities.
Environmental Compliance and Remediation Costs. At December 31, 2024, and September 30, 2024, the current amount of the environmental compliance and remediation costs reported in Accounts payable and accrued liabilities was $5 million and $3 million, respectively.
Long-Term Project Cost Accruals. At December 31, 2024, and September 30, 2024, the current amount of the long-term project cost accruals reported in Accounts payable and accrued liabilities was $252 million and $124 million, respectively.
Currency Swap Liabilities. See Note 13 — Risk Management Activities and Derivative Transactions — Overview of Accounting Treatment and Cash Flow Hedging Strategy for Currency Swaps for more information regarding the currency swap liabilities.
Operating Lease Liabilities. At December 31, 2024, and September 30, 2024, the current portion of TVA's operating leases reported in Accounts payable and accrued liabilities was $69 million and $63 million, respectively.
EnergyRight® Financing Obligation. At both December 31, 2024, and September 30, 2024, the carrying amount of the financing obligation reported in Accounts payable and accrued liabilities was $13 million. See Note 7 — Other Long-Term Assets for information regarding the associated loans receivable.
Long-Term Deferred Revenue. At December 31, 2024, and September 30, 2024, the current amount of deferred revenue recorded in Accounts payable and accrued liabilities was $27 million and $28 million, respectively.
Long-Term Deferred Compensation. At December 31, 2024, and September 30, 2024, the current amount of deferred compensation recorded in Accounts payable and accrued liabilities was $33 million and $74 million, respectively.
Commodity Contract Derivative Liabilities. See Note 13 — Risk Management Activities and Derivative Transactions — Derivatives Not Receiving Hedge Accounting Treatment — Commodity Derivatives and — Commodity Derivatives under the FHP for a discussion of TVA's commodity contract derivatives.
Advances for Construction. At December 31, 2024, and September 30, 2024, the current amount of advances for construction recorded in Accounts payable and accrued liabilities was $85 million and $60 million, respectively.
11. Asset Retirement Obligations
During the three months ended December 31, 2024, TVA's total asset retirement obligations ("ARO") liability increased $16 million as a result of increases from periodic accretion, partially offset by revisions in estimate to non-nuclear asset AROs and settlements related to retirement projects that were conducted during the period. The nuclear and non-nuclear accretion amounts were deferred as regulatory assets. During the three months ended December 31, 2024, $55 million of the related regulatory assets were amortized into expense as these amounts were collected in rates. See Note 8 — Regulatory Assets and Liabilities. TVA maintains investment trusts to help fund its decommissioning obligations. See Note 14 — Fair Value Measurements — Investment Funds and Note 20 — Contingencies and Legal Proceedings — Contingencies — Decommissioning Costs for a discussion of the trusts' objectives and the current balances of the trusts.
| | | | | | | | | | | | | | | | | | | | |
Asset Retirement Obligation Activity (in millions) | |
| | Nuclear | | Non-nuclear | | Total | |
| Balance at September 30, 2024 | $ | 3,814 | | | $ | 6,992 | | | $ | 10,806 | | (1) |
| Settlements | (7) | | | (61) | | | (68) | | |
| Revisions in estimate (non-cash) | — | | | (24) | | | (24) | | |
| | | | | | |
| | | | | | |
| Accretion (recorded as regulatory asset) | 43 | | | 65 | | | 108 | | |
| | | | | | |
| Balance at December 31, 2024 | $ | 3,850 | | | $ | 6,972 | | | $ | 10,822 | | (1) |
| | | | | | |
| | | | | | |
Note
(1) Includes $301 million and $283 million at December 31, 2024, and September 30, 2024, respectively, in Current liabilities.
Revisions in non-nuclear estimates decreased the liability balance by $24 million for the three months ended December 31, 2024. The decrease was primarily attributable to a change in closure liabilities of $34 million at Paradise Fossil Plant based on scope changes, new vendor bids, and updated cost estimates for activities associated with final closure. The decrease was partially offset by increased revisions in estimates of $16 million related to the final legacy coal combustion residual rule ("Legacy CCR Rule").
12. Debt and Other Obligations
Debt Outstanding
Total debt outstanding at December 31, 2024, and September 30, 2024, consisted of the following:
| | | | | | | | | | | |
Debt Outstanding
(in millions) |
| | At December 31, 2024 | | At September 30, 2024 |
| Short-term debt | | | |
| Short-term debt, net of discounts | $ | 1,357 | | | $ | 1,167 | |
| Current maturities of power bonds issued at par | 2,372 | | | 1,022 | |
| Current maturities of long-term debt of VIEs issued at par | 46 | | | 37 | |
| | | |
| Total current debt outstanding, net | 3,775 | | | 2,226 | |
| Long-term debt | | | |
Long-term power bonds(1) | 16,610 | | | 17,995 | |
| Long-term debt of VIEs, net | 1,675 | | | 897 | |
| | | |
| Unamortized discounts, premiums, issue costs, and other | (125) | | | (128) | |
| Total long-term debt, net | 18,160 | | | 18,764 | |
| Total debt outstanding | $ | 21,935 | | | $ | 20,990 | |
Note
(1) Includes total net exchange gain from currency transactions of $96 million and $62 million at December 31, 2024, and September 30, 2024, respectively.
Debt Securities Activity
The table below summarizes the long-term debt securities activity for the period from October 1, 2024, to December 31, 2024:
| | | | | | | | | | | | | | | | |
| Debt Securities Activity |
| | | Date | | Amount (in millions) | | |
| Issues | | | | | | |
| | | | | | |
| Debt of variable interest entities | | October 2024 | | $ | 800 | | | |
| | | | | | |
| Total | | | | $ | 800 | | | |
| | | | | | |
Redemptions/Maturities(1) | | | | | | |
| | | | | | |
| | | | | | |
| | | | | | |
| | | | | | |
| | | | | | |
| 2009 Series B | | December 2024 | | $ | 1 | | | |
| | | | | | |
| | | | | | |
| | | | | | |
| | | | | | |
| | | | | | |
| | | | | | |
| | | | | | |
| | | | | | |
| | | | | | |
| | | | | | |
| Total redemptions/maturities of debt | | | | $ | 1 | | | |
| | | | | | |
| | | | | | |
| | | | | | |
| | | | | | |
| | | | | | |
Note
(1) All redemptions were at 100 percent of par.
Credit Facility Agreements
TVA has funding available under four long-term revolving credit facilities totaling $2.7 billion. See the table below for additional information on the four long-term revolving credit facilities. The interest rate on any borrowing under these facilities varies based on market factors and the rating of TVA's senior unsecured, long-term, non-credit-enhanced debt. TVA is required to pay an unused facility fee on the portion of the total $2.7 billion that TVA has not borrowed or committed under letters of credit. This fee, along with letter of credit fees, may fluctuate depending on the rating of TVA's senior unsecured, long-term, non-credit-enhanced debt. At December 31, 2024, and September 30, 2024, there were $500 million and $566 million, respectively, of letters of credit outstanding under these facilities, and there were no borrowings outstanding. TVA's letters of credit are primarily posted as collateral under TVA's interest rate swaps. See Note 13 — Risk Management Activities and Derivative Transactions — Other Derivative Instruments — Collateral. TVA may also post collateral for TVA's currency swaps, for commodity derivatives under the Financial Hedging Program ("FHP"), or for certain transactions with third parties that require TVA to post letters of credit.
The following table provides additional information regarding TVA's funding available under the four long-term revolving credit facilities:
| | | | | | | | | | | | | | | | | | | | | | | | | | |
Summary of Long-Term Credit Facilities At December 31, 2024 (in millions) |
| Maturity Date | | Facility Limit | | Letters of Credit Outstanding | | Cash Borrowings | | Availability |
| | | | | | | | |
| March 2026 | | $ | 150 | | | $ | 38 | | | $ | — | | | $ | 112 | |
| | | | | | | | |
| September 2026 | | 1,000 | | | 68 | | | — | | | 932 | |
| March 2027 | | 1,000 | | | 180 | | | — | | | 820 | |
| February 2028 | | 500 | | | 214 | | | — | | | 286 | |
| Total | | $ | 2,650 | | | $ | 500 | | | $ | — | | | $ | 2,150 | |
TVA and the United States ("U.S.") Department of the Treasury ("U.S. Treasury"), pursuant to the TVA Act, have entered into a memorandum of understanding under which the U.S. Treasury provides TVA with a $150 million credit facility. This credit facility was renewed for 2025 with a maturity date of September 30, 2025. Access to this credit facility or other similar financing arrangements with the U.S. Treasury has been available to TVA since the 1960s. TVA can borrow under the U.S. Treasury credit facility only if it cannot issue bonds, notes, or other evidences of indebtedness (collectively, "Bonds") in the market on reasonable terms, and TVA considers the U.S. Treasury credit facility a secondary source of liquidity. The interest rate on any borrowing under this facility is based on the average rate on outstanding marketable obligations of the U.S. with maturities from date of issue of 12 months or less. There were no outstanding borrowings under the facility at December 31, 2024. The availability of this credit facility may be impacted by how the U.S. government addresses the possibility of approaching its debt limit.
13. Risk Management Activities and Derivative Transactions
TVA is exposed to various risks related to commodity prices, investment prices, interest rates, currency exchange rates, and inflation as well as counterparty credit and performance risks. To help manage certain of these risks, TVA has historically entered into various derivative transactions, principally commodity option contracts, forward contracts, swaps, swaptions, futures, and options on futures.
Overview of Accounting Treatment
TVA recognizes certain of its derivative instruments as either assets or liabilities on its Consolidated Balance Sheets at fair value. The accounting for changes in the fair value of these instruments depends on (1) whether TVA uses regulatory accounting to defer the derivative gains and losses, (2) whether the derivative instrument has been designated and qualifies for hedge accounting treatment, and (3) if so, the type of hedge relationship (for example, cash flow hedge).
The following tables summarize the accounting treatment that certain of TVA's financial derivative transactions receive:
| | | | | | | | | | | | | | | | | | | | | | | | | | | | | | | |
Summary of Derivative Instruments That Receive Hedge Accounting Treatment (part 1)
Amount of Mark-to-Market Gain (Loss) Recognized in Accumulated Other Comprehensive Income (Loss)
(in millions) |
| | | | | | Three Months Ended December 31 | | | |
| Derivatives in Cash Flow Hedging Relationship | | Objective of Hedge Transaction | | Accounting for Derivative
Hedging Instrument | | 2024 | | 2023 | | | | | |
| Currency swaps | | To protect against changes in cash flows caused by changes in foreign currency exchange rates (exchange rate risk) | | Unrealized gains and losses are recorded in AOCI and reclassified to Interest expense to the extent they are offset by gains and losses on the hedged transaction | | $ | (19) | | | $ | 20 | | | | | | |
| | | | | | | | | | | | | | | | | | | |
Summary of Derivative Instruments That Receive Hedge Accounting Treatment (part 2)(1)
Amount of Gain (Loss) Reclassified from Accumulated Other Comprehensive Income (Loss) to Interest Expense
(in millions) |
| | Three Months Ended December 31 | | | |
| Derivatives in Cash Flow Hedging Relationship | | 2024 | | 2023 | | | | | |
| Currency swaps | | $ | (37) | | | $ | 19 | | | | | | |
Note
(1) There were no amounts excluded from effectiveness testing for any of the periods presented. Based on forecasted foreign currency exchange rates, TVA expects to reclassify approximately $11 million of gains from Accumulated other comprehensive income (loss) ("AOCI") to Interest expense within the next 12 months to
offset amounts anticipated to be recorded in Interest expense related to the forecasted exchange loss on the debt.
| | | | | | | | | | | | | | | | | | | | | | | | | | | | | | |
Summary of Derivative Instruments That Do Not Receive Hedge Accounting Treatment Amount of Gain (Loss) Recognized in Income on Derivatives(1) (in millions) |
| | | | | | Three Months Ended December 31 | | |
| Derivative Type | | Objective of Derivative | | Accounting for Derivative Instrument | | 2024 | | 2023 | | | | |
| Interest rate swaps | | To fix short-term debt variable rate to a fixed rate (interest rate risk) | | Mark-to-market gains and losses are recorded as regulatory liabilities and assets, respectively
Realized gains and losses are recognized in Interest expense when incurred during the settlement period and are presented in operating cash flow | | $ | (10) | | | $ | (8) | | | | | |
| | | | | | | | | | | | |
| | | | | | | | | | | | |
Commodity derivatives
under the FHP | | To protect against fluctuations in market prices of purchased commodities (price risk) | | Mark-to-market gains and losses are recorded as regulatory liabilities and assets, respectively
Realized gains and losses are recognized in Fuel expense or Purchased power expense as the contracts settle to match the delivery period of the underlying commodity(2) | | (37) | | | (54) | | | | | |
Notes
(1) All of TVA's derivative instruments that do not receive hedge accounting treatment have unrealized gains (losses) that would otherwise be recognized in income but instead are deferred as regulatory assets and liabilities. As such, there were no related gains (losses) recognized in income for these unrealized gains (losses) for the three months ended December 31, 2024 and for the three months ended December 31, 2023.
(2) Of the amount recognized for the three months ended December 31, 2024, $30 million and $7 million were reported in Fuel expense and Purchased power expense, respectively, and of the amount recognized for the three months ended December 31, 2023, $44 million and $10 million were reported in Fuel expense and Purchased power expense, respectively.
| | | | | | | | | | | | | | | | | | | | | | | |
Fair Values of TVA Derivatives (in millions) |
| | At December 31, 2024 | | At September 30, 2024 |
| Derivatives That Receive Hedge Accounting Treatment: |
| Balance | | Balance Sheet Presentation | | Balance | | Balance Sheet Presentation |
| Currency swaps | | | | | | | |
| | | | | | | |
| £250 million Sterling | $ | (64) | | | Accounts payable and accrued liabilities $(5); Other long-term liabilities $(59) | | $ | (49) | | | Accounts payable and accrued liabilities $(4); Other long-term liabilities $(45) |
| £150 million Sterling | (72) | | | Accounts payable and accrued liabilities $(4); Other long-term liabilities $(68) | | (67) | | | Accounts payable and accrued liabilities $(3); Other long-term liabilities $(64) |
| | | | | | | |
| Derivatives That Do Not Receive Hedge Accounting Treatment: |
| Balance | | Balance Sheet Presentation | | Balance | | Balance Sheet Presentation |
| Interest rate swaps | | | | | | | |
| $1.0 billion notional | $ | (481) | | | Accounts payable and accrued liabilities $(29); Accrued interest $(7); Other long-term liabilities $(445) | | $ | (622) | | | Accounts payable and accrued liabilities $(10); Accrued interest $(26); Other long-term liabilities $(586) |
| $476 million notional | (154) | | | Accounts payable and accrued liabilities $(10); Other long-term liabilities $(144) | | (218) | | | Accounts payable and accrued liabilities $(3); Accrued interest $(9); Other long-term liabilities $(206) |
| Commodity contract derivatives | 6 | | | Other current assets $11; Other long-term assets $1; Accounts payable and accrued liabilities $(3); Other long-term liabilities $(3) | | 2 | | | Other current assets $5; Other long-term assets $2; Accounts payable and accrued liabilities $(3); Other long-term liabilities $(2) |
| Commodity derivatives under the FHP | (75) | | | Other current assets $6; Accounts payable and accrued liabilities $(52); Other long-term liabilities $(29) | | (161) | | | Accounts payable and accrued liabilities $(99); Other long-term liabilities $(62) |
| | | | | | | |
Cash Flow Hedging Strategy for Currency Swaps
To protect against exchange rate risk related to British pound sterling denominated Bond transactions, TVA entered into foreign currency hedges at the time the Bond transactions occurred. TVA had two currency swaps outstanding at December 31, 2024, with total currency exposure of £400 million and expiration dates in 2032 and 2043.
When the dollar strengthens against the British pound sterling, the exchange gain on the Bond liability and related accrued interest is offset by an equal amount of loss on the swap contract that is reclassified out of AOCI. Conversely, the exchange loss on the Bond liability and related accrued interest is offset by an equal amount of gain on the swap contract that is reclassified out of AOCI. All such exchange gains or losses on the Bond liability and related accrued interest are included in Long-term debt, net and Accrued interest, respectively. The offsetting exchange losses or gains on the swap contracts are recognized in AOCI. If any gain (loss) were to be incurred as a result of the early termination of the foreign currency swap contract, the resulting income (expense) would be amortized over the remaining life of the associated Bond as a component of Interest expense. The values of the currency swap liabilities are included in Accounts payable and accrued liabilities and Other long-term liabilities on the Consolidated Balance Sheets.
Derivatives Not Receiving Hedge Accounting Treatment
Interest Rate Derivatives. Generally TVA uses interest rate swaps to fix variable short-term debt to a fixed rate, and TVA uses regulatory accounting treatment to defer the mark-to-market ("MtM") gains and losses on its interest rate swaps. The net deferred unrealized gains and losses are classified as regulatory liabilities or assets on TVA's Consolidated Balance Sheets and are included in the ratemaking formula when gains or losses are realized. The values of these derivatives are included in Accounts payable and accrued liabilities, Accrued interest, and Other long-term liabilities on the Consolidated Balance Sheets, and realized gains and losses, if any, are included on TVA's Consolidated Statements of Operations. For the three months ended December 31, 2024 and the three months ended December 31, 2023, the changes in fair market value of the interest rate swaps resulted in the reduction in unrealized losses of $177 million and the increase in unrealized losses of $189 million, respectively. TVA may hold short-term debt balances lower than the notional amount of the interest rate swaps from time to time due to changes in business conditions and other factors. While actual balances vary, TVA generally plans to maintain average balances of short-term debt equal to or in excess of the combined notional amount of the interest rate swaps.
Commodity Derivatives. TVA enters into certain derivative contracts for natural gas that require physical delivery of the contracted quantity of the commodity. TVA may also enter into power purchase agreements ("PPAs") that provide an option to financially settle contracted power deliveries. This option creates an embedded derivative in the hosting PPA. TVA marks to market these contracts and defers the unrealized gains (losses) as regulatory liabilities (assets). At December 31, 2024, TVA's natural gas contract derivatives had terms of up to 11 years.
| | | | | | | | | | | | | | | | | | | | | | | | | | | | | | | | | | | |
Commodity Contract Derivatives |
| | At December 31, 2024 | | At September 30, 2024 |
| | Number of Contracts | | Notional Amount | | Fair Value (MtM) (in millions) | | Number of Contracts | | Notional Amount | | Fair Value (MtM) (in millions) |
| | | | | | | | | | | |
| Natural gas contract derivatives | 51 | | 508 million mmBtu | | $ | 6 | | | 45 | | 321 million mmBtu | | $ | 2 | |
| | | | | | | | | | | |
Commodity Derivatives under the FHP. Currently, TVA is hedging exposure to the price of natural gas under the FHP. There is no Value at Risk aggregate transaction limit under the current FHP structure, but the TVA Board reviews and authorizes the use of tolerances and measures annually. TVA's FHP policy prohibits trading financial instruments under the FHP for speculative purposes. At December 31, 2024, TVA's natural gas swap contracts under the FHP had remaining terms of up to three years.
| | | | | | | | | | | | | | | | | | | | | | | | | | | | | | | | | | | |
Commodity Derivatives under Financial Hedging Program(1) |
| At December 31, 2024 | | At September 30, 2024 |
| Number of Contracts | | Notional Amount | | Fair Value (MtM) (in millions) | | Number of Contracts | | Notional Amount | | Fair Value (MtM) (in millions) |
| | | | | | | | | | | |
| | | | | | | | | | | |
| Natural gas swap contracts | 173 | | 280 | million mmBtu | | $ | (75) | | | 126 | | 230 | million mmBtu | | $ | (161) | |
| | | | | | | | | | | |
| | | | | | | | | | | |
| | | | | | | | | | | |
| | | | | | | | | | | |
| | | | | | | | | | | |
| | | | | | | | | | | |
| | | | | | | | | | | |
| | | | | | | | | | | |
Note
(1) Fair value amounts presented are based on the net commodity position with the counterparty. Notional amounts disclosed represent the net value of contractual amounts.
TVA defers all FHP unrealized gains (losses) as regulatory liabilities (assets) and records the realized gains or losses in Fuel expense and Purchased power expense to match the delivery period of the underlying commodity.
Offsetting of Derivative Assets and Liabilities
The amounts of TVA's derivative instruments as reported on the Consolidated Balance Sheets are shown in the table below:
| | | | | | | | | | | | | | |
Derivative Assets and Liabilities(1)
(in millions) |
| | At December 31, 2024 | | | | | At September 30, 2024 |
| Assets | | | | | | |
| Commodity contract derivatives | $ | 12 | | | | | | $ | 7 | |
| | | | | | |
Commodity derivatives under the FHP(2) | 6 | | | | | | — | |
| Total derivatives subject to master netting or similar arrangement | $ | 18 | | | | | | $ | 7 | |
| | | | | | |
| | | | | | |
| | | | | | |
| Liabilities | | | | | | |
| Currency swaps | $ | 136 | | | | | | $ | 116 | |
Interest rate swaps(3) | 635 | | | | | | 840 | |
| Commodity contract derivatives | 6 | | | | | | 5 | |
Commodity derivatives under the FHP(2) | 81 | | | | | | 161 | |
| | | | | | |
| Total derivatives subject to master netting or similar arrangement | $ | 858 | | | | | | $ | 1,122 | |
| | | | | | |
| | | | | | |
| | | | | | |
| | |
| | | | | | |
| | | | | | |
| | | | | | |
| | | | | | |
| | | | | | |
| | | | | | |
| | | | | | |
| | | | | | |
| | | | | | |
| | | | | | |
| | | | | | |
| | | | | | |
| | | | | | |
| | | | | | |
| | | | | | |
Notes
(1) Offsetting amounts include counterparty netting of derivative contracts. Except as discussed below, there were no other material offsetting amounts on TVA's Consolidated Balance Sheets at either December 31, 2024, or September 30, 2024.
(2) At December 31, 2024, the gross derivative asset and gross derivative liability were $31 million and $106 million, respectively, with offsetting amounts for each totaling $25 million. At September 30, 2024, the gross derivative asset and gross derivative liability were $4 million and $165 million, respectively, with offsetting amounts for each totaling $4 million.
(3) Letters of credit of $469 million and $535 million were posted as collateral at December 31, 2024, and September 30, 2024, respectively, to partially secure the liability positions of one of the interest rate swaps in accordance with the collateral requirements for this derivative.
Other Derivative Instruments
Investment Fund Derivatives. Investment funds consist primarily of funds held in the Nuclear Decommissioning Trust ("NDT"), the Asset Retirement Trust ("ART"), the Supplemental Executive Retirement Plan ("SERP"), the TVA Deferred Compensation Plan ("DCP"), and the Restoration Plan ("RP"). See Note 14 — Fair Value Measurements — Investment Funds for a discussion of the trusts, plans, and types of investments. The NDT and ART may invest in derivative instruments which may include swaps, futures, options, forwards, and other instruments. At December 31, 2024, and September 30, 2024, the NDT held investments in forward contracts to purchase debt securities. The fair values of these derivatives were in net asset positions totaling $9 million and $11 million at December 31, 2024, and September 30, 2024, respectively.
Collateral. TVA's interest rate swaps, currency swaps, and commodity derivatives under the FHP contain contract provisions that require a party to post collateral (in a form such as cash or a letter of credit) when the party's liability balance under the agreement exceeds a certain threshold. At December 31, 2024, the aggregate fair value of all derivative instruments with credit-risk related contingent features that were in a liability position was $858 million. TVA's collateral obligations at December 31, 2024, under these arrangements were $411 million, for which TVA had posted $469 million in letters of credit. These letters of credit reduce the available balance under the related credit facilities. TVA's assessment of the risk of its nonperformance includes a reduction in its exposure under the interest rate swap contracts as a result of this posted collateral.
For all of its derivative instruments with credit-risk related contingent features:
•If TVA remains a majority-owned U.S. government entity but S&P Global Ratings ("S&P") or Moody's Investors Service, Inc. ("Moody's") downgrades TVA's credit rating to AA or Aa2, respectively, TVA's collateral obligations would likely increase by $22 million, and
•If TVA ceases to be majority-owned by the U.S. government, TVA's credit rating would likely be downgraded and TVA would be required to post additional collateral.
Counterparty Risk
TVA may be exposed to certain risks when a counterparty has the potential to fail to meet its obligations in accordance with agreed terms. These risks may be related to credit, operational, or nonperformance matters. To mitigate certain counterparty risk, TVA analyzes the counterparty's financial condition prior to entering into an agreement, establishes credit limits, monitors the appropriateness of those limits, as well as any changes in the creditworthiness of the counterparty, on an
ongoing basis, and when required, employs credit mitigation measures, such as collateral or prepayment arrangements and master purchase and sale agreements.
Customers. TVA is exposed to counterparty credit risk associated with trade accounts receivable from delivered power sales to local power company customers ("LPCs"), and from industries and federal agencies directly served, all located in the Tennessee Valley region. Of the $1.6 billion and $1.7 billion of receivables from power sales outstanding at December 31, 2024, and September 30, 2024, respectively, nearly all of the counterparties were rated investment grade. The majority of the obligations of these customers that are not investment grade are secured by collateral. TVA is also exposed to risk from exchange power arrangements with a small number of investor-owned regional utilities related to either delivered power or the replacement of open positions of longer-term purchased power or fuel agreements. TVA believes its policies and procedures for counterparty performance risk reviews have generally protected TVA against significant exposure related to market and economic conditions. See Note 1 — Summary of Significant Accounting Policies — Allowance for Uncollectible Accounts, Note 3 — Accounts Receivable, Net, and Note 7 — Other Long-Term Assets.
TVA had revenue from two LPCs that collectively accounted for 16 percent of total operating revenues for both the three months ended December 31, 2024 and the three months ended December 31, 2023.
Suppliers. TVA assesses potential supplier performance risks, including procurement of fuel, purchased power, parts, and services. If suppliers are unable to perform under TVA's existing contracts or if TVA is unable to obtain similar services or supplies from other vendors, TVA could experience delays, disruptions, additional costs, or other operational outcomes that may impact generation, maintenance, and capital programs. If certain fuel or purchased power suppliers fail to perform under the terms of their contract with TVA, TVA might lose the money that it paid to the supplier under the contract and have to purchase replacement fuel or power on the spot market, perhaps at a significantly higher price than TVA was entitled to pay under the contract. In addition, TVA might not be able to acquire replacement fuel or power in a timely manner and thus might be unable to satisfy its own obligations to deliver power. TVA continues evaluating potential supplier performance risks and supplier impact but cannot determine or predict the duration of such risks/impacts or the extent to which such risks/impacts could affect TVA's business, operations, and financial results or cause potential business disruptions.
TVA continues to experience impacts due to inflation, supply chain material challenges, and labor availability. This has led to project delays, limited availability, and/or price increases for supplies and labor. TVA has been able to manage these challenges with limited business disruptions at this time; however, should pressures continue long term, TVA could experience more significant disruptions and pressure to further increase power rates.
Natural Gas and Fuel Oil. TVA purchases a significant amount of its natural gas requirements through contracts with a variety of suppliers and purchases substantially all of its fuel oil requirements on the spot market. TVA delivers to its gas fleet under firm and non-firm transportation contracts on multiple interstate natural gas pipelines. TVA contracts for storage capacity that allows for operational flexibility and increased supply during peak gas demand scenarios or supply disruptions. TVA uses contracts of various lengths and terms to meet the projected natural gas needs of its natural gas fleet. TVA also maintains on-site, fuel oil backup to operate at the majority of the CT sites in the event of major supply disruptions. In the event a supplier experiences an incident that limits its ability to fulfill its firm contractual obligations to supply TVA with natural gas, TVA intends to leverage its storage and balancing services and/or replace the volume with a third party to ensure reliability of generation.
Coal. To help ensure a reliable supply of coal, TVA had coal contracts with multiple suppliers as of December 31, 2024. The contracted supply of coal is sourced from several geographic regions of the U.S. and is delivered via barge and rail. As a result of emerging technologies, environmental regulations, industry trends, and natural gas market volatility over the past few years, coal suppliers are facing increased financial pressure, which has led to relatively poor credit ratings and bankruptcies, restructuring, mine closures, or other scenarios. A long-term continued decline in demand for coal could result in more consolidations, additional bankruptcies, restructuring, mine closures, or other scenarios.
Nuclear Fuel. Nuclear fuel is obtained predominantly through long-term uranium concentrate supply contracts, contracted conversion services, contracted enrichment services, or a combination thereof, and contracted fuel fabrication services. The supply markets for uranium concentrates and certain nuclear fuel services are subject to price fluctuations and availability restrictions. Supply market conditions may make procurement contracts subject to credit risk related to the potential nonperformance of counterparties. In the event of nonperformance by these or other suppliers, TVA believes that replacement uranium concentrate and nuclear fuel services can be obtained, although at prices that may be unfavorable when compared to the prices under the current supply agreements.
Purchased Power. TVA acquires power from a variety of power producers through long-term and short-term PPAs as well as through spot market purchases. Because of the reliability risk of purchased power, TVA requires that the PPAs contain certain counterparty performance assurance requirements to help insure counterparty performance during the term of the agreements.
Other Suppliers. Mounting solar supply chain constraints, commodity price increases, and the trade policy investigations into solar panel imports have created challenges for the U.S. solar industry. TVA's existing solar PPA portfolio is
not immune from these challenges. Similar to the experience of the rest of the industry, the majority of TVA's contracted PPAs from previous requests for proposals ("RFPs") that are not yet online have been impacted by project delays and price increases.
Derivative Counterparties. TVA has entered into physical and financial contracts that are classified as derivatives for hedging purposes, and TVA's NDT, ART, and qualified defined benefit plan ("pension plan") have entered into derivative contracts for investment purposes. If a counterparty to one of the physical or financial derivative transactions defaults, TVA might incur costs in connection with entering into a replacement transaction. If a counterparty to the derivative contracts into which the NDT, the ART, or the pension plan have entered for investment purposes defaults, the value of the investment could decline significantly or perhaps become worthless. TVA has concentrations of credit risk from the banking, coal, and gas industries because multiple companies in these industries serve as counterparties to TVA in various derivative transactions. At December 31, 2024, all of TVA's commodity derivatives under the FHP, currency swaps, and interest rate swaps were with counterparties whose Moody's credit ratings were A2 or higher. TVA classifies forward natural gas contracts as derivatives. At December 31, 2024, the forward natural gas contracts were with counterparties whose ratings ranged from B1 to A1.
14. Fair Value Measurements
Fair value is determined based on the exchange price that would be received for an asset or paid to transfer a liability (an exit price) in the asset or liability's principal market, or in the absence of a principal market, the most advantageous market for the asset or liability in an orderly transaction between market participants. TVA uses market or observable inputs as the preferred source of values, followed by assumptions based on hypothetical transactions in the absence of market inputs.
Valuation Techniques
The measurement of fair value results in classification into a hierarchy by the inputs used to determine the fair value as follows:
| | | | | | | | | | | |
| Level 1 | —
| | Unadjusted quoted prices in active markets accessible by the reporting entity for identical assets or liabilities. Active markets are those in which transactions for the asset or liability occur with sufficient frequency and volume to provide pricing. |
Level 2
| —
| | Pricing inputs other than quoted market prices included in Level 1 that are based on observable market data and that are directly or indirectly observable for substantially the full term of the asset or liability. These include quoted market prices for similar assets or liabilities, quoted market prices for identical or similar assets in markets that are not active, adjusted quoted market prices, inputs from observable data such as interest rate and yield curves, volatilities and default rates observable at commonly quoted intervals, and inputs derived from observable market data by correlation or other means. |
| Level 3 | —
| | Pricing inputs that are unobservable, or less observable, from objective sources. Unobservable inputs are only to be used to the extent observable inputs are not available. These inputs maintain the concept of an exit price from the perspective of a market participant and should reflect assumptions of other market participants. An entity should consider all market participant assumptions that are available without unreasonable cost and effort. These are given the lowest priority and are generally used in internally developed methodologies to generate management's best estimate of the fair value when no observable market data is available. |
A financial instrument's level within the fair value hierarchy (where Level 1 is the highest and Level 3 is the lowest) is based on the lowest level of input significant to the fair value measurement.
The following sections describe the valuation methodologies TVA uses to measure different financial instruments at fair value. Except for gains and losses on SERP, DCP, and RP assets, all changes in fair value of these assets and liabilities have been recorded as changes in regulatory assets, regulatory liabilities, or AOCI on TVA's Consolidated Balance Sheets and Consolidated Statements of Comprehensive Income (Loss). Except for gains and losses on SERP and DCP assets, there has been no impact to the Consolidated Statements of Operations or the Consolidated Statements of Cash Flows related to these fair value measurements.
Investment Funds
At December 31, 2024, Investment funds were comprised of $4.9 billion of equity securities and debt securities classified as trading measured at fair value. Equity and trading debt securities are held in the NDT, ART, SERP, DCP, and RP. The NDT holds funds for the ultimate decommissioning of TVA's nuclear power plants. The ART holds funds primarily for the costs related to the future closure and retirement of TVA's other long-lived assets. The balances in the NDT and ART were $3.3 billion and $1.5 billion, respectively, at December 31, 2024.
TVA established a SERP to provide benefits to selected employees of TVA which are comparable to those provided by competing organizations. The DCP is designed to provide participants with the ability to defer compensation to future periods. The RP is a non-qualified excess 401(k) plan designed to allow certain eligible employees whose contributions to the 401(k) plan are limited by Internal Revenue Service ("IRS") rules to save additional amounts for retirement and receive non-elective and matching employer contributions. The NDT, ART, SERP, DCP, and RP funds are invested in portfolios of securities generally designed to achieve a return in line with overall equity and debt market performance.
The NDT, ART, SERP, DCP, and RP are composed of multiple types of investments and are managed by external institutional investment managers. Most U.S. and international equities, U.S. Treasury inflation-protected securities, and real estate investment trust securities and certain derivative instruments are measured based on quoted exchange prices in active markets and are classified as Level 1 valuations. Fixed-income investments, high-yield fixed-income investments, currencies, and most derivative instruments are non-exchange traded and are classified as Level 2 valuations. These measurements are based on market and income approaches with observable market inputs. Cash equivalents and other short-term investments are highly liquid securities with maturities of less than three months and 12 months, respectively. These consist primarily of discount securities such as repurchase agreements and U.S. Treasury bills. These securities may be priced at cost, which approximates fair value due to the short-term nature of the instruments. These securities are classified as Level 2. Active market pricing may be utilized for U.S. Treasury bills, which are classified as Level 1.
Private equity limited partnerships, private real asset investments, and private credit investments may include holdings of investments in private real estate, venture capital, buyout, mezzanine or subordinated debt, restructuring or distressed debt, and special situations through funds managed by third-party investment managers. These investments generally involve a three-to-four-year period where the investor contributes capital, followed by a period of distribution, typically over several years. The investment period is generally, at a minimum, 10 years or longer. The NDT had unfunded commitments related to private equity limited partnerships of $380 million, private real assets of $129 million, and private credit of $89 million at December 31, 2024. The ART had unfunded commitments related to limited partnerships in private equity of $146 million, private real assets of $68 million, and private credit of $47 million at December 31, 2024. These investments have no redemption or limited redemption options and may also impose restrictions on the NDT's and ART's ability to liquidate their investments. There are no readily available quoted exchange prices for these investments. The fair value of these investments is based on information provided by the investment managers. These investments are valued on a quarterly basis. TVA's private equity limited partnerships, private real asset investments, and private credit investments are valued at net asset values ("NAV") as a practical expedient for fair value. TVA classifies its interest in these types of investments as investments measured at NAV in the fair value hierarchy.
Commingled funds represent investment funds comprising multiple individual financial instruments. The commingled funds held by the NDT, ART, SERP, DCP, and RP consist of either a single class of securities, such as equity, debt, or foreign currency securities, or multiple classes of securities. All underlying positions in these commingled funds are either exchange traded or measured using observable inputs for similar instruments. The fair value of commingled funds is based on NAV per fund share (the unit of account), derived from the prices of the underlying securities in the funds. These commingled funds can be redeemed at the measurement date NAV and are classified as Commingled funds measured at NAV in the fair value hierarchy.
Realized and unrealized gains and losses on equity and trading debt securities are recognized in current earnings and are based on average cost. The gains and losses of the NDT and ART are subsequently reclassified to a regulatory asset or liability account in accordance with TVA's regulatory accounting policy. See Note 1 — Summary of Significant Accounting Policies of the Notes to Consolidated Financial Statements in the Annual Report and Note 8 — Regulatory Assets and Liabilities. TVA recorded unrealized gains and losses related to its equity and trading debt securities held during each period as follows:
| | | | | | | | | | | | | | | | | | | | | | | | | |
Unrealized Investment Gains (Losses)(1) (in millions) |
| | | | Three Months Ended December 31 | | | |
| Fund | | Financial Statement Presentation | | 2024 | | 2023 | | | | | |
| NDT | | Regulatory assets(2) | | $ | (75) | | | $ | 197 | | | | | | |
| ART | | Regulatory assets(3) | | (20) | | | 89 | | | | | | |
| SERP | | Other income, net | | (6) | | | 7 | | | | | | |
| DCP | | Other income, net | | (1) | | | 1 | | | | | | |
Notes
(1) The unrealized gains for the RP were less than $1 million for both the three months ended December 31, 2024 and December 31, 2023, and therefore were not represented in the table above.
(2) Includes $43 million of unrealized losses and $61 million of unrealized gains related to NDT equity securities (excluding commingled funds) for the three months ended December 31, 2024 and December 31, 2023, respectively.
(3) Includes $11 million of unrealized losses and $18 million of unrealized gains related to ART equity securities (excluding commingled funds) for the three months ended December 31, 2024 and December 31, 2023, respectively.
Currency and Interest Rate Swap Derivatives
See Note 13 — Risk Management Activities and Derivative Transactions — Cash Flow Hedging Strategy for Currency Swaps and Derivatives Not Receiving Hedge Accounting Treatment for a discussion of the nature, purpose, and contingent features of TVA's currency swaps and interest rate swaps. These swaps are classified as Level 2 valuations and are valued based on income approaches using observable market inputs for similar instruments.
Commodity Contract Derivatives and Commodity Derivatives under the FHP
Commodity Contract Derivatives. Most of these derivative contracts are valued based on market approaches, which utilize short-term and mid-term market-quoted prices from an external industry brokerage service. These contracts are classified as Level 2 valuations.
Commodity Derivatives under the FHP. Swap contracts are valued using a pricing model based on New York Mercantile Exchange inputs and are subject to nonperformance risk outside of the exit price. These contracts are classified as Level 2 valuations.
See Note 13 — Risk Management Activities and Derivative Transactions — Derivatives Not Receiving Hedge Accounting Treatment — Commodity Derivatives and — Commodity Derivatives under the FHP.
Nonperformance Risk
The assessment of nonperformance risk, which includes credit risk, considers changes in current market conditions, readily available information on nonperformance risk, letters of credit, collateral, other arrangements available, and the nature of master netting arrangements. TVA is a counterparty to currency swaps, interest rate swaps, commodity contracts, and other derivatives which subject TVA to nonperformance risk. Nonperformance risk on the majority of investments and certain exchange-traded instruments held by TVA is incorporated into the exit price that is derived from quoted market data that is used to mark the investment to market.
Nonperformance risk for most of TVA's derivative instruments is an adjustment to the initial asset/liability fair value. TVA adjusts for nonperformance risk, both of TVA (for liabilities) and the counterparty (for assets), by applying credit valuation adjustments ("CVAs"). TVA determines an appropriate CVA for each applicable financial instrument based on the term of the instrument and TVA's or the counterparty's credit rating as obtained from Moody's. For companies that do not have an observable credit rating, TVA uses internal analysis to assign a comparable rating to the counterparty. TVA discounts each financial instrument using the historical default rate (as reported by Moody's for CY 1983 to CY 2023) for companies with a similar credit rating over a time period consistent with the remaining term of the contract. The application of CVAs resulted in a less than $1 million decrease in the fair value of assets and a less than $1 million decrease in the fair value of liabilities at December 31, 2024.
Fair Value Measurements
The following tables set forth by level, within the fair value hierarchy, TVA's financial assets and liabilities that were measured at fair value on a recurring basis at December 31, 2024, and September 30, 2024. Financial assets and liabilities have been classified in their entirety based on the lowest level of input that is significant to the fair value measurement. TVA's assessment of the significance of a particular input to the fair value measurement requires judgment and may affect the determination of the fair value of the assets and liabilities and their classification in the fair value hierarchy levels.
| | | | | | | | | | | | | | | | | | | | | | | |
Fair Value Measurements
At December 31, 2024
(in millions) |
| Quoted Prices in Active
Markets for
Identical Assets
(Level 1) | | Significant Other
Observable Inputs
(Level 2) | | Significant
Unobservable
Inputs
(Level 3) | | Total |
| Assets | | | | | | | |
| Investments | | | | | | | |
| Equity securities | $ | 704 | | | $ | — | | | $ | — | | | $ | 704 | |
Government debt securities(1)(2) | 398 | | | 56 | | | — | | | 454 | |
Corporate debt securities(3) | — | | | 378 | | | — | | | 378 | |
| Mortgage and asset-backed securities | — | | | 41 | | | — | | | 41 | |
| Institutional mutual funds | 337 | | | — | | | — | | | 337 | |
| Forward debt securities contracts | — | | | 9 | | | — | | | 9 | |
Cash equivalents and other short-term investments(2)(4) | 49 | | | 215 | | | — | | | 264 | |
Private equity funds measured at net asset value(5) | — | | | — | | | — | | | 765 | |
Private real asset funds measured at net asset value(5) | — | | | — | | | — | | | 441 | |
Private credit funds measured at net asset value(5) | — | | | — | | | — | | | 258 | |
Commingled funds measured at net asset value(5) | — | | | — | | | — | | | 1,268 | |
| Total investments | 1,488 | | | 699 | | | — | | | 4,919 | |
| | | | | | | |
| Commodity contract derivatives | — | | | 12 | | | — | | | 12 | |
| Commodity derivatives under the FHP | — | | | 6 | | | — | | | 6 | |
| | | | | | | |
| Total | $ | 1,488 | | | $ | 717 | | | $ | — | | | $ | 4,937 | |
| | | | | | | |
| Quoted Prices in Active
Markets for
Identical Liabilities
(Level 1) | | Significant Other
Observable Inputs
(Level 2) | | Significant
Unobservable
Inputs
(Level 3) | | Total |
| Liabilities | | | | | | | |
Currency swaps(6) | $ | — | | | $ | 136 | | | $ | — | | | $ | 136 | |
| Interest rate swaps | — | | | 635 | | | — | | | 635 | |
| Commodity contract derivatives | — | | | 6 | | | — | | | 6 | |
| Commodity derivatives under the FHP | — | | | 81 | | | — | | | 81 | |
| | | | | | | |
| Total | $ | — | | | $ | 858 | | | $ | — | | | $ | 858 | |
Notes
(1) Includes obligations of government-sponsored entities.
(2) There are $398 million of U.S. Treasury securities in Level 1 Government debt securities and $49 million of U.S. Treasury securities in Level 1 Cash equivalents and other short-term investments for a total of $447 million of U.S. Treasury securities within Level 1 of the fair value hierarchy.
(3) Includes both U.S. and foreign debt.
(4) Includes $76 million net payables (interest receivable, dividends receivable, receivables for investments sold, and payables for investments purchased), and $179 million of repurchase agreements in Level 2 Cash equivalents and other short-term investments.
(5) Certain investments that are measured at fair value using the NAV or its equivalent (alternative investments) have not been categorized in the fair value hierarchy. The inputs to these fair value measurements include underlying NAVs, discounted cash flow valuations, comparable market valuations, and adjustments for currency, credit, liquidity, and other risks. The fair value amounts presented in this table are intended to permit reconciliation of the fair value hierarchy to the amounts presented on the Consolidated Balance Sheets.
(6) TVA records currency swaps net of cash collateral received from or paid to the counterparty, to the extent such amount is not recorded in Accounts payable and accrued liabilities. See Note 13 — Risk Management Activities and Derivative Transactions — Offsetting of Derivative Assets and Liabilities.
| | | | | | | | | | | | | | | | | | | | | | | |
Fair Value Measurements
At September 30, 2024
(in millions) |
| Quoted Prices in Active
Markets for
Identical Assets
(Level 1) | | Significant Other
Observable Inputs
(Level 2) | | Significant
Unobservable
Inputs
(Level 3) | | Total |
| Assets | | | | | | | |
| Investments | | | | | | | |
| Equity securities | $ | 770 | | | $ | — | | | $ | — | | | $ | 770 | |
Government debt securities(1)(2) | 400 | | | 57 | | | — | | | 457 | |
Corporate debt securities(3) | — | | | 378 | | | — | | | 378 | |
| Mortgage and asset-backed securities | — | | | 43 | | | — | | | 43 | |
| Institutional mutual funds | 342 | | | — | | | — | | | 342 | |
| Forward debt securities contracts | — | | | 11 | | | — | | | 11 | |
Cash equivalents and other short-term investments(2)(4) | 95 | | | 183 | | | — | | | 278 | |
Private equity funds measured at net asset value(5) | — | | | — | | | — | | | 738 | |
Private real asset funds measured at net asset value(5) | — | | | — | | | — | | | 432 | |
Private credit funds measured at net asset value(5) | — | | | — | | | — | | | 219 | |
Commingled funds measured at net asset value(5) | — | | | — | | | — | | | 1,300 | |
| Total investments | 1,607 | | | 672 | | | — | | | 4,968 | |
| | | | | | | |
| Commodity contract derivatives | — | | | 7 | | | — | | | 7 | |
| | | | | | | |
| | | | | | | |
| Total | $ | 1,607 | | | $ | 679 | | | $ | — | | | $ | 4,975 | |
| | | | | | | |
| | | | | | | |
| Quoted Prices in Active
Markets for
Identical Liabilities
(Level 1) | | Significant Other
Observable Inputs
(Level 2) | | Significant
Unobservable
Inputs
(Level 3) | | Total |
| Liabilities | | | | | | | |
Currency swaps(6) | $ | — | | | $ | 116 | | | $ | — | | | $ | 116 | |
| Interest rate swaps | — | | | 840 | | | — | | | 840 | |
| Commodity contract derivatives | — | | | 5 | | | — | | | 5 | |
| Commodity derivatives under the FHP | — | | | 161 | | | — | | | 161 | |
| | | | | | | |
| Total | $ | — | | | $ | 1,122 | | | $ | — | | | $ | 1,122 | |
Notes
(1) Includes obligations of government-sponsored entities.
(2) There are $400 million of U.S. Treasury securities in Level 1 Government debt securities and $95 million of U.S. Treasury securities in Level 1 Cash equivalents and other short-term investments for a total of $495 million of U.S. Treasury securities within Level 1 of the fair value hierarchy.
(3) Includes both U.S. and foreign debt.
(4) Includes $78 million net payables (interest receivable, dividends receivable, receivables for investments sold, and payables for investments purchased), and $174 million of repurchase agreements in Level 2 Cash equivalents and other short-term investments.
(5) Certain investments that are measured at fair value using the NAV or its equivalent (alternative investments) have not been categorized in the fair value hierarchy. The inputs to these fair value measurements include underlying NAVs, discounted cash flow valuations, comparable market valuations, estimated benchmark yields, and adjustments for currency, credit, liquidity, and other risks. The fair value amounts presented in this table are intended to permit reconciliation of the fair value hierarchy to the amounts presented on the Consolidated Balance Sheets.
(6) TVA records currency swaps net of cash collateral received from or paid to the counterparty, to the extent such amount is not recorded in Accounts payable and accrued liabilities. See Note 13 — Risk Management Activities and Derivative Transactions — Offsetting of Derivative Assets and Liabilities.
Other Financial Instruments Not Recorded at Fair Value
TVA uses the methods and assumptions described below to estimate the fair value of each significant class of financial instruments. The fair value of the financial instruments held at December 31, 2024, and September 30, 2024, may not be representative of the actual gains or losses that will be recorded when these instruments mature or are called or presented for early redemption. The estimated values of TVA's financial instruments not recorded at fair value at December 31, 2024, and September 30, 2024, were as follows:
| | | | | | | | | | | | | | | | | | | | | | | | | | | | | |
Estimated Values of Financial Instruments Not Recorded at Fair Value
(in millions) |
| | | | At December 31, 2024 | | At September 30, 2024 |
| | Valuation Classification | | Carrying
Amount | | Fair
Value | | Carrying
Amount | | Fair
Value |
EnergyRight® receivables, net (including current portion) | Level 2 | | $ | 56 | | | $ | 56 | | | $ | 56 | | | $ | 56 | |
| | | | | | | | | |
| Loans and other long-term receivables, net (including current portion) | Level 2 | | 94 | | | 86 | | | 105 | | | 99 | |
| | | | | | | | | |
EnergyRight® financing obligations (including current portion) | Level 2 | | 65 | | | 74 | | | 66 | | | 74 | |
| | | | | | | | | |
| | | | | | | | | |
| | | | | | | | | |
| Membership interests of VIEs subject to mandatory redemption (including current portion) | Level 2 | | 17 | | | 18 | | | 17 | | | 19 | |
| | | | | | | | | |
| Long-term outstanding power bonds, net (including current maturities) | Level 2 | | 18,857 | | | 18,356 | | | 18,889 | | | 19,416 | |
| | | | | | | | | |
| Long-term debt of VIEs, net (including current maturities) | Level 2 | | 1,721 | | | 1,694 | | | 934 | | | 966 | |
| | | | | | | | | |
| | | | | | | | | |
The carrying values of Cash and cash equivalents, Restricted cash and cash equivalents, Accounts receivable, net, and Short-term debt, net approximate their fair values.
The fair value for loans and other long-term receivables is estimated by determining the present value of future cash flows using a discount rate equal to lending rates for similar loans made to borrowers with similar credit ratings and for similar remaining maturities, where applicable. The fair value of long-term debt and membership interests of VIEs subject to mandatory redemption is estimated by determining the present value of future cash flows using current market rates for similar obligations, giving effect to credit ratings and remaining maturities.
15. Revenue
Revenue from Sales of Electricity
TVA's revenue from contracts with customers is primarily derived from the generation and sale of electricity to its customers and is included in Revenue from sales of electricity on the Consolidated Statements of Operations. Electricity is sold primarily to LPCs for distribution to their end-use customers. In addition, TVA sells electricity to directly served industrial companies, federal agencies, and others.
| | | | | |
| LPC sales | Approximately 91 percent of TVA's Revenue from sales of electricity for both the three months ended December 31, 2024 and the three months ended December 31, 2023, was from LPCs, which then distribute the power to their customers using their own distribution systems. Power is delivered to each LPC at delivery points within the LPC's service territory. TVA recognizes revenue when the customer takes possession of the power at the delivery point. For power sales, the performance obligation to deliver power is satisfied in a series over time because the sales of electricity over the term of the customer contract are a series of distinct goods that are substantially the same and have the same pattern of transfer to the customer. TVA has no continuing performance obligations subsequent to delivery. Using the output method for revenue recognition provides a faithful depiction of the transfer of electricity as customers obtain control of the power and benefit from its use at delivery. Additionally, TVA has an enforceable right to consideration for energy delivered at any discrete point in time and will recognize revenue at an amount that reflects the consideration to which TVA is entitled for the energy delivered.
The amount of revenue is based on contractual prices approved by the TVA Board. Customers are invoiced monthly for power delivered as measured by meters located at the delivery points. The net transaction price is offset by certain credits available to customers that are known at the time of billing. Credits are designed to achieve objectives of the TVA Act and include items such as hydro preference credits for residential customers of LPCs, economic development credits to promote growth in the Tennessee Valley, wholesale bill credits to maintain long-term partnerships with LPCs, and demand response credits allowing TVA to reduce industrial customer usage in periods of peak demand to balance system demand. Payments are typically due within approximately one month of invoice issuance. |
| |
| Directly served customers | Directly served customers, including industrial customers, federal agencies, and other customers, take power for their own consumption. Similar to LPCs, power is delivered to a delivery point, at which time the customer takes possession and TVA recognizes revenue. For all power sales, the performance obligation to deliver power is satisfied in a series over time since the sales of electricity over the term of the customer contract are a series of distinct goods that are substantially the same and have the same pattern of transfer to the customer. TVA has no continuing performance obligations subsequent to delivery. Using the output method for revenue recognition provides a faithful depiction of the transfer of electricity as customers obtain control of the power and benefit from its use at delivery. Additionally, TVA has an enforceable right to consideration for energy delivered at any discrete point in time and will recognize revenue at an amount that reflects the consideration to which TVA is entitled for the energy delivered.
The amount of revenue is based on contractual prices approved by the TVA Board. Customers are invoiced monthly for power delivered as measured by meters located at the delivery points. The net transaction price is offset by certain credits available to customers that are known at the time of billing. Examples of credits include items such as economic development credits to promote growth in the Tennessee Valley and demand response credits allowing TVA to reduce industrial customer usage in periods of peak demand to balance system demand. Payments are typically due within approximately one month of invoice issuance. |
Other Revenue
Other revenue consists primarily of wheeling and network transmission charges, sales of excess steam that is a by-product of power production, delivery point charges for interconnection points between TVA and the customer, Renewable Energy Certificate sales, and certain other ancillary goods or services.
Disaggregated Revenues
During the three months ended December 31, 2024, revenues generated from TVA's electricity sales were $2.9 billion, and accounted for virtually all of TVA's revenues. TVA's operating revenues by state for the three months ended December 31, 2024 and 2023, are detailed in the table below:
| | | | | | | | | | | | | | | |
Operating Revenues By State (in millions) |
| Three Months Ended December 31 | | |
| | 2024 | | 2023 | | | | |
| Alabama | $ | 431 | | | $ | 408 | | | | | |
| Georgia | 74 | | | 69 | | | | | |
| Kentucky | 182 | | | 177 | | | | | |
| Mississippi | 269 | | | 255 | | | | | |
| North Carolina | 21 | | | 23 | | | | | |
| Tennessee | 1,886 | | | 1,789 | | | | | |
| Virginia | 12 | | | 11 | | | | | |
| Subtotal | 2,875 | | | 2,732 | | | | | |
| Off-system sales | 1 | | | 2 | | | | | |
Revenue capitalized during pre-commercial plant operations(1) | — | | | (3) | | | | | |
| Revenue from sales of electricity | 2,876 | | | 2,731 | | | | | |
| Other revenue | 44 | | | 34 | | | | | |
| Total operating revenues | $ | 2,920 | | | $ | 2,765 | | | | | |
Note
(1) Represents revenue capitalized during pre-commercial operations at Johnsonville Aeroderivative CT Units 25-28 in the three months ended December 31, 2024 and Paradise CT Units 5-7 in the three months ended December 31, 2023. Revenue capitalized at Johnsonville Aeroderivative was less than $1 million for the three months ended December 31, 2024.
TVA's operating revenues by customer type for the three months ended December 31, 2024 and 2023, are detailed in the table below:
| | | | | | | | | | | | | | | |
Operating Revenues by Customer Type (in millions) |
| Three Months Ended December 31 | | |
| | 2024 | | 2023 | | | | |
| Revenue from sales of electricity | | | | | | | |
| Local power companies | $ | 2,616 | | | $ | 2,487 | | | | | |
| Industries directly served | 230 | | | 217 | | | | | |
| Federal agencies and other | 30 | | | 30 | | | | | |
Revenue capitalized during pre-commercial plant operations(1) | — | | | (3) | | | | | |
| Revenue from sales of electricity | 2,876 | | | 2,731 | | | | | |
| Other revenue | 44 | | | 34 | | | | | |
| Total operating revenues | $ | 2,920 | | | $ | 2,765 | | | | | |
Note
(1) Represents revenue capitalized during pre-commercial operations at Johnsonville Aeroderivative CT Units 25-28 in the three months ended December 31, 2024 and Paradise CT Units 5-7 in the three months ended December 31, 2023. Revenue capitalized at Johnsonville Aeroderivative was less than $1 million for the three months ended December 31, 2024.
TVA and LPCs continue to work together to meet the changing needs of consumers around the Tennessee Valley. In 2019, the TVA Board approved a partnership agreement option that better aligns the length of LPC power contracts with TVA's long-term commitments. Under the partnership arrangement, the LPC power contracts automatically renew each year and have a 20-year termination notice. The partnership arrangements can be terminated under certain circumstances, including TVA’s failure to limit rate increases to no more than 10 percent during any consecutive five-fiscal-year period, as more specifically described in the agreements. Participating LPCs receive benefits including a 3.1 percent wholesale bill credit in exchange for their long-term commitment, which enables TVA to recover its long-term financial commitments over a commensurate period. The total wholesale bill credits to LPCs participating in the Partnership Agreement were $50 million and $47 million for the three months ended December 31, 2024 and 2023, respectively. In 2020, TVA provided participating LPCs a flexibility option, named Generation Flexibility, that allows them to locally generate or purchase up to approximately five percent of their average total
hourly energy sales over a certain time period in order to meet their individual customers' needs. Revised flexibility agreements were made available to LPCs in 2023 which permit projects to be located anywhere in TVA's service area, either connected to the LPC distribution system or TVA's transmission system, and make it easier for LPCs to partner in projects. As of December 31, 2024, 148 LPCs had signed the Partnership Agreement with TVA, and 102 LPCs had signed a Power Supply Flexibility Agreement.
The number of LPCs by contract arrangement, the revenues derived from such arrangements for the three months ended December 31, 2024, and the percentage those revenues comprised of TVA's total operating revenues for the same period, are summarized in the table below:
| | | | | | | | | | | | | | | | | | | | |
TVA Local Power Company Contracts At or for the Three Months Ended December 31, 2024 |
Contract Arrangements(1) | | Number of LPCs | | Revenue from Sales of Electricity to LPCs
(in millions) | | Percentage of Total Operating Revenues |
| 20-year termination notice | | 148 | | | $ | 2,272 | | | 77.8 | % |
| | | | | | |
| | | | | | |
| | | | | | |
| | | | | | |
| 5-year termination notice | | 5 | | | 344 | | | 11.8 | % |
| Total | | 153 | | | $ | 2,616 | | | 89.6 | % |
Note
(1) Ordinarily, the LPCs and TVA have the same termination notice period; however, in a contract with one of the LPCs with a five-year termination notice, TVA has a 10-year termination notice (which becomes a five-year termination notice if TVA loses its discretionary wholesale rate-setting authority). Certain LPCs have five-year termination notices or a shorter period if any act of Congress, court decision, or regulatory change requires or permits that election.
TVA's two largest LPCs — Memphis Light, Gas and Water Division ("MLGW") and Nashville Electric Service ("NES") — have contracts with a five-year and a 20-year termination notice period, respectively. Sales to MLGW and NES each accounted for eight percent of TVA's total operating revenues for the three months ended December 31, 2024 and for the three months ended December 31, 2023.
Contract Balances
Contract assets represent an entity's right to consideration in exchange for goods and services that the entity has transferred to customers. TVA did not have any material contract assets at December 31, 2024.
Contract liabilities represent an entity's obligations to transfer goods or services to customers for which the entity has received consideration (or an amount of consideration is due) from the customers. These contract liabilities are primarily related to upfront consideration received prior to the satisfaction of the performance obligation. See Economic Development Incentives below and Note 10 — Other Long-Term Liabilities — Long-Term Deferred Revenue.
Economic Development Incentives. Under certain economic development programs, TVA offers incentives to existing and potential power customers in targeted business sectors that make multi-year commitments to invest in the Tennessee Valley. TVA records those incentives as reductions of revenue. Incentives recorded as a reduction to revenue were $85 million and $73 million for the three months ended December 31, 2024 and 2023, respectively. Incentives that have been approved but have not been paid are recorded in Accounts payable and accrued liabilities and Other long-term liabilities on the Consolidated Balance Sheets. At December 31, 2024, and September 30, 2024, the outstanding unpaid incentives were $189 million and $187 million, respectively. Incentives that have been paid out may be subject to claw back if the customer fails to meet certain program requirements.
16. Other Income, Net
Income and expenses not related to TVA's operating activities are summarized in the following table:
| | | | | | | | | | | | | | | |
Other Income, Net (in millions) |
| | Three Months Ended December 31 | | |
| | 2024 | | 2023 | | | | |
| | | | | | | |
| Interest income | $ | 10 | | | $ | 10 | | | | | |
| External services | 9 | | | 4 | | | | | |
| Gains (loss) on investments | (2) | | | 9 | | | | | |
| | | | | | | |
| Total other income, net | $ | 17 | | | $ | 23 | | | | | |
17. Supplemental Cash Flow Information
Construction in progress and nuclear fuel expenditures included in Accounts payable and accrued liabilities at December 31, 2024 and 2023, were $1.0 billion and $552 million, respectively, and are excluded from the Consolidated Statements of Cash Flows for both the three months ended December 31, 2024 and the three months ended December 31, 2023, as non-cash investing activities. ARO project accruals included in Accounts payable and accrued liabilities at December 31, 2024 and 2023, were $40 million and $46 million, respectively, and are excluded from the Consolidated Statements of Cash Flows for the three months ended December 31, 2024 and 2023, as non-cash operating activities.
Cash flows from swap contracts that are accounted for as hedges are classified in the same category as the item being
hedged or on a basis consistent with the nature of the instrument.
18. Benefit Plans
TVA sponsors a pension plan that covers most of its full-time employees hired before July 1, 2014, a qualified defined contribution plan ("401(k) plan") that covers most of its full-time employees, two unfunded post-retirement health care plans that provide for non-vested contributions toward the cost of eligible retirees' medical coverage, other post-employment benefits, such as workers' compensation, the SERP, and the RP. The pension plan and the 401(k) plan are administered by a separate legal entity, the TVA Retirement System ("TVARS"), which is governed by its own board of directors.
The components of net periodic benefit cost for the three months ended December 31, 2024 and 2023, were as follows:
| | | | | | | | | | | | | | | | | | | | | | | | | | | | | | | |
Components of Net Periodic Benefit Cost(1) (in millions) |
| | For the Three Months Ended December 31 | | |
| | Pension Benefits | | Other Post-Retirement Benefits | | | | |
| | 2024 | | 2023 | | 2024 | | 2023 | | | | | | | | |
| Service cost | $ | 8 | | | $ | 7 | | | $ | 3 | | | $ | 3 | | | | | | | | | |
| Interest cost | 131 | | | 144 | | | 4 | | | 5 | | | | | | | | | |
| Expected return on plan assets | (126) | | | (124) | | | — | | | — | | | | | | | | | |
| Amortization of prior service credit | (22) | | | (22) | | | (4) | | | (4) | | | | | | | | | |
| Recognized net actuarial loss (gain) | 42 | | | 25 | | | — | | | (1) | | | | | | | | | |
| Total net periodic benefit cost | 33 | | | 30 | | | 3 | | | 3 | | | | | | | | | |
| | | | | | | | | | | | | | | |
| | | | | | | | | | | | | | | |
Note
(1) The components of net benefit cost other than the service cost component are included in Other net periodic benefit cost on the Consolidated Statements of Operations.
TVA's minimum required pension plan contribution for 2025 is $300 million. TVA contributes $25 million per month to TVARS and as of December 31, 2024, had contributed $75 million. The remaining $225 million will be contributed by September 30, 2025. For the three months ended December 31, 2024, TVA also contributed $8 million (net of $1 million in rebates) to the other post-retirement plans. TVA expects to contribute $7 million to the SERP in 2025.
19. Collaborative Arrangement
In 2023, TVA, Ontario Power Generation, BWRX TCA sp. z.o.o., and GE Hitachi Nuclear Energy ("GEH") entered into a multi-party collaborative arrangement to advance the global deployment of the GEH BWRX-300 small modular reactor. GEH is responsible for standard design development. Under the agreement, TVA will contribute up to $88 million for design costs incurred by GEH through 2026. At the time feasibility is determined, TVA will have the right to use the design and may receive additional economic benefits.
Payments pursuant to the agreement are recorded as research and development expense, which is reflected as Operating and maintenance expense on TVA's Consolidated Statement of Operations in the period incurred. TVA recorded $7 million and $9 million of expenses related to this agreement for the three months ended December 31, 2024 and the three months ended December 31, 2023, respectively. TVA also had a $6 million letter of credit posted under this arrangement at December 31, 2024.
20. Contingencies and Legal Proceedings
Contingencies
Nuclear Insurance. Section 170 of the Atomic Energy Act, commonly known as the Price-Anderson Act, provides a layered framework of financial protection to compensate for liability claims of members of the public for personal injury and property damages arising from a nuclear incident in the U.S. This financial protection consists of two layers of coverage. The primary level is private insurance underwritten by American Nuclear Insurers and provides public liability insurance coverage of $500 million for each nuclear power plant licensed to operate. If this amount is not sufficient to cover claims arising from a nuclear incident, the second level, Secondary Financial Protection, applies. Within the Secondary Financial Protection level, the licensee of each nuclear reactor has a contingent obligation to pay a retrospective premium, equal to its proportionate share of the loss in excess of the primary level, regardless of proximity to the incident of fault, up to a maximum of approximately $166 million per reactor per incident. With TVA's seven reactors, the maximum total contingent obligation per incident is $1.2 billion. This retrospective premium is payable at a maximum rate currently set at approximately $25 million per year per nuclear incident per reactor. Currently, 95 reactors are participating in the Secondary Financial Protection program.
In the event that a nuclear incident results in public liability claims, the primary level provided by American Nuclear Insurers combined with the Secondary Financial Protection should provide up to $16.3 billion in coverage.
Federal law requires that each Nuclear Regulatory Commission ("NRC") power reactor licensee obtain property insurance from private sources to cover the cost of stabilizing and decontaminating a reactor and its station site after an accident. TVA carries property, decommissioning liability, and decontamination liability insurance from Nuclear Electric Insurance Limited ("NEIL") and European Mutual Association for Nuclear Insurance. The limits available for a loss are up to $2.1 billion for two of TVA's nuclear sites and up to $2.8 billion for the remaining site. Some of this insurance may require the payment of retrospective premiums up to a maximum of approximately $115 million.
TVA purchases accidental outage (business interruption) insurance for TVA's nuclear sites from NEIL. In the event that an accident covered by this policy takes a nuclear unit offline or keeps a nuclear unit offline, NEIL will pay TVA, after a waiting period, an indemnity (a set dollar amount per week) with a maximum indemnity of $490 million per unit. This insurance policy may require the payment of retrospective premiums up to a maximum of approximately $44 million, but only to the extent the retrospective premium is deemed necessary by the NEIL Board of Directors to pay losses unable to be covered by NEIL's surplus.
Decommissioning Costs. TVA recognizes legal obligations associated with the future retirement of certain tangible long-lived assets related primarily to nuclear generating plants, coal-fired generating plants, hydroelectric generating plants/dams, transmission structures, and other property-related assets. See Note 11 — Asset Retirement Obligations.
Nuclear Decommissioning. Provision for decommissioning costs of nuclear generating units is based on options prescribed by the NRC procedures to dismantle and decontaminate the facilities to meet the NRC criteria for license termination. At December 31, 2024, $3.9 billion, representing the discounted value of future estimated nuclear decommissioning costs, was included in nuclear AROs. The actual decommissioning costs may vary from the derived estimates because of, among other things, changes in current assumptions, such as the assumed dates of decommissioning, changes in regulatory requirements, changes in technology, and changes in the cost of labor, materials, and equipment. Utilities that own and operate nuclear plants are required to use different procedures in calculating nuclear decommissioning costs under GAAP than those that are used in calculating nuclear decommissioning costs when reporting to the NRC. The two sets of procedures produce different estimates for the costs of decommissioning primarily because of differences in the underlying assumptions. TVA bases its nuclear decommissioning estimates on site-specific cost studies. The most recent study was approved and implemented in September 2022. Site-specific cost studies are updated for each of TVA's nuclear units at least every five years.
TVA maintains an NDT to provide funding for the ultimate decommissioning of its nuclear power plants. See Note 14 — Fair Value Measurements — Investment Funds. TVA monitors the value of its NDT and believes that, over the long term and before cessation of nuclear plant operations and commencement of decommissioning activities, adequate funds from investments and additional contributions, if necessary, will be available to support decommissioning. TVA's operating nuclear power units are licensed through various dates between 2033 - 2055, depending on the unit. It may be possible to extend the operating life of some of the units with approval from the NRC. See Note 8 — Regulatory Assets and Liabilities and Note 11 — Asset Retirement Obligations.
Non-nuclear Decommissioning. At December 31, 2024, $7.0 billion, representing the discounted value of future estimated non-nuclear decommissioning costs, was included in non-nuclear AROs. This decommissioning cost estimate involves estimating the amount and timing of future expenditures and making judgments concerning whether or not such costs are considered a legal obligation. Estimating the amount and timing of future expenditures includes, among other things, making projections of the timing and duration of the asset retirement process and how costs will escalate with inflation. The actual decommissioning costs may vary from the derived estimates because of changes in current assumptions, such as the assumed dates of decommissioning, changes in regulatory requirements, changes in technology, and changes in the cost of labor, materials, and equipment. TVA updates its underlying assumptions for non-nuclear decommissioning AROs at least every five
years. However, material changes in underlying assumptions that impact the amount and timing of undiscounted cash flows are continuously monitored and incorporated into ARO balances in the period identified.
TVA maintains an ART to help fund the ultimate decommissioning of its non-nuclear power assets. See Note 14 — Fair Value Measurements — Investment Funds. Estimates involved in determining if additional funding will be made to the ART include inflation rate, rate of return projections on the fund investments, and the planned use of other sources to fund decommissioning costs. See Note 8 — Regulatory Assets and Liabilities and Note 11 — Asset Retirement Obligations.
Environmental Matters. TVA's generation activities, like those across the utility industry and in other industrial sectors, are subject to federal, state, and local environmental laws and regulations. Major areas of regulation affecting TVA's activities include air quality control, greenhouse gas ("GHG") emissions, water quality control, and management and disposal of solid and hazardous wastes. Regulations in these major areas continue to become more stringent and have, and will continue to have, a particular emphasis on climate change, renewable generation, and energy efficiency.
TVA has incurred, and expects to continue to incur, substantial capital and operating and maintenance costs to comply with evolving environmental requirements primarily associated with, but not limited to, the operation of TVA's coal-fired and natural gas-fired generating units in general and emissions of pollutants from those units. Environmental requirements placed on the operation of coal-fired and other generating units using fossil fuels such as oil and natural gas will likely continue to become more restrictive over time. Failure to comply with environmental and safety requirements can result in enforcement actions and litigation, which can lead to the imposition of significant civil liability, including fines and penalties, criminal sanctions, and/or temporary or permanent closure of non-compliant facilities. Historical non-compliance can also lead to difficulty in renewing existing permits, as well as difficulty in obtaining permits to bring new generation facilities online. Other obstacles to renewal or permitting of new facilities include a proliferation of non-government organizations seeking to use litigation tools to drive up costs associated with, and delay or prevent permitting of, new fossil fuel facilities in favor of renewable energy projects.
Compliance with the Environmental Protection Agency's ("EPA") 2015 CCR rule, as revised ("2015 CCR Rule") required implementation of a groundwater monitoring program, additional engineering, evaluation of authorized closure methods, coordination with certain state authorities, and ongoing analysis at each TVA CCR unit. As further analyses are performed, including evaluation of monitoring results, there is the potential for additional costs for investigation and/or remediation. In addition, on May 8, 2024, EPA published its Legacy CCR Rule, which expands the scope of the existing regulatory requirements of the 2015 CCR Rule to include two additional classes of CCR units: Legacy Surface Impoundments and Coal Combustion Residual Management Units. As a result of the enactment of the final rule, during 2024, TVA recorded additional estimated AROs and recorded a corresponding regulatory asset due to AROs being associated with closed sites and asset retirement costs having been fully depreciated. However, the amounts recorded are subject to various uncertainties, and actual amounts may differ materially based upon a number of factors, including, but not limited to, the outcome of legal challenges to the Legacy CCR Rule, ongoing evaluations of the number and scope of newly regulated units, and determinations on final closure requirements and performance standards.
In May 2024, EPA also published (1) a final rule that establishes more stringent technology-based effluent limitations for four waste streams from coal-fired plants, (2) a rule that strengthens and updates the Mercury and Air Toxics Standards for electric generating units to reflect recent developments in control technologies, and (3) a rule that establishes GHG emission guidelines for existing coal-fired plants and GHG performance standards for new natural gas-fired power plants. These rules are all subject to legal challenges, and if the challenges are not successful, TVA would incur substantial costs to comply with the rules.
Liability for releases, natural resource damages, and required cleanup of hazardous substances is primarily regulated by the federal Comprehensive Environmental Response, Compensation, and Liability Act ("CERCLA"), the Resource Conservation and Recovery Act ("RCRA"), and other federal and parallel state statutes. In a manner similar to many other governmental entities, industries, and power systems, TVA has generated or used hazardous substances over the years. TVA operations at some facilities have resulted in releases of contaminants that TVA has addressed or is addressing consistent with state and federal requirements. At both December 31, 2024, and September 30, 2024, TVA's estimated liability for required cleanup and similar environmental work for those sites for which sufficient information is available to develop a cost estimate was $15 million, on a non-discounted basis, and was included in Accounts payable and accrued liabilities and Other long-term liabilities on the Consolidated Balance Sheets. Additionally, the potential inclusion of new hazardous substances under CERCLA and RCRA jurisdiction could significantly affect TVA's future liability for remediating historical releases.
In August 2015, the Tennessee Department of Environment and Conservation ("TDEC") issued an order that includes an iterative process through which TVA and TDEC will identify and evaluate any CCR contamination risks and, if necessary, respond to such risks. TVA is also following a similar process pursuant to a consent order. At both December 31, 2024, and September 30, 2024, TVA's estimated liability for costs associated with environmental remediation activities for the sites covered by these orders for which sufficient information is available to develop a cost estimate was approximately $215 million on a non-discounted basis and was included in Accounts payable and accrued liabilities and Other long-term liabilities on the Consolidated Balance Sheets. The current estimated time frame for work related to these remediation activities for which TVA has a cost estimate is through 2046.
Legal Proceedings
From time to time, TVA is party to or otherwise involved in lawsuits, claims, proceedings, investigations, and other legal matters ("Legal Proceedings") that have arisen in the ordinary course of conducting TVA's activities. There have been no material changes to the Legal Proceedings described in Note 22 — Commitments and Contingencies — Legal Proceedings of the Annual Report, except as described below.
Case Involving Johnsonville Aeroderivative Combustion Turbine Project. On December 22, 2022, the Southern Environmental Law Center filed a lawsuit in the U.S. District Court for the Middle District of Tennessee on behalf of the Sierra Club, alleging that TVA violated the National Environmental Policy Act ("NEPA") in deciding to build a new aeroderivative combustion turbine project at its Johnsonville facility. Both parties moved for summary judgment, and on September 30, 2024, the court granted TVA's motion for summary judgment and dismissed the lawsuit. The Sierra Club did not file an appeal within 60 days from the date of the decision, so this litigation has now ended. See Note 22 — Commitments and Contingencies — Legal Proceedings — Case Involving Johnsonville Aeroderivative Combustion Turbine Project in the Annual Report.
Case Involving Kingston Gas-Fired Plant. On October 10, 2024, Appalachian Voices, the Center for Biological Diversity, and the Sierra Club filed a lawsuit in the U.S. District Court for the Eastern District of Tennessee alleging that TVA violated NEPA and TVA's least-cost planning obligations in deciding to build a gas plant at its Kingston Facility. TVA filed its response on December 16, 2024. See Note 22 — Commitments and Contingencies — Legal Proceedings — Case Involving Kingston Gas-Fired Plant in the Annual Report.
Challenge to Kingston Construction Permit. On December 16, 2024, the Southern Environmental Law Center filed an appeal on behalf of Appalachian Voices challenging the construction permit that the Division of Air Pollution Control of TDEC issued to TVA on November 15, 2024, for the construction of new natural gas generation at Kingston. Appalachian Voices alleges that TDEC unlawfully issued a construction permit that would allow TVA to construct the plant without meeting the requirements set forth in the Clean Air Act’s Prevention of Significant Deterioration program. Among other things, Appalachian Voices is requesting that the Tennessee Air Pollution Control Board stay the effectiveness of the permit and order TDEC to revoke the permit. On January 7, 2025, TVA filed a petition to intervene in the administrative proceeding, which was granted on January 15, 2025.
ITEM 2. MANAGEMENT'S DISCUSSION AND ANALYSIS OF FINANCIAL CONDITION AND RESULTS OF OPERATIONS
The Management's Discussion and Analysis of Financial Condition and Results of Operations ("MD&A") explains the results of operations and general financial condition of the Tennessee Valley Authority ("TVA"). The MD&A should be read in conjunction with the accompanying unaudited consolidated financial statements and TVA's Annual Report on Form 10-K for the year ended September 30, 2024 (the "Annual Report").
Executive Overview
TVA's operating revenues were $2.9 billion and $2.8 billion for the three months ended December 31, 2024 and 2023, respectively. Operating revenues increased for the three months ended December 31, 2024, as compared to the same period of the prior year, primarily as a result of higher effective base rates, sales volume, and fuel rates. Effective base rates were higher primarily due to the TVA Board of Directors ("TVA Board") action to approve a 5.25 percent wholesale base rate increase effective October 1, 2024. The higher sales volume was driven primarily by increases within the data processing, hosting, and related services sector, and higher fuel rates were primarily due to higher coal prices.
Total operating expenses increased $131 million for the three months ended December 31, 2024, as compared to the three months ended December 31, 2023. Fuel and purchased power expense increased $44 million for the three months ended December 31, 2024, as compared to the same period of the prior year, primarily due to less availability of nuclear generation and higher coal prices. There was a $38 million increase in Operating and maintenance expense primarily due to increases in payroll and benefit costs related to labor escalation for cost of living increases and additional headcount to support operational needs and outage expense primarily due to an increase in nuclear outage days. In addition, Depreciation and amortization expense increased $36 million primarily as a result of the decision to retire Kingston Fossil Plant ("Kingston"), increases in the amortization of finance leases and retirement of regulatory assets, and additions to net completed plant.
Pre-commercial plant operations began on Johnsonville Aeroderivative combustion turbine ("CT") Units 25-28 in the first quarter of 2025 and began on Units 29 and 30 in January 2025.
On January 22, 2025, TVA reached a preliminary all-time record high peak power demand of approximately 35,319 megawatts ("MW"). This estimated peak was over 700 MW greater than TVA's previous all-time peak set in January 2024.
Results of Operations
Sales of Electricity
Sales of electricity, which accounted for nearly all of TVA's operating revenues, were 38,031 million and 37,335 million kilowatt hours ("kWh") for the three months ended December 31, 2024 and the three months ended December 31, 2023, respectively. The total sales of electricity during the three months ended December 31, 2024 included 8 thousand kWh of pre-commercial generation at Johnsonville Aeroderivative CT Units 25-28. The total sales of electricity during the three months ended December 31, 2023 included 137 thousand kWh of pre-commercial generation at Paradise CT Units 5-7. TVA sells power at wholesale rates to local power company customers ("LPCs") that then resell the power to their customers at retail rates. TVA also sells power to directly served customers, consisting primarily of federal agencies and customers with large or nonstandard loads. In addition, power exceeding TVA's system needs is sold under exchange power arrangements with certain other power systems.
The following charts compare TVA's sales of electricity by customer type for the periods indicated:
The following charts show a breakdown of TVA's energy load:
Note
Information included in the charts above was derived from energy usage of directly served customers and customers served by LPCs during calendar year ("CY") 2023, and these graphs will continue to be updated on a CY basis.
Weather affects both the demand for TVA power and the price for that power. TVA uses degree days to measure the impact of weather on its power operations. Degree days measure the extent to which the TVA system 23-station average temperatures vary from 65 degrees Fahrenheit.
| | | | | | | | | | | | | | | | | | | | | | | | | | | | | | | | | | | | | | | | | |
| Degree Days | | |
| Variation from Normal | | Change from Prior Period |
| | 2024 | | Normal | | Percent Variation | | 2023 | | Normal | | Percent Variation | | Percent Change |
| Heating Degree Days | | | | | | | | | | | | | |
| Three Months Ended December 31 | 983 | | | 1,243 | | (20.9) | % | | 1,094 | | | 1,243 | | | (12.0) | % | | (10.1) | % |
| | | | | | | | | | | | | |
| | | | | | | | | | | | | |
| Cooling Degree Days | | | | | | | | | | | | | |
| Three Months Ended December 31 | 89 | | | 61 | | 45.9 | % | | 69 | | | 61 | | | 13.1 | % | | 29.0 | % |
| | | | | | | | | | | | | |
| | | | | | | | | | | | | |
| | | | | | | | | | | | | |
| | | | | | | | | | | | | |
| | | | | | | | | | | | | |
Sales of electricity increased two percent for the three months ended December 31, 2024, as compared to the same period of the prior year. The increased sales volume for LPCs and industries directly served was driven primarily by increases within the data processing, hosting, and related services sector.
Financial Results
The following table compares operating results for the three months ended December 31, 2024 and 2023:
| | | | | | | | | | | | | | | | | | | | | | | | | | | | | | | |
Summary Consolidated Statements of Operations (in millions) |
| | Three Months Ended December 31 | | |
| | 2024 | | 2023 | | Change | | Percent Change | | | | | | | | |
| Operating revenues | $ | 2,920 | | | $ | 2,765 | | | $ | 155 | | | 5.6 | % | | | | | | | | |
| Operating expenses | 2,507 | | | 2,376 | | | 131 | | | 5.5 | % | | | | | | | | |
| Operating income | 413 | | | 389 | | | 24 | | | 6.2 | % | | | | | | | | |
| Other income, net | 17 | | | 23 | | | (6) | | | (26.1) | % | | | | | | | | |
| Other net periodic benefit cost | 25 | | | 23 | | | 2 | | | 8.7 | % | | | | | | | | |
| Interest expense | 280 | | | 262 | | | 18 | | | 6.9 | % | | | | | | | | |
| Net income | $ | 125 | | | $ | 127 | | | $ | (2) | | | (1.6) | % | | | | | | | | |
Operating Revenues. Operating revenues for the three months ended December 31, 2024 and 2023, were $2.9 billion and $2.8 billion, respectively. The following table compares TVA's operating revenues for the periods indicated:
| | | | | | | | | | | | | | | | | | | | | | | | | | | | | | | |
Operating Revenues by Customer Type (in millions) |
| Three Months Ended December 31 | | |
| 2024 | | 2023 | | Change | | Percent Change | | | | | | | | |
| Operating revenues | | | | | | | | | | | | | | | |
| Local power company customers | $ | 2,616 | | | $ | 2,487 | | | $ | 129 | | | 5.2 | % | | | | | | | | |
| Industries directly served | 230 | | | 217 | | | 13 | | | 6.0 | % | | | | | | | | |
| Federal agencies and other | 30 | | | 30 | | | — | | | — | % | | | | | | | | |
Revenue capitalized during pre-commercial plant operations(1) | — | | | (3) | | | 3 | | | (100.0) | % | | | | | | | | |
| Other revenue | 44 | | | 34 | | | 10 | | | 29.4 | % | | | | | | | | |
| Total operating revenues | $ | 2,920 | | | $ | 2,765 | | | $ | 155 | | | 5.6 | % | | | | | | | | |
Note
(1) Represents revenue capitalized during pre-commercial operations at Johnsonville Aeroderivative CT Units 25-28 in the three months ended December 31, 2024 and Paradise CT Units 5-7 in the three months ended December 31, 2023. Revenue capitalized at Johnsonville Aeroderivative was less than $1 million for the three months ended December 31, 2024.
TVA's two largest LPCs — Memphis Light, Gas and Water Division ("MLGW") and Nashville Electric Service ("NES") — have contracts with a five-year and a 20-year termination notice period, respectively. Sales to MLGW and NES each accounted
for eight percent of TVA's total operating revenues for both the three months ended December 31, 2024 and the three months ended December 31, 2023.
TVA's rate structure uses pricing signals to indicate seasons and hours of higher cost to serve its customers and to capture a portion of TVA's fixed costs in fixed charges. The structure includes three base revenue components: time of use demand charges, time of use energy charges, and a grid access charge ("GAC"). The demand charges are based upon the customer's peak monthly usage. The energy charges are based on time differentiated kWh used by the customer. Both of these components can be significantly impacted by weather. The GAC captures a portion of fixed costs and is offset by a corresponding reduction to the energy rates. The GAC also reduces the impact of weather variability to the overall rate structure.
TVA has a Partnership Agreement option that better aligns the length of LPC power contracts with TVA's long-term commitments. Under the partnership arrangement, the LPC power contracts automatically renew each year and have a 20-year termination notice. The partnership arrangements can be terminated under certain circumstances, including TVA's failure to limit rate increases to no more than 10 percent during any consecutive five-fiscal-year period, as more specifically described in the
agreements. Participating LPCs receive benefits including a 3.1 percent wholesale bill credit in exchange for their long-term commitment, which enables TVA to recover its long-term financial commitments over a commensurate period. As of December 31, 2024, 148 LPCs had signed the 20-year Partnership Agreement with TVA.
In addition to base revenues, the rate structure includes a separate fuel rate that includes the costs of natural gas, fuel oil, purchased power, coal, emission allowances, nuclear fuel, and other fuel-related commodities; realized gains and losses on derivatives purchased to hedge the costs of such commodities; and payments to states and counties in lieu of taxes ("tax equivalents") associated with the fuel cost adjustments.
TVA is required to charge rates for power that will produce gross revenues sufficient to cover various costs as discussed in Part I, Item I, Business — Rates of the Annual Report. In August 2024, the TVA Board approved a 5.25 percent wholesale base rate increase (excluding fuel) effective October 1, 2024, primarily due to additional capacity needs and rising costs. This rate adjustment is estimated to produce an additional $495 million of revenue during 2025.
The changes in revenue components are summarized below:
| | | | | | | | | | | | | | | | | | | | | | | |
Changes in Revenue Components (in millions) |
| Three Months Ended December 31 | | |
| | 2024 | | 2023 | | Change | | | | | | |
| Base revenue | | | | | | | | | | | |
| Energy revenue | $ | 1,188 | | | $ | 1,112 | | | $ | 76 | | | | | | | |
| Demand revenue | 905 | | | 868 | | | 37 | | | | | | | |
| Grid access charge | 162 | | | 156 | | | 6 | | | | | | | |
| Long-term partnership credits for LPCs | (50) | | | (47) | | | (3) | | | | | | | |
| | | | | | | | | | | |
Other charges and credits(2) | (160) | | | (140) | | | (20) | | | | | | | |
| Total base revenue | 2,045 | | | 1,949 | | | 96 | | | | | | | |
| Fuel cost recovery | 830 | | | 783 | | | 47 | | | | | | | |
| Off-system sales | 1 | | | 2 | | | (1) | | | | | | | |
Pre-commercial operations(1) | — | | | (3) | | | 3 | | | | | | | |
| Revenue from sales of electricity | 2,876 | | | 2,731 | | | 145 | | | | | | | |
| Other revenue | 44 | | | 34 | | | 10 | | | | | | | |
| Total operating revenues | $ | 2,920 | | | $ | 2,765 | | | $ | 155 | | | | | | | |
Notes
(1) Represents revenue capitalized during pre-commercial operations at Johnsonville Aeroderivative CT Units 25-28 in the three months ended December 31, 2024 and Paradise CT Units 5-7 in the three months ended December 31, 2023. Revenue capitalized at Johnsonville Aeroderivative was less than $1 million for the three months ended December 31, 2024.
(2) Includes economic development credits to promote growth in the Tennessee Valley, hydro preference credits for residential customers of LPCs, and demand response credits allowing TVA to reduce industrial customer usage in periods of peak demand to balance system demand. See Note 15 — Revenue.
Operating revenues increased $155 million for the three months ended December 31, 2024, as compared to the same period of the prior year, primarily due to a $96 million increase in base revenue. The $96 million increase in base revenue was driven by a $54 million increase attributable to higher effective base rates and a $42 million increase attributable to higher sales volume. The increase in effective base rates was primarily due to the TVA Board action to approve a 5.25 percent wholesale base rate increase effective October 1, 2024. The higher sales volume was driven primarily by increases within the data processing, hosting, and related services sector. In addition, there was a $47 million increase in fuel cost recovery revenue
driven by a $32 million increase attributable to higher fuel rates and a $15 million increase attributable to higher sales volume. The higher fuel rates were primarily due to higher coal prices.
See Sales of Electricity above for further discussion of the change in the volume of sales of electricity and Operating Expenses below for further discussion of the change in fuel expense.
Operating Expenses. Operating expense components as a percentage of total operating expenses for the three months ended December 31, 2024 and December 31, 2023, consisted of the following:
| | | | | | | | | | | | | | | | | | | | | | | | | | | | | | | |
Operating Expenses (in millions) |
| Three Months Ended December 31 | | |
| 2024 | | 2023 | | Change | | Percent Change | | | | | | | | |
| Operating expenses | | | | | | | | | | | | | | | |
| Fuel | $ | 505 | | | $ | 496 | | | $ | 9 | | | 1.8 | % | | | | | | | | |
| Purchased power | 394 | | | 359 | | | 35 | | | 9.7 | % | | | | | | | | |
| Operating and maintenance | 905 | | | 867 | | | 38 | | | 4.4 | % | | | | | | | | |
| Depreciation and amortization | 557 | | | 521 | | | 36 | | | 6.9 | % | | | | | | | | |
| Tax equivalents | 146 | | | 133 | | | 13 | | | 9.8 | % | | | | | | | | |
| Total operating expenses | $ | 2,507 | | | $ | 2,376 | | | $ | 131 | | | 5.5 | % | | | | | | | | |
Fuel expense increased $9 million for the three months ended December 31, 2024, as compared to the same period of the prior year. This increase was primarily due to an increase in effective fuel rates due to higher coal prices, resulting in a $51 million increase in fuel expense. Partially offsetting this increase was a decrease of $33 million due primarily to the one-time collection of favorable coal contract price adjustments that occurred in the same period of the prior year. This collection was deferred and credited to customer rates in subsequent quarters. Additionally, fuel expense decreased $9 million due to less availability of nuclear generation as compared to the same period of the prior year.
Purchased power expense increased $35 million for the three months ended December 31, 2024, as compared to the same period of the prior year. This increase was primarily due to less availability of nuclear generation, resulting in an increase of $80 million. Partially offsetting this increase was a $45 million decrease in purchased power expense from lower purchased power market prices compared to the same period of the prior year.
Operating and maintenance expense increased $38 million for the three months ended December 31, 2024, as compared to the same period of the prior year. This increase was primarily due to $28 million of increased payroll and benefit costs primarily due to labor escalation for cost of living increases and additional headcount to support operational needs and a $28 million increase in outage expense primarily due to an increase in nuclear outage days. Partially offsetting these increases was a decrease in contract labor of $20 million primarily due to more natural gas project work in the prior year.
Depreciation and amortization expense increased $36 million for the three months ended December 31, 2024, as compared to the same period of the prior year. The increase was primarily driven by an increase in depreciation expense of $9 million related to the decision in April 2024 to retire Kingston and an $8 million increase in both amortization expense of finance leases and retirement of regulatory assets. Additionally, there was an increase due to depreciation of additions to net completed
plant.
Tax equivalents expense increased $13 million for the three months ended December 31, 2024, as compared to the same period of the prior year. This change is primarily driven by an increase in TVA's revenue from sales of electricity in 2024, which is used as the basis for calculating tax equivalent expense.
Generating Sources. The following tables show TVA's generation and purchased power by generating source as a percentage of all electrical power generated and purchased (based on kWh) for the periods indicated.
| | | | | | | | | | | | | | | | | | | | | | | | | | | | |
Total Power Supply by Generating Source For the three months ended December 31 (millions of kWh) |
| | 2024 | | 2023 | | | |
| | | | | | | | | | | | |
| Nuclear | 13,990 | | | 36 | % | | 17,851 | | | 47 | % | | | | | |
Natural gas and/or oil-fired(1) | 8,862 | | | 23 | % | | 7,513 | | | 20 | % | | | | | |
| Coal-fired | 5,336 | | | 14 | % | | 4,320 | | | 11 | % | | | | | |
| Hydroelectric | 3,359 | | | 8 | % | | 2,496 | | | 7 | % | | | | | |
Total TVA-operated generation facilities(2)(3) | 31,547 | | | 81 | % | | 32,180 | | | 85 | % | | | | | |
Purchased power (natural gas and/or oil-fired)(4) | 4,041 | | | 11 | % | | 3,424 | | | 9 | % | | | | | |
Purchased power (other renewables)(5) | 1,605 | | | 4 | % | | 1,686 | | | 4 | % | | | | | |
| | | | | | | | | | | | |
| Purchased power (coal-fired) | 934 | | | 2 | % | | 595 | | | 2 | % | | | | | |
| Purchased power (hydroelectric) | 657 | | | 2 | % | | 146 | | | — | % | | | | | |
Total purchased power(3) | 7,237 | | | 19 | % | | 5,851 | | | 15 | % | | | | | |
| Total power supply | 38,784 | | | 100 | % | | 38,031 | | | 100 | % | | | | | |
Notes
(1) The generation for the three months ended December 31, 2024 includes 8 thousand kWh of pre-commercial generation at Johnsonville Aeroderivative CT Units 25-28. The generation for the three months ended December 31, 2023 includes 137 thousand kWh of pre-commercial generation at Paradise CT Units 5-7.
(2) Generation from TVA-owned renewable resources (non-hydroelectric) is less than one percent for all periods shown and therefore is not represented in the table above.
(3) Raccoon Mountain Pumped-Storage Plant net generation is allocated against each TVA-operated generation facility and purchased power type for both the three months ended December 31, 2024, and three months ended December 31, 2023. See Part I, Item 1, Business — Power Supply and Load Management Resources — Hydroelectric Pumped-Storage in the Annual Report for a discussion of Raccoon Mountain Pumped-Storage Plant.
(4) Purchased power (natural gas and/or oil-fired) includes generation from Caledonia Combined Cycle Plant ("Caledonia CC"), which is currently a leased facility operated by TVA. Generation from Caledonia CC was 1,238 million kWh and 910 million kWh for the three months ended December 31, 2024, and three months ended December 31, 2023, respectively.
(5) Purchased power (other renewables) includes purchased power from the following renewable sources: solar, wind, biomass, and renewable cogeneration. TVA acquires Renewable Energy Certificates ("RECs") in connection with certain purchased power transactions and sells some of these RECs to customers.
In addition to power supply sources included here, TVA offers energy efficiency programs that effectively reduce energy needs. In 2025, TVA expects to invest $104 million on its energy efficiency programs and anticipates approximately 345 gigawatt hours of net incremental energy efficiency savings.
Interest Expense. Interest expense and interest rates for the three months ended December 31, 2024, and the three months ended December 31, 2023, were as follows:
| | | | | | | | | | | | | | | | | | | | | | | | |
Interest Expense and Rates (in millions) | |
| | Three Months Ended December 31 | | | |
| | 2024 | | 2023 | | Percent
Change | | | | | | | |
Interest expense(1) | $ | 280 | | | $ | 262 | | | 6.9 | % | | | | | | | |
| | | | | | | | | | | | |
Average blended debt balance(2) | $ | 21,509 | | | $ | 20,610 | | | 4.4 | % | | | | | | | |
| | | | | | | | | | | | |
Average blended interest rate(3) | 4.99 | % | | 4.89 | % | | 2.0 | % | | | | | | | |
Notes
(1) Includes amortization of debt discounts, issuance, and reacquisition costs, net.
(2) Includes average balances of long-term power bonds, debt of variable interest entities ("VIEs"), and discount notes.
(3) Includes interest on long-term power bonds, debt of VIE, and discount notes.
Total interest expense increased $18 million for the three months ended December 31, 2024, as compared to the same period of the prior year. This increase was primarily driven by a $10 million increase in alternative financing interest due to the
new Johnsonville lease financing arrangement and a $6 million increase primarily from higher average rates on long-term debt. The increase was also driven by a $2 million increase from higher average balances of short-term debt and a $1 million increase in interest related to finance leases, partially offset by a $1 million decrease from lower average rates on short‐term debt.
Liquidity and Capital Resources
Sources of Liquidity
TVA depends on various sources of liquidity to meet cash needs and contingencies. TVA's primary sources of liquidity are cash from operations and proceeds from the issuance of short-term debt in the form of discount notes, along with periodic issuances of long-term debt. TVA's balance of short-term debt typically changes frequently as TVA issues discount notes to meet short-term cash needs and pay scheduled maturities of discount notes and long-term debt. TVA’s next significant power bond maturity is $1.0 billion in May 2025. The periodic amounts of short-term debt issued are determined by near-term expectations for cash receipts, cash expenditures, and funding needs, while seeking to maintain a target range of cash and cash equivalents on hand. TVA may hold higher cash balances from time to time in response to potential market volatility or other business conditions. In addition, cash balances may include collateral received from counterparties.
In addition to cash from operations and proceeds from the issuance of short-term and long-term debt, TVA's sources of liquidity include four long-term revolving credit facilities totaling $2.7 billion, a $150 million credit facility with the United States Department of the Treasury ("U.S. Treasury"), and proceeds from other financings. See Note 12 — Debt and Other Obligations — Credit Facility Agreements. The TVA Board authorized TVA to issue power bonds and enter into other financing arrangements in an aggregate amount not to exceed $4.0 billion during 2025. Other financing arrangements may include, but are not limited to, lease financings, energy prepayments from customers, and other similar agreements. TVA may also engage in other alternative forms of financing such as sales of receivables, or loans, from time to time.
The Tennessee Valley Authority Act of 1933, as amended ("TVA Act"), authorizes TVA to issue bonds, notes, or other evidences of indebtedness (collectively, "Bonds") in an amount not to exceed $30.0 billion outstanding at any time. Bonds outstanding, excluding unamortized discounts and premiums and net exchange gains from foreign currency transactions, at December 31, 2024, were $20.4 billion (including current maturities). The balance of Bonds outstanding directly affects TVA's capacity to meet operational liquidity needs and to strategically use Bonds to fund certain capital investments as management and the TVA Board may deem desirable. Other options for financing not subject to the limit on Bonds, including lease financings, could provide supplementary funding if needed. Currently, TVA expects to utilize a combination of Bonds, other financings, and potentially additional power revenues through power rate increases to meet its ongoing operational liquidity needs while making planned capital investments through the decade. TVA may also utilize available funding through the Inflation Reduction Act of 2022 ("IRA") and the Bipartisan Infrastructure Law ("BIL"), other federal funding opportunities, or other third-party financing arrangements. See Lease Financings below, Note 9 — Variable Interest Entities, and Note 12 — Debt and Other Obligations for additional information.
TVA may from time to time seek to retire or purchase its outstanding debt through cash purchases and/or exchanges for securities, in open market purchases, privately negotiated transactions, or otherwise. Such repurchases or exchanges, if any, will depend on prevailing market conditions, TVA's liquidity requirements, contractual restrictions, and other factors. The amounts involved may be material.
Debt Securities. TVA's Bonds are not obligations of the U.S., and the U.S. does not guarantee the payments of principal or interest on Bonds. TVA's Bonds consist of power bonds and discount notes. Power bonds have maturities of between one and 50 years. At December 31, 2024, the average maturity of long-term power bonds was 13.71 years, and the weighted average interest rate was 4.69 percent. Discount notes have maturities of less than one year. Power bonds and discount notes have a first priority and equal claim of payment out of net power proceeds. Net power proceeds are defined as the remainder of TVA's gross power revenues after deducting the costs of operating, maintaining, and administering its power properties and tax equivalents, but before deducting depreciation accruals or other charges representing the amortization of capital expenditures, plus the net proceeds from the sale or other disposition of any power facility or interest therein. In addition to power bonds and discount notes, TVA had long-term debt associated with certain VIEs outstanding at December 31, 2024. See Lease Financings below, Note 9 — Variable Interest Entities, and Note 12 — Debt and Other Obligations for additional information.
The following table provides additional information regarding TVA's short-term borrowings:
| | | | | | | | | | | | | | | | | | | | | | | | | | | | | |
Short-Term Borrowings (in millions) |
| | At December 31, 2024 | | Three Months Ended December 31, 2024 | | | | | | At December 31, 2023 | | Three Months Ended December 31, 2023 | | |
| Gross Amount Outstanding (at End of Period) or Average Gross Amount Outstanding (During Period) | | | | | | | | | | | | | |
| Discount notes | $1,359 | | $683 | | | | | | $1,043 | | $525 | | |
| Maximum Month-End Gross Amount Outstanding (During Period) | | | | | | | | | | | | | |
| Discount notes | N/A | | $1,359 | | | | | | N/A | | $1,043 | | |
| Weighted Average Interest Rate | | | | | | | | | | | | | |
| Discount notes | 4.33% | | 4.68% | | | | | | 5.28% | | 5.41% | | |
Lease Financings. TVA has entered into certain leasing transactions with special purpose entities ("SPEs") to obtain third-party financing for its facilities. These SPEs are sometimes identified as VIEs of which TVA is determined to be the primary beneficiary. TVA is required to account for these VIEs on a consolidated basis. See Note 9 — Variable Interest Entities.
Summary Cash Flows
A major source of TVA's liquidity is operating cash flows resulting from the generation and sale of electricity. Cash, cash equivalents, and restricted cash totaled $553 million and $518 million at December 31, 2024 and 2023, respectively. A summary of cash flow components for the three months ended December 31, 2024 and 2023, follows:
Cash provided by (used in):
Operating Activities. TVA's cash flows from operations are primarily driven by sales of electricity, fuel expense, and operating and maintenance expense. The timing and level of cash flows from operations can be affected by the weather, changes in working capital, commodity price fluctuations, outages, and other project expenses.
Net cash flows provided by operating activities increased $57 million for the three months ended December 31, 2024, as compared to the same period of the prior year. The increase was primarily due to lower purchased power payments and higher revenue collections. This increase was partially offset by higher payroll and benefit related payments compared to the same period of the prior year. Revenue collections increased primarily due to the increase in the 2025 wholesale base rate in addition to higher sales volume.
Investing Activities. The majority of TVA's investing cash flows are due to investments to acquire, upgrade, or maintain generating and transmission assets, including environmental projects and the purchase of nuclear fuel.
Net cash flows used in investing activities increased $376 million for the three months ended December 31, 2024, as compared to the same period of the prior year, primarily driven by increased expenditures for capacity expansion projects and nuclear fuel during the period. Nuclear fuel expenditures vary depending on the number of outages and the prices and timing of purchases of uranium and enrichment services.
Financing Activities. TVA's cash flows provided by or used in financing activities are primarily driven by the timing and level of cash flows provided by operating activities, cash flows used in investing activities, and net issuance and redemption of debt instruments to maintain a strategic balance of cash on hand.
Net cash provided by financing activities increased $352 million for the three months ended December 31, 2024, as compared to the same period of the prior year, primarily due to higher debt issuances as a result of a new lease financing arrangement. Higher net cash flows provided by operating activities were offset by higher net cash used in investing activities which resulted in the need for net debt issuances to maintain targeted cash balance levels during the period. TVA anticipates a need to increase debt in the coming years as it continues to invest in power system assets, which may result in positive net cash flows provided by financing activities in future periods.
Contractual Obligations
TVA has certain obligations and commitments to make future payments under contracts. TVA's contractual obligations are discussed in the Annual Report in Part II, Item 7, Management's Discussion and Analysis of Financial Condition and Results of Operations — Liquidity and Capital Resources, Note 8 — Leases, Note 11 — Variable Interest Entities, Note 14 — Debt and Other Obligations, Note 20 — Benefit Plans, and Note 22 — Commitments and Contingencies.
During the three months ended December 31, 2024, TVA entered into multiple natural gas contracts totaling $640 million with new commitments from 2025 to 2035, and three new natural gas storage contracts totaling $193 million with commitments from 2025 through 2034. In addition, TVA entered into a new power purchase agreement ("PPA") totaling $293 million with commitments from 2025 to 2028. TVA also entered into a new lease financing arrangement during the three months ended December 31, 2024. See Note 9 — Variable Interest Entities.
Key Initiatives and Challenges
There have been no material changes to the key initiatives and challenges described in Part II, Item 7, Management's Discussion and Analysis of Financial Condition and Results of Operations — Key Initiatives and Challenges of the Annual Report, except as described below.
Optimum Energy Portfolio
Natural Gas-Fired Units. As TVA continues to evaluate the impact of retiring its coal-fired fleet by 2035 and works to
accelerate the growth of renewables, it also continues to evaluate adding flexible lower carbon-emitting gas plants as a strategy
to maintain reliability. Pre-commercial plant operations began on Johnsonville Aeroderivative CT Units 25-28 in the first quarter of 2025 and began on Units 29 and 30 in January 2025.
TVA is replacing generation for one unit at Cumberland with a 1,450 MW combined cycle plant that is expected to be operational by the end of CY 2026. As of December 31, 2024, TVA had spent $1.3 billion on this project. See Part II, Item 7, Management's Discussion and Analysis of Financial Condition and Results of Operations — Key Initiatives and Challenges — Natural Gas-Fired Units in the Annual Report.
Two cases are currently pending before the United States Court of Appeals for the Sixth Circuit ("Sixth Circuit") challenging permits for a pipeline that needs to be constructed to serve the Cumberland Combined Cycle Plant. On October 11, 2024, the Sixth Circuit issued an order staying the permit in both cases until the court can review the merits of these cases. The Sixth Circuit heard oral arguments on the merits on December 10, 2024, but has not yet issued a ruling. See Part II, Item 7, Management's Discussion and Analysis of Financial Condition and Results of Operations — Key Initiatives and Challenges — Optimum Energy Portfolio — Natural Gas-Fired Units in the Annual Report.
TVA is constructing 1,500 MW of natural gas generation at TVA's Kingston site that is expected to be operational by the end of CY 2027. As of December 31, 2024, TVA had spent $1.1 billion on this project. See Part II, Item 7, Management's Discussion and Analysis of Financial Condition and Results of Operations — Key Initiatives and Challenges — Natural Gas-Fired Units in the Annual Report.
On December 16, 2024, the Southern Environmental Law Center filed an appeal on behalf of Appalachian Voices challenging the construction permit that the Division of Air Pollution Control of the Tennessee Department of Environment and Conservation (“TDEC”) issued to TVA on November 15, 2024, for the construction of new natural gas generation at Kingston. Appalachian Voices alleges that TDEC unlawfully issued a construction permit that would allow TVA to construct the plant without meeting the requirements set forth in the Clean Air Act’s Prevention of Significant Deterioration program. Among other things, Appalachian Voices is requesting that the Tennessee Air Pollution Control Board stay the effectiveness of the permit and order TDEC to revoke the permit. On January 7, 2025, TVA filed a petition to intervene in the administrative proceeding, which was granted on January 15, 2025.
Small Modular Reactors. In January 2025, TVA and a consortium of co-applicants applied for a U.S. Department of Energy grant to support the potential development and future deployment of a small modular reactor (“SMR”) at TVA’s Clinch River site. The potential development and any future deployment of a SMR at the Clinch River site are subject to TVA Board approval. TVA is following a structured planning process that advances the Clinch River project in phases at which the TVA Board will evaluate and consider approving any next steps. This funding could support not only the deployment of this first-of-a-kind technology, but also help establish the supply chain for advanced nuclear and support future deployment of the reactor across the United States. In January 2025, TVA also requested public comment on a draft Supplemental Environmental Impact Statement that addresses the potential environmental effects associated with site preparation, construction, operation, and decommissioning of one SMR, the GE Hitachi Nuclear Energy BWRX-300, at the Clinch River site.
Hurricane Helene
In late September 2024, Hurricane Helene caused significant damage in communities in East Tennessee and Western
North Carolina. TVA completed inspections at numerous dams, finding no substantial impacts. TVA is working on debris management at Douglas Reservoir to aid major disaster declarations with the Federal Emergency Management Agency ("FEMA"). TVA anticipates reimbursement from FEMA for this work. See Part II, Item 7, Management's Discussion and Analysis of Financial Condition and Results of Operations — Key Initiatives and Challenges — Hurricane Helene in the Annual Report.
Corporate Governance
The terms of Beth H. Harwell and Brian E. Noland as members of the TVA Board ended January 3, 2025, with the adjournment of the most recent session of Congress. Although their terms of office expired May 18, 2024, the TVA Act permitted them to continue to serve as Directors until the end of this session of Congress.
On January 13, 2025, TVA announced that Thomas C. Rice had been appointed as TVA’s new Senior Vice President and Chief Financial Officer, effective January 27, 2025. Mr. Rice will be responsible for directing all of TVA’s financial functions, including treasury, risk management, accounting, financial operations and performance, financial planning and investor relations. He will succeed John M. Thomas, III, who, on December 2, 2024, announced his retirement from TVA effective March 7, 2025, as reported by TVA on December 5, 2024. Until his retirement, Mr. Thomas will serve as Executive Vice President and Advisor to the Chief Executive Officer ("CEO") and assist with the transition of his responsibilities.
On January 29, 2025, Jeffrey J. Lyash, TVA's President and CEO, notified his executive leadership team, and the TVA Board, of his intention to retire no later than October 2, 2025. Mr. Lyash will continue to serve in his current role as TVA undergoes a search for a new President and CEO.
Executive Actions
On January 20, 2025, President Trump issued an executive order (“EO”) that revoked a number of EOs, including the following EOs discussed in Part I, Item 1, Business — Environmental Matters — Climate Change — Executive Actions in TVA's Annual Report on Form 10-K for the year ended September 30, 2024: EO 13990, "Protecting Public Health and the Environment and Restoring Science To Tackle the Climate Crisis"; EO 14008, "Tackling the Climate Crisis at Home and Abroad”; EO 14030, “Climate-Related Financial Risk”; EO 14057, "Catalyzing Clean Energy Industries and Jobs Through Federal Sustainability"; EO 14082, “Implementation of the Energy and Infrastructure Provisions of the Inflation Reduction Act of 2022”; and EO 14096, “Revitalizing Our Nation's Commitment to Environmental Justice for All.” In addition, on January 21, 2025, the Office of Management and Budget issued Memorandum M-25-11, which requires agencies to immediately pause disbursement of certain funds appropriated under the IRA or the BIL, which may delay any award of grants for which TVA has applied under these acts. Furthermore, President Trump and the Administration have taken a number of other actions that may impact TVA, and TVA is currently reviewing these actions.
Environmental Matters
There have been no material changes to the environmental matters described in Part I, Item 1, Business — Environmental Matters of the Annual Report, except as described below.
Cleanup of Solid and Hazardous Wastes
Coal Combustion Residuals. In August 2015, TDEC issued an order that includes an iterative process through which TVA and TDEC will investigate, assess, and remediate any unacceptable risks resulting from coal combustion residual (“CCR”) management and disposal at TVA CCR units in the State of Tennessee. As part of this process, TVA has submitted environmental assessment reports (“EARs”) to TDEC, and after the EARs are approved, TVA will submit Corrective Action/Risk Assessment (“CARA”) Plans that will identify the unacceptable risks and TVA's proposed remediation. TDEC will review the CARA Plans and provide comments, and TVA will make revisions to address TDEC's comments until TDEC approves a final CARA Plan for each site. The public also will have an opportunity to review and comment on each CARA Plan prior to TDEC's approval of the final plan. TDEC approved the EAR for Bull Run Fossil Plant ("Bull Run") on November 15, 2024, and TVA
submitted the initial draft of the Bull Run CARA Plan to TDEC in January 2025. See Part I, Item I, Business — Environmental Matters — Cleanup of Solid and Hazardous Wastes — Coal Combustion Residuals in the Annual Report.
Legal Proceedings
From time to time, TVA is party to or otherwise involved in lawsuits, claims, proceedings, investigations, and other legal matters ("Legal Proceedings") that have arisen in the ordinary course of conducting its activities. As of December 31, 2024, TVA had accrued $11 million with respect to Legal Proceedings. No assurance can be given that TVA will not be subject to significant additional claims and liabilities. If actual liabilities significantly exceed the estimates made, TVA's results of operations, liquidity, and financial condition could be materially adversely affected.
For a discussion of certain current material Legal Proceedings, see Note 20 — Contingencies and Legal Proceedings — Legal Proceedings, which discussions are incorporated into this Part I, Item 2, Management's Discussion and Analysis of Financial Condition and Results of Operations.
Critical Accounting Estimates
The preparation of financial statements requires TVA to estimate the effects of various matters that are inherently uncertain as of the date of the financial statements. Although the financial statements are prepared in conformity with accounting principles generally accepted in the U.S., TVA is required to make estimates and assumptions that affect the reported amounts of assets and liabilities, the disclosure of contingent assets and liabilities, and the amounts of revenues and expenses reported during the reporting period. Each of these estimates varies in regard to the level of judgment involved and its potential impact on TVA's financial results. Estimates are deemed critical either when a different estimate could have reasonably been used, or where changes in the estimate are reasonably likely to occur from period to period, and such use or change would materially impact TVA's financial condition, results of operations, or cash flows. TVA's critical accounting estimates and policies are discussed in Part II, Item 7, Management's Discussion and Analysis of Financial Condition and Results of Operations — Critical Accounting Estimates and Note 1 — Summary of Significant Accounting Policies of the Notes to Consolidated Financial Statements in the Annual Report.
Legislative and Regulatory Matters
For additional discussion on legislative and regulatory matters, including a discussion of environmental legislation and regulation, see Environmental Matters and Key Initiatives and Challenges above. Also, see Part I, Item 1, Business — Environmental Matters and Part II, Item 7, Management's Discussion and Analysis of Financial Condition and Results of Operations — Key Initiatives and Challenges of the Annual Report.
TVA does not engage, and does not control any entity that is engaged, in any activity listed under Section 13(r) of the Securities Exchange Act of 1934 (the "Exchange Act"), which requires certain issuers to disclose certain activities relating to Iran involving the issuer and its affiliates. Based on information supplied by each such person, none of TVA's directors and executive officers are involved in any such activities. While TVA is an agency and instrumentality of the U.S., TVA does not believe its disclosure obligations, if any, under Section 13(r) extend to the activities of any other departments, divisions, or agencies of the U.S.
ITEM 3. QUANTITATIVE AND QUALITATIVE DISCLOSURES ABOUT MARKET RISK
There are no material changes related to market risks disclosed under Part II, Item 7, Management's Discussion and Analysis of Financial Condition and Results of Operations — Risk Management Activities in the Annual Report. See Note 13 — Risk Management Activities and Derivative Transactions for additional information regarding TVA's derivative transactions and risk management activities.
New Accounting Standards and Interpretations
For a discussion of new accounting standards and interpretations, see Note 2 — Impact of New Accounting Standards and Interpretations, which discussion is incorporated into this Part I, Item 2, Management's Discussion and Analysis of Financial Condition and Results of Operations.
ITEM 4. CONTROLS AND PROCEDURES
Disclosure Controls and Procedures
TVA maintains disclosure controls and procedures designed to ensure that information required to be disclosed by TVA in reports that it files or submits under the Exchange Act is recorded, processed, summarized, and reported, within the time periods specified in the Securities and Exchange Commission’s rules and forms, and is accumulated and communicated to TVA’s management, as appropriate, to allow timely decisions regarding required disclosure. TVA's management, including the President and CEO, the Senior Vice President and Chief Financial Officer, and members of the Disclosure Control Committee,
including the Vice President and Controller (Principal Accounting Officer) (collectively "management"), evaluated the effectiveness of TVA's disclosure controls and procedures (as defined in Rule 13a-15(e) under the Exchange Act) as of December 31, 2024. Based on this evaluation, management concluded that TVA's disclosure controls and procedures were effective as of December 31, 2024.
Changes in Internal Control over Financial Reporting
During the quarter ended December 31, 2024, there were no changes in TVA's internal control over financial reporting that materially affected, or are reasonably likely to materially affect, TVA's internal control over financial reporting.
PART II - OTHER INFORMATION
ITEM 1. LEGAL PROCEEDINGS
From time to time, TVA is party to or otherwise involved in lawsuits, claims, proceedings, investigations, and other legal matters ("Legal Proceedings") that have arisen in the ordinary course of conducting its activities. While the outcome of the Legal Proceedings to which TVA is a party cannot be predicted with certainty, any adverse outcome to a Legal Proceeding involving TVA may have a material adverse effect on TVA's financial condition, results of operations, and cash flows.
For a discussion of certain current material Legal Proceedings, see Note 20 — Contingencies and Legal Proceedings — Legal Proceedings, which discussions are incorporated by reference into this Part II, Item 1, Legal Proceedings.
ITEM 1A. RISK FACTORS
There are no material changes related to risk factors from the risk factors disclosed in Part I, Item 1A, Risk Factors in the Annual Report.
ITEM 5. OTHER INFORMATION
Insider Trading Arrangements and Policies
During the three months ended December 31, 2024, no director or officer of TVA notified TVA of the adoption or termination of a "Rule 10b5-1 trading arrangement" or "non-Rule 10b5-1 trading arrangement," as each term is defined in Item 408(a) of Regulation S-K.
Amended and Restated Executive Annual Incentive Plan
On January 30, 2025, TVA amended and restated its Executive Annual Incentive Plan (“EAIP”) to eliminate the use of the corporate multiplier and to authorize the TVA Board of Directors ("TVA Board") to utilize a standard discretionary range to adjust the scorecard achievement by plus or minus 20 percent beginning with the fiscal year 2025 performance cycle. This standard discretionary range allows the TVA Board to account for extraordinary occurrences or significant events that impact TVA’s performance. A copy of the amended and restated EAIP, which also includes minor administrative revisions, is attached as an exhibit to this report and is incorporated herein by reference. The foregoing description is qualified in its entirety by reference to such document.
ITEM 6. EXHIBITS
| | | | | |
| Exhibit No. | Description |
| 3.1 | |
| |
| 3.2 | Bylaws of the Tennessee Valley Authority Approved by the TVA Board on May 18, 2006, as amended on April 3, 2008, May 19, 2008, June 10, 2010, February 13, 2014, August 21, 2014, and November 6, 2014 (Incorporated by reference to Exhibit 3.2 to TVA's Annual Report on Form 10-K for the year ended September 30, 2014, File No. 000-52313) |
| |
| 10.1 | |
| |
| 10.2 | |
| |
| 10.3 | |
| |
| 10.4 | |
| |
| 10.5 | |
| |
| 31.1 | |
| | |
| 31.2 | |
| | |
| 32.1 | |
| | |
| 32.2 | |
| |
| |
| |
| 101.INS | Inline XBRL Instance Document - the instance document does not appear in the Interactive Data File because its XBRL tags are embedded within the Inline XBRL document |
| | |
| 101.SCH | Inline XBRL Taxonomy Extension Schema |
| | |
| 101.CAL | Inline XBRL Taxonomy Extension Calculation Linkbase |
| | |
| 101.DEF | Inline XBRL Taxonomy Extension Definition Linkbase |
| | |
| 101.LAB | Inline XBRL Taxonomy Extension Label Linkbase |
| | |
| 101.PRE | Inline XBRL Taxonomy Extension Presentation Linkbase |
| |
| 104 | Cover Page Interactive Data File - formatted in Inline XBRL and contained in Exhibit 101 |
SIGNATURES
Pursuant to the requirements of the Securities Exchange Act of 1934, the registrant has duly caused this report to be signed on its behalf by the undersigned, thereunto duly authorized.
| | | | | | | | | | | |
| Date: | February 4, 2025 | | TENNESSEE VALLEY AUTHORITY |
| | | (Registrant) |
| | | |
| | | |
| | By: | /s/ Jeffrey J. Lyash |
| | | Jeffrey J. Lyash |
| | | President and Chief Executive Officer
(Principal Executive Officer) |
| | By: | /s/ Thomas C. Rice |
| | | Thomas C. Rice |
| | | Senior Vice President and Chief Financial Officer
(Principal Financial Officer) |