|
|
|
|
| 31 March 2009 |
|
|
|
|
|
|
|
|
|
|
| RIO NARCEA RECURSOS S.A. PART OF |
|
|
|
|
|
|
|
|
|
|
|
|
|
| TECHNICAL REPORT ON THE |
|
|
|
|
| Submitted to: |
|
| Lundin Mining Corporation |
|
|
|
|
|
|
|
|
|
|
|
|
|
|
|
|
|
|
|
|
|
|
|
|
NI 43-101 |
|
|
|
|
|
|
| Report Number: 08511150292 |
|
| 2 copies Lundin Mining Corporation |
Aworldof |
| |
|
|
|
|
|
| TECHNICAL REPORT AGUABLANCA NI-CU DEPOSIT |
|
|
|
|
|
Table of Contents | ||||
|
|
|
|
|
1.0 | EXECUTIVE SUMMARY | - 1 - | ||
|
|
|
|
|
2.0 | INTRODUCTION | - 5 - | ||
|
|
| ||
| 2.1 | Preamble | - 5 - | |
|
|
|
| |
| 2.2 | Terms of reference | - 6 - | |
|
|
|
|
|
| 2.3 | Scope of Work | - 7 - | |
|
|
|
|
|
3.0 | RELIANCE ON OTHER EXPERTS | - 8 - | ||
|
|
|
|
|
4.0 | PROPERTY DESCRIPTION AND LOCATION | - 9 - | ||
|
|
|
|
|
5.0 | ACCESSIBILITY, CLIMATE, LOCAL RESOURCES, INFRASTRUCTURE AND PHYSIOGRAPHY | - 11 - | ||
|
|
| ||
| 5.1 | Access | - 11 - | |
|
|
|
|
|
| 5.2 | Climate | - 11 - | |
|
|
|
| |
| 5.3 | Landform and vegetation | - 11 - | |
|
|
|
|
|
6.0 | HISTORY | - 12 - | ||
|
|
| ||
| 6.1 | Historical ownership | - 12 - | |
|
|
|
| |
| 6.2 | Historical exploration | - 13 - | |
|
|
|
| |
| 6.3 | Historical resource estimates | - 13 - | |
|
|
|
| |
| 6.4 | Historical production | - 14 - | |
|
|
|
|
|
7.0 | GEOLOGICAL SETTING | - 15 - | ||
|
|
| ||
| 7.1 | Regional Geology | - 15 - | |
|
|
|
| |
| 7.2 | Property description | - 16 - | |
|
|
|
|
|
8.0 | DEPOSIT TYPES | - 18 - | ||
|
|
| ||
| 8.1 | Mineral genesis | - 18 - | |
|
|
|
|
|
9.0 | MINERALIZATION | - 20 - | ||
|
|
| ||
| 9.1 | Mineral zones | - 20 - | |
|
|
|
| |
| 9.2 | Fault systems | - 22 - | |
|
|
|
| |
| 9.3 | Mineral types | - 23 - | |
|
|
|
| |
| 9.3.1 | Massive to semi-massive mineralization (SB) | - 23 - | |
|
|
|
| |
| 9.3.2 | Disseminated mineralization (SS and S) | - 24 - | |
|
|
|
| |
| 9.3.3 | Irregular mineralization in patches (SP) | - 24 - | |
|
|
|
|
|
10.0 | EXPLORATION | - 26 - | ||
|
|
|
|
|
11.0 | DRILLING | - 27 - | ||
|
|
| ||
| 11.1 | Down hole surveying and orientation | - 29 - | |
|
|
|
|
|
|
31 March 2009 | i |
|
|
|
| TECHNICAL REPORT AGUABLANCA NI-CU DEPOSIT |
|
|
|
|
|
| 11.2 | Grade control drilling | - 29 - | |
|
|
|
|
|
12.0 | SAMPLING METHOD AND APPROACH | - 30 - | ||
|
|
| ||
| 12.1 | Core collection | - 30 - | |
|
|
|
| |
| 12.2 | Core storage and photography | - 31 - | |
|
|
|
| |
| 12.3 | Sampling | - 32 - | |
|
|
|
| |
| 12.4 | Logging | - 32 - | |
|
|
|
| |
| 12.5 | Densities | - 36 - | |
|
|
|
|
|
13.0 | SAMPLE PREPARATION, ANALYSES AND SECURITY | - 37 - | ||
|
|
| ||
|
| 13.1 | Sample preparation | - 37 - |
|
|
|
|
|
|
| 13.1.1 | Sample reception | - 37 - |
|
|
|
|
|
|
| 13.1.2 | Crushing | - 38 - |
|
|
|
|
|
|
| 13.1.3 | First stage splitting | - 39 - |
|
|
|
|
|
|
| 13.1.4 | Pulverization | - 39 - |
|
|
|
|
|
|
| 13.1.5 | Second stage splitting | - 39 - |
|
|
|
|
|
|
| 13.1.6 | Storage | - 40 - |
|
|
|
| |
| 13.2 | Quality assurance and quality control (QAQC) procedures | - 40 - | |
|
|
|
| |
|
| 13.2.1 | Standards | - 40 - |
|
|
|
|
|
|
| 13.2.2 | Inter-laboratory repeats | - 41 - |
|
|
|
| |
| 13.3 | Assaying | - 41 - | |
|
|
|
| |
|
|
|
|
|
14.0 | DATA VERIFICATION | - 42 - | ||
|
|
| ||
| 14.1 | Introduction | - 42 - | |
|
|
|
| |
| 14.2 | Drilling database | - 42 - | |
|
|
|
| |
| 14.3 | Comparison of geological logs with drill core | - 43 - | |
|
|
|
| |
| 14.4 | Standards | - 44 - | |
|
|
|
| |
| 14.5 | Inter-laboratory repeats | - 44 - | |
|
|
|
|
|
15.0 | ADJACENT PROPERTIES | - 46 - | ||
|
|
|
|
|
16.0 | MINERAL PROCESSING AND METALLURGICAL TESTING | - 47 - | ||
|
|
|
|
|
17.0 | MINERAL RESOURCE AND MINERAL RESERVE ESTIMATES | - 48 - | ||
|
|
| ||
| 17.1 | Introduction |
| - 48 - |
|
|
|
|
|
|
| 17.1.1 | Definitions | - 48 - |
|
|
|
| |
| 17.2 | Data provided | - 49 - | |
|
|
|
|
|
|
| 17.2.1 | Drill hole data | - 49 - |
|
|
|
|
|
|
| 17.2.2 | Other data | - 50 - |
|
|
|
| |
| 17.3 | Geological wireframe modelling | - 50 - | |
|
|
|
|
|
|
31 March 2009 | ii |
|
|
|
| TECHNICAL REPORT AGUABLANCA NI-CU DEPOSIT |
|
|
|
|
|
| 17.4 | Exploratory data analysis | - 53 - | |
|
|
| ||
|
| 17.4.1 | Compositing | - 53 - |
|
|
|
|
|
|
| 17.4.2 | Statistics | - 56 - |
|
|
|
|
|
|
| 17.4.3 | Treatment of high-grade samples during estimation | - 59 - |
|
|
|
|
|
| 17.5 | Variography |
| |
|
|
| ||
|
| 17.5.1 | Variography objectives and approach | - 60 - |
|
|
|
|
|
|
| 17.5.2 | Variogram interpretation and modelling | - 63 - |
|
|
|
|
|
|
| 17.5.3 | Summary of variogram orientations | - 64 - |
|
|
| - 65 - | |
| 17.6 | Geological block modelling |
| |
|
|
| ||
|
| 17.6.1 | Block model parameters | - 65 - |
|
|
|
|
|
|
| 17.6.2 | Geological domain allocation | - 65 - |
|
|
|
| |
| 17.7 | Bulk density | - 67 - | |
|
|
|
| |
| 17.8 | Interpolation plan | - 69 - | |
|
|
| ||
|
| 17.8.1 | Grade interpolation methodology | - 69 - |
|
|
|
|
|
|
| 17.8.2 | High-grade restraining | - 69 - |
|
|
|
|
|
|
| 17.8.3 | Kriging plan | - 70 - |
|
|
|
|
|
|
| 17.8.4 | Search ellipse orientations | - 71 - |
|
|
|
|
|
|
| 17.8.5 | Calculation of dominant lithology and mineralogy | - 72 - |
|
|
|
|
|
|
| 17.8.6 | Assignment of density | - 73 - |
|
|
|
| |
| 17.8.7 | Block size | - 74 - | |
|
|
| ||
|
| 17.8.8 | Block model variables | - 75 - |
|
|
|
| |
| 17.9 | Validation of grade estimates | - 75 - | |
|
|
| ||
|
| 17.9.1 | Visual Assessment of grade estimates | - 76 - |
|
|
|
|
|
|
| 17.9.2 | Global assessment of grade estimates | - 76 - |
|
|
|
|
|
|
| 17.9.3 | Swath plot validation | - 76 - |
|
|
|
| |
| 17.10 | Mineral Resource classification | - 79 - | |
|
|
|
| |
| 17.11 | December 2008 Aguablanca Mineral Resource Estimate | - 80 - | |
|
|
|
| |
| 17.12 | Mineral Reserve Estimation | - 81 - | |
|
|
| ||
|
| 17.12.1 | Initial topography | - 82 - |
|
|
|
|
|
|
| 17.12.2 | Geotechnical background | - 82 - |
|
|
|
|
|
|
| 17.12.3 | Cost structure | - 83 - |
|
|
|
|
|
|
| 17.12.4 | Mine design parameters | - 83 - |
|
|
|
|
|
|
| 17.12.5 | Commercial parameters | - 84 - |
|
|
|
|
|
|
| 17.12.6 | Metal recovery | - 84 - |
|
|
|
|
|
|
31 March 2009 | iii |
|
|
|
| TECHNICAL REPORT AGUABLANCA NI-CU DEPOSIT |
|
|
|
|
|
|
| 17.12.7 | Methodology for pit optimization and design | - 84 - |
|
|
|
|
|
|
| 17.12.8 | Cut-off grade | - 85 - |
|
|
|
|
|
|
| 17.12.9 | Pit optimisation results | - 85 - |
|
|
|
|
|
|
| 17.12.10 | Pit design | - 87 - |
|
|
|
|
|
|
| 17.12.11 | Scheduling | - 90 - |
|
|
|
|
|
|
| 17.12.12 | December 2008 Aguablanca Mineral Reserve Estimate | - 93 - |
|
|
|
|
|
|
| 17.12.13 | Risks | - 94 - |
|
|
|
|
|
|
| 17.12.14 | Conclusions and recommendations | - 95 - |
|
|
|
|
|
18.0 | OTHER RELEVANT DATA AND INFORMATION | - 96 - | ||
|
|
|
|
|
19.0 | INTERPRETATION AND CONCLUSIONS | - 97 - | ||
|
|
|
|
|
20.0 | RECOMMENDATIONS | - 98 - | ||
|
|
|
|
|
21.0 | REFERENCES |
| - 99 - | |
|
|
|
|
|
22.0 | DATE AND SIGNATURE PAGE | - 100 - | ||
|
|
| ||
| 22.1 | Certificate of Juan Alvarez | - 100 - | |
|
|
|
| |
| 22.2 | Certificate of Sia Khosrowshahi | - 101 - | |
|
|
|
| |
| 22.3 | Certificate of Juan Pablo Gonzalez | - 102 - | |
|
|
|
| |
| 22.4 | Certificate of Stephen Gatley | - 103 - | |
|
|
|
|
|
23.0 | ADDITIONAL REQUIREMENTS FOR TECHNICAL REPORTS ON DEVELOPMENT PROPERTIES AND PRODUCTION PROPERTIES |
| ||
|
|
|
| - 104 - |
| 23.1 | Mining operations | - 104 - | |
|
|
|
| |
| 23.2 | Process metal recoveries | - 106 - | |
|
|
|
| |
| 23.3 | Markets |
| - 106 - |
|
|
|
|
|
| 23.4 | Contracts |
| - 106 - |
|
|
|
|
|
| 23.5 | Environmental considerations | - 107 - | |
|
|
|
| |
| 23.6 | Taxes |
| - 107 - |
|
|
|
|
|
| 23.7 | Capital and operating cost estimates | - 107 - | |
|
|
|
| |
| 23.8 | Economic analysis | - 108 - | |
|
|
|
| |
| 23.9 | Payback | - 110 - | |
|
|
|
| |
| 23.10 | Mine life | - 110 - | |
|
|
|
|
|
|
31 March 2009 | iv |
|
|
|
| TECHNICAL REPORT AGUABLANCA NI-CU DEPOSIT |
|
|
|
LIST OF TABLES |
| |
|
|
|
Table 1: | Units of measure and abbreviations | - 7 - |
|
|
|
Table 2: | Drill holes removed from the database because of low confidence survey information | - 26 - |
|
|
|
Table 3: | Aguablanca logging codes | - 33 - |
|
|
|
Table 4: | Standards used at Aguablanca | - 40 - |
|
|
|
Table 5: | Drill holes checked against core and original assay sheets | - 43 - |
|
|
|
Table 6: | Comparison between Composite statistics and Raw statistics | - 54 - |
|
|
|
Table 7: | Raw and declustered statistics from composited 2 m map file | - 56 - |
|
|
|
Table 8: | Matrix showing% of total metal content for Ni and Cu, sub-divided by mineralization type and lithology group for a 0.1% Ni cut-off | - 57 - |
|
|
|
Table 9: | Parameters used for variogram generation | - 62 - |
|
|
|
Table 10: | Summary of variogram continuity orientations | - 64 - |
|
|
|
Table 11: | Geological Model Extents and Block Sizes for OK_21jan09_v1.bmf | - 65 - |
|
|
|
Table 12: | Variable assignment in the geological block model | - 66 - |
|
|
|
Table 13: | Kriging parameters | - 71 - |
|
|
|
Table 14: | Search ellipse orientations used during grade estimation | - 72 - |
|
|
|
Table 15: | Lithology grouping used in dominant lithology assignment | - 72 - |
|
|
|
Table 16: | Mineralization codes (variable “type” in the block models) | - 73 - |
|
|
|
Table 17: | Inverse distance interpolation parameters | - 73 - |
|
|
|
Table 18: | Average density values assigned to blocks not already interpolated with density | - 74 - |
|
|
|
Table 19: | Specifications of the block model | - 75 - |
|
|
|
Table 20: | Univariate Statistics of Declustered 2 m composite data (Declustered using 100m window) and OK model | - 78 - |
|
|
|
Table 21: | Resource Report for the Sub-blocked Block model (8x8x4) at 0.1% and 0.2% Ni cut-off grades | - 81 - |
|
|
|
Table 22: | Aguablanca – Cost Summary | - 83 - |
|
|
|
Table 23: | Aguablanca – Design Parameters | - 83 - |
|
|
|
Table 24: | Aguablanca – Recovery Equation | - 84 - |
|
|
|
Table 25: | Life of Mine Plan for the Aguablanca Mine | - 91 - |
|
|
|
Table 26: | Proven and Probable Mineral Reserves in the Aguablanca | - 93 - |
|
|
|
Table 27: | Mineral Reserves Risks | - 94 - |
|
|
|
Table 28: | Production forecast for the Aguablanca open pit reserves | - 105 - |
|
|
|
Table 29: | Historical metal recoveries | - 106 - |
|
|
|
Table 30: | Regression equation for the calculation of process recoveries | - 106 - |
|
|
|
Table 31: | Calculated operating costs | - 108 - |
|
|
|
Table 32: | Sensitivity analysis – base case | - 109 - |
|
|
|
Table 33: | Sensitivity analysis – changes to nickel price, operating costs or exchange rate | - 109 - |
|
|
|
|
|
|
31 March 2009 | v |
|
|
|
| TECHNICAL REPORT AGUABLANCA NI-CU DEPOSIT |
LIST OF FIGURES
|
|
|
Figure 4-1: | Location of the Aguablanca mine | - 9 - |
|
|
|
Figure 4-2: | Aguablanca mining rights | - 10 - |
|
|
|
Figure 7-1: | Geology of the Central part of the Ossa Morena Zone (Tornos.et al, 2006) | - 16 - |
|
|
|
Figure 7-2: | Map of the Aguablanca Stock and surrounding geology (Tornos. et al, 2006) | - 17 - |
|
|
|
Figure 8-1: | General model for the formation of a Ni-Cu-PGM sulphide mineralization (Lundin, 2004) | - 19 - |
|
|
|
Figure 9-1: | Section 7250 E as interpreted by Lundin staff showing South, North and Deep Zones | - 21 - |
|
|
|
Figure 9-2: | Plan 458 Z showing the South and North Zones and important faults as interpreted by Lundin staff | - 22 - |
|
|
|
Figure 9-3: | Magmatic breccia (Gsb) with semi-massive sulphides (SB) | - 23 - |
|
|
|
Figure 9-4: | Porphyritic Gabbro (GP) with disseminated sulphides (S) | - 24 - |
|
|
|
Figure 9-5: | Gabbro with irregular mineralization in patches | - 25 - |
|
|
|
Figure 11-1: | Aguablanca project drilling coverage | - 28 - |
|
|
|
Figure 12-1: | Labelling of core boxes for Aguablanca resource drilling | - 30 - |
|
|
|
Figure 12-2: | Aguablanca core shed | - 31 - |
|
|
|
Figure 12-3: | Example of core photography | - 31 - |
|
|
|
Figure 12-4: | Correct core sawing orientation being used at Aguablanca | - 32 - |
|
|
|
Figure 12-5: | Aguablanca drilling log | - 35 - |
|
|
|
Figure 13-1: | Sample preparation flow sheet as used for Aguablanca resource definition samples | - 37 - |
|
|
|
Figure 13-2: | Bar code system used at the Aguablanca site laboratory | - 38 - |
|
|
|
Figure 13-3: | Splitting of pulverised material using a spatula | - 39 - |
|
|
|
Figure 17-1: | Section 7317E showing a comparison between Indicators using 0.5%, 0.75% and 1.5%Ni cut-offs. The colours represent the probability (0-1) of the Ni grade in a block being above the given cut-off (expressed as a decimal) | - 51 - |
|
|
|
Figure 17-2: | Example of the sectional modelling and wireframe solids modelled by Golder (Section 7275 mE), Blue – 0.1% Ni envelope, Red – 0.5% Ni envelope | - 52 - |
|
|
|
Figure 17-3: | Fault surfaces modelled by Golder superimposed onto the modelled mineral envelope (0.1% Ni) | - 53 - |
|
|
|
Figure 17-4: | Probability plot showing Ni subdivided into High-grade (ore=2), Low-grade (ore=1) and Waste (ore=0) | - 58 - |
|
|
|
Figure 17-5: | Coefficient of Variation vs. Mean graphs showing the influence of mineralization on grade | - 59 - |
|
|
|
Figure 17-6: | Left: Histogram of low-grade Ni (ore=1), Right: Probability plot (Blue = >5000 Ni ppm) showing samples which were restrained (~10%) | - 60 - |
|
|
|
Figure 17-7: | Variogram Search Tolerances | - 61 - |
|
|
|
Figure 17-8: | Semi-major axis variograms (down-dip) for High-grade (top), and Low-grade (bottom), both have a very low nugget and show ranges ~100m | - 63 - |
|
|
|
Figure 17-9: | Section at 7350 mE showing density values limited to the upper half of the deposit | - 68 - |
|
|
|
Figure 17-10: | Graph showing the increase in Density with Grade Ni%. This shows density can be linked to the degree of mineralization | - 68 - |
|
|
|
Figure 17-11: | Measured (red) and Indicated (yellow) Resource wireframes governed by the drilling density | - 80 - |
|
|
|
Figure 17-12: | Topographic surface as at December 31 2008 | - 82 - |
|
|
|
|
|
|
31 March 2009 | vi |
|
|
|
| TECHNICAL REPORT AGUABLANCA NI-CU DEPOSIT |
|
|
|
Figure 17-13: | NPV for incremental pits | - 86 - |
|
|
|
Figure 17-14: | Quantities of material for incremental pits | - 86 - |
|
|
|
Figure 17-15: | Grade-Tonnage curve for the selected pit limit (pit 7) | - 87 - |
|
|
|
Figure 17-16: | Section 5300 North | - 88 - |
|
|
|
Figure 17-17: | Section 7300 East | - 88 - |
|
|
|
Figure 17-18: | Operational design - Phase 2 | - 89 - |
|
|
|
Figure 17-19: | Operational design - Phase 3 | - 89 - |
|
|
|
Figure 17-20: | Final Pit and Block Model | - 90 - |
|
|
|
Figure 17-21: | Summary Extraction Materials | - 92 - |
|
|
|
Figure 17-22: | Tonnages and grades by Period | - 92 - |
|
|
|
|
|
|
31 March 2009 | vii |
|
|
|
| TECHNICAL REPORT AGUABLANCA NI-CU DEPOSIT |
|
|
APPENDICES | |
|
|
Appendix A | Standards results |
Appendix B | Repeat analysis charts |
Appendix C | List of holes used in the estimation |
Appendix D | Wireframe model sections |
Appendix E | Probability Plots |
Appendix F | Search Ellipse Orientations |
Appendix G | Swath Plots |
|
|
|
|
|
|
|
|
31 March 2009 | viii |
|
|
|
| TECHNICAL REPORT AGUABLANCA NI-CU DEPOSIT |
|
|
1.0 | EXECUTIVE SUMMARY |
Introduction
Golder Associates Global Ibérica, S.L. (Golder) was commissioned by Mr Aden Muñoz of Lundin Mining Corporation (Lundin) to complete an independent Mineral Resource and Mineral Reserve estimation of the Aguablanca Deposit of the Aguablanca Mine.
This report details the results of work carried out by Golder between July 2008 and March 2009 and provides a statement of Mineral Resources and Mineral Reserves for the Aguablanca Deposit, which have been classified in conformance with the CIM Mineral Resource and Mineral Reserve definitions referred to in the National Instrument (NI) 43-101, Standards of Disclosure for Mineral Projects. It also involved the preparation of a Technical Report as defined in NI 43-101 and in compliance with Form 43-101F1 (the “Technical Report”).
Property description and location
The Aguablanca Mine is 100% owned by Lundin Mining Corporation and is located approximately 100 km north of Seville within the Monesterio municipal boundary in the south of Badajoz Province (Extremadura Region), and close to the Huelva and Sevilla (Andalucia Region) provincial boundaries, in the south of Spain. It lies at Latitude 37°57´40´´ and Longitude 6°11´7´´.
The Aguablanca Operation consists of an open pit mine and an on-site processing plant. Mining takes place via conventional open pit methods utilizing shovels and haul trucks. At full operating capacity the mine can produce 1.85 million tonnes of ore a year, and in 2008 produced 8,136 tonnes of Ni and 7,071 tonnes of Cu in concentrate.
Geological setting
The Aguablanca Stock is located in the northeast of the Santa Olalla Plutonic Complex which has yielded absolute ages of 338.6±0.8 Ma and 344±1.1 Ma. The intrusion consists of medium grained gabbro and gabbro-norites. Mineralisation occurs in igneous rocks formed by partial melting of the mantle. When basalt magma is emplaced within the crust, it cools slowly at depth and forms gabbro which is the host rock of the Aguablanca mineralization.
A clear transition from semi-massive mineralized breccia in the central part of the Aguablanca mineralization to disseminated mineralization along both sides of the central breccia, suggests a vertical, “feeder like” emplacement of the mineralization. The deepest portion of the main body is still open.
|
|
|
|
|
|
31 March 2009 | 1 |
|
|
|
| TECHNICAL REPORT AGUABLANCA NI-CU DEPOSIT |
Mineralisation consists of magmatic sulphide mineralization hosted by the gabbro and gabbro-norite units. Sulphide mineralization is predominantly represented by pyrrhotite, pentlandite, chalcopyrite and pyrite with minor marcasite and covellite. Magnetite is often present. Lesser amounts of platinum group minerals (PGM) and gold are also associated with the sulphide minerals.
Mineralization is generally hosted within a chaotic magmatic breccia, rich in fragments, in the matrix of which can be found semi-massive sulphides. The mineralization often grades laterally into more continuous disseminated sulphides and irregular patchy mineralization with variable textures. The mineralized body consists of two sub-parallel zones of mineralization, elongated in an east west direction and dipping subvertically. The larger South or Main Zone can be traced for 400 metres along an N115º orientation and dips between 75º and 80º to the north. This zone is over 100 metres thick and extends to a depth of more than 600 metres. The mineralization has a plunge of N65º to N80ºE. The North Zone contacts with the surrounding metamorphic country rocks and strikes N115º and is approximately 125 metres long in the strike direction, 50 metres thick and extends to a depth of more than 300 metres.
The main types of sulphide mineralization recognized at Aguablanca include massive to semi-massive mineralization (SB). This is further classified into disseminated (SS and S) and irregular (SP) mineralization in patches and lenses..
Exploration history
Exploration has been carried out in the area since the mid 1980’s. Geochemical stream sediment and soil sampling by the Presur/RTM Joint Venture between 1986 and 1994 delineated a drilling target. This target was drilled using diamond drilling methods by RTM and later by RNR and most recently by Lundin. The current drill hole database contains a total of 362 drill holes for a total of 96,515 m.
Mineral Resource Estimation
The December 31, 2008 Aguablanca Mineral Resource Estimate was completed by Mr J. Alvarez, Mr J. Purchase Dr. S. Khosrowshahi, and reviewed by Dr W Shaw. The Mineral Resource Estimate is based on diamond drill hole data provided by Lundin. Golder has reviewed the sources of the data provided by Lundin through validation checks against the digital data provided.
|
|
|
|
|
|
31 March 2009 | 2 |
|
|
|
| TECHNICAL REPORT AGUABLANCA NI-CU DEPOSIT |
The Resource report for the Aguablanca Deposit is shown in Table ES-1
Table ES-1: Resource Report for the Sub-blocked Block model (8x8x4) at 0.1% and 0.2% Ni cut-off grades
|
|
|
|
|
|
|
|
|
|
|
|
|
|
|
|
|
|
|
|
|
|
|
|
|
|
CLASS |
| Cut-off grade |
| Tonnes |
| Ni |
| Cu |
| Pt |
| Pd |
| Co |
| Au |
| ||||||||
Measured |
|
| 0.1 |
|
| 19,774 |
|
| 0.450 |
|
| 0.382 |
|
| 0.240 |
|
| 0.215 |
|
| 0.013 |
|
| 0.119 |
|
Indicated |
|
| 0.1 |
|
| 3,966 |
|
| 0.200 |
|
| 0.175 |
|
| 0.113 |
|
| 0.105 |
|
| 0.008 |
|
| 0.066 |
|
Measured+Indicated |
|
| 0.1 |
|
| 23,740 |
|
| 0.408 |
|
| 0.347 |
|
| 0.219 |
|
| 0.197 |
|
| 0.012 |
|
| 0.110 |
|
Inferred |
|
| 0.1 |
|
| 1,834 |
|
| 0.178 |
|
| 0.140 |
|
| 0.108 |
|
| 0.102 |
|
| 0.007 |
|
| 0.057 |
|
Measured |
|
| 0.2 |
|
| 14,966 |
|
| 0.545 |
|
| 0.457 |
|
| 0.256 |
|
| 0.230 |
|
| 0.015 |
|
| 0.128 |
|
Indicated |
|
| 0.2 |
|
| 1,569 |
|
| 0.279 |
|
| 0.236 |
|
| 0.132 |
|
| 0.124 |
|
| 0.011 |
|
| 0.077 |
|
Measured+Indicated |
|
| 0.2 |
|
| 16,535 |
|
| 0.520 |
|
| 0.436 |
|
| 0.244 |
|
| 0.220 |
|
| 0.014 |
|
| 0.123 |
|
Inferred |
|
| 0.2 |
|
| 525 |
|
| 0.271 |
|
| 0.189 |
|
| 0.138 |
|
| 0.133 |
|
| 0.010 |
|
| 0.066 |
|
Mineral Reserve Estimation
A Mineral Reserve Estimate for Aguablanca has also been carried out by Golder. This estimate has only considered the Measured and Indicated Mineral Resources. The estimate has used the pit geometry at December 31, 2008, taking into account recently revised geotechnical parameters. Based on the geometry and geotechnical parameters an optimized pit limit and production schedule was developed, adequately supported by an operational mine design. In particular, dilution and mining recovery were properly addressed and supported by historical data.
|
|
|
|
|
|
31 March 2009 | 3 |
|
|
|
| TECHNICAL REPORT AGUABLANCA NI-CU DEPOSIT |
Proven and Probable Reserves are summarized in Table ES-2.
Table ES-2: Proven and Probable Mineral Reserves in the Aguablanca Mine as at December 31, 2008 at a cut-off grade of 0.25% Ni
|
|
|
|
|
|
|
|
|
|
|
|
|
|
|
|
|
|
|
|
|
|
|
Aguablanca |
| Tonnes |
| Ni |
| Cu |
| Pt |
| Pd |
| Co |
| Au |
| |||||||
Proven Reserves |
|
| 8,668 |
|
| 0.65 |
|
| 0.48 |
|
| 0.222 |
|
| 0.208 |
|
| 0.017 |
|
| 0.106 |
|
|
|
|
|
|
|
|
|
|
|
|
|
|
|
|
|
|
|
|
|
|
|
|
Probable Reserves |
|
| 370 |
|
| 0.30 |
|
| 0.29 |
|
| 0.088 |
|
| 0.090 |
|
| 0.012 |
|
| 0.073 |
|
|
|
|
|
|
|
|
|
|
|
|
|
|
|
|
|
|
|
|
|
|
|
|
Subtotal |
|
| 9,038 |
|
| 0.63 |
|
| 0.47 |
|
| 0.218 |
|
| 0.203 |
|
| 0.017 |
|
| 0.105 |
|
Conclusions and recommendations
The completed project has met its objectives by providing a statement of Mineral Resources and Mineral Reserves for the Aguablanca Deposit, which have been classified in conformance with the CIM Mineral Resource and Mineral Reserve definitions referred to in the National Instrument (NI) 43-101, Standards of Disclosure for Mineral Projects.
Lundin’s QAQC program is considered acceptable by Golder but could be improved by implementing the following recommendations:
|
|
|
| • | Improving the splitting of the pulverised material by employing a small laboratory scale Jones riffle splitter or a rotary sampling device. |
|
|
|
| • | The pulverising size for the currently prepared standards is coarser than is generally used and the mixing (homogenisation) procedure may not be sufficient. The quality of the standards should be further evaluated as being suitable for QC. |
The methodology for measuring the bulk density of the rock types currently employed by Lundin may lead to a risk of bias in highly absorbent rocks. The sequence in which the measurements are taken may lead to the sample absorbing more water when P3 is measured than was present when P1 was measured thereby increasing the dry density. Golder does not believe this has a material impact on the estimation of densities but should be investigated.
|
|
|
|
|
|
31 March 2009 | 4 |
|
|
|
| TECHNICAL REPORT AGUABLANCA NI-CU DEPOSIT |
|
|
2.0 | INTRODUCTION |
|
|
2.1 | Preamble |
Golder Associates Global Ibérica, S.L. (Golder) was commissioned by Mr Aden Muñoz of Lundin Mining Corporation (Lundin) to complete an independent Mineral Resource and Mineral Reserve estimation of the Aguablanca Deposit of the Aguablanca Mine.
This report details the results of work carried out by Golder between July 2008 and March 2009 and provides a statement of Mineral Resources and Mineral Reserves for the Aguablanca Deposit, which have been classified in conformance with the CIM Mineral Resource and Mineral Reserve definitions referred to in the National Instrument (NI) 43-101, Standards of Disclosure for Mineral Projects. It also involved the preparation of a Technical Report as defined in NI 43-101 and in compliance with Form 43-101F1 (the “Technical Report”).
This report is intended to be used by Lundin subject to the terms and conditions of its contract with Golder. That contract permits Lundin to file this report as a Technical Report with Canadian Securities Regulatory Authorities pursuant to provincial securities legislation. Except for the purposes legislated under provincial securities laws, any other use of this report by any third party is at that party’s sole risk.
The qualified persons (QP) responsible for the preparation of this Technical Report are Dr. Sia Khosrowshahi PhD, MSc, BSc, FAusIMM, Mr. Juan Alvarez, BSc, MAusIMM, Mr. Juan Pablo Gonzalez, MBA, MAusIMM and Mr. Stephen Gatley, IMMM, CEng. Mr. Alvarez was responsible for the preparation Sections 1.0 to 14.0, Section 17.1 to 17.3 and Sections 19.0 to 22.0 Dr. Khosrowshahi was responsible for the preparation Sections 17.4 to 17.11. Mr. Gonzalez was responsible for the preparation of the Reserve Estimation section of the report (Section 17.12). Mr. Gatley was responsible for the preparation of Sections 15.0 16.0, 18.0 and 23.0 of the report.
A site visit was conducted by Mr. J. Alvarez for four days from July 21 2008 and for five days from August 18 2008, to observe drilling, drill hole survey systems, core logging and sampling preparation procedures as defined by Aguablanca’s QAQC sampling protocols. During the site visit, both Ni and Cu mineralization were observed in quantities that are consistent with the Mineral Resource reported for this deposit.
A site visit was conducted by Mr. J.P. Gonzalez for three days from August 6 2008, to discuss mine stability and geotechnical aspects and to observe mining operations carried out on site. During the visit it was possible to observe and discuss on Reserve Estimation parameters with Aguablanca personnel. Mining production was also observed in quantities that are consistent with the production capacity used to define the Mineral Reserves reported for this deposit.
|
|
|
|
|
|
31 March 2009 | 5 |
|
|
|
| TECHNICAL REPORT AGUABLANCA NI-CU DEPOSIT |
The sources of information that were provided in the preparation of the independent mineral resource estimate (Section 11.0 to 14.0 and 17.1 to 17.11) were provided by Lundin under the direction of Mr Enrique Martínez (Chief Geologist, Aguablanca Mine) and also referenced from sections of the Aguablanca Nickel-Copper Feasibility Report (MDM, 2002) and Tornoset. al. 2006. These sources of information include:
|
|
• | Various internal geological presentations; |
|
|
• | Drill hole database as at August 28, 2008 including results of quality assurance and quality control (QAQC) check assays and rock densities; |
|
|
• | Digitised geological sectional interpretations prepared by Lundin; |
|
|
• | Topographic surface; and |
|
|
• | Pit and underground development plans in digital format. |
The sources of information that were provided in the preparation of the independent mineral reserve estimate (Section 17.12) were provided by Lundin under the direction of Mr Andén Muñoz (Mine Manager, Aguablanca Mine) and also referenced from sections of the Aguablanca Nickel-Copper Feasibility Report (MDM, 2002).
The effective date of the updated Aguablanca property Technical Report is March 31 2009.
|
|
2.2 | Terms of reference |
All units of measure (see Table 1) used in this report are in the metric system, unless stated otherwise. The contained metal abundances shown in the mineral resource estimate for nickel, copper and cobalt are in parts per million (ppm) while platinum, palladium and gold and silver are expressed in parts per billion (ppb). Currencies outlined in the report are in US dollars unless otherwise stated.
|
|
|
|
|
|
31 March 2009 | 6 |
|
|
|
| TECHNICAL REPORT AGUABLANCA NI-CU DEPOSIT |
Table 1: Units of measure and abbreviations
|
|
Centimetre | cm |
comma separated values | csv |
Degree | ° |
Degrees Celsius | °C |
Drawing Exchange Format | dxf |
From Origin of Business | FOB |
Gram | g |
Grams per tonne | g/t |
Greater than | > |
Hectare (10,000 m2) | ha |
Inverse Distance to the Power | IDP |
Kilogram | kg |
Kilometre | km |
Less than | < |
Life of mine | LOM |
Meter | m |
Micrometre (micron) | µm |
Millimetre | mm |
Million pounds | Mlbs |
Million Tonnes | Mt |
Ordinary Kriging | OK |
Percent | % |
Parts per million | ppm |
Parts per billion | ppb |
Quality assurance and quality control | QAQC |
|
|
2.3 | Scope of Work |
The scope of work involves the production of Mineral Resources and Mineral Reserves for the Aguablanca Deposit, classified in conformance with the CIM Mineral Resource and Mineral Reserve definitions referred to in the National Instrument (NI) 43-101, Standards of Disclosure for Mineral Projects and the preparation of a Technical Report as defined in NI 43-101 and in compliance with Form 43-101F1 (the “Technical Report”).
|
|
|
|
|
|
31 March 2009 | 7 |
|
|
|
| TECHNICAL REPORT AGUABLANCA NI-CU DEPOSIT |
|
|
3.0 | RELIANCE ON OTHER EXPERTS |
The first Technical Report for the Aguablanca Property was published by Metallurgical Design and Management (Pty) Ltd (MDM, 2002). Information provided with respect to mineral tenure, environment, accessibility, permitting, geology and history were relied upon from the MDM Technical Report.
The authors have made no attempt to independently verify the legal status and ownership of the property claims and have relied on the information provided by Lundin.
|
|
|
|
|
|
31 March 2009 | 8 |
|
|
|
| TECHNICAL REPORT AGUABLANCA NI-CU DEPOSIT |
|
|
4.0 | PROPERTY DESCRIPTION AND LOCATION |
The Aguablanca Mine is 100% owned by Lundin Mining Corporation and is located approximately 100 km north of Seville within the Monesterio municipal boundary in the south of Badajoz Province (Extremadura Region), and close to the Huelva and Sevilla (Andalucia Region) provincial boundaries, in the south of Spain. It lies at Latitude 37°57´40´´ and Longitude 6°11´7´´.
The closest villages are Real de la Jara, 2 km south-east, and Santa Olalla de la Cala, 10 km southwest. The village of Santa Olalla del Cala is on the N630 national route, between Sevilla in the south and Merida in the north. Monesterio, with a population of approximately 10,000 is located approximately 30 km north.
A location diagram is shown in Figure 4-1.
Figure 4-1: Location of the Aguablanca mine

|
|
|
|
|
|
31 March 2009 | 9 |
|
|
|
| TECHNICAL REPORT AGUABLANCA NI-CU DEPOSIT |
Lundin holds various mineral licenses and exploration permits covering an area greater than 350 hectares (ha). The mining rights are covered under theReserva Definitiva a favor del Estado called La Moneguera which covers 95 contiguous claims with a surface area of 2,861.94 ha. AReserva Definitivadenotes a state mineral or “strategic” reserve and therefore the responsible government agencies for its control are the central government, not the regional government. The boundaries are valid for 30 years extendable for another 30. TheReserva Definitiva is shown in Figure 4-2.
The Aguablanca Operation consists of an open pit mine and an on-site processing plant. Mining takes place via conventional open pit methods utilizing shovels and haul trucks. At full operating capacity the mine can produce 1.85 million tonnes of ore a year, and in 2008 produced 8,136 tonnes of Ni and 7,071 tonnes of Cu in concentrate.
Figure 4-2: Aguablanca mining rights

|
|
|
|
|
|
31 March 2009 | 10 |
|
|
|
| TECHNICAL REPORT AGUABLANCA NI-CU DEPOSIT |
|
|
5.0 | ACCESSIBILITY, CLIMATE, LOCAL RESOURCES, INFRASTRUCTURE AND PHYSIOGRAPHY |
Accessibility, physiography, climate and infrastructure sections were summarized in the MDM Report (2002) and are as follows.
|
|
5.1 | Access |
The Aguablanca Mine is accessed via the paved, four lane N630 national highway from Seville. The highway runs approximately 100 km north from Seville towards the town of Santa Olalla del Cala. Visitors to the mine then turn off the N630 and head east on the paved A-5301 for approximately 8.5 km to the town of El Real de la Jara. Visitors access the mine via the paved Camino de Aguablanca for approximately 3 km directly to the mine.
|
|
5.2 | Climate |
The Aguablanca region has a Mediterranean climate. Temperatures in the summer months (May to October), range from 10° C to 33°C. Temperatures in the cool winter months (November to April) range from 3° C to 18°C. Rainfall and light snow prevail in this period.
|
|
5.3 | Landform and vegetation |
The Aguablanca Mine is at an elevation of 450 m to 500 m above sea level and the geography comprises low hills with moderate relief. The area is covered with trees and bushes forming the classical type of Mediterranean forest of the mountains of central and southern Spain. The area is vegetated with meadows comprising grass, oak trees and small olive trees.
|
|
|
|
|
|
31 March 2009 | 11 |
|
|
|
| TECHNICAL REPORT AGUABLANCA NI-CU DEPOSIT |
|
|
6.0 | HISTORY |
The historical ownership and exploration are summarized in the MDM Report (2002) and are as follows.
|
|
6.1 | Historical ownership |
|
|
| Exploration for nickel and copper deposits has been carried out in the area since the mid 1980’s. In 1986, the areas known as “La Monaguera” and “La Remonta”, which covered a total area of over 620,000 ha in the Provinces of Huelva and Badajos, were declared a State Reserve for Mineral Investigation and the investigation rights were awarded to Presur, the State Corporation which later entered into a joint venture agreement with Rio Tinto Minera (RTM). |
|
|
| In 1993, the Presur/Rio Tinto Minera Joint Venture discovered the Aguablanca target by further geochemical stream sediment and soil sampling and in 1994 discovered the Aguablanca Ni-Cu deposit by diamond drilling. During 1996, Freeport McMoRan Copper and Gold Company acquired Rio Tinto’s Spanish assets and later transferred their interest in the deposit to the newly formed subsidiary, Atlantic Copper S.A. |
|
|
| By March 1997, the State Reserves were categorised as either a “Priority Area”, in which Atlantic and Presur each had a 50% interest with the remainder categorized as “Secondary Area” in which Presur had a 100% interest. Under the terms of the Joint Venture agreement Atlantic had the option to include areas within the “Secondary Area” in the “Priority Area”, thereby giving Atlantic the right to a 50% interest. |
|
|
| In March 2001, Rio Narcea Recursos (RNR), a wholly owned Spanish subsidiary of Rio Narcea Gold Mines Ltd (RNGM) signed an option agreement with Atlantic Copper S.A. and the Spanish Government and in mid 2001, after due diligence work, exercised its option to acquire 100% interest in the Aguablanca project by purchasing 50% interest in the Monaguera Mineral Reserve from Atlantic Copper S.A. |
The Aguablanca mine was acquired by Lundin in July 2007, through its purchase of RNGM. Commercial production started in January 2005 and the first nickel-copper concentrate was sold in May 2005. In conjunction with the commencement of open pit operations, a 2,700 m long ramp to access the mineralization below the Aguablanca open pit was developed and completed in 2005. This facilitated commencement of an underground exploration drilling program to test the continuation of mineralization at depth. This was completed in 2008.
|
|
|
|
|
|
31 March 2009 | 12 |
|
|
|
| TECHNICAL REPORT AGUABLANCA NI-CU DEPOSIT |
|
|
6.2 | Historical exploration |
|
|
| Exploration has been carried out in the area since the mid 1980’s. |
|
|
| From 1986 to 1994, the Presur/RTM Joint Venture carried out geochemical stream sediment and soil sampling and diamond drilling in the area leading to the delineation of the Aguablanca target. Between 1994 and 1997, RTM carried out some 32,000 m of diamond drilling, completed a 65 m long adit for bulk sampling and a Pre-feasibility Study on an open pit. |
|
|
6.3 | Historical resource estimates |
|
|
| RTM estimated an initial Mineral Resource totalling some 18.9 million tonnes at an average grade of 0.67% Ni and 0.46% Cu with a stripping waste to ore ratio of 4.3 to 1. RTM then estimated the in-pit Mineral Resources to total some 12.4 million tonnes at an average grade of 0.80% Ni and 0.54% Cu with a stripping ratio of 4.45 to 1. |
|
|
Golder believes that the RTM historical resource estimates was not estimated in conformity with the categories outlined in Sections 1.2 and 1.3 of NI 43-101, are not current and should not be relied upon. | |
| |
| In August 2000, a Mineral Resource was estimated by Alan C. Noble of O.R.E. Reserves Engineering, Colorado USA (ORE). This estimate was based on a three-dimensional geological block model within an envelope of 0.1% Ni and was estimated using a 0.2% Ni cut-off based on a 4*4*4 block model using the results of drilling completed by RTM + RNR. Block grades for Ni, Cu, Au, Co, Pt + Pd were interpolated using IDP methods. |
|
|
| As an internal check, ORE utilized three other methods of estimating Mineral Resources and reported that the tonnage and grade estimates varied by about 8%. |
|
|
| The Measured and Indicated Resources of ORE estimate are reported as 19.7 million tonnes at an average grade of 0.66% Ni, 0.48% Cu, 0.50 g/t PGE (combined), 0.13 g/t Au and 0.02% Co. ORE also estimated an Inferred Resource of 6 million tonnes at an average grade of 0.53% Ni, 0.46% Cu, 0.40 g/t PGE (combined), 0.13 g/t Au and 0.02% Co. |
According to Lundin staff, the ORE Mineral Resource was estimated in conformity with the categories outlined in sections 1.2 and 1.3 of NI 43-101.
|
|
|
|
|
|
31 March 2009 | 13 |
|
|
|
| TECHNICAL REPORT AGUABLANCA NI-CU DEPOSIT |
|
|
6.4 | Historical production |
There was no historical production of the deposit before the current mining operation, started by RNR in 2005.
|
|
|
|
|
|
31 March 2009 | 14 |
|
|
|
| TECHNICAL REPORT AGUABLANCA NI-CU DEPOSIT |
|
|
7.0 | GEOLOGICAL SETTING |
|
|
7.1 | Regional Geology |
The regional geology of the area is described in detail in Tornos,et al (2006) and is as follows.
|
|
| The Aguablanca nickel-copper-PGM deposit is located in the Aguablanca Stock which forms part of the north eastern zone of the Santa Olalla Plutonic Complex, within the southernmost part of the Ossa Morena Zone of the Varsican Belt of Iberia. (Figure 7-1). |
|
|
| The Ossa Morena Zone underwent a complex geodynamic evolution with a Neoproterozoic Cadomian basement reworked by the Variscan Orogeny. The Cadomian Orogeny resulted from the subduction and subsequent collision of the exotic Ossa Morena terrane with the autochthonous Iberian terrane in the Late Neoproterozoic to Early Cambrian. The Variscan Orogeny resulted from the oblique collision of the South Portuguese terrane with the southern margin of the Iberian Massif in the Devonian to Early Carboniferous. The Ossa Morena Zone hosts a wide suite of igneous rocks related to the two orogenies and to an intermediate rift-related pulse of Cambrian–Ordovician age. |
|
|
| Variscan plutonism is volumetrically dominant and consists of calcalkaline metaluminous composite intrusions ranging in composition from gabbro to granodiorite and minor peraluminous granite. During the Variscan deformation, the Ossa Morena Zone underwent thick-skinned deformation with the development of south-verging longitudinal fold-and-thrust zones that involved both the Cadomian basement and the Palaeozoic sedimentary cover. There are abundant contemporaneous and younger strike-slip faults. All these structures show evidence of formation in a transpressional setting in response to oblique subduction and played a major role in focusing magma ascent and pluton formation. |
|
|
| The Aguablanca Stock and other intrusions are part of the Santa Olalla Plutonic Complex within the Ossa Morena Zone. The Plutonic Complex reached its final emplacement level after the main thrusting and folding phase of the Variscan Orogeny and produced an aureole of contact metamorphism about 2 km wide. Temperatures within the aureole attained values of the hypersthene hornfels facies (ca. 750°C) near the contact with the Aguablanca Stock, resulting in local partial melting. A depth of 1.7 to 3.5 km (0.5–1 kbar) was inferred for its emplacement from metamorphic mineral equilibria. Widespread garnet-pyroxene± magnetite skarn and minormagnesian skarn were formed by replacement of the marble and calc-silicate rocks before final emplacement of the Aguablanca Stock. |
|
|
|
|
|
|
31 March 2009 | 15 |
|
|
|
| TECHNICAL REPORT AGUABLANCA NI-CU DEPOSIT |
Figure 7-1: Geology of the Central part of the Ossa Morena Zone (Tornos.et al, 2006)

|
|
7.2 | Property description |
|
|
| The Aguablanca Property hosts the Aguablanca Stock and is located in the northeast of the Santa Olalla Plutonic Complex which has yielded absolute ages of 338.6±0.8 Ma and 344±1.1 Ma. It is a small (ca. 10 km2) and highly heterogeneous intrusion. The outer contacts are both concordant and discordant, and the internal architecture of the stock is interpreted as a half bell jar. Detailed surface mapping suggests that the roof of the intrusion is close to the present erosion level as evidenced by the presence of roof pendants of skarnified marble and calc-silicate hornfels. |
|
|
| The intrusion consists of medium grained gabbro and gabbro-norites. They have an inequigranular subeuhedral texture and consist of 2 to 3-mm sized crystals of weakly zoned plagioclase of intermediate composition, diopside–augite, actinolitic hornblende, and biotite–phlogopite. Accessory minerals include quartz and trace amounts of apatite, pyrrhotite, and zircon. |
|
|
| The gabbro-norite, which hosts the majority of the mineralization, consists for the most part of medium-grained massive gabbronorite with lesser amounts of pyroxene gabbro and norite. Subhorizontal veins of pegmatitic gabbro and scapolite are locally present. At the contact with the host metasedimentary rocks, there is a discontinuous and up to 5 to 6 m thick margin of fine-grained, phlogopite-rich gabbro. |
|
|
| The Aguablanca Stock has abundant xenoliths of the host rocks, ranging in size from centimetres to several metres, particularly garnet-pyroxene skarn and pelitic and calc-silicate hornfels. |
|
|
|
|
|
|
31 March 2009 | 16 |
|
|
|
| TECHNICAL REPORT AGUABLANCA NI-CU DEPOSIT |
Figure 7-2: Map of the Aguablanca Stock and surrounding geology (Tornos. et al, 2006)

|
|
|
|
|
|
31 March 2009 | 17 |
|
|
|
| TECHNICAL REPORT AGUABLANCA NI-CU DEPOSIT |
|
|
8.0 | DEPOSIT TYPES |
|
|
8.1 | Mineral genesis |
The following model for the genesis of mineralization at Aguablanca has been proposed by Lundin staff on site.
Mineralization at Aguablanca occurs in igneous rocks formed by partial melting of the mantle. When basalt magma is emplaced within the crust, it cools slowly at depth and forms gabbro which is the host rock of the Aguablanca mineralization.
Mantle derived magmas, however, have the potential to form a separate, immiscible magma or liquid of iron sulphide composition into which the small amounts of Ni and Cu may be concentrated and eventually crystallize as discrete sulphide minerals.
At Aguablanca, the sulphur necessary to concentrate Ni and Cu in the magma is abundantly found in the Proterozoic to Cambrian pyrite-rich sediments. Magma rising through the crust passes through sulphur-rich sedimentary rock unit. Sulphur is dissolved in the gabbroic magma.
The magma is emplaced in the upper part of the crust and as it cools droplets of immiscible iron sulphide liquid appear in the magma. These droplets are denser than the gabbro, and fall through the magma to accumulate at the bottom of the magmatic chamber, forming massive to semi-massive mineralization. As the sulphide droplets pass through the magma, they pick up trace metals that partition preferentially into sulphide liquid rather than the silicate magma. Traces of metals such as Cu and Ni, and others such as Co, Pt and Pd, will also be concentrated in the sulphide liquid. This sulphide liquid will eventually cool and form sulphide minerals. The last droplets of sulphide liquid to separate would be trapped by the crystallizing magma as disseminated sulphide mineralization. A schematic diagram of the mineral genesis model of the Aguablanca deposit is shown in Figure 8-1.
A clear transition from semi-massive mineralized breccia in the central part of the Aguablanca mineralization to disseminated mineralization along both sides of the central breccia, suggests a vertical, “feeder like” emplacement of the mineralization. The deepest portion of the main body is still open and it is precisely here that most of the evidence for a chamber bottom is found (increasing mafic lithologies and layering or oriented patches of sulphides), although the relationship of the chamber bottom to the upper mineralized zones has not yet been established.
|
|
|
|
|
|
31 March 2009 | 18 |
|
|
|
| TECHNICAL REPORT AGUABLANCA NI-CU DEPOSIT |
Figure 8-1: General model for the formation of a Ni-Cu-PGM sulphide mineralization (Lundin, 2004)

|
|
|
|
|
|
31 March 2009 | 19 |
|
|
|
| TECHNICAL REPORT AGUABLANCA NI-CU DEPOSIT |
|
|
9.0 | MINERALIZATION |
|
|
9.1 | Mineral zones |
The Aguablanca deposit consists of magmatic sulphide mineralization hosted by the gabbro and gabbro-norite units. Sulphide mineralization is predominantly represented by pyrrhotite, pentlandite, chalcopyrite and pyrite with minor marcasite and covellite. Magnetite is often present. Lesser amounts of platinum group minerals (PGM) and gold are also associated with the sulphide minerals.
Mineralization is generally hosted within the Aguablanca Stock in a chaotic magmatic breccia, rich in fragments, in the matrix of which can be found semi-massive sulphides. The mineralization often grades laterally into more continuous disseminated sulphides and irregular patchy mineralization with variable textures. The main mineralization types are discussed in detail in Section 9.3.
The mineralized body consists of two sub-parallel zones of mineralization, elongated in an east west direction and dipping subvertically. The larger South or Main Zone can be traced for 400 metres along an N115º orientation and dips between 75º and 80º to the north. This zone is over 100 metres thick and extends to a depth of more than 600 metres. The mineralization has a plunge of N65º to N80ºE. The North Zone contacts with the surrounding metamorphic country rocks and strikes N115º and is approximately 125 metres long in the strike direction, 50 metres thick and extends to a depth of more than 300 metres.
The deepest portion of the South Zone (called the deep zone) appears to have an average true thickness of approximately 50 metres. The deep zone is different from the upper mineralization in geometry, geochemistry and magmatic texture. Its relationship to the uppermost mineralized zone has not yet been determined but the presence of ultramafic rocks including pyroxenites and peridotites in some of the deepest drill holes suggest magmatic segregation.
Controlled by the geometry of the lithologies, both mineralized zones have a similar shape, with a central axis where the magmatic breccias (Gsb and Gb) are developed in and frequently associated with irregular gabbros. The central lithologies of the mineralized zones grade laterally into melanocratic, porphyritic and plagioclase gabbro.
Figure 9-1 is a section view at 7250 E local grid of the Aguablanca mineralized body as interpreted by Lundin staff showing the typical geometry of the mineralized zones.
|
|
|
|
|
|
31 March 2009 | 20 |
|
|
|
| TECHNICAL REPORT AGUABLANCA NI-CU DEPOSIT |
Figure 9-1: Section 7250 E as interpreted by Lundin staff showing South, North and Deep Zones

|
|
|
|
|
|
31 March 2009 | 21 |
|
|
|
| TECHNICAL REPORT AGUABLANCA NI-CU DEPOSIT |
|
|
9.2 | Fault systems |
The mineralized body is cut by a series of post mineralization strike slip faults (F1 to F3) striking N40°E and dipping between 75° to 80° to the SE. In plan, the apparent movement is minor, left lateral with one major fault of this system which is cutting both zones at surface and at depth. Each of the faults has a significant 50 to 100 meter vertical component of displacement.
This fault system forms the lateral limits of both the mineral zones and has a strong control on the mineralization. In particular, high grade Ni-Cu-PGE mineralization abruptly terminates against one of these faults at the eastern limit of the Main Zone. The major faults and their relationship with the Aguablanca mineralization is shown in Figure 9-2.
Figure 9-2: Plan 458 Z showing the South and North Zones and important faults as interpreted by Lundin staff

|
|
|
|
|
|
31 March 2009 | 22 |
|
|
|
| TECHNICAL REPORT AGUABLANCA NI-CU DEPOSIT |
|
|
9.3 | Mineral types |
The main types of sulphide mineralization recognized at Aguablanca include massive to semi-massive mineralization (SB). This is further classified into disseminated (SS and S) and irregular (SP) mineralization in patches and lenses.
|
|
9.3.1 | Massive to semi-massive mineralization (SB) |
This mineralization is associated with magmatic breccia which consists of sub-angular fragments of unmineralized clinopyroxenes and gabbros in a matrix of semi-massive sulphides. It is often narrow and discontinuous. Sulphides constitute 30% to 60% of the rock and pyrrhotite and pentlandite are dominant, while chalcopyrite is less common and cobaltite is occasionally present. Typical grades for this style of mineralization are between 1% and 4% Ni and less than 1% Cu. Within the higher-grade portions of the deposit (>1.0% Ni) the Ni/Cu ratios range from 3 to 5. The PGM’s identified include sperrylite (PtAs2) and michenerite [(Pd,Pt),BiTe)]. An example is shown in Figure 9-3.
Figure 9-3: Magmatic breccia (Gsb) with semi-massive sulphides (SB)

|
|
|
|
|
|
31 March 2009 | 23 |
|
|
|
| TECHNICAL REPORT AGUABLANCA NI-CU DEPOSIT |
|
|
9.3.2 | Disseminated mineralization (SS and S) |
This type of mineralization is categorised by Lundin staff as either “Strong” (SS) or “Weak” (S) and is characterised by sulphides interstitial to the silicates (pyroxene, amphibole and plagioclase). It is generally associated with porphyritic gabbro (GP) and sometimes occurs in melanocratic gabbro (GM). It is much more continuous than massive sulphide type and often present as an envelope of disseminated sulphide (0.2% Ni to 1.0% Ni) surrounding the higher-grade brecciated zones. Pyrrhotite, chalcopyrite and pentlandite are the main sulphides and constitute up to 20% of the rock, with the Ni/Cu ratios ranging from 1 to 1.5.
The “Strong” type of mineralization typically contains between 10% and 20 % sulphides and more than 0.7% Ni. The “Weak” type typically contains between 5% to 10% sulphides and less than 0.7% Ni. An example of disseminated mineralization is shown in Figure 9-4.
Figure 9-4: Porphyritic Gabbro (GP) with disseminated sulphides (S)

|
|
9.3.3 | Irregular mineralization in patches (SP) |
This mineralization contains variable amounts of sulphides in patches, lenses, aggregates or bands. It is associated with irregular gabbro (GI) and magmatic breccia (Gb), where the crystallization of the magma was turbulent or irregular and associated with contamination from the surrounding host rocks. It is typical of the distal parts of the deposit and represents the transition zone from the disseminated mineralization to the barren lithologies. An example is shown in Figure 9-5.
|
|
|
|
|
|
31 March 2009 | 24 |
|
|
|
| TECHNICAL REPORT AGUABLANCA NI-CU DEPOSIT |
Figure 9-5: Gabbro with irregular mineralization in patches

The mineralization type is closely related to a specific lithology. Although several types of mineralization occur in the breccia, semi-massive sulphides occur only in the breccia. Regular disseminated sulphides occur in gabbros with well developed crystalline frames (GM, GP, GPL, etc), and variable amounts of sulphides in patches are found in the gabbros with irregular textures (GI). Consequently the same symmetrical sketch is observed for the mineralization; a central breccia with semi-massive, disseminated or patchy mineralization, irregular mineralization in patches associated with irregular gabbro, and disseminated sulphides decreasing away from the central core.
|
|
|
|
|
|
31 March 2009 | 25 |
|
|
|
| TECHNICAL REPORT AGUABLANCA NI-CU DEPOSIT |
|
|
10.0 | EXPLORATION |
Exploration has been carried out in the area since the mid 1980’s. Geochemical stream sediment and soil sampling by the Presur/RTM Joint Venture between 1986 and 1994 delineated a drilling target. This target was drilled using diamond drilling methods by RTM and later by RNR and most recently by Lundin. A full account of the exploration history is shown in Section 6.2.
Since 2001, RNR/Lundin has drilled more than 260 diamond drill holes for some 64,000 m of surface and underground drilling. The drilling program was completed in 2008. RNR also completed a 2,700 m underground decline in 2005.
The current drill hole database includes over 32,000 m of diamond drilling, carried out by RTM from 1994 and 64,000 m of surface and underground drilling completed since 2001 by RNR and Lundin as detailed in Section 6.2. The drill hole database supplied to Golder contains a total of 362 drill holes for a total of 96,515 m.
AGU prefixes denote drilling undertaken by Rio Narcea. Drilling numbers without alpha numeric prefixes identify legacy holes drilled by RTM. The legacy drilling used single shot down hole surveying methods, measuring only the dip of the holes and not the azimuth. The holes were re-logged and re-assayed by Lundin and plotted on sections. Twenty drill holes which were considered by Lundin to have unacceptable down hole survey readings were removed from the drilling database. These holes are listed in Table 2.
Table 2: Drill holes removed from the database because of low confidence survey information
|
|
Hole id | |
6739 | 6758 |
6536 | 6758R |
6735 | AGU-46 |
6646 | AGU-47R |
6741 | 6715 |
6754 | 6630 |
Adit | 6750 |
6740 | 6718 |
6763 | 6729 |
6739 | AGU-46 |
6536 | AGU-47R |
6735 | 6715 |
6646 | 6630 |
6741 | 6750 |
6754 | 6718 |
Adit | 6729 |
6740 | 6763 |
|
|
|
|
|
|
31 March 2009 | 26 |
|
|
|
| TECHNICAL REPORT AGUABLANCA NI-CU DEPOSIT |
|
|
11.0 | DRILLING |
Resource definition and infill drilling at the Aguablanca Mine used two underground drill rigs and one surface drill rig around the periphery of the pit. These rigs are operated by Geonor Ltd and CGS Spanish drill contractors.
The current Aguablanca drill hole database contains a total of 362 drill holes for a total of 96,515 m. Lundin has completed 64,000 m of surface and underground drilling since 2001. The drilling coverage for the Aguablanca Project used in the 2009 Resource Estimate is shown in Figure 11-1.
The resource definition drill fleet currently comprises a Sandvik DE 140 underground diamond drill rig, an Omran wireline underground diamond drill rig and an ACKER MP8 surface diamond drill rig. Both the underground rigs are capable of drilling at least 400 m deep HQ (77.8 mm) and NQ (60.3 mm) diameter core.
The core diameter depends on the planned length of the hole (i.e. smaller diameter for longer holes), the information being targeted (i.e. larger diameter for geotechnical holes), and the likely geological units to be encountered (i.e. larger diameter if the hole is likely to go through a major fault zone).
Golder believes the drilling method of wireline with diamond core triple-tube is appropriate for the deposit. Golder believe the drill hole orientations are appropriate to intersect the mineralized zone.
|
|
|
|
|
|
31 March 2009 | 27 |
|
|
|
| TECHNICAL REPORT AGUABLANCA NI-CU DEPOSIT |
Figure 11-1: Aguablanca project drilling coverage

|
|
|
|
|
|
31 March 2009 | 28 |
|
|
|
| TECHNICAL REPORT AGUABLANCA NI-CU DEPOSIT |
|
|
11.1 | Down hole surveying and orientation |
Surveying of some historical holes was carried out by single shot methods as detailed in Section 10.0 which is considered by Golder to be a poor quality down hole survey method as only the dip was measured.
Down hole survey is currently carried out at 3 m intervals using Maxibore surveying equipment. The tool collects the dip and azimuth of the hole and this data is input into the drilling database. Magnetic rocks will not affect the performance of this survey tool.
Validation of the Maxibore tool is carried out by site personnel by running the tool through a 40 m length poly-pipe (simulating a drill hole) located on surface which has been surveyed using a total station. The results of the Maxibore and the total station survey are compared. This test is carried out every few months. The results were made available to Golder and these and the method are considered by Golder to be appropriate for the style of deposit. Rio Narcea has instigated a method for validating and checking the performance of the down hole survey tool which should be continued.
The core orientation is carried out using the Reflex method (see description at http://www.reflexinstruments.com/products.php?ID=16). This method has been examined and accepted by Golder at other sites.
|
|
11.2 | Grade control drilling |
Additional drilling and sampling is carried out by open hole percussion rigs for the purpose of grade control drilling. These holes are drilled to the depth of one bench (8 m), plus 0.5 m of sub drill. The sample is collected by spearing through the various parts of the cuttings around the drill collar using a stainless steel tube until a sample of approximately 10 to 15 kg in the mineral zone and 4 kg on the mineral/waste boundary is achieved. These samples are sent to the on-site laboratory for sample preparation and chemical analysis. This sampling practice is common amongst operating mines but the quality of the data gathered from the practice is considered by Golder to be poor due to the nature of the drilling and sampling methods employed and therefore these are not included in the Mineral Resource database.
|
|
|
|
|
|
31 March 2009 | 29 |
|
|
|
| TECHNICAL REPORT AGUABLANCA NI-CU DEPOSIT |
|
|
12.0 | SAMPLING METHOD AND APPROACH |
|
|
12.1 | Core collection |
Drill core is recovered in 3 m runs from the drill rig and placed in purpose built, wooden core trays. Wooden depth markers are placed in the boxes at the end of each ‘run’ or at regular depth intervals. The core boxes are appropriately numbered and labelled with indelible ink and incorporate the hole number, box number, metres and depth (Figure 12-1). Core is transported to the site core shed by utility vehicle. The labels were observed by Golder to be correct and appropriately reflect core intervals. It was also observed that core blocks were present and correct in the holes inspected by Golder.
Golder considers that the core handling procedures and core box labelling are appropriate.
Figure 12-1: Labelling of core boxes for Aguablanca resource drilling

|
|
|
|
|
|
31 March 2009 | 30 |
|
|
|
| TECHNICAL REPORT AGUABLANCA NI-CU DEPOSIT |
|
|
12.2 | Core storage and photography |
The core is stored in a covered core shed located at the mine site (Figure 12-2). The core is systematically photographed using a rack and a standard labelling system. This is shown in Figure 12-3.
Figure 12-2: Aguablanca core shed

Figure 12-3: Example of core photography

|
|
|
|
|
|
31 March 2009 | 31 |
|
|
|
| TECHNICAL REPORT AGUABLANCA NI-CU DEPOSIT |
12.3 Sampling
The drill core is cut in half with a core saw perpendicular to the predominant foliation of the rock (Figure 12-4) and sampled at approximately 2 m intervals, always sampling the same side of the core. Sampling intervals are broken by lithology. The maximum sampling interval is 2.2 m and the minimum sampling interval is 0.5 m.
The core samples are placed in a thick plastic bag with a sample identification tag placed inside the bag and sent to a site laboratory.
Figure 12-4: Correct core sawing orientation being used at Aguablanca

Potential loss of fines material from the core during sawing is not considered by Golder to impact on the sampling of mineralisation due to the competency of the core.
The current sampling interval and methodology is considered by Golder to be suitable for this style of deposit.
12.4 Logging
Drilled core is received at the Aguablanca core shed for logging and sampling. The core is simultaneously logged for geology and geotechnical parameters, and marked out for sampling. Geologists mark the sampling contacts onto the core box with a suitable marker and logging information is recorded on paper and later transposed to Microsoft Excel spreadsheets.
The core is logged using 23 codes for lithology and 4 codes for mineralogy. The geological unit, major faults, fragments types, alteration type, and estimated sulphide percentage are also logged.
|
|
|
|
|
|
31 March 2009 | 32 |
|
|
|
| TECHNICAL REPORT AGUABLANCA NI-CU DEPOSIT |
The list of codes for logging is shown in Table 3 and an example of a completed logging sheet is shown in Figure 12-5.
Table 3: Aguablanca logging codes
|
|
|
|
|
|
|
Rock Type |
| Code |
| Description | ||
Igneous rocks |
| Gabbros |
| GM |
| Melanocratic gabbro: low plagioclase content |
|
| GP |
| Porphyritic gabbro (gabbro-norite): porphyritic crystals of euhedral plagioclase in a pyroxenite matrix | ||
|
| GPL |
| Plagioclase gabbro: abundant plagioclase. | ||
|
| GD |
| Doleritic gabbro: abundant plagioclase connected with doleritic textures | ||
|
| GI |
| Irregular gabbro: variable texture variable, zones of poor crystallization and/or contaminates | ||
|
| GC |
| Contact gabbro: chilled texture chilled, fine grained, generally brecciated and/or banded | ||
|
| Gsm |
| Gabbro with abundant alteration to serpentinite-magnetite-talc. Associated with skarn | ||
| ||||||
| Breccias |
| Gb |
| Magmatic Breccia with enclosed fragments. Gabbroic Matrix gabbroic with or without sulphides | |
|
| Gsb |
| Magmatic Breccia with enclosed fragments. Semi massive sulphide matrix | ||
| ||||||
| Others |
| PX |
| Pyroxenite | |
|
| DI |
| Dioritic rocks | ||
|
| GR |
| Granite-Granodiorite | ||
|
| AN |
| Anorthosite bands and fragments, Calc silicate rocks | ||
Metamorphics |
|
|
| M |
| Banded marble |
|
|
| SK |
| Pyroxenite skarn | |
|
|
| ES |
| Endoskarn | |
|
|
| H |
| Hornfels | |
|
|
| VS |
| Volcano-sedimentary rocks | |
|
|
| PZ |
| Slates with volcanic intercalations | |
Others |
|
|
| OX |
| Gossan |
|
|
| ZF |
| Fault zone. Very fractured gabbro | |
|
|
| REC |
| Fold | |
|
|
| NR |
| Not recovered | |
| ||||||
|
|
|
|
|
|
31 March 2009 | 33 |
|
|
|
| TECHNICAL REPORT AGUABLANCA NI-CU DEPOSIT |
|
|
|
|
|
|
|
|
|
Mineralization |
| Code |
| Description |
| % |
| % |
|
|
|
|
|
|
|
|
|
Sterile |
| NS |
| No sulphides |
| <1 |
| <0.05 |
Disseminated |
| S |
| Disseminated intergranular, weak to moderate po- pn>=cpy>>py |
| 5-10 |
| <0.7 |
| SS |
| Disseminated intergranular, strong po-pn>=cpy>>py |
| 10-20 |
| >0.7 | |
Breccia |
| SB |
| Fragments in a semi massive sulphide matrix (po-pn>>cpy) |
| 20-60 |
| >1.0 |
Patchy |
| SP |
| Regular patches (net-texture) or irregular (associated with a GI y Gb) po-pn-py-cpy |
| variable |
| variable |
Core recovery is calculated by measuring actual core lengths and comparing it to the down hole depths listed as the start of each core run (marked on the core trays). Core recovery for the current drilling is generally around 80 to 95% in mineralized and waste zones.
Core logging procedures are appropriate for the geological setting and mineralization. Core recoveries above 85% are appropriate for Mineral Resource estimation.
|
|
|
|
|
|
31 March 2009 | 34 |
|
|
|
| TECHNICAL REPORT AGUABLANCA NI-CU DEPOSIT |
Figure 12-5: Aguablanca drilling log

|
|
|
|
|
|
31 March 2009 | 35 |
|
|
|
| TECHNICAL REPORT AGUABLANCA NI-CU DEPOSIT |
12.5 Densities
The density values for the various rock types of the deposit are determined by the water displacement method.
A sample interval of approximately 20 cm is selected by the field geologist. The sample is removed from the core box prior to splitting. The samples are weighed in air before drying, in air after drying and finally in water. The dry density is then calculated using the formula:
|
|
Dry density = | P2 / (P1 – P3) |
| |
where | P1 = weight in air (wet) |
| P2 = weight in air (dry) |
| P3 = weight in water |
The samples are taken from appropriate rock types, from a range of lithologies, and from a variety of drill holes. A density database called DensityStats_deAlan_fullset.xls was supplied to Golder which contains nearly 7,000 density measurements.
The order in which measurements are taken to measure bulk density is unusual and could lead to a risk of bias. Usually P3 would be measured first, then P1, then P2. In such a sequence, the degree of water saturation inherent in the P3 and P1 measurements can reasonably be assumed to be the same and therefore the dry density measurement will be correct.
The problem with the Aguablanca sequence is that the sample may absorb more water when P3 is measured than was present when P1 was measured. Absorbed water will increase P3 and hence decrease (P1-P3) and thereby increase dry density. For highly absorbent rocks, there is a risk of overestimating the dry bulk density with the stated method. Golder does not believe this has a material impact on the estimation of densities but should be investigated.
Golder checked the data set for outliers and the mean density value for each of the rock types and found the data to be appropriate and the mean values reasonable.
The method used by Golder to convert estimated volumes to tonnages is described in Section 17.7 and 17.8.6.
|
|
|
|
|
|
31 March 2009 | 36 |
|
|
|
| TECHNICAL REPORT AGUABLANCA NI-CU DEPOSIT |
13.0 SAMPLE PREPARATION, ANALYSES AND SECURITY
13.1 Sample preparation
Sample preparation is conducted at the site laboratory run by Rio Narcea staff which has been operating for eight years. Golder audited the site laboratory on 23rd July 2008 and reviewed the sampling and preparation procedures used. A sample preparation flow sheet is shown in Figure 13-1.
Figure 13-1: Sample preparation flow sheet as used for Aguablanca resource definition samples

13.1.1 Sample reception
The samples arrive at the sampling shed with a sample submission sheet which contains a list of the samples sent by the geologists. Each sample has a tag with an individual barcode indicating the hole identification and interval (Figure 13-2).
The samples are dried in an oven for 12 hours at no greater than 105°C. The samples are weighed after drying on a Viper SW 35 scale which has a precision of 2 decimal places.
|
|
|
|
|
|
31 March 2009 | 37 |
|
|
|
| TECHNICAL REPORT AGUABLANCA NI-CU DEPOSIT |
The sample reception system uses electronic barcodes to track the progress of the sample throughout the preparation flow sheet.
Figure 13-2: Bar code system used at the Aguablanca site laboratory

13.1.2 Crushing
The samples are crushed with a jaw crusher, reducing the particle size to approximately 3 to 4 mm. The entire sample is then passed through a rolls crusher to reduce the particle size to less than 1.4 mm. The crushers are cleaned by air and a quartz wash is passed through the crushers after every sample. Size fraction tests are currently carried out using a 1.4 mm sieve once per month. Golder does not consider this to be sufficient and recommends that the size fraction test be conducted at least once a week.
The condition of the crushing equipment is adequate, appears well maintained and is fit for purpose.
|
|
|
|
|
|
31 March 2009 | 38 |
|
|
|
| TECHNICAL REPORT AGUABLANCA NI-CU DEPOSIT |
13.1.3 First stage splitting
The entire crushed sample is split in a 50:50 Jones riffle splitter until a 500 to 600 g sample is achieved. The slots have even width and the sample is poured over all the slots evenly. The splitter is then cleaned by compressed air. Loss of material due to dust appears minimal.
The condition of the splitting equipment is acceptable.
13.1.4 Pulverization
The split sample is pulverized to -75 micron using an LM 2 pulveriser for approximately 2 minutes. The pulveriser appears to be in good condition. The pulveriser is cleaned by compressed air and washed with a quartz rinse after every sample. Size fraction tests are conducted once a month.
13.1.5 Second stage splitting
The pulverised samples are split by passing a thin spatula through the sample once it has been placed on a smooth work bench. The spatula is run though the full width of the sample several times until a 50 g sample is achieved as shown in Figure 13-3.
This splitting method is not ideal given the density of the mineralization particles as there is the chance that the sample will not be representative due to gravity separation. This can happen if the spatula does not pass through the entire width of the sample or if sample spills over the top of the spatula during the scooping action. It is not considered likely by Golder that this has a material impact on the representativity of the assays but the practice could be improved by employing a small laboratory scale Jones riffle splitter or a rotary sampling device..
Figure 13-3: Splitting of pulverised material using a spatula

|
|
|
|
|
|
31 March 2009 | 39 |
|
|
|
| TECHNICAL REPORT AGUABLANCA NI-CU DEPOSIT |
13.1.6 Storage
The sample rejects are stored on site in the core shed indefinitely inside heavy duty plastic bags which are in turn placed inside labelled plastic bins. The bins are stored in an orderly and retrievable fashion.
The general housekeeping at the site laboratory looks tidy and well organized and the samples are in orderly fashion. Appropriate dust extraction is installed to prevent contamination.
The storage of the sample rejects is considered appropriate by Golder.
13.2 Quality assurance and quality control (QAQC) procedures
13.2.1 Standards
Four standards have been prepared by Rio Narcea called A, B, C and D, manufactured on site by Rio Narcea personnel. The standard was manufactured by collecting 55 to 60 kg material sourced from the 1.4 mm reject fraction of exploration drilling assays. The material was mixed for 15 to 20 minutes by shovel before the entire sample was pulverized to -80 µm. The samples were then split, separating 4 kg from the main sample. This 4 kg sample was further split and 11 samples were sent to six external laboratories for analysis. An arithmetic mean and standard deviation of the results was calculated in Excel spreadsheets.
The list of the standards used with their expected grades and standard deviations is shown in Table 4.
Table 4: Standards used at Aguablanca
|
|
|
|
|
|
|
|
|
|
|
Standard |
| Description |
| Expected grade (ppm) |
| Standard deviation (ppm) | ||||
|
|
|
| |||||||
|
|
|
| Ni |
| Cu |
| Ni |
| Cu |
|
|
|
| |||||||
A |
| Waste |
| 197 |
| 58 |
| 25 |
| 35 |
B |
| Low grade |
| 3,492 |
| 3,924 |
| 104 |
| 173 |
C |
| Medium grade |
| 6,711 |
| 6,711 |
| 242 |
| 207 |
D |
| High grade |
| 13,768 |
| 8,414 |
| 667 |
| 361 |
| ||||||||||
Lundin submit the standards at a rate of 1 in every 20 samples.
|
|
|
|
|
|
31 March 2009 | 40 |
|
|
|
| TECHNICAL REPORT AGUABLANCA NI-CU DEPOSIT |
13.2.2 Inter-laboratory repeats
Inter-laboratory repeat assays of mineralized intervals from the drilling are selected by the site geologist and a 500 g split of material pulverized to -80 µm is prepared by the on-site laboratory and sent to the OMAC Laboratory in Ireland for assay by a four acid digest with reading by ICP.OMAC Laboratories Limited is owned by the Alex Stewart Group and is accredited to ISO/IEC 17025.
Lundin submits repeats at a rate of 1 in every 20 samples.
13.3Assaying
The pulverized sample is sent to the internal assay laboratory located on site. A second split of pulverized material of mineralized intervals, as chosen by the logging geologist is sent to the OMAC Laboratory in Ireland for repeat analysis.
Assaying is carried out by AAS in the site laboratory with some checks carried out using the site XRF machine. XRF is also used to assay arsenic and sulphur in the exploration samples.
Calibration standards are used by the laboratory at a rate of one every 10 readings. The laboratory uses seven standards for Ni, seven for Cu and four for Co. The results are recorded but there was no evidence that they were being charted and analyzed.
The assay results are entered into Excel worksheets manually by the laboratory staff and sent back to the resource geology department.
|
|
|
|
|
|
31 March 2009 | 41 |
|
|
|
| TECHNICAL REPORT AGUABLANCA NI-CU DEPOSIT |
14.0 DATA VERIFICATION
14.1 Introduction
Golder reviewed the geological logs, available sampling and assaying Quality Assurance (QA) procedures and the Quality Control (QC) results from the Aguablanca drilling program to date. Rio Narcea submits standards and repeats with their samples to assess the precision and accuracy of the assays provided by the laboratories.
Independent samples were not taken because of the following reasons:
|
|
|
| • | Aguablanca is an operating mine with 4 years of production mining, processing and sales of metal; |
|
|
|
| • | It is a base metal mine which means mineralisation is visible as massive sulphides. Golder personnel visited the mine twice and witnessed mineralisation in the pit and in underground development; and |
|
|
|
| • | Golder personnel inspected approximately 5% of the drill core (and cross checked against the logging and assay sheets) and witnessed an appropriate level of mineralisation in the core. |
14.2 Drilling database
The complete drill hole database was supplied to Golder in five text files: Assays.txt, Collar.txt, Deviations.txt, Lithology.txt, and Mineralization.txt.
Golder merged the supplied database into Microsoft Access and ran tests for internal consistency of database tables, incorrect characters, data mismatches and cross checks of the individual tables against each other. Minor errors were found in the database and these were corrected by Aguablanca staff prior to the mineral resource being estimated which have subsequently been corrected.
The drill hole database supplied to Golder appears to be of an industry standard and Golder believes the database is suitable for a Mineral Resource estimate.
|
|
|
|
|
|
31 March 2009 | 42 |
|
|
|
| TECHNICAL REPORT AGUABLANCA NI-CU DEPOSIT |
14.3 Comparison of geological logs with drill core
To check for correct transcription of logging and assaying data into the database, Golder randomly selected 19 drill holes from previous drilling campaigns and cross checked the drill core with hard copy logging sheets and the database and original assay sheets. During the site visit, five geological logs were compared with the original core. The rest were compared with the core photos. The drill holes checked by Golder are listed in Table 5.
Visual checking of remaining core against log sheets, assays and original assay sheets revealed no significant discrepancies.
Table 5: Drill holes checked against core and original assay sheets
|
|
|
| Drill hole ID |
|
|
| |
| AGU 1047 |
|
| AGU 1087 |
|
| AGU 1030 |
|
| AGU 1012 |
|
| AGU 126 |
|
| AGU 1068 |
|
| AGU 1114 |
|
| AGU 1002 |
|
| AGU 1118 |
|
| AGU 1138 |
|
| AGU 1040 |
|
| AGU 1058 |
|
| AGU 1069 |
|
| AGU 1078 |
|
| AGU 1090 |
|
| AGU 1105 |
|
| AGU 1115 |
|
|
|
|
|
|
|
31 March 2009 | 43 |
|
|
|
| TECHNICAL REPORT AGUABLANCA NI-CU DEPOSIT |
14.4 Standards
Rio Narcea has only just begun to use the standards and to date has submitted 30 of each standard. Golder analyzed and plotted the results as shown in Appendix A. Golder notes the following points:
|
|
|
| • | All the returned results for STD A copper are identical (50 ppm) and below the expected mean of 58 ppm, suggesting that 50 ppm is the limit of detection. This standard is therefore not suitable for assessing the accuracy at this grade; |
|
|
|
| • | The expected grade of Ni and Cu in STD C are identical which is considered unlikely and may indicate transposition errors; |
|
|
|
| • | There is evidence of a strong positive bias in STD A in Ni, especially in the later samples submitted; |
|
|
|
| • | STD B shows a weak negative bias in both Ni and Cu; and |
|
|
|
| • | STD C and D show strong negative bias (generally above 5%) in both Ni and Cu. |
It appears that the standards manufactured on site are returning generally lower values than expected and the assaying on site is therefore considered by Golder to be conservative.
The pulverizing size for the currently prepared standards is coarser than is generally used and the mixing (homogenization) procedure may not be sufficient. Thus Golder is concerned about the quality of the standards and considers that they should be further evaluated. Some commercially available standards (preferably matrix matched) should be purchased or commissioned if the current standard material proves to be insufficient.
14.5 Inter-laboratory repeats
Golder analyzed the results of the repeat analysis. The comparison charts for repeat versus original assays for Ni and Cu are shown in Appendix B. There is evidence of a slight conservative negative bias on the original assays from the site laboratory. This is especially evident for Ni. This is probably due to the fact that the site laboratory uses a 2 acid digest and the OMAC laboratory uses a 4 acid digest.
|
|
|
|
|
|
31 March 2009 | 44 |
|
|
|
| TECHNICAL REPORT AGUABLANCA NI-CU DEPOSIT |
The precision (repeatability) in these comparisons is poorer than expected for pulps at ±16% for Cu and ±36% for Ni. The differences in method may contribute to this and blind re-assaying of these same pulps at both laboratories would provide an excellent test of this.
|
|
|
|
|
|
31 March 2009 | 45 |
|
|
|
| TECHNICAL REPORT AGUABLANCA NI-CU DEPOSIT |
15.0 ADJACENT PROPERTIES
There are no material adjacent mineral properties to the Aguablanca mine.
|
|
|
|
|
|
31 March 2009 | 46 |
|
|
|
| TECHNICAL REPORT AGUABLANCA NI-CU DEPOSIT |
16.0 MINERAL PROCESSING AND METALLURGICAL TESTING
A description of the pre-production metallurgical test work is provided in the MDM 2002 Technical Report. The current processing plant and its performance is described in Section 23.
|
|
|
|
|
|
31 March 2009 | 47 |
|
|
|
| TECHNICAL REPORT AGUABLANCA NI-CU DEPOSIT |
17.0 MINERAL RESOURCE AND MINERAL RESERVE ESTIMATES
17.1 Introduction
The December 31, 2008 Aguablanca Mineral Resource Estimate was completed by Mr J. Alvarez, Mr J. Purchase Dr. S. Khosrowshahi, and reviewed by Dr W Shaw. The estimate was made from a 3D block model created in Vulcan (version 7.5) software.
The Mineral Resource Estimate is based on diamond drill hole data provided by Lundin. Golder has reviewed the sources of the data provided by Lundin through validation checks against the digital data provided on August 29, 2008 as a collection of text files and against a selection of the original source data provided by Lundin. Observations during the site visit and data validation procedures completed indicate that Lundin is following industry standard practices for their QA/QC program and Lundin’s 2008 drill hole database is sufficiently free of errors to be used in the December 2008 Mineral Resource update.
Golder has estimated the grades for six main elements: Ni, Cu, Au, Pd, Pt and Co.
A Mineral Reserve Estimate for Aguablanca has also been carried out by Golder. This estimate has only considered the Measured and Indicated Mineral Resources. The estimate has used the pit geometry at December 31, 2008, taking into account recently revised geotechnical parameters. Based on the geometry and geotechnical parameters an optimized pit limit and production schedule was developed, adequately supported by an operational mine design. In particular, dilution and mining recovery were properly addressed and supported by historical data.
17.1.1 Definitions
Easting, Northing and RL references used in this report relate to the truncated coordinate system supplied by Lundin.
Three-dimensional entities in this report are described in the format X by Y by Z, where X refers to the Easting distance in metres; Y refers to the Northing distance in metres and Z refers to the RL or vertical distance in metres.
The experimental and model semi-variograms produced as part of the geostatistical analysis are referred to as variograms.
|
|
|
|
|
|
31 March 2009 | 48 |
|
|
|
| TECHNICAL REPORT AGUABLANCA NI-CU DEPOSIT |
Linear orientations are defined in terms of plunge towards plunge azimuth (i.e. plunge → plunge azimuth). Resultant planes are defined in terms of dip towards dip azimuth (i.e. dip → dip azimuth).
In conventional three-dimensional variographic analysis, directional variograms are modelled in three principal directions as follows:
|
|
|
| • | major axis (in the direction of the plunge of the mineralization); |
|
|
|
| • | semi-major axis (perpendicular to the major axis but still in the plane of the mineralization); and |
|
|
|
| • | minor axis (in the direction across the dip of the mineralization). |
These directions relate respectively to the strike, down dip and cross-strike directions only if the major axis is modelled in the same direction as the strike of the geological plane (i.e. at zero plunge). For this reason, the terms ‘major axis’, ‘semi-major axis’ and ‘minor axis’ are used to describe the principal directions.
Compositing is a process of aggregating of analytical data by specified parameters such as constant length or geological entity.
Flagging is a process of coding data, typically assays, according to spatial location. For example, “data which lies within a certain wireframe is flagged with a code of 100”.
17.2 Data provided
17.2.1 Drill hole data
As outlined in Section 10.0, the current Aguablanca drill hole database contains a total of 362 drill holes for a total of 96,515 m. A copy of the database was supplied to Golder as five text files called Assays.txt, Collar.txt, Deviations.txt, Lithology.txt, and Mineralization.txt on the 29 August 2008.
Golder ran tests for internal database consistency, incorrect characters, data mismatches and cross checks of the individual tables against each other and found a small number of errors which have subsequently been corrected by Lundin staff. A description of the drilling database is found in Section 14.2.
|
|
|
|
|
|
31 March 2009 | 49 |
|
|
|
| TECHNICAL REPORT AGUABLANCA NI-CU DEPOSIT |
Twenty drill holes for which there is low confidence in the down hole survey data, and consequent locations in 3D space, were excluded from the drilling database. These holes are listed in Table 2.
A full list of the drill holes used in the modelling is found in Appendix C.
17.2.2 Other data
Lundin has supplied other data to Golder for the purpose of modelling the geology and mineralization. This includes the following:
|
|
|
| • | Mineralization interpretations on 25m sections; |
|
|
|
| • | Previous mineralization envelopes in Drawing Exchange Format (dxf) format; |
|
|
|
| • | Surface elevation (topography), and proposed pit in dxf format; |
|
|
|
| • | Fault surfaces as wireframes in dxf format; |
|
|
|
| • | A comprehensive density database with approximately 7300 bulk density determinations; and |
|
|
|
| • | Geological literature on the Aguablanca deposit, describing detailed mineralization types and morphology of the mineralized body. |
17.3 Geological wireframe modelling
The Aguablanca deposit consists of two mineralized zones which are described in detail in Section 9.1.
A wireframe model was created by Golder based on interpreted mineral shapes drawn by Lundin at 25m sections. Two mineralized envelopes were created: one at a grade cut-off of 0.1% Ni and a second envelope at a grade cut-off of 0.5% Ni. The wireframe interpretation conducted by Golder was based on sectional interpretation of the mineral types (SB, SS, S and SP) carried out by Lundin.
The 0.1% Ni mineralized envelope was chosen after discussions with Lundin. To decide if another cut-off envelope was necessary a test block model was created using indicators at different grade cut-offs (0.1%, 0.2%, 0.3%, 0.5%, 0.75%, 1.0%, 1.5% Ni) to test the viability of modelling a high-grade envelope. It was decided that any cut-off above 0.5% would result in ‘pod-like’ high-grade mineralization envelopes with little continuity. Figure 17-1 shows the pod-like structure of the mineralization when using a 0.75% Ni or 1.5% Ni cut-off which will result in poor estimation quality, due to the lack of samples within each pod.
|
|
|
|
|
|
31 March 2009 | 50 |
|
|
|
| TECHNICAL REPORT AGUABLANCA NI-CU DEPOSIT |
Therefore, a cut-off of 0.5% Ni was used for high-grade modelling. The 0.5% Ni cut-off grade also corresponds well with the semi-massive breccia and strongly disseminated zones of mineralization.
Figure 17-1: Section 7317E showing a comparison between Indicators using 0.5%, 0.75% and 1.5%Ni cut-offs. The colours represent the probability (0-1) of the Ni grade in a block being above the given cut-off (expressed as a decimal)

An example of the modelled wireframe is shown in section in Figure 17-2 which shows the drill holes coloured by Ni grade and the interpreted wireframe. The complete set of modelled sections is shown in Appendix D.
|
|
|
|
|
|
31 March 2009 | 51 |
|
|
|
| TECHNICAL REPORT AGUABLANCA NI-CU DEPOSIT |
Figure 17-2: Example of the sectional modelling and wireframe solids modelled by Golder (Section 7275 mE), Blue – 0.1% Ni envelope, Red – 0.5% Ni envelope
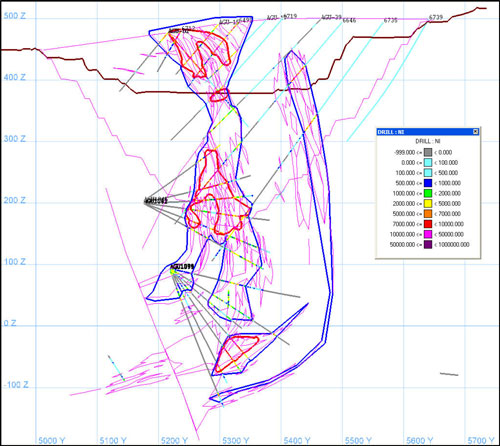
Five fault surfaces (F1 to F4 and FI) were also modelled by Golder based on data supplied by Lundin. These fault surfaces represent the most important fault systems in the mineralization. (Figure 17-3). The modelled faults were used by Golder to separate the estimation into seven discrete solid fault blocks as described in Section 17.8.1.
|
|
|
|
|
|
31 March 2009 | 52 |
|
|
|
| TECHNICAL REPORT AGUABLANCA NI-CU DEPOSIT |
Figure 17-3: Fault surfaces modelled by Golder superimposed onto the modelled mineral envelope (0.1% Ni)
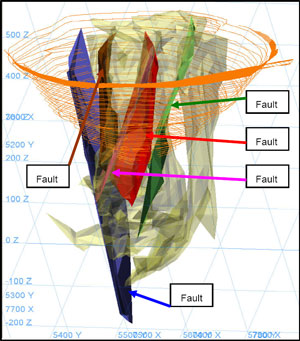
17.4 Exploratory data analysis
17.4.1 Compositing
The drill hole data supplied was composited to 2 m intervals using majority codes for “Min”, “Lith” and “Ore” fields. A 2 m composite length was chosen as the majority of the assays were sampled at 2 m intervals. The modelled wireframes were used to populate a “fault” field. Drill holes with inaccurate survey data (supplied by client) were excluded from the composite file as listed in Table 2.
Statistics were compiled to determine the effect that the compositing has had on the grade of each element. These are tabulated in Table 6. There was a slight reduction in the mean grade of all elements, which is shown in the “Deviation from Mean” column. There was also a consistent reduction in variance (15%-25%), which is expected with run-length compositing. Some of these effects are attributed to majority coding of the composites.
|
|
|
|
|
|
31 March 2009 | 53 |
|
|
|
| TECHNICAL REPORT AGUABLANCA NI-CU DEPOSIT |
Table 6: Comparison between Composite statistics and Raw statistics
|
|
|
|
|
|
|
|
|
|
|
|
|
|
|
|
|
|
|
|
|
|
|
|
|
|
|
|
|
Composites - 2m |
| Raw Data ( not composited) |
| Deviation From | ||||||||||||||||||||||||
|
| |||||||||||||||||||||||||||
|
|
|
|
|
|
|
|
|
|
|
|
|
|
|
|
|
|
|
|
|
|
|
|
|
|
|
|
|
NIPPM |
|
|
|
|
|
|
|
|
|
|
|
|
| NIPPM |
|
|
|
|
|
|
|
|
|
|
|
|
| NI% |
|
|
|
|
|
|
|
|
|
|
|
|
|
|
|
|
|
|
|
|
|
|
|
|
|
|
|
|
|
Case |
| ORE |
| No.Obs. |
| Minimum |
| Maximum |
| Mean |
| Variance |
| Case |
| ORE |
| No.Obs. |
| Minimum |
| Maximum |
| Mean |
| Variance |
|
|
Waste |
| 0 |
| 10175 |
| 0 |
| 27270 |
| 357 |
| 630383 |
| Waste |
| 0 |
| 10505 |
| 2 |
| 49238 |
| 373 |
| 971152 |
| -0.002 |
Low-grade |
| 1 |
| 6794 |
| 6 |
| 60329 |
| 2486 |
| 7403238 |
| Low-grade |
| 1 |
| 7383 |
| 10 |
| 69918 |
| 2487 |
| 9466299 |
| 0.000 |
High-Grade |
| 2 |
| 2697 |
| 189 |
| 73898 |
| 9690 |
| 46388672 |
| High-Grade |
| 2 |
| 2903 |
| 93 |
| 78880 |
| 9753 |
| 56041928 |
| -0.006 |
All |
| Global |
| 19666 |
| 0 |
| 73898 |
| 2375 |
| 18732254 |
| All |
| Global |
| 20791 |
| 2 |
| 78880 |
| 2455 |
| 21562218 |
| -0.008 |
CUPPM |
|
|
|
|
|
|
|
|
|
|
|
|
| CUPPM |
|
|
|
|
|
|
|
|
|
|
|
|
| CU% |
|
|
|
|
|
|
|
|
|
|
|
|
|
|
|
|
|
|
|
|
|
|
|
|
|
|
|
|
|
Case |
| ORE |
| No.Obs. |
| Minimum |
| Maximum |
| Mean |
| Variance |
| Case |
| ORE |
| No.Obs. |
| Minimum |
| Maximum |
| Mean |
| Variance |
|
|
Waste |
| 0 |
| 10114 |
| 0 |
| 10770 |
| 246 |
| 294405 |
| Waste |
| 0 |
| 10501 |
| 0 |
| 39900 |
| 255 |
| 411002 |
| -0.001 |
Low-grade |
| 1 |
| 6791 |
| 3 |
| 26892 |
| 2361 |
| 5693067 |
| Low-grade |
| 1 |
| 7383 |
| 6 |
| 32045 |
| 2372 |
| 6400258 |
| -0.001 |
High-Grade |
| 2 |
| 2697 |
| 119 |
| 23695 |
| 6807 |
| 8411580 |
| High-Grade |
| 2 |
| 2903 |
| 50 |
| 26000 |
| 6834 |
| 10022047 |
| -0.003 |
All |
| Global |
| 19602 |
| 0 |
| 26892 |
| 1883 |
| 8089949 |
| All |
| Global |
| 20787 |
| 0 |
| 39900 |
| 1940 |
| 8800685 |
| -0.006 |
PTPPB |
|
|
|
|
|
|
|
|
|
|
|
|
| PTPPB |
|
|
|
|
|
|
|
|
|
|
|
|
| PTPPB |
|
|
|
|
|
|
|
|
|
|
|
|
|
|
|
|
|
|
|
|
|
|
|
|
|
|
|
|
|
Case |
| ORE |
| No.Obs. |
| Minimum |
| Maximum |
| Mean |
| Variance |
| Case |
| ORE |
| No.Obs. |
| Minimum |
| Maximum |
| Mean |
| Variance |
|
|
Waste |
| 0 |
| 2430 |
| 0 |
| 791 |
| 25 |
| 2377 |
| Waste |
| 0 |
| 2629 |
| 0 |
| 2960 |
| 26 |
| 3646 |
| -1 |
Low-grade |
| 1 |
| 2524 |
| 0 |
| 1698 |
| 168 |
| 22691 |
| Low-grade |
| 1 |
| 2547 |
| 0 |
| 2260 |
| 181 |
| 27056 |
| -13 |
High-Grade |
| 2 |
| 1598 |
| 1 |
| 1347 |
| 330 |
| 28339 |
| High-Grade |
| 2 |
| 1692 |
| 15 |
| 1800 |
| 336 |
| 32480 |
| -6 |
All |
| Global |
| 6552 |
| 0 |
| 1698 |
| 154 |
| 30336 |
| All |
| Global |
| 6868 |
| 0 |
| 2960 |
| 162 |
| 34342 |
| -8 |
|
|
|
|
|
|
31 March 2009 | 54 |
|
|
|
| TECHNICAL REPORT AGUABLANCA NI-CU DEPOSIT |
|
|
|
|
|
|
|
|
|
|
|
|
|
|
|
|
|
|
|
|
|
|
|
|
|
|
|
|
|
Composites - 2m |
| Raw Data ( not composited) |
| Deviation From | ||||||||||||||||||||||||
|
| |||||||||||||||||||||||||||
|
|
|
|
|
|
|
|
|
|
|
|
|
|
|
|
|
|
|
|
|
|
|
|
|
|
|
|
|
NIPPM |
|
|
|
|
|
|
|
|
|
|
|
|
| NIPPM |
|
|
|
|
|
|
|
|
|
|
|
|
| NI% |
|
|
|
|
|
|
|
|
|
|
|
|
|
|
|
|
|
|
|
|
|
|
|
|
|
|
|
|
|
PDPPB |
|
|
|
|
|
|
|
|
|
|
|
|
| PDPPB |
|
|
|
|
|
|
|
|
|
|
|
|
| PDPPB |
|
|
|
|
|
|
|
|
|
|
|
|
|
|
|
|
|
|
|
|
|
|
|
|
|
|
|
|
|
Case |
| ORE |
| No.Obs. |
| Minimum |
| Maximum |
| Mean |
| Variance |
| Case |
| ORE |
| No.Obs. |
| Minimum |
| Maximum |
| Mean |
| Variance |
|
|
Waste |
| 0 |
| 2448 |
| 0 |
| 746 |
| 23 |
| 1808 |
| Waste |
| 0 |
| 2631 |
| 0 |
| 1860 |
| 25 |
| 2928 |
| -1 |
Low-grade |
| 1 |
| 2544 |
| 0 |
| 918 |
| 149 |
| 16526 |
| Low-grade |
| 1 |
| 2564 |
| 0 |
| 1764 |
| 161 |
| 20396 |
| -12 |
High-Grade |
| 2 |
| 1604 |
| 0 |
| 1326 |
| 310 |
| 25049 |
| High-Grade |
| 2 |
| 1703 |
| 0 |
| 2053 |
| 315 |
| 29622 |
| -5 |
All |
| Global |
| 6596 |
| 0 |
| 1326 |
| 142 |
| 25244 |
| All |
| Global |
| 6898 |
| 0 |
| 2053 |
| 149 |
| 28977 |
| -7 |
COPPM |
|
|
|
|
|
|
|
|
|
|
|
|
| COPPM |
|
|
|
|
|
|
|
|
|
|
|
|
| CO% |
|
|
|
|
|
|
|
|
|
|
|
|
|
|
|
|
|
|
|
|
|
|
|
|
|
|
|
|
|
Case |
| ORE |
| No.Obs. |
| Minimum |
| Maximum |
| Mean |
| Variance |
| Case |
| ORE |
| No.Obs. |
| Minimum |
| Maximum |
| Mean |
| Variance |
|
|
Waste |
| 0 |
| 8539 |
| 0 |
| 1242 |
| 40 |
| 1085 |
| Waste |
| 0 |
| 9093 |
| 2 |
| 1500 |
| 42 |
| 1482 |
| -0.0002 |
Low-grade |
| 1 |
| 5532 |
| 0 |
| 6242 |
| 85 |
| 19543 |
| Low-grade |
| 1 |
| 6116 |
| 1 |
| 7100 |
| 86 |
| 23009 |
| 0.0000 |
High-Grade |
| 2 |
| 2232 |
| 11 |
| 1660 |
| 249 |
| 36351 |
| High-Grade |
| 2 |
| 2434 |
| 7 |
| 1690 |
| 251 |
| 42954 |
| -0.0002 |
All |
| Global |
| 16303 |
| 0 |
| 6242 |
| 84 |
| 16937 |
| All |
| Global |
| 17643 |
| 1 |
| 7100 |
| 86 |
| 19556 |
| -0.0002 |
AUPPB |
|
|
|
|
|
|
|
|
|
|
|
|
| AUPPB |
|
|
|
|
|
|
|
|
|
|
|
|
| AUPPB |
|
|
|
|
|
|
|
|
|
|
|
|
|
|
|
|
|
|
|
|
|
|
|
|
|
|
|
|
|
Case |
| ORE |
| No.Obs. |
| Minimum |
| Maximum |
| Mean |
| Variance |
| Case |
| ORE |
| No.Obs. |
| Minimum |
| Maximum |
| Mean |
| Variance |
|
|
Waste |
| 0 |
| 3493 |
| 0 |
| 851 |
| 23 |
| 1683 |
| Waste |
| 0 |
| 3768 |
| 0 |
| 4100 |
| 24 |
| 2788 |
| -1 |
Low-grade |
| 1 |
| 2371 |
| 0 |
| 1260 |
| 83 |
| 8055 |
| Low-grade |
| 1 |
| 2491 |
| 1 |
| 1290 |
| 86 |
| 10051 |
| -3 |
High-Grade |
| 2 |
| 1466 |
| 2 |
| 912 |
| 155 |
| 9273 |
| High-Grade |
| 2 |
| 1579 |
| 3 |
| 1024 |
| 156 |
| 10631 |
| 0 |
All |
| Global |
| 7330 |
| 0 |
| 1260 |
| 69 |
| 7843 |
| All |
| Global |
| 7838 |
| 0 |
| 4100 |
| 70 |
| 9308 |
| -2 |
|
|
|
|
|
|
31 March 2009 | 55 |
|
|
|
| TECHNICAL REPORT AGUABLANCA NI-CU DEPOSIT |
17.4.2 Statistics
Statistics on the composite file were compiled and are summarised in Table 7. There were significantly fewer Pt, Pd and Au samples compared to Ni and Cu in the composite file, as these were only assayed after mining commenced in 2005. However, there was still sufficient coverage over the deposit to estimate them in addition to the Ni and Cu.
Table 7: Raw and declustered statistics from composited 2 m map file
|
|
|
|
|
|
|
|
|
|
|
|
|
|
|
|
|
|
|
|
|
|
|
| |||||
NIPPM |
|
|
|
|
|
|
|
|
|
|
|
|
|
|
|
|
|
|
|
|
|
|
| |||||
Case |
|
| Code |
|
| No.Obs. |
|
| Minimum |
|
| Maximum |
|
|
| Mean |
| Variance | ||||||||||
High Grade |
|
| 2 |
|
| 2697 |
|
|
| 189 |
|
|
| 73898 |
|
|
|
| 9690 |
|
| 4638867 |
| |||||
Low Grade |
|
| 1 |
|
| 6794 |
|
|
| 6 |
|
|
| 60329 |
|
|
|
| 2486 |
|
| 7403238 |
| |||||
Waste |
|
| 0 |
|
| 10175 |
|
|
| 0 |
|
|
| 27270 |
|
|
|
| 357 |
|
| 630383 |
| |||||
CUPPM |
|
|
|
|
|
|
|
|
|
|
|
|
|
|
|
|
|
|
|
|
|
|
| |||||
Case |
|
| Code |
|
| No.Obs. |
|
| Minimum |
|
| Maximum |
|
|
| Mean |
| Variance | ||||||||||
High Grade |
|
| 2 |
|
| 2697 |
|
|
| 119 |
|
|
| 23695 |
|
|
|
| 6807 |
|
| 8411580 |
| |||||
Low Grade |
|
| 1 |
|
| 6791 |
|
|
| 3 |
|
|
| 26892 |
|
|
|
| 2361 |
|
| 5693067 |
| |||||
Waste |
|
| 0 |
|
| 10114 |
|
|
| 0 |
|
|
| 10770 |
|
|
|
| 246 |
|
| 294405 |
| |||||
PTPPB |
|
|
|
|
|
|
|
|
|
|
|
|
|
|
|
|
|
|
|
|
|
|
| |||||
Case |
|
| Code |
|
| No.Obs. |
|
| Minimum |
|
| Maximum |
|
|
| Mean |
| Variance | ||||||||||
High Grade |
|
| 2 |
|
| 1598 |
|
|
| 1 |
|
|
| 1347 |
|
|
|
| 330 |
|
| 28339 |
| |||||
Low Grade |
|
| 1 |
|
| 2524 |
|
|
| 0 |
|
|
| 1698 |
|
|
|
| 168 |
|
| 22691 |
| |||||
Waste |
|
| 0 |
|
| 2430 |
|
|
| 0 |
|
|
| 791 |
|
|
|
| 25 |
|
| 2377 |
| |||||
PDPPB |
|
|
|
|
|
|
|
|
|
|
|
|
|
|
|
|
|
|
|
|
|
|
| |||||
Case |
|
| Code |
|
| No.Obs. |
|
| Minimum |
|
| Maximum |
|
|
| Mean |
| Variance | ||||||||||
High Grade |
|
| 2 |
|
| 1604 |
|
|
| 0 |
|
|
| 1326 |
|
|
|
| 310 |
|
| 25049 |
| |||||
Low Grade |
|
| 1 |
|
| 2544 |
|
|
| 0 |
|
|
| 918 |
|
|
|
| 149 |
|
| 16526 |
| |||||
Waste |
|
| 0 |
|
| 2448 |
|
|
| 0 |
|
|
| 746 |
|
|
|
| 23 |
|
| 1808 |
| |||||
COPPM |
|
|
|
|
|
|
|
|
|
|
|
|
|
|
|
|
|
|
|
|
|
|
| |||||
Case |
|
| Code |
|
| No.Obs. |
|
| Minimum |
|
| Maximum |
|
|
| Mean |
| Variance | ||||||||||
High Grade |
|
| 2 |
|
| 2232 |
|
|
| 11 |
|
|
| 1660 |
|
|
|
| 249 |
|
| 36351 |
| |||||
Low Grade |
|
| 1 |
|
| 5532 |
|
|
| 0 |
|
|
| 6242 |
|
|
|
| 85 |
|
| 19543 |
| |||||
Waste |
|
| 0 |
|
| 8539 |
|
|
| 0 |
|
|
| 1242 |
|
|
|
| 40 |
|
| 1085 |
| |||||
AUPPB |
|
|
|
|
|
|
|
|
|
|
|
|
|
|
|
|
|
|
|
|
|
|
| |||||
Case |
|
| Code |
|
| No.Obs. |
|
| Minimum |
|
| Maximum |
|
|
| Mean |
| Variance | ||||||||||
High Grade |
|
| 2 |
|
| 1466 |
|
|
| 2 |
|
|
| 912 |
|
|
|
| 155 |
|
| 9273 |
| |||||
Low Grade |
|
| 1 |
|
| 2371 |
|
|
| 0 |
|
|
| 1260 |
|
|
|
| 83 |
|
| 8055 |
| |||||
Waste |
|
| 0 |
|
| 3493 |
|
|
| 0 |
|
|
| 851 |
|
|
|
| 23 |
|
| 1683 |
| |||||
| ||||||||||||||||||||||||||||
|
|
|
|
|
|
31 March 2009 | 56 |
|
|
|
| TECHNICAL REPORT AGUABLANCA NI-CU DEPOSIT |
A detailed statistical analysis was undertaken to determine the influence of lithology on mineralization and grade. Tornos.et al, (2006) provides an excellent insight into the geological setting and emphasized the need to assess the spatial properties of each element. To determine this, the metal content of the assay file was compared for each lithology and mineralization group. Table 8 contains the results:
Table 8: Matrix showing % of total metal content for Ni and Cu, sub-divided by mineralization type and lithology group for a 0.1% Ni cut-off
|
|
|
|
|
|
|
|
|
|
|
|
|
|
|
|
|
|
|
|
|
|
|
Ni metal |
|
| Mineral type |
|
|
|
|
|
|
|
|
|
| |||||||||
|
|
|
|
|
| NS |
|
| SP |
|
| S |
|
| SS |
|
| SB |
|
| Total % |
|
Lithology |
|
| GABBRO |
|
| 1.09 |
|
| 14.14 |
|
| 25.48 |
|
| 15.56 |
|
| 0.09 |
|
| 56.36 |
|
|
| BRECCIA |
|
| 0.12 |
|
| 8.25 |
|
| 5 |
|
| 2.53 |
|
| 22.77 |
|
| 38.67 |
| |
|
| IGNEOUS |
|
| 0.01 |
|
| 0.03 |
|
| 0.08 |
|
|
|
|
|
|
|
| 0.12 |
| |
|
| META |
|
| 0.03 |
|
| 0.28 |
|
| 0.03 |
|
|
|
|
|
|
|
| 0.34 |
| |
|
| OTHERS |
|
| 0.52 |
|
| 2.09 |
|
| 1.02 |
|
| 0.44 |
|
| 0.29 |
|
| 4.37 |
| |
|
|
| Total % |
|
| 1.77 |
|
| 24.79 |
|
| 31.62 |
|
| 18.53 |
|
| 23.15 |
|
| 99.86 |
|
|
|
|
|
|
|
|
|
|
|
|
|
|
|
|
|
|
|
|
|
|
|
|
Cu metal % |
|
| Mineral type |
|
|
|
|
|
|
|
|
|
| |||||||||
|
|
|
|
|
| NS |
|
| SP |
|
| S |
|
| SS |
|
| SB |
|
| Total % |
|
Lithology |
|
| GABBRO |
|
| 1.14 |
|
| 13.29 |
|
| 37.49 |
|
| 15.68 |
|
| 0.07 |
|
| 67.67 |
|
|
| BRECCIA |
|
| 0.07 |
|
| 6.77 |
|
| 5.91 |
|
| 2.27 |
|
| 12.07 |
|
| 27.09 |
| |
|
| IGNEOU |
|
| 0.01 |
|
| 0.01 |
|
| 0.09 |
|
|
|
|
|
|
|
| 0.11 |
| |
|
| META |
|
| 0.05 |
|
| 0.39 |
|
| 0.03 |
|
|
|
|
|
|
|
| 0.47 |
| |
|
| OTHERS |
|
| 0.55 |
|
| 1.76 |
|
| 1.51 |
|
| 0.52 |
|
| 0.15 |
|
| 4.49 |
| |
|
|
| Total % |
|
| 1.81 |
|
| 22.23 |
|
| 45.03 |
|
| 18.47 |
|
| 12.29 |
|
| 99.82 |
|
Where: NS = No Mineralization, SP = Patchy, S = Slightly Disseminated, SS = Strongly disseminated, SB = Semi-Massive
Gabbro= GM, GP, GPL, GD, GI, GC, GSM
Breccia= Gb, Gsb
Igneous= PX, DI, GR, GAN
Meta= M, SK, ES, H, VS, PZ
Others= OX, ZF, REC, NR
Cu is more strongly associated with disseminated mineralization than Ni. A large proportion of the Ni is contained in the Breccia lithology as semi-massive mineralization. A high-grade envelope was used to capture both styles of mineralisation.
|
|
|
|
|
|
31 March 2009 | 57 |
|
|
|
| TECHNICAL REPORT AGUABLANCA NI-CU DEPOSIT |
Probability plots were used to compare grade distribution by mineralization zone for each relevant element to ensure that the samples were sub-domained into mineral zones effectively. Figure 17-4 shows the probability plot for Ni. The probability plots for MINCODE and LITHCODE can be found in Appendix E. The grade distribution indicates a clear separation of grade between the three mineralized zones.
Figure 17-4: Probability plot showing Ni subdivided into High-grade (ore=2), Low-grade (ore=1) and Waste (ore=0)
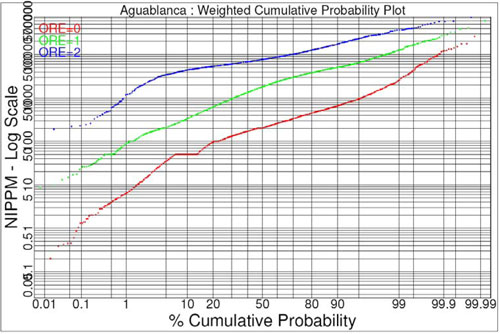
The influence of mineralization on grade can be shown by graphically comparing the variance and mean of each mineralization “type”. This is shown in Figure 17-5 and reveals the associations between certain metals and certain styles of mineralization.
|
|
|
| • | Mineralization type SB (semi-massive) is the higher grade mineralization zone, especially for Ni and Co. |
|
|
|
| • | Pt, Pd and Cu show an equal relationship with SS (Strongly disseminated) and SB, indicating the Cu, Pt and Pd are spread more consistently throughout the deposit. |
|
|
|
| • | Au is associated with SB, and also SP (Patchy mineralization). |
The coefficient of variation (CV) was used, as it gives a clearer indication of the different associations and relationships by standardising the variance to the mean.
|
|
|
|
|
|
31 March 2009 | 58 |
|
|
|
| TECHNICAL REPORT AGUABLANCA NI-CU DEPOSIT |
Figure 17-5: Coefficient of Variation vs. Mean graphs showing the influence of mineralization on grade
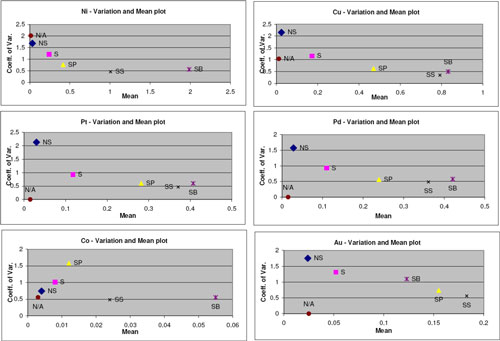
17.4.3 Treatment of high-grade samples during estimation
High-grade samples (outliers) can have an adverse effect on grade interpolation. There are many methods of reducing the influence of these high grade samples, with the most extreme method being complete removal. The most appropriate method for this deposit was considered to be high-grade restraining. Blocks around where these samples reside are flagged (using a small user-defined search ellipse) as high-grade and kriged separately. This restricts the spatial influence of the high grades to the high-grade flagged blocks. Deciding the threshold for the high-grade restraint depends on the geological continuity of the mineralization, and evaluating histograms and probability plots (see Figure 17-6). This ensures that high-grade samples are only used in the block they reside in. A detailed description of the high grade restraining is found in Section 17.8.2.
|
|
|
|
|
|
31 March 2009 | 59 |
|
|
|
| TECHNICAL REPORT AGUABLANCA NI-CU DEPOSIT |
Outlier grades for elements other than Ni were considered to be related to the nickel mineralisation and so the same restraining criteria were applied to these grades. This approach also retains the appropriate metal balance in poly-metallic mineralisation.
Figure 17-6: Left: Histogram of low-grade Ni (ore=1), Right: Probability plot (Blue = >5000 Ni ppm) showing samples which were restrained (~10%)
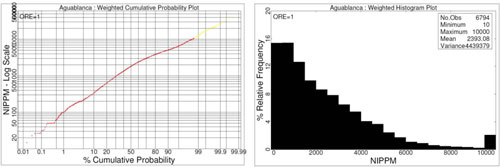
17.5 Variography
17.5.1 Variography objectives and approach
The objectives of the variography were to establish the directions of major grade continuity for each element in the domains and to provide variogram model parameters for use in geostatistical grade interpolation.
Variography was based on the 2 m composited map file and undertaken on the 0.1% Ni (Low-Grade) and 0.5% Ni (High-Grade) mineral envelopes. Six elements were examined (Ni, Cu, Pt, Pd, Co, Au) using directional variography. Fault blocks were not considered, as they restricted the number of samples.
Directional variography requires search tolerances to be used for calculation of variograms to address the fact that the drill hole samples are not perfectly aligned in a given direction in 3D space, and are not equally spaced along that direction. This requires the use of angular and distance tolerances. The tolerances used for directional variogram calculation are provided in Table 9.
|
|
|
|
|
|
31 March 2009 | 60 |
|
|
|
| TECHNICAL REPORT AGUABLANCA NI-CU DEPOSIT |
Figure 17-7 illustrates the relationship between the angular and distance tolerances with respect to the direction in which the variogram is required to be calculated.
An overview of the variography procedure used is as follows:
|
|
|
| • | Variograms were generated with a 20 m lag interval, in 5° increments horizontally and 5° increments vertically to provide directional coverage; |
|
|
|
| • | Correlograms were used for spatial continuity analysis as these generally produced the clearest variogram structure for all variables compared to other spatial continuity measures, e.g. traditional variograms; and |
|
|
|
| • | The nugget variances were modelled from average down hole variograms based on a 2 m lag, reflecting the down hole composite spacing. The down hole variogram model provided the most accurate interpretation of the nugget effect (0.05 – 0.1) due to the closer sample spacing. |
Figure 17-7: Variogram Search Tolerances
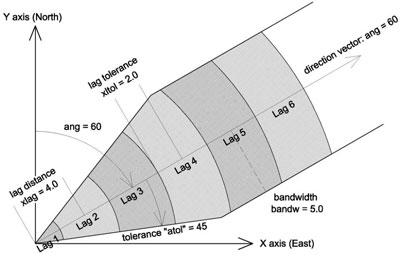
|
|
|
|
|
|
31 March 2009 | 61 |
|
|
|
| TECHNICAL REPORT AGUABLANCA NI-CU DEPOSIT |
Table 9: Parameters used for variogram generation
|
|
|
|
|
Parameter |
|
| Value |
|
Start Azimuth(ang) |
|
| 0° |
|
End Azimuth |
|
| 175° |
|
Step Azimuth |
|
| 5° |
|
Start Plunge |
|
| -90° |
|
End Plunge |
|
| 90° |
|
Step Plunge |
|
| 5° |
|
Horizontal Angle Tolerance(atol) |
|
| 10° |
|
Vertical Angle Tolerance(vtol) |
|
| 10° |
|
Horizontal Distance Bandwidth(bandw) |
|
| 50 m |
|
Vertical Distance Bandwidth |
|
| 50 m |
|
Lag Distance(xlag) |
|
| 20 m |
|
Lag Tolerance(xltol) |
|
| 10 m |
|
NB:Azimuth(horizontal direction vector) is defined as a clockwise bearing from grid north (0°). Plunge (vertical direction vector) is defined from the horizontal plane (0°), where a negative plunge is down and positive is up.
|
|
|
|
|
|
31 March 2009 | 62 |
|
|
|
| TECHNICAL REPORT AGUABLANCA NI-CU DEPOSIT |
17.5.2 Variogram interpretation and modelling
Variogram models were developed for the 0.1% Ni envelope and the 0.5% Ni envelope. The approach was to interpret and model the orthogonal orientations which reflect the interpreted major, semi major (Figure 17-8) and minor axes of continuity. The principal directions were modelled with two-structure spherical models.
The 0.1% Ni envelope was modelled with an overall strike orientation of 115° with a steep dip of 70° to the north. This trend is consistent with the morphology of the mineral-body, and interpretations of the massive mineralization in literature (Tornos.et al, 2006). The 0.5% Ni envelope was modelled with an overall strike orientation of 0° with a dip of 90° (vertical). This direction supports the morphology of the 0.5% Ni envelope, and also showed the longest range of influence.
Figure 17-8: Semi-major axis variograms (down-dip) for High-grade (top), and Low-grade (bottom), both have a very low nugget and show ranges ~100m

|
|
|
|
|
|
31 March 2009 | 63 |
|
|
|
| TECHNICAL REPORT AGUABLANCA NI-CU DEPOSIT |
17.5.3 Summary of variogram orientations
Table 10 shows the orientations of mineralization continuity that were identified and modelled for each domain. Linear orientations are specified in accordance with the conventions described in Section 17.1.1. The “separation” is the angle between the major and semi-major vectors. The “rotation” applies to the semi-major axis; it is the angle required to rotate the search ellipsoid around the major axis vector to align the ellipsoid with the interpreted resultant plane for grade interpolation.
Table 10: Summary of variogram continuity orientations
|
|
|
|
|
|
|
Domain | Variable | Major Axis | Semi-Major Axis | Resultant | Major & | Rotation |
|
| |||||
|
| Plunge/Direction | Plunge/Direction | Dip/Dip | Separation | R1/R2/R3 |
|
|
|
|
|
|
|
0.5% Ni | Ni | 90à 000 | 0à 090 | -90à 000 | 90 | 000/-90/0 |
Cu | 90à 000 | 0à 090 | -90à 000 | 90 | 000/-90/0 | |
Pt | 90à 000 | 0à 090 | -90à 000 | 90 | 000/-90/0 | |
Pd | 90à 000 | 0à 090 | -90à 000 | 90 | 000/-90/0 | |
Co | 90à 000 | 0à 090 | -90à 000 | 90 | 000/-90/0 | |
Au | 90à 000 | 0à 090 | -90à 000 | 90 | 000/-90/0 | |
0.1% Ni | Ni | 70à 025 | 0à 115 | -70à 025 | 90 | 025/-70/0 |
Cu | 70à 025 | 0à 115 | -70à 025 | 90 | 025/-70/0 | |
Pt | 70à 025 | 0à 115 | -70à 025 | 90 | 025/-70/0 | |
Pd | 70à 025 | 0à 115 | -70à 025 | 90 | 025/-70/0 | |
Co | 70à 025 | 0à 115 | -70à 025 | 90 | 025/-70/0 | |
Au | 70à 025 | 0à 115 | -70à 025 | 90 | 025/-70/0 | |
<0.1% | Ni | 70à 025 | 0à 115 | -70à 025 | 90 | 025/-70/0 |
Cu | 70à 025 | 0à 115 | -70à 025 | 90 | 025/-70/0 | |
Pt | 70à 025 | 0à 115 | -70à 025 | 90 | 025/-70/0 | |
Pd | 70à 025 | 0à 115 | -70à 025 | 90 | 025/-70/0 | |
Co | 70à 025 | 0à 115 | -70à 025 | 90 | 025/-70/0 | |
Au | 70à 025 | 0à 115 | -70à 025 | 90 | 025/-70/0 | |
|
|
KEY: | R1/R2/R3 Search orientations (conventional left hand rule) |
| R1 = azimuth rotation clockwise from north |
| R2 = plunge along R1 direction (+ve = up, -ve = down) |
| R3 = dip rotation around R1-R2 axis (+ve = anticlockwise, -ve = clockwise) |
|
|
|
|
|
|
31 March 2009 | 64 |
|
|
|
| TECHNICAL REPORT AGUABLANCA NI-CU DEPOSIT |
17.6 Geological block modelling
17.6.1 Block model parameters
A geological block model was constructed in Vulcan software. A parent block size of 8 x 8 x 4 m was used (based on current drill spacing) with sub-blocking to a minimum of 4 x 4 x 2 m to allow for adequate resolution of block attributes at wireframe boundaries. Details of these block model parameters are contained in Table 11. Further discussion on the selection of the 8 x 8 x 4 block size is provided in Section 17.8.7.
Table 11: Geological Model Extents and Block Sizes for OK_21jan09_v1.bmf
|
|
|
|
|
|
|
|
|
|
|
|
|
|
Direction |
| Minimum |
| Maximum |
| Parent |
|
| Sub-cell |
| Number of | ||
East (X) |
| 6900 |
|
| 7532 |
|
| 8 |
|
| 4 |
| 158 |
North (Y) |
| 4900 |
|
| 5625 |
|
| 8 |
|
| 4 |
| 182 |
Vertical (Z) |
| -190 |
|
| 510 |
|
| 4 |
|
| 2 |
| 430 |
17.6.2 Geological domain allocation
Numerical fields were created in the block model to allow for allocation of block attributes in preparation for grade estimation. Each block was then flagged using wireframe surfaces or solids and assigned a value according to the block’s position relative to the wireframe. In the case of multiple wireframes, the final block variable value was determined by priorities, where wireframes with the highest priority took precedence over wireframes with lower priorities for a particular block variable. The variables used are as follows:
|
|
|
| • | Blocks within different fault areas were coded using solid wireframes as described in Section 17.3, and identified in the “fault” field. This has a default of -9; |
|
|
|
| • | Blocks located within the limit of the mineral envelopes (described in Section 17.3) used during estimation are identified in the “ore” field with default code of -9, Code 0 for waste, Code 1 for blocks inside the 0.1% Ni envelope and Code 2 for blocks inside the 0.5% Ni envelope; |
|
|
|
|
|
|
31 March 2009 | 65 |
|
|
|
| TECHNICAL REPORT AGUABLANCA NI-CU DEPOSIT |
|
|
|
| • | The position of the current topographic surface is indicated in the “topo” field with default code -99. Code 1 denotes blocks below the original topography i.e. before mining, determined by collar locations. Code 2 denotes blocks below the current mined out topography determined by a topography surface supplied by Lundin as a file (Corta080922.dxf) which represents the mined out topography as at 22 September 2008; and |
|
|
|
| • | The position of the current pit design as defined by the file (Pit3.dxf) supplied by Lundin is indicated in the “pit” field with a default code of -9, Code 0 below the pit design and Code 1 above the pit design plus below the original topography. |
An explanation of the flagging parameters, codes and corresponding wireframes used in each geological model is listed in Table 12.
The geological model was visually validated in cross section by comparing it against the input wireframes. There were four blocks which did not code due to conflicts between the fault block wireframes. These were coded individually to ensure that blocks were correctly coded for the “fault” variable.
Table 12: Variable assignment in the geological block model
|
|
|
|
|
|
|
Variable | Flag | Wireframe Name | Priority | Inversion | Projection | Comment |
fault | 0 | Fb0.00t | 1 | Inside | Along Y axis | Fault block 0 |
|
|
|
|
|
|
|
fault | 1 | Fb1.00t | 2 | Inside | Along Y axis | Fault block 1 |
|
|
|
|
|
|
|
|
|
|
|
|
|
|
fault | 2 | Fb2.00t | 3 | Inside | Along Y axis | Fault block 2 |
|
|
|
|
|
|
|
|
|
|
|
|
|
|
fault | 3 | Fb3.00t | 4 | Inside | Along Y axis | Fault block 3 |
|
|
|
|
|
|
|
|
|
|
|
|
|
|
fault | 4 | Fb4.00t | 5 | Inside | Along Y axis | Fault block 4 |
|
|
|
|
|
|
|
|
|
|
|
|
|
|
fault | 5 | Fb5.00t | 6 | Inside | Along Y axis | Fault block 5 |
|
|
|
|
|
|
|
|
|
|
|
|
|
31 March 2009 | 66 |
|
|
|
| TECHNICAL REPORT AGUABLANCA NI-CU DEPOSIT |
|
|
|
|
|
|
|
Variable | Flag | Wireframe Name | Priority | Inversion | Projection | Comment |
fault | 6 | Fb6.00t | 7 | Inside | Along Y axis | Fault block 6 |
|
|
|
|
|
|
|
ore | 1 | NI_01_JA_NEW.00t | 8 | Inside | Along Z axis | Low-grade 0.1% |
|
|
|
|
|
|
|
ore | 2 | NI_05.00t | 9 | Inside | Along Z axis | High-grade 0.5% |
|
|
|
|
|
|
|
topo | 1 | Original_topo.00t | 10 | No | Along Z axis | Below original |
|
|
|
|
|
|
|
topo | 2 | Topo01_000t | 11 | Partial | Along Z axis | Below current |
|
|
|
|
|
|
|
Pit | 1 | Pit.00t | 12 | Partial | Along Z axis | Above proposed |
| ||||||
17.7 Bulk density
Density information was supplied by Lundin staff in the form of an Excel spreadsheet (DensityStats_deAlan_fullset.xls). This was loaded into a Vulcan Isis database, and composited to 2 m down hole. A total of 7281 density samples were available (11,300 after compositing to 2 m) to use during interpolation. However, the majority of the density data was restricted to the upper half of the deposit (see Figure 17-9).
To assess the appropriate approach to density assignment, the relationship between Ni grade and density was investigated. Figure 17-10 shows a potential positive linear relationship between grade and density. However, there are sparse density data for grades above 1.5% Ni (15,000 ppm) so using a regression curve to estimate density using Ni was not considered appropriate due to the risk of creating a positive bias in metal when the regression is applied to grades well above the cut-off grade.
The method of density estimation is described in Section 17.8.6.
|
|
|
|
|
|
31 March 2009 | 67 |
|
|
|
| TECHNICAL REPORT AGUABLANCA NI-CU DEPOSIT |
Figure 17-9: Section at 7350 mE showing density values limited to the upper half of the deposit
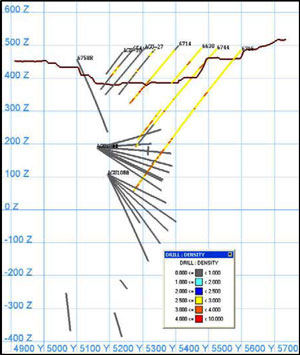
Figure 17-10: Graph showing the increase in Density with Grade Ni %. This shows density can be linked to the degree of mineralization
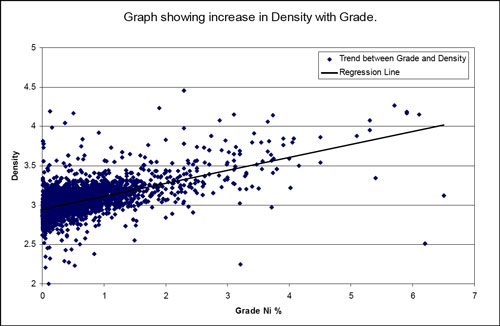
|
|
|
|
|
|
31 March 2009 | 68 |
|
|
|
| TECHNICAL REPORT AGUABLANCA NI-CU DEPOSIT |
17.8 Interpolation plan
17.8.1 Grade interpolation methodology
Six variables were estimated using Ordinary Kriging (OK), Ni, Cu, Pt, Pd, Co and Au, using Golder proprietary software. The estimation process is split into seven fault blocks (described in Section 17.3), which are executed separately. Density has been estimated using Inverse Distance Squared (ID2) for each fault block.
Grade estimation was completed using three separate estimation runs for the High-Grade Ni Envelope (>0.5% Ni), the Low-Grade Envelope (>0.1% Ni) and waste (<0.1% Ni) domains using the 2 m composite dataset. The interpolated block model isOK_29jan09_v1.bmf.
In all cases, grade estimates were made to the parent block volume of 8 m x 8 m x 4 m and sub cells within the model received the parent cell estimate. The 2 m composite dataset was used and composites were weighted by their length to account for the small proportion of the dataset where compositing resulted in sample lengths less than 2 m.
17.8.2 High-grade restraining
To limit the effect of high-grade samples on the estimation, a high-grade restraint on the Ni was applied in the low-grade and waste zones. This ensures that grades above a defined threshold are not used for interpolation beyond the local parent cell in which they occur. The discontinuous nature of Aguablanca mineralization requires a method which does not place excessive emphasis on high-grade samples lying outside the high-grade mineralization envelope.
|
|
|
| • | The High-Grade mineralization envelope used no restraining, as the semi-massive mineralization was considered reasonably continuous; |
|
|
|
| • | The Low-Grade mineralization envelope used a restraint threshold of 1.0% Ni, as it represents the patchy nature of the disseminated mineralization; |
|
|
|
| • | The waste envelope used a restraint of 0.1% Ni, to ensure that small high-grade areas were not over-extrapolated; and |
|
|
|
| • | High-grade blocks were flagged using an 8 m x 8 m x 8 m search ellipse around high-grade samples. |
|
|
|
|
|
|
31 March 2009 | 69 |
|
|
|
| TECHNICAL REPORT AGUABLANCA NI-CU DEPOSIT |
17.8.3 Kriging plan
The kriging parameters used for grade interpolation are summarised in Table 13.
Aspects of the kriging plan used to interpolate the grades within each fault block are as follows:
|
| |
| • | Ordinary Kriging is completed in four passes using 2 m composites; |
|
|
|
| • | An ellipsoidal octant search with a maximum of 5 composites per octant and maximum of 5 composites per drill hole was used to account for clustered sampling; |
|
|
|
| • | Pass 1 uses search radii of 100 x 100 x 10 m and a minimum of 8 samples, from at least 2 octants; |
|
|
|
| • | Pass 2 uses search radii of 200 x 200 x 20 m and a minimum of 6 samples, from at least 2 octants; |
|
|
|
| • | Pass 3 uses search radii of 400 x 400 x 40 m and a minimum of 2 samples from any octant; |
|
|
|
| • | Pass 4 uses search radii of 400 x 400 x 400 m and a minimum of 2 samples from any octant. This pass interpolates into the blocks in remote parts of the waste; |
|
|
|
| • | Block discretisation is set to 4 x 4 x 2 for the parent cell of 8 x 8 x 4 m; and |
|
|
|
| • | Inverse Distance Squared (power = 2) was used for the estimation of density. |
|
|
|
|
|
|
31 March 2009 | 70 |
|
|
|
| TECHNICAL REPORT AGUABLANCA NI-CU DEPOSIT |
Table 13: Kriging parameters
|
|
|
Estimation Method |
| Ordinary Kriging |
Variables Estimated |
| Ni, Cu, Pt, Pd, Co, Au |
Search Radius Pass 1 (X/Y/Z) |
| 100/100/10 |
Search Radius Pass 2 (X/Y/Z)) |
| 200/200/20 |
Search Radius Pass 3 (X/Y/Z)) |
| 400/400/40 |
Search Radius Pass 4(X/Y/Z)) |
| 400/400/400 |
Anisotropy |
| Variogram and geological strike |
Estimation Panel Size (X/Y/Z) |
| 8/8/4 |
Discretisation (X/Y/Z) |
| 4/4/2 |
Search Volume Geometry |
| Ellipsoid |
Search type |
| Octant (8 sectors in one slice) |
Minimum No. samples (Pass 1/2/3/4) |
| 4/4/2/2 |
Maximum No. of samples per octant |
| 8/8/8/8 |
Minimum No. of octants filled |
| 3/3/1/1 |
Minimum No. samples per octant |
| 1/1/1/1 |
Maximum No. samples per hole |
| 5/5/5/5 |
Length-weighting used (Y/N) |
| Y |
17.8.4 Search ellipse orientations
Due to the complex morphology of the Aguablanca ore body, a number of different search ellipsoid orientations were used to capture the various dips of the mineralisation. These are shown in Table 14. These orientations were applied based on discussions with Lundin regarding the local controls on mineralisation orientation and continuity.
Sections displaying search ellipse orientations are supplied in Appendix F.
|
|
|
|
|
|
31 March 2009 | 71 |
|
|
|
| TECHNICAL REPORT AGUABLANCA NI-CU DEPOSIT |
Table 14: Search ellipse orientations used during grade estimation
|
|
|
|
|
|
| Strike of Major axis |
| Dip/Dip Direction |
South Body |
|
|
|
|
Surface – 320rl |
| 106 |
| 65 N |
320rl – 50rl |
| 90 |
| 85 N |
<50rl and west of 7275E |
| 90 |
| 25 S |
<50rl and east of 7275E |
| 90 |
| 60 S |
North Body |
|
|
|
|
Surface – 50rl |
| 90 |
| 75 N |
<50rl |
| 90 |
| 40 S |
120 Area |
| 110 |
| 0 |
17.8.5 Calculation of dominant lithology and mineralogy
To determine the dominant lithology, indicators were used in association with Inverse Distance interpolation to determine the dominant geology from the composite file. Lithology codes were grouped into three main groups as shown in Table 15 and are simplified from the lithology codes in Table 8.
Table 15: Lithology grouping used in dominant lithology assignment
|
|
|
|
|
Group |
| Lithology codes |
| Block Model Code |
Gabbro |
| GM, GP, GPL, GD, GI, GC, GSM, GB, GSB, ZF, PX |
| 0 |
Waste rock |
| M, SK, ES, H, VS, PZ, DI, GR, GAN, NR |
| 1 |
Oxides |
| OX, REC |
| 2 |
Mineralogy was coded using the following criteria relating to the codes in the composite file, and is summarised in Table 16.
|
|
|
|
|
|
31 March 2009 | 72 |
|
|
|
| TECHNICAL REPORT AGUABLANCA NI-CU DEPOSIT |
Table 16: Mineralization codes (variable “type” in the block models)
|
|
|
|
|
Mineralization code |
| Mineralization description |
| Block Model Code |
NS |
| No mineralization |
| 0 |
SP |
| Patchy Mineralization |
| 1 |
S |
| Slight mineralization (slightly disseminated) |
| 2 |
SB |
| Semi-massive Breccia mineralization |
| 3 |
SS |
| Strongly disseminated mineralization |
| 4 |
17.8.6 Assignment of density
Using the composited density file, density was interpolated using the ID2 method with three passes. The search ellipse was orientated with a 90° dip (vertical). The ID2 parameters are shown in Table 17.
Table 17: Inverse distance interpolation parameters
|
|
|
|
|
|
|
|
|
|
|
Pass |
| Min. No. of |
| Min. No. of |
| Min. |
| Min |
| Search |
1 |
| 4 |
| 3 |
| 1 |
| 5 |
| 100 x 100 x 10 |
2 |
| 4 |
| 3 |
| 1 |
| 5 |
| 200 x 200 x 20 |
3 |
| 2 |
| 1 |
| 1 |
| 5 |
| 400 x 400 x 40 |
To estimate density (discussed in Section 17.7), the dominant mineralization field was used in conjunction with average density values in Table 18 to assign values to areas outside the pass 3 density search ellipse (mainly in the lower part of the mineralization).
|
|
|
|
|
|
31 March 2009 | 73 |
|
|
|
| TECHNICAL REPORT AGUABLANCA NI-CU DEPOSIT |
Table 18: Average density values assigned to blocks not already interpolated with density
|
|
|
|
|
|
|
|
|
|
|
|
|
Mineralization (“Type”) |
| N/A (<0) |
| NS (0) |
| S (2) |
| SP (1) |
| SS (4) |
| SB (3) |
Ni > 0.1% (Ore) |
| 2.99 |
| 2.99 |
| 3.04 |
| 3.07 |
| 3.12 |
| 3.22 |
Ni < 0.1% (waste) |
| 2.90 |
|
|
|
|
|
|
|
|
|
|
Where: NS = No Mineralization, SP = Patchy, S = Slightly Disseminated, SS = Strongly disseminated, SB = Semi-Massive
17.8.7 Block size
For grade estimation, Golder selected an estimation block size of 8 x 8 x 4 m. In Golder’s view, this is the minimum block size that can be estimated with acceptable precision from the drilling information.
To match their grade control and short term planning models, Lundin requested that the estimated block model be re-blocked to 4 x 4 x 4 m. The re-blocked block model is called OK_21jan09_4x4x4_new_origin.bmf. Model specifications provided in Table 19 shows the default values for all variables which were assigned to extra blocks created by extending the model.
The 4 x 4 x 4 m block size is very small with respect to the nominal exploration drilling spacing. In Golder’s opinion, this block size cannot be directly estimated with sufficient local precision due to the estimation smoothing effect. Accordingly, Golder selected a larger block size of 8 m x 8 m x 4 m for estimation.
|
|
|
|
|
|
31 March 2009 | 74 |
|
|
|
| TECHNICAL REPORT AGUABLANCA NI-CU DEPOSIT |
17.8.8 Block model variables
The description of the block model variables is shown in Table 19.
Table 19: Specifications of the block model
|
|
|
|
|
|
|
Variable |
| Default |
| Possible |
| Comment |
Ni |
| -9 |
| n/a |
| Ni PPM |
Cu |
| -9 |
| n/a |
| Cu PPM |
Pt |
| -9 |
| n/a |
| Pt PPB |
Pd |
| -9 |
| n/a |
| Pd PPB |
Co |
| -9 |
| n/a |
| Co PPM |
Au |
| -9 |
| n/a |
| Au PPB |
sg |
| 0 |
| n/a |
| Density (a mix of interpolated and assigned) |
Type |
| -99 |
| 0,1,2,3,4 |
| Dominant Lithology (as described in Table 16) |
Class |
| -99 |
| 1,2,3 |
| Resource Classification (1=Measured, 2=Indicated, 3=Inferred) |
Fault |
| -9 |
| 0,1,2,3,4,5,6, |
| Fault Block (see Table 12) |
Ore |
| -9 |
| 0,1,2 |
| Mineralization Zone (see Table 12) |
Topo |
| -9 |
| 1,2 |
| Current and collar-derived topography (see Table 12) |
Pit |
| -9 |
| 0,1 |
| Proposed pit outline (see Table 12) |
17.9 Validation of grade estimates
Numerical and visual assessment of the block model was undertaken to assess successful application of the various estimation passes and to ensure that so far as the data allowed, all blocks within mineralization domains were estimated.
Numerical assessment involves direct queries of the model, statistical comparison of sample grade to mean block grade by domain and spatially as panels representing easting, northing and elevation slices through the model (swath plots).
|
|
|
|
|
|
31 March 2009 | 75 |
|
|
|
| TECHNICAL REPORT AGUABLANCA NI-CU DEPOSIT |
|
|
17.9.1 | Visual Assessment of grade estimates |
An on-screen validation between samples and blocks was completed. This process involved comparing block estimates and composites grades in cross section. There is a good match between sample and block grades for all estimation variables taking into account the inherent smoothing effect expected in block grades resulting from the kriging process. The high-grade restraining was successful in isolating high-grade samples within the waste zone.
|
|
17.9.2 | Global assessment of grade estimates |
The global estimated mean grade was checked against the mean of the declustered 2 m composite data for each mineralization domain. Globally, the estimates for all variables are a good reproduction of the mean of the 2 m composite dataset, indicating the kriging process has generally dealt with the differing sample spacing across the deposit. The poorer mean grade reproduction in the waste domain may be influenced by extrapolation effects and a lack of data for Pt, Pd and Au. Table 20 shows the results.
Using the variogram, the block variance adjustment factor was calculated to provide an indication of smoothing. For each variable, the statistical summary provides the following information:
|
|
• | A check on the reproduction of the mean grade of the composite data in the OK model over the global domain. This is shown by ordinary kriging/drill hole grade, (OK/DH)% and should be close to 100% and provides an indication that the kriging estimates are not globally biased. |
|
|
• | The smoothing effect of the estimation is indicated by theactual variance adjustmentratio (f2),which is the OK block variance divided by the 2 m composite variance. |
|
|
• | Thetheoretical variance adjustmentratio (f3),defined for the parent block size of 8 × 8 × 4 m. |
|
|
• | The difference between the actual and theoretical variance adjustment ratios (theoretical ratio – actual ratio). This can be expressed as a relative smoothing effect percentage, representing the magnitude that the estimates are smoothed relative to the theoretical level of variance adjustment. |
|
|
|
|
|
|
31 March 2009 | 76 |
|
|
|
| TECHNICAL REPORT AGUABLANCA NI-CU DEPOSIT |
|
|
17.9.3 | Swath plot validation |
Swath plots allow assessment of block model estimates for global bias and are less influenced by extrapolation effects; the estimates should have a close relationship to the drill hole composite data used for estimation. The plots are useful when assessing average grade conformance, and to detect any obvious interpolation issues. The relationship between model and sample panel averages is also compared in the form of scatter plots and Q-Q plots. This allows some assessment of the smoothing effect of the interpolation.
Swath plots were produced for the estimation variables (Ni, Cu, Pt, Pd, Co and Au) for all estimated domains and are provided in Appendix G.
The process involved averaging both the blocks and samples in panels of 40 m (easting) by 40 m (northing) by 20 m RL.
Overall, the swath plot validation process shows that the block model estimates follow the trend of the 2 m composite grades across each group of deposits.
Pt, Pd and Au show a slight over-estimation in the Low-Grade zones, which is the result of high-grade samples influencing the estimation. No high-grade restraining was applied to Pt, Pd and Au. Also, the under-sampling of Pt, Pd and Au has resulted in a reduced confidence of the estimation, which is reflected in the kriging slope variable (pt_slope).
|
|
|
|
|
|
31 March 2009 | 77 |
|
|
|
| TECHNICAL REPORT AGUABLANCA NI-CU DEPOSIT |
Table 20: Univariate Statistics of Declustered 2 m composite data (Declustered using 100m window) and OK model
|
|
|
|
|
|
|
|
|
|
|
|
|
|
|
|
|
|
|
|
|
|
|
|
|
Domain |
| Variable |
| 2 m Drill Hole Composites |
| Ordinary Kriging |
|
|
| OK/DH(%)1 |
| f2 |
| f3 |
| f4 diff |
| Smoothing% | ||||||
|
|
|
|
|
|
|
|
|
|
|
|
|
| |||||||||||
|
|
|
| No. |
| Mean |
| Var. |
| No. |
| Mean |
| Var. |
|
|
|
|
|
|
|
|
|
|
High Grade |
| Ni ppm |
| 2697 |
| 9580 |
| 43973712 |
| 18694 |
| 9684 |
| 12130205 |
| 101.09 |
| 0.276 |
| 0.625 |
| 0.349 |
| 34.9 |
|
| Cu ppm |
| 2697 |
| 6842 |
| 8476247 |
| 18694 |
| 6741 |
| 2833201 |
| 98.53 |
| 0.334 |
| 0.625 |
| 0.291 |
| 29.1 |
no top cut |
| Pt ppb |
| 1599 |
| 329 |
| 26117 |
| 18694 |
| 312 |
| 13391 |
| 94.74 |
| 0.513 |
| 0.625 |
| 0.112 |
| 11.2 |
|
| Pd ppb |
| 1604 |
| 312 |
| 23716 |
| 18694 |
| 292 |
| 11387 |
| 93.67 |
| 0.480 |
| 0.625 |
| 0.145 |
| 14.5 |
|
| Co ppm |
| 2233 |
| 247 |
| 33834 |
| 18694 |
| 258 |
| 9813 |
| 104.58 |
| 0.290 |
| 0.625 |
| 0.335 |
| 33.5 |
|
| Au ppb |
| 1467 |
| 158 |
| 9143 |
| 18694 |
| 144 |
| 6227 |
| 91.21 |
| 0.681 |
| 0.625 |
| -0.056 |
| -5.6 |
Low Grade |
| Ni ppm |
| 6794 |
| 2222 |
| 3900687 |
| 74655 |
| 2262 |
| 1230829 |
| 101.82 |
| 0.316 |
| 0.625 |
| 0.309 |
| 30.9 |
|
| Cu ppm |
| 6794 |
| 2188 |
| 4977386 |
| 74655 |
| 2197 |
| 1914986 |
| 100.43 |
| 0.385 |
| 0.625 |
| 0.240 |
| 24.0 |
(1% restrained) |
| Pt ppb |
| 2565 |
| 169 |
| 19546 |
| 74655 |
| 165 |
| 12287 |
| 97.34 |
| 0.629 |
| 0.625 |
| -0.004 |
| -0.4 |
|
| Pd ppb |
| 2582 |
| 152 |
| 13931 |
| 74655 |
| 148 |
| 8739 |
| 97.24 |
| 0.627 |
| 0.625 |
| -0.002 |
| -0.2 |
|
| Co ppm |
| 5542 |
| 87 |
| 41721 |
| 74655 |
| 85 |
| 7293 |
| 98.21 |
| 0.175 |
| 0.625 |
| 0.450 |
| 45.0 |
|
| Au ppb |
| 2429 |
| 85 |
| 8053 |
| 74655 |
| 86 |
| 4980 |
| 101.30 |
| 0.618 |
| 0.625 |
| 0.007 |
| 0.7 |
Waste |
| Ni ppm |
| 10224 |
| 244 |
| 47629 |
| 1563115 |
| 237 |
| 20962 |
| 96.92 |
| 0.440 |
| 0.625 |
| 0.185 |
| 18.5 |
|
| Cu ppm |
| 10218 |
| 188 |
| 231709 |
| 1563115 |
| 171 |
| 34945 |
| 91.41 |
| 0.151 |
| 0.625 |
| 0.474 |
| 47.4 |
(0.1%restrained) |
| Pt ppb |
| 2550 |
| 19 |
| 456 |
| 1563115 |
| 15 |
| 243 |
| 80.16 |
| 0.532 |
| 0.625 |
| 0.093 |
| 9.3 |
|
| Pd ppb |
| 2571 |
| 18 |
| 410 |
| 1563115 |
| 15 |
| 186 |
| 81.07 |
| 0.454 |
| 0.625 |
| 0.171 |
| 17.1 |
|
| Co ppm |
| 8783 |
| 40 |
| 1167 |
| 1563115 |
| 38 |
| 223 |
| 94.43 |
| 0.191 |
| 0.625 |
| 0.434 |
| 43.4 |
|
| Au ppb |
| 3882 |
| 26 |
| 2418 |
| 1563115 |
| 13 |
| 53 |
| 48.57 |
| 0.022 |
| 0.625 |
| 0.603 |
| 60.3 |
1 between DH and OK mean values;2 actual variance adjustment (VA);3 theoretical VA;4 between real and theoreticalf factors
|
|
|
|
|
|
31 March 2009 | 78 |
|
|
|
| TECHNICAL REPORT AGUABLANCA NI-CU DEPOSIT |
|
|
17.10 | Mineral Resource classification |
The classification of the Mineral Resource was completed by Golder, in conformance with the CIM Mineral Resource and Mineral Reserve definitions referred to in National Instrument (NI) 43-101, Standards of Disclosure for Mineral Projects.
The Mineral Resource was classified as Measured and Indicated Resources based on a consideration of data density, confidence in the geological interpretation and confidence in the estimation.
This classification has been applied to the interpolated domains using a series of wireframe solids (see Figure 17-11) based on drill spacing. This was achieved by assigning a value to each block within the block model using the field “class” as follows:
Measured Resource (class = 1): Measured Resources are based on a maximum drill spacing of 25m by 50m (X by Y), which encompasses most of the High-Grade envelope. Golder believes this drilling spacing is sufficient to classify Measured Resources for Aguablanca.
Indicated Resource (class = 2): Based on a maximum drill spacing of 50m by 75m (X by Y), and confidence in the interpolation of the block model at outer extents of drilling. Golder believes this drilling spacing is sufficient in classifying Indicated Resources for Aguablanca; and
Inferred Resource (class = 3): Instead of producing a separate wireframe for Inferred Resources, all blocks lying outside of the Measured and Indicated wireframes are considered Inferred. The high-grade restraining has reduced the effect of small pods of mineralization lying outside of the main mineral body on the overall tonnages.
|
|
|
|
|
|
31 March 2009 | 79 |
|
|
|
| TECHNICAL REPORT AGUABLANCA NI-CU DEPOSIT |
Figure 17-11: Measured (red) and Indicated (yellow) Resource wireframes governed by the drilling density
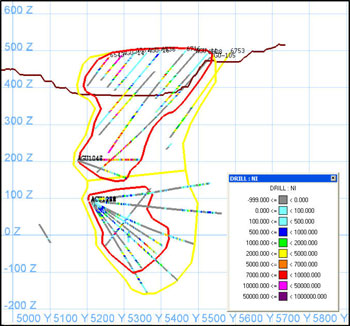
|
|
17.11 | December 2008 Aguablanca Mineral Resource Estimate |
In the body of this report all grades for Ni, Cu and Co are expressed in parts per million (ppm). For reporting purposes these have been converted to per cent (%) by dividing by 10,000 and then appropriately rounding them. Similarly grades for Pt, Pd and Au are expressed in parts per billion (ppb). For reporting purposes these have been converted to grams per tonne (g/t) by dividing by 1000 and then appropriately rounding them.
Golder has used a cut-off grade for reporting of 0.2% Ni. This is currently being used by Lundin as an economic cut-off of material mined as ore and fed to the process plant.
The resource figures estimated by Golder account for mined-out material using the topography surface at December 2008, as described in Section 17.6.2.
The Resource Report for the Aguablanca Deposit for the sub blocked model is shown in Table 21.
|
|
|
|
|
|
31 March 2009 | 80 |
|
|
|
| TECHNICAL REPORT AGUABLANCA NI-CU DEPOSIT |
Table 21: Resource Report for the Sub-blocked Block model (8x8x4) at 0.1% and 0.2% Ni cut-off grades
|
|
|
|
|
|
|
|
|
|
|
|
|
|
|
|
|
|
| |||||||||||||||
CLASS |
| Cut-off grade |
| Tonnes |
| Ni |
| Cu |
| Pt |
| Pd |
| Co |
| Au |
Measured |
| 0.1 |
| 19,774 |
| 0.450 |
| 0.382 |
| 0.240 |
| 0.215 |
| 0.013 |
| 0.119 |
Indicated |
| 0.1 |
| 3,966 |
| 0.200 |
| 0.175 |
| 0.113 |
| 0.105 |
| 0.008 |
| 0.066 |
Measured+Indicated |
| 0.1 |
| 23,740 |
| 0.408 |
| 0.347 |
| 0.219 |
| 0.197 |
| 0.012 |
| 0.110 |
Inferred |
| 0.1 |
| 1,834 |
| 0.178 |
| 0.140 |
| 0.108 |
| 0.102 |
| 0.007 |
| 0.057 |
Measured |
| 0.2 |
| 14,966 |
| 0.545 |
| 0.457 |
| 0.256 |
| 0.230 |
| 0.015 |
| 0.128 |
Indicated |
| 0.2 |
| 1,569 |
| 0.279 |
| 0.236 |
| 0.132 |
| 0.124 |
| 0.011 |
| 0.077 |
Measured+Indicated |
| 0.2 |
| 16,535 |
| 0.520 |
| 0.436 |
| 0.244 |
| 0.220 |
| 0.014 |
| 0.123 |
Inferred |
| 0.2 |
| 525 |
| 0.271 |
| 0.189 |
| 0.138 |
| 0.133 |
| 0.010 |
| 0.066 |
Mineral Resources are not Mineral Reserves and have no demonstrated economic viability.
|
|
17.12 | Mineral Reserve Estimation |
This section describes the procedures used and the results obtained in an estimation update for the Aguablanca reserves. This was carried out by Juan Pablo Gonzales of Golder, taking into account a new resource model and revised geotechnical parameters. The mineral resource model of the Aguablanca Copper-Nickel deposit, which supported the Mineral Reserve estimation, corresponds to the block model incorporated in the resource inventory, as shown in Table 21.
Reserves were estimated based on Measured and Indicated Resources only. The estimation was based on an optimized pit limit and a production schedule properly supported by an operational mine design. In particular, dilution and mining recovery were properly addressed and supported by historical data. The tonnages and grades are reported at an appropriate economic cut-off grade based on documented costs and prices.
|
|
|
|
|
|
31 March 2009 | 81 |
|
|
|
| TECHNICAL REPORT AGUABLANCA NI-CU DEPOSIT |
|
|
17.12.1 | Initial topography |
The initial topography was provided by the Aguablanca personnel in dxf format. Figure 17-12 presents an aerial view of this topographic surface. It corresponds to the pit topography as at December 31 2008. In Figure 17-12 it is possible to see the current progress of the operation within the limits of Phase 1, Phase 2 and upper benches of Phase 3.
Figure 17-12: Topographic surface as at December 31 2008
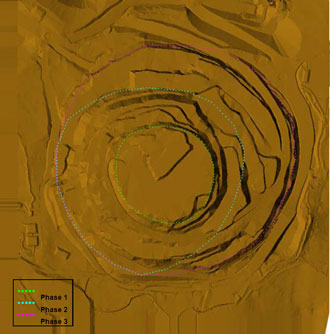
|
|
17.12.2 | Geotechnical background |
The geotechnical information for the final pit design and the slopes stability are available in the unpublished internal technical document, 087632028006 R Rev1 Global Stability Analyses January 2009. This report suggests the use of an overall slope angle of 55° considering it does not materially change the risk of large scale instability. The report does not recommend steepening the pit walls by increasing the height of batters to more than 16 m, or by decreasing the width of berms to less than 10 m.
The results of ongoing investigations in the pit will need to be considered in some detail, and additional modelling for this area is likely to be required.
|
|
|
|
|
|
31 March 2009 | 82 |
|
|
|
| TECHNICAL REPORT AGUABLANCA NI-CU DEPOSIT |
|
|
17.12.3 | Cost structure |
The cost information was provided by Aguablanca and corresponds to actual costs based on Aguablanca’s current budget and the historical cost database. A variable mining cost was considered depending on the depth of the mine. See Table 22.
Table 22: Aguablanca – Cost Summary
|
|
|
Ore Mining Cost (Base)* | 2.433 | US$/t proc. |
|
|
|
Waste Mining Cost(Base)* | 1.384 | US$/t proc. |
|
|
|
Incremental Mining Cost (*) | 0.0105 | US$/t x 100 m |
|
|
|
Processing Cost | 24.26 | US$/t proc. |
|
|
|
Shipping Cost | 30.496 | US$/t con. |
|
|
|
Royalty (NSR) | 2 | % |
Note: - This costs increases according to the depth of the pit. | ||
|
|
17.12.4 | Mine design parameters |
In the design of phases and final pit Golder used parameters provided by Aguablanca personnel that are based on current mining practices. The main difference in relation to the previous design is an increase in the overall slope angle. A summary of the design parameters is shown in Table 23.
Table 23: Aguablanca – Design Parameters
|
|
Item | Value |
Ramp Width (*) | 25 m- 12.5 m |
Gradient | 10% |
Bench Height | 16 m |
Bench Face Angle (**) | 90° |
Inter-ramp Angle | 58° |
Overall Slope | 55° |
|
|
|
|
|
|
31 March 2009 | 83 |
|
|
|
| TECHNICAL REPORT AGUABLANCA NI-CU DEPOSIT |
Note: (*)
For the last benches of the final pit a ramp width of 12.5 m was adopted to allow for a better recovery of the in-situ material.
Note: (**)
The bench face angle for zone Z2 is currently under revision.
|
|
17.12.5 | Commercial parameters |
The estimation of reserves was carried out considering a selling price of Nickel at 6.5 US$/lb, while for Copper price was set at 2.0 US$/lb. For the selection of the ultimate pit limit the criteria of maximum Net Present Value (NPV) was applied using a discount rate of 11%.
|
|
17.12.6 | Metal recovery |
The key process parameters used in the pit optimization are the metallurgical recovery for the relevant elements. These parameters were supplied by Aguablanca and have been validated by the current operation. The recoveries are calculated according to the equations presented in Table 24.
Table 24: Aguablanca – Recovery Equation
|
|
Element | Equation |
Nickel (%): as head grade function | = 6.286 x Ni% +76.952 |
Copper (%): as head grade function | =15 x Cu% + 85.502 |
Note: |
|
- Average from historical data Ni= 80.26%
|
|
17.12.7 | Methodology for pit optimization and design |
The most important aspect of Mineral Reserve estimation is to have available a suitable pit outline. This must meet all the economic, mining and other requirements that make it appropriate to use as a pit for reporting Reserves.
There are two ways that these reporting pits are typically created. One is by using optimization programs such as Whittle Four-X to create a suitable outline. The other is to report within a fully developed mine design backed by schedules and financial analysis. Fully developed designs are the best way to obtain Reserves but using properly created optimizations is quite acceptable.
|
|
|
|
|
|
31 March 2009 | 84 |
|
|
|
| TECHNICAL REPORT AGUABLANCA NI-CU DEPOSIT |
The procedure used for the development of the Life of Mine plan (LOM) for Aguablanca is summarised as follows:
|
|
|
| 1. | Open pit optimisation using Whittle Four-X. |
|
|
|
| 2. | Develop phases within the selected final pit shell. This included making changes to the current Phase 2 and adding Phase 3. |
|
|
|
| 3. | The NPV Scheduler was used to schedule and sequence the operations for the six year plan (2009 to 2014). |
|
|
|
| 4. | Design the pit configuration at the end of each period. |
The principal objective in the development of the mine plan was to provide 1.85 Mt of ore feed per annum to the process facility.
|
|
17.12.8 | Cut-off grade |
The current mine plan has been calculated using a cut-off grade of 0.25% Ni. This marginal cutoff grade was calculated as:
Marginal Cut-off = (Process Cost $/t + ∆ cost mining)/(Nickel Price – Selling Cost $/lb)/ R%
Where:
|
|
| R = Recovery |
| ∆Cost Mining = Ore Mining Cost – Waste Mining Cost |
|
|
17.12.9 | Pit optimisation results |
The criterion for selecting the final pit limit was based on finding the best balance between NPV and stripping ratio. The Whittle best case is achieved by scheduling on a pit by pit basis. Figure 17-13 shows that the highest NPV is reached in pit 9, but an insignificant NPV increment is achieved after pit 7. Figure 17-14 shows the quantities of ore, waste and stripping ratio as a function of the incremental pits.
Finally, pit 7 was selected as the final pit as it was considered to provide the best balance between NPV and stripping ratio. Figure 17-15 shows a grade tonnage curve calculated for the material inside pit 7.
|
|
|
|
|
|
31 March 2009 | 85 |
|
|
|
| TECHNICAL REPORT AGUABLANCA NI-CU DEPOSIT |
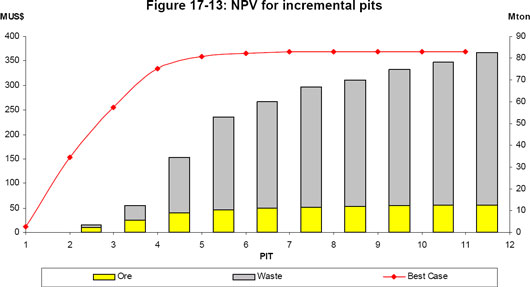
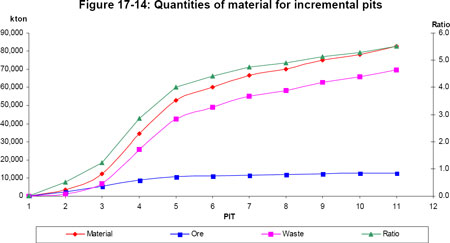
|
|
|
|
|
|
31 March 2009 | 86 |
|
|
|
| TECHNICAL REPORT AGUABLANCA NI-CU DEPOSIT |
Figure 17-15: Grade-Tonnage curve for the selected pit limit (pit 7)
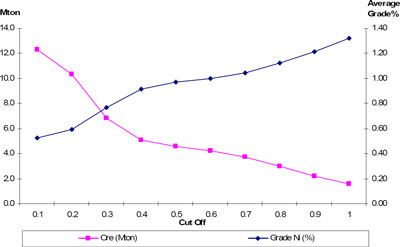
|
|
17.12.10 | Pit design |
Initially the pit shells from the optimisation were imported into the mine design software (Vulcan). The shells were then used to guide the design.
A check on the design against the initial Whittle shell was carried out to ensure the outline is properly followed. In general, the final pit has an average difference of 10 to 15 metres with respect to the economic shell. Visual checks show that the shell is followed within reasonable limits considering the requirements for mining (e.g. Figure 17-16 and Figure 17-17).
The dimensions by final pit were developed considering the actual topography can deepen by approximately 260 metres. The pit width at surface is more than 580 metres.
The last benches of the final pit were designed with ramps of 12.5 metres width, allowing a greater recovery of ore at the bottom of the pit.
The design of phases 2 and 3 are concentric and both which share the northwest wall. The final design for phases 2 and 3 can be seen in Figure 17-18 and Figure 17-19 respectively. Figure 17-20 shows the final optimised pit limit in relation to the current resource estimate and demonstrates resources below the pit limit. There may be potential for underground mining.
|
|
|
|
|
|
31 March 2009 | 87 |
|
|
|
| TECHNICAL REPORT AGUABLANCA NI-CU DEPOSIT |
Figure 17-16: Section 5300 North
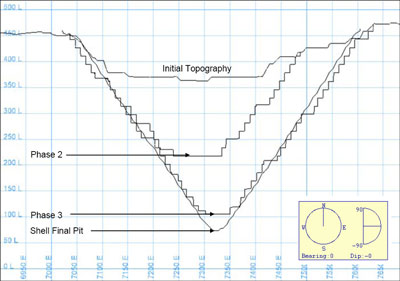
Figure 17-17: Section 7300 East
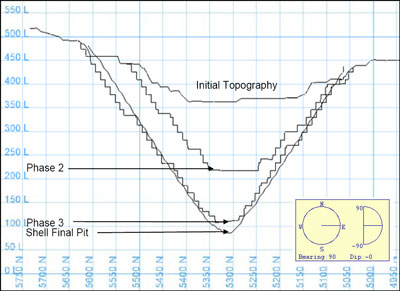
|
|
|
|
|
|
31 March 2009 | 88 |
|
|
|
| TECHNICAL REPORT AGUABLANCA NI-CU DEPOSIT |
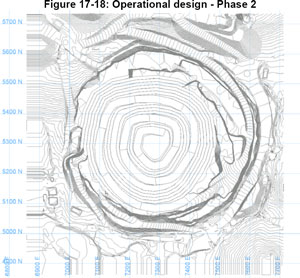
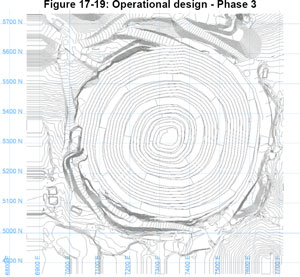
|
|
|
|
|
|
31 March 2009 | 89 |
|
|
|
| TECHNICAL REPORT AGUABLANCA NI-CU DEPOSIT |
Figure 17-20: Final Pit and Block Model
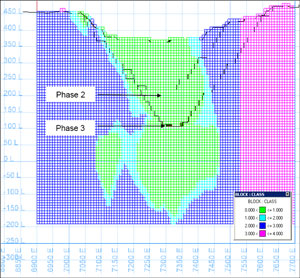
Class: Resource Classification (1=Measured, 2=Indicated, 3=Inferred)
|
|
17.12.11 | Scheduling |
In the construction of the mining schedule the software NPV Scheduler® was used considering 2 designed phases (phases 2 and 3) and an extraction rate of 1.85 Mt per annum. The current phase 1 was included in phase 2 due its current advanced depletion.
The continuity of plant feed is assured by an appropriate balance between the rate of mineral extraction and waste removal. The schedule assumes 365 days of mining operation per year. A mining dilution factor or 5.5% was considered. This value was based on the average mining dilution observed over the last three years at Aguablanca.
The mine plan recovers approximately 9.0 Mt of mineral with an average grade of 0.63% Ni and 0.47% Cu over a period of 6 years. The overall strip ratio is 7.1:1.
Table 25 presents general information of the life of mine plan for the Aguablanca mine.
|
|
|
|
|
|
31 March 2009 | 90 |
|
|
|
| TECHNICAL REPORT AGUABLANCA NI-CU DEPOSIT |
Table 25: Life of Mine Plan for the Aguablanca Mine
|
|
|
|
|
|
|
|
|
|
|
|
|
|
|
|
|
|
|
|
|
|
|
|
| |||||||||||||
|
|
|
|
|
| Year 1 |
| Year 2 |
| Year 3 |
| Year 4 |
| Year 5 |
| Year 6 |
| Total |
|
| Pre-Strip |
| Tonnes |
| — |
| — |
| — |
| — |
|
|
| — |
| — |
|
| Mined |
| Tonnes |
| 15,747,448 |
| 9,205,642 |
| 3,733,770 |
| 0 |
| 0 |
| 0 |
| 28,686,860 |
|
| Waste |
| Tonnes |
| 13,897,448 |
| 7,355,642 |
| 2,021,543 |
| 0 |
| 0 |
| 0 |
| 23,274,633 |
|
| Ore |
| Tonnes |
| 1,850,000 |
| 1,850,000 |
| 1,712,227 |
| 0 |
| 0 |
| 0 |
| 5,412,227 |
|
| Strip Ratio |
| W/O |
| 7.5 |
| 4.0 |
| 1.2 |
| 0.0 |
| 0.0 |
| 0.0 |
| 4.3 |
PHASE 2 |
| Ni Grade |
| % |
| 0.54 |
| 0.67 |
| 0.64 |
| 0.00 |
| 0.00 |
| 0.00 |
| 0.61 |
|
| Cu Grade |
| % |
| 0.41 |
| 0.45 |
| 0.46 |
| 0.00 |
| 0.00 |
| 0.00 |
| 0.44 |
|
| Pt |
| ppb |
| 210.74 |
| 217.89 |
| 217.48 |
| 0.00 |
| 0.00 |
| 0.00 |
| 215.31 |
|
| Pd |
| ppb |
| 202.66 |
| 207.27 |
| 201.55 |
| 0.00 |
| 0.00 |
| 0.00 |
| 203.89 |
|
| Co |
| ppm |
| 166.81 |
| 188.86 |
| 176.27 |
| 0.00 |
| 0.00 |
| 0.00 |
| 177.34 |
|
| Au |
| ppb |
| 108.30 |
| 105.69 |
| 101.39 |
| 0.00 |
| 0.00 |
| 0.00 |
| 105.22 |
|
| Pre-Strip |
| Tonnes |
| — |
| — |
| — |
| — |
|
|
| — |
| — |
|
| Mined |
| Tonnes |
| 1,435,273 |
| 8,823,913 |
| 15,751,185 |
| 14,692,101 |
| 2,472,126 |
| 1,017,793 |
| 44,192,391 |
|
| Waste |
| Tonnes |
| 1,435,273 |
| 8,823,913 |
| 15,613,413 |
| 13,212,101 |
| 1,269,627 |
| 212,154 |
| 40,566,480 |
|
| Ore |
| Tonnes |
| 0 |
| 0 |
| 137,772 |
| 1,480,000 |
| 1,202,499 |
| 805,639 |
| 3,625,911 |
|
| Strip Ratio |
| W/O |
| 0.0 |
| 0.0 |
| 113.3 |
| 8.9 |
| 1.1 |
| 0.3 |
| 11.2 |
PHASE 3 |
| Ni Grade |
| % |
| 0.00 |
| 0.00 |
| 0.25 |
| 0.62 |
| 0.71 |
| 0.73 |
| 0.66 |
|
| Cu Grade |
| % |
| 0.00 |
| 0.00 |
| 0.24 |
| 0.47 |
| 0.54 |
| 0.62 |
| 0.52 |
|
| Pt |
| ppb |
| 0.00 |
| 0.00 |
| 72.38 |
| 191.19 |
| 221.66 |
| 313.17 |
| 223.88 |
|
| Pd |
| ppb |
| 0.00 |
| 0.00 |
| 75.35 |
| 177.20 |
| 202.71 |
| 272.53 |
| 202.97 |
|
| Co |
| ppm |
| 0.00 |
| 0.00 |
| 76.19 |
| 158.44 |
| 168.85 |
| 166.72 |
| 160.61 |
|
| Au |
| ppb |
| 0.00 |
| 0.00 |
| 58.59 |
| 107.42 |
| 85.22 |
| 142.69 |
| 106.04 |
|
| Pre-Strip |
| Tonnes |
| — |
| — |
| — |
| — |
| — |
| — |
| — |
|
| Mined (ore + |
| Tonnes |
| 17,182,721 |
| 18,029,555 |
| 19,484,955 |
| 14,692,101 |
| 2,472,126 |
| 1,017,793 |
| 72,879,251 |
|
| waste) |
|
|
|
|
|
|
|
|
|
|
|
|
|
|
|
|
|
| Waste |
| Tonnes |
| 15,332,721 |
| 16,179,555 |
| 17,634,956 |
| 13,212,101 |
| 1,269,627 |
| 212,154 |
| 63,841,113 |
|
| Ore |
| Tonnes |
| 1,850,000 |
| 1,850,000 |
| 1,849,999 |
| 1,480,000 |
| 1,202,499 |
| 805,639 |
| 9,038,138 |
|
| Strip Ratio |
| W/O |
| 8.3 |
| 8.7 |
| 9.5 |
| 8.9 |
| 1.1 |
| 0.3 |
| 7.1 |
|
| Ore Processed |
| Tonnes |
| 1,850,000 |
| 1,850,000 |
| 1,849,999 |
| 1,480,000 |
| 1,202,499 |
| 805,639 |
| 9,038,138 |
|
| Ni Grade |
| % |
| 0.54 |
| 0.67 |
| 0.61 |
| 0.62 |
| 0.71 |
| 0.73 |
| 0.63 |
|
| Cu Grade |
| % |
| 0.41 |
| 0.45 |
| 0.44 |
| 0.47 |
| 0.54 |
| 0.62 |
| 0.47 |
Total |
| Pt |
| ppb |
| 210.74 |
| 217.89 |
| 206.67 |
| 191.19 |
| 221.66 |
| 313.17 |
| 218.75 |
Production |
|
|
|
|
|
|
|
|
|
|
|
|
|
|
|
|
|
|
|
| Pd |
| ppb |
| 202.66 |
| 207.27 |
| 192.16 |
| 177.20 |
| 202.71 |
| 272.53 |
| 203.52 |
|
| Co |
| ppm |
| 166.81 |
| 188.86 |
| 168.82 |
| 158.44 |
| 168.85 |
| 166.72 |
| 170.63 |
|
| Au |
| ppb |
| 108.30 |
| 105.69 |
| 98.20 |
| 107.42 |
| 85.22 |
| 142.69 |
| 105.55 |
|
| Contained Ni |
| Tonnes |
| 9,929 |
| 12,327 |
| 11,350 |
| 9,106 |
| 8,485 |
| 5,896 |
| 57,093 |
|
| Contained Cu |
| Tonnes |
| 7,500 |
| 8,248 |
| 8,165 |
| 6,945 |
| 6,542 |
| 5,007 |
| 42,407 |
|
| Contained Pt |
| kg |
| 390 |
| 403 |
| 382 |
| 283 |
| 267 |
| 252 |
| 1,977 |
|
| Contained Pd |
| kg |
| 375 |
| 383 |
| 355 |
| 262 |
| 244 |
| 220 |
| 1839 |
|
| Contained Co |
| kg |
| 308,604 |
| 349,399 |
| 312,316 |
| 234,486 |
| 203,046 |
| 134,313 |
| 1,542,164 |
|
| Contained Au |
| kg |
| 200.4 |
| 195.5 |
| 181.7 |
| 159.0 |
| 102.5 |
| 115.0 |
| 953.97 |
Figure 17-21 and Figure 17-22 show summary production figures.
|
|
|
|
|
|
31 March 2009 | 91 |
|
|
|
| TECHNICAL REPORT AGUABLANCA NI-CU DEPOSIT |
Figure 17-21: Summary Extraction Materials
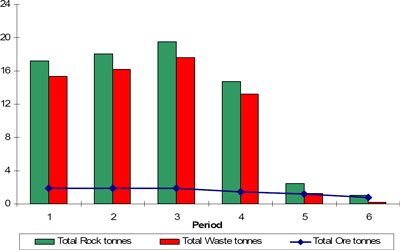
Figure 17-22: Tonnages and grades by Period
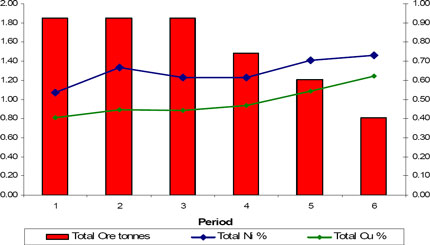
|
|
|
|
|
|
31 March 2009 | 92 |
|
|
|
| TECHNICAL REPORT AGUABLANCA NI-CU DEPOSIT |
|
|
17.12.12 | December 2008 Aguablanca Mineral Reserve Estimate |
Conversion of the mineral resource estimate into a mineral reserve was based on appropriate mine design and planning. In particular, dilution and mine recovery are supported by historical data following established practices at the mine. The tonnes and grades are reported at an appropriate economic cut-off grade of 0.25% Ni.
A mine plan has been developed that provides the basis for a reserve statement. The principal objective of the mine plan is to provide 1.85 Mt of plant feed material per annum to the process facility. The resulting mine plan is an open pit operation for 6 years. The mineable reserves have been estimated using long term prices of 6.5 US$/lb for Nickel and 2.0 US$/lb for Copper.
Due to the strong relationship between E/M, and the geometry of the orebody, the pit and therefore the Reserves is not very sensitive to increases in the price of metal. For instance a Price rise in Ni to $10 per pound would only increase the size of the optimized pit by a marginal amount.
The numbers are provided at the appropriate level of precision for public reporting and are considered an acceptable prediction of the available material expected from mining. Proven and Probable Reserves are summarized in Table 26.
Table 26: Proven and Probable Mineral Reserves in the Aguablanca
Mine as at December 31, 2008 at a cut-off grade of 0.25% Ni
|
|
|
|
|
|
|
|
|
|
|
|
|
|
|
Aguablanca |
| Tonnes |
| Ni |
| Cu |
| Pt |
| Pd |
| Co |
| Au |
|
|
|
|
|
|
|
|
|
|
|
|
|
|
|
Proven Reserves |
| 8,668 |
| 0.65 |
| 0.48 |
| 0.222 |
| 0.208 |
| 0.017 |
| 0.106 |
|
|
|
|
|
|
|
|
|
|
|
|
|
|
|
Probable Reserves |
| 370 |
| 0.30 |
| 0.29 |
| 0.088 |
| 0.090 |
| 0.012 |
| 0.073 |
|
|
|
|
|
|
|
|
|
|
|
|
|
|
|
Subtotal |
| 9,038 |
| 0.63 |
| 0.47 |
| 0.218 |
| 0.203 |
| 0.017 |
| 0.105 |
|
|
|
|
|
|
31 March 2009 | 93 |
|
|
|
| TECHNICAL REPORT AGUABLANCA NI-CU DEPOSIT |
|
|
17.12.13 | Risks |
Risks associated to each specific subject were analyzed. This analysis focused on factors that could affect the recovery of Mineral Reserves at Aguablanca. A summary of the results is presented in Table 27.
Table 27: Mineral Reserves Risks
|
|
|
Variables | Risk | Comments |
|
|
|
Weather | Low | Low severity, rainfall and light snow. Aguablanca staff has experience operating under these conditions. |
Altitude | Low | Does not represent risk to the operation. |
Mine Accessibility | Low | Good access. |
Resources estimation | Low | It is a relatively simple geology that is well known by Aguablanca’s technical staff. Reconciliation results support resource estimation. |
|
|
|
Metal prices | High | Uncertainty related to short-term rices given current unbalance between supply and demand for base metals can cause further drop in metal prices. |
|
|
|
Final pit and Reserves | Med | The probability that the final pit will encompass the full resource is low but the economic shell of the pit may change significantly with increasing or decreasing metal prices. |
Slope Stability | Med | Relatively aggressive slopes at 55 degrees provided by new geotechnical study. Requires constant monitoring and good operational standards. The bench face angle for zone Z2 is currently under revision. |
Mining Operation | Low | Reasonable mining rates and good operational standards. |
Mining Equipment | Low | The mine plan considers existing mining equipment that has proved to perform well over a period of 3 years. |
|
|
|
|
|
|
31 March 2009 | 94 |
|
|
|
| TECHNICAL REPORT AGUABLANCA NI-CU DEPOSIT |
|
|
17.12.14 | Conclusions and recommendations |
Aguablanca mine is an operating open pit mine which produces concentrates of nickel and copper.
The estimation of economically exploitable mineral reserves was carried out taking into account a new resource model, revised geotechnical parameters and updated technical and economical parameters, such as metal prices and costs.
Reserves were estimated based on Measured and Indicated Resources only. The estimation was based on an optimized pit limit and a production schedule properly supported by an operational mine design. In particular, dilution and mining recovery were properly addressed and supported by historical data. The tonnages and grades are reported at an appropriate economic cut-off grade based on documented costs and prices.
Golder considered the incremental Whittle shells for the design of two mining phases using a bench height of 16 metres, a face angle of 90° and an overall slope of 55°. In practice this overall slope angle will require constant monitoring and good operational standards.
The new final pit design has a steeper overall slope than the previous design and allowed for the pit to reach slightly deeper parts of the orebody. The last benches of the final pit were designed with ramps of 12.5 metres width, allowing a greater mining recovery at the pit bottom. Phases 2 and 3 are concentric and share the northwest wall of the pit.
The criteria used in the mine plan were (a) respect the order of precedence of the phases, (b) achieve the production rate of 1.85 Mtpa considering operational restrictions and (c) ensure the constant plant feed for as long as possible.
In accordance with the current cost structure of the Aguablanca Mine, the Mineral Reserve has been estimated using a cut-off grade of 0.25% Ni. Within the final pit selected, a life of mine plan for the Aguablanca mine was developed considering a total production period of 6 years. The plant feed was constrained by the plant capacity of 1.85 Mtpa. In total the mine plan amounts a total production of approximately 9.0 Mt with an average grade of 0.63% Ni and 0.47% Cu. Overall the stripping ratio is 7.1:1.
|
|
|
|
|
|
31 March 2009 | 95 |
|
|
|
| TECHNICAL REPORT AGUABLANCA NI-CU DEPOSIT |
|
|
18.0 | OTHER RELEVANT DATA AND INFORMATION |
There is no other relevant data or information to report.
|
|
|
|
|
|
31 March 2009 | 96 |
|
|
|
| TECHNICAL REPORT AGUABLANCA NI-CU DEPOSIT |
|
|
19.0 | INTERPRETATION AND CONCLUSIONS |
Exploration has been carried out on the Aguablanca deposit since the mid 1980’s including drilling programs conducted by the Presur/RTM Joint Venture and Lundin. Drilling of the deeper portions of the deposit continued during 2008. The main focus of the latest exploration program was to increase confidence in the resource (infill cored drilling), for ongoing metallurgical and geotechnical testing and to identify other potential mineralization areas including deep mineralization. The drill hole database supplied to Golder for the purpose of estimating a Mineral Resource contains a total of 362 drill holes for a total of 96,515 m.
During the drilling programs conducted by Lundin a QAQC sampling program was installed that was reviewed during a site visit by a Golder QP, which included reviews of the blanks, standards and duplicates used. In addition, Lundin has compiled all the historical drilling data including log descriptions, the diamond drill record sheets, and the daily assay reports which are all stored in digital format in Lundin’s Recmin software and in hard copy on site. Any errors (i.e. drill hole survey location, typos, etc.) identified were provided to Lundin for correction. The results of these reviews indicates that Lundin’s drilling database and their QAQC sampling program is to industry standard and acceptable for Mineral Resource evaluation.
The 31 December 2008 Aguablanca Mineral Resource Estimate was based on the Lundin drilling database.
The 31 December 2008 Mineral Resource Estimate and revised geotechnical parameters based on new geotechnical data were used in the development of a mineral reserve estimate carried out by Golder. The estimation was based on an optimized pit limit and a production schedule supported by an operational mine design. In particular, dilution and mining recovery were properly addressed and supported by historical data.
The completed project has met its objectives by providing a statement of Mineral Resources and Mineral Reserves for the Aguablanca Deposit, which have been classified in conformance with the CIM Mineral Resource and Mineral Reserve definitions referred to in the National Instrument (NI) 43-101, Standards of Disclosure for Mineral Projects.
|
|
|
|
|
|
31 March 2009 | 97 |
|
|
|
| TECHNICAL REPORT AGUABLANCA NI-CU DEPOSIT |
|
|
20.0 | RECOMMENDATIONS |
Lundin’s QAQC program is considered acceptable by Golder but could be improved by implementing the following recommendations:
|
|
• | Improving the splitting of the pulverised material by employing a small laboratory scale Jones riffle splitter or a rotary sampling device. |
|
|
• | The pulverising size for the currently prepared standards is coarser than is generally used and the mixing (homogenisation) procedure may not be sufficient. The quality of the standards should be further evaluated as being suitable for QC. |
The methodology for measuring the bulk density of the rock types currently employed by Lundin may lead to a risk of bias in highly absorbent rocks. The sequence in which the measurements are taken may lead to the sample absorbing more water when P3 is measured than was present when P1 was measured thereby increasing the dry density. Golder does not believe this has a material impact on the estimation of densities but should be investigated.
|
|
|
|
|
|
31 March 2009 | 98 |
|
|
|
| TECHNICAL REPORT AGUABLANCA NI-CU DEPOSIT |
|
|
21.0 | REFERENCES |
Lundin website: <http://www.lundinmining.com/s/AguaBlanca.asp> accessed October 6, 2008. Lundin (2004). Yacimiento de Aguablanca. Modelo Genetico y Objectivos. MDM. (2002). Aguablanca Nickel-Copper Feasibility Report. Ref 0471/4/DD/19789.
Tornos, F. Galindo, C. Casquet, C. Rodriguez Pevida. L. Martinez, C. Martinez, E. Velasco, F. Iriondon, A. (2006). The Aguablanca Ni-(Cu) sulphide deposit, WS Spain: geologic and geochemical controls and the relationship with a midcrustal layered mafic complex.
Reflex Instruments website <http://www.reflexinstruments.com/products.php?ID=16>, accessed November 3, 2008.
|
|
|
|
|
|
31 March 2009 | 99 |
|
|
|
| TECHNICAL REPORT AGUABLANCA NI-CU DEPOSIT |
|
|
22.0 | DATE AND SIGNATURE PAGE |
|
|
22.1 | Certificate of Juan Alvarez |
I, Juan Alvarez, of London England, do hereby certify that as the author of this“Technical report on the Aguablanca Ni-Cu deposit, Extremadura Region, Spain”,dated March 31, 2009, I hereby make the following statements:
|
|
• | I am employed as a Senior Mining Geologist with Golder Associates (UK) Ltd. with a business address at 1 Alie St London E1 8DE. |
|
|
• | I am a graduate of Macquarie University, (Bachelor of Science, 1993). |
|
|
• | I am a member in good standing of the Australasian Institute of Mining and Metallurgy (Member number 203626). |
|
|
• | I have practiced my profession continuously since graduation. |
|
|
• | I have read the definition of “qualified person” set out in National Instrument 43-101 (Nl 43-101) and certify that, by reason of my education, affiliation with a professional association (as defined in Nl 43-101) and past relevant work experience, I fulfil the requirements to be a “qualified person” for the purpose of Nl 43-101. |
|
|
• | My relevant experience with respect Aguablanca Deposit includes over 14 years in exploration, mining geology and grade estimation in Australia, South America and Europe. Over the last five years I have assisted in Mineral Resource estimates following CIM guidelines on a number of projects including the Roche Bay Deposit in Nunavit, Canada. |
|
|
• | I am responsible for the preparation of Sections 1.0 to 14.0, Section 17.1 to 17.3 and Sections 19.0 to 22.0 of this Technical Report titled“Technical report on the Aguablanca Ni-Cu deposit, Extremadura Region, Spain”,dated March 31 2009. In addition, I visited the Property for 4 days from July 21 2008 and for 5 days from August 18 2008. |
|
|
• | I have no prior involvement with the Property that is the subject of the Technical Report. |
|
|
• | As of the date of this Certificate, to my knowledge, information and belief, the sections of this Technical Report for which I am responsible contains all scientific and technical information that is required to be disclosed to make the Technical Report not misleading. |
|
|
• | I am independent of the Issuer as defined by Section 1.4 of the Instrument. I have read National Instrument 43-101 and the sections for which I am responsible in this Technical Report have been prepared in compliance with National Instrument 43-101 and Form 43-101F1. |
|
|
|
|
| |
Signature |
|
|
|
|
|
|
|
31 March 2009 | 100 |
|
|
|
| TECHNICAL REPORT AGUABLANCA NI-CU DEPOSIT |
|
|
22.2 | Certificate of Sia Khosrowshahi |
I, Sia Khosrowshahi of Perth Australia, do hereby certify that as the author of this“Technical report on the Aguablanca Ni-Cu deposit, Extremadura Region, Spain”,dated March 31 2009, I hereby make the following statements:
|
|
• | I am employed as a Principal Ore Evaluation with Golder Associates (Australia) Ltd. with a business address at 1 Havelock St., West Perth. |
|
|
• | I am a graduate of Leeds University, (PhD in Mining Geostatistics, 1982). |
|
|
• | I am a member in good standing of the Australasian Institute of Mining and Metallurgy (Member number 109344). |
|
|
• | I have practiced my profession continuously since graduation. |
|
|
• | I have read the definition of “qualified person” set out in National Instrument 43-101 (NI 43-101) and certify that, by reason of my education, affiliation with a professional association (as defined in NI 43-101) and past relevant work experience, I fulfil the requirements to be a “qualified person” for the purpose of NI 43-101. |
|
|
• | My relevant experience with respect Aguablanca Deposit includes over 25 years experience in geology, Mineral Resource estimation, ore reserves development, grade control, resource/reserves risk assessment techniques, computerized mine planning systems and technical engineering activities related to variety of commodities (in gold, Iron ore, nickel, bauxite, mineral sands, copper, rear earth, zinc, silver, manganese) and many projects specially in Australia, Chile, Indonesia, Africa, Papua New Guinea, Canada and Iran. |
|
|
• | I am responsible for the preparation of Section 17.4 to 17.11 of this Technical Report titled“Technical report on the Aguablanca Ni-Cu deposit, Extremadura Region, Spain”, dated March 31, 2009. |
|
|
• | I have no prior involvement with the Property that is the subject of the Technical Report. |
|
|
• | As of the date of this Certificate, to my knowledge, information and belief, the sections of this Technical Report for which I am responsible contains all scientific and technical information that is required to be disclosed to make the Technical Report not misleading. |
|
|
• | I am independent of the Issuer as defined by Section 1.4 of the Instrument. I have read National Instrument 43-101 and the sections for which I am responsible in this Technical Report have been prepared in compliance with National Instrument 43-101 and Form 43-101F1. |
|
|
|
|
| |
Signature |
|
|
|
|
|
|
|
31 March 2009 | 101 |
|
|
|
| TECHNICAL REPORT AGUABLANCA NI-CU DEPOSIT |
|
|
22.3 | Certificate of Juan Pablo Gonzalez |
I, Juan Pablo Gonzalez of Santiago Chile, do hereby certify that as the author of this“Technicalreport on the Aguablanca Ni-Cu deposit, Extremadura Region, Spain���,dated March 31 2009, I hereby make the following statements:
|
|
• | I am employed as a Senior Mining Engineer with Golder Associates S.A. (Chile) with a business address at Av. 11 de Septiembre 2353 piso 2, Providencia, Santiago, Chile. |
|
|
• | My formal education qualifications include MBA (Master of Business and Administration), Universidad Diego Portales, (2002) Chile and BSc (Bachelor of Science) in Mining Engineering, Universidad de Santiago de Chile, (1992). |
|
|
• | I am a member in good standing of the Australasian Institute of Mining and Metallurgy (MAusIMM) and the Chilean Institute of Mining Engineering (IIMCH). |
|
|
• | I have practiced my profession continuously since 1992. |
|
|
• | I have read the definition of “qualified person” set out in National Instrument 43-101 (NI 43-101) and certify that, by reason of my education, affiliation with a professional association (as defined in NI 43-101) and past relevant work experience, I fulfil the requirements to be a “qualified person” for the purpose of NI 43-101. |
|
|
• | My relevant experience with respect Aguablanca Deposit includes over 16 years experience in Mineral Reserves estimation, computerized mine planning systems and technical engineering activities related to a variety of commodities (in nickel, copper, gold and iron and manganese ore) and many projects in South America. |
|
|
• | I have personally visited the Aguablanca Property in December 2008. |
|
|
• | I am responsible for the preparation of Section 17.12 of this Technical Report titled “Technical report on the Aguablanca Ni-Cu deposit, Extremadura Region, Spain”, dated March 31 2009. |
|
|
• | I have no prior involvement with the Property that is the subject of the Technical Report. |
|
|
• | As of the date of this Certificate, to my knowledge, information and belief, the sections of this Technical Report for which I am responsible contains all scientific and technical information that is required to be disclosed to make the Technical Report not misleading. |
|
|
• | I am independent of the Issuer as defined by Section 1.4 of the Instrument. I have read National Instrument 43-101 and the sections for which I am responsible in this Technical Report have been prepared in compliance with National Instrument 43-101 and Form 43-101F1. |
|
|
|
|
| |
Signature |
|
|
|
|
|
|
|
26 March 2009 | 102 |
|
|
|
| TECHNICAL REPORT AGUABLANCA NI-CU DEPOSIT |
|
|
22.4 | Certificate of Stephen Gatley |
I, Stephen Gatley, of Haywards Heath, England, do hereby certify that as an author of this“Technical Report on the Aguablanca Ni-Cu deposit, Extremadura, Spain”dated March 31 2009,1 hereby make the following statements:
|
|
• | I am employed as Principle Mining Engineer with Lundin Mining Corporation with a business address at 70 Oathall Road, Haywards Heath, West Sussex, RH16 3EN, UK. |
|
|
• | I am a graduate of the Royal School of Mines, Imperial College, London (BSc Eng Mining 1981, ARSM). |
|
|
• | I am a member in good standing of the Institute of Mining, Metallurgy and Materials (IMMM) and a registered Chartered Engineer (CEng). |
|
|
• | I have worked in the base metal mining industry since graduation and have over 27 years of experience. |
|
|
• | I have read the definition of “qualified person” set out in National Instrument 43-101 (Nl 43-101) and certify, that by reason of my education, affiliation with a professional association (as defined in Nl 43-101) and past relevant work experience, I fulfil the requirements to be a “qualified person” for the purpose of Nl 43-101. |
|
|
• | I have visited Aguablanca on numerous occasions following Lundin’s acquisition of the mine in 2007. |
|
|
• | I am responsible for the preparation of Sections 15,16, 18 and 23 of this“Technical Reporttitled “Technical Report on the Aguablanca Ni-Cu deposit, Extremadura, Spain”dated March 31 2009.1 visited the property during both January and February 2009. |
|
|
• | Due to my position as Principle Mining Engineer with Lundin I am not considered independent of the issuer applying all of the tests in section 1.4 of the instrument. |
|
|
• | As of the date of this certificate, to my knowledge, information and belief, the sections of this Technical Report for which I am responsible contains all scientific and technical information that is required to be disclosed to make the Technical Report not misleading. |
|
|
• | I have read National Instrument 43-101 and sections for which I am responsible n this Technical Report have been prepared in compliance with National Instrument 43-101 and Form 43-101F |
|
|
|
|
| |
Signature |
|
|
|
|
|
|
|
31 March 2009 | 103 |
|
|
|
| TECHNICAL REPORT AGUABLANCA NI-CU DEPOSIT |
|
|
|
| 23.0 | ADDITIONAL REQUIREMENTS FOR TECHNICAL REPORTS ON DEVELOPMENT PROPERTIES AND PRODUCTION PROPERTIES |
|
|
|
| 23.1 | Mining operations |
The Aguablanca mine currently operates a simple, single open pit. The pit is mined with 8 m benches and the final slopes are designed with a double bench configuration. Geotechnical conditions in the pit are generally very good and final slope angles of 55o are planned, as discussed in Section 17.12.2 of this report. The ramp widths are 25.0 and 12.5 m as defined by the Reglamento General de Normas Basicas de Seguridad Minera (General Regulations of Mining Safety Standards) in Spain for the equipment utilized at the mine. All ramps have been designed with a maximum grade of 10%.
The open pit is operated by contractor using a conventional drill and blast, and truck and shovel fleet. Major mining equipment includes:
|
|
|
• | Waste equipment: | |
|
|
|
| • | Shovels: 2 Komatsu PC2000 (12 m3) and 2 Komatsu PC 1250 (5.5 m3) |
|
|
|
| • | Trucks: 20 Caterpillar 777 and 3 Komatsu 785 trucks (100 tons pay load) |
|
|
|
| • | Drill rigs: 7(4½”) |
|
|
|
• | Ore equipment: | |
|
|
|
| • | Shovels: 1 Hitachi EX 1200 (5 m3) |
|
|
|
| • | Trucks: 3 Caterpillar 777 (100 tons pay load) |
|
|
|
| • | Drill rigs: 2 (4½”) |
Blasting is carried out using emulsion and ore and waste are always blasted separately. Waste rock is stacked to the immediate North of the open pit and the waste dumps form the downstream wall of the tailings impoundment. Once the waste reaches a final stacking position, it is profiled and rehabilitated.
The run-of-mine ore is hauled from the pit to three stockpiles (high, medium and low grade). Ore from these stockpiles is blended using a conventional front end loader feeding a primary crusher and subsequent crushed ore stockpile. The crushed ore is conveyor fed to a semi-autogenous (SAG) and ball mill grinding circuit. Cycloned material from the mills is gravity fed to a flotation circuit that comprises rougher, cleaner and re-cleaner stages to produce a bulk nickel-copper concentrate. The concentrate is thickened and pumped to automated plate-type filter presses where a concentrate filter cake is produced suitable for onward transport. The dried concentrate is stored in a covered area adjacent to the concentrator. From there it is loaded in to trucks and hauled approximately 125 km to Huelva port from where it is ultimately shipped to customer smelter facilities. Tailings from the process plant are pumped to a fully lined tailings impoundment to the North of the plant site area. Decant water from the tailings dam is returned to the process plant.
|
|
|
|
|
|
31 March 2009 | 104 |
|
|
|
| TECHNICAL REPORT AGUABLANCA NI-CU DEPOSIT |
The long-term mine production forecast maximizes mill throughput based on cost and revenue forecasts and historic equipment productivities, as described in Section 17. A marginal 0.25% Ni cut off grade has been used in the generation of this production forecast.
Based on this production forecast, the current Aguablanca open pit reserves will be depleted in 6 years, i.e. by 2014 (see Table 28)
Table 28: Production forecast for the Aguablanca open pit reserves
|
|
|
|
|
|
|
|
|
|
|
|
|
|
|
|
|
|
|
|
|
|
|
Aguablanca pit |
| Production Forecast (000s of tonnes) |
|
|
|
|
|
|
|
| ||||||||||||
Year |
| 2009 |
| 2010 |
| 2011 |
| 2012 |
| 2013 |
| 2104 |
| Total |
| |||||||
Total ore |
|
| 1,850 |
|
| 1,850 |
|
| 1,850 |
|
| 1,480 |
|
| 1,202 |
|
| 0,81 |
|
| 9,042 |
|
Total mined |
|
| 17,183 |
|
| 18,030 |
|
| 19,845 |
|
| 14,692 |
|
| 2,472 |
|
| 1,018 |
|
| 73,240 |
|
The optimised open pit will be mined to a depth of 106 mL, and will be approximately 368 m deep. The overall remaining strip ration is 7.1:1.
The ore defined in this production forecast includes only that material that exceeds the Ni marginal cut off grade. During daily mining operations, lower grade material may potentially be mined and milled depending on cut off grades calculated at the time and other opportunities that may arise.
During the initial phases of the open pit mining at Aguablanca, a stockpile of shallow, partially oxidised mineralised material was created. This stockpile, which has been considered not-in-reserve (NIR), is estimated to contain 420,000t at a grade of 0.5%Ni and 0.4%Cu. Metallurgical tests have shown that reasonable recovery of nickel and copper to concentrate is possible from this material. In the event of low metal prices, the option exists to treat a blend of this material with ore from the open pit through the processing plant. Lower overall mine costs are achieved throughout the stockpile reclaim period as a result of the reduced rate of mining from the open pit.
Significant mineral resources remain below the bottom of the optimised open pit. Numerous studies have been carried out by Lundin on a small, high grade, underground operation producing in parallel with the open pit. Access to the underground mine would be via the existing decline, stoping by long hole methods and operation by contractor. At the metal prices assumed in the economic analysis presented below, an underground operation is not viable.
|
|
|
|
|
|
31 March 2009 | 105 |
|
|
|
| TECHNICAL REPORT AGUABLANCA NI-CU DEPOSIT |
|
|
|
| 23.2 | Process metal recoveries |
Metal recoveries for nickel and copper since production commenced in 2005 are summarised in Table 29 below.
Table 29: Historical metal recoveries
|
|
|
|
|
|
|
|
|
|
|
|
|
|
Process Recoveries | |||||||||||||
Element |
| 2005 |
| 2006 |
| 2007 |
| 2008 |
| ||||
Nickel |
|
| 71.3 | % |
| 72.2 | % |
| 76.1 | % |
| 80.5 | % |
Copper |
|
| 88.7 | % |
| 90.3 | % |
| 91.6 | % |
| 92.5 | % |
|
|
|
|
|
|
|
|
|
|
|
|
|
|
A regression for the calculation of process recoveries has been established, as shown below in Table 30, and this has been used in the open pit optimisation. Platinum, palladium and cobalt recoveries are assumed as 75%.
Table 30: Regression equation for the calculation of process recoveries
|
|
|
|
|
|
|
|
Nickel (as head grade function) |
|
| 6.268 x Ni% + 76.952 |
Copper (as head grade function) |
|
| 15.0 x Cu% + 85.502 |
Typical bulk concentrate grades are 7%Ni and 6%Cu.
|
|
|
| 23.3 | Markets |
All bulk nickel-copper concentrate produced from the Aguablanca operation is sold under the terms of a long-term sales contract to Glencore on a FOB Huelva basis. Principle payable metals are nickel and copper with by-product payments made platinum, palladium and cobalt.
Concentrates are hauled from the mine site in 23 tonne, contractor, covered road trucks to the port of Huelva. From there the concentrate is ultimately shipped to customer smelter facilities.
|
|
|
| 23.4 | Contracts |
The Aguablanca operation relies on contractors for mining, reclamation and concentrate haulage activities. These contracts are within industry norms for activities of these types.
Concentrates are sold to Glencore under a long term contract, as described above, and the payment terms are typical of those for bulk nickel/copper sulphide concentrates.
|
|
|
|
|
|
31 March 2009 | 106 |
|
|
|
| TECHNICAL REPORT AGUABLANCA NI-CU DEPOSIT |
|
|
|
| 23.5 | Environmental considerations |
The Aguablanca Mine operates under environmental permits granted by the Spanish Government. These permits cover all aspects of the operations including tailings management and project closure and were obtained in June of 2003.
Reclamation costs are estimated at US$2.5 million. Reclamation and remediation, primarily of the waste dumps, is continually ongoing at the mine site and is a budgeted item. The current reclamation bond for Aguablanca mine is set at €1.9 million and is in good standing.
The mine staff produces two annual reclamation reports as required for the Junta Extremadura (Extremadura Council). These reports document areas of disturbance, monitoring and areas of reclaimed ground.
The mine staff also produces an annual reclamation report (as part of the Plan de Labores – Annual Work Plan) as required by the Spanish Government. This report documents areas of disturbance, future development, monitoring and areas of reclaimed ground.
Throughout the operational history of the mine, all environmental regulations have been met and exceeded, and the operation continues to be in compliance will all existing regulations. All environmental audits completed on a bi-annual basis by the National Government authorities have been successful.
|
|
|
| 23.6 | Taxes |
The Aguablanca operation is currently subject to the following taxes:
|
|
|
• | Spanish Government Income tax | 30% of profit |
• | Spanish Government Royalty | 2% of NSR |
|
|
|
| 23.7 | Capital and operating cost estimates |
The original capital cost of the project in 2002 was US$64 million. The operation typically runs an annual sustaining capital budget of between US$0.5 and US$1.2 million for items such as tailings dam, concentrator and peripheral lands.
Capital expenditure for 2009 is budgeted at US$0.5 million and is mainly for minor works in the concentrator.
|
|
|
|
|
|
31 March 2009 | 107 |
|
|
|
| TECHNICAL REPORT AGUABLANCA NI-CU DEPOSIT |
The mill and the site general and administrative costs were assumed to be fixed throughout the mine life. A variable mining cost has been used depending on the depth of the mine. Operating costs have been calculated by increasing 5% on 2008 unit costs based on inflation and Contractors costs adjustments forecasts (see Table 31).
Table 31: Calculated operating costs
|
|
Function | (US$/t milled) |
Mining (average) | 12.48 |
Milling | 20.89 |
G&A, Other | 3.38 |
Total | 36.75 |
|
|
|
| 23.8 | Economic analysis |
The mine staff have completed a pre-tax economic analysis for the property using the mine long-term production forecast as a base. The assumptions incorporated within the model are as follows:
|
|
|
|
Interest Rate and Inflation | |||
|
|
|
|
| o | Inflation | all costs are in 2008 dollars, no inflation factor was applied |
|
|
|
|
Exchange Rate | |||
|
|
|
|
| o | US$1.30 per € 1.00 |
|
|
|
|
|
Metal Prices | |||
|
|
|
|
| o | Nickel | US$6.50 /lb |
|
|
|
|
| o | Copper | US$2.00 /lb |
|
|
|
|
| o | Platinum | US$700 /oz |
|
|
|
|
| o | Palladium | US$350 /oz |
|
|
|
|
| o | Cobalt | US$13.00 /lb |
|
|
|
|
Recoveries | |||
|
|
|
|
| o | Nickel | 6.286 x Ni% + 76.952 as head grade function |
|
|
|
|
| o | Copper | 15.0 x Cu% + 85.502 as head grade function |
|
|
|
|
| o | Platinum | 75% |
|
|
|
|
| o | Palladium | 75% |
|
|
|
|
| o | Cobalt | 75% |
|
|
|
|
|
|
31 March 2009 | 108 |
|
|
|
| TECHNICAL REPORT AGUABLANCA NI-CU DEPOSIT |
Sensitivities
Sensitivities to the model have been run on variations of the following items:
|
|
|
| o | Nickel price |
|
|
|
| o | Nickel grade |
|
|
|
| o | Operating costs |
|
|
|
| o | Exchange rate |
Details of the economic and sensitivity analysis are shown in Table 32 and Table 33 below:
Table 32: Sensitivity analysis – base case
|
|
|
|
|
|
|
|
|
|
|
|
| |
|
|
|
|
|
|
|
|
|
|
|
|
|
|
|
|
|
|
|
|
Projected Cash Flow (million US$) |
|
|
|
|
|
|
|
|
|
|
|
|
|
|
|
|
|
|
|
Year |
| 2009 |
| 2010 |
| 2011 |
| 2012 |
| 2013 |
| 2014 |
| ||||||
Cash Flow* |
|
| 11.9 |
|
| 30.5 |
|
| 24.6 |
|
| 21.0 |
|
| 39.0 |
|
| 36.4 |
|
*Note: the cash flow shown in Table 23.5 is in 2008 US$ and before taxes and is based on the assumptions shown above.
Table 33: Sensitivity analysis – changes to nickel price, operating costs or exchange rate
|
|
|
|
|
|
|
|
|
|
|
|
|
|
|
|
|
|
|
|
Sensitivity Analysis (million US$) |
|
|
|
|
|
|
|
|
|
|
|
|
|
|
|
|
|
|
|
|
| 2009 |
| 2010 |
| 2011 |
| 2012 |
| 2013 |
| 2014 |
| ||||||
-10% Ni price |
|
| 6.7 |
|
| 23.7 |
|
| 17.9 |
|
| 15.8 |
|
| 33.7 |
|
| 32.6 |
|
+10% Ni price |
|
| 17.1 |
|
| 37.4 |
|
| 31.2 |
|
| 26.2 |
|
| 44.3 |
|
| 40.1 |
|
-2% Ni grade |
|
| 12.1 |
|
| 30.8 |
|
| 24.8 |
|
| 21.1 |
|
| 39.0 |
|
| 36.5 |
|
+2% Ni grade |
|
| 12.9 |
|
| 30.8 |
|
| 24.9 |
|
| 21.2 |
|
| 39.0 |
|
| 36.4 |
|
-5% operating costs |
|
| 17.5 |
|
| 36.5 |
|
| 30.3 |
|
| 25.4 |
|
| 41.6 |
|
| 38.1 |
|
+5% operating costs |
|
| 6.8 |
|
| 25.1 |
|
| 19.5 |
|
| 16.9 |
|
| 36.4 |
|
| 34.8 |
|
-10% exchange rate |
|
| 13.0 |
|
| 31.7 |
|
| 25.8 |
|
| 21.9 |
|
| 39.6 |
|
| 36.9 |
|
+10% exchange rate |
|
| 11.3 |
|
| 29.9 |
|
| 24.0 |
|
| 20.5 |
|
| 38.4 |
|
| 36.0 |
|
The various cash flows of the sensitivity analysis shown in Table 23.6 are in 2008 US$ and before taxes and are based on variants in Ni prices, Ni grades, onsite operating costs and exchange rates.
|
|
|
|
|
|
31 March 2009 | 109 |
|
|
|
| TECHNICAL REPORT AGUABLANCA NI-CU DEPOSIT |
|
|
|
| 23.9 | Payback |
Under the assumptions made in Section 23.8 above the mine will fund all capital requirements through cash flow.
|
|
|
| 23.10 | Mine life |
Current Proven and Probable Mineral Reserves are projected to sustain the mining operation for a further 6 years until 2014. An underground operation in parallel with the open pit is possible if nickel prices increase above those forecast and this could result in a short increase in mine life.
|
|
|
|
|
|
31 March 2009 | 110 |
|
|
|
| TECHNICAL REPORT AGUABLANCA NI-CU DEPOSIT |
APPENDIX A
STANDARDS RESULTS
|
|
|
|
|
|
31 March 2009 |
|
|
STD A Ni and Cu results
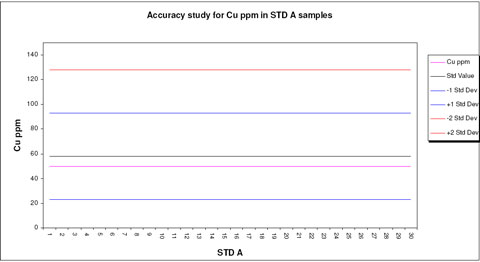
|
|
|
|
|
Standard: |
|
| STD A |
|
Assay: |
|
| Cu ppm |
|
Expected Mean: |
|
| 58 |
|
Expected Std Dev: |
|
| 35 |
|
|
|
|
|
|
Count |
|
| 30 |
|
Minimum |
|
| 50 |
|
Maximum |
|
| 50 |
|
Mean |
|
| 50 |
|
Median |
|
| 50 |
|
StdDev |
|
| 0.00 |
|
CV |
|
| 0.00 |
|
Bias |
|
| -13.79 | % |
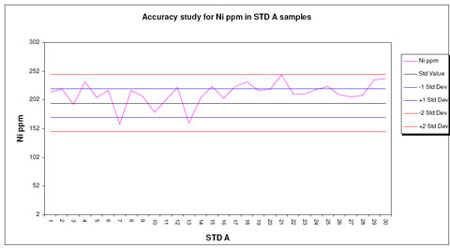
|
|
|
|
|
Standard: |
|
| STD A |
|
Assay: |
|
| Ni ppm |
|
Expected Mean: |
|
| 197 |
|
Expected Std Dev: |
|
| 25 |
|
|
|
|
|
|
Count |
|
| 30 |
|
Minimum |
|
| 160 |
|
Maximum |
|
| 246 |
|
Mean |
|
| 214 |
|
Median |
|
| 217 |
|
StdDev |
|
| 19.72 |
|
CV |
|
| 0.09 |
|
Bias |
|
| 8.55 | % |
STD B Ni and Cu results
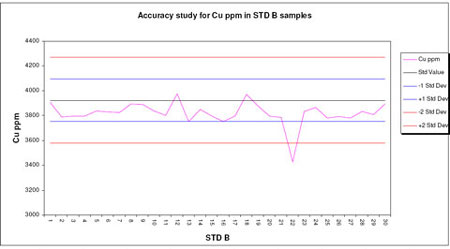
|
|
|
|
|
Standard: |
|
| STD B |
|
Assay: |
|
| Cu ppm |
|
Expected Mean: |
|
| 3924 |
|
Expected Std Dev: |
|
| 173 |
|
|
|
|
|
|
Count |
|
| 30 |
|
Minimum |
|
| 3428 |
|
Maximum |
|
| 3977 |
|
Mean |
|
| 3820 |
|
Median |
|
| 3809 |
|
StdDev |
|
| 92.90 |
|
CV |
|
| 0.02 |
|
Bias |
|
| -2.66 | % |
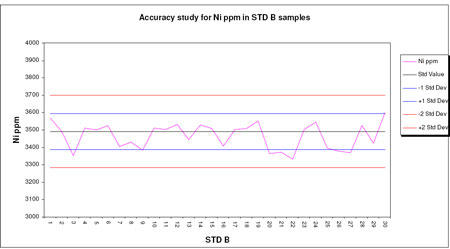
|
|
|
|
|
Standard: |
|
| STD B |
|
Assay: |
|
| Ni ppm |
|
Expected Mean: |
|
| 3492 |
|
Expected Std Dev: |
|
| 104 |
|
|
|
|
|
|
Count |
|
| 30 |
|
Minimum |
|
| 3331 |
|
Maximum |
|
| 3600 |
|
Mean |
|
| 3466 |
|
Median |
|
| 3501 |
|
StdDev |
|
| 74.42 |
|
CV |
|
| 0.021 |
|
Bias |
|
| -0.74 | % |
STD C Ni and Cu results
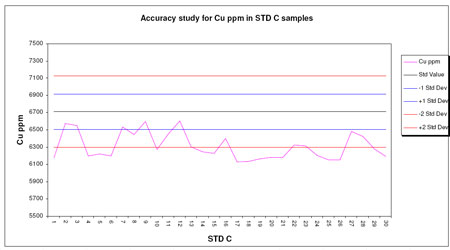
|
|
|
|
|
Standard: |
|
| STD C |
|
Assay: |
|
| Cu ppm |
|
Expected Mean: |
|
| 6711 |
|
Expected Std Dev: |
|
| 207 |
|
|
|
|
|
|
Count |
|
| 30 |
|
Minimum |
|
| 6130 |
|
Maximum |
|
| 6606 |
|
Mean |
|
| 6312 |
|
Median |
|
| 6246 |
|
StdDev |
|
| 154.70 |
|
CV |
|
| 0.025 |
|
Bias |
|
| -5.95 | % |
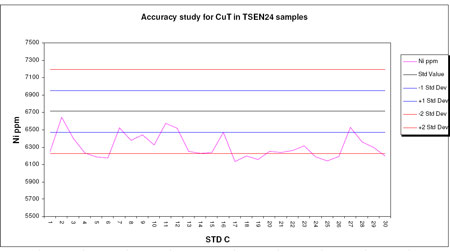
|
|
|
|
|
Standard: |
|
| STD C |
|
Assay: |
|
| Ni ppm |
|
Expected Mean: |
|
| 6711 |
|
Expected Std Dev: |
|
| 242 |
|
|
|
|
|
|
Count |
|
| 30 |
|
Minimum |
|
| 6135 |
|
Maximum |
|
| 6645 |
|
Mean |
|
| 6311 |
|
Median |
|
| 6253 |
|
StdDev |
|
| 141.72 |
|
CV |
|
| 0.022 |
|
Bias |
|
| -5.96 | % |
STD D Ni and Cu results
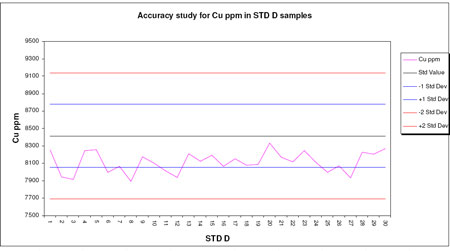
|
|
|
|
|
Standard: |
|
| STD D |
|
Assay: |
|
| Cu ppm |
|
Expected Mean: |
|
| 8414 |
|
Expected Std Dev: |
|
| 361 |
|
|
|
|
|
|
Count |
|
| 30 |
|
Minimum |
|
| 7893 |
|
Maximum |
|
| 8334 |
|
Mean |
|
| 8113 |
|
Median |
|
| 8110 |
|
StdDev |
|
| 120.36 |
|
CV |
|
| 0.015 |
|
Bias |
|
| -3.57 | % |
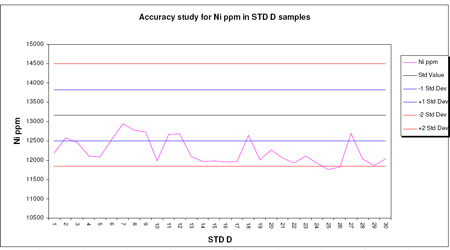
|
|
|
|
|
Standard: |
|
| STD D |
|
Assay: |
|
| Ni ppm |
|
Expected Mean: |
|
| 13168 |
|
Expected Std Dev: |
|
| 667 |
|
|
|
|
|
|
Count |
|
| 30 |
|
Minimum |
|
| 11766 |
|
Maximum |
|
| 12950 |
|
Mean |
|
| 12231 |
|
Median |
|
| 12087 |
|
StdDev |
|
| 340.36 |
|
CV |
|
| 0.028 |
|
Bias |
|
| -7.11 | % |
|
|
| TECHNICAL REPORT AGUABLANCA NI-CU DEPOSIT |
APPENDIX B
REPEAT ANALYSIS CHARTS
|
|
|
|
|
|
31 March 2009 |
|
|
Repeat analysis charts - Cu
|
|
|
|
|
|
|
|
|
|
|
|
|
|
Aguablanca | |||||||||||||
|
|
|
|
|
|
|
|
|
|
|
|
|
|
Original Cu (ppm) Repeat Cu (ppm) |
|
| Total mean |
| 3512.83 |
| ppm Cu | ||||||
Pairs |
| 133 |
| 133 |
|
|
|
| Average bias (-ve if original is lower) |
| -223.30 |
| ppm Cu |
Mean |
| 3401.17 |
| 3624.48 |
| ppm Cu |
|
| Regression slope Y on X (not plotted) |
| 1.08 |
|
|
Minimum |
| 116.00 |
| 112.00 |
| ppm Cu |
|
| Average HARD (= AMPD/2) |
| 5.65 |
| % |
Maximum |
| 14755.00 |
| 15716.00 |
| ppm Cu |
|
| Average HRD (Half Relative Diff.) |
| -2.31 |
| % |
Variance |
| 10221920.49 |
| 12153850.40 |
| ppm Cu sq. |
|
| Precision (at 83.4%) |
| 16.1 |
| % |
CV |
| 0.94 |
| 0.96 |
|
|
|
| Absolute error (at 83.4%) |
| 564.22 |
| ppm Cu |
Trimmed |
| 0 below 0 ppm Cu or above 99999.9 ppm Cu |
| (HARD limits 0% to 99999.9%) | |||||||||
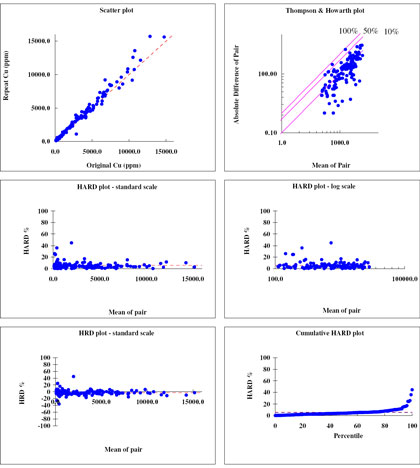
Repeat analysis charts - Ni
|
|
|
|
|
|
|
|
|
|
|
|
|
|
Aguablanca | |||||||||||||
Original Ni (ppm) Repeat Ni (ppm) |
|
| Total mean |
| 2880.08 |
| ppm Cu | ||||||
Pairs |
| 169 |
| 169 |
|
|
|
| Average bias (-ve if original is lower) |
| -198.39 |
| ppm Cu |
Mean |
| 2780.89 |
| 2979.28 |
| ppm Cu |
|
| Regression slope Y on X (not plotted) |
| 1.14 |
|
|
Minimum |
| 50.00 |
| 11.69 |
| ppm Cu |
|
| Average HARD (= AMPD/2) |
| 10.53 |
| % |
Maximum |
| 21430.00 |
| 27564.00 |
| ppm Cu |
|
| Average HRD (Half Relative Diff.) |
| 0.77 |
| % |
Variance |
| 13216414.01 |
| 17459512.38 |
| ppm Cu sq. |
|
| Precision (at 83.4%) |
| 35.7 |
| % |
CV |
| 1.31 |
| 1.40 |
|
|
|
| Absolute error (at 83.4%) |
| 1027.58 |
| ppm Cu |
Trimmed |
| 0 below 0 ppm Cu or above 99999.9 ppm Cu |
| (HARD limits 0% to 99999.9%) | |||||||||
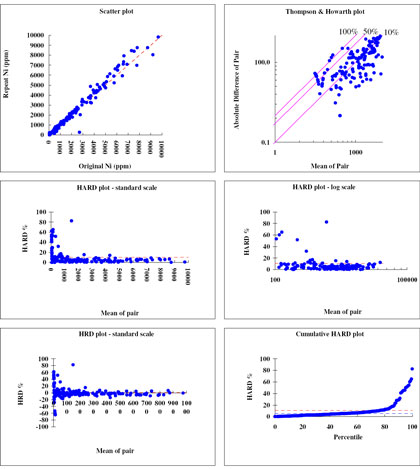
|
|
| TECHNICAL REPORT AGUABLANCA NI-CU DEPOSIT |
APPENDIX C
LIST OF HOLES USED IN THE ESTIMATION
|
|
|
|
|
|
31 March 2009 |
|
|
|
|
|
|
|
|
|
|
|
Drill Hole |
| Easting |
| Northing |
| Elevation |
| Depth |
6479 |
| 7307.53 |
| 5291.491 |
| 491.524 |
| 177.55 |
6487 |
| 7308.32 |
| 5342.451 |
| 496.576 |
| 186.5 |
6488 |
| 7104.64 |
| 5311.458 |
| 472.904 |
| 163.1 |
6489 |
| 7307.435 |
| 5418.048 |
| 501.781 |
| 252.4 |
6499 |
| 7269.662 |
| 5330.622 |
| 494.293 |
| 160.86 |
6507 |
| 7358.109 |
| 5342.531 |
| 494.867 |
| 184.45 |
6510 |
| 7159.026 |
| 5454.01 |
| 484.253 |
| 286.05 |
6535 |
| 7450 |
| 5300 |
| 487.81 |
| 204.65 |
6537 |
| 7051.251 |
| 5249.965 |
| 464.041 |
| 162.95 |
6540 |
| 7049.815 |
| 5179.495 |
| 457.952 |
| 81.75 |
6541 |
| 7463.24 |
| 5268.26 |
| 481.6 |
| 132.6 |
6542 |
| 7052.1 |
| 5321.105 |
| 466.545 |
| 142.4 |
6543 |
| 7249.691 |
| 5260.334 |
| 483.733 |
| 100.55 |
6544 |
| 7349.561 |
| 5269.864 |
| 485.954 |
| 155.8 |
6552 |
| 7514.55 |
| 5021.36 |
| 455.48 |
| 154.95 |
6553 |
| 7000.11 |
| 5283.554 |
| 457.608 |
| 106.35 |
6554 |
| 7202.01 |
| 5424.94 |
| 491.59 |
| 343.7 |
6555 |
| 7298.896 |
| 5275.973 |
| 489.134 |
| 115.8 |
6557 |
| 7099.67 |
| 5245.99 |
| 468.802 |
| 93.5 |
6558 |
| 7199.927 |
| 5295.473 |
| 485.434 |
| 153.85 |
6559 |
| 7148.866 |
| 5252.86 |
| 474.146 |
| 180.2 |
6560 |
| 7150.484 |
| 5318.503 |
| 481.485 |
| 202 |
6576 |
| 7200.03 |
| 5553.18 |
| 489.94 |
| 549.5 |
6577 |
| 7098.959 |
| 5446.7 |
| 473.852 |
| 359.75 |
6578 |
| 7150.304 |
| 5379.052 |
| 486.919 |
| 313.95 |
6579 |
| 7332.205 |
| 5374.304 |
| 498.383 |
| 242.1 |
6580 |
| 7224.659 |
| 5474.475 |
| 493.398 |
| 349.35 |
6606 |
| 7124.514 |
| 5413.416 |
| 479.384 |
| 280.2 |
6608 |
| 7249.962 |
| 5524.68 |
| 491.843 |
| 468.65 |
6609 |
| 7333.931 |
| 5440.865 |
| 499.977 |
| 340.45 |
6610 |
| 7500 |
| 4600 |
| 459 |
| 197.7 |
6628 |
| 7310.09 |
| 5510.68 |
| 493.21 |
| 407.35 |
6629 |
| 7324.828 |
| 5303.798 |
| 493.881 |
| 181.05 |
6645 |
| 7200 |
| 4250 |
| 457 |
| 236.2 |
6647 |
| 7403.945 |
| 5483.225 |
| 487.798 |
| 344 |
6648 |
| 7515.14 |
| 5458.57 |
| 483.19 |
| 699.55 |
6649 |
| 7407.547 |
| 5483.229 |
| 487.797 |
| 513.5 |
6650 |
| 7307.953 |
| 5517.448 |
| 491.926 |
| 584.6 |
6651 |
| 6957.18 |
| 5460.31 |
| 471.68 |
| 466.65 |
6695 |
| 7329.151 |
| 5509.819 |
| 491.612 |
| 700.2 |
6696 |
| 7199.635 |
| 5358.231 |
| 491.008 |
| 247.55 |
6697 |
| 7119.275 |
| 5347.131 |
| 479.303 |
| 175.1 |
6698 |
| 7123.25 |
| 5264.32 |
| 474.64 |
| 319.75 |
6699 |
| 7074.966 |
| 5285.298 |
| 468.168 |
| 106.05 |
6711 |
| 7025.017 |
| 5263.199 |
| 460.377 |
| 80.3 |
6712 |
| 7275.188 |
| 5237.03 |
| 480.957 |
| 78.8 |
6713 |
| 7175.021 |
| 5259.849 |
| 476.907 |
| 102 |
6714 |
| 7349.833 |
| 5408.611 |
| 498.952 |
| 229.2 |
6716 |
| 7251.327 |
| 5466.771 |
| 499.964 |
| 388.15 |
6717 |
| 7198.559 |
| 5493.528 |
| 492.416 |
| 424.4 |
6719 |
| 7275.131 |
| 5403.016 |
| 501.056 |
| 349.35 |
|
|
|
|
|
|
|
|
|
Drill Hole |
| Easting |
| Northing |
| Elevation |
| Depth |
6720 |
| 7374.818 |
| 5373.797 |
| 497.245 |
| 200 |
6727 |
| 7224.804 |
| 5338.887 |
| 492.452 |
| 183.5 |
6728 |
| 7298.944 |
| 5576.708 |
| 492.382 |
| 559.8 |
6730 |
| 7174.157 |
| 5405.925 |
| 491.026 |
| 291.4 |
6731 |
| 7248.883 |
| 5330.511 |
| 495.917 |
| 123.75 |
6732 |
| 7224.043 |
| 5410.885 |
| 497.316 |
| 293.5 |
6733 |
| 7174.93 |
| 5475.06 |
| 489.03 |
| 371.9 |
6734 |
| 7399.356 |
| 5561.43 |
| 485.002 |
| 468.35 |
6736 |
| 7174.819 |
| 5343.747 |
| 486.682 |
| 204.85 |
6737 |
| 7262.092 |
| 5431.893 |
| 499.84 |
| 326.7 |
6738 |
| 7221.599 |
| 5272.935 |
| 483.639 |
| 58 |
6742 |
| 7286.332 |
| 5460.986 |
| 501.947 |
| 340.6 |
6743 |
| 7373.85 |
| 5440.945 |
| 497.909 |
| 235.35 |
6744 |
| 7349.975 |
| 5524.67 |
| 488.629 |
| 387.7 |
6745 |
| 7324.757 |
| 5493.985 |
| 492.952 |
| 391.55 |
6746 |
| 7198.492 |
| 5650.896 |
| 498.805 |
| 591.9 |
6747 |
| 7397.943 |
| 5707.955 |
| 505.59 |
| 562.4 |
6748 |
| 7125.02 |
| 5205.17 |
| 465.09 |
| 76.4 |
6749 |
| 7336.348 |
| 5581.166 |
| 489.465 |
| 522.3 |
6751 |
| 7038.768 |
| 5545.067 |
| 483.61 |
| 586 |
6752 |
| 7224.98 |
| 5535.22 |
| 491.12 |
| 269.1 |
6753 |
| 7248.755 |
| 5586.307 |
| 493.902 |
| 282.05 |
6759 |
| 7424.367 |
| 5099.106 |
| 462.003 |
| 454.6 |
6760 |
| 7474.656 |
| 5099.916 |
| 457.101 |
| 319.3 |
6761 |
| 7509.145 |
| 5098.628 |
| 457.124 |
| 400.4 |
6762 |
| 7572.465 |
| 5257.774 |
| 473.361 |
| 612.65 |
6799 |
| 8524.56 |
| 4553.61 |
| 448.2 |
| 300.6 |
6800 |
| 8714.15 |
| 4505.19 |
| 433.63 |
| 300.2 |
6801 |
| 7938.82 |
| 4704.54 |
| 487.58 |
| 350.1 |
6802 |
| 8114.39 |
| 4539.42 |
| 483.93 |
| 184.15 |
6803 |
| 7942.29 |
| 5094.76 |
| 429.23 |
| 376 |
AGU-01 |
| 7326.416 |
| 5212.97 |
| 475.547 |
| 205 |
AGU-02 |
| 7276.264 |
| 5216.794 |
| 476.968 |
| 201.45 |
AGU-03 |
| 7129.369 |
| 5269.166 |
| 474.646 |
| 106.35 |
AGU-04 |
| 7126.854 |
| 5237.208 |
| 469.725 |
| 75 |
AGU-05 |
| 7103.611 |
| 5277.342 |
| 472.471 |
| 91.7 |
AGU-06 |
| 7074.904 |
| 5253.46 |
| 467.879 |
| 67 |
AGU-07 |
| 7150.14 |
| 5211.258 |
| 466.968 |
| 46.6 |
AGU-08 |
| 7176.891 |
| 5237.293 |
| 473.363 |
| 65.4 |
AGU-09 |
| 7198.839 |
| 5323.143 |
| 488.181 |
| 173.65 |
AGU-10 |
| 7352.002 |
| 5239.965 |
| 479.797 |
| 85 |
AGU-100 |
| 7000 |
| 4800 |
| 444 |
| 100 |
AGU1001 |
| 7272.83 |
| 5175.442 |
| 199.579 |
| 240.75 |
AGU1002 |
| 7272.876 |
| 5175.424 |
| 199.875 |
| 221.5 |
AGU1003 |
| 7300.384 |
| 5169.462 |
| 195.483 |
| 253.65 |
AGU1004 |
| 7300.502 |
| 5169.339 |
| 195.175 |
| 243.7 |
AGU1005 |
| 7321.297 |
| 5165.144 |
| 192.631 |
| 246.35 |
AGU1006 |
| 7348.958 |
| 5159.803 |
| 188.473 |
| 238 |
AGU1007 |
| 7349.101 |
| 5159.817 |
| 188.242 |
| 233.65 |
AGU1008 |
| 7321.303 |
| 5165.408 |
| 192.309 |
| 272.4 |
AGU1009 |
| 7349.064 |
| 5159.795 |
| 188.078 |
| 237.9 |
|
|
|
|
|
|
|
|
|
Drill Hole |
| Easting |
| Northing |
| Elevation |
| Depth |
AGU-101 |
| 6888.518 |
| 4795.71 |
| 437.752 |
| 100 |
AGU1010 |
| 7321.36 |
| 5165.411 |
| 192.193 |
| 259 |
AGU1011 |
| 7349.039 |
| 5159.746 |
| 187.911 |
| 246.7 |
AGU1012 |
| 7321.35 |
| 5165.372 |
| 192.175 |
| 282.45 |
AGU1013 |
| 7349.098 |
| 5159.653 |
| 188.3 |
| 225.1 |
AGU1014 |
| 7321.376 |
| 5165.312 |
| 192.046 |
| 280.9 |
AGU1015 |
| 7401.062 |
| 5156.783 |
| 181.42 |
| 233.25 |
AGU1016 |
| 7375.064 |
| 5155.436 |
| 184.642 |
| 235.9 |
AGU1017 |
| 7401.078 |
| 5156.768 |
| 181.221 |
| 223.1 |
AGU1018 |
| 7375.061 |
| 5155.807 |
| 184.455 |
| 236.9 |
AGU1019 |
| 7375.051 |
| 5155.86 |
| 184.259 |
| 253.1 |
AGU-102 |
| 7050.962 |
| 5050.101 |
| 447.532 |
| 1006.45 |
AGU1020 |
| 7375.061 |
| 5155.832 |
| 184.088 |
| 248.7 |
AGU1021 |
| 7375.072 |
| 5155.809 |
| 183.905 |
| 239.8 |
AGU1022 |
| 7218.56 |
| 5182.182 |
| 206.844 |
| 119.45 |
AGU1023 |
| 7225.521 |
| 5191.431 |
| 208.759 |
| 156.6 |
AGU1024 |
| 7225.495 |
| 5191.388 |
| 208.027 |
| 139.85 |
AGU1025 |
| 7349.176 |
| 5159.264 |
| 188.646 |
| 228.3 |
AGU1026 |
| 7375.02 |
| 5155.509 |
| 184.473 |
| 209 |
AGU1027 |
| 7349.079 |
| 5159.225 |
| 188.914 |
| 207.15 |
AGU1028 |
| 7374.958 |
| 5155.442 |
| 184.935 |
| 199.85 |
AGU1029 |
| 7300.183 |
| 5169.283 |
| 195.847 |
| 192.45 |
AGU-103 |
| 6249.501 |
| 5364.14 |
| 357.186 |
| 256 |
AGU1030 |
| 7374.935 |
| 5155.196 |
| 185.322 |
| 218.25 |
AGU1031 |
| 7300.173 |
| 5169.257 |
| 195.624 |
| 223.8 |
AGU1032 |
| 7375.001 |
| 5154.628 |
| 185.512 |
| 241.6 |
AGU1033 |
| 7320.917 |
| 5164.34 |
| 192.717 |
| 159.3 |
AGU1034 |
| 7320.913 |
| 5164.998 |
| 192.857 |
| 160 |
AGU1035 |
| 7374.92 |
| 5154.722 |
| 186.15 |
| 254.3 |
AGU1036 |
| 7320.83 |
| 5164.792 |
| 193.138 |
| 190.9 |
AGU1037 |
| 7320.85 |
| 5164.595 |
| 193.501 |
| 210.2 |
AGU1038 |
| 7320.889 |
| 5164.609 |
| 194.015 |
| 208.3 |
AGU1039 |
| 7273 |
| 5175.5 |
| 200 |
| 207.8 |
AGU-104 |
| 6249.384 |
| 5364.314 |
| 357.263 |
| 206 |
AGU1040 |
| 7300.188 |
| 5169.219 |
| 196.371 |
| 185.9 |
AGU1041 |
| 7274.092 |
| 5175.058 |
| 199.954 |
| 179.7 |
AGU1042 |
| 7400.44 |
| 5156.166 |
| 182.051 |
| 220.15 |
AGU1043 |
| 7274.05 |
| 5175.706 |
| 200.924 |
| 180.2 |
AGU1044 |
| 7401 |
| 5156.663 |
| 183.594 |
| 219.1 |
AGU1045 |
| 7274.095 |
| 5175.984 |
| 203.603 |
| 155.3 |
AGU1046 |
| 7250.128 |
| 5173.799 |
| 202.874 |
| 140.85 |
AGU1047 |
| 7250.016 |
| 5173.933 |
| 203.473 |
| 169.5 |
AGU1048 |
| 7349.955 |
| 5159.099 |
| 188.939 |
| 221.8 |
AGU1049 |
| 7174.917 |
| 5186.976 |
| 216.257 |
| 136.2 |
AGU-105 |
| 7249.894 |
| 5532.305 |
| 482.059 |
| 437.9 |
AGU1050 |
| 7058.483 |
| 5277.002 |
| 60.883 |
| 449.8 |
AGU1051 |
| 7058.389 |
| 5276.833 |
| 59.749 |
| 381.6 |
AGU1052 |
| 7058.047 |
| 5276.734 |
| 63.27 |
| 316 |
AGU1053 |
| 7299.937 |
| 5203.699 |
| 99.158 |
| 236 |
AGU1054 |
| 7057.578 |
| 5276.762 |
| 60.08 |
| 265.4 |
AGU1055 |
| 7299.926 |
| 5203.417 |
| 98.92 |
| 252.85 |
|
|
|
|
|
|
|
|
|
Drill Hole |
| Easting |
| Northing |
| Elevation |
| Depth |
AGU1056 |
| 7349.795 |
| 5192.846 |
| 107.386 |
| 251.85 |
AGU1057 |
| 7299.976 |
| 5203.199 |
| 98.832 |
| 353.15 |
AGU1058 |
| 7349.704 |
| 5192.911 |
| 107.924 |
| 325.1 |
AGU1059 |
| 7299.959 |
| 5203.684 |
| 99.645 |
| 386.6 |
AGU-106 |
| 7299.833 |
| 5479.038 |
| 482.7 |
| 144.1 |
AGU1060 |
| 7349.712 |
| 5192.741 |
| 107.305 |
| 265.3 |
AGU1061 |
| 7250.822 |
| 5209.507 |
| 92.153 |
| 317.9 |
AGU1062 |
| 7349.702 |
| 5192.363 |
| 107.754 |
| 292.7 |
AGU1063 |
| 7325.097 |
| 5197.589 |
| 102.987 |
| 328.1 |
AGU1064 |
| 7250.843 |
| 5209.572 |
| 92.645 |
| 302.2 |
AGU1065 |
| 7325.081 |
| 5197.366 |
| 102.789 |
| 262.5 |
AGU1066 |
| 7249.65 |
| 5209.801 |
| 91.491 |
| 297.6 |
AGU1067 |
| 7374.97 |
| 5187.81 |
| 110.555 |
| 386.4 |
AGU1068 |
| 7209.218 |
| 5218.459 |
| 85.674 |
| 354.8 |
AGU1069 |
| 7250.76 |
| 5209.559 |
| 93.202 |
| 355.8 |
AGU-107 |
| 7534.925 |
| 5035.898 |
| 456.619 |
| 317.6 |
AGU1070 |
| 7209.231 |
| 5218.63 |
| 85.459 |
| 377.3 |
AGU1071 |
| 7250.812 |
| 5209.713 |
| 93.801 |
| 327 |
AGU1072 |
| 7374.949 |
| 5187.592 |
| 110.429 |
| 263.1 |
AGU1073 |
| 7225.067 |
| 5215.589 |
| 88.339 |
| 236.6 |
AGU1074 |
| 7224.985 |
| 5215.139 |
| 88.872 |
| 245.45 |
AGU1075 |
| 7374.968 |
| 5188.12 |
| 110.744 |
| 255.1 |
AGU1076 |
| 7324.892 |
| 5197.972 |
| 103.305 |
| 226.2 |
AGU1077 |
| 7452.077 |
| 5178.628 |
| 122.119 |
| 391 |
AGU1078 |
| 7325 |
| 5197.447 |
| 103.215 |
| 236.4 |
AGU1079 |
| 7268.759 |
| 5218.518 |
| 94.888 |
| 306.4 |
AGU-108 |
| 7046.432 |
| 5658.941 |
| 492.112 |
| 475.15 |
AGU1080 |
| 7374.953 |
| 5188.298 |
| 111.048 |
| 271.75 |
AGU1081 |
| 7324.812 |
| 5197.636 |
| 103.226 |
| 262.4 |
AGU1082 |
| 7374.939 |
| 5187.952 |
| 110.652 |
| 264.7 |
AGU1083 |
| 7451.977 |
| 5178.881 |
| 122.631 |
| 264.4 |
AGU1084 |
| 7268.49 |
| 5218.584 |
| 94.585 |
| 209.5 |
AGU1085 |
| 7300.141 |
| 5203.718 |
| 99.88 |
| 223.1 |
AGU1086 |
| 7374.921 |
| 5187.705 |
| 110.47 |
| 259 |
AGU1087 |
| 7300.154 |
| 5203.761 |
| 99.191 |
| 231.7 |
AGU1088 |
| 7452.056 |
| 5179.105 |
| 122.952 |
| 345.1 |
AGU1089 |
| 7300.17 |
| 5203.558 |
| 99.047 |
| 257.8 |
AGU-109 |
| 6899.851 |
| 5895.987 |
| 513.508 |
| 297.8 |
AGU1090 |
| 7350.164 |
| 5192.794 |
| 107.435 |
| 264.3 |
AGU1091 |
| 7268.511 |
| 5218.721 |
| 93.894 |
| 231.7 |
AGU1092 |
| 7250.34 |
| 5209.678 |
| 91.837 |
| 227.9 |
AGU1093 |
| 7350 |
| 5192.176 |
| 107.072 |
| 264 |
AGU1094 |
| 7268.508 |
| 5218.952 |
| 93.348 |
| 217.55 |
AGU1095 |
| 7424.56 |
| 5174.18 |
| 118.92 |
| 261.1 |
AGU1096 |
| 7268.49 |
| 5219.156 |
| 93.493 |
| 226.05 |
AGU1097 |
| 7452.128 |
| 5179.128 |
| 123.369 |
| 363.05 |
AGU1098 |
| 7400.015 |
| 5179.117 |
| 114.793 |
| 258 |
AGU1099 |
| 7268.44 |
| 5218.062 |
| 93.546 |
| 268.1 |
AGU-11 |
| 7324.411 |
| 5258.988 |
| 486.917 |
| 70.3 |
AGU-110 |
| 6720.311 |
| 5955.364 |
| 512.779 |
| 291.6 |
AGU1100 |
| 7268.469 |
| 5218.688 |
| 93.624 |
| 261.35 |
|
|
|
|
|
|
|
|
|
Drill Hole |
| Easting |
| Northing |
| Elevation |
| Depth |
AGU1101 |
| 7424.635 |
| 5174.266 |
| 118.3 |
| 278 |
AGU1102 |
| 7399.996 |
| 5179.296 |
| 114.034 |
| 188.1 |
AGU1103 |
| 7452.104 |
| 5178.866 |
| 122.29 |
| 358.15 |
AGU1104 |
| 7424.753 |
| 5174.075 |
| 119.174 |
| 289 |
AGU1105 |
| 7399.824 |
| 5179.117 |
| 114.264 |
| 247 |
AGU1106 |
| 7424.775 |
| 5174.029 |
| 118.708 |
| 240.4 |
AGU1107 |
| 7399.85 |
| 5179.242 |
| 115.195 |
| 266 |
AGU1108 |
| 7424.708 |
| 5174.327 |
| 118.939 |
| 258.8 |
AGU1109 |
| 7399.868 |
| 5178.872 |
| 114.783 |
| 254.7 |
AGU-111 |
| 6448.868 |
| 5912.45 |
| 473.425 |
| 333.3 |
AGU1110 |
| 7399.875 |
| 5178.924 |
| 115.104 |
| 253.2 |
AGU1111 |
| 7250.062 |
| 5210.271 |
| 92.521 |
| 229.1 |
AGU1112 |
| 7250.062 |
| 5210.317 |
| 92.6 |
| 230 |
AGU1113 |
| 7225 |
| 5215.159 |
| 87.533 |
| 247.8 |
AGU1114 |
| 7073.765 |
| 5245.708 |
| 68.359 |
| 362.4 |
AGU1115 |
| 7175.049 |
| 5225.811 |
| 81.238 |
| 165.9 |
AGU1116 |
| 7175.151 |
| 5225.996 |
| 83.482 |
| 152 |
AGU1117 |
| 7532.039 |
| 5152.243 |
| 135.912 |
| 403.6 |
AGU1118 |
| 7150.152 |
| 5231.033 |
| 78.305 |
| 158.1 |
AGU1119 |
| 7150.088 |
| 5231.014 |
| 77.533 |
| 182.5 |
AGU-112 |
| 6323.399 |
| 5861.348 |
| 459.654 |
| 291.75 |
AGU1120 |
| 7299.958 |
| 5198.745 |
| 98.752 |
| 219.7 |
AGU1121 |
| 7074.332 |
| 5245.751 |
| 65.466 |
| 520.6 |
AGU1122 |
| 7150.102 |
| 5231.009 |
| 76.615 |
| 215.3 |
AGU1123 |
| 7100.29 |
| 5240.771 |
| 69.391 |
| 19.7 |
AGU1123B |
| 7100.29 |
| 5240.771 |
| 69.391 |
| 261.3 |
AGU1124 |
| 7325.773 |
| 5193.497 |
| 102.822 |
| 219.9 |
AGU1125 |
| 7100.258 |
| 5240.705 |
| 68.772 |
| 240.3 |
AGU1126 |
| 7124.468 |
| 5235.799 |
| 73.643 |
| 218.7 |
AGU1127 |
| 7325.774 |
| 5193.256 |
| 102.808 |
| 278.7 |
AGU1128 |
| 7124.587 |
| 5236.154 |
| 73.097 |
| 215.8 |
AGU1129 |
| 7211.632 |
| 5215.236 |
| 85.6 |
| 402.9 |
AGU-113 |
| 6607.733 |
| 5667.75 |
| 474.752 |
| 309.25 |
AGU1130 |
| 7124.435 |
| 5235.364 |
| 73.486 |
| 218 |
AGU1131 |
| 7124.573 |
| 5236.131 |
| 72.971 |
| 142.1 |
AGU-114 |
| 6446.757 |
| 5969.72 |
| 477.878 |
| 405.35 |
AGU-115 |
| 6453.205 |
| 6063.471 |
| 484.359 |
| 315 |
AGU-116 |
| 6202.944 |
| 5936.39 |
| 451.074 |
| 361 |
AGU-117 |
| 7172.467 |
| 5582.954 |
| 490.679 |
| 515.4 |
AGU-118 |
| 7174.68 |
| 5020.532 |
| 449.741 |
| 176 |
AGU-119 |
| 6838.016 |
| 5039.612 |
| 445.413 |
| 410.9 |
AGU-12 |
| 7298.101 |
| 5305.91 |
| 493.736 |
| 124.8 |
AGU-120 |
| 7299.438 |
| 4955.402 |
| 452.492 |
| 886.6 |
AGU-121 |
| 7299.595 |
| 4955.172 |
| 452.325 |
| 931.8 |
AGU-122 |
| 8139.289 |
| 4140.911 |
| 439.826 |
| 377.7 |
AGU-123 |
| 7400.728 |
| 4952.456 |
| 453.673 |
| 1151.2 |
AGU-124 |
| 9259.973 |
| 4437.061 |
| 439.05 |
| 352 |
AGU-125 |
| 7199.686 |
| 4819.846 |
| 449.018 |
| 992.7 |
AGU-126 |
| 9266.442 |
| 4430.471 |
| 439.196 |
| 316.15 |
AGU-127 |
| 7585.048 |
| 3853.727 |
| 430.25 |
| 303.35 |
AGU-128 |
| 7591.121 |
| 3855.348 |
| 429.21 |
| 315.5 |
|
|
|
|
|
|
|
|
|
Drill Hole |
| Easting |
| Northing |
| Elevation |
| Depth |
AGU-13 |
| 7225.317 |
| 5308.251 |
| 489.336 |
| 116 |
AGU-14 |
| 7249.086 |
| 5295.722 |
| 489.086 |
| 91.7 |
AGU-15 |
| 7275.765 |
| 5298.214 |
| 491.631 |
| 109 |
AGU-16 |
| 7252.269 |
| 5363.331 |
| 496.606 |
| 180.3 |
AGU-17 |
| 7271.274 |
| 5375.988 |
| 498.29 |
| 143.9 |
AGU-18 |
| 7306.115 |
| 5385.747 |
| 500.329 |
| 210 |
AGU-19 |
| 7327.675 |
| 5339.978 |
| 495.826 |
| 175 |
AGU-20 |
| 7149.366 |
| 5284.558 |
| 478.551 |
| 130 |
AGU-21 |
| 7175.037 |
| 5301.043 |
| 482.902 |
| 140 |
AGU-22 |
| 7123.821 |
| 5307.957 |
| 475.906 |
| 146 |
AGU-23 |
| 7049.462 |
| 5287.148 |
| 464.317 |
| 100.65 |
AGU-24 |
| 7074.729 |
| 5220.938 |
| 463.928 |
| 60 |
AGU-25 |
| 7046.482 |
| 5213.782 |
| 460.25 |
| 60 |
AGU-26 |
| 7025.912 |
| 5229.306 |
| 457.873 |
| 55 |
AGU-27 |
| 7352.19 |
| 5304.913 |
| 490.442 |
| 185.6 |
AGU-28 |
| 7384.744 |
| 5101.728 |
| 459.395 |
| 660.25 |
AGU-29 |
| 7377.098 |
| 5238.766 |
| 475.977 |
| 140.5 |
AGU-30 |
| 7000.975 |
| 5234.527 |
| 454.186 |
| 126.5 |
AGU-31 |
| 7199.353 |
| 5269.546 |
| 481.21 |
| 97.5 |
AGU-32 |
| 7224.565 |
| 5446.104 |
| 494.537 |
| 342.35 |
AGU-33 |
| 7004.905 |
| 5167.087 |
| 451.272 |
| 93.75 |
AGU-34 |
| 7141.718 |
| 5071.637 |
| 449.659 |
| 57.15 |
AGU-35 |
| 7146.523 |
| 5101.807 |
| 451.759 |
| 93.4 |
AGU-36 |
| 7199.708 |
| 5459.715 |
| 490.296 |
| 326.55 |
AGU-37 |
| 7173.958 |
| 5440.89 |
| 486.277 |
| 319.45 |
AGU-38 |
| 7148.056 |
| 5349.408 |
| 484.406 |
| 202.1 |
AGU-39 |
| 7276.933 |
| 5464.602 |
| 499.07 |
| 400 |
AGU-40 |
| 7124.486 |
| 5380.412 |
| 481.823 |
| 220.9 |
AGU-41 |
| 7225.568 |
| 5506.306 |
| 491.978 |
| 381.6 |
AGU-42 |
| 7148.599 |
| 5417.471 |
| 483.432 |
| 285.3 |
AGU-43 |
| 7199.143 |
| 5392.072 |
| 492.51 |
| 274.7 |
AGU-44 |
| 7251.4 |
| 5492.575 |
| 494.169 |
| 167.2 |
AGU-45 |
| 7225.885 |
| 5375.944 |
| 495.501 |
| 220 |
AGU-47 |
| 7323.971 |
| 5044.833 |
| 453.172 |
| 934.7 |
AGU-48 |
| 6955.738 |
| 5180.001 |
| 449.532 |
| 160.2 |
AGU-49 |
| 7199.472 |
| 5172.116 |
| 462.044 |
| 165.8 |
AGU-50 |
| 7399.139 |
| 5424.591 |
| 495.136 |
| 230.75 |
AGU-51 |
| 6213.355 |
| 5875.614 |
| 450.875 |
| 318.8 |
AGU-52 |
| 7196.757 |
| 5239.991 |
| 474.718 |
| 297 |
AGU-53 |
| 7202.081 |
| 5135.069 |
| 455.985 |
| 148.65 |
AGU-54 |
| 6997.114 |
| 5199.7 |
| 452.646 |
| 151.3 |
AGU-55 |
| 7202.081 |
| 5135.873 |
| 455.985 |
| 212 |
AGU-56 |
| 7028.85 |
| 5160.303 |
| 454.063 |
| 128.4 |
AGU-57 |
| 6994.797 |
| 5221.184 |
| 453.77 |
| 314.65 |
AGU-58 |
| 7225.926 |
| 5126.877 |
| 457.972 |
| 187.4 |
AGU-59 |
| 7225.93 |
| 5127.491 |
| 458.021 |
| 160.6 |
AGU-60 |
| 7108.681 |
| 5008.044 |
| 447.559 |
| 270.5 |
AGU-61 |
| 7073.522 |
| 5193.764 |
| 460.688 |
| 202.7 |
AGU-62 |
| 7420.882 |
| 4958.795 |
| 453.127 |
| 282.9 |
AGU-63 |
| 7073.197 |
| 5194.649 |
| 461.052 |
| 110.9 |
AGU-64 |
| 6648.696 |
| 5225.657 |
| 486.061 |
| 295.1 |
|
|
|
|
|
|
|
|
|
Drill Hole |
| Easting |
| Northing |
| Elevation |
| Depth |
AGU-65 |
| 7318.413 |
| 5345.947 |
| 496.797 |
| 692.25 |
AGU-66 |
| 7098.512 |
| 5199.205 |
| 462.602 |
| 120.85 |
AGU-67 |
| 7097.994 |
| 5224.347 |
| 466.339 |
| 72.95 |
AGU-68 |
| 7123.83 |
| 5188.284 |
| 462.581 |
| 86.85 |
AGU-69 |
| 7227.365 |
| 5224.173 |
| 474.863 |
| 96.6 |
AGU-70 |
| 7278.735 |
| 5215.154 |
| 476.785 |
| 123.45 |
AGU-71 |
| 7097.973 |
| 5176.324 |
| 458.668 |
| 34.6 |
AGU-72 |
| 7076.983 |
| 5166.813 |
| 457.261 |
| 35.55 |
AGU-73 |
| 7122.606 |
| 5163.029 |
| 458.572 |
| 28.6 |
AGU-74 |
| 7099.777 |
| 5151.506 |
| 455.726 |
| 43 |
AGU-75 |
| 7079.762 |
| 5147.156 |
| 455.099 |
| 42.8 |
AGU-76 |
| 7116.835 |
| 5133.574 |
| 454.312 |
| 42.3 |
AGU-77 |
| 7018.816 |
| 5193.894 |
| 455.064 |
| 66.7 |
AGU-78 |
| 7018.837 |
| 5192.204 |
| 454.894 |
| 65.55 |
AGU-79 |
| 6999.275 |
| 5144.005 |
| 449.055 |
| 81 |
AGU-80 |
| 7053.11 |
| 5149.649 |
| 454.815 |
| 34.8 |
AGU-81 |
| 7025.029 |
| 5100.552 |
| 451.147 |
| 59.3 |
AGU-82 |
| 7026.753 |
| 5125.257 |
| 452.375 |
| 39 |
AGU-83 |
| 7141.29 |
| 5015.8 |
| 448.161 |
| 29.7 |
AGU-84 |
| 6873.487 |
| 5295.426 |
| 459.758 |
| 206.55 |
AGU-85 |
| 6872.33 |
| 5333.133 |
| 461.52 |
| 301 |
AGU-86 |
| 6877.378 |
| 5223.399 |
| 456.041 |
| 179.85 |
AGU-87 |
| 6963.287 |
| 5310.893 |
| 456.9 |
| 271.85 |
AGU-88 |
| 7735.553 |
| 6107.87 |
| 497.666 |
| 200.6 |
AGU-89 |
| 6404.494 |
| 5687.515 |
| 473.73 |
| 253.45 |
AGU-90 |
| 6794.613 |
| 5676.998 |
| 478.049 |
| 486.85 |
AGU-91 |
| 7495.61 |
| 4933.145 |
| 465.548 |
| 307.4 |
AGU-92 |
| 6891.438 |
| 4897.682 |
| 439.55 |
| 150 |
AGU-93 |
| 6800 |
| 4900 |
| 442 |
| 100 |
AGU-94 |
| 6900 |
| 5000 |
| 443 |
| 150 |
AGU-95 |
| 6800 |
| 5000 |
| 446 |
| 150.1 |
AGU-96 |
| 6875 |
| 5100 |
| 448 |
| 150 |
AGU-97 |
| 7000 |
| 5000 |
| 444 |
| 100 |
AGU-98 |
| 6800 |
| 4800 |
| 435 |
| 100 |
AGU-99 |
| 7000 |
| 4900 |
| 442 |
| 100 |
GalRNR |
| 7300 |
| 5209.9 |
| 460 |
| 55.5 |
GTAGU-1 |
| 7530.107 |
| 5316.065 |
| 483.198 |
| 760.7 |
GTAGU-2 |
| 7075.09 |
| 5589.997 |
| 488.34 |
| 847.1 |
MT-1 |
| 7129.121 |
| 5262.193 |
| 474.111 |
| 151.75 |
MT-2 |
| 7325.147 |
| 5281.286 |
| 490.095 |
| 111.5 |
|
|
| TECHNICAL REPORT AGUABLANCA NI-CU DEPOSIT |
APPENDIX D
WIREFRAME MODEL SECTIONS
|
|
|
|
|
|
31 March 2009 |
|
|
Section 7000 mE
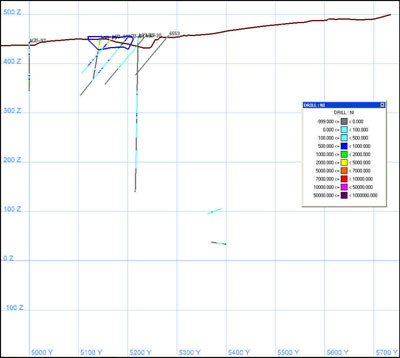
Section 7025 mE
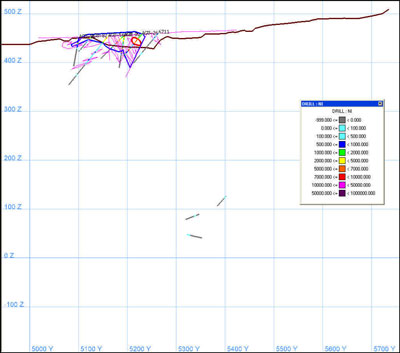
Section 7050 mE
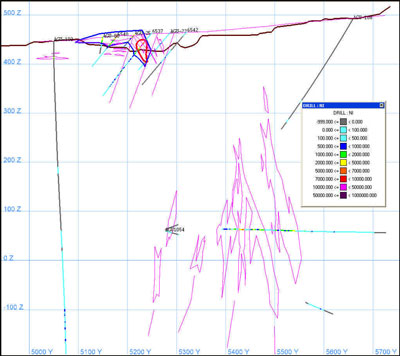
Section 7075 mE
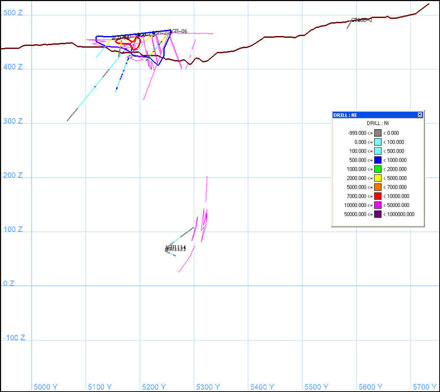
Section 7100 mE
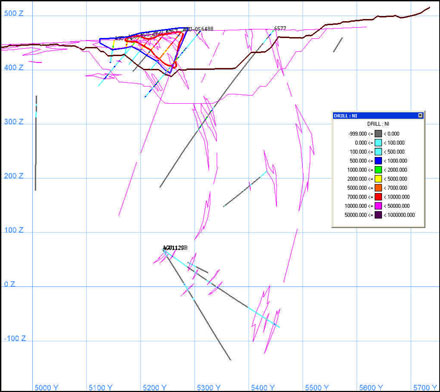
Section 7125 mE
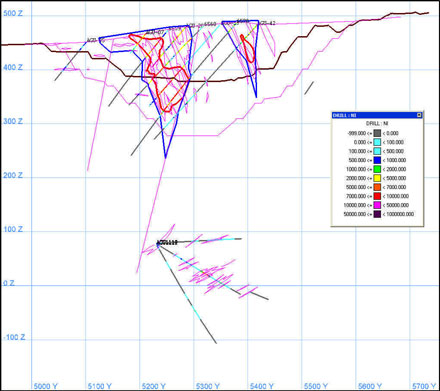
Section 7150 mE

Section 7175 mE
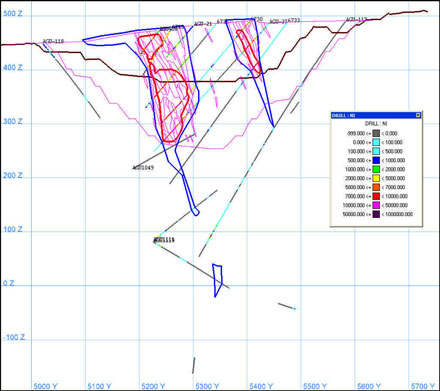
Section 7200 mE
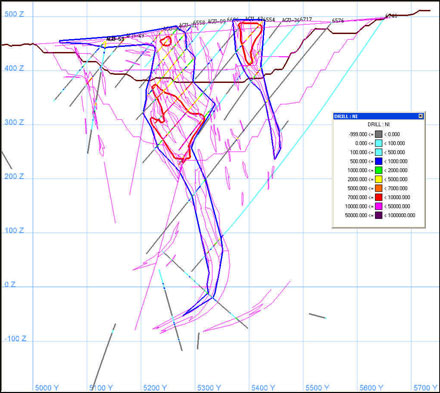
Section 7225 mE
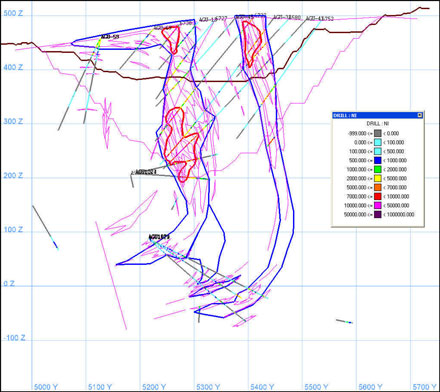
Section 7250 mE
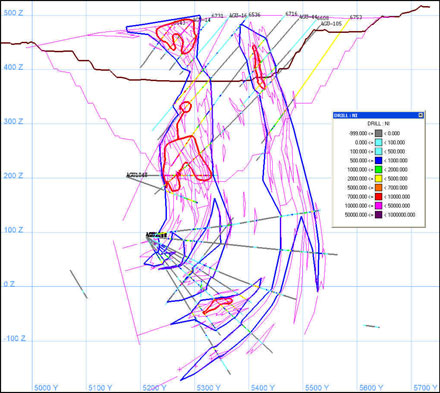
Section 7275 mE
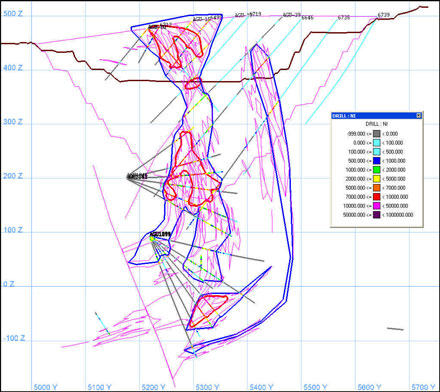
Section 7300 mE
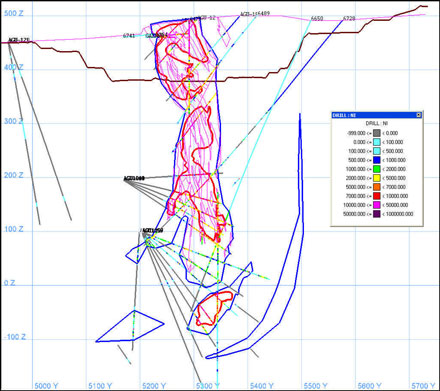
Section 7325 mE

Section 7350 mE
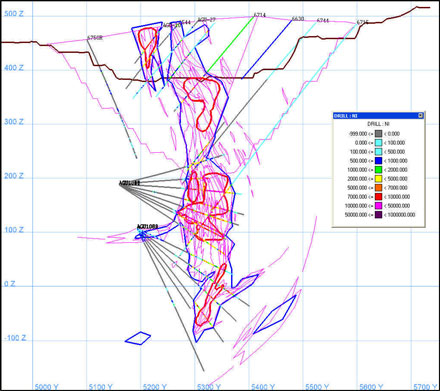
Section 7375 mE
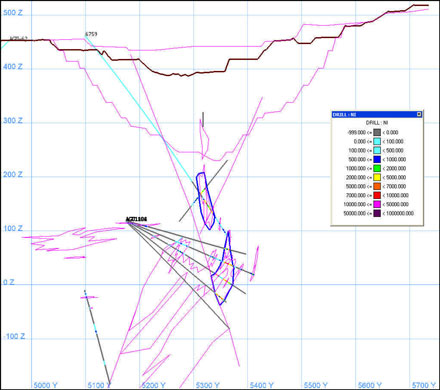
Section 7400 mE
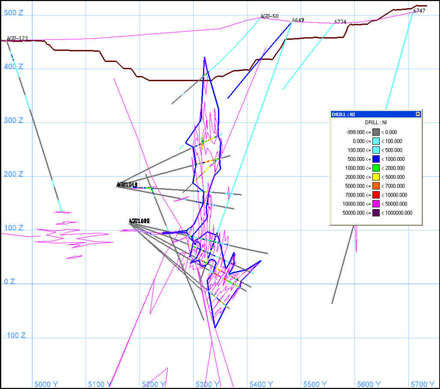
Section 7425 mE

Section 7450 mE
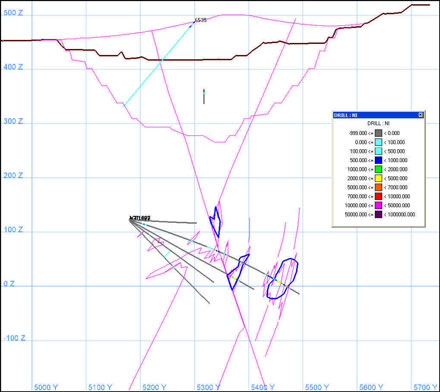
Section 7475 mE

|
|
| TECHNICAL REPORT AGUABLANCA NI-CU DEPOSIT |
APPENDIX E
PROBABILITY PLOTS
|
|
|
|
|
|
31 March 2009 |
|
|
Key to weighted cumulative probability plots
|
|
|
|
|
Lithology Type |
| Lithology codes |
| Prob. Plot code |
Gabbro |
| GM, GD, GPL, GD, GI, GC, GSM |
| 1 |
Breccia |
| GB, GSB |
| 2 |
Other Igneous |
| PX, DI, GR, GAN |
| 3 |
Metamorhpics |
| M, SK, ES, H, VS, PZ |
| 4 |
Others |
| OX, ZF, REC, NR |
| 5 |
|
|
|
|
|
Mineralisation code |
| Mineralisation description |
| Prob. Plot code |
NS |
| No mineralisation |
| 0 |
SP |
| Patchy Mineralisation |
| 1 |
S |
| Slight mineralisation (slightly disseminated) |
| 2 |
SB |
| Semi-massive Breccia mineralisation |
| 3 |
SS |
| Strongly disseminated mineralisation |
| 4 |
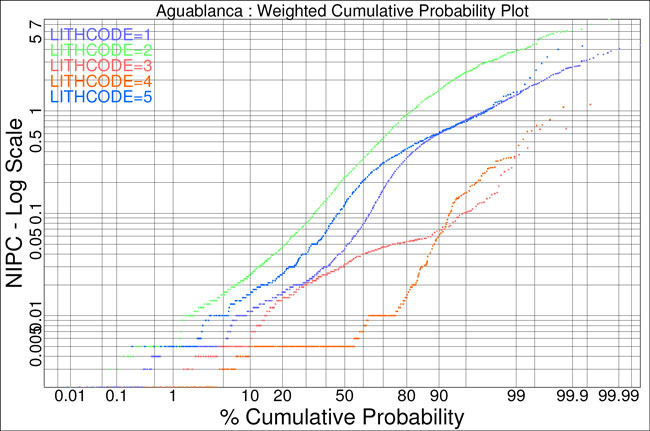

|
|
| TECHNICAL REPORT AGUABLANCA NI-CU DEPOSIT |
APPENDIX F
SEARCH ELLIPSE ORIENTATIONS
|
|
|
|
|
|
31 March 2009 |
|
|
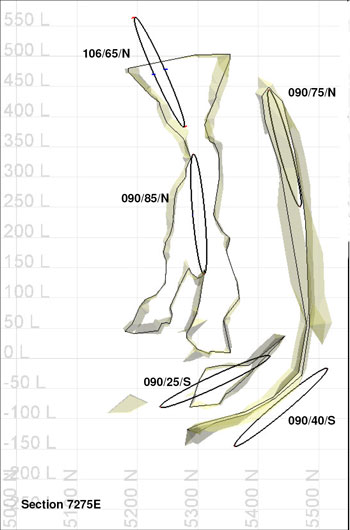
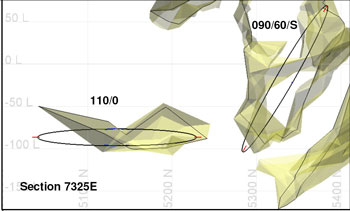
Summary of Search orientations
|
|
|
|
|
|
| Strike of Major axis |
| Dip/Dip Direction |
|
|
|
|
|
South Body |
|
|
|
|
|
|
|
|
|
Surface – 320rl |
| 106 |
| 65 N |
|
|
|
|
|
320rl – 50rl |
| 90 |
| 85 N |
|
|
|
|
|
<50rl and west of7275E |
| 90 |
| 25 S |
|
|
|
|
|
<50rl and east of7275E |
| 90 |
| 60 S |
|
|
|
|
|
North Body |
|
|
|
|
|
|
|
|
|
Surface – 50rl |
| 90 |
| 75 N |
|
|
|
|
|
<50rl |
| 90 |
| 40 S |
|
|
|
|
|
120 Area |
| 110 |
| 0 |
|
|
| TECHNICAL REPORT AGUABLANCA NI-CU DEPOSIT |
APPENDIX G
SWATH PLOTS
|
|
|
|
|
|
31 March 2009 |
|
|
Aguablanca - Blocks vs Samples in 40m x 40m x 20m Panels Domain - Low Grade
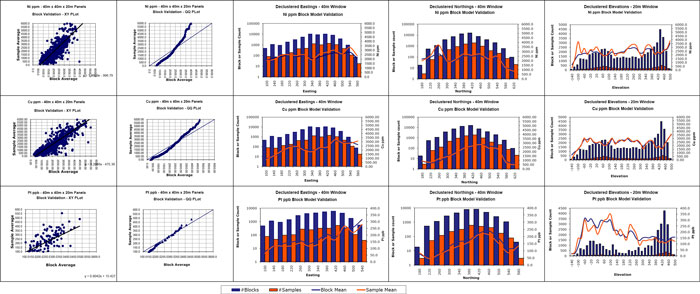
|
|
|
*blocks weighted by volume, samples weighted by sample length* | SWATHPLOT_LG.xls | 05/02/2009 |
Aguablanca - Blocks vs Samples in 40m x 40m x 20m Panels Domain - Low Grade
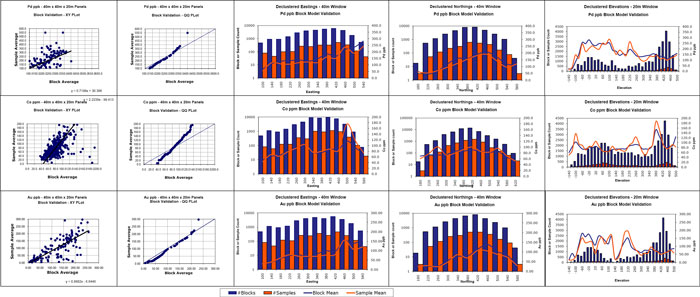
|
|
|
*blocks weighted by volume, samples weighted by sample length* | SWATHPLOT_LG.xls | 05/02/2009 |
Aguablanca - Blocks vs Samples in 40m x 40m x 20m Panels Domain - High Grade
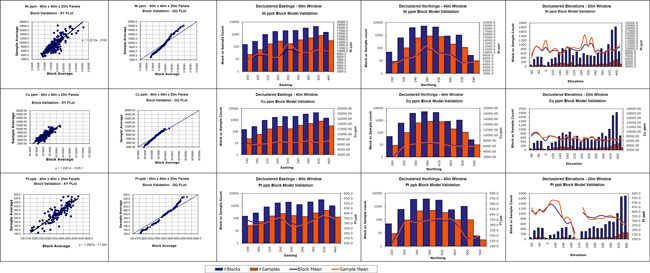
|
|
|
*blocks weighted by volume, samples weighted by sample length* | SWATHPLOT_HG.xls | 05/02/2009 |
Aguablanca - Blocks vs Samples in 40m x 40m x 20m Panels Domain - High Grade
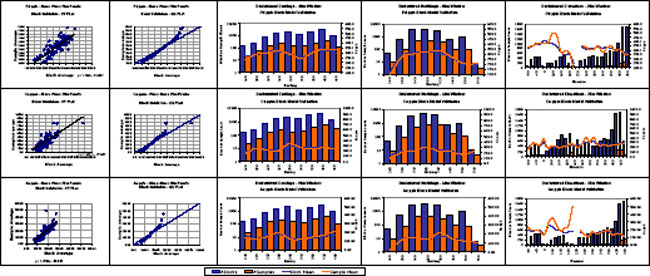
|
|
|
*blocks weighted by volume, samples weighted by sample length* | SWATHPLOT_HG.xls | 05/02/2009 |
|
|
| TECHNICAL REPORT AGUABLANCA NI-CU DEPOSIT |
Report Signature Page
GOLDER ASSOCIATES GLOBAL IBERICA
|
|
|
|
Arturo G. del Olmo |
|
Managing Director |
|
AOP/JA-MG_JPG/ST/AGO/BS
Company registered in Spain
C/ Rios Rosas 36 1 D
Madrid 28003
Spain
p:\proyectos abiertos\2008\08511150292_rnr_new resources model_sevilla\200 - informes\202 - informes finales\ni43101 combined report 31-mar-09\08511150292_rnragblc_41103_v12.doc
|
|
|
|
|
|
31 March 2009 |
|
|
|
|
|
|
|
|
| At Golder Associates we strive to be the most respected global group of companies specializing in ground engineering and environmental services. Employee owned since our formation in 1960. We have created a unique culture with pride in ownership, resulting in long-term organisational stability. Golder professionals take the time to build an understanding of client needs and of the specific environments in which they operate. We continue to expand our technical capabilities and have experienced steady growth with employees no operating from offices located throughout Africa, Asia, Australasia, Europe, North America and South America. |
| Africa | + 27 11 254 4800 |
|
Asia | + 852 2562 3658 |
| |||
Australasia | + 61 3 8862 3500 |
| |||
Europe | + 356 21 42 30 20 |
| |||
North America | + 1 800 275 3281 |
| |||
South America | + 55 21 3095 9500 |
| |||
|
|
| |||
| solutions@golder.com |
|
|

|
|
|
|
| Company registered in Spain |


