Washington, D.C. 20549
Item 1. Reports to Stockholders.
City National Rochdale High Yield Alternative Strategies Fund LLC
City National Rochdale High Yield Alternative Strategies Fund TEI LLC
Semi-Annual Report
September 30, 2014
Dear Fellow Shareholders,
The City National Rochdale High Yield Alternative Strategies Fund LLC (“Taxable Fund”) and City National Rochdale High Yield Alternative Strategies Fund TEI LLC (“TEI Fund”), (collectively “RHYAS”) seek to diversify clients’ traditional stock and bond only portfolios through inclusion of alternative strategies focusing on the fixed income markets. For the six months ended September 30, 2014, the Taxable Fund returned +2.53% and the TEI Fund returned +2.56% (fund total returns are net of fund fees and expenses). The benchmark of this strategy comprises a 50% weight in the Barclays U.S. Corporate High Yield and a 50% weight in the Credit Suisse Leveraged Loan Index. The strategy benchmark returned +0.81% over the previous six months. On a year to date basis, the fund has also performed well against the benchmark. For the year to date period ended September 30, 2014, the Taxable Fund returned +4.18% and the TEI Fund returned +4.19%. The benchmark returned +2.97% during the same period.
We are pleased with the performance over the past 6 months, especially since this has been a challenging market for Opportunistic Income. The months of July and September were especially interesting in the High Yield fixed income markets, providing us an interesting barometer to test our rationale for this fund. In July 2014, the Barclays US Corporate High Yield market returned -1.33%, and this strategy delivered positive performance for July. Again, in September, the markets were challenged with the previously mentioned index returning -2.09%, while the City National Rochdale High Yield Alternative Strategies Fund was close to flat. Our goal for structuring this strategy was to provide a vehicle less sensitive to directional market shifts dictated by interest rates, rather than fundamentals, and this period of time serves as a positive indicator for our strategy.
The investment objective of the Fund is to focus on unique investment opportunities in less liquid Fixed Income instruments, typically unavailable in a mutual fund structure. Specifically, the Fund’s targeted investments include Collateralized Loan Obligations, Residential Mortgage Backed Securities and Distressed Debt/Asset Backed Securities. As we orient the strategy to capture attractive opportunities in yield based asset classes, our focus is on a limited set of managers who target greater risk adjusted returns through unique opportunities. We believe the strategy can complement an existing portfolio in one of two ways: first, as a fixed income replacement providing higher return from yields than traditional fixed income with commensurately higher volatility, and second, as a supplement to a portion of an equity allocation with similar volatility expectations. By reducing a portfolio’s equity
570 Lexington Ave. New York, NY 10022-6937 | (T) 212-702-3500 | www.cnr.com
exposure it can serve as a risk stabilizer or by reducing fixed income exposure it can serve as a return enhancer, while providing greater asset class diversification in either situation.
Outlook
While we believe the U.S. economy is continuing to expand and key drivers of growth are evident, the continual low-rate monetary policy environment remains a pillar of support for the market. We expect Fed to potentially raise short-term target rates in 2015, but rates will remain anchored at low levels and the Federal Reserve to remain accommodative. Backed by an unprecedented central bank easing, solid credit conditions of corporate issues have made investors confident in moving towards lower credit quality to increase portfolio yield. Improvement in the financial health of the underlying debt issuers and strengthening balance sheets of U.S. corporations lead us to continue to favor these types of fixed income instruments. The portfolio has allocated to Europe over the past 6 months, where dislocation has created opportunities in the bank loan market.
While we see High Yield spreads being attractive on an absolute basis, on a relative basis they are below the long-term average. With yield to maturity projections in the current market so low, this leaves few options in the Core Fixed Income market to generate a high level of income. For those investors willing to take on the higher risk for higher return, we believe City National Rochdale High Yield Alternative Strategies Fund is an appropriate addition to client portfolios, relative to Core Fixed Income. Many of the managers in this strategy have structured the investment to benefit from a rising rate environment through re-investment opportunities, or themes based on valuation of distressed assets.
Sincerely,
Garrett R. D’Alessandro, CFA, CAIA, AIF®
Chief Executive Officer & President
City National Rochdale LLC
570 Lexington Ave. New York, NY 10022-6937 | (T) 212-702-3500 | www.cnr.com
Important Disclosures
The performance returns presented may contain figures estimated by the underlying manager which, if subsequently revised by the underlying manager, may change the returns indicated for the applicable period.
The unsubsidized total annual fund operating expense ratio for the City National Rochdale High Yield Alternative Strategies Fund and the City National Rochdale High Yield Alternative Strategies Fund TEI is 2.42% and 2.41%, respectively. Cumulative Return at POP (Public Offering Price, reflecting maximum front end sales charge of 2.00%) since inception of July 1, 2007 for the City National Rochdale High Yield Alternative Strategies Fund and the City National Rochdale High Yield Alternative Strategies Fund TEI is -0.71% and -1.38%, respectively. Performance quoted represents past performance. Past performance does not guarantee future results. The investment return and principal value of an investment will fluctuate, so that an investor’s shares, when redeemed, may be worth more or less than their original cost. Current performance may be lower or higher than the performance quoted. The most recent month-end performance can be obtained by calling 800-245-9888.
An investor should consider carefully the Fund’s investment objectives, risks, charges, and expenses. The prospectus contains this and other important information about the investment company, and it may be obtained by calling 800-245-9888. Please read it carefully before investing. RIM Securities LLC, the affiliated broker dealer for City National Rochdale, LLC, 570 Lexington Avenue, New York, NY 10022.
The views expressed herein represent the opinions of City National Rochdale, LLC and are subject to change without notice at anytime. This information should not in any way be construed to be investment, financial, tax, or legal advice or other professional advice or service, and should not be relied on in making any investment or other decisions. As with all investments, there is no guarantee that investment objectives will be met.
Please see the Offering Memorandum for more complete information regarding the Fund’s investment objectives, risks, fees and other expenses. Alternative investments are speculative, may entail substantial risks and may not be suitable for all investors.
The Fund employs the use of leverage through its investments in certain financial instruments. Leverage magnifies both gains and losses.
Indices are unmanaged and one cannot invest directly in an index. Index returns do not reflect the deduction for fees and expenses.
City National Rochdale High Yield Alternative Strategies Master Fund LLC
Financial Statements
September 30, 2014
City National Rochdale High Yield Alternative Strategies Master Fund LLC
Financial Statements
September 30, 2014
| TABLE OF CONTENTS | |
| | Page |
| | |
| Financial Statements | |
| | Statement of Assets, Liabilities and Members' Capital | 2 |
| | Statement of Operations | 3 |
| | Statements of Changes in Members' Capital | 4 |
| | Statement of Cash Flows | 5 |
| | Schedule of Investments | 6 - 7 |
| | Strategy Allocation Breakdown | 8 |
| | Notes to Financial Statements | 9 - 18 |
| | Financial Highlights | 19 |
| | | |
| | | |
| Approval of Investment Management Agreement | |
| Additional Information | |
| City National Rochdale High Yield Alternative Strategies Master Fund LLC | |
| | | | |
| Statement of Assets, Liabilities and Members' Capital | |
| | | | |
| September 30, 2014 (Unaudited) | |
| | | | |
| | | | |
| ASSETS | | | |
| Investments, at fair value (cost $31,851,302) | | $ | 36,365,359 | |
| Investments made in advance | | | 1,000,000 | |
| Receivable for fund investments sold | | | 2,708 | |
| Interest receivable | | | 5 | |
| | | | | |
| Total Assets | | | 37,368,072 | |
| | | | | |
| LIABILITIES AND MEMBERS' CAPITAL | | | | |
| Liabilities | | | | |
| Management fees payable | | | 38,380 | |
| Members' capital balances payable | | | 378,638 | |
| Professional fees payable | | | 42,973 | |
| Contributions received in advance | | | 25,000 | |
| Accrued expenses and other liabilities | | | 31,757 | |
| | | | | |
| Total Liabilities | | | 516,748 | |
| | | | | |
| Total Members' Capital | | $ | 36,851,324 | |
| | | | | |
| | | | | |
| | | | | |
| | | | | |
| | | | | |
| | | | | |
| | | | | |
| | | | | |
| | | | | |
| | | | | |
| | | | | |
| | | | | |
| The accompanying notes are an integral part of these financial statements | | | | |
City National Rochdale High Yield Alternative Strategies Master Fund LLC | |
| | | | |
| Statement of Operations | |
| | | | |
| Six Months Ended September 30, 2014 (Unaudited) | |
| | | | |
| | | | |
| INVESTMENT INCOME | | | |
| Interest income | | $ | 85 | |
| | | | | |
| Investment Income | | | 85 | |
| | | | | |
| EXPENSES | | | | |
| Management fees (see Note 4) | | | 225,333 | |
| Administration fees | | | 51,742 | |
| Professional fees | | | 43,854 | |
| Directors' fees | | | 3,831 | |
| Custody fees | | | 3,229 | |
| Other expenses | | | 2,009 | |
| | | | | |
| Total Expenses | | | 329,998 | |
| | | | | |
| Net Investment Loss | | | (329,913 | ) |
| | | | | |
| REALIZED AND UNREALIZED GAIN (LOSS) | | | | |
| ON INVESTMENTS | | | | |
| Net realized gain on investments | | | 490,658 | |
| Net change in unrealized appreciation/depreciation on investments | | | 834,609 | |
| | | | | |
| Net Realized and Unrealized Gain on Investments | | | 1,325,267 | |
| | | | | |
| Net Increase in Members' Capital Resulting from Operations | | $ | 995,354 | |
| | | | | |
| | | | | |
| | | | | |
| | | | | |
| | | | | |
| | | | | |
| | | | | |
| | | | | |
| | | | | |
| | | | | |
| | | | | |
| | | | | |
| The accompanying notes are an integral part of these financial statements | | | | |
City National Rochdale High Yield Alternative Strategies Master Fund LLC | |
| | | | | | | |
| Statements of Changes in Members' Capital | |
| | | | | | | |
| | |
| | |
| | | Six Months Ended | | | Year Ended | |
| | | September 30, 2014 | | | March 31, 2014 | |
| FROM OPERATIONS | | | | | | |
| | | | | | | |
| Net investment loss | | $ | (329,913 | ) | | $ | (630,647 | ) |
| Net realized gain (loss) on investments | | | 490,658 | | | | 538,923 | |
| Net change in unrealized appreciation/depreciation on investments | | | 834,609 | | | | 1,791,755 | |
| | | | | | | | | |
| Net Increase in Members' Capital Resulting From Operations | | | 995,354 | | | | 1,700,031 | |
| | | | | | | | | |
| | | | | | | | | |
| INCREASE (DECREASE) FROM TRANSACTIONS IN MEMBERS' CAPITAL | | | | | |
| | | | | | | | | |
| Proceeds from sales of members' interests (see Note 2) | | | 1,154,943 | | | | 8,031,329 | |
| | | | | | | | | |
| Total Increase in Members' Capital | | | 2,150,297 | | | | 9,731,360 | |
| | | | | | | | | |
| | | | | | | | | |
| MEMBERS' CAPITAL | | | | | | | | |
| | | | | | | | | |
| Beginning of year | | | 34,701,027 | | | | 24,969,667 | |
| | | | | | | | | |
| End of year | | $ | 36,851,324 | | | $ | 34,701,027 | |
| | | | | | | | | |
| | | | | | | | | |
| | | | | | | | | |
| | | | | | | | | |
| | | | | | | | | |
| | | | | | | | | |
| | | | | | | | | |
| | | | | | | | | |
| | | | | | | | | |
| | | | | | | | | |
| | | | | | | | | |
| The accompanying notes are an integral part of these financial statements | | | | | | | | |
City National Rochdale High Yield Alternative Strategies Master Fund LLC | |
| | | | |
| Statement of Cash Flows | |
| | | | |
| Six Months Ended September 30, 2014 (Unaudited) | |
| | | | |
| | | | |
| CASH FLOWS FROM OPERATING ACTIVITIES | | | |
| Net increase in members' capital resulting from operations | | $ | 995,354 | |
| | | | | |
| Adjustments to reconcile net increase in members' capital | | | | |
| resulting from operations to net cash from operating activities: | | | | |
| Purchases of investments | | | (7,746,454 | ) |
| Sales of investments | | | 2,867,944 | |
| Purchases of money market fund | | | (12,544,325 | ) |
| Sales of money market fund | | | 17,441,607 | |
| Net change in unrealized appreciation/depreciation on investments | | | (834,609 | ) |
| Net realized gain on investments | | | (490,658 | ) |
| | | | | |
| Change in Operating Assets and Liabilities: | | | | |
| Receivable for fund investments sold | | | 14,546 | |
| Investments made in advance | | | (1,000,000 | ) |
| Interest receivable | | | 20 | |
| Prepaid expenses | | | 30 | |
| Management fees payable | | | (33,300 | ) |
| Contributions received in advance | | | (175,000 | ) |
| Members' capital balances payable | | | 378,638 | |
| Professional fees payable | | | (10,713 | ) |
| Accrued expenses and other liabilities | | | (18,023 | ) |
| | | | | |
| Net Cash used in Operating Acivities | | | (1,154,943 | ) |
| | | | | |
| CASH FLOWS FROM FINANCING ACTIVITIES | | | | |
| Proceeds from sales of members' interests | | | 1,154,943 | |
| | | | | |
| Net Cash used in Financing Activities | | | 1,154,943 | |
| | | | | |
| Net Change in Cash and Cash Equivalents | | | - | |
| | | | | |
| CASH AND CASH EQUIVALENTS | | | | |
| Beginning of year | | | - | |
| | | | | |
| End of year | | | - | |
| | | | | |
| | | | | |
| | | | | |
| | | | | |
| | | | | |
| | | | | |
| The accompanying notes are an integral part of these financial statements | | | | |
City National Rochdale High Yield Alternative Strategies Master Fund LLC | | | | | | | | | | | | | |
| SCHEDULE OF INVESTMENTS, September 30, 2014 (Unaudited) | | | | | | | | | | | | | |
| | | | | | | | | | | | | | | | |
| | | | | | | | | | | | Redemptions | |
| | | Percentage of | | | | | | | | | | | | Notice Period | |
| | | Members' Capital | | | Cost | | | Fair Value | | | Frequency | | | # of Days | |
Long-Term Investment Funds: 1 | | | | | | | | | | | | | | | |
| High Yield/Credit: | | | | | | | | | | | | | | | |
| Canyon Value Realization Fund, LP - Series L | | | 16.9 | % | | $ | 5,000,000 | | | $ | 6,226,710 | | | Annually | | | | 100 | |
| GoldenTree Partners LP | | | 17.1 | | | | 4,847,125 | | | | 6,302,803 | | | Quarterly | | | | 90 | |
| | | | 34.0 | | | | 9,847,125 | | | | 12,529,513 | | | | | | | | |
| | | | | | | | | | | | | | | | | | | | |
| Structured Credit - CLO: | | | | | | | | | | | | | | | | | | | |
| Alcentra Structured Credit Opportunity Fund I | | | 2.8 | | | | 1,000,000 | | | | 1,022,353 | | | Quarterly | | | | 90 | |
| Alcentra Structured Credit Opportunity Fund II | | | 9.5 | | | | 3,412,416 | | | | 3,520,340 | | | Quarterly | | | | 90 | |
| Great Lakes III, LP | | | 27.0 | | | | 9,518,204 | | | | 9,941,342 | | | Quarterly | | | | 90 | |
| | | | 39.3 | | | | 13,930,620 | | | | 14,484,035 | | | | | | | | |
| | | | | | | | | | | | | | | | | | | | |
| Structured Credit - Mortgages: | | | | | | | | | | | | | | | | | | | |
| Midway Market Neutral Fund LLC | | | 14.1 | | | | 4,500,000 | | | | 5,193,945 | | | Monthly | | | | 90 | |
| Premium Point Mortgage Credit Fund, LP | | | 7.6 | | | | 2,516,722 | | | | 2,807,823 | | | Quarterly | | | | 90 | |
| | | | 21.7 | | | | 7,016,722 | | | | 8,001,768 | | | | | | | | |
| | | | | | | | | | | | | | | | | | | | |
| Liquidating Positions: | | | | | | | | | | | | | | | | | | | |
Bennelong Asia Pacific Multi Strategy Equity Fund, LP - Class S 2 | | | 0.2 | | | | 152,637 | | | | 72,808 | | | | ** | | | | ** | |
Brencourt SP Fund, LP 2 | | | 0.5 | | | | 106,864 | | | | 186,195 | | | | ** | | | | ** | |
CamCap Resources, LP 2 | | | 0.0 | | | | 17,257 | | | | 7,938 | | | | ** | | | | ** | |
Caxton Global Investments (USA) LLC 2 | | | 0.1 | | | | 12,541 | | | | 21,713 | | | | ** | | | | ** | |
GoldenTree Partners LP 2 | | | 2.1 | | | | 355,541 | | | | 771,032 | | | | ** | | | | ** | |
Keswick Onshore Trust 2 | | | 0.0 | | | | 17,574 | | | | 11,095 | | | | ** | | | | ** | |
King Street Capital LP 2 | | | 0.1 | | | | 10,908 | | | | 25,487 | | | | ** | | | | ** | |
| Polygon Recovery Fund, LP | | | 0.3 | | | | 243,490 | | | | 120,177 | | | | * | | | | * | |
Stark Select Asset Fund LLC 2 | | | 0.2 | | | | 63,540 | | | | 57,115 | | | | ** | | | | ** | |
| | | | 3.5 | | | | 980,352 | | | | 1,273,560 | | | | | | | | | |
| Total Long-Term Investment Funds: | | | 98.5 | | | | 31,774,819 | | | | 36,288,876 | | | | | | | | | |
| | | | | | | | | | | | | | | | | | | | | |
| Short-Term Investment: | | | | | | | | | | | | | | | | | | | | |
| Money Market Fund: | | | | | | | | | | | | | | | | | | | | |
First American Government Obligations Fund, 0.01% 3 | | | 0.2 | | | | 76,483 | | | | 76,483 | | | | | | | | | |
| | | | | | | | | | | | | | | | | | | | | |
| | | | | | | | | | | | | | | | | | | | | |
| Total Investments | | | 98.7 | % | | $ | 31,851,302 | | | $ | 36,365,359 | | | | | | | | | |
| | | | | | | | | | | |
1 All investments are non-income producing. | | | | | | | | | | |
2 Remaining value represents side pocket interests. | | | | | | | | | | |
3 7-Day Yield. | | | | | | | | | | |
| | | | | | | | | | | |
* Redemption restrictions exist for Hedge Funds whereby the Hedge Fund Managers may suspend redemption either in their sole discretion or other factors. Such | | |
| factors include the magnitude of redemptions requested, portfolio valuation issues or market conditions. Redemptions are currently suspended for the Polygon Recovery Fund, LP, |
| a portfolio comprised of an exchange listed but thinly traded security and several private equity holdings. | | | | | | |
| | | | | | | | | | | |
** Special Investments have been established for Bennelong Asia Pacific Multi Strategy Equity Fund, LP - Class S, Brencourt SP Fund, LP, CamCap Resources, LP, Caxton Global Investments |
| (USA) LLC LP, GoldenTree Partners LP, Keswick Onshore Trust, King Street Capital LP, and Stark Select Asset Fund LLC. These investments are long-term and illiquid. | | |
The investments in Hedge Funds shown above, representing 98.50% of net assets, have been fair valued in accordance with procedures established by the Board of Directors.
| City National Rochdale High Yield Alternative Strategies Master Fund LLC | | | | | | | | |
| SCHEDULE OF INVESTMENTS, September 30, 2014 (Unaudited), Continued | | | | | | | | |
| | | | | | | | | | | |
| High Yield / Credit. The credit strategy involves investing in the securities of companies that are non-investment grade, high yield and or distressed. Often, a corporate event results in the |
| re-pricing of these securities, which may lead to profits. A non-investment grade bond generally has a Standard & Poor's rating of lower than BBB- or a Moody's rating lower than Baa3. |
| In the event of a corporate event such as bankruptcy or default, bonds that rank higher in the capital structure of the issuers, such as first lien bank loan or a senior secured bond | |
| have priority over other bonds deemed junior in ranking in the capital structure. The distressed and high-yield sub-strategy involves investing in the securities (bank loans | | |
| and bonds) of companies experiencing financial or operational difficulties or otherwise having below investment grade credit ratings. These securities may trade at substantial | | |
| discounts to par value, because, in part, certain classes of investors who cannot hold non-investment grade, high yield or distressed bonds are forced to sell at discounted prices. | |
| Profits are made based on two kinds of mispricings: (1) fundamental or intrinsic value, and (2) relative value between comparable securities. Hedge Fund Managers may also take | |
| long/short positions throughout the capital structure of leveraged companies to implement a negative or positive credit view in the marketplace with the intention to offer better | | |
| risk adjusted returns than being outright long or short the market. | | | | | | | | | | |
| | | | | | | | | | | |
| Structured Credit. Structured credit strategy invests in stressed/distressed non-corporate fixed income asset classes in non-traditional markets such as residential real estate, commercial |
| real estate and asset backed lending that have become distressed and/or undergoing structural changes, with anticipated improvement in the fundamental value of the underlying asset. |
| Economic downturns and fundamental uncertainties can cause forced selling of securitized assets associated with such markets. In general, profits are made by identifying and investing |
| in securities priced significantly below their intrinsic values where the strategy can maximize long-term capital appreciation from earning interest income and cash flows from current | |
| amortizing principal payments, cash flows from liquidations and from the fundamental appreciation of the underlying assets. Investing in structured credit requires deep fundamental |
| analysis of the underlying assets and the behavior of the borrowers. Managers may invest in structured credit securities at deep discounts to fair value. Profits are realized | | |
| as these securities converge to or above fair value with fundamental improvements in underlying borrowers, assets or improved technical behavior. Typically, structured credit managers |
| will take positions in both agency and non-agency RMBS, CMBS, CLO, and other consumer and commercial loan ABS. At times, the strategy may also entail positions in other | | |
| income generating assets such as life settlements and annuities, trade finance, legal settlements, whole loans, etc. | | | | | | |
| | | | | | | | | | | |
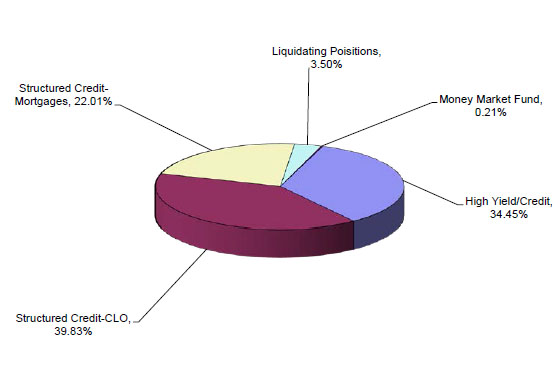
| City National Rochdale High Yield Alternative Strategies Master Fund LLC |
| | | | | | | | | |
| Schedule of Investments, Continued |
| | | | | | | | | |
| September 30, 2014 (Unaudited) |
| | | | | | | | | |
| Strategy Allocation Breakdown |
| (as a % of total investments) |
The accompanying notes are an integral part of these financial statements
City National Rochdale High Yield Alternative Strategies Master Fund LLC
Notes to Financial Statements (Unaudited)
September 30, 2014
City National Rochdale High Yield Alternative Strategies Master Fund LLC (the "Master Fund") is a closed-end, non-diversified management investment company that was organized as a limited liability company under the laws of the State of Delaware on September 11, 2006 and serves as a master fund in a master feeder structure. City National Rochdale High Yield Alternative Strategies Fund LLC and City National Rochdale High Yield Alternative Strategies Fund TEI LLC (the “Feeder Funds”) serve as the feeder funds in the master feeder structure. Interests in the Master Fund are issued solely in private placement transactions that do not involve any "public offering" within the meaning of Section 4(2) of the Securities Act of 1933, as amended (the "1933 Act"). Investments in the Master Fund may be made only by U.S. and foreign investment companies, common or commingled trust funds, organizations or trusts described in Sections 401(a) or 501(a) of the Internal Revenue Code of 1986, as amended, or similar organizations or entities that are "accredited investors" within the meaning of Regulation D under the 1933 Act. The Master Fund is a registered investment company under the Investment Company Act of 1940, as amended (the “1940 Act”).
City National Rochdale, LLC (the “Manager” or "Adviser"), is the investment adviser to the Master Fund. The Manager delegates sub-investment advisory responsibilities to PineBridge Investments LLC (the “Sub-Adviser”) with respect to the Master Fund.
The Master Fund seeks to achieve its objective by investing substantially all of its assets in the securities of privately placed investment vehicles, typically referred to as hedge funds (“Hedge Funds" or "Investment Funds”), that pursue a variety of high yield income generating strategies.
The Master Fund’s investment objective is to generate income from investments in higher yielding investments with lower credit quality and higher volatility than investment grade fixed income securities. “Lower credit quality” in this objective means investments rated below BBB, and “higher volatility” means the fluctuations in principal will be greater than the fluctuations in price associated with investment grade fixed income securities. Under normal circumstances, at least 80% of the Master Fund’s total assets will be invested either directly, or indirectly through Private Funds, in a variety of high yield income generating investments.
City National Rochdale High Yield Alternative Strategies Master Fund LLC
Notes to Financial Statements (Unaudited)
September 30, 2014
| 2. | Significant Accounting Policies |
The following is a summary of significant accounting policies followed by the Master Fund.
Basis of Presentation and Use of Estimates
The financial statements have been prepared in conformity with accounting principles generally accepted in the United States of America (“US GAAP”). The preparation of financial statements in conformity with US GAAP requires management to make estimates and assumptions that affect certain reported amounts and disclosures. Accordingly, actual results could differ from those estimates.
Investments Valuation
Investments are carried at fair value. The fair value of alternative investments has been estimated using the Net Asset Value (“NAV”) as reported by the management of the respective alternative investment fund. Financial Accounting Standards Board (FASB) guidance provides for the use of NAV as a “Practical Expedient” for estimating fair value of alternative investments. NAV reported by each alternative investment fund is used as a practical expedient to estimate the fair value of the Master Fund’s interest therein and their classification within Level 2 or 3 is based on the Master Fund’s ability to redeem its interest in the near term and liquidate the underlying portfolios.
Investments in Investment Funds are stated and recorded at fair value as determined in good faith by the Fair Value Committee in accordance with US GAAP. The Master Fund uses the NAV as reported by the Hedge Fund Managers, as a practical expedient, to determine the fair value of all the investments in Investment Funds which (a) do not have a readily determinable fair value and (b) either have the attributes of an investment company or prepare their financial statements consistent with the measurement principles of an investment company. Such values generally represent the Master Fund's proportionate share of the net assets of the Investment Funds as reported by the Hedge Fund Managers. Accordingly, the value of the investments in Investment Funds are generally increased by additional contributions to the Investment Funds and the Master Fund's share of net earnings from the Investment Funds, and decreased by distributions from the Investment Funds and the Master Fund's share of net losses from the Investment Funds.
City National Rochdale High Yield Alternative Strategies Master Fund LLC
Notes to Financial Statements (Unaudited)
September 30, 2014
| 2. | Significant Accounting Policies (continued) |
Investment Valuations (continued)
The Sub-Adviser reviews the details of the reported information obtained from the Hedge Fund Managers and considers: (i) the measurement date of the NAV provided, (ii) the basis of accounting and, (iii) in instances where the basis of accounting is other than fair value, fair valuation information provided by the Hedge Fund Managers. The Sub-Adviser may make adjustments to the NAV of various Investment Funds to obtain the best estimate of fair value, which is consistent with the measurement principles of an investment company. Any determinations made by the Sub-Adviser will be reviewed and approved by the Adviser’s Fair-Value Committee, which has been designated by the Board to make all necessary fair value determinations.
The Master Fund has not maintained any positions in derivative instruments or directly engaged in hedging activities.
Fair Value Measurements
The Master Fund follows fair valuation accounting standards which establish an authoritative definition of fair value and set out a hierarchy for measuring fair value. These standards require additional disclosures about the various inputs and valuation techniques used to develop the measurements of fair value and a discussion in changes in valuation techniques and related inputs during the period. These standards define fair value as the price that would be received to sell an asset or paid to transfer a liability in an orderly transaction between market participants at the measurement date. The fair value hierarchy is organized into three levels based upon the assumptions (referred to as “inputs”) used in pricing the asset or liability. These standards state that “observable inputs” reflect the assumptions market participants would use in pricing the asset or liability based on market data obtained from independent sources and “unobservable inputs” reflect an entity’s own assumptions about the assumptions market participants would use in pricing the asset or liability. These inputs are summarized in the three broad levels listed below:
Level 1 - Unadjusted quoted prices in active markets for identical assets or liabilities that the Master Fund has the ability to access.
Level 2 - Observable inputs other than quoted prices included in Level 1 that are observable for the asset or liability, either directly or indirectly. These inputs may include quoted prices for the identical instrument on an inactive market, prices for similar instruments, interest rates, prepayment speeds, credit risk, yield curves, default rates and similar data.
City National Rochdale High Yield Alternative Strategies Master Fund LLC
Notes to Financial Statements (Unaudited)
September 30, 2014
2. Significant Accounting Policies (continued)
Fair Value Measurements (continued)
Level 3 - Unobservable inputs for the asset or liability, to the extent relevant observable inputs are not available, representing the Master Fund’s own assumptions about the assumptions a market participant would use in valuing the asset or liability, and would be based on the best information available.
The inputs or methodology used for valuing securities are not necessarily an indication of the risk associated with investing in these securities. See Note 3 – Investments.
Investment Income Recognition
Purchases and sales of securities are recorded on a trade-date basis. Interest income is recorded on the accrual basis and dividends are recorded on the ex-dividend date. Realized and unrealized gains and losses are included in the determination of income.
Fund Expenses
The expenses of the Master Fund include, but are not limited to, the following: legal fees; accounting and auditing fees; custodial fees; management fees; an incentive fee; costs of computing the Master Fund's net asset value; costs of insurance; registration expenses; due diligence, including travel and related expenses; expenses of meetings of the Board and officers; all costs with respect to communications to Members; and other types of expenses as may be approved from time to time by the Board.
Income Taxes
The Master Fund’s tax year end is December 31. The Master Fund is treated as a partnership for Federal income tax purposes. Each Member is responsible for the tax liability or benefit relating to such Member’s distributive share of taxable income or loss. Accordingly, no provision for Federal income taxes is reflected in the accompanying financial statements.
The Master Fund has adopted authoritative guidance on uncertain tax positions. The Master Fund recognizes the effect of tax positions when they are more likely than not of being sustained. Management is not aware of any exposure to uncertain tax positions that could require accrual or which could affect its liquidity or future cash flows. As of September 30, 2014, the Master Fund’s tax years 2011 through 2013 remain open and subject to examination by relevant taxing authorities.
City National Rochdale High Yield Alternative Strategies Master Fund LLC
Notes to Financial Statements (Unaudited)
September 30, 2014
2. Significant Accounting Policies (continued)
Subsequent Events
The Master Fund has adopted financial reporting rules regarding subsequent events, which requires an entity to recognize in the financial statements the effects of all subsequent events that provide additional evidence about conditions that existed at the date of the balance sheet. Management has evaluated the Master Fund’s related events and transactions through the date the financial statements were available to be issued and determined that there were no significant subsequent events that would require adjustment to or additional disclosure in these financial statements.
Capital Accounts
Net profits or net losses of the Master Fund for each month are allocated to the capital accounts of Members as of the last day of each month in accordance with Members' respective investment percentages of the Master Fund. Net profits or net losses are measured as the net change in the value of the net assets of the Master Fund during a fiscal period, before giving effect to any repurchases of interest in the Master Fund, and excluding the amount of any items to be allocated to the capital accounts of the Members of the Master Fund, other than in accordance with the Members' respective investment percentages.
Prior to the end of each quarter and year end, the Master Fund receives Member contributions with an effective subscription date of the first day of the following month.
The Master Fund, in turn, makes contributions to certain Hedge Funds, which have effective subscription dates of the first day of the following month. These amounts are reported as "Contributions received in advance" and "Investments made in advance", respectively.
City National Rochdale High Yield Alternative Strategies Master Fund LLC
Notes to Financial Statements (Unaudited)
September 30, 2014
The following are the classes of investments grouped by the fair value hierarchy for those investments measured at fair value on a recurring basis at September 30, 2014. The alternative investments below were valued using the practical expedient:
| | | Quoted Prices in Active Markets for Identical Assets | | | Significant Other Observable Inputs | | | Significant Unobservable Inputs | | | | |
| Description | | (Level 1) | | | (Level 2) | | | (Level 3) | | | Total | |
| | | | | | | | | | | | | |
| Alternative Investments: | | | | | | | | | | | | |
| High Yield/Credit | | $ | - | | | $ | - | | | $ | 12,529,513 | | | $ | 12,529,513 | |
| Structured Credit - CLO | | | - | | | | - | | | | 14,484,035 | | | | 14,484,035 | |
| Structured Credit - Mortgages | | | - | | | | - | | | | 8,001,768 | | | | 8,001,768 | |
| Liquidating Positions | | | - | | | | - | | | | 1,273,560 | | | | 1,273,560 | |
| Total Alternative Investments | | | - | | | | - | | | | 36,288,876 | | | | 36,288,876 | |
| | | | | | | | | | | | | | | | | |
| Short-Term Investment | | | 76,483 | | | | - | | | | - | | | | 76,483 | |
| | | | | | | | | | | | | | | | | |
| Total Investments | | $ | 76,483 | | | $ | - | | | $ | 36,288,876 | | | $ | 36,365,359 | |
There were no transfers into or out of Level 1, Level 2 or Level 3 fair value measurements during the reporting period, as compared to their classification from the most recent annual report.
The following is a reconciliation of the beginning and ending balances for Level 3 investments during the six months ended September 30, 2014:
| | | Alternative Investments | |
| | | | |
| Balance, March 31, 2014 | | $ | 30,085,099 | |
| | | | | |
| Total Realized Gains/(Losses) | | | 490,658 | |
| Change in Unrealized Gains/Losses | | | 834,609 | |
| Purchases | | | 7,746,454 | |
| Sales | | | (2,867,944 | ) |
| | | | | |
| Balance, September 30, 2014 | | $ | 36,288,876 | |
Net unrealized gains relating to Level 3 alternative investments still held at September 30, 2014 amounted to $4,514,057.
City National Rochdale High Yield Alternative Strategies Master Fund LLC
Notes to Financial Statements (Unaudited)
September 30, 2014
4. Commitments and Other Related Party Transactions
Management and Incentive Fees
Under the supervision of the Master Fund’s Board and pursuant to an investment management agreement (“Investment Management Agreement”), City National Rochdale LLC, an investment adviser registered under the Investment Advisers Act of 1940, as amended, serves as the Manager for the Master Fund. The Manager is authorized, subject to the approval of the Master Fund’s Board, to retain one or more other organizations, including its affiliates, to provide any or all of the services required to be provided by the Manager to the Master Fund or to assist in providing these services.
The Manager has engaged the Sub-Adviser to provide sub-investment advisory services. The Sub-Adviser has investment discretion to manage the assets of the Master Fund and is responsible for identifying prospective Hedge Funds, performing due diligence and review of those Hedge Funds and their Hedge Fund Managers, selecting Hedge Funds, allocating and reallocating the Master Fund’s assets among Hedge Funds, and providing risk management services, subject to the general supervision of the Manager.
The investment management fee is shared by the Manager and the Sub-Adviser. The Master Fund pays the Manager an investment management fee at an annual rate equal to 1.25% of the Master Fund’s month-end net assets, including assets attributable to the Manager (or its affiliates) and before giving effect to any repurchases by the Master Fund of Member interests. The investment management fee is accrued monthly. The investment management fee is paid to the Manager out of the Master Fund’s assets.
The Manager pays a fee to the Sub-Adviser at a rate equal to 40% of the amount of the fee earned by the Manager pursuant to the Sub-Investment Advisory Agreement.
The Sub-Adviser is entitled to receive a performance-based incentive fee equal to 10% of each Member’s net profits (taking into account net realized and unrealized gains or losses and net investment income or loss), if any, in excess of the non-cumulative “Preferred Return,” subject to reduction of that excess for prior losses that have not been previously offset against net profits (the “Incentive Fee”). The Incentive Fee is calculated and paid at the Feeder Fund level. The Incentive Fee is accrued monthly and is generally payable annually on a calendar year basis. The Preferred Return is a non-cumulative, annual return equal to the weighted average returns of a composite benchmark consisting of 50% of the Barclays Capital U.S. Corporate High Yield Index (Total Return) and 50% of the Credit Suisse Institutional Leveraged Loan Index.
City National Rochdale High Yield Alternative Strategies Master Fund LLC
Notes to Financial Statements (Unaudited)
September 30, 2014
4. Commitments and Other Related Party Transactions (continued)
Administration Fee
U.S. Bancorp Fund Services, LLC (the “Administrator”) acts as the Funds’ Administrator under an Administration Agreement. The Administrator prepares various federal and state regulatory filings, reports and returns for the Funds; prepares reports and materials to be supplied to the Members of the Feeder Funds; monitors the activities of the Funds’ custodian, transfer agent and accountants; coordinates the preparation and payment of the Funds’ expenses and reviews the Funds’ expense accruals. For its services, the Administrator receives a monthly fee from the Master Fund at an annual rate of 0.12% for the first $150 million, 0.10% for the next $150 million and 0.08% thereafter of average net assets, with a minimum annual fee of $100,000.
Expense Reimbursement
The Manager has contractually agreed to waive and/or reimburse the Master Fund’s expenses to the extent needed to limit the Master Fund’s annual operating expenses combined with the annual operating expenses of the Feeder Funds to 2.25% of net assets for each Feeder Fund. To the extent that the Manager reimburses or absorbs fees and expenses, it may seek payment of such amounts for three years after the year in which the expenses were reimbursed or absorbed. A Feeder Fund will make no such payment, however, if its total annual operating expenses exceed the expense limits in effect at the time the expenses are to be reimbursed or at the time these payments are proposed.
The following is a schedule of when fees may be recouped by the Manager with respect to the Feeder Funds:
| | | | |
City National Rochdale High Yield Alternative Strategies Fund LLC | | | City National Rochdale High Yield Alternative Strategies Fund TEI LLC | | Expiration |
| | | | | | |
| $ | 21,099 | | | $ | - | | March 31, 2015 |
| | 51,220 | | | | 28,139 | | March 31, 2016 |
| | 111,311 | | | | 139,734 | | March 31, 2017 |
| | 2,325 | | | | 3,570 | | March 31, 2018 |
| $ | 185,955 | | | $ | 171,443 | | |
No accrual has been made for such contingent liability because of the uncertainty of the reimbursement from the Feeder Funds.
City National Rochdale High Yield Alternative Strategies Master Fund LLC
Notes to Financial Statements (Unaudited)
September 30, 2014
| 5. | Investment Risks and Uncertainties |
Alternative Investments consist of non-traditional, not readily marketable investments, some of which may be structured as offshore limited partnerships, venture capital funds, hedge funds, private equity funds and common trust funds. The underlying investments of such funds, whether invested in stock or other securities, are generally not currently traded in a public market and typically are subject to restrictions on resale. Values determined by investment managers and general partners of underlying securities that are thinly traded or not traded in an active market may be based on historical cost, appraisals, a review of the investees’ financial results, financial condition and prospects, together with comparisons to similar companies for which quoted market prices are available or other estimates that require varying degrees of judgment.
Investments are carried at fair value provided by the respective alternative investment’s management. Because of the inherent uncertainty of valuations, the estimated fair values may differ significantly from the values that would have been used had a ready market for such investments existed or had such investments been liquidated, and those differences could be material.
| 6. | Concentration, Liquidity and Off-Balance Sheet Risk |
The Master Fund invests primarily in Hedge Funds that are not registered under the 1940 Act and invest in and actively traded securities and other financial instruments using different strategies and investment techniques, including leverage, which may involve significant risks. These Hedge Funds may invest a high percentage of their assets in specific sectors of the market in order to achieve a potentially greater investment return. As a result, the Hedge Funds may be more susceptible to economic, political, and regulatory developments in a particular sector of the market, positive or negative, and may experience increased volatility of the Hedge Funds' net asset value.
Various risks are also associated with an investment in the Master Fund, including risks relating to the multi-manager structure of the Master Fund, risks relating to compensation arrangements and risks relating to limited liquidity, as described below.
Redemption restrictions exist for Hedge Funds whereby the Hedge Fund Managers may suspend redemption either in their sole discretion or other factors. Such factors include the magnitude of redemptions requested, portfolio valuation issues or market conditions.
Redemptions are currently restricted for certain Hedge Funds with a fair value at September 30, 2014 aggregating $1,273,560 as noted in the Schedule of Investments.
City National Rochdale High Yield Alternative Strategies Master Fund LLC
Notes to Financial Statements (Unaudited)
September 30, 2014
| 6. | Concentration, Liquidity and Off-Balance Sheet Risk (continued) |
In the normal course of business, the Hedge Funds in which the Master Fund invests trade various financial instruments and enter into various investment activities with off-balance sheet risk. These include, but are not limited to, short selling activities, writing option contracts, contracts for differences, and interest rate, credit default and total return equity swap contracts. The Master Fund's risk of loss in these Hedge Funds is limited to the value of its own investments reported in these financial statements by the Master Fund. The Master Fund itself does not invest directly in securities with off-balance sheet risk.
| 7. | Investment Transactions |
For the six months ended September 30, 2014 (excluding short-term securities), the aggregate purchases of investments were $7,746,454 and sales of investments were $2,867,944.
City National Rochdale High Yield Alternative Strategies Master Fund LLC |
| | |
| Financial Highlights |
| | | | | | | | | | | | | | | | | | | | | |
| | | | | | | | | | | | | | | | | | | | | |
| | | | | | | | | | | | | | | | | | | | | |
| | | | | | | | | | | | | | | | | | | | | |
| | | Six Months Ended | | | | �� | Year Ended | | | Year Ended | | | Year Ended | | | Year Ended | | | Year Ended | |
| | | September 30, 2014 | | | | | March 31, 2014 | | | March 31, 2013 | | | March 31, 2012 | | | March 31, 2011 | | | March 31, 2010 | |
| | | | | | | | | | | | | | | | | | | | | |
| TOTAL RETURN - NET | | | 3.25 | % | | 1 | | | 5.01 | % | | | (0.58 | %) | | | (4.08 | %) | | | 7.32 | % | | | 9.16 | % |
| | | | | | | | | | | | | | | | | | | | | | | | | | | |
| RATIOS/SUPPLEMENTAL DATA | | | | | | | | | | | | | | | | | | | | | | | | | | |
| | | | | | | | | | | | | | | | | | | | | | | | | | | |
| | | | | | | | | | | | | | | | | | | | | | | | | | | |
| Net Assets, end of period ($000's) | | $ | 36,851 | | | | | $ | 34,701 | | | $ | 24,970 | | | $ | 55,669 | | | $ | 58,990 | | | $ | 57,616 | |
| | | | | | | | | | | | | | | | | | | | | | | | | | | |
| Portfolio Turnover | | | 8.62 | % | | | | | 23.29 | % | | | 7.98 | % | | | 13.27 | % | | | 20.32 | % | | | 20.91 | % |
| | | | | | | | | | | | | | | | | | | | | | | | | | | |
| Ratio of Net Investment | | | | | | | | | | | | | | | | | | | | | | | | | | |
| Loss to Average Net Assets | | | (1.83 | %) | | 2 | | | (2.14 | %) | | | (1.79 | %) | | | (1.66 | %) | | | (1.67 | %) | | | (1.83 | %) |
| | | | | | | | | | | | | | | | | | | | | | | | | | | |
| Ratio of Expenses to | | | | | | | | | | | | | | | | | | | | | | | | | | |
| Average Net Assets | | | 1.83 | % | | 2 | | | 2.14 | % | | | 1.79 | % | | | 1.67 | % | | | 1.68 | % | | | 1.69 | % |
| | | | | | | | | | | | | | | |
| 1 | Not Annualized. | | | | | | | | | | | | |
| 2 | Annualized. | | | | | | | | | | | | |
| | | | | | | | | | | | | | | |
| | Total return is calculated for all Members taken as a whole and an individual Member's return may vary from these Master Fund returns based on the timing of capital transactions. | | |
| | | | | | | | | | | | | | | |
| | Total returns do not include the effect of any sales load. |
| | | | | | | | | | | | | | | |
| | The ratios of expenses to average net assets do not include expenses of the Hedge Funds in which the Master Fund invests. |
| | | | | | | | | | | | | | | |
| | The expense ratios are calculated for all Members taken as a whole. The computation of such ratios based on the amount of expenses assessed to an individual Member's capital may vary from these ratios based on the timing of capital transactions. | | |
| | | | | | | | | | | | | | | |
| | The ratios above do not include the proportionate share of income or loss from their investments in other funds. |
| | | | | | | | | | | | | | | |
| | | | | | | | | | | | | | | |
| | | | | | | | | | | | | | | |
| | | | | | | | | | | | | | | |
| | | | | | | | | | | | | | | |
| | | | | | | | | | | | | | | |
| | | | | | | | | | | | | | | |
| | | | | | | | | | | | | | | |
| ***** | | |
| | | | | | | | | | | | | | | |
| | | | | | | | | | | | | | | |
| | | | | | | | | | | | | | | |
| The accompanying notes are an integral part of these financial statements | | | | | | | | |
BOARD APPROVAL OF ADVISORY AGREEMENT (UNAUDITED)
The Board of Directors (collectively, the “Board”) of each of City National Rochdale High Yield Alternative Strategies Master Fund LLC (the “Master Fund”), City National Rochdale High Yield Alternative Strategies Fund TEI LLC and City National Rochdale High Yield Alternative Strategies Fund LLC (collectively, the “Funds”) is comprised of eight Directors, six of whom are independent of the Funds’ investment adviser (the “Independent Directors”). During the six months ended September 30, 2014, the Board and the Independent Directors approved renewal of the Funds’ advisory agreement with City National Rochdale, LLC (the “Adviser”), and the Adviser’s sub-advisory agreement with PineBridge Investments LLC (“PineBridge”) with respect to the Master Fund, as described below.
General Information
The following information summarizes the Board’s considerations associated with its review of the agreements. In connection with its deliberations, the Board considered such information and factors as the Board members believed, in light of the legal advice furnished to them and their own business judgment, to be relevant. As described below, the Board considered the nature, quality and extent of the various investment advisory and administrative services performed by the Adviser and PineBridge. In considering these matters, the Independent Directors discussed the approval of the agreements with management and in private sessions with their independent counsel at which no representatives of the Adviser or PineBridge were present.
The Board reviewed extensive materials regarding investment results of the Funds, advisory fee and expense comparisons, financial information with respect to the Adviser and PineBridge, descriptions of various functions such as compliance monitoring and portfolio trading practices, and information about the personnel providing investment management and administrative services to the Funds. The Board also took into account information it received at its past meetings and meetings of its committees with respect to these matters.
In deciding to renew the agreements, the Board and the Independent Directors did not identify a single factor as controlling and this summary does not describe all of the matters considered. In addition, each Board member did not necessarily attribute the same weight to each matter. However, the Board and the Independent Directors concluded that each of the various factors referred to below favored such approval.
City National Rochdale, LLC
Nature, Extent and Quality of Services
In reviewing the services provided by the Adviser, the Board considered a variety of matters, including the background, education and experience of the Adviser’s key portfolio management and operational personnel; its overall financial strength and stability; its resources and efforts to retain, attract and motivate capable personnel to serve the Funds; and the overall general quality and depth of its organization. The Board also took into account the experience, capability and integrity of the Adviser’s senior management; its investment philosophy and processes, including sub-adviser oversight processes; its portfolio trading and soft dollar practices; its commitment to compliance with applicable laws and regulations and the systems in place to ensure compliance with those requirements; and its disaster recovery and contingency planning practices. The Board found all of these matters to be satisfactory.
Investment Performance
The Board assessed the performance of the Funds compared with their relevant benchmark indexes for the one-year and since inception periods ended June 30, 2014. The Board noted that the Funds’ investment strategy had changed significantly in early 2013 and reviewed the Funds’ performance only for periods after March 28, 2013. The Board Members noted that the returns of the High Yield Fund and the High Yield TEI Fund were below the returns of the Funds’ benchmark, which was comprised 50% of the Barclays U.S. Corporate High Yield Index and 50% of the Credit Suisse Leveraged Loan Index, for the one-year period (by 157 basis points and 158 basis points, respectively), and for the period since inception (by 52 basis points and 58 basis points, respectively). The Board Members considered, however, a representation by the Adviser that the Funds had outperformed their benchmark in July 2014. The Board Members further considered that the Funds’ performance record after the implementation of the new strategy was short and that review of the Funds’ performance over longer periods would be more meaningful. The Board also noted that consideration of returns of market indexes needed to take into account that indexes do not reflect the expenses of operating funds. The Board concluded that the Adviser continued to provide satisfactory management and oversight services to the Funds.
Advisory Fees and Fund Expenses
The Board reviewed information regarding the advisory fees charged by the Adviser to the Funds and the total expenses of the Funds (as a percentage of average annual net assets). The Board noted that it was difficult to gather a peer group for comparison due to the unique investment strategy of the Funds and lack of public information regarding the Funds’ competitors. The Board reviewed fee and expense information from samples of closed-end funds and private funds with fund-of-funds strategies compiled by U.S. Bancorp Fund Services, LLC, the Funds’ administrator, in consultation with the Adviser, using data from Morningstar, Inc.
The Board observed that the investment advisory fees paid by the Funds were below the median advisory fee of a sample of 69 peer funds. The Board noted that the Adviser does not manage assets of any other clients using the same strategies as those used by the Funds and therefore it could not compare the fees charged by the Adviser to the Funds to those charged to its other clients. The Board considered that the total expense ratios of the Funds were lower than the total expenses of three funds in a peer group of 14 funds that voluntarily report their total expense ratios. The Board concluded that the advisory fees charged by the Adviser to the Funds were fair and reasonable, and the total expenses of the Funds continued to be reasonable.
Profitability, Benefits to the Adviser and Economies of Scale
The Board considered information prepared by the Adviser relating to its costs and profits with respect to the Funds, noting that the Adviser was waiving fees with respect to the Funds pursuant to an expense limitation agreement, and was currently not realizing a profit with respect to the Funds. The Board also considered the benefits received by the Adviser and its affiliates as a result of the Adviser’s relationship with the Funds, including investment advisory fees paid to the Adviser; fees paid to the Adviser’s affiliate, RIM Securities, LLC, for providing distribution services to the Funds; benefits to City National Bank’s wealth management business as a result of the availability of the Funds to its customers; and the intangible benefits of the Adviser’s association with the Funds generally and any favorable publicity arising in connection with the Funds’ performance. The Board noted the Adviser’s representation that no significant economies of scale with respect to the Funds had been realized in the last year. The Board also noted that although there were no advisory fee breakpoints, based on the Adviser’s operations significant economies of scale were not likely to be realized until the asset levels of the Funds were significantly higher than their current levels.
Conclusions
Based on their review, including their consideration of each of the factors referred to above, the Board and the Independent Directors concluded that the compensation payable to the Adviser with respect to the Funds pursuant to its advisory agreement with the Funds is fair and reasonable in light of the nature and quality of the services being provided by it to the Funds and their shareholders, and that renewal of the agreement was in the best interest of the Funds and their shareholders.
PineBridge Investments LLC
Nature, Extent and Quality of Services
In reviewing the services provided by PineBridge, the Board considered a variety of matters, including the background, education and experience of PineBridge’s key portfolio management and operational personnel; its overall financial strength and stability; its resources and efforts to retain, attract and motivate capable personnel to serve the Master Fund; and the overall general quality and depth of its organization. The Board also took into account the experience, capability and integrity of its senior management; its investment philosophy and processes; its portfolio trading and soft dollar practices; its commitment to compliance with applicable laws and regulations and the systems in place to ensure compliance with those requirements; and its disaster recovery and contingency planning practices. The Board found all of these matters to be satisfactory.
Investment Performance
The Board’s observations regarding the performance of the Funds are described above. The Board concluded that PineBridge continued to provide satisfactory services to the Master Fund.
Advisory Fees and Fund Expenses
The Board reviewed information regarding the sub-advisory fees charged by PineBridge and observed that PineBridge does not advise any other funds of hedge funds with investment strategies similar to the Funds and therefore it could not compare PineBridge’s sub-advisory fees with the fees PineBridge charges to other similar clients. The Board noted that the Adviser pays out of its advisory fees all sub-advisory fees to PineBridge.
Benefits to PineBridge
The Board considered the benefits received by PineBridge as a result of its relationship with the Funds, including the sub-advisory fees paid to PineBridge, and the intangible benefits of PineBridge’s association with the Funds generally and any favorable publicity arising in connection with the Funds’ performance.
Conclusions
Based on their review, including their consideration of each of the factors referred to above, the Board and the Independent Directors concluded that the compensation payable to PineBridge pursuant to its sub-advisory agreement is fair and reasonable in light of the nature and quality of the services being provided by PineBridge to the Funds and their shareholders, and that renewal of the sub-advisory agreement was in the best interest of the Funds and their shareholders.
Proxy Voting Policies and Procedures
A description of the policies and procedures that the Master Fund uses to determine how to vote proxies relating to portfolio securities, as well as information relating to how the Fund voted proxies relating to portfolio securities during the most recent 12-month period ended March 31, will be available (i) without charge, upon request, by calling 1-800-245-9888; and (ii) on the SEC’s website at www.sec.gov.
Portfolio Holdings Disclosure
The Master Fund will file its complete schedule of portfolio holdings with the SEC for the first and third quarters of each fiscal year on Form N-Q. The Fund’s Forms N-Q will be available on the SEC’s website at www.sec.gov, and may also be reviewed and copied at the SEC’s Public Reference Room in Washington, D.C. Information on the operation of the Public Reference Room may be obtained by calling 1-800-732-0330.
Item 2. Code of Ethics.
Not applicable for semi-annual reports.
Item 3. Audit Committee Financial Expert.
Not applicable for semi-annual reports.
Item 4. Principal Accountant Fees and Services.
Not applicable for semi-annual reports.
Item 5. Audit Committee of Listed Registrants.
Not applicable to registrants who are not listed issuers (as defined in Rule 10A-3 under the Securities Exchange Act of 1934).
Item 6. Investments.
Schedule of Investments is included as part of the report to shareholders filed under Item 1 of this Form.
Item 7. Disclosure of Proxy Voting Policies and Procedures for Closed-End Management Investment Companies.
Not applicable for semi-annual reports.
Item 8. Portfolio Managers of Closed-End Management Investment Companies.
Not applicable for semi-annual reports.
Item 9. Purchases of Equity Securities by Closed-End Management Investment Company and Affiliated Purchasers.
Item 10. Submission of Matters to a Vote of Security Holders.
The registrant’s nominating committee charter does not contain any procedures by which shareholders may recommend nominees to the registrant’s board of directors.
Item 11. Controls and Procedures.
Item 12. Exhibits.
Pursuant to the requirements of the Securities Exchange Act of 1934 and the Investment Company Act of 1940, the registrant has duly caused this report to be signed on its behalf by the undersigned, thereunto duly authorized.
Garrett R. D’Alessandro, President
Pursuant to the requirements of the Securities Exchange Act of 1934 and the Investment Company Act of 1940, this report has been signed below by the following persons on behalf of the registrant and in the capacities and on the dates indicated.
* Print the name and title of each signing officer under his or her signature.