EXHIBIT 99.2
EVALUATION OF
RESOURCE POTENTIAL
EAST WADI ARABA CONCESSION
Offshore Gulf of Suez, Egypt
Owned by
Mogul Energy International, Inc.
December 1, 2005
January 10, 2006
Mogul Energy International, Inc.
Suite 2210-520 Pike Street
Seattle, Washington, USA
Attention: Mr. Naeem Tyab
Dear Sir:
Re: Resource Assessment - East Wadi Araba (EWA) Concession
In accordance with your authorization, we have performed an evaluation of the resource potential of an exploration block owned by Mogul Energy International, Inc. (the "Company"), the East Wadi Araba Concession in the Gulf of Suez, Egypt, in order to determine the feasibility the Company participating in this prospect under the terms proposed. This evaluation has been conducted in accordance with NI 51-101, Sec 5.9 & 5.10, pertaining to prospects and resources. All references to monetary value in this report are expressed in terms of US dollars.
Our analysis has included a review of the available technical data including general geological and geophysical information presented by the Company, the terms of the Concession Agreement for Petroleum Exploration and Exploitation, information from relevant nearby wells and the proposed program for these prospects. We have reviewed the material presented by the Company with respect to the estimated resources and productivity that would be expected of a successful well, the anticipated capital costs (including drilling, completion and equipment), the average operating costs in the area and expected product prices. We have also considered the availability of oil markets, and transportation facilities within economic reach of the area.
2
In forming our opinion of this prospect we have relied to some extent on the information presented by the Company and its professional consultants which, together with our independent research and judgment, was sufficient for us to confidently establish the nature of a typical prospect on their concession and risks involved.
Economic analyses have been performed for the Company's interest position under the proposed terms, both before risk and after risk. This analysis has been utilized solely for formulating and supporting our recommendation on the project and is not meant to infer the "fair market value" of the project. Based on our review, after consideration of risk, we have concluded that the potential of the concession is of sufficient merit to justify the work program being proposed, and we therefore recommend and support the Company's participation in the project.
All data gathered and calculations created in support of this report are stored permanently in our files and can be made available or presented on request. We reserve the right to make revisions to this report in light of additional information made available or which becomes known subsequent to the preparation of this report. Due to the risks involved in exploring for oil and gas reserves, our assessment of the project cannot be considered a guarantee that any wells drilled will be successful.
It has been a pleasure to perform this evaluation and the opportunity to have been of service is appreciated.
Yours very truly,
Chapman Petroleum Engineering Ltd.
[ORIGINAL SIGNED BY:]
C. W. Chapman, P. Eng.,
President
3
[ORIGINAL SIGNED BY:]
Charles G.K. Moore, P.Eng.,
Associate
cwc/bd/3989
attachments
4
CERTIFICATE OF QUALIFICATION
I, C. W. CHAPMAN, P. Eng., Professional Engineer of the City of Calgary, Alberta, hereby certify:
| 1. | THAT I am a registered Professional Engineer in the Province of Alberta and a member of the Australasian Institute of Mining and Metallurgy, and I reside at 230 Mt. Cascade Place, S.E., Calgary, Alberta. |
| 2. | THAT I graduated from the University of Alberta with a Bachelor of Science degree in Mechanical Engineering in 1971. |
| 3. | THAT I have been employed in the petroleum industry since graduation by various companies and have been directly involved in reservoir engineering, petrophysics, operations, and evaluations during that time. |
| 4. | THAT I have in excess of 25 years in the conduct of evaluation and engineering studies relating to oil & gas fields in Canada and around the world. |
| 5. | THAT I participated directly in the evaluation of these assets and properties and preparation of this report for Mogul Energy International, Inc., dated January 10, 2006 and the parameters and conditions employed in this evaluation were examined by me and adopted as representative and appropriate in establishing the value of these oil and gas properties according to the information available to date. |
| 6. | THAT I have not, nor do I expect to receive, any direct or indirect interest in the properties or securities of Mogul Energy International, Inc., its participants or any affiliate thereof. |
| 7. | THAT I have not examined all of the documents pertaining to the ownership and agreements referred to in this report, or the chain of Title for the oil and gas properties discussed. |
| 8. | A personal field examination of these properties was considered to be unnecessary because the data available from the Company's records and public sources was satisfactory for our purposes. |
[ORIGINAL SIGNED BY:]
C. W. Chapman, P.Eng.
President
5
CERTIFICATE OF QUALIFICATION
| I, CHARLES G.K. MOORE, P. Eng., Professional Engineer of the City of Calgary, Alberta, hereby certify: |
| 1. | THAT I am a registered Professional Engineer in the Province of Alberta and I reside at 274 Carragana Crescent N.W., Calgary, Alberta. |
| 2. | THAT I graduated from the Technical University of Nova Scotia with a Bachelor of Engineering degree in Mining Engineering in 1972. |
| 3. | THAT I have been employed in the petroleum industry since graduation by various companies and have been directly involved in reservoir engineering, petrophysics, operations, and evaluations during that time. |
| 4. | THAT I have in excess of 10 years of experience in the conduct of evaluation and engineering studies relating to oil and gas fields in Canada and internationally. |
| 5. | THAT I participated directly in the evaluation of these assets and properties and preparation of this report for Mogul Energy International, Inc., dated January 10, 2006 and the parameters and conditions employed in this evaluation were examined by me and adopted as representative and appropriate in establishing the value of these oil and gas properties according to the information available to date. |
| 6. | THAT I have not, nor do I expect to receive, any direct or indirect interest in the properties or securities of Mogul Energy International, Inc., its participants or any affiliate thereof. |
| 7. | THAT I have not examined all of the documents pertaining to the ownership and agreements referred to in this report, or the chain of Title for the oil and gas properties discussed. |
| 8. | A personal field examination of these properties was considered to be unnecessary because the data available from the Company’s records and public sources was satisfactory for our purposes. |
[ORIGINAL SIGNED BY:]
Charles G.K. Moore, P.Eng.
6
CERTIFICATE OF QUALIFICATION
I, HESHAM M. MOUBARAK, B.Sc. in Geophysics, Alfateh University, Tripoli, Libya, and Marketing and Management Certificate, Befak, GmbH, Berlin, Germany certify:
| 1. | THAT I am a Geophysicist and I reside at Apt. #209, 605-13 Avenue S.W., Calgary, Alberta. |
| 2. | THAT I am a Master student at the University of Calgary. |
| 3. | THAT I am a researcher associate at the Consortium for Research in Elastic Wave Exploration Seismology (CREWES). |
| 4. | THAT I am a member of the Canadian Society of Exploration Geophysicists (CSEG), and Canadian Well Logging Society (CWLS), Calgary, Alberta. |
| 5. | THAT I graduated from Alfateh University, Tripoli, Libya with a Bachelor of Geophysics degree in 1994 and graduated from Befak GmbH, Berlin, Germany with a Marketing and Management degree in 2003. |
| 6. | THAT I worked for Schlumberger-GeoQuest as a well log analyst and worked for Assada Sports and Albatrik Supermarket as a Marketing Assistant. |
| 7. | THAT I have in excess of 10 years of experience in Marketing & Management, and seismic & Petrophysical interpretation. |
| 8. | THAT I participated directly in the evaluation of these assets and properties and preparation of this report for Mogul Energy International, Inc., dated January 5, 2006 and the parameters and conditions employed in this evaluation were examined by me and adopted as representative and appropriate in establishing the value of these oil and gas properties according to the information available to date. |
| 9. | THAT I have not, nor do I expect to receive, any direct or indirect interest in the properties or securities of Mogul Energy International, Inc., its participants or any affiliate thereof. |
| 10. | THAT I have not examined all of the documents pertaining to the ownership and agreements referred to in this report, or the chain of Title for the oil and gas properties discussed. |
| 11. | A personal field examination of these properties was considered to be unnecessary because the data available from the company’s records and public sources was satisfactory for our purposes. |
[ORIGINAL SIGNED BY:]
HESHAM M. MOUBARAK, B.Sc. (Geophysics)
7
EVALUATION OF
RESOURCE POTENTIAL
EAST WADI ARABA CONCESSION
Offshore Gulf of Suez, Egypt
Owned by
Mogul Energy International, Inc.
December 1, 2005
8
TABLE OF CONTENTS
Scope of Report
Authorization
Purpose
Executive Summary
Discussion
Ownership
Exploration History
Geology
Resource Potential
Productivity Estimates
Product Prices
Operating Environment
Capital Expenditures
Operating Costs
Economics and Risk
Attachments
| Figure 1: | Orientation Map |
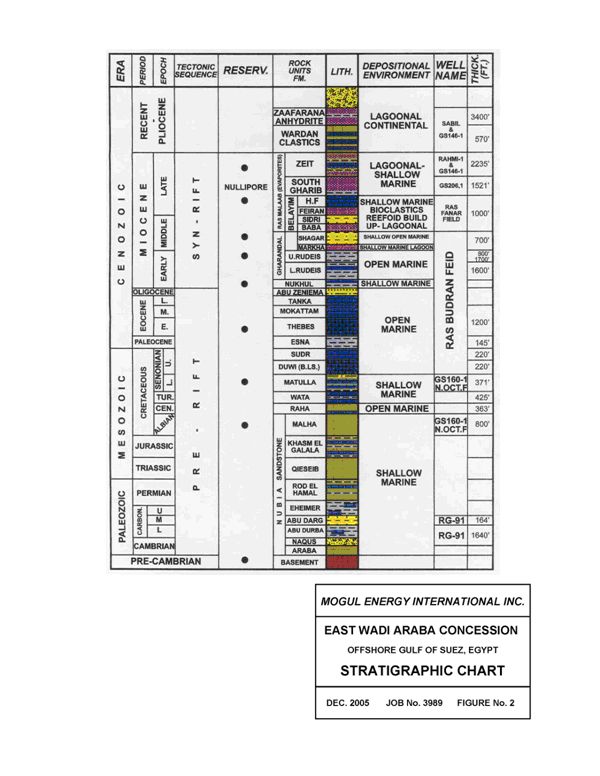
| Figure 2: | Stratigraphic Chart |
| Table 1: | Economic Model - Best Estimate |
| Table 2: | Economic Model - Low Estimate |
| Table 3: | Economic Model - High Estimate |
| Figure 3: | Risk Analysis |
| a) | Best Estimate |
| b) | Low Estimate |
| c) | High Estimate |
9
SCOPE OF REPORT
Authorization
This report has been authorized by Mr. Naeem Tyab, on behalf of Mogul Energy International, Inc.
The review and analysis of this prospect has been conducted during December 2005 and January 2006.
Purpose
The purpose of this report was to perform an independent technical and economic assessment of the exploration lands owned by the Company in the Gulf of Suez in Egypt, to establish the feasibility of developing this prospect.
This report may be submitted to the appropriate securities regulatory bodies in support of the Company’s planned transaction.
10
EAST WADI ARABA (EWA) CONCESSION
OFFSHORE GULF OF SUEZ
EXECUTIVE SUMMARY
This executive summary contains the information required to be disclosed under NI 51-101 Sec 5.9. More details regarding the Company’s prospect(s) are presented in the Report Discussion which follows:
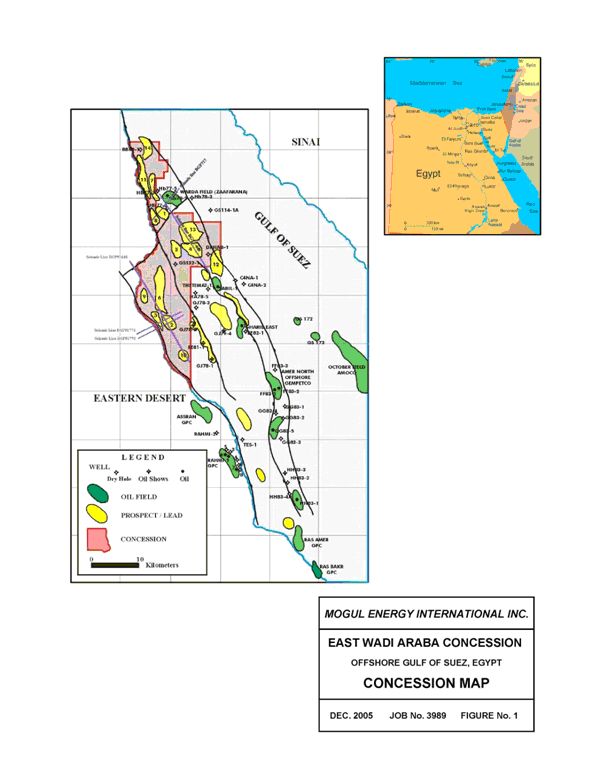
| a) | The Company’s exploration lands are located in East Wadi Araba (EWA), offshore Gulf of Suez, Egypt in the Gulf of Suez Basin. |
| b) | The company’s EWA concession (after the first 25 percent relinquishment) is comprised of 294.5 square kilometers (about 72,772 acres) gross and 58.9 square kilometers (14,554 acres) net to the Company’s 20% interest. |
| c) | The block was awarded as part of the Concession Agreement between the Egyptian General Petroleum Corporation (EGPC) and Dover Investments Ltd. on July 18, 2002. The three part exploration period continues for a total of seven years until July 18, 2009, during which the exploration program will be conducted, for which there is a six well and 12 million dollar work obligation. |
| d) | The prospective reservoirs in the concession cover shallow-marine, deltaic and turbidite sand and carbonate reservoirs of Miocene age as well as Eocene Carbonates and Cretaceous Sands. An additional target zone is the Nubian sandstone reservoir. |
| e) | The block surrounds the Warda oil field that produced over 50 million barrels since 1993. |
11
| f) | The expected product from the prospective reservoirs is oil with a gravity of 22 to 25o API. Under COGEH this is considered to be heavy oil however, in the Gulf of Suez this is thought of as conventional medium gravity crude. |
| g) | The expected pool sizes range from 106,672 MSTB to 213,328 MSTB of recoverable oil. |
| h) | The depth of the expected production is 5000 feet or less. |
| i) | The estimated cost to drill and complete a well is up to US $2,500,000. |
| j) | The Company is planning to drill two more wells before end of 2007. |
| k) | The price anticipated to be received on production from the block is $52.00 US/STB, which is the “Suez Blend” price at November 30, 2005 (Brent less $3.00). This value has been held constant in all years. |
| l) | Marketing and transportation should not be a problem since the property is located on a navigatable waterway allowing for easy access to tankers, and there are other productive oil fields nearby. |
| m) | Trans Pacific Petroleum Corp. is the operator of the project. The management has close to 40 years of experience operating in this basin. |
| n) | We estimate the probability of success (POS) of this project to be in the range of 19 to 41 percent, depending on the case as presented in the report. |
| o) | The economic and risk analysis, justifying the participation in this project is presented in the Discussion of the report and a summary of the after risk values follows: |
12
| Best Estimate MM$ | Low Estimate MM$ | High Estimate MM$ | ||||
| Undiscounted | 118 | 109 | 97 | |||
| Discounted @ 5%/year | 74 | 71 | 62 | |||
| Discounted @ 10%/year | 51 | 50 | 42 | |||
| Discounted @ 15%/year | 37 | 36 | 30 | |||
| Discounted @ 20%/year | 28 | 28 | 23 |
13
EAST WADI ARABA CONCESSION
OFFSHORE GULF OF SUEZ, EGYPT
DISCUSSION
Ownership
The Company owns a 20 percent working interest in approximately 72,772 acres of land in this area, as shown on the map, Figure 1.
Ownership on this block is governed by a Concession Agreement for Petroleum Exploration and Exploitation between the Arab Republic of Egypt (the Government), the Egyptian General Petroleum Corporation (EGPC), and Dover Investments Limited (the Contractor). The Exploration Period consists of three phases, the initial phase being three years, and the next two phases for two years each. The concession is now in the second phase. In the event of one or more commercial discoveries, the Company would establish a development plan and apply for a lease. The original term of a lease would be for 20 years with options to extend a further 5 to 10 years.
After each of the first two exploration phases 25 percent of the original license area must be relinquished. After the expiry of the third phase the Company will retain only the Development Areas and Discovery Areas.
Exploration History
The first two exploratory wells drilled on the block during the past three years were designed to test two different structures that are associated with two different depositional centres that have proved to be the source of huge quantities of oil that were generated and migrated to form several major oil pools in the area.
14
The EWA-1X Well was drilled close to the Warda oil field to target a structure that may contain the same type of reservoirs. The well was drilled down to the Nubia and reached a total depth of approximately 5,000 feet. The well logged 57 feet of heavy oil. The well was abandoned as non commercial but it did prove that oil had migrated across a fault into the EWA area.
The EWA-2 Well was drilled to test the potential oil accumulation of a large structure along a trend of producing oil fields towards the east, south and southeast. The oil had undoubtedly migrated through the area to reach the shore and be trapped in the Issaran oil field that is operated by Rally Energy of Calgary and contains over 700 million barrels of 11 to 19 API heavy oil in place.
Issaran oil is heavy due to the reservoir’s exposure to the bio-degradation process that has resulted in the loss of crude’s light components. The top reservoir depth is only 750 feet and its deepest oil-water contact is at 2,500 feet.
The EWA-2X was also drilled down to approximately 5000 feet and reached the Cretaceous sands. The logs indicated the presence of a 172 foot oil column in a highly fractured Belayim dolomite and a 360 foot oil column in the highly fractured Eocene dolomites.
The two intervals were drill stem tested; however, due to technical difficulties in running and completing the two tests and to avoid major potential cost overruns, the well was completed as an oil well, subject to further evaluation at a later date.
The EWA-3 well was drilled as a twin well to EWA-2 to reach the deeper targets of the Matulla and Nubia. The well reached a total depth of around 7,000 feet and offset the vertical hole by 800 meters towards the southeast at total depth. However, the Matulla and Nubia sands came in much lower than anticipated and crossed to the downthrown side of an older fault.
15
Geology
The block is located in the Gulf of Suez Basin. It comprises an area of about 294.5 sq. km (72,772 acres). Geologically, it is an extension of the Red Sea and the East African Rift Valley. The Gulf of Suez is the most prolific oil province in the world. The early deposits in the region were predominantly continental Paleozoic sands and shales that are collectively called the Nubia Group of sediments.
During the Cretaceous there was a major transgression of the sea that had resulted in the deposition of a sequence of open to restricted marine carbonates and shale deposits, that presented a major source for generating large quantities of oil in the basin.
The Cretaceous strata were later elevated and exposed to severe erosion that continued until the early Miocene and had resulted in the development of a major unconformity between the Cretaceous and the Tertiary rock sequence.
During the Miocene times, the entire region suffered a very major tectonic event that had resulted in the rifting of the area and the fast accumulation of thick deep to shallow marine sequence of sediments.
The active subsidence of the Miocene depositional basin had resulted in the deposition of, sometimes very thick deposits of Halites and Anhydites, representing a major cap rock for the Miocene reservoirs and had resulted in the higher than normal Gulf of Suez, Gulf of Aqaba and Red Sea geothermal gradient.
16
The abnormally high temperatures of the basin were a very major factor in cooking and maturing the very rich Miocene and older Cretaceous source rocks in the area and the generation of huge amounts of proto-oils that migrated through the basin to be matured and trapped in a relatively short geologic time.
The rift Basin is tectonically very complicated and those active tectonic movements had resulted in the development of huge and complicated faulting system, structural and also stratigraphic traps that were able to accumulate huge volumes of oil.
The recovery factor of the reservoir oil is one of the highest in the world and might reach 45-50% on primary recovery, as a result of three main factors namely, very active water drive, good quality reservoirs and higher than normal reservoir pressures and temperatures.
Resource Potential
There have been 14 major drillable prospects identified by the Company on EWA based on the seismic program which was made available to them with the evaluation package. The Company indicates that the reservoirs have structural closure. The oil rich Gulf of Suez, has a success ratio of 30% in the surrounding 700 square kilometers. Statistically, these 14 drillable prospects therefore have the potential for 4 to 5 commercial oil discoveries that may produce in the range of 700 million barrels of oil.
We have developed a resource model (best, low and high estimate) for one typical pool based on a scenario planned by the Company. This involves the drilling of sixteen producing wells in the pool. Specific prospect information was not reviewed in detail.
17
For the best estimate case, each well would have an ultimate recovery of 10 million STB or 160 million STB for the pool. The low and high estimated ultimate recoveries are one third lower and one third higher respectively.
Productivity Estimates
It has been estimated that the initial rate per well in the best estimate will be 3,000 STB/d. it has been estimated that the initial rate will be 2,000 STB/d per well in the low case and 4,000 STB/d per well in the high case. In all cases, wells begin an immediate decline to an eventual economic limit.
The forecast for the oil field has been based on performance of oil fields in Egypt in this area. The forecasts are presented in the economic analysis contained in the attachments.
Product Prices
A constant oil price of $52.00/STB has been utilized for this analysis, based on a $3.00 discount from the Brent posted price (November 30, 2005), which is reported to be the price in the area.
Operating Environment
This block is in the near vicinity of active oil operations to the south in the Gulf of Suez. The block is offshore but in shallow water near the shore, allowing facilities to be on land. Service and support facilities are readily available in the area.
Capital Expenditures
Total gross capital expenditures of $39,000,000 ($7,800,000 net to the Company) have been estimated. This consists of drilling one exploratory dry hole for $2,500,000, sixteen producing wells for $32,000,000 and constructing central facilities for $4,500,000, the capital has been assumed to be the same for the best, low and high resource cases.
18
Operating Costs
Fixed operating costs have been estimated to be $10,000 per well month plus variable costs of $1.00/STB for oil processing based on previous experience.
Economics and Risk
The before risk economic analyses for each case are presented in Tables 1, 2 and 3, representing the best, low and high estimates respectively, which are spread sheets incorporating all the economic criteria of the Concession Agreement. All taxes including income tax attributed to the Company, are paid by EGPC from their share of revenue and do not need to be considered in the cash flow of the Company. This analysis represents the results of an assumed successful exploration and development model for one typical pool discovery having parameters which are considered to be reasonable based on the information available. This is the 100% probability of success (POS) case.
A risk analysis has been performed to determine the feasibility of the Company participating in this project and to determine the after risk value, utilizing the “Expected Value” technique, a presentation of which is shown on Figure 3a, 3b and 3c.
The net capital exposure (POS - 0%) of this project is $2.0 million, representing the Company’s share of the Cost of four dry holes which may be required to define the potential of the concession.
19
The results of these risk analyses indicate that in order to achieve a 15 percent rate of return, a POS of 1.5, 2.1 and 1.2 percent would be required for the best, low and high cases, respectively. On the basis that we have estimated a probability of success of 30, 41 and 19 percent for the best, low and high cases, respectively, the Company’s development of this concession is considered feasible.
In establishing our probability of success, consideration has been given to both geological and engineering factors. The geological factors include the four main components of a petroleum system needed for commercial production, source rocks available to generate hydrocarbons, reservoir rocks to accumulate hydrocarbons, a stratigraphic or structural trapping mechanism with a seal to hold hydrocarbons and a mechanism and proper geological timing allowing for hydrocarbons to migrate into the trap.
The engineering risk, which has been applied, reflects the possibility of our economic model being inaccurate with regards to total reserves, initial production rates and forecasts, capital and operating expenses, development timing and product prices.
This is a prospect with little risk of source rock maturity, hydrocarbon migration, or timing as there are producing oil fields in the area. The main risks in this concession are the possibility of encountering a formation with poor reservoir quality, with heavy oil (13o API gravity or less) which is not producible at commercial rates or with a trap that is not sealed.
20
21
22
| Table 1, Page 1 | |||||||||||||||||||
Mogul Energy Ltd. | |||||||||||||||||||
East Wadi Araba Concession | |||||||||||||||||||
Production and Capital Forecast | |||||||||||||||||||
| Development Program - | |||||||||||||||||||
| Single Well Production Profile | # Wells | # Wells | # Wells | # Wells | # Wells | Total Oil Production | Capital Expenditures - $M | ||||||||||||
| Year | STB/d | Days On | MSTB/yr | Well Count | 4 | 4 | 4 | 4 | 0 | STB/yr. | STB/d | Production Bonuses - $ | Exploration | Drilling & Completion | Well Fac. & Tie-ins | Central Facilities | Total Capital | ||
| 2005 | 0 | 0 | 0 | 0.0 | 0 | 0 | 0 | 0 | |||||||||||
| 2006 | 0 | 0 | 0 | 0.0 | 0 | - | - | - | - | 0 | 0 | 0 | 0 | ||||||
| 2007 | 3000 | 182 | 547,200 | 2.0 | 2,188,800 | 0 | - | - | - | 2,188,800 | 12000 | 0 | 2,500 | 8,000 | 0 | 4,500 | 15,000 | ||
| 2008 | 3000 | 365 | 1,095,000 | 6.0 | 4,380,000 | 2,188,800 | 0 | - | - | 6,568,800 | 17997 | 0 | 8,000 | 0 | 8,000 | ||||
| 2009 | 3000 | 365 | 1,095,000 | 10.0 | 4,380,000 | 4,380,000 | 2,188,800 | 0 | - | 10,948,800 | 29997 | 0 | 8,000 | 0 | 8,000 | ||||
| 2010 | 2500 | 365 | 912,500 | 14.0 | 3,650,000 | 4,380,000 | 4,380,000 | 2,188,800 | 0 | 14,598,800 | 39997 | 0 | 8,000 | 0 | 8,000 | ||||
| 2011 | 2195 | 365 | 801,095 | 16.0 | 3,204,380 | 3,650,000 | 4,380,000 | 4,380,000 | 0 | 15,614,380 | 42779 | 0 | 0 | 0 | 0 | ||||
| 2012 | 1927 | 365 | 703,291 | 16.0 | 2,813,165 | 3,204,380 | 3,650,000 | 4,380,000 | 0 | 14,047,546 | 38486 | 0 | 0 | ||||||
| 2013 | 1692 | 366 | 619,120 | 16.0 | 2,476,479 | 2,813,165 | 3,204,380 | 3,650,000 | 0 | 12,144,025 | 33180 | 0 | 0 | ||||||
| 2014 | 1485 | 367 | 545,018 | 16.0 | 2,180,072 | 2,476,479 | 2,813,165 | 3,204,380 | 0 | 10,674,097 | 29085 | 0 | 0 | ||||||
| 2015 | 1304 | 368 | 479,782 | 16.0 | 1,919,127 | 2,180,072 | 2,476,479 | 2,813,165 | 0 | 9,388,843 | 25513 | 0 | 0 | ||||||
| 2016 | 1145 | 369 | 422,351 | 16.0 | 1,689,404 | 1,919,127 | 2,180,072 | 2,476,479 | 0 | 8,265,082 | 22399 | 0 | 0 | ||||||
| 2017 | 1005 | 370 | 371,792 | 16.0 | 1,487,168 | 1,689,404 | 1,919,127 | 2,180,072 | 0 | 7,275,771 | 19664 | 0 | 0 | ||||||
| 2018 | 882 | 371 | 327,283 | 16.0 | 1,309,132 | 1,487,168 | 1,689,404 | 1,919,127 | 0 | 6,404,831 | 17264 | 0 | 0 | ||||||
| 2019 | 774 | 372 | 288,100 | 16.0 | 1,152,401 | 1,309,132 | 1,487,168 | 1,689,404 | 0 | 5,638,105 | 15156 | 0 | 0 | ||||||
| 2020 | 680 | 373 | 253,607 | 16.0 | 1,014,427 | 1,152,401 | 1,309,132 | 1,487,168 | 0 | 4,963,128 | 13306 | 0 | 0 | ||||||
| 2021 | 597 | 374 | 223,241 | 16.0 | 892,966 | 1,014,427 | 1,152,401 | 1,309,132 | 0 | 4,368,925 | 11682 | 0 | 0 | ||||||
| 2022 | 524 | 375 | 196,510 | 16.0 | 786,042 | 892,966 | 1,014,427 | 1,152,401 | 0 | 3,845,835 | 10256 | 0 | 0 | ||||||
| 2023 | 460 | 376 | 172,979 | 16.0 | 691,916 | 786,042 | 892,966 | 1,014,427 | 0 | 3,385,350 | 9004 | 0 | 0 | ||||||
| 2024 | 404 | 377 | 152,264 | 16.0 | 609,057 | 691,916 | 786,042 | 892,966 | 0 | 2,979,980 | 7904 | 0 | 0 | ||||||
| 2025 | 355 | 372 | 131,902 | 16.0 | 527,607 | 609,057 | 691,916 | 786,042 | 0 | 2,614,622 | 7029 | 0 | 0 | ||||||
| 2026 | 311 | 373 | 116,110 | 16.0 | 464,438 | 527,607 | 609,057 | 691,916 | 0 | 2,293,018 | 6148 | 0 | 0 | ||||||
| 2027 | 273 | 374 | 102,207 | 16.0 | 408,829 | 464,438 | 527,607 | 609,057 | 0 | 2,009,932 | 5374 | 0 | 0 | ||||||
| 2028 | 240 | 375 | 89,969 | 16.0 | 359,876 | 408,829 | 464,438 | 527,607 | 0 | 1,760,750 | 4695 | 0 | 0 | ||||||
| 2029 | 211 | 376 | 79,195 | 16.0 | 316,782 | 359,876 | 408,829 | 464,438 | 0 | 1,549,925 | 4122 | 0 | 0 | ||||||
| 2030 | 185 | 377 | 69,712 | 16.0 | 278,846 | 316,782 | 359,876 | 408,829 | 0 | 1,364,333 | 3619 | 0 | 0 | ||||||
| 2031 | 162 | 378 | 61,363 | 16.0 | 245,452 | 278,846 | 316,782 | 359,876 | 0 | 1,200,956 | 3177 | 0 | 0 | ||||||
| 2032 | 143 | 379 | 54,014 | 16.0 | 216,056 | 245,452 | 278,846 | 316,782 | 0 | 1,057,136 | 2789 | 0 | 0 | ||||||
| 2033 | 125 | 380 | 47,545 | 16.0 | 190,178 | 216,056 | 245,452 | 278,846 | 0 | 930,532 | 2449 | 0 | 0 | ||||||
| 2034 | 110 | 381 | 41,850 | 16.0 | 167,399 | 190,178 | 216,056 | 245,452 | 0 | 819,085 | 2150 | 0 | 0 | ||||||
| 2035 | 0 | 382 | 0 | 16.0 | 0 | 167,399 | 190,178 | 216,056 | 0 | 573,633 | 1502 | 0 | 0 | ||||||
| 2036 | 0 | 383 | 0 | 16.0 | 0 | 0 | 167,399 | 190,178 | 0 | 357,578 | 934 | 0 | 0 | ||||||
| 2037 | 0 | 384 | 0 | 16.0 | 0 | 0 | 0 | 167,399 | 0 | 167,399 | 436 | 0 | 0 | ||||||
| 2038 | 0 | 385 | 0 | 16.0 | 0 | 0 | 0 | 0 | 0 | 0 | 0 | 0 | 0 | ||||||
| 2039 | 0 | 386 | 0 | 16.0 | 0 | 0 | 0 | 0 | 0 | 0 | 0 | 0 | 0 | ||||||
| Total | 10,000,000 | 40,000,000 | 40,000,000 | 40,000,000 | 40,000,000 | 0 | 160,000,000 | 2,500 | 32,000 | 0 | 4,500 | 39,000 | |||||||
23
| Table 1, Page 2 | |||||||||||||||||||||
Mogul Energy International, Inc. | |||||||||||||||||||||
East Wadi Araba Concession | |||||||||||||||||||||
Production Splits - Cost Oil | |||||||||||||||||||||
Prospect Best Estimate | |||||||||||||||||||||
| Cost Recovery | |||||||||||||||||||||
| Gross Production | Oil Price | Gross Revenue | Operating Costs - $/yr. | Available Cost Oil | Cost Oil Revenue Ceiling | Annual Costs For Recovery | Cumulative Outstanding Costs | Annual Cost Recovery | Cost Oil | Total Profit Oil | Total Daily Production | Contractors Share | Total Contractors Profit Oil | ||||||||
| Year | STB/yr. | $/STB | $/yr. | Fixed | Variable | Total | STB/yr. | $/yr | $/yr. | $/yr. | $/yr. | STB/yr. | STB/yr. | STB/d | STB/yr. | STB/yr. | STB/yr. | ||||
| 2005 | 0 | $52.00 | $0 | 0 | 0 | 0 | 0 | 0 | 0 | 0 | 0 | 0 | 0 | 0 | 0 | 0 | 0 | ||||
| 2006 | 0 | $52.00 | $0 | 0 | 0 | 0 | 0 | 0 | 0 | 0 | 0 | 0 | 0 | 0 | 0 | 0 | 0 | ||||
| 2007 | 2,188,800 | $52.00 | $113,817,600 | 240,000 | 2,188,800 | 2,428,800 | 656,640 | 34,145,280 | 13,178,800 | 13,178,800 | 13,178,800 | 253,438 | 1,935,362 | 10,611 | 483,840 | 0 | 483,840 | ||||
| 2008 | 6,568,800 | $52.00 | $341,577,600 | 720,000 | 6,568,800 | 7,288,800 | 1,970,640 | 102,473,280 | 20,038,800 | 20,038,800 | 20,038,800 | 385,362 | 6,183,438 | 16,941 | 1,545,860 | 0 | 1,545,860 | ||||
| 2009 | 10,948,800 | $52.00 | $569,337,600 | 1,200,000 | 10,948,800 | 12,148,800 | 3,284,640 | 170,801,280 | 26,898,800 | 26,898,800 | 26,898,800 | 517,285 | 10,431,515 | 28,579 | 2,281,250 | 261,303 | 2,542,553 | ||||
| 2010 | 14,598,800 | $52.00 | $759,137,600 | 1,680,000 | 14,598,800 | 16,278,800 | 4,379,640 | 227,741,280 | 33,028,800 | 33,028,800 | 33,028,800 | 635,169 | 13,963,631 | 38,257 | 2,281,250 | 967,726 | 3,248,976 | ||||
| 2011 | 15,614,380 | $52.00 | $811,947,776 | 1,920,000 | 15,614,380 | 17,534,380 | 4,684,314 | 243,584,333 | 23,534,380 | 23,534,380 | 23,534,380 | 452,584 | 15,161,796 | 41,539 | 2,281,250 | 1,207,359 | 3,488,609 | ||||
| 2012 | 14,047,546 | $52.00 | $730,472,370 | 1,920,000 | 14,047,546 | 15,967,546 | 4,214,264 | 219,141,711 | 19,967,546 | 19,967,546 | 19,967,546 | 383,991 | 13,663,554 | 37,434 | 2,281,250 | 907,711 | 3,188,961 | ||||
| 2013 | 12,144,025 | $52.00 | $631,489,280 | 1,920,000 | 12,144,025 | 14,064,025 | 3,643,207 | 189,446,784 | 16,064,025 | 16,064,025 | 16,064,025 | 308,924 | 11,835,101 | 32,336 | 2,287,500 | 537,020 | 2,824,520 | ||||
| 2014 | 10,674,097 | $52.00 | $555,053,020 | 1,920,000 | 10,674,097 | 12,594,097 | 3,202,229 | 166,515,906 | 12,594,097 | 12,594,097 | 12,594,097 | 242,194 | 10,431,902 | 28,425 | 2,293,750 | 251,380 | 2,545,130 | ||||
| 2015 | 9,388,843 | $52.00 | $488,219,861 | 1,920,000 | 9,388,843 | 11,308,843 | 2,816,653 | 146,465,958 | 11,308,843 | 11,308,843 | 11,308,843 | 217,478 | 9,171,366 | 24,922 | 2,292,841 | 0 | 2,292,841 | ||||
| 2016 | 8,265,082 | $52.00 | $429,784,273 | 1,920,000 | 8,265,082 | 10,185,082 | 2,479,525 | 128,935,282 | 10,185,082 | 10,185,082 | 10,185,082 | 195,867 | 8,069,215 | 21,868 | 2,017,304 | 0 | 2,017,304 | ||||
| 2017 | 7,275,771 | $52.00 | $378,340,104 | 1,920,000 | 7,275,771 | 9,195,771 | 2,182,731 | 113,502,031 | 9,195,771 | 9,195,771 | 9,195,771 | 176,842 | 7,098,929 | 19,186 | 1,774,732 | 0 | 1,774,732 | ||||
| 2018 | 6,404,831 | $52.00 | $333,051,226 | 1,920,000 | 6,404,831 | 8,324,831 | 1,921,449 | 99,915,368 | 8,324,831 | 8,324,831 | 8,324,831 | 160,093 | 6,244,738 | 16,832 | 1,561,185 | 0 | 1,561,185 | ||||
| 2019 | 5,638,105 | $52.00 | $293,181,465 | 1,920,000 | 5,638,105 | 7,558,105 | 1,691,432 | 87,954,439 | 7,558,105 | 7,558,105 | 7,558,105 | 145,348 | 5,492,757 | 14,765 | 1,373,189 | 0 | 1,373,189 | ||||
| 2020 | 4,963,128 | $52.00 | $258,082,655 | 1,920,000 | 4,963,128 | 6,883,128 | 1,488,938 | 77,424,796 | 6,883,128 | 6,883,128 | 6,883,128 | 132,368 | 4,830,760 | 12,951 | 1,207,690 | 0 | 1,207,690 | ||||
| 2021 | 4,368,925 | $52.00 | $227,184,122 | 1,920,000 | 4,368,925 | 6,288,925 | 1,310,678 | 68,155,237 | 6,288,925 | 6,288,925 | 6,288,925 | 120,941 | 4,247,985 | 11,358 | 1,061,996 | 0 | 1,061,996 | ||||
| 2022 | 3,845,835 | $52.00 | $199,983,424 | 1,920,000 | 3,845,835 | 5,765,835 | 1,153,751 | 59,995,027 | 5,765,835 | 5,765,835 | 5,765,835 | 110,881 | 3,734,954 | 9,960 | 933,738 | 0 | 933,738 | ||||
| 2023 | 3,385,350 | $52.00 | $176,038,196 | 1,920,000 | 3,385,350 | 5,305,350 | 1,015,605 | 52,811,459 | 5,305,350 | 5,305,350 | 5,305,350 | 102,026 | 3,283,324 | 8,732 | 820,831 | 0 | 820,831 | ||||
| 2024 | 2,979,980 | $52.00 | $154,958,970 | 1,920,000 | 2,979,980 | 4,899,980 | 893,994 | 46,487,691 | 4,899,980 | 4,899,980 | 4,899,980 | 94,230 | 2,885,750 | 7,655 | 721,437 | 0 | 721,437 | ||||
| 2025 | 2,614,622 | $52.00 | $135,960,342 | 1,920,000 | 2,614,622 | 4,534,622 | 784,387 | 40,788,102 | 4,534,622 | 4,534,622 | 4,534,622 | 87,204 | 2,527,418 | 6,794 | 631,854 | 0 | 631,854 | ||||
| 2026 | 2,293,018 | $52.00 | $119,236,960 | 1,920,000 | 2,293,018 | 4,213,018 | 687,906 | 35,771,088 | 4,213,018 | 4,213,018 | 4,213,018 | 81,020 | 2,211,999 | 5,930 | 553,000 | 0 | 553,000 | ||||
| 2027 | 2,009,932 | $52.00 | $104,516,447 | 1,920,000 | 2,009,932 | 3,929,932 | 602,980 | 31,354,934 | 3,929,932 | 3,929,932 | 3,929,932 | 75,576 | 1,934,356 | 5,172 | 483,589 | 0 | 483,589 | ||||
| 2028 | 1,760,750 | $52.00 | $91,559,021 | 1,920,000 | 1,760,750 | 3,680,750 | 528,225 | 27,467,706 | 3,680,750 | 3,680,750 | 3,680,750 | 70,784 | 1,689,967 | 4,507 | 422,492 | 0 | 422,492 | ||||
| 2029 | 1,549,925 | $52.00 | $80,596,105 | 1,920,000 | 1,549,925 | 3,469,925 | 464,978 | 24,178,831 | 3,469,925 | 3,469,925 | 3,469,925 | 66,729 | 1,483,196 | 3,945 | 370,799 | 0 | 370,799 | ||||
| 2030 | 1,364,333 | $52.00 | $70,945,338 | 1,920,000 | 1,364,333 | 3,284,333 | 409,300 | 21,283,601 | 3,284,333 | 3,284,333 | 3,284,333 | 63,160 | 1,301,173 | 3,451 | 325,293 | 0 | 325,293 | ||||
| 2031 | 1,200,956 | $52.00 | $62,449,733 | 1,920,000 | 1,200,956 | 3,120,956 | 360,287 | 18,734,920 | 3,120,956 | 3,120,956 | 3,120,956 | 60,018 | 1,140,938 | 3,018 | 285,235 | 0 | 285,235 | ||||
| 2032 | 1,057,136 | $52.00 | $54,971,078 | 1,920,000 | 1,057,136 | 2,977,136 | 317,141 | 16,491,323 | 2,977,136 | 2,977,136 | 2,977,136 | 57,253 | 999,883 | 2,638 | 249,971 | 0 | 249,971 | ||||
| 2033 | 930,532 | $52.00 | $48,387,687 | 1,920,000 | 930,532 | 2,850,532 | 279,160 | 14,516,306 | 2,850,532 | 2,850,532 | 2,850,532 | 54,818 | 875,715 | 2,305 | 218,929 | 0 | 218,929 | ||||
| 2034 | 819,085 | $52.00 | $42,592,432 | 1,920,000 | 819,085 | 2,739,085 | 245,726 | 12,777,730 | 2,739,085 | 2,739,085 | 2,739,085 | 52,675 | 766,411 | 2,012 | 191,603 | 0 | 191,603 | ||||
| 2035 | 573,633 | $52.00 | $29,828,921 | 1,440,000 | 573,633 | 2,013,633 | 172,090 | 8,948,676 | 2,013,633 | 2,013,633 | 2,013,633 | 38,724 | 534,909 | 1,400 | 133,727 | 0 | 133,727 | ||||
| 2036 | 357,578 | $52.00 | $18,594,034 | 960,000 | 357,578 | 1,317,578 | 107,273 | 5,578,210 | 1,317,578 | 1,317,578 | 1,317,578 | 25,338 | 332,240 | 867 | 83,060 | 0 | 83,060 | ||||
| 2037 | 167,399 | $52.00 | $8,704,762 | 480,000 | 167,399 | 647,399 | 50,220 | 2,611,429 | 647,399 | 647,399 | 647,399 | 12,450 | 154,949 | 404 | 38,737 | 0 | 38,737 | ||||
| 2038 | 0 | $52.00 | $0 | 0 | 0 | 0 | 0 | 0 | 0 | 0 | 0 | 0 | 0 | 0 | 0 | 0 | 0 | ||||
| 2039 | 0 | $52.00 | $0 | 0 | 0 | 0 | 0 | 0 | 0 | 0 | 0 | 0 | 0 | 0 | 0 | 0 | 0 | ||||
| Total | 160,000,000 | $8,320,000,000 | $52,800,000 | $160,000,000 | $212,800,000 | 279,800,000 | 279,800,000 | 5,380,769 | 154,619,231 | 33,489,183 | 4,132,500 | 37,621,683 | |||||||||
24
Mogul Energy International, Inc. | ||||||||||||||||||||
East Wadi Araba Concession | ||||||||||||||||||||
Cash Flow and Net Present Value | ||||||||||||||||||||
Prospect Best Estimate | ||||||||||||||||||||
| Undiscounted | Discounted @ | |||||||||||||||||||
| Year | Cost Oil STB/yr. | Net Profit Oil STB/yr. | Total Net Oil STB/yr. | Oil Price $/STB | Contractor's Total Revenue (Operating Cash Flow) M$/yr. | Total Operating Costs M$/yr. | Net Operating Income M$/yr. | Total Capital Costs M$/yr. | Contractor Net Cash Flow M$/yr. | Company Net Cash Flow M$/yr. | 5% M$ | 10% M$ | 15% M$ | 20% M$ | ||||||
| 2005 | 0 | 0 | 0 | $52.00 | 0 | 0 | 0 | 0 | 0 | 0 | 0 | 0 | 0 | 0 | ||||||
| 2006 | 0 | 0 | 0 | $52.00 | 0 | 0 | 0 | 0 | 0 | 0 | 0 | 0 | 0 | 0 | ||||||
| 2007 | 253,438 | 483,840 | 737,279 | $52.00 | 38,339 | 2,429 | 35,910 | 15,000 | 20,910 | 4,182 | 3,887 | 3,625 | 3,391 | 3,181 | ||||||
| 2008 | 385,362 | 1,545,860 | 1,931,221 | $52.00 | 100,424 | 7,289 | 93,135 | 8,000 | 85,135 | 17,027 | 15,072 | 13,417 | 12,006 | 10,794 | ||||||
| 2009 | 517,285 | 2,542,553 | 3,059,838 | $52.00 | 159,112 | 12,149 | 146,963 | 8,000 | 138,963 | 27,793 | 23,430 | 19,909 | 17,041 | 14,682 | ||||||
| 2010 | 635,169 | 3,248,976 | 3,884,145 | $52.00 | 201,976 | 16,279 | 185,697 | 8,000 | 177,697 | 35,539 | 28,534 | 23,144 | 18,948 | 15,646 | ||||||
| 2011 | 452,584 | 3,488,609 | 3,941,193 | $52.00 | 204,942 | 17,534 | 187,408 | 0 | 187,408 | 37,482 | 28,660 | 22,190 | 17,377 | 13,751 | ||||||
| 2012 | 383,991 | 3,188,961 | 3,572,952 | $52.00 | 185,794 | 15,968 | 169,826 | 0 | 169,826 | 33,965 | 24,735 | 18,280 | 13,693 | 10,384 | ||||||
| 2013 | 308,924 | 2,824,520 | 3,133,444 | $52.00 | 162,939 | 14,064 | 148,875 | 0 | 148,875 | 29,775 | 20,651 | 14,568 | 10,438 | 7,586 | ||||||
| 2014 | 242,194 | 2,545,130 | 2,787,325 | $52.00 | 144,941 | 12,594 | 132,347 | 0 | 132,347 | 26,469 | 17,484 | 11,773 | 8,069 | 5,620 | ||||||
| 2015 | 217,478 | 2,292,841 | 2,510,319 | $52.00 | 130,537 | 11,309 | 119,228 | 0 | 119,228 | 23,846 | 15,001 | 9,642 | 6,321 | 4,219 | ||||||
| 2016 | 195,867 | 2,017,304 | 2,213,171 | $52.00 | 115,085 | 10,185 | 104,900 | 0 | 104,900 | 20,980 | 12,569 | 7,712 | 4,836 | 3,093 | ||||||
| 2017 | 176,842 | 1,774,732 | 1,951,574 | $52.00 | 101,482 | 9,196 | 92,286 | 0 | 92,286 | 18,457 | 10,531 | 6,168 | 3,699 | 2,268 | ||||||
| 2018 | 160,093 | 1,561,185 | 1,721,277 | $52.00 | 89,506 | 8,325 | 81,182 | 0 | 81,182 | 16,236 | 8,823 | 4,933 | 2,830 | 1,662 | ||||||
| 2019 | 145,348 | 1,373,189 | 1,518,537 | $52.00 | 78,964 | 7,558 | 71,406 | 0 | 71,406 | 14,281 | 7,391 | 3,944 | 2,164 | 1,218 | ||||||
| 2020 | 132,368 | 1,207,690 | 1,340,058 | $52.00 | 69,683 | 6,883 | 62,800 | 0 | 62,800 | 12,560 | 6,191 | 3,154 | 1,655 | 893 | ||||||
| 2021 | 120,941 | 1,061,996 | 1,182,937 | $52.00 | 61,513 | 6,289 | 55,224 | 0 | 55,224 | 11,045 | 5,185 | 2,521 | 1,266 | 654 | ||||||
| 2022 | 110,881 | 933,738 | 1,044,620 | $52.00 | 54,320 | 5,766 | 48,554 | 0 | 48,554 | 9,711 | 4,341 | 2,015 | 968 | 479 | ||||||
| 2023 | 102,026 | 820,831 | 922,857 | $52.00 | 47,989 | 5,305 | 42,683 | 0 | 42,683 | 8,537 | 3,635 | 1,610 | 740 | 351 | ||||||
| 2024 | 94,230 | 721,437 | 815,668 | $52.00 | 42,415 | 4,900 | 37,515 | 0 | 37,515 | 7,503 | 3,042 | 1,287 | 565 | 257 | ||||||
| 2025 | 87,204 | 631,854 | 719,059 | $52.00 | 37,391 | 4,535 | 32,856 | 0 | 32,856 | 6,571 | 2,538 | 1,024 | 431 | 188 | ||||||
| 2026 | 81,020 | 553,000 | 634,019 | $52.00 | 32,969 | 4,213 | 28,756 | 0 | 28,756 | 5,751 | 2,115 | 815 | 328 | 137 | ||||||
| 2027 | 75,576 | 483,589 | 559,165 | $52.00 | 29,077 | 3,930 | 25,147 | 0 | 25,147 | 5,029 | 1,762 | 648 | 249 | 100 | ||||||
| 2028 | 70,784 | 422,492 | 493,275 | $52.00 | 25,650 | 3,681 | 21,970 | 0 | 21,970 | 4,394 | 1,466 | 515 | 189 | 73 | ||||||
| 2029 | 66,729 | 370,799 | 437,528 | $52.00 | 22,751 | 3,470 | 19,282 | 0 | 19,282 | 3,856 | 1,225 | 411 | 144 | 53 | ||||||
| 2030 | 63,160 | 325,293 | 388,454 | $52.00 | 20,200 | 3,284 | 16,915 | 0 | 16,915 | 3,383 | 1,024 | 327 | 110 | 39 | ||||||
| 2031 | 60,018 | 285,235 | 345,253 | $52.00 | 17,953 | 3,121 | 14,832 | 0 | 14,832 | 2,966 | 855 | 261 | 84 | 28 | ||||||
| 2032 | 57,253 | 249,971 | 307,223 | $52.00 | 15,976 | 2,977 | 12,998 | 0 | 12,998 | 2,600 | 714 | 208 | 64 | 21 | ||||||
| 2033 | 54,818 | 218,929 | 273,747 | $52.00 | 14,235 | 2,851 | 11,384 | 0 | 11,384 | 2,277 | 595 | 166 | 49 | 15 | ||||||
| 2034 | 52,675 | 191,603 | 244,277 | $52.00 | 12,702 | 2,739 | 9,963 | 0 | 9,963 | 1,993 | 496 | 132 | 37 | 11 | ||||||
| 2035 | 38,724 | 133,727 | 172,451 | $52.00 | 8,967 | 2,014 | 6,954 | 0 | 6,954 | 1,391 | 330 | 84 | 23 | 6 | ||||||
| 2036 | 25,338 | 83,060 | 108,398 | $52.00 | 5,637 | 1,318 | 4,319 | 0 | 4,319 | 864 | 195 | 47 | 12 | 3 | ||||||
| 2037 | 12,450 | 38,737 | 51,187 | $52.00 | 2,662 | 647 | 2,014 | 0 | 2,014 | 403 | 87 | 20 | 5 | 1 | ||||||
| 2038 | 0 | 0 | 0 | $52.00 | 0 | 0 | 0 | 0 | 0 | 0 | 0 | 0 | 0 | 0 | ||||||
| 2039 | 0 | 0 | 0 | $52.00 | 0 | 0 | 0 | 0 | 0 | 0 | 0 | 0 | 0 | 0 | ||||||
| Total | 5,380,769 | 37,621,683 | 43,002,452 | 2,236,128 | 212,800 | 2,023,328 | 39,000 | 1,984,328 | 396,866 | 252,561 | 174,551 | 127,732 | 97,414 | |||||||
25
Mogul Energy International, Inc. | ||||||||||||||||||
East Wadi Araba Concession | ||||||||||||||||||
Production and Capital Forecast | ||||||||||||||||||
Prospect Low Estimate | ||||||||||||||||||
| Development Program - | ||||||||||||||||||
| Single Well Production Profile | # Wells | # Wells | # Wells | # Wells | Total Oil Production | Capital Expenditures - $M | ||||||||||||
| Year | STB/d | Days On | MSTB/yr | Well Count | 4 | 4 | 4 | 4 | STB/yr. | STB/d | Production Bonuses - $ | Exploration | Drilling & Completion | Well Fac. & Tie-ins | Central Facilities | Total Capital | ||
| 2005 | 0 | 0 | 0 | 0 | 0 | 0 | 0 | 0 | 0 | 0 | 0 | 0 | 0 | 0 | 0 | 0 | ||
| 2006 | 0 | 0 | 0 | 0 | 0 | 0 | 0 | 0 | 0 | 0 | 0 | 0 | 0 | 0 | 0 | 0 | ||
| 2007 | 2,000 | 182 | 364,800 | 2 | 1,459,200 | 0 | 0 | 0 | 1,459,200 | 8,000 | 0 | 2,500 | 8,000 | 0 | 4,500 | 15,000 | ||
| 2008 | 2,000 | 365 | 730,000 | 6 | 2,920,000 | 1,459,200 | 0 | 0 | 4,379,200 | 11,998 | 0 | 0 | 8,000 | 0 | 0 | 8,000 | ||
| 2009 | 2,000 | 365 | 730,000 | 10 | 2,920,000 | 2,920,000 | 1,459,200 | 0 | 7,299,200 | 19,998 | 0 | 0 | 8,000 | 0 | 0 | 8,000 | ||
| 2010 | 2,000 | 365 | 730,000 | 14 | 2,920,000 | 2,920,000 | 2,920,000 | 1,459,200 | 10,219,200 | 27,998 | 0 | 0 | 8,000 | 0 | 0 | 8,000 | ||
| 2011 | 1,707 | 365 | 622,982 | 16 | 2,491,930 | 2,920,000 | 2,920,000 | 2,920,000 | 11,251,930 | 30,827 | 0 | 0 | 0 | 0 | 0 | 0 | ||
| 2012 | 1,457 | 365 | 531,654 | 16 | 2,126,614 | 2,491,930 | 2,920,000 | 2,920,000 | 10,458,544 | 28,654 | 0 | 0 | 0 | 0 | 0 | 0 | ||
| 2013 | 1,243 | 366 | 454,956 | 16 | 1,819,826 | 2,126,614 | 2,491,930 | 2,920,000 | 9,358,369 | 25,569 | 0 | 0 | 0 | 0 | 0 | 0 | ||
| 2014 | 1,061 | 367 | 389,321 | 16 | 1,557,284 | 1,819,826 | 2,126,614 | 2,491,930 | 7,995,653 | 21,787 | 0 | 0 | 0 | 0 | 0 | 0 | ||
| 2015 | 905 | 368 | 333,152 | 16 | 1,332,608 | 1,557,284 | 1,819,826 | 2,126,614 | 6,836,331 | 18,577 | 0 | 0 | 0 | 0 | 0 | 0 | ||
| 2016 | 773 | 369 | 285,085 | 16 | 1,140,339 | 1,332,608 | 1,557,284 | 1,819,826 | 5,850,056 | 15,854 | 0 | 0 | 0 | 0 | 0 | 0 | ||
| 2017 | 659 | 370 | 243,951 | 16 | 975,803 | 1,140,339 | 1,332,608 | 1,557,284 | 5,006,033 | 13,530 | 0 | 0 | 0 | 0 | 0 | 0 | ||
| 2018 | 563 | 371 | 208,750 | 16 | 835,001 | 975,803 | 1,140,339 | 1,332,608 | 4,283,751 | 11,546 | 0 | 0 | 0 | 0 | 0 | 0 | ||
| 2019 | 480 | 372 | 178,628 | 16 | 714,511 | 835,001 | 975,803 | 1,140,339 | 3,665,654 | 9,854 | 0 | 0 | 0 | 0 | 0 | 0 | ||
| 2020 | 410 | 373 | 152,851 | 16 | 611,404 | 714,511 | 835,001 | 975,803 | 3,136,719 | 8,409 | 0 | 0 | 0 | 0 | 0 | 0 | ||
| 2021 | 350 | 374 | 130,793 | 16 | 523,171 | 611,404 | 714,511 | 835,001 | 2,684,087 | 7,177 | 0 | 0 | 0 | 0 | 0 | 0 | ||
| 2022 | 298 | 375 | 111,917 | 16 | 447,668 | 523,171 | 611,404 | 714,511 | 2,296,754 | 6,125 | 0 | 0 | 0 | 0 | 0 | 0 | ||
| 2023 | 255 | 376 | 95,765 | 16 | 383,059 | 447,668 | 523,171 | 611,404 | 1,965,302 | 5,227 | 0 | 0 | 0 | 0 | 0 | 0 | ||
| 2024 | 217 | 377 | 81,943 | 16 | 327,772 | 383,059 | 447,668 | 523,171 | 1,681,670 | 4,461 | 0 | 0 | 0 | 0 | 0 | 0 | ||
| 2025 | 185 | 372 | 69,003 | 16 | 276,011 | 327,772 | 383,059 | 447,668 | 1,434,511 | 3,856 | 0 | 0 | 0 | 0 | 0 | 0 | ||
| 2026 | 158 | 373 | 59,045 | 16 | 236,181 | 276,011 | 327,772 | 383,059 | 1,223,024 | 3,279 | 0 | 0 | 0 | 0 | 0 | 0 | ||
| 2027 | 135 | 374 | 50,524 | 16 | 202,098 | 236,181 | 276,011 | 327,772 | 1,042,062 | 2,786 | 0 | 0 | 0 | 0 | 0 | 0 | ||
| 2028 | 115 | 375 | 43,233 | 16 | 172,931 | 202,098 | 236,181 | 276,011 | 887,221 | 2,366 | 0 | 0 | 0 | 0 | 0 | 0 | ||
| 2029 | 98 | 376 | 36,993 | 16 | 147,973 | 172,931 | 202,098 | 236,181 | 759,183 | 2,019 | 0 | 0 | 0 | 0 | 0 | 0 | ||
| 2030 | 84 | 377 | 31,654 | 16 | 126,616 | 147,973 | 172,931 | 202,098 | 649,618 | 1,723 | 0 | 0 | 0 | 0 | 0 | 0 | ||
| 2031 | 0 | 378 | 0 | 12 | 0 | 126,616 | 147,973 | 172,931 | 447,521 | 1,184 | 0 | 0 | 0 | 0 | 0 | 0 | ||
| 2032 | 0 | 379 | 0 | 8 | 0 | 0 | 126,616 | 147,973 | 274,590 | 725 | 0 | 0 | 0 | 0 | 0 | 0 | ||
| 2033 | 0 | 380 | 0 | 4 | 0 | 0 | 0 | 126,616 | 126,616 | 333 | 0 | 0 | 0 | 0 | 0 | 0 | ||
| 2034 | 0 | 381 | 0 | 0 | 0 | 0 | 0 | 0 | 0 | 0 | 0 | 0 | 0 | 0 | 0 | 0 | ||
| 2035 | 0 | 382 | 0 | 0 | 0 | 0 | 0 | 0 | 0 | 0 | 0 | 0 | 0 | 0 | 0 | 0 | ||
| 2036 | 0 | 383 | 0 | 0 | 0 | 0 | 0 | 0 | 0 | 0 | 0 | 0 | 0 | 0 | 0 | 0 | ||
| 2037 | 0 | 384 | 0 | 0 | 0 | 0 | 0 | 0 | 0 | 0 | 0 | 0 | 0 | 0 | 0 | 0 | ||
| 2038 | 0 | 385 | 0 | 0 | 0 | 0 | 0 | 0 | 0 | 0 | 0 | 0 | 0 | 0 | 0 | 0 | ||
| 2039 | 0 | 386 | 0 | 0 | 0 | 0 | 0 | 0 | 0 | 0 | 0 | 0 | 0 | 0 | 0 | 0 | ||
| Total | 6,667,000 | 26,668,000 | 26,668,000 | 26,668,000 | 26,668,000 | 106,672,000 | 0 | 2,500 | 32,000 | 0 | 4,500 | 39,000 | ||||||
26
Mogul Energy International, Inc. | |||||||||||||||||||||
East Wadi Araba Concession | |||||||||||||||||||||
Production Splits - Cost Oil | |||||||||||||||||||||
Prospect Low Estimate | |||||||||||||||||||||
| Cost Recovery | |||||||||||||||||||||
| Gross Production | Oil Price | Gross Revenue | Operating Costs - $/yr. | Available Cost Oil | Cost Oil Revenue Ceiling | Annual Costs For Recovery | Cumulative Outstanding Costs | Annual Cost Recovery | Cost Oil | Total Profit Oil | Total Daily Production | Contractors Share | Total Contractors Profit Oil | ||||||||
| Year | STB/yr. | $/STB | $/yr. | Fixed | Variable | Total | STB/yr. | $/yr | $/yr. | $/yr. | $/yr. | STB/yr. | STB/yr. | STB/d | STB/yr. | STB/yr. | STB/yr. | ||||
| 2005 | 0 | $52.00 | $0 | 0 | 0 | 0 | 0 | 0 | 0 | 0 | 0 | 0 | 0 | 0 | 0 | 0 | 0 | ||||
| 2006 | 0 | $52.00 | $0 | 0 | 0 | 0 | 0 | 0 | 0 | 0 | 0 | 0 | 0 | 0 | 0 | 0 | 0 | ||||
| 2007 | 1,459,200 | $52.00 | $75,878,400 | 240,000 | 1,459,200 | 1,699,200 | 437,760 | 22,763,520 | 12,449,200 | 12,449,200 | 12,449,200 | 239,408 | 1,219,792 | 6,687 | 304,948 | 0 | 304,948 | ||||
| 2008 | 4,379,200 | $52.00 | $227,718,400 | 720,000 | 4,379,200 | 5,099,200 | 1,313,760 | 68,315,520 | 17,849,200 | 17,849,200 | 17,849,200 | 343,254 | 4,035,946 | 11,057 | 1,008,987 | 0 | 1,008,987 | ||||
| 2009 | 7,299,200 | $52.00 | $379,558,400 | 1,200,000 | 7,299,200 | 8,499,200 | 2,189,760 | 113,867,520 | 23,249,200 | 23,249,200 | 23,249,200 | 447,100 | 6,852,100 | 18,773 | 1,713,025 | 0 | 1,713,025 | ||||
| 2010 | 10,219,200 | $52.00 | $531,398,400 | 1,680,000 | 10,219,200 | 11,899,200 | 3,065,760 | 159,419,520 | 28,649,200 | 28,649,200 | 28,649,200 | 550,946 | 9,668,254 | 26,488 | 2,281,250 | 108,651 | 2,389,901 | ||||
| 2011 | 11,251,930 | $52.00 | $585,100,338 | 1,920,000 | 11,251,930 | 13,171,930 | 3,375,579 | 175,530,101 | 19,171,930 | 19,171,930 | 19,171,930 | 368,691 | 10,883,239 | 29,817 | 2,281,250 | 351,648 | 2,632,898 | ||||
| 2012 | 10,458,544 | $52.00 | $543,844,269 | 1,920,000 | 10,458,544 | 12,378,544 | 3,137,563 | 163,153,281 | 16,378,544 | 16,378,544 | 16,378,544 | 314,972 | 10,143,572 | 27,791 | 2,281,250 | 203,714 | 2,484,964 | ||||
| 2013 | 9,358,369 | $52.00 | $486,635,209 | 1,920,000 | 9,358,369 | 11,278,369 | 2,807,511 | 145,990,563 | 13,278,369 | 13,278,369 | 13,278,369 | 255,353 | 9,103,016 | 24,872 | 2,275,754 | 0 | 2,275,754 | ||||
| 2014 | 7,995,653 | $52.00 | $415,773,956 | 1,920,000 | 7,995,653 | 9,915,653 | 2,398,696 | 124,732,187 | 9,915,653 | 9,915,653 | 9,915,653 | 190,686 | 7,804,967 | 21,267 | 1,951,242 | 0 | 1,951,242 | ||||
| 2015 | 6,836,331 | $52.00 | $355,489,227 | 1,920,000 | 6,836,331 | 8,756,331 | 2,050,899 | 106,646,768 | 8,756,331 | 8,756,331 | 8,756,331 | 168,391 | 6,667,940 | 18,119 | 1,666,985 | 0 | 1,666,985 | ||||
| 2016 | 5,850,056 | $52.00 | $304,202,905 | 1,920,000 | 5,850,056 | 7,770,056 | 1,755,017 | 91,260,871 | 7,770,056 | 7,770,056 | 7,770,056 | 149,424 | 5,700,632 | 15,449 | 1,425,158 | 0 | 1,425,158 | ||||
| 2017 | 5,006,033 | $52.00 | $260,313,715 | 1,920,000 | 5,006,033 | 6,926,033 | 1,501,810 | 78,094,115 | 6,926,033 | 6,926,033 | 6,926,033 | 133,193 | 4,872,840 | 13,170 | 1,218,210 | 0 | 1,218,210 | ||||
| 2018 | 4,283,751 | $52.00 | $222,755,042 | 1,920,000 | 4,283,751 | 6,203,751 | 1,285,125 | 66,826,513 | 6,203,751 | 6,203,751 | 6,203,751 | 119,303 | 4,164,448 | 11,225 | 1,041,112 | 0 | 1,041,112 | ||||
| 2019 | 3,665,654 | $52.00 | $190,614,024 | 1,920,000 | 3,665,654 | 5,585,654 | 1,099,696 | 57,184,207 | 5,585,654 | 5,585,654 | 5,585,654 | 107,416 | 3,558,238 | 9,565 | 889,559 | 0 | 889,559 | ||||
| 2020 | 3,136,719 | $52.00 | $163,109,400 | 1,920,000 | 3,136,719 | 5,056,719 | 941,016 | 48,932,820 | 5,056,719 | 5,056,719 | 5,056,719 | 97,245 | 3,039,475 | 8,149 | 759,869 | 0 | 759,869 | ||||
| 2021 | 2,684,087 | $52.00 | $139,572,540 | 1,920,000 | 2,684,087 | 4,604,087 | 805,226 | 41,871,762 | 4,604,087 | 4,604,087 | 4,604,087 | 88,540 | 2,595,547 | 6,940 | 648,887 | 0 | 648,887 | ||||
| 2022 | 2,296,754 | $52.00 | $119,431,212 | 1,920,000 | 2,296,754 | 4,216,754 | 689,026 | 35,829,364 | 4,216,754 | 4,216,754 | 4,216,754 | 81,091 | 2,215,663 | 5,908 | 553,916 | 0 | 553,916 | ||||
| 2023 | 1,965,302 | $52.00 | $102,195,690 | 1,920,000 | 1,965,302 | 3,885,302 | 589,591 | 30,658,707 | 3,885,302 | 3,885,302 | 3,885,302 | 74,717 | 1,890,584 | 5,028 | 472,646 | 0 | 472,646 | ||||
| 2024 | 1,681,670 | $52.00 | $87,446,860 | 1,920,000 | 1,681,670 | 3,601,670 | 504,501 | 26,234,058 | 3,601,670 | 3,601,670 | 3,601,670 | 69,263 | 1,612,407 | 4,277 | 403,102 | 0 | 403,102 | ||||
| 2025 | 1,434,511 | $52.00 | $74,594,550 | 1,920,000 | 1,434,511 | 3,354,511 | 430,353 | 22,378,365 | 3,354,511 | 3,354,511 | 3,354,511 | 64,510 | 1,370,001 | 3,683 | 342,500 | 0 | 342,500 | ||||
| 2026 | 1,223,024 | $52.00 | $63,597,230 | 1,920,000 | 1,223,024 | 3,143,024 | 366,907 | 19,079,169 | 3,143,024 | 3,143,024 | 3,143,024 | 60,443 | 1,162,581 | 3,117 | 290,645 | 0 | 290,645 | ||||
| 2027 | 1,042,062 | $52.00 | $54,187,235 | 1,920,000 | 1,042,062 | 2,962,062 | 312,619 | 16,256,170 | 2,962,062 | 2,962,062 | 2,962,062 | 56,963 | 985,099 | 2,634 | 246,275 | 0 | 246,275 | ||||
| 2028 | 887,221 | $52.00 | $46,135,510 | 1,920,000 | 887,221 | 2,807,221 | 266,166 | 13,840,653 | 2,807,221 | 2,807,221 | 2,807,221 | 53,985 | 833,236 | 2,222 | 208,309 | 0 | 208,309 | ||||
| 2029 | 759,183 | $52.00 | $39,477,538 | 1,920,000 | 759,183 | 2,679,183 | 227,755 | 11,843,261 | 2,679,183 | 2,679,183 | 2,679,183 | 51,523 | 707,661 | 1,882 | 176,915 | 0 | 176,915 | ||||
| 2030 | 649,618 | $52.00 | $33,780,160 | 1,920,000 | 649,618 | 2,569,618 | 194,886 | 10,134,048 | 2,569,618 | 2,569,618 | 2,569,618 | 49,416 | 600,203 | 1,592 | 150,051 | 0 | 150,051 | ||||
| 2031 | 447,521 | $52.00 | $23,271,086 | 1,440,000 | 447,521 | 1,887,521 | 134,256 | 6,981,326 | 1,887,521 | 1,887,521 | 1,887,521 | 36,298 | 411,222 | 1,088 | 102,806 | 0 | 102,806 | ||||
| 2032 | 274,590 | $52.00 | $14,278,656 | 960,000 | 274,590 | 1,234,590 | 82,377 | 4,283,597 | 1,234,590 | 1,234,590 | 1,234,590 | 23,742 | 250,847 | 662 | 62,712 | 0 | 62,712 | ||||
| 2033 | 126,616 | $52.00 | $6,584,047 | 480,000 | 126,616 | 606,616 | 37,985 | 1,975,214 | 606,616 | 606,616 | 606,616 | 11,666 | 114,951 | 303 | 28,738 | 0 | 28,738 | ||||
| 2034 | 0 | $52.00 | $0 | 0 | 0 | 0 | 0 | 0 | 0 | 0 | 0 | 0 | 0 | 0 | 0 | 0 | 0 | ||||
| 2035 | 0 | $52.00 | $0 | 0 | 0 | 0 | 0 | 0 | 0 | 0 | 0 | 0 | 0 | 0 | 0 | 0 | 0 | ||||
| 2036 | 0 | $52.00 | $0 | 0 | 0 | 0 | 0 | 0 | 0 | 0 | 0 | 0 | 0 | 0 | 0 | 0 | 0 | ||||
| 2037 | 0 | $52.00 | $0 | 0 | 0 | 0 | 0 | 0 | 0 | 0 | 0 | 0 | 0 | 0 | 0 | 0 | 0 | ||||
| 2038 | 0 | $52.00 | $0 | 0 | 0 | 0 | 0 | 0 | 0 | 0 | 0 | 0 | 0 | 0 | 0 | 0 | 0 | ||||
| 2039 | 0 | $52.00 | $0 | 0 | 0 | 0 | 0 | 0 | 0 | 0 | 0 | 0 | 0 | 0 | 0 | 0 | 0 | ||||
| Total | 106,672,000 | $5,546,944,000 | $45,120,000 | $106,672,000 | $151,792,000 | 218,792,000 | 218,792,000 | 218,792,000 | 4,207,538 | 102,464,462 | 24,786,099 | 664,013 | 25,450,112 | ||||||||
| 25% | 20% | ||||||||||||||||||||
| 0 to 25000 | 25001 + | ||||||||||||||||||||
27
| Table 2, Page 3 | ||||||||||||||||||||
Mogul Energy International, Inc. | ||||||||||||||||||||
East Wadi Araba Concession | ||||||||||||||||||||
Cash Flow and Net Present Value | ||||||||||||||||||||
Prospect Low Estimate | ||||||||||||||||||||
| Undiscounted | Discounted @ | |||||||||||||||||||
| Year | Cost Oil STB/yr. | Net Profit Oil STB/yr. | Total Net Oil STB/yr. | Oil Price $/STB | Contractor's Total Revenue (Operating Cash Flow) M$/yr. | Total Operating Costs M$/yr. | Net Operating Income M$/yr. | Total Capital Costs M$/yr. | Contractor Net Cash Flow M$/yr. | Company Net Cash Flow M$/yr. | 5% M$ | 10% M$ | 15% M$ | 20% M$ | ||||||
| 2005 | 0 | 0 | 0 | $52.00 | 0 | 0 | 0 | 0 | 0 | 0 | 0 | 0 | 0 | 0 | ||||||
| 2006 | 0 | 0 | 0 | $52.00 | 0 | 0 | 0 | 0 | 0 | 0 | 0 | 0 | 0 | 0 | ||||||
| 2007 | 239,408 | 304,948 | 544,356 | $52.00 | 28,307 | 1,699 | 26,607 | 15,000 | 11,607 | 2,321 | 2,158 | 2,012 | 1,882 | 1,766 | ||||||
| 2008 | 343,254 | 1,008,987 | 1,352,240 | $52.00 | 70,317 | 5,099 | 65,217 | 8,000 | 57,217 | 11,443 | 10,129 | 9,017 | 8,069 | 7,254 | ||||||
| 2009 | 447,100 | 1,713,025 | 2,160,125 | $52.00 | 112,327 | 8,499 | 103,827 | 8,000 | 95,827 | 19,165 | 16,157 | 13,729 | 11,751 | 10,125 | ||||||
| 2010 | 550,946 | 2,389,901 | 2,940,847 | $52.00 | 152,924 | 11,899 | 141,025 | 8,000 | 133,025 | 26,605 | 21,360 | 17,326 | 14,185 | 11,712 | ||||||
| 2011 | 368,691 | 2,632,898 | 3,001,589 | $52.00 | 156,083 | 13,172 | 142,911 | 0 | 142,911 | 28,582 | 21,855 | 16,921 | 13,251 | 10,486 | ||||||
| 2012 | 314,972 | 2,484,964 | 2,799,936 | $52.00 | 145,597 | 12,379 | 133,218 | 0 | 133,218 | 26,644 | 19,403 | 14,340 | 10,741 | 8,145 | ||||||
| 2013 | 255,353 | 2,275,754 | 2,531,107 | $52.00 | 131,618 | 11,278 | 120,339 | 0 | 120,339 | 24,068 | 16,692 | 11,776 | 8,437 | 6,132 | ||||||
| 2014 | 190,686 | 1,951,242 | 2,141,927 | $52.00 | 111,380 | 9,916 | 101,465 | 0 | 101,465 | 20,293 | 13,404 | 9,026 | 6,186 | 4,308 | ||||||
| 2015 | 168,391 | 1,666,985 | 1,835,376 | $52.00 | 95,440 | 8,756 | 86,683 | 0 | 86,683 | 17,337 | 10,906 | 7,010 | 4,596 | 3,067 | ||||||
| 2016 | 149,424 | 1,425,158 | 1,574,582 | $52.00 | 81,878 | 7,770 | 74,108 | 0 | 74,108 | 14,822 | 8,880 | 5,448 | 3,416 | 2,185 | ||||||
| 2017 | 133,193 | 1,218,210 | 1,351,403 | $52.00 | 70,273 | 6,926 | 63,347 | 0 | 63,347 | 12,669 | 7,229 | 4,234 | 2,539 | 1,557 | ||||||
| 2018 | 119,303 | 1,041,112 | 1,160,415 | $52.00 | 60,342 | 6,204 | 54,138 | 0 | 54,138 | 10,828 | 5,884 | 3,289 | 1,887 | 1,109 | ||||||
| 2019 | 107,416 | 889,559 | 996,976 | $52.00 | 51,843 | 5,586 | 46,257 | 0 | 46,257 | 9,251 | 4,788 | 2,555 | 1,402 | 789 | ||||||
| 2020 | 97,245 | 759,869 | 857,113 | $52.00 | 44,570 | 5,057 | 39,513 | 0 | 39,513 | 7,903 | 3,895 | 1,984 | 1,041 | 562 | ||||||
| 2021 | 88,540 | 648,887 | 737,427 | $52.00 | 38,346 | 4,604 | 33,742 | 0 | 33,742 | 6,748 | 3,168 | 1,540 | 773 | 400 | ||||||
| 2022 | 81,091 | 553,916 | 635,007 | $52.00 | 33,020 | 4,217 | 28,804 | 0 | 28,804 | 5,761 | 2,575 | 1,195 | 574 | 284 | ||||||
| 2023 | 74,717 | 472,646 | 547,363 | $52.00 | 28,463 | 3,885 | 24,578 | 0 | 24,578 | 4,916 | 2,093 | 927 | 426 | 202 | ||||||
| 2024 | 69,263 | 403,102 | 472,365 | $52.00 | 24,563 | 3,602 | 20,961 | 0 | 20,961 | 4,192 | 1,700 | 719 | 316 | 144 | ||||||
| 2025 | 64,510 | 342,500 | 407,010 | $52.00 | 21,165 | 3,355 | 17,810 | 0 | 17,810 | 3,562 | 1,376 | 555 | 233 | 102 | ||||||
| 2026 | 60,443 | 290,645 | 351,088 | $52.00 | 18,257 | 3,143 | 15,114 | 0 | 15,114 | 3,023 | 1,112 | 428 | 172 | 72 | ||||||
| 2027 | 56,963 | 246,275 | 303,238 | $52.00 | 15,768 | 2,962 | 12,806 | 0 | 12,806 | 2,561 | 897 | 330 | 127 | 51 | ||||||
| 2028 | 53,985 | 208,309 | 262,294 | $52.00 | 13,639 | 2,807 | 10,832 | 0 | 10,832 | 2,166 | 723 | 254 | 93 | 36 | ||||||
| 2029 | 51,523 | 176,915 | 228,438 | $52.00 | 11,879 | 2,679 | 9,200 | 0 | 9,200 | 1,840 | 585 | 196 | 69 | 25 | ||||||
| 2030 | 49,416 | 150,051 | 199,466 | $52.00 | 10,372 | 2,570 | 7,803 | 0 | 7,803 | 1,561 | 472 | 151 | 51 | 18 | ||||||
| 2031 | 36,298 | 102,806 | 139,104 | $52.00 | 7,233 | 1,888 | 5,346 | 0 | 5,346 | 1,069 | 308 | 94 | 30 | 10 | ||||||
| 2032 | 23,742 | 62,712 | 86,454 | $52.00 | 4,496 | 1,235 | 3,261 | 0 | 3,261 | 652 | 179 | 52 | 16 | 5 | ||||||
| 2033 | 11,666 | 28,738 | 40,403 | $52.00 | 2,101 | 607 | 1,494 | 0 | 1,494 | 299 | 78 | 22 | 6 | 2 | ||||||
| 2034 | 0 | 0 | 0 | $52.00 | 0 | 0 | 0 | 0 | 0 | 0 | 0 | 0 | 0 | 0 | ||||||
| 2035 | 0 | 0 | 0 | $52.00 | 0 | 0 | 0 | 0 | 0 | 0 | 0 | 0 | 0 | 0 | ||||||
| 2036 | 0 | 0 | 0 | $52.00 | 0 | 0 | 0 | 0 | 0 | 0 | 0 | 0 | 0 | 0 | ||||||
| 2037 | 0 | 0 | 0 | $52.00 | 0 | 0 | 0 | 0 | 0 | 0 | 0 | 0 | 0 | 0 | ||||||
| 2038 | 0 | 0 | 0 | $52.00 | 0 | 0 | 0 | 0 | 0 | 0 | 0 | 0 | 0 | 0 | ||||||
| 2039 | 0 | 0 | 0 | $52.00 | 0 | 0 | 0 | 0 | 0 | 0 | 0 | 0 | 0 | 0 | ||||||
| Total | 4,207,538 | 25,450,112 | 29,657,651 | 1,542,198 | 151,792 | 1,390,406 | 39,000 | 1,351,406 | 270,281 | 178,006 | 125,133 | 92,273 | 70,549 | |||||||
| Company Interest = | 20% | |||||||||||||||||||
28
| Table 3, Page 1 | ||||||||||||||||||
Mogul Energy International, Inc. | ||||||||||||||||||
East Wadi Araba Concession | ||||||||||||||||||
Production and Capital Forecast | ||||||||||||||||||
Prospect High Estimate | ||||||||||||||||||
| Development Program - | ||||||||||||||||||
| Single Well Production Profile | # Wells | # Wells | # Wells | # Wells | Total Oil Production | Capital Expenditures - $M | ||||||||||||
| Year | STB/d | Days On | MSTB/yr | Well Count | 4 | 4 | 4 | 4 | STB/yr. | STB/d | Production Bonuses - $ | Exploration | Drilling & Completion | Well Fac. & Tie-ins | Central Facilities | Total Capital | ||
| 2005 | 0 | 0 | 0 | 0 | 0 | 0 | 0 | 0 | 0 | 0 | 0 | 0 | 0 | 0 | 0 | 0 | ||
| 2006 | 0 | 0 | 0 | 0 | 0 | 0 | 0 | 0 | 0 | 0 | 0 | 0 | 0 | 0 | 0 | 0 | ||
| 2007 | 4,000 | 182 | 729,600 | 2 | 2,918,400 | 0 | 0 | 0 | 2,918,400 | 16,000 | 0 | 2,500 | 8,000 | 0 | 4,500 | 15,000 | ||
| 2008 | 4,000 | 365 | 1,460,000 | 6 | 5,840,000 | 2,918,400 | 0 | 0 | 8,758,400 | 23,996 | 0 | 0 | 8,000 | 0 | 0 | 8,000 | ||
| 2009 | 4,000 | 365 | 1,460,000 | 10 | 5,840,000 | 5,840,000 | 2,918,400 | 0 | 14,598,400 | 39,996 | 0 | 0 | 8,000 | 0 | 0 | 8,000 | ||
| 2010 | 3,500 | 365 | 1,277,500 | 14 | 5,110,000 | 5,840,000 | 5,840,000 | 2,918,400 | 19,708,400 | 53,996 | 0 | 0 | 8,000 | 0 | 0 | 8,000 | ||
| 2011 | 3,048 | 365 | 1,112,620 | 16 | 4,450,482 | 5,110,000 | 5,840,000 | 5,840,000 | 21,240,482 | 58,193 | 0 | 0 | 0 | 0 | 0 | 0 | ||
| 2012 | 2,655 | 365 | 969,021 | 16 | 3,876,084 | 4,450,482 | 5,110,000 | 5,840,000 | 19,276,566 | 52,813 | 0 | 0 | 0 | 0 | 0 | 0 | ||
| 2013 | 2,312 | 366 | 846,267 | 16 | 3,385,069 | 3,876,084 | 4,450,482 | 5,110,000 | 16,821,635 | 45,961 | 0 | 0 | 0 | 0 | 0 | 0 | ||
| 2014 | 2,014 | 367 | 739,058 | 16 | 2,956,233 | 3,385,069 | 3,876,084 | 4,450,482 | 14,667,867 | 39,967 | 0 | 0 | 0 | 0 | 0 | 0 | ||
| 2015 | 1,754 | 368 | 645,426 | 16 | 2,581,704 | 2,956,233 | 3,385,069 | 3,876,084 | 12,799,090 | 34,780 | 0 | 0 | 0 | 0 | 0 | 0 | ||
| 2016 | 1,528 | 369 | 563,652 | 16 | 2,254,609 | 2,581,704 | 2,956,233 | 3,385,069 | 11,177,615 | 30,292 | 0 | 0 | 0 | 0 | 0 | 0 | ||
| 2017 | 1,330 | 370 | 492,235 | 16 | 1,968,941 | 2,254,609 | 2,581,704 | 2,956,233 | 9,761,487 | 26,382 | 0 | 0 | 0 | 0 | 0 | 0 | ||
| 2018 | 1,159 | 371 | 429,864 | 16 | 1,719,456 | 1,968,941 | 2,254,609 | 2,581,704 | 8,524,710 | 22,978 | 0 | 0 | 0 | 0 | 0 | 0 | ||
| 2019 | 1,009 | 372 | 375,393 | 16 | 1,501,572 | 1,719,456 | 1,968,941 | 2,254,609 | 7,444,577 | 20,012 | 0 | 0 | 0 | 0 | 0 | 0 | ||
| 2020 | 879 | 373 | 327,822 | 16 | 1,311,288 | 1,501,572 | 1,719,456 | 1,968,941 | 6,501,257 | 17,430 | 0 | 0 | 0 | 0 | 0 | 0 | ||
| 2021 | 765 | 374 | 286,277 | 16 | 1,145,110 | 1,311,288 | 1,501,572 | 1,719,456 | 5,677,426 | 15,180 | 0 | 0 | 0 | 0 | 0 | 0 | ||
| 2022 | 667 | 375 | 249,996 | 16 | 999,984 | 1,145,110 | 1,311,288 | 1,501,572 | 4,957,954 | 13,221 | 0 | 0 | 0 | 0 | 0 | 0 | ||
| 2023 | 581 | 376 | 218,311 | 16 | 873,244 | 999,984 | 1,145,110 | 1,311,288 | 4,329,626 | 11,515 | 0 | 0 | 0 | 0 | 0 | 0 | ||
| 2024 | 506 | 377 | 190,641 | 16 | 762,562 | 873,244 | 999,984 | 1,145,110 | 3,780,899 | 10,029 | 0 | 0 | 0 | 0 | 0 | 0 | ||
| 2025 | 440 | 372 | 163,834 | 16 | 655,334 | 762,562 | 873,244 | 999,984 | 3,291,124 | 8,847 | 0 | 0 | 0 | 0 | 0 | 0 | ||
| 2026 | 384 | 373 | 143,072 | 16 | 572,288 | 655,334 | 762,562 | 873,244 | 2,863,429 | 7,677 | 0 | 0 | 0 | 0 | 0 | 0 | ||
| 2027 | 334 | 374 | 124,941 | 16 | 499,763 | 572,288 | 655,334 | 762,562 | 2,489,948 | 6,658 | 0 | 0 | 0 | 0 | 0 | 0 | ||
| 2028 | 291 | 375 | 109,106 | 16 | 436,425 | 499,763 | 572,288 | 655,334 | 2,163,811 | 5,770 | 0 | 0 | 0 | 0 | 0 | 0 | ||
| 2029 | 253 | 376 | 95,278 | 16 | 381,112 | 436,425 | 499,763 | 572,288 | 1,889,588 | 5,026 | 0 | 0 | 0 | 0 | 0 | 0 | ||
| 2030 | 221 | 377 | 83,202 | 16 | 332,807 | 381,112 | 436,425 | 499,763 | 1,650,106 | 4,377 | 0 | 0 | 0 | 0 | 0 | 0 | ||
| 2031 | 192 | 378 | 72,656 | 16 | 290,622 | 332,807 | 381,112 | 436,425 | 1,440,966 | 3,812 | 0 | 0 | 0 | 0 | 0 | 0 | ||
| 2032 | 167 | 379 | 63,446 | 16 | 253,783 | 290,622 | 332,807 | 381,112 | 1,258,323 | 3,320 | 0 | 0 | 0 | 0 | 0 | 0 | ||
| 2033 | 146 | 380 | 55,403 | 16 | 221,612 | 253,783 | 290,622 | 332,807 | 1,098,823 | 2,892 | 0 | 0 | 0 | 0 | 0 | 0 | ||
| 2034 | 127 | 381 | 48,379 | 16 | 193,517 | 221,612 | 253,783 | 290,622 | 959,534 | 2,518 | 0 | 0 | 0 | 0 | 0 | 0 | ||
| 2035 | 0 | 382 | 0 | 12 | 0 | 193,517 | 221,612 | 253,783 | 668,912 | 1,751 | 0 | 0 | 0 | 0 | 0 | 0 | ||
| 2036 | 0 | 383 | 0 | 8 | 0 | 0 | 193,517 | 221,612 | 415,129 | 1,084 | 0 | 0 | 0 | 0 | 0 | 0 | ||
| 2037 | 0 | 384 | 0 | 4 | 0 | 0 | 0 | 193,517 | 193,517 | 504 | 0 | 0 | 0 | 0 | 0 | 0 | ||
| 2038 | 0 | 385 | 0 | 0 | 0 | 0 | 0 | 0 | 0 | 0 | 0 | 0 | 0 | 0 | 0 | 0 | ||
| 2039 | 0 | 386 | 0 | 0 | 0 | 0 | 0 | 0 | 0 | 0 | 0 | 0 | 0 | 0 | 0 | 0 | ||
| Total | 13,333,000 | 53,332,000 | 53,332,000 | 53,332,000 | 53,332,000 | 213,328,000 | 0 | 2,500 | 32,000 | 0 | 4,500 | 39,000 | ||||||
29
| Table 3, Page 2 | |||||||||||||||||||||
Mogul Energy International, Inc. | |||||||||||||||||||||
East Wadi Araba Concession | |||||||||||||||||||||
Production Splits - Cost Oil | |||||||||||||||||||||
Prospect High Estimate | |||||||||||||||||||||
| Cost Recovery | |||||||||||||||||||||
| Gross Production | Oil Price | Gross Revenue | Operating Costs - $/yr. | Available Cost Oil | Cost Oil Revenue Ceiling | Annual Costs For Recovery | Cumulative Outstanding Costs | Annual Cost Recovery | Cost Oil | Total Profit Oil | Total Daily Production | Contractors Share | Total Contractors Profit Oil | ||||||||
| Year | STB/yr. | $/STB | $/yr. | Fixed | Variable | Total | STB/yr. | $/yr | $/yr. | $/yr. | $/yr. | STB/yr. | STB/yr. | STB/d | STB/yr. | STB/yr. | STB/yr. | ||||
| 2005 | 0 | $52.00 | $0 | 0 | 0 | 0 | 0 | 0 | 0 | 0 | 0 | 0 | 0 | 0 | 0 | 0 | 0 | ||||
| 2006 | 0 | $52.00 | $0 | 0 | 0 | 0 | 0 | 0 | 0 | 0 | 0 | 0 | 0 | 0 | 0 | 0 | 0 | ||||
| 2007 | 2,918,400 | $52.00 | $151,756,800 | 240,000 | 2,918,400 | 3,158,400 | 875,520 | 45,527,040 | 13,908,400 | 13,908,400 | 13,908,400 | 267,469 | 2,650,931 | 14,534 | 662,733 | 0 | 662,733 | ||||
| 2008 | 8,758,400 | $52.00 | $455,436,800 | 720,000 | 8,758,400 | 9,478,400 | 2,627,520 | 136,631,040 | 22,228,400 | 22,228,400 | 22,228,400 | 427,469 | 8,330,931 | 22,824 | 2,082,733 | 0 | 2,082,733 | ||||
| 2009 | 14,598,400 | $52.00 | $759,116,800 | 1,200,000 | 14,598,400 | 15,798,400 | 4,379,520 | 227,735,040 | 30,548,400 | 30,548,400 | 30,548,400 | 587,469 | 14,010,931 | 38,386 | 2,281,250 | 977,186 | 3,258,436 | ||||
| 2010 | 19,708,400 | $52.00 | $1,024,836,800 | 1,680,000 | 19,708,400 | 21,388,400 | 5,912,520 | 307,451,040 | 38,138,400 | 38,138,400 | 38,138,400 | 733,431 | 18,974,969 | 51,986 | 2,281,250 | 1,969,994 | 4,251,244 | ||||
| 2011 | 21,240,482 | $52.00 | $1,104,505,055 | 1,920,000 | 21,240,482 | 23,160,482 | 6,372,145 | 331,351,516 | 29,160,482 | 29,160,482 | 29,160,482 | 560,778 | 20,679,703 | 56,657 | 2,281,250 | 2,310,941 | 4,592,191 | ||||
| 2012 | 19,276,566 | $52.00 | $1,002,381,415 | 1,920,000 | 19,276,566 | 21,196,566 | 5,782,970 | 300,714,425 | 25,196,566 | 25,196,566 | 25,196,566 | 484,549 | 18,792,016 | 51,485 | 2,281,250 | 1,933,403 | 4,214,653 | ||||
| 2013 | 16,821,635 | $52.00 | $874,725,000 | 1,920,000 | 16,821,635 | 18,741,635 | 5,046,490 | 262,417,500 | 20,741,635 | 20,741,635 | 20,741,635 | 398,878 | 16,422,757 | 44,871 | 2,287,500 | 1,454,551 | 3,742,051 | ||||
| 2014 | 14,667,867 | $52.00 | $762,729,104 | 1,920,000 | 14,667,867 | 16,587,867 | 4,400,360 | 228,818,731 | 16,587,867 | 16,587,867 | 16,587,867 | 318,997 | 14,348,870 | 39,098 | 2,293,750 | 1,034,774 | 3,328,524 | ||||
| 2015 | 12,799,090 | $52.00 | $665,552,677 | 1,920,000 | 12,799,090 | 14,719,090 | 3,839,727 | 199,665,803 | 14,719,090 | 14,719,090 | 14,719,090 | 283,059 | 12,516,031 | 34,011 | 2,300,000 | 663,206 | 2,963,206 | ||||
| 2016 | 11,177,615 | $52.00 | $581,235,973 | 1,920,000 | 11,177,615 | 13,097,615 | 3,353,284 | 174,370,792 | 13,097,615 | 13,097,615 | 13,097,615 | 251,877 | 10,925,738 | 29,609 | 2,306,250 | 340,148 | 2,646,398 | ||||
| 2017 | 9,761,487 | $52.00 | $507,597,316 | 1,920,000 | 9,761,487 | 11,681,487 | 2,928,446 | 152,279,195 | 11,681,487 | 11,681,487 | 11,681,487 | 224,644 | 9,536,843 | 25,775 | 2,312,500 | 57,369 | 2,369,869 | ||||
| 2018 | 8,524,710 | $52.00 | $443,284,910 | 1,920,000 | 8,524,710 | 10,444,710 | 2,557,413 | 132,985,473 | 10,444,710 | 10,444,710 | 10,444,710 | 200,860 | 8,323,850 | 22,436 | 2,080,963 | 0 | 2,080,963 | ||||
| 2019 | 7,444,577 | $52.00 | $387,118,026 | 1,920,000 | 7,444,577 | 9,364,577 | 2,233,373 | 116,135,408 | 9,364,577 | 9,364,577 | 9,364,577 | 180,088 | 7,264,489 | 19,528 | 1,816,122 | 0 | 1,816,122 | ||||
| 2020 | 6,501,257 | $52.00 | $338,065,361 | 1,920,000 | 6,501,257 | 8,421,257 | 1,950,377 | 101,419,608 | 8,421,257 | 8,421,257 | 8,421,257 | 161,947 | 6,339,310 | 16,995 | 1,584,827 | 0 | 1,584,827 | ||||
| 2021 | 5,677,426 | $52.00 | $295,226,138 | 1,920,000 | 5,677,426 | 7,597,426 | 1,703,228 | 88,567,841 | 7,597,426 | 7,597,426 | 7,597,426 | 146,104 | 5,531,321 | 14,790 | 1,382,830 | 0 | 1,382,830 | ||||
| 2022 | 4,957,954 | $52.00 | $257,813,588 | 1,920,000 | 4,957,954 | 6,877,954 | 1,487,386 | 77,344,076 | 6,877,954 | 6,877,954 | 6,877,954 | 132,268 | 4,825,685 | 12,868 | 1,206,421 | 0 | 1,206,421 | ||||
| 2023 | 4,329,626 | $52.00 | $225,140,530 | 1,920,000 | 4,329,626 | 6,249,626 | 1,298,888 | 67,542,159 | 6,249,626 | 6,249,626 | 6,249,626 | 120,185 | 4,209,440 | 11,195 | 1,052,360 | 0 | 1,052,360 | ||||
| 2024 | 3,780,899 | $52.00 | $196,606,769 | 1,920,000 | 3,780,899 | 5,700,899 | 1,134,270 | 58,982,031 | 5,700,899 | 5,700,899 | 5,700,899 | 109,633 | 3,671,267 | 9,738 | 917,817 | 0 | 917,817 | ||||
| 2025 | 3,291,124 | $52.00 | $171,138,453 | 1,920,000 | 3,291,124 | 5,211,124 | 987,337 | 51,341,536 | 5,211,124 | 5,211,124 | 5,211,124 | 100,214 | 3,190,910 | 8,578 | 797,728 | 0 | 797,728 | ||||
| 2026 | 2,863,429 | $52.00 | $148,898,304 | 1,920,000 | 2,863,429 | 4,783,429 | 859,029 | 44,669,491 | 4,783,429 | 4,783,429 | 4,783,429 | 91,989 | 2,771,440 | 7,430 | 692,860 | 0 | 692,860 | ||||
| 2027 | 2,489,948 | $52.00 | $129,477,280 | 1,920,000 | 2,489,948 | 4,409,948 | 746,984 | 38,843,184 | 4,409,948 | 4,409,948 | 4,409,948 | 84,807 | 2,405,141 | 6,431 | 601,285 | 0 | 601,285 | ||||
| 2028 | 2,163,811 | $52.00 | $112,518,153 | 1,920,000 | 2,163,811 | 4,083,811 | 649,143 | 33,755,446 | 4,083,811 | 4,083,811 | 4,083,811 | 78,535 | 2,085,276 | 5,561 | 521,319 | 0 | 521,319 | ||||
| 2029 | 1,889,588 | $52.00 | $98,258,578 | 1,920,000 | 1,889,588 | 3,809,588 | 566,876 | 29,477,573 | 3,809,588 | 3,809,588 | 3,809,588 | 73,261 | 1,816,327 | 4,831 | 454,082 | 0 | 454,082 | ||||
| 2030 | 1,650,106 | $52.00 | $85,805,526 | 1,920,000 | 1,650,106 | 3,570,106 | 495,032 | 25,741,658 | 3,570,106 | 3,570,106 | 3,570,106 | 68,656 | 1,581,450 | 4,195 | 395,363 | 0 | 395,363 | ||||
| 2031 | 1,440,966 | $52.00 | $74,930,211 | 1,920,000 | 1,440,966 | 3,360,966 | 432,290 | 22,479,063 | 3,360,966 | 3,360,966 | 3,360,966 | 64,634 | 1,376,332 | 3,641 | 344,083 | 0 | 344,083 | ||||
| 2032 | 1,258,323 | $52.00 | $65,432,813 | 1,920,000 | 1,258,323 | 3,178,323 | 377,497 | 19,629,844 | 3,178,323 | 3,178,323 | 3,178,323 | 61,122 | 1,197,202 | 3,159 | 299,300 | 0 | 299,300 | ||||
| 2033 | 1,098,823 | $52.00 | $57,138,807 | 1,920,000 | 1,098,823 | 3,018,823 | 329,647 | 17,141,642 | 3,018,823 | 3,018,823 | 3,018,823 | 58,054 | 1,040,769 | 2,739 | 260,192 | 0 | 260,192 | ||||
| 2034 | 959,534 | $52.00 | $49,895,769 | 1,920,000 | 959,534 | 2,879,534 | 287,860 | 14,968,731 | 2,879,534 | 2,879,534 | 2,879,534 | 55,376 | 904,158 | 2,373 | 226,040 | 0 | 226,040 | ||||
| 2035 | 668,912 | $52.00 | $34,783,421 | 1,440,000 | 668,912 | 2,108,912 | 200,674 | 10,435,026 | 2,108,912 | 2,108,912 | 2,108,912 | 40,556 | 628,356 | 1,645 | 157,089 | 0 | 157,089 | ||||
| 2036 | 415,129 | $52.00 | $21,586,716 | 960,000 | 415,129 | 1,375,129 | 124,539 | 6,476,015 | 1,375,129 | 1,375,129 | 1,375,129 | 26,445 | 388,684 | 1,015 | 97,171 | 0 | 97,171 | ||||
| 2037 | 193,517 | $52.00 | $10,062,908 | 480,000 | 193,517 | 673,517 | 58,055 | 3,018,873 | 673,517 | 673,517 | 673,517 | 12,952 | 180,565 | 470 | 45,141 | 0 | 45,141 | ||||
| 2038 | 0 | $52.00 | $0 | 0 | 0 | 0 | 0 | 0 | 0 | 0 | 0 | 0 | 0 | 0 | 0 | 0 | 0 | ||||
| 2039 | 0 | $52.00 | $0 | 0 | 0 | 0 | 0 | 0 | 0 | 0 | 0 | 0 | 0 | 0 | 0 | 0 | 0 | ||||
| Total | 213,328,000 | $11,093,056,000 | $52,800,000 | $213,328,000 | $266,128,000 | 3,327,916,800 | 333,128,000 | 333,128,000 | 333,128,000 | 6,406,308 | 206,921,692 | 38,303,459 | 10,741,572 | 49,045,030 | |||||||
| 25% | 20% | ||||||||||||||||||||
| 0 to 25000 | 25001 + | ||||||||||||||||||||
30
| Table 3, Page 3 | ||||||||||||||||||||
Mogul Energy International, Inc. | ||||||||||||||||||||
East Wadi Araba Concession | ||||||||||||||||||||
Cash Flow and Net Present Value | ||||||||||||||||||||
Prospect High Estimate | ||||||||||||||||||||
| Undiscounted | Discounted @ | |||||||||||||||||||
| Year | Cost Oil STB/yr. | Net Profit Oil STB/yr. | Total Net Oil STB/yr. | Oil Price $/STB | Contractor's Total Revenue (Operating Cash Flow) M$/yr. | Total Operating Costs M$/yr. | Net Operating Income M$/yr. | Total Capital Costs M$/yr. | Contractor Net Cash Flow M$/yr. | Company Net Cash Flow M$/yr. | 5% M$ | 10% M$ | 15% M$ | 20% M$ | ||||||
| 2005 | 0 | 0 | 0 | $52.00 | 0 | 0 | 0 | 0 | 0 | 0 | 0 | 0 | 0 | 0 | ||||||
| 2006 | 0 | 0 | 0 | $52.00 | 0 | 0 | 0 | 0 | 0 | 0 | 0 | 0 | 0 | 0 | ||||||
| 2007 | 267,469 | 662,733 | 930,202 | $52.00 | 48,371 | 3,158 | 45,212 | 15,000 | 30,212 | 6,042 | 5,616 | 5,237 | 4,900 | 4,597 | ||||||
| 2008 | 427,469 | 2,082,733 | 2,510,202 | $52.00 | 130,531 | 9,478 | 121,052 | 8,000 | 113,052 | 22,610 | 20,014 | 17,817 | 15,943 | 14,334 | ||||||
| 2009 | 587,469 | 3,258,436 | 3,845,905 | $52.00 | 199,987 | 15,798 | 184,189 | 8,000 | 176,189 | 35,238 | 29,706 | 25,243 | 21,606 | 18,615 | ||||||
| 2010 | 733,431 | 4,251,244 | 4,984,675 | $52.00 | 259,203 | 21,388 | 237,815 | 8,000 | 229,815 | 45,963 | 36,903 | 29,932 | 24,506 | 20,234 | ||||||
| 2011 | 560,778 | 4,592,191 | 5,152,969 | $52.00 | 267,954 | 23,160 | 244,794 | 0 | 244,794 | 48,959 | 37,436 | 28,985 | 22,698 | 17,961 | ||||||
| 2012 | 484,549 | 4,214,653 | 4,699,203 | $52.00 | 244,359 | 21,197 | 223,162 | 0 | 223,162 | 44,632 | 32,503 | 24,021 | 17,993 | 13,645 | ||||||
| 2013 | 398,878 | 3,742,051 | 4,140,929 | $52.00 | 215,328 | 18,742 | 196,587 | 0 | 196,587 | 39,317 | 27,269 | 19,237 | 13,783 | 10,017 | ||||||
| 2014 | 318,997 | 3,328,524 | 3,647,521 | $52.00 | 189,671 | 16,588 | 173,083 | 0 | 173,083 | 34,617 | 22,865 | 15,397 | 10,552 | 7,349 | ||||||
| 2015 | 283,059 | 2,963,206 | 3,246,266 | $52.00 | 168,806 | 14,719 | 154,087 | 0 | 154,087 | 30,817 | 19,386 | 12,461 | 8,169 | 5,452 | ||||||
| 2016 | 251,877 | 2,646,398 | 2,898,275 | $52.00 | 150,710 | 13,098 | 137,613 | 0 | 137,613 | 27,523 | 16,489 | 10,117 | 6,344 | 4,058 | ||||||
| 2017 | 224,644 | 2,369,869 | 2,594,513 | $52.00 | 134,915 | 11,681 | 123,233 | 0 | 123,233 | 24,647 | 14,063 | 8,236 | 4,940 | 3,028 | ||||||
| 2018 | 200,860 | 2,080,963 | 2,281,822 | $52.00 | 118,655 | 10,445 | 108,210 | 0 | 108,210 | 21,642 | 11,761 | 6,575 | 3,772 | 2,216 | ||||||
| 2019 | 180,088 | 1,816,122 | 1,996,210 | $52.00 | 103,803 | 9,365 | 94,438 | 0 | 94,438 | 18,888 | 9,775 | 5,216 | 2,863 | 1,612 | ||||||
| 2020 | 161,947 | 1,584,827 | 1,746,775 | $52.00 | 90,832 | 8,421 | 82,411 | 0 | 82,411 | 16,482 | 8,124 | 4,138 | 2,172 | 1,172 | ||||||
| 2021 | 146,104 | 1,382,830 | 1,528,935 | $52.00 | 79,505 | 7,597 | 71,907 | 0 | 71,907 | 14,381 | 6,751 | 3,283 | 1,648 | 852 | ||||||
| 2022 | 132,268 | 1,206,421 | 1,338,690 | $52.00 | 69,612 | 6,878 | 62,734 | 0 | 62,734 | 12,547 | 5,609 | 2,603 | 1,250 | 620 | ||||||
| 2023 | 120,185 | 1,052,360 | 1,172,545 | $52.00 | 60,972 | 6,250 | 54,723 | 0 | 54,723 | 10,945 | 4,660 | 2,065 | 948 | 450 | ||||||
| 2024 | 109,633 | 917,817 | 1,027,449 | $52.00 | 53,427 | 5,701 | 47,726 | 0 | 47,726 | 9,545 | 3,871 | 1,637 | 719 | 327 | ||||||
| 2025 | 100,214 | 797,728 | 897,941 | $52.00 | 46,693 | 5,211 | 41,482 | 0 | 41,482 | 8,296 | 3,204 | 1,293 | 544 | 237 | ||||||
| 2026 | 91,989 | 692,860 | 784,849 | $52.00 | 40,812 | 4,783 | 36,029 | 0 | 36,029 | 7,206 | 2,650 | 1,021 | 411 | 172 | ||||||
| 2027 | 84,807 | 601,285 | 686,092 | $52.00 | 35,677 | 4,410 | 31,267 | 0 | 31,267 | 6,253 | 2,191 | 806 | 310 | 124 | ||||||
| 2028 | 78,535 | 521,319 | 599,854 | $52.00 | 31,192 | 4,084 | 27,109 | 0 | 27,109 | 5,422 | 1,809 | 635 | 234 | 90 | ||||||
| 2029 | 73,261 | 454,082 | 527,343 | $52.00 | 27,422 | 3,810 | 23,612 | 0 | 23,612 | 4,722 | 1,500 | 503 | 177 | 65 | ||||||
| 2030 | 68,656 | 395,363 | 464,018 | $52.00 | 24,129 | 3,570 | 20,559 | 0 | 20,559 | 4,112 | 1,244 | 398 | 134 | 47 | ||||||
| 2031 | 64,634 | 344,083 | 408,717 | $52.00 | 21,253 | 3,361 | 17,892 | 0 | 17,892 | 3,578 | 1,031 | 315 | 101 | 34 | ||||||
| 2032 | 61,122 | 299,300 | 360,422 | $52.00 | 18,742 | 3,178 | 15,564 | 0 | 15,564 | 3,113 | 854 | 249 | 77 | 25 | ||||||
| 2033 | 58,054 | 260,192 | 318,247 | $52.00 | 16,549 | 3,019 | 13,530 | 0 | 13,530 | 2,706 | 707 | 197 | 58 | 18 | ||||||
| 2034 | 55,376 | 226,040 | 281,415 | $52.00 | 14,634 | 2,880 | 11,754 | 0 | 11,754 | 2,351 | 585 | 155 | 44 | 13 | ||||||
| 2035 | 40,556 | 157,089 | 197,645 | $52.00 | 10,278 | 2,109 | 8,169 | 0 | 8,169 | 1,634 | 387 | 98 | 26 | 8 | ||||||
| 2036 | 26,445 | 97,171 | 123,616 | $52.00 | 6,428 | 1,375 | 5,053 | 0 | 5,053 | 1,011 | 228 | 55 | 14 | 4 | ||||||
| 2037 | 12,952 | 45,141 | 58,094 | $52.00 | 3,021 | 674 | 2,347 | 0 | 2,347 | 469 | 101 | 23 | 6 | 2 | ||||||
| 2038 | 0 | 0 | 0 | $52.00 | 0 | 0 | 0 | 0 | 0 | 0 | 0 | 0 | 0 | 0 | ||||||
| 2039 | 0 | 0 | 0 | $52.00 | 0 | 0 | 0 | 0 | 0 | 0 | 0 | 0 | 0 | 0 | ||||||
| Total | 6,406,308 | 49,045,030 | 55,451,338 | 2,883,470 | 266,128 | 2,617,342 | 39,000 | 2,578,342 | 515,668 | 329,294 | 227,951 | 166,942 | 127,376 | |||||||
| Company Interest = | 20% | |||||||||||||||||||
31
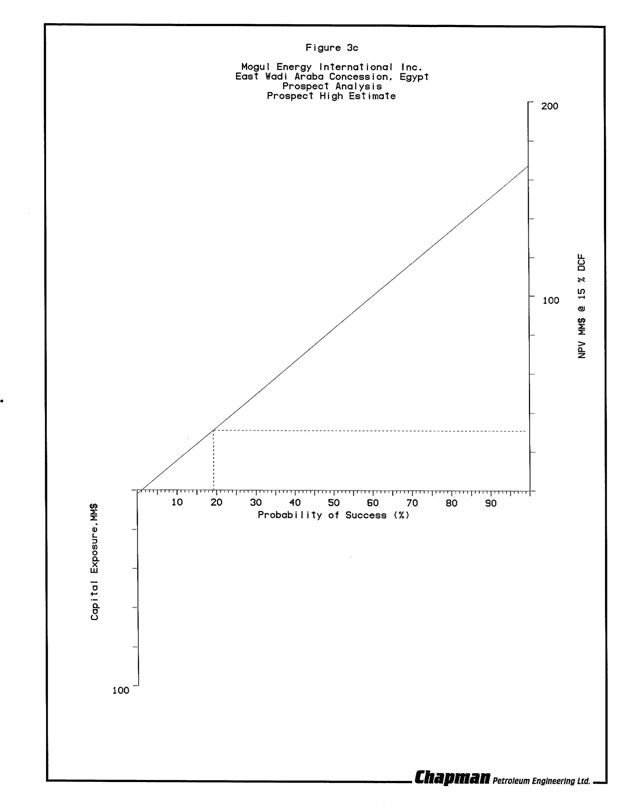
32
Figure 3c
(cont'd)
Mogul Energy International Inc.
East Wadi Araba Concession, Egypt
Prospect Analysis
Prospect High Estimate
ECONOMIC PARAMETERS | ||||||||||||||||
| Net Capital Exposure, M$ | 2000.0 | |||||||||||||||
| Probability of success, % | 19 | |||||||||||||||
TOTAL VALUES | ||||||||||||||||
| Discount Rate, % | undisc. | 5 | 10 | 15 | 20 | |||||||||||
| Unrisked Value, M$ | 515668.0 | 329294.0 | 227957.0 | 166942.0 | 127376.0 | |||||||||||
| Risked Value, M$ | 97392.3 | 61608.5 | 42151.7 | 30436.9 | 22840.2 | |||||||||||
| Minimum Prob. of Success Req'd, % | 0.4 | 0.6 | 0.9 | 1.2 | 1.5 | |||||||||||

33
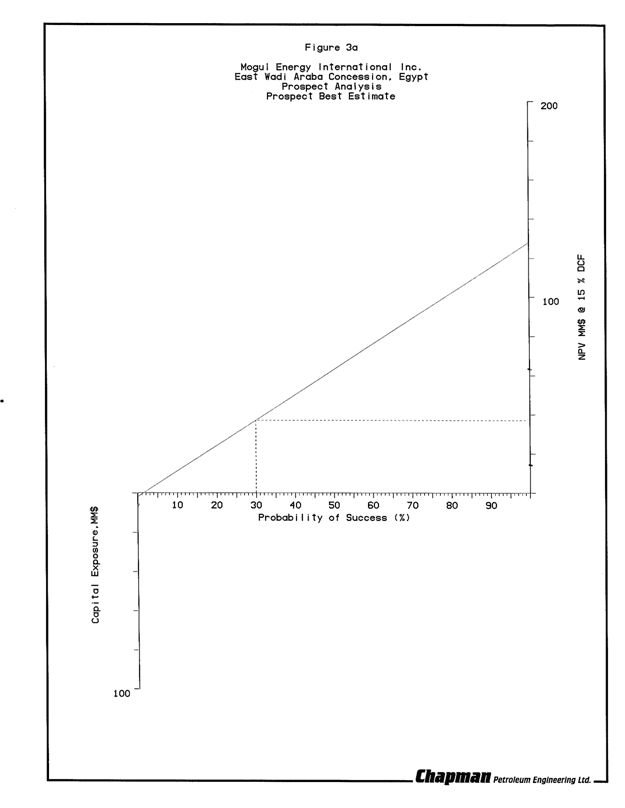
34
Figure 3a
(cont'd)
Mogul Energy International Inc.
East Wadi Araba Concession, Egypt
Prospect Analysis
Prospect Best Estimate
ECONOMIC PARAMETERS | ||||||||||||||||
| Net Capital Exposure, M$ | 2000.0 | |||||||||||||||
| Probability of success, % | 30 | |||||||||||||||
TOTALVALUES | ||||||||||||||||
| Discount Rate, % | undisc. | 5 | 10 | 15 | 20 | |||||||||||
| Unrisked Value, M$ | 396866.0 | 252561.0 | 174551.0 | 127732.0 | 97414.0 | |||||||||||
| Risked Value, M$ | 117659.8 | 74368.3 | 50965.3 | 36919.6 | 27824.2 | |||||||||||
| Minimum Prob. of Success Req'd, % | 0.5 | 0.8 | 1.1 | 1.5 | 2.0 | |||||||||||
35

36
Figure 3b
(cont'd)
Mogul Energy International Inc.
East Wadi Araba Concession, Egypt
Prospect Analysis
Prospect Low Estimate
ECONOMIC PARAMETERS | ||||||||||||||||
| Net Capital Exposure, M$ | 2000.0 | |||||||||||||||
| Probability of success, % | 41 | |||||||||||||||
TOTAL VALUES | ||||||||||||||||
| Discount Rate, % | undisc. | 5 | 10 | 15 | 20 | |||||||||||
| Unrisked Value, M$ | 270281.0 | 178006.0 | 125133.0 | 92273.0 | 70549.0 | |||||||||||
| Risked Value, M$ | 109090.6 | 71442.5 | 49870.3 | 36463.4 | 27600.0 | |||||||||||
| Minimum Prob. of Success Req'd, % | 0.7 | 1.1 | 1.6 | 2.1 | 2.8 | |||||||||||
37