Grupo Aeroportuario del Centro Norte, S.A.B. de C.V. (OMAB)
Filed: 24 Feb 25, 9:37pm
UNITED STATES
SECURITIES AND EXCHANGE COMMISSION
Washington, D.C. 20549
FORM 6-K
REPORT OF FOREIGN PRIVATE ISSUER
PURSUANT TO RULE 13a-16 OR 15d-16 UNDER
THE SECURITIES EXCHANGE ACT OF 1934
For the month of February 2025
GRUPO AEROPORTUARIO DEL CENTRO NORTE, S.A.B. DE C.V.
| (CENTRAL NORTH AIRPORT GROUP) |
(Translation of Registrant’s Name Into English)
| México |
(Jurisdiction of incorporation or organization)
Torre Latitud, L501, Piso 5
Av. Lázaro Cárdenas 2225
Col. Valle Oriente, San Pedro Garza García
| Nuevo León, México |
(Address of principal executive offices)
(Indicate by check mark whether the registrant files or will file annual reports under cover of Form 20-F or Form 40-F.)
| Form 20-F ☒ Form 40-F ☐ |
(Indicate by check mark whether the registrant by furnishing the information contained in this form is also thereby furnishing the information to the Commission pursuant to Rule 12g3-2(b) under the Securities Exchange Act of 1934.)
| Yes ☐ No ☒ |
(If “Yes” is marked, indicate below the file number assigned to the registrant in connection with Rule 12g3-2(b): 82- .)

OMA Announces Fourth Quarter 2024
Operating and Financial Results
Mexico City, Mexico, February 24, 2025— Mexican airport operator Grupo Aeroportuario del Centro Norte, S.A.B. de C.V., known as OMA (NASDAQ: OMAB; BMV: OMA), today reported its unaudited, consolidated financial and operating results for the fourth quarter 2024 (4Q24).
Full-year 2024 summary
| § | Passenger traffic decreased 1.2%, reaching 26.5 million passengers during 2024. |
| § | The capital investments and major maintenance works included in the Master Development Plans (MDPs) plus strategic investments in 2024 reached Ps.3,458 million. |
| § | In 2024, Adjusted EBITDA was Ps.9,069 million, remaining flat when compared against Adjusted EBITDA of 2023. |
| § | During the year, OMA distributed dividends for Ps.10.89 per share; the leverage level measured by Net Debt/Adjusted EBITDA was of 1.1x as of December 31, 2024. |
4Q24 summary
| § | Passenger traffic increased 4.6% during 4Q24, as compared to 4Q23, reaching 7.1 million passengers. The airports with the highest traffic growth compared to 4Q23 were Monterrey, Acapulco, Mazatlán, Durango, and San Luis Potosí. |
| § | The sum of aeronautical and non-aeronautical revenues grew 13.6%, as compared to 4Q23. |
| § | Adjusted EBITDA reached Ps.2,433 million. |
| § | Capital investments and major maintenance works included in the Master Development Plans (MDPs) plus strategic investments were Ps.951 million in the quarter. |

Chief Financial Officer Ruffo Pérez Pliego +52 (81) 8625 4300 rperezpliego@oma.aero | Investor Relations: Luis Emmanuel Camacho +52 (81) 8625 4308 ecamacho@oma.aero |

www.oma.aero


OMA will hold its 4Q24 earnings conference call on February 25, 2025 at 11:00 a.m. Eastern time, 10:00 a.m. Mexico City time.
Call +1-877-407-9208 toll-free from the U.S. or +1-201-493-6784 from outside the U.S. The conference ID is 13751612. The conference call will also be available by webcast at:
https://viavid.webcasts.com/starthere.jsp?ei=1707079&tp_key=999e3a9502.
2
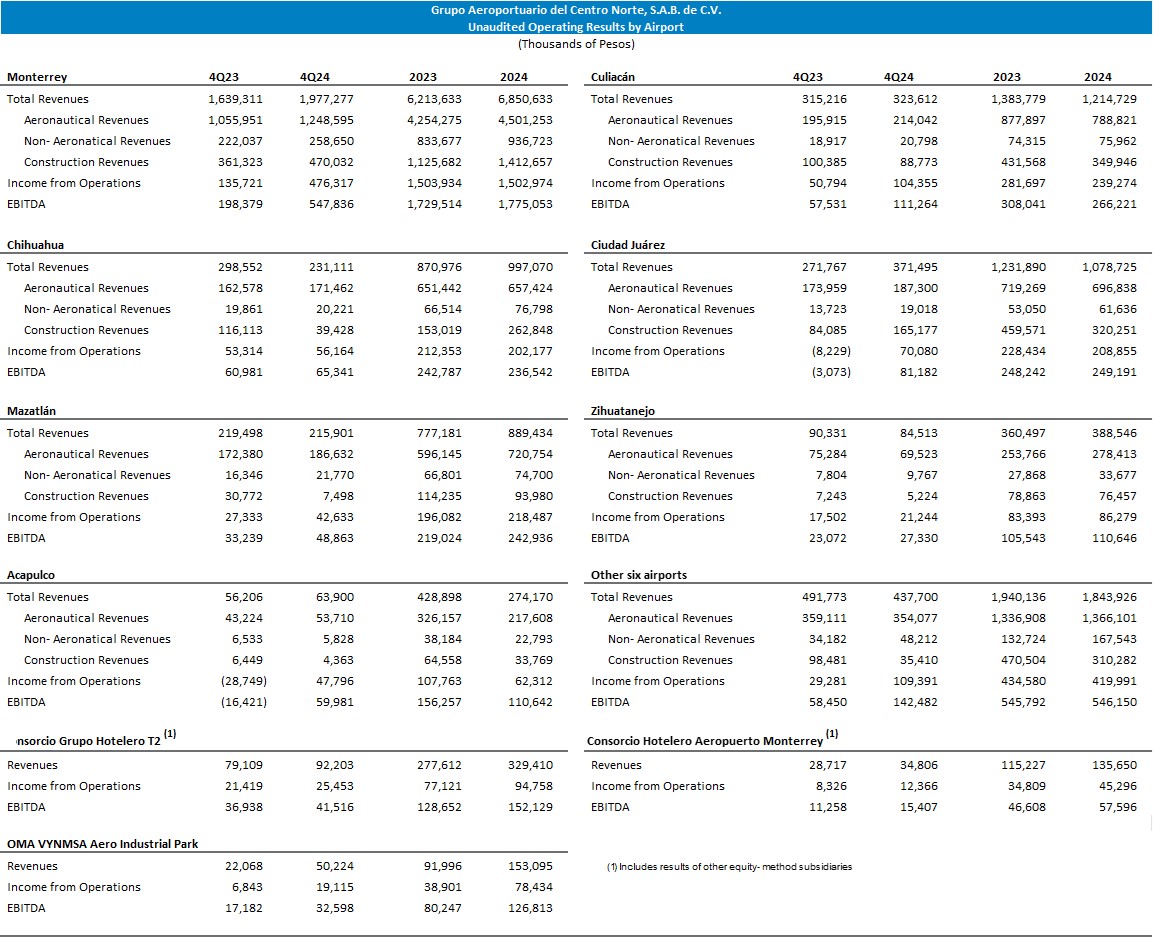
4Q24 Operating Results
Operations, Passengers, and Cargo
The number of seats offered increased 3.3% compared to 4Q23.
During the quarter, 28 routes started operations, of which 12 were domestic routes and 16 were international routes.

Total passenger traffic reached 7.1 million passengers, an increase of 4.6% as compared to 4Q23. During the quarter, of total traffic, 84.9% was domestic and 15.1% was international.
Domestic passenger traffic grew 1.5%, compared to 4Q23, while international traffic increased 26.4%.
3
The airports with the largest passenger traffic growth in volume terms as compared to 4Q23, were:
| § | Monterrey (+9.1%), on its Santa Lucía (AIFA), Querétaro, Ciudad Juárez, Toluca and Hermosillo routes. |
| § | Acapulco (+44.8%), on its Tijuana, Guadalajara and Santa Lucía (AIFA) routes, whose growth is mainly attributed to the impact of Hurricane Otis in 4Q23. |
| § | Mazatlán (+6.4%), on its Santa Lucía (AIFA), Tijuana and Dallas Fort Worth routes. |
The airports with the largest passenger traffic decrease in volume terms as compared to 4Q23, were:
| § | Culiacán (-6.4%), on its Mexicali, Mexico City and Cancún routes. |
| § | Zacatecas (-18.2%), on its Tijuana route. |
| § | Chihuahua (-3.6%), on its Cancún, Mexico City and Mexicali routes. |

Commercial Operations
The commercial space occupancy rate in the passenger terminals was 95.9% as of December 31, 2024.
Freight Logistics Services
| § | OMA Carga’s revenues increased by 18.0%, as compared to 4Q23, due to an increase in revenues from the ground cargo operations in Monterrey. |
Hotel Services
| § | The NH Collection Terminal 2 Hotel had an 84.4% occupancy rate, compared to 92.4% in 4Q23, with a 27.8% increase in the average room rate to Ps.3,447 per night. |
| § | Hilton Garden Inn had a 72.2% occupancy rate, compared to 68.0% in 4Q23, with a 21.7% increase in the average room rate to Ps.3,332 per night. |
4
Industrial Services
| § | OMA VYNMSA Aero Industrial Park: Revenues reached Ps.47.3 million, an increase of 130.8% versus 4Q23. The increase is mainly explained by a higher number of square meters leased as compared to 4Q23. |
Consolidated Financial Results
Revenues
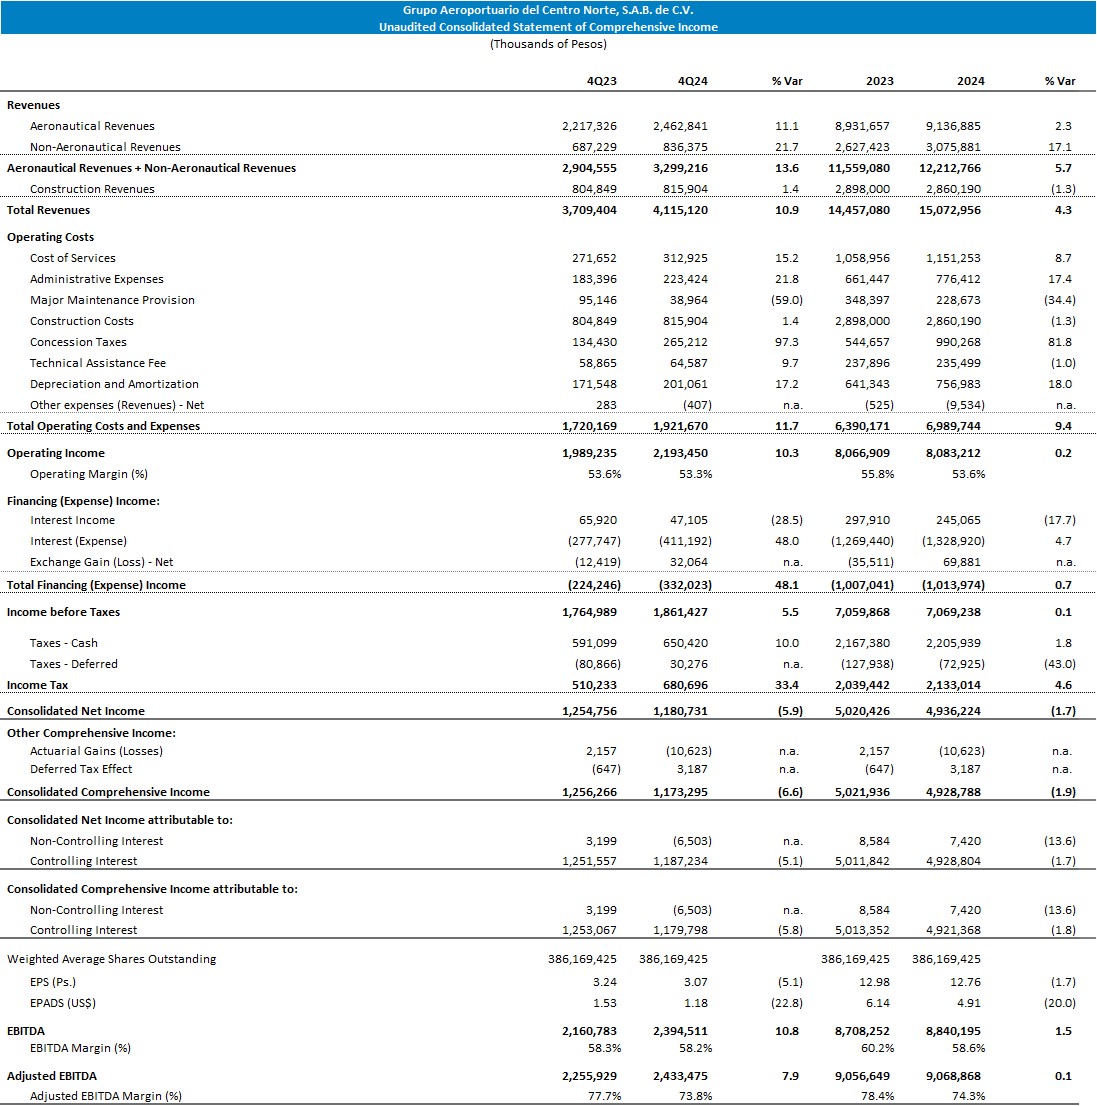
Aeronautical revenues increased 11.1%.

Non-aeronautical revenues increased 21.7%.
Commercial revenues increased 19.1%. The line items with the largest increases were:
| § | Restaurants, +29.4%, as a result of the opening or replacement of outlets throughout the year (8 outlets in the quarter), with higher variable rents. |
| § | VIP Lounges, +58.7%, as a result of an increase in rates and a higher number of users. In November 2024, a new lounge began operations at the Durango airport. |
| § | Retail, +29.4%, mainly as a result of the contribution of new spaces opened or replacements in existing spaces in previous quarters and the opening or replacement of 19 outlets in the quarter. |

5
Diversification revenues increased 28.0%, mainly due to higher revenues from Industrial Services and Hotel Services.

Construction revenues represent the value of improvements to concessioned assets. They are equal to construction costs and generate neither a gain nor a loss. Construction revenues and costs are determined based on the advance in the execution of projects in accordance with the airports’ Master Development Programs (MDP), and variations depend on the rate of project execution.

Costs and Operating Expenses
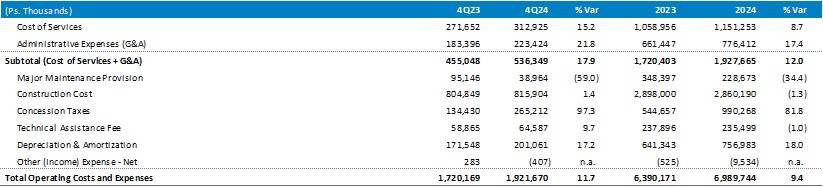
The sum of cost of airport services and general and administrative expenses (G&A) increased 14.9% as compared to 4Q23.
6

The major maintenance provision expense was Ps.39 million. The outstanding balance of the maintenance provision as of December 31, 2024 was Ps.2,284 million.
The airport concession tax increased 97% to Ps.265.2 million, as a result of the change in the rate from 5% to 9% applied to the revenues generated by OMA’s airport concessions, pursuant to the Mexican Federal Duties Law. Under the Tariff Regulation Bases effective as of October 20, 2023, payments made to the government related to aeronautical revenues, in excess of those included in the most recent tariff revision, will be added to the reference value to be used in the next joint maximum tariff revision. Therefore, starting in January 2026, these excess airport concession taxes amounts paid will begin to be recovered through the maximum tariff.
In the fourth quarter of 2024, the 4% excess of Concession Tax levied on aeronautical revenues amounted to Ps.101.7 million, equivalent to 3.1% of the sum of OMA's aeronautical and non-aeronautical revenues. This amount is included within the Ps.265.2 million recorded as Concession Tax expense in 4Q24. Excluding the Ps.101.7 million and its effects on OMA's results, Adjusted EBITDA for OMA would have been Ps.2,532 million, with a margin of 76.7%.
The technical assistance fee was Ps.64.6 million.
Total operating costs and expenses increased 11.7%.
7
Operating Income and Adjusted EBITDA
Operating Income was Ps.2,193 million, with an operating margin of 53.3%.
Adjusted EBITDA was Ps.2,433 million, with a margin of 73.8%.
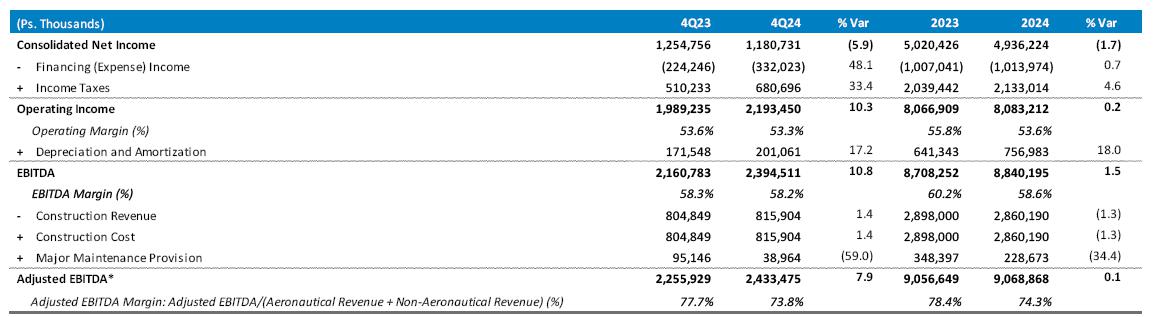
*Excluding the incremental effect of the concession tax on aeronautical revenues, OMA's Adjusted EBITDA would have been Ps.2,532 million, with a margin of 76.7% during 4Q24. For the twelve months ended on December 31, 2024, Adjusted EBITDA would have been Ps.9,440 million, with a margin of 77.3%
Financing Expense and Net Income
Financing Expense grew 48.1% as compared to 4Q23. The increase is primarily due to a higher interest expense resulting from a change in the present value of major maintenance provision as a result of a decrease in the discount rates used for its calculation. This cost does not impact the cash flow.

Consolidated net income in the quarter was Ps.1,181 million, a decrease of 5.9% as compared to 4Q23.
Earnings per share, based on net income of the controlling interest was Ps.3.07, and earnings per ADS was US$1.18. Each ADS represents eight Series B shares.

8
MDP and Strategic Investments
In 4Q24, capital investments and major maintenance works in the MDPs and strategic investments totaled Ps.951 million, comprised of Ps.816 million in improvements to concessioned assets, Ps.63 million in major maintenance, Ps.68 million in strategic investments and Ps.4 million in other concepts.
The most important investment expenditures included:

Indebtedness

9
Derivatives
As of the date of this report, OMA has no financial derivatives exposure.
Cash Flow Statement
During 4Q24, cash flows from operating activities generated cash of Ps.1,870 million.
Investing activities used cash for Ps.846 million in the fourth quarter. Financing activities reflect mainly the second installment of the ordinary dividend for Ps.2,125 million, resulting in a net cash outflow of Ps.1,784 million in the quarter.
The net reduction in cash resulting from operating, investing and financing activities in 4Q24 was Ps.761 million. This, combined with the positive effect of changes in the value of cash of Ps.20 million, resulted in a Cash and Cash Equivalents balance as of December 31, 2024 of Ps.1,656 million.

10
Relevant Events.
OMA obtains Ps.600 million in short-term financing. In November 2024, OMA obtained short-term loans for an aggregate amount of Ps.600 million with three banks. Proceeds were used to support working capital needs and strengthen the company’s liquidity position. Loans mature until May 2025 and carry an annual weighted average interest rate of TIIE 28 + 60 basis points. Through these financings, OMA continues to maintain a solid capital structure. From the previously mentioned amount, on February 12, 2025, OMA made a payment of Ps.150 million of the short-term loan contracted.
OMA's 13 airports achieve Level 3 "Optimization" Accreditation from the Airport Carbon Accreditation (ACA) Program. On February 13, 2025, the Company reports that its 13 airports achieved Level 3 accreditation under the Airport Carbon Accreditation (ACA) program. The carbon footprint accreditation program, led by Airports Council International (ACI), aims to reduce the carbon footprint in the airport industry.
11

12
13
14

15

16
17
Notes to the Financial Information
Financial statements are prepared in accordance with International Financial Reporting Standards (“IFRS”), and presented in accordance with IAS 34 “Interim Financial Reporting.” For more information, please refer to our Quarterly Financial Information submitted to the Mexican Stock Exchange (www.bmv.com.mx)
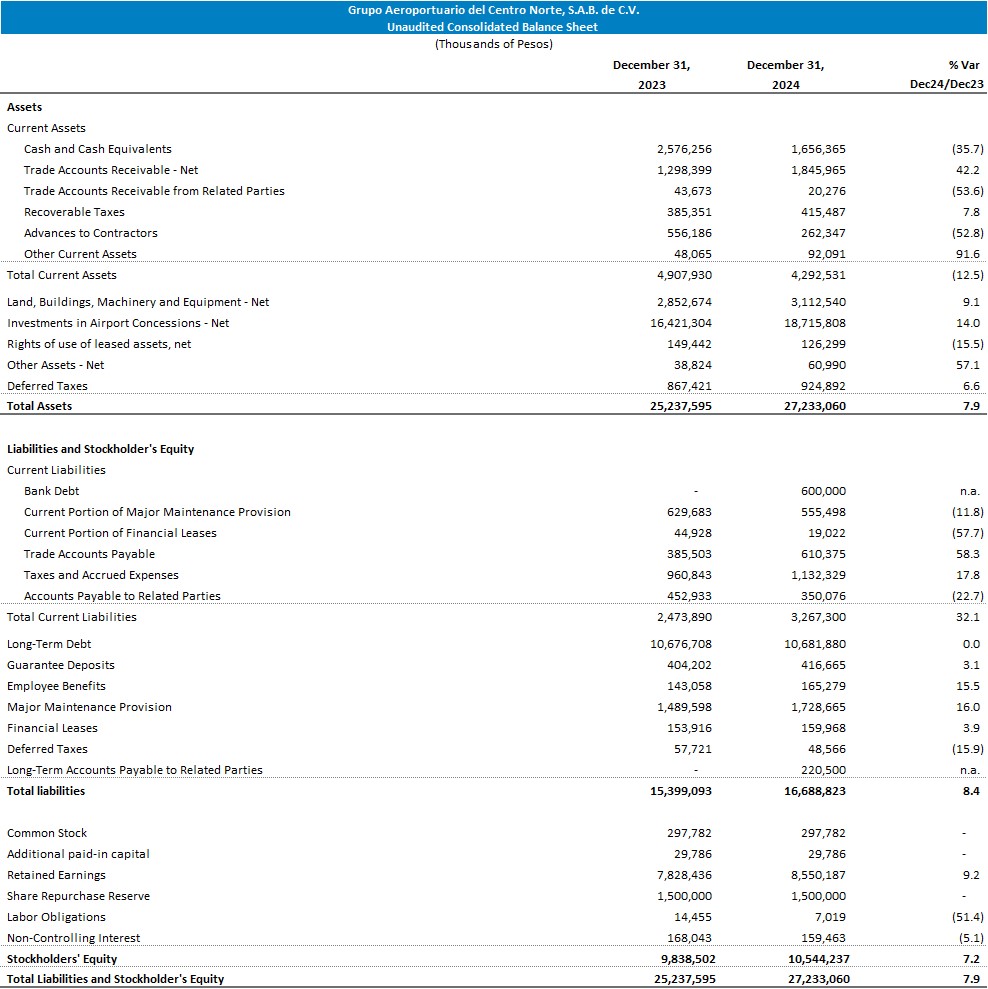
Unless stated otherwise, all comparisons of operating or financial results are made with respect to the comparable period of 2023. The exchange rates used to convert foreign currency amounts were Ps.16.9190 as of December 31, 2023, and Ps.20.7862 as of December 31, 2024.
Construction revenue, construction cost: IFRIC 12 “Service Concession Arrangements” addresses how service concession operators should account for the obligations they undertake and rights they receive in service concession arrangements. The concession contracts for each of OMA’s airport subsidiaries establishes that the concessionaire is obligated to carry out improvements to the infrastructure transferred in exchange for the rights over the concession granted by the Federal Government. The latter will receive all the assets at the end of the concession period. As a result, the concessionaire should recognize, using the percentage of completion method, the revenues and costs associated with the improvements to the concessioned assets. The amount of the revenues and costs so recognized should be the price that the concessionaire pays or would pay in an arm’s length transaction for the execution of the works or the purchase of machinery and equipment, with no profit recognized for the construction or improvement. The application of IFRIC 12 does not affect operating income, net income, or EBITDA, but does affect calculations of margins based on total revenues.
Capital investments: includes investments in fixed assets (including investments in land, machinery, and equipment) and improvements to concessioned properties under the Master Development Plan (MDP) plus strategic investments.
Strategic Investments: Refers only to those capital investments additional to the Master Development Program.
Passengers and Terminal passengers: All references to passenger traffic volumes are to Terminal passengers, which includes passengers on the three types of aviation (commercial, charter, and general aviation), and excludes passengers in transit. The definition of terminal passengers of OMA may differ from the definition utilized by its shareholder VINCI Airports.
Adjusted EBITDA and Adjusted EBITDA margin: OMA defines Adjusted EBITDA as EBITDA less construction revenue plus construction expense and maintenance provision. We calculate the Adjusted EBITDA margin as Adjusted EBITDA divided by the sum of aeronautical revenue and non-aeronautical revenue. Construction revenue and construction cost do not affect cash flow generation and the maintenance provision corresponds to capital investments. OMA defines EBITDA as net income minus net comprehensive financing income, taxes, and depreciation and amortization. Neither Adjusted EBITDA nor EBITDA should be considered as an alternative to net income as an indicator of our operating performance, or as an alternative to cash flow as an indicator of liquidity. It should be noted that neither Adjusted EBITDA nor EBITDA is defined under IFRS, and may be calculated differently by different companies.
18
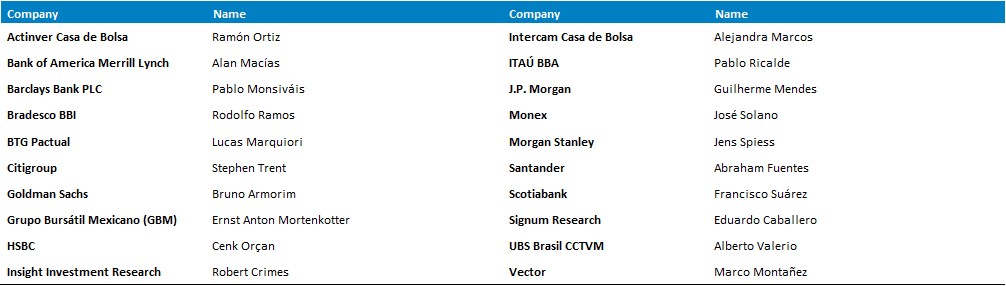
Analyst Coverage
In accordance with the requirements of the Mexican Stock Exchange, the analysts covering OMA are:
This report may contain forward-looking information and statements. Forward-looking statements are statements that are not historical facts. These statements are only predictions based on our current information and expectations and projections about future events. Forward-looking statements may be identified by the words “believe,” “expect,” “anticipate,” “target,” “estimate,” or similar expressions. While OMA's management believes that the expectations reflected in such forward-looking statements are reasonable, investors are cautioned that forward-looking information and statements are subject to various risks and uncertainties, many of which are difficult to predict and are generally beyond the control of OMA, that could cause actual results and developments to differ materially from those expressed in, or implied or projected by, the forward-looking information and statements. These risks and uncertainties include, but are not limited to, those discussed in our most recent annual report filed on Form 20-F under the caption “Risk Factors.” OMA undertakes no obligation to update publicly its forward-looking statements, whether as a result of new information, future events, or otherwise.
About OMA
Grupo Aeroportuario del Centro Norte, S.A.B. de C.V., known as OMA, operates 13 international airports in nine states of central and northern Mexico. OMA’s airports serve Monterrey, Mexico’s third largest metropolitan area, the tourist destinations of Acapulco, Mazatlán, and Zihuatanejo, and nine other regional centers and border cities. OMA also operates the NH Collection Hotel inside Terminal 2 of the Mexico City airport and the Hilton Garden Inn at the Monterrey airport. OMA employs over 1,200 persons in order to offer passengers and clients airport and commercial services in facilities. OMA is listed on the Mexican Stock Exchange (OMA) and on the NASDAQ Global Select Market (OMAB). For more information, visit:
| · | Webpage http://ir.oma.aero |
| · | Twitter http://twitter.com/OMAeropuertos |
| · | Facebook https://www.facebook.com/OMAeropuertos |
19
Pursuant to the requirements of the Securities Exchange Act of 1934, the registrant has duly caused this report to be signed on its behalf by the undersigned, thereunto duly authorized.
| Grupo Aeroportuario del Centro Norte, S.A.B. de C.V. |
| By: | /s/ Ruffo Pérez Pliego | ||
| Ruffo Pérez Pliego | |||
| Chief Financial Officer | |||
Dated: February 24, 2025