Exhibit 99.1

TravelCenters of America (Nasdaq: TA) November 2022 Investor Presentation

Warning Concerning Forward - Looking Statements and Non - GAAP Financial Measures 2 This presentation contains statements that constitute forward - looking statements within the meaning of the Private Securities Litigation Reform Act of 1995 and other securities laws . Whenever we use words such as "believe," "expect," "anticipate," "intend," "plan," "estimate," "will," "may" and negatives and derivatives of these or similar expressions, we are making forward - looking statements . Forward - looking statements in this presentation relate to various aspects of our business, including statements about TravelCenters of America Inc . ’s (“TA,” “the Company,” “our,” or “we”) financial targets ; transformation plan, including TA's growth strategy, IT development and other anticipated operational initiatives ; franchise expansion expectations ; use of artificial intelligence and other technology to improve fuel margin ; truck service growth ; alternative energy opportunities ; fleet customer strategy, including the impact of a private label billing card ; hospitality improvements ; and anticipated acquisitions . These forward - looking statements are based upon our present intent, beliefs or expectations, but forward - looking statements are not guaranteed and may not occur . Forward - looking statements involve known and unknown risks, uncertainties and other factors, some of which are beyond our control, such as demand for trucking services, fuel price volatility, fuel supply disruption, the availability and cost of labor, and acts of terrorism, geopolitical risks, war, public health crises, such as the COVID - 19 pandemic, or other man - made or natural disasters . For example : (a) the site locations we acquire may not generate increased operating income or it may take longer than we expect for these sites to generate sufficient profitability, if at all ; (b) managing and integrating acquired, developed and franchised locations may be more expensive than anticipated and expose us to new liabilities and financial losses ; (c) we may not have sufficient collateral or we may be unable to identify lenders willing to increase their commitments to us or join our credit facility ; (d) we may be unable to monetize our existing unencumbered real estate ; (e) improved fuel efficiency and alternative fuel technologies or other means of transportation that may be developed and widely adopted could reduce demand for the fuel we sell ; (f) customer demand and competitive conditions may significantly impact our nonfuel revenues and the cost of our nonfuel products ; (g) our suppliers may be unwilling or unable to extend to us reasonable credit terms for our purchases ; (h) our working capital requirements may increase ; ( i ) transaction fees associated with fuel cards used by our customers may increase and further reduce our profits ; (j) our return on investment in the growth of our business may be less than anticipated ; (k) compliance with, and changes to, federal, state and local laws and regulations may adversely affect our operating environment ; (l) litigation in which we are involved may be expensive and distract management, and the outcome of such litigation could adversely affect the business ; (m) we may be susceptible to actual and potential conflicts of interest with our related parties, and the benefits we anticipate from such relationships may not materialize ; and (n) increased fuel prices resulting from responses to international conflicts may impact our profitability and demand for fuel . These and other risks identified under the heading "Risk Factors” in our Annual Report on Form 10 - K for the year ended December 31 , 2021 , filed with the Securities and Exchange Commission, or SEC, as well as the other information we file with the SEC could cause our results to differ from those stated or implied by our forward - looking statements . You are encouraged to read our filings with the SEC, available at www . sec . gov, for a discussion of these and other risks and uncertainties . You should not place undue reliance upon forward - looking statements . Except as required by law, we undertake no obligation to update or revise any forward - looking statement as a result of new information, future events or otherwise . Certain information contained in this presentation relates to or is based on studies, publications, surveys and other data obtained from third - party sources . While we believe these third - party sources to be reliable as of the date of this presentation, we make no representation as to the adequacy, fairness, accuracy and completeness of any information from third - party sources . Non - GAAP Financial Measures This presentation contains non - GAAP financial measures . These non - GAAP financial measures should be considered only as supplemental to, and not as superior to, financial measures prepared in accordance with U . S . generally accepted accounting principles, or GAAP . TA believes the non - GAAP financial measures in this presentation are meaningful supplemental disclosures because they may help investors gain a better understanding of changes in TA's operating results and its ability to pay rent or service debt when due, make capital expenditures and expand its business . These non - GAAP financial measures also may help investors to make comparisons between TA and other companies and to make comparisons of TA's financial and operating results between periods . Management uses these measures in developing internal budgets and forecasts and analyzing TA's performance . Reconciliations of those metrics to the most directly comparable financial measure calculated in accordance with GAAP are included herein .

Introduction 3
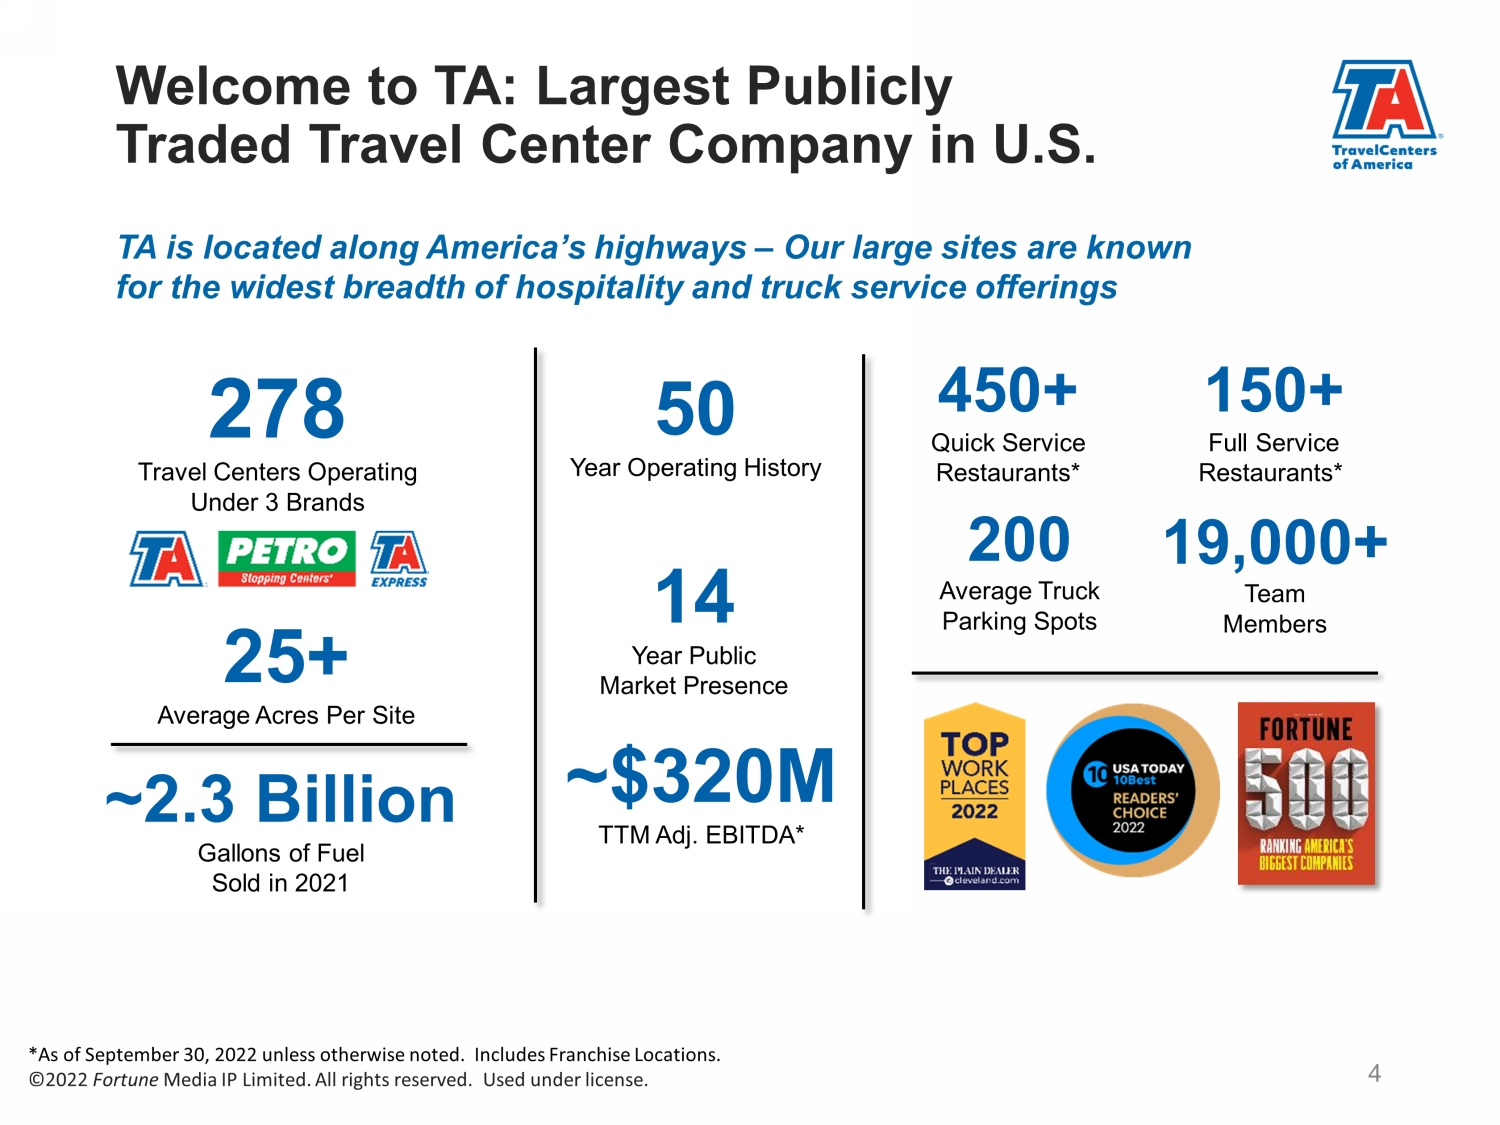
TA is located along America’s highways – Our large sites are known for the widest breadth of hospitality and truck service offerings 278 Travel Centers Operating Under 3 Brands 450+ Quick Service Restaurants* 50 Year Operating History 14 Year Public Market Presence ~$320M TTM Adj. EBITDA* ~2.3 Billion Gallons of Fuel Sold in 2021 25+ Average Acres Per Site 19,000+ Team Members 200 Average Truck Parking Spots Welcome to TA: Largest Publicly Traded Travel Center Company in U.S. 4 *As of September 30, 2022 unless otherwise noted. Includes Franchise Locations. ©2022 Fortune Media IP Limited. All rights reserved. Used under license. 150+ Full Service Restaurants*
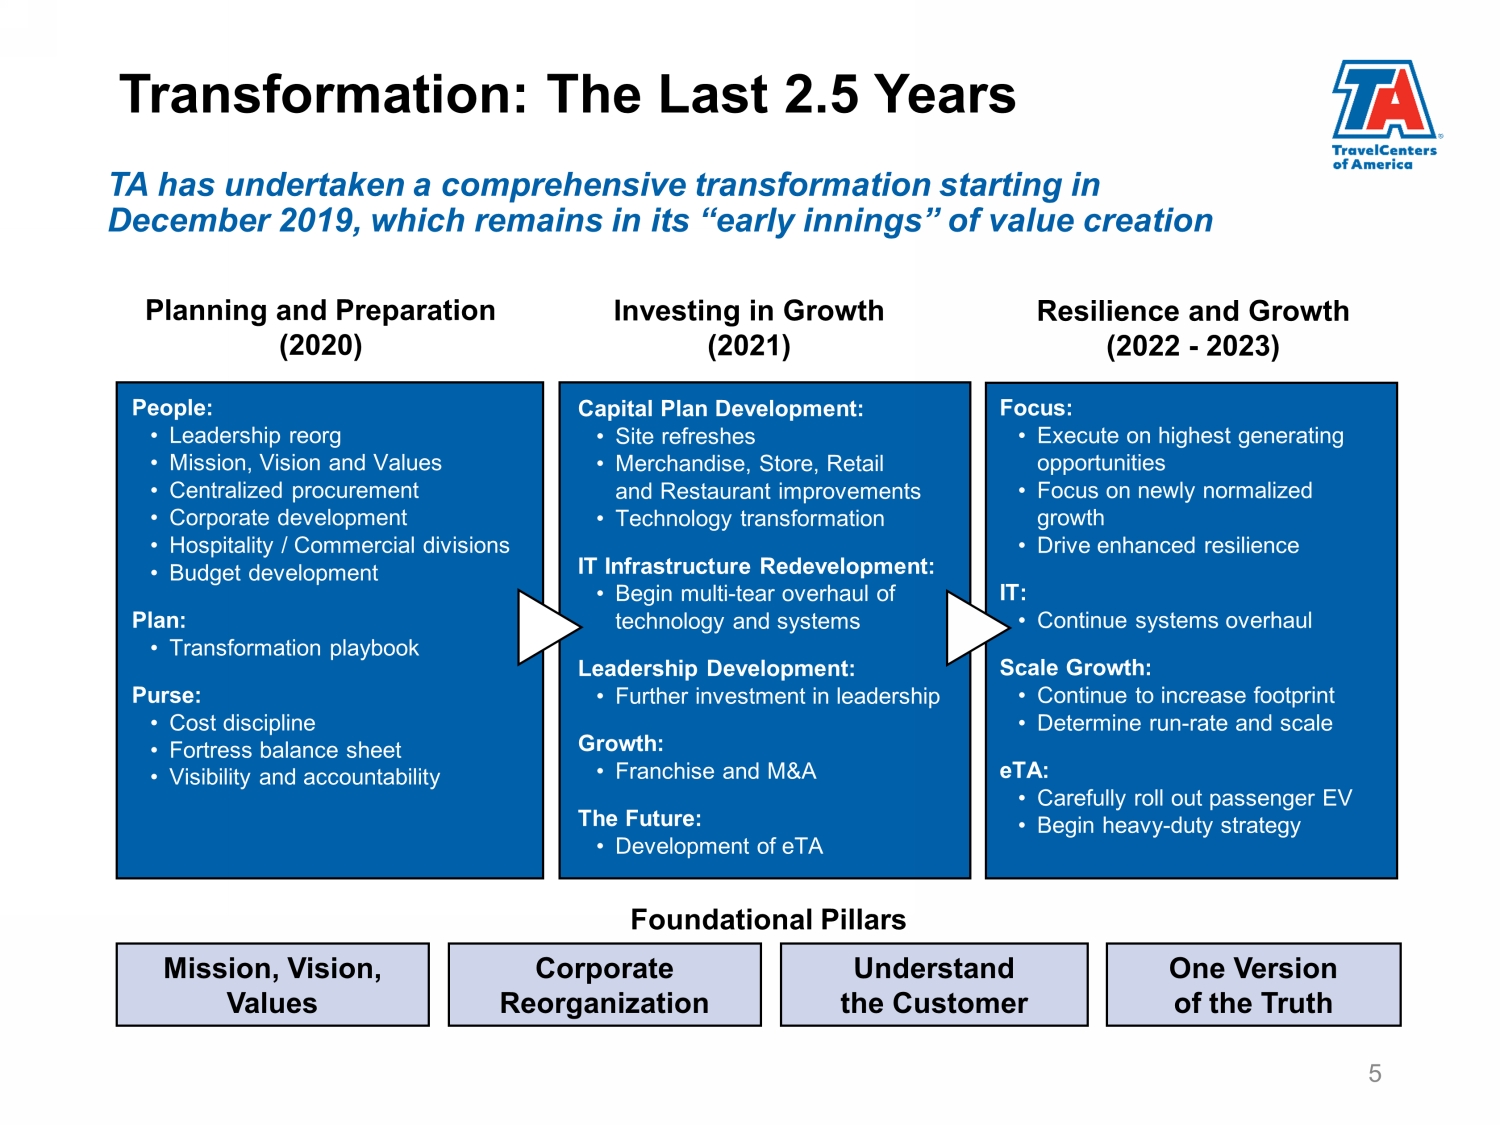
People: • Leadership reorg • Mission, Vision and Values • Centralized procurement • Corporate development • Hospitality / Commercial divisions • Budget development Plan: • Transformation playbook Purse: • Cost discipline • Fortress balance sheet • Visibility and accountability Investing in Growth (2021) Mission, Vision, Values Corporate Reorganization Understand the Customer One Version of the Truth Resilience and Growth (2022 - 2023) Planning and Preparation (2020) TA has undertaken a comprehensive transformation starting in December 2019 , which remains in its “early innings” of value creation Focus: • Execute on highest generating opportunities • Focus on newly normalized growth • Drive enhanced resilience IT: • Continue systems overhaul Scale Growth: • Continue to increase footprint • Determine run - rate and scale eTA: • Carefully roll out passenger EV • Begin heavy - duty strategy Foundational Pillars 5 Transformation: The Last 2.5 Years Capital Plan Development: • Site refreshes • Merchandise, Store, Retail and Restaurant improvements • Technology transformation IT Infrastructure Redevelopment: • Begin multi - tear overhaul of technology and systems Leadership Development: • Further investment in leadership Growth: • Franchise and M&A The Future: • Development of eTA
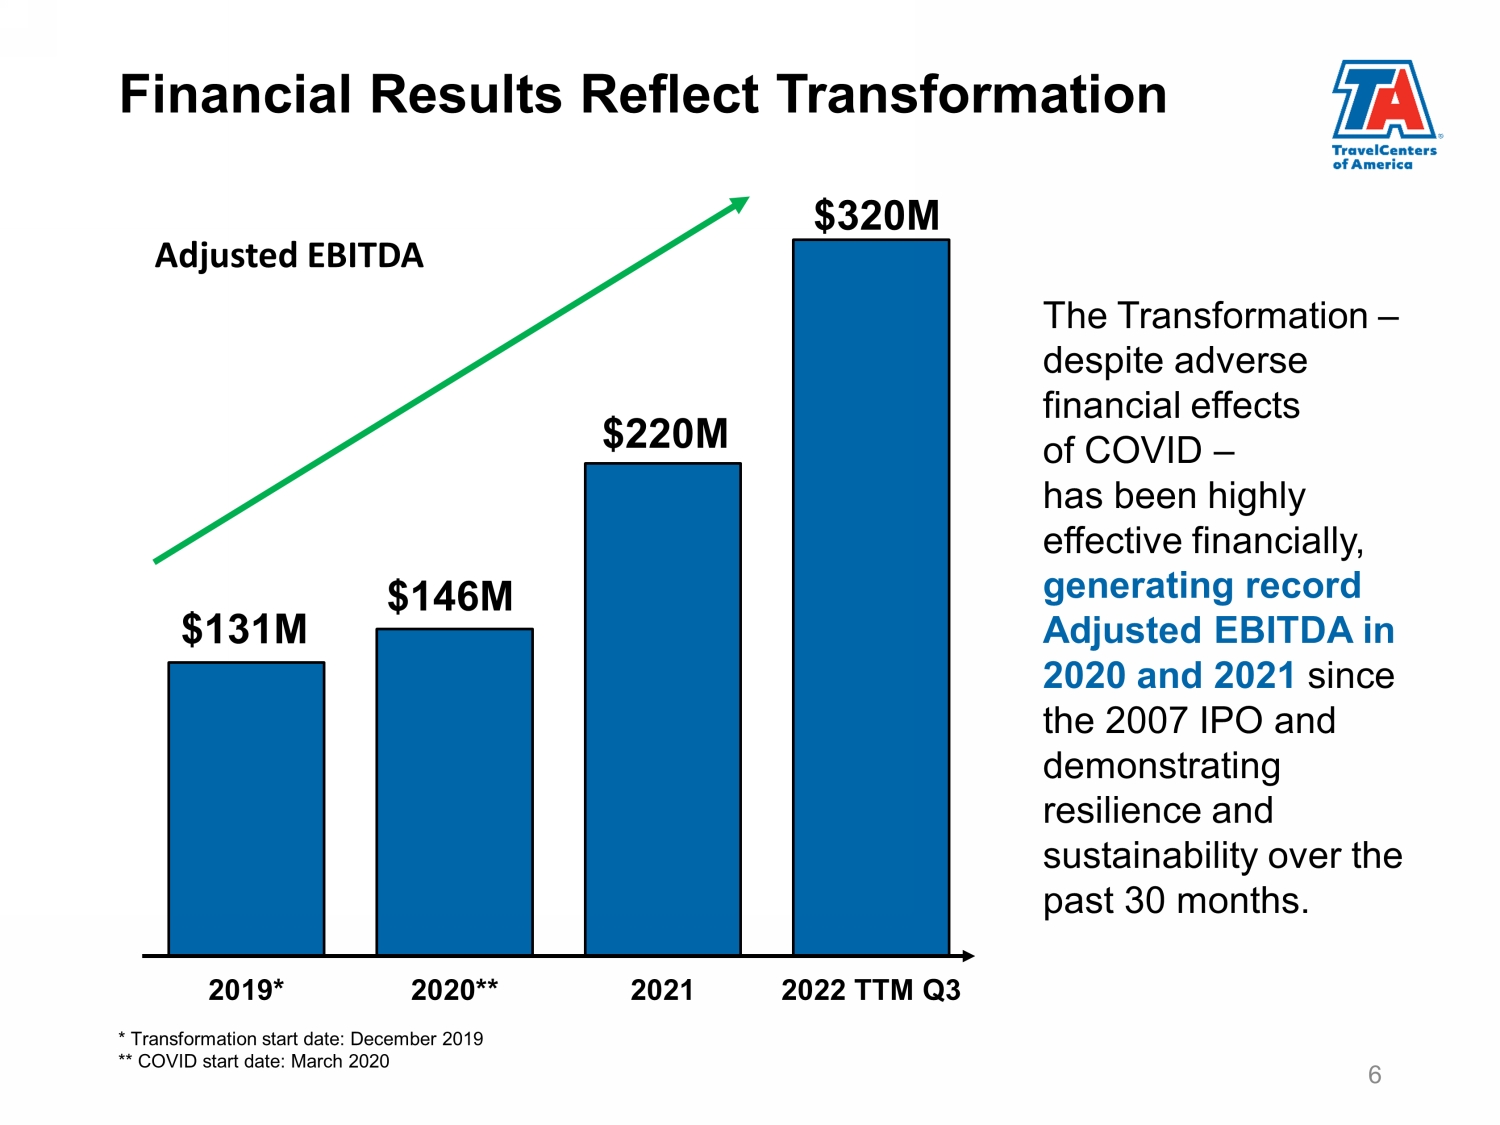
The Transformation – despite adverse financial effects of COVID – has been highly effective financially, generating record Adjusted EBITDA in 2020 and 2021 since the 2007 IPO and demonstrating resilience and sustainability over the past 30 months. $131M $146M $220M $320M 2019* 2020** 2021 2022 TTM Q3 Adjusted EBITDA * Transformation start date: December 2019 ** COVID start date: March 2020 Financial Results Reflect Transformation 6
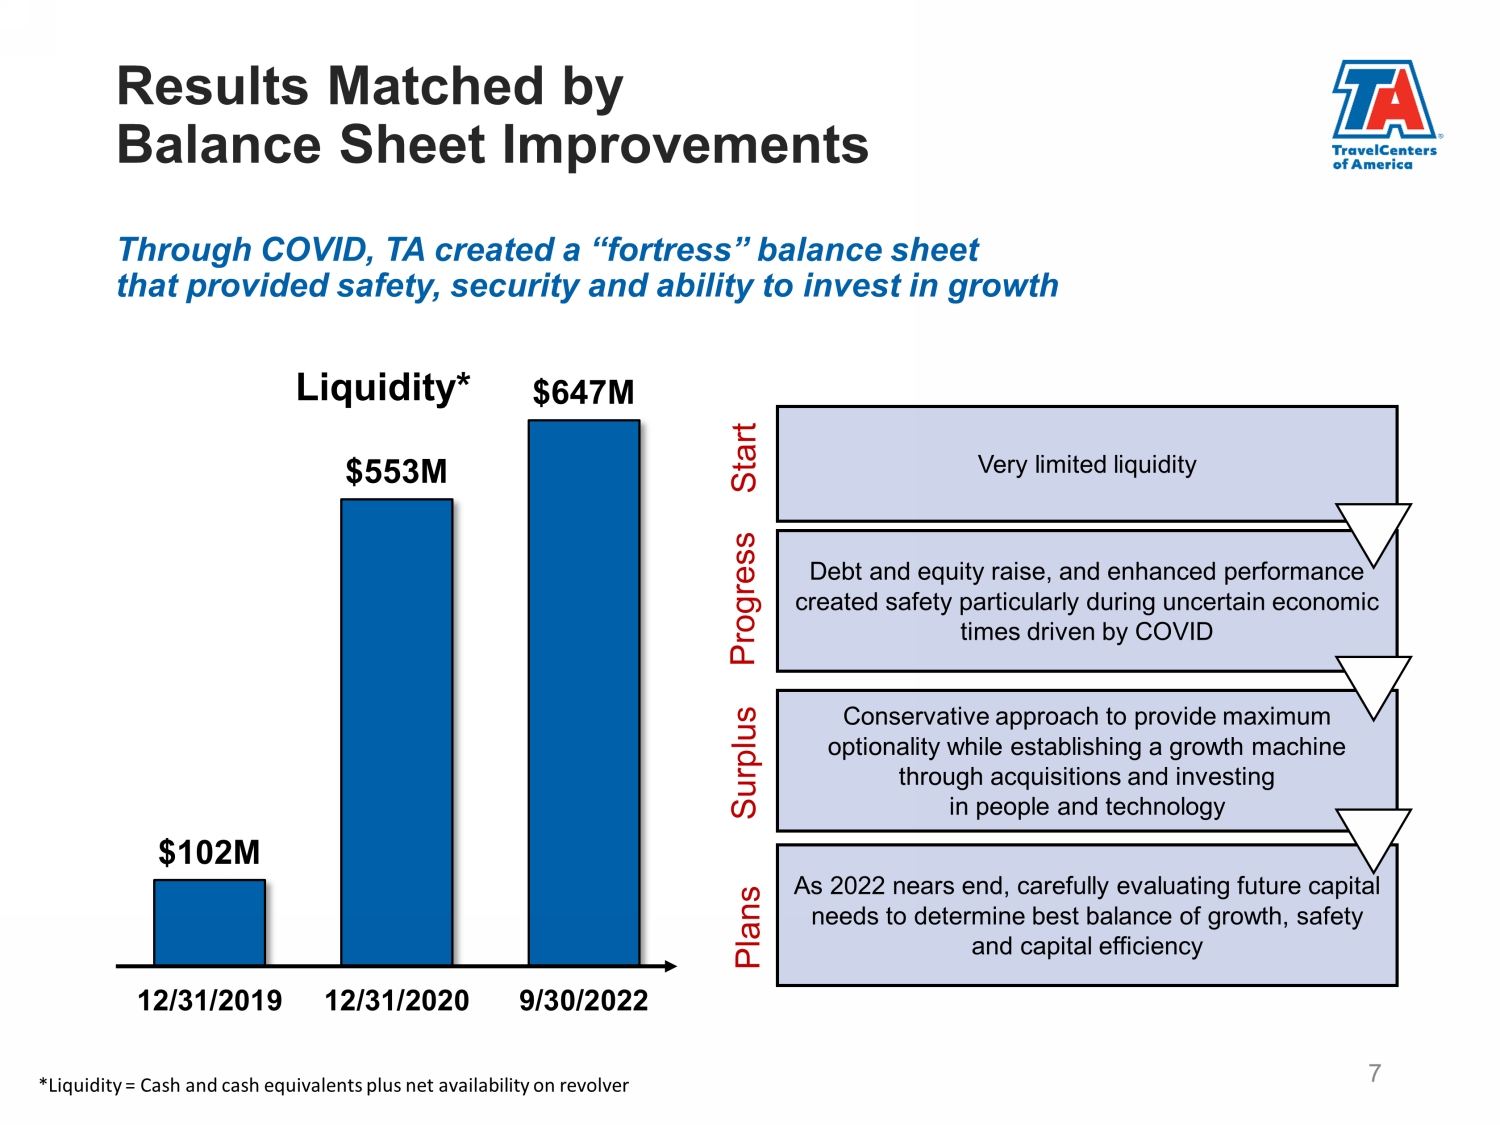
Through COVID, TA created a “fortress” balance sheet that provided safety, security and ability to invest in growth Very limited liquidity Debt and equity raise, and enhanced performance created safety particularly during uncertain economic times driven by COVID Conservative approach to provide maximum optionality while establishing a growth machine through acquisitions and investing in people and technology As 2022 nears end, carefully evaluating future capital needs to determine best balance of growth, safety and capital efficiency $102M $553M $647M 12/31/2019 12/31/2020 9/30/2022 Liquidity* Start Progress Surplus Plans 7 Results Matched by Balance Sheet Improvements *Liquidity = Cash and cash equivalents plus net availability on revolver
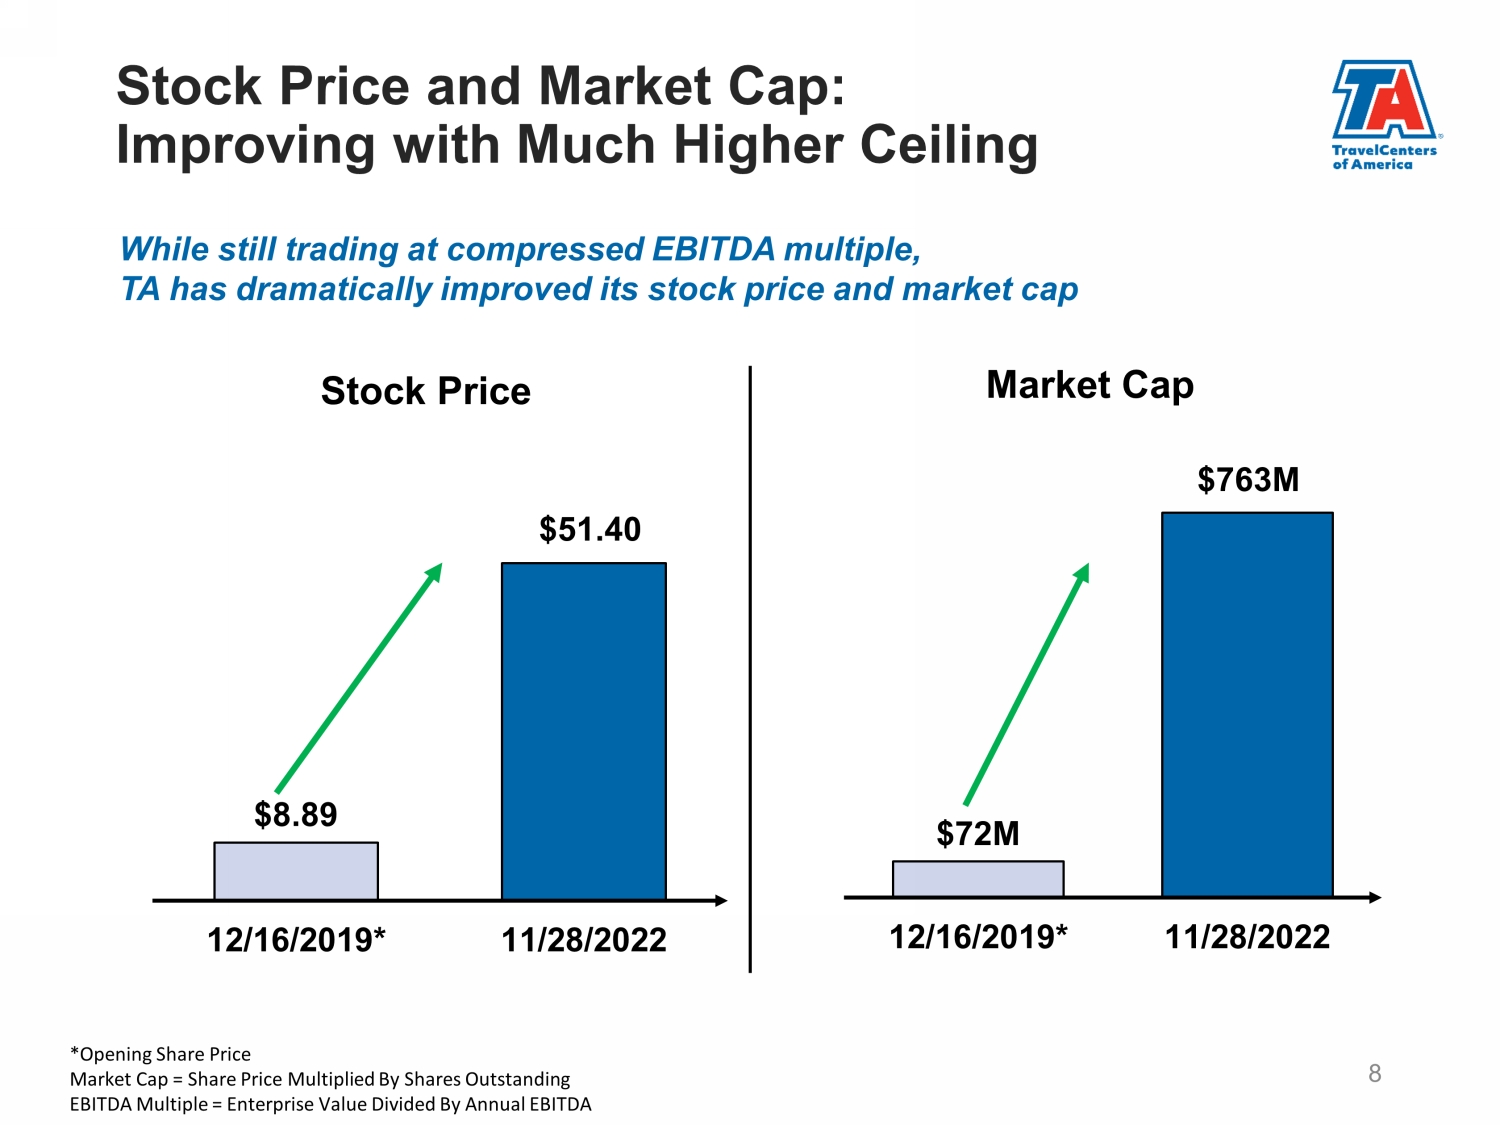
While still trading at compressed EBITDA multiple, TA has dramatically improved its stock price and market cap $8.89 $51.4 0 12/16/2019* 11/28/2022 Stock Price $72M $763M 12/16/2019* 11/28/2022 Market Cap 8 Stock Price and Market Cap: Improving with Much Higher Ceiling *Opening Share Price Market Cap = Share Price Multiplied By Shares Outstanding EBITDA Multiple = Enterprise Value Divided By Annual EBITDA
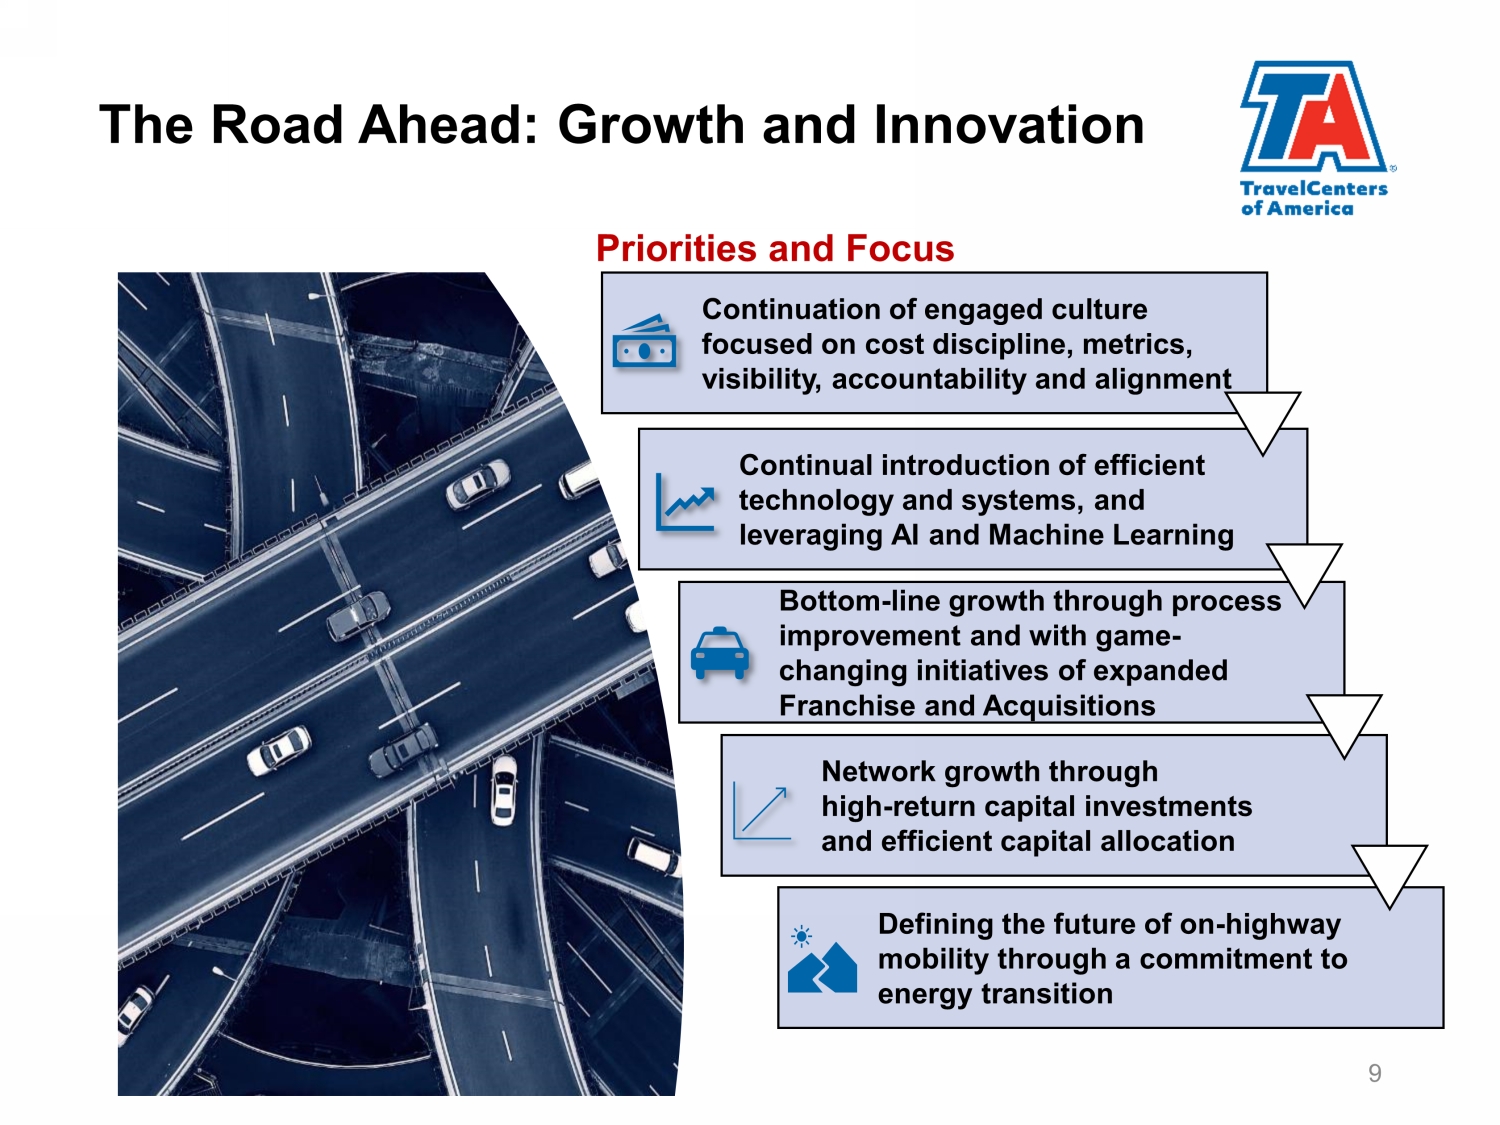
> 10% annual increase in Truck Service revenue Continuation of engaged culture focused on cost discipline, metrics, visibility, accountability and alignment Continual introduction of efficient technology and systems, and leveraging AI and Machine Learning Bottom - line growth through process improvement and with game - changing initiatives of expanded Franchise and Acquisitions Network growth through high - return capital investments and efficient capital allocation Priorities and Focus Defining the future of on - highway mobility through a commitment to energy transition 9 The Road Ahead: Growth and Innovation
Understanding the Business 10
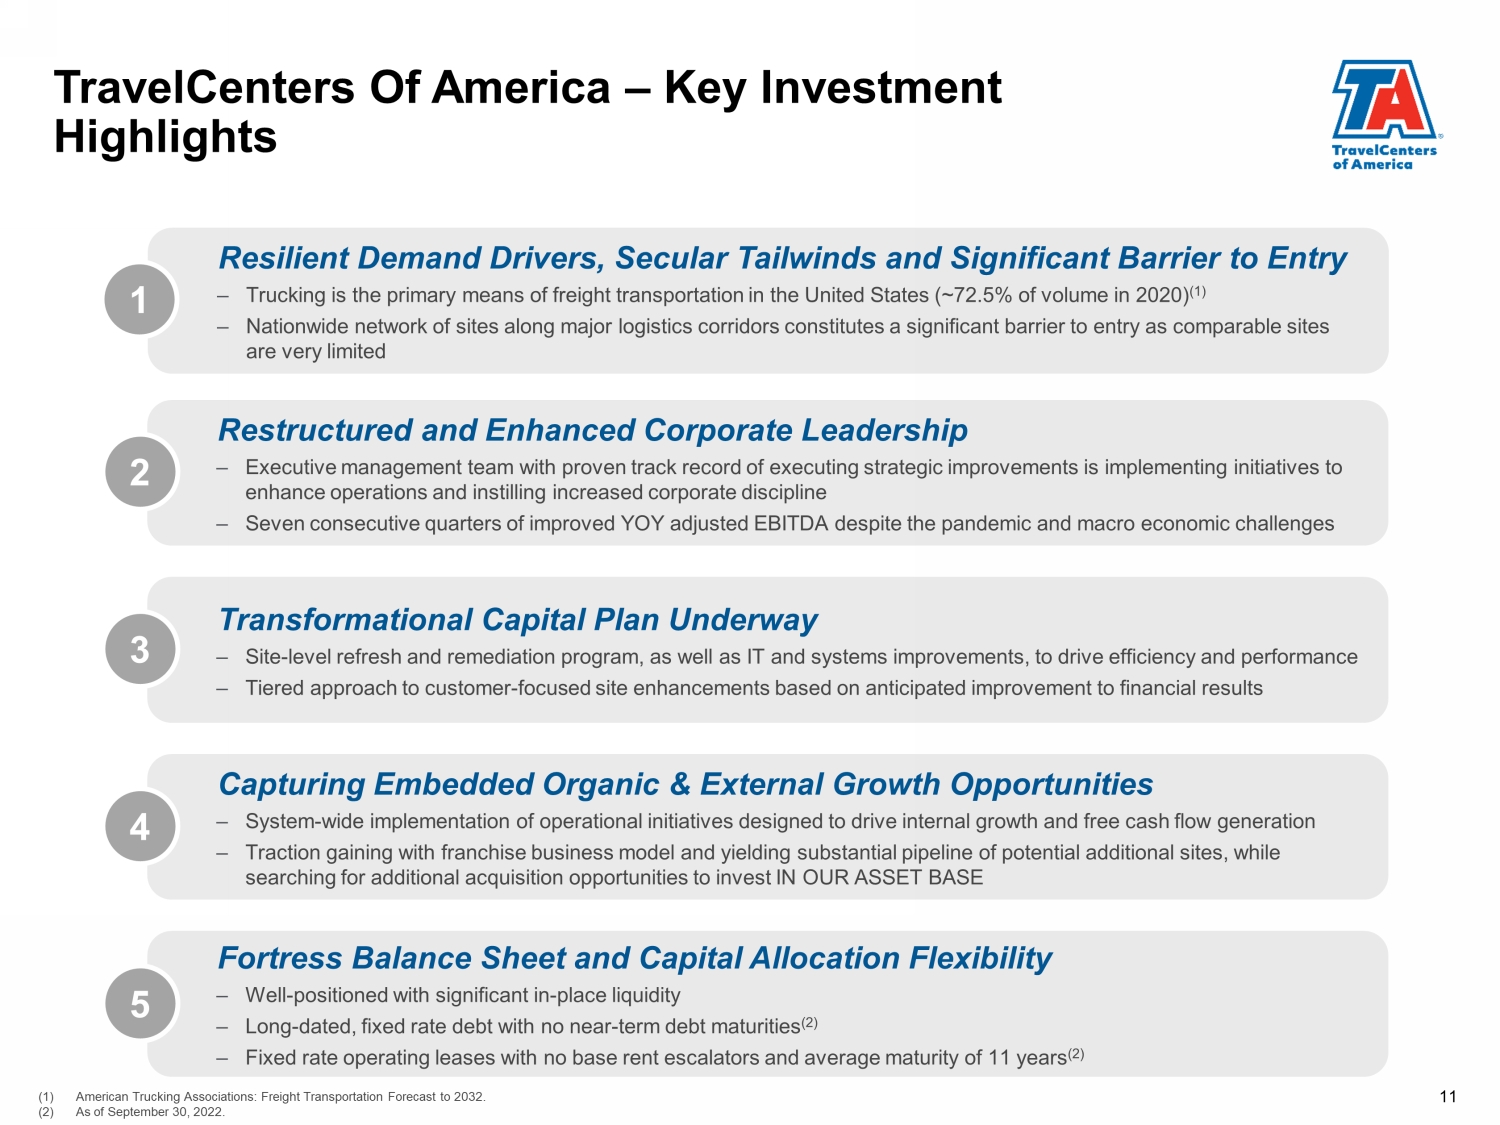
TravelCenters Of America – Key Investment Highlights Transformational Capital Plan Underway – Site - level refresh and remediation program, as well as IT and systems improvements, to drive efficiency and performance – Tiered approach to customer - focused site enhancements based on anticipated improvement to financial results 3 Restructured and Enhanced Corporate Leadership – Executive management team with proven track record of executing strategic improvements is implementing initiatives to enhance operations and instilling increased corporate discipline – Seven consecutive quarters of improved YOY adjusted EBITDA despite the pandemic and macro economic challenges 2 Capturing Embedded Organic & External Growth Opportunities – System - wide implementation of operational initiatives designed to drive internal growth and free cash flow generation – Traction gaining with franchise business model and yielding substantial pipeline of potential additional sites, while searching for additional acquisition opportunities to invest IN OUR ASSET BASE 4 Fortress Balance Sheet and Capital Allocation Flexibility – Well - positioned with significant in - place liquidity – Long - dated, fixed rate debt with no near - term debt maturities (2) – Fixed rate operating leases with no base rent escalators and average maturity of 11 years (2) 5 (1) American Trucking Associations: Freight Transportation Forecast to 2032. (2) As of September 30, 2022. 11 Resilient Demand Drivers, Secular Tailwinds and Significant Barrier to Entry – Trucking is the primary means of freight transportation in the United States (~72.5% of volume in 2020) (1) – Nationwide network of sites along major logistics corridors constitutes a significant barrier to entry as comparable sites are very limited 1
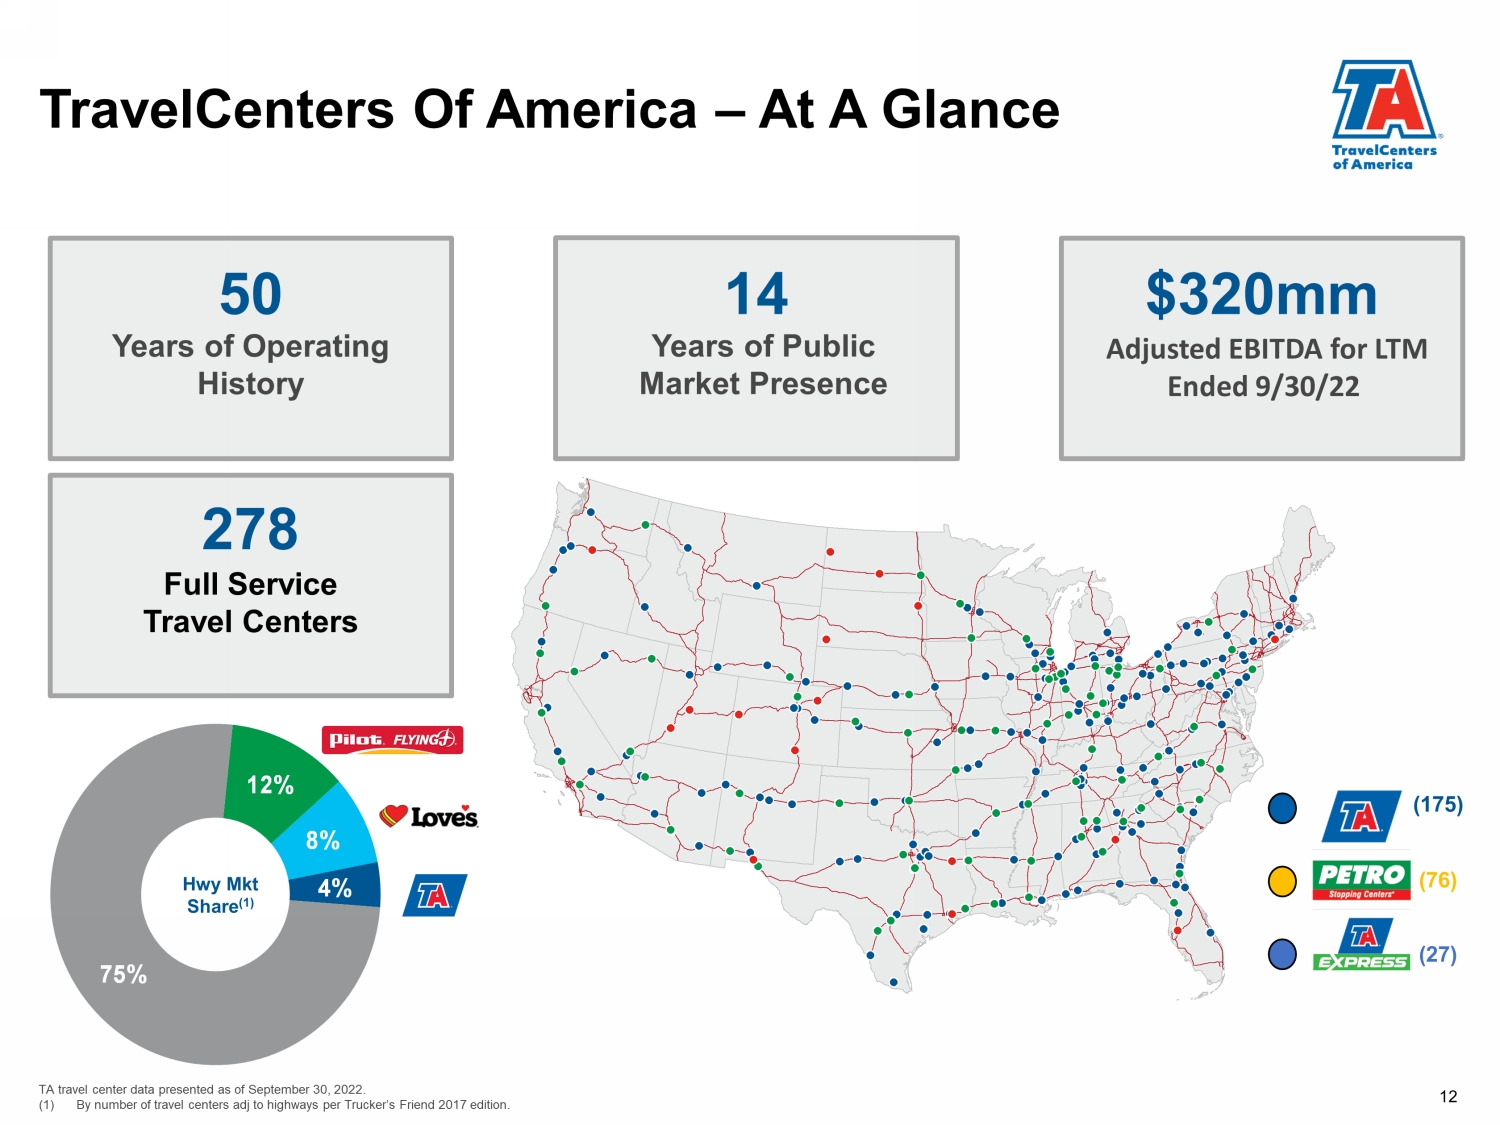
TravelCenters Of America – At A Glance 50 Years of Operating History 14 Years of Public Market Presence $320mm Adjusted EBITDA for LTM Ended 9/30/22 278 Full Service Travel Centers 12 (175) (27) ( 76 ) Hwy Mkt Share (1) TA travel center data presented as of September 30, 2022. (1) By number of travel centers adj to highways per Trucker’s Friend 2017 edition. 12% 8% 4% 75%
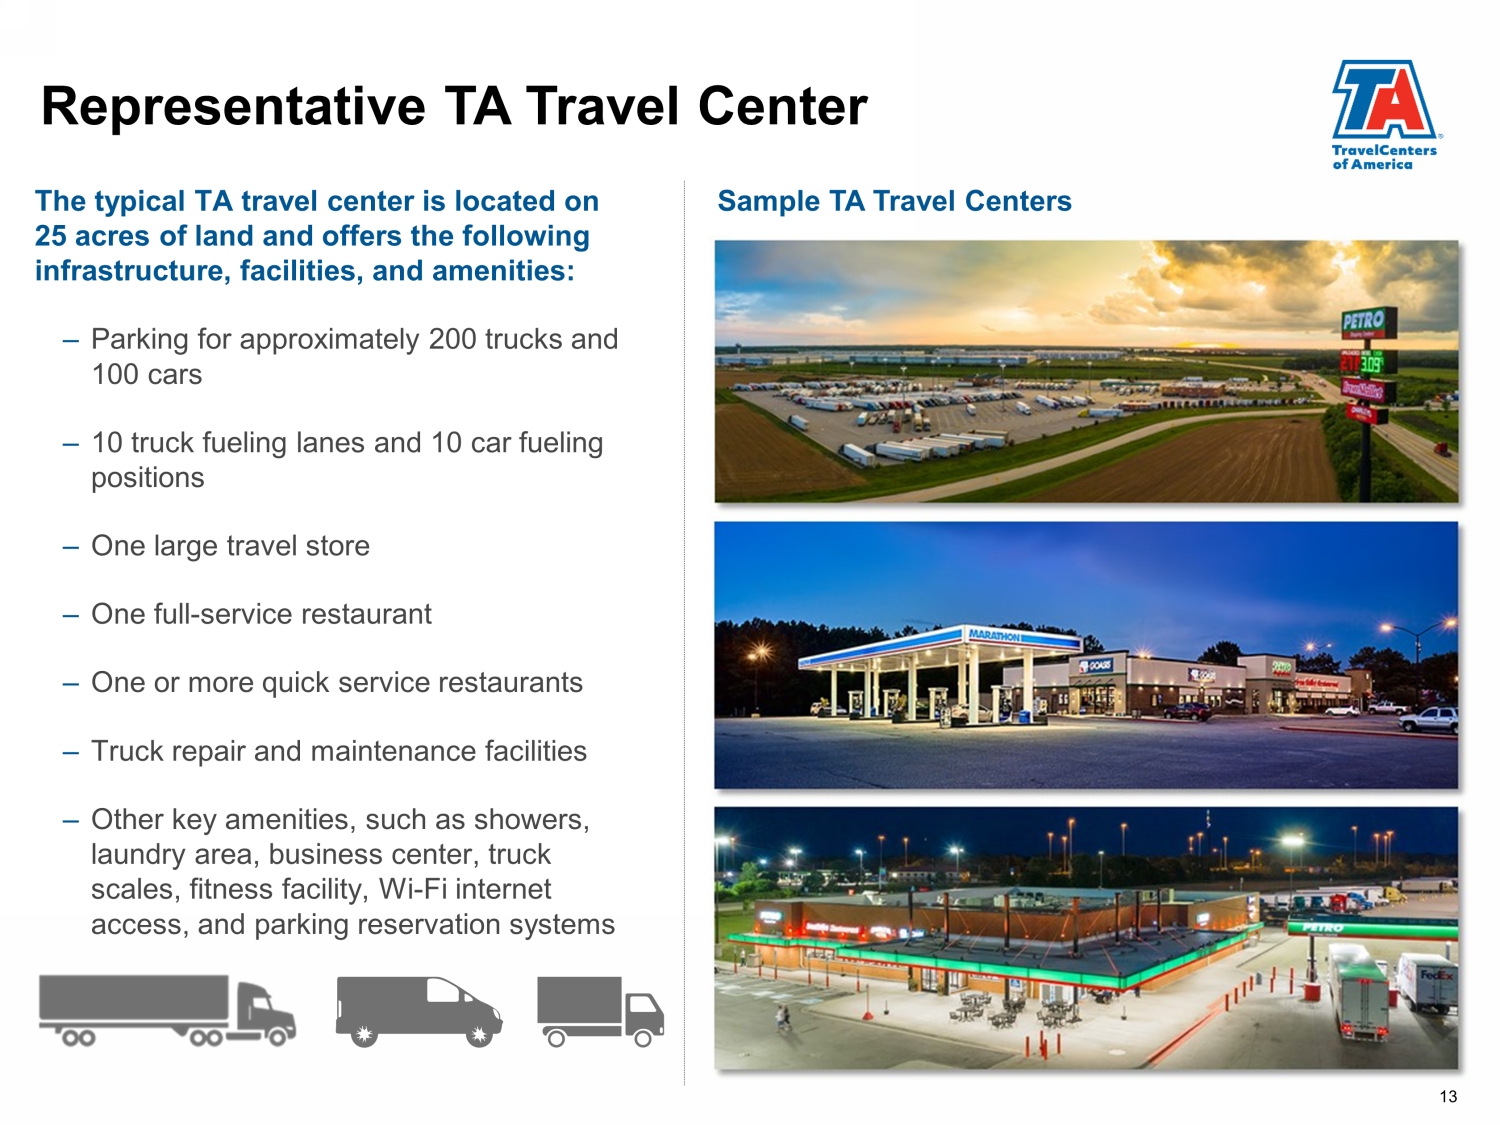
Representative TA Travel Center The typical TA travel center is located on 25 acres of land and offers the following infrastructure, facilities, and amenities: – Parking for approximately 200 trucks and 100 cars – 10 truck fueling lanes and 10 car fueling positions – One large travel store – One full - service restaurant – One or more quick service restaurants – Truck repair and maintenance facilities – Other key amenities, such as showers, laundry area, business center, truck scales, fitness facility, Wi - Fi internet access, and parking reservation systems Sample TA Travel Centers 13
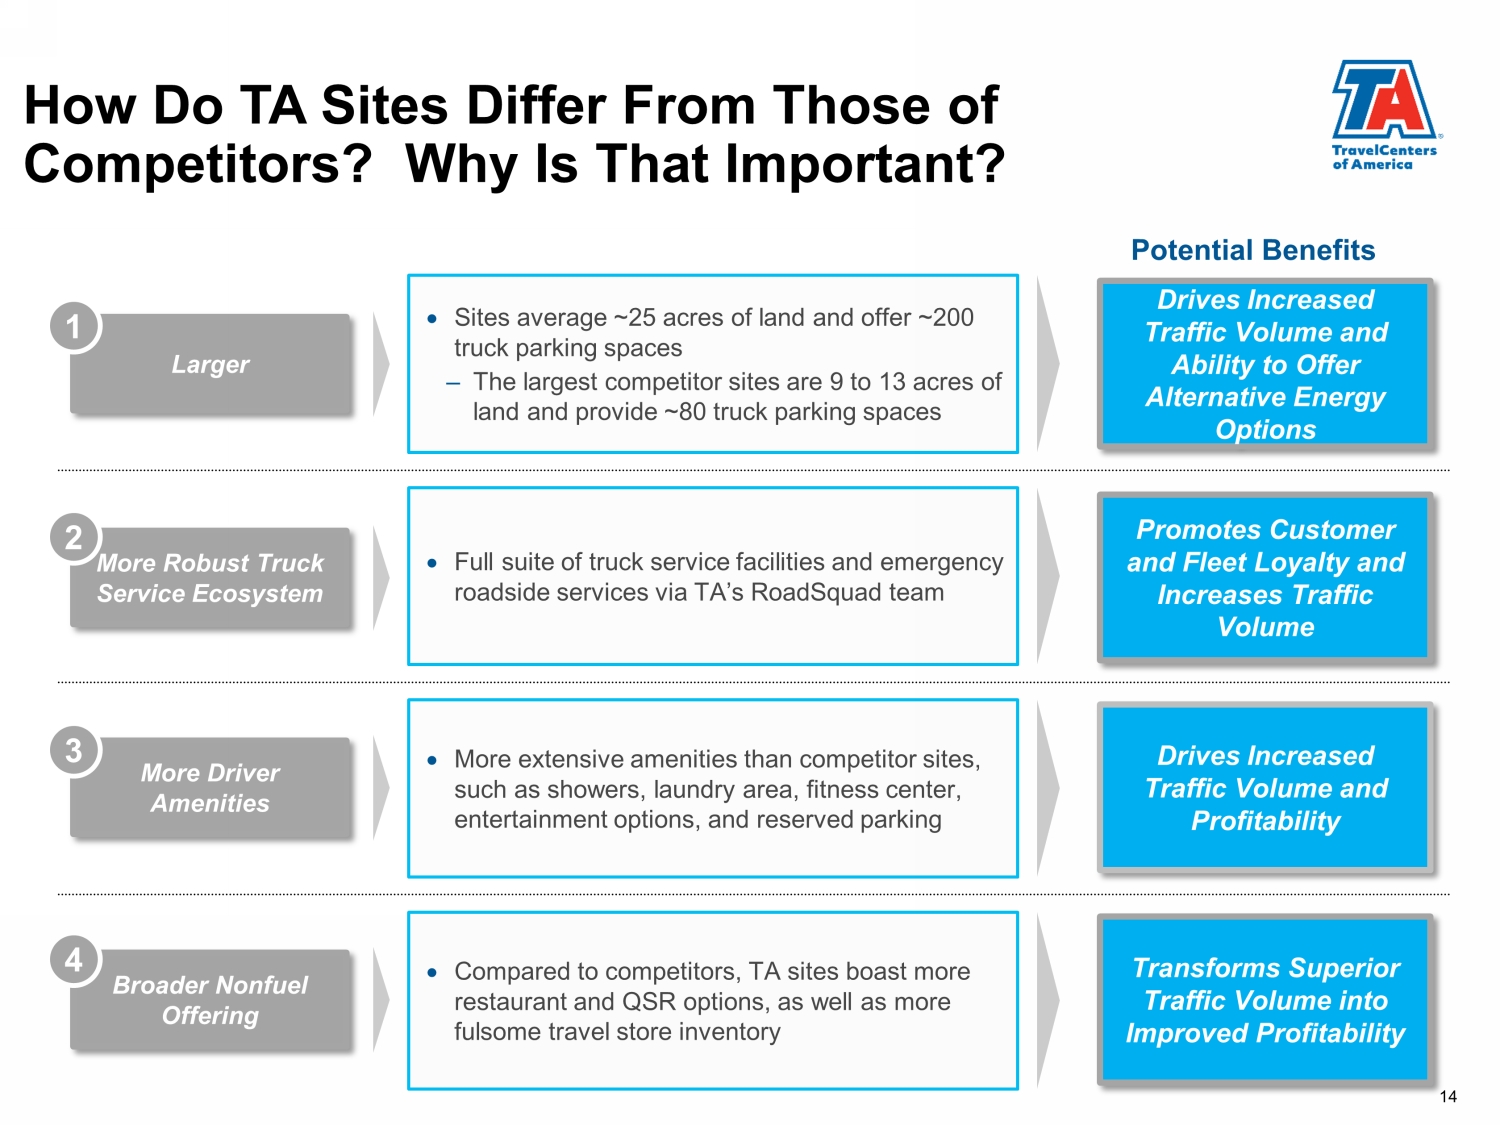
How Do TA Sites Differ From Those of Competitors? Why Is That Important? Larger Sites average ~ 25 acres of land and offer ~200 truck parking spaces – The largest competitor sites are 9 to 13 acres of land and provide ~80 truck parking spaces Drives Increased Traffic Volume and Ability to Offer Alternative Energy Options 1 More Robust Truck Service Ecosystem Full suite of truck service facilities and emergency roadside services via TA’s RoadSquad team Promotes Customer and Fleet Loyalty and Increases Traffic Volume 2 More Driver Amenities More extensive amenities than competitor sites, such as showers, laundry area, fitness center, entertainment options, and reserved parking Drives Increased Traffic Volume and Profitability 3 Broader Nonfuel Offering Compared to competitors, TA sites boast more restaurant and QSR options, as well as more fulsome travel store inventory Transforms Superior Traffic Volume into Improved Profitability 4 Potential Benefits 14

Recent Events
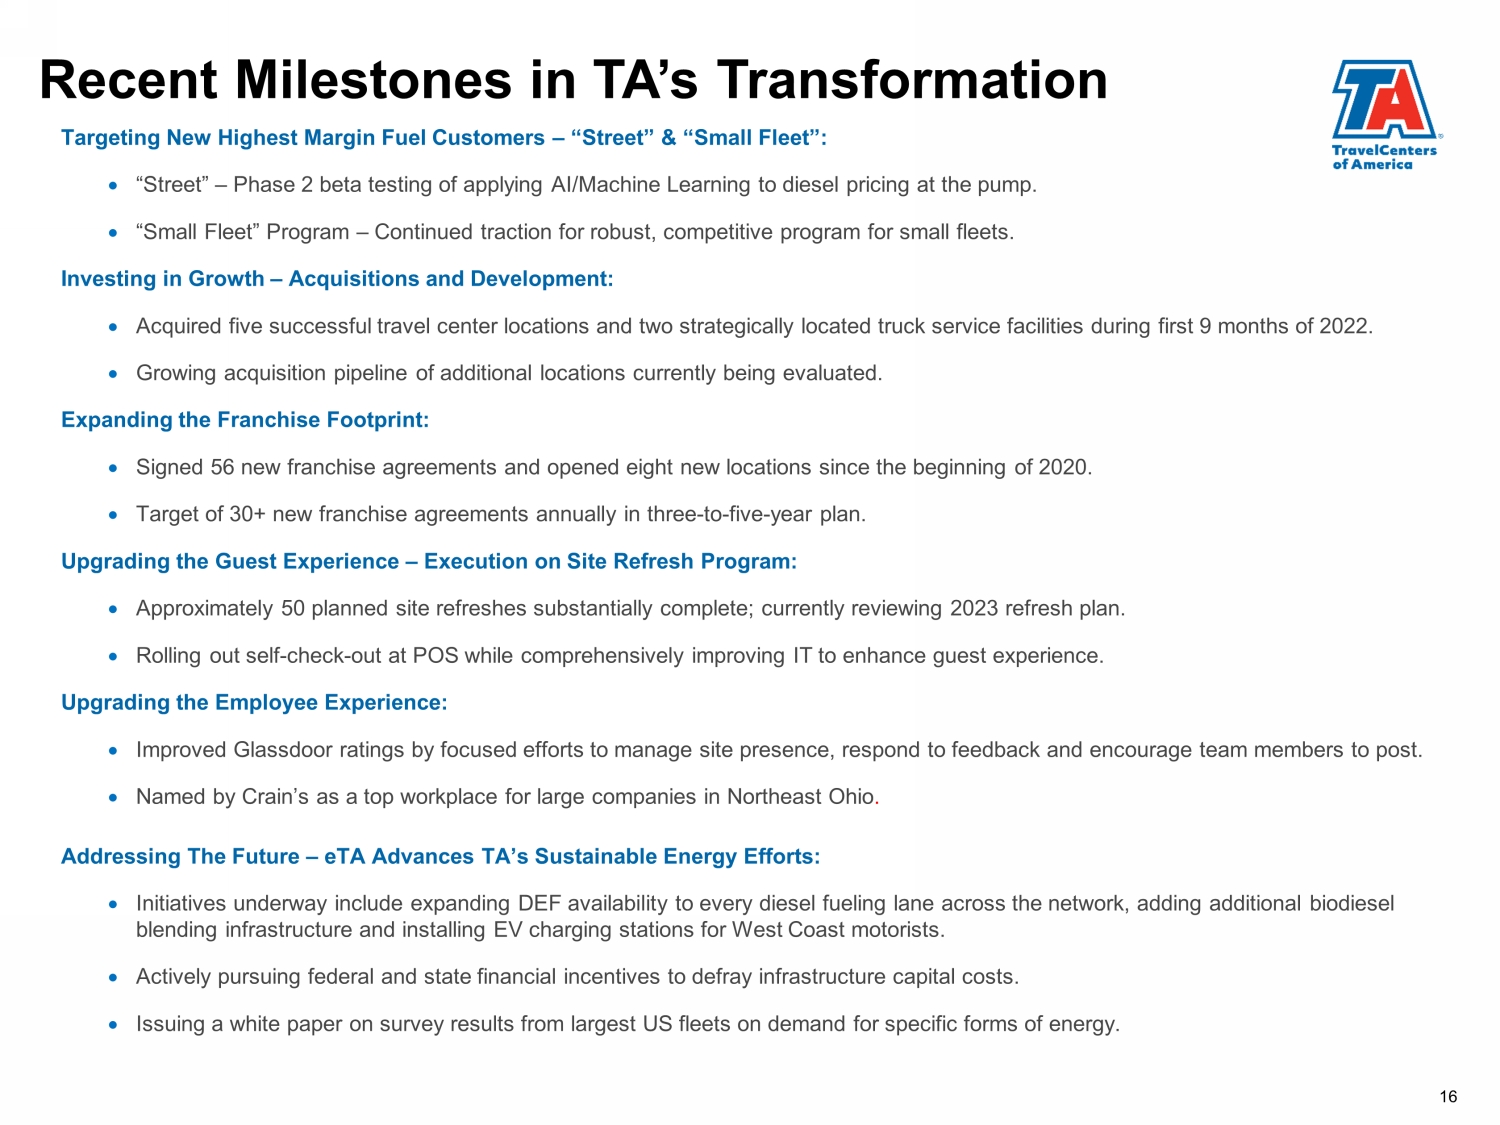
Recent Milestones in TA’s Transformation Targeting New Highest Margin Fuel Customers – “Street” & “ Small Fleet”: “Street” – Phase 2 beta testing of applying AI/Machine Learning to diesel pricing at the pump. “Small Fleet” Program – Continued traction for robust, competitive program for small fleets. Investing in Growth – Acquisitions and Development: Acquired five successful travel center locations and two strategically located truck service facilities during first 9 months of 2022. Growing acquisition pipeline of additional locations currently being evaluated. Expanding the Franchise Footprint: Signed 56 new franchise agreements and opened eight new locations since the beginning of 2020. Target of 30+ new franchise agreements annually in three - to - five - year plan. Upgrading the Guest Experience – Execution on Site Refresh Program: Approximately 50 planned site refreshes substantially complete; currently reviewing 2023 refresh plan. Rolling out self - check - out at POS while comprehensively improving IT to enhance guest experience. Upgrading the Employee Experience: Improved Glassdoor ratings by focused efforts to manage site presence, respond to feedback and encourage team members to post . Named by Crain’s as a top workplace for large companies in Northeast Ohio . Addressing The Future – eTA Advances TA’s Sustainable Energy Efforts: Initiatives underway include expanding DEF availability to every diesel fueling lane across the network, adding additional bi odi esel blending infrastructure and installing EV charging stations for West Coast motorists. Actively pursuing federal and state financial incentives to defray infrastructure capital costs. Issuing a white paper on survey results from largest US fleets on demand for specific forms of energy. 16
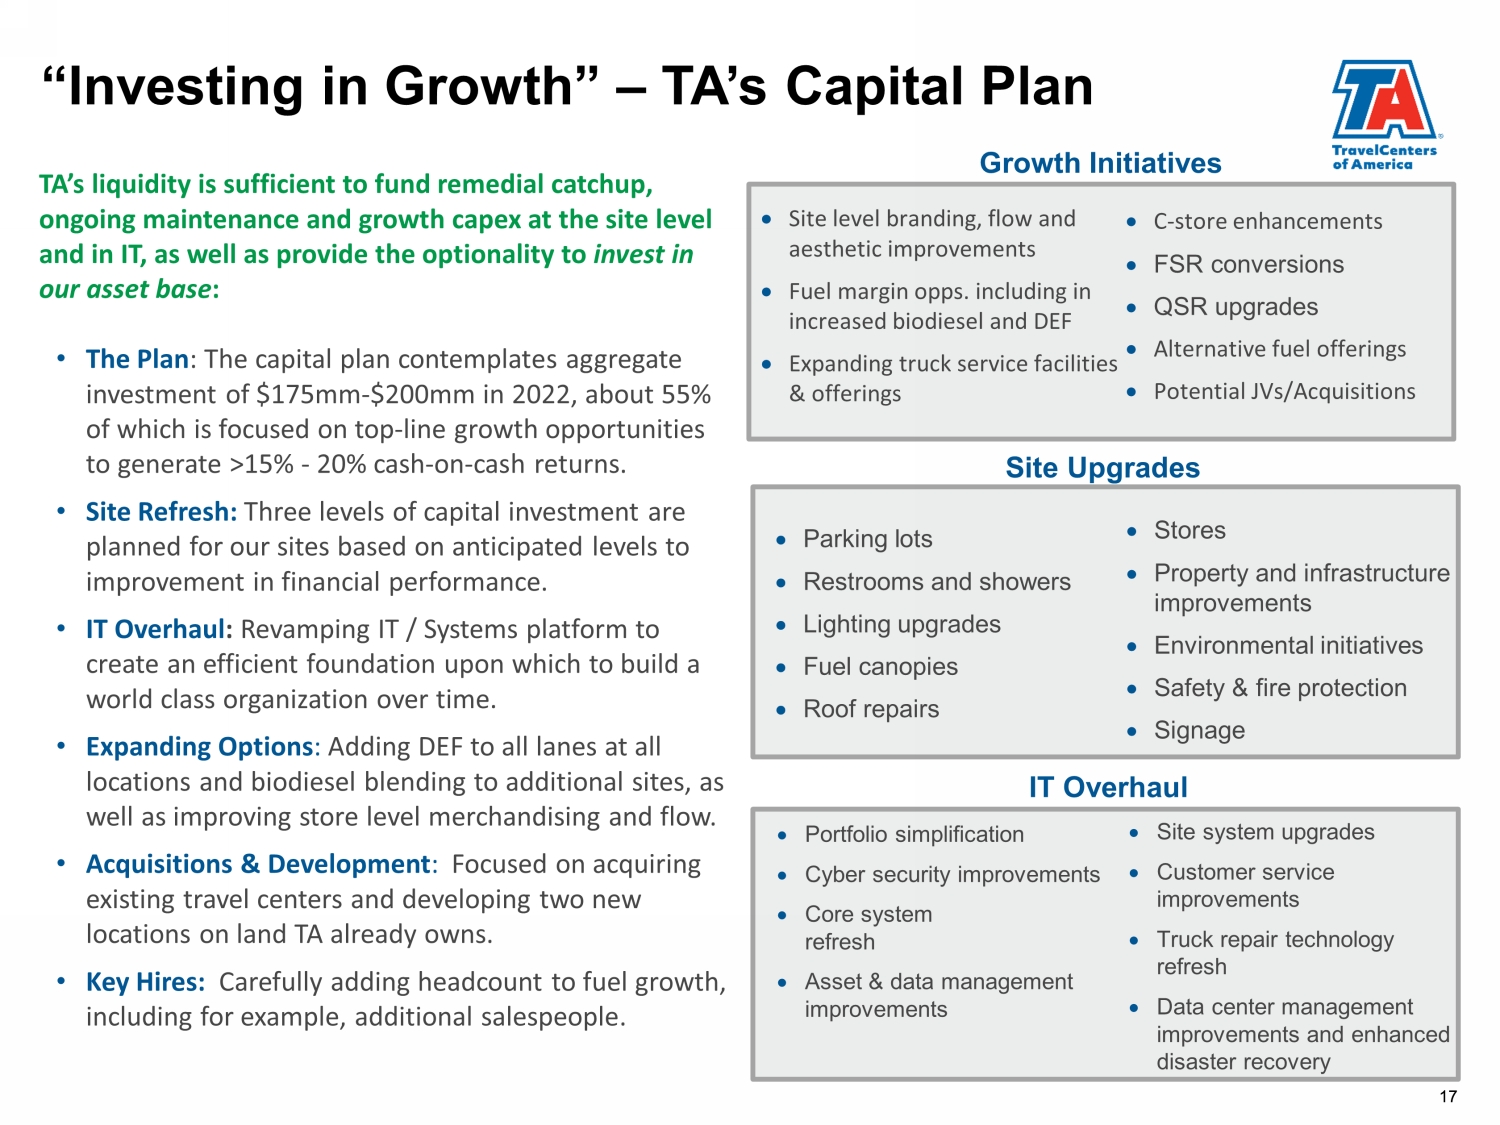
17 “Investing in Growth” – TA’s Capital Plan IT Overhaul Site Upgrades TA’s liquidity is sufficient to fund remedial catchup, ongoing maintenance and growth capex at the site level and in IT, as well as provide the optionality to invest in our asset base : • The Plan : The capital plan contemplates aggregate investment of $175mm - $200mm in 2022, about 55% of which is focused on top - line growth opportunities to generate >15% - 20% cash - on - cash returns. • Site Refresh: Three levels of capital investment are planned for our sites based on anticipated levels to improvement in financial performance. • IT Overhaul : Revamping IT / Systems platform to create an efficient foundation upon which to build a world class organization over time. • Expanding Options : Adding DEF to all lanes at all locations and biodiesel blending to additional sites, as well as improving store level merchandising and flow. • Acquisitions & Development : Focused on acquiring existing travel centers and developing two new locations on land TA already owns. • Key Hires: Carefully adding headcount to fuel growth, including for example, additional salespeople. 17 Growth Initiatives Site level branding, flow and aesthetic improvements Fuel margin opps. including in increased biodiesel and DEF Expanding truck service facilities & offerings C - store enhancements FSR conversions QSR upgrades Alternative fuel offerings Potential JVs/Acquisitions Stores Property and infrastructure improvements Environmental initiatives Safety & fire protection Signage Parking lots Restrooms and showers Lighting upgrades Fuel canopies Roof repairs Portfolio simplification Cyber security improvements Core system refresh Asset & data management improvements Site system upgrades Customer service improvements Truck repair technology refresh Data center management improvements and enhanced disaster recovery
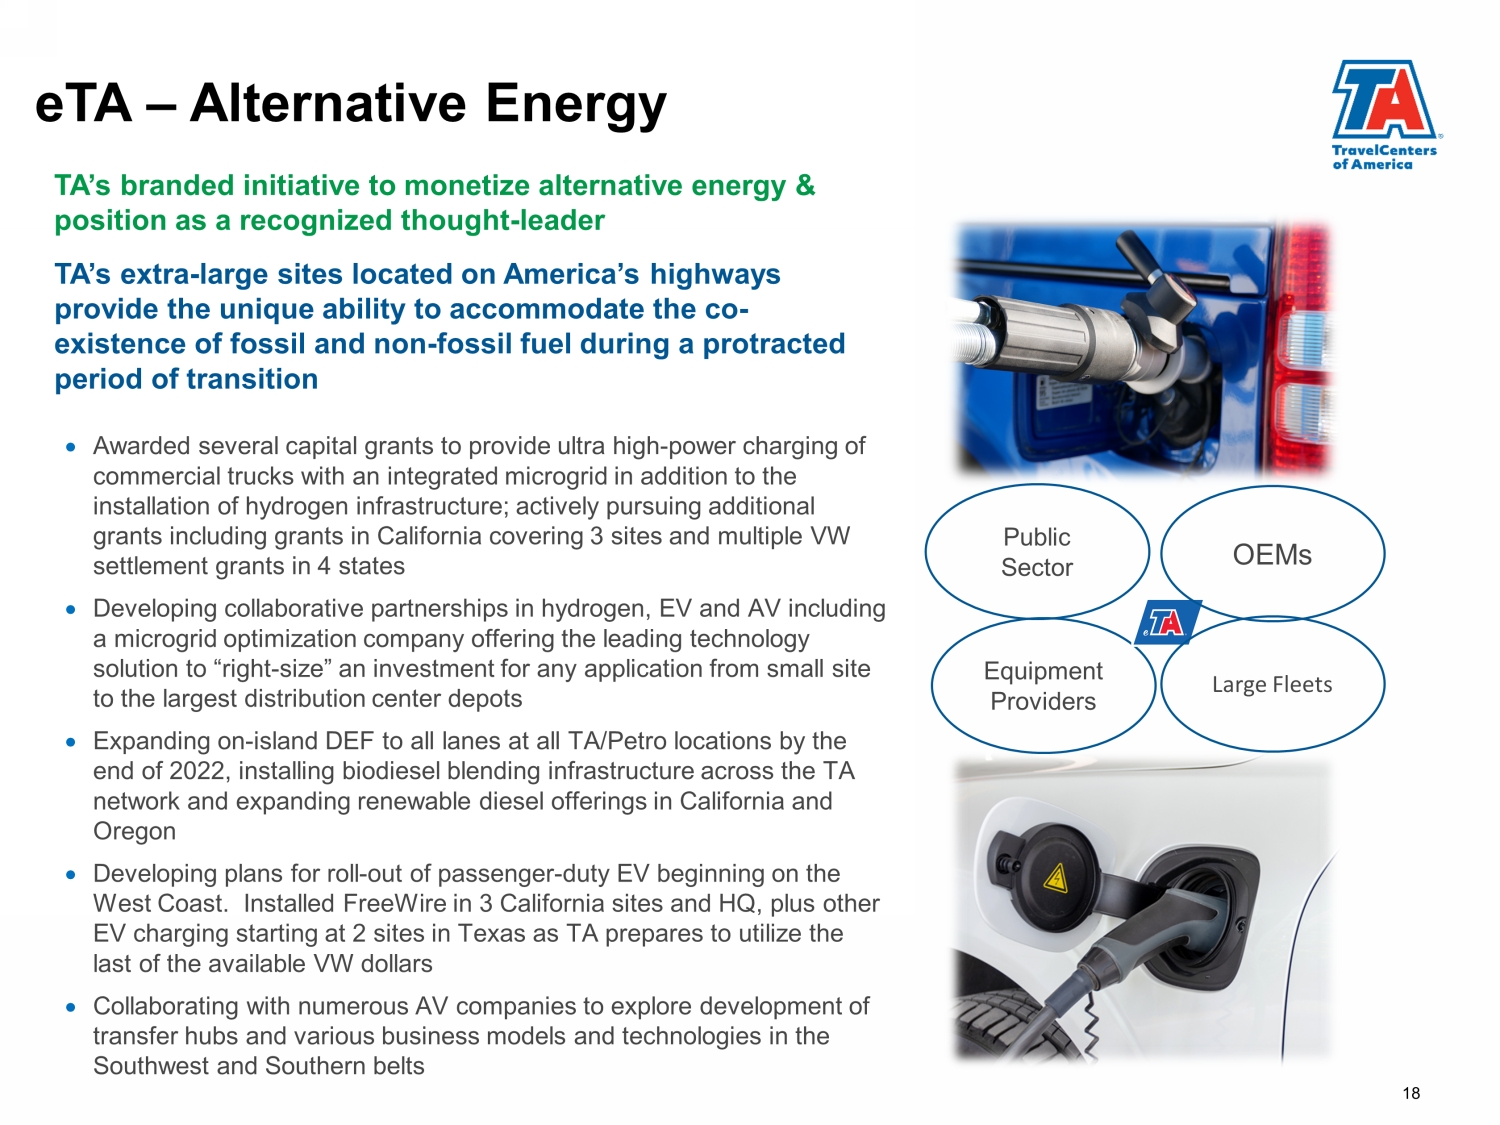
18 eTA – Alternative Energy TA’s branded initiative to monetize alternative energy & position as a recognized thought - leader Equipment Providers TA’s extra - large sites located on America’s highways provide the unique ability to accommodate the co - existence of fossil and non - fossil fuel during a protracted period of transition Awarded several capital grants to provide ultra high - power charging of commercial trucks with an integrated microgrid in addition to the installation of hydrogen infrastructure; actively pursuing additional grants including grants in California covering 3 sites and multiple VW settlement grants in 4 states Developing collaborative partnerships in hydrogen, EV and AV including a microgrid optimization company offering the leading technology solution to “right - size” an investment for any application from small site to the largest distribution center depots Expanding on - island DEF to all lanes at all TA/Petro locations by the end of 2022, installing biodiesel blending infrastructure across the TA network and expanding renewable diesel offerings in California and Oregon Developing plans for roll - out of passenger - duty EV beginning on the West Coast. Installed FreeWire in 3 California sites and HQ, plus other EV charging starting at 2 sites in Texas as TA prepares to utilize the last of the available VW dollars Collaborating with numerous AV companies to explore development of transfer hubs and various business models and technologies in the Southwest and Southern belts OEMs Large Fleets Public Sector
Financial Overview 19
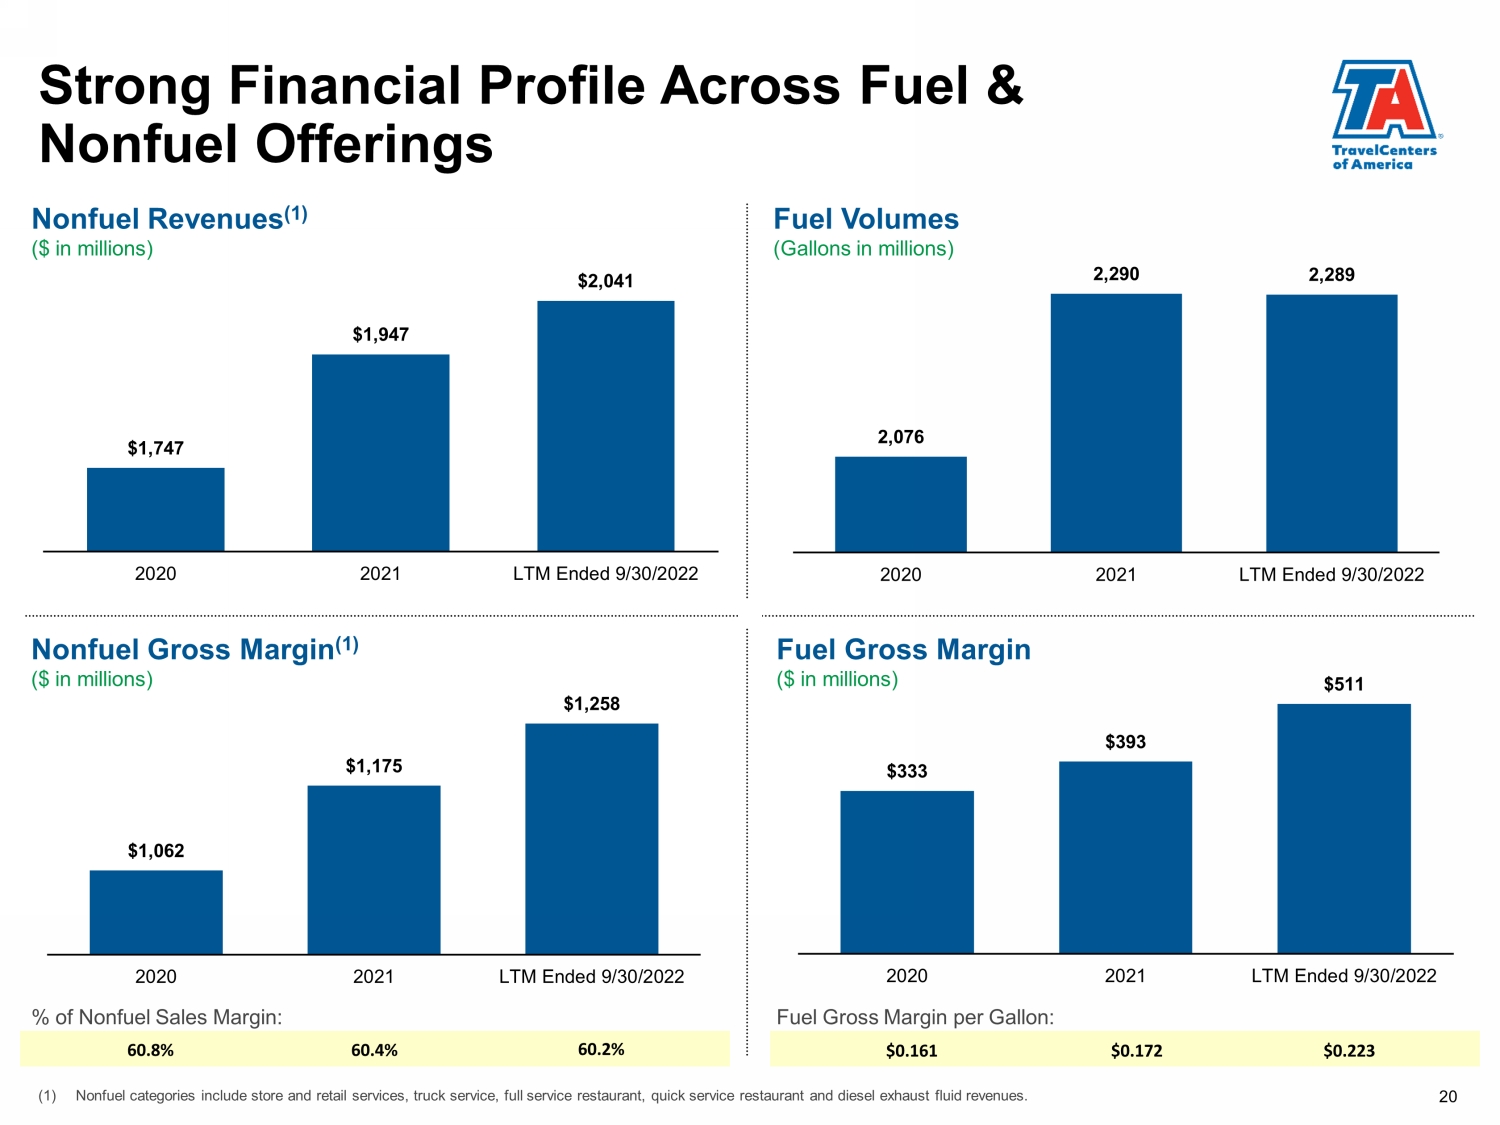
Strong Financial Profile Across Fuel & Nonfuel Offerings Fuel Volumes (Gallons in millions) Nonfuel Revenues (1) ($ in millions) Nonfuel Gross Margin (1) ($ in millions) Fuel Gross Margin ($ in millions) Fuel Gross Margin per Gallon: % of Nonfuel Sales Margin: 60.8% 60.4% 60.2% $0.161 $0.172 $0.223 20 (1) Nonfuel categories include store and retail services, truck service, full service restaurant, quick service restaurant and di ese l exhaust fluid revenues . $1,747 $1,947 $2,041 2020 2021 LTM Ended 9/30/2022 2,076 2,290 2,289 2020 2021 LTM Ended 9/30/2022 $1,062 $1,175 $1,258 2020 2021 LTM Ended 9/30/2022 $333 $393 $511 2020 2021 LTM Ended 9/30/2022
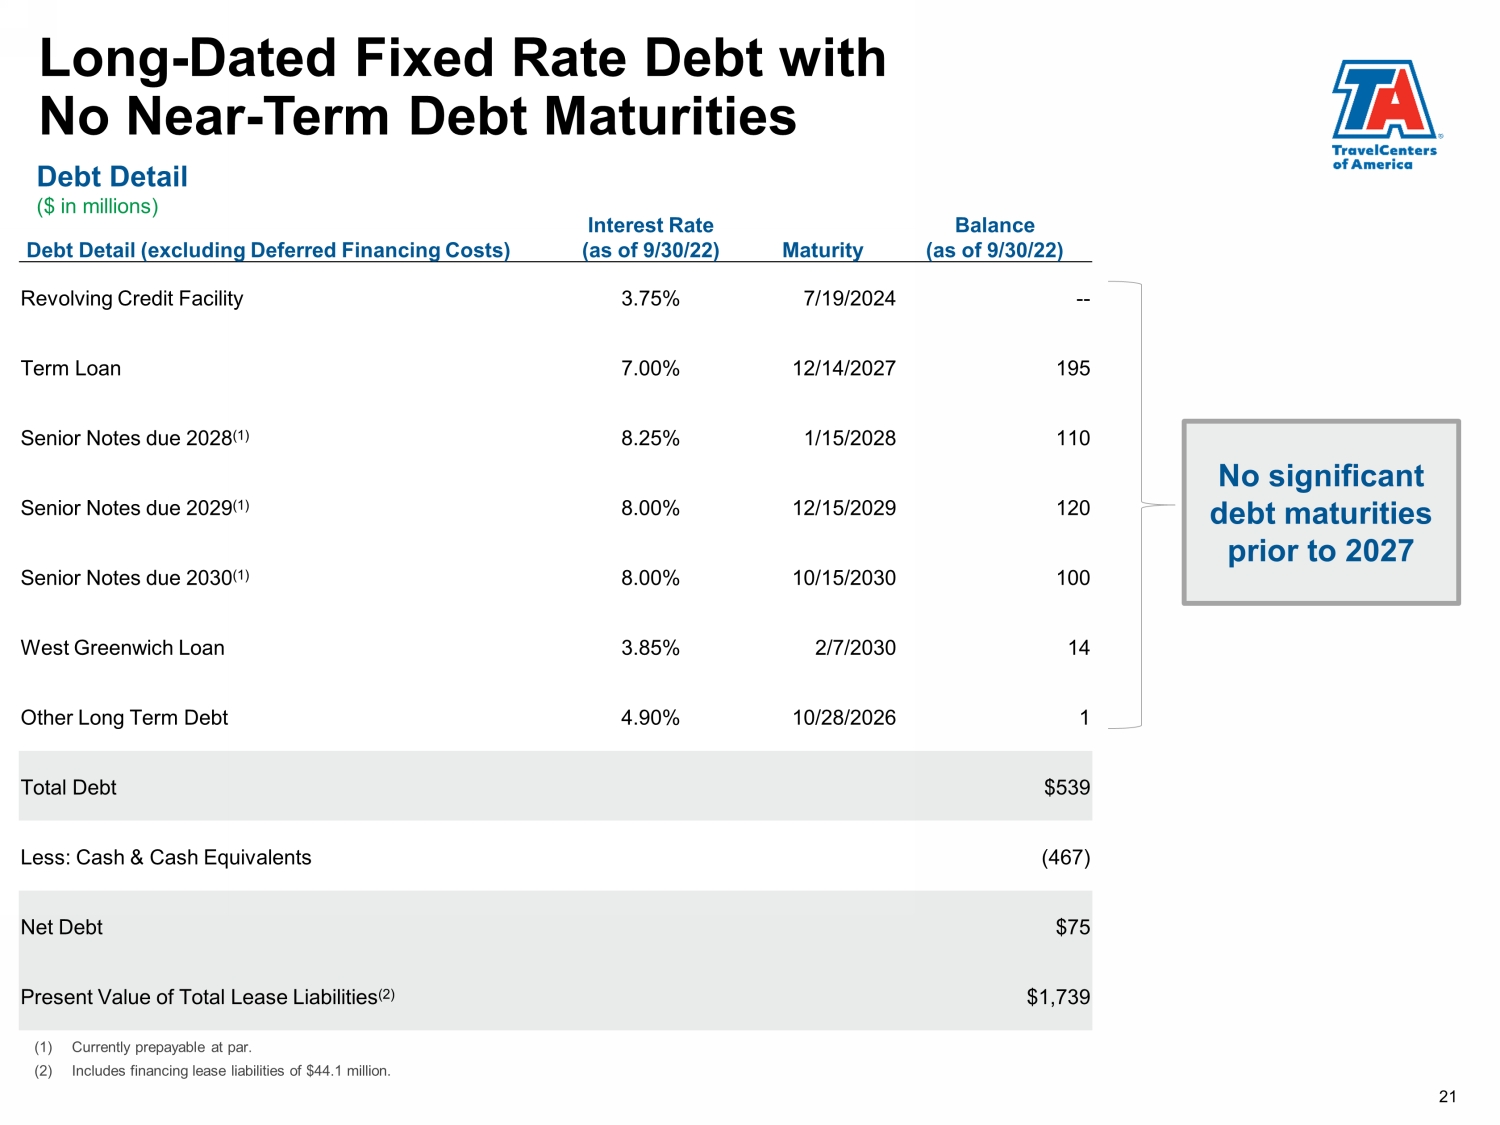
Long - Dated Fixed Rate Debt with No Near - Term Debt Maturities Debt Detail ($ in millions) No significant debt maturities prior to 2027 21 (1) Currently prepayable at par. (2) Includes financing lease liabilities of $44.1 million. Debt Detail (excluding Deferred Financing Costs) Interest Rate (as of 9/30/22) Maturity Balance (as of 9/30/22) Revolving Credit Facility 3.75% 7/19/2024 -- Term Loan 7.00% 12/14/2027 195 Senior Notes due 2028 (1) 8.25% 1/15/2028 110 Senior Notes due 2029 (1) 8.00% 12/15/2029 120 Senior Notes due 2030 (1) 8.00% 10/15/2030 100 West Greenwich Loan 3.85% 2/7/2030 14 Other Long Term Debt 4.90% 10/28/2026 1 Total Debt $539 Less: Cash & Cash Equivalents (467) Net Debt $75 Present Value of Total Lease Liabilities (2) $1,739
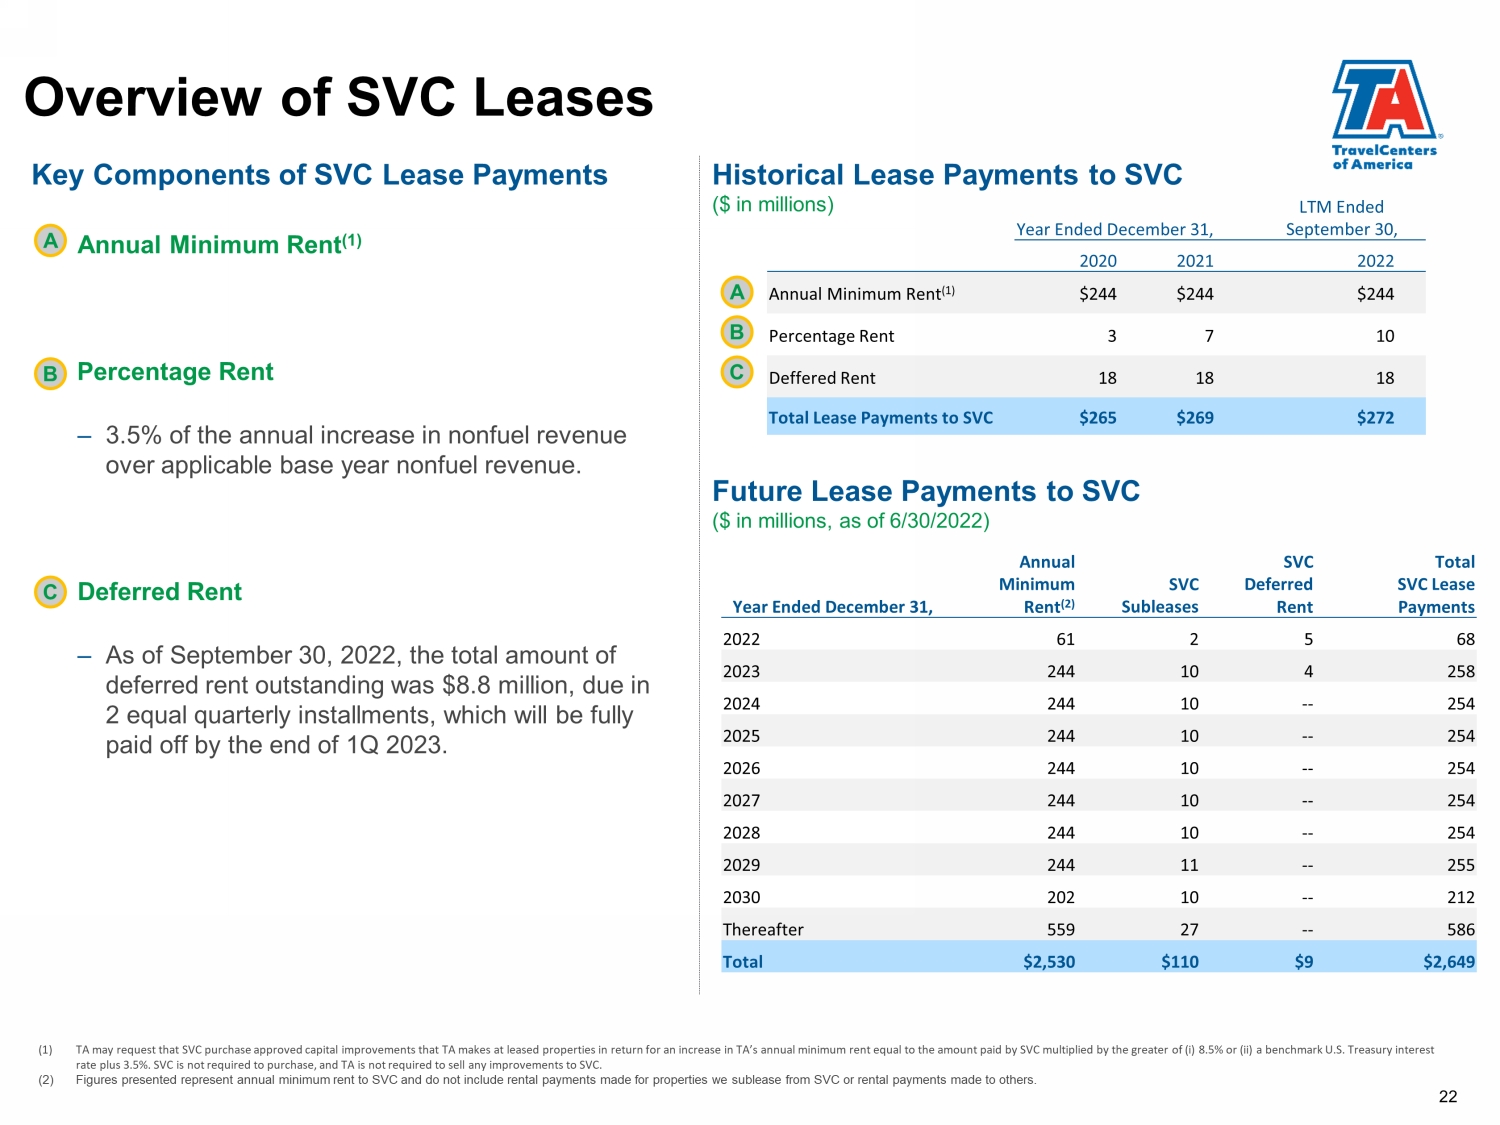
(1) TA may request that SVC purchase approved capital improvements that TA makes at leased properties in return for an increase i n T A’s annual minimum rent equal to the amount paid by SVC multiplied by the greater of (i) 8.5% or (ii) a benchmark U.S. Treasury interest rate plus 3.5%. SVC is not required to purchase, and TA is not required to sell any improvements to SVC. (2) Figures presented represent annual minimum rent to SVC and do not include rental payments made for properties we sublease fro m S VC or rental payments made to others. Key Components of SVC Lease Payments Annual Minimum Rent (1) Percentage Rent – 3.5% of the annual increase in nonfuel revenue over applicable base year nonfuel revenue. Deferred Rent – As of September 30, 2022, the total amount of deferred rent outstanding was $ 8 .8 million, due in 2 equal quarterly installments, which will be fully paid off by the end of 1Q 2023. Future Lease Payments to SVC ($ in millions, as of 6/30/2022) A B C Historical Lease Payments to SVC ($ in millions) A B C Overview of SVC Leases 22 Year Ended December 31, LTM Ended September 30, 2020 2021 2022 Annual Minimum Rent (1) $244 $244 $244 Percentage Rent 3 7 10 Deffered Rent 18 18 18 Total Lease Payments to SVC $265 $269 $272 Year Ended December 31, Annual Minimum Rent (2) SVC Subleases SVC Deferred Rent Total SVC Lease Payments 2022 61 2 5 68 2023 244 10 4 258 2024 244 10 -- 254 2025 244 10 -- 254 2026 244 10 -- 254 2027 244 10 -- 254 2028 244 10 -- 254 2029 244 11 -- 255 2030 202 10 -- 212 Thereafter 559 27 -- 586 Total $2,530 $110 $9 $2,649
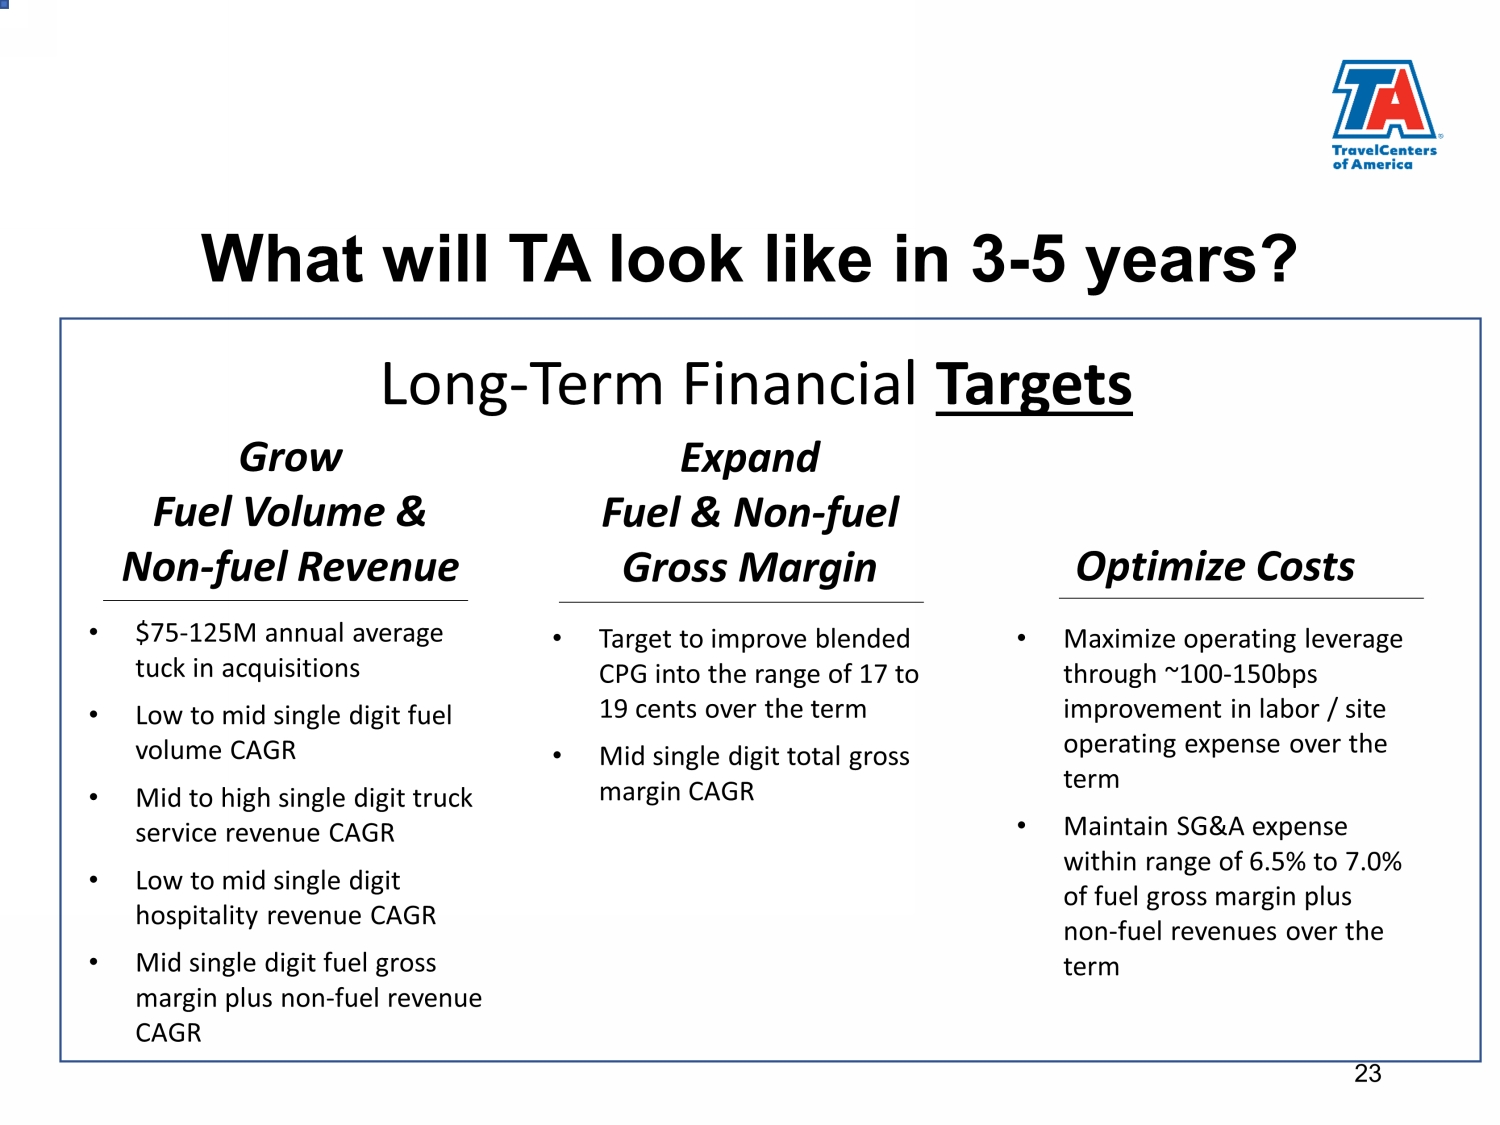
What will TA look like in 3 - 5 years? Grow Fuel Volume & Non - fuel Revenue • $75 - 125M annual average tuck in acquisitions • Low to mid single digit fuel volume CAGR • Mid to high single digit truck service revenue CAGR • Low to mid single digit hospitality revenue CAGR • Mid single digit fuel gross margin plus non - fuel revenue CAGR 23 Long - Term Financial Targets Expand Fuel & Non - fuel Gross Margin • Target to improve blended CPG into the range of 17 to 19 cents over the term • Mid single digit total gross margin CAGR Optimize Costs • Maximize operating leverage through ~ 100 - 150bps improvement in labor / site operating expense over the term • Maintain SG&A expense within range of 6.5% to 7.0% of fuel gross margin plus non - fuel revenues over the term
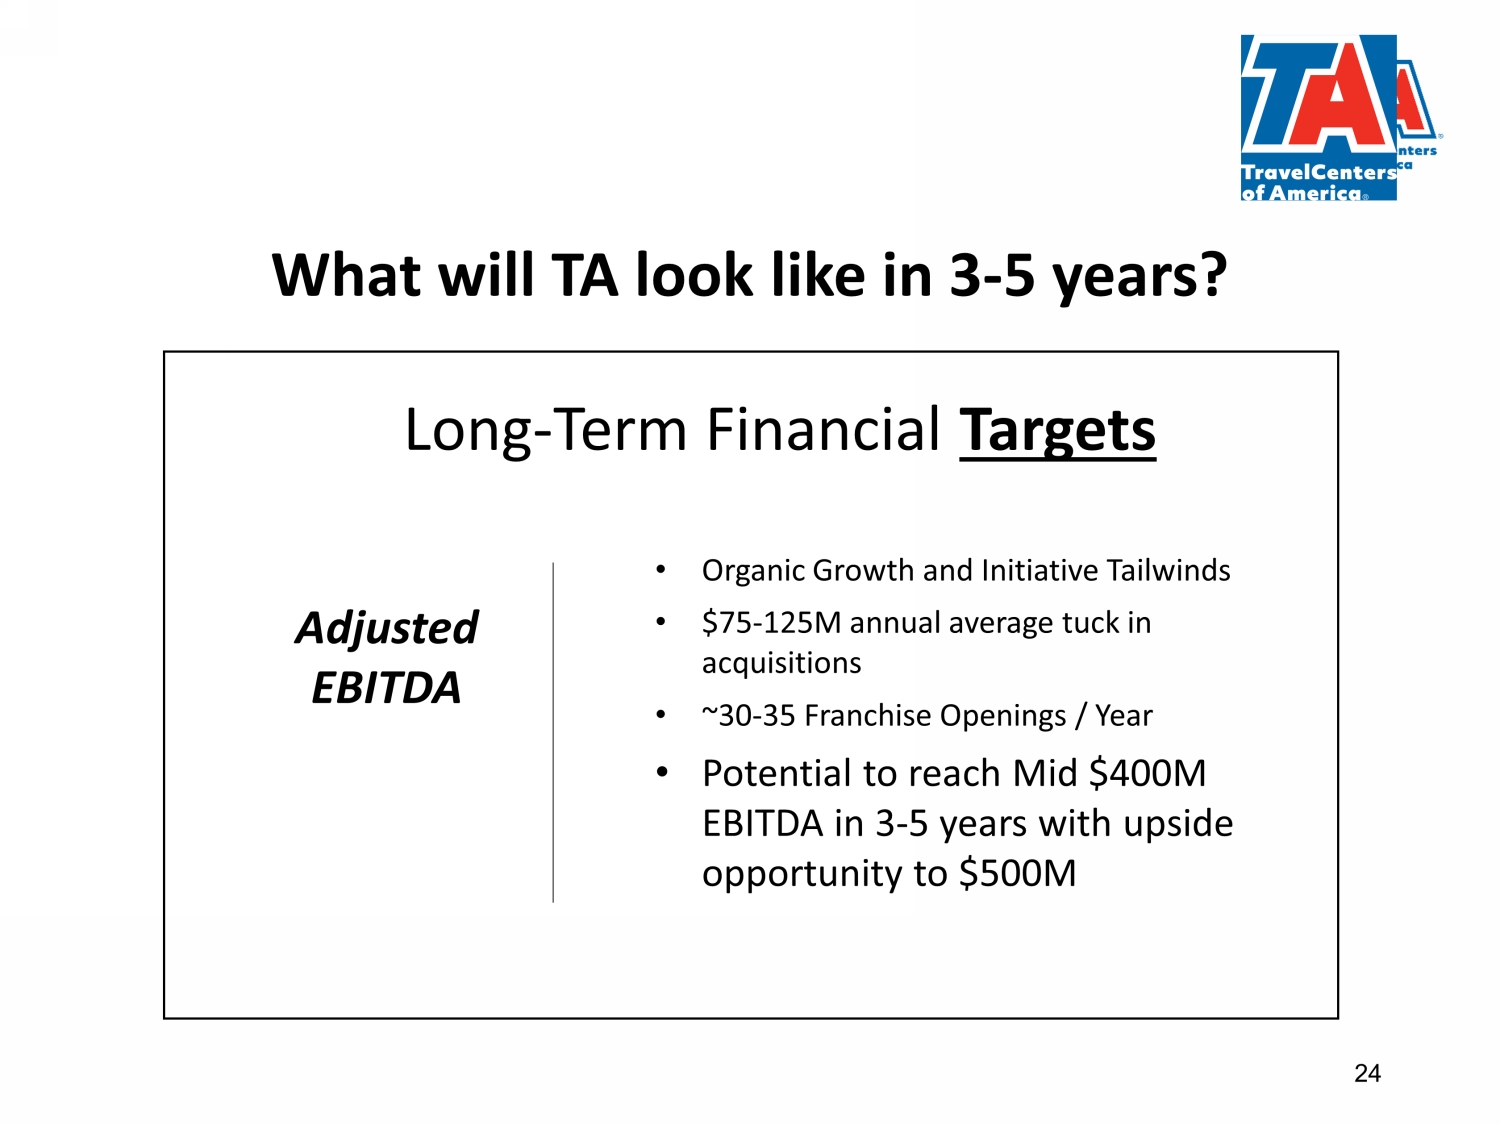
What will TA look like in 3 - 5 years? Long - Term Financial Targets Adjusted EBITDA • Organic Growth and Initiative Tailwinds • $75 - 125M annual average tuck in acquisitions • ~30 - 35 Franchise Openings / Year • Potential to reach Mid $400M EBITDA in 3 - 5 years with upside opportunity to $500M 24
Capital Allocation Key Considerations • Maintain business • High return growth • Optimal capital resources stewardship Guiding Principles • Maximum flexibility • Strength • Liquidity 25 Evaluate opportunities to reduce cost of debt & capital

Exhibits 26
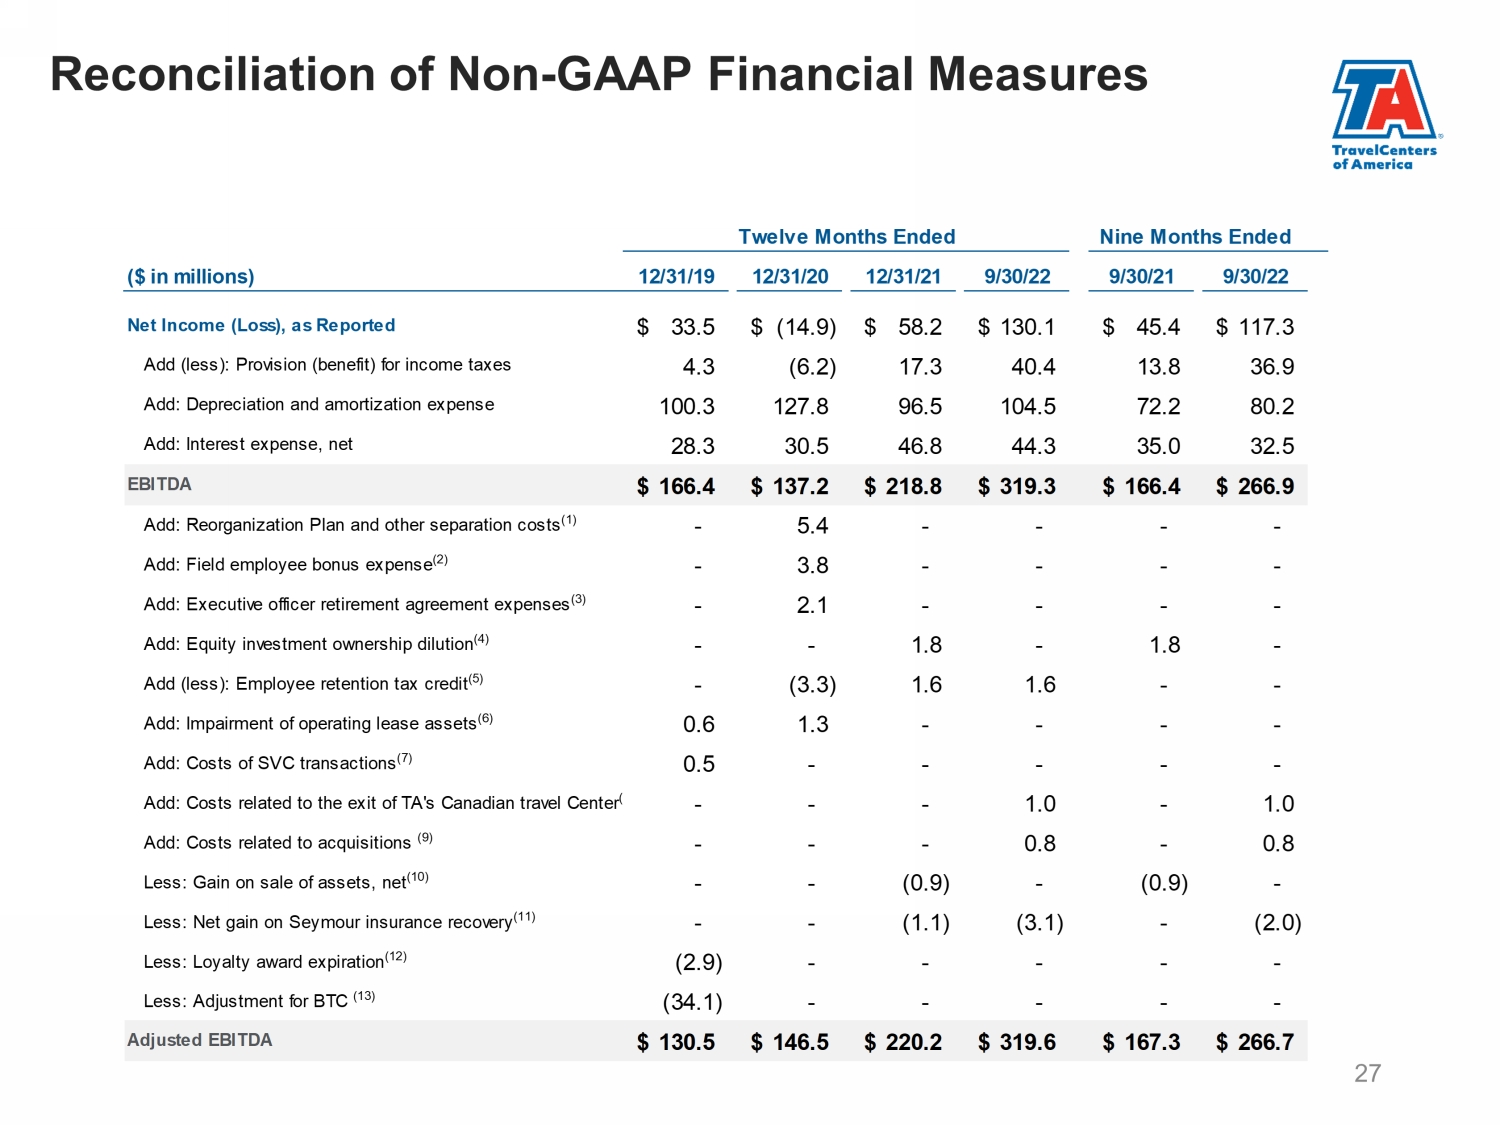
Reconciliation of Non - GAAP Financial Measures 27 ($ in millions) 12/31/19 12/31/20 12/31/21 9/30/22 9/30/21 9/30/22 Net Income (Loss), as Reported 33.5$ (14.9)$ 58.2$ 130.1$ 45.4$ 117.3$ Add (less): Provision (benefit) for income taxes 4.3 (6.2) 17.3 40.4 13.8 36.9 Add: Depreciation and amortization expense 100.3 127.8 96.5 104.5 72.2 80.2 Add: Interest expense, net 28.3 30.5 46.8 44.3 35.0 32.5 EBITDA 166.4$ 137.2$ 218.8$ 319.3$ 166.4$ 266.9$ Add: Reorganization Plan and other separation costs (1) - 5.4 - - - - Add: Field employee bonus expense (2) - 3.8 - - - - Add: Executive officer retirement agreement expenses (3) - 2.1 - - - - Add: Equity investment ownership dilution (4) - - 1.8 - 1.8 - Add (less): Employee retention tax credit (5) - (3.3) 1.6 1.6 - - Add: Impairment of operating lease assets (6) 0.6 1.3 - - - - Add: Costs of SVC transactions (7) 0.5 - - - - - Add: Costs related to the exit of TA's Canadian travel Center (8) - - - 1.0 - 1.0 Add: Costs related to acquisitions (9) - - - 0.8 - 0.8 Less: Gain on sale of assets, net (10) - - (0.9) - (0.9) - Less: Net gain on Seymour insurance recovery (11) - - (1.1) (3.1) - (2.0) Less: Loyalty award expiration (12) (2.9) - - - - - Less: Adjustment for BTC (13) (34.1) - - - - - Adjusted EBITDA 130.5$ 146.5$ 220.2$ 319.6$ 167.3$ 266.7$ Twelve Months Ended Nine Months Ended
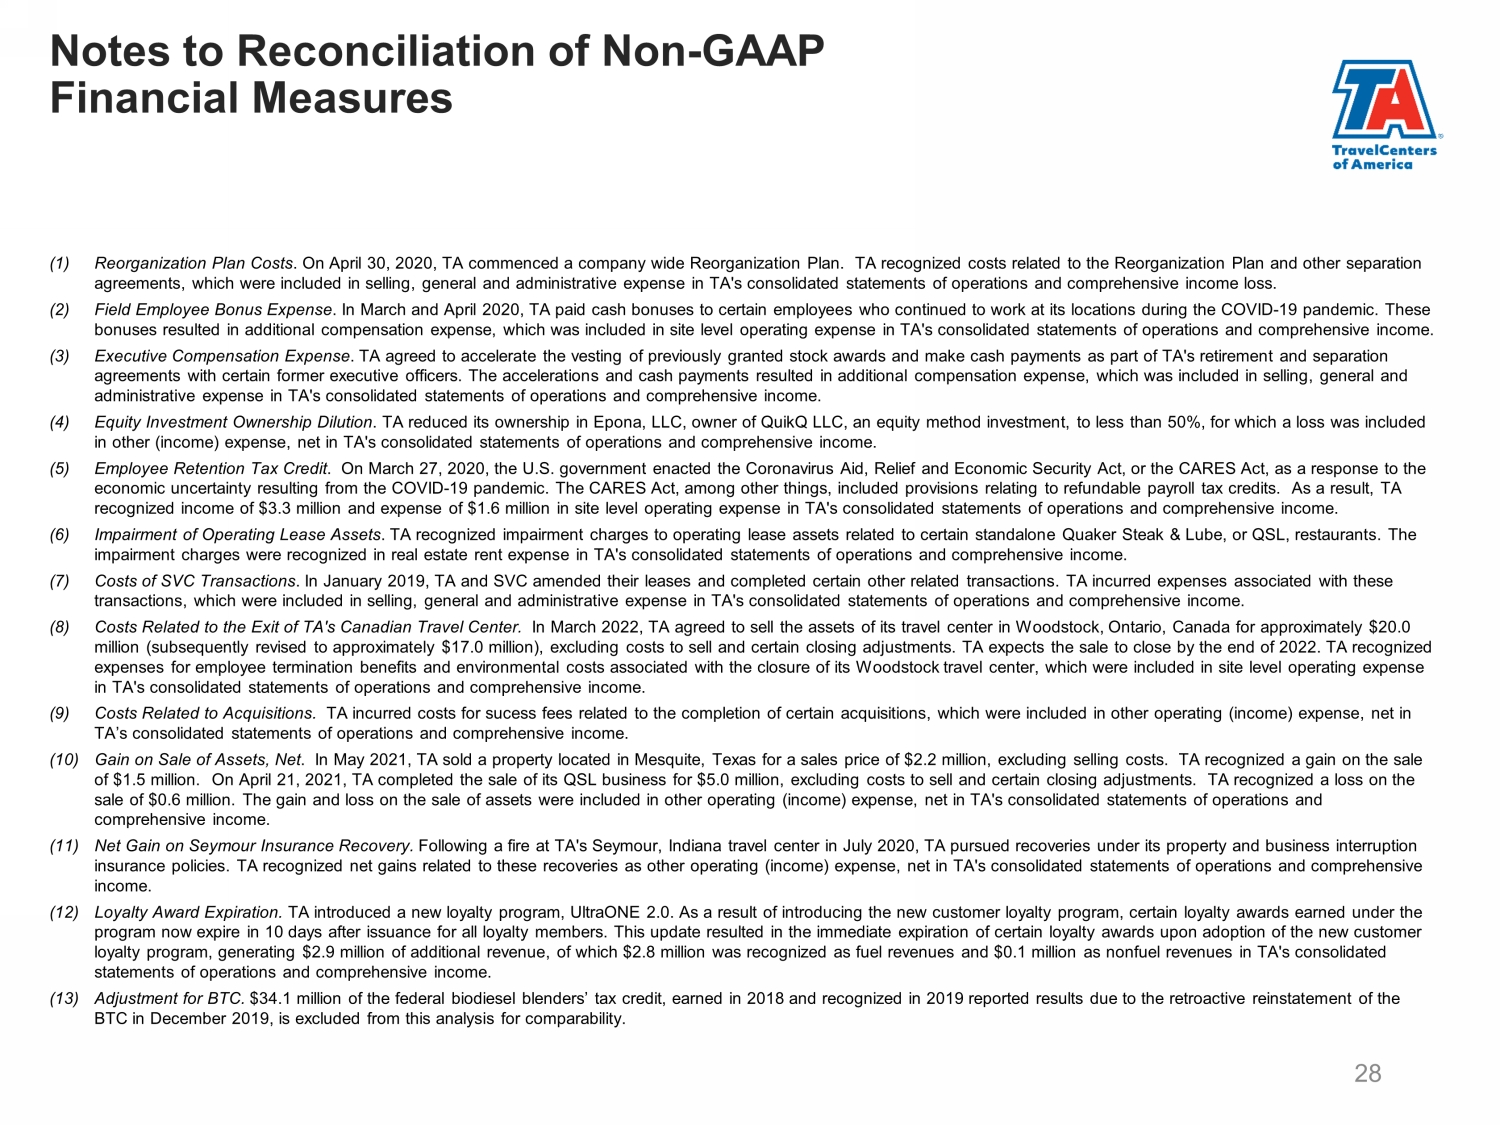
Notes to Reconciliation of Non - GAAP Financial Measures 28 (1) Reorganization Plan Costs . On April 30, 2020, TA commenced a company wide Reorganization Plan. TA recognized costs related to the Reorganization Plan an d other separation agreements, which were included in selling, general and administrative expense in TA's consolidated statements of operations and comprehensive income loss. (2) Field Employee Bonus Expense . In March and April 2020, TA paid cash bonuses to certain employees who continued to work at its locations during the COVID - 19 pandemic. These bonuses resulted in additional compensation expense, which was included in site level operating expense in TA's consolidated sta tements of operations and comprehensive income. (3) Executive Compensation Expense . TA agreed to accelerate the vesting of previously granted stock awards and make cash payments as part of TA's retirement an d s eparation agreements with certain former executive officers. The accelerations and cash payments resulted in additional compensation ex pen se, which was included in selling, general and administrative expense in TA's consolidated statements of operations and comprehensive income. (4) Equity Investment Ownership Dilution . TA reduced its ownership in Epona , LLC, owner of QuikQ LLC, an equity method investment, to less than 50%, for which a loss was included in other (income) expense, net in TA's consolidated statements of operations and comprehensive income. (5) Employee Retention Tax Credit . On March 27, 2020, the U.S. government enacted the Coronavirus Aid, Relief and Economic Security Act, or the CARES Act, as a response to the economic uncertainty resulting from the COVID - 19 pandemic. The CARES Act, among other things, included provisions relating to re fundable payroll tax credits. As a result, TA recognized income of $3.3 million and expense of $1.6 million in site level operating expense in TA's consolidated statements of operations and comprehensive income. (6) Impairment of Operating Lease Assets . TA recognized impairment charges to operating lease assets related to certain standalone Quaker Steak & Lube, or QSL, resta ura nts. The impairment charges were recognized in real estate rent expense in TA's consolidated statements of operations and comprehensiv e i ncome. (7) Costs of SVC Transactions . In January 2019, TA and SVC amended their leases and completed certain other related transactions. TA incurred expenses ass oci ated with these transactions, which were included in selling, general and administrative expense in TA's consolidated statements of operation s a nd comprehensive income. (8) Costs Related to the Exit of TA's Canadian Travel Center. In March 2022, TA agreed to sell the assets of its travel center in Woodstock, Ontario, Canada for approximately $20.0 million (subsequently revised to approximately $17.0 million), excluding costs to sell and certain closing adjustments. TA ex pec ts the sale to close by the end of 2022. TA recognized expenses for employee termination benefits and environmental costs associated with the closure of its Woodstock travel center , w hich were included in site level operating expense in TA's consolidated statements of operations and comprehensive income. (9) Costs Related to Acquisitions. TA incurred costs for sucess fees related to the completion of certain acquisitions, which were included in other operating (income) expense, net in TA’s consolidated statements of operations and comprehensive income. (10) Gain on Sale of Assets, Net . In May 2021, TA sold a property located in Mesquite, Texas for a sales price of $2.2 million, excluding selling costs. TA re cognized a gain on the sale of $1.5 million. On April 21, 2021, TA completed the sale of its QSL business for $5.0 million, excluding costs to sell and cer tain closing adjustments. TA recognized a loss on the sale of $0.6 million. The gain and loss on the sale of assets were included in other operating (income) expense, net in TA's con solidated statements of operations and comprehensive income. (11) Net Gain on Seymour Insurance Recovery. Following a fire at TA's Seymour, Indiana travel center in July 2020, TA pursued recoveries under its property and business i nte rruption insurance policies. TA recognized net gains related to these recoveries as other operating (income) expense, net in TA's cons oli dated statements of operations and comprehensive income. (12) Loyalty Award Expiration. TA introduced a new loyalty program, UltraONE 2.0. As a result of introducing the new customer loyalty program, certain loyalty awards earned under the program now expire in 10 days after issuance for all loyalty members. This update resulted in the immediate expiration of cer tai n loyalty awards upon adoption of the new customer loyalty program, generating $2.9 million of additional revenue, of which $2.8 million was recognized as fuel revenues and $0. 1 m illion as nonfuel revenues in TA's consolidated statements of operations and comprehensive income. (13) Adjustment for BTC. $34.1 million of the federal biodiesel blenders’ tax credit, earned in 2018 and recognized in 2019 reported results due to th e r etroactive reinstatement of the BTC in December 2019, is excluded from this analysis for comparability.
Transformation Plan in More Detail 29
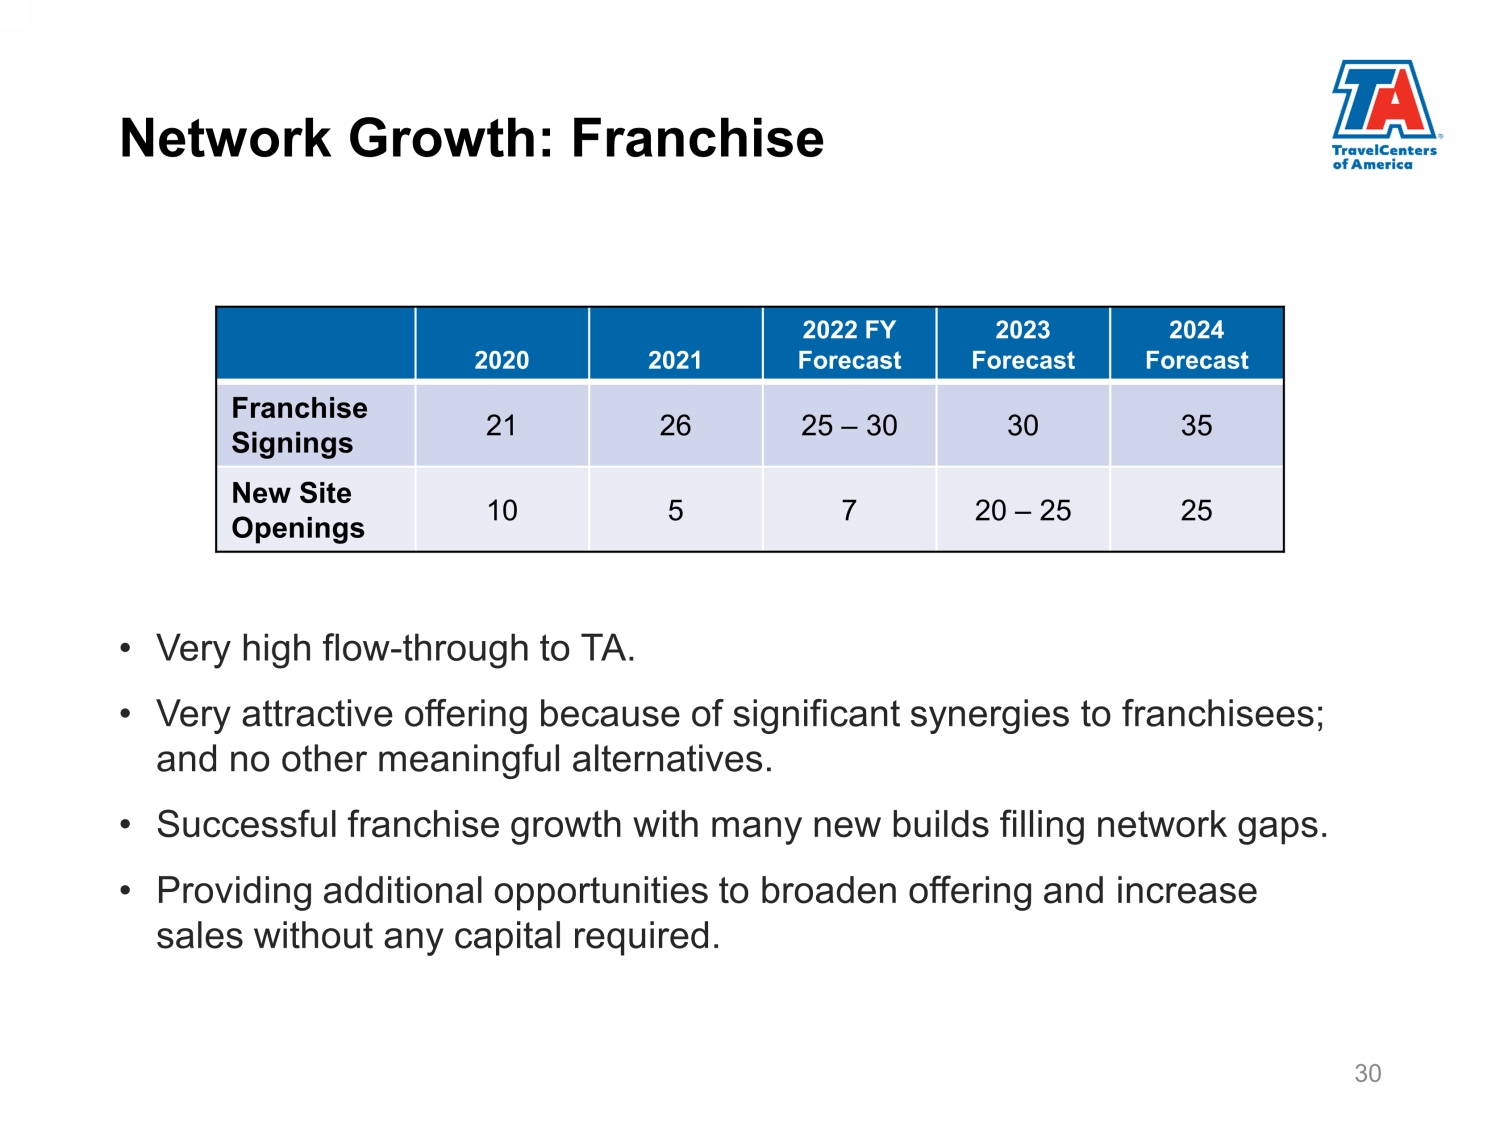
• Very high flow - through to TA. • Very attractive offering because of significant synergies to franchisees; and no other meaningful alternatives. • Successful franchise growth with many new builds filling network gaps. • Providing additional opportunities to broaden offering and increase sales without any capital required. 30 2020 2021 2022 FY Forecast 2023 Forecast 2024 Forecast Franchise Signings 21 26 25 – 30 30 35 New Site Openings 10 5 7 20 – 25 25 Network Growth: Franchise
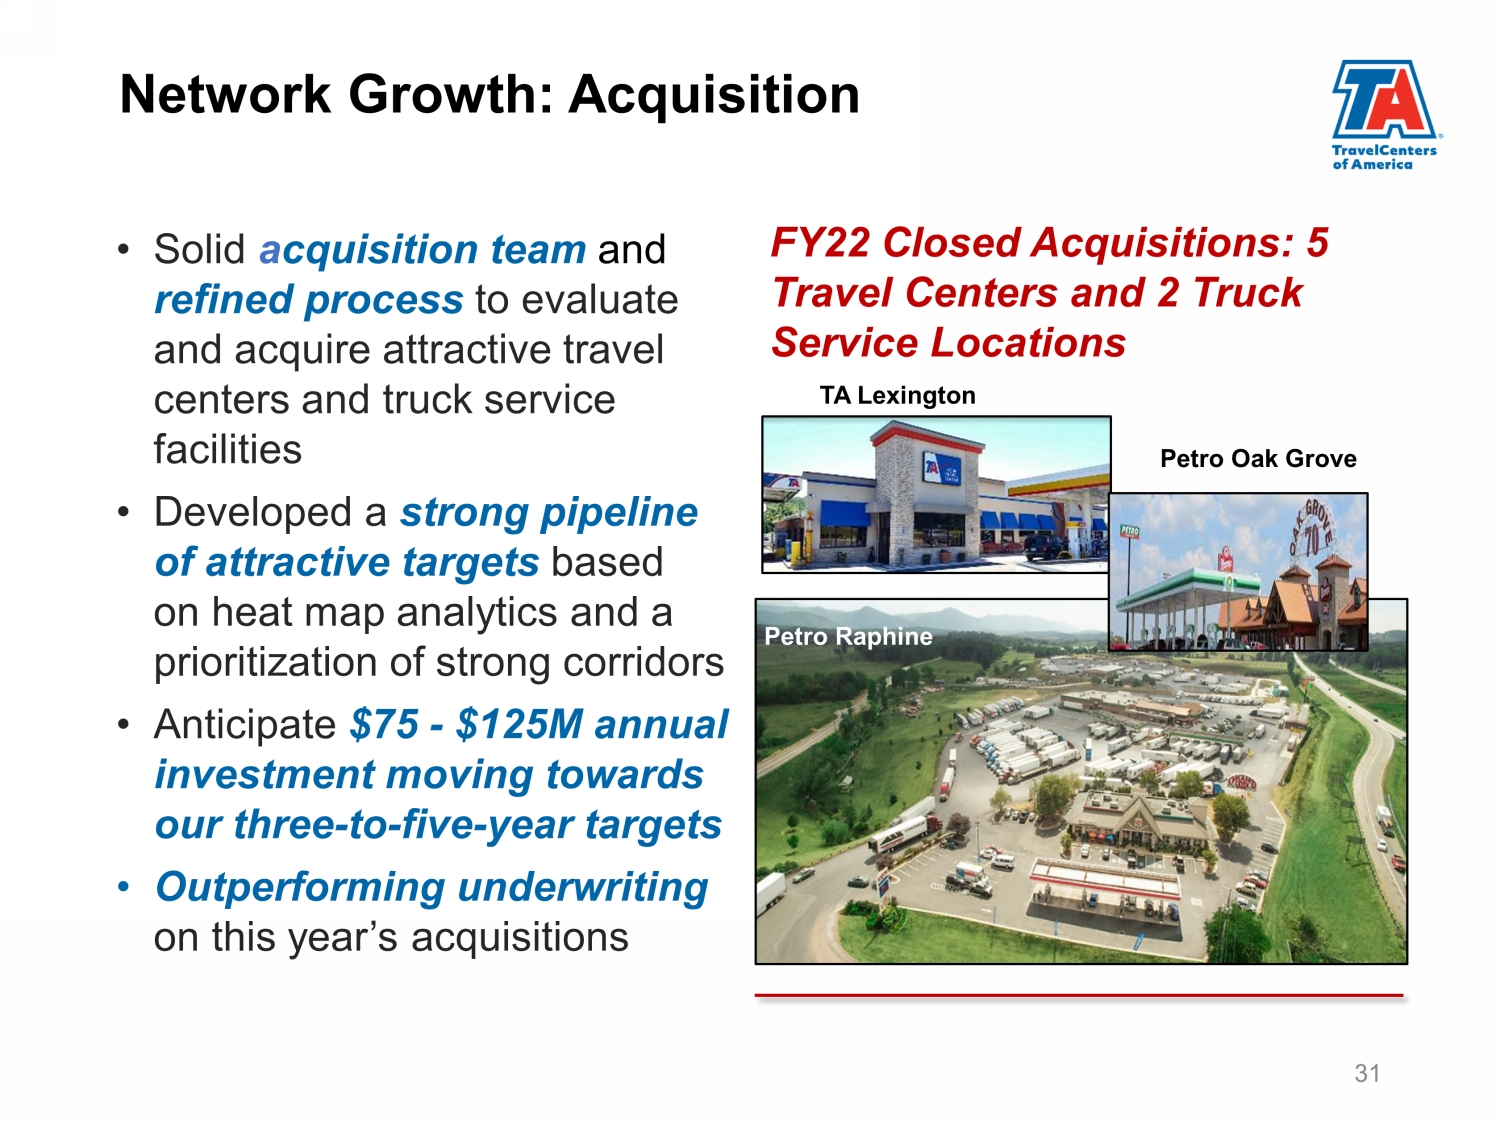
• Solid a cquisition team and refined process to evaluate and acquire attractive travel centers and truck service facilities • Developed a strong pipeline of attractive targets based on heat map analytics and a prioritization of strong corridors • Anticipate $75 - $125M annual investment moving towards our three - to - five - year targets • Outperforming underwriting on this year’s acquisitions 31 Petro Raphine Petro Oak Grove TA Lexington FY22 Closed Acquisitions: 5 Travel Centers and 2 Truck Service Locations Network Growth: Acquisition
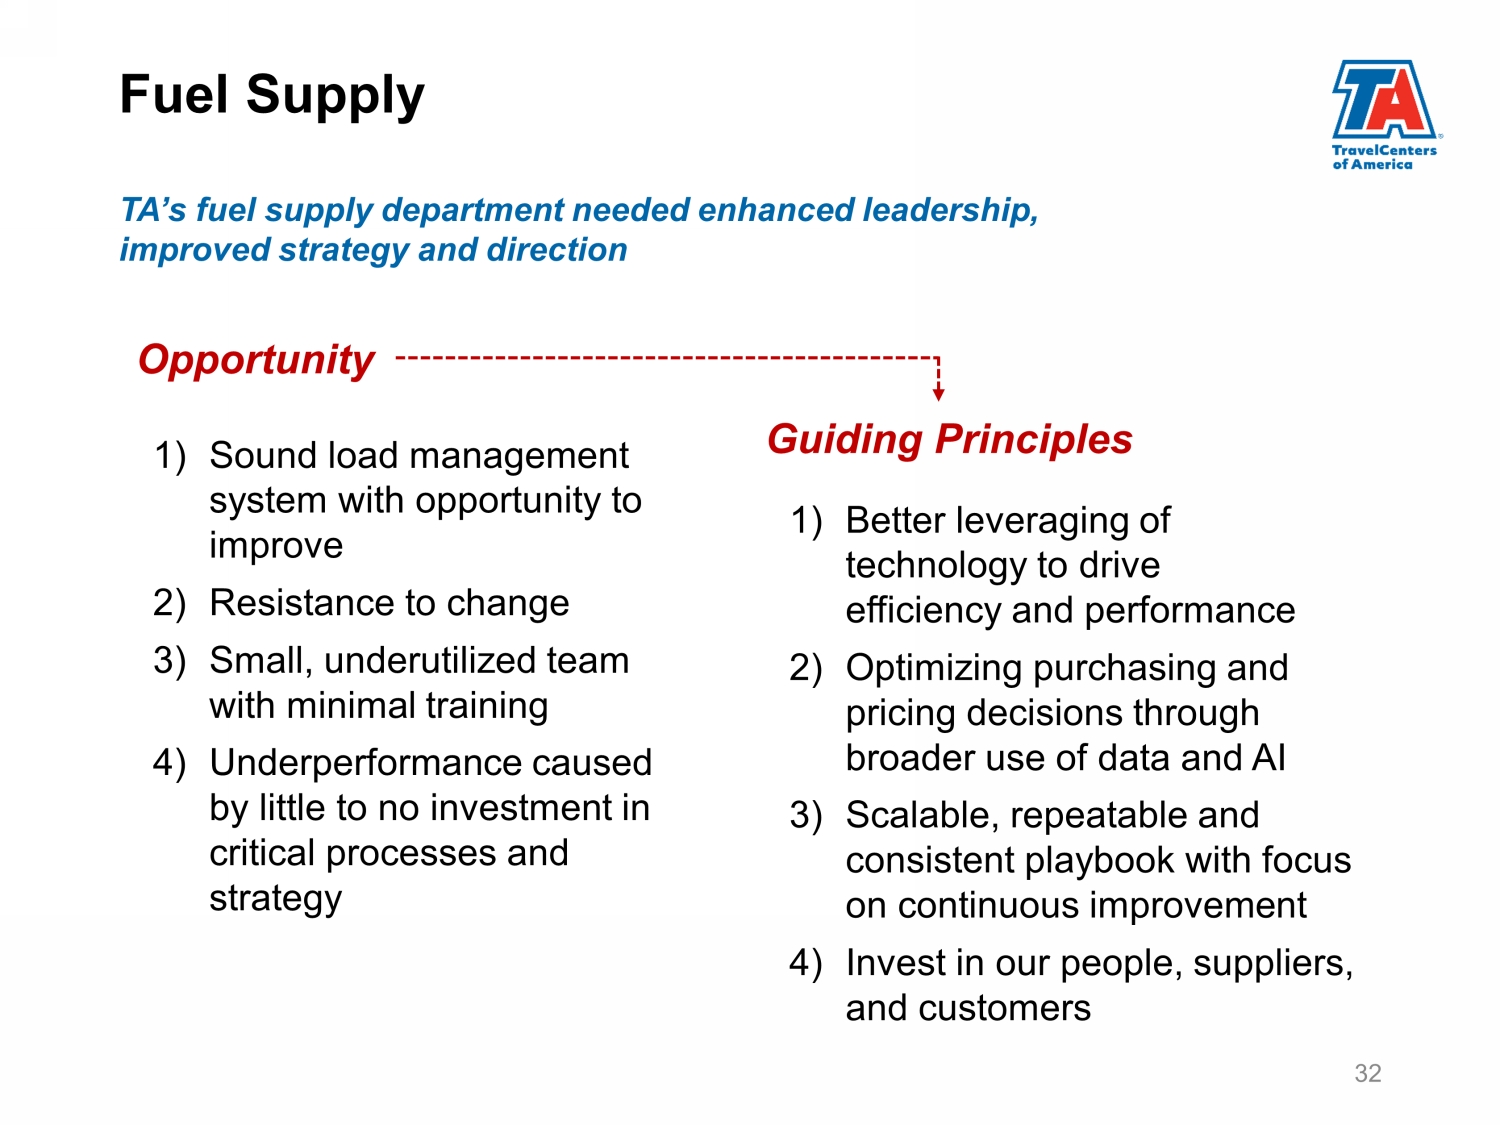
32 Opportunity Guiding Principles 1) Sound load management system with opportunity to improve 2) Resistance to change 3) Small, underutilized team with minimal training 4) Underperformance caused by little to no investment in critical processes and strategy 1) Better leveraging of technology to drive efficiency and performance 2) Optimizing purchasing and pricing decisions through broader use of data and AI 3) Scalable, repeatable and consistent playbook with focus on continuous improvement 4) Invest in our people, suppliers, and customers TA’s fuel supply department needed enhanced leadership, improved strategy and direction Fuel Supply
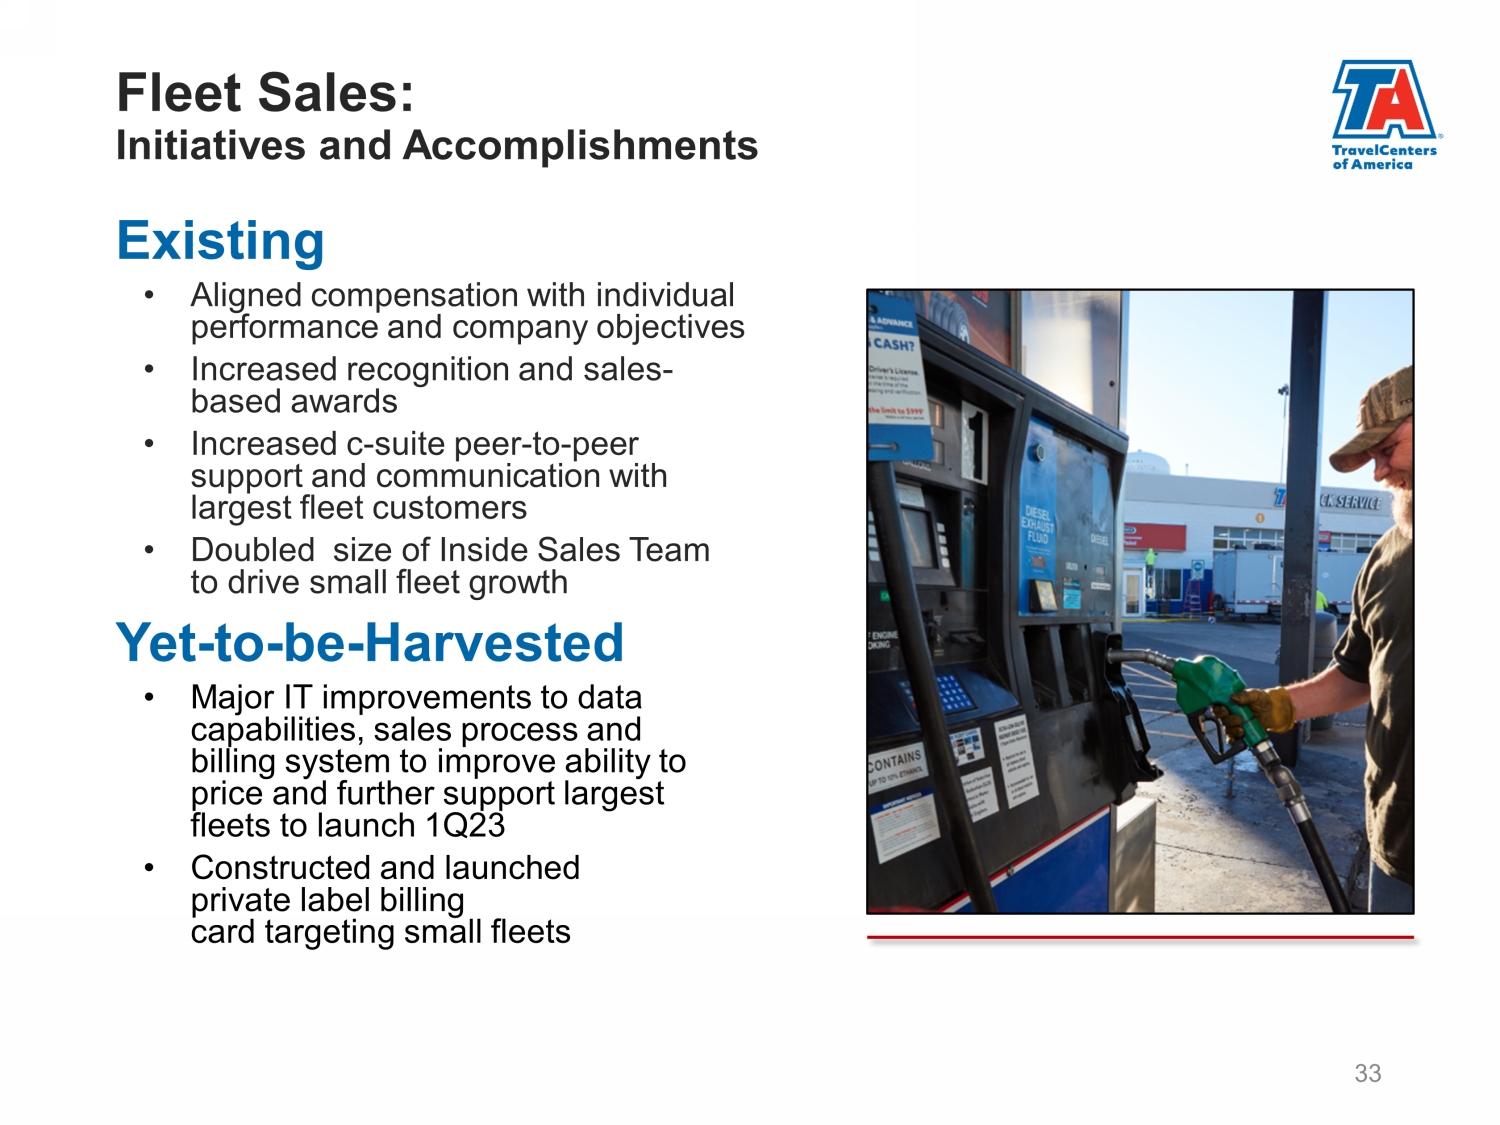
Existing • Aligned compensation with individual performance and company objectives • Increased recognition and sales - based awards • Increased c - suite peer - to - peer support and communication with largest fleet customers • Doubled size of Inside Sales Team to drive small fleet growth Yet - to - be - Harvested • Major IT improvements to data capabilities, sales process and billing system to improve ability to price and further support largest fleets to launch 1Q23 • Constructed and launched private label billing card targeting small fleets 33 Fleet Sales: Initiatives and Accomplishments
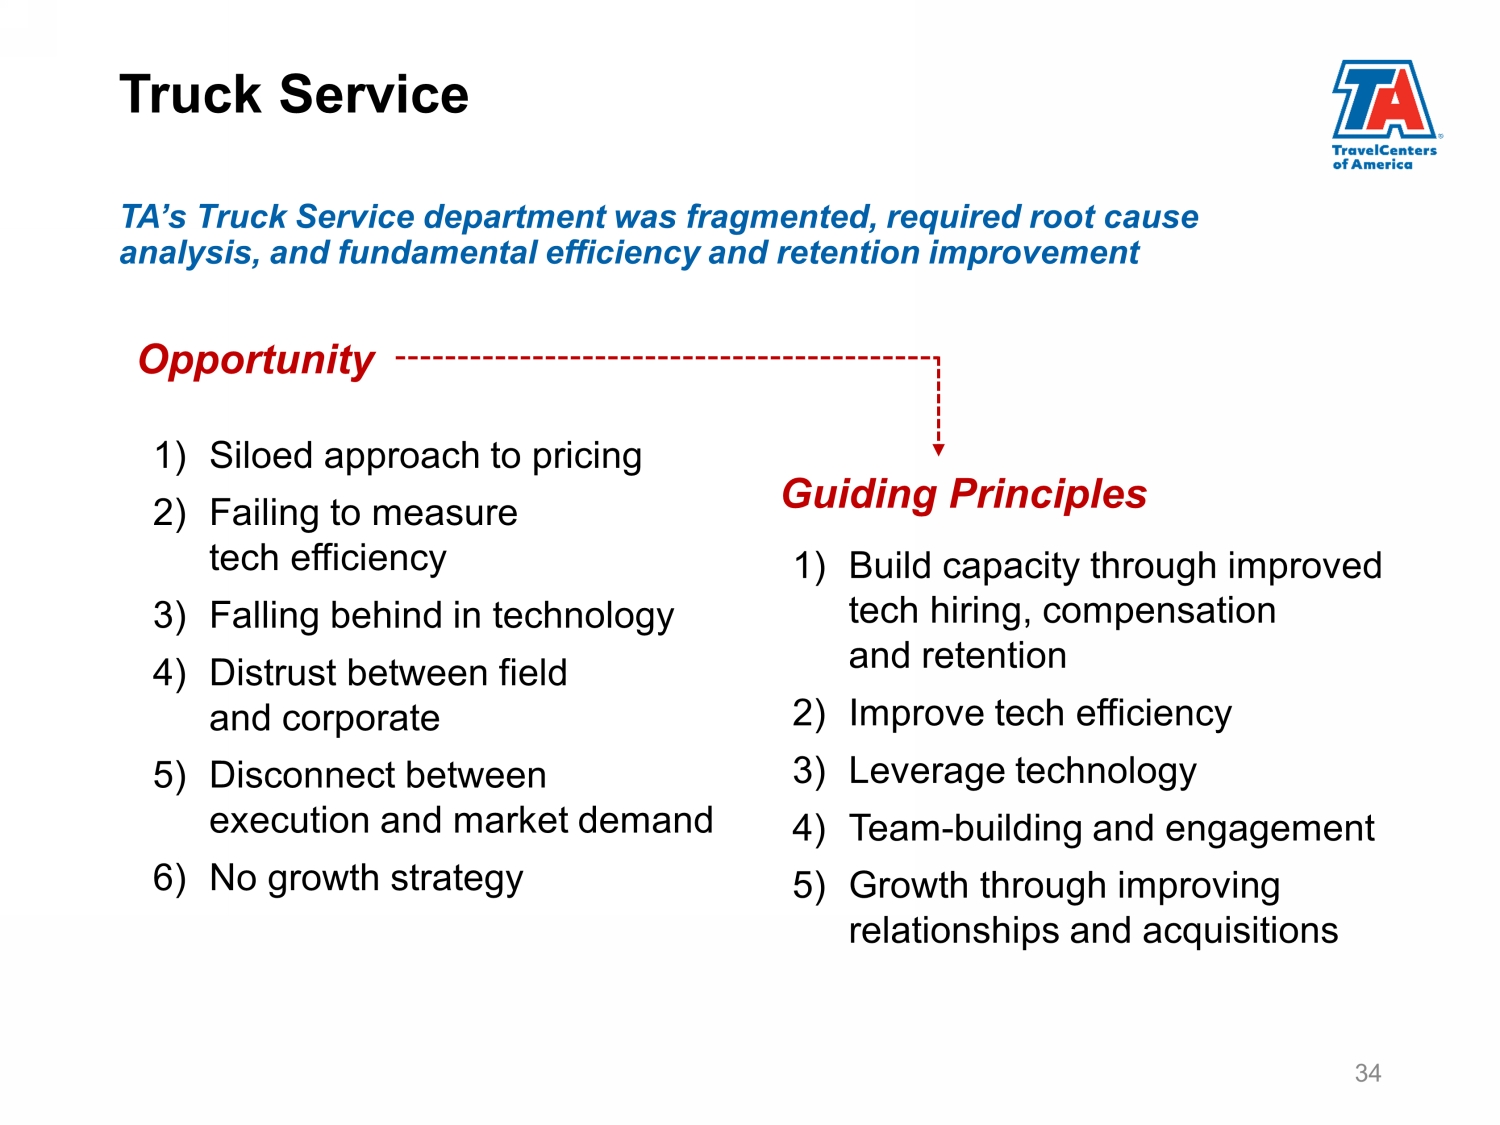
34 TA’s Truck Service department was fragmented, required root cause analysis, and fundamental efficiency and retention improvement Opportunity Guiding Principles 1) Siloed approach to pricing 2) Failing to measure tech efficiency 3) Falling behind in technology 4) Distrust between field and corporate 5) Disconnect between execution and market demand 6) No growth strategy 1) Build capacity through improved tech hiring, compensation and retention 2) Improve tech efficiency 3) Leverage technology 4) Team - building and engagement 5) Growth through improving relationships and acquisitions Truck Service
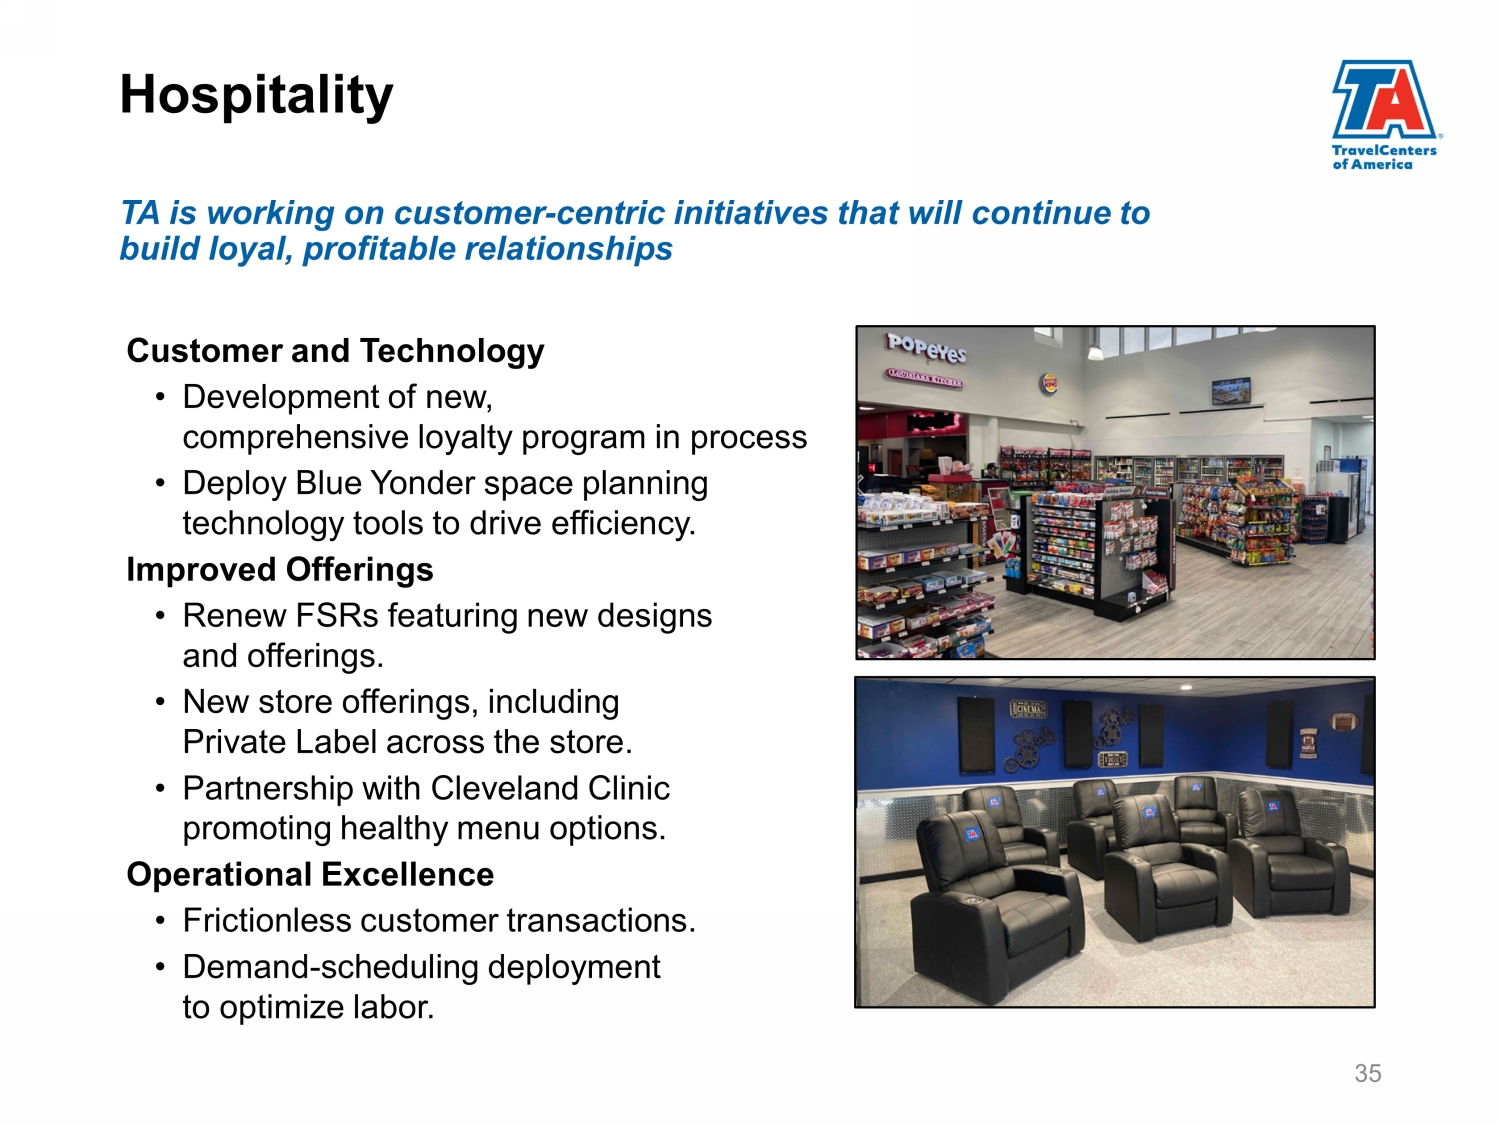
TA is working on customer - centric initiatives that will continue to build loyal, profitable relationships Customer and Technology • Development of new, comprehensive loyalty program in process • Deploy Blue Yonder space planning technology tools to drive efficiency. Improved Offerings • Renew FSRs featuring new designs and offerings. • New store offerings, including Private Label across the store. • Partnership with Cleveland Clinic promoting healthy menu options. Operational Excellence • Frictionless customer transactions. • Demand - scheduling deployment to optimize labor. 35 Hospitality
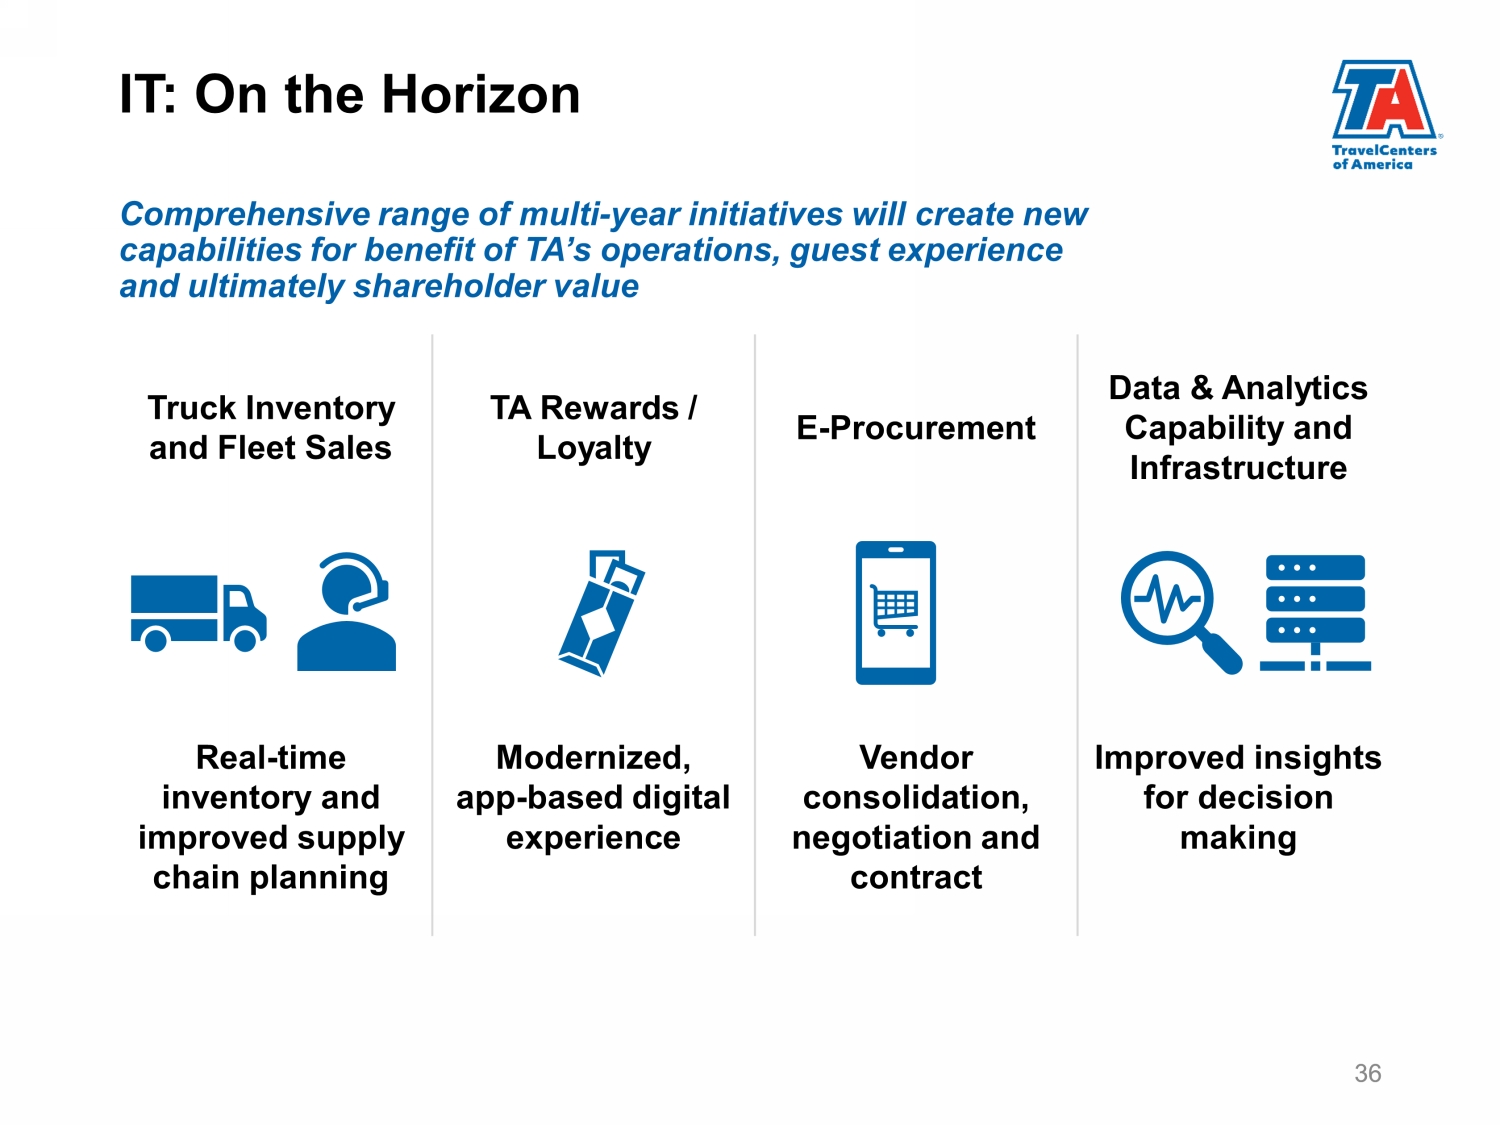
Truck Inventory and Fleet Sales TA Rewards / Loyalty E - Procurement Data & Analytics Capability and Infrastructure Real - time inventory and improved supply chain planning Modernized, app - based digital experience Vendor consolidation, negotiation and contract Improved insights for decision making 36 Comprehensive range of multi - year initiatives will create new capabilities for benefit of TA’s operations, guest experience and ultimately shareholder value 36 IT: On the Horizon
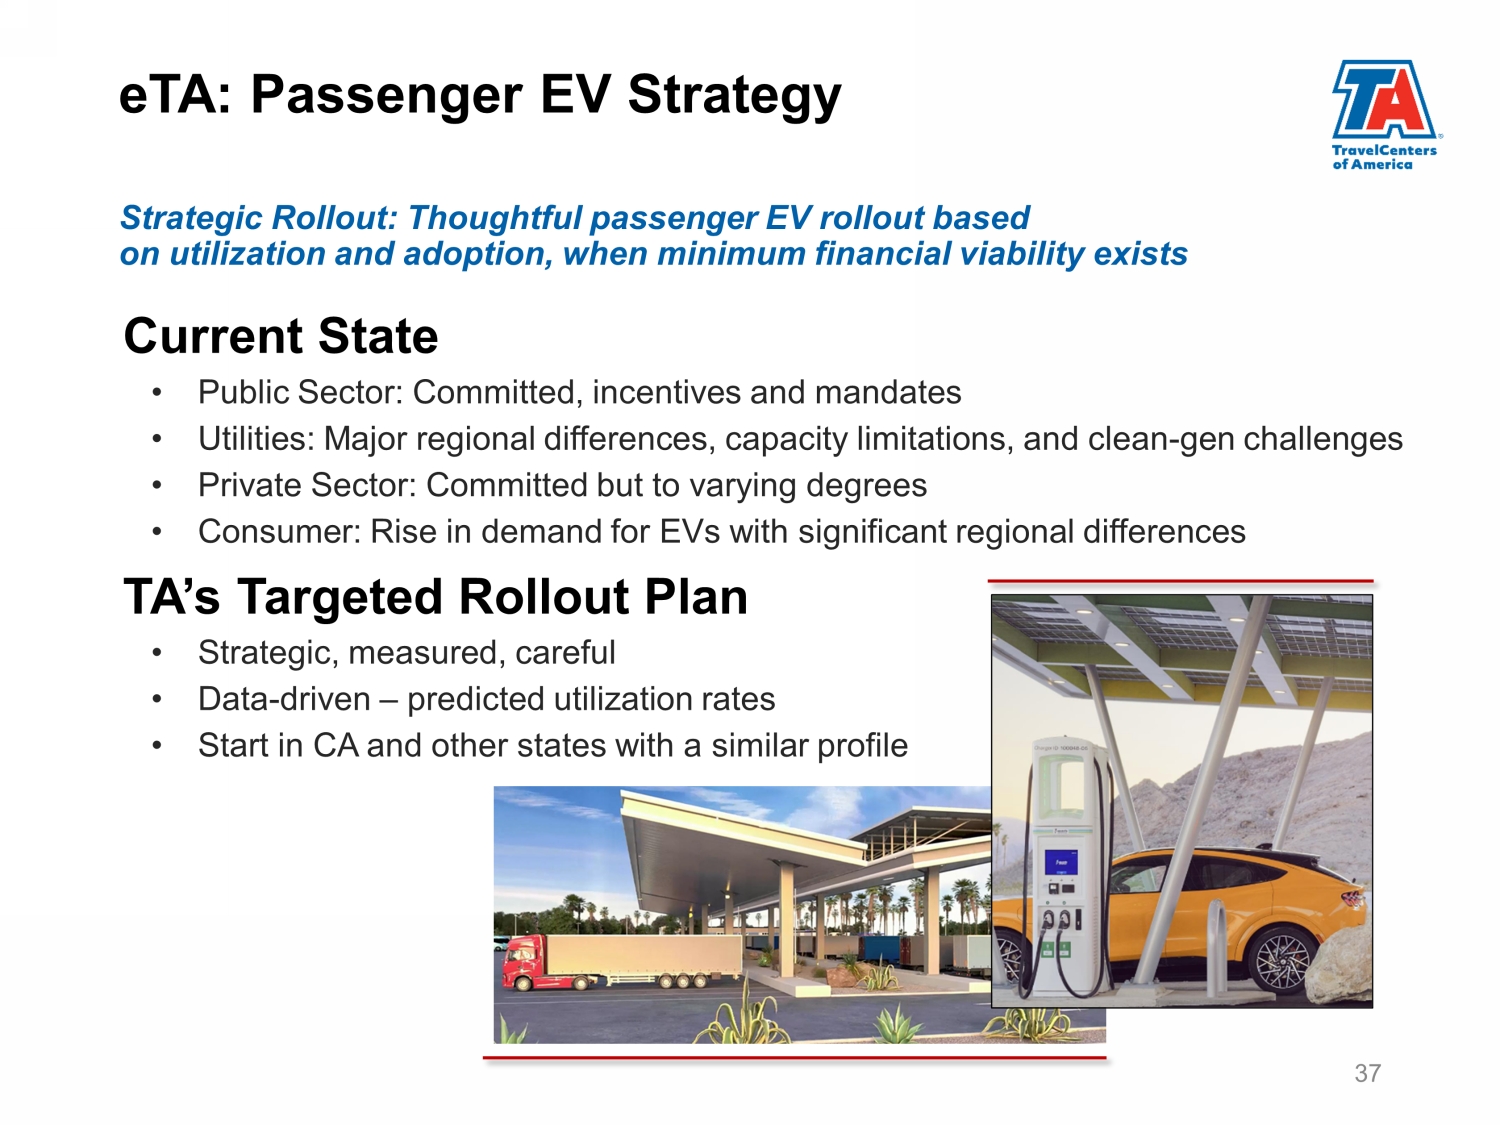
Current State • Public Sector: Committed, incentives and mandates • Utilities: Major regional differences, capacity limitations, and clean - gen challenges • Private Sector: Committed but to varying degrees • Consumer: Rise in demand for EVs with significant regional differences TA’s Targeted Rollout Plan • Strategic, measured, careful • Data - driven – predicted utilization rates • Start in CA and other states with a similar profile 37 Strategic Rollout: Thoughtful passenger EV rollout based on utilization and adoption, when minim um financial viability exists eTA : Passenger EV Strategy
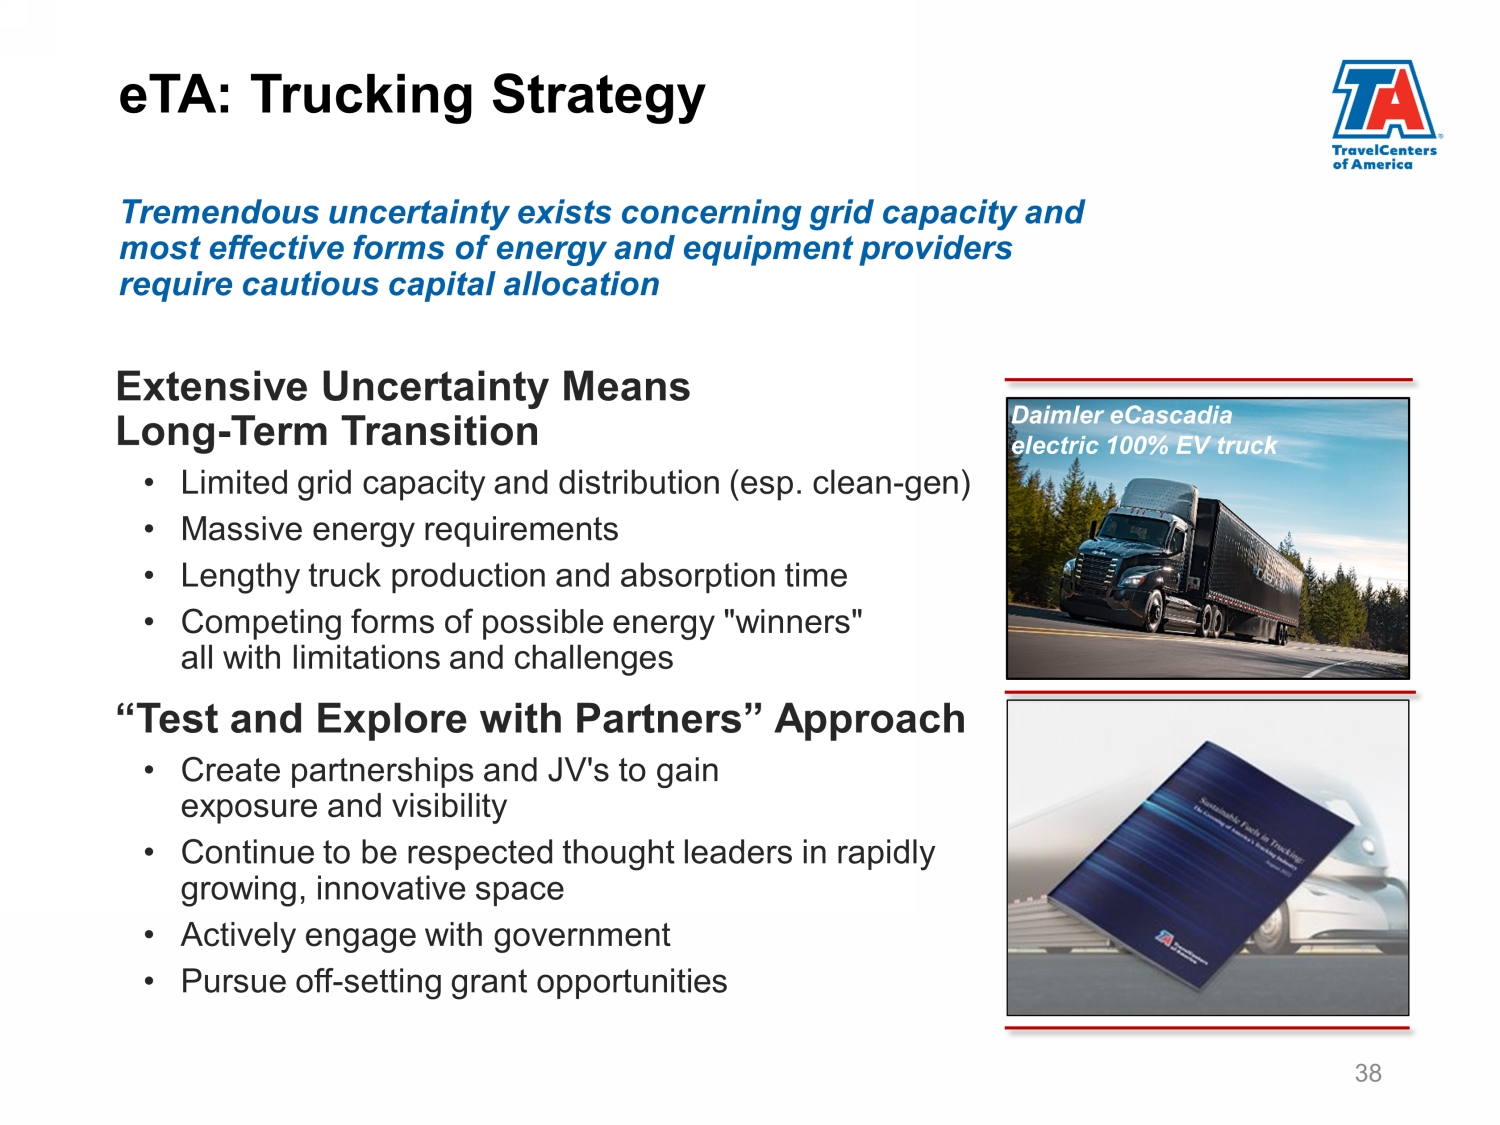
38 Daimler eCascadia electric 100% EV truck Tremendous uncertainty exists concerning grid capacity and most effective forms of energy and equipment providers require cautious capital allocation Extensive Uncertainty Means Long - Term Transition • Limited grid capacity and distribution (esp. clean - gen) • Massive energy requirements • Lengthy truck production and absorption time • Competing forms of possible energy "winners" all with limitations and challenges “Test and Explore with Partners” Approach • Create partnerships and JV's to gain exposure and visibility • Continue to be respected thought leaders in rapidly growing, innovative space • Actively engage with government • Pursue off - setting grant opportunities eTA : Trucking Strategy
TravelCenters of America (Nasdaq: TA) November 2022 Investor Presentation