August 13, 2010
Via EDGAR
H. Christopher Owings, Assistant Director
Mail Stop 3561
Securities and Exchange Commission
Division of Corporation Finance
100 F Street, NE
Washington, DC 20549
Re: American DG Energy Inc. (“we” or the “company”)
Registration Statement on Form S-3 filed June 8, 2010 (our “Form S-3”); Form 10-K for the Fiscal Year Ended December 31, 2009 filed March 31, 2010 (our “Form 10-K”); Definitive Proxy Statement on Schedule 14A filed April 30, 2010; Form 10-Q for the Fiscal Quarter Ended March 31, 2010 filed May 13, 2010 (together, the “Filings”)
File No. 001-34493
Response Letter Dated July 16, 2010
Dear Mr. Owings:
The purpose of this letter is to respond to your letter of August 2, 2010 regarding the Filings. For your convenience, your original comments appear in bold text, followed by our response. We will promptly file the amendments described in our response to comment 2 below after the conclusion of the comment process.
Registration Statement on Form S-3
| 1. | We note your intention to file an amendment to your registration statement on Form S-3 in response to our prior comments. |
Form 10-K for the Fiscal Year Ended December 31, 2010
General
| 2. | We note your intention to promptly file amendments after the conclusion of the comment process. Please confirm, to the extent you have not already done so, that you will incorporate, to the extent applicable, each response that you have provided to the comments directed at the above Exchange Act filings in your amended filings and indicate which filings you intend to amend. |
| We will incorporate, to the extent applicable, each response that we have provided to the comments directed at the above Exchange Act filings in amendments to the following: Registration Statement on Form S-3 filed June 8, 2010; Form 10-K for the Fiscal Year Ended December 31, 2009, filed March 31, 2010, including all applicable sections relating to our Definitive Proxy Statement on Schedule 14A filed April 30, 2010; and Form 10-Q for the Fiscal Quarter Ended March 31, 2010, filed May 13, 2010. We will also incorporate your comments on our Form 10-Q for the Fiscal Quarter Ended June 30, 2010, to the extent applicable. |

Securities and Exchange Commission
August 13, 2010
Page 2
Item 1, Business, page 2
General, page 2
| 3. | We note your response to comment four from our letter dated July 1, 2010. Please provide us a copy of the reports. In addition, please explicitly state, if true, that you created the estimate and describe in greater detail how the estimate was created. |
We are providing you with a copy of the “The Market and Technical Potential for Combined Heat and Power in the Industrial Sector” and “The Market and Technical Potential for Combined Heat and Power in the Commercial/Institutional Sector” prepared for the Energy Information Administration in January 2000, as Exhibits A and B attached hereto. These data sets were used to estimate the CHP market potential in the 100 kW to 1 MW size range for the hospitality, healthcare, institutional, recreational and light industrial facilities in California, Connecticut, Massachusetts, New Hampshire, New Jersey and New York, which are the states where commercial electricity rates exceed $0.12 per kWh. Based on those rates, those states define our market and comprise over 163,000 sites totaling 12.2 million kW of prospective DG capacity. This is the equivalent of an $11.7 billion annual electricity market plus a $7.3 billion heat and hot water energy market, for a combined market potential of $19 billion. A copy of our analysis is attached hereto as Exhibit C.
Competition, page 9
| 4. | We note your response to comment nine from our letter dated July 1, 2010. Please revise your intended disclosure to clearly indicate, if true, that the entities you identify are larger than you in terms of revenues, assets and resources or tell us why it is not appropriate for you to do so. |
We will revise our disclosure to clearly indicate that the entities we identify are larger than us in terms of revenues, assets and resources.
Recent Sales of Unregistered Securities, page 15
| 5. | We note your response to comment 10 from our letter dated July 1, 2010. Please provide us the disclosure that you intend to include in your amended Form 10-K. |
We will amend our Form 10-K to include sales of securities within the past three fiscal years that we did not register under the Securities Act as follows:
Recent Sales of Unregistered Securities
Set forth below is information regarding common stock issued, warrants issued and stock options granted by the company during fiscal years 2007 through 2009. Also included is the consideration, if any, we received and information relating to the section of the Securities Act of 1933, as amended, or the Securities Act, or rule of the SEC, under which exemption from registration was claimed.
Common Stock and Warrants
On March 8, 2007, the company raised $3,004,505 in a private placement of 4,292,150 shares of common stock at a price of $0.70 per share. The private placement was done exclusively by 10 accredited investors, representing 16.5% of the total shares then outstanding. All of such investors were accredited investors, and such transactions were exempt from registration under the Securities Act under Rule 506 of Regulation D.
Securities and Exchange Commission
August 13, 2010
Page 3
On April 30, 2007, the company raised $1,120,000 in a private placement of 1,600,000 shares of common stock at a price of $0.70 per share. The private placement was done exclusively by 4 accredited investors, representing 5.2% of the total shares then outstanding. All of such investors were accredited investors, and such transactions were exempt from registration under the Securities Act under Rule 506 of Regulation D.
On June 30, 2007, the company issued to a consultant 100,000 shares of common stock through an option exercise at $0.07 per share, representing 0.3% of the total shares then outstanding. The consultant was an accredited investor, and such transaction was exempt from registration under the Securities Act under Section 4(2).
On October 2, 2007, a holder of the company’s 8% Convertible Debenture elected to convert $50,000 of the outstanding principal amount of the debenture into 59,524 shares of common stock. The investor was an accredited investor, and such transaction was exempt from registration under the Securities Act under Section 4(2).
From December 2003 through December 2005, the company raised $2,236,500 through a private placement of common stock and warrants by issuing 3,195,000 shares of common stock and 3,195,000 warrants, at a price of $0.70 per share. Each warrant represents the right to purchase one share of common stock for a period of three years from the date the warrant was issued. The warrant holders started exercising their warrants in 2006. From February 2008 through December 2008, the company raised $707,000 through the exercise of 1,010,000 warrants at a price of $0.70 per share; such warrants were exercised exclusively by 17 accredited investors, representing 3.1% of the total shares then outstanding. All of such investors were accredited investors, and such transactions were exempt from registration under the Securities Act under Section 4(2).
In May 2008, two holders of the company’s 8% Convertible Debentures elected to convert $150,000 of the outstanding principal amount of such debentures into 178,572 shares of common stock. All of such investors were accredited investors, and such transactions were exempt from registration under the Securities Act under Section 4(2).
On February 24, 2009, the company sold a warrant to purchase shares of the company’s common stock to an accredited investor, for a purchase price of $10,500. The warrant, which expires on February 24, 2012, gives the investor the right but not the obligation to purchase 50,000 shares of the company’s common stock at an exercise price per share of $3.00. The investor was an accredited investor, and such transaction was exempt from registration under the Securities Act under Section 4(2).
On April 23, 2009, the company raised $2,260,000 in a private placement of 1,076,190 shares of common stock at a price of $2.10 per share. The private placement was done exclusively by 5 accredited investors, representing 3.1% of the total shares then outstanding. All of such investors were accredited investors, and such transactions were exempt from registration under the Securities Act under Rule 506 of Regulation D.
On July 24, 2009, the company raised $3,492,650 in a private placement of 1,663,167 shares of common stock at a price of $2.10 per share. The company also granted the investors the right to purchase additional shares of common stock at a purchase price of $3.10 per share by December 18, 2009, which as of December 31, 2009, have expired unexercised. The private placement was done exclusively by 22 accredited investors, representing 4.7% of the total shares then outstanding. All of such investors were accredited investors, and such transactions were exempt from registration under the Securities Act under Rule 506 of Regulation D.
Securities and Exchange Commission
August 13, 2010
Page 4
On October 1, 2009, the company signed an investor relations consulting agreement with Hayden IR for a period of twelve months. In connection with that agreement the company granted Hayden IR a warrant to purchase 12,000 shares of the company’s common stock at an exercise price per share of $2.98, with one-third vesting on October 1, 2009, one-third vesting on February 1, 2010, and one-third vesting on June 1, 2010, provided that at any such vesting date the agreement is still in effect and Hayden IR has provided all required services to the company. The warrants carry a cashless exercise provision and expire on May 30, 2013. The investor was an accredited investor, and such transaction was exempt from registration under the Securities Act under Section 4(2).
On October 14, 2009, the company raised $525,000 in a private placement of 250,000 shares of common stock at a price of $2.10 per share. The company also granted the investor the right to purchase additional shares of common stock at a purchase price of $3.10 per share by December 18, 2009, which as of December 31, 2009, have expired unexercised. The private placement was done exclusively by an accredited investor, representing 0.7% of the total shares then outstanding. The investor was an accredited investor, and such transaction was exempt from registration under the Securities Act under Section 4(2).
Restricted Stock Grants
On February 20, 2007, the company made restricted stock grants to employees, directors and consultants by permitting them to purchase an aggregate of 737,000 shares of common stock, representing 2.4% of the total shares then outstanding at a price of $0.001 per share. Prior to this transaction the company had 30,309,400 shares of common stock outstanding. Such transaction was exempt from registration under the Securities Act under Section 4(2).
In December 2008, the company made a restricted stock grant to one employee by permitting him to purchase an aggregate of 40,000 shares of common stock, representing 0.1% of the total shares then outstanding at a price of $0.001 per share. Those shares have a vesting schedule of four years. Such transaction was exempt from registration under the Securities Act under Section 4(2).
Stock Options
In 2007 the company granted nonqualified options to purchase 1,156,000 shares of the common stock to 7 employees at $0.90 per share. Of those shares 1,130,000 have a vesting schedule of 10 years and 26,000 shares have a vesting schedule of 4 years. The grant of such options was exempt from registration under Rule 701 under the Securities Act.
In December 2008, the company granted nonqualified options to purchase 100,000 shares of the common stock to one employee at $1.95 per share. Those options have a vesting schedule of 4 years and expire in 10 years. The grant of such options was exempt from registration under Rule 701 under the Securities Act.
In February 2009, the company granted nonqualified options to purchase 13,000 shares of the common stock to three employees at $1.82 per share. Those options have a vesting schedule of 4 years and expire in 5 years. The grant of such options was exempt from registration under Rule 701 under the Securities Act.
In July 2009, the company granted nonqualified options to purchase 6,000 shares of the common stock to one employee at $2.95 per share. Those options have a vesting schedule of 4 years and expire in 5 years. The grant of such options was exempt from registration under Rule 701 under the Securities Act.
Securities and Exchange Commission
August 13, 2010
Page 5
No underwriters were involved in the foregoing sales of securities. All purchasers of shares of our convertible debentures and warrants described above represented to us in connection with their purchase that they were accredited investors and made customary investment representations. All of the foregoing securities are deemed restricted securities for purposes of the Securities Act.
| 6. | We note your response to comment 13 from our letter dated July 1, 2010. When filing your response, please clearly indicate for each transaction whether it was exempt from registration under the Securities Act under section 4(2), Regulation D or both. Also, if applicable, please specify which rule under Regulation D provided the exemption from registration. Please refer to Item 703 of Regulation S-K. |
We will clearly indicate the applicable exemption for each transaction in our amended 10-K as described above in our response to comment 5.
Item 7. Management's Discussion and Analysis of Financial Condition...page 17
Critical Accounting Policies, page 19
Property and Equipment and Depreciation and Amortization, page 20
| 7. | We note your response to comment 15 from our letter dated July 1, 2010. Please tell us and disclose the amount of deferred income at each balance sheet date and the amount of income recognized related to utility rebates for the fiscal years ended December 31, 2009, and 2008. Further, it appears the up-front cash payments from the utility companies may represent advances for future production. Please explain to us the factors considered in distinguishing whether the incentive payment is applied against the cost of construction or a function of production. We assume you enter into agreements with the utility companies related to the rebates received. Please include in your explanation a summary of the relevant terms of the agreements as they relate to the rebates. We may have further comment. |
We will revise our disclosure as follows:
“The company receives rebates and incentives from various utility companies which are accounted for as a reduction in the book value of the assets. The rebates are payable from the utility to the company and are applied against the cost of construction, therefore reducing the book value of the installation. As a reduction of the facility construction costs, these rebates are treated as an investing activity in the statement of cash flows. When the rebates are a function of production of the DG unit, they are recorded as income over the period of production and treated in the statement of cash flows as an operating activity. The rebates the company receives from the utilities that apply to the cost of construction are one time rebates based on the installed cost, capacity and thermal efficiency of installed unit and are earned upon the installation and inspection by the utility and not related to or subject to adjustment based on the future operating performance of the installed unit. The rebate agreements with utilities are based on standard terms and conditions, the most significant being customer eligibility and post-installation work verification by a specific date. The only rebates that the company has recognized historically on the income statement are related to the company’s participation in demand response programs and are recognized only upon the occurrence of curtailed events of the applicable units. The cumulative amount of rebates applied to the cost of construction was $534,308 and $319,655 as of December 31, 2009 and 2008, respectively. Assuming that the average depreciation lives of the company’s projects is12 to 15 years, the unamortized amount on the company’s balance sheet was $403,065 and $235,815 for the years ended December 31, 2009 and 2008, respectively. The revenue recognized from demand response activity was $17,830 and $11,176 for the years ended December 31, 2009 and 2008, respectively.”
Securities and Exchange Commission
August 13, 2010
Page 6
Liquidity and Capital Resources, page 23
| 8. | We note your response to comment 20 from our letter dated July 1, 2010. Please clarify if the increase in your accounts payable was due to the fact that you had five sites under construction in 2009 versus two sites in 2008. Currently, your proposed disclosure does not indicate that your accounts payable increased because you have more sites under construction. Also, you state that your accounts payable amount of $455,167 relates to construction-in-process in 2009. Please clarify if $455,167 of your $740,474 in accounts payable was for construction in process or revise your disclosure to clarify the meaning of the statement. |
We will revise the third paragraph under Liquidity and Capital Resources as follows: “Accounts payable increased to $740,474 in 2009, compared to $270,852 at December 31, 2008, providing $469,622 of cash. The increase in accounts payable was a result of having five sites under construction representing 725 kW on December 31, 2009, compared to two sites at December 31, 2008 representing 150 kW. The accounts payable amount of $740,474 includes $455,167 related to construction-in-process that was higher in 2009 due to increase in construction projects.”
Item 9A(T). Controls and Procedures, page 25
| 9. | We note your response to comment 22 from our letter dated July 1, 2010. Please revise your disclosure to state, in clear and unqualified language, the conclusions reached by your chief executive officer and your chief financial officer on the effectiveness of your disclosure controls and procedures. For example, if true, you can state that your disclosure controls and procedures were effective including consideration of the identified matters, so long as you provide appropriate disclosure explaining how the disclosure controls and procedures were determined to be effective in light of the identified matters. Or, if true, you can state that given the identified matters, your disclosure controls and procedures were not effective. You should not, however, state the conclusion in your current disclosure, which appears to state that your disclosure controls and procedures were effective except for the material weakness you identified. |
We will revise the first paragraph under Item 9A(T) as follows, and will also apply this response in our future filings to the extent applicable:
“Our disclosure controls and procedures are designed to provide reasonable assurance that the control system’s objectives will be met. Our Chief Executive Officer and Chief Financial Officer, after evaluating the effectiveness of our disclosure controls and procedures as of the end of the period covered by this report, or the Evaluation Date, have concluded that as of the Evaluation Date, our disclosure controls and procedures were not effective due to material weakness in financial reporting relating to lack of personnel with a sufficient level of accounting knowledge and a small number of employees dealing with general controls over information technology.
For these purposes, the term disclosure controls and procedures of an issuer means controls and other procedures of an issuer that are designed to ensure that information required to be disclosed by the issuer in the reports that it files or submits under the Securities Exchange Act of 1934 is recorded, processed, summarized and reported, within the time periods specified in the SEC’s rules and forms. Disclosure controls and procedures include, without limitation, controls and procedures designed to ensure that information required to be disclosed by an issuer in the reports that it files or submits under the Exchange Act is accumulated and communicated to the issuer’s management, including its principal executive and principal financial officers, or persons performing similar functions, as appropriate to allow timely decisions regarding required disclosure.”
Securities and Exchange Commission
August 13, 2010
Page 7
We confirm that our disclosure controls and procedures apply to the accumulation and communication of all information to our management, not just “material information,” and the effectiveness of our disclosure controls and procedures is not limited to only when we are preparing periodic reports.
| 10. | Also, please confirm that in future filings you will either include the entire definition of disclosure controls and procedures as defined in Rules 13a-15(e) and 15d-15(e) or confirm that you will omit the definition of disclosure controls and procedures and merely provide your Chief Executive and Chief Financial Officer's determination regarding the effectiveness of your disclosure controls and procedures. |
We confirm that we will include the definition in future filings.
Definitive Proxy Statement on Schedule 14A
Board Leadership structure, page 9
| 11. | We note your response to comment 37 from our letter dated July 1, 2010. Please provide further information on how the separation of your Chief Executive Officer and Chairman of the Board “enhances high-level attention” to your business. |
Our Chairman, Dr. George N. Hatsopoulos is the founder and chairman emeritus of Thermo Electron Corporation, which is now Thermo Fisher Scientific (NYSE: TMO), he has served on the board of the Federal Reserve Bank of Boston, including a term as chairman. He was a member of the Securities and Exchange Commission Advisory Committee on Capital Formation and Regulatory Process, the Advisory Committee of the U.S. Export-Import Bank, and the boards of various corporations and institutions. In 1996, Dr. Hatsopoulos won the John Fritz Medal, which is the highest American award in the engineering profession and presented each year for scientific or industrial achievement in any field of pure or applied science. In 1997 he was awarded the 3rd Annual Heinz Award in Technology, the Economy and Employment. Dr. Hatsopoulos provides “high-level” guidance to our Chief Executive Officer, John N. Hatsopoulos, his brother, in the field of engineering, science, thermodynamics and thermionic energy conversion, which is the basis of our combined heat and power system. Our Chief Executive Officer, John Hatsopoulos, has a background in operations and finance and is responsible for setting the strategic direction for the company and the overall leadership and performance of the company. The Chairman’s role includes high level supervision over the strategic direction of the company, which is the primary responsibility of the Chief Executive Officer. In our case, we have two highly experienced and distinguished individuals performing distinct high level supervisory and executive functions for the company.
Employment Contracts and Termination of Employment and Change...page 14
| 12. | We note your response to comment 40 from our letter dated July 1, 2010. For each named executive officer, please quantify the stock and option awards that would vest if a change-in control was to occur. |
We will revise our disclosure as follows: “None of our executive officers has an employment contract or change-in-control arrangement, other than stock and option awards that contain certain change-in-control provisions such as accelerated vesting due to acquisition. In the event an acquisition that is not a private transaction occurs while the optionee maintains a business relationship with the company and the option has not fully vested, the option will become exercisable for 100% of the then number of shares as to which it has not vested and such vesting to occur immediately prior to the closing of the acquisition.
Securities and Exchange Commission
August 13, 2010
Page 8
The stock and option awards that would vest for each named executive if a change-in control were to occur are disclosed under our Outstanding Equity Awards at Fiscal Year-End Table. Specifically, as of April 30, 2010, Barry J. Sanders had 504,000 stock options and 117,500 shares of restricted stock that had not vested and Anthony S. Loumidis had 175,000 stock options and 27,500 shares of restricted stock that had not vested.”
Executive Compensation and Other Information, page 12
Executive Officers, page 12
| 13. | Please revise your disclosure regarding Mr. Loumidis’ business experience to clarify that Tecogen is an affiliate. Please see Item 401(e) of Regulation S-K. |
We will revise our disclosure as follows: “Anthony S. Loumidis has been our Chief Financial Officer since 2004 and our Treasurer since 2001. Mr. Loumidis devotes approximately half of his business time to the affairs of the company. He has been the Chief Financial Officer of GlenRose Instruments Inc., since 2006; GlenRose Instruments provides analytical services to the federal government and its prime contractors. He has also been the Vice President and Treasurer of Tecogen Inc., an affiliate of the company, since 2001; Tecogen is a manufacturer of natural gas, engine-driven commercial and industrial cooling and cogeneration systems. He also has been a Partner and President of Alexandros Partners LLC since 2000; Alexandros Partners is a financial advisory firm providing consulting services to early stage entrepreneurial ventures.”
* * *
We appreciate your comments and welcome the opportunity to discuss with you our responses provided above. Please call me at (781) 622-1117 or our attorney, Edwin Miller of Sullivan & Worcester in Boston, at (617) 338-2447 if you have any questions or require additional information.
| Sincerely, | ||
| AMERICAN DG ENERGY INC. | ||
| /s/ Anthony S. Loumidis | ||
| By: | Anthony S. Loumidis | |
| Chief Financial Officer | ||
cc: Robert Babula, Staff Accountant
Donna Di Silvio, Senior Staff Accountant
Exhibit A
Exhibit B
Exhibit C
American DG Energy Inc. - The DG Market Opportunity
Commercial CHP Market Assessment (1)
MW Potential | ||||||||||||||||||||||||||||||||
| Hospitality | Health Care | Institutional | Recreational | |||||||||||||||||||||||||||||
Hotel/Motels | Nurs. Homes | Hospitals | Schools | College/Univ. | Correctional | Museums | Health Clubs | |||||||||||||||||||||||||
States | ||||||||||||||||||||||||||||||||
| CA | 591.6 | 286.8 | 689.8 | 1,544.9 | 343.7 | 249.6 | 40.9 | 444.3 | ||||||||||||||||||||||||
| CT | 32.4 | 169.8 | 115.8 | 178.5 | 48.7 | 48.9 | 4.2 | 74.5 | ||||||||||||||||||||||||
| MA | 107.7 | 349.8 | 266.4 | 343.3 | 121.5 | 37.1 | 21.9 | 144.4 | ||||||||||||||||||||||||
| NH | 31.1 | 25.8 | 23.5 | 76.3 | 13.6 | 7.2 | 1.4 | 23.0 | ||||||||||||||||||||||||
| NJ | 226.8 | 345.1 | 315.1 | 546.0 | 109.5 | 58.8 | 7.1 | 150.6 | ||||||||||||||||||||||||
| NY | 359.9 | 820.4 | 692.4 | 1,364.7 | 260.7 | 153.6 | 34.6 | 256.0 | ||||||||||||||||||||||||
| 6 State Total | 1,349.5 | 1,997.7 | 2,103.0 | 4,053.7 | 897.7 | 555.2 | 110.1 | 1,092.8 | ||||||||||||||||||||||||
| % US | 20 | % | 25 | % | 24 | % | 27 | % | 21 | % | 20 | % | 28 | % | 31 | % | ||||||||||||||||
US | ||||||||||||||||||||||||||||||||
| 100-500 kW | 2,642.0 | 1,014.0 | 647.0 | 7,130.0 | 221.0 | 261.0 | 73.0 | 665.0 | ||||||||||||||||||||||||
| 500-1000 kW | 627.0 | 2,837.0 | 904.0 | 6,781.0 | 407.0 | 517.0 | 202.0 | 2,839.0 | ||||||||||||||||||||||||
| Total | 6,703.0 | 7,993.0 | 8,878.0 | 14,884.0 | 4,250.0 | 2,721.0 | 398.0 | 3,552.0 | ||||||||||||||||||||||||
| % < 1MW | 49 | % | 48 | % | 17 | % | 93 | % | 15 | % | 29 | % | 69 | % | 99 | % | ||||||||||||||||
| MW Potential (100 kW - 1 MW Applications) | ||||||||||||||||||||||||||||||||
| Hospitality | Health Care | Institutional | Recreational | |||||||||||||||||||||||||||||
| States | Hotel/Motels | Nurs. Homes | Hospitals | Schools | College/Univ. | Correctional | Museums | Health Clubs | ||||||||||||||||||||||||
| CA | 289 | 138 | 121 | 1,444 | 51 | 71 | 28 | 438 | ||||||||||||||||||||||||
| CT | 16 | 82 | 20 | 167 | 7 | 14 | 3 | 73 | ||||||||||||||||||||||||
| MA | 53 | 169 | 47 | 321 | 18 | 11 | 15 | 142 | ||||||||||||||||||||||||
| NH | 15 | 12 | 4 | 71 | 2 | 2 | 1 | 23 | ||||||||||||||||||||||||
| NJ | 111 | 166 | 55 | 510 | 16 | 17 | 5 | 149 | ||||||||||||||||||||||||
| NY | 176 | 395 | 121 | 1,275 | 39 | 44 | 24 | 253 | ||||||||||||||||||||||||
| 6 State Total | 658 | 962 | 367 | 3,789 | 133 | 159 | 76 | 1,078 | ||||||||||||||||||||||||
Industrial CHP Market Assessment (2)
| MW Potential | ||||||||
| Sector | 100-1000 kW | 6 State Est. | ||||||
| Food | 2,683.0 | 671 | ||||||
| Paper | 1,167.0 | 292 | ||||||
| Chemicals | 1,780.0 | 445 | ||||||
| Plastics | 2,772.0 | 693 | ||||||
| Fab. Metals | 4,050.0 | 1,013 | ||||||
| Machinery | 4,787.0 | 1,197 | ||||||
| Transportation | 1,169.0 | 292 | ||||||
| Misc | 1,756.0 | 439 | ||||||
| Total | 5,041 | |||||||
| Total Commercial & Industrial CHP Market in MW | 12,263 | |||
| Inputs | ||||
| American DG Energy Inc. CHP System in kW | 75 | |||
| Potential Sites | 163,000 | |||
| Electric | ||||
| Hours of operation per year | 8,000 | |||
| Average electric cost per kWh | $ | 0.12 | ||
| kW | 12,225,000 | |||
| Thermal | ||||
| Hours of operation per year | 8,000 | |||
| Gas cost per therm | $ | 1.00 | ||
| Available heat per unit | 4.9 | |||
| Displaced boiler efficiency | 70 | % | ||
| Heat utilization efficiency | 80 | % | ||
| Market Size in Billions | ||||
| Electric Revenue | $ | 11.7 | ||
| Thermal Revenue | 7.3 | |||
| Total Revenue | $ | 19.0 |
Note (1): The Market and Technical Potential for Combined Heat and Power in the Commercial/Institutional Sector prepared for the Energy Information Administration in January 2000, pages 14, 15, 57 & 58.
Note (2): The Market and Technical Potential for Combined Heat and Power in the Industrial Sector prepared for the
Energy Information Administration in January 2000, pages 37 & 39.
Exhibit A

The Market and Technical Potential
for Combined Heat and Power in the
Industrial Sector
| Prepared for: | |
| Energy Information Administration | |
| 1000 Independence Ave., SW | |
| Washington, DC 20585 |
| Prepared by: | |
| ONSITE SYCOM Energy | |
| Corporation | |
| 1010 Wisconsin Ave., NW | |
| Suite 340 | |
| Washington, DC 20007 |
January 2000
PREFACE
This report was prepared by ONSITE SYCOM Energy Corporation as an account of work sponsored by the Energy Information Administration. Bruce A. Hedman, Vice President of consulting services at ONSITE SYCOM was the principal investigator for the analysis. ONSITE SYCOM would like to acknowledge T. Crawford Honeycutt and Daniel H. Skelly of the Energy Information Administration for their technical guidance and support in the preparation of this report.
Table of Contents
| 1. CHP Technology Characterization | 2 | |
| 1.1 Performance Characteristics for Commercially Available Equipment | 4 | |
| 1.2 Capital Costs | 7 | |
| 1.3 O&M Costs | 9 | |
| 1.4 Selective Catalytic Reduction (SCR) | 10 | |
| 1.5 Advanced Technology Characteristics | 11 | |
| 2. Profile of Existing Industrial CHP | 16 | |
| 3. Technical Potential for Industrial CHP | 32 | |
| 3.1 Technical Approach | 32 | |
| 3.2 Estimate of Remaining CHP Potential | 34 | |
| 4. Factors Impacting Market Penetration | 40 | |
| 5. References | 43 | |
| Appendix : CHP Technology Characterization | 44 | |
| 1. Reciprocating Engines | 46 | |
| 2. Steam Turbines | 52 | |
| 3. Combustion Turbines and Combined Cycles | 55 |
The Market and Technical Potential for Combined Heat and Power in
the Industrial Sector
ONSITE SYCOM Energy Corporation (OSEC) is assisting the Energy Information Administration to determine the potential for cogeneration or combined heat and power (CHP) in the industrial market. As part of this effort, OSEC has characterized typical technologies used in industrial CHP, analyzed existing CHP capacity in industrial applications, and developed estimates of additional technical potential for CHP in industry.
This report is organized into four sections as follows:
| 1. | CHP Technology Characterization for the National Energy Modeling System |
| 2. | Existing Industrial CHP |
| 3. | Technical Potential for Industrial CHP |
| 4. | Factors Impacting Market Penetration. |
| ONSITE SYCOM Energy Corporation | 1 | Industrial CHP Assessment |
| 1. | CHP Technology Characterization for the National Energy Modeling System |
The National Energy Modeling System (NEMS) is a computer-based, energy-economy modeling system of U.S. energy markets for the midterm period through 2020. NEMS was designed and implemented by the Energy Information Administration (EIA) of the U.S. Department of Energy (DOE). NEMS projects the production, imports, conversion, consumption, and prices of energy, subject to assumptions on macroeconomic and financial factors, world energy markets, resource availability and costs, behavioral and technological choice criteria, cost and performance characteristics of energy technologies, and demographics.
A key feature of NEMS is the representation of technology and technology improvement over time. Five of the sectors—residential, commercial, transportation, electricity generation, and refining—include explicit treatment of individual technologies and their characteristics, such as initial cost, operating cost, date of availability, efficiency, and other characteristics specific to the sector.
This section provides a review and update of combined heat and power (CHP) technology choices for the industrial sector. CHP is an established technique within the industrial sector for simultaneously meeting power and process steam requirements. As will be shown in a later section 45,465 MW of CHP power capacity currently exists in the industrial sector (accounting for about 215,000 mmBtu/hr steam capacity). Two key changes in the nation's economic system are occurring that could make CHP more important economically and environmentally – the restructuring of the electric power industry may provide an enhanced economic driver and the efforts to comply with the Kyoto Protocol on global warming may provide an environmental driver for energy efficiency options such as CHP. It is critical, therefore, that NEMS include up-to-date and accurate information on CHP technology cost and performance.
The NEMS cogeneration module of the industrial model is now based on five size categories of gas turbine systems from 1,000 kW to 40,000 kW size as shown in Table 1.1. In this section, OSEC reviews these data and develops independent estimates for performance, equipment and installation costs, and O&M costs for gas turbine systems for input into the NEMS model.
| ONSITE SYCOM Energy Corporation | 2 | Industrial CHP Assessment |
Table 1.1. Existing CHP Cost and Performance Parameters Used in the Industrial Cogeneration Module of NEMS (1997 Costs)
| CHP Cost & Performance Assumptions | System 1 | System 2 | System 3 | System 4 | System 5 | |||||||||||||||
| Electricity Capacity (kW) | 1,000 | 2,500 | 5,000 | 10,000 | 40,000 | |||||||||||||||
| Total Installed Cost ($/kW) | 1600 | 1400 | 1200 | 1000 | 950 | |||||||||||||||
| Capacity Factor | 0.8 | 0.8 | 0.8 | 0.8 | 0.8 | |||||||||||||||
| Overall Heat Rate (Btus/kWh) HHV | 14,217 | 13,132 | 11,263 | 10,515 | 9,749 | |||||||||||||||
| Overall Efficiency (%) | 70 | 70 | 70 | 75 | 80 | |||||||||||||||
| Derived Technical Characteristics | ||||||||||||||||||||
| Elec Generating Efficiency (3412/Heat Rate) | 24.0 | % | 26.0 | % | 30.3 | % | 32.4 | % | 35.0 | % | ||||||||||
| Fuel input (mmBtu/hr) | 14.217 | 32.830 | 56.315 | 105.150 | 389.943 | |||||||||||||||
| Steam output (mmBtu/hr) | 6.540 | 14.451 | 22.361 | 44.743 | 175.474 | |||||||||||||||
| Steam Output/Fuel Input | 46.0 | % | 44.0 | % | 39.7 | % | 42.6 | % | 45.0 | % | ||||||||||
| Power Steam Ratio | 0.522 | 0.590 | 0.763 | 0.763 | 0.778 | |||||||||||||||
| Net Heat Rate (Btus/kWh) | 6,042 | 5,907 | 5,673 | 4,922 | 4,265 | |||||||||||||||
| Thermal Output as Fraction of Fuel Input | 0.46 | 0.44 | 0.40 | 0.43 | 0.45 | |||||||||||||||
| Electric Output as Fraction of Fuel Input | 0.24 | 0.26 | 0.30 | 0.32 | 0.35 | |||||||||||||||
In general, these estimates provide a reasonable reflection of combustion turbine performance characteristics for use in the model. Overall efficiency levels are within range of commercially available equipment, and the estimates accurately reflect changes in electrical efficiency and overall efficiency as one moves from the smallest size category to the largest. Installed cost estimates, however, are somewhat higher than currently found in the marketplace, particularly for larger turbines systems. Several additional observations are made on this technology data set.
| q | The sizes selected, especially the 1,000 and 2,500 kW sizes, may not reflect a good match between the market and the technology performance. An analysis of existing CHP shows that gas engine driven CHP systems dominate in this size range and also effectively compete with combustion turbines in applications up to 10 MW or more. OSEC has provided cost estimates for 800 kW and 3 MW engine driven systems as part of this analysis. Engine systems provide good electrical efficiency. They are best used in applications that use low-pressure steam or hot water, as the technology is limited in its ability to produce high-pressure steam. |
| q | In addition, 80% of the capacity of industrial CHP systems is made up of large size systems of 50 MW and more. Therefore, OSEC recommends adding a 100 MW system that would better reflect use of these larger applications. |
| ONSITE SYCOM Energy Corporation | 3 | Industrial CHP Assessment |
| q | It is not clear how the NEMS Industrial Cogeneration Module accounts for technological change in CHP technologies. There has been continual improvement in the capacities and heat rates for combustion turbines that will increase the acceptance levels for these technologies by improving the economics of their application. In addition, there is considerable development work underway to further improve the operating and environmental performance envelopes of both combustion turbines and reciprocating engines. These improvements will generally increase the power to steam ratios over time and reduce the environmental impact of these technologies. Since the NEMS module matches the technologies in the database to industrial steam-load, the shifting power to steam ratios may require a rematching of potential sites or a relaxation of the model requirement to use all power on-site. In addition, to the base case technologies, OSEC has provided projections of cost and performance characteristics for improvements in gas engine and gas turbine technologies. |
| q | Some of the proposed CHP Initiatives being discussed by DOE and industry to enhance the use of CHP by U.S. industry are investment tax credits, accelerated siting and permitting, standardized electrical connections, and other measures. It would be helpful if the technology characterizations in the model were of enough detail and flexibility to allow the model to test market response to these and other initiatives. |
| 1.1 | Performance Characteristics for Commercially Available Equipment |
OSEC recommends changing the original five size categories of combustion turbine CHP systems (1, 2.5, 5, 10, 40 MW) to 1, 5, 10, 25 and 40 MW. Expanding the size range at the top end and eliminating the 2.5 MW CHP system better reflects equipment availability and market acceptance of combustion turbines. OSEC has developed performance estimates (heat rate, steam output, etc.) for each of these size ranges based on published data for specific gas turbine systems. Table 1.2 summarizes these performance characteristics. The data in the table were derived from published performance specifications contained in trade publications.1, 2, 3 The heat rates for the listed combustion turbines (CTs) are taken from published data for typical turbines in each size class (the 1 MW size is based on the Solar 1205 kW Saturn 20 gas turbine; the 5 MW system is based on the Solar Taurus 60; the 10 MW system is based on the Solar Mars 100; the 25 MW is based on the GE LM2500; and the 40 MW is based on the GE LM6000). Available thermal energy (steam output) was calculated from published turbine data on steam produced from the selected systems. The estimates are based on an unfired heat recovery steam generator (HRSG) producing dry, saturated steam at 150 psig.
In general, the new calculated technology characteristics do not represent a dramatic change from the existing characteristics shown previously in Table 1.1. The revised capital costs, to be described in detail in the next section, are identical for the 1 MW size and only slightly lower for the 5 MW and 10 MW sizes. The one significant area of difference is a greater than 20% reduction in capital costs for the 40 MW size category ($700/kW versus $950/kW). In addition, the 25 MW size at $770/kW is also a significantly lower cost system compared to the existing 40 MW system. Since much of the market opportunity is in the larger sizes, these lower costs may support a greater potential for market acceptance.
| ONSITE SYCOM Energy Corporation | 4 | Industrial CHP Assessment |
Table 1.2. Revised CHP Performance Parameters Suggested for use in the Cogeneration Module of NEMS
| CHP Cost & Performance Assumptions | System 1 | System 2 | System 3 | System 4 | System 5 | |||||||||||||||
| Electricity Capacity (kW) | 1,000 | 5,000 | 10,000 | 25,000 | 40,000 | |||||||||||||||
| Total Installed Cost (99 $/kW) | $ | 1,600 | $ | 1,075 | $ | 965 | $ | 770 | $ | 700 | ||||||||||
| Capacity Factor | 0.8 | 0.8 | 0.8 | 0.8 | 0.8 | |||||||||||||||
| Electric Heat Rate (Btu/kWh), HHV | 15,600 | 12,375 | 11,750 | 9,950 | 9,220 | |||||||||||||||
| Overall Efficiency (%) | 72 | % | 73 | % | 74 | % | 78 | % | 78 | % | ||||||||||
| Derived Technical Characteristics | ||||||||||||||||||||
| Elec. Generating Efficiency (3412/Heat Rate) | 21.9 | % | 27.6 | % | 29.0 | % | 34.3 | % | 37.0 | % | ||||||||||
| Fuel Input (mmBtu/hr) | 15.60 | 61.88 | 117.50 | 248.75 | 368.80 | |||||||||||||||
| Steam Output (mmBtu/hr) | 7.82 | 28.11 | 52.83 | 108.72 | 151.18 | |||||||||||||||
| Steam Output/Fuel Input | 50.1 | % | 45.4 | % | 45.0 | % | 43.7 | % | 41.0 | % | ||||||||||
| Power Steam Ratio | 0.436 | 0.607 | 0.646 | 0.785 | 0.903 | |||||||||||||||
| Net Heat Rate (Btus/kWh) | 5825 | 5348 | 5146 | 4514 | 4496 | |||||||||||||||
| Thermal Output as Fraction of Fuel Input | 0.50 | 0.45 | 0.45 | 0.44 | 0.41 | |||||||||||||||
| Electric Output as Fraction of Fuel Input | 0.22 | 0.28 | 0.29 | 0.34 | 0.37 | |||||||||||||||
As described earlier, the heat rates are taken from published data for popular turbines in each size class.1, 2 All turbine and engine manufacturers quote heat rates in terms of the lower heating value (LHV) of the fuel. On the other hand, the usable energy content of fuels is typically measured on a higher heating value basis (HHV). The energy measurements in EIA publications are also measured in higher heating value. In addition, electric utilities measure power plant heat rates in terms of HHV. For natural gas, the average heat content of natural gas is 1030 Btu/kWh on an HHV basis and 930 Btu/kWh on an LHV basis – or about a 10% difference. Since all of the fuel data in NEMS is based on higher heating values, the manufacturers heat rates were converted to an HHV basis. Heat rates for the revised technologies are somewhat higher in all cases than the original NEMS dataset. Given the continual improvement of combustion turbines in terms of capacity and efficiency over time, we feel that the only rationale for the increase in values for this data set is that the original values were on an LHV basis.
Thermal energy was calculated from published turbine data on steam available from the selected systems.1, 2, 3 The estimates are based on an unfired heat recovery steam generator (HRSG) producing dry, saturated steam at 150 psig. This represents a change from the original method in the NEMS industrial cogeneration database in which overall efficiency of the system is specified and the thermal energy is calculated as the difference between total efficiency and electric efficiency. The overall efficiency percentages calculated from the published steam tables are somewhat higher than the original data in the smaller size categories and somewhat lower in the larger size turbines.
| ONSITE SYCOM Energy Corporation | 5 | Industrial CHP Assessment |
The derived data in the table show electrical efficiency increases as combustion turbines become larger. As electrical efficiency increases, the absolute quantity of thermal energy available to produce steam decreases and the ratio of power to heat for the CHP system increases. A changing ratio of power to heat impacts project economics and may affect the decisions that customers make in terms of CHP acceptance, sizing, and the need to sell power.
In addition to the revised set of five CT-based CHP systems, OSEC recommends the addition of reciprocating engine systems at the low size end and a large, more efficient system at the high size end. The systems selected for inclusion are an 800 kW engine-driven CHP system, a 3,000 kW engine-driven system, and a 100 MW combined cycle plant. The performance characteristics are shown in Table 1.3 and are derived from published data and manufacturers specifications.1, 2, 4, 5, 6, 7 The 800 kW engine is based on the Caterpillar G3516 gas engine system; the 3000 kW engine is based on the Caterpillar G3616. Capital cost estimates for the engine systems are based on OSEC experience with both Caterpillar and Waukesha engine installations.
Table 1.3. Performance Specifications for Engine-Driven CHP and Combined Cycle Systems
| CHP Cost & Performance Assumptions | Recip. Engine | Recip. Engine | Combined Cycle | |||||||||
| Electricity Capacity (kW) | 800 | 3000 | 100,000 | |||||||||
| Total Installed Cost ( $/kW) | $ | 975 | $ | 850 | $ | 690 | ||||||
| Capacity Factor | 0.8 | 0.8 | 0.9 | |||||||||
| Electrical Heat Rate (Btu/kWh), HHV | 11,050 | 10,158 | 7,344 | |||||||||
| Overall Efficiency (%) | 65.0 | % | 62.0 | % | 65.0 | % | ||||||
| Derived Technical Characteristics | ||||||||||||
| Elec Generating Efficiency (3412/Heatrate) | 30.9 | % | 33.6 | % | 46.5 | % | ||||||
| Fuel Input (mmBtu/hr) | 8.840 | 30.473 | 734.444 | |||||||||
| Steam Output (mmBtu/hr) | 3.002 | 8.658 | 136.160 | |||||||||
| Steam Output/Fuel Input | 33.9 | % | 28.4 | % | 18.5 | % | ||||||
| Power Steam Ratio | 0.909 | 1.182 | 2.506 | |||||||||
| Net Heat Rate (Btus/kWh) | 6359 | 6551 | 5642 | |||||||||
| Thermal Output as Fraction of Fuel Input | 0.34 | 0.28 | 0.19 | |||||||||
| Electric Output as Fraction of Fuel Input | 0.31 | 0.34 | 0.46 | |||||||||
Engine systems can provide higher electrical efficiencies than combustion turbines in small sizes. Because a significant portion of the waste heat from engine systems is rejected in the jacket water at a temperature generally too low to produce high-quality steam, the ability of engine systems to produce steam is limited. Steam can be produced from the engine's exhaust heat in the same manner as from the exhaust of a CT, though the volume of exhaust per unit of electrical output is generally much lower. The jacket water for most systems is suitable only for production of hot water, however, ebullient cooling systems for larger engines are capable of producing low-pressure steam from the jacket water. Engine systems may not serve the needs of some process industries with high-pressure steam requirements, but they are a good choice for many food and manufacturing industries that do not require high-pressure steam but use large quantities of wash water and low-pressure steam. The engine systems shown are producing 15 psig steam yielding overall efficiencies of 65% or less. Systems that can use hot water can provide higher overall efficiencies.
| ONSITE SYCOM Energy Corporation | 6 | Industrial CHP Assessment |
The combined cycle plant is based on two 40 MW LM6000 combustion turbines with heat recovery and a 27 MW steam turbine. The system has an overall electric efficiency of 46.5%. This 12 point increase compared to a simple cycle CT is achieved by diverting to power generation a portion of the thermal energy that otherwise would have been available for process steam use. Consequently, the high electric efficiency of a combined cycle plant is accompanied by only about half of the process steam produced by a simple cycle CT.
| 1.2 | Capital Costs |
This section provides the details on the cost estimates for the revised CHP technology data set. An industrial sized CHP plant is a complex process with many interrelated subsystems. Construction for the larger sizes in the database can take two years or more. The detailed capital costs for the six CT-CHP systems are shown in Table 1.4.
The system is designed around key equipment components. The most important is the turbine-generator set. Prices typically range from $300-400 per kW except for the 1 MW size which is considerably more expensive on a unit cost basis. A heat recovery steam generator (HRSG) is used for heat recovery. The next most important subsystem is the electrical switchgear and controls. After these main components there are still a large number of smaller components such as enclosures or buildings, water treatment systems, piping, pumps, storage tanks, equipment foundations and superstructures, fire suppression systems, and emissions control and monitoring equipment. Site preparation can also be a significant cost for some projects. Labor and materials for plant construction are also a major part of overall costs. The 25 MW CT-CHP plant estimate requires 52,000 labor hours for completion costing $3 million with an additional $1.2 million in material costs. The sum of these costs is termed total process capital in the table. To total process capital must be added engineering, general contractor fees, permitting fees, contingency, and financing costs. In the table, these costs add an additional 20% to total process capital to provide our estimate of total capital cost.
| ONSITE SYCOM Energy Corporation | 7 | Industrial CHP Assessment |
Table 1.4. Capital Cost Estimates for Industrial CHP Plants Based on Combustion Turbines
| Nominal Turbine Capacity MW | 1 | 5 | 10 | 25 | 40 | 100* | ||||||||||||||||||
| Combustion Turbines | $ | 550,000 | $ | 2,102,940 | $ | 4,319,200 | $ | 7,464,960 | $ | 14,897,920 | $ | 24,000,000 | ||||||||||||
| Steam Turbine Generators | $ | 4,000,000 | ||||||||||||||||||||||
| Heat Recovery Steam Generators | $ | 250,000 | $ | 350,000 | $ | 590,000 | $ | 1,020,000 | $ | 2,040,000 | $ | 7,000,000 | ||||||||||||
| Water Treatment System | $ | 30,000 | $ | 100,000 | $ | 150,000 | $ | 200,000 | $ | 225,000 | $ | 750,000 | ||||||||||||
| Electrical Equipment | $ | 150,000 | $ | 375,000 | $ | 625,000 | $ | 990,000 | $ | 1,500,000 | $ | 5,600,000 | ||||||||||||
| Other Equipment | $ | 145,000 | $ | 315,000 | $ | 575,000 | $ | 1,150,000 | $ | 1,875,000 | $ | 7,000,000 | ||||||||||||
| Total Equipment | $ | 1,125,000 | $ | 3,242,940 | $ | 6,259,200 | $ | 10,824,960 | $ | 20,537,920 | $ | 48,350,000 | ||||||||||||
| Materials | $ | 143,952 | $ | 356,723 | $ | 688,512 | $ | 1,190,746 | $ | 2,053,792 | $ | 3,626,250 | ||||||||||||
| Labor | $ | 347,509 | $ | 908,023 | $ | 1,752,576 | $ | 3,030,989 | $ | 4,723,722 | $ | 9,670,000 | ||||||||||||
| Total Process Capital $ | $ | 1,616,461 | $ | 4,507,686 | $ | 8,700,288 | $ | 15,046,694 | $ | 27,315,434 | $ | 61,646,250 | ||||||||||||
| General Facilities Capital $ | $ | 48,483 | $ | 135,231 | $ | 261,009 | $ | 451,401 | $ | 819,463 | $ | 1,849,388 | ||||||||||||
| Engineering and Fees $ | $ | 48,483 | $ | 135,231 | $ | 261,009 | $ | 451,401 | $ | 819,463 | $ | 1,849,388 | ||||||||||||
| Process Contingency $ | $ | 48,483 | $ | 135,231 | $ | 261,009 | $ | 451,401 | $ | 819,463 | $ | 1,849,388 | ||||||||||||
| Project Contingency $ | $ | 171,305 | $ | 477,815 | $ | 922,231 | $ | 1,594,436 | $ | 2,895,436 | $ | 6,534,503 | ||||||||||||
| Total Plant Cost $ | $ | 1,933,215 | $ | 5,391,193 | $ | 10,405,544 | $ | 17,995,847 | $ | 32,669,259 | $ | 73,728,915 | ||||||||||||
| Actual Turbine Capacity (kW) | 1,205 | 5,007 | 10,798 | 23,328 | 46,556 | 107,000 | ||||||||||||||||||
| Total Plant Cost per net kW $ | $ | 1,604 | $ | 1,076 | $ | 964 | $ | 771 | $ | 702 | $ | 689 | ||||||||||||
* Combined Cycle system
Combustion turbine costs are based on published specifications1 and package prices.2 The total installed cost estimation is based on the use of a proprietary cost and performance model – SOAPP-CT.25 – (for State-of-the-Art Power Plant, combustion turbine).3 The model output was adjusted based on OSEC engineering judgment and experience and input from vendors and packagers. 8, 9
| ONSITE SYCOM Energy Corporation | 8 | Industrial CHP Assessment |
| 1.3 | O&M Costs |
The O&M costs presented in Table 1-5 includes operating labor (distinguished between unmanned and 24 hour manned facilities) and total maintenance costs including routine inspections and procedures and major overhauls. O&M costs presented in Table 1-5 are based on 8,000 operating hours expressed in terms of annual electricity generation. Fixed costs are based on an interpolation of manufacturers' estimates. The variable component of the O&M cost represents the inspections and overhaul procedures that are normally conducted by the prime mover OEM through a service agreement usually based on run hours. It is recognized, however, that there is a fixed component aspect to OEM service agreements as well. However, for purposes of clarity, the information is presented as a variable cost. Consumables primarily include an estimate for water and chemicals that are consumed in proportion to electric capacity.
Gas Turbines
O&M costs presented in Table 1-5 are based on gas turbine manufacturer estimates for service contracts consisting of routine inspections and scheduled overhauls of the turbine generator set.8,10 Routine maintenance practices include on-line running maintenance, predictive maintenance, plotting trends, performance testing, fuel consumption, heat rate, vibration analysis, and preventive maintenance procedures.
Routine inspections are required to insure that the turbine is free of excessive vibration due to worn bearings, rotors and damaged blade tips. Inspections generally include on-site hot gas path borescope inspections and non-destructive component testing using dye penetrant and magnetic particle techniques to ensure the integrity of components. The combustion path is inspected for fuel nozzle cleanliness and wear along with the integrity of other hot gas path components.
A gas turbine overhaul is typically a complete inspection and rebuild of components to restore the gas turbine to original or current (upgraded) performance standards. A typical overhaul consists of dimensional inspections, product upgrades and testing of the turbine and compressor, rotor removal, inspection of thrust and journal bearings, blade inspection and clearances and setting packing seals.
Gas turbine maintenance costs can vary significantly depending on the quality and diligence of the preventative maintenance program and operating conditions. Although gas turbines can be cycled, maintenance costs can triple for a gas turbine that is cycled every hour versus a turbine that is operated for intervals of a 1000 hours or more. In addition, operating the turbine over the rated capacity for significant periods of time will dramatically increase the number of hot path inspections and overhauls. Gas turbines that operate for extended periods on liquid fuels will experience higher than average overhaul intervals.
| ONSITE SYCOM Energy Corporation | 9 | Industrial CHP Assessment |
Reciprocating Engines
O&M costs presented in Table 1-5 are based on engine manufacturer estimates for service contracts consisting of routine inspections and scheduled overhauls of the engine generator set.4,5,11 Engine service is comprised of routine inspections/adjustments and periodic replacement of engine oil, coolant and spark plugs. An oil analysis is part of most preventative maintenance programs to monitor engine wear. A top-end overhaul is generally recommended between 12,000-15,000 hours of operation that entails a cylinder head and turbocharger rebuild. A major overhaul is performed after 24,000-30,000 hours of operation and involves piston/liner replacement, crankshaft inspection, bearings and seals.
Table 1-5. O&M Cost Estimate
| Gas Turbines | Reciprocating Engine | |||||||||||||||||||||||||||||||
| O&M Costs ($/kWh) | 1 MW | 5 MW | 10 MW | 25 MW | 40 MW | 100 MW* | 800 kW | 3000 kW | ||||||||||||||||||||||||
| Variable (service contract) | 0.0045 | 0.0045 | 0.0045 | 0.0040 | 0.0035 | 0.0030 | 0.0100 | 0.0100 | ||||||||||||||||||||||||
| Variable (consumables) | 0.0001 | 0.0001 | 0.0001 | 0.0001 | 0.0001 | 0.0003 | 0.00015 | 0.00015 | ||||||||||||||||||||||||
| Fixed ($/kW-yr) | 40 | 10 | 7.5 | 6 | 5 | 3 | 4 | 1.5 | ||||||||||||||||||||||||
| ($/kWh) | 0.0050 | 0.0013 | 0.0009 | 0.0008 | 0.0006 | 0.0003 | 0.0005 | 0.0002 | ||||||||||||||||||||||||
| Total O&M ($/kWh) | 0.0096 | 0.0059 | 0.0055 | 0.0049 | 0.0042 | 0.0036 | 0.0107 | 0.0103 | ||||||||||||||||||||||||
* Combined Cycle System
1.4 Selective Catalytic Reduction (SCR)
Selective catalytic reduction (SCR) is a commonly employed emission control system for gas turbines where NOx emissions below 10 ppm are mandated by local air quality districts. Installation of such systems can be a significant cost impact especially in the smaller capacity gas turbines. For this reason the cost of SCR systems is treated separately in this report. SCR costs have dropped considerably in the last two years according a leading manufacturer due to more efficient designs and lower design costs. Operating costs have also been reduced through innovations such as using hot flue gas to pre-heat ammonia injection air to lower the power requirements. Conventional SCR must be placed between sections of the HRSG so that the catalyst is not damaged by excessive exhaust gas temperature. The cost estimate shown below does not include the cost to retrofit the HRSG since this cost is highly project and design dependent. Capital and annual costs are shown in the following table based on “Cost Analysis of NOx Control Alternatives for Stationary Gas Turbines”, November, 1999, prepared by ONSITE SYCOM Energy Corp. for U.S. DOE.12
As shown in Table 1.6, SCR capital costs can add between $20-$82/kW to unit capital costs – representing 5-15% of the installed cost depending on the electric capacity of the project. The cost impact is greatest for smaller gas turbine projects. In a similar manner, costs to operate and maintain SCR systems can be a significant addition to the annual non-fuel operating budget, as shown in Table 1.7.
| ONSITE SYCOM Energy Corporation | 10 | Industrial CHP Assessment |
Table 1.6 SCR Capital Cost Summary
| Gas Turbines | Electric Capacity (kW) | SCR Capital Cost ($) | SCR Capital Cost ($/kW) | |||||||||
| System 1 | 1,000 | N/A | N/A | |||||||||
| System 2 | 5,000 | $ | 460,000 | $ | 92 | |||||||
| System 3 | 10,000 | $ | 658,000 | * | $ | 66 | ||||||
| System 4 | 25,000 | $ | 1,200,000 | $ | 48 | |||||||
| System 5 | 40,000 | $ | 1,526,000 | * | $ | 38 | ||||||
| System 6 | 100,000 | $ | 2,700,000 | * | $ | 27 | ||||||
*Costs interpolated from smaller and larger engineering estimates
Table 1.7 SCR Annual Cost Summary
Gas Turbines | Electric Capacity (kW) | SCR Operating Cost ($) | SCR Maint Labor & Matl Cost ($) | SCR Electric Penalty, | SCR Ammonia, Catalyst Costs ($) | SCR Ovhd, Insurance, Taxes Costs ($) | SCR Total Annual Costs ($) | SCR Total Annual Costs assuming 6,000 hours ($/kWh) | ||||||||||||||||||||||||
| System 1 | 1,000 | Not economic | ||||||||||||||||||||||||||||||
| System 2 | 5,000 | $ | 15,000 | $ | 26,000 | $ | 13,000 | $ | 20,000 | * | $ | 45,000 | $ | 119,000 | .0040 | |||||||||||||||||
| System 3* | 10,000 | $ | 15,000 | $ | 26,000 | $ | 25,000 | $ | 40,000 | * | $ | 55,000 | $ | 161,000 | .0027 | |||||||||||||||||
| System 4 | 25,000 | $ | 15,000 | $ | 26,000 | $ | 60,000 | $ | 80,000 | $ | 75,000 | $ | 256,000 | .0017 | ||||||||||||||||||
| System 5* | 40,000 | $ | 15,000 | $ | 26,000 | $ | 100,000 | $ | 150,000 | * | $ | 90,000 | $ | 381,000 | .0016 | |||||||||||||||||
| System 6* | 100,000 | $ | 15,000 | $ | 26,000 | $ | 250,000 | $ | 350,000 | * | $ | 135,000 | $ | 776,000 | .0013 | |||||||||||||||||
*Costs interpolated from smaller and larger engineering estimates
SCR systems generally must be installed with continuous emissions monitoring system (CEMS). These systems generally cost about $250,000 per CT-HRSG train. This added cost adds significantly to the costs for smaller systems.
| 1.5 | Advanced Technology Characteristics |
The cost and performance for small power generation technologies has been continually improving. Both reciprocating engine systems and combustion turbines have increased efficiency, reduced capital cost, and reduced emissions. Over the twenty year forecast period of the NEMS model, it is reasonable to expect additional evolutionary improvement in the selected technologies. In addition, advances in emerging technologies such as fuel cells could provide for a significant industrial market opportunity in the latter part of the forecast period. There are several classes of improvements that should be considered:
| ONSITE SYCOM Energy Corporation | 11 | Industrial CHP Assessment |
| q | System heat rates are declining due to advances in materials and design. These have occurred over time and may accelerate with the use of ceramic materials |
| q | Heat recovery within combustion turbines such as in a recuperated cycle or through the implementation of combined cycle operation can significantly increase electric efficiency. |
| q | Emissions control can be improved either through the use of catalytic combustion or other means that would allow operation of these systems more economically than with the current generation of SCR technology. |
| q | More effective packaging and integration of systems and controls can reduce the cost of the basic components and also minimize the on-site cost of installation. Particularly in the smaller system sizes, the modular approach can greatly reduce site costs. |
| q | Streamlined siting, interconnection, and permitting procedures are another area that will reduce the cost of installing CHP plants. This area combines policy and technology in that it requires changes in government policy that will allow changes in technology and reductions in lead times. |
The following improvements are projected for this area:
| q | Small and large gas engines will reach higher efficiencies approaching the efficiencies of diesel cycle engines. |
| q | Small turbines will improve efficiencies as a result of improved materials that can withstand higher temperatures and recuperation that raises overall electric efficiencies from 29% to 37%. |
| q | The larger industrial turbine efficiencies are increased using combined cycle technology to provide electric efficiencies of 50% or higher. Currently, the largest state-of-the-art combined cycle systems can achieve electric efficiencies approaching 60%. |
| q | Package costs for engines and turbines will be reduced by 10-25%. |
| q | Interconnect costs will be cut in half for all technologies. This change has a greater importance in the smallest sizes rather than in the medium to large industrial size categories |
| q | Selective catalytic reduction costs cut in half or eliminated altogether through the use of catalytic combustion. |
| q | Contractor markups will be reduced across the board to reflect a high volume competitive market |
| q | Construction lead times will be reduced by 6 months resulting in lower carry charges for interest during construction |
| q | Capital costs for the basic combustion turbine generator package and heat recovery generator will be reduced by 10% |
Tables 1.8 and 1.9 present a comparison of current technology and expected 2020 technology for reciprocating engines and combustion turbines respectively.
| ONSITE SYCOM Energy Corporation | 12 | Industrial CHP Assessment |
Table 1-8 Current and Advanced Reciprocating Engine System Characteristics
| CHP Cost & Performance Assumptions | 800 kW Recip Engine | 3000 kW Recip Engine | ||||||||||||||
| Year | Current | 2020 | Current | 2020 | ||||||||||||
| Total Installed Cost ( $/kW) | $ | 975 | $ | 690 | $ | 850 | $ | 710 | ||||||||
| O&M Costs ($/kWh) | 0.0107 | 0.009 | 0.0103 | 0.009 | ||||||||||||
| Electrical Heat Rate (Btu/kWh), HHV | 11,050 | 9,382 | 10,158 | 8,982 | ||||||||||||
| Overall Efficiency (%) | 65.0 | % | 66.2 | % | 62.0 | % | 66.0 | % | ||||||||
| Derived Technical Characteristics | ||||||||||||||||
| Elec Generating Efficiency (3412/Heatrate) | 30.9 | % | 36.5 | % | 33.6 | % | 38.0 | % | ||||||||
| Fuel Input (mmBtu/hr) | 8.840 | 7.506 | 30.473 | 26.946 | ||||||||||||
| Steam Output (mmBtu/hr) | 3.002 | 2.493 | 8.658 | 7.543 | ||||||||||||
| Steam Output/Fuel Input | 33.9 | % | 33.1 | % | 28.4 | % | 28.0 | % | ||||||||
| Power Steam Ratio | 0.909 | 1.095 | 1.182 | 1.357 | ||||||||||||
| Net Heat Rate (Btus/kWh) | 6359 | 5487 | 6551 | 5839 | ||||||||||||
| Thermal Output as Fraction of Fuel Input | 0.34 | 0.33 | 0.28 | 0.28 | ||||||||||||
| Electric Output as Fraction of Fuel Input | 0.31 | 0.37 | 0.34 | 0.38 | ||||||||||||
The 800 kW gas engine system is based on the Caterpillar G3516 engine system. The advanced performance was based on target specifications for a high performance system being developed by the Gas Research Institute and Caterpillar. The 3000 kW size is based on the Caterpillar G3616. The base case specifications are based on the current product performance. The advanced system is based on preliminary goals of the Advanced Reciprocating Engine System (ARES) program.7, 13
| ONSITE SYCOM Energy Corporation | 13 | Industrial CHP Assessment |
Table 1-8 Current and Advanced Combustion Turbine System Characteristics
CHP Cost & Performance Assumptions | 1 MW Comb Turbine | 5 MW Comb Turbine | 10 MW Comb Turbine | |||||||||||||||||||||
| Year | Current | 2020 | Current | 2020 | Current | 2020 | ||||||||||||||||||
| Total Installed Cost ( $/kW) | $ | 1,600 | $ | 1,340 | $ | 1,075 | $ | 950 | $ | 965 | $ | 830 | ||||||||||||
| O&M Costs ($/kWh) | 0.0096 | 0.008 | 0.0059 | 0.0049 | 0.0055 | 0.0046 | ||||||||||||||||||
| Electrical Heat Rate (Btu/kWh), HHV | 15,600 | 12,375 | 12,375 | 9,605 | 11,750 | 9,054 | ||||||||||||||||||
| Overall Efficiency (%) | 72.0 | % | 73.0 | % | 73.0 | % | 74.0 | % | 74.0 | % | 74.0 | % | ||||||||||||
| Derived Technical Characteristics | ||||||||||||||||||||||||
| Elec Generating Efficiency (3412/Heatrate) | 21.9 | % | 27.6 | % | 27.6 | % | 35.5 | % | 29.0 | % | 37.7 | % | ||||||||||||
| Fuel Input (mmBtu/hr) | 15.60 | 12.38 | 61.88 | 48.03 | 117.50 | 90.54 | ||||||||||||||||||
| Steam Output (mmBtu/hr) | 7.82 | 5.622 | 28.11 | 18.55 | 52.83 | 32.80 | ||||||||||||||||||
| Steam Output/Fuel Input | 50.1 | % | 45.4 | % | 45.4 | % | 38.6 | % | 45.0 | % | 36.2 | % | ||||||||||||
| Power Steam Ratio | 0.436 | 0.607 | 0.607 | 0.920 | 0.646 | 1.041 | ||||||||||||||||||
| Net Heat Rate (Btus/kWh) | 5825 | 5348 | 5348 | 4967 | 5146 | 4954 | ||||||||||||||||||
| Thermal Output as Fraction of Fuel Input | 0.50 | 0.45 | 0.45 | 0.39 | 0.45 | 0.36 | ||||||||||||||||||
| Electric Output as Fraction of Fuel Input | 0.22 | 0.28 | 0.28 | 0.36 | 0.29 | 0.38 | ||||||||||||||||||
| ONSITE SYCOM Energy Corporation | 14 | Industrial CHP Assessment |
Table 1-8 (continued) Current and Advanced Combustion Turbine System Characteristics
| CHP Cost & Performance Assumptions | 25 MW Comb Turbine | 40 MW Comb Turbine | ||||||||||||||
| Year | Current | 2020 | Current | 2020 | ||||||||||||
| Total Installed Cost ( $/kW) | $ | 770 | $ | 675 | $ | 700 | $ | 625 | ||||||||
| O&M Costs ($/kWh) | 0.0049 | 0.0043 | 0.0042 | 0.0040 | ||||||||||||
| Electrical Heat Rate (Btu/kWh), HHV | 9,950 | 8,745 | 9,220 | 8,530 | ||||||||||||
| Overall Efficiency (%) | 78.0 | % | 74.0 | % | 78.0 | % | 72.0 | % | ||||||||
| Derived Technical Characteristics | ||||||||||||||||
| Elec Generating Efficiency (3412/Heatrate) | 34.3 | % | 39.0 | % | 37.0 | % | 40.0 | % | ||||||||
| Fuel Input (mmBtu/hr) | 248.75 | 218.63 | 368.80 | 341.20 | ||||||||||||
| Steam Output (mmBtu/hr) | 108.72 | 76.52 | 151.18 | 109.18 | ||||||||||||
| Steam Output/Fuel Input | 43.7 | % | 35.0 | % | 41.0 | % | 32.0 | % | ||||||||
| Power Steam Ratio | 0.785 | 1.114 | 0.903 | 1.125 | ||||||||||||
| Net Heat Rate (Btus/kWh) | 4514 | 4919 | 4514 | 5118 | ||||||||||||
| Thermal Output as Fraction of Fuel Input | 0.44 | 0.35 | 0.41 | 0.32 | ||||||||||||
| Electric Output as Fraction of Fuel Input | 0.34 | 0.39 | 0.37 | 0.40 | ||||||||||||
The base case 1 MW size is based on the Solar Turbines 1205 kW Saturn 20 gas turbine; the 5 MW system is based on the Solar Taurus 60; the 10 MW system is based on the Solar Mars 100; the base case 25 MW system is based on the GE LM2500; the base case 40 MW system is based on the GE LM6000. The advanced case 1 MW system is based on a qualitative assessment of potential efficiency improvement based on recuperation. The advanced 5 MW system is based on the 4.2 MW Solar Mercury 50, a recuperated turbine system that was the successful product of the DOE Advanced Turbine System program. The advanced 10 MW system is based on the Mitsui SB60 (17.7 MW) combined cycle turbine system. Advanced 25, and 40 MW systems are based on qualitative assessments of potential improvements based on the use of ceramic components and advanced combustors.
| ONSITE SYCOM Energy Corporation | 15 | Industrial CHP Assessment |
2. Profile of Existing Industrial CHP
An analysis of the most recent update to the Hagler Bailly Independent Power Data Base (HBI) was conducted to develop a profile of existing cogeneration activity in the industrial sector. 14 OSEC has not found any single database that contains a complete listing of existing CHP and independent power facilities (i.e., coverage of small systems in the HBI database is incomplete). However, OSEC considers the HBI data as the best available and has worked with it extensively over the past two years to understand its content and to enhance its coverage and value. The profile was developed to understand the technologies and applications that comprise existing CHP capacity and to provide insight into projections of future market development. The HBI database includes information for each CHP site including technology, fuel use, electrical capacity (MW), ownership and sell-back of power to the grid. Steam capacity was calculated based on typical power to heat ratios of the technology used at each site.
CHP installations in the following industries were reviewed:
| SIC | Industry | |
| 01 | Agriculture - Crops | |
| 07 | Agriculture - Services | |
| 11 | Metal Mining | |
| 12 | Coal Mining | |
| 14 | Mining - nonmetallic Minerals | |
| 20 | Food & Kindred Products | |
| 21 | Tobacco Products | |
| 22 | Textile Mill Products | |
| 23 | Apparel | |
| 24 | Lumber & Wood Products | |
| 25 | Furniture & Fixtures | |
| 26 | Paper & Allied Products | |
| 27 | Printing & Publishing | |
| 28 | Chemicals & Allied Products | |
| 29 | Petroleum Refining and Related Industries | |
| 30 | Rubber & Misc. Plastic Products | |
| 31 | Leather & Leather Products | |
| 32 | Stone, Clay, Glass and Concrete | |
| 33 | Primary Metals | |
| 34 | Fabricated Metal Products | |
| 35 | Industrial & Commercial Machinery | |
| 36 | Electronic & Other Electrical Equipment | |
| 37 | Transportation Equipment | |
| 38 | Measuring, Analyzing and Controlling Instruments | |
| 39 | Miscellaneous Manufacturing Industries |
| ONSITE SYCOM Energy Corporation | 16 | Industrial CHP Assessment |
As of the end of mid-1999, these industries had 1,016 CHP facilities with a total electrical capacity of 45,500 MW and an estimated cogenerated steam capacity of 225,000,000 pounds of steam/hour (225,000 million Btu/hour). Manufacturing industries (SIC 20-39) represented 44,242 MW at 980 sites (216,000 million Btu/hour steam capacity). Major conclusions from the database include:
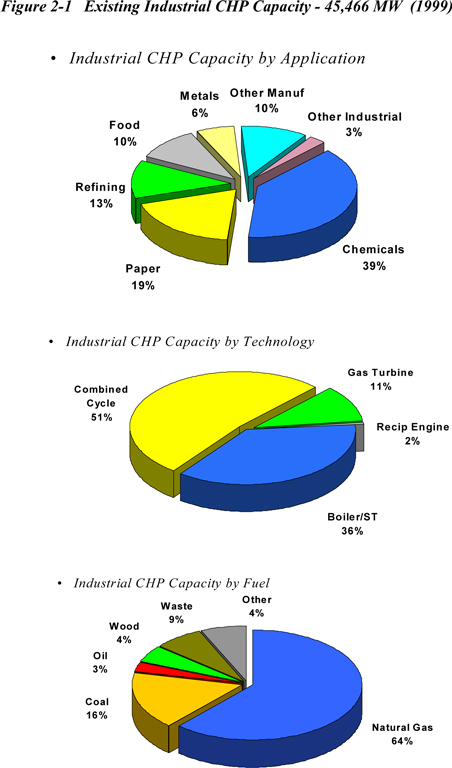
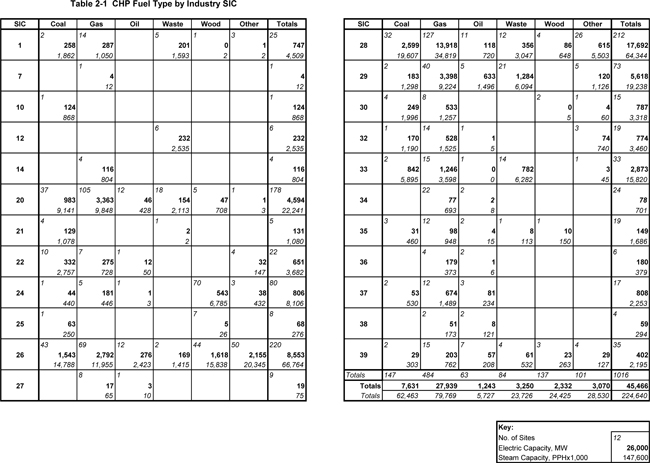
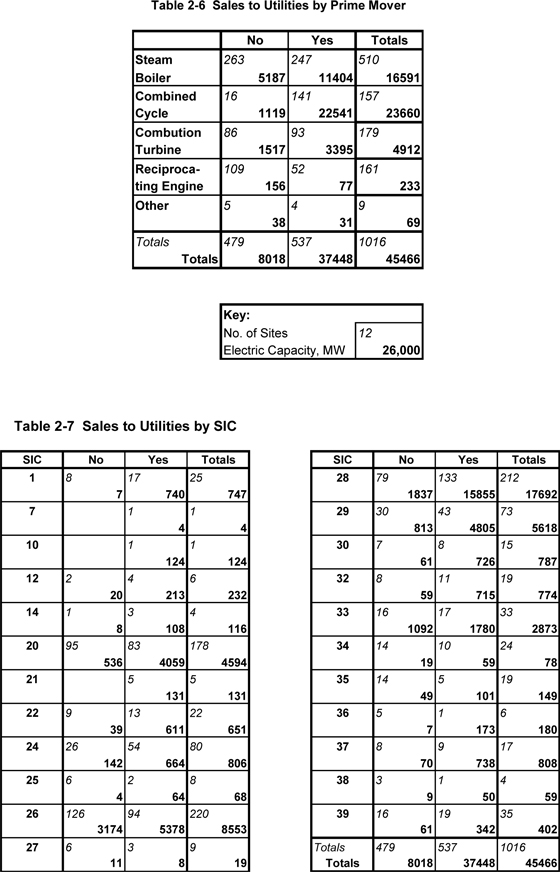
| ¨ | Existing CHP capacity is concentrated in a few industries - CHP facilities can be found in all manufacturing industries except Apparel Manufacturing and Leather and Tanning (SICs 21 and 31). However, SIC Groups 26, 28 and 29 (Paper and Allied Products, Chemicals and Allied Products, and Petroleum Refining and related Products) combined represent more than two thirds of the total electric and steam capacities at existing CHP installations. (Figure 2-1 and Table 2-1) Note that SIC 26 has approximately the same steam capacity as SIC 28 but only half the electrical capacity, a reflection of the types of cogeneration systems employed. (Table 2-2) SIC 26 has relied primarily on boiler/steam turbine systems with low power to heat ratios; SIC 28 CHP capacity is primarily combustion turbine and combined cycle systems that have much higher power to heat ratios. |
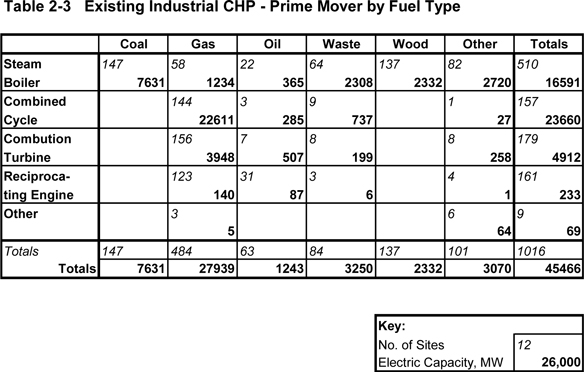
| ¨ | Existing CHP depends on a variety of technologies and fuels - Natural gas is the primary fuel used for CHP (61.3 % of capacity), but coal, wood and process wastes are used extensively by many industries (16.7 %, 5.1 %, and 7.1 % respectively). (Figure 2-1 and Table 2-1) Accordingly, combustion turbines are the predominant technology in use representing 62.8 % of installed CHP capacity in combined and simple cycle systems and are used by almost all industry segments. Boiler/steam turbines represent 36.4 % of installed CHP capacity and are concentrated in the paper, chemicals and primary metals industries. In terms of number of facilities, reciprocating engines are used in over 161 sites (almost 16 % of facilities), primarily in the food, chemicals and fabrication and equipment industries. |
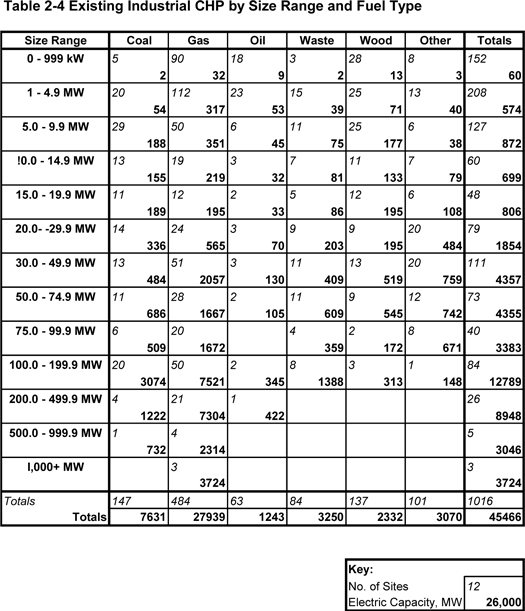
| ¨ | Large systems account for most existing CHP capacity - There is great variation in site electrical capacity at existing industrial CHP facilities, however, 80 % of existing capacity is represented by facilities of 50 MW and greater (Table 2-4). Two thirds of the coal is used in systems over 100 MW size. Recip engines predominate in facilities below 1 MW, and are used extensively in facilities up to 5 MW. Combined cycle systems dominate the larger facilities. (Table 2-5) |
| ¨ | Most existing CHP sells some power to the grid - As shown in Tables 2-6 and 2-7, over 80 % of existing CHP capacity sells at least a portion of its electricity output to the grid. |
| ¨ | Third party ownership is common - Almost 57 % of existing capacity is third party owned and/or financed (Tables 2-8 and 2-9). Third party financing represents a significant majority of the capacity in combined cycle systems and in systems in the food and chemicals industries. |
| ¨ | CHP is an important resource to a number of states - Tables 2-10 and 2-11 present existing CHP capacity by state as a function of system prime mover and fuel type. Texas has the most industrial CHP capacity followed by California, Florida, Louisiana, New Jersey and New York. |
| ONSITE SYCOM Energy Corporation | 17 | Industrial CHP Assessment |
Figure 2-1 Existing Industrial CHP Capacity - 45,466 MW (1999)
| ONSITE SYCOM Energy Corporation | 18 | Industrial CHP Assessment |
| ONSITE SYCOM Energy Corporation | 19 | Industrial CHP Assessment |

| ONSITE SYCOM Energy Corporation | 20 | Industrial CHP Assessment |
| ONSITE SYCOM Energy Corporation | 21 | Industrial CHP Assessment |
| ONSITE SYCOM Energy Corporation | 22 | Industrial CHP Assessment |

| ONSITE SYCOM Energy Corporation | 23 | Industrial CHP Assessment |
| ONSITE SYCOM Energy Corporation | 24 | Industrial CHP Assessment |

| ONSITE SYCOM Energy Corporation | 25 | Industrial CHP Assessment |
Table 2-10 State Profile of Existing CHP by Prime Movers
| State | Steam | CC | CT | Recip. | Other | Totals | |
| AK | 2 | 4 | 3 | 9 | |||
| 28 | 51 | 16 | 95 | ||||
| AL | 14 | 2 | 1 | 17 | |||
| 556 | 125 | 40 | 720 | ||||
| AR | 6 | 2 | 8 | ||||
| 126 | 38 | 164 | |||||
| AZ | 2 | 1 | 2 | 5 | |||
| 82 | 50 | 7 | 139 | ||||
| CA | 33 | 25 | 43 | 52 | 1 | 154 | |
| 581 | 1710 | 1024 | 46 | 0 | 3362 | ||
| CO | 2 | 4 | 4 | 10 | |||
| 43 | 429 | 47 | 519 | ||||
| CT | 8 | 2 | 1 | 5 | 16 | ||
| 236 | 82 | 5 | 4 | 327 | |||
| DE | 4 | 4 | |||||
| 89 | 89 | ||||||
| FL | 25 | 7 | 10 | 42 | |||
| 1494 | 712 | 293 | 2499 | ||||
| GA | 17 | 1 | 1 | 2 | 1 | 22 | |
| 490 | 300 | 2 | 2 | 2 | 796 | ||
| GU | 1 | 1 | 2 | ||||
| 0 | 50 | 50 | |||||
| HI | 7 | 1 | 1 | 3 | 12 | ||
| 240 | 180 | 9 | 1 | 430 | |||
| IA | 8 | 8 | |||||
| 135 | 135 | ||||||
| ID | 10 | 3 | 13 | ||||
| 120 | 23 | 143 | |||||
| IL | 13 | 2 | 10 | 8 | 2 | 35 | |
| 314 | 55 | 176 | 13 | 6 | 564 | ||
| IN | 8 | 1 | 1 | 10 | |||
| 1123 | 18 | 4 | 1145 | ||||
| KS | 3 | 1 | 1 | 5 | |||
| 8 | 40 | 10 | 58 | ||||
| KY | 1 | 1 | |||||
| 4 | 4 | ||||||
| LA | 18 | 8 | 12 | 2 | 40 | ||
| 1094 | 1421 | 732 | 1 | 3248 | |||
| MA | 13 | 7 | 4 | 4 | 28 | ||
| 76 | 941 | 32 | 5 | 1053 | |||
| MD | 4 | 1 | 5 | ||||
| 232 | 240 | 472 |
| ONSITE SYCOM Energy Corporation | 26 | Industrial CHP Assessment |
| ME | 18 | 18 | |||||
| 745 | 745 | ||||||
| MI | 23 | 4 | 8 | 6 | 41 | ||
| 289 | 1542 | 59 | 4 | 1894 | |||
| MN | 13 | 1 | 1 | 15 | |||
| 250 | 262 | 1 | 513 | ||||
| MO | 4 | 1 | 5 | ||||
| 44 | 4 | 48 | |||||
| MS | 13 | 3 | 16 | ||||
| 345 | 28 | 373 | |||||
| MT | 4 | 4 | |||||
| 68 | 68 | ||||||
| NC | 29 | 2 | 2 | 33 | |||
| 1064 | 185 | 8 | 1258 | ||||
| ND | 3 | 3 | |||||
| 24 | 24 | ||||||
| NE | 1 | 1 | 2 | ||||
| 7 | 0 | 7 | |||||
| NH | 3 | 1 | 1 | 5 | |||
| 5 | 1 | 12 | 18 | ||||
| NJ | 11 | 19 | 8 | 18 | 1 | 57 | |
| 592 | 2406 | 46 | 13 | 1 | 3057 | ||
| NM | 1 | 1 | 2 | ||||
| 33 | 3 | 37 | |||||
| NV | 4 | 1 | 5 | ||||
| 310 | 1 | 311 | |||||
| NY | 12 | 21 | 8 | 24 | 1 | 66 | |
| 366 | 3003 | 129 | 29 | 0 | 3528 | ||
| OH | 12 | 1 | 4 | 17 | |||
| 260 | 7 | 5 | 271 | ||||
| OK | 4 | 2 | 6 | ||||
| 456 | 220 | 676 | |||||
| OR | 15 | 2 | 1 | 18 | |||
| 109 | 499 | 49 | 657 | ||||
| PA | 35 | 4 | 4 | 9 | 52 | ||
| 1261 | 194 | 109 | 15 | 1580 | |||
| PR | 3 | 1 | 4 | ||||
| 9 | 20 | 29 | |||||
| RI | 1 | 1 | |||||
| 67 | 67 | ||||||
| SC | 7 | 2 | 1 | 10 | |||
| 374 | 500 | 7 | 881 | ||||
| TN | 16 | 1 | 2 | 19 | |||
| 338 | 24 | 59 | 421 |
| ONSITE SYCOM Energy Corporation | 27 | Industrial CHP Assessment |
| TX | 26 | 27 | 29 | 5 | 1 | 88 | |
| 719 | 7157 | 1467 | 4 | 1 | 9349 | ||
| UT | 3 | 1 | 4 | ||||
| 5 | 15 | 21 | |||||
| VA | 25 | 2 | 2 | 4 | 33 | ||
| 1400 | 476 | 20 | 12 | 1907 | |||
| VT | 2 | 1 | 1 | 4 | |||
| 21 | 8 | 0 | 28 | ||||
| WA | 8 | 4 | 3 | 15 | |||
| 194 | 590 | 165 | 949 | ||||
| WI | 20 | 1 | 1 | 22 | |||
| 409 | 180 | 1 | 590 | ||||
| WV | 2 | 2 | |||||
| 139 | 139 | ||||||
| WY | 1 | 1 | 1 | 3 | |||
| 7 | 3 | 0 | 10 | ||||
| Totals | 510 | 157 | 179 | 161 | 9 | 1016 | |
| Totals | 16591 | 23660 | 4912 | 233 | 69 | 45466 | |
| Key: | |||||||
| No. of Sites | 12 | ||||||
| Electric Capacity, MW | 26,000 | ||||||
| ONSITE SYCOM Energy Corporation | 28 | Industrial CHP Assessment |
Table 2-11 State Profile of Existing CHP by Fuel Type
| State | Coal | Gas | Oil | Waste | Wood | Other | Totals |
| AK | 1 | 3 | 4 | 1 | 9 | ||
| 25 | 43 | 24 | 3 | 95 | |||
| AL | 1 | 3 | 2 | 5 | 6 | 17 | |
| 65 | 165 | 12 | 159 | 319 | 720 | ||
| AR | 2 | 1 | 2 | 3 | 8 | ||
| 38 | 10 | 23 | 94 | 164 | |||
| AZ | 1 | 3 | 1 | 5 | |||
| 60 | 76 | 3 | 139 | ||||
| CA | 4 | 116 | 2 | 10 | 15 | 7 | 154 |
| 198 | 2545 | 3 | 301 | 194 | 123 | 3362 | |
| CO | 1 | 8 | 1 | 10 | |||
| 40 | 476 | 3 | 519 | ||||
| CT | 1 | 8 | 5 | 1 | 1 | 16 | |
| 181 | 93 | 42 | 11 | 0 | 327 | ||
| DE | 2 | 1 | 1 | 4 | |||
| 36 | 48 | 5 | 89 | ||||
| FL | 3 | 15 | 3 | 2 | 19 | 42 | |
| 810 | 904 | 50 | 200 | 535 | 2499 | ||
| GA | 4 | 5 | 1 | 6 | 6 | 22 | |
| 98 | 321 | 1 | 69 | 307 | 796 | ||
| GU | 1 | 1 | 2 | ||||
| 50 | 0 | 50 | |||||
| HI | 1 | 1 | 4 | 6 | 12 | ||
| 180 | 0 | 182 | 68 | 430 | |||
| IA | 5 | 1 | 2 | 8 | |||
| 121 | 2 | 13 | 135 | ||||
| ID | 2 | 2 | 8 | 1 | 13 | ||
| 9 | 20 | 111 | 3 | 143 | |||
| IL | 10 | 19 | 2 | 1 | 3 | 35 | |
| 280 | 206 | 21 | 28 | 29 | 564 | ||
| IN | 4 | 2 | 1 | 3 | 10 | ||
| 745 | 23 | 4 | 373 | 1145 | |||
| KS | 5 | 5 | |||||
| 58 | 58 | ||||||
| KY | 1 | 1 | |||||
| 4 | 4 | ||||||
| LA | 26 | 1 | 6 | 2 | 5 | 40 | |
| 2264 | 422 | 221 | 116 | 225 | 3248 | ||
| MA | 3 | 14 | 11 | 28 | |||
| 32 | 919 | 103 | 1053 | ||||
| MD | 2 | 1 | 1 | 1 | 5 | ||
| 250 | 169 | 50 | 3 | 472 |
| ONSITE SYCOM Energy Corporation | 29 | Industrial CHP Assessment |
| ME | 1 | 2 | 10 | 5 | 18 | ||
| 85 | 175 | 298 | 187 | 745 | |||
| MI | 9 | 23 | 7 | 2 | 41 | ||
| 147 | 1644 | 76 | 28 | 1894 | |||
| MN | 8 | 2 | 2 | 3 | 15 | ||
| 164 | 263 | 45 | 41 | 513 | |||
| MO | 2 | 1 | 2 | 5 | |||
| 43 | 4 | 1 | 48 | ||||
| MS | 3 | 1 | 8 | 4 | 16 | ||
| 28 | 5 | 150 | 190 | 373 | |||
| MT | 1 | 1 | 1 | 1 | 4 | ||
| 2 | 55 | 1 | 10 | 68 | |||
| NC | 20 | 3 | 1 | 1 | 3 | 5 | 33 |
| 814 | 189 | 7 | 19 | 57 | 172 | 1258 | |
| ND | 2 | 1 | 3 | ||||
| 19 | 5 | 24 | |||||
| NE | 1 | 1 | 2 | ||||
| 7 | 0 | 7 | |||||
| NH | 1 | 1 | 3 | 5 | |||
| 1 | 12 | 5 | 18 | ||||
| NJ | 2 | 46 | 6 | 2 | 1 | 57 | |
| 487 | 2420 | 56 | 94 | 1 | 3057 | ||
| NM | 2 | 2 | |||||
| 37 | 37 | ||||||
| NV | 5 | 5 | |||||
| 311 | 311 | ||||||
| NY | 2 | 48 | 8 | 4 | 4 | 66 | |
| 190 | 3147 | 51 | 83 | 56 | 3528 | ||
| OH | 8 | 5 | 2 | 2 | 17 | ||
| 186 | 12 | 53 | 22 | 271 | |||
| OK | 1 | 3 | 1 | 1 | 6 | ||
| 320 | 334 | 17 | 5 | 676 | |||
| OR | 1 | 3 | 12 | 2 | 18 | ||
| 8 | 548 | 89 | 13 | 657 | |||
| PA | 12 | 14 | 6 | 16 | 2 | 2 | 52 |
| 368 | 321 | 14 | 799 | 33 | 44 | 1580 | |
| PR | 4 | 4 | |||||
| 29 | 29 | ||||||
| RI | 1 | 1 | |||||
| 67 | 67 | ||||||
| SC | 1 | 3 | 1 | 2 | 3 | 10 | |
| 72 | 507 | 43 | 43 | 217 | 881 |
| ONSITE SYCOM Energy Corporation | 30 | Industrial CHP Assessment |
| TN | 7 | 8 | 4 | 19 | |||
| 223 | 110 | 87 | 421 | ||||
| TX | 64 | 13 | 4 | 7 | 88 | ||
| 8146 | 800 | 121 | 282 | 9349 | |||
| UT | 1 | 1 | 2 | 4 | |||
| 15 | 1 | 5 | 21 | ||||
| VA | 16 | 4 | 1 | 5 | 6 | 1 | 33 |
| 1280 | 482 | 3 | 27 | 97 | 19 | 1907 | |
| VT | 1 | 2 | 1 | 4 | |||
| 8 | 21 | 0 | 28 | ||||
| WA | 7 | 5 | 3 | 15 | |||
| 755 | 105 | 89 | 949 | ||||
| WI | 8 | 7 | 4 | 3 | 22 | ||
| 200 | 295 | 47 | 48 | 590 | |||
| WV | 2 | 2 | |||||
| 139 | 139 | ||||||
| WY | 1 | 1 | 1 | 3 | |||
| 3 | 7 | 0 | 10 | ||||
| Totals | 147 | 484 | 63 | 84 | 137 | 101 | 1016 |
| Totals | 7631 | 27939 | 1243 | 3250 | 2332 | 3070 | 45466 |
| Key: | |||||||
| No. of Sites | 12 | ||||||
| Electric Capacity, MW | 26,000 | ||||||
| ONSITE SYCOM Energy Corporation | 31 | Industrial CHP Assessment |
| 3. | Technical Potential for Industrial CHP |
This section summarizes the analysis of CHP technical potential in the manufacturing sector of the U.S. economy. This analysis is based on existing industrial facilities and estimates of their current power and steam consumption. The estimated potential is a snapshot of the technical potential for CHP at these facilities at the end of 1999 and does not include an analysis of sector growth over the time period of the EIA forecast. The technical market potential is an estimation of market size constrained only by technological limits—the ability of CHP technologies to fit existing customer energy needs. No consideration of economics is included in the analysis. The analysis also considers only traditional steam/electric power CHP. No estimate was made for mechanical drive applications or for uses of thermal energy other than steam.
| 3.1 | Technical Approach |
OSEC integrated the output of three separate databases to derive the remaining industrial CHP potential. A schematic of the approach and the databases is shown in Figure 3.1.
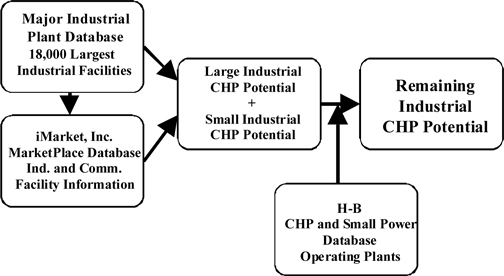
Figure 3.1. Methodology for Estimating Total Remaining CHP Potential in the Industrial Sector
Major Industrial Plant Database (MIPD)15
The MIPD is a very detailed description of over 18,000 of the largest industrial facilities in the U.S. Using this database, OSEC was able to aggregate the electrical capacity and steam utilization for each site and sort them into bins reflecting size and power-to-steam (P/S) ratios for each 2-digit SIC (20-39). It is also possible to get average hours of operation for each 2-digit SIC. Plants were sorted into three P/S bins as follows:
| ONSITE SYCOM Energy Corporation | 32 | Industrial CHP Assessment |
| q | P/S < 0.4 – These plants have a high steam load and CHP sizing would require either sizing to the steam load and exporting power or sizing to the site-power load and meeting only part of the on-site steam requirements. For this analysis, we have sized to the steam load, thereby requiring export of power from the site. |
| q | 0.4 < P/S < 1.5 – P/H ratios between 0.4 and 1.5 are sized to the steam load and provide only partial support for the on-site electric power needs |
| q | P/S > 1.5 – Sites with a P/H ratio of greater than 1.5 are not included in the CHP potential because their on-site steam load is too small compared to their electrical requirements to warrant economic consideration of CHP. |
Technical CHP potential was assigned to these P/S bins by assigning a specific technology P/S ratio for each bin. The excess steam category (P/S < 0.4) CHP potential was allocated to steam and power using a typical simple cycle combustion turbine system as defined in Section 1 of this report. The P/S chosen was 0.6. The potential for the balanced steam and power bin (P/S between 0.4 and 1.5) was assigned using a P/S ratio of 1.0 – reflective of a higher electric efficiency generation technology such as a recuperated cycle or combined cycle gas turbine.
MarketPlace Database16
The MIPD covers approximately 18,000 of the estimated 250,000 manufacturing facilities in the U.S. It is estimated by IHS Energy Group that the 18,000 represents about 80% of total energy consumption in the manufacturing sector as a whole – though this percentage varies by SIC. To estimate CHP potential at the small end of the market, the iMarket, Inc. MarketPlace Database was utilized to identify the number of sites by SIC code that have average electric loads between 100 kW and 1 MW. Unlike the MIPD, this database has limited site operating data. The database presorts facilities into discrete power use size bins; however, there is no direct steam consumption data, so there is no way to directly sort by P/S. SIC categories that are known to have adequate steam loads were selected based on power and steam data profiles contained in DOE's 1994 Manufacturing Energy Consumption Survey.17 The 100-1,000kW size range represents a single bin in the database. CHP power and steam potential were allocated to this bin using the performance characteristics of reciprocating engine systems, that is a P/S of 0.8.
The MIPD and MarketPlace analyses are summed together to provide an estimate of the gross CHP potential within the manufacturing sector for facilities of 100 kW demand and above.
Database of Operating CHP and Small Power Plants
The MIPD has limited data on CHP by facility and OSEC determined that these data were incomplete. The MarketPlace database does not provide any information on existing CHP. Therefore, we utilized the Hagler-Bailly database of CHP and small power plants to identify the number of operating CHP plants in the manufacturing sector. The detailed results of this analysis were presented in the previous section. For each of the 2-digit SIC categories (20-39) we subtracted the operating CHP from the total potential to arrive at the remaining technical CHP potential by 2-digit SIC and by size range.
| ONSITE SYCOM Energy Corporation | 33 | Industrial CHP Assessment |
| 3.2 | Estimate of Remaining Power and Steam Potential for CHP by SIC |
This section summarizes the results of the analysis based on the methodology described above. Table 3.1 summarizes CHP potential in terms of electric capacities (MW) by 2-digit SIC. Specific notes on the columns are as follows:
| q | Small Plants 100-1,000kW total represents the number of facilities in MarketPlace database in the 100-1,000 kW size category times an assumed average size per facility of 400 kW. |
| q | CHP Potential > 1MW, P/S< 0.4 represents the CHP MW potential for facilities larger than 1 MW with power to steam ratios less than 0.4. It is assumed that the steam load is met with a simple-cycle combustion turbine technology that has a P/S of 0.6. Therefore, in this category, the estimated capacity includes a portion of power that must be exported from the site. |
| q | CHP Potential > 1MW, 0.4<P/S<1.5 represents an analogous computation for facilities with P/S between 0.4 and 1.5. For this column, however, it is assumed that the CHP generating technology is a recuperated cycle combustion turbine with a P/S of 1.0. The CHP capacity is sized to the facility steam load with only a partial contribution to the facility electric requirements. |
| q | CHP Total Potential represents the sum of each of the three potential calculations described above. |
| q | Existing CHP by 2-digit SIC is taken from the enhanced Hagler Bailly Independent Power Database as described previously in Section 2. |
| q | Remaining CHP Potential is the difference between the total CHP and the existing CHP. The number represents the amount of CHP that can still be installed to existing industrial facilities. |
| q | CHP Saturation of Total Potential is the percentage of total CHP technical potential in existing industrial facilities that is already operating (existing.) |
We estimate that the technical potential for CHP at existing manufacturing facilities is approximately 132,000 MW. In Section 2 of this report we showed that approximately 44,000 MW of CHP capacity is already in place at existing manufacturing facilities, leaving a remaining CHP potential of just over 88,000 MW for the manufacturing sector (existing CHP represents a 33 % saturation of the total CHP potential for manufacturing as a whole). Much of the remaining potential is found in those industries that have traditionally relied on CHP — paper, chemicals, food, primary metals and refining. Paper in particular has the largest amount of remaining CHP potential, accounting for 26,000 MW of the total 88,000. However, significant remaining potential exists in industries such as textiles, rubber and plastics, metals fabrication and equipment — industries that have not aggressively implemented CHP to-date.
| ONSITE SYCOM Energy Corporation | 34 | Industrial CHP Assessment |
Table 3.2 presents CHP potential in terms of steam load, including calculated annual steam loads corresponding to both the total potential and existing CHP capacity presented in Table 3.1. Steam loads in trillion Btus (Tbtu) were calculated from CHP potential capacity estimates (in MW) and average operating hours derived for each SIC from the MIPD.
| q | Total Steam Load is an estimate in Tbtu of overall steam consumption by each 2-digit SIC. The data in the table are estimates for 1997 from EIA's internal cogeneration analysis and are based on the 1994 MECS and NEMS industrial and refining models. |
| q | Existing CHP Steam is based on the steam capacity derived from the enhanced Independent Power Database presented in Section 2 and the average operating hours of each SIC derived from the MIPD. |
| q | Existing CHP Steam Saturation is the percentage of total steam load that is satisfied by steam produced by existing CHP systems. |
| q | Remaining CHP Steam is derived from the remaining CHP potential, the average operating hours for each SIC, and the P/S ratios assumed for each category of CHP potential as outlined for Table 3.1. As indicated above, the P/S assumed for the two MIPD categories are 0.6 and 1.0 respectively. The less than 1 MW analysis based on the MarketPlace database assumed a P/S of 0.8 that is more characteristic of a reciprocating engine CHP system. |
| q | Total Potential CHP Steam Saturation represents the percentage of total steam load for each SIC that would be met by full implementation of the total CHP technical potential (sum of existing plus remaining CHP potential). |
Based on this analysis, existing CHP systems produce almost 24 % of the total manufacturing steam demand. We estimate that approximately 68 % of total manufacturing steam demand could be satisfied by CHP if the full technical potential was realized at existing plants. This potential saturation number is less than 100 %, reflecting the fact that many steam loads are not conducive to CHP implementation (i.e., P/S < 1.5) and also reflecting a margin of error introduced into the calculation itself through the use of average operating hours, average P/S ratios for categories of CHP systems, and the fact that the total steam loads are themselves estimates derived from calculated data.
Table 3.3 presents CHP technical potential (MW electric capacity) by size categories for primary SIC industries. For each CHP installation size category (< 1 MW, 1-4 MW, 4-20 MW, 20-50 MW, > 50 MW), the table contains the following:
| ONSITE SYCOM Energy Corporation | 35 | Industrial CHP Assessment |
| q | Total Potential represents the total CHP technical potential at existing plants for each SIC for systems in the specified size categories. Total technical potential is given in MW of electric capacity. |
| q | Existing CHP represents the installed CHP capacity in MW for each SIC in the specified size categories. |
| q | Remaining Potential is the difference between the total CHP potential and the existing CHP capacity for each SIC and size category. |
Major conclusions from review of the analysis results include:
| ¨ | Significant CHP potential remains at existing industrial facilities - Existing CHP capacity (MW) represents about one third of the total CHP potential at existing industrial facilities. Certain industries such as Chemicals and Petroleum Refining have saturation rates that are much higher (65% and 45% respectively). Total remaining potential is estimated to be in the range of 75,000 to 100,000 MW (the analysis developed a specific estimate of 88,000 MW based on a limited technology match - the range of 75,000 to 100,000 MW reflects the wide range of technologies that could be utilized and the varying power to heat ratios of those technologies). |
| ¨ | Much of the remaining CHP potential is with industries that have traditionally employed CHP - Two thirds of the remaining CHP potential is in five industries (Food, Paper, Chemicals, Refining, Primary Metals) that currently have significant levels of CHP saturation (i.e., > 25 %). |
| ¨ | CHP development to-date has focused on large systems - Over 90 % of existing CHP capacity in the industrial market is represented by systems of 20 MW or greater. Existing CHP capacity represents over 45 % of total CHP potential in this size range. |
| ¨ | Large systems represent a significant share of remaining CHP potential - Fifty five percent of the remaining CHP potential is in system sizes of 20 MW or greater. |
| ¨ | Small systems represent a large untapped market for CHP - Forty five percent of the remaining CHP potential (over 39,000 MW) is in system sizes of less than 20 MW. Thirty two percent of the remaining potential is in system sizes of 4 MW or less. Market saturation in these size categories is currently very low (7 % for systems less than 20 MW, 1 % for systems less than 4 MW). |
| ONSITE SYCOM Energy Corporation | 36 | Industrial CHP Assessment |
Table 3.1. Total CHP Potential, Existing CHP, and Remaining Potential by 2-Digit SIC (Megawatts)
SIC | SIC Description | Small Plants 100- 1,000kW total | CHP Potential > 1MW, P/S< 0.4 | CHP Potential >1MW, 0.4<P/S<1.5 | CHP Total Potential | Existing CHP | Remaining CHP Potential* | Existing CHP Saturation of Total MW Potential | ||||||||||||||||||||||
| — Total MW Capacity — | ||||||||||||||||||||||||||||||
| 20 | Food and Kindred Products | 2,683 | 6,652 | 3,345 | 12,680 | 4,594 | 8,086 | 36.2 | % | |||||||||||||||||||||
| 21 | Tobacco and Allied Products* | 16 | 24 | 63 | 103 | 131 | 0 | 100.0 | % | |||||||||||||||||||||
| 22 | Textile Mill Products | 766 | 1,854 | 1,157 | 3,777 | 651 | 3,126 | 17.2 | % | |||||||||||||||||||||
| 23 | Apparel Manufacturing | n.a. | 77 | 86 | 163 | 0 | 163 | 0.0 | % | |||||||||||||||||||||
| 24 | Lumber and Wood Products | 595 | 1,220 | 726 | 2,542 | 806 | 1,736 | 31.7 | % | |||||||||||||||||||||
| 25 | Furniture | n.a. | 108 | 294 | 401 | 68 | 333 | 16.9 | % | |||||||||||||||||||||
| 26 | Paper and Allied Products | 1,168 | 28,774 | 4,810 | 34,751 | 8,553 | 26,198 | 24.6 | % | |||||||||||||||||||||
| 27 | Printing and Publishing | n.a. | 258 | 146 | 404 | 19 | 385 | 4.7 | % | |||||||||||||||||||||
| 28 | Chemicals and Allied Products | 1,780 | 17,957 | 7,395 | 27,132 | 17,692 | 9,440 | 65.2 | % | |||||||||||||||||||||
| 29 | Petroleum and Coal Products | 154 | 8,067 | 4,186 | 12,407 | 5,618 | 6,789 | 45.3 | % | |||||||||||||||||||||
| 30 | Rubber and Misc. Plastics | 2,772 | 839 | 802 | 4,413 | 787 | 3,626 | 17.8 | % | |||||||||||||||||||||
| 31 | Leather and Tanning | n.a. | 89 | 9 | 98 | 0 | 98 | 0.0 | % | |||||||||||||||||||||
| 32 | Stone, Clay, Glass, Concrete | n.a. | 2,348 | 351 | 2,698 | 774 | 1,924 | 28.6 | % | |||||||||||||||||||||
| 33 | Primary Metals Industries | 294 | 4,744 | 4,776 | 9,814 | 2,873 | 6,941 | 29.3 | % | |||||||||||||||||||||
| 34 | Fabricated Metal Products | 4,050 | 920 | 756 | 5,726 | 78 | 5,648 | 1.4 | % | |||||||||||||||||||||
| 35 | Industrial Machinery and Equip. | 4,787 | 403 | 1,195 | 6,385 | 149 | 6,236 | 2.3 | % | |||||||||||||||||||||
| 36 | Electrical and Electron. Equip. | n.a. | 327 | 660 | 987 | 180 | 807 | 18.2 | % | |||||||||||||||||||||
| 37 | Transportation Equipment | 1,169 | 1,242 | 3,001 | 5,412 | 808 | 4,604 | 14.9 | % | |||||||||||||||||||||
| 38 | Instruments and Related Prod. | 972 | 344 | 246 | 1,562 | 59 | 1,503 | 3.8 | % | |||||||||||||||||||||
| 39 | Miscellaneous Manufacturing | 784 | 270 | 73 | 1,128 | 402 | 726 | 35.6 | % | |||||||||||||||||||||
| Total | 21,990 | 76,518 | 34,075 | 132,583 | 44,242 | 88,341 | 33.4 | % | ||||||||||||||||||||||
* Existing CHP is greater than estimated CHP potential
| ONSITE SYCOM Energy Corporation | 37 | Industrial CHP Assessment |
Table 3.2 CHP Steam Potential and Steam Saturation
| SIC | SIC Description | CHP Total Potential, MW | Existing CHP, MW | Remaining CHP Potential, MW | Total Steam Load, Tbtu | Existing CHP Steam, Tbtu | Existing CHP Steam Saturation | Remaining CHP Steam, Tbtu | Total Potential CHP Steam Saturation | |||||||||||||||||||||||||
| 20 | Food and Kindred Products | 12,680 | 4,594 | 8,086 | 549 | 127 | 23.1 | % | 219 | 63.0 | % | |||||||||||||||||||||||
| 26 | Paper and Allied Products | 34,751 | 8,553 | 26,198 | 1627 | 434 | 26.7 | % | 769 | 73.9 | % | |||||||||||||||||||||||
| 28 | Chemicals and Allied Products | 27,132 | 17,692 | 9,440 | 1332 | 450 | 33.8 | % | 495 | 70.9 | % | |||||||||||||||||||||||
| 29 | Petroleum and Coal Products | 12,407 | 5,618 | 6,789 | 1000 | 135 | 13.5 | % | 291 | 42.6 | % | |||||||||||||||||||||||
| 33 | Primary Metals Industries | 9,814 | 2,873 | 6,941 | 186 | 79 | 42.5 | % | 144 | 119.7 | % | |||||||||||||||||||||||
| - | Other Manufacturing | 35,799 | 4,912 | 30,887 | 1132 | 151 | 13.4 | % | 649 | 70.7 | % | |||||||||||||||||||||||
| Total | 132,583 | 44,242 | 88,341 | 5,827 | 1,375 | 23.6 | % | 2,566 | 67.6 | % | ||||||||||||||||||||||||
* Total potential CHP steam saturation of >100 % for SIC 33 reflects that steam loads calculated in the MIPD and MarketPlace databases are greater than the EIA estimates of total SIC 33 steam load in 1997
| ONSITE SYCOM Energy Corporation | 38 | Industrial CHP Assessment |
Table 3.3 CHP Potential by Size of CHP System
| < 1 MW | 1 - 4 MW | 4 - 20 MW | ||||||||||||||||||||||||||||||||||||
SIC | Industry | Total Potential (MW) | Existing Capacity (MW) | Remaining Potential (MW) | Total Potential MW | Existing Potential MW | Remaining Potential MW | Total Potential MW | Existing Potential MW | Remaining Potential MW | ||||||||||||||||||||||||||||
| 20 | Food | 2,683 | 14 | 2,669 | 1,777 | 89 | 1,688 | 2,734 | 598 | 2,136 | ||||||||||||||||||||||||||||
| 26 | Paper | 1,167 | 3 | 1,164 | 570 | 53 | 518 | 1,324 | 635 | 688 | ||||||||||||||||||||||||||||
| 28 | Chemicals | 1,780 | 8 | 1,772 | 515 | 77 | 437 | 2,353 | 443 | 1,910 | ||||||||||||||||||||||||||||
| 29 | Petroleum | 154 | 1 | 153 | 95 | 17 | 78 | 393 | 181 | 212 | ||||||||||||||||||||||||||||
| 33 | Primary Metals | 294 | 0 | 294 | 261 | 4 | 257 | 741 | 27 | 714 | ||||||||||||||||||||||||||||
| - | Other Manuf. | 15,912 | 34 | 15,878 | 3,221 | 129 | 3,092 | 6,234 | 558 | 5,676 | ||||||||||||||||||||||||||||
| TOTALS | 21,990 | 60 | 21,930 | 6,439 | 369 | 6,070 | 13,779 | 2,442 | 11,337 | |||||||||||||||||||||||||||||
| 20 - 50 MW | > 50 MW | Totals | ||||||||||||||||||||||||||||||||
SIC | Industry | Total Potential MW | Existing Potential MW | Remaining Potential MW | Total Potential MW | Existing Potential MW | Remaining Potential MW | MW | Net Remaining Potential | |||||||||||||||||||||||||
| 20 | Food | 1,922 | 655 | 1,267 | 3,564 | 3,239 | 325 | 12,680 | 8,086 | |||||||||||||||||||||||||
| 26 | Paper | 2,152 | 2,083 | 70 | 29,537 | 5,779 | 23,758 | 34,751 | 26,198 | |||||||||||||||||||||||||
| 28 | Chemicals | 3,125 | 1,487 | 1,637 | 19,360 | 15,676 | 3,684 | 27,132 | 9,440 | |||||||||||||||||||||||||
| 29 | Petroleum | 934 | 621 | 313 | 10,831 | 4,799 | 6,032 | 12,407 | 6,789 | |||||||||||||||||||||||||
| 33 | Primary Metals | 948 | 48 | 900 | 7,570 | 2,794 | 4,776 | 9,814 | 6,941 | |||||||||||||||||||||||||
| - | Other Manuf. | 4,718 | 1,118 | 3,601 | 5,714 | 3,074 | 2,640 | 35,799 | 30,887 | |||||||||||||||||||||||||
| TOTALS | 13,799 | 6,011 | 7,788 | 76,576 | 35,361 | 41,215 | 132,583 | 88,340 | ||||||||||||||||||||||||||
| ONSITE SYCOM Energy Corporation | 39 | Industrial CHP Assessment |
| 4. | Factors Impacting Market Penetration |
Decentralized combined heat and power systems located at industrial and municipal sites were the foundation of the early electric power industry in the United States. However, as generating technologies advanced, the power industry began to build larger and larger central station facilities to take advantage of increasing economies of scale. CHP became a limited practice utilized by a handful of industries — paper, chemicals, refining and steel — with certain characteristics — high and relatively constant steam and electric demands, access to byproduct or waste fuels. These systems were typically sized to meet the base-load thermal demand and produced electricity as a "byproduct." A large percentage of these systems consisted of boiler/steam turbines that burned low cost/low quality fuels. The very low power to heat ratio of these systems ensured that electricity generated would not exceed plant demand and resulted in very high overall fuel utilization.
By the 1970s, a mature, regulated electric utility industry controlled the electricity market in the U.S. Utilities more often then not discouraged customer CHP by imposing high back-up and standby rates and by refusing to purchase excess power from on-site generators. Along with utility resistance, a host of regulatory barriers at the state and federal level served to further discourage broader CHP development.
In 1978 Congress passed the Public Utilities Regulatory Policies Act (PURPA), partly to encourage energy efficiency in response to the second oil crisis. A portion of PURPA was meant to encourage energy efficient cogeneration (CHP) and small power production from renewables by requiring servicing utilities to interconnect with "qualified facilities" (QFs), to provide such facilities with reasonable standby and back-up charges, and to purchase excess electricity from these facilities at the utilities avoided cost. PURPA also exempted QFs from regulatory oversight under the Public Utilities Holding Company Act and from constraints on natural gas use imposed by the Fuel Use Act.
PURPA had the expected effect on CHP. Installed CHP capacity increased from about 12,000 MW in 1980 to over 52,000 MW in 1999. But PURPA also had unforeseen results. PURPA was enacted coincidentally with the availability of larger, more efficient, lower cost combustion turbines and combined cycle systems with high power to heat ratios. The power purchase provisions of PURPA coupled with the availability of this new technology resulted in the development of a number of very large merchant plants leveraged towards high electricity production. For the first time since the inception of the industry, non-utility participation was being allowed in the power market. This triggered the development of third party CHP developers who had greater interest in electric markets than thermal markets, and ultimately started the progression towards wholesale generation and open access.
In the 1980s and early 1990s CHP was a requirement for participation in the electric market and third party developers actively sought industrial facilities to serve as thermal hosts. As a result, CHP penetration in sites greater than 20 MW now approaches 45% and over half of existing CHP capacity — 29,000 MW — is concentrated in a relative small number of plants over 100 MW in size — 120 facilities.
| ONSITE SYCOM Energy Corporation | 40 | Industrial CHP Assessment |
The environment changed again in the mid 1990s with the advent of the wholesale market for electricity. Independent power producers could now sell directly to the market without the need for QF status and CHP development slowed. In the transition to a fully restructured market, CHP is once again disadvantaged in many ways, particularly in small applications. Access to power markets is restricted, utilities are again imposing high back-up rates and offering low buyback rates, and users are delaying purchase decisions with an expectation of low retail prices in the future.
Whether this is a temporary situation or a long term trend is unclear. Most analysts agree that CHP optimized to meet in-plant needs can be a very competitive energy option in a fully restructured market and that a variety of institutional and market hurdles are currently limiting CHP growth in the transition. Factors that could lead to more aggressive market penetration in the future include:
| ¨ | Technology Improvements - Over 45% of the remaining potential in the industrial market is in systems below 20 MW. Projects in this size range are currently marginal in many areas. Equipment and development costs are high and users perceive CHP to be a high risk, non-core investment. New technologies are entering the market that promise to significantly improve CHP economics for small to medium facilities due to reduced capital costs, higher efficiencies, and inherently low emissions |
| ¨ | Streamlined Project Implementation - Along with technology improvements, many analysts expect project implementation to become easier as well. This includes faster project implementation, lower interconnection costs due to standardization of technology and contracts, and lower installation costs due to a more competitive and stable environment for CHP. |
| ¨ | Third Party Financing and/or Ownership - Energy users use a variety of methods to determine if a particular investment is economically desirable. Simple payback is often used for preliminary evaluation of projects, and many users will not pursue an energy-related investment unless it has a payback of 2-3 years or less. Leasing arrangements and third party financing eliminate the need for the user to provide the initial investment, and are becoming more prevalent in CHP transactions — over 57% of existing industrial CHP capacity has some third party involvement in the transaction. Third party transactions typically have much lower economic hurdle rates as well. Third party financers often have a better understanding of the technology, have different risk aversion profiles, and will base project decisions on more flexible internal rate of return expectations. |
| ¨ | Electric Industry Restructuring - Restructuring is proceeding unevenly across the nation, but many states are considering provisions to ensure that on-site generation is not unfairly disadvantaged in a restructured environment. As an example, several states including California, New York and Texas are looking into the structure, level and equity of existing standby/back-up rates. Others including Texas, New Jersey, Massachusetts, Michigan, Illinois and California are exempting CHP either totally or partially from stranded cost recovery charges. |
| ONSITE SYCOM Energy Corporation | 41 | Industrial CHP Assessment |
| ¨ | Recognizing the Value of Ancillary Services - Users are beginning to realize that electric service is more than just the commodity cost. Services such as power quality, reliability, flexibility and independence are beginning to be recognized as having value and can impact project economics if properly monetized. Similarly, the value that on-site CHP can provide to the T&D system is beginning to be recognized, and may eventually be quantified and shared between the utility and the user. |
| ¨ | Recognizing Environmental Benefits of CHP - It is becoming widely accepted that CHP offers inherent environmental benefits because of it's increased efficiency. Future market penetration could be increased by efforts underway to advance adoption of output-based emissions standards that promote deployment of efficient technologies such as CHP and to streamline the environmental permitting process for efficient CHP installations. |
| ¨ | CHP Competes with Retail Rates - CHP optimized to meet plant thermal and power needs competes with retail electricity rates. Project economics are heavily dependent on the structure and level of the applicable rate structure including demand and time of use charges. |
| ¨ | CHP Initiatives - Financial incentives for CHP (e.g., investment tax credits) provided by either the federal or state governments are being discussed by various parties to promote CHP's efficiency and emissions benefits. The rationale for these incentives is that increased penetration of efficient CHP results in broad public benefits that accrue to the public at large. |
| ¨ | Increased Marketing Efforts - The competitive market has created a large number of energy service providers that will be aggressively marketing energy service options including CHP. With higher marketing efforts, market penetration rates will increase for a given level of economic value. As marketing efforts and government programs are implemented, customer confidence in the technology will increase, reducing the very high risk premium that has been placed on CHP projects. |
The enactment of PURPA was a watershed event that substantially changed the landscape for cogeneration in the U.S. and accelerated the penetration of large systems into the industrial market. Electric industry restructuring, the need for additional capacity to meet growing demand and maintain system integrity, advances in smaller generation technology, and concerns over climate change may collectively represent another watershed event that initiates a new cycle of accelerated growth for CHP. The evolution of the factors outlined above will determine how rapidly this new cycle grows and how sustained a market it becomes.
| ONSITE SYCOM Energy Corporation | 42 | Industrial CHP Assessment |
| 5. | References |
| 1. | 1998-1999 Gas Turbine World Handbook, Pequot Publishing, 1999 |
| 2. | Diesel & Gas Turbine Worldwide Catalog: Product Directory & Buyers Guide, Brookfield, Wisconsin, 1997. |
| 3. | SOAPP-CT.25 Workstation: Version 1, SEPRIL, llc, January 1999 |
| 4. | Caterpillar Datasheets, G3306, G3516, G3616, Caterpillar Inc., 1998 |
| 5. | Waukesha Datasheet, 5790GL, Waukesha Engines, 1998 |
| 6. | Heat Recovery Datasheet, Waukesha 5790GL, Maxim Co., 1995 |
| 7. | Liss, W.E., Kincaid, D.E., Distributed Generation Using High Power Output, High Efficiency Natural Gas Engines, Gas Research Institute, American Power Conference, 1999 |
| 8. | Personal communications with M. Jurgensen, Solar Turbines Inc., January 2000 |
| 9. | Personal communications with M. Scorrano, Trigen Energy Corp. |
| 10. | Personal communications with J. Polk, General Electric Co. |
| 11. | Personal communications with G. Deale, Hawthorne Power Systems |
| 12. | Cost Analysis of NOx Control Alternatives for Stationary Gas Turbines, November 1999, OSEC report to U.S. DOE |
| 13. | Program Summary: Advanced Reciprocating Engine Systems (ARES), 1999 |
| 14. | Independent Power Database, Hagler, Bailly Consulting Inc, Arlington, VA, 1999 |
| 15. | Major Industrial Plant Database, HIS Energy Group, Houston, TX, 1999 |
| 16. | MarketPlace Database, iMarket Inc, Waltham, MA., 1999 |
| 17. | Energy Information Administration, Manufacturing Consumption of Energy 1994, DOE/EIA-0512(94), Washington, DC, December 1997 |
| ONSITE SYCOM Energy Corporation | 43 | Industrial CHP Assessment |
Appendix : CHP Technology Characterization
Combined heat and power (CHP) technologies produce electricity or mechanical power and recover waste heat for process use. Conventional centralized power systems average less than 33% delivered efficiency for electricity in the U.S.; CHP systems can deliver energy with efficiencies exceeding 80%1, while significantly reducing emissions per delivered MWh. CHP systems can provide cost savings for industrial and commercial users and substantial emissions reductions. This report describes the leading CHP technologies, their efficiency, size, cost to install and maintain, fuels and emission characteristics.
The technologies included in this report include diesel engines, natural gas engines, steam turbines, gas turbines, and combined cycle units. These CHP technologies are commercially available for on-site generation and combined heat and power applications. The power industry is witnessing dramatic changes with utility restructuring and increased customer choice. As a result of these changes, CHP is expected to gain wider acceptance in the market.
Selecting a CHP technology for a specific application depends on many factors, including the amount of power needed, the duty cycle, space constraints, thermal needs, emission regulations, fuel availability, utility prices and interconnection issues. Table A-1 summarizes the characteristics of each CHP technology. The table shows that CHP covers a wide capacity range from 50 kW reciprocating engines to 300 MW gas turbines. Estimated costs per installed kW range from $500-$1400/kW.
1 T. Casten, CHP – Policy Implications for Climate Change and Electric Deregulation, May 1998, p2.
| ONSITE SYCOM Energy Corporation | 44 | Industrial CHP Assessment |
Table A-1. Comparison of CHP Technologies
| Recip Engine | Steam Turbine | Combustion Turbine | Combined Cycle | ||||||
| Electric Efficiency (LHV) | 25-45% | 15-25% | 25-40% | 40 - 50% | |||||
| Size (MW) | 0.05-5 | Any | 1-100 | 25 - 300 | |||||
| Footprint (sqft/kW) | 0.2-0.3 | <0.1 | 0.02-0.6 | 0.6 | |||||
| CHP installed cost ($/kW) | 800-1500 | 800-1000 | 700-900 | 600-800 | |||||
| O&M Cost ($/kWh) | 0.007-0.015 | 0.004 | 0.002-0.008 | 0.002-0.008 | |||||
| Availability | 92-97% | Near 100% | 90-98% | 90-98% | |||||
| Hours between overhauls | 24,000-60,000 | >50,000 | 30,000-50,000 | 30,000-50,000 | |||||
| Start-up Time | 10 sec | 1 hr-1 day | 10 min –1 hr | 10 min –1 hr | |||||
| Fuel pressure (psi) | 1-45 | n/a | 120-500 (may require compressor) | 120-500 (may require compressor) | |||||
| Fuels | natural gas, biogas, propane | all | natural gas, biogas, propane, distillate oil | natural gas, biogas, propane, distillate oil | |||||
| Noise | moderate to high (requires building enclosure) | moderate to high (requires building enclosure) | moderate (enclosure supplied with unit) | moderate (enclosure supplied with unit) | |||||
NOx Emissions(lb/MWh) | 2.2-28 | 1.8 | 0.3-4 | 0.3-4 | |||||
| Uses for Heat Recovery | hot water, LP steam, district heating | LP-HP steam, district heating | direct heat, hot water, LP-HP steam, district heating | direct heat, hot water, LP-HP steam, district heating | |||||
| CHP Thermal Output (Btu/kWh) | 1,000-5,000 | 5,000-25,000 | 3,400-12,000 | 2,000-8,000 | |||||
| Useable Temp for CHP (F) | 300-500 | n/a | 500-1,100 | 500-1,100 |
| ONSITE SYCOM Energy Corporation | 45 | Industrial CHP Assessment |
| 1. | Reciprocating Engines |
Introduction
Among the most widely used and most efficient prime movers are reciprocating (or internal combustion) engines. Electric efficiencies of 25-50% make reciprocating engines an economic CHP option in many applications. Several types of reciprocating engines are commercially available, however, two designs are of most significance to stationary power applications and include four cycle- spark-ignited (Otto cycle) and compression-ignited (diesel cycle) engines. They can range in size from small fractional portable gasoline engines to large 50,000 HP diesels for ship propulsion. In addition to CHP applications, diesel engines are widely used to provide standby or emergency power to hospitals, and commercial and industrial facilities for critical power requirements.
Technology Description
The essential mechanical parts of Otto-cycle and diesel engines are the same. Both use a cylindrical combustion chamber in which a close fitting piston travels the length of the cylinder. The piston is connected to a crankshaft which transforms the linear motion of the piston within the cylinder into the rotary motion of the crankshaft. Most engines have multiple cylinders that power a single crankshaft. Both Otto-cycle and diesel four stroke engines complete a power cycle in four strokes of the piston within the cylinder. Strokes include: 1) introduction of air (or air-fuel mixture) into the cylinder, 2) compression with combustion of fuel, 3) acceleration of the piston by the force of combustion (power stroke) and 4) expulsion of combustion products from the cylinder.
The primary difference between Otto and diesel cycles is the method of fuel combustion. An Otto cycle uses a spark plug to ignite a pre-mixed fuel-air mixture introduced to the cylinder. A diesel engine compresses the air introduced in the cylinder to a high pressure, raising its temperature to the ignition temperature of the fuel which is injected at high pressure.
A variation of the diesel is the dual fuel engine. Up to 80-90% of the diesel fuel is substituted with gasoline or natural gas while maintaining power output and achieving substantial emission reductions.
Large modern diesel engines can attain electric efficiencies near 50% and operate on a variety of fuels including diesel fuel, heavy fuel oil or crude oil. Diesel engines maintain higher part load efficiencies than an Otto cycle because of leaner fuel-air ratios at reduced load.
| ONSITE SYCOM Energy Corporation | 46 | Industrial CHP Assessment |
Design Characteristics
The features that have made reciprocating engines a leading prime mover for CHP include:
| Economical size range: | Reciprocating engines are available in sizes that match the electric demand of many end-users (institutional, commercial and industrial). |
| Fast start-up: | Fast start-up allows timely resumption of the system following a maintenance procedure. In peaking or emergency power applications, reciprocating engines can quickly supply electricity on demand. |
| Black-start capability: | In the event of a electric utility outage, reciprocating engines can be started with minimal auxiliary power requirements, generally only batteries are required. |
| Excellent availability: | Reciprocating engines have typically demonstrated availability in excess of 95%. |
| Good part load operation: | In electric load following applications, the high part load efficiency of reciprocating engines maintain economical operation. |
| Reliable and long life: | Reciprocating engines, particularly diesel and industrial block engines have provided many years of satisfactory service given proper maintenance. |
Performance Characteristics
Efficiency
Reciprocating engines have electric efficiencies of 25-50% (LHV) and are among the most efficient of any commercially available prime mover. The smaller stoichiometric engines that require 3-way catalyst after-treatment operate at the lower end of the efficiency scale while the larger diesel and lean burn natural gas engines operate at the higher end of the efficiency range.
Capital Cost
CHP projects using reciprocating engines are typically installed between $800-$1500/kW. The high end of this range is typical for small capacity projects that are sensitive to other costs associated with constructing a facility, such as fuel supply, engine enclosures, engineering costs, and permitting fees.
| ONSITE SYCOM Energy Corporation | 47 | Industrial CHP Assessment |
Availability
Reciprocating engines have proven performance and reliability. With proper maintenance and a good preventative maintenance program, availability is over 95%. Improper maintenance can have major impacts on availability and reliability.
Maintenance
Engine maintenance is comprised of routine inspections/adjustments and periodic replacement of engine oil, coolant and spark plugs every 500-2,000 hours. An oil analysis is an excellent method to determine the condition of engine wear. The time interval for overhauls is recommended by the manufacturer but is generally between 12,000-15,000 hours of operation for a top-end overhaul and 24,000-30,000 for a major overhaul. A top-end overhaul entails a cylinder head and turbo-charger rebuild. A major overhaul involves piston/ring replacement and crankshaft bearings and seals. Typical maintenance costs including an allowance for overhauls is 0.01 - 0.015$/kWhr.
Heat Recovery
Energy in the fuel is released during combustion and is converted to shaft work and heat. Shaft work drives the generator while heat is liberated from the engine through coolant, exhaust gas and surface radiation. Approximately 60-70% of the total energy input is converted to heat that can be recovered from the engine exhaust and jacket coolant, while smaller amounts are also available from the lube oil cooler and the turbocharger's intercooler and aftercooler (if so equipped). Steam or hot water can be generated from recovered heat that is typically used for space heating, reheat, domestic hot water and absorption cooling.
Heat in the engine jacket coolant accounts for up to 30% of the energy input and is capable of producing 200°F hot water. Some engines, such as those with high pressure or ebullient cooling systems, can operate with water jacket temperatures up to 265°.
Engine exhaust heat is 10-30% of the fuel input energy. Exhaust temperatures of 850°-1200°F are typical. Only a portion of the exhaust heat can be recovered since exhaust gas temperatures are generally kept above condensation thresholds. Most heat recovery units are designed for a 300°-350°F exhaust outlet temperature to avoid the corrosive effects of condensation in the exhaust piping. Exhaust heat is typically used to generate hot water to about 230°F or low-pressure steam (15 psig).
By recovering heat in the jacket water and exhaust, approximately 70-80% of the fuel's energy can be effectively utilized as shown in Figure A-1.1 for a typical spark-ignited engine.
| ONSITE SYCOM Energy Corporation | 48 | Industrial CHP Assessment |
Figure A-1.1 Energy Balance for a Reciprocating Engine
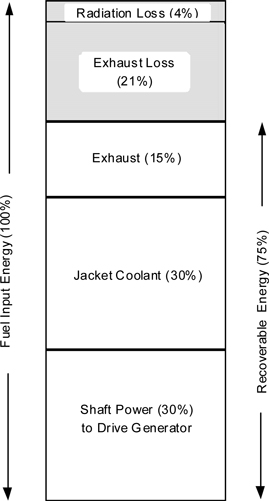
Closed-Loop Hot Water Cooling Systems
The most common method of recovering engine heat is the closed-loop cooling system as shown in Figure A-1.2. These systems are designed to cool the engine by forced circulation of a coolant through engine passages and an external heat exchanger. An ancillary heat exchanger transfers engine heat to a cooling tower or radiator when there is excess heat generated. Closed-loop water cooling systems can operate at coolant temperatures between 190°-250°F.
| ONSITE SYCOM Energy Corporation | 49 | Industrial CHP Assessment |

Figure A-1.2. Closed-Loop Heat Recovery System
Ebullient Cooling Systems
Ebullient cooling systems cool the engine by natural circulation of a boiling coolant through the engine. This type of cooling system is typically used in conjunction with exhaust heat recovery for production of low-pressure steam. Cooling water is introduced at the bottom of the engine where the transferred heat begins to boil the coolant generating two-phase flow. The formation of bubbles lowers the density of the coolant, causing a natural circulation to the top of the engine.
The coolant at the engine outlet is maintained at saturated steam conditions and is usually limited to 250°F and a maximum of 15 psig. Inlet cooling water is also near saturation conditions and is generally 2°- 3°F below the outlet temperature. The uniform temperature throughout the coolant circuit extends engine life, contributes to improved combustion efficiencies and reduces friction in the engine.
Emissions
The two primary methods of lowering emissions in Otto cycle engines is lean burn (combustion control) and rich burn with a catalytic after-treatment.
Lean burn engine technology was developed during the 1980's in response to the need for cleaner burning engines. Most lean burn engines use turbocharging to supply excess air to the engine and produce lean fuel-air ratios. Lean burn engines consume 50-100% excess air (above stoichiometric) to reduce temperatures in the combustion chamber and limit creation of nitrogen oxides (NOx,) carbon dioxide (CO) and non-methane hydrocarbons (NMHC.) The typical NOx emission rate for lean burn engines is between 0.5–2.0 grams/hphr. Emission levels can be reduced to less than 0.15gm/hphr with selective catalytic reduction (SCR) where ammonia is injected into the exhaust gas in the presence of a catalyst. SCR adds a significant cost burden to the installation cost and increases the O&M on the engine. This approach is typically used on large capacity engines.
| ONSITE SYCOM Energy Corporation | 50 | Industrial CHP Assessment |
Catalytic converters are used with rich burn (i.e. stoichiometric) Otto cycles. A reducing catalyst converts NOx to N2 and oxidizes some of the CO to CO2. A catalytic converter can contain both reducing and oxidizing catalytic material in a single bed. Electronic fuel–air ratio controls are typically needed to hold individual emission rates to within a very close tolerance. Also referred to as a three-way catalyst, hydrocarbon, NOx and CO are simultaneously controlled. Typical NOx emission rates for rich burn engines are approximately 9 grams/hphr. Catalytic converters have proven to be the most effective after treatment of exhaust gas with control efficiencies of 90-99%+, reducing NOx emissions to 0.15gm/hphr. A stoichiometric engine with a catalytic convertor operates with an efficiency of approximately 30%. Maintenance costs can increase by 25% for catalyst replacement.
Diesel engines operate at much higher air-fuel ratios than Otto cycle engines. The high excess air (lean condition) causes relatively low exhaust temperatures such that conventional catalytic converters for NOx reduction are not effective. Lean NOx catalytic converters are currently under development. Some diesel applications employ SCR to reduce emissions.
A major emission impact of a diesel engine is particulates. Particulate traps physically capture fine particulate matter generated by the combustion of diesel fuel and are typically 90% effective. Some filters are coated with a catalyst that must be regenerated for proper operation and long life.
Applications
Reciprocating engines are typically used in CHP applications where there is a substantial hot water or low pressure steam demand. When cooling is required, the thermal output of a reciprocating engine can be used in a single-effect absorption chiller. Reciprocating engines are available in a broad size range of approximately 50kW to 5,000kW suitable for a wide variety of commercial, institutional and small industrial facilities. Reciprocating engines are frequently used in load following applications where engine power output is regulated based on the electric demand of the facility. Thermal output varies accordingly. Thermal balance is achieved through supplemental heat sources such as boilers.
Technology Advancements
Advances in electronics, controls and remote monitoring capability should increase the reliability and availability of engines. Maintenance intervals are being extended through development of longer life spark plugs, improved air and fuel filters, synthetic lubricating oil and larger engine oil sumps.
Reciprocating engines have been commercially available for decades. A global network of manufacturers, dealers and distributors is well established.
| ONSITE SYCOM Energy Corporation | 51 | Industrial CHP Assessment |
| 2. | Steam Turbines |
Introduction
Steam turbines are one of the most versatile and oldest prime mover technologies used to drive a generator or mechanical machinery. Steam turbines are widely used for CHP applications in the U.S. and Europe where special designs have been developed to maximize efficient steam utilization.
Most of the electricity in the United States is generated by conventional steam turbine power plants. The capacity of steam turbines can range from a fractional horsepower to more than 1,300 MW for large utility power plants.
A steam turbine is captive to a separate heat source and does not directly convert a fuel source to electric energy. Steam turbines require a source of high pressure steam that is produced in a boiler or heat recovery steam generator (HRSG). Boiler fuels can include fossil fuels such as coal, oil and natural gas or renewable fuels like wood or municipal waste.
Steam turbines offer a wide array of designs and complexity to match the desired application and/or performance specifications. In utility applications, maximizing efficiency of the power plant is crucial for economic reasons. Steam turbines for utility service may have several pressure casings and elaborate design features. For industrial applications, steam turbines are generally of single casing design, single or multi-staged and less complicated for reliability and cost reasons. CHP can be adapted to both utility and industrial steam turbine designs.
Technology Description
The thermodynamic cycle for the steam turbine is the Rankine cycle. The cycle is the basis for conventional power generating stations and consists of a heat source (boiler) that converts water to high pressure steam. The steam flows through the turbine to produce power. The steam exiting the turbine is condensed and returned to the boiler to repeat the process.
A steam turbine consists of a stationary set of blades (called nozzles) and a moving set of adjacent blades (called buckets or rotor blades) installed within a casing. The two sets of blades work together such that the steam turns the shaft of the turbine and the connected load. A steam turbine converts pressure energy into velocity energy as it passes through the blades.
The primary type of turbine used for central power generation is the condensing turbine. Steam exhausts from the turbine at sub-atmospheric pressures, maximizing the heat extracted from the steam to produce useful work.
Steam turbines used for CHP can be classified into two main types:
| ONSITE SYCOM Energy Corporation | 52 | Industrial CHP Assessment |
The non-condensing turbine (also referred to as a back-pressure turbine) exhausts steam at a pressure suitable for a downstream process requirement. The term refers to turbines that exhaust steam at atmospheric pressures and above. The discharge pressure is established by the specific CHP application.
The extraction turbine has opening(s) in its casing for extraction of steam either for process or feedwater heating. The extraction pressure may or may not be automatically regulated depending on the turbine design. Regulated extraction permits more steam to flow through the turbine to generate additional electricity during periods of low thermal demand by the CHP system. In utility type steam turbines, there may be several extraction points each at a different pressure.
Design Characteristics
| Custom design: | Steam turbines can be designed to match CHP design pressure and temperature requirements. The steam turbine can be designed to maximize electric efficiency while providing the desired thermal output. |
| High thermal quality: | Steam turbines are capable of operating over the broadest available steam pressure range from subatmospheric to supercritical and can be custom designed to deliver the thermal requirements of the CHP application. |
| Fuel flexibility: | Steam turbines offer the best fuel flexibility using a variety of fuel sources including nuclear, coal, oil, natural gas, wood and waste products. |
Performance Characteristics
Efficiency
Modern large condensing steam turbine plants have efficiencies approaching 40-45%, however, efficiencies of smaller industrial or backpressure turbines can range from 15-35%.
Capital Cost
Boiler/ steam turbines installation costs are between $800-$1000/kW or greater depending on environmental requirements. The incremental cost of adding a steam turbine to an existing boiler system or to a combined cycle plant is approximately $400-$800/kW.
| ONSITE SYCOM Energy Corporation | 53 | Industrial CHP Assessment |
Availability
A steam turbine is generally considered to have 99%+ availability with longer than a year between shutdowns for maintenance and inspections. This high level of availability applies only for the steam turbine and does not include the heat source.
Maintenance
A maintenance issue with steam turbines is solids carry over from the boiler that deposit on turbine nozzles and degrades power output. The oil lubrication system must be clean and at the correct operating temperature and level to maintain proper performance. Other items include inspecting auxiliaries such as lubricating-oil pumps, coolers and oil strainers and check safety devices such as the operation of overspeed trips. Steam turbine maintenance costs are typically less than $0.004 per kWh.
Heat Recovery
Heat recovery methods from a steam turbine use exhaust or extraction steam. Heat recovery from a steam turbine is somewhat misleading since waste heat is generally associated with the heat source, in this case a boiler either with an economizer or air preheater.
A steam turbine can be defined as a heat recovery device. Producing electricity in a steam turbine from the exhaust heat of a gas turbine (combined cycle) is a form of heat recovery.
The amount and quality of the recovered heat is a function of the entering steam conditions and the design of the steam turbine. Exhaust steam from the turbine can be used directly in a process or for district heating. Or it can be converted to other forms of thermal energy including hot water or chilled water. Steam discharged or extracted from a steam turbine can be used in a single or double-effect absorption chiller. A steam turbine can also be used as a mechanical drive for a centrifugal chiller.
Emissions
Emissions associated with a steam turbine are dependent on the source of the steam. Steam turbines can be used with a boiler firing a large variety of fuel sources or it can be used with a gas turbine in a combined cycle. Boiler emissions can vary depending on environmental regulations. Large boilers can use SCR to reduce NOx emissions to single digit levels.
| ONSITE SYCOM Energy Corporation | 54 | Industrial CHP Assessment |
Applications
Steam Turbines for Industrial and CHP Applications
In industrial applications, steam turbines may drive an electric generator or equipment such as boiler feedwater pumps, process pumps, air compressors and refrigeration chillers. Turbines as industrial drivers are almost always a single casing machine, either single stage or multistage, condensing or non-condensing depending on steam conditions and the value of the steam. Steam turbines can operate at a single speed to drive an electric generator or operate over a speed range to drive a refrigeration compressor.
For non-condensing applications, steam is exhausted from the turbine at a pressure and temperature sufficient for the CHP heating application. Back pressure turbines can operate over a wide pressure range depending on the process requirements and exhaust steam at typically between 5 psig to 150 psig. Back pressure turbines are less efficient than condensing turbines, however, they are less expensive and do not require a surface condenser.
Technology Advancements
Steam turbines have been commercially available for decades. Advancements will more likely occur in gas turbine technology.
| 3. | Combustion Turbines and Combined Cycles |
Introduction
Over the last two decades, the combustion or gas turbine has seen tremendous development and market expansion. Whereas gas turbines represented only 20% of the power generation market twenty years ago, they now claim approximately 40% of new capacity additions. Gas turbines have been long used by utilities for peaking capacity, however, with changes in the power industry and increased efficiency, the gas turbine is now being used for base load power. Much of this growth can be accredited to large (>50 MW) combined cycle plants that exhibit low capital cost (less than $550/kW) and high thermal efficiency. Manufacturers are offering new and larger capacity machines that operate at higher efficiencies. Some forecasts predict that gas turbines may furnish more than 80% of all new U.S. generation capacity in coming decades.2
Gas turbine development accelerated in the 1930’s as a means of propulsion for jet aircraft. It was not until the early 1980’s that the efficiency and reliability of gas turbines had progressed sufficiently to be widely adopted for stationary power applications. Gas turbines range in size from 30 kW (microturbines) to 250 MW (industrial frames).
2 U.S. DOE Energy Information Administration
| ONSITE SYCOM Energy Corporation | 55 | Industrial CHP Assessment |
Technology Description
The thermodynamic cycle associated with the majority of gas turbine systems is the Brayton cycle, that passes atmospheric air, the working fluid, through the turbine only once. The thermodynamic steps of the Brayton cycle include compression of atmospheric air, introduction and ignition of fuel, and expansion of the heated combustion gases through the gas producing and power turbines. The developed power is used to drive the compressor and the electric generator. Primary components of a gas turbine are shown in Figure A-3.1.
Figure A-3.1. Components of a Gas
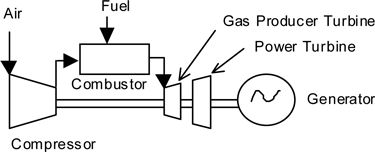
Aeroderivative gas turbines for stationary power are adapted from their jet engine counterpart. These turbines are light weight and thermally efficient, however, are limited in capacity. The largest aeroderivitives are approximately 40 MW in capacity today. Many aeroderivative gas turbines for stationary use operate with compression ratios up to 30:1 requiring an external fuel gas compressor. With advanced system developments, aeroderivitives are approaching 45% simple cycle efficiencies.
Industrial or frame gas turbines are available between 1 MW to 250 MW. They are more rugged, can operate longer between overhauls, and are more suited for continuous base-load operation. However, they are less efficient and much heavier than the aeroderivative. Industrial gas turbines generally have more modest compression ratios up to 16:1 and often do not require an external compressor. Industrial gas turbines are approaching simple cycle efficiencies of approximately 40% and in combined cycles are approaching 60%.
Small industrial gas turbines are being successfully used in industry for on-site power generation and as mechanical drivers. Turbine sizes are typically between 1–10 MW for these applications. Small gas turbines drive compressors along natural gas pipelines for cross country transport. In the petroleum industry they drive gas compressors to maintain well pressures. In the steel industry they drive air compressors used for blast furnaces. With the coming competitive electricity market, many experts believe that installation of small industrial gas turbines will proliferate as a cost effective alternative to grid power.
| ONSITE SYCOM Energy Corporation | 56 | Industrial CHP Assessment |
Design Characteristics
| Quality thermal output: | Gas turbines produce a high quality thermal output suitable for most CHP applications. |
| Cost effectiveness: | Gas turbines are among the lowest cost power generation technologies on a $/kW basis, especially in combined cycle. |
| Fuel flexibility: | Gas turbines operate on natural gas, synthetic gas and fuel oils. Plants are often designed to operate on gaseous fuel with a stored liquid fuel for backup. |
| Reliable and long life: | Modern gas turbines have proven to be reliable power generation devices, given proper maintenance. |
| Economical size range: | Gas turbines are available in sizes that match the electric demand of many end-users (institutional, commercial and industrial). |
Performance Characteristics
Efficiency
The thermal efficiency of the Brayton cycle is a function of pressure ratio, ambient air temperature, turbine inlet temperature, the efficiency of the compressor and turbine elements and any performance enhancements (i.e. recuperation, reheat, or combined cycle). Efficiency generally increases for higher power outputs and aeroderivative designs. Simple cycle efficiencies can vary between 25-40% lower heating value (LHV). Next generation combined cycles are being advertised with electric efficiencies approaching 60%.
Capital Cost
The capital cost of a gas turbine power plant on a kW basis ($/kW) can vary significantly depending on the capacity of the facility. Typical estimates vary between $300-$900/kW. The lower end applies to large industrial frame turbines in combined cycle.
Availability
Estimated availability of gas turbines operating on clean gaseous fuels like natural gas is in excess of 95%. Use of distillate fuels and other fuels with contaminants require more frequent shutdowns for preventative maintenance that reduce availability.
| ONSITE SYCOM Energy Corporation | 57 | Industrial CHP Assessment |
Maintenance
Although gas turbines can be cycled, maintenance costs can triple for a turbine that is cycled every hour versus a turbine that is operated for intervals of 1000 hours. Operating the turbine over the rated design capacity for significant time periods will also dramatically increase the number of hot path inspections and overhauls. Maintenance costs of a turbine operating on fuel oil can be approximately three times that as compared to natural gas. Typical maintenance costs for a gas turbine fired by natural gas is 0.003-0.005 $/kWh.
Figure A-3.2 Heat Recovery from a Gas Turbine System

Heat Recovery
The simple cycle gas turbine is the least efficient arrangement since there is no recovery of heat in the exhaust gas. Hot exhaust gas can be used directly in a process or by adding a heat recovery steam generator (HRSG), exhaust heat can generate steam or hot water. An important advantage of CHP using gas turbines is the high quality waste heat available in the exhaust gas. The high temperature exhaust gas is suitable for generating high-pressure steam that is used frequently for industrial processes.
For larger gas turbine installations, combined cycles become economical, achieving approximately 60% electric generation efficiencies using the most advanced utility-class gas turbines. The heat recovery options available from a steam turbine used in the combined cycle can be implemented to further improve the overall system efficiency (as discussed previously.)
Since gas turbine exhaust is oxygen rich, it can support additional combustion through supplementary firing. A duct burner is usually fitted within the HRSG to increase the exhaust gas temperature at efficiencies of 90% and greater.
| ONSITE SYCOM Energy Corporation | 58 | Industrial CHP Assessment |
Combined Cycle Power Plants
The trend in power plant design is the combined cycle that incorporates a steam turbine in a bottoming cycle with a gas turbine. Steam generated in the heat recovery steam generator (HRSG) of the gas turbine is used to drive a steam turbine to yield additional electricity and improve cycle efficiency. The steam turbine is usually an extraction-condensing type and can be designed for CHP applications.
Emissions
The dominant NOx control technologies for gas turbines include water/steam injection and lean pre-mix (combustion control) and selective catalytic reduction (post combustion control). Without any controls, gas turbines produce levels of NOx between 75-200 ppmv. By injecting water or steam into the combustor, NOx emissions can be reduced to approximately 42 ppmv with water and 25 ppmv with steam. NOx emissions from distillate-fired turbines can be reduced to about 42-75 ppmv. Water or steam injection requires very purified water to minimize the effects of water-induced corrosion of turbine components.
Lean pre-mix (dry low NOx) is a combustion modification where a lean mixture of natural gas and air are pre-mixed prior to entering the combustion section of the gas turbine. Pre-mixing avoids “hot spots” in the combustor where NOx forms. Turbine manufacturers have achieved NOx emissions of 9-42 ppmv using this technology. This technology is still being developed and early designs have caused turbine damage due to “flashback”. Elevated noise levels have also been encountered.
Selective catalytic reduction (SCR) is a post combustion treatment of the turbine’s exhaust gas in which ammonia is reacted with NOx in the presence of a catalyst to produce nitrogen and water. SCR is approximately 80-90% effective in the reduction of upstream NOx emission levels. Assuming a turbine has NOx emissions of 25 ppm, SCR can further reduce emissions to 3-5 ppm. SCR is used in series with water/steam injection or lean pre-mix to produce single-digit emission levels. SCR requires an upstream heat recovery device to temper the temperature of the exhaust gas in contact with the catalyst. SCR requires on-site storage of ammonia, a hazardous chemical. In addition ammonia can “slip” through the process unreacted that contributes to air pollution. SCR systems are expensive and significantly impact the economic feasibility of smaller gas turbine projects.
Applications
Gas turbines are a cost effective CHP alternative for commercial and industrial end-users with a base load electric demand greater than about 5 MW. Although gas turbines can operate satisfactorily at part load, they perform best at full power in base load operation. Gas turbines are frequently used in district steam heating systems since their high quality thermal output can be used for most medium pressure steam systems.
| ONSITE SYCOM Energy Corporation | 59 | Industrial CHP Assessment |
Gas turbines for CHP can be in either a simple cycle or a combined cycle configuration. Simple cycle applications are most prevalent in smaller installations typically less than 25 MW. Waste heat is recovered in a HRSG to generate high or low pressure steam or hot water. The thermal product can be used directly or converted to chilled water with single or double effect absorption chillers.
Technology Advancements
Advancements in blade design, cooling techniques and combustion modifications including lean premix (dry low NOx) and catalytic combustion are under development to achieve higher thermal efficiencies and single digit emission levels without post combustion treatment. Gas turbine manufacturers have been commercializing their products for decades. A global network of manufacturers, dealers and distributors is well established.
| ONSITE SYCOM Energy Corporation | 60 | Industrial CHP Assessment |
Exhibit B

The Market and Technical Potential for Combined Heat and Power in the Commercial/Institutional Sector
| Prepared for: | |
| U.S. Department of Energy | |
| Energy Information Agency | |
| 1000 Independence Ave., SW | |
| Washington, DC 20585 | |
| Prepared by: | |
| ONSITE SYCOM Energy | |
| Corporation | |
| 1010 Wisconsin Ave, NW | |
| Suite 340 | |
| Washington, DC 20007 | |
| 202-625-4119 |
January 2000
Table of Contents
| 1. | EXISTING CHP IN THE COMMERCIAL/INSTITUTIONAL SECTORS | 2 |
| 1.1 | Methodology | 2 |
| 1.2 | Profile of Existing Commercial/Institutional CHP | 3 |
| 1.3 | Implications for EIA Commercial Sector Modeling | 8 |
| 2. | TECHNICAL MARKET POTENTIAL FOR | 9 |
| COMMERCIAL/INSTITUTIONAL CHP | ||
| 2.1 | Technical Approach | 9 |
| 2.2 | Target CHP Applications | 10 |
| 2.3 | CHP Technical Market Potential | 12 |
| 3. | CHP TECHNOLOGY CHARACTERIZATION | 18 |
| 3.1 | NEMS CHP Technology Characterization | 18 |
| 3.2 | Recommended CHP Technologies for the Commercial Sector | 20 |
| 3.3 | Microturbines | 20 |
| 3.4 | Fuel Cell Power Systems | 23 |
| 3.5 | Reciprocating Engines | 25 |
| 3.6 | Combustion Turbines | 28 |
| 3.7 | Operating and Maintenance Costs | 32 |
| 4. | REFERENCES | 35 |
| APPENDIX A - PROFILE OF EXISTING CHP | 37 | |
| APPENDIX B - PROFILE OF TECHNICAL MARKET POTENTIAL | 55 | |
| APPENDIX C -CHP TECHNOLOGY CHARACTERIZATION | 60 | |
| 1. Reciprocating Engines | 62 | |
| 2. Steam Turbines | 67 | |
| 3. Combustion Turbines and Combined Cycles | 71 | |
| 4. Microturbines | 76 | |
| 5. Fuel Cells | 79 | |
| 6. System Issues | 83 | |
The Market and Technical Potential for Combined Heat and Power in the Commercial/Institutional Sector
ONSITE SYCOM Energy Corporation (OSEC) is assisting the U.S. Department of Energy's Energy Information Administration to determine the potential for cogeneration or combined heat and power (CHP) in the commercial/institutional market. As part of this effort, OSEC has characterized typical technologies used in commercial CHP, analyzed existing CHP capacity in commercial and institutional applications, and developed estimates of additional technical potential for CHP in these markets.
This report is organized into three sections as follows:
| 1. | Profile of Existing Commercial/Institutional CHP |
| 2. | Market Potential for Commercial/Institutional CHP |
| 3. | CHP Technology Characterization |
| ONSITE SYCOM Energy Corp. | 1 | Commercial CHP Assessment |
| 1. | Existing CHP in the Commercial/Institutional Sectors |
According to the Commercial Buildings Energy Consumption Survey, 19951 prepared by EIA, there were 4.6 million commercial buildings in the United States as of 1995. These buildings consumed 5.3 quads of energy, about half of which was in the form of electricity – or about 760 billion kWhs. OSEC analysis shows that there are currently over 980 operating CHP facilities in the commercial/institutional sector producing an estimated 29 billion kWhs of electricity and 0.15 quads of thermal energy. Therefore, CHP meets 3.8% of the total energy needs of the commercial sector as a whole while it is sited in only 2/100th of a percent of the total number of commercial buildings. Both of these penetration rates are much lower than that found in the industrial sector. OSEC conducted a parallel analysis for EIA of industrial sector CHP and found over nine times the CHP penetration as in the commercial sector. The industrial sector is characterized by approximately the same total electricity consumption as the commercial sector, but over five times the demand for fuels for both thermal processes and feedstocks.
The profile of existing CHP was developed to understand the technologies and applications that comprise existing CHP capacity and to provide insight into projections of future market development.
| 1.1 | Methodology |
OSEC used the most recent update to the Hagler Bailly Independent Power Database (HBI)2 to develop a profile of existing cogeneration activity in the commercial sector. OSEC has not found any single database that contains a comprehensive listing of existing CHP and independent power facilities (i.e., coverage of small systems in the HBI database is incomplete). However, OSEC considers the HBI data as the best available and has worked with it extensively to understand its content and to enhance its coverage and value. Since the HBI database is incomplete in the coverage of small systems (<1 MW), the following analysis is a conservative estimate of existing CHP in the commercial and institutional market sectors. The HBI database includes information for each CHP site including technology, fuel use, electrical capacity (MW), ownership and sell-back of power to the grid.
Before conducting the analysis, OSEC performed extensive quality control on the data in HBI. In particular, some prime mover technologies were recategorized and utility sites were assigned to the appropriate business area for the site. This characterization occurred frequently in 3rd party ownership and gas utility ownership of facilities.
Thermal heat capacity, thermal heat utilization, and hours of operation per year are not part of the HBI database. OSEC developed a thermal heat recovery profile for each CHP technology in the database and assigned these values to the appropriate technology type. To derive the total annual use figures discussed in the introduction, OSEC compared typical operating profiles and data on CHP output to the capacity figures in the database. The average CHP system operates 6000 hours/year and produces about 4900 Btu/kWh of useful thermal energy. The thermal heat utilization factor, which is the ratio of thermal energy from the CHP system that is utilized to the total amount available was not estimated as this figure is part of the EIA modeling assumptions.
| ONSITE SYCOM Energy Corp. | 2 | Commercial CHP Assessment |
| 1.2 | Profile of Existing Commercial/Institutional CHP |
This section characterizes the 980 sites and 4,926 MW of identified CHP in the commercial sector according to the following characteristics:
| 1. | Fuel use |
| 2. | Type of technology (prime mover) |
| 3. | Type of commercial application |
| 4. | State |
| 5. | Size of CHP system |
| 6. | Ownership and Sales |
This section provides a tabulation and discussion of these factors. Detailed tables with cross-tabulation of these results are contained in Appendix A.
Fuel Type
Figure 1.1 shows the share of operating commercial CHP by fuel type. Natural gas is by far the most common fuel type comprising over 72% of the total. The next most important fuel type is waste. Waste includes a variety of fuels but is dominated by landfill gas and biogas from sewage treatment facilities. Coal, oil, wood, and other fuel types make up the remaining 15% of installed CHP capacity.
Figure 1.1. Existing Commercial Sector CHP Capacity by Fuel Type (MW)
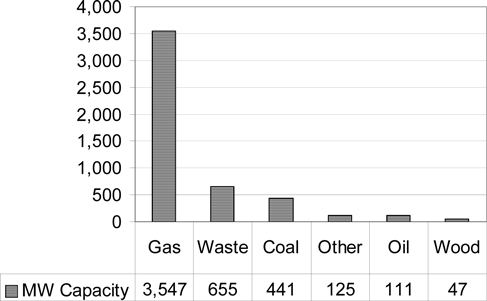
| ONSITE SYCOM Energy Corp. | 3 | Commercial CHP Assessment |
In terms of the number of operating sites, natural gas is the primary fuel in 88% of the 980 sites.
Type of Prime Mover
Table 1.1 characterizes the commercial sector CHP in terms of the prime mover driving the generator. The largest share of capacity (42.8%) comes from combined cycle power plants consisting of a combustion turbine and a heat recovery steam generator (HRSG) that drives a backpressure or extraction steam turbine. These plants are capable of high efficiency and are typically used only in comparatively large installations. Boilers and steam turbines make up 27% of total capacity. Boilers can fire any fuel type, but they are the only type of technology today that can be used to generate power from solid fuels like coal, wood, and certain types of waste. Combustion turbines make up about 19% of installed capacity. Both combined cycle and combustion turbines are technically capable of burning a variety of gaseous or liquid fuels, but, in U.S. CHP applications, they nearly always burn natural gas. Reciprocating engines make up 10% of capacity but represent 79% of the total number of installations. Reciprocating engines are commonly used in smaller installations; the average size for operating engine CHP systems is 0.7 MW. The average size for all operating commercial sector CHP is 5 MW.
Table 1.1. Commercial Sector CHP by Prime Mover in terms of Capacity, Number of Sites, and Average Size
| Prime Mover | Capacity MW | Share % | Sites | Share % | Avg. Size MW | |||||||||||||||
| Combined Cycle | 2,110 | 42.8 | % | 27 | 2.8 | % | 78.1 | |||||||||||||
| Boiler/Steam | 1,341 | 27.2 | % | 60 | 6.1 | % | 22.4 | |||||||||||||
| Combustion Turbine | 933 | 18.9 | % | 104 | 10.6 | % | 9.0 | |||||||||||||
| Recip. Engine | 506 | 10.3 | % | 770 | 78.6 | % | 0.7 | |||||||||||||
| Other/not specified | 36 | 0.7 | % | 19 | 1.9 | % | 1.9 | |||||||||||||
| Total | 4,926 | 100.0 | % | 980 | 100.0 | % | 5.0 | |||||||||||||
Type of Commercial/Institutional Applications
The commercial and institutional sectors are comprised of a broad range of activities that include private and government services but not including manufacturing, mining, or agriculture. Commercial applications, typically but not exclusively, are based on energy use in buildings. Unlike the industrial sector that, on balance, reflect an electric load limited environment for CHP, the commercial sector is predominantly thermal load limited. This limitation can occur in two ways; either the thermal load is inadequate or it is highly seasonal, i.e., noncoincident with the electric load – as in the thermal needs for space heating. Another limitation of commercial applications is the more limited hours of operation compared to an industrial process operation. An office building may operate 3,500 hours per year compared to a refinery that is operated continuously, or 8,760 hours per year. High and fairly constant thermal loads and a high number of operating hours per year characterize the commercial applications that are favorable to CHP. CHP systems are also typically sized to operate on a baseload basis and utilize the electric grid for supplementary and backup power.
| ONSITE SYCOM Energy Corp. | 4 | Commercial CHP Assessment |
Figure 1.2 shows the installed capacity of CHP by commercial application. The top eight applications represent 90% of the commercial sector installed CHP. These top eight sectors are as follows:
| 1. | Colleges and Universities – This is the number one commercial CHP application with 29% of the total installed capacity. Universities resemble district-heating systems for small cities. CHP systems in universities typically serve the power and thermal needs of a multibuilding site. |
| 2. | District Energy/Utilities – About 20% of the total is for district energy or utility applications. These systems tend to be large, multimegawatt facilities serving a variety of applications and buildings. |
| 3. | Government – Government use represents a broad range of activities and commercial/institutional buildings. |
| 4. | Hospitals – Hospitals are large facilities with around-the-clock operation and large, steady thermal and electric requirements. They typically have engineering and operating staff on-site to manage a CHP system. |
| 5. | Solid Waste – This is not a necessarily building energy application but reflects landfill or waste to energy projects with some form of heat recovery. |
| 6. | Offices – This is one of the largest types of commercial applications in terms of building space. |
| 7. | Airports – Nine major airports have CHP systems to serve multiple buildings. These systems are generally in the multi-megawatt size range. |
| 8. | Health/Sports Centers – Rounding out the top 90% of commercial applications are health clubs and sports centers. These facilities represent a good match of steady electric and thermal loads. |
Figure 1.2. Capacity of Commercial CHP by Type of Commercial Application (MW)
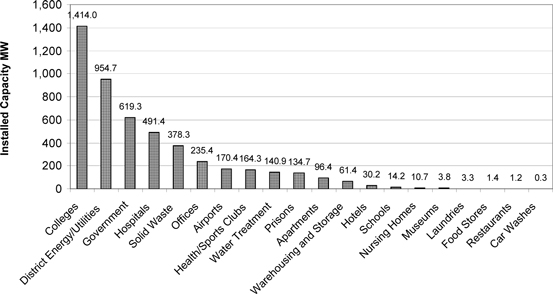
| ONSITE SYCOM Energy Corp. | 5 | Commercial CHP Assessment |
Commercial/Institutional CHP Distribution by State
Commercial CHP is concentrated in the populous industrialized states of the Northeast, Midwest and California and Texas. In addition to large population and economic activity, these states typically have higher energy costs than the rest of the United States. Figure 1.3 shows the distribution of CHP capacity by state. Nearly half the total installed capacity is in three states – New York, California, and Pennsylvania. Adding in the next five largest states – Texas, Wisconsin, Michigan, New Jersey, and Florida – brings the cumulative share up to 75%.
Figure 1.3 Installed Commercial CHP by State
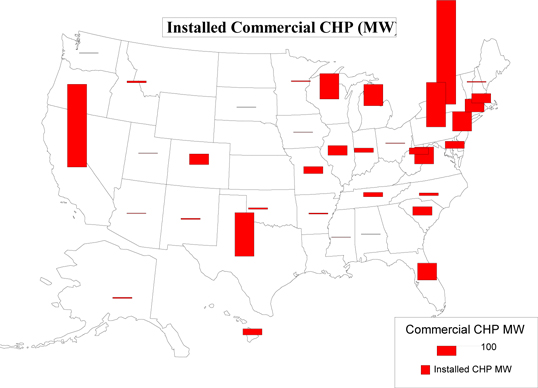
Distribution of CHP Systems by Size
Table 1.2 shows the size breakdown of commercial CHP by prime mover. Over 70% of the existing facilities are under 1 MW. Most of these small systems are powered by reciprocating engines. While the number of sites is dominated by the smaller sized systems, the total capacity impact of these small systems is comparatively small. The majority of the CHP capacity comes from the smaller number of large systems. There are 63 sites with capacities greater than 20 MW – including combustion turbine, combined cycle, and boiler/steam systems. These 63 large sites make up 77% of the existing commercial sector CHP capacity.
| ONSITE SYCOM Energy Corp. | 6 | Commercial CHP Assessment |
Table 1.2. Commercial Sector CHP by Size Range and Prime Mover (Units)
| Size Range | Boiler/ Steam | Combined Cycle | Combust. Turbine | Recip. Engine | Other | Total | ||||||||||||||||||
| 0 – 999 kW | 7 | 20 | 662 | 16 | 705 | |||||||||||||||||||
| 1.0 – 4.9 MW | 15 | 42 | 83 | 140 | ||||||||||||||||||||
| 5.0 – 9.9 MW | 4 | 3 | 16 | 16 | 1 | 40 | ||||||||||||||||||
| 10.0 – 14.9 MW | 3 | 11 | 7 | 2 | 23 | |||||||||||||||||||
| 15.0 – 19.9 MW | 7 | 2 | 9 | |||||||||||||||||||||
| 20.0 – 29.9 MW | 5 | 6 | 5 | 2 | 18 | |||||||||||||||||||
| 30.0 – 49.9 MW | 8 | 5 | 6 | 19 | ||||||||||||||||||||
| 50.0 – 74.9 MW | 11 | 4 | 15 | |||||||||||||||||||||
| 75.0 – 99.9 MW | 2 | 2 | 4 | |||||||||||||||||||||
| 100 – 199 MW | 5 | 5 | ||||||||||||||||||||||
| 200 – 499 MW | 2 | 2 | ||||||||||||||||||||||
| Total | 60 | 27 | 104 | 770 | 19 | 980 | ||||||||||||||||||
CHP Ownership and Sales
CHP facilities can be owned and operated by the site facility or by a 3rd party. In addition, the facility can either use all of the power onsite or sell all or part of the electrical output to the electric utility or a third party. Figure 1.4 shows that 3rd parties own 60% of facilities (69% of capacity) and that 25% of facilities (78% of capacity) sell some portion of their power.
Figure 1.4. Ownership and Sales Characteristics of Commercial Sector CHP
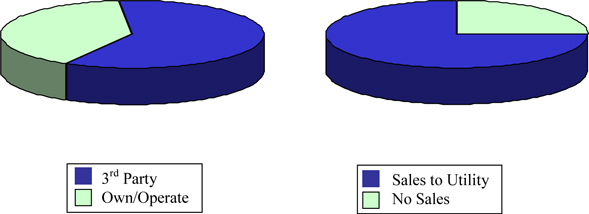
| ONSITE SYCOM Energy Corp. | 7 | Commercial CHP Assessment |
| 1.3 | Implications for EIA Commercial Sector Modeling |
The analysis of the existing CHP in the commercial sector leads to some conclusions regarding the scope of the CHP modeling and the technologies selected.
Natural gas is the predominant fuel for commercial CHP systems. Using natural gas-fired technologies as the basis for defining future growth in the sector seems appropriate. It may also be appropriate to do specific analyses of certain commercial activities such as solid waste and water treatment to identify specific opportunities for waste fueled systems.
The existing results show that the CHP in the commercial sector derived from 63 large (>20 MW) installations makes up 3/4th of the total capacity. These systems use large-scale technology such as combustion turbines and combined cycle systems that are also common in industrial CHP. These systems are not well reflected in the current EIA CHP technology profiles.
The commercial sector offers a promise of a large number of potential applications in small size ranges suitable for microturbines, fuel cells, and small gas engines. To date, penetration in this market has been extremely limited. A number of small engine CHP packagers have entered and exited the market in the last 15 years, as market conditions proved too difficult for many. Today, there is a new generation of technologies and developers hoping to reach the large number of customers in this small-end market. These developers envision sales in the tens, even hundreds, of thousands of units. It is important for the EIA CHP modeling framework to adequately represent the technologies in this area and reflect the real costs of the early entry market as well as the opportunity for technology improvement.
| ONSITE SYCOM Energy Corp. | 8 | Commercial CHP Assessment |
| 2. | Technical Market Potential for Commercial/Institutional CHP |
This section summarizes the analysis of CHP technical potential in the commercial/institutional sector of the U.S. economy. This analysis is based on existing facilities and estimates of their current power and thermal consumption. The derived potential is a snapshot of the technical potential for CHP at these facilities at the end of 1999 and does not include an analysis of sector growth over the time period of the EIA forecast. The technical market potential is an estimation of market size constrained only by technological limits—the ability of CHP technologies to fit existing customer energy needs. No consideration of economics is included in the analysis.
2.1 Technical Approach
The following approach was used to estimate the market potential for CHP in the commercial/institutional sectors:
| · | Identify applications where CHP provides a reasonable fit to the electric and thermal needs of the user. Target applications were identified based on reviewing the electric and thermal energy consumption data for various building types from the DOE EIA 1995 Commercial Buildings Energy Consumption Survey (CBECS) and various commercial market summaries developed by GRI and the American Gas Association.3,4,5,6,7 Existing CHP installations in the commercial/institutional sectors were also reviewed to understand the required profile for CHP applications and to identify target applications. |
| · | Quantify the number and size distribution of target applications. Once applications that could technically support CHP were identified, the iMarket, Inc. MarketPlace Database was utilized to identify potential CHP sites by SIC code.8 The MarketPlace Database is based on the Dun and Bradstreet financial listings and includes information on economic activity (8 digit SIC), location (metropolitan area, county, electric utility service area, state) and size (employees) for commercial, institutional and industrial facilities. In addition, for select SICs limited energy consumption information (electric and gas consumption, electric and gas expenditures) is provided based on data from Wharton Econometric Forecasting (WEFA). The MarketPlace Database was used to identify the number of facilities in target CHP applications and to group them into size categories based on average electric demand in kWs. |
| · | Estimate CHP potential in terms of MW capacity. Total CHP potential was then derived for each target application based on the number of target facilities in each size category. It was assumed that the CHP system would be sized to meet the average site electric demand for the target applications unless thermal loads limited electric capacity. |
| ONSITE SYCOM Energy Corp. | 9 | Commercial CHP Assessment |
| 2.2 | Target CHP Applications |
The simplest integration of CHP into the commercial and institutional sectors is in applications that meet the following criteria:
| · | relatively coincident electric and thermal loads |
| · | thermal energy loads in the form of steam or hot water |
| · | electric demand to thermal demand (steam and hot water) ratios in the 0.5 to 2.5 range (this matches available technologies as identified in Section 2), and |
| · | moderate to high operating hours (>4000 hours per year) |
A review of energy consumption intensity data for commercial/institutional building types as presented in the 1995 CBECS is shown in Table 2.1. Electric intensities are taken directly from the CBECS data for each building type. Space heating and water heating data in CBECS reflect fuel energy inputs for each category. These fuel inputs were modified to reflect building thermal demands using a conversion efficiency of 85%.
Table 2.1 Energy Intensities for Commercial/Institutional Buildings1
| Electricity Use | Electric Intensity | Space Heating | Water Heating | E/T Ratio | E/T Ratio | |||||||||||||||||||
Application | (Tbtu) | (kWh/sq ft) | (1000 Btu/sq ft) | (1000 Btu/sq ft) | (Total) | (Water Htg) | ||||||||||||||||||
| Education | 221 | 8.4 | 32.8 | 17.4 | 0.67 | 1.94 | ||||||||||||||||||
| Health care | 211 | 26.5 | 55.2 | 63 | 0.90 | 1.69 | ||||||||||||||||||
| Lodging | 187 | 15.2 | 22.7 | 51.4 | 0.82 | 1.19 | ||||||||||||||||||
| Food Service | 166 | 36 | 30.9 | 27.5 | 2.47 | 5.25 | ||||||||||||||||||
| Food Sales | 119 | 54.1 | 27.5 | 9.1 | 5.93 | 23.86 | ||||||||||||||||||
| Office | 676 | 18.9 | 24.3 | 8.7 | 2.30 | 8.72 | ||||||||||||||||||
| Mercantile/Service | 508 | 11.8 | 30.6 | 5.1 | 1.33 | 9.29 | ||||||||||||||||||
| Public Assembly | 170 | 12.7 | 53.6 | 17.5 | 0.72 | 2.91 | ||||||||||||||||||
| Public Order | 49 | 11.3 | 27.8 | 23.4 | 0.89 | 1.94 | ||||||||||||||||||
| Religious Worship | 33 | 3.5 | 23.7 | 3.2 | 0.52 | 4.35 | ||||||||||||||||||
| Warehouse/Storage | 176 | 6.4 | 15.7 | 2 | 1.46 | 12.92 | ||||||||||||||||||
| Other | 75 | 22.0 | 59.6 | 15.3 | 1.18 | 5.77 | ||||||||||||||||||
| ONSITE SYCOM Energy Corp. | 10 | Commercial CHP Assessment |
As described in Section 3, the outputs from available CHP technologies have electric to thermal ratios in the range of 0.5 to 2.5. Thermal energy output is usually in the form of steam or hot water. Thermal loads most amenable to CHP systems in commercial/institutional buildings are space heating and hot water requirements. The simplest thermal load to supply is hot water. Retrofits to the existing hot water supply are relatively straightforward, and the hot water load tends to be less seasonally dependent than space heating, and therefore, more coincident to the electric load in the building. Meeting space heating needs with CHP can be more complicated. Space heating is seasonal by nature, and is supplied by various methods in the commercial/institutional sector, centralized hot water or steam being only one. For these reasons, primary targets for CHP in the commercial/institutional sectors are those building types with electric to hot water demand ratios consistent with CHP technologies: Education, Health Care, Lodging, and certain Public Order and Public Assembly applications. Office Buildings, and certain Warehousing and Mercantile/Service applications can be target applications for CHP if space heating needs can be incorporated.
One difficulty with estimating market potential based on the classifications listed in Table 2.1 is that the classifications are quite broad in nature. As an example, health care includes not only hospitals that are ideal candidates for CHP because of their extended operating hours and electric and thermal profiles, but also clinics and outpatient services that have limited operating hours and limited thermal needs. Other categories such as office buildings that in total do not appear to be good candidates have subcategories such as large (>50,000 sq feet), 18 hour a day office buildings where the energy needs and operating characteristics support economic CHP. Table 2.2 presents the specific building types most amenable to existing CHP technologies based on an analysis of existing CHP in the commercial/institutional sectors and a review of available building energy characteristics.
Table 2.2 CHP Target Applications - Existing Technology
| Application | CHP System Size | Thermal Demand | ||
| Hotels/Motels | 100 kW - 1+ MW | Domestic hot water, space heating, pools | ||
| Nursing Homes | 100 - 500 kW | Domestic hot water, space heating, laundry | ||
| Hospitals | 300 kW - 5+ MW | Domestic hot water, space heating, laundry | ||
| Schools | 50 - 500 kW | Domestic hot water, space heating, pools | ||
| Colleges/Universities | 300 kW - 30 MW | Centralized space heating, domestic hot water | ||
| Commercial Laundries | 100 - 800 kW | Hot water | ||
| Car Washes | 100 - 500 kW | Hot water | ||
| Health Clubs/Spas | 50 - 500 kW | Domestic hot water, space heating, pools | ||
| Country/Golf Clubs | 100 kW - 1MW | Domestic hot water, space heating, pools | ||
| Museums | 100 kW - 1+ MW | Space heating, domestic hot water | ||
| Correctional Facilities | 300 kW - 5 MW | Domestic hot water, space heating | ||
| Water Treatment/Sanitary | 100 kW - 1 MW | Process heating | ||
| Large Office Buildings* | 250 kW - 1+ MW | Domestic hot water, space heating | ||
| * (>100,000 sq ft) |
| ONSITE SYCOM Energy Corp. | 11 | Commercial CHP Assessment |
Technology development efforts targeted at heat activated cooling/refrigeration and thermally regenerated desiccants could expand the application of CHP by increasing the base thermal energy loads in certain building types. Use of CHP thermal output for absorption cooling and/or desiccant dehumidification could increase the size and improve the economics of CHP systems in existing CHP markets such as schools, lodging, nursing homes and hospitals. Use of these advanced technologies in applications such as restaurants, supermarkets and refrigerated warehouses provides a base thermal load that opens these applications to CHP. Table 2.3 includes potential CHP target applications that are currently marginal because of inadequate thermal loads but that would be future target applications based on the use of these advanced technologies.
Table 2.3 CHP Target Applications - Advanced Technology
| Application | CHP System Size | Thermal Demand | ||
| Extended Service Restaurants | 50 - 300 kW | Domestic hot water, absorption cooling, desiccants | ||
| Supermarkets | 100 - 500 kW | Desiccants, domestic hot water, space heating | ||
| Refrigerated Warehouses | 300 kW - 5 MW | Desiccants, domestic hot water | ||
| Medium Office Buildings* | 100 - 500 kW | Absorption cooling, space heating, desiccants | ||
| * (25,000-100,000 sq ft) |
| 2.3 | CHP Technical Market Potential |
As described earlier, the iMarket, Inc. MarketPlace Database was utilized to identify potential CHP sites by building type (SIC) for the target applications included in Tables 2.2 and 2.3. The MarketPlace Database is based on the Dun and Bradstreet financial listings and includes information on economic activity (8 digit SIC), location (metropolitan area, county, electric utility service area, state) and size (employees) for commercial, institutional and industrial facilities. In addition, for select SICs limited energy consumption information (electric and gas consumption, electric and gas expenditures) is provided based on data from Wharton Econometric Forecasting (WEFA). The MarketPlace Database was used to identify the number of existing facilities in target CHP applications and to group them into size categories based on average electric demand in kWs. Office buildings represent the one exception to this approach. The MarketPlace Database includes information on individual tenants within an office building, but not on the building as a whole. The number of office building sites amenable to CHP was derived from CBECS data on office buildings with average electric demand of 100 kW or greater. These 73,000 office building represent the population of medium and large office buildings as described in Tables 2.2 and 2.3.
| ONSITE SYCOM Energy Corp. | 12 | Commercial CHP Assessment |
Table 2.4 lists the number of sites for the target applications in four categories based on average electric demand: 100 to 500 kW; 500 kW to 1 MW; 1 to 5 MW; and greater than 5 MW. Target CHP applications include those building types listed in Tables 2.2 and 2.3. As mentioned above, the Office Building category includes both medium and large office buildings (>25,000 sq ft). Restaurants includes full service restaurants only; fast food restaurants are not included due to their inadequate thermal loads.
Table 2.4 Target CHP Applications - Number of Establishments as a Function of Average Site Electric Demand
| Total | Establishments | Establishments | Establishments | Establishments | ||||||||||||||||
Application | Establishments | (100 - 500 kW) | (500 - 1000 kW) | (1 - 5 MW) | (> 5 MW) | |||||||||||||||
| Hotels/Motels | 66,400 | 12,010 | 895 | 540 | 220 | |||||||||||||||
| Nursing Homes | 19,200 | 4,610 | 4,050 | 1,570 | 25 | |||||||||||||||
| Hospitals | 16,400 | 2,945 | 1,290 | 2,110 | 215 | |||||||||||||||
| Schools | 123,890 | 32,400 | 9,690 | 390 | 0 | |||||||||||||||
| Colleges/Universities | 4,090 | 1,005 | 580 | 680 | 205 | |||||||||||||||
| Commercial Laundries | 7,275 | 830 | 400 | 10 | 0 | |||||||||||||||
| Car Washes | 20,630 | 1,150 | 40 | 0 | 0 | |||||||||||||||
| Health Clubs/Spas | 12,610 | 3,020 | 4,060 | 15 | 0 | |||||||||||||||
| Golf Clubs | 14,040 | 3,800 | 820 | 205 | 30 | |||||||||||||||
| Museums | 9,090 | 330 | 290 | 50 | 0 | |||||||||||||||
| Correctional Facilities | 3,950 | 1,190 | 740 | 610 | 45 | |||||||||||||||
| Water Treatment/Sanitary | 8,770 | 2,055 | 490 | 65 | 0 | |||||||||||||||
| Extended Service Restaurants | 271,000 | 25,475 | 495 | 330 | 0 | |||||||||||||||
| Supermarkets | 148,000 | 16,300 | 1,160 | 140 | 0 | |||||||||||||||
| Refrigerated Warehouses | 1,460 | 595 | 640 | 75 | 5 | |||||||||||||||
| Total | 726,805 | 107,715 | 25,640 | 6,790 | 745 | |||||||||||||||
| Office Buildings | 705,000 | 57,000 | 12,000 | 2,900 | 290 | |||||||||||||||
| Total | 1,431,805 | 164,715 | 37,640 | 9,690 | 1,035 | |||||||||||||||
The technical potential for CHP in terms of MW capacity was estimated assuming that the CHP systems would be sized to meet the average electric demand for most applications. For the majority of the target markets there is a reasonable match between electric to thermal ratios of the application and the power to heat output of existing CHP technologies. Sizing to meet average electric demand supplies thermal needs for these applications and maximizes the energy efficiency of CHP deployment. It should be noted that the existing CHP capacity described in Section 1 includes a number of large installations that are sized to sell significant amounts of excess power to the grid. The estimate of technical potential in this study assumes all power will be used on-site. A mean system size was calculated for each size category assuming a log normal distribution ( 220 kW for 100 to 500 kW; 700 kW for 500 to 1000 kW; 2.5 MW for 1 to 5 MW; and 9.5 MW for > 5 MW) and applied to the number of establishments in Table 2.4. The exceptions to this methodology are Office Buildings, Restaurants and Supermarkets. Thermal loads in these applications are generally inadequate to support CHP systems sized to the average electric demand based on current CHP technologies. MW capacities for these applications were reduced using factors that better reflect the electric to thermal ratio of these building types: 0.6 for Office Buildings, 0.5 for restaurants, and 0.25 for supermarkets. Based on this methodology, OSEC estimates that the technical potential for CHP systems in existing commercial/institutional buildings approaches 77,300 MW electric capacity. Table 2.5 presents estimated market potential in terms of MW capacity by specific target application and size category.
| ONSITE SYCOM Energy Corp. | 13 | Commercial CHP Assessment |
Table 2.5 CHP Technical Potential in the Commercial/Institutional Sectors - MW Capacity
| MW Capacity | MW Capacity | MW Capacity | MW Capacity | MW Capacity | ||||||||||||||||
Application | (100 - 500 kW) | (500 - 1000 kW) | (1 - 5 MW) | (> 5 MW) | Total | |||||||||||||||
| Hotels/Motels | 2,642 | 627 | 1,353 | 2,081 | 6,703 | |||||||||||||||
| Nursing Homes | 1,014 | 2,837 | 3,923 | 219 | 7,993 | |||||||||||||||
| Hospitals | 647 | 904 | 5,275 | 2,052 | 8,878 | |||||||||||||||
| Schools | 7,130 | 6,781 | 973 | 0 | 14,884 | |||||||||||||||
| Colleges/Universities | 221 | 407 | 1,693 | 1,929 | 4,250 | |||||||||||||||
| Commercial Laundries | 183 | 279 | 23 | 0 | 485 | |||||||||||||||
| Car Washes | 253 | 28 | 0 | 0 | 281 | |||||||||||||||
| Health Clubs/Spas | 665 | 2,839 | 48 | 0 | 3,552 | |||||||||||||||
| Golf Clubs | 836 | 574 | 513 | 285 | 2,208 | |||||||||||||||
| Museums | 73 | 202 | 123 | 0 | 398 | |||||||||||||||
| Correctional Facilities | 261 | 517 | 1,515 | 428 | 2,721 | |||||||||||||||
| Water Treatment/Sanitary | 452 | 342 | 155 | 0 | 949 | |||||||||||||||
| Extended Service Restaurants | 2,802 | 173 | 415 | 0 | 3,390 | |||||||||||||||
| Supermarkets | 897 | 203 | 84 | 0 | 1,184 | |||||||||||||||
| Refrigerated Warehouses | 131 | 448 | 183 | 30 | 792 | |||||||||||||||
| Office Buildings | 7,532 | 5,055 | 4,362 | 1,665 | 18,614 | |||||||||||||||
| Total | 25,739 | 22,216 | 20,638 | 8,689 | 77,281 | |||||||||||||||
Table 2.6 compares the CHP market potential for each target application and the existing CHP capacity as described in Section 1. The technical potential as calculated is based on existing commercial/institutional facilities. Subtracting the existing CHP capacity from each target application should result in the remaining technical potential left to be developed in that application based on the existing population of facilities. There are, however, several difficulties in this approach: 1) the application categories of existing CHP do not match the target application classifications exactly. Two categories included in "Other" under "Installed CHP" in Table 2.6, Government and District Heating, represent over 1500 MW of installed CHP capacity. These categories are not included as distinct target applications in this analysis. It is likely, however, that many of the building types most likely served by CHP systems in these two categories (offices, hospitals, etc) are included as individual applications in this analysis; 2) certain types of existing CHP included in "Other", Airports and Solid Waste, representing approximately 550 MW were not included in the current market analysis. Despite these shortcomings, the comparison is useful in revealing the low level of penetration of CHP into most commercial/institutional applications.
| ONSITE SYCOM Energy Corp. | 14 | Commercial CHP Assessment |
Table 2.6 Comparison of CHP Potential and Existing CHP Capacity
| Total Potential | Installed CHP | Remaining Potential | ||||||||||
Application | (MW) | (MW) | (MW) | |||||||||
| Hotels/Motels | 6,703 | 30 | 6,673 | |||||||||
| Nursing Homes | 7,993 | 11 | 7,982 | |||||||||
| Hospitals | 8,878 | 491 | 8,387 | |||||||||
| Schools | 14,884 | 14 | 14,870 | |||||||||
| Colleges/Universities | 4,250 | 1,414 | 2,836 | |||||||||
| Commercial Laundries | 485 | 3 | 482 | |||||||||
| Car Washes | 281 | 0 | 281 | |||||||||
| Health Clubs/Spas | 3,552 | 164 | 3,388 | |||||||||
| Golf Clubs | 2,208 | 0 | 2,208 | |||||||||
| Museums | 398 | 4 | 394 | |||||||||
| Correctional Facilities | 2,721 | 135 | 2,586 | |||||||||
| Water Treatment/Sanitary | 949 | 141 | 808 | |||||||||
| Extended Service Restaurants | 3,390 | 1 | 3,389 | |||||||||
| Supermarkets | 1,184 | 1 | 1,183 | |||||||||
| Refrigerated Warehouses | 792 | 0 | 792 | |||||||||
| Office Buildings | 18,614 | 235 | 18,379 | |||||||||
| Other | N/A | 2,282 | N/A | |||||||||
| Total | 77,282 | 4,926 | 74,638 | |||||||||
Figure 2.1 illustrates the 77,282 MW of CHP potential on a state basis. Fifty percent of the total commercial/institutional CHP potential identified in this analysis is located in nine states: California, Florida, Illinois, Michigan, New Jersey, New York, Ohio, Pennsylvania, and Texas. Appendix B includes detailed state tables.
| ONSITE SYCOM Energy Corp. | 15 | Commercial CHP Assessment |
Figure 2.1 Commercial/Institutional CHP Potential by State
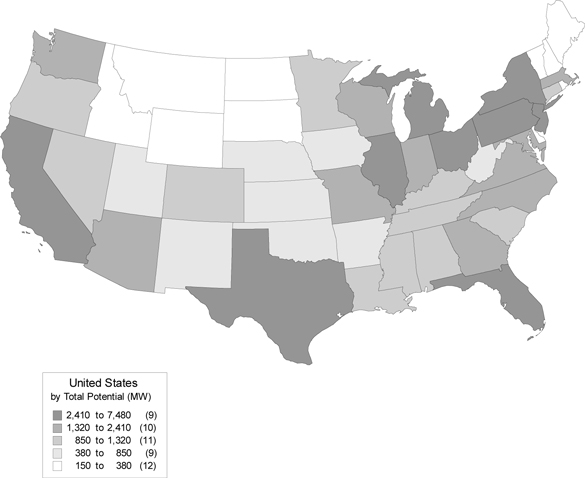
Major conclusions from review of the analysis results include:
| · | Significant CHP potential exists at commercial/institutional facilities - The total technical potential for the commercial/institutional sectors of approximately 75,000 MW electric capacity is on the same order of the remaining technical potential in the industrial sector (88,000 MW) |
| · | Market penetration to-date is extremely low in the commercial/institutional sectors - Except for colleges and universities, market penetration of CHP into commercial/institutional applications is minimal. |
| ONSITE SYCOM Energy Corp. | 16 | Commercial CHP Assessment |
| · | The bulk of existing CHP capacity is in larger systems - CHP systems of 20 MW or greater represent 63% of existing CHP capacity in the commercial/institutional market. |
| · | The majority of the technical potential is in small sizes - 62% of the technical market potential is in system sizes less than 1 MW. |
| · | Potential CHP sites represent a small fraction of commercial/institutional buildings - Based on existing technology, only about 5% of the 4.6 million existing commercial buildings in the United States technically meet the criteria for CHP (average electric demand > 100 kW and adequate thermal loads in the form of hot water or steam) |
| · | The technical market for CHP could be expanded in the commercial/institutional sectors with advanced technologies that utilize thermal energy for non-traditional applications - CHP potential is limited in commercial/institutional applications due to the lack of adequate thermal energy needs in many building types. Advanced technologies such as heat-activated cooling and thermally regenerated desiccants can expand the economic applications of CHP by providing a base thermal load in building types that do not currently have adequate thermal needs. Cost effective CHP systems in smaller sizes (below 100 kW) would also expand the potential market and increase application of CHP. |
| ONSITE SYCOM Energy Corp. | 17 | Commercial CHP Assessment |
3. CHP Technology Characterization
This section provides a discussion of CHP technology appropriate for the commercial/institutional sector and a recommended technology cost and performance dataset for use in the EIA commercial sector NEMS modeling.
| 3.1 | NEMS CHP Technology Characterization |
The National Energy Modeling System (NEMS) is a computer-based, energy-economy modeling system of U.S. energy markets for the mid-term period through 2020. NEMS was designed and implemented by the Energy Information Administration (EIA) of the U.S. Department of Energy (DOE). NEMS projects the production, imports, conversion, consumption, and prices of energy, subject to assumptions on macroeconomic and financial factors, world energy markets, resource availability and costs, behavioral and technological choice criteria, cost and performance characteristics of energy technologies, and demographics.
A key feature of NEMS is the representation of technology and technology improvement over time. Five of the sectors—residential, commercial, transportation, electricity generation, and refining—include explicit treatment of individual technologies and their characteristics, such as initial cost, operating cost, date of availability, efficiency, and other characteristics specific to the sector.
This section provides a review and update of combined heat and power (CHP) technology choices for the commercial sector. Of the total existing CHP capacity in the U.S. today, only a little more than 11% occurs within the commercial sector. Even though the commercial sector is about 3/4th as large as the industrial sector in terms of electricity demand, the existing application of CHP is nine times larger in the industrial sector. There are viable CHP opportunities in the commercial sector, but technology and application matching in the commercial sector is more difficult:
| · | On average, commercial sites are much smaller than industrial sites. Technologies for smaller applications have been more expensive and less efficient than larger CHP. |
| · | Commercial establishments generally operate fewer hours per year and have lower load factors, providing fewer hours of operation per year in which to payback their higher first costs. |
| · | Unlike the majority of industrial projects that can absorb the entire thermal output of a CHP system onsite, many commercial sites have either an inadequate thermal load or a highly seasonal load such as space heating. The best overall efficiency and economics come from a steady thermal load. These loads are concentrated in relatively few types of commercial applications. |
| ONSITE SYCOM Energy Corp. | 18 | Commercial CHP Assessment |
Two key changes in the economic system are occurring that could make CHP more important economically and environmentally – the restructuring of the electric power industry may provide an enhanced economic driver and efforts to comply with the Kyoto Protocol on global warming may provide an environmental driver for energy efficiency options such as CHP. In addition, there is a renewed interest in small scale power technologies and a number of emerging technologies that promise to decrease first costs, increase efficiencies, reduce maintenance, and lower environmental impact. It is critical, therefore, that NEMS have up-to-date and accurate information on CHP technology cost and performance.
The current commercial technology set used in NEMS is shown in Table 3.1.
Table 3.1. Existing CHP Cost and Performance Parameters Used in the Commercial Cogeneration Module of NEMS
| Size | Efficiency (HHV) | Heat Recovery. | Maint. Cost | Life | Current Capital Cost $/kW | 2020 Capital Cost $/kW | ||||||||||||||||||||||||||||||||||
| Technology | kW | Current | 2020 | Eff.* | $/kWyr | Years | Install. | Equip. | Install. | Equip. | ||||||||||||||||||||||||||||||
| Solar PV | 10 | 11 | % | 20 | % | 0 | % | 10 | 30 | $ | 500 | $ | 7,370 | $ | 275 | $ | 2,151 | |||||||||||||||||||||||
| Fuel Cell | 200 | 40 | % | 40 | % | 75 | % | 15 | 20 | $ | 125 | $ | 4,000 | $ | 125 | $ | 1,600 | |||||||||||||||||||||||
| Gas Engine | 200 | 35 | % | 35 | % | 60 | % | 15 | 20 | $ | 125 | $ | 775 | $ | 125 | $ | 775 | |||||||||||||||||||||||
| Conv Coal | 200 | 30 | % | 30 | % | 45 | % | 15 | 20 | N/A | N/A | N/A | N/A | |||||||||||||||||||||||||||
| Conv Oil | 200 | 33 | % | 33 | % | 0 | % | 15 | 20 | $ | 125 | $ | 375 | $ | 125 | $ | 375 | |||||||||||||||||||||||
| Conv MSW | 200 | 24 | % | 24 | % | 45 | % | 15 | 20 | N/A. | N/A. | N/A. | N/A. | |||||||||||||||||||||||||||
| Gas Turbine | 200 | 29 | % | 29 | % | 60 | % | 15 | 20 | $ | 125 | $ | 775 | $ | 125 | $ | 775 | |||||||||||||||||||||||
| Microturbine | 100 | 27 | % | 27 | % | 60 | % | 15 | 20 | $ | 125 | $ | 775 | $ | 125 | $ | 575 | |||||||||||||||||||||||
| Hydro | 200 | 29 | % | 29 | % | N/A. | 15 | 20 | N/A. | N/A. | N/A. | N/A. | ||||||||||||||||||||||||||||
| Wood | 200 | 24 | % | 24 | % | 45 | % | 15 | 20 | N/A. | N/A. | N/A. | N/A. | |||||||||||||||||||||||||||
* Heat Recovery Efficiency defined as the ratio of usable thermal energy to the difference between the energy content of the fuel input and the power produced
The database includes all CHP technology types in use in the commercial sector today, with the exception of certain combined cycle installations in use in very large installations. The relative level of cost and efficiencies for the technologies seem reasonable, though not necessarily for the 200 kW size outlined. For example:
| · | Combustion turbines (CTs) tend to be at least an order of magnitude larger than the 200 kW unit currently in the model (most commercial installations of CTs are in the1-50 MW size range with a few much larger installations). |
| · | There are a larger number of reciprocating engine installations in the 200 kW size and below, but the cost and performance in the current model seem appropriate for a much larger engine installation. |
| · | There is no projected improvement in efficiency for any technology other than solar PV over the 20-year forecasting period, and only PV and fuel cells show a capital cost reduction. Engine and turbine technologies have been improving continuously over the last twenty years and they will continue to do so. Emerging technologies such as microturbines and fuel cells will also show improvement. |
| ONSITE SYCOM Energy Corp. | 19 | Commercial CHP Assessment |
| 3.2 | Recommended Prototype CHP Technologies for the Commercial Sector |
The existing commercial CHP market breakdown presented in detail in Section 1 of this report provided the basis for defining a set of prototype CHP technologies that covers the range of applications found in the market today. In addition, emerging fuel-based technologies such as fuel cells and microturbines are in or are about to enter a phase of early market entry. The developers of these technologies envision significant market penetration occurring over the 20-year forecast period.
Table 3.2 shows the CHP technology types proposed as the basis for considering future market penetration. The list focuses on direct fuel fired systems. Boilers feeding steam turbines are not considered nor are non-fuel fired technologies such as PV. While boiler systems represent about one-quarter of existing commercial CHP systems, the majority of future market development will more likely occur with direct-fired systems. The analysis did not consider PV or other non-fuel systems that may achieve some level of market penetration in the next 20 years.
Table 3.2. Commercial CHP Prototype Technologies
| Technology | Size kW | Comments | ||
| Microturbine | 100 | Sizes expected to range from 30-300 kW | ||
| Fuel Cell | 200 | Smaller and larger sizes possible; early entry specifications based on current PAFC, end point based on 2nd and 3rd generation technologies | ||
| Reciprocating Engine | 100 | Expected to compete in the 30-300 kW size range | ||
| Reciprocating Engine | 800 | Representing 500-1,500 kW, currently the most competitive size range for recip engines | ||
| Reciprocating Engine | 3,000 | Engines compete with combustion turbines (CTs) up to 10-15 MW per site often in installations of multiple engines | ||
| Combustion Turbine | 1,000 | Not currently a strong market area due to competition with recip engines, technology improvements may enhance future competition | ||
| Combustion Turbine | 5,000 | First tier of the CT competitive range where CT systems begin to emerge as the strongest competitor | ||
| Combustion Turbine | 10,000 | Second tier of CT competitive range; only 12.5% of commercial CT sites-CHP systems are larger than 15 MW but these larger sites make up 60% of total simple cycle CT MW capacity (12% of total CHP capacity) |
The following sections present cost and performance estimates for CHP systems using the above technologies. Estimates are provided for a base case utilizing current commercial or about to be commercial technology and for an advanced case that reflects improvements in cost and performance through the year 2020. The improvements are primarily evolutionary in nature, and can be introduced into the NEMs analysis by a straight line interpolation of the timing of expected performance improvements. The one exception would be in the cost reduction of microturbine systems. Early market success could generate sufficient volumes to accelerate the expected cost reductions in equipment and installation.
| ONSITE SYCOM Energy Corp. | 20 | Commercial CHP Assessment |
| 3.3 | Microturbines |
Microturbines are very small combustion turbines with outputs of 30 kW to 200 kW. Several companies are developing systems with targeted product rollout within 1-3 years. Microturbine technology has evolved from automotive and truck turbochargers, auxiliary power units for airplanes or tanks, and small jet engines used for pilotless military aircraft. Recent development of these microturbines has been focused on this technology as the prime mover for hybrid electric vehicles and as a stationary power source for the distributed generation market. In most configurations, the turbine shaft spinning at up to 100,000 rpm drives a high-speed generator. The high frequency output is first rectified and then converted to 60 Hz (for the U.S. market). Advances in this power-electronics technology that support PV and fuel cell technologies are also making microturbine systems economically feasible. The systems are capable of producing power at around 25-30% efficiency by employing a recuperator that transfers heat energy from the exhaust stream back into the incoming air stream. The systems are air-cooled and some even use air bearings, thereby eliminating both water and oil systems. Low emission combustion systems are being demonstrated that provide emissions performance comparable to larger CTs. Microturbines are appropriately sized for commercial buildings or light industrial markets for CHP or power-only applications.
Technology Specifications
A summary of the technology specifications is shown in Table 3.3.9,10 Microturbine developers quote an electrical efficiency at the high-frequency generator terminals of 30-33% on a lower heating value (LHV) basis.* The power electronics component then introduces about 5% in additional losses in the conversion step from high frequency to 60 Hz power. Additional parasitic loads of up to 10% of the capacity are often required for a fuel compressor necessary to compress natural gas from typical delivery pressures of 2 psig or less to 75 psig. These adjustments bring the electrical efficiency down to below 26% in our current market configuration. Future developments in the technology are expected to improve efficiencies and bring costs down significantly. Performance targets for the 2020 advanced systems are based on DOE goals in the recently released microturbine program solicitation. The O&M costs shown in the table represent the sum of variable and fixed costs for a baseload system (8000 hours/year) expressed as a fixed cost per unit of output. The details of how these costs were derived are explained in Section 3.7.
* All turbine and engine manufacturers quote heat rates in terms of the lower heating value (LHV) of the fuel. On the other hand, the energy content of fuels is typically measured on a higher heating value basis (HHV). The energy measurements in EIA publications are measured in higher heating value, as are electric utilities’ measurements power plant heat rates. The dfference between HHV and LHV is the energy content of the water vapor in the combustion exhaust. Since, heat engines never capture this heat of vaporization, nor do heat recovery steam generators, design engineers prefer to quote efficiencies in LHV. For natural gas, the average heat content is 1030 Btu/cu ft on an HHV basis and 930 Btu/cu ft on an LHV basis – or about a 10% difference. Since all of the fuel data in NEMS is based on higher heating values, we converted the manufacturer’s heat rates to an HHV basis.
| ONSITE SYCOM Energy Corp. | 21 | Commercial CHP Assessment |
Capital Cost Details
Microturbine systems are just now entering the market. Costs are high for these current early market entry units. The current units have expensive power electronics components, nonstandard generators, and complex recuperators. The basic design of the prime mover is quite simple. It is expected that continued cost engineering and higher volume production will bring costs down significantly during the forecast period. To date, developers have been very optimistic about how cheaply they will be able to engineer and install these units in a CHP application. Installation costs are based on experience with engine driven packaged microcogeneration systems that have been in the market for nearly twenty years. Table 3.4 provides the detailed study estimate of capital costs for the current unit and for the advanced system that is expected to be available by the end of the NEMS forecasting period.
Table 3.3. Microturbine Cost and Performance Summary
| 100 kW Microturbine | ||||||||
CHP Cost and Performance Assumptions* | Current | 2020 | ||||||
| Total Installed Cost (99 $/kW) | $ | 1,970 | $ | 915 | ||||
| O&M Costs ($/kWyear) | $ | 90.00 | $ | 75.00 | ||||
| Elec. Heat Rate (Btu/kWh), HHV | 13,306 | 9,477 | ||||||
Elec. Generating Efficiency, HHV (3412/Heat Rate) | 25.7 | % | 36.0 | % | ||||
| Thermal Energy (Btu/kWh) | ||||||||
| Exhaust | 4498 | 2748 | ||||||
| Cooling Water | N/A. | N/A. | ||||||
| Overall Efficiency (%) | 59 | % | 65 | % | ||||
| Thermal Recov. Eff. | 45 | % | 46 | % | ||||
| Power to Heat Ratio | 0.759 | 1.24 | ||||||
| Net Elec. Heat Rate (Btus/kWh) | 7,684 | 6,042 | ||||||
* System performance for the base case system was based on initial Honeywell Energy Systems (formally Allied Signal) product information for the Parallon 75.9 Base case package costs are based on initial introduction costs and advanced case package costs are based on mature market projections that have been made by Honeywell and others. Published performance data was adjusted to take into account heat losses from the power electronics package and parasitic power for the fuel gas compressor. Installed CHP system costs were based on component prices (heat recovery, gas compression) provided by Unicom24 with OSEC estimates for engineering and construction based on OSEC experience with engine-driven microcogeneration plants.
| ONSITE SYCOM Energy Corp. | 22 | Commercial CHP Assessment |
Table 3.4 Microturbine Capital Cost Detail for Current and Advanced Units
| 100 kW Microturbine | ||||||||
| Cost Component | Current | 2020 | ||||||
| Size kW | 100 | 100 | ||||||
| Package Cost ($/kW) | $ | 800 | $ | 350 | ||||
| Heat Recovery | $ | 150 | $ | 150 | ||||
| Interconnect/Switchgear | $ | 100 | $ | 50 | ||||
| Miscellaneous Equipment | $ | 135 | $ | 40 | ||||
| Installation/Civil Work | $ | 210 | $ | 120 | ||||
| Engineering and Management | $ | 130 | $ | 55 | ||||
| General Contractor Markup | $ | 150 | $ | 80 | ||||
| Contingencies and Guarantees | $ | 95 | $ | 40 | ||||
| Carry Charges during Constr. | $ | 100 | $ | 30 | ||||
| Total | $ | 1,970 | $ | 915 | ||||
| 3.4 | Fuel Cell Power Systems |
Fuel cells produce power electrochemically like a battery rather than like a conventional generating system that converts fuel to heat to shaft-power and finally to electricity. Unlike a storage battery, however, which produces power from stored chemicals, fuel cells produce power when hydrogen fuel is delivered to the cathode of the cell and oxygen in air is delivered to the anode. The resultant chemical reactions at each pole create a stream of electrons (or direct current) across the oppositely charged poles of the cell. The hydrogen fuel can come from a variety of sources, but the most economic is steam reforming of natural gas – a chemical process that strips the hydrogen from both the fuel and the steam. There are several different liquid and solid media that can be used to create the fuel cell’s electrochemical reactions – phosphoric acid (PAFC), molten carbonate (MCFC), solid oxide (SOFC), and proton exchange membrane (PEM). Each of these media comprises a distinct fuel cell technology with its own performance characteristics and development schedule. PAFCs are in early commercial market development now with 200 kW units delivered to over 120 customers worldwide. The SOFC and MCFC technologies are now in field test or demonstration. PEM units are in early development and testing. Direct electrochemical reactions are generally more efficient than using fuel to drive a heat engine to produce electricity. Fuel cell efficiencies range from 35-40% for the PAFC to upwards of 60% with developing MCFC and SOFC systems. Fuel cells are inherently quiet and extremely clean running. Like a battery, fuel cells produce direct current (DC) that must be run through an inverter to get 60 Hz alternating current (AC). These power electronics components can be integrated with other components as part of a power quality control strategy for sensitive customers. Because of current high costs, fuel cells are best suited to environmentally sensitive areas and customers with power quality concerns. Some fuel cell technology is modular and capable of application in small commercial and even residential markets; other technology utilizes high temperatures in larger sized systems that would be well suited to industrial cogeneration applications.
| ONSITE SYCOM Energy Corp. | 23 | Commercial CHP Assessment |
Technology Specifications
Table 3.5 summarizes the cost and performance specifications for fuel cell systems in CHP duty.11 The current system is modeled after the early market entry phosphoric acid fuel cell (PAFC) that has entered the market in the last four years. The advanced system is not based on any one specific fuel cell design but represents an advance in efficiency and cost that could be achieved by one or more of the advanced systems under development today. The PAFC provides only a low temperature waste heat; however, such systems are compatible with many commercial applications that need hot water.
Capital Cost Details
Table 3.6 shows the study estimate for capital costs for the current and advanced fuel cell system. As previously described, the capital cost is based on the PAFC unit currently in the market. The capital cost estimate for the advanced fuel cell is not based on a specific developmental program goal, but reflects target forecasts for installed costs from developers of solid oxide and molten carbonate fuel cell systems.
Table 3.5. Fuel Cell Cost and Performance Summary
| 200 kW Fuel Cell | ||||||||
CHP Cost and Performance Assumptions* | Current | 2020 | ||||||
| Total Installed Cost (99 $/kW) | $ | 3,674 | $ | 1,433 | ||||
| O&M Costs ($/kWyear) | $ | 87.00 | $ | 72.50 | ||||
| Elec. Heat Rate (Btu/kWh), HHV | 9,481 | 6,895 | ||||||
Elec. Generating Efficiency, HHV (3412/Heat Rate) | 36.0 | % | 49.5 | % | ||||
| Thermal Energy (Btu/kWh) | ||||||||
| Exhaust | N/A. | N/A. | ||||||
| Cooling Water | 3500 | 1700 | ||||||
| Overall Efficiency (%) | 73 | % | 74 | % | ||||
| Thermal Recov. Eff. | 58 | % | 49 | % | ||||
| Power to Heat Ratio | 0.975 | 2.008 | ||||||
| Net Elec. Heat Rate (Btus/kWh) | 5,106 | 4,770 | ||||||
* The base case fuel cell cost and performance is based on the ONSI PC25 model with a 200 kW rating. The advanced system was based on a review of cost and performance ranges prepared by the California Alliance for Distributed Energy Resources.11 The cost and performance of the advanced system was based on a composite of second generation fuel cell technologies – molten carbonate, solid oxide, proton exchange membrane.
| ONSITE SYCOM Energy Corp. | 24 | Commercial CHP Assessment |
Table 3.6 Fuel Cell Capital Cost Detail for Current and Advanced Units
| 200 kW Fuel Cell | ||||||||
| Cost Component | Current | 2020 | ||||||
| Size kW | 200 | 200 | ||||||
| Package Cost ($/kW) | $ | 2,425 | $ | 900 | ||||
| Heat Recovery | $ | 75 | $ | 75 | ||||
| Interconnect/Switchgear | $ | 75 | $ | 35 | ||||
| Miscellaneous Equipment | $ | 0 | $ | 0 | ||||
| Installation/Civil Work | $ | 285 | $ | 145 | ||||
| Engineering and Management | $ | 180 | $ | 65 | ||||
| General Contractor Markup | $ | 310 | $ | 125 | ||||
| Contingencies and Guarantees | $ | 105 | $ | 40 | ||||
| Carry Charges during Constr. | $ | 220 | $ | 45 | ||||
| Total | $ | 3,675 | $ | 1,430 | ||||
| 3.5 | Reciprocating Engines |
Reciprocating internal combustion (IC) engines are a widespread and well-known technology. North American production tops 35 million units per year for automobiles, trucks, construction and mining equipment, lawn care, marine propulsion, and of course all types of power generation from small portable gen-sets to engines the size of a house powering generators of several megawatts. Spark ignition engines for power generation use natural gas as the preferred fuel – though they can be set up to run on propane or gasoline. Diesel cycle, compression ignition engines can operate on diesel fuel or heavy oil, or they can be set up in a dual-fuel configuration that burns primarily natural gas with a small amount of diesel pilot fuel and can be switched to 100% diesel. Current generation recip engines offer low first cost, easy start-up, proven reliability when properly maintained, and good load-following characteristics. Emissions of recip engines have been reduced significantly in the last several years by exhaust catalysts and through better design and control of the combustion process. Recip engines are well suited for standby, peaking, and intermediate applications and for packaged CHP in commercial and light industrial applications of less than 10 MW.
Technology Specifications
Reciprocating engine cost and performance summaries are shown in Table 3.7.12,13,14,15,16 Engine systems can provide higher electrical efficiencies than combustion turbines in the small sizes. Because a significant portion of the waste heat from engine systems is rejected in the jacket water at a temperature generally too low to produce high-quality steam, the ability of engine systems to produce steam is limited. This feature is generally less critical in commercial applications where it is more common to have hot water loads. The thermal heat evaluation calculations are based on the use of both the jacket water and the exhaust heat to produce hot water. In an industrial setting requiring steam, the thermal energy available would be lower.
| ONSITE SYCOM Energy Corp. | 25 | Commercial CHP Assessment |
Table 3.7. Summary Cost and Performance Specifications for Engine-Driven CHP
| CHP Cost & Performance | 100 kW IC-Eng. | 800 kW IC-Eng. | 3,000 kW IC-Eng. | |||||||||||||||||||||
Assumptions* | Current | 2020 | Current | 2020 | Current | 2020 | ||||||||||||||||||
| Total Installed Cost (99 $/kW) | $ | 1,390 | $ | 990 | $ | 975 | $ | 690 | $ | 850 | $ | 710 | ||||||||||||
| O&M Costs ($/kWyear) | $ | 131.20 | $ | 109.33 | $ | 85.20 | $ | 71.00 | $ | 82.70 | $ | 68.92 | ||||||||||||
| Elec. Heat Rate (Btu/kWh), HHV | 12,126 | 11,147 | 11,050 | 9,382 | 10,158 | 8,982 | ||||||||||||||||||
Elec. Generating Efficiency, HHV (3412/Heat Rate) | 28.1 | % | 30.6 | % | 30.9 | % | 36.4 | % | 33.6 | % | 38 | % | ||||||||||||
| Thermal Energy (Btu/kWh) | ||||||||||||||||||||||||
| Exhaust | 2273 | 2202 | 1491 | 1250 | 1934 | 1546 | ||||||||||||||||||
| Jacket Water | 3410 | 3303 | 2832 | 2374 | 975 | 1150 | ||||||||||||||||||
| Overall Efficiency (%) | 75 | % | 80 | % | 70 | % | 75 | % | 62 | % | 68 | % | ||||||||||||
| Thermal Recov. Eff. | 65 | % | 71 | % | 58 | % | 61 | % | 42 | % | 48 | % | ||||||||||||
| Power to Heat Ratio | 0.60 | 0.62 | 0.79 | 0.94 | 1.17 | 1.27 | ||||||||||||||||||
| Net Elec. Heat Rate (Btus/kWh) | 5,023 | 4,265 | 5,646 | 4,851 | 6,522 | 5,612 | ||||||||||||||||||
Engine systems can provide higher electrical efficiencies than combustion turbines in the small sizes. Because a significant portion of the waste heat from engine systems is rejected in the jacket water at a temperature generally too low to produce high-quality steam, the ability of engine systems to produce steam is limited. This feature is generally less critical in commercial applications where it is more common to have hot water loads. Steam can be produced from the exhaust heat in the same manner as from the exhaust of a combustion turbine, though the volume of exhaust per unit of electrical output is generally much lower. The jacket water for most systems is suitable only for production of hot water.
The 100 kW system is assumed to be a naturally aspirated engine whereas the two larger models are intercooled turbocharged engines. The larger engines have separate coolant flow to the turbochargers and also have oil coolers. It is not typical for heat from these subsystems to be recovered. For this reason, the small engine system has the highest overall efficiency – even though it has the lowest electrical efficiency.
| ONSITE SYCOM Energy Corp. | 26 | Commercial CHP Assessment |
The advanced case assumes that the larger engines approach current diesel cycle efficiency in the spark-ignited gas engine systems. This represents an evolutionary improvement of existing design and operation. A group of engine manufacturers has proposed a cooperative research effort that could ultimately raise the efficiency of the spark ignited recip engine to 45% on a HHV basis (50% LHV). The advanced case also assumes an increase in useful heat recovery (i.e., potential recovery from turbochargers and oil coolers in large engines).
Capital Cost Details
Table 3.8 provides study estimates of capital costs for the three sizes of recip engine CHP systems for commercial applications. For these systems, the total installed cost averages about double the cost of the basic engine generator and heat recovery equipment. The smallest engine systems are both more expensive on a $/kW basis and also have higher added costs for installation. The multi-megawatt size engines are not cheaper than the 800 kW engines because they typically operate at medium to slow speed (600-900 rpm) whereas the smaller engines operate at higher speed (1200-1800 rpm). Smaller systems are better packaged and require less site work than larger systems but this effect is overcome by fairly strong economies of scale in developing, managing, and installing a larger system. One of the biggest examples of economies of scale is the cost of interconnection switchgear which runs $150/kW for the 100 kW system to only $33/kW for the largest system.
The technologically advanced systems show lower costs due to higher specific outputs (more power from the same block), advances in interconnect switchgear, more competitive pricing and experience in engineering and installation, and the impact of a developed sales and service infrastructure.
Table 3.8. Internal Combustion Engine CHP System Capital Costs for Commercial Applications ($1999/kW)
| 100 kW Engine | 800 kW Engine | 3,000 kW Engine | ||||||||||||||||||||||
| Cost Component | Current | 2020 | Current | 2020 | Current | 2020 | ||||||||||||||||||
| Size Kw | 100 | 100 | 800 | 800 | 3,000 | 3000 | ||||||||||||||||||
| Package Cost ($/kW) | $ | 550 | $ | 400 | $ | 430 | $ | 300 | $ | 380 | $ | 320 | ||||||||||||
| Heat Recovery | $ | 100 | $ | 90 | $ | 75 | $ | 60 | $ | 65 | $ | 75 | ||||||||||||
| Interconnect/Switchgear | $ | 150 | $ | 75 | $ | 60 | $ | 35 | $ | 35 | $ | 20 | ||||||||||||
| Miscellaneous Equipment | $ | 70 | $ | 70 | $ | 50 | $ | 50 | $ | 50 | $ | 50 | ||||||||||||
| Installation/Civil Work | $ | 150 | $ | 100 | $ | 105 | $ | 70 | $ | 90 | $ | 70 | ||||||||||||
| Engineering and Management | $ | 90 | $ | 60 | $ | 60 | $ | 40 | $ | 60 | $ | 40 | ||||||||||||
| General Contractor Markup | $ | 150 | $ | 105 | $ | 105 | $ | 70 | $ | 90 | $ | 70 | ||||||||||||
| Contingencies and Guarantees | $ | 60 | $ | 40 | $ | 40 | $ | 30 | $ | 35 | $ | 30 | ||||||||||||
| Carrying Charges during Constr. | $ | 70 | $ | 50 | $ | 50 | $ | 35 | $ | 45 | $ | 35 | ||||||||||||
| Total ($/kW) | $ | 1,390 | $ | 990 | $ | 975 | $ | 690 | $ | 850 | $ | 710 | ||||||||||||
| ONSITE SYCOM Energy Corp. | 27 | Commercial CHP Assessment |
| 3.6 | Combustion Turbines |
Combustion turbines (CT) are an established technology in sizes from several hundred kilowatts to hundreds of megawatts. CTs are used to power aircraft, large marine vessels, gas compressors, and utility and industrial power generators. CTs produce high quality heat that can be used to generate steam for additional power generation (combined cycle) or onsite steam use. CTs can be set up to burn natural gas or a variety of petroleum fuels or can have a dual-fuel configuration.. CT emissions can be controlled to very low levels using dry combustion techniques, water or steam injection, or exhaust treatment such as selective catalytic reduction (SCR). Maintenance costs per unit of power output are among the lowest of CHP technology options. Low maintenance and high quality waste heat make CTs an excellent choice for industrial or commercial cogeneration applications larger than 5 MW.
Technology Specifications
Table 3.9 summarizes the turbine cost and performance parameters for three sizes and the two time periods.17,18,19,20,21 The sizes are 1, 5, and 10 MW, and the time periods reflect the current specifications and those that would be appropriate for the end-point of the NEMS modeling – 2020. The heat rates for the current Combustion turbines (CTs) are taken from published data for popular turbines in each size class. Thermal energy was calculated from published turbine data on steam available from selected systems. The estimates are based on an unfired heat recovery steam generator (HRSG) producing dry, saturated steam at 150 psig. The performance specifications for the 2020 systems are based on advanced technology that is just now becoming available in the market. The 5 MW system is based on a recuperated cycle system that was developed cooperatively by industry and the Department of Energy in the Advanced Turbine System program. The 10 MW system reflects a small-scale combined cycle system. The 1 MW system is based on the assumption that performance will approach the current performance for the 5 MW system.
The derived data in the table show that as CTs become larger, their electrical efficiency increases. As electrical efficiency increases, the absolute quantity or steam produced goes down and the ratio of power to heat increases. A changing ratio of power to heat may affect the decisions that customers make in terms of CHP acceptance, sizing, and the need to sell power.
| ONSITE SYCOM Energy Corp. | 28 | Commercial CHP Assessment |
Table 3.9. Summary Cost and Performance for Combustion Turbine CHP Systems
| CHP Cost & Performance | 1,000 kW CT | 5,000 kW CT | 10,000 kW CT | |||||||||||||||||||||
Assumptions* | Current | 2020 | Current | 2020 | Current | 2020 | ||||||||||||||||||
| Total Installed Cost (99 $/kW) | $ | 1,600 | $ | 1,340 | $ | 1,070 | $ | 925 | $ | 965 | $ | 830 | ||||||||||||
| O&M Costs ($/kWyear) | $ | 76.80 | $ | 64.00 | $ | 46.80 | $ | 39.00 | $ | 44.30 | $ | 36.92 | ||||||||||||
| Elec. Heat Rate (Btu/kWh), HHV | 15,600 | 12,375 | 12,375 | 9,605 | 11,750 | 9,054 | ||||||||||||||||||
| Elec. Generating Efficiency, HHV (3412/Heat Rate) | 21.9 | % | 27.6 | % | 27.6 | % | 35.5 | % | 29.0 | % | 37.7 | % | ||||||||||||
| Thermal Energy (Btu/kWh) | 7,820 | 5,622 | 5,622 | 3,709 | 5,283 | 3,280 | ||||||||||||||||||
| Overall Efficiency (%) | 72 | % | 73 | % | 73 | % | 74 | % | 74 | % | 74 | % | ||||||||||||
| Thermal Recov. Eff. | 64 | % | 63 | % | 63 | % | 60 | % | 63 | % | 58 | % | ||||||||||||
| Power Steam Ratio | 0.436 | 0.607 | 0.607 | .920 | 0.646 | 1.041 | ||||||||||||||||||
| Net Elec. Heat Rate (Btus/kWh) | 5825 | 5348 | 5348 | 4967 | 5146 | 4954 | ||||||||||||||||||
Capital Cost Details
The detailed capital costs for the current and advanced CT-CHP systems are shown in Table 3.10.17,19,20,21 A CT-CHP plant is a complex process with many interrelated subsystems. The system is designed around key equipment components. The most important is the turbine-generator set. Prices typically range from $300-400 per kW except for the 1 MW size which is considerably more expensive on a unit cost basis. A heat recovery steam generator (HRSG) accomplishes the heat recovery. The next most important subsystem is the electrical switchgear and controls. After these main components there are still a large number of smaller components such as enclosures or buildings, water treatment systems, piping, pumps, storage tanks, equipment foundations and superstructures, fire suppression systems, and emissions control and monitoring equipment. Site preparation can be a significant cost for some projects. Labor and materials for plant construction are also a major part of overall costs. The sum of these costs is termed total process capital in our table. To total process capital must be added engineering, general contractor fees, permitting fees, contingency, and financing costs. These costs add an additional 20% to total process capital to provide an estimate of total capital cost. The cost estimates do not include costs for exhaust treatment using SCR.
* Base case gas turbines are based on published specifications18 and package prices.17 The capital cost estimation is based on the use of a proprietary cost and performance model – SOAPP-CT.25 – (for State-of-the-Art Power Plant, combustion turbine).19 The model output was adjusted based on OSEC engineering judgment and experience. The base case 1 MW size is based on the Solar 1205 kW Saturn 20 gas turbine. The 5 MW system is based on the Solar Taurus 60. The 10 MW system is based on the Solar Mars 100. The advanced case 1 MW system is based on a qualitative assessment of potential efficiency improvement based on recuperation. The advanced 5 MW system is based on the 4.2 MW Solar Mercury 50, a recuperated turbine system that was the successful product of the DOE Advanced Turbine System program. The advanced 10 MW system is based on the Mitsui SB60 (17.7 MW) combined cycle turbine system.
| ONSITE SYCOM Energy Corp. | 29 | Commercial CHP Assessment |
The advanced capital costs are estimated based on the assumption that miscellaneous equipment, materials, and labor would be reduced by 20%. This reduction reflects the expectation that CHP system installation will become more streamlined in the future and that packaged systems will require less onsite labor and materials. The costs for the basic turbine generator package and heat recovery are also assumed to be reduced, but only by 10%. Cost engineering is expected to bring costs down, but additional equipment such as recuperators and more costly materials for the advanced CTs is expected to partially offset the cost engineering improvements.
| ONSITE SYCOM Energy Corp. | 30 | Commercial CHP Assessment |
Table 3.10. Capital Cost Estimates for CHP Plants Based on Combustion Turbines
| Nominal Turbine Capacity , kW | 1,000 kW CT | 5,000 kW CT | 10,000 kW CT | |||||||||||||||||||||
| Current | 2020 | Current | 2020 | Current | 2020 | |||||||||||||||||||
| Combustion Turbines | $ | 550,000 | $ | 467,500 | $ | 2,102,940 | $ | 1,892,646 | $ | 4,319,200 | $ | 3,887,280 | ||||||||||||
| Heat Recovery Steam Generators | $ | 250,000 | $ | 225,000 | $ | 350,000 | $ | 315,000 | $ | 590,000 | $ | 531,000 | ||||||||||||
| Water Treatment System | $ | 30,000 | $ | 30,000 | $ | 100,000 | $ | 100,000 | $ | 150,000 | $ | 150,000 | ||||||||||||
| Electrical Equipment | $ | 150,000 | $ | 120,000 | $ | 375,000 | $ | 300,000 | $ | 625,000 | $ | 500,000 | ||||||||||||
| Other Equipment | $ | 145,000 | $ | 115,700 | $ | 315,000 | $ | 255,000 | $ | 575,000 | $ | 460,000 | ||||||||||||
| Total Equipment | $ | 1,125,000 | $ | 1,351,369 | $ | 3,242,940 | $ | 2,862,646 | $ | 6,259,200 | $ | 5,528,280 | ||||||||||||
| Materials | $ | 143,952 | $ | 115,162 | $ | 356,723 | $ | 285,379 | $ | 688,512 | $ | 550,810 | ||||||||||||
| Labor | $ | 347,509 | $ | 278,007 | $ | 908,023 | $ | 726,419 | $ | 1,752,576 | $ | 1,402,061 | ||||||||||||
| Total Process Capital $ | $ | 1,616,461 | $ | 1,351,369 | $ | 4,507,687 | $ | 3,974,443 | $ | 8,700,288 | $ | 7,481,150 | ||||||||||||
| General Facilities Capital $ | $ | 48,483 | $ | 40,541 | $ | 135,231 | $ | 116,233 | $ | 261,009 | $ | 224,435 | ||||||||||||
| Engineering and Fees $ | $ | 48,483 | $ | 40,541 | $ | 135,231 | $ | 116,233 | $ | 261,009 | $ | 224,435 | ||||||||||||
| Process Contingency $ | $ | 48,483 | $ | 40,541 | $ | 135,231 | $ | 116,233 | $ | 261,009 | $ | 224,435 | ||||||||||||
| Project Contingency $ | $ | 171,305 | $ | 143,245 | $ | 450,769 | $ | 410,691 | $ | 922,231 | $ | 793,002 | ||||||||||||
| Total Plant Cost $ | $ | 1,933,215 | $ | 1,616,237 | $ | 5,364,147 | $ | 4,633,834 | $ | 10,405,544 | $ | 8,947,456 | ||||||||||||
| Actual Turbine Capacity (kW) | 1,205 | 1,205 | 5,007 | 5,007 | 10,798 | 10,798 | ||||||||||||||||||
| Total Plant Cost per net kW $ | $ | 1,604 | $ | 1,341 | $ | 1,071 | $ | 925 | $ | 964 | $ | 829 | ||||||||||||
| ONSITE SYCOM Energy Corp. | 31 | Commercial CHP Assessment |
| 3.7 | Operating and Maintenance Costs |
The operating and maintenance costs presented in Table 3.11 include total maintenance costs including routine inspections and procedures and major overhauls. O&M costs presented in Table 3.11 are based on 8,000 operating hours expressed in terms of annual electricity generation. Fixed costs are based on an interpolation of manufacturers' estimates. The variable component of the O&M cost represents the inspections and overhaul procedures that are normally conducted by the prime mover OEM through a service agreement usually based on run hours. It is recognized, however, that there is a fixed component aspect to original equipment manufacturer (OEM) service agreements as well. However, for purposes of clarity, the information is presented as a variable cost. Consumables include primarily an estimate for water and chemicals that are consumed in proportion to electric capacity. All costs shown are for current systems. For purposes of the NEMS modeling estimates, we assume a 20% reduction of O&M costs for the advanced systems.
Microturbines and Fuel Cells
O&M costs for these developing technologies are based on the report of the Technology Characterization Committee for the Collaborative Report of the California Alliance for Distributed Energy Resources.11 These costs were adjusted somewhat for consistency with the estimates developed below for reciprocating engines and combustion turbines.
Reciprocating Internal Combustion Engines
O&M costs presented in Table 3.11 are based on engine manufacturer estimates for service contracts consisting of routine inspections and scheduled overhauls of the engine generator set.12,13,22 Engine service is comprised of routine inspections/adjustments and periodic replacement of engine oil, coolant and spark plugs. An oil analysis is part of most preventative maintenance programs to monitor engine wear. A top-end overhaul is generally recommended between 12,000-15,000 hours of operation that entails a cylinder head and turbocharger rebuild. A major overhaul is performed after 24,000-30,000 hours of operation and involves piston/liner replacement, crankshaft inspection, bearings and seals.
Gas Turbines
O&M costs presented in Table 3.11 are based on gas turbine manufacturer estimates for service contracts consisting of routine inspections and scheduled overhauls of the turbine generator set.20,23 Routine maintenance practices include on-line running maintenance, predictive maintenance, plotting trends, performance testing, fuel consumption, heat rate, vibration analysis, and preventive maintenance procedures.
Routine inspections are required to insure that the turbine is free of excessive vibration due to worn bearings, rotors and damaged blade tips. Inspections generally include on-site hot gas path borescope inspections and non-destructive component testing using dye penetrant and magnetic particle techniques to ensure the integrity of components. The combustion path is inspected for fuel nozzle cleanliness and wear along with the integrity of other hot gas path components.
| ONSITE SYCOM Energy Corp. | 32 | Commercial CHP Assessment |
A gas turbine overhaul is typically a complete inspection and rebuild of components to restore the gas turbine to original or current (upgraded) performance standards. A typical overhaul consists of dimensional inspections, product upgrades and testing of the turbine and compressor, rotor removal, inspection of thrust and journal bearings, blade inspection and clearances and setting packing seals.
Gas turbine maintenance costs can vary significantly depending on the quality and diligence of the preventative maintenance program and operating conditions. Although gas turbines can be cycled, maintenance costs can triple for a gas turbine that is cycled every hour versus a turbine that is operated for intervals of a 1000 hours or more. In addition, operating the turbine over the rated capacity for significant periods of time will dramatically increase the number of hot path inspections and overhauls. Gas turbines that operate for extended periods on liquid fuels will experience higher than average overhaul intervals.
Table 3.11a. O&M Cost Estimates
| Size | Variable Costs $/kWh | Fixed Costs | Total O&M | |||||||||||||||||
Technology | kW | Service Contract | Consumables | $/kW-year | $/kWh* | |||||||||||||||
| Microturbine | 100 | $0.00500 | $ | 50.00 | $ | 0.01125 | ||||||||||||||
| Fuel Cell | 200 | $0.00900 | $ | 15.00 | $ | 0.01088 | ||||||||||||||
| Reciprocating Engine | 100 | $ | 0.01500 | $ | 0.00015 | $ | 10.00 | $ | 0.01640 | |||||||||||
| Reciprocating Engine | 800 | $ | 0.01000 | $ | 0.00015 | $ | 4.00 | $ | 0.01065 | |||||||||||
| Reciprocating Engine | 3,000 | $ | 0.01000 | $ | 0.00015 | $ | 1.50 | $ | 0.01034 | |||||||||||
| Combustion Turbine | 1,000 | $ | 0.00450 | $ | 0.00010 | $ | 40.00 | $ | 0.00960 | |||||||||||
| Combustion Turbine | 5,000 | $ | 0.00450 | $ | 0.00010 | $ | 10.00 | $ | 0.00585 | |||||||||||
| Combustion Turbine | 10,000 | $ | 0.00450 | $ | 0.00010 | $ | 7.50 | $ | 0.00554 | |||||||||||
* Total Costs based on 8,000 hours of operation per year
| ONSITE SYCOM Energy Corp. | 33 | Commercial CHP Assessment |
Table 3.11b O&M Total Costs Expressed in Terms of Total Costs per Year per Kilowatt (not additive with previous table)
| Size | Total O&M | |||||||
| Technology | kW | $/kW-year* | ||||||
| Microturbine | 100 | $ | 90.00 | |||||
| Fuel Cell | 200 | $ | 87.00 | |||||
| Reciprocating Engine | 100 | $ | 131.20 | |||||
| Reciprocating Engine | 800 | $ | 85.20 | |||||
| Reciprocating Engine | 3,000 | $ | 82.70 | |||||
| Combustion Turbine | 1,000 | $ | 76.80 | |||||
| Combustion Turbine | 5,000 | $ | 46.80 | |||||
| Combustion Turbine | 10,000 | $ | 44.30 | |||||
* based on 8,000 hours/year of operation
| ONSITE SYCOM Energy Corp. | 34 | Commercial CHP Assessment |
| 4. | References |
| 1. | Commercial Buildings Energy Consumption Survey, 1995, U.S.DOE, Energy Information Agency, Washington, DC, 1998 |
| 2. | Independent Power Database, Hagler, Bailly Consulting Inc, Arlington, VA, 1999 |
| 3. | Small Cogeneration Market Review, Draft Report, Gas Research Institute, Chicago, Il, 1996 |
| 4. | Commercial Market Segmentation Study: Education Sector, GRI, AGA, 1998 |
| 5. | Commercial Market Segmentation Study: Health Care Sector, GRI, AGA, 1998 |
| 6. | Commercial Market Segmentation Study: Lodging Sector, GRI, AGA, 1998 |
| 7. | Commercial Market Segmentation Study: Education Sector, GRI, AGA, 1998 |
| 8. | MarketPlace Database, iMarket Inc, Waltham, MA., 1999 |
| 9. | Product Demonstration Presentation, Allied Signal Parallon 75, Chicago, Il, November 10, 1999 |
| 10. | Cooperative Research and Development for Advanced Microturbine Systems, Solicitation for Financial Assistance Applications, No. DE-SC02-00CH11016, U.S.DOE, Argonne, IL |
| 11. | "Distributed Energy Technology Matrix", Collaborative Report and Action Agenda, California Alliance for Distributed Energy Resources, Sacramento, CA, January, 1998 |
| 12. | Caterpillar Datasheets, G3306, G3516, G3616, Caterpillar Inc., 1998 |
| 13. | Waukesha Datasheet, 5790GL, Waukesha Engines, 1998 |
| 14. | Heat Recovery Datasheet, Waukesha 5790GL, Maxim Co., 1995 |
| 15. | Liss, W.E., Kincaid, D.E., Distributed Generation Using High Power Output, High Efficiency Natural Gas Engines, , Gas Research Institute, American Power Conference, 1999 |
| 16. | Program Summary: Advanced Reciprocating Engine Systems (ARES), 1999 |
| 17. | 1998-1999 Gas Turbine World Handbook, Pequot Publishing, 1999 |
| ONSITE SYCOM Energy Corp. | 35 | Commercial CHP Assessment |
| 18. | Diesel & Gas Turbine Worldwide Catalog: Product Directory & Buyers Guide, Brookfield, Wisconsin, 1997. |
| 19. | SOAPP-CT.25 Workstation: Version 1, SEPRIL, llc, January 1999 |
| 20. | Personal communications with M. Jurgensen, Solar Turbines Inc., January 2000 |
| 21. | Personal communications with M. Scorrano, Trigen Energy Corp. |
| 22. | Personal communications with G. Deale, Hawthorne Power Systems |
| 23. | Personal communications with J. Polk, General Electric Co. |
| 24. | Personal communications with R. Krajcovic, Unicom |
| ONSITE SYCOM Energy Corp. | 36 | Commercial CHP Assessment |
Appendix A - Profile of Existing Commercial/Institutional CHP
| Table A1. | Commercial CHP Installations, Electric and Thermal Capacity by Fuel Type |
| Table A2. | Commercial CHP Installations and Capacity by State and Fuel Type |
| Table A3. | Commercial CHP Installations, Electric and Thermal Capacity by State and Prime Mover |
| Table A4. | Commercial CHP Installations, Electric and Thermal Capacity by Application and Prime Mover |
| Table A5. | Commercial CHP Installations and Capacity by Application and Ownership |
| Table A6. | Commercial CHP Installations and Capacity by Applications and Utility Sales Arrangements |
| Table A7. | Commercial CHP Installations and Capacity by State and by Utility Sales Arrangements |
| Table A8. | Commercial CHP Installations and Capacity by Size Range and Fuel Type |
| Table A9. | Commercial CHP Installations and Capacity by State and Prime Mover |
| Table A10. | Commercial CHP Installations and Capacity by Ownership and Prime Mover |
| Table A11. | Commercial CHP Installations and Capacity by Sales Arrangements and Prime Mover |
| Table A12. | Commercial CHP Installations and Capacity by Prime Mover and Fuel Type |
| Table A13. | Commercial CHP Installations and Capacity by Size Range and Prime Mover |
Data in these tables based on the Hagler, Bailly Independent Power Database updated by OSEC
| ONSITE SYCOM Energy Corp. | 37 | Commercial CHP Assessment |
Table A1. Commercial CHP Installations, Electric and Thermal Capacity by Fuel Type
| Coal | Natural Gas | Oil | Waste | Wood | Other | Totals | |
| Warehousing & | 4 | 1 | 1 | 6 | |||
| Storage | 58.29 | 3.00 | 0.08 | 61.37 | |||
| 233 | 12 | 0 | 245 | ||||
| 7 | 1 | 1 | 9 | ||||
| Airports | 151.44 | 5.50 | 13.50 | 170.44 | |||
| 606 | 22 | 54 | 682 | ||||
| Water | 12 | 1 | 1 | 12 | 26 | ||
| Treatment | 116.03 | 0.01 | 3.00 | 21.89 | 140.93 | ||
| 464 | 0 | 12 | 88 | 564 | |||
| Solid Waste | 9 | 2 | 11 | ||||
| Facilities | 372.45 | 5.80 | 378.25 | ||||
| 3,270 | 23 | 3,293 | |||||
| District Energy/ | 3 | 16 | 1 | 2 | 1 | 5 | 28 |
| Utilities | 88.50 | 728.39 | 54.00 | 31.70 | 39.60 | 12.50 | 954.69 |
| 500 | 1,959 | 485 | 385 | 360 | 81 | 3,770 | |
| Food | 10 | 10 | |||||
| Stores | 1.38 | 1.38 | |||||
| 6 | 6 | ||||||
| 11 | 1 | 1 | 13 | ||||
| Restaurants | 0.91 | 0.27 | 0.07 | 1.25 | |||
| 4 | 1 | 0 | 5 | ||||
| Commercial | 1 | 45 | 2 | 1 | 3 | 52 | |
| Office Buildings | 70.00 | 109.60 | 5.73 | 28.00 | 22.05 | 235.38 | |
| & Facilities | 560 | 569 | 23 | 280 | 208 | 1,640 | |
| Apartment | 97 | 1 | 98 | ||||
| Buildings | 95.38 | 0.98 | 96.35 | ||||
| 650 | 4 | 653 | |||||
| 78 | 2 | 3 | 83 | ||||
| Hotels | 25.74 | 3.39 | 1.04 | 30.16 | |||
| 136 | 11 | 4 | 151 | ||||
| 76 | 2 | 78 | |||||
| Laundries | 3.27 | 0.03 | 3.30 | ||||
| 13 | 0 | 13 | |||||
| 2 | 4 | 6 | |||||
| Car Washes | 0.16 | 0.15 | 0.31 | ||||
| 1 | 1 | 1 | |||||
| Health & | 81 | 3 | 1 | 85 | |||
| Country Clubs | 163.06 | 1.21 | 0.03 | 164.30 | |||
| 403 | 5 | 0 | 408 | ||||
| Nursing | 1 | 72 | 73 | ||||
| Homes | 1.00 | 9.68 | 10.68 | ||||
| 15 | 41 | 56 | |||||
| 1 | 119 | 8 | 1 | 1 | 1 | 131 | |
| Hospitals | 5.00 | 413.16 | 16.07 | 55.00 | 2.00 | 0.15 | 491.38 |
| 75 | 1,593 | 145 | 220 | 30 | 2 | 2,065 | |
| Elementary & | 101 | 1 | 4 | 106 | |||
| Primary Schools | 13.69 | 0.12 | 0.42 | 14.23 | |||
| 55 | 0 | 2 | 57 |
| ONSITE SYCOM Energy Corp. | 38 | Commercial CHP Assessment |
Table A1 continued
| Coal | Natural Gas | Oil | Waste | Wood | Other | Totals | |
| Colleges & | 8 | 93 | 8 | 1 | 1 | 1 | 112 |
| Universities | 215.57 | 1,103.90 | 20.36 | 62.00 | 1.13 | 11.00 | 1,413.95 |
| 2,032 | 3,856 | 249 | 488 | 16 | 44 | 6,685 | |
| 2 | 2 | ||||||
| Museums | 3.79 | 3.79 | |||||
| 30 | 30 | ||||||
| Government | 4 | 26 | 3 | 33 | |||
| Facilities | 60.65 | 501.45 | 57.20 | 619.30 | |||
| 606 | 2,105 | 613 | 3,324 | ||||
| 14 | 2 | 1 | 1 | 18 | |||
| Prisons | 48.00 | 45.70 | 4.00 | 37.00 | 134.70 | ||
| 195 | 455 | 60 | 148 | 858 | |||
| Totals | 18 | 866 | 30 | 25 | 4 | 37 | 980 |
| Totals | 440.72 | 3,547.31 | 110.62 | 655.28 | 46.73 | 125.48 | 4,926.13 |
| Totals | 3,788 | 12,918 | 957 | 5,724 | 466 | 654 | 24,507 |
| Key: | |
| Number of Sites | 12 |
| Electrical Capacity, MW | 42.67 |
| Thermal Capacity, mmBtu/Hour | 207 |
| ONSITE SYCOM Energy Corp. | 39 | Commercial CHP Assessment |
Table A2. Commercial CHP Installations and Capacity by State and Fuel Type
| Coal | Natural Gas | Oil | Waste | Wood | Other | Totals | |
| AK | 5 | 1 | 6 | ||||
| 12.70 | 0.33 | 13.02 | |||||
| AL | 1 | 1 | |||||
| 3.00 | 3.00 | ||||||
| AR | 2 | 2 | |||||
| 12.60 | 12.60 | ||||||
| AZ | 14 | 14 | |||||
| 5.81 | 5.81 | ||||||
| CA | 429 | 18 | 447 | ||||
| 795.27 | 55.52 | 850.79 | |||||
| CO | 5 | 1 | 6 | ||||
| 109.50 | 0.70 | 110.20 | |||||
| CT | 43 | 4 | 1 | 48 | |||
| 106.01 | 8.80 | 18.00 | 132.81 | ||||
| FL | 8 | 3 | 1 | 1 | 1 | 14 | |
| 53.22 | 12.81 | 70.00 | 39.60 | 0.13 | 175.75 | ||
| GA | 1 | 1 | |||||
| 0.01 | 0.01 | ||||||
| HI | 1 | 4 | 1 | 6 | |||
| 64.50 | 0.30 | 0.12 | 64.92 | ||||
| IA | 6 | 6 | |||||
| 5.64 | 5.64 | ||||||
| ID | 1 | 1 | |||||
| 20.00 | 20.00 | ||||||
| IL | 3 | 21 | 24 | ||||
| 49.00 | 52.06 | 101.06 | |||||
| IN | 1 | 3 | 1 | 5 | |||
| 40.00 | 5.55 | 0.20 | 45.75 | ||||
| KY | 1 | 1 | |||||
| 0.40 | 0.40 | ||||||
| MA | 29 | 1 | 30 | ||||
| 95.33 | 1.81 | 97.13 | |||||
| MD | 1 | 1 | 1 | 3 | |||
| 10.00 | 60.00 | 4.00 | 74.00 | ||||
| ME | 1 | 1 | 2 | ||||
| 0.01 | 1.13 | 1.14 | |||||
| MI | 1 | 15 | 4 | 1 | 21 | ||
| 61.00 | 74.24 | 82.78 | 1.60 | 219.62 | |||
| MN | 2 | 1 | 3 | ||||
| 5.35 | 4.20 | 9.55 | |||||
| MO | 3 | 3 | 6 | ||||
| 53.00 | 19.90 | 72.90 | |||||
| MS | 1 | 1 | |||||
| 4.35 | 4.35 | ||||||
| MT | 1 0.15 | 1 0.15 |
| ONSITE SYCOM Energy Corp. | 40 | Commercial CHP Assessment |
| NC | 1 | 1 | |||||
| 28.00 | 28.00 | ||||||
| NE | 1 | 1 | 2 | ||||
| 0.08 | 0.90 | 0.98 | |||||
| NH | 3 | 1 | 4 | ||||
| 6.37 | 2.00 | 8.37 | |||||
| NJ | 100 | 2 | 4 | 106 | |||
| 100.86 | 98.00 | 3.48 | 202.34 | ||||
| NM | 6 | 1 | 7 | ||||
| 10.96 | 2.26 | 13.22 | |||||
| NV | 1 | 1 | |||||
| 0.02 | 0.02 | ||||||
| NY | 2 | 98 | 10 | 4 | 2 | 116 | |
| 57.80 | 908.91 | 9.99 | 88.26 | 2.94 | 1,067.89 | ||
| OH | 1 | 6 | 7 | ||||
| 0.77 | 4.16 | 4.93 | |||||
| OK | 1 | 1 | |||||
| 16.30 | 16.30 | ||||||
| PA | 2 | 21 | 1 | 5 | 29 | ||
| 0.65 | 291.32 | 54.00 | 112.76 | 458.73 | |||
| RI | 5 | 5 | |||||
| 1.09 | 1.09 | ||||||
| SC | 2 | 1 | 3 | ||||
| 76.00 | 15.00 | 91.00 | |||||
| SD | 1 | 1 | |||||
| 2.70 | 2.70 | ||||||
| TN | 3 | 3 | 6 | ||||
| 15.40 | 31.80 | 47.20 | |||||
| TX | 18 | 1 | 19 | ||||
| 449.06 | 0.24 | 449.30 | |||||
| UT | 3 | 3 | |||||
| 5.25 | 5.25 | ||||||
| VA | 3 | 1 | 2 | 2 | 8 | ||
| 123.72 | 3.00 | 43.00 | 5.80 | 175.52 | |||
| VT | 2 | 2 | |||||
| 0.11 | 0.11 | ||||||
| WA | 1 | 1 | |||||
| 3.59 | 3.59 | ||||||
| WI | 3 | 1 | 2 | 6 | |||
| 252.35 | 10.00 | 1.28 | 263.63 | ||||
| WV | 1 | 1 | 1 | 3 | |||
| 0.24 | 3.15 | 62.00 | 65.39 | ||||
| Totals | 18 | 866 | 30 | 25 | 4 | 37 | 980 |
| Totals | 440.72 | 3,547.31 | 110.62 | 655.28 | 46.73 | 125.48 | 4,926.13 |
| Key: | |
| Number of Sites | 12 |
| Electrical Capacity, MW | 42.67 |
| ONSITE SYCOM Energy Corp. | 41 | Commercial CHP Assessment |
Table A3. Commercial CHP Installations, Electric and Thermal Capacity by Applications and Prime Mover
Boiler/Steam Turbine | Combined Cycle | Combustion Turbine | Reciprocating Engine | Other | Totals | |
| Warehousing & | 2 | 4 | 6 | |||
| Storage | 56.00 | 5.37 | 61.37 | |||
| 224 | 21 | 245 | ||||
| 2 | 1 | 4 | 2 | 9 | ||
| Airports | 137.00 | 14.00 | 5.76 | 13.68 | 170.44 | |
| 548 | 56 | 23 | 55 | 682 | ||
| Water | 1 | 25 | 26 | |||
| Treatment | 49.40 | 91.53 | 140.93 | |||
| 198 | 366 | 564 | ||||
| Solid Waste | 9 | 2 | 11 | |||
| Facilities | 372.45 | 5.80 | 378.25 | |||
| 3,270 | 23 | 3,293 | ||||
| District Energy/ | 7 | 6 | 2 | 10 | 3 | 28 |
| Utilities | 152.09 | 739.47 | 18.75 | 36.53 | 7.85 | 954.69 |
| 1,577 | 1,919 | 95 | 146 | 33 | 3,770 | |
| Food | 10 | 10 | ||||
| Stores | 1.38 | 1.38 | ||||
| 6 | 6 | |||||
| 12 | 1 | 13 | ||||
| Restaurants | 1.21 | 0.04 | 1.25 | |||
| 5 | 0 | 5 | ||||
| Commercial | 4 | 12 | 34 | 2 | 52 | |
| Office Buildings | 121.00 | 56.39 | 57.14 | 0.85 | 235.38 | |
| & Facilities | 1,085 | 323 | 229 | 3 | 1,640 | |
| Apartment | 2 | 1 | 95 | 98 | ||
| Buildings | 38.00 | 34.00 | 24.35 | 96.35 | ||
| 456 | 100 | 97 | 653 | |||
| 4 | 77 | 2 | 83 | |||
| Hotels | 8.05 | 21.01 | 1.10 | 30.16 | ||
| 65 | 81 | 4 | 151 | |||
| 76 | 2 | 78 | ||||
| Laundries | 3.20 | 0.10 | 3.30 | |||
| 13 | 0 | 13 | ||||
| 6 | 6 | |||||
| Car Washes | 0.31 | 0.31 | ||||
| 1 | 1 | |||||
| Health & | 2 | 1 | 82 | 85 | ||
| Country Clubs | 149.80 | 0.11 | 14.39 | 164.30 | ||
| 350 | 0 | 58 | 408 | |||
| Nursing | 2 | 71 | 73 | |||
| Homes | 1.23 | 9.46 | 10.68 | |||
| 18 | 38 | 56 | ||||
| 7 | 5 | 30 | 86 | 3 | 131 | |
| Hospitals | 69.45 | 229.41 | 96.72 | 95.00 | 0.80 | 491.38 |
| 437 | 688 | 556 | 380 | 3 | 2,065 | |
| Elementary & | 1 | 104 | 1 | 106 | ||
| Primary Schools | 0.06 | 13.97 | 0.20 | 14.23 | ||
| 0 | 56 | 1 | 57 |
| ONSITE SYCOM Energy Corp. | 42 | Commercial CHP Assessment |
| Colleges & | 15 | 7 | 39 | 49 | 2 | 112 |
| Universities | 294.63 | 449.60 | 563.31 | 95.21 | 11.20 | 1,413.95 |
| 2,775 | 1,037 | 2,439 | 389 | 45 | 6,685 | |
| 2 | 2 | |||||
| Museums | 3.79 | 3.79 | ||||
| 30 | 30 | |||||
| Government | 11 | 3 | 7 | 12 | 33 | |
| Facilities | 242.55 | 342.50 | 21.70 | 12.55 | 619.30 | |
| 2,501 | 643 | 130 | 50 | 3,324 | ||
| 3 | 1 | 4 | 9 | 1 | 18 | |
| Prisons | 49.70 | 28.14 | 48.80 | 7.87 | 0.20 | 134.70 |
| 515 | 85 | 226 | 31 | 1 | 858 | |
| Totals | 60 | 27 | 104 | 770 | 19 | 980 |
| Totals | 1,341.10 | 2,109.92 | 933.28 | 505.81 | 36.02 | 4,926.13 |
| Totals | 12,634 | 5,370 | 4,313 | 2,044 | 146 | 24,507 |
| Key: | |
| Number of Sites | 12 |
| Electrical Capacity, MW | 42.67 |
| Thermal Capacity, mmBtu/Hour | 207 |
| ONSITE SYCOM Energy Corp. | 43 | Commercial CHP Assessment |
Table A4. Commercial CHP Installations, Electric and Thermal Capacity by State and Prime Mover
| State | Boiler/Steam Turbine | Combined Cycle | Combustion Turbine | Reciprocating Engine | Other | Totals |
| AK | 2 | 4 | 6 | |||
| 6.15 | 6.87 | 13.02 | ||||
| AL | 1 | 1 | ||||
| 3.00 | 3.00 | |||||
| AR | 2 | 2 | ||||
| 12.60 | 12.60 | |||||
| AZ | 2 | 12 | 14 | |||
| 1.45 | 4.36 | 5.81 | ||||
| CA | 4 | 9 | 35 | 388 | 11 | 447 |
| 110.20 | 281.45 | 318.07 | 138.24 | 2.84 | 850.79 | |
| CO | 1 | 1 | 4 | 6 | ||
| 33.00 | 76.00 | 1.20 | 110.20 | |||
| CT | 5 | 1 | 7 | 35 | 48 | |
| 26.80 | 56.00 | 45.40 | 4.61 | 132.81 | ||
| FL | 2 | 1 | 3 | 8 | 14 | |
| 109.60 | 27.50 | 17.25 | 21.41 | 175.75 | ||
| GU | 1 | 1 | ||||
| 0.01 | 0.01 | |||||
| HI | 1 | 5 | 6 | |||
| 64.50 | 0.42 | 64.92 | ||||
| IA | 6 | 6 | ||||
| 5.64 | 5.64 | |||||
| ID | 1 | 1 | ||||
| 20.00 | 20.00 | |||||
| IL | 3 | 5 | 16 | 24 | ||
| 49.00 | 27.20 | 24.86 | 101.06 | |||
| IN | 1 | 1 | 2 | 1 | 5 | |
| 40.00 | 2.75 | 2.80 | 0.20 | 45.75 | ||
| KY | 1 | 1 | ||||
| 0.40 | 0.40 | |||||
| MA | 1 | 1 | 27 | 1 | 30 | |
| 64.00 | 22.00 | 10.78 | 0.35 | 97.13 | ||
| MD | 3 | 3 | ||||
| 74.00 | 74.00 | |||||
| ME | 1 | 1 | 2 | |||
| 1.13 | 0.01 | 1.14 | ||||
| MI | 4 | 7 | 10 | 21 | ||
| 143.70 | 68.46 | 7.46 | 219.62 | |||
| MN | 1 | 1 | 1 | 3 | ||
| 4.20 | 5.20 | 0.15 | 9.55 | |||
| MO | 3 | 1 | 2 | 6 | ||
| 53.00 | 15.45 | 4.45 | 72.90 | |||
| MS | 1 | 1 | ||||
| 4.35 | 4.35 |
| ONSITE SYCOM Energy Corp. | 44 | Commercial CHP Assessment |
| MT | 1 | 1 | ||||
| 0.15 | 0.15 | |||||
| NC | 1 | 1 | ||||
| 28.00 | 28.00 | |||||
| NE | 2 | 2 | ||||
| 0.98 | 0.98 | |||||
| NH | 2 | 2 | 4 | |||
| 5.00 | 3.37 | 8.37 | ||||
| NJ | 3 | 12 | 90 | 1 | 106 | |
| 98.23 | 74.50 | 29.16 | 0.45 | 202.34 | ||
| NM | 2 | 5 | 7 | |||
| 7.17 | 6.05 | 13.22 | ||||
| NV | 1 | 1 | ||||
| 0.02 | 0.02 | |||||
| NY | 10 | 7 | 4 | 95 | 116 | |
| 187.44 | 670.00 | 130.50 | 79.96 | 1,067.89 | ||
| OH | 1 | 3 | 3 | 7 | ||
| 0.77 | 3.28 | 0.88 | 4.93 | |||
| OK | 1 | 1 | ||||
| 16.30 | 16.30 | |||||
| PA | 7 | 1 | 4 | 15 | 2 | 29 |
| 184.85 | 183.97 | 20.67 | 68.86 | 0.38 | 458.73 | |
| RI | 5 | 5 | ||||
| 1.09 | 1.09 | |||||
| SC | 3 | 3 | ||||
| 91.00 | 91.00 | |||||
| SD | 1 | 1 | ||||
| 2.70 | 2.70 | |||||
| TN | 3 | 3 | 6 | |||
| 15.40 | 31.80 | 47.20 | ||||
| TX | 1 | 3 | 5 | 10 | 19 | |
| 0.94 | 361.00 | 48.90 | 38.46 | 449.30 | ||
| UT | 3 | 3 | ||||
| 5.25 | 5.25 | |||||
| VA | 1 | 1 | 6 | 8 | ||
| 40.00 | 120.00 | 15.52 | 175.52 | |||
| VT | 2 | 2 | ||||
| 0.11 | 0.11 | |||||
| WA | 1 | 1 | ||||
| 3.59 | 3.59 | |||||
| WI | 2 | 1 | 2 | 1 | 6 | |
| 11.25 | 248.50 | 3.85 | 0.03 | 263.63 | ||
| WV | 1 | 2 | 3 | |||
| 62.00 | 3.39 | 65.39 | ||||
| Totals | 60 | 27 | 104 | 770 | 19 | 980 |
| Totals | 1,341.10 | 2,109.92 | 933.28 | 505.81 | 36.02 | 4,926.13 |
| Key: | |
| Number of Sites | 12 |
| Electrical Capacity, MW | 42.67 |
| ONSITE SYCOM Energy Corp. | 45 | Commercial CHP Assessment |
Table A5. Commercial CHP Installations and Capacity by Application and Ownership
3rd Party | Self | Totals | |
| Warehousing & | 4 | 2 | 6 |
| Storage | 59.08 | 2.29 | 61.37 |
| Airports | 3 | 6 | 9 |
| 107.26 | 63.18 | 170.44 | |
| Water | 6 | 20 | 26 |
| Treatment | 40.11 | 100.82 | 140.93 |
| Solid Waste | 10 | 1 | 11 |
| Facilities | 374.05 | 4.20 | 378.25 |
| District Energy/ | 22 | 6 | 28 |
| Utilities | 928.93 | 25.76 | 954.69 |
| Food | 8 | 2 | 10 |
| Stores | 1.17 | 0.21 | 1.38 |
| Restaurants | 12 | 1 | 13 |
| 1.24 | 0.01 | 1.25 | |
| Commercial | 28 | 24 | 52 |
| Office Buildings | 131.73 | 103.65 | 235.38 |
| Apartment | 75 | 23 | 98 |
| Buildings | 44.27 | 52.08 | 96.35 |
| Hotels | 65 | 18 | 83 |
| 11.79 | 18.38 | 30.16 | |
| Laundries | 68 | 10 | 78 |
| 1.63 | 1.67 | 3.30 | |
| Car Washes | 5 | 1 | 6 |
| 0.21 | 0.10 | 0.31 | |
| Health & | 61 | 24 | 85 |
| Country Clubs | 155.25 | 9.05 | 164.30 |
| Nursing | 60 | 13 | 73 |
| Homes | 5.41 | 5.27 | 10.68 |
| Hospitals | 54 | 77 | 131 |
| 323.41 | 167.97 | 491.38 | |
| Elementary & | 57 | 49 | 106 |
| Primary Schools | 4.82 | 9.41 | 14.23 |
| Colleges & | 31 | 81 | 112 |
| Universities | 624.19 | 789.76 | 1,413.95 |
| Museums | 1 | 1 | 2 |
| 0.09 | 3.70 | 3.79 | |
| Government | 8 | 25 | 33 |
| Facilities | 485.76 | 133.54 | 619.30 |
| Prisons | 9 | 9 | 18 |
| 79.65 | 55.06 | 134.70 | |
| Totals | 587 | 393 | 980 |
| Totals | 3,380.04 | 1,546.09 | 4,926.13 |
| Key: | |
| Number of Sites | 12 |
| Electrical Capacity, MW | 42.67 |
| ONSITE SYCOM Energy Corp. | 46 | Commercial CHP Assessment |
Table A6. Commercial CHP Installations and Capacity by Applications and Utility Sales Arrangements
| No | Yes | Totals | |
| Warehousing & | 2 | 4 | 6 |
| Storage | 1.38 | 59.99 | 61.37 |
| Airports | 6 | 3 | 9 |
| 33.26 | 137.18 | 170.44 | |
| Water | 13 | 13 | 26 |
| Treatment | 27.27 | 113.66 | 140.93 |
| Solid Waste | 11 | 11 | |
| Facilities | 378.25 | 378.25 | |
| District Energy/ | 8 | 20 | 28 |
| Utilities | 12.93 | 941.76 | 954.69 |
| Food | 10 | 10 | |
| Stores | 1.38 | 1.38 | |
| Restaurants | 11 | 2 | 13 |
| 1.20 | 0.05 | 1.25 | |
| Commercial | 35 | 17 | 52 |
| Office Buildings | 132.80 | 102.58 | 235.38 |
| Apartment | 83 | 15 | 98 |
| Buildings | 55.69 | 40.66 | 96.35 |
| Hotels | 65 | 18 | 83 |
| 18.32 | 11.84 | 30.16 | |
| Laundries | 71 | 7 | 78 |
| 2.97 | 0.33 | 3.30 | |
| Car Washes | 6 | 6 | |
| 0.31 | 0.31 | ||
| Health & | 73 | 12 | 85 |
| Country Clubs | 12.04 | 152.26 | 164.30 |
| Nursing | 70 | 3 | 73 |
| Homes | 7.15 | 3.54 | 10.68 |
| Hospitals | 86 | 45 | 131 |
| 116.66 | 374.72 | 491.38 | |
| Elementary & | 94 | 12 | 106 |
| Primary Schools | 12.13 | 2.10 | 14.23 |
| Collages & | 77 | 35 | 112 |
| Universities | 553.54 | 860.41 | 1,413.95 |
| Museums | 1 | 1 | 2 |
| 0.09 | 3.70 | 3.79 | |
| Government | 10 | 23 | 33 |
| Facilities | 45.36 | 573.94 | 619.30 |
| Prisons | 10 | 8 | 18 |
| 48.89 | 85.81 | 134.70 | |
| Totals | 731 | 249 | 980 |
| Totals | 1,083.35 | 3,842.78 | 4,926.13 |
| Key: | |
| Number of Sites | 12 |
| Electrical Capacity, MW | 42.67 |
| ONSITE SYCOM Energy Corp. | 47 | Commercial CHP Assessment |
Table A7. Commercial CHP Installations and Capacity by State and by Utility Sales Arrangements
| No | Yes | Totals | |
| AK | 2 | 4 | 6 |
| 6.15 | 6.87 | 13.02 | |
| AL | 1 | 1 | |
| 3.00 | 3.00 | ||
| AR | 2 | 2 | |
| 12.60 | 12.60 | ||
| AZ | 11 | 3 | 14 |
| 4.67 | 1.14 | 5.81 | |
| CA | 330 | 117 | 447 |
| 189.42 | 661.37 | 850.79 | |
| CO | 1 | 5 | 6 |
| 0.04 | 110.16 | 110.20 | |
| CT | 38 | 10 | 48 |
| 28.51 | 104.30 | 132.81 | |
| FL | 10 | 4 | 14 |
| 24.11 | 151.65 | 175.75 | |
| GU | 1 | 1 | |
| 0.01 | 0.01 | ||
| HI | 5 | 1 | 6 |
| 0.42 | 64.50 | 64.92 | |
| IA | 4 | 2 | 6 |
| 2.08 | 3.56 | 5.64 | |
| ID | 1 | 1 | |
| 20.00 | 20.00 | ||
| IL | 19 | 5 | 24 |
| 62.70 | 38.36 | 101.06 | |
| IN | 5 | 5 | |
| 45.75 | 45.75 | ||
| KY | 1 | 1 | |
| 0.40 | 0.40 | ||
| MA | 25 | 5 | 30 |
| 25.72 | 71.42 | 97.13 | |
| MD | 1 | 2 | 3 |
| 10.00 | 64.00 | 74.00 | |
| ME | 1 | 1 | 2 |
| 1.13 | 0.01 | 1.14 | |
| MI | 15 | 6 | 21 |
| 30.82 | 188.80 | 219.62 | |
| MN | 2 | 1 | 3 |
| 5.35 | 4.20 | 9.55 | |
| MO | 4 | 2 | 6 |
| 57.30 | 15.60 | 72.90 | |
| MS | 1 | 1 | |
| 4.35 | 4.35 |
| ONSITE SYCOM Energy Corp. | 48 | Commercial CHP Assessment |
| MT | 1 | 1 | |
| 0.15 | 0.15 | ||
| NC | 1 | 1 | |
| 28.00 | 28.00 | ||
| NE | 2 | 2 | |
| 0.98 | 0.98 | ||
| NH | 3 | 1 | 4 |
| 6.37 | 2.00 | 8.37 | |
| NJ | 96 | 10 | 106 |
| 57.73 | 144.61 | 202.34 | |
| NM | 6 | 1 | 7 |
| 11.74 | 1.48 | 13.22 | |
| NV | 1 | 1 | |
| 0.02 | 0.02 | ||
| NY | 88 | 28 | 116 |
| 107.74 | 960.15 | 1,067.89 | |
| OH | 4 | 3 | 7 |
| 3.35 | 1.58 | 4.93 | |
| OK | 1 | 1 | |
| 16.30 | 16.30 | ||
| PA | 14 | 15 | 29 |
| 40.69 | 418.04 | 458.73 | |
| RI | 5 | 5 | |
| 1.09 | 1.09 | ||
| SC | 1 | 2 | 3 |
| 70.00 | 21.00 | 91.00 | |
| SD | 1 | 1 | |
| 2.70 | 2.70 | ||
| TN | 5 | 1 | 6 |
| 39.90 | 7.30 | 47.20 | |
| TX | 16 | 3 | 19 |
| 184.12 | 265.18 | 449.30 | |
| UT | 3 | 3 | |
| 5.25 | 5.25 | ||
| VA | 1 | 7 | 8 |
| 0.72 | 174.80 | 175.52 | |
| VT | 2 | 2 | |
| 0.11 | 0.11 | ||
| WA | 1 | 1 | |
| 3.59 | 3.59 | ||
| WI | 2 | 4 | 6 |
| 0.83 | 262.80 | 263.63 | |
| WV | 1 | 2 | 3 |
| 0.24 | 65.15 | 65.39 | |
| Totals | 731 | 249 | 980 |
| Totals | 1,083.35 | 3,842.78 | 4,926.13 |
| Key: | |
| Number of Sites | 12 |
| Electrical Capacity, MW | 42.67 |
| ONSITE SYCOM Energy Corp. | 49 | Commercial CHP Assessment |
Table A8. Commercial CHP Installations and Capacity by Size Range and Fuel Type
| Size Range | Coal | Natural Gas | Oil | Waste | Wood | Other | Totals |
| 0 – 999 kW | 3 | 661 | 15 | 5 | 21 | 705 | |
| 1.42 | 102.18 | 6.94 | 0.23 | 7.16 | 117.93 | ||
| 1.0 – 4.9 MW | 1 | 112 | 9 | 5 | 3 | 10 | 140 |
| 1.00 | 270.52 | 22.28 | 14.35 | 7.13 | 22.01 | 337.28 | |
| 5.0 – 9.9 MW | 4 | 30 | 4 | 2 | 40 | ||
| 24.80 | 190.58 | 17.41 | 14.80 | 247.58 | |||
| 10.0 – 14.9 MW | 1 | 18 | 1 | 1 | 2 | 23 | |
| 10.00 | 225.97 | 10.00 | 14.00 | 24.50 | 284.47 | ||
| 15.0 – 19.9 MW | 1 | 4 | 4 | 9 | |||
| 18.00 | 67.25 | 64.70 | 149.95 | ||||
| 20.0 – 29.9 MW | 1 | 15 | 1 | 1 | 18 | ||
| 28.00 | 390.25 | 28.00 | 20.00 | 466.25 | |||
| 30.0 – 49.9 MW | 3 | 12 | 2 | 1 | 1 | 19 | |
| 112.00 | 488.10 | 82.00 | 39.60 | 37.00 | 758.70 | ||
| 50.0 – 74.9 MW | 4 | 3 | 1 | 7 | 15 | ||
| 245.50 | 177.00 | 54.00 | 452.00 | 928.50 | |||
| 75.0 – 99.9 MW | 4 | 4 | |||||
| 332.00 | 332.00 | ||||||
| 100 – 199 MW | 5 | 5 | |||||
| 759.47 | 759.47 | ||||||
| 200 – 499 MW | 2 | 2 | |||||
| 544.00 | 544.00 | ||||||
| Totals | 18 | 866 | 30 | 25 | 4 | 37 | 980 |
| Totals | 440.72 | 3,547.31 | 110.62 | 655.28 | 46.73 | 125.48 | 4,926.13 |
| Key: | |
| Number of Sites | 12 |
| Electrical Capacity, MW | 42.67 |
| ONSITE SYCOM Energy Corp. | 50 | Commercial CHP Assessment |
Table A9. Commercial CHP Installations and Capacity by State and Prime Mover
| State | Boiler/Steam Turbine | Combined Cycle | Combustion Turbine | Reciprocating Engine | Other | Totals |
| AK | 2 | 4 | 6 | |||
| 6.15 | 6.87 | 13.02 | ||||
| AL | 1 | 1 | ||||
| 3.00 | 3.00 | |||||
| AR | 2 | 2 | ||||
| 12.60 | 12.60 | |||||
| AZ | 2 | 12 | 14 | |||
| 1.45 | 4.36 | 5.81 | ||||
| CA | 4 | 9 | 35 | 388 | 11 | 447 |
| 110.20 | 281.45 | 318.07 | 138.24 | 2.84 | 850.79 | |
| CO | 1 | 1 | 4 | 6 | ||
| 33.00 | 76.00 | 1.20 | 110.20 | |||
| CT | 5 | 1 | 7 | 35 | 48 | |
| 26.80 | 56.00 | 45.40 | 4.61 | 132.81 | ||
| FL | 2 | 1 | 3 | 8 | 14 | |
| 109.60 | 27.50 | 17.25 | 21.41 | 175.75 | ||
| GU | 1 | 1 | ||||
| 0.01 | 0.01 | |||||
| HI | 1 | 5 | 6 | |||
| 64.50 | 0.42 | 64.92 | ||||
| IA | 6 | 6 | ||||
| 5.64 | 5.64 | |||||
| ID | 1 | 1 | ||||
| 20.00 | 20.00 | |||||
| IL | 3 | 5 | 16 | 24 | ||
| 49.00 | 27.20 | 24.86 | 101.06 | |||
| IN | 1 | 1 | 2 | 1 | 5 | |
| 40.00 | 2.75 | 2.80 | 0.20 | 45.75 | ||
| KY | 1 | 1 | ||||
| 0.40 | 0.40 | |||||
| MA | 1 | 1 | 27 | 1 | 30 | |
| 64.00 | 22.00 | 10.78 | 0.35 | 97.13 | ||
| MD | 3 | 3 | ||||
| 74.00 | 74.00 | |||||
| ME | 1 | 1 | 2 | |||
| 1.13 | 0.01 | 1.14 | ||||
| MI | 4 | 7 | 10 | 21 | ||
| 143.70 | 68.46 | 7.46 | 219.62 | |||
| MN | 1 | 1 | 1 | 3 | ||
| 4.20 | 5.20 | 0.15 | 9.55 | |||
| MO | 3 | 1 | 2 | 6 | ||
| 53.00 | 15.45 | 4.45 | 72.90 | |||
| MS | 1 | 1 | ||||
| 4.35 | 4.35 | |||||
| MT | 1 | 1 | ||||
| 0.15 | 0.15 |
| ONSITE SYCOM Energy Corp. | 51 | Commercial CHP Assessment |
| NC | 1 | 1 | ||||
| 28.00 | 28.00 | |||||
| NE | 2 | 2 | ||||
| 0.98 | 0.98 | |||||
| NH | 2 | 2 | 4 | |||
| 5.00 | 3.37 | 8.37 | ||||
| NJ | 3 | 12 | 90 | 1 | 106 | |
| 98.23 | 74.50 | 29.16 | 0.45 | 202.34 | ||
| NM | 2 | 5 | 7 | |||
| 7.17 | 6.05 | 13.22 | ||||
| NV | 1 | 1 | ||||
| 0.02 | 0.02 | |||||
| NY | 10 | 7 | 4 | 95 | 116 | |
| 187.44 | 670.00 | 130.50 | 79.96 | 1,067.89 | ||
| OH | 1 | 3 | 3 | 7 | ||
| 0.77 | 3.28 | 0.88 | 4.93 | |||
| OK | 1 | 1 | ||||
| 16.30 | 16.30 | |||||
| PA | 7 | 1 | 4 | 15 | 2 | 29 |
| 184.85 | 183.97 | 20.67 | 68.86 | 0.38 | 458.73 | |
| RI | 5 | 5 | ||||
| 1.09 | 1.09 | |||||
| SC | 3 | 3 | ||||
| 91.00 | 91.00 | |||||
| SD | 1 | 1 | ||||
| 2.70 | 2.70 | |||||
| TN | 3 | 3 | 6 | |||
| 15.40 | 31.80 | 47.20 | ||||
| TX | 1 | 3 | 5 | 10 | 19 | |
| 0.94 | 361.00 | 48.90 | 38.46 | 449.30 | ||
| UT | 3 | 3 | ||||
| 5.25 | 5.25 | |||||
| VA | 1 | 1 | 6 | 8 | ||
| 40.00 | 120.00 | 15.52 | 175.52 | |||
| VT | 2 | 2 | ||||
| 0.11 | 0.11 | |||||
| WA | 1 | 1 | ||||
| 3.59 | 3.59 | |||||
| WI | 2 | 1 | 2 | 1 | 6 | |
| 11.25 | 248.50 | 3.85 | 0.03 | 263.63 | ||
| WV | 1 | 2 | 3 | |||
| 62.00 | 3.39 | 65.39 | ||||
| Totals | 60 | 27 | 104 | 770 | 19 | 980 |
| Totals | 1,341.10 | 2,109.92 | 933.28 | 505.81 | 36.02 | 4,926.13 |
| Key: | |
| Number of Sites | 12 |
| Electrical Capacity, MW | 42.67 |
| ONSITE SYCOM Energy Corp. | 52 | Commercial CHP Assessment |
Table A10. Commercial CHP Installations and Capacity by Ownership and Prime Mover
3rd Party | Self | Totals | |
| Boiler/Steam | 26 | 34 | 60 |
| Turbine | 936.96 | 404.13 | 1,341.10 |
| Combined Cycle | 20 | 7 | 27 |
| 1,899.72 | 210.20 | 2,109.92 | |
| Combustion | 26 | 78 | 104 |
| Turbine | 364.82 | 568.46 | 933.28 |
| Reciprocating | 502 | 268 | 770 |
| Engine | 174.89 | 330.93 | 505.81 |
| Other | 13 | 6 | 19 |
| 3.65 | 32.37 | 36.02 | |
| Totals | 587 | 393 | 980 |
| 3,380.04 | 1,546.09 | 4,926.13 |
| Key: | |
| Number of Sites | 12 |
| Electrical Capacity, MW | 42.67 |
Table A11. Commercial CHP Installations and Capacity by Sales Arrangements and Prime Mover
No | Yes | Totals | |
| Boiler/Steam | 22 | 38 | 60 |
| Turbine | 305.31 | 1,035.79 | 1,341.10 |
| Combined Cycle | 3 | 24 | 27 |
| 111.20 | 1,998.72 | 2,109.92 | |
| Combustion | 66 | 38 | 104 |
| Turbine | 378.59 | 554.69 | 933.28 |
| Reciprocating | 626 | 144 | 770 |
| Engine | 260.18 | 245.63 | 505.81 |
| Other | 14 | 5 | 19 |
| 28.07 | 7.95 | 36.02 | |
| Totals | 731 | 249 | 980 |
| Totals | 1,083.35 | 3,842.78 | 4,926.13 |
| Key: | |
| Number of Sites | 12 |
| Electrical Capacity, MW | 42.67 |
| ONSITE SYCOM Energy Corp. | 53 | Commercial CHP Assessment |
Table A12. Commercial CHP Installations and Capacity by Prime Mover and Fuel Type
| Coal | Natural Gas | Oil | Waste | Wood | Other | Totals | |
| Boiler/Steam | 17 | 9 | 8 | 19 | 4 | 3 | 60 |
| Turbine | 376.22 | 166.86 | 76.30 | 652.05 | 46.73 | 22.94 | 1,341.10 |
| Combined Cycle | 1 | 26 | 27 | ||||
| 64.50 | 2,045.42 | 2,109.92 | |||||
| Combustion | 102 | 1 | 1 | 104 | |||
| Turbine | 895.48 | 0.80 | 37.00 | 933.28 | |||
| Reciprocating | 717 | 21 | 6 | 26 | 770 | ||
| Engine | 436.90 | 33.52 | 3.23 | 32.17 | 505.81 | ||
| Other | 12 | 7 | 19 | ||||
| 2.65 | 33.37 | 36.02 | |||||
| Totals | 18 | 866 | 30 | 25 | 4 | 37 | 980 |
| Totals | 440.72 | 3,547.31 | 110.62 | 655.28 | 46.73 | 125.48 | 4,926.13 |
| Key: | |
| Number of Sites | 12 |
| Electrical Capacity, MW | 42.67 |
| ONSITE SYCOM Energy Corp. | 54 | Commercial CHP Assessment |
Table A13. Commercial CHP Installations and Capacity by Size Range and Prime Mover
| Size Range | Boiler/ Steam Turbine | Combined Cycle | Combust. Turbine | Recip. Engine | Other | Totals |
| 0 – 999 kW | 7 | 20 | 662 | 16 | 705 | |
| 3.23 | 15.38 | 95.09 | 4.22 | 117.93 | ||
| 1.0 – 4.9 MW | 15 | 42 | 83 | 140 | ||
| 37.06 | 118.21 | 182.02 | 337.28 | |||
| 5.0 – 9.9 MW | 4 | 3 | 16 | 16 | 1 | 40 |
| 24.80 | 22.20 | 97.48 | 95.80 | 7.30 | 247.58 | |
| 10.0 – 14.9 MW | 3 | 11 | 7 | 2 | 23 | |
| 34.00 | 139.37 | 86.60 | 24.50 | 284.47 | ||
| 15.0 – 19.9 MW | 7 | 2 | 9 | |||
| 118.20 | 31.75 | 149.95 | ||||
| 20.0 – 29.9 MW | 5 | 6 | 5 | 2 | 18 | |
| 119.70 | 170.05 | 130.20 | 46.30 | 466.25 | ||
| 30.0 – 49.9 MW | 8 | 5 | 6 | 19 | ||
| 317.10 | 196.70 | 244.90 | 758.70 | |||
| 50.0 – 74.9 MW | 11 | 4 | 15 | |||
| 687.00 | 241.50 | 928.50 | ||||
| 75.0 – 99.9 MW | 2 | 2 | 4 | |||
| 176.00 | 156.00 | 332.00 | ||||
| 100 – 199 MW | 5 | 5 | ||||
| 759.47 | 759.47 | |||||
| 200 – 499 MW | 2 | 2 | ||||
| 544.00 | 544.00 | |||||
| Totals | 60 | 27 | 104 | 770 | 19 | 980 |
| Totals | 1,341.10 | 2,109.92 | 933.28 | 505.81 | 36.02 | 4,926.13 |
| Key: | |
| Number of Sites | 12 |
| Electrical Capacity, MW | 42.67 |
| ONSITE SYCOM Energy Corp. | 55 | Commercial CHP Assessment |
Appendix B - CHP Technical Market Potential
| Table B-1 | Commercial/Institutional CHP Market Potential by Application and State (MW |
| Table B-2 | Commercial/Institutional CHP Potential by Size and State |
| ONSITE SYCOM Energy Corp. | 56 | Commercial CHP Assessment |
Table B-1 - Commercial/Institutional CHP Market Potential by Application and State (MW)
| MW Potential by Application | ||||||||||||||||||||||||||||||||
| Colleges & | Commercial | Health | ||||||||||||||||||||||||||||||
| State | Hotels/Motels | Nursing Homes | Hospitals | Schools | Universities | Laundries | Car Washes | Clubs/Spas | ||||||||||||||||||||||||
| Alabama | 57.4 | 152.9 | 158.3 | 231.3 | 82.0 | 9.8 | 4.9 | 53.1 | ||||||||||||||||||||||||
| Alaska | 19.7 | 5.0 | 27.0 | 31.4 | 10.6 | 0.4 | 0.0 | 16.6 | ||||||||||||||||||||||||
| Arizona | 245.7 | 115.0 | 127.8 | 210.0 | 78.1 | 9.4 | 12.3 | 52.7 | ||||||||||||||||||||||||
| Arkansas | 23.6 | 64.6 | 60.2 | 118.4 | 20.0 | 4.3 | 1.5 | 25.8 | ||||||||||||||||||||||||
| California | 591.6 | 286.8 | 689.8 | 1,544.9 | 343.7 | 50.2 | 51.1 | 444.3 | ||||||||||||||||||||||||
| Colorado | 115.2 | 97.1 | 87.5 | 185.8 | 72.3 | 6.4 | 5.3 | 76.6 | ||||||||||||||||||||||||
| Connecticut | 32.4 | 169.8 | 115.8 | 178.5 | 48.7 | 6.2 | 0.7 | 74.5 | ||||||||||||||||||||||||
| Delaware | 9.8 | 22.8 | 20.0 | 47.0 | 17.2 | 2.1 | 0.7 | 8.1 | ||||||||||||||||||||||||
| District of Columbia | 199.9 | 19.3 | 77.9 | 41.5 | 52.1 | 0.7 | 2.0 | 21.2 | ||||||||||||||||||||||||
| Florida | 801.5 | 527.5 | 517.2 | 813.7 | 172.6 | 31.2 | 18.5 | 221.8 | ||||||||||||||||||||||||
| Georgia | 238.4 | 184.1 | 266.2 | 527.2 | 68.1 | 17.2 | 11.5 | 101.1 | ||||||||||||||||||||||||
| Hawaii | 102.2 | 7.7 | 17.3 | 24.0 | 13.6 | 1.6 | 0.2 | 8.8 | ||||||||||||||||||||||||
| Idaho | 41.4 | 53.8 | 53.3 | 52.0 | 23.8 | 3.2 | 2.5 | 21.2 | ||||||||||||||||||||||||
| Illinois | 245.8 | 334.0 | 392.8 | 533.1 | 229.3 | 17.5 | 12.6 | 133.2 | ||||||||||||||||||||||||
| Indiana | 71.0 | 155.9 | 183.8 | 342.3 | 91.3 | 9.3 | 5.8 | 60.6 | ||||||||||||||||||||||||
| Iowa | 37.1 | 65.5 | 86.5 | 153.1 | 67.6 | 2.0 | 1.5 | 16.9 | ||||||||||||||||||||||||
| Kansas | 40.5 | 78.3 | 104.5 | 140.6 | 50.8 | 5.0 | 4.3 | 26.6 | ||||||||||||||||||||||||
| Kentucky | 35.6 | 69.4 | 115.2 | 218.2 | 50.1 | 6.1 | 1.8 | 26.0 | ||||||||||||||||||||||||
| Louisiana | 186.9 | 109.9 | 176.2 | 288.8 | 49.7 | 4.7 | 6.2 | 60.7 | ||||||||||||||||||||||||
| Maine | 15.4 | 31.2 | 41.3 | 70.5 | 24.2 | 1.1 | 0.0 | 17.5 | ||||||||||||||||||||||||
| Maryland | 93.1 | 263.5 | 200.7 | 274.3 | 69.7 | 11.5 | 5.7 | 86.6 | ||||||||||||||||||||||||
| Massachusetts | 107.7 | 349.8 | 266.4 | 343.3 | 121.5 | 15.6 | 1.5 | 144.4 | ||||||||||||||||||||||||
| Michigan | 126.6 | 297.9 | 330.7 | 459.2 | 131.0 | 16.7 | 8.4 | 116.0 | ||||||||||||||||||||||||
| Minnesota | 49.7 | 109.8 | 88.8 | 321.0 | 74.0 | 3.9 | 2.2 | 34.1 | ||||||||||||||||||||||||
| Mississippi | 176.9 | 70.0 | 105.9 | 163.3 | 55.7 | 3.4 | 0.9 | 31.6 | ||||||||||||||||||||||||
| Missouri | 116.9 | 243.7 | 254.7 | 253.2 | 92.5 | 16.1 | 9.3 | 58.8 | ||||||||||||||||||||||||
| Montana | 21.7 | 27.6 | 26.2 | 35.7 | 22.8 | 0.9 | 0.0 | 14.1 | ||||||||||||||||||||||||
| Nebraska | 28.1 | 48.9 | 60.4 | 77.5 | 31.3 | 1.4 | 1.8 | 11.5 | ||||||||||||||||||||||||
| Nevada | 747.5 | 10.0 | 20.9 | 72.2 | 10.6 | 4.3 | 0.9 | 20.7 | ||||||||||||||||||||||||
| New Hampshire | 31.1 | 25.8 | 23.5 | 76.3 | 13.6 | 1.5 | 0.0 | 23.0 | ||||||||||||||||||||||||
| New Jersey | 226.8 | 345.1 | 315.1 | 546.0 | 109.5 | 18.5 | 3.1 | 150.6 | ||||||||||||||||||||||||
| New Mexico | 33.2 | 30.2 | 38.3 | 98.0 | 32.7 | 1.8 | 1.1 | 21.2 | ||||||||||||||||||||||||
| New York | 359.9 | 820.4 | 692.4 | 1,364.7 | 260.7 | 34.4 | 3.3 | 256.0 | ||||||||||||||||||||||||
| North Carolina | 141.9 | 307.6 | 326.1 | 466.0 | 174.2 | 17.0 | 10.4 | 102.6 | ||||||||||||||||||||||||
| North Dakota | 9.1 | 31.7 | 17.2 | 31.2 | 25.5 | 0.9 | 0.2 | 8.3 | ||||||||||||||||||||||||
| Ohio | 115.7 | 439.4 | 376.8 | 567.8 | 195.8 | 24.5 | 9.7 | 114.6 | ||||||||||||||||||||||||
| Oklahoma | 33.0 | 79.0 | 131.5 | 136.9 | 57.0 | 5.7 | 1.1 | 24.0 | ||||||||||||||||||||||||
| Oregon | 63.4 | 63.3 | 122.0 | 140.8 | 94.4 | 4.7 | 3.7 | 76.5 | ||||||||||||||||||||||||
| Pennsylvania | 134.0 | 482.8 | 470.0 | 704.7 | 233.7 | 17.0 | 5.9 | 143.8 | ||||||||||||||||||||||||
| Rhode Island | 10.0 | 53.5 | 42.8 | 39.3 | 34.7 | 1.8 | 0.2 | 14.8 | ||||||||||||||||||||||||
| South Carolina | 109.8 | 135.6 | 135.8 | 244.0 | 57.2 | 7.8 | 5.9 | 43.4 | ||||||||||||||||||||||||
| South Dakota | 7.7 | 15.3 | 17.4 | 44.0 | 14.3 | 0.4 | 0.9 | 7.1 | ||||||||||||||||||||||||
| Tennessee | 70.1 | 66.0 | 150.6 | 281.0 | 71.3 | 7.5 | 0.9 | 46.3 | ||||||||||||||||||||||||
| Texas | 349.6 | 399.7 | 621.8 | 1,238.9 | 351.6 | 41.8 | 41.9 | 219.3 | ||||||||||||||||||||||||
| Utah | 58.9 | 32.8 | 55.8 | 114.9 | 47.1 | 5.7 | 2.0 | 40.1 | ||||||||||||||||||||||||
| Vermont | 26.0 | 11.9 | 9.0 | 45.2 | 23.8 | 0.2 | 0.0 | 8.1 | ||||||||||||||||||||||||
| Virginia | 137.7 | 171.7 | 231.3 | 371.2 | 98.4 | 11.1 | 5.9 | 88.4 | ||||||||||||||||||||||||
| Washington | 73.8 | 188.5 | 155.3 | 243.0 | 69.1 | 7.8 | 5.4 | 96.7 | ||||||||||||||||||||||||
| West Virginia | 33.2 | 43.1 | 79.1 | 67.2 | 24.3 | 1.8 | 0.4 | 18.7 | ||||||||||||||||||||||||
| Wisconsin | 75.6 | 266.5 | 172.6 | 287.6 | 68.8 | 9.1 | 0.0 | 53.0 | ||||||||||||||||||||||||
| Wyoming | 21.5 | 10.5 | 21.3 | 22.9 | 15.9 | 0.7 | 4.9 | 10.2 | ||||||||||||||||||||||||
| Totals | 6,702 | 7,992 | 8,879 | 14,883 | 4,249 | 484 | 281 | 3,552 | ||||||||||||||||||||||||
| ONSITE SYCOM Energy Corp. | 57 | Commercial CHP Assessment |
Table B-1 (continued) - Commercial/Institutional CHP Market Potential by Application and State (MW)
| MW Potential by Application | ||||||||||||||||||||||||||||||||
| Correctional | Water | Extended Service | Refrigerated | Total Potential | ||||||||||||||||||||||||||||
| State | Museums | Facilities | Treatment/Sanitary | Restaurants | Supermarkets | Warehouses | Office Buildings | (MW) | ||||||||||||||||||||||||
| Alabama | 6.2 | 19.9 | 18.3 | 45.4 | 20.5 | 10.7 | 223.1 | 1,132 | ||||||||||||||||||||||||
| Alaska | 0.4 | 7.9 | 5.3 | 5.1 | 2.5 | 3.9 | 54.9 | 219 | ||||||||||||||||||||||||
| Arizona | 10.1 | 51.2 | 8.3 | 92.0 | 21.3 | 7.1 | 338.6 | 1,443 | ||||||||||||||||||||||||
| Arkansas | 1.8 | 15.1 | 19.0 | 19.2 | 7.0 | 11.2 | 140.6 | 548 | ||||||||||||||||||||||||
| California | 40.9 | 249.6 | 118.0 | 320.7 | 112.5 | 113.0 | 2,359.9 | 7,475 | ||||||||||||||||||||||||
| Colorado | 4.6 | 32.8 | 14.6 | 82.9 | 18.0 | 11.3 | 286.3 | 1,120 | ||||||||||||||||||||||||
| Connecticut | 4.2 | 48.9 | 14.9 | 25.5 | 16.4 | 5.0 | 217.6 | 981 | ||||||||||||||||||||||||
| Delaware | 4.3 | 11.6 | 2.8 | 12.3 | 3.3 | 2.8 | 61.0 | 236 | ||||||||||||||||||||||||
| District of Columbia | 27.6 | 21.1 | 0.0 | 36.9 | 2.4 | 0.0 | 87.1 | 590 | ||||||||||||||||||||||||
| Florida | 16.2 | 223.0 | 57.5 | 310.6 | 91.6 | 29.0 | 1,151.5 | 5,339 | ||||||||||||||||||||||||
| Georgia | 9.8 | 138.3 | 19.3 | 114.1 | 46.2 | 45.3 | 460.1 | 2,353 | ||||||||||||||||||||||||
| Hawaii | 4.6 | 8.9 | 2.0 | 15.1 | 3.1 | 1.8 | 67.5 | 284 | ||||||||||||||||||||||||
| Idaho | 0.2 | 7.7 | 4.7 | 19.7 | 7.6 | 4.9 | 72.8 | 376 | ||||||||||||||||||||||||
| Illinois | 15.5 | 88.1 | 34.9 | 115.4 | 38.3 | 28.8 | 494.2 | 2,773 | ||||||||||||||||||||||||
| Indiana | 8.2 | 49.8 | 29.7 | 64.9 | 23.6 | 14.4 | 352.1 | 1,491 | ||||||||||||||||||||||||
| Iowa | 1.1 | 16.0 | 11.8 | 11.6 | 10.8 | 22.0 | 159.4 | 682 | ||||||||||||||||||||||||
| Kansas | 1.3 | 27.4 | 7.9 | 35.2 | 9.8 | 13.6 | 195.7 | 768 | ||||||||||||||||||||||||
| Kentucky | 1.8 | 37.3 | 21.3 | 34.8 | 14.2 | 6.9 | 243.0 | 901 | ||||||||||||||||||||||||
| Louisiana | 4.1 | 44.6 | 20.3 | 53.7 | 20.5 | 3.4 | 253.1 | 1,316 | ||||||||||||||||||||||||
| Maine | 0.9 | 8.0 | 6.0 | 7.5 | 5.5 | 3.2 | 63.5 | 300 | ||||||||||||||||||||||||
| Maryland | 7.4 | 42.3 | 7.0 | 93.3 | 29.9 | 5.6 | 436.6 | 1,711 | ||||||||||||||||||||||||
| Massachusetts | 21.9 | 37.1 | 36.0 | 77.8 | 23.8 | 19.9 | 357.5 | 1,960 | ||||||||||||||||||||||||
| Michigan | 16.0 | 96.8 | 21.6 | 163.9 | 46.8 | 23.4 | 654.0 | 2,560 | ||||||||||||||||||||||||
| Minnesota | 5.7 | 34.6 | 7.9 | 20.8 | 10.1 | 14.0 | 370.1 | 1,165 | ||||||||||||||||||||||||
| Mississippi | 0.9 | 21.9 | 15.5 | 24.0 | 11.3 | 10.6 | 145.5 | 854 | ||||||||||||||||||||||||
| Missouri | 8.2 | 42.0 | 12.4 | 86.1 | 21.4 | 18.0 | 345.9 | 1,639 | ||||||||||||||||||||||||
| Montana | 1.8 | 5.0 | 2.3 | 7.7 | 4.2 | 2.3 | 49.0 | 226 | ||||||||||||||||||||||||
| Nebraska | 2.8 | 15.2 | 1.4 | 16.7 | 8.5 | 12.7 | 95.6 | 428 | ||||||||||||||||||||||||
| Nevada | 0.9 | 14.6 | 3.8 | 47.3 | 5.2 | 1.6 | 140.6 | 1,117 | ||||||||||||||||||||||||
| New Hampshire | 1.4 | 7.2 | 3.9 | 6.3 | 4.0 | 0.7 | 62.2 | 287 | ||||||||||||||||||||||||
| New Jersey | 7.1 | 58.8 | 54.7 | 77.4 | 39.0 | 36.0 | 661.5 | 2,720 | ||||||||||||||||||||||||
| New Mexico | 4.7 | 23.0 | 6.4 | 17.8 | 6.8 | 0.4 | 89.1 | 418 | ||||||||||||||||||||||||
| New York | 34.6 | 153.6 | 38.8 | 160.7 | 73.7 | 28.1 | 1,741.3 | 6,092 | ||||||||||||||||||||||||
| North Carolina | 9.6 | 125.5 | 14.3 | 125.0 | 47.9 | 18.3 | 424.0 | 2,408 | ||||||||||||||||||||||||
| North Dakota | 1.4 | 2.7 | 1.6 | 5.1 | 1.8 | 0.9 | 41.3 | 181 | ||||||||||||||||||||||||
| Ohio | 13.6 | 80.2 | 45.5 | 138.9 | 47.7 | 15.8 | 821.9 | 3,075 | ||||||||||||||||||||||||
| Oklahoma | 3.5 | 29.3 | 9.1 | 31.6 | 13.9 | 5.3 | 236.2 | 818 | ||||||||||||||||||||||||
| Oregon | 6.8 | 21.7 | 9.2 | 52.3 | 18.2 | 16.5 | 307.4 | 1,014 | ||||||||||||||||||||||||
| Pennsylvania | 15.3 | 121.2 | 59.9 | 120.9 | 56.4 | 38.3 | 732.0 | 3,424 | ||||||||||||||||||||||||
| Rhode Island | 0.9 | 5.4 | 2.0 | 9.1 | 2.9 | 0.2 | 67.2 | 289 | ||||||||||||||||||||||||
| South Carolina | 5.5 | 51.2 | 17.3 | 76.1 | 26.0 | 6.0 | 192.4 | 1,194 | ||||||||||||||||||||||||
| South Dakota | 0.9 | 6.9 | 1.8 | 2.6 | 1.9 | 2.7 | 44.6 | 171 | ||||||||||||||||||||||||
| Tennessee | 4.2 | 45.3 | 20.7 | 34.7 | 11.2 | 17.3 | 319.7 | 1,167 | ||||||||||||||||||||||||
| Texas | 18.3 | 325.4 | 73.2 | 314.7 | 96.3 | 51.5 | 1,469.7 | 5,829 | ||||||||||||||||||||||||
| Utah | 4.1 | 13.3 | 2.9 | 21.5 | 10.2 | 7.8 | 115.6 | 537 | ||||||||||||||||||||||||
| Vermont | 0.2 | 14.7 | 0.4 | 3.6 | 2.5 | 1.1 | 28.8 | 179 | ||||||||||||||||||||||||
| Virginia | 17.7 | 100.0 | 15.6 | 91.4 | 35.9 | 17.0 | 418.1 | 1,858 | ||||||||||||||||||||||||
| Washington | 6.7 | 46.9 | 19.8 | 73.4 | 27.5 | 54.9 | 536.1 | 1,638 | ||||||||||||||||||||||||
| West Virginia | 2.1 | 15.3 | 14.0 | 17.3 | 8.7 | 1.1 | 88.2 | 424 | ||||||||||||||||||||||||
| Wisconsin | 7.4 | 50.3 | 13.6 | 44.0 | 21.2 | 24.9 | 302.3 | 1,420 | ||||||||||||||||||||||||
| Wyoming | 1.4 | 5.9 | 0.4 | 6.3 | 3.0 | 0.7 | 29.6 | 160 | ||||||||||||||||||||||||
| Totals | 397 | 2,721 | 949 | 3,390 | 1,184 | 792 | 18,614 | 77,282 | ||||||||||||||||||||||||
| ONSITE SYCOM Energy Corp. | 58 | Commercial CHP Assessment |
| Table B-2 | Commercial/Institutional CHP Potential by Size and State |
| MW Potential by Size | ||||||||||||||||||||
| State | 100-500 kW | 500-1000 kW | 1 - 5 MW | > 5 MW | Total | |||||||||||||||
| Alabama | 408.9 | 337.5 | 299.4 | 86.5 | 1,132 | |||||||||||||||
| Alaska | 68.5 | 57.9 | 40.4 | 52.6 | 219 | |||||||||||||||
| Arizona | 458.1 | 352.7 | 402.6 | 229.7 | 1,443 | |||||||||||||||
| Arkansas | 263.2 | 169.5 | 103.0 | 12.5 | 548 | |||||||||||||||
| California | 2,677.2 | 2,287.3 | 1,749.9 | 760.2 | 7,475 | |||||||||||||||
| Colorado | 414.4 | 340.2 | 263.8 | 101.7 | 1,120 | |||||||||||||||
| Connecticut | 276.6 | 311.7 | 326.0 | 66.9 | 981 | |||||||||||||||
| Delaware | 77.5 | 74.3 | 68.8 | 15.2 | 236 | |||||||||||||||
| District of Columbia | 106.5 | 95.3 | 152.3 | 236.0 | 590 | |||||||||||||||
| Florida | 1,545.4 | 1,537.1 | 1,565.4 | 691.0 | 5,339 | |||||||||||||||
| Georgia | 803.4 | 733.7 | 549.3 | 269.0 | 2,355 | |||||||||||||||
| Hawaii | 86.0 | 69.5 | 84.0 | 44.3 | 284 | |||||||||||||||
| Idaho | 130.0 | 91.1 | 109.9 | 44.8 | 376 | |||||||||||||||
| Illinois | 852.4 | 742.4 | 877.4 | 300.4 | 2,773 | |||||||||||||||
| Indiana | 561.5 | 424.1 | 370.0 | 135.9 | 1,491 | |||||||||||||||
| Iowa | 302.4 | 171.4 | 146.3 | 61.8 | 682 | |||||||||||||||
| Kansas | 300.8 | 223.5 | 169.0 | 74.7 | 768 | |||||||||||||||
| Kentucky | 397.3 | 264.6 | 189.5 | 50.2 | 901 | |||||||||||||||
| Louisiana | 475.3 | 362.6 | 303.8 | 174.8 | 1,316 | |||||||||||||||
| Maine | 133.3 | 77.8 | 63.8 | 24.7 | 300 | |||||||||||||||
| Maryland | 504.0 | 471.8 | 506.4 | 228.8 | 1,711 | |||||||||||||||
| Massachusetts | 556.3 | 664.9 | 583.4 | 155.4 | 1,960 | |||||||||||||||
| Michigan | 896.8 | 694.8 | 749.3 | 222.0 | 2,563 | |||||||||||||||
| Minnesota | 446.8 | 395.3 | 242.0 | 80.6 | 1,165 | |||||||||||||||
| Mississippi | 286.5 | 189.6 | 193.3 | 184.1 | 854 | |||||||||||||||
| Missouri | 564.7 | 462.3 | 419.8 | 192.3 | 1,639 | |||||||||||||||
| Montana | 97.5 | 62.7 | 52.0 | 14.1 | 226 | |||||||||||||||
| Nebraska | 176.4 | 123.2 | 81.9 | 46.6 | 428 | |||||||||||||||
| Nevada | 152.4 | 117.3 | 274.3 | 573.0 | 1,117 | |||||||||||||||
| New Hampshire | 110.4 | 99.1 | 52.5 | 24.7 | 287 | |||||||||||||||
| New Jersey | 744.9 | 790.0 | 822.0 | 362.7 | 2,720 | |||||||||||||||
| New Mexico | 187.5 | 119.6 | 83.5 | 27.0 | 418 | |||||||||||||||
| New York | 1,658.4 | 1,755.9 | 1,972.1 | 705.5 | 6,092 | |||||||||||||||
| North Carolina | 800.4 | 719.6 | 622.1 | 265.6 | 2,408 | |||||||||||||||
| North Dakota | 71.2 | 50.1 | 36.8 | 23.0 | 181 | |||||||||||||||
| Ohio | 1,055.9 | 914.3 | 803.9 | 301.0 | 3,075 | |||||||||||||||
| Oklahoma | 345.2 | 221.4 | 183.0 | 68.6 | 818 | |||||||||||||||
| Oregon | 348.8 | 300.1 | 233.3 | 131.9 | 1,014 | |||||||||||||||
| Pennsylvania | 1,051.4 | 1,023.2 | 1,077.3 | 274.0 | 3,426 | |||||||||||||||
| Rhode Island | 84.3 | 81.6 | 88.4 | 34.8 | 289 | |||||||||||||||
| South Carolina | 454.8 | 337.1 | 308.8 | 93.1 | 1,194 | |||||||||||||||
| South Dakota | 86.8 | 49.6 | 30.5 | 4.0 | 171 | |||||||||||||||
| Tennessee | 441.3 | 349.4 | 281.3 | 95.0 | 1,167 | |||||||||||||||
| Texas | 2,031.4 | 1,691.4 | 1,464.8 | 643.5 | 5,831 | |||||||||||||||
| Utah | 191.9 | 159.1 | 109.5 | 76.8 | 537 | |||||||||||||||
| Vermont | 63.9 | 56.7 | 36.3 | 21.9 | 179 | |||||||||||||||
| Virginia | 652.6 | 546.2 | 479.4 | 179.6 | 1,858 | |||||||||||||||
| Washington | 599.5 | 482.9 | 442.9 | 114.4 | 1,640 | |||||||||||||||
| West Virginia | 165.1 | 118.4 | 103.5 | 36.5 | 424 | |||||||||||||||
| Wisconsin | 503.1 | 394.9 | 438.0 | 83.8 | 1,420 | |||||||||||||||
| Wyoming | 70.0 | 50.0 | 27.5 | 12.4 | 160 | |||||||||||||||
| Totals | 25,739 | 22,217 | 20,638 | 8,689 | 77,281 | |||||||||||||||
| ONSITE SYCOM Energy Corp. | 59 | Commercial CHP Assessment |
Appendix C - CHP Technology Characterization
Combined heat and power (CHP) technologies produce electricity or mechanical power and recover waste heat for process use. Conventional centralized power systems average less than 33% delivered efficiency for electricity in the U.S.; CHP systems can deliver energy with efficiencies exceeding 80%3, while significantly reducing emissions per delivered MWh. CHP systems can provide cost savings for industrial and commercial users and substantial emissions reductions. This report describes the leading CHP technologies, their efficiency, size, cost to install and maintain, fuels and emission characteristics.
The technologies included in this appendix include diesel engines, natural gas engines, steam turbines, gas turbines, combined cycle units, microturbines and fuel cells. These CHP technologies are commercially available for on-site generation and combined heat and power applications. The power industry is witnessing dramatic changes with utility restructuring and increased customer choice. As a result of these changes, CHP is expected to gain wider acceptance in the market.
Selecting a CHP technology for a specific application depends on many factors, including the amount of power needed, the duty cycle, space constraints, thermal needs, emission regulations, fuel availability, utility prices and interconnection issues. Table C-1 summarizes the characteristics of each CHP technology. The table shows that CHP covers a wide capacity range from 50 kW reciprocating engines to 300 MW gas turbines. Estimated costs per installed kW range from $500-$1400/kW.
3 T. Casten, CHP – Policy Implications for Climate Change and Electric Deregulation, May 1998, p2.
| ONSITE SYCOM Energy Corp. | 60 | Commercial CHP Assessment |
Table C-1. Comparison of CHP Technologies
Diesel Engine | Natural Gas Engine | Steam Turbine | Gas Turbine | Micro- turbine | Fuel Cells | |||||||
| Electric Efficiency (LHV) | 30-50% | 25-45% | 15-35% | 25-40% (simple)40-60% (combined) | 20-30% | 40-70% | ||||||
| Size (MW) | 0.05-5 | 0.05-5 | Any | 0.5 -200 | 0.025-0.25 | 0.2-2 | ||||||
| Footprint (sqft/kW) | 0.22 | 0.22-0.31 | <0.1 | 0.02-0.61 | 0.15-1.5 | 0.6-4 | ||||||
| CHP installed cost ($/kW) | 800-1500 | 800-1500 | 800-1000 | 700-900 | 500-1300 | >3000 | ||||||
| O&M Cost ($/kWh) | 0.005-0.008 | 0.007-0.015 | 0.004 | 0.002-0.008 | 0.002-0.01 | 0.003-0.015 | ||||||
| Availability | 90-95% | 92-97% | Near 100% | 90-98% | 90-98% | >95% | ||||||
| Hours between overhauls | 25,000-30,000 | 24,000-60,000 | >50,000 | 30,000-50,000 | 5,000-40,000 | 10,000-40,000 | ||||||
| Start-up Time | 10 sec | 10 sec | 1 hr-1 day | 10 min –1 hr | 60 sec | 3 hrs-2 days | ||||||
| Fuel pressure (psi) | <5 | 1-45 | n/a | 120-500 (may require compressor) | 40-100 (may require compressor) | 0.5-45 | ||||||
| Fuels | diesel and residual oil | natural gas, biogas, propane | all | natural gas, biogas, propane, distillate oil | natural gas, biogas, propane, distillate oil | hydrogen, natural gas, propane | ||||||
| Noise | moderate to high (requires building enclosure) | moderate to high (requires building enclosure) | moderate to high (requires building enclosure) | moderate (enclosure supplied with unit) | moderate (enclosure supplied with unit) | low (no enclosure required) | ||||||
NOx Emissions(lb/MWh) | 3-33 | 2.2-28 | 1.8 | 0.3-4 | 0.4-2.2 | <0.02 | ||||||
| Uses for Heat Recovery | hot water, LP steam, district heating | hot water, LP steam, district heating | LP-HP steam, district heating | direct heat, hot water, LP-HP steam, district heating | direct heat, hot water, LP steam | hot water, LP-HP steam | ||||||
| CHP Output (Btu/kWh) | 3,400 | 1,000-5,000 | n/a | 3,400-12,000 | 4,000-15,000 | 500-3,700 | ||||||
| Useable Temp for CHP (F) | 180-900 | 300-500 | n/a | 500-1,100 | 400-650 | 140-700 |
| ONSITE SYCOM Energy Corp. | 61 | Commercial CHP Assessment |
1. Reciprocating Engines
Introduction
Among the most widely used and most efficient prime movers are reciprocating (or internal combustion) engines. Electric efficiencies of 25-50% make reciprocating engines an economic CHP option in many applications. Several types of reciprocating engines are commercially available, however, two designs are of most significance to stationary power applications and include four cycle- spark-ignited (Otto cycle) and compression-ignited (diesel cycle) engines. They can range in size from small fractional portable gasoline engines to large 50,000 HP diesels for ship propulsion. In addition to CHP applications, diesel engines are widely used to provide standby or emergency power to hospitals, and commercial and industrial facilities for critical power requirements.
Technology Description
The essential mechanical parts of Otto-cycle and diesel engines are the same. Both use a cylindrical combustion chamber in which a close fitting piston travels the length of the cylinder. The piston is connected to a crankshaft which transforms the linear motion of the piston within the cylinder into the rotary motion of the crankshaft. Most engines have multiple cylinders that power a single crankshaft. Both Otto-cycle and diesel four stroke engines complete a power cycle in four strokes of the piston within the cylinder. Strokes include: 1) introduction of air (or air-fuel mixture) into the cylinder, 2) compression with combustion of fuel, 3) acceleration of the piston by the force of combustion (power stroke) and 4) expulsion of combustion products from the cylinder.
The primary difference between Otto and diesel cycles is the method of fuel combustion. An Otto cycle uses a spark plug to ignite a pre-mixed fuel-air mixture introduced to the cylinder. A diesel engine compresses the air introduced in the cylinder to a high pressure, raising its temperature to the ignition temperature of the fuel which is injected at high pressure.
A variation of the diesel is the dual fuel engine. Up to 80-90% of the diesel fuel is substituted with gasoline or natural gas while maintaining power output and achieving substantial emission reductions.
Large modern diesel engines can attain electric efficiencies near 50% and operate on a variety of fuels including diesel fuel, heavy fuel oil or crude oil. Diesel engines maintain higher part load efficiencies than an Otto cycle because of leaner fuel-air ratios at reduced load.
| ONSITE SYCOM Energy Corp. | 62 | Commercial CHP Assessment |
Design Characteristics
The features that have made reciprocating engines a leading prime mover for CHP include:
| Economical size range: | Reciprocating engines are available in sizes that match the electric demand of many end-users (institutional, commercial and industrial). | |
| Fast start-up: | Fast start-up allows timely resumption of the system following a maintenance procedure. In peaking or emergency power applications, reciprocating engines can quickly supply electricity on demand. | |
| Black-start capability: | In the event of a electric utility outage, reciprocating engines can be started with minimal auxiliary power requirements, generally only batteries are required. | |
| Excellent availability: | Reciprocating engines have typically demonstrated availability in excess of 95%. | |
| Good part load operation: | In electric load following applications, the high part load efficiency of reciprocating engines maintain economical operation. | |
| Reliable and long life: | Reciprocating engines, particularly diesel and industrial block engines have provided many years of satisfactory service given proper maintenance. |
Performance Characteristics
Efficiency
Reciprocating engines have electric efficiencies of 25-50% (LHV) and are among the most efficient of any commercially available prime mover. The smaller stoichiometric engines that require 3-way catalyst after-treatment operate at the lower end of the efficiency scale while the larger diesel and lean burn natural gas engines operate at the higher end of the efficiency range.
Capital Cost
CHP projects using reciprocating engines are typically installed between $800-$1500/kW. The high end of this range is typical for small capacity projects that are sensitive to other costs associated with constructing a facility, such as fuel supply, engine enclosures, engineering costs, and permitting fees.
| ONSITE SYCOM Energy Corp. | 63 | Commercial CHP Assessment |
Availability
Reciprocating engines have proven performance and reliability. With proper maintenance and a good preventative maintenance program, availability is over 95%. Improper maintenance can have major impacts on availability and reliability.
Maintenance
Engine maintenance is comprised of routine inspections/adjustments and periodic replacement of engine oil, coolant and spark plugs every 500-2,000 hours. An oil analysis is an excellent method to determine the condition of engine wear. The time interval for overhauls is recommended by the manufacturer but is generally between 12,000-15,000 hours of operation for a top-end overhaul and 24,000-30,000 for a major overhaul. A top-end overhaul entails a cylinder head and turbo-charger rebuild. A major overhaul involves piston/ring replacement and crankshaft bearings and seals. Typical maintenance costs including an allowance for overhauls is 0.01 - 0.015$/kWhr.
Heat Recovery
Energy in the fuel is released during combustion and is converted to shaft work and heat. Shaft work drives the generator while heat is liberated from the engine through coolant, exhaust gas and surface radiation. Approximately 60-70% of the total energy input is converted to heat that can be recovered from the engine exhaust and jacket coolant, while smaller amounts are also available from the lube oil cooler and the turbocharger's intercooler and aftercooler (if so equipped). Steam or hot water can be generated from recovered heat that is typically used for space heating, reheat, domestic hot water and absorption cooling.
Heat in the engine jacket coolant accounts for up to 30% of the energy input and is capable of producing 200°F hot water. Some engines, such as those with high pressure or ebullient cooling systems, can operate with water jacket temperatures up to 265°.
Engine exhaust heat is 10-30% of the fuel input energy. Exhaust temperatures of 850°-1200°F are typical. Only a portion of the exhaust heat can be recovered since exhaust gas temperatures are generally kept above condensation thresholds. Most heat recovery units are designed for a 300°-350°F exhaust outlet temperature to avoid the corrosive effects of condensation in the exhaust piping. Exhaust heat is typically used to generate hot water to about 230°F or low-pressure steam (15 psig).
By recovering heat in the jacket water and exhaust, approximately 70-80% of the fuel's energy can be effectively utilized as shown in Figure C-1 for a typical spark-ignited engine.
| ONSITE SYCOM Energy Corp. | 64 | Commercial CHP Assessment |

Figure C.1 Energy Balance for a Reciprocating Engine
Closed-Loop Hot Water Cooling Systems
The most common method of recovering engine heat is the closed-loop cooling system as shown in Figure C-2. These systems are designed to cool the engine by forced circulation of a coolant through engine passages and an external heat exchanger. An excess heat exchanger transfers engine heat to a cooling tower or radiator when there is excess heat generated. Closed-loop water cooling systems can operate at coolant temperatures between 190°-250°F.
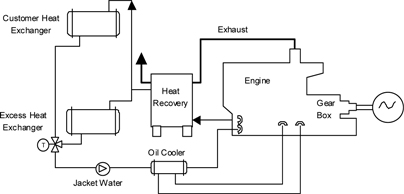
Figure C.2. Closed-Loop Heat Recovery System
| ONSITE SYCOM Energy Corp. | 65 | Commercial CHP Assessment |
Ebullient Cooling Systems
Ebullient cooling systems cool the engine by natural circulation of a boiling coolant through the engine. This type of cooling system is typically used in conjunction with exhaust heat recovery for production of low-pressure steam. Cooling water is introduced at the bottom of the engine where the transferred heat begins to boil the coolant generating two-phase flow. The formation of bubbles lowers the density of the coolant, causing a natural circulation to the top of the engine.
The coolant at the engine outlet is maintained at saturated steam conditions and is usually limited to 250°F and a maximum of 15 psig. Inlet cooling water is also near saturation conditions and is generally 2°- 3°F below the outlet temperature. The uniform temperature throughout the coolant circuit extends engine life, contributes to improved combustion efficiencies and reduces friction in the engine.
Emissions
The two primary methods of lowering emissions in Otto cycle engines is lean burn (combustion control) and rich burn with a catalytic after-treatment.
Lean burn engine technology was developed during the 1980's in response to the need for cleaner burning engines. Most lean burn engines use turbocharging to supply excess air to the engine and produce lean fuel-air ratios. Lean burn engines consume 50-100% excess air (above stoichiometric) to reduce temperatures in the combustion chamber and limit creation of nitrogen oxides (NOx,) carbon dioxide (CO) and non-methane hydrocarbons (NMHC.) The typical NOx emission rate for lean burn engines is between 0.5–2.0 grams/hphr. Emission levels can be reduced to less than 0.15gm/hphr with selective catalytic reduction (SCR) where ammonia is injected into the exhaust gas in the presence of a catalyst. SCR adds a significant cost burden to the installation cost and increases the O&M on the engine. This approach is typically used on large capacity engines.
Catalytic converters are used with rich burn (i.e. stoichiometric) Otto cycles. A reducing catalyst converts NOx to N2 and oxidizes some of the CO to CO2. A catalytic converter can contain both reducing and oxidizing catalytic material in a single bed. Electronic fuel–air ratio controls are typically needed to hold individual emission rates to within a very close tolerance. Also referred to as a three-way catalyst, hydrocarbon, NOx and CO are simultaneously controlled. Typical NOx emission rates for rich burn engines are approximately 9 grams/hphr. Catalytic converters have proven to be the most effective after treatment of exhaust gas with control efficiencies of 90-99%+, reducing NOx emissions to 0.15gm/hphr. A stoichiometric engine with a catalytic convertor operates with an efficiency of approximately 30%. Maintenance costs can increase by 25% for catalyst replacement.
Diesel engines operate at much higher air-fuel ratios than Otto cycle engines. The high excess air (lean condition) causes relatively low exhaust temperatures such that conventional catalytic converters for NOx reduction are not effective. Lean NOx catalytic converters are currently under development. Some diesel applications employ SCR to reduce emissions.
| ONSITE SYCOM Energy Corp. | 66 | Commercial CHP Assessment |
A major emission impact of a diesel engine is particulates. Particulate traps physically capture fine particulate matter generated by the combustion of diesel fuel and are typically 90% effective. Some filters are coated with a catalyst that must be regenerated for proper operation and long life.
Applications
Reciprocating engines are typically used in CHP applications where there is a substantial hot water or low pressure steam demand. When cooling is required, the thermal output of a reciprocating engine can be used in a single-effect absorption chiller. Reciprocating engines are available in a broad size range of approximately 50kW to 5,000kW suitable for a wide variety of commercial, institutional and small industrial facilities. Reciprocating engines are frequently used in load following applications where engine power output is regulated based on the electric demand of the facility. Thermal output varies accordingly. Thermal balance is achieved through supplemental heat sources such as boilers.
Technology Advancements
Advances in electronics, controls and remote monitoring capability should increase the reliability and availability of engines. Maintenance intervals are being extended through development of longer life spark plugs, improved air and fuel filters, synthetic lubricating oil and larger engine oil sumps.
Reciprocating engines have been commercially available for decades. A global network of manufacturers, dealers and distributors is well established.
2. Steam Turbines
Introduction
Steam turbines are one of the most versatile and oldest prime mover technologies used to drive a generator or mechanical machinery. Steam turbines are widely used for CHP applications in the U.S. and Europe where special designs have been developed to maximize efficient steam utilization.
Most of the electricity in the United States is generated by conventional steam turbine power plants. The capacity of steam turbines can range from a fractional horsepower to more than 1,300 MW for large utility power plants.
A steam turbine is captive to a separate heat source and does not directly convert a fuel source to electric energy. Steam turbines require a source of high pressure steam that is produced in a boiler or heat recovery steam generator (HRSG). Boiler fuels can include fossil fuels such as coal, oil and natural gas or renewable fuels like wood or municipal waste.
| ONSITE SYCOM Energy Corp. | 67 | Commercial CHP Assessment |
Steam turbines offer a wide array of designs and complexity to match the desired application and/or performance specifications. In utility applications, maximizing efficiency of the power plant is crucial for economic reasons. Steam turbines for utility service may have several pressure casings and elaborate design features. For industrial applications, steam turbines are generally of single casing design, single or multi-staged and less complicated for reliability and cost reasons. CHP can be adapted to both utility and industrial steam turbine designs.
Technology Description
The thermodynamic cycle for the steam turbine is the Rankine cycle. The cycle is the basis for conventional power generating stations and consists of a heat source (boiler) that converts water to high pressure steam. The steam flows through the turbine to produce power. The steam exiting the turbine is condensed and returned to the boiler to repeat the process.
A steam turbine consists of a stationary set of blades (called nozzles) and a moving set of adjacent blades (called buckets or rotor blades) installed within a casing. The two sets of blades work together such that the steam turns the shaft of the turbine and the connected load. A steam turbine converts pressure energy into velocity energy as it passes through the blades.
The primary type of turbine used for central power generation is the condensing turbine. Steam exhausts from the turbine at sub-atmospheric pressures, maximizing the heat extracted from the steam to produce useful work.
Steam turbines used for CHP can be classified into two main types:
The non-condensing turbine (also referred to as a back-pressure turbine) exhausts steam at a pressure suitable for a downstream process requirement. The term refers to turbines that exhaust steam at atmospheric pressures and above. The discharge pressure is established by the specific CHP application.
The extraction turbine has opening(s) in its casing for extraction of steam either for process or feedwater heating. The extraction pressure may or may not be automatically regulated depending on the turbine design. Regulated extraction permits more steam to flow through the turbine to generate additional electricity during periods of low thermal demand by the CHP system. In utility type steam turbines, there may be several extraction points each at a different pressure.
| ONSITE SYCOM Energy Corp. | 68 | Commercial CHP Assessment |
Design Characteristics
| Custom design: | Steam turbines can be designed to match CHP design pressure and temperature requirements. The steam turbine can be designed to maximize electric efficiency while providing the desired thermal output. | |
| High thermal quality: | Steam turbines are capable of operating over the broadest available steam pressure range from subatmospheric to supercritical and can be custom designed to deliver the thermal requirements of the CHP application. | |
| Fuel flexibility: | Steam turbines offer the best fuel flexibility using a variety of fuel sources including nuclear, coal, oil, natural gas, wood and waste products. |
Performance Characteristics
Efficiency
Modern large condensing steam turbine plants have efficiencies approaching 40-45%, however, efficiencies of smaller industrial or backpressure turbines can range from 15-35%.
| ONSITE SYCOM Energy Corp. | 69 | Commercial CHP Assessment |
Capital Cost
Boiler/ steam turbines installation costs are between $800-$1000/kW or greater depending on environmental requirements. The incremental cost of adding a steam turbine to an existing boiler system or to a combined cycle plant is approximately$400-$800/kW.
Availability
A steam turbine is generally considered to have 99%+ availability with longer than a year between shutdowns for maintenance and inspections. This high level of availability applies only for the steam turbine and does not include the heat source.
Maintenance
A maintenance issue with steam turbines is solids carry over from the boiler that deposit on turbine nozzles and degrades power output. The oil lubrication system must be clean and at the correct operating temperature and level to maintain proper performance. Other items include inspecting auxiliaries such as lubricating-oil pumps, coolers and oil strainers and check safety devices such as the operation of overspeed trips. Steam turbine maintenance costs are typically less than $0.004 per kWh.
Heat Recovery
Heat recovery methods from a steam turbine use exhaust or extraction steam. Heat recovery from a steam turbine is somewhat misleading since waste heat is generally associated with the heat source, in this case a boiler either with an economizer or air preheater.
A steam turbine can be defined as a heat recovery device. Producing electricity in a steam turbine from the exhaust heat of a gas turbine (combined cycle) is a form of heat recovery.
The amount and quality of the recovered heat is a function of the entering steam conditions and the design of the steam turbine. Exhaust steam from the turbine can be used directly in a process or for district heating. Or it can be converted to other forms of thermal energy including hot water or chilled water. Steam discharged or extracted from a steam turbine can be used in a single or double-effect absorption chiller. A steam turbine can also be used as a mechanical drive for a centrifugal chiller.
Emissions
Emissions associated with a steam turbine are dependent on the source of the steam. Steam turbines can be used with a boiler firing a large variety of fuel sources or it can be used with a gas turbine in a combined cycle. Boiler emissions can vary depending on environmental regulations. Large boilers can use SCR to reduce NOx emissions to single digit levels.
| ONSITE SYCOM Energy Corp. | 70 | Commercial CHP Assessment |
Applications
Steam Turbines for Industrial and CHP Applications
In industrial applications, steam turbines may drive an electric generator or equipment such as boiler feedwater pumps, process pumps, air compressors and refrigeration chillers. Turbines as industrial drivers are almost always a single casing machine, either single stage or multistage, condensing or non-condensing depending on steam conditions and the value of the steam. Steam turbines can operate at a single speed to drive an electric generator or operate over a speed range to drive a refrigeration compressor.
For non-condensing applications, steam is exhausted from the turbine at a pressure and temperature sufficient for the CHP heating application. Back pressure turbines can operate over a wide pressure range depending on the process requirements and exhaust steam at typically between 5 psig to 150 psig. Back pressure turbines are less efficient than condensing turbines, however, they are less expensive and do not require a surface condenser.
Technology Advancements
Steam turbines have been commercially available for decades. Advancements will more likely occur in gas turbine technology.
3. Combustion Turbines and Combined Cycles
Introduction
Over the last two decades, the combustion or gas turbine has seen tremendous development and market expansion. Whereas gas turbines represented only 20% of the power generation market twenty years ago, they now claim approximately 40% of new capacity additions. Gas turbines have been long used by utilities for peaking capacity, however, with changes in the power industry and increased efficiency, the gas turbine is now being used for base load power. Much of this growth can be accredited to large (>50 MW) combined cycle plants that exhibit low capital cost (less than $550/kW) and high thermal efficiency. Manufacturers are offering new and larger capacity machines that operate at higher efficiencies. Some forecasts predict that gas turbines may furnish more than 80% of all new U.S. generation capacity in coming decades.
Gas turbine development accelerated in the 1930’s as a means of propulsion for jet aircraft. It was not until the early 1980’s that the efficiency and reliability of gas turbines had progressed sufficiently to be widely adopted for stationary power applications. Gas turbines range in size from 30 kW (microturbines) to 250 MW (industrial frames).
| ONSITE SYCOM Energy Corp. | 71 | Commercial CHP Assessment |
Technology Description
The thermodynamic cycle associated with the majority of gas turbine systems is the Brayton cycle, that passes atmospheric air, the working fluid, through the turbine only once. The thermodynamic steps of the Brayton cycle include compression of atmospheric air, introduction and ignition of fuel, and expansion of the heated combustion gases through the gas producing and power turbines. The developed power is used to drive the compressor and the electric generator. Primary components of a gas turbine are shown in Figure C-3.
Figure C-3. Components of a Gas Turbine Turbine
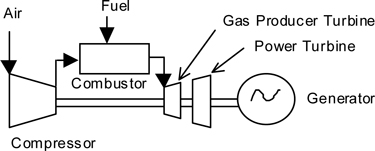
Aeroderivative gas turbines for stationary power are adapted from their jet engine counterpart. These turbines are light weight and thermally efficient, however, are limited in capacity. The largest aeroderivitives are approximately 40 MW in capacity today. Many aeroderivative gas turbines for stationary use operate with compression ratios up to 30:1 requiring an external fuel gas compressor. With advanced system developments, aeroderivitives are approaching 45% simple cycle efficiencies.
Industrial or frame gas turbines are available between 1 MW to 250 MW. They are more rugged, can operate longer between overhauls, and are more suited for continuous base-load operation. However, they are less efficient and much heavier than the aeroderivative. Industrial gas turbines generally have more modest compression ratios up to 16:1 and often do not require an external compressor. Industrial gas turbines are approaching simple cycle efficiencies of approximately 40% and in combined cycles are approaching 60%.
Small industrial gas turbines are being successfully used in industry for on-site power generation and as mechanical drivers. Turbine sizes are typically between 1–10 MW for these applications. Small gas turbines drive compressors along natural gas pipelines for cross country transport. In the petroleum industry they drive gas compressors to maintain well pressures. In the steel industry they drive air compressors used for blast furnaces. With the coming competitive electricity market, many experts believe that installation of small industrial gas turbines will proliferate as a cost effective alternative to grid power.
| ONSITE SYCOM Energy Corp. | 72 | Commercial CHP Assessment |
Design Characteristics
| Quality thermal output: | Gas turbines produce a high quality thermal output suitable for most CHP applications. | |
| Cost effectiveness: | Gas turbines are among the lowest cost power generation technologies on a $/kW basis, especially in combined cycle. | |
| Fuel flexibility: | Gas turbines operate on natural gas, synthetic gas and fuel oils. Plants are often designed to operate on gaseous fuel with a stored liquid fuel for backup. | |
| Reliable and long life: | Modern gas turbines have proven to be reliable power generation devices, given proper maintenance. | |
| Economical size range: | Gas turbines are available in sizes that match the electric demand of many end-users (institutional, commercial and industrial). |
Performance Characteristics
Efficiency
The thermal efficiency of the Brayton cycle is a function of pressure ratio, ambient air temperature, turbine inlet temperature, the efficiency of the compressor and turbine elements and any performance enhancements (i.e. recuperation, reheat, or combined cycle). Efficiency generally increases for higher power outputs and aeroderivative designs. Simple cycle efficiencies can vary between 25-40% lower heating value (LHV). Next generation combined cycles are being advertised with electric efficiencies approaching 60%.
Capital Cost
The capital cost of a gas turbine power plant on a kW basis ($/kW) can vary significantly depending on the capacity of the facility. Typical estimates vary between $300-$900/kW. The lower end applies to large industrial frame turbines in combined cycle.
Availability
Estimated availability of gas turbines operating on clean gaseous fuels like natural gas is in excess of 95%. Use of distillate fuels and other fuels with contaminants require more frequent shutdowns for preventative maintenance that reduce availability.
| ONSITE SYCOM Energy Corp. | 73 | Commercial CHP Assessment |
Maintenance
Although gas turbines can be cycled, maintenance costs can triple for a turbine that is cycled every hour versus a turbine that is operated for intervals of 1000 hours. Operating the turbine over the rated design capacity for significant time periods will also dramatically increase the number of hot path inspections and overhauls. Maintenance costs of a turbine operating on fuel oil can be approximately three times that as compared to natural gas. Typical maintenance costs for a gas turbine fired by natural gas is 0.003-0.005 $/kWh.
Figure C-4 Heat Recovery from a Gas Turbine System
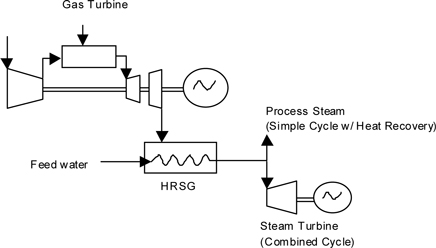
Heat Recovery
The simple cycle gas turbine is the least efficient arrangement since there is no recovery of heat in the exhaust gas. Hot exhaust gas can be used directly in a process or by adding a heat recovery steam generator (HRSG), exhaust heat can generate steam or hot water. An important advantage of CHP using gas turbines is the high quality waste heat available in the exhaust gas. The high temperature exhaust gas is suitable for generating high-pressure steam that is used frequently for industrial processes.
For larger gas turbine installations, combined cycles become economical, achieving approximately 60% electric generation efficiencies using the most advanced utility-class gas turbines. The heat recovery options available from a steam turbine used in the combined cycle can be implemented to further improve the overall system efficiency (as discussed previously.)
Since gas turbine exhaust is oxygen rich, it can support additional combustion through supplementary firing. A duct burner can be fitted within the HRSG to increase the gas temperature and attain overall efficiencies of 90% and greater.
| ONSITE SYCOM Energy Corp. | 74 | Commercial CHP Assessment |
Combined Cycle Power Plants
The trend in power plant design is the combined cycle that incorporates a steam turbine in a bottoming cycle with a gas turbine. Steam generated in the heat recovery steam generator (HRSG) of the gas turbine is used to drive a steam turbine to yield additional electricity and improve cycle efficiency. The steam turbine is usually an extraction-condensing type and can be designed for CHP applications.
Emissions
The dominant NOx control technologies for gas turbines include water/steam injection and lean pre-mix (combustion control) and selective catalytic reduction (post combustion control). Without any controls, gas turbines produce levels of NOx between 75-200 ppmv. By injecting water or steam into the combustor, NOx emissions can be reduced to approximately 42 ppmv with water and 25 ppmv with steam. NOx emissions from distillate-fired turbines can be reduced to about 42-75 ppmv. Water or steam injection requires very purified water to minimize the effects of water-induced corrosion of turbine components.
Lean pre-mix (dry low NOx) is a combustion modification where a lean mixture of natural gas and air are pre-mixed prior to entering the combustion section of the gas turbine. Pre-mixing avoids “hot spots” in the combustor where NOx forms. Turbine manufacturers have achieved NOx emissions of 9-42 ppmv using this technology. This technology is still being developed and early designs have caused turbine damage due to “flashback”. Elevated noise levels have also been encountered.
Selective catalytic reduction (SCR) is a post combustion treatment of the turbine’s exhaust gas in which ammonia is reacted with NOx in the presence of a catalyst to produce nitrogen and water. SCR is approximately 80-90% effective in the reduction of upstream NOx emission levels. Assuming a turbine has NOx emissions of 25 ppm, SCR can further reduce emissions to 3-5 ppm. SCR is used in series with water/steam injection or lean pre-mix to produce single-digit emission levels. SCR requires an upstream heat recovery device to temper the temperature of the exhaust gas in contact with the catalyst. SCR requires on-site storage of ammonia, a hazardous chemical. In addition ammonia can “slip” through the process unreacted that contributes to air pollution. SCR systems are expensive and significantly impact the economic feasibility of smaller gas turbine projects.
Applications
Gas turbines are a cost effective CHP alternative for commercial and industrial end-users with a base load electric demand greater than about 5 MW. Although gas turbines can operate satisfactorily at part load, they perform best at full power in base load operation. Gas turbines are frequently used in district steam heating systems since their high quality thermal output can be used for most medium pressure steam systems.
| ONSITE SYCOM Energy Corp. | 75 | Commercial CHP Assessment |
Gas turbines for CHP can be in either a simple cycle or a combined cycle configuration. Simple cycle applications are most prevalent in smaller installations typically less than 25 MW. Waste heat is recovered in a HRSG to generate high or low pressure steam or hot water. The thermal product can be used directly or converted to chilled water with single or double effect absorption chillers.
Technology Advancements
Advancements in blade design, cooling techniques and combustion modifications including lean premix (dry low NOx) and catalytic combustion are under development to achieve higher thermal efficiencies and single digit emission levels without post combustion treatment. Gas turbine manufacturers have been commercializing their products for decades. A global network of manufacturers, dealers and distributors is well established
4. Microturbines
Introduction
A new class of small gas turbines called microturbines is emerging for the distributed resource market. Several manufacturers are developing competing engines in the 25-250 kW range, however, multiple units can be integrated to produce higher electrical output while providing additional reliability. Most manufacturers are pursuing a single shaft design wherein the compressor, turbine and permanent-magnet generator are mounted on a single shaft supported on lubrication-free air bearings. These turbines operate at speeds of up to 120,000 rpm and are powered by natural gas, gasoline, diesel, and alcohol. The dual shaft design incorporates a power turbine and gear for mechanical drive applications and operate up to speeds of 40,000 rpm. Microturbines are a relatively new entry in the CHP industry and therefore many of the performance characteristics are estimates based on demonstration projects and laboratory testing.
Technology Description
The operating theory of the microturbine is similar to the gas turbine, except that most designs incorporate a recuperator to recover part of the exhaust heat for preheating the combustion air. Air is drawn through a compressor section, mixed with fuel and ignited to power the turbine section and the generator. The high frequency power that is generated is converted to grid compatible 60HZ through power conditioning electronics. For single shaft machines, a standard induction or synchronous generator can be used without any power conditioning electronics.
| ONSITE SYCOM Energy Corp. | 76 | Commercial CHP Assessment |
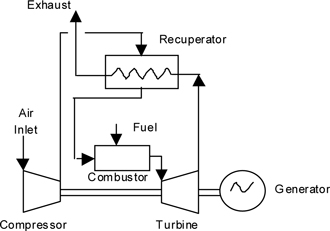
Figure C-5. Schematic of a Recuperated Microturbine
Design Characteristics
| Compact: | Their compact and lightweight design makes microturbines an attractive option for many light commercial/ industrial applications. | |
| Right-sized: | Microturbine capacity is right sized for many customers with relatively high electric costs. | |
| Lower noise: | Microturbines promise lower noise levels and can be located adjacent to occupied areas. |
Performance Characteristics
Efficiency
Most designs offer a recuperator to maintain high efficiency while operating at combustion temperatures below NOx formation levels. With recuperation, efficiency is currently in the 20%-30% LHV range.
Capital Cost
Installed prices of $500-1000/kW for CHP applications is estimated when microturbines are mass produced.
| ONSITE SYCOM Energy Corp. | 77 | Commercial CHP Assessment |
Availability
Although field experience is limited, manufacturers claim that availability will be similar to other competing distributed resource technologies, i.e. in the 90->95% range.
Maintenance
Microturbines have substantially fewer moving parts than engines. The single shaft design with air bearings will not require lubricating oil or water, so maintenance costs should be below conventional gas turbines. Microturbines that use lubricating oil should not require frequent oil changes since the oil is isolated from combustion products. Only an annual scheduled maintenance interval is planned for micoturbines. Maintenance costs are being estimated at 0.006-0.01$/kW.
Heat Recovery
Hot exhaust gas from the turbine section is available for CHP applications. As discussed previously, most designs incorporate a recuperator that limits the amount of heat available for CHP. Recovered heat can be used for hot water heating or low pressure steam applications.
Emissions
NOx emissions are targeted below 9 ppm using lean pre-mix technology without any post combustion treatment.
Applications
Markets for the microturbine include commercial and light industrial facilities. Since these customers often pay more for electricity than larger end-users, microturbines may offer these customers a cost effective alternative to the grid. Their relatively modest heat output may be ideally matched to customers with low pressure steam or hot water requirements. Manufacturers will target several electric generation applications, including standby power, peak shaving and base loaded operation with and without heat recovery.
One manufacturer is offering a two shaft turbine that can drive refrigeration chillers (100-350 tons), air compressors and other prime movers. The system also includes an optional heat recovery package for hot water and steam applications.
Technology Advancements
Microturbines are being developed in the near term to achieve thermal efficiencies of 30% and NOx emissions less than 10 ppm. It is expected that performance and maintenance requirements will vary among the initial offerings. Longer term goals are to achieve thermal efficiencies between 35-50% and NOx emissions between 2-3 ppm through the use of ceramic components, improved aerodynamic and recuperator designs and catalytic combustion.
| ONSITE SYCOM Energy Corp. | 78 | Commercial CHP Assessment |
Manufacturers are currently releasing prototype systems for demonstration and testing. Commercialization is planned by year 2000 with significant cost reductions expected as manufacturing volume increases.
5. Fuel Cells
Introduction
Fuel cells offer the potential for clean, quiet, and very efficient power generation, benefits that have driven their development in the past two decades. Fuel cells offer the ability to operate at electrical efficiencies of 40-60% (LHV) and up to 85% in CHP. Development of fuel cells for commercial use began in earnest in the 1970’s for stationary power and transportation applications.
Although several fuel cell designs are under development, only the phosphoric acid fuel cell (PAFC) is commercially available. The price of the most competitive PAFC is still around $3000/kW which is still too high for most industrial and commercial applications. The fuel cell requires continued research and development before it becomes a serious contender in the CHP market.
Technology Description
Fuel cells are similar to batteries in that they both produce a direct current (DC) through an electrochemical process without direct combustion of a fuel source. However, whereas a battery delivers power from a finite amount of stored energy, fuel cells can operate indefinitely provided that a fuel source is continuously supplied. Two electrodes (a cathode and anode) pass charged ions in an electrolyte to generate electricity and heat. A catalyst is used to enhance the process. Individual fuel cells produce between 0.5-0.9 volts of DC electricity. Fuel cells are combined into “stacks” like a battery to obtain usable voltage and power output.
A fuel cell consists of several major components including a fuel reformer to generate hydrogen-rich gas, a power section where the electrochemical process occurs and a power conditioner to convert the direct current (DC) generated in the fuel cell into alternating current (AC). Fuel reforming “frees” the hydrogen in the fuel and removes other contaminants that would otherwise poison the catalytic electrodes. Fuel processing is usually performed at the point of use eliminating storage of the hydrogen-rich mixture. Depending on the operating temperature of the fuel cell, fuel reforming can occur external or internal to the cell.
The general design of most fuel cells is similar except for the type of electrolyte used. The five main types of fuel cells are defined by their electrolyte and include alkaline, proton exchange membrane (PEMFC), phosphoric acid (PAFC), molten carbonate (MCFC) and solid oxide (SOFC) fuel cells. A comparison of fuel cell types is presented in Table C-2.
| ONSITE SYCOM Energy Corp. | 79 | Commercial CHP Assessment |
Alkaline fuel cells which are very efficient and have been used successfully in the space program, require very pure hydrogen that is expensive to produce and for this reason are not considered major contenders for the stationary power market.
Table C-2: Comparison of Fuel Cell Types
Alkaline (AFC) | Proton Exchange Membrane (PEM) | Phosphoric Acid (PAFC) | Molten Carbonate (MCFC) | Solid Oxide (SOFC) | ||||||
| Electrolyte | Alkaline lye | Perfluorated sulphonated polymer | Stabilized phosphoric acid | Molten carbonate solution | Ceramic solid electrolyte | |||||
| Typical Unit Sizes (kW) | <<100 | 0.1-500 | 5-200 (plants up to 5,000) | 800-2000 (plants up to 100,000) | 2.5-100,000 | |||||
| Electric Efficiency | Up to 70% | Up to 50% | 40-45% | 50-57% | 45-50% | |||||
| Installed Cost ($/kW) | 4,000 | 3,000-3,500 | 800-2,000 | 1,300-2,000 | ||||||
| Commercial Availability | Not for CHP | R&D | Yes | R&D | R&D | |||||
Power Density lbs/kW ft3/kW | 8-10 ~0.2 | ~25 0.4 | ~60 ~1 | ~40 ~1 | ||||||
| Heat Rejection (Btu/kWh) | 1640 @ 0.8 V | 1880 @0.74V | 850 @0.8V | 1780 @0.6V | ||||||
| Electric/ Thermal Energy | ~ 1 | ~ 1 | Up to 1.5 | Up to 1.5 | ||||||
| Oxidation Media | Oxygen | Oxygen from Air | Oxygen from Air | Oxygen from Air | Oxygen from Air | |||||
| Cooling Medium | Water | Boiling Water | Excess Air | Excess Air | ||||||
| Fuel | H2 | H2 and reformed H2 | H2 reformed from natural gas | H2 and CO reformed from natural gas or coal gas | H2 and CO reformed from natural gas or coal gas | |||||
| Operating Temp (F) | 160-210 | 120-210 | 320-410 | 1250 | 1500-1800 | |||||
| Operating Pressure (psig) | 14.7-74 | 14.7-118 | 14.7-44 | 14.7->150 | ||||||
| Applications | Space and military (today) | Stationary power (1997-2000) Bus, railroad, automotive propulsion (2000-2010) | Stationary power (1998) Railroad propulsion (1999) | Stationary power (2000->2005) | Stationary power and railroad propulsion (1998->2005) |
| ONSITE SYCOM Energy Corp. | 80 | Commercial CHP Assessment |
The PAFC represents the most mature technology and is commercially available today, having been installed in over 80 locations in the U.S., Europe and Japan.
The MCFC which is currently being demonstrated at several sites operates at higher temperature and is more efficient than the commercially available PAFC with efficiencies up to 55% (LHV) estimated. The high exhaust temperature of a MCFC can generate additional electricity in a steam turbine or in a gas turbine combined cycle. The MCFC is expected to target 1-20 MW stationary power applications and should be well suited for industrial CHP.
Many experts believe that the SOFC will be the dominant technology for stationary power applications. The SOFC offers the reliability of all-solid ceramic construction and is expected to have an electric efficiency of up to 50% (LHV). The high exhaust temperature of a SOFC can generate additional electricity in a steam turbine or in a gas turbine combined cycle. Hybrid systems using gas turbines or microturbines could increase electric efficiencies to 60%.
The PEMFC is of particular interest to the automotive industry as a future power plant for electric vehicles. Much of the current development effort is to introduce a PEMFC for the stationary power market as an intermediate step towards small and cost effective units for automobiles and buses. The PEMFC has very high power densities and can start-up quickly and meet varying demand.
Design Characteristics
| Emissions: | Installation of PAFC has been exempted from air quality permits in some of the strictest districts in the country including South Coast Air Quality Management District in the Los Angeles basin. | |
| Quiet operation: | Much of the appeal of the fuel cell is its quiet operation so that siting and special enclosures are of minimal concern. | |
| Commercial use: | The 200kW PAFC is ideally suited to typical commercial installations. | |
| Thermal quality: | The quality of the thermal product depends on the type of electrolyte. The commercially available PAFC operates at lower temperatures and therefore produces low pressure steam or hot water as a byproduct. |
| ONSITE SYCOM Energy Corp. | 81 | Commercial CHP Assessment |
Performance Characteristics
Efficiency
The electric efficiency of fuel cells can be dramatically higher than combustion-based power plants. The current efficiency of PAFC is 40% with a target of 40-60% (LHV) estimated. With the recovery of the thermal byproduct, overall fuel utilization could approach 85%. Fuel cells retain their efficiency at part load.
Capital Cost
The capital cost of fuel cells is currently much higher than competing distributed resources. The commercial PAFC currently costs approximately $3,000/kW. Fuel cell prices are expected to drop to $500-$1500/kW in the next decade with further advancements and increased manufacturing volumes. Substantial cost reductions in the stationary power market are expected from advancements in fuel cells used for transportation.
Availability
Theoretically, fuel cells should have higher availability and reliability than gas turbines or reciprocating engines since they have fewer moving parts. PAFC have run continuously for more than 5,500 hours which is comparable to other power plants. Limited test results for PAFC have demonstrated availability at 96% and 2500 hours between forced outages.
Maintenance
The electrodes within a fuel cell that comprise the “stack” degrade over time reducing the efficiency of the unit. Fuel cells are designed such that the “stack” can be removed. It is estimated that “stack” replacement is required between four and six years when the fuel cell is operated under continuous conditions. The maintenance cost for PAFC (200 kW) including an allowance for periodic stack replacements has been in the range of $0.02-$5 kWh. Improvements should bring the cost down to $0.015/kWhr over the twenty year life of the unit.
Heat Recovery
Significant heat is released in a fuel cell during electrical generation. The PAFC and PEMFC operate at lower temperatures and produce lower grades of waste heat generally suitable for commercial and industrial CHP applications. The MCFC and SOFC operate at much higher temperatures and produce heat that is sufficient to generate additional electricity with a steam turbine or a microturbine hybrid gas turbine combined cycle.
| ONSITE SYCOM Energy Corp. | 82 | Commercial CHP Assessment |
Emissions
Fuel cells have little environmental impact.
Applications
The type of fuel cell determines the temperature of the heat liberated during the process and its suitability for CHP applications. Low temperature fuel cells generate a thermal product suitable for low pressure steam and hot water CHP applications. High temperature fuel cells produce high pressure steam that can be used in combined cycles and other CHP process applications. Although some fuel cells can operate at part load, other designs do not permit on/off cycling and can only operate under continuous base load conditions.
For stationary power, fuel cells are being developed for small commercial and residential markets and as peak shaving units for commercial and industrial customers.
In a unique innovation, high temperature fuel cells and gas turbines are being integrated to boost electric generating efficiencies. Combined cycle systems are being evaluated for sizes up to 25 MW with electric efficiencies of 60-70% (LHV). The hot exhaust from the fuel cell is combusted and used to drive the gas turbine. Energy recovered from the turbine’s exhaust is used in a recuperator that preheats air from the turbine’s compressor section. The heated air is then directed to the fuel cell and the gas turbine. Any remaining energy from the turbine exhaust can be recovered for CHP.
Technology Advancements
With the exception of PAFC, fuel cell technology is still being demonstrated in the field or in the laboratory. Significant development and funding will be required over the next 5-10 years to achieve projected performance and cost. Major activities include reformer design, size reduction and improved manufacturing techniques. Collaboration between industry and government has been a important factor in sustaining development efforts.
Development in the mobile market should have a major impact on fuel cell technology. It is anticipated that PEM technology will be demonstrated by the year 2000.
6. System Issues
Integrating a CHP technology with a specific application together as a system, requires an understanding of the engineering and site-specific criteria that will provide the most economic solution. The final design must address siting issues like noise abatement and footprint constraints. Engineering information for designing a technically and economically feasible system should include electric and thermal load profiles, capacity factor, fuel type, performance characteristics of the prime mover, etc. CHP by definition implies the simultaneous generation of two or more energy products that function as a system. This section of the report reviews some of the primary issues faced by the design engineer in selecting and designing a CHP system.
| ONSITE SYCOM Energy Corp. | 83 | Commercial CHP Assessment |
Electric and Thermal Load Profiles
One of the first and most important elements in the analysis of CHP feasibility is obtaining accurate representations of electric and thermal loads. This is particularly true for load following applications where the prime mover must adjust its electric output to match the demand of the end-user while maintaining zero output to the grid. A 30-minute or hourly load profile provides the best results for such an analysis. Thermal load profiles can consist of hot water use, low and high pressure steam consumption and cooling loads. The shape of the electric load profile and the spread between minimum and maximum values will largely dictate the number, size and type of prime mover. It is recommended that electric and thermal loads be monitored if such information is not available.
For base load CHP applications that export power to the grid and meet a minimum thermal load required under PURPA, sizing a CHP facility is largely dictated by capacity requirements in the wholesale energy market. Rather than meeting the demand of an end-user, such plants are dispatched to the grid along with other generating systems as a function of cost of generation.
Capacity factor is a key indicator of how the capacity of the prime mover is utilized during operation. Capacity factor is a useful means of indicating the overall economics of the CHP system. The capacity factor indicates the facility’s proximity to baseload operation. Capacity factor is defined as follows:

A low capacity factor is indicative of peaking applications that derive economic benefits generally through the avoidance of high demand charges. A high capacity factor is desirable for most CHP applications to obtain the greatest economic benefit. A high capacity factor effectively reduces the fixed unit costs of the system ($/kWh) and increases the generator's ability to remain competitive with grid supplied power.
Gas turbines are typically selected for applications with relatively constant electric load profiles to minimize cycling the turbine or operating the turbine for a large percentage of hours at part load conditions where efficiency declines rapidly. Gas turbines are ideal for industrial or institutional end-users with 24 hour operations or where export to the grid is intended.
Most commercial end-users have a varying electric load profile, i.e., high peak loads during the day and low loads after business hours at night. Natural gas reciprocating engines are a popular choice for commercial CHP due to good part-load operation, ability to obtain an air quality permit and availability of size ranges that match the load of many commercial and institutional end-users. Reciprocating engines exhibit high electric efficiencies meaning that there is less available rejected heat. This is often compatible with the thermal requirements of the end-user.
| ONSITE SYCOM Energy Corp. | 84 | Commercial CHP Assessment |
Micro-turbines are just emerging as a as a future distributed resource that will be ideally sized to meet the electric load profiles of many commercial and institutional end-users.
Exhaust heat can be recovered for hot water or steam loads.
Thermal demand of a commercial or institutional end-user often consists of hot water or low pressure steam demand in the winter and a cooling demand in the summer. Heat from the prime movers often used in a single-stage steam or hot water absorption chiller. This option allows the CHP system to operate continuously throughout the year while maintaining a good thermal load without the need to reject heat to the environment.
Quality of Recoverable Heat
The thermal requirements of the end-user may dictate the feasibility of a CHP system or the selection of the prime mover. Gas turbines offer the highest quality heat that is often used to generate power in a steam turbine. Gas turbines reject heat almost exclusively in its exhaust gas stream. The high temperature of this exhaust can be used to generate high pressure steam or lower temperature applications such as low pressure steam or hot water. Larger gas turbines (typically above 25 MW) are frequently used in combined cycles where high pressure steam is produced in the HRSG and is used in a steam turbine to generate additional electricity. The high levels of oxygen present in the exhaust stream allows for supplemental fuel addition to generate additional steam at high efficiency.
Some of the developing fuel cell technologies including molten carbonate fuel cells (MCFC) and solid oxide fuel cells (SOFC) will also provide high quality rejected heat comparable to a gas turbine.
Reciprocating engines and the commercially available phosphoric acid fuel cell (PAFC) produce a lower grade of rejected heat, therefore heating applications that require low pressure steam (15 psig) or hot water are most suitable for these technologies. The exhaust from a reciprocating engine can generate steam up to 100 psig.
Reciprocating engines typically have a higher efficiency than most gas turbines in the same output range and are a good fit where the thermal load is low relative to electric demand. Reciprocating engines can produce low and high pressure steam from its exhaust gas, although low pressure steam or hot water is generally specified. Jacket water temperatures are typically limited to 210F so that jacket heat is usually recovered in the form of hot water. All the jacket heat can be recovered if there is sufficient demand, however, only 40-60% of the exhaust heat can be recovered to prevent condensation of corrosive exhaust products in the stack that will limit equipment life.
Noise
Although fuel cells are relatively expensive to install, they are being tested in a number of sites typically where the cost of a power outage is significant to lost revenues or lost productivity and where uninterrupted power is mandatory. Their relatively quiet operation has appeal and these units are being installed in congested commercial areas. Locating a turbine or engine in a residential area usually requires special consideration and design modifications to be acceptable.
| ONSITE SYCOM Energy Corp. | 85 | Commercial CHP Assessment |
Engine and turbine installations are often installed in building enclosures to attenuate noise to surrounding communities. Special exhaust silencers or mufflers are typically required on exhaust stacks. Gas turbines require a high volume of combustion air, causing high velocities and associated noise. Inlet air filters can be fitted with silencers to substantially reduce noise levels.
Gas turbines are more easily confined within a factory supplied enclosure than reciprocating engines. Reciprocating engines require greater ventilation due to radiated heat that makes their installation in a sound-attenuating building often the most practical solution. Gas turbines require much less ventilation and can be concealed within a compact steel enclosure.
Foot Print
Phosphoric acid fuel cells and micro-turbines offer compact packaging and have an appeal to those end-users that are seeking a non-obtrusive power generation or CHP system. Larger gas turbines and reciprocating engines generally are isolated in either a factory enclosure or a separate building along with ancillary equipment.
Fuel Supply
A potential system issue for gas turbines is the supply pressure of the natural gas distribution system at the end-user’s property line. Gas turbines need minimum gas pressures of about 120 psig for small turbines with substantially higher pressures for larger turbines. Assuming there is no high pressure gas service, the local gas distribution company would have to construct a high pressure gas line or the end-user must purchase a gas compressor. The economics of constructing a new line must consider the volume of gas sales over the life of the project.
Gas compressors may have reliability problems especially in the smaller size ranges. If "black start" capability is required, then a reciprocating engine may be needed to turn the gas compressor, adding cost and complexity.
Reciprocating engines and fuel cells are more accommodating to the fuel pressure issue, generally requiring under 50 psig. Reciprocating engines operating on diesel fuel storage do not have fuel pressure as an issue, however, there may be special permitting requirements for on-site fuel storage.
Diesel engines should be considered where natural gas is not available or very expensive. Diesel engines have excellent part load operating characteristics and high power densities. In most localities, environmental regulations have largely restricted their use for CHP. In California and elsewhere in the U.S., diesel engines are almost exclusively used for emergency power or where uninterrupted power supply is needed such as in hospitals and critical data operating centers. As emergency generators, diesel engines can be started and achieve full power in a relatively short period of time.
| ONSITE SYCOM Energy Corp. | 86 | Commercial CHP Assessment |