Exhibit 99.2
| Fourth Quarter and Full Year 2012 Conference Call November 13, 2012 |
| 2 Agenda Introduction Company Highlights Business Update Financial Overview Questions & Answers Mark Davidson Investor Relations Randy Snyder Chairman, Chief Executive Officer and President Hal Weinstein Executive Vice President, Sales and Marketing Greg Hann Executive Vice President, Chief Financial Officer |
| 3 Disclaimer Safe Harbor Statement The following information contains, or may be deemed to contain, “forward-looking statements” (as defined in the U.S. Private Securities Litigation Reform Act of 1995). Most forward-looking statements contain words that identify them as forward-looking, such as “may”, “plan”, “seek”, “will”, “expect”, “intend”, “estimate”, “anticipate”, “believe”, “project”, “opportunity”, “target”, “goal”, “growing” and “continue” or other words that relate to future events, as opposed to past or current events. By their nature, forward-looking statements are not statements of historical facts and involve risks and uncertainties because they relate to events and depend on circumstances that may or may not occur in the future. These statements give Wesco Aircraft’s current expectation of future events or its future performance and do not relate directly to historical or current events or Wesco Aircraft’s historical or future performance. As such, Wesco Aircraft’s future results may vary from any expectations or goals expressed in, or implied by, the forward-looking statements included in this presentation, possibly to a material degree. Wesco Aircraft cannot assure you that the assumptions made in preparing any of the forward-looking statements will prove accurate or that any long-term financial goals will be realized. All forward-looking statements included in this presentation speak only as of the date made, and Wesco Aircraft undertakes no obligation to update or revise publicly any such forward-looking statements, whether as a result of new information, future events, or otherwise. In particular, Wesco Aircraft cautions you not to place undue weight on certain forward-looking statements pertaining to potential growth opportunities, long-term financial projections or goals, future growth or the value we currently ascribe to certain attributes set forth herein. Actual results may vary significantly from these statements. Wesco Aircraft’s business is subject to numerous risks and uncertainties, which may cause future results of operations to vary significantly from those presented herein, including those highlighted in the section entitled “Risk Factors” in Wesco Aircraft’s Annual Report on Form 10-K for the fiscal year ended September 30, 2011 as supplemented by its Quarterly Reports on Form 10-Q for the periods ended December 31, 2011, March 31 2012 and June 30, 2012. Wesco Aircraft discloses Adjusted EBITDA and Adjusted Net Income, which are non-GAAP measures its management uses to evaluate its business, because it believes they assist investors and analysts in comparing its performance across reporting periods on a consistent basis by excluding items that Wesco Aircraft does not believe are indicative of its core operating performance. Wesco Aircraft believes these metrics are used in the financial community, and it presents these metrics to enhance investors’ understanding of its operating performance and cash flow. You should not consider Adjusted EBITDA and Adjusted Net Income as an alternative to net income, determined in accordance with GAAP, as an indicator of operating performance, or as an alternative to net cash provided by operating activities, determined in accordance with GAAP, as an indicator of Wesco Aircraft’s cash flow. See the Appendix for reconciliations of Adjusted EBITDA and Adjusted Net Income to GAAP net income. |
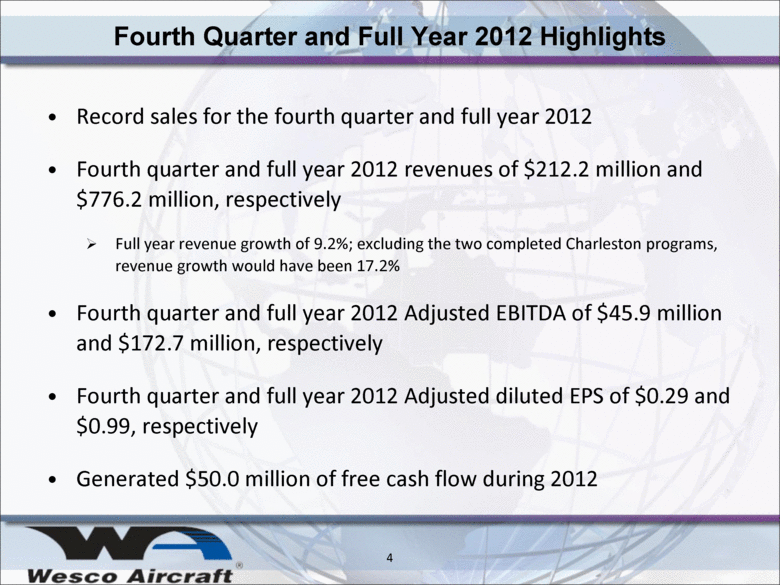
| 4 Fourth Quarter and Full Year 2012 Highlights Record sales for the fourth quarter and full year 2012 Fourth quarter and full year 2012 revenues of $212.2 million and $776.2 million, respectively Full year revenue growth of 9.2%; excluding the two completed Charleston programs, revenue growth would have been 17.2% Fourth quarter and full year 2012 Adjusted EBITDA of $45.9 million and $172.7 million, respectively Fourth quarter and full year 2012 Adjusted diluted EPS of $0.29 and $0.99, respectively Generated $50.0 million of free cash flow during 2012 |
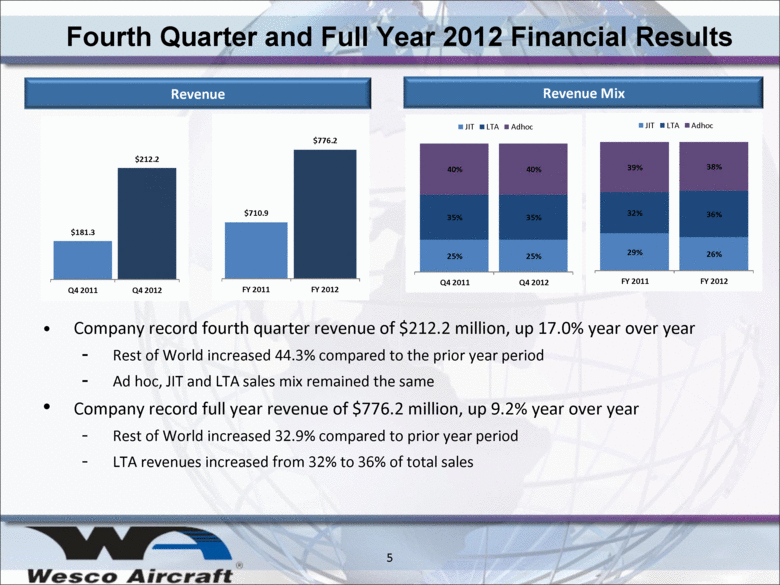
| 5 Fourth Quarter and Full Year 2012 Financial Results Company record fourth quarter revenue of $212.2 million, up 17.0% year over year Rest of World increased 44.3% compared to the prior year period Ad hoc, JIT and LTA sales mix remained the same Company record full year revenue of $776.2 million, up 9.2% year over year Rest of World increased 32.9% compared to prior year period LTA revenues increased from 32% to 36% of total sales +17.0% Revenue Revenue Mix +9.2% $710.9 $776.2 FY 2011 FY 2012 25% 25% 35% 35% 40% 40% Q4 2011 Q4 2012 JIT LTA Adhoc $181.3 $212.2 Q4 2011 Q4 2012 29% 26% 32% 36% 39% 38% FY 2011 FY 2012 JIT LTA Adhoc |
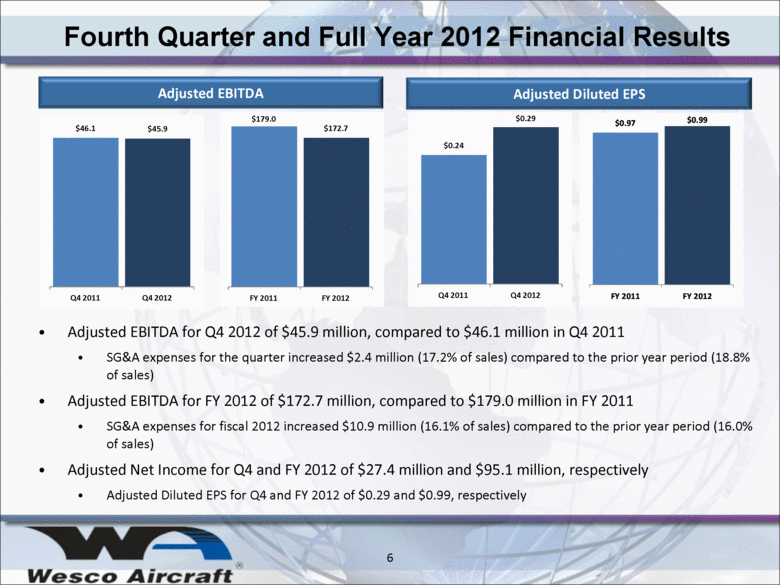
| 6 Fourth Quarter and Full Year 2012 Financial Results Adjusted EBITDA for Q4 2012 of $45.9 million, compared to $46.1 million in Q4 2011 SG&A expenses for the quarter increased $2.4 million (17.2% of sales) compared to the prior year period (18.8% of sales) Adjusted EBITDA for FY 2012 of $172.7 million, compared to $179.0 million in FY 2011 SG&A expenses for fiscal 2012 increased $10.9 million (16.1% of sales) compared to the prior year period (16.0% of sales) Adjusted Net Income for Q4 and FY 2012 of $27.4 million and $95.1 million, respectively Adjusted Diluted EPS for Q4 and FY 2012 of $0.29 and $0.99, respectively Adjusted EBITDA Adjusted Diluted EPS $46.1 $45.9 Q4 2011 Q4 2012 $0.24 $0.29 Q4 2011 Q4 2012 $179.0 $172.7 FY 2011 FY 2012 $0.97 $0.99 FY 2011 FY 2012 |
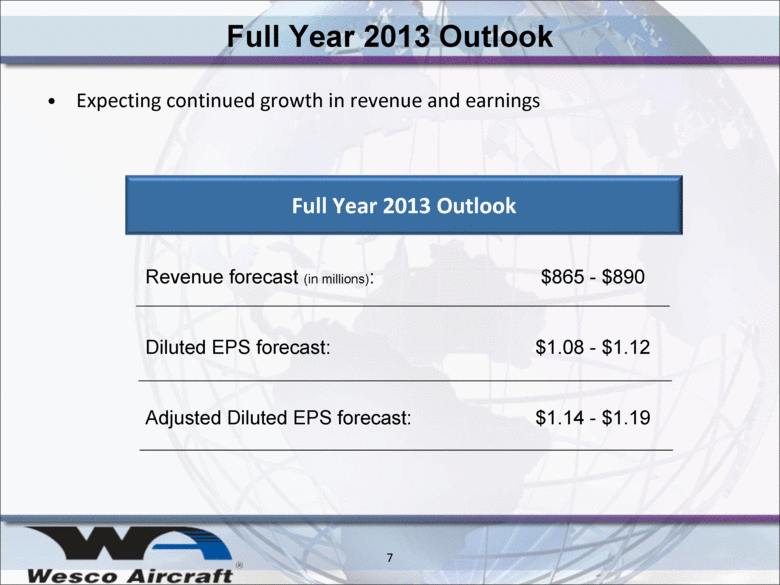
| 7 Full Year 2013 Outlook Expecting continued growth in revenue and earnings Revenue forecast (in millions): $865 - $890 Diluted EPS forecast: $1.08 - $1.12 Adjusted Diluted EPS forecast: $1.14 - $1.19 Full Year 2013 Outlook |
| Appendix 8 |
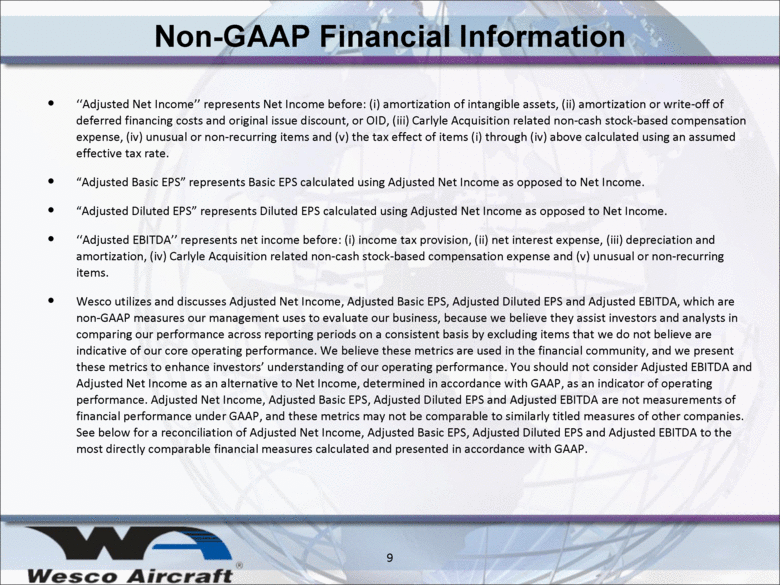
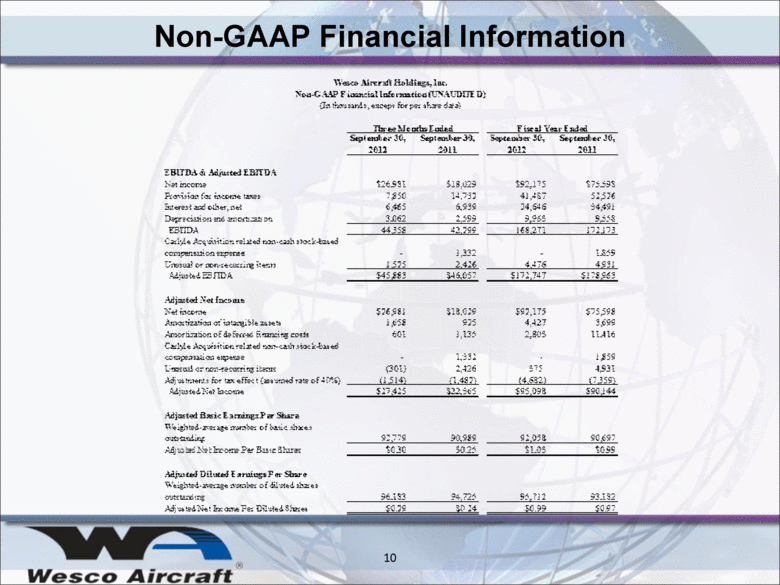
| 9 Non-GAAP Financial Information ‘‘Adjusted Net Income’’ represents Net Income before: (i) amortization of intangible assets, (ii) amortization or write-off of deferred financing costs and original issue discount, or OID, (iii) Carlyle Acquisition related non-cash stock-based compensation expense, (iv) unusual or non-recurring items and (v) the tax effect of items (i) through (iv) above calculated using an assumed effective tax rate. “Adjusted Basic EPS” represents Basic EPS calculated using Adjusted Net Income as opposed to Net Income. “Adjusted Diluted EPS” represents Diluted EPS calculated using Adjusted Net Income as opposed to Net Income. ‘‘Adjusted EBITDA’’ represents net income before: (i) income tax provision, (ii) net interest expense, (iii) depreciation and amortization, (iv) Carlyle Acquisition related non-cash stock-based compensation expense and (v) unusual or non-recurring items. Wesco utilizes and discusses Adjusted Net Income, Adjusted Basic EPS, Adjusted Diluted EPS and Adjusted EBITDA, which are non-GAAP measures our management uses to evaluate our business, because we believe they assist investors and analysts in comparing our performance across reporting periods on a consistent basis by excluding items that we do not believe are indicative of our core operating performance. We believe these metrics are used in the financial community, and we present these metrics to enhance investors’ understanding of our operating performance. You should not consider Adjusted EBITDA and Adjusted Net Income as an alternative to Net Income, determined in accordance with GAAP, as an indicator of operating performance. Adjusted Net Income, Adjusted Basic EPS, Adjusted Diluted EPS and Adjusted EBITDA are not measurements of financial performance under GAAP, and these metrics may not be comparable to similarly titled measures of other companies. See below for a reconciliation of Adjusted Net Income, Adjusted Basic EPS, Adjusted Diluted EPS and Adjusted EBITDA to the most directly comparable financial measures calculated and presented in accordance with GAAP. |
| 10 Non-GAAP Financial Information |
