Exhibit 99.2
| Fourth Quarter and Full Year FY 2013 Conference Call November 21, 2013 |
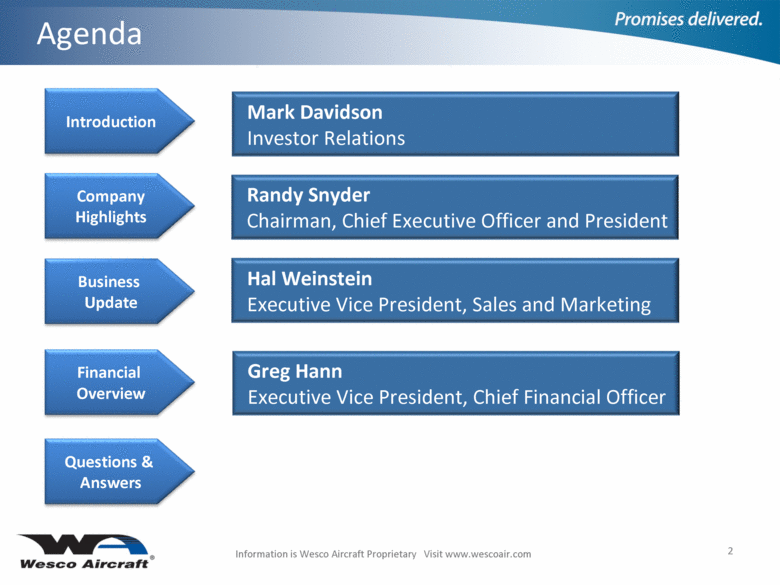
| Information is Wesco Aircraft Proprietary Visit www.wescoair.com 2 Agenda Introduction Company Highlights Business Update Financial Overview Questions & Answers Mark Davidson Investor Relations Randy Snyder Chairman, Chief Executive Officer and President Hal Weinstein Executive Vice President, Sales and Marketing Greg Hann Executive Vice President, Chief Financial Officer |
| Information is Wesco Aircraft Proprietary Visit www.wescoair.com 3 Disclaimer This presentation contains forward-looking statements within the meaning of federal securities regulations. Such forward-looking statements include the discussions of the Company’s business strategies and the Company’s expectations concerning future financial results. In some cases, you can identify forward-looking statements by terminology such as “guidance,” “may,” “will,” “could,” “should,” “forecasts,” “expects,” “intends,” “plans,” “anticipates,” “projects,” “outlook,” “believes,” “estimates,” “predicts,” “potential,” “continue,” “preliminary,” or the negative of these terms or other comparable terminology. Although the Company believes that such forward-looking statements are reasonable, it cannot assure you that any forward-looking statements will prove to be correct. Forward-looking statements are not guarantees of future performance and involve known and unknown risks, uncertainties and other factors which may cause the actual results to differ materially from those anticipated at the time the forward-looking statements are made. These risks include, but are not limited to: the condition of the aerospace industry; reductions in military spending; business risks as a result of supplying equipment and services to the U.S. Government; risks associated with the Company’s long-term, fixed-price agreements, which have no guarantee of future sales volume; risks associated with the loss of a significant customer; the Company’s failure to compete successfully in its highly competitive global industry; risks associated with the Company’s rapid expansion; supply-chain risk; the Company’s dependence on complex information technology, the Company’s dependence on key personnel; and other risks and uncertainties associated with our business described in the Company’s Annual Report on Form 10-K, Quarterly Reports on Form 10-Q and Current Reports on Form 8-K. The Company undertakes no obligation to update or revise forward-looking statements after the day of the release as a result of new information, future events or developments, except as required by law. The Company discloses Adjusted EBITDA and Adjusted Net Income, which are non-GAAP measures its management uses to evaluate its business, because it believes they assist investors and analysts in comparing its performance across reporting periods on a consistent basis by excluding items that the Company does not believe are indicative of its core operating performance. The Company believes these metrics are used in the financial community, and it presents these metrics to enhance investors’ understanding of its operating performance. You should not consider Adjusted EBITDA and Adjusted Net Income as an alternative to net income, determined in accordance with GAAP, as an indicator of operating performance. See the Appendix for reconciliations of Adjusted EBITDA and Adjusted Net Income to GAAP net income. |
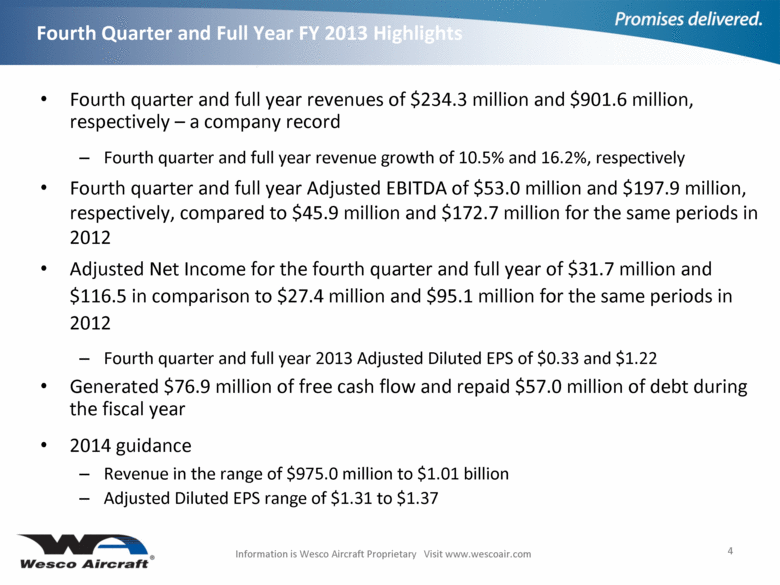
| Fourth quarter and full year revenues of $234.3 million and $901.6 million, respectively – a company record Fourth quarter and full year revenue growth of 10.5% and 16.2%, respectively Fourth quarter and full year Adjusted EBITDA of $53.0 million and $197.9 million, respectively, compared to $45.9 million and $172.7 million for the same periods in 2012 Adjusted Net Income for the fourth quarter and full year of $31.7 million and $116.5 in comparison to $27.4 million and $95.1 million for the same periods in 2012 Fourth quarter and full year 2013 Adjusted Diluted EPS of $0.33 and $1.22 Generated $76.9 million of free cash flow and repaid $57.0 million of debt during the fiscal year 2014 guidance Revenue in the range of $975.0 million to $1.01 billion Adjusted Diluted EPS range of $1.31 to $1.37 Information is Wesco Aircraft Proprietary Visit www.wescoair.com 4 Fourth Quarter and Full Year FY 2013 Highlights |
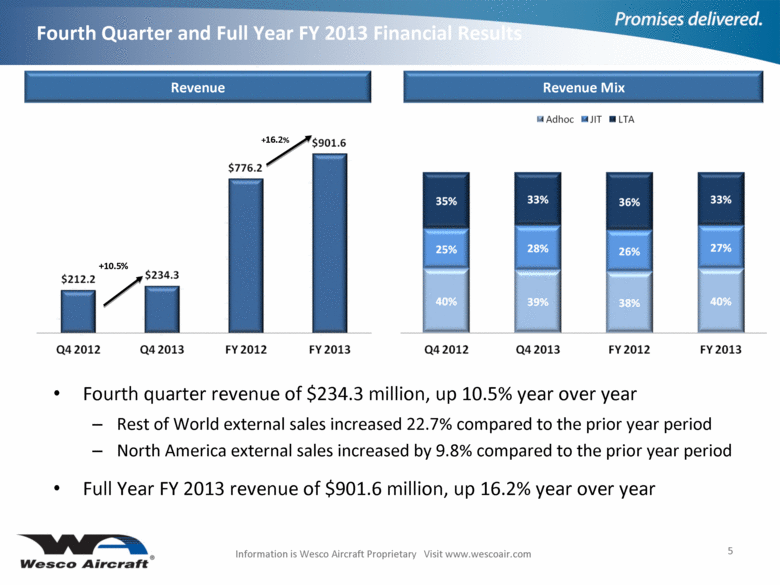
| Fourth quarter revenue of $234.3 million, up 10.5% year over year Rest of World external sales increased 22.7% compared to the prior year period North America external sales increased by 9.8% compared to the prior year period Full Year FY 2013 revenue of $901.6 million, up 16.2% year over year +10.5% Information is Wesco Aircraft Proprietary Visit www.wescoair.com 5 Fourth Quarter and Full Year FY 2013 Financial Results Revenue Revenue Mix +16.2% |
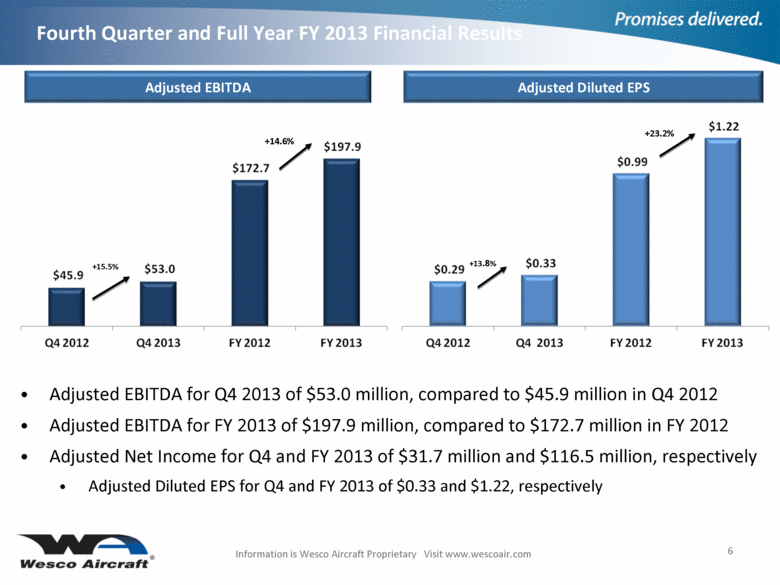
| Information is Wesco Aircraft Proprietary Visit www.wescoair.com 6 Fourth Quarter and Full Year FY 2013 Financial Results Adjusted EBITDA Adjusted Diluted EPS +15.5% +14.6% Adjusted EBITDA for Q4 2013 of $53.0 million, compared to $45.9 million in Q4 2012 Adjusted EBITDA for FY 2013 of $197.9 million, compared to $172.7 million in FY 2012 Adjusted Net Income for Q4 and FY 2013 of $31.7 million and $116.5 million, respectively Adjusted Diluted EPS for Q4 and FY 2013 of $0.33 and $1.22, respectively +13.8% +23.2% |
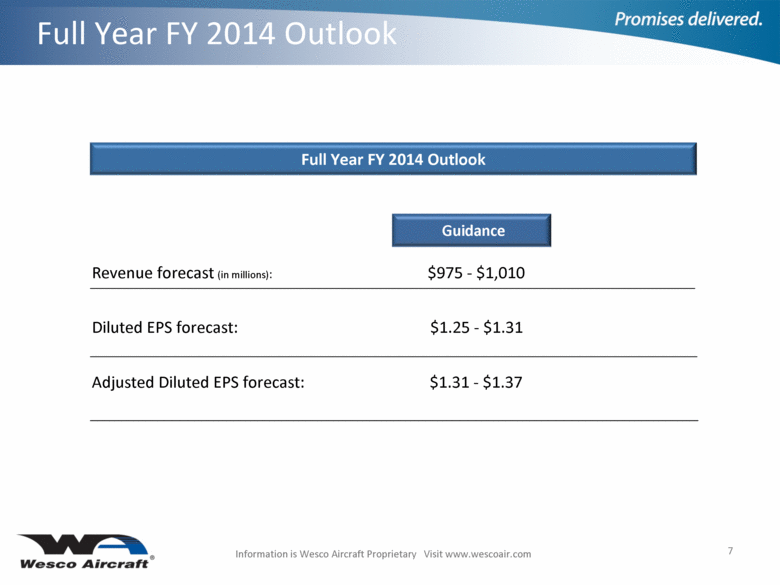
| Information is Wesco Aircraft Proprietary Visit www.wescoair.com 7 Full Year FY 2014 Outlook Revenue forecast (in millions): $975 - $1,010 Diluted EPS forecast: $1.25 - $1.31 Adjusted Diluted EPS forecast: $1.31 - $1.37 Full Year FY 2014 Outlook Guidance |
| Information is Wesco Aircraft Proprietary Visit www.wescoair.com 8 APPENDIX |
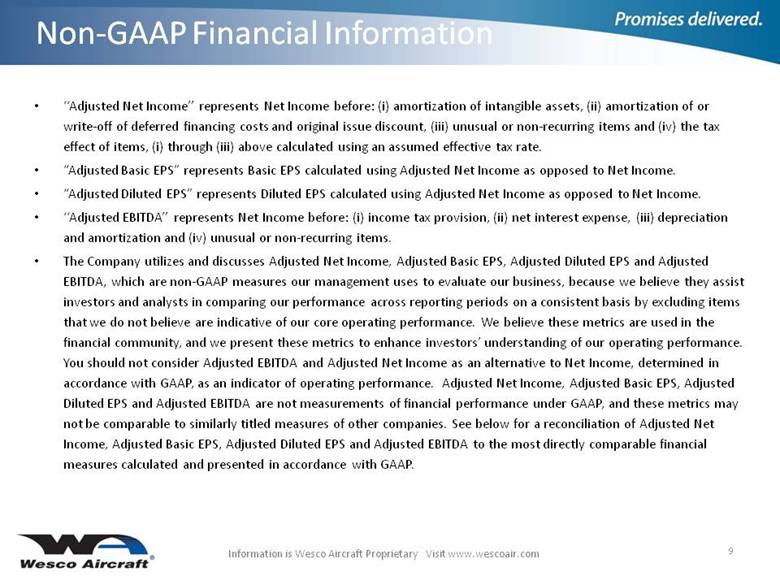
| Information is Wesco Aircraft Proprietary Visit www.wescoair.com 9 Non-GAAP Financial Information ‘‘Adjusted Net Income’’ represents Net Income before: (i) amortization of intangible assets, (ii) amortization of or write-off of deferred financing costs and original issue discount, (iii) unusual or non-recurring items and (iv) the tax effect of items, (i) through (iii) above calculated using an assumed effective tax rate. “Adjusted Basic EPS” represents Basic EPS calculated using Adjusted Net Income as opposed to Net Income. “Adjusted Diluted EPS” represents Diluted EPS calculated using Adjusted Net Income as opposed to Net Income. ‘‘Adjusted EBITDA’’ represents Net Income before: (i) income tax provision, (ii) net interest expense, (iii) depreciation and amortization and (iv) unusual or non-recurring items. The Company utilizes and discusses Adjusted Net Income, Adjusted Basic EPS, Adjusted Diluted EPS and Adjusted EBITDA, which are non-GAAP measures our management uses to evaluate our business, because we believe they assist investors and analysts in comparing our performance across reporting periods on a consistent basis by excluding items that we do not believe are indicative of our core operating performance. We believe these metrics are used in the financial community, and we present these metrics to enhance investors’ understanding of our operating performance. You should not consider Adjusted EBITDA and Adjusted Net Income as an alternative to Net Income, determined in accordance with GAAP, as an indicator of operating performance. Adjusted Net Income, Adjusted Basic EPS, Adjusted Diluted EPS and Adjusted EBITDA are not measurements of financial performance under GAAP, and these metrics may not be comparable to similarly titled measures of other companies. See below for a reconciliation of Adjusted Net Income, Adjusted Basic EPS, Adjusted Diluted EPS and Adjusted EBITDA to the most directly comparable financial measures calculated and presented in accordance with GAAP. |
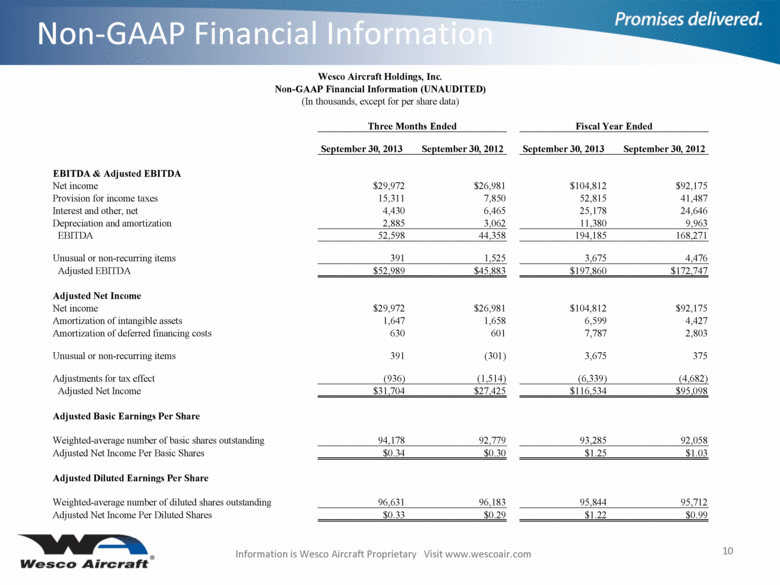
| Information is Wesco Aircraft Proprietary Visit www.wescoair.com 10 Non-GAAP Financial Information Wesco Aircraft Holdings, Inc. Non-GAAP Financial Information (UNAUDITED) (In thousands, except for per share data) Three Months Ended Fiscal Year Ended September 30, 2013 September 30, 2012 September 30, 2013 September 30, 2012 EBITDA & Adjusted EBITDA Net income $29,972 $26,981 $104,812 $92,175 Provision for income taxes 15,311 7,850 52,815 41,487 Interest and other, net 4,430 6,465 25,178 24,646 Depreciation and amortization 2,885 3,062 11,380 9,963 EBITDA 52,598 44,358 194,185 168,271 Unusual or non-recurring items 391 1,525 3,675 4,476 Adjusted EBITDA $52,989 $45,883 $197,860 $172,747 Adjusted Net Income Net income $29,972 $26,981 $104,812 $92,175 Amortization of intangible assets 1,647 1,658 6,599 4,427 Amortization of deferred financing costs 630 601 7,787 2,803 Unusual or non-recurring items 391 (301) 3,675 375 Adjustments for tax effect (936) (1,514) (6,339) (4,682) Adjusted Net Income $31,704 $27,425 $116,534 $95,098 Adjusted Basic Earnings Per Share Weighted-average number of basic shares outstanding 94,178 92,779 93,285 92,058 Adjusted Net Income Per Basic Shares $0.34 $0.30 $1.25 $1.03 Adjusted Diluted Earnings Per Share Weighted-average number of diluted shares outstanding 96,631 96,183 95,844 95,712 Adjusted Net Income Per Diluted Shares $0.33 $0.29 $1.22 $0.99 |

