Exhibit 99.1
| Public Lenders Presentation February 12, 2014 $525,000,000 Senior Secured Term Loan B |
| Special Notice Regarding Material Non-Public Information THE RECIPIENT OF THIS LENDER PRESENTATION HAS STATED THAT IT DOES NOT WISH TO RECEIVE INFORMATION CONCERNING WESCO AIRCRAFT HARDWARE CORPORATION (“WESCO” OR THE “COMPANY”), ITS SUBSIDIARIES AND AFFILIATES OR ITS OR THEIR RESPECTIVE SECURITIES THAT IS OF THE TYPE THAT CUSTOMARILY WOULD BE INCLUDED IN A PRIVATE VERSION OF (OR A PRIVATE SUPPLEMENT TO) A LENDER PRESENTATION (“MNPI”), AND ACKNOWLEDGES THAT OTHER LENDERS MAY HAVE RECEIVED A VERSION OF THE LENDER PRESENTATION (OR A SUPPLEMENT THERETO) THAT CONTAINS ADDITIONAL INFORMATION CONCERNING THE COMPANY, ITS SUBSIDIARIES AND AFFILIATES AND ITS OR THEIR RESPECTIVE SECURITIES THAT MAY BE MATERIAL. NONE OF THE COMPANY, BANK OF AMERICA, N.A. OR ANY OF THEIR RESPECTIVE AFFILIATES, TAKES ANY RESPONSIBILITY FOR THE RECIPIENT'S DECISION TO LIMIT THE SCOPE OF THE INFORMATION IT HAS OBTAINED IN CONNECTION WITH ITS EVALUATION OF THE COMPANY, ITS SUBSIDIARIES AND THE CREDIT FACILITIES DESCRIBED HEREIN. NOTWITHSTANDING THE RECIPIENT'S DESIRE TO ABSTAIN FROM RECEIVING MNPI AND THE COMPANY’S REPRESENTATION ABOVE, THE RECIPIENT ACKNOWLEDGES THAT (I) ANY INDIVIDUALS LISTED AS CONTACTS IN THIS LENDER PRESENTATION MAY BE IN RECEIPT OF MNPI OR OTHERWISE HAVE ACCESS TO INFORMATION THAT IS PROVIDED TO LENDERS OR POTENTIAL LENDERS WHO DESIRE TO RECEIVE MNPI AND THAT IF THE RECIPIENT CHOOSES TO COMMUNICATE WITH ANY SUCH INDIVIDUALS THE RECIPIENT ASSUMES THE RISK OF RECEIVING MNPI, (II) INFORMATION OBTAINED AS A RESULT OF BECOMING A LENDER MAY INCLUDE MNPI, AND (III) THE RECIPIENT HAS DEVELOPED COMPLIANCE PROCEDURES REGARDING THE USE OF MNPI AND THAT IT WILL HANDLE MNPI IN ACCORDANCE WITH APPLICABLE LAW, INCLUDING FEDERAL AND STATE SECURITIES LAWS. Forward-Looking Statements This presentation has been prepared by the Company. This presentation is confidential and may not be disclosed to third parties or used for any purpose other than to evaluate the Company in connection with the financing to be provided by lenders. Forward-looking statements should not be read as a guarantee of future performance or results, and will not necessarily be accurate indications of the times at, or by which, such performance or results will be achieved. Forward-looking information is based on information available at the time and/or the Company’s good faith belief with respect to future events, and is subject to risks and uncertainties that could cause actual performance or results to differ materially from those expressed in the statements. Forward-looking statements speak only as of the date the statements are made. The Company assumes no obligation to update forward-looking statements to reflect actual results, changes in assumptions or changes in other factors affecting forward-looking information except to the extent required by applicable securities laws. If the Company does update one or more forward-looking statements, no inference should be drawn that the Company will make additional updates with respect thereto or with respect to other forward-looking statements. Non-GAAP Statements To supplement the Company’s consolidated financial statements prepared in accordance with accounting principles generally accepted in the United States (GAAP) and to better reflect period-over-period comparisons, the Company uses non-GAAP financial measures of performance, financial position, or cash flows that either exclude or include amounts that are not normally excluded or included in the most directly comparable measure, calculated and presented in accordance with GAAP. Non-GAAP financial measures do not replace and are not superior to the presentation of GAAP financial results, but are provided to improve overall understanding of the Company’s current financial performance and its prospects for the future. The Company believes the non-GAAP financial results provide useful information to both management and investors regarding certain additional financial and business trends relating to financial condition and operating results. In addition, management uses these measures, along with GAAP information, for reviewing financial results and evaluating its historical operating performance. The non-GAAP adjustments for all periods presented are based upon information and assumptions available as of the date of this presentation. The non-GAAP information is not prepared in accordance with GAAP and may not be comparable to non-GAAP information used by other companies. Consolidated EBITDA as presented herein is as defined in Wesco’s credit agreement and may differ from Adjusted EBITDA as previously reported. 2 |
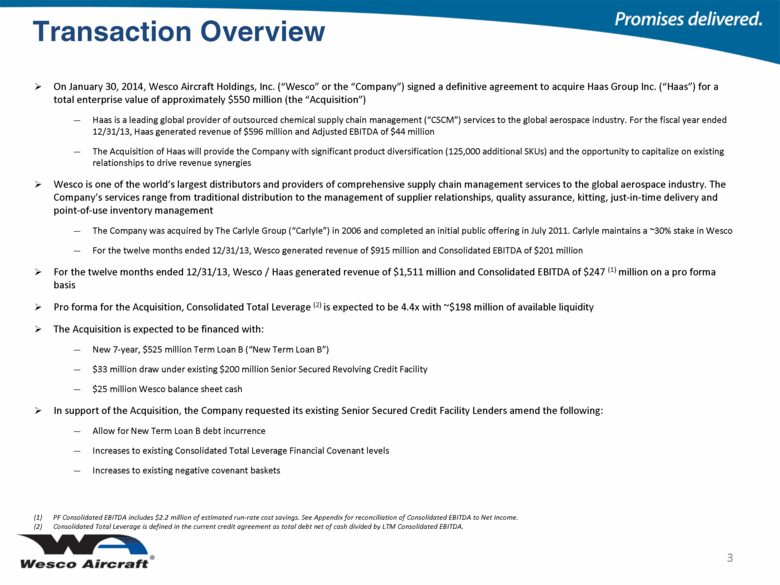
| 3 On January 30, 2014, Wesco Aircraft Holdings, Inc. (“Wesco” or the “Company”) signed a definitive agreement to acquire Haas Group Inc. (“Haas”) for a total enterprise value of approximately $550 million (the “Acquisition”) Haas is a leading global provider of outsourced chemical supply chain management (“CSCM”) services to the global aerospace industry. For the fiscal year ended 12/31/13, Haas generated revenue of $596 million and Adjusted EBITDA of $44 million The Acquisition of Haas will provide the Company with significant product diversification (125,000 additional SKUs) and the opportunity to capitalize on existing relationships to drive revenue synergies Wesco is one of the world’s largest distributors and providers of comprehensive supply chain management services to the global aerospace industry. The Company’s services range from traditional distribution to the management of supplier relationships, quality assurance, kitting, just-in-time delivery and point-of-use inventory management The Company was acquired by The Carlyle Group (“Carlyle”) in 2006 and completed an initial public offering in July 2011. Carlyle maintains a ~30% stake in Wesco For the twelve months ended 12/31/13, Wesco generated revenue of $915 million and Consolidated EBITDA of $201 million For the twelve months ended 12/31/13, Wesco / Haas generated revenue of $1,511 million and Consolidated EBITDA of $247 (1) million on a pro forma basis Pro forma for the Acquisition, Consolidated Total Leverage (2) is expected to be 4.4x with ~$198 million of available liquidity The Acquisition is expected to be financed with: New 7-year, $525 million Term Loan B (“New Term Loan B”) $33 million draw under existing $200 million Senior Secured Revolving Credit Facility $25 million Wesco balance sheet cash In support of the Acquisition, the Company requested its existing Senior Secured Credit Facility Lenders amend the following: Allow for New Term Loan B debt incurrence Increases to existing Consolidated Total Leverage Financial Covenant levels Increases to existing negative covenant baskets PF Consolidated EBITDA includes $2.2 million of estimated run-rate cost savings. See Appendix for reconciliation of Consolidated EBITDA to Net Income. Consolidated Total Leverage is defined in the current credit agreement as total debt net of cash divided by LTM Consolidated EBITDA. Transaction Overview |
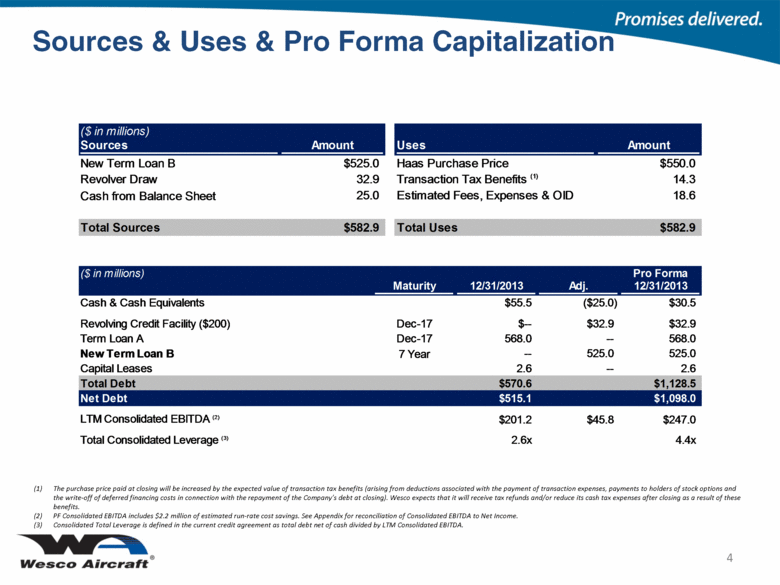
| 4 The purchase price paid at closing will be increased by the expected value of transaction tax benefits (arising from deductions associated with the payment of transaction expenses, payments to holders of stock options and the write-off of deferred financing costs in connection with the repayment of the Company’s debt at closing). Wesco expects that it will receive tax refunds and/or reduce its cash tax expenses after closing as a result of these benefits. PF Consolidated EBITDA includes $2.2 million of estimated run-rate cost savings. See Appendix for reconciliation of Consolidated EBITDA to Net Income. Consolidated Total Leverage is defined in the current credit agreement as total debt net of cash divided by LTM Consolidated EBITDA. Sources & Uses & Pro Forma Capitalization ($ in millions) Pro Forma Maturity 12/31/2013 Adj. 12/31/2013 Cash & Cash Equivalents $55.5 ($25.0) $30.5 Revolving Credit Facility ($200) Dec-17 $-- $32.9 $32.9 Term Loan A Dec-17 568.0 -- 568.0 New Term Loan B 7 Year -- 525.0 525.0 Capital Leases 2.6 -- 2.6 Total Debt $570.6 $1,128.5 Net Debt $515.1 $1,098.0 LTM Consolidated EBITDA (2) $201.2 $45.8 $247.0 Total Consolidated Leverage (3) 2.6x 4.4x ($ in millions) Sources Amount Uses Amount New Term Loan B $525.0 Revolver Draw 32.9 Cash from Balance Sheet 25.0 Total Sources $582.9 Haas Purchase Price $550.0 Transaction Tax Benefits (1) 14.3 Estimated Fees, Expenses & OID $582.9 (1) (2) (3) |
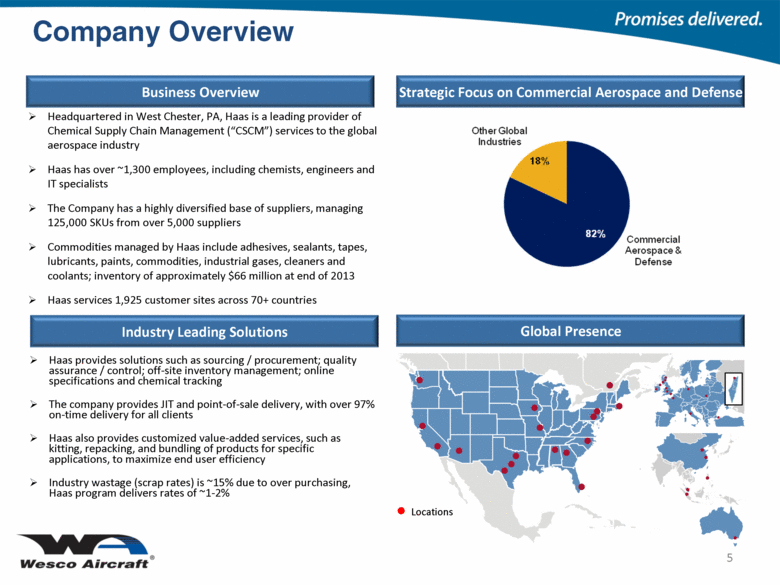
| Business Overview Strategic Focus on Commercial Aerospace and Defense Headquartered in West Chester, PA, Haas is a leading provider of Chemical Supply Chain Management (“CSCM”) services to the global aerospace industry Haas has over ~1,300 employees, including chemists, engineers and IT specialists The Company has a highly diversified base of suppliers, managing 125,000 SKUs from over 5,000 suppliers Commodities managed by Haas include adhesives, sealants, tapes, lubricants, paints, commodities, industrial gases, cleaners and coolants; inventory of approximately $66 million at end of 2013 Haas services 1,925 customer sites across 70+ countries Haas provides solutions such as sourcing / procurement; quality assurance / control; off-site inventory management; online specifications and chemical tracking The company provides JIT and point-of-sale delivery, with over 97% on-time delivery for all clients Haas also provides customized value-added services, such as kitting, repacking, and bundling of products for specific applications, to maximize end user efficiency Industry wastage (scrap rates) is ~15% due to over purchasing, Haas program delivers rates of ~1-2% Company Overview 5 Industry Leading Solutions Global Presence Locations |
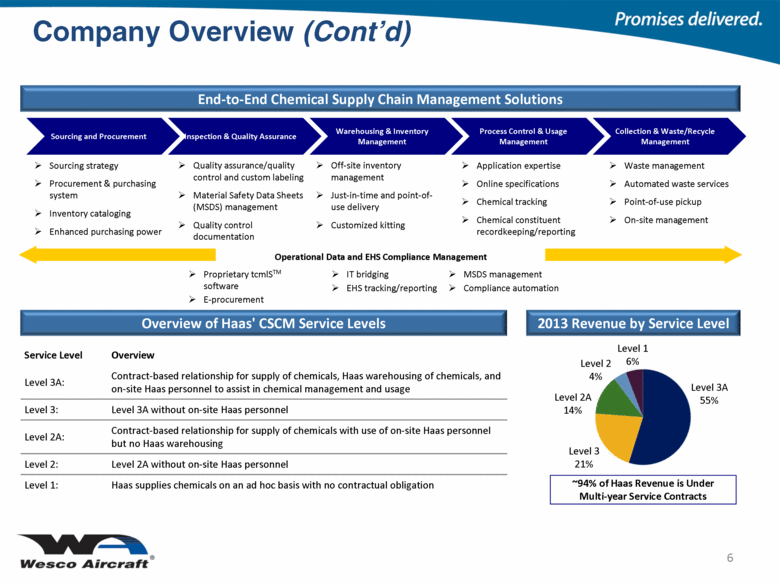
| End-to-End Chemical Supply Chain Management Solutions Sourcing and Procurement Inspection & Quality Assurance Warehousing & Inventory Management Process Control & Usage Management Collection & Waste/Recycle Management Sourcing strategy Procurement & purchasing system Inventory cataloging Enhanced purchasing power Quality assurance/quality control and custom labeling Material Safety Data Sheets (MSDS) management Quality control documentation Off-site inventory management Just-in-time and point-of-use delivery Customized kitting Application expertise Online specifications Chemical tracking Chemical constituent recordkeeping/reporting Waste management Automated waste services Point-of-use pickup On-site management Overview of Haas' CSCM Service Levels 2013 Revenue by Service Level Operational Data and EHS Compliance Management Proprietary tcmlSTM software E-procurement IT bridging EHS tracking/reporting MSDS management Compliance automation Level 3A 55% Level 3 21% Level 2A 14% Level 2 4% Level 1 6% ~94% of Haas Revenue is Under Multi-year Service Contracts Service Level Overview Level 3A: Contract-based relationship for supply of chemicals, Haas warehousing of chemicals, and on-site Haas personnel to assist in chemical management and usage Level 3: Level 3A without on-site Haas personnel Level 2A: Contract-based relationship for supply of chemicals with use of on-site Haas personnel but no Haas warehousing Level 2: Level 2A without on-site Haas personnel Level 1: Haas supplies chemicals on an ad hoc basis with no contractual obligation Company Overview (Cont’d) 6 |
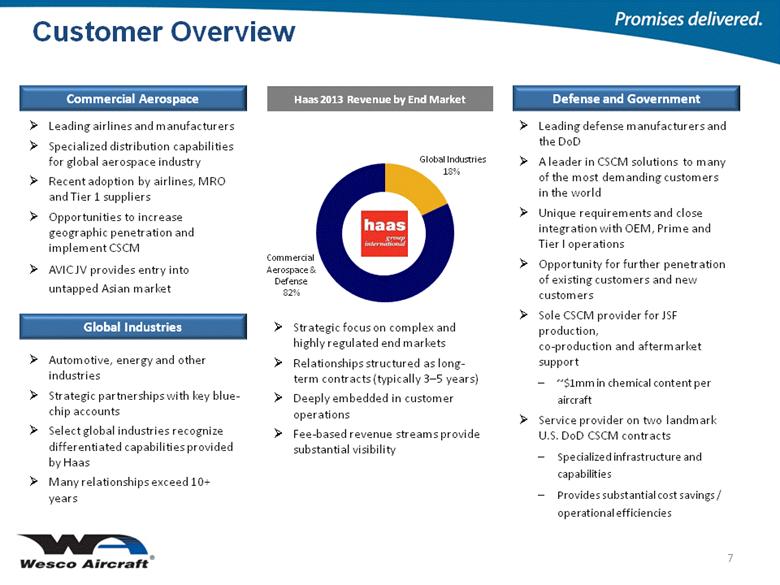
| Customer Overview Global Industries 18% Commercial Aerospace & Defense 82% Defense and Government Haas 2013 Revenue by End Market Commercial Aerospace Leading defense manufacturers and the DoD A leader in CSCM solutions to many of the most demanding customers in the world Unique requirements and close integration with OEM, Prime and Tier I operations Opportunity for further penetration of existing customers and new customers Sole CSCM provider for JSF production, co-production and aftermarket support ~$1mm in chemical content per aircraft Service provider on two landmark U.S. DoD CSCM contracts Specialized infrastructure and capabilities Provides substantial cost savings / operational efficiencies Leading airlines and manufacturers Specialized distribution capabilities for global aerospace industry Recent adoption by airlines, MRO and Tier 1 suppliers Opportunities to increase geographic penetration and implement CSCM AVIC JV provides entry into untapped Asian market Strategic focus on complex and highly regulated end markets Relationships structured as long-term contracts (typically 3–5 years) Deeply embedded in customer operations Fee-based revenue streams provide substantial visibility Automotive, energy and other industries Strategic partnerships with key blue-chip accounts Select global industries recognize differentiated capabilities provided by Haas Many relationships exceed 10+ years 7 Global Industries |
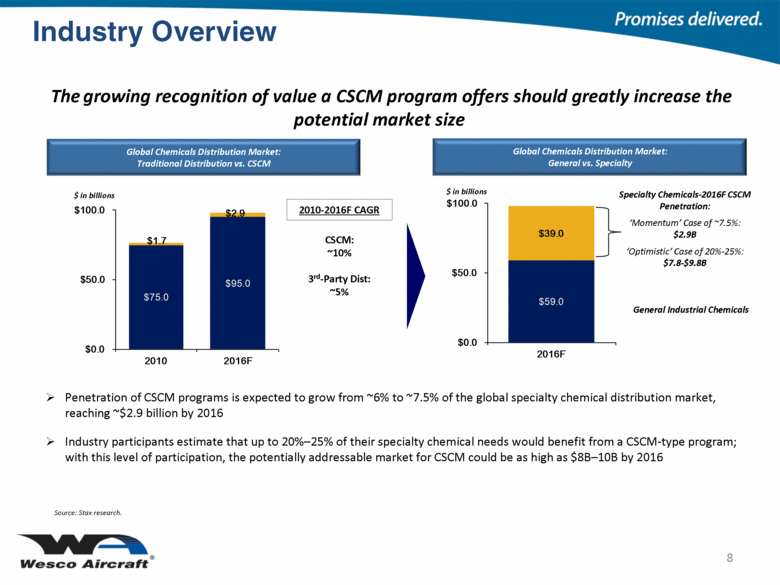
| Global Chemicals Distribution Market: Traditional Distribution vs. CSCM The growing recognition of value a CSCM program offers should greatly increase the potential market size Global Chemicals Distribution Market: General vs. Specialty Penetration of CSCM programs is expected to grow from ~6% to ~7.5% of the global specialty chemical distribution market, reaching ~$2.9 billion by 2016 Industry participants estimate that up to 20%–25% of their specialty chemical needs would benefit from a CSCM-type program; with this level of participation, the potentially addressable market for CSCM could be as high as $8B–10B by 2016 8 Industry Overview 2010-2016F CAGR CSCM: ~10% 3rd-Party Dist: ~5% Specialty Chemicals-2016F CSCM Penetration: ‘Momentum’ Case of ~7.5%: $2.9B ‘Optimistic’ Case of 20%-25%: $7.8-$9.8B $ in billions $ in billions General Industrial Chemicals Source: Stax research. $59.0 $39.0 $0.0 $50.0 $100.0 2016F $75.0 $95.0 $1.7 $2.9 $0.0 $50.0 $100.0 2010 2016F |
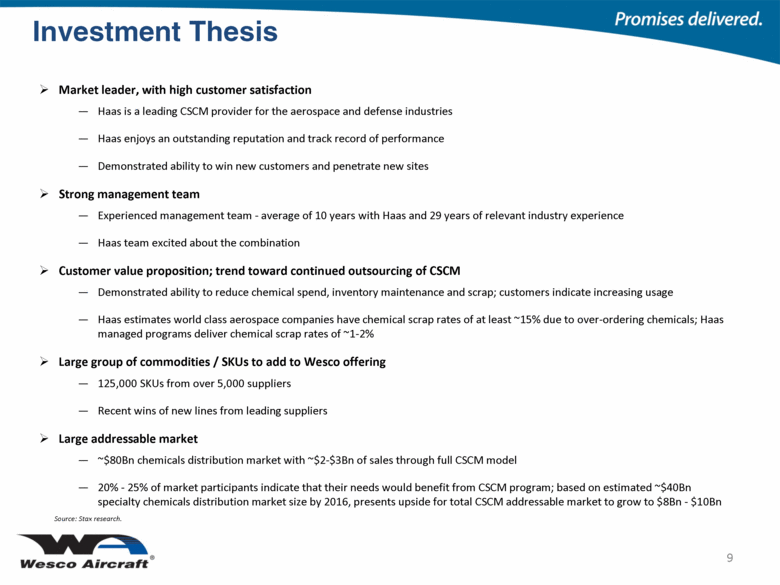
| Investment Thesis 9 Market leader, with high customer satisfaction Haas is a leading CSCM provider for the aerospace and defense industries Haas enjoys an outstanding reputation and track record of performance Demonstrated ability to win new customers and penetrate new sites Strong management team Experienced management team - average of 10 years with Haas and 29 years of relevant industry experience Haas team excited about the combination Customer value proposition; trend toward continued outsourcing of CSCM Demonstrated ability to reduce chemical spend, inventory maintenance and scrap; customers indicate increasing usage Haas estimates world class aerospace companies have chemical scrap rates of at least ~15% due to over-ordering chemicals; Haas managed programs deliver chemical scrap rates of ~1-2% Large group of commodities / SKUs to add to Wesco offering 125,000 SKUs from over 5,000 suppliers Recent wins of new lines from leading suppliers Large addressable market ~$80Bn chemicals distribution market with ~$2-$3Bn of sales through full CSCM model 20% - 25% of market participants indicate that their needs would benefit from CSCM program; based on estimated ~$40Bn specialty chemicals distribution market size by 2016, presents upside for total CSCM addressable market to grow to $8Bn - $10Bn Source: Stax research. |
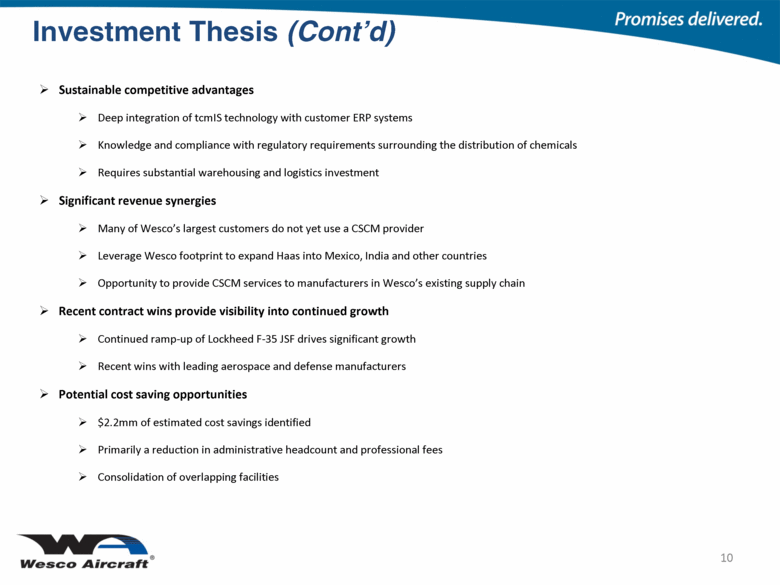
| Investment Thesis (Cont’d) 10 Sustainable competitive advantages Deep integration of tcmIS technology with customer ERP systems Knowledge and compliance with regulatory requirements surrounding the distribution of chemicals Requires substantial warehousing and logistics investment Significant revenue synergies Many of Wesco’s largest customers do not yet use a CSCM provider Leverage Wesco footprint to expand Haas into Mexico, India and other countries Opportunity to provide CSCM services to manufacturers in Wesco’s existing supply chain Recent contract wins provide visibility into continued growth Continued ramp-up of Lockheed F-35 JSF drives significant growth Recent wins with leading aerospace and defense manufacturers Potential cost saving opportunities $2.2mm of estimated cost savings identified Primarily a reduction in administrative headcount and professional fees Consolidation of overlapping facilities |
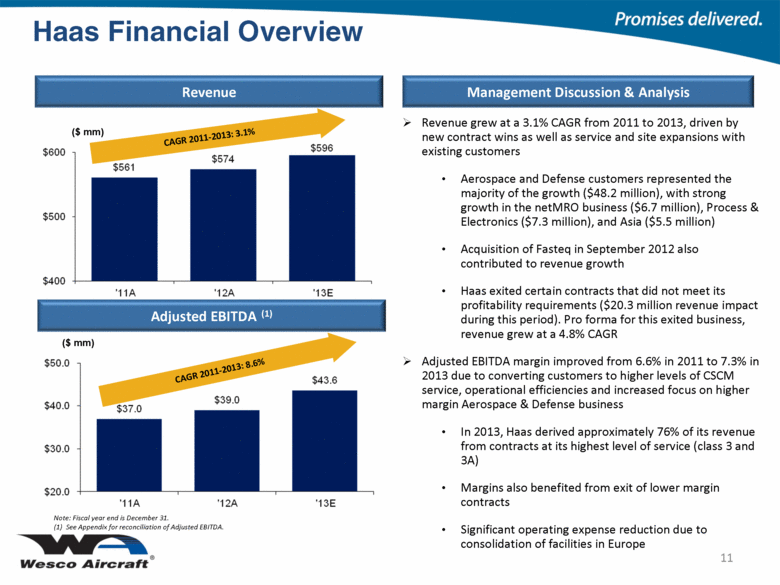
| 11 Revenue Adjusted EBITDA (1) Haas Financial Overview Management Discussion & Analysis Revenue grew at a 3.1% CAGR from 2011 to 2013, driven by new contract wins as well as service and site expansions with existing customers Aerospace and Defense customers represented the majority of the growth ($48.2 million), with strong growth in the netMRO business ($6.7 million), Process & Electronics ($7.3 million), and Asia ($5.5 million) Acquisition of Fasteq in September 2012 also contributed to revenue growth Haas exited certain contracts that did not meet its profitability requirements ($20.3 million revenue impact during this period). Pro forma for this exited business, revenue grew at a 4.8% CAGR Adjusted EBITDA margin improved from 6.6% in 2011 to 7.3% in 2013 due to converting customers to higher levels of CSCM service, operational efficiencies and increased focus on higher margin Aerospace & Defense business In 2013, Haas derived approximately 76% of its revenue from contracts at its highest level of service (class 3 and 3A) Margins also benefited from exit of lower margin contracts Significant operating expense reduction due to consolidation of facilities in Europe CAGR 2011-2013: 3.1% CAGR 2011-2013: 8.6% ($ mm) ($ mm) Note: Fiscal year end is December 31. (1) See Appendix for reconciliation of Adjusted EBITDA. |
| Appendix |
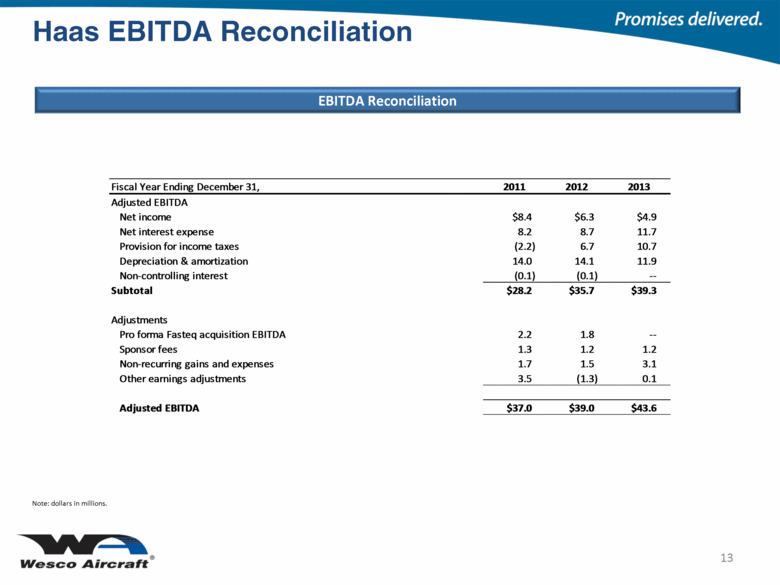
| Haas EBITDA Reconciliation EBITDA Reconciliation 13 Note: dollars in millions. Fiscal Year Ending December 31, 2011 2012 2013 Adjusted EBITDA Net income $8.4 $6.3 $4.9 Net interest expense 8.2 8.7 11.7 Provision for income taxes (2.2) 6.7 10.7 Depreciation & amortization 14.0 14.1 11.9 Non-controlling interest (0.1) (0.1) -- Subtotal $28.2 $35.7 $39.3 Adjustments Pro forma Fasteq acquisition EBITDA 2.2 1.8 -- Sponsor fees 1.3 1.2 1.2 Non-recurring gains and expenses 1.7 1.5 3.1 Other earnings adjustments 3.5 (1.3) 0.1 Adjusted EBITDA $37.0 $39.0 $43.6 |
