Exhibit 99.1

2015 Investor Day AerCap Holdings N.V. September 10, 2015, New York
This presentation contains certain statements, estimates and forecasts with respect to future performance and events. These statements, estimates and forecasts are “forward-looking statements”. In some cases, forward-looking statements can be identified by the use of forward-looking terminology such as “may,” “might,” “should,” “expect,” “plan,” “intend,” “estimate,” “anticipate,” “believe,” “predict,” “potential” or “continue” or the negatives thereof or variations thereon or similar terminology. All statements other than statements of historical fact included in this presentation are forward-looking statements and are based on various underlying assumptions and expectations and are subject to known and unknown risks, uncertainties and assumptions, may include projections of our future financial performance based on our growth strategies and anticipated trends in our business. These statements are only predictions based on our current expectations and projections about future events. There are important factors that could cause our actual results, level of activity performance or achievements to differ materially from the results, level of activity, performance or achievements expressed or implied in the forward-looking statements. As a result, there can be no assurance that the forward-looking statements included in this presentation will prove to be accurate or correct. In light of these risks, uncertainties and assumptions, the future performance or events described in the forward-looking statements in this presentation might not occur. Accordingly, you should not rely upon forward-looking statements as a prediction of actual results and we do not assume any responsibility for the accuracy or completeness of any of these forward-looking statements. We do not undertake any obligation to, and will not, update any forward-looking statements, whether as a result of new information, future events or otherwise.The information in this document is the property of AerCap Holdings N.V. and its subsidiaries and may not be copied or communicated to a fourth party, or used for any purpose other than that for which it is supplied without the express written consent of AerCap Holdings N.V. and its subsidiaries.No warranty or representation is given concerning such information, which must not be taken as establishing any contractual or other commitment binding upon AerCap Holdings N.V. or any of its subsidiaries or associated companies. Disclaimer Incl. Forward Looking Statements & Safe Harbor

Agenda | Introduction John WikoffHead of Investor Relations | AerCap Overview Aengus KellyChief Executive Officer | Leasing Strategy Philip ScruggsPresident & Chief Commercial Officer | Portfolio Management Edward O’ByrneChief Investment Officer | Q&A and Break

| Risk Management Anton JoinerChief Risk Officer | OEM Relations Martin OlsonHead of OEM Relations | Financial Performance Keith HelmingChief Financial Officer | Q&A | Summary and Closing Aengus KellyChief Executive Officer Agenda

AerCap Overview Aengus KellyChief Executive Officer
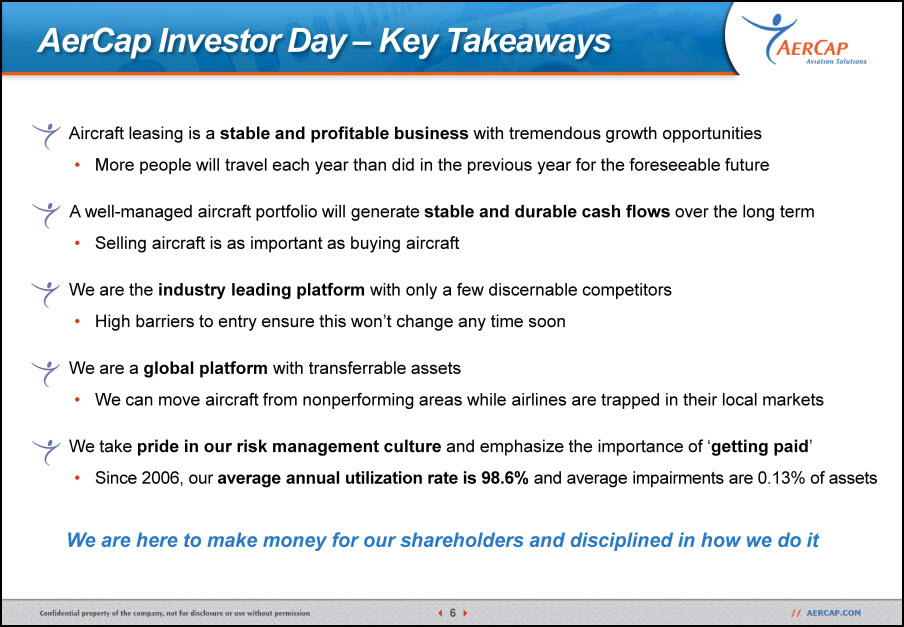
AerCap Investor Day – Key Takeaways Aircraft leasing is a stable and profitable business with tremendous growth opportunitiesMore people will travel each year than did in the previous year for the foreseeable future A well-managed aircraft portfolio will generate stable and durable cash flows over the long termSelling aircraft is as important as buying aircraft We are the industry leading platform with only a few discernable competitorsHigh barriers to entry ensure this won’t change any time soonWe are a global platform with transferrable assetsWe can move aircraft from nonperforming areas while airlines are trapped in their local marketsWe take pride in our risk management culture and emphasize the importance of ‘getting paid’Since 2006, our average annual utilization rate is 98.6% and average impairments are 0.13% of assets We are here to make money for our shareholders and disciplined in how we do it
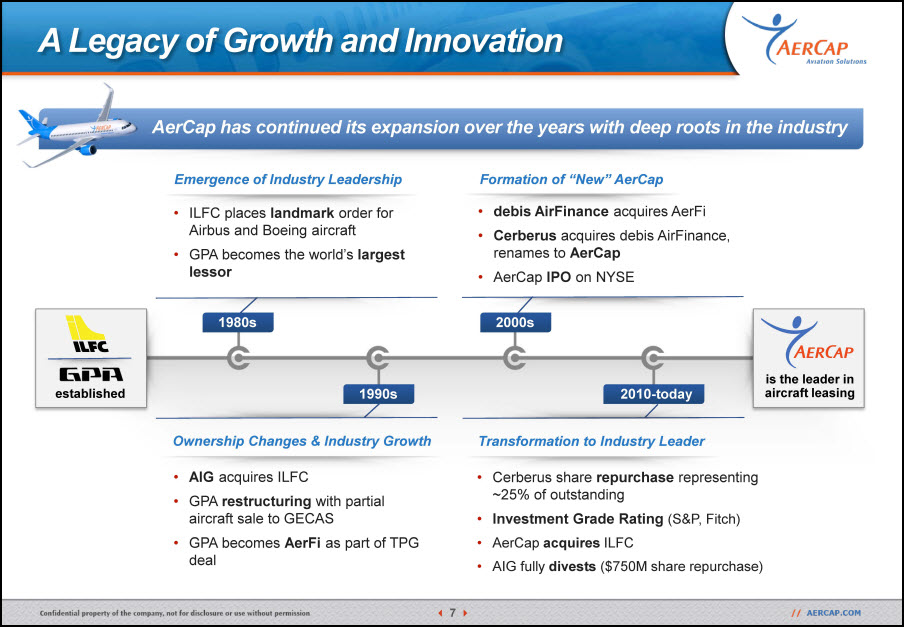
AerCap has continued its expansion over the years with deep roots in the industry 1980s 1990s 2000s 2010-today ILFC places landmark order for Airbus and Boeing aircraftGPA becomes the world’s largest lessor AIG acquires ILFC GPA restructuring with partial aircraft sale to GECASGPA becomes AerFi as part of TPG deal debis AirFinance acquires AerFiCerberus acquires debis AirFinance, renames to AerCapAerCap IPO on NYSE Cerberus share repurchase representing ~25% of outstandingInvestment Grade Rating (S&P, Fitch)AerCap acquires ILFCAIG fully divests ($750M share repurchase) established Emergence of Industry Leadership Formation of “New” AerCap Ownership Changes & Industry Growth Transformation to Industry Leader is the leader in aircraft leasing A Legacy of Growth and Innovation
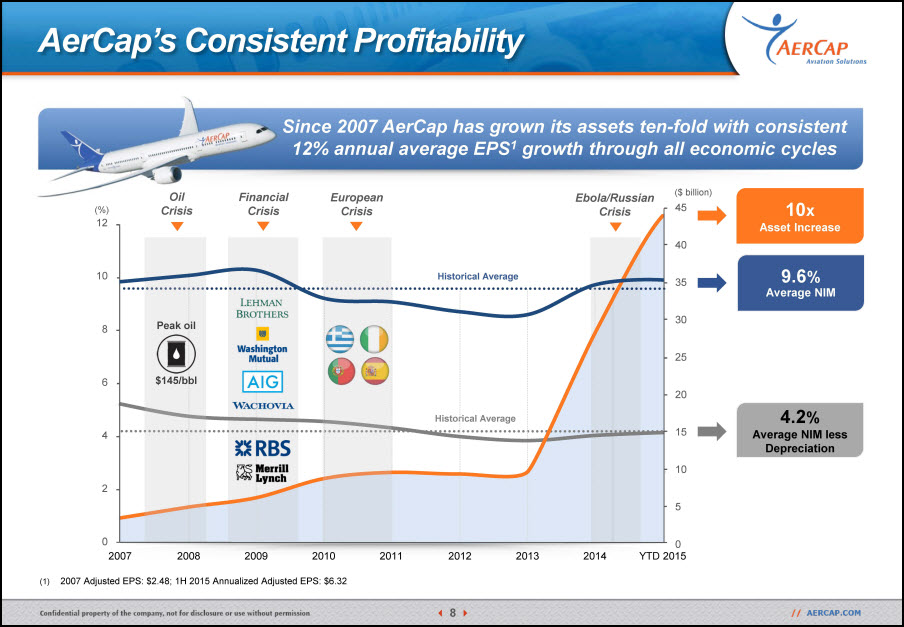
Since 2007 AerCap has grown its assets ten-fold with consistent 12% annual average EPS1 growth through all economic cycles 2007 Adjusted EPS: $2.48; 1H 2015 Annualized Adjusted EPS: $6.32 9.6%Average NIM 4.2%Average NIM less Depreciation 10xAsset Increase Financial Crisis Ebola/Russian Crisis European Crisis Oil Crisis Historical Average Historical Average 121086420 2007 2008 2009 2010 2011 2012 2013 2014 YTD 2015 454035302520151050 AerCap’s Consistent Profitability ($ billion) Peak oil $145/bbl (%)
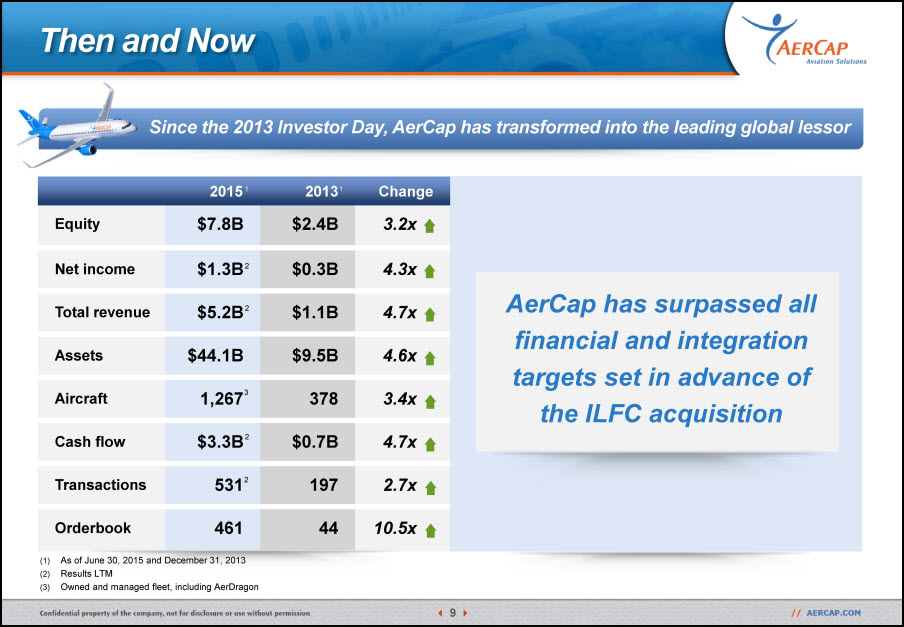
Then and Now Since the 2013 Investor Day, AerCap has transformed into the leading global lessor AerCap has surpassed all financial and integration targets set in advance of the ILFC acquisition Equity $7.8B $2.4B 3.2x Net income $1.3B $0.3B 4.3x Total revenue $5.2B $1.1B 4.7x Assets $44.1B $9.5B 4.6x Aircraft 1,267 378 3.4x Cash flow $3.3B $0.7B 4.7x Transactions 531 197 2.7x Orderbook 461 44 10.5x 2015 2013 Change As of June 30, 2015 and December 31, 2013 Results LTMOwned and managed fleet, including AerDragon 3 2 2 2 2 1 1
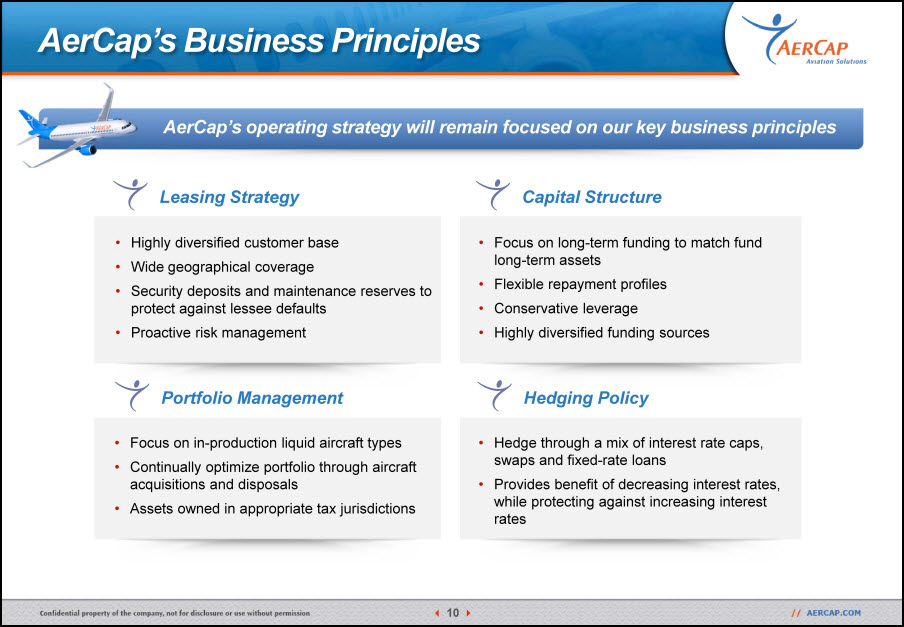
AerCap’s operating strategy will remain focused on our key business principles Highly diversified customer baseWide geographical coverageSecurity deposits and maintenance reserves to protect against lessee defaultsProactive risk management Focus on long-term funding to match fund long-term assetsFlexible repayment profilesConservative leverageHighly diversified funding sources Focus on in-production liquid aircraft typesContinually optimize portfolio through aircraft acquisitions and disposalsAssets owned in appropriate tax jurisdictions Hedge through a mix of interest rate caps, swaps and fixed-rate loansProvides benefit of decreasing interest rates, while protecting against increasing interest rates Leasing Strategy Capital Structure Portfolio Management Hedging Policy AerCap’s Business Principles
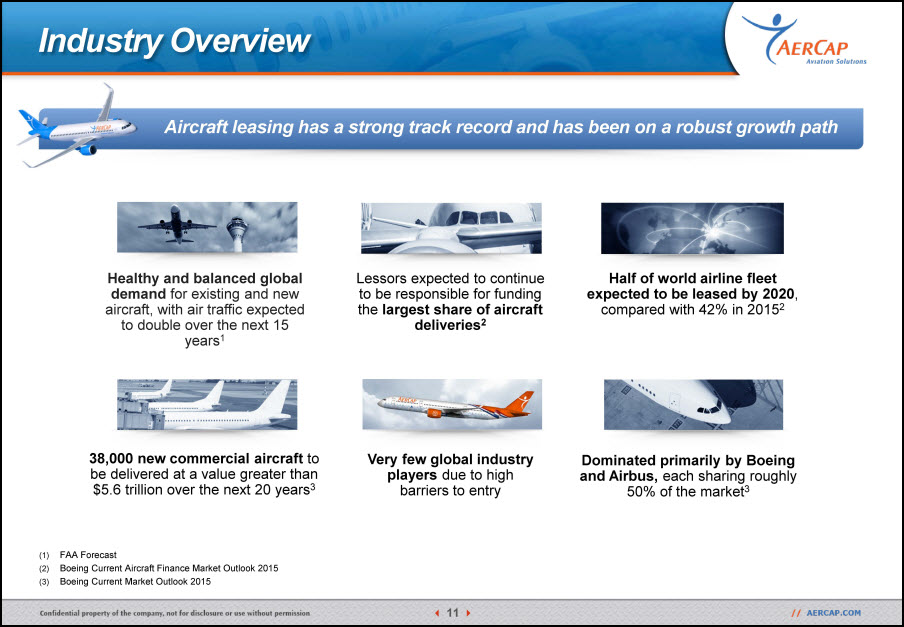
Industry Overview Aircraft leasing has a strong track record and has been on a robust growth path Healthy and balanced global demand for existing and new aircraft, with air traffic expected to double over the next 15 years1 Half of world airline fleet expected to be leased by 2020, compared with 42% in 20152 Lessors expected to continue to be responsible for funding the largest share of aircraft deliveries2 38,000 new commercial aircraft to be delivered at a value greater than $5.6 trillion over the next 20 years3 Dominated primarily by Boeing and Airbus, each sharing roughly 50% of the market3 Very few global industry players due to high barriers to entry FAA ForecastBoeing Current Aircraft Finance Market Outlook 2015Boeing Current Market Outlook 2015
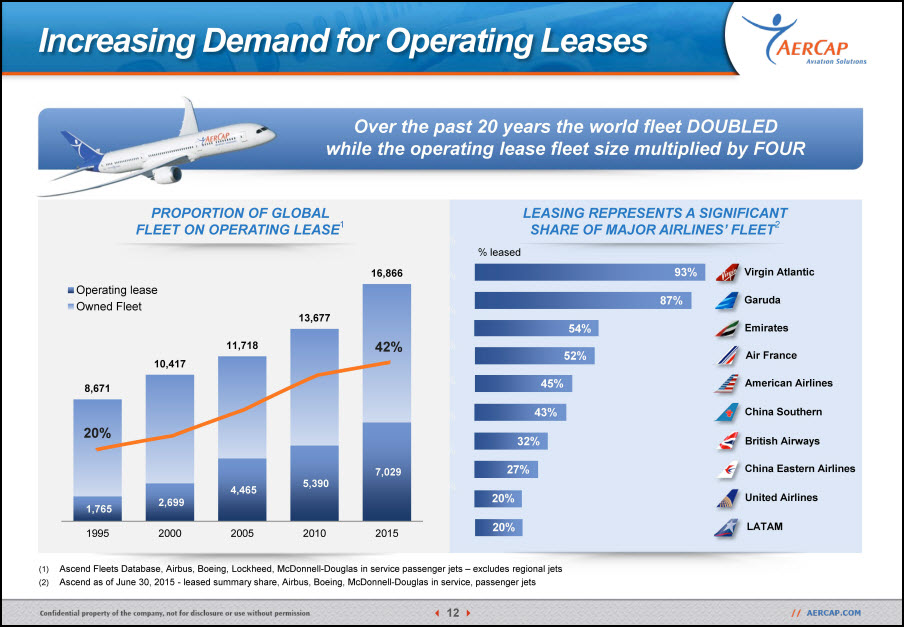
Increasing Demand for Operating Leases Ascend Fleets Database, Airbus, Boeing, Lockheed, McDonnell-Douglas in service passenger jets – excludes regional jetsAscend as of June 30, 2015 - leased summary share, Airbus, Boeing, McDonnell-Douglas in service, passenger jets PROPORTION OF GLOBAL FLEET ON OPERATING LEASE1 LEASING REPRESENTS A SIGNIFICANT SHARE OF MAJOR AIRLINES’ FLEET2 % leased Air France China Southern American Airlines British Airways China Eastern Airlines United Airlines Emirates Over the past 20 years the world fleet DOUBLEDwhile the operating lease fleet size multiplied by FOUR 54% 52% 45% 43% 32% 27% 20% LATAM 20% Virgin Atlantic 93% Garuda 87% 20% 42%
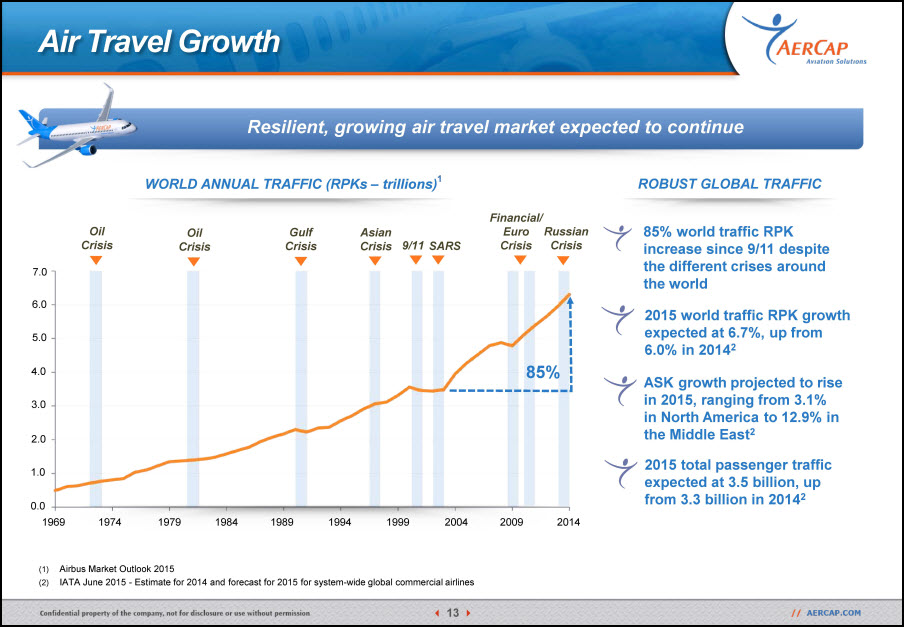
Resilient, growing air travel market expected to continue Air Travel Growth ASK growth projected to rise in 2015, ranging from 3.1% in North America to 12.9% in the Middle East2 85% world traffic RPK increase since 9/11 despite the different crises around the world ROBUST GLOBAL TRAFFIC WORLD ANNUAL TRAFFIC (RPKs – trillions)1 85% Oil Crisis Gulf Crisis Asian Crisis 9/11 SARS Financial/Euro Crisis 0.0 1.0 2.0 3.0 4.0 5.0 6.0 Airbus Market Outlook 2015IATA June 2015 - Estimate for 2014 and forecast for 2015 for system-wide global commercial airlines 2015 world traffic RPK growth expected at 6.7%, up from 6.0% in 20142 2015 total passenger traffic expected at 3.5 billion, up from 3.3 billion in 20142 7.0 Oil Crisis 1969 1974 1979 1984 1989 1994 1999 2004 2009 2014 Russian Crisis
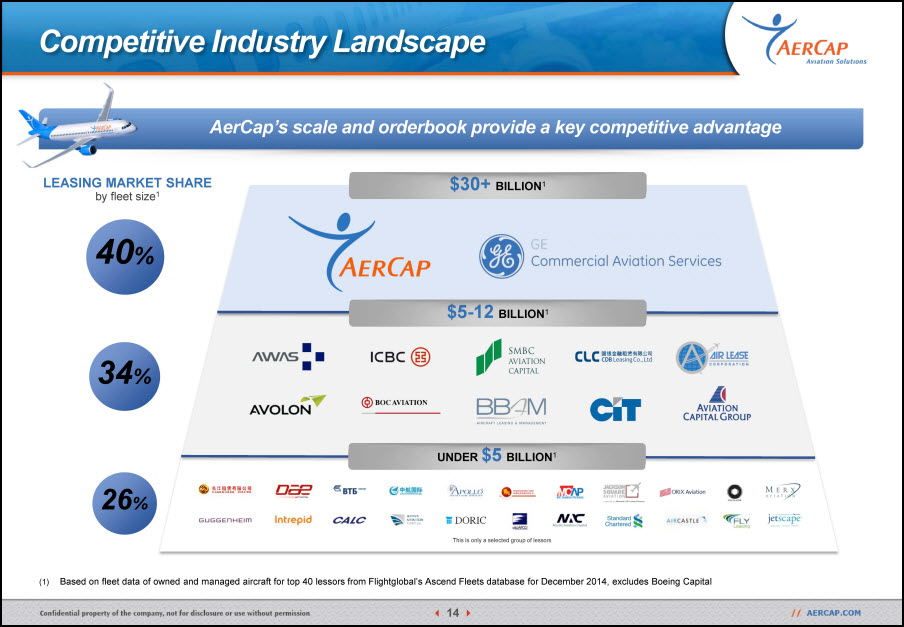
Based on fleet data of owned and managed aircraft for top 40 lessors from Flightglobal’s Ascend Fleets database for December 2014, excludes Boeing Capital AerCap’s scale and orderbook provide a key competitive advantage LEASING MARKET SHARE by fleet size1 1,6761 1,6091 Air Lease Corporation5751 SMBC Aviation Capital5991 $30+ BILLION1 $5-12 BILLION1 UNDER $5 BILLION1 This is only a selected group of lessors 31% 40% 34% 26% Competitive Industry Landscape
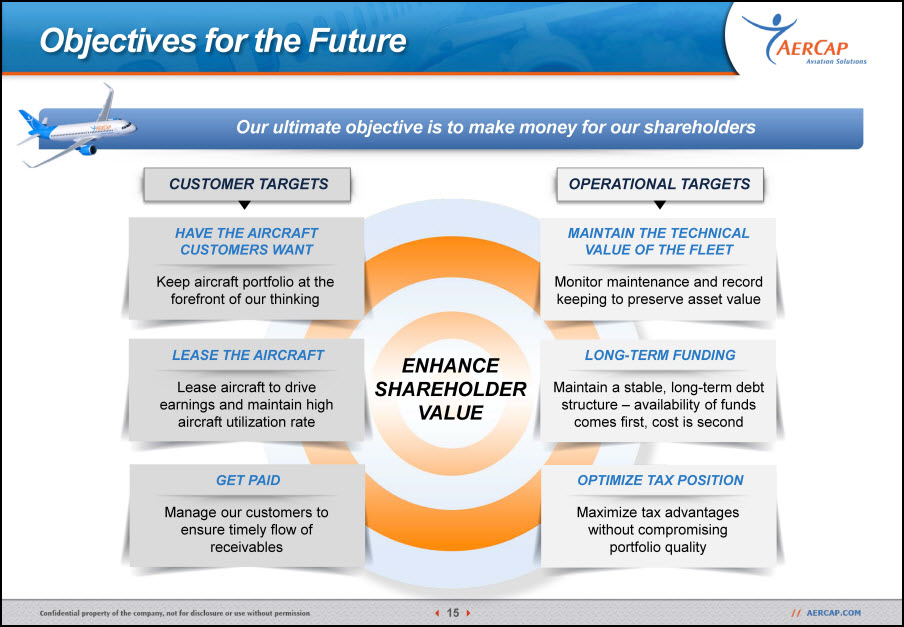
Objectives for the Future Our ultimate objective is to make money for our shareholders Keep aircraft portfolio at the forefront of our thinking HAVE THE AIRCRAFT CUSTOMERS WANT CUSTOMER TARGETS OPERATIONAL TARGETS Lease aircraft to drive earnings and maintain high aircraft utilization rate LEASE THE AIRCRAFT Manage our customers to ensure timely flow of receivables GET PAID Monitor maintenance and record keeping to preserve asset value MAINTAIN THE TECHNICAL VALUE OF THE FLEET Maintain a stable, long-term debt structure – availability of funds comes first, cost is second LONG-TERM FUNDING Maximize tax advantages without compromising portfolio quality OPTIMIZE TAX POSITION ENHANCE SHAREHOLDERVALUE
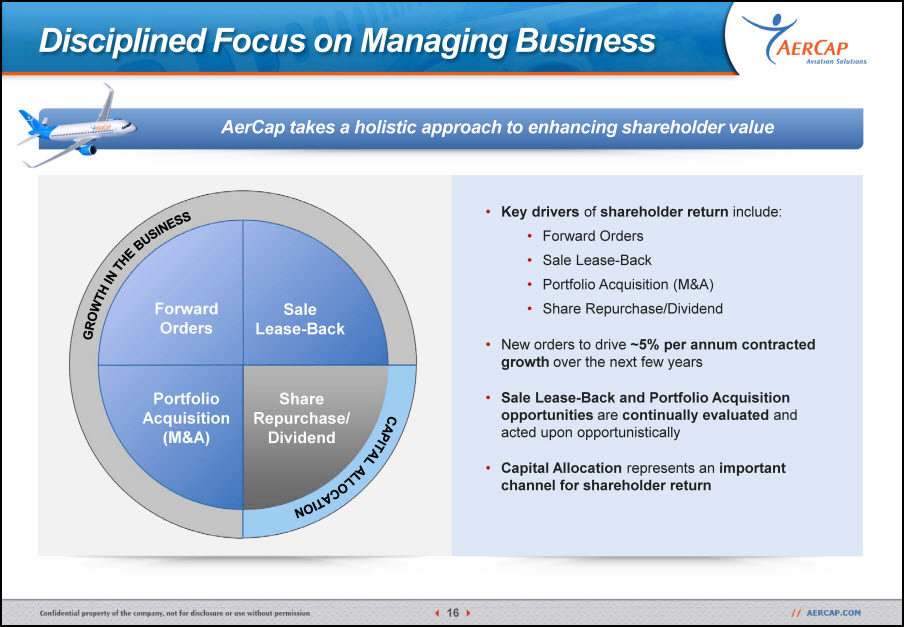
Key drivers of shareholder return include:Forward OrdersSale Lease-BackPortfolio Acquisition (M&A)Share Repurchase/DividendNew orders to drive ~5% per annum contracted growth over the next few yearsSale Lease-Back and Portfolio Acquisition opportunities are continually evaluated and acted upon opportunisticallyCapital Allocation represents an important channel for shareholder return Disciplined Focus on Managing Business AerCap takes a holistic approach to enhancing shareholder value GROWTH IN THE BUSINESS CAPITAL ALLOCATION Sale Lease-Back ForwardOrders Portfolio Acquisition(M&A) Share Repurchase/Dividend
Leasing Strategy Philip ScruggsPresident & Chief Commercial Officer

Global Customer Base A diverse global network of more than 200 customers in ~90 countries For the six months ended June 30, 2015 LESSEE DIVERSIFICATION NORTH AMERICA / CARIBBEAN 14% of YTD 20151 lease revenues EUROPE32% of YTD 20151 lease revenues LATIN AMERICA8% of YTD 20151 lease revenues AFRICA / MIDDLE EAST11% of YTD 20151 lease revenues ASIA / PACIFIC & RUSSIA35% of YTD 20151 lease revenues AerCap Office Locations SELECT TOP AIRLINE CUSTOMERS Emirates Air France American Aeromexico LATAM China Southern Virgin Atlantic United Southwest
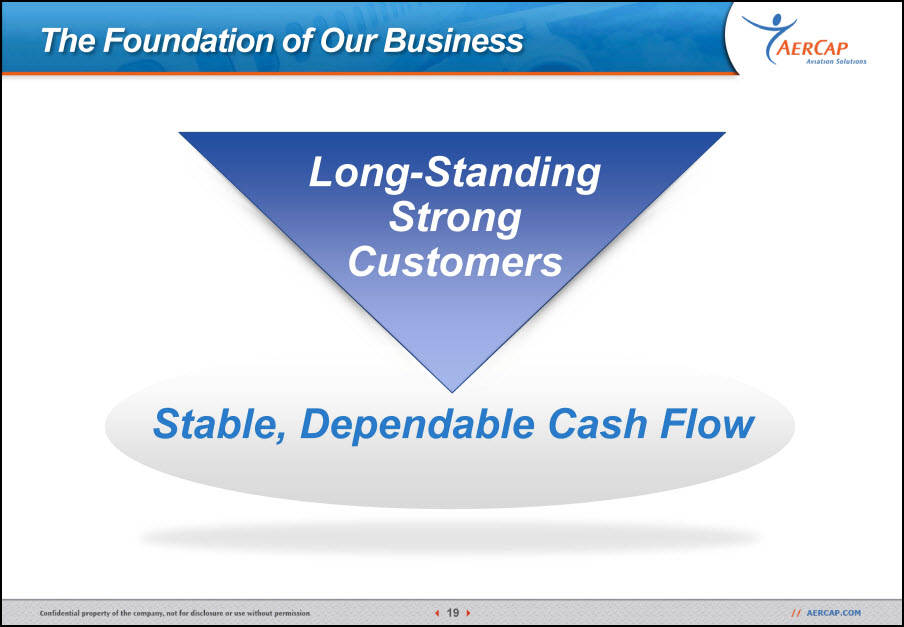
The Foundation of Our Business Stable, Dependable Cash Flow Long-Standing Strong Customers
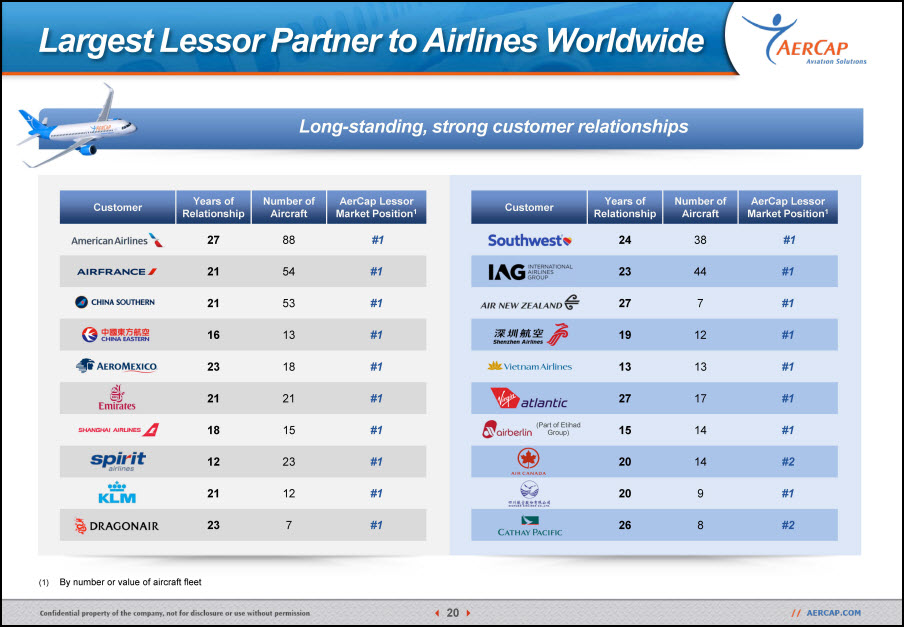
Largest Lessor Partner to Airlines Worldwide Long-standing, strong customer relationships By number or value of aircraft fleet Customer Years of Relationship Number of Aircraft AerCap Lessor Market Position1 27 88 #1 21 54 #1 21 53 #1 16 13 #1 23 18 #1 21 21 #1 18 15 #1 12 23 #1 21 12 #1 23 7 #1 Customer Years of Relationship Number of Aircraft AerCap Lessor Market Position1 24 38 #1 23 44 #1 27 7 #1 19 12 #1 13 13 #1 27 17 #1 15 14 #1 20 14 #2 20 9 #1 26 8 #2 (Part of Etihad Group)
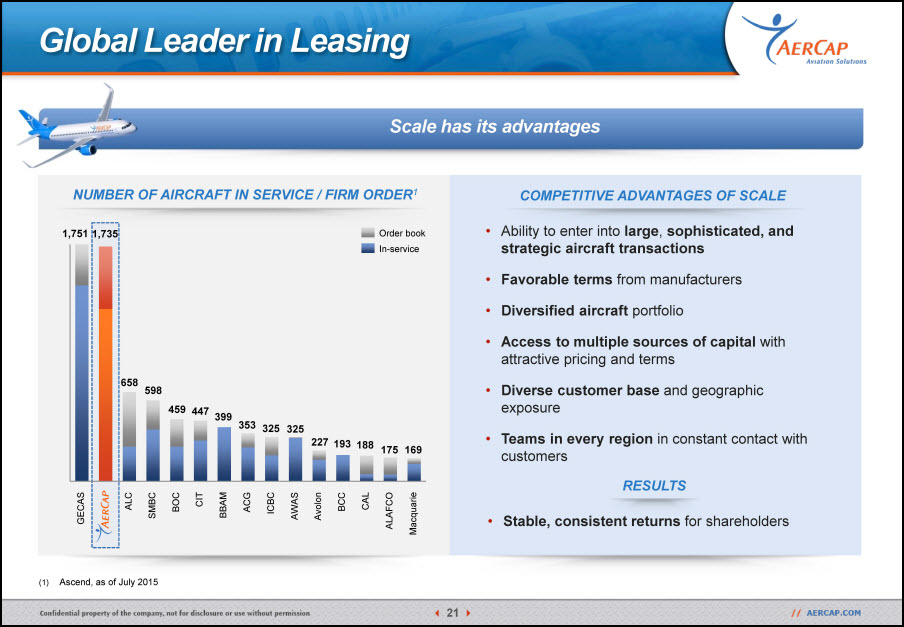
Global Leader in Leasing Scale has its advantages Ascend, as of July 2015 NUMBER OF AIRCRAFT IN SERVICE / FIRM ORDER1 COMPETITIVE ADVANTAGES OF SCALE Ability to enter into large, sophisticated, and strategic aircraft transactionsFavorable terms from manufacturersDiversified aircraft portfolioAccess to multiple sources of capital with attractive pricing and termsDiverse customer base and geographic exposureTeams in every region in constant contact with customers RESULTS Stable, consistent returns for shareholders GECAS 1,751 658 ALC SMBC BOC CAL 175 169 CIT BBAM ACG ICBC AWAS Avolon BCC ALAFCO Macquarie 188 598 459 447 353 325 325 227 Order book In-service 1,735
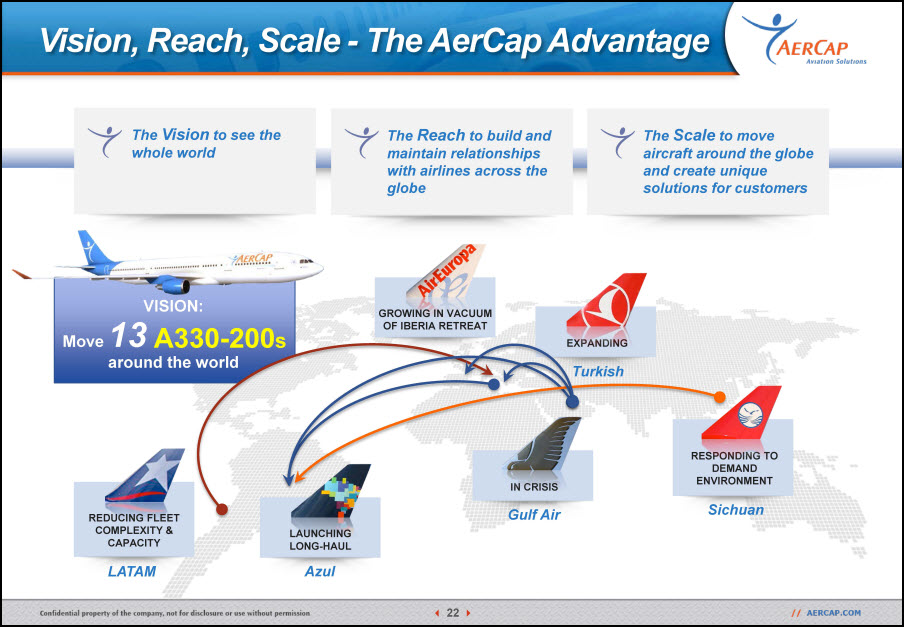
VISION: A330-200s around the world RESPONDING TO DEMAND ENVIRONMENT IN CRISIS EXPANDING GROWING IN VACUUM OF IBERIA RETREAT LAUNCHING LONG-HAUL REDUCING FLEET COMPLEXITY & CAPACITY Move 13 Vision, Reach, Scale - The AerCap Advantage The Vision to see the whole world The Reach to build and maintain relationships with airlines across the globe The Scale to move aircraft around the globe and create unique solutions for customers Turkish Sichuan Gulf Air Azul LATAM
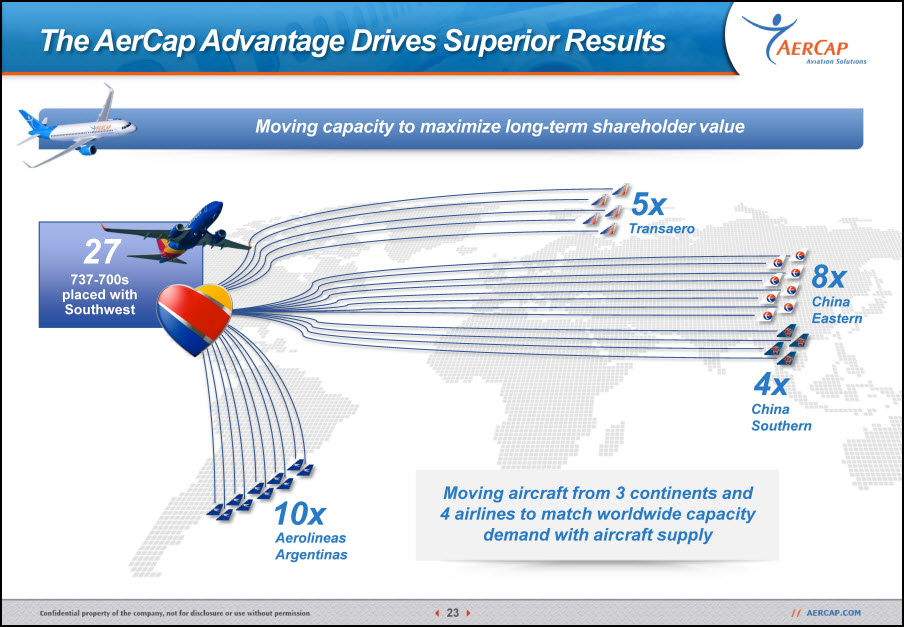
The AerCap Advantage Drives Superior Results Moving capacity to maximize long-term shareholder value 737-700s placed with Southwest 27 Transaero 5x Aerolineas Argentinas 10x China Eastern China Southern 8x 4x Moving aircraft from 3 continents and 4 airlines to match worldwide capacity demand with aircraft supply
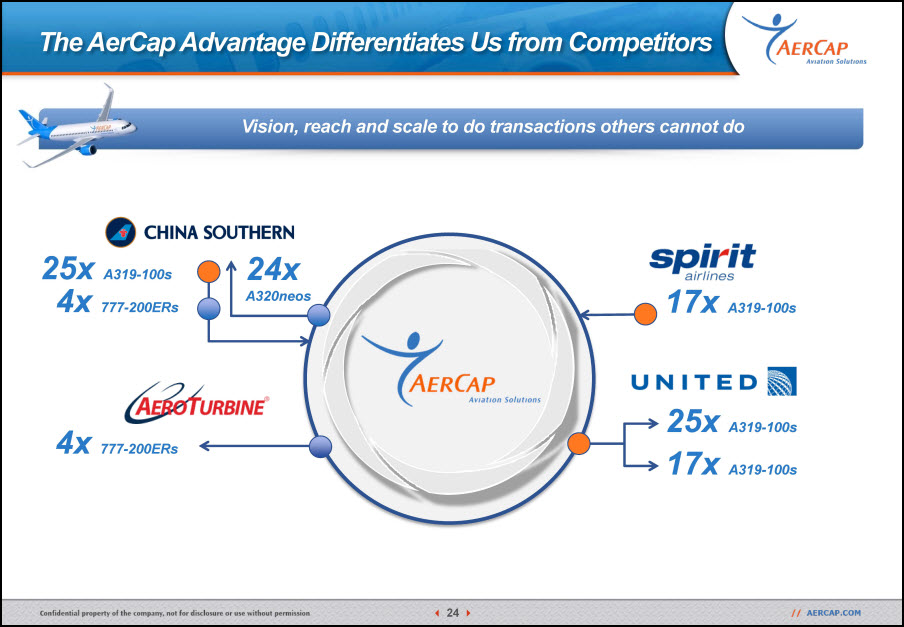
25x A319-100s 4x 777-200ERs 4x 777-200ERs 17x A319-100s 25x A319-100s 17x A319-100s 24x A320neos Vision, reach and scale to do transactions others cannot do The AerCap Advantage Differentiates Us from Competitors
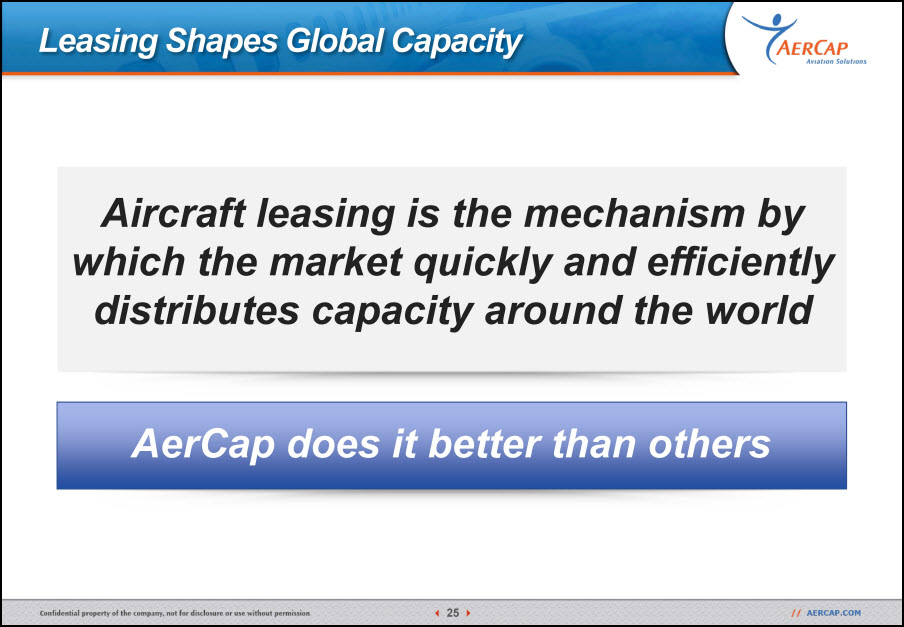
Leasing Shapes Global Capacity Aircraft leasing is the mechanism by which the market quickly and efficiently distributes capacity around the world AerCap does it better than others
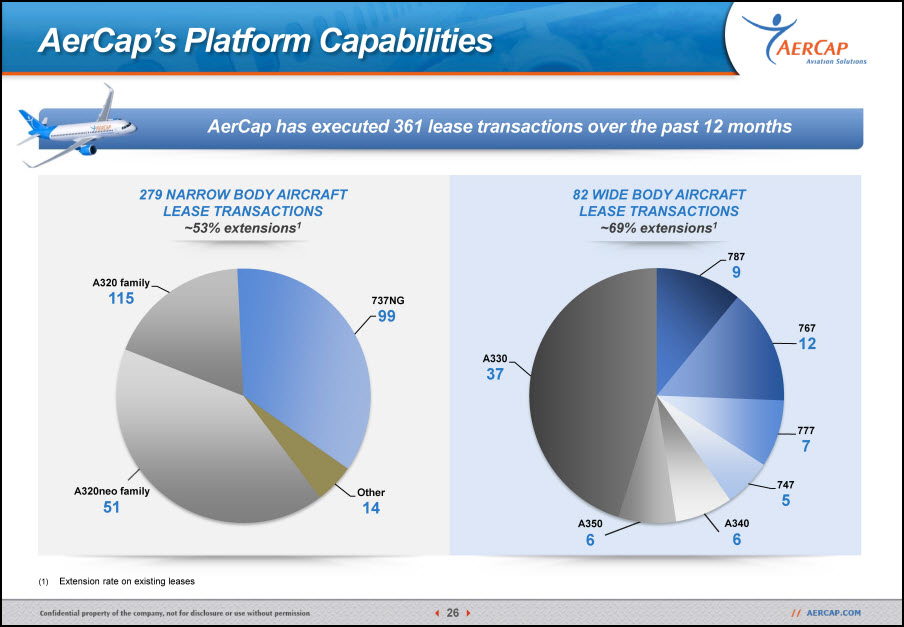
AerCap’s Platform Capabilities AerCap has executed 361 lease transactions over the past 12 months Extension rate on existing leases 279 NARROW BODY AIRCRAFT LEASE TRANSACTIONS ~53% extensions1 82 WIDE BODY AIRCRAFT LEASE TRANSACTIONS ~69% extensions1 A320neo family 51 A350 6 A3406
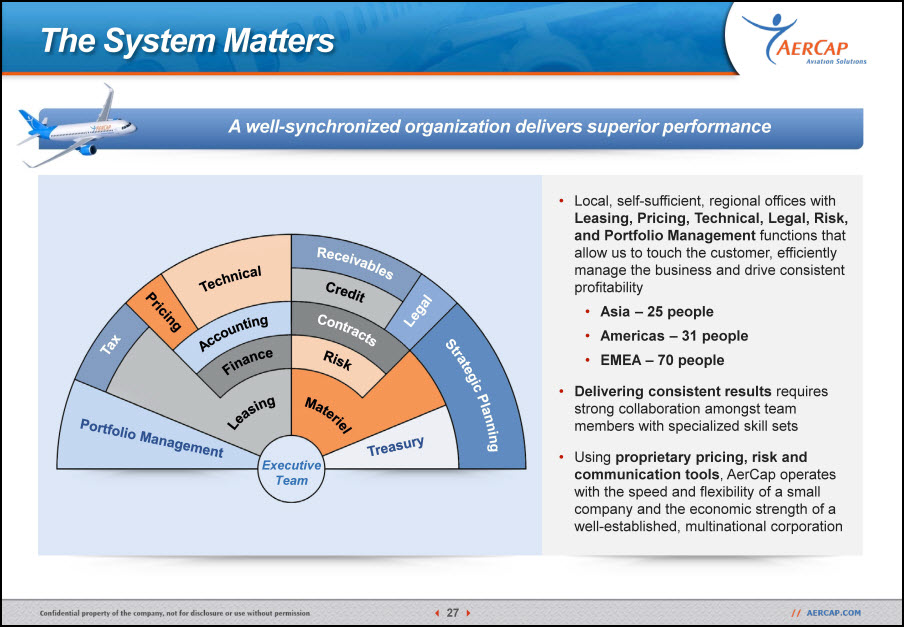
The System Matters A well-synchronized organization delivers superior performance Portfolio Management Pricing Receivables Legal Tax Executive Team Credit Contracts Risk Leasing Materiel Strategic Planning Treasury Technical Accounting Finance Local, self-sufficient, regional offices with Leasing, Pricing, Technical, Legal, Risk, and Portfolio Management functions that allow us to touch the customer, efficiently manage the business and drive consistent profitability Asia – 25 people Americas – 31 people EMEA – 70 people Delivering consistent results requires strong collaboration amongst team members with specialized skill setsUsing proprietary pricing, risk and communication tools, AerCap operates with the speed and flexibility of a small company and the economic strength of a well-established, multinational corporation
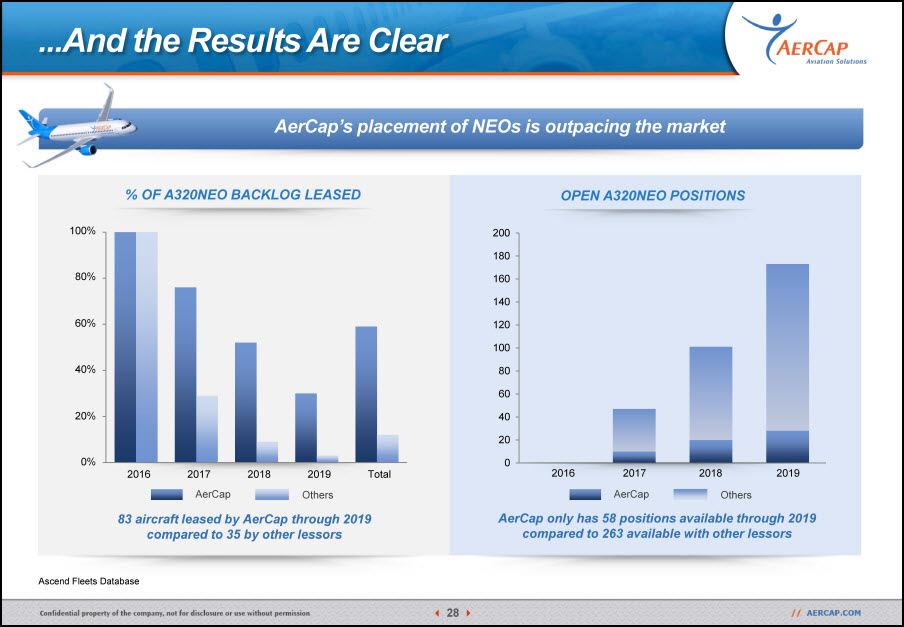
...And the Results Are Clear AerCap’s placement of NEOs is outpacing the market Ascend Fleets Database % OF A320NEO BACKLOG LEASED OPEN A320NEO POSITIONS 83 aircraft leased by AerCap through 2019 compared to 35 by other lessors AerCap only has 58 positions available through 2019compared to 263 available with other lessors 80% 100% 40% 60% 20% 0% Total 2016 2017 2019 2018 AerCap Others AerCap Others 2016 2017 2018 2019
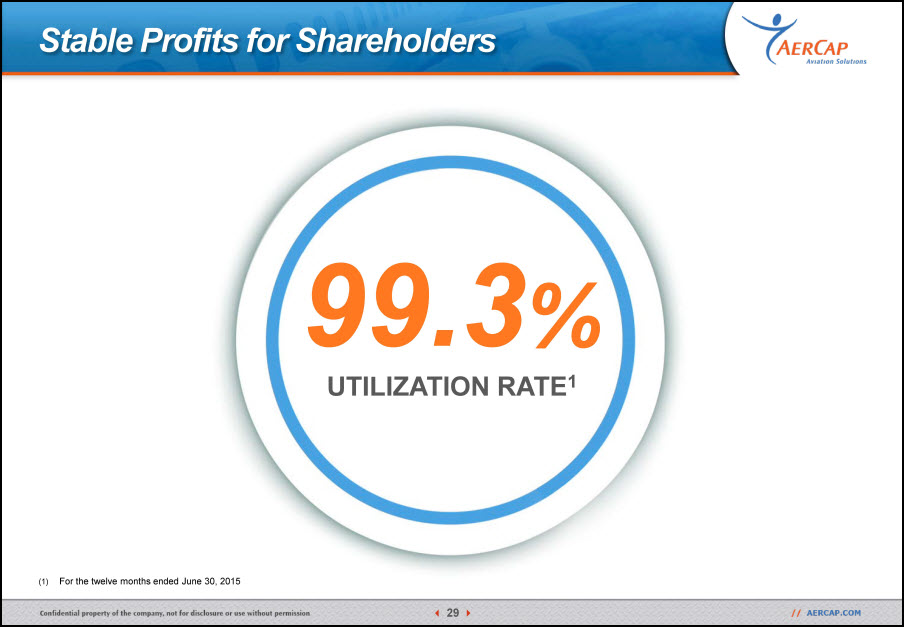
Stable Profits for Shareholders UTILIZATION RATE1 99.3% For the twelve months ended June 30, 2015

China
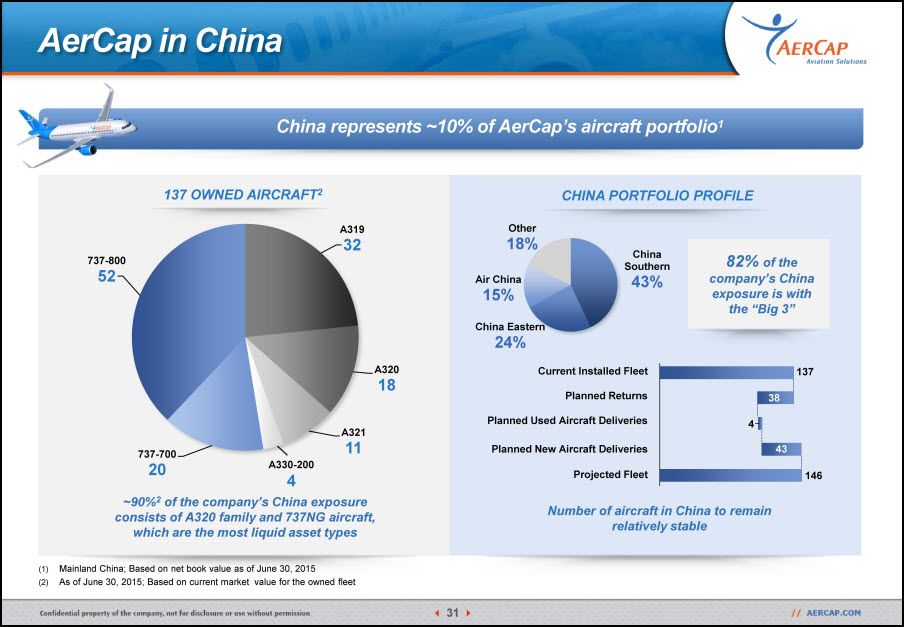
AerCap in China China represents ~10% of AerCap’s aircraft portfolio1 137 OWNED AIRCRAFT2 ~90%2 of the company’s China exposure consists of A320 family and 737NG aircraft, which are the most liquid asset types Mainland China; Based on net book value as of June 30, 2015As of June 30, 2015; Based on current market value for the owned fleet CHINA PORTFOLIO PROFILE Number of aircraft in China to remain relatively stable 82% of the company’s China exposure is with the “Big 3” Planned Returns Projected Fleet Current Installed Fleet Planned New Aircraft Deliveries Planned Used Aircraft Deliveries 137 43 4 38 146 A330-2004
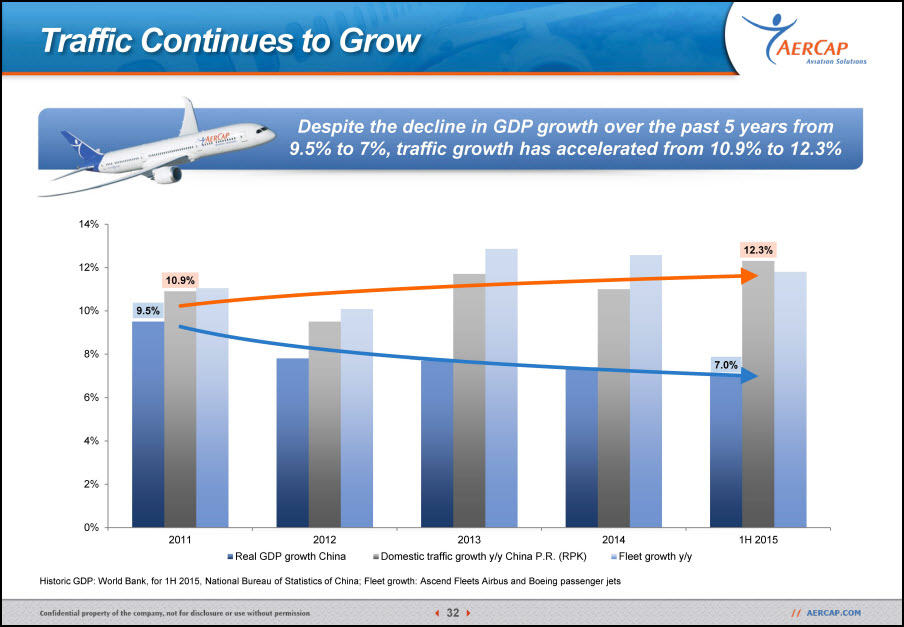
Despite the decline in GDP growth over the past 5 years from 9.5% to 7%, traffic growth has accelerated from 10.9% to 12.3% Historic GDP: World Bank, for 1H 2015, National Bureau of Statistics of China; Fleet growth: Ascend Fleets Airbus and Boeing passenger jets Traffic Continues to Grow
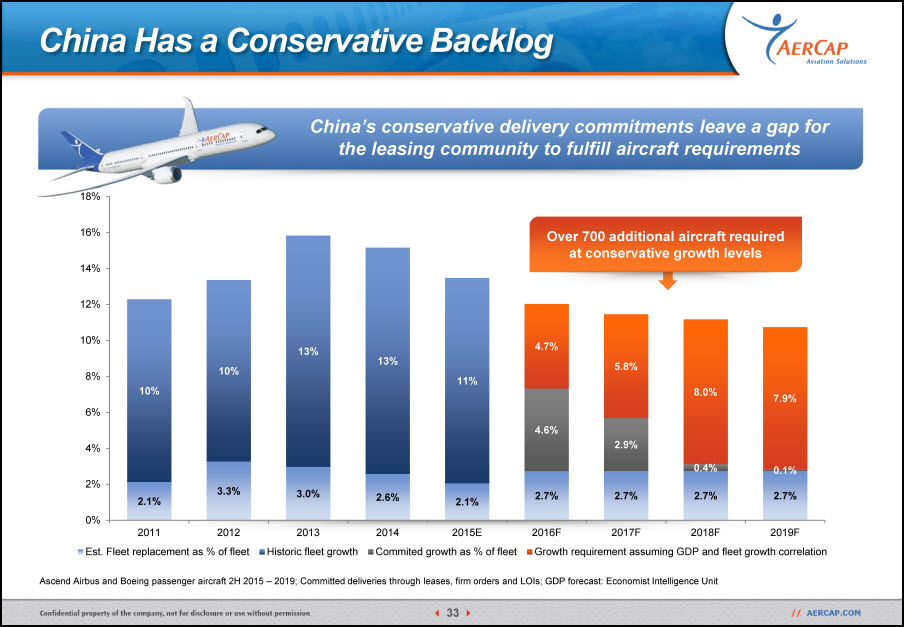
China’s conservative delivery commitments leave a gap for the leasing community to fulfill aircraft requirements Ascend Airbus and Boeing passenger aircraft 2H 2015 – 2019; Committed deliveries through leases, firm orders and LOIs; GDP forecast: Economist Intelligence Unit China Has a Conservative Backlog Over 700 additional aircraft required at conservative growth levels

Portfolio Management Edward O’Byrne Chief Investment Officer
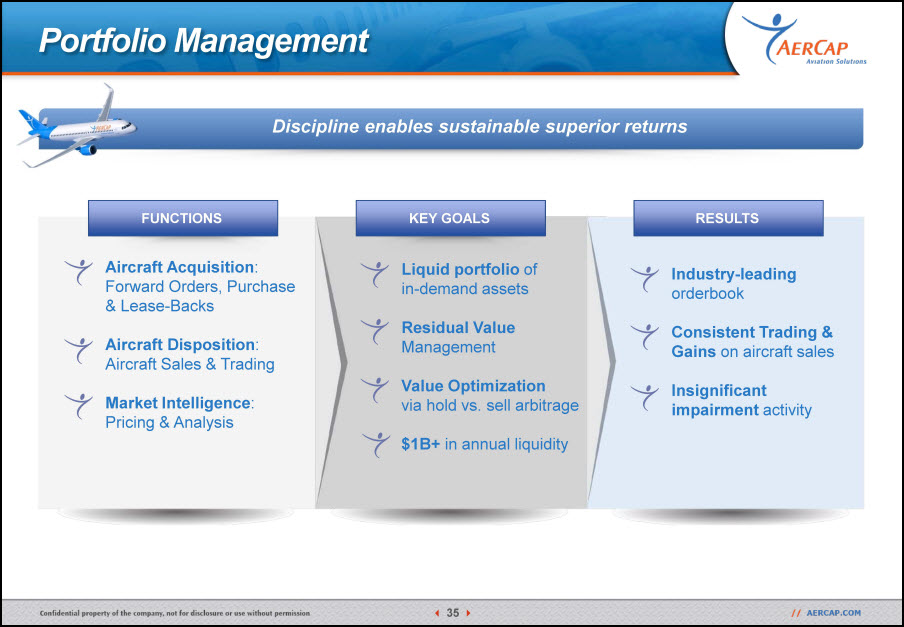
Portfolio Management Discipline enables sustainable superior returns Aircraft Acquisition: Forward Orders, Purchase & Lease-Backs Aircraft Disposition: Aircraft Sales & TradingMarket Intelligence: Pricing & Analysis FUNCTIONS Liquid portfolio of in-demand assetsResidual Value Management Value Optimizationvia hold vs. sell arbitrage$1B+ in annual liquidity KEY GOALS RESULTS Industry-leading orderbook Consistent Trading & Gains on aircraft salesInsignificant impairment activity
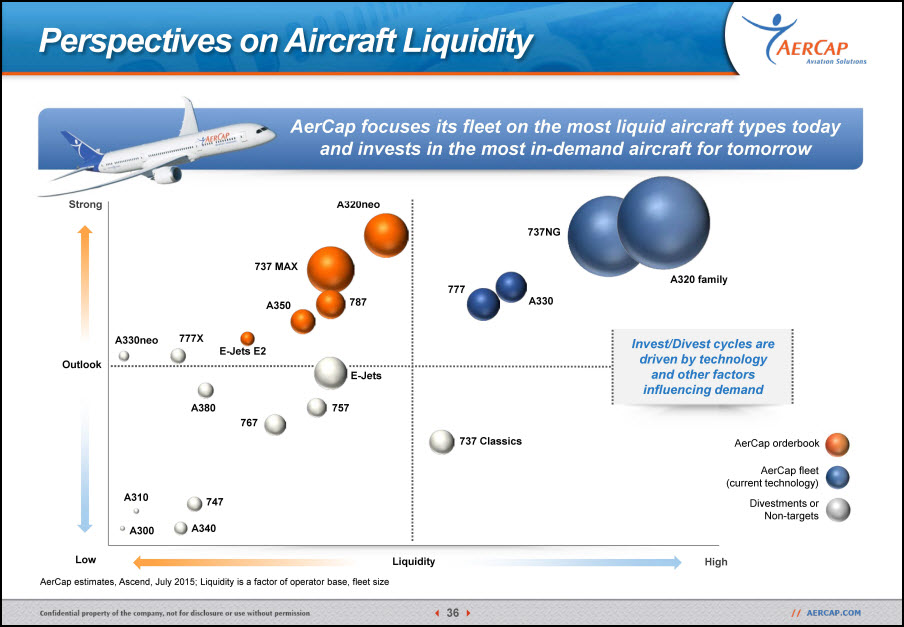
AerCap focuses its fleet on the most liquid aircraft types today and invests in the most in-demand aircraft for tomorrow AerCap estimates, Ascend, July 2015; Liquidity is a factor of operator base, fleet size Perspectives on Aircraft Liquidity AerCap orderbook AerCap fleet (current technology) Divestments or Non-targets Strong Outlook Low High Liquidity Invest/Divest cycles are driven by technology and other factors influencing demand
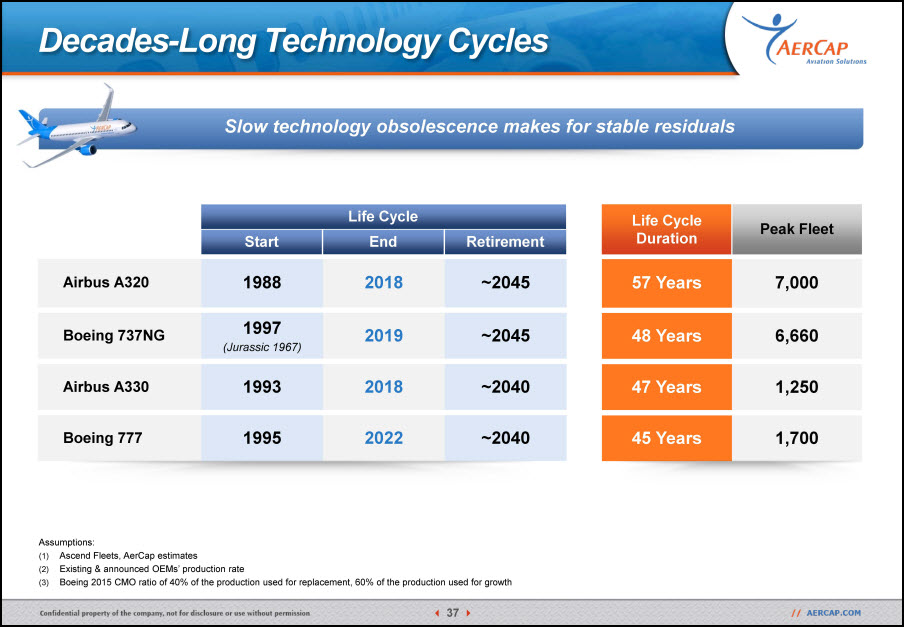
Decades-Long Technology Cycles Slow technology obsolescence makes for stable residuals Airbus A320 1988 2018 ~2045 Boeing 737NG 1997(Jurassic 1967) 2019 ~2045 Airbus A330 1993 2018 ~2040 Boeing 777 1995 2022 ~2040 Start End Retirement Assumptions:Ascend Fleets, AerCap estimatesExisting & announced OEMs’ production rateBoeing 2015 CMO ratio of 40% of the production used for replacement, 60% of the production used for growth 57 Years 7,000 48 Years 6,660 47 Years 1,250 45 Years 1,700 Life Cycle Duration Peak Fleet Life Cycle
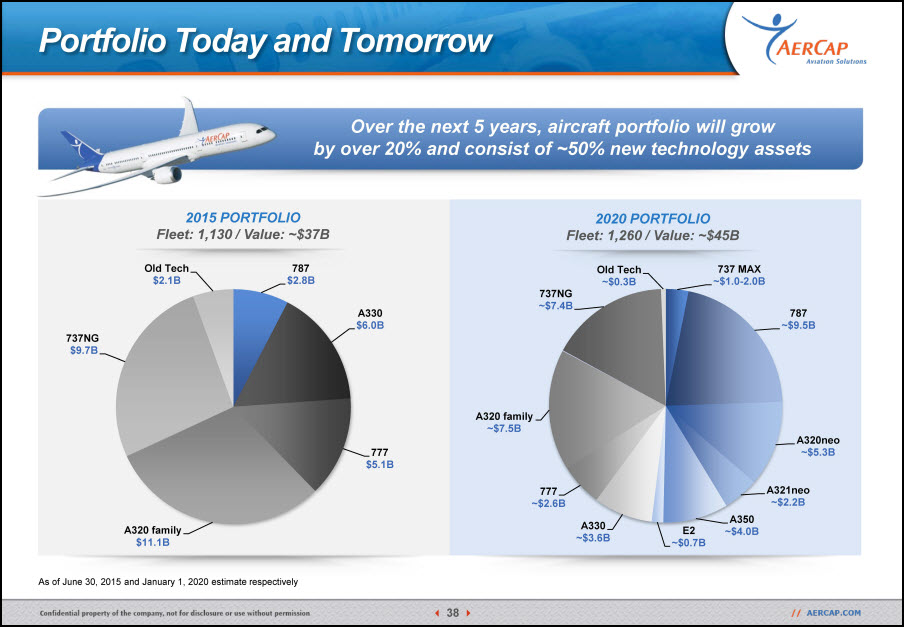
Portfolio Today and Tomorrow As of June 30, 2015 and January 1, 2020 estimate respectively Over the next 5 years, aircraft portfolio will grow by over 20% and consist of ~50% new technology assets 2015 PORTFOLIOFleet: 1,130 / Value: ~$37B 2020 PORTFOLIOFleet: 1,260 / Value: ~$45B
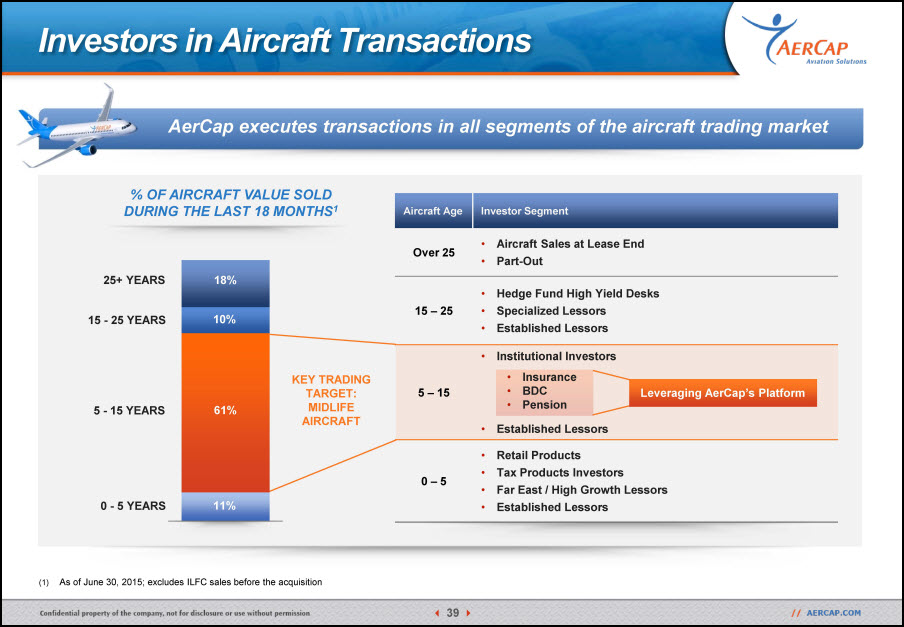
AerCap executes transactions in all segments of the aircraft trading market Investors in Aircraft Transactions As of June 30, 2015; excludes ILFC sales before the acquisition % OF AIRCRAFT VALUE SOLD DURING THE LAST 18 MONTHS1 0 - 5 YEARS 5 - 15 YEARS 15 - 25 YEARS 25+ YEARS 18% 10% 61% 11% KEY TRADING TARGET: MIDLIFE AIRCRAFT Leveraging AerCap’s Platform Aircraft Age Investor Segment Over 25 Aircraft Sales at Lease EndPart-Out 15 – 25 Hedge Fund High Yield DesksSpecialized LessorsEstablished Lessors 5 – 15 Institutional Investors InsuranceBDCPensionEstablished Lessors 0 – 5 Retail ProductsTax Products Investors Far East / High Growth LessorsEstablished Lessors
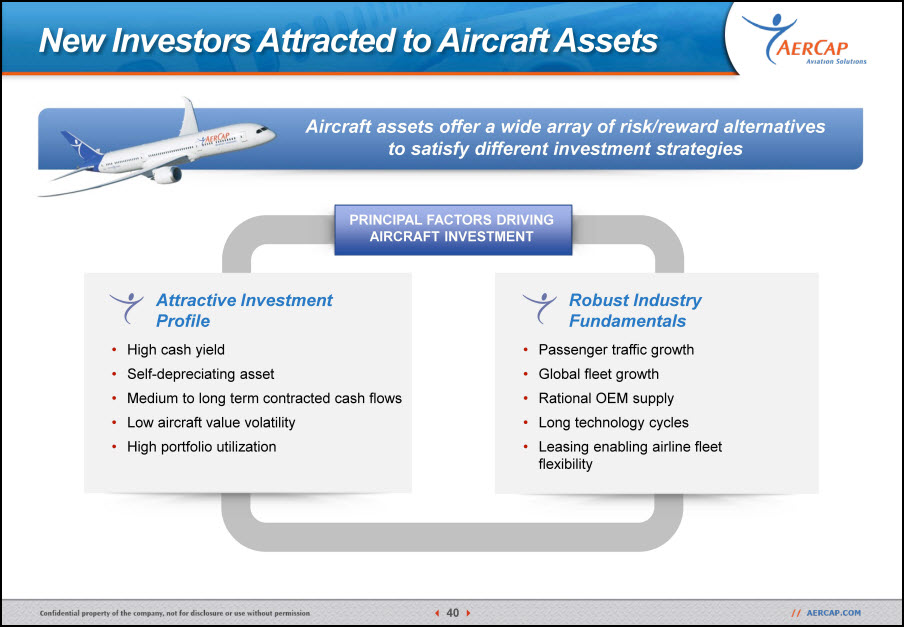
New Investors Attracted to Aircraft Assets Aircraft assets offer a wide array of risk/reward alternatives to satisfy different investment strategies PRINCIPAL FACTORS DRIVING AIRCRAFT INVESTMENT High cash yieldSelf-depreciating assetMedium to long term contracted cash flowsLow aircraft value volatilityHigh portfolio utilization Attractive Investment Profile Robust Industry Fundamentals Passenger traffic growth Global fleet growthRational OEM supplyLong technology cyclesLeasing enabling airline fleet flexibility
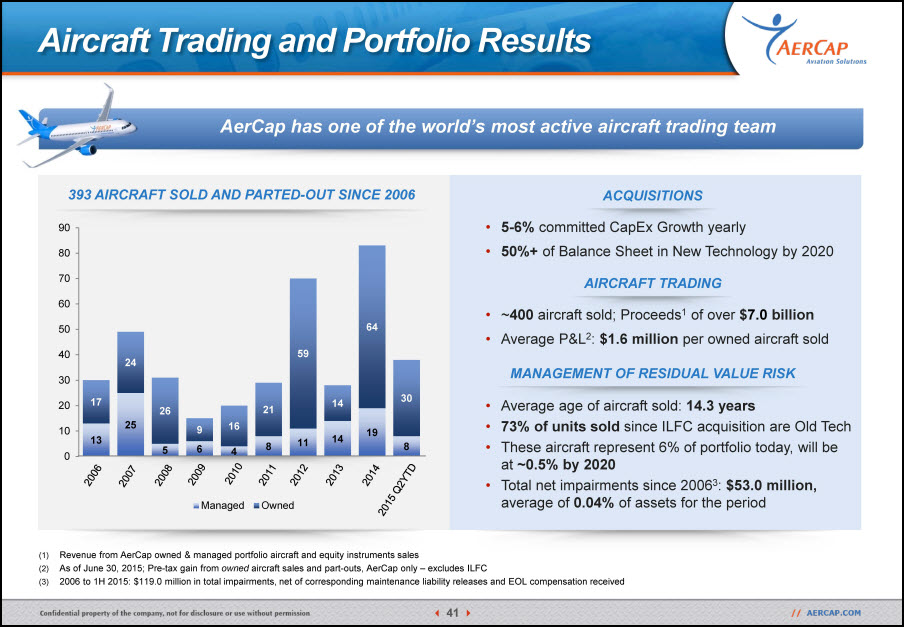
AerCap has one of the world’s most active aircraft trading team Aircraft Trading and Portfolio Results Revenue from AerCap owned & managed portfolio aircraft and equity instruments salesAs of June 30, 2015; Pre-tax gain from owned aircraft sales and part-outs, AerCap only – excludes ILFC2006 to 1H 2015: $119.0 million in total impairments, net of corresponding maintenance liability releases and EOL compensation received 393 AIRCRAFT SOLD AND PARTED-OUT SINCE 2006 ACQUISITIONS 5-6% committed CapEx Growth yearly50%+ of Balance Sheet in New Technology by 2020 MANAGEMENT OF RESIDUAL VALUE RISK Average age of aircraft sold: 14.3 years 73% of units sold since ILFC acquisition are Old TechThese aircraft represent 6% of portfolio today, will be at ~0.5% by 2020Total net impairments since 20063: $53.0 million, average of 0.04% of assets for the period 2006 2007 2008 2009 2010 2011 2012 2013 2014 2015 Q2YTD AIRCRAFT TRADING ~400 aircraft sold; Proceeds1 of over $7.0 billionAverage P&L2: $1.6 million per owned aircraft sold

Q&A Aengus KellyChief Executive Officer Edward O’Byrne Chief Investment Officer Philip ScruggsPresident & Chief Commercial Officer
AerCap Investor Day 2015 - Session Break

Risk Management Anton JoinerChief Risk Officer
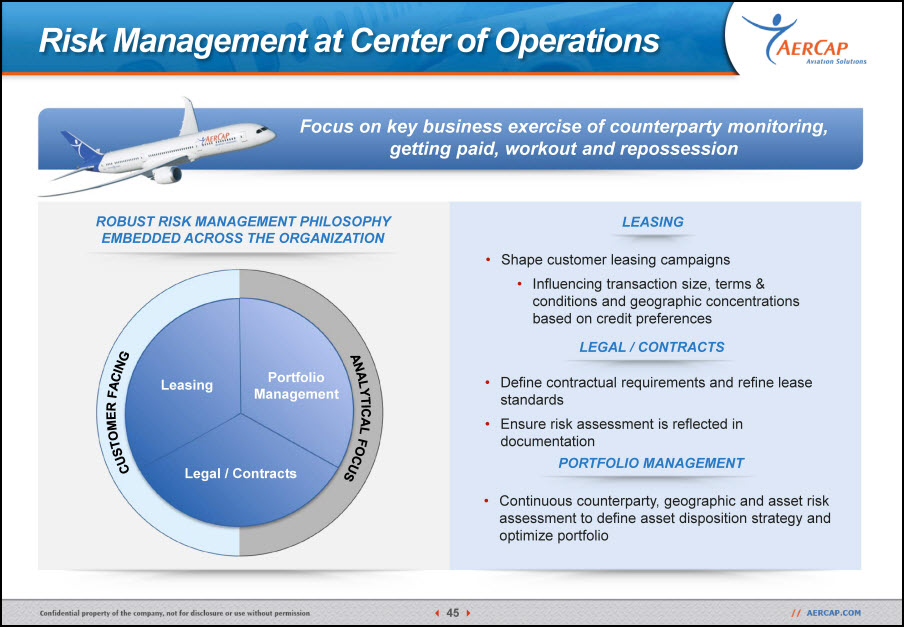
Risk Management at Center of Operations ROBUST RISK MANAGEMENT PHILOSOPHY EMBEDDED ACROSS THE ORGANIZATION CUSTOMER FACING ANALYTICAL FOCUS Leasing PortfolioManagement Legal / Contracts Shape customer leasing campaigns Influencing transaction size, terms & conditions and geographic concentrations based on credit preferences LEASING Define contractual requirements and refine lease standardsEnsure risk assessment is reflected in documentation LEGAL / CONTRACTS Continuous counterparty, geographic and asset risk assessment to define asset disposition strategy and optimize portfolio PORTFOLIO MANAGEMENT Focus on key business exercise of counterparty monitoring, getting paid, workout and repossession
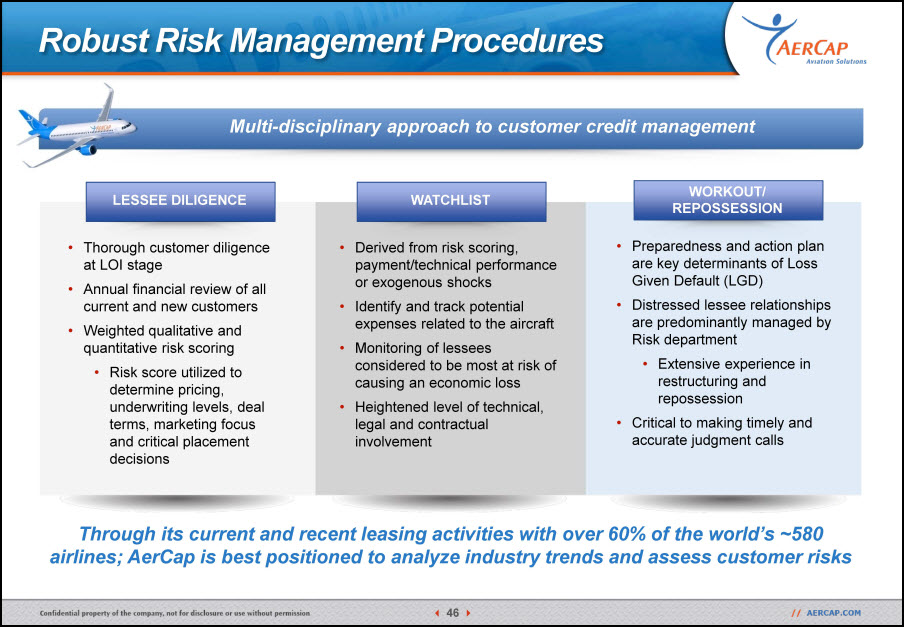
Robust Risk Management Procedures LESSEE DILIGENCE WATCHLIST Thorough customer diligence at LOI stage Annual financial review of all current and new customersWeighted qualitative and quantitative risk scoringRisk score utilized to determine pricing, underwriting levels, deal terms, marketing focus and critical placement decisions Derived from risk scoring, payment/technical performance or exogenous shocksIdentify and track potential expenses related to the aircraftMonitoring of lessees considered to be most at risk of causing an economic lossHeightened level of technical, legal and contractual involvement WORKOUT/REPOSSESSION Preparedness and action plan are key determinants of Loss Given Default (LGD)Distressed lessee relationships are predominantly managed by Risk departmentExtensive experience in restructuring and repossession Critical to making timely and accurate judgment calls Multi-disciplinary approach to customer credit management Through its current and recent leasing activities with over 60% of the world’s ~580 airlines; AerCap is best positioned to analyze industry trends and assess customer risks

Principal Lessor Credit Protections Lease standards have been refined over several decades and continue to be shaped with experience across industry cycles Restriction on removal of parts Advance rentals “Hell or high water” payment clause Maintenance Reserves Ability to ground aircraft Strict maintenance standards Full operational indemnities Lessee hull loss, war risk and liability insurance Security Deposits Restriction on habitual base Detailed return conditions Numerous separate events of default Lessor’s power to de-register Lessor can assign rights TOOLS AVAILABLE FOR ADDITIONAL ENHANCEMENT Lessee cash flow security assignments Foreign registry Guarantees Enhanced records protection Entire cost of operation to lessee Governing law (US/UK) Rights of set-off “As is where is” delivery
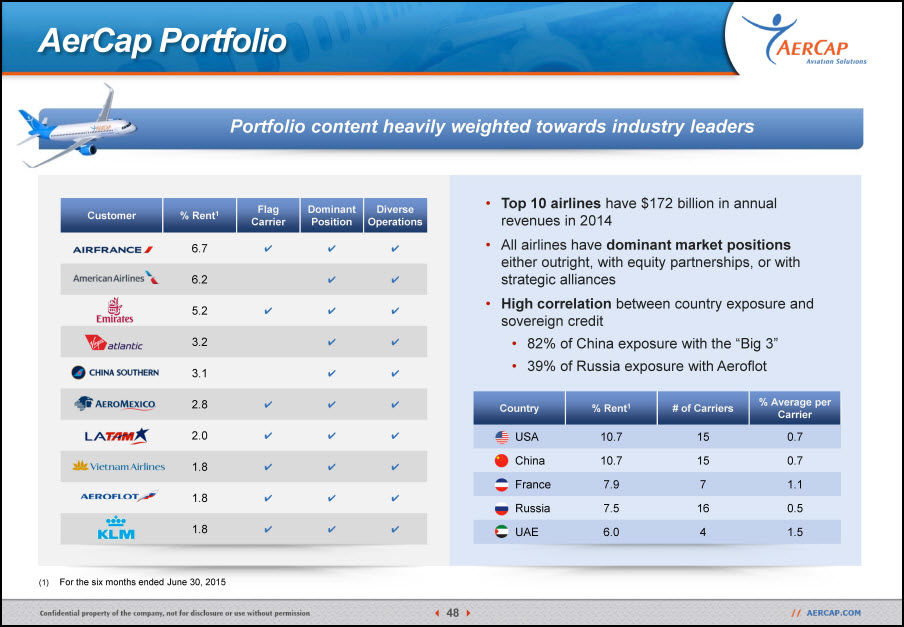
Portfolio content heavily weighted towards industry leaders AerCap Portfolio Customer % Rent1 Flag Carrier Dominant Position Diverse Operations 6.7 ✔ ✔ ✔ 6.2 ✔ ✔ 5.2 ✔ ✔ ✔ 3.2 ✔ ✔ 3.1 ✔ ✔ 2.8 ✔ ✔ ✔ 2.0 ✔ ✔ ✔ 1.8 ✔ ✔ ✔ 1.8 ✔ ✔ ✔ 1.8 ✔ ✔ ✔ Top 10 airlines have $172 billion in annual revenues in 2014All airlines have dominant market positions either outright, with equity partnerships, or with strategic alliances High correlation between country exposure and sovereign credit82% of China exposure with the “Big 3”39% of Russia exposure with Aeroflot For the six months ended June 30, 2015 Country % Rent1 # of Carriers % Average per Carrier USA 10.7 15 0.7 China 10.7 15 0.7 France 7.9 7 1.1 Russia 7.5 16 0.5 UAE 6.0 4 1.5
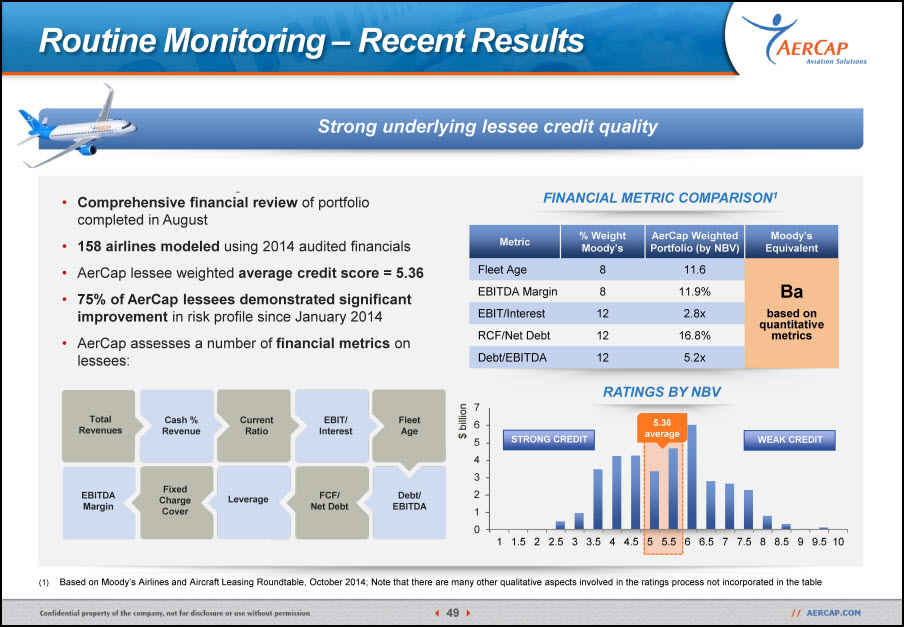
Strong underlying lessee credit quality Routine Monitoring – Recent Results Comprehensive financial review of portfolio completed in August158 airlines modeled using 2014 audited financials AerCap lessee weighted average credit score = 5.3675% of AerCap lessees demonstrated significant improvement in risk profile since January 2014AerCap assesses a number of financial metrics on lessees: FINANCIAL METRIC COMPARISON1 Total Revenues EBITDA Margin Cash % Revenue Fixed Charge Cover Current Ratio Leverage RATINGS BY NBV 76543210 5.36 average STRONG CREDIT WEAK CREDIT $ billion Based on Moody’s Airlines and Aircraft Leasing Roundtable, October 2014; Note that there are many other qualitative aspects involved in the ratings process not incorporated in the table EBIT/Interest FCF/Net Debt Fleet Age Debt/EBITDA Metric % Weight Moody’s AerCap Weighted Portfolio (by NBV) Moody’s Equivalent Fleet Age 8 11.6 Babased on quantitative metrics EBITDA Margin 8 11.9% EBIT/Interest 12 2.8x RCF/Net Debt 12 16.8% Debt/EBITDA 12 5.2x
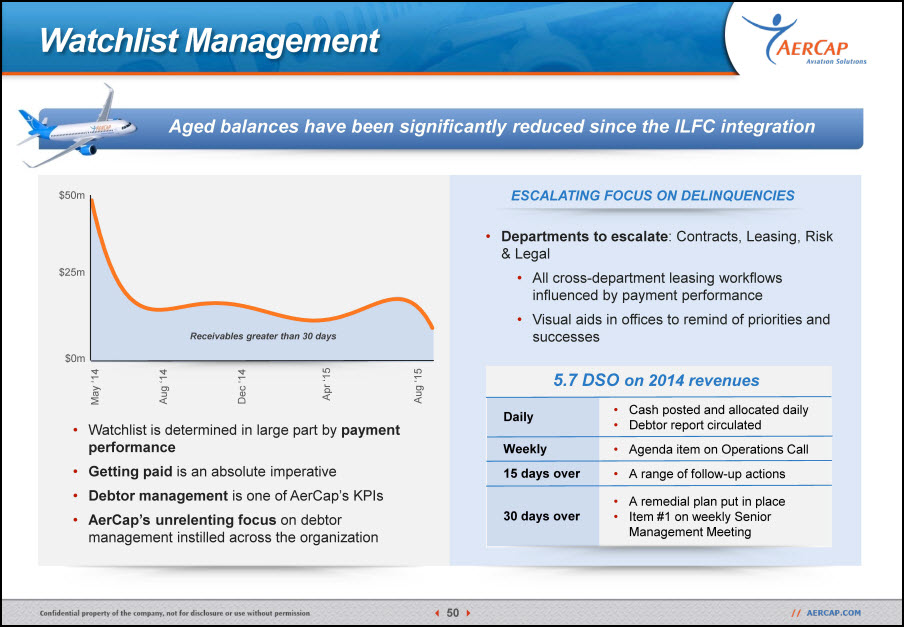
Aged balances have been significantly reduced since the ILFC integration Watchlist Management Departments to escalate: Contracts, Leasing, Risk & LegalAll cross-department leasing workflows influenced by payment performanceVisual aids in offices to remind of priorities and successes Watchlist is determined in large part by payment performanceGetting paid is an absolute imperativeDebtor management is one of AerCap’s KPIsAerCap’s unrelenting focus on debtor management instilled across the organization ESCALATING FOCUS ON DELINQUENCIES Receivables greater than 30 days May ‘14 Dec ‘14 Aug ‘15 Aug ‘14 Apr ‘15 $0m $50m $25m Daily Cash posted and allocated dailyDebtor report circulated Weekly Agenda item on Operations Call 15 days over A range of follow-up actions 30 days over A remedial plan put in placeItem #1 on weekly Senior Management Meeting 5.7 DSO on 2014 revenues
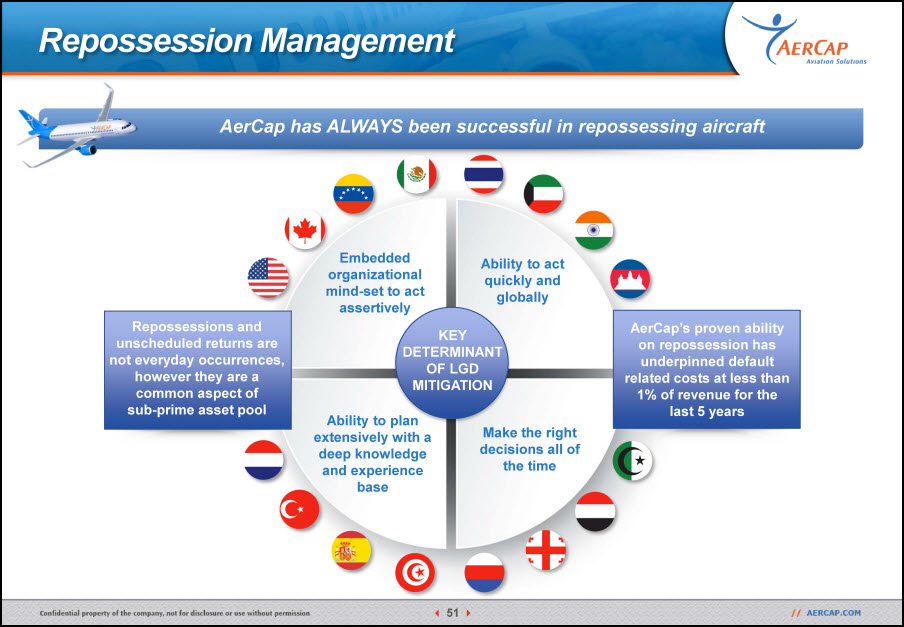
AerCap has ALWAYS been successful in repossessing aircraft Repossession Management KEY DETERMINANT OF LGD MITIGATION Embedded organizational mind-set to act assertively Ability to plan extensively with a deep knowledge and experience base Ability to act quickly and globally Make the right decisions all of the time Repossessions and unscheduled returns are not everyday occurrences, however they are a common aspect of sub-prime asset pool AerCap’s proven ability on repossession has underpinned default related costs at less than 1% of revenue for the last 5 years
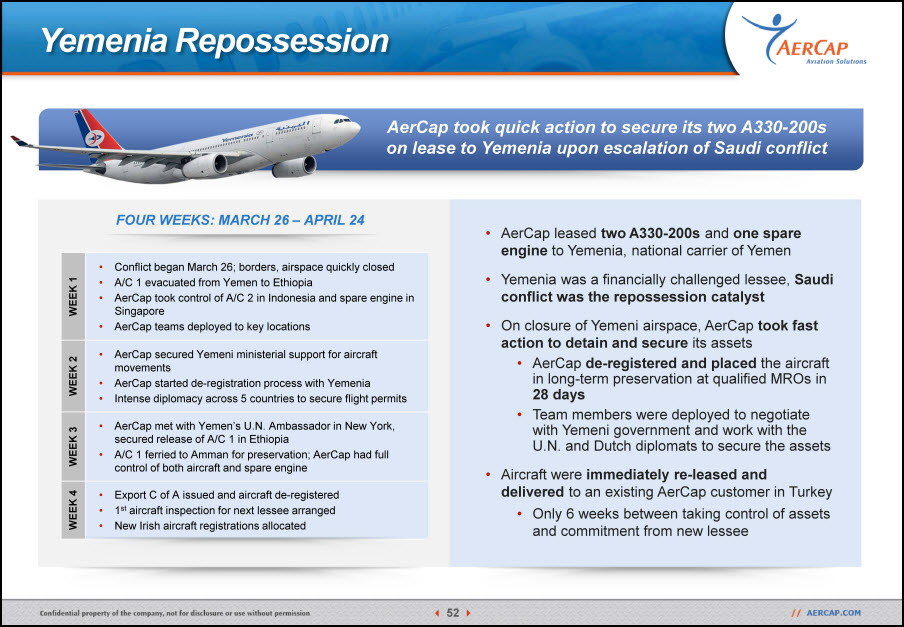
AerCap took quick action to secure its two A330-200s on lease to Yemenia upon escalation of Saudi conflict Yemenia Repossession AerCap leased two A330-200s and one spare engine to Yemenia, national carrier of YemenYemenia was a financially challenged lessee, Saudi conflict was the repossession catalystOn closure of Yemeni airspace, AerCap took fast action to detain and secure its assetsAerCap de-registered and placed the aircraft in long-term preservation at qualified MROs in 28 daysTeam members were deployed to negotiate with Yemeni government and work with the U.N. and Dutch diplomats to secure the assetsAircraft were immediately re-leased and delivered to an existing AerCap customer in TurkeyOnly 6 weeks between taking control of assets and commitment from new lessee WEEK 1 Conflict began March 26; borders, airspace quickly closedA/C 1 evacuated from Yemen to EthiopiaAerCap took control of A/C 2 in Indonesia and spare engine in SingaporeAerCap teams deployed to key locations WEEK 2 AerCap secured Yemeni ministerial support for aircraft movementsAerCap started de-registration process with Yemenia Intense diplomacy across 5 countries to secure flight permits WEEK 3 AerCap met with Yemen’s U.N. Ambassador in New York, secured release of A/C 1 in Ethiopia A/C 1 ferried to Amman for preservation; AerCap had full control of both aircraft and spare engine WEEK 4 Export C of A issued and aircraft de-registered1st aircraft inspection for next lessee arrangedNew Irish aircraft registrations allocated FOUR WEEKS: MARCH 26 – APRIL 24
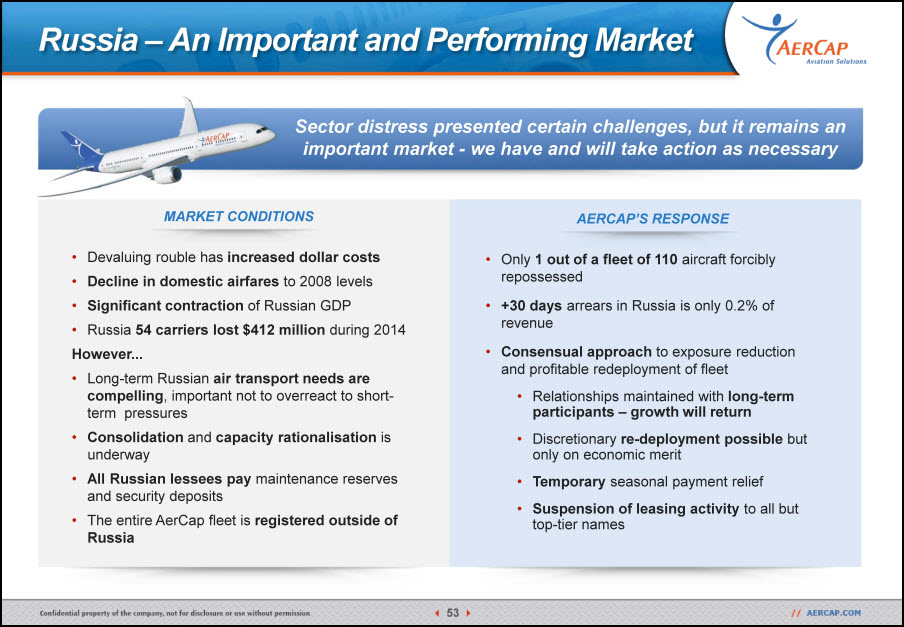
Sector distress presented certain challenges, but it remains an important market - we have and will take action as necessary Only 1 out of a fleet of 110 aircraft forcibly repossessed+30 days arrears in Russia is only 0.2% of revenueConsensual approach to exposure reduction and profitable redeployment of fleetRelationships maintained with long-term participants – growth will return Discretionary re-deployment possible but only on economic meritTemporary seasonal payment reliefSuspension of leasing activity to all but top-tier names AERCAP’S RESPONSE Devaluing rouble has increased dollar costsDecline in domestic airfares to 2008 levelsSignificant contraction of Russian GDPRussia 54 carriers lost $412 million during 2014However...Long-term Russian air transport needs are compelling, important not to overreact to short-term pressuresConsolidation and capacity rationalisation is underwayAll Russian lessees pay maintenance reserves and security deposits The entire AerCap fleet is registered outside of Russia MARKET CONDITIONS Russia – An Important and Performing Market

OEM Relations Martin OlsonHead of OEM Relations
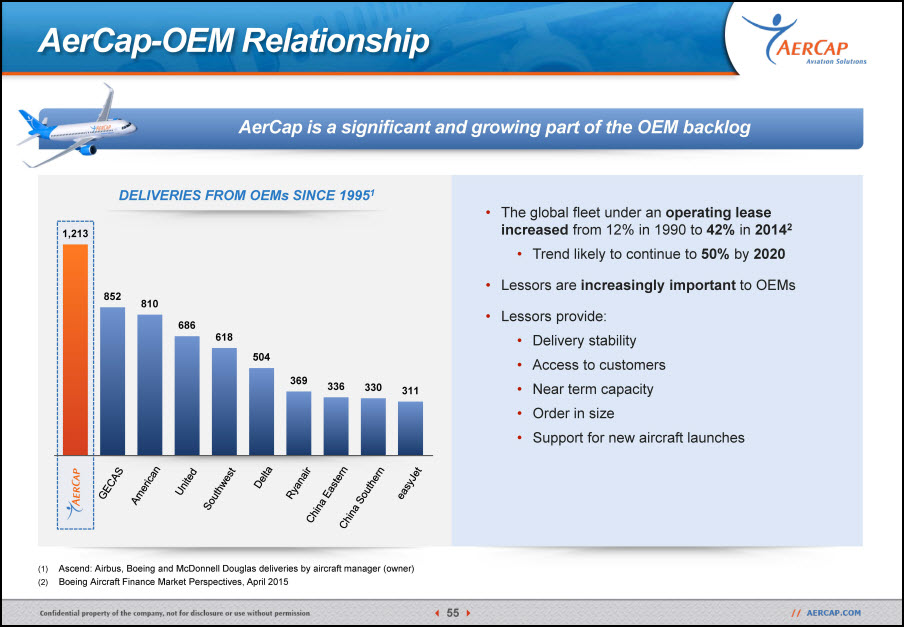
Ascend: Airbus, Boeing and McDonnell Douglas deliveries by aircraft manager (owner)Boeing Aircraft Finance Market Perspectives, April 2015 DELIVERIES FROM OEMs SINCE 19951 AerCap-OEM Relationship AerCap is a significant and growing part of the OEM backlog The global fleet under an operating lease increased from 12% in 1990 to 42% in 20142Trend likely to continue to 50% by 2020Lessors are increasingly important to OEMsLessors provide:Delivery stabilityAccess to customersNear term capacityOrder in sizeSupport for new aircraft launches GECAS American United Southwest Delta Ryanair China Eastern China Southern easyJet
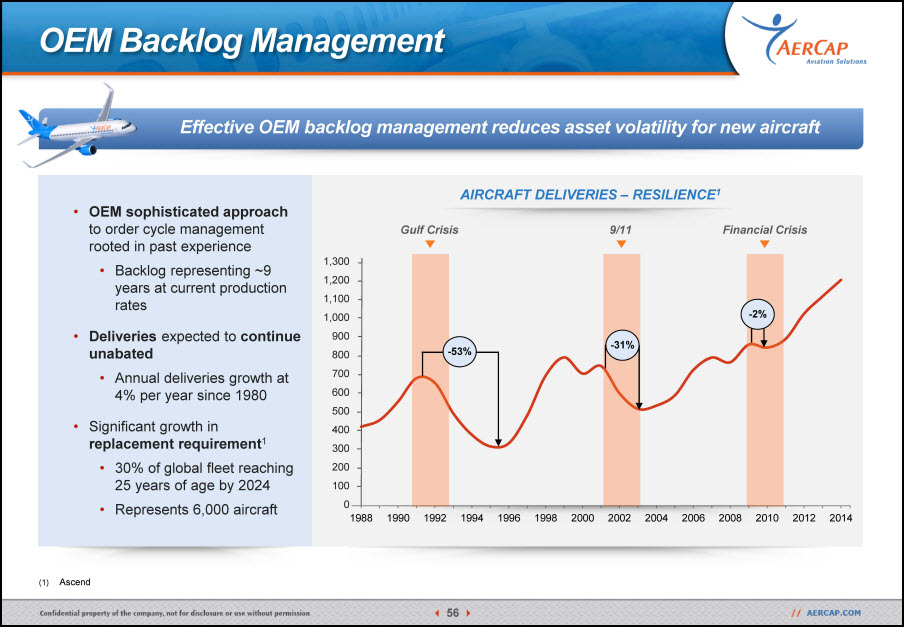
OEM Backlog Management Effective OEM backlog management reduces asset volatility for new aircraft Ascend AIRCRAFT DELIVERIES – RESILIENCE1 OEM sophisticated approach to order cycle management rooted in past experience Backlog representing ~9 years at current production ratesDeliveries expected to continue unabatedAnnual deliveries growth at 4% per year since 1980Significant growth in replacement requirement130% of global fleet reaching 25 years of age by 2024Represents 6,000 aircraft Gulf Crisis -53% 9/11 -31% Financial Crisis -2% 1,3001,2001,1001,0009008007006005004003002001000

Customer Diversification CAPA – Centre for AviationBoeing Current Market Outlook 2015-2034 Increased levels of customer diversification and maturation of LCCs LCC CAPACITY SHARE (%) OF TOTAL SEATS1 Market liberalization and significant growth of Low Cost Carriers (LCCs)2Increase in LCCs flying short-haul flights under 3,000 miles from 10% in 1994 to ~30% today40% of the 20-year single-aisle deliveries—400 to 500 airplanes every year—will be in this market segmentAverage annual growth rate of LCCs over the past 10 years2 Asia Pacific: 24.5%Europe: 13.4%North America: 2.2% 12.2% 14.2% 17.5% 20.3% 22.8% 25.6% 2003 2004 2005 2006 2007 2008 2009 2010 2011 2012 2013 2014 YTD 2015 2013 25.0%
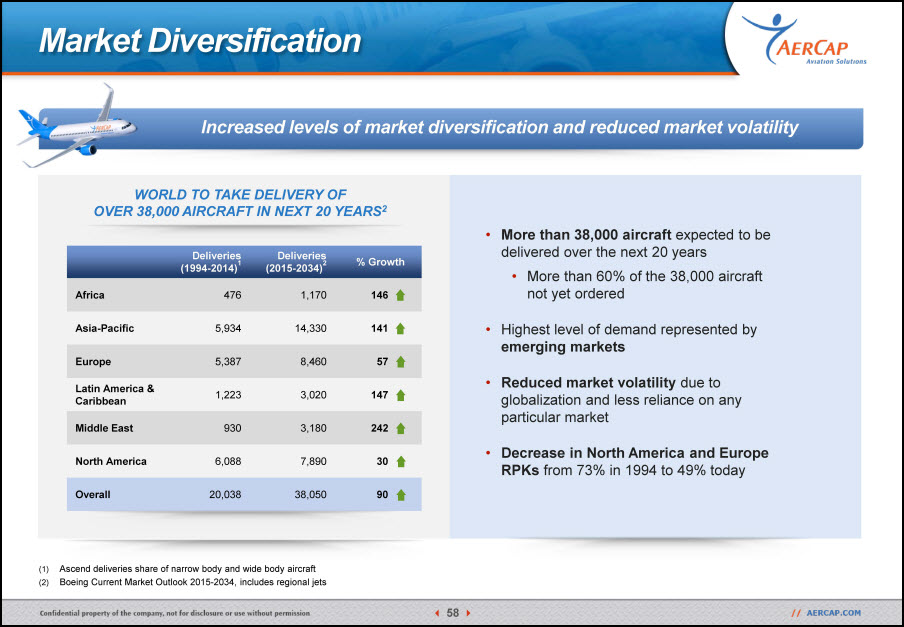
Market Diversification Ascend deliveries share of narrow body and wide body aircraftBoeing Current Market Outlook 2015-2034, includes regional jets Increased levels of market diversification and reduced market volatility WORLD TO TAKE DELIVERY OF OVER 38,000 AIRCRAFT IN NEXT 20 YEARS2 Deliveries (1994-2014)1 Deliveries (2015-2034)2 % Growth Africa 476 1,170 146 Asia-Pacific 5,934 14,330 141 Europe 5,387 8,460 57 Latin America & Caribbean 1,223 3,020 147 Middle East 930 3,180 242 North America 6,088 7,890 30 Overall 20,038 38,050 90 More than 38,000 aircraft expected to be delivered over the next 20 yearsMore than 60% of the 38,000 aircraft not yet ordered Highest level of demand represented by emerging markets Reduced market volatility due to globalization and less reliance on any particular marketDecrease in North America and Europe RPKs from 73% in 1994 to 49% today
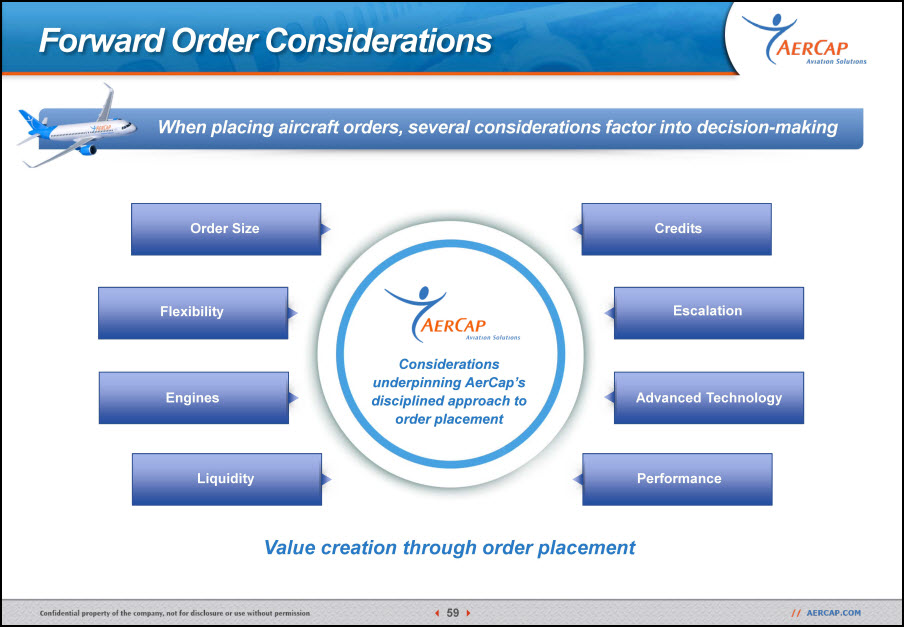
Forward Order Considerations When placing aircraft orders, several considerations factor into decision-making Considerations underpinning AerCap’s disciplined approach to order placement Order Size Flexibility Engines Credits Escalation Advanced Technology Liquidity Performance Value creation through order placement
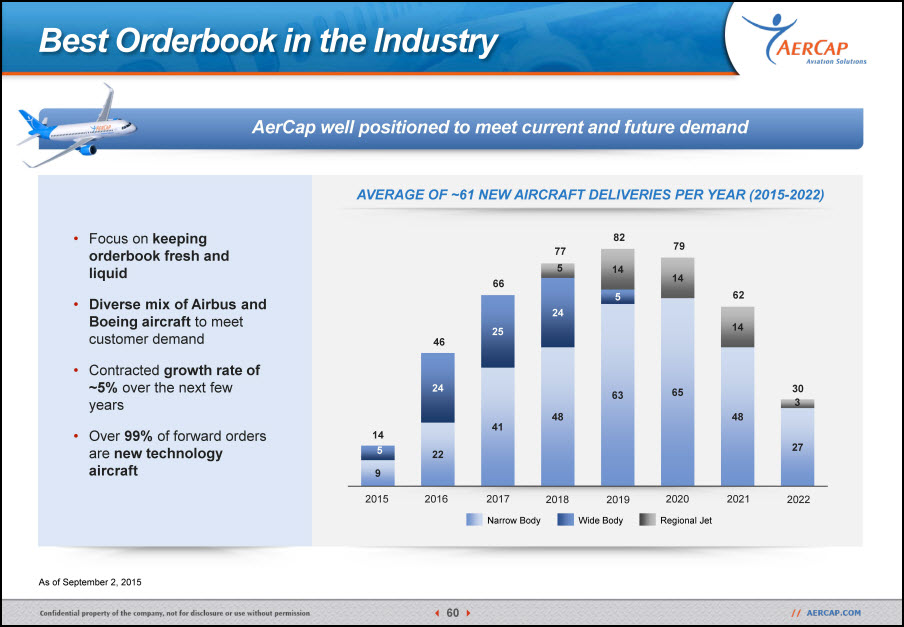
Best Orderbook in the Industry AerCap well positioned to meet current and future demand AVERAGE OF ~61 NEW AIRCRAFT DELIVERIES PER YEAR (2015-2022) Focus on keeping orderbook fresh and liquidDiverse mix of Airbus and Boeing aircraft to meet customer demandContracted growth rate of ~5% over the next few yearsOver 99% of forward orders are new technology aircraft As of September 2, 2015 Wide Body Narrow Body Regional Jet 3 2015 2016 2017 2018 2019 2020 2021 2022 14 46 66 77 82 79 62 30
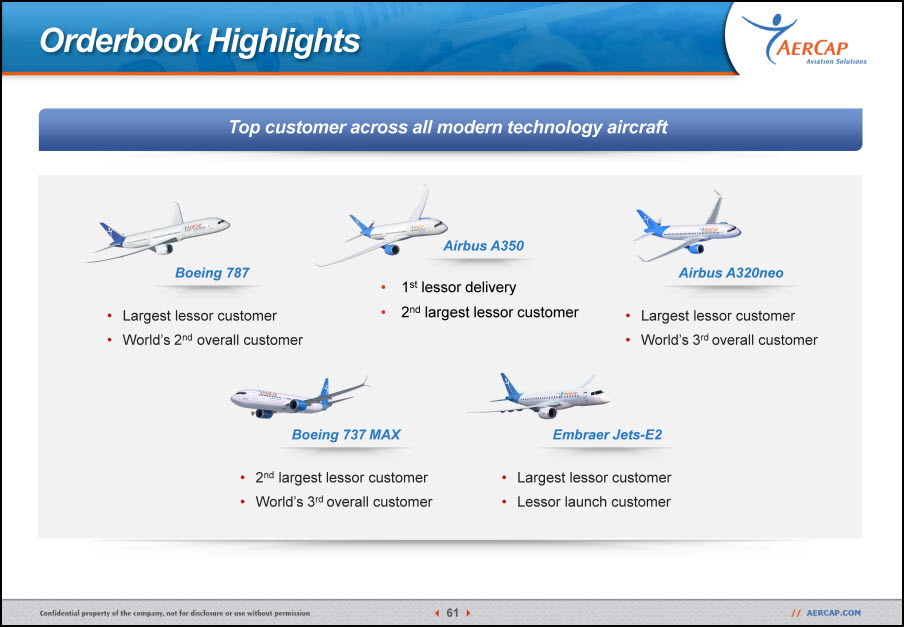
Orderbook Highlights Top customer across all modern technology aircraft Largest lessor customerWorld’s 2nd overall customer Boeing 787 1st lessor delivery2nd largest lessor customer Airbus A350 Largest lessor customerWorld’s 3rd overall customer Airbus A320neo 2nd largest lessor customerWorld’s 3rd overall customer Boeing 737 MAX Largest lessor customerLessor launch customer Embraer Jets-E2

Financial Performance Keith HelmingChief Financial Officer
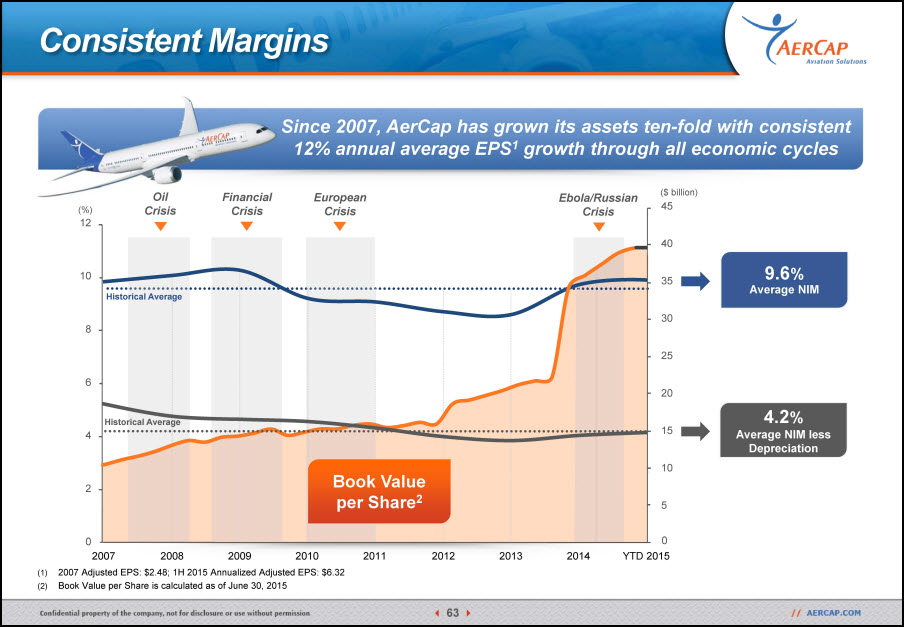
Since 2007, AerCap has grown its assets ten-fold with consistent 12% annual average EPS1 growth through all economic cycles 2007 Adjusted EPS: $2.48; 1H 2015 Annualized Adjusted EPS: $6.32Book Value per Share is calculated as of June 30, 2015 Consistent Margins 9.6%Average NIM 4.2%Average NIM less Depreciation Financial Crisis Ebola/Russian Crisis European Crisis Oil Crisis 121086420 2007 2008 2009 2010 2011 2012 2013 2014 YTD 2015 ($ billion) (%) 454035302520151050 0 Book Value per Share2 Historical Average Historical Average
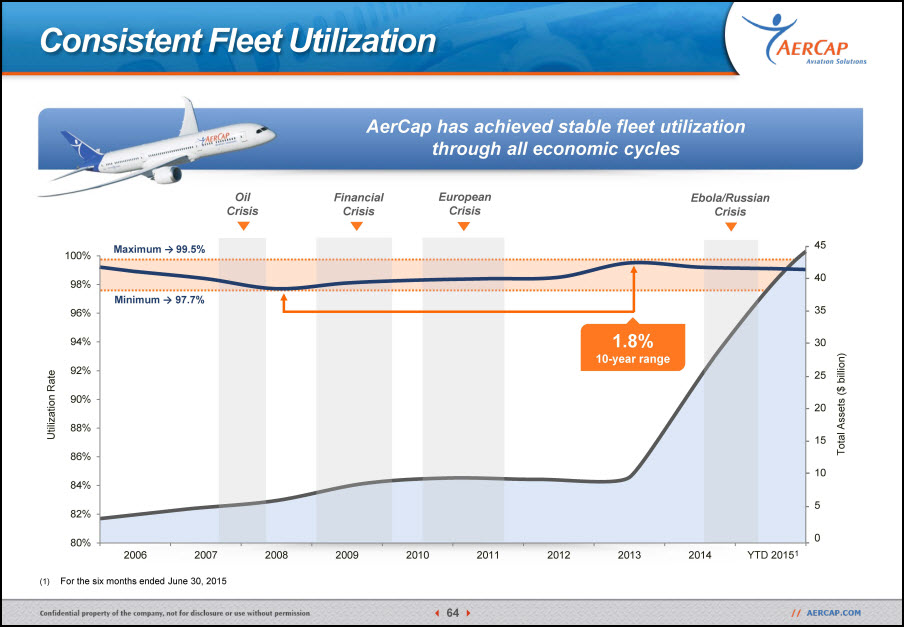
AerCap has achieved stable fleet utilization through all economic cycles For the six months ended June 30, 2015 Oil Crisis Ebola/Russian Crisis Financial Crisis European Crisis Consistent Fleet Utilization 1 Minimum → 97.7% Maximum → 99.5% 45 4035302520151050 Total Assets ($ billion) Utilization Rate 1.8%10-year range
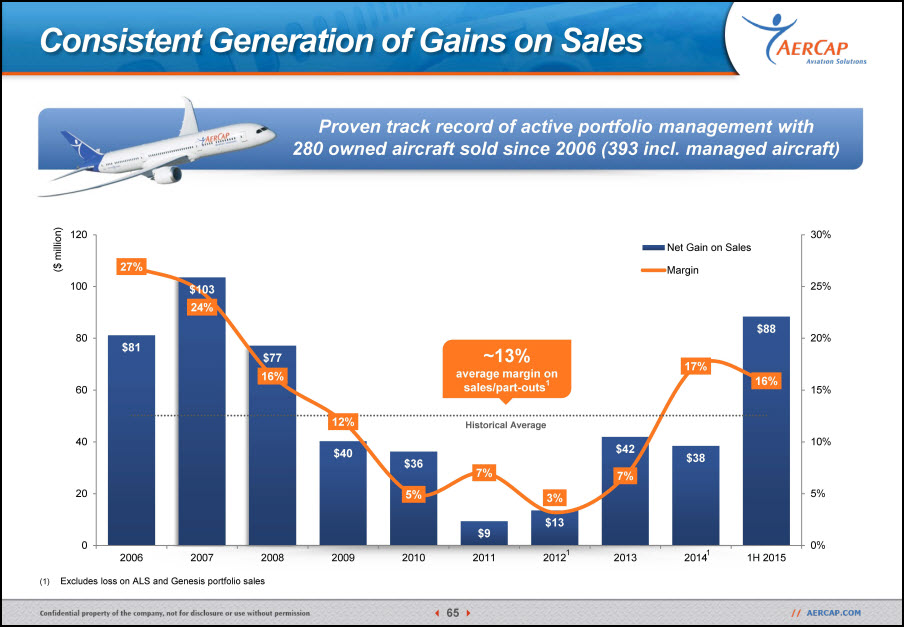
Proven track record of active portfolio management with 280 owned aircraft sold since 2006 (393 incl. managed aircraft) Excludes loss on ALS and Genesis portfolio sales Consistent Generation of Gains on Sales 1 1 Historical Average ~13%average margin on sales/part-outs1 ($ million)
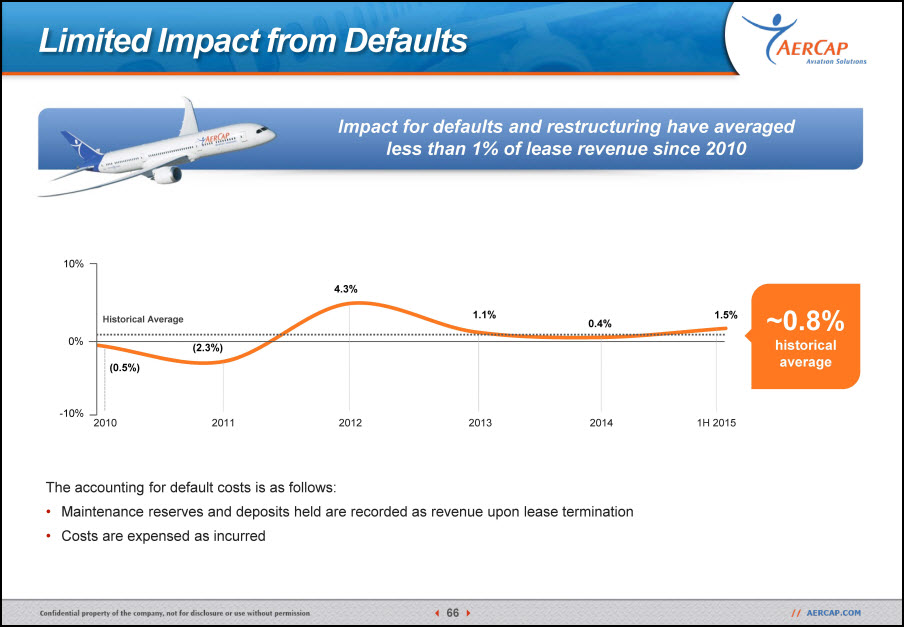
Impact for defaults and restructuring have averaged less than 1% of lease revenue since 2010 Limited Impact from Defaults Historical Average 2010 2011 2012 2013 2014 1H 2015 -10% 0% 10% ~0.8%historical average The accounting for default costs is as follows: Maintenance reserves and deposits held are recorded as revenue upon lease terminationCosts are expensed as incurred
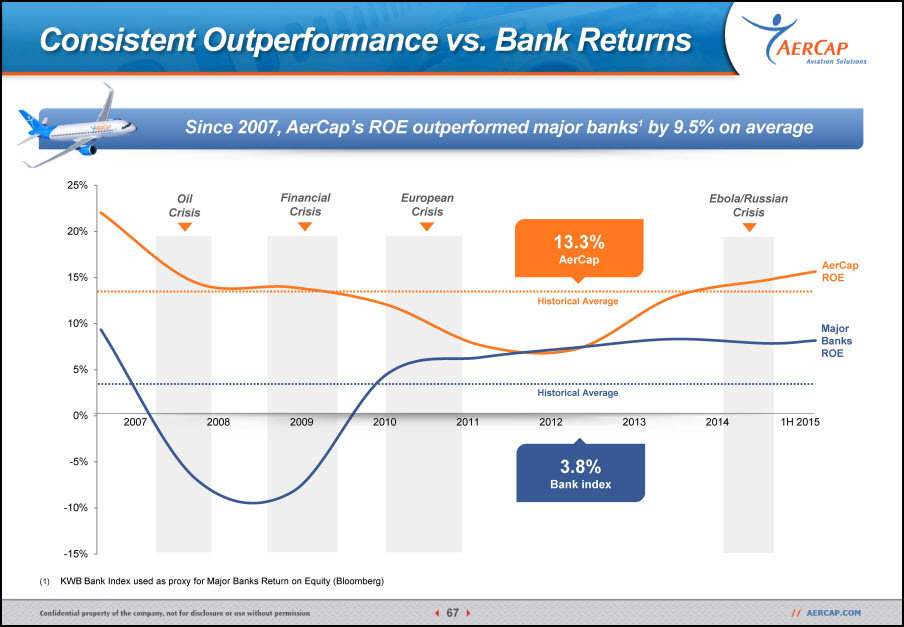
Consistent Outperformance vs. Bank Returns Since 2007, AerCap’s ROE outperformed major banks1 by 9.5% on average Financial Crisis Ebola/Russian Crisis Oil Crisis 2007 2009 2010 2011 2008 2012 2013 2014 1H 2015 Historical Average Historical Average KWB Bank Index used as proxy for Major Banks Return on Equity (Bloomberg) AerCap ROE Major Banks ROE European Crisis 13.3%AerCap 3.8%Bank index

Specific Financial Topics
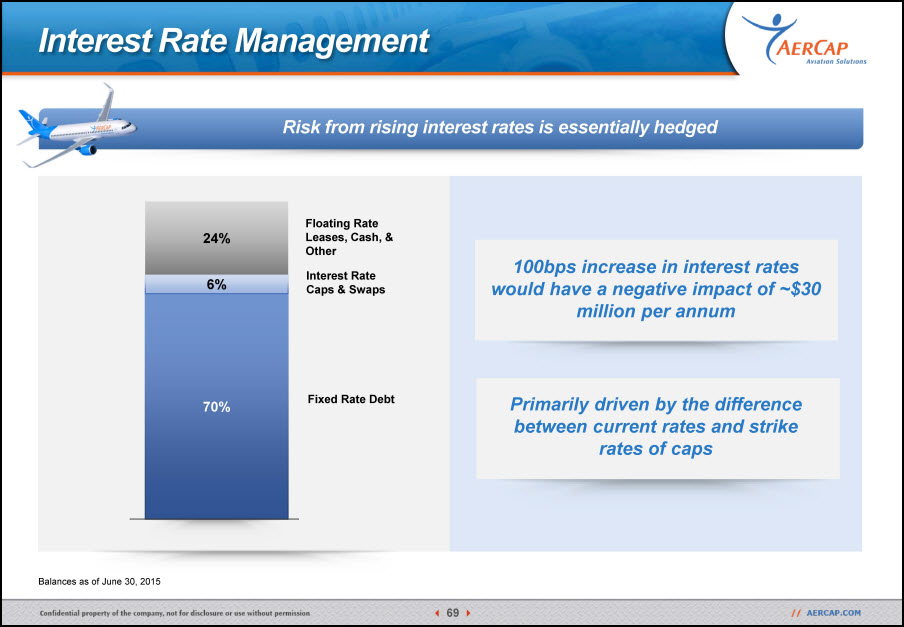
Interest Rate Management Risk from rising interest rates is essentially hedged Interest Rate Caps & Swaps Floating Rate Leases, Cash, & Other Fixed Rate Debt Balances as of June 30, 2015 100bps increase in interest rates would have a negative impact of ~$30 million per annumPrimarily driven by the difference between current rates and strike rates of caps
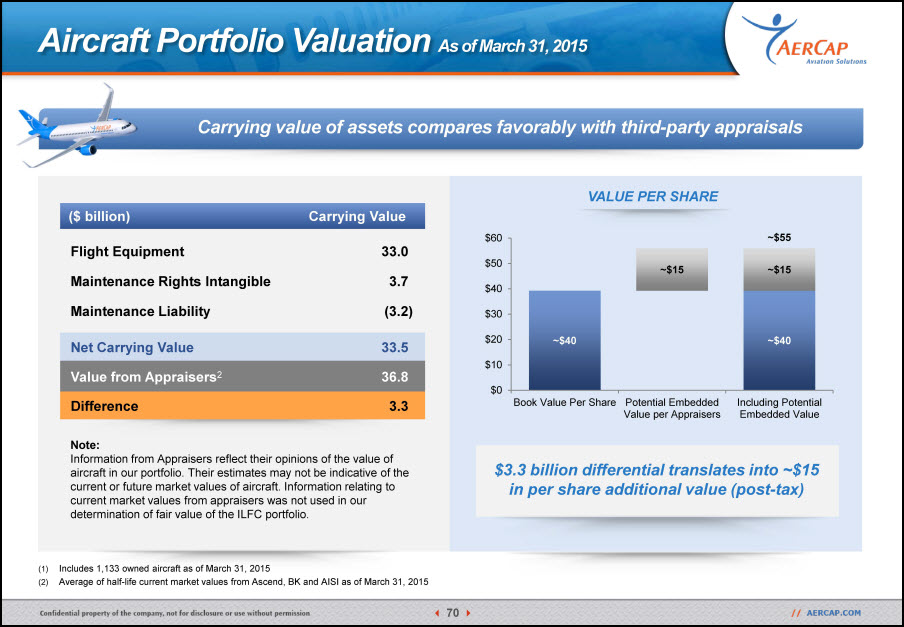
Aircraft Portfolio Valuation As of March 31, 2015 Carrying value of assets compares favorably with third-party appraisals Includes 1,133 owned aircraft as of March 31, 2015Average of half-life current market values from Ascend, BK and AISI as of March 31, 2015 1 Note:Information from Appraisers reflect their opinions of the value of aircraft in our portfolio. Their estimates may not be indicative of the current or future market values of aircraft. Information relating to current market values from appraisers was not used in our determination of fair value of the ILFC portfolio. $3.3 billion differential translates into ~$15 in per share additional value (post-tax) VALUE PER SHARE ($ billion) Carrying Value Flight Equipment 33.0 Maintenance Rights Intangible 3.7 Maintenance Liability (3.2) Net Carrying Value 33.5 Value from Appraisers2 36.8 Difference 3.3
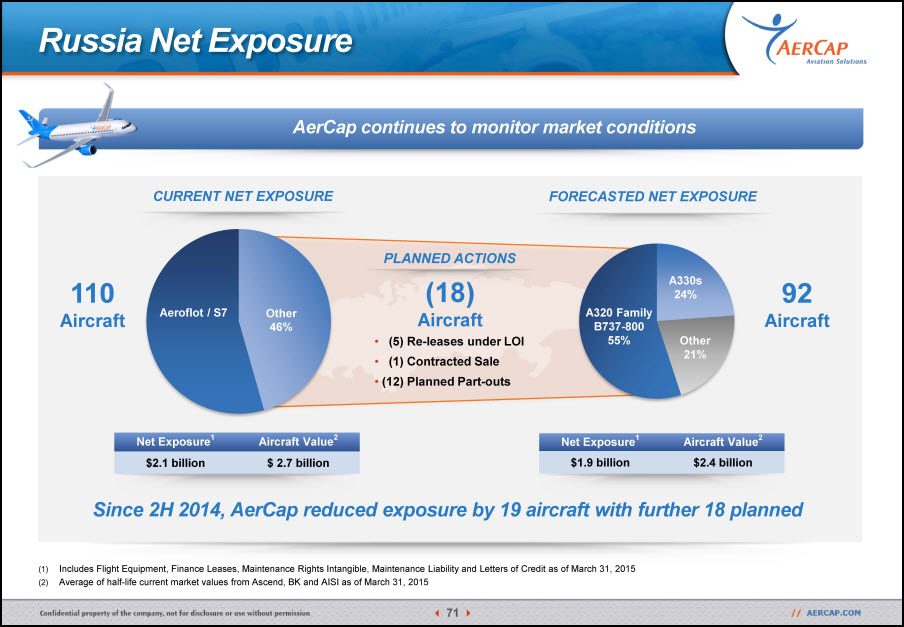
Russia Net Exposure CURRENT NET EXPOSURE FORECASTED NET EXPOSURE (5) Re-leases under LOI (1) Contracted Sale(12) Planned Part-outs PLANNED ACTIONS Since 2H 2014, AerCap reduced exposure by 19 aircraft with further 18 planned Includes Flight Equipment, Finance Leases, Maintenance Rights Intangible, Maintenance Liability and Letters of Credit as of March 31, 2015Average of half-life current market values from Ascend, BK and AISI as of March 31, 2015 Net Exposure1 Aircraft Value2 $2.1 billion $ 2.7 billion 110 Aircraft 92 Aircraft Net Exposure1 Aircraft Value2 $1.9 billion $2.4 billion (18) Aircraft A330s24% A320 Family B737-80055% Other 21% AerCap continues to monitor market conditions

Guidance
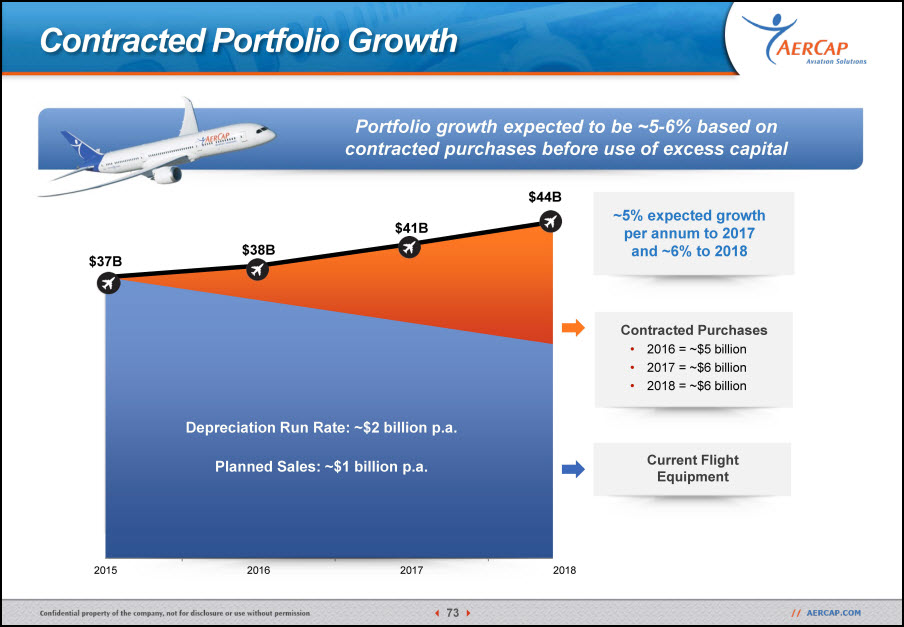
Portfolio growth expected to be ~5-6% based on contracted purchases before use of excess capital Contracted Portfolio Growth Depreciation Run Rate: ~$2 billion p.a.Planned Sales: ~$1 billion p.a. Current Flight Equipment ~5% expected growth per annum to 2017 and ~6% to 2018 Contracted Purchases2016 = ~$5 billion2017 = ~$6 billion2018 = ~$6 billion
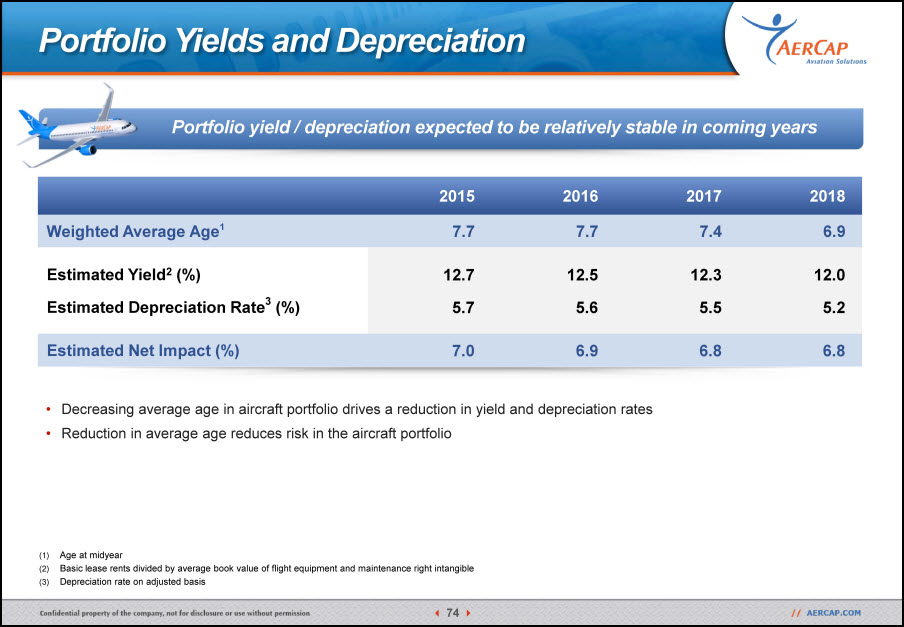
Portfolio Yields and Depreciation Portfolio yield / depreciation expected to be relatively stable in coming years 2015 2016 2017 2018 Weighted Average Age1 7.7 7.7 7.4 6.9 Estimated Yield2 (%) 12.7 12.5 12.3 12.0 Estimated Depreciation Rate3 (%) 5.7 5.6 5.5 5.2 Estimated Net Impact (%) 7.0 6.9 6.8 6.8 Age at midyearBasic lease rents divided by average book value of flight equipment and maintenance right intangibleDepreciation rate on adjusted basis Decreasing average age in aircraft portfolio drives a reduction in yield and depreciation ratesReduction in average age reduces risk in the aircraft portfolio
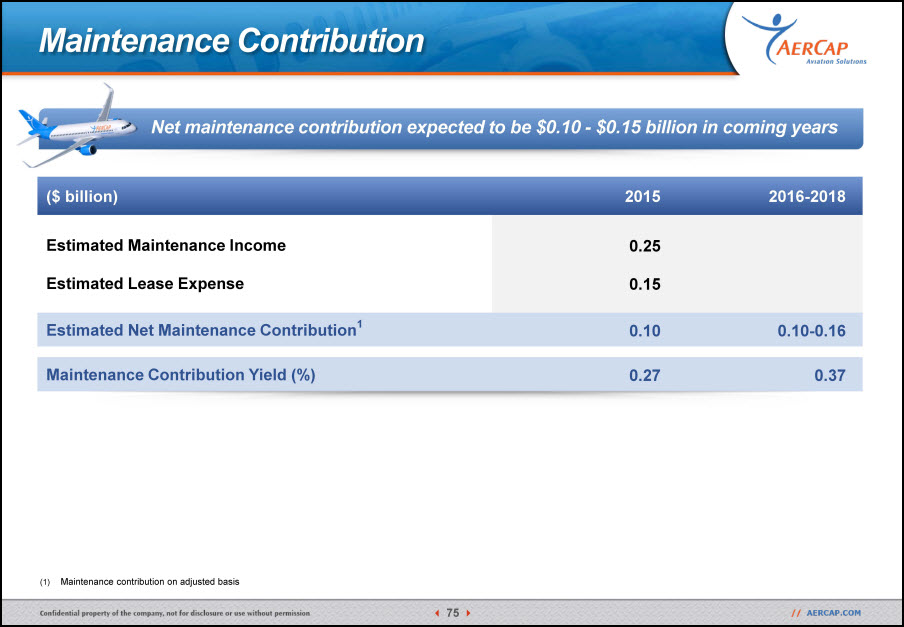
Maintenance Contribution Net maintenance contribution expected to be $0.10 - $0.15 billion in coming years Maintenance contribution on adjusted basis ($ billion) 2015 2016-2018 Estimated Maintenance Income 0.25 Estimated Lease Expense 0.15 Estimated Net Maintenance Contribution1 0.10 0.10-0.16 Maintenance Contribution Yield (%) 0.27 0.37
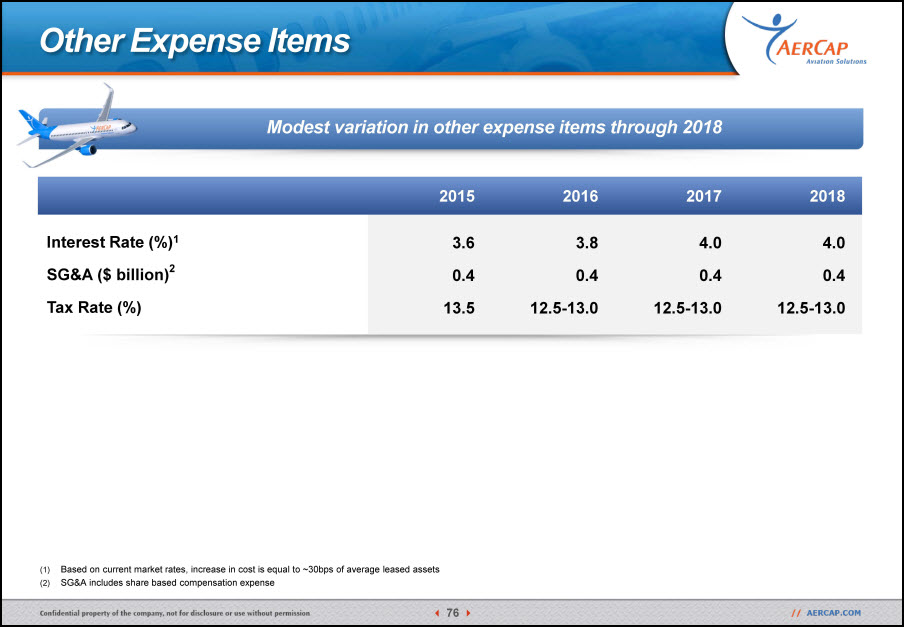
Other Expense Items Modest variation in other expense items through 2018 2015 2016 2017 2018 Interest Rate (%)1 3.6 3.8 4.0 4.0 SG&A ($ billion)2 0.4 0.4 0.4 0.4 Tax Rate (%) 13.5 12.5-13.0 12.5-13.0 12.5-13.0 Based on current market rates, increase in cost is equal to ~30bps of average leased assetsSG&A includes share based compensation expense

Debt/Equity ratio expected to be 3.0x at year end 2015; Excess capital of ~$500m+ expected to be generated per annum1 Rapid Deleveraging 5.5x5.0x4.5x4.0x3.5x3.0x2.5x2.0x Jun ‘14 Dec ‘14 Mar ‘15 Jun ‘15 Sep ‘15 Dec ‘15 Mar ‘16 ~2.7x - 3.0xTargeted debt/equity range AerCap’s estimated capital structure (debt/equity ratios), are subject to change, in light of highly fluid market conditions and other factors, refer to slide 2: Disclaimer Incl. Forward Looking Statements & Safe Harbor The debt/equity ratios are calculated by dividing adjusted net debt by adjusted equity. Adjusted net debt is calculated as follows: debt less cash and cash equivalents, less 50% equity credit for long-term subordinated debt. Adjusted equity is calculated as follows: total equity plus 50% equity credit for long-term subordinated debt
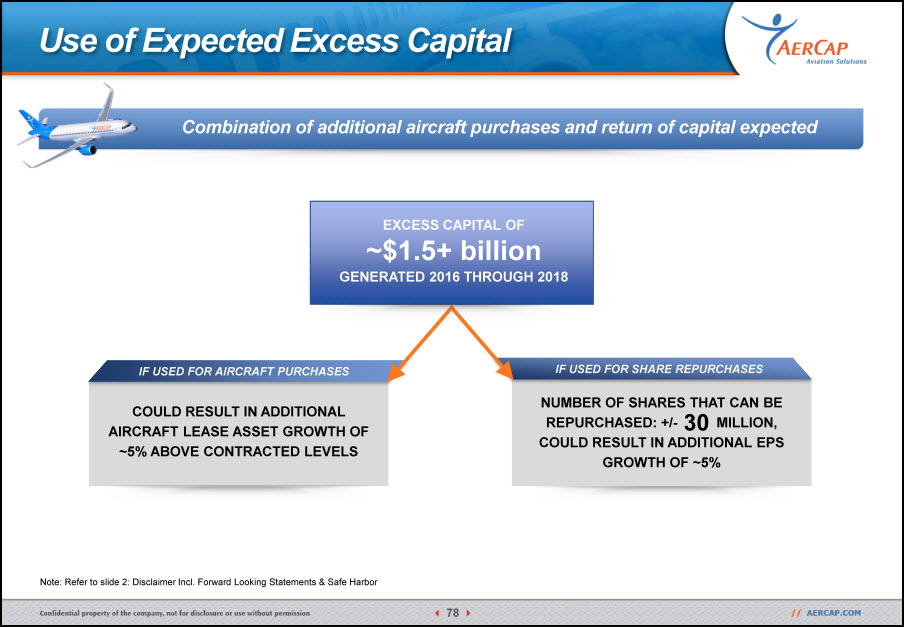
NUMBER OF SHARES THAT CAN BE REPURCHASED: +/- MILLION,COULD RESULT IN ADDITIONAL EPS GROWTH OF ~5% Use of Expected Excess Capital Combination of additional aircraft purchases and return of capital expected Note: Refer to slide 2: Disclaimer Incl. Forward Looking Statements & Safe Harbor COULD RESULT IN ADDITIONAL AIRCRAFT LEASE ASSET GROWTH OF ~5% ABOVE CONTRACTED LEVELS IF USED FOR AIRCRAFT PURCHASES IF USED FOR SHARE REPURCHASES EXCESS CAPITAL OF ~$1.5+ billionGENERATED 2016 THROUGH 2018 30
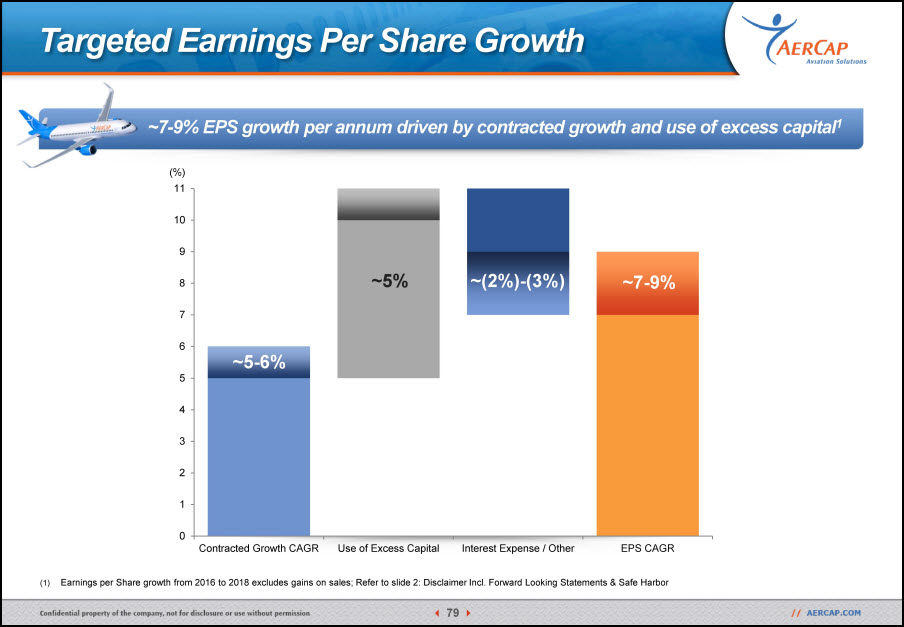
Targeted Earnings Per Share Growth ~7-9% EPS growth per annum driven by contracted growth and use of excess capital1 Earnings per Share growth from 2016 to 2018 excludes gains on sales; Refer to slide 2: Disclaimer Incl. Forward Looking Statements & Safe Harbor ~(2%)-(3%) ~7-9% ~5% ~5-6% (%)
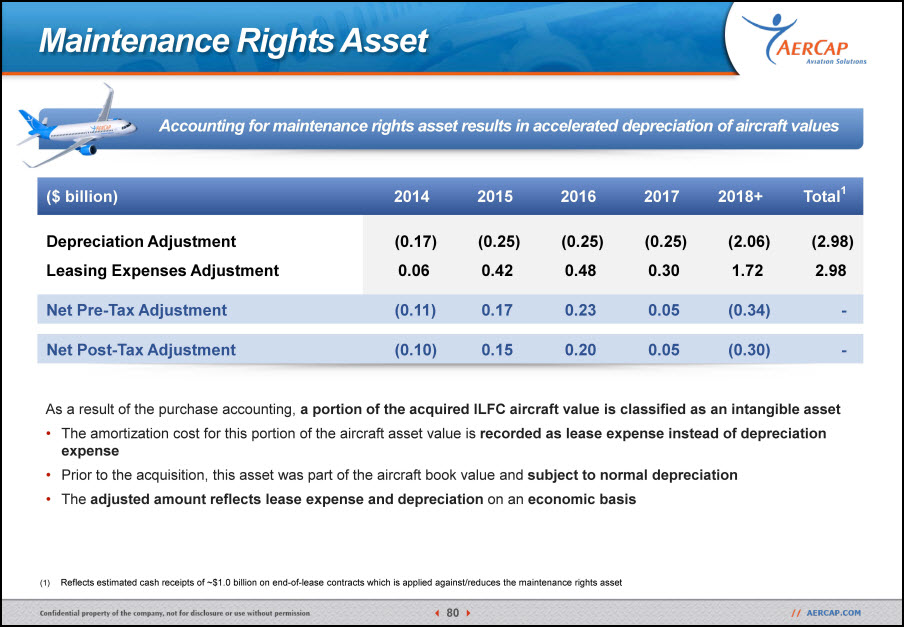
Maintenance Rights Asset Reflects estimated cash receipts of ~$1.0 billion on end-of-lease contracts which is applied against/reduces the maintenance rights asset ($ billion) 2014 2015 2016 2017 2018+ Total1 Depreciation Adjustment (0.17) (0.25) (0.25) (0.25) (2.06) (2.98) Leasing Expenses Adjustment 0.06 0.42 0.48 0.30 1.72 2.98 Net Pre-Tax Adjustment (0.11) 0.17 0.23 0.05 (0.34) - Net Post-Tax Adjustment (0.10) 0.15 0.20 0.05 (0.30) - As a result of the purchase accounting, a portion of the acquired ILFC aircraft value is classified as an intangible asset The amortization cost for this portion of the aircraft asset value is recorded as lease expense instead of depreciation expensePrior to the acquisition, this asset was part of the aircraft book value and subject to normal depreciationThe adjusted amount reflects lease expense and depreciation on an economic basis Accounting for maintenance rights asset results in accelerated depreciation of aircraft values
Keith Helming Chief Financial Officer Anton JoinerChief Risk Officer Martin OlsonHead of OEM Relations Q&A
Summary and Closing Aengus KellyChief Executive Officer
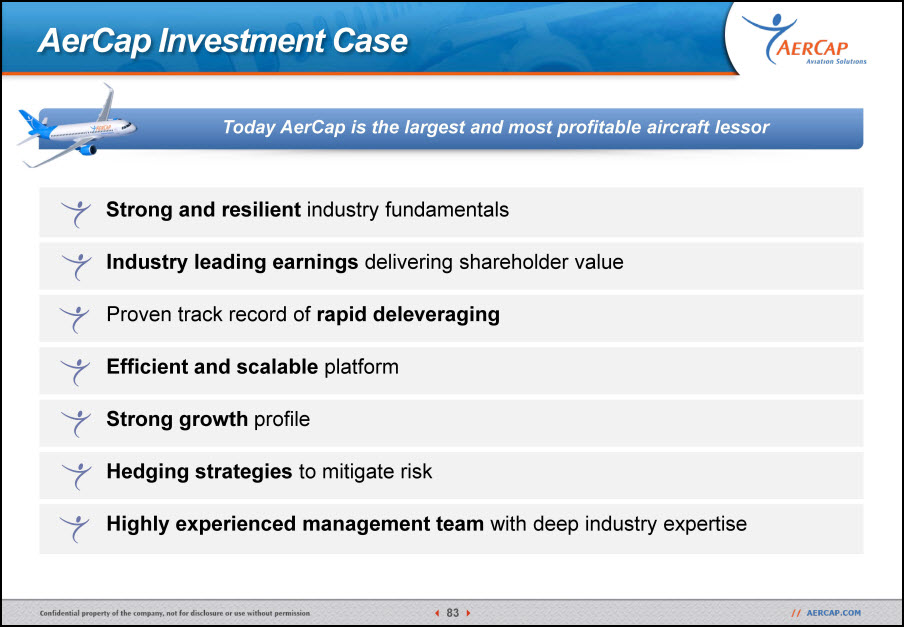
AerCap Investment Case Today AerCap is the largest and most profitable aircraft lessor Strong and resilient industry fundamentals Industry leading earnings delivering shareholder value Proven track record of rapid deleveraging Efficient and scalable platform Strong growth profile Hedging strategies to mitigate risk Highly experienced management team with deep industry expertise
Thank you
Head Office, AerCap House Stationsplein 965 1117 CE Schiphol, The Netherlands +31 20 655 9655 contact@aercap.com