Exhibit 99.1

November 16, 2016 2016 Investor Day AerCap Holdings N.V.
This presentation contains certain statements, estimates and forecasts with respect to future performance and events. These statements, estimates and forecasts are “forward-looking statements”. In some cases, forward-looking statements can be identified by the use of forward-looking terminology such as “may,” “might,” “should,” “expect,” “plan,” “intend,” “estimate,” “anticipate,” “believe,” “predict,” “potential” or “continue” or the negatives thereof or variations thereon or similar terminology. All statements other than statements of historical fact included in this presentation are forward-looking statements and are based on various underlying assumptions and expectations and are subject to known and unknown risks, uncertainties and assumptions, may include projections of our future financial performance based on our growth strategies and anticipated trends in our business. These statements are only predictions based on our current expectations and projections about future events. There are important factors that could cause our actual results, level of activity performance or achievements to differ materially from the results, level of activity, performance or achievements expressed or implied in the forward-looking statements. As a result, there can be no assurance that the forward-looking statements included in this presentation will prove to be accurate or correct. In light of these risks, uncertainties and assumptions, the future performance or events described in the forward-looking statements in this presentation might not occur. Accordingly, you should not rely upon forward-looking statements as a prediction of actual results and we do not assume any responsibility for the accuracy or completeness of any of these forward-looking statements. We do not undertake any obligation to, and will not, update any forward-looking statements, whether as a result of new information, future events or otherwise.The information in this document is the property of AerCap Holdings N.V. and its subsidiaries and may not be copied or communicated to a fourth party, or used for any purpose other than that for which it is supplied without the express written consent of AerCap Holdings N.V. and its subsidiaries.No warranty or representation is given concerning such information, which must not be taken as establishing any contractual or other commitment binding upon AerCap Holdings N.V. or any of its subsidiaries or associated companies. Disclaimer Incl. Forward Looking Statements & Safe Harbor

Agenda | Introduction John WikoffHead of Investor Relations | AerCap Update Aengus KellyChief Executive Officer | Leasing Philip ScruggsPresident & Chief Commercial Officer | Q&A and Break
Agenda | Portfolio Management Edward O’ByrneChief Investment Officer | Financial Performance Keith HelmingChief Financial Officer Peter JuhasDeputy Chief Financial Officer | Q&A and Closing Remarks
AerCap Update Aengus KellyChief Executive Officer
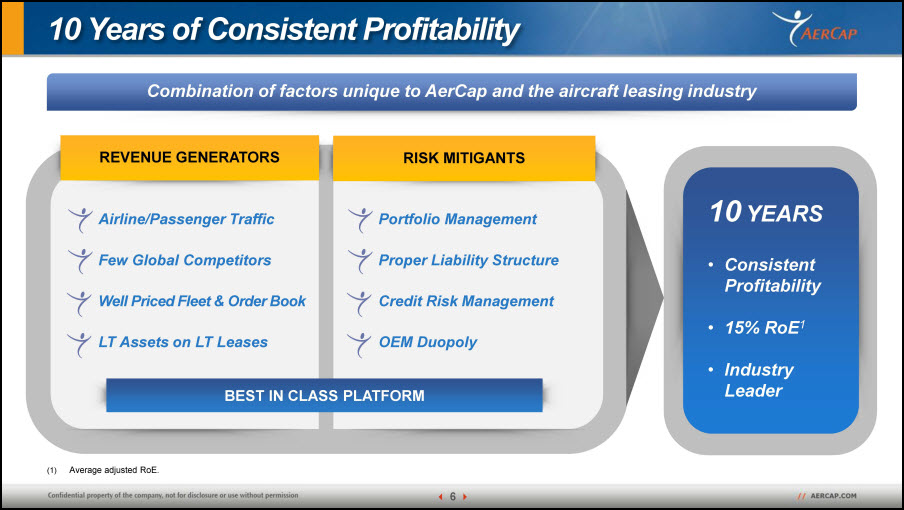
10 Years of Consistent Profitability Combination of factors unique to AerCap and the aircraft leasing industry Airline/Passenger TrafficFew Global CompetitorsWell Priced Fleet & Order BookLT Assets on LT Leases REVENUE GENERATORS RISK MITIGANTS Portfolio Management Proper Liability StructureCredit Risk ManagementOEM Duopoly BEST IN CLASS PLATFORM 10 YEARS Consistent Profitability15% RoE1 Industry Leader Average adjusted RoE.
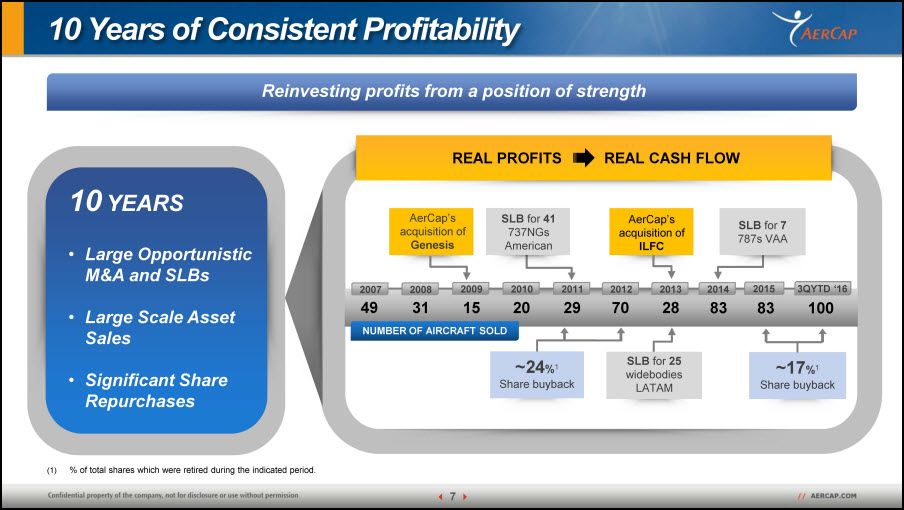
10 Years of Consistent Profitability Reinvesting profits from a position of strength 2012 2013 2014 2015 2009 2010 2011 2007 2008 AerCap’s acquisition of Genesis SLB for 41 737NGs American NUMBER OF AIRCRAFT SOLD SLB for 25 widebodies LATAM ~17%1Share buyback ~24%1Share buyback 49 31 15 20 29 70 28 83 83 % of total shares which were retired during the indicated period. REAL PROFITS REAL CASH FLOW 3QYTD ‘16 100 SLB for 7 787s VAA AerCap’s acquisition of ILFC 10 YEARS Large Opportunistic M&A and SLBsLarge Scale Asset SalesSignificant Share Repurchases
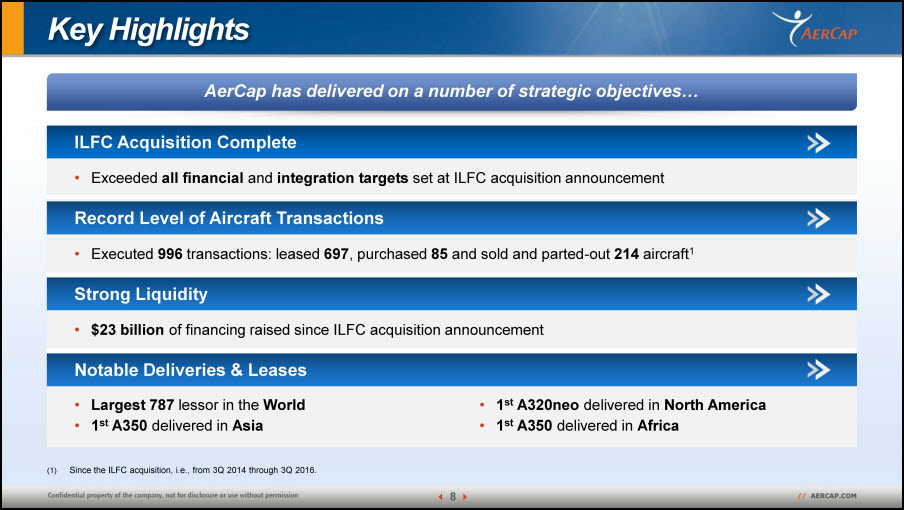
Key Highlights AerCap has delivered on a number of strategic objectives… ILFC Acquisition Complete Exceeded all financial and integration targets set at ILFC acquisition announcement Record Level of Aircraft Transactions Executed 996 transactions: leased 697, purchased 85 and sold and parted-out 214 aircraft1 Strong Liquidity $23 billion of financing raised since ILFC acquisition announcement Notable Deliveries & Leases Largest 787 lessor in the World 1st A350 delivered in Asia 1st A320neo delivered in North America 1st A350 delivered in Africa Since the ILFC acquisition, i.e., from 3Q 2014 through 3Q 2016.
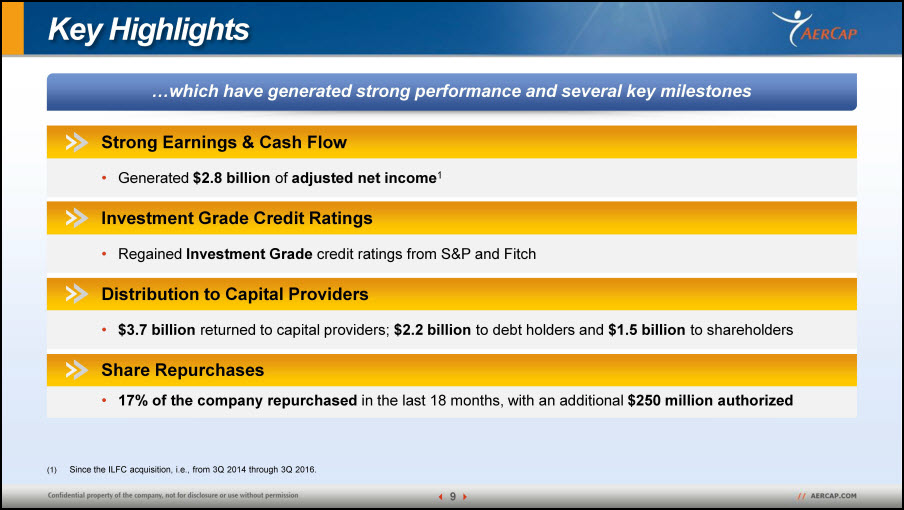
Key Highlights …which have generated strong performance and several key milestones Strong Earnings & Cash Flow Generated $2.8 billion of adjusted net income1 Investment Grade Credit Ratings Regained Investment Grade credit ratings from S&P and Fitch Distribution to Capital Providers $3.7 billion returned to capital providers; $2.2 billion to debt holders and $1.5 billion to shareholders Share Repurchases 17% of the company repurchased in the last 18 months, with an additional $250 million authorized Since the ILFC acquisition, i.e., from 3Q 2014 through 3Q 2016.
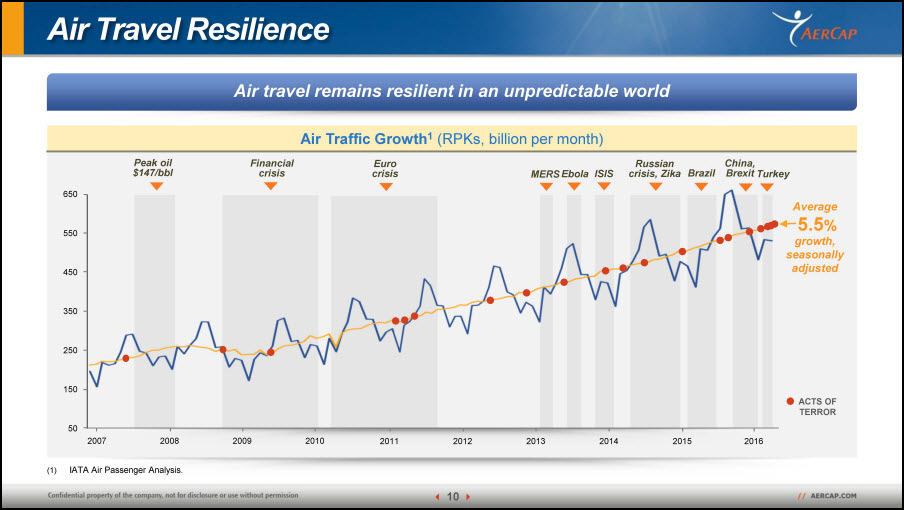
Air Travel Resilience Air travel remains resilient in an unpredictable world Air Traffic Growth1 (RPKs, billion per month) 650 550 450 350 250 150 50 China, Brexit Russiancrisis, Zika Average growth, seasonally adjusted 5.5% Ebola MERS ISIS 2007 2008 2009 2010 Turkey 2011 2012 2013 2014 2015 2016 Brazil Financial crisis Euro crisis ACTS OF TERROR Peak oil $147/bbl IATA Air Passenger Analysis.
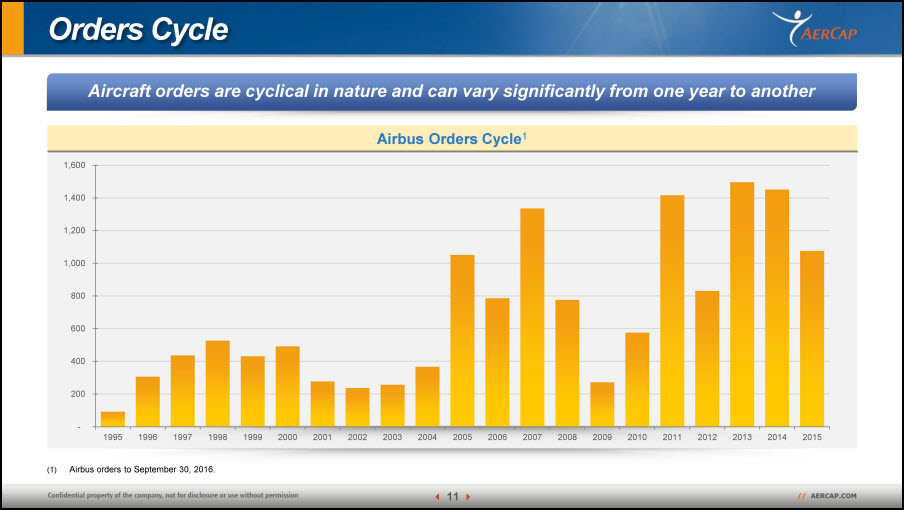
Orders Cycle Aircraft orders are cyclical in nature and can vary significantly from one year to another Airbus Orders Cycle1 Airbus orders to September 30, 2016.
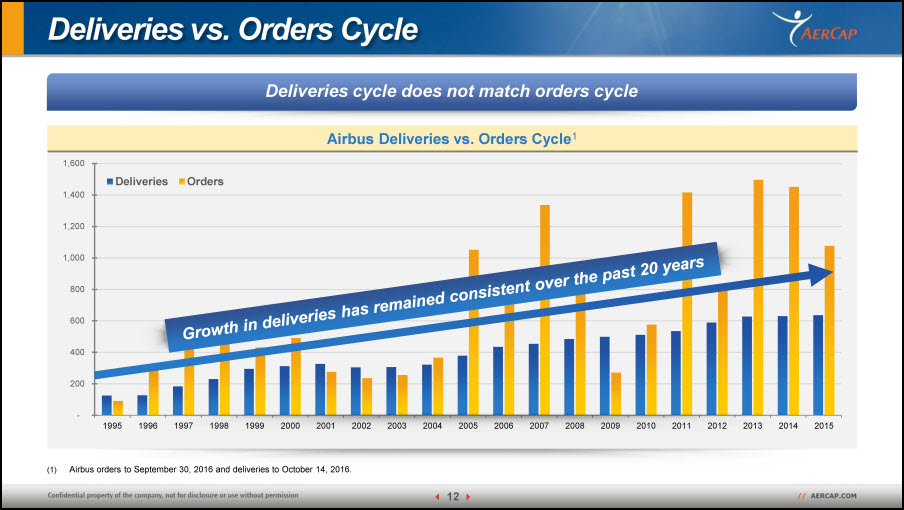
Deliveries vs. Orders Cycle Deliveries cycle does not match orders cycle Airbus Deliveries vs. Orders Cycle1 Airbus orders to September 30, 2016 and deliveries to October 14, 2016. Growth in deliveries has remained consistent over the past 20 years
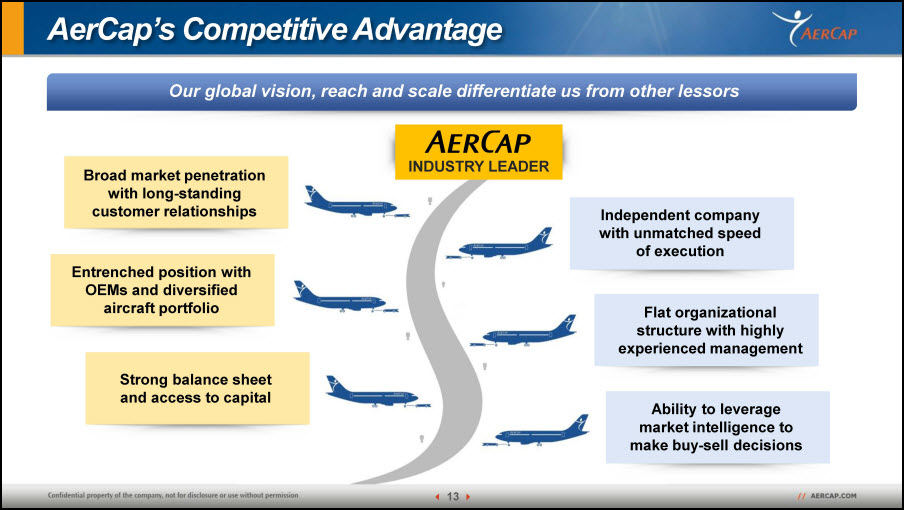
AerCap’s Competitive Advantage Our global vision, reach and scale differentiate us from other lessors INDUSTRY LEADER Broad market penetration with long-standing customer relationships Entrenched position with OEMs and diversified aircraft portfolio Strong balance sheet and access to capital Independent company with unmatched speed of execution Flat organizational structure with highly experienced management Ability to leverage market intelligence to make buy-sell decisions
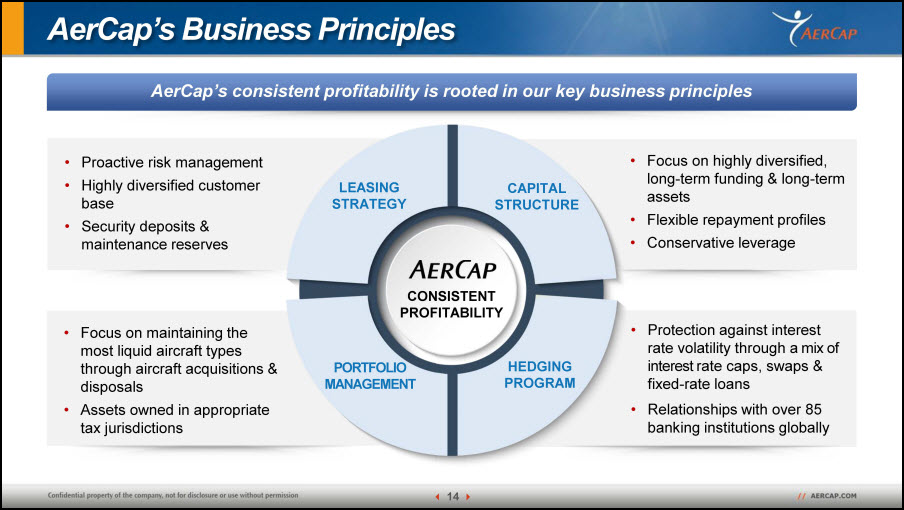
AerCap’s Business Principles AerCap’s consistent profitability is rooted in our key business principles Protection against interest rate volatility through a mix of interest rate caps, swaps & fixed-rate loansRelationships with over 85 banking institutions globally Focus on maintaining the most liquid aircraft types through aircraft acquisitions & disposals Assets owned in appropriate tax jurisdictions Focus on highly diversified, long-term funding & long-term assetsFlexible repayment profilesConservative leverage Proactive risk managementHighly diversified customer baseSecurity deposits & maintenance reserves HEDGING PROGRAM PORTFOLIOMANAGEMENT LEASINGSTRATEGY CAPITAL STRUCTURE CONSISTENT PROFITABILITY
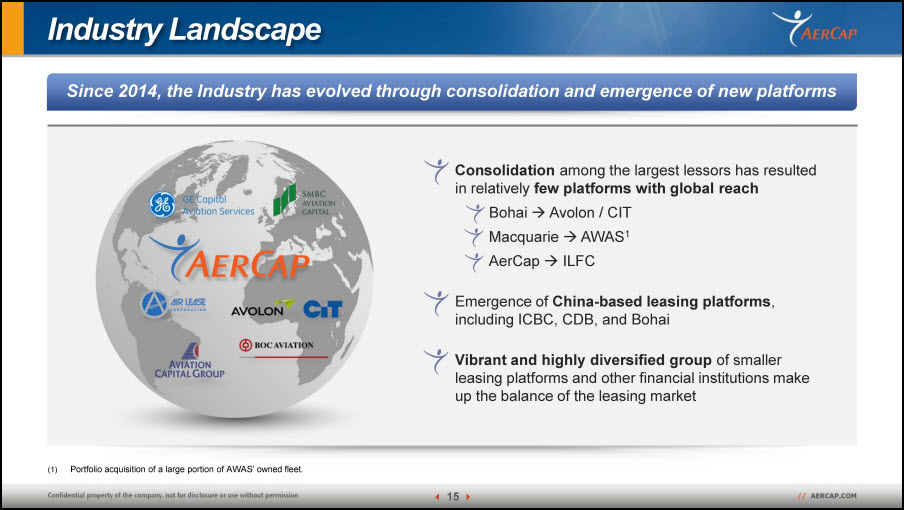
Industry Landscape Since 2014, the Industry has evolved through consolidation and emergence of new platforms Consolidation among the largest lessors has resulted in relatively few platforms with global reachBohai Avolon / CITMacquarie AWAS1 AerCap ILFCEmergence of China-based leasing platforms, including ICBC, CDB, and BohaiVibrant and highly diversified group of smaller leasing platforms and other financial institutions make up the balance of the leasing market Portfolio acquisition of a large portion of AWAS’ owned fleet.
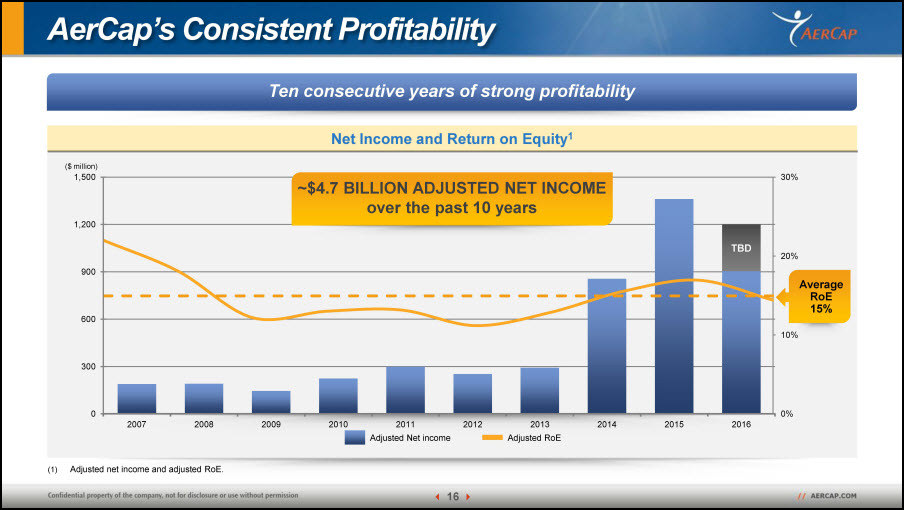
AerCap’s Consistent Profitability Ten consecutive years of strong profitability Adjusted Net income Net Income and Return on Equity1 Adjusted RoE ($ million) Average RoE15% ~$4.7 BILLION ADJUSTED NET INCOMEover the past 10 years Adjusted net income and adjusted RoE.
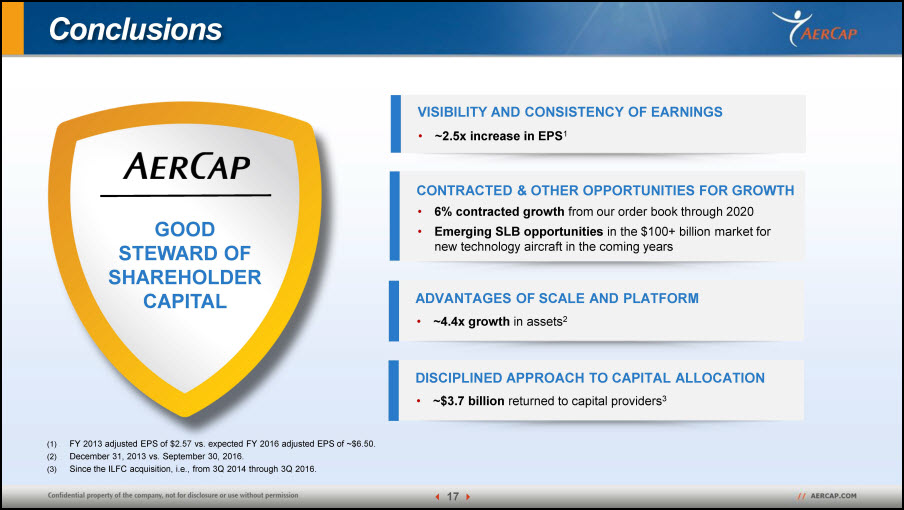
Conclusions VISIBILITY AND CONSISTENCY OF EARNINGS ~2.5x increase in EPS1 CONTRACTED & OTHER OPPORTUNITIES FOR GROWTH 6% contracted growth from our order book through 2020 Emerging SLB opportunities in the $100+ billion market for new technology aircraft in the coming years ADVANTAGES OF SCALE AND PLATFORM ~4.4x growth in assets2 DISCIPLINED APPROACH TO CAPITAL ALLOCATION ~$3.7 billion returned to capital providers3 GOOD STEWARD OF SHAREHOLDER CAPITAL FY 2013 adjusted EPS of $2.57 vs. expected FY 2016 adjusted EPS of ~$6.50. December 31, 2013 vs. September 30, 2016.Since the ILFC acquisition, i.e., from 3Q 2014 through 3Q 2016.
Leasing Philip ScruggsPresident & Chief Commercial Officer
The Sky is Falling!! BRAZIL RUSSIA COUP D’ETAT FINANCIAL CRISIS IN CHINA EBOLA is here! BREXIT GLOBAL ECONOMIC GROWTH SLOWING Another Terrible Attack! ZIKA OIL PRICE CRASHING
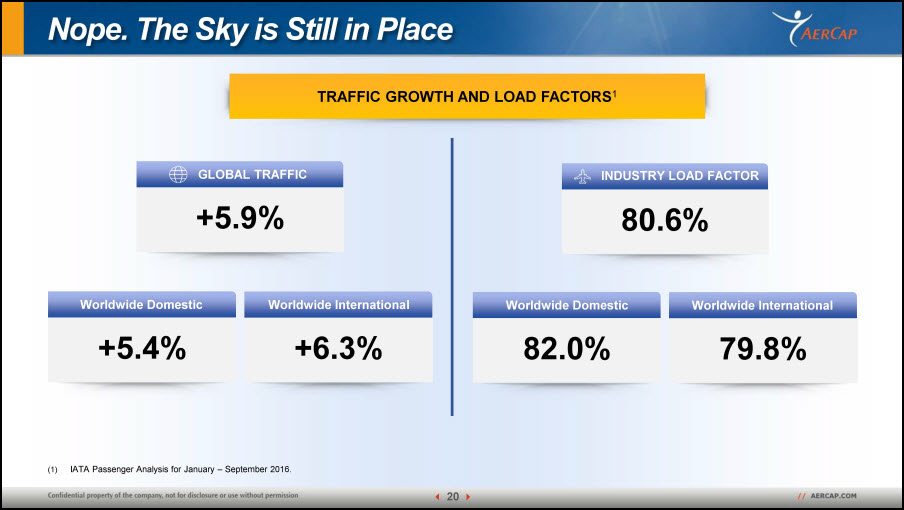
Nope. The Sky is Still in Place TRAFFIC GROWTH AND LOAD FACTORS1 IATA Passenger Analysis for January – September 2016. +5.9% GLOBAL TRAFFIC 80.6% INDUSTRY LOAD FACTOR +5.4% Worldwide Domestic +6.3% Worldwide International 82.0% Worldwide Domestic 79.8% Worldwide International
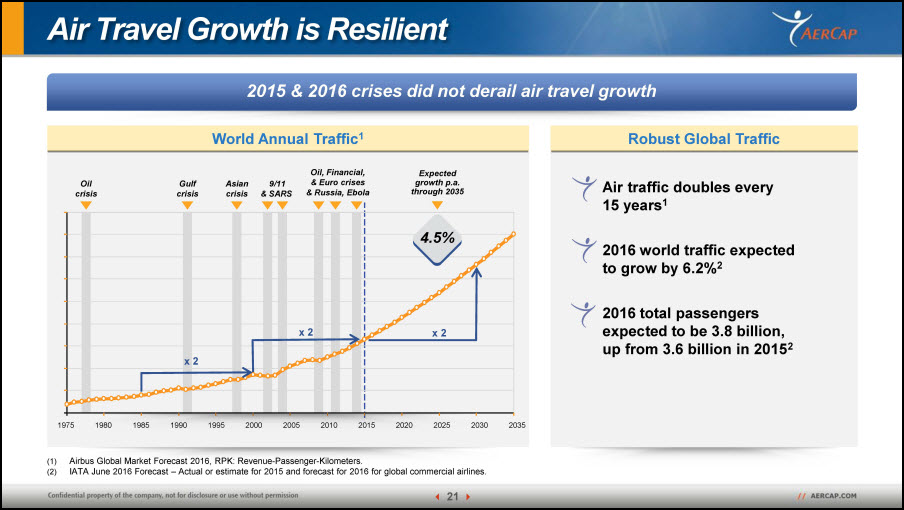
Robust Global Traffic World Annual Traffic1 Air Travel Growth is Resilient 2015 & 2016 crises did not derail air travel growth Airbus Global Market Forecast 2016, RPK: Revenue-Passenger-Kilometers.IATA June 2016 Forecast – Actual or estimate for 2015 and forecast for 2016 for global commercial airlines. Oil crisis Gulf crisis Asian crisis 9/11& SARS Oil, Financial, & Euro crises& Russia, Ebola x 2 x 2 x 2 Expected growth p.a. through 2035 4.5% 1975 1980 1985 1990 1995 2000 2005 2010 2015 2020 2025 2030 2035 Air traffic doubles every 15 years12016 world traffic expected to grow by 6.2%22016 total passengers expected to be 3.8 billion, up from 3.6 billion in 20152
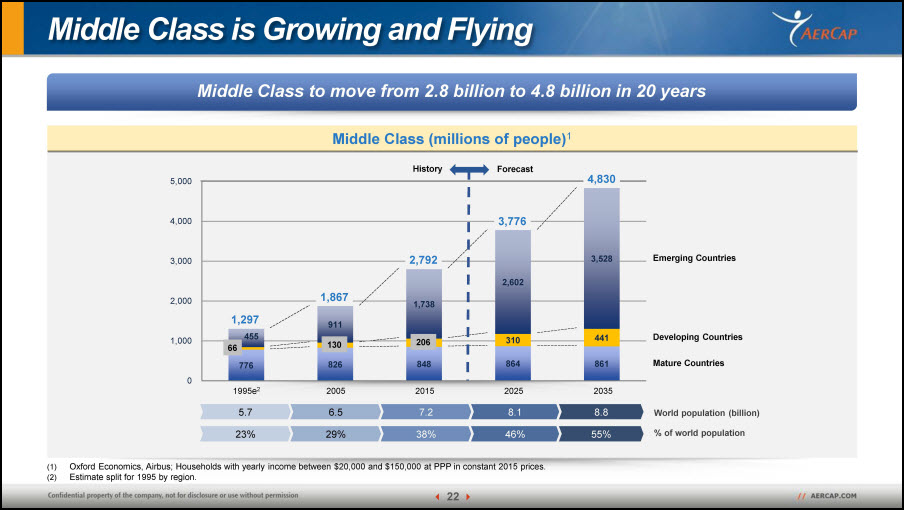
Middle Class is Growing and Flying Middle Class to move from 2.8 billion to 4.8 billion in 20 years Middle Class (millions of people)1 2005 1,867 130 1995e2 1,297 2015 2,792 206 66 Emerging Countries Developing Countries Mature Countries 2035 4,830 2025 3,776 5.7 6.5 7.2 8.1 8.8 World population (billion) 23% 29% 38% 46% 55% % of world population History Forecast Oxford Economics, Airbus; Households with yearly income between $20,000 and $150,000 at PPP in constant 2015 prices.Estimate split for 1995 by region.
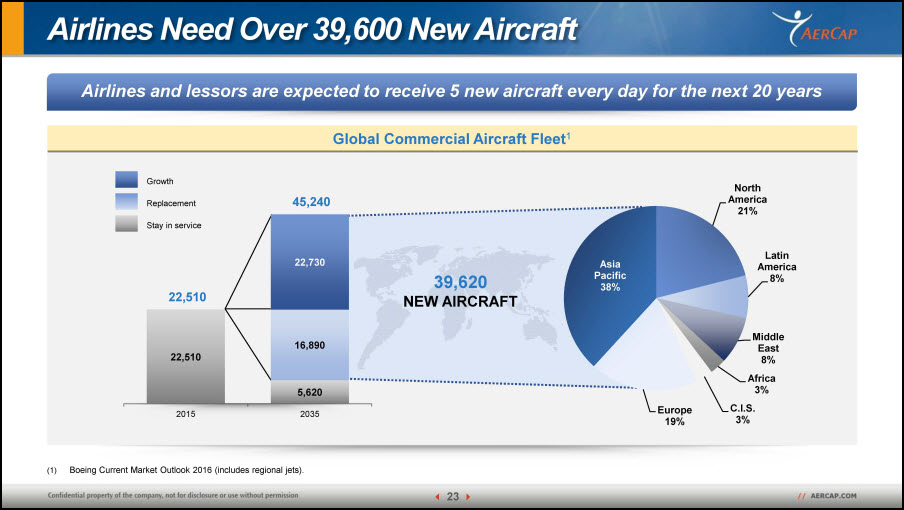
Airlines Need Over 39,600 New Aircraft Airlines and lessors are expected to receive 5 new aircraft every day for the next 20 years Global Commercial Aircraft Fleet1 Boeing Current Market Outlook 2016 (includes regional jets). Stay in service Replacement Growth 39,620 NEW AIRCRAFT
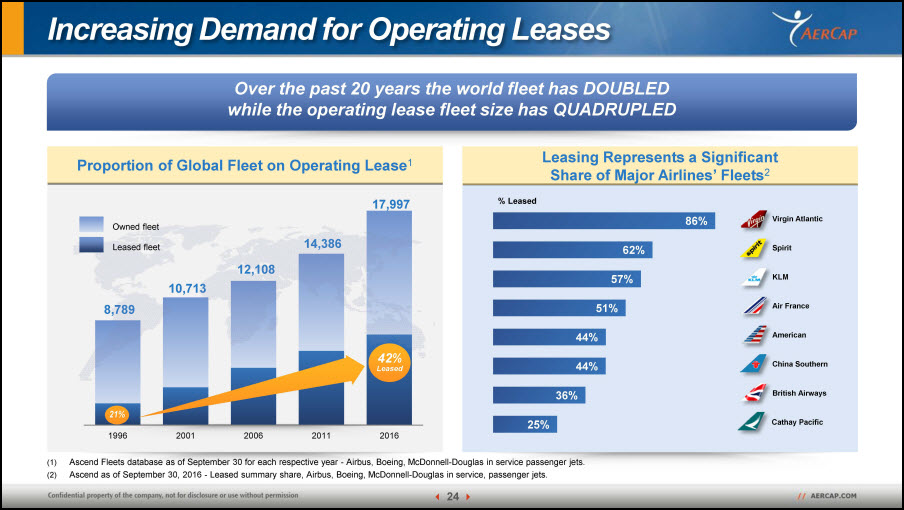
Leasing Represents a Significant Share of Major Airlines’ Fleets2 Increasing Demand for Operating Leases Over the past 20 years the world fleet has DOUBLEDwhile the operating lease fleet size has QUADRUPLED Proportion of Global Fleet on Operating Lease1 Leased fleet Owned fleet 21% 42%Leased % Leased Virgin Atlantic Spirit KLM Air France American China Southern British Airways Cathay Pacific Ascend Fleets database as of September 30 for each respective year - Airbus, Boeing, McDonnell-Douglas in service passenger jets.Ascend as of September 30, 2016 - Leased summary share, Airbus, Boeing, McDonnell-Douglas in service, passenger jets.
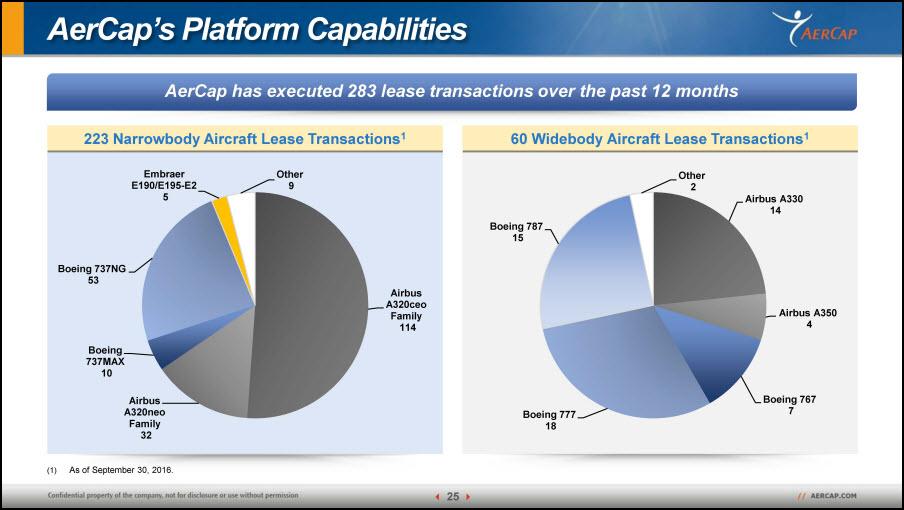
AerCap’s Platform Capabilities 60 Widebody Aircraft Lease Transactions1 AerCap has executed 283 lease transactions over the past 12 months 223 Narrowbody Aircraft Lease Transactions1 As of September 30, 2016.
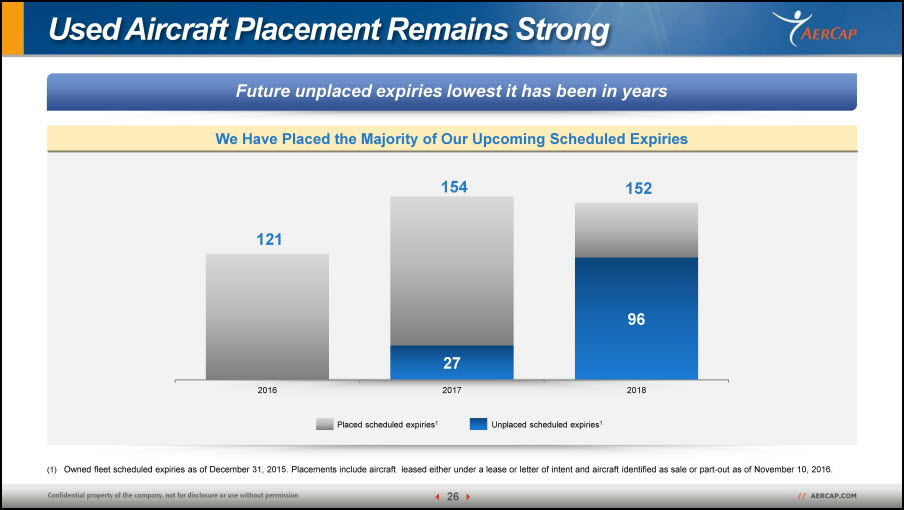
Used Aircraft Placement Remains Strong Owned fleet scheduled expiries as of December 31, 2015. Placements include aircraft leased either under a lease or letter of intent and aircraft identified as sale or part-out as of November 10, 2016. Future unplaced expiries lowest it has been in years We Have Placed the Majority of Our Upcoming Scheduled Expiries Placed scheduled expiries1 Unplaced scheduled expiries1
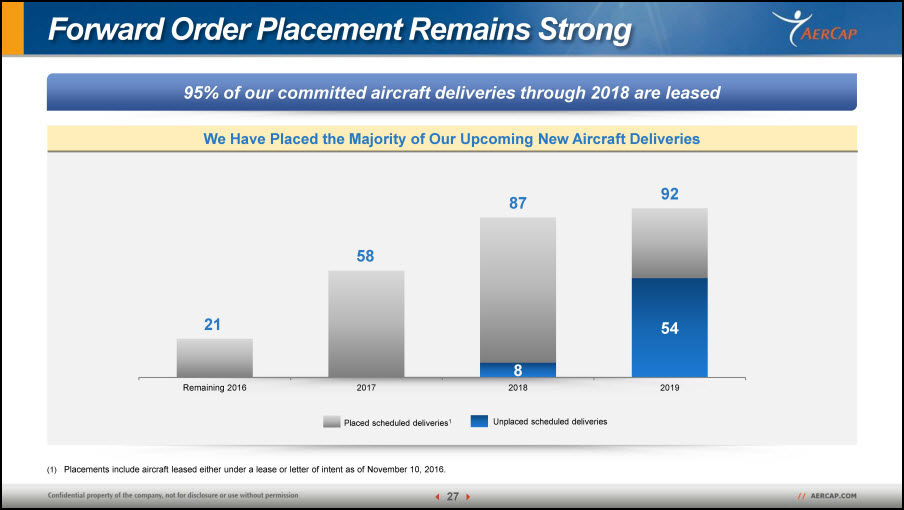
Forward Order Placement Remains Strong We Have Placed the Majority of Our Upcoming New Aircraft Deliveries Placed scheduled deliveries1 Unplaced scheduled deliveries Placements include aircraft leased either under a lease or letter of intent as of November 10, 2016. 95% of our committed aircraft deliveries through 2018 are leased
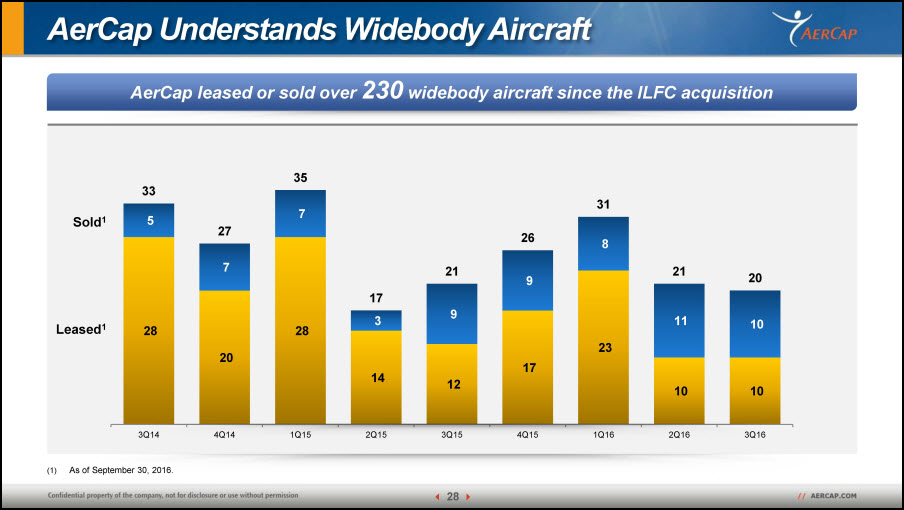
As of September 30, 2016. AerCap Understands Widebody Aircraft Leased1 Sold1 AerCap leased or sold over 230 widebody aircraft since the ILFC acquisition
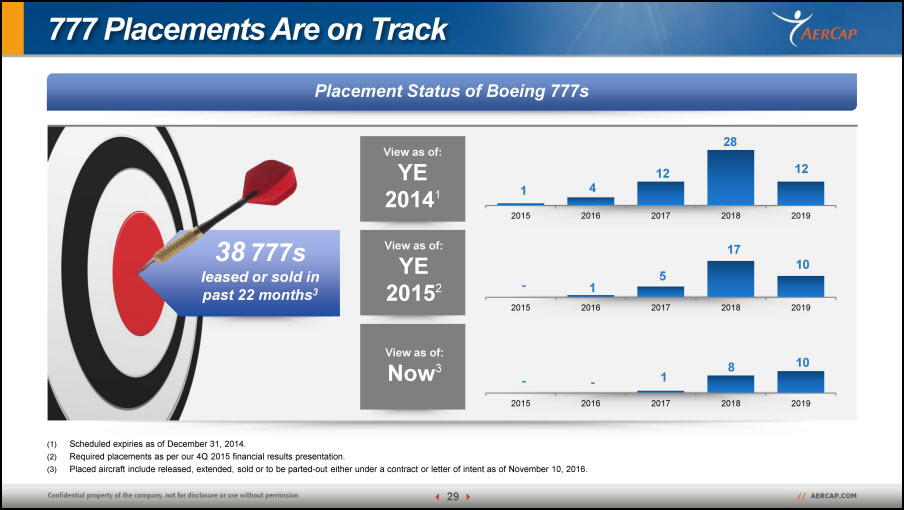
Scheduled expiries as of December 31, 2014.Required placements as per our 4Q 2015 financial results presentation.Placed aircraft include released, extended, sold or to be parted-out either under a contract or letter of intent as of November 10, 2016. Placement Status of Boeing 777s 777 Placements Are on Track 38 777s leased or sold in past 22 months3 View as of:Now3 View as of:YE 20152 View as of:YE 20141
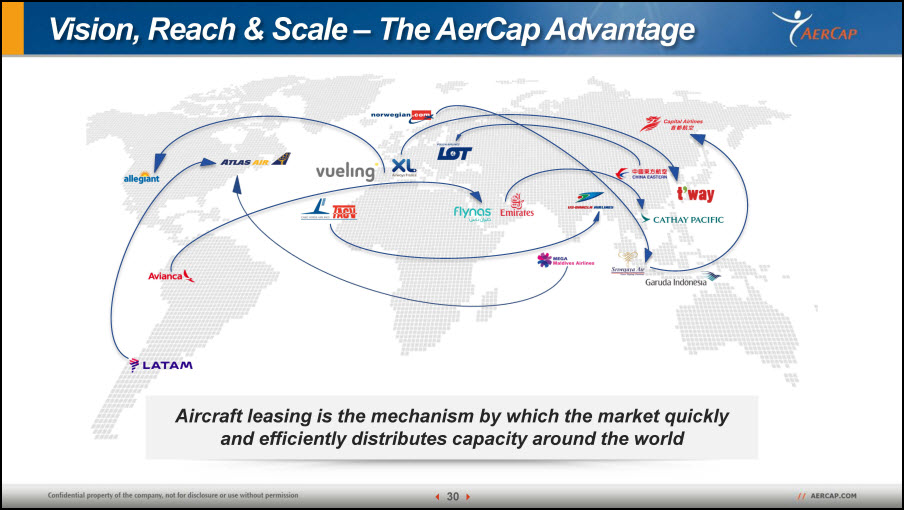
Aircraft leasing is the mechanism by which the market quickly and efficiently distributes capacity around the world Vision, Reach & Scale – The AerCap Advantage
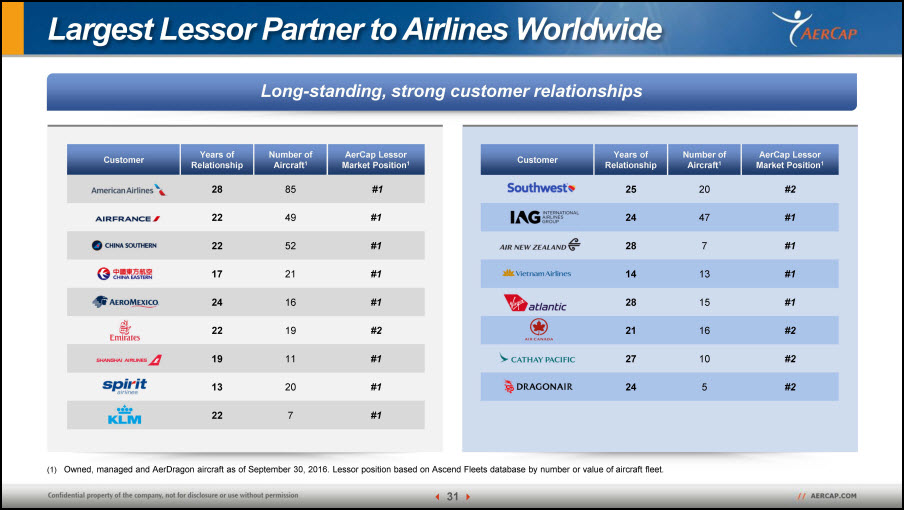
Long-standing, strong customer relationships Largest Lessor Partner to Airlines Worldwide Customer Years of Relationship Number of Aircraft1 AerCap Lessor Market Position1 28 85 #1 22 49 #1 22 52 #1 17 21 #1 24 16 #1 22 19 #2 19 11 #1 13 20 #1 22 7 #1 Customer Years of Relationship Number of Aircraft1 AerCap Lessor Market Position1 25 20 #2 24 47 #1 28 7 #1 14 13 #1 28 15 #1 21 16 #2 27 10 #2 24 5 #2 Owned, managed and AerDragon aircraft as of September 30, 2016. Lessor position based on Ascend Fleets database by number or value of aircraft fleet.
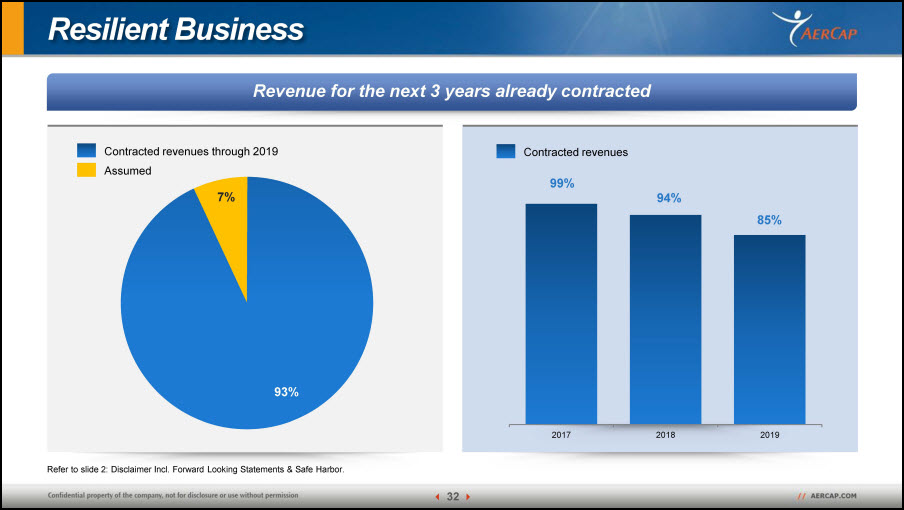
Resilient Business Revenue for the next 3 years already contracted Contracted revenues through 2019 Assumed Refer to slide 2: Disclaimer Incl. Forward Looking Statements & Safe Harbor. 99% 94% 85% Contracted revenues
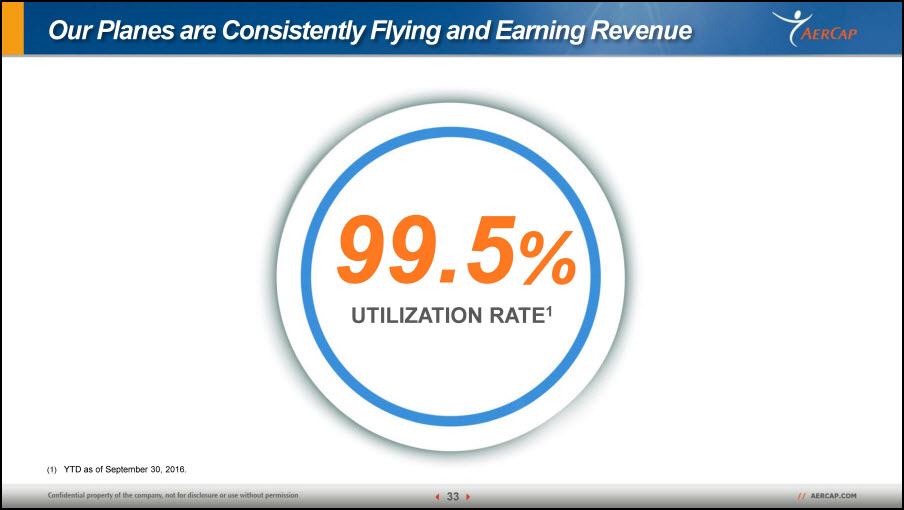
UTILIZATION RATE1 99.5% Our Planes are Consistently Flying and Earning Revenue YTD as of September 30, 2016.
Strong Company in a Solid Sector STABLE PROFITSFOR SHAREHOLDERS
Portfolio Management Edward O’ByrneChief Investment Officer
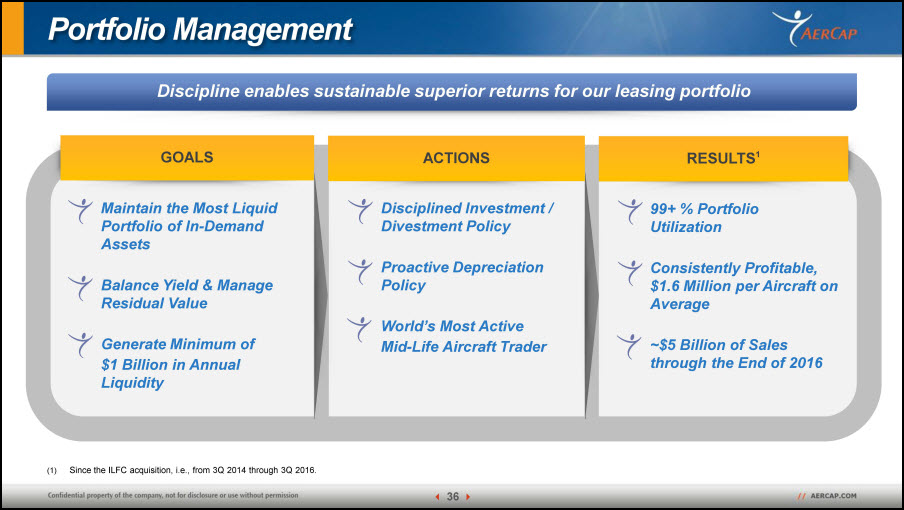
Portfolio Management Discipline enables sustainable superior returns for our leasing portfolio Maintain the Most Liquid Portfolio of In-Demand Assets Balance Yield & Manage Residual ValueGenerate Minimum of $1 Billion in Annual Liquidity GOALS RESULTS1 99+ % Portfolio UtilizationConsistently Profitable, $1.6 Million per Aircraft on Average ~$5 Billion of Sales through the End of 2016 Disciplined Investment / Divestment PolicyProactive Depreciation PolicyWorld’s Most Active Mid-Life Aircraft Trader ACTIONS Since the ILFC acquisition, i.e., from 3Q 2014 through 3Q 2016.
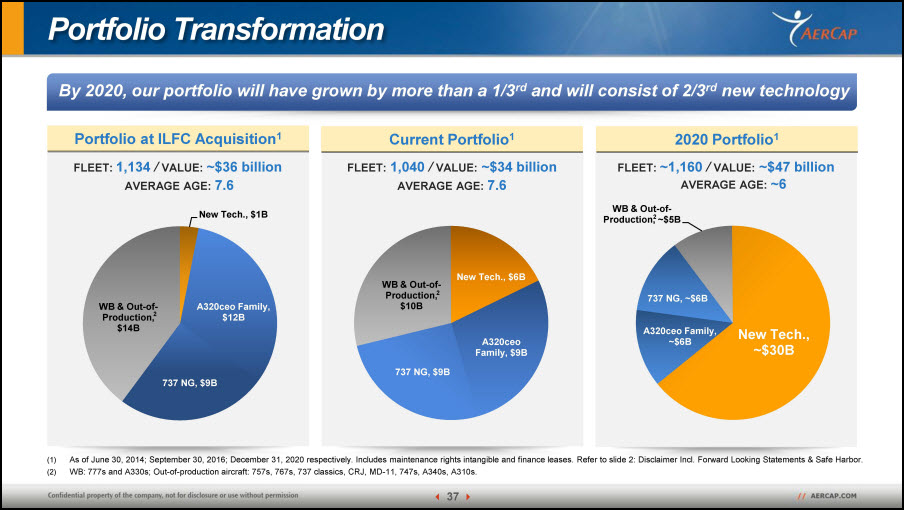
Portfolio Transformation By 2020, our portfolio will have grown by more than a 1/3rd and will consist of 2/3rd new technology Portfolio at ILFC Acquisition1 As of June 30, 2014; September 30, 2016; December 31, 2020 respectively. Includes maintenance rights intangible and finance leases. Refer to slide 2: Disclaimer Incl. Forward Looking Statements & Safe Harbor.WB: 777s and A330s; Out-of-production aircraft: 757s, 767s, 737 classics, CRJ, MD-11, 747s, A340s, A310s. Current Portfolio1 2020 Portfolio1 FLEET: 1,134 / VALUE: ~$36 billion FLEET: 1,040 / VALUE: ~$34 billion FLEET: ~1,160 / VALUE: ~$47 billion AVERAGE AGE: 7.6 AVERAGE AGE: 7.6 AVERAGE AGE: ~6 2 2 2
Buy-Side
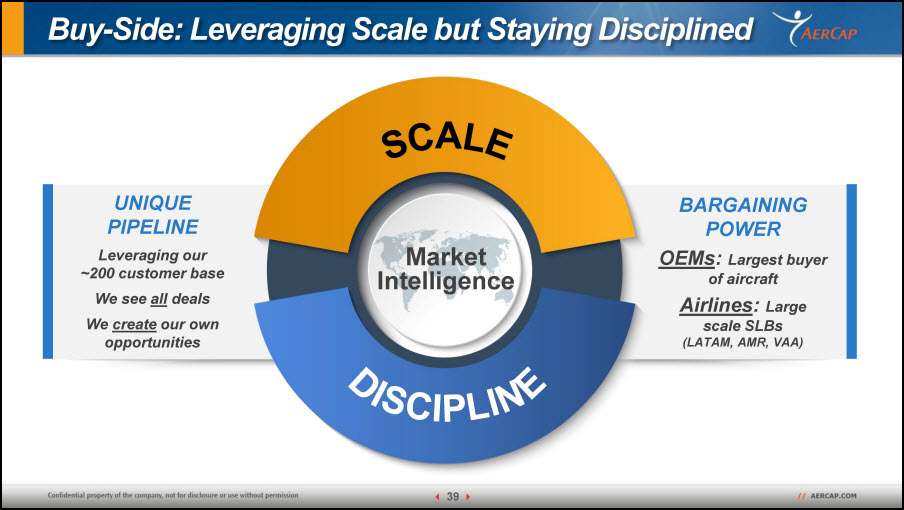
Buy-Side: Leveraging Scale but Staying Disciplined SCALE DISCIPLINE BARGAININGPOWEROEMs: Largest buyer of aircraftAirlines: Large scale SLBs (LATAM, AMR, VAA) UNIQUE PIPELINE Leveraging our ~200 customer baseWe see all dealsWe create our own opportunities Market Intelligence
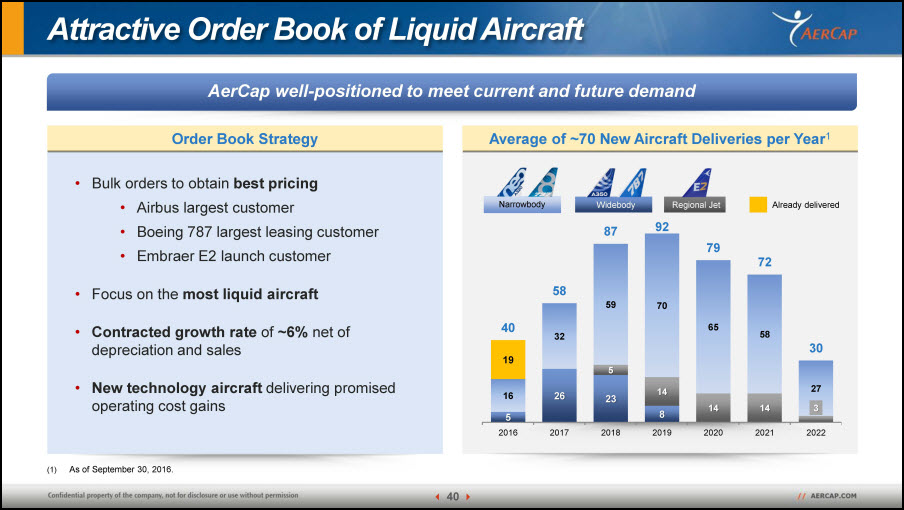
Average of ~70 New Aircraft Deliveries per Year1 Attractive Order Book of Liquid Aircraft AerCap well-positioned to meet current and future demand Bulk orders to obtain best pricingAirbus largest customerBoeing 787 largest leasing customerEmbraer E2 launch customerFocus on the most liquid aircraftContracted growth rate of ~6% net of depreciation and salesNew technology aircraft delivering promised operating cost gains Order Book Strategy As of September 30, 2016. Widebody Narrowbody Regional Jet Already delivered
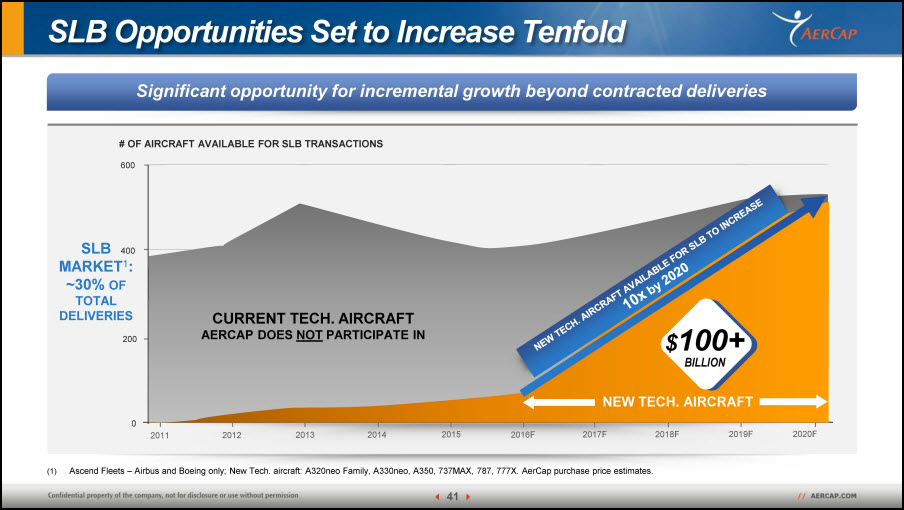
SLB Opportunities Set to Increase Tenfold Significant opportunity for incremental growth beyond contracted deliveries SLB MARKET1: ~30% OF TOTAL DELIVERIES Ascend Fleets – Airbus and Boeing only; New Tech. aircraft: A320neo Family, A330neo, A350, 737MAX, 787, 777X. AerCap purchase price estimates. # OF AIRCRAFT AVAILABLE FOR SLB TRANSACTIONS 200 400 600 0 2019F 2018F 2017F 2016F 2015 2014 2013 2012 2011 2020F CURRENT TECH. AIRCRAFTAERCAP DOES NOT PARTICIPATE IN NEW TECH. AIRCRAFT $100+BILLION NEW TECH. AIRCRAFT AVAILABLE FOR SLB TO INCREASE10x by 2020
Sell-Side
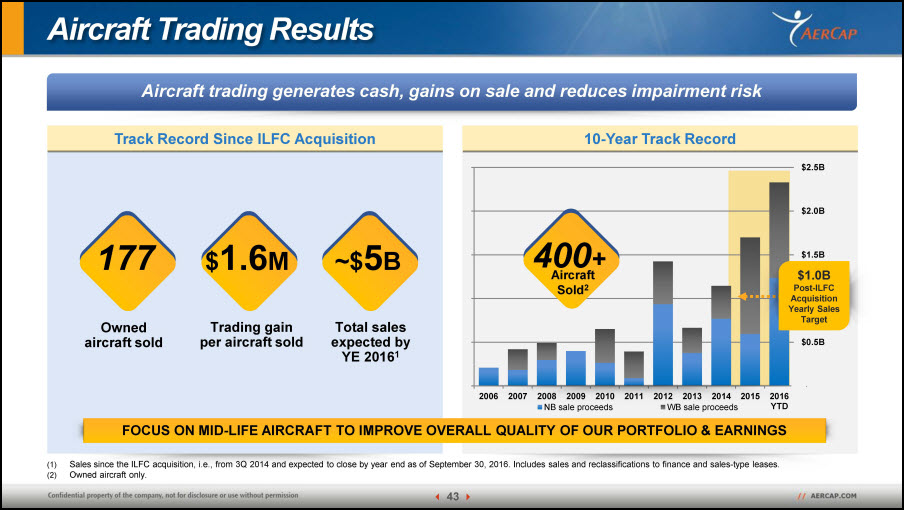
10-Year Track Record Track Record Since ILFC Acquisition Aircraft Trading Results Aircraft trading generates cash, gains on sale and reduces impairment risk Sales since the ILFC acquisition, i.e., from 3Q 2014 and expected to close by year end as of September 30, 2016. Includes sales and reclassifications to finance and sales-type leases.Owned aircraft only. Owned aircraft sold Trading gain per aircraft sold Total sales expected by YE 20161 177 $1.6M ~$5B FOCUS ON MID-LIFE AIRCRAFT TO IMPROVE OVERALL QUALITY OF OUR PORTFOLIO & EARNINGS $1.0BPost-ILFC Acquisition Yearly Sales Target 400+ Aircraft Sold2
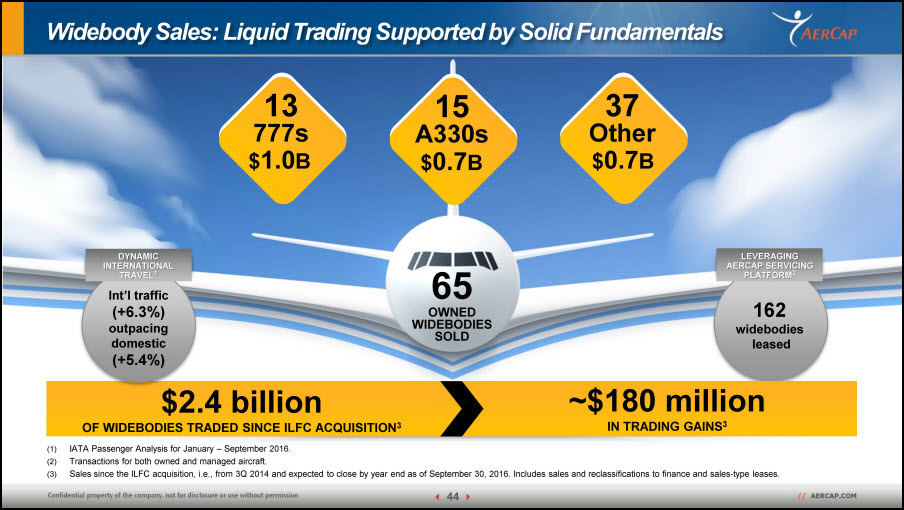
LEVERAGING AERCAP SERVICING PLATFORM2 Widebody Sales: Liquid Trading Supported by Solid Fundamentals $2.4 billionOF WIDEBODIES TRADED SINCE ILFC ACQUISITION3 ~$180 millionIN TRADING GAINS3 $0.7B 15A330s $1.0B 13777s $0.7B 37Other 65OWNED WIDEBODIESSOLD IATA Passenger Analysis for January – September 2016.Transactions for both owned and managed aircraft.Sales since the ILFC acquisition, i.e., from 3Q 2014 and expected to close by year end as of September 30, 2016. Includes sales and reclassifications to finance and sales-type leases. Int’l traffic (+6.3%) outpacing domestic (+5.4%) DYNAMIC INTERNATIONAL TRAVEL1
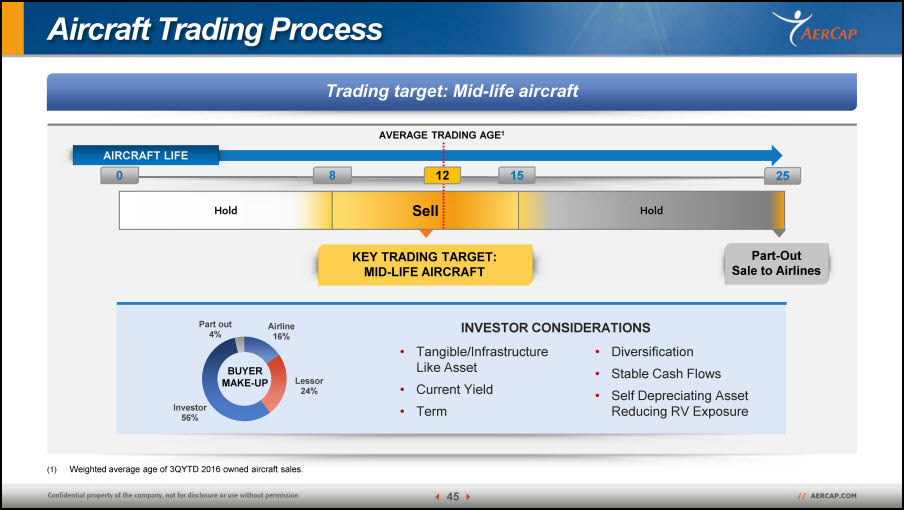
Aircraft Trading Process Trading target: Mid-life aircraft AIRCRAFT LIFE Hold Sell Hold 8 0 15 25 KEY TRADING TARGET:MID-LIFE AIRCRAFT Part-Out Sale to Airlines AVERAGE TRADING AGE1 12 Tangible/Infrastructure Like AssetCurrent YieldTermDiversificationStable Cash FlowsSelf Depreciating Asset Reducing RV Exposure BUYER MAKE-UP Weighted average age of 3QYTD 2016 owned aircraft sales. INVESTOR CONSIDERATIONS
Key Investment Themes
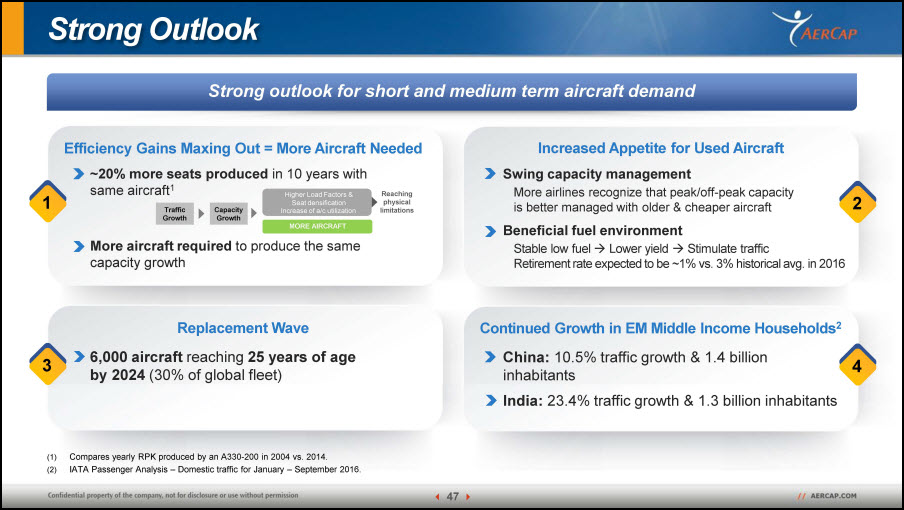
Efficiency Gains Maxing Out = More Aircraft Needed 1 2 ~20% more seats produced in 10 years with same aircraft1More aircraft required to produce the same capacity growth Traffic Growth Capacity Growth Higher Load Factors & Seat densification Increase of a/c utilization Reaching physical limitations MORE AIRCRAFT Replacement Wave 6,000 aircraft reaching 25 years of age by 2024 (30% of global fleet) 3 4 Strong Outlook Compares yearly RPK produced by an A330-200 in 2004 vs. 2014.IATA Passenger Analysis – Domestic traffic for January – September 2016. Strong outlook for short and medium term aircraft demand Swing capacity managementMore airlines recognize that peak/off-peak capacity is better managed with older & cheaper aircraftBeneficial fuel environmentStable low fuel Lower yield Stimulate trafficRetirement rate expected to be ~1% vs. 3% historical avg. in 2016 Increased Appetite for Used Aircraft Continued Growth in EM Middle Income Households2 China: 10.5% traffic growth & 1.4 billion inhabitantsIndia: 23.4% traffic growth & 1.3 billion inhabitants
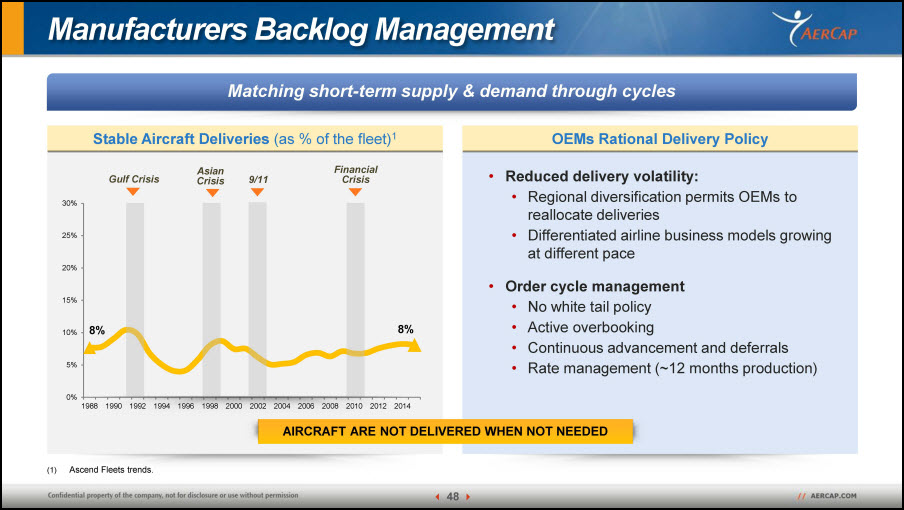
OEMs Rational Delivery Policy Manufacturers Backlog Management Matching short-term supply & demand through cycles Stable Aircraft Deliveries (as % of the fleet)1 Reduced delivery volatility:Regional diversification permits OEMs to reallocate deliveries Differentiated airline business models growing at different paceOrder cycle management No white tail policyActive overbookingContinuous advancement and deferralsRate management (~12 months production) Gulf Crisis Asian Crisis 9/11 Financial Crisis AIRCRAFT ARE NOT DELIVERED WHEN NOT NEEDED Ascend Fleets trends.
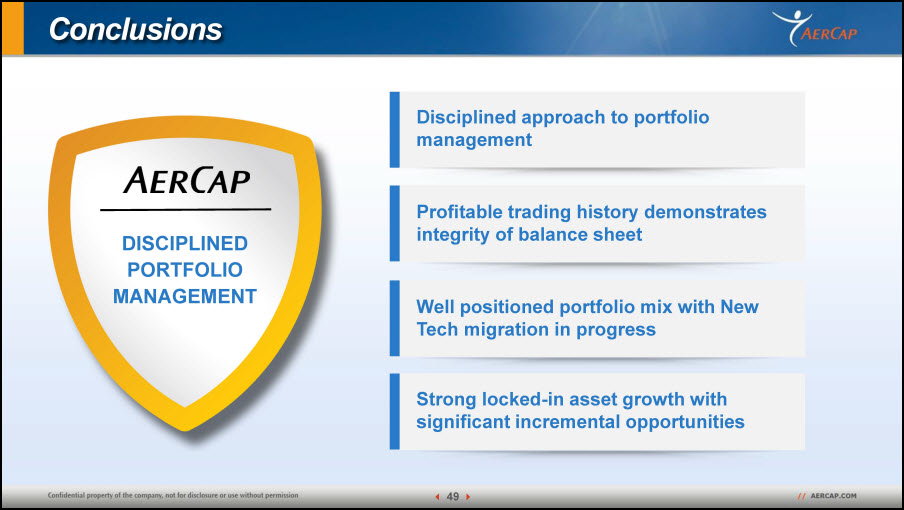
Conclusions Conclusions DISCIPLINEDPORTFOLIOMANAGEMENT Profitable trading history demonstrates integrity of balance sheet Disciplined approach to portfolio management Well positioned portfolio mix with New Tech migration in progress Strong locked-in asset growth with significant incremental opportunities
Financial Performance Keith HelmingChief Financial Officer Peter JuhasDeputy Chief Financial Officer
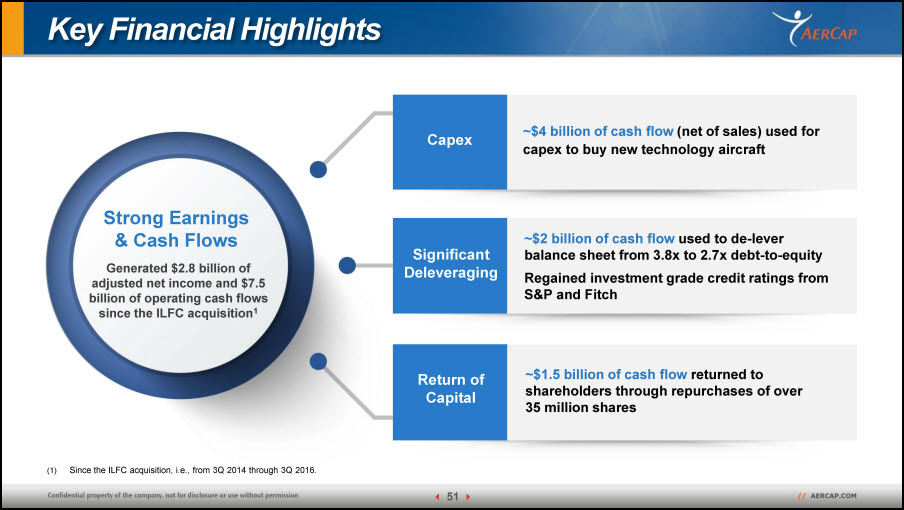
Key Financial Highlights Strong Earnings & Cash Flows Generated $2.8 billion of adjusted net income and $7.5 billion of operating cash flows since the ILFC acquisition1 Capex Significant Deleveraging Return of Capital ~$4 billion of cash flow (net of sales) used for capex to buy new technology aircraft ~$2 billion of cash flow used to de-lever balance sheet from 3.8x to 2.7x debt-to-equityRegained investment grade credit ratings from S&P and Fitch ~$1.5 billion of cash flow returned to shareholders through repurchases of over 35 million shares Since the ILFC acquisition, i.e., from 3Q 2014 through 3Q 2016.
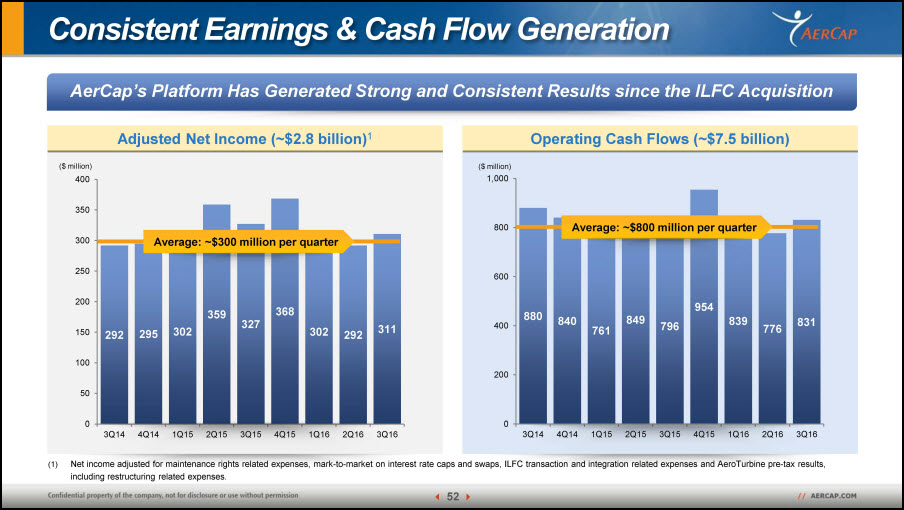
Consistent Earnings & Cash Flow Generation AerCap’s Platform Has Generated Strong and Consistent Results since the ILFC Acquisition Operating Cash Flows (~$7.5 billion) Adjusted Net Income (~$2.8 billion)1 Net income adjusted for maintenance rights related expenses, mark-to-market on interest rate caps and swaps, ILFC transaction and integration related expenses and AeroTurbine pre-tax results, including restructuring related expenses. ($ million) Average: ~$300 million per quarter ($ million) Average: ~$800 million per quarter
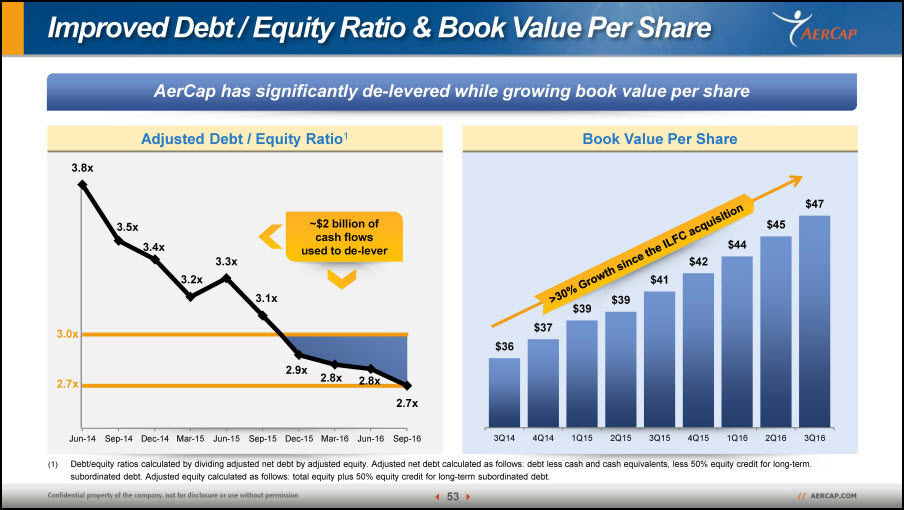
Improved Debt / Equity Ratio & Book Value Per Share AerCap has significantly de-levered while growing book value per share Book Value Per Share Adjusted Debt / Equity Ratio1 Debt/equity ratios calculated by dividing adjusted net debt by adjusted equity. Adjusted net debt calculated as follows: debt less cash and cash equivalents, less 50% equity credit for long-term. subordinated debt. Adjusted equity calculated as follows: total equity plus 50% equity credit for long-term subordinated debt. 3.0x ~$2 billion of cash flows used to de-lever >30% Growth since the ILFC acquisition 2.7x

Commitment to Investment Grade Ratings AerCap has regained Investment Grade credit ratings from S&P and Fitch MAY 2014Acquisition of ILFC FEB. 2015Both Standard & Poor’s and Moody’s place AerCap on positive outlook AUG. 2015Fitch places AerCap on positive outlook MAR. 2016Standard & Poor’s upgrades AerCap to BBB- APR. 2016Moody’s upgrades AerCap to Ba1 Moody’s(STABLE) Ba1 JUL. 2016Fitch upgrades AerCap to BBB- Standard & Poor’s(STABLE) BBB- Fitch(STABLE) BBB- INVESTMENT GRADE RATINGS STABLE RATINGS
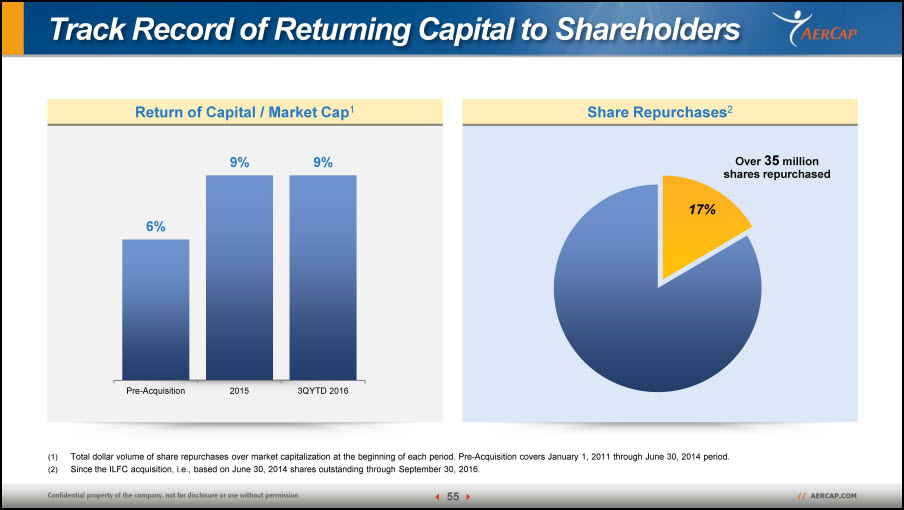
Share Repurchases2 Return of Capital / Market Cap1 Total dollar volume of share repurchases over market capitalization at the beginning of each period. Pre-Acquisition covers January 1, 2011 through June 30, 2014 period.Since the ILFC acquisition, i.e., based on June 30, 2014 shares outstanding through September 30, 2016. Track Record of Returning Capital to Shareholders Over 35 million shares repurchased 17%
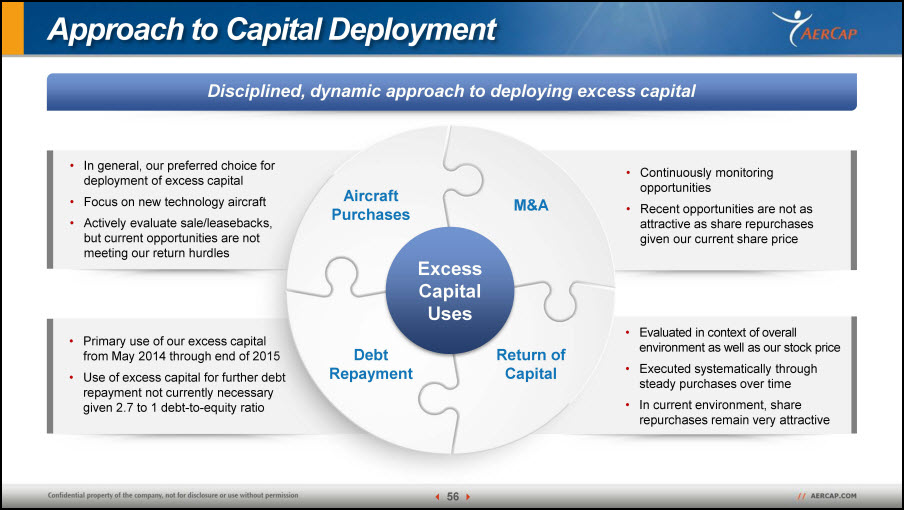
Disciplined, dynamic approach to deploying excess capital Approach to Capital Deployment We approach capital deployment dynamically, taking into account both the operating and market environments Evaluated in context of overall environment as well as our stock priceExecuted systematically through steady purchases over timeIn current environment, share repurchases remain very attractive Primary use of our excess capital from May 2014 through end of 2015Use of excess capital for further debt repayment not currently necessary given 2.7 to 1 debt-to-equity ratio Continuously monitoring opportunitiesRecent opportunities are not as attractive as share repurchases given our current share price In general, our preferred choice for deployment of excess capitalFocus on new technology aircraftActively evaluate sale/leasebacks, but current opportunities are not meeting our return hurdles Return of Capital M&A Debt Repayment Aircraft Purchases Excess CapitalUses
Liquidity & Funding
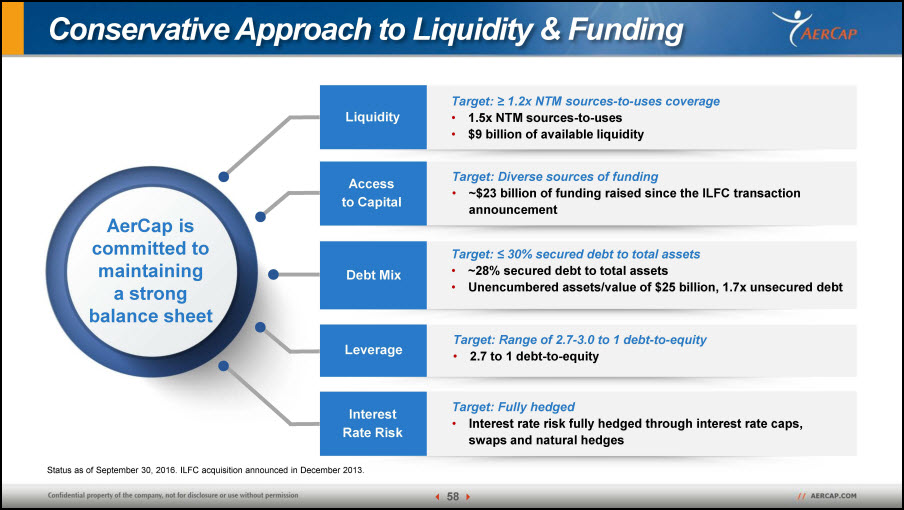
Conservative Approach to Liquidity & Funding AerCap is committed to maintaining a strong balance sheet Liquidity Target: ≥ 1.2x NTM sources-to-uses coverage1.5x NTM sources-to-uses$9 billion of available liquidity Status as of September 30, 2016. ILFC acquisition announced in December 2013. Access to Capital Target: Diverse sources of funding~$23 billion of funding raised since the ILFC transaction announcement Debt Mix Target: ≤ 30% secured debt to total assets~28% secured debt to total assetsUnencumbered assets/value of $25 billion, 1.7x unsecured debt Leverage Target: Range of 2.7-3.0 to 1 debt-to-equity2.7 to 1 debt-to-equity Interest Rate Risk Target: Fully hedgedInterest rate risk fully hedged through interest rate caps, swaps and natural hedges
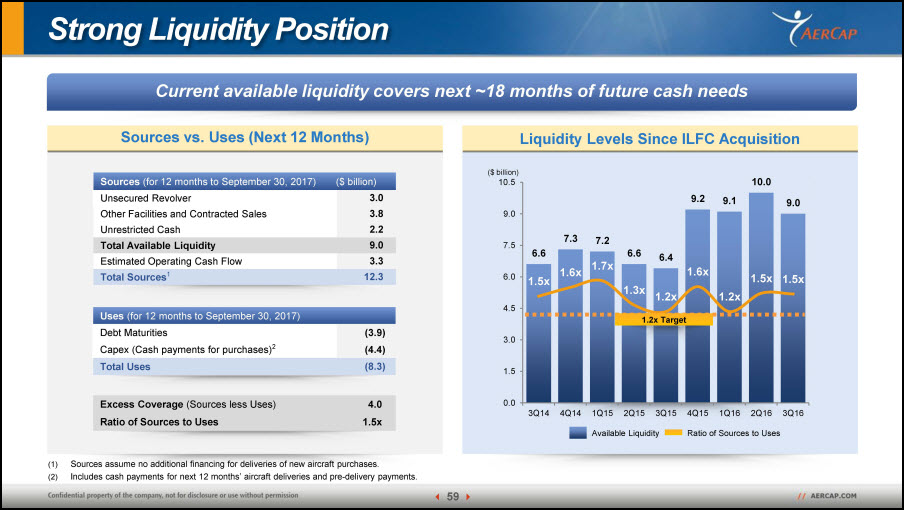
Strong Liquidity Position Current available liquidity covers next ~18 months of future cash needs Liquidity Levels Since ILFC Acquisition Sources vs. Uses (Next 12 Months) Sources assume no additional financing for deliveries of new aircraft purchases.Includes cash payments for next 12 months’ aircraft deliveries and pre-delivery payments. Sources (for 12 months to September 30, 2017) ($ billion) Unsecured Revolver 3.0 Other Facilities and Contracted Sales 3.8 Unrestricted Cash 2.2 Total Available Liquidity 9.0 Estimated Operating Cash Flow 3.3 Total Sources1 12.3 Uses (for 12 months to September 30, 2017) Debt Maturities (3.9) Capex (Cash payments for purchases)2 (4.4) Total Uses (8.3) Excess Coverage (Sources less Uses) 4.0 Ratio of Sources to Uses 1.5x ($ billion) 1.2x Target Available Liquidity Ratio of Sources to Uses
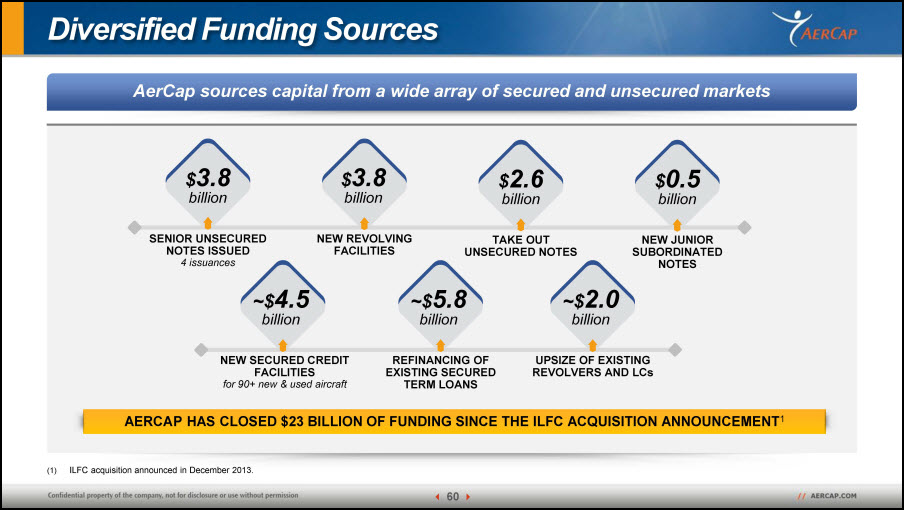
Diversified Funding Sources AerCap sources capital from a wide array of secured and unsecured markets UPSIZE OF EXISTING REVOLVERS AND LCs ~$2.0billion REFINANCING OF EXISTING SECURED TERM LOANS ~$5.8billion TAKE OUT UNSECURED NOTES $2.6billion NEW SECURED CREDIT FACILITIESfor 90+ new & used aircraft ~$4.5billion SENIOR UNSECURED NOTES ISSUED4 issuances $3.8billion NEW JUNIOR SUBORDINATED NOTES $0.5billion NEW REVOLVING FACILITIES $3.8billion AERCAP HAS CLOSED $23 BILLION OF FUNDING SINCE THE ILFC ACQUISITION ANNOUNCEMENT1 ILFC acquisition announced in December 2013.
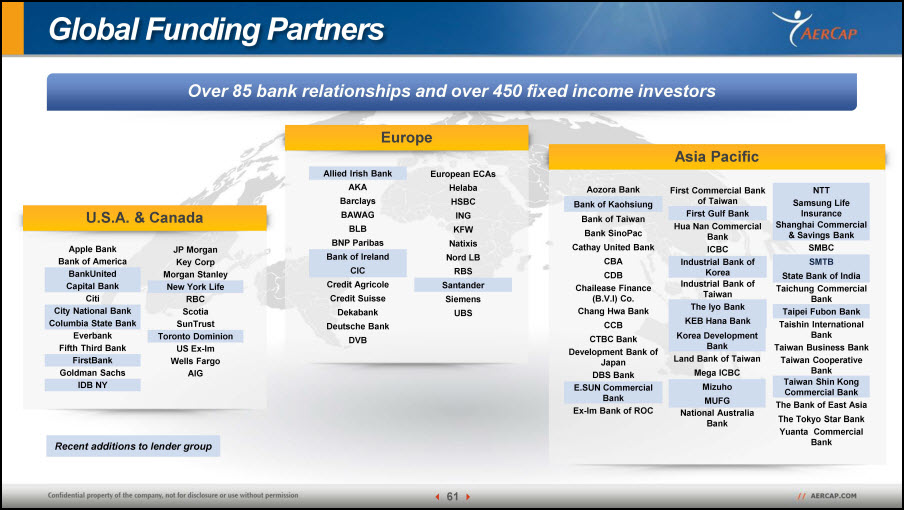
Global Funding Partners Over 85 bank relationships and over 450 fixed income investors U.S.A. & Canada Apple Bank Bank of America BankUnited Capital Bank Citi City National Bank Columbia State Bank Everbank Fifth Third Bank FirstBank Goldman Sachs IDB NY JP Morgan Key Corp Morgan Stanley New York Life RBC Scotia SunTrust Toronto Dominion US Ex-Im Wells Fargo AIG Europe Allied Irish Bank AKA Barclays BAWAG BLB BNP Paribas Bank of Ireland CIC Credit Agricole Credit Suisse Dekabank Deutsche Bank DVB European ECAs Helaba HSBC ING KFW Natixis Nord LB RBS Santander Siemens UBS Asia Pacific Aozora Bank Bank of Kaohsiung Bank of Taiwan Bank SinoPac Cathay United Bank CBA CDB Chailease Finance (B.V.I) Co. Chang Hwa Bank CCB CTBC Bank Development Bank of Japan DBS Bank E.SUN Commercial Bank Ex-Im Bank of ROC KGI Bank Korea Development Bank Land Bank of Taiwan Mega ICBC Mizuho MUFG National Australia Bank NTT Samsung Life Insurance Shanghai Commercial & Savings Bank SMBC SMTB State Bank of India Taichung Commercial Bank Taipei Fubon Bank Taishin International Bank Taiwan Business Bank Taiwan Cooperative Bank Taiwan Shin Kong Commercial Bank The Bank of East Asia The Tokyo Star Bank Yuanta Commercial Bank First Commercial Bank of Taiwan First Gulf Bank Hua Nan Commercial Bank ICBC Industrial Bank of Korea Industrial Bank of Taiwan The Iyo Bank KEB Hana Bank Recent additions to lender group
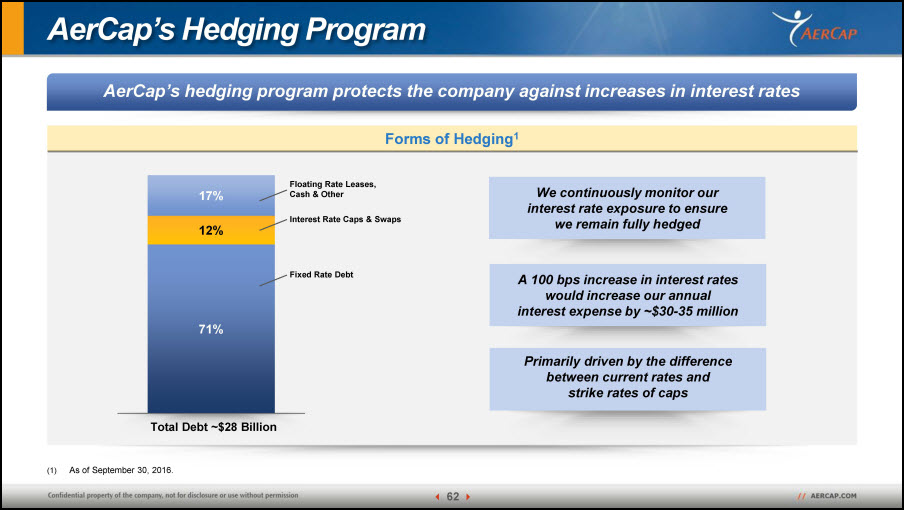
AerCap’s Hedging Program AerCap’s hedging program protects the company against increases in interest rates Forms of Hedging1 Interest Rate Caps & Swaps Floating Rate Leases,Cash & Other Fixed Rate Debt Total Debt ~$28 Billion We continuously monitor ourinterest rate exposure to ensure we remain fully hedged A 100 bps increase in interest rates would increase our annualinterest expense by ~$30-35 million Primarily driven by the difference between current rates and strike rates of caps As of September 30, 2016.
Portfolio Valuation
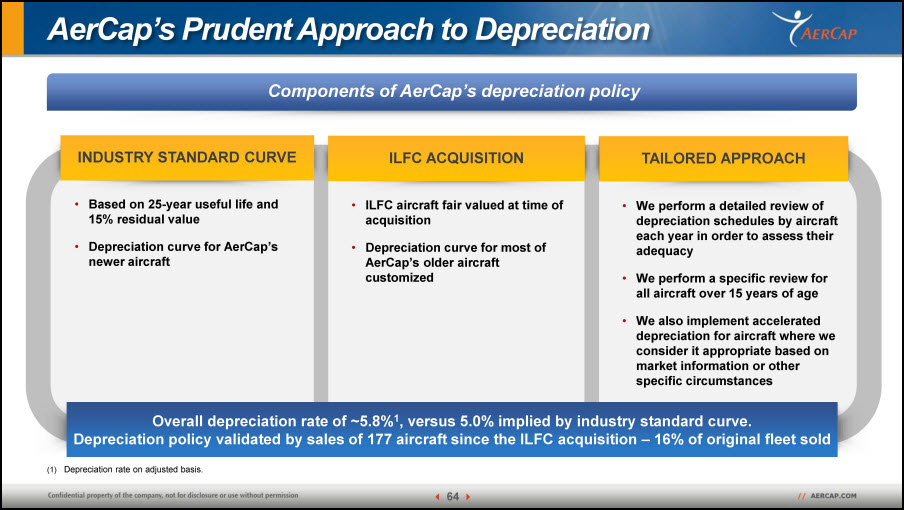
AerCap’s Prudent Approach to Depreciation Components of AerCap’s depreciation policy INDUSTRY STANDARD CURVE ILFC ACQUISITION TAILORED APPROACH Overall depreciation rate of ~5.8%1, versus 5.0% implied by industry standard curve.Depreciation policy validated by sales of 177 aircraft since the ILFC acquisition – 16% of original fleet sold Based on 25-year useful life and 15% residual valueDepreciation curve for AerCap’s newer aircraft ILFC aircraft fair valued at time of acquisitionDepreciation curve for most of AerCap’s older aircraft customized We perform a detailed review of depreciation schedules by aircraft each year in order to assess their adequacyWe perform a specific review for all aircraft over 15 years of ageWe also implement accelerated depreciation for aircraft where we consider it appropriate based on market information or other specific circumstances Depreciation rate on adjusted basis.
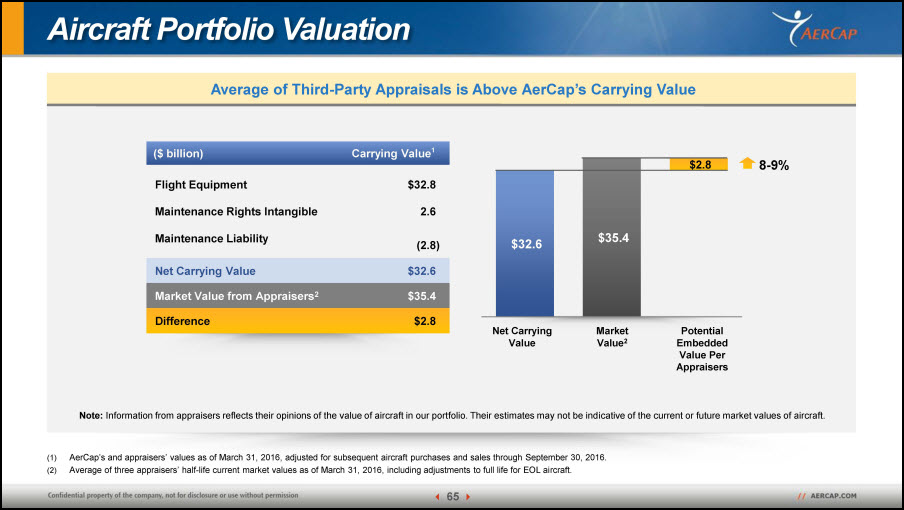
Average of Third-Party Appraisals is Above AerCap’s Carrying Value Aircraft Portfolio Valuation AerCap’s and appraisers’ values as of March 31, 2016, adjusted for subsequent aircraft purchases and sales through September 30, 2016.Average of three appraisers’ half-life current market values as of March 31, 2016, including adjustments to full life for EOL aircraft. ($ billion) Carrying Value1 Flight Equipment $32.8 Maintenance Rights Intangible 2.6 Maintenance Liability (2.8) Net Carrying Value $32.6 Market Value from Appraisers2 $35.4 Difference $2.8 Net Carrying Value Market Value2 Potential Embedded Value Per Appraisers 8-9% Note: Information from appraisers reflects their opinions of the value of aircraft in our portfolio. Their estimates may not be indicative of the current or future market values of aircraft.

Financial Outlook
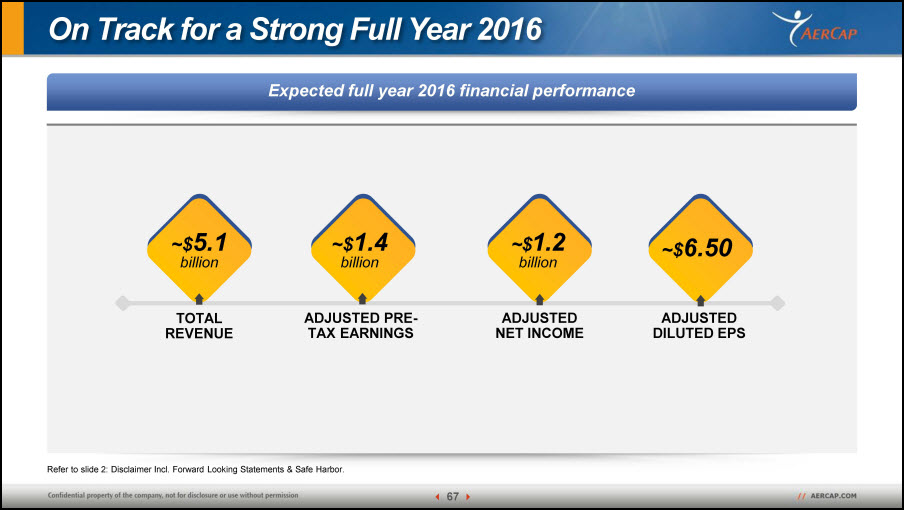
On Track for a Strong Full Year 2016 Expected full year 2016 financial performance Refer to slide 2: Disclaimer Incl. Forward Looking Statements & Safe Harbor. TOTAL REVENUE ~$5.1billion ~$6.50 ADJUSTED DILUTED EPS ~$1.4billion ADJUSTED PRE-TAX EARNINGS ~$1.2billion ADJUSTED NET INCOME
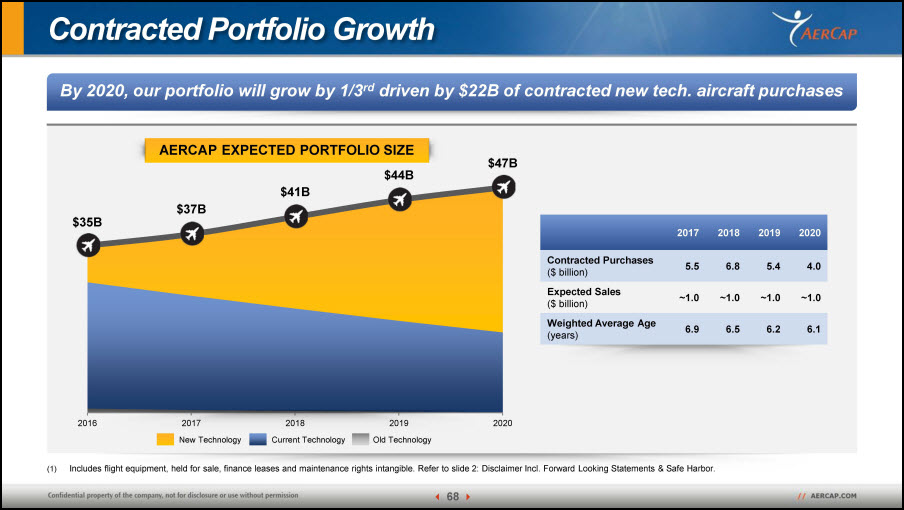
Contracted Portfolio Growth By 2020, our portfolio will grow by 1/3rd driven by $22B of contracted new tech. aircraft purchases Old Technology Current Technology New Technology 2017 2018 2019 2020 Contracted Purchases ($ billion) 5.5 6.8 5.4 4.0 Expected Sales ($ billion) ~1.0 ~1.0 ~1.0 ~1.0 Weighted Average Age (years) 6.9 6.5 6.2 6.1 Includes flight equipment, held for sale, finance leases and maintenance rights intangible. Refer to slide 2: Disclaimer Incl. Forward Looking Statements & Safe Harbor. AERCAP EXPECTED PORTFOLIO SIZE
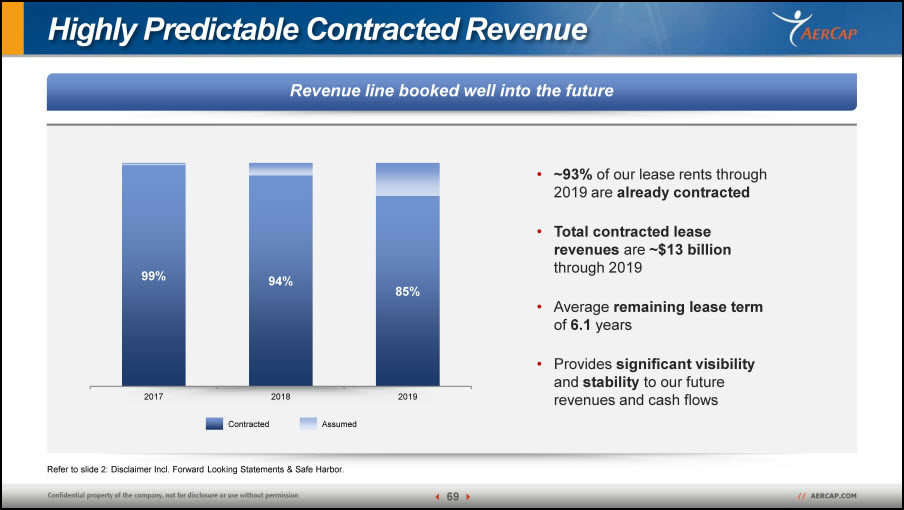
Highly Predictable Contracted Revenue Revenue line booked well into the future Refer to slide 2: Disclaimer Incl. Forward Looking Statements & Safe Harbor. Assumed Contracted ~93% of our lease rents through 2019 are already contractedTotal contracted lease revenues are ~$13 billion through 2019Average remaining lease term of 6.1 yearsProvides significant visibility and stability to our future revenues and cash flows
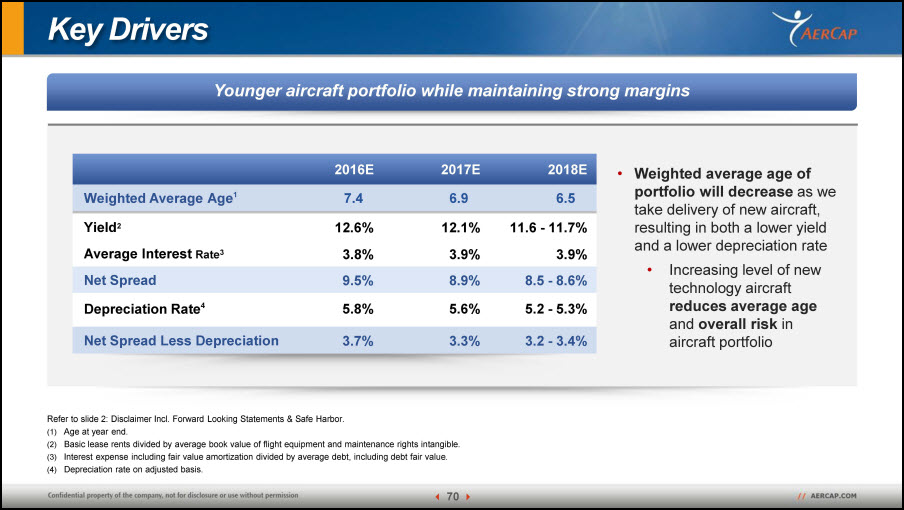
Key Drivers Younger aircraft portfolio while maintaining strong margins Refer to slide 2: Disclaimer Incl. Forward Looking Statements & Safe Harbor.Age at year end.Basic lease rents divided by average book value of flight equipment and maintenance rights intangible.Interest expense including fair value amortization divided by average debt, including debt fair value.Depreciation rate on adjusted basis. Weighted average age of portfolio will decrease as we take delivery of new aircraft, resulting in both a lower yield and a lower depreciation rateIncreasing level of new technology aircraft reduces average age and overall risk in aircraft portfolio 2016E 2017E 2018E Weighted Average Age1�� 7.4 6.9 6.5 Yield2 12.6% 12.1% 11.6 - 11.7% Average Interest Rate3 3.8% 3.9% 3.9% Net Spread 9.5% 8.9% 8.5 - 8.6% Depreciation Rate4 5.8% 5.6% 5.2 - 5.3% Net Spread Less Depreciation 3.7% 3.3% 3.2 - 3.4%
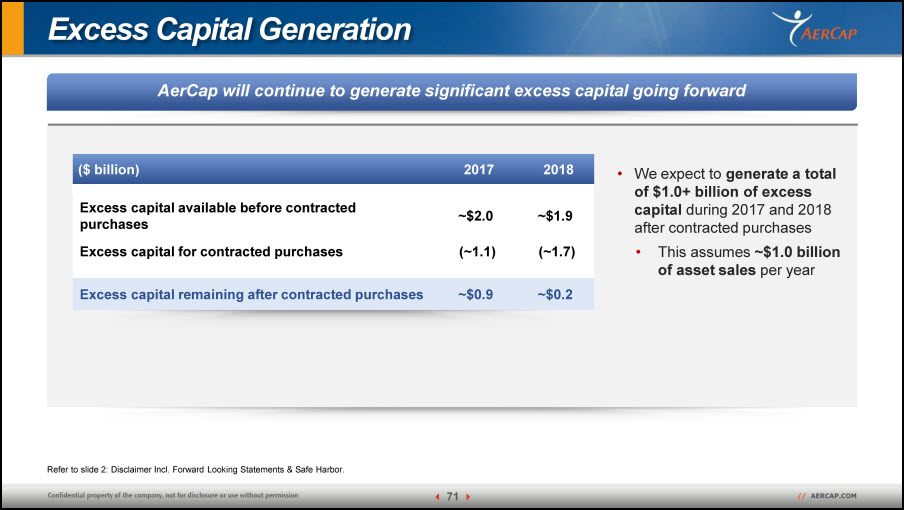
Excess Capital Generation AerCap will continue to generate significant excess capital going forward Refer to slide 2: Disclaimer Incl. Forward Looking Statements & Safe Harbor. We expect to generate a total of $1.0+ billion of excess capital during 2017 and 2018 after contracted purchasesThis assumes ~$1.0 billion of asset sales per year ($ billion) 2017 2018 Excess capital available before contracted purchases ~$2.0 ~$1.9 Excess capital for contracted purchases (~1.1) (~1.7) Excess capital remaining after contracted purchases ~$0.9 ~$0.2
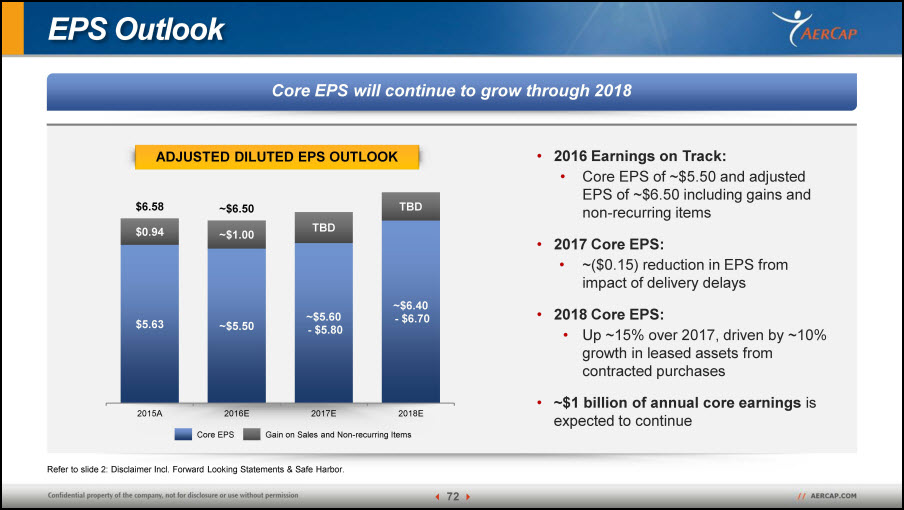
EPS Outlook Core EPS will continue to grow through 2018 Refer to slide 2: Disclaimer Incl. Forward Looking Statements & Safe Harbor. 2016 Earnings on Track:Core EPS of ~$5.50 and adjusted EPS of ~$6.50 including gains and non-recurring items2017 Core EPS:~($0.15) reduction in EPS from impact of delivery delays2018 Core EPS:Up ~15% over 2017, driven by ~10% growth in leased assets from contracted purchases~$1 billion of annual core earnings is expected to continue Core EPS Gain on Sales and Non-recurring Items ADJUSTED DILUTED EPS OUTLOOK
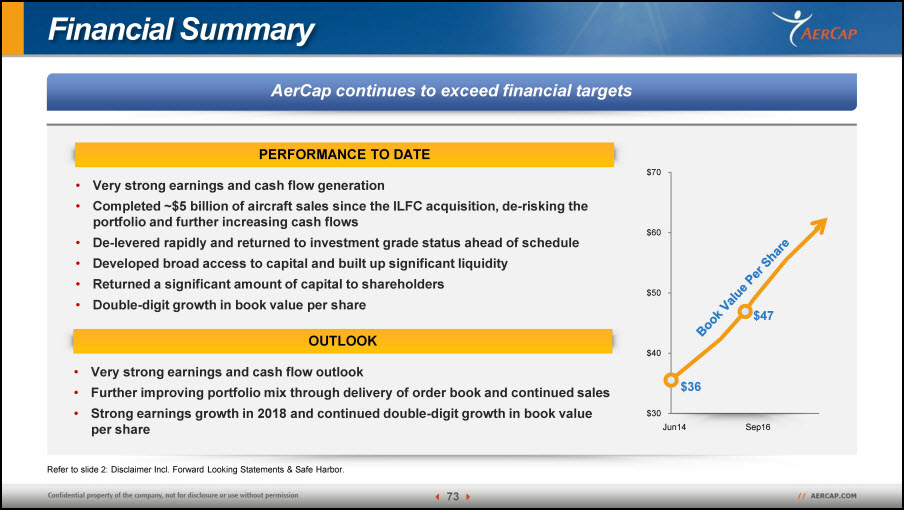
Financial Summary AerCap continues to exceed financial targets Very strong earnings and cash flow generationCompleted ~$5 billion of aircraft sales since the ILFC acquisition, de-risking the portfolio and further increasing cash flowsDe-levered rapidly and returned to investment grade status ahead of schedule Developed broad access to capital and built up significant liquidityReturned a significant amount of capital to shareholdersDouble-digit growth in book value per share Very strong earnings and cash flow outlookFurther improving portfolio mix through delivery of order book and continued salesStrong earnings growth in 2018 and continued double-digit growth in book value per share Book Value Per Share Jun14 Sep16 PERFORMANCE TO DATE OUTLOOK Refer to slide 2: Disclaimer Incl. Forward Looking Statements & Safe Harbor.
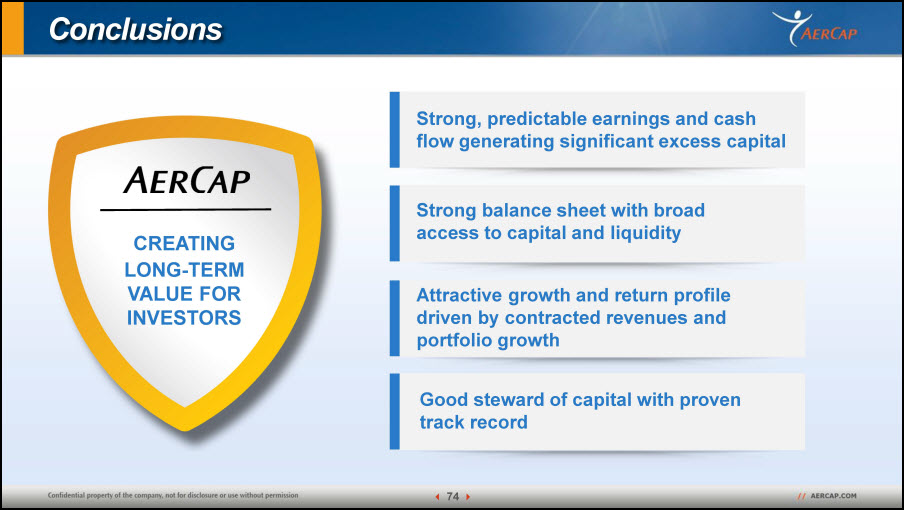
Conclusions Conclusions CREATING LONG-TERM VALUE FOR INVESTORS Strong balance sheet with broad access to capital and liquidity Strong, predictable earnings and cash flow generating significant excess capital Attractive growth and return profile driven by contracted revenues and portfolio growth Good steward of capital with proven track record
Q&A
AerCap Holdings N.V.AerCap House65 St. Stephen’s GreenDublin 2, Ireland+353 1 819 2010contact@aercap.com Follow us on