QuickLinks -- Click here to rapidly navigate through this document
Unless otherwise indicated or the context otherwise requires, the terms "AerCap," "we," "us," "our" and the "company" refer to AerCap Holdings N.V. and its subsidiaries.
We are the world's largest independent aircraft leasing company. Aircraft leasing is a high growth sector of the growing aviation industry. We deliver an industry-leading return on assets by acquiring in-demand aircraft at attractive prices, funding them efficiently, hedging interest rate risk conservatively and using our platform to deploy those assets with the objective of delivering superior risk adjusted returns.
We maintain one of the youngest fleets of fuel-efficient aircraft amongst our competitors. As of March 31, 2012, we owned approximately $8 billion of flight equipment. Our large, diversified and modern aircraft portfolio enables us to generate an industry-leading return on assets through recurring income from leases contracted over the long-term (more than 10 years, on average, for new aircraft). We believe that by applying our expertise through an integrated business model, we are able to identify and execute on a broad range of market opportunities that we expect will continue to generate attractive returns for our investors. We had total revenues of $1.1 billion and $257.9 million and Adjusted EBITDA of $0.9 billion and $226.9 million for the fiscal year ended December 31, 2011 and the three months ended March 31, 2012, respectively.
We operate our business on a global basis, providing aircraft to customers in every major geographical region. The diversification of our portfolio among customers and geographical regions and the sequencing of our lease maturities enable us to effectively manage potential concentration risk. At March 31, 2012, our largest individual lessee represented 7% of our lease revenues, and our largest individual country exposure represented 10% of our lease revenues.
As of March 31, 2012, we had the largest portfolio of any independent aircraft leasing company, with 254 owned aircraft, 40 managed aircraft, 53 new aircraft on order (including purchase rights for five Boeing 737 and the remaining 27 Boeing 737 aircraft to be delivered by American Airlines pursuant to the purchase-leaseback entered into in 2011). All the aircraft we have on order are subject to signed lease agreements or letters of intent. As of March 31, 2012, our owned and managed aircraft were leased to over 100 customers in 50 countries and managed from our offices in the Netherlands, Ireland, the United States, Singapore, China and the United Arab Emirates. The ownership structure of our fleet enabled us to achieve a blended tax rate of 6.7% in 2011.
We seek to maximize the returns on our investments by managing our financing costs, our aircraft lease rates, time off-lease and maintenance costs, and by carefully timing the sale of our aircraft assets. We have the infrastructure, expertise and resources to execute a large number of diverse aircraft transactions in a variety of market conditions. From January 1, 2007 to March 31, 2012, we executed over 600 aircraft purchases, leases, deliveries or sales. During this period, our weighted average owned aircraft utilization rate was 98.2%
Our team of dedicated marketing and asset trading professionals actively manage our portfolio through the acquisition and sale of aircraft. This has resulted in the low average age of our portfolio and an appropriate concentration of widebody and narrowbody aircraft and aircraft types. We purchase new and used aircraft directly from aircraft manufacturers, airlines, financial investors and other aircraft leasing and finance companies, often in large quantities to take advantage of volume discounts. As of March 31, 2012, the weighted average age of our owned portfolio was 5.6 years, and the proportion of our fleet comprising narrowbody aircraft was 73%.
1
Significant Scale with Industry-Leading Profitability and Cash Flow Generation. Our large, diversified and modern portfolio allows us to generate an industry-leading return on assets through recurring income from leases contracted over the long-term. As of March 31, 2012, we owned approximately $8 billion of flight equipment. Between January 1, 2007 and March 31, 2012, we achieved a weighted average owned aircraft utilization rate of 98.2% due, we believe, to our broad customer reach, quality product offering and strong portfolio management capabilities. The quality of our portfolio and high aircraft utilization rates enabled us to generate total revenue of $1.1 billion, of which $1.0 billion was leasing revenue, and Adjusted EBITDA of $0.9 million for the fiscal year ended December 31, 2011. Our cash flow generation is further strengthened by our low average cost of debt, standing at just 3.6% for 2011, and a blended tax rate that was 6.7% in 2011.
Modern Portfolio of In-Demand Aircraft. Our aircraft portfolio consists primarily of modern, technologically-advanced, and fuel-efficient narrowbody aircraft, with a particular focus on Airbus A320 family aircraft and Boeing 737-800 aircraft. As of March 31, 2012, we owned 254 aircraft and managed 40 aircraft, making us the largest independent aircraft lessor globally. The weighted average age of our owned aircraft fleet was 5.6 years as of March 31, 2012. We own one of the youngest aircraft fleets among aircraft leasing companies. Additionally, as of March 31, 2012, we had seven new Airbus A320 aircraft, four new Airbus A330 aircraft, and 15 new Boeing 737-800 aircraft on order and we had entered into call options on five A320NEO purchase and leaseback transactions. In 2011, we also entered into a commitment to purchase and leaseback 35 aircraft with American Airlines, under which eight aircraft were purchased and delivered as of March 31, 2012. The agreement, which was structured as a financial accommodation rather than an executory contract that could be assumed in bankruptcy, was terminated by its terms following American Airlines filing for bankruptcy protection in late 2011; however, since that date we have purchased and leased back four additional aircraft on a post-petition basis and we intend to continue to evaluate each delivery on a case-by-case basis in accordance with the original commitment schedule.
New aircraft deliveries from our direct orders with manufacturers and our purchase and leaseback arrangements with airlines will help us continue to maintain a modern, technologically-advanced and fuel-efficient portfolio.
Diversified Customer Base and Global Presence. We lease our owned and managed aircraft to customers located in 50 countries. In the three months ended March 31, 2012, we generated 40%, 38%, 12%, 6% and 4% of our lease rental revenues from lessees based in Asia Pacific/Russia, Europe, North America, Latin America and Africa/Middle East, respectively. As of March 31, 2012, our owned and managed aircraft were leased to over 100 individual customers. No customer constituted more than 8% of our
2
lease revenue in 2012. Our extensive experience, global reach, and operating capabilities allow us to rapidly complete numerous aircraft transactions.
| Geographic Concentration by Lease Revenue for the three months ended March 31, 2012 | Lessee Concentration by Lease Revenue for the three months ended March 31, 2012 | |
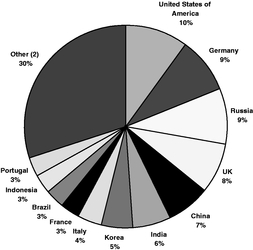 | 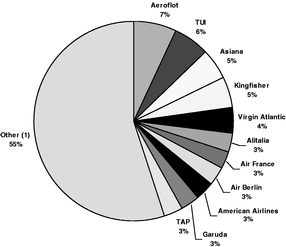 |
- (1)
- Consists of 84 individual lessees. No other lessee accounted for more than 2.5% of our 2012 first quarter lease revenue.
- (2)
- No other country accounting for more than 2.5% of our first quarter lease revenue.
Successful Record of Active Portfolio Management. We use our strong portfolio management capabilities to profitably manage aircraft throughout their lifecycle. Our dedicated portfolio management team consists of marketing, credit, financial, engineering, technical and legal professionals who analyze demand in the market and the risks and financial returns of potential transactions. The team then executes rapidly on identified opportunities in order to generate accretive returns on our aircraft investments and minimize the time that our aircraft are not generating revenue. By executing our leasing strategy, we have placed all of the aircraft in our order book that are currently scheduled to be delivered before December 31, 2016 and all marketing activity for leases maturing in 2012 is complete. As a result, between January 1, 2007 and March 31, 2012, our weighted average owned aircraft utilization rate was 98.2%. We also pursue an active sales strategy to continually optimize our portfolio. Between January 1, 2004 and March 31, 2012, we sold 144 aircraft with an average age of approximately 13 years, generating total gains on those sales of over $360 million.
Long-Term and Robust Funding Sources and Conservative Capital Structure. We have the ability to access a broad range of liquidity sources globally. Since 2007, we have raised in excess of $10.0 billion of new financing, from such diverse sources as secured bank debt, government-guaranteed export-based secured debt including export credit agency ("ECA") guaranteed loans, securitization, structured debt and capital markets debt. We also have in place undrawn lines of liquidity in our non-recourse "warehouse" facility which enables us to deploy capital rapidly to accretive purchasing opportunities that arise in the market. We employ a conservative funding strategy which has helped us reduce our leverage and interest costs. As of March 31, 2012, our debt to shareholders' equity ratio was 2.6 to 1.0. On March 13, 2012, we received a BBB-, investment grade rating from Standard & Poor's Ratings Services. On April 24, 2012, we received a BBB-, investment grade rating from Fitch Ratings, Inc., becoming the only independent aircraft leasing company with investment grade ratings from both Standard & Poor's Ratings Services and Fitch Ratings, Inc.. We employ a low risk tolerance interest rate hedging policy including the use of interest rate caps, swaps and fixed rate financing. Our average cost of debt in the fiscal year ended December 31, 2011 was 3.6%. For the three months ended March 31, 2012 our average cost of debt was 3.9%, and during this period we raised an additional $0.3 billion of debt.
3
Top-Class Management Team. Our management team, with over 130 years of combined aviation industry experience, has expertise in all aspects of our business including aircraft and engine leasing, trading, technical management, financing and risk management across a broad range of aircraft and industry economic cycles. We leverage our geographical reach, diverse aircraft portfolio and success in remarketing our aircraft to identify and execute on a broad range of market opportunities to generate attractive returns for our investors. We maintain close relationships with senior management at our lessees, our trading partners and the manufacturers to ensure that we proactively respond to and have a role in influencing the industry where appropriate.
Manage the Profitability of our Aircraft Portfolio. Our strategy is to profitably manage our portfolio of aircraft throughout their lifecycle by:
- •
- purchasing aircraft in volume directly from manufacturers in a counter-cyclical manner;
- •
- entering into sale-leaseback transactions with aircraft operators;
- •
- using our global customer relationships to obtain favorable lease terms for aircraft and maximizing aircraft utilization;
- •
- maintaining diverse sources of global funding; and
- •
- optimizing our portfolio by strategically selling aircraft.
Efficiently Manage our Liquidity. As of March 31, 2012, we had access to $0.8 billion of committed undrawn credit facilities, and held over $400 million of unrestricted cash and cash equivalents on our balance sheet. We strive to maintain a diverse financing strategy, both in terms of capital providers and structure, through the use of unsecured debt, bank debt, securitization structures and export credit financing including ECA-guaranteed loans, in order to maximize our financial flexibility. We also leverage our long-standing relationships with the major aircraft financiers and lenders to secure access to capital. In addition, we attempt to maximize cash flows and continue to pursue the strategic sale of aircraft to generate additional cash flows.
Expand Our Aircraft Portfolio. We intend to grow our portfolio of aircraft through new aircraft purchases, sale-leasebacks, airline re-fleetings, acquisitions and other opportunistic transactions. We will rely on our experienced team of portfolio management professionals to identify and purchase assets we believe are being sold at attractive prices or that we believe will increase in demand and retain value. In addition, we intend to continue to rebalance our aircraft portfolio through acquisitions and sales to maintain the appropriate mix of aviation assets to meet our customers' needs.
Maintain a Diversified and Satisfied Customer Base. We currently lease our owned and managed aircraft to over 100 different airlines in 50 different countries. We monitor our exposure concentrations by both lessee and country jurisdiction and intend to maintain a well diversified customer base. We believe we offer a quality product, both in terms of asset and customer service, to all of our customers. We have successfully worked with many airlines to find mutually beneficial solutions to operational and financial challenges. We believe we maintain excellent relations with our customers at all levels, from senior management to the in-house technical teams. We pride ourselves on being proactive rather than reactive in our fleet and lease management, and this has been reflected in the utilization statistics of our portfolio. We have been able to achieve a high utilization rate on our aircraft assets as a result of our customer reach, quality product offering and strong portfolio management capabilities.
Selectively Pursue Acquisitions. We intend to selectively pursue acquisitions that we believe will provide us with benefits currently not available to us, as we did in the amalgamation of Genesis Lease Limited and its portfolio of 54 aircraft with AerCap, and in the acquisition of an interest in Waha Capital PJSC's portfolio of 14 aircraft in return for which, among other consideration, shares in AerCap
4
Holdings N.V. were issued to Waha Capital PJSC. The synergies, economies of scale and operating efficiencies we expect to derive from our acquisitions will allow us to strengthen our competitive advantages and diversify our sources of revenue.
Generate Additional Revenue Through Management Services. We intend to continue to generate additional revenue by providing management services to securitization vehicles, our joint ventures, and other aircraft owners. We generated $19.1 million and $4.5 million of such revenue in the fiscal year ended December 31, 2011 and in the three months ended March 31, 2012, respectively.
Consider Strategic Alternatives. Our Board of Directors has decided to explore a range of strategic alternatives to enhance shareholder value. The strategic alternatives include continued execution of our operating strategies outlined above, in addition to possible further share repurchases, aircraft portfolio sales, or a sale or merger of the company. We may determine not to complete any transaction as a result of such exploration and we may be unsuccessful in implementing any particular strategic alternative. Any such alternatives may also not yield the expected results.
Our aircraft portfolio consists primarily of modern, technologically-advanced and fuel-efficient narrowbody aircraft. As of March 31, 2012, we owned 254 aircraft and managed 40 aircraft. The weighted average age of our 254 owned aircraft was 5.6 years as of March 31, 2012.
The following table provides details regarding our aircraft portfolio by type of aircraft as of March 31, 2012.
| | | | Managed portfolio | | | | |||||||||||||
|---|---|---|---|---|---|---|---|---|---|---|---|---|---|---|---|---|---|---|---|
| | Owned portfolio | | Number of aircraft under purchase/sale contract or letter of intent | | |||||||||||||||
| | | Total owned, managed and ordered aircraft | |||||||||||||||||
Aircraft type | Number of aircraft owned | Percentage of total net book value | Number of aircraft | Number of aircraft on order | |||||||||||||||
Airbus A300 Freighter | 1 | 0.3 | % | — | — | — | 1 | ||||||||||||
Airbus A319 | 30 | 9.9 | % | — | — | — | 30 | ||||||||||||
Airbus A320 | 104 | 36.8 | % | 8 | 7 | (3 | ) | 116 | |||||||||||
Airbus A320NEO | — | — | — | — | 5 | 5 | |||||||||||||
Airbus A321 | 20 | 7.2 | % | 2 | — | — | 22 | ||||||||||||
Airbus A330 | 23 | 22.1 | % | 4 | 4 | 5 | 36 | ||||||||||||
Boeing 737 Classics | 9 | 0.8 | % | 19 | — | (2 | ) | 26 | |||||||||||
Boeing 737 (NG) | 51 | 18.3 | % | — | 42 | (1) | — | 93 | |||||||||||
Boeing 747 | 2 | 0.9 | % | — | — | — | 2 | ||||||||||||
Boeing 757 | 3 | 0.5 | % | 1 | — | (2 | ) | 2 | |||||||||||
Boeing 767 | 4 | 1.7 | % | 2 | — | — | 6 | ||||||||||||
Boeing 777 | — | — | 2 | — | — | 2 | |||||||||||||
CRJ 705 | — | — | 1 | — | — | 1 | |||||||||||||
CRJ 900 | 4 | 0.9 | % | — | — | — | 4 | ||||||||||||
MD 11 Freighter | 1 | 0.3 | % | 1 | — | — | 2 | ||||||||||||
ERJ 170 | 2 | 0.3 | % | — | — | — | 2 | ||||||||||||
Total | 254 | 100 | % | 40 | 53 | 3 | 350 | ||||||||||||
- (1)
- Includes the remaining 27 Boeing 737 aircraft to be delivered by American Airlines pursuant to the purchase and leaseback entered into in 2011. On November 29, 2011, American Airlines filed for voluntary Chapter 11 bankruptcy protection and as a result our remaining obligations under the purchase and leaseback contract, which was structured as a financial accommodation rather than an executory contract that could be assumed in bankruptcy, automatically terminated. We intend to continue to evaluate each delivery on a case-by-case basis until such time as we agree to reinstate the original contract. Since the bankruptcy filing, and as of March 31, 2012, we took delivery of four additional aircraft. As of March 31, 2012, eight of the original 35 American Airlines purchase and leaseback Boeing 737 aircraft have been delivered and financed under the Skyfunding facility described in our 2011 Form 20-F filed with the SEC on March 23, 2012.
5
The following tables set forth information regarding the aircraft transactions we have executed between January 1, 2007 and March 31, 2012, the number of initial leases and re-leases we entered into, the number of leases we extended, the number of leases we restructured, the number of aircraft we purchased and the number of aircraft we sold. The trends shown in the table reflect the execution of the various elements of our leasing strategy for our owned and managed portfolio.
| | Owned Aircraft | |||||||||||||||||||||
|---|---|---|---|---|---|---|---|---|---|---|---|---|---|---|---|---|---|---|---|---|---|---|
Activity | 2007 | 2008 | 2009 | 2010 | 2011 | First Quarter 2012 | Total/ Average | |||||||||||||||
New leases on new aircraft | 22 | 45 | 21 | 6 | 14 | 4 | 112 | |||||||||||||||
New leases on used aircraft | 10 | 34 | 6 | 18 | 16 | 5 | 89 | |||||||||||||||
Extensions of lease contracts | 12 | 34 | 24 | 26 | 19 | 2 | 117 | |||||||||||||||
Average lease term for new leases (months)(1) | 96.5 | 123.2 | 138.3 | 138.0 | 133.7 | >160.0 | 124.5 | |||||||||||||||
Average lease term for re-leases (months)(1) | 72.0 | 63.6 | 42.3 | 61.6 | 80.8 | 54.0 | 65.2 | |||||||||||||||
Average lease term for lease extensions (months)(2) | 46.5 | 36.2 | 18.8 | 35.5 | 30.5 | 36.0 | 32.6 | |||||||||||||||
Aircraft purchases | 40 | 58 | 41 | 55 | 13 | 5 | 212 | |||||||||||||||
Aircraft sales | 24 | 26 | 9 | 16 | 21 | 2 | 98 | |||||||||||||||
Average aircraft utilization rates(3) | 98.4 | % | 97.7 | 98.1 | % | 98.3 | % | 98.5 | % | 98.2 | % | 98.2 | % | |||||||||
- (1)
- Average lease term for new leases and re-leases contracted during the period. The average lease term for new leases and re-leases is calculated by reference to the period between the date of contractual delivery and the date of contractual re-delivery of the aircraft.
- (2)
- Average lease term for aircraft extensions contracted during the period. The average lease term for lease extensions is calculated by reference to the period between the date of the original expiration of the lease and the new expiration date.
- (3)
- Our utilization rate for aircraft is calculated based on the average number of months the aircraft are on lease each year. The utilization rate is weighted proportionate to the net book value of the aircraft at the end of the period measured.
| | Managed Aircraft | |||||||||||||||||||||
|---|---|---|---|---|---|---|---|---|---|---|---|---|---|---|---|---|---|---|---|---|---|---|
Activity | 2007 | 2008 | 2009 | 2010 | 2011 | First Quarter 2012 | Total/ Average | |||||||||||||||
New leases on new aircraft | — | — | 1 | — | — | — | 1 | |||||||||||||||
New leases on used aircraft | 7 | 12 | 4 | 2 | 1 | — | 26 | |||||||||||||||
Extensions of lease contracts | 6 | 6 | 5 | 4 | 3 | 2 | 26 | |||||||||||||||
Average lease term for re-leases (months)(1) | 48.0 | 64.0 | 53.0 | 32.0 | 20.0 | — | 53.8 | |||||||||||||||
Average lease term for lease extensions (months)(2) | 46.0 | 46.5 | 26.4 | 33.8 | 27.0 | 20.5 | 36.3 | |||||||||||||||
Aircraft purchases | — | — | — | — | — | — | — | |||||||||||||||
Aircraft sales | 25 | 5 | 6 | 4 | 8 | 2 | 50 | |||||||||||||||
- (1)
- Average lease term of re-leases contracted during the period. The average lease term for re-leases is calculated by reference to the period between the date of contractual delivery and the date of contractual re-delivery of the aircraft.
- (2)
- Average lease term for aircraft lease extensions contracted during the period. The average lease term for lease extensions is calculated by reference to the period between the date of the original expiration of the lease and the new expiration date.
6
SUMMARY CONSOLIDATED FINANCIAL AND OPERATING DATA
The following tables set forth our summary historical consolidated financial and operating data for the periods ended and as of the dates indicated below.
The summary consolidated statements of income data presented below for 2009, 2010 and 2011 and the balance sheet data as of December 31, 2010 and 2011 have been derived from our audited consolidated financial statements included in our 2011 Form 20-F filed with the SEC on March 23, 2012 (the "2011 Form 20-F"). The summary consolidated statements of income data for 2007 and 2008 and the balance sheet data as of December 31, 2007, 2008 and 2009 have been derived from our audited consolidated financial statements. Due to certain reclassifications in our 2011 financial statements as a result of our sale of AeroTurbine, Inc. and the presentation of our sales on a "net gain (loss) on sale of assets" basis, the financial information for 2007 and 2008 can not be reconciled directly to our 2008 financial statements but only to footnote 1 of the financial statements included in the 2011 Form 20-F. The summary consolidated statements of income for the three months ended March 31, 2011 and 2012 have been derived from our unaudited condensed consolidated financial statements included in our quarterly report furnished on Form 6-K on May 8, 2012 (the "Q1 Form 6-K"). These historical results are not necessarily indicative of the results to be expected in the future. You should also read our historical financial statements and related notes and the section entitled "Operating and Financial Review and Prospects," in the 2011 Form 20-F, and the section entitled "Management's Discussion and Analysis of Financial Condition and Results of Operations," in the Q1 Form 6-K.
| | Year ended December 31, | Three Months ended March 31, | ||||||||||||||||||||
|---|---|---|---|---|---|---|---|---|---|---|---|---|---|---|---|---|---|---|---|---|---|---|
| | 2007(1)(2) | 2008(1)(2) | 2009(1)(2) | 2010(1)(2)(4) | 2011 | 2011(1)(2) | 2012 | |||||||||||||||
| | (U.S. dollars in thousands) | |||||||||||||||||||||
Income Statement Data | ||||||||||||||||||||||
Revenues | ||||||||||||||||||||||
Lease revenue | $ | 495,340 | $ | 541,455 | $ | 581,134 | $ | 902,320 | $ | 1,050,536 | $ | 257,242 | $ | 252,738 | ||||||||
Net gain (loss) on sale of assets | 103,455 | 77,107 | 40,243 | 36,204 | 9,284 | (1,315 | ) | (219 | ) | |||||||||||||
Management fee revenue | 14,343 | 11,749 | 12,964 | 12,975 | 19,059 | 5,148 | 4,530 | |||||||||||||||
Interest revenue | 28,595 | 18,018 | 9,459 | 3,913 | 2,761 | 580 | 622 | |||||||||||||||
Other revenue | 20,079 | 4,113 | 3,692 | 3,866 | 12,283 | 2,456 | 229 | |||||||||||||||
Total revenues | 661,812 | 652,442 | 647,492 | 959,278 | 1,093,923 | 264,111 | 257,900 | |||||||||||||||
Expenses | ||||||||||||||||||||||
Depreciation | 129,294 | 154,130 | 194,161 | 307,706 | 361,210 | 90,425 | 89,028 | |||||||||||||||
Asset impairment | — | 5,282 | 18,833 | 10,905 | 15,594 | 7,749 | — | |||||||||||||||
Interest on debt | 227,765 | 208,914 | 86,193 | 233,985 | 292,486 | 58,701 | 63,967 | |||||||||||||||
Other expenses | 33,941 | 59,843 | 68,067 | 67,829 | 73,836 | 14,108 | 20,999 | |||||||||||||||
Selling, general and administrative expenses(3) | 79,598 | 85,630 | 76,628 | 80,627 | 120,746 | 16,834 | 16,328 | |||||||||||||||
Total expenses | 470,598 | 513,799 | 443,882 | 701,052 | 863,872 | 187,817 | 190,322 | |||||||||||||||
Income from continuing operations before income taxes and income of investments accounted for under the equity method | 191,214 | 138,643 | 203,610 | 258,226 | 230,051 | 76,294 | 67,578 | |||||||||||||||
Provision for income taxes | (17,080 | ) | 833 | (953 | ) | (22,194 | ) | (15,460 | ) | (5,773 | ) | (5,878 | ) | |||||||||
Net income of investments accounted for under the equity method | — | — | 983 | 3,713 | 10,904 | 2,654 | 2,737 | |||||||||||||||
Net income from continuing operations | 174,134 | 139,476 | 203,640 | 239,745 | 225,495 | 73,175 | 64,437 | |||||||||||||||
Income (loss) from discontinued operations (AeroTurbine, Inc., including loss on disposal), net of tax | 13,164 | 1,447 | 2,731 | (3,199 | ) | (52,745 | ) | (646 | ) | — | ||||||||||||
Bargain purchase gain ("Amalgamation gain"), net of transaction expenses | — | — | — | 274 | — | — | — | |||||||||||||||
Net income | $ | 187,298 | $ | 140,923 | $ | 206,371 | $ | 236,820 | $ | 172,750 | $ | 72,529 | $ | 64,437 | ||||||||
Net loss (income) attributable to non-controlling interest, net of tax | 1,155 | 10,883 | (41,205 | ) | (29,247 | ) | (526 | ) | (440 | ) | 573 | |||||||||||
Net income attributable to AerCap Holdings N.V. | $ | 188,453 | $ | 151,806 | $ | 165,166 | $ | 207,573 | $ | 172,224 | $ | 72,089 | $ | 65,010 | ||||||||
7
| | As of December 31, | As of March 31, | ||||||||||||||||||||
|---|---|---|---|---|---|---|---|---|---|---|---|---|---|---|---|---|---|---|---|---|---|---|
| | 2007 | 2008 | 2009 | 2010 | 2011 | 2011 | 2012 | |||||||||||||||
| | (U.S. dollars in thousands) | |||||||||||||||||||||
Balance Sheet Data | ||||||||||||||||||||||
Assets | ||||||||||||||||||||||
Cash and cash equivalents | $ | 241,736 | $ | 193,563 | $ | 182,617 | $ | 404,450 | $ | 411,081 | $ | 322,450 | $ | 424,694 | ||||||||
Restricted cash | 95,072 | 113,397 | 140,746 | 222,464 | 237,325 | 210,134 | 303,652 | |||||||||||||||
Cash and cash equivalents including restricted cash | 336,808 | 306,960 | 323,363 | 626,914 | 648,406 | 532,584 | 728,346 | |||||||||||||||
Flight equipment held for operating leases, net | 3,050,160 | 3,989,629 | 5,230,437 | 8,061,260 | 7,895,874 | 8,366,553 | 7,974,747 | |||||||||||||||
Notes receivable, net of provisions | 184,820 | 134,067 | 138,488 | 15,497 | 5,200 | 18,153 | 4,282 | |||||||||||||||
Prepayments on flight equipment | 247,839 | 448,945 | 527,666 | 199,417 | 95,619 | 130,784 | 102,741 | |||||||||||||||
Other assets | 574,600 | 531,225 | 549,547 | 697,519 | 462,533 | 740,981 | 445,783 | |||||||||||||||
Total assets | $ | 4,394,227 | $ | 5,410,826 | $ | 6,769,501 | $ | 9,600,607 | $ | 9,107,632 | $ | 9,789,055 | $ | 9,255,899 | ||||||||
Debt | 2,892,744 | 3,790,487 | 4,846,664 | 6,566,163 | 6,111,165 | 6,731,055 | 6,176,754 | |||||||||||||||
Other liabilities | 520,328 | 494,284 | 509,505 | 817,047 | 713,150 | 765,319 | 730,679 | |||||||||||||||
Total liabilities | 3,413,072 | 4,284,771 | 5,356,169 | 7,383,210 | 6,824,315 | 7,496,374 | 6,907,433 | |||||||||||||||
AerCap Holdings N.V. shareholders' equity | 950,373 | 1,109,037 | 1,258,009 | 2,211,350 | 2,277,236 | 2,286,194 | 2,342,958 | |||||||||||||||
Non-controlling interest | 30,782 | 17,018 | 155,323 | 6,047 | 6,081 | 6,487 | 5,508 | |||||||||||||||
Total equity | 981,155 | 1,126,055 | 1,413,332 | 2,217,397 | 2,283,317 | 2,292,681 | 2,348,466 | |||||||||||||||
Total liabilities and equity | $ | 4,394,227 | $ | 5,410,826 | $ | 6,769,501 | $ | 9,600,607 | $ | 9,107,632 | $ | 9,789,055 | $ | 9,255,899 | ||||||||
| | As of or for the year ended December 31, | As of or for the three months ended March 31, | ||||||||||||||||||||
|---|---|---|---|---|---|---|---|---|---|---|---|---|---|---|---|---|---|---|---|---|---|---|
| | 2007 | 2008 | 2009 | 2010 | 2011 | 2011 | 2012 | |||||||||||||||
| | (U.S. dollars in thousands except ratios and percentages) | |||||||||||||||||||||
Other Financial Data | ||||||||||||||||||||||
EBITDA(5) | 545,315 | 507,170 | 493,707 | 818,948 | 906,186 | 231,677 | 225,467 | |||||||||||||||
Adjusted EBITDA(5) | 555,966 | 519,028 | 515,526 | 832,728 | 952,439 | 240,644 | 226,932 | |||||||||||||||
Net Interest Margin(6) | 270,645 | 325,029 | 431,871 | 633,751 | 718,209 | 180,197 | 174,493 | |||||||||||||||
Total Debt to Shareholders' Equity | 3.0x | 3.4x | 3.9x | 3.0x | 2.7x | 2.9x | 2.6x | |||||||||||||||
Ratio of Adjusted EBITDA to Fixed Charges | ||||||||||||||||||||||
Fixed Charges: | ||||||||||||||||||||||
Interest expense | $ | 227,765 | $ | 208,914 | $ | 86,193 | $ | 233,985 | $ | 292,486 | $ | 58,701 | $ | 63,967 | ||||||||
Amortization of deferred financing fees | (9,713 | ) | (15,234 | ) | (16,363 | ) | (24,144 | ) | (30,243 | ) | (6,804 | ) | (7,115 | ) | ||||||||
Mark-to-market (expense) income of interest rate caps | (14,433 | ) | (56,416 | ) | 23,527 | (27,327 | ) | (59,311 | ) | (1,714 | ) | (3,296 | ) | |||||||||
Extinguishment of debt | (27,402 | ) | — | — | — | — | — | — | ||||||||||||||
Total fixed charges | $ | 176,217 | $ | 137,264 | $ | 93,357 | $ | 182,514 | $ | 202,932 | $ | 50,183 | $ | 53,556 | ||||||||
Ratio of Adjusted EBITDA to Fixed Charges | 3.2x | 3.8x | 5.5x | 4.6x | 4.7x | 4.8x | 4.2x | |||||||||||||||
Aircraft Utilization | ||||||||||||||||||||||
Aircraft Utilization(7) | 98.9 | % | 97.7 | % | 98.1 | % | 98.3 | % | 98.5 | % | 99.3 | % | 98.2 | % | ||||||||
- (1)
- As a result of the sale of AeroTurbine, Inc. and based on ASC 205-20, which governs financial statements for discontinued operations, the results of AeroTurbine, Inc. have been reclassified to discontinued operations.
- (2)
- Certain reclassifications have been made to prior years' consolidated income statements to reflect the current year presentation. See footnote 1 in the financial statements included in the 2011 Form 20-F.
- (3)
- Includes share based compensation of $10.7 million ($9.4 million, net of tax), $6.6 million ($5.8 million, net of tax), $3.0 million ($2.6 million, net of tax), $2.9 million ($2.5 million, net of tax) and $6.2 million ($5.4 million, net of tax) in the years ended December 31, 2007, 2008, 2009, 2010 and 2011 respectively.
- (4)
- Includes the results of Genesis Lease Limited for the period from March 25, 2010 (date of acquisition) to December 31, 2010.
- (5)
- We define EBITDA as net income before depreciation, amortization of net lease premiums (discounts) and lease incentives, interest, provision for income tax and discontinued operations. We define Adjusted EBITDA as EBITDA after share based payment expenses, asset impairment and contract termination expenses. We use EBITDA and Adjusted EBITDA to assess our consolidated financial and operating performance, and we believe these non-U.S. GAAP measures are helpful in identifying trends in our performance. These measures provide an assessment of controllable revenue and expenses and
8
enhance management's ability to make decisions with respect to resource allocation and whether we are meeting established financial goals.
- EBITDA and Adjusted EBITDA assist us in comparing our operating performance in different periods without the impact of our capital structure (primarily interest charges on our outstanding debt) and non-cash expenses related to our long-lived asset base (primarily depreciation and amortization) on our operating results. Accordingly, EBITDA measures our financial performance based on operational factors that management believes will impact, in the short-term, our cost structure or expenses, and on a more medium-term basis, our revenues. Adjusted EBITDA measures our financial performance in light of certain recurring expenses. EBITDA and Adjusted EBITDA have limitations as analytical tools and should not be viewed in isolation. EBITDA and Adjusted EBITDA are measures of operating performance that are not calculated in accordance with U.S. GAAP. EBITDA and Adjusted EBITDA should not be considered substitutes for net income, income from operations or cash flows provided by or used in operations, as determined in accordance with U.S. GAAP.
- The table below shows the reconciliation of net income to EBITDA and Adjusted EBITDA for the years ended December 31, 2007, 2008, 2009, 2010 and 2011 and for the three months ended March 31, 2011 and 2012.
| | Year ended December 31, | Three months ended March 31, | ||||||||||||||||||||
|---|---|---|---|---|---|---|---|---|---|---|---|---|---|---|---|---|---|---|---|---|---|---|
| | 2007 | 2008 | 2009 | 2010 | 2011 | 2011 | 2012 | |||||||||||||||
| | (U.S. dollars in thousands) | |||||||||||||||||||||
Net income | $ | 187,298 | $ | 140,923 | $ | 206,371 | $ | 236,820 | $ | 172,750 | $ | 72,529 | $ | 64,437 | ||||||||
Depreciation | 129,294 | 154,130 | 194,161 | 307,706 | 361,210 | 90,425 | 89,028 | |||||||||||||||
Amortization of net lease premiums (discounts) and lease incentives | (2,958 | ) | 5,483 | 8,760 | 15,044 | 11,535 | 3,603 | 2,157 | ||||||||||||||
Interest | 227,765 | 208,914 | 86,193 | 233,985 | 292,486 | 58,701 | 63,967 | |||||||||||||||
Income tax provision | 17,080 | (833 | ) | 953 | 22,194 | 15,460 | 5,773 | 5,878 | ||||||||||||||
Discontinued operations, net of income taxes | (13,164 | ) | (1,447 | ) | (2,731 | ) | 3,199 | 52,745 | 646 | — | ||||||||||||
EBITDA | 545,315 | 507,170 | 493,707 | 818,948 | 906,186 | 231,677 | 225,467 | |||||||||||||||
Share-based payment expense | 10,651 | 6,576 | 2,986 | 2,875 | 6,159 | 1,218 | 1,465 | |||||||||||||||
Asset impairment | — | 5,282 | 18,833 | 10,905 | 15,594 | 7,749 | — | |||||||||||||||
Contract termination expense | — | — | — | — | 24,500 | — | — | |||||||||||||||
Adjusted EBITDA | $ | 555,966 | $ | 519,028 | $ | 515,526 | $ | 832,728 | $ | 952,439 | $ | 240,644 | $ | 226,932 | ||||||||
- (6)
- Net interest margin or net spread is the difference between basic lease rents and interest expense excluding the impact from the mark-to-market of interest rate caps and non-recurring charges. We believe this measure may further assist investors in their understanding of the changes and trends related to the earnings of our leasing activities. This measure reflects the impact from changes in the number of aircraft leased, lease rates and utilization rates, as well as the impact from the use of interest rate caps instead of swaps to hedge our interest rate risk. The following is a reconciliation of net spread to basic rents for the years ended December 31, 2007, 2008, 2009, 2010 and 2011 and for the three months ended March 31, 2011 and 2012:
| | Year ended December 31, | Three months ended March 31, | ||||||||||||||||||||
|---|---|---|---|---|---|---|---|---|---|---|---|---|---|---|---|---|---|---|---|---|---|---|
| | 2007 | 2008 | 2009 | 2010 | 2011 | 2011 | 2012 | |||||||||||||||
| | (U.S. dollars in thousands) | | | |||||||||||||||||||
Basic rents | $ | 456,575 | $ | 477,527 | $ | 541,591 | $ | 840,409 | $ | 951,384 | $ | 237,184 | $ | 235,164 | ||||||||
Interest on debt | 227,765 | 208,914 | 86,193 | 233,985 | 292,486 | 58,701 | 63,967 | |||||||||||||||
Plus: mark-to-market of interest rate caps | (14,433 | ) | (56,416 | ) | 23,527 | (27,327 | ) | (59,311 | ) | (1,714 | ) | (3,296 | ) | |||||||||
Less: Non-recurring charges from refinancing of securitized bonds | (27,402 | ) | — | — | — | — | — | — | ||||||||||||||
Interest on debt excluding the impact of mark-to-market of interest rate caps and non-recurring charges from refinancing of securitized bonds | 185,930 | 152,498 | 109,720 | 206,658 | 233,175 | 56,987 | 60,671 | |||||||||||||||
Net Interest Margin | $ | 270,645 | $ | 325,029 | $ | 431,871 | $ | 633,751 | $ | 718,209 | $ | 180,197 | $ | 174,493 | ||||||||
- (7)
- Our aircraft utilization rate is calculated based on the average number of months the aircraft are on lease each period. The aircraft utilization rate is weighted proportionate to the net book value of the aircraft at the end of the period measured.
9
Our Company
Our Strengths
Our Strategy
Aircraft Portfolio
Aircraft Transactions
SUMMARY CONSOLIDATED FINANCIAL AND OPERATING DATA