UNITED STATES
SECURITIES AND EXCHANGE COMMISSION
Washington, D.C. 20549
FORM N-CSR
CERTIFIED SHAREHOLDER REPORT OF REGISTERED
MANAGEMENT INVESTMENT COMPANIES
Investment Company Act file number 811-21977
Invesco Exchange-Traded Fund Trust II
(Exact name of registrant as specified in charter)
3500 Lacey Road
Downers Grove, IL 60515
(Address of principal executive offices) (Zip code)
Anna Paglia
President
3500 Lacey Road
Downers Grove, IL 60515
(Name and address of agent for service)
Registrant’s telephone number, including area code: 800-983-0903
Date of fiscal year end: August 31
Date of reporting period: August 31, 2020
Form N-CSR is to be used by management investment companies to file reports with the Commission not later than 10 days after the transmission to stockholders of any report that is required to be transmitted to stockholders under Rule 30e-1 under the Investment Company Act of 1940 (17 CFR 270.30e-1). The Commission may use the information provided on Form N-CSR in its regulatory, disclosure review, inspection, and policymaking roles.
A registrant is required to disclose the information specified by Form N-CSR, and the Commission will make this information public. A registrant is not required to respond to the collection of information contained in Form N-CSR unless the Form displays a currently valid Office of Management and Budget (“OMB”) control number. Please direct comments concerning the accuracy of the information collection burden estimate and any suggestions for reducing the burden to Secretary, Securities and Exchange Commission, 450 Fifth Street, NW, Washington, DC 20549-0609. The OMB has reviewed this collection of information under the clearance requirements of 44 U.S.C. § 3507.
Item 1. Reports to Stockholders.
The Registrant’s annual report transmitted to shareholders pursuant to Rule 30e-1 under the Investment Company Act of 1940 is as follows:
| | |
 | | |
| | Invesco Annual Report to Shareholders August 31, 2020 BKLN Invesco Senior Loan ETF |
Beginning on January 1, 2021, as permitted by regulations adopted by the Securities and Exchange Commission, paper copies of the Fund’s shareholder reports will no longer be sent by mail, unless you specifically request paper copies of the reports from your financial intermediary, such as a broker-dealer or bank. Instead, the reports will be made available on a website, and you will be notified by mail each time a report is posted and provided with a website link to access the report.
If you already elected to receive shareholder reports electronically, you will not be affected by this change and you need not take any action. If you hold accounts through a financial intermediary, you may contact your financial intermediary to enroll in electronic delivery. Please note that not all financial intermediaries may offer this service.
You may elect to receive all future reports in paper free of charge. If you hold accounts through a financial intermediary, you can follow the instructions included with this disclosure, if applicable, or contact your financial intermediary to request that you continue to receive paper copies of your shareholder reports. Please note that not all financial intermediaries may offer this service. Your election to receive reports in paper will apply to all funds held with your financial intermediary.

Table of Contents
The Market Environment
Bank Loans
During the fiscal year, the senior loan market was characterized by a sharp sell-off as the coronavirus (COVID-19) roiled capital markets. This risk-off sentiment was quickly followed by investor optimism that resulted in a similarly sharp rebound in the asset class. On a relative basis, senior loans exhibited less volatility than other leveraged credit asset classes. Senior loans returned 0.57% as represented by the Credit Suisse Leveraged Loan Index.1
COVID-19’s impact on capital markets resulted in a historically challenging first quarter of 2020. However, the initial sharp sell-off across risk assets was met by a remarkable recovery in the following months. Though unnerved by the unpredictable path of COVID-19, investors became increasingly willing to look beyond short-term disruptions for companies they expected to survive the pandemic-induced demand shock, once the initial adverse reaction passed. Moreover, investors took solace in the collective policy responses of the US Federal Reserve (“the Fed”) and Congress to mitigate the aftershocks of shutting down the economy. Themes of performance dispersion in the loan market based on credit rating and industry remained prevalent throughout the initial sell-off and the subsequent rebound. During the fiscal year BB-, B- and CCC-rated loans returned -0.29%, 1.86% and -6.26%, respectively.1 Food and drug was the best performing industry returning 17.33% for the fiscal year, while energy was the worst performing industry returning -16.05% .1
Going forward, we expect COVID-19 and the uncertainty associated with the virus to continue to sway capital markets. Both good news (vaccination breakthroughs) as well as negative news (resurgence in cases) will likely impact capital markets in the near term.
From a fundamentals standpoint, prior to COVID-19 the loan market continued to be on relatively solid footing. However, the economic shutdown as a result of the virus negatively impacted fundamentals as expected. As of August 31, 2020, the 12-month default rate was 4.08% 2, exceeding the long-term average of approximately 3%. Because defaults are a lagging indicator of credit stress, the default rate is likely to trend higher as a number of issuers face difficult operating conditions and over-levered balance sheets. Given these developments, support signals from policy makers at the Fed and in Congress will continue to play an outsized role in market sentiment and, relatedly, the default outlook.
The average price in the senior loan market was $92.33 as of August 31, 2020, with 2.09% of the market trading above par.1Given the price of senior loans at the end of the fiscal year, they provided a 6.13% yield.1
| 1 | Source: Credit Suisse Leveraged Loan Index August 31, 2020 |
| 2 | Source: S&P/LSTA Leveraged Loan Index August 31, 2020 |
Fixed Income
At the beginning of the fiscal year, despite US and China trade tensions, potential for new tariffs, and weakening global economic growth, US economic data remained supportive of slow but continued domestic economic expansion as 2019 third and fourth quarter gross domestic product grew at approximately 2.50% .1 The US economy continued to add jobs, stabilizing the unemployment rate to 3.50% at the close of 2019, while inflation remained subdued.2 In response to third quarter economic weakness, the US Federal Reserve (“the Fed”) maintained accommodative policies, cutting the federal funds target rate from a range of 2.00% to 2.25% at the start of the fiscal year to a range of 1.50% to 1.75% at the close of 2019.3 Despite the UK’s general election in December, which delivered a decisive victory to the conservative party, reaffirming the original Brexit vote and the UK’s eventual exit from the European Union, macroeconomic and geopolitical issues mostly abated during the fourth quarter of 2019, providing a favorable backdrop for continued US growth.
Fixed income markets started 2020 buoyed by positive economic data and the signing of the phase one US-China trade deal. However, initial optimism was dampened by the outbreak of the new coronavirus (COVID-19) that swiftly spread from China to other global regions. Global markets fell sharply as the human and economic cost of the COVID-19 pandemic mounted. As fear of a worldwide recession increased, the Fed took aggressive action to support both the domestic and global economy by slashing rates to a range of 0.00% to 0.25% .3 The unemployment rate reached a peak of 14.7% 2 while real gross domestic product decreased at an annual rate of 31.7% 1 (second estimate) in the second quarter of 2020.
Despite the continuing global spread of COVID-19, many countries achieved some success in controlling the spread and were able to slowly re-open their economies. Global equity markets benefited from government policy responses to the crisis, which were swift and encouraging. Many economies received fiscal stimulus and very significant monetary stimulus. The massive monetary policy response created an environment in which investors embraced risk, and stocks rose globally after a deep rout in the first quarter. In this environment, the broader bond market, both developed and emerging, ended the fiscal year in positive territory.
The 10-year US Treasury yield continued to decline at the start of the fiscal year as the Fed adopted a more dovish stance and continued geopolitical uncertainty forced investors to seek higher quality fixed income instruments. Elevated volatility levels due to the COVID-19 pandemic and ensuing global recession led to a severe “risk-off” tone in the markets driving Treasury yields even lower. The 10-year US Treasury yield ended the fiscal year at 0.68%, 82 basis points lower than at the beginning of the fiscal year.4 (A basis point is one one-hundredth of a percentage point.)
The Market Environment (continued)
Fixed Income (continued)
The broader bond market, as represented by the Bloomberg Barclays U.S. Aggregate Bond Index, gained 6.47% for the fiscal year. The strong performance by the index was largely attributable to the sharp decline in US Treasury yields as well as a rally in spread sector assets. The four primary sectors of the Bloomberg Barclays U.S. Aggregate Bond Index-government related, corporate, securitized and treasury-posted positive returns for the fiscal year.
| 1 | Source: Bureau of Economic Analysis |
| 2 | Source: Bureau of Labor Statistics |
| 3 | Source: US Federal Reserve |
| 4 | Source: US Department of the Treasury |
| | |
 | | Management’s Discussion of Fund Performance Invesco Senior Loan ETF (BKLN) |
As an index fund, the Invesco Senior Loan ETF (the “Fund”) is passively managed and seeks to track the investment results (before fees and expenses) of the S&P/LSTA U.S. Leveraged Loan 100 Index (the “Index”). The Fund generally will invest at least 80% of its total assets in senior loans that comprise the Index.
The Fund’s adviser, Invesco Capital Management LLC, and the Fund’s sub-adviser, Invesco Senior Secured Management, Inc., define senior loans to include leveraged loans, bank loans and/or floating rate loans. Banks and other lending institutions generally issue senior loans to corporations, partnerships or other entities (“borrowers”). These borrowers operate in a variety of industries and geographic regions, including foreign countries.
S&P Dow Jones Indices LLC (the “Index Provider”) compiles, maintains and calculates the Index, which tracks the market value weighted performance of the largest institutional leveraged loans based on market weightings, spreads and interest payments. Leveraged loans must be denominated in U.S. dollars and must have a minimum par amount of $50 million to be eligible for inclusion in the Index. A leveraged loan is rated below investment grade quality or is unrated but deemed to be of comparable quality. The Fund will invest in loans that are expected to be below investment grade quality and to bear interest at a floating rate that periodically resets. The Index may include, and the Fund may acquire and retain, loans of borrowers that are in default. The Fund does not purchase all of the securities in the Index; instead, the Fund utilizes a “sampling” methodology to seek to achieve its investment objective.
For the fiscal year ended August 31, 2020, on a market price basis, the Fund returned 1.05%. On a net asset value (“NAV”) basis, the Fund returned 0.66%. During the same time period, the Index returned 2.39%. The Fund’s performance, on a NAV basis, differed from the return of the Index primarily due to fees and operating expenses incurred by the Fund during the period, which was partially offset by a positive impact from the Fund’s sampling methodology. The Fund’s allocation to cash to manage liquidity, as needed, also resulted in a drag on overall performance.
During this same time period, the S&P/LSTA Leveraged Loan Index (the “Benchmark Index”) returned 0.89%. The Benchmark Index is an unmanaged index weighted by market capitalization based on the average performance of approximately 1,500 securities. The Benchmark Index was selected for its recognition in the marketplace, and its performance comparison is a useful measure for investors as a broad representation of the U.S investment-grade, fixed-rate bond market.
The majority of the Fund’s underperformance, on a NAV basis, relative to the Benchmark Index during the period can be attributed to the Fund’s fees and operating expenses. These were partially offset by the positive effects of the higher average credit quality of the Fund’s holdings versus those of the Benchmark Index.
For the fiscal year ended August 31, 2020, the technology industry contributed most significantly to the Fund’s return, followed by the healthcare and materials industries. The energy industry detracted most significantly from the Fund’s return, followed by the consumer discretionary industry.
Positions that contributed most significantly to the Fund’s return for the fiscal year ended August 31, 2020, included Bass Pro Group LLC., Term Loan, a retail company (portfolio average weight of 1.24%), and AkzoNobel Specialty Chemicals, First Lien Term Loan B, a chemicals company (no longer held at fiscal year-end). Positions that detracted most significantly from the Fund’s return included McDermott International, Inc., Term Loan B, an oil & gas services & equipment company (no longer held at fiscal year-end), and Seadrill Operating L.P., Term Loan, an energy equipment & services company (portfolio average weight of 0.27%).
Credit Quality Rating Breakdown*
(% of the Fund’s Net Assets) as of
August 31, 2020
| | | | | | |
Baa2 | | | 1.56 | | | |
Baa3 | | | 7.86 | | | |
Ba1 | | | 6.58 | | | |
Ba2 | | | 7.82 | | | |
Ba3 | | | 14.12 | | | |
B1 | | | 25.97 | | | |
B2 | | | 21.16 | | | |
B3 | | | 7.23 | | | |
Caa1 | | | 1.92 | | | |
Caa2 | | | 0.55 | | | |
Caa3 | | | 0.10 | | | |
| Money Market Fund Plus Other Assets Less Liabilities | | | 5.13 | | | |
| * | Source: Moody’s. A credit rating is an assessment provided by a nationally recognized statistical rating organization (NRSRO) of the creditworthiness of an issuer with respect to debt obligations, including specific securities, money market instruments or other debts. Ratings are measured on a scale that generally ranges from Aaa (highest) to C (lowest); ratings are subject to change without notice. “Non-Rated” indicates the debtor was not rated, and should not be interpreted as indicating low quality. For more information on Moody’s rating methodology, please visit moodys.com and select “Rating Methodologies” under Research and Ratings on the homepage. |
Invesco Senior Loan ETF (BKLN) (continued)
Top Ten Fund Holdings* (% of the Fund’s Net Assets)
as of August 31, 2020
| | | | | | |
| | | |
Security | | | | | | |
| | |
Refinitiv US Holdings, Inc., Term Loan, 3.41%, 10/01/2025 | | | 1.87 | | | |
New Red Finance, Inc., Term Loan B-4, 1.91%, 11/19/2026 | | | 1.70 | | | |
Charter Communications Operating LLC, Term Loan B-2, 1.91%, 02/01/2027 | | | 1.63 | | | |
CenturyLink, Inc., Term Loan B, 2.41%, 03/15/2027 | | | 1.60 | | | |
Asurion LLC, Term Loan B-6, 3.16%, 11/03/2023 | | | 1.57 | | | |
Western Digital Corp., Term Loan A-1, 1.66%, 02/27/2023 | | | 1.56 | | | |
Zayo Group LLC, Term Loan, 3.16%, 02/20/2027 | | | 1.55 | | | |
Dell International LLC, Term Loan B-1, 2.75%, 09/19/2025 | | | 1.51 | | | |
TransDigm, Inc., Term Loan F, 2.41%, 12/09/2025 | | | 1.41 | | | |
Berry Global, Inc., Term Loan Y, 2.16%, 07/01/2026 | | | 1.40 | | | |
Total | | | 15.80 | | | |
| * | Excluding money market fund holdings. |
Growth of a $10,000 Investment Since Inception
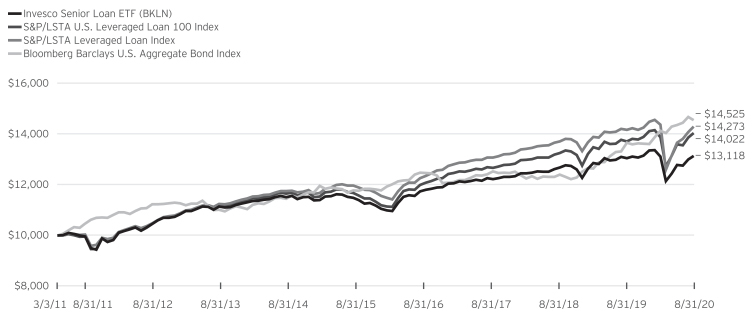
Fund Performance History as of August 31, 2020
| | | | | | | | | | | | | | | | | | | | | | | | | | | | | | | | |
| | | | | | | | | | | | | | | | | | | | | Fund Inception | |
Index | | 1 Year | | | 3 Years Average Annualized | | | 3 Years Cumulative | | | 5 Years Average Annualized | | | 5 Years Cumulative | | | | | | Average Annualized | | | Cumulative | |
|
|
S&P/LSTA U.S. Leveraged Loan 100 Index | | | 2.39 | % | | | 3.47 | % | | | 10.79 | % | | | 3.93 | % | | | 21.29 | % | | | | | | | 3.63 | % | | | 40.22 | % |
S&P/LSTA Leveraged Loan Index | | | 0.89 | | | | 3.02 | | | | 9.34 | | | | 3.74 | | | | 20.17 | | | | | | | | 3.82 | | | | 42.73 | |
Bloomberg Barclays U.S. Aggregate Bond Index | | | 6.47 | | | | 5.09 | | | | 16.07 | | | | 4.33 | | | | 23.60 | | | | | | | | 4.01 | | | | 45.25 | |
Fund | | | | | | | | | | | | | | | | | �� | | | | | | | | | | | | | | | |
NAV Return | | | 0.66 | | | | 2.41 | | | | 7.41 | | | | 2.86 | | | | 15.13 | | | | | | | | 2.90 | | | | 31.18 | |
Market Price Return | | | 1.05 | | | | 2.53 | | | | 7.80 | | | | 3.00 | | | | 15.93 | | | | | | | | 2.88 | | | | 30.99 | |
Invesco Senior Loan ETF (BKLN) (continued)
Fund Inception: March 3, 2011
Performance quoted above represents past performance. Past performance is not a guarantee of future results and current performance may be higher or lower than performance quoted. Investment returns and principal value will fluctuate, and shares of the Fund (“Fund Shares”), when redeemed or sold, may be worth more or less than their original cost. Fund performance reflects any applicable fee waivers and/or expense reimbursements. Had the adviser not waived fees and/or reimbursed expenses currently or in the past, returns would have been lower. See the current prospectus for more information. The adviser has contractually agreed to waive fees and/or pay certain Fund expenses through August 31, 2022. According to the Fund’s current prospectus, the Fund’s expense ratio of 0.66% (0.65% after fee waiver) includes the unitary management fee of 0.65% and acquired fund fees and expenses of 0.01% . NAV and Market Price returns assume that dividends and capital gain distributions have been reinvested in the Fund at NAV and Market Price, respectively. The returns shown in the table above do not reflect the deduction of taxes that a shareholder would pay on Fund distributions or the redemption or sale of Fund Shares. See invesco.com/ETFs to find the most recent month-end performance numbers.
Index and Benchmark Index performance results are based upon a hypothetical investment in their respective constituent securities. Index and Benchmark Index returns do not represent Fund returns. An investor cannot invest directly in an index. The Index and Benchmark Index do not charge management fees or brokerage expenses, and no such fees or expenses were deducted from the hypothetical performance shown. In addition, the results actual investors might have achieved would have differed from those shown because of differences in the timing, amounts of their investments, and fees and expenses associated with an investment in the Fund.
Notes Regarding Indexes and Fund Performance History:
| - | Average Annualized and Cumulative Inception returns for the Fund, Index and Benchmark Index are based on the inception date of the Fund. |
| - | Effective June 26, 2020, the Fund changed its designated broad based securities market benchmark index from the Bloomberg Barclays U.S. Aggregate Bond Index to the Benchmark Index, as the Benchmark Index more closely reflects the performance of the types of securities in which the Fund invests. |
Liquidity Risk Management Program
The Securities and Exchange Commission (“SEC”) has adopted Rule 22e-4 under the Investment Company Act of 1940 (the “Liquidity Rule”) in order to promote effective liquidity risk management throughout the open-end investment company industry, thereby reducing the risk that funds will be unable to meet their redemption obligations and mitigating dilution of the interests of fund shareholders. The Fund has adopted and implemented a liquidity risk management program in accordance with the Liquidity Rule (the “Program”). The Program is reasonably designed to assess and manage the Fund’s liquidity risk, which is the risk that the Fund could not meet redemption requests without significant dilution of remaining investors’ interests in the Fund. The Board of Trustees of the Fund (the “Board”) has appointed Invesco Capital Management LLC (“Invesco”), the Fund’s investment adviser, as the Program’s administrator, and Invesco has delegated oversight of the Program to the Liquidity Risk Management Committee (the “Committee”), which is composed of senior representatives from relevant business groups at Invesco and its affiliates.
As required by the Liquidity Rule, the Program includes policies and procedures providing for an assessment, no less frequently than annually, of the Fund’s liquidity risk that takes into account, as relevant to the Fund’s liquidity risk: (1) the Fund’s investment strategy and liquidity of portfolio investments during both normal and reasonably foreseeable stressed conditions; (2) short-term and long-term cash flow projections for the Fund during both normal and reasonably foreseeable stressed conditions; (3) the Fund’s holdings of cash and cash equivalents and any borrowing arrangements, including the terms of the Fund’s credit facility and the financial health of the institution providing the credit facility; (4) the relationship between the Fund’s portfolio liquidity and the way in which, and the prices and spreads at which, Fund shares trade, including the efficiency of the arbitrage function and the level of active participation by market participants, including authorized participants; and (5) the effect of the composition of baskets on the overall liquidity of the Fund’s portfolio. The Liquidity Rule also requires the classification of the Fund’s investments into categories that reflect the assessment of their relative liquidity under current market conditions. The Fund classifies its investments into one of four of the following categories defined in the Liquidity Rule: “Highly Liquid,” “Moderately Liquid,” “Less Liquid” and “Illiquid.” Funds that are not invested primarily in “Highly Liquid Investments” that are assets (cash or investments that are reasonably expected to be convertible into cash within three business days without significantly changing the market value of the investment) are required to establish a “Highly Liquid Investment Minimum” (“HLIM”), which is the minimum percentage of net assets that must be invested in Highly Liquid Investments. Funds with HLIMs have procedures for addressing HLIM shortfalls, including reporting to the Board and the SEC (on a non-public basis) as required by the Program and the Liquidity Rule. In addition, the Fund may not acquire an investment if, immediately after the acquisition, over 15% of the Fund’s net assets would consist of “Illiquid Investments” that are assets (an investment that cannot reasonably be expected to be sold or disposed of in current market conditions in seven calendar days or less without the sale or disposition significantly changing the market value of the investment). The Liquidity Rule and the Program also require reporting to the Board and the SEC (on a non-public basis) if a Fund’s holdings of Illiquid Investments exceed 15% of the Fund’s assets.
At a meeting held on March 12, 2020, the Committee presented a report to the Board that addressed the operation of the Program and assessed the Program’s adequacy and effectiveness of implementation (the “Report”). The Report covered the period from December 1, 2018 through December 31, 2019 (the “Program Reporting Period”).
The Report stated, in relevant part, that during the Program Reporting Period:
| | • | | The Program, as adopted and implemented, remained reasonably designed to assess and manage the Fund’s liquidity risk and was operated effectively to achieve that goal; |
| | • | | The Fund’s investment strategy remained appropriate for an open-end fund; |
| | • | | The Fund was able to meet requests for redemption without significant dilution of remaining investors’ interests in the Fund; |
| | • | | The Fund did not breach the 15% limit on Illiquid Investments; and |
| | • | | The Committee had established an HLIM for the Fund and the Fund complied with its HLIM. |
Invesco Senior Loan ETF (BKLN)
August 31, 2020
Schedule of Investments
| | | | | | | | | | | | | | | | |
| | | Interest
Rate | | | Maturity
Date | | | Principal
Amount
(000) | | | Value | |
|
|
Variable Rate Senior Loan Interests-92.49%(a)(b) | | | | | | | | | | | | | | | | |
Aerospace & Defense-1.52% | | | | | | | | | | | | | | | | |
TransDigm, Inc. | | | | | | | | | | | | | | | | |
Term Loan E (1 mo. USD LIBOR + 2.25%) | | | 2.41 | % | | | 05/30/2025 | | | $ | 5,120 | | | $ | 4,871,950 | |
Term Loan F (1 mo. USD LIBOR + 2.25%) | | | 2.41 | % | | | 12/09/2025 | | | | 66,893 | | | | 63,616,638 | |
| | | | | | | | | | | | | | | | |
| | | | | | | | | | | | | | | 68,488,588 | |
| | | | | | | | | | | | | | | | |
Air Transport-0.45% | | | | | | | | | | | | | | | | |
Mileage Plus Holdings LLC/Mileage Plus Intellectual Property Assets Ltd., Term Loan
(3 mo. USD LIBOR + 5.25%) | | | 6.25 | % | | | 06/21/2027 | | | | 19,909 | | | | 20,151,363 | |
| | | | | | | | | | | | | | | | |
Automotive-1.30% | | | | | | | | | | | | | | | | |
Panther BF Aggregator 2 L.P., Term Loan (Canada) (1 mo. USD LIBOR + 3.50%) | | | 3.66 | % | | | 04/30/2026 | | | | 59,358 | | | | 58,356,596 | |
| | | | | | | | | | | | | | | | |
Building & Development-2.18% | | | | | | | | | | | | | | | | |
DTZ U.S. Borrower LLC, Term Loan (1 mo. USD LIBOR + 2.75%) | | | 2.91 | % | | | 08/21/2025 | | | | 30,309 | | | | 29,185,378 | |
Pisces Midco, Inc., Term Loan (1 mo. USD LIBOR + 3.75%) | | | 3.92 | % | | | 04/12/2025 | | | | 34,749 | | | | 34,239,602 | |
Quikrete Holdings, Inc., Term Loan (1 mo. USD LIBOR + 2.50%) | | | 2.66 | % | | | 02/01/2027 | | | | 35,447 | | | | 34,633,033 | |
| | | | | | | | | | | | | | | | |
| | | | | | | | | | | | | | | 98,058,013 | |
| | | | | | | | | | | | | | | | |
Business Equipment & Services-12.48% | | | | | | | | | | | | | | | | |
Allied Universal Holdco LLC, Term Loan (2 mo. USD LIBOR + 4.25%) | | | 4.41 | % | | | 07/10/2026 | | | | 11,000 | | | | 10,939,500 | |
Asurion LLC | | | | | | | | | | | | | | | | |
Second Lien Term Loan B-2 (1 mo. USD LIBOR + 6.50%) | | | 6.66 | % | | | 08/04/2025 | | | | 57,887 | | | | 58,162,014 | |
Term Loan B-6 (1 mo. USD LIBOR + 3.00%) | | | 3.16 | % | | | 11/03/2023 | | | | 71,970 | | | | 70,860,637 | |
Brand Energy & Infrastructure Services, Inc., Term Loan (3 mo. USD LIBOR + 4.25%) | | | 5.25 | % | | | 06/21/2024 | | | | 42,762 | | | | 39,572,715 | |
Change Healthcare Holdings, Inc., Term Loan (3 mo. USD LIBOR + 2.50%) | | | 3.50 | % | | | 03/01/2024 | | | | 57,467 | | | | 56,524,785 | |
Dun & Bradstreet Corp. (The), Term Loan (1 mo. USD LIBOR + 3.75%) | | | 3.92 | % | | | 02/06/2026 | | | | 38,594 | | | | 38,555,539 | |
Prime Security Services Borrower LLC, Term Loan B-1 (1 mo. USD LIBOR + 3.25%) | | | 4.25 | % | | | 09/23/2026 | | | | 35,007 | | | | 34,941,491 | |
Red Ventures LLC (New Imagitas, Inc.), Term Loan B-2 (1 mo. USD LIBOR + 2.50%) | | | 2.66 | % | | | 11/08/2024 | | | | 33,952 | | | | 32,676,038 | |
Refinitiv US Holdings, Inc., Term Loan (1 mo. USD LIBOR + 3.25%) | | | 3.41 | % | | | 10/01/2025 | | | | 84,637 | | | | 84,024,749 | |
Tempo Acquisition LLC, Term Loan (3 mo. USD LIBOR + 3.25%) | | | 3.75 | % | | | 10/01/2026 | | | | 39,435 | | | | 38,720,044 | |
Trans Union LLC, Term Loan B-5 (1 mo. USD LIBOR + 1.75%) | | | 1.91 | % | | | 11/16/2026 | | | | 37,969 | | | | 37,145,324 | |
Travelport Finance (Luxembourg) S.a.r.l., Term Loan (Luxembourg) (3 mo. USD LIBOR + 5.00%) | | | 6.07 | % | | | 05/30/2026 | | | | 36,858 | | | | 24,919,245 | |
West Corp., Term Loan B (3 mo. USD LIBOR + 4.00%) | | | 5.00 | % | | | 10/10/2024 | | | | 38,386 | | | | 34,473,665 | |
| | | | | | | | | | | | | | | | |
| | | | | | | | | | | | | | | 561,515,746 | |
| | | | | | | | | | | | | | | | |
Cable & Satellite Television-7.52% | | | | | | | | | | | | | | | | |
Charter Communications Operating LLC | | | | | | | | | | | | | | | | |
Term Loan B-1 (1 mo. USD LIBOR + 1.75%) | | | 1.91 | % | | | 04/30/2025 | | | | 19,947 | | | | 19,658,225 | |
Term Loan B-2 (1 mo. USD LIBOR + 1.75%) | | | 1.91 | % | | | 02/01/2027 | | | | 74,549 | | | | 73,319,937 | |
CSC Holdings LLC | | | | | | | | | | | | | | | | |
Term Loan (1 mo. USD LIBOR + 2.25%) | | | 2.41 | % | | | 07/17/2025 | | | | 63,680 | | | | 61,689,720 | |
Term Loan (1 mo. USD LIBOR + 2.50%) | | | 2.66 | % | | | 04/15/2027 | | | | 19,932 | | | | 19,366,525 | |
Numericable-SFR S.A., Incremental Term Loan B-13 (France) (1 mo. USD LIBOR + 4.00%) | | | 4.75 | % | | | 08/14/2026 | | | | 32,992 | | | | 32,641,019 | |
Telenet Financing USD LLC, Term Loan AR (1 mo. USD LIBOR + 2.00%) | | | 2.16 | % | | | 04/15/2028 | | | | 35,314 | | | | 34,122,433 | |
Virgin Media Bristol LLC, Term Loan N (United Kingdom) (1 mo. USD LIBOR + 2.50%) | | | 2.66 | % | | | 01/31/2028 | | | | 44,117 | | | | 43,059,545 | |
WideOpenWest Finance LLC, Term Loan B (1 mo. USD LIBOR + 3.25%) | | | 4.25 | % | | | 08/18/2023 | | | | 25,389 | | | | 25,079,652 | |
Ziggo Secured Finance Partnership, Term Loan I (1 mo. USD LIBOR + 2.50%) | | | 2.66 | % | | | 04/15/2028 | | | | 30,367 | | | | 29,441,544 | |
| | | | | | | | | | | | | | | | |
| | | | | | | | | | | | | | | 338,378,600 | |
| | | | | | | | | | | | | | | | |
Chemicals & Plastics-2.05% | | | | | | | | | | | | | | | | |
Axalta Coating Systems US Holdings, Inc., Term Loan B-3 (3 mo. USD LIBOR + 1.75%) | | | 2.06 | % | | | 06/01/2024 | | | | 32 | | | | 31,351 | |
Messer Industries USA, Inc., Term Loan B-1 (3 mo. USD LIBOR + 2.50%) | | | 2.81 | % | | | 03/02/2026 | | | | 34,279 | | | | 33,682,502 | |
Starfruit US Holdco LLC, Term Loan (1 mo. USD LIBOR + 3.00%) | | | 3.16 | % | | | 10/01/2025 | | | | 59,983 | | | | 58,525,756 | |
| | | | | | | | | | | | | | | | |
| | | | | | | | | | | | | | | 92,239,609 | |
| | | | | | | | | | | | | | | | |
See accompanying Notes to Financial Statements which are an integral part of the financial statements.
Invesco Senior Loan ETF (BKLN)–(continued)
August 31, 2020
| | | | | | | | | | | | | | | | |
| | | Interest
Rate | | | Maturity
Date | | | Principal
Amount
(000) | | | Value | |
|
|
Containers & Glass Products-3.16% | | | | | | | | | | | | | | | | |
Berry Global, Inc., Term Loan Y (1 mo. USD LIBOR + 2.00%) | | | 2.16 | % | | | 07/01/2026 | | | $ | 64,826 | | | $ | 63,035,187 | |
Reynolds Consumer Products LLC, Term Loan B (1 mo. USD LIBOR + 1.75%) | | | 1.91 | % | | | 01/29/2027 | | | | 37,663 | | | | 37,156,660 | |
Reynolds Group Issuer, Inc./LLC, Incremental Term Loan (1 mo. USD LIBOR + 2.75%) | | | 2.91 | % | | | 02/05/2023 | | | | 42,415 | | | | 41,918,982 | |
| | | | | | | | | | | | | | | | |
| | | | | | | | | | | | | | | 142,110,829 | |
| | | | | | | | | | | | | | | | |
Drugs-4.90% | | | | | | | | | | | | | | | | |
Amneal Pharmaceuticals LLC, Term Loan (1 mo. USD LIBOR + 3.50%) | | | 3.69 | % | | | 05/04/2025 | | | | 38,960 | | | | 36,720,380 | |
Bausch Health Americas, Inc., Term Loan (Canada) (1 mo. USD LIBOR + 3.00%) | | | 3.18 | % | | | 06/02/2025 | | | | 53,867 | | | | 53,092,883 | |
Endo LLC, Term Loan (3 mo. USD LIBOR + 4.25%) | | | 5.00 | % | | | 04/29/2024 | | | | 48,207 | | | | 46,630,470 | |
Grifols Worldwide Operations USA, Inc., Term Loan B (1 mo. USD LIBOR + 2.00%) | | | 2.11 | % | | | 11/15/2027 | | | | 38,771 | | | | 38,081,747 | |
Pharmaceutical Product Development, Inc., Term Loan (1 mo. USD LIBOR + 2.50%) | | | 3.50 | % | | | 08/18/2022 | | | | 46,080 | | | | 46,050,966 | |
| | | | | | | | | | | | | | | | |
| | | | | | | | | | | | | | | 220,576,446 | |
| | | | | | | | | | | | | | | | |
Electronics & Electrical-10.40% | | | | | | | | | | | | | | | | |
Boxer Parent Co., Inc., Term Loan (1 mo. USD LIBOR + 4.25%) | | | 4.41 | % | | | 10/02/2025 | | | | 48,769 | | | | 47,991,388 | |
CommScope, Inc., Term Loan (1 mo. USD LIBOR + 3.25%) | | | 3.41 | % | | | 04/06/2026 | | | | 36,999 | | | | 36,348,143 | |
Dell International LLC | | | | | | | | | | | | | | | | |
Term Loan A-6 (1 mo. USD LIBOR + 1.75%) | | | 1.93 | % | | | 03/13/2024 | | | | 27,375 | | | | 27,306,563 | |
Term Loan B-1 (1 mo. USD LIBOR + 2.00%) | | | 2.75 | % | | | 09/19/2025 | | | | 68,445 | | | | 68,090,702 | |
Finastra USA, Inc., First Lien Term Loan (United Kingdom) (3 mo. USD LIBOR + 3.50%) | | | 4.50 | % | | | 06/13/2024 | | | | 51,086 | | | | 48,246,726 | |
MA FinanceCo. LLC, Term Loan B-3 (1 mo. USD LIBOR + 2.50%) | | | 2.81 | % | | | 06/21/2024 | | | | 4,620 | | | | 4,417,776 | |
McAfee LLC, Term Loan B (1 mo. USD LIBOR + 3.75%) | | | 3.91 | % | | | 09/30/2024 | | | | 46,105 | | | | 45,788,417 | |
Micro Holding L.P., First Lien Term Loan (3 mo. USD LIBOR + 3.50%) | | | 4.57 | % | | | 09/13/2024 | | | | 37,472 | | | | 36,631,477 | |
Seattle Spinco, Inc., Term Loan (1 mo. USD LIBOR + 2.50%) | | | 2.66 | % | | | 06/21/2024 | | | | 31,195 | | | | 29,830,640 | |
Ultimate Software Group, Inc. | | | | | | | | | | | | | | | | |
First Lien Term Loan (1 mo. USD LIBOR + 3.75%) | | | 3.91 | % | | | 05/04/2026 | | | | 32,952 | | | | 32,766,891 | |
Term Loan B (3 mo. USD LIBOR + 4.00%) | | | 4.75 | % | | | 05/04/2026 | | | | 20,000 | | | | 20,012,600 | |
Western Digital Corp., Term Loan A-1 (3 mo. USD LIBOR + 1.50%) | | | 1.66 | % | | | 02/27/2023 | | | | 70,633 | | | | 70,368,280 | |
| | | | | | | | | | | | | | | | |
| | | | | | | | | | | | | | | 467,799,603 | |
| | | | | | | | | | | | | | | | |
Financial Intermediaries-0.96% | | | | | | | | | | | | | | | | |
RPI 2019 Intermediate Finance Trust, Term Loan B (1 mo. USD LIBOR + 1.75%) | | | 1.91 | % | | | 02/11/2027 | | | | 43,168 | | | | 43,084,144 | |
| | | | | | | | | | | | | | | | |
Food Products-0.87% | | | | | | | | | | | | | | | | |
Froneri International PLC, Term Loan B-2 (United Kingdom) (1 mo. USD LIBOR + 2.25%) | | | 2.41 | % | | | 01/29/2027 | | | | 40,463 | | | | 39,065,263 | |
| | | | | | | | | | | | | | | | |
Food Service-2.51% | | | | | | | | | | | | | | | | |
IRB Holding Corp., Term Loan B (3 mo. USD LIBOR + 2.75%) | | | 3.75 | % | | | 02/05/2025 | | | | 37,781 | | | | 36,486,887 | |
New Red Finance, Inc., Term Loan B-4 (1 mo. USD LIBOR + 1.75%) | | | 1.91 | % | | | 11/19/2026 | | | | 79,134 | | | | 76,364,149 | |
| | | | | | | | | | | | | | | | |
| | | | | | | | | | | | | | | 112,851,036 | |
| | | | | | | | | | | | | | | | |
Health Care-10.24% | | | | | | | | | | | | | | | | |
athenahealth, Inc., First Lien Term Loan B (3 mo. USD LIBOR + 4.50%) | | | 4.82 | % | | | 02/11/2026 | | | | 54,334 | | | | 54,030,192 | |
DaVita HealthCare Partners, Inc., Term Loan B-1 (1 mo. USD LIBOR + 1.75%) | | | 1.91 | % | | | 08/12/2026 | | | | 41,562 | | | | 40,801,271 | |
Elanco Animal Health, Inc., Term Loan (1 mo. USD LIBOR + 1.75%) | | | 1.91 | % | | | 02/04/2027 | | | | 29,111 | | | | 28,586,474 | |
Envision Healthcare Corp., Term Loan (1 mo. USD LIBOR + 3.75%) | | | 3.91 | % | | | 10/10/2025 | | | | 79,442 | | | | 57,879,749 | |
Gentiva Health Services, Inc., First Lien Term Loan (1 mo. USD LIBOR + 3.25%) | | | 3.44 | % | | | 07/02/2025 | | | | 34,025 | | | | 33,812,723 | |
LifePoint Health, Inc., First Lien Term Loan B (1 mo. USD LIBOR + 3.75%) | | | 3.91 | % | | | 11/16/2025 | | | | 56,037 | | | | 55,076,396 | |
Milano Acquisition Corp., Term Loan B (1 mo. USD LIBOR + 4.00%) | | | 4.75 | % | | | 08/13/2027 | | | | 10,000 | | | | 9,950,000 | |
MPH Acquisition Holdings LLC, Term Loan (3 mo. USD LIBOR + 2.75%) | | | 3.75 | % | | | 06/07/2023 | | | | 41,195 | | | | 40,878,529 | |
Ortho-Clinical Diagnostics, Inc., Term Loan (1 mo. USD LIBOR + 3.25%) | | | 3.41 | % | | | 06/30/2025 | | | | 26,314 | | | | 25,417,507 | |
Sunshine Luxembourg VII S.a.r.l., Term Loan (Switzerland) (3 mo. USD LIBOR + 4.25%) | | | 5.32 | % | | | 07/23/2026 | | | | 38,410 | | | | 38,369,692 | |
Team Health Holdings, Inc., Term Loan (1 mo. USD LIBOR + 2.75%) | | | 3.75 | % | | | 02/06/2024 | | | | 33,697 | | | | 28,206,852 | |
Verscend Holding Corp., Term Loan B (1 mo. USD LIBOR + 4.50%) | | | 4.66 | % | | | 08/27/2025 | | | | 48,059 | | | | 47,854,658 | |
| | | | | | | | | | | | | | | | |
| | | | | | | | | | | | | | | 460,864,043 | |
| | | | | | | | | | | | | | | | |
Industrial Equipment-0.46% | | | | | | | | | | | | | | | | |
Thyssenkrupp Elevators (Vertical Midco GmbH), Term Loan B (Germany) (1 mo. USD LIBOR + 4.25%) | | | 4.41 | % | | | 06/30/2027 | | | | 21,000 | | | | 20,867,175 | |
| | | | | | | | | | | | | | | | |
Insurance-3.56% | | | | | | | | | | | | | | | | |
Acrisure LLC, Term Loan B (1 mo. USD LIBOR + 3.50%) | | | 3.66 | % | | | 01/31/2027 | | | | 44,895 | | | | 43,244,211 | |
See accompanying Notes to Financial Statements which are an integral part of the financial statements.
Invesco Senior Loan ETF (BKLN)–(continued)
August 31, 2020
| | | | | | | | | | | | | | | | |
| | | Interest
Rate | | | Maturity
Date | | | Principal
Amount
(000) | | | Value | |
|
|
Insurance-(continued) | | | | | | | | | | | | | | | | |
HUB International Ltd., Term Loan (3 mo. USD LIBOR + 3.00%) | | | 3.26 | % | | | 04/25/2025 | | | $ | 47,944 | | | $ | 46,831,653 | |
Sedgwick Claims Management Services, Inc., Term Loan (1 mo. USD LIBOR + 3.25%) | | | 3.41 | % | | | 12/31/2025 | | | | 34,275 | | | | 33,189,798 | |
USI, Inc., Term Loan (3 mo. USD LIBOR + 3.00%) | | | 3.31 | % | | | 05/16/2024 | | | | 37,927 | | | | 36,994,652 | |
| | | | | | | | | | | | | | | | |
| | | | | | | | | | | | | | | 160,260,314 | |
| | | | | | | | | | | | | | | | |
Leisure Goods, Activities & Movies-3.95% | | | | | | | | | | | | | | | | |
Alpha Topco Ltd., Term Loan B (United Kingdom) (1 mo. USD LIBOR + 2.50%) | | | 3.50 | % | | | 02/01/2024 | | | | 40,640 | | | | 39,611,297 | |
Crown Finance US, Inc., Term Loan (3 mo. USD LIBOR + 2.25%) | | | 3.32 | % | | | 02/28/2025 | | | | 41,293 | | | | 32,621,759 | |
Playtika Holding Corp., Term Loan B (3 mo. USD LIBOR + 6.00%) | | | 7.07 | % | | | 12/03/2024 | | | | 37,767 | | | | 38,147,156 | |
UFC Holdings LLC, Term Loan (3 mo. USD LIBOR + 3.25%) | | | 4.25 | % | | | 04/29/2026 | | | | 34,377 | | | | 34,022,807 | |
William Morris Endeavor Entertainment LLC, First Lien Term Loan B-1
(1 mo. USD LIBOR + 2.75%) | | | 2.91 | % | | | 05/16/2025 | | | | 40,707 | | | | 33,175,831 | |
| | | | | | | | | | | | | | | | |
| | | | | | | | | | | | | | | 177,578,850 | |
| | | | | | | | | | | | | | | | |
Lodging & Casinos-4.26% | | | | | | | | | | | | | | | | |
Caesars Resort Collection LLC, Term Loan B (1 mo. USD LIBOR + 2.75%) | | | 2.91 | % | | | 12/23/2024 | | | | 63,955 | | | | 60,291,477 | |
Golden Nugget, Inc., Term Loan (2 mo. USD LIBOR + 2.50%) | | | 3.25 | % | | | 10/04/2023 | | | | 35,959 | | | | 32,325,098 | |
Hilton Worldwide Finance LLC, Term Loan B-2 (1 mo. USD LIBOR + 1.75%) | | | 1.93 | % | | | 06/22/2026 | | | | 37,077 | | | | 35,820,071 | |
Scientific Games International, Inc., Term Loan B-5 (1 mo. USD LIBOR + 2.75%) | | | 2.91 | % | | | 08/14/2024 | | | | 52,476 | | | | 49,224,504 | |
Stars Group (US) Co-Borrower LLC, Term Loan (3 mo. USD LIBOR + 3.50%) | | | 3.81 | % | | | 07/10/2025 | | | | 14,233 | | | | 14,268,558 | |
| | | | | | | | | | | | | | | | |
| | | | | | | | | | | | | | | 191,929,708 | |
| | | | | | | | | | | | | | | | |
Oil & Gas-1.64% | | | | | | | | | | | | | | | | |
Blackstone CQP Holdco, Term Loan (3 mo. USD LIBOR + 3.50%) | | | 3.81 | % | | | 09/30/2024 | | | | 37,975 | | | | 37,404,954 | |
Buckeye Partners, Term Loan B (1 mo. USD LIBOR + 2.75%) | | | 2.91 | % | | | 11/02/2026 | | | | 32,235 | | | | 31,785,912 | |
Seadrill Operating L.P., Term Loan (3 mo. USD LIBOR + 6.00%) | | | 7.00 | % | | | 02/21/2021 | | | | 30,546 | | | | 4,505,578 | |
| | | | | | | | | | | | | | | | |
| | | | | | | | | | | | | | | 73,696,444 | |
| | | | | | | | | | | | | | | | |
Publishing-0.75% | | | | | | | | | | | | | | | | |
Nielsen Finance LLC, Term Loan B-4 (1 mo. USD LIBOR + 2.00%) | | | 2.16 | % | | | 10/04/2023 | | | | 34,338 | | | | 33,642,456 | |
| | | | | | | | | | | | | | | | |
Radio & Television-1.96% | | | | | | | | | | | | | | | | |
Diamond Sports Holdings LLC, Term Loan B (1 mo. USD LIBOR + 3.25%) | | | 3.41 | % | | | 08/24/2026 | | | | 45,963 | | | | 39,011,186 | |
Nexstar Broadcasting, Inc., Term Loan B-4 (1 mo. USD LIBOR + 2.75%) | | | 2.91 | % | | | 09/18/2026 | | | | 45,117 | | | | 44,411,741 | |
Univision Communications, Inc., First Lien Term Loan (1 mo. USD LIBOR + 2.75%) | | | 3.75 | % | | | 03/15/2024 | | | | 4,901 | | | | 4,753,073 | |
| | | | | | | | | | | | | | | | |
| | | | | | | | | | | | | | | 88,176,000 | |
| | | | | | | | | | | | | | | | |
Rail Industries-0.85% | | | | | | | | | | | | | | | | |
Genesee & Wyoming, Inc., Term Loan (3 mo. USD LIBOR + 2.00%) | | | 2.31 | % | | | 12/30/2026 | | | | 38,777 | | | | 38,249,425 | |
| | | | | | | | | | | | | | | | |
Retailers (except Food & Drug)-2.84% | | | | | | | | | | | | | | | | |
Bass Pro Group LLC, Term Loan (3 mo. USD LIBOR + 5.00%) | | | 6.07 | % | | | 09/25/2024 | | | | 62,415 | | | | 62,365,974 | |
Michaels Stores, Inc., Term Loan (3 mo. USD LIBOR + 2.50%) | | | 3.57 | % | | | 01/28/2023 | | | | 9 | | | | 8,248 | |
Petco Animal Supplies, Inc., Term Loan (3 mo. USD LIBOR + 3.25%) | | | 4.25 | % | | | 01/26/2023 | | | | 34,798 | | | | 29,939,047 | |
PetSmart, Inc., First Lien Term Loan (1 mo. USD LIBOR + 4.00%) | | | 5.00 | % | | | 03/11/2022 | | | | 35,651 | | | | 35,640,269 | |
| | | | | | | | | | | | | | | | |
| | | | | | | | | | | | | | | 127,953,538 | |
| | | | | | | | | | | | | | | | |
Telecommunications-8.96% | | | | | | | | | | | | | | | | |
Avaya, Inc., Term Loan B (1 mo. USD LIBOR + 4.25%) | | | 4.41 | % | | | 12/15/2024 | | | | 36,401 | | | | 35,498,574 | |
CenturyLink, Inc., Term Loan B (1 mo. USD LIBOR + 2.25%) | | | 2.41 | % | | | 03/15/2027 | | | | 74,365 | | | | 72,063,993 | |
Level 3 Financing, Inc., Term Loan B (1 mo. USD LIBOR + 1.75%) | | | 1.91 | % | | | 03/01/2027 | | | | 46,665 | | | | 45,303,540 | |
Rackspace Hosting, Inc., Term Loan B (2 mo. USD LIBOR + 3.00%) | | | 4.00 | % | | | 11/03/2023 | | | | 41,495 | | | | 41,145,041 | |
Radiate Holdco LLC, Term Loan (1 mo. USD LIBOR + 3.00%) | | | 3.75 | % | | | 02/01/2024 | | | | 44,869 | | | | 44,273,567 | |
SBA Senior Finance II LLC, Term Loan (1 mo. USD LIBOR + 1.75%) | | | 1.91 | % | | | 04/11/2025 | | | | 36,109 | | | | 35,349,649 | |
T-Mobile USA, Inc., Term Loan B (1 mo. USD LIBOR + 3.00%) | | | 3.16 | % | | | 04/20/2027 | | | | 59,975 | | | | 60,188,811 | |
Zayo Group LLC, Term Loan (1 mo. USD LIBOR + 3.00%) | | | 3.16 | % | | | 02/20/2027 | | | | 71,462 | | | | 69,576,084 | |
| | | | | | | | | | | | | | | | |
| | | | | | | | | | | | | | | 403,399,259 | |
| | | | | | | | | | | | | | | | |
Utilities-2.72% | | | | | | | | | | | | | | | | |
Brookfield WEC Holdings, Inc., First Lien Term Loan (1 mo. USD LIBOR + 3.00%) | | | 3.75 | % | | | 08/01/2025 | | | | 45,294 | | | | 44,650,953 | |
See accompanying Notes to Financial Statements which are an integral part of the financial statements.
Invesco Senior Loan ETF (BKLN)–(continued)
August 31, 2020
| | | | | | | | | | | | | | | | |
| | | Interest
Rate | | | Maturity
Date | | | Principal
Amount
(000) | | | Value | |
|
|
Utilities-(continued) | | | | | | | | | | | | | | | | |
Pacific Gas and Electric Co., Term Loan B (3 mo. USD LIBOR + 4.50%) | | | 5.50 | % | | | 07/01/2025 | | | $ | 38,000 | | | $ | 37,453,940 | |
Vistra Operations Co. LLC, Incremental Term Loan (1 mo. USD LIBOR + 1.75%) | | | 1.91 | % | | | 12/31/2025 | | | | 40,999 | | | | 40,428,905 | |
| | | | | | | | | | | | | | | | |
| | | | | | | | | | | | | | | 122,533,798 | |
| | | | | | | | | | | | | | | | |
Total Variable Rate Senior Loan Interests
(Cost $4,209,234,301) | | | | | | | | | | | | | | | 4,161,826,846 | |
| | | | | | | | | | | | | | | | |
U.S. Dollar Denominated Bonds & Notes-2.38% | | | | | | | | | | | | | | | | |
| | | | |
Aerospace & Defense-0.33% | | | | | | | | | | | | | | | | |
TransDigm, Inc.(c) | | | 6.25 | % | | | 03/15/2026 | | | | 14,081 | | | | 14,882,983 | |
| | | | | | | | | | | | | | | | |
| | | | |
Airlines-0.13% | | | | | | | | | | | | | | | | |
Mileage Plus Holdings LLC/Mileage Plus Intellectual Property Assets Ltd.(c) | | | 6.50 | % | | | 06/20/2027 | | | | 5,557 | | | | 5,793,172 | |
| | | | | | | | | | | | | | | | |
| | | | |
Auto Components-0.03% | | | | | | | | | | | | | | | | |
Clarios Global L.P.(c) | | | 6.75 | % | | | 05/15/2025 | | | | 1,365 | | | | 1,464,700 | |
| | | | | | | | | | | | | | | | |
| | | | |
Commercial Services & Supplies-0.27% | | | | | | | | | | | | | | | | |
Prime Security Services Borrower LLC/Prime Finance, Inc.(c) | | | 5.75 | % | | | 04/15/2026 | | | | 11,160 | | | | 12,354,081 | |
| | | | | | | | | | | | | | | | |
Diversified Telecommunication Services-0.19% | | | | | | | | | | | | | | | | |
CommScope, Inc.(c) | | | 6.00 | % | | | 03/01/2026 | | | | 8,250 | | | | 8,776,474 | |
| | | | | | | | | | | | | | | | |
| | | | |
Electric Utilities-0.07% | | | | | | | | | | | | | | | | |
PG&E Corp | | | 5.00 | % | | | 07/01/2028 | | | | 3,000 | | | | 2,996,475 | |
| | | | | | | | | | | | | | | | |
| | | | |
Hotels, Restaurants & Leisure-0.28% | | | | | | | | | | | | | | | | |
Caesars Resort Collection LLC/CRC Finco, Inc.(c) | | | 5.75 | % | | | 07/01/2025 | | | | 3,500 | | | | 3,670,625 | |
Scientific Games International, Inc.(c) | | | 5.00 | % | | | 10/15/2025 | | | | 8,900 | | | | 8,808,997 | |
| | | | | | | | | | | | | | | | |
| | | | | | | | | | | | | | | 12,479,622 | |
| | | | | | | | | | | | | | | | |
Machinery-0.08% | | | | | | | | | | | | | | | | |
Vertical US Newco, Inc. (Germany)(c) | | | 5.25 | % | | | 07/15/2027 | | | | 3,261 | | | | 3,403,669 | |
| | | | | | | | | | | | | | | | |
Media-0.34% | | | | | | | | | | | | | | | | |
Univision Communications, Inc.(c) | | | 5.13 | % | | | 02/15/2025 | | | | 2,000 | | | | 2,017,500 | |
Virgin Media Secured Finance PLC (United Kingdom)(c) | | | 5.50 | % | | | 08/15/2026 | | | | 5,000 | | | | 5,281,250 | |
Ziggo B.V. (Netherlands)(c) | | | 5.50 | % | | | 01/15/2027 | | | | 7,750 | | | | 8,159,626 | |
| | | | | | | | | | | | | | | | |
| | | | | | | | | | | | | | | 15,458,376 | |
| | | | | | | | | | | | | | | | |
Real Estate Management & Development-0.12% | | | | | | | | | | | | | | | | |
Cushman & Wakefield US Borrower LLC(c) | | | 6.75 | % | | | 05/15/2028 | | | | 5,000 | | | | 5,297,600 | |
| | | | | | | | | | | | | | | | |
Technology Hardware, Storage & Peripherals-0.54% | | | | | | | | | | | | | | | | |
Dell International LLC/EMC Corp.(c) | | | 5.45 | % | | | 06/15/2023 | | | | 21,793 | | | | 24,078,618 | |
| | | | | | | | | | | | | | | | |
Total U.S. Dollar Denominated Bonds & Notes
(Cost $100,744,829) | | | | | | | | | | | | | | | 106,985,770 | |
| | | | | | | | | | | | | | | | |
| | | | | | | | | Shares | | | | |
Money Market Funds-10.75% | | | | | | | | | | | | | | | | |
Invesco Premier U.S. Government Money Portfolio, Institutional Class, 0.01%(d)(e) | | | | | | | | | | | | | | | | |
(Cost $483,816,237) | | | | | | | | | | | 483,816,237 | | | | 483,816,237 | |
| | | | | | | | | | | | | | | | |
TOTAL INVESTMENTS IN SECURITIES-105.62% | | | | | | | | | | | | | | | | |
(Cost $4,793,795,367) | | | | | | | | | | | | | | | 4,752,628,853 | |
OTHER ASSETS LESS LIABILITIES-(5.62)% | | | | | | | | | | | | | | | (252,804,389 | ) |
| | | | | | | | | | | | | | | | |
NET ASSETS-100.00% | | | | | | | | | | | | | | $ | 4,499,824,464 | |
| | | | | | | | | | | | | | | | |
Investment Abbreviations:
LIBOR -London Interbank Offered Rate
USD -U.S. Dollar
See accompanying Notes to Financial Statements which are an integral part of the financial statements.
Invesco Senior Loan ETF (BKLN)–(continued)
August 31, 2020
Notes to Schedule of Investments:
| (a) | Variable rate senior loan interests often require prepayments from excess cash flow or permit the borrower to repay at its election. The degree to which borrowers repay, whether as a contractual requirement or at their election, cannot be predicted with any accuracy. As a result, the actual remaining maturity may be substantially less than the stated maturities shown. However, it is anticipated that the variable rate senior loan interests will have an expected average life of three to five years. |
| (b) | Variable rate senior loan interests are, at present, not readily marketable, not registered under the Securities Act of 1933, as amended (the “1933 Act”) and may be subject to contractual and legal restrictions on sale. Variable rate senior loan interests in the Fund’s portfolio generally have variable rates which adjust to a base, such as the London Interbank Offered Rate (“LIBOR”), on set dates, typically every 30 days, but not greater than one year, and/or have interest rates that float at margin above a widely recognized base lending rate such as the Prime Rate of a designated U.S. bank. |
| (c) | Security purchased or received in a transaction exempt from registration under the 1933 Act. The security may be resold pursuant to an exemption from registration under the 1933 Act, typically to qualified institutional buyers. The aggregate value of these securities at August 31, 2020 was $103,989,295, which represented 2.31% of the Fund’s Net Assets. |
| (d) | Affiliated issuer. The issuer and/or the Fund is a wholly-owned subsidiary of Invesco Ltd., or is affiliated by having an investment adviser that is under common control of Invesco Ltd. The table below shows the Fund’s transactions in, and earnings from, its investments in affiliates for the fiscal year ended August 31, 2020. |
| | | | | | | | | | | | | | | | | | | | | | | | | | | | |
| | | Value
August 31,
2019 | | | Purchases
at Cost | | | Proceeds
from Sales | | | Change in
Unrealized
Appreciation | | | Realized
Gain | | | Value
August 31, 2020 | | | Dividend
Income | |
|
Investments in Affiliated Money Market Funds: | | | | | | | | | | | | | | | | | | | | | | | | | | | | |
Invesco Premier U.S. Government Money Portfolio, Institutional Class | | | $514,841,874 | | | | $7,900,706,110 | | | | $(7,931,731,747) | | | | $- | | | | $- | | | | $483,816,237 | | | | $6,265,245 | |
| (e) | The rate shown is the 7-day SEC standardized yield as of August 31, 2020. |
See accompanying Notes to Financial Statements which are an integral part of the financial statements.
Statement of Assets and Liabilities
August 31, 2020
| | | | |
| | | Invesco Senior
Loan ETF
(BKLN) | |
Assets: | | | | |
Unaffiliated investments in securities, at value | | $ | 4,268,812,616 | |
Affiliated investments in securities, at value | | | 483,816,237 | |
Receivable for: | | | | |
Dividends and interest | | | 13,179,966 | |
Investments sold | | | 53,122,033 | |
Fund shares sold | | | 37,112,771 | |
| | | | |
Total assets | | | 4,856,043,623 | |
| | | | |
| |
Liabilities: | | | | |
Due to custodian | | | 31,029 | |
Payable for: | | | | |
Investments purchased | | | 353,849,458 | |
Accrued unitary management fees | | | 2,338,672 | |
| | | | |
Total liabilities | | | 356,219,159 | |
| | | | |
Net Assets | | $ | 4,499,824,464 | |
| | | | |
| |
Net assets consist of: | | | | |
Shares of beneficial interest | | $ | 5,357,904,378 | |
Distributable earnings (loss) | | | (858,079,914 | ) |
| | | | |
Net Assets | | $ | 4,499,824,464 | |
| | | | |
Shares outstanding (unlimited amount authorized, $0.01 par value) | | | 206,200,000 | |
Net asset value | | $ | 21.82 | |
| | | | |
Market price | | $ | 21.91 | |
| | | | |
Unaffiliated investments in securities, at cost | | $ | 4,309,979,130 | |
| | | | |
Affiliated investments in securities, at cost | | $ | 483,816,237 | |
| | | | |
See accompanying Notes to Financial Statements which are an integral part of the financial statements.
Statement of Operations
For the year ended August 31, 2020
| | | | |
| | | Invesco Senior
Loan ETF
(BKLN) | |
Investment income: | | | | |
Interest income | | $ | 222,684,529 | |
Affiliated dividend income | | | 6,265,245 | |
| | | | |
Total investment income | | | 228,949,774 | |
| | | | |
| |
Expenses: | | | | |
Unitary management fees | | | 30,689,416 | |
Tax expenses | | | 4,142 | |
| | | | |
Total expenses | | | 30,693,558 | |
| | | | |
Less: Waivers | | | (993,077 | ) |
| | | | |
Net expenses | | | 29,700,481 | |
| | | | |
Net investment income | | | 199,249,293 | |
| | | | |
| |
Realized and unrealized gain (loss) from: | | | | |
Net realized gain (loss) from investments | | | (211,684,130 | ) |
| | | | |
Change in net unrealized appreciation on investment securities | | | 15,798,019 | |
| | | | |
Net realized and unrealized gain (loss) | | | (195,886,111 | ) |
| | | | |
Net increase in net assets resulting from operations | | $ | 3,363,182 | |
| | | | |
See accompanying Notes to Financial Statements which are an integral part of the financial statements.
Statement of Changes in Net Assets
For the years ended August 31, 2020 and 2019
| | | | | | | | |
| | | Invesco Senior Loan ETF (BKLN) | |
| | | 2020 | | | 2019 | |
Operations: | | | | | | | | |
Net investment income | | $ | 199,249,293 | | | $ | 258,829,915 | |
Net realized gain (loss) | | | (211,684,130 | ) | | | (145,038,503 | ) |
Change in net unrealized appreciation (depreciation) | | | 15,798,019 | | | | (12,819,429 | ) |
| | | | | | | | |
Net increase in net assets resulting from operations | | | 3,363,182 | | | | 100,971,983 | |
| | | | | | | | |
| | |
Distributions to Shareholders from: | | | | | | | | |
Distributable earnings | | | (197,593,666 | ) | | | (268,253,366 | ) |
Return of capital | | | - | | | | (3,596,395 | ) |
| | | | | | | | |
Total distributions to shareholders | | | (197,593,666 | ) | | | (271,849,761 | ) |
| | | | | | | | |
| | |
Shareholder Transactions: | | | | | | | | |
Proceeds from shares sold | | | 4,108,541,862 | | | | 2,667,505,331 | |
Value of shares repurchased | | | (3,839,126,252 | ) | | | (5,486,757,971 | ) |
Transaction fees | | | 22,694,518 | | | | 13,848,677 | |
| | | | | | | | |
Net increase (decrease) in net assets resulting from share transactions | | | 292,110,128 | | | | (2,805,403,963 | ) |
| | | | | | | | |
Net increase (decrease) in net assets | | | 97,879,644 | | | | (2,976,281,741 | ) |
| | | | | | | | |
| | |
Net assets: | | | | | | | | |
Beginning of year | | | 4,401,944,820 | | | | 7,378,226,561 | |
| | | | | | | | |
End of year | | $ | 4,499,824,464 | | | $ | 4,401,944,820 | |
| | | | | | | | |
| | |
Changes in Shares Outstanding: | | | | | | | | |
Shares sold | | | 186,800,000 | | | | 116,700,000 | |
Shares repurchased | | | (175,600,000 | ) | | | (240,900,000 | ) |
Shares outstanding, beginning of year | | | 195,000,000 | | | | 319,200,000 | |
| | | | | | | | |
Shares outstanding, end of year | | | 206,200,000 | | | | 195,000,000 | |
| | | | | | | | |
See accompanying Notes to Financial Statements which are an integral part of the financial statements.
Financial Highlights
Invesco Senior Loan ETF (BKLN)
| | | | | | | | | | | | | | | | | | | | | | | | |
| | | Years Ended August 31, | | | Ten Months Ended
August 31,
2018 | | | Years Ended October 31, | |
| | | 2020 | | | 2019 | | | 2017 | | | 2016 | | | 2015 | |
Per Share Operating Performance: | | | | | | | | | | | | | | | | | | | | | | | | |
Net asset value at beginning of period | | $ | 22.57 | | | $ | 23.11 | | | $ | 23.15 | | | $ | 23.16 | | | $ | 23.05 | | | $ | 24.43 | |
| | | | | | | | | | | | | | | | | | | | | | | | |
Net investment income(a) | | | 0.93 | | | | 1.07 | | | | 0.77 | | | | 0.82 | | | | 0.99 | | | | 0.92 | |
Net realized and unrealized gain (loss) on investments | | | (0.88 | ) | | | (0.53 | ) | | | (0.08 | ) | | | (0.02 | ) | | | 0.15 | | | | (1.39 | ) |
| | | | | | | | | | | | | | | | | | | | | | | | |
Total from investment operations | | | 0.05 | | | | 0.54 | | | | 0.69 | | | | 0.80 | | | | 1.14 | | | | (0.47 | ) |
| | | | | | | | | | | | | | | | | | | | | | | | |
Distributions to shareholders from: | | | | | | | | | | | | | | | | | | | | | | | | |
Net investment income | | | (0.91 | ) | | | (1.12 | ) | | | (0.74 | ) | | | (0.82 | ) | | | (0.99 | ) | | | (0.92 | ) |
Return of capital | | | - | | | | (0.02 | ) | | | - | | | | - | | | | (0.08 | ) | | | (0.00 | )(b) |
| | | | | | | | | | | | | | | | | | | | | | | | |
Total distributions | | | (0.91 | ) | | | (1.14 | ) | | | (0.74 | ) | | | (0.82 | ) | | | (1.07 | ) | | | (0.92 | ) |
| | | | | | | | | | | | | | | | | | | | | | | | |
Transaction fees(a) | | | 0.11 | | | | 0.06 | | | | 0.01 | | | | 0.01 | | | | 0.04 | | | | 0.01 | |
| | | | | | | | | | | | | | | | | | | | | | | | |
Net asset value at end of period | | $ | 21.82 | | | $ | 22.57 | | | $ | 23.11 | | | $ | 23.15 | | | $ | 23.16 | | | $ | 23.05 | |
| | | | | | | | | | | | | | | | | | | | | | | | |
Market price at end of period(c) | | $ | 21.91 | | | $ | 22.61 | | | $ | 23.05 | | | $ | 23.12 | | | $ | 23.19 | | | $ | 23.01 | |
| | | | | | | | | | | | | | | | | | | | | | | | |
Net Asset Value Total Return(d) | | | 0.80 | % | | | 2.68 | % | | | 3.07 | % | | | 3.54 | % | | | 5.32 | % | | | (1.96 | )% |
Market Price Total Return(d) | | | 1.05 | % | | | 3.15 | % | | | 2.93 | % | | | 3.27 | % | | | 5.64 | % | | | (1.89 | )% |
Ratios/Supplemental Data: | | | | | | | | | | | | | | | | | | | | | | | | |
Net assets at end of period (000’s omitted) | | $ | 4,499,824 | | | $ | 4,401,945 | | | $ | 7,378,227 | | | $ | 8,763,831 | | | $ | 6,458,747 | | | $ | 4,808,978 | |
Ratio to average net assets of: | | | | | | | | | | | | | | | | | | | | | | | | |
Expenses, after Waivers | | | 0.63 | %(e) | | | 0.64 | %(e) | | | 0.63 | %(e)(f) | | | 0.63 | %(e) | | | 0.64 | % | | | 0.65 | %(e) |
Expenses, prior to Waivers | | | 0.65 | %(e) | | | 0.65 | %(e) | | | 0.65 | %(e)(f) | | | 0.65 | %(e) | | | 0.65 | % | | | 0.65 | %(e) |
Net investment income | | | 4.22 | % | | | 4.66 | % | | | 3.99 | %(f) | | | 3.52 | % | | | 4.33 | % | | | 3.82 | % |
Portfolio turnover rate(g) | | | 107 | % | | | 78 | % | | | 74 | % | | | 71 | % | | | 81 | % | | | 43 | % |
| (a) | Based on average shares outstanding. |
| (b) | Amount represents less than $0.005. |
| (c) | The mean between the last bid and ask prices. |
| (d) | Net asset value total return is calculated assuming an initial investment made at the net asset value at the beginning of the period, reinvestment of all dividends and distributions at net asset value during the period, and redemption at net asset value on the last day of the period. Net asset value total return includes adjustments in accordance with accounting principles generally accepted in the United States of America and as such, the net asset value for financial reporting purposes and the returns based upon those net asset values may differ from the net asset value and returns for shareholder transactions. Market price total return is calculated assuming an initial investment made at the market price at the beginning of the period, reinvestment of all dividends and distributions at market price during the period, and sale at the market price on the last day of the period. Total investment returns calculated for a period of less than one year are not annualized. |
| (e) | In addition to the fees and expenses which the Fund bears directly, the Fund indirectly bears a pro rata share of the fees and expenses of the investment companies in which the Fund invests. Estimated investment companies’ expenses are not expenses that are incurred directly by the Fund. They are expenses that are incurred directly by the investment companies and are deducted from the value of the investment companies the Fund invests in. The effect of the estimated investment companies’ expenses that the Fund bears indirectly is included in the Fund’s total return. |
| (g) | Portfolio turnover rate is not annualized for periods less than one year, if applicable, and does not include securities received or delivered from processing creations or redemptions. |
See accompanying Notes to Financial Statements which are an integral part of the financial statements.
Notes to Financial Statements
Invesco Exchange-Traded Fund Trust II
August 31, 2020
NOTE 1–Organization
Invesco Exchange-Traded Fund Trust II (the “Trust”) was organized as a Massachusetts business trust on October 10, 2006 and is authorized to have multiple series of portfolios. The Trust is an open-end management investment company registered under the Investment Company Act of 1940, as amended (the “1940 Act”). This report includes the following portfolio:
| | |
| Full Name | | Short Name |
| Invesco Senior Loan ETF (BKLN) | | “Senior Loan ETF” |
The portfolio (the “Fund”) represents a separate series of the Trust. The shares of the Fund are referred to herein as “Shares” or “Fund’s Shares.” The Fund’s Shares are listed and traded on NYSE Arca, Inc.
The market price of a Share may differ to some degree from the Fund’s net asset value (“NAV”). Unlike conventional mutual funds, the Fund issues and redeems Shares on a continuous basis, at NAV, only in a large specified number of Shares, each called a “Creation Unit.” Creation Units are issued and redeemed principally in exchange for the deposit or delivery of cash. Except when aggregated in Creation Units by Authorized Participants, the Shares are not individually redeemable securities of the Fund.
The investment objective of the Fund is to seek to track the investment results (before fees and expenses) of the S&P/LSTA U.S. Leveraged Loan 100 Index (the “Underlying Index”).
NOTE 2–Significant Accounting Policies
The following is a summary of the significant accounting policies followed by the Fund in preparation of its financial statements.
The Fund is an investment company and accordingly follows the investment company accounting and reporting guidance in accordance with Financial Accounting Standards Board Accounting Standards Codification Topic 946, Financial Services— Investment Companies.
| A. | Security Valuation - Securities, including restricted securities, are valued according to the following policies: |
Variable rate senior loan interests are fair valued using quotes provided by an independent pricing service. Quotes provided by the pricing service may reflect appropriate factors such as ratings, tranche type, industry, company performance, spread, individual trading characteristics, institution-size trading in similar groups of securities and other market data.
A security listed or traded on an exchange (except convertible securities) is generally valued at its last sales price or official closing price as of the close of the customary trading session on the exchange where the security is principally traded or, lacking any sales or official closing price on a particular day, the security may be valued at the closing bid price on that day. Securities traded in the over-the-counter market are valued based on prices furnished by independent pricing services or market makers. When such securities are valued by an independent pricing service they may be considered fair valued. Futures contracts are valued at the final settlement price set by an exchange on which they are principally traded. Listed options are valued at the mean between the last bid and asked prices from the exchange on which they are principally traded, or at the final settlement price set by such exchange. Swaps and options not listed on an exchange are valued by an independent source. For purposes of determining NAV per Share, futures and option contracts generally are valued 15 minutes after the close of the customary trading session of the New York Stock Exchange (“NYSE”).
Investment companies are valued using such company’s NAV per share, unless the shares are exchange-traded, in which case they are valued at the last sales price or official closing price as of the close of the customary trading session on the exchange where the security is principally traded.
Debt obligations (including convertible securities) and unlisted equities are fair valued using an evaluated quote provided by an independent pricing service. Evaluated quotes provided by the pricing service may be determined without exclusive reliance on quoted prices, and may reflect appropriate factors such as institution-size trading in similar groups of securities, developments related to specific securities, dividend rate (for unlisted equities), yield (for debt obligations), quality, type of issue, coupon rate (for debt obligations), maturity (for debt obligations), individual trading characteristics and other market data. Securities with a demand feature exercisable within one to seven days are valued at par. Pricing services generally value debt obligations assuming orderly transactions of institutional round lot size, but the Fund may hold or transact in the same securities in smaller, odd lot sizes. Odd lots often trade at lower prices than institutional round lots. Debt obligations are subject to interest rate and credit risks. In addition, all debt obligations involve some risk of default with respect to interest and/or principal payments.
Foreign securities’ (including foreign exchange contracts’) prices are converted into U.S. dollar amounts using the applicable exchange rates as of the close of the London world markets. If market quotations are available and reliable for foreign exchange-traded equity securities, the securities will be valued at the market quotations. Because trading hours for certain foreign securities end before the close of the NYSE, closing market quotations may become unreliable. If between the time
trading ends on a particular security and the close of the customary trading session on the NYSE, events occur that Invesco Capital Management LLC (the “Adviser”) determines are significant and make the closing price unreliable, the Fund may fair value the security. If the event is likely to have affected the closing price of the security, the security will be valued at fair value in good faith using procedures approved by the Board of Trustees. Adjustments to closing prices to reflect fair value may also be based on a screening process of an independent pricing service to indicate the degree of certainty, based on historical data, that the closing price in the principal market where a foreign security trades is not the current value as of the close of the NYSE. Foreign securities’ prices meeting the approved degree of certainty that the price is not reflective of current value will be priced at the indication of fair value from the independent pricing service. Multiple factors may be considered by the independent pricing service in determining adjustments to reflect fair value and may include information relating to sector indices, American Depositary Receipts and domestic and foreign index futures. Foreign securities may have additional risks including exchange rate changes, potential for sharply devalued currencies and high inflation, political and economic upheaval, the relative lack of issuer information, relatively low market liquidity and the potential lack of strict financial and accounting controls and standards.
Securities for which market prices are not provided by any of the above methods may be valued based upon quotes furnished by independent sources. The last bid price may be used to value exchange-traded equity securities. The mean between the last bid and asked prices may be used to value debt obligations, including corporate loans, and unlisted equity securities.
Securities for which market quotations are not readily available or became unreliable are valued at fair value as determined in good faith following procedures approved by the Board of Trustees. Issuer-specific events, market trends, bid/asked quotes of brokers and information providers and other market data may be reviewed in the course of making a good faith determination of a security’s fair value.
The Fund may invest in securities that are subject to interest rate risk, meaning the risk that the prices will generally fall as interest rates rise and, conversely, the prices will generally rise as interest rates fall. Specific securities differ in their sensitivity to changes in interest rates depending on their individual characteristics. Changes in interest rates may result in increased market volatility, which may affect the value and/or liquidity of certain Fund investments.
Valuations change in response to many factors, including the historical and prospective earnings of the issuer, the value of the issuer’s assets, general market conditions which are not specifically related to the particular issuer, such as real or perceived adverse economic conditions, changes in the general outlook for revenues or corporate earnings, changes in interest or currency rates, regional or global instability, natural or environmental disasters, widespread disease or other public health issues, war, acts of terrorism or adverse investor sentiment generally and market liquidity. Because of the inherent uncertainties of valuation, the values reflected in the financial statements may materially differ from the value received upon actual sale of those investments.
Authorized Participant Concentration Risk. Only authorized participants (“APs”) may engage in creation or redemption transactions directly with the Fund. The Fund has a limited number of institutions that may act as APs, and such APs have no obligation to submit creation or redemption orders. Consequently, there is no assurance that APs will establish or maintain an active trading market for the Shares. This risk may be heightened to the extent that securities held by the Fund are traded outside a collateralized settlement system. In that case, APs may be required to post collateral on certain trades on an agency basis (i.e., on behalf of other market participants), which only a limited number of APs may be able to do. In addition, to the extent that APs exit the business or are unable to proceed with creation and/or redemption orders with respect to the Fund and no other AP is able to step forward to create or redeem Creation Units, this may result in a significantly diminished trading market for Fund Shares, and Shares may be more likely to trade at a premium or discount to the Fund’s NAV and to face trading halts and/or delisting. Investments in non-U.S. securities, which may have lower trading volumes, may increase this risk.
Cash Transaction Risk. Most exchange-traded funds (“ETFs”) generally make in-kind redemptions to avoid being taxed on gains on the distributed portfolio securities at the fund level. However, unlike most ETFs, the Fund currently intends to effect creations and redemptions principally for cash, rather than principally in-kind, because of the nature of the Fund’s investments. As such, the Fund may be required to sell portfolio securities to obtain the cash needed to distribute redemption proceeds. Therefore, the Fund may recognize a capital gain on these sales that might not have been incurred if the Fund had made a redemption in-kind. This may decrease the tax efficiency of the Fund compared to ETFs that utilize an in-kind redemption process and there may be a substantial difference in the after-tax rate of return between the Fund and conventional ETFs.
Changing U.S. Fixed-Income Market Conditions Risk. The current historically low interest rate environment was created in part by the Federal Reserve Board (“FRB”) keeping the federal funds rates at, near or below zero. In recent years, the FRB began “tapering” its quantitative easing program, leading to fluctuations in the Federal Funds Rate. However, in response to the impact of the COVID-19 pandemic, in March 2020 the FRB announced cuts to the Federal Funds Rate and a new round of quantitative easing. Because there is little precedent for this situation, it is difficult to predict the impact of these rate changes or any future rate changes on various markets. Any additional changes to the monetary policy by the FRB or other regulatory actions may affect interest rates and/or reduce liquidity for fixed-income investments, particularly those with longer
maturities. In addition, decreases in fixed-income dealer market-making capacity may also potentially lead to heightened volatility and reduced liquidity in the fixed-income markets. As a result, the value of the Fund’s investments and share price may decline. Changes in FRB policies could also result in higher than normal shareholder redemptions, which could potentially increase portfolio turnover rate and the Fund’s transaction costs.
Fixed-Income Securities Risk. Fixed-income securities are subject to interest rate risk and credit risk. Interest rate risk refers to fluctuations in the value of a fixed-income security resulting from changes in the general level of interest rates. When the general level of interest rates goes up, the prices of most fixed-income securities go down. When the general level of interest rates goes down, the prices of most fixed-income securities go up. Fixed-income securities with longer maturities typically are more sensitive to changes in interest rates, making them more volatile than securities with shorter maturities. Credit risk refers to the possibility that the issuer of a security will be unable and/or unwilling to make timely interest payments and/or repay the principal on its debt. Debt instruments are subject to varying degrees of credit risk, which may be reflected in credit ratings. There is a possibility that the credit rating of a fixed-income security may be downgraded after purchase, which may adversely affect the value of the security.
Index Risk. Unlike many investment companies, the Fund does not utilize an investing strategy that seeks returns in excess of its Underlying Index. Therefore, the Fund would not necessarily buy or sell a security unless that security is added or removed, respectively, from its Underlying Index, even if that security generally is underperforming. Additionally, the Fund rebalances its portfolio in accordance with its Underlying Index, and, therefore, any changes to the Underlying Index’s rebalance schedule will result in corresponding changes to the Fund’s rebalance schedule.
Industry Concentration Risk. In following its methodology, the Fund’s Underlying Index from time to time may be concentrated to a significant degree in securities of issuers located in a single industry or industry group. To the extent that the Underlying Index concentrates in the securities of issuers in a particular industry or industry group, the Fund will also concentrate its investments to approximately the same extent. By concentrating its investments in an industry or industry group, the Fund may face more risks than if it were diversified broadly over numerous industries or industry groups. Such industry-based risks, any of which may adversely affect the companies in which the Fund invests, may include, but are not limited to, the following: general economic conditions or cyclical market patterns that could negatively affect supply and demand in a particular industry; competition for resources, adverse labor relations, political or world events; obsolescence of technologies; and increased competition or new product introductions that may affect the profitability or viability of companies in an industry. In addition, at times, such industry or industry group may be out of favor and underperform other industries or the market as a whole.
LIBOR Risk. The Fund may invest in instruments that use or may use a floating reference rate based on LIBOR. On July 27, 2017, the head of the United Kingdom’s Financial Conduct Authority announced a desire to phase out the use of LIBOR by the end of 2021. There remains uncertainty regarding the future utilization of LIBOR and the nature of any replacement rate. As a result, any impact of a transition away from LIBOR on the Fund or the instruments in which the Fund invests cannot yet be determined. Industry initiatives are underway to identify alternative reference rates; however, there is no assurance that the composition or characteristics of any such alternative reference rate will be similar to or produce the same value or economic equivalence as LIBOR or that instruments using an alternative rate will have the same volume or liquidity. As a result, the transition process might lead to increased volatility and reduced liquidity in markets that currently rely on LIBOR to determine interest rates; a reduction in the value of some LIBOR-based investments; and/or costs incurred in connection with closing out positions and entering into new agreements. These effects could occur prior to the end of 2021 as the utility of LIBOR as a reference rate could deteriorate during the transition period.
Liquidity Risk. Liquidity risk exists when a particular investment is difficult to purchase or sell. If the Fund invests in illiquid securities or current portfolio securities become illiquid, it may reduce the returns of the Fund because the Fund may be unable to sell the illiquid securities at an advantageous time or price.
Market Risk. Securities in the Underlying Index are subject to market fluctuations. You should anticipate that the value of the Shares will decline, more or less, in correlation with any decline in value of the securities in the Underlying Index. Additionally, natural or environmental disasters, widespread disease or other public health issues, war, acts of terrorism or other events could result in increased premiums or discounts to the Fund’s NAV.
Non-Correlation Risk. The Fund’s return may not match the return of its Underlying Index for a number of reasons. For example, the Fund incurs operating expenses not applicable to the Underlying Index, and incurs costs in buying and selling securities, especially when rebalancing the Fund’s securities holdings to reflect changes in the composition of its Underlying Index. Because the Fund issues and redeems Creation Units principally for cash, it will incur higher costs in buying and selling securities than if they issued and redeemed Creation Units in-kind. Additionally, the Fund’s use of a representative sampling approach may cause the Fund not to be as well-correlated with the return of its Underlying Index as would be the case if the Fund purchased all of the securities in its Underlying Index in the proportions represented in the Underlying Index. In addition, the performance of the Fund and its Underlying Index may vary due to asset valuation differences and differences between the Fund’s portfolio and its Underlying Index resulting from legal restrictions, costs or liquidity constraints.
Non-Investment Grade Securities Risk. Non-investment grade securities and unrated securities of comparable credit quality are considered speculative and are subject to the increased risk of an issuer’s inability to meet principal and interest payment obligations. These securities may be subject to greater price volatility due to such factors as specific corporate developments,
interest rate sensitivity, negative perceptions of the non-investment grade securities markets generally, real or perceived adverse economic and competitive industry conditions and less secondary market liquidity. If the issuer of non-investment grade securities defaults, the Fund may incur additional expenses to seek recovery.
Risk of Investing in Loans. Investments in loans are subject to interest rate risk and credit risk. Interest rate risk refers to fluctuations in the value of a loan resulting from changes in the general level of interest rates. Credit risk refers to the possibility that the borrower of a loan will be unable and/or unwilling to make timely interest payments and/or repay the principal on its obligation. Default in the payment of interest or principal on a loan will result in a reduction in the value of the loan and consequently a reduction in the value of the Fund’s investments and a potential decrease in the NAV of the Fund. Although the loans in which the Fund will invest generally will be secured by specific collateral, there can be no assurance that such collateral would satisfy the borrower’s obligation in the event of non-payment of scheduled interest or principal or that such collateral could be readily liquidated. In the event of the bankruptcy of a borrower, the Fund’s access to the collateral may be limited by bankruptcy or other insolvency loans and, therefore, the Fund could experience delays or limitations with respect to its ability to realize the benefits of the collateral securing a loan.
Risks of Loan Assignments and Participations. As the purchaser of an assignment, the Fund typically succeeds to all the rights and obligations of the assigning institution and becomes a lender under the credit agreement with respect to the debt obligation; however, the Fund may not be able to unilaterally enforce all rights and remedies under the loan and with regard to any associated collateral. Because assignments may be arranged through private negotiations between potential assignees and potential assignors, the rights and obligations acquired by the Fund as the purchaser of an assignment may differ from, and be more limited than, those held by the assigning lender. In addition, if the loan is foreclosed, the Fund could become part owner of any collateral and could bear the costs and liabilities of owning and disposing of the collateral. The Fund may be required to pass along to a purchaser that buys a loan from the Fund by way of assignment, a portion of any fees to which the Fund is entitled under the loan. In connection with purchasing participations, the Fund generally will have no right to enforce compliance by the borrower with the terms of the loan agreement relating to the loan, nor any rights of set-off against the borrower, and the Fund may not directly benefit from any collateral supporting the loan in which it has purchased the participation. As a result, the Fund will be subject to the credit risk of both the borrower and the lender that is selling the participation. In the event of the insolvency of the lender selling a participation, the Fund may be treated as a general creditor of the lender and may not benefit from any set-off between the lender and the borrower.
Sampling Risk. The Fund’s use of a representative sampling approach may result in the Fund holding a smaller number of securities than are in its Underlying Index. As a result, an adverse development with respect to an issuer of securities held by the Fund could result in a greater decline in NAV than would be the case if the Fund held all of the securities in its Underlying Index. To the extent the assets in the Fund are smaller, these risks will be greater.
Senior Loans Risk. The risks associated with senior loans are similar to the risks of junk bonds, although senior loans typically are senior and secured, whereas junk bonds often are subordinated and unsecured. Investments in senior loans typically are below investment grade and are considered speculative because of the credit risk of their issuers. Such companies are more likely to default on their payments of interest and principal owed, and such defaults could reduce the Fund’s NAV and income distributions. An economic downturn generally leads to a higher non-payment rate, and a senior loan may lose significant value before a default occurs. There is no assurance that the liquidation of the collateral would satisfy the claims of the borrower’s obligations in the event of the non-payment of scheduled interest or principal, or that the collateral could be readily liquidated. Economic and other events (whether real or perceived) can reduce the demand for certain senior loans or senior loans generally, which may reduce market prices. Senior loans and other debt securities also are subject to the risk of price declines and to increases in prevailing interest rates, although floating-rate debt instruments such as senior loans in which the Fund may be expected to invest are substantially less exposed to this risk than fixed-rate debt instruments. No active trading market may exist for certain senior loans, which may impair the ability of the Fund to realize full value in the event of the need to liquidate such assets. Adverse market conditions may impair the liquidity of some actively traded senior loans. Longer interest rate reset periods generally increase fluctuations in value as a result of changes in market interest rates.
Some loans are subject to the risk that a court, pursuant to fraudulent conveyance or other similar laws, could subordinate the loans to presently existing or future indebtedness of the borrower or take other action detrimental to lenders, including the Fund, such as invalidation of loans or causing interest previously paid to be refunded to the borrower. Investments in loans also are subject to the risk of changes in legislation or state or federal regulations. If such legislation or regulations impose additional requirements or restrictions on the ability of financial institutions to make loans, the availability of loans for investment by the Fund may be adversely affected. Many loans are not registered with the Securities and Exchange Commission (the “SEC”) or any state securities commission and often are not rated by any nationally recognized rating service. Generally, there is less readily available, reliable information about most loans than is the case for many other types of securities. Although a loan may be senior to equity and other debt securities in a borrower’s capital structure, such obligations may be structurally subordinated to obligations of the borrower’s subsidiaries.
There is no organized exchange on which loans are traded and reliable market quotations may not be readily available. Therefore, elements of judgment may play a greater role in valuation of loans than for securities with a more developed secondary market and the Fund may not realize full value in the event of the need to sell a loan. To the extent that a
secondary market does exist for certain loans, the market may be subject to volatility, irregular trading activity, wide bid/ask spreads, decreased liquidity and extended trade settlement periods, any of which may impair the Fund’s ability to sell loans within its desired time frame or at an acceptable price and its ability to accurately value existing and prospective investments. Extended trade settlement periods for certain loans may result in cash not being immediately available to the Fund upon sale of the loan. As a result, the Fund may have to sell other investments with shorter settlement periods or engage in borrowing transactions to raise cash to meet its obligations.
| C. | Investment Transactions and Investment Income - Investment transactions are accounted for on a trade date basis. Realized gains and losses from the sale or disposition of securities are computed on the specific identified cost basis. Interest income is recorded on an accrual basis from settlement date. Pay-in-kind interest income and non-cash dividend income received in the form of securities in-lieu of cash are recorded at the fair value of the securities received. Dividend income (net of withholding tax, if any) is recorded on the ex-dividend date. Dividend income from REITs is recorded based on the income included in the distributions received from the REIT investments using published REIT classifications, including some management estimates when actual amounts are not available. Distributions received in excess of this estimated amount are recorded as a reduction of the cost of investments or reclassified to capital gains. The actual amounts of income, return of capital, and capital gains are only determined by each REIT after its fiscal year- end, and may differ from the estimated amounts. Realized gains, dividends and interest received by the Fund may give rise to withholding and other taxes imposed by foreign countries. Tax conventions between certain countries and the United States may reduce or eliminate such taxes. |
The Fund may periodically participate in litigation related to the Fund’s investments. As such, the Fund may receive proceeds from litigation settlements. Any proceeds received are included in the Statement of Operations as realized gain (loss) for investments no longer held and as unrealized gain (loss) for investments still held.
Brokerage commissions and mark ups are considered transaction costs and are recorded as an increase to the cost basis of securities purchased and/or a reduction of proceeds on a sale of securities. Such transaction costs are included in the determination of net realized and unrealized gain (loss) from investment securities reported in the Statement of Operations and the Statement of Changes in Net Assets and the net realized and unrealized gains (losses) on securities per share in the Financial Highlights. Transaction costs are included in the calculation of the Fund’s NAV and, accordingly, they reduce the Fund’s total returns. These transaction costs are not considered operating expenses and are not reflected in net investment income reported in the Statement of Operations and the Statement of Changes in Net Assets, or the net investment income per share and the ratios of expenses and net investment income reported in the Financial Highlights, nor are they limited by any expense limitation arrangements between the Fund and the Adviser.
| D. | Country Determination - For the purposes of presentation in the Schedule of Investments, the Adviser may determine the country in which an issuer is located and/or credit risk exposure based on various factors. These factors include whether the Fund’s Underlying Index has made a country determination and may include the laws of the country under which the issuer is organized, where the issuer maintains a principal office, the country in which the issuer derives 50% or more of its total revenues and the country that has the primary market for the issuer’s securities, as well as other criteria. Among the other criteria that may be evaluated for making this determination are the country in which the issuer maintains 50% or more of its assets, the type of security, financial guarantees and enhancements, the nature of the collateral and the sponsor organization. Country of issuer and/or credit risk exposure has been determined to be the United States of America, unless otherwise noted. |
| E. | Dividends and Distributions to Shareholders - The Fund declares and pays dividends from net investment income, if any, to its shareholders monthly and records such dividends on the ex-dividend date. Generally, the Fund distributes net realized taxable capital gains, if any, annually in cash and records them on the ex-dividend date. Such distributions on a tax basis are determined in conformity with federal income tax regulations, which may differ from accounting principles generally accepted in the United States of America (“GAAP”). Distributions in excess of tax basis earnings and profits, if any, are reported in the Fund’s financial statements as a tax return of capital at fiscal year-end. |
| F. | Federal Income Taxes - The Fund intends to comply with the provisions of the Internal Revenue Code of 1986, as amended (the “Internal Revenue Code”), applicable to regulated investment companies and to distribute substantially all of the Fund’s taxable earnings to its shareholders. As such, the Fund will not be subject to federal income taxes on otherwise taxable income (including net realized gains) that is distributed to the shareholders. Therefore, no provision for federal income taxes is recorded in the financial statements. |
The Fund recognizes the tax benefits of uncertain tax positions only when the position is more likely than not to be sustained. Management has analyzed the Fund’s uncertain tax positions and concluded that no liability for unrecognized tax benefits should be recorded related to uncertain tax positions. Management is not aware of any tax positions for which it is reasonably possible that the total amounts of unrecognized tax benefits will change materially in the next 12 months.
Income and capital gain distributions are determined in accordance with federal income tax regulations, which may differ from GAAP. These differences are primarily due to differing book and tax treatments for in-kind transactions, losses deferred due to wash sales, and passive foreign investment company adjustments, if any.
The Fund files U.S. federal tax returns and tax returns in certain other jurisdictions. Generally, the Fund is subject to examinations by such taxing authorities for up to three years after the filing of the return for the tax period.
| G. | Expenses - Expenses of the Trust that are excluded from the Fund’s unitary management fee and are directly identifiable to the Fund are applied to the Fund. Expenses of the Trust that are excluded from the Fund’s unitary management fee and are not readily identifiable to the Fund are allocated in such a manner as deemed equitable, taking into consideration the nature and type of expense and the relative net assets of the Fund. |
The Fund has agreed to pay an annual unitary management fee to the Adviser. Out of the unitary management fee, the Adviser has agreed to pay for substantially all expenses of the Fund, including the payments to Invesco Senior Secured Management, Inc. (the “Sub-Adviser”), set-up fees and commitment fees associated with the line of credit and the costs of transfer agency, custody, fund administration, legal, audit and other services, except for advisory fees, distribution fees, if any, brokerage expenses, taxes, interest (including interest expenses associated with the line of credit), litigation expenses, acquired fund fees and expenses, if any, and other extraordinary expenses.
To the extent the Fund invests in other investment companies, the expenses shown in the accompanying financial statements reflect the expenses of the Fund and do not include any expenses of the investment companies in which it invests. The effects of such investment companies’ expenses are included in the realized and unrealized gain or loss on the investments in the investment companies.
| H. | Accounting Estimates - The preparation of the financial statements in accordance with GAAP requires management to make estimates and assumptions that affect the reported amounts and disclosures in the financial statements, including estimates and assumptions related to taxation. Actual results could differ from these estimates. In addition, the Fund monitors for material events or transactions that may occur or become known after the period-end date and before the date the financial statements are released to print. |
| I. | Indemnifications - Under the Trust’s organizational documents, its Officers and Trustees are indemnified against certain liabilities arising out of the performance of their duties to the Trust. Each Board member who is not an “interested person” (as defined in the 1940 Act) of the Trust (each, an “Independent Trustee”) is also indemnified against certain liabilities arising out of the performance of their duties to the Trust pursuant to an Indemnification Agreement between such trustee and the Trust. Additionally, in the normal course of business, the Trust enters into contracts with service providers that contain general indemnification clauses. The Trust’s maximum exposure under these arrangements is unknown, as this would involve future claims that may be made against the Trust that have not yet occurred. However, based on experience, the Trust believes the risk of loss to be remote. |
| J. | Securities Purchased on a When-Issued and Delayed Delivery Basis - The Fund may purchase and sell interests in corporate loans and corporate debt securities and other portfolio securities on a when issued and delayed delivery basis, with payment and delivery scheduled for a future date. No income accrues to the Fund on such interests or securities in connection with such transactions prior to the date the Fund actually takes delivery of such interests or securities. These transactions are subject to market fluctuations and are subject to the risk that the value of the interests or securities at delivery may be more or less than the trade date purchase price. Although the Fund will generally purchase these securities with the intention of acquiring such securities, it may sell such securities prior to the settlement date. |
NOTE 3–Investment Advisory Agreement and Other Agreements
The Trust has entered into an Investment Advisory Agreement with the Adviser on behalf of the Fund, pursuant to which the Adviser has overall responsibility for the selection and ongoing monitoring of the Fund’s investments, managing the Fund’s business affairs and providing certain clerical, bookkeeping and other administrative services, and oversight of the Sub-Adviser.
Pursuant to the Investment Advisory Agreement, the Fund accrues daily and pays monthly to the Adviser an annual unitary management fee of 0.65% of the Fund’s average daily net assets. Out of the unitary management fee, the Adviser has agreed to pay for substantially all expenses of the Fund, including the payments to the Sub-Adviser, set-up fees and commitment fees associated with the line of credit, the cost of transfer agency, custody, fund administration, legal, audit and other services, except for advisory fees, distribution fees, if any, brokerage expenses, taxes, interest (including interest expenses associated with the line of credit), litigation expenses, acquired fund fees and expenses, if any, and other extraordinary expenses.
The Adviser has entered into a sub-advisory agreement with the Sub-Adviser. The sub-advisory fee is paid by the Adviser to the Sub-Adviser at the annual rate of 40% of compensation paid to the Adviser from the Fund. Further, through August 31, 2022, the Adviser has contractually agreed to waive a portion of the Fund’s management fee in an amount equal to 100% of the net advisory fees an affiliate of the Adviser receives that are attributable to certain of the Fund’s investments of otherwise uninvested cash in money market funds managed by that affiliate (excluding investments of cash collateral from securities lending). There is no guarantee that the Adviser will extend the waiver of these fees past that date.
For the fiscal year ended August 31, 2020, the Adviser waived fees of $993,077.
The Trust has entered into a Distribution Agreement with Invesco Distributors, Inc. (the “Distributor”), which serves as the distributor of Creation Units for the Fund. The Distributor does not maintain a secondary market in the Shares. The Fund is not charged any fees pursuant to the Distribution Agreement. The Distributor is an affiliate of the Adviser.
The Adviser has entered into a licensing agreement for the Fund with S&P Dow Jones Indices LLC (the “Licensor”).
The Underlying Index name trademark is owned by the Licensor. This trademark has been licensed to the Adviser for use by the Fund. The Fund is entitled to use its Underlying Index pursuant to the Trust’s sub-licensing agreement with the Adviser. The Fund
is not sponsored, endorsed, sold or promoted by the Licensor, and the Licensor makes no representation regarding the advisability of investing in the Fund.
The Trust has entered into service agreements whereby The Bank of New York Mellon, a wholly-owned subsidiary of The Bank of New York Mellon Corporation, serves as the administrator, custodian, fund accountant and transfer agent for the Fund.
NOTE 4–Additional Valuation Information
GAAP defines fair value as the price that would be received to sell an asset or paid to transfer a liability in an orderly transaction between market participants at the measurement date, under current market conditions. GAAP establishes a hierarchy that prioritizes the inputs to valuation methods, giving the highest priority to readily available unadjusted quoted prices in an active market for identical assets (Level 1) and the lowest priority to significant unobservable inputs (Level 3), generally when market prices are not readily available or are unreliable. Based on the valuation inputs, the securities or other investments are tiered into one of three levels. Changes in valuation methods may result in transfers in or out of an investment’s assigned level:
| | |
Level 1 – | | Prices are determined using quoted prices in an active market for identical assets. |
Level 2 – | | Prices are determined using other significant observable inputs. Observable inputs are inputs that other market participants may use in pricing a security. These may include quoted prices for similar securities, interest rates, prepayment speeds, credit risk, yield curves, loss severities, default rates, discount rates, volatilities and others. |
Level 3 – | | Prices are determined using significant unobservable inputs. In situations where quoted prices or observable inputs are unavailable (for example, when there is little or no market activity for an investment at the end of the period), unobservable inputs may be used. Unobservable inputs reflect the Fund’s own assumptions about the factors market participants would use in determining fair value of the securities or instruments and would be based on the best available information. |
The following is a summary of the tiered valuation input levels, as of August 31, 2020. The level assigned to the securities valuations may not be an indication of the risk or liquidity associated with investing in those securities. Because of the inherent uncertainties of valuation, the values reflected in the financial statements may materially differ from the value received upon actual sale of those investments.
| | | | | | | | | | | | | | | | |
| | | Level 1 | | | Level 2 | | | Level 3 | | | Total | |
Investments in Securities | | | | | | | | | | | | | | | | |
Variable Rate Senior Loan Interests | | $ | - | | | $ | 4,161,826,846 | | | $ | - | | | $ | 4,161,826,846 | |
U.S. Dollar Denominated Bonds & Notes | | | - | | | | 106,985,770 | | | | - | | | | 106,985,770 | |
Money Market Funds | | | 483,816,237 | | | | - | | | | - | | | | 483,816,237 | |
| | | | | | | | | | | | | | | | |
Total Investments | | $ | 483,816,237 | | | $ | 4,268,812,616 | | | $ | - | | | $ | 4,752,628,853 | |
| | | | | | | | | | | | | | | | |
NOTE 5–Distributions to Shareholders and Tax Components of Net Assets
Tax Character of Distributions to Shareholders Paid During the Fiscal Year Ended August 31, 2020 and 2019:
| | | | | | | | |
| | | 2020 | | | 2019 | |
Ordinary income* | | $ | 197,593,666 | | | $ | 268,253,366 | |
Return of capital | | | - | | | | 3,596,395 | |
| * | Includes short-term capital gain distributions, if any. |
Tax Components of Net Assets at Fiscal Year-End:
| | | | |
Undistributed ordinary income | | $ | 1,655,627 | |
Net unrealized appreciation (depreciation) – investments | | | (128,708,485 | ) |
Capital loss carryforward | | | (731,027,056 | ) |
Shares of beneficial interest | | | 5,357,904,378 | |
| | | | |
Total net assets | | $ | 4,499,824,464 | |
| | | | |
Capital loss carryforwards are calculated and reported as of a specific date. Results of transactions and other activity after that date may affect the amount of capital loss carryforwards actually available for the Fund to utilize. The ability to utilize capital loss carryforwards in the future may be limited under the Internal Revenue Code and related regulations based on the results of future transactions.
The following table presents available capital loss carryforwards for the Fund as of August 31, 2020:
| | | | | | | | | | | | |
| | | No expiration | | | | |
| | | Short-Term | | | Long-Term | | | Total* | |
| | $ | 210,502,512 | | | $ | 520,524,544 | | | $ | 731,027,056 | |
| * | Capital loss carryforwards are reduced for limitations, if any, to the extent required by the Internal Revenue Code and may be further limited depending upon a variety of factors, including the realization of net unrealized gains or losses as of the date of any reorganization. |
NOTE 6–Investment Transactions
For the fiscal year ended August 31, 2020, the cost of securities purchased and proceeds from sales of securities (other than short-term securities, U.S. Treasury obligations, money market funds and in-kind transactions, if any) were $5,079,545,045 and $4,757,398,746, respectively.
At August 31, 2020, the aggregate cost of investments, including any derivatives, on a tax basis includes adjustments for financial reporting purposes as of the most recently completed federal income tax reporting period-end:
| | | | |
Aggregate unrealized appreciation of investments | | $ | 31,932,511 | |
Aggregate unrealized (depreciation) of investments | | | (160,640,996 | ) |
| | | | |
Net unrealized appreciation (depreciation) of investments | | $ | (128,708,485 | ) |
| | | | |
| Cost | of investments for tax purposes is $4,881,337,338. |
NOTE 7–Trustees’ and Officer’s Fees
Trustees’ and Officer’s Fees include amounts accrued by the Fund to pay remuneration to the Independent Trustees and an Officer of the Trust. The Adviser, as a result of the Fund’s unitary management fee, pays for such compensation for the Fund. The Trustee who is an “interested person” of the Trust does not receive any Trustees’ fees.
The Trust has adopted a deferred compensation plan (the “Plan”). Under the Plan, each Independent Trustee who has executed a Deferred Fee Agreement (a “Participating Trustee”) may defer receipt of all or a portion of their compensation (“Deferral Fees”). Such Deferral Fees are deemed to be invested in select Invesco ETFs. The Deferral Fees payable to a Participating Trustee are valued as of the date such Deferral Fees would have been paid to a Participating Trustee. The value increases with contributions or with increases in the value of the Shares selected, and the value decreases with distributions or with declines in the value of the Shares selected. Obligations under the Plan represent unsecured claims against the general assets of the Fund.
NOTE 8–Senior Loan Participation Commitments
The Fund may invest in participations, assignments, or act as a party to the primary lending syndicate of a senior loan interest to corporations, partnerships, and other entities. When the Fund purchases a participation of a senior loan interest, the Fund typically enters into a contractual agreement with the lender or other third party selling the participation, but not with the borrower directly. As such, the Fund assumes the credit risk of the borrower, selling participant or other persons interpositioned between the Fund and the borrower.
During the fiscal year ended August 31, 2020, there were no interests in senior loans purchased by the Fund on a participation basis.
NOTE 9–Borrowing
The Fund is a party to a committed line of credit facility with a syndicate administered by State Street Bank and Trust Company. The Fund may borrow up to the lesser of (1) $675,000,000 or (2) the limits set by its prospectus for borrowings. The Adviser, on behalf of the Fund, pays an upfront fee of 0.10% on the commitment amount and a commitment fee of 0.15% on the amount of the commitment that has not been utilized. In case of borrowings from the line of credit, the Fund pays the associated interest expenses.
During the fiscal year ended August 31, 2020, there were no outstanding borrowings from the line of credit.
NOTE 10–Capital
Shares are issued and redeemed by the Fund only in Creation Units consisting of a specified number of Shares as set forth in the Fund’s prospectus. Only Authorized Participants are permitted to purchase or redeem Creation Units from the Fund. Such transactions are principally permitted in exchange for cash. However, the Fund also reserves the right to permit or require Creation Units to be issued in exchange for the deposit of delivery of a basket of securities (“Deposit Securities”).
To the extent that the Fund permits transactions in exchange for Deposit Securities, the Fund may issue Shares in advance of receipt of Deposit Securities subject to various conditions, including a requirement to maintain on deposit with the Trust cash at least equal to 105% of the market value of the missing Deposit Securities. In accordance with the Trust’s Participant Agreement, Creation Units will be issued to an Authorized Participant, notwithstanding the fact that the corresponding Deposit Securities have
not been received in part or in whole, in reliance on the undertaking of the Authorized Participant to deliver the missing Deposit Securities as soon as possible, which undertaking shall be secured by the Authorized Participant’s delivery and maintenance of collateral consisting of cash in the form of U.S. dollars in immediately available funds having a value (marked-to-market daily) at least equal to 105%, which the Adviser may change from time to time, of the value of the missing Deposit Securities.
Certain transaction fees may be charged by the Fund for creations and redemptions, which are treated as increases in capital.
Transactions in the Fund’s Shares are disclosed in detail in the Statement of Changes in Net Assets.
NOTE 11–Coronavirus (COVID-19) Pandemic
During the first quarter of 2020, the World Health Organization declared COVID-19 to be a public health emergency. COVID-19 has led to increased short-term market volatility and may have adverse long-term effects on U.S. and world economies and markets in general. COVID-19 may adversely impact the value of the Fund’s investments. Because of the uncertainties on valuation, the global economy and business operations, values reflected in these financial statements may materially differ from the value received upon actual sales of those investments.
The extent of the impact on the performance of the Fund and its investments will depend on future developments, including the duration and spread of the COVID-19 outbreak, related restrictions and advisories, and the effects on the financial markets and economy overall, all of which are highly uncertain and cannot be predicted.
Report of Independent Registered Public Accounting Firm
To the Board of Trustees of Invesco Exchange-Traded Fund Trust II and Shareholders of Invesco Senior Loan ETF
Opinion on the Financial Statements
We have audited the accompanying statement of assets and liabilities, including the schedule of investments, of Invesco Senior Loan ETF (one of the funds constituting Invesco Exchange-Traded Fund Trust II, referred to hereafter as the “Fund”) as of August 31, 2020, the related statement of operations for the year ended August 31, 2020, the statement of changes in net assets for each of the two years in the period ended August 31, 2020, including the related notes, and the financial highlights for each of the two years in the period ended August 31, 2020, ten months in the period ended August 31, 2018 and three years in the period ended October 31, 2017 (collectively referred to as the “financial statements”). In our opinion, the financial statements present fairly, in all material respects, the financial position of the Fund as of August 31, 2020, the results of its operations for the year ended August 31, 2020, the changes in its net assets for each of the two years in the period ended August 31, 2020, and the financial highlights for each of the two years in the period ended August 31, 2020, ten months in the period ended August 31, 2018 and three years in the period ended October 31, 2017, in conformity with accounting principles generally accepted in the United States of America.
Basis for Opinion
These financial statements are the responsibility of the Fund’s management. Our responsibility is to express an opinion on the Fund’s financial statements based on our audits. We are a public accounting firm registered with the Public Company Accounting Oversight Board (United States) (“PCAOB”) and are required to be independent with respect to the Fund in accordance with the U.S. federal securities laws and the applicable rules and regulations of the Securities and Exchange Commission and the PCAOB.
We conducted our audits of these financial statements in accordance with the standards of the PCAOB. Those standards require that we plan and perform the audit to obtain reasonable assurance about whether the financial statements are free of material misstatement, whether due to error or fraud.
Our audits included performing procedures to assess the risks of material misstatement of the financial statements, whether due to error or fraud, and performing procedures that respond to those risks. Such procedures included examining, on a test basis, evidence regarding the amounts and disclosures in the financial statements. Our audits also included evaluating the accounting principles used and significant estimates made by management, as well as evaluating the overall presentation of the financial statements. Our procedures included confirmation of securities owned as of August 31, 2020 by correspondence with the custodian, transfer agent, agent banks, and brokers; when replies were not received from brokers, we performed other auditing procedures. We believe that our audits provide a reasonable basis for our opinion.
/s/PricewaterhouseCoopers LLP
Chicago, Illinois
October 28, 2020
We have served as the auditor of one or more of the investment companies in the Invesco group of investment companies since at least 1995. We have not been able to determine the specific year we began serving as auditor.
Calculating your ongoing Fund expenses
Example
As a shareholder of the Invesco Senior Loan ETF (the “Fund”), a series of the Invesco Exchange-Traded Fund Trust II, you incur a unitary management fee. In addition to the unitary management fee, a shareholder may pay distribution fees, if any, brokerage expenses, taxes, interest (including interest expenses associated with the line of credit), acquired fund fees and expenses, if any, litigation expenses and other extraordinary expenses. The expense examples below are intended to help you understand your ongoing costs (in dollars) of investing in the Fund and to compare these costs with the ongoing costs of investing in other funds.
The example is based on an investment of $1,000 invested at the beginning of the period and held through the six-month period ended August 31, 2020.
In addition to the fees and expenses which the Fund bears directly, the Fund indirectly bears a pro rata share of the fees and expenses of the investment companies in which the Fund invests. The amount of fees and expenses incurred indirectly by the Fund will vary because the investment companies have varied expenses and fee levels and the Fund may own different proportions of the investment companies at different times. Estimated investment companies’ expenses are not expenses that are incurred directly by the Fund. They are expenses that are incurred directly by the investment companies and are deducted from the value of the investment companies the Fund invests in. The effect of the estimated investment companies’ expenses that the Fund bears indirectly is included in the Fund’s total return.
Actual Expenses
The first line in the following table provides information about actual account values and actual expenses. You may use the information in this line, together with the amount you invested, to estimate the expenses that you paid over the period. Simply divide your account value by $1,000 (for example, an $8,600 account value divided by $1,000 = 8.6), then multiply the result by the number in the first line under the heading “Expenses Paid During the Six-Month Period” to estimate the expenses you paid on your account during this period.
Hypothetical Example for Comparison Purposes
The second line in the following table provides information about hypothetical account values and hypothetical expenses based on the Fund’s actual expense ratio and an assumed annualized rate of return of 5% per year before expenses, which is not the Fund’s actual return. The hypothetical account values and expenses may not be used to estimate the actual ending account balance or expenses you paid for the period. You may use this information to compare the ongoing costs of investing in the Fund and other funds. To do so, compare this 5% hypothetical example with the 5% hypothetical examples that appear in the shareholder reports of the other funds.
Please note that the expenses shown in the table are meant to highlight your ongoing costs only and do not reflect any transactional costs, such as sales charges and brokerage commissions. Therefore, the second line in the table is useful in comparing ongoing costs only, and will not help you determine the relative total costs of owning different funds. In addition, expenses shown in the table do not include the expenses of the underlying funds, which are borne indirectly by a Fund. If transaction costs and indirect expenses were included, your costs would have been higher.
| | | | | | | | | | | | | | | | |
| | | Beginning Account Value March 1, 2020 | | | Ending Account Value August 31, 2020 | | | Annualized Expense Ratio Based on the Six-Month Period | | | Expenses Paid During the Six-Month Period(1) | |
| | | | |
Invesco Senior Loan ETF (BKLN) | | | | | | | | | | | | | | | | |
| | | | |
Actual | | | $1,000.00 | | | | $1,001.40 | | | | 0.64% | | | | $3.22 | |
| | | | |
Hypothetical (5% return before expenses) | | | 1,000.00 | | | | 1,021.92 | | | | 0.64 | | | | 3.25 | |
| (1) | Expenses are calculated using the annualized expense ratio, which represents the ongoing expenses as a percentage of net assets for the six-month period ended August 31, 2020. Expenses are calculated by multiplying the Fund’s annualized expense ratio by the average account value for the period, then multiplying the result by 184/366. Expense ratios for the most recent six-month period may differ from expense ratios based on the annualized data in the Financial Highlights. |
Tax Information
Form 1099-DIV, Form 1042-S and other year–end tax information provide shareholders with actual calendar year amounts that should be included in their tax returns. Shareholders should consult their tax advisers.
The following distribution information is being provided as required by the Internal Revenue Code or to meet a specific state’s requirement.
The Fund designates the following amounts or, if subsequently determined to be different, the maximum amount allowable for its fiscal year ended August 31, 2020:
| | | | |
Business Interest Income* | | | 100 | % |
Qualified Dividend Income* | | | 0 | % |
Dividends-Received Deduction* | | | 0 | % |
Qualified Interest Income* | | | 94 | % |
| * | The above percentages are based on ordinary income dividends paid to shareholders during the Fund’s fiscal year. |
Trustees and Officers
The Independent Trustees of the Trust, their term of office and length of time served, their principal business occupations during at least the past five years, the number of portfolios in the Fund Complex (as defined below) overseen by each Independent Trustee and the other directorships, if any, held by each Independent Trustee are shown below.
As of August 31, 2020
| | | | | | | | | | |
Name, Address and Year of
Birth of Independent Trustees | | Position(s) Held with Trust | | Term of Office and Length of Time Served* | | Principal Occupation(s) During Past 5 Years | | Number of Portfolios in Fund Complex** Overseen by Independent Trustees | | Other Directorships Held by Independent Trustees During the Past 5 Years |
Ronn R. Bagge–1958 c/o Invesco Capital Management LLC 3500 Lacey Road, Suite 700 Downers Grove, IL 60515 | | Vice Chairman of the Board; Chairman of the Nominating and Governance Committee and Trustee | | Vice Chairman since 2018; Chairman of the Nominating and Governance Committee and Trustee since 2007 | | Founder and Principal, YQA Capital Management LLC (1998-Present); formerly, Owner/CEO of Electronic Dynamic Balancing Co., Inc. (high-speed rotating equipment service provider). | | 214 | | Trustee and Investment Oversight Committee member, Mission Aviation Fellowship (2017- Present). |
| | | | | |
Todd J. Barre–1957 c/o Invesco Capital Management LLC 3500 Lacey Road, Suite 700 Downers Grove, IL 60515 | | Trustee | | Since 2010 | | Assistant Professor of Business, Trinity Christian College (2010-2016); formerly, Vice President and Senior Investment Strategist (2001-2008), Director of Open Architecture and Trading (2007-2008), Head of Fundamental Research (2004-2007) and Vice President and Senior Fixed Income Strategist (1994-2001), BMO Financial Group/Harris Private Bank. | | 214 | | None. |
| * | This is the date the Independent Trustee began serving the Trust. Each Independent Trustee serves an indefinite term, until his or her successor is elected. |
| ** | Fund Complex includes all open- and closed-end funds (including all of their portfolios) advised by the Adviser and any affiliated person of the Adviser. |
Trustees and Officers–(continued)
| | | | | | | | | | |
Name, Address and Year of
Birth of Independent Trustees | | Position(s) Held with Trust | | Term of Office and Length of Time Served* | | Principal Occupation(s) During Past 5 Years | | Number of Portfolios in Fund Complex** Overseen by Independent Trustees | | Other Directorships Held by Independent Trustees During the Past 5 Years |
Edmund P. Giambastiani,
Jr.–1948
c/o Invesco Capital Management LLC 3500 Lacey Road, Suite 700
Downers Grove, IL 60515 | | Trustee | | Since 2019 | | President, Giambastiani Group LLC (national security and energy consulting) (2007-Present); Director, The Boeing Company (2009-Present); Trustee, MITRE Corporation (federally-funded research development) (2008-Present); Director, THL Credit, Inc. (alternative credit investment manager) (2016-Present); Trustee, U.S. Naval Academy Foundation Athletic & Scholarship Program (2010-Present); Advisory Board Member, Massachusetts Institute of Technology Lincoln Laboratory (federally-funded research development) (2010- Present); Defense Advisory Board Member, Lawrence Livermore National Laboratory (2013-Present); formerly, Chairman (2015-2016), Lead Director (2011-2015) and Director (2008-2011), Monster Worldwide, Inc. (career services); Advisory Board Member, Maxwell School of Citizenship and Public Affairs of Syracuse University (2012-2016); United States Navy, career nuclear submarine officer (1970-2007); Seventh Vice Chairman of the Joint Chiefs of Staff (2005-2007); first NATO Supreme Allied Commander Transformation (2003-2005); Commander, U.S. Joint Forces Command (2002-2005). | | 214 | | Formerly, Trustee, certain funds of the Oppenheimer Funds complex (2013- 2019); Director, Mercury Defense Systems Inc. (information technology) (2011-2013); Independent Director, QinetiQ Group Plc (defense technology and security) (2008-2011); Chairman, Alenia North America, Inc. (military and defense products) (2008-2009); Director, SRA International, Inc. (information technology and services) (2008- 2011). |
| * | This is the date the Independent Trustee began serving the Trust. Each Independent Trustee serves an indefinite term, until his or her successor is elected. |
| ** | Fund Complex includes all open- and closed-end funds (including all of their portfolios) advised by the Adviser and any affiliated person of the Adviser. |
Trustees and Officers–(continued)
| | | | | | | | | | |
Name, Address and Year of
Birth of Independent Trustees | | Position(s) Held with Trust | | Term of Office and Length of Time Served* | | Principal Occupation(s) During Past 5 Years | | Number of Portfolios in Fund Complex** Overseen by Independent Trustees | | Other Directorships Held by Independent Trustees During the Past 5 Years |
Victoria J. Herget–1951
c/o Invesco Capital
Management LLC
3500 Lacey Road, Suite 700
Downers Grove, IL 60515 | | Trustee | | Since 2019 | | Formerly, Managing Director (1993-2001), Principal (1985-1993), Vice President (1978-1985) and Assistant Vice President (1973- 1978), Zurich Scudder Investments (investment adviser) (and its predecessor firms). | | 214 | | Trustee (2000- Present) and Chair (2010-2017), Newberry Library; Trustee, Mather LifeWays (2001-Present); Trustee, Chikaming Open Lands (2014-Present); formerly, Trustee, certain funds in the Oppenheimer Funds complex (2012- 2019); Board Chair (2008-2015) and Director (2004- 2018), United Educators Insurance Company; Independent Director, First American Funds (2003-2011); Trustee (1992-2007), Chair of the Board of Trustees (1999-2007), Investment Committee Chair (1994-1999) and Investment Committee member (2007-2010), Wellesley College; Trustee, BoardSource (2006-2009); Trustee, Chicago City Day School (1994-2005). |
| * | This is the date the Independent Trustee began serving the Trust. Each Independent Trustee serves an indefinite term, until his or her successor is elected. |
| ** | Fund Complex includes all open- and closed-end funds (including all of their portfolios) advised by the Adviser and any affiliated person of the Adviser. |
Trustees and Officers–(continued)
| | | | | | | | | | |
Name, Address and Year of
Birth of Independent Trustees | | Position(s) Held with Trust | | Term of Office and Length of Time Served* | | Principal Occupation(s) During Past 5 Years | | Number of Portfolios in Fund Complex** Overseen by Independent Trustees | | Other Directorships Held by Independent Trustees During the Past 5 Years |
Marc M. Kole–1960
c/o Invesco Capital
Management LLC
3500 Lacey Road, Suite 700
Downers Grove, IL 60515 | | Chairman of the Audit Committee and Trustee | | Chairman of the Audit Committee since 2008; Trustee since 2007 | | Senior Director of Finance, By The Hand Club for Kids (not-for-profit) (2015-Present); formerly, Chief Financial Officer, Hope Network (social services) (2008-2012); Assistant Vice President and Controller, Priority Health (health insurance) (2005-2008); Regional Chief Financial Officer, United Healthcare (2005); Chief Accounting Officer, Senior Vice President of Finance, Oxford Health Plans (2000-2004); Audit Partner, Arthur Andersen LLP (1996-2000). | | 214 | | Treasurer (2018-Present), Finance Committee Member (2015- Present) and Audit Committee Member (2015), Thornapple Evangelical Covenant Church; formerly, Board and Finance Committee Member (2009-2017) and Treasurer (2010-2015, 2017), NorthPointe Christian Schools. |
| | | | | |
Yung Bong Lim–1964
c/o Invesco Capital
Management LLC
3500 Lacey Road, Suite 700
Downers Grove, IL 60515 | | Chairman of the Investment Oversight Committee and Trustee | | Chairman of the Investment Oversight Committee since 2014; Trustee since 2013 | | Managing Partner, RDG Funds LLC (real estate) (2008-Present); formerly, Managing Director, Citadel LLC (1999- 2007). | | 214 | | Advisory Board Member, Performance Trust Capital Partners, LLC (2008-Present); Board Director, Beacon Power Services, Corp. (2019-Present). |
| * | This is the date the Independent Trustee began serving the Trust. Each Independent Trustee serves an indefinite term, until his or her successor is elected. |
| ** | Fund Complex includes all open- and closed-end funds (including all of their portfolios) advised by the Adviser and any affiliated person of the Adviser. |
Trustees and Officers–(continued)
| | | | | | | | | | |
Name, Address and Year of
Birth of Independent Trustees | | Position(s) Held with Trust | | Term of Office and Length of Time Served* | | Principal Occupation(s) During Past 5 Years | | Number of Portfolios in Fund Complex** Overseen by Independent Trustees | | Other Directorships Held by Independent Trustees During the Past 5 Years |
Joanne Pace–1958
c/o Invesco Capital
Management LLC
3500 Lacey Road, Suite 700
Downers Grove, IL 60515 | | Trustee | | Since 2019 | | Formerly, Senior Advisor, SECOR Asset Management, LP (2010-2011); Managing Director and Chief Operating Officer, Morgan Stanley Investment Management (2006- 2010); Partner and Chief Operating Officer, FrontPoint Partners, LLC (alternative investments) (2005- 2006); Managing Director (2003-2005), Global Head of Human Resources and member of Executive Board and Operating Committee (2004-2005), Global Head of Operations and Product Control (2003-2004), Credit Suisse (investment banking); Managing Director (1997-2003), Controller and Principal Accounting Officer (1999-2003), Chief Financial Officer (temporary assignment) for the Oversight Committee, Long Term Capital Management (1998-1999). | | 214 | | Board Director, Horizon Blue Cross Blue Shield of New Jersey (2012- Present); Advisory Board Director, The Alberleen Group LLC (2012-Present); Governing Council Member (2016- Present) and Chair of Education Committee (2017-Present), Independent Directors Council (IDC); Board Member, 100 Women in Finance (2015-Present); Council Member, NewYork-Presbyterian Hospital’s Leadership Council on Children’s and Women’s Health (2012-Present); formerly, Trustee, certain funds in the Oppenheimer Funds complex (2012- 2019); Lead Independent Director and Chair of the Audit and Nominating Committee of The Global Chartist Fund, LLC, Oppenheimer Asset Management (2011-2012); Board Director, Managed Funds Association (2008-2010); Board Director (2007-2010) and Investment Committee Chair (2008-2010), Morgan Stanley Foundation. |
| * | This is the date the Independent Trustee began serving the Trust. Each Independent Trustee serves an indefinite term, until his or her successor is elected. |
| ** | Fund Complex includes all open- and closed-end funds (including all of their portfolios) advised by the Adviser and any affiliated person of the Adviser. |
Trustees and Officers–(continued)
| | | | | | | | | | |
Name, Address and Year of
Birth of Independent Trustees | | Position(s) Held with Trust | | Term of Office and Length of Time Served* | | Principal Occupation(s) During Past 5 Years | | Number of Portfolios in Fund Complex** Overseen by Independent Trustees | | Other Directorships Held by Independent Trustees During the Past 5 Years |
Gary R. Wicker - 1961
c/o Invesco Capital
Management LLC
3500 Lacey Road, Suite 700
Downers Grove, IL 60515 | | Trustee | | Since 2013 | | Senior Vice President of Global Finance and Chief Financial Officer, RBC Ministries (publishing company) (2013-Present); formerly, Executive Vice President and Chief Financial Officer, Zondervan Publishing (a division of Harper Collins/NewsCorp) (2007-2012); Senior Vice President and Group Controller (2005- 2006), Senior Vice President and Chief Financial Officer (2003-2004), Chief Financial Officer (2001-2003), Vice President, Finance and Controller (1999-2001) and Assistant Controller (1997-1999), divisions of The Thomson Corporation (information services provider); Senior Audit Manager (1994-1997), PricewaterhouseCoopers LLP. | | 214 | | Board Member and Treasurer, Our Daily Bread Ministries Canada (2015- Present); Board and Finance Committee Member, West Michigan Youth For Christ (2010- Present). |
| | | | | |
Donald H. Wilson - 1959
c/o Invesco Capital
Management LLC
3500 Lacey Road, Suite 700
Downers Grove, IL 60515 | | Chairman of the Board and Trustee | | Chairman since 2012; Trustee since 2007 | | Chairman, President and Chief Executive Officer, McHenry Bancorp Inc. and McHenry Savings Bank (subsidiary) (2018-Present); formerly, Chairman and Chief Executive Officer, Stone Pillar Advisors, Ltd. (2010-2017); President and Chief Executive Officer, Stone Pillar Investments, Ltd. (advisory services to the financial sector) (2016- 2018); Chairman, President and Chief Executive Officer, Community Financial Shares, Inc. and Community Bank–Wheaton/Glen Ellyn (subsidiary) (2013-2015); Chief Operating Officer, AMCORE Financial, Inc. (bank holding company) (2007-2009); Executive Vice President and Chief Financial Officer, AMCORE Financial, Inc. (2006-2007); Senior Vice President and Treasurer, Marshall & Ilsley Corp. (bank holding company) (1995-2006). | | 214 | | Director, Penfield Children’s Center (2004-Present); Board Chairman, Gracebridge Alliance, Inc. (2015-Present). |
| * | This is the date the Independent Trustee began serving the Trust. Each Independent Trustee serves an indefinite term, until his or her successor is elected. |
| ** | Fund Complex includes all open- and closed-end funds (including all of their portfolios) advised by the Adviser and any affiliated person of the Adviser. |
Trustees and Officers–(continued)
The Interested Trustee and the executive officers of the Trust, their term of office and length of time served, their principal business occupations during at least the past five years, the number of portfolios in the Fund Complex (as defined below) overseen by the Interested Trustee and the other directorships, if any, held by the Interested Trustee are shown below.
| | | | | | | | | | |
Name, Address and Year of
Birth of Interested Trustee | | Position(s)
Held
with Trust | | Term of
Office
and
Length of
Time
Served* | | Principal
Occupation(s) During
Past 5 Years | | Number of
Portfolios
in Fund
Complex**
Overseen by
Interested
Trustee | | Other
Directorships
Held by
Interested
Trustee During
the Past 5 Years |
Kevin M. Carome–1956 Invesco Ltd. Two Peachtree Pointe
1555 Peachtree St., N.E.,
Suite 1800
Atlanta, GA 30309 | | Trustee | | Since 2010 | | Senior Managing Director, Secretary and General Counsel, Invesco Ltd. (2007-Present); Director, Invesco Advisers, Inc. (2009-Present); Director (2006-Present) and Executive Vice President (2008-Present), Invesco North American Holdings, Inc.; Executive Vice President (2008-Present), Invesco Investments (Bermuda) Ltd.; Manager, Horizon Flight Works LLC; and Executive Vice President (2014-Present), INVESCO Asset Management (Bermuda) Ltd.; formerly, Director and Secretary (2012-2020), Invesco Services (Bahamas) Private Limited; Director, Invesco Finance PLC (2011-2019); Director, INVESCO Asset Management (Bermuda) Ltd. (2014-2019); Director and Executive Vice President, Invesco Finance, Inc. (2011-2018); Director (2006-2018) and Executive Vice President (2008-2018), Invesco Group Services, Inc., Invesco Holding Company (US), Inc.; Director, Invesco Holding Company Limited (2007-2019); Director and Chairman, INVESCO Funds Group, Inc., Senior Vice President, Secretary and General Counsel, Invesco Advisers, Inc. (2003-2006); Director, Invesco Investments (Bermuda) Ltd. (2008-2016); Senior Vice President and General Counsel, Liberty Financial Companies, Inc. (2000-2001); General Counsel of certain investment management subsidiaries of Liberty Financial Companies, Inc. (1998-2000); Associate General Counsel, Liberty Financial Companies, Inc. (1993-1998); Associate, Ropes & Gray LLP. | | 214 | | None |
| * | This is the date the Interested Trustee began serving the Trust. The Interested Trustee serves an indefinite term, until his successor is elected. |
| ** | Fund Complex includes all open- and closed-end funds (including all of their portfolios) advised by the Adviser and any affiliated person of the Adviser. |
Trustees and Officers–(continued)
| | | | | | |
Name, Address and Year of
Birth of Executive Officers | | Position(s)
Held
with Trust | | Length of
Time
Served* | | Principal
Occupation(s) During
Past 5 Years |
Anna Paglia–1974 Invesco Capital Management LLC 3500 Lacey Road, Suite 700
Downers Grove, IL 60515 | | President and Principal Executive Officer | | Since 2020 | | President and Principal Executive Officer, Invesco Exchange-Traded Fund Trust, Invesco Exchange-Traded Fund Trust II, Invesco India Exchange-Traded Fund Trust, Invesco Actively Managed Exchange-Traded Fund Trust, Invesco Actively Managed Exchange-Traded Commodity Fund Trust and Invesco Exchange- Traded Self-Indexed Fund Trust (2020-Present); Managing Director and Global Head of ETFs and Indexed Strategies, Chief Executive Officer and Principal Executive Officer, Invesco Capital Management LLC (2020-Present); Chief Executive Officer, Manager and Principal Executive Officer, Invesco Specialized Products, LLC (2020-Present); Vice President, Invesco Indexing LLC (2020-Present);formerly, Secretary, Invesco Exchange-Traded Fund Trust, Invesco Exchange-Traded Fund Trust II, Invesco India Exchange-Traded Fund Trust and Invesco Actively Managed Exchange-Traded Fund Trust (2011-2020), Invesco Actively Managed Exchange-Traded Commodity Fund Trust (2014-2020) and Invesco Exchange-Traded Self-Indexed Fund Trust (2015-2020); Head of Legal (2010-2020) and Secretary (2015-2020), Invesco Capital Management LLC; Manager and Assistant Secretary, Invesco Indexing LLC (2017-2020); Head of Legal and Secretary, Invesco Specialized Products, LLC (2018-2020); Partner, K&L Gates LLP (formerly, Bell Boyd & Lloyd LLP) (2007-2010); and Associate Counsel at Barclays Global Investors Ltd. (2004-2006). |
| | | |
Kelli Gallegos–1970 Invesco Capital Management LLC 11 Greenway Plaza, Suite 1000
Houston, TX 77046 | | Vice President and Treasurer | | Since 2018 | | Vice President, Invesco Advisers, Inc. (2020-Present); Principal Financial and Accounting Officer- Pooled Investments, Invesco Specialized Products, LLC (2018-Present); Vice President and Treasurer, Invesco Exchange-Traded Fund Trust, Invesco Exchange-Traded Fund Trust II, Invesco India Exchange-Traded Fund Trust, Invesco Actively Managed Exchange-Traded Fund Trust, Invesco Actively Managed Exchange-Traded Commodity Fund Trust and Invesco Exchange-Traded Self-Indexed Fund Trust (2018-Present); Principal Financial and Accounting Officer-Pooled Investments, Invesco Capital Management LLC (2018-Present); Vice President, Principal Financial Officer (2016-Present) and Assistant Treasurer (2008-Present), The Invesco Funds; formerly, Assistant Treasurer, Invesco Specialized Products, LLC (2018); Assistant Treasurer, Invesco Exchange-Traded Fund Trust, Invesco Exchange-Traded Fund Trust II, Invesco India Exchange-Traded Fund Trust and Invesco Actively Managed Exchange-Traded Fund Trust (2012-2018), Invesco Actively Managed Exchange-Traded Commodity Fund Trust (2014-2018) and Invesco Exchange-Traded Self-Indexed Fund Trust (2016-2018); Assistant Treasurer, Invesco Capital Management LLC (2013-2018); and Assistant Vice President, The Invesco Funds (2008-2016). |
| * | This is the date each Officer began serving the Trust in their current position. Each Officer serves an indefinite term, until his or her successor is elected. |
Trustees and Officers–(continued)
| | | | | | |
Name, Address and Year of
Birth of Executive Officers | | Position(s)
Held
with Trust | | Length of
Time
Served* | | Principal
Occupation(s) During
Past 5 Years |
Adam Henkel–1980 Invesco Capital Management LLC 3500 Lacey Road, Suite 700
Downers Grove, IL 60515 | | Secretary | | Since 2020 | | Head of Legal - US ETFs and Secretary, Invesco Capital Management LLC (2020-Present); Head of Legal and Secretary, Invesco Specialized Products, LLC (2020-Present); Secretary, Invesco Exchange-Traded Fund Trust, Invesco Exchange-Traded Fund Trust II, Invesco India Exchange-Traded Fund Trust, Invesco Actively Managed Exchange-Traded Fund Trust, Invesco Actively Managed Exchange-Traded Commodity Fund Trust and Invesco Exchange-Traded Self-Indexed Fund Trust (2020-Present); Manager and Assistant Secretary, Invesco Indexing LLC (2020-Present); Assistant Secretary (2020-Present), Invesco Capital Markets, Inc. and Invesco Investment Advisers LLC; Assistant Secretary, The Invesco Funds (2014-Present); formerly, Assistant Secretary, Invesco Capital Management LLC (2015-2020) and Invesco Specialized Products, LLC (2018-2020); Assistant Secretary (2014-2020) and Chief Compliance Officer (2017-2017), Invesco Exchange-Traded Fund Trust, Invesco Exchange-Traded Fund Trust II, Invesco India Exchange-Traded Fund Trust and Invesco Actively Managed Exchange-Traded Fund Trust, Invesco Actively Managed Exchange-Traded Commodity Fund Trust and Invesco Exchange-Traded Self-Indexed Fund Trust. |
| | | |
Peter Hubbard–1981 Invesco Capital Management LLC 3500 Lacey Road, Suite 700
Downers Grove, IL 60515 | | Vice President | | Since 2009 | | Vice President, Invesco Specialized Products, LLC (2018-Present); Vice President, Invesco Exchange-Traded Fund Trust, Invesco Exchange-Traded Fund Trust II, Invesco India Exchange-Traded Fund Trust, Invesco Actively Managed Exchange-Traded Fund Trust (2009-Present), Invesco Actively Managed Exchange-Traded Commodity Fund Trust (2014-Present) and Invesco Exchange-Traded Self-Indexed Fund Trust (2016-Present); Vice President and Director of Portfolio Management, Invesco Capital Management LLC (2010-Present); formerly, Vice President of Portfolio Management, Invesco Capital Management LLC (2008-2010); Portfolio Manager, Invesco Capital Management LLC (2007-2008); Research Analyst, Invesco Capital Management LLC (2005-2007); Research Analyst and Trader, Ritchie Capital, a hedge fund operator (2003-2005). |
| | | |
Sheri Morris–1964 Invesco Capital Management LLC 11 Greenway Plaza, Suite 1000
Houston, TX 77046 | | Vice President | | Since 2012 | | Head of Global Fund Services, Invesco Ltd. (2019-Present); Vice President, OppenheimerFunds, Inc. (2019-Present); President and Principal Executive Officer, The Invesco Funds (2016-Present); Treasurer, The Invesco Funds (2008-Present); Vice President, Invesco Advisers, Inc. (formerly known as Invesco Institutional (N.A.), Inc.) (registered investment adviser) (2009-Present) and Vice President, Invesco Exchange-Traded Fund Trust, Invesco Exchange-Traded Fund Trust II, Invesco India Exchange-Traded Fund Trust, Invesco Actively Managed Exchange-Traded Fund Trust (2012-Present), Invesco Actively Managed Exchange-Traded Commodity Fund Trust (2014-Present) and Invesco Exchange-Traded Self-Indexed Fund Trust (2016-Present); formerly, Vice President and Principal Financial Officer, The Invesco Funds (2008-2016); Treasurer, Invesco Exchange-Traded Fund Trust, Invesco Exchange-Traded Fund Trust II, Invesco India Exchange-Traded Fund Trust and Invesco Actively Managed Exchange-Traded Fund Trust (2011-2013); Vice President, Invesco Aim Advisers, Inc., Invesco Aim Capital Management, Inc. and Invesco Aim Private Asset Management, Inc.; Assistant Vice President and Assistant Treasurer, The Invesco Funds and Assistant Vice President, Invesco Advisers, Inc., Invesco Aim Capital Management, Inc. and Invesco Aim Private Asset Management, Inc. |
| * | This is the date each Officer began serving the Trust in their current position. Each Officer serves an indefinite term, until his or her successor is elected. |
Trustees and Officers–(continued)
| | | | | | |
Name, Address and Year of
Birth of Executive Officers | | Position(s)
Held
with Trust | | Length of
Time
Served* | | Principal
Occupation(s) During
Past 5 Years |
Rudolf E. Reitmann–1971 Invesco Capital Management LLC 3500 Lacey Road, Suite 700 Downers Grove, IL 60515 | | Vice President | | Since 2013 | | Head of Global Exchange Traded Funds Services, Invesco Specialized Products, LLC (2018-Present); Vice President, Invesco Exchange-Traded Fund Trust, Invesco Exchange-Traded Fund Trust II, Invesco India Exchange-Traded Fund Trust, Invesco Actively Managed Exchange-Traded Fund Trust (2013-Present), Invesco Actively Managed Exchange-Traded Commodity Fund Trust (2014-Present) and Invesco Exchange-Traded Self-Indexed Fund Trust (2016-Present); Head of Global Exchange Traded Funds Services, Invesco Capital Management LLC (2013-Present); Vice President, Invesco Capital Markets, Inc. (2018-Present). |
| | | |
Melanie Zimdars–1976 Invesco Capital Management LLC 3500 Lacey Road, Suite 700 Downers Grove, IL 60515 | | Chief Compliance Officer | | Since 2017 | | Chief Compliance Officer, Invesco Specialized Products, LLC (2018-Present); Chief Compliance Officer, Invesco Capital Management LLC (2017-Present); Chief Compliance Officer, Invesco Exchange-Traded Fund Trust, Invesco Exchange-Traded Fund Trust II, Invesco India Exchange-Traded Fund Trust, Invesco Actively Managed Exchange-Traded Fund Trust, Invesco Actively Managed Exchange-Traded Commodity Fund Trust and Invesco Exchange-Traded Self-Indexed Fund Trust (2017-Present); formerly, Vice President and Deputy Chief Compliance Officer, ALPS Holding, Inc. (2009-2017); Mutual Fund Treasurer/ Chief Financial Officer, Wasatch Advisors, Inc. (2005-2008); Compliance Officer, U.S. Bancorp Fund Services, LLC (2001-2005). |
| * | This is the date each Officer began serving the Trust in their current position. Each Officer serves an indefinite term, until his or her successor is elected. |
Availability of Additional Information About the Trustees
The Statement of Additional Information includes additional information about the Trustees and is available, without charge, upon request at (800) 983-0903.
Approval of Investment Advisory and Sub-Advisory Contracts
At a meeting held on April 14, 2020, the Board of Trustees of the Invesco Exchange-Traded Fund Trust II (the “Trust”), including the Independent Trustees, approved the continuation of the Investment Advisory Agreement between Invesco Capital Management LLC (the “Adviser”) and the Trust for the following 71 series (each, a “Fund” and collectively, the “Funds”):
| | |
| Invesco 1-30 Laddered Treasury ETF | | Invesco S&P 500 Enhanced Value ETF |
| Invesco California AMT-Free Municipal Bond ETF | | Invesco S&P 500® ex-Rate Sensitive Low Volatility ETF |
| Invesco CEF Income Composite ETF | | Invesco S&P 500® High Beta ETF |
| Invesco China Technology ETF | | Invesco S&P 500® High Dividend Low Volatility ETF |
| Invesco DWA Developed Markets Momentum ETF | | Invesco S&P 500® Low Volatility ETF |
| Invesco DWA Emerging Markets Momentum ETF | | Invesco S&P 500 Minimum Variance ETF |
| Invesco DWA SmallCap Momentum ETF | | Invesco S&P 500 Momentum ETF |
| Invesco Emerging Markets Sovereign Debt ETF | | Invesco S&P 500 Revenue ETF |
| Invesco FTSE International Low Beta Equal Weight ETF | | Invesco S&P Emerging Markets Low Volatility ETF |
| Invesco FTSE RAFI Developed Markets ex-U.S. ETF | | Invesco S&P Emerging Markets Momentum ETF |
Invesco FTSE RAFI Developed Markets ex-U.S. Small-Mid ETF Invesco FTSE RAFI Emerging Markets ETF | | Invesco S&P International Developed High Dividend Low Volatility ETF |
| Invesco Fundamental High Yield® Corporate Bond ETF | | Invesco S&P International Developed Low Volatility ETF |
Invesco Fundamental Investment Grade Corporate Bond ETF | | Invesco S&P International Developed Momentum ETF |
| Invesco Global Clean Energy ETF | | Invesco S&P International Developed Quality ETF |
| Invesco Global Short Term High Yield Bond ETF | | Invesco S&P MidCap 400 Revenue ETF |
| Invesco Global Water ETF | | Invesco S&P MidCap Low Volatility ETF |
| Invesco International BuyBack Achievers™ ETF | | Invesco S&P SmallCap 600 Revenue ETF |
| Invesco International Corporate Bond ETF | | Invesco S&P SmallCap Consumer Discretionary ETF |
| Invesco KBW Bank ETF | | Invesco S&P SmallCap Consumer Staples ETF |
| Invesco KBW High Dividend Yield Financial ETF | | Invesco S&P SmallCap Energy ETF |
| Invesco KBW Premium Yield Equity REIT ETF | | Invesco S&P SmallCap Financials ETF |
| Invesco KBW Property & Casualty Insurance ETF | | Invesco S&P SmallCap Health Care ETF |
| Invesco KBW Regional Banking ETF | | Invesco S&P SmallCap High Dividend Low Volatility ETF |
| Invesco National AMT-Free Municipal Bond ETF | | Invesco S&P SmallCap Industrials ETF |
| Invesco New York AMT-Free Municipal Bond ETF | | Invesco S&P SmallCap Information Technology ETF |
| Invesco Preferred ETF | | Invesco S&P SmallCap Low Volatility ETF |
| Invesco PureBetaSM 0-5 Yr US TIPS ETF | | Invesco S&P SmallCap Materials ETF |
| Invesco PureBetaSM FTSE Developedex-North America ETF | | Invesco S&P SmallCap Quality ETF |
| Invesco PureBetaSM FTSE Emerging Markets ETF | | Invesco S&P SmallCap Utilities & Communication Services ETF |
| Invesco PureBetaSM MSCI USA ETF | | Invesco S&P Ultra Dividend Revenue ETF |
| Invesco PureBetaSM MSCI USA SmallCap ETF | | Invesco Senior Loan ETF |
| Invesco PureBetaSM US Aggregate Bond ETF | | Invesco Taxable Municipal Bond ETF |
| Invesco Russell 1000 Enhanced Equal Weight ETF | | Invesco Treasury Collateral ETF |
| Invesco Russell 1000 Equal Weight ETF | | Invesco Variable Rate Preferred ETF |
| Invesco Russell 1000 Low Beta Equal Weight ETF | | Invesco VRDO Tax-Free Weekly ETF |
Also at the April 14, 2020 meeting, the Board of Trustees of the Trust, including the Independent Trustees, approved the continuation of the Investment Sub-Advisory Agreement between the Adviser and the following seven affiliated sub-advisers for each of Invesco Senior Loan ETF and Invesco Treasury Collateral ETF (the “Sub-Advisory Agreement”): Invesco Advisers, Inc.; Invesco Asset Management Deutschland, GmbH; Invesco Asset Management Limited; Invesco Asset Management (Japan) Limited; Invesco Hong Kong Limited; Invesco Senior Secured Management, Inc.; and Invesco Canada Ltd. (each, a “Sub-Adviser” and collectively, the “Sub-Advisers”).
Investment Advisory Agreement
The Trustees reviewed information from the Adviser describing: (i) the nature, extent and quality of services provided, (ii) the investment performance of each Fund and the Adviser, (iii) the fees paid by the Funds and comparisons to amounts paid by other comparable registered investment companies, (iv) the costs of services provided and estimated profits realized by the Adviser, (v) the extent to which economies of scale may be realized as a Fund grows and whether fee levels reflect any possible economies of
Approval of Investment Advisory and Sub-Advisory Contracts–(continued)
scale for the benefit of Fund shareholders, and (vi) any further benefits realized by the Adviser or its affiliates from the Adviser’s relationship with the Funds.
Nature, Extent and Quality of Services. In evaluating the nature, extent and quality of the Adviser’s services, the Trustees reviewed information concerning the functions performed by the Adviser for the Funds, information describing the Adviser’s current organization and staffing, including operational support provided by the Adviser’s parent organization, Invesco Ltd. (“Invesco”), and the background and experience of the persons responsible for the day-to-day management of the Funds. The Trustees reviewed matters related to the Adviser’s execution and/or oversight of execution of portfolio transactions on behalf of the Funds. The Trustees also reviewed information on the performance of the Funds and their underlying indexes for the one-year, three-year, five-year, ten-year and since-inception periods ended December 31, 2019, as applicable, including reports for each of those periods on the correlation and tracking error between each Fund’s performance and the performance of its underlying index, as well as the Adviser’s analysis of the tracking error and correlation between certain Funds and their underlying indexes. In reviewing the tracking error reports, the Trustees considered information provided by Invesco’s independent performance and risk management group with respect to general expected tracking error ranges. The Trustees also considered that certain Funds were created in connection with the purchases by Invesco of the exchange-traded funds businesses of Guggenheim Capital LLC on April 6, 2018 and Massachusetts Mutual Life Insurance Company (“Oppenheimer”) on May 24, 2019 (each, a “Transaction”), and that each such Fund’s performance prior to the closing of the applicable Transaction is that of its predecessor Guggenheim ETF or Oppenheimer ETF. The Trustees noted that, for each applicable period, the correlation for each Fund, other than the five-year and since-inception periods for Invesco Global Short Term High Yield Bond ETF and the one-year and ten-year periods for Invesco VRDO Tax-Free Weekly ETF, was within the targeted range set forth in the Trust’s registration statement. The Trustees reviewed the reasons provided by the Adviser for Invesco Global Short Term High Yield Bond ETF’s and Invesco VRDO Tax-Free Weekly ETF’s level of correlation to its underlying index, as well as the Adviser’s expectations for each Fund’s correlation going forward. The Trustees noted that, for each applicable period, the tracking error for all Funds was within the targeted range set forth in the Trust’s registration statement and concluded that each Fund’s correlation to its underlying index and the tracking error for each Fund were within an acceptable range given that Fund’s particular circumstances.
The Trustees considered the services provided by the Adviser in its oversight of the Funds’ administrator, custodian and transfer agent. They noted the significant amount of time, effort and resources that had been devoted to this oversight function.
Based on their review, the Trustees concluded that the nature, extent and quality of services provided by the Adviser to the Funds under the Investment Advisory Agreement were appropriate and reasonable.
Fees, Expenses and Profitability. The Trustees reviewed and discussed the information provided by the Adviser on each Fund’s net expense ratio and unitary advisory fee. The Trustees noted that the annual advisory fee charged to each Fund, as set forth below, is a unitary advisory fee and that the Adviser pays all other operating expenses of each Fund, including the fees payable to the Sub-Advisers for Invesco Senior Loan ETF and Invesco Treasury Collateral ETF, except that each Fund pays its brokerage expenses, taxes, interest (including, for Invesco Senior Loan ETF, interest expenses associated with its line of credit), litigation expenses and other extraordinary expenses (including acquired fund fees and expenses, if any).
| | • | | 0.04%: Invesco PureBetaSM MSCI USA ETF |
| | • | | 0.05%: Invesco PureBetaSM US Aggregate Bond ETF |
| | • | | 0.06%: Invesco PureBetaSM MSCI USA Small Cap ETF |
| | • | | 0.07%: Invesco PureBetaSM 0-5 Yr US TIPS ETF, Invesco PureBetaSM FTSE Developed ex-North America ETF |
| | • | | 0.08%: Invesco Treasury Collateral ETF |
| | • | | 0.10%: Invesco S&P 500 Minimum Variance ETF |
| | • | | 0.13%: Invesco S&P 500 Enhanced Value ETF, Invesco S&P 500 Momentum ETF |
| | • | | 0.14%: Invesco PureBetaSM FTSE Emerging Markets ETF |
| | • | | 0.20%: Invesco Russell 1000 Equal Weight ETF |
| | • | | 0.22%: Invesco Fundamental Investment Grade Corporate Bond ETF |
Approval of Investment Advisory and Sub-Advisory Contracts–(continued)
| | • | | 0.25%: Invesco 1-30 Laddered Treasury ETF, Invesco S&P 500® ex-Rate Sensitive Low Volatility ETF, Invesco S&P 500® High Beta ETF, Invesco S&P 500® Low Volatility ETF, Invesco S&P MidCap Low Volatility ETF, Invesco S&P SmallCap Low Volatility ETF, Invesco VRDO Tax-Free Weekly ETF |
| | • | | 0.28%: Invesco California AMT-Free Municipal Bond ETF, Invesco National AMT-Free Municipal Bond ETF, Invesco New York AMT-Free Municipal Bond ETF, Invesco Taxable Municipal Bond ETF |
| | • | | 0.29%: Invesco Russell 1000 Enhanced Equal Weight ETF, Invesco S&P International Developed Quality ETF, Invesco S&P SmallCap Consumer Discretionary ETF, Invesco S&P SmallCap Consumer Staples ETF, Invesco S&P SmallCap Energy ETF, Invesco S&P SmallCap Financials ETF, Invesco S&P SmallCap Health Care ETF, Invesco S&P SmallCap Industrials ETF, Invesco S&P SmallCap Information Technology ETF, Invesco S&P SmallCap Materials ETF, Invesco S&P SmallCap Quality ETF, Invesco S&P SmallCap Utilities & Communication Services ETF |
| | • | | 0.30%: Invesco S&P 500® High Dividend Low Volatility ETF, Invesco S&P International Developed High Dividend Low Volatility ETF, Invesco S&P SmallCap High Dividend Low Volatility ETF |
| | • | | 0.35%: Invesco Global Short Term High Yield Bond ETF, Invesco KBW Bank ETF, Invesco KBW High Dividend Yield Financial ETF, Invesco KBW Premium Yield Equity REIT ETF, Invesco KBW Property & Casualty Insurance ETF, Invesco KBW Regional Banking ETF, Invesco Russell 1000 Low Beta Equal Weight ETF, Invesco S&P International Developed Low Volatility ETF, Invesco S&P International Developed Momentum ETF |
| | • | | 0.39%: Invesco S&P 500 Revenue ETF, Invesco S&P MidCap 400 Revenue ETF, Invesco S&P SmallCap 600 Revenue ETF, Invesco S&P Ultra Dividend Revenue ETF |
| | • | | 0.45%: Invesco FTSE International Low Beta Equal Weight ETF, Invesco FTSE RAFI Developed Markets ex-U.S. ETF, Invesco S&P Emerging Markets Low Volatility ETF, Invesco S&P Emerging Markets Momentum ETF |
| | • | | 0.49%: Invesco FTSE RAFI Developed Markets ex-U.S. Small-Mid ETF, Invesco FTSE RAFI Emerging Markets ETF |
| | • | | 0.50%: Invesco CEF Income Composite ETF, Invesco Emerging Markets Sovereign Debt ETF, Invesco Fundamental High Yield® Corporate Bond ETF, Invesco International Corporate Bond ETF, Invesco Preferred ETF, Invesco Variable Rate Preferred ETF |
| | • | | 0.55%: Invesco International BuyBack AchieversTM ETF |
| | • | | 0.60%: Invesco DWA SmallCap Momentum ETF |
| | • | | 0.65%: Invesco Senior Loan ETF |
| | • | | 0.70%: Invesco China Technology ETF |
| | • | | 0.75%: Invesco Global Clean Energy ETF, Invesco Global Water ETF |
| | • | | 0.80%: Invesco DWA Developed Markets Momentum ETF |
| | • | | 0.90%: Invesco DWA Emerging Markets Momentum ETF |
The Trustees considered that, effective May 1, 2020, the Adviser had agreed to reduce the unitary advisory fee for Invesco S&P Emerging Markets Low Volatility ETF and Invesco S&P Emerging Markets Momentum ETF from 0.45% to 0.29% of average daily net assets, and to reduce the unitary advisory fee for Invesco S&P International Developed Low Volatility ETF and Invesco S&P International Developed Momentum ETF from 0.35% to 0.25% of average daily net assets.
The Trustees compared each Fund’s net expense ratio to information compiled by the Adviser from Lipper Inc. databases on the net expense ratios of comparable exchange-traded funds (“ETFs”), open-end (non-ETF) index funds and open-end (non-ETF) actively-managed funds, as applicable. The Trustees noted that the net expense ratios for certain Funds were equal to or lower than the median net expense ratios of their ETF and open-end index peer funds as illustrated in the table below. The Trustees also noted that the net expense ratios for all of the Funds were lower than the median net expense ratios of their open-end
Approval of Investment Advisory and Sub-Advisory Contracts–(continued)
actively-managed peer funds. The Trustees noted that a portion of each Fund’s operating expenses was attributable to a sub-license fee payable out of the unitary advisory fee charged to that Fund.
| | | | | | |
| Invesco Fund | | Equal to/Lower
than ETF Peer Median | | Equal to/Lower than Open-End Index Fund Peer Median* | | Lower than Open-Active Fund Peer Median |
Invesco 1-30 Laddered Treasury ETF | | | | | | X |
Invesco California AMT-Free Municipal Bond ETF | | | | N/A | | X |
Invesco CEF Income Composite ETF | | X | | N/A | | X |
Invesco China Technology ETF | | | | N/A | | X |
Invesco DWA Developed Markets Momentum ETF | | | | | | X |
Invesco DWA Emerging Markets Momentum ETF | | | | | | X |
Invesco DWA SmallCap Momentum ETF | | | | | | X |
Invesco Emerging Markets Sovereign Debt ETF | | | | | | X |
Invesco FTSE International Low Beta Equal Weight ETF | | X | | X | | X |
Invesco FTSE RAFI Developed Markets ex-U.S. ETF | | | | X | | X |
Invesco FTSE RAFI Developed Markets ex-U.S. Small-Mid ETF | | X | | X | | X |
Invesco FTSE RAFI Emerging Markets ETF | | X | | | | X |
Invesco Fundamental High Yield® Corporate Bond ETF | | | | X | | X |
Invesco Fundamental Investment Grade Corporate Bond ETF | | | | | | X |
Invesco Global Clean Energy ETF | | | | N/A | | X |
Invesco Global Short Term High Yield Bond ETF | | X | | N/A | | X |
Invesco Global Water ETF | | | | N/A | | X |
Invesco International BuyBack AchieversTM ETF | | X | | X | | X |
Invesco International Corporate Bond ETF | | | | | | X |
Invesco KBW Bank ETF | | X | | | | X |
Invesco KBW High Dividend Yield Financial ETF | | X | | | | X |
Invesco KBW Premium Yield Equity REIT ETF | | X | | | | X |
Invesco KBW Property & Casualty Insurance ETF | | X | | | | X |
Invesco KBW Regional Banking ETF | | X | | | | X |
Invesco National AMT-Free Municipal Bond ETF | | | | | | X |
Invesco New York AMT-Free Municipal Bond ETF | | | | N/A | | X |
Invesco Preferred ETF | | | | N/A | | X |
Invesco PureBetaTM 0-5 Yr US TIPS ETF | | | | | | X |
Invesco PureBetaTM FTSE Developed ex-North America ETF | | | | | | X |
Invesco PureBetaTM FTSE Emerging Markets ETF | | X | | | | X |
Invesco PureBetaTM MSCI USA ETF | | X | | X | | X |
Invesco PureBetaTM MSCI USA Small Cap ETF | | X | | X | | X |
Invesco PureBetaTM US Aggregate Bond ETF | | X | | X | | X |
Invesco Russell 1000 Enhanced Equal Weight ETF | | X | | X | | X |
Invesco Russell 1000 Equal Weight ETF | | X | | X | | X |
Invesco Russell 1000 Low Beta Equal Weight ETF | | | | X | | X |
Invesco S&P 500 Enhanced Value ETF | | X | | X | | X |
Invesco S&P 500® ex-Rate Sensitive Low Volatility ETF | | X | | X | | X |
Invesco S&P 500® High Beta ETF | | X | | X | | X |
Invesco S&P 500® High Dividend Low Volatility ETF | | X | | X | | X |
Invesco S&P 500® Low Volatility ETF | | X | | | | X |
Invesco S&P 500 Minimum Variance ETF | | X | | X | | X |
Invesco S&P 500 Momentum ETF | | | | X | | X |
Approval of Investment Advisory and Sub-Advisory Contracts–(continued)
| | | | | | |
| Invesco Fund | | Equal to/Lower
than ETF
Peer Median | | Equal to/Lower
than Open-End
Index Fund Peer Median* | | Lower than
Open-Active Fund Peer Median |
Invesco S&P 500 Revenue ETF | | | | X | | X |
Invesco S&P Emerging Markets Low Volatility ETF | | X | | X | | X |
Invesco S&P Emerging Markets Momentum ETF | | X | | | | X |
Invesco S&P International Developed High Dividend Low Volatility ETF | | X | | | | X |
Invesco S&P International Developed Low Volatility ETF | | X | | | | X |
Invesco S&P International Developed Momentum ETF | | | | | | X |
Invesco S&P International Developed Quality ETF | | X | | | | X |
Invesco S&P MidCap 400 Revenue ETF | | | | | | X |
Invesco S&P MidCap Low Volatility ETF | | | | | | X |
Invesco S&P SmallCap 600 Revenue ETF | | | | X | | X |
Invesco S&P SmallCap Consumer Discretionary ETF | | X | | | | X |
Invesco S&P SmallCap Consumer Staples ETF | | X | | | | X |
Invesco S&P SmallCap Energy ETF | | X | | | | X |
Invesco S&P SmallCap Financials ETF | | X | | | | X |
Invesco S&P SmallCap Health Care ETF | | X | | | | X |
Invesco S&P SmallCap High Dividend Low Volatility ETF | | X | | X | | X |
Invesco S&P SmallCap Industrials ETF | | X | | | | X |
Invesco S&P SmallCap Information Technology ETF | | X | | X | | X |
Invesco S&P SmallCap Low Volatility ETF | | X | | X | | X |
Invesco S&P SmallCap Materials ETF | | X | | | | X |
Invesco S&P SmallCap Quality ETF | | X | | | | X |
Invesco S&P SmallCap Utilities & Communication Services ETF | | X | | X | | X |
Invesco S&P Ultra Dividend Revenue ETF | | | | X | | X |
Invesco Senior Loan ETF | | | | X | | X |
Invesco Taxable Municipal Bond ETF | | | | N/A | | X |
Invesco Treasury Collateral ETF | | X | | | | X |
Invesco Variable Rate Preferred ETF | | | | X | | X |
Invesco VRDO Tax-Free Weekly ETF | | | | N/A | | X |
| * | The information provided by the Adviser indicated that certain Funds did not have any comparable open-end index fund peers. Those Funds have been designated in this column with an “N/A” for not available. |
In response to questions from the Independent Trustees, the Adviser provided supplemental information regarding each of Invesco 1-30 Laddered Treasury ETF, Invesco California AMT-Free Municipal Bond ETF, Invesco DWA Developed Markets Momentum ETF, Invesco Emerging Markets Sovereign Debt ETF, Invesco Global Clean Energy ETF, Invesco Global Water ETF, Invesco International Corporate Bond ETF, Invesco National AMT-Free Municipal Bond ETF, Invesco New York AMT-Free Municipal Bond ETF, Invesco Senior Loan ETF and Invesco VRDO Tax-Free Weekly ETF’s advisory fees and total expenses and the Lipper peer data. The Adviser explained its view that the advisory fees and total expenses for these Funds are competitive and generally in line with other comparable funds in the marketplace, particularly in light of the level and nature of services provided and the investment management style of the Adviser. The Trustees also considered the Adviser’s statements regarding its pricing philosophy and the differing pricing philosophy of certain of the peers.
The Trustees noted information, including fee information, provided by the Adviser regarding other investment products to which it provides investment advisory services, including products that have investment strategies comparable to certain of the Funds. The Trustees considered the Adviser’s explanation of the differences between the services provided to the Funds and to the other investment products it advises, noting the Adviser’s statement that the management and oversight of the Funds requires substantially more labor and expense.
Approval of Investment Advisory and Sub-Advisory Contracts–(continued)
Based on all the information provided, the Board concluded that each Fund’s unitary advisory fee was reasonable and appropriate in light of the services provided, the nature of the indexes, the distinguishing factors of the Funds, and the administrative, operational and management oversight costs for the Adviser.
In conjunction with their review of the unitary advisory fees, the Trustees considered information provided by the Adviser on the revenues received by the Adviser under the Investment Advisory Agreement for the Funds. The Trustees reviewed information provided by the Adviser on its overall profitability, as well as the estimated profitability to the Adviser from its relationship to each Fund. The Trustees concluded that the overall and estimated profitability to the Adviser was not unreasonable.
Economies of Scale and Whether Fee Levels Reflect These Economies of Scale. The Trustees reviewed the information provided by the Adviser as to the extent to which economies of scale may be realized as each Fund grows and whether fee levels reflect economies of scale for the benefit of shareholders. The Trustees reviewed each Fund’s asset size and unitary advisory fee. The Trustees noted that any reduction in fixed costs associated with the management of the Funds would be enjoyed by the Adviser, but a unitary advisory fee provides a level of certainty in expenses for the Funds. The Trustees considered whether the unitary advisory fee rate for each Fund was reasonable in relation to the asset size of that Fund, and concluded that the unitary advisory fee was reasonable and appropriate.
Fall-out Benefits. The Trustees considered that the Adviser identified no additional benefits it receives from its relationship with the Funds, and noted that the Adviser does not have any soft-dollar arrangements. The Trustees also considered benefits received by affiliates of the Adviser that may be directly or indirectly attributed to the Adviser’s relationship with the Funds, including brokerage fees and advisory fees for money market cash management vehicles. The Board concluded that the advisory fee was reasonable, taking into account any ancillary benefits received by affiliates of the Adviser.
Based on all of the information considered and the conclusions reached, the Board, including the Independent Trustees, determined to approve the continuation of the Investment Advisory Agreement for each Fund. No single factor was determinative in the Board’s analysis.
Investment Sub-Advisory Agreement
As noted above, the Board of Trustees of the Trust, including the Independent Trustees, approved the continuation of the Sub-Advisory Agreement for each of Invesco Senior Loan ETF and Invesco Treasury Collateral ETF at a meeting held on April 14, 2020. The review process followed by the Board is described in detail above. In connection with the review of the Sub-Advisory Agreement, the Board considered the factors described below, among others.
Nature, Extent and Quality of Services. The Trustees considered the nature, extent and quality of services provided under the Sub-Advisory Agreement. The Board reviewed the qualifications and background of each Sub-Adviser, the services provided or to be provided by each Sub-Adviser, the investment approach of the Sub-Adviser whose investment personnel manage Invesco Senior Loan ETF’s and Invesco Treasury Collateral ETF’s assets, the experience and skills of the investment personnel responsible for the day-to-day management of the Funds, and the resources made available to such personnel.
Based on their review, the Trustees concluded that the nature, extent and quality of services provided by the Sub-Advisers to Invesco Senior Loan ETF and Invesco Treasury Collateral ETF under the Sub-Advisory Agreement were appropriate and reasonable.
Fees, Expenses and Profitability. The Trustees reviewed and discussed the information provided by the Adviser and the Sub-Advisers on the sub-advisory fee rates under the Sub-Advisory Agreement. The Trustees noted that the sub-advisory fees charged by the Sub-Advisers under the Sub-Advisory Agreement are consistent with the compensation structure used throughout Invesco when Invesco’s affiliates provide sub-advisory services for funds managed by other Invesco affiliates. The Board considered how the sub-advisory fees relate to the overall advisory fee for each of Invesco Senior Loan ETF and Invesco Treasury Collateral ETF and noted that the Adviser compensates the Sub-Advisers from its fee.
The Trustees also reviewed the financial statements provided by Invesco Senior Secured Management, Inc., in connection with the March 12, 2020 Board meeting, and Invesco Advisers, Inc., in connection with the April 14, 2020 meeting, and noted the net income generated by each firm. The Trustees noted that the Adviser compensates the Sub-Advisers from its fee and that the Adviser provided profitability information with respect to Invesco Senior Loan ETF and Invesco Treasury Collateral ETF.
Approval of Investment Advisory and Sub-Advisory Contracts–(continued)
Economies of Scale and Whether Fee Levels Reflect These Economies of Scale. As part of their review of the Investment Advisory Agreement for Invesco Senior Loan ETF and Invesco Treasury Collateral ETF, the Trustees considered the extent to which economies of scale may be realized as the Funds grow and whether fee levels reflect economies of scale for the benefit of shareholders. The Trustees considered whether the sub-advisory fee rates for Invesco Senior Loan ETF and Invesco Treasury Collateral ETF were reasonable in relation to the asset size of the Funds, and concluded that the flat sub-advisory fee rates were reasonable and appropriate.
Fall-out Benefits. The Trustees noted that Invesco Advisers, Inc. receives management fees from money market funds into which the Funds’ and other Invesco ETFs’ excess cash and securities lending collateral may be invested, and that the Adviser waives its fees on the excess cash invested under such arrangement in amounts equal to fees received by Invesco Advisers, Inc. on the Funds’ and other Invesco ETFs’ excess cash invested in the money market funds. The Trustees noted that the Sub-Advisers had not identified any further benefits that they derived from their relationships with Invesco Senior Loan ETF and Invesco Treasury Collateral ETF and that the Sub-Advisers do not have any soft-dollar arrangements with respect to the Funds. The Board concluded that the sub-advisory fee with respect to each Fund was reasonable, taking into account any ancillary benefits received by the Sub-Advisers.
Based on all of the information considered and the conclusions reached, the Board, including the Independent Trustees, determined to approve the continuation of the Sub-Advisory Agreement for Invesco Senior Loan ETF and Invesco Treasury Collateral ETF. No single factor was determinative in the Board’s analysis.
Proxy Voting Policies and Procedures
A description of the Trust’s proxy voting policies and procedures that the Fund uses to determine how to vote proxies relating to portfolio securities is available, without charge and upon request, by calling (800) 983-0903. This information is also available on the Securities and Exchange Commission’s (the “Commission”) website at www.sec.gov.
Information regarding how the Fund voted proxies for portfolio securities, if applicable, during the most recent 12-month period ended June 30, is available, without charge and upon request, by (i) calling (800) 983-0903; or (ii) accessing the Trust’s Form N-PX on the Commission’s website at www.sec.gov.
Quarterly Portfolios
The Trust files its complete schedule of portfolio holdings for the Fund with the Commission for the first and third quarters of each fiscal year as an exhibit to its reports on Form N-PORT. The Forms N-PORT are available on the Commission’s website at www.sec.gov.
Frequency Distribution of Discounts and Premiums
A table showing the number of days the market price of the Fund’s shares was greater than the Fund’s net asset value, and the number of days it was less than the Fund’s net asset value (i.e., premium or discount) for the most recently completed calendar year, and the calendar quarters since that year end (or the life of the Fund, if shorter) may be found at the Fund’s website at www.invesco.com/ETFs.
| | | | |
©2020 Invesco Capital Management LLC 3500 Lacey Road, Suite 700 Downers Grove, IL 60515 | | P-BKLN-AR-1 | | invesco.com/ETFs |

| | | | | | |
| Invesco Annual Report to Shareholders |
|
August 31, 2020 |
| |
| KBWB | | Invesco KBW Bank ETF |
| KBWD | | Invesco KBW High Dividend Yield Financial ETF |
| KBWY | | Invesco KBW Premium Yield Equity REIT ETF |
| KBWP | | Invesco KBW Property & Casualty Insurance ETF |
| KBWR | | Invesco KBW Regional Banking ETF |
Beginning on January 1, 2021, as permitted by regulations adopted by the Securities and Exchange Commission, paper copies of the Funds’ shareholder reports will no longer be sent by mail, unless you specifically request paper copies of the reports from your financial intermediary, such as a broker-dealer or bank. Instead, the reports will be made available on a website, and you will be notified by mail each time a report is posted and provided with a website link to access the report.
If you already elected to receive shareholder reports electronically, you will not be affected by this change and you need not take any action. If you hold accounts through a financial intermediary, you may contact your financial intermediary to enroll in electronic delivery. Please note that not all financial intermediaries may offer this service.
You may elect to receive all future reports in paper free of charge. If you hold accounts through a financial intermediary, you can follow the instructions included with this disclosure, if applicable, or contact your financial intermediary to request that you continue to receive paper copies of your shareholder reports. Please note that not all financial intermediaries may offer this service. Your election to receive reports in paper will apply to all funds held with your financial intermediary.

Table of Contents
The Market Environment
Domestic Equity
Macroeconomic issues that concerned investors in the third quarter of 2019 mostly abated during the fourth quarter, providing the backdrop for strong equity market returns. During its September and October meetings, the US Federal Reserve (“the Fed”) cut interest rates by 0.25% each time, based on business investment and exports remaining weak.1 Investors were also encouraged by a resilient US economy and corporate earnings, putting the US equity market on track for its largest annual rise since 2013.
During the first quarter of 2020, as the spread of the new coronavirus (COVID-19) disrupted travel and suppressed consumer activity, investors became increasingly concerned about the global economy. At the same time, oil prices fell sharply as a price war between Saudi Arabia and Russia threatened to boost supply even as demand was falling. Beginning in late February, equity markets declined sharply and quickly, ushering in the first bear market since the financial crisis of 2008. Though the equity market stabilized somewhat toward the end of March, all sectors declined during the downturn. In response to the major collapse in demand and to help facilitate liquidity, the Fed cut interest rates two times in March by 0.50% and 1.00%, ending with a target range of 0.00% to 0.25% .1
In April, US unemployment numbers continued to climb and the initial gross domestic product (GDP) estimates for the first quarter of 2020 saw the economy shrink by 5%, the sharpest drop since the 2008 financial crisis.2 However, during the second and into the third quarter of 2020, US stocks largely shrugged off economic uncertainty, social unrest and a resurgence in coronavirus infections to rally from the market bottom. The rally followed a sharp economic decline caused by global shutdowns to slow the spread of COVID-19. Investor sentiment improved in response to trillions of dollars in economic stimulus, progress on a coronavirus vaccine and reopenings in many US regions. After oil futures contracts turned negative in early April, oil prices doubled in June, which supported struggling energy companies and millions of energy sector employees. In July, the Fed extended its emergency stimulus programs, originally scheduled to end in September, to year-end, which provided support to equities. Additionally, optimism about a vaccine, and better than anticipated US economic data and corporate earnings also boosted stocks. Most economists believe the US economy hit a low in April; however, in late August revised second quarter GDP fell by 31.7%, a record decline.2 Despite the extreme drop in the economy, the S&P 500 Index not only erased all of its losses from the first quarter but ended the fiscal year with record highs.
| 1 | Source: US Federal Reserve |
| 2 | Source: US Bureau of Economic Analysis |
| | |
 | | Management’s Discussion of Fund Performance Invesco KBW Bank ETF (KBWB) |
As an index fund, the Invesco KBW Bank ETF (the “Fund”) seeks to track the investment results (before fees and expenses) of the KBW Nasdaq Bank Index (the “Index”). The Fund generally will invest at least 90% of its total assets in the securities that comprise the Index.
Strictly in accordance with its guidelines and mandated procedures, Keefe, Bruyette & Woods, Inc. and Nasdaq, Inc. (the “Index Provider”) compile, calculate and maintain the Index, which is a modified-market capitalization-weighted index of companies primarily engaged in U.S. banking activities, as determined by the Index Provider. The Index is designed to track the performance of large national U.S. money centers, regional banks and thrift institutions that are publicly traded in the U.S. The Fund generally invests in all of the securities comprising the Index in proportion to their weightings in the Index.
For the fiscal year ended August 31, 2020, on a market price basis, the Fund returned (14.72)%. On a net asset value (“NAV”) basis, the Fund returned (14.81)%. During the same time period, the Index returned (14.61)%. During the fiscal year, the Fund fully replicated the components of the Index; therefore, the Fund’s performance, on a NAV basis, differed from the return of the Index primarily due to fees and operating expenses that the Fund incurred during the period, which were partially offset by the Fund holding cash to pay distributions in March, which coincided with overall market declines.
During this same time period, the S&P 500® Financials Index (the “Benchmark Index”) returned (4.45)%. The Benchmark Index is an unmanaged index weighted by market capitalization and based on the average performance of approximately 66 securities. The Benchmark Index was selected for its recognition in the marketplace, and its performance comparison is a useful measure for investors as a broad representation of the financial sector of the U.S. equity market.
The performance of the Fund differed from the Benchmark Index in part because the Benchmark Index is broadly diversified across all financial sub-industries and is not concentrated just in the banking sub-industry.
Relative to the Benchmark Index, the Fund was most overweight in the regional banks sub-industry and most underweight in the multi-sector holdings sub-industry during the fiscal year ended August 31, 2020. The majority of the Fund’s underperformance relative to the Benchmark Index during the period can be attributed to the Fund’s security selection and overweight allocation in the diversified banks and regional banks sub-industries.
For the fiscal year ended August 31, 2020, the asset management & custody banks sub-industry was the only sub-industry that contributed to the Fund’s return. The diversified banks sub-industry detracted most significantly from the Fund’s
return, followed by the consumer finance and regional banks sub-industries, respectively.
Positions that contributed most significantly to the Fund’s return for the fiscal year ended August 31, 2020, included State Street Corp., an asset management & custody banks company (portfolio average weight of 1.41%) and SVB Financial Group, a regional banks company (portfolio average weight of 2.92%). Positions that detracted most significantly from the Fund’s return included Wells Fargo & Co., a diversified banks company (portfolio average weight of 7.36%) and U.S. Bancorp, a diversified banks company (portfolio average weight of 7.71%).
Sub-Industry Breakdown (% of the Fund’s Net Assets) as of August 31, 2020
| | | | | | |
| | | |
Regional Banks | | | 44.35 | | | |
| | |
Diversified Banks | | | 39.45 | | | |
| | |
Asset Management & Custody Banks | | | 12.18 | | | |
| | |
Consumer Finance | | | 3.93 | | | |
| | |
Other Assets Less Liabilities | | | 0.09 | | | |
Top Ten Fund Holdings (% of the Fund’s Net Assets) as of August 31, 2020
| | | | | | |
| Security | | | | | |
| | |
Bank of America Corp. | | | 8.26 | | | |
| | |
Citigroup, Inc. | | | 8.25 | | | |
| | |
JPMorgan Chase & Co. | | | 7.96 | | | |
| | |
U.S. Bancorp | | | 7.92 | | | |
| | |
Wells Fargo & Co. | | | 7.06 | | | |
| | |
State Street Corp. | | | 4.32 | | | |
| | |
SVB Financial Group | | | 4.20 | | | |
| | |
Fifth Third Bancorp | | | 4.12 | | | |
| | |
Truist Financial Corp. | | | 4.08 | | | |
| | |
First Republic Bank | | | 4.04 | | | |
| | |
Total | | | 60.21 | | | |
Invesco KBW Bank ETF (KBWB) (continued)
Growth of a $10,000 Investment Since Inception
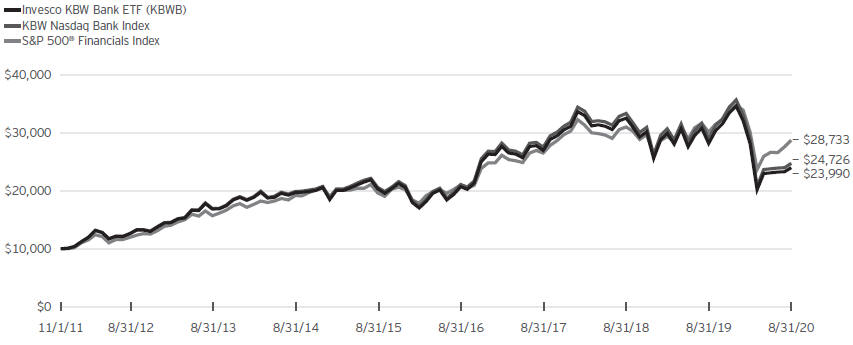
Fund Performance History as of Aug 31, 2020
| | | | | | | | | | | | | | | | |
| | | | | | | | | | | | | | | Fund Inception |
Index | | 1Year | | 3 Years
Average
Annualized | | 3 Years
Cumulative | | 5 Years
Average
Annualized | | 5 Years
Cumulative | | | | Average
Annualized | | Cumulative |
| | | | | | | | |
KBW Nasdaq Bank Index | | (14.61)% | | (3.52)% | | (10.19)% | | 3.75% | | 20.20% | | | | 10.80% | | 147.26% |
| | | | | | | | |
S&P 500® Financials Index | | (4.45) | | 2.75 | | 8.49 | | 7.94 | | 46.50 | | | | 12.70 | | 187.33 |
| | | | | | | | |
Fund | | | | | | | | | | | | | | | | |
| | | | | | | | |
NAV Return | | (14.81) | | (3.82) | | (11.02) | | 3.41 | | 18.26 | | | | 10.42 | | 139.90 |
| | | | | | | | |
Market Price Return | | (14.72) | | (3.71) | | (10.72) | | 3.43 | | 18.39 | | | | 10.46 | | 140.73 |
Fund Inception: November 1, 2011
Performance quoted above represents past performance. Past performance is not a guarantee of future results and current performance may be higher or lower than performance quoted. Investment returns and principal value will fluctuate, and shares of the Fund (“Fund Shares”), when redeemed or sold, may be worth more or less than their original cost. Fund performance reflects any applicable fee waivers and/or expense reimbursements. Had the adviser not waived fees and/or reimbursed expenses currently or in the past, returns would have been lower. See the current prospectus for more information. According to the Fund’s current prospectus, the Fund’s expense ratio of 0.35% is expressed as a unitary management fee to cover operating expenses and expenses incurred in connection with managing the portfolio. NAV and Market Price returns assume that dividends and capital gain distributions have been reinvested in the Fund at NAV and Market Price, respectively. The returns shown in the table above do not reflect the deduction of taxes that a shareholder would pay on Fund
distributions or the redemption or sale of Fund Shares. See invesco.com/ ETFs to find the most recent month-end performance numbers.
Index and Benchmark Index performance results are based upon a hypothetical investment in their respective constituent securities. Index and Benchmark Index returns do not represent Fund returns. An investor cannot invest directly in an index. The Index and Benchmark Index do not charge management fees or brokerage expenses, and no such fees or expenses were deducted from the hypothetical performance shown. In addition, the results actual investors might have achieved would have differed from those shown because of differences in the timing, amounts of their investments, and fees and expenses associated with an investment in the Fund.
Notes Regarding Indexes and Fund Performance History:
| - | Average Annualized and Cumulative Inception returns for the Fund, Index and Benchmark Index are based on the inception date of the Fund. |
| | |
 | | Management’s Discussion of Fund Performance Invesco KBW High Dividend Yield Financial ETF (KBWD) |
As an index fund, the Invesco KBW High Dividend Yield Financial ETF (the “Fund”) seeks to track the investment results (before fees and expenses) of the KBW Nasdaq Financial Sector Dividend Yield Index (the “Index”). The Fund generally will invest at least 90% of its total assets in the securities that comprise the Index.
Strictly in accordance with its guidelines and mandated procedures, Keefe, Bruyette & Woods, Inc. and Nasdaq, Inc. (the “Index Provider”) compile, maintain and calculate the Index, which is a modified-dividend yield-weighted index of companies principally engaged in the business of providing financial services and products, as determined by the Index Provider. The Index is designed to track the performance of financial companies with competitive dividend yields that are publicly-traded in the U.S. The Fund generally invests in all of the securities comprising the Index in proportion to their weightings in the Index.
For the fiscal year ended August 31, 2020, on a market price basis, the Fund returned (22.18)%. On a net asset value (“NAV”) basis, the Fund returned (22.34)%. During the same time period, the Index returned (22.85)%. During the fiscal year, the Fund utilized sampling for certain holdings. The Fund’s performance, on a NAV basis, differed from the return of the Index primarily due to the Fund holding cash to pay distributions in March, which coincided with overall market declines and by revenue generated from the securities lending program in which the Fund participates.
During this same time period, the S&P 500® Financials Index (the “Benchmark Index”) returned (4.45)%. The Benchmark Index is an unmanaged index weighted by market capitalization and based on the average performance of approximately 66 securities. The Benchmark Index was selected for its recognition in the marketplace, and its performance comparison is a useful measure for investors as a broad representation of the financial sector of the U.S. equity market.
The performance of the Fund differed from the Benchmark Index because the Fund seeks to track an Index that employs a proprietary stock selection and weighting methodology, whereas the Benchmark Index selects and weights stocks based on market capitalization.
Relative to the Benchmark Index, the Fund was most overweight in the mortgage REITs sub-industry and most underweight in the diversified banks sub-industry during the fiscal year ended August 31, 2020. The majority of the Fund’s underperformance relative to the Benchmark Index during the period can be attributed to the Fund’s overweight allocation to the mortgage REITs sub-industry and security selection in the asset management & custody banks sub-industry.
For the fiscal year ended August 31, 2020, the investment banking & brokerage sub-industry contributed most significantly to the Fund’s return, followed by the trading companies &
distributors and life & health insurance sub-industries, respectively. The mortgage REITs sub-industry detracted most significantly from the Fund’s return, followed by the regional banks and thrifts & mortgage finance sub-industries, respectively.
Positions that contributed most significantly to the Fund’s return for the fiscal year ended August 31, 2020, included Artisan Partners Asset Management, Inc., Class A, an asset management & custody banks company (portfolio average weight of 2.90%), and Apollo Global Management Inc., an asset management & custody banks company (portfolio average weight of 1.26%). Positions that detracted most significantly from the Fund’s return included Invesco Mortgage Capital Inc., a mortgage REITs company (portfolio average weight of 3.99%) and MFA Financial, Inc., a mortgage REITs company (no longer held at fiscal year-end).
Sub-Industry Breakdown (% of the Fund’s Net Assets) as of August 31, 2020
| | | | | | |
| | | |
Asset Management & Custody Banks | | | 39.59 | | | |
| | |
Mortgage REITs | | | 35.59 | | | |
| | |
Regional Banks | | | 5.95 | | | |
| | |
Life & Health Insurance | | | 5.58 | | | |
| | |
Investment Banking & Brokerage | | | 4.03 | | | |
| | |
Sub-Industry Types Each Less Than 3% | | | 9.26 | | | |
| | |
Money Market Funds Plus Other Assets Less Liabilities | | | 0.00 | | | |
Top Ten Fund Holdings* (% of the Fund’s Net Assets) as of August 31, 2020
| | | | | | |
Security | | | | | | |
| | |
Invesco Mortgage Capital, Inc. | | | 8.40 | | | |
| | |
Apollo Commercial Real Estate Finance, Inc. | | | 5.01 | | | |
| | |
Orchid Island Capital, Inc. | | | 4.60 | | | |
| | |
Annaly Capital Management, Inc. | | | 4.59 | | | |
| | |
FS KKR Capital Corp. | | | 4.14 | | | |
| | |
Dynex Capital, Inc. | | | 4.09 | | | |
| | |
ARMOUR Residential REIT, Inc. | | | 4.05 | | | |
| | |
TCG BDC, Inc. | | | 3.89 | | | |
| | |
Apollo Investment Corp. | | | 3.79 | | | |
| | |
Prospect Capital Corp. | | | 3.39 | | | |
| | |
Total | | | 45.95 | | | |
| * | Excluding money market fund holdings. |
Invesco KBW High Dividend Yield Financial ETF (KBWD) (continued)
Growth of a $10,000 Investment Since Inception
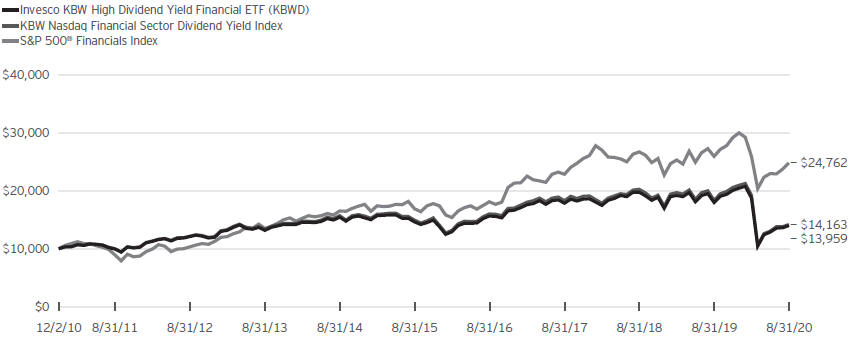
Fund Performance History as of Aug 31, 2020
| | | | | | | | | | | | | | | | |
| | | | | | | | | | | | | | | Fund Inception |
| Index | | 1 Year | | 3 Years
Average
Annualized | | 3 Years
Cumulative | | 5 Years
Average
Annualized | | 5 Years
Cumulative | | | | Average
Annualized | | Cumulative |
| | | | | | | | |
KBW Nasdaq Financial Sector Dividend Yield Index | | (22.85)% | | (8.14)% | | (22.48)% | | (1.02)% | | (4.99)% | | | | 3.64% | | 41.63% |
| | | | | | | | |
S&P 500® Financials Index | | (4.45) | | 2.75 | | 8.49 | | 7.94 | | 46.50 | | | | 9.75 | | 147.62 |
| | | | | | | | |
Fund | | | | | | | | | | | | | | | | |
| | | | | | | | |
NAV Return | | (22.34) | | (7.80) | | (21.62) | | (0.90) | | (4.41) | | | | 3.48 | | 39.59 |
| | | | | | | | |
Market Price Return | | (22.18) | | (7.78) | | (21.58) | | (0.88) | | (4.34) | | | | 3.51 | | 39.94 |
Fund Inception: December 2, 2010
Performance quoted above represents past performance. Past performance is not a guarantee of future results and current performance may be higher or lower than performance quoted. Investment returns and principal value will fluctuate, and shares of the Fund (“Fund Shares”), when redeemed or sold, may be worth more or less than their original cost. Fund performance reflects any applicable fee waivers and/or expense reimbursements. Had the adviser not waived fees and/or reimbursed expenses currently or in the past, returns would have been lower. See the current prospectus for more information. According to the Fund’s current prospectus, the Fund’s expense ratio of 1.58% includes the unitary management fee of 0.35% and acquired fund fees and expenses of 1.23% . NAV and Market Price returns assume that dividends and capital gain distributions have been reinvested in the Fund at NAV and Market Price, respectively. The returns shown in the table above do not reflect the deduction of taxes that a shareholder would pay on Fund distributions or the redemption or sale of Fund
Shares. See invesco.com/ETFs to find the most recent month-end performance numbers.
Index and Benchmark Index performance results are based upon a hypothetical investment in their respective constituent securities. Index and Benchmark Index returns do not represent Fund returns. An investor cannot invest directly in an index. The Index and Benchmark Index do not charge management fees or brokerage expenses, and no such fees or expenses were deducted from the hypothetical performance shown. In addition, the results actual investors might have achieved would have differed from those shown because of differences in the timing, amounts of their investments, and fees and expenses associated with an investment in the Fund.
Notes Regarding Indexes and Fund Performance History:
| - | Average Annualized and Cumulative Inception returns for the Fund, Index and Benchmark Index are based on the inception date of the Fund. |
| | |
 | | Management’s Discussion of Fund Performance Invesco KBW Premium Yield Equity REIT ETF (KBWY) |
As an index fund, the Invesco KBW Premium Yield Equity REIT ETF (the “Fund”) seeks to track the investment results (before fees and expenses) of the KBW Nasdaq Premium Yield Equity REIT Index (the “Index”). The Fund generally will invest at least 90% of its total assets in the securities that comprise the Index.
Strictly in accordance with its guidelines and mandated procedures, Keefe, Bruyette & Woods, Inc. and Nasdaq, Inc. (the “Index Provider”) compile, maintain and calculate the Index, which is a modified-dividend yield-weighted index of domestic equity real estate investment trusts (“REITs”) of small and mid-capitalization, as determined by the Index Provider. The Index is designed to track the performance of small- and mid-capitalization equity REITs that have competitive dividend yields and are publicly-traded in the U.S. The Fund generally invests in all of the securities comprising the Index in proportion to their weightings in the Index.
For the fiscal year ended August 31, 2020, on a market price basis, the Fund returned (28.87)%. On a net asset value (“NAV”) basis, the Fund returned (28.96)%. During the same time period, the Index returned (29.60)%. During the fiscal year, the Fund fully replicated the components of the Index; therefore, the Fund’s performance, on a NAV basis, differed from the return of the Index primarily due to the Fund holding cash to pay distributions in March, which coincided with overall market declines and by revenue generated from the securities lending program in which the Fund participates.
During this same time period, the Dow Jones U.S. Real Estate Index (the “Benchmark Index”) returned (7.65)%. The Benchmark Index is an unmanaged index weighted by market capitalization and based on the average performance of approximately 114 securities. The Benchmark Index was selected for its recognition in the marketplace, and its performance comparison is a useful measure for investors as a broad representation of the United States REIT market.
The performance of the Fund differed from the Benchmark Index because the Fund seeks to track an Index that employs a proprietary stock selection and weighting methodology, whereas the Benchmark Index selects and weights stocks based on market capitalization.
Relative to the Benchmark Index, the Fund was most overweight in the retail REITs sub-industry and most underweight in the specialized REITs sub-industry during the fiscal year ended August 31, 2020. The majority of the Fund’s underperformance relative to the Benchmark Index during the period can be attributed to the Fund’s security selection in the specialized REITs sub-industry and overweight allocation to the retail REITs sub-industry.
For the fiscal year ended August 31, 2020, the diversified REITs sub-industry contributed most significantly to the Fund’s return, followed by the industrial REITs sub-industry. The retail REITs sub-industry detracted most significantly from the Fund’s return,
followed by the hotel & resort REITs and specialized REITs sub-industries, respectively.
Positions that contributed most significantly to the Fund’s return for the fiscal year ended August 31, 2020, included Kite Realty Group Trust, a retail REITs company (no longer held as of fiscal year-end), and Washington Prime Group Inc., a retail REITs company (no longer held as of fiscal year end). Positions that detracted most significantly from the Fund’s return included Macerich Co. (The), a retail REITs company (portfolio average weight of 3.39%) and Pennsylvania REIT, a retail REITs company (portfolio average weight of 4.76%).
REIT Sub-Industry Breakdown (% of the Fund’s Net Assets) as of August 31, 2020
| | | | | | | | |
| | | |
Retail REITs | | | 25.86 | | | | | |
| | |
Office REITs | | | 17.56 | | | | | |
| | |
Specialized REITs | | | 14.50 | | | | | |
| | |
Health Care REITs | | | 12.88 | | | | | |
| | |
Diversified REITs | | | 12.06 | | | | | |
| | |
Residential REITs | | | 11.13 | | | | | |
| | |
Industrial REITs | | | 5.60 | | | | | |
| | |
Hotel & Resort REITs | | | 0.41 | | | | | |
| | |
Money Market Funds Plus Other Assets Less Liabilities | | | 0.00 | | | | | |
Top Ten Fund Holdings* (% of the Fund’s Net Assets) as of August 31, 2020
| | | | | | | | |
Security | | | | | | | | |
| | |
Macerich Co. (The) | | | 8.63 | | | | | |
| | |
GEO Group, Inc. (The) | | | 5.64 | | | | | |
| | |
Brookfield Property REIT, Inc., Class A | | | 5.37 | | | | | |
| | |
New Senior Investment Group, Inc. | | | 5.20 | | | | | |
| | |
Global Net Lease, Inc. | | | 4.62 | | | | | |
| | |
CoreCivic, Inc. | | | 4.30 | | | | | |
| | |
Bluerock Residential Growth REIT, Inc. | | | 4.29 | | | | | |
| | |
American Finance Trust, Inc. | | | 4.12 | | | | | |
| | |
STORE Capital Corp. | | | 3.90 | | | | | |
| | |
Sabra Health Care REIT, Inc. | | | 3.79 | | | | | |
| | |
Total | | | 49.86 | | | | | |
| * | Excluding money market fund holdings. |
Invesco KBW Premium Yield Equity REIT ETF (KBWY) (continued)
Growth of a $10,000 Investment Since Inception
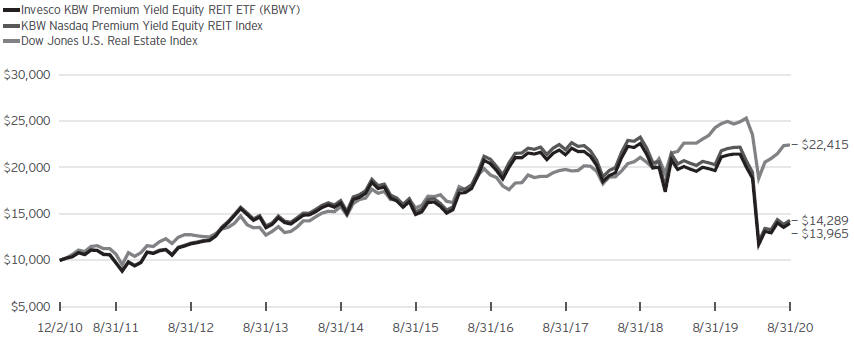
Fund Performance History as of Aug 31, 2020
| | | | | | | | | | | | | | | | |
| | | | | | | | | | | | | | | Fund Inception |
| Index | | 1 Year | | 3 Years
Average
Annualized | | 3 Years
Cumulative | | 5 Years
Average
Annualized | | 5 Years
Cumulative | | | | Average
Annualized | | Cumulative |
| | | | | | | | |
KBW Nasdaq Premium Yield Equity REIT Index | | (29.60)% | | (13.28)% | | (34.79)% | | (1.24)% | | (6.04)% | | | | 3.73% | | 42.89% |
| | | | | | | | |
Dow Jones U.S. Real Estate Index | | (7.65) | | 4.25 | �� | 13.30 | | 7.47 | | 43.35 | | | | 8.64 | | 124.15 |
| | | | | | | | |
Fund | | | | | | | | | | | | | | | | |
| | | | | | | | |
NAV Return | | (28.96) | | (13.18) | | (34.55) | | (1.31) | | (6.36) | | | | 3.49 | | 39.65 |
| | | | | | | | |
Market Price Return | | (28.87) | | (13.15) | | (34.49) | | (1.26) | | (6.15) | | | | 3.52 | | 40.12 |
Fund Inception: December 2, 2010
Performance quoted above represents past performance. Past performance is not a guarantee of future results and current performance may be higher or lower than performance quoted. Investment returns and principal value will fluctuate, and shares of the Fund (“Fund Shares”), when redeemed or sold, may be worth more or less than their original cost. Fund performance reflects any applicable fee waivers and/or expense reimbursements. Had the adviser not waived fees and/or reimbursed expenses currently or in the past, returns would have been lower. See the current prospectus for more information. According to the Fund’s current prospectus, the Fund’s expense ratio of 0.35% is expressed as a unitary management fee to cover operating expenses and expenses incurred in connection with managing the portfolio. NAV and Market Price returns assume that dividends and capital gain distributions have been reinvested in the Fund at NAV and Market Price, respectively. The returns shown in the table above do not reflect the deduction of taxes that a shareholder would pay on Fund distributions or the redemption or sale of Fund Shares. See invesco.com/ ETFs to find the most recent month-end performance numbers.
Index and Benchmark Index performance results are based upon a hypothetical investment in their respective constituent securities. Index and Benchmark Index returns do not represent Fund returns. An investor cannot invest directly in an index. The Index and Benchmark Index do not charge management fees or brokerage expenses, and no such fees or expenses were deducted from the hypothetical performance shown. In addition, the results actual investors might have achieved would have differed from those shown because of differences in the timing, amounts of their investments, and fees and expenses associated with an investment in the Fund.
Notes Regarding Indexes and Fund Performance History:
| - | Average Annualized and Cumulative Inception returns for the Fund, Index and Benchmark Index are based on the inception date of the Fund. |
| | |
 | | Management’s Discussion of Fund Performance Invesco KBW Property & Casualty Insurance ETF (KBWP) |
As an index fund, the Invesco KBW Property & Casualty Insurance ETF (the “Fund”) seeks to track the investment results (before fees and expenses) of the KBW Nasdaq Property & Casualty Index (the “Index”). The Fund generally will invest at least 90% of its total assets in the securities that comprise the Index.
Strictly in accordance with its guidelines and mandated procedures, Keefe, Bruyette & Woods, Inc. and Nasdaq, Inc. (the “Index Provider”) compile, maintain and calculate the Index, which is a modified-market capitalization-weighted index of companies primarily engaged in U.S. property and casualty insurance activities, as determined by the Index Provider. The Index is designed to track the performance of such companies. The Fund generally invests in all of the securities comprising the Index in proportion to their weightings in the Index.
For the fiscal year ended August 31, 2020, on a market price basis, the Fund returned (13.03)%. On a net asset value (“NAV”) basis, the Fund returned (13.11)%. During the same time period, the Index returned (12.90)%. During the fiscal year, the Fund fully replicated the components of the Index; therefore, the Fund’s performance, on a NAV basis, differed from the return of the Index primarily due to fees and operating expenses that the Fund incurred during the period, which were offset by the Fund holding cash to pay distributions in March, which coincided with overall market declines.
During this same time period, the S&P 500® Property & Casualty Index (the “Benchmark Index”) returned (8.06)%. The Benchmark Index is an unmanaged index weighted by market capitalization and based on the average performance of approximately 10 securities. The Benchmark Index was selected for its recognition in the marketplace, and its performance comparison is a useful measure for investors as a broad representation of the United States property and casualty insurance market.
The performance of the Fund differed from the Benchmark Index because the Fund seeks to track an Index that employs a proprietary stock selection and weighting methodology, whereas the Benchmark Index selects and weights stocks based on market capitalization.
Relative to the Benchmark Index, the Fund was most overweight in the multi-line insurance and reinsurance sub-industries and most underweight in the property & casualty insurance sub-industry during the fiscal year ended August 31, 2020. The majority of the Fund’s underperformance relative to the Benchmark Index during the period can be attributed to the Fund’s overweight allocation in the multi-line insurance sub-industry.
For the fiscal year ended August 31, 2020, the reinsurance sub-industry contributed most significantly to the Fund’s return. The property & casualty insurance sub-industry detracted most significantly from the Fund’s return, followed by the multi-line insurance sub-industry.
Positions that contributed most significantly to the Fund’s return for the fiscal year ended August 31, 2020, included Progressive Corp. (The), a property & casualty insurance company (portfolio average weight of 8.74%), and RLI Corp., a property & casualty insurance company (portfolio average weight of 3.90%). Positions that detracted most significantly from the Fund’s return included American International Group, Inc., a multi-line insurance company (portfolio average weight of 7.24%) and Chubb Ltd., a property & casualty insurance company (portfolio average weight of 7.87%).
Sub-Industry Breakdown (% of the Fund’s Net Assets) as of August 31, 2020
| | | | | | | | |
| | | |
Property & Casualty Insurance | | | 69.78 | | | | | |
| | |
Multi-line Insurance | | | 20.71 | | | | | |
| | |
Reinsurance | | | 9.39 | | | | | |
| | |
Money Market Funds Plus Other Assets Less Liabilities | | | 0.12 | | | | | |
Top Ten Fund Holdings* (% of the Fund’s Net Assets) as of August 31, 2020
| | | | | | | | |
| | | |
Security | | | | | | | | |
| | |
Progressive Corp. (The) | | | 8.77 | | | | | |
| | |
Travelers Cos., Inc. (The) | | | 7.78 | | | | | |
| | |
Chubb Ltd. | | | 7.35 | | | | | |
| | |
American International Group, Inc. | | | 6.95 | | | | | |
| | |
Allstate Corp. (The) | | | 6.82 | | | | | |
| | |
Cincinnati Financial Corp. | | | 4.83 | | | | | |
| | |
RenaissanceRe Holdings Ltd. | | | 4.53 | | | | | |
| | |
Kemper Corp. | | | 4.39 | | | | | |
| | |
AXIS Capital Holdings Ltd. | | | 4.36 | | | | | |
| | |
RLI Corp. | | | 4.26 | | | | | |
| | |
Total | | | 60.04 | | | | | |
| * | Excluding money market fund holdings. |
Invesco KBW Property & Casualty Insurance ETF (KBWP) (continued)
Growth of a $10,000 Investment Since Inception
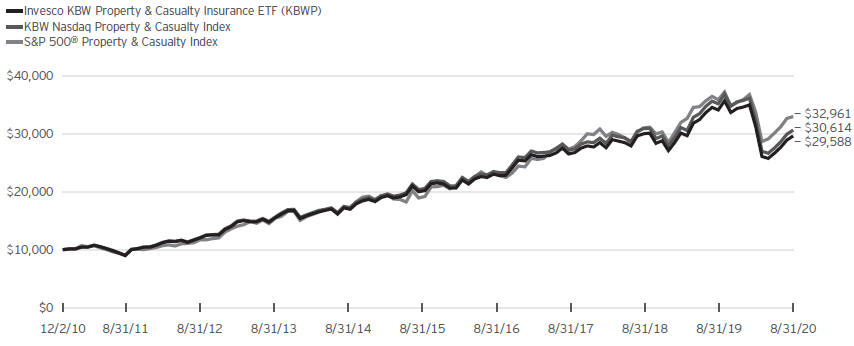
Fund Performance History as of Aug 31, 2020
| | | | | | | | | | | | | | | | |
| | | | | | | | | | | | | | | Fund Inception |
| Index | | 1
Year | | 3 Years
Average
Annualized | | 3 Years
Cumulative | | 5 Years
Average
Annualized | | 5 Years
Cumulative | | | | Average
Annualized | | Cumulative |
| | | | | | | | |
KBW Nasdaq Property & Casualty Index | | (12.90)% | | 4.11% | | 12.84% | | 8.51% | | 50.44% | | | | 12.17% | | 206.14% |
| | | | | | | | |
S&P 500® Property & Casualty Index | | (8.06) | | 6.45 | | 20.63 | | 11.73 | | 74.16 | | | | 13.02 | | 229.61 |
| | | | | | | | |
Fund | | | | | | | | | | | | | | | | |
| | | | | | | | |
NAV Return | | (13.11) | | 3.78 | | 11.76 | | 8.15 | | 47.95 | | | | 11.78 | | 195.88 |
| | | | | | | | |
Market Price Return | | (13.03) | | 3.87 | | 12.05 | | 8.15 | | 47.98 | | | | 11.80 | | 196.45 |
Fund Inception: December 2, 2010
Performance quoted above represents past performance. Past performance is not a guarantee of future results and current performance may be higher or lower than performance quoted. Investment returns and principal value will fluctuate, and shares of the Fund (“Fund Shares”), when redeemed or sold, may be worth more or less than their original cost. Fund performance reflects any applicable fee waivers and/or expense reimbursements. Had the adviser not waived fees and/or reimbursed expenses currently or in the past, returns would have been lower. See the current prospectus for more information. According to the Fund’s current prospectus, the Fund’s expense ratio of 0.35% is expressed as a unitary management fee to cover operating expenses and expenses incurred in connection with managing the portfolio. NAV and Market Price returns assume that dividends and capital gain distributions have been reinvested in the Fund at NAV and Market Price, respectively. The returns shown in the table above do not reflect the deduction of taxes that a shareholder would pay on Fund
distributions or the redemption or sale of Fund Shares. See invesco.com/ ETFs to find the most recent month-end performance numbers.
Index and Benchmark Index performance results are based upon a hypothetical investment in their respective constituent securities. Index and Benchmark Index returns do not represent Fund returns. An investor cannot invest directly in an index. The Index and Benchmark Index do not charge management fees or brokerage expenses, and no such fees or expenses were deducted from the hypothetical performance shown. In addition, the results actual investors might have achieved would have differed from those shown because of differences in the timing, amounts of their investments, and fees and expenses associated with an investment in the Fund.
Notes Regarding Indexes and Fund Performance History:
| - | Average Annualized and Cumulative Inception returns for the Fund, Index and Benchmark Index are based on the inception date of the Fund. |
| | |
 | | Management’s Discussion of Fund Performance Invesco KBW Regional Banking ETF (KBWR) |
As an index fund, the Invesco KBW Regional Banking ETF (the “Fund”) seeks to track the investment results (before fees and expenses) of the KBW Nasdaq Regional Banking Index (the “Index”). The Fund generally will invest at least 90% of its total assets in the securities that comprise the Index.
Strictly in accordance with its guidelines and mandated procedures, Keefe, Bruyette & Woods, Inc. and Nasdaq, Inc. (the “Index Provider”) compile, maintain and calculate the Index, which is a modified-market capitalization-weighted index comprised of companies primarily engaged in U.S. regional banking activities, as determined by the Index Provider. The Index is designed to track the performance of U.S. regional banking and thrift companies that are publicly-traded in the U.S. The Fund generally invests in all of the securities comprising the Index in proportion to their weightings in the Index.
For the fiscal year ended August 31, 2020, on a market price basis, the Fund returned (22.80)%. On a net asset value (“NAV”) basis, the Fund returned (22.87)%. During the same time period, the Index returned (22.75)%. During the fiscal year, the Fund fully replicated the components of the Index; therefore, the Fund’s performance, on a NAV basis, differed from the return of the Index primarily due to slippage around rebalances and fees and operating expenses that the Fund incurred during the period, which were partially offset by the Fund holding cash to pay distributions in March, which coincided with overall market declines.
During this same time period, the S&P Composite 1500® Commercial Banks Index (the “Benchmark Index”) returned (16.45)%. The Benchmark Index is an unmanaged index weighted by market capitalization and based on the average performance of approximately 100 securities. The Benchmark Index was selected for its recognition in the marketplace, and its performance comparison is a useful measure for investors as a broad representation of the United States commercial banking market.
The performance of the Fund differed from the Benchmark Index because the Fund seeks to track an Index that employs a proprietary stock selection and weighting methodology, whereas the Benchmark Index selects and weights stocks based on market capitalization.
Relative to the Benchmark Index, the Fund was most overweight in the regional banks sub-industry and most underweight in the diversified banks sub-industry during the fiscal year ended August 31, 2020. The majority of the Fund’s underperformance relative to the Benchmark Index during the period can be attributed to the Fund’s overweight allocation and security selection in the regional banks sub-industry.
For the fiscal year ended August 31, 2020, the regional banks sub-industry detracted most significantly from the Fund’s return,
followed by the thrifts & mortgage finance sub-industry. There were no contributing sub-industries.
Positions that contributed most significantly to the Fund’s return for the fiscal year ended August 31, 2020, included Commerce Bancshares, Inc., a regional banks company (portfolio average weight of 4.22%), and First Financial Bankshares, Inc., regional banks company (portfolio average weight of 2.13%). Positions that detracted most significantly from the Fund’s return include PacWest Bancorp, a regional banks company (portfolio average weight of 1.90%) and IBERIABANK Corp., a regional banks company (no longer held at fiscal year-end).
Sub-Industry Breakdown (% of the Fund’s Net Assets) as of August 31, 2020
| | | | | | |
| | | |
Regional Banks | | | 95.29 | | | |
| | |
Thrifts & Mortgage Finance | | | 4.52 | | | |
| | |
Other Assets Less Liabilities | | | 0.19 | | | |
Top Ten Fund Holdings (% of the Fund’s Net Assets) as of August 31, 2020
| | | | | | |
| | | |
Security | | | | | | |
| | |
South State Corp. | | | 4.18 | | | |
| | |
East West Bancorp, Inc. | | | 4.01 | | | |
| | |
Signature Bank | | | 3.76 | | | |
| | |
Commerce Bancshares, Inc. | | | 3.73 | | | |
| | |
Cullen/Frost Bankers, Inc. | | | 3.35 | | | |
| | |
Prosperity Bancshares, Inc. | | | 3.33 | | | |
| | |
BankUnited, Inc. | | | 2.29 | | | |
| | |
Synovus Financial Corp. | | | 2.27 | | | |
| | |
Home BancShares, Inc. | | | 2.24 | | | |
| | |
PacWest Bancorp | | | 2.20 | | | |
| | |
Total | | | 31.36 | | | |
Invesco KBW Regional Banking ETF (KBWR) (continued)
Growth of a $10,000 Investment Since Inception
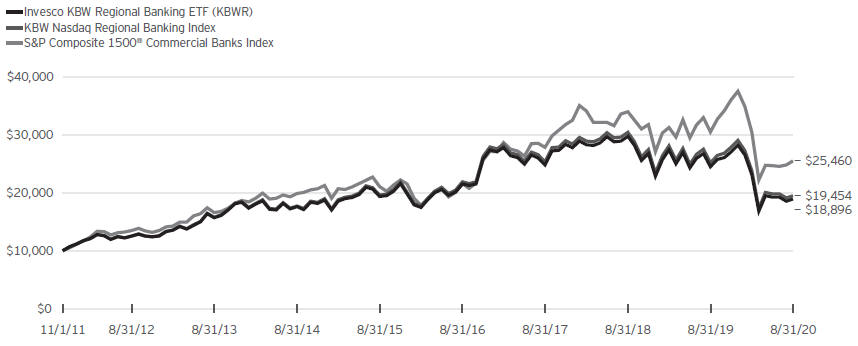
Fund Performance History as of Aug 31, 2020
| | | | | | | | | | | | | | | | |
| | | | | | | | | | | | | | | Fund Inception |
| Index | | 1
Year | | 3 Years
Average
Annualized | | 3 Years
Cumulative | | 5 Years
Average
Annualized | | 5 Years
Cumulative | | | | Average
Annualized | | Cumulative |
KBW Nasdaq Regional Banking Index | | (22.75)% | | (8.40)% | | (23.15)% | | (0.17)% | | (0.85)% | | | | 7.83% | | 94.54% |
S&P Composite 1500® Commercial Banks Index | | (16.45) | | (2.89) | | (8.43) | | 3.88 | | 20.95 | | | | 11.16 | | 154.60 |
Fund | | | | | | | | | | | | | | | | |
NAV Return | | (22.87) | | (8.68) | | (23.84) | | (0.49) | | (2.43) | | | | 7.47 | | 88.96 |
Market Price Return | | (22.80) | | (8.61) | | (23.67) | | (0.48) | | (2.38) | | | | 7.51 | | 89.52 |
Fund Inception: November 1, 2011
Performance quoted above represents past performance. Past performance is not a guarantee of future results and current performance may be higher or lower than performance quoted. Investment returns and principal value will fluctuate, and shares of the Fund (“Fund Shares”), when redeemed or sold, may be worth more or less than their original cost. Fund performance reflects any applicable fee waivers and/or expense reimbursements. Had the adviser not waived fees and/or reimbursed expenses currently or in the past, returns would have been lower. See the current prospectus for more information. According to the Fund’s current prospectus, the Fund’s expense ratio of 0.35% is expressed as a unitary management fee to cover operating expenses and expenses incurred in connection with managing the portfolio. NAV and Market Price returns assume that dividends and capital gain distributions have been reinvested in the Fund at NAV and Market Price, respectively. The returns shown in the table above do not reflect the deduction of taxes that a shareholder would pay on Fund distributions or the redemption or sale of Fund Shares. See invesco.com/
ETFs to find the most recent month-end performance numbers.
Index and Benchmark Index performance results are based upon a hypothetical investment in their respective constituent securities. Index and Benchmark Index returns do not represent Fund returns. An investor cannot invest directly in an index. The Index and Benchmark Index do not charge management fees or brokerage expenses, and no such fees or expenses were deducted from the hypothetical performance shown. In addition, the results actual investors might have achieved would have differed from those shown because of differences in the timing, amounts of their investments, and fees and expenses associated with an investment in the Fund.
Notes Regarding Indexes and Fund Performance History:
| - | Average Annualized and Cumulative Inception returns for the Fund, Index and Benchmark Index are based on the inception date of the Fund. |
Liquidity Risk Management Program
The Securities and Exchange Commission (“SEC”)has adopted Rule 22e-4 under the Investment Company Act of 1940 (the “Liquidity Rule”)in order to promote effective liquidity risk management throughout the open-end investment company industry, thereby reducing the risk that funds will be unable to meet their redemption obligations and mitigating dilution of the interests of fund shareholders. The Funds have adopted and implemented a liquidity risk management program in accordance with the Liquidity Rule (the “Program”). The Program is reasonably designed to assess and manage the Funds’ liquidity risk, which is the risk that the Funds could not meet redemption requests without significant dilution of remaining investors’ interests in the Funds. The Board of Trustees of the Funds (the “Board”)has appointed Invesco Capital Management LLC (“Invesco”), the Funds’ investment adviser, as the Program’s administrator, and Invesco has delegated oversight of the Program to the Liquidity Risk Management Committee (the “Committee”),which is composed of senior representatives from relevant business groups at Invesco and its affiliates.
As required by the Liquidity Rule, the Program includes policies and procedures providing for an assessment, no less frequently than annually, of the Funds’ liquidity risk that takes into account, as relevant to the Funds’ liquidity risk: (1)each Fund’s investment strategy and liquidity of portfolio investments during both normal and reasonably foreseeable stressed conditions; (2) short-term and long-term cash flow projections for the Funds during both normal and reasonably foreseeable stressed conditions; (3)each Fund’s holdings of cash and cash equivalents and any borrowing arrangements; (4)the relationship between the Funds’ portfolio liquidity and the way in which, and the prices and spreads at which, Fund shares trade, including the efficiency of the arbitrage function and the level of active participation by market participants, including authorized participants; and (5)the effect of the composition of baskets on the overall liquidity of each Fund’s portfolio. The Liquidity Rule also requires the classification of each Fund’s investments into categories that reflect the assessment of their relative liquidity under current market conditions. Each Fund classifies its investments into one of four of the following categories defined in the Liquidity Rule: “Highly Liquid,” “Moderately Liquid,” “Less Liquid” and “Illiquid.” Funds that are not invested primarily in “Highly Liquid Investments” that are assets (cash or investments that are reasonably expected to be convertible into cash within three business days without significantly changing the market value of the investment) are required to establish a “Highly Liquid Investment Minimum” (“HLIM”),which is the minimum percentage of net assets that must be invested in Highly Liquid Investments. Funds with HLIMs have procedures for addressing HLIM shortfalls, including reporting to the Board and the SEC (on a non-public basis) as required by the Program and the Liquidity Rule. In addition, a Fund may not acquire an investment if, immediately after the acquisition, over 15% of such Fund’s net assets would consist of “Illiquid Investments” that are assets (an investment that cannot reasonably be expected to be sold or disposed of in current market conditions in seven calendar days or less without the sale or disposition significantly changing the market value of the investment). The Liquidity Rule and the Program also require reporting to the Board and the SEC (on a non-public basis)if a Fund’s holdings of Illiquid Investments exceed 15% of such Fund’s assets.
At a meeting held on March 12, 2020, the Committee presented a report to the Board that addressed the operation of the Program and assessed the Program’s adequacy and effectiveness of implementation (the “Report”). The Report covered the period from December 1, 2018 through December 31, 2019 (the “Program Reporting Period”).
The Report stated, in relevant part, that during the Program Reporting Period:
| | • | | The Program, as adopted and implemented, remained reasonably designed to assess and manage the Funds’ liquidity risk and was operated effectively to achieve that goal; |
| | • | | Each Fund’s investment strategy remained appropriate for an open-end fund; |
| | • | | Each Fund was able to meet requests for redemption without significant dilution of remaining investors’ interests in the Fund; |
| | • | | The Funds did not breach the 15% limit on Illiquid Investments; and |
| | • | | The Funds primarily held Highly Liquid Investments and therefore have not adopted an HLIM. |
Invesco KBW Bank ETF (KBWB)
August 31, 2020
Schedule of Investments(a)
| | | | | | | | |
| | | Shares | | | Value | |
Common Stocks & Other Equity Interests-99.91% | | | | | |
Asset Management & Custody Banks-12.18% | | | | | |
Bank of New York Mellon Corp. (The) | | | 795,365 | | | $ | 29,412,598 | |
Northern Trust Corp | | | 374,186 | | | | 30,642,091 | |
State Street Corp | | | 484,846 | | | | 33,013,164 | |
| | | | | | | | |
| | | | | | | 93,067,853 | |
| | | | | | | | |
Consumer Finance-3.93% | | | | | | | | |
Capital One Financial Corp | | | 434,545 | | | | 29,996,641 | |
| | | | | | | | |
Diversified Banks-39.45% | | | | | | | | |
Bank of America Corp | | | 2,450,221 | | | | 63,068,689 | |
Citigroup, Inc | | | 1,233,570 | | | | 63,060,098 | |
JPMorgan Chase & Co | | | 607,331 | | | | 60,848,493 | |
U.S. Bancorp | | | 1,662,096 | | | | 60,500,294 | |
Wells Fargo & Co | | | 2,232,851 | | | | 53,923,352 | |
| | | | | | | | |
| | | | | | | 301,400,926 | |
| | | | | | | | |
Regional Banks-44.35% | | | | | | | | |
CIT Group, Inc | | | 238,932 | | | | 4,699,793 | |
Citizens Financial Group, Inc | | | 1,039,984 | | | | 26,904,386 | |
Comerica, Inc | | | 337,727 | | | | 13,350,348 | |
| | | | | | | | |
| | | Shares | | | Value | |
Regional Banks-(continued) | | | | | | | | |
Fifth Third Bancorp | | | 1,523,302 | | | $ | 31,471,419 | |
First Horizon National Corp | | | 757,452 | | | | 7,233,667 | |
First Republic Bank | | | 273,291 | | | | 30,857,287 | |
Huntington Bancshares, Inc | | | 2,470,092 | | | | 23,243,566 | |
KeyCorp | | | 2,377,383 | | | | 29,289,359 | |
M&T Bank Corp | | | 279,805 | | | | 28,892,664 | |
People’s United Financial, Inc | | | 1,031,467 | | | | 10,912,921 | |
PNC Financial Services Group, Inc. (The) | | | 259,292 | | | | 28,833,270 | |
Regions Financial Corp | | | 2,339,095 | | | | 27,039,938 | |
SVB Financial Group(b) | | | 125,532 | | | | 32,058,362 | |
Truist Financial Corp | | | 803,780 | | | | 31,194,702 | |
Zions Bancorporation N.A | | | 398,007 | | | | 12,799,905 | |
| | | | | | | | |
| | | | | | | 338,781,587 | |
| | | | | | | | |
TOTAL INVESTMENTS IN SECURITIES-99.91% (Cost $925,149,591) | | | | | | | 763,247,007 | |
OTHER ASSETS LESS LIABILITIES-0.09% | | | | | | | 716,183 | |
| | | | | | | | |
NET ASSETS-100.00% | | | | | | $ | 763,963,190 | |
| | | | | | | | |
Notes to Schedule of Investments:
| (a) | Industry and/or sector classifications used in this report are generally according to the Global Industry Classification Standard, which was developed by and is the exclusive property and a service mark of MSCI Inc. and Standard & Poor’s. |
| (b) | Non-income producing security. |
Affiliated issuer. The issuer and/or the Fund is a wholly-owned subsidiary of Invesco Ltd., or is affiliated by having an investment adviser that is under common control of Invesco Ltd. The table below shows the Fund’s transactions in, and earnings from, its investments in affiliates for the fiscal year ended August 31, 2020.
| | | | | | | | | | | | | | | | | | | | | | | | | | | | |
| | | Value
August 31, 2019 | | | Purchases
at Cost | | | Proceeds
from Sales | | | Change in
Unrealized
Appreciation | | | Realized
Gain | | | Value
August 31, 2020 | | | Dividend
Income | |
Investments in Affiliated Money Market Funds: | | | | | | | | | | | | | | | | | | | | | | | | | | | | |
Invesco Premier U.S. Government | | | | | | | | | | | | | | | | | | | | | | | | | | | | |
Money Portfolio, Institutional Class | | $ | — | | | $ | 21,106,229 | | | $ | (21,106,229 | ) | | $ | — | | | $ | — | | | $ | — | | | $ | 3,259 | |
Investments Purchased with Cash Collateral from Securities on Loan: | | | | | | | | | | | | | | | | | | | | | | | | | | | | |
Invesco Government & Agency Portfolio, Institutional Class | | | — | | | | 80 | | | | (80 | ) | | | — | | | | — | | | | — | | | | — | |
Invesco Private Government Fund | | | — | | | | 17,594 | | | | (17,594 | ) | | | — | | | | — | | | | — | | | | — | |
Invesco Private Prime Fund | | | — | | | | 5,175 | | | | (5,175 | ) | | | — | | | | — | | | | — | | | | — | |
| | | | | | | | | | | | | | | | | | | | | | | | | | | | |
Total | | $ | — | | | $ | 21,129,078 | | | $ | (21,129,078 | ) | | $ | — | | | $ | — | | | $ | — | | | $ | 3,259 | |
| | | | | | | | | | | | | | | | | | | | | | | | | | | | |
See accompanying Notes to Financial Statements which are an integral part of the financial statements.
Invesco KBW High Dividend Yield Financial ETF (KBWD)
August 31, 2020
Schedule of Investments(a)
| | | | | | | | |
| | | Shares | | | Value | |
Common Stocks & Other Equity Interests-100.00% | |
Asset Management & Custody Banks-39.59% | | | | | | | | |
Apollo Global Management, Inc | | | 40,375 | | | $ | 1,892,376 | |
Apollo Investment Corp.(b) | | | 960,835 | | | | 8,705,165 | |
Ares Management Corp., Class A | | | 61,105 | | | | 2,471,697 | |
Artisan Partners Asset Management, Inc., Class A | | | 158,311 | | | | 6,128,219 | |
BlackRock TCP Capital Corp | | | 753,667 | | | | 7,431,157 | |
FS KKR Capital Corp.(b) | | | 593,420 | | | | 9,506,588 | |
Invesco Ltd.(c) | | | 531,490 | | | | 5,421,198 | |
Janus Henderson Group PLC (United Kingdom) | | | 168,687 | | | | 3,495,195 | |
New Mountain Finance Corp.(b) | | | 724,024 | | | | 7,233,000 | |
Newtek Business Services Corp | | | 325,459 | | | | 6,160,939 | |
Oxford Square Capital Corp.(b) | | | 1,433,701 | | | | 3,827,982 | |
PennantPark Investment Corp | | | 1,944,243 | | | | 6,863,178 | |
Prospect Capital Corp.(b) | | | 1,525,232 | | | | 7,778,683 | |
TCG BDC, Inc.(b) | | | 1,015,141 | | | | 8,943,392 | |
Waddell & Reed Financial, Inc., Class A | | | 320,230 | | | | 5,043,622 | |
| | | | | | | | |
| | | | | | | 90,902,391 | |
| | | | | | | | |
Consumer Finance-2.49% | | | | | | | | |
Navient Corp | | | 629,586 | | | | 5,722,937 | |
| | | | | | | | |
Diversified Banks-1.76% | | | | | | | | |
Bank of NT Butterfield & Son Ltd. (The) (Bermuda) | | | 160,579 | | | | 4,046,591 | |
| | | | | | | | |
Investment Banking & Brokerage-4.03% | | | | | | | | |
BGC Partners, Inc., Class A | | | 328,492 | | | | 827,800 | |
Lazard Ltd., Class A | | | 141,895 | | | | 4,493,814 | |
Moelis & Co., Class A | | | 49,110 | | | | 1,567,100 | |
Virtu Financial, Inc., Class A | | | 91,901 | | | | 2,373,803 | |
| | | | | | | | |
| | | | | | | 9,262,517 | |
| | | | | | | | |
Life & Health Insurance-5.58% | | | | | | | | |
Principal Financial Group, Inc | | | 81,780 | | | | 3,443,756 | |
Prudential Financial, Inc | | | 64,473 | | | | 4,369,335 | |
Unum Group | | | 270,458 | | | | 4,998,064 | |
| | | | | | | | |
| | | | | | | 12,811,155 | |
| | | | | | | | |
Mortgage REITs-35.59% | | | | | | | | |
AGNC Investment Corp | | | 468,288 | | | | 6,607,544 | |
Annaly Capital Management, Inc | | | 1,435,021 | | | | 10,547,404 | |
Apollo Commercial Real Estate Finance, Inc | | | 1,286,292 | | | | 11,499,450 | |
ARMOUR Residential REIT, Inc | | | 959,221 | | | | 9,294,852 | |
| | |
Investment Abbreviations: | | | | | | | | |
REIT -Real Estate Investment Trust | | | | | | | | |
| | | | | | | | |
| | | Shares | | | Value | |
Mortgage REITs-(continued) | | | | | | | | |
Dynex Capital, Inc.(b) | | | 592,665 | | | $ | 9,387,814 | |
Invesco Mortgage Capital, Inc.(b)(c) | | | 6,426,320 | | | | 19,278,960 | |
New Residential Investment Corp | | | 211,841 | | | | 1,639,649 | |
Orchid Island Capital, Inc.(b) | | | 2,066,758 | | | | 10,561,133 | |
Two Harbors Investment Corp | | | 533,057 | | | | 2,905,161 | |
| | | | | | | | |
| | | | | | | 81,721,967 | |
| | | | | | | | |
Property & Casualty Insurance-1.65% | | | | | | | | |
Mercury General Corp | | | 84,786 | | | | 3,792,478 | |
| | | | | | | | |
Regional Banks-5.95% | | | | | | | | |
Hanmi Financial Corp | | | 320,540 | | | | 3,054,746 | |
PacWest Bancorp | | | 181,729 | | | | 3,467,390 | |
People’s United Financial, Inc | | | 299,047 | | | | 3,163,917 | |
Umpqua Holdings Corp | | | 352,575 | | | | 3,977,046 | |
| | | | | | | | |
| | | | | | | 13,663,099 | |
| | | | | | | | |
| | | | | | | | |
Thrifts & Mortgage Finance-1.45% | | | | | | | | |
New York Community Bancorp, Inc | | | 366,604 | | | | 3,317,766 | |
| | | | | | | | |
| | | | | | | | |
Trading Companies & Distributors-1.91% | | | | | | | | |
Triton International Ltd. (Bermuda) | | | 121,754 | | | | 4,390,449 | |
| | | | | | | | |
TOTAL INVESTMENTS IN SECURITIES (excluding investments purchased with cash collateral from securities on loan)-100.00% (Cost $285,004,887) | | | | | | | 229,631,350 | |
| | | | | | | | |
| |
Investments Purchased with Cash Collateral from Securities on Loan | | | | | |
| | |
Money Market Funds-25.83% | | | | | | | | |
Invesco Private Government Fund, 0.03%(c)(d)(e) | | | 44,488,963 | | | | 44,488,963 | |
Invesco Private Prime Fund, 0.14%(c)(d)(e) | | | 14,831,636 | | | | 14,834,602 | |
| | | | | | | | |
Total Investments Purchased with Cash Collateral from Securities on Loan (Cost $59,323,566) | | | | | | | 59,323,565 | |
| | | | | | | | |
TOTAL INVESTMENTS IN SECURITIES-125.83% (Cost $344,328,453) | | | | | | | 288,954,915 | |
OTHER ASSETS LESS LIABILITIES-(25.83)% | | | | | | | (59,319,295 | ) |
| | | | | | | | |
NET ASSETS-100.00% | | | | | | $ | 229,635,620 | |
| | | | | | | | |
See accompanying Notes to Financial Statements which are an integral part of the financial statements.
Invesco KBW High Dividend Yield Financial ETF (KBWD)–(continued)
August 31, 2020
Notes to Schedule of Investments:
| (a) | Industry and/or sector classifications used in this report are generally according to the Global Industry Classification Standard, which was developed by and is the exclusive property and a service mark of MSCI Inc. and Standard & Poor’s. |
| (b) | All or a portion of this security was out on loan at August 31, 2020. |
| (c) | Affiliated issuer. The issuer and/or the Fund is a wholly-owned subsidiary of Invesco Ltd., or is affiliated by having an investment adviser that is under common control of Invesco Ltd. The table below shows the Fund’s transactions in, and earnings from, its investments in affiliates for the fiscal year ended August 31, 2020. |
| | | | | | | | | | | | | | | | | | | | | | | | | | | | |
| | | Value
August 31, 2019 | | | Purchases
at Cost | | | Proceeds
from Sales | | | Change in
Unrealized
Appreciation
(Depreciation) | | | Realized
Gain
(Loss) | | | Value
August 31, 2020 | | | Dividend
Income | |
Invesco Ltd. | | $ | 3,906,490 | | | $ | 5,520,110 | | | $ | (2,176,268 | ) | | $ | (381,376 | ) | | $ | (1,447,758 | ) | | $ | 5,421,198 | | | $ | 379,840 | |
Invesco Mortgage Capital, Inc. | | | 8,751,037 | | | | 28,439,529 | | | | (3,490,551 | ) | | | (12,234,080 | ) | | | (2,186,975 | ) | | | 19,278,960 | | | | 478,174 | |
Investments in Affiliated Money Market Funds: | | | | | | | | | | | | | | | | | | | | | | | | | | | | |
Invesco Premier U.S. Government Money Portfolio, Institutional Class | | | — | | | | 16,555,334 | | | | (16,555,334 | ) | | | — | | | | — | | | | — | | | | 1,461 | |
Investments Purchased with Cash Collateral from Securities on Loan: | | | | | | | | | | | | | | | | | | | | | | | | | | | | |
Invesco Government & Agency Portfolio, Institutional Class | | | 8,917,097 | | | | 133,455,754 | | | | (142,372,851 | ) | | | — | | | | — | | | | — | | | | 116,210 | * |
Invesco Liquid Assets Portfolio, Institutional Class | | | 2,977,466 | | | | 32,178,519 | | | | (35,154,368 | ) | | | — | | | | (1,617 | ) | | | — | | | | 43,149 | * |
Invesco Private Government Fund | | | — | | | | 146,012,045 | | | | (101,523,082 | ) | | | — | | | | — | | | | 44,488,963 | | | | 5,038 | * |
Invesco Private Prime Fund | | | — | | | | 30,277,194 | | | | (15,443,505 | ) | | | (1 | ) | | | 914 | | | | 14,834,602 | | | | 3,648 | * |
| | | | | | | | | | | | | | | | | | | | | | | | | | | | |
Total | | $ | 24,552,090 | | | $ | 392,438,485 | | | $ | (316,715,959 | ) | | $ | (12,615,457 | ) | | $ | (3,635,436 | ) | | $ | 84,023,723 | | | $ | 1,027,520 | |
| | | | | | | | | | | | | | | | | | | | | | | | | | | | |
| * | Represents the income earned on the investment of cash collateral, which is included in securities lending income on the Statements of Operations. Does not include rebates and fees paid to lending agent or premiums received from borrowers, if any. |
| (d) | The rate shown is the 7-day SEC standardized yield as of August 31, 2020. |
| (e) | The security has been segregated to satisfy the commitment to return the cash collateral received in securities lending transactions upon the borrower’s return of the securities loaned. See Note 2J. |
See accompanying Notes to Financial Statements which are an integral part of the financial statements.
Invesco KBW Premium Yield Equity REIT ETF (KBWY)
August 31, 2020
Schedule of Investments(a)
| | | | | | | | |
| | | Shares | | | Value | |
Common Stocks & Other Equity Interests-100.00% | |
Diversified REITs-12.06% | | | | | | | | |
Gladstone Commercial Corp | | | 312,051 | | | $ | 6,119,320 | |
Global Net Lease, Inc | | | 456,777 | | | | 7,993,598 | |
STORE Capital Corp | | | 249,749 | | | | 6,753,213 | |
| | | | | | | | |
| | | | | | | 20,866,131 | |
| | | | | | | | |
Health Care REITs-12.88% | | | | | | | | |
Diversified Healthcare Trust | | | 208,245 | | | | 791,331 | |
Global Medical REIT, Inc | | | 464,504 | | | | 5,941,006 | |
New Senior Investment Group, Inc | | | 2,052,725 | | | | 8,990,936 | |
Sabra Health Care REIT, Inc | | | 441,956 | | | | 6,554,207 | |
| | | | | | | | |
| | | | | | | 22,277,480 | |
| | | | | | | | |
Hotel & Resort REITs-0.41% | | | | | | | | |
RLJ Lodging Trust | | | 25,111 | | | | 237,048 | |
Service Properties Trust | | | 58,579 | | | | 480,933 | |
| | | | | | | | |
| | | | | | | 717,981 | |
| | | | | | | | |
Industrial REITs-5.60% | | | | | | | | |
Industrial Logistics Properties Trust | | | 250,531 | | | | 5,403,953 | |
STAG Industrial, Inc | | | 132,786 | | | | 4,288,988 | |
| | | | | | | | |
| | | | | | | 9,692,941 | |
| | | | | | | | |
Office REITs-17.56% | | | | | | | | |
Brandywine Realty Trust | | | 544,560 | | | | 6,060,953 | |
City Office REIT, Inc | | | 464,882 | | | | 3,737,651 | |
Columbia Property Trust, Inc | | | 345,869 | | | | 4,081,254 | |
Office Properties Income Trust | | | 229,517 | | | | 5,471,685 | |
SL Green Realty Corp | | | 133,143 | | | | 6,225,767 | |
Vornado Realty Trust | | | 134,349 | | | | 4,813,725 | |
| | | | | | | | |
| | | | | | | 30,391,035 | |
| | | | | | | | |
Residential REITs-11.13% | | | | | | | | |
Bluerock Residential Growth REIT, Inc | | | 1,001,580 | | | | 7,421,708 | |
Independence Realty Trust, Inc | | | 491,167 | | | | 5,751,566 | |
Preferred Apartment Communities, Inc., | | | | | | | | |
Class A | | | 921,339 | | | | 6,080,837 | |
| | | | | | | | |
| | | | | | | 19,254,111 | |
| | | | | | | | |
| | |
Investment Abbreviations: | | | | | | | | |
REIT -Real Estate Investment Trust | | | | | | | | |
| | | | | | | | |
| | | Shares | | | Value | |
Retail REITs-25.86% | | | | | | | | |
American Finance Trust, Inc | | | 1,042,501 | | | $ | 7,125,494 | |
Brookfield Property REIT, Inc., Class A(b) | | | 805,690 | | | | 9,289,606 | |
Macerich Co. (The)(b) | | | 1,882,111 | | | | 14,925,140 | |
Pennsylvania REIT(b)(c) | | | 4,180,408 | | | | 4,598,449 | |
Taubman Centers, Inc | | | 105,417 | | | | 4,037,471 | |
Whitestone REIT | | | 740,951 | | | | 4,764,315 | |
| | | | | | | | |
| | | | | | | 44,740,475 | |
| | | | | | | | |
Specialized REITs-14.50% | | | | | | | | |
CoreCivic, Inc | | | 799,212 | | | | 7,440,664 | |
GEO Group, Inc. (The) | | | 874,850 | | | | 9,763,326 | |
Lamar Advertising Co., Class A | | | 30,359 | | | | 2,101,753 | |
Uniti Group, Inc | | | 588,207 | | | | 5,776,193 | |
| | | | | | | | |
| | | | | | | 25,081,936 | |
| | | | | | | | |
TOTAL INVESTMENTS IN SECURITIES (excluding investments purchased with cash collateral from securities on loan)-100.00% Cost $209,702,402) | | | | | | | 173,022,090 | |
| | | | | | | | |
| |
Investments Purchased with Cash Collateral from Securities on Loan | | | | | |
| | |
Money Market Funds-16.15% | | | | | | | | |
Invesco Private Government Fund, 0.03%(c)(d)(e) | | | 20,956,410 | | | | 20,956,410 | |
Invesco Private Prime Fund, 0.14%(c)(d)(e) | | | 6,984,173 | | | | 6,985,570 | |
| | | | | | | | |
Total Investments Purchased with Cash Collateral from Securities on Loan (Cost $27,941,980) | | | | 27,941,980 | |
| | | | | | | | |
TOTAL INVESTMENTS IN SECURITIES-116.15% (Cost $237,644,382) | | | | | | | 200,964,070 | |
OTHER ASSETS LESS LIABILITIES-(16.15)% | �� | | | | | | (27,938,797 | ) |
| | | | | | | | |
NET ASSETS-100.00% | | | | | | $ | 173,025,273 | |
| | | | | | | | |
See accompanying Notes to Financial Statements which are an integral part of the financial statements.
Invesco KBW Premium Yield Equity REIT ETF (KBWY)—(continued)
August 31, 2020
Notes to Schedule of Investments:
| (a) | Industry and/or sector classifications used in this report are generally according to the Global Industry Classification Standard, which was developed by and is the exclusive property and a service mark of MSCI Inc. and Standard & Poor’s. |
| (b) | All or a portion of this security was out on loan at August 31, 2020. |
| (c) | Affiliated issuer. The issuer is affiliated by having an investment adviser that is under common control of Invesco Ltd. and/or the Investment Company Act of 1940, as amended (the “1940 Act”), defines “affiliated person” to include an issuer of which a fund holds 5% or more of the outstanding voting securities. The Fund has not owned enough of the outstanding voting securities of the issuer to have control (as defined in the 1940 Act) of that issuer. The table below shows the Fund’s transactions in, and earnings from, its investments in affiliates for the fiscal year ended August 31, 2020. |
| | | | | | | | | | | | | | | | | | | | | | | | | | | | |
| | | Value
August 31, 2019 | | | Purchases
at Cost | | | Proceeds
from Sales | | | Change in
Unrealized
Appreciation
(Depreciation) | | | Realized
Gain
(Loss) | | | Value
August 31, 2020 | | | Dividend
Income | |
Investments in Affiliated Money Market Funds: | | | | | | | | | | | | | | | | | | | | | | | | | | | | |
Invesco Premier U.S. Government Money Portfolio, Institutional Class | | $ | 49,287 | | | $ | 26,554,265 | | | $ | (26,603,552 | ) | | $ | — | | | $ | — | | | $ | — | | | $ | 6,376 | |
Investments Purchased with Cash Collateral from Securities on Loan: | | | | | | | | | | | | | | | | | | | | | | | | | | | | |
Invesco Government & Agency Portfolio, Institutional Class | | | 26,540,877 | | | | 110,818,902 | | | | (137,359,779 | ) | | | — | | | | — | | | | — | | | | 291,965 | * |
Invesco Liquid Assets Portfolio, Institutional Class | | | 8,852,559 | | | | 32,321,847 | | | | (41,172,804 | ) | | | (257 | ) | | | (1,345 | ) | | | — | | | | 108,998 | * |
Invesco Private Government Fund | | | — | | | | 81,137,048 | | | | (60,180,638 | ) | | | — | | | | — | | | | 20,956,410 | | | | 2,804 | * |
Invesco Private Prime Fund | | | — | | | | 15,595,589 | | | | (8,610,662 | ) | | | — | | | | 643 | | | | 6,985,570 | | | | 1,956 | * |
Investments in Other Affiliates: | | | | | | | | | | | | | | | | | | | | | | | | | | | | |
Pennsylvania REIT** | | | 14,992,691 | | | | 19,875,765 | | | | (17,236,566 | ) | | | 7,707,951 | | | | (20,741,392 | ) | | | 4,598,449 | | | | 1,529,719 | |
| | | | | | | | | | | | | | | | | | | | | | | | | | | | |
Total | | $ | 50,435,414 | | | $ | 286,303,416 | | | $ | (291,164,001 | ) | | $ | 7,707,694 | | | $ | (20,742,094 | ) | | $ | 32,540,429 | | | $ | 1,941,818 | |
| | | | | | | | | | | | | | | | | | | | | | | | | | | | |
| * | Represents the income earned on the investment of cash collateral, which is included in securities lending income on the Statements of Operations. Does not include rebates and fees paid to lending agent or premiums received from borrowers, if any. |
| ** | As of August 31, 2019, this security was not considered as an affiliate of the Fund. |
| (d) | The rate shown is the 7-day SEC standardized yield as of August 31, 2020. |
| (e) | The security has been segregated to satisfy the commitment to return the cash collateral received in securities lending transactions upon the borrower’s return of the securities loaned. See Note 2J. |
See accompanying Notes to Financial Statements which are an integral part of the financial statements.
Invesco KBW Property & Casualty Insurance ETF (KBWP)
August 31, 2020
Schedule of Investments(a)
| | | | | | | | |
| | | Shares | | | Value | |
Common Stocks & Other Equity Interests-99.88% | |
Multi-line Insurance-20.71% | | | | | | | | |
American Financial Group, Inc | | | 108,985 | | | $ | 7,285,647 | |
American International Group, Inc | | | 436,798 | | | | 12,728,294 | |
Assurant, Inc | | | 63,997 | | | | 7,779,475 | |
Hartford Financial Services Group, Inc. (The) | | | 171,458 | | | | 6,935,476 | |
Horace Mann Educators Corp | | | 81,935 | | | | 3,200,381 | |
| | | | | | | | |
| | | | | | | 37,929,273 | |
| | | | | | | | |
Property & Casualty Insurance-69.78% | | | | | |
Allstate Corp. (The) | | | 134,243 | | | | 12,484,599 | |
Arch Capital Group Ltd.(b) | | | 232,640 | | | | 7,337,466 | |
AXIS Capital Holdings Ltd | | | 167,281 | | | | 7,989,341 | |
Chubb Ltd | | | 107,674 | | | | 13,459,250 | |
Cincinnati Financial Corp | | | 111,369 | | | | 8,843,812 | |
Hanover Insurance Group, Inc. (The) | | | 65,416 | | | | 6,704,486 | |
James River Group Holdings Ltd | | | 60,565 | | | | 2,950,121 | |
Kemper Corp | | | 103,554 | | | | 8,042,004 | |
Mercury General Corp | | | 109,851 | | | | 4,913,635 | |
ProAssurance Corp | | | 106,850 | | | | 1,636,942 | |
Progressive Corp. (The) | | | 169,028 | | | | 16,064,421 | |
RLI Corp | | | 83,143 | | | | 7,797,982 | |
Selective Insurance Group, Inc | | | 118,477 | | | | 7,086,109 | |
Travelers Cos., Inc. (The) | | | 122,733 | | | | 14,241,937 | |
| | | | | | | | |
| | | Shares | | | Value | |
Property & Casualty Insurance-(continued) | | | | | |
Universal Insurance Holdings, Inc | | | 64,298 | | | $ | 1,192,728 | |
W.R. Berkley Corp | | | 113,286 | | | | 7,029,396 | |
| | | | | | | | |
| | | | | | | 127,774,229 | |
| | | | | | | | |
Reinsurance-9.39% | | | | | | | | |
Everest Re Group Ltd | | | 33,084 | | | | 7,281,127 | |
RenaissanceRe Holdings Ltd. (Bermuda)(b) | | | 45,131 | | | | 8,292,370 | |
Third Point Reinsurance Ltd. (Bermuda) | | | 188,282 | | | | 1,611,694 | |
| | | | | | | | |
| | | | | | | 17,185,191 | |
| | | | | | | | |
Total Common Stocks & Other Equity Interests (Cost $185,260,086) | | | | | | | 182,888,693 | |
| | | | | | | | |
| | |
Money Market Funds-0.03% | | | | | | | | |
Invesco Premier U.S. Government Money Portfolio, Institutional Class, 0.01%(c)(d) (Cost $53,572) | | | 53,572 | | | | 53,572 | |
| | | | | | | | |
TOTAL INVESTMENTS IN SECURITIES-99.91%
(Cost $185,313,658) | | | | | | | 182,942,265 | |
OTHER ASSETS LESS LIABILITIES-0.09% | | | | | | | 161,743 | |
| | | | | | | | |
NET ASSETS-100.00% | | | | | | $ | 183,104,008 | |
| | | | | | | | |
Notes to Schedule of Investments:
| (a) | Industry and/or sector classifications used in this report are generally according to the Global Industry Classification Standard, which was developed by and is the exclusive property and a service mark of MSCI Inc. and Standard & Poor’s. |
| (b) | Non-income producing security. |
| (c) | Affiliated issuer. The issuer and/or the Fund is a wholly-owned subsidiary of Invesco Ltd., or is affiliated by having an investment adviser that is under common control of Invesco Ltd. The table below shows the Fund’s transactions in, and earnings from, its investments in affiliates for the fiscal year ended August 31, 2020. |
| | | | | | | | | | | | | | | | | | | | | | | | | | | | |
| | | Value
August 31, 2019 | | | Purchases
at Cost | | | Proceeds
from Sales | | | Change in
Unrealized
Appreciation | | | Realized
Gain | | | Value
August 31, 2020 | | | Dividend
Income | |
| Investments in Affiliated Money Market Funds: | | | | | | | | | | | | | | | | | | | | | | | | | | | | |
| Invesco Premier U.S. Government Money Portfolio, Institutional Class | | $ | 20,139 | | | $ | 4,038,434 | | | $ | (4,005,001 | ) | | $ | — | | | $ | — | | | $ | 53,572 | | | $ | 566 | |
| (d) | The rate shown is the 7-day SEC standardized yield as of August 31, 2020. |
See accompanying Notes to Financial Statements which are an integral part of the financial statements.
Invesco KBW Regional Banking ETF (KBWR)
August 31, 2020
Schedule of Investments(a)
| | | | | | | | |
| | | Shares | | | Value | |
Common Stocks & Other Equity Interests-99.81% | | | | | |
Regional Banks-95.29% | | | | | | | | |
Associated Banc-Corp | | | 40,376 | | | $ | 542,653 | |
BancorpSouth Bank | | | 25,445 | | | | 549,103 | |
Bank of Hawaii Corp | | | 8,772 | | | | 482,811 | |
Bank OZK | | | 25,148 | | | | 579,410 | |
BankUnited, Inc | | | 27,718 | | | | 648,047 | |
Boston Private Financial Holdings, Inc | | | 24,487 | | | | 145,453 | |
Brookline Bancorp, Inc | | | 23,624 | | | | 226,790 | |
Cadence BanCorp | | | 37,696 | | | | 358,112 | |
Cathay General Bancorp | | | 20,753 | | | | 512,392 | |
Columbia Banking System, Inc | | | 21,472 | | | | 599,284 | |
Commerce Bancshares, Inc | | | 17,739 | | | | 1,056,712 | |
Community Bank System, Inc | | | 9,515 | | | | 572,518 | |
Cullen/Frost Bankers, Inc | | | 13,657 | | | | 948,615 | |
CVB Financial Corp | | | 28,921 | | | | 526,651 | |
East West Bancorp, Inc | | | 30,888 | | | | 1,136,061 | |
F.N.B. Corp | | | 76,332 | | | | 572,490 | |
First Commonwealth Financial Corp | | | 29,376 | | | | 240,883 | |
First Financial Bancorp | | | 29,325 | | | | 402,339 | |
First Financial Bankshares, Inc | | | 18,461 | | | | 558,907 | |
First Hawaiian, Inc | | | 32,711 | | | | 540,713 | |
First Midwest Bancorp, Inc | | | 34,202 | | | | 426,157 | |
Fulton Financial Corp | | | 48,432 | | | | 473,665 | |
Glacier Bancorp, Inc | | | 13,699 | | | | 480,629 | |
Hancock Whitney Corp | | | 25,829 | | | | 516,838 | |
Home BancShares, Inc | | | 39,084 | | | | 633,552 | |
Hope Bancorp, Inc | | | 36,876 | | | | 311,971 | |
Investors Bancorp, Inc | | | 65,007 | | | | 503,804 | |
Old National Bancorp | | | 41,612 | | | | 581,736 | |
PacWest Bancorp | | | 32,668 | | | | 623,305 | |
Pinnacle Financial Partners, Inc | | | 14,190 | | | | 566,890 | |
| | | | | | | | |
| | | Shares | | | Value | |
Regional Banks-(continued) | | | | | | | | |
Popular, Inc | | | 14,289 | | | $ | 529,265 | |
Prosperity Bancshares, Inc | | | 17,290 | | | | 942,651 | |
Signature Bank | | | 10,985 | | | | 1,065,875 | |
South State Corp | | | 21,262 | | | | 1,183,868 | |
Sterling Bancorp | | | 45,875 | | | | 535,361 | |
Synovus Financial Corp | | | 29,461 | | | | 644,312 | |
TCF Financial Corp | | | 19,512 | | | | 524,483 | |
Texas Capital Bancshares, Inc.(b) | | | 15,095 | | | | 488,927 | |
Trustmark Corp | | | 18,984 | | | | 445,744 | |
UMB Financial Corp | | | 11,026 | | | | 592,317 | |
Umpqua Holdings Corp | | | 49,659 | | | | 560,154 | |
United Bankshares, Inc | | | 19,404 | | | | 507,221 | |
United Community Banks, Inc | | | 25,884 | | | | 469,018 | |
Valley National Bancorp | | | 70,710 | | | | 531,032 | |
Webster Financial Corp | | | 19,939 | | | | 548,322 | |
Western Alliance Bancorporation | | | 14,791 | | | | 522,122 | |
Wintrust Financial Corp | | | 13,349 | | | | 580,948 | |
| | | | | | | | |
| | | | | | | 26,990,111 | |
| | | | | | | | |
Thrifts & Mortgage Finance-4.52% | | | | | | | | |
New York Community Bancorp, Inc | | | 56,146 | | | | 508,121 | |
Provident Financial Services, Inc | | | 19,730 | | | | 260,042 | |
Washington Federal, Inc | | | 21,820 | | | | 511,679 | |
| | | | | | | | |
| | | | | | | 1,279,842 | |
| | | | | | | | |
TOTAL INVESTMENTS IN SECURITIES-99.81% (Cost $46,110,550) | | | | | | | 28,269,953 | |
OTHER ASSETS LESS LIABILITIES-0.19% | | | | | | | 54,802 | |
| | | | | | | | |
NET ASSETS-100.00% | | | | | | $ | 28,324,755 | |
| | | | | | | | |
Notes to Schedule of Investments:
| (a) | Industry and/or sector classifications used in this report are generally according to the Global Industry Classification Standard, which was developed by and is the exclusive property and a service mark of MSCI Inc. and Standard & Poor’s. |
| (b) | Non-income producing security. |
Affiliated issuer. The issuer and/or the Fund is a wholly-owned subsidiary of Invesco Ltd., or is affiliated by having an investment adviser that is under common control of Invesco Ltd. The table below shows the Fund’s transactions in, and earnings from, its investments in affiliates for the fiscal year ended August 31, 2020.
| | | | | | | | | | | | | | | | | | | | | | | | | | | | |
| | | Value
August 31, 2019 | | | Purchases
at Cost | | | Proceeds
from Sales | | | Change in
Unrealized
Appreciation | | | Realized
Gain
(Loss) | | | Value
August 31, 2020 | | | Dividend
Income | |
Investments in Affiliated Money Market Funds: | | | | | | | | | | | | | | | | | | | | | | | | | | | | |
Invesco Premier U.S. Government Money Portfolio, Institutional Class | | $ | 77,787 | | | $ | 1,899,839 | | | $ | (1,977,626 | ) | | $ | — | | | $ | — | | | $ | — | | | $ | 512 | |
Investments Purchased with Cash Collateral from Securities on Loan: | | | | | | | | | | | | | | | | | | | | | | | | | | | | |
Invesco Government & Agency Portfolio, Institutional Class | | | 1,260,658 | | | | 6,601,163 | | | | (7,861,821 | ) | | | — | | | | — | | | | — | | | | 11,028 | * |
Invesco Liquid Assets Portfolio, Institutional Class | | | 420,219 | | | | 2,208,537 | | | | (2,628,755 | ) | | | — | | | | (1 | ) | | | — | | | | 4,055 | * |
| | | | | | | | | | | | | | | | | | | | | | | | | | | | |
Total | | $ | 1,758,664 | | | $ | 10,709,539 | | | $ | (12,468,202 | ) | | $ | — | | | $ | (1 | ) | | $ | — | | | $ | 15,595 | |
| | | | | | | | | | | | | | | | | | | | | | | | | | | | |
| * | Represents the income earned on the investment of cash collateral, which is included in securities lending income on the Statements of Operations. Does not include rebates and fees paid to lending agent or premiums received from borrowers, if any. |
See accompanying Notes to Financial Statements which are an integral part of the financial statements.
Statements of Assets and Liabilities
August 31, 2020
| | | | | | | | | | | | | | | | | | | | |
| | | Invesco KBW
Bank ETF
(KBWB) | | | Invesco KBW High
Dividend Yield
Financial ETF
(KBWD) | | | Invesco KBW
Premium Yield
Equity REIT ETF
(KBWY) | | | Invesco
KBW
Property &
Casualty
Insurance
ETF (KBWP) | | | Invesco KBW
Regional Banking
ETF (KBWR) | |
Assets: | | | | | | | | | | | | | | | | | | | | |
Unaffiliated investments in securities, at value(a) | | $ | 763,247,007 | | | $ | 204,931,192 | | | $ | 168,423,641 | | | $ | 182,888,693 | | | $ | 28,269,953 | |
Affiliated investments in securities, at value | | | - | | | | 84,023,723 | | | | 32,540,429 | | | | 53,572 | | | | - | |
Receivable for: | | | | | | | | | | | | | | | | | | | | |
Dividends | | | 1,298,321 | | | | 640,736 | | | | 705,314 | | | | 215,738 | | | | 75,637 | |
Securities lending | | | - | | | | 142,058 | | | | 203,079 | | | | - | | | | - | |
Fund shares sold | | | 8,076,368 | | | | - | | | | - | | | | - | | | | - | |
| | | | | | | | | | | | | | | | | | | | |
Total assets | | | 772,621,696 | | | | 289,737,709 | | | | 201,872,463 | | | | 183,158,003 | | | | 28,345,590 | |
| | | | | | | | | | | | | | | | | | | | |
Liabilities: | | | | | | | | | | | | | | | | | | | | |
Due to custodian | | | 366,577 | | | | 306,399 | | | | 255,527 | | | | - | | | | 11,998 | |
Payable for: | | | | | | | | | | | | | | | | | | | | |
Investments purchased | | | 8,076,370 | | | | 403,663 | | | | 598,071 | | | | - | | | | - | |
Collateral upon return of securities loaned | | | - | | | | 59,323,566 | | | | 27,941,980 | | | | - | | | | - | |
Accrued unitary management fees | | | 215,559 | | | | 68,461 | | | | 51,612 | | | | 53,995 | | | | 8,837 | |
| | | | | | | | | | | | | | | | | | | | |
Total liabilities | | | 8,658,506 | | | | 60,102,089 | | | | 28,847,190 | | | | 53,995 | | | | 20,835 | |
| | | | | | | | | | | | | | | | | | | | |
Net Assets | | $ | 763,963,190 | | | $ | 229,635,620 | | | $ | 173,025,273 | | | $ | 183,104,008 | | | $ | 28,324,755 | |
| | | | | | | | | | | | | | | | | | | | |
Net assets consist of: | | | | | | | | | | | | | | | | | | | | |
Shares of beneficial interest | | $ | 930,104,687 | | | $ | 434,367,306 | | | $ | 367,275,581 | | | $ | 191,609,507 | | | $ | 54,243,512 | |
Distributable earnings (loss) | | | (166,141,497 | ) | | | (204,731,686 | ) | | | (194,250,308 | ) | | | (8,505,499 | ) | | | (25,918,757 | ) |
| | | | | | | | | | | | | | | | | | | | |
Net Assets | | $ | 763,963,190 | | | $ | 229,635,620 | | | $ | 173,025,273 | | | $ | 183,104,008 | | | $ | 28,324,755 | |
| | | | | | | | | | | | | | | | | | | | |
Shares outstanding (unlimited amount authorized, $0.01 par value) | | | 19,300,000 | | | | 16,700,000 | | | | 9,250,000 | | | | 3,050,000 | | | | 800,000 | |
Net asset value | | $ | 39.58 | | | $ | 13.75 | | | $ | 18.71 | | | $ | 60.03 | | | $ | 35.41 | |
| | | | | | | | | | | | | | | | | | | | |
Market price | | $ | 39.68 | | | $ | 13.77 | | | $ | 18.74 | | | $ | 60.13 | | | $ | 35.44 | |
| | | | | | | | | | | | | | | | | | | | |
Unaffiliated investments in securities, at cost | | $ | 925,149,591 | | | $ | 245,381,339 | | | $ | 204,145,053 | | | $ | 185,260,086 | | | $ | 46,110,550 | |
| | | | | | | | | | | | | | | | | | | | |
Affiliated investments in securities, at cost | | $ | - | | | $ | 98,947,114 | | | $ | 33,499,329 | | | $ | 53,572 | | | $ | - | |
| | | | | | | | | | | | | | | | | | | | |
(a)Includes securities on loan with an aggregate value of: | | $ | - | | | $ | 56,084,832 | | | $ | 26,018,824 | | | | - | | | $ | - | |
| | | | | | | | | | | | | | | | | | | | |
See accompanying Notes to Financial Statements which are an integral part of the financial statements.
Statements of Operations
For the year ended August 31, 2020
| | | | | | | | | | | | | | | | | | | | |
| | | Invesco
KBW
Bank ETF
(KBWB) | | | Invesco KBW High
Dividend Yield
Financial ETF
(KBWD) | | | Invesco KBW
Premium Yield
Equity REIT ETF
(KBWY) | | | Invesco
KBW
Property &
Casualty
Insurance
ETF
(KBWP) | | | Invesco KBW
Regional Banking
ETF (KBWR) | |
Investment income: | | | | | | | | | | | | | | | | | | | | |
Unaffiliated dividend income | | $ | 17,866,190 | | | $ | 19,206,231 | | | $ | 10,811,039 | | | $ | 2,586,524 | | | $ | 1,632,674 | |
Affiliated dividend income | | | 3,259 | | | | 859,475 | | | | 1,536,095 | | | | 566 | | | | 512 | |
Securities lending income | | | 1 | | | | 1,056,926 | | | | 1,863,704 | | | | - | | | | 1,662 | |
Foreign withholding tax | | | - | | | | - | | | | - | | | | - | | | | (3,277 | ) |
| | | | | | | | | | | | | | | | | | | | |
Total investment income | | | 17,869,450 | | | | 21,122,632 | | | | 14,210,838 | | | | 2,587,090 | | | | 1,631,571 | |
| | | | | | | | | | | | | | | | | | | | |
| | | | | |
Expenses: | | | | | | | | | | | | | | | | | | | | |
Unitary management fees | | | 1,826,318 | | | | 877,061 | | | | 857,246 | | | | 378,505 | | | | 172,711 | |
| | | | | | | | | | | | | | | | | | | | |
Less: Waivers | | | (682 | ) | | | (430 | ) | | | (1,101 | ) | | | (111 | ) | | | (82 | ) |
| | | | | | | | | | | | | | | | | | | | |
Net expenses | | | 1,825,636 | | | | 876,631 | | | | 856,145 | | | | 378,394 | | | | 172,629 | |
| | | | | | | | | | | | | | | | | | | | |
Net investment income | | | 16,043,814 | | | | 20,246,001 | | | | 13,354,693 | | | | 2,208,696 | | | | 1,458,942 | |
| | | | | | | | | | | | | | | | | | | | |
| | | | | |
Realized and unrealized gain (loss) from: | | | | | | | | | | | | | | | | | | | | |
Net realized gain (loss) from: | | | | | | | | | | | | | | | | | | | | |
Unaffiliated investment securities | | | (19,994,377 | ) | | | (56,801,088 | ) | | | (80,143,645 | ) | | | (2,378,201 | ) | | | (4,237,915 | ) |
Affiliated investment securities | | | - | | | | (3,730,874 | ) | | | (20,742,094 | ) | | | - | | | | (1 | ) |
Unaffiliated in-kind redemptions | | | 33,078,195 | | | | 9,430,534 | | | | 15,864,458 | | | | 7,045,591 | | | | (7,541,048 | ) |
Affiliated in-kind redemptions | | | - | | | | 95,438 | | | | - | | | | - | | | | - | |
| | | | | | | | | | | | | | | | | | | | |
Net realized gain (loss) | | | 13,083,818 | | | | (51,005,990 | ) | | | (85,021,281 | ) | | | 4,667,390 | | | | (11,778,964 | ) |
| | | | | | | | | | | | | | | | | | | | |
Change in net unrealized appreciation (depreciation) of: | | | | | | | | | | | | | | | | | | | | |
Unaffiliated investment securities | | | (60,618,490 | ) | | | (14,674,551 | ) | | | (16,216,721 | ) | | | (16,642,913 | ) | | | (1,607,950 | ) |
Affiliated investment securities | | | - | | | | (12,615,457 | ) | | | 7,707,694 | | | | - | | | | - | |
| | | | | | | | | | | | | | | | | | | | |
Change in net unrealized appreciation (depreciation) | | | (60,618,490 | ) | | | (27,290,008 | ) | | | (8,509,027 | ) | | | (16,642,913 | ) | | | (1,607,950 | ) |
| | | | | | | | | | | | | | | | | | | | |
Net realized and unrealized gain (loss) | | | (47,534,672 | ) | | | (78,295,998 | ) | | | (93,530,308 | ) | | | (11,975,523 | ) | | | (13,386,914 | ) |
| | | | | | | | | | | | | | | | | | | | |
Net increase (decrease) in net assets resulting from operations | | $ | (31,490,858 | ) | | $ | (58,049,997 | ) | | $ | (80,175,615 | ) | | $ | (9,766,827 | ) | | $ | (11,927,972 | ) |
| | | | | | | | | | | | | | | | | | | | |
See accompanying Notes to Financial Statements which are an integral part of the financial statements.
Statements of Changes in Net Assets
For the years ended August 31, 2020 and 2019
| | | | | | | | | | | | | | | | |
| | | Invesco KBW Bank ETF (KBWB) | | | Invesco KBW High Dividend Yield
Financial ETF (KBWD) | |
| | | 2020 | | | 2019 | | | 2020 | | | 2019 | |
Operations: | | | | | | | | | | | | | | | | |
Net investment income | | $ | 16,043,814 | | | $ | 17,150,254 | | | $ | 20,246,001 | | | $ | 22,014,767 | |
Net realized gain (loss) | | | 13,083,818 | | | | (56,856,971 | ) | | | (51,005,990 | ) | | | (21,394,770 | ) |
Change in net unrealized appreciation (depreciation) | | | (60,618,490 | ) | | | (84,126,403 | ) | | | (27,290,008 | ) | | | (31,822,333 | ) |
| | | | | | | | | | | | | | | | |
Net increase (decrease) in net assets resulting from operations | | | (31,490,858 | ) | | | (123,833,120 | ) | | | (58,049,997 | ) | | | (31,202,336 | ) |
| | | | | | | | | | | | | | | | |
| | | | |
Distributions to Shareholders from: | | | | | | | | | | | | | | | | |
Distributable earnings | | | (16,218,566 | ) | | | (18,039,786 | ) | | | (25,952,241 | ) | | | (24,710,760 | ) |
| | | | | | | | | | | | | | | | |
| | | | |
Shareholder Transactions: | | | | | | | | | | | | | | | | |
Proceeds from shares sold | | | 1,567,902,553 | | | | 1,393,839,744 | | | | 92,698,284 | | | | 28,111,323 | |
Value of shares repurchased | | | (1,319,623,259 | ) | | | (1,711,833,157 | ) | | | (49,449,953 | ) | | | (46,365,139 | ) |
| | | | | | | | | | | | | | | | |
Net increase (decrease) in net assets resulting from share transactions | | | 248,279,294 | | | | (317,993,413 | ) | | | 43,248,331 | | | | (18,253,816 | ) |
| | | | | | | | | | | | | | | | |
Net increase (decrease) in net assets | | | 200,569,870 | | | | (459,866,319 | ) | | | (40,753,907 | ) | | | (74,166,912 | ) |
| | | | | | | | | | | | | | | | |
| | | | |
Net assets: | | | | | | | | | | | | | | | | |
Beginning of period | | | 563,393,320 | | | | 1,023,259,639 | | | | 270,389,527 | | | | 344,556,439 | |
| | | | | | | | | | | | | | | | |
End of period | | $ | 763,963,190 | | | $ | 563,393,320 | | | $ | 229,635,620 | | | $ | 270,389,527 | |
| | | | | | | | | | | | | | | | |
| | | | |
Changes in Shares Outstanding: | | | | | | | | | | | | | | | | |
Shares sold | | | 37,200,000 | | | | 28,050,000 | | | | 5,450,000 | | | | 1,300,000 | |
Shares repurchased | | | (29,600,000 | ) | | | (34,300,000 | ) | | | (2,400,000 | ) | | | (2,200,000 | ) |
Shares outstanding, beginning of period | | | 11,700,000 | | | | 17,950,000 | | | | 13,650,000 | | | | 14,550,000 | |
| | | | | | | | | | | | | | | | |
Shares outstanding, end of period | | | 19,300,000 | | | | 11,700,000 | | | | 16,700,000 | | | | 13,650,000 | |
| | | | | | | | | | | | | | | | |
See accompanying Notes to Financial Statements which are an integral part of the financial statements.
| | | | | | | | | | | | | | | | | | | | | | | | |
Invesco KBW Premium Yield
Equity REIT ETF (KBWY) | | | Invesco KBW Property & Casualty
Insurance ETF (KBWP) | | | Invesco KBW Regional
Banking ETF (KBWR) | | | |
| 2020 | | | 2019 | | | 2020 | | | 2019 | | | 2020 | | | 2019 | | | |
| | | | | | | | | | | | | | | | | | | | | | | | |
| $ | 13,354,693 | | | $ | 13,979,490 | | | $ | 2,208,696 | | | $ | 1,508,168 | | | $ | 1,458,942 | | | $ | 2,434,167 | | | |
| | (85,021,281 | ) | | | (32,285,480 | ) | | | 4,667,390 | | | | (754,483 | ) | | | (11,778,964 | ) | | | (8,793,542 | ) | | |
| | (8,509,027 | ) | | | (40,138,634 | ) | | | (16,642,913 | ) | | | 7,881,520 | | | | (1,607,950 | ) | | | (23,157,162 | ) | | |
| | | | | | | | | | | | | | | | | | | | | | | | |
| | (80,175,615 | ) | | | (58,444,624 | ) | | | (9,766,827 | ) | | | 8,635,205 | | | | (11,927,972 | ) | | | (29,516,537 | ) | | |
| | | | | | | | | | | | | | | | | | | | | | | | |
| | | | | | |
| | | | | | | | | | | | | | | | | | | | | | | | |
| | (22,239,204 | ) | | | (21,935,164 | ) | | | (2,288,777 | ) | | | (1,692,235 | ) | | | (1,689,665 | ) | | | (2,779,862 | ) | | |
| | | | | | | | | | | | | | | | | | | | | | | | |
| | | | | | |
| | | | | | | | | | | | | | | | | | | | | | | | |
| | 77,741,685 | | | | 39,271,834 | | | | 135,387,753 | | | | 38,563,108 | | | | - | | | | 8,317,576 | | | |
| | (119,691,168 | ) | | | (83,628,921 | ) | | | (49,858,481 | ) | | | (2,915,566 | ) | | | (27,104,447 | ) | | | (102,311,944 | ) | | |
| | | | | | | | | | | | | | | | | | | | | | | | |
| | (41,949,483 | ) | | | (44,357,087 | ) | | | 85,529,272 | | | | 35,647,542 | | | | (27,104,447 | ) | | | (93,994,368 | ) | | |
| | | | | | | | | | | | | | | | | | | | | | | | |
| | (144,364,302 | ) | | | (124,736,875 | ) | | | 73,473,668 | | | | 42,590,512 | | | | (40,722,084 | ) | | | (126,290,767 | ) | | |
| | | | | | | | | | | | | | | | | | | | | | | | |
| | | | | | |
| | | | | | | | | | | | | | | | | | | | | | | | |
| | 317,389,575 | | | | 442,126,450 | | | | 109,630,340 | | | | 67,039,828 | | | | 69,046,839 | | | | 195,337,606 | | | |
| | | | | | | | | | | | | | | | | | | | | | | | |
| $ | 173,025,273 | | | $ | 317,389,575 | | | $ | 183,104,008 | | | $ | 109,630,340 | | | $ | 28,324,755 | | | $ | 69,046,839 | | | |
| | | | | | | | | | | | | | | | | | | | | | | | |
| | | | | | |
| | | | | | | | | | | | | | | | | | | | | | | | |
| | 2,750,000 | | | | 1,300,000 | | | | 2,300,000 | | | | 550,000 | | | | - | | | | 150,000 | | | |
| | (4,350,000 | ) | | | (2,800,000 | ) | | | (800,000 | ) | | | (50,000 | ) | | | (650,000 | ) | | | (2,000,000 | ) | | |
| | 10,850,000 | | | | 12,350,000 | | | | 1,550,000 | | | | 1,050,000 | | | | 1,450,000 | | | | 3,300,000 | | | |
| | | | | | | | | | | | | | | | | | | | | | | | |
| | 9,250,000 | | | | 10,850,000 | | | | 3,050,000 | | | | 1,550,000 | | | | 800,000 | | | | 1,450,000 | | | |
| | | | | | | | | | | | | | | | | | | | | | | | |
Financial Highlights
Invesco KBW Bank ETF (KBWB)
| | | | | | | | | | | | | | | | | | | | | | | | |
| | | Years Ended August 31, | | | Ten Months Ended August 31, | | | Years Ended October 31, | |
| | | 2020 | | | 2019 | | | 2018 | | | 2017 | | | 2016 | | | 2015 | |
Per Share Operating Performance: | | | | | | | | | | | | | | | | | | | | | | | | |
Net asset value at beginning of period | | $ | 48.15 | | | $ | 57.01 | | | $ | 52.36 | | | $ | 38.40 | | | $ | 37.43 | | | $ | 37.12 | |
| | | | | | | | | | | | | | | | | | | | | | | | |
Net investment income(a) | | | 1.40 | | | | 1.27 | | | | 0.83 | | | | 0.77 | | | | 0.68 | | | | 0.66 | |
Net realized and unrealized gain (loss) on investments | | | (8.45 | ) | | | (8.86 | ) | | | 4.51 | | | | 13.92 | | | | 0.98 | | | | 0.22 | |
| | | | | | | | | | | | | | | | | | | | | | | | |
Total from investment operations | | | (7.05 | ) | | | (7.59 | ) | | | 5.34 | | | | 14.69 | | | | 1.66 | | | | 0.88 | |
| | | | | | | | | | | | | | | | | | | | | | | | |
Distributions to shareholders from: | | | | | | | | | | | | | | | | | | | | | | | | |
Net investment income | | | (1.52 | ) | | | (1.27 | ) | | | (0.69 | ) | | | (0.73 | ) | | | (0.69 | ) | | | (0.55 | ) |
Net realized gains | | | - | | | | - | | | | - | | | | - | | | | - | | | | (0.02 | ) |
| | | | | | | | | | | | | | | | | | | | | | | | |
Total distributions | | | (1.52 | ) | | | (1.27 | ) | | | (0.69 | ) | | | (0.73 | ) | | | (0.69 | ) | | | (0.57 | ) |
| | | | | | | | | | | | | | | | | | | | | | | | |
Net asset value at end of period | | $ | 39.58 | | | $ | 48.15 | | | $ | 57.01 | | | $ | 52.36 | | | $ | 38.40 | | | $ | 37.43 | |
| | | | | | | | | | | | | | | | | | | | | | | | |
Market price at end of period(b) | | $ | 39.68 | | | $ | 48.22 | | | $ | 57.01 | | | $ | 52.39 | | | $ | 38.44 | | | $ | 37.49 | |
| | | | | | | | | | | | | | | | | | | | | | | | |
Net Asset Value Total Return(c) | | | (14.81 | )% | | | (13.30 | )% | | | 10.24 | % | | | 38.42 | % | | | 4.61 | % | | | 2.35 | % |
Market Price Total Return(c) | | | (14.72 | )% | | | (13.18 | )% | | | 10.18 | % | | | 38.36 | % | | | 4.55 | % | | | 2.49 | % |
Ratios/Supplemental Data: | | | | | | | | | | | | | | | | | | | | | | | | |
Net assets at end of period (000’s omitted) | | $ | 763,963 | | | $ | 563,393 | | | $ | 1,023,260 | | | $ | 932,052 | | | $ | 430,134 | | | $ | 559,632 | |
Ratio to average net assets of: | | | | | | | | | | | | | | | | | | | | | | | | |
Expenses | | | 0.35 | % | | | 0.35 | % | | | 0.35 | %(d) | | | 0.35 | % | | | 0.35 | % | | | 0.35 | % |
Net investment income | | | 3.07 | % | | | 2.51 | % | | | 1.78 | %(d) | | | 1.60 | % | | | 1.92 | % | | | 1.74 | % |
Portfolio turnover rate(e) | | | 18 | % | | | 13 | % | | | 7 | % | | | 9 | % | | | 12 | % | | | 17 | % |
| (a) | Based on average shares outstanding. |
| (b) | The mean between the last bid and ask prices. |
| (c) | Net asset value total return is calculated assuming an initial investment made at the net asset value at the beginning of the period, reinvestment of all dividends and distributions at net asset value during the period, and redemption at net asset value on the last day of the period. Net asset value total return includes adjustments in accordance with accounting principles generally accepted in the United States of America and as such, the net asset value for financial reporting purposes and the returns based upon those net asset values may differ from the net asset value and returns for shareholder transactions. Market price total return is calculated assuming an initial investment made at the market price at the beginning of the period, reinvestment of all dividends and distributions at market price during the period, and sale at the market price on the last day of the period. Total investment returns calculated for a period of less than one year are not annualized. |
| (e) | Portfolio turnover rate is not annualized for periods less than one year, if applicable, and does not include securities received or delivered from processing creations or redemptions. |
See accompanying Notes to Financial Statements which are an integral part of the financial statements.
Financial Highlights–(continued)
Invesco KBW High Dividend Yield Financial ETF (KBWD)
| | | | | | | | | | | | | | | | | | | | | | | | |
| | | Years Ended August 31, | | | Ten Months Ended August 31, | | | Years Ended October 31, | |
| | | 2020 | | | 2019 | | | 2018 | | | 2017 | | | 2016 | | | 2015 | |
Per Share Operating Performance: | | | | | | | | | | | | | | | | | | | | | | | | |
Net asset value at beginning of period | | $ | 19.81 | | | $ | 23.68 | | | $ | 23.43 | | | $ | 21.49 | | | $ | 22.39 | | | $ | 25.81 | |
| | | | | | | | | | | | | | | | | | | | | | | | |
Net investment income(a) | | | 1.39 | | | | 1.59 | | | | 1.23 | | | | 1.84 | | | | 1.57 | | | | 1.75 | |
Net realized and unrealized gain (loss) on investments | | | (5.66 | ) | | | (3.67 | ) | | | 0.69 | | | | 2.16 | | | | (0.53 | ) | | | (3.22 | ) |
| | | | | | | | | | | | | | | | | | | | | | | | |
Total from investment operations | | | (4.27 | ) | | | (2.08 | ) | | | 1.92 | | | | 4.00 | | | | 1.04 | | | | (1.47 | ) |
| | | | | | | | | | | | | | | | | | | | | | | | |
Distributions to shareholders from: | | | | | | | | | | | | | | | | | | | | | | | | |
Net investment income | | | (1.79 | ) | | | (1.79 | ) | | | (1.67 | ) | | | (1.88 | ) | | | (1.81 | ) | | | (1.87 | ) |
Return of capital | | | - | | | | - | | | | - | | | | (0.18 | ) | | | (0.13 | ) | | | (0.08 | ) |
| | | | | | | | | | | | | | | | | | | | | | | | |
Total distributions | | | (1.79 | ) | | | (1.79 | ) | | | (1.67 | ) | | | (2.06 | ) | | | (1.94 | ) | | | (1.95 | ) |
| | | | | | | | | | | | | | | | | | | | | | | | |
Net asset value at end of period. | | $ | 13.75 | | | $ | 19.81 | | | $ | 23.68 | | | $ | 23.43 | | | $ | 21.49 | | | $ | 22.39 | |
| | | | | | | | | | | | | | | | | | | | | | | | |
Market price at end of period(b) | | $ | 13.77 | | | $ | 19.80 | | | $ | 23.69 | | | $ | 23.46 | | | $ | 21.51 | | | $ | 22.39 | |
| | | | | | | | | | | | | | | | | | | | | | | | |
Net Asset Value Total Return(c) | | | (22.34 | )% | | | (9.06 | )% | | | 8.57 | % | | | 18.95 | % | | | 5.46 | % | | | (6.08 | )% |
Market Price Total Return(c) | | | (22.18 | )% | | | (9.15 | )% | | | 8.47 | % | | | 18.99 | % | | | 5.56 | % | | | (6.12 | )% |
Ratios/Supplemental Data: | | | | | | | | | | | | | | | | | | | | | | | | |
Net assets at end of period (000’s omitted) | | $ | 229,636 | | | $ | 270,390 | | | $ | 344,556 | | | $ | 319,788 | | | $ | 221,379 | | | $ | 277,692 | |
Ratio to average net assets of: | | | | | | | | | | | | | | | | | | | | | | | | |
Expenses(d) | | | 0.35 | % | | | 0.35 | % | | | 0.35 | %(e) | | | 0.35 | % | | | 0.35 | % | | | 0.35 | % |
Net investment income | | | 8.08 | % | | | 7.32 | % | | | 6.36 | %(e) | | | 7.77 | % | | | 7.45 | % | | | 7.15 | % |
Portfolio turnover rate(f) | | | 77 | % | | | 54 | % | | | 46 | % | | | 52 | % | | | 113 | % | | | 49 | % |
| (a) | Based on average shares outstanding. |
| (b) | The mean between the last bid and ask prices. |
| (c) | Net asset value total return is calculated assuming an initial investment made at the net asset value at the beginning of the period, reinvestment of all dividends and distributions at net asset value during the period, and redemption at net asset value on the last day of the period. Net asset value total return includes adjustments in accordance with accounting principles generally accepted in the United States of America and as such, the net asset value for financial reporting purposes and the returns based upon those net asset values may differ from the net asset value and returns for shareholder transactions. Market price total return is calculated assuming an initial investment made at the market price at the beginning of the period, reinvestment of all dividends and distributions at market price during the period, and sale at the market price on the last day of the period. Total investment returns calculated for a period of less than one year are not annualized. |
| (d) | In addition to the fees and expenses which the Fund bears directly, the Fund indirectly bears a pro rata share of the fees and expenses of the investment companies in which the Fund invests. Estimated investment companies’ expenses are not expenses that are incurred directly by the Fund. They are expenses that are incurred directly by the investment companies and are deducted from the value of the investment companies the Fund invests in. The effect of the estimated investment companies’ expenses that the Fund bears indirectly is included in the Fund’s total return. |
| (f) | Portfolio turnover rate is not annualized for periods less than one year, if applicable, and does not include securities received or delivered from processing creations or redemptions. |
See accompanying Notes to Financial Statements which are an integral part of the financial statements.
Financial Highlights–(continued)
Invesco KBW Premium Yield Equity REIT ETF (KBWY)
| | | | | | | | | | | | | | | | | | | | | | | | |
| | | Years Ended August 31, | | | Ten Months Ended August 31, | | | Years Ended October 31, | |
| | | 2020 | | | 2019 | | | 2018 | | | 2017 | | | 2016 | | | 2015 | |
Per Share Operating Performance: | | | | | | | | | | | | | | | | | | | | | | | | |
Net asset value at beginning of period | | $ | 29.25 | | | $ | 35.80 | | | $ | 36.64 | | | $ | 33.95 | | | $ | 31.51 | | | $ | 33.83 | |
| | | | | | | | | | | | | | | | | | | | | | | | |
Net investment income(a) | | | 1.36 | | | | 1.21 | | | | 1.45 | | | | 1.49 | | | | 1.40 | | | | 1.19 | |
Net realized and unrealized gain (loss) on investments | | | (9.62 | ) | | | (5.86 | ) | | | (0.18 | ) | | | 3.78 | | | | 3.36 | | | | (1.80 | ) |
| | | | | | | | | | | | | | | | | | | | | | | | |
Total from investment operations | | | (8.26 | ) | | | (4.65 | ) | | | 1.27 | | | | 5.27 | | | | 4.76 | | | | (0.61 | ) |
| | | | | | | | | | | | | | | | | | | | | | | | |
Distributions to shareholders from: | | | | | | | | | | | | | | | | | | | | | | | | |
Net investment income | | | (2.28 | ) | | | (1.90 | ) | | | (2.11 | ) | | | (2.58 | ) | | | (2.32 | ) | | | (1.71 | ) |
| | | | | | | | | | | | | | | | | | | | | | | | |
Net asset value at end of period. | | $ | 18.71 | | | $ | 29.25 | | | $ | 35.80 | | | $ | 36.64 | | | $ | 33.95 | | | $ | 31.51 | |
| | | | | | | | | | | | | | | | | | | | | | | | |
Market price at end of period(b) | | $ | 18.74 | | | $ | 29.26 | | | $ | 35.80 | | | $ | 36.67 | | | $ | 33.95 | | | $ | 31.52 | |
| | | | | | | | | | | | | | | | | | | | | | | | |
Net Asset Value Total Return(c) | | | (28.96 | )% | | | (12.94 | )% | | | 4.05 | % | | | 15.71 | % | | | 15.68 | % | | | (1.94 | )% |
Market Price Total Return(c) | | | (28.87 | )% | | | (12.91 | )% | | | 3.95 | % | | | 15.79 | % | | | 15.64 | % | | | (1.88 | )% |
Ratios/Supplemental Data: | | | | | | | | | | | | | | | | | | | | | | | | |
Net assets at end of period (000’s omitted) | | $ | 173,025 | | | $ | 317,390 | | | $ | 442,126 | | | $ | 381,021 | | | $ | 188,425 | | | $ | 110,279 | |
Ratio to average net assets of: | | | | | | | | | | | | | | | | | | | | | | | | |
Expenses | | | 0.35 | % | | | 0.35 | % | | | 0.35 | %(d) | | | 0.35 | % | | | 0.35 | % | | | 0.35 | % |
Net investment income | | | 5.45 | % | | | 3.94 | % | | | 5.16 | %(d) | | | 4.04 | % | | | 4.18 | % | | | 3.58 | % |
Portfolio turnover rate(e) | | | 100 | % | | | 69 | % | | | 53 | % | | | 61 | % | | | 87 | % | | | 25 | % |
| (a) | Based on average shares outstanding. |
| (b) | The mean between the last bid and ask prices. |
| (c) | Net asset value total return is calculated assuming an initial investment made at the net asset value at the beginning of the period, reinvestment of all dividends and distributions at net asset value during the period, and redemption at net asset value on the last day of the period. Net asset value total return includes adjustments in accordance with accounting principles generally accepted in the United States of America and as such, the net asset value for financial reporting purposes and the returns based upon those net asset values may differ from the net asset value and returns for shareholder transactions. Market price total return is calculated assuming an initial investment made at the market price at the beginning of the period, reinvestment of all dividends and distributions at market price during the period, and sale at the market price on the last day of the period. Total investment returns calculated for a period of less than one year are not annualized. |
| (e) | Portfolio turnover rate is not annualized for periods less than one year, if applicable, and does not include securities received or delivered from processing creations or redemptions. |
Invesco KBW Property & Casualty Insurance ETF (KBWP)
| | | | | | | | | | | | | | | | | | | | | | | | |
| | | Years Ended August 31, | | | Ten Months Ended August 31, | | | Years Ended October 31, | |
| | | 2020 | | | 2019 | | | 2018 | | | 2017 | | | 2016 | | | 2015 | |
Per Share Operating Performance: | | | | | | | | | | | | | | | | | | | | | | | | |
Net asset value at beginning of period | | $ | 70.73 | | | $ | 63.85 | | | $ | 59.67 | | | $ | 50.41 | | | $ | 48.24 | | | $ | 41.27 | |
| | | | | | | | | | | | | | | | | | | | | | | | |
Net investment income(a) | | | 1.28 | | | | 1.35 | | | | 1.22 | | | | 1.12 | | | | 1.08 | | | | 0.75 | |
Net realized and unrealized gain (loss) on investments | | | (10.63 | ) | | | 7.06 | | | | 4.06 | | | | 9.23 | | | | 2.06 | | | | 7.10 | |
| | | | | | | | | | | | | | | | | | | | | | | | |
Total from investment operations. | | | (9.35 | ) | | | 8.41 | | | | 5.28 | | | | 10.35 | | | | 3.14 | | | | 7.85 | |
| | | | | | | | | | | | | | | | | | | | | | | | |
Distributions to shareholders from: | | | | | | | | | | | | | | | | | | | | | | | | |
Net investment income | | | (1.35 | ) | | | (1.53 | ) | | | (1.10 | ) | | | (1.09 | ) | | | (0.93 | ) | | | (0.78 | ) |
Net realized gains | | | - | | | | - | | | | - | | | | - | | | | (0.04 | ) | | | (0.10 | ) |
| | | | | | | | | | | | | | | | | | | | | | | | |
Total distributions | | | (1.35 | ) | | | (1.53 | ) | | | (1.10 | ) | | | (1.09 | ) | | | (0.97 | ) | | | (0.88 | ) |
| | | | | | | | | | | | | | | | | | | | | | | | |
Net asset value at end of period | | $ | 60.03 | | | $ | 70.73 | | | $ | 63.85 | | | $ | 59.67 | | | $ | 50.41 | | | $ | 48.24 | |
| | | | | | | | | | | | | | | | | | | | | | | | |
Market price at end of period(b) | | $ | 60.13 | | | $ | 70.78 | | | $ | 63.92 | | | $ | 59.68 | | | $ | 50.44 | | | $ | 48.36 | |
| | | | | | | | | | | | | | | | | | | | | | | | |
Net Asset Value Total Return(c) | | | (13.11 | )% | | | 13.54 | % | | | 8.99 | % | | | 20.68 | % | | | 6.63 | % | | | 19.31 | % |
Market Price Total Return(c) | | | (13.03 | )% | | | 13.50 | % | | | 9.09 | % | | | 20.63 | % | | | 6.43 | % | | | 19.60 | % |
Ratios/Supplemental Data: | | | | | | | | | | | | | | | | | | | | | | | | |
Net assets at end of period (000’s omitted) | | $ | 183,104 | | | $ | 109,630 | | | $ | 67,040 | | | $ | 98,462 | | | $ | 63,010 | | | $ | 86,828 | |
Ratio to average net assets of: | | | | | | | | | | | | | | | | | | | | | | | | |
Expenses | | | 0.35 | % | | | 0.36 | %(d) | | | 0.35 | %(e) | | | 0.35 | % | | | 0.35 | % | | | 0.35 | % |
Net investment income | | | 2.04 | % | | | 2.09 | %(d) | | | 2.41 | %(e) | | | 1.97 | % | | | 2.23 | % | | | 1.69 | % |
Portfolio turnover rate(f) | | | 16 | % | | | 14 | % | | | 22 | % | | | 16 | % | | | 20 | % | | | 35 | % |
| (a) | Based on average shares outstanding. |
| (b) | The mean between the last bid and ask prices. |
| (c) | Net asset value total return is calculated assuming an initial investment made at the net asset value at the beginning of the period, reinvestment of all dividends and distributions at net asset value during the period, and redemption at net asset value on the last day of the period. Net asset value total return includes adjustments in accordance with accounting principles generally accepted in the United States of America and as such, the net asset value for financial reporting purposes and the returns based upon those net asset values may differ from the net asset value and returns for shareholder transactions. Market price total return is calculated assuming an initial investment made at the market price at the beginning of the period, reinvestment of all dividends and distributions at market price during the period, and sale at the market price on the last day of the period. Total investment returns calculated for a period of less than one year are not annualized. |
| (d) | Ratios include non-recurring costs associated with a proxy statement of 0.01%. |
| (f) | Portfolio turnover rate is not annualized for periods less than one year, if applicable, and does not include securities received or delivered from processing creations or redemptions. |
See accompanying Notes to Financial Statements which are an integral part of the financial statements.
Financial Highlights–(continued)
Invesco KBW Regional Banking ETF (KBWR)
| | | | | | | | | | | | | | | | | | | | | | | | |
| | | Years Ended August 31, | | | Ten Months Ended August 31, | | | Years Ended October 31, | |
| | | 2020 | | | 2019 | | | 2018 | | | 2017 | | | 2016 | | | 2015 | |
Per Share Operating Performance: | | | | | | | | | | | | | | | | | | | | | | | | |
Net asset value at beginning of period | | $ | 47.62 | | | $ | 59.19 | | | $ | 55.13 | | | $ | 44.09 | | | $ | 42.40 | | | $ | 39.21 | |
| | | | | | | | | | | | | | | | | | | | | | | | |
Net investment income(a) | | | 1.32 | | | | 1.20 | | | | 0.89 | | | | 0.94 | | | | 0.87 | | | | 0.80 | |
Net realized and unrealized gain (loss) on investments | | | (12.07 | ) | | | (11.52 | ) | | | 3.94 | | | | 10.96 | | | | 1.63 | | | | 3.17 | |
| | | | | | | | | | | | | | | | | | | | | | | | |
Total from investment operations | | | (10.75 | ) | | | (10.32 | ) | | | 4.83 | | | | 11.90 | | | | 2.50 | | | | 3.97 | |
| | | | | | | | | | | | | | | | | | | | | | | | |
Distributions to shareholders from: | | | | | | | | | | | | | | | | | | | | | | | | |
Net investment income | | | (1.46 | ) | | | (1.25 | ) | | | (0.77 | ) | | | (0.86 | ) | | | (0.81 | ) | | | (0.78 | ) |
| | | | | | | | | | | | | | | | | | | | | | | | |
Net asset value at end of period | | $ | 35.41 | | | $ | 47.62 | | | $ | 59.19 | | | $ | 55.13 | | | $ | 44.09 | | | $ | 42.40 | |
| | | | | | | | | | | | | | | | | | | | | | | | |
Market price at end of period(b) | | $ | 35.44 | | | $ | 47.61 | | | $ | 59.19 | | | $ | 55.20 | | | $ | 44.15 | | | $ | 42.42 | |
| | | | | | | | | | | | | | | | | | | | | | | | |
Net Asset Value Total Return(c) | | | (22.87 | )% | | | (17.48 | )% | | | 8.79 | % | | | 27.06 | % | | | 6.05 | % | | | 10.24 | % |
Market Price Total Return(c) | | | (22.80 | )% | | | (17.50 | )% | | | 8.65 | % | | | 27.05 | % | | | 6.14 | % | | | 10.29 | % |
Ratios/Supplemental Data: | | | | | | | | | | | | | | | | | | | | | | | | |
Net assets at end of period (000’s omitted) | | $ | 28,325 | | | $ | 69,047 | | | $ | 195,338 | | | $ | 148,854 | | | $ | 136,682 | | | $ | 52,996 | |
Ratio to average net assets of: | | | | | | | | | | | | | | | | | | | | | | | | |
Expenses | | | 0.35 | % | | | 0.36 | %(d) | | | 0.35 | %(e) | | | 0.35 | % | | | 0.35 | % | | | 0.35 | % |
Net investment income | | | 2.96 | % | | | 2.33 | %(d) | | | 1.85 | %(e) | | | 1.75 | % | | | 2.11 | % | | | 1.97 | % |
Portfolio turnover rate(f) | | | 21 | % | | | 15 | % | | | 14 | % | | | 21 | % | | | 23 | % | | | 25 | % |
| (a) | Based on average shares outstanding. |
| (b) | The mean between the last bid and ask prices. |
| (c) | Net asset value total return is calculated assuming an initial investment made at the net asset value at the beginning of the period, reinvestment of all dividends and distributions at net asset value during the period, and redemption at net asset value on the last day of the period. Net asset value total return includes adjustments in accordance with accounting principles generally accepted in the United States of America and as such, the net asset value for financial reporting purposes and the returns based upon those net asset values may differ from the net asset value and returns for shareholder transactions. Market price total return is calculated assuming an initial investment made at the market price at the beginning of the period, reinvestment of all dividends and distributions at market price during the period, and sale at the market price on the last day of the period. Total investment returns calculated for a period of less than one year are not annualized. |
| (d) | Ratios include non-recurring costs associated with a proxy statement of 0.01%. |
| (f) | Portfolio turnover rate is not annualized for periods less than one year, if applicable, and does not include securities received or delivered from processing creations or redemptions. |
See accompanying Notes to Financial Statements which are an integral part of the financial statements.
Notes to Financial Statements
Invesco Exchange-Traded Fund Trust II
August 31, 2020
NOTE 1–Organization
Invesco Exchange-Traded Fund Trust II (the “Trust”) was organized as a Massachusetts business trust on October 10, 2006 and is authorized to have multiple series of portfolios. The Trust is an open-end management investment company registered under the Investment Company Act of 1940, as amended (the “1940 Act”). This report includes the following portfolios:
| | |
| Full Name | | Short Name |
| Invesco KBW Bank ETF (KBWB) | | “KBW Bank ETF” |
| Invesco KBW High Dividend Yield Financial ETF (KBWD) | | “KBW High Dividend Yield Financial ETF” |
| Invesco KBW Premium Yield Equity REIT ETF (KBWY) | | “KBW Premium Yield Equity REIT ETF” |
| Invesco KBW Property & Casualty Insurance ETF (KBWP) | | “KBW Property & Casualty Insurance ETF” |
| Invesco KBW Regional Banking ETF (KBWR) | | “KBW Regional Banking ETF” |
Each portfolio (each, a “Fund”, and collectively, the “Funds”) represents a separate series of the Trust. The shares of the Funds are referred to herein as “Shares” or “Fund’s Shares.” Each Fund’s Shares are listed and traded on The Nasdaq Stock Market.
The market price of each Share may differ to some degree from a Fund’s net asset value (“NAV”). Unlike conventional mutual funds, each Fund issues and redeems Shares on a continuous basis, at NAV, only in a large specified number of Shares, each called a “Creation Unit.” Creation Units are issued and redeemed principally in exchange for the deposit or delivery of a basket of securities (“Deposit Securities”). Except when aggregated in Creation Units by Authorized Participants, the Shares are not individually redeemable securities of the Funds.
The investment objective of each Fund is to seek to track the investment results (before fees and expenses) of its respective index listed below (each, an “Underlying Index”):
| | |
| Fund | | Underlying Index |
| KBW Bank ETF | | KBW Nasdaq Bank Index |
| KBW High Dividend Yield Financial ETF | | KBW Nasdaq Financial Sector Dividend Yield Index |
| KBW Premium Yield Equity REIT ETF | | KBW Nasdaq Premium Yield Equity REIT Index |
| KBW Property & Casualty Insurance ETF | | KBW Nasdaq Property & Casualty Index |
| KBW Regional Banking ETF | | KBW Nasdaq Regional Banking Index |
NOTE 2–Significant Accounting Policies
The following is a summary of the significant accounting policies followed by the Funds in preparation of their financial statements.
Each Fund is an investment company and accordingly follows the investment company accounting and reporting guidance in accordance with Financial Accounting Standards Board Accounting Standards Codification Topic946, Financial Services–Investment Companies.
| A. | Security Valuation - Securities, including restricted securities, are valued according to the following policies: |
A security listed or traded on an exchange (except convertible securities) is generally valued at its last sales price or official closing price as of the close of the customary trading session on the exchange where the security is principally traded or, lacking any sales or official closing price on a particular day, the security may be valued at the closing bid price on that day. Securities traded in the over-the-counter market are valued based on prices furnished by independent pricing services or market makers. When such securities are valued by an independent pricing service they may be considered fair valued. Futures contracts are valued at the final settlement price set by an exchange on which they are principally traded. Listed options are valued at the mean between the last bid and asked prices from the exchange on which they are principally traded, or at the final settlement price set by such exchange. Swaps and options not listed on an exchange are valued by an independent source. For purposes of determining NAV per Share, futures and option contracts generally are valued 15 minutes after the close of the customary trading session of the New York Stock Exchange (“NYSE”).
Investment companies are valued using such company’s NAV per share, unless the shares are exchange-traded, in which case they are valued at the last sales price or official closing price as of the close of the customary trading session on the exchange where the security is principally traded.
Debt obligations (including convertible securities) and unlisted equities are fair valued using an evaluated quote provided by an independent pricing service. Evaluated quotes provided by the pricing service may be determined without exclusive reliance on quoted prices, and may reflect appropriate factors such as institution-size trading in similar groups of securities,
developments related to specific securities, dividend rate (for unlisted equities), yield (for debt obligations), quality, type of issue, coupon rate (for debt obligations), maturity (for debt obligations), individual trading characteristics and other market data. Securities with a demand feature exercisable within one to seven days are valued at par. Pricing services generally value debt obligations assuming orderly transactions of institutional round lot size, but a Fund may hold or transact in the same securities in smaller, odd lot sizes. Odd lots often trade at lower prices than institutional round lots. Debt obligations are subject to interest rate and credit risks. In addition, all debt obligations involve some risk of default with respect to interest and/or principal payments.
Foreign securities’ (including foreign exchange contracts’) prices are converted into U.S. dollar amounts using the applicable exchange rates as of the close of the London world markets. If market quotations are available and reliable for foreign exchange-traded equity securities, the securities will be valued at the market quotations. Because trading hours for certain foreign securities end before the close of the NYSE, closing market quotations may become unreliable. If between the time trading ends on a particular security and the close of the customary trading session on the NYSE, events occur that Invesco Capital Management LLC (the “Adviser”) determines are significant and make the closing price unreliable, a Fund may fair value the security. If the event is likely to have affected the closing price of the security, the security will be valued at fair value in good faith using procedures approved by the Board of Trustees. Adjustments to closing prices to reflect fair value may also be based on a screening process of an independent pricing service to indicate the degree of certainty, based on historical data, that the closing price in the principal market where a foreign security trades is not the current value as of the close of the NYSE. Foreign securities’ prices meeting the approved degree of certainty that the price is not reflective of current value will be priced at the indication of fair value from the independent pricing service. Multiple factors may be considered by the independent pricing service in determining adjustments to reflect fair value and may include information relating to sector indices, American Depositary Receipts and domestic and foreign index futures. Foreign securities may have additional risks including exchange rate changes, the potential for sharply devalued currencies and high inflation, political and economic upheaval, the relative lack of issuer information, relatively low market liquidity and the potential lack of strict financial and accounting controls and standards.
Securities for which market prices are not provided by any of the above methods may be valued based upon quotes furnished by independent sources. The last bid price may be used to value exchange-traded equity securities. The mean between the last bid and asked prices may be used to value debt obligations, including corporate loans, and unlisted equity securities.
Securities for which market quotations are not readily available or became unreliable are valued at fair value as determined in good faith following procedures approved by the Board of Trustees. Issuer-specific events, market trends, bid/asked quotes of brokers and information providers and other market data may be reviewed in the course of making a good faith determination of a security’s fair value.
Each Fund may invest in securities that are subject to interest rate risk, meaning the risk that the prices will generally fall as interest rates rise and, conversely, the prices will generally rise as interest rates fall. Specific securities differ in their sensitivity to changes in interest rates depending on their individual characteristics. Changes in interest rates may result in increased market volatility, which may affect the value and/or liquidity of certain Fund investments.
Valuations change in response to many factors, including the historical and prospective earnings of the issuer, the value of the issuer’s assets, general market conditions which are not specifically related to the particular issuer, such as real or perceived adverse economic conditions, changes in the general outlook for revenues or corporate earnings, changes in interest or currency rates, regional or global instability, natural or environmental disasters, widespread disease or other public health issues, war, acts of terrorism or adverse investor sentiment generally and market liquidity. Because of the inherent uncertainties of valuation, the values reflected in the financial statements may materially differ from the value received upon actual sale of those investments.
Authorized Participant Concentration Risk. Only authorized participants (“APs”) may engage in creation or redemption transactions directly with each Fund. Each Fund has a limited number of institutions that may act as APs, and such APs have no obligation to submit creation or redemption orders. Consequently, there is no assurance that APs will establish or maintain an active trading market for the Shares. This risk may be heightened to the extent that securities held by each Fund are traded outside a collateralized settlement system. In that case, APs may be required to post collateral on certain trades on an agency basis (i.e., on behalf of other market participants), which only a limited number of APs may be able to do. In addition, to the extent that APs exit the business or are unable to proceed with creation and/or redemption orders with respect to each Fund and no other AP is able to step forward to create or redeem Creation Units, this may result in a significantly diminished trading market for Fund Shares, and Shares may be more likely to trade at a premium or discount to a Fund’s NAV and to face trading halts and/or delisting. Investments in non-U.S. securities, which may have lower trading volumes, may increase this risk.
Equity Risk. Equity risk is the risk that the value of equity securities, including common stocks, may fall due to both changes in general economic conditions that impact the market as a whole, as well as factors that directly relate to a specific company or its industry. Such general economic conditions include changes in interest rates, periods of market turbulence or instability, or general and prolonged periods of economic decline and cyclical change. It is possible that a drop in the stock market may
depress the price of most or all of the common stocks that each Fund holds. In addition, equity risk includes the risk that investor sentiment toward one or more industries will become negative, resulting in those investors exiting their investments in those industries, which could cause a reduction in the value of companies in those industries more broadly. The value of a company’s common stock may fall solely because of factors, such as an increase in production costs that negatively impact other companies in the same region, industry or sector of the market. A company’s common stock also may decline significantly in price over a short period of time due to factors specific to that company, including decisions made by its management or lower demand for the company’s products or services. For example, an adverse event, such as an unfavorable earnings report or the failure to make anticipated dividend payments, may depress the value of common stock.
High Dividend Paying Securities Risk. Certain Funds invest in securities that pay high dividends. As a group, these securities can fall out of favor with the market, causing such companies to underperform companies that do not pay high dividends. Also, changes in the dividend policies of the companies in which a Fund invests and the capital resources available for such companies’ dividend payments may adversely affect a Fund.
Index Risk. Unlike many investment companies, each Fund does not utilize an investing strategy that seeks returns in excess of its Underlying Index. Therefore, a Fund would not necessarily buy or sell a security unless that security is added or removed, respectively, from its Underlying Index, even if that security generally is underperforming. Additionally, each Fund rebalances its portfolio in accordance with its Underlying Index, and, therefore, any changes to the Underlying Index’s rebalance schedule will result in corresponding changes to each Fund’s rebalance schedule.
Industry Concentration Risk. In following its methodology, each Fund’s Underlying Index from time to time may be concentrated to a significant degree in securities of issuers located in a single industry or industry group. To the extent that each Underlying Index concentrates in the securities of issuers in a particular industry or industry group, the corresponding Fund will also concentrate its investments to approximately the same extent. By concentrating its investments in an industry or industry group, each Fund may face more risks than if it were diversified broadly over numerous industries or industry groups. Such industry-based risks, any of which may adversely affect the companies in which each Fund invests, may include, but are not limited to, the following: general economic conditions or cyclical market patterns that could negatively affect supply and demand in a particular industry; competition for resources, adverse labor relations, political or world events; obsolescence of technologies; and increased competition or new product introductions that may affect the profitability or viability of companies in an industry. In addition, at times, such industry or industry group may be out of favor and underperform other industries or the market as a whole.
Market Risk. Securities in the Underlying Index are subject to market fluctuations. You should anticipate that the value of the Shares will decline, more or less, in correlation with any decline in value of the securities in the Underlying Index. Additionally, natural or environmental disasters, widespread disease or other public health issues, war, acts of terrorism or other events could result in increased premiums or discounts to each Fund’s NAV.
Non-Correlation Risk. Each Fund’s return may not match the return of its corresponding Underlying Index for a number of reasons. For example, each Fund incurs operating expenses not applicable to the Underlying Index, and incurs costs in buying and selling securities, especially when rebalancing the Fund’s securities holdings to reflect changes in the composition of its corresponding Underlying Index. In addition, the performance of each Fund and its corresponding Underlying Index may vary due to asset valuation differences and differences between each Fund’s portfolio and its corresponding Underlying Index resulting from legal restrictions, costs or liquidity constraints.
Non-Diversified Fund Risk. KBW Bank ETF and KBW Property & Casualty Insurance ETF are non-diversified and can invest a greater portion of its assets in securities of individual issuers than a diversified fund. As a result, changes in the market value of a single investment could cause greater fluctuations in Share price than would occur in a diversified fund. This may increase a Fund’s volatility and cause the performance of a relatively small number of issuers to have a greater impact on a Fund’s performance.
REIT Risk. REITs are pooled investment vehicles that trade like stocks and invest substantially all of their assets in real estate and may qualify for special tax considerations. REITs are subject to certain risks inherent in the direct ownership of real estate, including without limitation, a possible lack of mortgage funds and associated interest rate risks, overbuilding, property vacancies, increases in property taxes and operating expenses, changes in zoning laws, losses due to environmental damages and changes in neighborhood values and appeal to purchasers. Further, failure of a company to qualify as a REIT under federal tax law may have adverse consequences to the REIT’s shareholders. In addition, REITs may have expenses, including advisory and administration expenses, and REIT shareholders will incur a proportionate share of the underlying expenses.
Small-and Mid-Capitalization Company Risk. Investing in securities of small- and mid-capitalization companies involves greater risk than customarily is associated with investing in larger, more established companies. These companies’ securities may be more volatile and less liquid than those of more established companies. These securities may have returns that vary, sometimes significantly, from the overall securities market. Often small- and mid-capitalization companies and the industries in which they focus are still evolving and, as a result, they may be more sensitive to changing market conditions.
| C. | Investment Transactions and Investment Income - Investment transactions are accounted for on a trade date basis. Realized gains and losses from the sale or disposition of securities are computed on the specific identified cost basis. Interest income is recorded on an accrual basis from settlement date. Pay-in-kind interest income and non-cash dividend income received in the form of securities in-lieu of cash are recorded at the fair value of the securities received. Dividend income (net |
of withholding tax, if any) is recorded on the ex-dividend date. Dividend income from REITs is recorded based on the income included in the distributions received from the REIT investments using published REIT classifications, including some management estimates when actual amounts are not available. Distributions received in excess of this estimated amount are recorded as a reduction of the cost of investments or reclassified to capital gains. The actual amounts of income, return of capital, and capital gains are only determined by each REIT after its fiscal year-end, and may differ from the estimated amounts. Realized gains, dividends and interest received by a Fund may give rise to withholding and other taxes imposed by foreign countries. Tax conventions between certain countries and the United States may reduce or eliminate such taxes.
The Funds may periodically participate in litigation related to each Fund’s investments. As such, the Funds may receive proceeds from litigation settlements. Any proceeds received are included in the Statements of Operations as realized gain (loss) for investments no longer held and as unrealized gain (loss) for investments still held.
Brokerage commissions and mark ups are considered transaction costs and are recorded as an increase to the cost basis of securities purchased and/or a reduction of proceeds on a sale of securities. Such transaction costs are included in the determination of net realized and unrealized gain (loss) from investment securities reported in the Statements of Operations and the Statements of Changes in Net Assets and the net realized and unrealized gains (losses) on securities per share in the Financial Highlights. Transaction costs are included in the calculation of each Fund’s NAV and, accordingly, they reduce each Fund’s total returns. These transaction costs are not considered operating expenses and are not reflected in net investment income reported in the Statements of Operations and the Statements of Changes in Net Assets, or the net investment income per share and the ratios of expenses and net investment income reported in the Financial Highlights, nor are they limited by any expense limitation arrangements between each Fund and the Adviser.
| D. | Country Determination - For the purposes of presentation in the Schedules of Investments, the Adviser may determine the country in which an issuer is located and/or credit risk exposure based on various factors. These factors include whether each Fund’s Underlying Index has made a country determination and may include the laws of the country under which the issuer is organized, where the issuer maintains a principal office, the country in which the issuer derives 50% or more of its total revenues and the country that has the primary market for the issuer’s securities, as well as other criteria. Among the other criteria that may be evaluated for making this determination are the country in which the issuer maintains 50% or more of its assets, the type of security, financial guarantees and enhancements, the nature of the collateral and the sponsor organization. Country of issuer and/or credit risk exposure has been determined to be the United States of America, unless otherwise noted. |
| E. | Dividends and Distributions to Shareholders - Each Fund (except for KBW High Dividend Yield Financial ETF and KBW Premium Yield Equity REIT ETF) declares and pays dividends from net investment income, if any, to its shareholders quarterly and records such dividends on the ex-dividend date. KBW High Dividend Yield Financial ETF and KBW Premium Yield Equity REIT ETF each declares and pays dividends from net investment income, if any, to its shareholders monthly and records such dividends on the ex-dividend date. Generally, each Fund distributes net realized taxable capital gains, if any, annually in cash and records them on ex-dividend date. Such distributions on a tax basis are determined in conformity with federal income tax regulations, which may differ from accounting principles generally accepted in the United States of America (“GAAP”). Distributions in excess of tax basis earnings and profits, if any, are reported in such Fund’s financial statements as a tax return of capital at fiscal year-end. |
| F. | Federal Income Taxes - Each Fund intends to comply with the provisions of the Internal Revenue Code of 1986, as amended (the “Internal Revenue Code”), applicable to regulated investment companies and to distribute substantially all of the Fund’s taxable earnings to its shareholders. As such, the Funds will not be subject to federal income taxes on otherwise taxable income (including net realized gains) that is distributed to the shareholders. Therefore, no provision for federal income taxes is recorded in the financial statements. |
Each Fund recognizes the tax benefits of uncertain tax positions only when the position is more likely than not to be sustained. Management has analyzed each Fund’s uncertain tax positions and concluded that no liability for unrecognized tax benefits should be recorded related to uncertain tax positions. Management is not aware of any tax positions for which it is reasonably possible that the total amounts of unrecognized tax benefits will change materially in the next 12 months.
Income and capital gain distributions are determined in accordance with federal income tax regulations, which may differ from GAAP. These differences are primarily due to differing book and tax treatments for in-kind transactions, losses deferred due to wash sales, and passive foreign investment company adjustments, if any.
The Funds file U.S. federal tax returns and tax returns in certain other jurisdictions. Generally, a Fund is subject to examinations by such taxing authorities for up to three years after the filing of the return for the tax period.
| G. | Expenses - Expenses of the Trust that are excluded from a Fund’s unitary management fee and are directly identifiable to a specific Fund are applied to that Fund. Expenses of the Trust that are excluded from a Fund’s unitary management fee and are not readily identifiable to a specific Fund are allocated in such a manner as deemed equitable, taking into consideration the nature and type of expense and the relative net assets of each Fund. |
Each Fund has agreed to pay an annual unitary management fee to the Adviser. Out of the unitary management fee, the Adviser has agreed to pay for substantially all expenses of the Funds, including the costs of transfer agency, custody, fund administration, legal, audit and other services, except for advisory fees, distribution fees, if any, brokerage expenses, taxes, interest, litigation expenses, acquired fund fees and expenses, if any, and other extraordinary expenses.
To the extent a Fund invests in other investment companies, the expenses shown in the accompanying financial statements reflect the expenses of the Fund and do not include any expenses of the investment companies in which it invests. The effects of such investment companies’ expenses are included in the realized and unrealized gain or loss on the investments in the investment companies.
| H. | Accounting Estimates - The preparation of the financial statements in accordance with GAAP requires management to make estimates and assumptions that affect the reported amounts and disclosures in the financial statements, including estimates and assumptions related to taxation. Actual results could differ from these estimates. In addition, the Funds monitor for material events or transactions that may occur or become known after the period-end date and before the date the financial statements are released to print. |
| I. | Indemnifications - Under the Trust’s organizational documents, its Officers and Trustees are indemnified against certain liabilities arising out of the performance of their duties to the Trust. Each Board member who is not an “interested person” (as defined in the 1940 Act) of the Trust (each, an “Independent Trustee”) is also indemnified against certain liabilities arising out of the performance of their duties to the Trust pursuant to an Indemnification Agreement between such trustee and the Trust. Additionally, in the normal course of business, the Trust enters into contracts with service providers that contain general indemnification clauses. The Trust’s maximum exposure under these arrangements is unknown, as this would involve future claims that may be made against the Trust that have not yet occurred. However, based on experience, the Trust believes the risk of loss to be remote. |
| J. | Securities Lending - Each Fund may participate in securities lending and may loan portfolio securities having a market value up to one-third of the Fund’s total assets. Such loans are secured by cash collateral equal to no less than 102% (105% for international securities) of the market value of the loaned securities determined daily by the securities lending provider. Cash collateral received in connection with these loans is generally invested in an affiliated money market fund and is shown as such on the Schedules of Investments. Each Fund bears the risk of loss with respect to the investment of collateral. It is the policy of these Funds to obtain additional collateral from or return excess collateral to the borrower by the end of the next business day, following the valuation date of the securities loaned. Therefore, the value of the collateral held may be temporarily less than the value of the securities on loan. When loaning securities, each Fund retains certain benefits of owning the securities, including the economic equivalent of dividends or interest generated by the security. Lending securities entails a risk of loss to each Fund if, and to the extent that, the market value of the securities loaned were to increase, and the borrower did not increase the collateral accordingly, and the borrower failed to return the securities. The securities loaned are subject to termination at the option of the borrower or each Fund. Upon termination, the borrower will return to each Fund the securities loaned and each Fund will return the collateral. Upon the failure of the borrower to return the securities, collateral may be liquidated and the securities may be purchased on the open market to replace the loaned securities. Each Fund could experience delays and costs in gaining access to the collateral and the securities may lose value during the delay which could result in potential losses to each Fund. Some of these losses may be indemnified by the lending agent. Each Fund bears the risk of any deficiency in the amount of the collateral available for return to the borrower due to any loss on the collateral invested. For Funds that participated in securities lending, dividends received on cash collateral investments for securities lending transactions, which are net of compensation to counterparties, are included in Securities lending income on the Statements of Operations. The aggregate value of securities out on loan, if any, is shown on the Statements of Assets and Liabilities. |
NOTE 3-Investment Advisory Agreement and Other Agreements
The Trust has entered into an Investment Advisory Agreement with the Adviser on behalf of each Fund, pursuant to which the Adviser has overall responsibility for the selection and ongoing monitoring of the Funds’ investments, managing the Funds’ business affairs and providing certain clerical, bookkeeping and other administrative services.
Pursuant to the Investment Advisory Agreement, each Fund accrues daily and pays monthly to the Adviser an annual unitary management fee. Out of the unitary management fee, the Adviser has agreed to pay for substantially all expenses of the Funds, including the cost of transfer agency, custody, fund administration, legal, audit and other services, except for advisory fees, distribution fees, if any, brokerage expenses, taxes, interest, litigation expenses, acquired fund fees and expenses, if any, and other extraordinary expenses. The unitary management fee is paid by each Fund to the Adviser at the following annual rates:
| | |
| | | Unitary Management Fees
(as a % of average daily net assets) |
KBW Bank ETF | | 0.35% |
KBW High Dividend Yield Financial ETF | | 0.35% |
KBW Premium Yield Equity REIT ETF | | 0.35% |
KBW Property & Casualty Insurance ETF | | 0.35% |
KBW Regional Banking ETF | | 0.35% |
Further, through at least August 31, 2022, the Adviser has contractually agreed to waive a portion of each Fund’s management fee in an amount equal to 100% of the net advisory fees an affiliate of the Adviser receives that are attributable to
the Fund’s investments of otherwise uninvested cash in money market funds managed by that affiliate (excluding investments of cash collateral from securities lending). There is no guarantee that the Adviser will extend the waiver of these fees past that date.
For the fiscal year ended August 31, 2020, the Adviser waived fees for each Fund in the following amounts:
| | | | |
KBW Bank ETF | | $ | 682 | |
KBW High Dividend Yield Financial ETF | | | 430 | |
KBW Premium Yield Equity REIT ETF | | | 1,101 | |
KBW Property & Casualty Insurance ETF | | | 111 | |
KBW Regional Banking ETF | | | 82 | |
The Trust has entered into a Distribution Agreement with Invesco Distributors, Inc. (the “Distributor”),which serves as the distributor of Creation Units for each Fund. The Distributor does not maintain a secondary market in the Shares. The Funds are not charged any fees pursuant to the Distribution Agreement. The Distributor is an affiliate of the Adviser.
The Adviser has entered into a licensing agreement for each Fund with Keefe, Bruyette & Woods, Inc. (the “Licensor”).
Each Underlying Index name trademark is owned by the Licensor. These trademarks have been licensed to the Adviser for use by the Funds. Each Fund is entitled to use its Underlying Index pursuant to the Trust’s sub-licensing agreement with the Adviser. The Funds are not sponsored, endorsed, sold or promoted by the Licensor, and the Licensor makes no representation regarding the advisability of investing in any of the Funds.
The Trust has entered into service agreements whereby The Bank of New York Mellon, a wholly-owned subsidiary of The Bank of New York Mellon Corporation, serves as the administrator, custodian, fund accountant and transfer agent for each Fund.
For fiscal year ended August 31, 2020, the following Funds incurred brokerage commissions with Invesco Capital Markets, Inc. (“ICMI”), an affiliate of the Adviser and Distributor, for portfolio transactions executed on behalf of the Fund, as listed below:
| | | | |
KBW Bank ETF | | $ | 8,610 | |
KBW High Dividend Yield Financial ETF | | | 18,689 | |
KBW Premium Yield Equity REIT ETF | | | 13,765 | |
KBW Property & Casualty Insurance ETF | | | 1,036 | |
KBW Regional Banking ETF | | | 1,586 | |
Portfolio transactions with ICMI that have not settled at period-end, if any, are shown in the Statements of Assets and Liabilities under the receivable caption Investments sold - affiliated broker and/or payable caption Investments purchased - affiliated broker.
NOTE 4-Security Transactions with Affiliated Funds
Each Fund is permitted to purchase or sell securities from or to certain other affiliated funds under specified conditions outlined in procedures adopted by the Board of Trustees of the Trust. The procedures have been designed to ensure that any purchase or sale of securities by each Fund from or to another fund or portfolio that is or could be considered an affiliate by virtue of having a common investment adviser (or affiliated investment advisers), common Trustees and/or common officers complies with Rule 17a-7 of the 1940 Act. Further, as defined under the procedures, each transaction is effected at the current market price.
For the fiscal year ended August 31, 2020, the following Funds engaged in transactions with affiliates as listed below:
| | | | | | | | | | | | |
| | | Securities Purchases | | | Securities Sales | | | Net Realized Gains (Losses) * | |
KBW Bank ETF | | | $ 9,845 | | | | $50,632 | | | | $(76,647) | |
KBW High Dividend Yield Financial ETF | | | 443,603 | | | | 53,650 | | | | (9,662) | |
KBW Premium Yield Equity REIT ETF | | | 6,905 | | | | 84,096 | | | | (8,471) | |
KBW Property & Casualty Insurance ETF | | | 514,644 | | | | 56,181 | | | | (13,812) | |
KBW Regional Banking ETF | | | 841 | | | | 7,572 | | | | (12,102) | |
| * | Net realized gains (losses) from securities sold to affiliates are included in net realized gain (loss)from investment securities in the Statements of Operations. |
NOTE 5-Additional Valuation Information
GAAP defines fair value as the price that would be received to sell an asset or paid to transfer a liability in an orderly transaction between market participants at the measurement date, under current market conditions. GAAP establishes a hierarchy that prioritizes the inputs to valuation methods, giving the highest priority to readily available unadjusted quoted prices in an active market for identical assets (Level1)and the lowest priority to significant unobservable inputs (Level3), generally when market prices are not readily available or are unreliable. Based on the valuation inputs, the securities or other investments are tiered into one of three levels. Changes in valuation methods may result in transfers in or out of an investment’s assigned level:
| | | | |
| Level 1 | | – | | Prices are determined using quoted prices in an active market for identical assets. |
| | | | |
Level 2 | | – | | Prices are determined using other significant observable inputs. Observable inputs are inputs that other market participants may use in pricing a security. These may include quoted prices for similar securities, interest rates, prepayment speeds, credit risk, yield curves, loss severities, default rates, discount rates, volatilities and others. |
| Level 3 | | – | | Prices are determined using significant unobservable inputs. In situations where quoted prices or observable inputs are unavailable (for example, when there is little or no market activity for an investment at the end of the period), unobservable inputs may be used. Unobservable inputs reflect a Fund’s own assumptions about the factors market participants would use in determining fair value of the securities or instruments and would be based on the best available information. |
Except for the Funds listed below, as of August 31, 2020, all of the securities in each Fund were valued based on Level 1 inputs (see the Schedules of Investments for security categories). The level assigned to the securities valuations may not be an indication of the risk or liquidity associated with investing in those securities. Because of the inherent uncertainties of valuation, the values reflected in the financial statements may materially differ from the value received upon actual sale of those investments.
| | | | | | | | | | | | | | | | |
| | | Level 1 | | | Level 2 | | | Level 3 | | | Total | |
KBW High Dividend Yield Financial ETF | | | | | | | | | | | | | | | | |
Investments in Securities | | | | | | | | | | | | | | | | |
Common Stocks & Other Equity Interests | | $ | 229,631,350 | | | $ | - | | | | $- | | | $ | 229,631,350 | |
Money Market Funds | | | - | | | | 59,323,565 | | | | - | | | | 59,323,565 | |
| | | | | | | | | | | | | | | | |
Total Investments | | $ | 229,631,350 | | | $ | 59,323,565 | | | | $- | | | $ | 288,954,915 | |
| | | | | | | | | | | | | | | | |
KBW Premium Yield Equity REIT ETF | | | | | | | | | | | | | | | | |
Investments in Securities | | | | | | | | | | | | | | | | |
Common Stocks & Other Equity Interests | | $ | 173,022,090 | | | $ | - | | | | $- | | | $ | 173,022,090 | |
Money Market Funds | | | - | | | | 27,941,980 | | | | - | | | | 27,941,980 | |
| | | | | | | | | | | | | | | | |
Total Investments | | $ | 173,022,090 | | | $ | 27,941,980 | | | | $- | | | $ | 200,964,070 | |
| | | | | | | | | | | | | | | | |
NOTE 6-Distributions to Shareholders and Tax Components of Net Assets
Tax Character of Distributions to Shareholders Paid During the Fiscal Years Ended August 31, 2020 and 2019:
| | | | | | | | |
| | | 2020 | | | 2019 | |
| | | Ordinary
Income* | | | Ordinary
Income* | |
|
KBW Bank ETF | | $ | 16,218,566 | | | $ | 18,039,786 | |
KBW High Dividend Yield Financial ETF | | | 25,952,241 | | | | 24,710,760 | |
KBW Premium Yield Equity REIT ETF | | | 22,239,204 | | | | 21,935,164 | |
KBW Property & Casualty Insurance ETF | | | 2,288,777 | | | | 1,692,235 | |
KBW Regional Banking ETF | | | 1,689,665 | | | | 2,779,862 | |
| * | Includes short-term capital gain distributions, if any. |
Tax Components of Net Assets at Fiscal Year-End:
| | | | | | | | | | | | | | | | | | | | |
| | | Undistributed
Ordinary
Income | | | Net
Unrealized
Appreciation
(Depreciation)-
Investments | | | Capital Loss
Carryforwards | | | Shares of
Beneficial
Interest | | | Total Net
Assets | |
KBW Bank ETF | | | $3,352,737 | | | $ | (166,431,901 | ) | | $ | (3,062,333 | ) | | $ | 930,104,687 | | | $ | 763,963,190 | |
KBW High Dividend Yield Financial ETF | | | - | | | | (74,036,097 | ) | | | (130,695,589 | ) | | | 434,367,306 | | | | 229,635,620 | |
KBW Premium Yield Equity REIT ETF | | | - | | | | (45,884,860 | ) | | | (148,365,448 | ) | | | 367,275,581 | | | | 173,025,273 | |
KBW Property & Casualty Insurance ETF | | | - | | | | (4,301,615 | ) | | | (4,203,884 | ) | | | 191,609,507 | | | | 183,104,008 | |
KBW Regional Banking ETF | | | 198,920 | | | | (18,412,916 | ) | | | (7,704,761 | ) | | | 54,243,512 | | | | 28,324,755 | |
Capital loss carryforwards are calculated and reported as of a specific date. Results of transactions and other activity after that date may affect the amount of capital loss carryforwards actually available for the Funds to utilize. The ability to utilize capital loss carryforwards in the future may be limited under the Internal Revenue Code and related regulations based on the results of future transactions.
The following table presents available capital loss carryforwards for each Fund as of August 31, 2020:
| | | | | | | | | | | | |
| | | No expiration | | | | |
| | | Short-Term | | | Long-Term | | | Total* | |
KBW Bank ETF | | $ | - | | | $ | 3,062,333 | | | $ | 3,062,333 | |
KBW High Dividend Yield Financial ETF | | | 24,675,421 | | | | 106,020,168 | | | | 130,695,589 | |
KBW Premium Yield Equity REIT ETF | | | 44,878,228 | | | | 103,487,220 | | | | 148,365,448 | |
KBW Property & Casualty Insurance ETF | | | 1,180,566 | | | | 3,023,318 | | | | 4,203,884 | |
KBW Regional Banking ETF | | | 1,596,732 | | | | 6,108,029 | | | | 7,704,761 | |
| * | Capital loss carryforwards are reduced for limitations, if any, to the extent required by the Internal Revenue Code and may be further limited depending upon a variety of factors, including the realization of net unrealized gains or losses as of the date of any reorganization. |
NOTE 7–Investment Transactions
For the fiscal year ended August 31, 2020, the cost of securities purchased and the proceeds from sales of securities (other than short-term securities, U.S. Treasury obligations, money market funds and in-kind transactions, if any)were as follows:
| | | | | | | | |
| | | Purchases | | | Sales | |
KBW Bank ETF | | $ | 95,159,473 | | | $ | 92,141,185 | |
KBW High Dividend Yield Financial ETF | | | 197,416,302 | | | | 191,566,003 | |
KBW Premium Yield Equity REIT ETF | | | 244,126,265 | | | | 244,310,956 | |
KBW Property & Casualty Insurance ETF | | | 17,307,968 | | | | 17,779,111 | |
KBW Regional Banking ETF | | | 10,336,840 | | | | 10,453,520 | |
For the fiscal year ended August 31, 2020, in-kind transactions associated with creations and redemptions were as follows:
| | | | | | | | |
| | | Cost of
Securities
Received | | | Value of
Securities
Delivered | |
KBW Bank ETF | | $ | 1,550,907,657 | | | $ | 1,305,945,895 | |
KBW High Dividend Yield Financial ETF | | | 85,535,117 | | | | 48,520,703 | |
KBW Premium Yield Equity REIT ETF | | | 75,197,608 | | | | 113,076,423 | |
KBW Property & Casualty Insurance ETF | | | 132,393,158 | | | | 46,583,623 | |
KBW Regional Banking ETF | | | - | | | | 27,079,902 | |
Gains (losses)on in-kind transactions are generally not considered taxable gains (losses)for federal income tax purposes.
At August 31, 2020, the aggregate cost of investments, including any derivatives, on a tax basis includes adjustments for financial reporting purposes as of the most recently completed federal income tax reporting period-end:
| | | | | | | | | | | | | | | | |
| | | Gross
Unrealized
Appreciation | | | Gross
Unrealized
(Depreciation) | | | Net
Unrealized
Appreciation
(Depreciation) | | | Cost | |
KBW Bank ETF | | $ | 209,671 | | | $ | (166,641,572 | ) | | $ | (166,431,901 | ) | | $ | 929,678,908 | |
KBW High Dividend Yield Financial ETF | | | 8,107,195 | | | | (82,143,292 | ) | | | (74,036,097 | ) | | | 362,991,012 | |
KBW Premium Yield Equity REIT ETF | | | 4,156,817 | | | | (50,041,677 | ) | | | (45,884,860 | ) | | | 246,848,930 | |
KBW Property & Casualty Insurance ETF | | | 8,224,179 | | | | (12,525,794 | ) | | | (4,301,615 | ) | | | 187,243,880 | |
KBW Regional Banking ETF | | | 117,019 | | | | (18,529,935 | ) | | | (18,412,916 | ) | | | 46,682,869 | |
NOTE 8–Reclassification of Permanent Differences
Primarily as a result of differing book/tax treatment of in-kind transactions, taxable overdistributions and real estate investment trust distributions, amounts were reclassified between undistributed net investment income (loss), undistributed net realized gain (loss) and Shares of beneficial interest. These reclassifications had no effect on the net assets of each Fund. For the fiscal year ended August 31, 2020, the reclassifications were as follows:
| | | | | | | | | | | | |
| | | Undistributed Net
Investment Income | | | Undistributed Net
Realized Gain (Loss) | | | Shares of
Beneficial Interest | |
KBW Bank ETF | | | $ - | | | | $(18,905,272) | | | | $18,905,272 | |
KBW High Dividend Yield Financial ETF | | | 7,059,013 | | | | (6,881,777) | | |
| (177,236)
|
|
KBW Premium Yield Equity REIT ETF | | | 8,884,511 | | | | (7,484,296) | | | | (1,400,215) | |
| | | | | | | | | | | | |
| | | Undistributed Net
Investment Income | | | Undistributed Net
Realized Gain (Loss) | | | Shares of
Beneficial Interest | |
KBW Property & Casualty Insurance ETF | | | $ 53,760 | | | | $ (6,547,047) | | | | $ 6,493,287 | |
KBW Regional Banking ETF | | | - | | | | 8,086,551 | | | | (8,086,551) | |
NOTE 9–Trustees’ and Officer’s Fees
Trustees’ and Officer’s Fees include amounts accrued by the Funds to pay remuneration to the Independent Trustees and an Officer of the Trust. The Adviser, as a result of each Fund’s unitary management fee, pays for such compensation for the Funds. The Trustee who is an “interested person” of the Trust does not receive any Trustees’ fees.
The Trust has adopted a deferred compensation plan (the “Plan”). Under the Plan, each Independent Trustee who has executed a Deferred Fee Agreement (a “Participating Trustee”) may defer receipt of all or a portion of their compensation (“Deferral Fees”). Such Deferral Fees are deemed to be invested in select Invesco ETFs. The Deferral Fees payable to a Participating Trustee are valued as of the date such Deferral Fees would have been paid to a Participating Trustee. The value increases with contributions or with increases in the value of the Shares selected, and the value decreases with distributions or with declines in the value of the Shares selected. Obligations under the Plan represent unsecured claims against the general assets of the Funds.
NOTE 10–Capital
Shares are issued and redeemed by each Fund only in Creation Units consisting of a specified number of Shares as set forth in the Funds’ prospectus. Only Authorized Participants are permitted to purchase or redeem Creation Units from the Funds. Such transactions are principally permitted in exchange for Deposit Securities, with a balancing cash component to equate the transaction to the NAV per Share of a Fund of the Trust on the transaction date. However, for all Funds, cash in an amount equivalent to the value of certain securities may be substituted, generally when the securities are not available in sufficient quantity for delivery, not eligible for trading by the Authorized Participant or as a result of other market circumstances.
To the extent that the Funds permit transactions in exchange for Deposit Securities, each Fund may issue Shares in advance of receipt of Deposit Securities subject to various conditions, including a requirement to maintain on deposit with the Trust cash at least equal to 105% of the market value of the missing Deposit Securities. In accordance with the Trust’s Participant Agreement, Creation Units will be issued to an Authorized Participant, notwithstanding the fact that the corresponding Deposit Securities have not been received in part or in whole, in reliance on the undertaking of the Authorized Participant to deliver the missing Deposit Securities as soon as possible, which undertaking shall be secured by the Authorized Participant’s delivery and maintenance of collateral consisting of cash in the form of U.S. dollars in immediately available funds having a value (marked-to-market daily) at least equal to 105%, which the Adviser may change from time to time, of the value of the missing Deposit Securities.
Certain transaction fees may be charged by the Funds for creations and redemptions, which are treated as increases in capital.
Transactions in each Fund’s Shares are disclosed in detail in the Statements of Changes in Net Assets.
NOTE 11–Coronavirus (COVID-19) Pandemic
During the first quarter of 2020, the World Health Organization declared COVID-19 to be a public health emergency. COVID-19 has led to increased short-term market volatility and may have adverse long-term effects on U.S. and world economies and markets in general. COVID-19 may adversely impact the value of the Funds’ investments. Because of the uncertainties on valuation, the global economy and business operations, values reflected in these financial statements may materially differ from the value received upon actual sales of those investments.
The extent of the impact on the performance of the Funds and their investments will depend on future developments, including the duration and spread of the COVID-19 outbreak, related restrictions and advisories, and the effects on the financial markets and economy overall, all of which are highly uncertain and cannot be predicted.
Report of Independent Registered Public Accounting Firm
To the Board of Trustees of Invesco Exchange-Traded Fund Trust II and Shareholders of Invesco KBW Bank ETF, Invesco KBW High Dividend Yield Financial ETF, Invesco KBW Premium Yield Equity REIT ETF, Invesco KBW Property & Casualty Insurance ETF and Invesco KBW Regional Banking ETF
Opinions on the Financial Statements
We have audited the accompanying statements of assets and liabilities, including the schedules of investments, of Invesco KBW Bank ETF, Invesco KBW High Dividend Yield Financial ETF, Invesco KBW Premium Yield Equity REIT ETF, Invesco KBW Property & Casualty Insurance ETF and Invesco KBW Regional Banking ETF (five of the funds constituting Invesco Exchange-Traded Fund Trust II, hereafter collectively referred to as the “Funds”) as of August 31, 2020, the related statements of operations for the year ended August 31, 2020, the statements of changes in net assets for each of the two years in the period ended August 31, 2020, including the related notes, and the financial highlights for each of the two years in the period ended August 31, 2020, ten months in the period ended August 31, 2018 and three years in the period ended October 31, 2017 (collectively referred to as the “financial statements”). In our opinion, the financial statements present fairly, in all material respects, the financial position of each of the Funds as of August 31, 2020, the results of each of their operations for the year ended August 31, 2020, the changes in each of their net assets for each of the two years in the period ended August 31, 2020 and each of the financial highlights for each of the two years in the period ended August 31, 2020, ten months in the period ended August 31, 2018 and three years in the period ended October 31, 2017, in conformity with accounting principles generally accepted in the United States of America.
Basis for Opinions
These financial statements are the responsibility of the Funds’ management. Our responsibility is to express an opinion on the Funds’ financial statements based on our audits. We are a public accounting firm registered with the Public Company Accounting Oversight Board (United States) (“PCAOB”) and are required to be independent with respect to the Funds in accordance with the U.S. federal securities laws and the applicable rules and regulations of the Securities and Exchange Commission and the PCAOB.
We conducted our audits of these financial statements in accordance with the standards of the PCAOB. Those standards require that we plan and perform the audit to obtain reasonable assurance about whether the financial statements are free of material misstatement, whether due to error or fraud.
Our audits included performing procedures to assess the risks of material misstatement of the financial statements, whether due to error or fraud, and performing procedures that respond to those risks. Such procedures included examining, on a test basis, evidence regarding the amounts and disclosures in the financial statements. Our audits also included evaluating the accounting principles used and significant estimates made by management, as well as evaluating the overall presentation of the financial statements. Our procedures included confirmation of securities owned as of August 31, 2020 by correspondence with the custodian, transfer agent, and brokers; when replies were not received from brokers, we performed other auditing procedures. We believe that our audits provide a reasonable basis for our opinions.
/s/PricewaterhouseCoopers LLP
Chicago, Illinois
October 28, 2020
We have served as the auditor of one or more of the investment companies in the Invesco group of investment companies since at least 1995. We have not been able to determine the specific year we began serving as auditor.
Calculating your ongoing Fund expenses
Example
As a shareholder of a Fund of the Invesco Exchange-Traded Fund Trust II, you incur a unitary management fee. In addition to the unitary management fee, a shareholder may pay distribution fees, if any, brokerage expenses, taxes, interest, acquired fund fees and expenses, if any, litigation expenses and other extraordinary expenses. The expense examples below are intended to help you understand your ongoing costs (in dollars) of investing in the Funds and to compare these costs with the ongoing costs of investing in other funds.
The example is based on an investment of $1,000 invested at the beginning of the period and held through the six-month period ended August 31, 2020.
In addition to the fees and expenses which the Invesco KBW High Dividend Yield Financial ETF (the “Portfolio”) bears directly, the Portfolio indirectly bears a pro rata share of the fees and expenses of the investment companies in which the Portfolio invests. The amount of fees and expenses incurred indirectly by the Portfolio will vary because the investment companies have varied expenses and fee levels and the Portfolio may own different proportions of the investment companies at different times. Estimated investment companies’ expenses are not expenses that are incurred directly by the Portfolio. They are expenses that are incurred directly by the investment companies and are deducted from the value of the investment companies the Portfolio invests in. The effect of the estimated investment companies’ expenses that the Portfolio bears indirectly are included in the Portfolio’s total returns.
Actual Expenses
The first line in the following table provides information about actual account values and actual expenses. You may use the information in this line, together with the amount you invested, to estimate the expenses that you paid over the period. Simply divide your account value by $1,000 (for example, an $8,600 account value divided by $1,000 = 8.6), then multiply the result by the number in the first line under the heading “Expenses Paid During the Six-Month Period” to estimate the expenses you paid on your account during this period.
Hypothetical Example for Comparison Purposes
The second line in the following table provides information about hypothetical account values and hypothetical expenses based on the Fund’s actual expense ratio and an assumed annualized rate of return of 5% per year before expenses, which is not the Fund’s actual return. The hypothetical account values and expenses may not be used to estimate the actual ending account balance or expenses you paid for the period. You may use this information to compare the ongoing costs of investing in the Fund and other funds. To do so, compare this 5% hypothetical example with the 5% hypothetical examples that appear in the shareholder reports of the other funds.
Please note that the expenses shown in the table are meant to highlight your ongoing costs only and do not reflect any transactional costs, such as sales charges and brokerage commissions. Therefore, the second line in the table is useful in comparing ongoing costs only, and will not help you determine the relative total costs of owning different funds. In addition, expenses shown in the table do not include the expenses of the underlying funds, which are borne indirectly by a Fund. If transaction costs and indirect expenses were included, your costs would have been higher.
| | | | | | | | | | | | | | | | |
| | | Beginning Account Value March 1, 2020 | | | Ending
Account Value
August 31, 2020 | | | Annualized
Expense Ratio
Based on the
Six-Month Period | | | Expenses Paid
During the
Six-Month Period(1) | |
Invesco KBW Bank ETF (KBWB) | | | | | | | | | | | | | | | | |
Actual | | | $1,000.00 | | | | $ 854.90 | | | | 0.35 | % | | | $1.63 | |
Hypothetical (5% return before expenses) | | | 1,000.00 | | | | 1,023.38 | | | | 0.35 | | | | 1.78 | |
Invesco KBW High Dividend Yield Financial ETF (KBWD) | | | | | | | | | | | | | | | | |
Actual | | | 1,000.00 | | | | 744.50 | | | | 0.35 | | | | 1.53 | |
Hypothetical (5% return before expenses) | | | 1,000.00 | | | | 1,023.38 | | | | 0.35 | | | | 1.78 | |
Invesco KBW Premium Yield Equity REIT ETF (KBWY) | | | | | | | | | | | | | | | | |
Actual | | | 1,000.00 | | | | 741.60 | | | | 0.35 | | | | 1.53 | |
Hypothetical (5% return before expenses) | | | 1,000.00 | | | | 1,023.38 | | | | 0.35 | | | | 1.78 | |
Calculating your ongoing Fund expenses–(continued)
| | | | | | | | | | | | | | | | |
| | | Beginning
Account Value
March 1, 2020 | | | Ending
Account Value
August 31, 2020 | | | Annualized
Expense Ratio
Based on the
Six-Month Period | | | Expenses Paid
During the
Six-Month Period(1) | |
| Invesco KBW Property & Casualty Insurance ETF (KBWP) | | | | | | | | | | | | | | | | |
Actual | | | $1,000.00 | | | | $ 949.70 | | | | 0.35 | % | | | $1.72 | |
Hypothetical (5% return before expenses) | | | 1,000.00 | | | | 1,023.38 | | | | 0.35 | | | | 1.78 | |
| Invesco KBW Regional Banking ETF (KBWR) | | | | | | | | | | | | | | | | |
Actual | | | 1,000.00 | | | | 818.00 | | | | 0.35 | | | | 1.60 | |
Hypothetical (5% return before expenses) | | | 1,000.00 | | | | 1,023.38 | | | | 0.35 | | | | 1.78 | |
| (1) | Expenses are calculated using the annualized expense ratio, which represents the ongoing expenses as a percentage of net assets for the six-month period ended August 31, 2020. Expenses are calculated by multiplying the Fund’s annualized expense ratio by the average account value for the period, then multiplying the result by 184/366. Expense ratios for the most recent six-month period may differ from expense ratios based on the annualized data in the Financial Highlights. |
Tax Information
Form 1099-DIV, Form 1042-S and other year–end tax information provide shareholders with actual calendar year amounts that should be included in their tax returns. Shareholders should consult their tax advisers.
The following distribution information is being provided as required by the Internal Revenue Code or to meet a specific state’s requirement.
Each Fund designates the following amounts or, if subsequently determined to be different, the maximum amount allowable for its fiscal year ended August 31, 2020:
| | | | | | | | | | | | | | | | | | | | |
| | | Qualified
Business
Income* | | | Qualified
Dividend
Income* | | | Dividends-
Received
Deduction* | | | Business
Interest
Income* | | | Qualified
Interest
Income* | |
Invesco KBW Bank ETF | | | 0% | | | | 98% | | | | 100% | | | | 0% | | | | 0% | |
Invesco KBW High Dividend Yield Financial ETF | | | 21% | | | | 13% | | | | 13% | | | | 1% | | | | 1% | |
Invesco KBW Premium Yield Equity REIT ETF | | | 30% | | | | 1% | | | | 0% | | | | 1% | | | | 1% | |
Invesco KBW Property & Casualty Insurance ETF | | | 0% | | | | 98% | | | | 92% | | | | 0% | | | | 0% | |
Invesco KBW Regional Banking ETF | | | 0% | | | | 100% | | | | 100% | | | | 0% | | | | 0% | |
| * | The above percentages are based on ordinary income dividends paid to shareholders during the Trust’s fiscal year. |
Trustees and Officers
The Independent Trustees of the Trust, their term of office and length of time served, their principal business occupations during at least the past five years, the number of portfolios in the Fund Complex (as defined below)overseen by each Independent Trustee and the other directorships, if any, held by each Independent Trustee are shown below.
As of August 31, 2020
| | | | | | | | | | |
Name, Address and Year of
Birth of Independent Trustees | | Position(s) Held with Trust | | Term of Office and Length of Time Served* | | Principal Occupation(s) During Past 5 Years | | Number of
Portfolios in Fund
Complex**
Overseen by
Independent
Trustees | | Other
Directorships Held by
Independent
Trustees During
the Past 5 Years |
Ronn R. Bagge–1958 c/o Invesco Capital Management LLC 3500 Lacey Road, Suite 700 Downers Grove, IL 60515 | | Vice Chairman of the Board; Chairman of the Nominating and Governance Committee and Trustee | | Vice Chairman since 2018; Chairman of the Nominating and Governance Committee and Trustee since 2007 | | Founder and Principal, YQA Capital Management LLC (1998-Present); formerly, Owner/CEO of Electronic Dynamic Balancing Co., Inc. (high-speed rotating equipment service provider). | | 214 | | Trustee and Investment Oversight Committee member, Mission Aviation Fellowship (2017- Present). |
| | | | | |
Todd J. Barre–1957 c/o Invesco Capital Management LLC 3500 Lacey Road, Suite 700 Downers Grove, IL 60515 | | Trustee | | Since 2010 | | Assistant Professor of Business, Trinity Christian College (2010-2016); formerly, Vice President and Senior Investment Strategist (2001- 2008), Director of Open Architecture and Trading (2007-2008), Head of Fundamental Research (2004-2007) and Vice President and Senior Fixed Income Strategist (1994-2001), BMO Financial Group/Harris Private Bank. | | 214 | | None. |
| * | This is the date the Independent Trustee began serving the Trust. Each Independent Trustee serves an indefinite term, until his or her successor is elected. |
| ** | Fund Complex includes all open- and closed-end funds (including all of their portfolios) advised by the Adviser and any affiliated person of the Adviser. |
Trustees and Officers—(continued)
| | | | | | | | | | |
Name, Address and Year of
Birth of Independent Trustees | | Position(s) Held with Trust | | Term of Office and Length of Time Served* | | Principal Occupation(s) During Past 5 Years | | Number of
Portfolios in Fund
Complex**
Overseen by
Independent
Trustees | | Other
Directorships Held by
Independent
Trustees During
the Past 5 Years |
Edmund P. Giambastiani, Jr.–1948 c/o Invesco Capital Management LLC 3500 Lacey Road, Suite 700 Downers Grove, IL 60515 | | Trustee | | Since 2019 | | President, Giambastiani Group LLC (national security and energy consulting) (2007-Present); Director, The Boeing Company (2009-Present); Trustee, MITRE Corporation (federally-funded research development) (2008-Present); Director, THL Credit, Inc. (alternative credit investment manager) (2016-Present); Trustee, U.S. Naval Academy Foundation Athletic & Scholarship Program (2010-Present); Advisory Board Member, Massachusetts Institute of Technology Lincoln Laboratory (federally-funded research development) (2010- Present); Defense Advisory Board Member, Lawrence Livermore National Laboratory (2013-Present); formerly, Chairman (2015-2016), Lead Director (2011-2015) and Director (2008-2011), Monster Worldwide, Inc. (career services); Advisory Board Member, Maxwell School of Citizenship and Public Affairs of Syracuse University (2012-2016); United States Navy, career nuclear submarine officer (1970-2007); Seventh Vice Chairman of the Joint Chiefs of Staff (2005-2007); first NATO Supreme Allied Commander Transformation (2003-2005); Commander, U.S. Joint Forces Command (2002-2005). | | 214 | | Formerly, Trustee, certain funds of the Oppenheimer Funds complex (2013- 2019); Director, Mercury Defense Systems Inc. (information technology) (2011-2013); Independent Director, QinetiQ Group Plc (defense technology and security) (2008-2011); Chairman, Alenia North America, Inc. (military and defense products) (2008-2009); Director, SRA International, Inc. (information technology and services) (2008- 2011). |
| * | This is the date the Independent Trustee began serving the Trust. Each Independent Trustee serves an indefinite term, until his or her successor is elected. |
| ** | Fund Complex includes all open- and closed-end funds (including all of their portfolios) advised by the Adviser and any affiliated person of the Adviser. |
Trustees and Officers—(continued)
| | | | | | | | | | |
Name, Address and Year of
Birth of Independent Trustees | | Position(s) Held with Trust | | Term of Office and Length of Time Served* | | Principal Occupation(s) During Past 5 Years | | Number of
Portfolios in Fund
Complex**
Overseen by
Independent
Trustees | | Other
Directorships Held by
Independent
Trustees During
the Past 5 Years |
| Victoria J. Herget–1951 c/o Invesco Capital Management LLC 3500 Lacey Road, Suite 700 Downers Grove, IL 60515 | | Trustee | | Since 2019 | | Formerly, Managing Director (1993-2001), Principal (1985-1993), Vice President (1978-1985) and Assistant Vice President (1973- 1978), Zurich Scudder Investments (investment adviser) (and its predecessor firms). | | 214 | | Trustee (2000- Present) and Chair (2010-2017), Newberry Library; Trustee, Mather LifeWays (2001-Present); Trustee, Chikaming Open Lands (2014-Present); formerly, Trustee, certain funds in the Oppenheimer Funds complex (2012- 2019); Board Chair (2008-2015) and Director (2004- 2018), United Educators Insurance Company; Independent Director, First American Funds (2003-2011); Trustee (1992-2007), Chair of the Board of Trustees (1999-2007), Investment Committee Chair (1994-1999) and Investment Committee member (2007-2010), Wellesley College; Trustee, BoardSource (2006-2009); Trustee, Chicago City Day School (1994-2005). |
| * | This is the date the Independent Trustee began serving the Trust. Each Independent Trustee serves an indefinite term, until his or her successor is elected. |
| ** | Fund Complex includes all open- and closed-end funds (including all of their portfolios) advised by the Adviser and any affiliated person of the Adviser. |
Trustees and Officers–(continued)
| | | | | | | | | | |
Name, Address and Year of
Birth of Independent Trustees | | Position(s) Held with Trust | | Term of Office and Length of Time Served* | | Principal Occupation(s) During Past 5 Years | | Number of
Portfolios in Fund
Complex**
Overseen by
Independent
Trustees | | Other
Directorships Held by
Independent
Trustees During
the Past 5 Years |
| Marc M. Kole–1960 c/o Invesco Capital Management LLC 3500 Lacey Road, Suite 700 Downers Grove, IL 60515 | | Chairman of the Audit Committee and Trustee | | Chairman of the Audit Committee since 2008; Trustee since 2007 | | Senior Director of Finance, By The Hand Club for Kids (not-for-profit) (2015-Present); formerly, Chief Financial Officer, Hope Network (social services) (2008-2012); Assistant Vice President and Controller, Priority Health (health insurance) (2005-2008); Regional Chief Financial Officer, United Healthcare (2005); Chief Accounting Officer, Senior Vice President of Finance, Oxford Health Plans (2000-2004); Audit Partner, Arthur Andersen LLP (1996-2000). | | 214 | | Treasurer (2018-Present), Finance Committee Member (2015- Present) and Audit Committee Member (2015), Thornapple Evangelical Covenant Church; formerly, Board and Finance Committee Member (2009-2017) and Treasurer (2010-2015, 2017), NorthPointe Christian Schools. |
| Yung Bong Lim–1964 c/o Invesco Capital Management LLC 3500 Lacey Road, Suite 700 Downers Grove, IL 60515 | | Chairman of the Investment Oversight Committee and Trustee | | Chairman of the Investment Oversight Committee since 2014; Trustee since 2013 | | Managing Partner, RDG Funds LLC (real estate) (2008-Present); formerly, Managing Director, Citadel LLC (1999-2007). | | 214 | | Advisory Board Member, Performance Trust Capital Partners, LLC (2008-Present); Board Director, Beacon Power Services, Corp. (2019-Present). |
| * | This is the date the Independent Trustee began serving the Trust. Each Independent Trustee serves an indefinite term, until his or her successor is elected. |
| ** | Fund Complex includes all open- and closed-end funds (including all of their portfolios) advised by the Adviser and any affiliated person of the Adviser. |
Trustees and Officers–(continued)
| | | | | | | | | | |
Name, Address and Year of
Birth of Independent Trustees | | Position(s) Held with Trust | | Term of Office and Length of Time Served* | | Principal Occupation(s) During Past 5 Years | | Number of
Portfolios in Fund
Complex**
Overseen by
Independent
Trustees | | Other
Directorships Held by
Independent
Trustees During
the Past 5 Years |
| Joanne Pace–1958 c/o Invesco Capital Management LLC 3500 Lacey Road, Suite 700 Downers Grove, IL 60515 | | Trustee | | Since 2019 | | Formerly, Senior Advisor, SECOR Asset Management, LP (2010-2011); Managing Director and Chief Operating Officer, Morgan Stanley Investment Management (2006- 2010); Partner and Chief Operating Officer, FrontPoint Partners, LLC (alternative investments) (2005- 2006); Managing Director (2003-2005), Global Head of Human Resources and member of Executive Board and Operating Committee (2004-2005), Global Head of Operations and Product Control (2003-2004), Credit Suisse (investment banking); Managing Director (1997-2003), Controller and Principal Accounting Officer (1999-2003), Chief Financial Officer (temporary assignment) for the Oversight Committee, Long Term Capital Management (1998-1999). | | 214 | | Board Director, Horizon Blue Cross Blue Shield of New Jersey (2012- Present); Advisory Board Director, The Alberleen Group LLC (2012-Present); Governing Council Member (2016- Present) and Chair of Education Committee (2017-Present), Independent Directors Council (IDC); Board Member, 100 Women in Finance (2015-Present); Council Member, NewYork-Presbyterian Hospital’s Leadership Council on Children’s and Women’s Health (2012-Present); formerly, Trustee, certain funds in the Oppenheimer Funds complex (2012- 2019); Lead Independent Director and Chair of the Audit and Nominating Committee of The Global Chartist Fund, LLC, Oppenheimer Asset Management (2011-2012); Board Director, Managed Funds Association (2008-2010); Board Director (2007-2010) and Investment Committee Chair (2008-2010), Morgan Stanley Foundation. |
| * | This is the date the Independent Trustee began serving the Trust. Each Independent Trustee serves an indefinite term, until his or her successor is elected. |
| ** | Fund Complex includes all open- and closed-end funds (including all of their portfolios) advised by the Adviser and any affiliated person of the Adviser. |
Trustees and Officers–(continued)
| | | | | | | | | | |
Name, Address and Year of
Birth of Independent Trustees | | Position(s) Held with Trust | | Term of Office and Length of Time Served* | | Principal Occupation(s) During Past 5 Years | | Number of
Portfolios in Fund
Complex**
Overseen by
Independent
Trustees | | Other
Directorships Held by
Independent
Trustees During
the Past 5 Years |
Gary R. Wicker–1961 c/o Invesco Capital Management LLC 3500 Lacey Road, Suite 700 Downers Grove, IL 60515 | | Trustee | | Since 2013 | | Senior Vice President of Global Finance and Chief Financial Officer, RBC Ministries (publishing company) (2013-Present); formerly, Executive Vice President and Chief Financial Officer, Zondervan Publishing (a division of Harper Collins/NewsCorp) (2007-2012); Senior Vice President and Group Controller (2005- 2006), Senior Vice President and Chief Financial Officer (2003-2004), Chief Financial Officer (2001-2003), Vice President, Finance and Controller (1999-2001) and Assistant Controller (1997-1999), divisions of The Thomson Corporation (information services provider); Senior Audit Manager (1994-1997), PricewaterhouseCoopers LLP. | | 214 | | Board Member and Treasurer, Our Daily Bread Ministries Canada (2015- Present); Board and Finance Committee Member, West Michigan Youth For Christ (2010- Present). |
| | | | | |
| Donald H. Wilson–1959 c/o Invesco Capital Management LLC 3500 Lacey Road, Suite 700 Downers Grove, IL 60515 | | Chairman of the Board and Trustee | | Chairman since 2012; Trustee since 2007 | | Chairman, President and Chief Executive Officer, McHenry Bancorp Inc. and McHenry Savings Bank (subsidiary) (2018-Present); formerly, Chairman and Chief Executive Officer, Stone Pillar Advisors, Ltd. (2010-2017); President and Chief Executive Officer, Stone Pillar Investments, Ltd. (advisory services to the financial sector) (2016- 2018); Chairman, President and Chief Executive Officer, Community Financial Shares, Inc. and Community Bank—Wheaton/Glen Ellyn (subsidiary) (2013-2015); Chief Operating Officer, AMCORE Financial, Inc. (bank holding company) (2007-2009); Executive Vice President and Chief Financial Officer, AMCORE Financial, Inc. (2006-2007); Senior Vice President and Treasurer, Marshall & Ilsley Corp. (bank holding company) (1995-2006). | | 214 | | Director, Penfield Children’s Center (2004-Present); Board Chairman, Gracebridge Alliance, Inc. (2015-Present). |
| * | This is the date the Independent Trustee began serving the Trust. Each Independent Trustee serves an indefinite term, until his or her successor is elected. |
| ** | Fund Complex includes all open- and closed-end funds (including all of their portfolios) advised by the Adviser and any affiliated person of the Adviser. |
Trustees and Officers–(continued)
The Interested Trustee and the executive officers of the Trust, their term of office and length of time served, their principal business occupations during at least the past five years, the number of portfolios in the Fund Complex (as defined below) overseen by the Interested Trustee and the other directorships, if any, held by the Interested Trustee are shown below.
| | | | | | | | | | |
Name, Address and Year of
Birth of Independent Trustees | | Position(s) Held with Trust | | Term of Office and Length of Time Served* | | Principal Occupation(s) During Past 5 Years | | Number of
Portfolios in Fund
Complex**
Overseen by
Independent
Trustees | | Other
Directorships Held by
Independent
Trustees During
the Past 5 Years |
| Kevin M. Carome–1956 Invesco Ltd. Two Peachtree Pointe 1555 Peachtree St., N.E., Suite 1800 Atlanta, GA 30309 | | Trustee | | Since 2010 | | Senior Managing Director, Secretary and General Counsel, Invesco Ltd. (2007-Present); Director, Invesco Advisers, Inc. (2009-Present); Director (2006-Present) and Executive Vice President (2008-Present), Invesco North American Holdings, Inc.; Executive Vice President (2008-Present), Invesco Investments (Bermuda) Ltd.; Manager, Horizon Flight Works LLC; and Executive Vice President (2014-Present), INVESCO Asset Management (Bermuda) Ltd.; formerly, Director and Secretary (2012-2020), Invesco Services (Bahamas) Private Limited; Director, Invesco Finance PLC (2011-2019); Director, INVESCO Asset Management (Bermuda) Ltd. (2014-2019); Director and Executive Vice President, Invesco Finance, Inc. (2011-2018); Director (2006-2018) and Executive Vice President (2008-2018), Invesco Group Services, Inc., Invesco Holding Company (US), Inc.; Director, Invesco Holding Company Limited (2007- 2019); Director and Chairman, INVESCO Funds Group, Inc., Senior Vice President, Secretary and General Counsel, Invesco Advisers, Inc. (2003-2006); Director, Invesco Investments (Bermuda) Ltd. (2008- 2016); Senior Vice President and General Counsel, Liberty Financial Companies, Inc. (2000-2001); General Counsel of certain investment management subsidiaries of Liberty Financial Companies, Inc. (1998-2000); Associate General Counsel, Liberty Financial Companies, Inc. (1993-1998); Associate, Ropes & Gray LLP. | | 214 | | None |
| * | This is the date the Interested Trustee began serving the Trust. The Interested Trustee serves an indefinite term, until his successor is elected. |
| ** | Fund Complex includes all open- and closed-end funds (including all of their portfolios) advised by the Adviser and any affiliated person of the Adviser. |
Trustees and Officers–(continued)
| | | | | | |
Name, Address and Year of Birth
of Executive Officers | | Position(s)
Held with Trust | | Length of Time Served* | | Principal Occupation(s) During Past 5 Years |
| Anna Paglia–1974 Invesco Capital Management LLC 3500 Lacey Road, Suite 700 Downers Grove, IL 60515 | | President and Principal Executive Officer | | Since 2020 | | President and Principal Executive Officer, Invesco Exchange-Traded Fund Trust, Invesco Exchange-Traded Fund Trust II, Invesco India Exchange-Traded Fund Trust, Invesco Actively Managed Exchange-Traded Fund Trust, Invesco Actively Managed Exchange-Traded Commodity Fund Trust and Invesco Exchange- Traded Self-Indexed Fund Trust (2020-Present); Managing Director and Global Head of ETFs and Indexed Strategies, Chief Executive Officer and Principal Executive Officer, Invesco Capital Management LLC (2020-Present); Chief Executive Officer, Manager and Principal Executive Officer, Invesco Specialized Products, LLC (2020-Present); Vice President, Invesco Indexing LLC (2020-Present);formerly, Secretary, Invesco Exchange-Traded Fund Trust, Invesco Exchange-Traded Fund Trust II, Invesco India Exchange-Traded Fund Trust and Invesco Actively Managed Exchange-Traded Fund Trust (2011-2020), Invesco Actively Managed Exchange-Traded Commodity Fund Trust (2014-2020) and Invesco Exchange-Traded Self-Indexed Fund Trust (2015-2020); Head of Legal (2010-2020) and Secretary (2015-2020), Invesco Capital Management LLC; Manager and Assistant Secretary, Invesco Indexing LLC (2017-2020); Head of Legal and Secretary, Invesco Specialized Products, LLC (2018-2020); Partner, K&L Gates LLP (formerly, Bell Boyd & Lloyd LLP) (2007-2010); and Associate Counsel at Barclays Global Investors Ltd. (2004-2006). |
| | | |
| Kelli Gallegos–1970 Invesco Capital Management LLC 11 Greenway Plaza, Suite 1000 Houston, TX 77046 | | Vice President and Treasurer | | Since 2018 | | Vice President, Invesco Advisers, Inc. (2020-Present); Principal Financial and Accounting Officer- Pooled Investments, Invesco Specialized Products, LLC (2018-Present); Vice President and Treasurer, Invesco Exchange-Traded Fund Trust, Invesco Exchange-Traded Fund Trust II, Invesco India Exchange-Traded Fund Trust, Invesco Actively Managed Exchange-Traded Fund Trust, Invesco Actively Managed Exchange-Traded Commodity Fund Trust and Invesco Exchange-Traded Self-Indexed Fund Trust (2018-Present); Principal Financial and Accounting Officer-Pooled Investments, Invesco Capital Management LLC (2018-Present); Vice President, Principal Financial Officer (2016-Present) and Assistant Treasurer (2008-Present), The Invesco Funds; formerly, Assistant Treasurer, Invesco Specialized Products, LLC (2018); Assistant Treasurer, Invesco Exchange-Traded Fund Trust, Invesco Exchange-Traded Fund Trust II, Invesco India Exchange-Traded Fund Trust and Invesco Actively Managed Exchange-Traded Fund Trust (2012-2018), Invesco Actively Managed Exchange-Traded Commodity Fund Trust (2014-2018) and Invesco Exchange-Traded Self-Indexed Fund Trust (2016-2018); Assistant Treasurer, Invesco Capital Management LLC (2013-2018); and Assistant Vice President, The Invesco Funds (2008-2016). |
| * | This is the date each Officer began serving the Trust in their current position. Each Officer serves an indefinite term, until his or her successor is elected. |
Trustees and Officers–(continued)
| | | | | | |
Name, Address and Year of Birth
of Executive Officers | | Position(s)
Held with Trust | | Length of Time Served* | | Principal Occupation(s) During Past 5 Years |
| Adam Henkel–1980 Invesco Capital Management LLC 3500 Lacey Road, Suite 700 Downers Grove, IL 60515 | | Secretary | | Since 2020 | | Head of Legal – US ETFs and Secretary, Invesco Capital Management LLC (2020-Present); Head of Legal and Secretary, Invesco Specialized Products, LLC (2020-Present); Secretary, Invesco Exchange-Traded Fund Trust, Invesco Exchange-Traded Fund Trust II, Invesco India Exchange-Traded Fund Trust, Invesco Actively Managed Exchange-Traded Fund Trust, Invesco Actively Managed Exchange-Traded Commodity Fund Trust and Invesco Exchange- Traded Self-Indexed Fund Trust (2020-Present); Manager and Assistant Secretary, Invesco Indexing LLC (2020-Present); Assistant Secretary (2020-Present), Invesco Capital Markets, Inc. and Invesco Investment Advisers LLC; Assistant Secretary, The Invesco Funds (2014-Present); formerly, Assistant Secretary, Invesco Capital Management LLC (2015-2020) and Invesco Specialized Products, LLC (2018-2020); Assistant Secretary (2014-2020) and Chief Compliance Officer (2017-2017), Invesco Exchange- Traded Fund Trust, Invesco Exchange-Traded Fund Trust II, Invesco India Exchange-Traded Fund Trust and Invesco Actively Managed Exchange-Traded Fund Trust, Invesco Actively Managed Exchange-Traded Commodity Fund Trust and Invesco Exchange-Traded Self-Indexed Fund Trust. |
| | | |
| Peter Hubbard–1981 Invesco Capital Management LLC 3500 Lacey Road, Suite 700 Downers Grove, IL 60515 | | Vice President | | Since 2009 | | Vice President, Invesco Specialized Products, LLC (2018-Present); Vice President, Invesco Exchange-Traded Fund Trust, Invesco Exchange-Traded Fund Trust II, Invesco India Exchange-Traded Fund Trust, Invesco Actively Managed Exchange-Traded Fund Trust (2009-Present), Invesco Actively Managed Exchange-Traded Commodity Fund Trust (2014-Present) and Invesco Exchange-Traded Self-Indexed Fund Trust (2016-Present); Vice President and Director of Portfolio Management, Invesco Capital Management LLC (2010-Present); formerly, Vice President of Portfolio Management, Invesco Capital Management LLC (2008-2010); Portfolio Manager, Invesco Capital Management LLC (2007-2008); Research Analyst, Invesco Capital Management LLC (2005-2007); Research Analyst and Trader, Ritchie Capital, a hedge fund operator (2003-2005). |
| | | |
| Sheri Morris–1964 Invesco Capital Management LLC 11 Greenway Plaza, Suite 1000 Houston, TX 77046 | | Vice President | | Since 2012 | | Head of Global Fund Services, Invesco Ltd. (2019-Present); Vice President, OppenheimerFunds, Inc. (2019-Present); President and Principal Executive Officer, The Invesco Funds (2016-Present); Treasurer, The Invesco Funds (2008-Present); Vice President, Invesco Advisers, Inc. (formerly known as Invesco Institutional (N.A.), Inc.) (registered investment adviser) (2009-Present) and Vice President, Invesco Exchange-Traded Fund Trust, Invesco Exchange- Traded Fund Trust II, Invesco India Exchange-Traded Fund Trust, Invesco Actively Managed Exchange-Traded Fund Trust (2012-Present), Invesco Actively Managed Exchange-Traded Commodity Fund Trust (2014-Present) and Invesco Exchange-Traded Self-Indexed Fund Trust (2016-Present); formerly, Vice President and Principal Financial Officer, The Invesco Funds (2008-2016); Treasurer, Invesco Exchange-Traded Fund Trust, Invesco Exchange-Traded Fund Trust II, Invesco India Exchange-Traded Fund Trust and Invesco Actively Managed Exchange-Traded Fund Trust (2011-2013); Vice President, Invesco Aim Advisers, Inc., Invesco Aim Capital Management, Inc. and Invesco Aim Private Asset Management, Inc.; Assistant Vice President and Assistant Treasurer, The Invesco Funds and Assistant Vice President, Invesco Advisers, Inc., Invesco Aim Capital Management, Inc. and Invesco Aim Private Asset Management, Inc. |
* This is the date each Officer began serving the Trust in their current position. Each Officer serves an indefinite term, until his or her successor is elected.
Trustees and Officers–(continued)
| | | | | | |
Name, Address and Year of Birth
of Executive Officers | | Position(s)
Held with Trust | | Length of Time Served* | | Principal Occupation(s) During Past 5 Years |
| Rudolf E. Reitmann—1971 Invesco Capital Management LLC 3500 Lacey Road, Suite 700 Downers Grove, IL 60515 | | Vice President | | Since 2013 | | Head of Global Exchange Traded Funds Services, Invesco Specialized Products, LLC (2018-Present); Vice President, Invesco Exchange-Traded Fund Trust, Invesco Exchange-Traded Fund Trust II, Invesco India Exchange-Traded Fund Trust, Invesco Actively Managed Exchange-Traded Fund Trust (2013-Present), Invesco Actively Managed Exchange-Traded Commodity Fund Trust (2014-Present) and Invesco Exchange-Traded Self-Indexed Fund Trust (2016-Present); Head of Global Exchange Traded Funds Services, Invesco Capital Management LLC (2013-Present); Vice President, Invesco Capital Markets, Inc. (2018-Present). |
| | | |
| Melanie Zimdars—1976 Invesco Capital Management LLC 3500 Lacey Road, Suite 700 Downers Grove, IL 60515 | | Chief Compliance Officer | | Since 2017 | | Chief Compliance Officer, Invesco Specialized Products, LLC (2018-Present); Chief Compliance Officer, Invesco Capital Management LLC (2017-Present); Chief Compliance Officer, Invesco Exchange-Traded Fund Trust, Invesco Exchange-Traded Fund Trust II, Invesco India Exchange-Traded Fund Trust, Invesco Actively Managed Exchange-Traded Fund Trust, Invesco Actively Managed Exchange-Traded Commodity Fund Trust and Invesco Exchange- Traded Self-Indexed Fund Trust (2017-Present); formerly, Vice President and Deputy Chief Compliance Officer, ALPS Holding, Inc. (2009-2017); Mutual Fund Treasurer/ Chief Financial Officer, Wasatch Advisors, Inc. (2005-2008); Compliance Officer, U.S. Bancorp Fund Services, LLC (2001-2005). |
* This is the date each Officer began serving the Trust in their current position. Each Officer serves an indefinite term, until his or her successor is elected.
Availability of Additional Information About the Trustees
The Statement of Additional Information includes additional information about the Trustees and is available, without charge, upon request at (800)983-0903.
Approval of Investment Advisory and Sub-Advisory Contract
At a meeting held on April14, 2020, the Board of Trustees of the Invesco Exchange-Traded Fund Trust II (the “Trust”), including the Independent Trustees, approved the continuation of the Investment Advisory Agreement between Invesco Capital Management LLC (the “Adviser”)and the Trust for the following 71 series (each, a “Fund” and collectively, the “Funds”):
| | |
Invesco 1-30 Laddered Treasury ETF Invesco California AMT-Free Municipal Bond ETF Invesco CEF Income Composite ETF Invesco China Technology ETF Invesco DWA Developed Markets Momentum ETF Invesco DWA Emerging Markets Momentum ETF Invesco DWA SmallCap Momentum ETF Invesco Emerging Markets Sovereign Debt ETF Invesco FTSE International Low Beta Equal Weight ETF Invesco FTSE RAFI Developed Markets ex-U.S. ETF Invesco FTSE RAFI Developed Markets ex-U.S. Small-Mid ETF Invesco FTSE RAFI Emerging Markets ETF Invesco Fundamental High Yield® Corporate Bond ETF Invesco Fundamental Investment Grade Corporate Bond ETF Invesco Global Clean Energy ETF Invesco Global Short Term High Yield Bond ETF Invesco Global Water ETF Invesco International BuyBack Achievers™ ETF Invesco International Corporate Bond ETF Invesco KBW Bank ETF Invesco KBW High Dividend Yield Financial ETF Invesco KBW Premium Yield Equity REIT ETF Invesco KBW Property & Casualty Insurance ETF Invesco KBW Regional Banking ETF Invesco National AMT-Free Municipal Bond ETF Invesco New York AMT-Free Municipal Bond ETF Invesco Preferred ETF Invesco PureBetaSM0-5 Yr US TIPS ETF Invesco PureBetaSM FTSE Developed ex-North America ETF Invesco PureBetaSM FTSE Emerging Markets ETF Invesco PureBetaSM MSCI USA ETF Invesco PureBetaSM US Aggregate Bond ETF Invesco Russell 1000 Enhanced Equal Weight ETF Invesco Russell 1000 Equal Weight ETF Invesco Russell 1000 Low Beta Equal Weight ETF | | Invesco S&P 500 Enhanced Value ETF Invesco S&P 500® ex-Rate Sensitive Low Volatility ETF Invesco S&P 500® High Beta ETF Invesco S&P 500® High Dividend Low Volatility ETF Invesco S&P 500® Low Volatility ETF Invesco S&P 500 Minimum Variance ETF Invesco S&P 500 Momentum ETF Invesco S&P 500 Revenue ETF Invesco S&P Emerging Markets Low Volatility ETF Invesco S&P Emerging Markets Momentum ETF Invesco S&P International Developed High Dividend Low Volatility ETF Invesco S&P International Developed Low Volatility ETF Invesco S&P International Developed Momentum ETF Invesco S&P International Developed Quality ETF Invesco S&P MidCap 400 Revenue ETF Invesco S&P MidCap Low Volatility ETF Invesco S&P SmallCap 600 Revenue ETF Invesco S&P SmallCap Consumer Discretionary ETF Invesco S&P SmallCap Consumer Staples ETF Invesco S&P SmallCap Energy ETF Invesco S&P SmallCap Financials ETF Invesco S&P SmallCap Health Care ETF Invesco S&P SmallCap High Dividend Low Volatility ETF Invesco S&P SmallCap Industrials ETF Invesco S&P SmallCap Information Technology ETF Invesco S&P SmallCap Low Volatility ETF Invesco S&P SmallCap Materials ETF Invesco S&P SmallCap Quality ETF Invesco S&P SmallCap Utilities & Communication Services ETF Invesco S&P Ultra Dividend Revenue ETF Invesco Senior Loan ETF Invesco Taxable Municipal Bond ETF Invesco Treasury Collateral ETF Invesco Variable Rate Preferred ETF Invesco VRDO Tax-Free Weekly ETF |
Also at the April 14, 2020 meeting, the Board of Trustees of the Trust, including the Independent Trustees, approved the continuation of the Investment Sub-Advisory Agreement between the Adviser and the following seven affiliated sub-advisers for each of Invesco Senior Loan ETF and Invesco Treasury Collateral ETF (the “Sub-Advisory Agreement”): Invesco Advisers, Inc.; Invesco Asset Management Deutschland, GmbH; Invesco Asset Management Limited; Invesco Asset Management (Japan)Limited; Invesco Hong Kong Limited; Invesco Senior Secured Management, Inc.; and Invesco Canada Ltd. (each, a “Sub-Adviser” and collectively, the “Sub-Advisers”).
Investment Advisory Agreement
The Trustees reviewed information from the Adviser describing: (i) the nature, extent and quality of services provided, (ii)the investment performance of each Fund and the Adviser, (iii) the fees paid by the Funds and comparisons to amounts paid by other comparable registered investment companies, (iv)the costs of services provided and estimated profits realized by the Adviser, (v) the extent to which economies of scale may be realized as a Fund grows and whether fee levels reflect any possible economies of
Approval of Investment Advisory and Sub-Advisory Contracts–(continued)
scale for the benefit of Fund shareholders, and (vi)any further benefits realized by the Adviser or its affiliates from the Adviser’s relationship with the Funds.
Nature, Extent and Quality of Services. In evaluating the nature, extent and quality of the Adviser’s services, the Trustees reviewed information concerning the functions performed by the Adviser for the Funds, information describing the Adviser’s current organization and staffing, including operational support provided by the Adviser’s parent organization, Invesco Ltd. (“Invesco”), and the background and experience of the persons responsible for the day-to-day management of the Funds. The Trustees reviewed matters related to the Adviser’s execution and/or oversight of execution of portfolio transactions on behalf of the Funds. The Trustees also reviewed information on the performance of the Funds and their underlying indexes for the one-year, three-year, five-year, ten-year and since-inception periods ended December 31, 2019, as applicable, including reports for each of those periods on the correlation and tracking error between each Fund’s performance and the performance of its underlying index, as well as the Adviser’s analysis of the tracking error and correlation between certain Funds and their underlying indexes. In reviewing the tracking error reports, the Trustees considered information provided by Invesco’s independent performance and risk management group with respect to general expected tracking error ranges. The Trustees also considered that certain Funds were created in connection with the purchases by Invesco of the exchange-traded funds businesses of Guggenheim Capital LLC on April 6, 2018 and Massachusetts Mutual Life Insurance Company (“Oppenheimer”) on May 24, 2019 (each, a “Transaction”), and that each such Fund’s performance prior to the closing of the applicable Transaction is that of its predecessor Guggenheim ETF or Oppenheimer ETF. The Trustees noted that, for each applicable period, the correlation for each Fund, other than the five-year and since-inception periods for Invesco Global Short Term High Yield Bond ETF and the one-year and ten-year periods for Invesco VRDO Tax-Free Weekly ETF, was within the targeted range set forth in the Trust’s registration statement. The Trustees reviewed the reasons provided by the Adviser for Invesco Global Short Term High Yield Bond ETF’s and Invesco VRDO Tax-Free Weekly ETF’s level of correlation to its underlying index, as well as the Adviser’s expectations for each Fund’s correlation going forward. The Trustees noted that, for each applicable period, the tracking error for all Funds was within the targeted range set forth in the Trust’s registration statement and concluded that each Fund’s correlation to its underlying index and the tracking error for each Fund were within an acceptable range given that Fund’s particular circumstances.
The Trustees considered the services provided by the Adviser in its oversight of the Funds’ administrator, custodian and transfer agent. They noted the significant amount of time, effort and resources that had been devoted to this oversight function.
Based on their review, the Trustees concluded that the nature, extent and quality of services provided by the Adviser to the Funds under the Investment Advisory Agreement were appropriate and reasonable.
Fees, Expenses and Profitability. The Trustees reviewed and discussed the information provided by the Adviser on each Fund’s net expense ratio and unitary advisory fee. The Trustees noted that the annual advisory fee charged to each Fund, as set forth below, is a unitary advisory fee and that the Adviser pays all other operating expenses of each Fund, including the fees payable to the Sub-Advisers for Invesco Senior Loan ETF and Invesco Treasury Collateral ETF, except that each Fund pays its brokerage expenses, taxes, interest (including, for Invesco Senior Loan ETF, interest expenses associated with its line of credit), litigation expenses and other extraordinary expenses (including acquired fund fees and expenses, if any).
| | • | | 0.04%: Invesco PureBetaSM MSCI USA ETF |
| | • | | 0.05%: Invesco PureBetaSM US Aggregate Bond ETF |
| | • | | 0.06%: Invesco PureBetaSM MSCI USA Small Cap ETF |
| | • | | 0.07%: Invesco PureBetaSM 0-5 Yr US TIPS ETF, Invesco PureBetaSM FTSE Developed ex-North America ETF |
| | • | | 0.08%: Invesco Treasury Collateral ETF |
| | • | | 0.10%: Invesco S&P 500 Minimum Variance ETF |
| | • | | 0.13%: Invesco S&P 500 Enhanced Value ETF, Invesco S&P 500 Momentum ETF |
| | • | | 0.14%: Invesco PureBetaSM FTSE Emerging Markets ETF |
| | • | | 0.20%: Invesco Russell 1000 Equal Weight ETF |
| | • | | 0.22%: Invesco Fundamental Investment Grade Corporate Bond ETF |
Approval of Investment Advisory and Sub-Advisory Contracts–(continued)
| | • | | 0.25%: Invesco 1-30 Laddered Treasury ETF, Invesco S&P 500® ex-Rate Sensitive Low Volatility ETF, Invesco S&P 500® High Beta ETF, Invesco S&P 500® Low Volatility ETF, Invesco S&P MidCap Low Volatility ETF, Invesco S&P SmallCap Low Volatility ETF, Invesco VRDO Tax-Free Weekly ETF |
| | • | | 0.28%: Invesco California AMT-Free Municipal Bond ETF, Invesco National AMT-Free Municipal Bond ETF, Invesco New York AMT-Free Municipal Bond ETF, Invesco Taxable Municipal Bond ETF |
| | • | | 0.29%: Invesco Russell 1000 Enhanced Equal Weight ETF, Invesco S&P International Developed Quality ETF, Invesco S&P SmallCap Consumer Discretionary ETF, Invesco S&P SmallCap Consumer Staples ETF, Invesco S&P SmallCap Energy ETF, Invesco S&P SmallCap Financials ETF, Invesco S&P SmallCap Health Care ETF, Invesco S&P SmallCap Industrials ETF, Invesco S&P SmallCap Information Technology ETF, Invesco S&P SmallCap Materials ETF, Invesco S&P SmallCap Quality ETF, Invesco S&P SmallCap Utilities & Communication Services ETF |
| | • | | 0.30%: Invesco S&P 500® High Dividend Low Volatility ETF, Invesco S&P International Developed High Dividend Low Volatility ETF, Invesco S&P SmallCap High Dividend Low Volatility ETF |
| | • | | 0.35%: Invesco Global Short Term High Yield Bond ETF, Invesco KBW Bank ETF, Invesco KBW High Dividend Yield Financial ETF, Invesco KBW Premium Yield Equity REIT ETF, Invesco KBW Property & Casualty Insurance ETF, Invesco KBW Regional Banking ETF, Invesco Russell 1000 Low Beta Equal Weight ETF, Invesco S&P International Developed Low Volatility ETF, Invesco S&P International Developed Momentum ETF |
| | • | | 0.39%: Invesco S&P 500 Revenue ETF, Invesco S&P MidCap 400 Revenue ETF, Invesco S&P SmallCap 600 Revenue ETF, Invesco S&P Ultra Dividend Revenue ETF |
| | • | | 0.45%: Invesco FTSE International Low Beta Equal Weight ETF, Invesco FTSE RAFI Developed Markets ex-U.S. ETF, Invesco S&P Emerging Markets Low Volatility ETF, Invesco S&P Emerging Markets Momentum ETF |
| | • | | 0.49%: Invesco FTSE RAFI Developed Markets ex-U.S. Small-Mid ETF, Invesco FTSE RAFI Emerging Markets ETF |
| | • | | 0.50%: Invesco CEF Income Composite ETF, Invesco Emerging Markets Sovereign Debt ETF, Invesco Fundamental High Yield® Corporate Bond ETF, Invesco International Corporate Bond ETF, Invesco Preferred ETF, Invesco Variable Rate Preferred ETF |
| | • | | 0.55%: Invesco International BuyBack AchieversTM ETF |
| | • | | 0.60%: Invesco DWA SmallCap Momentum ETF |
| | • | | 0.65%: Invesco Senior Loan ETF |
| | • | | 0.70%: Invesco China Technology ETF |
| | • | | 0.75%: Invesco Global Clean Energy ETF, Invesco Global Water ETF |
| | • | | 0.80%: Invesco DWA Developed Markets Momentum ETF |
| | • | | 0.90%: Invesco DWA Emerging Markets Momentum ETF |
The Trustees considered that, effective May 1, 2020, the Adviser had agreed to reduce the unitary advisory fee for Invesco S&P Emerging Markets Low Volatility ETF and Invesco S&P Emerging Markets Momentum ETF from 0.45% to 0.29% of average daily net assets, and to reduce the unitary advisory fee for Invesco S&P International Developed Low Volatility ETF and Invesco S&P International Developed Momentum ETF from 0.35% to 0.25% of average daily net assets.
The Trustees compared each Fund’s net expense ratio to information compiled by the Adviser from Lipper Inc. databases on the net expense ratios of comparable exchange-traded funds (“ETFs”), open-end (non-ETF) index funds and open-end (non-ETF) actively-managed funds, as applicable. The Trustees noted that the net expense ratios for certain Funds were equal to or lower than the median net expense ratios of their ETF and open-end index peer funds as illustrated in the table below. The Trustees also noted that the net expense ratios for all of the Funds were lower than the median net expense ratios of their open-end
Approval of Investment Advisory and Sub-Advisory Contracts–(continued)
actively-managed peer funds. The Trustees noted that a portion of each Fund’s operating expenses was attributable to a sub-license fee payable out of the unitary advisory fee charged to that Fund.
| | | | | | |
| Invesco Fund | | Equal
to/Lower
than ETF
Peer Median | | Equal to/Lower
than Open-End
Index Fund
Peer Median* | | Lower than
Open-Active Fund
Peer Median |
Invesco 1-30 Laddered Treasury ETF | | | | | | X |
Invesco California AMT-Free Municipal Bond ETF | | | | N/A | | X |
Invesco CEF Income Composite ETF | | X | | N/A | | X |
Invesco China Technology ETF | | | | N/A | | X |
Invesco DWA Developed Markets Momentum ETF | | | | | | X |
Invesco DWA Emerging Markets Momentum ETF | | | | | | X |
Invesco DWA SmallCap Momentum ETF | | | | | | X |
Invesco Emerging Markets Sovereign Debt ETF | | | | | | X |
Invesco FTSE International Low Beta Equal Weight ETF | | X | | X | | X |
Invesco FTSE RAFI Developed Markets ex-U.S. ETF | | | | X | | X |
Invesco FTSE RAFI Developed Markets ex-U.S. Small-Mid ETF | | X | | X | | X |
Invesco FTSE RAFI Emerging Markets ETF | | X | | | | X |
Invesco Fundamental High Yield® Corporate Bond ETF | | | | X | | X |
Invesco Fundamental Investment Grade Corporate Bond ETF | | | | | | X |
Invesco Global Clean Energy ETF | | | | N/A | | X |
Invesco Global Short Term High Yield Bond ETF | | X | | N/A | | X |
Invesco Global Water ETF | | | | N/A | | X |
Invesco International BuyBack AchieversTM ETF | | X | | X | | X |
Invesco International Corporate Bond ETF | | | | | | X |
Invesco KBW Bank ETF | | X | | | | X |
Invesco KBW High Dividend Yield Financial ETF | | X | | | | X |
Invesco KBW Premium Yield Equity REIT ETF | | X | | | | X |
Invesco KBW Property & Casualty Insurance ETF | | X | | | | X |
Invesco KBW Regional Banking ETF | | X | | | | X |
Invesco National AMT-Free Municipal Bond ETF | | | | | | X |
Invesco New York AMT-Free Municipal Bond ETF | | | | N/A | | X |
Invesco Preferred ETF | | | | N/A | | X |
Invesco PureBetaTM 0-5 Yr US TIPS ETF | | | | | | X |
Invesco PureBetaTM FTSE Developed ex-North America ETF | | | | | | X |
Invesco PureBetaTM FTSE Emerging Markets ETF | | X | | | | X |
Invesco PureBetaTM MSCI USA ETF | | X | | X | | X |
Invesco PureBetaTM MSCI USA Small Cap ETF | | X | | X | | X |
Invesco PureBetaTM US Aggregate Bond ETF | | X | | X | | X |
Invesco Russell 1000 Enhanced Equal Weight ETF | | X | | X | | X |
Invesco Russell 1000 Equal Weight ETF | | X | | X | | X |
Invesco Russell 1000 Low Beta Equal Weight ETF | | | | X | | X |
Invesco S&P 500 Enhanced Value ETF | | X | | X | | X |
Invesco S&P 500® ex-Rate Sensitive Low Volatility ETF | | X | | X | | X |
Invesco S&P 500® High Beta ETF | | X | | X | | X |
Invesco S&P 500® High Dividend Low Volatility ETF | | X | | X | | X |
Invesco S&P 500® Low Volatility ETF | | X | | | | X |
Invesco S&P 500 Minimum Variance ETF | | X | | X | | X |
Invesco S&P 500 Momentum ETF | | | | X | | X |
Approval of Investment Advisory and Sub-Advisory Contracts–(continued)
| | | | | | |
| Invesco Fund | | Equal
to/Lower
than ETF
Peer Median | | Equal to/Lower
than Open-End
Index Fund
Peer Median* | | Lower than
Open-Active Fund
Peer Median |
Invesco S&P 500 Revenue ETF | | | | x | | x |
Invesco S&P Emerging Markets Low Volatility ETF | | x | | x | | x |
Invesco S&P Emerging Markets Momentum ETF | | x | | | | x |
Invesco S&P International Developed High Dividend Low Volatility ETF | | x | | | | x |
Invesco S&P International Developed Low Volatility ETF | | x | | | | x |
Invesco S&P International Developed Momentum ETF | | | | | | x |
Invesco S&P International Developed Quality ETF | | x | | | | x |
Invesco S&P MidCap 400 Revenue ETF | | | | | | x |
Invesco S&P MidCap Low Volatility ETF | | | | | | x |
Invesco S&P SmallCap 600 Revenue ETF | | | | x | | x |
Invesco S&P SmallCap Consumer Discretionary ETF | | x | | | | x |
Invesco S&P SmallCap Consumer Staples ETF | | x | | | | x |
Invesco S&P SmallCap Energy ETF | | x | | | | x |
Invesco S&P SmallCap Financials ETF | | x | | | | x |
Invesco S&P SmallCap Health Care ETF | | x | | | | x |
Invesco S&P SmallCap High Dividend Low Volatility ETF | | x | | x | | x |
Invesco S&P SmallCap Industrials ETF | | x | | | | x |
Invesco S&P SmallCap Information Technology ETF | | x | | x | | x |
Invesco S&P SmallCap Low Volatility ETF | | x | | x | | x |
Invesco S&P SmallCap Materials ETF | | x | | | | x |
Invesco S&P SmallCap Quality ETF | | x | | | | x |
Invesco S&P SmallCap Utilities & Communication Services ETF | | x | | x | | x |
Invesco S&P Ultra Dividend Revenue ETF | | | | x | | x |
Invesco Senior Loan ETF | | | | x | | x |
Invesco Taxable Municipal Bond ETF | | | | N/A | | x |
Invesco Treasury Collateral ETF | | x | | | | x |
Invesco Variable Rate Preferred ETF | | | | x | | x |
Invesco VRDO Tax-Free Weekly ETF | | | | N/A | | x |
| * | The information provided by the Adviser indicated that certain Funds did not have any comparable open-end index fund peers. Those Funds have been designated in this column with an “N/A” for not available. |
In response to questions from the Independent Trustees, the Adviser provided supplemental information regarding each of Invesco 1-30 Laddered Treasury ETF, Invesco California AMT-Free Municipal Bond ETF, Invesco DWA Developed Markets Momentum ETF, Invesco Emerging Markets Sovereign Debt ETF, Invesco Global Clean Energy ETF, Invesco Global Water ETF, Invesco International Corporate Bond ETF, Invesco National AMT-Free Municipal Bond ETF, Invesco New York AMT-Free Municipal Bond ETF, Invesco Senior Loan ETF and Invesco VRDO Tax-Free Weekly ETF’s advisory fees and total expenses and the Lipper peer data. The Adviser explained its view that the advisory fees and total expenses for these Funds are competitive and generally in line with other comparable funds in the marketplace, particularly in light of the level and nature of services provided and the investment management style of the Adviser. The Trustees also considered the Adviser’s statements regarding its pricing philosophy and the differing pricing philosophy of certain of the peers.
The Trustees noted information, including fee information, provided by the Adviser regarding other investment products to which it provides investment advisory services, including products that have investment strategies comparable to certain of the Funds. The Trustees considered the Adviser’s explanation of the differences between the services provided to the Funds and to the other investment products it advises, noting the Adviser’s statement that the management and oversight of the Funds requires substantially more labor and expense.
Approval of Investment Advisory and Sub-Advisory Contracts–(continued)
Based on all the information provided, the Board concluded that each Fund’s unitary advisory fee was reasonable and appropriate in light of the services provided, the nature of the indexes, the distinguishing factors of the Funds, and the administrative, operational and management oversight costs for the Adviser.
In conjunction with their review of the unitary advisory fees, the Trustees considered information provided by the Adviser on the revenues received by the Adviser under the Investment Advisory Agreement for the Funds. The Trustees reviewed information provided by the Adviser on its overall profitability, as well as the estimated profitability to the Adviser from its relationship to each Fund. The Trustees concluded that the overall and estimated profitability to the Adviser was not unreasonable.
Economies of Scale and Whether Fee Levels Reflect These Economies of Scale. The Trustees reviewed the information provided by the Adviser as to the extent to which economies of scale may be realized as each Fund grows and whether fee levels reflect economies of scale for the benefit of shareholders. The Trustees reviewed each Fund’s asset size and unitary advisory fee. The Trustees noted that any reduction in fixed costs associated with the management of the Funds would be enjoyed by the Adviser, but a unitary advisory fee provides a level of certainty in expenses for the Funds. The Trustees considered whether the unitary advisory fee rate for each Fund was reasonable in relation to the asset size of that Fund, and concluded that the unitary advisory fee was reasonable and appropriate.
Fall-out Benefits. The Trustees considered that the Adviser identified no additional benefits it receives from its relationship with the Funds, and noted that the Adviser does not have any soft-dollar arrangements. The Trustees also considered benefits received by affiliates of the Adviser that may be directly or indirectly attributed to the Adviser’s relationship with the Funds, including brokerage fees and advisory fees for money market cash management vehicles. The Board concluded that the advisory fee was reasonable, taking into account any ancillary benefits received by affiliates of the Adviser.
Based on all of the information considered and the conclusions reached, the Board, including the Independent Trustees, determined to approve the continuation of the Investment Advisory Agreement for each Fund. No single factor was determinative in the Board’s analysis.
Investment Sub-Advisory Agreement
As noted above, the Board of Trustees of the Trust, including the Independent Trustees, approved the continuation of the Sub-Advisory Agreement for each of Invesco Senior Loan ETF and Invesco Treasury Collateral ETF at a meeting held on April 14, 2020. The review process followed by the Board is described in detail above. In connection with the review of the Sub-Advisory Agreement, the Board considered the factors described below, among others.
Nature, Extent and Quality of Services. The Trustees considered the nature, extent and quality of services provided under the Sub-Advisory Agreement. The Board reviewed the qualifications and background of each Sub-Adviser, the services provided or to be provided by each Sub-Adviser, the investment approach of the Sub-Adviser whose investment personnel manage Invesco Senior Loan ETF’s and Invesco Treasury Collateral ETF’s assets, the experience and skills of the investment personnel responsible for the day-to-day management of the Funds, and the resources made available to such personnel.
Based on their review, the Trustees concluded that the nature, extent and quality of services provided by the Sub-Advisers to Invesco Senior Loan ETF and Invesco Treasury Collateral ETF under the Sub-Advisory Agreement were appropriate and reasonable.
Fees, Expenses and Profitability. The Trustees reviewed and discussed the information provided by the Adviser and the Sub-Advisers on the sub-advisory fee rates under the Sub-Advisory Agreement. The Trustees noted that the sub-advisory fees charged by the Sub-Advisers under the Sub-Advisory Agreement are consistent with the compensation structure used throughout Invesco when Invesco’s affiliates provide sub-advisory services for funds managed by other Invesco affiliates. The Board considered how the sub-advisory fees relate to the overall advisory fee for each of Invesco Senior Loan ETF and Invesco Treasury Collateral ETF and noted that the Adviser compensates the Sub-Advisers from its fee.
The Trustees also reviewed the financial statements provided by Invesco Senior Secured Management, Inc., in connection with the March 12, 2020 Board meeting, and Invesco Advisers, Inc., in connection with the April 14, 2020 meeting, and noted the net income generated by each firm. The Trustees noted that the Adviser compensates the Sub-Advisers from its fee and that the Adviser provided profitability information with respect to Invesco Senior Loan ETF and Invesco Treasury Collateral ETF.
Approval of Investment Advisory and Sub-Advisory Contracts—(continued)
Economies of Scale and Whether Fee Levels Reflect These Economies of Scale. As part of their review of the Investment Advisory Agreement for Invesco Senior Loan ETF and Invesco Treasury Collateral ETF, the Trustees considered the extent to which economies of scale may be realized as the Funds grow and whether fee levels reflect economies of scale for the benefit of shareholders. The Trustees considered whether the sub-advisory fee rates for Invesco Senior Loan ETF and Invesco Treasury Collateral ETF were reasonable in relation to the asset size of the Funds, and concluded that the flat sub-advisory fee rates were reasonable and appropriate.
Fall-out Benefits. The Trustees noted that Invesco Advisers, Inc. receives management fees from money market funds into which the Funds’ and other Invesco ETFs’ excess cash and securities lending collateral may be invested, and that the Adviser waives its fees on the excess cash invested under such arrangement in amounts equal to fees received by Invesco Advisers, Inc. on the Funds’ and other Invesco ETFs’ excess cash invested in the money market funds. The Trustees noted that the Sub-Advisers had not identified any further benefits that they derived from their relationships with Invesco Senior Loan ETF and Invesco Treasury Collateral ETF and that the Sub-Advisers do not have any soft-dollar arrangements with respect to the Funds. The Board concluded that the sub-advisory fee with respect to each Fund was reasonable, taking into account any ancillary benefits received by the Sub-Advisers.
Based on all of the information considered and the conclusions reached, the Board, including the Independent Trustees, determined to approve the continuation of the Sub-Advisory Agreement for Invesco Senior Loan ETF and Invesco Treasury Collateral ETF. No single factor was determinative in the Board’s analysis.
(This Page Intentionally Left Blank)
(This Page Intentionally Left Blank)
(This Page Intentionally Left Blank)
Proxy Voting Policies and Procedures
A description of the Trust’s proxy voting policies and procedures that the Funds use to determine how to vote proxies relating to portfolio securities is available, without charge and upon request, by calling (800) 983-0903. This information is also available on the Securities and Exchange Commission’s (the “Commission”) website at www.sec.gov.
Information regarding how each Fund voted proxies for portfolio securities, if applicable, during the most recent 12-month period ended June 30, is available, without charge and upon request, by (i) calling (800) 983-0903; or (ii) accessing the Trust’s Form N-PX on the Commission’s website at www.sec.gov.
Quarterly Portfolios
The Trust files its complete schedule of portfolio holdings for the Funds with the Commission for the first and third quarters of each fiscal year as an exhibit to its reports on Form N-PORT. The Forms N-PORT are available on the Commission’s website at www.sec.gov.
Frequency Distribution of Discounts and Premiums
A table showing the number of days the market price of each Fund’s shares was greater than the Fund’s net asset value, and the number of days it was less than the Fund’s net asset value (i.e., premium or discount) for the most recently completed calendar year, and the calendar quarters since that yearend (or the life of the Fund, if shorter) may be found at the Fund’s website at www.invesco.com/ETFs.
| | | | |
©2020 Invesco Capital Management LLC 3500 Lacey Road, Suite 700 Downers Grove, IL60515 | | P-KBW-AR-1 | | invesco.com/ETFs |

| | |
|
Invesco Annual Report to Shareholders August 31, 2020 |
| |
| PBUS | | Invesco PureBetaSM MSCI USA ETF |
| |
| PBSM | | Invesco PureBetaSM MSCI USA Small Cap ETF |
| |
| PBND | | Invesco PureBetaSM US Aggregate Bond ETF |
Beginning on January 1, 2021, as permitted by regulations adopted by the Securities and Exchange Commission, paper copies of the Funds’ shareholder reports will no longer be sent by mail, unless you specifically request paper copies of the reports from your financial intermediary, such as a broker-dealer or bank. Instead, the reports will be made available on a website, and you will be notified by mail each time a report is posted and provided with a website link to access the report.
If you already elected to receive shareholder reports electronically, you will not be affected by this change and you need not take any action. If you hold accounts through a financial intermediary, you may contact your financial intermediary to enroll in electronic delivery. Please note that not all financial intermediaries may offer this service.
You may elect to receive all future reports in paper free of charge. If you hold accounts through a financial intermediary, you can follow the instructions included with this disclosure, if applicable, or contact your financial intermediary to request that you continue to receive paper copies of your shareholder reports. Please note that not all financial intermediaries may offer this service. Your election to receive reports in paper will apply to all funds held with your financial intermediary.

Table of Contents
The Market Environment
Domestic
Macroeconomic issues that concerned investors in the third quarter of 2019 mostly abated during the fourth quarter, providing the backdrop for strong equity market returns. During its September and October meetings, the US Federal Reserve (“the Fed”) cut interest rates by 0.25% each time, based on business investment and exports remaining weak.1 Investors were also encouraged by a resilient US economy and corporate earnings, putting the US equity market on track for its largest annual rise since 2013.
During the first quarter of 2020, as the spread of the new coronavirus (COVID-19) disrupted travel and suppressed consumer activity, investors became increasingly concerned about the global economy. At the same time, oil prices fell sharply as a price war between Saudi Arabia and Russia threatened to boost supply even as demand was falling. Beginning in late February, equity markets declined sharply and quickly, ushering in the first bear market since the financial crisis of 2008. Though the equity market stabilized somewhat toward the end of March, all sectors declined during the downturn. In response to the major collapse in demand and to help facilitate liquidity, the Fed cut interest rates two times in March by 0.50% and 1.00%, ending with a target range of 0.00% to 0.25%.1
In April, US unemployment numbers continued to climb and the initial gross domestic product (GDP) estimates for the first quarter of 2020 saw the economy shrink by 5%, the sharpest drop since the 2008 financial crisis.2 However, during the second and into the third quarter of 2020, US stocks largely shrugged off economic uncertainty, social unrest and a resurgence in coronavirus infections to rally from the market bottom. The rally followed a sharp economic decline caused by global shutdowns to slow the spread of COVID-19. Investor sentiment improved in response to trillions of dollars in economic stimulus, progress on a coronavirus vaccine and reopenings in many US regions. After oil futures contracts turned negative in early April, oil prices doubled in June, which supported struggling energy companies and millions of energy sector employees. In July, the Fed extended its emergency stimulus programs, originally scheduled to end in September, to year-end, which provided support to equities. Additionally, optimism about a vaccine, and better than anticipated US economic data and corporate earnings also boosted stocks. Most economists believe the US economy hit a low in April; however, in late August revised second quarter GDP fell by 31.7%, a record decline.2 Despite the extreme drop in the economy, the S&P 500 Index not only erased all of its losses from the first quarter but ended the fiscal year with record highs.
| 1 | Source: US Federal Reserve |
| 2 | Source: US Bureau of Economic Analysis |
Fixed Income
At the beginning of the fiscal year, despite US and China trade tensions, potential for new tariffs, and weakening global economic growth, US economic data remained supportive of slow but continued domestic economic expansion as 2019 third and fourth quarter gross domestic product grew at approximately 2.50%.1 The US economy continued to add jobs, stabilizing the unemployment rate to 3.50% at the close of 2019, while inflation remained subdued.2 In response to third quarter economic weakness, the US Federal Reserve (the Fed) maintained accommodative policies, cutting the federal funds target rate from a range of 2.00% to 2.25% at the start of the fiscal year to a range of 1.50% to 1.75% at the close of 2019.3 Despite the UK’s general election in December, which delivered a decisive victory to the conservative party, reaffirming the original Brexit vote and the UK’s eventual exit from the European Union, macroeconomic and geopolitical issues mostly abated during the fourth quarter of 2019, providing a favorable backdrop for continued US growth.
Fixed income markets started 2020 buoyed by positive economic data and the signing of the phase one US-China trade deal. However, initial optimism was dampened by the outbreak of the new coronavirus (COVID-19) that swiftly spread from China to other global regions. Global markets fell sharply as the human and economic cost of the COVID-19 pandemic mounted. As fear of a worldwide recession increased, the Fed took aggressive action to support both the domestic and global economy by slashing rates to a range of 0.00% to 0.25%.3 The unemployment rate reached a peak of 14.7%2 while real gross domestic product decreased at an annual rate of 31.7%1 (second estimate) in the second quarter of 2020.
Despite the continuing global spread of COVID-19, many countries achieved some success in controlling the spread and were able to slowly re-open their economies. Global equity markets benefited from government policy responses to the crisis, which were swift and encouraging. Many economies received fiscal stimulus and very significant monetary stimulus. The massive monetary policy response created an environment in which investors embraced risk, and stocks rose globally after a deep rout in the first quarter. In this environment, the broader bond market, both developed and emerging, ended the fiscal year in positive territory.
The 10-year US Treasury yield continued to decline at the start of the fiscal year as the Fed adopted a more dovish stance and continued geopolitical uncertainty forced investors to seek higher quality fixed income instruments. Elevated volatility levels due to the COVID-19 pandemic and ensuing global recession led to a severe “risk-off” tone in the markets driving Treasury yields even lower. The 10-year US Treasury yield ended the fiscal year at 0.68%, 82 basis points lower than at the beginning of the fiscal year.4 (A basis point is one one-hundredth of a percentage point.)
| 1 | Source: Bureau of Economic Analysis |
| 2 | Source: Bureau of Labor Statistics |
| 3 | Source: US Federal Reserve |
| 4 | Source: US Department of the Treasury |
The Market Environment (continued)
The broader bond market, as represented by the Bloomberg Barclays U.S. Aggregate Bond Index, gained 6.47% for the fiscal year. The strong performance by the index was largely attributable to the sharp decline in US Treasury yields as well as a rally in spread sector assets. The four primary sectors of the Bloomberg Barclays U.S. Aggregate Bond Index–government-related, corporate, securitized and treasury–posted positive returns for the fiscal year.
| | |
 | | Management’s Discussion of Fund Performance |
| | Invesco PureBetaSM MSCI USA ETF (PBUS) |
As an index fund, the Invesco PureBetaSM MSCI USA ETF (the “Fund”) is passively managed and seeks to track the investment results (before fees and expenses) of the MSCI USA Index (the “Index”). The Fund generally will invest at least 90% of its total assets in the securities that comprise the Index.
Strictly in accordance with its guidelines and mandated procedures, MSCI Inc. (the “Index Provider”) compiles, maintains and calculates the Index, which is designed to measure the performance of the large-and mid-capitalization segments of the U.S. equity market. The Index Provider weights securities in the Index by their free float-adjusted market capitalization. The Fund generally invests in all of the securities comprising its Index in proportion to their weightings in the Index.
For the fiscal year ended August 31, 2020, on a market price basis, the Fund returned 24.36%. On a net asset value (“NAV”) basis, the Fund returned 23.71%. During the same time period, the Index returned 23.76%. During the fiscal year, the Fund fully replicated the components of the Index; therefore, the Fund’s performance, on a NAV basis, differed from the return of the Index primarily due to fees and operating expenses incurred by the Fund during the period.
For the fiscal year ended August 31, 2020, the information technology sector contributed most significantly to the Fund’s return, followed by the consumer discretionary and health care sectors, respectively. The energy sector detracted most significantly from the Fund’s return, followed by the financials and real estate sectors, respectively.
Positions that contributed most significantly to the Fund’s return for the fiscal year ended August 31, 2020, included Apple, Inc., an information technology company (portfolio average weight of 5.02%), and Amazon.com, Inc., a consumer discretionary company (portfolio average weight of 3.45%). Positions that detracted most significantly from the Fund’s return included Boeing Co. (The), an industrials company (portfolio average weight of 0.51%), and Exxon Mobil Corp., an energy company (portfolio average weight of 0.87%).
Sector Breakdown (% of the Fund’s Net Assets) as of August 31, 2020
| | | | |
Information Technology | | | 29.03 | |
Health Care | | | 13.78 | |
Consumer Discretionary | | | 12.33 | |
Communication Services | | | 10.88 | |
Financials | | | 9.40 | |
Industrials | | | 7.90 | |
Consumer Staples | | | 6.54 | |
Sector Types Each Less Than 3% | | | 10.02 | |
| Money Market Funds Plus Other Assets Less Liabilities | | | 0.12 | |
Top Ten Fund Holdings* (% of the Fund’s Net Assets) as of August 31, 2020
| | | | |
Security | | | | |
Apple, Inc. | | | 7.18 | |
Microsoft Corp. | | | 5.22 | |
Amazon.com, Inc. | | | 4.68 | |
Facebook, Inc., Class A | | | 2.26 | |
Alphabet, Inc., Class C | | | 1.59 | |
Alphabet, Inc., Class A | | | 1.56 | |
Johnson & Johnson | | | 1.30 | |
Tesla, Inc. | | | 1.18 | |
Visa, Inc., Class A | | | 1.15 | |
Procter & Gamble Co. (The) | | | 1.10 | |
Total | | | 27.22 | |
| * | Excluding money market fund holdings. |
Invesco PureBetaSM MSCI USA ETF (PBUS) (continued)
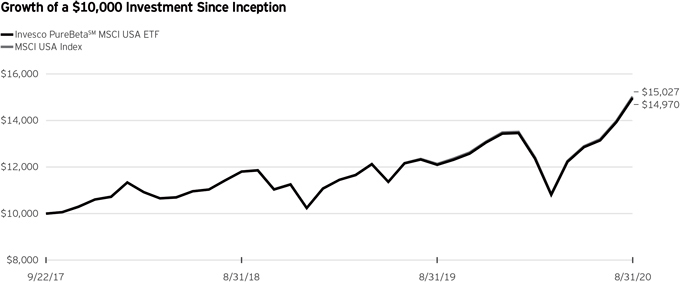
Fund Performance History as of August 31, 2020
| | | | | | | | | | | | | | | | |
| | | | | | | | | Fund Inception | |
| Index | | 1 Year | | | | | | Average
Annualized | | | Cumulative | |
MSCI USA Index | | | 23.76 | % | | | | | | | 14.86 | % | | | 50.27 | % |
Fund | | | | | | | | | | | | | | | | |
NAV Return | | | 23.71 | | | | | | | | 14.72 | | | | 49.70 | |
Market Price Return | | | 24.36 | | | | | | | | 14.96 | | | | 50.66 | |
Fund Inception: September 22, 2017
Performance quoted above represents past performance. Past performance is not a guarantee of future results and current performance may be higher or lower than performance quoted. Investment returns and principal value will fluctuate, and shares of the Fund (“Fund Shares”), when redeemed or sold, may be worth more or less than their original cost. Fund performance reflects any applicable fee waivers and/or expense reimbursements. Had the adviser not waived fees and/or reimbursed expenses currently or in the past, returns would have been lower. See the current prospectus for more information. According to the Fund’s current prospectus, the Fund’s expense ratio of 0.04% is expressed as a unitary management fee to cover operating expenses and expenses incurred in connection with managing the portfolio. NAV and Market Price returns assume that dividends and capital gain distributions have been reinvested in the Fund at NAV and
Market Price, respectively. See invesco.com/ETFs to find the most recent month-end performance numbers.
Index performance results are based upon a hypothetical investment in their respective constituent securities. Index returns do not represent Fund returns. An investor cannot invest directly in an index. The Index does not charge management fees or brokerage expenses, and no such fees or expenses were deducted from the hypothetical performance shown. In addition, the results actual investors might have achieved would have differed from those shown because of differences in the timing, amounts of their investments, and fees and expenses associated with an investment in the Fund.
Notes Regarding Index and Fund Performance History:
| - | Average Annualized and Cumulative Inception returns for the Fund and Index are based on the inception date of the Fund. |
| | |
 | | Management’s Discussion of Fund Performance |
| | Invesco PureBetaSM MSCI USA Small Cap ETF (PBSM) |
As an index fund, the Invesco PureBetaSM MSCI USA Small Cap ETF (the “Fund”) is passively managed and seeks to track the investment results (before fees and expenses) of the MSCI USA Small Cap Index (the “Index”). The Fund generally will invest at least 90% of its total assets in the securities that comprise the Index.
Strictly in accordance with its guidelines and mandated procedures, MSCI Inc. (the “Index Provider”) compiles, maintains and calculates the Index, which is designed to measure the performance of the small-capitalization segment of the U.S. equity market. The Index Provider weights securities in the Index by their free float-adjusted market capitalization. The Fund generally invests in all of the securities comprising its Index in proportion to their weightings in the Index.
For the fiscal year ended August 31, 2020, on a market price basis, the Fund returned 4.79%. On a net asset value (“NAV”) basis, the Fund returned 4.87%. During the same time period, the Index returned 5.01%. During the fiscal year, the Fund fully replicated the components of the Index with exception to a short period of time in September; therefore, the Fund’s performance, on a NAV basis, differed from the return of the Index primarily due to fees and operating expenses incurred by the Fund during the period along with the sampling that occurred in September.
For the fiscal year ended August 31, 2020, the health care sector contributed most significantly to the Fund’s return, followed by the information technology and consumer discretionary sectors, respectively. The financials sector detracted most significantly from the Fund’s return, followed by the real estate and energy sectors, respectively.
Positions that contributed most significantly to the Fund’s return for the fiscal year ended August 31, 2020, included Carvana Co., a consumer discretionary company (portfolio average weight of 0.17%), and Horizon Therapeutics PLC, a health care company (portfolio average weight of 0.24%). Positions that detracted most significantly from the Fund’s return included New Residential Investment Corp., a financials company (portfolio average weight of 0.15%), and Sage Therapeutics, Inc., a health care company (portfolio average weight of 0.12%).
Sector Breakdown (% of the Fund’s Net Assets) as of August 31, 2020
| | | | |
Information Technology | | | 16.83 | |
Health Care | | | 16.11 | |
Industrials | | | 15.02 | |
Consumer Discretionary | | | 14.31 | |
Financials | | | 13.01 | |
Real Estate | | | 8.39 | |
Materials | | | 4.55 | |
Consumer Staples | | | 3.54 | |
Sector Types Each Less Than 3% | | | 7.40 | |
| Money Market Funds Plus Other Assets Less Liabilities | | | 0.84 | |
Top Ten Fund Holdings* (% of the Fund’s Net Assets) as of August 31, 2020
| | | | |
Security | | | | |
Horizon Therapeutics PLC | | | 0.42 | |
Etsy, Inc. | | | 0.41 | |
Carvana Co. | | | 0.40 | |
Pool Corp. | | | 0.38 | |
HubSpot, Inc. | | | 0.36 | |
Generac Holdings, Inc. | | | 0.35 | |
Monolithic Power Systems, Inc. | | | 0.33 | |
SolarEdge Technologies, Inc. | | | 0.32 | |
Zendesk, Inc. | | | 0.32 | |
| Charles River Laboratories International, Inc. | | | 0.31 | |
Total | | | 3.60 | |
| * | Excluding money market fund holdings. |
Invesco PureBetaSM MSCI USA Small Cap ETF (PBSM) (continued)
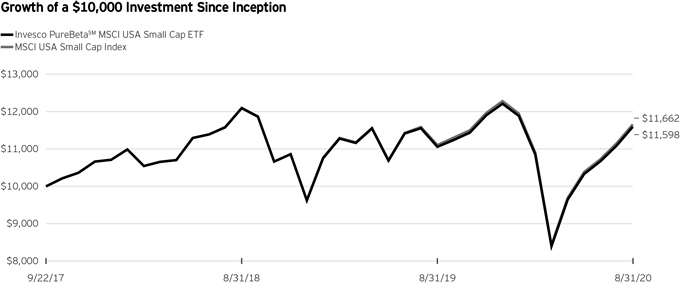
Fund Performance History as of August 31, 2020
| | | | | | | | | | | | |
| | | | | | | | | Fund Inception |
| | | | | | | | | Average | | |
| Index | | 1 Year | | | | | | Annualized | | Cumulative |
| MSCI USA Small Cap Index | | | 5.01 | % | | | | | | 5.37% | | 16.62% |
| | | | |
| Fund | | | | | | | | | | | | |
| NAV Return | | | 4.87 | | | | | | | 5.17 | | 15.98 |
| Market Price Return | | | 4.79 | | | | | | | 5.18 | | 15.99 |
Fund Inception: September 22, 2017
Performance quoted above represents past performance. Past performance is not a guarantee of future results and current performance may be higher or lower than performance quoted. Investment returns and principal value will fluctuate, and shares of the Fund (“Fund Shares”), when redeemed or sold, may be worth more or less than their original cost. Fund performance reflects any applicable fee waivers and/or expense reimbursements. Had the adviser not waived fees and/or reimbursed expenses currently or in the past, returns would have been lower. See the current prospectus for more information. According to the Fund’s current prospectus, the Fund’s expense ratio of 0.06% is expressed as a unitary management fee to cover operating expenses and expenses incurred in connection with managing the portfolio. NAV and Market Price returns assume that dividends and capital gain distributions have been reinvested in the Fund at NAV and
Market Price, respectively. See invesco.com/ETFs to find the most recent month-end performance numbers.
Index performance results are based upon a hypothetical investment in their respective constituent securities. Index returns do not represent Fund returns. An investor cannot invest directly in an index. The Index does not charge management fees or brokerage expenses, and no such fees or expenses were deducted from the hypothetical performance shown. In addition, the results actual investors might have achieved would have differed from those shown because of differences in the timing, amounts of their investments, and fees and expenses associated with an investment in the Fund.
Notes Regarding Index and Fund Performance History:
| - | Average Annualized and Cumulative Inception returns for the Fund and Index are based on the inception date of the Fund. |
| | |
 | | Management’s Discussion of Fund Performance |
| | Invesco PureBetaSM US Aggregate Bond ETF (PBND) |
As an index fund, the Invesco PureBetaSM US Aggregate Bond ETF (the “Fund”) is passively managed and seeks to track the investment results (before fees and expenses) of the ICE BofAML US Broad Market IndexSM (the “Index”). The Fund generally will invest at least 80% of its total assets in the component securities that comprise the Index.
Strictly in accordance with its guidelines and mandated procedures, ICE Data Indices, LLC (the “Index Provider”) compiles, maintains and calculates the Index, which is designed to provide a broad measure of the performance of the domestic investment grade bond market, represented by U.S. dollar-denominated, investment grade debt securities that are publicly offered for sale in the United States. Constituent securities may include U.S. Treasury notes and bonds, quasi-government securities, corporate securities, residential and commercial mortgage-backed securities and asset-backed securities. Transactions in U.S. government agency mortgage-backed securities may occur through standardized agreements for forward or future delivery in which the actual mortgage pools to be delivered are not specified until shortly prior to settlement (to be announced (“TBA”) transactions). The Fund may engage in such TBA transactions. Pending settlement of TBA transactions, the Fund will invest its assets in high-quality, liquid, short-term instruments, including affiliated money market funds. The Fund also may acquire interests in mortgage pools through means other than such standardized agreements for forward or future delivery.
To qualify for inclusion in the Index, securities must have: (i) at least one year to final maturity; (ii) at least 18 months to final maturity when issued; (iii) a fixed coupon schedule; and (iv) with the exception of U.S. Treasuries, an investment grade rating (based on an average of Moody’s Investors Services, Inc. (“Moody’s”), S&P Global Ratings, a division of S&P Global Inc. (“S&P”) and Fitch Ratings, Inc. (“Fitch”)). Original issue zero coupon bonds, Rule 144A securities, corporate pay-in-kind securities and “hybrid” securities (including those that may convert into preferred shares) are eligible for inclusion in the Index. Index constituents are capitalization-weighted, based on their current amount outstanding multiplied by the market price, plus accrued interest. The Fund does not purchase all of the securities in the Index; instead, the Fund utilizes a “sampling” methodology to seek to achieve its investment objective.
For the fiscal year ended August 31, 2020, on a market price basis, the Fund returned 6.49%. On a net asset value (“NAV”) basis, the Fund returned 6.42%. During the same time period, the Index returned 6.43%. During the fiscal year, the Fund’s performance, on a NAV basis, differed from the return of the Index primarily due to fees and operating expenses that the Fund incurred, which was partially offset by positive effects of sampling.
For the fiscal year ended August 31, 2020, U.S. Treasuries contributed most significantly to the Fund’s return, followed by
securitized instruments. No security type detracted from the Fund’s return.
Positions that contributed most significantly to the Fund’s return for the fiscal year ended August 31, 2020, included U.S. Treasury Bond, 4.25% coupon, due 05/15/2039, (portfolio average weight of 0.41%), and U.S. Treasury Bond, 2.25% coupon, due 08/15/2046, (portfolio average weight of 0.38%). Positions that detracted most significantly from the Fund’s return included Petroleos Mexicanos, 6.84% coupon, due 01/23/2030, an oil & gas equipment & services company (no longer held at fiscal year-end), and Energy Transfer Operating LP, 6.13% coupon, due 12/15/2045, an oil & gas storage & transportation company (portfolio average weight of 0.56%).
Security Type Breakdown (% of the Fund’s Net Assets) as of August 31, 2020
| | | | |
| U.S. Treasury Securities | | | 40.94 | |
| U.S. Dollar Denominated Bonds & Notes | | | 31.43 | |
| U.S. Government Sponsored Agency Mortgage-Backed Securities | | | 23.78 | |
| Asset-Backed Securities | | | 2.73 | |
| Municipal Obligations | | | 0.60 | |
| Money Market Funds Plus Other Assets Less Liabilities | | | 0.52 | |
Top Ten Fund Holdings* (% of the Fund’s Net Assets) as of August 31, 2020
| | | | |
Security | | | | |
| Government National Mortgage Association, 3.00%, 11/20/2046 | | | 1.26 | |
U.S. Treasury Bonds,
4.25%, 05/15/2039 | | | 1.04 | |
U.S. Treasury Notes,
0.13%, 07/31/2022 | | | 0.85 | |
U.S. Treasury Notes,
0.25%, 07/31/2025 | | | 0.81 | |
Federal Home Loan Mortgage Corp.,
3.00%, 06/01/2046 | | | 0.81 | |
| Government National Mortgage Association, 3.50%, 08/20/2047 | | | 0.80 | |
HSBC Holdings PLC,
4.58%, 06/19/2029 | | | 0.79 | |
| Japan Bank for International Cooperation, 2.88%, 06/01/2027 | | | 0.77 | |
U.S. Treasury Bonds,
3.63%, 02/15/2044 | | | 0.76 | |
| Hungary Government International Bond, 5.38%, 02/21/2023 | | | 0.75 | |
Total | | | 8.63 | |
| * | Excluding money market fund holdings. |
Invesco PureBetaSM US Aggregate Bond ETF (PBND) (continued)
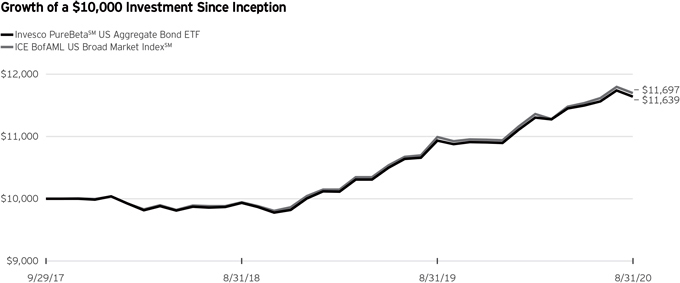
Fund Performance History as of August 31, 2020
| | | | | | | | | | | | |
| | | | | | | | | Fund Inception |
| | | | | | | | | Average | | |
| Index | | 1 Year | | | | | | Annualized | | Cumulative |
| ICE BofAML US Broad Market IndexSM | | | 6.43 | % | | | | | | 5.52% | | 16.97% |
| | | | |
| Fund | | | | | | | | | | | | |
| NAV Return | | | 6.42 | | | | | | | 5.34 | | 16.39 |
| Market Price Return | | | 6.49 | | | | | | | 5.49 | | 16.88 |
Fund Inception: September 29, 2017
Performance quoted above represents past performance. Past performance is not a guarantee of future results and current performance may be higher or lower than performance quoted. Investment returns and principal value will fluctuate, and shares of the Fund (“Fund Shares”), when redeemed or sold, may be worth more or less than their original cost. Fund performance reflects any applicable fee waivers and/or expense reimbursements. Had the adviser not waived fees and/or reimbursed expenses currently or in the past, returns would have been lower. See the current prospectus for more information. According to the Fund’s current prospectus, the Fund’s expense ratio of 0.05% is expressed as a unitary management fee to cover operating expenses and expenses incurred in connection with managing the portfolio. NAV and Market Price returns assume that dividends and capital gain distributions have been reinvested in the Fund at NAV and
Market Price, respectively. See invesco.com/ETFs to find the most recent month-end performance numbers.
Index performance results are based upon a hypothetical investment in their respective constituent securities. Index returns do not represent Fund returns. An investor cannot invest directly in an index. The Index does not charge management fees or brokerage expenses, and no such fees or expenses were deducted from the hypothetical performance shown. In addition, the results actual investors might have achieved would have differed from those shown because of differences in the timing, amounts of their investments, and fees and expenses associated with an investment in the Fund.
Notes Regarding Index and Fund Performance History:
| - | Average Annualized and Cumulative Inception returns for the Fund and Index are based on the inception date of the Fund. |
Liquidity Risk Management Program
The Securities and Exchange Commission (“SEC”) has adopted Rule 22e-4 under the Investment Company Act of 1940 (the “Liquidity Rule”) in order to promote effective liquidity risk management throughout the open-end investment company industry, thereby reducing the risk that funds will be unable to meet their redemption obligations and mitigating dilution of the interests of fund shareholders. The Funds have adopted and implemented a liquidity risk management program in accordance with the Liquidity Rule (the “Program”). The Program is reasonably designed to assess and manage the Funds’ liquidity risk, which is the risk that the Funds could not meet redemption requests without significant dilution of remaining investors’ interests in the Funds. The Board of Trustees of the Funds (the “Board”) has appointed Invesco Capital Management LLC (“Invesco”), the Funds’ investment adviser, as the Program’s administrator, and Invesco has delegated oversight of the Program to the Liquidity Risk Management Committee (the “Committee”), which is composed of senior representatives from relevant business groups at Invesco and its affiliates.
As required by the Liquidity Rule, the Program includes policies and procedures providing for an assessment, no less frequently than annually, of the Funds’ liquidity risk that takes into account, as relevant to the Funds’ liquidity risk: (1) each Fund’s investment strategy and liquidity of portfolio investments during both normal and reasonably foreseeable stressed conditions; (2) short-term and long-term cash flow projections for the Funds during both normal and reasonably foreseeable stressed conditions; (3) each Fund’s holdings of cash and cash equivalents and any borrowing arrangements; (4) the relationship between the Funds’ portfolio liquidity and the way in which, and the prices and spreads at which, Fund shares trade, including the efficiency of the arbitrage function and the level of active participation by market participants, including authorized participants; and (5) the effect of the composition of baskets on the overall liquidity of each Fund’s portfolio. The Liquidity Rule also requires the classification of each Fund’s investments into categories that reflect the assessment of their relative liquidity under current market conditions. Each Fund classifies its investments into one of four of the following categories defined in the Liquidity Rule: “Highly Liquid,” “Moderately Liquid,” “Less Liquid” and “Illiquid.” Funds that are not invested primarily in “Highly Liquid Investments” that are assets (cash or investments that are reasonably expected to be convertible into cash within three business days without significantly changing the market value of the investment) are required to establish a “Highly Liquid Investment Minimum” (“HLIM”), which is the minimum percentage of net assets that must be invested in Highly Liquid Investments. Funds with HLIMs have procedures for addressing HLIM shortfalls, including reporting to the Board and the SEC (on a non-public basis) as required by the Program and the Liquidity Rule. In addition, a Fund may not acquire an investment if, immediately after the acquisition, over 15% of such Fund’s net assets would consist of “Illiquid Investments” that are assets (an investment that cannot reasonably be expected to be sold or disposed of in current market conditions in seven calendar days or less without the sale or disposition significantly changing the market value of the investment). The Liquidity Rule and the Program also require reporting to the Board and the SEC (on a non-public basis) if a Fund’s holdings of Illiquid Investments exceed 15% of such Fund’s assets.
At a meeting held on March 12, 2020, the Committee presented a report to the Board that addressed the operation of the Program and assessed the Program’s adequacy and effectiveness of implementation (the “Report”). The Report covered the period from December 1, 2018 through December 31, 2019 (the “Program Reporting Period”).
The Report stated, in relevant part, that during the Program Reporting Period:
| | ● | | The Program, as adopted and implemented, remained reasonably designed to assess and manage the Funds’ liquidity risk and was operated effectively to achieve that goal; |
| | ● | | Each Fund’s investment strategy remained appropriate for an open-end fund; |
| | ● | | Each Fund was able to meet requests for redemption without significant dilution of remaining investors’ interests in the Fund; |
| | ● | | The Funds did not breach the 15% limit on Illiquid Investments; and |
| | ● | | The Funds primarily held Highly Liquid Investments and therefore have not adopted an HLIM. |
Invesco PureBetaSM MSCI USA ETF (PBUS)
August 31, 2020
Schedule of Investments(a)
| | | | | | | | |
| | | Shares | | | Value | |
| Common Stocks & Other Equity Interests-99.88% | |
Communication Services-10.88% | | | | | | | | |
Activision Blizzard, Inc. | | | 218 | | | $ | 18,207 | |
Alphabet, Inc., Class A(b) | | | 85 | | | | 138,510 | |
Alphabet, Inc., Class C(b) | | | 86 | | | | 140,540 | |
Altice USA, Inc., Class A(b) | | | 95 | | | | 2,620 | |
AT&T, Inc. | | | 2,036 | | | | 60,693 | |
Cable One, Inc. | | | 1 | | | | 1,840 | |
CenturyLink, Inc. | | | 263 | | | | 2,827 | |
Charter Communications, Inc., Class A(b) | | | 42 | | | | 25,856 | |
Comcast Corp., Class A | | | 1,290 | | | | 57,805 | |
Discovery, Inc., Class A(b)(c) | | | 45 | | | | 993 | |
Discovery, Inc., Class C(b) | | | 96 | | | | 1,917 | |
DISH Network Corp., Class A(b) | | | 69 | | | | 2,451 | |
Electronic Arts, Inc.(b) | | | 82 | | | | 11,437 | |
Facebook, Inc., Class A(b) | | | 682 | | | | 199,962 | |
Fox Corp., Class A | | | 98 | | | | 2,730 | |
Fox Corp., Class B | | | 48 | | | | 1,334 | |
IAC/InterActiveCorp.(b) | | | 22 | | | | 2,926 | |
Interpublic Group of Cos., Inc. (The) | | | 110 | | | | 1,954 | |
Liberty Broadband Corp., Class A(b) | | | 7 | | | | 967 | |
Liberty Broadband Corp., Class C(b) | | | 30 | | | | 4,203 | |
Liberty Global PLC, Class A (United Kingdom)(b) | | | 46 | | | | 1,075 | |
Liberty Global PLC, Class C (United Kingdom)(b) | | | 118 | | | | 2,715 | |
Liberty Media Corp.-Liberty Formula One, Class C(b) | | | 58 | | | | 2,261 | |
Liberty Media Corp.-Liberty SiriusXM,
Class A(b) | | | 25 | | | | 908 | |
Liberty Media Corp.-Liberty SiriusXM,
Class C(b) | | | 49 | | | | 1,764 | |
Live Nation Entertainment, Inc.(b) | | | 45 | | | | 2,556 | |
Match Group, Inc.(b) | | | 72 | | | | 8,041 | |
Netflix, Inc.(b) | | | 124 | | | | 65,666 | |
News Corp., Class A | | | 110 | | | | 1,663 | |
Omnicom Group, Inc | | | 62 | | | | 3,354 | |
Pinterest, Inc., Class A(b) | | | 103 | | | | 3,789 | |
Roku, Inc.(b) | | | 27 | | | | 4,684 | |
Sirius XM Holdings, Inc. | | | 313 | | | | 1,837 | |
Snap, Inc., Class A(b) | | | 248 | | | | 5,602 | |
Take-Two Interactive Software, Inc.(b) | | | 32 | | | | 5,478 | |
T-Mobile US, Inc.(b) | | | 157 | | | | 18,319 | |
Twitter, Inc.(b) | | | 222 | | | | 9,009 | |
Verizon Communications, Inc. | | | 1,174 | | | | 69,583 | |
ViacomCBS, Inc., Class B | | | 159 | | | | 4,428 | |
Walt Disney Co. (The) | | | 509 | | | | 67,122 | |
Zillow Group, Inc., Class C(b) | | | 40 | | | | 3,430 | |
| | | | | | | | |
| | | | | | | 963,056 | |
| | | | | | | | |
Consumer Discretionary-12.33% | | | | | | | | |
Advance Auto Parts, Inc | | | 20 | | | | 3,126 | |
Amazon.com, Inc.(b) | | | 120 | | | | 414,115 | |
Aptiv PLC | | | 72 | | | | 6,201 | |
Aramark | | | 64 | | | | 1,764 | |
Autoliv, Inc. (Sweden) | | | 24 | | | | 1,880 | |
AutoZone, Inc.(b) | | | 7 | | | | 8,374 | |
Best Buy Co., Inc. | | | 66 | | | | 7,320 | |
Booking Holdings, Inc.(b) | | | 12 | | | | 22,925 | |
BorgWarner, Inc. | | | 59 | | | | 2,395 | |
Burlington Stores, Inc.(b) | | | 19 | | | | 3,742 | |
CarMax, Inc.(b) | | | 46 | | | | 4,919 | |
Carnival Corp. | | | 134 | | | | 2,208 | |
| | | | | | | | |
| | | Shares | | | Value | |
Consumer Discretionary-(continued) | |
Chipotle Mexican Grill, Inc.(b) | | | 8 | | | $ | 10,482 | |
D.R. Horton, Inc. | | | 99 | | | | 7,066 | |
Darden Restaurants, Inc. | | | 37 | | | | 3,207 | |
Dollar General Corp. | | | 72 | | | | 14,535 | |
Dollar Tree, Inc.(b) | | | 67 | | | | 6,450 | |
Domino’s Pizza, Inc. | | | 11 | | | | 4,499 | |
eBay, Inc. | | | 200 | | | | 10,956 | |
Expedia Group, Inc. | | | 38 | | | | 3,730 | |
Ford Motor Co. | | | 1,105 | | | | 7,536 | |
Garmin Ltd. | | | 41 | | | | 4,248 | |
General Motors Co. | | | 365 | | | | 10,815 | |
Genuine Parts Co. | | | 41 | | | | 3,872 | |
Hasbro, Inc. | | | 37 | | | | 2,921 | |
Hilton Worldwide Holdings, Inc. | | | 79 | | | | 7,138 | |
Home Depot, Inc. (The) | | | 310 | | | | 88,362 | |
Las Vegas Sands Corp. | | | 98 | | | | 4,970 | |
Lear Corp. | | | 16 | | | | 1,823 | |
Lennar Corp., Class A | | | 78 | | | | 5,836 | |
LKQ Corp.(b) | | | 83 | | | | 2,634 | |
Lowe’s Cos., Inc. | | | 218 | | | | 35,902 | |
lululemon athletica, inc.(b) | | | 35 | | | | 13,149 | |
Marriott International, Inc., Class A | | | 78 | | | | 8,027 | |
McDonald’s Corp. | | | 212 | | | | 45,266 | |
MercadoLibre, Inc. (Argentina)(b) | | | 13 | | | | 15,192 | |
MGM Resorts International | | | 133 | | | | 2,993 | |
Mohawk Industries, Inc.(b) | | | 17 | | | | 1,570 | |
Newell Brands, Inc. | | | 114 | | | | 1,822 | |
NIKE, Inc., Class B | | | 353 | | | | 39,497 | |
NVR, Inc.(b) | | | 1 | | | | 4,168 | |
O’Reilly Automotive, Inc.(b) | | | 21 | | | | 9,778 | |
Peloton Interactive, Inc., Class A(b) | | | 55 | | | | 4,217 | |
PulteGroup, Inc. | | | 77 | | | | 3,433 | |
Ralph Lauren Corp. | | | 14 | | | | 964 | |
Ross Stores, Inc. | | | 102 | | | | 9,290 | |
Royal Caribbean Cruises Ltd. | | | 50 | | | | 3,442 | |
Starbucks Corp. | | | 333 | | | | 28,129 | |
Target Corp. | | | 144 | | | | 21,774 | |
Tesla, Inc.(b) | | | 210 | | | | 104,647 | |
Tiffany & Co. | | | 31 | | | | 3,798 | |
TJX Cos., Inc. (The) | | | 341 | | | | 18,683 | |
Tractor Supply Co. | | | 33 | | | | 4,911 | |
Ulta Beauty, Inc.(b) | | | 15 | | | | 3,483 | |
Vail Resorts, Inc. | | | 11 | | | | 2,394 | |
VF Corp. | | | 95 | | | | 6,246 | |
Wayfair, Inc., Class A(b)(c) | | | 18 | | | | 5,338 | |
Whirlpool Corp. | | | 18 | | | | 3,199 | |
Wynn Resorts Ltd. | | | 27 | | | | 2,361 | |
Yum! Brands, Inc. | | | 85 | | | | 8,147 | |
| | | | | | | | |
| | | | | | | 1,091,869 | |
| | | | | | | | |
Consumer Staples-6.54% | | | | | | | | |
Altria Group, Inc. | | | 527 | | | | 23,051 | |
Archer-Daniels-Midland Co. | | | 158 | | | | 7,072 | |
Brown-Forman Corp., Class B | | | 88 | | | | 6,439 | |
Bunge Ltd. | | | 40 | | | | 1,825 | |
Campbell Soup Co. | | | 51 | | | | 2,683 | |
Church & Dwight Co., Inc. | | | 70 | | | | 6,708 | |
Clorox Co. (The) | | | 36 | | | | 8,046 | |
See accompanying Notes to Financial Statements which are an integral part of the financial statements.
Invesco PureBetaSM MSCI USA ETF (PBUS)–(continued)
August 31, 2020
| | | | | | | | |
| | | Shares | | | Value | |
| Consumer Staples-(continued) | |
Coca-Cola Co. (The) | | | 1,157 | | | $ | 57,306 | |
Colgate-Palmolive Co. | | | 231 | | | | 18,309 | |
Conagra Brands, Inc. | | | 138 | | | | 5,294 | |
Constellation Brands, Inc., Class A | | | 48 | | | | 8,855 | |
Costco Wholesale Corp. | | | 127 | | | | 44,153 | |
Estee Lauder Cos., Inc. (The), Class A | | | 63 | | | | 13,968 | |
General Mills, Inc. | | | 172 | | | | 10,999 | |
Hershey Co. (The) | | | 42 | | | | 6,243 | |
Hormel Foods Corp. | | | 83 | | | | 4,231 | |
Ingredion, Inc. | | | 19 | | | | 1,528 | |
JM Smucker Co. (The) | | | 32 | | | | 3,846 | |
Kellogg Co. | | | 73 | | | | 5,176 | |
Keurig Dr Pepper, Inc. | | | 100 | | | | 2,983 | |
Kimberly-Clark Corp. | | | 97 | | | | 15,303 | |
Kraft Heinz Co. (The) | | | 191 | | | | 6,693 | |
Kroger Co. (The) | | | 227 | | | | 8,099 | |
Lamb Weston Holdings, Inc. | | | 41 | | | | 2,577 | |
McCormick & Co., Inc. | | | 35 | | | | 7,217 | |
Molson Coors Beverage Co., Class B | | | 54 | | | | 2,033 | |
Mondelez International, Inc., Class A | | | 407 | | | | 23,777 | |
Monster Beverage Corp.(b) | | | 114 | | | | 9,560 | |
PepsiCo, Inc. | | | 394 | | | | 55,184 | |
Philip Morris International, Inc. | | | 442 | | | | 35,267 | |
Procter & Gamble Co. (The) | | | 703 | | | | 97,246 | |
Sysco Corp. | | | 137 | | | | 8,239 | |
Tyson Foods, Inc., Class A | | | 84 | | | | 5,275 | |
Walgreens Boots Alliance, Inc. | | | 214 | | | | 8,136 | |
Walmart, Inc. | | | 403 | | | | 55,957 | |
| | | | | | | | |
| | | | | | | 579,278 | |
| | | | | | | | |
Energy-2.12% | | | | | | | | |
Baker Hughes Co., Class A | | | 185 | | | | 2,642 | |
Cabot Oil & Gas Corp. | | | 113 | | | | 2,144 | |
Cheniere Energy, Inc.(b) | | | 65 | | | | 3,383 | |
Chevron Corp. | | | 533 | | | | 44,735 | |
Concho Resources, Inc. | | | 56 | | | | 2,911 | |
ConocoPhillips | | | 307 | | | | 11,632 | |
Diamondback Energy, Inc. | | | 45 | | | | 1,753 | |
EOG Resources, Inc. | | | 165 | | | | 7,481 | |
Exxon Mobil Corp. | | | 1,201 | | | | 47,968 | |
Halliburton Co. | | | 250 | | | | 4,045 | |
Hess Corp. | | | 78 | | | | 3,591 | |
Kinder Morgan, Inc. | | | 579 | | | | 8,002 | |
Marathon Petroleum Corp. | | | 184 | | | | 6,525 | |
National Oilwell Varco, Inc. | | | 110 | | | | 1,320 | |
Occidental Petroleum Corp. | | | 254 | | | | 3,236 | |
ONEOK, Inc. | | | 117 | | | | 3,215 | |
Phillips 66 | | | 125 | | | | 7,309 | |
Pioneer Natural Resources Co. | | | 47 | | | | 4,885 | |
Schlumberger Ltd. | | | 394 | | | | 7,490 | |
Valero Energy Corp. | | | 116 | | | | 6,100 | |
Williams Cos., Inc. (The) | | | 344 | | | | 7,141 | |
| | | | | | | | |
| | | | | | | 187,508 | |
| | | | | | | | |
Financials-9.40% | | | | | | | | |
Aflac, Inc | | | 195 | | | | 7,082 | |
AGNC Investment Corp. | | | 154 | | | | 2,173 | |
Alleghany Corp. | | | 4 | | | | 2,218 | |
Allstate Corp. (The) | | | 90 | | | | 8,370 | |
Ally Financial, Inc. | | | 106 | | | | 2,425 | |
American Express Co. | | | 195 | | | | 19,810 | |
| | | | | | | | |
| | | Shares | | | Value | |
Financials-(continued) | | | | | | | | |
American Financial Group, Inc. | | | 22 | | | $ | 1,471 | |
American International Group, Inc. | | | 248 | | | | 7,227 | |
Ameriprise Financial, Inc. | | | 35 | | | | 5,488 | |
Annaly Capital Management, Inc. | | | 406 | | | | 2,984 | |
Aon PLC, Class A | | | 66 | | | | 13,199 | |
Apollo Global Management, Inc. | | | 49 | | | | 2,297 | |
Arch Capital Group Ltd.(b) | | | 115 | | | | 3,627 | |
Arthur J. Gallagher & Co. | | | 53 | | | | 5,581 | |
Assurant, Inc. | | | 17 | | | | 2,066 | |
Athene Holding Ltd., Class A(b) | | | 41 | | | | 1,499 | |
Bank of America Corp. | | | 2,230 | | | | 57,400 | |
Bank of New York Mellon Corp. (The) | | | 227 | | | | 8,394 | |
Berkshire Hathaway, Inc., Class B(b) | | | 396 | | | | 86,344 | |
BlackRock, Inc. | | | 44 | | | | 26,144 | |
Blackstone Group, Inc. (The), Class A | | | 191 | | | | 10,113 | |
Brown & Brown, Inc. | | | 68 | | | | 3,155 | |
Capital One Financial Corp. | | | 130 | | | | 8,974 | |
Carlyle Group, Inc. (The) | | | 40 | | | | 1,032 | |
Cboe Global Markets, Inc. | | | 31 | | | | 2,845 | |
Charles Schwab Corp. (The) | | | 329 | | | | 11,689 | |
Chubb Ltd. | | | 128 | | | | 16,000 | |
Cincinnati Financial Corp. | | | 44 | | | | 3,494 | |
Citigroup, Inc. | | | 598 | | | | 30,570 | |
Citizens Financial Group, Inc. | | | 121 | | | | 3,130 | |
CME Group, Inc., Class A | | | 102 | | | | 17,939 | |
Comerica, Inc. | | | 40 | | | | 1,581 | |
Discover Financial Services | | | 88 | | | | 4,671 | |
E*TRADE Financial Corp. | | | 63 | | | | 3,408 | |
East West Bancorp, Inc. | | | 41 | | | | 1,508 | |
Equitable Holdings, Inc. | | | 119 | | | | 2,522 | |
Erie Indemnity Co., Class A | | | 7 | | | | 1,494 | |
Everest Re Group Ltd. | | | 12 | | | | 2,641 | |
FactSet Research Systems, Inc. | | | 11 | | | | 3,854 | |
Fidelity National Financial, Inc. | | | 79 | | | | 2,594 | |
Fifth Third Bancorp | | | 201 | | | | 4,153 | |
First Republic Bank | | | 49 | | | | 5,533 | |
Franklin Resources, Inc. | | | 85 | | | | 1,790 | |
Globe Life, Inc. | | | 29 | | | | 2,392 | |
Goldman Sachs Group, Inc. (The) | | | 93 | | | | 19,053 | |
Hartford Financial Services Group, Inc. (The) | | | 102 | | | | 4,126 | |
Huntington Bancshares, Inc. | | | 289 | | | | 2,719 | |
Intercontinental Exchange, Inc. | | | 157 | | | | 16,678 | |
Invesco Ltd.(d) | | | 109 | | | | 1,112 | |
JPMorgan Chase & Co | | | 877 | | | | 87,867 | |
KeyCorp. | | | 275 | | | | 3,388 | |
KKR & Co., Inc., Class A | | | 143 | | | | 5,122 | |
Lincoln National Corp. | | | 55 | | | | 1,983 | |
Loews Corp. | | | 74 | | | | 2,654 | |
M&T Bank Corp. | | | 37 | | | | 3,821 | |
Markel Corp.(b) | | | 4 | | | | 4,347 | |
MarketAxess Holdings, Inc. | | | 11 | | | | 5,345 | |
Marsh & McLennan Cos., Inc. | | | 143 | | | | 16,432 | |
MetLife, Inc. | | | 221 | | | | 8,500 | |
Moody’s Corp. | | | 48 | | | | 14,143 | |
Morgan Stanley | | | 340 | | | | 17,768 | |
MSCI, Inc. | | | 24 | | | | 8,958 | |
Nasdaq, Inc. | | | 33 | | | | 4,436 | |
Northern Trust Corp. | | | 56 | | | | 4,586 | |
People’s United Financial, Inc. | | | 126 | | | | 1,333 | |
PNC Financial Services Group, Inc. (The) | | | 123 | | | | 13,678 | |
See accompanying Notes to Financial Statements which are an integral part of the financial statements.
Invesco PureBetaSM MSCI USA ETF (PBUS)–(continued)
August 31, 2020
| | | | | | | | |
| | | Shares | | | Value | |
Financials-(continued) | | | | | | | | |
Principal Financial Group, Inc. | | | 78 | | | $ | 3,285 | |
Progressive Corp. (The) | | | 166 | | | | 15,777 | |
Prudential Financial, Inc. | | | 113 | | | | 7,658 | |
Raymond James Financial, Inc. | | | 36 | | | | 2,726 | |
Regions Financial Corp. | | | 272 | | | | 3,144 | |
Reinsurance Group of America, Inc. | | | 18 | | | | 1,650 | |
RenaissanceRe Holdings Ltd. (Bermuda) | | | 13 | | | | 2,389 | |
S&P Global, Inc. | | | 69 | | | | 25,283 | |
SEI Investments Co. | | | 36 | | | | 1,885 | |
Signature Bank | | | 15 | | | | 1,455 | |
State Street Corp. | | | 101 | | | | 6,877 | |
SVB Financial Group(b) | | | 15 | | | | 3,831 | |
Synchrony Financial | | | 157 | | | | 3,895 | |
T. Rowe Price Group, Inc. | | | 67 | | | | 9,327 | |
TD Ameritrade Holding Corp. | | | 77 | | | | 2,955 | |
Tradeweb Markets, Inc., Class A | | | 23 | | | | 1,318 | |
Travelers Cos., Inc. (The) | | | 72 | | | | 8,355 | |
Truist Financial Corp. | | | 381 | | | | 14,787 | |
U.S. Bancorp | | | 389 | | | | 14,160 | |
Voya Financial, Inc. | | | 38 | | | | 1,973 | |
W.R. Berkley Corp. | | | 42 | | | | 2,606 | |
Wells Fargo & Co. | | | 1,105 | | | | 26,686 | |
Willis Towers Watson PLC | | | 37 | | | | 7,605 | |
Zions Bancorporation N.A. | | | 47 | | | | 1,512 | |
| | | | | | | | |
| | | | | | | 832,069 | |
| | | | | | | | |
Health Care-13.78% | | | | | | | | |
Abbott Laboratories | | | 500 | | | | 54,735 | |
AbbVie, Inc. | | | 501 | | | | 47,981 | |
ABIOMED, Inc.(b) | | | 13 | | | | 3,999 | |
Agilent Technologies, Inc. | | | 88 | | | | 8,837 | |
Alexion Pharmaceuticals, Inc.(b) | | | 63 | | | | 7,196 | |
Align Technology, Inc.(b) | | | 21 | | | | 6,237 | |
Alnylam Pharmaceuticals, Inc.(b) | | | 32 | | | | 4,245 | |
AmerisourceBergen Corp. | | | 44 | | | | 4,269 | |
Amgen, Inc. | | | 167 | | | | 42,304 | |
Anthem, Inc. | | | 72 | | | | 20,269 | |
Avantor, Inc.(b) | | | 122 | | | | 2,754 | |
Baxter International, Inc. | | | 145 | | | | 12,625 | |
Becton, Dickinson and Co. | | | 77 | | | | 18,693 | |
Biogen, Inc.(b) | | | 49 | | | | 14,094 | |
BioMarin Pharmaceutical, Inc.(b) | | | 51 | | | | 3,980 | |
Bio-Rad Laboratories, Inc.,
Class A(b) | | | 6 | | | | 3,052 | |
Boston Scientific Corp.(b) | | | 396 | | | | 16,244 | |
Bristol-Myers Squibb Co. | | | 641 | | | | 39,870 | |
Cardinal Health, Inc. | | | 83 | | | | 4,213 | |
Catalent, Inc.(b) | | | 44 | | | | 4,070 | |
Centene Corp.(b) | | | 167 | | | | 10,240 | |
Cerner Corp. | | | 89 | | | | 6,530 | |
Cigna Corp. | | | 106 | | | | 18,801 | |
Cooper Cos., Inc. (The) | | | 14 | | | | 4,401 | |
CVS Health Corp. | | | 370 | | | | 22,984 | |
Danaher Corp. | | | 178 | | | | 36,752 | |
DaVita, Inc.(b) | | | 25 | | | | 2,169 | |
DENTSPLY SIRONA, Inc. | | | 63 | | | | 2,827 | |
DexCom, Inc.(b) | | | 26 | | | | 11,061 | |
Edwards Lifesciences Corp.(b) | | | 177 | | | | 15,194 | |
Elanco Animal Health, Inc.(b) | | | 113 | | | | 3,284 | |
Eli Lilly and Co. | | | 244 | | | | 36,207 | |
Exact Sciences Corp.(b) | | | 42 | | | | 3,162 | |
| | | | | | | | |
| | | Shares | | | Value | |
Health Care-(continued) | | | | | | | | |
Gilead Sciences, Inc. | | | 359 | | | $ | 23,963 | |
HCA Healthcare, Inc. | | | 77 | | | | 10,450 | |
Henry Schein, Inc.(b) | | | 41 | | | | 2,724 | |
Hologic, Inc.(b) | | | 75 | | | | 4,479 | |
Humana, Inc. | | | 39 | | | | 16,192 | |
IDEXX Laboratories, Inc.(b) | | | 24 | | | | 9,385 | |
Illumina, Inc.(b) | | | 42 | | | | 15,003 | |
Incyte Corp.(b) | | | 52 | | | | 5,010 | |
Insulet Corp.(b) | | | 18 | | | | 3,929 | |
Intuitive Surgical, Inc.(b) | | | 33 | | | | 24,118 | |
Ionis Pharmaceuticals, Inc.(b) | | | 38 | | | | 2,071 | |
IQVIA Holdings, Inc.(b) | | | 55 | | | | 9,006 | |
Jazz Pharmaceuticals PLC(b) | | | 16 | | | | 2,150 | |
Johnson & Johnson | | | 751 | | | | 115,211 | |
Laboratory Corp. of America Holdings(b) | | | 28 | | | | 4,921 | |
Masimo Corp.(b) | | | 15 | | | | 3,360 | |
McKesson Corp. | | | 46 | | | | 7,058 | |
Medtronic PLC | | | 381 | | | | 40,946 | |
Merck & Co., Inc. | | | 720 | | | | 61,394 | |
Mettler-Toledo International, Inc.(b) | | | 7 | | | | 6,795 | |
Moderna, Inc.(b) | | | 77 | | | | 4,997 | |
Molina Healthcare, Inc.(b) | | | 17 | | | | 3,145 | |
Mylan N.V.(b) | | | 146 | | | | 2,392 | |
Neurocrine Biosciences, Inc.(b) | | | 25 | | | | 2,911 | |
PerkinElmer, Inc. | | | 32 | | | | 3,767 | |
Perrigo Co. PLC | | | 39 | | | | 2,040 | |
Pfizer, Inc. | | | 1,571 | | | | 59,368 | |
Quest Diagnostics, Inc. | | | 38 | | | | 4,227 | |
Regeneron Pharmaceuticals, Inc.(b) | | | 28 | | | | 17,358 | |
ResMed, Inc. | | | 41 | | | | 7,412 | |
Sarepta Therapeutics, Inc.(b) | | | 21 | | | | 3,075 | |
Seattle Genetics, Inc.(b) | | | 34 | | | | 5,384 | |
STERIS PLC | | | 24 | | | | 3,831 | |
Stryker Corp. | | | 96 | | | | 19,023 | |
Teladoc Health, Inc.(b)(c) | | | 20 | | | | 4,314 | |
Teleflex, Inc. | | | 13 | | | | 5,108 | |
Thermo Fisher Scientific, Inc. | | | 113 | | | | 48,475 | |
UnitedHealth Group, Inc. | | | 268 | | | | 83,763 | |
Universal Health Services, Inc., Class B | | | 23 | | | | 2,538 | |
Varian Medical Systems, Inc.(b) | | | 26 | | | | 4,515 | |
Veeva Systems, Inc., Class A(b) | | | 38 | | | | 10,726 | |
Vertex Pharmaceuticals, Inc.(b) | | | 74 | | | | 20,655 | |
Waters Corp.(b) | | | 18 | | | | 3,893 | |
West Pharmaceutical Services, Inc. | | | 21 | | | | 5,963 | |
Zimmer Biomet Holdings, Inc. | | | 59 | | | | 8,312 | |
Zoetis, Inc. | | | 135 | | | | 21,614 | |
| | | | | | | | |
| | | | | | | 1,220,250 | |
| | | | | | | | |
Industrials-7.90% | | | | | | | | |
3M Co. | | | 163 | | | | 26,572 | |
A.O. Smith Corp. | | | 39 | | | | 1,910 | |
Allegion PLC | | | 26 | | | | 2,688 | |
AMERCO | | | 3 | | | | 1,065 | |
AMETEK, Inc. | | | 65 | | | | 6,546 | |
Boeing Co. (The) | | | 152 | | | | 26,117 | |
C.H. Robinson Worldwide, Inc. | | | 38 | | | | 3,735 | |
Carrier Global Corp. | | | 233 | | | | 6,955 | |
Caterpillar, Inc. | | | 156 | | | | 22,200 | |
Cintas Corp. | | | 25 | | | | 8,331 | |
Copart, Inc.(b) | | | 60 | | | | 6,199 | |
See accompanying Notes to Financial Statements which are an integral part of the financial statements.
Invesco PureBetaSM MSCI USA ETF (PBUS)–(continued)
August 31, 2020
| | | | | | | | |
| | | Shares | | | Value | |
Industrials-(continued) | | | | | | | | |
CoStar Group, Inc.(b) | | | 11 | | | $ | 9,335 | |
CSX Corp. | | | 220 | | | | 16,821 | |
Cummins, Inc. | | | 43 | | | | 8,912 | |
Deere & Co. | | | 85 | | | | 17,855 | |
Delta Air Lines, Inc. | | | 45 | | | | 1,388 | |
Dover Corp. | | | 41 | | | | 4,503 | |
Eaton Corp. PLC | | | 117 | | | | 11,946 | |
Emerson Electric Co. | | | 174 | | | | 12,088 | |
Equifax, Inc. | | | 34 | | | | 5,721 | |
Expeditors International of Washington, Inc. | | | 48 | | | | 4,243 | |
Fastenal Co. | | | 163 | | | | 7,964 | |
FedEx Corp. | | | 70 | | | | 15,389 | |
Fortive Corp. | | | 86 | | | | 6,201 | |
Fortune Brands Home & Security, Inc. | | | 40 | | | | 3,363 | |
General Dynamics Corp. | | | 70 | | | | 10,455 | |
General Electric Co. | | | 2,481 | | | | 15,730 | |
HD Supply Holdings, Inc.(b) | | | 46 | | | | 1,824 | |
HEICO Corp. | | | 12 | | | | 1,319 | |
HEICO Corp., Class A | | | 21 | | | | 1,877 | |
Honeywell International, Inc. | | | 202 | | | | 33,441 | |
Howmet Aerospace, Inc. | | | 111 | | | | 1,945 | |
Huntington Ingalls Industries, Inc. | | | 12 | | | | 1,818 | |
IDEX Corp. | | | 22 | | | | 3,965 | |
IHS Markit Ltd. | | | 108 | | | | 8,631 | |
Illinois Tool Works, Inc. | | | 90 | | | | 17,780 | |
Ingersoll Rand, Inc.(b) | | | 100 | | | | 3,506 | |
J.B. Hunt Transport Services, Inc. | | | 24 | | | | 3,373 | |
Jacobs Engineering Group, Inc. | | | 38 | | | | 3,430 | |
Johnson Controls International PLC | | | 217 | | | | 8,838 | |
Kansas City Southern | | | 27 | | | | 4,915 | |
Knight-Swift Transportation Holdings, Inc. | | | 36 | | | | 1,637 | |
L3Harris Technologies, Inc. | | | 63 | | | | 11,387 | |
Lennox International, Inc. | | | 10 | | | | 2,803 | |
Lockheed Martin Corp. | | | 72 | | | | 28,099 | |
Masco Corp. | | | 79 | | | | 4,606 | |
Nielsen Holdings PLC | | | 101 | | | | 1,543 | |
Nordson Corp. | | | 16 | | | | 2,984 | |
Norfolk Southern Corp. | | | 73 | | | | 15,515 | |
Northrop Grumman Corp. | | | 45 | | | | 15,417 | |
Old Dominion Freight Line, Inc. | | | 27 | | | | 5,459 | |
Otis Worldwide Corp. | | | 116 | | | | 7,296 | |
Owens Corning | | | 31 | | | | 2,097 | |
PACCAR, Inc. | | | 98 | | | | 8,412 | |
Parker-Hannifin Corp. | | | 36 | | | | 7,416 | |
Pentair PLC | | | 48 | | | | 2,167 | |
Raytheon Technologies Corp. | | | 429 | | | | 26,169 | |
Republic Services, Inc. | | | 63 | | | | 5,841 | |
Robert Half International, Inc. | | | 33 | | | | 1,756 | |
Rockwell Automation, Inc. | | | 33 | | | | 7,608 | |
Rollins, Inc. | | | 42 | | | | 2,316 | |
Roper Technologies, Inc. | | | 30 | | | | 12,816 | |
Sensata Technologies Holding PLC(b) | | | 45 | | | | 1,874 | |
Snap-on, Inc. | | | 15 | | | | 2,224 | |
Southwest Airlines Co. | | | 41 | | | | 1,541 | |
Stanley Black & Decker, Inc. | | | 44 | | | | 7,097 | |
Teledyne Technologies, Inc.(b) | | | 10 | | | | 3,136 | |
Textron, Inc. | | | 65 | | | | 2,563 | |
Trane Technologies PLC | | | 68 | | | | 8,051 | |
TransDigm Group, Inc. | | | 14 | | | | 6,995 | |
TransUnion | | | 54 | | | | 4,683 | |
| | | | | | | | |
| | | Shares | | | Value | |
Industrials-(continued) | | | | | | | | |
Uber Technologies, Inc.(b) | | | 270 | | | $ | 9,080 | |
Union Pacific Corp. | | | 196 | | | | 37,718 | |
United Parcel Service, Inc., Class B | | | 199 | | | | 32,560 | |
United Rentals, Inc.(b) | | | 21 | | | | 3,718 | |
Verisk Analytics, Inc. | | | 44 | | | | 8,213 | |
W.W. Grainger, Inc. | | | 13 | | | | 4,751 | |
Wabtec Corp. | | | 52 | | | | 3,461 | |
Waste Connections, Inc. | | | 75 | | | | 7,502 | |
Waste Management, Inc. | | | 121 | | | | 13,794 | |
XPO Logistics, Inc.(b) | | | 26 | | | | 2,295 | |
Xylem, Inc. | | | 51 | | | | 4,089 | |
| | | | | | | | |
| | | | | | | 699,583 | |
| | | | | | | | |
Information Technology-29.03% | | | | | | | | |
Accenture PLC, Class A | | | 180 | | | | 43,187 | |
Adobe, Inc.(b) | | | 137 | | | | 70,334 | |
Advanced Micro Devices, Inc.(b) | | | 332 | | | | 30,152 | |
Akamai Technologies, Inc.(b) | | | 46 | | | | 5,356 | |
Amphenol Corp., Class A | | | 85 | | | | 9,333 | |
Analog Devices, Inc. | | | 105 | | | | 12,272 | |
ANSYS, Inc.(b) | | | 24 | | | | 8,136 | |
Apple, Inc. | | | 4,928 | | | | 635,909 | |
Applied Materials, Inc. | | | 261 | | | | 16,078 | |
Arista Networks, Inc.(b) | | | 16 | | | | 3,575 | |
Arrow Electronics, Inc.(b) | | | 23 | | | | 1,807 | |
Autodesk, Inc.(b) | | | 62 | | | | 15,233 | |
Automatic Data Processing, Inc. | | | 123 | | | | 17,108 | |
Avalara, Inc.(b) | | | 21 | | | | 2,781 | |
Black Knight, Inc.(b) | | | 42 | | | | 3,532 | |
Booz Allen Hamilton Holding Corp. | | | 40 | | | | 3,522 | |
Broadcom, Inc. | | | 115 | | | | 39,922 | |
Broadridge Financial Solutions, Inc. | | | 33 | | | | 4,534 | |
Cadence Design Systems, Inc.(b) | | | 80 | | | | 8,873 | |
CDK Global, Inc. | | | 34 | | | | 1,585 | |
CDW Corp. | | | 41 | | | | 4,660 | |
Cisco Systems, Inc. | | | 1,204 | | | | 50,833 | |
Citrix Systems, Inc. | | | 33 | | | | 4,792 | |
Cognex Corp. | | | 49 | | | | 3,390 | |
Cognizant Technology Solutions Corp., Class A | | | 156 | | | | 10,430 | |
Corning, Inc. | | | 217 | | | | 7,044 | |
Coupa Software, Inc.(b) | | | 19 | | | | 6,227 | |
Crowdstrike Holdings, Inc., Class A(b) | | | 29 | | | | 3,646 | |
Datadog, Inc., Class A(b) | | | 30 | | | | 2,507 | |
Dell Technologies, Inc., Class C(b) | | | 69 | | | | 4,560 | |
DocuSign, Inc.(b) | | | 48 | | | | 10,704 | |
Dropbox, Inc., Class A(b) | | | 70 | | | | 1,482 | |
Dynatrace, Inc.(b) | | | 36 | | | | 1,592 | |
EPAM Systems, Inc.(b) | | | 16 | | | | 5,234 | |
F5 Networks, Inc.(b) | | | 17 | | | | 2,250 | |
Fair Isaac Corp.(b) | | | 8 | | | | 3,366 | |
Fidelity National Information Services, Inc. | | | 175 | | | | 26,399 | |
Fiserv, Inc.(b) | | | 164 | | | | 16,331 | |
FleetCor Technologies, Inc.(b) | | | 24 | | | | 6,035 | |
FLIR Systems, Inc. | | | 38 | | | | 1,402 | |
Fortinet, Inc.(b) | | | 42 | | | | 5,544 | |
Gartner, Inc.(b) | | | 25 | | | | 3,246 | |
Global Payments, Inc. | | | 85 | | | | 15,013 | |
GoDaddy, Inc., Class A(b) | | | 49 | | | | 4,100 | |
Guidewire Software, Inc.(b) | | | 23 | | | | 2,583 | |
Hewlett Packard Enterprise Co. | | | 367 | | | | 3,549 | |
See accompanying Notes to Financial Statements which are an integral part of the financial statements.
Invesco PureBetaSM MSCI USA ETF (PBUS)–(continued)
August 31, 2020
| | | | | | | | |
| | | Shares | | | Value | |
Information Technology-(continued) | | | | | | | | |
HP, Inc. | | | 407 | | | $ | 7,957 | |
Intel Corp. | | | 1,214 | | | | 61,853 | |
International Business Machines Corp. | | | 252 | | | | 31,074 | |
Intuit, Inc. | | | 74 | | | | 25,559 | |
IPG Photonics Corp.(b) | | | 11 | | | | 1,779 | |
Jack Henry & Associates, Inc. | | | 22 | | | | 3,639 | |
Juniper Networks, Inc. | | | 94 | | | | 2,350 | |
Keysight Technologies, Inc.(b) | | | 53 | | | | 5,222 | |
KLA Corp. | | | 44 | | | | 9,026 | |
Lam Research Corp. | | | 41 | | | | 13,790 | |
Leidos Holdings, Inc. | | | 38 | | | | 3,439 | |
Marvell Technology Group Ltd. | | | 190 | | | | 7,368 | |
Mastercard, Inc., Class A | | | 254 | | | | 90,980 | |
Maxim Integrated Products, Inc. | | | 76 | | | | 5,201 | |
Microchip Technology, Inc. | | | 68 | | | | 7,460 | |
Micron Technology, Inc.(b) | | | 315 | | | | 14,336 | |
Microsoft Corp. | | | 2,048 | | | | 461,885 | |
MongoDB, Inc.(b) | | | 13 | | | | 3,039 | |
Motorola Solutions, Inc. | | | 48 | | | | 7,428 | |
NetApp, Inc. | | | 63 | | | | 2,986 | |
NortonLifeLock, Inc. | | | 162 | | | | 3,810 | |
NVIDIA Corp. | | | 174 | | | | 93,087 | |
NXP Semiconductors N.V. (Netherlands) | | | 79 | | | | 9,935 | |
Okta, Inc.(b) | | | 32 | | | | 6,892 | |
ON Semiconductor Corp.(b) | | | 117 | | | | 2,500 | |
Oracle Corp. | | | 582 | | | | 33,302 | |
Palo Alto Networks, Inc.(b) | | | 28 | | | | 7,208 | |
Paychex, Inc. | | | 92 | | | | 7,035 | |
Paycom Software, Inc.(b) | | | 14 | | | | 4,192 | |
PayPal Holdings, Inc.(b) | | | 316 | | | | 64,508 | |
PTC, Inc.(b) | | | 31 | | | | 2,834 | |
Qorvo, Inc.(b) | | | 33 | | | | 4,233 | |
QUALCOMM, Inc. | | | 324 | | | | 38,588 | |
RingCentral, Inc., Class A(b) | | | 21 | | | | 6,106 | |
salesforce.com, inc.(b) | | | 256 | | | | 69,798 | |
Seagate Technology PLC | | | 67 | | | | 3,215 | |
ServiceNow, Inc.(b) | | | 54 | | | | 26,029 | |
Skyworks Solutions, Inc. | | | 48 | | | | 6,953 | |
Slack Technologies, Inc., Class A(b) | | | 87 | | | | 2,857 | |
Splunk, Inc.(b) | | | 44 | | | | 9,651 | |
Square, Inc., Class A(b) | | | 101 | | | | 16,116 | |
SS&C Technologies Holdings, Inc. | | | 65 | | | | 4,142 | |
Synopsys, Inc.(b) | | | 43 | | | | 9,516 | |
TE Connectivity Ltd. | | | 95 | | | | 9,177 | |
Teradyne, Inc. | | | 48 | | | | 4,079 | |
Texas Instruments, Inc. | | | 265 | | | | 37,670 | |
Trade Desk, Inc. (The), Class A(b) | | | 12 | | | | 5,776 | |
Trimble, Inc.(b) | | | 71 | | | | 3,721 | |
Twilio, Inc., Class A(b) | | | 34 | | | | 9,172 | |
Tyler Technologies, Inc.(b) | | | 11 | | | | 3,798 | |
VeriSign, Inc.(b) | | | 30 | | | | 6,444 | |
Visa, Inc., Class A | | | 480 | | | | 101,755 | |
VMware, Inc., Class A(b)(c) | | | 23 | | | | 3,322 | |
Western Digital Corp. | | | 85 | | | | 3,266 | |
Western Union Co. (The) | | | 117 | | | | 2,760 | |
Workday, Inc., Class A(b) | | | 47 | | | | 11,266 | |
Xilinx, Inc. | | | 71 | | | | 7,395 | |
Zebra Technologies Corp., Class A(b) | | | 15 | | | | 4,298 | |
| | | | | | | | |
| | | Shares | | | Value | |
Information Technology-(continued) | | | | | | | | |
Zoom Video Communications, Inc., Class A(b) | | | 45 | | | $ | 14,630 | |
Zscaler, Inc.(b) | | | 21 | | | | 3,010 | |
| | | | | | | | |
| | | | | | | 2,570,565 | |
| | | | | | | | |
Materials-2.43% | | | | | | | | |
Air Products and Chemicals, Inc. | | | 63 | | | | 18,412 | |
Albemarle Corp. | | | 30 | | | | 2,730 | |
Amcor PLC | | | 455 | | | | 5,032 | |
Avery Dennison Corp. | | | 24 | | | | 2,769 | |
Axalta Coating Systems Ltd.(b) | | | 60 | | | | 1,431 | |
Ball Corp. | | | 92 | | | | 7,394 | |
Celanese Corp. | | | 34 | | | | 3,439 | |
CF Industries Holdings, Inc. | | | 61 | | | | 1,990 | |
Corteva, Inc. | | | 213 | | | | 6,081 | |
Crown Holdings, Inc.(b) | | | 38 | | | | 2,920 | |
Dow, Inc. | | | 211 | | | | 9,520 | |
DuPont de Nemours, Inc. | | | 210 | | | | 11,710 | |
Eastman Chemical Co. | | | 39 | | | | 2,851 | |
Ecolab, Inc. | | | 74 | | | | 14,584 | |
FMC Corp. | | | 37 | | | | 3,954 | |
Freeport-McMoRan, Inc. | | | 412 | | | | 6,431 | |
International Flavors & Fragrances, Inc.(c) | | | 24 | | | | 2,971 | |
International Paper Co. | | | 106 | | | | 3,845 | |
Linde PLC (United Kingdom) | | | 151 | | | | 37,711 | |
LyondellBasell Industries N.V., Class A | | | 76 | | | | 4,977 | |
Martin Marietta Materials, Inc. | | | 18 | | | | 3,652 | |
Mosaic Co. (The) | | | 102 | | | | 1,859 | |
Newmont Corp. | | | 229 | | | | 15,407 | |
Nucor Corp. | | | 86 | | | | 3,910 | |
Packaging Corp. of America | | | 27 | | | | 2,734 | |
PPG Industries, Inc. | | | 67 | | | | 8,067 | |
RPM International, Inc. | | | 37 | | | | 3,137 | |
Sealed Air Corp. | | | 44 | | | | 1,729 | |
Sherwin-Williams Co. (The) | | | 23 | | | | 15,434 | |
Steel Dynamics, Inc. | | | 61 | | | | 1,801 | |
Vulcan Materials Co. | | | 38 | | | | 4,560 | |
Westrock Co. | | | 73 | | | | 2,214 | |
| | | | | | | | |
| | | | | | | 215,256 | |
| | | | | | | | |
Real Estate-2.72% | | | | | | | | |
Alexandria Real Estate Equities, Inc. | | | 35 | | | | 5,893 | |
American Tower Corp. | | | 126 | | | | 31,393 | |
AvalonBay Communities, Inc. | | | 40 | | | | 6,322 | |
Boston Properties, Inc. | | | 42 | | | | 3,649 | |
Camden Property Trust | | | 28 | | | | 2,546 | |
CBRE Group, Inc., Class A(b) | | | 95 | | | | 4,468 | |
Crown Castle International Corp. | | | 118 | | | | 19,263 | |
Digital Realty Trust, Inc. | | | 75 | | | | 11,674 | |
Duke Realty Corp. | | | 105 | | | | 4,048 | |
Equinix, Inc. | | | 24 | | | | 18,955 | |
Equity LifeStyle Properties, Inc. | | | 49 | | | | 3,248 | |
Equity Residential | | | 106 | | | | 5,984 | |
Essex Property Trust, Inc. | | | 19 | | | | 4,114 | |
Extra Space Storage, Inc. | | | 37 | | | | 3,942 | |
Federal Realty Investment Trust | | | 20 | | | | 1,585 | |
Healthpeak Properties, Inc. | | | 143 | | | | 3,953 | |
Host Hotels & Resorts, Inc. | | | 200 | | | | 2,246 | |
Invitation Homes, Inc. | | | 154 | | | | 4,409 | |
Iron Mountain, Inc.(c) | | | 82 | | | | 2,467 | |
Jones Lang LaSalle, Inc. | | | 15 | | | | 1,546 | |
Medical Properties Trust, Inc. | | | 148 | | | | 2,750 | |
See accompanying Notes to Financial Statements which are an integral part of the financial statements.
Invesco PureBetaSM MSCI USA ETF (PBUS)–(continued)
August 31, 2020
| | | | | | | | |
| | | Shares | | | Value | |
Real Estate-(continued) | | | | | | | | |
Mid-America Apartment Communities, Inc. | | | 32 | | | $ | 3,748 | |
National Retail Properties, Inc. | | | 49 | | | | 1,737 | |
Omega Healthcare Investors, Inc. | | | 64 | | | | 1,982 | |
Prologis, Inc. | | | 210 | | | | 21,391 | |
Public Storage | | | 45 | | | | 9,558 | |
Realty Income Corp. | | | 95 | | | | 5,893 | |
Regency Centers Corp. | | | 48 | | | | 1,906 | |
SBA Communications Corp., Class A | | | 32 | | | | 9,794 | |
Simon Property Group, Inc. | | | 87 | | | | 5,903 | |
Sun Communities, Inc. | | | 26 | | | | 3,876 | |
UDR, Inc. | | | 84 | | | | 2,924 | |
Ventas, Inc. | | | 106 | | | | 4,368 | |
VEREIT, Inc. | | | 306 | | | | 2,056 | |
VICI Properties, Inc. | | | 133 | | | | 2,971 | |
Vornado Realty Trust | | | 46 | | | | 1,648 | |
Welltower, Inc. | | | 116 | | | | 6,672 | |
Weyerhaeuser Co. | | | 212 | | | | 6,426 | |
WP Carey, Inc. | | | 49 | | | | 3,399 | |
| | | | | | | | |
| | | | | | | 240,707 | |
| | | | | | | | |
Utilities-2.75% | | | | | | | | |
AES Corp. (The) | | | 188 | | | | 3,337 | |
Alliant Energy Corp. | | | 70 | | | | 3,790 | |
Ameren Corp. | | | 70 | | | | 5,538 | |
American Electric Power Co., Inc. | | | 140 | | | | 11,036 | |
American Water Works Co., Inc. | | | 51 | | | | 7,208 | |
Atmos Energy Corp. | | | 35 | | | | 3,494 | |
CenterPoint Energy, Inc. | | | 143 | | | | 2,870 | |
CMS Energy Corp. | | | 81 | | | | 4,900 | |
Consolidated Edison, Inc. | | | 95 | | | | 6,777 | |
Dominion Energy, Inc. | | | 238 | | | | 18,669 | |
DTE Energy Co. | | | 55 | | | | 6,527 | |
Duke Energy Corp. | | | 208 | | | | 16,711 | |
Edison International | | | 103 | | | | 5,405 | |
Entergy Corp. | | | 57 | | | | 5,651 | |
Essential Utilities, Inc. | | | 63 | | | | 2,678 | |
Evergy, Inc. | | | 65 | | | | 3,459 | |
Eversource Energy | | | 94 | | | | 8,057 | |
Exelon Corp. | | | 277 | | | | 10,224 | |
FirstEnergy Corp. | | | 153 | | | | 4,374 | |
NextEra Energy, Inc. | | | 139 | | | | 38,805 | |
NiSource, Inc. | | | 108 | | | | 2,393 | |
| | | | | | | | |
| | | Shares | | | Value | |
Utilities-(continued) | | | | | | | | |
NRG Energy, Inc. | | | 70 | | | $ | 2,409 | |
OGE Energy Corp. | | | 57 | | | | 1,816 | |
PG&E Corp.(b) | | | 304 | | | | 2,815 | |
Pinnacle West Capital Corp. | | | 32 | | | | 2,347 | |
PPL Corp. | | | 218 | | | | 6,023 | |
Public Service Enterprise Group, Inc. | | | 143 | | | | 7,470 | |
Sempra Energy | | | 83 | | | | 10,263 | |
Southern Co. (The) | | | 299 | | | | 15,602 | |
UGI Corp. | | | 59 | | | | 2,037 | |
Vistra Corp. | | | 124 | | | | 2,385 | |
WEC Energy Group, Inc. | | | 90 | | | | 8,467 | |
Xcel Energy, Inc. | | | 149 | | | | 10,352 | |
| | | | | | | | |
| | | | | | | 243,889 | |
| | | | | | | | |
Total Common Stocks & Other Equity Interests
(Cost $6,741,661) | | | | | | | 8,844,030 | |
| | | | | | | | |
| | |
Money Market Funds-0.01% | | | | | | | | |
Invesco Premier U.S. Government Money Portfolio, Institutional Class, 0.01%(d)(e)
(Cost $817) | | | 817 | | | | 817 | |
| | | | | | | | |
TOTAL INVESTMENTS IN SECURITIES | | | | | | | | |
(excluding investments purchased with cash collateral from securities on loan)-99.89%
(Cost $6,742,478) | | | | | | | 8,844,847 | |
| | | | | | | | |
|
| Investments Purchased with Cash Collateral from Securities on Loan | |
| | |
Money Market Funds-0.22% | | | | | | | | |
Invesco Private Government Fund,
0.03%(d)(e)(f) | | | 14,282 | | | | 14,282 | |
Invesco Private Prime Fund, 0.14%(d)(e)(f) | | | 4,902 | | | | 4,903 | |
| | | | | | | | |
Total Investments Purchased with Cash Collateral from Securities on Loan | | | | | | | | |
(Cost $19,185) | | | | | | | 19,185 | |
| | | | | | | | |
TOTAL INVESTMENTS IN SECURITIES-100.11% | | | | | | | | |
(Cost $6,761,663) | | | | | | | 8,864,032 | |
OTHER ASSETS LESS LIABILITIES-(0.11)% | | | | | | | (9,369 | ) |
| | | | | | | | |
NET ASSETS-100.00% | | | | | | $ | 8,854,663 | |
| | | | | | | | |
Notes to Schedule of Investments:
| (a) | Industry and/or sector classifications used in this report are generally according to the Global Industry Classification Standard, which was developed by and is the exclusive property and a service mark of MSCI Inc. and Standard & Poor’s. |
| (b) | Non-income producing security. |
| (c) | All or a portion of this security was out on loan at August 31, 2020. |
| (d) | Affiliated issuer. The issuer and/or the Fund is a wholly-owned subsidiary of Invesco Ltd., or is affiliated by having an investment adviser that is under common control of Invesco Ltd. The table below shows the Fund’s transactions in, and earnings from, its investments in affiliates for the fiscal year ended August 31, 2020. |
| | | | | | | | | | | | | | | | | | | | | | | | | | | | | | | | | | | |
| | | | | | | | | Change in | | Realized | | | | |
| | | Value | | Purchases | | Proceeds | | Unrealized | | Gain | | Value | | Dividend |
| | | August 31, 2019 | | at Cost | | from Sales | | Appreciation | | (Loss) | | August 31, 2020 | | Income |
Invesco Ltd. | | | $ | 738 | | | | $ | 569 | | | | $ | (55 | ) | | | $ | 39 | | | | $ | (179 | ) | | | $ | 1,112 | | | | $ | 56 | |
Investments in Affiliated Money Market Funds: | | | | | | | | | | | | | | | | | | | | | | | | | | | | | | | | | | | |
Invesco Premier U.S. Government Money Portfolio, Institutional Class | | | | 6,852 | | | | | 141,574 | | | | | (147,609 | ) | | | | - | | | | | - | | | | | 817 | | | | | 70 | |
See accompanying Notes to Financial Statements which are an integral part of the financial statements.
Invesco PureBetaSM MSCI USA ETF (PBUS)–(continued)
August 31, 2020
| | | | | | | | | | | | | | | | | | | | | | | | | | | | | | | | | | | |
| | | | | | | | | Change in | | Realized | | | | |
| | | Value | | Purchases | | Proceeds | | Unrealized | | Gain | | Value | | Dividend |
| | | April 31, 2019 | | at Cost | | from Sales | | Appreciation | | (Loss) | | August 31, 2020 | | Income |
Investments Purchased with Cash
Collateral from Securities on Loan: | | | | | | | | | | | | | | | | | | | | | | | | | | | | | | | | | | | |
Invesco Government & Agency Portfolio, Institutional Class | | | $ | 10,519 | | | | $ | 95,881 | | | | $ | (106,400 | ) | | | $ | - | | | | $ | - | | | | $ | - | | | | $ | 78 | * |
Invesco Liquid Assets Portfolio, Institutional Class | | | | 3,506 | | | | | 21,019 | | | | | (24,524 | ) | | | | - | | | | | (1 | ) | | | | - | | | | | 29 | * |
Invesco Private Government Fund | | | | - | | | | | 129,852 | | | | | (115,570 | ) | | | | - | | | | | - | | | | | 14,282 | | | | | 2 | * |
Invesco Private Prime Fund | | | | - | | | | | 21,389 | | | | | (16,486 | ) | | | | - | | | | | - | | | | | 4,903 | | | | | 1 | * |
| | | | | | | | | | | | | | | | | | | | | | | | | | | | | | | | | | | |
Total | | | $ | 21,615 | | | | $ | 410,284 | | | | $ | (410,644 | ) | | | $ | 39 | | | | $ | (180 | ) | | | $ | 21,114 | | | | $ | 236 | |
| | | | | | | | | | | | | | | | | | | | | | | | | | | | | | | | | | | |
| * | Represents the income earned on the investment of cash collateral, which is included in securities lending income on the Statements of Operations. Does not include rebates and fees paid to lending agent or premiums received from borrowers, if any. |
| (e) | The rate shown is the 7-day SEC standardized yield as of August 31, 2020. |
| (f) | The security has been segregated to satisfy the commitment to return the cash collateral received in securities lending transactions upon the borrower’s return of the securities loaned. See Note 2J. |
See accompanying Notes to Financial Statements which are an integral part of the financial statements.
Invesco PureBetaSM MSCI USA Small Cap ETF (PBSM)
August 31, 2020
Schedule of Investments(a)
| | | | | | | | |
| | | Shares | | | Value | |
| Common Stocks & Other Equity Interests-99.16% | |
Communication Services-2.48% | |
AMC Entertainment Holdings, Inc., Class A(b) | | | 61 | | | $ | 359 | |
AMC Networks, Inc., Class A(c) | | | 54 | | | | 1,312 | |
ANGI Homeservices, Inc., Class A(b)(c) | | | 99 | | | | 1,374 | |
Anterix, Inc.(c) | | | 15 | | | | 656 | |
ATN International, Inc. | | | 13 | | | | 754 | |
Bandwidth, Inc., Class A(c) | | | 21 | | | | 3,307 | |
Boingo Wireless, Inc.(c) | | | 54 | | | | 701 | |
Boston Omaha Corp., Class A(c) | | | 10 | | | | 163 | |
Cardlytics, Inc.(c) | | | 29 | | | | 2,200 | |
Cargurus, Inc.(c) | | | 93 | | | | 2,267 | |
Cars.com, Inc.(b)(c) | | | 76 | | | | 660 | |
Cincinnati Bell, Inc.(c) | | | 54 | | | | 813 | |
Cinemark Holdings, Inc.(b) | | | 135 | | | | 1,978 | |
Clear Channel Outdoor Holdings, Inc.(c) | | | 460 | | | | 538 | |
Cogent Communications Holdings, Inc. | | | 50 | | | | 3,363 | |
Consolidated Communications Holdings,
Inc.(c) | | | 72 | | | | 560 | |
E.W. Scripps Co. (The), Class A | | | 57 | | | | 634 | |
Eventbrite, Inc., Class A(b)(c) | | | 68 | | | | 731 | |
EverQuote, Inc., Class A(c) | | | 9 | | | | 319 | |
GCI Liberty, Inc., Class A(c) | | | 115 | | | | 9,290 | |
Globalstar, Inc.(c) | | | 945 | | | | 316 | |
Glu Mobile, Inc.(c) | | | 154 | | | | 1,223 | |
Gray Television, Inc.(c) | | | 114 | | | | 1,769 | |
Hemisphere Media Group, Inc.(c) | | | 21 | | | | 187 | |
iHeartCommunications, Inc., Class A(b)(c) | | | 69 | | | | 636 | |
IMAX Corp.(c) | | | 67 | | | | 1,030 | |
Iridium Communications, Inc.(c) | | | 142 | | | | 3,977 | |
John Wiley & Sons, Inc., Class A | | | 54 | | | | 1,709 | |
Liberty Latin America Ltd., Class A (Chile)(c) | | | 51 | | | | 500 | |
Liberty Latin America Ltd., Class C (Chile)(c) | | | 142 | | | | 1,355 | |
Liberty Media Corp.-Liberty Braves, Class A(b)(c) | | | 10 | | | | 196 | |
Liberty Media Corp.-Liberty Braves,
Class C(c) | | | 42 | | | | 816 | |
Liberty TripAdvisor Holdings, Inc., Class A(c) | | | 28 | | | | 78 | |
Lions Gate Entertainment Corp., Class A(b)(c) | | | 27 | | | | 263 | |
Lions Gate Entertainment Corp., Class B(c) | | | 58 | | | | 525 | |
Loral Space & Communications, Inc. | | | 15 | | | | 354 | |
Madison Square Garden Entertainment
Corp.(c) | | | 19 | | | | 1,428 | |
Madison Square Garden Sports Corp.,
Class A(c) | | | 19 | | | | 3,116 | |
Marcus Corp. (The) | | | 24 | | | | 376 | |
Meet Group, Inc. (The)(c) | | | 80 | | | | 504 | |
Meredith Corp.(b) | | | 17 | | | | 238 | |
MSG Networks, Inc., Class A(c) | | | 54 | | | | 526 | |
National CineMedia, Inc. | | | 73 | | | | 264 | |
New York Times Co. (The), Class A | | | 166 | | | | 7,193 | |
Nexstar Media Group, Inc., Class A | | | 53 | | | | 5,089 | |
QuinStreet, Inc.(c) | | | 55 | | | | 723 | |
Scholastic Corp. | | | 36 | | | | 810 | |
Shenandoah Telecommunications Co. | | | 57 | | | | 3,152 | |
Sinclair Broadcast Group, Inc., Class A(b) | | | 81 | | | | 1,686 | |
TechTarget, Inc.(c) | | | 28 | | | | 1,111 | |
TEGNA, Inc. | | | 235 | | | | 2,942 | |
Telephone & Data Systems, Inc. | | | 109 | | | | 2,521 | |
Tribune Publishing Co. | | | 19 | | | | 216 | |
TripAdvisor, Inc. | | | 124 | | | | 2,898 | |
TrueCar, Inc.(c) | | | 103 | | | | 487 | |
United States Cellular Corp.(c) | | | 16 | | | | 582 | |
Vonage Holdings Corp.(c) | | | 279 | | | | 3,195 | |
| | | | | | | | |
| | | Shares | | | Value | |
Communication Services-(continued) | |
WideOpenWest, Inc.(c) | | | 28 | | | $ | 161 | |
World Wrestling Entertainment, Inc., Class A(b) | | | 57 | | | | 2,512 | |
Yelp, Inc.(c) | | | 85 | | | | 1,965 | |
Zynga, Inc., Class A(c) | | | 1,087 | | | | 9,848 | |
| | | | | | | | |
| | | | | | | 100,456 | |
| | | | | | | | |
Consumer Discretionary-14.31% | |
1-800-Flowers.com, Inc., Class A(c) | | | 30 | | | | 898 | |
Aaron’s, Inc. | | | 82 | | | | 4,583 | |
Abercrombie & Fitch Co., Class A | | | 78 | | | | 1,015 | |
Accel Entertainment, Inc.(c) | | | 51 | | | | 605 | |
Acushnet Holdings Corp. | | | 45 | | | | 1,588 | |
Adient PLC(c) | | | 109 | | | | 1,890 | |
Adtalem Global Education, Inc.(c) | | | 67 | | | | 2,224 | |
American Axle & Manufacturing Holdings, Inc.(c) | | | 132 | | | | 1,027 | |
American Eagle Outfitters, Inc.(b) | | | 196 | | | | 2,472 | |
American Outdoor Brands, Inc.(c) | | | 16 | | | | 244 | |
American Public Education, Inc.(c) | | | 19 | | | | 597 | |
America’s Car-Mart, Inc.(c) | | | 7 | | | | 703 | |
Asbury Automotive Group, Inc.(c) | | | 24 | | | | 2,539 | |
AutoNation, Inc.(c) | | | 71 | | | | 4,037 | |
Bed Bath & Beyond, Inc.(b) | | | 162 | | | | 1,973 | |
Big Lots, Inc. | | | 46 | | | | 2,169 | |
BJ’s Restaurants, Inc. | | | 25 | | | | 788 | |
Bloomin’ Brands, Inc. | | | 78 | | | | 1,119 | |
Boot Barn Holdings, Inc.(c) | | | 34 | | | | 960 | |
Boyd Gaming Corp. | | | 93 | | | | 2,491 | |
Bright Horizons Family Solutions, Inc.(c) | | | 69 | | | | 9,178 | |
Brinker International, Inc. | | | 49 | | | | 2,207 | |
Brunswick Corp. | | | 94 | | | | 5,818 | |
Buckle, Inc. (The)(b) | | | 34 | | | | 637 | |
Caesars Entertainment, Inc.(c) | | | 173 | | | | 7,923 | |
Callaway Golf Co. | | | 108 | | | | 2,253 | |
Camping World Holdings, Inc., Class A | | | 33 | | | | 959 | |
Capri Holdings Ltd.(c) | | | 168 | | | | 2,661 | |
Carriage Services, Inc. | | | 21 | | | | 465 | |
Carter’s, Inc. | | | 51 | | | | 4,061 | |
Carvana Co.(c) | | | 75 | | | | 16,197 | |
Cato Corp. (The), Class A | | | 27 | | | | 216 | |
Cavco Industries, Inc.(c) | | | 9 | | | | 1,718 | |
Century Communities, Inc.(c) | | | 30 | | | | 1,070 | |
Cheesecake Factory, Inc. (The)(b) | | | 51 | | | | 1,506 | |
Chegg, Inc.(c) | | | 144 | | | | 10,619 | |
Children’s Place, Inc. (The) | | | 6 | | | | 120 | |
Choice Hotels International, Inc. | | | 42 | | | | 4,170 | |
Churchill Downs, Inc. | | | 42 | | | | 7,340 | |
Columbia Sportswear Co. | | | 37 | | | | 3,166 | |
Cooper Tire & Rubber Co. | | | 61 | | | | 2,109 | |
Core-Mark Holding Co., Inc. | | | 54 | | | | 1,805 | |
Cracker Barrel Old Country Store, Inc. | | | 28 | | | | 3,744 | |
Crocs, Inc.(c) | | | 78 | | | | 3,113 | |
Dana, Inc. | | | 174 | | | | 2,427 | |
Dave & Buster’s Entertainment, Inc.(b) | | | 35 | | | | 582 | |
Deckers Outdoor Corp.(c) | | | 33 | | | | 6,728 | |
Delphi Technologies PLC(c) | | | 111 | | | | 1,928 | |
Denny’s Corp.(c) | | | 72 | | | | 825 | |
Designer Brands, Inc., Class A | | | 78 | | | | 550 | |
Dick’s Sporting Goods, Inc. | | | 72 | | | | 3,897 | |
See accompanying Notes to Financial Statements which are an integral part of the financial statements.
Invesco PureBetaSM MSCI USA Small Cap ETF (PBSM)–(continued)
August 31, 2020
| | | | | | | | |
| | | Shares | | | Value | |
Consumer Discretionary-(continued) | | | | | |
Dillard’s, Inc., Class A(b) | | | 13 | | | $ | 393 | |
Dine Brands Global, Inc. | | | 19 | | | | 1,132 | |
Dorman Products, Inc.(c) | | | 34 | | | | 2,879 | |
Dunkin’ Brands Group, Inc. | | | 98 | | | | 7,456 | |
El Pollo Loco Holdings, Inc.(c) | | | 27 | | | | 482 | |
Ethan Allen Interiors, Inc. | | | 30 | | | | 427 | |
Etsy, Inc.(c) | | | 140 | | | | 16,758 | |
Everi Holdings, Inc.(b)(c) | | | 108 | | | | 838 | |
Extended Stay America, Inc. | | | 200 | | | | 2,498 | |
Five Below, Inc.(c) | | | 66 | | | | 7,224 | |
Floor & Decor Holdings, Inc., Class A(c) | | | 96 | | | | 7,031 | |
Foot Locker, Inc. | | | 120 | | | | 3,640 | |
Fox Factory Holding Corp.(c) | | | 46 | | | | 4,637 | |
Frontdoor, Inc.(c) | | | 99 | | | | 4,313 | |
GameStop Corp., Class A(b)(c) | | | 46 | | | | 307 | |
Gap, Inc. (The) | | | 264 | | | | 4,591 | |
Garrett Motion, Inc. (Switzerland)(c) | | | 29 | | | | 80 | |
Genesco, Inc.(c) | | | 19 | | | | 370 | |
Gentex Corp. | | | 297 | | | | 8,034 | |
Gentherm, Inc.(c) | | | 40 | | | | 1,809 | |
G-III Apparel Group Ltd.(c) | | | 49 | | | | 542 | |
Goodyear Tire & Rubber Co. (The) | | | 282 | | | | 2,706 | |
GoPro, Inc., Class A(c) | | | 151 | | | | 693 | |
Graham Holdings Co., Class B | | | 5 | | | | 2,140 | |
Grand Canyon Education, Inc.(c) | | | 57 | | | | 5,360 | |
Green Brick Partners, Inc.(c) | | | 30 | | | | 427 | |
Group 1 Automotive, Inc. | | | 21 | | | | 1,815 | |
Groupon, Inc.(c) | | | 26 | | | | 828 | |
Grubhub, Inc.(c) | | | 109 | | | | 7,886 | |
Guess?, Inc.(b) | | | 40 | | | | 460 | |
H&R Block, Inc. | | | 224 | | | | 3,248 | |
Hanesbrands, Inc. | | | 423 | | | | 6,468 | |
Harley-Davidson, Inc. | | | 181 | | | | 5,015 | |
Haverty Furniture Cos., Inc. | | | 21 | | | | 444 | |
Helen of Troy Ltd.(c) | | | 29 | | | | 5,998 | |
Hibbett Sports, Inc.(c) | | | 21 | | | | 701 | |
Hilton Grand Vacations, Inc.(c) | | | 90 | | | | 1,972 | |
Installed Building Products, Inc.(c) | | | 27 | | | | 2,344 | |
iRobot Corp.(b)(c) | | | 34 | | | | 2,517 | |
Jack in the Box, Inc. | | | 24 | | | | 1,977 | |
Johnson Outdoors, Inc., Class A | | | 7 | | | | 600 | |
K12, Inc.(c) | | | 45 | | | | 1,674 | |
KB Home | | | 96 | | | | 3,433 | |
Kohl’s Corp. | | | 184 | | | | 3,930 | |
Kontoor Brands, Inc. | | | 58 | | | | 1,282 | |
L Brands, Inc. | | | 285 | | | | 8,379 | |
Lands’ End, Inc.(c) | | | 13 | | | | 174 | |
Laureate Education, Inc., Class A(c) | | | 119 | | | | 1,490 | |
La-Z-Boy, Inc. | | | 55 | | | | 1,787 | |
LCI Industries | | | 30 | | | | 3,409 | |
Leggett & Platt, Inc. | | | 156 | | | | 6,396 | |
Levi Strauss & Co., Class A | | | 81 | | | | 998 | |
LGI Homes, Inc.(c) | | | 26 | | | | 2,908 | |
Lindblad Expeditions Holdings, Inc.(c) | | | 30 | | | | 297 | |
Lithia Motors, Inc., Class A | | | 27 | | | | 6,722 | |
M.D.C. Holdings, Inc. | | | 60 | | | | 2,603 | |
M/I Homes, Inc.(c) | | | 33 | | | | 1,404 | |
Macy’s, Inc.(b) | | | 375 | | | | 2,614 | |
Magnite, Inc.(c) | | | 115 | | | | 845 | |
Malibu Boats, Inc., Class A(c) | | | 25 | | | | 1,296 | |
| | | | | | | | |
| | | Shares | | | Value | |
Consumer Discretionary-(continued) | | | | | |
MarineMax, Inc.(c) | | | 27 | | | $ | 794 | |
Marriott Vacations Worldwide Corp. | | | 49 | | | | 4,639 | |
Mattel, Inc.(c) | | | 418 | | | | 4,491 | |
Meritage Homes Corp.(c) | | | 46 | | | | 4,417 | |
Michaels Cos., Inc. (The)(b)(c) | | | 84 | | | | 945 | |
Monarch Casino & Resort, Inc.(c) | | | 15 | | | | 690 | |
Monro, Inc. | | | 40 | | | | 1,844 | |
Murphy USA, Inc.(c) | | | 35 | | | | 4,720 | |
National Vision Holdings, Inc.(c) | | | 91 | | | | 3,419 | |
Nordstrom, Inc.(b) | | | 129 | | | | 2,064 | |
Norwegian Cruise Line Holdings Ltd.(b)(c) | | | 295 | | | | 5,047 | |
ODP Corp. (The) | | | 58 | | | | 1,356 | |
Ollie’s Bargain Outlet Holdings, Inc.(c) | | | 69 | | | | 6,592 | |
OneSpaWorld Holdings Ltd. (Bahamas) | | | 55 | | | | 381 | |
Overstock.com, Inc.(b)(c) | | | 44 | | | | 3,850 | |
Oxford Industries, Inc. | | | 21 | | | | 1,040 | |
Papa John’s International, Inc. | | | 34 | | | | 3,342 | |
Penn National Gaming, Inc.(c) | | | 149 | | | | 7,614 | |
Penske Automotive Group, Inc. | | | 35 | | | | 1,651 | |
Perdoceo Education Corp.(c) | | | 85 | | | | 1,221 | |
PetMed Express, Inc. | | | 24 | | | | 834 | |
Planet Fitness, Inc., Class A(c) | | | 93 | | | | 5,653 | |
Playa Hotels & Resorts N.V.(c) | | | 69 | | | | 291 | |
Polaris, Inc. | | | 69 | | | | 6,972 | |
Pool Corp. | | | 47 | | | | 15,408 | |
PVH Corp. | | | 84 | | | | 4,684 | |
Quotient Technology, Inc.(c) | | | 94 | | | | 819 | |
Qurate Retail, Inc., Class A(c) | | | 471 | | | | 5,205 | |
RealReal, Inc. (The)(c) | | | 25 | | | | 401 | |
Red Rock Resorts, Inc., Class A | | | 85 | | | | 1,451 | |
Regis Corp.(b)(c) | | | 33 | | | | 244 | |
Rent-A-Center, Inc. | | | 54 | | | | 1,658 | |
Revolve Group, Inc.(b)(c) | | | 16 | | | | 321 | |
RH(c) | | | 18 | | | | 5,950 | |
Ruth’s Hospitality Group, Inc. | | | 34 | | | | 349 | |
Sally Beauty Holdings, Inc.(c) | | | 147 | | | | 1,641 | |
Scientific Games Corp.(c) | | | 67 | | | | 1,386 | |
SeaWorld Entertainment, Inc.(c) | | | 61 | | | | 1,244 | |
Service Corp. International | | | 214 | | | | 9,769 | |
ServiceMaster Global Holdings, Inc.(c) | | | 164 | | | | 6,544 | |
Shake Shack, Inc., Class A(b)(c) | | | 35 | | | | 2,389 | |
Shoe Carnival, Inc. | | | 15 | | | | 493 | |
Shutterstock, Inc. | | | 24 | | | | 1,208 | |
Signet Jewelers Ltd. | | | 67 | | | | 1,157 | |
Six Flags Entertainment Corp. | | | 91 | | | | 1,977 | |
Skechers U.S.A., Inc., Class A(c) | | | 162 | | | | 4,836 | |
Skyline Champion Corp.(c) | | | 56 | | | | 1,598 | |
Sleep Number Corp.(c) | | | 36 | | | | 1,728 | |
Smith & Wesson Brands, Inc.(c) | | | 64 | | | | 1,169 | |
Sonic Automotive, Inc., Class A | | | 28 | | | | 1,183 | |
Sonos, Inc.(c) | | | 104 | | | | 1,463 | |
Stamps.com, Inc.(c) | | | 20 | | | | 4,987 | |
Standard Motor Products, Inc. | | | 24 | | | | 1,091 | |
Steven Madden Ltd. | | | 97 | | | | 2,053 | |
Stitch Fix, Inc., Class A(b)(c) | | | 58 | | | | 1,401 | |
Stoneridge, Inc.(c) | | | 33 | | | | 667 | |
Strategic Education, Inc. | | | 25 | | | | 2,564 | |
Sturm Ruger & Co., Inc. | | | 21 | | | | 1,488 | |
Tapestry, Inc. | | | 326 | | | | 4,802 | |
Taylor Morrison Home Corp., Class A(c) | | | 156 | | | | 3,671 | |
See accompanying Notes to Financial Statements which are an integral part of the financial statements.
Invesco PureBetaSM MSCI USA Small Cap ETF (PBSM)–(continued)
August 31, 2020
| | | | | | | | |
| | | Shares | | | Value | |
Consumer Discretionary-(continued) | | | | | |
Tempur Sealy International, Inc.(c) | | | 57 | | | $ | 4,876 | |
Tenneco, Inc., Class A(c) | | | 70 | | | | 569 | |
Texas Roadhouse, Inc. | | | 76 | | | | 4,787 | |
Thor Industries, Inc. | | | 65 | | | | 6,138 | |
Toll Brothers, Inc. | | | 147 | | | | 6,206 | |
TopBuild Corp.(c) | | | 41 | | | | 6,306 | |
TRI Pointe Group, Inc.(c) | | | 154 | | | | 2,599 | |
Twin River Worldwide Holdings, Inc. | | | 14 | | | | 335 | |
Under Armour, Inc., Class A(b)(c) | | | 223 | | | | 2,188 | |
Under Armour, Inc., Class C(c) | | | 230 | | | | 2,035 | |
Universal Electronics, Inc.(c) | | | 16 | | | | 657 | |
Urban Outfitters, Inc.(c) | | | 81 | | | | 1,907 | |
Veoneer, Inc. (Sweden)(b)(c) | | | 65 | | | | 902 | |
Vista Outdoor, Inc.(c) | | | 70 | | | | 1,359 | |
Visteon Corp.(c) | | | 34 | | | | 2,565 | |
Wendy’s Co. (The) | | | 223 | | | | 4,670 | |
Williams-Sonoma, Inc.(b) | | | 92 | | | | 8,074 | |
Wingstop, Inc. | | | 34 | | | | 5,556 | |
Winmark Corp. | | | 3 | | | | 463 | |
Winnebago Industries, Inc. | | | 36 | | | | 1,943 | |
Wolverine World Wide, Inc. | | | 99 | | | | 2,473 | |
WW International, Inc.(c) | | | 49 | | | | 1,151 | |
Wyndham Destinations, Inc. | | | 103 | | | | 2,986 | |
Wyndham Hotels & Resorts, Inc. | | | 110 | | | | 5,760 | |
YETI Holdings, Inc.(c) | | | 84 | | | | 4,316 | |
Zumiez, Inc.(c) | | | 24 | | | | 616 | |
| | | | | | | | |
| | | | | | | 578,898 | |
| | | | | | | | |
Consumer Staples-3.54% | | | | | | | | |
Andersons, Inc. (The) | | | 36 | | | | 638 | |
B&G Foods, Inc.(b) | | | 76 | | | | 2,367 | |
BellRing Brands, Inc., Class A(c) | | | 47 | | | | 914 | |
Beyond Meat, Inc.(b)(c) | | | 29 | | | | 3,940 | |
BJ’s Wholesale Club Holdings, Inc.(c) | | | 162 | | | | 7,194 | |
Boston Beer Co., Inc. (The), Class A(c) | | | 11 | | | | 9,702 | |
Calavo Growers, Inc. | | | 21 | | | | 1,333 | |
Cal-Maine Foods, Inc.(c) | | | 37 | | | | 1,428 | |
Casey’s General Stores, Inc. | | | 43 | | | | 7,648 | |
Central Garden & Pet Co.(c) | | | 13 | | | | 529 | |
Central Garden & Pet Co., Class A(c) | | | 49 | | | | 1,821 | |
Chefs’ Warehouse, Inc. (The)(c) | | | 31 | | | | 459 | |
Coca-Cola Consolidated, Inc. | | | 6 | | | | 1,640 | |
Coty, Inc., Class A | | | 360 | | | | 1,289 | |
Darling Ingredients, Inc.(c) | | | 199 | | | | 6,362 | |
Edgewell Personal Care Co.(c) | | | 66 | | | | 1,895 | |
elf Beauty, Inc.(c) | | | 49 | | | | 957 | |
Energizer Holdings, Inc. | | | 72 | | | | 3,333 | |
Flowers Foods, Inc. | | | 231 | | | | 5,650 | |
Fresh Del Monte Produce, Inc. | | | 37 | | | | 858 | |
Freshpet, Inc.(c) | | | 47 | | | | 5,339 | |
Grocery Outlet Holding Corp.(c) | | | 77 | | | | 3,167 | |
Hain Celestial Group, Inc. (The)(c) | | | 99 | | | | 3,246 | |
Herbalife Nutrition Ltd.(c) | | | 113 | | | | 5,554 | |
Hostess Brands, Inc.(c) | | | 147 | | | | 1,887 | |
Ingles Markets, Inc., Class A | | | 15 | | | | 606 | |
Inter Parfums, Inc. | | | 21 | | | | 938 | |
J&J Snack Foods Corp. | | | 18 | | | | 2,447 | |
John B. Sanfilippo & Son, Inc. | | | 10 | | | | 796 | |
Lancaster Colony Corp. | | | 22 | | | | 3,910 | |
Landec Corp.(c) | | | 31 | | | | 317 | |
| | | | | | | | |
| | | Shares | | | Value | |
Consumer Staples-(continued) | | | | | |
Medifast, Inc. | | | 12 | | | $ | 1,953 | |
MGP Ingredients, Inc. | | | 16 | | | | 569 | |
National Beverage Corp.(b)(c) | | | 13 | | | | 1,057 | |
Nu Skin Enterprises, Inc., Class A | | | 67 | | | | 3,167 | |
Performance Food Group Co.(c) | | | 154 | | | | 5,623 | |
Pilgrim’s Pride Corp.(b)(c) | | | 81 | | | | 1,296 | |
Post Holdings, Inc.(c) | | | 77 | | | | 6,778 | |
PriceSmart, Inc. | | | 23 | | | | 1,512 | |
Rite Aid Corp.(c) | | | 72 | | | | 937 | |
Sanderson Farms, Inc. | | | 24 | | | | 2,807 | |
Simply Good Foods Co. (The)(c) | | | 108 | | | | 2,684 | |
SpartanNash Co. | | | 42 | | | | 839 | |
Spectrum Brands Holdings, Inc. | | | 49 | | | | 2,920 | |
Sprouts Farmers Market, Inc.(c) | | | 145 | | | | 3,386 | |
Tootsie Roll Industries, Inc.(b) | | | 21 | | | | 672 | |
TreeHouse Foods, Inc.(c) | | | 65 | | | | 2,783 | |
Turning Point Brands, Inc.(b) | | | 13 | | | | 376 | |
United Natural Foods, Inc.(c) | | | 69 | | | | 1,245 | |
Universal Corp. | | | 30 | | | | 1,302 | |
US Foods Holding Corp.(c) | | | 254 | | | | 6,185 | |
USANA Health Sciences, Inc.(c) | | | 16 | | | | 1,255 | |
Vector Group Ltd. | | | 144 | | | | 1,450 | |
Village Super Market, Inc., Class A | | | 10 | | | | 254 | |
WD-40 Co. | | | 16 | | | | 3,270 | |
Weis Markets, Inc. | | | 19 | | | | 935 | |
| | | | | | | | |
| | | | | | | 143,419 | |
| | | | | | | | |
Energy-2.66% | | | | | | | | |
Antero Midstream Corp.(b) | | | 364 | | | | 2,464 | |
Antero Resources Corp.(b)(c) | | | 309 | | | | 995 | |
Apache Corp. | | | 446 | | | | 6,601 | |
Arch Resources, Inc. | | | 19 | | | | 716 | |
Archrock, Inc. | | | 153 | | | | 1,004 | |
Bonanza Creek Energy, Inc.(c) | | | 18 | | | | 361 | |
Brigham Minerals, Inc., Class A | | | 40 | | | | 472 | |
Cactus, Inc., Class A | | | 57 | | | | 1,259 | |
ChampionX Corp.(c) | | | 164 | | | | 1,679 | |
Cimarex Energy Co. | | | 123 | | | | 3,417 | |
Clean Energy Fuels Corp.(c) | | | 168 | | | | 444 | |
CNX Resources Corp.(c) | | | 234 | | | | 2,565 | |
Continental Resources, Inc.(b) | | | 108 | | | | 1,855 | |
Core Laboratories N.V | | | 22 | | | | 460 | |
CVR Energy, Inc. | | | 36 | | | | 601 | |
Delek US Holdings, Inc. | | | 91 | | | | 1,431 | |
Devon Energy Corp. | | | 454 | | | | 4,935 | |
Diamond S Shipping, Inc.(c) | | | 27 | | | | 221 | |
DMC Global, Inc. | | | 18 | | | | 638 | |
Dorian LPG Ltd.(c) | | | 48 | | | | 405 | |
Dril-Quip, Inc.(c) | | | 43 | | | | 1,425 | |
EnLink Midstream LLC(c) | | | 115 | | | | 344 | |
EQT Corp. | | | 310 | | | | 4,920 | |
Equitrans Midstream Corp. | | | 484 | | | | 4,976 | |
Frank’s International N.V.(c) | | | 45 | | | | 104 | |
Helix Energy Solutions Group, Inc.(c) | | | 166 | | | | 594 | |
Helmerich & Payne, Inc. | | | 133 | | | | 2,192 | |
HollyFrontier Corp. | | | 183 | | | | 4,368 | |
International Seaways, Inc. | | | 24 | | | | 407 | |
Kosmos Energy Ltd. (Ghana) | | | 289 | | | | 425 | |
Liberty Oilfield Services, Inc., Class A | | | 66 | | | | 426 | |
Magnolia Oil & Gas Corp., Class A(c) | | | 142 | | | | 914 | |
See accompanying Notes to Financial Statements which are an integral part of the financial statements.
Invesco PureBetaSM MSCI USA Small Cap ETF (PBSM)–(continued)
August 31, 2020
| | | | | | | | |
| | | Shares | | | Value | |
Energy-(continued) | | | | | | | | |
Marathon Oil Corp. | | | 934 | | | $ | 4,932 | |
Matador Resources Co.(b)(c) | | | 132 | | | | 1,284 | |
Matrix Service Co.(c) | | | 31 | | | | 286 | |
Murphy Oil Corp.(b) | | | 164 | | | | 2,253 | |
NexTier Oilfield Solutions, Inc.(c) | | | 164 | | | | 413 | |
Noble Energy, Inc. | | | 573 | | | | 5,701 | |
Northern Oil and Gas, Inc.(c) | | | 81 | | | | 55 | |
Oceaneering International, Inc.(c) | | | 43 | | | | 232 | |
Ovintiv, Inc.(b) | | | 307 | | | | 3,402 | |
Par Pacific Holdings, Inc.(c) | | | 40 | | | | 347 | |
Parsley Energy, Inc., Class A | | | 345 | | | | 3,709 | |
Patterson-UTI Energy, Inc. | | | 85 | | | | 327 | |
PBF Energy, Inc., Class A | | | 114 | | | | 976 | |
PDC Energy, Inc.(c) | | | 85 | | | | 1,287 | |
Peabody Energy Corp. | | | 29 | | | | 76 | |
Plains GP Holdings L.P., Class A(c) | | | 210 | | | | 1,535 | |
ProPetro Holding Corp.(c) | | | 72 | | | | 452 | |
Range Resources Corp.(b) | | | 283 | | | | 2,111 | |
Rattler Midstream L.P. | | | 52 | | | | 435 | |
Renewable Energy Group, Inc.(c) | | | 48 | | | | 1,605 | |
REX American Resources Corp.(c) | | | 7 | | | | 432 | |
RPC, Inc.(c) | | | 100 | | | | 313 | |
SEACOR Holdings, Inc.(c) | | | 22 | | | | 695 | |
Select Energy Services, Inc.,
Class A(c) | | | 49 | | | | 234 | |
Southwestern Energy Co.(c) | | | 604 | | | | 1,679 | |
Talos Energy, Inc.(c) | | | 9 | | | | 68 | |
Targa Resources Corp. | | | 276 | | | | 4,695 | |
TechnipFMC PLC (United Kingdom) | | | 503 | | | | 3,873 | |
Tellurian, Inc.(c) | | | 37 | | | | 34 | |
Texas Pacific Land Trust(b) | | | 8 | | | | 4,214 | |
Transocean Ltd.(b)(c) | | | 210 | | | | 256 | |
Viper Energy Partners L.P. | | | 76 | | | | 774 | |
W&T Offshore, Inc.(b)(c) | | | 115 | | | | 256 | |
World Fuel Services Corp. | | | 79 | | | | 2,086 | |
WPX Energy, Inc.(c) | | | 513 | | | | 2,852 | |
| | | | | | | | |
| | | | | | | 107,497 | |
| | | | | | | | |
Financials-13.01% | | | | | | | | |
1st Source Corp. | | | 21 | | | | 723 | |
Affiliated Managers Group, Inc. | | | 55 | | | | 3,776 | |
Allegiance Bancshares, Inc. | | | 26 | | | | 661 | |
Altabancorp | | | 18 | | | | 371 | |
Amalgamated Bank, Class A | | | 16 | | | | 188 | |
Ambac Financial Group, Inc.(c) | | | 54 | | | | 682 | |
Amerant Bancorp, Inc.(c) | | | 26 | | | | 342 | |
American Equity Investment Life Holding Co. | | | 111 | | | | 2,654 | |
American National Group, Inc. | | | 10 | | | | 750 | |
Ameris Bancorp | | | 79 | | | | 1,937 | |
AMERISAFE, Inc. | | | 24 | | | | 1,602 | |
Apollo Commercial Real Estate Finance, Inc. | | | 177 | | | | 1,582 | |
Arbor Realty Trust, Inc. | | | 132 | | | | 1,494 | |
Ares Commercial Real Estate Corp. | | | 30 | | | | 299 | |
Ares Management Corp., Class A | | | 118 | | | | 4,773 | |
Argo Group International Holdings Ltd | | | 42 | | | | 1,560 | |
ARMOUR Residential REIT, Inc. | | | 72 | | | | 698 | |
Arrow Financial Corp. | | | 16 | | | | 458 | |
Artisan Partners Asset Management, Inc., Class A . | | | 64 | | | | 2,477 | |
Assetmark Financial Holdings,
Inc.(c) | | | 18 | | | | 435 | |
Associated Banc-Corp. | | | 178 | | | | 2,392 | |
Associated Capital Group, Inc., Class A | | | 4 | | | | 155 | |
| | | | | | | | |
| | | Shares | | | Value | |
Financials-(continued) | | | | | | | | |
Assured Guaranty Ltd. | | | 109 | | | $ | 2,338 | |
Atlantic Capital Bancshares, Inc.(c) | | | 30 | | | | 346 | |
Atlantic Union Bankshares Corp. | | | 90 | | | | 2,093 | |
AXIS Capital Holdings Ltd. | | | 102 | | | | 4,872 | |
Axos Financial, Inc.(c) | | | 67 | | | | 1,660 | |
B. Riley Financial, Inc. | | | 15 | | | | 402 | |
Banc of California, Inc. | | | 52 | | | | 571 | |
BancFirst Corp. | | | 22 | | | | 968 | |
Bancorp, Inc. (The)(c) | | | 60 | | | | 570 | |
BancorpSouth Bank | | | 124 | | | | 2,676 | |
Bank First Corp. | | | 8 | | | | 499 | |
Bank of Hawaii Corp. | | | 49 | | | | 2,697 | |
Bank of Marin Bancorp | | | 15 | | | | 477 | |
Bank OZK | | | 140 | | | | 3,226 | |
BankUnited, Inc. | | | 115 | | | | 2,689 | |
Banner Corp. | | | 42 | | | | 1,517 | |
Bar Harbor Bankshares | | | 18 | | | | 365 | |
Berkshire Hills Bancorp, Inc. | | | 17 | | | | 156 | |
BGC Partners, Inc., Class A | | | 144 | | | | 363 | |
Blackstone Mortgage Trust, Inc., Class A | | | 154 | | | | 3,661 | |
Blucora, Inc.(c) | | | 60 | | | | 716 | |
BOK Financial Corp. | | | 39 | | | | 2,189 | |
Boston Private Financial Holdings, Inc. | | | 99 | | | | 588 | |
Bridge Bancorp, Inc. | | | 19 | | | | 380 | |
Brighthouse Financial, Inc.(c) | | | 124 | | | | 3,765 | |
Brightsphere Investment Group, Inc. | | | 91 | | | | 1,261 | |
Broadmark Realty Capital, Inc.(b) | | | 148 | | | | 1,450 | |
Brookline Bancorp, Inc. | | | 94 | | | | 902 | |
Bryn Mawr Bank Corp. | | | 24 | | | | 651 | |
Byline Bancorp, Inc. | | | 19 | | | | 240 | |
Cadence BanCorp. | | | 125 | | | | 1,188 | |
Camden National Corp. | | | 18 | | | | 588 | |
Cannae Holdings, Inc.(c) | | | 100 | | | | 3,773 | |
Capital City Bank Group, Inc. | | | 15 | | | | 304 | |
Capitol Federal Financial, Inc. | | | 163 | | | | 1,522 | |
Capstead Mortgage Corp. | | | 114 | | | | 703 | |
Cathay General Bancorp | | | 91 | | | | 2,247 | |
CBTX, Inc. | | | 22 | | | | 347 | |
Central Pacific Financial Corp. | | | 34 | | | | 527 | |
Century Bancorp, Inc., Class A | | | 3 | | | | 211 | |
Chimera Investment Corp. | | | 226 | | | | 2,009 | |
CIT Group, Inc. | | | 115 | | | | 2,262 | |
Citizens, Inc.(b)(c) | | | 57 | | | | 333 | |
City Holding Co. | | | 19 | | | | 1,216 | |
CNB Financial Corp. | | | 18 | | | | 287 | |
CNO Financial Group, Inc. | | | 167 | | | | 2,722 | |
Cohen & Steers, Inc. | | | 28 | | | | 1,694 | |
Colony Credit Real Estate, Inc. | | | 102 | | | | 614 | |
Columbia Banking System, Inc. | | | 88 | | | | 2,456 | |
Columbia Financial, Inc.(c) | | | 70 | | | | 747 | |
Commerce Bancshares, Inc. | | | 119 | | | | 7,089 | |
Community Bank System, Inc. | | | 63 | | | | 3,791 | |
Community Trust Bancorp, Inc. | | | 19 | | | | 613 | |
ConnectOne Bancorp, Inc. | | | 39 | | | | 590 | |
Cowen, Inc., Class A | | | 31 | | | | 561 | |
Crawford & Co., Class A | | | 19 | | | | 130 | |
Credit Acceptance Corp.(b)(c) | | | 12 | | | | 4,642 | |
CrossFirst Bankshares, Inc.(c) | | | 55 | | | | 508 | |
Cullen/Frost Bankers, Inc. | | | 72 | | | | 5,001 | |
Customers Bancorp, Inc.(c) | | | 34 | | | | 434 | |
See accompanying Notes to Financial Statements which are an integral part of the financial statements.
Invesco PureBetaSM MSCI USA Small Cap ETF (PBSM)–(continued)
August 31, 2020
| | | | | | | | |
| | | Shares | | | Value | |
Financials-(continued) | | | | | | | | |
CVB Financial Corp. | | | 157 | | | $ | 2,859 | |
Diamond Hill Investment Group, Inc. | | | 4 | | | | 496 | |
Dime Community Bancshares, Inc. | | | 36 | | | | 464 | |
Donegal Group, Inc., Class A | | | 15 | | | | 216 | |
Dynex Capital, Inc.(b) | | | 30 | | | | 475 | |
Eagle Bancorp, Inc. | | | 40 | | | | 1,151 | |
Eaton Vance Corp. | | | 135 | | | | 5,538 | |
eHealth, Inc.(c) | | | 25 | | | | 1,578 | |
Ellington Financial, Inc.(b) | | | 60 | | | | 748 | |
Employers Holdings, Inc. | | | 39 | | | | 1,271 | |
Encore Capital Group, Inc.(c) | | | 31 | | | | 1,424 | |
Enova International, Inc.(c) | | | 42 | | | | 717 | |
Enstar Group Ltd. (Bermuda)(c) | | | 13 | | | | 2,327 | |
Enterprise Financial Services Corp. | | | 31 | | | | 927 | |
Equity Bancshares, Inc., Class A(c) | | | 18 | | | | 286 | |
Essent Group Ltd. | | | 131 | | | | 4,677 | |
Evercore, Inc., Class A | | | 48 | | | | 2,970 | |
EZCORP, Inc., Class A(c) | | | 61 | | | | 328 | |
F.N.B. Corp. | | | 394 | | | | 2,955 | |
FB Financial Corp. | | | 36 | | | | 972 | |
FBL Financial Group, Inc., Class A | | | 13 | | | | 482 | |
Federal Agricultural Mortgage Corp., Class C | | | 10 | | | | 682 | |
Federated Hermes, Inc., Class B | | | 117 | | | | 2,797 | |
Financial Institutions, Inc. | | | 18 | | | | 310 | |
First American Financial Corp. | | | 133 | | | | 6,992 | |
First Bancorp | | | 264 | | | | 1,513 | |
First Bancorp/Southern Pines NC | | | 36 | | | | 736 | |
First Bancshares, Inc. (The) | | | 30 | | | | 643 | |
First Busey Corp. | | | 58 | | | | 1,033 | |
First Citizens BancShares, Inc., Class A | | | 6 | | | | 2,359 | |
First Commonwealth Financial Corp. | | | 120 | | | | 984 | |
First Community Bancshares, Inc. | | | 24 | | | | 462 | |
First Financial Bancorp | | | 120 | | | | 1,646 | |
First Financial Bankshares, Inc. | | | 148 | | | | 4,481 | |
First Financial Corp. | | | 13 | | | | 447 | |
First Foundation, Inc. | | | 45 | | | | 684 | |
First Hawaiian, Inc. | | | 146 | | | | 2,413 | |
First Horizon National Corp. | | | 672 | | | | 6,418 | |
First Interstate BancSystem, Inc., Class A | | | 49 | | | | 1,607 | |
First Merchants Corp. | | | 70 | | | | 1,791 | |
First Mid Bancshares, Inc. | | | 16 | | | | 417 | |
First Midwest Bancorp, Inc. | | | 139 | | | | 1,732 | |
First of Long Island Corp. (The) | | | 30 | | | | 461 | |
FirstCash, Inc. | | | 48 | | | | 2,868 | |
Flagstar Bancorp, Inc. | | | 46 | | | | 1,445 | |
Flushing Financial Corp. | | | 31 | | | | 376 | |
Focus Financial Partners, Inc., Class A(c) | | | 31 | | | | 1,097 | |
Freedom Holding Corp. (Kazakhstan)(b)(c) | | | 21 | | | | 500 | |
Fulton Financial Corp. | | | 199 | | | | 1,946 | |
Genworth Financial, Inc., Class A(c) | | | 610 | | | | 1,842 | |
German American Bancorp, Inc. | | | 30 | | | | 851 | |
Glacier Bancorp, Inc. | | | 106 | | | | 3,719 | |
Global Indemnity Group LLC, Class A | | | 10 | | | | 232 | |
Goosehead Insurance, Inc., Class A | | | 15 | | | | 1,541 | |
Granite Point Mortgage Trust, Inc. | | | 66 | | | | 438 | |
Great Southern Bancorp, Inc. | | | 13 | | | | 501 | |
Great Western Bancorp, Inc. | | | 69 | | | | 961 | |
Green Dot Corp., Class A(c) | | | 58 | | | | 3,020 | |
Greenlight Capital Re Ltd., Class A(c) | | | 33 | | | | 240 | |
Hamilton Lane, Inc., Class A | | | 27 | | | | 1,974 | |
| | | | | | | | |
| | | Shares | | | Value | |
Financials-(continued) | | | | | | | | |
Hancock Whitney Corp. | | | 109 | | | $ | 2,181 | |
Hanmi Financial Corp. | | | 36 | | | | 343 | |
Hannon Armstrong Sustainable Infrastructure Capital, Inc. | | | 79 | | | | 3,354 | |
Hanover Insurance Group, Inc. (The) | | | 45 | | | | 4,612 | |
HarborOne Bancorp, Inc. | | | 47 | | | | 407 | |
HCI Group, Inc. | | | 9 | | | | 492 | |
Heartland Financial USA, Inc. | | | 42 | | | | 1,446 | |
Heritage Commerce Corp. | | | 76 | | | | 527 | |
Heritage Financial Corp. | | | 43 | | | | 857 | |
Heritage Insurance Holdings, Inc. | | | 33 | | | | 431 | |
Hilltop Holdings, Inc. | | | 88 | | | | 1,813 | |
Home BancShares, Inc. | | | 193 | | | | 3,129 | |
HomeStreet, Inc. | | | 30 | | | | 821 | |
HomeTrust Bancshares, Inc. | | | 21 | | | | 295 | |
Hope Bancorp, Inc. | | | 153 | | | | 1,294 | |
Horace Mann Educators Corp. | | | 49 | | | | 1,914 | |
Horizon Bancorp, Inc. | | | 49 | | | | 548 | |
Houlihan Lokey, Inc. | | | 52 | | | | 3,047 | |
Independence Holding Co. | | | 6 | | | | 210 | |
Independent Bank Corp. | | | 42 | | | | 2,640 | |
Independent Bank Corp. | | | 25 | | | | 373 | |
Independent Bank Group, Inc. | | | 42 | | | | 1,953 | |
Interactive Brokers Group, Inc., Class A | | | 88 | | | | 4,666 | |
International Bancshares Corp. | | | 67 | | | | 2,116 | |
Invesco Mortgage Capital, Inc.(b)(d) | | | 88 | | | | 264 | |
Investors Bancorp, Inc. | | | 286 | | | | 2,217 | |
James River Group Holdings Ltd. | | | 37 | | | | 1,802 | |
Janus Henderson Group PLC (United Kingdom) | | | 183 | | | | 3,792 | |
Jefferies Financial Group, Inc. | | | 270 | | | | 4,736 | |
Kearny Financial Corp. | | | 103 | | | | 799 | |
Kemper Corp. | | | 75 | | | | 5,825 | |
Kinsale Capital Group, Inc. | | | 25 | | | | 5,181 | |
KKR Real Estate Finance Trust, Inc. | | | 31 | | | | 564 | |
Ladder Capital Corp. | | | 111 | | | | 827 | |
Lakeland Bancorp, Inc. | | | 58 | | | | 617 | |
Lakeland Financial Corp. | | | 31 | | | | 1,416 | |
LendingClub Corp.(c) | | | 25 | | | | 133 | |
LendingTree, Inc.(b)(c) | | | 9 | | | | 2,780 | |
Live Oak Bancshares, Inc.(b) | | | 28 | | | | 621 | |
LPL Financial Holdings, Inc. | | | 94 | | | | 7,723 | |
Luther Burbank Corp. | | | 22 | | | | 204 | |
MBIA, Inc.(c) | | | 102 | | | | 827 | |
Mercantile Bank Corp. | | | 18 | | | | 393 | |
Merchants Bancorp | | | 10 | | | | 204 | |
Mercury General Corp. | | | 33 | | | | 1,476 | |
Meridian Bancorp, Inc. | | | 60 | | | | 698 | |
Meta Financial Group, Inc. | | | 42 | | | | 810 | |
MFA Financial, Inc. | | | 275 | | | | 737 | |
MGIC Investment Corp. | | | 397 | | | | 3,641 | |
Midland States Bancorp, Inc. | | | 25 | | | | 365 | |
MidWestOne Financial Group, Inc. | | | 18 | | | | 342 | |
Moelis & Co., Class A | | | 60 | | | | 1,915 | |
Morningstar, Inc. | | | 28 | | | | 4,484 | |
Mr. Cooper Group, Inc.(c) | | | 85 | | | | 1,558 | |
National Bank Holdings Corp., Class A | | | 36 | | | | 1,024 | |
National General Holdings Corp. | | | 82 | | | | 2,792 | |
National Western Life Group, Inc., Class A | | | 3 | | | | 660 | |
Navient Corp. | | | 217 | | | | 1,973 | |
NBT Bancorp, Inc. | | | 52 | | | | 1,584 | |
See accompanying Notes to Financial Statements which are an integral part of the financial statements.
Invesco PureBetaSM MSCI USA Small Cap ETF (PBSM)–(continued)
August 31, 2020
| | | | | | | | |
| | | Shares | | | Value | |
Financials-(continued) | | | | | | | | |
Nelnet, Inc., Class A | | | 24 | | | $ | 1,572 | |
New Residential Investment Corp. | | | 480 | | | | 3,715 | |
New York Community Bancorp, Inc. | | | 560 | | | | 5,068 | |
New York Mortgage Trust, Inc. | | | 477 | | | | 1,259 | |
Nicolet Bankshares, Inc.(c) | | | 10 | | | | 600 | |
NMI Holdings, Inc., Class A(c) | | | 102 | | | | 1,749 | |
Northfield Bancorp, Inc. | | | 52 | | | | 502 | |
Northwest Bancshares, Inc. | | | 157 | | | | 1,587 | |
OceanFirst Financial Corp. | | | 75 | | | | 1,171 | |
OFG Bancorp | | | 63 | | | | 809 | |
Old National Bancorp | | | 210 | | | | 2,936 | |
Old Republic International Corp. | | | 349 | | | | 5,622 | |
OneMain Holdings, Inc. | | | 99 | | | | 2,879 | |
Origin Bancorp, Inc. | | | 21 | | | | 497 | |
Pacific Premier Bancorp, Inc. | | | 101 | | | | 2,282 | |
PacWest Bancorp | | | 144 | | | | 2,748 | |
Palomar Holdings, Inc.(c) | | | 21 | | | | 2,359 | |
Park National Corp.(b) | | | 18 | | | | 1,618 | |
Peapack-Gladstone Financial Corp. | | | 19 | | | | 323 | |
PennyMac Financial Services, Inc. | | | 76 | | | | 4,007 | |
PennyMac Mortgage Investment Trust | | | 124 | | | | 2,125 | |
Peoples Bancorp, Inc. | | | 24 | | | | 507 | |
Pinnacle Financial Partners, Inc. | | | 88 | | | | 3,516 | |
Piper Sandler Cos | | | 21 | | | | 1,584 | |
PJT Partners, Inc., Class A | | | 25 | | | | 1,480 | |
Popular, Inc. | | | 110 | | | | 4,074 | |
PRA Group, Inc.(c) | | | 55 | | | | 2,567 | |
Preferred Bank | | | 18 | | | | 673 | |
Premier Financial Corp. | | | 49 | | | | 896 | |
Primerica, Inc. | | | 48 | | | | 5,993 | |
ProAssurance Corp. | | | 28 | | | | 429 | |
ProSight Global, Inc.(c) | | | 13 | | | | 123 | |
Prosperity Bancshares, Inc. | | | 112 | | | | 6,106 | |
Provident Financial Services, Inc. | | | 76 | | | | 1,002 | |
QCR Holdings, Inc. | | | 18 | | | | 539 | |
Radian Group, Inc. | | | 233 | | | | 3,598 | |
Ready Capital Corp. | | | 57 | | | | 583 | |
Redwood Trust, Inc. | | | 136 | | | | 943 | |
Renasant Corp. | | | 70 | | | | 1,776 | |
Republic Bancorp, Inc., Class A | | | 12 | | | | 369 | |
RLI Corp. | | | 49 | | | | 4,596 | |
S&T Bancorp, Inc. | | | 48 | | | | 969 | |
Safety Insurance Group, Inc. | | | 18 | | | | 1,303 | |
Sandy Spring Bancorp, Inc. | | | 58 | | | | 1,387 | |
Seacoast Banking Corp. of Florida(c) | | | 63 | | | | 1,275 | |
Selective Insurance Group, Inc. | | | 72 | | | | 4,306 | |
ServisFirst Bancshares, Inc. | | | 55 | | | | 2,016 | |
Simmons First National Corp., Class A | | | 141 | | | | 2,407 | |
SLM Corp. | | | 448 | | | | 3,423 | |
South State Corp. | | | 84 | | | | 4,677 | |
Southside Bancshares, Inc. | | | 39 | | | | 1,075 | |
Starwood Property Trust, Inc. | | | 342 | | | | 5,335 | |
State Auto Financial Corp. | | | 21 | | | | 324 | |
Sterling Bancorp | | | 227 | | | | 2,649 | |
Stewart Information Services Corp. | | | 28 | | | | 1,195 | |
Stifel Financial Corp. | | | 84 | | | | 4,260 | |
Stock Yards Bancorp, Inc. | | | 25 | | | | 1,073 | |
StoneX Group, Inc.(c) | | | 19 | | | | 1,077 | |
Synovus Financial Corp. | | | 178 | | | | 3,893 | |
TCF Financial Corp. | | | 176 | | | | 4,731 | |
| | | | | | | | |
| | | Shares | | | Value | |
Financials-(continued) | | | | | | | | |
Texas Capital Bancshares, Inc.(c) | | | 61 | | | $ | 1,976 | |
TFS Financial Corp. | | | 66 | | | | 1,020 | |
Third Point Reinsurance Ltd. (Bermuda)(c) | | | 88 | | | | 753 | |
Tompkins Financial Corp. | | | 16 | | | | 1,059 | |
Towne Bank | | | 88 | | | | 1,560 | |
TPG RE Finance Trust, Inc. | | | 52 | | | | 459 | |
TriCo Bancshares | | | 33 | | | | 914 | |
TriState Capital Holdings, Inc.(c) | | | 27 | | | | 375 | |
Triumph Bancorp, Inc.(c) | | | 30 | | | | 857 | |
Trupanion, Inc.(c) | | | 36 | | | | 2,258 | |
TrustCo Bank Corp. | | | 114 | | | | 679 | |
Trustmark Corp. | | | 73 | | | | 1,714 | |
Two Harbors Investment Corp. | | | 218 | | | | 1,188 | |
UMB Financial Corp. | | | 57 | | | | 3,062 | |
Umpqua Holdings Corp. | | | 267 | | | | 3,012 | |
United Bankshares, Inc. | | | 157 | | | | 4,104 | |
United Community Banks, Inc. | | | 96 | | | | 1,740 | |
United Fire Group, Inc. | | | 25 | | | | 630 | |
United Insurance Holdings Corp. | | | 25 | | | | 189 | |
Universal Insurance Holdings, Inc. | | | 39 | | | | 723 | |
Univest Financial Corp. | | | 34 | | | | 547 | |
Unum Group | | | 240 | | | | 4,435 | |
Valley National Bancorp | | | 439 | | | | 3,297 | |
Veritex Holdings, Inc. | | | 51 | | | | 917 | |
Victory Capital Holdings, Inc., Class A | | | 15 | | | | 261 | |
Virtu Financial, Inc., Class A | | | 64 | | | | 1,653 | |
Virtus Investment Partners, Inc. | | | 9 | | | | 1,277 | |
Waddell & Reed Financial, Inc., Class A | | | 70 | | | | 1,103 | |
Walker & Dunlop, Inc. | | | 36 | | | | 1,972 | |
Washington Federal, Inc. | | | 96 | | | | 2,251 | |
Washington Trust Bancorp, Inc. | | | 19 | | | | 634 | |
Waterstone Financial, Inc. | | | 30 | | | | 465 | |
Watford Holdings Ltd., Class A (Bermuda)(c) | | | 25 | | | | 400 | |
Webster Financial Corp. | | | 112 | | | | 3,080 | |
WesBanco, Inc. | | | 78 | | | | 1,733 | |
Westamerica Bancorporation | | | 33 | | | | 2,008 | |
Western Alliance Bancorporation | | | 113 | | | | 3,989 | |
White Mountains Insurance Group Ltd. | | | 4 | | | | 3,566 | |
Wintrust Financial Corp. | | | 69 | | | | 3,003 | |
WisdomTree Investments, Inc. | | | 144 | | | | 539 | |
World Acceptance Corp.(c) | | | 5 | | | | 455 | |
WSFS Financial Corp. | | | 61 | | | | 1,787 | |
| | | | | | | | |
| | | | | | | 526,680 | |
| | | | | | | | |
Health Care-16.11% | | | | | | | | |
1Life Healthcare, Inc.(b)(c) | | | 30 | | | | 875 | |
Acadia Healthcare Co., Inc.(c) | | | 94 | | | | 2,906 | |
ACADIA Pharmaceuticals, Inc.(c) | | | 136 | | | | 5,384 | |
Accelerate Diagnostics, Inc.(b)(c) | | | 34 | | | | 414 | |
Acceleron Pharma, Inc.(c) | | | 55 | | | | 5,361 | |
Adaptive Biotechnologies Corp.(c) | | | 90 | | | | 3,745 | |
Addus HomeCare Corp.(c) | | | 18 | | | | 1,686 | |
Adverum Biotechnologies, Inc.(c) | | | 76 | | | | 927 | |
Aerie Pharmaceuticals, Inc.(b)(c) | | | 17 | | | | 187 | |
Agenus, Inc.(c) | | | 130 | | | | 566 | |
Agios Pharmaceuticals, Inc.(c) | | | 73 | | | | 2,994 | |
Aimmune Therapeutics, Inc.(b)(c) | | | 51 | | | | 1,745 | |
Akcea Therapeutics, Inc.(c) | | | 21 | | | | 384 | |
Akebia Therapeutics, Inc.(c) | | | 134 | | | | 1,395 | |
Akero Therapeutics, Inc.(c) | | | 21 | | | | 685 | |
See accompanying Notes to Financial Statements which are an integral part of the financial statements.
Invesco PureBetaSM MSCI USA Small Cap ETF (PBSM)–(continued)
August 31, 2020
| | | | | | | | |
| | | Shares | | | Value | |
| Health Care-(continued) | | | | | | | | |
| Alder Biopharmaceuticals, Inc., CVR(c)(e) | | | 48 | | | $ | 42 | |
| Alector, Inc.(c) | | | 51 | | | | 659 | |
| Alkermes PLC(c) | | | 190 | | | | 3,143 | |
| Allakos, Inc.(b)(c) | | | 30 | | | | 2,687 | |
| Allogene Therapeutics, Inc.(c) | | | 66 | | | | 2,353 | |
| Allscripts Healthcare Solutions, Inc.(c) | | | 201 | | | | 1,795 | |
| AMAG Pharmaceuticals, Inc.(b)(c) | | | 40 | | | | 414 | |
| Amedisys, Inc.(c) | | | 38 | | | | 9,192 | |
| Amicus Therapeutics, Inc.(c) | | | 309 | | | | 4,511 | |
| AMN Healthcare Services, Inc.(c) | | | 57 | | | | 3,069 | |
| Amneal Pharmaceuticals, Inc.(c) | | | 85 | | | | 349 | |
| Amphastar Pharmaceuticals, Inc.(c) | | | 43 | | | | 876 | |
| AnaptysBio, Inc.(c) | | | 14 | | | | 243 | |
| AngioDynamics, Inc.(c) | | | 43 | | | | 403 | |
| ANI Pharmaceuticals, Inc.(c) | | | 10 | | | | 314 | |
| Anika Therapeutics, Inc.(c) | | | 16 | | | | 613 | |
| Antares Pharma, Inc.(c) | | | 187 | | | | 529 | |
| Apellis Pharmaceuticals, Inc.(c) | | | 73 | | | | 2,251 | |
| Apollo Medical Holdings, Inc.(c) | | | 30 | | | | 567 | |
| Applied Therapeutics, Inc.(c) | | | 16 | | | | 386 | |
| Aprea Therapeutics, Inc. (Sweden)(b)(c) | | | 11 | | | | 298 | |
| Arcturus Therapeutics Holdings, Inc.(c) | | | 18 | | | | 868 | |
| Arcus Biosciences, Inc.(c) | | | 43 | | | | 1,023 | |
| Arcutis Biotherapeutics, Inc.(c) | | | 11 | | | | 276 | |
| Ardelyx, Inc.(c) | | | 68 | | | | 390 | |
| Arena Pharmaceuticals, Inc.(c) | | | 66 | | | | 4,608 | |
| Arrowhead Pharmaceuticals, Inc.(c) | | | 115 | | | | 4,858 | |
| Arvinas, Inc.(c) | | | 25 | | | | 649 | |
| Assembly Biosciences, Inc.(c) | | | 36 | | | | 787 | |
| Atara Biotherapeutics, Inc.(c) | | | 86 | | | | 1,159 | |
| Athenex, Inc.(c) | | | 57 | | | | 655 | |
| Athersys, Inc.(c) | | | 221 | | | | 482 | |
| Atreca, Inc., Class A(c) | | | 39 | | | | 555 | |
| AtriCure, Inc.(c) | | | 54 | | | | 2,415 | |
| Atrion Corp. | | | 2 | | | | 1,263 | |
| Avanos Medical, Inc.(c) | | | 58 | | | | 1,879 | |
| Avrobio, Inc.(c) | | | 26 | | | | 450 | |
| AxoGen, Inc.(c) | | | 40 | | | | 475 | |
Axonics Modulation Technologies,
Inc.(b)(c) | | | 28 | | | | 1,183 | |
| Axsome Therapeutics, Inc.(c) | | | 34 | | | | 2,493 | |
| Beam Therapeutics, Inc.(b)(c) | | | 15 | | | | 377 | |
| BioCryst Pharmaceuticals, Inc.(c) | | | 180 | | | | 747 | |
| BioDelivery Sciences International, Inc.(c) | | | 97 | | | | 379 | |
| Biohaven Pharmaceutical Holding Co. Ltd.(c) | | | 57 | | | | 3,613 | |
| BioSpecifics Technologies Corp.(c) | | | 6 | | | | 387 | |
| Bio-Techne Corp. | | | 45 | | | | 11,496 | |
| BioTelemetry, Inc.(c) | | | 40 | | | | 1,583 | |
| Bioxcel Therapeutics, Inc.(c) | | | 12 | | | | 489 | |
| Black Diamond Therapeutics, Inc.(c) | | | 11 | | | | 316 | |
| Bluebird Bio, Inc.(c) | | | 75 | | | | 4,447 | |
| Blueprint Medicines Corp.(c) | | | 61 | | | | 4,723 | |
| Brookdale Senior Living, Inc.(c) | | | 66 | | | | 181 | |
| Bruker Corp. | | | 126 | | | | 5,295 | |
| Calithera Biosciences, Inc.(c) | | | 57 | | | | 230 | |
| Cantel Medical Corp. | | | 45 | | | | 2,362 | |
| Cara Therapeutics, Inc.(c) | | | 49 | | | | 759 | |
| Cardiovascular Systems, Inc.(c) | | | 43 | | | | 1,405 | |
| CareDx, Inc.(c) | | | 46 | | | | 1,571 | |
| Castle Biosciences, Inc.(c) | | | 15 | | | | 686 | |
| Catalyst Pharmaceuticals, Inc.(c) | | | 109 | | | | 358 | |
| | | | | | | | |
| | | Shares | | | Value | |
| Health Care-(continued) | | | | | | | | |
| CEL-SCI Corp.(b)(c) | | | 42 | | | $ | 543 | |
| Cerus Corp.(c) | | | 214 | | | | 1,363 | |
| Change Healthcare, Inc.(c) | | | 276 | | | | 3,905 | |
| Charles River Laboratories International, Inc.(c) | | | 58 | | | | 12,699 | |
| Chemed Corp. | | | 19 | | | | 9,825 | |
| ChemoCentryx, Inc.(c) | | | 46 | | | | 2,461 | |
| Clovis Oncology, Inc.(b)(c) | | | 99 | | | | 516 | |
| Codexis, Inc.(c) | | | 67 | | | | 925 | |
| Co-Diagnostics, Inc.(b)(c) | | | 29 | | | | 316 | |
| Coherus Biosciences, Inc.(b)(c) | | | 63 | | | | 1,195 | |
| Collegium Pharmaceutical, Inc.(c) | | | 31 | | | | 591 | |
| Community Health Systems, Inc.(c) | | | 145 | | | | 750 | |
| Computer Programs & Systems, Inc. | | | 15 | | | | 410 | |
| CONMED Corp. | | | 34 | | | | 2,935 | |
| Constellation Pharmaceuticals, Inc.(c) | | | 27 | | | | 568 | |
| Corbus Pharmaceuticals Holdings, Inc.(b)(c) | | | 77 | | | | 715 | |
| Corcept Therapeutics, Inc.(b)(c) | | | 121 | | | | 1,537 | |
| Cortexyme, Inc.(c) | | | 17 | | | | 747 | |
| CorVel Corp.(c) | | | 12 | | | | 996 | |
| Covetrus, Inc.(c) | | | 123 | | | | 2,818 | |
| Crinetics Pharmaceuticals, Inc.(c) | | | 22 | | | | 353 | |
| CRISPR Therapeutics AG (Switzerland)(c) | | | 61 | | | | 5,701 | |
| CryoLife, Inc.(c) | | | 43 | | | | 869 | |
| CryoPort, Inc.(b)(c) | | | 43 | | | | 2,386 | |
| Cue Biopharma, Inc.(c) | | | 25 | | | | 447 | |
| Cytokinetics, Inc.(b)(c) | | | 75 | | | | 1,797 | |
| CytomX Therapeutics, Inc.(c) | | | 36 | | | | 263 | |
| Deciphera Pharmaceuticals, Inc.(c) | | | 42 | | | | 1,890 | |
| Denali Therapeutics, Inc.(c) | | | 93 | | | | 2,967 | |
| Dicerna Pharmaceuticals, Inc.(c) | | | 80 | | | | 1,482 | |
| Durect Corp.(c) | | | 231 | | | | 401 | |
| Dynavax Technologies Corp.(b)(c) | | | 102 | | | | 610 | |
| Eagle Pharmaceuticals, Inc.(c) | | | 13 | | | | 516 | |
| Editas Medicine, Inc.(b)(c) | | | 69 | | | | 2,431 | |
| Eidos Therapeutics, Inc.(c) | | | 9 | | | | 390 | |
| Emergent BioSolutions, Inc.(c) | | | 51 | | | | 5,817 | |
| Enanta Pharmaceuticals, Inc.(c) | | | 18 | | | | 939 | |
| Encompass Health Corp. | | | 115 | | | | 7,503 | |
| Endo International PLC(c) | | | 247 | | | | 743 | |
| Ensign Group, Inc. (The) | | | 61 | | | | 3,571 | |
| Envista Holdings Corp.(c) | | | 187 | | | | 4,486 | |
| Epizyme, Inc.(c) | | | 88 | | | | 1,144 | |
| Esperion Therapeutics, Inc.(b)(c) | | | 30 | | | | 1,083 | |
| Evolent Health, Inc., Class A(c) | | | 91 | | | | 1,304 | |
| Exelixis, Inc.(c) | | | 361 | | | | 8,021 | |
| Fate Therapeutics, Inc.(c) | | | 68 | | | | 2,475 | |
| FibroGen, Inc.(c) | | | 90 | | | | 4,035 | |
| Flexion Therapeutics, Inc.(b)(c) | | | 54 | | | | 630 | |
| G1 Therapeutics, Inc.(c) | | | 30 | | | | 460 | |
| GenMark Diagnostics, Inc.(c) | | | 83 | | | | 1,076 | |
| Geron Corp.(c) | | | 368 | | | | 754 | |
| Glaukos Corp.(b)(c) | | | 48 | | | | 2,296 | |
| Global Blood Therapeutics, Inc.(c) | | | 65 | | | | 4,081 | |
| Globus Medical, Inc., Class A(c) | | | 93 | | | | 5,256 | |
| Gossamer Bio., Inc.(c) | | | 62 | | | | 862 | |
| Guardant Health, Inc.(c) | | | 67 | | | | 6,398 | |
| Haemonetics Corp.(c) | | | 59 | | | | 5,290 | |
| Halozyme Therapeutics, Inc.(c) | | | 160 | | | | 4,639 | |
| Hanger, Inc.(c) | | | 39 | | | | 771 | |
| Health Catalyst, Inc.(b)(c) | | | 20 | | | | 624 | |
See accompanying Notes to Financial Statements which are an integral part of the financial statements.
Invesco PureBetaSM MSCI USA Small Cap ETF (PBSM)–(continued)
August 31, 2020
| | | | | | | | |
| | | Shares | | | Value | |
| Health Care-(continued) | | | | | | | | |
| HealthEquity, Inc.(c) | | | 82 | | | $ | 4,713 | |
| HealthStream, Inc.(c) | | | 30 | | | | 621 | |
| Heron Therapeutics, Inc.(c) | | | 102 | | | | 1,459 | |
| Heska Corp.(c) | | | 9 | | | | 932 | |
| Hill-Rom Holdings, Inc. | | | 79 | | | | 7,409 | |
| HMS Holdings Corp.(c) | | | 106 | | | | 2,956 | |
| Homology Medicines, Inc.(c) | | | 22 | | | | 234 | |
| Horizon Therapeutics PLC(c) | | | 225 | | | | 16,902 | |
| ICU Medical, Inc.(c) | | | 24 | | | | 4,806 | |
| IGM Biosciences, Inc.(b)(c) | | | 9 | | | | 387 | |
| ImmunoGen, Inc.(c) | | | 187 | | | | 692 | |
| Immunomedics, Inc.(c) | | | 233 | | | | 10,382 | |
| Immunovant, Inc.(c) | | | 39 | | | | 1,324 | |
| Innoviva, Inc.(c) | | | 84 | | | | 984 | |
| Inogen, Inc.(c) | | | 8 | | | | 242 | |
| Inovalon Holdings, Inc., Class A(c) | | | 81 | | | | 2,004 | |
| Inovio Pharmaceuticals, Inc.(b)(c) | | | 172 | | | | 2,062 | |
| Insmed, Inc.(c) | | | 114 | | | | 3,214 | |
| Inspire Medical Systems, Inc.(c) | | | 26 | | | | 3,106 | |
| Integer Holdings Corp.(c) | | | 40 | | | | 2,770 | |
| Integra LifeSciences Holdings Corp.(c) | | | 85 | | | | 4,062 | |
| Intellia Therapeutics, Inc.(b)(c) | | | 57 | | | | 1,230 | |
| Intercept Pharmaceuticals, Inc.(b)(c) | | | 29 | | | | 1,447 | |
| Intersect ENT, Inc.(c) | | | 36 | | | | 723 | |
| Intra-Cellular Therapies, Inc.(c) | | | 76 | | | | 1,385 | |
| Invitae Corp.(b)(c) | | | 142 | | | | 4,964 | |
| Iovance Biotherapeutics, Inc.(c) | | | 128 | | | | 4,266 | |
| iRhythm Technologies, Inc.(c) | | | 31 | | | | 6,826 | |
| Ironwood Pharmaceuticals, Inc.(c) | | | 190 | | | | 1,919 | |
| Kadmon Holdings, Inc.(c) | | | 142 | | | | 710 | |
| Kala Pharmaceuticals, Inc.(c) | | | 39 | | | | 347 | |
| Karuna Therapeutics, Inc.(c) | | | 14 | | | | 1,070 | |
| Karyopharm Therapeutics, Inc.(c) | | | 60 | | | | 913 | |
| Kiniksa Pharmaceuticals Ltd., Class A(c) | | | 20 | | | | 353 | |
| Kodiak Sciences, Inc.(c) | | | 26 | | | | 1,367 | |
| Krystal Biotech, Inc.(c) | | | 13 | | | | 622 | |
| Kura Oncology, Inc.(c) | | | 66 | | | | 1,643 | |
| Lannett Co., Inc.(c) | | | 39 | | | | 205 | |
| Lantheus Holdings, Inc.(c) | | | 73 | | | | 980 | |
| LeMaitre Vascular, Inc.(b) | | | 21 | | | | 678 | |
| LHC Group, Inc.(c) | | | 35 | | | | 7,295 | |
| Ligand Pharmaceuticals, Inc.(c) | | | 21 | | | | 2,142 | |
| LivaNova PLC(c) | | | 58 | | | | 2,720 | |
| Livongo Health, Inc.(c) | | | 46 | | | | 6,316 | |
| Luminex Corp. | | | 48 | | | | 1,281 | |
| MacroGenics, Inc.(c) | | | 50 | | | | 1,447 | |
| Madrigal Pharmaceuticals, Inc.(c) | | | 13 | | | | 1,400 | |
| Magellan Health, Inc.(c) | | | 28 | | | | 2,113 | |
| MEDNAX, Inc.(c) | | | 103 | | | | 1,914 | |
| Medpace Holdings, Inc.(c) | | | 34 | | | | 4,413 | |
| MeiraGTx Holdings PLC(c) | | | 18 | | | | 234 | |
| Meridian Bioscience, Inc.(c) | | | 49 | | | | 693 | |
| Merit Medical Systems, Inc.(c) | | | 59 | | | | 2,897 | |
| Mersana Therapeutics, Inc.(c) | | | 52 | | | | 996 | |
| Merus N.V. (Netherlands)(c) | | | 18 | | | | 217 | |
| Mesa Laboratories, Inc. | | | 6 | | | | 1,476 | |
| Mirati Therapeutics, Inc.(c) | | | 34 | | | | 5,079 | |
| Molecular Templates, Inc.(c) | | | 24 | | | | 279 | |
| Momenta Pharmaceuticals, Inc.(c) | | | 132 | | | | 6,886 | |
| MyoKardia, Inc.(c) | | | 58 | | | | 6,348 | |
| | | | | | | | |
| | | Shares | | | Value | |
| Health Care-(continued) | | | | | | | | |
| Myovant Sciences Ltd.(c) | | | 49 | | | $ | 999 | |
| Myriad Genetics, Inc.(c) | | | 90 | | | | 1,203 | |
| NanoString Technologies, Inc.(c) | | | 40 | | | | 1,619 | |
| Natera, Inc.(c) | | | 78 | | | | 4,969 | |
| National HealthCare Corp. | | | 13 | | | | 828 | |
| National Research Corp. | | | 15 | | | | 840 | |
| Natus Medical, Inc.(c) | | | 42 | | | | 763 | |
| Nektar Therapeutics(c) | | | 213 | | | | 4,119 | |
| Neogen Corp.(c) | | | 62 | | | | 4,724 | |
| NeoGenomics, Inc.(c) | | | 119 | | | | 4,635 | |
| Neoleukin Therapeutics, Inc.(c) | | | 32 | | | | 407 | |
| Nevro Corp.(c) | | | 36 | | | | 4,951 | |
| NextGen Healthcare, Inc.(c) | | | 60 | | | | 796 | |
| Novavax, Inc.(c) | | | 69 | | | | 7,613 | |
| Novocure Ltd.(c) | | | 99 | | | | 8,192 | |
| NuVasive, Inc.(c) | | | 63 | | | | 3,284 | |
| Odonate Therapeutics, Inc.(c) | | | 18 | | | | 291 | |
| Omeros Corp.(b)(c) | | | 55 | | | | 657 | |
| Omnicell, Inc.(c) | | | 51 | | | | 3,401 | |
| Ontrak, Inc.(c) | | | 8 | | | | 584 | |
| OPKO Health, Inc.(b)(c) | | | 488 | | | | 1,581 | |
| Option Care Health, Inc.(c) | | | 42 | | | | 488 | |
| OraSure Technologies, Inc.(c) | | | 91 | | | | 1,067 | |
| Orthofix Medical, Inc.(c) | | | 22 | | | | 667 | |
| OrthoPediatrics Corp.(c) | | | 10 | | | | 504 | |
| Owens & Minor, Inc. | | | 76 | | | | 1,260 | |
| Pacific Biosciences of California, Inc.(c) | | | 151 | | | | 997 | |
| Pacira BioSciences, Inc.(c) | | | 45 | | | | 2,813 | |
| Passage Bio, Inc.(c) | | | 16 | | | | 265 | |
| Patterson Cos., Inc. | | | 103 | | | | 2,988 | |
| PDL BioPharma, Inc.(c) | | | 171 | | | | 573 | |
| Pennant Group, Inc. (The)(c) | | | 36 | | | | 1,333 | |
| Penumbra, Inc.(c) | | | 39 | | | | 8,157 | |
| PetIQ, Inc.(b)(c) | | | 22 | | | | 774 | |
| Phathom Pharmaceuticals, Inc.(c) | | | 9 | | | | 331 | |
| Phibro Animal Health Corp., Class A | | | 24 | | | | 515 | |
| Phreesia, Inc.(c) | | | 27 | | | | 852 | |
| PRA Health Sciences, Inc.(c) | | | 75 | | | | 8,018 | |
| Precigen, Inc.(c) | | | 53 | | | | 321 | |
| Precision BioSciences, Inc.(c) | | | 43 | | | | 243 | |
| Premier, Inc., Class A | | | 84 | | | | 2,751 | |
| Prestige Consumer Healthcare, Inc.(c) | | | 61 | | | | 2,222 | |
| Principia Biopharma, Inc.(c) | | | 30 | | | | 3,000 | |
| Progyny, Inc.(c) | | | 20 | | | | 571 | |
| Prothena Corp. PLC (Ireland)(c) | | | 24 | | | | 311 | |
| Provention Bio, Inc.(c) | | | 39 | | | | 509 | |
| Providence Service Corp. (The)(c) | | | 13 | | | | 1,204 | |
| PTC Therapeutics, Inc.(c) | | | 64 | | | | 3,163 | |
| Puma Biotechnology, Inc.(c) | | | 51 | | | | 525 | |
| Quanterix Corp.(c) | | | 27 | | | | 961 | |
| Quidel Corp.(c) | | | 45 | | | | 7,918 | |
| Quotient Ltd.(b)(c) | | | 85 | | | | 430 | |
| R1 RCM, Inc.(c) | | | 109 | | | | 1,580 | |
| Radius Health, Inc.(c) | | | 51 | | | | 631 | |
| RadNet, Inc.(c) | | | 49 | | | | 707 | |
| Reata Pharmaceuticals, Inc., Class A(c) | | | 27 | | | | 2,834 | |
| REGENXBIO, Inc.(c) | | | 40 | | | | 1,221 | |
| Relmada Therapeutics, Inc.(b)(c) | | | 14 | | | | 500 | |
| Repligen Corp.(c) | | | 59 | | | | 9,140 | |
| Replimune Group, Inc.(c) | | | 14 | | | | 378 | |
See accompanying Notes to Financial Statements which are an integral part of the financial statements.
Invesco PureBetaSM MSCI USA Small Cap ETF (PBSM)–(continued)
August 31, 2020
| | | | | | | | |
| | | Shares | | | Value | |
| Health Care-(continued) | | | | | | | | |
| Repro-Med Systems, Inc.(c) | | | 30 | | | $ | 261 | |
| Retrophin, Inc.(c) | | | 43 | | | | 842 | |
| Revance Therapeutics, Inc.(c) | | | 63 | | | | 1,841 | |
| REVOLUTION Medicines, Inc.(c) | | | 14 | | | | 397 | |
| Rhythm Pharmaceuticals, Inc.(c) | | | 24 | | | | 708 | |
| Rigel Pharmaceuticals, Inc.(c) | | | 196 | | | | 488 | |
| Rocket Pharmaceuticals, Inc.(c) | | | 39 | | | | 997 | |
| Rubius Therapeutics, Inc.(c) | | | 12 | | | | 58 | |
| Sage Therapeutics, Inc.(c) | | | 57 | | | | 2,989 | |
| Sangamo Therapeutics, Inc.(c) | | | 141 | | | | 1,556 | |
| Scholar Rock Holding Corp.(c) | | | 22 | | | | 332 | |
| Schrodinger, Inc.(c) | | | 15 | | | | 907 | |
| Select Medical Holdings Corp.(c) | | | 123 | | | | 2,469 | |
| Shockwave Medical, Inc.(c) | | | 29 | | | | 1,843 | |
| SI-BONE, Inc.(c) | | | 25 | | | | 545 | |
| SIGA Technologies, Inc.(c) | | | 64 | | | | 445 | |
| Silk Road Medical, Inc.(c) | | | 33 | | | | 2,012 | |
| Simulations Plus, Inc. | | | 15 | | | | 894 | |
| SmileDirectClub, Inc.(c) | | | 67 | | | | 544 | |
| Sorrento Therapeutics, Inc.(b)(c) | | | 139 | | | | 1,113 | |
| Spectrum Pharmaceuticals, Inc.(c) | | | 110 | | | | 463 | |
| SpringWorks Therapeutics, Inc.(c) | | | 15 | | | | 666 | |
| STAAR Surgical Co.(c) | | | 40 | | | | 1,918 | |
| Stemline Therapeutics, Inc.(c) | | | 64 | | | | 21 | |
| Stoke Therapeutics, Inc.(b)(c) | | | 10 | | | | 294 | |
| Supernus Pharmaceuticals, Inc.(c) | | | 58 | | | | 1,275 | |
| Surgery Partners, Inc.(c) | | | 22 | | | | 420 | |
| SurModics, Inc.(c) | | | 16 | | | | 724 | |
| Syneos Health, Inc.(c) | | | 72 | | | | 4,543 | |
| Tabula Rasa HealthCare, Inc.(b)(c) | | | 22 | | | | 1,113 | |
| Tactile Systems Technology, Inc.(c) | | | 21 | | | | 807 | |
| Tandem Diabetes Care, Inc.(c) | | | 66 | | | | 7,440 | |
| Tenet Healthcare Corp.(c) | | | 106 | | | | 2,987 | |
| TG Therapeutics, Inc.(c) | | | 117 | | | | 2,902 | |
| TherapeuticsMD, Inc.(c) | | | 184 | | | | 269 | |
| Theravance Biopharma, Inc.(c) | | | 55 | | | | 1,008 | |
| Tilray, Inc., Class 2 (Canada)(c) | | | 9 | | | | 60 | |
| Tivity Health, Inc.(c) | | | 31 | | | | 507 | |
| Translate Bio, Inc.(c) | | | 55 | | | | 775 | |
| Tricida, Inc.(c) | | | 34 | | | | 359 | |
| Triple-S Management Corp., Class B(c) | | | 30 | | | | 558 | |
| Turning Point Therapeutics, Inc.(c) | | | 39 | | | | 3,049 | |
| Twist Bioscience Corp.(c) | | | 36 | | | | 2,517 | |
| Ultragenyx Pharmaceutical, Inc.(c) | | | 66 | | | | 5,614 | |
| uniQure N.V. (Netherlands)(c) | | | 37 | | | | 1,508 | |
| United Therapeutics Corp.(c) | | | 51 | | | | 5,455 | |
| US Physical Therapy, Inc. | | | 16 | | | | 1,422 | |
| Vanda Pharmaceuticals, Inc.(c) | | | 58 | | | | 597 | |
| Vapotherm, Inc.(c) | | | 11 | | | | 342 | |
| Varex Imaging Corp.(c) | | | 45 | | | | 499 | |
| Veracyte, Inc.(c) | | | 68 | | | | 2,265 | |
| Verastem, Inc.(c) | | | 124 | | | | 156 | |
| Vericel Corp.(c) | | | 49 | | | | 777 | |
| ViewRay, Inc.(c) | | | 141 | | | | 384 | |
| Viking Therapeutics, Inc.(b)(c) | | | 75 | | | | 502 | |
| Vocera Communications, Inc.(c) | | | 36 | | | | 1,008 | |
| Voyager Therapeutics, Inc.(c) | | | 33 | | | | 389 | |
| WaVe Life Sciences Ltd.(c) | | | 14 | | | | 175 | |
| Wright Medical Group N.V.(c) | | | 151 | | | | 4,565 | |
| XBiotech, Inc.(c) | | | 18 | | | | 341 | |
| | | | | | | | |
| | | Shares | | | Value | |
| Health Care-(continued) | | | | | | | | |
| Xencor, Inc.(c) | | | 61 | | | $ | 2,181 | |
| Xenon Pharmaceuticals, Inc. (Canada)(c) | | | 33 | | | | 401 | |
| Y-mAbs Therapeutics, Inc.(c) | | | 20 | | | | 861 | |
| ZIOPHARM Oncology, Inc.(b)(c) | | | 289 | | | | 812 | |
| Zogenix, Inc.(c) | | | 56 | | | | 1,326 | |
| Zymeworks, Inc. (Canada)(c) | | | 40 | | | | 1,297 | |
| Zynex, Inc.(b)(c) | | | 22 | | | | 326 | |
| | | | | | | | |
| | | | | | | 651,748 | |
| | | | | | | | |
| Industrials-15.02% | | | | | | | | |
| AAON, Inc. | | | 51 | | | | 2,903 | |
| AAR Corp. | | | 40 | | | | 807 | |
| ABM Industries, Inc. | | | 81 | | | | 3,089 | |
| ACCO Brands Corp. | | | 120 | | | | 778 | |
| Acuity Brands, Inc. | | | 47 | | | | 5,137 | |
| ADT, Inc.(b) | | | 178 | | | | 1,896 | |
| Advanced Disposal Services, Inc.(c) | | | 91 | | | | 2,742 | |
| Advanced Drainage Systems, Inc. | | | 63 | | | | 3,495 | |
| AECOM(c) | | | 185 | | | | 7,309 | |
| Aegion Corp.(c) | | | 37 | | | | 599 | |
| Aerojet Rocketdyne Holdings, Inc.(c) | | | 77 | | | | 3,185 | |
| AeroVironment, Inc.(c) | | | 28 | | | | 2,139 | |
| AGCO Corp. | | | 74 | | | | 5,261 | |
| Air Lease Corp. | | | 129 | | | | 4,009 | |
| Air Transport Services Group, Inc.(c) | | | 18 | | | | 458 | |
| Alamo Group, Inc. | | | 12 | | | | 1,331 | |
| Alaska Air Group, Inc. | | | 36 | | | | 1,402 | |
| Albany International Corp., Class A | | | 37 | | | | 1,920 | |
| Allegiant Travel Co. | | | 6 | | | | 772 | |
| Allison Transmission Holdings, Inc. | | | 141 | | | | 5,058 | |
| Altra Industrial Motion Corp. | | | 78 | | | | 3,046 | |
| Ameresco, Inc., Class A(c) | | | 24 | | | | 819 | |
| American Airlines Group, Inc.(b) | | | 150 | | | | 1,957 | |
| American Woodmark Corp.(c) | | | 18 | | | | 1,575 | |
| Apogee Enterprises, Inc. | | | 30 | | | | 628 | |
| Applied Industrial Technologies, Inc. | | | 46 | | | | 2,770 | |
| ArcBest Corp. | | | 30 | | | | 1,015 | |
| Arcosa, Inc. | | | 60 | | | | 2,777 | |
| Argan, Inc. | | | 16 | | | | 677 | |
| Armstrong World Industries, Inc. | | | 57 | | | | 4,203 | |
| ASGN, Inc.(c) | | | 64 | | | | 4,593 | |
| Astec Industries, Inc, | | | 25 | | | | 1,318 | |
| Astronics Corp.(c) | | | 26 | | | | 235 | |
| Atkore International Group, Inc.(c) | | | 57 | | | | 1,524 | |
| Atlas Air Worldwide Holdings, Inc.(c) | | | 7 | | | | 395 | |
| Avis Budget Group, Inc.(b)(c) | | | 66 | | | | 2,251 | |
| Axon Enterprise, Inc.(c) | | | 69 | | | | 5,912 | |
| AZZ, Inc. | | | 31 | | | | 1,077 | |
| Barnes Group, Inc. | | | 58 | | | | 2,297 | |
| Barrett Business Services, Inc. | | | 9 | | | | 518 | |
| Beacon Roofing Supply, Inc.(c) | | | 65 | | | | 2,203 | |
| Bloom Energy Corp., Class A(b)(c) | | | 106 | | | | 1,660 | |
| Blue Bird Corp.(c) | | | 16 | | | | 182 | |
| BMC Stock Holdings, Inc.(c) | | | 79 | | | | 3,154 | |
| Brady Corp., Class A | | | 60 | | | | 2,813 | |
| BrightView Holdings, Inc.(c) | | | 37 | | | | 454 | |
| Brink’s Co. (The) | | | 57 | | | | 2,757 | |
| Builders FirstSource, Inc.(c) | | | 139 | | | | 4,256 | |
| BWX Technologies, Inc. | | | 112 | | | | 6,228 | |
| CAI International, Inc.(c) | | | 21 | | | | 458 | |
See accompanying Notes to Financial Statements which are an integral part of the financial statements.
Invesco PureBetaSM MSCI USA Small Cap ETF (PBSM)–(continued)
August 31, 2020
| | | | | | | | |
| | | Shares | | | Value | |
Industrials-(continued) | | | | | | | | |
Carlisle Cos., Inc. | | | 66 | | | $ | 8,643 | |
Casella Waste Systems, Inc., Class A(c) | | | 54 | | | | 3,032 | |
CBIZ, Inc.(c) | | | 61 | | | | 1,484 | |
Chart Industries, Inc.(c) | | | 42 | | | | 2,760 | |
Cimpress PLC (Ireland)(c) | | | 23 | | | | 2,132 | |
Clean Harbors, Inc.(c) | | | 64 | | | | 3,910 | |
Colfax Corp.(c) | | | 114 | | | | 3,794 | |
Columbus McKinnon Corp. | | | 27 | | | | 982 | |
Comfort Systems USA, Inc. | | | 45 | | | | 2,280 | |
Construction Partners, Inc.(c) | | | 22 | | | | 411 | |
CoreLogic, Inc. | | | 94 | | | | 6,242 | |
Cornerstone Building Brands, Inc.(c) | | | 81 | | | | 645 | |
Covanta Holding Corp. | | | 144 | | | | 1,359 | |
Crane Co. | | | 58 | | | | 3,279 | |
CSW Industrials, Inc. | | | 18 | | | | 1,300 | |
Cubic Corp. | | | 36 | | | | 1,695 | |
Curtiss-Wright Corp. | | | 49 | | | | 5,014 | |
Deluxe Corp. | | | 52 | | | | 1,477 | |
Donaldson Co., Inc. | | | 147 | | | | 7,403 | |
Douglas Dynamics, Inc. | | | 27 | | | | 1,037 | |
Ducommun, Inc.(c) | | | 13 | | | | 486 | |
DXP Enterprises, Inc.(c) | | | 21 | | | | 404 | |
Dycom Industries, Inc.(b)(c) | | | 37 | | | | 2,276 | |
Echo Global Logistics, Inc.(c) | | | 33 | | | | 902 | |
EMCOR Group, Inc. | | | 65 | | | | 4,876 | |
Encore Wire Corp. | | | 25 | | | | 1,290 | |
Energy Recovery, Inc.(b)(c) | | | 37 | | | | 315 | |
Enerpac Tool Group Corp. | | | 75 | | | | 1,560 | |
EnerSys | | | 51 | | | | 3,671 | |
Ennis, Inc. | | | 30 | | | | 550 | |
EnPro Industries, Inc. | | | 24 | | | | 1,404 | |
ESCO Technologies, Inc. | | | 31 | | | | 2,788 | |
Evoqua Water Technologies Corp.(c) | | | 97 | | | | 1,985 | |
Exponent, Inc. | | | 63 | | | | 5,069 | |
Federal Signal Corp. | | | 73 | | | | 2,345 | |
Flowserve Corp. | | | 154 | | | | 4,571 | |
Fluor Corp. | | | 162 | | | | 1,542 | |
Forrester Research, Inc.(c) | | | 13 | | | | 461 | |
Forward Air Corp. | | | 34 | | | | 2,006 | |
Foundation Building Materials, Inc.(c) | | | 25 | | | | 406 | |
Franklin Covey Co.(c) | | | 12 | | | | 237 | |
Franklin Electric Co., Inc. | | | 48 | | | | 2,849 | |
FTI Consulting, Inc.(b)(c) | | | 45 | | | | 5,164 | |
Gates Industrial Corp. PLC(c) | | | 67 | | | | 756 | |
GATX Corp. | | | 37 | | | | 2,475 | |
Genco Shipping & Trading Ltd. | | | 19 | | | | 135 | |
Generac Holdings, Inc.(c) | | | 74 | | | | 14,058 | |
Gibraltar Industries, Inc.(c) | | | 39 | | | | 2,435 | |
GMS, Inc.(c) | | | 52 | | | | 1,377 | |
Gorman-Rupp Co. (The) | | | 22 | | | | 703 | |
Graco, Inc. | | | 199 | | | | 11,546 | |
GrafTech International Ltd. | | | 85 | | | | 566 | |
Granite Construction, Inc. | | | 19 | | | | 353 | |
Great Lakes Dredge & Dock Corp.(c) | | | 66 | | | | 618 | |
Greenbrier Cos., Inc. (The) | | | 45 | | | | 1,224 | |
Griffon Corp. | | | 43 | | | | 934 | |
H&E Equipment Services, Inc. | | | 39 | | | | 790 | |
Harsco Corp.(c) | | | 97 | | | | 1,373 | |
Hawaiian Holdings, Inc. | | | 13 | | | | 175 | |
Healthcare Services Group, Inc. | | | 90 | | | | 1,872 | |
| | | | | | | | |
| | | Shares | | | Value | |
Industrials-(continued) | | | | | | | | |
Heartland Express, Inc. | | | 52 | | | $ | 1,076 | |
Heidrick & Struggles International, Inc. | | | 22 | | | | 476 | |
Helios Technologies, Inc. | | | 34 | | | | 1,398 | |
Herc Holdings, Inc.(c) | | | 25 | | | | 1,024 | |
Heritage-Crystal Clean, Inc.(c) | | | 18 | | | | 264 | |
Herman Miller, Inc. | | | 72 | | | | 1,716 | |
Hexcel Corp. | | | 96 | | | | 3,781 | |
Hillenbrand, Inc. | | | 90 | | | | 2,854 | |
HNI Corp. | | | 52 | | | | 1,656 | |
Hub Group, Inc., Class A(c) | | | 40 | | | | 2,154 | |
Hubbell, Inc. | | | 64 | | | | 9,275 | |
Huron Consulting Group, Inc.(c) | | | 28 | | | | 1,215 | |
Hyster-Yale Materials Handling, Inc. | | | 7 | | | | 282 | |
IAA, Inc.(c) | | | 155 | | | | 8,110 | |
ICF International, Inc. | | | 22 | | | | 1,503 | |
IES Holdings, Inc.(c) | | | 10 | | | | 288 | |
Insperity, Inc. | | | 43 | | | | 2,897 | |
Insteel Industries, Inc. | | | 21 | | | | 387 | |
Interface, Inc. | | | 70 | | | | 529 | |
ITT, Inc. | | | 104 | | | | 6,532 | |
JELD-WEN Holding, Inc.(c) | | | 79 | | | | 1,663 | |
JetBlue Airways Corp.(c) | | | 80 | | | | 922 | |
John Bean Technologies Corp. | | | 39 | | | | 3,998 | |
Kadant, Inc. | | | 13 | | | | 1,514 | |
Kaman Corp. | | | 30 | | | | 1,387 | |
KAR Auction Services, Inc. | | | 144 | | | | 2,497 | |
Kelly Services, Inc., Class A | | | 37 | | | | 703 | |
Kennametal, Inc. | | | 100 | | | | 2,902 | |
Kforce, Inc. | | | 27 | | | | 927 | |
Kimball International, Inc., Class B | | | 43 | | | | 482 | |
Kirby Corp.(c) | | | 18 | | | | 764 | |
Knoll, Inc. | | | 58 | | | | 746 | |
Korn Ferry | | | 69 | | | | 2,104 | |
Kratos Defense & Security Solutions, Inc.(c) | | | 143 | | | | 2,796 | |
Landstar System, Inc. | | | 48 | | | | 6,388 | |
Lincoln Electric Holdings, Inc. | | | 68 | | | | 6,576 | |
Lindsay Corp. | | | 13 | | | | 1,299 | |
Luxfer Holdings PLC (United Kingdom) | | | 33 | | | | 469 | |
Macquarie Infrastructure Corp. | | | 91 | | | | 2,550 | |
Manitowoc Co., Inc. (The)(c) | | | 17 | | | | 160 | |
ManpowerGroup, Inc. | | | 69 | | | | 5,058 | |
Marten Transport Ltd. | | | 72 | | | | 1,308 | |
Masonite International Corp.(c) | | | 30 | | | | 2,739 | |
MasTec, Inc.(c) | | | 73 | | | | 3,373 | |
Matson, Inc. | | | 13 | | | | 521 | |
Matthews International Corp., Class A | | | 37 | | | | 810 | |
Maxar Technologies, Inc. | | | 72 | | | | 1,667 | |
McGrath RentCorp. | | | 30 | | | | 1,991 | |
Mercury Systems, Inc.(c) | | | 64 | | | | 4,847 | |
Meritor, Inc.(c) | | | 88 | | | | 2,003 | |
Middleby Corp. (The)(c) | | | 66 | | | | 6,461 | |
Moog, Inc., Class A | | | 39 | | | | 2,351 | |
MRC Global, Inc.(c) | | | 33 | | | | 188 | |
MSA Safety, Inc. | | | 43 | | | | 5,416 | |
MSC Industrial Direct Co., Inc., Class A | | | 53 | | | | 3,493 | |
Mueller Industries, Inc. | | | 66 | | | | 1,960 | |
Mueller Water Products, Inc., Class A | | | 190 | | | | 2,052 | |
MYR Group, Inc.(c) | | | 19 | | | | 737 | |
National Presto Industries, Inc. | | | 6 | | | | 540 | |
Navistar International Corp.(c) | | | 54 | | | | 1,727 | |
See accompanying Notes to Financial Statements which are an integral part of the financial statements.
Invesco PureBetaSM MSCI USA Small Cap ETF (PBSM)–(continued)
August 31, 2020
| | | | | | | | |
| | | Shares | | | Value | |
Industrials-(continued) | | | | | | | | |
NOW, Inc.(c) | | | 132 | | | $ | 960 | |
NV5 Global, Inc.(c) | | | 12 | | | | 621 | |
nVent Electric PLC | | | 187 | | | | 3,575 | |
Omega Flex, Inc. | | | 4 | | | | 527 | |
Oshkosh Corp. | | | 81 | | | | 6,238 | |
PAE, Inc.(c) | | | 65 | | | | 574 | |
Park Aerospace Corp. | | | 21 | | | | 233 | |
Parsons Corp.(c) | | | 30 | | | | 998 | |
Patrick Industries, Inc. | | | 27 | | | | 1,518 | |
PGT Innovations, Inc.(c) | | | 69 | | | | 1,251 | |
Pitney Bowes, Inc. | | | 238 | | | | 1,307 | |
Plug Power, Inc.(b)(c) | | | 382 | | | | 4,958 | |
Powell Industries, Inc. | | | 12 | | | | 324 | |
Primoris Services Corp. | | | 51 | | | | 972 | |
Proto Labs, Inc.(c) | | | 31 | | | | 4,557 | |
Quanex Building Products Corp. | | | 39 | | | | 656 | |
Quanta Services, Inc. | | | 168 | | | | 8,610 | |
Raven Industries, Inc. | | | 43 | | | | 1,069 | |
RBC Bearings, Inc.(c) | | | 29 | | | | 3,829 | |
Regal Beloit Corp. | | | 47 | | | | 4,646 | |
Resideo Technologies, Inc.(c) | | | 137 | | | | 1,830 | |
Resources Connection, Inc. | | | 36 | | | | 442 | |
REV Group, Inc. | | | 11 | | | | 85 | |
Rexnord Corp. | | | 140 | | | | 4,054 | |
Rush Enterprises, Inc., Class A | | | 34 | | | | 1,643 | |
Rush Enterprises, Inc., Class B | | | 4 | | | | 167 | |
Ryder System, Inc. | | | 64 | | | | 2,618 | |
Saia, Inc.(c) | | | 30 | | | | 4,026 | |
Schneider National, Inc., Class B | | | 61 | | | | 1,651 | |
Shyft Group, Inc. (The) | | | 39 | | | | 779 | |
Simpson Manufacturing Co., Inc. | | | 46 | | | | 4,524 | |
SiteOne Landscape Supply, Inc.(c) | | | 51 | | | | 6,378 | |
SkyWest, Inc. | | | 15 | | | | 505 | |
SP Plus Corp.(c) | | | 28 | | | | 574 | |
Spirit AeroSystems Holdings, Inc., Class A | | | 124 | | | | 2,549 | |
Spirit Airlines, Inc.(b)(c) | | | 21 | | | | 375 | |
SPX Corp.(c) | | | 54 | | | | 2,259 | |
SPX FLOW, Inc.(c) | | | 51 | | | | 2,217 | |
Standex International Corp. | | | 15 | | | | 868 | |
Steelcase, Inc., Class A | | | 108 | | | | 1,129 | |
Stericycle, Inc.(c) | | | 106 | | | | 6,796 | |
Sterling Construction Co., Inc.(c) | | | 33 | | | | 467 | |
Sunrun, Inc.(b)(c) | | | 102 | | | | 5,769 | |
Systemax, Inc. | | | 15 | | | | 333 | |
Tennant Co. | | | 21 | | | | 1,396 | |
Terex Corp. | | | 87 | | | | 1,703 | |
Tetra Tech, Inc. | | | 66 | | | | 6,092 | |
Thermon Group Holdings, Inc.(c) | | | 39 | | | | 513 | |
Timken Co. (The) | | | 82 | | | | 4,444 | |
Toro Co. (The) | | | 127 | | | | 9,561 | |
TPI Composites, Inc.(c) | | | 33 | | | | 1,013 | |
Trex Co., Inc.(c) | | | 69 | | | | 10,315 | |
TriMas Corp.(c) | | | 54 | | | | 1,365 | |
TriNet Group, Inc.(c) | | | 55 | | | | 3,731 | |
Trinity Industries, Inc. | | | 113 | | | | 2,313 | |
Triton International Ltd. (Bermuda) | | | 64 | | | | 2,308 | |
Triumph Group, Inc. | | | 20 | | | | 145 | |
TrueBlue, Inc.(c) | | | 46 | | | | 778 | |
Tutor Perini Corp.(c) | | | 46 | | | | 577 | |
UFP Industries, Inc. | | | 75 | | | | 4,451 | |
| | | | | | | | |
| | | Shares | | | Value | |
Industrials-(continued) | | | | | | | | |
UniFirst Corp. | | | 19 | | | $ | 3,660 | |
Univar Solutions, Inc.(c) | | | 200 | | | | 3,638 | |
Upwork, Inc.(c) | | | 92 | | | | 1,401 | |
US Ecology, Inc. | | | 31 | | | | 1,151 | |
Valmont Industries, Inc. | | | 25 | | | | 3,176 | |
Vectrus, Inc.(c) | | | 13 | | | | 564 | |
Vertiv Holdings Co.(c) | | | 252 | | | | 4,090 | |
Viad Corp. | | | 24 | | | | 514 | |
Vicor Corp.(c) | | | 22 | | | | 1,915 | |
Virgin Galactic Holdings, Inc.(b)(c) | | | 153 | | | | 2,739 | |
Vivint Solar, Inc.(c) | | | 61 | | | | 1,884 | |
Wabash National Corp. | | | 64 | | | | 781 | |
Watsco, Inc. | | | 39 | | | | 9,555 | |
Watts Water Technologies, Inc., Class A | | | 30 | | | | 2,872 | |
Welbilt, Inc.(c) | | | 66 | | | | 487 | |
Werner Enterprises, Inc. | | | 77 | | | | 3,543 | |
WESCO International, Inc.(c) | | | 59 | | | | 2,764 | |
Willdan Group, Inc.(c) | | | 12 | | | | 338 | |
WillScot Mobile Mini Holdings Corp.(c) | | | 201 | | | | 3,598 | |
Woodward, Inc. | | | 70 | | | | 5,998 | |
| | | | | | | | |
| | | | | | | 607,808 | |
| | | | | | | | |
Information Technology-16.83% | | | | | | | | |
2U, Inc.(c) | | | 76 | | | | 3,146 | |
3D Systems Corp.(b)(c) | | | 138 | | | | 758 | |
8x8, Inc.(c) | | | 120 | | | | 2,026 | |
A10 Networks, Inc.(c) | | | 61 | | | | 522 | |
Acacia Communications, Inc.(c) | | | 46 | | | | 3,104 | |
ACI Worldwide, Inc.(c) | | | 141 | | | | 4,143 | |
ACM Research, Inc., Class A(c) | | | 13 | | | | 1,155 | |
ADTRAN, Inc. | | | 55 | | | | 610 | |
Advanced Energy Industries, Inc.(c) | | | 46 | | | | 3,410 | |
Agilysys, Inc.(c) | | | 24 | | | | 609 | |
Alarm.com Holdings, Inc.(c) | | | 52 | | | | 3,113 | |
Alliance Data Systems Corp. | | | 53 | | | | 2,391 | |
Altair Engineering, Inc., Class A(c) | | | 43 | | | | 1,807 | |
Alteryx, Inc., Class A(b)(c) | | | 62 | | | | 7,491 | |
Ambarella, Inc.(c) | | | 36 | | | | 1,897 | |
American Software, Inc., Class A | | | 36 | | | | 510 | |
Amkor Technology, Inc.(c) | | | 127 | | | | 1,549 | |
Anaplan, Inc.(c) | | | 129 | | | | 7,901 | |
AppFolio, Inc., Class A(c) | | | 18 | | | | 3,025 | |
Appian Corp.(c) | | | 34 | | | | 2,082 | |
Aspen Technology, Inc.(c) | | | 80 | | | | 10,162 | |
Avaya, Inc.(c) | | | 113 | | | | 1,754 | |
Avnet, Inc. | | | 114 | | | | 3,136 | |
Axcelis Technologies, Inc.(c) | | | 39 | | | | 922 | |
Badger Meter, Inc. | | | 36 | | | | 2,221 | |
Belden, Inc. | | | 55 | | | | 1,852 | |
Benchmark Electronics, Inc. | | | 45 | | | | 882 | |
Benefitfocus, Inc.(c) | | | 22 | | | | 227 | |
Bill.Com Holdings, Inc.(c) | | | 60 | | | | 5,939 | |
Blackbaud, Inc. | | | 60 | | | | 3,831 | |
Blackline, Inc.(c) | | | 56 | | | | 4,893 | |
Bottomline Technologies (DE), Inc.(c) | | | 51 | | | | 2,429 | |
Box, Inc., Class A(c) | | | 171 | | | | 3,357 | |
Brooks Automation, Inc. | | | 87 | | | | 4,492 | |
Cabot Microelectronics Corp. | | | 34 | | | | 5,178 | |
CACI International, Inc., Class A(c) | | | 29 | | | | 6,791 | |
Calix, Inc.(c) | | | 60 | | | | 1,167 | |
See accompanying Notes to Financial Statements which are an integral part of the financial statements.
Invesco PureBetaSM MSCI USA Small Cap ETF (PBSM)–(continued)
August 31, 2020
| | | | | | | | |
| | | Shares | | | Value | |
Information Technology-(continued) | |
Cardtronics PLC, Class A(c) | | | 46 | | | $ | 999 | |
Casa Systems, Inc.(c) | | | 12 | | | | 55 | |
Cass Information Systems, Inc. | | | 15 | | | | 587 | |
Cerence, Inc.(c) | | | 42 | | | | 2,234 | |
Ceridian HCM Holding, Inc.(c) | | | 137 | | | | 10,894 | |
CEVA, Inc.(c) | | | 25 | | | | 1,056 | |
ChannelAdvisor Corp.(c) | | | 30 | | | | 505 | |
Ciena Corp.(c) | | | 181 | | | | 10,275 | |
Cirrus Logic, Inc.(c) | | | 70 | | | | 4,241 | |
Cloudera, Inc.(c) | | | 238 | | | | 3,144 | |
Coherent, Inc.(c) | | | 28 | | | | 3,154 | |
Cohu, Inc. | | | 48 | | | | 826 | |
CommScope Holding Co., Inc.(c) | | | 235 | | | | 2,420 | |
CommVault Systems, Inc.(c) | | | 52 | | | | 2,248 | |
Comtech Telecommunications Corp. | | | 30 | | | | 498 | |
Conduent, Inc.(c) | | | 73 | | | | 247 | |
Cornerstone OnDemand, Inc.(c) | | | 63 | | | | 2,222 | |
Cree, Inc.(c) | | | 128 | | | | 8,077 | |
CSG Systems International, Inc. | | | 40 | | | | 1,703 | |
CTS Corp. | | | 36 | | | | 752 | |
Diebold Nixdorf, Inc.(c) | | | 85 | | | | 709 | |
Digital Turbine, Inc.(c) | | | 90 | | | | 2,177 | |
Diodes, Inc.(c) | | | 52 | | | | 2,541 | |
Dolby Laboratories, Inc., Class A | | | 78 | | | | 5,448 | |
Domo, Inc., Class B(c) | | | 25 | | | | 1,018 | |
DSP Group, Inc.(c) | | | 26 | | | | 373 | |
DXC Technology Co. | | | 300 | | | | 5,994 | |
Ebix, Inc.(b) | | | 29 | | | | 669 | |
EchoStar Corp., Class A(c) | | | 60 | | | | 1,763 | |
Elastic N.V.(c) | | | 63 | | | | 6,841 | |
Endurance International Group Holdings,
Inc.(c) | | | 76 | | | | 495 | |
Enphase Energy, Inc.(c) | | | 107 | | | | 8,264 | |
Entegris, Inc. | | | 160 | | | | 10,702 | |
Envestnet, Inc.(c) | | | 62 | | | | 5,145 | |
ePlus, Inc.(c) | | | 16 | | | | 1,228 | |
Euronet Worldwide, Inc.(c) | | | 62 | | | | 6,410 | |
Everbridge, Inc.(c) | | | 41 | | | | 6,093 | |
EVERTEC, Inc. | | | 70 | | | | 2,451 | |
Evo Payments, Inc., Class A(c) | | | 54 | | | | 1,551 | |
ExlService Holdings, Inc.(c) | | | 42 | | | | 2,675 | |
Extreme Networks, Inc.(c) | | | 147 | | | | 642 | |
Fabrinet (Thailand)(c) | | | 45 | | | | 3,140 | |
FARO Technologies, Inc.(c) | | | 21 | | | | 1,186 | |
Fastly, Inc., Class A(b)(c) | | | 84 | | | | 7,799 | |
FireEye, Inc.(c) | | | 261 | | | | 3,831 | |
First Solar, Inc.(c) | | | 96 | | | | 7,353 | |
Fitbit, Inc., Class A(c) | | | 276 | | | | 1,755 | |
Five9, Inc.(c) | | | 72 | | | | 9,176 | |
Flex Ltd.(c) | | | 596 | | | | 6,473 | |
FormFactor, Inc.(c) | | | 91 | | | | 2,378 | |
GTT Communications, Inc.(b)(c) | | | 18 | | | | 90 | |
Hackett Group, Inc. (The) | | | 30 | | | | 378 | |
Harmonic, Inc.(c) | | | 108 | | | | 637 | |
HubSpot, Inc.(c) | | | 49 | | | | 14,684 | |
Ichor Holdings Ltd.(c) | | | 25 | | | | 629 | |
II-VI, Inc.(c) | | | 119 | | | | 5,295 | |
Impinj, Inc.(b)(c) | | | 19 | | | | 465 | |
Infinera Corp.(c) | | | 196 | | | | 1,429 | |
Inphi Corp.(c) | | | 54 | | | | 6,155 | |
Inseego Corp.(b)(c) | | | 74 | | | | 850 | |
| | | | | | | | |
| | | Shares | | | Value | |
Information Technology-(continued) | |
Insight Enterprises, Inc.(c) | | | 43 | | | $ | 2,572 | |
InterDigital, Inc. | | | 39 | | | | 2,385 | |
International Money Express, Inc.(c) | | | 27 | | | | 457 | |
Itron, Inc.(c) | | | 43 | | | | 2,561 | |
j2 Global, Inc.(c) | | | 54 | | | | 3,779 | |
Jabil, Inc. | | | 158 | | | | 5,396 | |
KBR, Inc. | | | 171 | | | | 4,273 | |
Kimball Electronics, Inc.(c) | | | 30 | | | | 405 | |
Knowles Corp.(c) | | | 111 | | | | 1,672 | |
Kulicke & Soffa Industries, Inc. (Singapore) | | | 78 | | | | 1,870 | |
Lattice Semiconductor Corp.(c) | | | 164 | | | | 4,690 | |
Limelight Networks, Inc.(c) | | | 135 | | | | 765 | |
Littelfuse, Inc. | | | 29 | | | | 5,244 | |
LivePerson, Inc.(c) | | | 75 | | | | 4,474 | |
LiveRamp Holdings, Inc.(c) | | | 78 | | | | 4,356 | |
Lumentum Holdings, Inc.(c) | | | 88 | | | | 7,568 | |
MACOM Technology Solutions Holdings, Inc.(c) | | | 52 | | | | 1,853 | |
MagnaChip Semiconductor Corp. (South Korea)(b)(c) | | | 37 | | | | 444 | |
Manhattan Associates, Inc.(c) | | | 74 | | | | 7,196 | |
ManTech International Corp., Class A | | | 33 | | | | 2,470 | |
Maxeon Solar Technologies Ltd. (Singapore)(c) | | | 13 | | | | 270 | |
MAXIMUS, Inc. | | | 74 | | | | 5,739 | |
MaxLinear, Inc.(c) | | | 82 | | | | 1,997 | |
Medallia, Inc.(c) | | | 90 | | | | 3,257 | |
Methode Electronics, Inc. | | | 45 | | | | 1,274 | |
MicroStrategy, Inc., Class A(c) | | | 10 | | | | 1,444 | |
Mimecast Ltd.(c) | | | 70 | | | | 3,447 | |
Mitek Systems, Inc.(c) | | | 45 | | | | 571 | |
MKS Instruments, Inc. | | | 64 | | | | 7,650 | |
MobileIron, Inc.(c) | | | 75 | | | | 490 | |
Model N, Inc.(c) | | | 28 | | | | 1,101 | |
Monolithic Power Systems, Inc. | | | 50 | | | | 13,356 | |
MTS Systems Corp. | | | 24 | | | | 586 | |
Napco Security Technologies, Inc.(c) | | | 15 | | | | 374 | |
National Instruments Corp. | | | 144 | | | | 5,168 | |
NCR Corp.(c) | | | 145 | | | | 2,964 | |
NeoPhotonics Corp.(c) | | | 55 | | | | 366 | |
NETGEAR, Inc.(c) | | | 37 | | | | 1,234 | |
NetScout Systems, Inc.(c) | | | 91 | | | | 2,106 | |
New Relic, Inc.(c) | | | 58 | | | | 3,563 | |
NIC, Inc. | | | 81 | | | | 1,732 | |
nLight, Inc.(c) | | | 33 | | | | 771 | |
Novanta, Inc.(c) | | | 40 | | | | 4,287 | |
Nuance Communications, Inc.(c) | | | 334 | | | | 10,007 | |
Nutanix, Inc., Class A(c) | | | 203 | | | | 5,828 | |
NVE Corp. | | | 6 | | | | 321 | |
OneSpan, Inc.(c) | | | 37 | | | | 797 | |
Onto Innovation, Inc.(c) | | | 60 | | | | 1,874 | |
OSI Systems, Inc.(c) | | | 21 | | | | 1,654 | |
PagerDuty, Inc.(c) | | | 29 | | | | 947 | |
Paylocity Holding Corp.(c) | | | 41 | | | | 6,037 | |
Paysign, Inc.(b)(c) | | | 34 | | | | 219 | |
PC Connection, Inc. | | | 15 | | | | 664 | |
PDF Solutions, Inc.(c) | | | 33 | | | | 683 | |
Pegasystems, Inc. | | | 48 | | | | 6,167 | |
Perficient, Inc.(c) | | | 40 | | | | 1,716 | |
Perspecta, Inc. | | | 177 | | | | 3,676 | |
Photronics, Inc.(c) | | | 79 | | | | 792 | |
Ping Identity Holding Corp.(c) | | | 42 | | | | 1,448 | |
See accompanying Notes to Financial Statements which are an integral part of the financial statements.
Invesco PureBetaSM MSCI USA Small Cap ETF (PBSM)–(continued)
August 31, 2020
| | | | | | | | |
| | | Shares | | | Value | |
Information Technology-(continued) | | | | | |
Plantronics, Inc. | | | 13 | | | $ | 161 | |
Plexus Corp.(c) | | | 36 | | | | 2,739 | |
Pluralsight, Inc., Class A(c) | | | 124 | | | | 2,373 | |
Power Integrations, Inc. | | | 72 | | | | 4,030 | |
Progress Software Corp. | | | 54 | | | | 2,046 | |
Proofpoint, Inc.(c) | | | 67 | | | | 7,348 | |
PROS Holdings, Inc.(c) | | | 49 | | | | 1,911 | |
Pure Storage, Inc., Class A(c) | | | 270 | | | | 4,120 | |
Q2 Holdings, Inc.(c) | | | 57 | | | | 5,546 | |
QAD, Inc., Class A | | | 13 | | | | 591 | |
Qualys, Inc.(c) | | | 40 | | | | 4,246 | |
Rambus, Inc.(c) | | | 135 | | | | 1,813 | |
Rapid7, Inc.(c) | | | 57 | | | | 3,680 | |
RealPage, Inc.(c) | | | 109 | | | | 6,826 | |
Repay Holdings Corp.(c) | | | 54 | | | | 1,366 | |
Ribbon Communications, Inc.(c) | | | 63 | | | | 270 | |
Rogers Corp.(c) | | | 21 | | | | 2,379 | |
Rosetta Stone, Inc.(c) | | | 24 | | | | 729 | |
Sabre Corp. | | | 324 | | | | 2,265 | |
SailPoint Technologies Holding, Inc.(c) | | | 109 | | | | 4,276 | |
Sanmina Corp.(c) | | | 84 | | | | 2,377 | |
ScanSource, Inc.(c) | | | 30 | | | | 741 | |
Science Applications International Corp. | | | 63 | | | | 5,258 | |
SecureWorks Corp., Class A(c) | | | 9 | | | | 116 | |
Semtech Corp.(c) | | | 81 | | | | 4,751 | |
ShotSpotter, Inc.(c) | | | 10 | | | | 300 | |
Silicon Laboratories, Inc.(c) | | | 50 | | | | 5,120 | |
SMART Global Holdings, Inc.(c) | | | 16 | | | | 403 | |
Smartsheet, Inc., Class A(c) | | | 125 | | | | 6,816 | |
SolarEdge Technologies, Inc.(c) | | | 59 | | | | 13,048 | |
SolarWinds Corp.(c) | | | 74 | | | | 1,556 | |
Sprout Social, Inc., Class A(c) | | | 14 | | | | 542 | |
SPS Commerce, Inc.(c) | | | 43 | | | | 3,435 | |
SunPower Corp.(b)(c) | | | 109 | | | | 1,220 | |
Super Micro Computer, Inc.(c) | | | 52 | | | | 1,424 | |
SVMK, Inc.(c) | | | 127 | | | | 3,161 | |
Switch, Inc., Class A | | | 77 | | | | 1,324 | |
Sykes Enterprises, Inc.(c) | | | 48 | | | | 1,589 | |
Synaptics, Inc.(c) | | | 40 | | | | 3,413 | |
SYNNEX Corp. | | | 51 | | | | 6,485 | |
Tenable Holdings, Inc.(c) | | | 64 | | | | 2,409 | |
Teradata Corp.(c) | | | 138 | | | | 3,360 | |
TTEC Holdings, Inc. | | | 19 | | | | 1,077 | |
TTM Technologies, Inc.(c) | | | 121 | | | | 1,387 | |
Tucows, Inc., Class A(c) | | | 12 | | | | 759 | |
Ultra Clean Holdings, Inc.(c) | | | 46 | | | | 1,128 | |
Unisys Corp.(c) | | | 75 | | | | 874 | |
Universal Display Corp. | | | 50 | | | | 8,775 | |
Upland Software, Inc.(c) | | | 25 | | | | 980 | |
Varonis Systems, Inc.(c) | | | 37 | | | | 4,571 | |
Veeco Instruments, Inc.(c) | | | 57 | | | | 678 | |
Verint Systems, Inc.(c) | | | 77 | | | | 3,662 | |
Verra Mobility Corp.(c) | | | 160 | | | | 1,690 | |
ViaSat, Inc.(c) | | | 58 | | | | 2,306 | |
Viavi Solutions, Inc.(c) | | | 277 | | | | 3,694 | |
VirnetX Holding Corp. | | | 75 | | | | 373 | |
Virtusa Corp.(c) | | | 34 | | | | 1,344 | |
Vishay Intertechnology, Inc. | | | 160 | | | | 2,558 | |
Vishay Precision Group, Inc.(c) | | | 13 | | | | 324 | |
WEX, Inc.(c) | | | 51 | | | | 8,145 | |
| | | | | | | | |
| | | Shares | | | Value | |
Information Technology-(continued) | | | | | |
Workiva, Inc.(c) | | | 39 | | | $ | 2,301 | |
Xerox Holdings Corp. | | | 214 | | | | 4,036 | |
Xperi Holding Corp. | | | 128 | | | | 1,604 | |
Yext, Inc.(c) | | | 101 | | | | 2,006 | |
Zendesk, Inc.(c) | | | 134 | | | | 12,915 | |
Zuora, Inc.(c) | | | 120 | | | | 1,631 | |
| | | | | | | | |
| | | | | | | 680,899 | |
| | | | | | | | |
Materials-4.55% | | | | | | | | |
AdvanSix, Inc.(c) | | | 34 | | | | 433 | |
Alcoa Corp.(c) | | | 101 | | | | 1,477 | |
Allegheny Technologies, Inc.(c) | | | 149 | | | | 1,241 | |
American Vanguard Corp. | | | 31 | | | | 439 | |
Amyris, Inc.(c) | | | 63 | | | | 207 | |
AptarGroup, Inc. | | | 75 | | | | 8,879 | |
Arconic Corp.(c) | | | 117 | | | | 2,603 | |
Ashland Global Holdings, Inc. | | | 64 | | | | 4,716 | |
Avient Corp. | | | 104 | | | | 2,654 | |
Balchem Corp. | | | 39 | | | | 3,810 | |
Berry Global Group, Inc.(c) | | | 157 | | | | 8,092 | |
Boise Cascade Co. | | | 48 | | | | 2,198 | |
Cabot Corp. | | | 70 | | | | 2,591 | |
Carpenter Technology Corp. | | | 58 | | | | 1,220 | |
Century Aluminum Co.(c) | | | 79 | | | | 780 | |
Chase Corp. | | | 9 | | | | 878 | |
Chemours Co. (The) | | | 198 | | | | 4,091 | |
Clearwater Paper Corp.(c) | | | 19 | | | | 640 | |
Cleveland-Cliffs, Inc.(b) | | | 492 | | | | 3,237 | |
Coeur Mining, Inc.(c) | | | 316 | | | | 2,673 | |
Commercial Metals Co. | | | 142 | | | | 2,964 | |
Compass Minerals International, Inc. | | | 40 | | | | 2,277 | |
Domtar Corp. | | | 62 | | | | 1,768 | |
Eagle Materials, Inc. | | | 45 | | | | 3,680 | |
Element Solutions, Inc.(c) | | | 280 | | | | 3,010 | |
Ferro Corp.(c) | | | 93 | | | | 1,160 | |
Forterra, Inc.(c) | | | 24 | | | | 318 | |
FutureFuel Corp. | | | 31 | | | | 375 | |
GCP Applied Technologies, Inc.(c) | | | 56 | | | | 1,459 | |
Graphic Packaging Holding Co | | | 335 | | | | 4,683 | |
Greif, Inc., Class A | | | 31 | | | | 1,142 | |
Greif, Inc., Class B | | | 6 | | | | 246 | |
H.B. Fuller Co. | | | 61 | | | | 2,938 | |
Hawkins, Inc. | | | 12 | | | | 603 | |
Haynes International, Inc. | | | 15 | | | | 281 | |
Hecla Mining Co. | | | 595 | | | | 3,582 | |
Huntsman Corp. | | | 234 | | | | 5,059 | |
Ingevity Corp.(c) | | | 51 | | | | 2,865 | |
Innospec, Inc. | | | 30 | | | | 2,241 | |
Kaiser Aluminum Corp. | | | 19 | | | | 1,221 | |
Kraton Corp.(c) | | | 37 | | | | 519 | |
Kronos Worldwide, Inc. | | | 27 | | | | 337 | |
Livent Corp.(b)(c) | | | 171 | | | | 1,450 | |
Louisiana-Pacific Corp. | | | 132 | | | | 4,348 | |
Materion Corp. | | | 25 | | | | 1,365 | |
McEwen Mining, Inc. (Canada)(b)(c) | | | 388 | | | | 489 | |
Mercer International, Inc. (Germany) | | | 49 | | | | 411 | |
Minerals Technologies, Inc. | | | 42 | | | | 2,132 | |
Myers Industries, Inc. | | | 37 | | | | 566 | |
Neenah, Inc. | | | 21 | | | | 930 | |
NewMarket Corp. | | | 11 | | | | 4,097 | |
See accompanying Notes to Financial Statements which are an integral part of the financial statements.
Invesco PureBetaSM MSCI USA Small Cap ETF (PBSM)–(continued)
August 31, 2020
| | | | | | | | |
| | | Shares | | | Value | |
Materials-(continued) | | | | | | | | |
O-I Glass, Inc. | | | 189 | | | $ | 2,056 | |
Olin Corp. | | | 82 | | | | 923 | |
Orion Engineered Carbons S.A. (Germany) | | | 72 | | | | 875 | |
PH Glatfelter Co. | | | 52 | | | | 780 | |
PQ Group Holdings, Inc.(c) | | | 48 | | | | 559 | |
Quaker Chemical Corp. | | | 16 | | | | 3,040 | |
Ranpak Holdings Corp.(c) | | | 33 | | | | 295 | |
Reliance Steel & Aluminum Co. | | | 78 | | | | 8,180 | |
Royal Gold, Inc. | | | 78 | | | | 10,633 | |
Schnitzer Steel Industries, Inc., Class A | | | 31 | | | | 612 | |
Schweitzer-Mauduit International, Inc., Class A | | | 37 | | | | 1,122 | |
Scotts Miracle-Gro Co. (The) | | | 49 | | | | 8,258 | |
Sensient Technologies Corp. | | | 51 | | | | 2,816 | |
Silgan Holdings, Inc. | | | 94 | | | | 3,578 | |
Sonoco Products Co. | | | 119 | | | | 6,311 | |
Stepan Co. | | | 25 | | | | 2,882 | |
Summit Materials, Inc., Class A(c) | | | 136 | | | | 2,025 | |
SunCoke Energy, Inc. | | | 105 | | | | 376 | |
Tredegar Corp. | | | 31 | | | | 525 | |
Trinseo S.A. | | | 32 | | | | 797 | |
Tronox Holdings PLC, Class A | | | 111 | | | | 995 | |
United States Lime & Minerals, Inc. | | | 3 | | | | 276 | |
United States Steel Corp.(b) | | | 127 | | | | 994 | |
US Concrete, Inc.(c) | | | 19 | | | | 507 | |
Valvoline, Inc. | | | 228 | | | | 4,651 | |
Verso Corp., Class A | | | 40 | | | | 524 | |
W.R. Grace & Co. | | | 67 | | | | 2,728 | |
Warrior Met Coal, Inc. | | | 57 | | | | 882 | |
Westlake Chemical Corp. | | | 45 | | | | 2,669 | |
Worthington Industries, Inc. | | | 48 | | | | 1,993 | |
| | | | | | | | |
| | | | | | | 184,237 | |
| | | | | | | | |
Real Estate-8.39% | | | | | | | | |
Acadia Realty Trust | | | 102 | | | | 1,157 | |
Agree Realty Corp. | | | 64 | | | | 4,283 | |
Alexander & Baldwin, Inc. | | | 50 | | | | 605 | |
Alexander’s, Inc. | | | 3 | | | | 765 | |
American Assets Trust, Inc. | | | 61 | | | | 1,559 | |
American Campus Communities, Inc. | | | 162 | | | | 5,492 | |
American Finance Trust, Inc. | | | 129 | | | | 882 | |
American Homes 4 Rent, Class A | | | 319 | | | | 9,136 | |
Americold Realty Trust | | | 237 | | | | 9,089 | |
Apartment Investment & Management Co., Class A | | | 173 | | | | 6,233 | |
Apple Hospitality REIT, Inc. | | | 258 | | | | 2,624 | |
Armada Hoffler Properties, Inc. | | | 64 | | | | 646 | |
Brandywine Realty Trust | | | 214 | | | | 2,382 | |
Brixmor Property Group, Inc. | | | 361 | | | | 4,260 | |
CareTrust REIT, Inc. | | | 120 | | | | 2,324 | |
CatchMark Timber Trust, Inc., Class A | | | 58 | | | | 576 | |
Chatham Lodging Trust | | | 49 | | | | 339 | |
City Office REIT, Inc. | | | 66 | | | | 531 | |
Colony Capital, Inc. | | | 561 | | | | 1,520 | |
Columbia Property Trust, Inc. | | | 142 | | | | 1,676 | |
Community Healthcare Trust, Inc. | | | 22 | | | | 1,027 | |
CoreCivic, Inc. | | | 144 | | | | 1,341 | |
CoreSite Realty Corp. | | | 44 | | | | 5,388 | |
Corporate Office Properties Trust | | | 136 | | | | 3,351 | |
Cousins Properties, Inc. | | | 173 | | | | 5,164 | |
CubeSmart | | | 229 | | | | 7,241 | |
| | | | | | | | |
| | | Shares | | | Value | |
Real Estate-(continued) | | | | | | | | |
Cushman & Wakefield PLC(c) | | | 118 | | | $ | 1,370 | |
CyrusOne, Inc. | | | 138 | | | | 11,527 | |
DiamondRock Hospitality Co. | | | 243 | | | | 1,288 | |
Diversified Healthcare Trust | | | 106 | | | | 403 | |
Douglas Emmett, Inc. | | | 192 | | | | 5,361 | |
Easterly Government Properties, Inc. | | | 94 | | | | 2,274 | |
EastGroup Properties, Inc. | | | 45 | | | | 5,992 | |
Empire State Realty Trust, Inc., Class A | | | 82 | | | | 517 | |
EPR Properties | | | 94 | | | | 3,037 | |
Equity Commonwealth | | | 148 | | | | 4,646 | |
Essential Properties Realty Trust, Inc. | | | 107 | | | | 1,816 | |
eXp World Holdings, Inc.(c) | | | 25 | | | | 1,112 | |
First Industrial Realty Trust, Inc. | | | 150 | | | | 6,397 | |
Five Point Holdings LLC, Class A(c) | | | 58 | | | | 302 | |
Forestar Group, Inc.(c) | | | 19 | | | | 338 | |
Four Corners Property Trust, Inc. | | | 78 | | | | 1,969 | |
Franklin Street Properties Corp. | | | 126 | | | | 558 | |
Front Yard Residential Corp. | | | 60 | | | | 585 | |
FRP Holdings, Inc.(c) | | | 9 | | | | 370 | |
Gaming and Leisure Properties, Inc. | | | 249 | | | | 9,051 | |
GEO Group, Inc. (The) | | | 147 | | | | 1,641 | |
Getty Realty Corp. | | | 42 | | | | 1,230 | |
Gladstone Commercial Corp. | | | 37 | | | | 726 | |
Global Medical REIT, Inc. | | | 58 | | | | 742 | |
Global Net Lease, Inc. | | | 99 | | | | 1,732 | |
Healthcare Realty Trust, Inc. | | | 156 | | | | 4,501 | |
Healthcare Trust of America, Inc., Class A | | | 258 | | | | 6,809 | |
Highwoods Properties, Inc. | | | 126 | | | | 4,695 | |
Howard Hughes Corp. (The)(c) | | | 47 | | | | 2,778 | |
Hudson Pacific Properties, Inc. | | | 187 | | | | 4,391 | |
Independence Realty Trust, Inc. | | | 109 | | | | 1,276 | |
Industrial Logistics Properties Trust | | | 79 | | | | 1,704 | |
Innovative Industrial Properties, Inc.(b) | | | 25 | | | | 3,077 | |
Investors Real Estate Trust | | | 13 | | | | 924 | |
iStar, Inc. | | | 79 | | | | 978 | |
JBG SMITH Properties | | | 144 | | | | 3,984 | |
Jernigan Capital, Inc. | | | 27 | | | | 465 | |
Kennedy-Wilson Holdings, Inc. | | | 156 | | | | 2,229 | |
Kilroy Realty Corp. | | | 123 | | | | 7,198 | |
Kimco Realty Corp. | | | 511 | | | | 6,127 | |
Kite Realty Group Trust | | | 102 | | | | 1,146 | |
Lamar Advertising Co., Class A | | | 100 | | | | 6,923 | |
Lexington Realty Trust | | | 311 | | | | 3,536 | |
Life Storage, Inc. | | | 54 | | | | 5,693 | |
LTC Properties, Inc. | | | 48 | | | | 1,752 | |
Macerich Co. (The)(b) | | | 50 | | | | 396 | |
Mack-Cali Realty Corp. | | | 109 | | | | 1,377 | |
Marcus & Millichap, Inc.(c) | | | 28 | | | | 790 | |
MGM Growth Properties LLC, Class A | | | 155 | | | | 4,351 | |
Monmouth Real Estate Investment Corp. | | | 109 | | | | 1,582 | |
National Health Investors, Inc. | | | 51 | | | | 3,175 | |
National Storage Affiliates Trust | | | 72 | | | | 2,470 | |
Newmark Group, Inc., Class A | | | 180 | | | | 797 | |
NexPoint Residential Trust, Inc. | | | 28 | | | | 1,159 | |
Office Properties Income Trust | | | 42 | | | | 1,001 | |
One Liberty Properties, Inc. | | | 16 | | | | 307 | |
Outfront Media, Inc. | | | 174 | | | | 2,946 | |
Paramount Group, Inc. | | | 226 | | | | 1,672 | |
Park Hotels & Resorts, Inc. | | | 281 | | | | 2,667 | |
Pebblebrook Hotel Trust | | | 159 | | | | 2,007 | |
See accompanying Notes to Financial Statements which are an integral part of the financial statements.
Invesco PureBetaSM MSCI USA Small Cap ETF (PBSM)–(continued)
August 31, 2020
| | | | | | | | |
| | | Shares | | | Value | |
Real Estate-(continued) | | | | | | | | |
Physicians Realty Trust | | | 237 | | | $ | 4,302 | |
Piedmont Office Realty Trust, Inc., Class A | | | 153 | | | | 2,342 | |
PotlatchDeltic Corp. | | | 81 | | | | 3,729 | |
Preferred Apartment Communities, Inc., Class A | | | 39 | | | | 257 | |
PS Business Parks, Inc. | | | 25 | | | | 3,155 | |
QTS Realty Trust, Inc., Class A | | | 67 | | | | 4,544 | |
Rayonier, Inc. | | | 157 | | | | 4,597 | |
RE/MAX Holdings, Inc., Class A | | | 21 | | | | 738 | |
Realogy Holdings Corp. | | | 150 | | | | 1,662 | |
Redfin Corp.(c) | | | 105 | | | | 4,995 | |
Retail Opportunity Investments Corp. | | | 138 | | | | 1,536 | |
Retail Properties of America, Inc., Class A | | | 259 | | | | 1,634 | |
Rexford Industrial Realty, Inc. | | | 138 | | | | 6,621 | |
RLJ Lodging Trust | | | 208 | | | | 1,963 | |
RMR Group, Inc. (The), Class A | | | 18 | | | | 508 | |
RPT Realty | | | 94 | | | | 551 | |
Ryman Hospitality Properties, Inc. | | | 60 | | | | 2,290 | |
Sabra Health Care REIT, Inc. | | | 244 | | | | 3,618 | |
Safehold, Inc. | | | 15 | | | | 832 | |
Saul Centers, Inc. | | | 16 | | | | 448 | |
Seritage Growth Properties, Class A(b)(c) | | | 16 | | | | 224 | |
Service Properties Trust | | | 76 | | | | 624 | |
SITE Centers Corp. | | | 166 | | | | 1,247 | |
SL Green Realty Corp. | | | 92 | | | | 4,302 | |
Spirit Realty Capital, Inc. | | | 124 | | | | 4,403 | |
St. Joe Co. (The)(c) | | | 42 | | | | 975 | |
STAG Industrial, Inc. | | | 177 | | | | 5,717 | |
STORE Capital Corp. | | | 270 | | | | 7,301 | |
Summit Hotel Properties, Inc. | | | 127 | | | | 748 | |
Sunstone Hotel Investors, Inc. | | | 273 | | | | 2,274 | |
Tanger Factory Outlet Centers, Inc. | | | 39 | | | | 222 | |
Taubman Centers, Inc. | | | 75 | | | | 2,872 | |
Tejon Ranch Co.(c) | | | 25 | | | | 358 | |
Terreno Realty Corp. | | | 78 | | | | 4,652 | |
UMH Properties, Inc. | | | 40 | | | | 582 | |
Uniti Group, Inc. | | | 202 | | | | 1,984 | |
Universal Health Realty Income Trust | | | 16 | | | | 1,068 | |
Urban Edge Properties | | | 150 | | | | 1,584 | |
Urstadt Biddle Properties, Inc., Class A | | | 34 | | | | 316 | |
Washington REIT | | | 97 | | | | 2,128 | |
Weingarten Realty Investors | | | 148 | | | | 2,586 | |
Whitestone REIT | | | 42 | | | | 270 | |
Xenia Hotels & Resorts, Inc. | | | 136 | | | | 1,221 | |
| | | | | | | | |
| | | | | | | 339,438 | |
| | | | | | | | |
Utilities-2.26% | | | | | | | | |
ALLETE, Inc. | | | 63 | | | | 3,399 | |
American States Water Co. | | | 45 | | | | 3,424 | |
Avista Corp. | | | 77 | | | | 2,838 | |
Black Hills Corp. | | | 76 | | | | 4,262 | |
Cadiz, Inc.(b)(c) | | | 41 | | | | 429 | |
California Water Service Group | | | 58 | | | | 2,630 | |
Chesapeake Utilities Corp. | | | 21 | | | | 1,718 | |
Clearway Energy, Inc., Class A | | | 40 | | | | 966 | |
| | | | | | | | |
Investment Abbreviations: | | | | | | | | |
CVR -Contingent Value Rights | | | | | | | | |
REIT -Real Estate Investment Trust | | | | | |
| | | | | | | | |
| | | Shares | | | Value | |
Utilities-(continued) | | | | | | | | |
Clearway Energy, Inc., Class C | | | 88 | | | $ | 2,245 | |
Hawaiian Electric Industries, Inc. | | | 132 | | | | 4,568 | |
IDACORP, Inc. | | | 61 | | | | 5,484 | |
MDU Resources Group, Inc. | | | 237 | | | | 5,598 | |
MGE Energy, Inc. | | | 42 | | | | 2,730 | |
Middlesex Water Co. | | | 22 | | | | 1,411 | |
National Fuel Gas Co. | | | 94 | | | | 4,290 | |
New Jersey Resources Corp. | | | 109 | | | | 3,285 | |
NextEra Energy Partners L.P.(b) | | | 76 | | | | 4,584 | |
Northwest Natural Holding Co. | | | 37 | | | | 1,891 | |
NorthWestern Corp. | | | 61 | | | | 3,150 | |
ONE Gas, Inc. | | | 64 | | | | 4,744 | |
Ormat Technologies, Inc. | | | 46 | | | | 2,800 | |
Otter Tail Corp. | | | 43 | | | | 1,670 | |
PNM Resources, Inc. | | | 88 | | | | 3,844 | |
Portland General Electric Co. | | | 108 | | | | 4,120 | |
SJW Group | | | 30 | | | | 1,876 | |
South Jersey Industries, Inc. | | | 112 | | | | 2,481 | |
Southwest Gas Holdings, Inc. | | | 66 | | | | 4,149 | |
Spire, Inc. | | | 60 | | | | 3,493 | |
Star Group L.P. | | | 58 | | | | 568 | |
Sunnova Energy International, Inc.(c) | | | 58 | | | | 1,376 | |
Unitil Corp. | | | 18 | | | | 760 | |
York Water Co. (The) | | | 15 | | | | 684 | |
| | | | | | | | |
| | | | | | | 91,467 | |
| | | | | | | | |
Total Common Stocks & Other Equity Interests
(Cost $3,528,687) | | | | | | | 4,012,547 | |
| | | | | | | | |
| | |
| Money Market Funds-0.15% | | | | | | | | |
Invesco Premier U.S. Government Money Portfolio, Institutional Class, 0.01%(d)(f)
(Cost $6,187) | | | 6,187 | | | | 6,187 | |
| | | | | | | | |
TOTAL INVESTMENTS IN SECURITIES
(excluding investments purchased with cash collateral from
securities on loan)-99.31%
(Cost $3,534,874) | | | | | | | 4,018,734 | |
| | | | | | | | |
|
| Investments Purchased with Cash Collateral from Securities on Loan | |
| | |
| Money Market Funds-5.01% | | | | | | | | |
Invesco Private Government Fund,
0.03%(d)(f)(g) | | | 151,867 | | | | 151,867 | |
Invesco Private Prime Fund, 0.14%(d)(f)(g) | | | 50,590 | | | | 50,600 | |
| | | | | | | | |
Total Investments Purchased with Cash Collateral from Securities on Loan (Cost $202,467) | | | | | | | 202,467 | |
| | | | | | | | |
TOTAL INVESTMENTS IN SECURITIES-104.32%
(Cost $3,737,341) | | | | | | | 4,221,201 | |
OTHER ASSETS LESS LIABILITIES-(4.32)% | | | | | | | (174,802 | ) |
| | | | | | | | |
NET ASSETS-100.00% | | | | | | $ | 4,046,399 | |
| | | | | | | | |
See accompanying Notes to Financial Statements which are an integral part of the financial statements.
Invesco PureBetaSM MSCI USA Small Cap ETF (PBSM)–(continued)
August 31, 2020
Notes to Schedule of Investments:
| (a) | Industry and/or sector classifications used in this report are generally according to the Global Industry Classification Standard, which was developed by and is the exclusive property and a service mark of MSCI Inc. and Standard & Poor’s. |
| (b) | All or a portion of this security was out on loan at August 31, 2020. |
| (c) | Non-income producing security. |
| (d) | Affiliated issuer. The issuer and/or the Fund is a wholly-owned subsidiary of Invesco Ltd., or is affiliated by having an investment adviser that is under common control of Invesco Ltd. The table below shows the Fund’s transactions in, and earnings from, its investments in affiliates for the fiscal year ended August 31, 2020. |
| | | | | | | | | | | | | | | | | | | | | | | | | | | | | | | | | | | |
| | | | | | | | | Change in | | | | | | |
| | | | | | | | | Unrealized | | Realized | | | | |
| | | Value | | Purchases | | Proceeds | | Appreciation | | Gain | | Value | | Dividend |
| | | August 31, 2019 | | at Cost | | from Sales | | (Depreciation) | | (Loss) | | August 31, 2020 | | Income |
| Invesco Mortgage Capital, Inc. | | | | $ 1,503 | | | | | $ 852 | | | | | $ (500 | ) | | | | $216 | | | | | $(1,807 | ) | | | | $ 264 | | | | | $ 121 | |
| Investments in Affiliated Money Market Funds: | | | | | | | | | | | | | | | | | | | | | | | | | | | | | | | | | | | |
| Invesco Premier U.S. Government Money Portfolio, Institutional Class | | | | 24,959 | | | | | 140,484 | | | | | (159,256 | ) | | | | - | | | | | - | | | | | 6,187 | | | | | 94 | |
| Investments Purchased with Cash Collateral from Securities on Loan: | | | | | | | | | | | | | | | | | | | | | | | | | | | | | | | | | | | |
| Invesco Government & Agency Portfolio, Institutional Class | | | | 79,372 | | | | | 474,170 | | | | | (553,542 | ) | | | | - | | | | | - | | | | | - | | | | | 804 | * |
| Invesco Liquid Assets Portfolio, Institutional Class | | | | 27,558 | | | | | 111,027 | | | | | (138,577 | ) | | | | (1 | ) | | | | (7 | ) | | | | - | | | | | 300 | * |
| Invesco Private Government Fund | | | | - | | | | | 536,324 | | | | | (384,457 | ) | | | | - | | | | | - | | | | | 151,867 | | | | | 20 | * |
| Invesco Private Prime Fund | | | | - | | | | | 98,412 | | | | | (47,816 | ) | | | | - | | | | | 4 | | | | | 50,600 | | | | | 14 | * |
| | | | | | | | | | | | | | | | | | | | | | | | | | | | | | | | | | | |
| Total | | | | $133,392 | | | | | $1,361,269 | | | | | $(1,284,148 | ) | | | | $215 | | | | | $(1,810 | ) | | | $ | 208,918 | | | | $ | 1,353 | |
| | | | | | | | | | | | | | | | | | | | | | | | | | | | | | | | | | | |
| * | Represents the income earned on the investment of cash collateral, which is included in securities lending income on the Statements of Operations. Does not include rebates and fees paid to lending agent or premiums received from borrowers, if any. |
| (e) | Security valued using significant unobservable inputs (Level 3). See Note 5. |
| (f) | The rate shown is the 7-day SEC standardized yield as of August 31, 2020. |
| (g) | The security has been segregated to satisfy the commitment to return the cash collateral received in securities lending transactions upon the borrower’s return of the securities loaned. See Note 2J. |
See accompanying Notes to Financial Statements which are an integral part of the financial statements.
Invesco PureBetaSM US Aggregate Bond ETF (PBND)
August 31, 2020
Schedule of Investments(a)
| | | | | | | | |
| | | Principal
Amount | | | Value | |
| U.S. Treasury Securities-40.94% | |
U.S. Treasury Bonds-11.08% | | | | | | | | |
7.63%, 11/15/2022 | | $ | 75,000 | | | $ | 87,420 | |
6.25%, 08/15/2023 | | | 20,000 | | | | 23,608 | |
6.50%, 11/15/2026 | | | 20,000 | | | | 27,522 | |
6.63%, 02/15/2027 | | | 50,000 | | | | 69,818 | |
6.25%, 05/15/2030 | | | 25,000 | | | | 38,222 | |
5.38%, 02/15/2031 | | | 30,000 | | | | 44,275 | |
4.50%, 02/15/2036 | | | 15,000 | | | | 22,696 | |
4.25%, 05/15/2039 | | | 200,000 | | | | 306,266 | |
4.50%, 08/15/2039 | | | 100,000 | | | | 157,805 | |
4.38%, 11/15/2039 | | | 100,000 | | | | 155,899 | |
4.63%, 02/15/2040 | | | 25,000 | | | | 40,190 | |
1.13%, 05/15/2040 | | | 135,000 | | | | 133,059 | |
1.13%, 08/15/2040 | | | 20,000 | | | | 19,645 | |
4.75%, 02/15/2041 | | | 100,000 | | | | 164,637 | |
2.75%, 08/15/2042 | | | 100,000 | | | | 127,836 | |
2.75%, 11/15/2042 | | | 20,000 | | | | 25,538 | |
2.88%, 05/15/2043 | | | 100,000 | | | | 130,234 | |
3.75%, 11/15/2043 | | | 50,000 | | | | 74,115 | |
3.63%, 02/15/2044 | | | 155,000 | | | | 226,003 | |
2.88%, 08/15/2045 | | | 115,000 | | | | 150,789 | |
2.50%, 02/15/2046 | | | 110,000 | | | | 135,528 | |
2.25%, 08/15/2046 | | | 130,000 | | | | 153,227 | |
3.00%, 05/15/2047 | | | 150,000 | | | | 202,887 | |
2.75%, 08/15/2047 | | | 80,000 | | | | 103,781 | |
3.13%, 05/15/2048 | | | 50,000 | | | | 69,492 | |
3.00%, 08/15/2048 | | | 50,000 | | | | 68,150 | |
3.38%, 11/15/2048 | | | 60,000 | | | | 87,293 | |
3.00%, 02/15/2049 | | | 50,000 | | | | 68,387 | |
2.88%, 05/15/2049 | | | 25,000 | | | | 33,488 | |
2.25%, 08/15/2049 | | | 55,000 | | | | 65,461 | |
2.38%, 11/15/2049 | | | 65,000 | | | | 79,427 | |
2.00%, 02/15/2050 | | | 25,000 | | | | 28,305 | |
1.25%, 05/15/2050 | | | 165,000 | | | | 156,776 | |
| | | | | | | | |
| | | | | | | 3,277,779 | |
| | | | | | | | |
U.S. Treasury Notes-29.86% | | | | | | | | |
1.13%, 09/30/2021 | | | 200,000 | | | | 202,086 | |
2.00% - 2.88%, 11/15/2021 | | | 150,000 | | | | 153,879 | |
1.75% - 1.88%, 11/30/2021 | | | 400,000 | | | | 408,258 | |
2.00% - 2.50%, 02/15/2022 | | | 250,000 | | | | 257,101 | |
0.38% - 1.88%, 03/31/2022 | | | 300,000 | | | | 305,852 | |
0.13%, 04/30/2022 | | | 50,000 | | | | 49,990 | |
1.75% - 2.13%, 05/15/2022 | | | 300,000 | | | | 308,852 | |
2.13%, 06/30/2022 | | | 200,000 | | | | 207,246 | |
0.13%, 07/31/2022 | | | 250,000 | | | | 249,941 | |
1.50% - 1.63%, 08/15/2022 | | | 160,000 | | | | 164,516 | |
1.50%, 09/15/2022 | | | 50,000 | | | | 51,395 | |
1.63%, 11/15/2022 | | | 100,000 | | | | 103,277 | |
2.00%, 11/30/2022 | | | 100,000 | | | | 104,184 | |
2.13%, 12/31/2022 | | | 100,000 | | | | 104,621 | |
1.38% - 2.00%, 02/15/2023 | | | 150,000 | | | | 156,099 | |
1.50% - 2.63%, 02/28/2023 | | | 300,000 | | | | 313,004 | |
1.75%, 05/15/2023 | | | 100,000 | | | | 104,348 | |
2.75%, 05/31/2023 | | | 100,000 | | | | 107,152 | |
0.25%, 06/15/2023 | | | 50,000 | | | | 50,154 | |
| | | | | | | | |
| | | Principal
Amount | | | Value | |
U.S. Treasury Notes-(continued) | | | | | | | | |
0.13%, 07/15/2023 | | $ | 200,000 | | | $ | 199,906 | |
0.13% - 2.50%, 08/15/2023 | | | 150,000 | | | | 156,916 | |
2.75%, 11/15/2023 | | | 200,000 | | | | 216,562 | |
2.63%, 12/31/2023 | | | 40,000 | | | | 43,266 | |
2.25%, 01/31/2024 | | | 200,000 | | | | 214,172 | |
2.75%, 02/15/2024 | | | 50,000 | | | | 54,449 | |
2.38%, 02/29/2024 | | | 100,000 | | | | 107,664 | |
2.13%, 03/31/2024 | | | 50,000 | | | | 53,476 | |
2.50%, 05/15/2024 | | | 100,000 | | | | 108,570 | |
2.00%, 05/31/2024 | | | 50,000 | | | | 53,375 | |
1.75% - 2.00%, 06/30/2024 | | | 240,000 | | | | 256,148 | |
1.75%, 07/31/2024 | | | 100,000 | | | | 106,049 | |
2.38%, 08/15/2024 | | | 200,000 | | | | 217,148 | |
2.25%, 11/15/2024 | | | 150,000 | | | | 162,809 | |
1.50%, 11/30/2024 | | | 30,000 | | | | 31,626 | |
1.75%, 12/31/2024 | | | 50,000 | | | | 53,289 | |
1.38%, 01/31/2025 | | | 50,000 | | | | 52,516 | |
2.00%, 02/15/2025 | | | 200,000 | | | | 215,687 | |
1.13%, 02/28/2025 | | | 75,000 | | | | 78,003 | |
2.88%, 04/30/2025 | | | 75,000 | | | | 84,158 | |
2.13%, 05/15/2025 | | | 100,000 | | | | 108,766 | |
0.25%, 06/30/2025 | | | 75,000 | | | | 74,994 | |
0.25% - 2.88%, 07/31/2025 | | | 250,000 | | | | 251,163 | |
2.00%, 08/15/2025 | | | 100,000 | | | | 108,527 | |
0.25%, 08/31/2025 | | | 30,000 | | | | 29,982 | |
2.25%, 11/15/2025 | | | 200,000 | | | | 220,219 | |
2.88%, 11/30/2025 | | | 60,000 | | | | 68,065 | |
1.63%, 02/15/2026 | | | 100,000 | | | | 107,031 | |
1.63%, 05/15/2026 | | | 50,000 | | | | 53,604 | |
1.50%, 08/15/2026 | | | 100,000 | | | | 106,602 | |
2.00%, 11/15/2026 | | | 200,000 | | | | 219,594 | |
2.25%, 02/15/2027 | | | 50,000 | | | | 55,813 | |
0.50%, 04/30/2027 | | | 25,000 | | | | 25,081 | |
2.38%, 05/15/2027 | | | 100,000 | | | | 112,727 | |
0.50%, 06/30/2027 | | | 50,000 | | | | 50,109 | |
0.38%, 07/31/2027 | | | 145,000 | | | | 144,026 | |
2.25%, 08/15/2027 | | | 150,000 | | | | 168,264 | |
2.25%, 11/15/2027 | | | 50,000 | | | | 56,232 | |
2.75%, 02/15/2028 | | | 100,000 | | | | 116,371 | |
2.88%, 05/15/2028 | | | 100,000 | | | | 117,666 | |
2.88%, 08/15/2028 | | | 50,000 | | | | 59,032 | |
3.13%, 11/15/2028 | | | 50,000 | | | | 60,228 | |
2.63%, 02/15/2029 | | | 100,000 | | | | 116,742 | |
2.38%, 05/15/2029 | | | 100,000 | | | | 114,973 | |
1.63%, 08/15/2029 | | | 100,000 | | | | 108,723 | |
1.75%, 11/15/2029 | | | 50,000 | | | | 54,990 | |
1.50%, 02/15/2030 | | | 60,000 | | | | 64,655 | |
0.63%, 05/15/2030 | | | 140,000 | | | | 139,245 | |
0.63%, 08/15/2030 | | | 50,000 | | | | 49,668 | |
| | | | | | | | |
| | | | | | | 8,830,836 | |
| | | | | | | | |
Total U.S. Treasury Securities (Cost $11,095,191) | | | | | | | 12,108,615 | |
| | | | | | | | |
See accompanying Notes to Financial Statements which are an integral part of the financial statements.
Invesco PureBetaSM US Aggregate Bond ETF (PBND)–(continued)
August 31, 2020
| | | | | | | | |
| | | Principal
Amount | | | Value | |
| U.S. Dollar Denominated Bonds & Notes-31.43% | |
Aerospace & Defense-0.51% | | | | | | | | |
Boeing Co. (The), 4.88%, 05/01/2025 | | $ | 50,000 | | | $ | 54,463 | |
Raytheon Technologies Corp., 4.50%, 06/01/2042 | | | 75,000 | | | | 95,493 | |
| | | | | | | | |
| | | | | | | 149,956 | |
| | | | | | | | |
Agricultural & Farm Machinery-0.35% | | | | | | | | |
B.A.T. Capital Corp. (United Kingdom), 2.76%, 08/15/2022 | | | 50,000 | | | | 51,983 | |
CNH Industrial Capital LLC, 4.38%, 04/05/2022 | | | 50,000 | | | | 52,535 | |
| | | | | | | | |
| | | | | | | 104,518 | |
| | | | | | | | |
Air Freight & Logistics-0.20% | | | | | | | | |
United Parcel Service, Inc., 3.63%, 10/01/2042 | | | 50,000 | | | | 58,167 | |
| | | | | | | | |
Asset Management & Custody Banks-0.38% | | | | | | | | |
Apollo Management Holdings L.P., 4.87%, 02/15/2029(b) | | | 50,000 | | | | 58,697 | |
Bank of New York Mellon Corp. (The), 2.20%, 08/16/2023 | | | 50,000 | | | | 52,488 | |
| | | | | | | | |
| | | | | | | 111,185 | |
| | | | | | | | |
Automobile Manufacturers-0.40% | | | | | | | | |
Toyota Motor Corp. (Japan), 3.67%, 07/20/2028 | | | 100,000 | | | | 118,428 | |
| | | | | | | | |
Biotechnology-0.64% | | | | | | | | |
AbbVie, Inc., 3.60%, 05/14/2025 | | | 50,000 | | | | 55,838 | |
Amgen, Inc., 4.66%, 06/15/2051 | | | 50,000 | | | | 66,235 | |
Gilead Sciences, Inc., 4.75%, 03/01/2046 | | | 50,000 | | | | 67,027 | |
| | | | | | | | |
| | | | | | | 189,100 | |
| | | | | | | | |
Brewers-0.38% | | | | | | | | |
Anheuser-Busch Cos. LLC/Anheuser-Busch InBev Worldwide, Inc. (Belgium), 3.65%, 02/01/2026 | | | 100,000 | | | | 113,298 | |
| | | | | | | | |
Broadcasting-0.19% | | | | | | | | |
Discovery Communications LLC, 3.95%, 03/20/2028 | | | 50,000 | | | | 56,655 | |
| | | | | | | | |
Cable & Satellite-0.59% | | | | | | | | |
Charter Communications Operating LLC/Charter Communications Operating Capital Corp., 4.91%, 07/23/2025 | | | 50,000 | | | | 58,221 | |
Comcast Corp. 4.15%, 10/15/2028 | | | 50,000 | | | | 60,678 | |
3.25%, 11/01/2039 | | | 50,000 | | | | 55,578 | |
| | | | | | | | |
| | | | | | | 174,477 | |
| | | | | | | | |
Consumer Finance-0.72% | | | | | | | | |
American Express Credit Corp., 2.70%, 03/03/2022 | | | 100,000 | | | | 103,385 | |
Capital One Financial Corp., 3.75%, 07/28/2026 | | | 100,000 | | | | 109,871 | |
| | | | | | | | |
| | | | | | | 213,256 | |
| | | | | | | | |
Diversified Banks-4.94% | | | | | | | | |
Asian Development Bank (Supranational), 0.63%, 04/29/2025 | | | 100,000 | | | | 101,098 | |
Bank of America Corp. | | | | | | | | |
2.82%, 07/21/2023(c) | | | 50,000 | | | | 52,062 | |
3.88%, 08/01/2025 | | | 100,000 | | | | 114,174 | |
Bank of Montreal (Canada), 4.34%, 10/05/2028(c) | | | 50,000 | | | | 54,026 | |
| | | | | | | | |
| | | Principal
Amount | | | Value | |
Diversified Banks-(continued) | | | | | | | | |
Citigroup, Inc., 8.13%, 07/15/2039 | | $ | 75,000 | | | $ | 132,501 | |
European Investment Bank (Supranational), 2.25%, 03/15/2022 | | | 100,000 | | | | 103,181 | |
HSBC Holdings PLC (United Kingdom), 4.58%, 06/19/2029(c) | | | 200,000 | | | | 233,835 | |
Inter-American Development Bank (Supranational), 3.00%, 02/21/2024 | | | 100,000 | | | | 109,347 | |
JPMorgan Chase & Co., 3.96%, 11/15/2048(c) | | | 100,000 | | | | 123,072 | |
Mitsubishi UFJ Financial Group, Inc. (Japan), 3.76%, 07/26/2023 | | | 50,000 | | | | 54,512 | |
Natwest Group PLC (United Kingdom), 6.00%, 12/19/2023 | | | 100,000 | | | | 112,850 | |
Sumitomo Mitsui Financial Group, Inc. (Japan), 3.20%, 09/17/2029 | | | 50,000 | | | | 54,365 | |
Toronto-Dominion Bank (The) (Canada), 3.63%, 09/15/2031(c) | | | 50,000 | | | | 56,957 | |
U.S. Bancorp, 3.38%, 02/05/2024 | | | 50,000 | | | | 54,718 | |
Wells Fargo & Co., 3.07%, 01/24/2023 | | | 100,000 | | | | 103,482 | |
| | | | | | | | |
| | | | | | | 1,460,180 | |
| | | | | | | | |
Diversified Chemicals-0.38% | | | | | | | | |
Dow Chemical Co. (The), 4.38%, 11/15/2042 | | | 100,000 | | | | 113,001 | |
| | | | | | | | |
Diversified Metals & Mining-0.19% | | | | | | | | |
Glencore Funding LLC (Australia), 4.00%, 03/27/2027(b) | | | 50,000 | | | | 54,981 | |
| | | | | | | | |
Electric Utilities-1.80% | | | | | | | | |
Duke Energy Corp., 3.75%, 09/01/2046 | | | 50,000 | | | | 57,895 | |
Entergy Louisiana LLC, 4.00%, 03/15/2033 | | | 100,000 | | | | 125,909 | |
Georgia Power Co., 4.30%, 03/15/2043 | | | 100,000 | | | | 120,086 | |
NextEra Energy Capital Holdings, Inc., 2.75%, 05/01/2025 | | | 100,000 | | | | 108,757 | |
Oncor Electric Delivery Co. LLC, 3.75%, 04/01/2045 | | | 50,000 | | | | 59,989 | |
Xcel Energy, Inc., 4.00%, 06/15/2028 | | | 50,000 | | | | 58,981 | |
| | | | | | | | |
| | | | | | | 531,617 | |
| | | | | | | | |
Environmental & Facilities Services-0.32% | | | | | | | | |
Waste Management, Inc., 4.15%, 07/15/2049 | | | 75,000 | | | | 94,690 | |
| | | | | | | | |
Health Care Equipment-0.24% | | | | | | | | |
Abbott Laboratories, 4.90%, 11/30/2046 | | | 50,000 | | | | 71,839 | |
| | | | | | | | |
Health Care Facilities-0.19% | | | | | | | | |
HCA, Inc., 5.00%, 03/15/2024 | | | 50,000 | | | | 56,544 | |
| | | | | | | | |
Health Care Services-0.46% | | | | | | | | |
Cigna Corp., 3.20%, 03/15/2040 | | | 25,000 | | | | 26,707 | |
CVS Health Corp., 2.88%, 06/01/2026(d) | | | 100,000 | | | | 109,084 | |
| | | | | | | | |
| | | | | | | 135,791 | |
| | | | | | | | |
Home Improvement Retail-0.25% | | | | | | | | |
Home Depot, Inc. (The), 5.88%, 12/16/2036 | | | 50,000 | | | | 74,998 | |
| | | | | | | | |
Household Products-0.29% | | | | | | | | |
Procter & Gamble Co. (The), 3.00%, 03/25/2030 | | | 75,000 | | | | 86,796 | |
| | | | | | | | |
Hypermarkets & Super Centers-0.18% | | | | | | | | |
Walmart, Inc., 2.55%, 04/11/2023 | | | 50,000 | | | | 52,809 | |
| | | | | | | | |
See accompanying Notes to Financial Statements which are an integral part of the financial statements.
Invesco PureBetaSM US Aggregate Bond ETF (PBND)–(continued)
August 31, 2020
| | | | | | | | |
| | | Principal
Amount | | | Value | |
Industrial Conglomerates-0.63% | | | | | | | | |
3M Co., 3.70%, 04/15/2050 | | $ | 50,000 | | | $ | 60,929 | |
General Electric Co., 6.75%, 03/15/2032 | | | 100,000 | | | | 125,393 | |
| | | | | | | | |
| | | | | | | 186,322 | |
| | | | | | | | |
Integrated Oil & Gas-1.27% | | | | | | | | |
BP Capital Markets PLC (United Kingdom), | | | | | | | | |
3.12%, 05/04/2026 | | | 100,000 | | | | 109,436 | |
Exxon Mobil Corp. | | | | | | | | |
2.73%, 03/01/2023 | | | 50,000 | | | | 52,780 | |
4.33%, 03/19/2050 | | | 50,000 | | | | 64,339 | |
Shell International Finance B.V. (Netherlands), | | | | | | | | |
6.38%, 12/15/2038 | | | 100,000 | | | | 150,150 | |
| | | | | | | | |
| | | | | | | 376,705 | |
| | | | | | | | |
Integrated Telecommunication Services-0.61% | | | | | | | | |
AT&T, Inc., 3.40%, 05/15/2025 | | | 100,000 | | | | 111,350 | |
Verizon Communications, Inc., 5.01%, 04/15/2049 | | | 50,000 | | | | 69,920 | |
| | | | | | | | |
| | | | | | | 181,270 | |
| | | | | | | | |
Internet & Direct Marketing Retail-0.41% | | | | | | | | |
Amazon.com, Inc., 2.50%, 11/29/2022 | | | 115,000 | | | | 120,234 | |
| | | | | | | | |
Investment Banking & Brokerage-0.86% | | | | | | | | |
Goldman Sachs Group, Inc. (The), 4.25%, 10/21/2025 | | | 125,000 | | | | 142,552 | |
Morgan Stanley, Series F, 3.88%, 04/29/2024 | | | 100,000 | | | | 111,297 | |
| | | | | | | | |
| | | | | | | 253,849 | |
| | | | | | | | |
IT Consulting & Other Services-0.46% | | | | | | | | |
International Business Machines Corp., 6.50%, 01/15/2028 | | | 100,000 | | | | 135,721 | |
| | | | | | | | |
Life & Health Insurance-0.61% | | | | | | | | |
MetLife, Inc., 6.40%, 12/15/2036 | | | 100,000 | | | | 126,329 | |
Prudential Financial, Inc., 5.20%, 03/15/2044(c) | | | 50,000 | | | | 53,042 | |
| | | | | | | | |
| | | | | | | 179,371 | |
| | | | | | | | |
Managed Health Care-0.27% | | | | | | | | |
UnitedHealth Group, Inc., 2.00%, 05/15/2030 | | | 75,000 | | | | 78,731 | |
| | | | | | | | |
Movies & Entertainment-0.23% | | | | | | | | |
Walt Disney Co. (The), 4.70%, 03/23/2050 | | | 50,000 | | | | 66,675 | |
| | | | | | | | |
Multi-line Insurance-0.46% | | | | | | | | |
American International Group, Inc., 2.50%, 06/30/2025 | | | 50,000 | | | | 53,545 | |
Liberty Mutual Group, Inc., 3.95%, 05/15/2060(b) | | | 75,000 | | | | 82,401 | |
| | | | | | | | |
| | | | | | | 135,946 | |
| | | | | | | | |
Multi-Sector Holdings-0.58% | | | | | | | | |
Berkshire Hathaway Energy Co. | | | | | | | | |
3.75%, 11/15/2023 | | | 50,000 | | | | 54,932 | |
4.25%, 10/15/2050(b) | | | 50,000 | | | | 63,712 | |
Berkshire Hathaway, Inc., 2.75%, 03/15/2023 | | | 50,000 | | | | 52,898 | |
| | | | | | | | |
| | | | | | | 171,542 | |
| | | | | | | | |
Multi-Utilities-0.18% | | | | | | | | |
Delmarva Power & Light Co., 3.50%, 11/15/2023 | | | 50,000 | | | | 54,441 | |
| | | | | | | | |
Office REITs-0.37% | | | | | | | | |
Boston Properties L.P., 3.80%, 02/01/2024 | | | 100,000 | | | | 108,833 | |
| | | | | | | | |
| | | | | | | | |
| | | Principal
Amount | | | Value | |
Oil & Gas Exploration & Production-0.26% | | | | | | | | |
ConocoPhillips, 4.95%, 03/15/2026 | | $ | 65,000 | | | $ | 78,387 | |
| | | | | | | | |
Oil & Gas Refining & Marketing-0.37% | | | | | | | | |
Valero Energy Corp., 3.40%, 09/15/2026 | | | 100,000 | | | | 110,373 | |
| | | | | | | | |
Oil & Gas Storage & Transportation-0.75% | | | | | | | | |
Energy Transfer Operating L.P., 6.13%, 12/15/2045 | | | 100,000 | | | | 102,458 | |
TransCanada PipeLines Ltd. (Canada), 4.63%, 03/01/2034 | | | 100,000 | | | | 120,520 | |
| | | | | | | | |
| | | | | | | 222,978 | |
| | | | | | | | |
Packaged Foods & Meats-0.41% | | | | | | | | |
Conagra Brands, Inc., 3.80%, 10/22/2021 | | | 50,000 | | | | 51,889 | |
Tyson Foods, Inc., 5.10%, 09/28/2048 | | | 50,000 | | | | 68,861 | |
| | | | | | | | |
| | | | | | | 120,750 | |
| | | | | | | | |
Paper Products-0.18% | | | | | | | | |
Georgia-Pacific LLC, 2.30%, 04/30/2030(b) | | | 50,000 | | | | 53,194 | |
| | | | | | | | |
Pharmaceuticals-0.81% | | | | | | | | |
Bristol-Myers Squibb Co., 5.88%, 11/15/2036 | | | 50,000 | | | | 73,359 | |
Pfizer, Inc., 3.40%, 05/15/2024 | | | 150,000 | | | | 165,870 | |
| | | | | | | | |
| | | | | | | 239,229 | |
| | | | | | | | |
Railroads-0.52% | | | | | | | | |
CSX Corp., 2.40%, 02/15/2030(d) | | | 50,000 | | | | 52,841 | |
Union Pacific Corp., 4.50%, 09/10/2048 | | | 75,000 | | | | 99,935 | |
| | | | | | | | |
| | | | | | | 152,776 | |
| | | | | | | | |
Restaurants-0.21% | | | | | | | | |
McDonald’s Corp., 4.20%, 04/01/2050 | | | 50,000 | | | | 61,238 | |
| | | | | | | | |
Retail REITs-0.37% | | | | | | | | |
Simon Property Group L.P., 3.38%, 12/01/2027 | | | 100,000 | | | | 108,200 | |
| | | | | | | | |
Semiconductors-0.65% | | | | | | | | |
Broadcom, Inc., 5.00%, 04/15/2030 | | | 50,000 | | | | 59,624 | |
Intel Corp., 2.70%, 12/15/2022 | | | 100,000 | | | | 105,652 | |
QUALCOMM, Inc., 3.25%, 05/20/2050 | | | 25,000 | | | | 28,248 | |
| | | | | | | | |
| | | | | | | 193,524 | |
| | | | | | | | |
Soft Drinks-0.19% | | | | | | | | |
PepsiCo, Inc., 2.63%, 07/29/2029 | | | 50,000 | | | | 55,671 | |
| | | | | | | | |
Sovereign Debt-3.43% | | | | | | | | |
Hungary Government International Bond (Hungary), 5.38%, 02/21/2023 | | | 200,000 | | | | 221,289 | |
Indonesia Government International Bond (Indonesia), 8.50%, 10/12/2035(b) | | | 100,000 | | | | 162,859 | |
International Bank for Reconstruction & | | | | | | | | |
Development (Supranational), 0.63%, 04/22/2025 | | | 50,000 | | | | 50,565 | |
Japan Bank for International Cooperation (Japan), 2.88%, 06/01/2027 | | | 200,000 | | | | 227,057 | |
Mexico Government International Bond (Mexico) | | | | | | | | |
4.75%, 03/08/2044 | | | 100,000 | | | | 112,580 | |
5.75%, 10/12/2110 | | | 100,000 | | | | 122,079 | |
Province of Alberta Canada (Canada), 2.20%, 07/26/2022 | | | 115,000 | | | | 119,010 | |
| | | | | | | | |
| | | | | | | 1,015,439 | |
| | | | | | | | |
Specialized REITs-0.36% | | | | | | | | |
American Tower Corp., 3.50%, 01/31/2023 | | | 100,000 | | | | 106,928 | |
| | | | | | | | |
See accompanying Notes to Financial Statements which are an integral part of the financial statements.
Invesco PureBetaSM US Aggregate Bond ETF (PBND)–(continued)
August 31, 2020
| | | | | | | | |
| | | Principal
Amount | | | Value | |
| Specialty Chemicals-0.17% | | | | | | | | |
| DuPont de Nemours, Inc., 2.17%, 05/01/2023 | | $ | 50,000 | | | $ | 51,010 | |
| | | | | | | | |
| Steel-0.20% | | | | | | | | |
| Vale Overseas Ltd. (Brazil), 6.25%, 08/10/2026 | | | 50,000 | | | | 59,487 | |
| | | | | | | | |
| Systems Software-0.77% | | | | | | | | |
| Microsoft Corp., 3.70%, 08/08/2046 | | | 100,000 | | | | 125,526 | |
| Oracle Corp., 1.90%, 09/15/2021 | | | 100,000 | | | | 101,596 | |
| | | | | | | | |
| | | | | | | 227,122 | |
| | | | | | | | |
| Technology Hardware, Storage & Peripherals-0.41% | | | | | |
| Apple, Inc., 2.40%, 05/03/2023 | | | 115,000 | | | | 121,451 | |
| | | | | | | | |
| Tobacco-0.20% | | | | | | | | |
| Philip Morris International, Inc., 4.13%, 03/04/2043 | | | 50,000 | | | | 59,414 | |
| | | | | | | | |
| Trading Companies & Distributors-0.34% | | | | | | | | |
| Air Lease Corp., 3.63%, 04/01/2027 | | | 100,000 | | | | 100,350 | |
| | | | | | | | |
| Wireless Telecommunication Services-0.29% | | | | | |
| T-Mobile USA, Inc., 3.88%, 04/15/2030(b) | | | 75,000 | | | | 86,061 | |
| | | | | | | | |
Total U.S. Dollar Denominated Bonds & Notes
(Cost $8,670,512) | | | | 9,295,508 | |
| | | | | | | | |
|
| U.S. Government Sponsored Agency Mortgage-Backed Securities-23.78% | |
| Federal Home Loan Bank (FHLB)-0.36% | | | | | | | | |
| 2.13%, 06/09/2023 | | | 100,000 | | | | 105,184 | |
| | | | | | | | |
| Federal Home Loan Mortgage Corp. (FHLMC)-6.60% | | | | | |
| 2.38%, 01/13/2022 | | | 200,000 | | | | 206,149 | |
| 2.50%, 09/01/2028 to 05/01/2050 | | | 322,389 | | | | 342,380 | |
| 3.00%, 11/01/2028 to 09/01/2049 | | | 485,477 | | | | 514,122 | |
| 3.50%, 02/01/2043 to 10/01/2047 | | | 407,892 | | | | 439,662 | |
| 4.00%, 08/01/2047 to 09/01/2049 | | | 293,736 | | | | 315,147 | |
| 4.50%, 03/01/2049 to 06/01/2050 | | | 123,630 | | | | 134,033 | |
| | | | | | | | |
| | | | | | | 1,951,493 | |
| | | | | | | | |
| Federal National Mortgage Association (FNMA)-10.40% | | | | | |
| 2.63%, 09/06/2024 | | | 200,000 | | | | 218,820 | |
| 3.50%, 12/01/2028 to 03/01/2050 | | | 709,848 | | | | 758,013 | |
| 2.50%, 02/01/2032 to 05/01/2050 | | | 331,988 | | | | 350,844 | |
| 3.00%, 09/01/2032 to 03/01/2050 | | | 894,149 | | | | 952,462 | |
| 4.00%, 09/01/2047 to 06/01/2049 | | | 463,136 | | | | 495,507 | |
| 5.00%, 05/01/2048 to 07/01/2049 | | | 161,602 | | | | 180,179 | |
| 4.50%, 04/01/2049 | | | 110,033 | | | | 121,336 | |
| | | | | | | | |
| | | | | | | 3,077,161 | |
| | | | | | | | |
| Government National Mortgage Association (GNMA)-6.42% | |
| 3.50%, 04/20/2033 to 03/20/2050 | | | 614,817 | | | | 655,319 | |
| 4.00%, 11/15/2046 to 05/20/2050 | | | 311,206 | | | | 334,519 | |
| 3.00%, 11/20/2046 to 05/20/2050 | | | 536,147 | | | | 569,971 | |
| 5.00%, 05/20/2048 | | | 38,688 | | | | 42,093 | |
| 4.50%, 01/20/2049 to 07/20/2049 | | | 117,732 | | | | 126,781 | |
| 2.50%, 06/20/2049 | | | 160,635 | | | | 170,581 | |
| | | | | | | | |
| | | | | | | 1,899,264 | |
| | | | | | | | |
Total U.S. Government Sponsored Agency Mortgage- Backed Securities
(Cost $6,815,416) | | | | 7,033,102 | |
| | | | | | | | |
| | | | | | | | |
| Investment Abbreviations: | | | | | | | | |
| GO -General Obligation | | | | | | | | |
| REIT -Real Estate Investment Trust | | | | | | | | |
| | | | | | | | |
| | | Principal
Amount | | | Value | |
| Asset-Backed Securities-2.73% | |
American Express Credit Account Master Trust, Series 2017-6, Class A, 2.04%, 05/15/2023 | | $ | 100,000 | | | $ | 100,222 | |
CarMax Auto Owner Trust, Series 2017-2,
Class A4, 2.25%, 09/15/2022 | | | 100,000 | | | | 101,211 | |
Commercial Mortgage Trust, Series 2015-CR22, Class A5, 3.31%, 03/10/2048 | | | 100,000 | | | | 109,229 | |
Ford Credit Auto Owner Trust, Series 2018-1,
Class A, 3.19%, 07/15/2031(b) | | | 100,000 | | | | 110,567 | |
Verizon Owner Trust, Series 2017-3A, Class A1A, 2.06%, 04/20/2022(b) | | | 15,601 | | | | 15,657 | |
| Wells Fargo Commercial Mortgage Trust | | | | | | | | |
Series 2015-LC20, Class B, 3.72%, 04/15/2050 | | | 100,000 | | | | 103,739 | |
Series 2015-NXS2, Class A4, 3.50%, 07/15/2058 | | | 200,000 | | | | 219,568 | |
WFRBS Commercial Mortgage Trust,
Series 2012-C9, Class C, 4.54%,
11/15/2045(e) | | | 50,000 | | | | 48,762 | |
| | | | | | | | |
Total Asset-Backed Securities
(Cost $776,329) | | | | 808,955 | |
| | | | | | | | |
|
| Municipal Obligations-0.60% | |
California (State of), Series 2009, GO Bonds,
7.55%, 04/01/2039
(Cost $149,116) | | | 100,000 | | | | 177,173 | |
| | | | | | | | |
| | | Shares | | | | |
| Money Market Funds-0.14% | |
Invesco Premier U.S. Government Money
Portfolio, Institutional Class, 0.01%(f)(g)
(Cost $41,331) | | | 41,331 | | | | 41,331 | |
| | | | | | | | |
TOTAL INVESTMENTS IN SECURITIES
(excluding investments purchased with cash collateral from securities on loan)-99.62%
(Cost $27,547,895) | | | | | | | 29,464,684 | |
| | | | | | | | |
|
Investments Purchased with Cash Collateral
from Securities on Loan | |
|
| Money Market Funds-0.55% | |
| Invesco Private Government Fund, 0.03%(f)(g)(h) | | | 123,130 | | | | 123,130 | |
| Invesco Private Prime Fund, 0.14%(f)(g)(h) | | | 41,202 | | | | 41,210 | |
| | | | | | | | |
Total Investments Purchased with Cash Collateral from Securities on Loan
(Cost $164,340) | | | | 164,340 | |
| | | | | | | | |
TOTAL INVESTMENTS IN SECURITIES-100.17%
(Cost $27,712,235) | | | | | | | 29,629,024 | |
| OTHER ASSETS LESS LIABILITIES-(0.17)% | | | | | | | (51,571 | ) |
| | | | | | | | |
| NET ASSETS-100.00% | | | | | | $ | 29,577,453 | |
| | | | | | | | |
See accompanying Notes to Financial Statements which are an integral part of the financial statements.
Invesco PureBetaSM US Aggregate Bond ETF (PBND)–(continued)
August 31, 2020
Notes to Schedule of Investments:
| (a) | Industry and/or sector classifications used in this report are generally according to the Global Industry Classification Standard, which was developed by and is the exclusive property and a service mark of MSCI Inc. and Standard & Poor’s. |
| (b) | Security purchased or received in a transaction exempt from registration under the Securities Act of 1933, as amended (the “1933 Act”). The security may be resold pursuant to an exemption from registration under the 1933 Act, typically to qualified institutional buyers. The aggregate value of these securities at August 31, 2020 was $688,129, which represented 2.33% of the Fund’s Net Assets. |
| (c) | Security issued at a fixed rate for a specific period of time, after which it will convert to a variable rate. |
| (d) | All or a portion of this security was out on loan at August 31, 2020. |
| (e) | Interest rate is redetermined periodically based on the cash flows generated by the pool of assets backing the security, less any applicable fees. The rate shown is the rate in effect on August 31, 2020. |
| (f) | Affiliated issuer. The issuer and/or the Fund is a wholly-owned subsidiary of Invesco Ltd., or is affiliated by having an investment adviser that is under common control of Invesco Ltd. The table below shows the Fund’s transactions in, and earnings from, its investments in affiliates for the fiscal year ended August 31, 2020. |
| | | | | | | | | | | | | | | | | | | | | | | | | | | | | | | | | | | |
| | | | | | | | | Change in | | | | | | |
| | | Value | | Purchases | | Proceeds | | Unrealized | | Realized | | Value | | Dividend |
| | | August 31, 2019 | | at Cost | | from Sales | | Appreciation | | Gain | | August 31, 2020 | | Income |
Investments in Affiliated Money Market Funds: | | | | | | | | | | | | | | | | | | | | | | | | | | |
Invesco Premier U.S. Government
Money Portfolio, Institutional Class | | | $ | 24,081 | | | | $ | 2,300,377 | | | | $ | (2,283,127 | ) | | | $ | - | | | | $ | - | | | | $ | 41,331 | | | | $ | 355 | |
Investments Purchased with Cash Collateral from Securities on Loan: | | | | | | | | | | | | | | | | | | | | | | | | | | |
| Invesco Government & Agency Portfolio, Institutional Class | | | | - | | | | | 986,576 | | | | | (986,576 | ) | | | | - | | | | | - | | | | | - | | | | | 249 | * |
Invesco Liquid Assets Portfolio,
Institutional Class | | | | - | | | | | 219,861 | | | | | (219,864 | ) | | | | - | | | | | 3 | | | | | - | | | | | 93 | * |
| Invesco Private Government Fund | | | | - | | | | | 866,195 | | | | | (743,065 | ) | | | | - | | | | | - | | | | | 123,130 | | | | | 15 | * |
| Invesco Private Prime Fund | | | | - | | | | | 194,665 | | | | | (153,461 | ) | | | | - | | | | | 6 | | | | | 41,210 | | | | | 12 | * |
| | | | | | | | | | | | | | | | | | | | | | | | | | | | | | | | | | | |
| Total | | | $ | 24,081 | | | | $ | 4,567,674 | | | | $ | (4,386,093 | ) | | | $ | - | | | | $ | 9 | | | | $ | 205,671 | | | | $ | 724 | |
| | | | | | | | | | | | | | | | | | | | | | | | | | | | | | | | | | | |
| * | Represents the income earned on the investment of cash collateral, which is included in securities lending income on the Statements of Operations. Does not include rebates and fees paid to lending agent or premiums received from borrowers, if any. |
| (g) | The rate shown is the 7-day SEC standardized yield as of August 31, 2020. |
| (h) | The security has been segregated to satisfy the commitment to return the cash collateral received in securities lending transactions upon the borrower’s return of the securities loaned. See Note 2J. |
See accompanying Notes to Financial Statements which are an integral part of the financial statements.
Statements of Assets and Liabilities
August 31, 2020
| | | | | | | | | | | | | | | |
| | | Invesco
PureBetaSM
MSCI USA ETF
(PBUS) | | Invesco
PureBetaSM
MSCI USA
Small Cap ETF
(PBSM) | | Invesco
PureBetaSM
US Aggregate
Bond ETF
(PBND) |
| Assets: | | | | | | | | | | | | | | | |
Unaffiliated investments in securities, at value(a) | | | | $8,842,918 | | | | | $4,012,283 | | | | | $29,423,353 | |
Affiliated investments in securities, at value | | | | 21,114 | | | | | 208,918 | | | | | 205,671 | |
Cash | | | | 83 | | | | | - | | | | | 750 | |
Receivable for: | | | | | | | | | | | | | | | |
Dividends and interest | | | | 12,738 | | | | | 3,472 | | | | | 158,374 | |
Securities lending | | | | 3 | | | | | 180 | | | | | 33 | |
Investments sold | | | | - | | | | | - | | | | | 394,598 | |
Investments sold - affiliated broker | | | | 16,511 | | | | | 39,680 | | | | | - | |
| | | | | | | | | | | | | | | |
Total assets | | | | 8,893,367 | | | | | 4,264,533 | | | | | 30,182,779 | |
| | | | | | | | | | | | | | | |
| | | |
| Liabilities: | | | | | | | | | | | | | | | |
Payable for: | | | | | | | | | | | | | | | |
Investments purchased | | | | - | | | | | - | | | | | 439,779 | |
Investments purchased - affiliated broker | | | | 19,231 | | | | | 15,463 | | | | | - | |
Collateral upon return of securities loaned | | | | 19,185 | | | | | 202,467 | | | | | 164,340 | |
Accrued unitary management fees | | | | 288 | | | | | 204 | | | | | 1,207 | |
| | | | | | | | | | | | | | | |
Total liabilities | | | | 38,704 | | | | | 218,134 | | | | | 605,326 | |
| | | | | | | | | | | | | | | |
| Net Assets | | | | $8,854,663 | | | | | $4,046,399 | | | | | $29,577,453 | |
| | | | | | | | | | | | | | | |
| | | |
| Net assets consist of: | | | | | | | | | | | | | | | |
Shares of beneficial interest | | | | $6,766,139 | | | | | $3,590,331 | | | | | $27,683,054 | |
Distributable earnings | | | | 2,088,524 | | | | | 456,068 | | | | | 1,894,399 | |
| | | | | | | | | | | | | | | |
| Net Assets | | | | $8,854,663 | | | | | $4,046,399 | | | | | $29,577,453 | |
| | | | | | | | | | | | | | | |
Shares outstanding (unlimited amount authorized, $0.01 par value) | | | | 250,001 | | | | | 150,001 | | | | | 1,100,001 | |
Net asset value | | | | $35.42 | | | | | $26.98 | | | | | $26.89 | |
| | | | | | | | | | | | | | | |
Market price | | | | $35.61 | | | | | $27.00 | | | | | $26.93 | |
Unaffiliated investments in securities, at cost | | | | $6,739,779 | | | | | $3,528,453 | | | | | $27,506,564 | |
| | | | | | | | | | | | | | | |
Affiliated investments in securities, at cost | | | | $ 21,884 | | | | | $ 208,888 | | | | | $ 205,671 | |
| | | | | | | | | | | | | | | |
(a) Includes securities on loan with an aggregate value of: | | | | $ 18,573 | | | | | $ 195,315 | | | | | $ 160,305 | |
| | | | | | | | | | | | | | | |
See accompanying Notes to Financial Statements which are an integral part of the financial statements.
Statements of Operations
For the year ended August 31, 2020
| | | | | | | | | | | | | | | |
| | | |
| | | Invesco
PureBetaSM
MSCI USA ETF
(PBUS) | | Invesco
PureBetaSM
MSCI USA
Small Cap ETF
(PBSM) | | Invesco
PureBetaSM
US Aggregate
Bond ETF
(PBND) |
| Investment income: | | | | | | | | | | | | | | | |
Unaffiliated interest income | | | $ | - | | | | $ | - | | | | $ | 634,446 | |
Unaffiliated dividend income | | | | 84,302 | | | | | 43,794 | | | | | - | |
Affiliated dividend income | | | | 126 | | | | | 215 | | | | | 355 | |
Securities lending income | | | | 78 | | | | | 1,824 | | | | | 217 | |
Foreign withholding tax | | | | (9 | ) | | | | (29 | ) | | | | - | |
| | | | | | | | | | | | | | | |
Total investment income | | | | 84,497 | | | | | 45,804 | | | | | 635,018 | |
| | | | | | | | | | | | | | | |
| | | |
| Expenses: | | | | | | | | | | | | | | | |
Unitary management fees | | | | 1,816 | | | | | 1,776 | | | | | 13,180 | |
| | | | | | | | | | | | | | | |
Less: Waivers | | | | (11 | ) | | | | (11 | ) | | | | (78 | ) |
| | | | | | | | | | | | | | | |
Net expenses | | | | 1,805 | | | | | 1,765 | | | | | 13,102 | |
| | | | | | | | | | | | | | | |
Net investment income | | | | 82,692 | | | | | 44,039 | | | | | 621,916 | |
| | | | | | | | | | | | | | | |
| | | |
| Realized and unrealized gain (loss) from: | | | | | | | | | | | | | | | |
Net realized gain (loss) from: | | | | | | | | | | | | | | | |
Unaffiliated investment securities | | | | (32,210 | ) | | | | (14,471 | ) | | | | 212,633 | |
Affiliated investment securities | | | | (180 | ) | | | | (1,810 | ) | | | | 9 | |
| | | | | | | | | | | | | | | |
Net realized gain (loss) | | | | (32,390 | ) | | | | (16,281 | ) | | | | 212,642 | |
| | | | | | | | | | | | | | | |
Change in net unrealized appreciation (depreciation) of: | | | | | | | | | | | | | | | |
Unaffiliated investment securities | | | | 1,688,828 | | | | | 354,753 | | | | | 788,325 | |
Affiliated investment securities | | | | 39 | | | | | 215 | | | | | - | |
| | | | | | | | | | | | | | | |
Change in net unrealized appreciation | | | | 1,688,867 | | | | | 354,968 | | | | | 788,325 | |
| | | | | | | | | | | | | | | |
Net realized and unrealized gain | | | | 1,656,477 | | | | | 338,687 | | | | | 1,000,967 | |
| | | | | | | | | | | | | | | |
Net increase in net assets resulting from operations | | | $ | 1,739,169 | | | | $ | 382,726 | | | | $ | 1,622,883 | |
| | | | | | | | | | | | | | | |
See accompanying Notes to Financial Statements which are an integral part of the financial statements.
Statements of Changes in Net Assets
For the years ended August 31, 2020 and 2019
| | | | | | | | | | |
| | | Invesco PureBetaSM
MSCI USA ETF (PBUS) |
| | | 2020 | | 2019 |
| Operations: | | | | | | | | | | |
Net investment income | | | $ | 82,692 | | | | $ | 47,560 | |
Net realized gain (loss) | | | | (32,390 | ) | | | | (1,083 | ) |
Change in net unrealized appreciation (depreciation) | | | | 1,688,867 | | | | | 19,713 | |
| | | | | | | | | | |
Net increase (decrease) in net assets resulting from operations | | | | 1,739,169 | | | | | 66,190 | |
| | | | | | | | | | |
| | |
| Distributions to Shareholders from: | | | | | | | | | | |
Distributable earnings | | | | (66,477 | ) | | | | (59,334 | ) |
| | | | | | | | | | |
| | |
| Shareholder Transactions: | | | | | | | | | | |
Proceeds from shares sold | | | | 4,266,114 | | | | | - | |
| | | | | | | | | | |
Net increase (decrease) in net assets | | | | 5,938,806 | | | | | 6,856 | |
| | | | | | | | | | |
| | |
| Net assets: | | | | | | | | | | |
Beginning of year | | | | 2,915,857 | | | | | 2,909,001 | |
| | | | | | | | | | |
End of year | | | $ | 8,854,663 | | | | $ | 2,915,857 | |
| | | | | | | | | | |
| | |
| Changes in Shares Outstanding: | | | | | | | | | | |
Shares sold | | | | 150,000 | | | | | - | |
Shares outstanding, beginning of year | | | | 100,001 | | | | | 100,001 | |
| | | | | | | | | | |
Shares outstanding, end of year | | | | 250,001 | | | | | 100,001 | |
| | | | | | | | | | |
See accompanying Notes to Financial Statements which are an integral part of the financial statements.
| | | | | | | | | | | | | | | | | | |
Invesco PureBetaSM
MSCI USA Small Cap ETF (PBSM) | | Invesco PureBetaSM
US Aggregate Bond ETF (PBND) |
| 2020 | | 2019 | | 2020 | | 2019 |
| | | | | | | | | | | | | | | | | | | |
| | $ | 44,039 | | | | $ | 30,840 | | | | $ | 621,916 | | | | $ | 666,029 | |
| | | (16,281 | ) | | | | (7,557 | ) | | | | 212,642 | | | | | (93,021 | ) |
| | | 354,968 | | | | | (297,294 | ) | | | | 788,325 | | | | | 1,832,143 | |
| | | | | | | | | | | | | | | | | | | |
| | | 382,726 | | | | | (274,011 | ) | | | | 1,622,883 | | | | | 2,405,151 | |
| | | | | | | | | | | | | | | | | | | |
| | | |
| | | | | | | | | | | | | | | | | | | |
| | | (43,279 | ) | | | | (120,640 | ) | | | | (691,688 | ) | | | | (698,051 | ) |
| | | | | | | | | | | | | | | | | | | |
| | | |
| | | | | | | | | | | | | | | | | | | |
| | | 1,090,306 | | | | | - | | | | | 2,705,966 | | | | | - | |
| | | | | | | | | | | | | | | | | | | |
| | | 1,429,753 | | | | | (394,651 | ) | | | | 3,637,161 | | | | | 1,707,100 | |
| | | | | | | | | | | | | | | | | | | |
| | | |
| | | | | | | | | | | | | | | | | | | |
| | | 2,616,646 | | | | | 3,011,297 | | | | | 25,940,292 | | | | | 24,233,192 | |
| | | | | | | | | | | | | | | | | | | |
| | $ | 4,046,399 | | | | $ | 2,616,646 | | | | $ | 29,577,453 | | | | $ | 25,940,292 | |
| | | | | | | | | | | | | | | | | | | |
| | | |
| | | | | | | | | | | | | | | | | | | |
| | | 50,000 | | | | | - | | | | | 100,000 | | | | | - | |
| | | 100,001 | | | | | 100,001 | | | | | 1,000,001 | | | | | 1,000,001 | |
| | | | | | | | | | | | | | | | | | | |
| | | 150,001 | | | | | 100,001 | | | | | 1,100,001 | | | | | 1,000,001 | |
| | | | | | | | | | | | | | | | | | | |
Financial Highlights
Invesco PureBetaSM MSCI USA ETF (PBUS)
| | | | | | | | | | | | | | | | | | | | |
| | | Years Ended August 31, | | Ten Months Ended
August 31,
2018 | | For the Period
September 19, 2017(a)
Through
October 31,
2017 |
| | | 2020 | | 2019 |
Per Share Operating Performance: | | | | | | | | | | | | | | | | |
Net asset value at beginning of period | | | | $29.16 | | | | | $29.09 | | | | | $25.70 | | | | | $25.00 | |
| | | | | | | | | | | | | | | | | | | | |
Net investment income(b) | | | | 0.56 | | | | | 0.48 | | | | | 0.43 | | | | | 0.04 | |
Net realized and unrealized gain on investments | | | | 6.21 | | | | | 0.19 | | | | | 3.32 | | | | | 0.66 | |
| | | | | | | | | | | | | | | | | | | | |
Total from investment operations | | | | 6.77 | | | | | 0.67 | | | | | 3.75 | | | | | 0.70 | |
| | | | | | | | | | | | | | | | | | | | |
Distributions to shareholders from: | | | | | | | | | | | | | | | | |
Net investment income | | | | (0.51 | ) | | | | (0.53 | ) | | | | (0.36 | ) | | | | - | |
Net realized gains | | | | - | | | | | (0.07 | ) | | | | - | | | | | - | |
| | | | | | | | | | | | | | | | | | | | |
Total distributions | | | | (0.51 | ) | | | | (0.60 | ) | | | | (0.36 | ) | | | | - | |
| | | | | | | | | | | | | | | | | | | | |
Net asset value at end of period | | | | $35.42 | | | | | $29.16 | | | | | $29.09 | | | | | $25.70 | |
| | | | | | | | | | | | | | | | | | | | |
Market price at end of period(c) | | | | $35.61 | | | | | $29.16 | | | | | $29.09 | | | | | $25.70 | |
| | | | | | | | | | | | | | | | | | | | |
Net Asset Value Total Return(d) | | | | 23.71 | % | | | | 2.48 | % | | | | 14.68 | % | | | | 2.80 | %(e) |
Market Price Total Return(d) | | | | 24.36 | % | | | | 2.48 | % | | | | 14.68 | % | | | | 2.80 | %(e) |
Ratios/Supplemental Data: | | | | | | | | | | | | | | | | |
Net assets at end of period (000’s omitted) | | | | $8,855 | | | | | $2,916 | | | | | $2,909 | | | | | $2,570 | |
Ratio to average net assets of: | | | | | | | | | | | | | | | | | | | | |
Expenses | | | | 0.04 | % | | | | 0.29 | %(f) | | | | 0.04 | %(g) | | | | 0.04 | %(g) |
Net investment income | | | | 1.82 | % | | | | 1.70 | %(f) | | | | 1.91 | %(g) | | | | 1.31 | %(g) |
Portfolio turnover rate(h) | | | | 5 | % | | | | 5 | % | | | | 4 | % | | | | 0 | %(i) |
| (a) | Commencement of investment operations. |
| (b) | Based on average shares outstanding. |
| (c) | The mean between the last bid and ask prices. |
| (d) | Net asset value total return is calculated assuming an initial investment made at the net asset value at the beginning of the period, reinvestment of all dividends and distributions at net asset value during the period, and redemption at net asset value on the last day of the period. Net asset value total return includes adjustments in accordance with accounting principles generally accepted in the United States of America and as such, the net asset value for financial reporting purposes and the returns based upon those net asset values may differ from the net asset value and returns for shareholder transactions. Market price total return is calculated assuming an initial investment made at the market price at the beginning of the period, reinvestment of all dividends and distributions at market price during the period, and sale at the market price on the last day of the period. Total investment returns calculated for a period of less than one year are not annualized. |
| (e) | The net asset value total return from Fund Inception (September 22, 2017, the first day of trading on the Exchange) to October 31, 2017 was 2.96%. The market price total return from Fund Inception to October 31, 2017 was 3.09%. |
| (f) | Ratios include non-recurring costs associated with a proxy statement of 0.25%. |
| (h) | Portfolio turnover rate is not annualized for periods less than one year, if applicable, and does not include securities received or delivered from processing creations or redemptions. |
| (i) | Amount represents less than 0.5%. |
See accompanying Notes to Financial Statements which are an integral part of the financial statements.
Financial Highlights–(continued)
Invesco PureBetaSM MSCI USA Small Cap ETF (PBSM)
| | | | | | | | | | | | | | | | | | | | |
| | | Years Ended August 31, | | Ten Months Ended
August 31,
2018 | | For the Period
September 19, 2017(a)
Through
October 31,
2017 |
| | | 2020 | | 2019 |
Per Share Operating Performance: | | | | | | | | | | | | | | | | |
Net asset value at beginning of period | | | | $26.17 | | | | | $30.11 | | | | | $26.06 | | | | | $25.00 | |
| | | | | | | | | | | | | | | | | | | | |
Net investment income(b) | | | | 0.38 | | | | | 0.31 | | | | | 0.32 | | | | | 0.04 | |
Net realized and unrealized gain (loss) on investments | | | | 0.82 | | | | | (3.05 | ) | | | | 4.00 | | | | | 1.02 | |
| | | | | | | | | | | | | | | | | | | | |
Total from investment operations | | | | 1.20 | | | | | (2.74 | ) | | | | 4.32 | | | | | 1.06 | |
| | | | | | | | | | | | | | | | | | | | |
Distributions to shareholders from: | | | | | | | | | | | | | | | | |
Net investment income | | | | (0.38 | ) | | | | (0.38 | ) | | | | (0.27 | ) | | | | - | |
Net realized gains | | | | (0.01 | ) | | | | (0.82 | ) | | | | - | | | | | - | |
| | | | | | | | | | | | | | | | | | | | |
Total distributions | | | | (0.39 | ) | | | | (1.20 | ) | | | | (0.27 | ) | | | | - | |
| | | | | | | | | | | | | | | | | | | | |
Net asset value at end of period | | | | $26.98 | | | | | $26.17 | | | | | $30.11 | | | | | $26.06 | |
| | | | | | | | | | | | | | | | | | | | |
Market price at end of period(c) | | | | $27.00 | | | | | $26.21 | | | | | $30.11 | | | | | $26.08 | |
| | | | | | | | | | | | | | | | | | | | |
Net Asset Value Total Return(d) | | | | 4.87 | % | | | | (8.54 | )% | | | | 16.66 | % | | | | 4.24 | %(e) |
Market Price Total Return(d) | | | | 4.79 | % | | | | (8.40 | )% | | | | 16.57 | % | | | | 4.32 | %(e) |
Ratios/Supplemental Data: | | | | | | | | | | | | | | | | |
Net assets at end of period (000’s omitted) | | | | $4,046 | | | | | $2,617 | | | | | $3,011 | | | | | $2,606 | |
Ratio to average net assets of: | | | | | | | | | | | | | | | | | | | | |
Expenses | | | | 0.06 | % | | | | 0.32 | %(f) | | | | 0.06 | %(g) | | | | 0.06 | %(g) |
Net investment income | | | | 1.49 | % | | | | 1.16 | %(f) | | | | 1.39 | %(g) | | | | 1.21 | %(g) |
Portfolio turnover rate(h) | | | | 21 | % | | | | 17 | % | | | | 15 | % | | | | 1 | % |
| (a) | Commencement of investment operations. |
| (b) | Based on average shares outstanding. |
| (c) | The mean between the last bid and ask prices. |
| (d) | Net asset value total return is calculated assuming an initial investment made at the net asset value at the beginning of the period, reinvestment of all dividends and distributions at net asset value during the period, and redemption at net asset value on the last day of the period. Net asset value total return includes adjustments in accordance with accounting principles generally accepted in the United States of America and as such, the net asset value for financial reporting purposes and the returns based upon those net asset values may differ from the net asset value and returns for shareholder transactions. Market price total return is calculated assuming an initial investment made at the market price at the beginning of the period, reinvestment of all dividends and distributions at market price during the period, and sale at the market price on the last day of the period. Total investment returns calculated for a period of less than one year are not annualized. |
| (e) | The net asset value total return from Fund Inception (September 22, 2017, the first day of trading on the Exchange) to October 31, 2017 was 3.66%. The market price total return from Fund Inception to October 31, 2017 was 3.66%. |
| (f) | Ratios include non-recurring costs associated with a proxy statement of 0.26%. |
| (h) | Portfolio turnover rate is not annualized for periods less than one year, if applicable, and does not include securities received or delivered from processing creations or redemptions. |
See accompanying Notes to Financial Statements which are an integral part of the financial statements.
Financial Highlights–(continued)
Invesco PureBetaSM US Aggregate Bond ETF (PBND)
| | | | | | | | | | | | | | | | | | | | |
| | | Years Ended August 31, | | Ten Months Ended
August 31,
2018 | | For the Period
September 27, 2017(a)
Through
October 31,
2017 |
| | | 2020 | | 2019 |
Per Share Operating Performance: | | | | | | | | | | | | | | | | |
Net asset value at beginning of period | | | $ | 25.94 | | | | $ | 24.23 | | | | $ | 24.96 | | | | $ | 25.00 | |
| | | | | | | | | | | | | | | | | | | | |
Net investment income(b) | | | | 0.62 | | | | | 0.67 | | | | | 0.52 | | | | | 0.06 | |
Net realized and unrealized gain (loss) on investments | | | | 1.02 | | | | | 1.74 | | | | | (0.70 | ) | | | | (0.05 | ) |
| | | | | | | | | | | | | | | | | | | | |
Total from investment operations | | | | 1.64 | | | | | 2.41 | | | | | (0.18 | ) | | | | 0.01 | |
| | | | | | | | | | | | | | | | | | | | |
Distributions to shareholders from: | | | | | | | | | | | | | | | | |
Net investment income | | | | (0.69 | ) | | | | (0.70 | ) | | | | (0.54 | ) | | | | (0.05 | ) |
Return of capital | | | | - | | | | | - | | | | | (0.01 | ) | | | | - | |
| | | | | | | | | | | | | | | | | | | | |
Total distributions | | | | (0.69 | ) | | | | (0.70 | ) | | | | (0.55 | ) | | | | (0.05 | ) |
| | | | | | | | | | | | | | | | | | | | |
Net asset value at end of period | | | $ | 26.89 | | | | $ | 25.94 | | | | $ | 24.23 | | | | $ | 24.96 | |
| | | | | | | | | | | | | | | | | | | | |
Market price at end of period(c) | | | $ | 26.93 | | | | $ | 25.96 | | | | $ | 24.25 | | | | $ | 24.96 | |
| | | | | | | | | | | | | | | | | | | | |
Net Asset Value Total Return(d) | | | | 6.42 | % | | | | 10.14 | % | | | | (0.72 | )% | | | | 0.05 | %(e) |
Market Price Total Return(d) | | | | 6.49 | % | | | | 10.14 | % | | | | (0.64 | )% | | | | 0.05 | %(e) |
Ratios/Supplemental Data: | | | | | | | | | | | | | | | | |
Net assets at end of period (000’s omitted) | | | $ | 29,577 | | | | $ | 25,940 | | | | $ | 24,233 | | | | $ | 24,964 | |
Ratio to average net assets of: | | | | | | | | | | | | | | | | | | | | |
Expenses, after Waivers | | | | 0.05 | % | | | | 0.08 | %(f) | | | | 0.05 | %(g) | | | | 0.04 | %(g) |
Expenses, prior to Waivers | | | | 0.05 | % | | | | 0.08 | %(f) | | | | 0.05 | %(g) | | | | 0.05 | %(g) |
Net investment income | | | | 2.36 | % | | | | 2.71 | %(f) | | | | 2.55 | %(g) | | | | 2.44 | %(g) |
Portfolio turnover rate(h) | | | | 30 | % | | | | 29 | % | | | | 20 | % | | | | 0 | %(i) |
| (a) | Commencement of investment operations. |
| (b) | Based on average shares outstanding. |
| (c) | The mean between the last bid and ask prices. |
| (d) | Net asset value total return is calculated assuming an initial investment made at the net asset value at the beginning of the period, reinvestment of all dividends and distributions at net asset value during the period, and redemption at net asset value on the last day of the period. Net asset value total return includes adjustments in accordance with accounting principles generally accepted in the United States of America and as such, the net asset value for financial reporting purposes and the returns based upon those net asset values may differ from the net asset value and returns for shareholder transactions. Market price total return is calculated assuming an initial investment made at the market price at the beginning of the period, reinvestment of all dividends and distributions at market price during the period, and sale at the market price on the last day of the period. Total investment returns calculated for a period of less than one year are not annualized. |
| (e) | The net asset value total return from Fund Inception (September 29, 2017, the first day of trading on the Exchange) to October 31, 2017 was 0.01%. The market price total return from Fund Inception to October 31, 2017 was 0.29%. |
| (f) | Ratios include non-recurring costs associated with a proxy statement of 0.03%. |
| (h) | Portfolio turnover rate is not annualized for periods less than one year, if applicable, and does not include securities received or delivered from processing creations or redemptions. |
| (i) | Amount represents less than 0.5%. |
See accompanying Notes to Financial Statements which are an integral part of the financial statements.
Notes to Financial Statements
Invesco Exchange-Traded Fund Trust II
August 31, 2020
NOTE 1–Organization
Invesco Exchange-Traded Fund Trust II (the “Trust”) was organized as a Massachusetts business trust on October 10, 2006 and is authorized to have multiple series of portfolios. The Trust is an open-end management investment company registered under the Investment Company Act of 1940, as amended (the “1940 Act”). This report includes the following portfolios:
| | |
Full Name | | Short Name |
| |
| Invesco PureBetaSM MSCI USA ETF (PBUS) | | “PureBetaSM MSCI USA ETF” |
| |
| Invesco PureBetaSM MSCI USA Small Cap ETF (PBSM) | | “PureBetaSM MSCI USA Small Cap ETF” |
| |
| Invesco PureBetaSM US Aggregate Bond ETF (PBND) | | “PureBetaSM US Aggregate Bond ETF” |
Each portfolio (each, a “Fund”, and collectively, the “Funds”) represents a separate series of the Trust. The shares of the Funds are referred to herein as “Shares” or “Fund’s Shares.” Each Fund’s Shares are listed and traded on Cboe BZX Exchange, Inc.
The market price of each Share may differ to some degree from a Fund’s net asset value (“NAV”). Unlike conventional mutual funds, each Fund issues and redeems Shares on a continuous basis, at NAV, only in a large specified number of Shares, each called a “Creation Unit.” Creation Units are issued and redeemed principally in exchange for the deposit or delivery of a basket of securities (“Deposit Securities”). Except when aggregated in Creation Units by Authorized Participants, the Shares are not individually redeemable securities of the Funds.
The investment objective of each Fund is to seek to track the investment results (before fees and expenses) of its respective index listed below (each, an “Underlying Index”):
| | |
Fund | | Underlying Index |
| |
| PureBetaSM MSCI USA ETF | | MSCI USA Index |
| |
| PureBetaSM MSCI USA Small Cap ETF | | MSCI USA Small Cap Index |
| |
| PureBetaSM US Aggregate Bond ETF | | ICE BofAML US Broad Market IndexSM |
NOTE 2–Significant Accounting Policies
The following is a summary of the significant accounting policies followed by the Funds in preparation of their financial statements.
Each Fund is an investment company and accordingly follows the investment company accounting and reporting guidance in accordance with Financial Accounting Standards Board Accounting Standards Codification Topic 946, Financial Services–Investment Companies.
A. Security Valuation - Securities, including restricted securities, are valued according to the following policies:
A security listed or traded on an exchange (except convertible securities) is generally valued at its last sales price or official closing price as of the close of the customary trading session on the exchange where the security is principally traded or, lacking any sales or official closing price on a particular day, the security may be valued at the closing bid price on that day. Securities traded in the over-the-counter market are valued based on prices furnished by independent pricing services or market makers. When such securities are valued by an independent pricing service they may be considered fair valued. Futures contracts are valued at the final settlement price set by an exchange on which they are principally traded. Listed options are valued at the mean between the last bid and asked prices from the exchange on which they are principally traded, or at the final settlement price set by such exchange. Swaps and options not listed on an exchange are valued by an independent source. For purposes of determining NAV per Share, futures and option contracts generally are valued 15 minutes after the close of the customary trading session of the New York Stock Exchange (“NYSE”).
Investment companies are valued using such company’s NAV per share, unless the shares are exchange-traded, in which case they are valued at the last sales price or official closing price as of the close of the customary trading session on the exchange where the security is principally traded.
Debt obligations (including convertible securities) and unlisted equities are fair valued using an evaluated quote provided by an independent pricing service. Evaluated quotes provided by the pricing service may be determined without exclusive reliance on quoted prices, and may reflect appropriate factors such as institution-size trading in similar groups of securities, developments related to specific securities, dividend rate (for unlisted equities), yield (for debt obligations), quality, type of issue, coupon rate (for debt obligations), maturity (for debt obligations), individual trading characteristics and other market data. Securities with a demand feature exercisable within one to seven days are valued at par. Pricing services generally value debt obligations assuming orderly transactions of institutional round lot size, but a Fund may hold or transact in the same securities in smaller, odd lot sizes. Odd lots often trade at lower prices than institutional round lots. Debt obligations are
subject to interest rate and credit risks. In addition, all debt obligations involve some risk of default with respect to interest and/or principal payments.
Foreign securities’ (including foreign exchange contracts’) prices are converted into U.S. dollar amounts using the applicable exchange rates as of the close of the London world markets. If market quotations are available and reliable for foreign exchange-traded equity securities, the securities will be valued at the market quotations. Because trading hours for certain foreign securities end before the close of the NYSE, closing market quotations may become unreliable. If between the time trading ends on a particular security and the close of the customary trading session on the NYSE, events occur that Invesco Capital Management LLC (the “Adviser”) determines are significant and make the closing price unreliable, a Fund may fair value the security. If the event is likely to have affected the closing price of the security, the security will be valued at fair value in good faith using procedures approved by the Board of Trustees. Adjustments to closing prices to reflect fair value may also be based on a screening process of an independent pricing service to indicate the degree of certainty, based on historical data, that the closing price in the principal market where a foreign security trades is not the current value as of the close of the NYSE. Foreign securities’ prices meeting the approved degree of certainty that the price is not reflective of current value will be priced at the indication of fair value from the independent pricing service. Multiple factors may be considered by the independent pricing service in determining adjustments to reflect fair value and may include information relating to sector indices, American Depositary Receipts and domestic and foreign index futures. Foreign securities may have additional risks including exchange rate changes, the potential for sharply devalued currencies and high inflation, political and economic upheaval, the relative lack of issuer information, relatively low market liquidity and the potential lack of strict financial and accounting controls and standards.
Securities for which market prices are not provided by any of the above methods may be valued based upon quotes furnished by independent sources. The last bid price may be used to value exchange-traded equity securities. The mean between the last bid and asked prices may be used to value debt obligations, including corporate loans, and unlisted equity securities.
Securities for which market quotations are not readily available or became unreliable are valued at fair value as determined in good faith following procedures approved by the Board of Trustees. Issuer-specific events, market trends, bid/asked quotes of brokers and information providers and other market data may be reviewed in the course of making a good faith determination of a security’s fair value.
Each Fund may invest in securities that are subject to interest rate risk, meaning the risk that the prices will generally fall as interest rates rise and, conversely, the prices will generally rise as interest rates fall. Specific securities differ in their sensitivity to changes in interest rates depending on their individual characteristics. Changes in interest rates may result in increased market volatility, which may affect the value and/or liquidity of certain Fund investments.
Valuations change in response to many factors, including the historical and prospective earnings of the issuer, the value of the issuer’s assets, general market conditions which are not specifically related to the particular issuer, such as real or perceived adverse economic conditions, changes in the general outlook for revenues or corporate earnings, changes in interest or currency rates, regional or global instability, natural or environmental disasters, widespread disease or other public health issues, war, acts of terrorism or adverse investor sentiment generally and market liquidity. Because of the inherent uncertainties of valuation, the values reflected in the financial statements may materially differ from the value received upon actual sale of those investments.
Authorized Participant Concentration Risk. Only authorized participants (“APs”) may engage in creation or redemption transactions directly with each Fund. Each Fund has a limited number of institutions that may act as APs, and such APs have no obligation to submit creation or redemption orders. Consequently, there is no assurance that APs will establish or maintain an active trading market for the Shares. This risk may be heightened to the extent that securities held by each Fund are traded outside a collateralized settlement system. In that case, APs may be required to post collateral on certain trades on an agency basis (i.e., on behalf of other market participants), which only a limited number of APs may be able to do. In addition, to the extent that APs exit the business or are unable to proceed with creation and/or redemption orders with respect to each Fund and no other AP is able to step forward to create or redeem Creation Units, this may result in a significantly diminished trading market for Fund Shares, and Shares may be more likely to trade at a premium or discount to a Fund’s NAV and to face trading halts and/or delisting. Investments in non-U.S. securities, which may have lower trading volumes, may increase this risk.
Call Risk. If interest rates fall, it is possible that issuers of callable securities with high interest coupons will “call” (or prepay) their bonds before their maturity date. If an issuer exercises such a call during a period of declining interest rates, a Fund may have to replace such called security with a lower yielding security. If that were to happen, such Fund’s net investment income could fall.
Changing U.S. Fixed-Income Market Conditions Risk. The current historically low interest rate environment was created in part by the Federal Reserve Board (“FRB”) keeping the federal funds rates at, near or below zero. In recent years, the FRB began “tapering” its quantitative easing program, leading to fluctuations in the Federal Funds Rate. However, in response to the impact of the COVID-19 pandemic, in March 2020 the FRB announced cuts to the Federal Funds Rate and a new round of quantitative easing. Because there is little precedent for this situation, it is difficult to predict the impact of these rate changes
or any future rate changes on various markets. Any additional changes to the monetary policy by the FRB or other regulatory actions may affect interest rates and/or reduce liquidity for fixed-income investments, particularly those with longer maturities. In addition, decreases in fixed-income dealer market-making capacity may also potentially lead to heightened volatility and reduced liquidity in the fixed-income markets. As a result, the value of a Fund’s investments and share price may decline. Changes in FRB policies could also result in higher than normal shareholder redemptions, which could potentially increase portfolio turnover rate and a Fund’s transaction costs.
Equity Risk. Equity risk is the risk that the value of equity securities, including common stocks, may fall due to both changes in general economic conditions that impact the market as a whole, as well as factors that directly relate to a specific company or its industry. Such general economic conditions include changes in interest rates, periods of market turbulence or instability, or general and prolonged periods of economic decline and cyclical change. It is possible that a drop in the stock market may depress the price of most or all of the common stocks that each Fund holds. In addition, equity risk includes the risk that investor sentiment toward one or more industries will become negative, resulting in those investors exiting their investments in those industries, which could cause a reduction in the value of companies in those industries more broadly. The value of a company’s common stock may fall solely because of factors, such as an increase in production costs that negatively impact other companies in the same region, industry or sector of the market. A company’s common stock also may decline significantly in price over a short period of time due to factors specific to that company, including decisions made by its management or lower demand for the company’s products or services. For example, an adverse event, such as an unfavorable earnings report or the failure to make anticipated dividend payments, may depress the value of common stock.
Fixed-Income Securities Risk. Fixed-income securities are subject to interest rate risk and credit risk. Interest rate risk refers to fluctuations in the value of a fixed-income security resulting from changes in the general level of interest rates. When the general level of interest rates goes up, the prices of most fixed-income securities go down. When the general level of interest rates goes down, the prices of most fixed-income securities go up. Fixed-income securities with longer maturities typically are more sensitive to changes in interest rates, making them more volatile than securities with shorter maturities. Credit risk refers to the possibility that the issuer of a security will be unable and/or unwilling to make timely interest payments and/or repay the principal on its debt. Debt instruments are subject to varying degrees of credit risk, which may be reflected in credit ratings. There is a possibility that the credit rating of a fixed-income security may be downgraded after purchase, which may adversely affect the value of the security.
Index Risk. Unlike many investment companies, each Fund does not utilize an investing strategy that seeks returns in excess of its Underlying Index. Therefore, a Fund would not necessarily buy or sell a security unless that security is added or removed, respectively, from its Underlying Index, even if that security generally is underperforming. Additionally, each Fund rebalances its portfolio in accordance with its Underlying Index, and, therefore, any changes to the Underlying Index’s rebalance schedule will result in corresponding changes to each Fund’s rebalance schedule.
Industry Concentration Risk. In following its methodology, each Fund’s Underlying Index from time to time may be concentrated to a significant degree in securities of issuers located in a single industry or industry group. To the extent that each Underlying Index concentrates in the securities of issuers in a particular industry or industry group, the corresponding Fund will also concentrate its investments to approximately the same extent. By concentrating its investments in an industry or industry group, each Fund may face more risks than if it were diversified broadly over numerous industries or industry groups. Such industry-based risks, any of which may adversely affect the companies in which each Fund invests, may include, but are not limited to, the following: general economic conditions or cyclical market patterns that could negatively affect supply and demand in a particular industry; competition for resources, adverse labor relations, political or world events; obsolescence of technologies; and increased competition or new product introductions that may affect the profitability or viability of companies in an industry. In addition, at times, such industry or industry group may be out of favor and underperform other industries or the market as a whole.
Liquidity Risk. Liquidity risk exists when a particular investment is difficult to purchase or sell. If a Fund invests in illiquid securities or current portfolio securities become illiquid, it may reduce the returns of the Fund because the Fund may be unable to sell the illiquid securities at an advantageous time or price.
Mortgage-Backed and Asset-Backed Securities Risk. For certain Funds, investments in mortgage- and asset-backed securities are subject to prepayment or call risk, which is the risk that payments from the borrower may be received earlier than expected due to changes in the rate at which the underlying loans are prepaid. Securities may be prepaid at a price less than the original purchase value. In addition, TBA transactions involve the risk that the securities received may be less favorable than what was anticipated by the Fund when entering into the TBA transaction and counterparty risk. Default or bankruptcy of a counterparty to a TBA transaction would expose the Fund to potential loss and could affect the Fund’s returns.
Non-Correlation Risk. Each Fund’s return may not match the return of its corresponding Underlying Index for a number of reasons. For example, each Fund incurs operating expenses not applicable to the Underlying Index, and incurs costs in buying and selling securities, especially when rebalancing the Fund’s securities holdings to reflect changes in the composition of its corresponding Underlying Index. Additionally, a Fund’s use of a representative sampling approach may cause the Fund not to be as well-correlated with the return of its corresponding Underlying Index as would be the case if the Fund purchased all of the securities in its corresponding Underlying Index in the proportions represented in the Underlying Index. In addition, the
performance of each Fund and its corresponding Underlying Index may vary due to asset valuation differences and differences between each Fund’s portfolio and its corresponding Underlying Index resulting from legal restrictions, costs or liquidity constraints.
Non-Diversified Fund Risk. Because each Fund is non-diversified and can invest a greater portion of its assets in securities of individual issuers than a diversified fund, changes in the market value of a single investment could cause greater fluctuations in Share price than would occur in a diversified fund. This may increase a Fund’s volatility and cause the performance of a relatively small number of issuers to have a greater impact on a Fund’s performance.
Sampling Risk. Certain Funds’ use of a representative sampling approach may result in the Fund holding a smaller number of securities than are in its respective Underlying Index. As a result, an adverse development with respect to an issuer of securities held by the Fund could result in a greater decline in NAV than would be the case if the Fund held all of the securities in its Underlying Index. To the extent the assets in the Fund are smaller, these risks will be greater.
Small-and Mid-Capitalization Company Risk. Investing in securities of small-and mid-capitalization companies involves greater risk than customarily is associated with investing in larger, more established companies. These companies’ securities may be more volatile and less liquid than those of more established companies. These securities may have returns that vary, sometimes significantly, from the overall securities market. Often small- and mid-capitalization companies and the industries in which they focus are still evolving and, as a result, they may be more sensitive to changing market conditions.
U.S. Government Obligation Risk. Certain Funds may invest in U.S. government obligations issued or guaranteed by the U.S. Government, its agencies and instrumentalities, including bills, notes and bonds issued by the U.S. Treasury. U.S. Government securities include securities that are issued or guaranteed by the United States Treasury, by various agencies of the U.S. Government, or by various instrumentalities which have been established or sponsored by the U.S. Government. U.S. Treasury securities are backed by the “full faith and credit” of the United States. Securities issued or guaranteed by federal agencies and U.S. Government-sponsored instrumentalities may or may not be backed by the full faith and credit of the United States. In the case of those U.S. Government securities not backed by the full faith and credit of the United States, the investor must look principally to the agency or instrumentality issuing or guaranteeing the security for ultimate repayment, and may not be able to assert a claim against the United States itself in the event that the agency or instrumentality does not meet its commitment. The U.S. Government, its agencies and instrumentalities do not guarantee the market value of their securities, and consequently, the value of such securities may fluctuate.
| C. | Investment Transactions and Investment Income - Investment transactions are accounted for on a trade date basis. Realized gains and losses from the sale or disposition of securities are computed on the specific identified cost basis. Interest income is recorded on an accrual basis from settlement date. Pay-in-kind interest income and non-cash dividend income received in the form of securities in-lieu of cash are recorded at the fair value of the securities received. Dividend income (net of withholding tax, if any) is recorded on the ex-dividend date. Dividend income from REITs is recorded based on the income included in the distributions received from the REIT investments using published REIT classifications, including some management estimates when actual amounts are not available. Distributions received in excess of this estimated amount are recorded as a reduction of the cost of investments or reclassified to capital gains. The actual amounts of income, return of capital, and capital gains are only determined by each REIT after its fiscal year-end, and may differ from the estimated amounts. Realized gains, dividends and interest received by a Fund may give rise to withholding and other taxes imposed by foreign countries. Tax conventions between certain countries and the United States may reduce or eliminate such taxes. |
The Funds may periodically participate in litigation related to each Fund’s investments. As such, the Funds may receive proceeds from litigation settlements. Any proceeds received are included in the Statements of Operations as realized gain (loss) for investments no longer held and as unrealized gain (loss) for investments still held.
Brokerage commissions and mark ups are considered transaction costs and are recorded as an increase to the cost basis of securities purchased and/or a reduction of proceeds on a sale of securities. Such transaction costs are included in the determination of net realized and unrealized gain (loss) from investment securities reported in the Statements of Operations and the Statements of Changes in Net Assets and the net realized and unrealized gains (losses) on securities per share in the Financial Highlights. Transaction costs are included in the calculation of each Fund’s NAV and, accordingly, they reduce each Fund’s total returns. These transaction costs are not considered operating expenses and are not reflected in net investment income reported in the Statements of Operations and the Statements of Changes in Net Assets, or the net investment income per share and the ratios of expenses and net investment income reported in the Financial Highlights, nor are they limited by any expense limitation arrangements between each Fund and the Adviser.
| D. | Country Determination - For the purposes of presentation in the Schedules of Investments, the Adviser may determine the country in which an issuer is located and/or credit risk exposure based on various factors. These factors include whether each Fund’s Underlying Index has made a country determination and may include the laws of the country under which the issuer is organized, where the issuer maintains a principal office, the country in which the issuer derives 50% or more of its total revenues and the country that has the primary market for the issuer’s securities, as well as other criteria. Among the other criteria that may be evaluated for making this determination are the country in which the issuer maintains 50% or more of its assets, the type of security, financial guarantees and enhancements, the nature of the collateral and the sponsor organization. Country of issuer and/or credit risk exposure has been determined to be the United States of America, unless otherwise noted. |
| E. | Dividends and Distributions to Shareholders - Each Fund (except for PureBetaSM US Aggregate Bond ETF) declares and pays dividends from net investment income, if any, to its shareholders quarterly and records such dividends on the ex-dividend date. PureBetaSM US Aggregate Bond ETF declares and pays dividends from net investment income, if any, to its shareholders monthly and records such dividends on the ex-dividend date. Generally, each Fund distributes net realized taxable capital gains, if any, annually in cash and records them on the ex-dividend date. Such distributions on a tax basis are determined in conformity with federal income tax regulations, which may differ from accounting principles generally accepted in the United States of America (“GAAP”). Distributions in excess of tax basis earnings and profits, if any, are reported in such Fund’s financial statements as a tax return of capital at fiscal year-end. |
| F. | Federal Income Taxes - Each Fund intends to comply with the provisions of the Internal Revenue Code of 1986, as amended (the “Internal Revenue Code”), applicable to regulated investment companies and to distribute substantially all of the Fund’s taxable earnings to its shareholders. As such, the Funds will not be subject to federal income taxes on otherwise taxable income (including net realized gains) that is distributed to the shareholders. Therefore, no provision for federal income taxes is recorded in the financial statements. |
Each Fund recognizes the tax benefits of uncertain tax positions only when the position is more likely than not to be sustained. Management has analyzed each Fund’s uncertain tax positions and concluded that no liability for unrecognized tax benefits should be recorded related to uncertain tax positions. Management is not aware of any tax positions for which it is reasonably possible that the total amounts of unrecognized tax benefits will change materially in the next 12 months.
Income and capital gain distributions are determined in accordance with federal income tax regulations, which may differ from GAAP. These differences are primarily due to differing book and tax treatments for in-kind transactions, losses deferred due to wash sales, and passive foreign investment company adjustments, if any.
The Funds file U.S. federal tax returns and tax returns in certain other jurisdictions. Generally, a Fund is subject to examinations by such taxing authorities for up to three years after the filing of the return for the tax period.
| G. | Expenses - Expenses of the Trust that are excluded from a Fund’s unitary management fee and are directly identifiable to a specific Fund are applied to that Fund. Expenses of the Trust that are excluded from a Fund’s unitary management fee and are not readily identifiable to a specific Fund are allocated in such a manner as deemed equitable, taking into consideration the nature and type of expense and the relative net assets of each Fund. |
Each Fund has agreed to pay an annual unitary management fee to the Adviser. Out of the unitary management fee, the Adviser has agreed to pay for substantially all expenses of the Funds, including the costs of transfer agency, custody, fund administration, legal, audit and other services, except for advisory fees, distribution fees, if any, brokerage expenses, taxes, interest, litigation expenses, acquired fund fees and expenses, if any, and other extraordinary expenses.
To the extent a Fund invests in other investment companies, the expenses shown in the accompanying financial statements reflect the expenses of the Fund and do not include any expenses of the investment companies in which it invests. The effects of such investment companies’ expenses are included in the realized and unrealized gain or loss on the investments in the investment companies.
| H. | Accounting Estimates - The preparation of the financial statements in accordance with GAAP requires management to make estimates and assumptions that affect the reported amounts and disclosures in the financial statements, including estimates and assumptions related to taxation. Actual results could differ from these estimates. In addition, the Funds monitor for material events or transactions that may occur or become known after the period-end date and before the date the financial statements are released to print. |
| I. | Indemnifications - Under the Trust’s organizational documents, its Officers and Trustees are indemnified against certain liabilities arising out of the performance of their duties to the Trust. Each Board member who is not an “interested person” (as defined in the 1940 Act) of the Trust (each, an “Independent Trustee”) is also indemnified against certain liabilities arising out of the performance of their duties to the Trust pursuant to an Indemnification Agreement between such trustee and the Trust. Additionally, in the normal course of business, the Trust enters into contracts with service providers that contain general indemnification clauses. The Trust’s maximum exposure under these arrangements is unknown, as this would involve future claims that may be made against the Trust that have not yet occurred. However, based on experience, the Trust believes the risk of loss to be remote. |
| J. | Securities Lending - Each Fund may participate in securities lending and may loan portfolio securities having a market value up to one-third of the Fund’s total assets. Such loans are secured by cash collateral equal to no less than 102% (105% for international securities) of the market value of the loaned securities determined daily by the securities lending provider. Cash collateral received in connection with these loans is generally invested in an affiliated money market fund and is shown as such on the Schedules of Investments. Each Fund bears the risk of loss with respect to the investment of collateral. It is the policy of these Funds to obtain additional collateral from or return excess collateral to the borrower by the end of the next business day, following the valuation date of the securities loaned. Therefore, the value of the collateral held may be temporarily less than the value of the securities on loan. When loaning securities, each Fund retains certain benefits of owning the securities, including the economic equivalent of dividends or interest generated by the security. Lending securities entails a risk of loss to each Fund if, and to the extent that, the market value of the securities loaned were to increase, and the borrower did not increase the collateral accordingly, and the borrower failed to return the securities. The securities loaned are subject to termination at the option of the borrower or each Fund. Upon termination, the borrower will return to each Fund the |
| | securities loaned and each Fund will return the collateral. Upon the failure of the borrower to return the securities, collateral may be liquidated and the securities may be purchased on the open market to replace the loaned securities. Each Fund could experience delays and costs in gaining access to the collateral and the securities may lose value during the delay which could result in potential losses to each Fund. Some of these losses may be indemnified by the lending agent. Each Fund bears the risk of any deficiency in the amount of the collateral available for return to the borrower due to any loss on the collateral invested. For Funds that participated in securities lending, dividends received on cash collateral investments for securities lending transactions, which are net of compensation to counterparties, are included in Securities lending income on the Statements of Operations. The aggregate value of securities out on loan, if any, is shown on the Statements of Assets and Liabilities. |
| K. | Foreign Currency Translations - Foreign currency is valued at the close of the NYSE based on quotations posted by banks and major currency dealers. Portfolio securities and other assets and liabilities denominated in foreign currencies are translated into U.S. dollar amounts at the date of valuation. Purchases and sales of portfolio securities (net of foreign taxes withheld on disposition) and income items denominated in foreign currencies are translated into U.S. dollar amounts on the respective dates of such transactions. Each Fund does not separately account for the portion of the results of operations resulting from changes in foreign exchange rates on investments and the fluctuations arising from changes in market prices of securities held. The combined results of changes in foreign exchange rates and the fluctuation of market prices on investments (net of estimated foreign tax withholding) are included with the net realized and unrealized gain or loss from investments in the Statements of Operations. Reported net realized foreign currency gains or losses arise from (1) sales of foreign currencies, (2) currency gains or losses realized between the trade and settlement dates on securities transactions, and (3) the difference between the amounts of dividends, interest, and foreign withholding taxes recorded on each Fund’s books and the U.S. dollar equivalent of the amounts actually received or paid. Net unrealized foreign currency gains and losses arise from changes in the fair values of assets and liabilities, other than investments in securities at fiscal period-end, resulting from changes in exchange rates. |
Each Fund may invest in foreign securities, which may be subject to foreign taxes on income, gains on investments or currency repatriation, a portion of which may be recoverable. Foreign taxes, if any, are recorded based on the tax regulations and rates that exist in the foreign markets in which each Fund invests.
NOTE 3–Investment Advisory Agreement and Other Agreements
The Trust has entered into an Investment Advisory Agreement with the Adviser on behalf of each Fund, pursuant to which the Adviser has overall responsibility for the selection and ongoing monitoring of the Funds’ investments, managing the Funds’ business affairs and providing certain clerical, bookkeeping and other administrative services.
Pursuant to the Investment Advisory Agreement, each Fund accrues daily and pays monthly to the Adviser an annual unitary management fee. Out of the unitary management fee, the Adviser has agreed to pay for substantially all expenses of the Funds, including the cost of transfer agency, custody, fund administration, legal, audit and other services, except for advisory fees, distribution fees, if any, brokerage expenses, taxes, interest, litigation expenses, acquired fund fees and expenses, if any, and other extraordinary expenses. The unitary management fee is paid by each Fund to the Adviser at the following annual rates:
| | |
| | | Unitary Management Fees
(as a % of average daily net assets) |
| |
PureBetaSM MSCI USA ETF | | 0.04% |
| |
PureBetaSM MSCI USA Small Cap ETF | | 0.06% |
| |
PureBetaSM US Aggregate Bond ETF | | 0.05% |
Further, through at least August 31, 2022, the Adviser has contractually agreed to waive a portion of each Fund’s management fee in an amount equal to 100% of the net advisory fees an affiliate of the Adviser receives that are attributable to the Fund’s investments of otherwise uninvested cash in money market funds managed by that affiliate (excluding investments of cash collateral from securities lending). There is no guarantee that the Adviser will extend the waiver of these fees past that date.
For the fiscal year ended August 31, 2020, the Adviser waived fees for each Fund in the following amounts:
| | | | |
PureBetaSM MSCI USA ETF | | $ | 11 | |
| |
PureBetaSM MSCI USA Small Cap ETF | | | 11 | |
PureBetaSM US Aggregate Bond ETF | | | 78 | |
The Trust has entered into a Distribution Agreement with Invesco Distributors, Inc. (the “Distributor”), which serves as the distributor of Creation Units for each Fund. The Distributor does not maintain a secondary market in the Shares. The Funds are not charged any fees pursuant to the Distribution Agreement. The Distributor is an affiliate of the Adviser.
The Adviser has entered into a licensing agreement for each Fund with the following entities (each, a “Licensor”):
| | |
Fund | | Licensor |
| |
| PureBetaSM MSCI USA ETF | | MSCI Inc. |
| |
| PureBetaSM MSCI USA Small Cap ETF | | MSCI Inc. |
| |
| PureBetaSM US Aggregate Bond ETF | | ICE Data Indices, LLC |
Each Underlying Index name trademark is owned by its respective Licensor. These trademarks have been licensed to the Adviser for use by the Funds. Each Fund is entitled to use its Underlying Index pursuant to the Trust’s sub-licensing agreement with the Adviser. The Funds are not sponsored, endorsed, sold or promoted by the Licensors, and the Licensors make no representation regarding the advisability of investing in any of the Funds.
The Trust has entered into service agreements whereby The Bank of New York Mellon, a wholly-owned subsidiary of The Bank of New York Mellon Corporation, serves as the administrator, custodian, fund accountant and transfer agent for each Fund.
Portfolio transactions executed on behalf of each Fund with Invesco Capital Markets, Inc., an affiliate of the Adviser and Distributor, that have not settled at period-end, if any, are shown in the Statements of Assets and Liabilities under the receivable caption Investments sold - affiliated broker and/or payable caption Investments purchased - affiliated broker.
NOTE 4–Security Transactions with Affiliated Funds
Each Fund is permitted to purchase or sell securities from or to certain other affiliated funds under specified conditions outlined in procedures adopted by the Board of Trustees of the Trust. The procedures have been designed to ensure that any purchase or sale of securities by each Fund from or to another fund or portfolio that is or could be considered an affiliate by virtue of having a common investment adviser (or affiliated investment advisers), common Trustees and/or common officers complies with Rule 17a-7 of the 1940 Act. Further, as defined under the procedures, each transaction is effected at the current market price.
For the fiscal year ended August 31, 2020, the following Fund engaged in transactions with affiliates as listed below:
| | | | | | |
| | | Securities Purchases | | Securities Sales | | Net Realized Gains |
PureBetaSM MSCI USA ETF | | $352 | | $- | | $- |
NOTE 5–Additional Valuation Information
GAAP defines fair value as the price that would be received to sell an asset or paid to transfer a liability in an orderly transaction between market participants at the measurement date, under current market conditions. GAAP establishes a hierarchy that prioritizes the inputs to valuation methods, giving the highest priority to readily available unadjusted quoted prices in an active market for identical assets (Level 1) and the lowest priority to significant unobservable inputs (Level 3), generally when market prices are not readily available or are unreliable. Based on the valuation inputs, the securities or other investments are tiered into one of three levels. Changes in valuation methods may result in transfers in or out of an investment’s assigned level:
| | |
Level 1 – | | Prices are determined using quoted prices in an active market for identical assets. |
| |
Level 2 – | | Prices are determined using other significant observable inputs. Observable inputs are inputs that other market participants may use in pricing a security. These may include quoted prices for similar securities, interest rates, prepayment speeds, credit risk, yield curves, loss severities, default rates, discount rates, volatilities and others. |
| |
Level 3 – | | Prices are determined using significant unobservable inputs. In situations where quoted prices or observable inputs are unavailable (for example, when there is little or no market activity for an investment at the end of the period), unobservable inputs may be used. Unobservable inputs reflect a Fund’s own assumptions about the factors market participants would use in determining fair value of the securities or instruments and would be based on the best available information. |
The following is a summary of the tiered valuation input levels, as of August 31, 2020. The level assigned to the securities valuations may not be an indication of the risk or liquidity associated with investing in those securities. Because of the inherent uncertainties of valuation, the values reflected in the financial statements may materially differ from the value received upon actual sale of those investments.
| | | | | | | | | | | | | | | | |
| | | Level 1 | | | Level 2 | | | Level 3 | | | Total | |
PureBetaSM MSCI USA ETF | | | | | | | | | | | | | | | | |
| | | | |
Investments in Securities | | | | | | | | | | | | | | | | |
| | | | |
Common Stocks & Other Equity Interests | | | $8,844,030 | | | $ | - | | | $ | - | | | $ | 8,844,030 | |
| | | | |
Money Market Funds | | | 817 | | | | 19,185 | | | | - | | | | 20,002 | |
| | | | | | | | | | | | | | | | |
| | | | |
Total Investments | | | $8,844,847 | | | $ | 19,185 | | | $ | - | | | $ | 8,864,032 | |
| | | | | | | | | | | | | | | | |
| | | | | | | | | | | | | | | | | | | | |
| | | Level 1 | | Level 2 | | Level 3 | | Total |
PureBetaSM MSCI USA Small Cap ETF | | | | | | | | | | | | | | | | | | | | |
| | | | |
Investments in Securities | | | | | | | | | | | | | | | | | | | | |
| | | | |
Common Stocks & Other Equity Interests | | | $ | 4,012,484 | | | | $ | 21 | | | | $ | 42 | | | | $ | 4,012,547 | |
| | | | |
Money Market Funds | | | | 6,187 | | | | | 202,467 | | | | | - | | | | | 208,654 | |
| | | | | | | | | | | | | | | | | | | | |
| | | | |
Total Investments | | | $ | 4,018,671 | | | | $ | 202,488 | | | | $ | 42 | | | | $ | 4,221,201 | |
| | | | | | | | | | | | | | | | | | | | |
PureBetaSM US Aggregate Bond ETF | | | | | | | | | | | | | | | | | | | | |
| | | | |
Investments in Securities | | | | | | | | | | | | | | | | | | | | |
| | | | |
U.S. Treasury Securities | | | $ | - | | | | $ | 12,108,615 | | | | $ | - | | | | $ | 12,108,615 | |
| | | | |
U.S. Dollar Denominated Bonds & Notes | | | | - | | | | | 9,295,508 | | | | | - | | | | | 9,295,508 | |
| | | | |
U.S. Government Sponsored Agency Mortgage-Backed Securities | | | | - | | | | | 7,033,102 | | | | | - | | | | | 7,033,102 | |
| | | | |
Asset-Backed Securities | | | | - | | | | | 808,955 | | | | | - | | | | | 808,955 | |
| | | | |
Municipal Obligations | | | | - | | | | | 177,173 | | | | | - | | | | | 177,173 | |
| | | | |
Money Market Funds | | | | 41,331 | | | | | 164,340 | | | | | - | | | | | 205,671 | |
| | | | | | | | | | | | | | | | | | | | |
| | | | |
Total Investments | | | $ | 41,331 | | | | $ | 29,587,693 | | | | $ | - | | | | $ | 29,629,024 | |
| | | | | | | | | | | | | | | | | | | | |
NOTE 6–Distributions to Shareholders and Tax Components of Net Assets
Tax Character of Distributions to Shareholders Paid During the Fiscal Years Ended August 31, 2020 and 2019:
| | | | | | | | | | | | | | | | | | | | |
| | | 2020 | | 2019 |
| | | Ordinary
Income* | | Long-Term
Capital Gains | | Ordinary
Income* | | Long-Term
Capital Gains |
PureBetaSM MSCI USA ETF | | | $ | 66,477 | | | | $ | - | | | | $ | 57,036 | | | | $ | 2,298 | |
| | | | |
PureBetaSM MSCI USA Small Cap ETF | | | | 42,620 | | | | | 659 | | | | | 116,041 | | | | | 4,599 | |
PureBetaSM US Aggregate Bond ETF | | | | 691,688 | | | | | - | | | | | 698,051 | | | | | - | |
| * | Includes short-term capital gain distributions, if any. |
Tax Components of Net Assets at Fiscal Year-end:
| | | | | | | | | | | | | | | | | | | | |
| | | Undistributed
Ordinary
Income | | | Net
Unrealized
Appreciation-
Investments | | | Capital Loss
Carryforwards | | | Shares of
Beneficial
Interest | | | Total
Net Assets | |
PureBetaSM MSCI USA ETF | | | $22,382 | | | | $2,087,971 | | | | $(21,829 | ) | | $ | 6,766,139 | | | $ | 8,854,663 | |
| | | | | |
PureBetaSM MSCI USA Small Cap ETF | | | 3,714 | | | | 456,906 | | | | (4,552 | ) | | | 3,590,331 | | | | 4,046,399 | |
PureBetaSM US Aggregate Bond ETF | | | - | | | | 1,916,643 | | | | (22,244 | ) | | | 27,683,054 | | | | 29,577,453 | |
Capital loss carryforwards are calculated and reported as of a specific date. Results of transactions and other activity after that date may affect the amount of capital loss carryforwards actually available for the Funds to utilize. The ability to utilize capital loss carryforwards in the future may be limited under the Internal Revenue Code and related regulations based on the results of future transactions.
The following table presents available capital loss carryforwards for each Fund as of August 31, 2020:
| | | | | | | | | | | | |
| | | No expiration | | | | |
| | | Short-Term | | | Long-Term | | | Total* | |
PureBetaSM MSCI USA ETF | | $ | - | | | | $21,829 | | | $ | 21,829 | |
| | | |
PureBetaSM MSCI USA Small Cap ETF | | | - | | | | 4,552 | | | | 4,552 | |
| | | |
PureBetaSM US Aggregate Bond ETF | | | 22,244 | | | | - | | | | 22,244 | |
| * | Capital loss carryforwards are reduced for limitations, if any, to the extent required by the Internal Revenue Code and may be further limited depending upon a variety of factors, including the realization of net unrealized gains or losses as of the date of any reorganization. |
NOTE 7–Investment Transactions
For the fiscal year ended August 31, 2020, the cost of securities purchased and the proceeds from sales of securities (other than short-term securities, U.S. Treasury obligations, money market funds and in-kind transactions, if any) were as follows:
| | | | | | | | |
| | | Purchases | | | Sales | |
PureBetaSM MSCI USA ETF | | $ | 294,554 | | | $ | 246,459 | |
PureBetaSM MSCI USA Small Cap ETF | | | 625,766 | | | | 609,520 | |
PureBetaSM US Aggregate Bond ETF | | | 5,879,851 | | | | 5,318,963 | |
For the fiscal year ended August 31, 2020, the cost of securities purchased and proceeds from sales of U.S. Treasury obligations (other than short-term securities, money market funds and in-kind transactions), for PureBetaSM US Aggregate Bond ETF amounted to $2,594,622 and $2,503,437, respectively.
For the fiscal year ended August 31, 2020, in-kind transactions associated with creations and redemptions were as follows:
| | | | |
| | | Cost of | | Value of |
| | | Securities | | Securities |
| | | Received | | Delivered |
PureBetaSM MSCI USA ETF | | $4,230,000 | | $- |
PureBetaSM MSCI USA Small Cap ETF | | 1,067,870 | | - |
PureBetaSM US Aggregate Bond ETF | | 2,111,004 | | - |
Gains (losses) on in-kind transactions are generally not considered taxable gains (losses) for federal income tax purposes.
At August 31, 2020, the aggregate cost of investments, including any derivatives, on a tax basis includes adjustments for financial reporting purposes as of the most recently completed federal income tax reporting period-end:
| | | | | | | | | | | | | | | | |
| | | Gross | | | Gross | | | Net | | | | |
| | | Unrealized | | | Unrealized | | | Unrealized | | | | |
| | | Appreciation | | | (Depreciation) | | | Appreciation | | | Cost | |
PureBetaSM MSCI USA ETF | | | $2,290,257 | | | | $(202,286 | ) | | | $2,087,971 | | | | $ 6,776,061 | |
PureBetaSM MSCI USA Small Cap ETF | | | 816,236 | | | | (359,330 | ) | | | 456,906 | | | | 3,764,295 | |
PureBetaSM US Aggregate Bond ETF | | | 1,948,984 | | | | (32,341 | ) | | | 1,916,643 | | | | 27,712,381 | |
NOTE 8–Reclassification of Permanent Differences
Primarily as a result of differing book/tax treatment of distributions and paydowns, amounts were reclassified between undistributed net investment income (loss), undistributed net realized gain (loss) and Shares of beneficial interest. These reclassifications had no effect on the net assets of each Fund. For the fiscal year ended August 31, 2020, the reclassifications were as follows:
| | | | | | | | | | | | | | | |
| | | Undistributed Net
Investment Income | | Undistributed Net
Realized Gain (Loss) | | Shares of
Beneficial Interest |
| | | |
PureBetaSM MSCI USA ETF | | | $ | - | | | | $ | - | | | | $ | - | |
| | | |
PureBetaSM MSCI USA Small Cap ETF | | | | 262 | | | | | (262 | ) | | | | - | |
| | | |
PureBetaSM US Aggregate Bond ETF | | | | 69,772 | | | | | (67,244 | ) | | | | (2,528 | ) |
NOTE 9–Trustees’ and Officer’s Fees
Trustees’ and Officer’s Fees include amounts accrued by the Funds to pay remuneration to the Independent Trustees and an Officer of the Trust. The Adviser, as a result of each Fund’s unitary management fee, pays for such compensation for the Funds. The Trustee who is an “interested person” of the Trust does not receive any Trustees’ fees.
The Trust has adopted a deferred compensation plan (the “Plan”). Under the Plan, each Independent Trustee who has executed a Deferred Fee Agreement (a “Participating Trustee”) may defer receipt of all or a portion of their compensation (“Deferral Fees”). Such Deferral Fees are deemed to be invested in select Invesco ETFs. The Deferral Fees payable to a Participating Trustee are valued as of the date such Deferral Fees would have been paid to a Participating Trustee. The value increases with contributions or with increases in the value of the Shares selected, and the value decreases with distributions or with declines in the value of the Shares selected. Obligations under the Plan represent unsecured claims against the general assets of the Funds.
NOTE 10–Capital
Shares are issued and redeemed by each Fund only in Creation Units consisting of a specified number of Shares as set forth in the Funds’ prospectus. Only Authorized Participants are permitted to purchase or redeem Creation Units from the Funds. Such transactions are principally permitted in exchange for Deposit Securities, with a balancing cash component to equate the
transaction to the NAV per Share of a Fund of the Trust on the transaction date. However, for all Funds, cash in an amount equivalent to the value of certain securities may be substituted, generally when the securities are not available in sufficient quantity for delivery, not eligible for trading by the Authorized Participant or as a result of other market circumstances.
To the extent that the Funds permit transactions in exchange for Deposit Securities, each Fund may issue Shares in advance of receipt of Deposit Securities subject to various conditions, including a requirement to maintain on deposit with the Trust cash at least equal to 105% of the market value of the missing Deposit Securities. In accordance with the Trust’s Participant Agreement, Creation Units will be issued to an Authorized Participant, notwithstanding the fact that the corresponding Deposit Securities have not been received in part or in whole, in reliance on the undertaking of the Authorized Participant to deliver the missing Deposit Securities as soon as possible, which undertaking shall be secured by the Authorized Participant’s delivery and maintenance of collateral consisting of cash in the form of U.S. dollars in immediately available funds having a value (marked-to-market daily) at least equal to 105%, which the Adviser may change from time to time, of the value of the missing Deposit Securities.
Certain transaction fees may be charged by the Funds for creations and redemptions, which are treated as increases in capital.
Transactions in each Fund’s Shares are disclosed in detail in the Statements of Changes in Net Assets.
NOTE 11–Coronavirus (COVID-19) Pandemic
During the first quarter of 2020, the World Health Organization declared COVID-19 to be a public health emergency. COVID-19 has led to increased short-term market volatility and may have adverse long-term effects on U.S. and world economies and markets in general. COVID-19 may adversely impact the value of the Funds’ investments. Because of the uncertainties on valuation, the global economy and business operations, values reflected in these financial statements may materially differ from the value received upon actual sales of those investments.
The extent of the impact on the performance of the Funds and their investments will depend on future developments, including the duration and spread of the COVID-19 outbreak, related restrictions and advisories, and the effects on the financial markets and economy overall, all of which are highly uncertain and cannot be predicted.
NOTE 12–Significant Event
On October 9, 2020, the Funds changed their classification from “non-diversified” to “diversified” and therefore are now required to meet certain diversification requirements under the Investment Company Act of 1940.
Report of Independent Registered Public Accounting Firm
To the Board of Trustees of Invesco Exchange-Traded Fund Trust II and Shareholders of Invesco PureBetaSM MSCI USA ETF, Invesco PureBetaSM MSCI USA Small Cap ETF and Invesco PureBetaSM US Aggregate Bond ETF
Opinions on the Financial Statements
We have audited the accompanying statements of assets and liabilities, including the schedules of investments, of Invesco PureBetaSM MSCI USA ETF, Invesco PureBetaSM MSCI USA Small Cap ETF and Invesco PureBetaSM US Aggregate Bond ETF (three of the funds constituting Invesco Exchange-Traded Fund Trust II, hereafter collectively referred to as the “Funds”) as of August 31, 2020, the related statements of operations for the year ended August 31, 2020, the statements of changes in net assets for each of the two years in the period ended August 31, 2020, including the related notes, and the financial highlights for each of the periods indicated therein (collectively referred to as the “financial statements”). In our opinion, the financial statements present fairly, in all material respects, the financial position of each of the Funds as of August 31, 2020, the results of each of their operations for the year ended August 31, 2020, the changes in each of their net assets for each of the two years in the period ended August 31, 2020, and each of the financial highlights for each of the periods indicated therein, in conformity with accounting principles generally accepted in the United States of America.
Basis for Opinions
These financial statements are the responsibility of the Funds’ management. Our responsibility is to express an opinion on the Funds’ financial statements based on our audits. We are a public accounting firm registered with the Public Company Accounting Oversight Board (United States) (“PCAOB”) and are required to be independent with respect to the Funds in accordance with the U.S. federal securities laws and the applicable rules and regulations of the Securities and Exchange Commission and the PCAOB.
We conducted our audits of these financial statements in accordance with the standards of the PCAOB. Those standards require that we plan and perform the audit to obtain reasonable assurance about whether the financial statements are free of material misstatement, whether due to error or fraud.
Our audits included performing procedures to assess the risks of material misstatement of the financial statements, whether due to error or fraud, and performing procedures that respond to those risks. Such procedures included examining, on a test basis, evidence regarding the amounts and disclosures in the financial statements. Our audits also included evaluating the accounting principles used and significant estimates made by management, as well as evaluating the overall presentation of the financial statements. Our procedures included confirmation of securities owned as of August 31, 2020 by correspondence with the custodian, transfer agent, and brokers; when replies were not received from brokers, we performed other auditing procedures. We believe that our audits provide a reasonable basis for our opinions.
/s/PricewaterhouseCoopers LLP
Chicago, Illinois
October 28, 2020
We have served as the auditor of one or more of the investment companies in the Invesco group of investment companies since at least 1995. We have not been able to determine the specific year we began serving as auditor.
Calculating your ongoing Fund expenses
Example
As a shareholder of a Fund of the Invesco Exchange-Traded Fund Trust II, you incur a unitary management fee. In addition to the unitary management fee, a shareholder may pay distribution fees, if any, brokerage expenses, taxes, interest, litigation expenses, acquired fund fees and expenses, if any, and other extraordinary expenses. The expense examples below are intended to help you understand your ongoing costs (in dollars) of investing in the Funds and to compare these costs with the ongoing costs of investing in other funds.
The example is based on an investment of $1,000 invested at the beginning of the period and held through the six-month period ended August 31, 2020.
Actual Expenses
The first line in the following table provides information about actual account values and actual expenses. You may use the information in this line, together with the amount you invested, to estimate the expenses that you paid over the period. Simply divide your account value by $1,000 (for example, an $8,600 account value divided by $1,000 = 8.6), then multiply the result by the number in the first line under the heading “Expenses Paid During the Six-Month Period” to estimate the expenses you paid on your account during this period.
Hypothetical Example for Comparison Purposes
The second line in the following table provides information about hypothetical account values and hypothetical expenses based on each Fund’s actual expense ratio and an assumed annualized rate of return of 5% per year before expenses, which is not the Fund’s actual return. The hypothetical account values and expenses may not be used to estimate the actual ending account balance or expenses you paid for the period. You may use this information to compare the ongoing costs of investing in the Funds and other funds. To do so, compare this 5% hypothetical example with the 5% hypothetical examples that appear in the shareholder reports of the other funds.
Please note that the expenses shown in the table are meant to highlight your ongoing costs only, and do not reflect any transactional costs, such as sales charges and brokerage commissions. Therefore, the second line in the table is useful in comparing ongoing costs only, and will not help you determine the relative total costs of owning different funds. In addition, expenses shown in the table do not include the expenses of the underlying funds, which are borne indirectly by a Fund. If transaction costs and indirect expenses were included, your costs would have been higher.
| | | | | | | | | | | | | | | | | | | | |
| | | | | | | Annualized | | |
| | | Beginning | | Ending | | Expense Ratio | | Expenses Paid |
| | | Account Value | | Account Value | | Based on the | | During the |
| | | March 1, 2020 | | August 31, 2020 | | Six-Month Period | | Six-Month Period(1) |
Invesco PureBetaSM MSCI USA ETF (PBUS) | | | | | | | | | | | | | | | | | | | | |
Actual | | | $ | 1,000.00 | | | | $ | 1,210.50 | | | | | 0.04 | % | | | $ | 0.22 | |
Hypothetical (5% return before expenses) | | | | 1,000.00 | | | | | 1,024.94 | | | | | 0.04 | | | | | 0.20 | |
Invesco PureBetaSM MSCI USA Small Cap ETF (PBSM) | | | | | | | | | | | | | | | | | | | | |
Actual | | | | 1,000.00 | | | | | 1,068.40 | | | | | 0.06 | | | | | 0.31 | |
Hypothetical (5% return before expenses) | | | | 1,000.00 | | | | | 1,024.83 | | | | | 0.06 | | | | | 0.31 | |
Invesco PureBetaSM US Aggregate Bond ETF (PBND) | | | | | | | | | | | | | | | | | | | | |
Actual | | | | 1,000.00 | | | | | 1,029.50 | | | | | 0.05 | | | | | 0.26 | |
Hypothetical (5% return before expenses) | | | | 1,000.00 | | | | | 1,024.89 | | | | | 0.05 | | | | | 0.25 | |
| (1) | Expenses are calculated using the annualized expense ratio, which represents the ongoing expenses as a percentage of net assets for the six-month period ended August 31, 2020. Expenses are calculated by multiplying the Fund’s annualized expense ratio by the average account value for the period, then multiplying the result by 184/366. Expense ratios for the most recent six-month period may differ from expense ratios based on the annualized data in the Financial Highlights. |
Tax Information
Form 1099-DIV, Form 1042-S and other year–end tax information provide shareholders with actual calendar year amounts that should be included in their tax returns. Shareholders should consult their tax advisers.
The following distribution information is being provided as required by the Internal Revenue Code or to meet a specific state’s requirement.
Each Fund designates the following amounts or, if subsequently determined to be different, the maximum amount allowable for its fiscal year ended August 31, 2020:
| | | | | | | | | | | | | | | | |
| | | Qualified | | Qualified | | | | | | Business | | Qualified | | | | |
| | | Business | | Dividend | | Dividends-Received | | U.S. Treasury | | Interest | | Interest | | Long Term | | Qualified Short |
| | | Income* | | Income* | | Deduction* | | Obligations* | | Income* | | Income* | | Capital Gains | | Term Gains |
Invesco PureBetaSM MSCI
USA ETF | | 0% | | 95% | | 93% | | 0% | | 0% | | 0% | | $ - | | $ - |
Invesco PureBetaSM MSCI
USA Small Cap ETF | | 21% | | 67% | | 66% | | 0% | | 1% | | 1% | | $659 | | $601 |
Invesco PureBetaSM US
Aggregate Bond ETF | | 0% | | 0% | | 0% | | 36% | | 99% | | 89% | | $ - | | $ - |
| * | The above percentages are based on ordinary income dividends paid to shareholders during the Fund’s fiscal year. |
Trustees and Officers
The Independent Trustees of the Trust, their term of office and length of time served, their principal business occupations during at least the past five years, the number of portfolios in the Fund Complex (as defined below) overseen by each Independent Trustee and the other directorships, if any, held by each Independent Trustee are shown below.
As of August 31, 2020
| | | | | | | | | | |
Name, Address and Year of
Birth of Independent Trustees | | Position(s)
Held
with Trust | | Term of
Office
and
Length of
Time
Served* | | Principal
Occupation(s) During
Past 5 Years | | Number of
Portfolios in Fund
Complex**
Overseen by
Independent
Trustees | | Other
Directorships
Held by
Independent
Trustees During
the Past 5 Years |
Ronn R. Bagge – 1958 c/o Invesco Capital Management LLC 3500 Lacey Road, Suite 700 Downers Grove, IL 60515 | | Vice Chairman of the Board; Chairman of the Nominating and Governance Committee and Trustee | | Vice Chairman since 2018; Chairman of the Nominating and Governance Committee and Trustee since 2007 | | Founder and Principal, YQA Capital Management LLC (1998-Present); formerly, Owner/CEO of Electronic Dynamic Balancing Co., Inc. (high-speed rotating equipment service provider). | | 214 | | Trustee and Investment Oversight Committee member, Mission Aviation Fellowship (2017- Present). |
| | | | | |
Todd J. Barre – 1957 c/o Invesco Capital Management LLC 3500 Lacey Road, Suite 700 Downers Grove, IL 60515 | | Trustee | | Since 2010 | | Assistant Professor of Business, Trinity Christian College (2010-2016); formerly, Vice President and Senior Investment Strategist (2001-2008), Director of Open Architecture and Trading (2007-2008), Head of Fundamental Research (2004-2007) and Vice President and Senior Fixed Income Strategist (1994-2001), BMO Financial Group/Harris Private Bank. | | 214 | | None. |
| * | This is the date the Independent Trustee began serving the Trust. Each Independent Trustee serves an indefinite term, until his or her successor is elected. |
| ** | Fund Complex includes all open- and closed-end funds (including all of their portfolios) advised by the Adviser and any affiliated person of the Adviser. |
Trustees and Officers–(continued)
| | | | | | | | | | |
Name, Address and Year of
Birth of Independent Trustees | | Position(s)
Held
with Trust | | Term of
Office and
Length of
Time
Served* | | Principal
Occupation(s) During
Past 5 Years | | Number of
Portfolios in Fund
Complex**
Overseen by
Independent
Trustees | | Other
Directorships
Held by
Independent
Trustees During
the Past 5 Years |
Edmund P. Giambastiani, Jr.–1948 c/o Invesco Capital Management LLC 3500 Lacey Road, Suite 700 Downers Grove, IL 60515 | | Trustee | | Since 2019 | | President, Giambastiani Group LLC (national security and energy consulting) (2007-Present); Director, The Boeing Company (2009-Present); Trustee, MITRE Corporation (federally-funded research development) (2008-Present); Director, THL Credit, Inc. (alternative credit investment manager) (2016-Present); Trustee, U.S. Naval Academy Foundation Athletic & Scholarship Program (2010-Present); Advisory Board Member, Massachusetts Institute of Technology Lincoln Laboratory (federally-funded research development) (2010-Present); Defense Advisory Board Member, Lawrence Livermore National Laboratory (2013-Present); formerly, Chairman (2015-2016), Lead Director (2011-2015) and Director (2008-2011), Monster Worldwide, Inc. (career services); Advisory Board Member, Maxwell School of Citizenship and Public Affairs of Syracuse University (2012-2016); United States Navy, career nuclear submarine officer (1970-2007); Seventh Vice Chairman of the Joint Chiefs of Staff (2005-2007); first NATO Supreme Allied Commander Transformation (2003-2005); Commander, U.S. Joint Forces Command (2002-2005). | | 214 | | Formerly, Trustee, certain funds of the Oppenheimer Funds complex (2013-2019); Director, Mercury Defense Systems Inc. (information technology) (2011-2013); Independent Director, QinetiQ Group Plc (defense technology and security) (2008-2011); Chairman, Alenia North America, Inc. (military and defense products) (2008-2009); Director, SRA International, Inc. (information technology and services) (2008-2011). |
| * | This is the date the Independent Trustee began serving the Trust. Each Independent Trustee serves an indefinite term, until his or her successor is elected. |
| ** | Fund Complex includes all open- and closed-end funds (including all of their portfolios) advised by the Adviser and any affiliated person of the Adviser. |
Trustees and Officers–(continued)
| | | | | | | | | | |
Name, Address and Year of
Birth of Independent Trustees | | Position(s)
Held
with Trust | | Term of
Office and
Length of
Time
Served* | | Principal
Occupation(s) During
Past 5 Years | | Number of
Portfolios in Fund
Complex**
Overseen by
Independent
Trustees | | Other Directorships Held
by Independent Trustees
During the Past 5 Years |
| Victoria J. Herget–1951 c/o Invesco Capital Management LLC 3500 Lacey Road, Suite 700 Downers Grove, IL 60515 | | Trustee | | Since 2019 | | Formerly, Managing Director (1993-2001), Principal (1985-1993), Vice President (1978-1985) and Assistant Vice President (1973-1978), Zurich Scudder Investments (investment adviser) (and its predecessor firms). | | 214 | | Trustee (2000-Present) and Chair (2010-2017), Newberry Library; Trustee, Mather LifeWays (2001-Present); Trustee, Chikaming Open Lands (2014-Present); formerly, Trustee, certain funds in the Oppenheimer Funds complex (2012- 2019); Board Chair (2008-2015) and Director (2004-2018), United Educators Insurance Company; Independent Director, First American Funds (2003-2011); Trustee (1992-2007), Chair of the Board of Trustees (1999-2007), Investment Committee Chair (1994-1999) and Investment Committee member (2007-2010), Wellesley College; Trustee, BoardSource (2006-2009); Trustee, Chicago City Day School (1994-2005). |
| * | This is the date the Independent Trustee began serving the Trust. Each Independent Trustee serves an indefinite term, until his or her successor is elected. |
| ** | Fund Complex includes all open- and closed-end funds (including all of their portfolios) advised by the Adviser and any affiliated person of the Adviser. |
Trustees and Officers–(continued)
| | | | | | | | | | |
Name, Address and Year of
Birth of Independent Trustees | | Position(s)
Held
with Trust | | Term of
Office and
Length of
Time
Served* | | Principal
Occupation(s) During
Past 5 Years | | Number of
Portfolios in Fund
Complex**
Overseen by
Independent
Trustees | | Other Directorships Held
by Independent Trustees
During the Past 5 Years |
Marc M. Kole–1960
c/o Invesco Capital
Management LLC 3500 Lacey Road, Suite 700 Downers Grove, IL 60515 | | Chairman of the Audit Committee and Trustee | | Chairman of the Audit Committee since 2008; Trustee since 2007 | | Senior Director of Finance, By The Hand Club for Kids (not-for-profit) (2015-Present); formerly, Chief Financial Officer, Hope Network (social services) (2008-2012); Assistant Vice President and Controller, Priority Health (health insurance) (2005-2008); Regional Chief Financial Officer, United Healthcare (2005); Chief Accounting Officer, Senior Vice President of Finance, Oxford Health Plans (2000-2004); Audit Partner, Arthur Andersen LLP (1996-2000). | | 214 | | Treasurer (2018-Present), Finance Committee Member (2015- Present) and Audit Committee Member (2015), Thornapple Evangelical Covenant Church; formerly, Board and Finance Committee Member (2009-2017) and Treasurer (2010-2015, 2017), NorthPointe Christian Schools. |
| | | | | |
Yung Bong Lim–1964 c/o Invesco Capital Management LLC 3500 Lacey Road, Suite 700 Downers Grove, IL 60515 | | Chairman of the Investment Oversight Committee and Trustee | | Chairman of the Investment Oversight Committee since 2014; Trustee since 2013 | | Managing Partner, RDG Funds LLC (real estate) (2008-Present); formerly, Managing Director, Citadel LLC (1999-2007). | | 214 | | Advisory Board Member, Performance Trust Capital Partners, LLC (2008-Present); Board Director, Beacon Power Services, Corp. (2019-Present). |
| * | This is the date the Independent Trustee began serving the Trust. Each Independent Trustee serves an indefinite term, until his or her successor is elected. |
| ** | Fund Complex includes all open- and closed-end funds (including all of their portfolios) advised by the Adviser and any affiliated person of the Adviser. |
Trustees and Officers–(continued)
| | | | | | | | | | |
Name, Address and Year of
Birth of Independent Trustees | | Position(s)
Held
with Trust | | Term of
Office and
Length of
Time
Served* | | Principal
Occupation(s) During
Past 5 Years | | Number of
Portfolios in Fund
Complex**
Overseen by
Independent
Trustees | | Other Directorships Held
by Independent Trustees
During the Past 5 Years |
Joanne Pace–1958 c/o Invesco Capital Management LLC 3500 Lacey Road, Suite 700 Downers Grove, IL 60515 | | Trustee | | Since 2019 | | Formerly, Senior Advisor, SECOR Asset Management, LP (2010-2011); Managing Director and Chief Operating Officer, Morgan Stanley Investment Management (2006-2010); Partner and Chief Operating Officer, FrontPoint Partners, LLC (alternative investments) (2005- 2006); Managing Director (2003-2005), Global Head of Human Resources and member of Executive Board and Operating Committee (2004-2005), Global Head of Operations and Product Control (2003-2004), Credit Suisse (investment banking); Managing Director (1997-2003), Controller and Principal Accounting Officer (1999-2003), Chief Financial Officer (temporary assignment) for the Oversight Committee, Long Term Capital Management (1998-1999). | | 214 | | Board Director, Horizon Blue Cross Blue Shield of New Jersey (2012- Present); Advisory Board Director, The Alberleen Group LLC (2012-Present); Governing Council Member (2016- Present) and Chair of Education Committee (2017-Present), Independent Directors Council (IDC); Board Member, 100 Women in Finance (2015-Present); Council Member, NewYork-Presbyterian Hospital’s Leadership Council on Children’s and Women’s Health (2012-Present); formerly, Trustee, certain funds in the Oppenheimer Funds complex (2012- 2019); Lead Independent Director and Chair of the Audit and Nominating Committee of The Global Chartist Fund, LLC, Oppenheimer Asset Management (2011-2012); Board Director, Managed Funds Association (2008-2010); Board Director (2007-2010) and Investment Committee Chair (2008-2010), Morgan Stanley Foundation. |
| * | This is the date the Independent Trustee began serving the Trust. Each Independent Trustee serves an indefinite term, until his or her successor is elected. |
| ** | Fund Complex includes all open- and closed-end funds (including all of their portfolios) advised by the Adviser and any affiliated person of the Adviser. |
Trustees and Officers–(continued)
| | | | | | | | | | |
Name, Address and Year of
Birth of Independent Trustees | | Position(s)
Held
with Trust | | Term of
Office and
Length of
Time
Served* | | Principal
Occupation(s) During
Past 5 Years | | Number of
Portfolios in Fund
Complex**
Overseen by
Independent
Trustees | | Other Directorships Held
by Independent Trustees
During the Past 5 Years |
Gary R. Wicker - 1961 c/o Invesco Capital Management LLC 3500 Lacey Road, Suite 700 Downers Grove, IL 60515 | | Trustee | | Since 2013 | | Senior Vice President of Global Finance and Chief Financial Officer, RBC Ministries (publishing company) (2013-Present); formerly, Executive Vice President and Chief Financial Officer, Zondervan Publishing (a division of Harper Collins/NewsCorp) (2007-2012); Senior Vice President and Group Controller (2005- 2006), Senior Vice President and Chief Financial Officer (2003-2004), Chief Financial Officer (2001-2003), Vice President, Finance and Controller (1999-2001) and Assistant Controller (1997-1999), divisions of The Thomson Corporation (information services provider); Senior Audit Manager (1994-1997), PricewaterhouseCoopers LLP. | | 214 | | Board Member and Treasurer, Our Daily Bread Ministries Canada (2015- Present); Board and Finance Committee Member, West Michigan Youth For Christ (2010-Present). |
| | | | | |
Donald H. Wilson - 1959 c/o Invesco Capital Management LLC 3500 Lacey Road, Suite 700 Downers Grove, IL 60515 | | Chairman of the Board and Trustee | | Chairman since 2012; Trustee since 2007 | | Chairman, President and Chief Executive Officer, McHenry Bancorp Inc. and McHenry Savings Bank (subsidiary) (2018-Present); formerly, Chairman and Chief Executive Officer, Stone Pillar Advisors, Ltd. (2010-2017); President and Chief Executive Officer, Stone Pillar Investments, Ltd. (advisory services to the financial sector) (2016-2018); Chairman, President and Chief Executive Officer, Community Financial Shares, Inc. and Community Bank–Wheaton/Glen Ellyn (subsidiary) (2013-2015); Chief Operating Officer, AMCORE Financial, Inc. (bank holding company) (2007-2009); Executive Vice President and Chief Financial Officer, AMCORE Financial, Inc. (2006-2007); Senior Vice President and Treasurer, Marshall & Ilsley Corp. (bank holding company) (1995-2006). | | 214 | | Director, Penfield Children’s Center (2004-Present); Board Chairman, Gracebridge Alliance, Inc. (2015-Present). |
| * | This is the date the Independent Trustee began serving the Trust. Each Independent Trustee serves an indefinite term, until his or her successor is elected. |
| ** | Fund Complex includes all open- and closed-end funds (including all of their portfolios) advised by the Adviser and any affiliated person of the Adviser. |
Trustees and Officers–(continued)
The Interested Trustee and the executive officers of the Trust, their term of office and length of time served, their principal business occupations during at least the past five years, the number of portfolios in the Fund Complex (as defined below) overseen by the Interested Trustee and the other directorships, if any, held by the Interested Trustee are shown below.
| | | | | | | | | | |
Name, Address and Year of Birth
of Interested Trustee | | Position(s)
Held
with Trust | | Term of
Office and
Length of
Time
Served* | | Principal Occupation(s) During Past 5 Years | | Number of
Portfolios
in Fund
Complex**
Overseen by
Interested
Trustee | | Other
Directorships
Held by
Interested
Trustee During
the Past 5 Years |
Kevin M. Carome–1956 Invesco Ltd. Two Peachtree Pointe 1555 Peachtree St., N.E., Suite 1800 Atlanta, GA 30309 | | Trustee | | Since 2010 | | Senior Managing Director, Secretary and General Counsel, Invesco Ltd. (2007-Present); Director, Invesco Advisers, Inc. (2009-Present); Director (2006-Present) and Executive Vice President (2008-Present), Invesco North American Holdings, Inc.; Executive Vice President (2008-Present), Invesco Investments (Bermuda) Ltd.; Manager, Horizon Flight Works LLC; and Executive Vice President (2014-Present), INVESCO Asset Management (Bermuda) Ltd.; formerly, Director and Secretary (2012-2020), Invesco Services (Bahamas) Private Limited; Director, Invesco Finance PLC (2011-2019); Director, INVESCO Asset Management (Bermuda) Ltd. (2014-2019); Director and Executive Vice President, Invesco Finance, Inc. (2011-2018); Director (2006-2018) and Executive Vice President (2008-2018), Invesco Group Services, Inc., Invesco Holding Company (US), Inc.; Director, Invesco Holding Company Limited (2007- 2019); Director and Chairman, INVESCO Funds Group, Inc., Senior Vice President, Secretary and General Counsel, Invesco Advisers, Inc. (2003-2006); Director, Invesco Investments (Bermuda) Ltd. (2008- 2016); Senior Vice President and General Counsel, Liberty Financial Companies, Inc. (2000-2001); General Counsel of certain investment management subsidiaries of Liberty Financial Companies, Inc. (1998-2000); Associate General Counsel, Liberty Financial Companies, Inc. (1993-1998); Associate, Ropes & Gray LLP. | | 214 | | None |
| * | This is the date the Interested Trustee began serving the Trust. The Interested Trustee serves an indefinite term, until his successor is elected. |
| ** | Fund Complex includes all open- and closed-end funds (including all of their portfolios) advised by the Adviser and any affiliated person of the Adviser. |
Trustees and Officers–(continued)
| | | | | | |
Name, Address and Year of Birth of Executive Officers | | Position(s)
Held
with Trust | | Length of
Time
Served* | | Principal Occupation(s) During Past 5 Years |
Anna Paglia–1974 Invesco Capital Management LLC 3500 Lacey Road, Suite 700 Downers Grove, IL 60515 | | President and Principal Executive Officer | | Since 2020 | | President and Principal Executive Officer, Invesco Exchange-Traded Fund Trust, Invesco Exchange-Traded Fund Trust II, Invesco India Exchange-Traded Fund Trust, Invesco Actively Managed Exchange-Traded Fund Trust, Invesco Actively Managed Exchange-Traded Commodity Fund Trust and Invesco Exchange- Traded Self-Indexed Fund Trust (2020-Present); Managing Director and Global Head of ETFs and Indexed Strategies, Chief Executive Officer and Principal Executive Officer, Invesco Capital Management LLC (2020-Present); Chief Executive Officer, Manager and Principal Executive Officer, Invesco Specialized Products, LLC (2020-Present); Vice President, Invesco Indexing LLC (2020-Present);formerly, Secretary, Invesco Exchange-Traded Fund Trust, Invesco Exchange-Traded Fund Trust II, Invesco India Exchange-Traded Fund Trust and Invesco Actively Managed Exchange-Traded Fund Trust (2011-2020), Invesco Actively Managed Exchange-Traded Commodity Fund Trust (2014-2020) and Invesco Exchange-Traded Self-Indexed Fund Trust (2015-2020); Head of Legal (2010-2020) and Secretary (2015-2020), Invesco Capital Management LLC; Manager and Assistant Secretary, Invesco Indexing LLC (2017-2020); Head of Legal and Secretary, Invesco Specialized Products, LLC (2018-2020); Partner, K&L Gates LLP (formerly, Bell Boyd & Lloyd LLP) (2007-2010); and Associate Counsel at Barclays Global Investors Ltd. (2004-2006). |
| | | |
Kelli Gallegos–1970 Invesco Capital Management LLC 11 Greenway Plaza, Suite 1000 Houston, TX 77046 | | Vice President and Treasurer | | Since 2018 | | Vice President, Invesco Advisers, Inc. (2020-Present); Principal Financial and Accounting Officer- Pooled Investments, Invesco Specialized Products, LLC (2018-Present); Vice President and Treasurer, Invesco Exchange-Traded Fund Trust, Invesco Exchange-Traded Fund Trust II, Invesco India Exchange-Traded Fund Trust, Invesco Actively Managed Exchange-Traded Fund Trust, Invesco Actively Managed Exchange-Traded Commodity Fund Trust and Invesco Exchange-Traded Self-Indexed Fund Trust (2018-Present); Principal Financial and Accounting Officer-Pooled Investments, Invesco Capital Management LLC (2018-Present); Vice President, Principal Financial Officer (2016-Present) and Assistant Treasurer (2008-Present), The Invesco Funds; formerly, Assistant Treasurer, Invesco Specialized Products, LLC (2018); Assistant Treasurer, Invesco Exchange-Traded Fund Trust, Invesco Exchange-Traded Fund Trust II, Invesco India Exchange-Traded Fund Trust and Invesco Actively Managed Exchange-Traded Fund Trust (2012-2018), Invesco Actively Managed Exchange-Traded Commodity Fund Trust (2014-2018) and Invesco Exchange-Traded Self-Indexed Fund Trust (2016-2018); Assistant Treasurer, Invesco Capital Management LLC (2013-2018); and Assistant Vice President, The Invesco Funds (2008-2016). |
| * | This is the date each Officer began serving the Trust in their current position. Each Officer serves an indefinite term, until his or her successor is elected. |
Trustees and Officers–(continued)
| | | | | | |
Name, Address and Year of Birth of Executive Officers | | Position(s)
Held
with Trust | | Length of
Time
Served* | | Principal Occupation(s) During
Past 5 Years |
Adam Henkel– 1980 Invesco Capital Management LLC 3500 Lacey Road, Suite 700 Downers Grove, IL 60515 | | Secretary | | Since 2020 | | Head of Legal – US ETFs and Secretary, Invesco Capital Management LLC (2020-Present); Head of Legal and Secretary, Invesco Specialized Products, LLC (2020-Present); Secretary, Invesco Exchange-Traded Fund Trust, Invesco Exchange-Traded Fund Trust II, Invesco India Exchange-Traded Fund Trust, Invesco Actively Managed Exchange-Traded Fund Trust, Invesco Actively Managed Exchange-Traded Commodity Fund Trust and Invesco Exchange- Traded Self-Indexed Fund Trust (2020-Present); Manager and Assistant Secretary, Invesco Indexing LLC (2020-Present); Assistant Secretary (2020-Present), Invesco Capital Markets, Inc. and Invesco Investment Advisers LLC; Assistant Secretary, The Invesco Funds (2014-Present); formerly, Assistant Secretary, Invesco Capital Management LLC (2015-2020) and Invesco Specialized Products, LLC (2018-2020); Assistant Secretary (2014-2020) and Chief Compliance Officer (2017-2017), Invesco Exchange- Traded Fund Trust, Invesco Exchange-Traded Fund Trust II, Invesco India Exchange-Traded Fund Trust and Invesco Actively Managed Exchange-Traded Fund Trust, Invesco Actively Managed Exchange-Traded Commodity Fund Trust and Invesco Exchange-Traded Self-Indexed Fund Trust. |
| | | |
Peter Hubbard– 1981 Invesco Capital Management LLC 3500 Lacey Road, Suite 700 Downers Grove, IL 60515 | | Vice President | | Since 2009 | | Vice President, Invesco Specialized Products, LLC (2018-Present); Vice President, Invesco Exchange-Traded Fund Trust, Invesco Exchange-Traded Fund Trust II, Invesco India Exchange-Traded Fund Trust, Invesco Actively Managed Exchange-Traded Fund Trust (2009-Present), Invesco Actively Managed Exchange-Traded Commodity Fund Trust (2014-Present) and Invesco Exchange-Traded Self-Indexed Fund Trust (2016-Present); Vice President and Director of Portfolio Management, Invesco Capital Management LLC (2010-Present); formerly, Vice President of Portfolio Management, Invesco Capital Management LLC (2008-2010); Portfolio Manager, Invesco Capital Management LLC (2007-2008); Research Analyst, Invesco Capital Management LLC (2005-2007); Research Analyst and Trader, Ritchie Capital, a hedge fund operator (2003-2005). |
| | | |
Sheri Morris– 1964 Invesco Capital Management LLC 11 Greenway Plaza, Suite 1000 Houston, TX 77046 | | Vice President | | Since 2012 | | Head of Global Fund Services, Invesco Ltd. (2019-Present); Vice President, OppenheimerFunds, Inc. (2019-Present); President and Principal Executive Officer, The Invesco Funds (2016-Present); Treasurer, The Invesco Funds (2008-Present); Vice President, Invesco Advisers, Inc. (formerly known as Invesco Institutional (N.A.), Inc.) (registered investment adviser) (2009-Present) and Vice President, Invesco Exchange-Traded Fund Trust, Invesco Exchange- Traded Fund Trust II, Invesco India Exchange-Traded Fund Trust, Invesco Actively Managed Exchange-Traded Fund Trust (2012-Present), Invesco Actively Managed Exchange-Traded Commodity Fund Trust (2014-Present) and Invesco Exchange-Traded Self-Indexed Fund Trust (2016-Present); formerly, Vice President and Principal Financial Officer, The Invesco Funds (2008-2016); Treasurer, Invesco Exchange-Traded Fund Trust, Invesco Exchange-Traded Fund Trust II, Invesco India Exchange-Traded Fund Trust and Invesco Actively Managed Exchange-Traded Fund Trust (2011-2013); Vice President, Invesco Aim Advisers, Inc., Invesco Aim Capital Management, Inc. and Invesco Aim Private Asset Management, Inc.; Assistant Vice President and Assistant Treasurer, The Invesco Funds and Assistant Vice President, Invesco Advisers, Inc., Invesco Aim Capital Management, Inc. and Invesco Aim Private Asset Management, Inc. |
| * | This is the date each Officer began serving the Trust in their current position. Each Officer serves an indefinite term, until his or her successor is elected. |
Trustees and Officers–(continued)
| | | | | | |
Name, Address and Year of Birth
of Executive Officers | | Position(s)
Held
with Trust | | Length of
Time
Served* | | Principal Occupation(s) During
Past 5 Years |
Rudolf E. Reitmann–1971 Invesco Capital Management LLC 3500 Lacey Road, Suite 700 Downers Grove, IL 60515 | | Vice President | | Since 2013 | | Head of Global Exchange Traded Funds Services, Invesco Specialized Products, LLC (2018-Present); Vice President, Invesco Exchange-Traded Fund Trust, Invesco Exchange-Traded Fund Trust II, Invesco India Exchange-Traded Fund Trust, Invesco Actively Managed Exchange-Traded Fund Trust (2013-Present), Invesco Actively Managed Exchange-Traded Commodity Fund Trust (2014-Present) and Invesco Exchange-Traded Self-Indexed Fund Trust (2016-Present); Head of Global Exchange Traded Funds Services, Invesco Capital Management LLC (2013-Present); Vice President, Invesco Capital Markets, Inc. (2018-Present). |
| | | |
Melanie Zimdars–1976 Invesco Capital Management LLC 3500 Lacey Road, Suite 700 Downers Grove, IL 60515 | | Chief Compliance Officer | | Since 2017 | | Chief Compliance Officer, Invesco Specialized Products, LLC (2018-Present); Chief Compliance Officer, Invesco Capital Management LLC (2017-Present); Chief Compliance Officer, Invesco Exchange-Traded Fund Trust, Invesco Exchange-Traded Fund Trust II, Invesco India Exchange-Traded Fund Trust, Invesco Actively Managed Exchange-Traded Fund Trust, Invesco Actively Managed Exchange-Traded Commodity Fund Trust and Invesco Exchange- Traded Self-Indexed Fund Trust (2017-Present); formerly, Vice President and Deputy Chief Compliance Officer, ALPS Holding, Inc. (2009-2017); Mutual Fund Treasurer/ Chief Financial Officer, Wasatch Advisors, Inc. (2005-2008); Compliance Officer, U.S. Bancorp Fund Services, LLC (2001-2005). |
| * | This is the date each Officer began serving the Trust in their current position. Each Officer serves an indefinite term, until his or her successor is elected. |
Availability of Additional Information About the Trustees
The Statement of Additional Information includes additional information about the Trustees and is available, without charge, upon request at (800) 983-0903.
Approval of Investment Advisory and Sub-Advisory Contracts
At a meeting held on April 14, 2020, the Board of Trustees of the Invesco Exchange-Traded Fund Trust II (the “Trust”), including the Independent Trustees, approved the continuation of the Investment Advisory Agreement between Invesco Capital Management LLC (the “Adviser”) and the Trust for the following 71 series (each, a “Fund” and collectively, the “Funds”):
|
Invesco 1-30 Laddered Treasury ETF Invesco California AMT-Free Municipal Bond ETF Invesco CEF Income Composite ETF Invesco China Technology ETF Invesco DWA Developed Markets Momentum ETF Invesco DWA Emerging Markets Momentum ETF Invesco DWA SmallCap Momentum ETF Invesco Emerging Markets Sovereign Debt ETF Invesco FTSE International Low Beta Equal Weight ETF Invesco FTSE RAFI Developed Markets ex-U.S. ETF Invesco FTSE RAFI Developed Markets ex-U.S. Small-Mid ETF Invesco FTSE RAFI Emerging Markets ETF Invesco Fundamental High Yield® Corporate Bond ETF Invesco Fundamental Investment Grade Corporate Bond ETF Invesco Global Clean Energy ETF Invesco Global Short Term High Yield Bond ETF Invesco Global Water ETF Invesco International BuyBack Achievers™ ETF Invesco International Corporate Bond ETF Invesco KBW Bank ETF Invesco KBW High Dividend Yield Financial ETF Invesco KBW Premium Yield Equity REIT ETF Invesco KBW Property & Casualty Insurance ETF Invesco KBW Regional Banking ETF Invesco National AMT-Free Municipal Bond ETF Invesco New York AMT-Free Municipal Bond ETF Invesco Preferred ETF Invesco PureBetaSM 0-5 Yr US TIPS ETF Invesco PureBetaSM FTSE Developed ex-North America ETF Invesco PureBetaSM FTSE Emerging Markets ETF Invesco PureBetaSM MSCI USA ETF Invesco PureBetaSM MSCI USA Small Cap ETF Invesco PureBetaSM US Aggregate Bond ETF Invesco Russell 1000 Enhanced Equal Weight ETF Invesco Russell 1000 Equal Weight ETF Invesco Russell 1000 Low Beta Equal Weight ETF |
|
Invesco S&P 500 Enhanced Value ETF Invesco S&P 500® ex-Rate Sensitive Low Volatility ETF Invesco S&P 500® High Beta ETF Invesco S&P 500® High Dividend Low Volatility ETF Invesco S&P 500® Low Volatility ETF Invesco S&P 500 Minimum Variance ETF Invesco S&P 500 Momentum ETF Invesco S&P 500 Revenue ETF Invesco S&P Emerging Markets Low Volatility ETF Invesco S&P Emerging Markets Momentum ETF Invesco S&P International Developed High Dividend Low Volatility ETF Invesco S&P International Developed Low Volatility ETF Invesco S&P International Developed Momentum ETF Invesco S&P International Developed Quality ETF Invesco S&P MidCap 400 Revenue ETF Invesco S&P MidCap Low Volatility ETF Invesco S&P SmallCap 600 Revenue ETF Invesco S&P SmallCap Consumer Discretionary ETF Invesco S&P SmallCap Consumer Staples ETF Invesco S&P SmallCap Energy ETF Invesco S&P SmallCap Financials ETF Invesco S&P SmallCap Health Care ETF Invesco S&P SmallCap High Dividend Low Volatility ETF Invesco S&P SmallCap Industrials ETF Invesco S&P SmallCap Information Technology ETF Invesco S&P SmallCap Low Volatility ETF Invesco S&P SmallCap Materials ETF Invesco S&P SmallCap Quality ETF Invesco S&P SmallCap Utilities & Communication Services ETF Invesco S&P Ultra Dividend Revenue ETF Invesco Senior Loan ETF Invesco Taxable Municipal Bond ETF Invesco Treasury Collateral ETF Invesco Variable Rate Preferred ETF Invesco VRDO Tax-Free Weekly ETF |
Also at the April 14, 2020 meeting, the Board of Trustees of the Trust, including the Independent Trustees, approved the continuation of the Investment Sub-Advisory Agreement between the Adviser and the following seven affiliated sub-advisers for each of Invesco Senior Loan ETF and Invesco Treasury Collateral ETF (the “Sub-Advisory Agreement”): Invesco Advisers, Inc.; Invesco Asset Management Deutschland, GmbH; Invesco Asset Management Limited; Invesco Asset Management (Japan) Limited; Invesco Hong Kong Limited; Invesco Senior Secured Management, Inc.; and Invesco Canada Ltd. (each, a “Sub-Adviser” and collectively, the “Sub-Advisers”).
Investment Advisory Agreement
The Trustees reviewed information from the Adviser describing: (i) the nature, extent and quality of services provided, (ii) the investment performance of each Fund and the Adviser, (iii) the fees paid by the Funds and comparisons to amounts paid by other comparable registered investment companies, (iv) the costs of services provided and estimated profits realized by the Adviser, (v) the extent to which economies of scale may be realized as a Fund grows and whether fee levels reflect any possible economies of
Approval of Investment Advisory and Sub-Advisory Contracts–(continued)
scale for the benefit of Fund shareholders, and (vi) any further benefits realized by the Adviser or its affiliates from the Adviser’s relationship with the Funds.
Nature, Extent and Quality of Services. In evaluating the nature, extent and quality of the Adviser’s services, the Trustees reviewed information concerning the functions performed by the Adviser for the Funds, information describing the Adviser’s current organization and staffing, including operational support provided by the Adviser’s parent organization, Invesco Ltd. (“Invesco”), and the background and experience of the persons responsible for the day-to-day management of the Funds. The Trustees reviewed matters related to the Adviser’s execution and/or oversight of execution of portfolio transactions on behalf of the Funds. The Trustees also reviewed information on the performance of the Funds and their underlying indexes for the one-year, three-year, five-year, ten-year and since-inception periods ended December 31, 2019, as applicable, including reports for each of those periods on the correlation and tracking error between each Fund’s performance and the performance of its underlying index, as well as the Adviser’s analysis of the tracking error and correlation between certain Funds and their underlying indexes. In reviewing the tracking error reports, the Trustees considered information provided by Invesco’s independent performance and risk management group with respect to general expected tracking error ranges. The Trustees also considered that certain Funds were created in connection with the purchases by Invesco of the exchange-traded funds businesses of Guggenheim Capital LLC on April 6, 2018 and Massachusetts Mutual Life Insurance Company (“Oppenheimer”) on May 24, 2019 (each, a “Transaction”), and that each such Fund’s performance prior to the closing of the applicable Transaction is that of its predecessor Guggenheim ETF or Oppenheimer ETF. The Trustees noted that, for each applicable period, the correlation for each Fund, other than the five-year and since-inception periods for Invesco Global Short Term High Yield Bond ETF and the one-year and ten-year periods for Invesco VRDO Tax-Free Weekly ETF, was within the targeted range set forth in the Trust’s registration statement. The Trustees reviewed the reasons provided by the Adviser for Invesco Global Short Term High Yield Bond ETF’s and Invesco VRDO Tax-Free Weekly ETF’s level of correlation to its underlying index, as well as the Adviser’s expectations for each Fund’s correlation going forward. The Trustees noted that, for each applicable period, the tracking error for all Funds was within the targeted range set forth in the Trust’s registration statement and concluded that each Fund’s correlation to its underlying index and the tracking error for each Fund were within an acceptable range given that Fund’s particular circumstances.
The Trustees considered the services provided by the Adviser in its oversight of the Funds’ administrator, custodian and transfer agent. They noted the significant amount of time, effort and resources that had been devoted to this oversight function.
Based on their review, the Trustees concluded that the nature, extent and quality of services provided by the Adviser to the Funds under the Investment Advisory Agreement were appropriate and reasonable.
Fees, Expenses and Profitability. The Trustees reviewed and discussed the information provided by the Adviser on each Fund’s net expense ratio and unitary advisory fee. The Trustees noted that the annual advisory fee charged to each Fund, as set forth below, is a unitary advisory fee and that the Adviser pays all other operating expenses of each Fund, including the fees payable to the Sub-Advisers for Invesco Senior Loan ETF and Invesco Treasury Collateral ETF, except that each Fund pays its brokerage expenses, taxes, interest (including, for Invesco Senior Loan ETF, interest expenses associated with its line of credit), litigation expenses and other extraordinary expenses (including acquired fund fees and expenses, if any).
| | ● | | 0.04%: Invesco PureBetaSM MSCI USA ETF |
| | ● | | 0.05%: Invesco PureBetaSM US Aggregate Bond ETF |
| | ● | | 0.06%: Invesco PureBetaSM MSCI USA Small Cap ETF |
| | ● | | 0.07%: Invesco PureBetaSM 0-5 Yr US TIPS ETF, Invesco PureBetaSM FTSE Developed ex-North America ETF |
| | ● | | 0.08%: Invesco Treasury Collateral ETF |
| | ● | | 0.10%: Invesco S&P 500 Minimum Variance ETF |
| | ● | | 0.13%: Invesco S&P 500 Enhanced Value ETF, Invesco S&P 500 Momentum ETF |
| | ● | | 0.14%: Invesco PureBetaSM FTSE Emerging Markets ETF |
| | ● | | 0.20%: Invesco Russell 1000 Equal Weight ETF |
| | ● | | 0.22%: Invesco Fundamental Investment Grade Corporate Bond ETF |
Approval of Investment Advisory and Sub-Advisory Contracts–(continued)
| | ● | | 0.25%: Invesco 1-30 Laddered Treasury ETF, Invesco S&P 500® ex-Rate Sensitive Low Volatility ETF, Invesco S&P 500® High Beta ETF, Invesco S&P 500® Low Volatility ETF, Invesco S&P MidCap Low Volatility ETF, Invesco S&P SmallCap Low Volatility ETF, Invesco VRDO Tax-Free Weekly ETF |
| | ● | | 0.28%: Invesco California AMT-Free Municipal Bond ETF, Invesco National AMT-Free Municipal Bond ETF, Invesco New York AMT-Free Municipal Bond ETF, Invesco Taxable Municipal Bond ETF |
| | ● | | 0.29%: Invesco Russell 1000 Enhanced Equal Weight ETF, Invesco S&P International Developed Quality ETF, Invesco S&P SmallCap Consumer Discretionary ETF, Invesco S&P SmallCap Consumer Staples ETF, Invesco S&P SmallCap Energy ETF, Invesco S&P SmallCap Financials ETF, Invesco S&P SmallCap Health Care ETF, Invesco S&P SmallCap Industrials ETF, Invesco S&P SmallCap Information Technology ETF, Invesco S&P SmallCap Materials ETF, Invesco S&P SmallCap Quality ETF, Invesco S&P SmallCap Utilities & Communication Services ETF |
| | ● | | 0.30%: Invesco S&P 500® High Dividend Low Volatility ETF, Invesco S&P International Developed High Dividend Low Volatility ETF, Invesco S&P SmallCap High Dividend Low Volatility ETF |
| | ● | | 0.35%: Invesco Global Short Term High Yield Bond ETF, Invesco KBW Bank ETF, Invesco KBW High Dividend Yield Financial ETF, Invesco KBW Premium Yield Equity REIT ETF, Invesco KBW Property & Casualty Insurance ETF, Invesco KBW Regional Banking ETF, Invesco Russell 1000 Low Beta Equal Weight ETF, Invesco S&P International Developed Low Volatility ETF, Invesco S&P International Developed Momentum ETF |
| | ● | | 0.39%: Invesco S&P 500 Revenue ETF, Invesco S&P MidCap 400 Revenue ETF, Invesco S&P SmallCap 600 Revenue ETF, Invesco S&P Ultra Dividend Revenue ETF |
| | ● | | 0.45%: Invesco FTSE International Low Beta Equal Weight ETF, Invesco FTSE RAFI Developed Markets ex-U.S. ETF, Invesco S&P Emerging Markets Low Volatility ETF, Invesco S&P Emerging Markets Momentum ETF |
| | ● | | 0.49%: Invesco FTSE RAFI Developed Markets ex-U.S. Small-Mid ETF, Invesco FTSE RAFI Emerging Markets ETF |
| | ● | | 0.50%: Invesco CEF Income Composite ETF, Invesco Emerging Markets Sovereign Debt ETF, Invesco Fundamental High Yield® Corporate Bond ETF, Invesco International Corporate Bond ETF, Invesco Preferred ETF, Invesco Variable Rate Preferred ETF |
| | ● | | 0.55%: Invesco International BuyBack AchieversTM ETF |
| | ● | | 0.60%: Invesco DWA SmallCap Momentum ETF |
| | ● | | 0.65%: Invesco Senior Loan ETF |
| | ● | | 0.70%: Invesco China Technology ETF |
| | ● | | 0.75%: Invesco Global Clean Energy ETF, Invesco Global Water ETF |
| | ● | | 0.80%: Invesco DWA Developed Markets Momentum ETF |
| | ● | | 0.90%: Invesco DWA Emerging Markets Momentum ETF |
The Trustees considered that, effective May 1, 2020, the Adviser had agreed to reduce the unitary advisory fee for Invesco S&P Emerging Markets Low Volatility ETF and Invesco S&P Emerging Markets Momentum ETF from 0.45% to 0.29% of average daily net assets, and to reduce the unitary advisory fee for Invesco S&P International Developed Low Volatility ETF and Invesco S&P International Developed Momentum ETF from 0.35% to 0.25% of average daily net assets.
The Trustees compared each Fund’s net expense ratio to information compiled by the Adviser from Lipper Inc. databases on the net expense ratios of comparable exchange-traded funds (“ETFs”), open-end (non-ETF) index funds and open-end (non-ETF) actively-managed funds, as applicable. The Trustees noted that the net expense ratios for certain Funds were equal to or lower than the median net expense ratios of their ETF and open-end index peer funds as illustrated in the table below. The Trustees also noted that the net expense ratios for all of the Funds were lower than the median net expense ratios of their open-end
Approval of Investment Advisory and Sub-Advisory Contracts–(continued)
actively-managed peer funds. The Trustees noted that a portion of each Fund’s operating expenses was attributable to a sub-license fee payable out of the unitary advisory fee charged to that Fund.
| | | | | | |
| Invesco Fund | | Equal
to/Lower
than ETF
Peer Median | | Equal to/Lower
than Open-End
Index Fund
Peer Median* | | Lower than
Open-Active Fund
Peer Median |
Invesco 1-30 Laddered Treasury ETF | | | | | | X |
Invesco California AMT-Free Municipal Bond ETF | | | | N/A | | X |
Invesco CEF Income Composite ETF | | X | | N/A | | X |
Invesco China Technology ETF | | | | N/A | | X |
Invesco DWA Developed Markets Momentum ETF | | | | | | X |
Invesco DWA Emerging Markets Momentum ETF | | | | | | X |
Invesco DWA SmallCap Momentum ETF | | | | | | X |
Invesco Emerging Markets Sovereign Debt ETF | | | | | | X |
Invesco FTSE International Low Beta Equal Weight ETF | | X | | X | | X |
Invesco FTSE RAFI Developed Markets ex-U.S. ETF | | | | X | | X |
Invesco FTSE RAFI Developed Markets ex-U.S. Small-Mid ETF | | X | | X | | X |
Invesco FTSE RAFI Emerging Markets ETF | | X | | | | X |
Invesco Fundamental High Yield® Corporate Bond ETF | | | | X | | X |
Invesco Fundamental Investment Grade Corporate Bond ETF | | | | | | X |
Invesco Global Clean Energy ETF | | | | N/A | | X |
Invesco Global Short Term High Yield Bond ETF | | X | | N/A | | X |
Invesco Global Water ETF | | | | N/A | | X |
Invesco International BuyBack AchieversTM ETF | | X | | X | | X |
Invesco International Corporate Bond ETF | | | | | | X |
Invesco KBW Bank ETF | | X | | | | X |
Invesco KBW High Dividend Yield Financial ETF | | X | | | | X |
Invesco KBW Premium Yield Equity REIT ETF | | X | | | | X |
Invesco KBW Property & Casualty Insurance ETF | | X | | | | X |
Invesco KBW Regional Banking ETF | | X | | | | X |
Invesco National AMT-Free Municipal Bond ETF | | | | | | X |
Invesco New York AMT-Free Municipal Bond ETF | | | | N/A | | X |
Invesco Preferred ETF | | | | N/A | | X |
Invesco PureBetaTM 0-5 Yr US TIPS ETF | | | | | | X |
Invesco PureBetaTM FTSE Developed ex-North America ETF | | | | | | X |
Invesco PureBetaTM FTSE Emerging Markets ETF | | X | | | | X |
Invesco PureBetaTM MSCI USA ETF | | X | | X | | X |
Invesco PureBetaTM MSCI USA Small Cap ETF | | X | | X | | X |
Invesco PureBetaTM US Aggregate Bond ETF | | X | | X | | X |
Invesco Russell 1000 Enhanced Equal Weight ETF | | X | | X | | X |
Invesco Russell 1000 Equal Weight ETF | | X | | X | | X |
Invesco Russell 1000 Low Beta Equal Weight ETF | | | | X | | X |
Invesco S&P 500 Enhanced Value ETF | | X | | X | | X |
Invesco S&P 500® ex-Rate Sensitive Low Volatility ETF | | X | | X | | X |
Invesco S&P 500® High Beta ETF | | X | | X | | X |
Invesco S&P 500® High Dividend Low Volatility ETF | | X | | X | | X |
Invesco S&P 500® Low Volatility ETF | | X | | | | |
Invesco S&P 500 Minimum Variance ETF | | X | | X | | X |
Invesco S&P 500 Momentum ETF | | | | X | | X |
Approval of Investment Advisory and Sub-Advisory Contracts–(continued)
| | | | | | |
| Invesco Fund | | Equal to/Lower
than ETF
Peer Median | | Equal to/Lower
than Open-End
Index Fund
Peer Median* | | Lower than
Open-Active Fund Peer Median |
Invesco S&P 500 Revenue ETF | | | | X | | X |
Invesco S&P Emerging Markets Low Volatility ETF | | X | | X | | X |
Invesco S&P Emerging Markets Momentum ETF | | X | | | | X |
Invesco S&P International Developed High Dividend Low Volatility ETF | | X | | | | X |
Invesco S&P International Developed Low Volatility ETF | | X | | | | X |
Invesco S&P International Developed Momentum ETF | | | | | | X |
Invesco S&P International Developed Quality ETF | | X | | | | X |
Invesco S&P MidCap 400 Revenue ETF | | | | | | X |
Invesco S&P MidCap Low Volatility ETF | | | | | | X |
Invesco S&P SmallCap 600 Revenue ETF | | | | X | | X |
Invesco S&P SmallCap Consumer Discretionary ETF | | X | | | | X |
Invesco S&P SmallCap Consumer Staples ETF | | X | | | | X |
Invesco S&P SmallCap Energy ETF | | X | | | | X |
Invesco S&P SmallCap Financials ETF | | X | | | | X |
Invesco S&P SmallCap Health Care ETF | | X | | | | X |
Invesco S&P SmallCap High Dividend Low Volatility ETF | | X | | X | | X |
Invesco S&P SmallCap Industrials ETF | | X | | | | X |
Invesco S&P SmallCap Information Technology ETF | | X | | X | | X |
Invesco S&P SmallCap Low Volatility ETF | | X | | X | | X |
Invesco S&P SmallCap Materials ETF | | X | | | | X |
Invesco S&P SmallCap Quality ETF | | X | | | | X |
Invesco S&P SmallCap Utilities & Communication Services ETF | | X | | X | | X |
Invesco S&P Ultra Dividend Revenue ETF | | | | X | | X |
Invesco Senior Loan ETF | | | | X | | X |
Invesco Taxable Municipal Bond ETF | | | | N/A | | X |
Invesco Treasury Collateral ETF | | X | | | | X |
Invesco Variable Rate Preferred ETF | | | | X | | X |
Invesco VRDO Tax-Free Weekly ETF | | | | N/A | | X |
| * | The information provided by the Adviser indicated that certain Funds did not have any comparable open-end index fund peers. Those Funds have been designated in this column with an “N/A” for not available. |
In response to questions from the Independent Trustees, the Adviser provided supplemental information regarding each of Invesco 1-30 Laddered Treasury ETF, Invesco California AMT-Free Municipal Bond ETF, Invesco DWA Developed Markets Momentum ETF, Invesco Emerging Markets Sovereign Debt ETF, Invesco Global Clean Energy ETF, Invesco Global Water ETF, Invesco International Corporate Bond ETF, Invesco National AMT-Free Municipal Bond ETF, Invesco New York AMT-Free Municipal Bond ETF, Invesco Senior Loan ETF and Invesco VRDO Tax-Free Weekly ETF’s advisory fees and total expenses and the Lipper peer data. The Adviser explained its view that the advisory fees and total expenses for these Funds are competitive and generally in line with other comparable funds in the marketplace, particularly in light of the level and nature of services provided and the investment management style of the Adviser. The Trustees also considered the Adviser’s statements regarding its pricing philosophy and the differing pricing philosophy of certain of the peers.
The Trustees noted information, including fee information, provided by the Adviser regarding other investment products to which it provides investment advisory services, including products that have investment strategies comparable to certain of the Funds. The Trustees considered the Adviser’s explanation of the differences between the services provided to the Funds and to the other investment products it advises, noting the Adviser’s statement that the management and oversight of the Funds requires substantially more labor and expense.
Approval of Investment Advisory and Sub-Advisory Contracts–(continued)
Based on all the information provided, the Board concluded that each Fund’s unitary advisory fee was reasonable and appropriate in light of the services provided, the nature of the indexes, the distinguishing factors of the Funds, and the administrative, operational and management oversight costs for the Adviser.
In conjunction with their review of the unitary advisory fees, the Trustees considered information provided by the Adviser on the revenues received by the Adviser under the Investment Advisory Agreement for the Funds. The Trustees reviewed information provided by the Adviser on its overall profitability, as well as the estimated profitability to the Adviser from its relationship to each Fund. The Trustees concluded that the overall and estimated profitability to the Adviser was not unreasonable.
Economies of Scale and Whether Fee Levels Reflect These Economies of Scale. The Trustees reviewed the information provided by the Adviser as to the extent to which economies of scale may be realized as each Fund grows and whether fee levels reflect economies of scale for the benefit of shareholders. The Trustees reviewed each Fund’s asset size and unitary advisory fee. The Trustees noted that any reduction in fixed costs associated with the management of the Funds would be enjoyed by the Adviser, but a unitary advisory fee provides a level of certainty in expenses for the Funds. The Trustees considered whether the unitary advisory fee rate for each Fund was reasonable in relation to the asset size of that Fund, and concluded that the unitary advisory fee was reasonable and appropriate.
Fall-out Benefits. The Trustees considered that the Adviser identified no additional benefits it receives from its relationship with the Funds, and noted that the Adviser does not have any soft-dollar arrangements. The Trustees also considered benefits received by affiliates of the Adviser that may be directly or indirectly attributed to the Adviser’s relationship with the Funds, including brokerage fees and advisory fees for money market cash management vehicles. The Board concluded that the advisory fee was reasonable, taking into account any ancillary benefits received by affiliates of the Adviser.
Based on all of the information considered and the conclusions reached, the Board, including the Independent Trustees, determined to approve the continuation of the Investment Advisory Agreement for each Fund. No single factor was determinative in the Board’s analysis.
Investment Sub-Advisory Agreement
As noted above, the Board of Trustees of the Trust, including the Independent Trustees, approved the continuation of the Sub-Advisory Agreement for each of Invesco Senior Loan ETF and Invesco Treasury Collateral ETF at a meeting held on April 14, 2020. The review process followed by the Board is described in detail above. In connection with the review of the Sub-Advisory Agreement, the Board considered the factors described below, among others.
Nature, Extent and Quality of Services. The Trustees considered the nature, extent and quality of services provided under the Sub-Advisory Agreement. The Board reviewed the qualifications and background of each Sub-Adviser, the services provided or to be provided by each Sub-Adviser, the investment approach of the Sub-Adviser whose investment personnel manage Invesco Senior Loan ETF’s and Invesco Treasury Collateral ETF’s assets, the experience and skills of the investment personnel responsible for the day-to-day management of the Funds, and the resources made available to such personnel.
Based on their review, the Trustees concluded that the nature, extent and quality of services provided by the Sub-Advisers to Invesco Senior Loan ETF and Invesco Treasury Collateral ETF under the Sub-Advisory Agreement were appropriate and reasonable.
Fees, Expenses and Profitability. The Trustees reviewed and discussed the information provided by the Adviser and the Sub-Advisers on the sub-advisory fee rates under the Sub-Advisory Agreement. The Trustees noted that the sub-advisory fees charged by the Sub-Advisers under the Sub-Advisory Agreement are consistent with the compensation structure used throughout Invesco when Invesco’s affiliates provide sub-advisory services for funds managed by other Invesco affiliates. The Board considered how the sub-advisory fees relate to the overall advisory fee for each of Invesco Senior Loan ETF and Invesco Treasury Collateral ETF and noted that the Adviser compensates the Sub-Advisers from its fee.
The Trustees also reviewed the financial statements provided by Invesco Senior Secured Management, Inc., in connection with the March 12, 2020 Board meeting, and Invesco Advisers, Inc., in connection with the April 14, 2020 meeting, and noted the net income generated by each firm. The Trustees noted that the Adviser compensates the Sub-Advisers from its fee and that the Adviser provided profitability information with respect to Invesco Senior Loan ETF and Invesco Treasury Collateral ETF.
Approval of Investment Advisory and Sub-Advisory Contracts–(continued)
Economies of Scale and Whether Fee Levels Reflect These Economies of Scale. As part of their review of the Investment Advisory Agreement for Invesco Senior Loan ETF and Invesco Treasury Collateral ETF, the Trustees considered the extent to which economies of scale may be realized as the Funds grow and whether fee levels reflect economies of scale for the benefit of shareholders. The Trustees considered whether the sub-advisory fee rates for Invesco Senior Loan ETF and Invesco Treasury Collateral ETF were reasonable in relation to the asset size of the Funds, and concluded that the flat sub-advisory fee rates were reasonable and appropriate.
Fall-out Benefits. The Trustees noted that Invesco Advisers, Inc. receives management fees from money market funds into which the Funds’ and other Invesco ETFs’ excess cash and securities lending collateral may be invested, and that the Adviser waives its fees on the excess cash invested under such arrangement in amounts equal to fees received by Invesco Advisers, Inc. on the Funds’ and other Invesco ETFs’ excess cash invested in the money market funds. The Trustees noted that the Sub-Advisers had not identified any further benefits that they derived from their relationships with Invesco Senior Loan ETF and Invesco Treasury Collateral ETF and that the Sub-Advisers do not have any soft-dollar arrangements with respect to the Funds. The Board concluded that the sub-advisory fee with respect to each Fund was reasonable, taking into account any ancillary benefits received by the Sub-Advisers.
Based on all of the information considered and the conclusions reached, the Board, including the Independent Trustees, determined to approve the continuation of the Sub-Advisory Agreement for Invesco Senior Loan ETF and Invesco Treasury Collateral ETF. No single factor was determinative in the Board’s analysis.
(This Page Intentionally Left Blank)
(This Page Intentionally Left Blank)
Proxy Voting Policies and Procedures
A description of the Trust’s proxy voting policies and procedures that the Funds use to determine how to vote proxies relating to portfolio securities is available, without charge and upon request, by calling (800) 983-0903. This information is also available on the Securities and Exchange Commission’s (the “Commission”) website at www.sec.gov.
Information regarding how each Fund voted proxies for portfolio securities, if applicable, during the most recent 12-month period ended June 30, is available, without charge and upon request, by (i) calling (800) 983-0903; or (ii) accessing the Trust’s Form N-PX on the Commission’s website at www.sec.gov.
Quarterly Portfolios
The Trust files its complete schedule of portfolio holdings for the Funds with the Commission for the first and third quarters of each fiscal year as an exhibit to its reports on Form N-PORT. The Forms N-PORT are available on the Commission’s website at www.sec.gov.
Frequency Distribution of Discounts and Premiums
A table showing the number of days the market price of each Fund’s shares was greater than the Fund’s net asset value, and the number of days it was less than the Fund’s net asset value (i.e., premium or discount) for the most recently completed calendar year, and the calendar quarters since that year end (or the life of the Fund, if shorter) may be found at the Fund’s website at www.invesco.com/ETFs.
| | | | |
| ©2020 Invesco Capital Management LLC | | | | |
| 3500 Lacey Road, Suite 700 | | | | |
| Downers Grove, IL 60515 | | P-PBETA-AR-2 | | invesco.com/ETFs |

| | | | | | |
| Invesco Annual Report to Shareholders |
|
August 31, 2020 |
| |
| DWAS | | Invesco DWA SmallCap Momentum ETF |
| PSCD | | Invesco S&P SmallCap Consumer Discretionary ETF |
| PSCC | | Invesco S&P SmallCap Consumer Staples ETF |
| PSCE | | Invesco S&P SmallCap Energy ETF |
| PSCF | | Invesco S&P SmallCap Financials ETF |
| PSCH | | Invesco S&P SmallCap Health Care ETF |
| PSCI | | Invesco S&P SmallCap Industrials ETF |
| PSCT | | Invesco S&P SmallCap Information Technology ETF |
| PSCM | | Invesco S&P SmallCap Materials ETF |
| PSCU | | Invesco S&P SmallCap Utilities & Communication Services ETF |
Beginning on January 1, 2021, as permitted by regulations adopted by the Securities and Exchange Commission, paper copies of the Funds’ shareholder reports will no longer be sent by mail, unless you specifically request paper copies of the reports from your financial intermediary, such as a broker-dealer or bank. Instead, the reports will be made available on a website, and you will be notified by mail each time a report is posted and provided with a website link to access the report.
If you already elected to receive shareholder reports electronically, you will not be affected by this change and you need not take any action. If you hold accounts through a financial intermediary, you may contact your financial intermediary to enroll in electronic delivery. Please note that not all financial intermediaries may offer this service.
You may elect to receive all future reports in paper free of charge. If you hold accounts through a financial intermediary, you can follow the instructions included with this disclosure, if applicable, or contact your financial intermediary to request that you continue to receive paper copies of your shareholder reports. Please note that not all financial intermediaries may offer this service. Your election to receive reports in paper will apply to all funds held with your financial intermediary.

Table of Contents
The Market Environment
Domestic Equity
Macroeconomic issues that concerned investors in the third quarter of 2019 mostly abated during the fourth quarter, providing the backdrop for strong equity market returns. During its September and October meetings, the US Federal Reserve (“the Fed”) cut interest rates by 0.25% each time, based on business investment and exports remaining weak.1 Investors were also encouraged by a resilient US economy and corporate earnings, putting the US equity market on track for its largest annual rise since 2013.
During the first quarter of 2020, as the spread of the new coronavirus (COVID-19) disrupted travel and suppressed consumer activity, investors became increasingly concerned about the global economy. At the same time, oil prices fell sharply as a price war between Saudi Arabia and Russia threatened to boost supply even as demand was falling. Beginning in late February, equity markets declined sharply and quickly, ushering in the first bear market since the financial crisis of 2008. Though the equity market stabilized somewhat toward the end of March, all sectors declined during the downturn. In response to the major collapse in demand and to help facilitate liquidity, the Fed cut interest rates two times in March by 0.50% and 1.00%, ending with a target range of 0.00% to 0.25%.1
In April, US unemployment numbers continued to climb and the initial gross domestic product (GDP) estimates for the first quarter of 2020 saw the economy shrink by 5%, the sharpest drop since the 2008 financial crisis.2 However, during the second and into the third quarter of 2020, US stocks largely shrugged off economic uncertainty, social unrest and a resurgence in coronavirus infections to rally from the market bottom. The rally followed a sharp economic decline caused by global shutdowns to slow the spread of COVID-19. Investor sentiment improved in response to trillions of dollars in economic stimulus, progress on a coronavirus vaccine and reopenings in many US regions. After oil futures contracts turned negative in early April, oil prices doubled in June, which supported struggling energy companies and millions of energy sector employees. In July, the Fed extended its emergency stimulus programs, originally scheduled to end in September, to year-end, which provided support to equities. Additionally, optimism about a vaccine, and better than anticipated US economic data and corporate earnings also boosted stocks. Most economists believe the US economy hit a low in April; however, in late August revised second quarter GDP fell by 31.7%, a record decline.2 Despite the extreme drop in the economy, the S&P 500 Index not only erased all of its losses from the first quarter but ended the fiscal year with record highs.
| 1 | Source: US Federal Reserve |
| 2 | Source: US Bureau of Economic Analysis |
| | |
 | | Management’s Discussion of Fund Performance Invesco DWA SmallCap Momentum ETF (DWAS) |
As an index fund, the Invesco DWA SmallCap Momentum ETF (the “Fund”) is passively managed and seeks to track the investment results (before fees and expenses) of the Dorsey Wright® SmallCap Technical Leaders Index (the “Index”). The Fund generally will invest at least 90% of its total assets in securities of small-capitalization companies that comprise the Index.
Strictly in accordance with its guidelines and mandated procedures, Dorsey, Wright & Associates (“Dorsey Wright” or the “Index Provider”) selects securities for inclusion in the Index pursuant to a proprietary selection methodology, which is designed to identify securities that demonstrate powerful relative strength characteristics. “Relative strength” is an investing technique that seeks to determine the strongest performing securities by measuring certain factors, such as a security’s relative performance against the overall market or a security’s relative strength value, which is derived by comparing the rate of increase of the security’s price over a set period as compared to that of a benchmark index. The Index Provider selects securities for inclusion in the Index from an eligible universe of the smallest 2,000 constituents by market capitalization that trade on a U.S. exchange and that are included within the NASDAQ US Benchmark Index. The Index Provider assigns a relative strength score to each eligible security and selects approximately 200 securities with the greatest scores for inclusion in the Index. Component security weights are based on relative scores, with securities with higher scores receiving larger weights. The Fund generally invests in all of the securities comprising the Index in proportion to their weightings in the Index.
For the fiscal year ended August 31, 2020, on a market price basis, the Fund returned 11.77%. On a net asset value (“NAV”) basis, the Fund returned 11.67%. During the same time period, the Index returned 12.08%. During the fiscal year, the Fund fully replicated the components of the Index; therefore, the Fund’s performance, on a NAV basis, differed from the return of the Index primarily due to fees and operating expenses that the Fund incurred during the period that were partially offset by revenue generated from the securities lending program in which the Fund participates. During this same time period, the Russell 2000® Index returned 6.02%.
For the fiscal year ended August 31, 2020, the information technology sector contributed most significantly to the Fund’s return, followed by the real estate and utilities sectors, respectively. The health care, consumer discretionary and industrials sectors detracted from the Fund’s return.
Positions that contributed most significantly to the Fund’s return for the fiscal year ended August 31, 2020, included Axsome Therapeutics, Inc., a health care company (no longer held at fiscal year-end), and Novavax, Inc., a health care company (portfolio average weight of 0.82%). Positions that detracted most significantly from the Fund’s return included Caesars
Entertainment, Inc., a consumer discretionary company (no longer held at fiscal year-end), and Arrowhead Pharmaceuticals, Inc., a health care company (no longer held at fiscal year-end).
Sector Breakdown (% of the Fund’s Net Assets) as of August 31, 2020
| | | | | | |
Health Care | | | 39.62 | | | |
Consumer Discretionary | | | 18.13 | | | |
Information Technology | | | 16.91 | | | |
Industrials | | | 12.55 | | | |
Financials | | | 4.88 | | | |
Sector Types Each Less Than 3% | | | 7.89 | | | |
Money Market Funds Plus Other Assets Less Liabilities | | | 0.02 | | | |
Top Ten Fund Holdings* (% of the Fund’s Net Assets) as of August 31, 2020
| | | | | | |
Security | | | | | | |
Overstock.com, Inc. | | | 2.63 | | | |
CryoPort, Inc. | | | 2.60 | | | |
Novavax, Inc. | | | 2.32 | | | |
Mirati Therapeutics, Inc. | | | 1.86 | | | |
Heska Corp. | | | 1.32 | | | |
Sunrun, Inc. | | | 1.23 | | | |
Plug Power, Inc. | | | 1.21 | | | |
Casella Waste Systems, Inc., Class A | | | 1.20 | | | |
AppFolio, Inc., Class A | | | 1.14 | | | |
Mersana Therapeutics, Inc. | | | 1.10 | | | |
Total | | | 16.61 | | | |
| * | Excluding money market fund holdings. |
Invesco DWA SmallCap Momentum ETF (DWAS) (continued)
Growth of a $10,000 Investment Since Inception
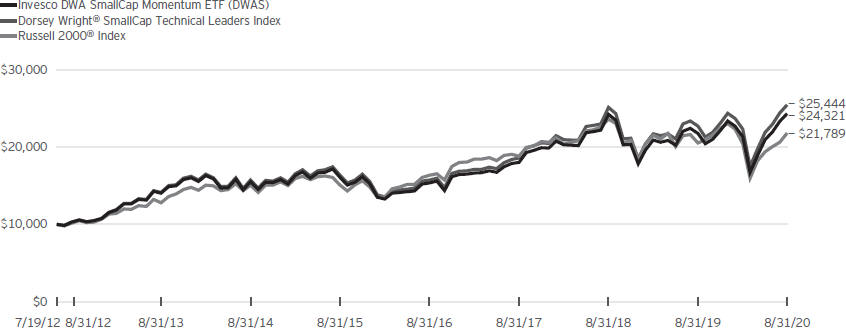
Fund Performance History as of August 31, 2020
| | | | | | | | | | | | | | | | | | | | | | | | | | | | | | | | |
| | | | | | | | | | | | | | | | | | | | | Fund Inception | |
| | | | | | 3 Years | | | | | | 5 Years | | | | | | | | | | |
| | | | | | Average | | | 3 Years | | | Average | | | 5 Years | | | | | | Average | | | | |
| Index | | 1 Year | | | Annualized | | | Cumulative | | | Annualized | | | Cumulative | | | | | | Annualized | | | Cumulative | |
| | | | | | | | |
Dorsey Wright® SmallCap Technical Leaders Index | | | 12.08 | % | | | 11.07% | | | | 37.04% | | | | 9.20% | | | | 55.27% | | | | | | | | 12.20% | | | | 154.44% | |
| | | | | | | | |
Russell 2000® Index | | | 6.02 | | | | 5.03 | | | | 15.85 | | | | 7.65 | | | | 44.57 | | | | | | | | 10.07 | | | | 117.89 | |
| | | | | | | | |
| Fund | | | | | | | | | | | | | | | | | | | | | | | | |
| | | | | | | | |
NAV Return | | | 11.67 | | | | 10.51 | | | | 34.96 | | | | 8.62 | | | | 51.23 | | | | | | | | 11.57 | | | | 143.21 | |
| | | | | | | | |
Market Price Return | | | 11.77 | | | | 10.56 | | | | 35.13 | | | | 8.66 | | | | 51.46 | | | | | | | | 11.57 | | | | 143.17 | |
Fund Inception: July 19, 2012
Performance quoted above represents past performance. Past performance is not a guarantee of future results and current performance may be higher or lower than performance quoted. Investment returns and principal value will fluctuate, and shares of the Fund (“Fund Shares”), when redeemed or sold, may be worth more or less than their original cost. Fund performance reflects any applicable fee waivers and/or expense reimbursements. Had the adviser not waived fees and/or reimbursed expenses currently or in the past, returns would have been lower. See the current prospectus for more information. According to the Fund’s current prospectus, the Fund’s expense ratio of 0.60% is expressed as a unitary management fee to cover operating expenses and expenses incurred in connection with managing the portfolio. NAV and Market Price returns assume that dividends and capital gain distributions have been reinvested in the Fund at NAV and Market Price, respectively. The returns shown in the table above do not reflect the deduction of taxes that a shareholder would pay on Fund distributions or the redemption or sale of Fund Shares. See invesco.com/ETFs to find the most recent month-end performance numbers.
Performance results for the indexes stated above are based upon a hypothetical investment in their respective constituent securities. The returns of an index do not represent Fund returns. An investor cannot invest directly in an index. The indexes do not charge management fees or brokerage expenses, and no such fees or expenses were deducted from the hypothetical performance shown. In addition, the results actual investors might have achieved would have differed from those shown because of differences in the timing, amounts of their investments, and fees and expenses associated with an investment in the Fund.
Notes Regarding Indexes and Fund Performance History:
| - | Average Annualized and Cumulative Inception returns for the Fund and the indexes are based on the inception date of the Fund. |
| - | Effective June 26, 2020, the Fund changed its designated broad-based securities market benchmark index from the Russell 2000® Index to the Index, as the Index more closely reflects the performance of the types of securities in which the Fund invests. |
| | |
 | | Management’s Discussion of Fund Performance Invesco S&P SmallCap Consumer Discretionary ETF (PSCD) |
As an index fund, the Invesco S&P SmallCap Consumer Discretionary ETF (the “Fund”) is passively managed and seeks to track the investment results (before fees and expenses) of the S&P SmallCap 600® Capped Consumer Discretionary Index (the “Index”). The Fund generally will invest at least 90% of its total assets in the securities of small-capitalization U.S. consumer discretionary companies that comprise the Index. These companies are principally engaged in the business of providing consumer goods and services that are cyclical in nature, including, but not limited to, household durables, leisure products and services, apparel and luxury goods, computers and electronics, automobiles and auto components, hotel and restaurant services and television and other entertainment goods and services.
S&P Dow Jones Indices, LLC, the Index provider, defines sectors according to the Global Industry Classification Standard (“GICS”) and compiles, maintains and calculates the Index strictly in accordance with its guidelines and mandated procedures. The Fund generally invests in all of the securities comprising the Index in proportion to their weightings in the Index.
For the fiscal year ended August 31, 2020, on a market price basis, the Fund returned 14.74%. On a net asset value (“NAV”) basis, the Fund returned 14.68%. During the same time period, the Index returned 14.86%. During the fiscal year, the Fund fully replicated the components of the Index; therefore, the Fund’s performance, on a NAV basis, differed from the return of the Index primarily due to fees and operating expenses that the Fund incurred during the period, which were partially offset by revenue generated from the securities lending program in which the Fund participates.
During this same time period, the S&P SmallCap 600® Index (the “Benchmark Index”) returned (0.55)%. The Benchmark Index is an unmanaged index weighted by market capitalization based on the average performance of approximately 600 small-cap securities. The Benchmark Index was selected for its recognition in the marketplace, and its performance comparison is a useful measure for investors as a broad representation of the overall U.S. small-cap stock market.
Relative to the Benchmark Index, the Fund was most overweight in the specialty retail industry and most underweight in the banks industry during the fiscal year ended August 31, 2020. The majority of the Fund’s outperformance relative to the Benchmark Index during the period can be attributed to the Fund’s overweight allocations in the internet & direct marketing retail, leisure products, and household durables industries.
For the fiscal year ended August 31, 2020, the internet & direct marketing retail industry contributed most significantly to the Fund’s return, followed by the leisure products and household durables industries, respectively. The textiles apparel & luxury goods industry detracted most significantly from the Fund’s
return, followed by the specialty retail and diversified consumer services industries, respectively.
Positions that contributed most significantly to the Fund’s return for the fiscal year ended August 31, 2020, included Stamps.com, Inc., an internet & direct marketing retail company (portfolio average weight of 2.38%), and Wingstop, Inc., a hotels, restaurants & leisure company (portfolio average weight of 3.24%). Positions that detracted most significantly from the Fund’s return included Kontoor Brands, Inc., a textiles, apparel & luxury goods company (portfolio average weight of 1.41%), and Steven Madden Ltd., a textiles, apparel & luxury goods company (portfolio average weight of 2.52%).
Industry Breakdown (% of the Fund’s Net Assets) as of August 31, 2020
| | | | | | |
| | | |
Specialty Retail | | | 20.63 | | | |
| | |
Household Durables | | | 17.69 | | | |
| | |
Hotels, Restaurants & Leisure | | | 15.04 | | | |
| | |
Auto Components | | | 14.23 | | | |
| | |
Textiles, Apparel & Luxury Goods | | | 11.01 | | | |
| | |
Leisure Products | | | 7.17 | | | |
| | |
Internet & Direct Marketing Retail | | | 5.50 | | | |
| | |
Multiline Retail | | | 3.73 | | | |
| | |
Industry Types Each Less Than 3% | | | 4.61 | | | |
| | |
Money Market Funds Plus Other Assets Less Liabilities | | | 0.39 | | | |
Top Ten Fund Holdings* (% of the Fund’s Net Assets) as of August 31, 2020
| | | | | | |
Security | | | | | |
| | |
Wingstop, Inc. | | | 4.50 | | | |
| | |
Fox Factory Holding Corp. | | | 3.85 | | | |
| | |
Stamps.com, Inc. | | | 3.77 | | | |
| | |
YETI Holdings, Inc. | | | 3.20 | | | |
| | |
Meritage Homes Corp. | | | 3.16 | | | |
| | |
LCI Industries | | | 2.66 | | | |
| | |
Crocs, Inc. | | | 2.50 | | | |
| | |
Dorman Products, Inc. | | | 2.28 | | | |
| | |
LGI Homes, Inc. | | | 2.27 | | | |
| | |
Shake Shack, Inc., Class A | | | 2.23 | | | |
| | |
Total | | | 30.42 | | | |
| * | Excluding money market fund holdings. |
Invesco S&P SmallCap Consumer Discretionary ETF (PSCD) (continued)
Growth of a $10,000 Investment
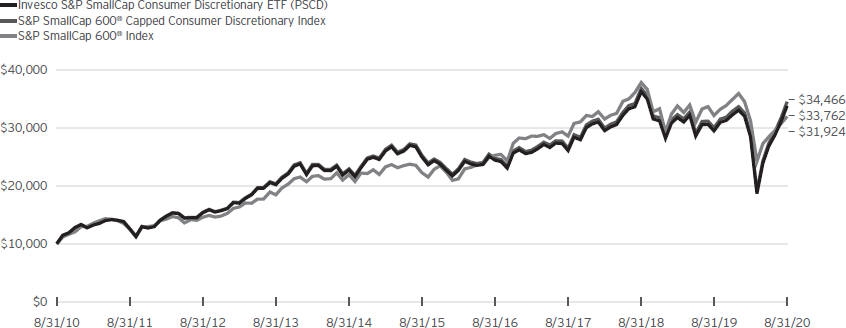
Fund Performance History as of August 31, 2020
| | | | | | | | | | | | | | | | | | | | | | | | | | | | | | | | | | | | | | | | |
| | | | | | | | | | | | | | | | | | | | | | | | | | | Fund Inception | |
| Index | | 1 Year | | | 3 Years
Average
Annualized | | | 3 Years
Cumulative | | | 5 Years
Average
Annualized | | | 5 Years
Cumulative | | | 10 Years
Average
Annualized | | | 10 Years
Cumulative | | | | | | Average
Annualized | | | Cumulative | |
| | | | | | | | | | |
S&P SmallCap 600® Capped Consumer Discretionary Index | | | 14.86 | % | | | 9.21% | | | | 30.26% | | | | 6.39% | | | | 36.32% | | | | 13.17% | | | | 244.66% | | | | | | | | 10.48% | | | | 181.96% | |
| | | | | | | | | | |
S&P SmallCap 600® Index | | | (0.55 | ) | | | 3.82 | | | | 11.90 | | | | 7.47 | | | | 43.35 | | | | 12.31 | | | | 219.24 | | | | | | | | 10.34 | | | | 178.24 | |
| | | | | | | | | | |
Fund | | | | | | | | | | | | | | | | | | | | | | | | | | | | | | |
| | | | | | | | | | |
NAV Return | | | 14.68 | | | | 9.04 | | | | 29.64 | | | | 6.22 | | | | 35.24 | | | | 12.94 | | | | 237.62 | | | | | | | | 10.25 | | | | 175.77 | |
| | | | | | | | | | |
Market Price Return | | | 14.74 | | | | 9.08 | | | | 29.79 | | | | 6.23 | | | | 35.27 | | | | 12.94 | | | | 237.56 | | | | | | | | 10.26 | | | | 176.08 | |
Fund Inception: April 7, 2010
Performance quoted above represents past performance. Past performance is not a guarantee of future results and current performance may be higher or lower than performance quoted. Investment returns and principal value will fluctuate, and shares of the Fund (“Fund Shares”), when redeemed or sold, may be worth more or less than their original cost. Fund performance reflects any applicable fee waivers and/or expense reimbursements. Had the adviser not waived fees and/or reimbursed expenses currently or in the past, returns would have been lower. See the current prospectus for more information. According to the Fund’s current prospectus, the Fund’s expense ratio of 0.29% is expressed as a unitary management fee to cover operating expenses and expenses incurred in connection with managing the portfolio. NAV and Market Price returns assume that dividends and capital gain distributions have been reinvested in the Fund at NAV and Market Price, respectively. The returns shown in the table above do not reflect the deduction of taxes that a shareholder would pay on Fund distributions or the redemption or sale of Fund Shares.
See invesco.com/ETFs to find the most recent month-end performance numbers.
Index and Benchmark Index performance results are based upon a hypothetical investment in their respective constituent securities. Index and Benchmark Index returns do not represent Fund returns. An investor cannot invest directly in an index. The Index and Benchmark Index do not charge management fees or brokerage expenses, and no such fees or expenses were deducted from the hypothetical performance shown. In addition, the results actual investors might have achieved would have differed from those shown because of differences in the timing, amounts of their investments, and fees and expenses associated with an investment in the Fund.
Notes Regarding Indexes and Fund Performance History:
| - | Average Annualized and Cumulative Inception returns for the Fund, Index and Benchmark Index are based on the inception date of the Fund. |
| | |
 | | Management’s Discussion of Fund Performance Invesco S&P SmallCap Consumer Staples ETF (PSCC) |
|
As an index fund, the Invesco S&P SmallCap Consumer Staples ETF (the “Fund”) is passively managed and seeks to track the investment results (before fees and expenses) of the S&P SmallCap 600® Capped Consumer Staples Index (the “Index”). The Fund generally will invest at least 90% of its total assets in the securities of small-capitalization U.S. consumer staples companies that comprise the Index. These companies are principally engaged in the business of providing consumer goods and services that have non-cyclical characteristics, including tobacco, food and beverage, and non-discretionary retail.
S&P Dow Jones Indices, LLC, the Index provider, defines sectors according to the Global Industry Classification Standard (“GICS”) and compiles, maintains and calculates the Index strictly in accordance with its guidelines and mandated procedures. The Fund generally invests in all of the securities comprising the Index in proportion to their weightings in the Index.
For the fiscal year ended August 31, 2020, on a market price basis, the Fund returned 11.60%. On a net asset value (“NAV”) basis, the Fund returned 10.97%. During the same time period, the Index returned 11.20%. During the fiscal year, the Fund fully replicated the components of the Index; therefore, the Fund’s performance, on a NAV basis, differed from the return of the Index primarily due to fees and operating expenses that the Fund incurred during the period, which were partially offset by revenue generated from the securities lending program in which the Fund participates.
During this same time period, the S&P SmallCap 600® Index (the “Benchmark Index”) returned (0.55)%. The Benchmark Index is an unmanaged index weighted by market capitalization based on the average performance of approximately 600 small-cap securities. The Benchmark Index was selected for its recognition in the marketplace, and its performance comparison is a useful measure for investors as a broad representation of the overall U.S. small-cap stock market.
Relative to the Benchmark Index, the Fund was most overweight in the food products industry and most underweight in the banks industry during the fiscal year ended August 31, 2020. The majority of the Fund’s outperformance relative to the Benchmark Index during the period can be attributed to the Fund’s overweight allocation in the household products industry, followed by a lack of allocation to the equity real estate investment trusts and banks industries.
For the fiscal year ended August 31, 2020, the household products industry contributed most significantly to the Fund’s return, followed by the personal products and food products industries, respectively. Tobacco was the only industry to detract from the Fund’s return.
Positions that contributed most significantly to the Fund’s return for the fiscal year ended August 31, 2020, included United
Natural Foods, Inc., a food & staples retailing company (portfolio average weight of 2.77%), and B&G Foods, Inc., a food products company (portfolio average weight of 4.70%). Positions that detracted most significantly from the Fund’s return included Dean Foods Co., a food products company (no longer held at fiscal year-end), and Chefs’ Warehouse, Inc. (The), a food & staples retailing company (portfolio average weight of 2.61%).
Industry Breakdown (% of the Fund’s Net Assets) as of August 31, 2020
| | | | | | |
| | | |
Food Products | | | 32.88 | | | |
| | |
Household Products | | | 18.19 | | | |
| | |
Food & Staples Retailing | | | 16.15 | | | |
| | |
Personal Products | | | 13.33 | | | |
| | |
Beverages | | | 10.66 | | | |
| | |
Tobacco | | | 8.79 | | | |
| | |
Money Market Funds Plus Other Assets Less Liabilities | | | 0.00 | | | |
Top Ten Fund Holdings* (% of the Fund’s Net Assets) as of August 31, 2020
| | | | | | |
| | | |
Security | | | | | |
| | |
WD-40 Co. | | | 10.95 | | | |
| | |
J&J Snack Foods Corp. | | | 7.95 | | | |
| | |
B&G Foods, Inc. | | | 7.82 | | | |
| | |
Medifast, Inc. | | | 6.06 | | | |
| | |
Central Garden & Pet Co., Class A | | | 5.71 | | | |
| | |
Cal-Maine Foods, Inc. | | | 5.51 | | | |
| | |
PriceSmart, Inc. | | | 4.75 | | | |
| | |
Coca-Cola Consolidated, Inc. | | | 4.73 | | | |
| | |
Vector Group Ltd. | | | 4.71 | | | |
| | |
Calavo Growers, Inc. | | | 4.36 | | | |
| | |
Total | | | 62.55 | | | |
| * | Excluding money market fund holdings. |
Invesco S&P SmallCap Consumer Staples ETF (PSCC) (continued)
Growth of a $10,000 Investment
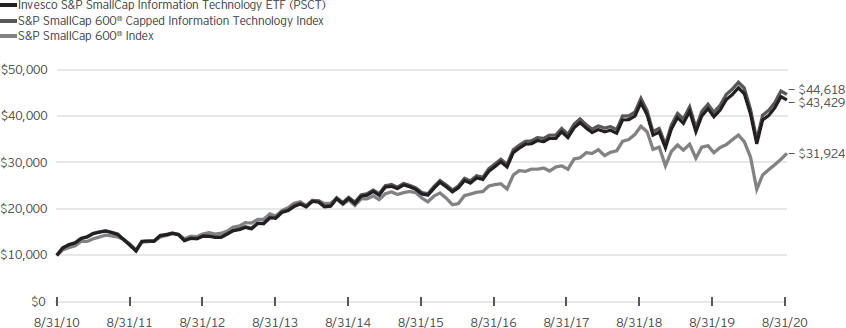
Fund Performance History as of August 31, 2020
| | | | | | | | | | | | | | | | | | | | | | | | | | | | | | | | | | | | | | | | |
| | | | | | | | | | | | | | | | | | | | | | | | | | | Fund Inception | |
| Index | | 1 Year | | | 3 Years
Average
Annualized | | | 3 Years
Cumulative | | | 5 Years
Average
Annualized | | | 5 Years
Cumulative | | | 10 Years
Average
Annualized | | | 10 Years
Cumulative | | | | | | Average
Annualized | | | Cumulative | |
S&P SmallCap 600® Capped Consumer Staples Index | | | 11.20 | % | | | 6.57% | | | | 21.04% | | | | 9.45% | | | | 57.05% | | | | 13.60% | | | | 257.91% | | | | | | | | 13.03% | | | | 257.21% | |
| | | | | | | | | | |
S&P SmallCap 600® Index | | | (0.55 | ) | | | 3.82 | | | | 11.90 | | | | 7.47 | | | | 43.35 | | | | 12.31 | | | | 219.24 | | | | | | | | 10.34 | | | | 178.24 | |
| | | | | | | | | | |
Fund | | | | | | | | | | | | | | | | | | | | | | | | | | | | | | |
| | | | | | | | | | |
NAV Return | | | 10.97 | | | | 6.35 | | | | 20.27 | | | | 9.11 | | | | 54.65 | | | | 13.32 | | | | 249.33 | | | | | | | | 12.75 | | | | 248.35 | |
| | | | | | | | | | |
Market Price Return | | | 11.60 | | | | 6.51 | | | | 20.83 | | | | 9.18 | | | | 55.13 | | | | 13.37 | | | | 250.69 | | | | | | | | 12.78 | | | | 249.28 | |
Fund Inception: April 7, 2010
Performance quoted above represents past performance. Past performance is not a guarantee of future results and current performance may be higher or lower than performance quoted. Investment returns and principal value will fluctuate, and shares of the Fund (“Fund Shares”), when redeemed or sold, may be worth more or less than their original cost. Fund performance reflects any applicable fee waivers and/or expense reimbursements. Had the adviser not waived fees and/or reimbursed expenses currently or in the past, returns would have been lower. See the current prospectus for more information. According to the Fund’s current prospectus, the Fund’s expense ratio of 0.29% is expressed as a unitary management fee to cover operating expenses and expenses incurred in connection with managing the portfolio. NAV and Market Price returns assume that dividends and capital gain distributions have been reinvested in the Fund at NAV and Market Price, respectively. The returns shown in the table above do not reflect the deduction of taxes that a shareholder would pay on Fund distributions or the redemption or sale of Fund Shares.
See invesco.com/ETFs to find the most recent month-end performance numbers.
Index and Benchmark Index performance results are based upon a hypothetical investment in their respective constituent securities. Index and Benchmark Index returns do not represent Fund returns. An investor cannot invest directly in an index. The Index and Benchmark Index do not charge management fees or brokerage expenses, and no such fees or expenses were deducted from the hypothetical performance shown. In addition, the results actual investors might have achieved would have differed from those shown because of differences in the timing, amounts of their investments, and fees and expenses associated with an investment in the Fund.
Notes Regarding Indexes and Fund Performance History:
| - | Average Annualized and Cumulative Inception returns for the Fund, Index and Benchmark Index are based on the inception date of the Fund. |
| | |
 | | Management’s Discussion of Fund Performance Invesco S&P SmallCap Energy ETF (PSCE) |
|
As an index fund, the Invesco S&P SmallCap Energy ETF (the “Fund”) is passively managed and seeks to track the investment results (before fees and expenses) of the S&P SmallCap 600® Capped Energy Index (the “Index”). The Fund generally will invest at least 90% of its total assets in the securities of small capitalization U.S. energy companies that comprise the Index. These companies are principally engaged in the business of producing, distributing or servicing energy related products, including oil and gas exploration and production, refining, oil services and pipelines.
S&P Dow Jones Indices, LLC, the Index provider, defines sectors according to the Global Industry Classification Standard (“GICS”) and compiles, maintains and calculates the Index strictly in accordance with its guidelines and mandated procedures. The Fund generally invests in all of the securities comprising the Index in proportion to their weightings in the Index.
For the fiscal year ended August 31, 2020, on a market price basis, the Fund returned (49.09)%. On a net asset value (“NAV”) basis, the Fund returned (49.31)%. During the same time period, the Index returned (49.21)%. During the fiscal year, the Fund fully replicated the components of the Index; therefore, the Fund’s performance, on a NAV basis, differed from the return of the Index primarily due to fees and operating expenses that the Fund incurred during the period, which were partially offset by revenue generated from the securities lending program in which the Fund participates and the Fund holding cash to pay distributions in March, which coincided with overall market declines.
During this same time period, the S&P SmallCap 600® Index (the “Benchmark Index”) returned (0.55)%. The Benchmark Index is an unmanaged index weighted by market capitalization based on the average performance of approximately 600 small-cap securities. The Benchmark Index was selected for its recognition in the marketplace, and its performance comparison is a useful measure for investors as a broad representation of the overall U.S. small-cap stock market.
Relative to the Benchmark Index, the Fund was most overweight in the oil, gas & consumable fuels industry and most underweight in the banks industry during the fiscal year ended August 31, 2020. The majority of the Fund’s underperformance relative to the Benchmark Index during the period can be attributed to the Fund’s single-sector energy allocation.
For the fiscal year ended August 31, 2020, the energy equipment & services industry detracted most significantly from the Fund’s return, followed by the oil, gas & consumable fuels industry. There were no contributing industries.
Positions that contributed most significantly to the Fund’s return for the fiscal year ended August 31, 2020, included Southwestern Energy Co., an oil,
gas & consumable fuels company (portfolio average weight of 5.07%), and Range Resources Corp., an oil, gas & consumable fuels company (portfolio average weight of 4.77%). Positions that detracted most significantly from the Fund’s return included Valaris PLC, Class A, an energy equipment & services company (no longer held at fiscal year-end), and Callon Petroleum Co., an oil, gas & consumable fuels company (portfolio average weight of 2.84%).
Industry Breakdown (% of the Fund’s Net Assets) as of August 31, 2020
| | | | | | |
Oil, Gas & Consumable Fuels | | | 51.05 | | | |
Energy Equipment & Services | | | 48.93 | | | |
Money Market Funds Plus Other Assets Less Liabilities | | | 0.02 | | | |
Top Ten Fund Holdings* (% of the Fund’s Net Assets) as of August 31, 2020
| | | | | | |
Security | | | | | |
Helmerich & Payne, Inc. | | | 8.75 | | | |
Range Resources Corp. | | | 7.83 | | | |
Southwestern Energy Co. | | | 7.45 | | | |
PDC Energy, Inc. | | | 7.15 | | | |
Renewable Energy Group, Inc. | | | 6.45 | | | |
Dril-Quip, Inc. | | | 5.74 | | | |
Matador Resources Co. | | | 5.17 | | | |
Core Laboratories N.V. | | | 4.62 | | | |
Archrock, Inc. | | | 4.19 | | | |
Patterson-UTI Energy, Inc. | | | 3.57 | | | |
Total | | | 60.92 | | | |
| * | Excluding money market fund holdings. |
Invesco S&P SmallCap Energy ETF (PSCE) (continued)
Growth of a $10,000 Investment
Fund Performance History as of August 31, 2020
| | | | | | | | | | | | | | | | | | | | | | | | | | | | | | | | | | | | | | | | |
| | | | | | | | | | | | | | | | | | | | | | | | | | | Fund Inception | |
| Index | | 1 Year | | | 3 Years Average Annualized | | | 3 Years Cumulative | | | 5 Years Average Annualized | | | 5 Years Cumulative | | | 10 Years Average Annualized | | | 10 Years Cumulative | | | | | | Average Annualized | | | Cumulative | |
S&P SmallCap 600® Capped Energy Index | | | (49.21)% | | | | (33.39)% | | | | (70.45)% | | | | (28.97)% | | | | (81.92)% | | | | (16.19)% | | | | (82.91)% | | | | | | | | (16.84)% | | | | (85.29)% | |
S&P SmallCap 600® Index | | | (0.55) | | | | 3.82 | | | | 11.90 | | | | 7.47 | | | | 43.35 | | | | 12.31 | | | | 219.24 | | | | | | | | 10.34 | | | | 178.24 | |
Fund | | | | | | | | | | | | | | | | | | | | | | | | | | | | | | | | | | | | | | | | |
NAV Return | | | (49.31) | | | | (33.58) | | | | (70.70) | | | | (29.13) | | | | (82.12) | | | | (16.42) | | | | (83.36) | | | | | | | | (17.06) | | | | (85.70) | |
Market Price Return | | | (49.09) | | | | (33.47) | | | | (70.56) | | | | (29.02) | | | | (81.99) | | | | (16.36) | | | | (83.25) | | | | | | | | (17.01) | | | | (85.60) | |
Fund Inception: April 7, 2010
Performance quoted above represents past performance. Past performance is not a guarantee of future results and current performance may be higher or lower than performance quoted. Investment returns and principal value will fluctuate, and shares of the Fund (“Fund Shares”), when redeemed or sold, may be worth more or less than their original cost. Fund performance reflects any applicable fee waivers and/or expense reimbursements. Had the adviser not waived fees and/or reimbursed expenses currently or in the past, returns would have been lower. See the current prospectus for more information. According to the Fund’s current prospectus, the Fund’s expense ratio of 0.29% is expressed as a unitary management fee to cover operating expenses and expenses incurred in connection with managing the portfolio. NAV and Market Price returns assume that dividends and capital gain distributions have been reinvested in the Fund at NAV and Market Price, respectively. The returns shown in the table above do not reflect the deduction of taxes that a shareholder would pay on Fund distributions or the redemption or sale of Fund Shares.
See invesco.com/ETFs to find the most recent month-end performance numbers.
Index and Benchmark Index performance results are based upon a hypothetical investment in their respective constituent securities. Index and Benchmark Index returns do not represent Fund returns. An investor cannot invest directly in an index. The Index and Benchmark Index do not charge management fees or brokerage expenses, and no such fees or expenses were deducted from the hypothetical performance shown. In addition, the results actual investors might have achieved would have differed from those shown because of differences in the timing, amounts of their investments, and fees and expenses associated with an investment in the Fund.
Notes Regarding Indexes and Fund Performance History:
| - | Average Annualized and Cumulative Inception returns for the Fund, Index and Benchmark Index are based on the inception date of the Fund. |
| | |

| | Management’s Discussion of Fund Performance Invesco S&P SmallCap Financials ETF (PSCF) |
As an index fund, the Invesco S&P SmallCap Financials ETF (the “Fund”) is passively managed and seeks to track the investment results (before fees and expenses) of the S&P SmallCap 600® Capped Financials & Real Estate Index (the “Index”). The Fund generally will invest at least 90% of its total assets in the securities, which may include real estate investment trusts (“REITs”), of small-capitalization U.S. financial service companies that comprise the Index. These companies are principally engaged in the business of providing financial services and products, including banking, investment services, insurance and real estate finance services.
S&P Dow Jones Indices, LLC, the Index provider, defines sectors according to the Global Industry Classification Standard (“GICS”) and compiles, maintains and calculates the Index strictly in accordance with its guidelines and mandated procedures. The Fund generally invests in all of the securities comprising the Index in proportion to their weightings in the Index.
For the fiscal year ended August 31, 2020, on a market price basis, the Fund returned (17.72)%. On a net asset value (“NAV”) basis, the Fund returned (18.02)%. During the same time period, the Index returned (17.93)%. During the fiscal year, the Fund fully replicated the components of the Index; therefore, the Fund’s performance, on a NAV basis, differed from the return of the Index primarily due to fees and operating expenses that the Fund incurred during the period that was offset by the Fund holding cash to pay distributions in March, which coincided with overall market declines.
During this same time period, the S&P SmallCap 600® Index (the “Benchmark Index”) returned (0.55)%. The Benchmark Index is an unmanaged index weighted by market capitalization based on the average performance of approximately 600 small-cap securities. The Benchmark Index was selected for its recognition in the marketplace, and its performance comparison is a useful measure for investors as a broad representation of the overall U.S. small-cap stock market.
Relative to the Benchmark Index, the Fund was most overweight in the banks industry and most underweight in the machinery industry during the fiscal year ended August 31, 2020. The majority of the Fund’s underperformance relative to the Benchmark Index during the period can be attributed to the overweight allocation to the banks industry, followed by the mortgage REITs and equity REITs industries, respectively.
For the fiscal year ended August 31, 2020, the consumer finance industry contributed most significantly to the Fund’s return, followed by the capital markets and real estate management & development industries, respectively. The banks industry detracted most significantly from the Fund’s return, followed by the equity REITs and mortgage REITs industries, respectively.
Positions that contributed most significantly to the Fund’s return for the fiscal year ended August 31, 2020, included Kinsale
Capital Group, Inc., an insurance company (portfolio average weight of 1.35%), and Green Dot Corp., Class A, a consumer finance company (portfolio average weight of 0.69%). Positions that detracted most significantly from the Fund’s return included Invesco Mortgage Capital, Inc., a mortgage REITs company (portfolio average weight of 0.87%), and New York Mortgage Trust, Inc., a mortgage REITs company (portfolio average weight of 0.78%).
Industry Breakdown (% of the Fund’s Net Assets)
as of August 31, 2020
| | | | | | |
| | | |
Banks | | | 33.09 | | | |
| | |
Equity REITs | | | 31.99 | | | |
| | |
Insurance | | | 13.90 | | | |
| | |
Thrifts & Mortgage Finance | | | 6.01 | | | |
| | |
Mortgage REITs | | | 4.65 | | | |
| | |
Consumer Finance | | | 4.34 | | | |
| | |
Capital Markets | | | 3.89 | | | |
| | |
Real Estate Management & Development | | | 1.99 | | | |
| | |
Money Market Funds Plus Other Assets Less Liabilities | | | 0.14 | | | |
Top Ten Fund Holdings* (% of the Fund’s Net Assets)
as of August 31, 2020
| | | | | | |
| | | |
Security | | | | | | |
| | |
Kinsale Capital Group, Inc. | | | 2.58 | | | |
| | |
Agree Realty Corp. | | | 2.17 | | | |
| | |
Lexington Realty Trust | | | 1.89 | | | |
| | |
Community Bank System, Inc. | | | 1.89 | | | |
| | |
Innovative Industrial Properties, Inc. | | | 1.58 | | | |
| | |
Green Dot Corp., Class A | | | 1.53 | | | |
| | |
CVB Financial Corp. | | | 1.41 | | | |
| | |
Old National Bancorp | | | 1.39 | | | |
| | |
American Equity Investment Life Holding Co. | | | 1.32 | | | |
| | |
BankUnited, Inc. | | | 1.30 | | | |
| | |
Total | | | 17.06 | | | |
| * | Excluding money market fund holdings. |
Invesco S&P SmallCap Energy ETF (PSCF) (continued)
Growth of a $10,000 Investment
Fund Performance History as of August 31, 2020
| | | | | | | | | | | | | | | | | | | | | | | | | | | | | | | | | | | | | | | | |
| | | | | | | | | | | | | | | | | | | | | | | | | | | Fund Inception | |
| Index | | 1 Year | | | 3 Years Average Annualized | | | 3 Years Cumulative | | | 5 Years Average Annualized | | | 5 Years Cumulative | | | 10 Years Average Annualized | | | 10 Years Cumulative | | | | | | Average Annualized | | | Cumulative | |
S&P SmallCap 600® Capped Financials & Real Estate Index | | | (17.93)% | | | | (2.62)% | | | | (7.66)% | | | | 4.25% | | | | 23.14% | | | | 9.46% | | | | 146.89% | | | | | | | | 7.82% | | | | 118.78% | |
S&P SmallCap 600® Index | | | (0.55) | | | | 3.82 | | | | 11.90 | | | | 7.47 | | | | 43.35 | | | | 12.31 | | | | 219.24 | | | | | | | | 10.34 | | | | 178.24 | |
Fund | | | | | | | | | | | | | | | | | | | | | | | | | | | | | | | | | | | | | | | | |
NAV Return | | | (18.02) | | | | (2.80) | | | | (8.18) | | | | 4.03 | | | | 21.82 | | | | 9.18 | | | | 140.73 | | | | | | | | 7.54 | | | | 112.99 | |
Market Price Return | | | (17.72) | | | | (2.72) | | | | (7.95) | | | | 4.06 | | | | 22.01 | | | | 9.21 | | | | 141.35 | | | | | | | | 7.56 | | | | 113.35 | |
Fund Inception: April 7, 2010
Performance quoted above represents past performance. Past performance is not a guarantee of future results and current performance may be higher or lower than performance quoted. Investment returns and principal value will fluctuate, and shares of the Fund (“Fund Shares”), when redeemed or sold, may be worth more or less than their original cost. Fund performance reflects any applicable fee waivers and/or expense reimbursements. Had the adviser not waived fees and/or reimbursed expenses currently or in the past, returns would have been lower. See the current prospectus for more information. According to the Fund’s current prospectus, the Fund’s expense ratio of 0.29% is expressed as a unitary management fee to cover operating expenses and expenses incurred in connection with managing the portfolio. NAV and Market Price returns assume that dividends and capital gain distributions have been reinvested in the Fund at NAV and Market Price, respectively. The returns shown in the table above do not reflect the deduction of taxes that a shareholder would pay on Fund distributions or the redemption or sale of Fund Shares.
See invesco.com/ETFs to find the most recent month-end performance numbers.
Index and Benchmark Index performance results are based upon a hypothetical investment in their respective constituent securities. Index and Benchmark Index returns do not represent Fund returns. An investor cannot invest directly in an index. The Index and Benchmark Index do not charge management fees or brokerage expenses, and no such fees or expenses were deducted from the hypothetical performance shown. In addition, the results actual investors might have achieved would have differed from those shown because of differences in the timing, amounts of their investments, and fees and expenses associated with an investment in the Fund.
Notes Regarding Indexes and Fund Performance History:
| - | Average Annualized and Cumulative Inception returns for the Fund, Index and Benchmark Index are based on the inception date of the Fund. |
| | |

| | Management’s Discussion of Fund Performance Invesco S&P SmallCap Health Care ETF (PSCH) |
As an index fund, the Invesco S&P SmallCap Health Care ETF (the “Fund”) is passively managed and seeks to track the investment results (before fees and expenses) of the S&P SmallCap 600® Capped Health Care Index (the “Index”). The Fund generally will invest at least 90% of its total assets in the securities of small capitalization U.S. health care companies that comprise the Index. These companies are principally engaged in the business of providing health care-related products, facilities and services including biotechnology, pharmaceuticals, medical technology and supplies.
S&P Dow Jones Indices, LLC, the Index provider, defines sectors according to the Global Industry Classification Standard (“GICS”) and compiles, maintains and calculates the Index strictly in accordance with its guidelines and mandated procedures. The Fund generally invests in all of the securities comprising the Index in proportion to their weightings in the Index.
For the fiscal year ended August 31, 2020, on a market price basis, the Fund returned 15.69%. On a net asset value (“NAV”) basis, the Fund returned 15.58%. During the same time period, the Index returned 15.91%. During the fiscal year, the Fund fully replicated the components of the Index; therefore, the Fund’s performance, on a NAV basis, differed from the return of the Index primarily due to fees and operating expenses that the Fund incurred during the period.
During this same time period, the S&P SmallCap 600® Index (the “Benchmark Index”) returned (0.55)%. The Benchmark Index is an unmanaged index weighted by market capitalization based on the average performance of approximately 600 small-cap securities. The Benchmark Index was selected for its recognition in the marketplace, and its performance comparison is a useful measure for investors as a broad representation of the overall U.S. small-cap stock market.
Relative to the Benchmark Index, the Fund was most overweight in the health care equipment & supplies industry and most underweight in the banks industry during the fiscal year ended August 31, 2020. The majority of the Fund’s outperformance relative to the Benchmark Index during the period can be attributed to the Fund’s overweight allocation to the biotechnology industry.
For the fiscal year ended August 31, 2020, the biotechnology industry contributed most significantly to the Fund’s return, followed by the pharmaceuticals and life sciences tools & services industries, respectively. The health care equipment & supplies industry detracted most significantly from the Fund’s return, followed by health care technology.
Positions that contributed most significantly to the Fund’s return for the fiscal year ended August 31, 2020, included Momenta Pharmaceuticals, Inc., a biotechnology company (portfolio average weight of 3.42%), and Medicines Co., a pharmaceuticals
company (no longer held at fiscal year-end). Positions that detracted most significantly from the Fund’s return included AMN Healthcare Services, Inc., a health care providers & services company (portfolio average weight of 3.09%), and US Physical Therapy, Inc., a health care providers & services company (portfolio average weight of 1.47%).
Industry Breakdown (% of the Fund’s Net Assets)
as of August 31, 2020
| | | | | | |
Health Care Equipment & Supplies | | | 27.56 | | | |
Health Care Providers & Services | | | 24.61 | | | |
Biotechnology | | | 17.28 | | | |
Health Care Technology | | | 11.21 | | | |
Life Sciences Tools & Services | | | 9.93 | | | |
Pharmaceuticals | | | 9.43 | | | |
Money Market Funds Plus Other Assets Less Liabilities | | | (0.02 | ) | | |
Top Ten Fund Holdings* (% of the Fund’s Net Assets) as of August 31, 2020
| | | | | | |
Security | | | | | | |
Momenta Pharmaceuticals, Inc. | | | 6.85 | | | |
NeoGenomics, Inc. | | | 4.77 | | | |
Neogen Corp. | | | 4.50 | | | |
Medpace Holdings, Inc. | | | 3.89 | | | |
Ensign Group, Inc. (The) | | | 3.29 | | | |
Omnicell, Inc. | | | 3.17 | | | |
Merit Medical Systems, Inc. | | | 3.03 | | | |
Pacira BioSciences, Inc. | | | 2.94 | | | |
AMN Healthcare Services, Inc. | | | 2.82 | | | |
HMS Holdings Corp. | | | 2.75 | | | |
Total | | | 38.01 | | | |
| * | Excluding money market fund holdings. |
Invesco S&P SmallCap Health Care ETF (PSCH) (continued)
Growth of a $10,000 Investment
Fund Performance History as of August 31, 2020
| | | | | | | | | | | | | | | | | | | | | | | | | | | | | | | | | | | | | | | | |
| | | | | | | | | | | | | | | | | | | | | | | | | | | Fund Inception | |
| Index | | 1 Year | | | 3 Years Average Annualized | | | 3 Years Cumulative | | | 5 Years Average Annualized | | | 5 Years Cumulative | | | 10 Years Average Annualized | | | 10 Years Cumulative | | | | | | Average Annualized | | | Cumulative | |
S&P SmallCap 600® Capped Health Care Index | | | 15.91% | | | | 14.95% | | | | 51.89% | | | | 13.80% | | | | 90.88% | | | | 20.33% | | | | 536.46% | | | | | | | | 18.18% | | | | 468.00% | |
S&P SmallCap 600® Index | | | (0.55) | | | | 3.82 | | | | 11.90 | | | | 7.47 | | | | 43.35 | | | | 12.31 | | | | 219.24 | | | | | | | | 10.34 | | | | 178.24 | |
Fund | | | | | | | | | | | | | | | | | | | | | | | | | | | | | | | | | | | | | | | | |
NAV Return | | | 15.58 | | | | 14.66 | | | | 50.73 | | | | 13.52 | | | | 88.53 | | | | 20.00 | | | | 519.18 | | | | | | | | 17.86 | | | | 452.01 | |
Market Price Return | | | 15.69 | | | | 14.69 | | | | 50.84 | | | | 13.55 | | | | 88.75 | | | | 20.00 | | | | 519.31 | | | | | | | | 17.88 | | | | 452.84 | |
Fund Inception: April 7, 2010
Performance quoted above represents past performance. Past performance is not a guarantee of future results and current performance may be higher or lower than performance quoted. Investment returns and principal value will fluctuate, and shares of the Fund (“Fund Shares”), when redeemed or sold, may be worth more or less than their original cost. Fund performance reflects any applicable fee waivers and/or expense reimbursements. Had the adviser not waived fees and/or reimbursed expenses currently or in the past, returns would have been lower. See the current prospectus for more information. According to the Fund’s current prospectus, the Fund’s expense ratio of 0.29% is expressed as a unitary management fee to cover operating expenses and expenses incurred in connection with managing the portfolio. NAV and Market Price returns assume that dividends and capital gain distributions have been reinvested in the Fund at NAV and Market Price, respectively. The returns shown in the table above do not reflect the deduction of taxes that a shareholder would pay on Fund distributions or the redemption or sale of Fund Shares.
See invesco.com/ETFs to find the most recent month-end performance numbers.
Index and Benchmark Index performance results are based upon a hypothetical investment in their respective constituent securities. Index and Benchmark Index returns do not represent Fund returns. An investor cannot invest directly in an index. The Index and Benchmark Index do not charge management fees or brokerage expenses, and no such fees or expenses were deducted from the hypothetical performance shown. In addition, the results actual investors might have achieved would have differed from those shown because of differences in the timing, amounts of their investments, and fees and expenses associated with an investment in the Fund.
Notes Regarding Indexes and Fund Performance History:
| - | Average Annualized and Cumulative Inception returns for the Fund, Index and Benchmark Index are based on the inception date of the Fund. |
| | |

| | Management’s Discussion of Fund Performance Invesco S&P SmallCap Industrials ETF (PSCI) |
As an index fund, the Invesco S&P SmallCap Industrials ETF (the “Fund”) is passively managed and seeks to track the investment results (before fees and expenses) of the S&P SmallCap 600® Capped Industrials Index (the “Index”). The Fund generally will invest at least 90% of its total assets in the securities of small capitalization U.S. industrial companies that comprise the Index. These companies are principally engaged in the business of providing industrial products and services including engineering, heavy machinery, construction, electrical equipment, aerospace and defense, and general manufacturing.
S&P Dow Jones Indices, LLC, the Index provider, defines sectors according to the Global Industry Classification Standard (“GICS”) and compiles, maintains and calculates the Index strictly in accordance with its guidelines and mandated procedures. The Fund generally invests in all of the securities comprising the Index in proportion to their weightings in the Index.
For the fiscal year ended August 31, 2020, on a market price basis, the Fund returned 3.76%. On a net asset value (“NAV”) basis, the Fund returned 3.68%. During the same time period, the Index returned 3.94%. During the fiscal year, the Fund fully replicated the components of the Index; therefore, the Fund’s performance, on a NAV basis, differed from the return of the Index primarily due to fees and operating expenses that the Fund incurred during the period.
During this same time period, the S&P SmallCap 600® Index (the “Benchmark Index”) returned (0.55)%. The Benchmark Index is an unmanaged index weighted by market capitalization based on the average performance of approximately 600 small-cap securities. The Benchmark Index was selected for its recognition in the marketplace, and its performance comparison is a useful measure for investors as a broad representation of the overall U.S. small-cap stock market.
Relative to the Benchmark Index, the Fund was most overweight in the machinery industry and most underweight in the banks industry during the fiscal year ended August 31, 2020. The majority of the Fund’s outperformance relative to the Benchmark Index during the period can be attributed to the Fund’s overweight allocation to the building products and machinery industries.
For the fiscal year ended August 31, 2020, the building products industry contributed most significantly to the Fund’s return, followed by the machinery and electrical equipment industries. The aerospace & defense industry detracted most significantly from the Fund’s return, followed by the commercial services & supplies and airlines industries, respectively.
Positions that contributed most significantly to the Fund’s return for the fiscal year ended August 31, 2020, included Proto Labs, Inc., a machinery company (portfolio average weight of 2.28%), and Sunrun, Inc., an electrical equipment company (no longer held
at fiscal year-end). Positions that detracted most significantly from the Fund’s return included SkyWest, Inc., an airlines company (portfolio average weight of 1.81%), and Viad Corp., a commercial services & supplies company (portfolio average weight of 0.68%).
Industry Breakdown (% of the Fund’s Net Assets)
as of August 31, 2020
| | | | | | |
Machinery | | | 32.57 | | | |
Building Products | | | 15.39 | | | |
Commercial Services & Supplies | | | 10.77 | | | |
Aerospace & Defense | | | 8.52 | | | |
Professional Services | | | 6.43 | | | |
Road & Rail | | | 4.97 | | | |
Construction & Engineering | | | 4.75 | | | |
Air Freight & Logistics | | | 4.41 | | | |
Trading Companies & Distributors | | | 3.96 | | | |
Airlines | | | 3.12 | | | |
Industry Types Each Less Than 3% | | | 5.02 | | | |
Money Market Funds Plus Other Assets Less Liabilities | | | 0.09 | | | |
Top Ten Fund Holdings* (% of the Fund’s Net
Assets) as of August 31, 2020
| | | | | | |
Security | | | | | | |
Exponent, Inc. | | | 3.23 | | | |
Proto Labs, Inc. | | | 3.05 | | | |
Simpson Manufacturing Co., Inc. | | | 3.03 | | | |
UFP Industries, Inc. | | | 2.83 | | | |
Saia, Inc. | | | 2.73 | | | |
John Bean Technologies Corp. | | | 2.53 | | | |
Aerojet Rocketdyne Holdings, Inc. | | | 2.33 | | | |
UniFirst Corp. | | | 2.29 | | | |
Watts Water Technologies, Inc., Class A | | | 2.05 | | | |
ABM Industries, Inc. | | | 1.98 | | | |
Total | | | 26.05 | | | |
| * | Excluding money market fund holdings. |
Invesco S&P SmallCap Industrials ETF (PSCI) (continued)
Growth of a $10,000 Investment
Fund Performance History as of August 31, 2020
| | | | | | | | | | | | | | | | | | | | | | | | | | | | | | | | | | | | | | | | |
| | | | | | | | | | | | | | | | | | | | | | | | | | | Fund Inception | |
| Index | | 1 Year | | | 3 Years Average Annualized | | | 3 Years Cumulative | | | 5 Years Average Annualized | | | 5 Years Cumulative | | | 10 Years Average Annualized | | | 10 Years Cumulative | | | | | | Average Annualized | | | Cumulative | |
S&P SmallCap 600® Capped Industrials Index | | | 3.94% | | | | 7.27% | | | | 23.44% | | | | 9.50% | | | | 57.39% | | | | 12.92% | | | | 236.93% | | | | | | | | 10.90% | | | | 193.20% | |
S&P SmallCap 600® Index | | | (0.55) | | | | 3.82 | | | | 11.90 | | | | 7.47 | | | | 43.35 | | | | 12.31 | | | | 219.24 | | | | | | | | 10.34 | | | | 178.24 | |
Fund | | | | | | | | | | | | | | | | | | | | | | | | | | | | | | | | | | | | | | | | |
NAV Return | | | 3.68 | | | | 6.96 | | | | 22.37 | | | | 9.22 | | | | 55.44 | | | | 12.60 | | | | 227.53 | | | | | | | | 10.59 | | | | 184.77 | |
Market Price Return | | | 3.76 | | | | 7.04 | | | | 22.65 | | | | 9.28 | | | | 55.82 | | | | 12.61 | | | | 228.02 | | | | | | | | 10.61 | | | | 185.30 | |
Fund Inception: April 7, 2010
Performance quoted above represents past performance. Past performance is not a guarantee of future results and current performance may be higher or lower than performance quoted. Investment returns and principal value will fluctuate, and shares of the Fund (“Fund Shares”), when redeemed or sold, may be worth more or less than their original cost. Fund performance reflects any applicable fee waivers and/or expense reimbursements. Had the adviser not waived fees and/or reimbursed expenses currently or in the past, returns would have been lower. See the current prospectus for more information. According to the Fund’s current prospectus, the Fund’s expense ratio of 0.29% is expressed as a unitary management fee to cover operating expenses and expenses incurred in connection with managing the portfolio. NAV and Market Price returns assume that dividends and capital gain distributions have been reinvested in the Fund at NAV and Market Price, respectively. The returns shown in the table above do not reflect the deduction of taxes that a shareholder would pay on Fund distributions or the
redemption or sale of Fund Shares. See invesco.com/ETFs to find the most recent month-end performance numbers.
Index and Benchmark Index performance results are based upon a hypothetical investment in their respective constituent securities. Index and Benchmark Index returns do not represent Fund returns. An investor cannot invest directly in an index. The Index and Benchmark Index do not charge management fees or brokerage expenses, and no such fees or expenses were deducted from the hypothetical performance shown. In addition, the results actual investors might have achieved would have differed from those shown because of differences in the timing, amounts of their investments, and fees and expenses associated with an investment in the Fund.
Notes Regarding Indexes and Fund Performance History:
| - | Average Annualized and Cumulative Inception returns for the Fund, Index and Benchmark Index are based on the inception date of the Fund. |
| | |

| | Management’s Discussion of Fund Performance Invesco S&P SmallCap Information Technology ETF (PSCT) |
As an index fund, the Invesco S&P SmallCap Information Technology ETF (the “Fund”) is passively managed and seeks to track the investment results (before fees and expenses) of the S&P SmallCap 600® Capped Information Technology Index (the “Index”). The Fund generally will invest at least 90% of its total assets in the securities of small-capitalization U.S. information technology companies that comprise the Index. These companies are principally engaged in the business of providing information technology-related products and services including computer hardware and software, internet, electronics and semiconductors, and communication technologies.
S&P Dow Jones Indices, LLC, the Index provider, defines sectors according to the Global Industry Classification Standard (“GICS”) and compiles, maintains and calculates the Index strictly in accordance with its guidelines and mandated procedures. The Fund generally invests in all of the securities comprising the Index in proportion to their weightings in the Index.
For the fiscal year ended August 31, 2020, on a market price basis, the Fund returned 9.35%. On a net asset value (“NAV”) basis, the Fund returned 9.14%. During the same time period, the Index returned 9.43%. During the fiscal year, the Fund fully replicated the components of the Index; therefore, the Fund’s performance, on a NAV basis, differed from the return of the Index primarily due to fees and operating expenses that the Fund incurred during the period.
During this same time period, the S&P SmallCap 600® Index (the “Benchmark Index”) returned (0.55)%. The Benchmark Index is an unmanaged index weighted by market capitalization based on the average performance of approximately 600 small-cap securities. The Benchmark Index was selected for its recognition in the marketplace, and its performance comparison is a useful measure for investors as a broad representation of the overall U.S. small-cap stock market.
Relative to the Benchmark Index, the Fund was most overweight in the electronic equipment instruments & components industry and most underweight in the banks industry during the fiscal year ended August 31, 2020. The majority of the Fund’s outperformance relative to the Benchmark Index during the period can be attributed to the Fund’s single-sector information technology allocation.
For the fiscal year ended August 31, 2020, the semiconductors & semiconductor equipment industry contributed most significantly to the Fund’s return, followed by the software and distributors industries, respectively. The electronic equipment instruments & components industry detracted most significantly from the Fund’s return, followed by the communications equipment and IT services industries, respectively.
Positions that contributed most significantly to the Fund’s return for the fiscal year ended August 31, 2020, included Brooks
Automation, Inc., a semiconductors & semiconductor equipment company (portfolio average weight of 3.00%), and LivePerson, Inc., a software company (portfolio average weight of 2.28%). Positions that detracted most significantly from the Fund’s return included MTS Systems Corp., an electronic equipment, instruments & components company (portfolio average weight of 0.63%), and ExlService Holdings, Inc., an IT services company (portfolio average weight of 2.26%).
Industry Breakdown (% of the Fund’s Net Assets)
as of August 31, 2020
| | | | | | |
Semiconductors & Semiconductor Equipment | | | 28.12 | | | |
Electronic Equipment, Instruments & Components | | | 26.82 | | | |
Software | | | 19.60 | | | |
IT Services | | | 16.28 | | | |
Communications Equipment | | | 7.80 | | | |
Technology Hardware, Storage & Peripherals | | | 1.37 | | | |
Money Market Funds Plus Other Assets Less Liabilities | | | 0.01 | | | |
Top Ten Fund Holdings* (% of the Fund’s Net
Assets) as of August 31, 2020
| | | | | | |
Security | | | | | | |
Brooks Automation, Inc. | | | 4.03 | | | |
LivePerson, Inc. | | | 3.88 | | | |
Power Integrations, Inc. | | | 3.53 | | | |
Viavi Solutions, Inc. | | | 3.21 | | | |
Advanced Energy Industries, Inc. | | | 3.00 | | | |
SPS Commerce, Inc. | | | 2.95 | | | |
Fabrinet | | | 2.71 | | | |
Alarm.com Holdings, Inc. | | | 2.68 | | | |
Plexus Corp. | | | 2.35 | | | |
ExlService Holdings, Inc. | | | 2.31 | | | |
Total | | | 30.65 | | | |
| * | Excluding money market fund holdings. |
Invesco S&P SmallCap Information Technology ETF (PSCT) (continued)
Growth of a $10,000 Investment
Fund Performance History as of August 31, 2020
| | | | | | | | | | | | | | | | | | | | | | | | | | | | | | | | | | | | | | | | |
| | | | | | | | | | | | | | | | | | | | | | | | | | | Fund Inception | |
| Index | | 1 Year | | | 3 Years Average Annualized | | | 3 Years Cumulative | | | 5 Years Average Annualized | | | 5 Years Cumulative | | | 10 Years Average Annualized | | | 10 Years Cumulative | | | | | | Average Annualized | | | Cumulative | |
S&P SmallCap 600® Capped Information Technology Index | | | 9.43% | | | | 7.36% | | | | 23.73% | | | | 13.68% | | | | 89.82% | | | | 16.13% | | | | 346.18% | | | | | | | | 13.58% | | | | 275.78% | |
S&P SmallCap 600® Index | | | (0.55) | | | | 3.82 | | | | 11.90 | | | | 7.47 | | | | 43.35 | | | | 12.31 | | | | 219.24 | | | | | | | | 10.34 | | | | 178.24 | |
Fund | | | | | | | | | | | | | | | | | | | | | | | | | | | | | | | | | | | | | | | | |
NAV Return | | | 9.14 | | | | 7.10 | | | | 22.85 | | | | 13.40 | | | | 87.51 | | | | 15.82 | | | | 334.29 | | | | | | | | 13.26 | | | | 265.11 | |
Market Price Return | | | 9.35 | | | | 7.18 | | | | 23.13 | | | | 13.40 | | | | 87.56 | | | | 15.83 | | | | 334.76 | | | | | | | | 13.28 | | | | 265.65 | |
Fund Inception: April 7, 2010
Performance quoted above represents past performance. Past performance is not a guarantee of future results and current performance may be higher or lower than performance quoted. Investment returns and principal value will fluctuate, and shares of the Fund (“Fund Shares”), when redeemed or sold, may be worth more or less than their original cost. Fund performance reflects any applicable fee waivers and/or expense reimbursements. Had the adviser not waived fees and/or reimbursed expenses currently or in the past, returns would have been lower. See the current prospectus for more information. According to the Fund’s current prospectus, the Fund’s expense ratio of 0.29% is expressed as a unitary management fee to cover operating expenses and expenses incurred in connection with managing the portfolio. NAV and Market Price returns assume that dividends and capital gain distributions have been reinvested in the Fund at NAV and Market Price, respectively. The returns shown in the table above do not reflect the deduction of taxes that a shareholder would pay on Fund distributions or the
redemption or sale of Fund Shares. See invesco.com/ETFs to find the most recent month-end performance numbers.
Index and Benchmark Index performance results are based upon a hypothetical investment in their respective constituent securities. Index and Benchmark Index returns do not represent Fund returns. An investor cannot invest directly in an index. The Index and Benchmark Index do not charge management fees or brokerage expenses, and no such fees or expenses were deducted from the hypothetical performance shown. In addition, the results actual investors might have achieved would have differed from those shown because of differences in the timing, amounts of their investments, and fees and expenses associated with an investment in the Fund.
Notes Regarding Indexes and Fund Performance History:
| - | Average Annualized and Cumulative Inception returns for the Fund, Index and Benchmark Index are based on the inception date of the Fund. |
| | |

| | Management’s Discussion of Fund Performance Invesco S&P SmallCap Materials ETF (PSCM) |
As an index fund, the Invesco S&P SmallCap Materials ETF (the “Fund”) is passively managed and seeks to track the investment results (before fees and expenses) of the S&P SmallCap 600® Capped Materials Index (the “Index”). The Fund generally will invest at least 90% of its total assets in the securities of small capitalization U.S. basic materials companies that comprise the Index. These companies are principally engaged in the business of producing raw materials, including paper or wood products, chemicals, construction materials, and mining and metals.
S&P Dow Jones Indices, LLC, the Index provider, defines sectors according to the Global Industry Classification Standard (“GICS”) and compiles, maintains and calculates the Index strictly in accordance with its guidelines and mandated procedures. The Fund generally invests in all of the securities comprising the Index in proportion to their weightings in the Index.
For the fiscal year ended August 31, 2020, on a market price basis, the Fund returned 4.59%. On a net asset value (“NAV”) basis, the Fund returned 4.91%. During the same time period, the Index returned 4.86%. During the fiscal year, the Fund fully replicated the components of the Index; therefore, the Fund’s performance, on a NAV basis, differed from the return of the Index primarily due to the Fund holding cash to pay distributions in March, which coincided with overall market declines.
During this same time period, the S&P SmallCap 600® Index (the “Benchmark Index”) returned (0.55)%. The Benchmark Index is an unmanaged index weighted by market capitalization based on the average performance of approximately 600 small-cap securities. The Benchmark Index was selected for its recognition in the marketplace, and its performance comparison is a useful measure for investors as a broad representation of the overall U.S. small-cap stock market.
Relative to the Benchmark Index, the Fund was most overweight in the chemicals industry and most underweight in the banks industry during the fiscal year ended August 31, 2020. The majority of the Fund’s outperformance relative to the Benchmark Index during the period can be attributed to the Fund’s single-sector materials allocation.
For the fiscal year ended August 31, 2020, the chemicals industry contributed most significantly to the Fund’s return, followed by the paper & forests products and metals & mining industries, respectively. The construction materials industry detracted most significantly from the Fund’s return, followed by the containers & packaging industry.
Positions that contributed most significantly to the Fund’s return for the fiscal year ended August 31, 2020, included Arconic Corp., a metals & mining company (portfolio average weight of 1.70%), and Stepan Co., a chemicals company (portfolio average weight of 6.00%). Positions that detracted most significantly from the Fund’s return included Kaiser Aluminum Corp., a metals &
mining company (portfolio average weight of 4.19%), and Neenah, Inc., a paper & forest products company (portfolio average weight of 2.91%).
Industry Breakdown (% of the Fund’s Net Assets)
as of August 31, 2020
| | | | | | |
Chemicals | | | 55.74 | | | |
Metals & Mining | | | 27.28 | | | |
Paper & Forest Products | | | 13.86 | | | |
Industry Types Each Less Than 3% | | | 2.73 | | | |
Money Market Funds Plus Other Assets Less Liabilities | | | 0.39 | | | |
Top Ten Fund Holdings* (% of the Fund’s Net Assets) as of August 31, 2020
| | | | | | |
Security | | | | | | |
Balchem Corp. | | | 8.81 | | | |
Cleveland-Cliffs, Inc. | | | 7.32 | | | |
H.B. Fuller Co. | | | 6.91 | | | |
Quaker Chemical Corp. | | | 6.87 | | | |
Stepan Co. | | | 6.43 | | | |
Arconic Corp. | | | 5.34 | | | |
Innospec, Inc. | | | 5.12 | | | |
Boise Cascade Co. | | | 4.71 | | | |
GCP Applied Technologies, Inc. | | | 3.96 | | | |
Livent Corp. | | | 3.50 | | | |
Total | | | 58.97 | | | |
| * | Excluding money market fund holdings. |
Invesco S&P SmallCap Materials ETF (PSCM) (continued)
Growth of a $10,000 Investment
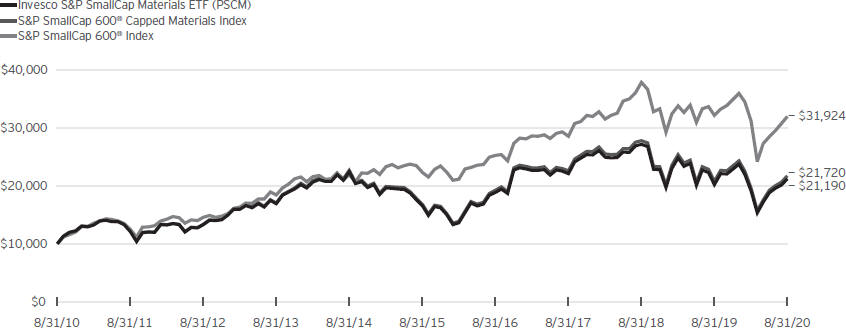
Fund Performance History as of August 31, 2020
| | | | | | | | | | | | | | | | | | | | | | | | | | | | | | | | | | | | | | | | |
| | | | | | | | | | | | | | | | | | | | | | | | | | | Fund Inception | |
Index | | | 1 Year | | |
| 3 Years
Average
Annualized |
| |
| 3 Years
Cumulative |
| |
| 5 Years
Average
Annualized |
| |
| 5 Years
Cumulative |
| |
| 10 Years
Average
Annualized�� |
| |
| 10 Years
Cumulative |
| | | | | |
| Average
Annualized |
| | | Cumulative | |
S&P SmallCap 600® Capped Materials Index | | | 4.86 | % | | | (1.24 | )% | | | (3.68 | )% | | | 5.31 | % | | | 29.53 | % | | | 8.07 | % | | | 117.20 | % | | | | | | | 6.14 | % | | | 85.84 | % |
S&P SmallCap 600® Index | | | (0.55 | ) | | | 3.82 | | | | 11.90 | | | | 7.47 | | | | 43.35 | | | | 12.31 | | | | 219.24 | | | | | | | | 10.34 | | | | 178.24 | |
Fund | | | | | | | | | | | | | | | | | | | | | | | | | | | | | | | | | | | | | | | | |
NAV Return | | | 4.91 | | | | (1.37 | ) | | | (4.05 | ) | | | 5.11 | | | | 28.28 | | | | 7.80 | | | | 111.90 | | | | | | | | 5.88 | | | | 81.16 | |
Market Price Return | | | 4.59 | | | | (1.40 | ) | | | (4.14 | ) | | | 5.05 | | | | 27.95 | | | | 7.77 | | | | 111.26 | | | | | | | | 5.85 | | | | 80.53 | |
Fund Inception: April 7, 2010
Performance quoted above represents past performance. Past performance is not a guarantee of future results and current performance may be higher or lower than performance quoted. Investment returns and principal value will fluctuate, and shares of the Fund (“Fund Shares”), when redeemed or sold, may be worth more or less than their original cost. Fund performance reflects any applicable fee waivers and/or expense reimbursements. Had the adviser not waived fees and/or reimbursed expenses currently or in the past, returns would have been lower. See the current prospectus for more information. According to the Fund’s current prospectus, the Fund’s expense ratio of 0.29% is expressed as a unitary management fee to cover operating expenses and expenses incurred in connection with managing the portfolio. NAV and Market Price returns assume that dividends and capital gain distributions have been reinvested in the Fund at NAV and Market Price, respectively. The returns shown in the table above do not reflect the deduction of taxes that a shareholder would pay on Fund distributions or the
redemption or sale of Fund Shares. See invesco.com/ETFs to find the most recent month-end performance numbers.
Index and Benchmark Index performance results are based upon a hypothetical investment in their respective constituent securities. Index and Benchmark Index returns do not represent Fund returns. An investor cannot invest directly in an index. The Index and Benchmark Index do not charge management fees or brokerage expenses, and no such fees or expenses were deducted from the hypothetical performance shown. In addition, the results actual investors might have achieved would have differed from those shown because of differences in the timing, amounts of their investments, and fees and expenses associated with an investment in the Fund.
Notes Regarding Indexes and Fund Performance History:
| - | Average Annualized and Cumulative Inception returns for the Fund, Index and Benchmark Index are based on the inception date of the Fund. |
| | |

| | Management’s Discussion of Fund Performance Invesco S&P SmallCap Utilities & Communication Services ETF (PSCU) |
As an index fund, the Invesco S&P SmallCap Utilities & Communication Services ETF (the “Fund”) is passively managed and seeks to track the investment results (before fees and expenses) of the S&P SmallCap 600® Capped Utilities & Communication Services Index (the “Index”). The Fund generally will invest at least 90% of its total assets in the securities of small-capitalization U.S. utility companies and companies in the communication services sector that comprise the Index. The utilities companies are principally engaged in providing either energy, water, electric or natural gas utilities. These companies may include, but are not limited to, companies that generate and supply electricity, including electricity wholesalers; distribute natural gas to customers; provide water to customers, as well as deal with associated wastewater. The communication services sector includes companies that facilitate communication or offer related content and information through various types of media and is comprised of companies from the following industries: diversified telecommunications services; wireless telecommunication services; media; entertainment; and interactive media and services.
S&P Dow Jones Indices, LLC, the Index provider, defines sectors according to the Global Industry Classification Standard (“GICS”) and compiles, maintains and calculates the Index strictly in accordance with its guidelines and mandated procedures. The Fund generally invests in all of the securities comprising the Index in proportion to their weightings in the Index.
For the fiscal year ended August 31, 2020, on a market price basis, the Fund returned (5.70)%. On a net asset value (“NAV”) basis, the Fund returned (5.92)%. During the same time period, the Index returned (5.69)%. During the fiscal year, the Fund fully replicated the components of the Index; therefore, the Fund’s performance, on a NAV basis, differed from the return of the Index primarily due to fees and operating expenses incurred by the Fund during the period, which were partially offset by revenue generated from the securities lending program in which the Fund participates.
During this same time period, the S&P SmallCap 600® Index (the “Benchmark Index”) returned (0.55)%. The Benchmark Index is an unmanaged index weighted by market capitalization based on the average performance of approximately 600 small-cap securities. The Benchmark Index was selected for its recognition in the marketplace, and its performance comparison is a useful measure for investors as a broad representation of the overall U.S. small-cap stock market.
Relative to the Benchmark Index, the Fund was most overweight in the diversified telecommunication services industry and most underweight in the banks industry during the fiscal year ended August 31, 2020. The majority of the Fund’s underperformance relative to the Benchmark Index during the period can be attributed to the Fund’s utilities & communication services sectors allocations.
For the fiscal year ended August 31, 2020, the diversified telecommunication services industry contributed most significantly to the Fund’s return, followed by the wireless telecommunication services and interactive media & services industries, respectively. The media industry detracted most significantly from the Fund’s return, followed by the gas utilities and water utilities industries, respectively.
Positions that contributed most significantly to the Fund’s return for the fiscal year ended August 31, 2020, included Cincinnati Bell, Inc., a diversified telecommunication services company (portfolio average weight of 3.10%), and Shenandoah Telecommunications Co., a wireless telecommunication services company (portfolio average weight of 4.40%). Positions that detracted most significantly from the Fund’s return included Gannett Co., Inc., a media company (portfolio average weight of 2.25%), and South Jersey Industries, Inc., a gas utilities company (portfolio average weight of 6.99%).
Industry Breakdown (% of the Fund’s Net Assets) as of August 31, 2020
| | | | | | |
Diversified Telecommunication Services | | | 35.60 | | | |
Media | | | 16.39 | | | |
Water Utilities | | | 14.39 | | | |
Gas Utilities | | | 8.63 | | | |
Multi-Utilities | | | 8.49 | | | |
Entertainment | | | 6.55 | | | |
Wireless Telecommunication Services | | | 6.28 | | | |
Interactive Media & Services | | | 3.37 | | | |
Money Market Funds Plus Other Assets Less Liabilities | | | 0.30 | | | |
Top Ten Fund Holdings* (% of the Fund’s Net Assets) as of August 31, 2020
| | | | | | |
| | | |
Security | | | | | | |
Cogent Communications Holdings, Inc. | | | 9.66 | | | |
American States Water Co. | | | 9.60 | | | |
Iridium Communications, Inc. | | | 9.38 | | | |
Avista Corp. | | | 8.49 | | | |
Vonage Holdings Corp. | | | 5.80 | | | |
Shenandoah Telecommunications Co. | | | 5.23 | | | |
TechTarget, Inc. | | | 4.98 | | | |
California Water Service Group | | | 4.79 | | | |
Glu Mobile, Inc. | | | 4.56 | | | |
Northwest Natural Holding Co. | | | 4.34 | | | |
Total | | | 66.83 | | | |
| * | Excluding money market fund holdings. |
Invesco S&P SmallCap Utilities & Communication Services ETF (PSCU) (continued)
Growth of a $10,000 Investment
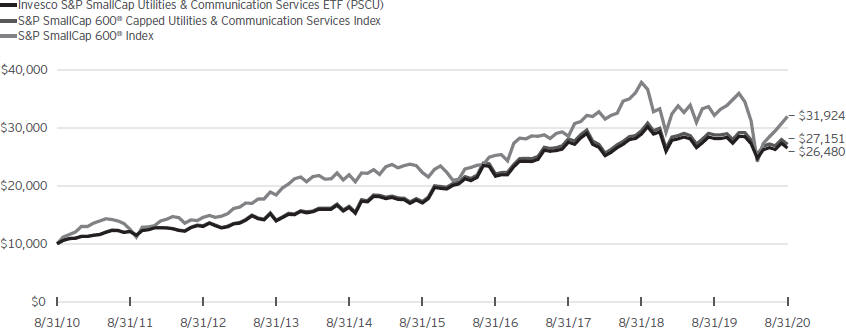
Fund Performance History as of August 31, 2020
| | | | | | | | | | | | | | | | | | | | | | | | | | | | | | | | | | | | | | | | |
| | | | | | | | | | | | | | | | | | | | | | | | | | | Fund Inception | |
Index | | | 1 Year | | |
| 3 Years
Average
Annualized |
| |
| 3 Years
Cumulative |
| |
| 5 Years
Average
Annualized |
| |
| 5 Years
Cumulative |
| |
| 10 Years
Average
Annualized |
| |
| 10 Years
Cumulative |
| | | | | |
| Average
Annualized |
| | | Cumulative | |
S&P SmallCap 600® Capped Utilities & Communication Services Index | | | (5.69 | )% | | | (1.13 | )% | | | (3.34 | )% | | | 9.46 | % | | | 57.11 | % | | | 10.50 | % | | | 171.51 | % | | | | | | | 10.10 | % | | | 171.82 | % |
S&P SmallCap 600® Index | | | (0.55 | ) | | | 3.82 | | | | 11.90 | | | | 7.47 | | | | 43.35 | | | | 12.31 | | | | 219.24 | | | | | | | | 10.34 | | | | 178.24 | |
Fund | | | | | | | | | | | | | | | | | | | | | | | | | | | | | | | | | | | | | | | | |
NAV Return | | | (5.92 | ) | | | (1.28 | ) | | | (3.79 | ) | | | 9.24 | | | | 55.59 | | | | 10.23 | | | | 164.80 | | | | | | | | 9.82 | | | | 164.83 | |
Market Price Return | | | (5.70 | ) | | | (1.24 | ) | | | (3.68 | ) | | | 9.28 | | | | 55.83 | | | | �� 10.24 | | | | 165.04 | | | | | | | | 9.83 | | | | 165.18 | |
Fund Inception: April 7, 2010
Performance quoted above represents past performance. Past performance is not a guarantee of future results and current performance may be higher or lower than performance quoted. Investment returns and principal value will fluctuate, and shares of the Fund (“Fund Shares”), when redeemed or sold, may be worth more or less than their original cost. Fund performance reflects any applicable fee waivers and/or expense reimbursements. Had the adviser not waived fees and/or reimbursed expenses currently or in the past, returns would have been lower. See the current prospectus for more information. According to the Fund’s current prospectus, the Fund’s expense ratio of 0.29% is expressed as a unitary management fee to cover operating expenses and expenses incurred in connection with managing the portfolio. NAV and Market Price returns assume that dividends and capital gain distributions have been reinvested in the Fund at NAV and Market Price, respectively. The returns shown in the table above do not reflect the deduction of taxes that a shareholder would
pay on Fund distributions or the redemption or sale of Fund Shares. See invesco.com/ETFs to find the most recent month-end performance numbers.
Index and Benchmark Index performance results are based upon a hypothetical investment in their respective constituent securities. Index and Benchmark Index returns do not represent Fund returns. An investor cannot invest directly in an index. The Index and Benchmark Index do not charge management fees or brokerage expenses, and no such fees or expenses were deducted from the hypothetical performance shown. In addition, the results actual investors might have achieved would have differed from those shown because of differences in the timing, amounts of their investments, and fees and expenses associated with an investment in the Fund.
Notes Regarding Indexes and Fund Performance History:
| - | Average Annualized and Cumulative Inception returns for the Fund, Index and Benchmark Index are based on the inception date of the Fund. |
Liquidity Risk Management Program
The Securities and Exchange Commission (“SEC”)has adopted Rule 22e-4 under the Investment Company Act of 1940 (the “Liquidity Rule”)in order to promote effective liquidity risk management throughout the open-end investment company industry, thereby reducing the risk that funds will be unable to meet their redemption obligations and mitigating dilution of the interests of fund shareholders. The Funds have adopted and implemented a liquidity risk management program in accordance with the Liquidity Rule (the “Program”). The Program is reasonably designed to assess and manage the Funds’ liquidity risk, which is the risk that the Funds could not meet redemption requests without significant dilution of remaining investors’ interests in the Funds. The Board of Trustees of the Funds (the “Board”)has appointed Invesco Capital Management LLC (“Invesco”), the Funds’ investment adviser, as the Program’s administrator, and Invesco has delegated oversight of the Program to the Liquidity Risk Management Committee (the “Committee”),which is composed of senior representatives from relevant business groups at Invesco and its affiliates.
As required by the Liquidity Rule, the Program includes policies and procedures providing for an assessment, no less frequently than annually, of the Funds’ liquidity risk that takes into account, as relevant to the Funds’ liquidity risk: (1) each Fund’s investment strategy and liquidity of portfolio investments during both normal and reasonably foreseeable stressed conditions; (2) short-term and long-term cash flow projections for the Funds during both normal and reasonably foreseeable stressed conditions; (3) each Fund’s holdings of cash and cash equivalents and any borrowing arrangements; (4) the relationship between the Funds’ portfolio liquidity and the way in which, and the prices and spreads at which, Fund shares trade, including the efficiency of the arbitrage function and the level of active participation by market participants, including authorized participants; and (5) the effect of the composition of baskets on the overall liquidity of each Fund’s portfolio. The Liquidity Rule also requires the classification of each Fund’s investments into categories that reflect the assessment of their relative liquidity under current market conditions. Each Fund classifies its investments into one of four of the following categories defined in the Liquidity Rule: “Highly Liquid,” “Moderately Liquid,” “Less Liquid” and “Illiquid.” Funds that are not invested primarily in “Highly Liquid Investments” that are assets (cash or investments that are reasonably expected to be convertible into cash within three business days without significantly changing the market value of the investment)are required to establish a “Highly Liquid Investment Minimum” (“HLIM”),which is the minimum percentage of net assets that must be invested in Highly Liquid Investments. Funds with HLIMs have procedures for addressing HLIM shortfalls, including reporting to the Board and the SEC (on a non-public basis) as required by the Program and the Liquidity Rule. In addition, a Fund may not acquire an investment if, immediately after the acquisition, over 15% of such Fund’s net assets would consist of “Illiquid Investments” that are assets (an investment that cannot reasonably be expected to be sold or disposed of in current market conditions in seven calendar days or less without the sale or disposition significantly changing the market value of the investment). The Liquidity Rule and the Program also require reporting to the Board and the SEC (on a non-public basis) if a Fund’s holdings of Illiquid Investments exceed 15% of such Fund’s assets.
At a meeting held on March 12, 2020, the Committee presented a report to the Board that addressed the operation of the Program and assessed the Program’s adequacy and effectiveness of implementation (the “Report”). The Report covered the period from December 1, 2018 through December 31, 2019 (the “Program Reporting Period”).
The Report stated, in relevant part, that during the Program Reporting Period:
| | • | | The Program, as adopted and implemented, remained reasonably designed to assess and manage the Funds’ liquidity risk and was operated effectively to achieve that goal; |
| | • | | Each Fund’s investment strategy remained appropriate for an open-end fund; |
| | • | | Each Fund was able to meet requests for redemption without significant dilution of remaining investors’ interests in the Fund; |
| | • | | The Funds did not breach the 15% limit on Illiquid Investments; and |
| | • | | The Funds primarily held Highly Liquid Investments and therefore have not adopted an HLIM. |
Invesco DWA SmallCap Momentum ETF (DWAS)
August 31, 2020
Schedule of Investments(a)
| | | | | | | | |
| | | Shares | | | Value | |
Common Stocks & Other Equity Interests-99.98% | |
Communication Services-2.76% | | | | | | | | |
AMC Entertainment Holdings, Inc., Class A(b) | | | 146,083 | | | $ | 858,968 | |
ANGI Homeservices, Inc., Class A(c) | | | 62,702 | | | | 869,990 | |
Bandwidth, Inc., Class A(c) | | | 13,305 | | | | 2,095,272 | |
EverQuote, Inc., Class A(c) | | | 45,722 | | | | 1,623,131 | |
TechTarget, Inc.(c) | | | 25,924 | | | | 1,028,664 | |
| | | | | | | | |
| | | | | | | 6,476,025 | |
| | | | | | | | |
Consumer Discretionary-18.13% | | | | | | | | |
1-800-Flowers.com, Inc., Class A(c) | | | 33,732 | | | | 1,009,599 | |
America’s Car-Mart, Inc.(c) | | | 9,235 | | | | 928,117 | |
At Home Group, Inc.(c) | | | 120,015 | | | | 2,293,487 | |
Bed Bath & Beyond, Inc.(b) | | | 78,101 | | | | 951,270 | |
Big Lots, Inc. | | | 23,247 | | | | 1,096,096 | |
Camping World Holdings, Inc., Class A | | | 50,260 | | | | 1,460,556 | |
Cavco Industries, Inc.(c) | | | 4,187 | | | | 799,340 | |
Chewy, Inc., Class A(b)(c) | | | 15,345 | | | | 937,119 | |
Collectors Universe, Inc. | | | 24,407 | | | | 1,085,867 | |
Franchise Group, Inc. | | | 30,709 | | | | 754,213 | |
Installed Building Products, Inc.(c) | | | 11,347 | | | | 985,147 | |
Jack in the Box, Inc. | | | 10,954 | | | | 902,500 | |
KB Home | | | 23,241 | | | | 831,098 | |
Lithia Motors, Inc., Class A | | | 5,274 | | | | 1,313,015 | |
Lovesac Co. (The)(b)(c) | | | 51,730 | | | | 1,369,293 | |
Lumber Liquidators Holdings, Inc.(c) | | | 61,546 | | | | 1,476,489 | |
M/I Homes, Inc.(c) | | | 23,279 | | | | 990,754 | |
Malibu Boats, Inc., Class A(c) | | | 16,177 | | | | 838,777 | |
MasterCraft Boat Holdings, Inc.(c) | | | 41,226 | | | | 862,036 | |
Ollie’s Bargain Outlet Holdings, Inc.(c) | | | 7,507 | | | | 717,219 | |
Overstock.com, Inc.(c) | | | 70,458 | | | | 6,165,075 | |
Peloton Interactive, Inc., Class A(c) | | | 14,706 | | | | 1,127,509 | |
Red Rock Resorts, Inc., Class A | | | 64,691 | | | | 1,104,599 | |
Smith & Wesson Brands, Inc.(c) | | | 44,996 | | | | 821,627 | |
Sonic Automotive, Inc., Class A | | | 25,996 | | | | 1,098,591 | |
Sportsman’s Warehouse Holdings, Inc.(c) | | | 73,055 | | | | 1,146,598 | |
TopBuild Corp.(c) | | | 10,521 | | | | 1,618,130 | |
Twin River Worldwide Holdings, Inc. | | | 33,408 | | | | 799,453 | |
Universal Technical Institute, Inc.(c) | | | 125,859 | | | | 887,306 | |
Vivint Smart Home, Inc.(b)(c) | | | 43,306 | | | | 768,682 | |
Winnebago Industries, Inc. | | | 11,818 | | | | 637,936 | |
Workhorse Group, Inc.(b)(c) | | | 135,792 | | | | 2,459,193 | |
XPEL, Inc.(c)(d) | | | 62,011 | | | | 1,544,074 | |
Zumiez, Inc.(c) | | | 27,731 | | | | 712,132 | |
| | | | | | | | |
| | | | | | | 42,492,897 | |
| | | | | | | | |
Consumer Staples-0.67% | | | | | | | | |
Boston Beer Co., Inc. (The), Class A(c) | | | 1,767 | | | | 1,558,459 | |
| | | | | | | | |
Energy-1.55% | | | | | | | | |
Antero Midstream Corp.(b) | | | 136,406 | | | | 923,468 | |
Liberty Oilfield Services, Inc., Class A | | | 119,607 | | | | 771,465 | |
Range Resources Corp. | | | 129,606 | | | | 966,861 | |
Renewable Energy Group, Inc.(c) | | | 29,286 | | | | 979,031 | |
| | | | | | | | |
| | | | | | | 3,640,825 | |
| | | | | | | | |
Financials-4.88% | | | | | | | | |
Cohen & Steers, Inc. | | | 10,915 | | | | 660,358 | |
Goosehead Insurance, Inc., Class A | | | 11,831 | | | | 1,215,754 | |
Green Dot Corp., Class A(c) | | | 18,617 | | | | 969,201 | |
Hamilton Lane, Inc., Class A | | | 13,950 | | | | 1,019,884 | |
| | | | | | | | |
| | | Shares | | | Value | |
Financials-(continued) | | | | | | | | |
Kinsale Capital Group, Inc. | | | 11,975 | | | $ | 2,481,579 | |
NMI Holdings, Inc., Class A(c) | | | 46,323 | | | | 794,439 | |
Palomar Holdings, Inc.(c) | | | 14,835 | | | | 1,666,712 | |
PennyMac Financial Services, Inc. | | | 19,354 | | | | 1,020,343 | |
PennyMac Mortgage Investment Trust | | | 46,753 | | | | 801,346 | |
TPG RE Finance Trust, Inc. | | | 91,141 | | | | 803,864 | |
| | | | | | | | |
| | | | | | | 11,433,480 | |
| | | | | | | | |
Health Care-39.62% | | | | | | | | |
AdaptHealth Corp.(c) | | | 36,162 | | | | 767,719 | |
Addus HomeCare Corp.(c) | | | 11,269 | | | | 1,055,455 | |
Adverum Biotechnologies, Inc.(c) | | | 58,461 | | | | 713,224 | |
Aeglea BioTherapeutics, Inc.(c) | | | 70,608 | | | | 513,673 | |
Amneal Pharmaceuticals, Inc.(c) | | | 152,441 | | | | 626,533 | |
Anavex Life Sciences Corp.(b)(c) | | | 150,872 | | | | 639,697 | |
Arcturus Therapeutics Holdings, Inc.(c) | | | 33,743 | | | | 1,627,762 | |
Arena Pharmaceuticals, Inc.(c) | | | 11,955 | | | | 834,698 | |
Atreca, Inc., Class A(c) | | | 37,001 | | | | 526,154 | |
AtriCure, Inc.(c) | | | 17,359 | | | | 776,468 | |
Axonics Modulation Technologies, Inc.(b)(c) | | | 21,394 | | | | 904,110 | |
Biohaven Pharmaceutical Holding Co. Ltd.(c) | | | 14,447 | | | | 915,795 | |
BioTelemetry, Inc.(c) | | | 33,078 | | | | 1,309,227 | |
Bioxcel Therapeutics, Inc.(b)(c) | | | 13,842 | | | | 564,062 | |
Castle Biosciences, Inc.(c) | | | 18,862 | | | | 862,559 | |
ChemoCentryx, Inc.(c) | | | 37,341 | | | | 1,997,744 | |
Concert Pharmaceuticals, Inc.(c) | | | 67,598 | | | | 650,293 | |
Covetrus, Inc.(c) | | | 41,836 | | | | 958,463 | |
CRISPR Therapeutics AG (Switzerland)(c) | | | 11,038 | | | | 1,031,612 | |
CryoPort, Inc.(b)(c) | | | 109,677 | | | | 6,084,880 | |
Cytokinetics, Inc.(b)(c) | | | 34,357 | | | | 823,194 | |
Deciphera Pharmaceuticals, Inc.(c) | | | 13,192 | | | | 593,772 | |
Dicerna Pharmaceuticals, Inc.(c) | | | 31,108 | | | | 576,120 | |
Dyadic International, Inc.(b)(c) | | | 76,613 | | | | 609,073 | |
Fate Therapeutics, Inc.(c) | | | 23,678 | | | | 861,879 | |
Five Prime Therapeutics, Inc.(c) | | | 121,966 | | | | 520,795 | |
Halozyme Therapeutics, Inc.(c) | | | 30,471 | | | | 883,507 | |
Heska Corp.(c) | | | 29,790 | | | | 3,086,244 | |
Immunovant, Inc.(c) | | | 29,246 | | | | 993,194 | |
Inovalon Holdings, Inc., Class A(c) | | | 39,566 | | | | 979,061 | |
Inovio Pharmaceuticals, Inc.(b)(c) | | | 130,079 | | | | 1,559,647 | |
Insmed, Inc.(c) | | | 26,473 | | | | 746,274 | |
Inspire Medical Systems, Inc.(c) | | | 11,484 | | | | 1,371,764 | |
Integer Holdings Corp.(c) | | | 11,225 | | | | 777,444 | |
Intellia Therapeutics, Inc.(b)(c) | | | 34,057 | | | | 734,950 | |
Intra-Cellular Therapies, Inc.(c) | | | 33,591 | | | | 612,028 | |
Invitae Corp.(b)(c) | | | 28,858 | | | | 1,008,876 | |
iRadimed Corp.(c) | | | 33,505 | | | | 710,306 | |
IVERIC bio, Inc.(c) | | | 289,887 | | | | 1,301,593 | |
Jounce Therapeutics, Inc.(c) | | | 116,450 | | | | 563,618 | |
Kala Pharmaceuticals, Inc.(b)(c) | | | 77,270 | | | | 687,703 | |
Karuna Therapeutics, Inc.(c) | | | 21,797 | | | | 1,665,291 | |
Kiniksa Pharmaceuticals Ltd., Class A(c) | | | 57,106 | | | | 1,009,063 | |
Kodiak Sciences, Inc.(c) | | | 39,751 | | | | 2,090,505 | |
Liquidia Technologies, Inc.(c) | | | 86,576 | | | | 443,269 | |
Livongo Health, Inc.(b)(c) | | | 15,686 | | | | 2,153,688 | |
Medpace Holdings, Inc.(c) | | | 10,171 | | | | 1,320,094 | |
Meridian Bioscience, Inc.(c) | | | 40,660 | | | | 574,932 | |
Mersana Therapeutics, Inc.(c) | | | 134,909 | | | | 2,584,856 | |
See accompanying Notes to Financial Statements which are an integral part of the financial statements.
Invesco DWA SmallCap Momentum ETF (DWAS)–(continued)
August 31, 2020
| | | | | | | | |
| | | Shares | | | Value | |
Health Care-(continued) | | | | | | | | |
Mirati Therapeutics, Inc.(c) | | | 29,218 | | | $ | 4,364,293 | |
Momenta Pharmaceuticals, Inc.(c) | | | 27,681 | | | | 1,444,118 | |
Morphic Holding, Inc.(c) | | | 26,414 | | | | 699,971 | |
NantKwest, Inc.(b)(c) | | | 72,632 | | | | 530,214 | |
National Research Corp. | | | 15,722 | | | | 880,432 | |
Novavax, Inc.(c) | | | 49,374 | | | | 5,447,927 | |
Ocular Therapeutix, Inc.(c) | | | 97,323 | | | | 846,710 | |
Odonate Therapeutics, Inc.(c) | | | 19,356 | | | | 312,599 | |
OrthoPediatrics Corp.(c) | | | 18,146 | | | | 914,558 | |
Ovid therapeutics, Inc.(c) | | | 107,649 | | | | 617,905 | |
Oyster Point Pharma, Inc.(b)(c) | | | 24,791 | | | | 564,243 | |
Phathom Pharmaceuticals, Inc.(c) | | | 17,404 | | | | 639,771 | |
Precigen, Inc.(b)(c) | | | 142,838 | | | | 864,170 | |
Provention Bio, Inc.(c) | | | 128,761 | | | | 1,679,043 | |
Quidel Corp.(c) | | | 11,970 | | | | 2,106,241 | |
R1 RCM, Inc.(c) | | | 142,560 | | | | 2,067,120 | |
Relmada Therapeutics, Inc.(b)(c) | | | 62,648 | | | | 2,235,281 | |
Revance Therapeutics, Inc.(c) | | | 32,326 | | | | 944,889 | |
Rocket Pharmaceuticals, Inc.(c) | | | 34,648 | | | | 885,949 | |
Simulations Plus, Inc. | | | 29,734 | | | | 1,771,552 | |
STAAR Surgical Co.(c) | | | 37,255 | | | | 1,786,377 | |
TCR2 Therapeutics, Inc.(c) | | | 47,101 | | | | 952,382 | |
Turning Point Therapeutics, Inc.(c) | | | 11,676 | | | | 912,830 | |
Ultragenyx Pharmaceutical, Inc.(c) | | | 10,160 | | | | 864,210 | |
Vapotherm, Inc.(c) | | | 37,840 | | | | 1,177,202 | |
Vir Biotechnology, Inc.(c) | | | 22,935 | | | | 928,409 | |
Y-mAbs Therapeutics, Inc.(c) | | | 15,801 | | | | 679,917 | |
Zynex, Inc.(b)(c) | | | 35,469 | | | | 524,941 | |
| | | | | | | | |
| | | | | | | 92,846,122 | |
| | | | | | | | |
Industrials-12.55% | | | | | | | | |
Advanced Drainage Systems, Inc. | | | 15,742 | | | | 873,366 | |
Alamo Group, Inc. | | | 8,595 | | | | 953,186 | |
Ameresco, Inc., Class A(c) | | | 48,587 | | | | 1,658,760 | |
Atlas Air Worldwide Holdings, Inc.(c) | | | 19,245 | | | | 1,085,226 | |
Avis Budget Group, Inc.(c) | | | 31,901 | | | | 1,088,143 | |
Bloom Energy Corp., Class A(b)(c) | | | 98,409 | | | | 1,541,085 | |
Builders FirstSource, Inc.(c) | | | 37,662 | | | | 1,153,210 | |
Casella Waste Systems, Inc., Class A(c) | | | 50,188 | | | | 2,818,056 | |
CBIZ, Inc.(c) | | | 32,712 | | | | 795,556 | |
Federal Signal Corp. | | | 26,363 | | | | 846,780 | |
Fluor Corp. | | | 57,657 | | | | 548,895 | |
Kadant, Inc. | | | 8,727 | | | | 1,016,172 | |
Kratos Defense & Security Solutions, Inc.(c) | | | 56,469 | | | | 1,103,969 | |
Meritor, Inc.(c) | | | 39,106 | | | | 890,053 | |
Patrick Industries, Inc. | | | 12,940 | | | | 727,357 | |
Plug Power, Inc.(b)(c) | | | 218,498 | | | | 2,836,104 | |
Proto Labs, Inc.(c) | | | 6,867 | | | | 1,009,449 | |
Resideo Technologies, Inc.(c) | | | 66,647 | | | | 890,404 | |
Saia, Inc.(c) | | | 9,231 | | | | 1,238,800 | |
Shyft Group, Inc. (The) | | | 48,088 | | | | 960,317 | |
Sunrun, Inc.(b)(c) | | | 50,927 | | | | 2,880,177 | |
Tutor Perini Corp.(c) | | | 69,453 | | | | 871,635 | |
Vectrus, Inc.(c) | | | 15,384 | | | | 667,819 | |
Vicor Corp.(c) | | | 10,878 | | | | 946,712 | |
| | | | | | | | |
| | | | | | | 29,401,231 | |
| | | | | | | | |
Information Technology-16.91% | | | | | | | | |
2U, Inc.(c) | | | 21,915 | | | | 907,062 | |
Alarm.com Holdings, Inc.(c) | | | 16,243 | | | | 972,468 | |
AppFolio, Inc., Class A(c) | | | 15,910 | | | | 2,673,357 | |
| | | | | | | | |
| | | Shares | | | Value | |
Information Technology-(continued) | |
Axcelis Technologies, Inc.(c) | | | 27,810 | | | $ | 657,150 | |
Badger Meter, Inc. | | | 12,466 | | | | 769,028 | |
Blackline, Inc.(c) | | | 9,855 | | | | 861,031 | |
Bottomline Technologies (DE), Inc.(c) | | | 15,374 | | | | 732,264 | |
Brooks Automation, Inc | | | 21,628 | | | | 1,116,654 | |
Calix, Inc.(c) | | | 57,366 | | | | 1,115,769 | |
Cloudera, Inc.(c) | | | 61,854 | | | | 817,091 | |
CyberOptics Corp.(c) | | | 22,644 | | | | 725,740 | |
Datadog, Inc., Class A(c) | | | 9,275 | | | | 774,926 | |
Digital Turbine, Inc.(c) | | | 71,035 | | | | 1,718,337 | |
Diodes, Inc.(c) | | | 15,574 | | | | 760,946 | |
Domo, Inc., Class B(c) | | | 24,658 | | | | 1,004,074 | |
eGain Corp.(c) | | | 184,832 | | | | 2,473,052 | |
ExlService Holdings, Inc.(c) | | | 12,353 | | | | 786,763 | |
Fastly, Inc., Class A(b)(c) | | | 15,295 | | | | 1,419,988 | |
FormFactor, Inc.(c) | | | 26,312 | | | | 687,533 | |
Infinera Corp.(c) | | | 128,422 | | | | 936,196 | |
Inphi Corp.(c) | | | 11,014 | | | | 1,255,376 | |
Lattice Semiconductor Corp.(c) | | | 56,843 | | | | 1,625,710 | |
Limelight Networks, Inc.(c) | | | 140,273 | | | | 795,348 | |
MACOM Technology Solutions Holdings, Inc.(c) | | | 23,496 | | | | 837,162 | |
Mimecast Ltd.(c) | | | 27,536 | | | | 1,355,873 | |
Model N, Inc.(c) | | | 28,947 | | | | 1,138,196 | |
OneSpan, Inc.(c) | | | 31,147 | | | | 671,218 | |
PDF Solutions, Inc.(c) | | | 41,323 | | | | 855,386 | |
Power Integrations, Inc. | | | 13,136 | | | | 735,222 | |
Rapid7, Inc.(c) | | | 19,342 | | | | 1,248,913 | |
Repay Holdings Corp.(c) | | | 31,695 | | | | 801,883 | |
SPS Commerce, Inc.(c) | | | 11,160 | | | | 891,461 | |
Super Micro Computer, Inc.(c) | | | 25,514 | | | | 698,828 | |
SVMK, Inc.(c) | | | 34,021 | | | | 846,783 | |
Synaptics, Inc.(c) | | | 12,474 | | | | 1,064,406 | |
TTEC Holdings, Inc. | | | 17,206. | | | | 975,408 | |
Ultra Clean Holdings, Inc.(c) | | | 35,618 | | | | 873,353 | |
Workiva, Inc. | | | 17,955 | | | | 1,059,345 | |
| | | | | | | | |
| | | | | | | 39,639,300 | |
| | | | | | | | |
Materials-1.59% | | | | | | | | |
Chase Corp. | | | 12,749 | | | | 1,243,920 | |
Clearwater Paper Corp.(c) | | | 22,093 | | | | 743,650 | |
Forterra, Inc.(c) | | | 80,787 | | | | 1,070,428 | |
Kraton Corp.(c) | | | 48,221 | | | | 677,023 | |
| | | | | | | | |
| | | | | | | 3,735,021 | |
| | | | | | | | |
| | | | | | | | |
Real Estate-1.32% | | | | | | | | |
Realogy Holdings Corp. | | | 104,762 | | | | 1,160,763 | |
Redfin Corp.(c) | | | 20,432 | | | | 971,950 | |
Safehold, Inc. | | | 17,392 | | | | 964,734 | |
| | | | | | | | |
| | | | | | | 3,097,447 | |
| | | | | | | | |
Total Common Stocks & Other Equity Interests (Cost $189,695,608) | | | | 234,320,807 | |
| | | | | | | | |
See accompanying Notes to Financial Statements which are an integral part of the financial statements.
Invesco DWA SmallCap Momentum ETF (DWAS)–(continued)
August 31, 2020
| | | | | | | | |
| | | Shares | | | Value | |
Money Market Funds-0.04% | | | | | | | | |
Invesco Premier U.S. Government Money Portfolio, Institutional Class, 0.01%(e)(f) (Cost $95,743) | | | 95,743 | | | $ | 95,743 | |
| | | | | | | | |
TOTAL INVESTMENTS IN SECURITIES (excluding investments purchased with cash collateral from securities on loan)-100.02% (Cost $189,791,351) | | | | 234,416,550 | |
| | | | | | | | |
| | | | | | | | |
Investments Purchased with Cash Collateral from Securities on Loan | |
| | | | | | | | |
Money Market Funds-10.87% | | | | | |
Invesco Private Government Fund, 0.03%(e)(f)(g) | | | 19,112,455 | | | | 19,112,455 | |
| | | | | | | | |
| | | Shares | | | Value | |
Money Market Funds-(continued) | | | | | | | | |
Invesco Private Prime Fund, 0.14%(e)(f)(g) | | | 6,369,644 | | | $ | 6,370,917 | |
| | | | | | | | |
Total Investments Purchased with Cash Collateral from Securities on Loan (Cost $25,483,373) | | | | 25,483,372 | |
| | | | | | | | |
TOTAL INVESTMENTS IN SECURITIES-110.89% (Cost $215,274,724) | | | | 259,899,922 | |
| | | | | | | | |
OTHER ASSETS LESS LIABILITIES-(10.89)% | | | | (25,526,810 | ) |
| | | | | | | | |
NET ASSETS-100.00% | | | $ | 234,373,112 | |
| | | | | | | | |
| | | | | | | | |
| | | | | | | | |
| | | | | | | | |
| | | | | | | | |
Notes to Schedule of Investments:
| (a) | Industry and/or sector classifications used in this report are generally according to the Global Industry Classification Standard, which was developed by and is the exclusive property and a service mark of MSCI Inc. and Standard & Poor’s. |
| (b) | All or a portion of this security was out on loan at August 31, 2020. |
| (c) | Non-income producing security. |
| (d) | Security purchased or received in a transaction exempt from registration under the Securities Act of 1933, as amended (the “1933 Act”). The security may be resold pursuant to an exemption from registration under the 1933 Act, typically to qualified institutional buyers. The value of this security at August 31, 2020 represented less than 1% of the Fund’s Net Assets. |
| (e) | Affiliated issuer. The issuer and/or the Fund is a wholly-owned subsidiary of Invesco Ltd., or is affiliated by having an investment adviser that is under common control of Invesco Ltd. The table below shows the Fund’s transactions in, and earnings from, its investments in affiliates for the fiscal year ended August 31, 2020. |
| | | | | | | | | | | | | | | | | | | | | | | | | | | | | | | | |
| | | Value
August 31, 2019 | | | Purchases
at Cost | | | Proceeds
from Sales | | | Change in
Unrealized
Appreciation
(Depreciation) | | | Realized
Gain
(Loss) | | | | | | Value
August 31, 2020 | | | Dividend
Income | |
Investments in Affiliated Money Market Funds: | | | | | | | | | | | | | | | | | | | | | | | | | | | | | | | | |
Invesco Premier U.S. Government Money Portfolio, Institutional Class | | $ | 249,702 | | | $ | 8,027,152 | | | $ | (8,181,111 | ) | | $ | - | | | | | | | $ | - | | | $ | 95,743 | | | $ | 4,477 | |
Investments Purchased with Cash Collateral from Securities on Loan: | | | | | | | | | | | | | | | | | | | | | | | | | | | | | | | | |
Invesco Government & Agency Portfolio, Institutional Class | | | 16,063,301 | | | | 81,907,103 | | | | (97,970,404 | ) | | | - | | | | | | | | - | | | | - | | | | 99,419 | * |
Invesco Liquid Assets Portfolio, Institutional Class | | | 5,486,419 | | | | 23,426,344 | | | | (28,911,342 | ) | | | - | | | | (1,421 | ) | | | | | | | - | | | | 36,831 | * |
Invesco Private Government Fund | | | - | | | | 83,892,688 | | | | (64,780,233 | ) | | | - | | | | | | | | - | | | | 19,112,455 | | | | 2,748 | * |
Invesco Private Prime Fund | | | - | | | | 17,793,637 | | | | (11,423,194 | ) | | | (1 | ) | | | 475 | | | | 6,370,917 | | | | 2,092 | * |
| | | | | | | | | | | | | | | | | | | | | | | | | | | | | | | | |
Total | | $ | 21,799,422 | | | $ | 215,046,924 | | | $ | (211,266,284 | ) | | $ | (1 | ) | | | $ (946) | | | $ | 25,579,115 | | | $ | 145,567 | |
| | | | | | | | | | | | | | | | | | | | | | | | | | | | | | | | |
| * | Represents the income earned on the investment of cash collateral, which is included in securities lending income on the Statements of Operations. Does not include rebates and fees paid to lending agent or premiums received from borrowers, if any. |
| (f) | The rate shown is the 7-day SEC standardized yield as of August 31, 2020. |
| (g) | The security has been segregated to satisfy the commitment to return the cash collateral received in securities lending transactions upon the borrower’s return of the securities loaned. See Note 2J. |
See accompanying Notes to Financial Statements which are an integral part of the financial statements.
Invesco S&P SmallCap Consumer Discretionary ETF (PSCD)
August 31, 2020
Schedule of Investments(a)
| | | | | | | | |
| | | Shares | | | Value | |
Common Stocks & Other Equity Interests-99.61% | |
Auto Components-14.23% | | | | | | | | |
American Axle & Manufacturing Holdings, Inc.(b) | | | 20,492 | | | $ | 159,428 | |
Cooper Tire & Rubber Co. | | | 9,112 | | | | 315,002 | |
Cooper-Standard Holdings, Inc.(b) | | | 3,060 | | | | 55,447 | |
Dorman Products, Inc.(b) | | | 5,232 | | | | 443,098 | |
Fox Factory Holding Corp.(b) | | | 7,430 | | | | 749,018 | |
Garrett Motion, Inc. (Switzerland)(b) | | | 13,697 | | | | 37,667 | |
Gentherm, Inc.(b) | | | 5,907 | | | | 267,174 | |
LCI Industries | | | 4,555 | | | | 517,585 | |
Motorcar Parts of America, Inc.(b) | | | 3,437 | | | | 59,838 | |
Standard Motor Products, Inc. | | | 3,639 | | | | 165,356 | |
| | | | | | | | |
| | | | | | | 2,769,613 | |
| | | | | | | | |
Automobiles-1.69% | | | | | | | | |
Winnebago Industries, Inc. | | | 6,106 | | | | 329,602 | |
| | | | | | | | |
Distributors-1.40% | | | | | | | | |
Core-Mark Holding Co., Inc. | | | 8,170 | | | | 273,041 | |
| | | | | | | | |
Diversified Consumer Services-1.52% | | | | | | | | |
American Public Education, Inc.(b) | | | 2,678 | | | | 84,196 | |
Perdoceo Education Corp.(b) | | | 12,515 | | | | 179,841 | |
Regis Corp.(b) | | | 4,383 | | | | 32,390 | |
| | | | | | | | |
| | | | | | | 296,427 | |
| | | | | | | | |
Hotels, Restaurants & Leisure-15.04% | | | | | | | | |
BJ’s Restaurants, Inc. | | | 4,034 | | | | 127,151 | |
Bloomin’ Brands, Inc. | | | 15,853 | | | | 227,332 | |
Brinker International, Inc. | | | 8,146 | | | | 366,896 | |
Cheesecake Factory, Inc. (The)(c) | | | 7,579 | | | | 223,808 | |
Chuy’s Holdings, Inc.(b) | | | 3,016 | | | | 67,076 | |
Dave & Buster’s Entertainment, Inc.(c) | | | 8,587 | | | | 142,802 | |
Dine Brands Global, Inc. | | | 2,975 | | | | 177,191 | |
El Pollo Loco Holdings, Inc.(b)(c) | | | 3,562 | | | | 63,653 | |
Fiesta Restaurant Group, Inc.(b) | | | 3,669 | | | | 36,763 | |
Monarch Casino & Resort, Inc.(b) | | | 2,173 | | | | 99,980 | |
Red Robin Gourmet Burgers, Inc.(b)(c) | | | 2,339 | | | | 25,963 | |
Ruth’s Hospitality Group, Inc. | | | 5,701 | | | | 58,578 | |
Shake Shack, Inc., Class A(b)(c) | | | 6,364 | | | | 434,343 | |
Wingstop, Inc. | | | 5,361 | | | | 875,987 | |
| | | | | | | | |
| | | | | | | 2,927,523 | |
| | | | | | | | |
Household Durables-17.69% | | | | | | | | |
Cavco Industries, Inc.(b) | | | 1,563 | | | | 298,392 | |
Century Communities, Inc.(b) | | | 5,195 | | | | 185,358 | |
Ethan Allen Interiors, Inc. | | | 4,177 | | | | 59,480 | |
Installed Building Products, Inc.(b) | | | 3,833 | | | | 332,781 | |
iRobot Corp.(b)(c) | | | 5,053 | | | | 374,074 | |
La-Z-Boy, Inc. | | | 8,342 | | | | 271,115 | |
LGI Homes, Inc.(b) | | | 3,953 | | | | 442,182 | |
M.D.C. Holdings, Inc. | | | 9,141 | | | | 396,537 | |
M/I Homes, Inc.(b) | | | 5,169 | | | | 219,993 | |
Meritage Homes Corp.(b) | | | 6,404 | | | | 614,976 | |
Tupperware Brands Corp. | | | 8,882 | | | | 144,688 | |
Universal Electronics, Inc.(b) | | | 2,521 | | | | 103,563 | |
| | | | | | | | |
| | | | | | | 3,443,139 | |
| | | | | | | | |
Internet & Direct Marketing Retail-5.50% | | | | | | | | |
Liquidity Services, Inc.(b) | | | 4,932 | | | | 35,560 | |
PetMed Express, Inc.(c) | | | 3,654 | | | | 127,013 | |
| | | | | | | | |
| | | Shares | | | Value | |
Internet & Direct Marketing Retail-(continued) | | | | | | | | |
Shutterstock, Inc. | | | 3,487 | | | $ | 175,466 | |
Stamps.com, Inc.(b) | | | 2,941 | | | | 733,309 | |
| | | | | | | | |
| | | | | | | 1,071,348 | |
| | | | | | | | |
Leisure Products-7.17% | | | | | | | | |
Callaway Golf Co. | | | 17,053 | | | | 355,726 | |
Sturm Ruger & Co., Inc. | | | 3,010 | | | | 213,289 | |
Vista Outdoor, Inc.(b) | | | 10,513 | | | | 204,057 | |
YETI Holdings, Inc.(b) | | | 12,133 | | | | 623,393 | |
| | | | | | | | |
| | | | | | | 1,396,465 | |
| | | | | | | | |
Multiline Retail-3.73% | | | | | | | | |
Big Lots, Inc. | | | 7,109 | | | | 335,189 | |
Macy’s, Inc.(c) | | | 56,115 | | | | 391,122 | |
| | | | | | | | |
| | | | | | | 726,311 | |
| | | | | | | | |
Specialty Retail-20.63% | | | | | | | | |
Abercrombie & Fitch Co., Class A | | | 11,162 | | | | 145,218 | |
America’s Car-Mart, Inc.(b) | | | 1,127 | | | | 113,263 | |
Asbury Automotive Group, Inc.(b) | | | 3,496 | | | | 369,842 | |
Barnes & Noble Education, Inc.(b) | | | 7,002 | | | | 15,965 | |
Bed Bath & Beyond, Inc.(c) | | | 22,933 | | | | 279,324 | |
Boot Barn Holdings, Inc.(b)(c) | | | 5,221 | | | | 147,389 | |
Buckle, Inc. (The) | | | 5,193 | | | | 97,317 | |
Caleres, Inc. | | | 7,291 | | | | 56,943 | |
Cato Corp. (The), Class A | | | 3,831 | | | | 30,648 | |
Chico’s FAS, Inc. | | | 21,815 | | | | 27,923 | |
Children’s Place, Inc. (The)(c) | | | 2,636 | | | | 52,628 | |
Conn’s, Inc.(b)(c) | | | 3,471 | | | | 44,359 | |
Designer Brands, Inc., Class A | | | 9,843 | | | | 69,393 | |
Express, Inc.(b) | | | 11,681 | | | | 12,966 | |
GameStop Corp., Class A(b)(c) | | | 11,735 | | | | 78,390 | |
Genesco, Inc.(b) | | | 2,528 | | | | 49,296 | |
Group 1 Automotive, Inc. | | | 3,096 | | | | 267,618 | |
Guess?, Inc. | | | 7,968 | | | | 91,632 | |
Haverty Furniture Cos., Inc. | | | 3,129 | | | | 66,084 | |
Hibbett Sports, Inc.(b) | | | 2,996 | | | | 99,976 | |
Lumber Liquidators Holdings, Inc.(b) | | | 5,222 | | | | 125,276 | |
MarineMax, Inc.(b) | | | 3,891 | | | | 114,434 | |
Michaels Cos., Inc. (The)(b)(c) | | | 13,884 | | | | 156,195 | |
Monro, Inc. | | | 6,031 | | | | 277,969 | |
ODP Corp. (The) | | | 9,538 | | | | 222,998 | |
Rent-A-Center, Inc. (c) | | | 8,771 | | | | 269,270 | |
Shoe Carnival, Inc. | | | 1,608 | | | | 52,871 | |
Signet Jewelers Ltd. (b) | | | 9,485 | | | | 163,806 | |
Sleep Number Corp. | | | 5,008 | | | | 240,384 | |
Sonic Automotive, Inc., Class A(b) | | | 4,366 | | | | 184,507 | |
Zumiez, Inc. | | | 3,641 | | | | 93,501 | |
| | | | | | | | |
| | | | | | | 4,017,385 | |
| | | | | | | | |
Textiles, Apparel & Luxury Goods-11.01% | | | | | | | | |
Capri Holdings Ltd.(b) | | | 27,066 | | | | 428,725 | |
Crocs, Inc.(b) | | | 12,209 | | | | 487,261 | |
Fossil Group, Inc.(b) | | | 8,431 | | | | 54,254 | |
G-III Apparel Group Ltd.(b) | | | 7,837 | | | | 86,677 | |
Kontoor Brands, Inc. | | | 8,485 | | | | 187,519 | |
Movado Group, Inc. | | | 2,994 | | | | 32,665 | |
Oxford Industries, Inc. | | | 3,040 | | | | 150,571 | |
Steven Madden Ltd. | | | 13,863 | | | | 293,341 | |
See accompanying Notes to Financial Statements which are an integral part of the financial statements
Invesco S&P SmallCap Consumer Discretionary ETF (PSCD)–(continued)
August 31, 2020
| | | | | | | | |
| | | Shares | | | Value | |
Textiles, Apparel & Luxury Goods-(continued) | | | | | | | | |
Unifi, Inc.(b) | | | 2,641 | | | $ | 32,299 | |
Vera Bradley, Inc.(b) | | | 4,164 | | | | 21,944 | |
Wolverine World Wide, Inc. | | | 14,712 | | | | 367,506 | |
| | | | | | | | |
| | | | | | | 2,142,762 | |
| | | | | | | | |
Total Common Stocks & Other Equity Interests (Cost $21,644,337) | | | | 19,393,616 | |
| | | | | | | | |
| | |
Money Market Funds-0.10% | | | | | | | | |
Invesco Premier U.S. Government Money Portfolio, Institutional Class, 0.01%(d)(e) (Cost $19,479) | | | 19,479 | | | | 19,479 | |
| | | | | | | | |
TOTAL INVESTMENTS IN SECURITIES (excluding investments purchased with cash collateral from securities on loan)-99.71% (Cost $21,663,816) | | | | 19,413,095 | |
| | | | | | | | |
| | | | | | | | |
| | | Shares | | | Value | |
Investments Purchased with Cash Collateral from Securities on Loan | | | | | |
Money Market Funds-13.46% | | | | | | | | |
Invesco Private Government Fund, 0.03%(d)(e)(f) | | | 1,965,473 | | | $ | 1,965,473 | |
Invesco Private Prime Fund, 0.14%(d)(e)(f) | | | 655,040 | | | | 655,171 | |
| | | | | | | | |
Total Investments Purchased with Cash Collateral from Securities on Loan (Cost $2,620,644) | | | | 2,620,644 | |
| | | | | | | | |
TOTAL INVESTMENTS IN SECURITIES-113.17% (Cost $24,284,460) | | | | 22,033,739 | |
OTHER ASSETS LESS LIABILITIES-(13.17)% | | | | (2,563,742 | ) |
| | | | | | | | |
NET ASSETS-100.00% | | | $ | 19,469,997 | |
| | | | | | | | |
Notes to Schedule of Investments:
| (a) | Industry and/or sector classifications used in this report are generally according to the Global Industry Classification Standard, which was developed by and is the exclusive property and a service mark of MSCI Inc. and Standard & Poor’s. |
| (b) | Non-income producing security. |
| (c) | All or a portion of this security was out on loan at August 31, 2020. |
| (d) | Affiliated issuer. The issuer and/or the Fund is a wholly-owned subsidiary of Invesco Ltd., or is affiliated by having an investment adviser that is under common control of Invesco Ltd. The table below shows the Fund’s transactions in, and earnings from, its investments in affiliates for the fiscal year ended August 31, 2020. |
| | | | | | | | | | | | | | | | | | | | | | | | | | | | |
| | | Value
August 31, 2019 | | | Purchases
at Cost | | | Proceeds
from Sales | | | Change in
Unrealized
Appreciation | | | Realized
Gain
(Loss) | | | Value
August 31, 2020 | | | Dividend
Income | |
Investments in Affiliated Money Market Funds: | | | | | | | | | | | | | | | | | | | | | | | | | | | | |
Invesco Premier U.S. Government Money Portfolio, Institutional Class | | $ | 5,021 | | | $ | 743,809 | | | $ | (729,351 | ) | | $ | - | | | $ | - | | | $ | 19,479 | | | $ | 227 | |
Investments Purchased with Cash Collateral from Securities on Loan: | | | | | | | | | | | | | | | | | | | | | | | | | | | | |
Invesco Government & Agency Portfolio, Institutional Class | | | 1,274,237 | | | | 10,871,367 | | | | (12,145,604 | ) | | | - | | | | - | | | | - | | | | 9,628 | * |
Invesco Liquid Assets Portfolio, Institutional Class | | | 424,746 | | | | 2,856,679 | | | | (3,281,390 | ) | | | - | | | | (35 | ) | | | - | | | | 3,560 | * |
Invesco Private Government Fund | | | - | | | | 11,201,121 | | | | (9,235,648 | ) | | | - | | | | - | | | | 1,965,473 | | | | 233 | * |
Invesco Private Prime Fund | | | - | | | | 2,146,756 | | | | (1,491,631 | ) | | | - | | | | 46 | | | | 655,171 | | | | 158 | * |
| | | | | | | | | | | | | | | | | | | | | | | | | | | | |
Total | | $ | 1,704,004 | | | $ | 27,819,732 | | | $ | (26,883,624 | ) | | $ | - | | | $ | 11 | | | $ | 2,640,123 | | | $ | 13,806 | |
| | | | | | | | | | | | | | | | | | | | | | | | | | | | |
| * | Represents the income earned on the investment of cash collateral, which is included in securities lending income on the Statements of Operations. Does not include rebates and fees paid to lending agent or premiums received from borrowers, if any. |
| (e) | The rate shown is the 7-day SEC standardized yield as of August 31, 2020. |
| (f) | The security has been segregated to satisfy the commitment to return the cash collateral received in securities lending transactions upon the borrower’s return of the securities loaned. See Note 2J. |
See accompanying Notes to Financial Statements which are an integral part of the financial statements.
Invesco S&P SmallCap Consumer Staples ETF (PSCC)
August 31, 2020
Schedule of Investments(a)
| | | | | | | | |
| | | Shares | | | Value | |
Common Stocks & Other Equity Interests-100.00% | |
Beverages-10.66% | | | | | | | | |
Coca-Cola Consolidated, Inc. | | | 6,783 | | | $ | 1,853,794 | |
MGP Ingredients, Inc. | | | 21,617 | | | | 768,484 | |
National Beverage Corp.(b)(c) | | | 19,116 | | | | 1,554,513 | |
| | | | | | | | |
| | | | | | | 4,176,791 | |
| | | | | | | | |
Food & Staples Retailing-16.15% | | | | | | | | |
Andersons, Inc. (The) | | | 53,967 | | | | 956,835 | |
Chefs’ Warehouse, Inc. (The)(b) | | | 50,707 | | | | 750,971 | |
PriceSmart, Inc. | | | 28,330 | | | | 1,862,697 | |
SpartanNash Co. | | | 58,529 | | | | 1,169,409 | |
United Natural Foods, Inc.(b) | | | 87,953 | | | | 1,587,552 | |
| | | | | | | | |
| | | | | | | 6,327,464 | |
| | | | | | | | |
Food Products-32.88% | | | | | | | | |
B&G Foods, Inc.(c) | | | 98,455 | | | | 3,065,889 | |
Calavo Growers, Inc. | | | 26,908 | | | | 1,707,851 | |
Cal-Maine Foods, Inc.(b) | | | 55,943 | | | | 2,158,840 | |
Fresh Del Monte Produce, Inc. | | | 49,316 | | | | 1,143,638 | |
J&J Snack Foods Corp. | | | 22,914 | | | | 3,115,158 | |
John B. Sanfilippo & Son, Inc. | | | 14,664 | | | | 1,167,841 | |
Seneca Foods Corp., Class A(b) | | | 11,076 | | | | 524,559 | |
| | | | | | | | |
| | | | | | | 12,883,776 | |
| | | | | | | | |
Household Products-18.19% | | | | | | | | |
Central Garden & Pet Co.(b) | | | 14,751 | | | | 600,218 | |
Central Garden & Pet Co., Class A(b) | | | 60,208 | | | | 2,237,329 | |
WD-40 Co. | | | 20,988 | | | | 4,289,528 | |
| | | | | | | | |
| | | | | | | 7,127,075 | |
| | | | | | | | |
Personal Products-13.33% | | | | | | | | |
Inter Parfums, Inc. | | | 28,964 | | | | 1,293,822 | |
Medifast, Inc. | | | 14,591 | | | | 2,374,248 | |
USANA Health Sciences, Inc.(b) | | | 19,810 | | | | 1,553,302 | |
| | | | | | | | |
| | | | | | | 5,221,372 | |
| | | | | | | | |
| | | | | | | | |
| | | Shares | | | Value | |
Tobacco-8.79% | | | | | | | | |
Universal Corp. | | | 36,839 | | | $ | 1,599,181 | |
Vector Group Ltd. | | | 183,356 | | | | 1,846,395 | |
| | | | | | | | |
| | | | | | | 3,445,576 | |
Total Common Stocks & Other Equity Interests (Cost $42,984,823) | | | | | | | 39,182,054 | |
| | | | | | | | |
| | |
Money Market Funds-0.01% | | | | | | | | |
Invesco Premier U.S. Government Money Portfolio, Institutional Class, 0.01%(d)(e) (Cost $3,119) | | | 3,119 | | | | 3,119 | |
| | | | | | | | |
TOTAL INVESTMENTS IN SECURITIES (excluding investments purchased with cash collateral from securities on loan)-100.01% (Cost $42,987,942) | | | | | | | 39,185,173 | |
| | | | | | | | |
| |
Investments Purchased with Cash Collateral from Securities on Loan | | | | | |
| | |
Money Market Funds-10.46% | | | | | | | | |
Invesco Private Government Fund, 0.03%(d)(e)(f) | | | 2,923,102 | | | | 2,923,102 | |
Invesco Private Prime Fund, 0.14%(d)(e)(f) | | | 1,176,998 | | | | 1,177,233 | |
| | | | | | | | |
Total Investments Purchased with Cash Collateral from Securities on Loan (Cost $4,100,335) | | | | 4,100,335 | |
| | | | | | | | |
TOTAL INVESTMENTS IN SECURITIES-110.47% (Cost $47,088,277) | | | | 43,285,508 | |
OTHER ASSETS LESS LIABILITIES-(10.47)% | | | | (4,103,365 | ) |
| | | | | | | | |
NET ASSETS-100.00% | | | $ | 39,182,143 | |
| | | | | | | | |
Notes to Schedule of Investments:
| (a) | Industry and/or sector classifications used in this report are generally according to the Global Industry Classification Standard, which was developed by and is the exclusive property and a service mark of MSCI Inc. and Standard & Poor’s. |
| (b) | Non-income producing security. |
| (c) | All or a portion of this security was out on loan at August 31, 2020. |
| (d) | Affiliated issuer. The issuer and/or the Fund is a wholly-owned subsidiary of Invesco Ltd., or is affiliated by having an investment adviser that is under common control of Invesco Ltd. The table below shows the Fund’s transactions in, and earnings from, its investments in affiliates for the fiscal year ended August 31, 2020. |
| | | | | | | | | | | | | | | | | | | | | | | | | | | | |
| | | Value
August 31, 2019 | | | Purchases
at Cost | | | Proceeds
from Sales | | | Change in
Unrealized
Appreciation | | | Realized
Gain
(Loss) | | | Value
August 31, 2020 | | | Dividend
Income | |
Investments in Affiliated Money Market Funds: | | | | | | | | | | | | | | | | | | | | | | | | | | | | |
Invesco Premier U.S. Government Money Portfolio, Institutional Class | | $ | 12,409 | | | $ | 1,771,176 | | | $ | (1,780,466 | ) | | $ | - | | | $ | - | | | $ | 3,119 | | | $ | 309 | |
Investments Purchased with Cash Collateral from Securities on Loan: | | | | | | | | | | | | | | | | | | | | | | | | | | | | |
Invesco Government & Agency Portfolio, Institutional Class | | | 3,778,679 | | | | 33,424,875 | | | | (37,203,554 | ) | | | - | | | | - | | | | - | | | | 35,619 | * |
Invesco Liquid Assets Portfolio, Institutional Class | | | 1,259,560 | | | | 7,704,755 | | | | (8,963,885 | ) | | | - | | | | (430 | ) | | | - | | | | 13,348 | * |
See accompanying Notes to Financial Statements which are an integral part of the financial statements.
Invesco S&P SmallCap Consumer Staples ETF (PSCC)–(continued)
August 31, 2020
| | | | | | | | | | | | | | | | | | | | | | |
| | | Value
August 31, 2019 | | | Purchases
at Cost | | | Proceeds
from Sales | | | Change in
Unrealized
Appreciation | | Realized
Gain
(Loss) | | Value
August 31, 2020 | | Dividend
Income | |
Invesco Private Government Fund | | | $ - | | | | $28,923,143 | | | | $(26,000,041 | ) | | $- | | $ - | | $2,923,102 | | | $ 752 | * |
Invesco Private Prime Fund | | | - | | | | 6,527,840 | | | | (5,350,889 | ) | | - | | 282 | | 1,177,233 | | | 482 | * |
| | | | | | | | | | | | | | | | | | | | | | |
Total | | | $5,050,648 | | | | $78,351,789 | | | | $(79,298,835 | ) | | $- | | $(148) | | $4,103,454 | | | $50,510 | |
| | | | | | | | | | | | | | | | | | | | | | |
| * | Represents the income earned on the investment of cash collateral, which is included in securities lending income on the Statements of Operations. Does not include rebates and fees paid to lending agent or premiums received from borrowers, if any. |
| (e) | The rate shown is the 7-day SEC standardized yield as of August 31, 2020. |
| (f) | The security has been segregated to satisfy the commitment to return the cash collateral received in securities lending transactions upon the borrower’s return of the securities loaned. See Note 2J. |
See accompanying Notes to Financial Statements which are an integral part of the financial statements.
Invesco S&P SmallCap Energy ETF (PSCE)
August 31, 2020
Schedule of Investments(a)
| | | | | | | | |
| | | Shares | | | Value | |
Common Stocks & Other Equity Interests-99.98% | |
Energy Equipment & Services-48.93% | | | | | | | | |
Archrock, Inc. | | | 93,915 | | | $ | 616,082 | |
Bristow Group, Inc.(b) | | | 4,899 | | | | 92,640 | |
Core Laboratories N.V. | | | 32,442 | | | | 679,011 | |
DMC Global, Inc. | | | 10,790 | | | | 382,290 | |
Dril-Quip, Inc.(b) | | | 25,506 | | | | 845,014 | |
Exterran Corp.(b) | | | 20,456 | | | | 94,098 | |
Geospace Technologies Corp.(b) | | | 10,055 | | | | 65,860 | |
Helix Energy Solutions Group, Inc.(b) | | | 104,253 | | | | 373,226 | |
Helmerich & Payne, Inc. | | | 78,129 | | | | 1,287,566 | |
Matrix Service Co.(b) | | | 19,150 | | | | 176,946 | |
Nabors Industries Ltd.(c) | | | 4,972 | | | | 198,781 | |
Newpark Resources, Inc.(b) | | | 65,939 | | | | 128,581 | |
Oceaneering International, Inc.(b) | | | 72,602 | | | | 391,325 | |
Oil States International, Inc.(b) | | | 44,532 | | | | 195,495 | |
Patterson-UTI Energy, Inc. | | | 136,380 | | | | 525,063 | |
ProPetro Holding Corp.(b) | | | 60,241 | | | | 378,313 | |
RPC, Inc.(b) | | | 37,885 | | | | 118,580 | |
SEACOR Holdings, Inc.(b) | | | 12,938 | | | | 408,970 | |
US Silica Holdings, Inc.(c) | | | 53,932 | | | | 240,537 | |
| | | | | | | | |
| | | | | | | 7,198,378 | |
| | | | | | | | |
Oil, Gas & Consumable Fuels-51.05% | | | | | | | | |
Bonanza Creek Energy, Inc.(b) | | | 13,678 | | | | 274,107 | |
Callon Petroleum Co.(b)(c) | | | 29,081 | | | | 192,807 | |
CONSOL Energy, Inc.(b) | | | 19,114 | | | | 98,819 | |
Dorian LPG Ltd.(b) | | | 19,725 | | | | 166,479 | |
Green Plains, Inc.(b) | | | 24,412 | | | | 326,633 | |
Gulfport Energy Corp.(b) | | | 106,912 | | | | 75,448 | |
Laredo Petroleum, Inc.(b) | | | 6,674 | | | | 109,120 | |
Matador Resources Co.(b)(c) | | | 78,214 | | | | 761,022 | |
Oasis Petroleum, Inc.(b) | | | 213,811 | | | | 118,751 | |
Par Pacific Holdings, Inc.(b) | | | 28,388 | | | | 246,408 | |
PDC Energy, Inc.(b) | | | 69,520 | | | | 1,052,533 | |
Penn Virginia Corp.(b)(c) | | | 9,894 | | | | 112,989 | |
QEP Resources, Inc. | | | 177,225 | | | | 230,393 | |
| | | | | | | | |
| | | Shares | | | Value | |
Oil, Gas & Consumable Fuels-(continued) | | | | | | | | |
Range Resources Corp.(c) | | | 154,396 | | | $ | 1,151,794 | |
Renewable Energy Group, Inc.(b) | | | 28,405 | | | | 949,579 | |
REX American Resources Corp.(b) | | | 4,028 | | | | 248,850 | |
SM Energy Co. | | | 77,601 | | | | 188,570 | |
Southwestern Energy Co.(b) | | | 394,021 | | | | 1,095,378 | |
Talos Energy, Inc.(b) | | | 14,855 | | | | 111,561 | |
| | | | | | | | |
| | | | | | | 7,511,241 | |
| | | | | | | | |
Total Common Stocks & Other Equity Interests
(Cost $22,431,042) | | | | 14,709,619 | |
| | | | | | | | |
| | |
Money Market Funds-0.03% | | | | | | | | |
Invesco Premier U.S. Government Money Portfolio, Institutional Class, 0.01%(d)(e)
(Cost $3,793) | | | 3,793 | | | | 3,793 | |
| | | | | | | | |
TOTAL INVESTMENTS IN SECURITIES (excluding investments purchased with cash collateral from securities on loan)-100.01%
(Cost $22,434,835) | | | | | | | 14,713,412 | |
| | | | | | | | |
| |
| Investments Purchased with Cash Collateral from Securities on Loan | | | | | |
| | |
Money Market Funds-6.31% | | | | | | | | |
Invesco Private Government Fund, 0.03%(d)(e)(f) | | | 696,441 | | | | 696,441 | |
Invesco Private Prime Fund, 0.14%(d)(e)(f) | | | 232,121 | | | | 232,167 | |
| | | | | | | | |
Total Investments Purchased with Cash Collateral from Securities on Loan (Cost $928,608) | | | | | | | 928,608 | |
| | | | | | | | |
TOTAL INVESTMENTS IN SECURITIES-106.32%
(Cost $23,363,443) | | | | 15,642,020 | |
OTHER ASSETS LESS LIABILITIES-(6.32)% | | | | (929,365 | ) |
| | | | | | | | |
NET ASSETS-100.00% | | | $ | 14,712,655 | |
| | | | | | | | |
Notes to Schedule of Investments:
| (a) | Industry and/or sector classifications used in this report are generally according to the Global Industry Classification Standard, which was developed by and is the exclusive property and a service mark of MSCI Inc. and Standard & Poor’s. |
| (b) | Non-income producing security. |
| (c) | All or a portion of this security was out on loan at August 31, 2020. |
| (d) | Affiliated issuer. The issuer and/or the Fund is a wholly-owned subsidiary of Invesco Ltd., or is affiliated by having an investment adviser that is under common control of Invesco Ltd. The table below shows the Fund’s transactions in, and earnings from, its investments in affiliates for the fiscal year ended August 31, 2020. |
| | | | | | | | | | | | | | | | | | | | | | | | | | | | |
| | | Value
August 31, 2019 | | | Purchases
at Cost | | | Proceeds
from Sales | | | Change in
Unrealized
Appreciation | | | Realized
Gain
(Loss) | | | Value
August 31, 2020 | | | Dividend
Income | |
| Investments in Affiliated Money Market Funds: | | | | | | | | | | | | | | | | | | | | | | | | | | | | |
| Invesco Premier U.S. Government Money Portfolio, Institutional Class | | | $ 9,419 | | | | $ 364,328 | | | | $ (369,954) | | | | $- | | | | $ - | | | | $ 3,793 | | | | $ 101 | |
See accompanying Notes to Financial Statements which are an integral part of the financial statements.
Invesco S&P SmallCap Energy ETF (PSCE)–(continued)
August 31, 2020
| | | | | | | | | | | | | | | | | | | | | | | | | | | | |
| | | Value
August 31, 2019 | | | Purchases
at Cost | | | Proceeds
from Sales | | | Change in
Unrealized
Appreciation | | | Realized
Gain
(Loss) | | | Value
August 31, 2020 | | | Dividend
Income | |
| Investments Purchased with Cash Collateral from Securities on Loan: | | | | | | | | | | | | | | | | | | | | | | | | | | | | |
| Invesco Government & Agency Portfolio, Institutional Class | | | $1,130,963 | | | | $17,319,524 | | | | $(18,450,487) | | | | $- | | | | $ - | | | | $ - | | | | $19,816* | |
| Invesco Liquid Assets Portfolio, Institutional Class | | | 390,071 | | | | 4,991,331 | | | | (5,381,013) | | | | - | | | | (389) | | | | - | | | | 7,404* | |
| Invesco Private Government Fund | | | - | | | | 13,542,939 | | | | (12,846,498) | | | | - | | | | - | | | | 696,441 | | | | 208* | |
| Invesco Private Prime Fund | | | - | | | | 2,495,625 | | | | (2,263,546) | | | | - | | | | 88 | | | | 232,167 | | | | 133* | |
| | | | | | | | | | | | | | | | | | | | | | | | | | | | |
Total | | | $1,530,453 | | | | $38,713,747 | | | | $(39,311,498) | | | | $- | | | | $(301) | | | | $932,401 | | | | $27,662 | |
| | | | | | | | | | | | | | | | | | | | | | | | | | | | |
| * | Represents the income earned on the investment of cash collateral, which is included in securities lending income on the Statements of Operations. Does not include rebates and fees paid to lending agent or premiums received from borrowers, if any. |
| (e) | The rate shown is the 7-day SEC standardized yield as of August 31, 2020. |
| (f) | The security has been segregated to satisfy the commitment to return the cash collateral received in securities lending transactions upon the borrower’s return of the securities loaned. See Note 2J. |
See accompanying Notes to Financial Statements which are an integral part of the financial statements.
Invesco S&P SmallCap Financials ETF (PSCF)
August 31, 2020
Schedule of Investments(a)
| | | | | | | | |
| | | Shares | | | Value | |
Common Stocks & Other Equity Interests-99.86% | |
Banks-33.09% | | | | | | | | |
Allegiance Bancshares, Inc. | | | 2,972 | | | $ | 75,548 | |
Ameris Bancorp | | | 10,336 | | | | 253,439 | |
Banc of California, Inc. | | | 7,001 | | | | 76,941 | |
BancFirst Corp. | | | 2,843 | | | | 125,092 | |
BankUnited, Inc. | | | 14,630 | | | | 342,049 | |
Banner Corp. | | | 5,567 | | | | 201,080 | |
Berkshire Hills Bancorp, Inc. | | | 6,834 | | | | 62,736 | |
Boston Private Financial Holdings, Inc. | | | 12,953 | | | | 76,941 | |
Brookline Bancorp, Inc. | | | 12,496 | | | | 119,962 | |
Cadence BanCorp | | | 19,941 | | | | 189,440 | |
Central Pacific Financial Corp. | | | 4,452 | | | | 68,961 | |
City Holding Co. | | | 2,557 | | | | 163,597 | |
Columbia Banking System, Inc. | | | 11,333 | | | | 316,304 | |
Community Bank System, Inc. | | | 8,249 | | | | 496,342 | |
Customers Bancorp, Inc.(b) | | | 4,585 | | | | 58,550 | |
CVB Financial Corp. | | | 20,385 | | | | 371,211 | |
Dime Community Bancshares, Inc. | | | 4,536 | | | | 58,514 | |
Eagle Bancorp, Inc. | | | 5,098 | | | | 146,720 | |
FB Financial Corp. | | | 4,858 | | | | 131,166 | |
First Bancorp (Puerto Rico) | | | 34,545 | | | | 197,943 | |
First Commonwealth Financial Corp. | | | 15,539 | | | | 127,420 | |
First Financial Bancorp | | | 15,512 | | | | 212,825 | |
First Hawaiian, Inc. | | | 20,558 | | | | 339,824 | |
First Midwest Bancorp, Inc. | | | 18,085 | | | | 225,339 | |
Great Western Bancorp, Inc. | | | 8,712 | | | | 121,358 | |
Hanmi Financial Corp. | | | 4,849 | | | | 46,211 | |
Heritage Financial Corp. | | | 5,683 | | | | 113,319 | |
Hope Bancorp, Inc. | | | 19,507 | | | | 165,029 | |
Independent Bank Corp. | | | 5,215 | | | | 327,763 | |
Independent Bank Group, Inc. | | | 5,793 | | | | 269,375 | |
National Bank Holdings Corp., Class A | | | 4,840 | | | | 137,650 | |
NBT Bancorp, Inc. | | | 6,902 | | | | 210,304 | |
OFG Bancorp (Puerto Rico) | | | 8,129 | | | | 104,376 | |
Old National Bancorp | | | 26,090 | | | | 364,738 | |
Pacific Premier Bancorp, Inc. | | | 12,797 | | | | 289,084 | |
Park National Corp.(c) | | | 2,245 | | | | 201,848 | |
Preferred Bank | | | 2,149 | | | | 80,373 | |
S&T Bancorp, Inc. | | | 6,028 | | | | 121,735 | |
Seacoast Banking Corp. of Florida(b) | | | 8,346 | | | | 168,923 | |
ServisFirst Bancshares, Inc. | | | 7,333 | | | | 268,754 | |
Simmons First National Corp., Class A | | | 17,255 | | | | 294,543 | |
Southside Bancshares, Inc. | | | 4,914 | | | | 135,405 | |
Tompkins Financial Corp. | | | 1,936 | | | | 128,125 | |
Triumph Bancorp, Inc.(b) | | | 3,511 | | | | 100,274 | |
United Community Banks, Inc. | | | 12,397 | | | | 224,634 | |
Veritex Holdings, Inc. | | | 7,260 | | | | 130,535 | |
Westamerica Bancorporation | | | 4,266 | | | | 259,629 | |
| | | | | | | | |
| | | | | | | 8,701,929 | |
| | | | | | | | |
Capital Markets-3.89% | | | | | | | | |
Blucora, Inc.(b) | | | 7,577 | | | | 90,394 | |
Brightsphere Investment Group, Inc. | | | 9,871 | | | | 136,812 | |
Donnelley Financial Solutions, Inc.(b) | | | 4,861 | | | | 52,985 | |
Greenhill & Co., Inc. | | | 2,320 | | | | 26,030 | |
Piper Sandler Cos. | | | 2,296 | | | | 173,233 | |
StoneX Group, Inc.(b) | | | 2,586 | | | | 146,626 | |
Virtus Investment Partners, Inc. | | | 1,148 | | | | 162,901 | |
| | | | | | | | |
| | | Shares | | | Value | |
Capital Markets-(continued) | | | | | | | | |
Waddell & Reed Financial, Inc., Class A | | | 10,392 | | | $ | 163,674 | |
WisdomTree Investments, Inc. | | | 18,825 | | | | 70,406 | |
| | | | | | | | |
| | | | | | | 1,023,061 | |
| | | | | | | | |
Consumer Finance-4.34% | | | | | | | | |
Encore Capital Group, Inc.(b) | | | 4,402 | | | | 202,228 | |
Enova International, Inc.(b) | | | 4,757 | | | | 81,249 | |
EZCORP, Inc., Class A(b) | | | 8,249 | | | | 44,380 | |
Green Dot Corp., Class A(b) | | | 7,718 | | | | 401,799 | |
PRA Group, Inc.(b) | | | 7,211 | | | | 336,573 | |
World Acceptance Corp.(b)(c) | | | 832 | | | | 75,704 | |
| | | | | | | | |
| | | | | | | 1,141,933 | |
| | | | | | | | |
Equity REITs-31.99% | | | | | | | | |
Acadia Realty Trust | | | 13,632 | | | | 154,587 | |
Agree Realty Corp. | | | 8,527 | | | | 570,627 | |
Alexander & Baldwin, Inc. | | | 10,762 | | | | 130,328 | |
American Assets Trust, Inc. | | | 7,610 | | | | 194,435 | |
Armada Hoffler Properties, Inc. | | | 8,946 | | | | 90,355 | |
Brandywine Realty Trust | | | 26,998 | | | | 300,488 | |
CareTrust REIT, Inc. | | | 15,155 | | | | 293,552 | |
Chatham Lodging Trust | | | 7,437 | | | | 51,464 | |
Community Healthcare Trust, Inc. | | | 3,261 | | | | 152,289 | |
CoreCivic, Inc. | | | 18,943 | | | | 176,359 | |
DiamondRock Hospitality Co. | | | 31,550 | | | | 167,215 | |
Diversified Healthcare Trust | | | 37,670 | | | | 143,146 | |
Easterly Government Properties, Inc. | | | 11,895 | | | | 287,740 | |
Essential Properties Realty Trust, Inc. | | | 14,567 | | | | 247,202 | |
Four Corners Property Trust, Inc. | | | 11,136 | | | | 281,184 | |
Franklin Street Properties Corp. | | | 16,986 | | | | 75,248 | |
Getty Realty Corp. | | | 5,440 | | | | 159,338 | |
Global Net Lease, Inc. | | | 14,166 | | | | 247,905 | |
Hersha Hospitality Trust | | | 5,701 | | | | 36,657 | |
Independence Realty Trust, Inc. | | | 14,996 | | | | 175,603 | |
Industrial Logistics Properties Trust | | | 10,322 | | | | 222,645 | |
Innovative Industrial Properties, Inc.(c) | | | 3,373 | | | | 415,182 | |
Investors Real Estate Trust | | | 1,927 | | | | 137,010 | |
iStar, Inc.(c) | | | 11,507 | | | | 142,457 | |
Kite Realty Group Trust | | | 13,320 | | | | 149,717 | |
Lexington Realty Trust | | | 43,744 | | | | 497,369 | |
LTC Properties, Inc. | | | 6,210 | | | | 226,603 | |
National Storage Affiliates Trust | | | 9,819 | | | | 336,890 | |
NexPoint Residential Trust, Inc. | | | 3,463 | | | | 143,368 | |
Office Properties Income Trust | | | 7,633 | | | | 181,971 | |
Pennsylvania REIT(c) | | | 9,617 | | | | 10,579 | |
Retail Opportunity Investments Corp. | | | 18,425 | | | | 205,070 | |
Retail Properties of America, Inc., Class A | | | 33,906 | | | | 213,947 | |
RPT Realty | | | 12,761 | | | | 74,779 | |
Safehold, Inc. | | | 2,102 | | | | 116,598 | |
Saul Centers, Inc. | | | 1,874 | | | | 52,509 | |
SITE Centers Corp. | | | 23,550 | | | | 176,860 | |
Summit Hotel Properties, Inc. | | | 16,722 | | | | 98,493 | |
Tanger Factory Outlet Centers, Inc.(c) | | | 14,801 | | | | 84,218 | |
Uniti Group, Inc. | | | 30,738 | | | | 301,847 | |
Universal Health Realty Income Trust | | | 2,005 | | | | 133,774 | |
Urstadt Biddle Properties, Inc., Class A | | | 4,750 | | | | 44,175 | |
Washington Prime Group, Inc.(c) | | | 29,668 | | | | 20,174 | |
Washington REIT | | | 13,035 | | | | 285,988 | |
See accompanying Notes to Financial Statements which are an integral part of the financial statements.
Invesco S&P SmallCap Financials ETF (PSCF)–(continued)
August 31, 2020
| | | | | | | | |
| | | Shares | | | Value | |
Equity REITs-(continued) | | | | | | | | |
Whitestone REIT | | | 6,672 | | | $ | 42,901 | |
Xenia Hotels & Resorts, Inc. | | | 17,965 | | | | 161,326 | |
| | | | | | | | |
| | | | | | | 8,412,172 | |
| | | | | | | | |
Insurance-13.90% | | | | | | | | |
Ambac Financial Group, Inc.(b) | | | 7,249 | | | | 91,555 | |
American Equity Investment Life Holding Co. | | | 14,493 | | | | 346,528 | |
AMERISAFE, Inc. | | | 3,057 | | | | 203,994 | |
eHealth, Inc.(b) | | | 4,056 | | | | 256,015 | |
Employers Holdings, Inc. | | | 4,810 | | | | 156,710 | |
HCI Group, Inc. | | | 998 | | | | 54,611 | |
Horace Mann Educators Corp. | | | 6,538 | | | | 255,374 | |
James River Group Holdings Ltd. | | | 4,833 | | | | 235,415 | |
Kinsale Capital Group, Inc. | | | 3,278 | | | | 679,300 | |
Palomar Holdings, Inc.(b) | | | 2,804 | | | | 315,029 | |
ProAssurance Corp. | | | 8,526 | | | | 130,618 | |
Safety Insurance Group, Inc. | | | 2,303 | | | | 166,737 | |
Stewart Information Services Corp. | | | 3,750 | | | | 160,012 | |
Third Point Reinsurance Ltd. (Bermuda)(b) | | | 12,771 | | | | 109,320 | |
Trupanion, Inc.(b) | | | 4,725 | | | | 296,399 | |
United Fire Group, Inc. | | | 3,367 | | | | 84,781 | |
United Insurance Holdings Corp. | | | 3,267 | | | | 24,731 | |
Universal Insurance Holdings, Inc. | | | 4,721 | | | | 87,575 | |
| �� | | | | | | | |
| | | | | | | 3,654,704 | |
| | | | | | | | |
Mortgage REITs-4.65% | | | | | | | | |
Apollo Commercial Real Estate Finance, Inc. | | | 22,653 | | | | 202,518 | |
ARMOUR Residential REIT, Inc. | | | 10,227 | | | | 99,100 | |
Capstead Mortgage Corp. | | | 15,264 | | | | 94,179 | |
Granite Point Mortgage Trust, Inc. | | | 8,731 | | | | 57,974 | |
Invesco Mortgage Capital, Inc.(c)(d) | | | 28,703 | | | | 86,109 | |
KKR Real Estate Finance Trust, Inc. | | | 3,689 | | | | 67,140 | |
New York Mortgage Trust, Inc. | | | 59,771 | | | | 157,795 | |
PennyMac Mortgage Investment Trust | | | 15,810 | | | | 270,983 | |
Ready Capital Corp. | | | 5,992 | | | | 61,298 | |
Redwood Trust, Inc. | | | 18,183 | | | | 126,008 | |
| | | | | | | | |
| | | | | | | 1,223,104 | |
| | | | | | | | |
Real Estate Management & Development-1.99% | | | | | |
Marcus & Millichap, Inc.(b) | | | 3,731 | | | | 105,251 | |
RE/MAX Holdings, Inc., Class A | | | 2,870 | | | | 100,852 | |
Realogy Holdings Corp. | | | 18,269 | | | | 202,421 | |
St. Joe Co. (The)(b) | | | 4,944 | | | | 114,750 | |
| | | | | | | | |
| | | | | | | 523,274 | |
| | | | | | | | |
Investment Abbreviations: | | | | | | | | |
REIT -Real Estate Investment Trust | | | | | | | | |
| | | | | | | | |
| | | Shares | | | Value | |
Thrifts & Mortgage Finance-6.01% | | | | | | | | |
Axos Financial, Inc.(b) | | | 8,218 | | | $ | 203,642 | |
Flagstar Bancorp, Inc. | | | 6,467 | | | | 203,193 | |
HomeStreet, Inc. | | | 3,704 | | | | 101,378 | |
Meta Financial Group, Inc. | | | 5,041 | | | | 97,190 | |
NMI Holdings, Inc., Class A(b) | | | 13,420 | | | | 230,153 | |
Northfield Bancorp, Inc. | | | 6,869 | | | | 66,355 | |
Northwest Bancshares, Inc. | | | 18,787 | | | | 189,937 | |
Provident Financial Services, Inc. | | | 11,092 | | | | 146,193 | |
TrustCo Bank Corp. | | | 15,270 | | | | 91,009 | |
Walker & Dunlop, Inc. | | | 4,574 | | | | 250,564 | |
| | | | | | | | |
| | | | | | | 1,579,614 | |
| | | | | | | | |
Total Common Stocks & Other Equity Interests
(Cost $35,053,266) | | | | 26,259,791 | |
| | | | | | | | |
| | |
Money Market Funds-0.05% | | | | | | | | |
Invesco Premier U.S. Government Money Portfolio, Institutional Class, 0.01%(d)(e)
(Cost $12,423) | | | 12,423 | | | | 12,423 | |
| | | | | | | | |
TOTAL INVESTMENTS IN SECURITIES (excluding investments purchased with cash collateral from securities on loan)-99.91%
(Cost $35,065,689) | | | | 26,272,214 | |
| | | | | | | | |
| |
| Investments Purchased with Cash Collateral from Securities on Loan | | | | | |
| | |
Money Market Funds-4.12% | | | | | | | | |
Invesco Private Government Fund, 0.03%(d)(e)(f) | | | 812,376 | | | | 812,376 | |
Invesco Private Prime Fund, 0.14%(d)(e)(f) | | | 270,744 | | | | 270,798 | |
| | | | | | | | |
Total Investments Purchased with Cash Collateral from Securities on Loan
(Cost $1,083,174) | | | | 1,083,174 | |
| | | | | | | | |
TOTAL INVESTMENTS IN SECURITIES-104.03%
(Cost $36,148,863) | | | | 27,355,388 | |
OTHER ASSETS LESS LIABILITIES-(4.03)% | | | | (1,058,515 | ) |
| | | | | | | | |
NET ASSETS-100.00% | | | $ | 26,296,873 | |
| | | | | | | | |
See accompanying Notes to Financial Statements which are an integral part of the financial statements.
Invesco S&P SmallCap Financials ETF (PSCF)–(continued)
August 31, 2020
Notes to Schedule of Investments:
| (a) | Industry and/or sector classifications used in this report are generally according to the Global Industry Classification Standard, which was developed by and is the exclusive property and a service mark of MSCI Inc. and Standard & Poor’s. |
| (b) | Non-income producing security. |
| (c) | All or a portion of this security was out on loan at August 31, 2020. |
| (d) | Affiliated issuer. The issuer and/or the Fund is a wholly-owned subsidiary of Invesco Ltd., or is affiliated by having an investment adviser that is under common control of Invesco Ltd. The table below shows the Fund’s transactions in, and earnings from, its investments in affiliates for the fiscal year ended August 31, 2020. |
| | | | | | | | | | | | | | | | | | | | | | | | | | | | |
| | | Value
August 31, 2019 | | | Purchases
at Cost | | | Proceeds
from Sales | | | Change in
Unrealized
Appreciation
(Depreciation) | | | Realized
Gain
(Loss) | | | Value
August 31, 2020 | | | Dividend
Income | |
| Invesco Mortgage Capital, Inc. | | $ | 1,486,407 | | | $ | 352,758 | | | $ | (1,393,637 | ) | | $ | (110,509 | ) | | $ | (248,910 | ) | | $ | 86,109 | | | $ | 83,622 | |
| Investments in Affiliated Money Market Funds: | | | | | | | | | | | | | | | | | | | | | | | | | | | | |
| Invesco Premier U.S. Government Money Portfolio, Institutional Class | | | 87,739 | | | | 5,488,949 | | | | (5,564,265 | ) | | | - | | | | - | | | | 12,423 | | | | 1,507 | |
| Investments Purchased with Cash Collateral from Securities on Loan: | | | | | | | | | | | | | | | | | | | | | | | | | | | | |
| Invesco Government & Agency Portfolio, Institutional Class | | | 3,127,354 | | | | 17,058,979 | | | | (20,186,333 | ) | | | - | | | | - | | | | - | | | | 23,633* | |
| Invesco Liquid Assets Portfolio, Institutional Class | | | 1,163,251 | | | | 5,050,542 | | | | (6,213,628 | ) | | | - | | | | (165 | ) | | | - | | | | 8,831* | |
| Invesco Private Government Fund | | | - | | | | 6,191,307 | | | | (5,378,931 | ) | | | - | | | | - | | | | 812,376 | | | | 125* | |
| Invesco Private Prime Fund | | | - | | | | 1,178,131 | | | | (907,371 | ) | | | - | | | | 38 | | | | 270,798 | | | | 80* | |
| | | | | | | | | | | | | | | | | | | | | | | | | | | | |
Total | | $ | 5,864,751 | | | $ | 35,320,666 | | | $ | (39,644,165 | ) | | $ | (110,509 | ) | | $ | (249,037 | ) | | $ | 1,181,706 | | | $ | 117,798 | |
| | | | | | | | | | | | | | | | | | | | | | | | | | | | |
| * | Represents the income earned on the investment of cash collateral, which is included in securities lending income on the Statements of Operations. Does not include rebates and fees paid to lending agent or premiums received from borrowers, if any. |
| (e) | The rate shown is the 7-day SEC standardized yield as of August 31, 2020. |
| (f) | The security has been segregated to satisfy the commitment to return the cash collateral received in securities lending transactions upon the borrower’s return of the securities loaned. See Note 2J. |
See accompanying Notes to Financial Statements which are an integral part of the financial statements.
Invesco S&P SmallCap Health Care ETF (PSCH)
August 31, 2020
Schedule of Investments(a)
| | | | | | | | |
| | | Shares | | | Value | |
Common Stocks & Other Equity Interests-100.02% | |
Biotechnology-17.28% | | | | | | | | |
Anika Therapeutics, Inc.(b) | | | 61,200 | | | $ | 2,345,796 | |
Coherus Biosciences, Inc.(b)(c) | | | 262,800 | | | | 4,985,316 | |
Cytokinetics, Inc.(b)(c) | | | 286,550 | | | | 6,865,738 | |
Eagle Pharmaceuticals, Inc.(b) | | | 43,640 | | | | 1,731,635 | |
Enanta Pharmaceuticals, Inc.(b) | | | 69,823 | | | | 3,644,063 | |
Momenta Pharmaceuticals, Inc.(b) | | | 505,626 | | | | 26,378,509 | |
Myriad Genetics, Inc.(b) | | | 321,276 | | | | 4,295,460 | |
REGENXBIO, Inc.(b) | | | 136,408 | | | | 4,163,172 | |
Spectrum Pharmaceuticals, Inc.(b) | | | 494,697 | | | | 2,082,674 | |
Vanda Pharmaceuticals, Inc.(b) | | | 233,746 | | | | 2,405,246 | |
Xencor, Inc.(b) | | | 212,896 | | | | 7,611,032 | |
| | | | | | | | |
| | | | | | | 66,508,641 | |
| | | | | | | | |
Health Care Equipment & Supplies-27.56% | | | | | |
AngioDynamics, Inc.(b) | | | 162,436 | | | | 1,521,213 | |
Cardiovascular Systems, Inc.(b) | | | 152,004 | | | | 4,965,971 | |
CONMED Corp. | | | 122,506 | | | | 10,573,493 | |
CryoLife, Inc.(b) | | | 162,631 | | | | 3,288,399 | |
Cutera, Inc.(b) | | | 75,253 | | | | 1,231,892 | |
Glaukos Corp.(b)(c) | | | 170,864 | | | | 8,172,425 | |
Heska Corp.(b) | | | 36,425 | | | | 3,773,630 | |
Inogen, Inc.(b) | | | 78,858 | | | | 2,383,877 | |
Integer Holdings Corp.(b) | | | 140,953 | | | | 9,762,405 | |
Invacare Corp. | | | 148,320 | | | | 1,005,610 | |
Lantheus Holdings, Inc.(b) | | | 284,577 | | | | 3,819,023 | |
LeMaitre Vascular, Inc. | | | 71,305 | | | | 2,301,725 | |
Meridian Bioscience, Inc.(b) | | | 184,579 | | | | 2,609,947 | |
Merit Medical Systems, Inc.(b) | | | 237,824 | | | | 11,677,158 | |
Mesa Laboratories, Inc. | | | 17,431 | | | | 4,286,632 | |
Natus Medical, Inc.(b) | | | 145,662 | | | | 2,645,222 | |
Neogen Corp.(b) | | | 227,289 | | | | 17,319,422 | |
OraSure Technologies, Inc.(b) | | | 305,443 | | | | 3,579,792 | |
Orthofix Medical, Inc.(b) | | | 82,750 | | | | 2,510,635 | |
SurModics, Inc.(b) | | | 58,640 | | | | 2,653,460 | |
Tactile Systems Technology, Inc.(b) | | | 82,880 | | | | 3,185,078 | |
Varex Imaging Corp.(b) | | | 168,491 | | | | 1,868,565 | |
Zynex, Inc.(b)(c) | | | 65,798 | | | | 973,810 | |
| | | | | | | | |
| | | | | | | 106,109,384 | |
| | | | | | | | |
Health Care Providers & Services-24.61% | | | | | |
Addus HomeCare Corp.(b) | | | 58,044 | | | | 5,436,401 | |
AMN Healthcare Services, Inc.(b) | | | 201,726 | | | | 10,860,928 | |
BioTelemetry, Inc.(b) | | | 146,476 | | | | 5,797,520 | |
Community Health Systems, Inc.(b) | | | 515,665 | | | | 2,665,988 | |
CorVel Corp.(b) | | | 37,942 | | | | 3,149,945 | |
Covetrus, Inc.(b) | | | 417,995 | | | | 9,576,265 | |
Cross Country Healthcare, Inc.(b) | | | 161,429 | | | | 1,031,531 | |
Ensign Group, Inc. (The) | | | 216,637 | | | | 12,681,930 | |
Hanger, Inc.(b) | | | 162,859 | | | | 3,218,094 | |
Magellan Health, Inc.(b) | | | 95,395 | | | | 7,198,507 | |
Owens & Minor, Inc. | | | 271,517 | | | | 4,501,752 | |
Pennant Group, Inc. (The)(b) | | | 113,051 | | | | 4,187,409 | |
Providence Service Corp. (The)(b) | | | 49,306 | | | | 4,565,243 | |
RadNet, Inc.(b) | | | 180,264 | | | | 2,599,407 | |
| | | | | | | | |
| | | Shares | | | Value | |
Health Care Providers & Services-(continued) | | | | | |
Select Medical Holdings Corp.(b) | | | 461,272 | | | $ | 9,257,729 | |
Tivity Health, Inc.(b)(c) | | | 188,044 | | | | 3,076,400 | |
US Physical Therapy, Inc. | | | 55,348 | | | | 4,920,437 | |
| | | | | | | | |
| | | | | | | 94,725,486 | |
| | | | | | | | |
Health Care Technology-11.21% | | | | | | | | |
Allscripts Healthcare Solutions, Inc.(b) | | | 696,942 | | | | 6,223,692 | |
Computer Programs & Systems, Inc. | | | 54,406 | | | | 1,488,548 | |
HealthStream, Inc.(b) | | | 108,931 | | | | 2,256,506 | |
HMS Holdings Corp.(b) | | | 379,715 | | | | 10,590,251 | |
NextGen Healthcare, Inc.(b) | | | 210,799 | | | | 2,795,195 | |
Omnicell, Inc.(b) | | | 183,045 | | | | 12,205,441 | |
Simulations Plus, Inc. | | | 52,831 | | | | 3,147,671 | |
Tabula Rasa HealthCare, Inc.(b)(c) | | | 87,850 | | | | 4,445,210 | |
| | | | | | | | |
| | | | | | | 43,152,514 | |
| | | | | | | | |
Life Sciences Tools & Services-9.93% | | | | | | | | |
Luminex Corp. | | | 182,765 | | | | 4,877,998 | |
Medpace Holdings, Inc.(b) | | | 115,477 | | | | 14,987,760 | |
NeoGenomics, Inc.(b) | | | 471,668 | | | | 18,371,468 | |
| | | | | | | | |
| | | | | | | 38,237,226 | |
| | | | | | | | |
Pharmaceuticals-9.43% | | | | | | | | |
AMAG Pharmaceuticals, Inc.(b)(c) | | | 147,691 | | | | 1,530,079 | |
Amphastar Pharmaceuticals, Inc.(b) | | | 145,327 | | | | 2,961,764 | |
ANI Pharmaceuticals, Inc.(b) | | | 40,913 | | | | 1,283,032 | |
Corcept Therapeutics, Inc.(b) | | | 442,759 | | | | 5,623,039 | |
Endo International PLC(b) | | | 880,971 | | | | 2,651,723 | |
Innoviva, Inc.(b) | | | 288,165 | | | | 3,374,412 | |
Lannett Co., Inc.(b) | | | 144,323 | | | | 759,139 | |
Pacira BioSciences, Inc.(b) | | | 180,856 | | | | 11,307,117 | |
Phibro Animal Health Corp., Class A | | | 87,427 | | | | 1,876,183 | |
Supernus Pharmaceuticals, Inc.(b) | | | 225,348 | | | | 4,955,403 | |
| | | | | | | | |
| | | | | | | 36,321,891 | |
| | | | | | | | |
TOTAL INVESTMENTS IN SECURITIES
(excluding investments purchased with cash collateral from securities on loan)-100.02%
(Cost $443,928,316) | | | | 385,055,142 | |
| | | | | | | | |
| |
| Investments Purchased with Cash Collateral from Securities on Loan | | | | | |
| | |
Money Market Funds-4.97% | | | | | | | | |
Invesco Private Government Fund, 0.03%(d)(e)(f) | | | 14,338,219 | | | | 14,338,219 | |
Invesco Private Prime Fund, 0.14%(d)(e)(f) | | | 4,778,540 | | | | 4,779,495 | |
| | | | | | | | |
Total Investments Purchased with Cash Collateral from Securities on Loan
(Cost $19,117,714) | | | | 19,117,714 | |
| | | | | | | | |
TOTAL INVESTMENTS IN SECURITIES-104.99%
(Cost $463,046,030) | | | | 404,172,856 | |
OTHER ASSETS LESS LIABILITIES-(4.99)% | | | | (19,215,428 | ) |
| | | | | | | | |
NET ASSETS-100.00% | | | $ | 384,957,428 | |
| | | | | | | | |
See accompanying Notes to Financial Statements which are an integral part of the financial statements.
Invesco S&P SmallCap Health Care ETF (PSCH)–(continued)
August 31, 2020
Notes to Schedule of Investments:
| (a) | Industry and/or sector classifications used in this report are generally according to the Global Industry Classification Standard, which was developed by and is the exclusive property and a service mark of MSCI Inc. and Standard & Poor’s. |
| (b) | Non-income producing security. |
| (c) | All or a portion of this security was out on loan at August 31, 2020. |
| (d) | Affiliated issuer. The issuer and/or the Fund is a wholly-owned subsidiary of Invesco Ltd., or is affiliated by having an investment adviser that is under common control of Invesco Ltd. The table below shows the Fund’s transactions in, and earnings from, its investments in affiliates for the fiscal year ended August 31, 2020. |
| | | | | | | | | | | | | | | | | | | | | | | | | | | | |
| | | Value
August 31, 2019 | | | Purchases
at Cost | | | Proceeds
from Sales | | | Change in
Unrealized
Appreciation | | | Realized
Gain
(Loss) | | | Value
August 31, 2020 | | | Dividend
Income | |
| | | | | | | |
| Investments in Affiliated Money Market Funds: | | | | | | | | | | | | | | | | | | | | | | | | | | | | |
| | | | | | | |
| Invesco Premier U.S. Government Money Portfolio, Institutional Class | | | $ - | | | | $ 47,040,844 | | | | $ (47,040,844) | | | | $- | | | | $ - | | | | $ - | | | | $ 11,075 | |
| | | | | | | |
| Investments Purchased with Cash Collateral from Securities on Loan: | | | | | | | | | | | | | | | | | | | | | | | | | | | | |
| | | | | | | |
| Invesco Government & Agency Portfolio, Institutional Class | | | 9,247,252 | | | | 119,189,080 | | | | (128,436,332) | | | | - | | | | - | | | | - | | | | 137,207 | * |
| | | | | | | |
| Invesco Liquid Assets Portfolio, Institutional Class | | | 3,103,587 | | | | 37,405,309 | | | | (40,507,636) | | | | - | | | | (1,260) | | | | - | | | | 51,035 | * |
| | | | | | | |
| Invesco Private Government Fund | | | - | | | | 60,625,639 | | | | (46,287,420) | | | | - | | | | - | | | | 14,338,219 | | | | 1,673 | * |
| | | | | | | |
| Invesco Private Prime Fund | | | - | | | | 13,365,798 | | | | (8,586,583) | | | | - | | | | 280 | | | | 4,779,495 | | | | 1,204 | * |
| | | | | | | | | | | | | | | | | | | | | | | | | | | | |
| | | | | | | |
Total | | | $ 12,350,839 | | | | $ 277,626,670 | | | | $ (270,858,815) | | | | $- | | | | $ (980) | | | | $ 19,117,714 | | | | $202,194 | |
| | | | | | | | | | | | | | | | | | | | | | | | | | | | |
| * | Represents the income earned on the investment of cash collateral, which is included in securities lending income on the Statements of Operations. Does not include rebates and fees paid to lending agent or premiums received from borrowers, if any. |
| (e) | The rate shown is the 7-day SEC standardized yield as of August 31, 2020. |
| (f) | The security has been segregated to satisfy the commitment to return the cash collateral received in securities lending transactions upon the borrower’s return of the securities loaned. See Note 2J. |
See accompanying Notes to Financial Statements which are an integral part of the financial statements.
Invesco S&P SmallCap Industrials ETF (PSCI)
August 31, 2020
Schedule of Investments(a)
| | | | | | | | |
| | | Shares | | | Value | |
Common Stocks & Other Equity Interests-99.91% | |
Aerospace & Defense-8.52% | | | | | | | | |
AAR Corp. | | | 11,894 | | | $ | 240,021 | |
Aerojet Rocketdyne Holdings, Inc.(b) | | | 26,013 | | | | 1,076,158 | |
AeroVironment, Inc.(b) | | | 7,784 | | | | 594,620 | |
Cubic Corp. | | | 11,282 | | | | 531,157 | |
Kaman Corp. | | | 9,965 | | | | 460,881 | |
Moog, Inc., Class A | | | 10,816 | | | | 652,097 | |
National Presto Industries, Inc. | | | 1,821 | | | | 163,762 | |
Park Aerospace Corp. | | | 7,027 | | | | 77,929 | |
Triumph Group, Inc. | | | 18,689 | | | | 135,121 | |
| | | | | | | | |
| | | | | | | 3,931,746 | |
| | | | | | | | |
Air Freight & Logistics-4.41% | | | | | | | | |
Atlas Air Worldwide Holdings, Inc.(b) | | | 9,418 | | | | 531,081 | |
Echo Global Logistics, Inc.(b) | | | 9,593 | | | | 262,081 | |
Forward Air Corp. | | | 10,083 | | | | 594,796 | |
Hub Group, Inc., Class A(b) | | | 12,085 | | | | 650,656 | |
| | | | | | | | |
| | | | | | | 2,038,614 | |
| | | | | | | | |
Airlines-3.12% | | | | | | | | |
Allegiant Travel Co. | | | 4,730 | | | | 608,278 | |
Hawaiian Holdings, Inc. | | | 16,563 | | | | 222,607 | |
SkyWest, Inc. | | | 18,073 | | | | 608,156 | |
| | | | | | | | |
| | | | | | | 1,439,041 | |
| | | | | | | | |
Building Products-15.39% | | | | | | | | |
AAON, Inc. | | | 14,669 | | | | 835,106 | |
American Woodmark Corp.(b) | | | 5,613 | | | | 491,138 | |
Apogee Enterprises, Inc. | | | 9,488 | | | | 198,584 | |
Gibraltar Industries, Inc.(b) | | | 11,681 | | | | 729,420 | |
Griffon Corp. | | | 18,391 | | | | 399,636 | |
Insteel Industries, Inc. | | | 6,595 | | | | 121,612 | |
Patrick Industries, Inc. | | | 7,964 | | | | 447,657 | |
PGT Innovations, Inc.(b) | | | 21,240 | | | | 385,081 | |
Quanex Building Products Corp. | | | 11,825 | | | | 198,778 | |
Resideo Technologies, Inc.(b) | | | 44,390 | | | | 593,050 | |
Simpson Manufacturing Co., Inc. | | | 14,242 | | | | 1,400,558 | |
UFP Industries, Inc. | | | 22,008 | | | | 1,306,175 | |
| | | | | | | | |
| | | | | | | 7,106,795 | |
| | | | | | | | |
Commercial Services & Supplies-10.77% | | | | | | | | |
ABM Industries, Inc. | | | 24,012 | | | | 915,818 | |
Brady Corp., Class A | | | 17,426 | | | | 817,105 | |
Deluxe Corp. | | | 15,078 | | | | 428,215 | |
Harsco Corp.(b) | | | 28,434 | | | | 402,341 | |
Interface, Inc. | | | 21,079 | | | | 159,357 | |
Matthews International Corp., Class A | | | 11,271 | | | | 246,835 | |
Pitney Bowes, Inc. | | | 62,225 | | | | 341,615 | |
RR Donnelley & Sons Co. | | | 25,701 | | | | 33,926 | |
Team, Inc.(b) | | | 11,041 | | | | 70,331 | |
UniFirst Corp. | | | 5,490 | | | | 1,057,484 | |
US Ecology, Inc. | | | 9,198 | | | | 341,522 | |
Viad Corp. | | | 7,347 | | | | 157,446 | |
| | | | | | | | |
| | | | | | | 4,971,995 | |
| | | | | | | | |
Construction & Engineering-4.75% | | | | | | | | |
Aegion Corp.(b) | | | 11,060 | | | | 179,006 | |
Arcosa, Inc. | | | 17,346 | | | | 802,946 | |
Comfort Systems USA, Inc. | | | 13,120 | | | | 664,791 | |
| | | | | | | | |
| | | Shares | | | Value | |
Construction & Engineering-(continued) | | | | | |
Granite Construction, Inc. | | | 16,847 | | | $ | 313,186 | |
MYR Group, Inc.(b) | | | 6,015 | | | | 233,442 | |
| | | | | | | | |
| | | | | | | 2,193,371 | |
| | | | | | | | |
Electrical Equipment-2.98% | | | | | | | | |
AZZ, Inc. | | | 9,430 | | | | 327,504 | |
Encore Wire Corp. | | | 7,409 | | | | 382,379 | |
Powell Industries, Inc. | | | 3,181 | | | | 85,855 | |
Vicor Corp.(b) | | | 6,667 | | | | 580,229 | |
| | | | | | | | |
| | | | | | | 1,375,967 | |
| | | | | | | | |
Industrial Conglomerates-0.69% | | | | | | | | |
Raven Industries, Inc. | | | 12,918 | | | | 321,012 | |
| | | | | | | | |
Machinery-32.57% | | | | | | | | |
Alamo Group, Inc. | | | 3,505 | | | | 388,704 | |
Albany International Corp., Class A | | | 11,065 | | | | 574,273 | |
Astec Industries, Inc. | | | 8,142 | | | | 429,246 | |
Barnes Group, Inc. | | | 17,092 | | | | 676,843 | |
Chart Industries, Inc.(b) | | | 12,720 | | | | 835,958 | |
CIRCOR International, Inc.(b) | | | 7,206 | | | | 213,658 | |
Enerpac Tool Group Corp. | | | 19,167 | | | | 398,674 | |
EnPro Industries, Inc. | | | 7,394 | | | | 432,697 | |
ESCO Technologies, Inc. | | | 9,411 | | | | 846,237 | |
Federal Signal Corp. | | | 21,715 | | | | 697,486 | |
Franklin Electric Co., Inc. | | | 13,788 | | | | 818,456 | |
Greenbrier Cos., Inc. (The) | | | 11,775 | | | | 320,162 | |
Hillenbrand, Inc. | | | 26,891 | | | | 852,714 | |
John Bean Technologies Corp. | | | 11,405 | | | | 1,169,126 | |
Lindsay Corp. | | | 3,906 | | | | 390,327 | |
Lydall, Inc.(b) | | | 6,379 | | | | 119,798 | |
Meritor, Inc.(b) | | | 26,045 | | | | 592,784 | |
Mueller Industries, Inc. | | | 20,464 | | | | 607,781 | |
Proto Labs, Inc.(b) | | | 9,585 | | | | 1,408,995 | |
SPX Corp.(b) | | | 16,030 | | | | 670,535 | |
SPX FLOW, Inc.(b) | | | 15,373 | | | | 668,418 | |
Standex International Corp. | | | 4,474 | | | | 258,776 | |
Tennant Co. | | | 6,648 | | | | 441,893 | |
Titan International, Inc. | | | 18,131 | | | | 43,152 | |
Wabash National Corp. | | | 19,051 | | | | 232,613 | |
Watts Water Technologies, Inc., Class A | | | 9,894 | | | | 947,350 | |
| | | | | | | | |
| | | | | | | 15,036,656 | |
| | | | | | | | |
Marine-1.35% | | | | | | | | |
Matson, Inc. | | | 15,514 | | | | 621,646 | |
| | | | | | | | |
Professional Services-6.43% | | | | | | | | |
Exponent, Inc. | | | 18,565 | | | | 1,493,647 | |
Forrester Research, Inc.(b) | | | 3,854 | | | | 136,663 | |
Heidrick & Struggles International, Inc. | | | 6,947 | | | | 150,264 | |
Kelly Services, Inc., Class A | | | 12,011 | | | | 228,089 | |
Korn Ferry | | | 19,840 | | | | 605,120 | |
Resources Connection, Inc. | | | 10,891 | | | | 133,850 | |
TrueBlue, Inc.(b) | | | 13,022 | | | | 220,332 | |
| | | | | | | | |
| | | | | | | 2,967,965 | |
| | | | | | | | |
Road & Rail-4.97% | | | | | | | | |
ArcBest Corp. | | | 9,105 | | | | 307,931 | |
Heartland Express, Inc. | | | 16,715 | | | | 345,750 | |
See accompanying Notes to Financial Statements which are an integral part of the financial statements.
Invesco S&P SmallCap Industrials ETF (PSCI)–(continued)
August 31, 2020
| | | | | | | | |
| | | Shares | | | Value | |
Road & Rail-(continued) | | | | | | | | |
Marten Transport Ltd. | | | 21,059 | | | $ | 382,431 | |
Saia, Inc.(b) | | | 9,388 | | | | 1,259,870 | |
| | | | | | | | |
| | | | | | | 2,295,982 | |
| | | | | | | | |
Trading Companies & Distributors-3.96% | | | | | | | | |
Applied Industrial Technologies, Inc. | | | 13,988 | | | | 842,218 | |
DXP Enterprises, Inc.(b) | | | 5,813 | | | | 111,842 | |
Foundation Building Materials, Inc.(b) | | | 6,385 | | | | 103,629 | |
GMS, Inc.(b) | | | 15,256 | | | | 404,131 | |
NOW, Inc.(b) | | | 39,400 | | | | 286,438 | |
Veritiv Corp.(b) | | | 4,519 | | | | 78,540 | |
| | | | | | | | |
| | | | | | | 1,826,798 | |
| | | | | | | | |
Total Common Stocks & Other Equity Interests
(Cost $50,144,061) | | | | 46,127,588 | |
| | | | | | | | |
| | | | | | | | |
| | | Shares | | | Value | |
Money Market Funds-0.04% | | | | | | | | |
Invesco Premier U.S. Government Money Portfolio, Institutional Class, 0.01%(c)(d)
(Cost $17,286) | | | 17,286 | | | $ | 17,286 | |
| | | | | | | | |
TOTAL INVESTMENTS IN SECURITIES-99.95%
(Cost $50,161,347) | | | | 46,144,874 | |
OTHER ASSETS LESS LIABILITIES-0.05% | | | | | | | 22,916 | |
| | | | | | | | |
NET ASSETS-100.00% | | | | | | $ | 46,167,790 | |
| | | | | | | | |
Notes to Schedule of Investments:
| (a) | Industry and/or sector classifications used in this report are generally according to the Global Industry Classification Standard, which was developed by and is the exclusive property and a service mark of MSCI Inc. and Standard & Poor’s. |
| (b) | Non-income producing security. |
| (c) | Affiliated issuer. The issuer and/or the Fund is a wholly-owned subsidiary of Invesco Ltd., or is affiliated by having an investment adviser that is under common control of Invesco Ltd. The table below shows the Fund’s transactions in, and earnings from, its investments in affiliates for the fiscal year ended August 31, 2020. |
| | | | | | | | | | | | | | | | | | | | | | | | | | | | |
| | | Value
August 31, 2019 | | | Purchases
at Cost | | | Proceeds
from Sales | | | Change in
Unrealized
Appreciation | | | Realized
Gain | | | Value
August 31, 2020 | | | Dividend
Income | |
| Investments in Affiliated Money Market Funds: | | | | | | | | | | | | | | | | | | | | | | | | | | | | |
| Invesco Premier U.S. Government Money Portfolio, Institutional Class | | | $ 874,278 | | | | $ 640,155 | | | | $ (1,497,147) | | | | $- | | | | $ - | | | | $17,286 | | | | $ 269 | |
| Investments Purchased with Cash Collateral from Securities on Loan: | | | | | | | | | | | | | | | | | | | | | | | | | | | | |
| Invesco Government & Agency Portfolio, Institutional Class | | | 152,184 | | | | 5,841,808 | | | | (5,993,992) | | | | - | | | | - | | | | - | | | | 3,999 | * |
| Invesco Liquid Assets Portfolio, Institutional Class | | | 50,728 | | | | 1,755,700 | | | | (1,806,490) | | | | - | | | | 62 | | | | - | | | | 1,478 | * |
| Invesco Private Government Fund | | | - | | | | 2,888,039 | | | | (2,888,039) | | | | - | | | | - | | | | - | | | | 16 | * |
| Invesco Private Prime Fund | | | - | | | | 95,326 | | | | (95,327) | | | | - | | | | 1 | | | | - | | | | 1 | * |
| | | | | | | | | | | | | | | | | | | | | | | | | | | | |
Total | | | $1,077,190 | | | | $11,221,028 | | | | $(12,280,995) | | | | $- | | | | $63 | | | | $17,286 | | | | $5,763 | |
| | | | | | | | | | | | | | | | | | | | | | | | | | | | |
| * | Represents the income earned on the investment of cash collateral, which is included in securities lending income on the Statements of Operations. Does not include rebates and fees paid to lending agent or premiums received from borrowers, if any. |
| (d) | The rate shown is the 7-day SEC standardized yield as of August 31, 2020. |
See accompanying Notes to Financial Statements which are an integral part of the financial statements.
Invesco S&P SmallCap Information Technology ETF (PSCT)
August 31, 2020
Schedule of Investments(a)
| | | | | | | | |
| | | Shares | | | Value | |
Common Stocks & Other Equity Interests-99.99% | |
Communications Equipment-7.80% | | | | | | | | |
ADTRAN, Inc. | | | 123,988 | | | $ | 1,375,027 | |
Applied Optoelectronics, Inc.(b)(c) | | | 49,957 | | | | 581,000 | |
CalAmp Corp.(b) | | | 88,838 | | | | 725,806 | |
Comtech Telecommunications Corp. | | | 63,941 | | | | 1,061,421 | |
Digi International, Inc.(b) | | | 74,859 | | | | 1,019,580 | |
Extreme Networks, Inc.(b) | | | 310,784 | | | | 1,358,126 | |
Harmonic, Inc.(b) | | | 249,692 | | | | 1,473,183 | |
NETGEAR, Inc.(b) | | | 76,393 | | | | 2,547,706 | |
Plantronics, Inc. | | | 86,249 | | | | 1,066,038 | |
Viavi Solutions, Inc.(b) | | | 589,386 | | | | 7,859,462 | |
| | | | | | | | |
| | | | | | | 19,067,349 | |
| | | | | | | | |
Electronic Equipment, Instruments & Components-26.82% | |
Arlo Technologies, Inc.(b) | | | 201,725 | | | | 1,155,884 | |
Badger Meter, Inc. | | | 75,277 | | | | 4,643,838 | |
Bel Fuse, Inc., Class B | | | 26,165 | | | | 314,503 | |
Benchmark Electronics, Inc. | | | 94,149 | | | | 1,846,262 | |
CTS Corp. | | | 83,403 | | | | 1,743,123 | |
Daktronics, Inc. | | | 96,726 | | | | 427,529 | |
ePlus, Inc.(b) | | | 34,903 | | | | 2,677,758 | |
Fabrinet (Thailand)(b) | | | 94,939 | | | | 6,624,843 | |
FARO Technologies, Inc.(b) | | | 45,810 | | | | 2,588,265 | |
Insight Enterprises, Inc.(b) | | | 91,170 | | | | 5,452,422 | |
Itron, Inc.(b) | | | 92,409 | | | | 5,504,804 | |
Knowles Corp.(b) | | | 222,425 | | | | 3,349,721 | |
Methode Electronics, Inc. | | | 95,892 | | | | 2,714,703 | |
MTS Systems Corp. | | | 46,251 | | | | 1,128,524 | |
OSI Systems, Inc.(b) | | | 43,305 | | | | 3,410,269 | |
PC Connection, Inc. | | | 28,348 | | | | 1,255,533 | |
Plexus Corp.(b) | | | 75,456 | | | | 5,739,938 | |
Rogers Corp.(b) | | | 48,248 | | | | 5,466,981 | |
Sanmina Corp.(b) | | | 176,340 | | | | 4,990,422 | |
ScanSource, Inc.(b) | | | 65,529 | | | | 1,617,911 | |
TTM Technologies, Inc.(b) | | | 255,448 | | | | 2,927,434 | |
| | | | | | | | |
| | | | | | | 65,580,667 | |
| | | | | | | | |
IT Services-16.28% | | | | | | | | |
Cardtronics PLC, Class A(b) | | | 93,111 | | | | 2,021,440 | |
CSG Systems International, Inc. | | | 85,487 | | | | 3,639,181 | |
EVERTEC, Inc. (Puerto Rico) | | | 154,209 | | | | 5,400,399 | |
ExlService Holdings, Inc.(b) | | | 88,718 | | | | 5,650,449 | |
ManTech International Corp., Class A | | | 69,996 | | | | 5,239,201 | |
NIC, Inc. | | | 173,140 | | | | 3,701,733 | |
Perficient, Inc.(b) | | | 85,528 | | | | 3,670,006 | |
Sykes Enterprises, Inc.(b) | | | 97,387 | | | | 3,223,997 | |
TTEC Holdings, Inc. | | | 45,778 | | | | 2,595,155 | |
Unisys Corp.(b) | | | 135,123 | | | | 1,575,534 | |
Virtusa Corp.(b) | | | 77,903 | | | | 3,080,285 | |
| | | | | | | | |
| | | | | | | 39,797,380 | |
| | | | | | | | |
Semiconductors & Semiconductor Equipment-28.12% | | | | | |
Advanced Energy Industries, Inc.(b) | | | 98,931 | | | | 7,332,766 | |
Axcelis Technologies, Inc.(b) | | | 84,993 | | | | 2,008,385 | |
Brooks Automation, Inc. | | | 190,692 | | | | 9,845,428 | |
CEVA, Inc.(b) | | | 56,889 | | | | 2,403,560 | |
Cohu, Inc. | | | 107,815 | | | | 1,854,418 | |
Diodes, Inc.(b) | | | 107,819 | | | | 5,268,036 | |
DSP Group, Inc.(b) | | | 60,001 | | | | 860,414 | |
| | | | | | | | |
| | | Shares | | | Value | |
Semiconductors & Semiconductor Equipment-(continued) | |
FormFactor, Inc.(b) | | | 196,905 | | | $ | 5,145,128 | |
Ichor Holdings Ltd.(b) | | | 58,966 | | | | 1,483,585 | |
Kulicke & Soffa Industries, Inc. (Singapore) | | | 161,397 | | | | 3,870,300 | |
MaxLinear, Inc.(b) | | | 170,232 | | | | 4,145,149 | |
Onto Innovation, Inc.(b) | | | 123,013 | | | | 3,842,926 | |
PDF Solutions, Inc.(b) | | | 72,887 | | | | 1,508,761 | |
Photronics, Inc.(b) | | | 168,356 | | | | 1,688,611 | |
Power Integrations, Inc. | | | 154,292 | | | | 8,635,723 | |
Rambus, Inc.(b) | | | 292,854 | | | | 3,933,029 | |
SMART Global Holdings, Inc.(b) | | | 35,357 | | | | 890,996 | |
Ultra Clean Holdings, Inc.(b) | | | 103,155 | | | | 2,529,361 | |
Veeco Instruments, Inc.(b) | | | 127,789 | | | | 1,519,411 | |
| | | | | | | | |
| | | | | | | 68,765,987 | |
| | | | | | | | |
Software-19.60% | | | | | | | | |
8x8, Inc.(b) | | | 267,949 | | | | 4,522,979 | |
Agilysys, Inc.(b) | | | 52,029 | | | | 1,319,976 | |
Alarm.com Holdings, Inc.(b) | | | 109,664 | | | | 6,565,584 | |
Bottomline Technologies (DE), Inc.(b) | | | 98,111 | | | | 4,673,027 | |
Ebix, Inc.(c) | | | 57,576 | | | | 1,328,278 | |
LivePerson, Inc.(b) | | | 159,165 | | | | 9,495,784 | |
MicroStrategy, Inc., Class A(b) | | | 19,982 | | | | 2,886,200 | |
OneSpan, Inc.(b) | | | 84,423 | | | | 1,819,315 | |
Progress Software Corp. | | | 115,793 | | | | 4,387,397 | |
SPS Commerce, Inc.(b) | | | 90,301 | | | | 7,213,244 | |
Xperi Holding Corp. | | | 297,343 | | | | 3,725,708 | |
| | | | | | | | |
| | | | | | | 47,937,492 | |
| | | | | | | | |
Technology Hardware, Storage & Peripherals-1.37% | | | | | |
3D Systems Corp.(b)(c) | | | 307,340 | | | | 1,687,296 | |
Diebold Nixdorf, Inc.(b) | | | 200,343 | | | | 1,670,861 | |
| | | | | | | | |
| | | | | | | 3,358,157 | |
| | | | | | | | |
Total Common Stocks & Other Equity Interests
(Cost $240,681,440) | | | | 244,507,032 | |
| | | | | | | | |
| | |
Money Market Funds-0.00% | | | | | | | | |
Invesco Premier U.S. Government Money Portfolio, Institutional Class, 0.01%(d)(e)
(Cost $13,058) | | | 13,058 | | | | 13,058 | |
| | | | | | | | |
TOTAL INVESTMENTS IN SECURITIES (excluding investments purchased with cash collateral from securities on loan)-99.99%
(Cost $240,694,498) | | | | 244,520,090 | |
| | | | | | | | |
|
Investments Purchased with Cash Collateral from Securities on Loan | |
| | |
Money Market Funds-1.54% | | | | | | | | |
Invesco Private Government Fund, 0.03%(d)(e)(f) | | | 2,815,934 | | | | 2,815,934 | |
See accompanying Notes to Financial Statements which are an integral part of the financial statements.
Invesco S&P SmallCap Information Technology ETF (PSCT)–(continued)
August 31, 2020
| | | | | | | | |
| | | Shares | | | Value | |
Money Market Funds-(continued) | |
Invesco Private Prime Fund, 0.14%(d)(e)(f) | | | 938,482 | | | $ | 938,669 | |
| | | | | | | | |
Total Investments Purchased with Cash Collateral from Securities on Loan
(Cost $3,754,603) | | | | 3,754,603 | |
| | | | | | | | |
TOTAL INVESTMENTS IN SECURITIES-101.53%
(Cost $244,449,101) | | | | 248,274,693 | |
OTHER ASSETS LESS LIABILITIES-(1.53)% | | | | (3,733,318 | ) |
| | | | | | | | |
NET ASSETS-100.00% | | | $ | 244,541,375 | |
| | | | | | | | |
Notes to Schedule of Investments:
| (a) | Industry and/or sector classifications used in this report are generally according to the Global Industry Classification Standard, which was developed by and is the exclusive property and a service mark of MSCI Inc. and Standard & Poor’s. |
| (b) | Non-income producing security. |
| (c) | All or a portion of this security was out on loan at August 31, 2020. |
| (d) | Affiliated issuer. The issuer and/or the Fund is a wholly-owned subsidiary of Invesco Ltd., or is affiliated by having an investment adviser that is under common control of Invesco Ltd. The table below shows the Fund’s transactions in, and earnings from, its investments in affiliates for the fiscal year ended August 31, 2020. |
| | | | | | | | | | | | | | | | | | | | | | | | | | | | |
| | | Value
August 31, 2019 | | | Purchases
at Cost | | | Proceeds
from Sales | | | Change in
Unrealized
Appreciation | | | Realized
Gain | | | Value
August 31, 2020 | | | Dividend
Income | |
| Investments in Affiliated Money Market Funds: | | | | | | | | | | | | | | | | | | | | | | | | | | | | |
Invesco Premier U.S. Government | | | | | | | | | | | | | | | | | | | | | | | | | | | | |
Money Portfolio, Institutional Class | | | $ 26,379 | | | | $11,318,348 | | | $ | (11,331,669 | ) | | | $- | | | $ | - | | | | $ 13,058 | | | | $ 804 | |
| Investments Purchased with Cash Collateral from Securities on Loan: | | | | | | | | | | | | | | | | | | | | | | | | | | | | |
| Invesco Government & Agency Portfolio, Institutional Class | | | 3,210,992 | | | | 25,482,777 | | | | (28,693,769 | ) | | | - | | | | - | | | | - | | | | 26,241 | * |
| Invesco Liquid Assets Portfolio, Institutional Class | | | 1,070,331 | | | | 6,911,501 | | | | (7,981,844 | ) | | | - | | | | 12 | | | | - | | | | 9,793 | * |
Invesco Private Government Fund | | | - | | | | 22,467,807 | | | | (19,651,873 | ) | | | - | | | | - | | | | 2,815,934 | | | | 384 | * |
Invesco Private Prime Fund | | | - | | | | 2,879,433 | | | | (1,940,869 | ) | | | - | | | | 105 | | | | 938,669 | | | | 236 | * |
| | | | | | | | | | | | | | | | | | | | | | | | | | | | |
Total | | | $4,307,702 | | | | $69,059,866 | | | $ | (69,600,024 | ) | | | $- | | | $ | 117 | | | | $3,767,661 | | | | $37,458 | |
| | | | | | | | | | | | | | | | | | | | | | | | | | | | |
| * | Represents the income earned on the investment of cash collateral, which is included in securities lending income on the Statements of Operations. Does not include rebates and fees paid to lending agent or premiums received from borrowers, if any. |
| (e) | The rate shown is the 7-day SEC standardized yield as of August 31, 2020. |
| (f) | The security has been segregated to satisfy the commitment to return the cash collateral received in securities lending transactions upon the borrower’s return of the securities loaned. See Note 2J. |
See accompanying Notes to Financial Statements which are an integral part of the financial statements.
Invesco S&P SmallCap Materials ETF (PSCM)
August 31, 2020
Schedule of Investments(a)
| | | | | | | | |
| | | Shares | | | Value | |
Common Stocks & Other Equity Interests-99.61% | |
Chemicals-55.74% | | | | | | | | |
AdvanSix, Inc.(b) | | | 6,623 | | | $ | 84,311 | |
American Vanguard Corp. | | | 6,279 | | | | 88,848 | |
Balchem Corp. | | | 7,600 | | | | 742,520 | |
Ferro Corp.(b) | | | 19,553 | | | | 243,826 | |
FutureFuel Corp. | | | 6,104 | | | | 73,858 | |
GCP Applied Technologies, Inc.(b) | | | 12,823 | | | | 334,167 | |
H.B. Fuller Co. | | | 12,091 | | | | 582,423 | |
Hawkins, Inc. | | | 2,233 | | | | 112,141 | |
Innospec, Inc. | | | 5,778 | | | | 431,559 | |
Koppers Holdings, Inc.(b) | | | 4,970 | | | | 119,578 | |
Kraton Corp.(b) | | | 7,540 | | | | 105,862 | |
Livent Corp.(b) | | | 34,742 | | | | 294,612 | |
Quaker Chemical Corp. | | | 3,049 | | | | 579,310 | |
Rayonier Advanced Materials, Inc.(b) | | | 11,791 | | | | 37,260 | |
Stepan Co. | | | 4,704 | | | | 542,324 | |
Tredegar Corp. | | | 5,870 | | | | 99,379 | |
Trinseo S.A. | | | 9,090 | | | | 226,432 | |
| | | | | | | | |
| | | | | | | 4,698,410 | |
| | | | | | | | |
Construction Materials-1.19% | | | | | | | | |
US Concrete, Inc.(b) | | | 3,748 | | | | 100,034 | |
| | | | | | | | |
Containers & Packaging-1.54% | | | | | | | | |
Myers Industries, Inc. | | | 8,473 | | | | 129,637 | |
| | | | | | | | |
Metals & Mining-27.28% | | | | | | | | |
Arconic Corp.(b) | | | 20,239 | | | | 450,318 | |
Carpenter Technology Corp. | | | 11,342 | | | | 238,522 | |
Century Aluminum Co.(b) | | | 11,930 | | | | 117,749 | |
Cleveland-Cliffs, Inc.(c) | | | 93,744 | | | | 616,835 | |
Haynes International, Inc. | | | 2,967 | | | | 55,602 | |
Kaiser Aluminum Corp. | | | 3,743 | | | | 240,600 | |
Materion Corp. | | | 4,828 | | | | 263,561 | |
Olympic Steel, Inc. | | | 2,139 | | | | 23,529 | |
| | | | | | | | |
| | | Shares | | | Value | |
Metals & Mining-(continued) | | | | | | | | |
SunCoke Energy, Inc. | | | 19,571 | | | $ | 70,064 | |
TimkenSteel Corp.(b) | | | 9,427 | | | | 35,540 | |
Warrior Met Coal, Inc. | | | 12,126 | | | | 187,589 | |
| | | | | | | | |
| | | | | | | 2,299,909 | |
| | | | | | | | |
Paper & Forest Products-13.86% | | | | | | | | |
Boise Cascade Co. | | | 8,672 | | | | 397,178 | |
Clearwater Paper Corp.(b) | | | 3,925 | | | | 132,116 | |
Mercer International, Inc. (Germany) | | | 9,493 | | | | 79,551 | |
Neenah, Inc. | | | 3,994 | | | | 176,854 | |
PH Glatfelter Co. | | | 10,544 | | | | 158,055 | |
Schweitzer-Mauduit International, Inc., Class A | | | 7,395 | | | | 224,290 | |
| | | | | | | | |
| | | | | | | 1,168,044 | |
| | | | | | | | |
TOTAL INVESTMENTS IN SECURITIES (excluding investments purchased with cash collateral from securities on loan)-99.61%
(Cost $10,374,722) | | | | 8,396,034 | |
| | | | | | | | |
| |
| Investments Purchased with Cash Collateral from Securities on Loan | | | | | |
| | |
Money Market Funds-7.34% | | | | | | | | |
Invesco Private Government Fund, 0.03%(d)(e)(f) | | | 463,942 | | | | 463,942 | |
Invesco Private Prime Fund, 0.14%(d)(e)(f) | | | 154,622 | | | | 154,653 | |
| | | | | | | | |
Total Investments Purchased with Cash Collateral from Securities on Loan
(Cost $618,595) | | | | 618,595 | |
| | | | | | | | |
TOTAL INVESTMENTS IN SECURITIES-106.95%
(Cost $10,993,317) | | | | 9,014,629 | |
OTHER ASSETS LESS LIABILITIES-(6.95)% | | | | (585,942 | ) |
| | | | | | | | |
NET ASSETS-100.00% | | | $ | 8,428,687 | |
| | | | | | | | |
Notes to Schedule of Investments:
| (a) | Industry and/or sector classifications used in this report are generally according to the Global Industry Classification Standard, which was developed by and is the exclusive property and a service mark of MSCI Inc. and Standard & Poor’s. |
| (b) | Non-income producing security. |
| (c) | All or a portion of this security was out on loan at August 31, 2020. |
| (d) | Affiliated issuer. The issuer and/or the Fund is a wholly-owned subsidiary of Invesco Ltd., or is affiliated by having an investment adviser that is under common control of Invesco Ltd. The table below shows the Fund’s transactions in, and earnings from, its investments in affiliates for the fiscal year ended August 31, 2020. |
| | | | | | | | | | | | | | | | | | | | | | | | | | | | |
| | | Value
August 31, 2019 | | | Purchases
at Cost | | | Proceeds
from Sales | | | Change in
Unrealized
Appreciation
(Depreciation) | | | Realized
Gain
(Loss) | | | Value
August 31, 2020 | | | Dividend
Income | |
| Investments in Affiliated Money Market Funds: | | | | | | | | | | | | | | | | | | | | | | | | | | | | |
| Invesco Premier U.S. Government Money Portfolio, Institutional Class | | | $ 201 | | | | $ 528,936 | | | | $ (529,137) | | | | $ - | | | | $ - | | | | $ - | | | | $ 105 | |
See accompanying Notes to Financial Statements which are an integral part of the financial statements.
Invesco S&P SmallCap Materials ETF (PSCM)–(continued)
August 31, 2020
| | | | | | | | | | | | | | | | | | | | | | | | | | | | |
| | | Value
August 31, 2019 | | | Purchases
at Cost | | | Proceeds
from Sales | | | Change in
Unrealized
Appreciation
(Depreciation) | | | Realized
Gain
(Loss) | | | Value
August 31, 2020 | | | Dividend
Income | |
| Investments Purchased with Cash Collateral from Securities on Loan: | | | | | | | | | | | | | | | | | | | | | | | | | | | | |
| Invesco Government & Agency Portfolio, Institutional Class | | | $275,653 | | | | $ 3,187,809 | | | | $ (3,463,462) | | | | $ - | | | | $ - | | | | $ - | | | | $4,431* | |
| Invesco Liquid Assets Portfolio, Institutional Class | | | 91,885 | | | | 814,885 | | | | (906,652) | | | | (2) | | | | (116) | | | | - | | | | 1,677* | |
| Invesco Private Government Fund | | | - | | | | 7,307,897 | | | | (6,843,955) | | | | - | | | | - | | | | 463,942 | | | | 87* | |
| Invesco Private Prime Fund | | | - | | | | 938,667 | | | | (784,035) | | | | - | | | | 21 | | | | 154,653 | | | | 59* | |
| | | | | | | | | | | | | | | | | | | | | | | | | | | | |
| Total | | | $367,739 | | | | $12,778,194 | | | | $(12,527,241) | | | | $(2) | | | | $ (95) | | | | $618,595 | | | | $6,359 | |
| | | | | | | | | | | | | | | | | | | | | | | | | | | | |
| * | Represents the income earned on the investment of cash collateral, which is included in securities lending income on the Statements of Operations. Does not include rebates and fees paid to lending agent or premiums received from borrowers, if any. |
| (e) | The rate shown is the 7-day SEC standardized yield as of August 31, 2020. |
| (f) | The security has been segregated to satisfy the commitment to return the cash collateral received in securities lending transactions upon the borrower’s return of the securities loaned. See Note 2J. |
See accompanying Notes to Financial Statements which are an integral part of the financial statements.
Invesco S&P SmallCap Utilities & Communication Services ETF (PSCU)
August 31, 2020
Schedule of Investments(a)
| | | | | | | | |
| | | Shares | | | Value | |
Common Stocks & Other Equity Interests-99.70% | |
Diversified Telecommunication Services-35.60% | | | | | |
ATN International, Inc. | | | 13,113 | | | $ | 760,554 | |
Cincinnati Bell, Inc.(b) | | | 61,013 | | | | 918,856 | |
Cogent Communications Holdings, Inc. | | | 31,566 | | | | 2,123,129 | |
Consolidated Communications Holdings, Inc.(b) | | | 88,135 | | | | 685,690 | |
Iridium Communications, Inc.(b) | | | 73,605 | | | | 2,061,676 | |
Vonage Holdings Corp.(b) | | | 111,423 | | | | 1,275,794 | |
| | | | | | | | |
| | | | | | | 7,825,699 | |
| | | | | | | | |
Entertainment-6.55% | | | | | | | | |
Glu Mobile, Inc.(b) | | | 126,257 | | | | 1,002,481 | |
Marcus Corp. (The) | | | 27,912 | | | | 437,381 | |
| | | | | | | | |
| | | | | | | 1,439,862 | |
| | | | | | | | |
Gas Utilities-8.63% | | | | | | | | |
Northwest Natural Holding Co. | | | 18,674 | | | | 954,428 | |
South Jersey Industries, Inc. | | | 42,573 | | | | 942,992 | |
| | | | | | | | |
| | | | | | | 1,897,420 | |
| | | | | | | | |
Interactive Media & Services-3.37% | | | | | | | | |
QuinStreet, Inc.(b) | | | 56,420 | | | | 741,923 | |
| | | | | | | | |
Media-16.39% | | | | | | | | |
E.W. Scripps Co. (The), Class A | | | 66,209 | | | | 736,244 | |
Gannett Co., Inc.(c) | | | 159,394 | | | | 275,752 | |
Meredith Corp.(c) | | | 48,633 | | | | 680,862 | |
Scholastic Corp. | | | 36,337 | | | | 817,582 | |
TechTarget, Inc.(b) | | | 27,571 | | | | 1,094,017 | |
| | | | | | | | |
| | | | | | | 3,604,457 | |
| | | | | | | | |
Multi-Utilities-8.49% | | | | | | | | |
Avista Corp. | | | 50,620 | | | | 1,865,853 | |
| | | | | | | | |
Water Utilities-14.39% | | | | | | | | |
American States Water Co. | | | 27,745 | | | | 2,110,840 | |
California Water Service Group | | | 23,218 | | | | 1,052,704 | |
| | | | | | | | |
| | | | | | | 3,163,544 | |
| | | | | | | | |
| | | | | | | | |
| | | Shares | | | Value | |
Wireless Telecommunication Services-6.28% | | | | | |
Shenandoah Telecommunications Co. | | | 20,773 | | | $ | 1,148,747 | |
Spok Holdings, Inc. | | | 21,327 | | | | 231,184 | |
| | | | | | | | |
| | | | | | | 1,379,931 | |
| | | | | | | | |
Total Common Stocks & Other Equity Interests
(Cost $25,188,330) | | | | | | | 21,918,689 | |
| | | | | | | | |
| | |
Money Market Funds-0.05% | | | | | | | | |
Invesco Premier U.S. Government Money Portfolio, Institutional Class, 0.01%(d)(e)
(Cost $11,301) | | | 11,301 | | | | 11,301 | |
| | | | | | | | |
TOTAL INVESTMENTS IN SECURITIES (excluding investments purchased with cash collateral from securities on loan)-99.75%
(Cost $25,199,631) | | | | | | | 21,929,990 | |
| | | | | | | | |
| |
| Investments Purchased with Cash Collateral from Securities on Loan | | | | | |
| | |
Money Market Funds-3.38% | | | | | | | | |
Invesco Private Government Fund, 0.03%(d)(e)(f) | | | 557,235 | | | | 557,235 | |
Invesco Private Prime Fund, 0.14%(d)(e)(f) | | | 185,709 | | | | 185,746 | |
| | | | | | | | |
Total Investments Purchased with Cash Collateral from Securities on Loan
(Cost $742,981) | | | | 742,981 | |
| | | | | | | | |
TOTAL INVESTMENTS IN SECURITIES-103.13%
(Cost $25,942,612) | | | | 22,672,971 | |
OTHER ASSETS LESS LIABILITIES-(3.13)% | | | | (688,286 | ) |
| | | | | | | | |
NET ASSETS-100.00% | | | $ | 21,984,685 | |
| | | | | | | | |
Notes to Schedule of Investments:
| (a) | Industry and/or sector classifications used in this report are generally according to the Global Industry Classification Standard, which was developed by and is the exclusive property and a service mark of MSCI Inc. and Standard & Poor’s. |
| (b) | Non-income producing security. |
| (c) | All or a portion of this security was out on loan at August 31, 2020. |
| (d) | Affiliated issuer. The issuer and/or the Fund is a wholly-owned subsidiary of Invesco Ltd., or is affiliated by having an investment adviser that is under common control of Invesco Ltd. The table below shows the Fund’s transactions in, and earnings from, its investments in affiliates for the fiscal year ended August 31, 2020. |
| | | | | | | | | | | | | | | | | | | | | | | | | | | | |
| | | Value
August 31, 2019 | | | Purchases
at Cost | | �� | Proceeds
from Sales | | | Change in
Unrealized
Appreciation | | | Realized
Gain | | | Value
August 31, 2020 | | | Dividend
Income | |
| Investments in Affiliated Money Market Funds: | | | | | | | | | | | | | | | | | | | | | | | | | | | | |
| Invesco Premier U.S. Government Money Portfolio, Institutional Class | | | $102,756 | | | | $ 5,509,097 | | | | $ (5,600,552) | | | | $- | | | | $ - | | | | $ 11,301 | | | | $ 600 | |
See accompanying Notes to Financial Statements which are an integral part of the financial statements.
Invesco S&P SmallCap Utilities & Communication Services ETF (PSCU)–(continued)
August 31, 2020
| | | | | | | | | | | | | | | | | | | | | | | | | | | | |
| | | Value
August 31, 2019 | | | Purchases
at Cost | | | Proceeds
from Sales | | | Change in
Unrealized
Appreciation | | | Realized
Gain | | | Value
August 31, 2020 | | | Dividend
Income | |
| Investments Purchased with Cash Collateral from Securities on Loan: | | | | | | | | | | | | | | | | | | | | | | | | | | | | |
| Invesco Government & Agency Portfolio, Institutional Class | | | $210,052 | | | | $ 9,592,830 | | | | $ (9,802,882) | | | | $- | | | | $ - | | | | $ - | | | | $ 8,403* | |
| Invesco Liquid Assets Portfolio, Institutional Class | | | 70,010 | | | | 2,863,006 | | | | (2,933,020) | | | | - | | | | 4 | | | | - | | | | 3,092* | |
| Invesco Private Government Fund | | | - | | | | 4,063,675 | | | | (3,506,440) | | | | - | | | | - | | | | 557,235 | | | | 37* | |
| Invesco Private Prime Fund | | | - | | | | 694,342 | | | | (508,606) | | | | - | | | | 10 | | | | 185,746 | | | | 29* | |
| | | | | | | | | | | | | | | | | | | | | | | | | | | | |
| Total | | | $382,818 | | | | $22,722,950 | | | | $(22,351,500) | | | | $- | | | | $14 | | | | $754,282 | | | | $12,161 | |
| | | | | | | | | | | | | | | | | | | | | | | | | | | | |
| * | Represents the income earned on the investment of cash collateral, which is included in securities lending income on the Statements of Operations. Does not include rebates and fees paid to lending agent or premiums received from borrowers, if any. |
| (e) | The rate shown is the 7-day SEC standardized yield as of August 31, 2020. |
| (f) | The security has been segregated to satisfy the commitment to return the cash collateral received in securities lending transactions upon the borrower’s return of the securities loaned. See Note 2J. |
See accompanying Notes to Financial Statements which are an integral part of the financial statements.
(This Page Intentionally Left Blank)
Statements of Assets and Liabilities
August 31, 2020
| | | | | | | | | | | | | | | | |
| | | Invesco
DWA SmallCap
Momentum
ETF (DWAS) | | | Invesco
S&P SmallCap
Consumer
Discretionary
ETF (PSCD) | | | Invesco
S&P SmallCap
Consumer
Staples
ETF (PSCC) | | | Invesco
S&P SmallCap
Energy
ETF (PSCE) | |
Assets: | | | | | | | | | | | | | | | | |
Unaffiliated investments in securities, at value(a) | | $ | 234,320,807 | | | $ | 19,393,616 | | | $ | 39,182,054 | | | $ | 14,709,619 | |
Affiliated investments in securities, at value(a) | | | 25,579,115 | | | | 2,640,123 | | | | 4,103,454 | | | | 932,401 | |
Receivable for: | | | | | | | | | | | | | | | | |
Dividends | | | 16,945 | | | | 4,578 | | | | 6,639 | | | | - | |
Securities lending | | | 65,485 | | | | 1,418 | | | | 3,182 | | | | 5,927 | |
Investments sold | | | - | | | | 1,112,851 | | | | 11,926,333 | | | | 29,334 | |
Investments sold - affiliated broker | | | - | | | | 2,187,963 | | | | - | | | | - | |
| | | | | | | | | | | | | | | | |
Total assets | | | 259,982,352 | | | | 25,340,549 | | | | 55,221,662 | | | | 15,677,281 | |
| | | | | | | | | | | | | | | | |
| | | | |
Liabilities: | | | | | | | | | | | | | | | | |
Due to custodian | | | 8,685 | | | | - | | | | - | | | | - | |
Payable for: | | | | | | | | | | | | | | | | |
Investments purchased | | | - | | | | - | | | | - | | | | 32,194 | |
Collateral upon return of securities loaned | | | 25,483,373 | | | | 2,620,644 | | | | 4,100,335 | | | | 928,608 | |
Fund shares repurchased | | | - | | | | 3,245,181 | | | | 11,926,696 | | | | - | |
Accrued unitary management fees | | | 117,182 | | | | 4,727 | | | | 12,488 | | | | 3,824 | |
| | | | | | | | | | | | | | | | |
Total liabilities | | | 25,609,240 | | | | 5,870,552 | | | | 16,039,519 | | | | 964,626 | |
| | | | | | | | | | | | | | | | |
Net Assets | | $ | 234,373,112 | | | $ | 19,469,997 | | | $ | 39,182,143 | | | $ | 14,712,655 | |
| | | | | | | | | | | | | | | | |
| | | | |
Net assets consist of: | | | | | | | | | | | | | | | | |
Shares of beneficial interest | | $ | 477,315,163 | | | $ | 30,891,380 | | | $ | 54,527,196 | | | $ | 89,119,770 | |
Distributable earnings (loss) | | | (242,942,051 | ) | | | (11,421,383 | ) | | | (15,345,053 | ) | | | (74,407,115 | ) |
| | | | | | | | | | | | | | | | |
Net Assets | | $ | 234,373,112 | | | $ | 19,469,997 | | | $ | 39,182,143 | | | $ | 14,712,655 | |
| | | | | | | | | | | | | | | | |
Shares outstanding (unlimited amount authorized, $0.01 par value) | | | 3,950,000 | | | | 300,000 | | | | 500,000 | | | | 4,200,000 | |
Net asset value | | $ | 59.33 | | | $ | 64.90 | | | $ | 78.36 | | | $ | 3.50 | |
| | | | | | | | | | | | | | | | |
Market price | | $ | 59.39 | | | $ | 64.92 | | | $ | 78.57 | | | $ | 3.52 | |
| | | | | | | | | | | | | | | | |
Unaffiliated investments in securities, at cost | | $ | 189,695,608 | | | $ | 21,644,337 | | | $ | 42,984,823 | | | $ | 22,431,042 | |
| | | | | | | | | | | | | | | | |
Affiliated investments in securities, at cost | | $ | 25,579,116 | | | $ | 2,640,123 | | | $ | 4,103,454 | | | $ | 932,401 | |
| | | | | | | | | | | | | | | | |
(a) Includes securities on loan with an aggregate value of: | | $ | 25,049,500 | | | $ | 2,563,446 | | | $ | 3,982,143 | | | $ | 864,139 | |
| | | | | | | | | | | | | | | | |
See accompanying Notes to Financial Statements which are an integral part of the financial statements.
| | | | | | | | | | | | | | | | | | | | | | | | |
Invesco
S&P SmallCap
Financials
ETF (PSCF) | | | Invesco
S&P SmallCap
Health Care
ETF (PSCH) | | | Invesco
S&P SmallCap
Industrials
ETF (PSCI) | | | Invesco
S&P SmallCap
Information
Technology
ETF (PSCT) | | | Invesco
S&P SmallCap
Materials
ETF (PSCM) | | | Invesco
S&P SmallCap
Utilities &
Communication
Services
ETF (PSCU) | | | |
| | | | | | | | | | | | | | | | | | | | | | | | |
| $ | 26,173,682 | | | $ | 385,055,142 | | | $ | 46,127,588 | | | $ | 244,507,032 | | | $ | 8,396,034 | | | $ | 21,918,689 | | | |
| | 1,181,706 | | | | 19,117,714 | | | | 17,286 | | | | 3,767,661 | | | | 618,595 | | | | 754,282 | | | |
| | | | | | | | | | | | | | | | | | | | | | | | |
| | 34,003 | | | | 9,564 | | | | 32,992 | | | | 82,594 | | | | 12,406 | | | | 60,168 | | | |
| | 1,658 | | | | 4,017 | | | | 2 | | | | 574 | | | | 152 | | | | 105 | | | |
| | 633,916 | | | | - | | | | - | | | | - | | | | - | | | | - | | | |
| | - | | | | - | | | | - | | | | - | | | | 29,353 | | | | - | | | |
| | | | | | | | | | | | | | | | | | | | | | | | |
| | 28,024,965 | | | | 404,186,437 | | | | 46,177,868 | | | | 248,357,861 | | | | 9,056,540 | | | | 22,733,244 | | | |
| | | | | | | | | | | | | | | | | | | | | | | | |
| | | | | | |
| | | | | | | | | | | | | | | | | | | | | | | | |
| | - | | | | 16,939 | | | | - | | | | - | | | | 7,173 | | | | - | | | |
| | | | | | | | | | | | | | | | | | | | | | | | |
| | 638,429 | | | | - | | | | - | | | | - | | | | - | | | | - | | | |
| | 1,083,174 | | | | 19,117,714 | | | | - | | | | 3,754,603 | | | | 618,595 | | | | 742,981 | | | |
| | - | | | | - | | | | - | | | | - | | | | - | | | | - | | | |
| | 6,489 | | | | 94,356 | | | | 10,078 | | | | 61,883 | | | | 2,085 | | | | 5,578 | | | |
| | | | | | | | | | | | | | | | | | | | | | | | |
| | 1,728,092 | | | | 19,229,009 | | | | 10,078 | | | | 3,816,486 | | | | 627,853 | | | | 748,559 | | | |
| | | | | | | | | | | | | | | | | | | | | | | | |
| $ | 26,296,873 | | | $ | 384,957,428 | | | $ | 46,167,790 | | | $ | 244,541,375 | | | $ | 8,428,687 | | | $ | 21,984,685 | | | |
| | | | | | | | | | | | | | | | | | | | | | | | |
| | | | | | |
| | | | | | | | | | | | | | | | | | | | | | | | |
| $ | 39,464,846 | | | $ | 516,799,761 | | | $ | 56,485,255 | | | $ | 259,414,878 | | | $ | 13,920,430 | | | $ | 31,745,103 | | | |
| | (13,167,973 | ) | | | (131,842,333 | ) | | | (10,317,465 | ) | | | (14,873,503 | ) | | | (5,491,743 | ) | | | (9,760,418 | ) | | |
| | | | | | | | | | | | | | | | | | | | | | | | |
| $ | 26,296,873 | | | $ | 384,957,428 | | | $ | 46,167,790 | | | $ | 244,541,375 | | | $ | 8,428,687 | | | $ | 21,984,685 | | | |
| | | | | | | | | | | | | | | | | | | | | | | | |
| | 650,000 | | | | 2,900,000 | | | | 700,000 | | | | 2,700,000 | | | | 200,000 | | | | 450,000 | | | |
| $ | 40.46 | | | $ | 132.74 | | | $ | 65.95 | | | $ | 90.57 | | | $ | 42.14 | | | $ | 48.85 | | | |
| | | | | | | | | | | | | | | | | | | | | | | | |
| $ | 40.54 | | | $ | 132.83 | | | $ | 66.05 | | | $ | 90.67 | | | $ | 41.99 | | | $ | 48.91 | | | |
| | | | | | | | | | | | | | | | | | | | | | | | |
| $ | 34,583,780 | | | $ | 443,928,316 | | | $ | 50,144,061 | | | $ | 240,681,440 | | | $ | 10,374,722 | | | $ | 25,188,330 | | | |
| | | | | | | | | | | | | | | | | | | | | | | | |
| $ | 1,565,083 | | | $ | 19,117,714 | | | $ | 17,286 | | | $ | 3,767,661 | | | $ | 618,595 | | | $ | 754,282 | | | |
| | | | | | | | | | | | | | | | | | | | | | | | |
| $ | 1,030,493 | | | $ | 18,652,636 | | | $ | - | | | $ | 3,533,790 | | | $ | 609,736 | | | $ | 678,644 | | | |
| | | | | | | | | | | | | | | | | | | | | | | | |
Statements of Operations
For the year ended August 31, 2020
| | | | | | | | | | | | | | | | |
| | | Invesco
DWA SmallCap
Momentum
ETF (DWAS) | | | Invesco S&P
SmallCap
Consumer
Discretionary
ETF (PSCD) | | | Invesco
S&P SmallCap
Consumer
Staples
ETF (PSCC) | | | Invesco
S&P SmallCap
Energy
ETF (PSCE) | |
Investment income: | | | | | | | | | | | | | | | | |
Unaffiliated dividend income | | $ | 1,391,626 | | | $ | 238,330 | | | $ | 811,362 | | | $ | 165,421 | |
Affiliated dividend income | | | 4,477 | | | | 227 | | | | 309 | | | | 101 | |
Securities lending income | | | 694,412 | | | | 29,238 | | | | 66,412 | | | | 55,727 | |
Foreign withholding tax | | | (2,053 | ) | | | - | | | | - | | | | (104 | ) |
| | | | | | | | | | | | | | | | |
Total investment income | | | 2,088,462 | | | | 267,795 | | | | 878,083 | | | | 221,145 | |
| | | | | | | | | | | | | | | | |
| | | | |
Expenses: | | | | | | | | | | | | | | | | |
Unitary management fees | | | 1,270,120 | | | | 56,696 | | | | 130,410 | | | | 49,234 | |
| | | | | | | | | | | | | | | | |
Less: Waivers | | | (593 | ) | | | (27 | ) | | | (45 | ) | | | (14 | ) |
| | | | | | | | | | | | | | | | |
Net expenses | | | 1,269,527 | | | | 56,669 | | | | 130,365 | | | | 49,220 | |
| | | | | | | | | | | | | | | | |
Net investment income (loss) | | | 818,935 | | | | 211,126 | | | | 747,718 | | | | 171,925 | |
| | | | | | | | | | | | | | | | |
| | | | |
Realized and unrealized gain (loss) from: | | | | | | | | | | | | | | | | |
Net realized gain (loss) from: | | | | | | | | | | | | | | | | |
Unaffiliated investment securities | | | (57,139,509 | ) | | | (3,864,216 | ) | | | (5,058,359 | ) | | | (20,472,894 | ) |
Affiliated investment securities | | | (946 | ) | | | 11 | | | | (148 | ) | | | (301 | ) |
Unaffiliated in-kind redemptions | | | 56,244,096 | | | | 1,475,251 | | | | 6,232,240 | | | | 1,226,098 | |
Affiliated in-kind redemptions | | | - | | | | - | | | | - | | | | - | |
| | | | | | | | | | | | | | | | |
Net realized gain (loss) | | | (896,359 | ) | | | (2,388,954 | ) | | | 1,173,733 | | | | (19,247,097 | ) |
| | | | | | | | | | | | | | | | |
Change in net unrealized appreciation (depreciation) of: | | | | | | | | | | | | | | | | |
Unaffiliated investment securities | | | 5,778,307 | | | | 5,091,787 | | | | 3,019,613 | | | | 9,081,669 | |
Affiliated investment securities | | | (1 | ) | | | - | | | | - | | | | - | |
| | | | | | | | | | | | | | | | |
Change in net unrealized appreciation (depreciation) | | | 5,778,306 | | | | 5,091,787 | | | | 3,019,613 | | | | 9,081,669 | |
| | | | | | | | | | | | | | | | |
Net realized and unrealized gain (loss) | | | 4,881,947 | | | | 2,702,833 | | | | 4,193,346 | | | | (10,165,428 | ) |
| | | | | | | | | | | | | | | | |
Net increase (decrease) in net assets resulting from operations | | $ | 5,700,882 | | | $ | 2,913,959 | | | $ | 4,941,064 | | | $ | (9,993,503 | ) |
| | | | | | | | | | | | | | | | |
See accompanying Notes to Financial Statements which are an integral part of the financial statements.
| | | | | | | | | | | | | | | | | | | | | | | | |
Invesco
S&P SmallCap
Financials
ETF (PSCF) | | | Invesco
S&P SmallCap
Health Care
ETF (PSCH) | | | Invesco
S&P SmallCap
Industrials
ETF (PSCI) | | | Invesco
S&P SmallCap
Information
Technology
ETF (PSCT) | | | Invesco
S&P SmallCap
Materials ETF
(PSCM) | | | Invesco
S&P SmallCap
Utilities &
Communication
Services
ETF (PSCU) | | | |
| | | | | | | | | | | | | | | | | | | | | | | | |
| $ | 2,312,408 | | | $ | 402,152 | | | $ | 484,852 | | | $ | 1,168,956 | | | $ | 206,179 | | | $ | 684,522 | | | |
| | 85,129 | | | | 11,075 | | | | 269 | | | | 804 | | | | 105 | | | | 600 | | | |
| | 38,833 | | | | 44,606 | | | | 565 | | | | 14,955 | | | | 7,802 | | | | 28,621 | | | |
| | (2,153 | ) | | | - | | | | - | | | | - | | | | (1,284 | ) | | | - | | | |
| | | | | | | | | | | | | | | | | | | | | | | | |
| | 2,434,217 | | | | 457,833 | | | | 485,686 | | | | 1,184,715 | | | | 212,802 | | | | 713,743 | | | |
| | | | | | | | | | | | | | | | | | | | | | | | |
| | | | | | |
| | | | | | | | | | | | | | | | | | | | | | | | |
| | 226,465 | | | | 1,250,954 | | | | 136,738 | | | | 821,640 | | | | 33,006 | | | | 100,076 | | | |
| | | | | | | | | | | | | | | | | | | | | | | | |
| | (189 | ) | | | (1,789 | ) | | | (31 | ) | | | (279 | ) | | | (18 | ) | | | (98 | ) | | |
| | | | | | | | | | | | | | | | | | | | | | | | |
| | 226,276 | | | | 1,249,165 | | | | 136,707 | | | | 821,361 | | | | 32,988 | | | | 99,978 | | | |
| | | | | | | | | | | | | | | | | | | | | | | | |
| | 2,207,941 | | | | (791,332 | ) | | | 348,979 | | | | 363,354 | | | | 179,814 | | | | 613,765 | | | |
| | | | | | | | | | | | | | | | | | | | | | | | |
| | | | | | |
| | | | | | | | | | | | | | | | | | | | | | | | |
| | | | | | | | | | | | | | | | | | | | | | | | |
| | (4,562,314 | ) | | | (45,725,522 | ) | | | (3,345,988 | ) | | | (5,467,872 | ) | | | (1,898,221 | ) | | | (4,808,122 | ) | | |
| | (129,377 | ) | | | (980 | ) | | | 63 | | | | 117 | | | | (95 | ) | | | 14 | | | |
| | 1,931,914 | | | | 51,149,550 | | | | (511,082 | ) | | | 32,719,972 | | | | (1,120,920 | ) | | | 2,775,182 | | | |
| | (119,660 | ) | | | - | | | | - | | | | - | | | | - | | | | - | | | |
| | | | | | | | | | | | | | | | | | | | | | | | |
| | (2,879,437 | ) | | | 5,423,048 | | | | (3,857,007 | ) | | | 27,252,217 | | | | (3,019,236 | ) | | | (2,032,926 | ) | | |
| | | | | | | | | | | | | | | | | | | | | | | | |
| | | | | | | | | | | | | | | | | | | | | | | | |
| | (4,685,863 | ) | | | 42,905,790 | | | | 2,344,318 | | | | (7,922,730 | ) | | | 3,599,601 | | | | (662,580 | ) | | |
| | (110,509 | ) | | | - | | | | - | | | | - | | | | (2 | ) | | | - | | | |
| | | | | | | | | | | | | | | | | | | | | | | | |
| | (4,796,372 | ) | | | 42,905,790 | | | | 2,344,318 | | | | (7,922,730 | ) | | | 3,599,599 | | | | (662,580 | ) | | |
| | | | | | | | | | | | | | | | | | | | | | | | |
| | (7,675,809 | ) | | | 48,328,838 | | | | (1,512,689 | ) | | | 19,329,487 | | | | 580,363 | | | | (2,695,506 | ) | | |
| | | | | | | | | | | | | | | | | | | | | | | | |
| $ | (5,467,868 | ) | | $ | 47,537,506 | | | $ | (1,163,710 | ) | | $ | 19,692,841 | | | $ | 760,177 | | | $ | (2,081,741 | ) | | |
| | | | | | | | | | | | | | | | | | | | | | | | |
Statements of Changes in Net Assets
For the years ended August 31, 2020 and 2019
| | | | | | | | | | | | | | | | |
| | | Invesco DWA SmallCap
Momentum ETF (DWAS) | | | Invesco S&P SmallCap
Consumer Discretionary ETF (PSCD) | |
| | | 2020 | | | 2019 | | | 2020 | | | 2019 | |
Operations: | | | | | | | | | | | | | | | | |
Net investment income (loss) | | $ | 818,935 | | | $ | (85,314 | ) | | $ | 211,126 | | | $ | 600,065 | |
Net realized gain (loss) | | | (896,359 | ) | | | (15,499,347 | ) | | | (2,388,954 | ) | | | 428,508 | |
Change in net unrealized appreciation (depreciation) | | | 5,778,306 | | | | (48,298,523 | ) | | | 5,091,787 | | | | (15,935,546 | ) |
| | | | | | | | | | | | | | | | |
Net increase (decrease) in net assets resulting from operations | | | 5,700,882 | | | | (63,883,184 | ) | | | 2,913,959 | | | | (14,906,973 | ) |
| | | | | | | | | | | | | | | | |
| | | | |
Distributions to Shareholders from: | | | | | | | | | | | | | | | | |
Distributable earnings | | | (729,666 | ) | | | - | | | | (234,072 | ) | | | (792,177 | ) |
| | | | | | | | | | | | | | | | |
| | | | |
Shareholder Transactions: | | | | | | | | | | | | | | | | |
Proceeds from shares sold | | | 280,618,408 | | | | 225,176,675 | | | | 19,431,251 | | | | 13,006,122 | |
Value of shares repurchased | | | (315,226,495 | ) | | | (351,255,273 | ) | | | (25,590,390 | ) | | | (67,075,644 | ) |
| | | | | | | | | | | | | | | | |
Net increase (decrease) in net assets resulting from share transactions | | | (34,608,087 | ) | | | (126,078,598 | ) | | | (6,159,139 | ) | | | (54,069,522 | ) |
| | | | | | | | | | | | | | | | |
Net increase (decrease) in net assets | | | (29,636,871 | ) | | | (189,961,782 | ) | | | (3,479,252 | ) | | | (69,768,672 | ) |
| | | | | | | | | | | | | | | | |
| | | | |
Net assets: | | | | | | | | | | | | | | | | |
Beginning of year | | | 264,009,983 | | | | 453,971,765 | | | | 22,949,249 | | | | 92,717,921 | |
| | | | | | | | | | | | | | | | |
End of year | | $ | 234,373,112 | | | $ | 264,009,983 | | | $ | 19,469,997 | | | $ | 22,949,249 | |
| | | | | | | | | | | | | | | | |
| | | | |
Changes in Shares Outstanding: | | | | | | | | | | | | | | | | |
Shares sold | | | 5,250,000 | | | | 4,200,000 | | | | 350,000 | | | | 200,000 | |
Shares repurchased | | | (6,250,000 | ) | | | (6,900,000 | ) | | | (450,000 | ) | | | (1,100,000 | ) |
Shares outstanding, beginning of year | | | 4,950,000 | | | | 7,650,000 | | | | 400,000 | | | | 1,300,000 | |
| | | | | | | | | | | | | | | | |
Shares outstanding, end of year | | | 3,950,000 | | | | 4,950,000 | | | | 300,000 | | | | 400,000 | |
| | | | | | | | | | | | | | | | |
See accompanying Notes to Financial Statements which are an integral part of the financial statements.
| | | | | | | | | | | | | | | | | | | | | | | | |
Invesco S&P SmallCap
Consumer Staples ETF (PSCC) | | | Invesco S&P SmallCap
Energy ETF (PSCE) | | | Invesco S&P SmallCap
Financials ETF (PSCF) | | | |
| 2020 | | | 2019 | | | 2020 | | | 2019 | | | 2020 | | | 2019 | | | |
| | | | | | | | | | | | | | | | | | | | | | | | |
| $ | 747,718 | | | $ | 1,035,473 | | | $ | 171,925 | | | $ | (66,464 | ) | | $ | 2,207,941 | | | $ | 4,370,364 | | | |
| | 1,173,733 | | | | (1,017,338 | ) | | | (19,247,097 | ) | | | (12,023,404 | ) | | | (2,879,437 | ) | | | 20,891,462 | | | |
| | 3,019,613 | | | | (15,486,237 | ) | | | 9,081,669 | | | | (17,126,028 | ) | | | (4,796,372 | ) | | | (48,340,473 | ) | | |
| | | | | | | | | | | | | | | | | | | | | | | | |
| | 4,941,064 | | | | (15,468,102 | ) | | | (9,993,503 | ) | | | (29,215,896 | ) | | | (5,467,868 | ) | | | (23,078,647 | ) | | |
| | | | | | | | | | | | | | | | | | | | | | | | |
| | | | | | |
| | | | | | | | | | | | | | | | | | | | | | | | |
| | (860,763 | ) | | | (1,108,459 | ) | | | (116,495 | ) | | | (67,203 | ) | | | (4,431,775 | ) | | | (7,581,864 | ) | | |
| | | | | | | | | | | | | | | | | | | | | | | | |
| | | | | | |
| | | | | | | | | | | | | | | | | | | | | | | | |
| | 25,313,403 | | | | 24,629,279 | | | | 12,794,138 | | | | 5,097,304 | | | | 11,130,955 | | | | 13,732,604 | | | |
| | (36,933,651 | ) | | | (51,011,220 | ) | | | (7,494,212 | ) | | | (16,766,857 | ) | | | (98,588,944 | ) | | | (126,586,776 | ) | | |
| | | | | | | | | | | | | | | | | | | | | | | | |
| | (11,620,248 | ) | | | (26,381,941 | ) | | | 5,299,926 | | | | (11,669,553 | ) | | | (87,457,989 | ) | | | (112,854,172 | ) | | |
| | | | | | | | | | | | | | | | | | | | | | | | |
| | (7,539,947 | ) | | | (42,958,502 | ) | | | (4,810,072 | ) | | | (40,952,652 | ) | | | (97,357,632 | ) | | | (143,514,683 | ) | | |
| | | | | | | | | | | | | | | | | | | | | | | | |
| | | | | | |
| | | | | | | | | | | | | | | | | | | | | | | | |
| | 46,722,090 | | | | 89,680,592 | | | | 19,522,727 | | | | 60,475,379 | | | | 123,654,505 | | | | 267,169,188 | | | |
| | | | | | | | | | | | | | | | | | | | | | | | |
| $ | 39,182,143 | | | $ | 46,722,090 | | | $ | 14,712,655 | | | $ | 19,522,727 | | | $ | 26,296,873 | | | $ | 123,654,505 | | | |
| | | | | | | | | | | | | | | | | | | | | | | | |
| | | | | | |
| | | | | | | | | | | | | | | | | | | | | | | | |
| | 350,000 | | | | 300,000 | | | | 2,550,000 | | | | 550,000 | | | | 200,000 | | | | 250,000 | | | |
| | (500,000 | ) | | | (700,000 | ) | | | (1,150,000 | ) | | | (1,450,000 | ) | | | (1,900,000 | ) | | | (2,350,000 | ) | | |
| | 650,000 | | | | 1,050,000 | | | | 2,800,000 | | | | 3,700,000 | | | | 2,350,000 | | | | 4,450,000 | | | |
| | | | | | | | | | | | | | | | | | | | | | | | |
| | 500,000 | | | | 650,000 | | | | 4,200,000 | | | | 2,800,000 | | | | 650,000 | | | | 2,350,000 | | | |
| | | | | | | | | | | | | | | | | | | | | | | | |
Statements of Changes in Net Assets–(continued)
For the years ended August 31, 2020 and 2019
| | | | | | | | | | | | | | | | |
| | | Invesco S&P SmallCap
Health Care ETF (PSCH) | | | Invesco S&P SmallCap
Industrials ETF (PSCI) | |
| | | 2020 | | | 2019 | | | 2020 | | | 2019 | |
Operations: | | | | | | | | | | | | | | | | |
Net investment income (loss) | | $ | (791,332 | ) | | $ | (1,052,728 | ) | | $ | 348,979 | | | $ | 507,129 | |
Net realized gain (loss) | | | 5,423,048 | | | | 13,255,461 | | | | (3,857,007 | ) | | | 14,820,610 | |
Change in net unrealized appreciation (depreciation) | | | 42,905,790 | | | | (307,211,301 | ) | | | 2,344,318 | | | | (40,566,278 | ) |
| | | | | | | | | | | | | | | | |
Net increase (decrease) in net assets resulting from operations | | | 47,537,506 | | | | (295,008,568 | ) | | | (1,163,710 | ) | | | (25,238,539 | ) |
| | | | | | | | | | | | | | | | |
| | | | |
Distributions to Shareholders from: | | | | | | | | | | | | | | | | |
Distributable earnings | | | - | | | | (51,156 | ) | | | (379,899 | ) | | | (548,473 | ) |
| | | | | | | | | | | | | | | | |
| | | | |
Shareholder Transactions: | | | | | | | | | | | | | | | | |
Proceeds from shares sold | | | 166,002,432 | | | | 444,665,077 | | | | 16,499,914 | | | | 16,943,354 | |
Value of shares repurchased | | | (293,724,183 | ) | | | (857,032,957 | ) | | | (23,335,122 | ) | | | (90,814,418 | ) |
| | | | | | | | | | | | | | | | |
Net increase (decrease) in net assets resulting from share transactions | | | (127,721,751 | ) | | | (412,367,880 | ) | | | (6,835,208 | ) | | | (73,871,064 | ) |
| | | | | | | | | | | | | | | | |
Net increase (decrease) in net assets | | | (80,184,245 | ) | | | (707,427,604 | ) | | | (8,378,817 | ) | | | (99,658,076 | ) |
| | | | | | | | | | | | | | | | |
| | | | |
Net assets: | | | | | | | | | | | | | | | | |
Beginning of year | | | 465,141,673 | | | | 1,172,569,277 | | | | 54,546,607 | | | | 154,204,683 | |
| | | | | | | | | | | | | | | | |
End of year | | $ | 384,957,428 | | | $ | 465,141,673 | | | $ | 46,167,790 | | | $ | 54,546,607 | |
| | | | | | | | | | | | | | | | |
| | | | |
Changes in Shares Outstanding: | | | | | | | | | | | | | | | | |
Shares sold | | | 1,350,000 | | | | 3,300,000 | | | | 250,000 | | | | 250,000 | |
Shares repurchased | | | (2,500,000 | ) | | | (7,350,000 | ) | | | (400,000 | ) | | | (1,450,000 | ) |
Shares outstanding, beginning of year | | | 4,050,000 | | | | 8,100,000 | | | | 850,000 | | | | 2,050,000 | |
| | | | | | | | | | | | | | | | |
Shares outstanding, end of year | | | 2,900,000 | | | | 4,050,000 | | | | 700,000 | | | | 850,000 | |
| | | | | | | | | | | | | | | | |
See accompanying Notes to Financial Statements which are an integral part of the financial statements.
| | | | | | | | | | | | | | | | | | | | | | | | |
Invesco S&P SmallCap
Information Technology ETF (PSCT) | | | Invesco S&P SmallCap
Materials ETF (PSCM) | | | Invesco S&P SmallCap
Utilities & Communication
Services ETF (PSCU) | | | |
| 2020 | | | 2019 | | | 2020 | | | 2019 | | | 2020 | | | 2019 | | | |
| | | | | | | | | | | | | | | | | | | | | | | | |
| $ | 363,354 | | | $ | 1,088,443 | | | $ | 179,814 | | | $ | 193,991 | | | $ | 613,765 | | | $ | 1,392,024 | | | |
| | 27,252,217 | | | | 37,285,395 | | | | (3,019,236 | ) | | | (1,118,318 | ) | | | (2,032,926 | ) | | | 2,307,103 | | | |
| | (7,922,730 | ) | | | (82,316,420 | ) | | | 3,599,599 | | | | (6,007,807 | ) | | | (662,580 | ) | | | (6,803,443 | ) | | |
| | | | | | | | | | | | | | | | | | | | | | | | |
| | 19,692,841 | | | | (43,942,582 | ) | | | 760,177 | | | | (6,932,134 | ) | | | (2,081,741 | ) | | | (3,104,316 | ) | | |
| | | | | | | | | | | | | | | | | | | | | | | | |
| | | | | | |
| | | | | | | | | | | | | | | | | | | | | | | | |
| | (419,646 | ) | | | (1,350,753 | ) | | | (202,623 | ) | | | (233,740 | ) | | | (832,908 | ) | | | (1,441,686 | ) | | |
| | | | | | | | | | | | | | | | | | | | | | | | |
| | 57,560,906 | | | | 40,581,225 | | | | - | | | | 4,777,183 | | | | 7,655,636 | | | | 27,992,459 | | | |
| | (135,701,019 | ) | | | (167,837,979 | ) | | | (6,455,764 | ) | | | (13,850,155 | ) | | | (33,177,725 | ) | | | (34,405,985 | ) | | |
| | | | | | | | | | | | | | | | | | | | | | | | |
| | (78,140,113 | ) | | | (127,256,754 | ) | | | (6,455,764 | ) | | | (9,072,972 | ) | | | (25,522,089 | ) | | | (6,413,526 | ) | | |
| | | | | | | | | | | | | | | | | | | | | | | | |
| | (58,866,918 | ) | | | (172,550,089 | ) | | | (5,898,210 | ) | | | (16,238,846 | ) | | | (28,436,738 | ) | | | (10,959,528 | ) | | |
| | | | | | | | | | | | | | | | | | | | | | | | |
| | | | | | |
| | | | | | | | | | | | | | | | | | | | | | | | |
| | 303,408,293 | | | | 475,958,382 | | | | 14,326,897 | | | | 30,565,743 | | | | 50,421,423 | | | | 61,380,951 | | | |
| | | | | | | | | | | | | | | | | | | | | | | | |
| $ | 244,541,375 | | | $ | 303,408,293 | | | $ | 8,428,687 | | | $ | 14,326,897 | | | $ | 21,984,685 | | | $ | 50,421,423 | | | |
| | | | | | | | | | | | | | | | | | | | | | | | |
| | | | | | |
| | | | | | | | | | | | | | | | | | | | | | | | |
| | 650,000 | | | | 500,000 | | | | - | | | | 100,000 | | | | 150,000 | | | | 500,000 | | | |
| | (1,600,000 | ) | | | (2,150,000 | ) | | | (150,000 | ) | | | (300,000 | ) | | | (650,000 | ) | | | (650,000 | ) | | |
| | 3,650,000 | | | | 5,300,000 | | | | 350,000 | | | | 550,000 | | | | 950,000 | | | | 1,100,000 | | | |
| | | | | | | | | | | | | | | | | | | | | | | | |
| | 2,700,000 | | | | 3,650,000 | | | | 200,000 | | | | 350,000 | | | | 450,000 | | | | 950,000 | | | |
| | | | | | | | | | | | | | | | | | | | | | | | |
Financial Highlights
Invesco DWA SmallCap Momentum ETF (DWAS)
| | | | | | | | | | | | | | | | | | | | | | | | |
| | | Years Ended August 31, | | | Ten Months Ended
August 31, | | �� | Years Ended October 31, | |
| | | 2020 | | | 2019 | | | 2018 | | | 2017 | | | 2016 | | | 2015 | |
Per Share Operating Performance: | | | | | | | | | | | | | | | | | | | | | | | | |
Net asset value at beginning of period | | $ | 53.34 | | | $ | 59.34 | | | $ | 48.11 | | | $ | 35.42 | | | $ | 38.19 | | | $ | 38.24 | |
| | | | | | | | | | | | | | | | | | | | | | | | |
Net investment income (loss)(a) | | | 0.20 | | | | (0.01 | ) | | | (0.01 | ) | | | 0.14 | | | | 0.15 | | | | 0.02 | |
Net realized and unrealized gain (loss) on investments | | | 5.97 | | | | (5.99 | ) | | | 11.34 | | | | 12.71 | | | | (2.81 | ) | | | (0.04 | ) |
| | | | | | | | | | | | | | | | | | | | | | | | |
Total from investment operations | | | 6.17 | | | | (6.00 | ) | | | 11.33 | | | | 12.85 | | | | (2.66 | ) | | | (0.02 | ) |
| | | | | | | | | | | | | | | | | | | | | | | | |
Distributions to shareholders from: | | | | | | | | | | | | | | | | | | | | | | | | |
Net investment income | | | (0.18 | ) | | | - | | | | (0.10 | ) | | | (0.16 | ) | | | (0.11 | ) | | | (0.03 | ) |
| | | | | | | | | | | | | | | | | | | | | | | | |
Net asset value at end of period | | $ | 59.33 | | | $ | 53.34 | | | $ | 59.34 | | | $ | 48.11 | | | $ | 35.42 | | | $ | 38.19 | |
| | | | | | | | | | | | | | | | | | | | | | | | |
Market price at end of period(b) | | $ | 59.39 | | | $ | 53.34 | | | $ | 59.36 | | | $ | 48.16 | | | $ | 35.40 | | | $ | 38.18 | |
| | | | | | | | | | | | | | | | | | | | | | | | |
Net Asset Value Total Return(c) | | | 11.65 | % | | | (10.11 | )% | | | 23.60 | % | | | 36.38 | % | | | (6.97 | )% | | | (0.05 | )% |
Market Price Total Return(c) | | | 11.77 | % | | | (10.14 | )% | | | 23.51 | % | | | 36.60 | % | | | (7.00 | )% | | | (0.08 | )% |
Ratios/Supplemental Data: | | | | | | | | | | | | | | | | | | | | | | | | |
Net assets at end of period (000’s omitted) | | $ | 234,373 | | | $ | 264,010 | | | $ | 453,972 | | | $ | 228,517 | | | $ | 155,857 | | | $ | 416,316 | |
Ratio to average net assets of: | | | | | | | | | | | | | | | | | | | | | | | | |
Expenses | | | 0.60 | % | | | 0.60 | % | | | 0.60 | %(d) | | | 0.60 | % | | | 0.60 | % | | | 0.60 | % |
Net investment income (loss) | | | 0.39 | % | | | (0.03 | )% | | | (0.02 | )%(d) | | | 0.34 | % | | | 0.41 | % | | | 0.06 | % |
Portfolio turnover rate(e) | | | 185 | % | | | 159 | % | | | 100 | % | | | 131 | % | | | 169 | % | | | 141 | % |
| (a) | Based on average shares outstanding. |
| (b) | The mean between the last bid and ask prices. |
| (c) | Net asset value total return is calculated assuming an initial investment made at the net asset value at the beginning of the period, reinvestment of all dividends and distributions at net asset value during the period, and redemption at net asset value on the last day of the period. Net asset value total return includes adjustments in accordance with accounting principles generally accepted in the United States of America and as such, the net asset value for financial reporting purposes and the returns based upon those net asset values may differ from the net asset value and returns for shareholder transactions. Market price total return is calculated assuming an initial investment made at the market price at the beginning of the period, reinvestment of all dividends and distributions at market price during the period, and sale at the market price on the last day of the period. Total investment returns calculated for a period of less than one year are not annualized. |
| (e) | Portfolio turnover rate is not annualized for periods less than one year, if applicable, and does not include securities received or delivered from processing creations or redemptions. |
Invesco S&P SmallCap Consumer Discretionary ETF (PSCD)
| | | | | | | | | | | | | | | | | | | | | | | | |
| | | Years Ended August 31, | | | Ten Months Ended
August 31, | | | Years Ended October 31, | |
| | | 2020 | | | 2019 | | | 2018 | | | 2017 | | | 2016 | | | 2015 | |
Per Share Operating Performance: | | | | | | | | | | | | | | | | | | | | | | | | |
Net asset value at beginning of period | | $ | 57.37 | | | $ | 71.32 | | | $ | 55.45 | | | $ | 46.40 | | | $ | 49.35 | | | $ | 47.26 | |
| | | | | | | | | | | | | | | | | | | | | | | | |
Net investment income(a) | | | 0.61 | | | | 0.57 | | | | 0.56 | | | | 0.66 | | | | 0.41 | | | | 0.50 | |
Net realized and unrealized gain (loss) on investments | | | 7.57 | | | | (13.81 | ) | | | 15.78 | | | | 9.12 | | | | (2.99 | ) | | | 2.10 | |
| | | | | | | | | | | | | | | | | | | | | | | | |
Total from investment operations | | | 8.18 | | | | (13.24 | ) | | | 16.34 | | | | 9.78 | | | | (2.58 | ) | | | 2.60 | |
| | | | | | | | | | | | | | | | | | | | | | | | |
Distributions to shareholders from: | | | | | | | | | | | | | | | | | | | | | | | | |
Net investment income | | | (0.65 | ) | | | (0.71 | ) | | | (0.47 | ) | | | (0.73 | ) | | | (0.37 | ) | | | (0.51 | ) |
| | | | | | | | | | | | | | | | | | | | | | | | |
Net asset value at end of period | | $ | 64.90 | | | $ | 57.37 | | | $ | 71.32 | | | $ | 55.45 | | | $ | 46.40 | | | $ | 49.35 | |
| | | | | | | | | | | | | | | | | | | | | | | | |
Market price at end of period(b) | | $ | 64.92 | | | $ | 57.36 | | | $ | 71.31 | | | $ | 55.51 | | | $ | 46.41 | | | $ | 49.37 | |
| | | | | | | | | | | | | | | | | | | | | | | | |
Net Asset Value Total Return(c) | | | 14.68 | % | | | (18.57 | )% | | | 29.58 | % | | | 21.15 | % | | | (5.23 | )% | | | 5.43 | % |
Market Price Total Return(c) | | | 14.74 | % | | | (18.58 | )% | | | 29.43 | % | | | 21.26 | % | | | (5.24 | )% | | | 5.45 | % |
Ratios/Supplemental Data: | | | | | | | | | | | | | | | | | | | | | | | | |
Net assets at end of period (000’s omitted) | | $ | 19,470 | | | $ | 22,949 | | | $ | 92,718 | | | $ | 66,543 | | | $ | 74,235 | | | $ | 115,974 | |
Ratio to average net assets of: | | | | | | | | | | | | | | | | | | | | | | | | |
Expenses | | | 0.29 | % | | | 0.30 | %(d) | | | 0.29 | %(e) | | | 0.29 | % | | | 0.29 | % | | | 0.29 | % |
Net investment income | | | 1.08 | % | | | 0.93 | %(d) | | | 1.07 | %(e) | | | 1.25 | % | | | 0.86 | % | | | 0.96 | % |
Portfolio turnover rate(f) | | | 27 | % | | | 27 | % | | | 9 | % | | | 19 | % | | | 33 | % | | | 19 | % |
| (a) | Based on average shares outstanding. |
| (b) | The mean between the last bid and ask prices. |
| (c) | Net asset value total return is calculated assuming an initial investment made at the net asset value at the beginning of the period, reinvestment of all dividends and distributions at net asset value during the period, and redemption at net asset value on the last day of the period. Net asset value total return includes adjustments in accordance with accounting principles generally accepted in the United States of America and as such, the net asset value for financial reporting purposes and the returns based upon those net asset values may differ from the net asset value and returns for shareholder transactions. Market price total return is calculated assuming an initial investment made at the market price at the beginning of the period, reinvestment of all dividends and distributions at market price during the period, and sale at the market price on the last day of the period. Total investment returns calculated for a period of less than one year are not annualized. |
| (d) | Ratios include non-recurring costs associated with a proxy statement of 0.01%. |
| (f) | Portfolio turnover rate is not annualized for periods less than one year, if applicable, and does not include securities received or delivered from processing creations or redemptions. |
See accompanying Notes to Financial Statements which are an integral part of the financial statements.
Financial Highlights–(continued)
Invesco S&P SmallCap Consumer Staples ETF (PSCC)
| | | | | | | | | | | | | | | | | | | | | | | | |
| | | Years Ended August 31, | | | Ten Months Ended
August 31, | | | Years Ended October 31, | |
| | | 2020 | | | 2019 | | | 2018 | | | 2017 | | | 2016 | | | 2015 | |
Per Share Operating Performance: | | | | | | | | | | | | | | | | | | | | | | | | |
Net asset value at beginning of period | | $ | 71.88 | | | $ | 85.41 | | | $ | 72.47 | | | $ | 63.05 | | | $ | 57.26 | | | $ | 53.83 | |
| | | | | | | | | | | | | | | | | | | | | | | | |
Net investment income(a) | | | 1.21 | | | | 1.09 | | | | 0.56 | | | | 0.94 | | | | 0.90 | | | | 0.61 | |
Net realized and unrealized gain (loss) on investments | | | 6.60 | | | | (13.48 | ) | | | 12.91 | | | | 9.64 | | | | 5.75 | | | | 3.88 | |
| | | | | | | | | | | | | | | | | | | | | | | | |
Total from investment operations | | | 7.81 | | | | (12.39 | ) | | | 13.47 | | | | 10.58 | | | | 6.65 | | | | 4.49 | |
| | | | | | | | | | | | | | | | | | | | | | | | |
Distributions to shareholders from: | | | | | | | | | | | | | | | | | | | | | | | | |
Net investment income | | | (1.33 | ) | | | (1.14 | ) | | | (0.53 | ) | | | (1.16 | ) | | | (0.86 | ) | | | (0.36 | ) |
Net realized gains | | | - | | | | - | | | | - | | | | - | | | | - | | | | (0.70 | ) |
| | | | | | | | | | | | | | | | | | | | | | | | |
Total distributions | | | (1.33 | ) | | | (1.14 | ) | | | (0.53 | ) | | | (1.16 | ) | | | (0.86 | ) | | | (1.06 | ) |
| | | | | | | | | | | | | | | | | | | | | | | | |
Net asset value at end of period | | $ | 78.36 | | | $ | 71.88 | | | $ | 85.41 | | | $ | 72.47 | | | $ | 63.05 | | | $ | 57.26 | |
| | | | | | | | | | | | | | | | | | | | | | | | |
Market price at end of period(b) | | $ | 78.57 | | | $ | 71.66 | | | $ | 85.34 | | | $ | 72.54 | | | $ | 62.99 | | | $ | 57.31 | |
| | | | | | | | | | | | | | | | | | | | | | | | |
Net Asset Value Total Return(c) | | | 10.97 | % | | | (14.52 | )% | | | 18.70 | % | | | 16.88 | % | | | 11.79 | % | | | 8.43 | % |
Market Price Total Return(c) | | | 11.60 | % | | | (14.71 | )% | | | 18.49 | % | | | 17.11 | % | | | 11.59 | % | | | 8.54 | % |
Ratios/Supplemental Data: | | | | | | | | | | | | | | | | | | | | | | | | |
Net assets at end of period (000’s omitted) | | $ | 39,182 | | | $ | 46,722 | | | $ | 89,681 | | | $ | 54,350 | | | $ | 69,360 | | | $ | 31,494 | |
Ratio to average net assets of: | | | | | | | | | | | | | | | | | | | | | | | | |
Expenses | | | 0.29 | % | | | 0.30 | %(d) | | | 0.29 | %(e) | | | 0.29 | % | | | 0.29 | % | | | 0.29 | % |
Net investment income | | | 1.66 | % | | | 1.41 | %(d) | | | 0.89 | %(e) | | | 1.38 | % | | | 1.46 | % | | | 1.11 | % |
Portfolio turnover rate(f) | | | 40 | % | | | 59 | % | | | 42 | % | | | 62 | % | | | 68 | % | | | 39 | % |
| (a) | Based on average shares outstanding. |
| (b) | The mean between the last bid and ask prices. |
| (c) | Net asset value total return is calculated assuming an initial investment made at the net asset value at the beginning of the period, reinvestment of all dividends and distributions at net asset value during the period, and redemption at net asset value on the last day of the period. Net asset value total return includes adjustments in accordance with accounting principles generally accepted in the United States of America and as such, the net asset value for financial reporting purposes and the returns based upon those net asset values may differ from the net asset value and returns for shareholder transactions. Market price total return is calculated assuming an initial investment made at the market price at the beginning of the period, reinvestment of all dividends and distributions at market price during the period, and sale at the market price on the last day of the period. Total investment returns calculated for a period of less than one year are not annualized. |
| (d) | Ratios include non-recurring costs associated with a proxy statement of 0.01%. |
| (f) | Portfolio turnover rate is not annualized for periods less than one year, if applicable, and does not include securities received or delivered from processing creations or redemptions. |
See accompanying Notes to Financial Statements which are an integral part of the financial statements.
Financial Highlights–(continued)
Invesco S&P SmallCap Energy ETF (PSCE)
| | | | | | | | | | | | | | | | | | | | | | | | |
| | | Years Ended August 31, | | | Ten Months Ended
August 31, | | | Years Ended October 31, | |
| | | 2020 | | | 2019 | | | 2018 | | | 2017 | | | 2016 | | | 2015 | |
Per Share Operating Performance: | | | | | | | | | | | | | | | | | | | | | | | | |
Net asset value at beginning of period | | $ | 6.97 | | | $ | 16.34 | | | $ | 14.26 | | | $ | 16.73 | | | $ | 18.12 | | | $ | 37.85 | |
| | | | | | | | | | | | | | | | | | | | | | | | |
Net investment income (loss)(a) | | | 0.05 | | | | (0.02 | ) | | | (0.00 | )(b) | | | (0.01 | ) | | | 0.06 | | | | 0.14 | |
Net realized and unrealized gain (loss) on investments | | | (3.49 | ) | | | (9.33 | ) | | | 2.09 | | | | (2.44 | ) | | | (1.36 | ) | | | (19.74 | ) |
| | | | | | | | | | | | | | | | | | | | | | | | |
Total from investment operations | | | (3.44 | ) | | | (9.35 | ) | | | 2.09 | | | | (2.45 | ) | | | (1.30 | ) | | | (19.60 | ) |
| | | | | | | | | | | | | | | | | | | | | | | | |
Distributions to shareholders from: | | | | | | | | | | | | | | | | | | | | | | | | |
Net investment income | | | (0.03 | ) | | | (0.02 | ) | | | (0.01 | ) | | | (0.01 | ) | | | (0.09 | ) | | | (0.13 | ) |
Return of capital | | | - | | | | - | | | | - | | | | (0.01 | ) | | | - | | | | - | |
| | | | | | | | | | | | | | | | | | | | | | | | |
Total distributions | | | (0.03 | ) | | | (0.02 | ) | | | (0.01 | ) | | | (0.02 | ) | | | (0.09 | ) | | | (0.13 | ) |
| | | | | | | | | | | | | | | | | | | | | | | | |
Net asset value at end of period | | $ | 3.50 | | | $ | 6.97 | | | $ | 16.34 | | | $ | 14.26 | | | $ | 16.73 | | | $ | 18.12 | |
| | | | | | | | | | | | | | | | | | | | | | | | |
Market price at end of period(c) | | $ | 3.52 | | | $ | 6.98 | | | $ | 16.33 | | | $ | 14.30 | | | $ | 16.75 | | | $ | 18.13 | |
| | | | | | | | | | | | | | | | | | | | | | | | |
Net Asset Value Total Return(d) | | | (49.31 | )% | | | (57.29 | )% | | | 14.64 | % | | | (14.69 | )% | | | (7.11 | )% | | | (51.89 | )% |
Market Price Total Return(d) | | | (49.09 | )% | | | (57.20 | )% | | | 14.25 | % | | | (14.55 | )% | | | (7.05 | )% | | | (51.85 | )% |
Ratios/Supplemental Data: | | | | | | | | | | | | | | | | | | | | | | | | |
Net assets at end of period (000’s omitted) | | $ | 14,713 | | | $ | 19,523 | | | $ | 60,475 | | | $ | 48,477 | | | $ | 52,686 | | | $ | 37,149 | |
Ratio to average net assets of: | | | | | | | | | | | | | | | | | | | | | | | | |
Expenses | | | 0.29 | % | | | 0.31 | %(e) | | | 0.29 | %(f) | | | 0.29 | % | | | 0.29 | % | | | 0.29 | % |
Net investment income (loss) | | | 1.01 | % | | | (0.20 | )%(e) | | | 0.04 | %(f) | | | (0.05 | )% | | | 0.38 | % | | | 0.57 | % |
Portfolio turnover rate(g) | | | 74 | % | | | 48 | % | | | 40 | % | | | 39 | % | | | 21 | % | | | 38 | % |
| (a) | Based on average shares outstanding. |
| (b) | Amount represents less than $0.005. |
| (c) | The mean between the last bid and ask prices. |
| (d) | Net asset value total return is calculated assuming an initial investment made at the net asset value at the beginning of the period, reinvestment of all dividends and distributions at net asset value during the period, and redemption at net asset value on the last day of the period. Net asset value total return includes adjustments in accordance with accounting principles generally accepted in the United States of America and as such, the net asset value for financial reporting purposes and the returns based upon those net asset values may differ from the net asset value and returns for shareholder transactions. Market price total return is calculated assuming an initial investment made at the market price at the beginning of the period, reinvestment of all dividends and distributions at market price during the period, and sale at the market price on the last day of the period. Total investment returns calculated for a period of less than one year are not annualized. |
| (e) | Ratios include non-recurring costs associated with a proxy statement of 0.02%. |
| (g) | Portfolio turnover rate is not annualized for periods less than one year, if applicable, and does not include securities received or delivered from processing creations or redemptions. |
See accompanying Notes to Financial Statements which are an integral part of the financial statements.
Financial Highlights–(continued)
Invesco S&P SmallCap Financials ETF (PSCF)
| | | | | | | | | | | | | | | | | | | | | | | | |
| | | Years Ended August 31, | | | Ten Months Ended
August 31, | | | Years Ended October 31, | |
| | | 2020 | | | 2019 | | | 2018 | | | 2017 | | | 2016 | | | 2015 | |
Per Share Operating Performance: | | | | | | | | | | | | | | | | | | | | | | | | |
Net asset value at beginning of period | | $ | 52.62 | | | $ | 60.04 | | | $ | 54.25 | | | $ | 43.73 | | | $ | 42.41 | | | $ | 40.98 | |
| | | | | | | | | | | | | | | | | | | | | | | | |
Net investment income(a) | | | 1.45 | | | | 1.48 | | | | 1.05 | | | | 1.25 | | | | 1.14 | | | | 0.98 | |
Net realized and unrealized gain (loss) on investments | | | (10.89 | ) | | | (6.48 | ) | | | 5.63 | | | | 10.58 | | | | 1.44 | | | | 1.32 | |
| | | | | | | | | | | | | | | | | | | | | | | | |
Total from investment operations | | | (9.44 | ) | | | (5.00 | ) | | | 6.68 | | | | 11.83 | | | | 2.58 | | | | 2.30 | |
| | | | | | | | | | | | | | | | | | | | | | | | |
Distributions to shareholders from: | | | | | | | | | | | | | | | | | | | | | | | | |
Net investment income | | | (2.23 | ) | | | (1.85 | ) | | | (0.89 | ) | | | (1.09 | ) | | | (1.18 | ) | | | (0.87 | ) |
Net realized gains | | | (0.49 | ) | | | (0.57 | ) | | | - | | | | (0.22 | ) | | | (0.08 | ) | | | - | |
| | | | | | | | | | | | | | | | | | | | | | | | |
Total distributions | | | (2.72 | ) | | | (2.42 | ) | | | (0.89 | ) | | | (1.31 | ) | | | (1.26 | ) | | | (0.87 | ) |
| | | | | | | | | | | | | | | | | | | | | | | | |
Net asset value at end of period | | $ | 40.46 | | | $ | 52.62 | | | $ | 60.04 | | | $ | 54.25 | | | $ | 43.73 | | | $ | 42.41 | |
| | | | | | | | | | | | | | | | | | | | | | | | |
Market price at end of period(b) | | $ | 40.54 | | | $ | 52.54 | | | $ | 60.09 | | | $ | 54.31 | | | $ | 43.73 | | | $ | 42.45 | |
| | | | | | | | | | | | | | | | | | | | | | | | |
Net Asset Value Total Return(c) | | | (18.02 | )% | | | (8.05 | )% | | | 12.44 | % | | | 27.23 | % | | | 6.29 | % | | | 5.68 | % |
Market Price Total Return(c) | | | (17.72 | )% | | | (8.27 | )% | | | 12.41 | % | | | 27.37 | % | | | 6.19 | % | | | 5.80 | % |
Ratios/Supplemental Data: | | | | | | | | | | | | | | | | | | | | | | | | |
Net assets at end of period (000’s omitted) | | $ | 26,297 | | | $ | 123,655 | | | $ | 267,169 | | | $ | 254,975 | | | $ | 196,797 | | | $ | 182,347 | |
Ratio to average net assets of: | | | | | | | | | | | | | | | | | | | | | | | | |
Expenses | | | 0.29 | % | | | 0.30 | %(d) | | | 0.29 | %(e) | | | 0.29 | % | | | 0.29 | % | | | 0.29 | %(f) |
Net investment income | | | 2.83 | % | | | 2.73 | %(d) | | | 2.26 | %(e) | | | 2.44 | % | | | 2.73 | % | | | 2.38 | % |
Portfolio turnover rate(g) | | | 31 | % | | | 16 | % | | | 17 | % | | | 21 | % | | | 16 | % | | | 16 | % |
| (a) | Based on average shares outstanding. |
| (b) | The mean between the last bid and ask prices. |
| (c) | Net asset value total return is calculated assuming an initial investment made at the net asset value at the beginning of the period, reinvestment of all dividends and distributions at net asset value during the period, and redemption at net asset value on the last day of the period. Net asset value total return includes adjustments in accordance with accounting principles generally accepted in the United States of America and as such, the net asset value for financial reporting purposes and the returns based upon those net asset values may differ from the net asset value and returns for shareholder transactions. Market price total return is calculated assuming an initial investment made at the market price at the beginning of the period, reinvestment of all dividends and distributions at market price during the period, and sale at the market price on the last day of the period. Total investment returns calculated for a period of less than one year are not annualized. |
| (d) | Ratios include non-recurring costs associated with a proxy statement of 0.01%. |
| (f) | In addition to the fees and expenses which the Fund bears directly, the Fund indirectly bears a pro rata share of the fees and expenses of the investment companies in which the Fund invests. Estimated investment companies’ expenses are not expenses that are incurred directly by the Fund. They are expenses that are incurred directly by the investment companies and are deducted from the value of the investment companies the Fund invests in. The effect of the estimated investment companies’ expenses that the Fund bears indirectly is included in the Fund’s total return. |
| (g) | Portfolio turnover rate is not annualized for periods less than one year, if applicable, and does not include securities received or delivered from processing creations or redemptions. |
See accompanying Notes to Financial Statements which are an integral part of the financial statements.
Financial Highlights–(continued)
Invesco S&P SmallCap Health Care ETF (PSCH)
| | | | | | | | | | | | | | | | | | | | | | | | |
| | | Years Ended August 31, | | | Ten Months Ended
August 31, | | | Years Ended October 31, | |
| | | 2020 | | | 2019 | | | 2018 | | | 2017 | | | 2016 | | | 2015 | |
Per Share Operating Performance: | | | | | | | | | | | | | | | | | | | | | | | | |
Net asset value at beginning of period | | $ | 114.85 | | | $ | 144.76 | | | $ | 91.43 | | | $ | 67.03 | | | $ | 66.81 | | | $ | 60.07 | |
| | | | | | | | | | | | | | | | | | | | | | | | |
Net investment income (loss)(a) | | | (0.22 | ) | | | (0.16 | ) | | | (0.04 | ) | | | (0.03 | ) | | | 0.00 | (b) | | | (0.01 | ) |
Net realized and unrealized gain (loss) on investments | | | 18.11 | | | | (29.74 | ) | | | 53.37 | | | | 24.45 | | | | 0.22 | | | | 8.22 | |
| | | | | | | | | | | | | | | | | | | | | | | | |
Total from investment operations | | | 17.89 | | | | (29.90 | ) | | | 53.33 | | | | 24.42 | | | | 0.22 | | | | 8.21 | |
| | | | | | | | | | | | | | | | | | | | | | | | |
Distributions to shareholders from: | | | | | | | | | | | | | | | | | | | | | | | | |
Net investment income | | | - | | | | (0.01 | ) | | | - | | | | (0.02 | ) | | | - | | | | (0.03 | ) |
Net realized gains | | | - | | | | - | | | | - | | | | - | | | | - | | | | (1.44 | ) |
| | | | | | | | | | | | | | | | | | | | | | | | |
Total distributions | | | - | | | | (0.01 | ) | | | - | | | | (0.02 | ) | | | - | | | | (1.47 | ) |
| | | | | | | | | | | | | | | | | | | | | | | | |
Net asset value at end of period | | $ | 132.74 | | | $ | 114.85 | | | $ | 144.76 | | | $ | 91.43 | | | $ | 67.03 | | | $ | 66.81 | |
| | | | | | | | | | | | | | | | | | | | | | | | |
Market price at end of period(c) | | $ | 132.83 | | | $ | 114.81 | | | $ | 144.99 | | | $ | 91.58 | | | $ | 67.00 | | | $ | 66.86 | |
| | | | | | | | | | | | | | | | | | | | | | | | |
Net Asset Value Total Return(d) | | | 15.58 | % | | | (20.66 | )% | | | 58.32 | % | | | 36.44 | % | | | 0.33 | % | | | 13.96 | % |
Market Price Total Return(d) | | | 15.69 | % | | | (20.82 | )% | | | 58.31 | % | | | 36.72 | % | | | 0.21 | % | | | 14.12 | % |
Ratios/Supplemental Data: | | | | | | | | | | | | | | | | | | | | | | | | |
Net assets at end of period (000’s omitted) | | $ | 384,957 | | | $ | 465,142 | | | $ | 1,172,569 | | | $ | 237,717 | | | $ | 167,586 | | | $ | 230,504 | |
Ratio to average net assets of: | | | | | | | | | | | | | | | | | | | | | | | | |
Expenses | | | 0.29 | % | | | 0.29 | % | | | 0.29 | %(e) | | | 0.29 | % | | | 0.29 | % | | | 0.29 | % |
Net investment income (loss) | | | (0.18 | )% | | | (0.13 | )% | | | (0.04 | )%(e) | | | (0.04 | )% | | | 0.01 | % | | | (0.02 | )% |
Portfolio turnover rate(f) | | | 19 | % | | | 36 | % | | | 20 | % | | | 19 | % | | | 23 | % | | | 22 | % |
| (a) | Based on average shares outstanding. |
| (b) | Amount represents less than $0.005. |
| (c) | The mean between the last bid and ask prices. |
| (d) | Net asset value total return is calculated assuming an initial investment made at the net asset value at the beginning of the period, reinvestment of all dividends and distributions at net asset value during the period, and redemption at net asset value on the last day of the period. Net asset value total return includes adjustments in accordance with accounting principles generally accepted in the United States of America and as such, the net asset value for financial reporting purposes and the returns based upon those net asset values may differ from the net asset value and returns for shareholder transactions. Market price total return is calculated assuming an initial investment made at the market price at the beginning of the period, reinvestment of all dividends and distributions at market price during the period, and sale at the market price on the last day of the period. Total investment returns calculated for a period of less than one year are not annualized. |
| (f) | Portfolio turnover rate is not annualized for periods less than one year, if applicable, and does not include securities received or delivered from processing creations or redemptions. |
See accompanying Notes to Financial Statements which are an integral part of the financial statements.
Financial Highlights–(continued)
Invesco S&P SmallCap Industrials ETF (PSCI)
| | | | | | | | | | | | | | | | | | | | | | | | |
| | | Years Ended August 31, | | | Ten Months Ended
August 31, | | | Years Ended October 31, | |
| | | 2020 | | | 2019 | | | 2018 | | | 2017 | | | 2016 | | | 2015 | |
Per Share Operating Performance: | | | | | | | | | | | | | | | | | | | | | | | | |
Net asset value at beginning of period | | $ | 64.17 | | | $ | 75.22 | | | $ | 62.13 | | | $ | 47.51 | | | $ | 45.55 | | | $ | 44.89 | |
| | | | | | | | | | | | | | | | | | | | | | | | |
Net investment income(a) | | | 0.47 | | | | 0.37 | | | | 0.36 | | | | 0.53 | | | | 0.34 | | | | 0.45 | |
Net realized and unrealized gain (loss) on investments | | | 1.81 | | | | (11.03 | ) | | | 13.07 | | | | 14.62 | | | | 1.96 | | | | 0.68 | |
| | | | | | | | | | | | | | | | | | | | | | | | |
Total from investment operations | | | 2.28 | | | | (10.66 | ) | | | 13.43 | | | | 15.15 | | | | 2.30 | | | | 1.13 | |
| | | | | | | | | | | | | | | | | | | | | | | | |
Distributions to shareholders from: | | | | | | | | | | | | | | | | | | | | | | | | |
Net investment income | | | (0.50 | ) | | | (0.39 | ) | | | (0.34 | ) | | | (0.53 | ) | | | (0.34 | ) | | | (0.47 | ) |
| | | | | | | | | | | | | | | | | | | | | | | | |
Net asset value at end of period | | $ | 65.95 | | | $ | 64.17 | | | $ | 75.22 | | | $ | 62.13 | | | $ | 47.51 | | | $ | 45.55 | |
| | | | | | | | | | | | | | | | | | | | | | | | |
Market price at end of period(b) | | $ | 66.05 | | | $ | 64.21 | | | $ | 75.25 | | | $ | 62.21 | | | $ | 47.42 | | | $ | 45.57 | |
| | | | | | | | | | | | | | | | | | | | | | | | |
Net Asset Value Total Return(c) | | | 3.68 | % | | | (14.16 | )% | | | 21.69 | % | | | 32.00 | % | | | 5.10 | % | | | 2.51 | % |
Market Price Total Return(c) | | | 3.76 | % | | | (14.14 | )% | | | 21.59 | % | | | 32.42 | % | | | 4.86 | % | | | 2.69 | % |
Ratios/Supplemental Data: | | | | | | | | | | | | | | | | | | | | | | | | |
Net assets at end of period (000’s omitted) | | $ | 46,168 | | | $ | 54,547 | | | $ | 154,205 | | | $ | 99,414 | | | $ | 57,007 | | | $ | 70,608 | |
Ratio to average net assets of: | | | | | | | | | | | | | | | | | | | | | | | | |
Expenses | | | 0.29 | % | | | 0.30 | %(d) | | | 0.29 | %(e) | | | 0.29 | % | | | 0.29 | % | | | 0.29 | % |
Net investment income | | | 0.74 | % | | | 0.58 | %(d) | | | 0.66 | %(e) | | | 0.94 | % | | | 0.75 | % | | | 0.98 | % |
Portfolio turnover rate(f) | | | 10 | % | | | 9 | % | | | 2 | % | | | 7 | % | | | 16 | % | | | 11 | % |
| (a) | Based on average shares outstanding. |
| (b) | The mean between the last bid and ask prices. |
| (c) | Net asset value total return is calculated assuming an initial investment made at the net asset value at the beginning of the period, reinvestment of all dividends and distributions at net asset value during the period, and redemption at net asset value on the last day of the period. Net asset value total return includes adjustments in accordance with accounting principles generally accepted in the United States of America and as such, the net asset value for financial reporting purposes and the returns based upon those net asset values may differ from the net asset value and returns for shareholder transactions. Market price total return is calculated assuming an initial investment made at the market price at the beginning of the period, reinvestment of all dividends and distributions at market price during the period, and sale at the market price on the last day of the period. Total investment returns calculated for a period of less than one year are not annualized. |
| (d) | Ratios include non-recurring costs associated with a proxy statement of 0.01%. |
| (f) | Portfolio turnover rate is not annualized for periods less than one year, if applicable, and does not include securities received or delivered from processing creations or redemptions. |
Invesco S&P SmallCap Information Technology ETF (PSCT)
| | | | | | | | | | | | | | | | | | | | | | | | |
| | | Years Ended August 31, | | | Ten Months Ended
August 31, | | | Years Ended October 31, | |
| | | 2020 | | | 2019 | | | 2018 | | | 2017 | | | 2016 | | | 2015 | |
Per Share Operating Performance: | | | | | | | | | | | | | | | | | | | | | | | | |
Net asset value at beginning of period | | $ | 83.13 | | | $ | 89.80 | | | $ | 81.13 | | | $ | 61.26 | | | $ | 51.70 | | | $ | 48.02 | |
| | | | | | | | | | | | | | | | | | | | | | | | |
Net investment income(a) | | | 0.11 | | | | 0.25 | | | | 0.27 | | | | 0.19 | | | | 0.10 | | | | 0.08 | |
Net realized and unrealized gain (loss) on investments | | | 7.46 | | | | (6.62 | ) | | | 8.69 | | | | 19.83 | | | | 9.58 | | | | 3.64 | |
| | | | | | | | | | | | | | | | | | | | | | | | |
Total from investment operations | | | 7.57 | | | | (6.37 | ) | | | 8.96 | | | | 20.02 | | | | 9.68 | | | | 3.72 | |
| | | | | | | | | | | | | | | | | | | | | | | | |
Distributions to shareholders from: | | | | | | | | | | | | | | | | | | | | | | | | |
Net investment income | | | (0.13 | ) | | | (0.30 | ) | | | (0.29 | ) | | | (0.15 | ) | | | (0.12 | ) | | | (0.04 | ) |
| | | | | | | | | | | | | | | | | | | | | | | | |
Net asset value at end of period | | $ | 90.57 | | | $ | 83.13 | | | $ | 89.80 | | | $ | 81.13 | | | $ | 61.26 | | | $ | 51.70 | |
| | | | | | | | | | | | | | | | | | | | | | | | |
Market price at end of period(b) | | $ | 90.67 | | | $ | 83.05 | | | $ | 89.71 | | | $ | 81.23 | | | $ | 61.28 | | | $ | 51.77 | |
| | | | | | | | | | | | | | | | | | | | | | | | |
Net Asset Value Total Return(c) | | | 9.12 | % | | | (7.08 | )% | | | 11.09 | % | | | 32.71 | % | | | 18.75 | % | | | 7.75 | % |
Market Price Total Return(c) | | | 9.35 | % | | | (7.08 | )% | | | 10.85 | % | | | 32.84 | % | | | 18.63 | % | | | 7.92 | % |
Ratios/Supplemental Data: | | | | | | | | | | | | | | | | | | | | | | | | |
Net assets at end of period (000’s omitted) | | $ | 244,541 | | | $ | 303,408 | | | $ | 475,958 | | | $ | 575,996 | | | $ | 508,447 | | | $ | 390,315 | |
Ratio to average net assets of: | | | | | | | | | | | | | | | | | | | | | | | | |
Expenses | | | 0.29 | % | | | 0.29 | % | | | 0.29 | %(d) | | | 0.29 | % | | | 0.29 | % | | | 0.29 | % |
Net investment income | | | 0.13 | % | | | 0.32 | % | | | 0.40 | %(d) | | | 0.26 | % | | | 0.18 | % | | | 0.16 | % |
Portfolio turnover rate(e) | | | 19 | % | | | 11 | % | | | 15 | % | | | 16 | % | | | 15 | % | | | 15 | % |
| (a) | Based on average shares outstanding. |
| (b) | The mean between the last bid and ask prices. |
| (c) | Net asset value total return is calculated assuming an initial investment made at the net asset value at the beginning of the period, reinvestment of all dividends and distributions at net asset value during the period, and redemption at net asset value on the last day of the period. Net asset value total return includes adjustments in accordance with accounting principles generally accepted in the United States of America and as such, the net asset value for financial reporting purposes and the returns based upon those net asset values may differ from the net asset value and returns for shareholder transactions. Market price total return is calculated assuming an initial investment made at the market price at the beginning of the period, reinvestment of all dividends and distributions at market price during the period, and sale at the market price on the last day of the period. Total investment returns calculated for a period of less than one year are not annualized. |
| (e) | Portfolio turnover rate is not annualized for periods less than one year, if applicable, and does not include securities received or delivered from processing creations or redemptions. |
See accompanying Notes to Financial Statements which are an integral part of the financial statements.
Financial Highlights–(continued)
Invesco S&P SmallCap Materials ETF (PSCM)
| | | | | | | | | | | | | | | | | | | | | | | | |
| | | Years Ended August 31, | | | Ten Months Ended
August 31, | | | Years Ended October 31, | |
| | | 2020 | | | 2019 | | | 2018 | | | 2017 | | | 2016 | | | 2015 | |
Per Share Operating Performance: | | | | | | | | | | | | | | | | | | | | | | | | |
Net asset value at beginning of period | | $ | 40.93 | | | $ | 55.57 | | | $ | 50.96 | | | $ | 38.70 | | | $ | 34.36 | | | $ | 43.97 | |
| | | | | | | | | | | | | | | | | | | | | | | | |
Net investment income(a) | | | 0.66 | | | | 0.44 | | | | 0.40 | | | | 0.41 | | | | 0.35 | | | | 0.35 | |
Net realized and unrealized gain (loss) on investments | | | 1.27 | | | | (14.56 | ) | | | 4.54 | | | | 12.19 | | | | 4.36 | | | | (9.50 | ) |
| | | | | | | | | | | | | | | | | | | | | | | | |
Total from investment operations | | | 1.93 | | | | (14.12 | ) | | | 4.94 | | | | 12.60 | | | | 4.71 | | | | (9.15 | ) |
| | | | | | | | | | | | | | | | | | | | | | | | |
Distributions to shareholders from: | | | | | | | | | | | | | | | | | | | | | | | | |
Net investment income | | | (0.72 | ) | | | (0.52 | ) | | | (0.33 | ) | | | (0.34 | ) | | | (0.37 | ) | | | (0.46 | ) |
| | | | | | | | | | | | | | | | | | | | | | | | |
Net asset value at end of period | | $ | 42.14 | | | $ | 40.93 | | | $ | 55.57 | | | $ | 50.96 | | | $ | 38.70 | | | $ | 34.36 | |
| | | | | | | | | | | | | | | | | | | | | | | | |
Market price at end of period(b) | | $ | 41.99 | | | $ | 40.91 | | | $ | 55.57 | | | $ | 51.00 | | | $ | 38.77 | | | $ | 34.37 | |
| | | | | | | | | | | | | | | | | | | | | | | | |
Net Asset Value Total Return(c) | | | 4.91 | % | | | (25.50 | )% | | | 9.73 | % | | | 32.62 | % | | | 13.89 | % | | | (20.94 | )% |
Market Price Total Return(c) | | | 4.59 | % | | | (25.54 | )% | | | 9.65 | % | | | 32.48 | % | | | 14.07 | % | | | (20.88 | )% |
Ratios/Supplemental Data: | | | | | | | | | | | | | | | | | | | | | | | | |
Net assets at end of period (000’s omitted) | | $ | 8,429 | | | $ | 14,327 | | | $ | 30,566 | | | $ | 48,411 | | | $ | 17,414 | | | $ | 10,309 | |
Ratio to average net assets of: | | | | | | | | | | | | | | | | | | | | | | | | |
Expenses | | | 0.29 | % | | | 0.32 | %(d) | | | 0.29 | %(e) | | | 0.29 | % | | | 0.29 | % | | | 0.29 | % |
Net investment income | | | 1.58 | % | | | 0.93 | %(d) | | | 0.91 | %(e) | | | 0.87 | % | | | 1.01 | % | | | 0.87 | % |
Portfolio turnover rate(f) | | | 25 | % | | | 24 | % | | | 9 | % | | | 21 | % | | | 16 | % | | | 17 | % |
| (a) | Based on average shares outstanding. |
| (b) | The mean between the last bid and ask prices. |
| (c) | Net asset value total return is calculated assuming an initial investment made at the net asset value at the beginning of the period, reinvestment of all dividends and distributions at net asset value during the period, and redemption at net asset value on the last day of the period. Net asset value total return includes adjustments in accordance with accounting principles generally accepted in the United States of America and as such, the net asset value for financial reporting purposes and the returns based upon those net asset values may differ from the net asset value and returns for shareholder transactions. Market price total return is calculated assuming an initial investment made at the market price at the beginning of the period, reinvestment of all dividends and distributions at market price during the period, and sale at the market price on the last day of the period. Total investment returns calculated for a period of less than one year are not annualized. |
| (d) | Ratios include non-recurring costs associated with a proxy statement of 0.03%. |
| (f) | Portfolio turnover rate is not annualized for periods less than one year, if applicable, and does not include securities received or delivered from processing creations or redemptions. |
See accompanying Notes to Financial Statements which are an integral part of the financial statements.
Financial Highlights–(continued)
Invesco S&P SmallCap Utilities & Communication Services ETF (PSCU)
| | | | | | | | | | | | | | | | | | | | | | | | |
| | | Years Ended August 31, | | | Ten Months Ended
August 31, | | | Years Ended October 31, | |
| | | 2020 | | | 2019 | | | 2018 | | | 2017 | | | 2016 | | | 2015 | |
Per Share Operating Performance: | | | | | | | | | | | | | | | | | | | | | | | | |
Net asset value at beginning of period | | $ | 53.08 | | | $ | 55.80 | | | $ | 55.67 | | | $ | 45.61 | | | $ | 41.99 | | | $ | 38.34 | |
| | | | | | | | | | | | | | | | | | | | | | | | |
Net investment income(a) | | | 0.91 | | | | 1.22 | | | | 1.14 | | | | 0.87 | | | | 1.06 | | | | 1.02 | |
Net realized and unrealized gain (loss) on investments | | | (4.03 | ) | | | (2.70 | ) | | | 0.23 | | | | 11.81 | | | | 3.67 | | | | 3.96 | |
| | | | | | | | | | | | | | | | | | | | | | | | |
Total from investment operations | | | (3.12 | ) | | | (1.48 | ) | | | 1.37 | | | | 12.68 | | | | 4.73 | | | | 4.98 | |
| | | | | | | | | | | | | | | | | | | | | | | | |
Distributions to shareholders from: | | | | | | | | | | | | | | | | | | | | | | | | |
Net investment income | | | (1.11 | ) | | | (1.24 | ) | | | (1.24 | ) | | | (0.86 | ) | | | (1.11 | ) | | | (1.33 | ) |
Net realized gains | | | - | | | | - | | | | - | | | | (1.76 | ) | | | - | | | | - | |
| | | | | | | | | | | | | | | | | | | | | | | | |
Total distributions | | | (1.11 | ) | | | (1.24 | ) | | | (1.24 | ) | | | (2.62 | ) | | | (1.11 | ) | | | (1.33 | ) |
| | | | | | | | | | | | | | | | | | | | | | | | |
Net asset value at end of period | | $ | 48.85 | | | $ | 53.08 | | | $ | 55.80 | | | $ | 55.67 | | | $ | 45.61 | | | $ | 41.99 | |
| | | | | | | | | | | | | | | | | | | | | | | | |
Market price at end of period(b) | | $ | 48.91 | | �� | $ | 53.01 | | | $ | 55.82 | | | $ | 55.70 | | | $ | 45.57 | | | $ | 42.01 | |
| | | | | | | | | | | | | | | | | | | | | | | | |
Net Asset Value Total Return(c) | | | (5.94 | )% | | | (2.58 | )% | | | 2.55 | % | | | 28.66 | % | | | 11.38 | % | | | 13.43 | % |
Market Price Total Return(c) | | | (5.70 | )% | | | (2.74 | )% | | | 2.54 | % | | | 28.83 | % | | | 11.23 | % | | | 13.52 | % |
Ratios/Supplemental Data: | | | | | | | | | | | | | | | | | | | | | | | | |
Net assets at end of period (000’s omitted) | | $ | 21,985 | | | $ | 50,421 | | | $ | 61,381 | | | $ | 52,887 | | | $ | 47,895 | | | $ | 39,887 | |
Ratio to average net assets of: | | | | | | | | | | | | | | | | | | | | | | | | |
Expenses | | | 0.29 | % | | | 0.30 | %(d) | | | 0.29 | %(e) | | | 0.29 | % | | | 0.29 | % | | | 0.29 | % |
Net investment income | | | 1.78 | % | | | 2.27 | %(d) | | | 2.58 | %(e) | | | 1.73 | % | | | 2.35 | % | | | 2.63 | % |
Portfolio turnover rate(f) | | | 64 | % | | | 66 | % | | | 48 | % | | | 48 | % | | | 69 | % | | | 18 | % |
| (a) | Based on average shares outstanding. |
| (b) | The mean between the last bid and ask prices. |
| (c) | Net asset value total return is calculated assuming an initial investment made at the net asset value at the beginning of the period, reinvestment of all dividends and distributions at net asset value during the period, and redemption at net asset value on the last day of the period. Net asset value total return includes adjustments in accordance with accounting principles generally accepted in the United States of America and as such, the net asset value for financial reporting purposes and the returns based upon those net asset values may differ from the net asset value and returns for shareholder transactions. Market price total return is calculated assuming an initial investment made at the market price at the beginning of the period, reinvestment of all dividends and distributions at market price during the period, and sale at the market price on the last day of the period. Total investment returns calculated for a period of less than one year are not annualized. |
| (d) | Ratios include non-recurring costs associated with a proxy statement of 0.01%. |
| (f) | Portfolio turnover rate is not annualized for periods less than one year, if applicable, and does not include securities received or delivered from processing creations or redemptions. |
See accompanying Notes to Financial Statements which are an integral part of the financial statements.
Notes to Financial Statements
Invesco Exchange-Traded Fund Trust II
August 31, 2020
NOTE 1–Organization
Invesco Exchange-Traded Fund Trust II (the “Trust”) was organized as a Massachusetts business trust on October 10, 2006 and is authorized to have multiple series of portfolios. The Trust is an open-end management investment company registered under the Investment Company Act of 1940, as amended (the “1940 Act”). This report includes the following portfolios:
| | |
| FullName | | Short Name |
| Invesco DWA SmallCap Momentum ETF (DWAS) | | “DWA SmallCap Momentum ETF” |
| Invesco S&P SmallCap Consumer Discretionary ETF (PSCD) | | “S&P SmallCap Consumer Discretionary ETF” |
| Invesco S&P SmallCap Consumer Staples ETF (PSCC) | | “S&P SmallCap Consumer Staples ETF” |
| Invesco S&P SmallCap Energy ETF (PSCE) | | “S&P SmallCap Energy ETF” |
| Invesco S&P SmallCap Financials ETF (PSCF) | | “S&P SmallCap Financials ETF” |
| Invesco S&P SmallCap Health Care ETF (PSCH) | | “S&P SmallCap Health Care ETF” |
| Invesco S&P SmallCap Industrials ETF (PSCI) | | “S&P SmallCap Industrials ETF” |
| Invesco S&P SmallCap Information Technology ETF (PSCT) | | “S&P SmallCap Information Technology ETF” |
| Invesco S&P SmallCap Materials ETF (PSCM) | | “S&P SmallCap Materials ETF” |
| Invesco S&P SmallCap Utilities& Communication Services ETF (PSCU) | | “S&P SmallCap Utilities& Communication Services ETF” |
Each portfolio (each, a “Fund”, and collectively, the “Funds”) represents a separate series of the Trust. The shares of the Funds are referred to herein as “Shares” or “Fund’s Shares.” Each Fund’s Shares are listed and traded on The Nasdaq Stock Market.
The market price of each Share may differ to some degree from a Fund’s net asset value (“NAV”). Unlike conventional mutual funds, each Fund issues and redeems Shares on a continuous basis, at NAV, only in a large specified number of Shares, each called a “Creation Unit.” Creation Units are issued and redeemed principally in exchange for the deposit or delivery of a basket of securities (“Deposit Securities”). Except when aggregated in Creation Units by Authorized Participants, the Shares are not individually redeemable securities of the Funds.
The investment objective of each Fund is to seek to track the investment results (before fees and expenses) of its respective index listed below (each, an “Underlying Index”):
| | |
| Fund | | Underlying Index |
| DWA SmallCap Momentum ETF | | Dorsey Wright® SmallCap TechnicalLeaders Index |
| S&P SmallCap Consumer Discretionary ETF | | S&P SmallCap 600® Capped Consumer Discretionary Index |
| S&P SmallCap Consumer Staples ETF | | S&P SmallCap 600® Capped Consumer Staples Index |
| S&P SmallCap Energy ETF | | S&P SmallCap 600® Capped Energy Index |
| S&P SmallCap Financials ETF | | S&P SmallCap 600® Capped Financials& RealEstate Index |
| S&P SmallCap Health Care ETF | | S&P SmallCap 600® Capped Health Care Index |
| S&P SmallCap Industrials ETF | | S&P SmallCap 600® Capped Industrials Index |
| S&P SmallCap Information Technology ETF | | S&P SmallCap 600® Capped Information Technology Index |
| S&P SmallCap Materials ETF | | S&P SmallCap 600® Capped Materials Index |
| S&P SmallCap Utilities& Communication Services ETF | | S&P SmallCap 600® Capped Utilities& Communication Services Index |
NOTE 2–Significant Accounting Policies
The following is a summary of the significant accounting policies followed by the Funds in preparation of their financial statements.
Each Fund is an investment company and accordingly follows the investment company accounting and reporting guidance in accordance with Financial Accounting Standards Board Accounting Standards Codification Topic 946, Financial Services-Investment Companies.
| A. | Security Valuation - Securities, including restricted securities, are valued according to the following policies: |
A security listed or traded on an exchange (except convertible securities) is generally valued at its last sales price or official closing price as of the close of the customary trading session on the exchange where the security is principally traded or, lacking any sales or official closing price on a particular day, the security may be valued at the closing bid price on that day. Securities traded in the over-the-counter market are valued based on prices furnished by independent pricing services or market makers. When such securities are valued by an independent pricing service they may be considered fair valued. Futures contracts are valued at the final settlement price set by an exchange on which they are principally traded. Listed
options are valued at the mean between the last bid and asked prices from the exchange on which they are principally traded, or at the final settlement price set by such exchange. Swaps and options not listed on an exchange are valued by an independent source. For purposes of determining NAV per Share, futures and option contracts generally are valued 15 minutes after the close of the customary trading session of the New York Stock Exchange (“NYSE”).
Investment companies are valued using such company’s NAV per share, unless the shares are exchange-traded, in which case they are valued at the last sales price or official closing price as of the close of the customary trading session on the exchange where the security is principally traded.
Debt obligations (including convertible securities) and unlisted equities are fair valued using an evaluated quote provided by an independent pricing service. Evaluated quotes provided by the pricing service may be determined without exclusive reliance on quoted prices, and may reflect appropriate factors such as institution-size trading in similar groups of securities, developments related to specific securities, dividend rate (for unlisted equities), yield (for debt obligations), quality, type of issue, coupon rate (for debt obligations), maturity (for debt obligations), individual trading characteristics and other market data. Securities with a demand feature exercisable within one to seven days are valued at par. Pricing services generally value debt obligations assuming orderly transactions of institutional round lot size, but a Fund may hold or transact in the same securities in smaller, odd lot sizes. Odd lots often trade at lower prices than institutional round lots. Debt obligations are subject to interest rate and credit risks. In addition, all debt obligations involve some risk of default with respect to interest and/or principal payments.
Foreign securities’ (including foreign exchange contracts’) prices are converted into U.S. dollar amounts using the applicable exchange rates as of the close of the London world markets. If market quotations are available and reliable for foreign exchange-traded equity securities, the securities will be valued at the market quotations. Because trading hours for certain foreign securities end before the close of the NYSE, closing market quotations may become unreliable. If between the time trading ends on a particular security and the close of the customary trading session on the NYSE, events occur that Invesco Capital Management LLC (the “Adviser”) determines are significant and make the closing price unreliable, a Fund may fair value the security. If the event is likely to have affected the closing price of the security, the security will be valued at fair value in good faith using procedures approved by the Board of Trustees. Adjustments to closing prices to reflect fair value may also be based on a screening process of an independent pricing service to indicate the degree of certainty, based on historical data, that the closing price in the principal market where a foreign security trades is not the current value as of the close of the NYSE. Foreign securities’ prices meeting the approved degree of certainty that the price is not reflective of current value will be priced at the indication of fair value from the independent pricing service. Multiple factors may be considered by the independent pricing service in determining adjustments to reflect fair value and may include information relating to sector indices, American Depositary Receipts and domestic and foreign index futures. Foreign securities may have additional risks including exchange rate changes, the potential for sharply devalued currencies and high inflation, political and economic upheaval, the relative lack of issuer information, relatively low market liquidity and the potential lack of strict financial and accounting controls and standards.
Securities for which market prices are not provided by any of the above methods may be valued based upon quotes furnished by independent sources. The last bid price may be used to value exchange-traded equity securities. The mean between the last bid and asked prices may be used to value debt obligations, including corporate loans, and unlisted equity securities.
Securities for which market quotations are not readily available or became unreliable are valued at fair value as determined in good faith following procedures approved by the Board of Trustees. Issuer-specific events, market trends, bid/asked quotes of brokers and information providers and other market data may be reviewed in the course of making a good faith determination of a security’s fair value.
Each Fund may invest in securities that are subject to interest rate risk, meaning the risk that the prices will generally fall as interest rates rise and, conversely, the prices will generally rise as interest rates fall. Specific securities differ in their sensitivity to changes in interest rates depending on their individual characteristics. Changes in interest rates may result in increased market volatility, which may affect the value and/or liquidity of certain Fund investments.
Valuations change in response to many factors, including the historical and prospective earnings of the issuer, the value of the issuer’s assets, general market conditions which are not specifically related to the particular issuer, such as real or perceived adverse economic conditions, changes in the general outlook for revenues or corporate earnings, changes in interest or currency rates, regional or global instability, natural or environmental disasters, widespread disease or other public health issues, war, acts of terrorism or adverse investor sentiment generally and market liquidity. Because of the inherent uncertainties of valuation, the values reflected in the financial statements may materially differ from the value received upon actual sale of those investments.
Authorized Participant Concentration Risk. Only authorized participants (“APs”) may engage in creation or redemption transactions directly with each Fund. Each Fund has a limited number of institutions that may act as APs, and such APs have no obligation to submit creation or redemption orders. Consequently, there is no assurance that APs will establish or maintain an active trading market for the Shares. This risk may be heightened to the extent that securities held by each Fund are traded outside a collateralized settlement system. In that case, APs may be required to post collateral on certain trades on an
agency basis (i.e., on behalf of other market participants), which only a limited number of APs may be able to do. In addition, to the extent that APs exit the business or are unable to proceed with creation and/or redemption orders with respect to each Fund and no other AP is able to step forward to create or redeem Creation Units, this may result in a significantly diminished trading market for Fund Shares, and Shares may be more likely to trade at a premium or discount to a Fund’s NAV and to face trading halts and/or delisting. Investments in non-U.S. securities, which may have lower trading volumes, may increase this risk.
Equity Risk. Equity risk is the risk that the value of equity securities, including common stocks, may fall due to both changes in general economic conditions that impact the market as a whole, as well as factors that directly relate to a specific company or its industry. Such general economic conditions include changes in interest rates, periods of market turbulence or instability, or general and prolonged periods of economic decline and cyclical change. It is possible that a drop in the stock market may depress the price of most or all of the common stocks that each Fund holds. In addition, equity risk includes the risk that investor sentiment toward one or more industries will become negative, resulting in those investors exiting their investments in those industries, which could cause a reduction in the value of companies in those industries more broadly. The value of a company’s common stock may fall solely because of factors, such as an increase in production costs that negatively impact other companies in the same region, industry or sector of the market. A company’s common stock also may decline significantly in price over a short period of time due to factors specific to that company, including decisions made by its management or lower demand for the company’s products or services. For example, an adverse event, such as an unfavorable earnings report or the failure to make anticipated dividend payments, may depress the value of common stock.
Index Risk. Unlike many investment companies, each Fund does not utilize an investing strategy that seeks returns in excess of its Underlying Index. Therefore, a Fund would not necessarily buy or sell a security unless that security is added or removed, respectively, from its Underlying Index, even if that security generally is underperforming. Additionally, each Fund rebalances its portfolio in accordance with its Underlying Index, and, therefore, any changes to the Underlying Index’s rebalance schedule will result in corresponding changes to each Fund’s rebalance schedule.
Industry Concentration Risk. In following its methodology, each Fund’s Underlying Index from time to time may be concentrated to a significant degree in securities of issuers located in a single industry or industry group. To the extent that each Underlying Index concentrates in the securities of issuers in a particular industry or industry group, the corresponding Fund will also concentrate its investments to approximately the same extent. By concentrating its investments in an industry or industry group, each Fund may face more risks than if it were diversified broadly over numerous industries or industry groups. Such industry-based risks, any of which may adversely affect the companies in which each Fund invests, may include, but are not limited to, the following: general economic conditions or cyclical market patterns that could negatively affect supply and demand in a particular industry; competition for resources, adverse labor relations, political or world events; obsolescence of technologies; and increased competition or new product introductions that may affect the profitability or viability of companies in an industry. In addition, at times, such industry or industry group may be out of favor and underperform other industries or the market as a whole.
Market Risk. Securities in the Underlying Index are subject to market fluctuations. You should anticipate that the value of the Shares will decline, more or less, in correlation with any decline in value of the securities in the Underlying Index. Additionally, natural or environmental disasters, widespread disease or other public health issues, war, acts of terrorism or other events could result in increased premiums or discounts to each Fund’s NAV.
Non-Correlation Risk. Each Fund’s return may not match the return of its corresponding Underlying Index for a number of reasons. For example, each Fund incurs operating expenses not applicable to the Underlying Index, and incurs costs in buying and selling securities, especially when rebalancing the Fund’s securities holdings to reflect changes in the composition of its corresponding Underlying Index. In addition, the performance of each Fund and its corresponding Underlying Index may vary due to asset valuation differences and differences between each Fund’s portfolio and its corresponding Underlying Index resulting from legal restrictions, costs or liquidity constraints.
Non-Diversified Fund Risk. S&P SmallCap Consumer Staples ETF, S&P SmallCap Energy ETF, S&P SmallCap Materials ETF and S&P SmallCap Utilities & Communication Services ETF are non-diversified and can invest a greater portion of its assets in securities of individual issuers than a diversified fund. As a result, changes in the market value of a single investment could cause greater fluctuations in Share price than would occur in a diversified fund. This may increase a Fund’s volatility and cause the performance of a relatively small number of issuers to have a greater impact on a Fund’s performance.
Portfolio Turnover Risk. Certain Funds may engage in frequent trading of its portfolio securities in connection with the rebalancing or adjustment of its Underlying Index. A portfolio turnover rate of 200%, for example, is equivalent to a Fund buying and selling all of its securities two times during the course of a year. A high portfolio turnover rate (such as 100% or more) could result in high brokerage costs for a Fund. While a high portfolio turnover rate can result in an increase in taxable capital gains distributions to a Fund’s shareholders, a Fund will seek to utilize the in-kind creation and redemption mechanism to minimize realization of capital gains to the extent possible.
Small Capitalization Company Risk. Investing in securities of small capitalization companies involves greater risk than customarily is associated with investing in larger, more established companies. These companies’ securities may be more volatile and less liquid than those of more established companies. These securities may have returns that vary, sometimes
significantly, from the overall securities market. Often small capitalization companies and the industries in which they focus are still evolving and, as a result, they may be more sensitive to changing market conditions.
| C. | Investment Transactions and Investment Income - Investment transactions are accounted for on a trade date basis. Realized gains and losses from the sale or disposition of securities are computed on the specific identified cost basis. Interest income is recorded on an accrual basis from settlement date. Pay-in-kind interest income and non-cash dividend income received in the form of securities in-lieu of cash are recorded at the fair value of the securities received. Dividend income (net of withholding tax, if any) is recorded on the ex-dividend date. Dividend income from REITs is recorded based on the income included in the distributions received from the REIT investments using published REIT classifications, including some management estimates when actual amounts are not available. Distributions received in excess of this estimated amount are recorded as a reduction of the cost of investments or reclassified to capital gains. The actual amounts of income, return of capital, and capital gains are only determined by each REIT after its fiscal year-end, and may differ from the estimated amounts. Realized gains, dividends and interest received by a Fund may give rise to withholding and other taxes imposed by foreign countries. Tax conventions between certain countries and the United States may reduce or eliminate such taxes. |
The Funds may periodically participate in litigation related to each Fund’s investments. As such, the Funds may receive proceeds from litigation settlements. Any proceeds received are included in the Statements of Operations as realized gain (loss) for investments no longer held and as unrealized gain (loss) for investments still held.
Brokerage commissions and mark ups are considered transaction costs and are recorded as an increase to the cost basis of securities purchased and/or a reduction of proceeds on a sale of securities. Such transaction costs are included in the determination of net realized and unrealized gain (loss) from investment securities reported in the Statements of Operations and the Statements of Changes in Net Assets and the net realized and unrealized gains (losses) on securities per share in the Financial Highlights. Transaction costs are included in the calculation of each Fund’s NAV and, accordingly, they reduce each Fund’s total returns. These transaction costs are not considered operating expenses and are not reflected in net investment income reported in the Statements of Operations and the Statements of Changes in Net Assets, or the net investment income per share and the ratios of expenses and net investment income reported in the Financial Highlights, nor are they limited by any expense limitation arrangements between each Fund and the Adviser.
| D. | Country Determination - For the purposes of presentation in the Schedules of Investments, the Adviser may determine the country in which an issuer is located and/or credit risk exposure based on various factors. These factors include whether each Fund’s Underlying Index has made a country determination and may include the laws of the country under which the issuer is organized, where the issuer maintains a principal office, the country in which the issuer derives 50% or more of its total revenues and the country that has the primary market for the issuer’s securities, as well as other criteria. Among the other criteria that may be evaluated for making this determination are the country in which the issuer maintains 50% or more of its assets, the type of security, financial guarantees and enhancements, the nature of the collateral and the sponsor organization. Country of issuer and/or credit risk exposure has been determined to be the United States of America, unless otherwise noted. |
| E. | Dividends and Distributions to Shareholders - Each Fund declares and pays dividends from net investment income, if any, to its shareholders quarterly and records such dividends on the ex-dividend date. Generally, each Fund distributes net realized taxable capital gains, if any, annually in cash and records them on the ex-dividend date. Such distributions on a tax basis are determined in conformity with federal income tax regulations, which may differ from accounting principles generally accepted in the United States of America (“GAAP”). Distributions in excess of tax basis earnings and profits, if any, are reported in such Fund’s financial statements as a tax return of capital at fiscal year-end. |
| F. | Federal Income Taxes - Each Fund intends to comply with the provisions of the Internal Revenue Code of 1986, as amended (the “Internal Revenue Code”), applicable to regulated investment companies and to distribute substantially all of the Fund’s taxable earnings to its shareholders. As such, the Funds will not be subject to federal income taxes on otherwise taxable income (including net realized gains) that is distributed to the shareholders. Therefore, no provision for federal income taxes is recorded in the financial statements. |
Each Fund recognizes the tax benefits of uncertain tax positions only when the position is more likely than not to be sustained. Management has analyzed each Fund’s uncertain tax positions and concluded that no liability for unrecognized tax benefits should be recorded related to uncertain tax positions. Management is not aware of any tax positions for which it is reasonably possible that the total amounts of unrecognized tax benefits will change materially in the next 12 months.
Income and capital gain distributions are determined in accordance with federal income tax regulations, which may differ from GAAP. These differences are primarily due to differing book and tax treatments for in-kind transactions, losses deferred due to wash sales, and passive foreign investment company adjustments, if any.
The Funds file U.S. federal tax returns and tax returns in certain other jurisdictions. Generally, a Fund is subject to examinations by such taxing authorities for up to three years after the filing of the return for the tax period.
| G. | Expenses - Expenses of the Trust that are excluded from a Fund’s unitary management fee and are directly identifiable to a specific Fund are applied to that Fund. Expenses of the Trust that are excluded from a Fund’s unitary management fee and are not readily identifiable to a specific Fund are allocated in such a manner as deemed equitable, taking into consideration the nature and type of expense and the relative net assets of each Fund. |
Each Fund has agreed to pay an annual unitary management fee to the Adviser. Out of the unitary management fee, the Adviser has agreed to pay for substantially all expenses of the Funds, including the costs of transfer agency, custody, fund
administration, legal, audit and other services, except for advisory fees, distribution fees, if any, brokerage expenses, taxes, interest, litigation expenses, acquired fund fees and expenses, if any, and other extraordinary expenses.
To the extent a Fund invests in other investment companies, the expenses shown in the accompanying financial statements reflect the expenses of the Fund and do not include any expenses of the investment companies in which it invests. The effects of such investment companies’ expenses are included in the realized and unrealized gain or loss on the investments in the investment companies.
| H. | Accounting Estimates - The preparation of the financial statements in accordance with GAAP requires management to make estimates and assumptions that affect the reported amounts and disclosures in the financial statements, including estimates and assumptions related to taxation. Actual results could differ from these estimates. In addition, the Funds monitor for material events or transactions that may occur or become known after the period-end date and before the date the financial statements are released to print. |
| I. | Indemnifications - Under the Trust’s organizational documents, its Officers and Trustees are indemnified against certain liabilities arising out of the performance of their duties to the Trust. Each Board member who is not an “interested person” (as defined in the 1940 Act) of the Trust (each, an “Independent Trustee”) is also indemnified against certain liabilities arising out of the performance of their duties to the Trust pursuant to an Indemnification Agreement between such trustee and the Trust. Additionally, in the normal course of business, the Trust enters into contracts with service providers that contain general indemnification clauses. The Trust’s maximum exposure under these arrangements is unknown, as this would involve future claims that may be made against the Trust that have not yet occurred. However, based on experience, the Trust believes the risk of loss to be remote. |
| J. | Securities Lending - Each Fund may participate in securities lending and may loan portfolio securities having a market value up to one-third of the Fund’s total assets. Such loans are secured by cash collateral equal to no less than 102% (105% for international securities) of the market value of the loaned securities determined daily by the securities lending provider. Cash collateral received in connection with these loans is generally invested in an affiliated money market fund and is shown as such on the Schedules of Investments. Each Fund bears the risk of loss with respect to the investment of collateral. It is the policy of these Funds to obtain additional collateral from or return excess collateral to the borrower by the end of the next business day, following the valuation date of the securities loaned. Therefore, the value of the collateral held may be temporarily less than the value of the securities on loan. When loaning securities, each Fund retains certain benefits of owning the securities, including the economic equivalent of dividends or interest generated by the security. Lending securities entails a risk of loss to each Fund if, and to the extent that, the market value of the securities loaned were to increase, and the borrower did not increase the collateral accordingly, and the borrower failed to return the securities. The securities loaned are subject to termination at the option of the borrower or each Fund. Upon termination, the borrower will return to each Fund the securities loaned and each Fund will return the collateral. Upon the failure of the borrower to return the securities, collateral may be liquidated and the securities may be purchased on the open market to replace the loaned securities. Each Fund could experience delays and costs in gaining access to the collateral and the securities may lose value during the delay which could result in potential losses to each Fund. Some of these losses may be indemnified by the lending agent. Each Fund bears the risk of any deficiency in the amount of the collateral available for return to the borrower due to any loss on the collateral invested. For Funds that participated in securities lending, dividends received on cash collateral investments for securities lending transactions, which are net of compensation to counterparties, are included in Securities lending income on the Statements of Operations. The aggregate value of securities out on loan, if any, is shown on the Statements of Assets and Liabilities. |
NOTE 3–Investment Advisory Agreement and Other Agreements
The Trust has entered into an Investment Advisory Agreement with the Adviser on behalf of each Fund, pursuant to which the Adviser has overall responsibility for the selection and ongoing monitoring of the Funds’ investments, managing the Funds’ business affairs and providing certain clerical, bookkeeping and other administrative services.
Pursuant to the Investment Advisory Agreement, each Fund accrues daily and pays monthly to the Adviser an annual unitary management fee. Out of the unitary management fee, the Adviser has agreed to pay for substantially all expenses of the Funds, including the cost of transfer agency, custody, fund administration, legal, audit and other services, except for advisory fees,
distribution fees, if any, brokerage expenses, taxes, interest, litigation expenses, acquired fund fees and expenses, if any, and other extraordinary expenses. The unitary management fee is paid by each Fund to the Adviser at the following annual rates:
| | |
| | | Unitary Management Fees
(as a % of average daily net assets) |
DWA SmallCap Momentum ETF | | 0.60% |
S&P SmallCap Consumer Discretionary ETF | | 0.29% |
S&P SmallCap Consumer Staples ETF | | 0.29% |
S&P SmallCap Energy ETF | | 0.29% |
S&P SmallCap Financials ETF | | 0.29% |
S&P SmallCap Health Care ETF | | 0.29% |
S&P SmallCap Industrials ETF | | 0.29% |
S&P SmallCap Information Technology ETF | | 0.29% |
S&P SmallCap Materials ETF | | 0.29% |
S&P SmallCap Utilities & Communication Services ETF | | 0.29% |
Further, through at least August 31, 2022, the Adviser has contractually agreed to waive a portion of each Fund’s management fee in an amount equal to 100% of the net advisory fees an affiliate of the Adviser receives that are attributable to the Fund’s investments of otherwise uninvested cash in money market funds managed by that affiliate (excluding investments of cash collateral from securities lending). There is no guarantee that the Adviser will extend the waiver of these fees past that date.
For the fiscal year ended August 31, 2020, the Adviser waived fees for each Fund in the following amounts:
| | | | |
DWA SmallCap Momentum ETF | | $ | 593 | |
S&P SmallCap Consumer Discretionary ETF | | | 27 | |
S&P SmallCap Consumer Staples ETF | | | 45 | |
S&P SmallCap Energy ETF | | | 14 | |
S&P SmallCap Financials ETF | | | 189 | |
S&P SmallCap Health Care ETF | | | 1,789 | |
S&P SmallCap Industrials ETF | | | 31 | |
S&P SmallCap Information Technology ETF | | | 279 | |
S&P SmallCap Materials ETF | | | 18 | |
S&P SmallCap Utilities & Communication Services ETF | | | 98 | |
The Trust has entered into a Distribution Agreement with Invesco Distributors, Inc. (the “Distributor”), which serves as the distributor of Creation Units for each Fund. The Distributor does not maintain a secondary market in the Shares. The Funds are not charged any fees pursuant to the Distribution Agreement. The Distributor is an affiliate of the Adviser.
The Adviser has entered into a licensing agreement for each Fund with the following entities (each, a “Licensor”):
| | |
| Fund | | Licensor |
| DWA SmallCap Momentum ETF | | Dorsey Wright& Associates, LLC |
| S&P SmallCap Consumer Discretionary ETF | | S&P DowJones Indices LLC |
| S&P SmallCap Consumer Staples ETF | | S&P DowJones Indices LLC |
| S&P SmallCap Energy ETF | | S&P DowJones Indices LLC |
| S&P SmallCap Financials ETF | | S&P DowJones Indices LLC |
| S&P SmallCap Health Care ETF | | S&P DowJones Indices LLC |
| S&P SmallCap Industrials ETF | | S&P DowJones Indices LLC |
| S&P SmallCap Information Technology ETF | | S&P DowJones Indices LLC |
| S&P SmallCap Materials ETF | | S&P DowJones Indices LLC |
| S&P SmallCap Utilities& Communication Services ETF | | S&P DowJones Indices LLC |
Each Underlying Index name trademark is owned by its respective Licensor. These trademarks have been licensed to the Adviser for use by the Funds. Each Fund is entitled to use its Underlying Index pursuant to the Trust’s sub-licensing agreement with the Adviser. The Funds are not sponsored, endorsed, sold or promoted by the Licensors, and the Licensors make no representation regarding the advisability of investing in any of the Funds.
The Trust has entered into service agreements whereby The Bank of New York Mellon, a wholly-owned subsidiary of The Bank of New York Mellon Corporation, serves as the administrator, custodian, fund accountant and transfer agent for each Fund.
For fiscal year ended August 31, 2020, the following Funds incurred brokerage commissions with Invesco Capital Markets, Inc. (“ICMI”), an affiliate of the Adviser and Distributor, for portfolio transactions executed on behalf of the Fund, as listed below:
| | | | |
DWA SmallCap Momentum ETF | | $ | 30,009 | |
S&P SmallCap Consumer Discretionary ETF | | | 1,953 | |
S&P SmallCap Consumer Staples ETF | | | 2,403 | |
S&P SmallCap Energy ETF | | | 11,487 | |
S&P SmallCap Financials ETF | | | 6,466 | |
S&P SmallCap Health Care ETF | | | 13,515 | |
S&P SmallCap Industrials ETF | | | 717 | |
S&P SmallCap Information Technology ETF | | | 8,222 | |
S&P SmallCap Materials ETF | | | 531 | |
S&P SmallCap Utilities & Communication Services ETF | | | 5,690 | |
Portfolio transactions with ICMI that have not settled at period-end, if any, are shown in the Statements of Assets and Liabilities under the receivable caption Investments sold - affiliated broker and/or payable caption Investments purchased - affiliated broker.
NOTE 4–Security Transactions with Affiliated Funds
Each Fund is permitted to purchase or sell securities from or to certain other affiliated funds under specified conditions outlined in procedures adopted by the Board of Trustees of the Trust. The procedures have been designed to ensure that any purchase or sale of securities by each Fund from or to another fund or portfolio that is or could be considered an affiliate by virtue of having a common investment adviser (or affiliated investment advisers), common Trustees and/or common officers complies with Rule 17a-7 of the 1940 Act. Further, as defined under the procedures, each transaction is effected at the current market price.
For the fiscal year ended August 31, 2020, the following Funds engaged in transactions with affiliates as listed below:
| | | | | | | | | | | | |
| | | Securities Purchases | | | Securities Sales | | | Net Realized Gains (Losses)* | |
DWA SmallCap Momentum ETF | | $ | 663,890 | | | $ | 4,073,210 | | | $ | 142,783 | |
S&P SmallCap Consumer Discretionary ETF | | | 729,656 | | | | 23,519 | | | | (7,450 | ) |
S&P SmallCap Consumer Staples ETF | | | - | | | | 42,203 | | | | (1,462 | ) |
S&P SmallCap Energy ETF | | | 1,907,286 | | | | - | | | | - | |
S&P SmallCap Financials ETF | | | 2,026,486 | | | | 183,835 | | | | (9,007 | ) |
S&P SmallCap Health Care ETF | | | 164,893 | | | | - | | | | - | |
S&P SmallCap Materials ETF | | | 241,316 | | | | - | | | | - | |
| * | Net realized gains (losses) from securities sold to affiliates are included in net realized gain (loss) from investment securities in the Statements of Operations. |
NOTE 5–Additional Valuation Information
GAAP defines fair value as the price that would be received to sell an asset or paid to transfer a liability in an orderly transaction between market participants at the measurement date, under current market conditions. GAAP establishes a hierarchy that prioritizes the inputs to valuation methods, giving the highest priority to readily available unadjusted quoted prices in an active market for identical assets (Level 1) and the lowest priority to significant unobservable inputs (Level 3), generally when market prices are not readily available or are unreliable. Based on the valuation inputs, the securities or other investments are tiered into one of three levels. Changes in valuation methods may result in transfers in or out of an investment’s assigned level:
| | | | |
| | Level 1 – | | Prices are determined using quoted prices in an active market for identical assets. |
| | |
| | Level 2 – | | Prices are determined using other significant observable inputs. Observable inputs are inputs that other market participants may use in pricing a security. These may include quoted prices for similar securities, interest rates, pre Prices are determined using significant unobservable inputs. In situations where quoted prices or observable inputs are unavailable (for example, when there is little or no market activity for an investment at the end of the period), unobservable inputs may be used. Unobservable inputs reflect a Fund’s own assumptions about the factors market participants would use in determining fair value of the securities or instruments and would be based on the best available information.payment speeds, credit risk, yield curves, loss severities, default rates, discount rates, volatilities and others. |
| | |
| | Level 3 – | | Prices are determined using significant unobservable inputs. In situations where quoted prices or observable inputs are unavailable (for example, when there is little or no market activity for an investment at the end of the period), unobservable inputs may be used. Unobservable inputs reflect a Fund’s own assumptions about the factors market participants would use in determining fair value of the securities or instruments and would be based on the best available information. |
Except for all the securities in Invesco S&P SmallCap Industrials ETF, the following is a summary of the tiered valuation input levels, as of August 31, 2020. All of the securities in Invesco S&P SmallCap Industrials ETF were valued based on Level 1 inputs (see the Schedules of Investments for security categories).The level assigned to the securities valuations may not be an indication
of the risk or liquidity associated with investing in those securities. Because of the inherent uncertainties of valuation, the values reflected in the financial statements may materially differ from the value received upon actual sale of those investments.
| | | | | | | | | | | | | | | | |
| | | Level 1 | | | Level 2 | | | Level 3 | | | Total | |
DWA SmallCap Momentum ETF | | | | | | | | | | | | | | | | |
Investments in Securities | | | | | | | | | | | | | | | | |
Common Stocks & Other Equity Interests | | $ | 234,320,807 | | | $ | - | | | $ | - | | | $ | 234,320,807 | |
Money Market Funds | | | 95,743 | | | | 25,483,372 | | | | - | | | | 25,579,115 | |
| | | | | | | | | | | | | | | | |
Total Investments | | $ | 234,416,550 | | | $ | 25,483,372 | | | $ | - | | | $ | 259,899,922 | |
| | | | | | | | | | | | | | | | |
S&P SmallCap Consumer Discretionary ETF | | | | | | | | | | | | | | | | |
Investments in Securities | | | | | | | | | | | | | | | | |
Common Stocks & Other Equity Interests | | $ | 19,393,616 | | | $ | - | | | $ | - | | | $ | 19,393,616 | |
Money Market Funds | | | 19,479 | | | | 2,620,644 | | | | - | | | | 2,640,123 | |
| | | | | | | | | | | | | | | | |
Total Investments | | $ | 19,413,095 | | | $ | 2,620,644 | | | $ | - | | | $ | 22,033,739 | |
| | | | | | | | | | | | | | | | |
S&P SmallCap Consumer Staples ETF | | | | | | | | | | | | | | | | |
Investments in Securities | | | | | | | | | | | | | | | | |
Common Stocks & Other Equity Interests | | $ | 39,182,054 | | | $ | - | | | $ | - | | | $ | 39,182,054 | |
Money Market Funds | | | 3,119 | | | | 4,100,335 | | | | - | | | | 4,103,454 | |
| | | | | | | | | | | | | | | | |
Total Investments | | $ | 39,185,173 | | | $ | 4,100,335 | | | $ | - | | | $ | 43,285,508 | |
| | | | | | | | | | | | | | | | |
S&P SmallCap Energy ETF | | | | | | | | | | | | | | | | |
Investments in Securities | | | | | | | | | | | | | | | | |
Common Stocks & Other Equity Interests | | $ | 14,709,619 | | | $ | | | | $ | - | | | $ | 14,709,619 | |
Money Market Funds | | | 3,793 | | | | 928,608 | | | | - | | | | 932,401 | |
| | | | | | | | | | | | | | | | |
Total Investments | | $ | 14,713,412 | | | $ | 928,608 | | | $ | - | | | $ | 15,642,020 | |
| | | | | | | | | | | | | | | | |
S&P SmallCap Financials ETF | | | | | | | | | | | | | | | | |
Investments in Securities | | | | | | | | | | | | | | | | |
Common Stocks & Other Equity Interests | | $ | 26,259,791 | | | | | | | $ | - | | | $ | 26,259,791 | |
Money Market Funds | | | 12,423 | | | | 1,083,174 | | | | - | | | | 1,095,597 | |
| | | | | | | | | | | | | | | | |
Total Investments | | $ | 26,272,214 | | | $ | 1,083,174 | | | $ | - | | | $ | 27,355,388 | |
| | | | | | | | | | | | | | | | |
S&P SmallCap Health Care ETF | | | | | | | | | | | | | | | | |
Investments in Securities | | | | | | | | | | | | | | | | |
Common Stocks & Other Equity Interests | | $ | 385,055,142 | | | $ | - | | | $ | - | | | $ | 385,055,142 | |
Money Market Funds | | | - | | | | 19,117,714 | | | | - | | | | 19,117,714 | |
| | | | | | | | | | | | | | | | |
Total Investments | | $ | 385,055,142 | | | $ | 19,117,714 | | | $ | - | | | $ | 404,172,856 | |
| | | | | | | | | | | | | | | | |
S&P SmallCap Information Technology ETF | | | | | | | | | | | | | | | | |
Investments in Securities | | | | | | | | | | | | | | | | |
Common Stocks & Other Equity Interests | | $ | 244,507,032 | | | $ | - | | | $ | - | | | $ | 244,507,032 | |
Money Market Funds | | | 13,058 | | | | 3,754,603 | | | | - | | | | 3,767,661 | |
| | | | | | | | | | | | | | | | |
Total Investments | | $ | 244,520,090 | | | $ | 3,754,603 | | | $ | - | | | $ | 248,274,693 | |
| | | | | | | | | | | | | | | | |
S&P SmallCap Materials ETF | | | | | | | | | | | | | | | | |
Investments in Securities | | | | | | | | | | | | | | | | |
Common Stocks & Other Equity Interests | | $ | 8,396,034 | | | $ | - | | | $ | - | | | $ | 8,396,034 | |
Money Market Funds | | | - | | | | 618,595 | | | | - | | | | 618,595 | |
| | | | | | | | | | | | | | | | |
Total Investments | | $ | 8,396,034 | | | $ | 618,595 | | | $ | - | | | $ | 9,014,629 | |
| | | | | | | | | | | | | | | | |
S&P SmallCap Utilities & Communication Services ETF | | | | | | | | | | | | | | | | |
Investments in Securities | | | | | | | | | | | | | | | | |
Common Stocks & Other Equity Interests | | $ | 21,918,689 | | | $ | - | | | $ | - | | | $ | 21,918,689 | |
Money Market Funds | | | 11,301 | | | | 742,981 | | | | - | | | | 754,282 | |
| | | | | | | | | | | | | | | | |
Total Investments | | $ | 21,929,990 | | | $ | 742,981 | | | $ | - | | | $ | 22,672,971 | |
| | | | | | | | | | | | | | | | |
NOTE 6–Distributions to Shareholders and Tax Components of Net Assets
Tax Character of Distributions to Shareholders Paid During the Fiscal Years Ended August 31, 2020 and 2019:
| | | | | | | | | | | | | | | | |
| | | 2020 | | | 2019 | |
| | | Ordinary
Income* | | | Long-Term
Capital Gains | | | Ordinary
Income* | | | Long-Term
Capital Gains | |
DWA SmallCap Momentum ETF | | $ | 729,666 | | | $ | - | | | $ | - | | | $ | - | |
S&P SmallCap Consumer Discretionary ETF | | | 234,072 | | | | - | | | | 792,177 | | | | - | |
S&P SmallCap Consumer Staples ETF | | | 860,763 | | | | - | | | | 1,108,459 | | | | - | |
S&P SmallCap Energy ETF | | | 116,495 | | | | - | | | | 67,203 | | | | - | |
S&P SmallCap Financials ETF | | | 3,392,383 | | | | 1,039,392 | | | | 6,294,395 | | | | 1,287,469 | |
S&P SmallCap Health Care ETF | | | - | | | | - | | | | 51,156 | | | | - | |
S&P SmallCap Industrials ETF | | | 379,899 | | | | - | | | | 548,473 | | | | - | |
S&P SmallCap Information Technology ETF | | | 419,646 | | | | - | | | | 1,350,753 | | | | - | |
S&P SmallCap Materials ETF | | | 202,623 | | | | - | | | | 233,740 | | | | - | |
S&P SmallCap Utilities & Communication Services ETF | | | 832,908 | | | | - | | | | 1,441,686 | | | | - | |
| * | Includes short-term capital gain distributions, if any. |
Tax Components of Net Assets at Fiscal Year-end:
| | | | | | | | | | | | | | | | | | | | | | | | | | | | |
| | | Undistributed
Ordinary
Income | | | Net
Unrealized
Appreciation
(Depreciation)-
Investments | | | Capital Loss
Carryforwards | | | Late-Year
Ordinary
Loss
Deferral | | | Post-October
Capital
Losses
Deferrals | | | Shares of
Beneficial
Interest | | | Total
Net Assets | |
DWA SmallCap Momentum ETF | | $ | 89,486 | | | $ | 43,977,575 | | | $ | (287,009,112 | ) | | $ | - | | | $ | - | | | $ | 477,315,163 | | | $ | 234,373,112 | |
S&P SmallCap Consumer Discretionary ETF | | | 9,909 | | | | (3,215,302 | ) | | | (8,215,990 | ) | | | - | | | | - | | | | 30,891,380 | | | | 19,469,997 | |
S&P SmallCap Consumer Staples ETF | | | 103,359 | | | | (5,553,253 | ) | | | (9,895,159 | ) | | | - | | | | - | | | | 54,527,196 | | | | 39,182,143 | |
S&P SmallCap Energy ETF | | | 55,430 | | | | (13,190,702 | ) | | | (61,271,843 | ) | | | - | | | | - | | | | 89,119,770 | | | | 14,712,655 | |
S&P SmallCap Financials ETF | | | - | | | | (9,577,650 | ) | | | (3,584,265 | ) | | | - | | | | (6,058 | ) | | | 39,464,846 | | | | 26,296,873 | |
S&P SmallCap Health Care ETF | | | - | | | | (64,220,099 | ) | | | (67,082,895 | ) | | | (539,339 | ) | | | - | | | | 516,799,761 | | | | 384,957,428 | |
S&P SmallCap Industrials ETF | | | 59,983 | | | | (5,594,296 | ) | | | (4,783,152 | ) | | | - | | | | - | | | | 56,485,255 | | | | 46,167,790 | |
S&P SmallCap Information Technology ETF | | | - | | | | (630,682 | ) | | | (14,242,821 | ) | | | - | | | | - | | | | 259,414,878 | | | | 244,541,375 | |
S&P SmallCap Materials ETF | | | 20,414 | | | | (2,055,965 | ) | | | (3,456,192 | ) | | | - | | | | - | | | | 13,920,430 | | | | 8,428,687 | |
| S&P SmallCap Utilities & Communication Services ETF | | | 72,988 | | | | (4,558,844 | ) | | | (5,274,562 | ) | | | - | | | | - | | | | 31,745,103 | | | | 21,984,685 | |
Capital loss carryforwards are calculated and reported as of a specific date. Results of transactions and other activity after that date may affect the amount of capital loss carryforwards actually available for the Funds to utilize. The ability to utilize capital loss carryforwards in the future may be limited under the Internal Revenue Code and related regulations based on the results of future transactions.
The following table presents available capital loss carryforwards for each Fund as of August 31, 2020:
| | | | | | | | | | | | |
| | | No expiration | | | | |
| | | Short-Term | | | Long-Term | | | Total* | |
DWA SmallCap Momentum ETF | | $ | 283,384,237 | | | $ | 3,624,875 | | | $ | 287,009,112 | |
S&P SmallCap Consumer Discretionary ETF | | | 375,082 | | | | 7,840,908 | | | | 8,215,990 | |
S&P SmallCap Consumer Staples ETF | | | 3,830,733 | | | | 6,064,426 | | | | 9,895,159 | |
S&P SmallCap Energy ETF | | | 14,646,211 | | | | 46,625,632 | | | | 61,271,843 | |
S&P SmallCap Financials ETF | | | 248,221 | | | | 3,336,044 | | | | 3,584,265 | |
S&P SmallCap Health Care ETF | | | 23,960,646 | | | | 43,122,249 | | | | 67,082,895 | |
S&P SmallCap Industrials ETF | | | 984,350 | | | | 3,798,802 | | | | 4,783,152 | |
S&P SmallCap Information Technology ETF | | | 222,401 | | | | 14,020,420 | | | | 14,242,821 | |
S&P SmallCap Materials ETF | | | 147,518 | | | | 3,308,674 | | | | 3,456,192 | |
S&P SmallCap Utilities & Communication Services ETF | | | 1,407,630 | | | | 3,866,932 | | | | 5,274,562 | |
| * | Capital loss carryforwards are reduced for limitations, if any, to the extent required by the Internal Revenue Code and may be further limited depending upon a variety of factors, including the realization of net unrealized gains or losses as of the date of any reorganization. |
NOTE 7–Investment Transactions
For the fiscal year ended August 31, 2020, the cost of securities purchased and the proceeds from sales of securities (other than short-term securities, U.S. Treasury obligations, money market funds and in-kind transactions, if any) were as follows:
| | | | | | | | |
| | | Purchases | | | Sales | |
DWA SmallCap Momentum ETF | | $ | 427,842,975 | | | $ | 425,206,840 | |
S&P SmallCap Consumer Discretionary ETF | | | 5,205,287 | | | | 7,490,764 | |
S&P SmallCap Consumer Staples ETF | | | 17,771,830 | | | | 17,670,358 | |
S&P SmallCap Energy ETF | | | 12,615,906 | | | | 12,668,887 | |
S&P SmallCap Financials ETF | | | 24,126,839 | | | | 27,005,407 | |
S&P SmallCap Health Care ETF | | | 82,272,764 | | | | 84,453,371 | |
S&P SmallCap Industrials ETF | | | 4,910,567 | | | | 10,168,098 | |
S&P SmallCap Information Technology ETF | | | 52,213,860 | | | | 56,438,198 | |
S&P SmallCap Materials ETF | | | 2,843,059 | | | | 2,913,815 | |
S&P SmallCap Utilities & Communication Services ETF | | | 21,991,416 | | | | 21,756,343 | |
For the fiscal year ended August 31, 2020, in-kind transactions associated with creations and redemptions were as follows:
| | | | | | | | |
| | | Cost of
Securities
Received | | | Value of
Securities
Delivered | |
DWA SmallCap Momentum ETF | | $ | 279,909,451 | | | $ | 316,683,533 | |
S&P SmallCap Consumer Discretionary ETF | | | 19,379,896 | | | | 23,342,552 | |
S&P SmallCap Consumer Staples ETF | | | 25,281,241 | | | | 36,855,512 | |
S&P SmallCap Energy ETF | | | 12,759,919 | | | | 7,356,859 | |
S&P SmallCap Financials ETF | | | 11,069,866 | | | | 97,175,453 | |
S&P SmallCap Health Care ETF | | | 166,004,126 | | | | 292,373,667 | |
S&P SmallCap Industrials ETF | | | 16,497,150 | | | | 18,127,872 | |
S&P SmallCap Information Technology ETF | | | 57,551,718 | | | | 131,513,040 | |
S&P SmallCap Materials ETF | | | - | | | | 6,450,788 | |
S&P SmallCap Utilities & Communication Services ETF | | | 7,634,586 | | | | 33,312,738 | |
Gains (losses) on in-kind transactions are generally not considered taxable gains (losses) for federal income tax purposes. At August 31, 2020, the aggregate cost of investments, including any derivatives, on a tax basis includes adjustments for financial reporting purposes as of the most recently completed federal income tax reporting period-end:
| | | | | | | | | | | | | | | | |
| | | Gross
Unrealized
Appreciation | | | Gross
Unrealized
(Depreciation) | | | Net
Unrealized
Appreciation
(Depreciation) | | | Cost | |
DWA SmallCap Momentum ETF | | $ | 53,199,845 | | | $ | (9,222,270 | ) | | $ | 43,977,575 | | | $ | 215,922,347 | |
S&P SmallCap Consumer Discretionary ETF | | | 1,701,003 | | | | (4,916,305 | ) | | | (3,215,302 | ) | | | 25,249,041 | |
S&P SmallCap Consumer Staples ETF | | | 2,686,196 | | | | (8,239,449 | ) | | | (5,553,253 | ) | | | 48,838,761 | |
S&P SmallCap Energy ETF | | | 1,213,592 | | | | (14,404,294 | ) | | | (13,190,702 | ) | | | 28,832,722 | |
S&P SmallCap Financials ETF | | | 1,643,402 | | | | (11,221,052 | ) | | | (9,577,650 | ) | | | 36,933,038 | |
S&P SmallCap Health Care ETF | | | 54,887,094 | | | | (119,107,193 | ) | | | (64,220,099 | ) | | | 468,392,955 | |
S&P SmallCap Industrials ETF | | | 4,257,764 | | | | (9,852,060 | ) | | | (5,594,296 | ) | | | 51,739,170 | |
S&P SmallCap Information Technology ETF | | | 38,257,737 | | | | (38,888,419 | ) | | | (630,682 | ) | | | 248,905,375 | |
S&P SmallCap Materials ETF | | | 896,205 | | | | (2,952,170 | ) | | | (2,055,965 | ) | | | 11,070,594 | |
S&P SmallCap Utilities & Communication Services ETF | | | 1,502,492 | | | | (6,061,336 | ) | | | (4,558,844 | ) | | | 27,231,815 | |
NOTE 8–Reclassification of Permanent Differences
Primarily as a result of differing book/tax treatment of in-kind transactions and distributions, amounts were reclassified between undistributed net investment income (loss), undistributed net realized gain (loss) and Shares of beneficial interest. These reclassifications had no effect on the net assets of each Fund. For the fiscal year ended August 31, 2020, the reclassifications were as follows:
| | | | | | | | | | | | |
| | | Undistributed Net
Investment Income | | | Undistributed Net
Realized Gain (Loss) | | | Shares of
Beneficial Interest | |
DWA SmallCap Momentum ETF | | $ | - | | | $ | (55,191,753 | ) | | $ | 55,191,753 | |
S&P SmallCap Consumer Discretionary ETF | | | - | | | | (973,617 | ) | | | 973,617 | |
S&P SmallCap Consumer Staples ETF | | | 43,716 | | | | (4,708,833 | ) | | | 4,665,117 | |
S&P SmallCap Energy ETF | | | - | | | | 1,367,913 | | | | (1,367,913 | ) |
S&P SmallCap Financials ETF | | | 346,417 | | | | 1,754,964 | | | | (2,101,381 | ) |
S&P SmallCap Health Care ETF | | | 1,064,722 | | | | (33,520,581 | ) | | | 32,455,859 | |
S&P SmallCap Industrials ETF | | | 46 | | | | 1,667,972 | | | | (1,668,018 | ) |
S&P SmallCap Information Technology ETF | | | 5,296 | | | | (29,156,691 | ) | | | 29,151,395 | |
S&P SmallCap Materials ETF | | | - | | | | 1,330,908 | | | | (1,330,908 | ) |
S&P SmallCap Utilities & Communication Services ETF | | | - | | | | (935,593 | ) | | | 935,593 | |
NOTE 9–Trustees’ and Officer’s Fees
Trustees’ and Officer’s Fees include amounts accrued by the Funds to pay remuneration to the Independent Trustees and an Officer of the Trust. The Adviser, as a result of each Fund’s unitary management fee, pays for such compensation for the Funds. The Trustee who is an “interested person” of the Trust does not receive any Trustees’ fees.
The Trust has adopted a deferred compensation plan (the “Plan”). Under the Plan, each Independent Trustee who has executed a Deferred Fee Agreement (a “Participating Trustee”) may defer receipt of all or a portion of their compensation (“Deferral Fees”). Such Deferral Fees are deemed to be invested in select Invesco ETFs. The Deferral Fees payable to a Participating Trustee are valued as of the date such Deferral Fees would have been paid to a Participating Trustee. The value increases with contributions or with increases in the value of the Shares selected, and the value decreases with distributions or with declines in the value of the Shares selected. Obligations under the Plan represent unsecured claims against the general assets of the Funds.
NOTE 10–Capital
Shares are issued and redeemed by each Fund only in Creation Units consisting of a specified number of Shares as set forth in the Funds’ prospectus. Only Authorized Participants are permitted to purchase or redeem Creation Units from the Funds. Such transactions are principally permitted in exchange for Deposit Securities, with a balancing cash component to equate the transaction to the NAV per Share of a Fund of the Trust on the transaction date. However, for all Funds, cash in an amount equivalent to the value of certain securities may be substituted, generally when the securities are not available in sufficient quantity for delivery, not eligible for trading by the Authorized Participant or as a result of other market circumstances.
To the extent that the Funds permit transactions in exchange for Deposit Securities, each Fund may issue Shares in advance of receipt of Deposit Securities subject to various conditions, including a requirement to maintain on deposit with the Trust cash at least equal to 105% of the market value of the missing Deposit Securities. In accordance with the Trust’s Participant Agreement, Creation Units will be issued to an Authorized Participant, notwithstanding the fact that the corresponding Deposit Securities have not been received in part or in whole, in reliance on the undertaking of the Authorized Participant to deliver the missing Deposit Securities as soon as possible, which undertaking shall be secured by the Authorized Participant’s delivery and maintenance of collateral consisting of cash in the form of U.S. dollars in immediately available funds having a value (marked-to-market daily) at least equal to 105%, which the Adviser may change from time to time, of the value of the missing Deposit Securities.
Certain transaction fees may be charged by the Funds for creations and redemptions, which are treated as increases in capital. Transactions in each Fund’s Shares are disclosed in detail in the Statements of Changes in Net Assets.
NOTE 11–Coronavirus (COVID-19) Pandemic
During the first quarter of 2020, the World Health Organization declared COVID-19 to be a public health emergency. COVID-19 has led to increased short-term market volatility and may have adverse long-term effects on U.S. and world economies and markets in general. COVID-19 may adversely impact the value of the Funds’ investments. Because of the uncertainties on valuation, the global economy and business operations, values reflected in these financial statements may materially differ from the value received upon actual sales of those investments.
The extent of the impact on the performance of the Funds and their investments will depend on future developments, including the duration and spread of the COVID-19 outbreak, related restrictions and advisories, and the effects on the financial markets and economy overall, all of which are highly uncertain and cannot be predicted.
Report of Independent Registered Public Accounting Firm
To the Board of Trustees of Invesco Exchange-Traded Fund Trust II and Shareholders of Invesco DWA SmallCap Momentum ETF, Invesco S&P SmallCap Consumer Discretionary ETF, Invesco S&P SmallCap Consumer Staples ETF, Invesco S&P SmallCap Energy ETF, Invesco S&P SmallCap Financials ETF, Invesco S&P SmallCap Health Care ETF, Invesco S&P SmallCap Industrials ETF, Invesco S&P SmallCap Information Technology ETF, Invesco S&P SmallCap Materials ETF and Invesco S&P SmallCap Utilities & Communication Services ETF
Opinions on the Financial Statements
We have audited the accompanying statements of assets and liabilities, including the schedules of investments, of Invesco DWA SmallCap Momentum ETF, Invesco S&P SmallCap Consumer Discretionary ETF, Invesco S&P SmallCap Consumer Staples ETF, Invesco S&P SmallCap Energy ETF, Invesco S&P SmallCap Financials ETF, Invesco S&P SmallCap Health Care ETF, Invesco S&P SmallCap Industrials ETF, Invesco S&P SmallCap Information Technology ETF, Invesco S&P SmallCap Materials ETF and Invesco S&P SmallCap Utilities & Communication Services ETF (ten of the funds constituting Invesco Exchange-Traded Fund Trust II, hereafter collectively referred to as the “Funds”) as of August 31, 2020, the related statements of operations for the year ended August 31, 2020, the statements of changes in net assets for each of the two years in the period ended August 31, 2020, including the related notes, and the financial highlights for each of the two years in the period ended August 31, 2020, ten months in the period ended August 31, 2018 and three years in the period ended October 31, 2017 (collectively referred to as the “financial statements”). In our opinion, the financial statements present fairly, in all material respects, the financial position of each of the Funds as of August 31, 2020, the results of each of their operations for the year ended August 31, 2020, the changes in each of their net assets for each of the two years in the period ended August 31, 2020, and each of the financial highlights for each of the two years in the period ended August 31, 2020, ten months in the period ended August 31, 2018 and three years in the period ended October 31, 2017, in conformity with accounting principles generally accepted in the United States of America.
Basis for Opinions
These financial statements are the responsibility of the Funds’ management. Our responsibility is to express an opinion on the Funds’ financial statements based on our audits. We are a public accounting firm registered with the Public Company Accounting Oversight Board (United States) (“PCAOB”) and are required to be independent with respect to the Funds in accordance with the U.S. federal securities laws and the applicable rules and regulations of the Securities and Exchange Commission and the PCAOB.
We conducted our audits of these financial statements in accordance with the standards of the PCAOB. Those standards require that we plan and perform the audit to obtain reasonable assurance about whether the financial statements are free of material misstatement, whether due to error or fraud.
Our audits included performing procedures to assess the risks of material misstatement of the financial statements, whether due to error or fraud, and performing procedures that respond to those risks. Such procedures included examining, on a test basis, evidence regarding the amounts and disclosures in the financial statements. Our audits also included evaluating the accounting principles used and significant estimates made by management, as well as evaluating the overall presentation of the financial statements. Our procedures included confirmation of securities owned as of August 31, 2020 by correspondence with the custodian, transfer agent, and brokers; when replies were not received from brokers, we performed other auditing procedures. We believe that our audits provide a reasonable basis for our opinions.
/s/PricewaterhouseCoopers LLP
Chicago, Illinois
October 28, 2020
We have served as the auditor of one or more of the investment companies in the Invesco group of investment companies since at least 1995. We have not been able to determine the specific year we began serving as auditor.
Calculating your ongoing Fund expenses
Example
As a shareholder of a Fund of the Invesco Exchange-Traded Fund Trust II, you incur a unitary management fee. In addition to the unitary management fee, a shareholder may pay distribution fees, if any, brokerage expenses, taxes, interest, acquired fund fees and expenses, if any, litigation expenses and other extraordinary expenses. The expense examples below are intended to help you understand your ongoing costs (in dollars) of investing in the Funds and to compare these costs with the ongoing costs of investing in other funds.
The example is based on an investment of $1,000 invested at the beginning of the period and held through the six-month period ended August 31, 2020.
Actual Expenses
The first line in the following table provides information about actual account values and actual expenses. You may use the information in this line, together with the amount you invested, to estimate the expenses that you paid over the period. Simply divide your account value by $1,000 (for example, an $8,600 account value divided by $1,000 = 8.6), then multiply the result by the number in the first line under the heading “Expenses Paid During the Six-Month Period” to estimate the expenses you paid on your account during this period.
Hypothetical Example for Comparison Purposes
The second line in the following table provides information about hypothetical account values and hypothetical expenses based on each Fund’s actual expense ratio and an assumed annualized rate of return of 5% per year before expenses, which is not the Fund’s actual return. The hypothetical account values and expenses may not be used to estimate the actual ending account balance or expenses you paid for the period. You may use this information to compare the ongoing costs of investing in the Funds and other funds. To do so, compare this 5% hypothetical example with the 5% hypothetical examples that appear in the shareholder reports of the other funds.
Please note that the expenses shown in the table are meant to highlight your ongoing costs only, and do not reflect any transactional costs, such as sales charges and brokerage commissions. Therefore, the second line in the table is useful in comparing ongoing costs only, and will not help you determine the relative total costs of owning different funds. If transaction costs and indirect expenses were included, your costs would have been higher.
| | | | | | | | | | | | | | | | |
| | | Beginning Account Value March 1, 2020 | | | Ending Account Value August 31, 2020 | | | Annualized Expense Ratio Based on the Six-Month Period | | | Expenses Paid During the Six-Month Period(1) | |
Invesco DWA SmallCap Momentum ETF (DWAS) | | | | | | | | | | | | | | | | |
Actual | | | $1,000.00 | | | | $1,138.50 | | | | 0.60% | | | | $3.23 | |
Hypothetical (5% return before expenses) | | | 1,000.00 | | | | 1,022.12 | | | | 0.60 | | | | 3.05 | |
Invesco S&P SmallCap Consumer Discretionary ETF (PSCD) | | | | | | | | | | | | | | | | |
Actual | | | 1,000.00 | | | | 1,190.10 | | | | 0.29 | | | | 1.60 | |
Hypothetical (5% return before expenses) | | | 1,000.00 | | | | 1,023.68 | | | | 0.29 | | | | 1.48 | |
Invesco S&P SmallCap Consumer Staples ETF (PSCC) | | | | | | | | | | | | | | | | |
Actual | | | 1,000.00 | | | | 1,192.20 | | | | 0.29 | | | | 1.60 | |
Hypothetical (5% return before expenses) | | | 1,000.00 | | | | 1,023.68 | | | | 0.29 | | | | 1.48 | |
Invesco S&P SmallCap Energy ETF (PSCE) | | | | | | | | | | | | | | | | |
Actual | | | 1,000.00 | | | | 757.10 | | | | 0.29 | | | | 1.28 | |
Hypothetical (5% return before expenses) | | | 1,000.00 | | | | 1,023.68 | | | | 0.29 | | | | 1.48 | |
Invesco S&P SmallCap Financials ETF (PSCF) | | | | | | | | | | | | | | | | |
Actual | | | 1,000.00 | | | | 843.20 | | | | 0.29 | | | | 1.34 | |
Hypothetical (5% return before expenses) | | | 1,000.00 | | | | 1,023.68 | | | | 0.29 | | | | 1.48 | |
Invesco S&P SmallCap Health Care ETF (PSCH) | | | | | | | | | | | | | | | | |
Actual | | | 1,000.00 | | | | 1,102.40 | | | | 0.29 | | | | 1.53 | |
Hypothetical (5% return before expenses) | | | 1,000.00 | | | | 1,023.68 | | | | 0.29 | | | | 1.48 | |
Calculating your ongoing Fund expenses–(continued)
| | | | | | | | | | | | | | | | |
| | | Beginning Account Value March 1, 2020 | | | Ending Account Value August 31, 2020 | | | Annualized Expense Ratio Based on the Six-Month Period | | | Expenses Paid During the Six-Month Period(1) | |
Invesco S&P SmallCap Industrials ETF (PSCI) | | | | | | | | | | | | | | | | |
Actual | | | $1,000.00 | | | | $1,065.10 | | | | 0.29% | | | | $1.51 | |
Hypothetical (5% return before expenses) | | | 1,000.00 | | | | 1,023.68 | | | | 0.29 | | | | 1.48 | |
Invesco S&P SmallCap Information Technology ETF (PSCT) | | | | | | | | | | | | | | | | |
Actual | | | 1,000.00 | | | | 1,075.80 | | | | 0.29 | | | | 1.51 | |
Hypothetical (5% return before expenses) | | | 1,000.00 | | | | 1,023.68 | | | | 0.29 | | | | 1.48 | |
Invesco S&P SmallCap Materials ETF (PSCM) | | | | | | | | | | | | | | | | |
Actual | | | 1,000.00 | | | | 1,109.30 | | | | 0.29 | | | | 1.54 | |
Hypothetical (5% return before expenses) | | | 1,000.00 | | | | 1,023.68 | | | | 0.29 | | | | 1.48 | |
Invesco S&P SmallCap Utilities & Communication Services ETF (PSCU) | | | | | | | | | | | | | | | | |
Actual | | | 1,000.00 | | | | 971.60 | | | | 0.29 | | | | 1.44 | |
Hypothetical (5% return before expenses) | | | 1,000.00 | | | | 1,023.68 | | | | 0.29 | | | | 1.48 | |
| (1) | Expenses are calculated using the annualized expense ratio, which represents the ongoing expenses as a percentage of net assets for the six-month period ended August 31, 2020. Expenses are calculated by multiplying the Fund’s annualized expense ratio by the average account value for the period, then multiplying the result by 184/366. Expense ratios for the most recent six-month period may differ from expense ratios based on the annualized data in the Financial Highlights. |
Tax Information
Form 1099-DIV, Form 1042-S and other year–end tax information provide shareholders with actual calendar year amounts that should be included in their tax returns. Shareholders should consult their tax advisers.
The following distribution information is being provided as required by the Internal Revenue Code or to meet a specific state’s requirement.
Each Fund designates the following amounts or, if subsequently determined to be different, the maximum amount allowable for its fiscal year ended August 31, 2020:
| | | | | | | | | | | | | | | | | | | | |
| | | Qualified
Business
Income* | | | Qualified
Dividend
Income* | | | Dividends-Received
Deduction* | | | Qualified
Interest
Income* | | | Long Term
Capital Gains | |
Invesco DWA SmallCap Momentum ETF | | | 0 | % | | | 100 | % | | | 100 | % | | | 0 | % | | $ | - | |
Invesco S&P SmallCap Consumer Discretionary ETF | | | 0 | % | | | 87 | % | | | 89 | % | | | 0 | % | | $ | - | |
Invesco S&P SmallCap Consumer Staples ETF | | | 0 | % | | | 61 | % | | | 62 | % | | | 0 | % | | $ | - | |
Invesco S&P SmallCap Energy ETF | | | 0 | % | | | 80 | % | | | 80 | % | | | 0 | % | | $ | - | |
Invesco S&P SmallCap Financials ETF | | | 36 | % | | | 48 | % | | | 47 | % | | | 0 | % | | $ | 1,039,392 | |
Invesco S&P SmallCap Health Care ETF | | | 0 | % | | | 0 | % | | | 0 | % | | | 0 | % | | $ | - | |
Invesco S&P SmallCap Industrials ETF | | | 0 | % | | | 100 | % | | | 100 | % | | | 0 | % | | $ | - | |
Invesco S&P SmallCap Information Technology ETF | | | 0 | % | | | 100 | % | | | 100 | % | | | 0 | % | | $ | - | |
Invesco S&P SmallCap Materials ETF | | | 0 | % | | | 100 | % | | | 96 | % | | | 0 | % | | $ | - | |
Invesco S&P SmallCap Utilities & Communication Services ETF | | | 0 | % | | | 96 | % | | | 96 | % | | | 0 | % | | $ | - | |
| * | The above percentages are based on ordinary income dividends paid to shareholders during the Trust’s fiscal year. |
Trustees and Officers
The Independent Trustees of the Trust, their term of office and length of time served, their principal business occupations during at least the past five years, the number of portfolios in the Fund Complex (as defined below) overseen by each Independent Trustee and the other directorships, if any, held by each Independent Trustee are shown below.
As of August 31, 2020
| | | | | | | | | | |
Name, Address and Year of
Birth of Independent Trustees | | Position(s) Held with Trust | | Term of Office and Length of Time Served* | | Principal Occupation(s) During Past 5 Years | | Number of Portfolios in Fund Complex** Overseen by Independent Trustees | | Other Directorships Held by Independent Trustees During the Past 5 Years |
Ronn R. Bagge–1958
c/o Invesco Capital
Management LLC
3500 Lacey Road, Suite 700
Downers Grove, IL 60515 | | Vice Chairman of the Board; Chairman of the Nominating and Governance Committee and Trustee | | Vice Chairman since 2018; Chairman of the Nominating and Governance Committee and Trustee since 2007 | | Founder and Principal, YQA Capital Management LLC (1998-Present); formerly, Owner/CEO of Electronic Dynamic Balancing Co., Inc. (high-speed rotating equipment service provider). | | 214 | | Trustee and Investment Oversight Committee member, Mission Aviation Fellowship (2017-Present). |
| | | | | |
Todd J. Barre–1957
c/o Invesco Capital
Management LLC
3500 Lacey Road, Suite 700
Downers Grove, IL 60515 | | Trustee | | Since 2010 | | Assistant Professor of Business, Trinity Christian College (2010-2016); formerly, Vice President and Senior Investment Strategist (2001-2008), Director of Open Architecture and Trading (2007-2008), Head of Fundamental Research (2004-2007) and Vice President and Senior Fixed Income Strategist (1994-2001), BMO Financial Group/Harris Private Bank. | | 214 | | None. |
| * | This is the date the Independent Trustee began serving the Trust. Each Independent Trustee serves an indefinite term, until his or her successor is elected. |
| ** | Fund Complex includes all open- and closed-end funds (including all of their portfolios) advised by the Adviser and any affiliated person of the Adviser. |
Trustees and Officers–(continued)
| | | | | | | | | | |
Name, Address and Year of Birth of Independent Trustees | | Position(s) Held with Trust | | Term of Office and Length of Time Served* | | Principal Occupation(s) During Past 5 Years | | Number of Portfolios in Fund Complex** Overseen by Independent Trustees | | Other Directorships Held by Independent Trustees During the Past 5 Years |
Edmund P. Giambastiani,
Jr.–1948
c/o Invesco Capital
Management LLC
3500 Lacey Road, Suite 700
Downers Grove, IL 60515 | | Trustee | | Since 2019 | | President, Giambastiani Group LLC (national security and energy consulting) (2007-Present); Director, The Boeing Company (2009-Present); Trustee, MITRE Corporation (federally-funded research development) (2008-Present); Director, THL Credit, Inc. (alternative credit investment manager) (2016-Present); Trustee, U.S. Naval Academy Foundation Athletic & Scholarship Program (2010-Present); Advisory Board Member, Massachusetts Institute of Technology Lincoln Laboratory (federally-funded research development) (2010-Present); Defense Advisory Board Member, Lawrence Livermore National Laboratory (2013-Present); formerly, Chairman (2015-2016), Lead Director (2011-2015) and Director (2008-2011), Monster Worldwide, Inc. (career services); Advisory Board Member, Maxwell School of Citizenship and Public Affairs of Syracuse University (2012-2016); United States Navy, career nuclear submarine officer (1970-2007); Seventh Vice Chairman of the Joint Chiefs of Staff (2005-2007); first NATO Supreme Allied Commander Transformation (2003-2005); Commander, U.S. Joint Forces Command (2002-2005). | | 214 | | Formerly, Trustee, certain funds of the Oppenheimer Funds complex (2013- 2019); Director, Mercury Defense Systems Inc. (information technology) (2011-2013); Independent Director, QinetiQ Group Plc (defense technology and security) (2008-2011); Chairman, Alenia North America, Inc. (military and defense products) (2008-2009); Director, SRA International, Inc. (information technology and services) (2008-2011). |
| * | This is the date the Independent Trustee began serving the Trust. Each Independent Trustee serves an indefinite term, until his or her successor is elected. |
| ** | Fund Complex includes all open- and closed-end funds (including all of their portfolios) advised by the Adviser and any affiliated person of the Adviser. |
Trustees and Officers–(continued)
| | | | | | | | | | |
Name, Address and Year of Birth of Independent Trustees | | Position(s) Held with Trust | | Term of Office and Length of Time Served* | | Principal Occupation(s) During Past 5 Years | | Number of Portfolios in Fund Complex** Overseen by Independent Trustees | | Other Directorships Held by Independent Trustees During the Past 5 Years |
Victoria J. Herget–1951
c/o Invesco Capital
Management LLC
3500 Lacey Road, Suite 700
Downers Grove, IL 60515 | | Trustee | | Since 2019 | | Formerly, Managing Director (1993-2001), Principal (1985-1993), Vice President (1978-1985) and Assistant Vice President (1973-1978), Zurich Scudder Investments (investment adviser) (and its predecessor firms). | | 214 | | Trustee (2000-Present) and Chair (2010-2017), Newberry Library; Trustee, Mather LifeWays (2001-Present); Trustee, Chikaming Open Lands (2014-Present); formerly, Trustee, certain funds in the Oppenheimer Funds complex (2012-2019); Board Chair (2008-2015) and Director (2004-2018), United Educators Insurance Company; Independent Director, First American Funds (2003-2011); Trustee (1992-2007), Chair of the Board of Trustees (1999-2007), Investment Committee Chair (1994-1999) and Investment Committee member (2007-2010), Wellesley College; Trustee, BoardSource (2006-2009); Trustee, Chicago City Day School (1994-2005). |
| * | This is the date the Independent Trustee began serving the Trust. Each Independent Trustee serves an indefinite term, until his or her successor is elected. |
| ** | Fund Complex includes all open- and closed-end funds (including all of their portfolios) advised by the Adviser and any affiliated person of the Adviser. |
Trustees and Officers–(continued)
| | | | | | | | | | |
Name, Address and Year of Birth of Independent Trustees | | Position(s) Held with Trust | | Term of Office and Length of Time Served* | | Principal Occupation(s) During Past 5 Years | | Number of Portfolios in Fund Complex** Overseen by Independent Trustees | | Other Directorships Held by Independent Trustees During the Past 5 Years |
Marc M. Kole–1960
c/o Invesco Capital
Management LLC
3500 Lacey Road, Suite 700 D
owners Grove, IL 60515 | | Chairman of the Audit Committee and Trustee | | Chairman of the Audit Committee since 2008; Trustee since 2007 | | Senior Director of Finance, By The Hand Club for Kids (not-for-profit) (2015-Present); formerly, Chief Financial Officer, Hope Network (social services) (2008-2012); Assistant Vice President and Controller, Priority Health (health insurance) (2005-2008); Regional Chief Financial Officer, United Healthcare (2005); Chief Accounting Officer, Senior Vice President of Finance, Oxford Health Plans (2000-2004); Audit Partner, Arthur Andersen LLP (1996-2000). | | 214 | | Treasurer (2018-Present), Finance Committee Member (2015-Present) and Audit Committee Member (2015), Thornapple Evangelical Covenant Church; formerly, Board and Finance Committee Member (2009-2017) and Treasurer (2010-2015, 2017), NorthPointe Christian Schools. |
| | | | | |
Yung Bong Lim–1964
c/o Invesco Capital
Management LLC
3500 Lacey Road, Suite 700
Downers Grove, IL 60515 | | Chairman of the Investment Oversight Committee and Trustee | | Chairman of the Investment Oversight Committee since 2014; Trustee since 2013 | | Managing Partner, RDG Funds LLC
(real estate) (2008-Present); formerly, Managing Director, Citadel LLC
(1999-2007). | | 214 | | Advisory Board Member, Performance Trust Capital Partners, LLC (2008-Present); Board Director, Beacon Power Services, Corp. (2019-Present). |
| * | This is the date the Independent Trustee began serving the Trust. Each Independent Trustee serves an indefinite term, until his or her successor is elected. |
| ** | Fund Complex includes all open- and closed-end funds (including all of their portfolios) advised by the Adviser and any affiliated person of the Adviser. |
Trustees and Officers–(continued)
| | | | | | | | | | |
Name, Address and Year of Birth of Independent Trustees | | Position(s) Held with Trust | | Term of Office and Length of Time Served* | | Principal Occupation(s) During Past 5 Years | | Number of Portfolios in Fund Complex** Overseen by Independent Trustees | | Other Directorships Held by Independent Trustees During the Past 5 Years |
Joanne Pace–1958
c/o Invesco Capital
Management LLC
3500 Lacey Road, Suite 700
Downers Grove, IL 60515 | | Trustee | | Since 2019 | | Formerly, Senior Advisor, SECOR Asset Management, LP (2010-2011); Managing Director and Chief Operating Officer, Morgan Stanley Investment Management (2006-2010); Partner and Chief Operating Officer, FrontPoint Partners, LLC (alternative investments) (2005- 2006); Managing Director (2003-2005), Global Head of Human Resources and member of Executive Board and Operating Committee (2004-2005), Global Head of Operations and Product Control (2003-2004), Credit Suisse (investment banking); Managing Director (1997-2003), Controller and Principal Accounting Officer (1999-2003), Chief Financial Officer (temporary assignment) for the Oversight Committee, Long Term Capital Management (1998-1999). | | 214 | | Board Director, Horizon Blue Cross Blue Shield of New Jersey (2012- Present); Advisory Board Director, The Alberleen Group LLC (2012-Present); Governing Council Member (2016-Present) and Chair of Education Committee (2017-Present), Independent Directors Council (IDC); Board Member, 100 Women in Finance (2015-Present); Council Member, NewYork-Presbyterian Hospital’s Leadership Council on Children’s and Women’s Health (2012-Present); formerly, Trustee, certain funds in the Oppenheimer Funds complex (2012- 2019); Lead Independent Director and Chair of the Audit and Nominating Committee of The Global Chartist Fund, LLC, Oppenheimer Asset Management (2011-2012); Board Director, Managed Funds Association (2008-2010); Board Director (2007-2010) and Investment Committee Chair (2008-2010), Morgan Stanley Foundation. |
| * | This is the date the Independent Trustee began serving the Trust. Each Independent Trustee serves an indefinite term, until his or her successor is elected. |
| ** | Fund Complex includes all open- and closed-end funds (including all of their portfolios) advised by the Adviser and any affiliated person of the Adviser. |
Trustees and Officers–(continued)
| | | | | | | | | | |
Name, Address and Year of Birth of Independent Trustees | | Position(s) Held with Trust | | Term of Office and Length of Time Served* | | Principal Occupation(s) During Past 5 Years | | Number of Portfolios in Fund Complex** Overseen by Independent Trustees | | Other Directorships Held by Independent Trustees During the Past 5 Years |
Gary R. Wicker - 1961
c/o Invesco Capital
Management LLC
3500 Lacey Road, Suite 700 D
owners Grove, IL 60515 | | Trustee | | Since 2013 | | Senior Vice President of Global Finance and Chief Financial Officer, RBC Ministries (publishing company) (2013-Present); formerly, Executive Vice President and Chief Financial Officer, Zondervan Publishing (a division of Harper Collins/NewsCorp) (2007-2012); Senior Vice President and Group Controller (2005-2006), Senior Vice President and Chief Financial Officer (2003-2004), Chief Financial Officer (2001-2003), Vice President, Finance and Controller (1999-2001) and Assistant Controller (1997-1999), divisions of The Thomson Corporation (information services provider); Senior Audit Manager (1994-1997), PricewaterhouseCoopers LLP. | | 214 | | Board Member and Treasurer, Our Daily Bread Ministries Canada (2015-Present); Board and Finance Committee Member, West Michigan Youth For Christ (2010-Present). |
| | | | | |
Donald H. Wilson - 1959 c/o Invesco Capital Management LLC 3500 Lacey Road, Suite 700 Downers Grove, IL 60515 | | Chairman of the Board and Trustee | | Chairman since 2012; Trustee since 2007 | | Chairman, President and Chief Executive Officer, McHenry Bancorp Inc. and McHenry Savings Bank (subsidiary) (2018-Present); formerly, Chairman and Chief Executive Officer, Stone Pillar Advisors, Ltd. (2010-2017); President and Chief Executive Officer, Stone Pillar Investments,
Ltd. (advisory services to the financial sector) (2016-2018); Chairman, President and Chief Executive Officer, Community Financial Shares, Inc. and Community Bank–Wheaton/Glen Ellyn (subsidiary) (2013-2015); Chief Operating Officer, AMCORE Financial, Inc. (bank holding company) (2007-2009); Executive Vice President and Chief Financial Officer, AMCORE Financial, Inc. (2006-2007); Senior Vice President and Treasurer, Marshall & Ilsley Corp. (bank holding company) (1995-2006). | | 214 | | Director, Penfield Children’s Center (2004-Present); Board Chairman, Gracebridge Alliance, Inc. (2015-Present). |
| * | This is the date the Independent Trustee began serving the Trust. Each Independent Trustee serves an indefinite term, until his or her successor is elected. |
| ** | Fund Complex includes all open- and closed-end funds (including all of their portfolios) advised by the Adviser and any affiliated person of the Adviser. |
Trustees and Officers–(continued)
The Interested Trustee and the executive officers of the Trust, their term of office and length of time served, their principal business occupations during at least the past five years, the number of portfolios in the Fund Complex (as defined below) overseen by the Interested Trustee and the other directorships, if any, held by the Interested Trustee are shown below.
| | | | | | | | | | |
Name, Address and Year of Birth of Interested Trustee | | Position(s) Held with Trust | | Term of Office and Length of Time Served* | | Principal Occupation(s) During Past 5 Years | | Number of Portfolios in Fund Complex** Overseen by Interested Trustee | | Other Directorships Held by Interested Trustee During the Past 5 Years |
Kevin M. Carome–1956
Invesco Ltd.
Two Peachtree Pointe
1555 Peachtree St., N.E.,
Suite 1800
Atlanta, GA 30309 | | Trustee | | Since 2010 | | Senior Managing Director, Secretary and General Counsel, Invesco Ltd. (2007-Present); Director, Invesco Advisers, Inc. (2009-Present); Director (2006-Present) and Executive Vice President (2008-Present), Invesco North American Holdings, Inc.; Executive Vice President (2008-Present), Invesco Investments (Bermuda) Ltd.; Manager, Horizon Flight Works LLC; and Executive Vice President (2014-Present), INVESCO Asset Management (Bermuda) Ltd.; formerly, Director and Secretary (2012-2020), Invesco Services (Bahamas) Private Limited; Director, Invesco Finance PLC (2011-2019); Director, INVESCO Asset Management (Bermuda) Ltd. (2014-2019); Director and Executive Vice President, Invesco Finance, Inc. (2011-2018); Director (2006-2018) and Executive Vice President (2008-2018), Invesco Group Services, Inc., Invesco Holding Company (US), Inc.; Director, Invesco Holding Company Limited (2007-2019); Director and Chairman, INVESCO Funds Group, Inc., Senior Vice President, Secretary and General Counsel, Invesco Advisers, Inc. (2003-2006); Director, Invesco Investments (Bermuda) Ltd. (2008-2016); Senior Vice President and General Counsel, Liberty Financial Companies, Inc. (2000-2001); General Counsel of certain investment management subsidiaries of Liberty Financial Companies, Inc. (1998-2000); Associate General Counsel, Liberty Financial Companies, Inc. (1993-1998); Associate, Ropes & Gray LLP. | | 214 | | None |
| * | Thi.s is the date the Interested Trustee began serving the Trust. The Interested Trustee serves an indefinite term, until his successor is elected. |
| ** | Fund Complex includes all open- and closed-end funds (including all of their portfolios) advised by the Adviser and any affiliated person of the Adviser. |
Trustees and Officers–(continued)
| | | | | | |
Name, Address and Year of Birth of Executive Officers | | Position(s) Held with Trust | | Length of Time Served* | | Principal Occupation(s) During Past 5 Years |
Anna Paglia–1974 Invesco Capital Management LLC 3500 Lacey Road, Suite 700 Downers Grove, IL 60515 | | President and Principal Executive Officer | | Since 2020 | | President and Principal Executive Officer, Invesco Exchange-Traded Fund Trust, Invesco Exchange-Traded Fund Trust II, Invesco India Exchange-Traded Fund Trust, Invesco Actively Managed Exchange-Traded Fund Trust, Invesco Actively Managed Exchange-Traded Commodity Fund Trust and Invesco Exchange-Traded Self-Indexed Fund Trust (2020-Present); Managing Director and Global Head of ETFs and Indexed Strategies, Chief Executive Officer and Principal Executive Officer, Invesco Capital Management LLC (2020-Present); Chief Executive Officer, Manager and Principal Executive Officer, Invesco Specialized Products, LLC (2020-Present); Vice President, Invesco Indexing LLC (2020-Present);formerly, Secretary, Invesco Exchange-Traded Fund Trust, Invesco Exchange-Traded Fund Trust II, Invesco India Exchange-Traded Fund Trust and Invesco Actively Managed Exchange-Traded Fund Trust (2011-2020), Invesco Actively Managed Exchange-Traded Commodity Fund Trust (2014-2020) and Invesco Exchange-Traded Self-Indexed Fund Trust (2015-2020); Head of Legal (2010-2020) and Secretary (2015-2020), Invesco Capital Management LLC; Manager and Assistant Secretary, Invesco Indexing LLC (2017-2020); Head of Legal and Secretary, Invesco Specialized Products, LLC (2018-2020); Partner, K&L Gates LLP (formerly, Bell Boyd & Lloyd LLP) (2007-2010); and Associate Counsel at Barclays Global Investors Ltd. (2004-2006). |
| | | |
Kelli Gallegos–1970 Invesco Capital Management LLC 11 Greenway Plaza, Suite 1000 Houston, TX 77046 | | Vice President and Treasurer | | Since 2018 | | Vice President, Invesco Advisers, Inc. (2020-Present); Principal Financial and Accounting Officer- Pooled Investments, Invesco Specialized Products, LLC (2018-Present); Vice President and Treasurer, Invesco Exchange-Traded Fund Trust, Invesco Exchange-Traded Fund Trust II, Invesco India Exchange-Traded Fund Trust, Invesco Actively Managed Exchange-Traded Fund Trust, Invesco Actively Managed Exchange-Traded Commodity Fund Trust and Invesco Exchange-Traded Self-Indexed Fund Trust (2018-Present); Principal Financial and Accounting Officer-Pooled Investments, Invesco Capital Management LLC (2018-Present); Vice President, Principal Financial Officer (2016-Present) and Assistant Treasurer (2008-Present), The Invesco Funds; formerly, Assistant Treasurer, Invesco Specialized Products, LLC (2018); Assistant Treasurer, Invesco Exchange-Traded Fund Trust, Invesco Exchange-Traded Fund Trust II, Invesco India Exchange-Traded Fund Trust and Invesco Actively Managed Exchange-Traded Fund Trust (2012-2018), Invesco Actively Managed Exchange-Traded Commodity Fund Trust (2014-2018) and Invesco Exchange-Traded Self-Indexed Fund Trust (2016-2018); Assistant Treasurer, Invesco Capital Management LLC (2013-2018); and Assistant Vice President, The Invesco Funds (2008-2016). |
| * | This is the date each Officer began serving the Trust in their current position. Each Officer serves an indefinite term, until his or her successor is elected. |
Trustees and Officers–(continued)
| | | | | | |
Name, Address and Year of Birth of Executive Officers | | Position(s) Held with Trust | | Length of Time Served* | | Principal Occupation(s) During Past 5 Years |
Adam Henkel–1980 Invesco Capital Management LLC 3500 Lacey Road, Suite 700 Downers Grove, IL 60515 | | Secretary | | Since 2020 | | Head of Legal – US ETFs and Secretary, Invesco Capital Management LLC (2020-Present); Head of Legal and Secretary, Invesco Specialized Products, LLC (2020-Present); Secretary, Invesco Exchange-Traded Fund Trust, Invesco Exchange-Traded Fund Trust II, Invesco India Exchange-Traded Fund Trust, Invesco Actively Managed Exchange-Traded Fund Trust, Invesco Actively Managed Exchange-Traded Commodity Fund Trust and Invesco Exchange-Traded Self-Indexed Fund Trust (2020-Present); Manager and Assistant Secretary, Invesco Indexing LLC (2020-Present); Assistant Secretary (2020-Present), Invesco Capital Markets, Inc. and Invesco Investment Advisers LLC; Assistant Secretary, The Invesco Funds (2014-Present); formerly, Assistant Secretary, Invesco Capital Management LLC (2015-2020) and Invesco Specialized Products, LLC (2018-2020); Assistant Secretary (2014-2020) and Chief Compliance Officer (2017-2017), Invesco Exchange-Traded Fund Trust, Invesco Exchange-Traded Fund Trust II, Invesco India Exchange-Traded Fund Trust and Invesco Actively Managed Exchange-Traded Fund Trust, Invesco Actively Managed Exchange-Traded Commodity Fund Trust and Invesco Exchange-Traded Self-Indexed Fund Trust. |
| | | |
Peter Hubbard–1981 Invesco Capital Management LLC 3500 Lacey Road, Suite 700 Downers Grove, IL 60515 | | Vice President | | Since 2009 | | Vice President, Invesco Specialized Products, LLC (2018-Present); Vice President, Invesco Exchange-Traded Fund Trust, Invesco Exchange-Traded Fund Trust II, Invesco India Exchange-Traded Fund Trust, Invesco Actively Managed Exchange-Traded Fund Trust (2009-Present), Invesco Actively Managed Exchange-Traded Commodity Fund Trust (2014-Present) and Invesco Exchange-Traded Self-Indexed Fund Trust (2016-Present); Vice President and Director of Portfolio Management, Invesco Capital Management LLC (2010-Present); formerly, Vice President of Portfolio Management, Invesco Capital Management LLC (2008-2010); Portfolio Manager, Invesco Capital Management LLC (2007-2008); Research Analyst, Invesco Capital Management LLC (2005-2007); Research Analyst and Trader, Ritchie Capital, a hedge fund operator (2003-2005). |
| | | |
Sheri Morris–1964 Invesco Capital Management LLC 11 Greenway Plaza, Suite 1000 Houston, TX 77046 | | Vice President | | Since 2012 | | Head of Global Fund Services, Invesco Ltd. (2019-Present); Vice President, OppenheimerFunds, Inc. (2019-Present); President and Principal Executive Officer, The Invesco Funds (2016-Present); Treasurer, The Invesco Funds (2008-Present); Vice President, Invesco Advisers, Inc. (formerly known as Invesco Institutional (N.A.), Inc.) (registered investment adviser) (2009-Present) and Vice President, Invesco Exchange-Traded Fund Trust, Invesco Exchange-Traded Fund Trust II, Invesco India Exchange-Traded Fund Trust, Invesco Actively Managed Exchange-Traded Fund Trust (2012-Present), Invesco Actively Managed Exchange-Traded Commodity Fund Trust (2014-Present) and Invesco Exchange-Traded Self-Indexed Fund Trust (2016-Present); formerly, Vice President and Principal Financial Officer, The Invesco Funds (2008-2016); Treasurer, Invesco Exchange-Traded Fund Trust, Invesco Exchange-Traded Fund Trust II, Invesco India Exchange-Traded Fund Trust and Invesco Actively Managed Exchange-Traded Fund Trust (2011-2013); Vice President, Invesco Aim Advisers, Inc., Invesco Aim Capital Management, Inc. and Invesco Aim Private Asset Management, Inc.; Assistant Vice President and Assistant Treasurer, The Invesco Funds and Assistant Vice President, Invesco Advisers, Inc., Invesco Aim Capital Management, Inc. and Invesco Aim Private Asset Management, Inc. |
| * | This is the date each Officer began serving the Trust in their current position. Each Officer serves an indefinite term, until his or her successor is elected. |
Trustees and Officers–(continued)
| | | | | | |
Name, Address and Year of Birth of Executive Officers | | Position(s) Held with Trust | | Length of Time Served* | | Principal Occupation(s) During Past 5 Years |
Rudolf E. Reitmann–1971 Invesco Capital Management LLC 3500 Lacey Road, Suite 700 Downers Grove, IL 60515 | | Vice President | | Since 2013 | | Head of Global Exchange Traded Funds Services, Invesco Specialized Products, LLC (2018-Present); Vice President, Invesco Exchange-Traded Fund Trust, Invesco Exchange-Traded Fund Trust II, Invesco India Exchange-Traded Fund Trust, Invesco Actively Managed Exchange-Traded Fund Trust (2013-Present), Invesco Actively Managed Exchange-Traded Commodity Fund Trust (2014-Present) and Invesco Exchange-Traded Self-Indexed Fund Trust (2016-Present); Head of Global Exchange Traded Funds Services, Invesco Capital Management LLC (2013-Present); Vice President, Invesco Capital Markets, Inc. (2018-Present). |
| | | |
Melanie Zimdars–1976 Invesco Capital Management LLC 3500 Lacey Road, Suite 700 Downers Grove, IL 60515 | | Chief Compliance Officer | | Since 2017 | | Chief Compliance Officer, Invesco Specialized Products, LLC (2018-Present); Chief Compliance Officer, Invesco Capital Management LLC (2017-Present); Chief Compliance Officer, Invesco Exchange-Traded Fund Trust, Invesco Exchange-Traded Fund Trust II, Invesco India Exchange-Traded Fund Trust, Invesco Actively Managed Exchange-Traded Fund Trust, Invesco Actively Managed Exchange-Traded Commodity Fund Trust and Invesco Exchange-Traded Self-Indexed Fund Trust (2017-Present); formerly, Vice President and Deputy Chief Compliance Officer, ALPS Holding, Inc. (2009-2017); Mutual Fund Treasurer/ Chief Financial Officer, Wasatch Advisors, Inc. (2005-2008); Compliance Officer, U.S. Bancorp Fund Services, LLC (2001-2005). |
| * | This is the date each Officer began serving the Trust in their current position. Each Officer serves an indefinite term, until his or her successor is elected. |
Availability of Additional Information About the Trustees
The Statement of Additional Information includes additional information about the Trustees and is available, without charge, upon request at (800) 983-0903.
Approval of Investment Advisory and Sub-Advisory Contracts
At a meeting held on April 14, 2020, the Board of Trustees of the Invesco Exchange-Traded Fund Trust II (the “Trust”), including the Independent Trustees, approved the continuation of the Investment Advisory Agreement between Invesco Capital Management LLC (the “Adviser”) and the Trust for the following 71 series (each, a “Fund” and collectively, the “Funds”):
| | |
Invesco 1-30 Laddered Treasury ETF Invesco California AMT-Free Municipal Bond ETF Invesco CEF Income Composite ETF Invesco China Technology ETF Invesco DWA Developed Markets Momentum ETF Invesco DWA Emerging Markets Momentum ETF Invesco DWA SmallCap Momentum ETF Invesco Emerging Markets Sovereign Debt ETF Invesco FTSE International Low Beta Equal Weight ETF Invesco FTSE RAFI Developed Markets ex-U.S. ETF Invesco FTSE RAFI Developed Markets ex-U.S. Small-Mid ETF Invesco FTSE RAFI Emerging Markets ETF Invesco Fundamental High Yield® Corporate Bond ETF Invesco Fundamental Investment Grade Corporate Bond ETF Invesco Global Clean Energy ETF Invesco Global Short Term High Yield Bond ETF Invesco Global Water ETF Invesco International BuyBack Achievers™ ETF Invesco International Corporate Bond ETF Invesco KBW Bank ETF Invesco KBW High Dividend Yield Financial ETF Invesco KBW Premium Yield Equity REIT ETF Invesco KBW Property & Casualty Insurance ETF Invesco KBW Regional Banking ETF Invesco National AMT-Free Municipal Bond ETF Invesco New York AMT-Free Municipal Bond ETF Invesco Preferred ETF Invesco PureBetaSM 0-5 Yr US TIPS ETF Invesco PureBetaSM FTSE Developed ex-North America ETF Invesco PureBetaSM FTSE Emerging Markets ETF Invesco PureBetaSM MSCI USA ETF Invesco PureBetaSM MSCI USA Small Cap ETF Invesco PureBetaSM US Aggregate Bond ETF Invesco Russell 1000 Enhanced Equal Weight ETF Invesco Russell 1000 Equal Weight ETF Invesco Russell 1000 Low Beta Equal Weight ETF | | Invesco S&P 500 Enhanced Value ETF Invesco S&P 500® ex-Rate Sensitive Low Volatility ETF Invesco S&P 500® High Beta ETF Invesco S&P 500® High Dividend Low Volatility ETF Invesco S&P 500® Low Volatility ETF Invesco S&P 500 Minimum Variance ETF Invesco S&P 500 Momentum ETF Invesco S&P 500 Revenue ETF Invesco S&P Emerging Markets Low Volatility ETF Invesco S&P Emerging Markets Momentum ETF Invesco S&P International Developed High Dividend Low Volatility ETF Invesco S&P International Developed Low Volatility ETF Invesco S&P International Developed Momentum ETF Invesco S&P International Developed Quality ETF Invesco S&P MidCap 400 Revenue ETF Invesco S&P MidCap Low Volatility ETF Invesco S&P SmallCap 600 Revenue ETF Invesco S&P SmallCap Consumer Discretionary ETF Invesco S&P SmallCap Consumer Staples ETF Invesco S&P SmallCap Energy ETF Invesco S&P SmallCap Financials ETF Invesco S&P SmallCap Health Care ETF Invesco S&P SmallCap High Dividend Low Volatility ETF Invesco S&P SmallCap Industrials ETF Invesco S&P SmallCap Information Technology ETF Invesco S&P SmallCap Low Volatility ETF Invesco S&P SmallCap Materials ETF Invesco S&P SmallCap Quality ETF Invesco S&P SmallCap Utilities & Communication Services ETF Invesco S&P Ultra Dividend Revenue ETF Invesco Senior Loan ETF Invesco Taxable Municipal Bond ETF Invesco Treasury Collateral ETF Invesco Variable Rate Preferred ETF Invesco VRDO Tax-Free Weekly ETF |
Also at the April 14, 2020 meeting, the Board of Trustees of the Trust, including the Independent Trustees, approved the continuation of the Investment Sub-Advisory Agreement between the Adviser and the following seven affiliated sub-advisers for each of Invesco Senior Loan ETF and Invesco Treasury Collateral ETF (the “Sub-Advisory Agreement”): Invesco Advisers, Inc.; Invesco Asset Management Deutschland, GmbH; Invesco Asset Management Limited; Invesco Asset Management (Japan) Limited; Invesco Hong Kong Limited; Invesco Senior Secured Management, Inc.; and Invesco Canada Ltd. (each, a “Sub-Adviser” and collectively, the “Sub-Advisers”).
Investment Advisory Agreement
The Trustees reviewed information from the Adviser describing: (i) the nature, extent and quality of services provided, (ii) the investment performance of each Fund and the Adviser, (iii) the fees paid by the Funds and comparisons to amounts paid by other comparable registered investment companies, (iv) the costs of services provided and estimated profits realized by the Adviser, (v) the extent to which economies of scale may be realized as a Fund grows and whether fee levels reflect any possible economies of
Approval of Investment Advisory and Sub-Advisory Contracts–(continued)
scale for the benefit of Fund shareholders, and (vi) any further benefits realized by the Adviser or its affiliates from the Adviser’s relationship with the Funds.
Nature, Extent and Quality of Services. In evaluating the nature, extent and quality of the Adviser’s services, the Trustees reviewed information concerning the functions performed by the Adviser for the Funds, information describing the Adviser’s current organization and staffing, including operational support provided by the Adviser’s parent organization, Invesco Ltd. (“Invesco”), and the background and experience of the persons responsible for the day-to-day management of the Funds. The Trustees reviewed matters related to the Adviser’s execution and/or oversight of execution of portfolio transactions on behalf of the Funds. The Trustees also reviewed information on the performance of the Funds and their underlying indexes for the one-year, three-year, five-year, ten-year and since-inception periods ended December 31, 2019, as applicable, including reports for each of those periods on the correlation and tracking error between each Fund’s performance and the performance of its underlying index, as well as the Adviser’s analysis of the tracking error and correlation between certain Funds and their underlying indexes. In reviewing the tracking error reports, the Trustees considered information provided by Invesco’s independent performance and risk management group with respect to general expected tracking error ranges. The Trustees also considered that certain Funds were created in connection with the purchases by Invesco of the exchange-traded funds businesses of Guggenheim Capital LLC on April 6, 2018 and Massachusetts Mutual Life Insurance Company (“Oppenheimer”) on May 24, 2019 (each, a “Transaction”), and that each such Fund’s performance prior to the closing of the applicable Transaction is that of its predecessor Guggenheim ETF or Oppenheimer ETF. The Trustees noted that, for each applicable period, the correlation for each Fund, other than the five-year and since-inception periods for Invesco Global Short Term High Yield Bond ETF and the one-year and ten-year periods for Invesco VRDO Tax-Free Weekly ETF, was within the targeted range set forth in the Trust’s registration statement. The Trustees reviewed the reasons provided by the Adviser for Invesco Global Short Term High Yield Bond ETF’s and Invesco VRDO Tax-Free Weekly ETF’s level of correlation to its underlying index, as well as the Adviser’s expectations for each Fund’s correlation going forward. The Trustees noted that, for each applicable period, the tracking error for all Funds was within the targeted range set forth in the Trust’s registration statement and concluded that each Fund’s correlation to its underlying index and the tracking error for each Fund were within an acceptable range given that Fund’s particular circumstances.
The Trustees considered the services provided by the Adviser in its oversight of the Funds’ administrator, custodian and transfer agent. They noted the significant amount of time, effort and resources that had been devoted to this oversight function.
Based on their review, the Trustees concluded that the nature, extent and quality of services provided by the Adviser to the Funds under the Investment Advisory Agreement were appropriate and reasonable.
Fees, Expenses and Profitability. The Trustees reviewed and discussed the information provided by the Adviser on each Fund’s net expense ratio and unitary advisory fee. The Trustees noted that the annual advisory fee charged to each Fund, as set forth below, is a unitary advisory fee and that the Adviser pays all other operating expenses of each Fund, including the fees payable to the Sub-Advisers for Invesco Senior Loan ETF and Invesco Treasury Collateral ETF, except that each Fund pays its brokerage expenses, taxes, interest (including, for Invesco Senior Loan ETF, interest expenses associated with its line of credit), litigation expenses and other extraordinary expenses (including acquired fund fees and expenses, if any).
| | • | | 0.04%: Invesco PureBetaSM MSCI USA ETF |
| | • | | 0.05%: Invesco PureBetaSM US Aggregate Bond ETF |
| | • | | 0.06%: Invesco PureBetaSM MSCI USA Small Cap ETF |
| | • | | 0.07%: Invesco PureBetaSM 0-5 Yr US TIPS ETF, Invesco PureBetaSM FTSE Developed ex-North America ETF |
| | • | | 0.08%: Invesco Treasury Collateral ETF |
| | • | | 0.10%: Invesco S&P 500 Minimum Variance ETF |
| | • | | 0.13%: Invesco S&P 500 Enhanced Value ETF, Invesco S&P 500 Momentum ETF |
| | • | | 0.14%: Invesco PureBetaSM FTSE Emerging Markets ETF |
| | • | | 0.20%: Invesco Russell 1000 Equal Weight ETF |
| | • | | 0.22%: Invesco Fundamental Investment Grade Corporate Bond ETF |
Approval of Investment Advisory and Sub-Advisory Contracts–(continued)
| | • | | 0.25%: Invesco 1-30 Laddered Treasury ETF, Invesco S&P 500® ex-Rate Sensitive Low Volatility ETF, Invesco S&P 500® High Beta ETF, Invesco S&P 500® Low Volatility ETF, Invesco S&P MidCap Low Volatility ETF, Invesco S&P SmallCap Low Volatility ETF, Invesco VRDO Tax-Free Weekly ETF |
| | • | | 0.28%: Invesco California AMT-Free Municipal Bond ETF, Invesco National AMT-Free Municipal Bond ETF, Invesco New York AMT-Free Municipal Bond ETF, Invesco Taxable Municipal Bond ETF |
| | • | | 0.29%: Invesco Russell 1000 Enhanced Equal Weight ETF, Invesco S&P International Developed Quality ETF, Invesco S&P SmallCap Consumer Discretionary ETF, Invesco S&P SmallCap Consumer Staples ETF, Invesco S&P SmallCap Energy ETF, Invesco S&P SmallCap Financials ETF, Invesco S&P SmallCap Health Care ETF, Invesco S&P SmallCap Industrials ETF, Invesco S&P SmallCap Information Technology ETF, Invesco S&P SmallCap Materials ETF, Invesco S&P SmallCap Quality ETF, Invesco S&P SmallCap Utilities & Communication Services ETF |
| | • | | 0.30%: Invesco S&P 500® High Dividend Low Volatility ETF, Invesco S&P International Developed High Dividend Low Volatility ETF, Invesco S&P SmallCap High Dividend Low Volatility ETF |
| | • | | 0.35%: Invesco Global Short Term High Yield Bond ETF, Invesco KBW Bank ETF, Invesco KBW High Dividend Yield Financial ETF, Invesco KBW Premium Yield Equity REIT ETF, Invesco KBW Property & Casualty Insurance ETF, Invesco KBW Regional Banking ETF, Invesco Russell 1000 Low Beta Equal Weight ETF, Invesco S&P International Developed Low Volatility ETF, Invesco S&P International Developed Momentum ETF |
| | • | | 0.39%: Invesco S&P 500 Revenue ETF, Invesco S&P MidCap 400 Revenue ETF, Invesco S&P SmallCap 600 Revenue ETF, Invesco S&P Ultra Dividend Revenue ETF |
| | • | | 0.45%: Invesco FTSE International Low Beta Equal Weight ETF, Invesco FTSE RAFI Developed Markets ex-U.S. ETF, Invesco S&P Emerging Markets Low Volatility ETF, Invesco S&P Emerging Markets Momentum ETF |
| | • | | 0.49%: Invesco FTSE RAFI Developed Markets ex-U.S. Small-Mid ETF, Invesco FTSE RAFI Emerging Markets ETF |
| | • | | 0.50%: Invesco CEF Income Composite ETF, Invesco Emerging Markets Sovereign Debt ETF, Invesco Fundamental High Yield® Corporate Bond ETF, Invesco International Corporate Bond ETF, Invesco Preferred ETF, Invesco Variable Rate Preferred ETF |
| | • | | 0.55%: Invesco International BuyBack Achievers™ ETF |
| | • | | 0.60%: Invesco DWA SmallCap Momentum ETF |
| | • | | 0.65%: Invesco Senior Loan ETF |
| | • | | 0.70%: Invesco China Technology ETF |
| | • | | 0.75%: Invesco Global Clean Energy ETF, Invesco Global Water ETF |
| | • | | 0.80%: Invesco DWA Developed Markets Momentum ETF |
| | • | | 0.90%: Invesco DWA Emerging Markets Momentum ETF |
The Trustees considered that, effective May 1, 2020, the Adviser had agreed to reduce the unitary advisory fee for Invesco S&P Emerging Markets Low Volatility ETF and Invesco S&P Emerging Markets Momentum ETF from 0.45% to 0.29% of average daily net assets, and to reduce the unitary advisory fee for Invesco S&P International Developed Low Volatility ETF and Invesco S&P International Developed Momentum ETF from 0.35% to 0.25% of average daily net assets.
The Trustees compared each Fund’s net expense ratio to information compiled by the Adviser from Lipper Inc. databases on the net expense ratios of comparable exchange-traded funds (“ETFs”), open-end (non-ETF) index funds and open-end (non-ETF) actively-managed funds, as applicable. The Trustees noted that the net expense ratios for certain Funds were equal to or lower than the median net expense ratios of their ETF and open-end index peer funds as illustrated in the table below. The Trustees also noted that the net expense ratios for all of the Funds were lower than the median net expense ratios of their open-end
Approval of Investment Advisory and Sub-Advisory Contracts–(continued)
actively-managed peer funds. The Trustees noted that a portion of each Fund’s operating expenses was attributable to a sub-license fee payable out of the unitary advisory fee charged to that Fund.
| | | | | | |
Invesco Fund | | Equal to/Lower than ETF Peer Median | | Equal to/Lower than Open-End Index Fund Peer Median* | | Lower than Open-Active Fund Peer Median |
Invesco 1-30 Laddered Treasury ETF | | | | | | X |
Invesco California AMT-Free Municipal Bond ETF | | | | N/A | | X |
Invesco CEF Income Composite ETF | | X | | N/A | | X |
Invesco China Technology ETF | | | | N/A | | X |
Invesco DWA Developed Markets Momentum ETF | | | | | | X |
Invesco DWA Emerging Markets Momentum ETF | | | | | | X |
Invesco DWA SmallCap Momentum ETF | | | | | | X |
Invesco Emerging Markets Sovereign Debt ETF | | | | | | X |
Invesco FTSE International Low Beta Equal Weight ETF | | X | | X | | X |
Invesco FTSE RAFI Developed Markets ex-U.S. ETF | | | | X | | X |
Invesco FTSE RAFI Developed Markets ex-U.S. Small-Mid ETF | | X | | X | | X |
Invesco FTSE RAFI Emerging Markets ETF | | X | | | | X |
Invesco Fundamental High Yield® Corporate Bond ETF | | | | X | | X |
Invesco Fundamental Investment Grade Corporate Bond ETF | | | | | | X |
Invesco Global Clean Energy ETF | | | | N/A | | X |
Invesco Global Short Term High Yield Bond ETF | | X | | N/A | | X |
Invesco Global Water ETF | | | | N/A | | X |
Invesco International BuyBack AchieversTM ETF | | X | | X | | X |
Invesco International Corporate Bond ETF | | | | | | X |
Invesco KBW Bank ETF | | X | | | | X |
Invesco KBW High Dividend Yield Financial ETF | | X | | | | X |
Invesco KBW Premium Yield Equity REIT ETF | | X | | | | X |
Invesco KBW Property & Casualty Insurance ETF | | X | | | | X |
Invesco KBW Regional Banking ETF | | X | | | | X |
Invesco National AMT-Free Municipal Bond ETF | | | | | | X |
Invesco New York AMT-Free Municipal Bond ETF | | | | N/A | | X |
Invesco Preferred ETF | | | | N/A | | X |
Invesco PureBetaTM 0-5 Yr US TIPS ETF | | | | | | X |
Invesco PureBetaTM FTSE Developed ex-North America ETF | | | | | | X |
Invesco PureBetaTM FTSE Emerging Markets ETF | | X | | | | X |
Invesco PureBetaTM MSCI USA ETF | | X | | X | | X |
Invesco PureBetaTM MSCI USA Small Cap ETF | | X | | X | | X |
Invesco PureBetaTM US Aggregate Bond ETF | | X | | X | | X |
Invesco Russell 1000 Enhanced Equal Weight ETF | | X | | X | | X |
Invesco Russell 1000 Equal Weight ETF | | X | | X | | X |
Invesco Russell 1000 Low Beta Equal Weight ETF | | | | X | | X |
Invesco S&P 500 Enhanced Value ETF | | X | | X | | X |
Invesco S&P 500® ex-Rate Sensitive Low Volatility ETF | | X | | X | | X |
Invesco S&P 500® High Beta ETF | | X | | X | | X |
Invesco S&P 500® High Dividend Low Volatility ETF | | X | | X | | X |
Invesco S&P 500® Low Volatility ETF | | X | | | | X |
Invesco S&P 500 Minimum Variance ETF | | X | | X | | X |
Invesco S&P 500 Momentum ETF | | | | X | | X |
Approval of Investment Advisory and Sub-Advisory Contracts–(continued)
| | | | | | |
| Invesco Fund | | Equal
to/Lower
than ETF
Peer Median | | Equal to/Lower
than Open-End
Index Fund
Peer Median* | | Lower than
Open-Active Fund
Peer Median |
Invesco S&P 500 Revenue ETF | | | | X | | X |
Invesco S&P Emerging Markets Low Volatility ETF | | X | | X | | X |
Invesco S&P Emerging Markets Momentum ETF | | X | | | | X |
Invesco S&P International Developed High Dividend Low Volatility ETF | | X | | | | X |
Invesco S&P International Developed Low Volatility ETF | | X | | | | X |
Invesco S&P International Developed Momentum ETF | | | | | | X |
Invesco S&P International Developed Quality ETF | | X | | | | X |
Invesco S&P MidCap 400 Revenue ETF | | | | | | X |
Invesco S&P MidCap Low Volatility ETF | | | | | | X |
Invesco S&P SmallCap 600 Revenue ETF | | | | X | | X |
Invesco S&P SmallCap Consumer Discretionary ETF | | X | | | | X |
Invesco S&P SmallCap Consumer Staples ETF | | X | | | | X |
Invesco S&P SmallCap Energy ETF | | X | | | | X |
Invesco S&P SmallCap Financials ETF | | X | | | | X |
Invesco S&P SmallCap Health Care ETF | | X | | | | X |
Invesco S&P SmallCap High Dividend Low Volatility ETF | | X | | X | | X |
Invesco S&P SmallCap Industrials ETF | | X | | | | X |
Invesco S&P SmallCap Information Technology ETF | | X | | X | | X |
Invesco S&P SmallCap Low Volatility ETF | | X | | X | | X |
Invesco S&P SmallCap Materials ETF | | X | | | | X |
Invesco S&P SmallCap Quality ETF | | X | | | | X |
Invesco S&P SmallCap Utilities & Communication Services ETF | | X | | X | | X |
Invesco S&P Ultra Dividend Revenue ETF | | | | X | | X |
Invesco Senior Loan ETF | | | | X | | X |
Invesco Taxable Municipal Bond ETF | | | | N/A | | X |
Invesco Treasury Collateral ETF | | X | | | | X |
Invesco Variable Rate Preferred ETF | | | | X | | X |
Invesco VRDO Tax-Free Weekly ETF | | | | N/A | | X |
| * | The information provided by the Adviser indicated that certain Funds did not have any comparable open-end index fund peers. Those Funds have been designated in this column with an “N/A” for not available. |
In response to questions from the Independent Trustees, the Adviser provided supplemental information regarding each of Invesco 1-30 Laddered Treasury ETF, Invesco California AMT-Free Municipal Bond ETF, Invesco DWA Developed Markets Momentum ETF, Invesco Emerging Markets Sovereign Debt ETF, Invesco Global Clean Energy ETF, Invesco Global Water ETF, Invesco International Corporate Bond ETF, Invesco National AMT-Free Municipal Bond ETF, Invesco New York AMT-Free Municipal Bond ETF, Invesco Senior Loan ETF and Invesco VRDO Tax-Free Weekly ETF’s advisory fees and total expenses and the Lipper peer data. The Adviser explained its view that the advisory fees and total expenses for these Funds are competitive and generally in line with other comparable funds in the marketplace, particularly in light of the level and nature of services provided and the investment management style of the Adviser. The Trustees also considered the Adviser’s statements regarding its pricing philosophy and the differing pricing philosophy of certain of the peers.
The Trustees noted information, including fee information, provided by the Adviser regarding other investment products to which it provides investment advisory services, including products that have investment strategies comparable to certain of the Funds. The Trustees considered the Adviser’s explanation of the differences between the services provided to the Funds and to the other investment products it advises, noting the Adviser’s statement that the management and oversight of the Funds requires substantially more labor and expense.
Approval of Investment Advisory and Sub-Advisory Contracts–(continued)
Based on all the information provided, the Board concluded that each Fund’s unitary advisory fee was reasonable and appropriate in light of the services provided, the nature of the indexes, the distinguishing factors of the Funds, and the administrative, operational and management oversight costs for the Adviser.
In conjunction with their review of the unitary advisory fees, the Trustees considered information provided by the Adviser on the revenues received by the Adviser under the Investment Advisory Agreement for the Funds. The Trustees reviewed information provided by the Adviser on its overall profitability, as well as the estimated profitability to the Adviser from its relationship to each Fund. The Trustees concluded that the overall and estimated profitability to the Adviser was not unreasonable.
Economies of Scale and Whether Fee Levels Reflect These Economies of Scale. The Trustees reviewed the information provided by the Adviser as to the extent to which economies of scale may be realized as each Fund grows and whether fee levels reflect economies of scale for the benefit of shareholders. The Trustees reviewed each Fund’s asset size and unitary advisory fee. The Trustees noted that any reduction in fixed costs associated with the management of the Funds would be enjoyed by the Adviser, but a unitary advisory fee provides a level of certainty in expenses for the Funds. The Trustees considered whether the unitary advisory fee rate for each Fund was reasonable in relation to the asset size of that Fund, and concluded that the unitary advisory fee was reasonable and appropriate.
Fall-out Benefits. The Trustees considered that the Adviser identified no additional benefits it receives from its relationship with the Funds, and noted that the Adviser does not have any soft-dollar arrangements. The Trustees also considered benefits received by affiliates of the Adviser that may be directly or indirectly attributed to the Adviser’s relationship with the Funds, including brokerage fees and advisory fees for money market cash management vehicles. The Board concluded that the advisory fee was reasonable, taking into account any ancillary benefits received by affiliates of the Adviser.
Based on all of the information considered and the conclusions reached, the Board, including the Independent Trustees, determined to approve the continuation of the Investment Advisory Agreement for each Fund. No single factor was determinative in the Board’s analysis.
Investment Sub-Advisory Agreement
As noted above, the Board of Trustees of the Trust, including the Independent Trustees, approved the continuation of the Sub-Advisory Agreement for each of Invesco Senior Loan ETF and Invesco Treasury Collateral ETF at a meeting held on April 14, 2020. The review process followed by the Board is described in detail above. In connection with the review of the Sub-Advisory Agreement, the Board considered the factors described below, among others.
Nature, Extent and Quality of Services. The Trustees considered the nature, extent and quality of services provided under the Sub-Advisory Agreement. The Board reviewed the qualifications and background of each Sub-Adviser, the services provided or to be provided by each Sub-Adviser, the investment approach of the Sub-Adviser whose investment personnel manage Invesco Senior Loan ETF’s and Invesco Treasury Collateral ETF’s assets, the experience and skills of the investment personnel responsible for the day-to-day management of the Funds, and the resources made available to such personnel.
Based on their review, the Trustees concluded that the nature, extent and quality of services provided by the Sub-Advisers to Invesco Senior Loan ETF and Invesco Treasury Collateral ETF under the Sub-Advisory Agreement were appropriate and reasonable.
Fees, Expenses and Profitability. The Trustees reviewed and discussed the information provided by the Adviser and the Sub-Advisers on the sub-advisory fee rates under the Sub-Advisory Agreement. The Trustees noted that the sub-advisory fees charged by the Sub-Advisers under the Sub-Advisory Agreement are consistent with the compensation structure used throughout Invesco when Invesco’s affiliates provide sub-advisory services for funds managed by other Invesco affiliates. The Board considered how the sub-advisory fees relate to the overall advisory fee for each of Invesco Senior Loan ETF and Invesco Treasury Collateral ETF and noted that the Adviser compensates the Sub-Advisers from its fee.
The Trustees also reviewed the financial statements provided by Invesco Senior Secured Management, Inc., in connection with the March 12, 2020 Board meeting, and Invesco Advisers, Inc., in connection with the April 14, 2020 meeting, and noted the net income generated by each firm. The Trustees noted that the Adviser compensates the Sub-Advisers from its fee and that the Adviser provided profitability information with respect to Invesco Senior Loan ETF and Invesco Treasury Collateral ETF.
Approval of Investment Advisory and Sub-Advisory Contracts–(continued)
Economies of Scale and Whether Fee Levels Reflect These Economies of Scale. As part of their review of the Investment Advisory Agreement for Invesco Senior Loan ETF and Invesco Treasury Collateral ETF, the Trustees considered the extent to which economies of scale may be realized as the Funds grow and whether fee levels reflect economies of scale for the benefit of shareholders. The Trustees considered whether the sub-advisory fee rates for Invesco Senior Loan ETF and Invesco Treasury Collateral ETF were reasonable in relation to the asset size of the Funds, and concluded that the flat sub-advisory fee rates were reasonable and appropriate.
Fall-out Benefits. The Trustees noted that Invesco Advisers, Inc. receives management fees from money market funds into which the Funds’ and other Invesco ETFs’ excess cash and securities lending collateral may be invested, and that the Adviser waives its fees on the excess cash invested under such arrangement in amounts equal to fees received by Invesco Advisers, Inc. on the Funds’ and other Invesco ETFs’ excess cash invested in the money market funds. The Trustees noted that the Sub-Advisers had not identified any further benefits that they derived from their relationships with Invesco Senior Loan ETF and Invesco Treasury Collateral ETF and that the Sub-Advisers do not have any soft-dollar arrangements with respect to the Funds. The Board concluded that the sub-advisory fee with respect to each Fund was reasonable, taking into account any ancillary benefits received by the Sub-Advisers.
Based on all of the information considered and the conclusions reached, the Board, including the Independent Trustees, determined to approve the continuation of the Sub-Advisory Agreement for Invesco Senior Loan ETF and Invesco Treasury Collateral ETF. No single factor was determinative in the Board’s analysis.
(This Page Intentionally Left Blank)
(This Page Intentionally Left Blank)
(This Page Intentionally Left Blank)
Proxy Voting Policies and Procedures
A description of the Trust’s proxy voting policies and procedures that the Funds use to determine how to vote proxies relating to portfolio securities is available, without charge and upon request, by calling (800) 983-0903. This information is also available on the Securities and Exchange Commission’s (the “Commission”) website at www.sec.gov.
Information regarding how each Fund voted proxies for portfolio securities, if applicable, during the most recent 12-month period ended June 30, is available, without charge and upon request, by (i) calling (800) 983-0903; or (ii) accessing the Trust’s Form N-PX on the Commission’s website at www.sec.gov.
Quarterly Portfolios
The Trust files its complete schedule of portfolio holdings for the Funds with the Commission for the first and third quarters of each fiscal year as an exhibit to its reports on Form N-PORT. The Forms N-PORT are available on the Commission’s website at www.sec.gov.
Frequency Distribution of Discounts and Premiums
A table showing the number of days the market price of each Fund’s shares was greater than the Fund’s net asset value, and the number of days it was less than the Fund’s net asset value (i.e., premium or discount) for the most recently completed calendar year, and the calendar quarters since that year end (or the life of the Fund, if shorter) may be found at the Fund’s website at www.invesco.com/ETFs.
| | | | |
©2020 Invesco Capital Management LLC 3500 Lacey Road, Suite 700 Downers Grove, IL 60515 | | P-SCS-AR-1 | | invesco.com/ETFs |
| | |
 | | |
| | Invesco Annual Report to Shareholders August 31, 2020 TAN Invesco Solar ETF |
Beginning on January 1, 2021, as permitted by regulations adopted by the Securities and Exchange Commission, paper copies of the Fund’s shareholder reports will no longer be sent by mail, unless you specifically request paper copies of the reports from your financial intermediary, such as a broker-dealer or bank. Instead, the reports will be made available on a website, and you will be notified by mail each time a report is posted and provided with a website link to access the report.
If you already elected to receive shareholder reports electronically, you will not be affected by this change and you need not take any action. If you hold accounts through a financial intermediary, you may contact your financial intermediary to enroll in electronic delivery. Please note that not all financial intermediaries may offer this service.
You may elect to receive all future reports in paper free of charge. If you hold accounts through a financial intermediary, you can follow the instructions included with this disclosure, if applicable, or contact your financial intermediary to request that you continue to receive paper copies of your shareholder reports. Please note that not all financial intermediaries may offer this service. Your election to receive reports in paper will apply to all funds held with your financial intermediary.

Table of Contents
The Market Environment
Domestic Equity
Macroeconomic issues that concerned investors in the third quarter of 2019 mostly abated during the fourth quarter, providing the backdrop for strong equity market returns. During its September and October meetings, the US Federal Reserve (“the Fed”) cut interest rates by 0.25% each time, based on business investment and exports remaining weak.1 Investors were also encouraged by a resilient US economy and corporate earnings, putting the US equity market on track for its largest annual rise since 2013.
During the first quarter of 2020, as the spread of the new coronavirus (COVID-19) disrupted travel and suppressed consumer activity, investors became increasingly concerned about the global economy. At the same time, oil prices fell sharply as a price war between Saudi Arabia and Russia threatened to boost supply even as demand was falling. Beginning in late February, equity markets declined sharply and quickly, ushering in the first bear market since the financial crisis of 2008. Though the equity market stabilized somewhat toward the end of March, all sectors declined during the downturn. In response to the major collapse in demand and to help facilitate liquidity, the Fed cut interest rates two times in March by 0.50% and 1.00%, ending with a target range of 0.00% to 0.25%.1
In April, US unemployment numbers continued to climb and the initial gross domestic product (GDP) estimates for the first quarter of 2020 saw the economy shrink by 5%, the sharpest drop since the 2008 financial crisis.2 However, during the second and into the third quarter of 2020, US stocks largely shrugged off economic uncertainty, social unrest and a resurgence in coronavirus infections to rally from the market bottom. The rally followed a sharp economic decline caused by global shutdowns to slow the spread of COVID-19. Investor sentiment improved in response to trillions of dollars in economic stimulus, progress on a coronavirus vaccine and reopenings in many US regions. After oil futures contracts turned negative in early April, oil prices doubled in June, which supported struggling energy companies and millions of energy sector employees. In July, the Fed extended its emergency stimulus programs, originally scheduled to end in September, to year-end, which provided support to equities. Additionally, optimism about a vaccine, and better than anticipated US economic data and corporate earnings also boosted stocks. Most economists believe the US economy hit a low in April; however, in late August revised second quarter GDP fell by 31.7%, a record decline.2 Despite the extreme drop in the economy, the S&P 500 Index not only erased all of its losses from the first quarter but ended the fiscal year with record highs.
| 1 | Source: US Federal Reserve |
| 2 | Source: US Bureau of Economic Analysis |
| | |
 | | Management’s Discussion of Fund Performance Invesco Solar ETF (TAN) |
As an index fund, the Invesco Solar ETF (the “Fund”) is passively managed and attempts to track the returns of an underlying index. The Fund seeks to track the investment results (before fees and expenses) of the MAC Global Solar Energy Index (the “Index”). The Fund generally will invest at least 90% of its total assets in the securities (including American depositary receipts (“ADRs”) and global depositary receipts (“GDRs”)) that comprise the Index. The depositary receipts included in the Index may be sponsored or unsponsored.
Strictly in accordance with its guidelines and mandated procedures, MAC Indexing LLC (the “Index Provider”) compiles, maintains and calculates the Index, which is designed to provide exposure to companies listed on exchanges in developed markets that derive a significant amount of their revenues from the following business segments of the solar industry: solar power equipment producers including ancillary or enabling products such as tracking systems, inverters, or batteries; suppliers of raw materials, components or services to solar producers or developers; companies that produce solar equipment fabrication systems; companies involved in solar power system installation, development, integration, maintenance, or finance; or companies that sell electricity derived from solar power. While the equity securities comprising the Index are traded in developed markets, the issuers of such securities may be located in emerging markets. The Fund generally will invest in all of the securities comprising the Index in proportion to their weightings in the Index.
For the fiscal year ended August 31, 2020, on a market price basis, the Fund returned 86.67%. On a net asset value (“NAV”) basis, the Fund returned 85.82%. During the same time period, the Index returned 87.30%. During the fiscal year, the Fund’s performance, on a NAV basis, differed from the return of the Index primarily due to fees and operating expenses that the Fund incurred during the period, as well as portfolio slippage around thinly traded securities.
During this same time period, the MSCI World Index (Net) (the “Benchmark Index”) returned 16.79%. The Benchmark Index is an unmanaged index weighted by market capitalization based on the average performance of approximately 1,601 securities. The Benchmark Index was selected for its recognition in the marketplace, and its performance comparison is a useful measure for investors as a broad representation of equity markets in developed countries.
The performance of the Fund differed from the Benchmark Index because the Fund seeks to target solar stocks whereas the Benchmark Index tracks a broad market universe.
Relative to the Benchmark Index, the Fund was most overweight in the semiconductor equipment industry and most underweight in the diversified banks industry during the fiscal year ended August 31, 2020. The majority of the Fund’s outperformance relative to the Benchmark Index during that period can be attributed to the Fund being overweight in the semiconductor equipment industry.
For the fiscal year ended August 31, 2020, the semiconductor equipment industry contributed most significantly to the Fund’s return, followed by the renewable electricity and electrical components & equipment industries, respectively. There was no industry that detracted from the Fund’s performance.
Positions that contributed most significantly to the Fund’s return for the fiscal year ended August 31, 2020, included SolarEdge Technologies, Inc., a semiconductor equipment company (portfolio average weight of 9.38%), and Sunrun, Inc., an electrical component & equipment company (portfolio average weight of 5.75%). Positions that detracted most significantly from the Fund’s return during this period included GCL-Poly Energy Holdings Ltd., a semiconductor equipment company (portfolio average weight of 3.26%), and Beijing Enterprises Clean Energy Group Ltd., a semiconductor equipment company (no longer held at fiscal year-end).
Industry Breakdown (% of the Fund’s Net Assets) as of August 31, 2020
| | | | | | |
Semiconductors & Semiconductor Equipment | | | 53.15 | | | |
Independent Power and Renewable Electricity Producers | | | 26.61 | | | |
Electrical Equipment | | | 16.25 | | | |
Mortgage REITs | | | 4.01 | | | |
Money Market Funds Plus Other Assets Less Liabilities | | | (0.02 | ) | | |
Top Ten Fund Holdings* (% of the Fund’s Net Assets) as of August 31, 2020
| | | | | | |
Security | | | | | | |
Sunrun, Inc. | | | 9.90 | | | |
SolarEdge Technologies, Inc. | | | 8.54 | | | |
Enphase Energy, Inc. | | | 7.27 | | | |
First Solar, Inc. | | | 6.92 | | | |
Vivint Solar, Inc. | | | 6.35 | | | |
Xinyi Solar Holdings Ltd. | | | 6.16 | | | |
Canadian Solar, Inc. | | | 4.68 | | | |
Solaria Energia y Medio Ambiente S.A. | | | 4.61 | | | |
Scatec Solar ASA | | | 4.42 | | | |
Daqo New Energy Corp., ADR | | | 4.27 | | | |
Total | | | 63.12 | | | |
| * | Excluding money market fund holdings. |
Invesco Solar ETF (TAN) (continued)
Growth of a $10,000 Investment
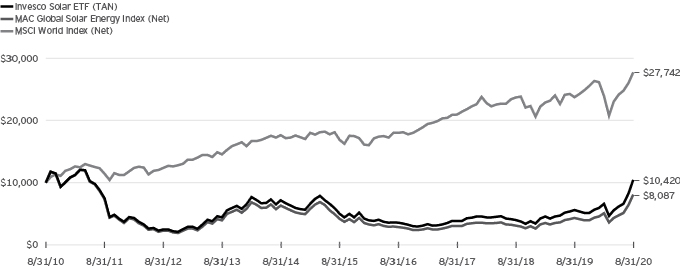
Fund Performance History as of August 31, 2020
| | | | | | | | | | | | | | | | | | | | | | | | | | | | | | | | | | | | | | | | |
| | | | | | | | | | | | | | | | | | | | | | | | | | | Fund Inception | |
| Index | | 1 Year | | | 3 Years Average Annualized | | | 3 Years Cumulative | | | 5 Years Average Annualized | | | 5 Years
Cumulative | | | 10 Years Average
Annualized | | | 10 Years
Cumulative | | | | | | Average Annualized | | | Cumulative | |
MAC Global Solar Energy Index (Net) | | | 87.30 | % | | | 38.26 | % | | | 164.27 | % | | | 14.15 | % | | | 93.81 | % | | | (2.10 | )% | | | (19.13 | )% | | | | | | | (10.88 | )% | | | (75.97 | )% |
MSCI World Index (Net) | | | 16.79 | | | | 9.82 | | | | 32.43 | | | | 10.42 | | | | 64.15 | | | | 10.74 | | | | 177.42 | | | | | | | | 6.48 | | | | 117.44 | |
Fund | | | | | | | | | | | | | | | | | | | | | | | | | | | | | | | | | | | | | | | | |
NAV Return | | | 85.82 | | | | 39.22 | | | | 169.85 | | | | 15.94 | | | | 109.51 | | | | 0.41 | | | | 4.20 | | | | | | | | (9.16 | ) | | | (69.56 | ) |
Market Price Return | | | 86.67 | | | | 39.12 | | | | 169.27 | | | | 16.09 | | | | 110.88 | | | | 0.48 | | | | 4.94 | | | | | | | | (9.15 | ) | | | (69.52 | ) |
Guggenheim Solar ETF (the “Predecessor Fund”) Inception: April 15, 2008
Performance quoted above represents past performance. Past performance is not a guarantee of future results and current performance may be higher or lower than performance quoted. Investment returns and principal value will fluctuate, and shares of the Fund (“Fund Shares”), when redeemed or sold, may be worth more or less than their original cost. Fund performance reflects any applicable fee waivers and/or expense reimbursements. Had the adviser not waived fees and/or reimbursed expenses currently or in the past, returns would have been lower. See the current prospectus for more information. According to the Fund’s current prospectus, the Fund’s expense ratio of 0.71% includes the management fee of 0.50% and 0.21% of other expenses. NAV and Market Price returns assume that dividends and capital gain distributions have been reinvested in the Fund at NAV and Market Price, respectively. The returns shown in the table above do not reflect the deduction of taxes that a shareholder would pay on Fund distributions or the redemption or sale of Fund Shares. See invesco.com/ETFs to find the most recent month-end performance numbers.
Index and Benchmark Index performance results are based upon a hypothetical investment in their respective constituent securities. Index and Benchmark Index returns do not represent Fund returns. An investor cannot invest directly in an index. The Index and Benchmark Index do not charge management fees or brokerage expenses, and no such fees or expenses were deducted from the hypothetical performance shown. In addition, the results actual investors might have achieved would have differed from those shown because of differences in the timing, amounts of their investments, and fees and expenses associated with an investment in the Fund.
Notes Regarding Indexes and Fund Performance History:
| - | Effective after the close of business on May 18, 2018, the Predecessor Fund was reorganized into the Fund. Fund returns shown are blended returns of the Predecessor Fund and the Fund. |
| - | Average Annualized and Cumulative Inception returns for the Fund, Index and Benchmark Index are based on the inception date of the Predecessor Fund. |
| - | Net returns reflect reinvested dividends net of withholding taxes. |
Liquidity Risk Management Program
The Securities and Exchange Commission (“SEC”) has adopted Rule 22e-4 under the Investment Company Act of 1940 (the “Liquidity Rule”) in order to promote effective liquidity risk management throughout the open-end investment company industry, thereby reducing the risk that funds will be unable to meet their redemption obligations and mitigating dilution of the interests of fund shareholders. The Fund has adopted and implemented a liquidity risk management program in accordance with the Liquidity Rule (the “Program”). The Program is reasonably designed to assess and manage the Fund’s liquidity risk, which is the risk that the Fund could not meet redemption requests without significant dilution of remaining investors’ interests in the Fund. The Board of Trustees of the Fund (the “Board”) has appointed Invesco Capital Management LLC (“Invesco”), the Fund’s investment adviser, as the Program’s administrator, and Invesco has delegated oversight of the Program to the Liquidity Risk Management Committee (the “Committee”), which is composed of senior representatives from relevant business groups at Invesco and its affiliates.
As required by the Liquidity Rule, the Program includes policies and procedures providing for an assessment, no less frequently than annually, of the Fund’s liquidity risk that takes into account, as relevant to the Fund’s liquidity risk: (1) the Fund’s investment strategy and liquidity of portfolio investments during both normal and reasonably foreseeable stressed conditions; (2) short-term and long-term cash flow projections for the Fund during both normal and reasonably foreseeable stressed conditions; (3) the Fund’s holdings of cash and cash equivalents and any borrowing arrangements; (4) the relationship between the Fund’s portfolio liquidity and the way in which, and the prices and spreads at which, Fund shares trade, including the efficiency of the arbitrage function and the level of active participation by market participants, including authorized participants; and (5) the effect of the composition of baskets on the overall liquidity of the Fund’s portfolio. The Liquidity Rule also requires the classification of the Fund’s investments into categories that reflect the assessment of their relative liquidity under current market conditions. The Fund classifies its investments into one of four of the following categories defined in the Liquidity Rule: “Highly Liquid,” “Moderately Liquid,” “Less Liquid” and “Illiquid.” Funds that are not invested primarily in “Highly Liquid Investments” that are assets (cash or investments that are reasonably expected to be convertible into cash within three business days without significantly changing the market value of the investment) are required to establish a “Highly Liquid Investment Minimum” (“HLIM”), which is the minimum percentage of net assets that must be invested in Highly Liquid Investments. Funds with HLIMs have procedures for addressing HLIM shortfalls, including reporting to the Board and the SEC (on a non-public basis) as required by the Program and the Liquidity Rule. In addition, the Fund may not acquire an investment if, immediately after the acquisition, over 15% of the Fund’s net assets would consist of “Illiquid Investments” that are assets (an investment that cannot reasonably be expected to be sold or disposed of in current market conditions in seven calendar days or less without the sale or disposition significantly changing the market value of the investment). The Liquidity Rule and the Program also require reporting to the Board and the SEC (on a non-public basis) if a Fund’s holdings of Illiquid Investments exceed 15% of the Fund’s assets.
At a meeting held on March 12, 2020, the Committee presented a report to the Board that addressed the operation of the Program and assessed the Program’s adequacy and effectiveness of implementation (the “Report”). The Report covered the period from December 1, 2018 through December 31, 2019 (the “Program Reporting Period”).
The Report stated, in relevant part, that during the Program Reporting Period:
| | • | | The Program, as adopted and implemented, remained reasonably designed to assess and manage the Fund’s liquidity risk and was operated effectively to achieve that goal; |
| | • | | The Fund’s investment strategy remained appropriate for an open-end fund; |
| | • | | The Fund was able to meet requests for redemption without significant dilution of remaining investors’ interests in the Fund; |
| | • | | The Fund did not breach the 15% limit on Illiquid Investments; and |
| | • | | The Fund primarily held Highly Liquid Investments and therefore has not adopted an HLIM. |
Invesco Solar ETF (TAN)
August 31, 2020
Schedule of Investments(a)
| | | | | | | | |
| | | Shares | | | Value | |
Common Stocks & Other Equity Interests-100.02% | |
Electrical Equipment-16.25% | | | | | | | | |
Sunrun, Inc.(b) | | | 2,336,219 | | | $ | 132,124,866 | |
Vivint Solar, Inc.(b) | | | 2,747,779 | | | | 84,851,415 | |
| | | | | | | | |
| | | | | | | 216,976,281 | |
| | | | | | | | |
Independent Power and Renewable Electricity Producers-26.61% | |
Atlantica Sustainable Infrastructure PLC (Spain) | | | 1,267,529 | | | | 38,063,896 | |
Encavis AG (Germany)(c) | | | 3,019,378 | | | | 55,248,708 | |
Neoen S.A. (France)(b)(c)(d) | | | 798,284 | | | | 44,202,988 | |
Scatec Solar ASA (Norway)(d) | | | 2,702,764 | | | | 59,082,085 | |
Solaria Energia y Medio Ambiente S.A. (Spain)(b) | | | 3,011,978 | | | | 61,597,220 | |
Sunnova Energy International, Inc.(b) | | | 1,316,591 | | | | 31,229,538 | |
West Holdings Corp. (Japan) | | | 1,104,333 | | | | 30,210,477 | |
Xinyi Energy Holdings Ltd. (China) | | | 102,050,266 | | | | 35,683,983 | |
| | | | | | | | |
| | | | | | | 355,318,895 | |
| | | | | | | | |
Mortgage REITs-4.01% | | | | | | | | |
Hannon Armstrong Sustainable | | | | | | | | |
Infrastructure Capital, Inc | | | 1,261,975 | | | | 53,583,459 | |
| | | | | | | | |
Semiconductors & Semiconductor Equipment-53.15% | | | | | |
Canadian Solar, Inc. (Canada)(b) | | | 1,922,172 | | | | 62,451,368 | |
Daqo New Energy Corp., ADR (China)(b) | | | 505,982 | | | | 57,079,829 | |
Enphase Energy, Inc.(b)(c) | | | 1,256,613 | | | | 97,048,222 | |
First Solar, Inc.(b) | | | 1,206,317 | | | | 92,391,819 | |
Flat Glass Group Co. Ltd., H Shares (China)(c)(e) | | | 24,702,047 | | | | 37,546,385 | |
GCL-Poly Energy Holdings Ltd. (China)(b)(c) | | | 814,378,542 | | | | 33,099,907 | |
JinkoSolar Holding Co. Ltd., ADR (China)(b)(c) | | | 1,674,141 | | | | 38,237,381 | |
Investment Abbreviations:
ADR -American Depositary Receipt
REIT-Real Estate Investment Trust
| | | | | | | | |
| | | Shares | | | Value | |
Semiconductors & Semiconductor Equipment-(continued) | | | | | |
Maxeon Solar Technologies Ltd. (Singapore)(b) | | | 527,116 | | | $ | 10,953,471 | |
SMA Solar Technology AG (Germany)(b) | | | 824,251 | | | | 37,360,433 | |
SolarEdge Technologies, Inc.(b) | | | 515,516 | | | | 114,006,363 | |
SunPower Corp.(b)(c) | | | 4,216,939 | | | | 47,187,547 | |
Xinyi Solar Holdings Ltd. (China) | | | 65,165,056 | | | | 82,316,587 | |
| | | | | | | | |
| | | | | | | 709,679,312 | |
| | | | | | | | |
TOTAL INVESTMENTS IN SECURITIES
(excluding investments purchased with cash collateral from securities on loan)-100.02% (Cost $743,821,359) | | | | 1,335,557,947 | |
| | | | | | | | |
|
Investments Purchased with Cash Collateral from Securities on Loan | |
|
Money Market Funds-14.04% | |
Invesco Private Government Fund, 0.03%(e)(f)(g) | | | 140,619,171 | | | | 140,619,171 | |
Invesco Private Prime Fund, 0.14%(e)(f)(g) . | | | 46,864,245 | | | | 46,873,617 | |
| | | | | | | | |
Total Investments Purchased with Cash Collateral from Securities on Loan (Cost $187,492,789) | | | | 187,492,788 | |
| | | | | | | | |
TOTAL INVESTMENTS IN SECURITIES-114.06% (Cost $931,314,148) | | | | 1,523,050,735 | |
OTHER ASSETS LESS LIABILITIES-(14.06)% | | | | (187,776,813 | ) |
| | | | | | | | |
NET ASSETS-100.00% | | | $ | 1,335,273,922 | |
| | | | | | | | |
See accompanying Notes to Financial Statements which are an integral part of the financial statements.
Invesco Solar ETF (TAN)–(continued)
August 31, 2020
Notes to Schedule of Investments:
| (a) | Industry and/or sector classifications used in this report are generally according to the Global Industry Classification Standard, which was developed by and is the exclusive property and a service mark of MSCI Inc. and Standard & Poor’s. |
| (b) | Non-income producing security. |
| (c) | All or a portion of this security was out on loan at August 31, 2020. |
| (d) | Security purchased or received in a transaction exempt from registration under the Securities Act of 1933, as amended (the “1933 Act”). The security may be resold pursuant to an exemption from registration under the 1933 Act, typically to qualified institutional buyers. The aggregate value of these securities at August 31, 2020 was $103,285,073, which represented 7.74% of the Fund’s Net Assets. |
| (e) | Affiliated issuer. The issuer is affiliated by having an investment adviser that is under common control of Invesco Ltd. and/or the Investment Company Act of 1940, as amended (the “1940 Act”), defines “affiliated person” to include an issuer of which a fund holds 5% or more of the outstanding voting securities. The Fund has not owned enough of the outstanding voting securities of the issuer to have control (as defined in the 1940 Act) of that issuer. The table below shows the Fund’s transactions in, and earnings from, its investments in affiliates for the fiscal year ended August 31, 2020. |
| | | | | | | | | | | | | | | | | | | | | | | | | | | | |
| | | Value
August 31, 2019 | | | Purchases
at Cost | | | Proceeds
from Sales | | | Change in
Unrealized
Appreciation
(Depreciation) | | | Realized
Gain
(Loss) | | | Value
August 31, 2020 | | | Dividend
Income | |
Investments in Affiliated Money Market Funds: | | | | | | | | | | | | | | | | | | | | | | | | | | | | |
Invesco Premier U.S. Government Money Portfolio, Institutional Class | | $ | 97,412 | | | $ | 33,212,526 | | | $ | (33,309,938 | ) | | $ | — | | | $ | — | | | $ | — | | | $ | 10,327 | |
Investments Purchased with Cash Collateral from Securities on Loan: | | | | | | | | | | | | | | | | | | | | | | | | | | | | |
Invesco Government & Agency Portfolio, Institutional Class | | | 68,752,694 | | | | 353,350,207 | | | | (422,102,901 | ) | | | — | | | | — | | | | — | | | | 633,807 | * |
Invesco Liquid Assets Portfolio, Institutional Class | | | 22,917,565 | | | | 87,562,201 | | | | (110,468,699 | ) | | | — | | | | (11,067 | ) | | | — | | | | 236,396 | * |
Invesco Private Government Fund | | | — | | | | 385,081,647 | | | | (244,462,476 | ) | | | — | | | | — | | | | 140,619,171 | | | | 16,168 | * |
Invesco Private Prime Fund | | | — | | | | 85,847,122 | | | | (38,976,679 | ) | | | (1 | ) | | | 3,175 | | | | 46,873,617 | | | | 11,642 | * |
Investments in Other Affiliates: | | | | | | | | | | | | | | | | | | | | | | | | | | | | |
Flat Glass Group Co. Ltd., H Shares | | | — | | | | 22,558,970 | | | | (276,985 | ) | | | 15,270,498 | | | | (6,098 | ) | | | 37,546,385 | | | | — | |
| | | | | | | | | | | | | | | | | | | | | | | | | | | | |
Total | | $ | 91,767,671 | | | $ | 967,612,673 | | | $ | (849,597,678 | ) | | $ | 15,270,497 | | | $ | (13,990 | ) | | $ | 225,039,173 | | | $ | 908,340 | |
| | | | | | | | | | | | | | | | | | | | | | | | | | | | |
| * | Represents the income earned on the investment of cash collateral, which is included in securities lending income on the Statement of Operations. Does not include rebates and fees paid to lending agent or premiums received from borrowers, if any. |
| (f) | The rate shown is the 7-day SEC standardized yield as of August 31, 2020. |
| (g) | The security has been segregated to satisfy the commitment to return the cash collateral received in securities lending transactions upon the borrower’s return of the securities loaned. See Note 2J. |
This Fund has holdings greater than 10% of net assets in the following country:
See accompanying Notes to Financial Statements which are an integral part of the financial statements.
Statement of Assets and Liabilities
August 31, 2020
| | | | |
| | | Invesco Solar
ETF (TAN) | |
Assets: | | | | |
Unaffiliated investments in securities, at value(a) | | $ | 1,298,011,562 | |
Affiliated investments in securities, at value | | | 225,039,173 | |
Deposits with brokers: | | | | |
Cash segregated as collateral | | | 12,200,680 | |
Receivable for: | | | | |
Dividends | | | 2,321,636 | |
Securities lending | | | 70,342 | |
Fund shares sold | | | 10,047,980 | |
Foreign tax reclaims | | | 23,422 | |
| | | | |
Total assets | | | 1,547,714,795 | |
| | | | |
| |
Liabilities: | | | | |
Due to custodian | | | 1,131,100 | |
Due to foreign custodian | | | 8,144 | |
Payable for: | | | | |
Investments purchased | | | 10,119,735 | |
Collateral upon return of securities loaned | | | 187,492,789 | |
Collateral upon receipt of securities in-kind | | | 12,200,680 | |
Accrued advisory fees | | | 466,719 | |
Accrued trustees’ and officer’s fees | | | 24,757 | |
Accrued expenses | | | 996,949 | |
| | | | |
Total liabilities | | | 212,440,873 | |
| | | | |
Net Assets | | $ | 1,335,273,922 | |
| | | | |
| |
Net assets consist of: | | | | |
Shares of beneficial interest | | $ | 1,198,768,372 | |
Distributable earnings | | | 136,505,550 | |
| | | | |
Net Assets | | $ | 1,335,273,922 | |
| | | | |
Shares outstanding (unlimited amount authorized, $0.01 par value) | | | 23,528,000 | |
Net asset value | | $ | 56.75 | |
| | | | |
Market price | | $ | 56.84 | |
| | | | |
Unaffiliated investments in securities, at cost | | $ | 721,545,472 | |
| | | | |
Affiliated investments in securities, at cost | | $ | 209,768,676 | |
| | | | |
Foreign currencies (due to foreign custodian), at cost | | $ | (7,745 | ) |
| | | | |
(a) Includes securities on loan with an aggregate value of: | | $ | 174,890,698 | |
| | | | |
See accompanying Notes to Financial Statements which are an integral part of the financial statements.
Statement of Operations
For the year ended August 31, 2020
| | | | |
| | | Invesco Solar
ETF (TAN) | |
Investment income: | | | | |
Unaffiliated dividend income | | $ | 6,219,189 | |
Affiliated dividend income | | | 10,327 | |
Securities lending income | | | 636,171 | |
Foreign withholding tax | | | (249,331 | ) |
| | | | |
Total investment income | | | 6,616,356 | |
| | | | |
| |
Expenses: | | | | |
Advisory fees | | | 2,823,155 | |
Sub-licensing fees | | | 806,823 | |
Accounting & administration fees | | | 39,739 | |
Custodian & transfer agent fees | | | 18,258 | |
Trustees’ and officer’s fees | | | 12,512 | |
Recapture (Note 3) | | | 78,522 | |
Other expenses | | | 97,491 | |
| | | | |
Total expenses | | | 3,876,500 | |
| | | | |
Less: Waivers | | | (1,671 | ) |
| | | | |
Net expenses | | | 3,874,829 | |
| | | | |
Net investment income | | | 2,741,527 | |
| | | | |
| |
Realized and unrealized gain (loss) from: | | | | |
Net realized gain (loss) from: | | | | |
Unaffiliated investment securities | | | (60,605,753 | ) |
Affiliated investment securities | | | (15,806 | ) |
Unaffiliated in-kind redemptions | | | 43,762,622 | |
Affiliated in-kind redemptions | | | 1,816 | |
Foreign currencies | | | (17,873 | ) |
| | | | |
Net realized gain (loss) | | | (16,874,994 | ) |
| | | | |
Change in net unrealized appreciation (depreciation) of: | | | | |
Unaffiliated investment securities | | | 474,270,567 | |
Affiliated investment securities | | | 15,270,497 | |
Foreign currencies | | | 2,299 | |
| | | | |
Change in net unrealized appreciation | | | 489,543,363 | |
| | | | |
Net realized and unrealized gain | | | 472,668,369 | |
| | | | |
Net increase in net assets resulting from operations | | $ | 475,409,896 | |
| | | | |
See accompanying Notes to Financial Statements which are an integral part of the financial statements.
Statement of Changes in Net Assets
For the years ended August 31, 2020 and 2019
| | | | | | | | |
| | | Invesco Solar
ETF (TAN) | |
| | | 2020 | | | 2019 | |
Operations: | | | | | | | | |
Net investment income | | $ | 2,741,527 | | | $ | 670,099 | |
Net realized gain (loss) | | | (16,874,994 | ) | | | (17,707,844 | ) |
Change in net unrealized appreciation | | | 489,543,363 | | | | 121,978,800 | |
| | | | | | | | |
Net increase in net assets resulting from operations | | | 475,409,896 | | | | 104,941,055 | |
| | | | | | | | |
| | |
Distributions to Shareholders from: | | | | | | | | |
Distributable earnings | | | (1,308,390 | ) | | | (1,690,755 | ) |
| | | | | | | | |
| | |
Shareholder Transactions: | | | | | | | | |
Proceeds from shares sold | | | 510,224,198 | | | | 107,850,010 | |
Value of shares repurchased | | | (105,138,215 | ) | | | (74,397,063 | ) |
| | | | | | | | |
Net increase in net assets resulting from share transactions | | | 405,085,983 | | | | 33,452,947 | |
| | | | | | | | |
Net increase in net assets | | | 879,187,489 | | | | 136,703,247 | |
| | | | | | | | |
| | |
Net assets: | | | | | | | | |
Beginning of year | | | 456,086,433 | | | | 319,383,186 | |
| | | | | | | | |
End of year | | $ | 1,335,273,922 | | | $ | 456,086,433 | |
| | | | | | | | |
| | |
Changes in Shares Outstanding: | | | | | | | | |
Shares sold | | | 12,240,000 | | | | 3,840,000 | |
Shares repurchased | | | (3,600,000 | ) | | | (3,520,000 | ) |
Shares outstanding, beginning of year | | | 14,888,000 | | | | 14,568,000 | |
| | | | | | | | |
Shares outstanding, end of year | | | 23,528,000 | | | | 14,888,000 | |
| | | | | | | | |
See accompanying Notes to Financial Statements which are an integral part of the financial statements.
Financial Highlights
Invesco Solar ETF (TAN)
| | | | | | | | | | | | | | | | | | | | |
| | | Years Ended August 31, | |
| | | 2020 | | | 2019 | | | 2018 | | | 2017 | | | 2016 | |
Per Share Operating Performance: | | | | | | | | | | | | | | | | | | | | |
Net asset value at beginning of year | | $ | 30.63 | | | $ | 21.92 | | | $ | 21.62 | | | $ | 20.89 | | | $ | 29.72 | |
| | | | | | | | | | | | | | | | | | | | |
Net investment income(a) | | | 0.17 | | | | 0.05 | | | | 0.54 | | | | 0.49 | | | | 0.80 | |
Net realized and unrealized gain (loss) on investments | | | 26.04 | | | | 8.79 | | | | 0.20 | | | | 1.07 | | | | (9.14 | ) |
| | | | | | | | | | | | | | | | | | | | |
Total from investment operations | | | 26.21 | | | | 8.84 | | | | 0.74 | | | | 1.56 | | | | (8.34 | ) |
| | | | | | | | | | | | | | | | | | | | |
Distributions to shareholders from: | | | | | | | | | | | | | | | | | | | | |
Net investment income | | | (0.09 | ) | | | (0.13 | ) | | | (0.44 | ) | | | (0.83 | ) | | | (0.49 | ) |
| | | | | | | | | | | | | | | | | | | | |
Net asset value at end of year | | $ | 56.75 | | | $ | 30.63 | | | $ | 21.92 | | | $ | 21.62 | | | $ | 20.89 | |
| | | | | | | | | | | | | | | | | | | | |
Market price at end of year | | $ | 56.84 | (b) | | $ | 30.54 | (b) | | $ | 21.82 | (b) | | $ | 21.70 | | | $ | 20.91 | |
| | | | | | | | | | | | | | | | | | | | |
Net Asset Value Total Return(c) | | | 85.82 | % | | | 40.73 | % | | | 3.19 | % | | | 8.72 | % | | | (28.59 | )% |
Market Price Total Return(c) | | | 86.67 | % | | | 40.96 | % | | | 2.33 | % | | | | | | | | |
Ratios/Supplemental Data: | | | | | | | | | | | | | | | | | | | | |
Net assets at end of year (000’s omitted) | | $ | 1,335,274 | | | $ | 456,086 | | | $ | 319,383 | | | $ | 360,008 | | | $ | 230,754 | |
Ratio to average net assets of: | | | | | | | | | | | | | | | | | | | | |
Expenses, after Waivers | | | 0.69 | % | | | 0.70 | % | | | 0.65 | % | | | 0.70 | % | | | 0.71 | % |
Expenses, prior to Waivers | | | 0.69 | % | | | 0.71 | % | | | 0.69 | % | | | 0.76 | % | | | 0.88 | % |
Net investment income | | | 0.49 | % | | | 0.22 | % | | | 2.23 | % | | | 2.57 | % | | | 3.26 | % |
Portfolio turnover rate(d) | | | 28 | % | | | 29 | % | | | 54 | % | | | 57 | % | | | 53 | % |
| (a) | Based on average shares outstanding. |
| (b) | The mean between the last bid and ask prices. |
| (c) | Net asset value total return is calculated assuming an initial investment made at the net asset value at the beginning of the period, reinvestment of all dividends and distributions at net asset value during the period, and redemption at net asset value on the last day of the period. Net asset value total return includes adjustments in accordance with accounting principles generally accepted in the United States of America and as such, the net asset value for financial reporting purposes and the returns based upon those net asset values may differ from the net asset value and returns for shareholder transactions. Market price total return is calculated assuming an initial investment made at the market price at the beginning of the period, reinvestment of all dividends and distributions at market price during the period, and sale at the market price on the last day of the period. Total investment returns calculated for a period of less than one year are not annualized. |
| (d) | Portfolio turnover rate is not annualized for periods less than one year, if applicable, and does not include securities received or delivered from processing creations or redemptions. |
See accompanying Notes to Financial Statements which are an integral part of the financial statements.
Notes to Financial Statements
Invesco Exchange-Traded Fund Trust II
August 31, 2020
NOTE 1–Organization
Invesco Exchange-Traded Fund Trust II (the “Trust”) was organized as a Massachusetts business trust on October 10, 2006 and is authorized to have multiple series of portfolios. The Trust is an open-end management investment company registered under the Investment Company Act of 1940, as amended (the “1940 Act”). This report includes the following portfolio:
| | |
| Full Name | | Short Name |
| Invesco Solar ETF (TAN) | | “Solar ETF” |
The portfolio (the “Fund”) represents a separate series of the Trust. The shares of the Fund are referred to herein as “Shares” or “Fund’s Shares.” The Fund’s Shares are listed and traded on NYSE Arca, Inc.
The market price of a Share may differ to some degree from the Fund’s net asset value (“NAV”). Unlike conventional mutual funds, the Fund issues and redeems Shares on a continuous basis, at NAV, only in a large specified number of Shares, each called a “Creation Unit.” Creation Units are issued and redeemed principally in exchange for the deposit or delivery of a basket of securities (“Deposit Securities”). Except when aggregated in Creation Units by Authorized Participants, the Shares are not individually redeemable securities of the Fund.
The investment objective of the Fund is to seek to track the investment results (before the Fund’s fees and expenses) of the MAC Global Solar Energy Index (the “Underlying Index”).
NOTE 2–Significant Accounting Policies
The following is a summary of the significant accounting policies followed by the Fund in preparation of its financial statements.
The Fund is an investment company and accordingly follows the investment company accounting and reporting guidance in accordance with Financial Accounting Standards Board Accounting Standards Codification Topic 946, Financial Services–Investment Companies.
| A. | Security Valuation - Securities, including restricted securities, are valued according to the following policies: |
A security listed or traded on an exchange (except convertible securities) is generally valued at its last sales price or official closing price as of the close of the customary trading session on the exchange where the security is principally traded or, lacking any sales or official closing price on a particular day, the security may be valued at the closing bid price on that day. Securities traded in the over-the-counter market are valued based on prices furnished by independent pricing services or market makers. When such securities are valued by an independent pricing service they may be considered fair valued. Futures contracts are valued at the final settlement price set by an exchange on which they are principally traded. Listed options are valued at the mean between the last bid and asked prices from the exchange on which they are principally traded, or at the final settlement price set by such exchange. Swaps and options not listed on an exchange are valued by an independent source. For purposes of determining NAV per Share, futures and option contracts generally are valued 15 minutes after the close of the customary trading session of the New York Stock Exchange (“NYSE”).
Investment companies are valued using such company’s NAV per share, unless the shares are exchange-traded, in which case they are valued at the last sales price or official closing price as of the close of the customary trading session on the exchange where the security is principally traded.
Debt obligations (including convertible securities) and unlisted equities are fair valued using an evaluated quote provided by an independent pricing service. Evaluated quotes provided by the pricing service may be determined without exclusive reliance on quoted prices, and may reflect appropriate factors such as institution-size trading in similar groups of securities, developments related to specific securities, dividend rate (for unlisted equities), yield (for debt obligations), quality, type of issue, coupon rate (for debt obligations), maturity (for debt obligations), individual trading characteristics and other market data. Securities with a demand feature exercisable within one to seven days are valued at par. Pricing services generally value debt obligations assuming orderly transactions of institutional round lot size, but the Fund may hold or transact in the same securities in smaller, odd lot sizes. Odd lots often trade at lower prices than institutional round lots. Debt obligations are subject to interest rate and credit risks. In addition, all debt obligations involve some risk of default with respect to interest and/or principal payments.
Foreign securities’ (including foreign exchange contracts’) prices are converted into U.S. dollar amounts using the applicable exchange rates as of the close of the London world markets. If market quotations are available and reliable for foreign exchange-traded equity securities, the securities will be valued at the market quotations. Because trading hours for certain foreign securities end before the close of the NYSE, closing market quotations may become unreliable. If between the time trading ends on a particular security and the close of the customary trading session on the NYSE, events occur that Invesco Capital Management LLC (the “Adviser”) determines are significant and make the closing price unreliable, the Fund may fair
value the security. If the event is likely to have affected the closing price of the security, the security will be valued at fair value in good faith using procedures approved by the Board of Trustees. Adjustments to closing prices to reflect fair value may also be based on a screening process of an independent pricing service to indicate the degree of certainty, based on historical data, that the closing price in the principal market where a foreign security trades is not the current value as of the close of the NYSE. Foreign securities’ prices meeting the approved degree of certainty that the price is not reflective of current value will be priced at the indication of fair value from the independent pricing service. Multiple factors may be considered by the independent pricing service in determining adjustments to reflect fair value and may include information relating to sector indices, American Depositary Receipts and domestic and foreign index futures. Foreign securities may have additional risks including exchange rate changes, the potential for sharply devalued currencies and high inflation, political and economic upheaval, the relative lack of issuer information, relatively low market liquidity and the potential lack of strict financial and accounting controls and standards.
Securities for which market prices are not provided by any of the above methods may be valued based upon quotes furnished by independent sources. The last bid price may be used to value exchange-traded equity securities. The mean between the last bid and asked prices may be used to value debt obligations, including corporate loans, and unlisted equity securities.
Securities for which market quotations are not readily available or became unreliable are valued at fair value as determined in good faith following procedures approved by the Board of Trustees. Issuer-specific events, market trends, bid/asked quotes of brokers and information providers and other market data may be reviewed in the course of making a good faith determination of a security’s fair value.
The Fund may invest in securities that are subject to interest rate risk, meaning the risk that the prices will generally fall as interest rates rise and, conversely, the prices will generally rise as interest rates fall. Specific securities differ in their sensitivity to changes in interest rates depending on their individual characteristics. Changes in interest rates may result in increased market volatility, which may affect the value and/or liquidity of certain Fund investments.
Valuations change in response to many factors, including the historical and prospective earnings of the issuer, the value of the issuer’s assets, general market conditions which are not specifically related to the particular issuer, such as real or perceived adverse economic conditions, changes in the general outlook for revenues or corporate earnings, changes in interest or currency rates, regional or global instability, natural or environmental disasters, widespread disease or other public health issues, war, acts of terrorism or adverse investor sentiment generally and market liquidity. Because of the inherent uncertainties of valuation, the values reflected in the financial statements may materially differ from the value received upon actual sale of those investments.
ADR and GDR Risk. The Fund may invest in American Depositary Receipts (“ADRs”) and Global Depositary Receipts (“GDRs”). ADRs are certificates that evidence ownership of shares of a foreign issuer and are alternatives to purchasing the underlying foreign securities directly in their national markets and currencies. GDRs are certificates issued by an international bank that generally are traded and denominated in the currencies of countries other than the home country of the issuer of the underlying shares. ADRs and GDRs may be subject to certain of the risks associated with direct investments in the securities of foreign companies, such as currency, political, economic and market risks, because their values depend on the performance of the non-dollar denominated underlying foreign securities. Moreover, ADRs and GDRs may not track the price of the underlying foreign securities on which they are based, and their value may change materially at times when U.S. markets are not open for trading.
Authorized Participant Concentration Risk. Only authorized participants (“APs”) may engage in creation or redemption transactions directly with the Fund. The Fund has a limited number of institutions that may act as APs, and such APs have no obligation to submit creation or redemption orders. Consequently, there is no assurance that APs will establish or maintain an active trading market for the Shares. This risk may be heightened to the extent that securities held by the Fund are traded outside a collateralized settlement system. In that case, APs may be required to post collateral on certain trades on an agency basis (i.e., on behalf of other market participants), which only a limited number of APs may be able to do. In addition, to the extent that APs exit the business or are unable to proceed with creation and/or redemption orders with respect to the Fund and no other AP is able to step forward to create or redeem Creation Units, this may result in a significantly diminished trading market for Fund Shares, and Shares may be more likely to trade at a premium or discount to the Fund’s NAV and to face trading halts and/or delisting. Investments in non-U.S. securities, which may have lower trading volumes, may increase this risk.
Currency Risk. Because the Fund’s NAV is determined in U.S. dollars, the Fund’s NAV could decline if the currency of a non-U.S. market in which the Fund invests depreciates against the U.S. dollar. Generally, an increase in the value of the U.S. dollar against a foreign currency will reduce the value of a security denominated in that foreign currency, thereby decreasing the Fund’s overall NAV. Exchange rates may be volatile and may change quickly and unpredictably in response to both global economic developments and economic conditions, causing an adverse impact on the Fund. As a result, investors have the potential for losses regardless of the length of time they intend to hold Shares.
Equity Risk. Equity risk is the risk that the value of equity securities, including common stocks, may fall due to both changes in general economic conditions that impact the market as a whole, as well as factors that directly relate to a specific company
or its industry. Such general economic conditions include changes in interest rates, periods of market turbulence or instability, or general and prolonged periods of economic decline and cyclical change. It is possible that a drop in the stock market may depress the price of most or all of the common stocks that the Fund holds. In addition, equity risk includes the risk that investor sentiment toward one or more industries will become negative, resulting in those investors exiting their investments in those industries, which could cause a reduction in the value of companies in those industries more broadly. The value of a company’s common stock may fall solely because of factors, such as an increase in production costs that negatively impact other companies in the same region, industry or sector of the market. A company’s common stock also may decline significantly in price over a short period of time due to factors specific to that company, including decisions made by its management or lower demand for the company’s products or services. For example, an adverse event, such as an unfavorable earnings report or the failure to make anticipated dividend payments, may depress the value of common stock.
Foreign Investment Risk. Investments in the securities of non-U.S. issuers involve risks beyond those associated with investments in U.S. securities. Foreign securities may have relatively low market liquidity, greater market volatility, decreased publicly available information and less reliable financial information about issuers. Foreign securities also are subject to the risks of expropriation, nationalization, political instability, and inconsistent and potentially less stringent accounting, auditing and financial reporting requirements and standards of practice comparable to those applicable to domestic issuers or other adverse political or economic developments and the difficulty of enforcing obligations in other countries. Investments in foreign securities also may be subject to dividend withholding or confiscatory taxes, currency blockage and/or transfer restrictions and higher transactional costs. If the Fund invests in securities denominated in foreign currencies, fluctuations in the value of the U.S. dollar relative to the values of other currencies may adversely affect investments in foreign securities and may negatively impact the Fund’s returns.
Index Risk. Unlike many investment companies, the Fund does not utilize an investing strategy that seeks returns in excess of its Underlying Index. Therefore, the Fund would not necessarily buy or sell a security unless that security is added or removed, respectively, from its Underlying Index, even if that security generally is underperforming. Additionally, the Fund rebalances its portfolio in accordance with its Underlying Index, and, therefore, any changes to the Underlying Index’s rebalance schedule will result in corresponding changes to the Fund’s rebalance schedule.
Industry Concentration Risk. In following its methodology, the Fund’s Underlying Index from time to time may be concentrated to a significant degree in securities of issuers located in a single industry or industry group. To the extent that the Underlying Index concentrates in the securities of issuers in a particular industry or industry group, the Fund will also concentrate its investments to approximately the same extent. By concentrating its investments in an industry or industry group, the Fund may face more risks than if it were diversified broadly over numerous industries or industry groups. Such industry-based risks, any of which may adversely affect the companies in which the Fund invests, may include, but are not limited to, the following: general economic conditions or cyclical market patterns that could negatively affect supply and demand in a particular industry; competition for resources, adverse labor relations, political or world events; obsolescence of technologies; and increased competition or new product introductions that may affect the profitability or viability of companies in an industry. In addition, at times, such industry or industry group may be out of favor and underperform other industries or the market as a whole.
Market Risk. Securities in the Underlying Index are subject to market fluctuations. You should anticipate that the value of the Shares will decline, more or less, in correlation with any decline in value of the securities in the Underlying Index. Additionally, natural or environmental disasters, widespread disease or other public health issues, war, acts of terrorism or other events could result in increased premiums or discounts to the Fund’s NAV.
Micro-Capitalization Securities Risk. Micro-capitalization stocks involve substantially greater risks of loss and price fluctuations because their earnings and revenues tend to be less predictable (and some companies may be experiencing significant losses), and their share prices tend to be more volatile and their markets less liquid than companies with larger market capitalizations.
Non-Correlation Risk. The Fund’s return may not match the return of its Underlying Index for a number of reasons. For example, the Fund incurs operating expenses not applicable to the Underlying Index, and incurs costs in buying and selling securities, especially when rebalancing the Fund’s securities holdings to reflect changes in the composition of its Underlying Index. In addition, the performance of the Fund and its Underlying Index may vary due to asset valuation differences and differences between the Fund’s portfolio and its Underlying Index resulting from legal restrictions, costs or liquidity constraints.
Non-Diversified Fund Risk. Because the Fund is non-diversified and can invest a greater portion of its assets in securities of individual issuers than a diversified fund, changes in the market value of a single investment could cause greater fluctuations in Share price than would occur in a diversified fund. This may increase the Fund’s volatility and cause the performance of a relatively small number of issuers to have a greater impact on the Fund’s performance.
Small-and Mid-Capitalization Company Risk. Investing in securities of small- and mid-capitalization companies involves greater risk than customarily is associated with investing in larger, more established companies. These companies’ securities may be more volatile and less liquid than those of more established companies. These securities may have returns that vary, sometimes significantly, from the overall securities market. Often small- and mid-capitalization companies and the industries in which they focus are still evolving and, as a result, they may be more sensitive to changing market conditions.
| C. | Investment Transactions and Investment Income - Investment transactions are accounted for on a trade date basis. Realized gains and losses from the sale or disposition of securities are computed on the specific identified cost basis. Interest income is recorded on an accrual basis from settlement date. Pay-in-kind interest income and non-cash dividend income received in the form of securities in-lieu of cash are recorded at the fair value of the securities received. Dividend income (net of withholding tax, if any) is recorded on the ex-dividend date. Realized gains, dividends and interest received by the Fund may give rise to withholding and other taxes imposed by foreign countries. Tax conventions between certain countries and the United States may reduce or eliminate such taxes. |
The Fund may periodically participate in litigation related to the Fund’s investments. As such, the Fund may receive proceeds from litigation settlements. Any proceeds received are included in the Statement of Operations as realized gain (loss) for investments no longer held and as unrealized gain (loss) for investments still held.
Brokerage commissions and mark ups are considered transaction costs and are recorded as an increase to the cost basis of securities purchased and/or a reduction of proceeds on a sale of securities. Such transaction costs are included in the determination of net realized and unrealized gain (loss) from investment securities reported in the Statement of Operations and the Statement of Changes in Net Assets and the net realized and unrealized gains (losses) on securities per share in the Financial Highlights. Transaction costs are included in the calculation of the Fund’s NAV and, accordingly, they reduce the Fund’s total returns. These transaction costs are not considered operating expenses and are not reflected in net investment income reported in the Statement of Operations and the Statement of Changes in Net Assets, or the net investment income per share and the ratios of expenses and net investment income reported in the Financial Highlights, nor are they limited by any expense limitation arrangements between the Fund and the Adviser.
| D. | Country Determination - For the purposes of presentation in the Schedule of Investments, the Adviser may determine the country in which an issuer is located and/or credit risk exposure based on various factors. These factors include whether the Fund’s Underlying Index has made a country determination and may include the laws of the country under which the issuer is organized, where the issuer maintains a principal office, the country in which the issuer derives 50% or more of its total revenues and the country that has the primary market for the issuer’s securities, as well as other criteria. Among the other criteria that may be evaluated for making this determination are the country in which the issuer maintains 50% or more of its assets, the type of security, financial guarantees and enhancements, the nature of the collateral and the sponsor organization. Country of issuer and/or credit risk exposure has been determined to be the United States of America, unless otherwise noted. |
| E. | Dividends and Distributions to Shareholders - The Fund declares and pays dividends from net investment income, if any, to its shareholders annually and records such dividends on the ex-dividend date. Generally, the Fund distributes net realized taxable capital gains, if any, annually in cash and records them on the ex-dividend date. Such distributions on a tax basis are determined in conformity with federal income tax regulations, which may differ from accounting principles generally accepted in the United States of America (“GAAP”). Distributions in excess of tax basis earnings and profits, if any, are reported in such Fund’s financial statements as a tax return of capital at fiscal year-end. |
| F. | Federal Income Taxes - The Fund intends to comply with the provisions of the Internal Revenue Code of 1986, as amended (the “Internal Revenue Code”), applicable to regulated investment companies and to distribute substantially all of the Fund’s taxable earnings to its shareholders. As such, the Fund will not be subject to federal income taxes on otherwise taxable income (including net realized gains) that is distributed to the shareholders. Therefore, no provision for federal income taxes is recorded in the financial statements. |
The Fund recognizes the tax benefits of uncertain tax positions only when the position is more likely than not to be sustained. Management has analyzed the Fund’s uncertain tax positions and concluded that no liability for unrecognized tax benefits should be recorded related to uncertain tax positions. Management is not aware of any tax positions for which it is reasonably possible that the total amounts of unrecognized tax benefits will change materially in the next 12 months.
Income and capital gain distributions are determined in accordance with federal income tax regulations, which may differ from GAAP. These differences are primarily due to differing book and tax treatments for in-kind transactions, losses deferred due to wash sales, and passive foreign investment company adjustments, if any.
The Fund files U.S. federal tax returns and tax returns in certain other jurisdictions. Generally, the Fund is subject to examinations by such taxing authorities for up to three years after the filing of the return for the tax period.
| G. | Expenses - Expenses of the Trust that are directly identifiable to the Fund are applied to the Fund. Expenses of the Trust that are not readily identifiable to the Fund are allocated in such a manner as deemed equitable, taking into consideration the nature and type of expense and the relative net assets of the Fund. |
The Fund is responsible for all of its expenses, including the investment advisory fees, cost of transfer agency, custody, fund administration, legal, audit and other services, interest, taxes, acquired fund fees and expenses, if any, brokerage commissions and other expenses connected with executions of portfolio transactions, licensing fees related to its Underlying Index, any distribution fees or expenses, litigation expenses, fees payable to the Trust’s Board members and officers who are not “interested persons” (as defined in the 1940 Act) of the Trust or the Adviser (the “Independent Trustees”), expenses incurred in connection with the Board members’ services, including travel expenses and legal fees of counsel for the Independent Trustees and extraordinary expenses.
To the extent the Fund invests in other investment companies, the expenses shown in the accompanying financial statements reflect the expenses of the Fund and do not include any expenses of the investment companies in which it invests.
The effects of such investment companies’ expenses are included in the realized and unrealized gain or loss on the investments in the investment companies.
| H. | Accounting Estimates - The preparation of the financial statements in accordance with GAAP requires management to make estimates and assumptions that affect the reported amounts and disclosures in the financial statements, including estimates and assumptions related to taxation. Actual results could differ from these estimates. In addition, the Fund monitors for material events or transactions that may occur or become known after the period-end date and before the date the financial statements are released to print. |
| I. | Indemnifications - Under the Trust’s organizational documents, its Officers and Trustees are indemnified against certain liabilities arising out of the performance of their duties to the Trust. Each Independent Trustee is also indemnified against certain liabilities arising out of the performance of their duties to the Trust pursuant to an Indemnification Agreement between such trustee and the Trust. Additionally, in the normal course of business, the Trust enters into contracts with service providers that contain general indemnification clauses. The Trust’s maximum exposure under these arrangements is unknown, as this would involve future claims that may be made against the Trust that have not yet occurred. However, based on experience, the Trust believes the risk of loss to be remote. |
| J. | Securities Lending - The Fund may participate in securities lending and may loan portfolio securities having a market value up to one-third of the Fund’s total assets. Such loans are secured by cash collateral equal to no less than 102% (105% for international securities) of the market value of the loaned securities determined daily by the securities lending provider. Cash collateral received in connection with these loans is generally invested in an affiliated money market fund and is shown as such on the Schedules of Investments. The Fund bears the risk of loss with respect to the investment of collateral. It is the policy of the Fund to obtain additional collateral from or return excess collateral to the borrower by the end of the next business day, following the valuation date of the securities loaned. Therefore, the value of the collateral held may be temporarily less than the value of the securities on loan. When loaning securities, the Fund retains certain benefits of owning the securities, including the economic equivalent of dividends or interest generated by the security. Lending securities entails a risk of loss to the Fund if, and to the extent that, the market value of the securities loaned were to increase, and the borrower did not increase the collateral accordingly, and the borrower failed to return the securities. The securities loaned are subject to termination at the option of the borrower or the Fund. Upon termination, the borrower will return to the Fund the securities loaned and the Fund will return the collateral. Upon the failure of the borrower to return the securities, collateral may be liquidated and the securities may be purchased on the open market to replace the loaned securities. The Fund could experience delays and costs in gaining access to the collateral and the securities may lose value during the delay which could result in potential losses to the Fund. Some of these losses may be indemnified by the lending agent. The Fund bears the risk of any deficiency in the amount of the collateral available for return to the borrower due to any loss on the collateral invested. Dividends received on cash collateral investments for securities lending transactions, which are net of compensation to counterparties, are included in Securities lending income on the Statement of Operations. The aggregate value of securities out on loan, if any, is shown on the Statement of Assets and Liabilities. |
| K. | Foreign Currency Translations - Foreign currency is valued at the close of the NYSE based on quotations posted by banks and major currency dealers. Portfolio securities and other assets and liabilities denominated in foreign currencies are translated into U.S. dollar amounts at the date of valuation. Purchases and sales of portfolio securities (net of foreign taxes withheld on disposition) and income items denominated in foreign currencies are translated into U.S. dollar amounts on the respective dates of such transactions. The Fund does not separately account for the portion of the results of operations resulting from changes in foreign exchange rates on investments and the fluctuations arising from changes in market prices of securities held. The combined results of changes in foreign exchange rates and the fluctuation of market prices on investments (net of estimated foreign tax withholding) are included with the net realized and unrealized gain or loss from investments in the Statement of Operations. Reported net realized foreign currency gains or losses arise from (1) sales of foreign currencies, (2) currency gains or losses realized between the trade and settlement dates on securities transactions, and (3) the difference between the amounts of dividends, interest, and foreign withholding taxes recorded on the Fund’s books and the U.S. dollar equivalent of the amounts actually received or paid. Net unrealized foreign currency gains and losses arise from changes in the fair values of assets and liabilities, other than investments in securities at fiscal period-end, resulting from changes in exchange rates. |
The Fund may invest in foreign securities, which may be subject to foreign taxes on income, gains on investments or currency repatriation, a portion of which may be recoverable. Foreign taxes, if any, are recorded based on the tax regulations and rates that exist in the foreign markets in which the Fund invests.
NOTE 3–Investment Advisory Agreement and Other Agreements
The Trust has entered into an Investment Advisory Agreement with the Adviser on behalf of the Fund, pursuant to which the Adviser has overall responsibility for the selection and ongoing monitoring of the Fund’s investments, managing the Fund’s business affairs and providing certain clerical, bookkeeping and other administrative services. Pursuant to the Investment Advisory Agreement, the Fund accrues daily and pays monthly to the Adviser an annual fee equal to 0.50% of the Fund’s average daily net assets.
The Trust also has entered into an Amended and Restated Excess Expense Agreement (the “Expense Agreement”), pursuant to which the Adviser has agreed to waive fees and/or pay Fund expenses to the extent necessary to prevent the operating expenses of the Fund (excluding interest expenses, brokerage commissions and other trading expenses, sub-licensing fees, offering costs, taxes, acquired fund fees and expenses, if applicable, and extraordinary expenses) from exceeding 0.65% of the Fund’s average daily net assets per year through August 31, 2022 (the “Expense Cap”). There is no guarantee that the Adviser will extend the waiver of these fees past that date.
Further, the Adviser agreed to reimburse the Fund in the amount equal to the licensing fees that the Fund paid that caused the Fund’s operating expenses (excluding interest expenses, offering costs, brokerage commissions and other trading expenses, taxes, acquired fund fees and expenses and extraordinary expenses) to exceed 0.70% through May 18, 2020.
Further, through at least August 31, 2022, the Adviser has agreed to waive a portion of the Fund’s management fee in an amount equal to 100% of the net advisory fees an affiliate of the Adviser receives that are attributable to the Fund’s investments of otherwise uninvested cash in money market funds managed by that affiliate (excluding investments of cash collateral from securities lending). There is no guarantee that the Adviser will extend the waiver of these fees past that date.
For the fiscal year ended August 31, 2020, the Adviser waived fees and/or paid Fund expenses of $1,671.
The fees waived and/or expenses borne by the Adviser pursuant to the Expense Cap for the Fund are subject to recapture by the Adviser up to three years from the date the fees were waived or the expenses were incurred, but no recapture payment will be made by the Fund if it would result in the Fund exceeding (i) the Expense Cap or (ii) the expense cap in effect at the time the fees and/or expenses subject to recapture were waived and/or borne by the Adviser. There are no amounts available for potential recapture by the Adviser as of August 31, 2020.
The Trust has entered into a Distribution Agreement with Invesco Distributors, Inc. (the “Distributor”), which serves as the distributor of Creation Units for the Fund. The Distributor does not maintain a secondary market in the Shares. The Fund is not charged any fees pursuant to the Distribution Agreement. The Distributor is an affiliate of the Adviser.
The Adviser has entered into a licensing agreement on behalf of the Fund with MAC Indexing LLC (the “Licensor”).
The Underlying Index name trademark is owned by the Licensor. These trademarks have been licensed to the Adviser for use by the Fund. The Fund is entitled to use its Underlying Index pursuant to the Trust’s sub-licensing agreement with the Adviser. The Fund is not sponsored, endorsed, sold or promoted by the Licensor, and the Licensor makes no representation regarding the advisability of investing in the Fund.
The Trust has entered into service agreements whereby The Bank of New York Mellon, a wholly-owned subsidiary of The Bank of New York Mellon Corporation, serves as the administrator, custodian, fund accountant and transfer agent for the Fund.
For fiscal year ended August 31, 2020, the Fund incurred $6,266 in brokerage commissions with Invesco Capital Markets, Inc. (“ICMI”), an affiliate of the Adviser and Distributor, for portfolio transactions executed on behalf of the Fund. Portfolio transactions with ICMI that have not settled at period-end, if any, are shown in the Statement of Assets and Liabilities under the receivable caption Investments sold - due from an affiliate and/or payable caption Investments purchased - due to an affiliate.
NOTE 4–Additional Valuation Information
GAAP defines fair value as the price that would be received to sell an asset or paid to transfer a liability in an orderly transaction between market participants at the measurement date, under current market conditions. GAAP establishes a hierarchy that prioritizes the inputs to valuation methods, giving the highest priority to readily available unadjusted quoted prices in an active market for identical assets (Level 1) and the lowest priority to significant unobservable inputs (Level 3), generally when market prices are not readily available or are unreliable. Based on the valuation inputs, the securities or other investments are tiered into one of three levels. Changes in valuation methods may result in transfers in or out of an investment’s assigned level:
| | |
Level 1 – | | Prices are determined using quoted prices in an active market for identical assets. |
| |
Level 2 – | | Prices are determined using other significant observable inputs. Observable inputs are inputs that other market participants may use in pricing a security. These may include quoted prices for similar securities, interest rates, prepayment speeds, credit risk, yield curves, loss severities, default rates, discount rates, volatilities and others. |
| |
Level 3 – | | Prices are determined using significant unobservable inputs. In situations where quoted prices or observable inputs are unavailable (for example, when there is little or no market activity for an investment at the end of the period), unobservable inputs may be used. Unobservable inputs reflect the Fund’s own assumptions about the factors market participants would use in determining fair value of the securities or instruments and would be based on the best available information. |
The following is a summary of the tiered valuation input levels, as of August 31, 2020. The level assigned to the securities valuations may not be an indication of the risk or liquidity associated with investing in those securities. Because of the inherent
uncertainties of valuation, the values reflected in the financial statements may materially differ from the value received upon actual sale of those investments.
| | | | | | | | | | | | | | | | |
| | | Level 1 | | | Level 2 | | | Level 3 | | | Total | |
Investments in Securities | | | | | | | | | | | | | | | | |
| | | | |
Common Stocks & Other Equity Interests | | $ | 1,335,557,947 | | | $ | - | | | $ | - | | | $ | 1,335,557,947 | |
| | | | |
Money Market Funds | | | - | | | | 187,492,788 | | | | - | | | | 187,492,788 | |
| | | | | | | | | | | | | | | | |
Total Investments | | $ | 1,335,557,947 | | | $ | 187,492,788 | | | $ | - | | | $ | 1,523,050,735 | |
| | | | | | | | | | | | | | | | |
NOTE 5–Distributions to Shareholders and Tax Components of Net Assets
Tax Character of Distributions to Shareholders Paid During the Fiscal Years Ended August 31, 2020 and 2019:
| | | | | | | | |
| | | 2020 | | | 2019 | |
| | | Ordinary
Income* | | | Ordinary
Income* | |
Solar ETF | | $ | 1,308,390 | | | $ | 1,690,755 | |
| * | Includes short-term capital gain distributions, if any. |
Tax Components of Net Assets at Fiscal Year-End:
| | | | | | | | | | | | | | | | | | | | | | | | | | | | |
| | | Undistributed
Ordinary
Income | | | Temporary
Book/Tax
Differences | | | Net
Unrealized
Appreciation-
Investments | | | Net
Unrealized
Depreciation -
Foreign
Currencies | | | Capital Loss
Carryforwards | | | Shares of
Beneficial
Interest | | | Total
Net Assets | |
Solar ETF | | $ | 3,055,858 | | | $ | (5,900 | ) | | $ | 560,995,638 | | | $ | (1,988 | ) | | $ | (427,538,058 | ) | | $ | 1,198,768,372 | | | $ | 1,335,273,922 | |
Capital loss carryforwards are calculated and reported as of a specific date. Results of transactions and other activity after that date may affect the amount of capital loss carryforwards actually available for the Fund to utilize. The ability to utilize capital loss carryforwards in the future may be limited under the Internal Revenue Code and related regulations based on the results of future transactions.
The following table presents available capital loss carryforwards for the Fund as of August 31, 2020:
| | | | | | | | | | | | |
| | | No expiration | | | | |
| | | Short-Term | | | Long-Term | | | Total* | |
| | $ | 97,821,939 | | | $ | 329,716,119 | | | $ | 427,538,058 | |
| * | Capital loss carryforwards are reduced for limitations, if any, to the extent required by the Internal Revenue Code and may be further limited depending upon a variety of factors, including the realization of net unrealized gains or losses as of the date of any reorganization. |
NOTE 6–Investment Transactions
For the fiscal year ended August 31, 2020, the cost of securities purchased and proceeds from sales of securities (other than short-term securities, U.S. Treasury obligations, money market funds and in-kind transactions, if any) were $168,973,222 and $163,810,691, respectively.
For the fiscal year ended August 31, 2020, in-kind transactions associated with creations and redemptions were $507,836,300 and $105,270,112, respectively.
Gains (losses) on in-kind transactions are generally not considered taxable gains (losses) for federal income tax purposes.
At August 31, 2020, the aggregate cost of investments, including any derivatives, on a tax basis includes adjustments for financial reporting purposes as of the most recently completed federal income tax reporting period-end:
| | | | |
| |
Federal Tax Cost | | $ | 962,055,097 | |
| |
Aggregate unrealized appreciation of investments | | | 594,313,059 | |
| |
Aggregate unrealized (depreciation) of investments | | | (33,317,421 | ) |
| | | | |
Net unrealized appreciation of investments | | $ | 560,995,638 | |
| | | | |
NOTE 7–Reclassification of Permanent Differences
Primarily as a result of differing book/tax treatment of in-kind transactions, amounts were reclassified between undistributed net investment income (loss), undistributed net realized gain (loss) and Shares of beneficial interest. These reclassifications had no effect on the net assets of the Fund. For the fiscal year ended August 31, 2020, the reclassifications were as follows:
| | | | | | | | | | | | |
| | | Undistributed Net
Investment Income | | | Undistributed Net
Realized Gain (Loss) | | | Shares of
Beneficial Interest | |
Solar ETF | | $ | 1,526,909 | | | $ | (36,326,257 | ) | | $ | 34,799,348 | |
NOTE 8–Trustees’ and Officer’s Fees
Trustees’ and Officer’s Fees include amounts accrued by the Fund to pay remuneration to the Independent Trustees and an Officer of the Trust. The Trustee who is an “interested person” of the Trust does not receive any Trustees’ fees.
The Trust has adopted a deferred compensation plan (the “Plan”). Under the Plan, each Independent Trustee who has executed a Deferred Fee Agreement (a “Participating Trustee”) may defer receipt of all or a portion of their compensation (“Deferral Fees”). Such Deferral Fees are deemed to be invested in select Invesco ETFs. The Deferral Fees payable to a Participating Trustee are valued as of the date such Deferral Fees would have been paid to a Participating Trustee. The value increases with contributions or with increases in the value of the Shares selected, and the value decreases with distributions or with declines in the value of the Shares selected. Obligations under the Plan represent unsecured claims against the general assets of the Fund.
NOTE 9–Capital
Shares are issued and redeemed by the Fund only in Creation Units consisting of a specified number of Shares as set forth in the Fund’s prospectus. Only Authorized Participants are permitted to purchase or redeem Creation Units from the Fund. Such transactions are principally permitted in exchange for Deposit Securities, with a balancing cash component to equate to the transaction to the NAV per Share of the Fund on the transaction date. However, cash in an amount equivalent to the value of certain securities may be substituted, generally when the securities are not available in sufficient quantity for delivery, not eligible for trading by the Authorized Participant or as a result of other market circumstances.
To the extent that the Fund permits transactions in exchange for Deposit Securities, the Fund may issue Shares in advance of receipt of Deposit Securities subject to various conditions, including a requirement to maintain on deposit with the Trust cash at least equal to 105% of the market value of the missing Deposit Securities. In accordance with the Trust’s Participant Agreement, Creation Units will be issued to an Authorized Participant, notwithstanding the fact that the corresponding Deposit Securities have not been received in part or in whole, in reliance on the undertaking of the Authorized Participant to deliver the missing Deposit Securities as soon as possible, which undertaking shall be secured by the Authorized Participant’s delivery and maintenance of collateral consisting of cash in the form of U.S. dollars in immediately available funds having a value (marked-to-market daily) at least equal to 105%, which the Adviser may change from time to time, of the value of the missing Deposit Securities.
Certain transaction fees may be charged by the Fund for creations and redemptions, which are treated as increases in capital.
Transactions in the Fund’s Shares are disclosed in detail in the Statement of Changes in Net Assets
NOTE 10–Coronavirus (COVID-19) Pandemic
During the first quarter of 2020, the World Health Organization declared COVID-19 to be a public health emergency. COVID-19 has led to increased short-term market volatility and may have adverse long-term effects on U.S. and world economies and markets in general. COVID-19 may adversely impact the value of the Fund’s investments. Because of the uncertainties on valuation, the global economy and business operations, values reflected in these financial statements may materially differ from the value received upon actual sales of those investments.
The extent of the impact on the performance of the Fund and its investments will depend on future developments, including the duration and spread of the COVID-19 outbreak, related restrictions and advisories, and the effects on the financial markets and economy overall, all of which are highly uncertain and cannot be predicted.
Report of Independent Registered Public Accounting Firm
To the Board of Trustees of Invesco Exchange-Traded Fund Trust II and Shareholders of Invesco Solar ETF
Opinion on the Financial Statements
We have audited the accompanying statement of assets and liabilities, including the schedule of investments, of Invesco Solar ETF, (hereafter referred to as the “Fund”) as of August 31, 2020, the related statement of operations for the year ended August 31, 2020, the statement of changes in net assets for each of the two years in the period ended August 31, 2020, including the related notes, and the financial highlights for each of the three years in the period ended August 31, 2020 (collectively referred to as the “financial statements”). In our opinion, the financial statements present fairly, in all material respects, the financial position of the Fund as of August 31, 2020, the results of its operations for the year ended August 31, 2020, and the changes in its net assets for each of the two years in the period ended August 31, 2020, and the financial highlights for each of the three years in the period ended August 31, 2020 in conformity with accounting principles generally accepted in the United States of America.
The financial statements of Invesco Solar ETF (Predecessor Fund Guggenheim Solar ETF) as of and for the year ended August 31, 2017 and the financial highlights for each of the periods ended on or prior to August 31, 2017 (not presented herein, other than the financial highlights) were audited by other auditors whose report dated October 30, 2017 expressed an unqualified opinion on those financial statements and financial highlights.
Basis for Opinion
These financial statements are the responsibility of the Fund’s management. Our responsibility is to express an opinion on the Fund’s financial statements based on our audits. We are a public accounting firm registered with the Public Company Accounting Oversight Board (United States) (“PCAOB”) and are required to be independent with respect to the Fund in accordance with the U.S. federal securities laws and the applicable rules and regulations of the Securities and Exchange Commission and the PCAOB.
We conducted our audits of these financial statements in accordance with the standards of the PCAOB. Those standards require that we plan and perform the audit to obtain reasonable assurance about whether the financial statements are free of material misstatement, whether due to error or fraud.
Our audits included performing procedures to assess the risks of material misstatement of the financial statements, whether due to error or fraud, and performing procedures that respond to those risks. Such procedures included examining, on a test basis, evidence regarding the amounts and disclosures in the financial statements. Our audits also included evaluating the accounting principles used and significant estimates made by management, as well as evaluating the overall presentation of the financial statements. Our procedures included confirmation of securities owned as of August 31, 2020 by correspondence with the custodian, transfer agent, and brokers; when replies were not received from brokers, we performed other auditing procedures. We believe that our audits provide a reasonable basis for our opinion.
/s/PricewaterhouseCoopers LLP
Chicago, Illinois
October 28, 2020
We have served as the auditor of one or more of the investment companies in the Invesco group of investment companies since at least 1995. We have not been able to determine the specific year we began serving as auditor.
Calculating your ongoing Fund expenses
Example
As a shareholder of Invesco Solar ETF (the “Fund”), a series of the Invesco Exchange-Traded Fund Trust II, you incur advisory fees and other Fund expenses. The expense examples below are intended to help you understand your ongoing costs (in dollars) of investing in the Fund and to compare these costs with the ongoing costs of investing in other funds.
The example is based on an investment of $1,000 invested at the beginning of the period and held for the entire period March 1, 2020 through August 31, 2020.
Actual Expenses
The first line in the following table provides information about actual account values and actual expenses. You may use the information in this line, together with the amount you invested, to estimate the expenses that you paid over the period. Simply divide your account value by $1,000 (for example, an $8,600 account value divided by $1,000 = 8.6), then multiply the result by the number in the first line under the heading “Expenses Paid During the Six-Month Period” to estimate the expenses you paid on your account during this period.
Hypothetical Example for Comparison Purposes
The second line in the following table provides information about hypothetical account values and hypothetical expenses based on the Fund’s actual expense ratio and an assumed annualized rate of return of 5% per year before expenses, which is not the Fund’s actual return. The hypothetical account values and expenses may not be used to estimate the actual ending account balance or expenses you paid for the period. You may use this information to compare the ongoing costs of investing in the Fund and other funds. To do so, compare this 5% hypothetical example with the 5% hypothetical examples that appear in the shareholder reports of the other funds.
Please note that the expenses shown in the table are meant to highlight your ongoing costs only, and do not reflect any transactional costs, such as sales charges and brokerage commissions. Therefore, the second line in the table is useful in comparing ongoing costs only, and will not help you determine the relative total costs of owning different funds. If transaction costs and indirect expenses were included, your costs would have been higher.
| | | | | | | | | | | | | | | | |
| | | Beginning Account Value
March 1, 2020 | | | Ending Account Value
August 31, 2020 | | | Annualized Expense Ratio Based on the
Six-Month Period | | | Expenses Paid During the
Six-Month Period(1) | |
| | | | |
Invesco Solar ETF (TAN) | | | | | | | | | | | | | | | | |
| | | | |
Actual | | | $1,000.00 | | | | $1,572.90 | | | | 0.67% | | | | $4.33 | |
| | | | |
Hypothetical (5% return before expenses) | | | 1,000.00 | | | | 1,021.77 | | | | 0.67 | | | | 3.40 | |
| (1) | Expenses are calculated using the annualized expense ratio, which represents the ongoing expenses as a percentage of net assets for the six-month period ended August 31, 2020. Expenses are calculated by multiplying the Fund’s annualized expense ratio by the average account value for the period, then multiplying the result by 184/366. Expense ratios for the most recent six-month period may differ from expense ratios based on the annualized data in the Financial Highlights. |
Tax Information
Form 1099-DIV, Form 1042-S and other year–end tax information provide shareholders with actual calendar year amounts that should be included in their tax returns. Shareholders should consult their tax advisers.
The following distribution information is being provided as required by the Internal Revenue Code or to meet a specific state’s requirement.
The Fund designates the following amounts or, if subsequently determined to be different, the maximum amount allowable for its fiscal year ended August 31, 2020:
| | | | | | | | | | |
| | | Qualified
Business
Income* | | Qualified
Dividend
Income* | | Dividends-Received
Deduction* | | Business
Interest
Income* | | Qualified
Interest
Income* |
| | | | | |
Invesco Solar ETF | | 0% | | 29% | | 1% | | 0% | | 0% |
| * | The above percentages are based on ordinary income dividends paid to shareholders during the Fund’s fiscal year. |
Trustees and Officers
The Independent Trustees of the Trust, their term of office and length of time served, their principal business occupations during at least the past five years, the number of portfolios in the Fund Complex (as defined below) overseen by each Independent Trustee and the other directorships, if any, held by each Independent Trustee are shown below.
As of August 31, 2020
| | | | | | | | | | |
Name, Address and Year of
Birth of Independent Trustees | | Position(s)
Held
with Trust | | Term of
Office
and
Length of
Time
Served* | | Principal
Occupation(s) During
Past 5 Years | | Number of
Portfolios in
Fund Com plex**
Overseen by
Independent
Trustees | | Other Directorships Held by Independent Trustees During the Past 5 Years |
Ronn R. Bagge–1958
c/o Invesco Capital
Management LLC
3500 Lacey Road, Suite 700
Downers Grove, IL 60515 | | Vice Chairman of the Board; Chairman of the Nominating and Governance Committee and Trustee | | Vice Chairman since 2018; Chairman of the Nominating and Governance Committee and Trustee since 2007 | | Founder and Principal, YQA Capital Management LLC (1998-Present); formerly, Owner/CEO of Electronic Dynamic Balancing Co., Inc. (high-speed rotating equipment service provider). | | 214 | | Trustee and Investment Oversight Committee member, Mission Aviation Fellowship (2017-Present). |
| | | | | |
Todd J. Barre–1957
c/o Invesco Capital
Management LLC
3500 Lacey Road, Suite 700
Downers Grove, IL 60515 | | Trustee | | Since 2010 | | Assistant Professor of Business, Trinity Christian College (2010-2016); formerly, Vice President and Senior Investment Strategist (2001-2008), Director of Open Architecture and Trading (2007-2008), Head of Fundamental Research (2004-2007) and Vice President and Senior Fixed Income Strategist (1994-2001), BMO Financial Group/Harris Private Bank. | | 214 | | None. |
| * | This is the date the Independent Trustee began serving the Trust. Each Independent Trustee serves an indefinite term, until his or her successor is elected. |
| ** | Fund Complex includes all open- and closed-end funds (including all of their portfolios) advised by the Adviser and any affiliated person of the Adviser. |
Trustees and Officers–(continued)
| | | | | | | | | | |
Name, Address and Year of
Birth of Independent Trustees | | Position(s)
Held
with Trust | | Term of
Office and
Length of
Time
Served* | | Principal Occupation(s) During
Past 5 Years | | Number of
Portfolios
in Fund
Complex**
Overseen by
Independent
Trustees | | Other
Directorships
Held by
Independent
Trustees During
the Past 5 Years |
Edmund P. Giambastiani,
Jr.–1948
c/o Invesco Capital
Management LLC
3500 Lacey Road, Suite 700
Downers Grove, IL 60515 | | Trustee | | Since 2019 | | President, Giambastiani Group LLC (national security and energy consulting) (2007-Present); Director, The Boeing Company (2009-Present); Trustee, MITRE Corporation (federally-funded research development) (2008-Present); Director, THL Credit, Inc. (alternative credit investment manager) (2016-Present); Trustee, U.S. Naval Academy Foundation Athletic & Scholarship Program (2010-Present); Advisory Board Member, Massachusetts Institute of Technology Lincoln Laboratory (federally-funded research development) (2010-Present); Defense Advisory Board Member, Lawrence Livermore National Laboratory (2013-Present); formerly, Chairman (2015-2016), Lead Director (2011-2015) and Director (2008-2011), Monster Worldwide, Inc. (career services); Advisory Board Member, Maxwell School of Citizenship and Public Affairs of Syracuse University (2012-2016); United States Navy, career nuclear submarine officer (1970-2007); Seventh Vice Chairman of the Joint Chiefs of Staff (2005-2007); first NATO Supreme Allied Commander Transformation (2003-2005); Commander, U.S. Joint Forces Command (2002-2005). | | 214 | | Formerly, Trustee, certain funds of the Oppenheimer Funds complex (2013-2019); Director, Mercury Defense Systems Inc. (information technology) (2011-2013); Independent Director, QinetiQ Group Plc (defense technology and security) (2008-2011); Chairman, Alenia North America, Inc. (military and defense products) (2008-2009); Director, SRA International, Inc. (information technology and services) (2008-2011). |
| * | This is the date the Independent Trustee began serving the Trust. Each Independent Trustee serves an indefinite term, until his or her successor is elected. |
| ** | Fund Complex includes all open- and closed-end funds (including all of their portfolios) advised by the Adviser and any affiliated person of the Adviser. |
Trustees and Officers–(continued)
| | | | | | | | | | |
Name, Address and Year of
Birth of Independent Trustees | | Position(s) Held with Trust | | Term of Office and Length of Time Served* | | Principal
Occupation(s) During Past 5 Years | | Number of Portfolios in Fund Complex** Overseen by Independent Trustees | | Other Directorships Held by Independent Trustees During the Past 5 Years |
Victoria J. Herget–1951
c/o Invesco Capital
Management LLC
3500 Lacey Road, Suite 7
00 Downers Grove, IL 60515 | | Trustee | | Since 2019 | | Formerly, Managing Director (1993-2001), Principal (1985-1993), Vice President (1978-1985) and Assistant Vice President (1973-1978), Zurich Scudder Investments (investment adviser) (and its predecessor firms). | | 214 | | Trustee (2000-Present) and Chair (2010-2017), Newberry Library; Trustee, Mather LifeWays (2001-Present); Trustee, Chikaming Open Lands (2014-Present); formerly, Trustee, certain funds in the Oppenheimer Funds complex (2012-2019); Board Chair (2008-2015) and Director (2004-2018), United Educators Insurance Company; Independent Director, First American Funds (2003-2011); Trustee (1992-2007), Chair of the Board of Trustees (1999-2007), Investment Committee Chair (1994-1999) and Investment Committee member (2007-2010), Wellesley College; Trustee, BoardSource (2006-2009); Trustee, Chicago City Day School (1994-2005). |
| * | This is the date the Independent Trustee began serving the Trust. Each Independent Trustee serves an indefinite term, until his or her successor is elected. |
| ** | Fund Complex includes all open- and closed-end funds (including all of their portfolios) advised by the Adviser and any affiliated person of the Adviser. |
Trustees and Officers–(continued)
| | | | | | | | | | |
Name, Address and Year of Birth of Independent Trustees | | Position(s) Held with Trust | | Term of Office and Length of Time Served* | | Principal
Occupation(s) During Past 5 Years | | Number of Portfolios in Fund Complex** Overseen by Independent Trustees | | Other Directorships Held by Independent Trustees During the Past 5 Years |
| Marc M. Kole–1960 c/o Invesco Capital Management LLC 3500 Lacey Road, Suite 700 Downers Grove, IL 60515 | | Chairman of the Audit Committee and Trustee | | Chairman of the Audit Committee since 2008; Trustee since 2007 | | Senior Director of Finance, By The Hand Club for Kids (not-for-profit) (2015-Present); formerly, Chief Financial Officer, Hope Network (social services) (2008-2012); Assistant Vice President and Controller, Priority Health (health insurance) (2005-2008); Regional Chief Financial Officer, United Healthcare (2005); Chief Accounting Officer, Senior Vice President of Finance, Oxford Health Plans (2000-2004); Audit Partner, Arthur Andersen LLP (1996-2000). | | 214 | | Treasurer (2018-Present), Finance Committee Member (2015-Present) and Audit Committee Member (2015), Thornapple Evangelical Covenant Church; formerly, Board and Finance Committee Member (2009-2017) and Treasurer (2010-2015, 2017), NorthPointe Christian Schools. |
| | | | | |
| Yung Bong Lim–1964 c/o Invesco Capital Management LLC 3500 Lacey Road, Suite 700 Downers Grove, IL 60515 | | Chairman of the Investment Oversight Committee and Trustee | | Chairman of the Investment Oversight Committee since 2014; Trustee since 2013 | | Managing Partner, RDG Funds LLC (real estate) (2008-Present); formerly, Managing Director, Citadel LLC (1999-2007). | | 214 | | Advisory Board Member, Performance Trust Capital Partners, LLC (2008-Present); Board Director, Beacon Power Services, Corp. (2019-Present). |
| * | This is the date the Independent Trustee began serving the Trust. Each Independent Trustee serves an indefinite term, until his or her successor is elected. |
| ** | Fund Complex includes all open- and closed-end funds (including all of their portfolios) advised by the Adviser and any affiliated person of the Adviser. |
Trustees and Officers–(continued)
| | | | | | | | | | |
Name, Address and Year of Birth of Independent Trustees | | Position(s) Held with Trust | | Term of Office and Length of Time Served* | | Principal Occupation(s) During Past 5 Years | | Number of Portfolios in Fund Complex** Overseen by Independent Trustees | | Other Directorships Held by Independent Trustees During the Past 5 Years |
Joanne Pace–1958
c/o Invesco Capital
Management LLC
3500 Lacey Road, Suite 700
Downers Grove, IL 60515 | | Trustee | | Since 2019 | | Formerly, Senior Advisor, SECOR Asset Management, LP (2010-2011); Managing Director and Chief Operating Officer, Morgan Stanley Investment Management (2006-2010); Partner and Chief Operating Officer, FrontPoint Partners, LLC (alternative investments) (2005-2006); Managing Director (2003-2005), Global Head of Human Resources and member of Executive Board and Operating Committee (2004-2005), Global Head of Operations and Product Control (2003-2004), Credit Suisse (investment banking); Managing Director (1997-2003), Controller and Principal Accounting Officer (1999-2003), Chief Financial Officer (temporary assignment) for the Oversight Committee, Long Term Capital Management (1998-1999). | | 214 | | Board Director, Horizon Blue Cross Blue Shield of New Jersey (2012- Present); Advisory Board Director, The Alberleen Group LLC (2012-Present); Governing Council Member (2016-Present) and Chair of Education Committee (2017-Present), Independent Directors Council (IDC); Board Member, 100 Women in Finance (2015-Present); Council Member, NewYork-Presbyterian Hospital’s Leadership Council on Children’s and Women’s Health (2012-Present); formerly, Trustee, certain funds in the Oppenheimer Funds complex (2012-2019); Lead Independent Director and Chair of the Audit and Nominating Committee of The Global Chartist Fund, LLC, Oppenheimer Asset Management (2011-2012); Board Director, Managed Funds Association (2008-2010); Board Director (2007-2010) and Investment Committee Chair (2008-2010), Morgan Stanley Foundation. |
| * | This is the date the Independent Trustee began serving the Trust. Each Independent Trustee serves an indefinite term, until his or her successor is elected. |
| ** | Fund Complex includes all open- and closed-end funds (including all of their portfolios) advised by the Adviser and any affiliated person of the Adviser. |
Trustees and Officers–(continued)
| | | | | | | | | | |
Name, Address and Year of Birth of Independent Trustees | | Position(s) Held with Trust | | Term of Office and Length of Time Served* | | Principal Occupation(s) During Past 5 Years | | Number of Portfolios in Fund Complex** Overseen by Independent Trustees | | Other Directorships Held by Independent Trustees During the Past 5 Years |
Gary R. Wicker - 1961
c/o Invesco Capital
Management LLC
3500 Lacey Road, Suite 700
Downers Grove, IL 60515 | | Trustee | | Since 2013 | | Senior Vice President of Global Finance and Chief Financial Officer, RBC Ministries (publishing company) (2013-Present); formerly, Executive Vice President and Chief Financial Officer, Zondervan Publishing (a division of Harper Collins/NewsCorp) (2007-2012); Senior Vice President and Group Controller (2005- 2006), Senior Vice President and Chief Financial Officer (2003-2004), Chief Financial Officer (2001-2003), Vice President, Finance and Controller (1999-2001) and Assistant Controller (1997-1999), divisions of The Thomson Corporation (information services provider); Senior Audit Manager (1994-1997), PricewaterhouseCoopers LLP. | | 214 | | Board Member and Treasurer, Our Daily Bread Ministries Canada (2015-Present); Board and Finance Committee Member, West Michigan Youth For Christ (2010-Present). |
| | | | | |
Donald H. Wilson - 195
c/o Invesco Capital
Management LLC
3500 Lacey Road, Suite 700
Downers Grove, IL 60515 | | Chairman of the Board and Trustee | | Chairman since 2012; Trustee since 2007 | | Chairman, President and Chief Executive Officer, McHenry Bancorp Inc. and McHenry Savings Bank (subsidiary) (2018-Present); formerly, Chairman and Chief Executive Officer, Stone Pillar Advisors, Ltd. (2010-2017); President and Chief Executive Officer, Stone Pillar Investments, Ltd. (advisory services to the financial sector) (2016-2018); Chairman, President and Chief Executive Officer, Community Financial Shares, Inc. and Community Bank–Wheaton/Glen Ellyn (subsidiary) (2013-2015); Chief Operating Officer, AMCORE Financial, Inc. (bank holding company) (2007-2009); Executive Vice President and Chief Financial Officer, AMCORE Financial, Inc. (2006-2007); Senior Vice President and Treasurer, Marshall & Ilsley Corp. (bank holding company) (1995-2006). | | 214 | | Director, Penfield Children’s Center (2004-Present); Board Chairman, Gracebridge Alliance, Inc. (2015-Present). |
| * | This is the date the Independent Trustee began serving the Trust. Each Independent Trustee serves an indefinite term, until his or her successor is elected. |
| ** | Fund Complex includes all open- and closed-end funds (including all of their portfolios) advised by the Adviser and any affiliated person of the Adviser. |
Trustees and Officers–(continued)
The Interested Trustee and the executive officers of the Trust, their term of office and length of time served, their principal business occupations during at least the past five years, the number of portfolios in the Fund Complex (as defined below) overseen by the Interested Trustee and the other directorships, if any, held by the Interested Trustee are shown below.
| | | | | | | | | | |
Name, Address and Year of
Birth of Interested Trustee | | Position(s) Held with Trust | | Term of Office and Length of Time Served* | | Principal Occupation(s) During Past 5 Years | | Number of Portfolios in Fund Complex** Overseen by Interested Trustee | | Other Directorships Held by Interested Trustee During the Past 5 Years |
Kevin M. Carome–1956 Invesco Ltd. Two Peachtree Pointe 1555 Peachtree St., N.E., Suite 1800 Atlanta, GA 30309 | | Trustee | | Since 2010 | | Senior Managing Director, Secretary and General Counsel, Invesco Ltd. (2007-Present); Director, Invesco Advisers, Inc. (2009-Present); Director (2006-Present) and Executive Vice President (2008-Present), Invesco North American Holdings, Inc.; Executive Vice President (2008-Present), Invesco Investments (Bermuda) Ltd.; Manager, Horizon Flight Works LLC; and Executive Vice President (2014-Present), INVESCO Asset Management (Bermuda) Ltd.; formerly, Director and Secretary (2012-2020), Invesco Services (Bahamas) Private Limited; Director, Invesco Finance PLC (2011-2019); Director, INVESCO Asset Management (Bermuda) Ltd. (2014-2019); Director and Executive Vice President, Invesco Finance, Inc. (2011-2018); Director (2006-2018) and Executive Vice President (2008-2018), Invesco Group Services, Inc., Invesco Holding Company (US), Inc.; Director, Invesco Holding Company Limited (2007- 2019); Director and Chairman, INVESCO Funds Group, Inc., Senior Vice President, Secretary and General Counsel, Invesco Advisers, Inc. (2003-2006); Director, Invesco Investments (Bermuda) Ltd. (2008- 2016); Senior Vice President and General Counsel, Liberty Financial Companies, Inc. (2000-2001); General Counsel of certain investment management subsidiaries of Liberty Financial Companies, Inc. (1998-2000); Associate General Counsel, Liberty Financial Companies, Inc. (1993-1998); Associate, Ropes & Gray LLP. | | 214 | | None |
| * | This is the date the Interested Trustee began serving the Trust. The Interested Trustee serves an indefinite term, until his successor is elected. |
| ** | Fund Complex includes all open- and closed-end funds (including all of their portfolios) advised by the Adviser and any affiliated person of the Adviser. |
Trustees and Officers–(continued)
| | | | | | |
Name, Address and Year of Birth of Executive Officers | | Position(s) Held with Trust | | Length of Time Served* | | Principal Occupation(s) During Past 5 Years |
Anna Paglia—1974 Invesco Capital Management LLC 3500 Lacey Road, Suite 700 Downers Grove, IL 60515 | | President and Principal Executive Officer | | Since 2020 | | President and Principal Executive Officer, Invesco Exchange-Traded Fund Trust, Invesco Exchange-Traded Fund Trust II, Invesco India Exchange-Traded Fund Trust, Invesco Actively Managed Exchange-Traded Fund Trust, Invesco Actively Managed Exchange-Traded Commodity Fund Trust and Invesco Exchange- Traded Self-Indexed Fund Trust (2020-Present); Managing Director and Global Head of ETFs and Indexed Strategies, Chief Executive Officer and Principal Executive Officer, Invesco Capital Management LLC (2020-Present); Chief Executive Officer, Manager and Principal Executive Officer, Invesco Specialized Products, LLC (2020-Present); Vice President, Invesco Indexing LLC (2020-Present);formerly, Secretary, Invesco Exchange-Traded Fund Trust, Invesco Exchange-Traded Fund Trust II, Invesco India Exchange-Traded Fund Trust and Invesco Actively Managed Exchange-Traded Fund Trust (2011-2020), Invesco Actively Managed Exchange-Traded Commodity Fund Trust (2014-2020) and Invesco Exchange-Traded Self-Indexed Fund Trust (2015-2020); Head of Legal (2010-2020) and Secretary (2015-2020), Invesco Capital Management LLC; Manager and Assistant Secretary, Invesco Indexing LLC (2017-2020); Head of Legal and Secretary, Invesco Specialized Products, LLC (2018-2020); Partner, K&L Gates LLP (formerly, Bell Boyd & Lloyd LLP) (2007-2010); and Associate Counsel at Barclays Global Investors Ltd. (2004-2006). |
| | | |
Kelli Gallegos—1970 Invesco Capital Management LLC 11 Greenway Plaza, Suite 1000 Houston, TX 77046 | | Vice President and Treasurer | | Since 2018 | | Vice President, Invesco Advisers, Inc. (2020-Present); Principal Financial and Accounting Officer- Pooled Investments, Invesco Specialized Products, LLC (2018-Present); Vice President and Treasurer, Invesco Exchange-Traded Fund Trust, Invesco Exchange-Traded Fund Trust II, Invesco India Exchange-Traded Fund Trust, Invesco Actively Managed Exchange-Traded Fund Trust, Invesco Actively Managed Exchange-Traded Commodity Fund Trust and Invesco Exchange-Traded Self-Indexed Fund Trust (2018-Present); Principal Financial and Accounting Officer-Pooled Investments, Invesco Capital Management LLC (2018-Present); Vice President, Principal Financial Officer (2016-Present) and Assistant Treasurer (2008-Present), The Invesco Funds; formerly, Assistant Treasurer, Invesco Specialized Products, LLC (2018); Assistant Treasurer, Invesco Exchange-Traded Fund Trust, Invesco Exchange-Traded Fund Trust II, Invesco India Exchange-Traded Fund Trust and Invesco Actively Managed Exchange-Traded Fund Trust (2012-2018), Invesco Actively Managed Exchange-Traded Commodity Fund Trust (2014-2018) and Invesco Exchange-Traded Self-Indexed Fund Trust (2016-2018); Assistant Treasurer, Invesco Capital Management LLC (2013-2018); and Assistant Vice President, The Invesco Funds (2008-2016). |
|
|
|
|
|
|
|
|
|
|
|
|
|
|
|
|
|
| * | This is the date each Officer began serving the Trust in their current position. Each Officer serves an indefinite term, until his or her successor is elected. |
Trustees and Officers–(continued)
| | | | | | |
Name, Address and Year of Birth of Executive Officers | | Position(s) Held with Trust | | Length of Time Served* | | Principal Occupation(s) During Past 5 Years |
Adam Henkel—1980 Invesco Capital Management LLC 3500 Lacey Road, Suite 700 Downers Grove, IL 60515 | | Secretary | | Since 2020 | | Head of Legal – US ETFs and Secretary, Invesco Capital Management LLC (2020-Present); Head of Legal and Secretary, Invesco Specialized Products, LLC (2020-Present); Secretary, Invesco Exchange-Traded Fund Trust, Invesco Exchange-Traded Fund Trust II, Invesco India Exchange-Traded Fund Trust, Invesco Actively Managed Exchange-Traded Fund Trust, Invesco Actively Managed Exchange-Traded Commodity Fund Trust and Invesco Exchange- Traded Self-Indexed Fund Trust (2020-Present); Manager and Assistant Secretary, Invesco Indexing LLC (2020-Present); Assistant Secretary (2020-Present), Invesco Capital Markets, Inc. and Invesco Investment Advisers LLC; Assistant Secretary, The Invesco Funds (2014-Present); formerly, Assistant Secretary, Invesco Capital Management LLC (2015-2020) and Invesco Specialized Products, LLC (2018-2020); Assistant Secretary (2014-2020) and Chief Compliance Officer (2017-2017), Invesco Exchange- Traded Fund Trust, Invesco Exchange-Traded Fund Trust II, Invesco India Exchange-Traded Fund Trust and Invesco Actively Managed Exchange-Traded Fund Trust, Invesco Actively Managed Exchange-Traded Commodity Fund Trust and Invesco Exchange-Traded Self-Indexed Fund Trust. |
| | | |
Peter Hubbard—1981 Invesco Capital Management LLC 3500 Lacey Road, Suite 700 Downers Grove, IL 60515 | | Vice President | | Since 2009 | | Vice President, Invesco Specialized Products, LLC (2018-Present); Vice President, Invesco Exchange-Traded Fund Trust, Invesco Exchange-Traded Fund Trust II, Invesco India Exchange-Traded Fund Trust, Invesco Actively Managed Exchange-Traded Fund Trust (2009-Present), Invesco Actively Managed Exchange-Traded Commodity Fund Trust (2014-Present) and Invesco Exchange-Traded Self-Indexed Fund Trust (2016-Present); Vice President and Director of Portfolio Management, Invesco Capital Management LLC (2010-Present); formerly, Vice President of Portfolio Management, Invesco Capital Management LLC (2008-2010); Portfolio Manager, Invesco Capital Management LLC (2007-2008); Research Analyst, Invesco Capital Management LLC (2005-2007); Research Analyst and Trader, Ritchie Capital, a hedge fund operator (2003-2005). |
| | | |
Sheri Morris—1964 Invesco Capital Management LLC 11 Greenway Plaza, Suite 1000 Houston, TX 77046 | | Vice President | | Since 2012 | | Head of Global Fund Services, Invesco Ltd. (2019-Present); Vice President, OppenheimerFunds, Inc. (2019-Present); President and Principal Executive Officer, The Invesco Funds (2016-Present); Treasurer, The Invesco Funds (2008-Present); Vice President, Invesco Advisers, Inc. (formerly known as Invesco Institutional (N.A.), Inc.) (registered investment adviser) (2009-Present) and Vice President, Invesco Exchange-Traded Fund Trust, Invesco Exchange- Traded Fund Trust II, Invesco India Exchange-Traded Fund Trust, Invesco Actively Managed Exchange-Traded Fund Trust (2012-Present), Invesco Actively Managed Exchange-Traded Commodity Fund Trust (2014-Present) and Invesco Exchange-Traded Self-Indexed Fund Trust (2016-Present); formerly, Vice President and Principal Financial Officer, The Invesco Funds (2008-2016); Treasurer, Invesco Exchange-Traded Fund Trust, Invesco Exchange-Traded Fund Trust II, Invesco India Exchange-Traded Fund Trust and Invesco Actively Managed Exchange-Traded Fund Trust (2011-2013); Vice President, Invesco Aim Advisers, Inc., Invesco Aim Capital Management, Inc. and Invesco Aim Private Asset Management, Inc.; Assistant Vice President and Assistant Treasurer, The Invesco Funds and Assistant Vice President, Invesco Advisers, Inc., Invesco Aim Capital Management, Inc. and Invesco Aim Private Asset Management, Inc. |
| * | This is the date each Officer began serving the Trust in their current position. Each Officer serves an indefinite term, until his or her successor is elected. |
Trustees and Officers–(continued)
| | | | | | |
Name, Address and Year of Birth of Executive Officers | | Position(s) Held with Trust | | Length of Time Served* | | Principal Occupation(s) During Past 5 Years |
Rudolf E. Reitmann–1971 Invesco Capital Management LLC 3500 Lacey Road, Suite 700 Downers Grove, IL 60515 | | Vice President | | Since 2013 | | Head of Global Exchange Traded Funds Services, Invesco Specialized Products, LLC (2018-Present); Vice President, Invesco Exchange-Traded Fund Trust, Invesco Exchange-Traded Fund Trust II, Invesco India Exchange-Traded Fund Trust, Invesco Actively Managed Exchange-Traded Fund Trust (2013-Present), Invesco Actively Managed Exchange-Traded Commodity Fund Trust (2014-Present) and Invesco Exchange-Traded Self-Indexed Fund Trust (2016-Present); Head of Global Exchange Traded Funds Services, Invesco Capital Management LLC (2013-Present); Vice President, Invesco Capital Markets, Inc. (2018-Present). |
| | | |
Melanie Zimdars–1976 Invesco Capital Management LLC 3500 Lacey Road, Suite 700 Downers Grove, IL 60515 | | Chief Compliance Officer | | Since 2017 | | Chief Compliance Officer, Invesco Specialized Products, LLC (2018-Present); Chief Compliance Officer, Invesco Capital Management LLC (2017-Present); Chief Compliance Officer, Invesco Exchange-Traded Fund Trust, Invesco Exchange-Traded Fund Trust II, Invesco India Exchange-Traded Fund Trust, Invesco Actively Managed Exchange-Traded Fund Trust, Invesco Actively Managed Exchange-Traded Commodity Fund Trust and Invesco Exchange-Traded Self-Indexed Fund Trust (2017-Present); formerly, Vice President and Deputy Chief Compliance Officer, ALPS Holding, Inc. (2009-2017); Mutual Fund Treasurer/ Chief Financial Officer, Wasatch Advisors, Inc. (2005-2008); Compliance Officer, U.S. Bancorp Fund Services, LLC (2001-2005). |
| * | This is the date each Officer began serving the Trust in their current position. Each Officer serves an indefinite term, until his or her successor is elected. |
Availability of Additional Information About the Trustees
The Statement of Additional Information includes additional information about the Trustees and is available, without charge, upon request at (800) 983-0903.
Approval of Investment Advisory Contracts
At a meeting held on April 14, 2020, the Board of Trustees of the Invesco Exchange-Traded Fund Trust II (the “Trust”), including the Independent Trustees, approved the continuation of the Investment Advisory Agreement between Invesco Capital Management LLC (the “Adviser”) and the Trust for Invesco MSCI Global Timber ETF, Invesco S&P Global Water Index ETF and Invesco Solar ETF (each, a “Fund” and collectively, the “Funds”).
The Trustees reviewed information from the Adviser describing: (i) the nature, extent and quality of services provided, (ii) the investment performance of the Funds and the Adviser, (iii) the fees and expenses paid by the Funds and comparisons to amounts paid by other comparable registered investment companies, (iv) the costs of services provided and estimated profits realized by the Adviser, (v) the extent to which economies of scale may be realized as a Fund grows and whether fee levels reflect any possible economies of scale for the benefit of Fund shareholders, and (vi) any further benefits realized by the Adviser or its affiliates from the Adviser’s relationship with the Funds.
Nature, Extent and Quality of Services. In evaluating the nature, extent and quality of the Adviser’s services, the Trustees reviewed information concerning the functions performed by the Adviser for the Funds, information describing the Adviser’s current organization and staffing, including operational support provided by the Adviser’s parent organization, Invesco Ltd. (“Invesco”), and the background and experience of the persons responsible for the day-to-day management of the Funds. The Trustees reviewed matters related to the Adviser’s oversight of execution of portfolio transactions on behalf of the Funds. The Trustees also reviewed information on the performance of the Funds and their underlying indexes for the one-year, three-year, five-year, ten-year and since-inception periods ended December 31, 2019, as applicable, including reports for each of those periods on the correlation and tracking error between each Fund’s performance and the performance of its underlying index, as well as the Adviser’s analysis of the tracking error between certain Funds and their underlying indexes. In reviewing the tracking error reports, the Trustees considered information provided by Invesco’s independent performance and risk management group with respect to general expected tracking error ranges. The Trustees also considered that the Funds were created in connection with the purchase by Invesco of the exchange-traded funds business of Guggenheim Capital LLC (the “Transaction”) and that each such Fund’s performance prior to the closing of the Transaction on April 6, 2018, and on May 18, 2018 for the Invesco Solar ETF, is that of its predecessor Guggenheim ETF. The Trustees noted that, for each applicable period, the correlation and tracking error for each Fund was within the targeted range set forth in the Trust’s registration statement and concluded that each Fund was correlated to its underlying index and that the tracking error for each Fund was within an acceptable range given that Fund’s particular circumstances.
The Trustees considered the services provided by the Adviser in its oversight of the Funds’ administrator, custodian and transfer agent. They noted the significant amount of time, effort and resources that had been devoted to this oversight function.
Based on their review, the Trustees concluded that the nature, extent and quality of services provided by the Adviser to the Funds under the Investment Advisory Agreement were appropriate and reasonable.
Fees, Expenses and Profitability. The Trustees reviewed and discussed the information provided by the Adviser on each Fund’s contractual advisory fee, net advisory fee, and gross and net expense ratio. The Trustees noted that the annual contractual advisory fee charged to each Fund is 0.50% of the Fund’s average daily net assets and that the Adviser has agreed to waive a portion of its contractual advisory fee and/or pay expenses (an “Expense Cap”) to the extent necessary to prevent the annual operating expenses of each Fund (excluding interest expenses, sub-licensing fees, offering costs, brokerage commissions and other trading expenses, taxes, acquired fund fees and expenses, if applicable, and extraordinary expenses) from exceeding the percentage of that Fund’s average daily net assets, until at least August 31, 2022, as set forth below:
| | ● | | 0.55% for Invesco MSCI Global Timber ETF; |
| | ● | | 0.63% for Invesco S&P Global Water Index ETF; and |
| | ● | | 0.65% for Invesco Solar ETF. |
The Trustees compared each Fund’s contractual advisory fee and net expense ratio to information compiled by the Adviser from Lipper Inc. databases on the net advisory fees and net expense ratios of comparable exchange-traded funds (“ETFs”), open-end (non-ETF) actively-managed funds and open-end (non-ETF) index funds, noting that comparative information for an open-end (non-ETF) index fund was only available for the Invesco MSCI Global Timber ETF. The Trustees noted that each Fund’s contractual advisory fee was higher than the median net advisory fees of its ETF peer funds and lower than the median net advisory fees of their open-end actively-managed peer funds. The Trustees noted that each Fund’s net expense ratio was higher than the median
Approval of Investment Advisory Contracts—(continued)
net expense ratio of its ETF peers and lower than the median net expense ratio of its open-end actively-managed peer funds. The Trustees noted that a significant component of the non-advisory fee expenses was the sub-license fees paid by the Funds, and noted, with the exception of Invesco S&P Global Water Index ETF, the Adviser has agreed to reimburse the amount equal to the sub-licensing fee paid that causes a Fund’s annual operating expenses (excluding interest expenses, offering costs, brokerage commissions and other trading expenses, taxes, acquired fund fees and expenses and extraordinary expenses) to exceed the percentage of the Fund’s average daily net assets as set forth below:
| | | | |
Invesco Fund | | Percentage of
Average Daily Net
Assets | | Termination Date |
Invesco MSCI Global Timber ETF | | 0.55% | | December 31, 2020 |
| | |
Invesco Solar ETF | | 0.70% | | May 18, 2020 |
The Trustees noted information, including fee information, provided by the Adviser regarding other investment products to which it provides investment advisory services, noting that the Adviser indicated that none of the other investment products have comparable investment strategies to the Funds. The Trustees considered the Adviser’s explanation of the differences between the services provided to the Funds and to the other investment products it advises, noting the Adviser’s statement that the management and oversight of the Funds requires substantially more labor and expense.
Based on all the information provided, the Trustees determined that the contractual advisory fee and net expense ratio of each Fund were reasonable and appropriate in light of the services provided, the nature of the indexes, the distinguishing factors of the Funds, and the administrative, operational and management oversight costs for the Adviser.
In conjunction with their review of fees, the Trustees considered information provided by the Adviser on the revenues received by the Adviser under the Investment Advisory Agreement for the Funds, as well as the fees waived and expenses reimbursed by the Adviser for the Funds. The Trustees reviewed information provided by the Adviser on its overall profitability, as well as the estimated profitability to the Adviser from its relationship to each Fund. The Trustees concluded that the overall and estimated profitability to the Adviser was not unreasonable.
Economies of Scale and Whether Fee Levels Reflect These Economies of Scale. The Trustees reviewed the information provided by the Adviser as to the extent to which economies of scale may be realized as each Fund grows and whether fee levels reflect economies of scale for the benefit of shareholders. The Trustees reviewed each Fund’s asset size, advisory fee, expense ratio and Expense Cap agreed to by the Adviser. The Trustees also noted that the Expense Cap agreement with the Trust provides that the Adviser is entitled to be reimbursed by each Fund for fees waived or expenses absorbed pursuant to the Expense Cap for a period of three years from the date the fee or expense was incurred, provided that no reimbursement would be made that would result in a Fund exceeding its Expense Cap then in effect or in effect at the time the fees and/or expenses subject to reimbursement were waived and/or borne by the Adviser. The Trustees considered whether the advisory fee rate for each Fund was reasonable in relation to the asset size of that Fund, and concluded that the flat advisory fee was reasonable and appropriate.
Fall-out Benefits. The Trustees considered that the Adviser identified no additional benefits it receives from its relationship with the Funds, and noted that the Adviser does not have any soft-dollar arrangements. The Trustees also considered benefits received by affiliates of the Adviser that may be directly or indirectly attributed to the Adviser’s relationship with the Funds, including brokerage fees and advisory fees for money market cash management vehicles. The Board concluded that the advisory fee was reasonable, taking into account any ancillary benefits received by affiliates of the Adviser.
Based on all of the information considered and the conclusions reached, the Board, including the Independent Trustees, determined to approve the continuation of the Investment Advisory Agreement for each Fund. No single factor was determinative in the Board’s analysis.
(This Page Intentionally Left Blank)
(This Page Intentionally Left Blank)
(This Page Intentionally Left Blank)
Proxy Voting Policies and Procedures
A description of the Trust’s proxy voting policies and procedures that the Fund uses to determine how to vote proxies relating to portfolio securities is available, without charge and upon request, by calling (800) 983-0903. This information is also available on the Securities and Exchange Commission’s (the “Commission”) website at www.sec.gov.
Information regarding how the Fund voted proxies for portfolio securities, if applicable, during the most recent 12-month period ended June 30, is available, without charge and upon request, by (i) calling (800) 983-0903; or (ii) accessing the Trust’s Form N-PX on the Commission’s website at www.sec.gov.
Quarterly Portfolios
The Trust files its complete schedule of portfolio holdings for the Fund with the Commission for the first and third quarters of each fiscal year as an exhibit to its reports on Form N-PORT. The Forms N-PORT are available on the Commission’s website at www.sec.gov.
Frequency Distribution of Discounts and Premiums
A table showing the number of days the market price of the Fund’s shares was greater than the Fund’s net asset value, and the number of days it was less than the Fund’s net asset value (i.e., premium or discount) for the most recently completed calendar year, and the calendar quarters since that year end (or the life of the Fund, if shorter) may be found at the Fund’s website at www.invesco.com/ETFs.
| | | | |
©2020 Invesco Capital Management LLC 3500 Lacey Road, Suite 700 Downers Grove, IL 60515 | | P-TRST2-AR-2 | | invesco.com/ETFs |
| | | | |
 | | |
| | Invesco Annual Report to Shareholders |
| |
| | August 31, 2020 |
| | |
| | PLW | | Invesco 1-30 Laddered Treasury ETF |
| | PWZ | | Invesco California AMT-Free Municipal Bond ETF |
| | PCEF | | Invesco CEF Income Composite ETF |
| | PHB | | Invesco Fundamental High Yield® Corporate Bond ETF |
| | PFIG | | Invesco Fundamental Investment Grade Corporate Bond ETF |
| | PZA | | Invesco National AMT-Free Municipal Bond ETF |
| | PZT | | Invesco New York AMT-Free Municipal Bond ETF |
| | PGX | | Invesco Preferred ETF |
| | BAB | | Invesco Taxable Municipal Bond ETF |
| | CLTL | | Invesco Treasury Collateral ETF |
| | VRP | | Invesco Variable Rate Preferred ETF |
| | PVI | | Invesco VRDO Tax-Free Weekly ETF |
Beginning on January 1, 2021, as permitted by regulations adopted by the Securities and Exchange Commission, paper copies of the Funds’ shareholder reports will no longer be sent by mail, unless you specifically request paper copies of the reports from your financial intermediary, such as a broker-dealer or bank. Instead, the reports will be made available on a website, and you will be notified by mail each time a report is posted and provided with a website link to access the report.
If you already elected to receive shareholder reports electronically, you will not be affected by this change and you need not take any action. If you hold accounts through a financial intermediary, you may contact your financial intermediary to enroll in electronic delivery. Please note that not all financial intermediaries may offer this service.
You may elect to receive all future reports in paper free of charge. If you hold accounts through a financial intermediary, you can follow the instructions included with this disclosure, if applicable, or contact your financial intermediary to request that you continue to receive paper copies of your shareholder reports. Please note that not all financial intermediaries may offer this service. Your election to receive reports in paper will apply to all funds held with your financial intermediary.

Table of Contents
The Market Environment
Domestic Equity Overview
Macroeconomic issues that concerned investors in the third quarter of 2019 mostly abated during the fourth quarter, providing the backdrop for strong equity market returns. During its September and October meetings, the US Federal Reserve (“the Fed”) cut interest rates by 0.25% each time, based on business investment and exports remaining weak.1 Investors were also encouraged by a resilient US economy and corporate earnings, putting the US equity market on track for its largest annual rise since 2013.
During the first quarter of 2020, as the spread of the new coronavirus (COVID-19) disrupted travel and suppressed consumer activity, investors became increasingly concerned about the global economy. At the same time, oil prices fell sharply as a price war between Saudi Arabia and Russia threatened to boost supply even as demand was falling. Beginning in late February, equity markets declined sharply and quickly, ushering in the first bear market since the financial crisis of 2008. Though the equity market stabilized somewhat toward the end of March, all sectors declined during the downturn. In response to the major collapse in demand and to help facilitate liquidity, the Fed cut interest rates two times in March by 0.50% and 1.00%, ending with a target range of 0.00% to 0.25%.1
In April, US unemployment numbers continued to climb and the initial gross domestic product (GDP) estimates for the first quarter of 2020 saw the economy shrink by 5%, the sharpest drop since the 2008 financial crisis.2 However, during the second and into the third quarter of 2020, US stocks largely shrugged off economic uncertainty, social unrest and a resurgence in coronavirus infections to rally from the market bottom. The rally followed a sharp economic decline caused by global shutdowns to slow the spread of COVID-19. Investor sentiment improved in response to trillions of dollars in economic stimulus, progress on a coronavirus vaccine and reopenings in many US regions. After oil futures contracts turned negative in early April, oil prices doubled in June, which supported struggling energy companies and millions of energy sector employees. In July, the Fed extended its emergency stimulus programs, originally scheduled to end in September, to year-end, which provided support to equities. Additionally, optimism about a vaccine, and better than anticipated US economic data and corporate earnings also boosted stocks. Most economists believe the US economy hit a low in April; however, in late August revised second quarter GDP fell by 31.7%, a record decline.2 Despite the extreme drop in the economy, the S&P 500 Index not only erased all of its losses from the first quarter but ended the fiscal year with record highs.
| 1 | Source: US Federal Reserve |
| 2 | Source: US Bureau of Economic Analysis |
Fixed Income
At the beginning of the fiscal year, despite US and China trade tensions, potential for new tariffs, and weakening global economic growth, US economic data remained supportive of slow but continued domestic economic expansion as 2019 third and fourth quarter gross domestic product grew at approximately 2.50%.1 The US economy continued to add jobs, stabilizing the unemployment rate to 3.50% at the close of 2019, while inflation remained subdued.2 In response to third quarter economic weakness, the Fed maintained accommodative policies, cutting the federal funds target rate from a range of 2.00% to 2.25% at the start of the fiscal year to a range of 1.50% to 1.75% at the close of 2019.3 Despite the UK’s general election in December, which delivered a decisive victory to the conservative party, reaffirming the original Brexit vote and the UK’s eventual exit from the European Union, macroeconomic and geopolitical issues mostly abated during the fourth quarter of 2019, providing a favorable backdrop for continued US growth.
Fixed income markets started 2020 buoyed by positive economic data and the signing of the phase one US-China trade deal. However, initial optimism was dampened by the outbreak of the new coronavirus (COVID-19) that swiftly spread from China to other global regions. Global markets fell sharply as the human and economic cost of the COVID-19 pandemic mounted. As fear of a worldwide recession increased, the Fed took aggressive action to support both the domestic and global economy by slashing rates to a range of 0.00% to 0.25%.3 The unemployment rate reached a peak of 14.7%2 while real gross domestic product decreased at an annual rate of 31.7%1 (second estimate) in the second quarter of 2020.
Despite the continuing global spread of COVID-19, many countries achieved some success in controlling the spread and were able to slowly re-open their economies. Global equity markets benefited from government policy responses to the crisis, which were swift and encouraging. Many economies received fiscal stimulus and very significant monetary stimulus. The massive monetary policy response created an environment in which investors embraced risk, and stocks rose globally after a deep rout in the first quarter. In this environment, the broader bond market, both developed and emerging, ended the fiscal year in positive territory.
The 10-year US Treasury yield continued to decline at the start of the fiscal year as the Fed adopted a more dovish stance and continued geopolitical uncertainty forced investors to seek higher quality fixed income instruments. Elevated volatility levels due to the COVID-19 pandemic and ensuing global recession led to a severe “risk-off” tone in the markets driving Treasury yields even lower. The 10-year US Treasury yield ended the fiscal year at 0.68%, 82 basis points lower than at the beginning of the fiscal year.4 (A basis point is one one-hundredth of a percentage point.)
The Market Environment (continued)
The broader bond market, as represented by the Bloomberg Barclays U.S. Aggregate Bond Index, gained 6.47% for the fiscal year. The strong performance by the index was largely attributable to the sharp decline in US Treasury yields as well as a rally in spread sector assets. The four primary sectors of the Bloomberg Barclays U.S. Aggregate Bond Index–government-related, corporate, securitized and treasury–posted positive returns for the fiscal year.
| 1 | Source: Bureau of Economic Analysis |
| 2 | Source: Bureau of Labor Statistics |
| 3 | Source: US Federal Reserve |
| 4 | Source: US Department of the Treasury |
| | |
 | | Management’s Discussion of Fund Performance Invesco 1-30 Laddered Treasury ETF (PLW) |
As an index fund, the Invesco 1-30 Laddered Treasury ETF (the “Fund”) is passively managed and seeks to track the investment results (before fees and expenses) of the Ryan/NASDAQ U.S. 1-30 Year Treasury Laddered Index (the “Index”). The Fund generally will invest at least 80% of its total assets in U.S. Treasury securities that comprise the Index. The Index measures potential returns of a theoretical portfolio of U.S. Treasury securities with a yield curve based upon 30 distinct annual maturities. The Index seeks to maintain a continuous maturity laddered portfolio of securities, meaning that securities holdings are scheduled to mature in a proportional, annual sequential pattern. Nasdaq, Inc. (the “Index Provider”) allows a six-month maturity deviation if securities with a desired maturity date are not available.
Strictly in accordance with its guidelines and mandated procedures, the Index Provider selects securities for inclusion in the Index that are U.S. Treasury-auctioned issues with fixed coupon rates that are non-callable. The Index Provider does not include treasury inflation-protected securities, bills or zero-coupon securities in the Index. The Fund generally invests in all of the securities comprising its Index in proportion to their weightings in the Index.
For the fiscal year ended August 31, 2020, on a market price basis, the Fund returned 9.50%. On a net asset value (“NAV”) basis, the Fund returned 9.82%. During the same time period, the Index returned 10.14%. During the fiscal year, the Fund fully replicated the components of the Index; therefore, the Fund’s performance, on a NAV basis, differed from the return of the Index primarily due to fees and operating expenses that the Fund incurred during the period.
During this same time period, the Bloomberg Barclays U.S. Treasury Index (the “Benchmark Index”) returned 6.98%. The Benchmark Index is an unmanaged index weighted by market capitalization, which is based on the average performance of approximately 250 securities. The Benchmark Index was selected for its recognition in the marketplace, and its performance comparison is a useful measure for investors as a broad representation of the roughly 5-year average duration U.S. Treasury market.
Relative to the Benchmark Index, the Fund was most overweight in bonds with maturities between 10-20 years duration and most underweight in bonds with maturities between 0-5 years duration during the fiscal year ended August 31, 2020. The majority of the Fund’s outperformance relative to the Benchmark Index during the period can be attributed to the Fund’s overweight allocation to bonds with maturities greater than ten years.
For the fiscal year ended August 31, 2020, bonds with maturities with between 10 and 19 years contributed most significantly to the Fund’s return, followed by bonds with maturities between 20 to 30 years. No maturity bands detracted from the Fund’s return over the period.
Positions that contributed most significantly to the Fund’s return for the fiscal year ended August 31, 2020, included U.S. Treasury Bond, 4.50% coupon, due 02/15/2036 (portfolio average weight of 10.10%), and U.S. Treasury Bond, 5.38% coupon, due 02/15/2031 (portfolio average weight of 9.83%). No positions detracted from the Fund’s return over the period.
Duration Breakdown (% of the Fund’s Net Assets)
as of August 31, 2020
| | | | |
| |
Maturing in 0-5 Years | | | 15.40 | |
| |
Maturing in 6-10 Years | | | 16.23 | |
| |
Maturing in 11-15 Years | | | 9.83 | |
| |
Maturing in 16-20 Years | | | 23.65 | |
| |
Maturing in 21-25 Years | | | 17.23 | |
| |
Maturing in 26-30 Years | | | 17.49 | |
| |
Money Market Funds Plus Other Assets Less Liabilities | | | 0.17 | |
Top Ten Fund Holdings* (% of the Fund’s Net Assets)
as of August 31, 2020
| | | | |
| Security | | |
| |
U.S. Treasury Bonds, 4.50%, 02/15/2036 | | | 10.09 | |
| |
U.S. Treasury Bonds, 5.38%, 02/15/2031 | | | 9.83 | |
| |
U.S. Treasury Bonds, 2.00%, 02/15/2050 | | | 3.57 | |
| |
U.S. Treasury Bonds, 2.50%, 02/15/2046 | | | 3.49 | |
| |
U.S. Treasury Bonds, 3.00%, 02/15/2049 | | | 3.48 | |
| |
U.S. Treasury Bonds, 2.50%, 02/15/2045 | | | 3.48 | |
| |
U.S. Treasury Bonds, 3.00%, 02/15/2048 | | | 3.48 | |
| |
U.S. Treasury Bonds, 3.00%, 02/15/2047 | | | 3.47 | |
| |
U.S. Treasury Bonds, 3.13%, 02/15/2043 | | | 3.46 | |
| |
U.S. Treasury Bonds, 3.13%, 02/15/2042 | | | 3.45 | |
| |
Total | | | 47.80 | |
| * | Excluding money market fund holdings. |
Invesco 1-30 Laddered Treasury ETF (PLW) (continued)
Growth of a $10,000 Investment
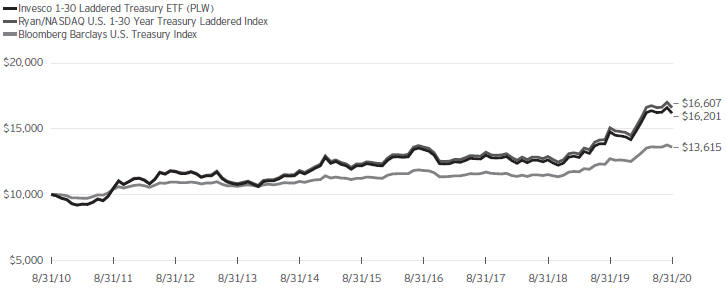
Fund Performance History as of August 31, 2020
| | | | | | | | | | | | | | | | | | | | | | | | | | | | | | | | | | | | | | | | |
| | | | | | 3 Years | | | | | | 5 Years | | | | | | 10 Years | | | | | | | | | Fund Inception | |
| Index | | 1 Year | | | Average
Annualized | | | 3 Years
Cumulative | | | Average
Annualized | | | 5 Years
Cumulative | | | Average
Annualized | | | 10 Years
Cumulative | | | | | | Average
Annualized | | | Cumulative | |
| | | | | | | | | | |
Ryan/NASDAQ U.S. 1-30 Year Treasury Laddered Index | | | 10.14 | % | | | 7.90 | % | | | 25.63 | % | | | 6.14 | % | | | 34.69 | % | | | 5.20 | % | | | 66.07 | % | | | | | | | 6.47 | % | | | 124.30 | % |
| | | | | | | | | | |
Bloomberg Barclays U.S. Treasury Index | | | 6.98 | | | | 5.15 | | | | 16.26 | | | | 3.90 | | | | 21.08 | | | | 3.13 | | | | 36.15 | | | | | | | | 4.18 | | | | 69.44 | |
| | | | | | | | | | |
Fund | | | | | | | | | | | | | | | | | | | | | | | | | | | | | | | | | | | | | | | | |
| | | | | | | | | | |
NAV Return | | | 9.82 | | | | 7.64 | | | | 24.72 | | | | 5.87 | | | | 33.03 | | | | 4.94 | | | | 62.01 | | | | | | | | 6.17 | | | | 116.43 | |
| | | | | | | | | | |
Market Price Return | | | 9.50 | | | | 7.58 | | | | 24.50 | | | | 5.89 | | | | 33.10 | | | | 4.91 | | | | 61.57 | | | | | | | | 6.14 | | | | 115.54 | |
Fund Inception: October 11, 2007
Performance quoted above represents past performance. Past performance is not a guarantee of future results and current performance may be higher or lower than performance quoted. Investment returns and principal value will fluctuate, and shares of the Fund (“Fund Shares”), when redeemed or sold, may be worth more or less than their original cost. Fund performance reflects any applicable fee waivers and/or expense reimbursements. Had the adviser not waived fees and/or reimbursed expenses currently or in the past, returns would have been lower. See the current prospectus for more information. According to the Fund’s current prospectus, the Fund’s expense ratio of 0.25% is expressed as a unitary management fee to cover operating expenses and expenses incurred in connection with managing the portfolio. NAV and Market Price returns assume that dividends and capital gain distributions have been reinvested in the Fund at NAV and Market Price, respectively. The returns shown in the table above do not reflect the deduction of taxes that a shareholder would pay on Fund distributions or the redemption or sale of Fund Shares. See
invesco.com/ETFs to find the most recent month-end performance numbers.
Index and Benchmark Index performance results are based upon a hypothetical investment in their respective constituent securities. Index and Benchmark Index returns do not represent Fund returns. An investor cannot invest directly in an index. The Index and Benchmark Index do not charge management fees or brokerage expenses, and no such fees or expenses were deducted from the hypothetical performance shown. In addition, the results actual investors might have achieved would have differed from those shown because of differences in the timing, amounts of their investments, and fees and expenses associated with an investment in the Fund.
Notes Regarding Indexes and Fund Performance History:
| - | Average Annualized and Cumulative Inception returns for the Fund, Index and Benchmark Index are based on the inception date of the Fund. |
| | |
 | | Management’s Discussion of Fund Performance Invesco California AMT-Free Municipal Bond ETF (PWZ) |
As an index fund, the Invesco California AMT-Free Municipal Bond ETF (the “Fund”) is passively managed and seeks to track the investment results (before fees and expenses) of the ICE BofAML California Long-Term Core Plus Municipal Securities Index (the “Index”). The Fund generally will invest at least 80% of its total assets in municipal securities that comprise the Index and that are also exempt from the federal alternative minimum tax.
ICE Data Indices, LLC is the Index provider for the Index. The Index is composed of U.S. dollar-denominated, investment grade, tax-exempt debt publicly issued by California or any U.S. territory, or their political subdivisions, in the U.S. domestic market with a term of at least 15 years remaining to final maturity. The Fund does not purchase all of the securities in the Index; instead, the Fund utilizes a “sampling” methodology to seek to achieve its investment objective.
For the fiscal year ended August 31, 2020, on a market price basis, the Fund returned 2.34%. On a net asset value (“NAV”) basis, the Fund returned 2.53%. During the same time period, the Index returned 3.60%. During the fiscal year, the Fund’s performance, on a NAV basis, differed from the return of the Index primarily due to the sampling approach employed by the portfolio management team as well as fees and operating expenses incurred by the Fund as well as costs associated with portfolio rebalancing and sampling during the period.
During this same time period, the Bloomberg Barclays Municipal Bond 20 Year Index (the “Benchmark Index”) returned 3.35%. The Benchmark Index is an unmanaged index weighted by market capitalization and based on the average performance of approximately 900 securities. The Benchmark Index was selected for its recognition in the marketplace, and its performance comparison is a useful measure for investors as a broad representation of municipal securities with maturities of 17 to 22 years.
Relative to the Benchmark Index, the Fund was most overweight in the State of California and most underweight in the State of New York during the fiscal year ended August 31, 2020. The majority of the Fund’s underperformance relative to the Benchmark Index during the period can be attributed to the Fund’s lack of exposure to New York State bonds, as well as fees and operating expenses incurred by the Fund during the period.
For the fiscal year ended August 31, 2020, the State of California contributed most significantly to the Fund’s return. There were no states that detracted from the Fund’s return over the period.
Positions that contributed most significantly to the Fund’s return for the fiscal year ended August 31, 2020, included Los Angeles County California Public Works Rev. Bond, 5.00% coupon, due 12/01/2049 (portfolio average weight of 3.00%), and Los Angeles California Department of Water & Power Rev. Bond, 5.00% coupon, due 07/01/2049 (portfolio average weight of
1.48%). Positions that detracted most significantly from the Fund’s return included California Health Facilities Financing Refunding Sutter Health Series A, 5.00% coupon, due 11/15/2048 (no longer held at fiscal year end), and Sacramento California Convention Center Complex Rev. Bond, 5.00% coupon, due 06/01/2048 (portfolio average weight of 1.49%).
Revenue Type Breakdown (% of the Fund’s Net Assets)
as of August 31, 2020
| | | | | | | | |
| | |
Ad Valorem Property Tax | | | 26.34 | | | | | |
| | |
Health, Hospital, Nursing Home Revenue | | | 11.46 | | | | | |
| | |
Port, Airport & Marina Revenue | | | 8.98 | | | | | |
| | |
Water Revenue | | | 8.58 | | | | | |
| | |
Lease Revenue | | | 8.48 | | | | | |
| | |
College & University Revenue | | | 5.75 | | | | | |
| | |
Electric Power Revenue | | | 5.17 | | | | | |
| | |
Sewer Revenue | | | 5.07 | | | | | |
| | |
Sales Tax Revenue | | | 4.54 | | | | | |
| | |
Revenue Types Each Less Than 3% | | | 13.61 | | | | | |
| | |
Other Assets Less Liabilities | | | 2.02 | | | | | |
Invesco California AMT-Free Municipal Bond ETF (PWZ) (continued)
| | | | | | | | |
Top Ten Fund Holdings (% of the Fund’s Net Assets) as of August 31, 2020 | | | | | | |
| | |
| Security | | | | | | |
| | |
California (State of) Health Facilities Financing Authority (Stanford Health Care), Series 2020 A, Ref. RB, 4.00%, 08/15/2050 | | | 5.66 | | | | | |
| | |
San Diego Unified School District (Election of 2012), Series 2017 I, GO Bonds, 5.00%, 07/01/2041 | | | 3.71 | | | | | |
| | |
San Diego Unified School District, Series 2020 D-2, GO Bonds, 5.00%, 07/01/2022 | | | 3.61 | | | | | |
| | |
San Mateo & Foster (Cities of), CA Public Financing Authority (Clean Water Program), Series 2019, RB, 5.00%, 08/01/2049 | | | 3.09 | | | | | |
| | |
Los Angeles (County of), CA Public Works Financing Authority, Series 2019 E-1, RB, 5.00%, 12/01/2049 | | | 2.97 | | | | | |
| | |
Metropolitan Water District of Southern California, Series 2020 A, RB, 5.00%, 10/01/2045 | | | 2.02 | | | | | |
| | |
San Francisco (City & County of), CA Airport Commission (San Francisco International Airport), Series 2018, RB, 5.00%, 05/01/2048 | | | 1.86 | | | | | |
| | |
Los Angeles (County of), CA Metropolitan Transportation Authority, Series 2017 A, RB, 5.00%, 07/01/2042 | | | 1.79 | | | | | |
| | |
Los Angeles (City of), CA Department of Water & Power, Series 2019 D, Ref. RB, 5.00%, 07/01/2049 | | | 1.48 | | | | | |
| | |
Sacramento (City of), CA (Convention Center Complex), Series 2018 A, RB, 5.00%, 06/01/2048 | | | 1.47 | | | | | |
| | |
Total | | | 27.66 | | | | | |
Growth of a $10,000 Investment
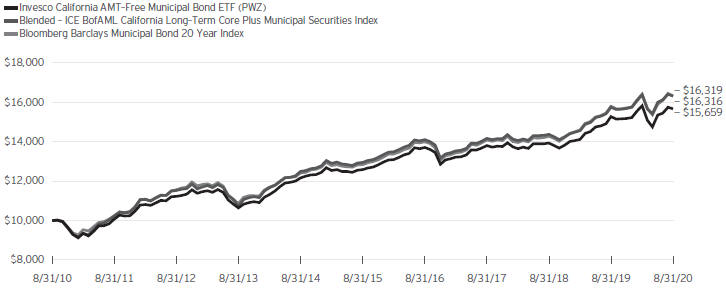
Fund Performance History as of August 31, 2020
| | | | | | | | | | | | | | | | | | | | | | | | | | | | | | | | | | | | | | | | |
| | | | | 3 Years | | | | 5 Years | | | | 10 Years | | | | | | | Fund Inception |
| Index | | 1 Year | | Average
Annualized | | 3 Years
Cumulative | | Average
Annualized | | 5 Years
Cumulative | | Average
Annualized | | 10 Years
Cumulative | | | | | Average
Annualized | | Cumulative |
| | | | | | | | | | |
Blended–ICE BofAML California Long-Term Core Plus Municipal Securities Index | | | 3.60 | % | | | 4.84 | % | | | 15.24 | % | | | 4.74 | % | | | 26.05 | % | | | 5.02 | % | | | 63.16 | % | | | | | | | 4.99 | % | | | 87.31 | % |
| | | | | | | | | | |
Bloomberg Barclays Municipal Bond 20 Year Index | | | 3.35 | | | | 5.04 | | | | 15.88 | | | | 4.92 | | | | 27.15 | | | | 5.02 | | | | 63.19 | | | | | | | | 5.31 | | | | 94.69 | |
| | | | | | | | | | |
Fund | | | | | | | | | | | | | | | | | | | | | | | | | | | | | | | | | | | | | | | | |
| | | | | | | | | | |
NAV Return | | | 2.53 | | | | 4.30 | | | | 13.47 | | | | 4.46 | | | | 24.39 | | | | 4.59 | | | | 56.59 | | | | | | | | 4.50 | | | | 76.35 | |
| | | | | | | | | | |
Market Price Return | | | 2.34 | | | | 4.16 | | | | 13.01 | | | | 4.36 | | | | 23.81 | | | | 4.57 | | | | 56.39 | | | | | | | | 4.42 | | | | 74.71 | |
Invesco California AMT-Free Municipal Bond ETF (PWZ) (continued)
Fund Inception: October 11, 2007
Performance quoted above represents past performance. Past performance is not a guarantee of future results and current performance may be higher or lower than performance quoted. Investment returns and principal value will fluctuate, and shares of the Fund (“Fund Shares”), when redeemed or sold, may be worth more or less than their original cost. Fund performance reflects any applicable fee waivers and/or expense reimbursements. Had the adviser not waived fees and/or reimbursed expenses currently or in the past, returns would have been lower. See the current prospectus for more information. According to the Fund’s current prospectus, the Fund’s expense ratio of 0.28% is expressed as a unitary management fee to cover operating expenses and expenses incurred in connection with managing the portfolio. NAV and Market Price returns assume that dividends and capital gain distributions have been reinvested in the Fund at NAV and Market Price, respectively. The returns shown in the table above do not reflect the deduction of taxes that a shareholder would pay on Fund distributions or the redemption or sale of Fund Shares. See invesco.com/ETFs to find the most recent month-end performance numbers.
Blended-Index and Benchmark Index performance results are based upon a hypothetical investment in their respective constituent securities.
Blended-Index and Benchmark Index returns do not represent Fund returns. An investor cannot invest directly in an index. The Blended-Index and Benchmark Index do not charge management fees or brokerage expenses, and no such fees or expenses were deducted from the hypothetical performance shown. In addition, the results actual investors might have achieved would have differed from those shown because of differences in the timing, amounts of their investments, and fees and expenses associated with an investment in the Fund.
Notes Regarding Indexes and Fund Performance History:
| - | The Blended – ICE BofAML California Long-Term Core Plus Municipal Securities Index is comprised of the performance of the BofA Merrill Lynch California Insured Long-Term Core Municipal Securities Index, the Fund’s underlying index from Fund inception through the conversion date, May 29, 2009, followed by the performance of the BofA Merrill Lynch California Insured Long-Term Core Plus Municipal Securities Index, the Fund’s underlying index for the period May 29, 2009 through July 8, 2014, followed by the performance of the Index for the period July 8, 2014 through August 31, 2020. |
| - | Average Annualized and Cumulative Inception returns for the Fund, Blended-Index and Benchmark Index are based on the inception date of the Fund. |
| | |
 | | Management’s Discussion of Fund Performance Invesco CEF Income Composite ETF (PCEF) |
As an index fund, the Invesco CEF Income Composite ETF (the “Fund”) is passively managed and seeks to track the investment results (before fees and expenses) of the S-Network Composite Closed-End Fund IndexSM (the “Index”). The Fund generally will invest at least 90% of its total assets in securities of U.S.-listed closed-end funds that comprise the Index. The Fund is a “fund of funds,” as it invests its assets in the common shares of funds included in the Index rather than in individual securities.
S-Network Global Indexes, Inc. compiles, maintains and calculates the Index, which tracks the overall performance of a universe of U.S.-listed closed-end funds that are organized under the laws of the United States, which may be invested in taxable investment grade fixed-income securities, taxable high yield fixed-income securities and taxable equity options. The Index may include closed-end funds that are advised by an affiliate of Invesco Capital Management LLC. The Fund generally invests in all of the securities comprising its Index in proportion to their weightings in the Index.
For the fiscal year ended August 31, 2020, on a market price basis, the Fund returned 1.80%. On a net asset value (“NAV”) basis, the Fund returned 1.84%. During the same time period, the Index returned 1.94%. During the fiscal year, the Fund fully replicated the components of the Index; therefore, the Fund’s performance, on a NAV basis, differed from the return of the Index primarily due to fees and operating expenses that the Fund incurred during the period, which were partially offset by income received from securities lending practices, as well as beneficial effects associated with rebalancing.
During this same time period, the S&P 500® Index (the “Benchmark Index”) returned 21.94%. The Benchmark Index is an unmanaged index weighted by market capitalization, which is based on the average performance of approximately 500 equity securities. The Benchmark Index was selected for its recognition in the marketplace, and its performance comparison is a useful measure for investors as a broad representation of the overall U.S. stock market.
Relative to the Benchmark Index, the Fund was most overweight in investment grade and high yield fixed-income closed-end funds during the fiscal year ended August 31, 2020. The majority of the Fund’s underperformance relative to the Benchmark Index can be attributed to the Fund’s fixed-income exposure, which generally underperformed the equity markets during the period.
For the fiscal year ended August 31, 2020, the BlackRock Science & Technology Trust (portfolio average weight of 0.77%) contributed most significantly to the Fund’s return, followed by the AllianzGI Dividend Interest & Premium Strategy Fund (portfolio average weight of 2.13%). Positions that detracted most significantly from the Fund’s return included Highland Floating Rate Opportunities Fund (no longer held at fiscal year-end), and NexPoint Strategic Opportunities Fund (portfolio average weight of 1.54%).
Asset Class Breakdown* (% of the Fund’s Net
Assets)
as of August 31, 2020
| | | | | | | | |
| | |
Bonds | | | 38.16 | | | | | |
| | |
Option Income | | | 31.70 | | | | | |
| | |
Bonds/High Yield | | | 27.18 | | | | | |
| | |
Domestic Equity | | | 3.02 | | | | | |
| | |
Money Market Funds Plus Other Assets Less Liabilities | | | (0.06) | | | | | |
| * | Reflects exposure acheved through investments in underlying funds. |
Top Ten Fund Holdings* (% of the Fund’s Net
Assets)
as of August 31, 2020
| | | | | | | | |
| | |
| Security | | | | | | |
| | |
Eaton Vance Tax-Managed Global Diversified Equity Income Fund | | | 3.93 | | | | | |
| | |
BlackRock Enhanced Equity Dividend Trust | | | 2.64 | | | | | |
| | |
Eaton Vance Limited Duration Income Fund | | | 2.61 | | | | | |
| | |
AllianzGI Dividend Interest & Premium Strategy Fund | | | 2.47 | | | | | |
| | |
Nuveen Preferred & Income Securities Fund | | | 2.32 | | | | | |
| | |
Eaton Vance Tax-Managed Diversified Equity Income Fund | | | 2.28 | | | | | |
| | |
Aberdeen Asia-Pacific Income Fund, Inc. | | | 2.25 | | | | | |
| | |
BlackRock Corporate High Yield Fund, Inc. | | | 2.20 | | | | | |
| | |
Nuveen S&P 500 Buy-Write Income Fund | | | 2.09 | | | | | |
| | |
AllianceBernstein Global High Income Fund, Inc. | | | 1.78 | | | | | |
| | |
Total | | | 24.57 | | | | | |
| * | Excluding money market fund holdings. |
Invesco CEF Income Composite ETF (PCEF) (continued)
Growth of a $10,000 Investment
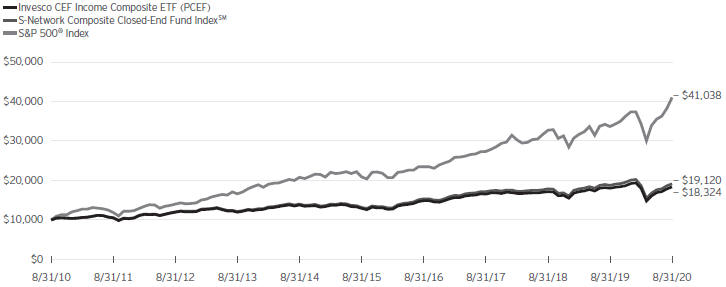
Fund Performance History as of August 31, 2020
| | | | | | | | | | | | | | | | | | | | | | | | | | | | | | | | | | | | | | |
| | | | | 3 Years Average Annualized | | | | 5 Years Average Annualized | | | | 10 Years Average Annualized | | | | | | Fund Inception |
| | | | | 3 Years | | 5 Years | | 10 Years | | | | Average | | |
| Index | | 1 Year | | Cumulative | | Cumulative | | Cumulative | | | | Annualized | | Cumulative |
S-Network Composite Closed-End Fund IndexSM | | | 1.94 | % | | | 3.77 | % | | | 11.73 | % | | | 7.72 | % | | | 45.05 | % | | | 6.70 | % | | | 91.20 | % | | | | | 6.82 | % | | | 100.24 | % |
S&P 500® Index | | | 21.94 | | | | 14.52 | | | | 50.17 | | | | 14.46 | | | | 96.47 | | | | 15.16 | | | | 310.38 | | | | | | 13.87 | | | | 292.35 | |
| | | | | | | | | | |
| Fund | | | | | | | | | | | | | | | | | | | | |
NAV Return | | | 1.84 | | | | 3.45 | | | | 10.72 | | | | 7.31 | | | | 42.33 | | | | 6.24 | | | | 83.24 | | | | | | 6.36 | | | | 91.32 | |
Market Price Return | | | 1.80 | | | | 3.39 | | | | 10.52 | | | | 7.32 | | | | 42.39 | | | | 6.22 | | | | 82.88 | | | | | | 6.34 | | | | 90.92 | |
Fund Inception: February 19, 2010
Performance quoted above represents past performance. Past performance is not a guarantee of future results and current performance may be higher or lower than performance quoted. Investment returns and principal value will fluctuate, and shares of the Fund (“Fund Shares”), when redeemed or sold, may be worth more or less than their original cost. Fund performance reflects any applicable fee waivers and/or expense reimbursements. Had the adviser not waived fees and/or reimbursed expenses currently or in the past, returns would have been lower. See the current prospectus for more information. According to the Fund’s current prospectus, the Fund’s expense ratio of 2.55% includes the unitary management fee of 0.50% and acquired fund fees and expenses of 2.05%. NAV and Market Price returns assume that dividends and capital gain distributions have been reinvested in the Fund at NAV and Market Price, respectively. The returns shown in the table above do not reflect the deduction of taxes that a shareholder would pay on Fund distributions or the redemption or sale of Fund
Shares. See invesco.com/ETFs to find the most recent month-end performance numbers.
Index and Benchmark Index performance results are based upon a hypothetical investment in their respective constituent securities. Index and Benchmark Index returns do not represent Fund returns. An investor cannot invest directly in an index. The Index and Benchmark Index do not charge management fees or brokerage expenses, and no such fees or expenses were deducted from the hypothetical performance shown. In addition, the results actual investors might have achieved would have differed from those shown because of differences in the timing, amounts of their investments, and fees and expenses associated with an investment in the Fund.
Notes Regarding Indexes and Fund Performance History:
| - | Average Annualized and Cumulative Inception returns for the Fund, Index and Benchmark Index are based on the inception date of the Fund. |
| | |
 | | Management’s Discussion of Fund Performance Invesco Fundamental High Yield® Corporate Bond ETF (PHB) |
As an index fund, the Invesco Fundamental High Yield® Corporate Bond ETF (the “Fund”) is passively managed and seeks to track the investment results (before fees and expenses) of the RAFI® Bonds U.S. High Yield 1-10 Index (the “Index”). The Fund generally will invest at least 80% of its total assets in securities that comprise the Index.
The Index is comprised of U.S. dollar-denominated high yield corporate bonds that are securities registered with the U.S. Securities and Exchange Commission or Rule 144A securities with registration rights (issued after July 31, 2013) and whose issuers are public companies listed on a major U.S. stock exchange. Strictly in accordance with its guidelines and mandated procedures, Research Affiliates, LLC (the “Index Provider”) or its agent compiles and calculates the Index. The Index selects and weights securities based on the Fundamental Index® approach developed by the Index Provider that uses four fundamental factors of company size: book value of assets, sales, dividends and cash flow. Only investible, non-convertible, non-exchangeable, non-zero, fixed coupon high-yield corporate bonds qualify for inclusion in the Index. The Fund does not purchase all of the securities in the Index; instead, the Fund utilizes a “sampling” methodology to seek to achieve its investment objective.
For the fiscal year ended August 31, 2020, on a market price basis, the Fund returned 3.28%. On a net asset value (“NAV”) basis, the Fund returned 3.33%. During the same time period, the Index returned 4.74%. The Fund’s performance, on a NAV basis, differed from the return of the Index primarily due to costs associated with rebalancing and sampling, as well as fees and operating expenses that the Fund incurred during the period.
During this same time period, the Bloomberg Barclays U.S. Corporate High Yield Index (the “Benchmark Index”) returned 4.71%. The Benchmark Index is an unmanaged index weighted by market capitalization and based on the average performance of approximately 2,100 securities. The Benchmark Index was selected for its recognition in the marketplace, and its performance comparison is a useful measure for investors as a broad representation of the broad-based U.S. high-yield corporate bond market.
Relative to the Benchmark Index, the Fund was most overweight in the technology hardware, storage & peripherals industry and most underweight in the media industry during the fiscal year ended August 31, 2020. The majority of the Fund’s underperformance relative to the Benchmark Index during the period can be attributed to its overweight allocation to and security selection within the oil, gas & consumable fuels industry.
For the fiscal year ended August 31, 2020, the media industry contributed most significantly to the Fund’s return, followed by the diversified telecommunications services and health care providers & services industries, respectively. Industries that detracted most significantly from the Fund’s return for the period
included energy equipment & services, followed by metals & mining.
Positions that contributed most significantly to the Fund’s return for the fiscal year ended August 31, 2020, included Occidental Petroleum Corp., 3.50% coupon, due 08/15/2029, an oil, gas & consumable fuels company (portfolio average weight of 1.07%), and Occidental Petroleum Corp., 2.90% coupon, due 08/15/2024, an oil, gas & consumable fuels company (portfolio average weight of 1.00%). Positions that detracted most significantly from the Fund’s return included Nabors Industries, Inc., 5.75% coupon, due 02/01/2025, an energy equipment & services company (no longer held at fiscal year-end), and AK Steel Corp., 7.00% coupon, due 03/15/2027, metals & mining company (portfolio average weight of 0.15%).
Sector Breakdown (% of the Fund’s Net Assets)
as of August 31, 2020
| | | | |
| |
Consumer Discretionary | | | 21.83 | |
| |
Energy | | | 13.32 | |
| |
Industrials | | | 11.70 | |
| |
Information Technology | | | 9.79 | |
| |
Materials | | | 9.10 | |
| |
Communication Services | | | 8.21 | |
| |
Health Care | | | 7.05 | |
| |
Financials | | | 6.72 | |
| |
Real Estate | | | 5.23 | |
| |
Consumer Staples | | | 3.23 | |
| |
Utilities | | | 2.30 | |
| |
Money Market Funds Plus Other Assets Less Liabilities | | | 1.52 | |
Credit Quality Rating (S&P)*
(% of the Fund’s Net Assets)
as of August 31, 2020
| | | | |
| |
BBB | | | 12.01 | |
| |
BB | | | 62.49 | |
| |
B | | | 22.02 | |
| |
CCC | | | 0.36 | |
| |
Not Rated | | | 1.60 | |
| |
Money Market Funds Plus Other Assets Less Liabilities | | | 1.52 | |
| * | Source: Standard & Poor’s. A credit rating is an assessment provided by a nationally recognized statistical rating organization (NRSRO) of the creditworthiness of an issuer with respect to debt obligations, including specific securities, money market instruments or other debts. Ratings are measured on a scale that generally ranges from AAA (highest) to C (lowest); ratings are subject to change without notice. For more information on Standard & Poor’s rating methodology, please visit standardandpoors.com and select “Understanding Ratings” under Ratings Resources on the homepage. |
Invesco Fundamental High Yield® Corporate Bond ETF (PHB) (continued)
| | | | |
Top Ten Fund Holdings* (% of the Fund’s Net Assets) as of August 31, 2020 | | |
| Security | | |
| |
EMC Corp., 3.38%, 06/01/2023 | | | 1.80 | |
| |
Ford Motor Co., 4.35%, 12/08/2026 | | | 1.66 | |
| |
United Airlines Holdings, Inc., 4.25%, 10/01/2022 | | | 1.55 | |
| |
Ford Motor Credit Co. LLC, 5.58%, 03/18/2024 | | | 1.48 | |
| |
Macy’s Retail Holdings, Inc., 2.88%, 02/15/2023 | | | 1.28 | |
| |
Centene Corp., 4.63%, 12/15/2029 | | | 1.20 | |
| |
Western Digital Corp., 4.75%, 02/15/2026 | | | 1.10 | |
| |
Genworth Holdings, Inc., 7.63%, 09/24/2021 | | | 1.06 | |
| |
Occidental Petroleum Corp., 3.50%, 08/15/2029 | | | 1.05 | |
| |
Occidental Petroleum Corp., 2.90%, 08/15/2024 | | | 1.00 | |
| |
Total | | | 13.18 | |
| * | Excluding money market fund holdings. |
Growth of a $10,000 Investment
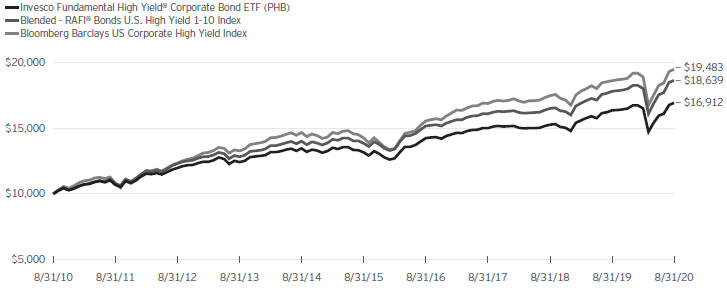
Fund Performance History as of August 31, 2020
| | | | | | | | | | | | | | | | | | | | | | | | | | | | | | | | | | | | | | |
| | | | | 3 Years | | | | 5 Years | | | | 10 Years | | | | | | Fund Inception |
| | | | | Average | | 3 Years | | Average | | 5 Years | | Average | | 10 Years | | | | Average | | |
| Index | | 1 Year | | Annualized | | Cumulative | | Annualized | | Cumulative | | Annualized | | Cumulative | | | | Annualized | | Cumulative |
| | | | | | | | | | |
| Blended–RAFI® Bonds U.S. High Yield 1-10 Index | | | 4.74 | % | | | 5.00 | % | | | 15.76 | % | | | 6.12 | % | | | 34.61 | % | | | 6.42 | % | | | 86.39 | % | | | | | 5.39 | % | | | 95.77 | % |
| | | | | | | | | | |
| Bloomberg Barclays US Corporate High Yield Index | | | 4.71 | | | | 4.88 | | | | 15.37 | | | | 6.45 | | | | 36.69 | | | | 6.90 | | | | 94.83 | | | | | | 7.30 | | | | 146.34 | |
| | | | | | | | | | |
| Fund | | | | | | | | | | | | | | | | | | | | |
| | | | | | | | | | |
| NAV Return | | | 3.33 | | | | 4.05 | | | | 12.66 | | | | 5.16 | | | | 28.63 | | | | 5.39 | | | | 69.12 | | | | | | 3.68 | | | | 58.69 | |
| | | | | | | | | | |
| Market Price Return | | | 3.28 | | | | 4.01 | | | | 12.51 | | | | 5.14 | | | | 28.45 | | | | 5.39 | | | | 69.08 | | | | | | 3.49 | | | | 55.02 | |
Invesco Fundamental High Yield® Corporate Bond ETF (PHB) (continued)
Fund Inception: November 15, 2007
Performance quoted above represents past performance. Past performance is not a guarantee of future results and current performance may be higher or lower than performance quoted. Investment returns and principal value will fluctuate, and shares of the Fund (“Fund Shares”), when redeemed or sold, may be worth more or less than their original cost. Fund performance reflects any applicable fee waivers and/or expense reimbursements. Had the adviser not waived fees and/or reimbursed expenses currently or in the past, returns would have been lower. See the current prospectus for more information. According to the Fund’s current prospectus, the Fund’s expense ratio of 0.50% is expressed as a unitary management fee to cover operating expenses and expenses incurred in connection with managing the portfolio. NAV and Market Price returns assume that dividends and capital gain distributions have been reinvested in the Fund at NAV and Market Price, respectively. The returns shown in the table above do not reflect the deduction of taxes that a shareholder would pay on Fund distributions or the redemption or sale of Fund Shares. See invesco.com/ETFs to find the most recent month-end performance numbers.
Blended-Index and Benchmark Index performance results are based upon a hypothetical investment in their respective constituent securities. Blended-Index and Benchmark Index returns do not represent Fund returns. An investor cannot invest directly in an index. The Blended-Index and Benchmark Index do not charge management fees or brokerage expenses, and no such fees or expenses were deducted from the hypothetical performance shown. In addition, the results actual investors might have achieved would have differed from those shown because of differences in the timing, amounts of their investments, and fees and expenses associated with an investment in the Fund.
Notes Regarding Indexes and Fund Performance History:
| - | Average Annualized and Cumulative Inception returns for the Fund, Blended-Index and Benchmark Index are based on the inception date of the Fund. |
| - | The Blended-RAFI® Bonds U.S. High Yield 1-10 Index is comprised of the performance of the Wells Fargo® High Yield Bond Index, the Fund’s previous index, from Fund inception through the conversion date, August 2, 2010, followed by the performance of the Index starting at the conversion date through August 31, 2020. |
| | |
 | | Management’s Discussion of Fund Performance Invesco Fundamental Investment Grade Corporate Bond ETF (PFIG) |
As an index fund, the Invesco Fundamental Investment Grade Corporate Bond ETF (the “Fund”) is passively managed and seeks to track the investment results (before fees and expenses) of the RAFI® Bonds U.S. Investment Grade 1-10 Index (the “Index”). The Fund generally will invest at least 80% of its total assets in the component securities that comprise the Index.
The Index is comprised of U.S. dollar denominated investment grade corporate bonds which are securities registered with the U.S. Securities and Exchange Commission or Rule 144A securities with registration rights (issued after July 31, 2013) and whose issuers are public companies listed on a major U.S. stock exchange. Strictly in accordance with its guidelines and mandated procedures, Research Affiliates, LLC (the “Index Provider”) or its agent compiles and calculates the Index. The Index selects and weights securities based on the Fundamental Index® approach developed by the Index Provider that uses four fundamental factors of company size: book value of assets, sales, dividends and cash flows. Only investible, non-convertible, non-exchangeable, non-zero, fixed coupon investment grade corporate bonds qualify for inclusion in the Index. The Fund does not purchase all of the securities in the Index; instead, the Fund utilizes a “sampling” methodology to seek to achieve its investment objective.
For the fiscal year ended August 31, 2020, on a market price basis, the Fund returned 6.95%. On a net asset value (“NAV”) basis, the Fund returned 6.87%. During the same time period, the Index returned 7.23%. The Fund’s performance, on a NAV basis, differed from the return of the Index primarily due to the fees and operating expenses that the Fund incurred during the period, as well as rebalance-related trading and sampling costs.
During this same time period, the Bloomberg Barclays U.S. Corporate Index (the “Benchmark Index”) returned 7.50%. The Benchmark Index is an unmanaged index weighted by market capitalization and based on the average performance of approximately 6,600 securities. The Benchmark Index was selected for its recognition in the marketplace, and its performance comparison is a useful measure for investors as a broad representation of the broad-based U.S. corporate bond market.
Relative to the Benchmark Index, the Fund was most overweight in the insurance industry and most underweight in the banks industry during the fiscal year ended August 31, 2020. The majority of the Fund’s underperformance relative to the Benchmark Index during the period can be attributed to its under-allocation to the banks industry.
For the fiscal year ended August 31, 2020, the banks industry contributed most significantly to the Fund’s return, followed by the insurance and health care providers & services industries, respectively. The construction & engineering and trading companies & distributors industries detracted from the Fund’s return over the period.
Positions that contributed most significantly to the Fund’s return for the fiscal year ended August 31, 2020, included JPMorgan Chase & Co., 2.95% coupon, due 10/01/2026, a banks company (portfolio average weight of 0.56%), and Apple, Inc., 3.25% coupon, due 02/23/2026, a technology hardware, storage & peripherals company (portfolio average weight of 0.51%). Positions that detracted most significantly from the Fund’s return included Occidental Petroleum Corp., 3.50% coupon, due 08/15/2029, an oil, gas & consumable fuels company (no longer held at fiscal year-end), and Occidental Petroleum Corp., 2.90% coupon, due 08/15/2024, an oil, gas & consumable fuels company (no longer held at fiscal year-end).
Sector Breakdown (% of the Fund’s Net Assets) as of August 31, 2020
| | | | |
| |
Financials | | | 20.62 | |
| |
Information Technology | | | 11.78 | |
| |
Health Care | | | 10.35 | |
| |
Industrials | | | 10.20 | |
| |
Consumer Staples | | | 9.57 | |
| |
Consumer Discretionary | | | 8.80 | |
| |
Energy | | | 6.60 | |
| |
Utilities | | | 6.12 | |
| |
Real Estate | | | 5.63 | |
| |
Communication Services | | | 5.27 | |
| |
Materials | | | 4.90 | |
| |
Money Market Funds Plus Other Assets Less Liabilities | | | 0.16 | |
Credit Quality Rating (S&P)*
(% of the Fund’s Net Assets)
as of August 31, 2020
| | | | |
| |
AAA | | | 1.42 | |
| |
AA | | | 9.67 | |
| |
A | | | 34.39 | |
| |
BBB | | | 54.06 | |
| |
BB | | | 0.19 | |
| |
Not Rated | | | 0.11 | |
| |
Money Market Funds Plus Other Assets Less Liabilities | | | 0.16 | |
| * | Source: Standard & Poor’s. A credit rating is an assessment provided by a nationally recognized statistical rating organization (NRSRO) of the creditworthiness of an issuer with respect to debt obligations, including specific securities, money market instruments or other debts. Ratings are measured on a scale that generally ranges from AAA (highest) to C (lowest); ratings are subject to change without notice. For more information on Standard & Poor’s rating methodology, please visit standardandpoors.com and select “Understanding Ratings” under Ratings Resources on the homepage. |
Invesco Fundamental Investment Grade Corporate Bond ETF (PFIG) (continued)
| | | | |
Top Ten Fund Holdings* (% of the Fund’s Net Assets) as of August 31, 2020 | | |
| Security | | |
| |
JPMorgan Chase & Co., 2.95%, 10/01/2026 | | | 0.56 | |
| |
JPMorgan Chase & Co., 4.50%, 01/24/2022 | | | 0.52 | |
| |
Apple, Inc., 3.25%, 02/23/2026 | | | 0.51 | |
| |
Walmart, Inc., 3.70%, 06/26/2028 | | | 0.50 | |
| |
Wells Fargo & Co., 3.00%, 04/22/2026 | | | 0.50 | |
| |
Apple, Inc., 2.40%, 05/03/2023 | | | 0.50 | |
| |
Walmart, Inc., 3.40%, 06/26/2023 | | | 0.49 | |
| |
Exxon Mobil Corp., 3.04%, 03/01/2026 | | | 0.49 | |
| |
Wells Fargo & Co., 2.63%, 07/22/2022 | | | 0.48 | |
| |
Bank of America Corp., 3.25%, 10/21/2027 | | | 0.48 | |
| |
Total | | | 5.03 | |
| * | Excluding money market fund holdings. |
Growth of a $10,000 Investment Since Inception
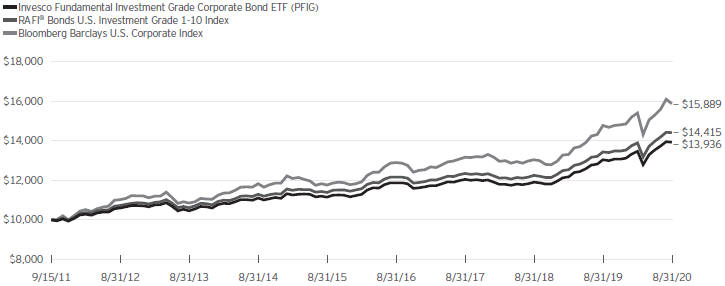
Fund Performance History as of August 31, 2020
| | | | | | | | | | | | | | | | | | | | | | | | | | | | | | |
| | | | | | 3 Years | | | | | | 5 Years | | | | | | | | Fund Inception | |
| | | | | | Average | | | 3 Years | | | Average | | | 5 Years | | | | | Average | | | | |
| Index | | 1 Year | | | Annualized | | | Cumulative | | | Annualized | | | Cumulative | | | | | Annualized | | | Cumulative | |
RAFI® Bonds U.S. Investment Grade 1-10 Index | | | 7.23 | % | | | 5.28 | % | | | 16.69 | % | | | 4.82 | % | | | 26.54 | % | | | | | 4.17 | % | | | 44.15 | % |
Bloomberg Barclays U.S. Corporate Index | | | 7.50 | | | | 6.45 | | | | 20.61 | | | | 6.20 | | | | 35.06 | | | | | | 5.30 | | | | 58.89 | |
| | | | | | | | |
| Fund | | | | | | | | | | | | | | | | | | | | | | | |
NAV Return | | | 6.87 | | | | 4.98 | | | | 15.69 | | | | 4.56 | | | | 25.00 | | | | | | 3.77 | | | | 39.36 | |
Market Price Return | | | 6.95 | | | | 4.90 | | | | 15.42 | | | | 4.51 | | | | 24.70 | | | | | | 3.79 | | | | 39.51 | |
Invesco Fundamental Investment Grade Corporate Bond ETF (PFIG) (continued)
Fund Inception: September 15, 2011
Performance quoted above represents past performance. Past performance is not a guarantee of future results and current performance may be higher or lower than performance quoted. Investment returns and principal value will fluctuate, and shares of the Fund (“Fund Shares”), when redeemed or sold, may be worth more or less than their original cost. Fund performance reflects any applicable fee waivers and/or expense reimbursements. Had the adviser not waived fees and/or reimbursed expenses currently or in the past, returns would have been lower. See the current prospectus for more information. According to the Fund’s current prospectus, the Fund’s expense ratio of 0.22% is expressed as a unitary management fee to cover operating expenses and expenses incurred in connection with managing the portfolio. NAV and Market Price returns assume that dividends and capital gain distributions have been reinvested in the Fund at NAV and Market Price, respectively. The returns shown in the table above do not reflect the deduction of taxes that a shareholder would pay on Fund distributions or the redemption or sale of Fund Shares. See
invesco.com/ETFs to find the most recent month-end performance numbers.
Index and Benchmark Index performance results are based upon a hypothetical investment in their respective constituent securities. Index and Benchmark Index returns do not represent Fund returns. An investor cannot invest directly in an index. The Index and Benchmark Index do not charge management fees or brokerage expenses, and no such fees or expenses were deducted from the hypothetical performance shown. In addition, the results actual investors might have achieved would have differed from those shown because of differences in the timing, amounts of their investments, and fees and expenses associated with an investment in the Fund.
Notes Regarding Indexes and Fund Performance History:
| - | Average Annualized and Cumulative Inception returns for the Fund, Index and Benchmark Index are based on the inception date of the Fund. |
| | |
 | | Management’s Discussion of Fund Performance Invesco National AMT-Free Municipal Bond ETF (PZA) |
As an index fund, the Invesco National AMT-Free Municipal Bond ETF (the “Fund”) is passively managed and seeks to track the investment results (before fees and expenses) of the ICE BofAML National Long-Term Core Plus Municipal Securities Index (the “Index”). The Fund generally will invest at least 80% of its total assets in municipal securities that comprise the Index and that are also exempt from the federal alternative minimum tax.
ICE Data Indices, LLC is the Index provider for the Index. The Index is composed of U.S. dollar-denominated, investment grade, tax- exempt debt publicly issued by U.S. states and territories, or their political subdivisions, in the U.S. domestic market with a term of at least 15 years remaining to final maturity. The Fund does not purchase all of the securities in the Index; instead, the Fund utilizes a “sampling” methodology to seek to achieve its investment objective.
For the fiscal year ended August 31, 2020, on a market price basis, the Fund returned 2.42%. On a net asset value (“NAV”) basis, the Fund returned 2.56%. During the same time period, the Index returned 3.32%. The Fund’s performance, on a NAV basis, differed from the return of the Index primarily due to fees and operating expenses that the Fund incurred during the period as well as costs associated with portfolio rebalancing and sampling.
During this same time period, the Bloomberg Barclays Municipal Bond 20 Year Index (the “Benchmark Index”) returned 3.35%. The Benchmark Index is an unmanaged index weighted by market capitalization and based on the average performance of approximately 900 securities. The Benchmark Index was selected for its recognition in the marketplace, and its performance comparison is a useful measure for investors as a broad representation of municipal securities with maturities of 17 to 22 years.
Relative to the Benchmark Index, the Fund was most overweight in the State of California and most underweight in the State of Washington during the fiscal year ended August 31, 2020. The majority of the Fund’s underperformance relative to the Benchmark Index during the period can be attributed to differences in state weightings relative to the Benchmark Index as well as fees and trading costs incurred by the Fund.
For the fiscal year ended August 31, 2020, the State of California contributed most significantly to the Fund’s return, followed by the State of Texas and the State of New York, respectively. The State of Minnesota was the only state to detract from the Fund’s return during the period.
Positions that contributed most significantly to the Fund’s return for the fiscal year ended August 31, 2020, included Weld County School District No. 6 Greeley GO Bond, 5.00% coupon, due 12/01/2044 (portfolio average weight of 0.97%), and Chino Valley University School District GO Bond, 3.38% coupon, due 08/01/2050 (portfolio average weight of 0.41%). Positions that
detracted most significantly from the Fund’s return included Hillsborough County Florida Aviation, 5.00% coupon, due 10/01/2043 (no longer held at fiscal year-end), and Massachusetts State School Building Authority, 5.25% coupon, due 02/15/2048 (no longer held at fiscal year-end).
Revenue Type Breakdown (% of the Fund’s Net Assets)
as of August 31, 2020
| | | | |
Ad Valorem Property Tax | | | 19.53 | |
Water Revenue | | | 11.58 | |
College & University Revenue | | | 9.48 | |
Health, Hospital, Nursing Home Revenue | | | 8.66 | |
Highway Tolls Revenue | | | 7.62 | |
Port, Airport & Marina Revenue | | | 6.72 | |
Sales Tax Revenue | | | 6.26 | |
Electric Power Revenue | | | 6.06 | |
Income Tax Revenue | | | 5.95 | |
Lease Revenue | | | 3.60 | |
Revenue Types Each Less Than 3% | | | 13.21 | |
Other Assets Less Liabilities | | | 1.33 | |
Invesco National AMT-Free Municipal Bond ETF (PZA) (continued)
| | | | |
Top Ten Fund Holdings (% of the Fund’s Net Assets) as of August 31, 2020 | | |
| Security | | |
| |
New York (City of), NY Water & Sewer System, Series 2020 GG-1, RB, 5.00%, 06/15/2048 | | | 1.56 | |
| |
Los Angeles (City of), CA Department of Water & Power, Series 2019 A, RB, 5.25%, 07/01/2049 | | | 1.44 | |
| |
San Diego Unified School District, Series 2020 M-2, GO Bonds, 5.00%, 07/01/2022 | | | 1.32 | |
| |
Bay Area Toll Authority, Series 2019 D, Ref. VRD RB, 0.02%, 04/01/2047 | | | 1.20 | |
| |
New York (State of) Dormitory Authority (Montefiore Obligated Group), Series 2020 A, Ref. RB, 3.00%, 09/01/2050 | | | 1.17 | |
| |
New York (City of), NY, Subseries 2010 G-4, VRD GO Bonds, 0.07%, 03/01/2039 | | | 1.12 | |
| |
Weld County School District No. 6 Greeley, Series 2020, GO Bonds, 5.00%, 12/01/2044 | | | 0.96 | |
| |
New York (State of) Dormitory Authority, Series 2020 B, RN, 5.00%, 03/31/2021 | | | 0.96 | |
| |
Chicago (City of), IL, Series 2012, RB, 5.00%, 01/01/2037 | | | 0.95 | |
| |
Weld County School District Re-2, Series 2019, GO Bonds, 5.00%, 12/01/2044 | | | 0.94 | |
| |
Total | | | 11.62 | |
Growth of a $10,000 Investment
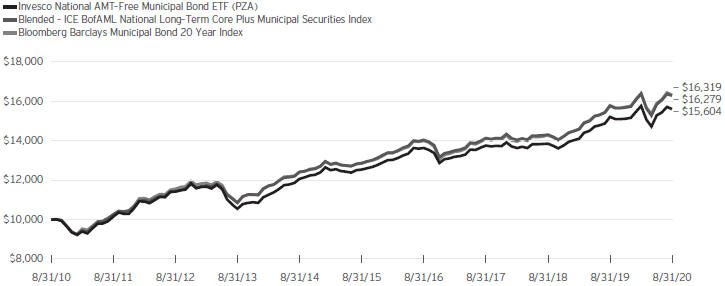
Fund Performance History as of August 31, 2020
| | | | | | | | | | | | | | | | | | | | | | | | | | | | | | | | | | | | | | |
| | | | | | 3 Years | | | | | | 5 Years | | | | | | 10 Years | | | | | | | | Fund Inception | |
| | | | | | Average | | | 3 Years | | | Average | | | 5 Years | | | Average | | | 10 Years | | | | | Average | | | | |
| Index | | 1 Year | | | Annualized | | | Cumulative | | | Annualized | | | Cumulative | | | Annualized | | | Cumulative | | | | | Annualized | | | Cumulative | |
| Blended–ICE BofAML National Long-Term Core Plus Municipal Securities Index | | | 3.32 | % | | | 4.83 | % | | | 15.21 | % | | | 4.81 | % | | | 26.48 | % | | | 4.99 | % | | | 62.79 | % | | | | | 5.04 | % | | | 88.44 | % |
| Bloomberg Barclays Municipal Bond 20 Year Index | | | 3.35 | | | | 5.04 | | | | 15.88 | | | | 4.92 | | | | 27.15 | | | | 5.02 | | | | 63.19 | | | | | | 5.31 | | | | 94.69 | |
| | | | | | | | | | |
| Fund | | | | | | | | | | | | | | | | | | | | | | | | | | | | | |
| NAV Return | | | 2.56 | | | | 4.29 | | | | 13.44 | | | | 4.47 | | | | 24.42 | | | | 4.55 | | | | 56.04 | | | | | | 4.51 | | | | 76.66 | |
| Market Price Return | | | 2.42 | | | | 4.29 | | | | 13.43 | | | | 4.46 | | | | 24.39 | | | | 4.53 | | | | 55.80 | | | | | | 4.44 | | | | 75.00 | |
Invesco National AMT-Free Municipal Bond ETF (PZA) (continued)
Fund Inception: October 11, 2007
Performance quoted above represents past performance. Past performance is not a guarantee of future results and current performance may be higher or lower than performance quoted. Investment returns and principal value will fluctuate, and shares of the Fund (“Fund Shares”), when redeemed or sold, may be worth more or less than their original cost. Fund performance reflects any applicable fee waivers and/or expense reimbursements. Had the adviser not waived fees and/or reimbursed expenses currently or in the past, returns would have been lower. See the current prospectus for more information. According to the Fund’s current prospectus, the Fund’s expense ratio of 0.28% is expressed as a unitary management fee to cover operating expenses and expenses incurred in connection with managing the portfolio. NAV and Market Price returns assume that dividends and capital gain distributions have been reinvested in the Fund at NAV and Market Price, respectively. The returns shown in the table above do not reflect the deduction of taxes that a shareholder would pay on Fund distributions or the redemption or sale of Fund Shares. See invesco.com/ETFs to find the most recent month-end performance numbers.
Blended-Index and Benchmark Index performance results are based upon a hypothetical investment in their respective constituent securities.
Blended-Index and Benchmark Index returns do not represent Fund returns. An investor cannot invest directly in an index. The Blended-Index and Benchmark Index do not charge management fees or brokerage expenses, and no such fees or expenses were deducted from the hypothetical performance shown. In addition, the results actual investors might have achieved would have differed from those shown because of differences in the timing, amounts of their investments, and fees and expenses associated with an investment in the Fund.
Notes Regarding Indexes and Fund Performance History:
| - | The Blended-ICE BofAML National Long-Term Core Plus Municipal Securities Index is comprised of the performance of the BofA Merrill Lynch National Insured Long-Term Core Municipal Securities Index, the Fund’s underlying index from Fund inception through the conversion date, May 29, 2009, followed by the performance of the BofA Merrill Lynch National Insured Long-Term Core Plus Municipal Securities Index, the Fund’s underlying index for the period May 29, 2009 through July 8, 2014, followed by the performance of the Index for the period July 8, 2014 through August 31, 2020. |
| - | Average Annualized and Cumulative Inception returns for the Fund, Blended-Index and Benchmark Index are based on the inception date of the Fund. |
| | |

| | Management’s Discussion of Fund Performance Invesco New York AMT-Free Municipal Bond ETF (PZT) |
As an index fund, the Invesco New York AMT-Free Municipal Bond ETF (the “Fund”) is passively managed and seeks to track the investment results (before fees and expenses) of the ICE BofAML New York Long-Term Core Plus Municipal Securities Index (the “Index”). The Fund generally will invest at least 80% of its total assets in municipal securities that comprise the Index and that are also exempt from the federal alternative minimum tax.
ICE Data Indices, LLC is the Index provider for the Index. The Index is composed of U.S. dollar-denominated, investment grade, tax-exempt debt publicly issued by New York or any U.S. territory, or their political subdivisions in the U.S. domestic market with a term of at least 15 years remaining to final maturity. The Fund does not purchase all of the securities in the Index; instead, the Fund utilizes a “sampling” methodology to seek to achieve its investment objective.
For the fiscal year ended August 31, 2020, on a market price basis, the Fund returned 2.83%. On a net asset value (“NAV”) basis, the Fund returned 2.66%. During the same time period, the Index returned 2.24%. The Fund’s performance, on a NAV basis, differed from the return of the Index primarily due to the positive impact of the Fund’s sampling methodology and by the Fund holding cash to pay distributions in March, which coincided with overall market declines, which were partially offset by fees and operating expenses that the Fund incurred during the period.
During this same time period, the Bloomberg Barclays Municipal Bond 20 Year Index (the “Benchmark Index”) returned 3.35%. The Benchmark Index is an unmanaged index weighted by market capitalization based and on the average performance of approximately 900 securities. The Benchmark Index was selected for its recognition in the marketplace, and its performance comparison is a useful measure for investors as a broad representation of the market for municipal securities with maturities of 17 to 22 years.
Relative to the Benchmark Index, the Fund was most overweight in the State of New York and most underweight in the State of California during the fiscal year ended August 31, 2020. The majority of the Fund’s underperformance relative to the Benchmark Index during the period can be attributed to underweight allocations to the states of California, Massachusetts, and Texas, respectively.
For the fiscal year ended August 31, 2020, the State of New York contributed most significantly to the Fund’s return, followed by the US territory of Guam. Puerto Rico was the only detractor from the Fund’s return.
Positions that contributed most significantly to the Fund’s return for the fiscal year ended August 31, 2020, included New York State Dormitory Authority Rev. Bond, 4.00% coupon, due 02/15/2044 (portfolio average weight of 5.70%), and New York City Industrial Development Agency (Queens Baseball Stadium)
Rev. Bond, 6.50% coupon, due 01/01/2046 (portfolio average weight of 2.57%). Positions that detracted most significantly from the Fund’s return included New York City Municipal Water Finance Authority, 4.00% coupon, due 06/15/2042 (no longer held at fiscal year-end), and New York Convention Center Development, 5.00% coupon, due 11/05/2040 (no longer held at fiscal year-end).
Revenue Type Breakdown (% of the Fund’s Net Assets)
as of August 31, 2020
| | | | | | | | |
College & University Revenue | | | 18.52 | | | | | |
| | |
Income Tax Revenue | | | 18.42 | | | | | |
| | |
Miscellaneous Revenue | | | 9.73 | | | | | |
| | |
Electric Power Revenue | | | 7.67 | | | | | |
| | |
Lease Revenue | | | 6.99 | | | | | |
| | |
Ad Valorem Property Tax | | | 6.64 | | | | | |
| | |
Highway Tolls Revenue | | | 5.36 | | | | | |
| | |
Water Revenue | | | 4.66 | | | | | |
| | |
Health, Hospital, Nursing Home Revenue | | | 4.00 | | | | | |
| | |
Transit Revenue | | | 3.34 | | | | | |
| | |
Port, Airport & Marina Revenue | | | 3.02 | | | | | |
| | |
Revenue Types Each Less Than 3% | | | 8.31 | | | | | |
| | |
Other Assets Less Liabilities | | | 3.34 | | | | | |
Invesco New York AMT-Free Municipal Bond ETF (PZT) (continued)
Top Ten Fund Holdings (% of the Fund’s Net Assets)
as of August 31, 2020
| | | | | | | | |
| Security | | | | | | |
| | |
New York (State of) Dormitory Authority, Series 2017 B, Ref. RB, 4.00%, 02/15/2044 | | | 5.69 | | | | | |
| | |
Battery Park (City of), NY Authority, Series 2019, RB, 5.00%, 11/01/2049 | | | 3.25 | | | | | |
| | |
Onondaga (County of), NY Trust for Cultural Resources (Syracuse University), Series 2019, Ref. RB, 5.00%, 12/01/2043 | | | 3.22 | | | | | |
| | |
New York (State of) Dormitory Authority (Rockefeller University) (Green Bonds), Series 2019 B, RB, 5.00%, 07/01/2050 | | | 2.56 | | | | | |
| | |
Utility Debt Securitization Authority, Series 2017, RB, 5.00%, 12/15/2038 | | | 2.55 | | | | | |
| | |
New York (City of), NY Industrial Development Agency (Queens Baseball Stadium), Series 2009, RB, 6.50%, 01/01/2046 | | | 2.54 | | | | | |
| | |
New York (City of), NY, Series 2019 B-1, GO Bonds, 5.00%, 10/01/2039 | | | 2.54 | | | | | |
| | |
New York (State of) Dormitory Authority (Icahn School of Medicine at Mount Sinai), Series 2015 A, Ref. RB, 5.00%, 07/01/2035 | | | 2.33 | | | | | |
| | |
New York State Urban Development Corp., Series 2019 A, Ref. RB, 4.00%, 03/15/2044 | | | 2.33 | | | | | |
| | |
New York (City of), NY Transitional Finance Authority, Series 2019, RB, 4.00%, 11/01/2042 | | | 2.32 | | | | | |
| | |
Total | | | 29.33 | | | | | |
Growth of a $10,000 Investment
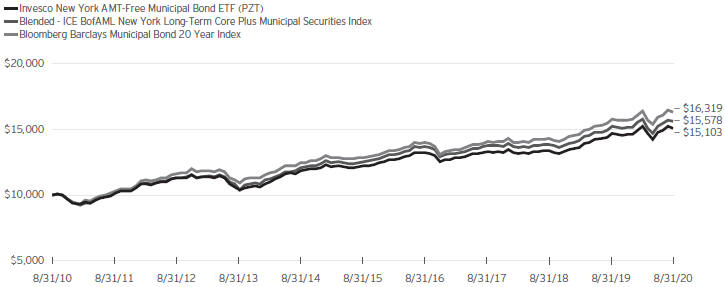
Fund Performance History as of August 31, 2020
| | | | | | | | | | | | | | | | | | | | | | | | | | | | | | | | | | | | | | | | |
| | | | | 3 Years | | | | 5 Years | | | | 10 Years | | | | | | | Fund Inception |
| Index | | 1 Year | | Average
Annualized | | 3 Years
Cumulative | | Average
Annualized | | 5 Years
Cumulative | | Average
Annualized | | 10 Years
Cumulative | | | | | Average
Annualized | | Cumulative |
| | | | | | | | | | |
Blended–ICE BofAML New York Long-Term Core Plus Municipal Securities Index | | | 2.24 | % | | | 4.23 | % | | | 13.24 | % | | | 4.47 | % | | | 24.45 | % | | | 4.53 | % | | | 55.78 | % | | | | | | | 4.62 | % | | | 79.05 | % |
| | | | | | | | | | |
Bloomberg Barclays Municipal Bond 20 Year Index | | | 3.35 | | | | 5.04 | | | | 15.88 | | | | 4.92 | | | | 27.15 | | | | 5.02 | | | | 63.19 | | | | | | | | 5.31 | | | | 94.69 | |
| | | | | | | | | | |
Fund | | | | | | | | | | | | | | | | | | | | | | | | | | | | | | | | | | | | | | | | |
| | | | | | | | | | |
NAV Return | | | 2.66 | | | | 4.31 | | | | 13.51 | | | | 4.41 | | | | 24.07 | | | | 4.21 | | | | 51.03 | | | | | | | | 4.09 | | | | 67.53 | |
| | | | | | | | | | |
Market Price Return | | | 2.83 | | | | 4.44 | | | | 13.93 | | | | 4.49 | | | | 24.58 | | | | 4.23 | | | | 51.31 | | | | | | | | 4.03 | | | | 66.33 | |
Invesco New York AMT-Free Municipal Bond ETF (PZT) (continued)
Fund Inception: October 11, 2007
Performance quoted above represents past performance. Past performance is not a guarantee of future results and current performance may be higher or lower than performance quoted. Investment returns and principal value will fluctuate, and shares of the Fund (“Fund Shares”), when redeemed or sold, may be worth more or less than their original cost. Fund performance reflects any applicable fee waivers and/or expense reimbursements. Had the adviser not waived fees and/or reimbursed expenses currently or in the past, returns would have been lower. See the current prospectus for more information. According to the Fund’s current prospectus, the Fund’s expense ratio of 0.28% is expressed as a unitary management fee to cover operating expenses and expenses incurred in connection with managing the portfolio. NAV and Market Price returns assume that dividends and capital gain distributions have been reinvested in the Fund at NAV and Market Price, respectively. The returns shown in the table above do not reflect the deduction of taxes that a shareholder would pay on Fund distributions or the redemption or sale of Fund Shares. See invesco.com/ETFs to find the most recent month-end performance numbers.
Blended-Index and Benchmark Index performance results are based upon a hypothetical investment in their respective constituent securities.
Blended-Index and Benchmark Index returns do not represent Fund returns. An investor cannot invest directly in an index. The Blended-Index and Benchmark Index do not charge management fees or brokerage expenses, and no such fees or expenses were deducted from the hypothetical performance shown. In addition, the results actual investors might have achieved would have differed from those shown because of differences in the timing, amounts of their investments, and fees and expenses associated with an investment in the Fund.
Notes Regarding Indexes and Fund Performance History:
| - | The Blended-ICE BofAML New York Long-Term Core Plus Municipal Securities Index is comprised of the performance of the BofA Merrill Lynch New York Insured Long-Term Core Municipal Securities Index, the Fund’s underlying index from Fund inception through the conversion date, May 29, 2009, followed by the performance of the BofA Merrill Lynch New York Insured Long-Term Core Plus Municipal Securities Index, the Fund’s underlying index for the period May 29, 2009 through July 8, 2014, followed by the performance of the Index for the period July 8, 2014 through August 31, 2020. |
| - | Average Annualized and Cumulative Inception returns for the Fund, Blended-Index and Benchmark Index are based on the inception date of the Fund. |
| | |

| | Management’s Discussion of Fund Performance Invesco Preferred ETF (PGX) |
As an index fund, the Invesco Preferred ETF (the “Fund”) is passively managed and seeks to track the investment results (before fees and expenses) of the ICE BofAML Core Plus Fixed Rate Preferred Securities Index (the “Index”). The Fund generally will invest at least 80% of its total assets in fixed-rate U.S. dollar denominated preferred securities that comprise the Index.
The Index is a market capitalization-weighted index designed to reflect the total return performance of the fixed-rate U.S. dollar-denominated preferred securities market. The Index includes both traditional and other preferred securities, including preferred securities issued by foreign companies in the form of American depositary receipts, as well as senior and subordinated debt securities. Unlisted preferred securities are excluded from the Index, but unlisted senior or subordinated debt-like securities are eligible for inclusion. The Index may include Rule 144A securities. Strictly in accordance with its guidelines and mandated procedures, ICE Data Indices, LLC selects securities for the Index using a rules-based methodology. Qualifying securities must be rated at least B3 (based on an average of Moody’s Investors Services, Inc. (“Moody’s”), S&P Global Ratings, a division of S&P Global Inc. (“S&P”) and Fitch Ratings, Inc. (“Fitch”)) and must have an investment grade country risk profile (based on an average of Moody’s, S&P and Fitch foreign currency long-term sovereign debt ratings). The Fund does not purchase all of the securities in the Index; instead, the Fund utilizes a “sampling” methodology to seek to achieve its investment objective.
For the fiscal year ended August 31, 2020, on a market price basis, the Fund returned 5.04%. On a net asset value (“NAV”) basis, the Fund returned 4.98%. During the same time period, the Index returned 5.17%. The Fund’s performance, on a NAV basis, differed from the return of the Index primarily due to fees and operating expenses that the Fund incurred during the period, which were partially offset by the positive impact of the Fund’s sampling methodology.
During this same time period, the S&P U.S. Preferred Stock Index (the “Benchmark Index”) returned 4.61%. The Benchmark Index is an unmanaged index weighted by modified market capitalization, which is based on the average performance of approximately 300 securities. The Benchmark Index was selected for its recognition in the marketplace, and its performance comparison is a useful measure for investors as a broad representation of the preferred stock market, which includes convertible preferred stocks.
Relative to the Benchmark Index, the Fund was most overweight in the electric utilities industry and most underweight in the mortgage REITs industry during the fiscal year ended August 31, 2020. The majority of the Fund’s outperformance relative to the Benchmark Index during the period can be attributed to the underweight allocations to the mortgage REITs and equity REITs industries.
For the fiscal year ended August 31, 2020, the banks industry contributed most significantly to the Fund’s return, followed by the insurance and capital markets industries, respectively. The oil, gas & consumable fuels industry detracted most significantly from the Fund’s return during the period, followed by the real estate management & development industry.
Positions that contributed most significantly to the Fund’s return for the fiscal year ended August 31, 2020, included Citigroup, Inc., 6.88%, Series K, a banks company (portfolio average weight 1.64%), and Bank of America Corp., 6.00%, Series GG, a banks company (portfolio average weight 1.16%). Positions that detracted most significantly from the Fund’s return included Truist Financial Corp., 5.63%, Series H, a banks company (portfolio average weight of 0.35%), and Diversified Healthcare Trust, 5.63%, an equity REIT company (portfolio average weight of 0.20%).
Sector Breakdown (% of the Fund’s Net Assets)
as of August 31, 2020
| | | | | | | | |
| | |
Financials | | | 64.08 | | | | | |
| | |
Utilities | | | 13.46 | | | | | |
| | |
Real Estate | | | 9.09 | | | | | |
| | |
Communication Services | | | 7.35 | | | | | |
| | |
Sector Types Each Less Than 3% | | | 5.61 | | | | | |
| | |
Money Market Funds Plus Other Assets Less Liabilities | | | 0.41 | | |
|
|
|
Top Ten Fund Holdings* (% of the Fund’s Net Assets)
as of August 31, 2020
| | | | | | | | |
| | |
| Security | | | | | | |
| | |
Citigroup, Inc., Series K, Pfd., 6.88% | | | 1.64 | | | | | |
| | |
Wells Fargo & Co., Series Z, Pfd., 4.75% | | | 1.37 | | | | | |
| | |
PNC Financial Services Group, Inc. (The), | | | | | | | | |
| | |
Series P, Pfd., 6.13% | | | 1.35 | | | | | |
| | |
Wells Fargo & Co., Series Q, Pfd., 5.85% | | | 1.33 | | | | | |
| | |
JPMorgan Chase & Co., Series DD, Pfd., 5.75% | | | 1.31 | | | | | |
| | |
Bank of America Corp., Series KK, Pfd., 5.38% | | | 1.24 | | | | | |
| | |
AT&T, Inc., Series C, Pfd., 4.75% | | | 1.17 | | | | | |
| | |
JPMorgan Chase & Co., Series EE, Pfd., 6.00% | | | 1.17 | | | | | |
| | |
Bank of America Corp., Series GG, Pfd., 6.00% | | | 1.16 | | | | | |
| | |
Bank of America Corp., Series LL, Pfd., 5.00% | | | 1.09 | | | | | |
| | |
Total | | | 12.83 | | | | | |
| * | Excluding money market fund holdings. |
Invesco Preferred ETF (PGX) (continued)
Growth of a $10,000 Investment
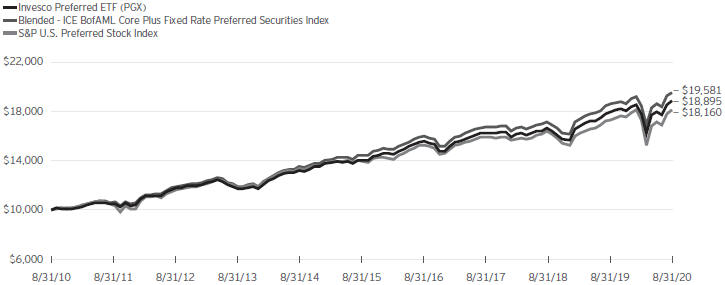
Fund Performance History as of August 31, 2020
| | | | | | | | | | | | | | | | | | | | | | | | | | | | | | | | | | | | | | | | |
| | | | | 3 Years | | | | 5 Years | | | | 10 Years | | | | | | | Fund Inception |
| Index | | 1 Year | | Average
Annualized | | 3 Years
Cumulative | | Average
Annualized | | 5 Years
Cumulative | | Average
Annualized | | 10 Years
Cumulative | | | | | Average
Annualized | | Cumulative |
| | | | | | | | | | |
Blended–ICE BofAML Core Plus Fixed Rate Preferred Securities Index | | | 5.17 | % | | | 5.43 | % | | | 17.18 | % | | | 6.35 | % | | | 36.07 | % | | | 6.95 | % | | | 95.81 | % | | | | | | | 4.74 | % | | | 79.17 | % |
| | | | | | | | | | |
S&P U.S. Preferred Stock Index | | | 4.61 | | | | 4.53 | | | | 14.21 | | | | 5.40 | | | | 30.07 | | | | 6.15 | | | | 81.60 | | | | | | | | 5.63 | | | | 99.18 | |
| | | | | | | | | | |
Fund | | | | | | | | | | | | | | | | | | | | | | | | | | | | | | | | | | | | | | | | |
| | | | | | | | | | |
NAV Return | | | 4.98 | | | | 5.13 | | | | 16.20 | | | | 6.15 | | | | 34.75 | | | | 6.57 | | | | 88.95 | | | | | | | | 4.15 | | | | 66.90 | |
| | | | | | | | | | |
Market Price Return | | | 5.04 | | | | 5.27 | | | | 16.65 | | | | 6.20 | | | | 35.09 | | | | 6.57 | | | | 88.99 | | | | | | | | 4.05 | | | | 64.72 | |
Fund Inception: January 31, 2008
Performance quoted above represents past performance. Past performance is not a guarantee of future results and current performance may be higher or lower than performance quoted. Investment returns and principal value will fluctuate, and shares of the Fund (“Fund Shares”), when redeemed or sold, may be worth more or less than their original cost. Fund performance reflects any applicable fee waivers and/or expense reimbursements. Had the adviser not waived fees and/or reimbursed expenses currently or in the past, returns would have been lower. See the current prospectus for more information. According to the Fund’s current prospectus, the Fund’s expense ratio of 0.52% includes the unitary management fee of 0.50% and acquired fund fees and expenses of 0.02%. NAV and Market Price returns assume that dividends and capital gain distributions have been reinvested in the Fund at NAV and Market Price, respectively. The returns shown in the table above do not reflect the deduction of taxes that a shareholder would pay on Fund distributions or the redemption or sale of Fund Shares. See invesco.com/ETFs to find the most recent month-end performance numbers.
Blended-Index and Benchmark Index performance results are based upon a hypothetical investment in their respective constituent securities.
Blended-Index and Benchmark Index returns do not represent Fund returns. An investor cannot invest directly in an index. The Blended-Index and Benchmark Index do not charge management fees or brokerage expenses, and no such fees or expenses were deducted from the hypothetical performance shown. In addition, the results actual investors might have achieved would have differed from those shown because of differences in the timing, amounts of their investments, and fees and expenses associated with an investment in the Fund.
Notes Regarding Indexes and Fund Performance History:
| - | Average Annualized and Cumulative Inception returns for the Fund, Blended-Index and Benchmark Index are based on the inception date of the Fund. |
| - | The Blended-ICE BofAML Core Plus Fixed Rate Preferred Securities Index is comprised of the performance of The BofA Merrill Lynch Core Fixed Rate Preferred Securities Index, the Fund’s previous underlying index, from Fund inception through the conversion date, April 1, 2012, followed by the performance of the Index starting from the conversion date through August 31, 2020. |
| | |

| | Management’s Discussion of Fund Performance Invesco Taxable Municipal Bond ETF (BAB) |
As an index fund, the Invesco Taxable Municipal Bond ETF (the “Fund”) is passively managed and seeks to track the investment results (before fees and expenses) of the ICE BofAML US Taxable Municipal Securities Plus Index (the “Index”). The Fund generally will invest at least 80% of its total assets in taxable municipal securities that comprise the Index. The Index is designed to track the performance of U.S. dollar denominated taxable municipal debt publicly issued by U.S. states and territories, and their political subdivisions, in the U.S. market.
Securities eligible for inclusion in the Index must have: (i) at least 18 months to final maturity at the time of issuance, (ii) at least one year remaining term to final maturity, (iii) a fixed coupon schedule, and (iv) an investment grade rating (based on an average of Moody’s Investors Services, Inc., S&P Global Ratings, a division of S&P Global Inc. and Fitch Ratings, Inc. Securities also must have a minimum amount outstanding that varies according to the bond’s initial term to final maturity at time of issuance: maturities between 1-5 years must have at least $10 million outstanding; maturities between 5-10 years must have at least $15 million outstanding; maturities of 10 years or more must have at least $25 million outstanding. The Index excludes Rule 144A securities and securities in default. However, it may include bonds eligible to participate in the Build America Bond program created under the American Recovery and Reinvestment Act of 2009 or other legislation providing for the issuance of taxable municipal securities on which the issuer receives federal support of the interest paid.
ICE Data Indices, LLC uses a capitalization weighted methodology, weighting the Index’s constituent bonds using a factor that equals their current amount outstanding multiplied by their market price, plus accrued interest. The Fund does not purchase all of the securities in the Index; instead, the Fund utilizes a “sampling” methodology to seek to achieve its investment objective.
For the fiscal year ended August 31, 2020, on a market price basis, the Fund returned 4.88%. On a net asset value (“NAV”) basis, the Fund returned 5.25%. During the same time period, the Index returned 6.01%. The Fund’s performance, on a NAV basis, differed from the return of the Index primarily due to the positive impact of the Fund’s sampling methodology, which was partially offset by fees and operating expenses that the Fund incurred during the period as well as costs associated with portfolio rebalancing.
During this same time period, ICE BofAML U.S. Corporate Master Index returned 7.45% and Bloomberg Barclays U.S. Aggregate Bond Index returned 6.47% (each, a “Benchmark Index” and, collectively the “Benchmark Indices”). The Benchmark Indices are unmanaged indices weighted by market capitalization and based on the average performance of approximately 8,100 securities and 10,800 securities, respectively. These Benchmark Indices were selected for their recognition in the marketplace, and their
performance comparisons are a useful measure for investors as broad representations of the market for investment grade corporate debt with at least one year to maturity, and the market for U.S. investment grade, fixed-rate bonds, respectively.
Relative to the ICE BofAML U.S. Corporate Master Index, the majority of the Fund’s underperformance during the period can be attributed to the limited supply of taxable municipal securities held by the Benchmark Index.
Relative to the Bloomberg Barclays U.S. Aggregate Bond Index, the majority of the Fund’s underperformance during the period can be attributed to the limited supply of taxable municipal securities held by the Benchmark Index.
For the fiscal year ended August 31, 2020, the State of California contributed most significantly to the Fund’s return, followed by the State of New York and the State of Texas, respectively. The state of Kentucky was the only state to detract from the Fund’s return during the period.
Positions that contributed most significantly to the Fund’s return for the fiscal year ended August 31, 2020, included University of California Rev. Bonds, 4.13% coupon, due 05/15/2045 (portfolio average weight of 1.54%), and California State GO Bonds, 7.30% coupon, due 10/01/2039 (portfolio average weight of 1.20%). Positions that detracted most significantly from the Fund’s return included Pennsylvania State University Rev. Bonds, 2.89% coupon, due 09/01/2050 (no longer held at fiscal year-end), and Metropolitan Transit Authority of New York Rev. Bonds, 6.81% coupon, due 11/15/2040 (portfolio average weight of 0.42%).
Revenue Type Breakdown (% of the Fund’s Net Assets)
as of August 31, 2020
| | | | | | | | |
Ad Valorem Property Tax | | | 17.13 | | | | | |
| | |
College & University Revenue | | | 15.33 | | | | | |
| | |
Port, Airport & Marina Revenue | | | 9.38 | | | | | |
| | |
General Fund | | | 9.11 | | | | | |
| | |
Electric Power Revenue | | | 8.13 | | | | | |
| | |
Miscellaneous Revenue | | | 5.78 | | | | | |
| | |
Sales Tax Revenue | | | 5.28 | | | | | |
| | |
Water Revenue | | | 4.93 | | | | | |
| | |
Health, Hospital, Nursing Home Revenue | | | 3.40 | | | | | |
| | |
Appropriations | | | 3.13 | | | | | |
| | |
Revenue and Security Types Each Less Than 3% | | | 14.96 | | | | | |
| | |
Money Market Funds Plus Other Assets Less Liabilities | | | 3.44 | | | | | |
Invesco Taxable Municipal Bond ETF (BAB) (continued)
Top Ten Fund Holdings* (% of the Fund’s Net Assets)
as of August 31, 2020
| | | | | | | | |
| Security | | | | | | |
| | |
Allegheny (County of), PA, Series 2020 C-79, Ref. GO Bonds, 2.34%, 11/01/2037 | | | 1.92 | | | | | |
| | |
California (State of), Series 2009, GO Bonds, 7.55%, 04/01/2039 | | | 1.67 | | | | | |
| | |
University of California, Series 2015 J, Ref. RB, 4.13%, 05/15/2045 | | | 1.53 | | | | | |
| | |
California (State of), Series 2009, GO Bonds, 7.30%, 10/01/2039 | | | 1.17 | | | | | |
| | |
New York & New Jersey (States of) Port Authority, Series 2020 AAA, RB, 1.09%, 07/01/2023 | | | 1.14 | | | | | |
| | |
Fort Lauderdale (City of), FL, Series 2020, Ref. RB, 0.75%, 01/01/2024 | | | 1.13 | | | | | |
| | |
Commonwealth Financing Authority, Series 2019 A, RB, 3.66%, 06/01/2038 | | | 1.13 | | | | | |
| | |
Dallas-Fort Worth (Cities of), TX International Airport, Series 2020 C, Ref. RB, 2.92%, 11/01/2050 | | | 1.00 | | | | | |
| | |
California (State of), Series 2009, GO Bonds, 7.50%, 04/01/2034 | | | 0.96 | | | | | |
| | |
American Municipal Power, Inc. (Combined Hydroelectric), Series 2010 B, RB, 8.08%, 02/15/2050 | | | 0.94 | | | | | |
| | |
Total | | | 12.59 | | | | | |
| * | Excluding money market fund holdings. |
Growth of a $10,000 Investment
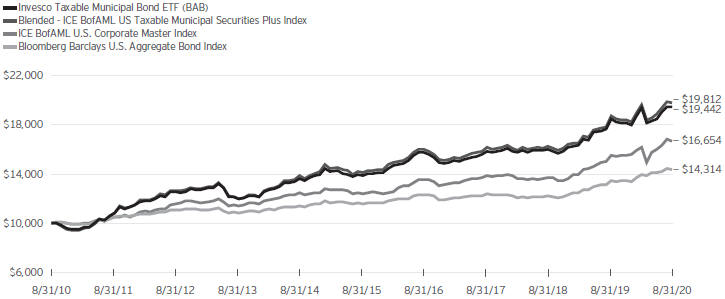
Fund Performance History as of August 31, 2020
| | | | | | | | | | | | | | | | | | | | | | | | | | | | | | | | | | | | | | | | |
| | | | | 3 Years | | | | 5 Years | | | | 10 Years | | | | | | | Fund Inception |
| Index | | 1 Year | | Average
Annualized | | 3 Years
Cumulative | | Average
Annualized | | 5 Years
Cumulative | | Average
Annualized | | 10 Years
Cumulative | | | | | Average
Annualized | | Cumulative |
| | | | | | | | | | |
Blended–ICE BofAML US Taxable Municipal Securities Plus Index | | | 6.01 | % | | | 7.04 | % | | | 22.65 | % | | | 7.01 | % | | | 40.29 | % | | | 7.08 | % | | | 98.12 | % | | | | | | | 7.63 | % | | | 121.10 | % |
| | | | | | | | | | |
ICE BofAML U.S. Corporate Master Index | | | 7.45 | | | | 6.39 | | | | 20.42 | | | | 6.13 | | | | 34.62 | | | | 5.23 | | | | 66.54 | | | | | | | | 5.78 | | | | 83.40 | |
| | | | | | | | | | |
Bloomberg Barclays U.S. Aggregate Bond Index | | | 6.47 | | | | 5.09 | | | | 16.07 | | | | 4.33 | | | | 23.60 | | | | 3.65 | | | | 43.14 | | | | | | | | 4.01 | | | | 52.84 | |
| | | | | | | | | | |
Fund | | | | | | | | | | | | | | | | | | | | | | | | | | | | | | | | | | | | | | | | |
| | | | | | | | | | |
NAV Return | | | 5.25 | | | | 7.00 | | | | 22.52 | | | | 7.01 | | | | 40.35 | | | | 6.87 | | | | 94.42 | | | | | | | | 7.56 | | | | 119.56 | |
| | | | | | | | | | |
Market Price Return | | | 4.88 | | | | 6.97 | | | | 22.41 | | | | 7.13 | | | | 41.09 | | | | 6.88 | | | | 94.54 | | | | | | | | 7.54 | | | | 118.93 | |
Invesco Taxable Municipal Bond ETF (BAB) (continued)
Fund Inception: November 17, 2009
Performance quoted above represents past performance. Past performance is not a guarantee of future results and current performance may be higher or lower than performance quoted. Investment returns and principal value will fluctuate, and shares of the Fund (“Fund Shares”), when redeemed or sold, may be worth more or less than their original cost. Fund performance reflects any applicable fee waivers and/or expense reimbursements. Had the adviser not waived fees and/or reimbursed expenses currently or in the past, returns would have been lower. See the current prospectus for more information. According to the Fund’s current prospectus, the Fund’s expense ratio of 0.28% is expressed as a unitary management fee to cover operating expenses and expenses incurred in connection with managing the portfolio. NAV and Market Price returns assume that dividends and capital gain distributions have been reinvested in the Fund at NAV and Market Price, respectively. The returns shown in the table above do not reflect the deduction of taxes that a shareholder would pay on Fund distributions or the redemption or sale of Fund Shares. See invesco.com/ETFs to find the most recent month-end performance numbers.
Blended-Index and Benchmark Indices performance results are based upon a hypothetical investment in their respective constituent securities.
Blended-Index and Benchmark Indices returns do not represent Fund returns. An investor cannot invest directly in an index. The Blended-Index and Benchmark Indices do not charge management fees or brokerage expenses, and no such fees or expenses were deducted from the hypothetical performance shown. In addition, the results actual investors might have achieved would have differed from those shown because of differences in the timing, amounts of their investments, and fees and expenses associated with an investment in the Fund.
Notes Regarding Indexes and Fund Performance History:
| - | Average Annualized and Cumulative Inception returns for the Fund, Blended-Index and Benchmark Indices are based on the inception date of the Fund. |
| - | The Blended-ICE BofAML US Taxable Municipal Securities Plus Index is comprised of the performance of the ICE BofAML Build America Bond Index, the Fund’s previous underlying index, from Fund inception through the conversion date, May 31, 2017, followed by the performance of the Index starting at the conversion date through August 31, 2020. |
| | |

| | Management’s Discussion of Fund Performance Invesco Treasury Collateral ETF (CLTL) |
As an index fund, the Invesco Treasury Collateral ETF (the “Fund”) is passively managed and seeks to track the investment results (before fees and expenses) of the ICE U.S. Treasury Short Bond Index (the “Index”). The Fund generally will invest at least 80% of its total assets in the components of the Index. The Index is designed to measure the performance of U.S. Treasury Obligations with a maximum remaining maturity of 12 months. “U.S. Treasury Obligations” refer to securities issued or guaranteed by the U.S. Treasury where the payment of principal and interest is backed by the full faith and credit of the U.S. government. They include U.S. Treasury notes, bills and bonds. The Fund expects to invest 100% of its total assets in cash and U.S. Treasury Obligations with a maximum remaining maturity of 12 months. The Index includes all publicly-issued, non-convertible U.S. Treasury Obligations that: (i) are issued in U.S. dollars, (ii) have a minimum remaining maturity of at least one month and a maximum remaining maturity of 12 months at the time of rebalance, and (iii) have a minimum amount outstanding of $300 million.
The Index excludes inflation-linked securities, floating rate notes, cash management bills, and any government agency debt issued with or without a government guarantee and Separate Trading of Registered Interest and Principal of Securities. The Index uses a market value-weighted methodology. The Fund does not purchase all of the securities in the Index; instead, the Fund utilizes a “sampling” methodology to seek to achieve its investment objective. In managing the Fund, Invesco Advisers, Inc., the sub-adviser, selects component securities that are expected to have, in the aggregate, investment characteristics, risk factors and liquidity measures that are similar to, and therefore are representative of, the Index.
For the fiscal year ended August 31, 2020, on a market price basis, the Fund returned 1.55%. On a net asset value (“NAV”) basis, the Fund returned 1.55%. During the same time period, the Index returned 1.58%. The Fund’s performance, on a NAV basis, differed from the return of the Index primarily due to fees and operating expenses that the Fund incurred during the period.
For the fiscal year ended August 31, 2020, the bonds with maturities between 61-90 days duration contributed most significantly to the Fund’s return, followed by the bonds with maturities between 120-360 days duration. There were no maturity ranges that detracted from the Fund’s return over the period.
Positions that contributed most significantly to the Fund’s return for the fiscal year ended August 31, 2020, included U.S. Treasury Note, 1.38% coupon, due 10/31/2020 (portfolio average weight of 3.06%), and U.S. Treasury Note, zero-coupon, due 08/31/2020 (no longer held at fiscal year-end). Positions that detracted most significantly from the Fund’s return included U.S. Treasury Bill, zero-coupon, due 01/14/2021 (portfolio average weight of 1.50%), and U.S. Treasury Bill, zero coupon, due 02/04/2021 (portfolio average weight of 1.50%).
Security Type Breakdown (% of the Fund’s Net Assets) as of August 31, 2020
| | | | | | | | |
| | |
U.S. Treasury Bills | | | 60.87 | | | | | |
| | |
U.S. Treasury Notes | | | 39.10 | | | | | |
| | |
Money Market Funds Plus Other Assets Less Liabilities | | | 0.03 | | | | | |
Top Ten Fund Holdings* (% of the Fund’s Net Assets)
as of August 31, 2020
| | | | | | | | |
| Security | | | | | | |
| | |
U.S. Treasury Bills, 0.01%-1.49%, 10/08/2020 | | | 3.59 | | | | | |
| | |
U.S. Treasury Bills, 0.04%-1.48%, 11/05/2020 | | | 3.58 | | | | | |
| | |
U.S. Treasury Bills, 0.09%-0.16%, 11/12/2020 | | | 3.17 | | | | | |
| | |
U.S. Treasury Bills, 0.09%-0.16%, 10/22/2020 | | | 3.17 | | | | | |
| | |
U.S. Treasury Bills, 0.10%-0.16%, 12/31/2020 | | | 3.15 | | | | | |
| | |
U.S. Treasury Notes, 1.38%, 10/31/2020 | | | 3.05 | | | | | |
| | |
U.S. Treasury Bills, 0.09%-0.15%, 10/15/2020 | | | 3.00 | | | | | |
| | |
U.S. Treasury Bills, 0.09-0.16%, 12/03/2020 | | | 2.95 | | | | | |
| | |
U.S. Treasury Bills, 0.09%-0.17%, 10/01/2020 | | | 2.82 | | | | | |
| | |
U.S. Treasury Bills, 0.12%-0.17%, 03/25/2021 | | | 2.67 | | | | | |
| | |
Total | | | 31.15 | | | | | |
| * | Excluding money market fund holdings. |
Invesco Treasury Collateral ETF (CLTL) (continued)
Growth of a $10,000 Investment Since Inception
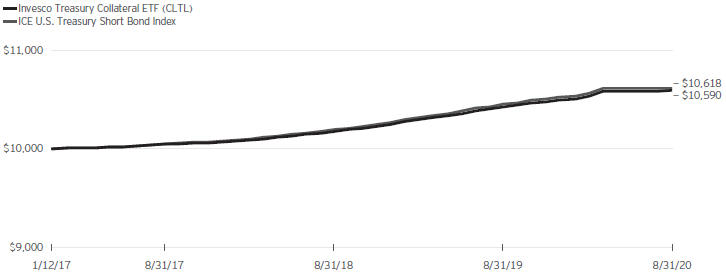
Fund Performance History as of August 31, 2020
| | | | | | | | | | | | | | | | | | | | | | | | |
| | | | | 3 Years | | | | | | | Fund Inception |
| Index | | 1 Year | | Average
Annualized | | 3 Years
Cumulative | | | | | Average
Annualized | | Cumulative |
| | | | | | |
ICE U.S. Treasury Short Bond Index | | | 1.58 | % | | | 1.86 | % | | | 5.69 | % | | | | | | | 1.66 | % | | | 6.18 | % |
| | | | | | |
Fund | | | | | | | | | | | | | | | | | | | | | | | | |
| | | | | | |
NAV Return | | | 1.55 | | | | 1.79 | | | | 5.45 | | | | | | | | 1.59 | | | | 5.90 | |
| | | | | | |
Market Price Return | | | 1.55 | | | | 1.78 | | | | 5.44 | | | | | | | | 1.58 | | | | 5.86 | |
Fund Inception: January 12, 2017
Performance quoted above represents past performance. Past performance is not a guarantee of future results and current performance may be higher or lower than performance quoted. Investment returns and principal value will fluctuate, and shares of the Fund (“Fund Shares”), when redeemed or sold, may be worth more or less than their original cost. Fund performance reflects any applicable fee waivers and/or expense reimbursements. Had the adviser not waived fees and/or reimbursed expenses currently or in the past, returns would have been lower. See the current prospectus for more information. According to the Fund’s current prospectus, the Fund’s expense ratio of 0.08% is expressed as a unitary management fee to cover operating expenses and expenses incurred in connection with managing the portfolio. NAV and Market Price returns assume that dividends and capital gain distributions have been reinvested in the Fund at NAV and Market Price, respectively. The returns shown in the table above do not reflect the deduction of taxes that a shareholder would pay on Fund
distributions or the redemption or sale of Fund Shares. See invesco.com/ETFs to find the most recent month-end performance numbers.
Index performance results are based upon a hypothetical investment in their respective constituent securities. Index returns do not represent Fund returns. An investor cannot invest directly in an index. The Index does not charge management fees or brokerage expenses, and no such fees or expenses were deducted from the hypothetical performance shown. In addition, the results actual investors might have achieved would have differed from those shown because of differences in the timing, amounts of their investments, and fees and expenses associated with an investment in the Fund.
Notes Regarding Index and Fund Performance History:
| - | Average Annualized and Cumulative Inception returns for the Fund and Index are based on the inception date of the Fund. |
| | |
 | | Management’s Discussion of Fund Performance Invesco Variable Rate Preferred ETF (VRP) |
As an index fund, the Invesco Variable Rate Preferred ETF (the “Fund”) is passively managed and seeks to track the investment results (before fees and expenses) of the Wells Fargo® Hybrid and Preferred Securities Floating and Variable Rate Index (the “Index”). The Fund generally will invest at least 90% of its total assets in the securities that comprise the Index. The Index is a market capitalization-weighted index designed to track the performance of preferred stock, as well as certain types of “hybrid securities” that are functionally equivalent to preferred stocks, that are issued by U.S.-based or foreign issuers and that pay a floating or variable rate dividend or coupon.
Strictly in accordance with its guidelines and mandated procedures, Wells Fargo Securities, LLC (together with Wells Fargo & Company, the “Index Provider”), employs a proprietary methodology to select for the Index issues of preferred stock and hybrid securities that, in the Index Provider’s judgment, are functionally equivalent to preferred stock based on the inclusion of equity features. To be eligible for inclusion in the Index, the preferred stock or hybrid security must: (i) maintain a minimum par value of $100 million outstanding or a minimum of 10 million shares outstanding; (ii) have floating or variable dividends or coupons; (iii) be U.S. dollar-denominated and have a tranche that is offered in the U.S.; and (iv) be U.S. registered (or otherwise exempt from registration in the United States). The Fund considers the traditional preferred stocks and functionally equivalent hybrid securities included in the Index, collectively, to be “Hybrid and Preferred Securities.” The Fund does not purchase all of the Hybrid and Preferred Securities in the Index; instead, the Fund utilizes a “sampling” methodology to seek to achieve its investment objective.
For the fiscal year ended August 31, 2020, on a market price basis, the Fund returned 3.51%. On a net asset value (“NAV”) basis, the Fund returned 3.44%. During the same time period, the Index returned 3.58%. The Fund’s performance, on a NAV basis, differed from the return of the Index primarily due to the fees and operating expenses that the Fund incurred during the period, which were partially offset by the positive impact of the Fund’s sampling methodology.
During this same time period, the S&P U.S. Preferred Stock Index (the “Benchmark Index”) returned 4.61%. The Benchmark Index is an unmanaged index weighted by modified market capitalization and based on the average performance of approximately 300 securities. The Benchmark Index was selected for its recognition in the marketplace, and its performance comparison is a useful measure for investors as a broad representation of the primarily fixed-rate preferred stock market.
Relative to the Benchmark Index, the Fund was most overweight in the banks industry and most underweight in the equity REITs industry during the fiscal year ended August 31, 2020. The majority of the Fund’s underperformance relative to the Benchmark Index during the period can be attributed to the Fund’s
overweight allocation to the industrial conglomerates industry, followed by the Fund’s lack of holdings in both the semiconductors & semiconductor equipment and diversified telecommunication services industries.
For the fiscal year ended August 31, 2020, the banks industry contributed most significantly to the Fund’s return, followed by the capital markets and insurance industries, respectively. The oil, gas & consumable fuels industry detracted most significantly from the Fund’s return, followed by the industrial conglomerates and mortgage REITs industries, respectively.
Positions that contributed most significantly to the Fund’s return for the fiscal year ended August 31, 2020, included Vodafone Group PLC, 7.00%, a wireless telecommunications company (portfolio average weight of 1.19%), and BP Capital Markets PLC, 4.88%, an oil, gas & consumable fuel company (portfolio average weight of 1.32%). Positions that detracted most significantly from the Fund’s return included General Electric Co., 5.00%, an industrial conglomerates company (portfolio average weight of 2.15%), and Plains All American Pipeline L.P., 6.13%, an oil, gas & consumable fuels company (portfolio average weight of 0.27%).
Sector Breakdown (% of the Fund’s Net Assets)
as of August 31, 2020
| | | | |
| |
Financials | | | 77.11 | |
| |
Energy | | | 10.80 | |
| |
Utilities | | | 4.81 | |
| |
Industrials | | | 3.32 | |
| |
Sector Types Each Less Than 3% | | | 2.96 | |
| |
Money Market Funds Plus Other Assets Less Liabilities | | | 1.00 | |
Top Ten Fund Holdings* (% of the Fund’s Net Assets) as of August 31, 2020
| | | | |
| Security | | |
| |
General Electric Co., Series D, 5.00% | | | 2.12 | |
| |
JPMorgan Chase & Co., Series HH, 4.60% | | | 1.46 | |
| |
JPMorgan Chase & Co., Series I, 3.74% | | | 1.37 | |
| |
BP Capital Markets PLC, 4.88% | | | 1.32 | |
| |
Charles Schwab Corp. (The), Series G, 5.38% | | | 1.30 | |
| |
GMAC Capital Trust I, Series 2, Pfd., 6.07% | | | 1.28 | |
| |
BP Capital Markets PLC, 4.38% | | | 1.26 | |
| |
Bank of America Corp., Series FF, 5.88% | | | 1.22 | |
| |
Wachovia Capital Trust III, 5.57% | | | 1.20 | |
| |
Citigroup Capital XIII, Pfd., 6.64% | | | 1.18 | |
| |
Total | | | 13.71 | |
| * | Excluding money market fund holdings. |
Invesco Variable Rate Preferred ETF (VRP) (continued)
Growth of a $10,000 Investment Since Inception
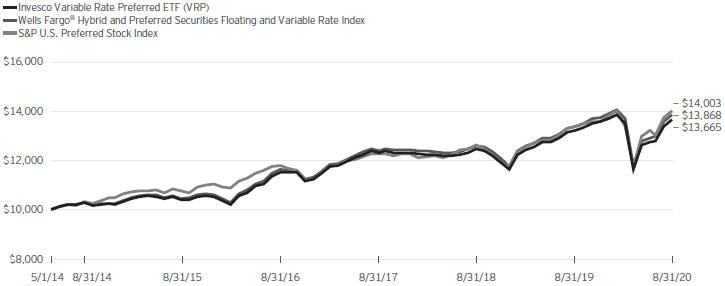
Fund Performance History as of August 31, 2020
| | | | | | | | | | | | | | | | | | | | | | | | | | | | | | |
| | | | | 3 Years | | | | 5 Years | | | | | | Fund Inception |
| | | | | Average | | 3 Years | | Average | | 5 Years | | | | Average | | |
| Index | | 1 Year | | Annualized | | Cumulative | | Annualized | | Cumulative | | | | Annualized | | Cumulative |
| | | | | | | | |
Wells Fargo® Hybrid and Preferred Securities Floating and Variable Rate Index | | | 3.58 | % | | | 3.83 | % | | | 11.94 | % | | | 5.83 | % | | | 32.77 | % | | | | | 5.30 | % | | | 38.68 | % |
| | | | | | | | |
S&P U.S. Preferred Stock Index | | | 4.61 | | | | 4.53 | | | | 14.21 | | | | 5.40 | | | | 30.07 | | | | | | 5.46 | | | | 40.03 | |
| | | | | | | | |
| Fund | | | | | | | | | | | | | | | | |
| | | | | | | | |
NAV Return | | | 3.44 | | | | 3.60 | | | | 11.21 | | | | 5.65 | | | | 31.63 | | | | | | 5.06 | | | | 36.65 | |
| | | | | | | | |
Market Price Return | | | 3.51 | | | | 3.66 | | | | 11.38 | | | | 5.61 | | | | 31.38 | | | | | | 5.06 | | | | 36.66 | |
Fund Inception: May 1, 2014
Performance quoted above represents past performance. Past performance is not a guarantee of future results and current performance may be higher or lower than performance quoted. Investment returns and principal value will fluctuate, and shares of the Fund (“Fund Shares”), when redeemed or sold, may be worth more or less than their original cost. Fund performance reflects any applicable fee waivers and/or expense reimbursements. Had the adviser not waived fees and/or reimbursed expenses currently or in the past, returns would have been lower. See the current prospectus for more information. According to the Fund’s current prospectus, the Fund’s expense ratio of 0.50% is expressed as a unitary management fee to cover operating expenses and expenses incurred in connection with managing the portfolio. NAV and Market Price returns assume that dividends and capital gain distributions have been reinvested in the Fund at NAV and Market Price, respectively. The returns shown in the table above do not reflect the deduction of taxes that a shareholder would pay on Fund distributions or the redemption or sale of Fund Shares. See
invesco.com/ETFs to find the most recent month-end performance numbers.
Index and Benchmark Index performance results are based upon a hypothetical investment in their respective constituent securities. Index and Benchmark Index returns do not represent Fund returns. An investor cannot invest directly in an index. The Index and Benchmark Index do not charge management fees or brokerage expenses, and no such fees or expenses were deducted from the hypothetical performance shown. In addition, the results actual investors might have achieved would have differed from those shown because of differences in the timing, amounts of their investments, and fees and expenses associated with an investment in the Fund.
Notes Regarding Indexes and Fund Performance History:
| - | Average Annualized and Cumulative Inception returns for the Fund, Index and Benchmark Index are based on the inception date of the Fund. |
| | |
 | | Management’s Discussion of Fund Performance Invesco VRDO Tax-Free Weekly ETF (PVI) |
As an index fund, the Invesco VRDO Tax-Free Weekly ETF (the “Fund”) is passively managed and seeks to track the investment results (before fees and expenses) of the Bloomberg U.S. Municipal AMT-Free Weekly VRDO Index (the “Index”). The Fund generally will invest at least 80% of its total assets in variable rate demand obligation (“VRDO”) bonds that are exempt from federal income tax with interest rates that reset weekly, which comprise the Index.
Bloomberg Index Services Limited compiles and calculates the Index, which is comprised of municipal securities issued in the primary market as VRDOs. Bonds in the Index must be rated by at least one of the following statistical rating agencies: Moody’s Investors Services, Inc. as A-3 for long-term bonds or Prime-2 for short-term bonds; by S&P Global Ratings, a division of S&P Global Inc. as A- for long-term bonds or A-2 for short-term bonds; and by Fitch Ratings, Inc. as A- for long-term bonds or F-2 for short-term bonds. To be eligible for inclusion in the Index, bonds must also have a minimum amount outstanding of $10 million and a minimum maturity of one month at the time of the Underlying Index’s last rebalance. The Fund does not purchase all of the securities in the Index; instead, the Fund utilizes a “sampling” methodology to seek to achieve its investment objective.
For the fiscal year ended August 31, 2020, on a market price basis, the Fund returned 0.58%. On a net asset value (“NAV”) basis, the Fund returned 0.69%. During the same time period, the Index returned 0.86%. The Fund’s performance, on a NAV basis, differed from the return of the Index primarily due to fees and expenses that the Fund incurred during the period, as well as costs associated with portfolio rebalancing and sampling, which were partially offset by the positive impact of the impact of the Fund’s sampling methodology.
During this same time period, the Bloomberg Barclays Municipal 1-Year Index (the “Benchmark Index”) returned 1.95%. The Benchmark Index is an unmanaged index weighted by market capitalization and based on the average performance of approximately 3,900 securities. The Benchmark Index was selected for its recognition in the marketplace, and its performance comparison is a useful measure for investors as a broad representation of the market for municipal securities with no more than a 1-year duration.
Relative to the Benchmark Index, the Fund was most overweight in the State of New York and most underweight in the State of California during the fiscal year ended August 31, 2020. The majority of the Fund’s underperformance relative to the Benchmark Index during the period can be attributed to the Fund being underweight in the State of California and the State of Texas.
For the fiscal year ended August 31, 2020, the State of New York contributed most significantly to the Fund’s return, followed by the State of Florida and the State of Massachusetts, respectively. There were no detracting states during the period.
Positions that contributed most significantly to the Fund’s return for the fiscal year ended August 31, 2020, included Arizona Health Facilities Authority (Catholic Healthcare West Loan Program) Rev. Bond, 0.10% coupon, due 07/01/2035 (portfolio average weight of 5.01%), and Franklin County Ohio Hospital (OhioHealth Corp.) Rev. Bond, 0.08% coupon, due 11/15/2041 (portfolio average weight of 5.01%). There were no detracting positions.
Revenue Type Breakdown (% of the Fund’s Net Assets) as of August 31, 2020
| | | | |
Health, Hospital, Nursing Home Revenue | | | 24.77 | |
Miscellaneous Revenue | | | 15.64 | |
Port, Airport & Marina Revenue | | | 14.04 | |
College & University Revenue | | | 9.83 | |
Water Revenue | | | 9.23 | |
Local or GTD Housing | | | 7.92 | |
Ad Valorem Property Tax | | | 4.41 | |
Sales Tax Revenue | | | 3.21 | |
Lease Revenue | | | 3.01 | |
Revenue Types Each Less Than 3% | | | 4.95 | |
Other Assets Less Liabilities | | | 2.99 | |
Invesco VRDO Tax-Free Weekly ETF (PVI) (continued)
| | | | |
Top Ten Fund Holdings (% of the Fund’s Net Assets) as of August 31, 2020 | | |
| Security | | |
| |
Franklin (County of), OH (OhioHealth Corp.), Series 2009 A, Ref. VRD RB, 0.08%, 11/15/2041 | | | 5.02 | |
| |
Massachusetts (State of) Health & Educational Facilities Authority (Partners Healthcare), Series 1997 P1, VRD RB, 0.09%, 07/01/2027 | | | 5.02 | |
| |
Arizona (State of) Health Facilities Authority (Catholic Healthcare West Loan Program), Series 2005 B, VRD RB, 0.10%, 07/01/2035 | | | 5.01 | |
| |
Houston (City of), TX, Series 2010, Ref. VRD RB, 0.10%, 07/01/2030 | | | 5.01 | |
| |
Indianapolis (City of), IN, Series 2008, VRD RB, 0.06%, 05/15/2038 | | | 5.01 | |
| |
Clark (County of), NV Department of Aviation, Series 2008 D-3, VRD RB, 0.09%, 07/01/2029 | | | 5.01 | |
| |
Build NYC Resource Corp., Series 2015, Ref. VRD RB, 0.09%, 04/01/2045 | | | 5.01 | |
| |
Missouri (State of) Health & Educational Facilities Authority (BJC Health System), Series 2008 C, VRD RB, 0.07%, 05/15/2038 | | | 4.82 | |
| |
Colorado Springs (City of), CO, Series 2006 B, VRD RB, 0.11%, 11/01/2036 | | | 4.61 | |
| |
University of Massachusetts Building Authority, Series 2008 1, VRD RB, 0.08%, 05/01/2038 | | | 4.61 | |
| |
Total | | | 49.13 | |
Growth of a $10,000 Investment
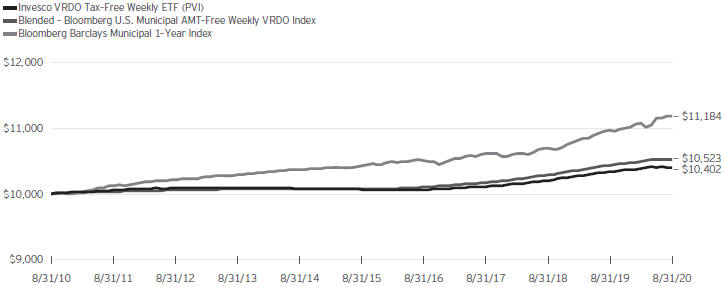
| | | | | | | | | | | | | | | | | | | | | | | | | | | | | | | | | | | | | | |
| Fund Performance History as of August 31, 2020 | |
| | | | | | | | | |
| | | | | 3 Years | | | | 5 Years | | | | 10 Years | | | | | | Fund Inception |
| | | | | Average | | 3 Years | | Average | | 5 Years | | Average | | 10 Years | | | | Average | | |
| Index | | 1 Year | | Annualized | | Cumulative | | Annualized | | Cumulative | | Annualized | | Cumulative | | | | Annualized | | Cumulative |
| | | | | | | | | | |
Blended–Bloomberg U.S. Municipal AMT-Free Weekly VRDO Index | | | 0.86 | % | | | 1.15 | % | | | 3.50 | % | | | 0.87 | % | | | 4.44 | % | | | 0.51 | % | | | 5.23 | % | | | | | 0.73 | % | | | 9.69 | % |
| | | | | | | | | | |
Bloomberg Barclays Municipal 1-Year Index | | | 1.95 | | | | 1.75 | | | | 5.33 | | | | 1.41 | | | | 7.24 | | | | 1.13 | | | | 11.84 | | | | | | 1.67 | | | | 23.62 | |
| | | | | | | | | | |
| Fund | | | | | | | | | | | | | | | | | | | | |
| | | | | | | | | | |
NAV Return | | | 0.69 | | | | 0.96 | | | | 2.90 | | | | 0.67 | | | | 3.40 | | | | 0.39 | | | | 4.02 | | | | | | 0.71 | | | | 9.43 | |
| | | | | | | | | | |
Market Price Return | | | 0.58 | | | | 0.97 | | | | 2.95 | | | | 0.66 | | | | 3.36 | | | | 0.39 | | | | 4.02 | | | | | | 0.71 | | | | 9.43 | |
Invesco VRDO Tax-Free Weekly ETF (PVI) (continued)
Fund Inception: November 15, 2007
Performance quoted above represents past performance. Past performance is not a guarantee of future results and current performance may be higher or lower than performance quoted. Investment returns and principal value will fluctuate, and shares of the Fund (“Fund Shares”), when redeemed or sold, may be worth more or less than their original cost. Fund performance reflects any applicable fee waivers and/or expense reimbursements. Had the adviser not waived fees and/or reimbursed expenses currently or in the past, returns would have been lower. See the current prospectus for more information. According to the Fund’s current prospectus, the Fund’s expense ratio of 0.25% is expressed as a unitary management fee to cover operating expenses and expenses incurred in connection with managing the portfolio. NAV and Market Price returns assume that dividends and capital gain distributions have been reinvested in the Fund at NAV and Market Price, respectively. The returns shown in the table above do not reflect the deduction of taxes that a shareholder would pay on Fund distributions or the redemption or sale of Fund Shares. See invesco.com/ETFs to find the most recent month-end performance numbers.
Blended-Index and Benchmark Index performance results are based upon a hypothetical investment in their respective constituent securities. Blended-Index and Benchmark Index returns do not represent Fund returns. An investor cannot invest directly in an index. The Blended-Index and Benchmark Index do not charge management fees or brokerage expenses, and no such fees or expenses were deducted from the hypothetical performance shown. In addition, the results actual investors might have achieved would have differed from those shown because of differences in the timing, amounts of their investments, and fees and expenses associated with an investment in the Fund.
Notes Regarding Indexes and Fund Performance History:
| - | Average Annualized and Cumulative Inception returns for the Fund, Blended-Index and Benchmark Index are based on the inception date of the Fund. |
| - | The Blended-Bloomberg U.S. Municipal AMT-Free Weekly VRDO Index is comprised of the performance of the Thomson Municipal Market Data VRDO Index, the Fund’s previous underlying index, from Fund inception through the conversion date, August 5, 2010, followed by the performance of the Index starting at the conversion date through August 31, 2020. |
Liquidity Risk Management Program
The Securities and Exchange Commission (“SEC”) has adopted Rule 22e-4 under the Investment Company Act of 1940 (the “Liquidity Rule”) in order to promote effective liquidity risk management throughout the open-end investment company industry, thereby reducing the risk that funds will be unable to meet their redemption obligations and mitigating dilution of the interests of fund shareholders. The Funds have adopted and implemented a liquidity risk management program in accordance with the Liquidity Rule (the “Program”). The Program is reasonably designed to assess and manage the Funds’ liquidity risk, which is the risk that the Funds could not meet redemption requests without significant dilution of remaining investors’ interests in the Funds. The Board of Trustees of the Funds (the “Board”) has appointed Invesco Capital Management LLC (“Invesco”), the Funds’ investment adviser, as the Program’s administrator, and Invesco has delegated oversight of the Program to the Liquidity Risk Management Committee (the “Committee”), which is composed of senior representatives from relevant business groups at Invesco and its affiliates.
As required by the Liquidity Rule, the Program includes policies and procedures providing for an assessment, no less frequently than annually, of the Funds’ liquidity risk that takes into account, as relevant to the Funds’ liquidity risk: (1) each Fund’s investment strategy and liquidity of portfolio investments during both normal and reasonably foreseeable stressed conditions; (2) short-term and long-term cash flow projections for the Funds during both normal and reasonably foreseeable stressed conditions; (3) each Fund’s holdings of cash and cash equivalents and any borrowing arrangements; (4) the relationship between the Funds’ portfolio liquidity and the way in which, and the prices and spreads at which, Fund shares trade, including the efficiency of the arbitrage function and the level of active participation by market participants, including authorized participants; and (5) the effect of the composition of baskets on the overall liquidity of each Fund’s portfolio. The Liquidity Rule also requires the classification of each Fund’s investments into categories that reflect the assessment of their relative liquidity under current market conditions. Each Fund classifies its investments into one of four of the following categories defined in the Liquidity Rule: “Highly Liquid,” “Moderately Liquid,” “Less Liquid” and “Illiquid.” Funds that are not invested primarily in “Highly Liquid Investments” that are assets (cash or investments that are reasonably expected to be convertible into cash within three business days without significantly changing the market value of the investment) are required to establish a “Highly Liquid Investment Minimum” (“HLIM”), which is the minimum percentage of net assets that must be invested in Highly Liquid Investments. Funds with HLIMs have procedures for addressing HLIM shortfalls, including reporting to the Board and the SEC (on a non-public basis) as required by the Program and the Liquidity Rule. In addition, a Fund may not acquire an investment if, immediately after the acquisition, over 15% of such Fund’s net assets would consist of “Illiquid Investments” that are assets (an investment that cannot reasonably be expected to be sold or disposed of in current market conditions in seven calendar days or less without the sale or disposition significantly changing the market value of the investment). The Liquidity Rule and the Program also require reporting to the Board and the SEC (on a non-public basis) if a Fund’s holdings of Illiquid Investments exceed 15% of such Fund’s assets.
At a meeting held on March 12, 2020, the Committee presented a report to the Board that addressed the operation of the Program and assessed the Program’s adequacy and effectiveness of implementation (the “Report”). The Report covered the period from December 1, 2018 through December 31, 2019 (the “Program Reporting Period”).
The Report stated, in relevant part, that during the Program Reporting Period:
| | • | | The Program, as adopted and implemented, remained reasonably designed to assess and manage the Funds’ liquidity risk and was operated effectively to achieve that goal; |
| | • | | Each Fund’s investment strategy remained appropriate for an open-end fund; |
| | • | | Each Fund was able to meet requests for redemption without significant dilution of remaining investors’ interests in the Fund; |
| | • | | The Funds did not breach the 15% limit on Illiquid Investments; and |
| | • | | The Funds primarily held Highly Liquid Investments and therefore have not adopted an HLIM. |
Invesco 1-30 Laddered Treasury ETF (PLW)
August 31, 2020
Schedule of Investments
| | | | | | | | |
| | | Principal
Amount | | | Value | |
U.S. Treasury Securities-99.83% | |
U.S. Treasury Bonds-86.83% | |
7.88%, 02/15/2021 | | $ | 5,779,200 | | | $ | 5,981,744 | |
7.13%, 02/15/2023 | | | 5,284,300 | | | | 6,191,300 | |
7.63%, 02/15/2025 | | | 4,761,300 | | | | 6,323,602 | |
6.00%, 02/15/2026 | | | 4,923,700 | | | | 6,436,776 | |
6.63%, 02/15/2027 | | | 4,622,800 | | | | 6,455,126 | |
5.25%, 02/15/2029 | | | 4,763,700 | | | | 6,607,959 | |
5.38%, 02/15/2031 | | | 13,575,900 | | | | 20,035,589 | |
4.50%, 02/15/2036 | | | 13,598,500 | | | | 20,575,699 | |
4.75%, 02/15/2037 | | | 4,358,100 | | | | 6,864,178 | |
4.38%, 02/15/2038 | | | 4,494,700 | | | | 6,911,128 | |
3.50%, 02/15/2039 | | | 4,970,400 | | | | 6,966,132 | |
4.63%, 02/15/2040 | | | 4,298,800 | | | | 6,910,657 | |
4.75%, 02/15/2041 | | | 4,207,600 | | | | 6,927,255 | |
3.13%, 02/15/2042 | | | 5,212,400 | | | | 7,041,423 | |
3.13%, 02/15/2043 | | | 5,215,800 | | | | 7,049,276 | |
3.63%, 02/15/2044 | | | 4,813,000 | | | | 7,017,768 | |
2.50%, 02/15/2045 | | | 5,784,500 | | | | 7,102,733 | |
2.50%, 02/15/2046 | | | 5,770,900 | | | | 7,110,155 | |
3.00%, 02/15/2047 | | | 5,236,700 | | | | 7,075,068 | |
3.00%, 02/15/2048 | | | 5,221,000 | | | | 7,092,810 | |
3.00%, 02/15/2049 | | | 5,194,000 | | | | 7,104,012 | |
2.00%, 02/15/2050 | | | 6,425,000 | | | | 7,274,305 | |
| | | | | | | | |
| | | | | | | 177,054,695 | |
| | | | | | | | |
| | | | | | | | |
| | | Principal
Amount | | | Value | |
U.S. Treasury Notes-13.00% | | | | | | | | |
2.00%, 02/15/2022 | | $ | 6,231,200 | | | $ | 6,399,028 | |
2.75%, 02/15/2024 | | | 5,968,000 | | | | 6,499,059 | |
2.75%, 02/15/2028 | | | 5,755,000 | | | | 6,697,156 | |
1.50%, 02/15/2030 | | | 6,410,000 | | | | 6,907,276 | |
| | | | | | | | |
| | | | | | | 26,502,519 | |
| | | | | | | | |
Total U.S. Treasury Securities
(Cost $204,326,806) | | | | | | | 203,557,214 | |
| | | | | | | | |
| | |
| | | Shares | | | | |
Money Market Funds-0.06% | | | | | | | | |
Invesco Premier U.S. Government Money Portfolio, Institutional Class, 0.01%(a)(b) (Cost $115,706) | | | 115,706 | | | | 115,706 | |
| | | | | | | | |
TOTAL INVESTMENTS IN SECURITIES-99.89%
(Cost $204,442,512) | | | | 203,672,920 | |
OTHER ASSETS LESS LIABILITIES-0.11% | | | | 230,175 | |
| | | | | | | | |
NET ASSETS-100.00% | | | | | | $ | 203,903,095 | |
| | | | | | | | |
Notes to Schedule of Investments:
| (a) | Affiliated issuer. The issuer and/or the Fund is a wholly-owned subsidiary of Invesco Ltd., or is affiliated by having an investment adviser that is under common control of Invesco Ltd. The table below shows the Fund’s transactions in, and earnings from, its investments in affiliates for the fiscal year ended August 31, 2020. |
| | | | | | | | | | | | | | | | | | | | | | | | | | | | | | | | | | | |
| | | Value
August 31, 2019 | | Purchases
at Cost | | Proceeds
from Sales | | Change in
Unrealized
Appreciation | | Realized
Gain
(Loss) | | Value
August 31, 2020 | | Dividend
Income |
Investments in Affiliated Money Market Funds: | | | | | | | | | | | | | | | | | | | | | | | | | | | | | | | | | | | |
| | | | | | | |
Invesco Premier U.S. Government Money Portfolio, Institutional Class | | | $ | 41,740 | | | | $ | 3,498,721 | | | | $ | (3,424,755 | ) | | | $ | - | | | | $ | - | | | | $ | 115,706 | | | | $ | 1,108 | |
| | | | | | | |
Investments Purchased with Cash Collateral from Securities on Loan: | | | | | | | | | | | | | | | | | | | | | | | | | | | | | | | | | | | |
| | | | | | | |
Invesco Government & Agency Portfolio, Institutional Class | | | | - | | | | | 36,202,654 | | | | | (36,202,654 | ) | | | | - | | | | | - | | | | | - | | | | | 4,587 | * |
| | | | | | | |
Invesco Liquid Assets Portfolio, Institutional Class | | | | - | | | | | 5,566,546 | | | | | (5,566,420 | ) | | | | - | | | | | (126 | ) | | | | - | | | | | 1,134 | * |
| | | | | | | |
Invesco Private Government Fund | | | | - | | | | | 57,889,353 | | | | | (57,889,353 | ) | | | | - | | | | | - | | | | | - | | | | | 41 | * |
| | | | | | | | | | | | | | | | | | | | | | | | | | | | | | | | | | | |
| | | | | | | |
Total | | | $ | 41,740 | | | | $ | 103,157,274 | | | | $ | (103,083,182 | ) | | | $ | - | | | | $ | (126 | ) | | | $ | 115,706 | | | | $ | 6,870 | |
| | | | | | | | | | | | | | | | | | | | | | | | | | | | | | | | | | | |
| * | Represents the income earned on the investment of cash collateral, which is included in securities lending income on the Statements of Operations. Does not include rebates and fees paid to lending agent or premiums received from borrowers, if any. |
| (b) | The rate shown is the 7-day SEC standardized yield as of August 31, 2020. |
See accompanying Notes to Financial Statements which are an integral part of the financial statements.
Invesco California AMT-Free Municipal Bond ETF (PWZ)
August 31, 2020
Schedule of Investments
| | | | | | | | | | | | | | | | |
| | | Interest
Rate | | Maturity
Date | | | Principal
Amount
(000) | | | Value | |
Municipal Obligations-97.98% | | | | | | | | | | | | | | | | |
California-97.63% | | | | | | | | | | | | | | | | |
Alameda (City of), CA Corridor Transportation Authority, Series 2016 B, Ref. RB, (INS - AGM)(a) | | | 3.00 | % | | | 10/01/2034 | | | $ | 2,000 | | | $ | 2,107,680 | |
Alameda (City of), CA Corridor Transportation Authority, Series 2016 B, Ref. RB, (INS - AGM)(a) | | | 5.00 | % | | | 10/01/2035 | | | | 1,500 | | | | 1,754,385 | |
Anaheim (City of), CA Public Financing Authority, Series 2014 A, Ref. RB | | | 5.00 | % | | | 05/01/2039 | | | | 540 | | | | 597,056 | |
Bay Area Toll Authority (San Francisco Bay Area), Series 2017 S-7, Ref. RB | | | 4.00 | % | | | 04/01/2042 | | | | 3,000 | | | | 3,408,690 | |
California (State of), Series 2012, Ref. GO Bonds | | | 5.00 | % | | | 02/01/2038 | | | | 775 | | | | 822,880 | |
California (State of), Series 2013, GO Bonds | | | 5.00 | % | | | 04/01/2037 | | | | 1,160 | | | | 1,288,574 | |
California (State of), Series 2013, GO Bonds | | | 5.00 | % | | | 04/01/2043 | | | | 2,000 | | | | 2,217,880 | |
California (State of), Series 2013, GO Bonds | | | 5.00 | % | | | 11/01/2043 | | | | 1,965 | | | | 2,225,677 | |
California (State of), Series 2014, GO Bonds | | | 5.00 | % | | | 10/01/2044 | | | | 1,000 | | | | 1,162,110 | |
California (State of), Series 2015, GO Bonds | | | 5.00 | % | | | 03/01/2045 | | | | 1,000 | | | | 1,172,100 | |
California (State of), Series 2015, Ref. GO Bonds | | | 5.00 | % | | | 08/01/2035 | | | | 1,500 | | | | 1,808,085 | |
California (State of), Series 2016, GO Bonds | | | 5.00 | % | | | 09/01/2046 | | | | 2,000 | | | | 2,441,840 | |
California (State of), Series 2016, Ref. GO Bonds | | | 5.00 | % | | | 09/01/2036 | | | | 1,000 | | | | 1,235,940 | |
California (State of), Series 2020, GO Bonds | | | 4.00 | % | | | 03/01/2046 | | | | 660 | | | | 783,110 | |
California (State of), Series 2020, GO Bonds | | | 3.00 | % | | | 03/01/2050 | | | | 2,860 | | | | 3,063,889 | |
California (State of) (Green Bonds), Series 2014, GO Bonds | | | 5.00 | % | | | 10/01/2037 | | | | 1,500 | | | | 1,754,985 | |
California (State of) Department of Water Resources, Series 2016 AW, Ref. RB | | | 5.00 | % | | | 12/01/2033 | | | | 1,000 | | | | 1,257,100 | |
California (State of) Educational Facilities Authority (Pepperdine University), Series 2016, Ref. RB | | | 5.00 | % | | | 10/01/2046 | | | | 1,500 | | | | 1,794,270 | |
California (State of) Educational Facilities Authority (University of San Francisco), Series 2018 A, RB | | | 5.00 | % | | | 10/01/2053 | | | | 2,000 | | | | 2,371,600 | |
California (State of) Health Facilities Financing Authority (Cedars-Sinai Medical Center), Series 2016 B, Ref. RB | | | 5.00 | % | | | 08/15/2035 | | | | 500 | | | | 606,135 | |
California (State of) Health Facilities Financing Authority (Children’s Hospital Los Angeles), Series 2017 A, Ref. RB | | | 5.00 | % | | | 08/15/2042 | | | | 1,500 | | | | 1,708,395 | |
California (State of) Health Facilities Financing Authority (Kaiser Permanente), Series 2017 A-2, RB | | | 5.00 | % | | | 11/01/2047 | | | | 1,000 | | | | 1,561,680 | |
California (State of) Health Facilities Financing Authority (Lucile Salter Packard Children’s Hospital at Stanford), Series 2016 B, RB | | | 5.00 | % | | | 08/15/2055 | | | | 1,000 | | | | 1,157,240 | |
California (State of) Health Facilities Financing Authority (Providence St. Joseph Health), Series 2016 A, Ref. RB | | | 4.00 | % | | | 10/01/2036 | | | | 500 | | | | 562,545 | |
California (State of) Health Facilities Financing Authority (Stanford Health Care), Series 2020 A, Ref. RB | | | 4.00 | % | | | 08/15/2050 | | | | 22,000 | | | | 25,586,440 | |
California (State of) Health Facilities Financing Authority (Sutter Health), Series 2011 D, Ref. RB | | | 5.00 | % | | | 08/15/2035 | | | | 3,000 | | | | 3,108,390 | |
California (State of) Health Facilities Financing Authority (Sutter Health), Series 2015 A, Ref. RB | | | 5.00 | % | | | 08/15/2043 | | | | 1,000 | | | | 1,158,230 | |
California (State of) Health Facilities Financing Authority (Sutter Health), Series 2016 B, Ref. RB | | | 4.00 | % | | | 11/15/2041 | | | | 685 | | | | 760,994 | |
California (State of) Infrastructure & Economic Development Bank, Series 2016 A, RB | | | 4.00 | % | | | 10/01/2045 | | | | 1,000 | | | | 1,132,230 | |
California (State of) Infrastructure & Economic Development Bank (California State Teachers’ Retirement System Headquarters Expansion) (Green Bonds), Series 2019, RB | | | 5.00 | % | | | 08/01/2049 | | | | 1,250 | | | | 1,579,325 | |
California (State of) Municipal Finance Authority (Clinicas Del Camino Real, Inc.), Series 2020, RB | | | 4.00 | % | | | 03/01/2050 | | | | 3,085 | | | | 3,323,625 | |
California (State of) Municipal Finance Authority (Community Medical Centers), Series 2017 A, Ref. RB | | | 4.00 | % | | | 02/01/2042 | | | | 1,000 | | | | 1,088,350 | |
California (State of) Municipal Finance Authority (Eisenhower Medical Centers), Series 2017 A, Ref. RB | | | 5.00 | % | | | 07/01/2042 | | | | 1,000 | | | | 1,135,630 | |
California (State of) Municipal Finance Authority (NorthBay Healthcare Group), Series 2017 A, RB | | | 5.00 | % | | | 11/01/2047 | | | | 1,000 | | | | 1,088,180 | |
California (State of) Municipal Finance Authority (NorthBay Healthcare Group), Series 2017 A, RB | | | 5.25 | % | | | 11/01/2047 | | | | 500 | | | | 550,985 | |
California (State of) Municipal Finance Authority (Orange (County of) Civic Center Infrastructure | | | | | | | | | | | | | | | | |
Improvement Program - Phase I), Series 2017 A, RB | | | 5.00 | % | | | 06/01/2042 | | | | 1,000 | | | | 1,182,140 | |
California (State of) Municipal Finance Authority (Pomona College), Series 2017, Ref. RB | | | 5.00 | % | | | 01/01/2048 | | | | 1,000 | | | | 1,247,350 | |
California (State of) Municipal Finance Authority (UCR North District Phase 1 Student Housing), Series 2019, RB | | | 5.00 | % | | | 05/15/2049 | | | | 2,000 | | | | 2,305,400 | |
California (State of) Public Works Board, Series 2016 C, Ref. RB | | | 5.00 | % | | | 11/01/2034 | | | | 670 | | | | 828,515 | |
California (State of) Statewide Communities Development Authority (Cottage Health System Obligated Group), Series 2015, Ref. RB(b)(c) | | | 5.00 | % | | | 11/01/2024 | | | | 1,000 | | | | 1,192,960 | |
California (State of) Statewide Communities Development Authority (John Muir Health), Series 2016 A, Ref. RB | | | 4.00 | % | | | 08/15/2046 | | | | 1,650 | | | | 1,813,102 | |
See accompanying Notes to Financial Statements which are an integral part of the financial statements.
Invesco California AMT-Free Municipal Bond ETF (PWZ)—(continued)
August 31, 2020
| | | | | | | | | | | | | | | | |
| | | Interest
Rate | | Maturity
Date | | | Principal
Amount
(000) | | | Value | |
California-(continued) | | | | | | | | | | | | | | | | |
California (State of) Statewide Communities Development Authority (John Muir Health), Series 2016 A, Ref. RB | | | 5.00 | % | | | 08/15/2051 | | | $ | 1,000 | | | $ | 1,155,420 | |
California (State of) Statewide Communities Development Authority (John Muir Health), Series 2018 A, Ref. RB | | | 5.00 | % | | | 12/01/2057 | | | | 850 | | | | 1,006,086 | |
California (State of) Statewide Communities Development Authority (Kaiser Permanente), Series 2012 A, RB | | | 5.00 | % | | | 04/01/2042 | | | | 1,000 | | | | 1,053,230 | |
California (State of) Statewide Communities Development Authority (Marin General Hospital), | | | | | | | | | | | | | | | | |
Series 2018, RB | | | 4.00 | % | | | 08/01/2045 | | | | 1,000 | | | | 1,045,090 | |
California (State of) Statewide Communities Development Authority (Trinity Health Credit Group), | | | | | | | | | | | | | | | | |
Series 2011, Ref. RB(b)(c) | | | 5.00 | % | | | 12/01/2021 | | | | 1,045 | | | | 1,108,264 | |
California (State of) Statewide Communities Development Authority (University of California - Irvine East Campus Apartments - CHF-Irvine, LLC), Series 2016, Ref. RB | | | 5.00 | % | | | 05/15/2040 | | | | 1,000 | | | | 1,098,570 | |
California (State of) Statewide Communities Development Authority (University of California - Irvine East Campus Apartments, Phase IV-A - CHF-Irvine, LLC), Series 2017 A, RB | | | 5.00 | % | | | 05/15/2047 | | | | 1,500 | | | | 1,654,995 | |
California Infrastructure & Economic Development Bank (Academy Motion Picture Arts & Sciences Obligated Group), Series 2015 A, Ref. RB | | | 5.00 | % | | | 11/01/2041 | | | | 1,000 | | | | 1,112,360 | |
California State University, Series 2012 A, RB | | | 5.00 | % | | | 11/01/2037 | | | | 2,940 | | | | 3,219,182 | |
California State University, Series 2016 A, Ref. RB | | | 5.00 | % | | | 11/01/2045 | | | | 1,500 | | | | 1,822,140 | |
California State University, Series 2017 A, Ref. RB | | | 5.00 | % | | | 11/01/2037 | | | | 500 | | | | 619,350 | |
California State University, Series 2018 A, Ref. RB | | | 5.00 | % | | | 11/01/2048 | | | | 3,000 | | | | 3,784,590 | |
Centinela Valley Union High School District (Election of 2010), Series 2012 B, GO Bonds(d) | | | 5.00 | % | | | 08/01/2050 | | | | 800 | | | | 871,056 | |
Chabot-Las Positas Community College District (Election of 2016), Series 2017 A, GO Bonds | | | 4.00 | % | | | 08/01/2047 | | | | 4,750 | | | | 5,443,500 | |
Chaffey Joint Union High School District (Election of 2012), Series 2015 B, GO Bonds | | | 5.00 | % | | | 08/01/2044 | | | | 2,000 | | | | 2,326,020 | |
Chino Valley Unified School District, Series 2020 B, GO Bonds | | | 5.00 | % | | | 08/01/2055 | | | | 5,000 | | | | 6,436,550 | |
Chula Vista (City of), CA (San Diego Gas & Electric Co.), Series 2004 A, RB | | | 5.88 | % | | | 02/15/2034 | | | | 2,500 | | | | 2,509,325 | |
Coachella Valley Unified School District (2005 Election), Series 2016 E, GO Bonds, (INS - AGM)(a) | | | 4.00 | % | | | 08/01/2045 | | | | 1,500 | | | | 1,680,015 | |
East Bay Municipal Utility District Water System Revenue, Series 2015 A, Ref. RB | | | 5.00 | % | | | 06/01/2037 | | | | 1,500 | | | | 1,790,310 | |
East Bay Municipal Utility District Water System Revenue, Series 2017 A, RB | | | 5.00 | % | | | 06/01/2042 | | | | 1,500 | | | | 1,863,825 | |
East Bay Municipal Utility District Water System Revenue, Series 2017 A, RB | | | 5.00 | % | | | 06/01/2045 | | | | 2,000 | | | | 2,472,860 | |
East Whittier City School District, Series 2020 C, GO Bonds | | | 4.00 | % | | | 08/01/2047 | | | | 2,775 | | | | 3,150,652 | |
Foothill-Eastern Transportation Corridor Agency, Subseries 2014 B-1, Ref. RB | | | 3.95 | % | | | 01/15/2053 | | | | 2,000 | | | | 2,170,900 | |
Fremont Union High School District, Series 2019 A, GO Bonds | | | 4.00 | % | | | 08/01/2046 | | | | 3,000 | | | | 3,444,600 | |
Inland Valley Development Agency, Series 2014 A, Ref. RB, (INS - AGM)(a) | | | 5.00 | % | | | 09/01/2044 | | | | 1,000 | | | | 1,110,490 | |
Irvine Unified School District (Community Facilities District No. 01-1), Series 2015, Ref. RB, (INS - BAM)(a) | | | 5.00 | % | | | 09/01/2038 | | | | 2,600 | | | | 2,985,892 | |
Jurupa Unified School District, Series 2017 B, GO Bonds | | | 4.00 | % | | | 08/01/2041 | | | | 2,000 | | | | 2,294,160 | |
Lodi Unified School District, Series 2020, GO Bonds | | | 3.00 | % | | | 08/01/2043 | | | | 5,000 | | | | 5,190,800 | |
Long Beach (City of), CA, Series 2015, RB | | | 5.00 | % | | | 05/15/2045 | | | | 500 | | | | 539,340 | |
Long Beach (City of), CA, Series 2017 C, Ref. RB | | | 5.00 | % | | | 05/15/2047 | | | | 1,500 | | | | 1,779,225 | |
Long Beach (City of), CA (Alamitos Bay Marina), Series 2015, RB | | | 5.00 | % | | | 05/15/2040 | | | | 500 | | | | 543,480 | |
Long Beach Community College District, Series 2019 C, GO Bonds | | | 4.00 | % | | | 08/01/2049 | | | | 1,500 | | | | 1,744,890 | |
Los Angeles (City of), CA (Green Bonds), Series 2017 A, RB | | | 5.25 | % | | | 06/01/2047 | | | | 1,000 | | | | 1,241,430 | |
Los Angeles (City of), CA Department of Airports, Series 2015 C, Ref. RB | | | 5.00 | % | | | 05/15/2038 | | | | 2,000 | | | | 2,311,740 | |
Los Angeles (City of), CA Department of Airports, Series 2017 B, RB | | | 5.00 | % | | | 05/15/2042 | | | | 3,500 | | | | 4,196,850 | |
Los Angeles (City of), CA Department of Airports (Los Angeles International Airport), Series 2020 A, Ref. RB | | | 5.00 | % | | | 05/15/2040 | | | | 3,000 | | | | 3,807,090 | |
Los Angeles (City of), CA Department of Water, Series 2011 A, RB | | | 5.00 | % | | | 07/01/2041 | | | | 1,250 | | | | 1,268,125 | |
Los Angeles (City of), CA Department of Water, Series 2016 A, Ref. RB | | | 5.00 | % | | | 07/01/2046 | | | | 1,000 | | | | 1,199,830 | |
Los Angeles (City of), CA Department of Water, Series 2018 A, RB | | | 5.00 | % | | | 07/01/2048 | | | | 2,000 | | | | 2,482,880 | |
Los Angeles (City of), CA Department of Water, Series 2018 B, Ref. RB | | | 5.00 | % | | | 07/01/2048 | | | | 5,000 | | | | 6,284,800 | |
Los Angeles (City of), CA Department of Water & Power, Series 2012 B, RB | | | 5.00 | % | | | 07/01/2043 | | | | 2,000 | | | | 2,157,280 | |
Los Angeles (City of), CA Department of Water & Power, Series 2012 B, RB | | | 5.00 | % | | | 07/01/2043 | | | | 4,445 | | | | 4,790,288 | |
Los Angeles (City of), CA Department of Water & Power, Series 2014 D, RB | | | 5.00 | % | | | 07/01/2039 | | | | 1,000 | | | | 1,156,920 | |
Los Angeles (City of), CA Department of Water & Power, Series 2015 E, RB | | | 5.00 | % | | | 07/01/2044 | | | | 1,000 | | | | 1,150,380 | |
Los Angeles (City of), CA Department of Water & Power, Series 2016 A, Ref. RB | | | 5.00 | % | | | 07/01/2046 | | | | 2,500 | | | | 2,992,400 | |
Los Angeles (City of), CA Department of Water & Power, Series 2016 B, RB | | | 5.00 | % | | | 07/01/2042 | | | | 1,500 | | | | 1,804,050 | |
Los Angeles (City of), CA Department of Water & Power, Series 2017 A, RB | | | 5.00 | % | | | 07/01/2042 | | | | 1,500 | | | | 1,830,720 | |
Los Angeles (City of), CA Department of Water & Power, Series 2019 D, Ref. RB | | | 5.00 | % | | | 07/01/2049 | | | | 5,235 | | | | 6,671,798 | |
See accompanying Notes to Financial Statements which are an integral part of the financial statements.
Invesco California AMT-Free Municipal Bond ETF (PWZ)—(continued)
August 31, 2020
| | | | | | | | | | | | | | | | |
| | | Interest
Rate | | Maturity
Date | | | Principal
Amount
(000) | | | Value | |
California-(continued) | | | | | | | | | | | | | | | | |
Los Angeles (City of), CA Department of Water & Power, Series 2020 B, Ref. RB | | | 5.00 | % | | | 07/01/2039 | | | $ | 2,250 | | | $ | 2,983,972 | |
Los Angeles (County of), CA Metropolitan Transportation Authority, Series 2017 A, RB | | | 5.00 | % | | | 07/01/2042 | | | | 6,500 | | | | 8,079,565 | |
Los Angeles (County of), CA Metropolitan Transportation Authority (Green Bonds), Series 2017 A, RB. | | | 5.00 | % | | | 07/01/2041 | | | | 1,000 | | | | 1,245,540 | |
Los Angeles (County of), CA Metropolitan Transportation Authority (Green Bonds), Series 2019 A, RB. | | | 5.00 | % | | | 07/01/2044 | | | | 2,000 | | | | 2,541,480 | |
Los Angeles (County of), CA Public Works Financing Authority, Series 2015 A, RB | | | 5.00 | % | | | 12/01/2044 | | | | 2,000 | | | | 2,308,880 | |
Los Angeles (County of), CA Public Works Financing Authority, Series 2016 D, RB | | | 5.00 | % | | | 12/01/2045 | | | | 1,050 | | | | 1,230,432 | |
Los Angeles (County of), CA Public Works Financing Authority, Series 2019 E-1, RB | | | 5.00 | % | | | 12/01/2049 | | | | 10,645 | | | | 13,438,142 | |
Los Angeles (County of), CA Public Works Financing Authority (Multiple Capital Project II), Series 2012, RB | | | 5.00 | % | | | 08/01/2037 | | | | 1,130 | | | | 1,215,665 | |
Los Angeles (County of), CA Public Works Financing Authority (Multiple Capital Project II), Series 2012, RB | | | 5.00 | % | | | 08/01/2042 | | | | 2,330 | | | | 2,498,342 | |
Los Angeles Community College District, Series 2016, Ref. GO Bonds | | | 5.00 | % | | | 08/01/2036 | | | | 1,000 | | | | 1,219,920 | |
Los Angeles Community College District, Series 2016, Ref. GO Bonds | | | 4.00 | % | | | 08/01/2037 | | | | 1,215 | | | | 1,395,598 | |
Los Angeles Community College District (Election of 2008), Series 2017 J, GO Bonds | | | 4.00 | % | | | 08/01/2041 | | | | 250 | | | | 289,418 | |
Los Angeles Community College District (Election of 2008), Series 2019 K, GO Bonds | | | 3.00 | % | | | 08/01/2039 | | | | 3,800 | | | | 4,031,876 | |
Los Angeles County Facilities, Inc. (Vermont Corridor County Administration Building), Series 2018 A, RB | | | 5.00 | % | | | 12/01/2043 | | | | 5,000 | | | | 6,196,100 | |
Los Angeles Unified School District (Election of 2008), Series 2018 B-1, GO Bonds | | | 5.00 | % | | | 07/01/2038 | | | | 1,000 | | | | 1,259,320 | |
Madera Unified School District, Series 2017, GO Bonds | | | 4.00 | % | | | 08/01/2046 | | | | 3,000 | | | | 3,413,130 | |
Marin (County of), CA Healthcare District (Election of 2013), Series 2017 A, GO Bonds | | | 5.00 | % | | | 08/01/2041 | | | | 5,000 | | | | 6,078,050 | |
Metropolitan Water District of Southern California, Series 2020 A, RB | | | 5.00 | % | | | 10/01/2045 | | | | 7,000 | | | | 9,119,880 | |
Morgan Hill Unified School District (Election of 2012), Series 2017 B, GO Bonds | | | 4.00 | % | | | 08/01/2047 | | | | 3,000 | | | | 3,410,760 | |
Mountain View Shoreline Regional Park Community, Series 2018 A, RB, (INS - AGM)(a) | | | 5.00 | % | | | 08/01/2048 | | | | 5,000 | | | | 6,179,650 | |
Orange (County of), CA Local Transportation Authority, Series 2019, RB | | | 5.00 | % | | | 02/15/2041 | | | | 3,000 | | | | 3,840,690 | |
Orange (County of), CA Water District, Series 2017 A, Ref. RB | | | 4.00 | % | | | 08/15/2041 | | | | 2,000 | | | | 2,321,760 | |
Regents of the University of California, Series 2013 AI, RB | | | 5.00 | % | | | 05/15/2038 | | | | 1,500 | | | | 1,675,185 | |
Rio Elementary School District, Series 2020 C, GO Bonds, (INS - BAM)(a) | | | 5.00 | % | | | 08/01/2047 | | | | 1,340 | | | | 1,660,662 | |
Sacramento (City of), CA (Convention Center Complex), Series 2018 A, RB | | | 5.00 | % | | | 06/01/2043 | | | | 4,500 | | | | 5,014,935 | |
Sacramento (City of), CA (Convention Center Complex), Series 2018 A, RB | | | 5.00 | % | | | 06/01/2048 | | | | 6,000 | | | | 6,654,120 | |
Sacramento (County of), CA Sanitation Districts Financing Authority, Series 2014 A, Ref. RB | | | 5.00 | % | | | 12/01/2044 | | | | 1,525 | | | | 1,754,451 | |
San Bernardino Community College District, Series 2019 A, GO Bonds | | | 4.00 | % | | | 08/01/2049 | | | | 3,500 | | | | 4,005,995 | |
San Diego (City of), CA Association of Governments, Series 2017 A, RB | | | 5.00 | % | | | 07/01/2042 | | | | 1,000 | | | | 1,156,480 | |
San Diego (City of), CA Public Facilities Financing Authority (Capital Improvement), Series 2015 A, RB . | | | 5.00 | % | | | 10/15/2044 | | | | 1,000 | | | | 1,182,710 | |
San Diego (City of), CA Public Facilities Financing Authority (Master), Series 2010 A,
Ref. RB(b)(c) | | | 5.25 | % | | | 09/01/2020 | | | | 700 | | | | 700,000 | |
San Diego (County of), CA Regional Airport Authority, Series 2019 A, Ref. RB | | | 5.00 | % | | | 07/01/2044 | | | | 1,500 | | | | 1,850,895 | |
San Diego (County of), CA Regional Airport Authority, Series 2019 A, Ref. RB | | | 5.00 | % | | | 07/01/2049 | | | | 3,000 | | | | 3,684,960 | |
San Diego (County of), CA Regional Transportation Commission, Series 2016 A, RB | | | 5.00 | % | | | 04/01/2048 | | | | 4,000 | | | | 4,806,160 | |
San Diego (County of), CA Water Authority, Series 2016 B, Ref. RB | | | 5.00 | % | | | 05/01/2037 | | | | 1,000 | | | | 1,210,480 | |
San Diego Unified School District, Series 2020 D-2, GO Bonds | | | 5.00 | % | | | 07/01/2022 | | | | 15,000 | | | | 16,326,450 | |
San Diego Unified School District (Election of 2012), Series 2013 C, GO Bonds | | | 5.00 | % | | | 07/01/2035 | | | | 1,000 | | | | 1,124,850 | |
San Diego Unified School District (Election of 2012), Series 2016 F, GO Bonds | | | 5.00 | % | | | 07/01/2040 | | | | 1,000 | | | | 1,196,000 | |
San Diego Unified School District (Election of 2012), Series 2017 I, GO Bonds | | | 5.00 | % | | | 07/01/2041 | | | | 13,535 | | | | 16,778,257 | |
San Diego Unified School District (Election of 2012), Series 2017 I, GO Bonds | | | 5.00 | % | | | 07/01/2047 | | | | 3,000 | | | | 3,686,250 | |
San Francisco (City & County of), CA Airport Commission (San Francisco International Airport), Series 2014 B, RB | | | 5.00 | % | | | 05/01/2044 | | | | 2,000 | | | | 2,255,920 | |
San Francisco (City & County of), CA Airport Commission (San Francisco International Airport), Series 2016, RB | | | 5.00 | % | | | 05/01/2046 | | | | 4,465 | | | | 5,198,912 | |
San Francisco (City & County of), CA Airport Commission (San Francisco International Airport), Series 2017 B, RB | | | 5.00 | % | | | 05/01/2047 | | | | 2,000 | | | | 2,360,780 | |
San Francisco (City & County of), CA Airport Commission (San Francisco International Airport), Series 2018, RB | | | 5.00 | % | | | 05/01/2048 | | | | 7,000 | | | | 8,404,340 | |
San Francisco (City & County of), CA Airport Commission (San Francisco International Airport), Series 2019, RB | | | 5.00 | % | | | 05/01/2049 | | | | 3,000 | | | | 3,668,790 | |
San Francisco Bay Area Rapid Transit District (Green Bonds), Series 2019 F1, GO Bonds | | | 3.00 | % | | | 08/01/2038 | | | | 3,500 | | | | 3,864,000 | |
San Jose (City of), CA Financing Authority (Civic Center), Series 2013 A, Ref. RB | | | 5.00 | % | | | 06/01/2039 | | | | 3,000 | | | | 3,284,250 | |
San Mateo & Foster (Cities of), CA Public Financing Authority (Clean Water Program), Series 2019, RB | | | 5.00 | % | | | 08/01/2049 | | | | 11,000 | | | | 13,949,870 | |
San Mateo Foster (City of), CA Public Financing Authority (Clean Water Program), Series 2019, RB | | | 4.00 | % | | | 08/01/2044 | | | | 5,000 | | | | 5,962,050 | |
See accompanying Notes to Financial Statements which are an integral part of the financial statements.
Invesco California AMT-Free Municipal Bond ETF (PWZ)—(continued)
August 31, 2020
| | | | | | | | | | | | | | | | |
| | | Interest
Rate | | | Maturity
Date | | | Principal
Amount
(000) | | | Value | |
California-(continued) | | | | | | | | | | | | | | | | |
San Rafael City High School District (Election of 2015), Series 2018 B, GO Bonds | | | 4.00% | | | | 08/01/2047 | | | $ | 5,000 | | | $ | 5,776,500 | |
Santa Clara (County of), CA Financing Authority, Series 2019 A, RB | | | 3.00% | | | | 05/01/2041 | | | | 2,000 | | | | 2,085,000 | |
Santa Clara Valley Water District, Series 2016 A, Ref. RB | | | 5.00% | | | | 06/01/2046 | | | | 4,090 | | | | 4,844,646 | |
Santa Cruz (County of), CA Redevelopment Agency, Series 2015 A, Ref. RB, (INS - AGM)(a) | | | 5.00% | | | | 09/01/2035 | | | | 2,500 | | | | 2,935,950 | |
Simi Valley Unified School District (Election of 2016), Series 2017 A, GO Bonds | | | 4.00% | | | | 08/01/2046 | | | | 1,000 | | | | 1,139,800 | |
Sonoma Valley Unified School District, Series 2020, GO Bonds | | | 4.00% | | | | 08/01/2047 | | | | 1,300 | | | | 1,510,197 | |
Transbay Joint Powers Authority (Green Bonds), Series 2020 A, RB | | | 5.00% | | | | 10/01/2049 | | | | 2,200 | | | | 2,724,832 | |
Tulare (County of), CA Local Health Care District, Series 2020, Ref. GO Bonds, (INS - BAM)(a) | | | 4.00% | | | | 08/01/2039 | | | | 2,000 | | | | 2,322,160 | |
University of California, Series 2012 G, RB(b)(c) | | | 5.00% | | | | 05/15/2022 | | | | 745 | | | | 805,889 | |
University of California, Series 2012 G, RB | | | 5.00% | | | | 05/15/2037 | | | | 755 | | | | 811,474 | |
University of California, Series 2017 AV, RB | | | 5.25% | | | | 05/15/2042 | | | | 2,000 | | | | 2,486,660 | |
University of California, Series 2018 AZ, Ref. RB | | | 5.00% | | | | 05/15/2048 | | | | 1,500 | | | | 1,867,320 | |
University of California, Series 2018 O, Ref. RB | | | 5.00% | | | | 05/15/2058 | | | | 1,500 | | | | 1,844,955 | |
| | | | | | | | | | | | | | | | |
| | | | | | | | | | | | | | | 441,190,745 | |
| | | | | | | | | | | | | | | | |
Puerto Rico-0.35% | | | | | | | | | | | | | | | | |
Puerto Rico (Commonwealth of), Series 2007 A-4, Ref. GO Bonds, (INS - AGM)(a) | | | 5.00% | | | | 07/01/2031 | | | | 1,100 | | | | 1,106,182 | |
Puerto Rico (Commonwealth of) Aqueduct & Sewer Authority, Series 2008 A, RB,
(INS - AGC)(a) | | | 5.13% | | | | 07/01/2047 | | | | 500 | | | | 500,125 | |
| | | | | | | | | | | | | | | | |
| | | | | | | | | | | | | | | 1,606,307 | |
| | | | | | | | | | | | | | | | |
TOTAL INVESTMENTS IN SECURITIES(e) -97.98%
(Cost $413,488,723) | | | | | | | | | | | | | | | 442,797,052 | |
OTHER ASSETS LESS LIABILITIES-2.02% | | | | | | | | | | | | | | | 9,120,503 | |
| | | | | | | | | | | | | | | | |
NET ASSETS-100.00% | | | | | | | | | | | | | | $ | 451,917,555 | |
| | | | | | | | | | | | | | | | |
Investment Abbreviations:
| | |
AGC | | -Assured Guaranty Corp. |
AGM | | -Assured Guaranty Municipal Corp. |
BAM | | -Build America Mutual Assurance Co. |
GO | | -General Obligation |
INS | | -Insurer |
RB | | -Revenue Bonds |
Ref. | | -Refunding |
Notes to Schedule of Investments:
| (a) | Principal and/or interest payments are secured by the bond insurance company listed. |
| (b) | Advance refunded; secured by an escrow fund of U.S. Government obligations or other highly rated collateral. |
| (c) | Security has an irrevocable call by the issuer or mandatory put by the holder. Maturity date reflects such call or put. |
| (d) | Security subject to crossover refunding. |
| (e) | Entities may either issue, guarantee, back or otherwise enhance the credit quality of a security. The entities are not primarily responsible for the borrower’s obligations but may be called upon to satisfy the borrower’s obligations. No concentration of any single entity was greater than 5% each. |
See accompanying Notes to Financial Statements which are an integral part of the financial statements.
Invesco CEF Income Composite ETF (PCEF)
August 31, 2020
Schedule of Investments
| | | | | | | | |
| | | Shares | | | Value | |
Closed-End Funds-100.06% | |
Bonds-38.16% | | | | | | | | |
Aberdeen Asia-Pacific Income Fund, Inc.(a) | | | 4,115,414 | | | $ | 16,996,660 | |
BlackRock Core Bond Trust | | | 517,595 | | | | 8,136,593 | |
BlackRock Credit Allocation Income Trust(a) | | | 938,093 | | | | 13,095,778 | |
BlackRock Income Trust, Inc.(a) | | | 606,060 | | | | 3,751,511 | |
BlackRock Limited Duration Income Trust(a) | | | 507,073 | | | | 7,575,671 | |
BlackRock Multi-Sector Income Trust(a) | | | 519,973 | | | | 8,345,567 | |
BlackRock Taxable Municipal Bond Trust(a) | | | 404,842 | | | | 10,687,829 | |
Cohen & Steers Limited Duration Preferred and Income Fund, Inc.(a) | | | 210,014 | | | | 5,004,634 | |
Cohen & Steers Select Preferred and Income Fund, Inc. | | | 83,900 | | | | 2,293,826 | |
DoubleLine Income Solutions Fund | | | 748,574 | | | | 12,014,613 | |
DoubleLine Opportunistic Credit Fund(a) | | | 106,975 | | | | 2,086,012 | |
Duff & Phelps Utility and Corporate Bond Trust, Inc.(a) | | | 269,011 | | | | 2,488,352 | |
Eaton Vance Limited Duration Income Fund(a) | | | 1,682,446 | | | | 19,751,916 | |
Eaton Vance Short Duration Diversified Income Fund | | | 256,981 | | | | 2,945,002 | |
Eaton Vance Tax-Managed Buy-Write Strategy Fund | | | 94,985 | | | | 908,057 | |
First Trust Aberdeen Global Opportunity Income Fund(a) | | | 178,199 | | | | 1,815,848 | |
First Trust Intermediate Duration Preferred & Income Fund(a) | | | 518,056 | | | | 11,485,301 | |
Flaherty & Crumrine Dynamic Preferred and Income Fund, Inc.(a) | | | 132,298 | | | | 3,507,220 | |
Flaherty & Crumrine Preferred & Income Securities Fund, Inc.(a) | | | 298,110 | | | | 6,579,288 | |
Flaherty & Crumrine Total Return Fund, Inc. | | | 71,498 | | | | 1,577,961 | |
Franklin Ltd. Duration Income Trust(a) | | | 369,719 | | | | 3,227,647 | |
Franklin Universal Trust(a) | | | 397,662 | | | | 2,783,634 | |
Guggenheim Taxable Municipal Managed Duration Trust(a) | | | 133,607 | | | | 3,205,232 | |
Invesco Bond Fund(a)(b) | | | 109,525 | | | | 2,212,405 | |
John Hancock Preferred Income Fund(a) | | | 171,897 | | | | 3,460,287 | |
John Hancock Preferred Income Fund II | | | 149,922 | | | | 2,754,067 | |
John Hancock Preferred Income Fund III(a) | | | 223,288 | | | | 3,684,252 | |
John Hancock Premium Dividend Fund | | | 324,629 | | | | 4,291,595 | |
MFS Charter Income Trust(a) | | | 441,332 | | | | 3,760,149 | |
MFS Government Markets Income Trust(a) | | | 278,584 | | | | 1,298,201 | |
MFS Intermediate Income Trust(a) | | | 1,140,490 | | | | 4,368,077 | |
MFS Multimarket Income Trust(a) | | | 784,123 | | | | 4,587,119 | |
Nuveen Credit Strategies Income Fund | | | 1,953,692 | | | | 11,917,521 | |
Nuveen Global High Income Fund(a) | | | 364,779 | | | | 5,143,384 | |
Nuveen Preferred & Income Opportunities Fund | | | 866,010 | | | | 7,612,228 | |
Nuveen Preferred & Income Securities Fund(a) | | | 1,918,878 | | | | 17,538,545 | |
Nuveen Preferred & Income Term Fund | | | 185,530 | | | | 4,207,820 | |
Nuveen Taxable Municipal Income Fund(a) | | | 199,015 | | | | 4,517,640 | |
PIMCO Income Opportunity Fund | | | 125,705 | | | | 2,930,183 | |
PIMCO Income Strategy Fund | | | 208,179 | | | | 2,102,608 | |
PIMCO Income Strategy Fund II(a) | | | 483,640 | | | | 4,391,451 | |
Pioneer Floating Rate Trust(a) | | | 340,897 | | | | 3,330,564 | |
Putnam Master Intermediate Income Trust | | | 381,922 | | | | 1,584,976 | |
Putnam Premier Income Trust(a) | | | 729,650 | | | | 3,341,797 | |
RiverNorth/DoubleLine Strategic Opportunity Fund, Inc.(a) | | | 132,545 | | | | 1,882,139 | |
| | | | | | | | |
| | | Shares | | | Value | |
Bonds-(continued) | |
TCW Strategic Income Fund, Inc.(a) | | | 352,174 | | | $ | 2,049,653 | |
Templeton Global Income Fund(a) | | | 2,170,673 | | | | 11,569,687 | |
Virtus Global Multi-Sector Income
Fund(a) | | | 140,767 | | | | 1,628,674 | |
Western Asset Global Corporate Defined Opportunity Fund, Inc.(a) | | | 150,635 | | | | 2,612,011 | |
Western Asset Inflation-Linked Opportunities & Income Fund | | | 957,601 | | | | 11,069,868 | |
Western Asset Inflation-Linked Securities & Income Fund(a) | | | 407,237 | | | | 5,204,489 | |
Western Asset Investment Grade Defined Opportunity Trust, Inc. | | | 76,692 | | | | 1,670,352 | |
Western Asset Premier Bond Fund(a) | | | 112,957 | | | | 1,511,365 | |
| | | | | | | | |
| �� | | | | | | 288,497,259 | |
| | | | | | | | |
Bonds/High Yield-27.18% | |
AllianceBernstein Global High Income Fund, Inc. | | | 1,239,724 | | | | 13,475,800 | |
AllianzGI Convertible & Income 2024 Target | | | 179,632 | | | | 1,647,226 | |
Barings Global Short Duration High Yield Fund(a) | | | 284,572 | | | | 3,801,882 | |
BlackRock Corporate High Yield Fund, Inc. | | | 1,499,828 | | | | 16,663,089 | |
BlackRock Debt Strategies Fund, Inc.(a) | | | 673,089 | | | | 6,730,890 | |
BlackRock Floating Rate Income Strategies Fund, Inc. | | | 570,332 | | | | 6,684,291 | |
BlackRock Floating Rate Income Trust | | | 355,649 | | | | 4,065,068 | |
BNY Mellon High Yield Strategies
Fund(a) | | | 1,060,948 | | | | 2,906,998 | |
Credit Suisse Asset Management Income Fund, Inc.(a) | | | 757,992 | | | | 2,152,697 | |
Credit Suisse High Yield Bond Fund(a) | | | 1,453,882 | | | | 3,053,152 | |
Eaton Vance Floating-Rate Income Trust(a) | | | 627,765 | | | | 7,558,291 | |
Eaton Vance Senior Floating-Rate
Trust(a) | | | 578,302 | | | | 6,870,228 | |
First Eagle Senior Loan Fund | | | 119,738 | | | | 1,477,567 | |
First Trust High Income Long/Short Fund(a) | | | 484,530 | | | | 6,822,182 | |
First Trust Senior Floating Rate 2022 Target Term Fund | | | 443,369 | | | | 3,786,371 | |
First Trust Senior Floating Rate Income Fund II(a) | | | 406,040 | | | | 4,551,708 | |
Guggenheim Credit Allocation Fund(a) | | | 62,112 | | | | 1,127,333 | |
Insight Select Income Fund | | | 108,488 | | | | 2,235,395 | |
Invesco High Income 2023 Target Term Fund(b) | | | 166,269 | | | | 1,301,886 | |
Invesco High Income Trust II(b) | | | 121,323 | | | | 1,540,802 | |
Ivy High Income Opportunities Fund | | | 238,534 | | | | 2,860,023 | |
Morgan Stanley Emerging Markets Debt Fund, Inc. | | | 325,110 | | | | 2,828,457 | |
New America High Income Fund, Inc. (The) | | | 340,673 | | | | 2,841,213 | |
Nuveen Mortgage and Income Fund(a) | | | 67,318 | | | | 1,312,028 | |
Nuveen NASDAQ 100 Dynamic Overwrite Fund(a) | | | 297,957 | | | | 7,857,126 | |
PGIM Global High Yield Fund, Inc. | | | 652,495 | | | | 8,776,058 | |
PGIM High Yield Bond Fund, Inc.(a) | | | 480,997 | | | | 6,762,818 | |
PIMCO High Income Fund(a) | | | 891,407 | | | | 4,884,910 | |
Pioneer High Income Trust(a) | | | 412,523 | | | | 3,357,937 | |
Stone Harbor Emerging Markets Total Income Fund(a) | | | 71,022 | | | | 564,625 | |
Templeton Emerging Markets Income Fund(a) | | | 750,295 | | | | 5,709,745 | |
Voya Prime Rate Trust | | | 2,125,875 | | | | 9,375,109 | |
Wells Fargo Income Opportunities
Fund(a) | | | 874,436 | | | | 6,567,014 | |
See accompanying Notes to Financial Statements which are an integral part of the financial statements.
Invesco CEF Income Composite ETF (PCEF)—(continued)
August 31, 2020
| | | | | | | | |
| | | Shares | | | Value | |
Bonds/High Yield-(continued) | |
Wells Fargo Multi-Sector Income Fund | | | 398,339 | | | $ | 4,497,247 | |
Western Asset Emerging Markets Debt Fund, Inc.(a) | | | 963,582 | | | | 12,507,294 | |
Western Asset Global High Income Fund, Inc. | | | 544,821 | | | | 5,355,591 | |
Western Asset High Income Fund II, Inc | | | 1,198,602 | | | | 7,934,745 | |
Western Asset High Income Opportunity Fund, Inc.(a) | | | 1,777,253 | | | | 8,957,355 | |
Western Asset High Yield Defined Opportunity Fund, Inc. | | | 278,014 | | | | 4,100,707 | |
| | | | | | | | |
| | | | | | | 205,502,858 | |
| | | | | | | | |
Domestic Equity-3.02% | | | | | | | | |
Guggenheim Strategic Opportunities Fund(a) | | | 292,804 | | | | 5,305,608 | |
John Hancock Tax-Advantaged Dividend Income Fund | | | 435,362 | | | | 8,515,681 | |
NexPoint Strategic Opportunities Fund | | | 961,797 | | | | 9,040,892 | |
| | | | | | | | |
| | | | | | | 22,862,181 | |
| | | | | | | | |
Option Income-31.70% | | | | | | | | |
AllianzGI Dividend Interest & Premium Strategy Fund | | | 1,490,540 | | | | 18,691,371 | |
BlackRock Energy and Resources
Trust(a) | | | 384,524 | | | | 2,660,906 | |
BlackRock Enhanced Capital and Income Fund, Inc.(a) | | | 555,945 | | | | 8,895,120 | |
BlackRock Enhanced Equity Dividend Trust(a) | | | 2,623,108 | | | | 19,935,621 | |
BlackRock Enhanced Global Dividend Trust | | | 926,386 | | | | 9,078,583 | |
BlackRock Enhanced International Dividend Trust(a) | | | 1,488,206 | | | | 8,140,487 | |
BlackRock Health Sciences Trust(a) | | | 83,079 | | | | 3,605,629 | |
BlackRock Resources & Commodities Strategy Trust(a) | | | 1,460,748 | | | | 9,509,469 | |
BlackRock Science & Technology Trust(a) | | | 175,647 | | | | 7,819,804 | |
Brookfield Real Assets Income Fund, Inc. | | | 634,808 | | | | 10,747,299 | |
Columbia Seligman Premium Technology Growth Fund, Inc. | | | 104,140 | | | | 2,391,054 | |
Eaton Vance Enhanced Equity Income Fund | | | 381,521 | | | | 5,917,391 | |
Eaton Vance Enhanced Equity Income Fund II(a) | | | 353,784 | | | | 6,951,856 | |
Eaton Vance Risk-Managed Diversified Equity Income Fund(a) | | | 530,348 | | | | 5,446,674 | |
Eaton Vance Tax-Managed Buy-Write Income Fund | | | 180,022 | | | | 2,558,113 | |
Eaton Vance Tax-Managed Buy-Write Opportunities Fund(a) | | | 608,744 | | | | 8,978,974 | |
Eaton Vance Tax-Managed Diversified Equity Income Fund(a) | | | 1,502,139 | | | | 17,259,577 | |
| | | | | | | | |
| | | Shares | | | Value | |
Option Income-(continued) | |
Eaton Vance Tax-Managed Global Buy Write Opportunities Fund(a) | | | 1,318,969 | | | $ | 11,870,721 | |
Eaton Vance Tax-Managed Global Diversified Equity Income Fund(a) | | | 3,797,855 | | | | 29,699,226 | |
First Trust Enhanced Equity Income
Fund(a) | | | 200,701 | | | | 3,169,069 | |
GAMCO Natural Resources Gold & Income Trust | | | 305,696 | | | | 1,577,391 | |
Guggenheim Enhanced Equity Income Fund(a) | | | 497,507 | | | | 2,845,740 | |
John Hancock Hedged Equity & Income Fund(a) | | | 147,882 | | | | 1,675,503 | |
Madison Covered Call & Equity Strategy Fund | | | 302,772 | | | | 1,831,771 | |
Nuveen Dow 30sm Dynamic Overwrite Fund | | | 458,475 | | | | 6,487,421 | |
Nuveen S&P 500 Buy-Write Income Fund | | | 1,330,119 | | | | 15,815,115 | |
Nuveen S&P 500 Dynamic Overwrite
Fund(a) | | | 215,048 | | | | 3,047,230 | |
Voya Global Advantage and Premium Opportunity Fund | | | 286,865 | | | | 2,412,535 | |
Voya Global Equity Dividend and Premium Opportunity Fund(a) | | | 1,525,974 | | | | 7,736,688 | |
Voya Infrastructure Industrials and Materials Fund(a) | | | 306,282 | | | | 2,909,679 | |
| | | | | | | | |
| | | | | | | 239,666,017 | |
| | | | | | | | |
TOTAL INVESTMENTS IN SECURITIES (excluding investments purchased with cash collateral from securities on loan)-100.06%
(Cost $777,951,396) | | | | | | | 756,528,315 | |
| | | | | | | | |
|
| Investments Purchased with Cash Collateral from Securities on Loan | |
| | |
Money Market Funds-1.67% | | | | | | | | |
Invesco Private Government Fund,
0.03%(b)(c)(d) | | | 9,472,276 | | | | 9,472,276 | |
Invesco Private Prime Fund, 0.14%(b)(c)(d) | | | 3,157,862 | | | | 3,158,494 | |
| | | | | | | | |
Total Investments Purchased with Cash Collateral from Securities on Loan
(Cost $12,630,770) | | | | 12,630,770 | |
| | | | | | | | |
TOTAL INVESTMENTS IN SECURITIES-101.73%
(Cost $790,582,166) | | | | 769,159,085 | |
OTHER ASSETS LESS LIABILITIES-(1.73)% | | | | (13,052,639 | ) |
| | | | | | | | |
NET ASSETS-100.00% | | | | | | $ | 756,106,446 | |
| | | | | | | | |
See accompanying Notes to Financial Statements which are an integral part of the financial statements.
Invesco CEF Income Composite ETF (PCEF)—(continued)
August 31, 2020
Notes to Schedule of Investments:
| (a) | All or a portion of this security was out on loan at August 31, 2020. |
| (b) | Affiliated issuer. The issuer and/or the Fund is a wholly-owned subsidiary of Invesco Ltd., or is affiliated by having an investment adviser that is under common control of Invesco Ltd. The table below shows the Fund’s transactions in, and earnings from, its investments in affiliates for the fiscal year ended August 31, 2020. |
| | | | | | | | | | | | | | | | | | | | | | | | | | | | | | | | | | | |
| | | | | | | | | Change in | | | | | | |
| | | | | | | | | Unrealized | | Realized | | | | |
| | | Value | | Purchases | | Proceeds | | Appreciation | | Gain | | Value | | Dividend |
| | | August 31, 2019 | | at Cost | | from Sales | | (Depreciation) | | (Loss) | | August 31, 2020 | | Income |
| | | | | | | |
Invesco Bond Fund | | | $ | 2,070,561 | | | | $ | 528,037 | | | | $ | (408,087 | ) | | | $ | 14,325 | | | | $ | 7,569 | | | | $ | 2,212,405 | | | | $ | 108,431 | |
| | | | | | | |
Invesco High Income 2023 Target Term Fund | | | | 1,961,967 | | | | | 355,267 | | | | | (489,093 | ) | | | | (434,503 | ) | | | | (91,752 | ) | | | | 1,301,886 | | | | | 113,117 | |
| | | | | | | |
Invesco High Income Trust II | | | | - | | | | | 1,387,657 | | | | | (73,568 | ) | | | | 226,031 | | | | | 682 | | | | | 1,540,802 | | | | | 55,885 | |
| | | | | | | |
Invesco Senior Income Trust | | | | 9,522,696 | | | | | 2,029,914 | | | | | (9,327,078 | ) | | | | 451,104 | | | | | (2,676,636 | ) | | | | - | | | | | 405,751 | |
| | | | | | | |
Investments in Affiliated Money Market Funds: | | | | | | | | | | | | | | | | | | | | | | | | | | | | | | | | | | | |
| | | | | | | |
Invesco Premier U.S. Government Money Portfolio, Institutional Class | | | | - | | | | | 29,351,944 | | | | | (29,351,944 | ) | | | | - | | | | | - | | | | | - | | | | | 5,562 | |
| | | | | | | |
Investments Purchased with Cash Collateral from Securities on Loan: | | | | | | | | | | | | | | | | | | | | | | | | | | | | | | | | | | | |
| | | | | | | |
Invesco Government & Agency Portfolio, Institutional Class | | | | 8,437,185 | | | | | 150,913,805 | | | | | (159,350,990 | ) | | | | - | | | | | - | | | | | - | | | | | 124,807 | * |
| | | | | | | |
Invesco Liquid Assets Portfolio, Institutional Class | | | | 2,812,395 | | | | | 41,359,407 | | | | | (44,172,649 | ) | | | | - | | | | | 847 | | | | | - | | | | | 46,745 | * |
| | | | | | | |
Invesco Private Government Fund | | | | - | | | | | 79,978,505 | | | | | (70,506,229 | ) | | | | - | | | | | - | | | | | 9,472,276 | | | | | 1,737 | * |
| | | | | | | |
Invesco Private Prime Fund | | | | - | | | | | 13,095,216 | | | | | (9,937,246 | ) | | | | - | | | | | 524 | | | | | 3,158,494 | | | | | 1,008 | * |
| | | | | | | | | | | | | | | | | | | | | | | | | | | | | | | | | | | |
Total | | | $ | 24,804,804 | | | | $ | 318,999,752 | | | | $ | (323,616,884 | ) | | | $ | 256,957 | | | | $ | (2,758,766 | ) | | | $ | 17,685,863 | | | | $ | 863,043 | |
| | | | | | | | | | | | | | | | | | | | | | | | | | | | | | | | | | | |
| * | Represents the income earned on the investment of cash collateral, which is included in securities lending income on the Statements of Operations. Does not include rebates and fees paid to lending agent or premiums received from borrowers, if any. |
| (c) | The rate shown is the 7-day SEC standardized yield as of August 31, 2020. |
| (d) | The security has been segregated to satisfy the commitment to return the cash collateral received in securities lending transactions upon the borrower’s return of the securities loaned. See Note 2J. |
See accompanying Notes to Financial Statements which are an integral part of the financial statements.
Invesco Fundamental High Yield® Corporate Bond ETF (PHB)
August 31, 2020
Schedule of Investments(a)
| | | | | | | | |
| | | Principal
Amount | | | Value | |
U.S. Dollar Denominated Bonds & Notes-98.48% | |
Aerospace & Defense-2.13% | | | | | | | | |
Howmet Aerospace, Inc. | | | | | | | | |
5.13%, 10/01/2024 | | $ | 2,950,000 | | | $ | 3,165,909 | |
5.90%, 02/01/2027 | | | 2,731,000 | | | | 3,092,113 | |
Spirit AeroSystems, Inc., 4.60%, 06/15/2028 | | | 3,500,000 | | | | 2,756,250 | |
TransDigm, Inc. | | | | | | | | |
6.50%, 07/15/2024 | | | 3,487,075 | | | | 3,513,019 | |
5.50%, 11/15/2027 | | | 3,700,000 | | | | 3,618,970 | |
| | | | | | | | |
| | | | | | | 16,146,261 | |
| | | | | | | | |
Airlines-3.19% | | | | | | | | |
Delta Air Lines, Inc. | | | | | | | | |
3.63%, 03/15/2022 | | | 5,916,000 | | | | 5,883,562 | |
4.38%, 04/19/2028 | | | 6,933,000 | | | | 6,495,939 | |
United Airlines Holdings, Inc.,
4.25%, 10/01/2022(b) | | | 12,706,100 | | | | 11,773,028 | |
| | | | | | | | |
| | | | | | | 24,152,529 | |
| | | | | | | | |
Auto Components-2.11% | | | | | | | | |
American Axle & Manufacturing, Inc. | | | | | | | | |
6.25%, 04/01/2025(b) | | | 2,474,000 | | | | 2,556,768 | |
6.88%, 07/01/2028 | | | 2,485,000 | | | | 2,592,799 | |
Dana, Inc. | | | | | | | | |
5.50%, 12/15/2024 | | | 1,938,000 | | | | 1,983,824 | |
5.63%, 06/15/2028 | | | 1,981,000 | | | | 2,088,242 | |
Goodyear Tire & Rubber Co. (The) | | | | | | | | |
5.13%, 11/15/2023 | | | 3,276,000 | | | | 3,290,365 | |
5.00%, 05/31/2026(b) | | | 3,474,000 | | | | 3,491,370 | |
| | | | | | | | |
| | | | | | | 16,003,368 | |
| | | | | | | | |
Automobiles-3.14% | | | | | | | | |
Ford Motor Co., 4.35%, 12/08/2026 | | | 12,536,000 | | | | 12,585,392 | |
Ford Motor Credit Co. LLC, 5.58%, 03/18/2024 | | | 10,515,000 | | | | 11,224,762 | |
| | | | | | | | |
| | | | | | | 23,810,154 | |
| | | | | | | | |
Banks-0.69% | | | | | | | | |
CIT Group, Inc. | | | | | | | | |
5.00%, 08/15/2022 | | | 2,481,000 | | | | 2,599,319 | |
6.13%, 03/09/2028 | | | 2,190,000 | | | | 2,589,259 | |
| | | | | | | | |
| | | | | | | 5,188,578 | |
| | | | | | | | |
Building Products-0.28% | | | | | | | | |
Griffon Corp., 5.75%, 03/01/2028 | | | 2,010,000 | | | | 2,137,936 | |
| | | | | | | | |
| | |
Chemicals-4.06% | | | | | | | | |
Ashland LLC, 4.75%, 08/15/2022 | | | 2,817,000 | | | | 2,959,611 | |
Avient Corp., 5.25%, 03/15/2023 | | | 2,721,000 | | | | 2,958,203 | |
Blue Cube Spinco LLC, 9.75%, 10/15/2023 . | | | 1,808,000 | | | | 1,871,669 | |
CF Industries, Inc., 3.45%, 06/01/2023 | | | 5,035,000 | | | | 5,250,624 | |
Chemours Co. (The) | | | | | | | | |
6.63%, 05/15/2023 | | | 2,112,000 | | | | 2,126,436 | |
5.38%, 05/15/2027 | | | 2,347,000 | | | | 2,365,905 | |
Huntsman International LLC | | | | | | | | |
5.13%, 11/15/2022 | | | 2,344,000 | | | | 2,522,335 | |
4.50%, 05/01/2029 | | | 2,449,000 | | | | 2,713,647 | |
Olin Corp., 5.63%, 08/01/2029 | | | 1,939,000 | | | | 1,941,433 | |
| | | | | | | | |
| | | Principal
Amount | | | Value | |
Chemicals-(continued) | | | | | | | | |
Scotts Miracle-Gro Co. (The),
4.50%, 10/15/2029 | | $ | 3,390,000 | | | $ | 3,637,792 | |
Valvoline, Inc., 4.38%, 08/15/2025 | | | 2,323,000 | | | | 2,419,044 | |
| | | | | | | | |
| | | | | | | 30,766,699 | |
| | | | | | | | |
Commercial Services & Supplies-1.01% | |
ADT Security Corp. (The),
3.50%, 07/15/2022 | | | 4,472,000 | | | | 4,586,550 | |
Covanta Holding Corp.
| | | | | | | | |
5.88%, 03/01/2024 | | | 1,451,000 | | | | 1,483,858 | |
6.00%, 01/01/2027 | | | 1,486,000 | | | | 1,558,160 | |
| | | | | | | | |
| | | | | | | 7,628,568 | |
| | | | | | | | |
Communications Equipment-0.42% | | | | | | | | |
Hughes Satellite Systems Corp.
| | | | | | | | |
7.63%, 06/15/2021 | | | 1,477,150 | | | | 1,534,389 | |
6.63%, 08/01/2026 | | | 1,460,000 | | | | 1,658,648 | |
| | | | | | | | |
| | | | | | | 3,193,037 | |
| | | | | | | | |
Construction & Engineering-1.56% | | | | | | | | |
AECOM | | | | | | | | |
5.88%, 10/15/2024 | | | 2,835,000 | | | | 3,164,866 | |
5.13%, 03/15/2027 | | | 2,865,000 | | | | 3,151,815 | |
Fluor Corp. | | | | | | | | |
3.50%, 12/15/2024 | | | 3,510,000 | | | | 2,733,413 | |
4.25%, 09/15/2028 | | | 3,430,000 | | | | 2,749,762 | |
| | | | | | | | |
| | | | | | | 11,799,856 | |
| | | | | | | | |
Consumer Finance-3.01% | | | | | | | | |
Ally Financial, Inc. | | | | | | | | |
5.13%, 09/30/2024 | | | 4,564,000 | | | | 5,113,642 | |
5.75%, 11/20/2025 | | | 4,433,000 | | | | 4,975,024 | |
Navient Corp. | | | | | | | | |
6.50%, 06/15/2022 | | | 3,405,000 | | | | 3,558,225 | |
5.00%, 03/15/2027 | | | 3,860,000 | | | | 3,720,577 | |
OneMain Finance Corp. | | | | | | | | |
6.13%, 03/15/2024 | | | 2,500,000 | | | | 2,713,800 | |
6.63%, 01/15/2028 | | | 2,400,000 | | | | 2,743,680 | |
| | | | | | | | |
| | | | | | | 22,824,948 | |
| | | | | | | | |
Containers & Packaging-2.91% | | | | | | | | |
Ball Corp. | | | | | | | | |
5.25%, 07/01/2025 | | | 2,315,000 | | | | 2,628,358 | |
2.88%, 08/15/2030 | | | 2,600,000 | | | | 2,600,650 | |
Berry Global, Inc., 5.13%, 07/15/2023 | | | 4,205,000 | | | | 4,262,819 | |
Crown Americas LLC/Crown Americas Capital Corp. IV, 4.50%, 01/15/2023 | | | 2,566,000 | | | | 2,702,293 | |
Crown Americas LLC/Crown Americas Capital Corp. VI, 4.75%, 02/01/2026 | | | 2,582,000 | | | | 2,700,798 | |
Graphic Packaging International LLC, 4.75%, 04/15/2021 | | | 3,693,000 | | | | 3,748,395 | |
Silgan Holdings, Inc., 4.13%, 02/01/2028 | | | 3,282,000 | | | | 3,409,178 | |
| | | | | | | | |
| | | | | | | 22,052,491 | |
| | | | | | | | |
Diversified Consumer Services-0.49% | | | | | |
Service Corp. International | | | | | | | | |
5.38%, 05/15/2024 | | | 1,709,000 | | | | 1,744,727 | |
5.13%, 06/01/2029 | | | 1,799,000 | | | | 1,997,753 | |
| | | | | | | | |
| | | | | | | 3,742,480 | |
| | | | | | | | |
See accompanying Notes to Financial Statements which are an integral part of the financial statements.
Invesco Fundamental High Yield® Corporate Bond ETF (PHB)—(continued)
August 31, 2020
| | | | | | | | |
| | | Principal
Amount | | | Value | |
Diversified Telecommunication Services-1.48% | | | | | |
CenturyLink, Inc. | | | | | | | | |
Series G, 6.88%, 01/15/2028(b) | | $ | 5,044,000 | | | $ | 5,566,357 | |
Series S, 6.45%, 06/15/2021 | | | 5,458,000 | | | | 5,649,739 | |
| | | | | | | | |
| | | | | | | 11,216,096 | |
| | | | | | | | |
Electric Utilities-1.13% | | | | | | | | |
DPL, Inc., 4.13%, 07/01/2025(c) | | | 3,600,000 | | | | 3,802,500 | |
NRG Energy, Inc., 6.63%, 01/15/2027 | | | 4,444,000 | | | | 4,762,457 | |
| | | | | | | | |
| | | | | | | 8,564,957 | |
| | | | | | | | |
Electronic Equipment, Instruments & Components-1.05% | |
CDW LLC/CDW Finance Corp. | | | | | | | | |
5.50%, 12/01/2024 | | | 2,361,000 | | | | 2,615,055 | |
5.00%, 09/01/2025 | | | 2,459,000 | | | | 2,554,299 | |
3.25%, 02/15/2029 | | | 2,750,000 | | | | 2,815,670 | |
| | | | | | | | |
| | | | | | | 7,985,024 | |
| | | | | | | | |
Energy Equipment & Services-1.10% | |
Oceaneering International, Inc., 4.65%, 11/15/2024(b) | | | 5,097,000 | | | | 3,501,002 | |
Patterson-UTI Energy, Inc. | | | | | | | | |
3.95%, 02/01/2028 | | | 905,000 | | | | 755,059 | |
5.15%, 11/15/2029 | | | 4,925,000 | | | | 4,071,255 | |
SESI LLC, 7.75%, 09/15/2024 | | | 620 | | | | 216 | |
| | | | | | | | |
| | | | | | | 8,327,532 | |
| | | | | | | | |
Entertainment-0.73% | | | | | | | | |
Netflix, Inc. | | | | | | | | |
5.50%, 02/15/2022 | | | 2,514,000 | | | | 2,652,270 | |
4.88%, 04/15/2028 | | | 2,486,000 | | | | 2,881,597 | |
| | | | | | | | |
| | | | | | | 5,533,867 | |
| | | | | | | | |
Equity REITs-4.99% | | | | | | | | |
CyrusOne L.P./CyrusOne Finance Corp. | | | | | | | | |
2.90%, 11/15/2024 | | | 1,335,000 | | | | 1,429,177 | |
3.45%, 11/15/2029 | | | 1,365,000 | | | | 1,492,935 | |
Diversified Healthcare Trust, 4.75%, 02/15/2028 | | | 4,667,000 | | | | 4,358,807 | |
FelCor Lodging L.P., 6.00%, 06/01/2025 | | | 3,343,000 | | | | 3,346,828 | |
GEO Group, Inc. (The), 6.00%, 04/15/2026(b) | | | 4,790,000 | | | | 3,688,300 | |
GLP Capital L.P./GLP Financing II, Inc. | | | | | | | | |
5.38%, 11/01/2023 | | | 1,801,000 | | | | 1,935,291 | |
5.38%, 04/15/2026 | | | 1,778,000 | | | | 1,976,460 | |
iStar, Inc., 4.75%, 10/01/2024 | | | 2,345,000 | | | | 2,343,300 | |
MPT Operating Partnership L.P./MPT Finance Corp., 5.00%, 10/15/2027 | | | 3,010,000 | | | | 3,188,418 | |
RHP Hotel Properties L.P./RHP Finance Corp. | | | | | | | | |
5.00%, 04/15/2023(b) | | | 1,628,000 | | | | 1,608,269 | |
4.75%, 10/15/2027 | | | 1,684,000 | | | | 1,535,286 | |
Sabra Health Care L.P., 5.13%, 08/15/2026 | | | 2,563,000 | | | | 2,795,565 | |
SBA Communications Corp. | | | | | | | | |
4.88%, 09/01/2024 | | | 1,643,000 | | | | 1,689,743 | |
3.88%, 02/15/2027(c) | | | 1,655,000 | | | | 1,720,588 | |
Service Properties Trust | | | | | | | | |
4.35%, 10/01/2024 | | | 2,530,000 | | | | 2,383,741 | |
4.75%, 10/01/2026 | | | 2,500,000 | | | | 2,300,000 | |
| | | | | | | | |
| | | | | | | 37,792,708 | |
| | | | | | | | |
Food Products-2.40% | | | | | | | | |
B&G Foods, Inc., 5.25%, 04/01/2025 | | | 2,661,000 | | | | 2,756,024 | |
| | | | | | | | |
| | | Principal
Amount | | | Value | |
Food Products-(continued) | | | | | | | | |
Kraft Heinz Foods Co. (The) | | | | | | | | |
3.50%, 06/06/2022 | | $ | 5,745,000 | | | $ | 6,043,303 | |
3.00%, 06/01/2026 | | | 5,935,000 | | | | 6,192,932 | |
TreeHouse Foods, Inc., 4.88%, 03/15/2022 | | | 3,210,000 | | | | 3,224,493 | |
| | | | | | | | |
| | | | | | | 18,216,752 | |
| | | | | | | | |
Gas Utilities-0.68% | | | | | | | | |
AmeriGas Partners L.P./AmeriGas Finance Corp. | | | | | | | | |
5.63%, 05/20/2024 | | | 2,337,000 | | | | 2,558,735 | |
5.88%, 08/20/2026 | | | 2,285,000 | | | | 2,594,640 | |
| | | | | | | | |
| | | | | | | 5,153,375 | |
| | | | | | | | |
Health Care Equipment & Supplies-1.43% | |
Becton, Dickinson and Co. | | | | | | | | |
2.89%, 06/06/2022 | | | 3,734,000 | | | | 3,877,673 | |
3.70%, 06/06/2027 | | | 3,623,000 | | | | 4,112,070 | |
Teleflex, Inc., 4.63%, 11/15/2027 | | | 2,692,000 | | | | 2,866,482 | |
| | | | | | | | |
| | | | | | | 10,856,225 | |
| | | | | | | | |
Health Care Providers & Services-5.22% | |
Centene Corp., 4.63%, 12/15/2029 | | | 8,276,000 | | | | 9,091,393 | |
Encompass Health Corp. | | | | | | | | |
5.75%, 11/01/2024 | | | 1,673,000 | | | | 1,685,706 | |
4.75%, 02/01/2030 | | | 1,680,000 | | | | 1,753,702 | |
HCA, Inc. | | | | | | | | |
5.38%, 02/01/2025 | | | 4,791,000 | | | | 5,400,631 | |
5.63%, 09/01/2028 | | | 4,750,000 | | | | 5,657,677 | |
Magellan Health, Inc., 4.90%, 09/22/2024 | | | 3,201,000 | | | | 3,340,708 | |
Molina Healthcare, Inc., 5.38%, 11/15/2022 | | | 5,072,000 | | | | 5,323,698 | |
Tenet Healthcare Corp., 4.88%, 01/01/2026(c) | | | 7,040,000 | | | | 7,330,329 | |
| | | | | | | | |
| | | | | | | 39,583,844 | |
| | | | | | | | |
Hotels, Restaurants & Leisure-5.57% | |
Aramark Services, Inc., 4.75%, 06/01/2026 | | | 5,637,000 | | | | 5,620,625 | |
Churchill Downs, Inc., 5.50%, 04/01/2027(c) . | | | 1,910,000 | | | | 2,009,922 | |
Cinemark USA, Inc., 4.88%, 06/01/2023 | | | 3,936,000 | | | | 3,630,566 | |
Hilton Domestic Operating Co., Inc., 4.88%, 01/15/2030 | | | 2,339,000 | | | | 2,414,269 | |
Hilton Worldwide Finance LLC/Hilton Worldwide Finance Corp., 4.63%, 04/01/2025 | | | 2,419,000 | | | | 2,452,007 | |
Marriott Ownership Resorts, Inc./ILG LLC, 6.50%, 09/15/2026 | | | 2,757,000 | | | | 2,868,576 | |
MGM Resorts International | | | | | | | | |
6.00%, 03/15/2023 | | | 2,956,000 | | | | 3,124,123 | |
5.50%, 04/15/2027 | | | 2,925,000 | | | | 3,097,297 | |
Royal Caribbean Cruises Ltd. | | | | | | | | |
5.25%, 11/15/2022 | | | 4,334,000 | | | | 3,887,056 | |
3.70%, 03/15/2028 | | | 4,735,000 | | | | 3,586,763 | |
Wyndham Destinations, Inc. 4.25%, 03/01/2022 | | | 1,708,000 | | | | 1,721,860 | |
Series J, 5.75%, 04/01/2027 | | | 1,889,000 | | | | 1,942,950 | |
Yum! Brands, Inc., 3.75%, 11/01/2021 | | | 5,780,000 | | | | 5,858,752 | |
| | | | | | | | |
| | | | | | | 42,214,766 | |
| | | | | �� | | | |
Household Durables-4.68% | | | | | | | | |
Century Communities, Inc., 6.75%, 06/01/2027 | | | 1,875,000 | | | | 2,014,041 | |
See accompanying Notes to Financial Statements which are an integral part of the financial statements.
Invesco Fundamental High Yield® Corporate Bond ETF (PHB)—(continued)
August 31, 2020
| | | | | | | | |
| | | Principal
Amount | | | Value | |
Household Durables-(continued) | | | | | | | | |
KB Home, 7.00%, 12/15/2021 | | $ | 2,470,000 | | | $ | 2,599,366 | |
Lennar Corp. | | | | | | | | |
4.50%, 04/30/2024 | | | 2,658,000 | | | | 2,857,363 | |
4.75%, 11/29/2027 | | | 2,727,000 | | | | 3,112,189 | |
M/I Homes, Inc., 4.95%, 02/01/2028 | | | 2,380,000 | | | | 2,476,688 | |
Meritage Homes Corp., 6.00%, 06/01/2025 | | | 2,535,000 | | | | 2,880,660 | |
Newell Brands, Inc. | | | | | | | | |
4.35%, 04/01/2023 | | | 2,405,000 | | | | 2,547,797 | |
4.70%, 04/01/2026 | | | 2,324,000 | | | | 2,507,433 | |
PulteGroup, Inc. | | | | | | | | |
4.25%, 03/01/2021 | | | 2,260,500 | | | | 2,291,299 | |
5.50%, 03/01/2026 | | | 2,153,000 | | | | 2,460,674 | |
Tempur Sealy International, Inc., 5.50%, 06/15/2026 | | | 2,946,000 | | | | 3,089,073 | |
Toll Brothers Finance Corp. | | | | | | | | |
4.38%, 04/15/2023 | | | 1,760,340 | | | | 1,850,373 | |
4.88%, 03/15/2027 | | | 1,688,000 | | | | 1,905,009 | |
TRI Pointe Group, Inc., 5.70%, 06/15/2028. | | | 1,335,000 | | | | 1,475,175 | |
TRI Pointe Group, Inc./TRI Pointe Homes, Inc., 5.88%, 06/15/2024 | | | 1,304,000 | | | | 1,419,593 | |
| | | | | | | | |
| | | | | | | 35,486,733 | |
| | | | | | | | |
Household Products-0.49% | | | | | | | | |
Spectrum Brands, Inc., 5.75%, 07/15/2025 | | | 3,561,000 | | | | 3,685,635 | |
| | | | | | | | |
|
Independent Power and Renewable Electricity Producers-0.49% | |
AES Corp. (The), 5.13%, 09/01/2027 | | | 3,422,000 | | | | 3,701,937 | |
| | | | | | | | |
| | |
Insurance-1.06% | | | | | | | | |
Genworth Holdings, Inc., 7.63%, 09/24/2021(b) | | | 7,805,000 | | | | 8,002,584 | |
| | | | | | | | |
|
Internet & Direct Marketing Retail-0.88% | |
QVC, Inc. | | | | | | | | |
4.38%, 03/15/2023 | | | 3,130,000 | | | | 3,274,763 | |
4.75%, 02/15/2027 | | | 3,185,000 | | | | 3,402,997 | |
| | | | | | | | |
| | | | | | | 6,677,760 | |
| | | | | | | | |
IT Services-0.33% | | | | | | | | |
VeriSign, Inc. | | | | | | | | |
4.63%, 05/01/2023 | | | 1,170,000 | | | | 1,185,971 | |
4.75%, 07/15/2027 | | | 1,239,000 | | | | 1,322,279 | |
| | | | | | | | |
| | | | | | | 2,508,250 | |
| | | | | | | | |
Machinery-1.32% | | | | | | | | |
Hillenbrand, Inc., 4.50%, 09/15/2026 | | | 2,296,000 | | | | 2,471,070 | |
Trinity Industries, Inc., 4.55%, 10/01/2024. | | | 3,844,000 | | | | 3,874,752 | |
Wabtec Corp. | | | | | | | | |
4.40%, 03/15/2024 | | | 1,586,000 | | | | 1,725,697 | |
4.95%, 09/15/2028 | | | 1,695,000 | | | | 1,951,670 | |
| | | | | | | | |
| | | | | | | 10,023,189 | |
| | | | | | | | |
Media-3.83% | | | | | | | | |
AMC Networks, Inc., 5.00%, 04/01/2024 | | | 3,646,000 | | | | 3,721,199 | |
CCO Holdings LLC/CCO Holdings Capital Corp., 4.75%, 03/01/2030(c) | | | 6,250,000 | | | | 6,722,500 | |
Charter Communications Operating LLC/ Charter Communications Operating Capital Corp., 4.91%, 07/23/2025 | | | 5,636,000 | | | | 6,562,717 | |
| | | | | | | | |
| | | Principal
Amount | | | Value | |
Media-(continued) | | | | | | | | |
DISH DBS Corp. | | | | | | | | |
6.75%, 06/01/2021 | | $ | 3,570,000 | | | $ | 3,662,820 | |
7.75%, 07/01/2026 | | | 3,786,000 | | | | 4,339,759 | |
Lamar Media Corp., 5.75%, 02/01/2026 | | | 3,847,000 | | | | 4,018,480 | |
| | | | | | | | |
| | | | | | | 29,027,475 | |
| | | | | | | | |
Metals & Mining-2.13% | | | | | | | | |
AK Steel Corp., 7.00%, 03/15/2027 | | | 760 | | | | 643 | |
Allegheny Technologies, Inc. | | | | | | | | |
7.88%, 08/15/2023 | | | 1,349,000 | | | | 1,420,908 | |
5.88%, 12/01/2027(b) | | | 1,444,000 | | | | 1,393,424 | |
Carpenter Technology Corp., 6.38%, 07/15/2028 | | | 2,600,000 | | | | 2,719,593 | |
Commercial Metals Co., 5.75%, 04/15/2026 | | | 3,174,000 | | | | 3,310,371 | |
Freeport-McMoRan, Inc. | | | | | | | | |
3.88%, 03/15/2023 | | | 3,220,000 | | | | 3,340,364 | |
5.25%, 09/01/2029(b) | | | 3,634,000 | | | | 3,985,371 | |
| | | | | | | | |
| | | | | | | 16,170,674 | |
| | | | | | | | |
Mortgage REITs-0.80% | | | | | | | | |
Starwood Property Trust, Inc., 5.00%, 12/15/2021 | | | 5,982,000 | | | | 6,087,971 | |
| | | | | | | | |
| | |
Multiline Retail-1.28% | | | | | | | | |
Macy’s Retail Holdings, Inc., 2.88%, 02/15/2023 | | | 11,672,000 | | | | 9,695,347 | |
| | | | | | | | |
| | |
Oil, Gas & Consumable Fuels-12.22% | | | | | | | | |
Apache Corp., 4.38%, 10/15/2028 | | | 7,490,000 | | | | 7,452,250 | |
Cheniere Corpus Christi Holdings LLC | | | | | | | | |
5.88%, 03/31/2025 | | | 2,166,000 | | | | 2,505,648 | |
3.70%, 11/15/2029(c) | | | 2,445,000 | | | | 2,585,306 | |
Continental Resources, Inc. | | | | | | | | |
4.50%, 04/15/2023 | | | 3,325,000 | | | | 3,362,257 | |
4.38%, 01/15/2028(b) | | | 3,868,000 | | | | 3,691,194 | |
Devon Energy Corp., 5.85%, 12/15/2025 | | | 5,502,000 | | | | 6,317,121 | |
Diamondback Energy, Inc. | | | | | | | | |
2.88%, 12/01/2024 | | | 1,744,000 | | | | 1,799,037 | |
3.50%, 12/01/2029 | | | 1,870,000 | | | | 1,907,683 | |
EQM Midstream Partners L.P. | | | | | | | | |
4.75%, 07/15/2023 | | | 1,660,000 | | | | 1,706,065 | |
5.50%, 07/15/2028 | | | 1,735,000 | | | | 1,800,704 | |
EQT Corp. | | | | | | | | |
3.00%, 10/01/2022(b) | | | 1,650,000 | | | | 1,633,500 | |
3.90%, 10/01/2027 | | | 1,865,000 | | | | 1,808,453 | |
Hess Corp., 4.30%, 04/01/2027 | | | 6,330,000 | | | | 6,748,182 | |
Murphy Oil Corp., 5.75%, 08/15/2025 | | | 6,464,000 | | | | 6,214,199 | |
Occidental Petroleum Corp. | | | | | | | | |
2.90%, 08/15/2024 | | | 8,225,000 | | | | 7,582,381 | |
3.50%, 08/15/2029 | | | 9,205,000 | | | | 7,931,028 | |
PBF Holding Co. LLC/PBF Finance Corp., 6.00%, 02/15/2028(c) | | | 7,950,000 | | | | 6,718,744 | |
PDC Energy, Inc., 6.13%, 09/15/2024 | | | 2,957,000 | | | | 3,030,615 | |
Range Resources Corp., 4.88%, 05/15/2025(b) | | | 3,993,000 | | | | 3,735,551 | |
Southwestern Energy Co. | | | | | | | | |
6.45%, 01/23/2025 | | | 1,466,000 | | | | 1,466,894 | |
7.75%, 10/01/2027 | | | 1,575,000 | | | | 1,614,375 | |
Targa Resources Partners L.P./Targa Resources Partners Finance Corp., 5.50%, 03/01/2030(c) | | | 6,480,000 | | | | 6,840,450 | |
See accompanying Notes to Financial Statements which are an integral part of the financial statements.
Invesco Fundamental High Yield® Corporate Bond ETF (PHB)—(continued)
August 31, 2020
| | | | | | | | |
| | | Principal
Amount | | | Value | |
Oil, Gas & Consumable Fuels-(continued) | |
WPX Energy, Inc. | | | | | | | | |
5.25%, 09/15/2024 | | $ | 2,043,380 | | | $ | 2,089,591 | |
5.25%, 10/15/2027 | | | 2,075,000 | | | | 2,067,509 | |
| | | | | | | | |
| | | | | | | 92,608,737 | |
| | | | | | | | |
| | |
Personal Products-0.34% | | | | | | | | |
Edgewell Personal Care Co., 4.70%, 05/24/2022 | | | 2,414,000 | | | | 2,530,150 | |
| | | | | | | | |
Pharmaceuticals-0.40% | | | | | | | | |
Elanco Animal Health, Inc. | | | | | | | | |
5.27%, 08/28/2023 | | | 1,320,000 | | | | 1,447,875 | |
5.90%, 08/28/2028 | | | 1,300,000 | | | | 1,542,957 | |
| | | | | | | | |
| | | | | | | 2,990,832 | |
| | | | | | | | |
Professional Services-0.52% | | | | | | | | |
IHS Markit Ltd. | | | | | | | | |
4.13%, 08/01/2023 | | | 1,768,000 | | | | 1,934,767 | |
4.25%, 05/01/2029 | | | 1,740,000 | | | | 2,034,173 | |
| | | | | | | | |
| | | | | | | 3,968,940 | |
| | | | | | | | |
Real Estate Management & Development-0.66% | |
Kennedy-Wilson, Inc., 5.88%, 04/01/2024 | | | 2,598,000 | | | | 2,632,891 | |
Newmark Group, Inc., 6.13%, 11/15/2023 | | | 2,290,000 | | | | 2,353,150 | |
| | | | | | | | |
| | | | | | | 4,986,041 | |
| | | | | | | | |
Semiconductors & Semiconductor Equipment-0.96% | |
Amkor Technology, Inc., 6.63%, 09/15/2027(c) | | | 3,531,000 | | | | 3,874,619 | |
Qorvo, Inc., 5.50%, 07/15/2026 | | | 3,210,000 | | | | 3,410,850 | |
| | | | | | | | |
| | | | | | | 7,285,469 | |
| | | | | | | | |
Software-1.88% | | | | | | | | |
CDK Global, Inc. | | | | | | | | |
5.00%, 10/15/2024 | | | 1,248,000 | | | | 1,414,458 | |
4.88%, 06/01/2027 | | | 1,361,000 | | | | 1,439,673 | |
Citrix Systems, Inc., 4.50%, 12/01/2027 | | | 2,572,000 | | | | 2,946,076 | |
NortonLifeLock, Inc., 4.20%, 09/15/2020 | | | 6,157,000 | | | | 6,160,386 | |
Nuance Communications, Inc., 5.63%, 12/15/2026 | | | 2,146,640 | | | | 2,281,674 | |
| | | | | | | | |
| | | | | | | 14,242,267 | |
| | | | | | | | |
Specialty Retail-3.72% | | | | | | | | |
Group 1 Automotive, Inc., 5.00%, 06/01/2022 | | | 3,880,000 | | | | 3,880,000 | |
L Brands, Inc. | | | | | | | | |
5.63%, 02/15/2022 | | | 4,472,000 | | | | 4,604,930 | |
5.25%, 02/01/2028 | | | 5,620,000 | | | | 5,407,648 | |
Murphy Oil USA, Inc., 4.75%, 09/15/2029 | | | 3,955,000 | | | | 4,284,827 | |
Penske Automotive Group, Inc. | | | | | | | | |
5.75%, 10/01/2022 | | | 2,725,000 | | | | 2,735,396 | |
5.50%, 05/15/2026 | | | 3,030,000 | | | | 3,161,699 | |
Sally Holdings LLC/Sally Capital, Inc., 5.63%, 12/01/2025 | | | 4,050,000 | | | | 4,117,939 | |
| | | | | | | | |
| | | | | | | 28,192,439 | |
| | | | | | | | |
Technology Hardware, Storage & Peripherals-5.15% | | | | | |
EMC Corp., 3.38%, 06/01/2023 | | | 13,201,000 | | | | 13,671,154 | |
NCR Corp., 6.38%, 12/15/2023 | | | 3,974,000 | | | | 4,060,931 | |
Seagate HDD Cayman | | | | | | | | |
4.75%, 01/01/2025 | | | 3,145,000 | | | | 3,434,691 | |
4.09%, 06/01/2029(c) | | | 3,760,000 | | | | 4,038,369 | |
| | | | | | | | |
| | | Principal
Amount | | | Value | |
Technology Hardware, Storage & Peripherals-(continued) | |
Western Digital Corp., 4.75%, 02/15/2026 | | $ | 7,703,000 | | | $ | 8,345,353 | |
Xerox Corp., 4.50%, 05/15/2021 | | | 5,319,000 | | | | 5,436,098 | |
| | | | | | | | |
| | | | | | | 38,986,596 | |
| | | | | | | | |
|
Textiles, Apparel & Luxury Goods-0.44% | |
Under Armour, Inc., 3.25%, 06/15/2026(b) | | | 3,530,000 | | | | 3,318,200 | |
| | | | | | | | |
Thrifts & Mortgage Finance-0.74% | | | | | | | | |
MGIC Investment Corp., 5.75%, 08/15/2023 | | | 2,705,000 | | | | 2,904,210 | |
Radian Group, Inc. | | | | | | | | |
4.50%, 10/01/2024 | | | 1,349,420 | | | | 1,359,540 | |
4.88%, 03/15/2027 | | | 1,352,000 | | | | 1,359,436 | |
| | | | | | | | |
| | | | | | | 5,623,186 | |
| | | | | | | | |
Trading Companies & Distributors-1.69% | |
H&E Equipment Services, Inc., 5.63%, 09/01/2025 | | | 2,219,000 | | | | 2,304,986 | |
United Rentals North America, Inc., 4.88%, 01/15/2028 | | | 6,118,000 | | | | 6,462,138 | |
WESCO Distribution, Inc., 5.38%, 12/15/2021 | | | 4,012,000 | | | | 4,048,088 | |
| | | | | | | | |
| | | | | | | 12,815,212 | |
| | | | | | | | |
Wireless Telecommunication Services-1.69% | |
Sprint Capital Corp., 6.88%, 11/15/2028 | | | 4,933,000 | | | | 6,311,157 | |
Sprint Corp., 7.88%, 09/15/2023 | | | 5,590,000 | | | | 6,508,856 | |
| | | | | | | | |
| | | | | | | 12,820,013 | |
| | | | | | | | |
Total U.S. Dollar Denominated Bonds & Notes
(Cost $726,035,843) | | | | 746,327,688 | |
| | | | | | | | |
| | |
| | | Shares | | | | |
Money Market Funds-0.54% | | | | | | | | |
Invesco Premier U.S. Government Money Portfolio, Institutional
Class, 0.01%(d)(e)
(Cost $4,085,897) | | | 4,085,897 | | | | 4,085,897 | |
| | | | | | | | |
TOTAL INVESTMENTS IN SECURITIES (excluding investments purchased with cash collateral
from securities on loan)-99.02%
(Cost $730,121,740) | | | | 750,413,585 | |
| | | | | | | | |
|
| Investments Purchased with Cash Collateral from Securities on Loan | |
| | |
Money Market Funds-2.94% | | | | | | | | |
Invesco Private Government Fund, 0.03%(d)(e)(f) | | | 16,700,947 | | | | 16,700,947 | |
Invesco Private Prime Fund,
0.14%(d)(e)(f) | | | 5,574,985 | | | | 5,576,100 | |
| | | | | | | | |
Total Investments Purchased with Cash Collateral from Securities on Loan
(Cost $22,277,047) | | | | 22,277,047 | |
| | | | | | | | |
TOTAL INVESTMENTS IN SECURITIES-101.96% (Cost $752,398,787) | | | | 772,690,632 | |
OTHER ASSETS LESS LIABILITIES-(1.96)% | | | | (14,879,891 | ) |
| | | | | | | | |
NET ASSETS-100.00% | | | | | | $ | 757,810,741 | |
| | | | | | | | |
See accompanying Notes to Financial Statements which are an integral part of the financial statements.
Invesco Fundamental High Yield® Corporate Bond ETF (PHB)—(continued)
August 31, 2020
Investment Abbreviations:
REIT-Real Estate Investment Trust
Notes to Schedule of Investments:
| (a) | Industry and/or sector classifications used in this report are generally according to the Global Industry Classification Standard, which was developed by and is the exclusive property and a service mark of MSCI Inc. and Standard & Poor’s. |
| (b) | All or a portion of this security was out on loan at August 31, 2020. |
| (c) | Security purchased or received in a transaction exempt from registration under the Securities Act of 1933, as amended (the “1933 Act”). The security may be resold pursuant to an exemption from registration under the 1933 Act, typically to qualified institutional buyers. The aggregate value of these securities at August 31, 2020 was $45,643,327, which represented 6.02% of the Fund’s Net Assets. |
| (d) | Affiliated issuer. The issuer and/or the Fund is a wholly-owned subsidiary of Invesco Ltd., or is affiliated by having an investment adviser that is under common control of Invesco Ltd. The table below shows the Fund’s transactions in, and earnings from, its investments in affiliates for the fiscal year ended August 31, 2020. |
| | | | | | | | | | | | | | | | | | | | | | | | | | | | |
| | | Value
August 31, 2019 | | | Purchases
at Cost | | | Proceeds
from Sales | | | Change in
Unrealized
Appreciation
(Depreciation) | | | Realized
Gain
(Loss) | | | Value
August 31, 2020 | | | Dividend
Income | |
Investments in Affiliated Money Market Funds: | | | | | | | | | | | | | | | | | | | | | | | | | | | | |
Invesco Premier U.S. Government Money Portfolio, Institutional Class | | $ | 322,733 | | | $ | 141,836,638 | | | $ | (138,073,474 | ) | | $ | - | | | $ | - | | | $ | 4,085,897 | | | $ | 43,994 | |
Investments Purchased with Cash Collateral from Securities on Loan: | | | | | | | | | | | | | | | | | | | | | | | | | | | | |
Invesco Government & Agency Portfolio, Institutional Class | | | 38,027,490 | | | | 127,155,166 | | | | (165,182,656 | ) | | | - | | | | - | | | | - | | | | 307,363 | * |
Invesco Liquid Assets Portfolio, Institutional Class | | | 12,267,205 | | | | 38,909,196 | | | | (51,173,238 | ) | | | (285 | ) | | | (2,878 | ) | | | - | | | | 115,126 | * |
Invesco Private Government Fund | | | - | | | | 119,349,184 | | | | (102,648,237 | ) | | | - | | | | - | | | | 16,700,947 | | | | 2,109 | * |
Invesco Private Prime Fund | | | - | | | | 18,864,381 | | | | (13,288,728 | ) | | | - | | | | 447 | | | | 5,576,100 | | | | 1,435 | * |
| | | | | | | | | | | | | | | | | | | | | | | | | | | | |
Total | | $ | 50,617,428 | | | $ | 446,114,565 | | | $ | (470,366,333 | ) | | $ | (285 | ) | | $ | (2,431 | ) | | $ | 26,362,944 | | | $ | 470,027 | |
| | | | | | | | | | | | | | | | | | | | | | | | | | | | |
| * | Represents the income earned on the investment of cash collateral, which is included in securities lending income on the Statements of Operations. Does not include rebates and fees paid to lending agent or premiums received from borrowers, if any. |
| (e) | The rate shown is the 7-day SEC standardized yield as of August 31, 2020. |
| (f) | The security has been segregated to satisfy the commitment to return the cash collateral received in securities lending transactions upon the borrower’s return of the securities loaned. |
See accompanying Notes to Financial Statements which are an integral part of the financial statements.
Invesco Fundamental Investment Grade Corporate Bond ETF (PFIG)
August 31, 2020
Schedule of Investments(a)
| | | | | | | | |
| | | Principal
Amount | | | Value | |
U.S. Dollar Denominated Bonds & Notes-99.84% | |
Aerospace & Defense-2.42% | | | | | | | | |
Boeing Co. (The) | | | | | | | | |
2.70%, 05/01/2022 | | $ | 160,000 | | | $ | 163,326 | |
5.15%, 05/01/2030 | | | 150,000 | | | | 168,420 | |
General Dynamics Corp. | | | | | | | | |
3.00%, 05/11/2021 | | | 91,000 | | | | 92,730 | |
3.75%, 05/15/2028 | | | 81,000 | | | | 95,436 | |
Huntington Ingalls Industries, Inc. | | | | | | | | |
3.84%, 05/01/2025(b) | | | 40,000 | | | | 43,878 | |
3.48%, 12/01/2027 | | | 40,000 | | | | 43,722 | |
L3Harris Technologies, Inc. | | | | | | | | |
3.85%, 06/15/2023 | | | 43,000 | | | | 46,740 | |
4.40%, 06/15/2028 | | | 58,000 | | | | 69,354 | |
Lockheed Martin Corp. | | | | | | | | |
2.90%, 03/01/2025 | | | 125,000 | | | | 136,942 | |
3.55%, 01/15/2026 | | | 104,000 | | | | 119,079 | |
Northrop Grumman Corp. | | | | | | | | |
2.55%, 10/15/2022 | | | 78,000 | | | | 81,633 | |
3.25%, 01/15/2028 | | | 76,000 | | | | 86,086 | |
Raytheon Technologies Corp. | | | | | | | | |
2.50%, 12/15/2022(b) | | | 100,000 | | | | 104,167 | |
4.13%, 11/16/2028 | | | 139,000 | | | | 165,792 | |
Textron, Inc., 3.00%, 06/01/2030 | | | 105,000 | | | | 110,539 | |
| | | | | | | | |
| | | | | | | 1,527,844 | |
| | | | | | | | |
Air Freight & Logistics-0.96% | | | | | | | | |
C.H. Robinson Worldwide, Inc., 4.20%, 04/15/2028 | | | 80,000 | | | | 94,594 | |
FedEx Corp. | | | | | | | | |
3.80%, 05/15/2025 | | | 100,000 | | | | 113,064 | |
3.10%, 08/05/2029 | | | 108,000 | | | | 119,991 | |
United Parcel Service, Inc. | | | | | | | | |
3.13%, 01/15/2021 | | | 136,000 | | | | 137,414 | |
3.05%, 11/15/2027 | | | 124,000 | | | | 140,604 | |
| | | | | | | | |
| | | | | | | 605,667 | |
| | | | | | | | |
Airlines-0.26% | | | | | | | | |
Southwest Airlines Co. | | | | | | | | |
5.25%, 05/04/2025 | | | 75,000 | | | | 81,941 | |
2.63%, 02/10/2030 | | | 85,000 | | | | 80,062 | |
| | | | | | | | |
| | | | | | | 162,003 | |
| | | | | | | | |
Auto Components-0.35% | | | | | | | | |
BorgWarner, Inc. | | | | | | | | |
3.38%, 03/15/2025(c) | | | 42,000 | | | | 45,794 | |
2.65%, 07/01/2027 | | | 40,000 | | | | 42,444 | |
Lear Corp., 3.80%, 09/15/2027 | | | 125,000 | | | | 133,658 | |
| | | | | | | | |
| | | | | | | 221,896 | |
| | | | | | | | |
Automobiles-0.61% | | | | | | | | |
General Motors Financial Co., Inc. | | | | | | | | |
3.20%, 07/06/2021 | | | 177,000 | | | | 179,847 | |
4.35%, 01/17/2027 | | | 189,000 | | | | 205,133 | |
| | | | | | | | |
| | | | | | | 384,980 | |
| | | | | | | | |
Banks-7.16% | | | | | | | | |
Bank of America Corp. | | | | | | | | |
3.30%, 01/11/2023 | | | 271,000 | | | | 289,225 | |
3.25%, 10/21/2027 | | | 270,000 | | | | 300,810 | |
| | | | | | | | |
| | | Principal
Amount | | | Value | |
Banks-(continued) | | | | | | | | |
Citigroup, Inc. | | | | | | | | |
4.50%, 01/14/2022 | | $ | 254,000 | | | $ | 268,487 | |
4.45%, 09/29/2027 | | | 250,000 | | | | 290,813 | |
Citizens Bank N.A. | | | | | | | | |
3.25%, 02/14/2022 | | | 50,000 | | | | 51,914 | |
3.75%, 02/18/2026 | | | 76,000 | | | | 87,451 | |
Comerica, Inc. | | | | | | | | |
3.70%, 07/31/2023 | | | 50,000 | | | | 54,275 | |
4.00%, 02/01/2029 | | | 53,000 | | | | 61,234 | |
Fifth Third Bancorp, 2.55%, 05/05/2027 | | | 100,000 | | | | 108,493 | |
Fifth Third Bank, 2.25%, 06/14/2021 | | | 76,000 | | | | 77,086 | |
First Horizon National Corp., 3.50%, 12/15/2020 | | | 71,000 | | | | 71,399 | |
First Republic Bank, 2.50%, 06/06/2022 | | | 101,000 | | | | 104,296 | |
Huntington Bancshares, Inc. | | | | | | | | |
3.15%, 03/14/2021 | | | 66,000 | | | | 66,850 | |
2.55%, 02/04/2030 | | | 67,000 | | | | 70,429 | |
JPMorgan Chase & Co. | | | | | | | | |
4.50%, 01/24/2022 | | | 307,000 | | | | 324,791 | |
2.95%, 10/01/2026 | | | 316,000 | | | | 350,453 | |
KeyCorp | | | | | | | | |
5.10%, 03/24/2021 | | | 69,000 | | | | 70,867 | |
2.25%, 04/06/2027 | | | 70,000 | | | | 74,158 | |
Manufacturers and Traders Trust Co., 2.90%, 02/06/2025 | | | 88,000 | | | | 96,756 | |
People’s United Financial, Inc., 3.65%, 12/06/2022 | | | 81,000 | | | | 86,073 | |
PNC Bank N.A., 2.15%, 04/29/2021 | | | 102,000 | | | | 103,133 | |
PNC Financial Services Group, Inc. (The), 2.55%, 01/22/2030 | | | 125,000 | | | | 136,174 | |
Regions Financial Corp., 3.80%, 08/14/2023 | | | 134,000 | | | | 146,153 | |
SVB Financial Group, 3.13%, 06/05/2030 | | | 100,000 | | | | 111,454 | |
Truist Bank | | | | | | | | |
3.20%, 04/01/2024 | | | 96,000 | | | | 104,913 | |
3.63%, 09/16/2025 | | | 86,000 | | | | 97,673 | |
U.S. Bancorp | | | | | | | | |
3.38%, 02/05/2024 | | | 109,000 | | | | 119,286 | |
Series V, 2.38%, 07/22/2026 | | | 156,000 | | | | 171,054 | |
Wells Fargo & Co. | | | | | | | | |
2.63%, 07/22/2022 | | | 292,000 | | | | 303,892 | |
3.00%, 04/22/2026 | | | 286,000 | | | | 313,696 | |
| | | | | | | | |
| | | | | | | 4,513,288 | |
| | | | | | | | |
Beverages-1.65% | | | | | | | | |
Coca-Cola Co. (The) | | | | | | | | |
3.30%, 09/01/2021 | | | 160,000 | | | | 165,019 | |
2.88%, 10/27/2025 | | | 147,000 | | | | 163,089 | |
Constellation Brands, Inc. | | | | | | | | |
4.25%, 05/01/2023 | | | 54,000 | | | | 59,145 | |
3.60%, 02/15/2028 | | | 58,000 | | | | 65,418 | |
Keurig Dr Pepper, Inc. | | | | | | | | |
4.06%, 05/25/2023 | | | 55,000 | | | | 60,132 | |
4.60%, 05/25/2028 | | | 71,000 | | | | 85,985 | |
Molson Coors Beverage Co. | | | | | | | | |
2.10%, 07/15/2021 | | | 59,000 | | | | 59,753 | |
3.00%, 07/15/2026 | | | 58,000 | | | | 62,042 | |
See accompanying Notes to Financial Statements which are an integral part of the financial statements.
Invesco Fundamental Investment Grade Corporate Bond ETF (PFIG)—(continued)
August 31, 2020
| | | | | | | | |
| | | Principal
Amount | | | Value | |
Beverages-(continued) | |
PepsiCo, Inc. | | | | | | | | |
2.75%, 03/01/2023 | | $ | 150,000 | | | $ | 159,080 | |
3.00%, 10/15/2027 | | | 144,000 | | | | 163,277 | |
| | | | | | | | |
| | | | | | | 1,042,940 | |
| | | | | | | | |
Biotechnology-1.66% | | | | | | | | |
AbbVie, Inc. | | | | | | | | |
2.60%, 11/21/2024(b) | | | 130,000 | | | | 139,253 | |
3.20%, 11/21/2029(b) | | | 124,000 | | | | 137,872 | |
Amgen, Inc. | | | | | | | | |
3.88%, 11/15/2021 | | | 141,686 | | | | 146,353 | |
2.20%, 02/21/2027 | | | 125,000 | | | | 132,878 | |
Biogen, Inc. | | | | | | | | |
3.63%, 09/15/2022 | | | 75,000 | | | | 79,815 | |
4.05%, 09/15/2025 | | | 56,000 | | | | 64,606 | |
Gilead Sciences, Inc. | | | | | | | | |
3.50%, 02/01/2025 | | | 110,000 | | | | 123,439 | |
3.65%, 03/01/2026 | | | 108,000 | | | | 123,985 | |
Regeneron Pharmaceuticals, Inc., 1.75%, 09/15/2030 | | | 100,000 | | | | 98,174 | |
| | | | | | | | |
| | | | | | | 1,046,375 | |
| | | | | | | | |
Building Products-0.26% | |
Fortune Brands Home & Security, Inc. | | | | | | | | |
4.00%, 09/21/2023 | | | 29,000 | | | | 31,895 | |
3.25%, 09/15/2029 | | | 38,000 | | | | 42,445 | |
Masco Corp. | | | | | | | | |
4.45%, 04/01/2025 | | | 35,000 | | | | 40,439 | |
4.38%, 04/01/2026 | | | 41,000 | | | | 48,136 | |
| | | | | | | | |
| | | | | | | 162,915 | |
| | | | | | | | |
Capital Markets-4.03% | | | | | | | | |
Ameriprise Financial, Inc. | | | | | | | | |
4.00%, 10/15/2023 | | | 69,000 | | | | 76,687 | |
2.88%, 09/15/2026 | | | 78,000 | | | | 86,315 | |
Bank of New York Mellon Corp. (The) | | | | | | | | |
2.20%, 08/16/2023 | | | 122,000 | | | | 128,072 | |
3.85%, 04/28/2028 | | | 109,000 | | | | 132,336 | |
BlackRock, Inc. | | | | | | | | |
3.50%, 03/18/2024 | | | 99,000 | | | | 109,367 | |
2.40%, 04/30/2030 | | | 120,000 | | | | 131,342 | |
Charles Schwab Corp. (The) | | | | | | | | |
2.65%, 01/25/2023 | | | 90,000 | | | | 94,862 | |
3.20%, 03/02/2027 | | | 91,000 | | | | 102,279 | |
CME Group, Inc. | | | | | | | | |
3.00%, 03/15/2025 | | | 51,000 | | | | 55,933 | |
3.75%, 06/15/2028 | | | 65,000 | | | | 77,227 | |
E*TRADE Financial Corp., 2.95%, 08/24/2022 | | | 86,000 | | | | 89,912 | |
Goldman Sachs Group, Inc. (The) | | | | | | | | |
5.75%, 01/24/2022 | | | 167,000 | | | | 179,301 | |
3.50%, 11/16/2026 | | | 167,000 | | | | 186,449 | |
Jefferies Group LLC, 6.88%, 04/15/2021 | | | 48,000 | | | | 49,796 | |
Jefferies Group LLC/Jefferies Group Capital Finance, Inc., 4.15%, 01/23/2030 | | | 50,000 | | | | 56,570 | |
Morgan Stanley | | | | | | | | |
3.63%, 01/20/2027 | | | 152,000 | | | | 173,795 | |
Series F, 3.88%, 04/29/2024 | | | 163,000 | | | | 181,413 | |
Nasdaq, Inc. | | | | | | | | |
4.25%, 06/01/2024 | | | 36,000 | | | | 40,378 | |
3.85%, 06/30/2026 | | | 38,000 | | | | 43,806 | |
| | | | | | | | |
| | | Principal
Amount | | | Value | |
Capital Markets-(continued) | |
Northern Trust Corp. | | | | | | | | |
3.45%, 11/04/2020 | | $ | 73,000 | | | $ | 73,403 | |
1.95%, 05/01/2030 | | | 65,000 | | | | 68,103 | |
Raymond James Financial, Inc., 3.63%, 09/15/2026 | | | 91,000 | | | | 104,168 | |
State Street Corp. | | | | | | | | |
3.55%, 08/18/2025 | | | 71,000 | | | | 81,040 | |
2.40%, 01/24/2030 | | | 90,000 | | | | 97,923 | |
TD Ameritrade Holding Corp. | | | | | | | | |
2.95%, 04/01/2022 | | | 54,000 | | | | 56,041 | |
3.30%, 04/01/2027 | | | 55,000 | | | | 62,250 | |
| | | | | | | | |
| | | | | | | 2,538,768 | |
| | | | | | | | |
Chemicals-2.91% | | | | | | | | |
Air Products and Chemicals, Inc., 2.05%, 05/15/2030 | | | 125,000 | | | | 132,015 | |
Celanese US Holdings LLC, 4.63%, 11/15/2022 | | | 86,000 | | | | 92,837 | |
DuPont de Nemours, Inc. | | | | | | | | |
4.21%, 11/15/2023 | | | 100,000 | | | | 110,556 | |
4.73%, 11/15/2028 | | | 100,000 | | | | 121,551 | |
Eastman Chemical Co. | | | | | | | | |
3.80%, 03/15/2025 | | | 53,000 | | | | 58,694 | |
4.50%, 12/01/2028 | | | 50,000 | | | | 59,338 | |
Ecolab, Inc. | | | | | | | | |
4.35%, 12/08/2021 | | | 51,000 | | | | 53,584 | |
2.70%, 11/01/2026 | | | 120,000 | | | | 134,845 | |
EI du Pont de Nemours and Co. | | | | | | | | |
1.70%, 07/15/2025 | | | 50,000 | | | | 52,048 | |
2.30%, 07/15/2030 | | | 60,000 | | | | 63,721 | |
FMC Corp., 3.20%, 10/01/2026 | | | 58,000 | | | | 64,612 | |
LYB International Finance II B.V., 3.50%, 03/02/2027 | | | 101,000 | | | | 112,280 | |
LyondellBasell Industries N.V., 5.75%, 04/15/2024 | | | 96,000 | | | | 110,896 | |
Mosaic Co. (The) | | | | | | | | |
4.25%, 11/15/2023 | | | 53,000 | | | | 57,558 | |
4.05%, 11/15/2027 | | | 49,000 | | | | 54,406 | |
PPG Industries, Inc., 3.75%, 03/15/2028 | | | 126,000 | | | | 152,303 | |
Praxair, Inc. | | | | | | | | |
2.45%, 02/15/2022 | | | 95,000 | | | | 97,466 | |
3.20%, 01/30/2026 | | | 91,000 | | | | 102,204 | |
Sherwin-Williams Co. (The) | | | | | | | | |
3.13%, 06/01/2024 | | | 50,000 | | | | 54,351 | |
3.45%, 06/01/2027 | | | 48,000 | | | | 54,550 | |
Westlake Chemical Corp., 3.60%, 08/15/2026 | | | 89,000 | | | | 97,340 | |
| | | | | | | | |
| | | | | | | 1,837,155 | |
| | | | | | | | |
Commercial Services & Supplies-0.51% | |
Cintas Corp. No. 2 | | | | | | | | |
2.90%, 04/01/2022 | | | 38,000 | | | | 39,401 | |
3.70%, 04/01/2027 | | | 38,000 | | | | 43,454 | |
Republic Services, Inc. | | | | | | | | |
3.55%, 06/01/2022 | | | 47,000 | | | | 49,200 | |
3.95%, 05/15/2028 | | | 49,000 | | | | 58,025 | |
Waste Management, Inc. | | | | | | | | |
3.13%, 03/01/2025 | | | 70,000 | | | | 76,936 | |
3.15%, 11/15/2027 | | | 50,000 | | | | 55,847 | |
| | | | | | | | |
| | | | | | | 322,863 | |
| | | | | | | | |
See accompanying Notes to Financial Statements which are an integral part of the financial statements.
Invesco Fundamental Investment Grade Corporate Bond ETF (PFIG)—(continued)
August 31, 2020
| | | | | | | | |
| | | Principal
Amount | | | Value | |
Communications Equipment-0.78% | |
Cisco Systems, Inc. | | | | | | | | |
3.63%, 03/04/2024 | | $ | 144,000 | | | $ | 160,282 | |
2.50%, 09/20/2026 | | | 140,000 | | | | 155,021 | |
Juniper Networks, Inc. | | | | | | | | |
4.50%, 03/15/2024 | | | 37,000 | | | | 41,614 | |
3.75%, 08/15/2029 | | | 38,000 | | | | 43,348 | |
Motorola Solutions, Inc. | | | | | | | | |
4.00%, 09/01/2024 | | | 38,000 | | | | 42,226 | |
4.60%, 05/23/2029 | | | 43,000 | | | | 50,520 | |
| | | | | | | | |
| | | | | | | 493,011 | |
| | | | | | | | |
Construction Materials-0.24% | |
Martin Marietta Materials, Inc., 3.50%, 12/15/2027 | | | 66,000 | | | | 74,008 | |
Vulcan Materials Co., 3.50%, 06/01/2030 | | | 70,000 | | | | 79,398 | |
| | | | | | | | |
| | | | | | | 153,406 | |
| | | | | | | | |
Consumer Finance-1.49% | |
American Express Co., 2.50%, 08/01/2022 | | | 110,000 | | | | 114,202 | |
American Express Credit Corp., 3.30%, 05/03/2027 | | | 106,000 | | | | 121,231 | |
Capital One Financial Corp. | | | | | | | | |
3.30%, 10/30/2024 | | | 130,000 | | | | 141,593 | |
4.20%, 10/29/2025 | | | 131,000 | | | | 146,978 | |
Discover Bank | | | | | | | | |
4.20%, 08/08/2023 | | | 100,000 | | | | 110,282 | |
3.45%, 07/27/2026 | | | 86,000 | | | | 94,422 | |
GE Capital Funding LLC, 4.40%, 05/15/2030(b) | | | 200,000 | | | | 211,440 | |
| | | | | | | | |
| | | | | | | 940,148 | |
| | | | | | | | |
Containers & Packaging-1.05% | |
Avery Dennison Corp., 4.88%, 12/06/2028 | | | 86,000 | | | | 105,971 | |
Bemis Co., Inc., 2.63%, 06/19/2030 | | | 100,000 | | | | 107,654 | |
International Paper Co. | | | | | | | | |
3.65%, 06/15/2024 | | | 68,000 | | | | 75,308 | |
3.00%, 02/15/2027 | | | 73,000 | | | | 80,495 | |
Packaging Corp. of America | | | | | | | | |
4.50%, 11/01/2023 | | | 40,000 | | | | 44,241 | |
3.40%, 12/15/2027 | | | 35,000 | | | | 39,354 | |
Sonoco Products Co., 3.13%, 05/01/2030 | | | 75,000 | | | | 82,352 | |
WRKCo, Inc. | | | | | | | | |
3.75%, 03/15/2025 | | | 50,000 | | | | 56,271 | |
4.90%, 03/15/2029 | | | 55,000 | | | | 67,807 | |
| | | | | | | | |
| | | | | | | 659,453 | |
| | | | | | | | |
Diversified Consumer Services-0.12% | |
Block Financial LLC | | | | | | | | |
4.13%, 10/01/2020 | | | 37,000 | | | | 37,086 | |
3.88%, 08/15/2030 | | | 40,000 | | | | 40,763 | |
| | | | | | | | |
| | | | | | | 77,849 | |
| | | | | | | | |
Diversified Financial Services-1.36% | |
Berkshire Hathaway, Inc. | | | | | | | | |
2.75%, 03/15/2023 | | | 251,000 | | | | 265,550 | |
3.13%, 03/15/2026 | | | 238,000 | | | | 266,505 | |
Equitable Holdings, Inc. | | | | | | | | |
3.90%, 04/20/2023 | | | 76,000 | | | | 81,927 | |
4.35%, 04/20/2028 | | | 81,000 | | | | 92,701 | |
Voya Financial, Inc., 3.65%, 06/15/2026 | | | 135,000 | | | | 153,026 | |
| | | | | | | | |
| | | | | | | 859,709 | |
| | | | | | | | |
| | | | | | | | |
| | | Principal
Amount | | | Value | |
Diversified Telecommunication Services-1.79% | |
AT&T, Inc. | | | | | | | | |
3.40%, 05/15/2025 | | $ | 260,000 | | | $ | 289,510 | |
4.30%, 02/15/2030 | | | 250,000 | | | | 298,937 | |
Verizon Communications, Inc. | | | | | | | | |
5.15%, 09/15/2023 | | | 243,000 | | | | 276,601 | |
4.33%, 09/21/2028 | | | 215,000 | | | | 260,519 | |
| | | | | | | | |
| | | | | | | 1,125,567 | |
| | | | | | | | |
Electric Utilities-4.09% | | | | | | | | |
American Electric Power Co., Inc., 3.20%, 11/13/2027 | | | 86,000 | | | | 94,827 | |
Avangrid, Inc. | | | | | | | | |
3.15%, 12/01/2024 | | | 53,000 | | | | 58,052 | |
3.80%, 06/01/2029 | | | 48,000 | | | | 56,141 | |
Consolidated Edison Co. of New York, Inc., Series D, 4.00%, 12/01/2028 | | | 61,000 | | | | 72,777 | |
Duke Energy Corp. | | | | | | | | |
3.75%, 04/15/2024 | | | 119,000 | | | | 131,240 | |
2.65%, 09/01/2026 | | | 121,000 | | | | 132,147 | |
Edison International, 4.13%, 03/15/2028 | | | 91,000 | | | | 95,131 | |
Entergy Corp. | | | | | | | | |
4.00%, 07/15/2022 | | | 63,000 | | | | 66,873 | |
2.95%, 09/01/2026 | | | 55,000 | | | | 61,212 | |
Evergy, Inc. | | | | | | | | |
2.45%, 09/15/2024 | | | 40,000 | | | | 42,503 | |
2.90%, 09/15/2029 | | | 50,000 | | | | 54,247 | |
Eversource Energy, Series K, 2.75%, 03/15/2022 | | | 62,000 | | | | 64,120 | |
Exelon Corp. | | | | | | | | |
3.50%, 06/01/2022 | | | 79,000 | | | | 82,743 | |
4.05%, 04/15/2030 | | | 105,000 | | | | 124,668 | |
FirstEnergy Corp. | | | | | | | | |
Series B, 4.25%, 03/15/2023 | | | 73,000 | | | | 77,487 | |
Series B, 3.90%, 07/15/2027 | | | 68,000 | | | | 74,737 | |
Interstate Power and Light Co. | | | | | | | | |
3.25%, 12/01/2024 | | | 44,000 | | | | 48,568 | |
4.10%, 09/26/2028 | | | 33,000 | | | | 39,316 | |
NextEra Energy Capital Holdings, Inc. | | | | | | | | |
2.75%, 05/01/2025 | | | 100,000 | | | | 108,757 | |
2.25%, 06/01/2030 | | | 101,000 | | | | 106,124 | |
NSTAR Electric Co., 3.20%, 05/15/2027 | | | 53,000 | | | | 59,819 | |
Ohio Power Co., Series M, 5.38%, 10/01/2021 | | | 86,000 | | | | 90,741 | |
Pinnacle West Capital Corp., 1.30%, 06/15/2025 | | | 100,000 | | | | 102,097 | |
PPL Capital Funding, Inc. | | | | | | | | |
3.40%, 06/01/2023 | | | 79,000 | | | | 84,279 | |
4.13%, 04/15/2030 | | | 75,000 | | | | 88,860 | |
Southern California Edison Co., Series E, 3.70%, 08/01/2025 | | | 70,000 | | | | 78,080 | |
Southern Co. (The) | | | | | | | | |
2.35%, 07/01/2021 | | | 111,000 | | | | 112,650 | |
3.25%, 07/01/2026 | | | 108,000 | | | | 121,278 | |
Virginia Electric & Power Co., Series C, 2.75%, 03/15/2023 | | | 99,000 | | | | 104,138 | |
Xcel Energy, Inc. | | | | | | | | |
3.30%, 06/01/2025 | | | 60,000 | | | | 66,576 | |
4.00%, 06/15/2028 | | | 65,000 | | | | 76,675 | |
| | | | | | | | |
| | | | | | | 2,576,863 | |
| | | | | | | | |
See accompanying Notes to Financial Statements which are an integral part of the financial statements.
Invesco Fundamental Investment Grade Corporate Bond ETF (PFIG)—(continued)
August 31, 2020
| | | | | | | | |
| | | Principal
Amount | | | Value | |
Electrical Equipment-0.57% | | | | | |
Eaton Corp. | | | | | | | | |
2.75%, 11/02/2022 | | $ | 81,000 | | | $ | 85,088 | |
3.10%, 09/15/2027 | | | 74,000 | | | | 82,507 | |
Emerson Electric Co. | | | | | | | | |
3.15%, 06/01/2025 | | | 88,000 | | | | 98,030 | |
1.80%, 10/15/2027 | | | 90,000 | | | | 94,778 | |
| | | | | | | | |
| | | | | | | 360,403 | |
| | | | | | | | |
Electronic Equipment, Instruments & Components-1.24% | |
Amphenol Corp., 2.80%, 02/15/2030 | | | 95,000 | | | | 104,396 | |
Arrow Electronics, Inc. | | | | | | | | |
3.25%, 09/08/2024 | | | 68,000 | | | | 73,150 | |
3.88%, 01/12/2028 | | | 68,000 | | | | 74,471 | |
Avnet, Inc., 4.63%, 04/15/2026 | | | 96,000 | | | | 107,044 | |
Flex Ltd. | | | | | | | | |
4.75%, 06/15/2025 | | | 63,000 | | | | 70,703 | |
4.88%, 06/15/2029 | | | 60,000 | | | | 69,058 | |
FLIR Systems, Inc., 2.50%, 08/01/2030 | | | 50,000 | | | | 51,371 | |
Jabil, Inc. | | | | | | | | |
4.70%, 09/15/2022 | | | 48,000 | | | | 51,648 | |
3.95%, 01/12/2028 | | | 53,000 | | | | 58,389 | |
Keysight Technologies, Inc. | | | | | | | | |
4.55%, 10/30/2024 | | | 20,000 | | | | 22,618 | |
4.60%, 04/06/2027 | | | 28,000 | | | | 33,025 | |
Trimble, Inc., 4.90%, 06/15/2028 | | | 53,000 | | | | 63,415 | |
| | | | | | | | |
| | | | | | | 779,288 | |
| | | | | | | | |
Energy Equipment & Services-0.84% | |
Halliburton Co. | | | | | | | | |
3.50%, 08/01/2023 | | | 70,000 | | | | 74,653 | |
3.80%, 11/15/2025 | | | 73,000 | | | | 80,152 | |
National Oilwell Varco, Inc., 3.60%, 12/01/2029 | | | 133,000 | | | | 131,228 | |
Schlumberger Investment S.A. | | | | | | | | |
3.65%, 12/01/2023 | | | 109,000 | | | | 118,284 | |
2.65%, 06/26/2030 | | | 120,000 | | | | 122,839 | |
| | | | | | | | |
| | | | | | | 527,156 | |
| | | | | | | | |
Entertainment-0.85% | | | | | | | | |
Activision Blizzard, Inc. | | | | | | | | |
2.30%, 09/15/2021 | | | 48,000 | | | | 48,890 | |
3.40%, 09/15/2026 | | | 93,000 | | | | 106,634 | |
Electronic Arts, Inc., 3.70%, 03/01/2021 | | | 81,000 | | | | 82,105 | |
Walt Disney Co. (The) | | | | | | | | |
1.75%, 08/30/2024(c) | | | 139,000 | | | | 144,828 | |
2.00%, 09/01/2029 | | | 149,000 | | | | 155,249 | |
| | | | | | | | |
| | | | | | | 537,706 | |
| | | | | | | | |
Equity REITs-5.73% | | | | | | | | |
Alexandria Real Estate Equities, Inc. | | | | | | | | |
3.45%, 04/30/2025 | | | 53,000 | | | | 59,052 | |
4.90%, 12/15/2030 | | | 30,000 | | | | 38,198 | |
American Homes 4 Rent L.P., 4.25%, 02/15/2028 | | | 48,000 | | | | 54,765 | |
American Tower Corp. | | | | | | | | |
3.50%, 01/31/2023 | | | 69,000 | | | | 73,780 | |
3.80%, 08/15/2029 | | | 63,000 | | | | 73,013 | |
AvalonBay Communities, Inc. | | | | | | | | |
3.45%, 06/01/2025 | | | 50,000 | | | | 56,103 | |
2.30%, 03/01/2030 | | | 45,000 | | | | 47,706 | |
| | | | | | | | |
| | | Principal
Amount | | | Value | |
Equity REITs-(continued) | | | | | | | | |
Boston Properties L.P. | | | | | | | | |
4.13%, 05/15/2021 | | $ | 56,000 | | | $ | 56,924 | |
3.25%, 01/30/2031 | | | 60,000 | | | | 65,582 | |
Brixmor Operating Partnership L.P. | | | | | | | | |
3.85%, 02/01/2025 | | | 34,000 | | | | 36,081 | |
4.13%, 05/15/2029 | | | 30,000 | | | | 32,560 | |
Camden Property Trust, 2.80%, 05/15/2030 | | | 70,000 | | | | 76,919 | |
CBRE Services, Inc., 4.88%, 03/01/2026 | | | 105,000 | | | | 121,898 | |
Crown Castle International Corp. | | | | | | | | |
5.25%, 01/15/2023 | | | 66,000 | | | | 73,172 | |
3.65%, 09/01/2027 | | | 66,000 | | | | 74,895 | |
Digital Realty Trust L.P., 3.70%, 08/15/2027 | | | 98,000 | | | | 112,056 | |
EPR Properties, 3.75%, 08/15/2029 | | | 68,000 | | | | 60,189 | |
Equinix, Inc. | | | | | | | | |
2.63%, 11/18/2024 | | | 50,000 | | | | 53,606 | |
3.20%, 11/18/2029 | | | 50,000 | | | | 55,240 | |
ERP Operating L.P. | | | | | | | | |
4.63%, 12/15/2021 | | | 58,000 | | | | 60,500 | |
2.85%, 11/01/2026 | | | 63,000 | | | | 69,865 | |
Essex Portfolio L.P. | | | | | | | | |
3.50%, 04/01/2025 | | | 40,000 | | | | 44,286 | |
3.00%, 01/15/2030 | | | 40,000 | | | | 43,413 | |
Federal Realty Investment Trust, 3.95%, 01/15/2024 | | | 75,000 | | | | 81,518 | |
Healthcare Trust of America Holdings L.P., 3.10%, 02/15/2030 | | | 58,000 | | | | 61,409 | |
Healthpeak Properties, Inc. | | | | | | | | |
3.88%, 08/15/2024 | | | 48,000 | | | | 53,560 | |
3.50%, 07/15/2029 | | | 43,000 | | | | 48,356 | |
Host Hotels & Resorts L.P. | | | | | | | | |
Series E, 4.00%, 06/15/2025 | | | 60,000 | | | | 62,774 | |
Series H, 3.38%, 12/15/2029 | | | 64,000 | | | | 62,298 | |
Hudson Pacific Properties L.P., 4.65%, 04/01/2029 | | | 43,000 | | | | 48,583 | |
Kilroy Realty L.P., 3.05%, 02/15/2030 | | | 58,000 | | | | 60,390 | |
Kimco Realty Corp. | | | | | | | | |
3.30%, 02/01/2025 | | | 33,000 | | | | 35,458 | |
2.80%, 10/01/2026 | | | 40,000 | | | | 41,989 | |
LifeStorage L.P., 3.50%, 07/01/2026 | | | 50,000 | | | | 54,847 | |
Mid-America Apartments L.P., 3.60%, 06/01/2027 | | | 74,000 | | | | 83,266 | |
Omega Healthcare Investors, Inc. | | | | | | | | |
4.38%, 08/01/2023 | | | 31,000 | | | | 33,386 | |
5.25%, 01/15/2026 | | | 28,000 | | | | 30,753 | |
Prologis L.P. | | | | | | | | |
4.25%, 08/15/2023 | | | 19,000 | | | | 20,967 | |
2.25%, 04/15/2030 | | | 120,000 | | | | 128,108 | |
Public Storage | | | | | | | | |
2.37%, 09/15/2022 | | | 58,000 | | | | 60,287 | |
3.09%, 09/15/2027 | | | 56,000 | | | | 63,535 | |
Realty Income Corp. | | | | | | | | |
3.25%, 10/15/2022 | | | 41,000 | | | | 43,152 | |
3.25%, 01/15/2031 | | | 40,000 | | | | 44,489 | |
Regency Centers L.P., 3.60%, 02/01/2027 | | | 67,000 | | | | 71,940 | |
Simon Property Group L.P. | | | | | | | | |
2.00%, 09/13/2024 | | | 86,000 | | | | 88,999 | |
2.45%, 09/13/2029 | | | 76,000 | | | | 75,975 | |
SL Green Operating Partnership L.P., 3.25%, 10/15/2022 | | | 78,000 | | | | 79,702 | |
See accompanying Notes to Financial Statements which are an integral part of the financial statements.
Invesco Fundamental Investment Grade Corporate Bond ETF (PFIG)—(continued)
August 31, 2020
| | | | | | | | |
| | | Principal
Amount | | | Value | |
Equity REITs-(continued) | |
Spirit Realty L.P., 3.40%, 01/15/2030 | | $ | 63,000 | | | $ | 62,841 | |
UDR, Inc., 3.20%, 01/15/2030 | | | 70,000 | | | | 77,928 | |
Ventas Realty L.P., 4.40%, 01/15/2029 | | | 54,000 | | | | 60,637 | |
Ventas Realty L.P./Ventas Capital Corp., 3.25%, 08/15/2022 | | | 68,000 | | | | 70,345 | |
VEREIT Operating Partnership L.P. | | | | | | | | |
4.60%, 02/06/2024 | | | 61,000 | | | | 65,701 | |
4.88%, 06/01/2026 | | | 43,000 | | | | 48,035 | |
Welltower, Inc. | | | | | | | | |
4.00%, 06/01/2025 | | | 71,000 | | | | 80,040 | |
3.10%, 01/15/2030 | | | 70,000 | | | | 73,752 | |
Weyerhaeuser Co. | | | | | | | | |
4.63%, 09/15/2023 | | | 52,000 | | | | 57,977 | |
4.00%, 11/15/2029 | | | 53,000 | | | | 60,990 | |
WP Carey, Inc., 4.60%, 04/01/2024 | | | 69,000 | | | | 75,927 | |
| | | | | | | | |
| | | | | | | 3,609,717 | |
| | | | | | | | |
Food & Staples Retailing-2.69% | |
Costco Wholesale Corp. | | | | | | | | |
2.75%, 05/18/2024 | | | 119,000 | | | | 128,813 | |
1.60%, 04/20/2030 | | | 145,000 | | | | 147,994 | |
Kroger Co. (The) | | | | | | | | |
3.85%, 08/01/2023 | | | 93,000 | | | | 101,107 | |
2.65%, 10/15/2026 | | | 117,000 | | | | 128,088 | |
Sysco Corp. | | | | | | | | |
2.60%, 10/01/2020 | | | 91,000 | | | | 91,000 | |
5.65%, 04/01/2025 | | | 75,000 | | | | 88,831 | |
5.95%, 04/01/2030 | | | 80,000 | | | | 101,158 | |
Walgreens Boots Alliance, Inc. | | | | | | | | |
3.80%, 11/18/2024 | | | 122,000 | | | | 134,891 | |
3.45%, 06/01/2026 | | | 134,000 | | | | 147,446 | |
Walmart, Inc. | | | | | | | | |
3.40%, 06/26/2023 | | | 283,000 | | | | 306,941 | |
3.70%, 06/26/2028 | | | 268,000 | | | | 317,600 | |
| | | | | | | | |
| | | | | | | 1,693,869 | |
| | | | | | | | |
Food Products-2.73% | |
Archer-Daniels-Midland Co. | | | | | | | | |
2.75%, 03/27/2025 | | | 90,000 | | | | 98,166 | |
2.50%, 08/11/2026 | | | 90,000 | | | | 98,172 | |
Bunge Ltd. Finance Corp. | | | | | | | | |
3.50%, 11/24/2020 | | | 79,000 | | | | 79,456 | |
3.25%, 08/15/2026 | | | 79,000 | | | | 84,847 | |
Campbell Soup Co. | | | | | | | | |
3.95%, 03/15/2025 | | | 50,000 | | | | 56,419 | |
4.15%, 03/15/2028 | | | 43,000 | | | | 50,284 | |
Conagra Brands, Inc. | | | | | | | | |
3.80%, 10/22/2021 | | | 53,000 | | | | 55,003 | |
4.85%, 11/01/2028 | | | 40,000 | | | | 48,963 | |
General Mills, Inc. | | | | | | | | |
3.15%, 12/15/2021 | | | 83,000 | | | | 85,369 | |
4.20%, 04/17/2028 | | | 71,000 | | | | 84,302 | |
Hershey Co. (The) | | | | | | | | |
3.38%, 05/15/2023 | | | 50,000 | | | | 53,936 | |
2.30%, 08/15/2026 | | | 58,000 | | | | 62,942 | |
Hormel Foods Corp., 1.80%, 06/11/2030 | | | 100,000 | | | | 103,617 | |
Ingredion, Inc., 3.20%, 10/01/2026 | | | 73,000 | | | | 80,905 | |
JM Smucker Co. (The) | | | | | | | | |
3.50%, 03/15/2025 | | | 43,000 | | | | 48,336 | |
2.38%, 03/15/2030 | | | 50,000 | | | | 52,191 | |
| | | | | | | | |
| | | Principal
Amount | | | Value | |
Food Products-(continued) | |
Kellogg Co. | | | | | | | | |
4.00%, 12/15/2020 | | $ | 68,000 | | | $ | 68,721 | |
3.25%, 04/01/2026 | | | 61,000 | | | | 68,768 | |
McCormick & Co., Inc. | | | | | | | | |
2.70%, 08/15/2022 | | | 33,000 | | | | 34,394 | |
3.40%, 08/15/2027 | | | 33,000 | | | | 37,312 | |
Mondelez International, Inc. | | | | | | | | |
4.00%, 02/01/2024 | | | 91,000 | | | | 101,240 | |
2.75%, 04/13/2030 | | | 90,000 | | | | 98,707 | |
Tyson Foods, Inc. | | | | | | | | |
3.95%, 08/15/2024 | | | 76,000 | | | | 84,715 | |
3.55%, 06/02/2027 | | | 76,000 | | | | 86,141 | |
| | | | | | | | |
| | | | | | | 1,722,906 | |
| | | | | | | | |
Gas Utilities-0.22% | | | | | | | | |
Atmos Energy Corp., 3.00%, 06/15/2027 | | | 71,000 | | | | 79,051 | |
National Fuel Gas Co., 3.75%, 03/01/2023 | | | 60,000 | | | | 62,129 | |
| | | | | | | | |
| | | | | | | 141,180 | |
| | | | | | | | |
Health Care Equipment & Supplies-1.25% | |
Abbott Laboratories | | | | | | | | |
3.40%, 11/30/2023 | | | 91,000 | | | | 99,679 | |
3.75%, 11/30/2026 | | | 87,000 | | | | 101,903 | |
Baxter International, Inc., 2.60%, 08/15/2026 | | | 104,000 | | | | 114,119 | |
Boston Scientific Corp. | | | | | | | | |
3.45%, 03/01/2024 | | | 50,000 | | | | 54,458 | |
2.65%, 06/01/2030 | | | 50,000 | | | | 53,376 | |
DENTSPLY SIRONA, Inc., 3.25%, 06/01/2030 | | | 50,000 | | | | 54,281 | |
Edwards Lifesciences Corp., 4.30%, 06/15/2028 | | | 57,000 | | | | 68,922 | |
Stryker Corp. | | | | | | | | |
2.63%, 03/15/2021 | | | 66,000 | | | | 66,622 | |
3.50%, 03/15/2026 | | | 64,000 | | | | 72,604 | |
Zimmer Biomet Holdings, Inc. | | | | | | | | |
3.55%, 04/01/2025 | | | 43,000 | | | | 47,821 | |
3.55%, 03/20/2030 | | | 50,000 | | | | 55,896 | |
| | | | | | | | |
| | | | | | | 789,681 | |
| | | | | | | | |
Health Care Providers & Services-4.14% | |
AmerisourceBergen Corp. | | | | | | | | |
3.25%, 03/01/2025 | | | 110,000 | | | | 121,061 | |
3.45%, 12/15/2027 | | | 116,000 | | | | 133,138 | |
Anthem, Inc. | | | | | | | | |
2.38%, 01/15/2025 | | | 125,000 | | | | 133,482 | |
3.65%, 12/01/2027 | | | 125,000 | | | | 143,639 | |
Cardinal Health, Inc. | | | | | | | | |
2.62%, 06/15/2022 | | | 115,000 | | | | 118,944 | |
3.41%, 06/15/2027 | | | 109,000 | | | | 122,241 | |
Cigna Corp. | | | | | | | | |
3.75%, 07/15/2023 | | | 91,000 | | | | 99,127 | |
4.38%, 10/15/2028 | | | 84,000 | | | | 100,689 | |
CVS Health Corp. | | | | | | | | |
3.70%, 03/09/2023 | | | 142,000 | | | | 152,940 | |
4.30%, 03/25/2028 | | | 150,000 | | | | 176,701 | |
DH Europe Finance II S.a.r.l. | | | | | | | | |
2.20%, 11/15/2024 | | | 73,000 | | | | 77,386 | |
2.60%, 11/15/2029 | | | 56,000 | | | | 61,118 | |
HCA, Inc. | | | | | | | | |
5.00%, 03/15/2024 | | | 65,000 | | | | 73,508 | |
4.13%, 06/15/2029 | | | 90,000 | | | | 103,809 | |
See accompanying Notes to Financial Statements which are an integral part of the financial statements.
Invesco Fundamental Investment Grade Corporate Bond ETF (PFIG)—(continued)
August 31, 2020
| | | | | | | | |
| | | Principal
Amount | | | Value | |
Health Care Providers & Services-(continued) | |
Humana, Inc. | | | | | | | | |
3.15%, 12/01/2022 | | $ | 80,000 | | | $ | 84,215 | |
3.95%, 03/15/2027 | | | 74,000 | | | | 85,274 | |
Laboratory Corp. of America Holdings | | | | | | | | |
3.60%, 02/01/2025 | | | 33,000 | | | | 36,815 | |
2.95%, 12/01/2029 | | | 55,000 | | | | 60,280 | |
McKesson Corp. | | | | | | | | |
3.80%, 03/15/2024 | | | 135,000 | | | | 148,335 | |
3.95%, 02/16/2028 | | | 129,000 | | | | 151,328 | |
Quest Diagnostics, Inc. | | | | | | | | |
4.70%, 04/01/2021 | | | 44,000 | | | | 45,135 | |
2.95%, 06/30/2030 | | | 45,000 | | | | 49,228 | |
UnitedHealth Group, Inc. | | | | | | | | |
3.75%, 07/15/2025 | | | 144,000 | | | | 165,184 | |
2.00%, 05/15/2030 | | | 160,000 | | | | 167,959 | |
| | | | | | | | |
| | | | | | | 2,611,536 | |
| | | | | | | | |
Hotels, Restaurants & Leisure-1.46% | |
Darden Restaurants, Inc., 3.85%, 05/01/2027 | | | 99,000 | | | | 102,222 | |
Las Vegas Sands Corp. | | | | | | | | |
3.20%, 08/08/2024 | | | 101,000 | | | | 102,349 | |
3.50%, 08/18/2026 | | | 106,000 | | | | 108,219 | |
Marriott International, Inc. | | | | | | | | |
4.63%, 06/15/2030 | | | 60,000 | | | | 65,865 | |
Series EE, 5.75%, 05/01/2025 | | | 45,000 | | | | 50,587 | |
McDonald’s Corp. | | | | | | | | |
2.63%, 01/15/2022 | | | 129,000 | | | | 133,146 | |
3.70%, 01/30/2026 | | | 127,000 | | | | 145,252 | |
Starbucks Corp. | | | | | | | | |
3.80%, 08/15/2025 | | | 101,000 | | | | 114,950 | |
2.55%, 11/15/2030 | | | 90,000 | | | | 95,677 | |
| | | | | | | | |
| | | | | | | 918,267 | |
| | | | | | | | |
Household Durables-0.80% | |
D.R. Horton, Inc., 2.50%, 10/15/2024 | | | 90,000 | | | | 96,043 | |
Leggett & Platt, Inc., 3.50%, 11/15/2027 | | | 70,000 | | | | 73,537 | |
Mohawk Industries, Inc. | | | | | | | | |
3.85%, 02/01/2023 | | | 46,000 | | | | 48,937 | |
3.63%, 05/15/2030 | | | 55,000 | | | | 58,996 | |
NVR, Inc. | | | | | | | | |
3.95%, 09/15/2022 | | | 40,000 | | | | 42,356 | |
3.00%, 05/15/2030 | | | 40,000 | | | | 43,451 | |
Whirlpool Corp., 4.75%, 02/26/2029 | | | 114,000 | | | | 139,861 | |
| | | | | | | | |
| | | | | | | 503,181 | |
| | | | | | | | |
Household Products-1.34% | |
Clorox Co. (The) | | | | | | | | |
3.05%, 09/15/2022 | | | 47,000 | | | | 49,310 | |
3.90%, 05/15/2028 | | | 45,000 | | | | 53,525 | |
Colgate-Palmolive Co., 3.25%, 03/15/2024 | | | 175,000 | | | | 192,455 | |
Kimberly-Clark Corp., 3.20%, 04/25/2029 | | | 147,000 | | | | 169,209 | |
Procter & Gamble Co. (The) | | | | | | | | |
2.15%, 08/11/2022 | | | 185,000 | | | | 191,978 | |
3.00%, 03/25/2030 | | | 165,000 | | | | 190,952 | |
| | | | | | | | |
| | | | | | | 847,429 | |
| | | | | | | | |
Industrial Conglomerates-1.37% | |
3M Co. | | | | | | | | |
3.25%, 02/14/2024 | | | 114,000 | | | | 124,500 | |
2.88%, 10/15/2027 | | | 113,000 | | | | 127,240 | |
| | | | | | | | |
| | | Principal
Amount | | | Value | |
Industrial Conglomerates-(continued) | |
Carlisle Cos., Inc., 2.75%, 03/01/2030 | | $ | 70,000 | | | $ | 74,333 | |
GE Capital International Funding Co. Unlimited Co., 2.34%, 11/15/2020 | | | 215,000 | | | | 215,875 | |
Honeywell International, Inc. | | | | | | | | |
1.85%, 11/01/2021 | | | 113,000 | | | | 114,906 | |
2.50%, 11/01/2026 | | | 108,000 | | | | 119,063 | |
Roper Technologies, Inc. | | | | | | | | |
3.00%, 12/15/2020 | | | 39,000 | | | | 39,209 | |
3.80%, 12/15/2026 | | | 42,000 | | | | 48,710 | |
| | | | | | | | |
| | | | | | | 863,836 | |
| | | | | | | | |
Insurance-6.48% | | | | | | | | |
Aflac, Inc. | | | | | | | | |
3.63%, 11/15/2024 | | | 101,000 | | | | 114,235 | |
3.60%, 04/01/2030 | | | 90,000 | | | | 105,645 | |
Alleghany Corp., 3.63%, 05/15/2030 | | | 75,000 | | | | 84,293 | |
Allstate Corp. (The) | | | | | | | | |
3.15%, 06/15/2023 | | | 86,000 | | | | 92,777 | |
3.28%, 12/15/2026 | | | 91,000 | | | | 105,191 | |
American International Group, Inc. | | | | | | | | |
4.88%, 06/01/2022 | | | 143,000 | | | | 153,931 | |
3.90%, 04/01/2026 | | | 139,000 | | | | 159,101 | |
Aon Corp., 2.80%, 05/15/2030 | | | 75,000 | | | | 81,442 | |
Aon PLC, 3.50%, 06/14/2024 | | | 53,000 | | | | 58,300 | |
Brighthouse Financial, Inc., 3.70%, 06/22/2027 | | | 162,000 | | | | 170,591 | |
Brown & Brown, Inc., 4.20%, 09/15/2024 | | | 56,000 | | | | 62,156 | |
Chubb INA Holdings, Inc. | | | | | | | | |
2.30%, 11/03/2020 | | | 118,000 | | | | 118,213 | |
3.35%, 05/03/2026 | | | 96,000 | | | | 109,906 | |
CNA Financial Corp. | | | | | | | | |
3.95%, 05/15/2024 | | | 67,000 | | | | 74,059 | |
3.90%, 05/01/2029 | | | 57,000 | | | | 65,189 | |
CNO Financial Group, Inc. | | | | | | | | |
5.25%, 05/30/2025 | | | 30,000 | | | | 34,315 | |
5.25%, 05/30/2029 | | | 38,000 | | | | 44,380 | |
Fidelity National Financial, Inc., 3.40%, 06/15/2030 | | | 80,000 | | | | 86,543 | |
Globe Life, Inc., 4.55%, 09/15/2028 | | | 66,000 | | | | 78,524 | |
Hartford Financial Services Group, Inc. (The), 2.80%, 08/19/2029(c) | | | 124,000 | | | | 134,175 | |
Lincoln National Corp. | | | | | | | | |
4.00%, 09/01/2023 | | | 71,000 | | | | 77,716 | |
3.80%, 03/01/2028 | | | 91,000 | | | | 103,371 | |
Loews Corp. | | | | | | | | |
2.63%, 05/15/2023 | | | 63,000 | | | | 66,382 | |
3.75%, 04/01/2026 | | | 58,000 | | | | 65,888 | |
Marsh & McLennan Cos., Inc. | | | | | | | | |
3.88%, 03/15/2024 | | | 69,000 | | | | 76,604 | |
4.38%, 03/15/2029 | | | 58,000 | | | | 70,692 | |
MetLife, Inc. | | | | | | | | |
3.60%, 04/10/2024 | | | 139,000 | | | | 154,778 | |
4.55%, 03/23/2030 | | | 135,000 | | | | 170,198 | |
Old Republic International Corp., 3.88%, 08/26/2026 | | | 84,000 | | | | 93,316 | |
Principal Financial Group, Inc., 3.70%, 05/15/2029 | | | 167,000 | | | | 194,988 | |
Progressive Corp. (The) | | | | | | | | |
3.75%, 08/23/2021 | | | 76,000 | | | | 78,585 | |
2.45%, 01/15/2027 | | | 73,000 | | | | 79,371 | |
See accompanying Notes to Financial Statements which are an integral part of the financial statements.
Invesco Fundamental Investment Grade Corporate Bond ETF (PFIG)—(continued)
August 31, 2020
| | | | | | | | |
| | | Principal
Amount | | | Value | |
Insurance-(continued) | | | | | | | | |
Prudential Financial, Inc. | | | | | | | | |
3.50%, 05/15/2024 | | $ | 164,000 | | | $ | 182,632 | |
3.88%, 03/27/2028 | | | 157,000 | | | | 184,978 | |
Reinsurance Group of America, Inc., 3.90%, 05/15/2029 | | | 104,000 | | | | 118,002 | |
Travelers Cos., Inc. (The), 3.90%, 11/01/2020 | | | 210,000 | | | | 211,298 | |
Unum Group, 4.50%, 03/15/2025 | | | 110,000 | | | | 122,293 | |
Willis North America, Inc. | | | | | | | | |
3.60%, 05/15/2024 | | | 42,000 | | | | 46,014 | |
2.95%, 09/15/2029 | | | 50,000 | | | | 54,300 | |
| | | | | | | | |
| | | | | | | 4,084,372 | |
| | | | | | | | |
Interactive Media & Services-0.64% | | | | | | | | |
Alphabet, Inc. | | | | | | | | |
0.45%, 08/15/2025 | | | 200,000 | | | | 200,091 | |
2.00%, 08/15/2026 | | | 187,000 | | | | 201,120 | |
| | | | | | | | |
| | | | | | | 401,211 | |
| | | | | | | | |
Internet & Direct Marketing Retail-1.13% | |
Amazon.com, Inc. | | | | | | | | |
2.80%, 08/22/2024 | | | 160,000 | | | | 174,352 | |
3.15%, 08/22/2027 | | | 155,000 | | | | 177,505 | |
Booking Holdings, Inc. | | | | | | | | |
4.10%, 04/13/2025 | | | 61,000 | | | | 69,291 | |
4.63%, 04/13/2030 | | | 65,000 | | | | 78,665 | |
eBay, Inc. | | | | | | | | |
2.60%, 07/15/2022 | | | 58,000 | | | | 60,008 | |
3.60%, 06/05/2027 | | | 50,000 | | | | 56,589 | |
Expedia Group, Inc. | | | | | | | | |
4.50%, 08/15/2024(c) | | | 43,000 | | | | 45,210 | |
3.80%, 02/15/2028 | | | 48,000 | | | | 47,989 | |
| | | | | | | | |
| | | | | | | 709,609 | |
| | | | | | | | |
IT Services-2.75% | | | | | | | | |
Amdocs Ltd., 2.54%, 06/15/2030 | | | 70,000 | | | | 73,040 | |
Automatic Data Processing, Inc., 3.38%, 09/15/2025 | | | 106,000 | | | | 119,951 | |
Broadridge Financial Solutions, Inc., 2.90%, 12/01/2029 | | | 57,000 | | | | 62,276 | |
DXC Technology Co., 4.25%, 04/15/2024 | | | 128,000 | | | | 139,293 | |
Fidelity National Information Services, Inc. | | | | | | | | |
3.50%, 04/15/2023 | | | 58,000 | | | | 61,953 | |
3.00%, 08/15/2026 | | | 52,000 | | | | 58,206 | |
Fiserv, Inc. | | | | | | | | |
2.75%, 07/01/2024 | | | 44,000 | | | | 47,281 | |
3.50%, 07/01/2029 | | | 38,000 | | | | 43,313 | |
Global Payments, Inc. | | | | | | | | |
4.00%, 06/01/2023 | | | 30,000 | | | | 32,647 | |
3.20%, 08/15/2029 | | | 33,000 | | | | 36,257 | |
International Business Machines Corp. | | | | | | | | |
3.00%, 05/15/2024 | | | 167,000 | | | | 181,687 | |
3.50%, 05/15/2029 | | | 175,000 | | | | 203,275 | |
Leidos, Inc. | | | | | | | | |
2.95%, 05/15/2023(b) | | | 50,000 | | | | 52,806 | |
4.38%, 05/15/2030(b) | | | 40,000 | | | | 46,878 | |
Mastercard, Inc. | | | | | | | | |
3.38%, 04/01/2024 | | | 53,000 | | | | 58,585 | |
3.35%, 03/26/2030 | | | 75,000 | | | | 88,226 | |
| | | | | | | | |
| | | Principal
Amount | | | Value | |
IT Services-(continued) | | | | | | | | |
PayPal Holdings, Inc. | | | | | | | | |
2.40%, 10/01/2024 | | $ | 65,000 | | | $ | 69,442 | |
2.85%, 10/01/2029 | | | 55,000 | | | | 61,066 | |
Visa, Inc. | | | | | | | | |
2.20%, 12/14/2020 | | | 100,000 | | | | 100,361 | |
3.15%, 12/14/2025 | | | 96,000 | | | | 108,007 | |
Western Union Co. (The), 3.60%, 03/15/2022 | | | 86,000 | | | | 89,591 | |
| | | | | | | | |
| | | | | | | 1,734,141 | |
| | | | | | | | |
Leisure Products-0.11% | | | | | | | | |
Hasbro, Inc. | | | | | | | | |
3.00%, 11/19/2024 | | | 43,000 | | | | 45,603 | |
3.90%, 11/19/2029 | | | 23,000 | | | | 24,206 | |
| | | | | | | | |
| | | | | | | 69,809 | |
| | | | | | | | |
Life Sciences Tools & Services-0.45% | |
Agilent Technologies, Inc. | | | | | | | | |
3.88%, 07/15/2023 | | | 38,000 | | | | 41,290 | |
2.75%, 09/15/2029 | | | 38,000 | | | | 41,233 | |
PerkinElmer, Inc., 3.30%, 09/15/2029 | | | 43,000 | | | | 47,839 | |
Thermo Fisher Scientific, Inc. | | | | | | | | |
4.15%, 02/01/2024 | | | 66,000 | | | | 73,260 | |
2.95%, 09/19/2026 | | | 71,000 | | | | 79,491 | |
| | | | | | | | |
| | | | | | | 283,113 | |
| | | | | | | | |
Machinery-2.22% | | | | | | | | |
Caterpillar, Inc. | | | | | | | | |
3.90%, 05/27/2021 | | | 89,000 | | | | 91,382 | |
2.60%, 09/19/2029 | | | 119,000 | | | | 130,906 | |
Cummins, Inc., 3.65%, 10/01/2023 | | | 141,000 | | | | 154,013 | |
Flowserve Corp., 3.50%, 09/15/2022 | | | 58,000 | | | | 60,270 | |
Fortive Corp. | | | | | | | | |
2.35%, 06/15/2021 | | | 44,000 | | | | 44,586 | |
3.15%, 06/15/2026 | | | 43,000 | | | | 47,613 | |
IDEX Corp., 3.00%, 05/01/2030 | | | 60,000 | | | | 65,645 | |
Illinois Tool Works, Inc. | | | | | | | | |
3.50%, 03/01/2024 | | | 66,000 | | | | 72,488 | |
2.65%, 11/15/2026 | | | 68,000 | | | | 75,644 | |
John Deere Capital Corp. | | | | | | | | |
3.45%, 03/13/2025 | | | 96,000 | | | | 108,256 | |
2.80%, 07/18/2029 | | | 95,000 | | | | 106,664 | |
PACCAR Financial Corp., 2.65%, 05/10/2022 | | | 149,000 | | | | 154,985 | |
Parker-Hannifin Corp. | | | | | | | | |
2.70%, 06/14/2024 | | | 58,000 | | | | 62,198 | |
3.25%, 06/14/2029 | | | 37,000 | | | | 41,888 | |
Stanley Black & Decker, Inc. | | | | | | | | |
2.90%, 11/01/2022 | | | 55,000 | | | | 57,993 | |
2.30%, 03/15/2030 | | | 55,000 | | | | 58,537 | |
Xylem, Inc. | | | | | | | | |
4.88%, 10/01/2021 | | | 28,000 | | | | 29,298 | |
3.25%, 11/01/2026 | | | 35,000 | | | | 39,324 | |
| | | | | | | | |
| | | | | | | 1,401,690 | |
| | | | | | | | |
Marine-0.10% | | | | | | | | |
Kirby Corp., 4.20%, 03/01/2028 | | | 58,000 | | | | 61,201 | |
| | | | | | | | |
Media-1.63% | | | | | | | | |
Comcast Corp. | | | | | | | | |
3.70%, 04/15/2024 | | | 169,000 | | | | 187,782 | |
4.15%, 10/15/2028 | | | 162,000 | | | | 196,596 | |
See accompanying Notes to Financial Statements which are an integral part of the financial statements.
Invesco Fundamental Investment Grade Corporate Bond ETF (PFIG)—(continued)
August 31, 2020
| | | | | | | | |
| | | Principal
Amount | | | Value | |
Media-(continued) | | | | | | | | |
Discovery Communications LLC | | | | | | | | |
2.95%, 03/20/2023 | | $ | 58,000 | | | $ | 61,368 | |
3.95%, 03/20/2028 | | | 58,000 | | | | 65,720 | |
Fox Corp. | | | | | | | | |
4.03%, 01/25/2024 | | | 55,000 | | | | 60,799 | |
4.71%, 01/25/2029 | | | 50,000 | | | | 60,154 | |
Interpublic Group of Cos., Inc. (The) | | | | | | | | |
4.20%, 04/15/2024 | | | 42,000 | | | | 46,674 | |
4.75%, 03/30/2030 | | | 65,000 | | | | 78,332 | |
Omnicom Group, Inc./Omnicom Capital, Inc. | | | | | | | | |
3.63%, 05/01/2022 | | | 65,000 | | | | 68,309 | |
3.60%, 04/15/2026 | | | 58,000 | | | | 65,409 | |
ViacomCBS, Inc. | | | | | | | | |
4.75%, 05/15/2025 | | | 75,000 | | | | 86,643 | |
4.95%, 01/15/2031 | | | 40,000 | | | | 47,884 | |
| | | | | | | | |
| | | | | | | 1,025,670 | |
| | | | | | | | |
Metals & Mining-0.70% | | | | | | | | |
Newmont Corp., 2.80%, 10/01/2029 | | | 98,000 | | | | 106,689 | |
Nucor Corp. | | | | | | | | |
4.13%, 09/15/2022 | | | 67,000 | | | | 71,535 | |
3.95%, 05/01/2028 | | | 59,000 | | | | 68,923 | |
Reliance Steel & Aluminum Co. | | | | | | | | |
4.50%, 04/15/2023 | | | 41,000 | | | | 44,262 | |
2.15%, 08/15/2030 | | | 45,000 | | | | 44,713 | |
Steel Dynamics, Inc., 3.45%, 04/15/2030 | | | 96,000 | | | | 105,708 | |
| | | | | | | | |
| | | | | | | 441,830 | |
| | | | | | | | |
Multiline Retail-1.07% | | | | | | | | |
Dollar General Corp. | | | | | | | | |
3.25%, 04/15/2023 | | | 44,000 | | | | 46,773 | |
3.50%, 04/03/2030 | | | 60,000 | | | | 68,771 | |
Dollar Tree, Inc. | | | | | | | | |
3.70%, 05/15/2023 | | | 55,000 | | | | 59,305 | |
4.20%, 05/15/2028 | | | 52,000 | | | | 61,401 | |
Kohl’s Corp., 4.25%, 07/17/2025 | | | 69,000 | | | | 68,161 | |
Nordstrom, Inc. | | | | | | | | |
4.00%, 10/15/2021 | | | 60,000 | | | | 59,997 | |
4.38%, 04/01/2030(c) | | | 73,000 | | | | 59,050 | |
Target Corp. | | | | | | | | |
2.25%, 04/15/2025 | | | 120,000 | | | | 128,842 | |
2.50%, 04/15/2026 | | | 109,000 | | | | 119,643 | |
| | | | | | | | |
| | | | | | | 671,943 | |
| | | | | | | | |
Multi-Utilities-1.59% | | | | | | | | |
Ameren Corp., 3.50%, 01/15/2031 | | | 110,000 | | | | 126,483 | |
Black Hills Corp., 4.25%, 11/30/2023 | | | 53,000 | | | | 58,298 | |
CenterPoint Energy Resources Corp., 4.50%, 01/15/2021 | | | 50,000 | | | | 50,252 | |
Consolidated Edison, Inc., 2.00%, 05/15/2021 | | | 85,000 | | | | 85,899 | |
Dominion Energy, Inc., Series C, 3.38%, 04/01/2030 | | | 115,000 | | | | 131,120 | |
DTE Energy Co., 2.85%, 10/01/2026 | | | 72,000 | | | | 78,714 | |
NiSource, Inc., 3.49%, 05/15/2027 | | | 43,000 | | | | 48,671 | |
PSEG Power LLC, 3.00%, 06/15/2021 | | | 80,000 | | | | 81,496 | |
Public Service Enterprise Group, Inc., 1.60%, 08/15/2030 | | | 80,000 | | | | 79,481 | |
| | | | | | | | |
| | | Principal
Amount | | | Value | |
Multi-Utilities-(continued) | | | | | | | | |
Sempra Energy | | | | | | | | |
2.90%, 02/01/2023 | | $ | 55,000 | | | $ | 57,873 | |
3.40%, 02/01/2028 | | | 71,000 | | | | 79,372 | |
WEC Energy Group, Inc., 3.55%, 06/15/2025 | | | 110,000 | | | | 123,663 | |
| | | | | | | | |
| | | | | | | 1,001,322 | |
| | | | | | | | |
Oil, Gas & Consumable Fuels-5.76% | |
Cheniere Corpus Christi Holdings LLC, 5.88%, 03/31/2025 | | | 40,000 | | | | 46,272 | |
Chevron Corp. | | | | | | | | |
1.55%, 05/11/2025 | | | 220,000 | | | | 229,230 | |
2.95%, 05/16/2026 | | | 212,000 | | | | 236,248 | |
Cimarex Energy Co. | | | | | | | | |
4.38%, 06/01/2024 | | | 21,000 | | | | 22,621 | |
3.90%, 05/15/2027 | | | 23,000 | | | | 23,718 | |
Concho Resources, Inc., 3.75%, 10/01/2027 | | | 91,000 | | | | 99,970 | |
ConocoPhillips Holding Co., 6.95%, 04/15/2029 | | | 200,000 | | | | 279,868 | |
Enable Midstream Partners L.P., 4.40%, 03/15/2027 | | | 90,000 | | | | 88,476 | |
EOG Resources, Inc. | | | | | | | | |
2.63%, 03/15/2023 | | | 71,000 | | | | 74,731 | |
4.15%, 01/15/2026 | | | 64,000 | | | | 74,191 | |
Exxon Mobil Corp. | | | | | | | | |
2.22%, 03/01/2021 | | | 282,000 | | | | 284,311 | |
3.04%, 03/01/2026 | | | 275,000 | | | | 306,573 | |
HollyFrontier Corp., 5.88%, 04/01/2026 | | | 111,000 | | | | 122,179 | |
Kinder Morgan, Inc. | | | | | | | | |
4.30%, 06/01/2025 | | | 94,000 | | | | 106,726 | |
4.30%, 03/01/2028 | | | 85,000 | | | | 98,604 | |
Marathon Oil Corp. | | | | | | | | |
2.80%, 11/01/2022 | | | 63,000 | | | | 64,389 | |
4.40%, 07/15/2027 | | | 68,000 | | | | 69,830 | |
Marathon Petroleum Corp. | | | | | | | | |
4.70%, 05/01/2025 | | | 110,000 | | | | 125,606 | |
5.13%, 12/15/2026 | | | 131,000 | | | | 155,582 | |
Noble Energy, Inc. | | | | | | | | |
3.90%, 11/15/2024 | | | 67,000 | | | | 74,422 | |
3.85%, 01/15/2028 | | | 58,000 | | | | 65,899 | |
ONEOK Partners L.P., 3.38%, 10/01/2022 | | | 59,000 | | | | 61,497 | |
ONEOK, Inc., 4.55%, 07/15/2028 | | | 76,000 | | | | 80,969 | |
Phillips 66 | | | | | | | | |
4.30%, 04/01/2022 | | | 118,000 | | | | 125,079 | |
3.90%, 03/15/2028(c) | | | 119,000 | | | | 134,976 | |
Pioneer Natural Resources Co., 1.90%, 08/15/2030 | | | 100,000 | | | | 97,482 | |
Valero Energy Corp. | | | | | | | | |
3.65%, 03/15/2025 | | | 128,000 | | | | 140,427 | |
3.40%, 09/15/2026 | | | 128,000 | | | | 141,278 | |
Williams Cos., Inc. (The) | | | | | | | | |
3.60%, 03/15/2022 | | | 84,000 | | | | 87,272 | |
3.75%, 06/15/2027 | | | 100,000 | | | | 110,549 | |
| | | | | | | | |
| | | | | | | 3,628,975 | |
| | | | | | | | |
Personal Products-0.16% | | | | | | | | |
Estee Lauder Cos., Inc. (The) | | | | | | | | |
2.00%, 12/01/2024 | | | 40,000 | | | | 42,430 | |
2.38%, 12/01/2029 | | | 53,000 | | | | 56,945 | |
| | | | | | | | |
| | | | | | | 99,375 | |
| | | | | | | | |
See accompanying Notes to Financial Statements which are an integral part of the financial statements.
Invesco Fundamental Investment Grade Corporate Bond ETF (PFIG)—(continued)
August 31, 2020
| | | | | | | | |
| | | Principal
Amount | | | Value | |
Pharmaceuticals-2.85% | | | | | | | | |
Bristol-Myers Squibb Co. | | | | | | | | |
2.90%, 07/26/2024 | | $ | 100,000 | | | $ | 109,102 | |
3.40%, 07/26/2029 | | | 94,000 | | | | 109,912 | |
Eli Lilly and Co. | | | | | | | | |
2.35%, 05/15/2022 | | | 101,000 | | | | 104,681 | |
3.38%, 03/15/2029 | | | 86,000 | | | | 100,283 | |
Johnson & Johnson | | | | | | | | |
2.25%, 03/03/2022 | | | 194,000 | | | | 199,702 | |
2.45%, 03/01/2026 | | | 203,000 | | | | 223,207 | |
Merck & Co., Inc. | | | | | | | | |
2.75%, 02/10/2025 | | | 164,000 | | | | 179,073 | |
3.40%, 03/07/2029 | | | 135,000 | | | | 157,974 | |
Mylan N.V. | | | | | | | | |
3.15%, 06/15/2021 | | | 64,000 | | | | 65,194 | |
3.95%, 06/15/2026 | | | 58,000 | | | | 65,739 | |
Pfizer, Inc. | | | | | | | | |
1.95%, 06/03/2021 | | | 187,000 | | | | 189,535 | |
3.00%, 12/15/2026 | | | 173,000 | | | | 197,396 | |
Zoetis, Inc. | | | | | | | | |
3.25%, 02/01/2023 | | | 43,000 | | | | 45,595 | |
3.00%, 09/12/2027 | | | 45,000 | | | | 50,285 | |
| | | | | | | | |
| | | | | | | 1,797,678 | |
| | | | | | | | |
Professional Services-0.24% | | | | | | | | |
Equifax, Inc. | | | | | | | | |
2.60%, 12/01/2024 | | | 38,000 | | | | 40,655 | |
3.10%, 05/15/2030 | | | 40,000 | | | | 43,779 | |
Verisk Analytics, Inc. | | | | | | | | |
4.00%, 06/15/2025 | | | 30,000 | | | | 34,378 | |
4.13%, 03/15/2029 | | | 30,000 | | | | 35,845 | |
| | | | | | | | |
| | | | | | | 154,657 | |
| | | | | | | | |
Road & Rail-1.12% | | | | | | | | |
CSX Corp. | | | | | | | | |
3.40%, 08/01/2024 | | | 66,000 | | | | 73,280 | |
3.25%, 06/01/2027 | | | 72,000 | | | | 81,432 | |
J.B. Hunt Transport Services, Inc., 3.88%, 03/01/2026 | | | 70,000 | | | | 81,065 | |
Norfolk Southern Corp. | | | | | | | | |
3.00%, 04/01/2022 | | | 71,000 | | | | 73,458 | |
2.90%, 06/15/2026 | | | 73,000 | | | | 81,286 | |
Ryder System, Inc., 3.65%, 03/18/2024 | | | 91,000 | | | | 99,367 | |
Union Pacific Corp. | | | | | | | | |
4.16%, 07/15/2022 | | | 84,000 | | | | 89,254 | |
3.95%, 09/10/2028 | | | 104,000 | | | | 123,880 | |
| | | | | | | | |
| | | | | | | 703,022 | |
| | | | | | | | |
Semiconductors & Semiconductor Equipment-2.97% | |
Analog Devices, Inc. | | | | | | | | |
2.88%, 06/01/2023 | | | 52,000 | | | | 55,075 | |
3.90%, 12/15/2025 | | | 43,000 | | | | 49,456 | |
Applied Materials, Inc., 3.30%, 04/01/2027 | | | 115,000 | | | | 131,644 | |
Broadcom Corp./Broadcom Cayman Finance Ltd. | | | | | | | | |
3.63%, 01/15/2024 | | | 80,000 | | | | 86,469 | |
3.88%, 01/15/2027 | | | 88,000 | | | | 97,684 | |
Intel Corp. | | | | | | | | |
3.70%, 07/29/2025 | | | 150,000 | | | | 171,049 | |
2.45%, 11/15/2029 | | | 177,000 | | | | 192,809 | |
| | | | | | | | |
| | | Principal
Amount | | | Value | |
Semiconductors & Semiconductor Equipment-(continued) | |
KLA Corp. | | | | | | | | |
4.65%, 11/01/2024 | | $ | 43,000 | | | $ | 49,450 | |
4.10%, 03/15/2029 | | | 42,000 | | | | 50,522 | |
Lam Research Corp. | | | | | | | | |
2.80%, 06/15/2021 | | | 43,000 | | | | 43,756 | |
4.00%, 03/15/2029 | | | 43,000 | | | | 51,534 | |
Marvell Technology Group Ltd. | | | | | | | | |
4.20%, 06/22/2023 | | | 28,000 | | | | 30,239 | |
4.88%, 06/22/2028 | | | 28,000 | | | | 33,788 | |
Maxim Integrated Products, Inc. | | | | | | | | |
3.38%, 03/15/2023 | | | 33,000 | | | | 34,971 | |
3.45%, 06/15/2027 | | | 35,000 | | | | 38,889 | |
Micron Technology, Inc. | | | | | | | | |
4.64%, 02/06/2024 | | | 90,000 | | | | 100,185 | |
4.19%, 02/15/2027 | | | 91,000 | | | | 104,449 | |
NVIDIA Corp. | | | | | | | | |
2.20%, 09/16/2021 | | | 50,000 | | | | 50,915 | |
2.85%, 04/01/2030 | | | 50,000 | | | | 55,836 | |
QUALCOMM, Inc. | | | | | | | | |
3.00%, 05/20/2022 | | | 110,000 | | | | 115,008 | |
3.25%, 05/20/2027 | | | 110,000 | | | | 124,466 | |
Texas Instruments, Inc. | | | | | | | | |
1.38%, 03/12/2025 | | | 100,000 | | | | 103,760 | |
2.25%, 09/04/2029 | | | 91,000 | | | | 97,659 | |
| | | | | | | | |
| | | | | | | 1,869,613 | |
| | | | | | | | |
Software-1.97% | | | | | | | | |
Adobe, Inc. | | | | | | | | |
3.25%, 02/01/2025 | | | 43,000 | | | | 47,824 | |
2.30%, 02/01/2030 | | | 50,000 | | | | 54,083 | |
Autodesk, Inc., 3.50%, 06/15/2027 | | | 33,000 | | | | 37,465 | |
Intuit, Inc. | | | | | | | | |
0.95%, 07/15/2025 | | | 50,000 | | | | 50,645 | |
1.65%, 07/15/2030 | | | 50,000 | | | | 51,182 | |
Microsoft Corp. | | | | | | | | |
1.55%, 08/08/2021 | | | 230,000 | | | | 232,661 | |
3.30%, 02/06/2027 | | | 210,000 | | | | 240,726 | |
Oracle Corp. | | | | | | | | |
1.90%, 09/15/2021 | | | 148,000 | | | | 150,362 | |
2.65%, 07/15/2026 | | | 134,000 | | | | 147,175 | |
salesforce.com, inc. | | | | | | | | |
3.25%, 04/11/2023 | | | 43,000 | | | | 46,176 | |
3.70%, 04/11/2028 | | | 42,000 | | | | 49,199 | |
ServiceNow, Inc., 1.40%, 09/01/2030 | | | 40,000 | | | | 39,446 | |
VMware, Inc. | | | | | | | | |
2.95%, 08/21/2022 | | | 34,000 | | | | 35,491 | |
3.90%, 08/21/2027 | | | 53,000 | | | | 58,882 | |
| | | | | | | | |
| | | | | | | 1,241,317 | |
| | | | | | | | |
Specialty Retail-2.23% | | | | | | | | |
AutoNation, Inc., 4.75%, 06/01/2030 | | | 110,000 | | | | 129,232 | |
AutoZone, Inc. | | | | | | | | |
3.13%, 07/15/2023 | | | 56,000 | | | | 59,882 | |
4.00%, 04/15/2030 | | | 55,000 | | | | 65,489 | |
Best Buy Co., Inc. | | | | | | | | |
5.50%, 03/15/2021 | | | 76,000 | | | | 77,099 | |
4.45%, 10/01/2028 | | | 61,000 | | | | 72,236 | |
Home Depot, Inc. (The) | | | | | | | | |
2.63%, 06/01/2022 | | | 156,000 | | | | 162,226 | |
2.95%, 06/15/2029 | | | 150,000 | | | | 169,249 | |
See accompanying Notes to Financial Statements which are an integral part of the financial statements.
Invesco Fundamental Investment Grade Corporate Bond ETF (PFIG)—(continued)
August 31, 2020
| | | | | | | | |
| | | Principal
Amount | | | Value | |
Specialty Retail-(continued) | | | | | | | | |
Lowe’s Cos., Inc. | | | | | | | | |
3.12%, 04/15/2022 | | $ | 105,000 | | | $ | 109,050 | |
2.50%, 04/15/2026 | | | 114,000 | | | | 124,174 | |
O’Reilly Automotive, Inc. | | | | | | | | |
4.88%, 01/14/2021 | | | 51,000 | | | | 51,271 | |
3.60%, 09/01/2027 | | | 49,000 | | | | 56,356 | |
Ross Stores, Inc., 4.60%, 04/15/2025 | | | 100,000 | | | | 115,352 | |
TJX Cos., Inc. (The) | | | | | | | | |
3.50%, 04/15/2025 | | | 85,000 | | | | 95,001 | |
3.88%, 04/15/2030 | | | 100,000 | | | | 118,996 | |
| | | | | | | | |
| | | | | | | 1,405,613 | |
| | | | | | | | |
Technology Hardware, Storage & Peripherals-2.07% | |
Apple, Inc. | | | | | | | | |
2.40%, 05/03/2023 | | | 296,000 | | | | 312,603 | |
3.25%, 02/23/2026 | | | 284,000 | | | | 321,276 | |
Dell International LLC/EMC Corp. | | | | | | | | |
4.42%, 06/15/2021(b) | | | 84,000 | | | | 86,181 | |
6.02%, 06/15/2026(b) | | | 111,000 | | | | 131,111 | |
Hewlett Packard Enterprise Co. | | | | | | | | |
4.40%, 10/15/2022 | | | 80,000 | | | | 85,801 | |
4.90%, 10/15/2025 | | | 81,000 | | | | 93,700 | |
HP, Inc. | | | | | | | | |
2.20%, 06/17/2025 | | | 90,000 | | | | 94,872 | |
3.00%, 06/17/2027 | | | 85,000 | | | | 92,139 | |
NetApp, Inc. | | | | | | | | |
1.88%, 06/22/2025 | | | 35,000 | | | | 36,460 | |
2.70%, 06/22/2030 | | | 50,000 | | | | 52,499 | |
| | | | | | | | |
| | | | | | | 1,306,642 | |
| | | | | | | | |
Textiles, Apparel & Luxury Goods-0.92% | |
NIKE, Inc. | | | | | | | | |
2.40%, 03/27/2025 | | | 90,000 | | | | 97,184 | |
2.85%, 03/27/2030 | | | 90,000 | | | | 100,689 | |
PVH Corp., 4.63%, 07/10/2025(b) | | | 80,000 | | | | 82,224 | |
Ralph Lauren Corp., 2.95%, 06/15/2030 | | | 80,000 | | | | 82,922 | |
Tapestry, Inc. | | | | | | | | |
4.25%, 04/01/2025 | | | 50,000 | | | | 51,005 | |
4.13%, 07/15/2027 | | | 50,000 | | | | 48,890 | |
VF Corp. | | | | | | | | |
2.40%, 04/23/2025 | | | 55,000 | | | | 58,508 | |
2.95%, 04/23/2030 | | | 55,000 | | | | 59,849 | |
| | | | | | | | |
| | | | | | | 581,271 | |
| | | | | | | | |
Tobacco-1.00% | | | | | | | | |
Altria Group, Inc. | | | | | | | | |
2.85%, 08/09/2022 | | | 141,000 | | | | 147,251 | |
4.80%, 02/14/2029 | | | 125,000 | | | | 149,553 | |
| | | | | | | | |
| | | Principal
Amount | | | Value | |
Tobacco-(continued) | | | | | | | | |
Philip Morris International, Inc. | | | | | | | | |
3.25%, 11/10/2024 | | $ | 146,000 | | | $ | 161,977 | |
3.38%, 08/15/2029 | | | 152,000 | | | | 173,455 | |
| | | | | | | | |
| | | | | | | 632,236 | |
| | | | | | | | |
Trading Companies & Distributors-0.17% | |
WW Grainger, Inc., 1.85%, 02/15/2025 | | | 100,000 | | | | 105,070 | |
| | | | | | | | |
Water Utilities-0.22% | | | | | | | | |
American Water Capital Corp. | | | | | | | | |
3.40%, 03/01/2025 | | | 32,000 | | | | 35,492 | |
3.75%, 09/01/2028 | | | 40,000 | | | | 46,913 | |
Essential Utilities, Inc., 2.70%, 04/15/2030 | | | 50,000 | | | | 54,197 | |
| | | | | | | | |
| | | | | | | 136,602 | |
| | | | | | | | |
Wireless Telecommunication Services-0.36% | |
T-Mobile USA, Inc. | | | | | | | | |
3.50%, 04/15/2025(b) | | | 100,000 | | | | 110,592 | |
3.88%, 04/15/2030(b) | | | 100,000 | | | | 114,748 | |
| | | | | | | | |
| | | | | | | 225,340 | |
| | | | | | | | |
Total U.S. Dollar Denominated Bonds & Notes
(Cost $58,900,839) | | | | | | | 62,932,177 | |
| | | | | | | | |
| | | Shares | | | | |
Money Market Funds-0.37% | |
Invesco Premier U.S. Government Money Portfolio, Institutional Class, 0.01%(d)(e) (Cost $232,848) | | | 232,848 | | | | 232,848 | |
| | | | | | | | |
TOTAL INVESTMENTS IN SECURITIES
(excluding investments purchased with cash collateral from securities on loan)-100.21% (Cost $59,133,687) | | | | 63,165,025 | |
| | | | | | | | |
|
| Investments Purchased with Cash Collateral from Securities on Loan | |
|
Money Market Funds-0.94% | |
Invesco Private Government Fund,
0.03%(d)(e)(f) | | | 443,526 | | | | 443,526 | |
Invesco Private Prime Fund, 0.14%(d)(e)(f) | | | 147,817 | | | | 147,846 | |
| | | | | | | | |
Total Investments Purchased with Cash Collateral from Securities on Loan
(Cost $591,372) | | | | 591,372 | |
| | | | | | | | |
TOTAL INVESTMENTS IN SECURITIES-101.15%
(Cost $59,725,059) | | | | | | | 63,756,397 | |
OTHER ASSETS LESS LIABILITIES-(1.15)% | | | | | | | (726,724 | ) |
| | | | | | | | |
NET ASSETS-100.00% | | | | | | $ | 63,029,673 | |
| | | | | | | | |
Investment Abbreviations:
REIT - Real Estate Investment Trust
See accompanying Notes to Financial Statements which are an integral part of the financial statements.
Invesco Fundamental Investment Grade Corporate Bond ETF (PFIG)—(continued)
August 31, 2020
Notes to Schedule of Investments:
| (a) | Industry and/or sector classifications used in this report are generally according to the Global Industry Classification Standard, which was developed by and is the exclusive property and a service mark of MSCI Inc. and Standard & Poor’s. |
| (b) | Security purchased or received in a transaction exempt from registration under the Securities Act of 1933, as amended (the “1933 Act”). The security may be resold pursuant to an exemption from registration under the 1933 Act, typically to qualified institutional buyers. The aggregate value of these securities at August 31, 2020 was $1,261,150, which represented 2.00% of the Fund’s Net Assets. |
| (c) | All or a portion of this security was out on loan at August 31, 2020. |
| (d) | Affiliated issuer. The issuer and/or the Fund is a wholly-owned subsidiary of Invesco Ltd., or is affiliated by having an investment adviser that is under common control of Invesco Ltd. The table below shows the Fund’s transactions in, and earnings from, its investments in affiliates for the fiscal year ended August 31, 2020. |
| | | | | | | | | | | | | | | | | | | | | | | | | | | | | | | | | | | |
| | | Value
August 31, 2019 | | Purchases
at Cost | | Proceeds
from Sales | | Change in
Unrealized
Appreciation | | Realized
Gain
(Loss) | | Value
August 31, 2020 | | Dividend
Income |
| Investments in Affiliated Money Market Funds: | | | | | | | | | | | | | | | | | | | | | | | | | | | | | | | | | | | |
| Invesco Premier U.S. Government Money Portfolio, Institutional Class | | | $ | 128,387 | | | | $ | 8,269,376 | | | | $ | (8,164,915 | ) | | | $ | - | | | | $ | - | | | | $ | 232,848 | | | | $ | 3,315 | |
| Investments Purchased with Cash Collateral from Securities on Loan: | | | | | | | | | | | | | | | | | | | | | | | | | | | | | | | | | | | |
| Invesco Government & Agency Portfolio, Institutional Class | | | | 552,320 | | | | | 5,882,502 | | | | | (6,434,822 | ) | | | | - | | | | | - | | | | | - | | | | | 5,556 | * |
| Invesco Liquid Assets Portfolio, Institutional Class | | | | 184,107 | | | | | 1,611,085 | | | | | (1,795,162 | ) | | | | - | | | | | (30 | ) | | | | - | | | | | 2,072 | * |
| Invesco Private Government Fund | | | | - | | | | | 4,093,521 | | | | | (3,649,995 | ) | | | | - | | | | | - | | | | | 443,526 | | | | | 72 | * |
| Invesco Private Prime Fund | | | | - | | | | | 739,916 | | | | | (592,087 | ) | | | | - | | | | | 17 | | | | | 147,846 | | | | | 49 | * |
| | | | | | | | | | | | | | | | | | | | | | | | | | | | | | | | | | | |
| Total | | | $ | 864,814 | | | | $ | 20,596,400 | | | | $ | (20,636,981 | ) | | | $ | - | | | | $ | (13 | ) | | | $ | 824,220 | | | | $ | 11,064 | |
| | | | | | | | | | | | | | | | | | | | | | | | | | | | | | | | | | | |
| * | Represents the income earned on the investment of cash collateral, which is included in securities lending income on the Statements of Operations. Does not include rebates and fees paid to lending agent or premiums received from borrowers, if any. |
| (e) | The rate shown is the 7-day SEC standardized yield as of August 31, 2020. |
| (f) | The security has been segregated to satisfy the commitment to return the cash collateral received in securities lending transactions upon the borrower’s return of the securities loaned. See Note 2J. |
See accompanying Notes to Financial Statements which are an integral part of the financial statements.
Invesco National AMT-Free Municipal Bond ETF (PZA)
August 31, 2020
Schedule of Investments
| | | | | | | | | | | | | | | | |
| | | Interest
Rate | | | Maturity
Date | | | Principal
Amount
(000) | | | Value | |
Municipal Obligations-98.67% | | | | | | | | | | | | | | | | |
Alabama-0.59% | | | | | | | | | | | | | | | | |
Birmingham (City of) & Jefferson (County of), AL Civic Center Authority, Series 2018 A, RB | | | 5.00% | | | | 07/01/2048 | | | $ | 3,000 | | | $ | 3,212,670 | |
Birmingham (City of), AL Water Works Board, Series 2015 A, Ref. RB(a)(b) | | | 5.00% | | | | 01/01/2025 | | | | 1,000 | | | | 1,201,590 | |
Jasper (City of), AL, Series 2014, GO Wts.(a)(b) | | | 5.00% | | | | 03/01/2024 | | | | 4,000 | | | | 4,664,200 | |
Jefferson (County of), AL, Series 2013 A, Revenue Wts., (INS - AGM)(c) | | | 5.50% | | | | 10/01/2053 | | | | 5,000 | | | | 5,582,050 | |
Tuscaloosa (City of), AL Board of Education, Series 2016, Revenue Wts | | | 5.00% | | | | 08/01/2046 | | | | 1,000 | | | | 1,191,280 | |
| | | | | | | | | | | | | | | | |
| | | | | | | | | | | | | | | 15,851,790 | |
| | | | | | | | | | | | | | | | |
Arizona-1.47% | | | | | | | | | | | | | | | | |
Arizona (State of) Industrial Development Authority, Series 2020 A, RB | | | 4.00% | | | | 11/01/2050 | | | | 2,000 | | | | 2,286,660 | |
Arizona (State of) Industrial Development Authority (Phoenix Children’s Hospital), Series 2020, RB | | | 3.00% | | | | 02/01/2045 | | | | 2,000 | | | | 2,073,440 | |
Arizona (State of) Industrial Development Authority (Phoenix Children’s Hospital), Series 2020, RB | | | 4.00% | | | | 02/01/2050 | | | | 4,000 | | | | 4,556,320 | |
City of Phoenix Civic Improvement Corp., Series 2019, RB | | | 5.00% | | | | 07/01/2049 | | | | 5,000 | | | | 5,990,350 | |
Phoenix (City of), AZ Industrial Development Authority (Downtown Phoenix Student Housing, LLC-Arizona State University), Series 2018 A, Ref. RB | | | 5.00% | | | | 07/01/2042 | | | | 1,000 | | | | 1,059,680 | |
Phoenix Civic Improvement Corp., Series 2015 A, RB | | | 5.00% | | | | 07/01/2045 | | | | 2,000 | | | | 2,272,960 | |
Phoenix Civic Improvement Corp., Series 2019 A, RB | | | 5.00% | | | | 07/01/2045 | | | | 5,000 | | | | 5,709,450 | |
Phoenix Civic Improvement Corp., Series 2020, RB | | | 5.00% | | | | 07/01/2044 | | | | 5,000 | | | | 6,524,700 | |
Queen Creek (Town of), AZ, Series 2020, RB | | | 4.00% | | | | 08/01/2045 | | | | 1,250 | | | | 1,480,187 | |
Queen Creek (Town of), AZ, Series 2020, RB | | | 4.00% | | | | 08/01/2050 | | | | 2,500 | | | | 2,930,550 | |
University of Arizona (The), Series 2020, Ref. RB | | | 4.00% | | | | 08/01/2044 | | | | 4,000 | | | | 4,589,040 | |
| | | | | | | | | | | | | | | | |
| | | | | | | | | | | | | | | 39,473,337 | |
| | | | | | | | | | | | | | | | |
Arkansas-0.09% | | | | | | | | | | | | | | | | |
University of Arkansas (Fayetteville Campus), Series 2017, RB | | | 5.00% | | | | 11/01/2047 | | | | 2,000 | | | | 2,428,100 | |
| | | | | | | | | | | | | | | | |
California-23.50% | | | | | | | | | | | | | | | | |
Alameda (City of), CA Corridor Transportation Authority, Series 2016 B, Ref. RB,
(INS - AGM)(c) | | | 5.00% | | | | 10/01/2036 | | | | 1,000 | | | | 1,166,110 | |
Alameda (City of), CA Corridor Transportation Authority, Series 2016 B, Ref. RB,
(INS - AGM)(c) | | | 5.00% | | | | 10/01/2037 | | | | 940 | | | | 1,093,587 | |
Bay Area Toll Authority, Series 2019 D, Ref. VRD RB, (LOC - Sumitomo Mitsui Banking)(d)(e) | | | 0.02% | | | | 04/01/2047 | | | | 31,995 | | | | 31,995,000 | |
Bay Area Toll Authority, Series 2019 H, Ref. RB | | | 5.00% | | | | 04/01/2049 | | | | 4,000 | | | | 4,962,360 | |
Bay Area Toll Authority (San Francisco Bay Area), Series 2014 S-6, RB(a)(b) | | | 5.00% | | | | 10/01/2024 | | | | 2,500 | | | | 2,972,825 | |
Bay Area Toll Authority (San Francisco Bay Area), Series 2017 F-1, RB | | | 4.00% | | | | 04/01/2056 | | | | 5,000 | | | | 5,509,750 | |
Bay Area Toll Authority (San Francisco Bay Area), Series 2017 S-7, Ref. RB | | | 4.00% | | | | 04/01/2042 | | | | 2,500 | | | | 2,840,575 | |
Beaumont (City of), CA Public Improvement Authority, Series 2018 A, RB, (INS - AGM)(c) | | | 5.00% | | | | 09/01/2049 | | | | 1,000 | | | | 1,213,520 | |
California (State of), Series 2014, GO Bonds | | | 5.00% | | | | 10/01/2039 | | | | 5,000 | | | | 5,834,600 | |
California (State of), Series 2016, GO Bonds | | | 5.00% | | | | 09/01/2046 | | | | 3,000 | | | | 3,662,760 | |
California (State of), Series 2017, Ref. GO Bonds | | | 4.00% | | | | 08/01/2038 | | | | 1,000 | | | | 1,149,180 | |
California (State of), Series 2019, GO Bonds | | | 5.00% | | | | 04/01/2045 | | | | 4,000 | | | | 5,067,320 | |
California (State of), Series 2019, GO Bonds | | | 5.00% | | | | 04/01/2049 | | | | 1,000 | | | | 1,257,680 | |
California (State of), Series 2019, Ref. GO Bonds | | | 5.00% | | | | 10/01/2039 | | | | 4,500 | | | | 5,814,630 | |
California (State of) (Green Bonds), Series 2014, GO Bonds | | | 5.00% | | | | 10/01/2037 | | | | 3,500 | | | | 4,094,965 | |
California (State of) Educational Facilities Authority (Pepperdine University), Series 2016, Ref. RB | | | 5.00% | | | | 10/01/2046 | | | | 2,000 | | | | 2,392,360 | |
California (State of) Educational Facilities Authority (Pepperdine University), Series 2016, Ref. RB | | | 5.00% | | | | 10/01/2049 | | | | 3,000 | | | | 3,579,630 | |
California (State of) Educational Facilities Authority (Stanford University), Series 2007 T-1, RB | | | 5.00% | | | | 03/15/2039 | | | | 10,000 | | | | 15,106,300 | |
California (State of) Educational Facilities Authority (Stanford University), Series 2019 V-1, RB | | | 5.00% | | | | 05/01/2049 | | | | 4,000 | | | | 6,519,480 | |
California (State of) Health Facilities Financing Authority (Cedars-Sinai Medical Center), Series 2016 B, Ref. RB | | | 5.00% | | | | 08/15/2035 | | | | 1,000 | | | | 1,212,270 | |
California (State of) Health Facilities Financing Authority (El Camino Hospital), Series 2017, RB | | | 4.00% | | | | 02/01/2042 | | | | 3,000 | | | | 3,334,560 | |
California (State of) Health Facilities Financing Authority (El Camino Hospital), Series 2017, RB | | | 5.00% | | | | 02/01/2042 | | | | 2,250 | | | | 2,651,377 | |
California (State of) Health Facilities Financing Authority (Kaiser Permanente), Series 2017 A-2, RB | | | 5.00% | | | | 11/01/2047 | | | | 3,500 | | | | 5,465,880 | |
California (State of) Health Facilities Financing Authority (Stanford Health Care), Series 2020 A, Ref RB | | | 4.00% | | | | 08/15/2050 | | | | 3,425 | | | | 3,983,343 | |
California (State of) Health Facilities Financing Authority (Sutter Health), Series 2011 D, Ref. RB | | | 5.00% | | | | 08/15/2035 | | | | 305 | | | | 316,020 | |
California (State of) Infrastructure & Economic Development Bank (California State Teachers’ | | | | | | | | | | | | | | | | |
Retirement System Headquarters Expansion) (Green Bonds), Series 2019, RB | | | 5.00% | | | | 08/01/2044 | | | | 1,930 | | | | 2,453,281 | |
See accompanying Notes to Financial Statements which are an integral part of the financial statements.
Invesco National AMT-Free Municipal Bond ETF (PZA)—(continued)
August 31, 2020
| | | | | | | | | | | | | | | | |
| | | Interest
Rate | | | Maturity
Date | | | Principal
Amount
(000) | | | Value | |
California-(continued) | | | | | | | | | | | | | | | | |
California (State of) Municipal Finance Authority (Community Medical Centers), Series 2017 A, Ref. RB | | | 4.00% | | | | 02/01/2042 | | | $ | 4,000 | | | $ | 4,353,400 | |
California (State of) Municipal Finance Authority (Community Medical Centers), Series 2017 A, Ref. RB | | | 5.00% | | | | 02/01/2042 | | | | 1,715 | | | | 1,984,066 | |
California (State of) Municipal Finance Authority (Community Medical Centers), Series 2017 A, Ref. RB | | | 5.00% | | | | 02/01/2047 | | | | 2,500 | | | | 2,872,450 | |
California (State of) Municipal Finance Authority (NorthBay Healthcare Group), Series 2017 A, RB | | | 5.25% | | | | 11/01/2041 | | | | 1,000 | | | | 1,113,090 | |
California (State of) Municipal Finance Authority (Orange (County of) Civic Center Infrastructure Improvement Program - Phase I), Series 2017 A, RB | | | 5.00% | | | | 06/01/2042 | | | | 6,000 | | | | 7,092,840 | |
California (State of) Municipal Finance Authority (Pomona College), Series 2017, Ref. RB | | | 5.00% | | | | 01/01/2048 | | | | 1,000 | | | | 1,247,350 | |
California (State of) Municipal Finance Authority (University of La Verne), Series 2017 A, Ref. RB | | | 5.00% | | | | 06/01/2043 | | | | 1,750 | | | | 2,044,578 | |
California (State of) Public Works Board, Series 2014 B, RB | | | 5.00% | | | | 10/01/2039 | | | | 1,500 | | | | 1,745,130 | |
California (State of) Statewide Communities Development Authority (John Muir Health), Series 2018 A, Ref. RB | | | 4.00% | | | | 12/01/2057 | | | | 500 | | | | 521,265 | |
California State University, Series 2017 A, Ref. RB | | | 5.00% | | | | 11/01/2038 | | | | 2,500 | | | | 3,089,450 | |
California State University, Series 2017 A, Ref. RB | | | 5.00% | | | | 11/01/2042 | | | | 6,080 | | | | 7,448,669 | |
California State University, Series 2017 A, Ref. RB | | | 5.00% | | | | 11/01/2047 | | | | 11,310 | | | | 13,770,038 | |
Centinela Valley Union High School District (Election of 2010), Series 2012 B, GO Bonds(f) | | | 5.00% | | | | 08/01/2050 | | | | 600 | | | | 653,292 | |
Chino Valley Unified School District, Series 2020 B, GO Bonds | | | 4.00% | | | | 08/01/2045 | | | | 2,500 | | | | 2,960,375 | |
Chino Valley Unified School District, Series 2020 B, GO Bonds | | | 3.38% | | | | 08/01/2050 | | | | 10,000 | | | | 10,948,500 | |
Chula Vista (City of), CA (San Diego Gas & Electric Co.), Series 2004 A, RB | | | 5.88% | | | | 02/15/2034 | | | | 3,655 | | | | 3,668,633 | |
El Dorado Irrigation District, Series 2014 A, Ref. RB(a)(b) | | | 5.00% | | | | 03/01/2024 | | | | 3,000 | | | | 3,495,870 | |
El Dorado Irrigation District, Series 2014 A, Ref. RB(a)(b) | | | 5.25% | | | | 03/01/2024 | | | | 3,500 | | | | 4,108,965 | |
Foothill-Eastern Transportation Corridor Agency, Subseries 2014 B-1, Ref. RB | | | 3.95% | | | | 01/15/2053 | | | | 3,000 | | | | 3,256,350 | |
Inland Valley Development Agency, Series 2014 A, Ref. RB, (INS - AGM)(c) | | | 5.00% | | | | 09/01/2044 | | | | 17,000 | | | | 18,878,330 | |
Jurupa Unified School District, Series 2017 B, GO Bonds | | | 4.00% | | | | 08/01/2041 | | | | 10,000 | | | | 11,470,800 | |
Livermore Valley Joint Unified School District, Series 2019, GO Bonds | | | 4.00% | | | | 08/01/2046 | | | | 7,000 | | | | 7,832,090 | |
Long Beach Unified School District (Election of 2016), Series 2019 B, GO Bonds | | | 3.00% | | | | 08/01/2050 | | | | 1,270 | | | | 1,316,380 | |
Los Angeles (City of), CA, Series 2015 A, RB | | | 5.00% | | | | 06/01/2044 | | | | 1,000 | | | | 1,179,220 | |
Los Angeles (City of), CA (Green Bonds), Series 2015 C, Ref. RB | | | 5.00% | | | | 06/01/2045 | | | | 1,500 | | | | 1,766,550 | |
Los Angeles (City of), CA (Green Bonds), Series 2017 A, RB | | | 5.25% | | | | 06/01/2047 | | | | 1,500 | | | | 1,862,145 | |
Los Angeles (City of), CA Department of Water & Power, Series 2012 B, RB | | | 5.00% | | | | 07/01/2043 | | | | 8,000 | | | | 8,629,120 | |
Los Angeles (City of), CA Department of Water & Power, Series 2015 A, Ref. RB | | | 5.00% | | | | 07/01/2035 | | | | 2,500 | | | | 2,949,450 | |
Los Angeles (City of), CA Department of Water & Power, Series 2019 A, RB | | | 5.25% | | | | 07/01/2049 | | | | 30,025 | | | | 38,546,996 | |
Los Angeles (City of), CA Department of Water & Power, Series 2019 D, Ref. RB | | | 5.00% | | | | 07/01/2044 | | | | 12,360 | | | | 15,836,497 | |
Los Angeles (City of), CA Department of Water & Power, Series 2019 D, Ref. RB | | | 5.00% | | | | 07/01/2049 | | | | 9,000 | | | | 11,470,140 | |
Los Angeles (County of), CA Metropolitan Transportation Authority (Green Bonds), Series 2020 A, RB | | | 4.00% | | | | 06/01/2036 | | | | 5,000 | | | | 6,124,600 | |
Los Angeles (County of), CA Metropolitan Transportation Authority (Green Bonds), Series 2020 A, RB | | | 5.00% | | | | 06/01/2036 | | | | 10,000 | | | | 13,269,600 | |
Los Angeles (County of), CA Metropolitan Transportation Authority (Green Bonds), Series 2020 A, RB | | | 4.00% | | | | 06/01/2037 | | | | 3,750 | | | | 4,571,737 | |
Los Angeles (County of), CA Metropolitan Transportation Authority (Green Bonds), Series 2020 A, RB | | | 5.00% | | | | 06/01/2037 | | | | 9,000 | | | | 11,897,190 | |
Los Angeles (County of), CA Public Works Financing Authority, Series 2015 A, RB | | | 5.00% | | | | 12/01/2039 | | | | 2,250 | | | | 2,613,713 | |
Los Angeles (County of), CA Public Works Financing Authority, Series 2015 A, RB | | | 5.00% | | | | 12/01/2044 | | | | 1,000 | | | | 1,154,440 | |
Los Angeles (County of), CA Public Works Financing Authority, Series 2016 D, RB | | | 5.00% | | | | 12/01/2045 | | | | 11,400 | | | | 13,358,976 | |
Los Angeles County Facilities, Inc. (Vermont Corridor County Administration Building), Series 2018 A, RB | | | 5.00% | | | | 12/01/2051 | | | | 4,400 | | | | 5,397,832 | |
Los Angeles Unified School District (Election of 2008), Series 2016 A, GO Bonds | | | 5.00% | | | | 07/01/2040 | | | | 1,610 | | | | 1,901,265 | |
Madera Unified School District, Series 2017, GO Bonds | | | 4.00% | | | | 08/01/2046 | | | | 5,000 | | | | 5,688,550 | |
Manhattan Beach Unified School District, Series 2020 B, GO Bonds | | | 4.00% | | | | 09/01/2045 | | | | 5,635 | | | | 6,770,396 | |
Marin (County of), CA Healthcare District (Election of 2013), Series 2017 A, GO Bonds | | | 4.00% | | | | 08/01/2047 | | | | 3,000 | | | | 3,396,210 | |
Metropolitan Water District of Southern California, Series 2020 A, RB | | | 5.00% | | | | 10/01/2049 | | | | 7,500 | | | | 9,726,825 | |
Morgan Hill Unified School District (Election of 2012), Series 2017 B, GO Bonds | | | 4.00% | | | | 08/01/2047 | | | | 2,000 | | | | 2,273,840 | |
Norman Y Mineta San Jose International Airport SJC, Series 2017 B, Ref. RB | | | 5.00% | | | | 03/01/2042 | | | | 1,300 | | | | 1,551,979 | |
Norman Y Mineta San Jose International Airport SJC, Series 2017 B, Ref. RB | | | 5.00% | | | | 03/01/2047 | | | | 5,000 | | | | 5,928,300 | |
Oxnard School District (Election of 2016), Series 2017 A, GO Bonds, (INS - BAM)(c) | | | 5.00% | | | | 08/01/2045 | | | | 10,000 | | | | 12,072,700 | |
See accompanying Notes to Financial Statements which are an integral part of the financial statements.
Invesco National AMT-Free Municipal Bond ETF (PZA)—(continued)
August 31, 2020
| | | | | | | | | | | | | | | | |
| | | Interest
Rate | | | Maturity
Date | | | Principal
Amount
(000) | | | Value | |
California-(continued) | | | | | | | | | | | | | | | | |
Perris Union High School District, Series 2019 A, GO Bonds, (INS - AGM)(c) | | | 4.00% | | | | 09/01/2048 | | | $ | 7,500 | | | $ | 8,682,675 | |
Sacramento (County of), CA, Series 2016 A, Ref. RB | | | 5.00% | | | | 07/01/2041 | | | | 2,400 | | | | 2,818,920 | |
Sacramento (County of), CA, Series 2016 B, Ref. RB | | | 5.00% | | | | 07/01/2041 | | | | 2,250 | | | | 2,627,843 | |
Sacramento (County of), CA Sanitation Districts Financing Authority, Series 2020 A, Ref. RB | | | 5.00% | | | | 12/01/2050 | | | | 13,600 | | | | 18,010,208 | |
San Diego (County of), CA Regional Transportation Commission, Series 2016 A, RB | | | 5.00% | | | | 04/01/2048 | | | | 6,620 | | | | 7,954,195 | |
San Diego Unified School District, Series 2020 D-2, GO Bonds | | | 5.00% | | | | 07/01/2022 | | | | 4,850 | | | | 5,278,885 | |
San Diego Unified School District, Series 2020 D-2, GO Bonds | | | 2.00% | | | | 07/01/2045 | | | | 20,000 | | | | 18,991,600 | |
San Diego Unified School District, Series 2020 M-2, GO Bonds | | | 5.00% | | | | 07/01/2022 | | | | 32,490 | | | | 35,363,091 | |
San Diego Unified School District, Series 2020 M-2, GO Bonds | | | 4.00% | | | | 07/01/2050 | | | | 20,000 | | | | 23,732,400 | |
San Diego Unified School District (Election of 2012), Series 2017 I, GO Bonds | | | 4.00% | | | | 07/01/2047 | | | | 5,000 | | | | 5,711,600 | |
San Diego Unified School District (Election of 2012), Series 2017 I, GO Bonds | | | 5.00% | | | | 07/01/2047 | | | | 14,165 | | | | 17,405,244 | |
San Francisco (City & County of), CA Airport Commission (San Francisco International Airport), Series 2014 B, RB | | | 5.00% | | | | 05/01/2044 | | | | 2,000 | | | | 2,255,920 | |
San Francisco (City & County of), CA Airport Commission (San Francisco International Airport), Series 2016, RB | | | 5.00% | | | | 05/01/2046 | | | | 17,315 | | | | 20,161,067 | |
San Francisco Bay Area Rapid Transit District (Election of 2016) (Green Bonds), Series 2017 A, GO Bonds | | | 5.00% | | | | 08/01/2047 | | | | 2,000 | | | | 2,479,000 | |
Simi Valley Unified School District (Election of 2016), Series 2017 A, GO Bonds | | | 4.00% | | | | 08/01/2046 | | | | 4,000 | | | | 4,559,200 | |
Transbay Joint Powers Authority (Green Bonds), Series 2020 A, RB | | | 5.00% | | | | 10/01/2045 | | | | 2,000 | | | | 2,488,860 | |
University of California, Series 2016 AR, Ref. RB | | | 5.00% | | | | 05/15/2046 | | | | 9,500 | | | | 11,422,420 | |
University of California, Series 2018 O, Ref. RB | | | 5.00% | | | | 05/15/2043 | | | | 1,500 | | | | 1,872,975 | |
Val Verde Unified School District, Series 2020 A, GO Bonds, (INS - BAM)(c) | | | 4.00% | | | | 08/01/2046 | | | | 700 | | | | 805,455 | |
Val Verde Unified School District, Series 2020 A, GO Bonds, (INS - BAM)(c) | | | 2.75% | | | | 08/01/2049 | | | | 2,750 | | | | 2,787,372 | |
Val Verde Unified School District, Series 2020 E, GO Bonds, (INS - BAM)(c) | | | 2.75% | | | | 08/01/2046 | | | | 2,200 | | | | 2,236,498 | |
| | | | | | | | | | | | | | | | |
| | | | | | | | | | | | | | | 629,104,973 | |
| | | | | | | | | | | | | | | | |
Colorado-2.97% | | | | | | | | | | | | | | | | |
Colorado (State of) Educational & Cultural Facilities Authority (University of Denver), Series 2017 A, RB | | | 5.00% | | | | 03/01/2047 | | | | 2,000 | | | | 2,327,540 | |
Colorado (State of) Health Facilities Authority (Evangelical Lutheran Good Samaritan Society (The)), Series 2017, Ref. RB(a)(b) | | | 5.00% | | | | 06/01/2027 | | | | 1,750 | | | | 2,269,137 | |
Colorado (State of) Health Facilities Authority (Parkview Medical Center), Series 2020 A, RB | | | 4.00% | | | | 09/01/2050 | | | | 2,800 | | | | 3,055,416 | |
Denver (City & County of), CO, Series 2016 A, Ref. RB | | | 5.00% | | | | 08/01/2042 | | | | 1,000 | | | | 1,153,650 | |
Denver (City & County of), CO, Series 2016 A, Ref. RB | | | 5.00% | | | | 08/01/2044 | | | | 750 | | | | 862,545 | |
Denver (City & County of), CO Board of Water Commissioners (Green Bonds), Series 2017 A, RB | | | 5.00% | | | | 09/15/2047 | | | | 5,000 | | | | 6,171,900 | |
E-470 Public Highway Authority, Series 2020 A, Ref. RB | | | 5.00% | | | | 09/01/2040 | | | | 2,725 | | | | 3,110,424 | |
Loveland (City of), CO Electric & Communications Enterprise, Series 2019 A, RB | | | 5.00% | | | | 12/01/2044 | | | | 5,000 | | | | 6,205,800 | |
Weld County School District No. 6 Greeley, Series 2020, GO Bonds | | | 5.00% | | | | 12/01/2039 | | | | 2,750 | | | | 3,587,485 | |
Weld County School District No. 6 Greeley, Series 2020, GO Bonds | | | 5.00% | | | | 12/01/2044 | | | | 20,000 | | | | 25,753,000 | |
Weld County School District Re-2, Series 2019, GO Bonds | | | 5.00% | | | | 12/01/2044 | | | | 19,550 | | | | 25,057,626 | |
| | | | | | | | | | | | | | | | |
| | | | | | | | | | | | | | | 79,554,523 | |
| | | | | | | | | | | | | | | | |
Connecticut-0.77% | | | | | | | | | | | | | | | | |
Connecticut (State of), Series 2017 A, GO Bonds | | | 5.00% | | | | 04/15/2035 | | | | 3,745 | | | | 4,553,471 | |
Connecticut (State of), Series 2018 B, RB | | | 5.00% | | | | 10/01/2038 | | | | 4,000 | | | | 4,951,040 | |
Connecticut (State of), Series 2020 A, GO Bonds | | | 5.00% | | | | 01/15/2040 | | | | 3,000 | | | | 3,788,670 | |
Connecticut (State of), Series 2020 C, GO Bonds | | | 4.00% | | | | 06/01/2036 | | | | 850 | | | | 1,006,493 | |
Connecticut (State of), Series 2020 C, GO Bonds | | | 4.00% | | | | 06/01/2037 | | | | 725 | | | | 855,145 | |
Connecticut (State of), Series 2020 C, GO Bonds | | | 4.00% | | | | 06/01/2039 | | | | 950 | | | | 1,113,115 | |
Connecticut (State of), Series 2020 C, GO Bonds | | | 3.00% | | | | 06/01/2040 | | | | 2,000 | | | | 2,078,240 | |
Connecticut (State of), Series 2020 C, GO Bonds | | | 5.00% | | | | 06/01/2040 | | | | 350 | | | | 444,903 | |
University of Connecticut, Series 2018 A, Special Obligation RB | | | 5.00% | | | | 11/15/2043 | | | | 1,450 | | | | 1,771,827 | |
| | | | | | | | | | | | | | | | |
| | | | | | | | | | | | | | | 20,562,904 | |
| | | | | | | | | | | | | | | | |
District of Columbia-0.82% | | | | | | | | | | | | | | | | |
District of Columbia, Series 2011 G, RB(a)(b) | | | 5.00% | | | | 12/01/2021 | | | | 395 | | | | 418,451 | |
District of Columbia, Series 2011 G, RB | | | 5.00% | | | | 12/01/2036 | | | | 805 | | | | 846,941 | |
District of Columbia, Series 2017 A, Ref. GO Bonds | | | 5.00% | | | | 06/01/2036 | | | | 2,500 | | | | 3,119,475 | |
District of Columbia, Series 2017 A, Ref. GO Bonds | | | 5.00% | | | | 06/01/2037 | | | | 2,000 | | | | 2,491,580 | |
See accompanying Notes to Financial Statements which are an integral part of the financial statements.
Invesco National AMT-Free Municipal Bond ETF (PZA)—(continued)
August 31, 2020
| | | | | | | | | | | | | | | | |
| | | Interest
Rate | | | Maturity
Date | | | Principal
Amount
(000) | | | Value | |
District of Columbia-(continued) | | | | | | | | | | | | | | | | |
District of Columbia, Series 2020 A, RB | | | 2.63% | | | | 03/01/2045 | | | $ | 6,000 | | | $ | 6,139,680 | |
Metropolitan Washington Airports Authority (Dulles Metrorail and Capital Improvement), Series 2019 A, Ref. RB | | | 5.00% | | | | 10/01/2044 | | | | 1,500 | | | | 1,823,970 | |
Washington (State of) Metropolitan Area Transit Authority, Series 2020 A, RB | | | 5.00% | | | | 07/15/2045 | | | | 5,500 | | | | 7,051,990 | |
| | | | | | | | | | | | | | | | |
| | | | | | | | | | | | | | | 21,892,087 | |
| | | | | | | | | | | | | | | | |
Florida-3.92% | | | | | | | | | | | | | | | | |
Cape Coral (City of), FL, Series 2011, Ref. RB(a)(b) | | | 5.00% | | | | 10/01/2021 | | | | 200 | | | | 210,088 | |
Davie (Town of), FL (Nova Southeastern University), Series 2018, Ref. RB | | | 5.00% | | | | 04/01/2048 | | | | 2,000 | | | | 2,287,480 | |
Escambia (County of), FL Health Facilities Authority, Series 2020, Ref. RB, (INS - AGM)(c) | | | 3.00% | | | | 08/15/2050 | | | | 5,000 | | | | 5,149,750 | |
Florida (State of) Municipal Loan Council, Series 2011 D, RB, (INS - AGM)(c) | | | 5.50% | | | | 10/01/2041 | | | | 1,500 | | | | 1,577,340 | |
Hillsborough (County of), FL Aviation Authority (Tampa International Airport), Series 2018 F, RB | | | 5.00% | | | | 10/01/2048 | | | | 16,745 | | | | 20,209,708 | |
JEA Electric System Revenue, Series 2013 C, RB | | | 5.00% | | | | 10/01/2037 | | | | 950 | | | | 1,032,679 | |
Lakeland (City of), FL (Lakeland Regional Health), Series 2015, RB | | | 5.00% | | | | 11/15/2040 | | | | 1,050 | | | | 1,175,339 | |
Miami Beach (City of), FL, Series 2015, RB | | | 5.00% | | | | 09/01/2045 | | | | 2,000 | | | | 2,323,980 | |
Miami Beach (City of), FL, Series 2019, Ref. GO Bonds | | | 4.00% | | | | 05/01/2049 | | | | 8,250 | | | | 9,582,127 | |
Miami Beach (City of), FL Redevelopment Agency (City Center), Series 2015, Ref. RB, (INS - AGM)(c) | | | 5.00% | | | | 02/01/2040 | | | | 4,000 | | | | 4,572,400 | |
Miami-Dade (County of), FL, Series 2010 B, RB, (INS - AGM)(c) | | | 5.00% | | | | 10/01/2035 | | | | 7,000 | | | | 7,023,660 | |
Miami-Dade (County of), FL, Series 2010, RB(a)(b) | | | 5.00% | | | | 10/01/2020 | | | | 1,000 | | | | 1,003,930 | |
Miami-Dade (County of), FL, Series 2012 B, Ref. RB | | | 5.00% | | | | 10/01/2037 | | | | 2,215 | | | | 2,384,514 | |
Miami-Dade (County of), FL, Series 2017 A, RB | | | 3.38% | | | | 10/01/2047 | | | | 10,000 | | | | 10,910,000 | |
Miami-Dade (County of), FL Transit System, Series 2012, RB(a)(b) | | | 5.00% | | | | 07/01/2022 | | | | 2,000 | | | | 2,174,160 | |
North Sumter County Utility Dependent District, Series 2010, RB, (INS - AGM)(c) | | | 5.38% | | | | 10/01/2040 | | | | 2,000 | | | | 2,008,380 | |
Orlando (City of), FL, Series 2018 B, RB | | | 5.00% | | | | 10/01/2048 | | | | 11,185 | | | | 13,958,880 | |
Tampa (City of) & Hillsborough (County of), FL Expressway Authority, Series 2017 C, RB | | | 5.00% | | | | 07/01/2048 | | | | 2,000 | | | | 2,408,980 | |
Tampa (City of) & Hillsborough (County of), FL Expressway Authority, Series 2017, RB | | | 5.00% | | | | 07/01/2047 | | | | 5,000 | | | | 5,989,150 | |
Tampa (City of), FL, Series 2016 A, RB | | | 5.00% | | | | 11/15/2046 | | | | 1,750 | | | | 2,061,412 | |
Tampa (City of), FL (H. Lee Moffitt Cancer Center), Series 2020 B, RB | | | 4.00% | | | | 07/01/2045 | | | | 2,500 | | | | 2,811,850 | |
Tampa (City of), FL (H. Lee Moffitt Cancer Center), Series 2020 B, RB | | | 5.00% | | | | 07/01/2050 | | | | 3,250 | | | | 3,983,167 | |
| | | | | | | | | | | | | | | | |
| | | | | | | | | | | | | | | 104,838,974 | |
| | | | | | | | | | | | | | | | |
Georgia-0.67% | | | | | | | | | | | | | | | | |
Atlanta (City of), GA, Series 2018 B, RB | | | 5.00% | | | | 11/01/2047 | | | | 5,000 | | | | 6,172,350 | |
Cobb (County of), GA Kennestone Hospital Authority (Wellstar Health System, Inc.), Series 2020, Ref. RB | | | 5.00% | | | | 04/01/2050 | | | | 850 | | | | 1,050,736 | |
Fulton (County of), GA Development Authority (Wellstar Health System, Inc.), Series 2020, RB | | | 4.00% | | | | 04/01/2050 | | | | 1,000 | | | | 1,142,060 | |
Gainesville & Hall (County of), GA Hospital Authority (Northeast Georgia Health System, Inc.), Series 2017 B, Ref. RB | | | 5.50% | | | | 02/15/2042 | | | | 2,000 | | | | 2,444,560 | |
Glynn (County of) & Brunswick (City of), GA Memorial Hospital Authority (Southeast Georgia Health System), Series 2017, RAC | | | 5.00% | | | | 08/01/2047 | | | | 3,000 | | | | 3,436,800 | |
Municipal Electric Authority of Georgia, Series 2019 A, Ref. RB | | | 5.00% | | | | 01/01/2044 | | | | 1,000 | | | | 1,232,560 | |
Sandy Springs (City of), GA Public Facilities Authority (City Center), Series 2015, RB | | | 5.00% | | | | 05/01/2041 | | | | 2,000 | | | | 2,418,300 | |
| | | | | | | | | | | | | | | | |
| | | | | | | | | | | | | | | 17,897,366 | |
| | | | | | | | | | | | | | | | |
Guam-0.44% | | | | | | | | | | | | | | | | |
Guam (Territory of) Power Authority, Series 2010 A, RB(a)(b) | | | 5.00% | | | | 10/01/2020 | | | | 1,150 | | | | 1,154,519 | |
Guam (Territory of) Power Authority, Series 2012 A, Ref. RB, (INS - AGM)(c) | | | 5.00% | | | | 10/01/2030 | | | | 9,835 | | | | 10,539,088 | |
| | | | | | | | | | | | | | | | |
| | | | | | | | | | | | | | | 11,693,607 | |
| | | | | | | | | | | | | | | | |
Hawaii-0.33% | | | | | | | | | | | | | | | | |
Hawaii (State of) Department of Budget & Finance, Series 2015 A, Ref. RB | | | 5.00% | | | | 07/01/2035 | | | | 2,000 | | | | 2,293,060 | |
Honolulu (City & County of), HI, Series 2015 A, GO Bonds | | | 5.00% | | | | 10/01/2039 | | | | 4,000 | | | | 4,748,280 | |
Honolulu (City & County of), HI Wastewater System Revenue, Series 2019 A, RB | | | 5.00% | | | | 07/01/2049 | | | | 1,500 | | | | 1,907,445 | |
| | | | | | | | | | | | | | | | |
| | | | | | | | | | | | | | | 8,948,785 | |
| | | | | | | | | | | | | | | | |
Illinois-5.29% | | | | | | | | | | | | | | | | |
Chicago (City of), IL, Series 2008, Ref. RB, (INS - AGM)(c) | | | 5.25% | | | | 11/01/2033 | | | | 440 | | | | 441,545 | |
Chicago (City of), IL, Series 2012, RB, (INS - AGM)(c) | | | 5.00% | | | | 01/01/2037 | | | | 24,375 | | | | 25,407,281 | |
Chicago (City of), IL, Series 2017 A, RB, (INS - AGM)(c) | | | 5.25% | | | | 01/01/2042 | | | | 2,500 | | | | 3,019,200 | |
See accompanying Notes to Financial Statements which are an integral part of the financial statements.
Invesco National AMT-Free Municipal Bond ETF (PZA)—(continued)
August 31, 2020
| | | | | | | | | | | | | | | | |
| | | Interest
Rate | | | Maturity
Date | | | Principal
Amount
(000) | | | Value | |
Illinois-(continued) | | | | | | | | | | | | | | | | |
Chicago (City of), IL, Series 2017 A, RB, (INS - AGM)(c) | | | 4.00% | | | | 01/01/2052 | | | $ | 7,000 | | | $ | 7,626,640 | |
Chicago (City of), IL, Series 2017 A, Ref. GO Bonds | | | 6.00% | | | | 01/01/2038 | | | | 1,000 | | | | 1,154,300 | |
Chicago (City of), IL, Series 2019 A, GO Bonds | | | 5.00% | | | | 01/01/2044 | | | | 2,000 | | | | 2,191,600 | |
Chicago (City of), IL, Series 2019 A, GO Bonds | | | 5.50% | | | | 01/01/2049 | | | | 1,500 | | | | 1,702,320 | |
Chicago (City of), IL (O’Hare International Airport), Series 2015 D, RB | | | 5.00% | | | | 01/01/2046 | | | | 1,250 | | | | 1,431,025 | |
Chicago (City of), IL (O’Hare International Airport), Series 2016 C, Ref. RB | | | 5.00% | | | | 01/01/2037 | | | | 2,900 | | | | 3,345,904 | |
Chicago (City of), IL (O’Hare International Airport), Series 2017 B, Ref. RB | | | 5.00% | | | | 01/01/2039 | | | | 7,500 | | | | 8,777,175 | |
Chicago (City of), IL (O’Hare International Airport), Series 2018 B, RB, (INS - AGM)(c) | | | 4.00% | | | | 01/01/2053 | | | | 16,375 | | | | 18,193,771 | |
Chicago (City of), IL Board of Education, Series 2016, RB | | | 6.00% | | | | 04/01/2046 | | | | 2,000 | | | | 2,336,920 | |
Chicago (City of), IL Board of Education, Series 2017 B, Ref. GO Bonds(g) | | | 7.00% | | | | 12/01/2042 | | | | 5,000 | | | | 6,330,200 | |
Chicago (City of), IL Midway International Airport, Series 2016 B, Ref. RB | | | 5.00% | | | | 01/01/2046 | | | | 6,000 | | | | 6,729,360 | |
Chicago (City of), IL Transit Authority, Series 2017, RB, (INS - AGM)(c) | | | 5.00% | | | | 12/01/2051 | | | | 10,000 | | | | 11,508,500 | |
Du Page (County of), IL (Morton Abroretum), Series 2020, Ref. RB | | | 3.00% | | | | 05/15/2047 | | | | 5,000 | | | | 5,039,150 | |
Illinois (State of), Series 2020, GO Bonds | | | 5.50% | | | | 05/01/2039 | | | | 1,500 | | | | 1,754,190 | |
Illinois (State of) Finance Authority (Chicago LLC - University of Chicago), Series 2017 A, RB | | | 5.00% | | | | 02/15/2047 | | | | 1,000 | | | | 957,560 | |
Illinois (State of) Finance Authority (The Carle Foundation), Series 2011 A, RB, (INS - AGM)(c) | | | 6.00% | | | | 08/15/2041 | | | | 1,000 | | | | 1,042,940 | |
Illinois (State of) Finance Authority (University of Illinois Health Services), Series 2020, RB | | | 4.00% | | | | 10/01/2050 | | | | 1,500 | | | | 1,647,285 | |
Illinois (State of) Finance Authority (University of Illinois Health Services), Series 2020, RB | | | 4.00% | | | | 10/01/2055 | | | | 1,450 | | | | 1,572,641 | |
Illinois (State of) Toll Highway Authority, Series 2017 A, RB | | | 5.00% | | | | 01/01/2042 | | | | 5,000 | | | | 6,037,750 | |
Regional Transportation Authority, Series 2000, RB, (INS - NATL)(c) | | | 6.50% | | | | 07/01/2030 | | | | 1,815 | | | | 2,491,305 | |
Sales Tax Securitization Corp., Series 2018 A, Ref. RB | | | 5.00% | | | | 01/01/2040 | | | | 10,000 | | | | 11,456,300 | |
Sales Tax Securitization Corp., Series 2020 A, Ref. RB | | | 4.00% | | | | 01/01/2038 | | | | 1,000 | | | | 1,085,780 | |
Sales Tax Securitization Corp., Series 2020 A, Ref. RB | | | 4.00% | | | | 01/01/2039 | | | | 500 | | | | 541,190 | |
Sales Tax Securitization Corp., Series 2020 A, Ref. RB, (INS - BAM)(c) | | | 5.00% | | | | 01/01/2037 | | | | 1,750 | | | | 2,115,505 | |
Sales Tax Securitization Corp., Series 2020 A, Ref. RB, (INS - BAM)(c) | | | 4.00% | | | | 01/01/2040 | | | | 2,000 | | | | 2,201,140 | |
Springfield (City of), IL Electric Revenue, Series 2015, Ref. RB, (INS - AGM)(c) | | | 5.00% | | | | 03/01/2040 | | | | 3,000 | | | | 3,481,410 | |
| | | | | | | | | | | | | | | | |
| | | | | | | | | | | | | | | 141,619,887 | |
| | | | | | | | | | | | | | | | |
Indiana-0.84% | | | | | | | | | | | | | | | | |
Indiana (State of) Health & Educational Facilities Financing Authority (Ascension Senior Credit Group), Series 2006, Ref. RB | | | 5.00% | | | | 11/15/2046 | | | | 3,000 | | | | 3,564,630 | |
Indianapolis Local Public Improvement Bond Bank (Courthouse and Jail), Series 2019 A, RB | | | 5.00% | | | | 02/01/2044 | | | | 5,000 | | | | 6,247,200 | |
Indianapolis Local Public Improvement Bond Bank (Courthouse and Jail), Series 2019 A, RB | | | 5.00% | | | | 02/01/2049 | | | | 9,000 | | | | 11,176,650 | |
Northern Indiana Commuter Transportation District, Series 2016, RB | | | 5.00% | | | | 07/01/2041 | | | | 1,250 | | | | 1,463,663 | |
| | | | | | | | | | | | | | | | |
| | | | | | | | | | | | | | | 22,452,143 | |
| | | | | | | | | | | | | | | | |
Kansas-0.20% | | | | | | | | | | | | | | | | |
Kansas (State of) Department of Transportation, Series 2015, RB | | | 5.00% | | | | 09/01/2035 | | | | 2,000 | | | | 2,392,560 | |
Wyandotte (County of) & Kansas City (City of), KS Unified Government, Series 2016 A, RB | | | 5.00% | | | | 09/01/2040 | | | | 1,000 | | | | 1,169,320 | |
Wyandotte (County of) & Kansas City (City of), KS Unified Government, Series 2016 A, RB | | | 5.00% | | | | 09/01/2045 | | | | 1,500 | | | | 1,741,665 | |
| | | | | | | | | | | | | | | | |
| | | | | | | | | | | | | | | 5,303,545 | |
| | | | | | | | | | | | | | | | |
Kentucky-0.08% | | | | | | | | | | | | | | | | |
Kentucky (Commonwealth of) Economic Development Finance Authority (Louisville Arena Authority, Inc.), Series 2017 A, Ref. RB, (INS - AGM)(c) | | | 5.00% | | | | 12/01/2045 | | | | 1,000 | | | | 1,177,460 | |
Kentucky (Commonwealth of) Economic Development Finance Authority (Louisville Arena Authority, Inc.), Series 2017 A, Ref. RB, (INS - AGM)(c) | | | 5.00% | | | | 12/01/2047 | | | | 1,000 | | | | 1,064,380 | |
| | | | | | | | | | | | | | | | |
| | | | | | | | | | | | | | | 2,241,840 | |
| | | | | | | | | | | | | | | | |
Louisiana-1.24% | | | | | | | | | | | | | | | | |
Greater New Orleans Expressway Commission, Series 2017, RB, (INS - AGM)(c) | | | 5.00% | | | | 11/01/2042 | | | | 2,000 | | | | 2,330,920 | |
Greater New Orleans Expressway Commission, Series 2017, RB, (INS - AGM)(c) | | | 5.00% | | | | 11/01/2047 | | | | 2,000 | | | | 2,326,920 | |
Jefferson (Parish of), LA Sales Tax District, Series 2019 B, RB, (INS - AGM)(c) | | | 5.00% | | | | 12/01/2042 | | | | 2,750 | | | | 3,300,467 | |
Lafayette (City of), LA Public Trust Financing Authority (Ragin’ Cajun Facilities, Inc. - Housing & Parking), Series 2010, RB(a)(b) | | | 5.50% | | | | 10/01/2020 | | | | 1,000 | | | | 1,004,290 | |
Louisiana (State of) Local Government Environmental Facilities & Community Development Authority (LCTCS Act 360), Series 2014, RB | | | 5.00% | | | | 10/01/2039 | | | | 2,000 | | | | 2,236,440 | |
Louisiana (State of) Local Government Environmental Facilities & Community Development Authority (Ragin Cajun Facilities, Inc.), Series 2018, RB, (INS - AGM)(c) | | | 5.00% | | | | 10/01/2048 | | | | 3,500 | | | | 4,029,760 | |
See accompanying Notes to Financial Statements which are an integral part of the financial statements.
Invesco National AMT-Free Municipal Bond ETF (PZA)—(continued)
August 31, 2020
| | | | | | | | | | | | | | | | |
| | | Interest
Rate | | | Maturity
Date | | | Principal
Amount
(000) | | | Value | |
Louisiana-(continued) | | | | | | | | | | | | | | | | |
Louisiana (State of) Local Government Environmental Facilities & Community Development Authority (Woman’s Hospital Foundation), Series 2017 A, Ref. RB | | | 5.00% | | | | 10/01/2041 | | | $ | 3,285 | | | $ | 3,887,436 | |
Louisiana (State of) Public Facilities Authority (LA Children’s Medical Center), Series 2020, RB, (INS - AGM)(c) | | | 3.00% | | | | 06/01/2050 | | | | 6,500 | | | | 6,667,180 | |
New Orleans (City of), LA Aviation Board (Parking Facilities Corp. Consolidated Garage System), Series 2018 A, RB, (INS - AGM)(c) | | | 5.00% | | | | 10/01/2048 | | | | 5,000 | | | | 5,872,650 | |
Shreveport (City of), LA, Series 2019 B, RB, (INS - AGM)(c) | | | 4.00% | | | | 12/01/2049 | | | | 1,250 | | | | 1,423,563 | |
| | | | | | | | | | | | | | | | |
| | | | | | | | | | | | | | | 33,079,626 | |
| | | | | | | | | | | | | | | | |
Maine-0.08% | | | | | | | | | | | | | | | | |
Maine (State of) Health & Higher Educational Facilities Authority, Series 2020 A, RB | | | 4.00% | | | | 07/01/2050 | | | | 2,000 | | | | 2,275,180 | |
| | | | | | | | | | | | | | | | |
Maryland-1.32% | | | | | | | | | | | | | | | | |
Baltimore (City of), MD, Series 2017, Ref. RB | | | 5.00% | | | | 09/01/2042 | | | | 500 | | | | 442,755 | |
Baltimore (City of), MD (Convention Center Hotel), Series 2017, Ref. RB | | | 5.00% | | | | 09/01/2039 | | | | 1,000 | | | | 888,880 | |
Baltimore (City of), MD (Water), Series 2017 A, RB | | | 5.00% | | | | 07/01/2046 | | | | 9,510 | | | | 11,126,890 | |
Maryland (State of) Transportation Authority (Transportation Facilities), Series 2020, RB | | | 4.00% | | | | 07/01/2050 | | | | 17,500 | | | | 20,526,100 | |
Maryland Stadium Authority (Baltimore City Public Schools), Series 2016, RB(a)(b) | | | 5.00% | | | | 05/01/2026 | | | | 1,900 | | | | 2,397,477 | |
| | | | | | | | | | | | | | | | |
| | | | | | | | | | | | | | | 35,382,102 | |
| | | | | | | | | | | | | | | | |
Massachusetts-6.17% | | | | | | | | | | | | | | | | |
Massachusetts (Commonwealth of), Series 2015 A, Ref. GO Bonds | | | 5.00% | | | | 07/01/2036 | | | | 4,000 | | | | 4,789,320 | |
Massachusetts (Commonwealth of), Series 2016 A, GO Bonds | | | 5.00% | | | | 03/01/2041 | | | | 7,150 | | | | 8,139,775 | |
Massachusetts (Commonwealth of), Series 2016 A, GO Bonds | | | 5.00% | | | | 03/01/2046 | | | | 5,000 | | | | 5,665,500 | |
Massachusetts (Commonwealth of), Series 2016 J, GO Bonds | | | 4.00% | | | | 12/01/2044 | | | | 2,900 | | | | 3,268,880 | |
Massachusetts (Commonwealth of), Series 2017 A, GO Bonds | | | 5.00% | | | | 04/01/2042 | | | | 4,210 | | | | 5,143,062 | |
Massachusetts (Commonwealth of), Series 2017 A, Ref. RB | | | 5.00% | | | | 06/01/2043 | | | | 5,000 | | | | 6,181,000 | |
Massachusetts (Commonwealth of), Series 2017 F, GO Bonds | | | 5.00% | | | | 11/01/2041 | | | | 10,000 | | | | 12,413,000 | |
Massachusetts (Commonwealth of), Series 2019 A, GO Bonds | | | 5.25% | | | | 01/01/2044 | | | | 10,675 | | | | 13,740,540 | |
Massachusetts (Commonwealth of), Series 2019 A, GO Bonds | | | 5.00% | | | | 01/01/2049 | | | | 5,000 | | | | 6,255,800 | |
Massachusetts (Commonwealth of) (Rail Enhancement & Accelerated Bridge Program), Series 2018 A, RB | | | 5.25% | | | | 06/01/2043 | | | | 5,000 | | | | 6,327,800 | |
Massachusetts (Commonwealth of) (Rail Enhancement Program), Series 2015 A, RB | | | 5.00% | | | | 06/01/2045 | | | | 3,000 | | | | 3,502,560 | |
Massachusetts (Commonwealth of) Development Finance Agency (Wellforce, Inc.), Series 2020 C, Ref. RB, (INS - AGM)(c) | | | 4.00% | | | | 10/01/2045 | | | | 1,500 | | | | 1,720,965 | |
Massachusetts (State of) Bay Transportation Authority, Series 2015 A, RB | | | 5.00% | | | | 07/01/2040 | | | | 7,145 | | | | 8,401,806 | |
Massachusetts (State of) Bay Transportation Authority, Series 2020, Ref. RB | | | 5.00% | | | | 07/01/2050 | | | | 15,380 | | | | 18,935,702 | |
Massachusetts (State of) Development Finance Agency (Boston University), Series 2013 X, RB | | | 5.00% | | | | 10/01/2048 | | | | 875 | | | | 961,800 | |
Massachusetts (State of) Development Finance Agency (Boston University), Series 2016 BB1, RB | | | 5.00% | | | | 10/01/2046 | | | | 4,500 | | | | 5,283,360 | |
Massachusetts (State of) Development Finance Agency (Dana-Farber Cancer Institute), Series 2016, RB | | | 5.00% | | | | 12/01/2041 | | | | 2,665 | | | | 3,124,579 | |
Massachusetts (State of) Development Finance Agency (Dana-Farber Cancer Institute), Series 2016, RB | | | 5.00% | | | | 12/01/2046 | | | | 2,000 | | | | 2,328,740 | |
Massachusetts (State of) Development Finance Agency (Wellforce, Inc.), Series 2020 C, Ref. RB, (INS - AGM)(c) | | | 3.00% | | | | 10/01/2045 | | | | 3,500 | | | | 3,588,515 | |
Massachusetts (State of) School Building Authority, Series 2015 C, Ref. RB | | | 5.00% | | | | 08/15/2037 | | | | 8,770 | | | | 10,514,528 | |
Massachusetts (State of) School Building Authority, Series 2016 A, RB | | | 5.00% | | | | 11/15/2045 | | | | 3,410 | | | | 4,068,471 | |
Massachusetts (State of) School Building Authority, Series 2019 A, RB | | | 5.00% | | | | 02/15/2049 | | | | 5,000 | | | | 5,898,700 | |
Massachusetts (State of) Water Resources Authority, Series 2018 B, RB | | | 5.00% | | | | 08/01/2043 | | | | 5,000 | | | | 6,306,500 | |
Massachusetts (State of) Water Resources Authority (Green Bonds), Series 2016 B, Ref. RB | | | 5.00% | | | | 08/01/2040 | | | | 10,000 | | | | 12,233,400 | |
University of Massachusetts Building Authority, Series 2020 1, RB | | | 5.00% | | | | 11/01/2050 | | | | 5,000 | | | | 6,287,350 | |
| | | | | | | | | | | | | | | | |
| | | | | | | | | | | | | | | 165,081,653 | |
| | | | | | | | | | | | | | | | |
Michigan-0.78% | | | | | | | | | | | | | | | | |
Detroit (City of), MI Water and Sewerage Department, Series 2012 A, Ref. RB(a)(b) | | | 5.00% | | | | 07/01/2022 | | | | 5,000 | | | | 5,440,250 | |
Michigan (State of) Hospital Finance Authority (Ascension Health), Series 2010, Ref. RB | | | 5.00% | | | | 11/15/2047 | | | | 3,000 | | | | 3,780,480 | |
Michigan State University Board of Trustees, Series 2019 B, RB | | | 5.00% | | | | 02/15/2044 | | | | 1,250 | | | | 1,558,550 | |
University of Michigan, Series 2017 A, Ref. RB | | | 5.00% | | | | 04/01/2042 | | | | 2,000 | | | | 2,447,480 | |
University of Michigan, Series 2017 A, Ref. RB | | | 5.00% | | | | 04/01/2047 | | | | 3,100 | | | | 3,767,647 | |
See accompanying Notes to Financial Statements which are an integral part of the financial statements.
Invesco National AMT-Free Municipal Bond ETF (PZA)—(continued)
August 31, 2020
| | | | | | | | | | | | | | | | |
| | | Interest
Rate | | | Maturity
Date | | | Principal
Amount
(000) | | | Value | |
Michigan-(continued) | | | | | | | | | | | | | | | | |
Walled Lake Consolidated School District, Series 2020, GO Bonds | | | 5.00% | | | | 05/01/2050 | | | $ | 2,500 | | | $ | 3,181,950 | |
Wayne (County of), MI Airport Authority (Detroit Michigan Wayne County Airport), Series 2015 D, RB | | | 5.00% | | | | 12/01/2040 | | | | 500 | | | | 578,240 | |
| | | | | | | | | | | | | | | | |
| | | | | | | | | | | | | | | 20,754,597 | |
| | | | | | | | | | | | | | | | |
Minnesota-0.04% | | | | | | | | | | | | | | | | |
Minnesota (State of) Higher Education Facilities Authority (Bethel University), Series 2017, Ref. RB | | | 5.00% | | | | 05/01/2047 | | | | 1,000 | | | | 1,067,820 | |
| | | | | | | | | | | | | | | | |
Missouri-0.42% | | | | | | | | | | | | | | | | |
Cape Girardeau (County of), MO Industrial Development Authority (South Eastern Health), Series 2017 A, Ref. RB | | | 5.00% | | | | 03/01/2036 | | | | 1,000 | | | | 1,084,360 | |
Kansas City (City of), MO (Downtown Arena), Series 2016 E, Ref. RB | | | 5.00% | | | | 04/01/2040 | | | | 2,190 | | | | 2,510,485 | |
Metropolitan St. Louis Sewer District, Series 2016 C, RB | | | 5.00% | | | | 05/01/2046 | | | | 1,000 | | | | 1,201,840 | |
Metropolitan St. Louis Sewer District, Series 2017 A, Ref. RB | | | 5.00% | | | | 05/01/2047 | | | | 750 | | | | 919,275 | |
Missouri (State of) Health & Educational Facilities Authority (Mosaic Health System), Series 2019A, Ref. RB | | | 4.00% | | | | 02/15/2049 | | | | 5,000 | | | | 5,608,850 | |
| | | | | | | | | | | | | | | | |
| | | | | | | | | | | | | | | 11,324,810 | |
| | | | | | | | | | | | | | | | |
Montana-0.10% | | | | | | | | | | | | | | | | |
Missoula (City of), MT, Series 2019 A, RB | | | 4.00% | | | | 07/01/2044 | | | | 2,400 | | | | 2,760,264 | |
| | | | | | | | | | | | | | | | |
Nebraska-0.05% | | | | | | | | | | | | | | | | |
Omaha (City of), NE Public Power District, Series 2017 A, Ref. RB | | | 5.00% | | | | 02/01/2042 | | | | 1,000 | | | | 1,247,230 | |
| | | | | | | | | | | | | | | | |
Nevada-0.70% | | | | | | | | | | | | | | | | |
Clark (County of), NV Department of Aviation, Series 2015 A, Ref. RB | | | 5.00% | | | | 07/01/2040 | | | | 5,000 | | | | 5,767,050 | |
Clark (County of), NV Department of Aviation, Series 2017 A-2, Ref. RB | | | 5.00% | | | | 07/01/2040 | | | | 9,335 | | | | 11,195,559 | |
Las Vegas Valley Water District, Series 2012 B, GO Bonds | | | 5.00% | | | | 06/01/2042 | | | | 1,650 | | | | 1,763,140 | |
| | | | | | | | | | | | | | | | |
| | | | | | | | | | | | | | | 18,725,749 | |
| | | | | | | | | | | | | | | | |
New Jersey-0.54% | | | | | | | | | | | | | | | | |
New Jersey (State of) Economic Development Authority (State House), Series 2017 B, RB | | | 5.00% | | | | 06/15/2043 | | | | 1,000 | | | | 1,158,790 | |
New Jersey (State of) Educational Facilities Authority (Stevens Institute of Technology) (Green Bonds), Series 2020 A, RB | | | 3.00% | | | | 07/01/2050 | | | | 1,000 | | | | 973,240 | |
New Jersey (State of) Educational Facilities Authority (Stevens Institute of Technology) (Green Bonds), Series 2020 A, RB | | | 4.00% | | | | 07/01/2050 | | | | 2,800 | | | | 3,039,568 | |
New Jersey (State of) Health Care Facilities Financing Authority (Barnabas Health), Series 2011 A, Ref. RB(a)(b) | | | 5.63% | | | | 07/01/2021 | | | | 500 | | | | 522,240 | |
New Jersey (State of) Health Care Facilities Financing Authority (Princeton HealthCare System), Series 2016 A, Ref. RB | | | 5.00% | | | | 07/01/2039 | | | | 1,000 | | | | 1,179,330 | |
New Jersey (State of) Health Care Facilities Financing Authority (University Hospital), Series 2015 A, RB, (INS - AGM)(c) | | | 5.00% | | | | 07/01/2046 | | | | 3,000 | | | | 3,353,850 | |
New Jersey (State of) Turnpike Authority, Series 2017 B, Ref. RB | | | 5.00% | | | | 01/01/2040 | | | | 1,000 | | | | 1,200,630 | |
Newark (City of), NJ Housing Authority, Series 2016, Ref. RB, (INS - AGM)(c) | | | 5.00% | | | | 12/01/2038 | | | | 2,500 | | | | 2,982,700 | |
| | | | | | | | | | | | | | | | |
| | | | | | | | | | | | | | | 14,410,348 | |
| | | | | | | | | | | | | | | | |
New Mexico-0.06% | | | | | | | | | | | | | | | | |
Albuquerque (City of), NM, Series 2020, RB | | | 5.00% | | | | 07/01/2046 | | | | 1,335 | | | | 1,699,562 | |
| | | | | | | | | | | | | | | | |
New York-21.69% | | | | | | | | | | | | | | | | |
Broome County Local Development Corp. (United Health Services Hospital), Series 2020, Ref. RB, (INS - AGM)(c) | | | 3.00% | | | | 04/01/2045 | | | | 9,000 | | | | 9,372,060 | |
Broome County Local Development Corp. (United Health Services Hospital), Series 2020, Ref. RB, (INS - AGM)(c) | | | 3.00% | | | | 04/01/2050 | | | | 3,750 | | | | 3,880,837 | |
Broome County Local Development Corp. (United Health Services Hospital), Series 2020, Ref. RB, (INS - AGM)(c) | | | 4.00% | | | | 04/01/2050 | | | | 3,000 | | | | 3,448,380 | |
Build NYC Resource Corp. (New York Law School), Series 2016, Ref. RB | | | 5.00% | | | | 07/01/2041 | | | | 5,000 | | | | 5,157,750 | |
Erie (County of), NY, Series 2020, GO Notes | | | 3.00% | | | | 06/24/2021 | | | | 5,000 | | | | 5,105,900 | |
Hudson Yards Infrastructure Corp., Series 2017 A, Ref. RB | | | 5.00% | | | | 02/15/2042 | | | | 5,000 | | | | 5,943,150 | |
Long Island (City of), NY Power Authority, Series 2012 A, RB(a)(b) | | | 5.00% | | | | 09/01/2022 | | | | 2,305 | | | | 2,526,879 | |
Long Island (City of), NY Power Authority, Series 2012 A, RB | | | 5.00% | | | | 09/01/2037 | | | | 4,630 | | | | 4,974,102 | |
Long Island (City of), NY Power Authority, Series 2014 A, Ref. RB | | | 5.00% | | | | 09/01/2039 | | | | 2,500 | | | | 2,873,450 | |
See accompanying Notes to Financial Statements which are an integral part of the financial statements.
Invesco National AMT-Free Municipal Bond ETF (PZA)—(continued)
August 31, 2020
| | | | | | | | | | | | | | | | |
| | | Interest
Rate | | | Maturity
Date | | | Principal
Amount
(000) | | | Value | |
New York-(continued) | | | | | | | | | | | | | | | | |
Long Island (City of), NY Power Authority, Series 2017, RB | | | 5.00% | | | | 09/01/2042 | | | $ | 1,300 | | | $ | 1,578,148 | |
Long Island (City of), NY Power Authority, Series 2017, RB | | | 5.00% | | | | 09/01/2047 | | | | 1,000 | | | | 1,206,610 | |
Metropolitan Transportation Authority, Series 2012 A-1, RB | | | 5.00% | | | | 11/15/2040 | | | | 13,190 | | | | 13,689,505 | |
Metropolitan Transportation Authority, Series 2012 E, RB, (INS - AGM)(c) | | | 5.00% | | | | 11/15/2042 | | | | 1,510 | | | | 1,601,476 | |
Metropolitan Transportation Authority, Series 2015 C-1, Ref. RB | | | 5.00% | | | | 11/15/2035 | | | | 5,000 | | | | 5,390,500 | |
Metropolitan Transportation Authority (Green Bonds), Series 2016 B-1, RB | | | 5.00% | | | | 11/15/2046 | | | | 2,350 | | | | 2,692,512 | |
Metropolitan Transportation Authority (Green Bonds), Series 2019 B, RB | | | 5.00% | | | | 11/15/2052 | | | | 7,025 | | | | 7,685,069 | |
Metropolitan Transportation Authority (Green Bonds), Series 2019 B, RB, (INS - AGM)(c) | | | 4.00% | | | | 11/15/2049 | | | | 9,000 | | | | 9,887,940 | |
Metropolitan Transportation Authority (Green Bonds), Series 2020 A-1, RB | | | 4.00% | | | | 11/15/2051 | | | | 2,900 | | | | 2,913,050 | |
Metropolitan Transportation Authority (Green Bonds), Series 2020 A-1, RB, (INS - AGM)(c) | | | 4.00% | | | | 11/15/2050 | | | | 5,000 | | | | 5,596,750 | |
Metropolitan Transportation Authority (Green Bonds), Series 2020 C-1, RB | | | 5.25% | | | | 11/15/2055 | | | | 6,000 | | | | 6,753,960 | |
Monroe County Industrial Development Corp. (University of Rochester), Series 2020 A, RB | | | 4.00% | | | | 07/01/2050 | | | | 2,000 | | | | 2,314,980 | |
MTA Hudson Rail Yards Trust Obligations, Series 2016 A, RB | | | 5.00% | | | | 11/15/2051 | | | | 2,000 | | | | 2,101,000 | |
Nassau (County of), NY, Series 2019 B, GO Bonds, (INS - AGM)(c) | | | 5.00% | | | | 04/01/2049 | | | | 5,000 | | | | 6,271,000 | |
New York & New Jersey (States of) Port Authority, Series 2014, RB | | | 5.00% | | | | 09/01/2039 | | | | 6,000 | | | | 6,813,180 | |
New York & New Jersey (States of) Port Authority, Series 2015, Ref. RB | | | 5.00% | | | | 10/15/2041 | | | | 4,460 | | | | 5,204,998 | |
New York & New Jersey (States of) Port Authority, Series 2015, Ref. RB | | | 5.00% | | | | 05/01/2045 | | | | 3,500 | | | | 4,019,645 | |
New York & New Jersey (States of) Port Authority, Series 2017 200, Ref. RB | | | 5.25% | | | | 10/15/2057 | | | | 2,400 | | | | 2,861,568 | |
New York & New Jersey (States of) Port Authority, Series 2018, Ref. RB | | | 5.00% | | | | 09/01/2048 | | | | 6,590 | | | | 7,979,304 | |
New York & New Jersey (States of) Port Authority, Series 2020, Ref. RB | | | 4.00% | | | | 07/15/2040 | | | | 2,000 | | | | 2,356,920 | |
New York (City of), NY, Series 2017 B-1, GO Bonds | | | 5.00% | | | | 12/01/2041 | | | | 4,955 | | | | 5,927,964 | |
New York (City of), NY, Series 2019 B-1, GO Bonds | | | 5.00% | | | | 10/01/2038 | | | | 6,500 | | | | 8,165,755 | |
New York (City of), NY, Series 2020 D-1, GO Bonds | | | 5.00% | | | | 03/01/2038 | | | | 6,250 | | | | 7,933,562 | |
New York (City of), NY, Subseries 2010 G-4, VRD GO Bonds, (CEP - Barclays Bank PLC)(d) | | | 0.07% | | | | 03/01/2039 | | | | 29,975 | | | | 29,975,000 | |
New York (City of), NY Industrial Development Agency (Queens Baseball Stadium), Series 2009, RB, (INS - AGC)(c) | | | 6.50% | | | | 01/01/2046 | | | | 500 | | | | 502,435 | |
New York (City of), NY Industrial Development Agency (Yankee Stadium), Series 2009, RB, (INS - AGC)(c) | | | 7.00% | | | | 03/01/2049 | | | | 3,000 | | | | 3,016,620 | |
New York (City of), NY Municipal Water Finance Authority, Series 2012 BB, RB | | | 5.00% | | | | 06/15/2044 | | | | 3,295 | | | | 3,482,024 | |
New York (City of), NY Municipal Water Finance Authority, Series 2013 BB, RB | | | 5.00% | | | | 06/15/2047 | | | | 9,640 | | | | 10,571,128 | |
New York (City of), NY Municipal Water Finance Authority, Series 2013 EE, RB | | | 5.00% | | | | 06/15/2047 | | | | 500 | | | | 557,780 | |
New York (City of), NY Municipal Water Finance Authority, Series 2015 EE, Ref. RB | | | 5.00% | | | | 06/15/2036 | | | | 600 | | | | 692,622 | |
New York (City of), NY Municipal Water Finance Authority, Series 2017 EE, Ref. RB | | | 5.00% | | | | 06/15/2037 | | | | 5,750 | | | | 7,166,110 | |
New York (City of), NY Municipal Water Finance Authority, Series 2019 BB-1, RB | | | 5.00% | | | | 06/15/2049 | | | | 10,000 | | | | 12,757,900 | |
New York (City of), NY Municipal Water Finance Authority, Series 2019 CC-1, RB | | | 5.00% | | | | 06/15/2044 | | | | 5,000 | | | | 6,419,600 | |
New York (City of), NY Municipal Water Finance Authority (Water & Sewer System), Series 2012 CC, Ref. RB(a)(b) | | | 5.00% | | | | 12/15/2021 | | | | 1,535 | | | | 1,629,387 | |
New York (City of), NY Municipal Water Finance Authority (Water & Sewer System), Series 2012 CC, Ref. RB | | | 5.00% | | | | 06/15/2045 | | | | 8,670 | | | | 9,160,982 | |
New York (City of), NY Municipal Water Finance Authority (Water & Sewer System), Series 2019 FF, RB | | | 4.00% | | | | 06/15/2049 | | | | 2,500 | | | | 2,886,500 | |
New York (City of), NY Municipal Water Finance Authority (Water & Sewer System), Series 2019 FF, RB | | | 5.00% | | | | 06/15/2049 | | | | 6,165 | | | | 7,780,600 | |
New York (City of), NY Transitional Finance Authority, Series 2011 S-1, RB | | | 5.25% | | | | 07/15/2037 | | | | 4,200 | | | | 4,363,464 | |
New York (City of), NY Transitional Finance Authority, Series 2015 A-1, RB | | | 5.00% | | | | 08/01/2035 | | | | 2,000 | | | | 2,312,820 | |
New York (City of), NY Transitional Finance Authority, Series 2015 B-1, RB | | | 5.00% | | | | 08/01/2042 | | | | 4,330 | | | | 4,974,824 | |
New York (City of), NY Transitional Finance Authority, Series 2015 S-1, RB | | | 5.00% | | | | 07/15/2040 | | | | 3,000 | | | | 3,474,990 | |
New York (City of), NY Transitional Finance Authority, Series 2017 B-1, RB | | | 4.00% | | | | 08/01/2041 | | | | 1,850 | | | | 2,053,925 | |
New York (City of), NY Transitional Finance Authority, Series 2019 S-3A, Ref. RB | | | 5.00% | | | | 07/15/2037 | | | | 1,000 | | | | 1,236,920 | |
New York (City of), NY Transitional Finance Authority, Series 2019, RB | | | 4.00% | | | | 11/01/2040 | | | | 10,000 | | | | 11,540,200 | |
New York (City of), NY Transitional Finance Authority, Series 2020, Ref. RB | | | 3.00% | | | | 11/01/2037 | | | | 9,000 | | | | 9,716,580 | |
New York (City of), NY Transitional Finance Authority, Series 2020, Ref. RB | | | 4.00% | | | | 11/01/2038 | | | | 3,000 | | | | 3,559,830 | |
New York (City of), NY Transitional Finance Authority, Series 2020, Ref. RB | | | 3.00% | | | | 11/01/2039 | | | | 4,000 | | | | 4,288,760 | |
New York (City of), NY Water & Sewer System, Series 2020 GG-1, RB | | | 5.00% | | | | 06/15/2048 | | | | 32,500 | | | | 41,631,850 | |
New York (State of) Dormitory Authority, Series 2011 C, RB | | | 5.00% | | | | 03/15/2041 | | | | 4,000 | | | | 4,089,920 | |
New York (State of) Dormitory Authority, Series 2012 A, RB(a)(b) | | | 5.00% | | | | 07/01/2022 | | | | 5,000 | | | | 5,437,350 | |
New York (State of) Dormitory Authority, Series 2012 B, RB | | | 5.00% | | | | 03/15/2042 | | | | 4,500 | | | | 4,768,245 | |
New York (State of) Dormitory Authority, Series 2013 A, RB(a)(b) | | | 5.00% | | | | 07/01/2023 | | | | 5,000 | | | | 5,670,950 | |
See accompanying Notes to Financial Statements which are an integral part of the financial statements.
Invesco National AMT-Free Municipal Bond ETF (PZA)—(continued)
August 31, 2020
| | | | | | | | | | | | | | | | |
| | | Interest
Rate | | | Maturity
Date | | | Principal
Amount
(000) | | | Value | |
New York-(continued) | | | | | | | | | | | | | | | | |
New York (State of) Dormitory Authority, Series 2014 E, Ref. RB | | | 5.00% | | | | 02/15/2044 | | | $ | 1,905 | | | $ | 2,193,741 | |
New York (State of) Dormitory Authority, Series 2015 A, Ref. RB(a)(b) | | | 5.00% | | | | 03/15/2025 | | | | 5 | | | | 6,048 | |
New York (State of) Dormitory Authority, Series 2015 A, Ref. RB | | | 5.00% | | | | 03/15/2035 | | | | 7,525 | | | | 8,803,046 | |
New York (State of) Dormitory Authority, Series 2020 A, RB | | | 3.00% | | | | 07/01/2048 | | | | 4,000 | | | | 4,142,040 | |
New York (State of) Dormitory Authority, Series 2020 A, RB | | | 4.00% | | | | 07/01/2053 | | | | 4,000 | | | | 4,498,200 | |
New York (State of) Dormitory Authority, Series 2020 B, RN | | | 5.00% | | | | 03/31/2021 | | | | 25,000 | | | | 25,705,250 | |
New York (State of) Dormitory Authority (Columbia University), Series 2016 A-2, RB | | | 5.00% | | | | 10/01/2046 | | | | 500 | | | | 604,370 | |
New York (State of) Dormitory Authority (Columbia University), Series 2018 B, Ref. RB | | | 5.00% | | | | 10/01/2038 | | | | 5,000 | | | | 6,342,850 | |
New York (State of) Dormitory Authority (Cornell University), Series 2020 A, Ref. RB | | | 5.00% | | | | 07/01/2050 | | | | 10,000 | | | | 13,072,000 | |
New York (State of) Dormitory Authority (Fordham University), Series 2016 A, Ref. RB | | | 5.00% | | | | 07/01/2041 | | | | 750 | | | | 876,398 | |
New York (State of) Dormitory Authority (Fordham University), Series 2020, RB | | | 4.00% | | | | 07/01/2050 | | | | 2,000 | | | | 2,279,060 | |
New York (State of) Dormitory Authority (General Purpose), Series 2020 D, Ref. RB | | | 5.00% | | | | 02/15/2048 | | | | 5,000 | | | | 6,220,550 | |
New York (State of) Dormitory Authority (Icahn School of Medicine at Mount Sinai), Series 2015 A, Ref. RB | | | 5.00% | | | | 07/01/2035 | | | | 3,000 | | | | 3,453,090 | |
New York (State of) Dormitory Authority (Icahn School of Medicine at Mount Sinai), Series 2015 A, Ref. RB | | | 5.00% | | | | 07/01/2040 | | | | 3,235 | | | | 3,676,933 | |
New York (State of) Dormitory Authority (Maimonides Medical Center), Series 2020, RB | | | 3.00% | | | | 02/01/2050 | | | | 2,000 | | | | 2,089,680 | |
New York (State of) Dormitory Authority (Montefiore Obligated Group), Series 2020 A, Ref. RB, (INS - AGM)(c) | | | 3.00% | | | | 09/01/2050 | | | | 30,325 | | | | 31,365,147 | |
New York (State of) Dormitory Authority (New School (The)), Series 2015 A, Ref. RB | | | 5.00% | | | | 07/01/2045 | | | | 3,500 | | | | 3,849,405 | |
New York (State of) Dormitory Authority (New School (The)), Series 2016 A, Ref. RB | | | 5.00% | | | | 07/01/2046 | | | | 1,000 | | | | 1,124,570 | |
New York (State of) Dormitory Authority (New York University), Series 2012 A, RB(a)(b) | | | 5.00% | | | | 07/01/2022 | | | | 1,200 | | | | 1,304,964 | |
New York (State of) Dormitory Authority (New York University), Series 2015 A, Ref. RB | | | 5.00% | | | | 07/01/2035 | | | | 2,350 | | | | 2,800,777 | |
New York (State of) Dormitory Authority (New York University), Series 2019 A, RB | | | 5.00% | | | | 07/01/2042 | | | | 7,000 | | | | 8,747,410 | |
New York (State of) Dormitory Authority (North Shore - Long Island Jewish Obligated Group), Series 2015 A, Ref. RB | | | 5.00% | | | | 05/01/2036 | | | | 2,440 | | | | 2,771,938 | |
New York (State of) Dormitory Authority (State University of New York), Series 2015 B, Ref. RB | | | 5.00% | | | | 07/01/2045 | | | | 6,325 | | | | 7,235,231 | |
New York (State of) Dormitory Authority (State University of New York), Series 2019 A, RB | | | 4.00% | | | | 07/01/2049 | | | | 1,000 | | | | 1,130,240 | |
New York (State of) Power Authority, Series 2020 A, Ref. RB | | | 3.25% | | | | 11/15/2060 | | | | 3,620 | | | | 3,788,801 | |
New York (State of) Thruway Authority, Series 2016 A, RB | | | 5.25% | | | | 01/01/2056 | | | | 4,000 | | | | 4,601,600 | |
New York (State of) Thruway Authority, Series 2019 B, RB, (INS - AGM)(c) | | | 4.00% | | | | 01/01/2040 | | | | 5,000 | | | | 5,866,200 | |
New York Convention Center Development Corp. (Hotel Unit Fee Secured), Series 2015, Ref. RB | | | 5.00% | | | | 11/15/2040 | | | | 2,000 | | | | 2,199,140 | |
New York Convention Center Development Corp. (Hotel Unit Fee Secured), Series 2015, Ref. RB | | | 5.00% | | | | 11/15/2045 | | | | 3,000 | | | | 3,286,320 | |
New York Liberty Development Corp., Series 2019, Ref. RB | | | 2.80% | | | | 09/15/2069 | | | | 1,500 | | | | 1,442,910 | |
New York State Environmental Facilities Corp., Series 2020, Ref. RB | | | 4.00% | | | | 06/15/2045 | | | | 2,000 | | | | 2,356,800 | |
New York State Environmental Facilities Corp., Series 2020, Ref. RB | | | 4.00% | | | | 06/15/2049 | | | | 5,500 | | | | 6,451,555 | |
New York State Urban Development Corp., Series 2013 A-1, RB | | | 5.00% | | | | 03/15/2043 | | | | 1,000 | | | | 1,096,240 | |
New York State Urban Development Corp., Series 2020 A, RB | | | 5.00% | | | | 03/15/2041 | | | | 7,000 | | | | 8,961,890 | |
New York State Urban Development Corp., Series 2020 A, RB | | | 3.00% | | | | 03/15/2050 | | | | 12,000 | | | | 12,709,200 | |
New York State Urban Development Corp., Series 2020, Ref. RB | | | 3.00% | | | | 03/15/2040 | | | | 1,000 | | | | 1,081,380 | |
Triborough Bridge & Tunnel Authority, Series 2015 A, RB | | | 5.00% | | | | 11/15/2040 | | | | 525 | | | | 613,069 | |
Triborough Bridge & Tunnel Authority, Series 2016 A, Ref. RB | | | 5.00% | | | | 11/15/2041 | | | | 4,000 | | | | 4,708,280 | |
Triborough Bridge & Tunnel Authority, Series 2016 A, Ref. RB | | | 5.00% | | | | 11/15/2046 | | | | 3,000 | | | | 3,518,760 | |
Triborough Bridge & Tunnel Authority, Series 2017 B, Ref. RB | | | 5.00% | | | | 11/15/2038 | | | | 1,500 | | | | 1,813,680 | |
Triborough Bridge & Tunnel Authority (MTA Bridges & Tunnels), Series 2020 A, RB | | | 5.00% | | | | 11/15/2054 | | | | 1,500 | | | | 1,889,355 | |
| | | | | | | | | | | | | | | | |
| | | | | | | | | | | | | | | 580,625,338 | |
| | | | | | | | | | | | | | | | |
North Carolina-0.77% | | | | | | | | | | | | | | | | |
Charlotte (City of), NC (Charlotte Douglas International Airport), Series 2017 A, RB | | | 5.00% | | | | 07/01/2047 | | | | 2,000 | | | | 2,375,920 | |
Charlotte (City of), NC (Charlotte Douglas International Airport), Series 2019 A, RB | | | 5.00% | | | | 07/01/2049 | | | | 11,750 | | | | 14,464,603 | |
North Carolina (State of) Capital Facilities Finance Agency (Duke University), Series 2015 B, Ref. RB(a)(b) | | | 5.00% | | | | 10/01/2025 | | | | 3,000 | | | | 3,705,270 | |
| | | | | | | | | | | | | | | | |
| | | | | | | | | | | | | | | 20,545,793 | |
| | | | | | | | | | | | | | | | |
Ohio-1.76% | | | | | | | | | | | | | | | | |
American Municipal Power, Inc. (Greenup Hydroelectric), Series 2016 A, RB | | | 5.00% | | | | 02/15/2041 | | | | 2,000 | | | | 2,346,440 | |
American Municipal Power, Inc. (Greenup Hydroelectric), Series 2016 A, RB | | | 5.00% | | | | 02/15/2046 | | | | 2,000 | | | | 2,324,920 | |
Franklin (County of), OH Convention Facilities Authority (Greater Columbus Convention Center), Series 2019, RB | | | 5.00% | | | | 12/01/2051 | | | | 1,000 | | | | 961,320 | |
See accompanying Notes to Financial Statements which are an integral part of the financial statements.
Invesco National AMT-Free Municipal Bond ETF (PZA)—(continued)
August 31, 2020
| | | | | | | | | | | | | | | | |
| | | Interest
Rate | | | Maturity
Date | | | Principal
Amount
(000) | | | Value | |
Ohio-(continued) | | | | | | | | | | | | | | | | |
Hamilton (County of), OH (Christ Hospital), Series 2012, RB(a)(b) | | | 5.00% | | | | 06/01/2022 | | | $ | 4,400 | | | $ | 4,765,728 | |
Miami University, Series 2020 A, Ref. RB | | | 4.00% | | | | 09/01/2045 | | | | 3,500 | | | | 4,090,030 | |
North Royalton City School District, Series 2017, GO Bonds | | | 5.00% | | | | 12/01/2047 | | | | 5,000 | | | | 5,825,500 | |
Ohio (State of) Higher Educational Facility Commission (Summa Health System-2010), Series 2010, RB, (INS - AGM)(c) | | | 5.25% | | | | 11/15/2035 | | | | 1,000 | | | | 1,002,740 | |
Ohio (State of) Water Development Authority (Water Pollution Control Loan Fund), Series 2019 B, RB | | | 5.00% | | | | 12/01/2044 | | | | 10,000 | | | | 12,936,100 | |
Ohio State University (The), Series 2014 A, RB | | | 5.00% | | | | 12/01/2039 | | | | 11,100 | | | | 12,995,103 | |
| | | | | | | | | | | | | | | | |
| | | | | | | | | | | | | | | 47,247,881 | |
| | | | | | | | | | | | | | | | |
Oklahoma-0.53% | | | | | | | | | | | | | | | | |
Grand River Dam Authority, Series 2014 A, RB | | | 5.00% | | | | 06/01/2039 | | | | 3,500 | | | | 3,976,525 | |
Oklahoma (State of) Turnpike Authority, Series 2017 A, RB | | | 5.00% | | | | 01/01/2042 | | | | 5,000 | | | | 5,888,250 | |
Oklahoma (State of) Turnpike Authority, Series 2017 C, RB | | | 5.00% | | | | 01/01/2047 | | | | 1,660 | | | | 1,973,989 | |
Oklahoma (State of) Turnpike Authority, Series 2018 A, RB | | | 5.00% | | | | 01/01/2043 | | | | 2,000 | | | | 2,397,200 | |
| | | | | | | | | | | | | | | | |
| | | | | | | | | | | | | | | 14,235,964 | |
| | | | | | | | | | | | | | | | |
Oregon-1.68% | | | | | | | | | | | | | | | | |
Medford (City of), OR Hospital Facilities Authority (Asante), Series 2020 A, Ref. RB,
(INS - AGM)(c) | | | 4.00% | | | | 08/15/2045 | | | | 7,000 | | | | 8,080,730 | |
Medford (City of), OR Hospital Facilities Authority (Asante), Series 2020 A, Ref. RB,
(INS - AGM)(c) | | | 3.00% | | | | 08/15/2050 | | | | 15,000 | | | | 15,443,400 | |
Oregon (State of) (Article XI-G OHSU), Series 2017 H, GO Bonds | | | 5.00% | | | | 08/01/2042 | | | | 5,000 | | | | 6,176,050 | |
Oregon (State of) (Article XI-Q State), Series 2017 A, GO Bonds | | | 5.00% | | | | 05/01/2042 | | | | 2,500 | | | | 3,069,175 | |
Oregon (State of) Facilities Authority (Reed College), Series 2017, Ref. RB | | | 5.00% | | | | 07/01/2047 | | | | 1,000 | | | | 1,204,230 | |
University of Oregon, Series 2015 A, RB | | | 5.00% | | | | 04/01/2045 | | | | 7,515 | | | | 8,577,771 | |
University of Oregon, Series 2020 A, RB | | | 5.00% | | | | 04/01/2050 | | | | 2,000 | | | | 2,533,420 | |
| | | | | | | | | | | | | | | | |
| | | | | | | | | | | | | | | 45,084,776 | |
| | | | | | | | | | | | | | | | |
Pennsylvania-2.67% | | | | | | | | | | | | | | | | |
Allegheny (County of), PA, Series 2020 C-78, GO Bonds | | | 4.00% | | | | 11/01/2045 | | | | 3,875 | | | | 4,626,595 | |
Allegheny (County of), PA, Series 2020 C-78, GO Bonds | | | 4.00% | | | | 11/01/2049 | | | | 5,000 | | | | 5,939,600 | |
Berks (County of), PA Industrial Development Authority (Tower Health), Series 2017, Ref. RB | | | 3.75% | | | | 11/01/2042 | | | | 1,000 | | | | 967,110 | |
Delaware River Joint Toll Bridge Commission (Pennsylvania - New Jersey), Series 2017, RB | | | 5.00% | | | | 07/01/2042 | | | | 1,000 | | | | 1,218,150 | |
Geisinger Authority (Geisinger Health System), Series 2020, Ref. RB | | | 5.00% | | | | 04/01/2050 | | | | 2,500 | | | | 3,092,825 | |
Lackawanna (County of), PA, Series 2010 B, GO Bonds, (INS - AGM)(c) | | | 5.00% | | | | 09/01/2035 | | | | 745 | | | | 745,000 | |
Lancaster (County of), PA Hospital Authority (University of Pennsylvania), Series 2016, Ref. RB | | | 5.00% | | | | 08/15/2046 | | | | 1,500 | | | | 1,763,490 | |
Pennsylvania (Commonwealth of) (Municipal Real Estate Funding, LLC), Series 2018 A, Ref. COP | | | 5.00% | | | | 07/01/2043 | | | | 250 | | | | 301,703 | |
Pennsylvania (Commonwealth of) Turnpike Commission, Series 2018 B, RB | | | 5.25% | | | | 12/01/2048 | | | | 5,000 | | | | 6,125,150 | |
Pennsylvania (State of) Higher Educational Facilities Authority (Trustees of the University of Pennsylvania), Series 2017 A, RB | | | 5.00% | | | | 08/15/2046 | | | | 2,000 | | | | 2,380,440 | |
Pennsylvania (State of) Higher Educational Facilities Authority (Trustees University of Pennsylvania), Series 2018 A, RB | | | 5.00% | | | | 02/15/2048 | | | | 1,410 | | | | 1,710,823 | |
Pennsylvania (State of) Turnpike Commission, Series 2012 B, RB(a)(b) | | | 5.00% | | | | 12/01/2022 | | | | 1,985 | | | | 2,193,782 | |
Pennsylvania (State of) Turnpike Commission, Series 2012 B, RB(a)(b) | | | 5.00% | | | | 12/01/2022 | | | | 6,815 | | | | 7,548,090 | |
Pennsylvania (State of) Turnpike Commission, Series 2014 B, RB | | | 5.25% | | | | 12/01/2039 | | | | 15,000 | | | | 16,931,850 | |
Philadelphia (City of), PA, Series 2010 A, RB, (INS - AGM)(c) | | | 5.00% | | | | 06/15/2035 | | | | 600 | | | | 603,804 | |
Philadelphia (City of), PA, Series 2020 A, RB | | | 5.00% | | | | 11/01/2045 | | | | 1,500 | | | | 1,922,640 | |
Philadelphia (City of), PA, Series 2020 A, RB | | | 5.00% | | | | 11/01/2050 | | | | 2,400 | | | | 3,035,976 | |
Philadelphia (City of), PA (Philadelphia Gas Works Co.), Series 2017 15, Ref. RB | | | 5.00% | | | | 08/01/2047 | | | | 7,000 | | | | 8,014,440 | |
Philadelphia (City of), PA Industrial Development Authority (Thomas Jefferson University), Series 2017 A, Ref. RB | | | 5.00% | | | | 09/01/2042 | | | | 1,950 | | | | 2,264,886 | |
| | | | | | | | | | | | | | | | |
| | | | | | | | | | | | | | | 71,386,354 | |
| | | | | | | | | | | | | | | | |
Puerto Rico-0.45% | | | | | | | | | | | | | | | | |
Puerto Rico (Commonwealth of), Series 2007 A-4, Ref. GO Bonds, (INS - AGM)(c) | | | 5.00% | | | | 07/01/2031 | | | | 500 | | | | 502,810 | |
Puerto Rico (Commonwealth of), Series 2012 A, Ref. GO Bonds, (INS - AGM)(c) | | | 5.00% | | | | 07/01/2035 | | | | 7,150 | | | | 7,459,380 | |
Puerto Rico (Commonwealth of) Aqueduct & Sewer Authority, Series 2008 A, RB,
(INS - AGC)(c) | | | 5.13% | | | | 07/01/2047 | | | | 4,050 | | | | 4,051,013 | |
| | | | | | | | | | | | | | | | |
| | | | | | | | | | | | | | | 12,013,203 | |
| | | | | | | | | | | | | | | | |
Rhode Island-0.09% | | | | | | | | | | | | | | | | |
Rhode Island Health & Educational Building Corp. (Providence College), Series 2017, RB | | | 5.00% | | | | 11/01/2047 | | | | 2,000 | | | | 2,298,540 | |
| | | | | | | | | | | | | | | | |
See accompanying Notes to Financial Statements which are an integral part of the financial statements.
Invesco National AMT-Free Municipal Bond ETF (PZA)—(continued)
August 31, 2020
| | | | | | | | | | | | | | | | |
| | | Interest
Rate | | | Maturity
Date | | | Principal
Amount
(000) | | | Value | |
South Carolina-0.97% | | | | | | | | | | | | | | | | |
South Carolina (State of) Public Service Authority, Series 2013 E, RB | | | 5.00% | | | | 12/01/2048 | | | $ | 4,660 | | | $ | 5,113,418 | |
South Carolina (State of) Public Service Authority, Series 2014 C, Ref. RB | | | 5.00% | | | | 12/01/2039 | | | | 2,000 | | | | 2,267,860 | |
South Carolina (State of) Public Service Authority, Series 2015 E, RB | | | 5.25% | | | | 12/01/2055 | | | | 2,500 | | | | 2,902,700 | |
South Carolina (State of) Public Service Authority, Series 2016 A, Ref. RB | | | 5.00% | | | | 12/01/2035 | | | | 6,250 | | | | 7,396,688 | |
South Carolina (State of) Public Service Authority, Series 2016 A, Ref. RB | | | 5.00% | | | | 12/01/2037 | | | | 7,000 | | | | 8,243,550 | |
| | | | | | | | | | | | | | | | |
| | | | | | | | | | | | | | | 25,924,216 | |
| | | | | | | | | | | | | | | | |
Tennessee-0.67% | | | | | | | | | | | | | | | | |
Metropolitan Government Nashville & Davidson County Health & Educational Facs Board (Vanderbilt University), Series 2016, RB | | | 5.00% | | | | 07/01/2040 | | | | 3,000 | | | | 3,468,420 | |
Metropolitan Government Nashville & Davidson County Health & Educational Facs Board (Vanderbilt University), Series 2017 A, RB | | | 4.00% | | | | 07/01/2047 | | | | 1,250 | | | | 1,352,500 | |
Metropolitan Nashville Airport Authority (The), Series 2015 A, RB | | | 5.00% | | | | 07/01/2045 | | | | 1,500 | | | | 1,713,630 | |
Nashville (City of) & Davidson (County of), TN Metropolitan Government Health & Educational Facilities Board (The) (Vanderbilt University Medical Center), Series 2016 A, RB | | | 5.00% | | | | 07/01/2035 | | | | 2,000 | | | | 2,332,520 | |
Nashville (City of) & Davidson (County of), TN Metropolitan Government Health & Educational Facilities Board (The) (Vanderbilt University Medical Center), Series 2016 A, RB | | | 5.00% | | | | 07/01/2046 | | | | 2,750 | | | | 3,150,345 | |
Nashville (City of) & Davidson (County of), TN Metropolitan Government Health & Educational Facilities Board (The) (Vanderbilt University Medical Center), Series 2017 A, RB | | | 5.00% | | | | 07/01/2048 | | | | 2,000 | | | | 2,320,500 | |
Tennessee (State of) School Bond Authority, Series 2017, RB | | | 5.00% | | | | 11/01/2047 | | | | 3,000 | | | | 3,662,430 | |
| | | | | | | | | | | | | | | | |
| | | | | | | | | | | | | | | 18,000,345 | |
| | | | | | | | | | | | | | | | |
Texas-10.95% | | | | | | | | | | | | | | | | |
Austin (City of), TX, Series 2016, Ref. RB | | | 5.00% | | | | 11/15/2041 | | | | 1,000 | | | | 1,231,030 | |
Austin (City of), TX, Series 2016, Ref. RB | | | 5.00% | | | | 11/15/2045 | | | | 1,000 | | | | 1,223,640 | |
Austin (City of), TX, Series 2019 B, RB | | | 5.00% | | | | 11/15/2049 | | | | 15,000 | | | | 19,166,700 | |
Central Texas Regional Mobility Authority, Series 2016, Ref. RB | | | 5.00% | | | | 01/01/2040 | | | | 1,250 | | | | 1,444,213 | |
Central Texas Regional Mobility Authority, Series 2016, Ref. RB | | | 5.00% | | | | 01/01/2046 | | | | 700 | | | | 803,516 | |
Clifton Higher Education Finance Corp. (Idea Public Schools), Series 2017, Ref. RB, (CEP - Texas Permanent School Fund) | | | 4.00% | | | | 08/15/2042 | | | | 8,500 | | | | 9,676,570 | |
Dallas (City of), TX, Series 2017, RB | | | 5.00% | | | | 10/01/2046 | | | | 6,000 | | | | 7,419,300 | |
Dallas (City of), TX, Series 2020 C, Ref. RB | | | 5.00% | | | | 10/01/2045 | | | | 11,000 | | | | 14,467,200 | |
Dallas (City of), TX (Civic Center Convention Complex), Series 2009, Ref. RB, (INS - AGC)(c) | | | 5.25% | | | | 08/15/2034 | | | | 2,500 | | | | 2,509,425 | |
Dallas (City of), TX Area Rapid Transit, Series 2016 A, Ref. RB | | | 5.00% | | | | 12/01/2046 | | | | 5,540 | | | | 6,614,926 | |
Grand Parkway Transportation Corp., Series 2018 A, RB | | | 5.00% | | | | 10/01/2043 | | | | 10,000 | | | | 12,295,600 | |
Harris County-Houston Sports Authority, Series 2014 A, Ref. RB | | | 5.00% | | | | 11/15/2053 | | | | 3,950 | | | | 4,124,116 | |
Houston (City of), TX, Series 2020 C, Ref. RB | | | 4.00% | | | | 11/15/2043 | | | | 3,500 | | | | 4,194,330 | |
Houston (City of), TX, Series 2020 C, Ref. RB | | | 5.00% | | | | 11/15/2045 | | | | 3,500 | | | | 4,587,625 | |
Houston (City of), TX, Series 2020 C, Ref. RB | | | 3.00% | | | | 11/15/2047 | | | | 7,000 | | | | 7,501,340 | |
Houston (City of), TX, Series 2020 C, Ref. RB | | | 4.00% | | | | 11/15/2049 | | | | 3,000 | | | | 3,562,530 | |
Hutto (City of), TX, Series 2017, GO Bonds, (INS - AGM)(c) | | | 5.00% | | | | 08/01/2057 | | | | 10,000 | | | | 11,863,900 | |
Lamar Consolidated Independent School District, Series 2018, GO Bonds, (CEP - Texas Permanent School Fund) | | | 5.00% | | | | 02/15/2043 | | | | 5,000 | | | | 6,047,300 | |
Lamar Consolidated Independent School District, Series 2020, Ref. GO Bonds, (CEP - Texas Permanent School Fund) | | | 4.00% | | | | 02/15/2047 | | | | 5,000 | | | | 5,993,600 | |
Leander Independent School District, Series 2020 B, Ref. GO Bonds, (CEP - Texas Permanent School Fund) | | | 4.00% | | | | 08/15/2045 | | | | 10,000 | | | | 12,119,100 | |
Lower Colorado River Authority, Series 2012 A, Ref. RB | | | 5.00% | | | | 05/15/2039 | | | | 1,900 | | | | 2,027,357 | |
Lower Colorado River Authority, Series 2013, Ref. RB | | | 5.00% | | | | 05/15/2039 | | | | 1,000 | | | | 1,102,020 | |
Lower Colorado River Authority, Series 2015, Ref. RB | | | 5.00% | | | | 05/15/2040 | | | | 500 | | | | 581,145 | |
Lower Colorado River Authority (LCRA Transmission Services Corp.), Series 2019, Ref. RB | | | 5.00% | | | | 05/15/2044 | | | | 2,000 | | | | 2,396,560 | |
Mesquite Independent School District, Series 2018, GO Bonds, (CEP - Texas Permanent School Fund) | | | 5.00% | | | | 08/15/2048 | | | | 5,000 | | | | 6,233,700 | |
Mesquite Independent School District, Series 2020 A, GO Bonds, (CEP - Texas Permanent School Fund) | | | 4.00% | | | | 08/15/2045 | | | | 4,000 | | | | 4,790,760 | |
New Hope Cultural Education Facilities Finance Corp. (Cardinal Bay, Inc.), Series 2016, RB | | | 5.00% | | | | 07/01/2046 | | | | 1,000 | | | | 978,630 | |
New Hope Cultural Education Facilities Finance Corp. (Cardinal Bay, Inc.), Series 2016, RB | | | 5.00% | | | | 07/01/2051 | | | | 1,000 | | | | 943,040 | |
New Hope Cultural Education Facilities Finance Corp. (CHF-Collegiate Housing College Station I, LLC-Texas A&M University), Series 2014 A, RB, (INS - AGM)(c) | | | 5.00% | | | | 04/01/2046 | | | | 1,250 | | | | 1,349,638 | |
See accompanying Notes to Financial Statements which are an integral part of the financial statements.
Invesco National AMT-Free Municipal Bond ETF (PZA)—(continued)
August 31, 2020
| | | | | | | | | | | | | | | | |
| | | Interest
Rate | | | Maturity
Date | | | Principal
Amount
(000) | | | Value | |
Texas-(continued) | | | | | | | | | | | | | | | | |
North Fort Bend Water Authority, Series 2011, RB, (INS - AGM)(c) | | | 5.00% | | | | 12/15/2036 | | | $ | 2,500 | | | $ | 2,644,575 | |
North Texas Tollway Authority, Series 2015 B, Ref. RB | | | 5.00% | | | | 01/01/2040 | | | | 2,500 | | | | 2,707,250 | |
North Texas Tollway Authority, Series 2016 A, Ref. RB | | | 5.00% | | | | 01/01/2039 | | | | 1,800 | | | | 2,113,326 | |
North Texas Tollway Authority, Series 2017 A, Ref. RB | | | 5.00% | | | | 01/01/2048 | | | | 11,270 | | | | 13,621,485 | |
North Texas Tollway Authority, Series 2018, Ref. RB | | | 5.00% | | | | 01/01/2048 | | | | 5,000 | | | | 5,967,850 | |
Prosper Independent School District, Series 2017, GO Bonds, (CEP - Texas Permanent School Fund) | �� | | 5.00% | | | | 02/15/2047 | | | | 1,000 | | | | 1,223,180 | |
Prosper Independent School District, Series 2019, GO Bonds, (CEP - Texas Permanent School Fund) | | | 5.00% | | | | 02/15/2049 | | | | 6,500 | | | | 8,240,895 | |
Richardson Independent School District, Series 2017, GO Bonds, (CEP - Texas Permanent School Fund) | | | 5.00% | | | | 02/15/2042 | | | | 2,285 | | | | 2,737,476 | |
Rockwall Independent School District, Series 2016, GO Bonds(a)(b) | | | 5.00% | | | | 02/15/2025 | | | | 2,045 | | | | 2,473,857 | |
San Antonio (City of), TX, Series 2017, RB | | | 5.00% | | | | 02/01/2047 | | | | 10,000 | | | | 12,332,200 | |
San Antonio (City of), TX, Series 2020, RB | | | 5.00% | | | | 02/01/2049 | | | | 4,000 | | | | 5,140,280 | |
San Antonio (City of), TX Water System, Series 2018 A, Ref. RB | | | 5.00% | | | | 05/15/2043 | | | | 2,500 | | | | 3,140,200 | |
San Antonio (City of), TX Water System, Series 2020 A, Ref. RB | | | 5.00% | | | | 05/15/2050 | | | | 10,000 | | | | 12,839,500 | |
San Antonio (City of), TX Water System, Series 2020 C, RB | | | 5.00% | | | | 05/15/2046 | | | | 5,000 | | | | 6,457,950 | |
San Jacinto College District, Series 2019 A, GO Bonds | | | 5.00% | | | | 02/15/2049 | | | | 2,000 | | | | 2,455,800 | |
San Jacinto River Authority (Groundwater Reduction Plan Division), Series 2011, RB, (INS - AGM)(c) | | | 5.00% | | | | 10/01/2037 | | | | 1,000 | | | | 1,003,660 | |
Sherman Independent School District, Series 2018 A, GO Bonds, (CEP - Texas Permanent School Fund) | | | 5.00% | | | | 02/15/2045 | | | | 6,785 | | | | 8,389,245 | |
Socorro Independent School District, Series 2019, GO Bonds, (CEP - Texas Permanent School Fund) | | | 4.00% | | | | 08/15/2044 | | | | 4,000 | | | | 4,704,680 | |
Spring Independent School District, Series 2017, GO Bonds, (CEP - Texas Permanent School Fund) | | | 5.00% | | | | 08/15/2042 | | | | 2,000 | | | | 2,460,080 | |
Tarrant County Cultural Education Facilities Finance Corp. (Baylor Scott & White Health), Series 2016, Ref. RB | | | 5.00% | | | | 11/15/2045 | | | | 750 | | | | 863,955 | |
Texas (State of), Series 2014 A, Ref. GO Bonds(a)(b) | | | 5.00% | | | | 10/01/2024 | | | | 3,280 | | | | 3,910,646 | |
Texas (State of) Transportation Commission (Central Texas Turnpike System), Series 2015 C, Ref. RB | | | 5.00% | | | | 08/15/2042 | | | | 2,500 | | | | 2,793,975 | |
Texas (State of) Water Development Board, Series 2015 A, RB | | | 5.00% | | | | 10/15/2045 | | | | 3,910 | | | | 4,712,606 | |
Texas (State of) Water Development Board, Series 2016, RB | | | 5.00% | | | | 10/15/2046 | | | | 1,000 | | | | 1,231,180 | |
Texas (State of) Water Development Board, Series 2017 A, RB | | | 5.00% | | | | 10/15/2047 | | | | 4,975 | | | | 6,210,889 | |
Texas (State of) Water Development Board, Series 2018 B, RB | | | 5.00% | | | | 04/15/2049 | | | | 10,000 | | | | 12,645,900 | |
Ysleta Independent School District, Series 2017, GO Bonds, (CEP - Texas Permanent School Fund) | | | 5.00% | | | | 08/15/2047 | | | | 2,500 | | | | 3,014,100 | |
| | | | | | | | | | | | | | | | |
| | | | | | | | | | | | | | | 293,285,551 | |
| | | | | | | | | | | | | | | | |
Utah-0.40% | | | | | | | | | | | | | | | | |
Salt Lake City Corp., Series 2017 B, RB | | | 5.00% | | | | 07/01/2042 | | | | 2,000 | | | | 2,383,520 | |
Salt Lake City Corp., Series 2017 B, RB | | | 5.00% | | | | 07/01/2047 | | | | 4,000 | | | | 4,735,040 | |
Salt Lake City Corp., Series 2018 B, RB | | | 5.00% | | | | 07/01/2048 | | | | 3,000 | | | | 3,611,070 | |
| | | | | | | | | | | | | | | | |
| | | | | | | | | | | | | | | 10,729,630 | |
| | | | | | | | | | | | | | | | |
Virginia-0.27% | | | | | | | | | | | | | | | | |
Chesapeake Bay Bridge & Tunnel District, Series 2016, RB | | | 5.00% | | | | 07/01/2051 | | | | 3,395 | | | | 3,845,109 | |
Lynchburg Economic Development Authority, Series 2017 A, Ref. RB | | | 5.00% | | | | 01/01/2047 | | | | 1,000 | | | | 1,136,560 | |
Virginia (Commonwealth of) Transportation Board, Series 2017 A, Ref. RB | | | 4.00% | | | | 05/15/2036 | | | | 2,000 | | | | 2,337,560 | |
| | | | | | | | | | | | | | | | |
| | | | | | | | | | | | | | | 7,319,229 | |
| | | | | | | | | | | | | | | | |
Washington-2.01% | | | | | | | | | | | | | | | | |
Central Puget Sound Regional Transit Authority (Green Bonds), Series 2016 S-1, RB | | | 5.00% | | | | 11/01/2041 | | | | 6,500 | | | | 7,937,865 | |
Central Puget Sound Regional Transit Authority (Green Bonds), Series 2016 S-1, RB | | | 5.00% | | | | 11/01/2046 | | | | 3,000 | | | | 4,687,440 | |
King & Snohomish Counties School District No. 417 Northshore, Series 2018, GO Bonds, (CEP - Oregon School Bond Guaranty) | | | 5.00% | | | | 12/01/2036 | | | | 2,000 | | | | 2,552,980 | |
King (County of), WA, Series 2016 B, Ref. RB(a)(b) | | | 5.00% | | | | 07/01/2023 | | | | 14,695 | | | | 16,680,441 | |
Snohomish (County of) Public Utility District No. 1, Series 2015, RB | | | 5.00% | | | | 12/01/2040 | | | | 1,000 | | | | 1,203,070 | |
Washington (State of), Series 2017 D, GO Bonds | | | 5.00% | | | | 02/01/2038 | | | | 5,000 | | | | 6,188,650 | |
Washington (State of), Series 2017 D, GO Bonds | | | 5.00% | | | | 02/01/2041 | | | | 4,855 | | | | 5,969,951 | |
Washington (State of) (SR 520 Corridor Program –Toll Revenue), Series 2011 C, GO Bonds(a) | | | 5.00% | | | | 06/01/2041 | | | | 1,340 | | | | 1,385,935 | |
Washington (State of) Health Care Facilities Authority (Seattle Cancer Care Alliance), Series 2020, Ref. RB | | | 5.00% | | | | 09/01/2055 | | | | 3,000 | | | | 3,731,790 | |
Washington (State of) Health Care Facilities Authority (Virginia Mason Medical Center), Series 2017, Ref. RB | | | 4.00% | | | | 08/15/2042 | | | | 1,000 | | | | 1,047,100 | |
See accompanying Notes to Financial Statements which are an integral part of the financial statements.
Invesco National AMT-Free Municipal Bond ETF (PZA)—(continued)
August 31, 2020
| | | | | | | | | | | | | | | | |
| | | Interest
Rate | | | Maturity
Date | | | Principal
Amount
(000) | | | Value | |
Washington-(continued) | | | | | | | | | | | | | | | | |
Washington (State of) Higher Education Facilities Authority (Seattle University), Series 2020, RB | | | 4.00% | | | | 05/01/2045 | | | $ | 1,000 | | | $ | 1,105,120 | |
Washington (State of) Higher Education Facilities Authority (Seattle University), Series 2020, RB | | | 4.00% | | | | 05/01/2050 | | | | 1,200 | | | | 1,317,192 | |
| | | | | | | | | | | | | | | | |
| | | | | | | | | | | | | | | 53,807,534 | |
| | | | | | | | | | | | | | | | |
Wisconsin-0.28% | | | | | | | | | | | | | | | | |
Public Finance Authority (KU Campus Development Corp. - Central District Development), Series 2016, RB | | | 5.00% | | | | 03/01/2041 | | | | 5,000 | | | | 5,750,500 | |
Wisconsin (State of) Health & Educational Facilities Authority (ProHealth Care, Inc. Obligated Group), Series 2015, Ref. RB | | | 5.00% | | | | 08/15/2039 | | | | 1,500 | | | | 1,674,705 | |
| | | | | | | | | | | | | | | | |
| | | | | | | | | | | | | | | 7,425,205 | |
| | | | | | | | | | | | | | | | |
TOTAL INVESTMENTS IN SECURITIES(h)-98.67%
(Cost $2,513,048,877) | | | | | | | | | | | | | | | 2,641,602,361 | |
OTHER ASSETS LESS LIABILITIES-1.33% | | | | 35,550,913 | |
| | | | | | | | | | | | | | | | |
NET ASSETS-100.00% | | | $ | 2,677,153,274 | |
| | | | | | | | | | | | | | | | |
| | |
| Investment Abbreviations: |
| AGC | | -Assured Guaranty Corp. |
| AGM | | -Assured Guaranty Municipal Corp. |
| BAM | | -Build America Mutual Assurance Co. |
| CEP | | -Credit Enhancement Provider |
| COP | | -Certificates of Participation |
| GO | | -General Obligation |
| INS | | -Insurer |
| LOC | | -Letter of Credit |
| NATL | | -National Public Finance Guarantee Corp. |
| RAC | | -Revenue Anticipation Certificates |
| RB | | -Revenue Bonds |
| Ref. | | -Refunding |
| RN | | -Revenue Notes |
| VRD | | -Variable Rate Demand |
| Wts. | | -Warrants |
Notes to Schedule of Investments:
| (a) | Advance refunded; secured by an escrow fund of U.S. Government obligations or other highly rated collateral. |
| (b) | Security has an irrevocable call by the issuer or mandatory put by the holder. Maturity date reflects such call or put. |
| (c) | Principal and/or interest payments are secured by the bond insurance company listed. |
| (d) | Demand security payable upon demand by the Fund at specified time intervals no greater than thirteen months. Interest rate is redetermined periodically by the issuer or agent based on current market conditions. Rate shown is the rate in effect on August 31, 2020. |
| (e) | Principal and interest payments are fully enhanced by a letter of credit from the bank listed or a predecessor bank, branch or subsidiary. |
| (f) | Security subject to crossover refunding. |
| (g) | Security purchased or received in a transaction exempt from registration under the Securities Act of 1933, as amended (the “1933 Act”). The security may be resold pursuant to an exemption from registration under the 1933 Act, typically to qualified institutional buyers. The value of this security at August 31, 2020 represented less than 1% of the Fund’s Net Assets. |
| (h) | This table provides a listing of those entities that have either issued, guaranteed, backed or otherwise enhanced the credit quality of more than 5% of the securities held in the portfolio. In instances where the entity has guaranteed, backed or otherwise enhanced the credit quality of a security, it is not primarily responsible for the issuer’s obligations but may be called upon to satisfy the issuer’s obligations. |
| | | | |
| Entities | | Percentage | |
Assured Guaranty Municipal Corp. | | | 11.59% | |
See accompanying Notes to Financial Statements which are an integral part of the financial statements.
Invesco New York AMT-Free Municipal Bond ETF (PZT)
August 31, 2020
Schedule of Investments
| | | | | | | | | | | | | | | | |
| | | Interest
Rate | | | Maturity
Date | | | Principal
Amount
(000) | | | Value | |
Municipal Obligations-96.66% | | | | | | | | | | | | | |
Guam-1.08% | | | | | | | | | | | | | | | | |
Guam (Territory of) Power Authority, Series 2012 A, Ref. RB, (INS - AGM)(a) | | | 5.00% | | | | 10/01/2030 | | | $ | 1,000 | | | $ | 1,071,590 | |
| | | | | | | | | | | | | | | | |
New York-95.58% | | | | | | | | | | | | | | | | |
Battery Park (City of), NY Authority, Series 2019, RB | | | 4.00% | | | | 11/01/2044 | | | | 1,000 | | | | 1,180,110 | |
Battery Park (City of), NY Authority, Series 2019, RB | | | 5.00% | | | | 11/01/2049 | | | | 2,500 | | | | 3,213,825 | |
Brooklyn Arena Local Development Corp. (Barclays Center), Series 2016 A, Ref. RB | | | 5.00% | | | | 07/15/2042 | | | | 2,000 | | | | 2,175,820 | |
Build NYC Resource Corp. (New York Law School), Series 2016, Ref. RB | | | 5.00% | | | | 07/01/2041 | | | | 1,000 | | | | 1,031,550 | |
Dutchess County Local Development Corp. (Health Quest Systems, Inc.), Series 2016 B, RB | | | 5.00% | | | | 07/01/2046 | | | | 500 | | | | 567,245 | |
Hudson Yards Infrastructure Corp., Series 2017 A, Ref. RB | | | 5.00% | | | | 02/15/2042 | | | | 450 | | | | 534,884 | |
Long Island (City of), NY Power Authority, Series 2014 A, Ref. RB | | | 5.00% | | | | 09/01/2044 | | | | 2,000 | | | | 2,294,520 | |
Metropolitan Transportation Authority (Green Bonds), Series 2016 A1, RB | | | 5.25% | | | | 11/15/2056 | | | | 1,000 | | | | 1,080,010 | |
Metropolitan Transportation Authority (Green Bonds), Series 2016 B-1, RB | | | 5.00% | | | | 11/15/2046 | | | | 1,500 | | | | 1,718,625 | |
Metropolitan Transportation Authority (Green Bonds), Series 2019 B, RB, (INS - AGM)(a) | | | 4.00% | | | | 11/15/2049 | | | | 1,000 | | | | 1,098,660 | |
Metropolitan Transportation Authority (Green Bonds), Series 2020 C-1, RB | | | 5.25% | | | | 11/15/2055 | | | | 1,000 | | | | 1,125,660 | |
Monroe County Industrial Development Corp. (University of Rochester), Series 2020 A, RB | | | 4.00% | | | | 07/01/2050 | | | | 1,000 | | | | 1,157,490 | |
MTA Hudson Rail Yards Trust Obligations, Series 2016 A, RB | | | 5.00% | | | | 11/15/2051 | | | | 1,240 | | | | 1,302,620 | |
New York & New Jersey (States of) Port Authority, Series 2015, Ref. RB | | | 5.25% | | | | 10/15/2055 | | | | 1,000 | | | | 1,168,560 | |
New York & New Jersey (States of) Port Authority, Series 2018, Ref. RB | | | 5.00% | | | | 09/01/2048 | | | | 1,500 | | | | 1,816,230 | |
New York (City of), NY, Series 2017 A-1, GO Bonds | | | 5.00% | | | | 08/01/2038 | | | | 500 | | | | 596,695 | |
New York (City of), NY, Series 2017 B-1, GO Bonds | | | 4.00% | | | | 12/01/2043 | | | | 2,000 | | | | 2,239,040 | |
New York (City of), NY, Series 2018 E-1, GO Bonds | | | 5.00% | | | | 03/01/2038 | | | | 1,000 | | | | 1,221,260 | |
New York (City of), NY, Series 2019 B-1, GO Bonds | | | 5.00% | | | | 10/01/2039 | | | | 2,000 | | | | 2,505,340 | |
New York (City of), NY Industrial Development Agency (Queens Baseball Stadium), Series 2009, RB, (INS - AGC)(a) | | | 6.50% | | | | 01/01/2046 | | | | 2,500 | | | | 2,512,175 | |
New York (City of), NY Industrial Development Agency (Yankee Stadium), Series 2009, RB, (INS - AGC)(a) | | | 7.00% | | | | 03/01/2049 | | | | 2,000 | | | | 2,011,080 | |
New York (City of), NY Municipal Water Finance Authority, Series 2017 EE, Ref. RB | | | 5.25% | | | | 06/15/2037 | | | | 1,000 | | | | 1,264,750 | |
New York (City of), NY Municipal Water Finance Authority, Series 2018 DD-1, RB | | | 3.63% | | | | 06/15/2048 | | | | 2,000 | | | | 2,178,480 | |
New York (City of), NY Municipal Water Finance Authority, Series 2019 BB-1, RB | | | 4.00% | | | | 06/15/2049 | | | | 1,000 | | | | 1,162,590 | |
New York (City of), NY Transitional Finance Authority, Series 2015 S-2, RB | | | 5.00% | | | | 07/15/2035 | | | | 1,000 | | | | 1,185,300 | |
New York (City of), NY Transitional Finance Authority, Series 2016 S-1, RB | | | 5.00% | | | | 07/15/2043 | | | | 1,000 | | | | 1,182,050 | |
New York (City of), NY Transitional Finance Authority, Series 2017 E-1, RB | | | 5.00% | | | | 02/01/2043 | | | | 1,500 | | | | 1,784,295 | |
New York (City of), NY Transitional Finance Authority, Series 2018 B-1, RB | | | 5.00% | | | | 08/01/2045 | | | | 1,000 | | | | 1,198,640 | |
New York (City of), NY Transitional Finance Authority, Series 2018 S-3, RB | | | 4.00% | | | | 07/15/2046 | | | | 1,000 | | | | 1,130,430 | |
New York (City of), NY Transitional Finance Authority, Series 2018 S-4A, Ref. RB | | | 5.00% | | | | 07/15/2037 | | | | 1,000 | | | | 1,236,920 | |
New York (City of), NY Transitional Finance Authority, Series 2019, RB | | | 4.00% | | | | 11/01/2042 | | | | 2,000 | | | | 2,295,380 | |
New York (State of) Dormitory Authority, Series 2012 B, RB | | | 5.00% | | | | 03/15/2042 | | | | 1,200 | | | | 1,271,532 | |
New York (State of) Dormitory Authority, Series 2017 A, Ref. RB | | | 5.00% | | | | 02/15/2038 | | | | 1,000 | | | | 1,203,790 | |
New York (State of) Dormitory Authority, Series 2017 B, Ref. RB | | | 4.00% | | | | 02/15/2044 | | | | 5,000 | | | | 5,623,900 | |
New York (State of) Dormitory Authority, Series 2018 C, Ref. RB | | | 5.00% | | | | 03/15/2043 | | | | 1,000 | | | | 1,222,520 | |
New York (State of) Dormitory Authority (Catholic Health System Obligated Group), Series 2019 A, Ref. RB | | | 4.00% | | | | 07/01/2045 | | | | 500 | | | | 544,735 | |
New York (State of) Dormitory Authority (Columbia University), Series 2017 A, RB | | | 5.00% | | | | 10/01/2047 | | | | 1,000 | | | | 1,630,510 | |
New York (State of) Dormitory Authority (Fordham University), Series 2020, RB | | | 4.00% | | | | 07/01/2050 | | | | 1,000 | | | | 1,139,530 | |
New York (State of) Dormitory Authority (Icahn School of Medicine at Mount Sinai), Series 2015 A, Ref. RB | | | 5.00% | | | | 07/01/2035 | | | | 2,000 | | | | 2,302,060 | |
New York (State of) Dormitory Authority (Maimonides Medical Center), Series 2020, RB | | | 3.00% | | | | 02/01/2050 | | | | 1,110 | | | | 1,159,772 | |
New York (State of) Dormitory Authority (New School (The)), Series 2016 A, Ref. RB | | | 5.00% | | | | 07/01/2046 | | | | 1,000 | | | | 1,124,570 | |
New York (State of) Dormitory Authority (New York University), Series 2001-1, RB, (INS - AMBAC)(a) | | | 5.50% | | | | 07/01/2040 | | | | 1,500 | | | | 2,187,135 | |
New York (State of) Dormitory Authority (NYU Hospitals Center), Series 2014, Ref. RB | | | 5.00% | | | | 07/01/2034 | | | | 1,500 | | | | 1,683,225 | |
New York (State of) Dormitory Authority (Rockefeller University) (Green Bonds), Series 2019 B, RB | | | 5.00% | | | | 07/01/2050 | | | | 2,000 | | | | 2,526,160 | |
New York (State of) Dormitory Authority (State University of New York), Series 2019 A, RB | | | 4.00% | | | | 07/01/2049 | | | | 1,785 | | | | 2,017,478 | |
New York (State of) Thruway Authority, Series 2016 A, RB | | | 5.00% | | | | 01/01/2046 | | | | 1,000 | | | | 1,147,340 | |
New York (State of) Utility Debt Securitization Authority, Series 2013, RB | | | 5.00% | | | | 12/15/2041 | | | | 1,500 | | | | 1,696,440 | |
See accompanying Notes to Financial Statements which are an integral part of the financial statements.
Invesco New York AMT-Free Municipal Bond ETF (PZT)—(continued)
August 31, 2020
| | | | | | | | | | | | | | | | |
| | | Interest
Rate | | | Maturity
Date | | | Principal
Amount
(000) | | | Value | |
New York-(continued) | | | | | | | | | | | | | | | | |
New York Convention Center Development Corp. (Hotel Unit Fee Secured), Series 2015, Ref. RB | | | 5.00% | | | | 11/15/2040 | | | $ | 1,885 | | | $ | 2,072,690 | |
New York Liberty Development Corp. (4 World Trade Center), Series 2011, Ref. RB | | | 5.00% | | | | 11/15/2044 | | | | 2,000 | | | | 2,095,760 | |
New York State Environmental Facilities Corp., Series 2016, Ref. RB | | | 5.00% | | | | 06/15/2041 | | | | 1,000 | | | | 1,210,730 | |
New York State Urban Development Corp., Series 2019 A, Ref. RB | | | 4.00% | | | | 03/15/2044 | | | | 2,000 | | | | 2,299,460 | |
New York State Urban Development Corp., Series 2020 A, RB | | | 5.00% | | | | 03/15/2041 | | | | 1,000 | | | | 1,280,270 | |
Onondaga (County of), NY Trust for Cultural Resources (Syracuse University), Series 2019, Ref. RB | | | 5.00% | | | | 12/01/2043 | | | | 2,500 | | | | 3,186,500 | |
Triborough Bridge & Tunnel Authority, Series 2016 A, Ref. RB | | | 5.00% | | | | 11/15/2046 | | | | 1,470 | | | | 1,724,192 | |
Triborough Bridge & Tunnel Authority, Series 2017 B, Ref. RB | | | 5.00% | | | | 11/15/2037 | | | | 1,000 | | | | 1,212,680 | |
Triborough Bridge & Tunnel Authority, Series 2017 B, Ref. RB | | | 5.00% | | | | 11/15/2038 | | | | 1,000 | | | | 1,209,120 | |
Utility Debt Securitization Authority, Series 2017, RB | | | 5.00% | | | | 12/15/2038 | | | | 2,000 | | | | 2,515,960 | |
| | | | | | | | | | | | | | | | |
| | | | | | | | | | | | | | | 94,458,293 | |
| | | | | | | | | | | | | | | | |
TOTAL INVESTMENTS IN SECURITIES(b)-96.66%
(Cost $90,174,567) | | | | 95,529,883 | |
OTHER ASSETS LESS LIABILITIES-3.34% | | | | 3,298,878 | |
| | | | | | | | | | | | | | | | |
NET ASSETS-100.00% | | | $ | 98,828,761 | |
| | | | | | | | | | | | | | | | |
| | |
| Investment Abbreviations: |
| AGC | | -Assured Guaranty Corp. |
| AGM | | -Assured Guaranty Municipal Corp. |
| AMBAC | | -American Municipal Bond Assurance Corp. |
| GO | | -General Obligation |
| INS | | -Insurer |
| RB | | -Revenue Bonds |
| Ref. | | -Refunding |
Notes to Schedule of Investments:
| (a) | Principal and/or interest payments are secured by the bond insurance company listed. |
| (b) | Entities may either issue, guarantee, back or otherwise enhance the credit quality of a security. The entities are not primarily responsible for the borrower’s obligations but may be called upon to satisfy the borrower’s obligations. No concentration of any single entity was greater than 5% each. |
See accompanying Notes to Financial Statements which are an integral part of the financial statements.
Invesco Preferred ETF (PGX)
August 31, 2020
Schedule of Investments(a)
| | | | | | | | |
| | | Shares | | | Value | |
Preferred Stocks-99.59% | |
Automobiles-1.08% | | | | | | | | |
Ford Motor Co. | | | | | | | | |
Pfd., 6.00% | | | 1,408,429 | | | $ | 34,717,775 | |
Pfd., 6.20% | | | 1,319,651 | | | | 32,780,131 | |
| | | | | | | | |
| | | | | | | 67,497,906 | |
| | | | | | | | |
Banks-33.04% | | | | | | | | |
Associated Banc-Corp., Series E, Pfd., 5.88% | | | 175,562 | | | | 4,798,109 | |
BancorpSouth Bank, Series A, Pfd., 5.50% | | | 259,675 | | | | 6,816,469 | |
Bank of America Corp. | | | | | | | | |
Series LL, Pfd., 5.00%(b) | | | 2,540,127 | | | | 67,973,798 | |
Series KK, Pfd., 5.38%(b) | | | 2,863,685 | | | | 77,720,411 | |
Series HH, Pfd., 5.88% | | | 1,820,022 | | | | 49,814,002 | |
Series EE, Pfd., 6.00% | | | 1,626,830 | | | | 42,834,434 | |
Series GG, Pfd., 6.00% | | | 2,623,588 | | | | 72,699,623 | |
Series CC, Pfd., 6.20%(b) | | | 2,029,880 | | | | 52,675,386 | |
BOK Financial Corp., Pfd., 5.38%(b) | | | 261,161 | | | | 6,892,039 | |
CIT Group, Inc., Series B, Pfd., 5.63% | | | 336,868 | | | | 7,872,605 | |
Citigroup, Inc. | | | | | | | | |
Series S, Pfd., 6.30% | | | 1,772,195 | | | | 45,598,577 | |
Series K, Pfd., 6.88%(b)(c) | | | 3,626,949 | | | | 102,570,118 | |
Series J, Pfd., 7.13%(b)(c) | | | 450,350 | | | | 12,871,003 | |
Citizens Financial Group, Inc. | | | | | | | | |
Series E, Pfd., 5.00%(b) | | | 784,128 | | | | 19,712,978 | |
Series D, Pfd., 6.35%(c) | | | 532,908 | | | | 14,356,541 | |
Commerce Bancshares, Inc., Series B, Pfd., 6.00% | | | 283,390 | | | | 7,084,750 | |
Dime Community Bancshares, Inc., Series A, Pfd., 5.50% | | | 180,480 | | | | 4,087,872 | |
Fifth Third Bancorp | | | | | | | | |
Series K, Pfd., 4.95%(b) | | | 444,825 | | | | 11,859,034 | |
Series A, Pfd., 6.00% | | | 200,714 | | | | 5,399,207 | |
Series I, Pfd., 6.63%(b)(c) | | | 908,506 | | | | 25,574,444 | |
First Citizens BancShares, Inc., Series A, Pfd., 5.38% | | | 570,028 | | | | 15,008,837 | |
First Horizon National Corp. | | | | | | | | |
Series D, Pfd., 6.10%(b)(c) | | | 173,169 | | | | 4,614,954 | |
Series A, Pfd., 6.20%(b) | | | 177,198 | | | | 4,738,275 | |
Pfd., 6.50%(b) | | | 251,941 | | | | 6,754,538 | |
First Midwest Bancorp, Inc. | | | | | | | | |
Series A, Pfd., 7.00%(b) | | | 24,860 | | | | 655,310 | |
Series C, Pfd., 7.00% | | | 44,712 | | | | 1,170,113 | |
First Republic Bank | | | | | | | | |
Series J, Pfd., 4.70%(b) | | | 617,381 | | | | 16,249,468 | |
Series H, Pfd., 5.13% | | | 345,150 | | | | 9,094,702 | |
Series G, Pfd., 5.50%(b) | | | 295,738 | | | | 7,659,614 | |
Series I, Pfd., 5.50%(b) | | | 555,398 | | | | 15,190,135 | |
Series F, Pfd., 5.70%(b) | | | 258,539 | | | | 6,561,720 | |
Hancock Whitney Corp. | | | | | | | | |
Pfd., 5.95% | | | 288,439 | | | | 7,447,495 | |
Pfd., 6.25%(b) | | | 319,398 | | | | 8,387,391 | |
Huntington Bancshares, Inc. | | | | | | | | |
Series C, Pfd., 5.88%(b) | | | 194,905 | | | | 5,229,301 | |
Series D, Pfd., 6.25% | | | 1,038,832 | | | | 26,646,041 | |
| | | | | | | | |
| | | Shares | | | Value | |
Banks-(continued) | | | | | | | | |
JPMorgan Chase & Co. | | | | | | | | |
Series GG, Pfd., 4.75%(b) | | | 1,549,874 | | | $ | 41,257,646 | |
Series DD, Pfd., 5.75% | | | 3,004,234 | | | | 82,225,885 | |
Series EE, Pfd., 6.00% | | | 2,622,391 | | | | 73,033,589 | |
Series AA, Pfd., 6.10%(b) | | | 2,420,062 | | | | 61,735,782 | |
Series BB, Pfd., 6.15%(b) | | | 2,241,365 | | | | 57,939,285 | |
KeyCorp | | | | | | | | |
Series G, Pfd., 5.63%(b) | | | 738,875 | | | | 20,429,894 | |
Series F, Pfd., 5.65% | | | 722,000 | | | | 19,075,240 | |
Series E, Pfd., 6.13%(b)(c) | | | 906,379 | | | | 26,955,711 | |
People’s United Financial, Inc., Series A, Pfd., 5.63%(c) | | | 485,781 | | | | 12,921,775 | |
PNC Financial Services Group, Inc. (The), Series P, Pfd., 6.13%(c) | | | 3,178,285 | | | | 84,351,684 | |
Regions Financial Corp. | | | | | | | | |
Series C, Pfd., 5.70%(b)(c) | | | 838,294 | | | | 22,759,682 | |
Series A, Pfd., 6.38%(b) | | | 928,484 | | | | 23,676,342 | |
Series B, Pfd., 6.38%(c) | | | 897,660 | | | | 24,730,533 | |
SVB Financial Group, Series A, Pfd., 5.25%(b) | | | 603,732 | | | | 15,805,704 | |
Synovus Financial Corp. | | | | | | | | |
Series E, Pfd., 5.88%(b)(c) | | | 650,449 | | | | 16,241,712 | |
Series D, Pfd., 6.30%(c) | | | 380,438 | | | | 9,902,801 | |
TCF Financial Corp., Series C, Pfd., 5.70% | | | 350,535 | | | | 9,078,856 | |
Texas Capital Bancshares, Inc., Series A, Pfd., 6.50%(b) | | | 474,804 | | | | 12,202,463 | |
Truist Financial Corp. | | | | | | | | |
Series R, Pfd., 4.75% | | | 1,523,148 | | | | 40,256,802 | |
Series G, Pfd., 5.20%(b) | | | 52,022 | | | | 1,318,237 | |
Series O, Pfd., 5.25%(b) | | | 373,423 | | | | 10,306,475 | |
Series H, Pfd., 5.63%(b) | | | 842,874 | | | | 22,032,726 | |
U.S. Bancorp | | | | | | | | |
Pfd., 5.15%(b) | | | 884,418 | | | | 23,003,712 | |
Series K, Pfd., 5.50% | | | 1,146,817 | | | | 32,110,876 | |
Series F, Pfd., 6.50%(b)(c) | | | 1,784,471 | | | | 48,055,804 | |
Valley National Bancorp | | | | | | | | |
Series B, Pfd., 5.50%(c) | | | 183,560 | | | | 4,480,700 | |
Series A, Pfd., 6.25%(c) | | | 234,271 | | | | 6,533,818 | |
Webster Financial Corp., Series F, Pfd., 5.25%(b) | | | 287,775 | | | | 7,617,404 | |
Wells Fargo & Co. | | | | | | | | |
Series Z, Pfd., 4.75%(b) | | | 3,469,645 | | | | 86,012,500 | |
Series O, Pfd., 5.13%(b) | | | 1,004,307 | | | | 25,559,613 | |
Pfd., 5.20%(b) | | | 1,067,752 | | | | 27,281,064 | |
Series X, Pfd., 5.50%(b) | | | 2,112,255 | | | | 55,256,591 | |
Series Y, Pfd., 5.63%(b) | | | 1,511,145 | | | | 40,559,132 | |
Series W, Pfd., 5.70% | | | 1,899,531 | | | | 48,646,989 | |
Series Q, Pfd., 5.85%(c) | | | 3,190,612 | | | | 83,243,067 | |
Series T, Pfd., 6.00%(b) | | | 214,910 | | | | 5,568,318 | |
Series V, Pfd., 6.00% | | | 1,713,512 | | | | 43,488,935 | |
Series R, Pfd., 6.63%(c) | | | 1,563,020 | | | | 43,092,461 | |
Wintrust Financial Corp. | | | | | | | | |
Series D, Pfd., 6.50%(b)(c) | | | 218,318 | | | | 5,685,001 | |
Series E, Pfd., 6.88%(c) | | | 502,670 | | | | 13,365,995 | |
See accompanying Notes to Financial Statements which are an integral part of the financial statements.
Invesco Preferred ETF (PGX)—(continued)
August 31, 2020
| | | | | | | | |
| | | Shares | | | Value | |
Banks-(continued) | | | | | | | | |
Zions Bancorporation N.A | | | | | | | | |
Series H, Pfd., 5.75%(b) | | | 226,310 | | | $ | 5,829,746 | |
Series G, Pfd., 6.30%(c) | | | 22,000 | | | | 595,100 | |
| | | | | | | | |
| | | | | | | 2,068,844,944 | |
| | | | | | | | |
Capital Markets-10.61% | | | | | | | | |
Affiliated Managers Group, Inc., Pfd., 5.88%(b) | | | 529,867 | | | | 14,544,849 | |
Apollo Global Management, Inc. | | | | | | | | |
Series A, Pfd., 6.38%(b) | | | 491,572 | | | | 13,208,540 | |
Series B, Pfd., 6.38%(b) | | | 541,564 | | | | 14,714,294 | |
Ares Management Corp., Series A, Pfd., 7.00% | | | 605,651 | | | | 15,880,169 | |
Bank of New York Mellon Corp. (The), Pfd., 5.20% | | | 1,040,595 | | | | 26,805,727 | |
Brightsphere Investment Group, Inc., Pfd., 5.13% | | | 224,669 | | | | 5,650,425 | |
Charles Schwab Corp. (The) | | | | | | | | |
Series D, Pfd., 5.95% | | | 1,298,476 | | | | 33,903,208 | |
Series C, Pfd., 6.00%(b) | | | 1,024,649 | | | | 26,087,564 | |
Goldman Sachs Group, Inc. (The) | | | | | | | | |
Series J, Pfd., 5.50%(c) | | | 1,774,464 | | | | 48,052,485 | |
Series N, Pfd., 6.30% | | | 1,176,744 | | | | 30,736,553 | |
Series K, Pfd., 6.38%(c) | | | 1,218,139 | | | | 33,961,715 | |
KKR & Co., Inc. | | | | | | | | |
Series B, Pfd., 6.50%(b) | | | 299,971 | | | | 8,210,206 | |
Series A, Pfd., 6.75%(b) | | | 653,440 | | | | 17,303,091 | |
Legg Mason, Inc. | | | | | | | | |
Pfd., 5.45%(b) | | | 836,890 | | | | 21,633,606 | |
Pfd., 6.38%(b) | | | 412,844 | | | | 10,614,219 | |
Morgan Stanley | | | | | | | | |
Series L, Pfd., 4.88%(b) | | | 848,401 | | | | 22,287,494 | |
Series K, Pfd., 5.85%(c) | | | 1,742,640 | | | | 49,212,154 | |
Series I, Pfd., 6.38%(c) | | | 1,920,157 | | | | 54,167,629 | |
Series F, Pfd., 6.88%(c) | | | 1,106,846 | | | | 31,224,126 | |
Series E, Pfd., 7.13%(b)(c) | | | 1,464,596 | | | | 42,238,949 | |
Northern Trust Corp., Series E, Pfd., 4.70%(b) | | | 683,751 | | | | 18,768,965 | |
Oaktree Capital Group LLC | | | | | | | | |
Series B, Pfd., 6.55% | | | 441,159 | | | | 12,092,168 | |
Series A, Pfd., 6.63% | | | 354,075 | | | | 9,786,633 | |
Prospect Capital Corp., Pfd., 6.25% | | | 371,849 | | | | 9,325,973 | |
State Street Corp. | | | | | | | | |
Series G, Pfd., 5.35%(c) | | | 865,588 | | | | 24,046,035 | |
Series D, Pfd., 5.90%(b)(c) | | | 1,290,498 | | | | 35,540,315 | |
Stifel Financial Corp. | | | | | | | | |
Pfd., 5.20%(b) | | | 437,847 | | | | 11,576,675 | |
Series C, Pfd., 6.13% | | | 354,932 | | | | 9,558,319 | |
Series A, Pfd., 6.25% | | | 301,260 | | | | 7,817,697 | |
Series B, Pfd., 6.25%(b) | | | 208,318 | | | | 5,645,418 | |
| | | | | | | | |
| | | | | | | 664,595,201 | |
| | | | | | | | |
Chemicals-0.14% | | | | | | | | |
EI du Pont de Nemours and Co., Series B, Pfd., 4.50%(b) | | | 83,764 | | | | 8,923,555 | |
| | | | | | | | |
Commercial Services & Supplies-0.25% | |
Pitney Bowes, Inc., Pfd., 6.70% | | | 846,775 | | | | 15,622,999 | |
| | | | | | | | |
| | | | | | | | |
| | | Shares | | | Value | |
Consumer Finance-3.68% | |
Capital One Financial Corp. | | | | | | | | |
Series J, Pfd., 4.80% | | | 2,006,670 | | | $ | 48,701,881 | |
Series I, Pfd., 5.00% | | | 2,560,487 | | | | 64,473,063 | |
Series G, Pfd., 5.20% | | | 1,038,529 | | | | 26,555,187 | |
Series H, Pfd., 6.00%(b) | | | 892,141 | | | | 23,061,845 | |
Series F, Pfd., 6.20%(b) | | | 882,017 | | | | 22,350,311 | |
Navient Corp., Pfd., 6.00%(b) | | | 607,196 | | | | 13,765,133 | |
Synchrony Financial, Series A, Pfd., 5.63%(b) | | | 1,284,586 | | | | 31,241,131 | |
| | | | | | | | |
| | | | | | | 230,148,551 | |
| | | | | | | | |
Diversified Financial Services-1.48% | |
Equitable Holdings, Inc., Series A, Pfd., 5.25% | | | 1,362,501 | | | | 34,212,400 | |
National Rural Utilities Cooperative Finance Corp., Pfd., 5.50% | | | 440,299 | | | | 11,998,148 | |
PartnerRe Ltd. | | | | | | | | |
Series I, Pfd., 5.88% (Bermuda)(b) | | | 683,323 | | | | 17,499,902 | |
Series H, Pfd., 7.25% (Bermuda)(b) | | | 578,188 | | | | 14,963,506 | |
Voya Financial, Inc., Series B, Pfd., 5.35%(b)(c) | | | 502,171 | | | | 14,141,135 | |
| | | | | | | | |
| | | | | | | 92,815,091 | |
| | | | | | | | |
Diversified Telecommunication Services-5.80% | |
AT&T, Inc. | | | | | | | | |
Series C, Pfd., 4.75%(b) | | | 2,878,842 | | | | 73,036,222 | |
Series A, Pfd., 5.00%(b) | | | 2,056,283 | | | | 55,128,947 | |
Pfd., 5.35% | | | 2,258,512 | | | | 60,415,196 | |
Pfd., 5.63%(b) | | | 1,438,871 | | | | 39,482,620 | |
Qwest Corp. | | | | | | | | |
Pfd., 6.13%(b) | | | 1,499,228 | | | | 37,135,878 | |
Pfd., 6.50%(b) | | | 1,745,357 | | | | 43,982,996 | |
Pfd., 6.63% | | | 701,497 | | | | 17,719,814 | |
Pfd., 6.75%(b) | | | 1,039,682 | | | | 27,208,478 | |
Pfd., 7.00% | | | 341,339 | | | | 8,792,893 | |
| | | | | | | | |
| | | | | | | 362,903,044 | |
| | | | | | | | |
Electric Utilities-8.90% | | | | | | | | |
Alabama Power Co., Series A, Pfd., 5.00% | | | 445,400 | | | | 12,471,200 | |
Duke Energy Corp. | | | | | | | | |
Pfd., 5.13% | | | 951,898 | | | | 24,663,677 | |
Pfd., 5.63% | | | 917,490 | | | | 25,854,868 | |
Series A, Pfd., 5.75% | | | 1,590,115 | | | | 44,857,144 | |
Entergy Arkansas LLC | | | | | | | | |
Pfd., 4.88%(b) | | | 552,637 | | | | 14,700,144 | |
Pfd., 4.90%(b) | | | 61,241 | | | | 1,619,824 | |
Entergy Louisiana LLC | | | | | | | | |
Pfd., 4.88%(b) | | | 503,294 | | | | 13,090,677 | |
Pfd., 5.25% | | | 500,670 | | | | 13,392,923 | |
Entergy Mississippi LLC, Pfd., 4.90%(b) | | | 498,643 | | | | 13,568,076 | |
Entergy New Orleans LLC, Pfd.,
5.50%(b) | | | 505,121 | | | | 13,890,828 | |
Entergy Texas, Inc., Pfd., 5.63%(b) | | | 614,702 | | | | 16,289,603 | |
Georgia Power Co., Series 2017A, Pfd., 5.00%(b) | | | 501,653 | | | | 13,865,689 | |
Interstate Power and Light Co., Series D, Pfd., 5.10% | | | 370,816 | | | | 9,492,890 | |
NextEra Energy Capital Holdings, Inc. Pfd., 5.00% | | | 882,151 | | | | 22,503,672 | |
Series I, Pfd., 5.13% | | | 877,288 | | | | 22,441,027 | |
Series K, Investment Units, 5.25%(b) | | | 876,980 | | | | 22,748,861 | |
Series N, Pfd., 5.65% | | | 1,225,990 | | | | 34,082,522 | |
See accompanying Notes to Financial Statements which are an integral part of the financial statements.
Invesco Preferred ETF (PGX)—(continued)
August 31, 2020
| | | | | | | | |
| | | Shares | | | Value | |
Electric Utilities-(continued) | | | | | | | | |
PPL Capital Funding, Inc., Series B, Pfd., 5.90% | | | 780,071 | | | $ | 20,196,038 | |
SCE Trust II, Pfd., 5.10%(b) | | | 336,583 | | | | 8,306,868 | |
SCE Trust III, Series H, Pfd., 5.75%(c) | | | 408,194 | | | | 9,380,298 | |
SCE Trust IV, Series J, Pfd.,
5.38%(b)(c) | | | 604,552 | | | | 13,916,787 | |
SCE Trust V, Series K, Pfd., 5.45%(c) | | | 604,833 | | | | 14,038,174 | |
SCE Trust VI, Pfd., 5.00% | | | 1,071,522 | | | | 25,705,813 | |
Southern Co. (The) | | | | | | | | |
Series 2020, Pfd., 4.95% | | | 1,713,077 | | | | 45,944,725 | |
Pfd., 5.25%(b) | | | 1,365,703 | | | | 35,467,307 | |
Pfd., 5.25% | | | 769,127 | | | | 20,712,590 | |
Pfd., 6.25% | | | 1,711,748 | | | | 43,786,514 | |
| | | | | | | | |
| | | | | | | 556,988,739 | |
| | | | | | | | |
Equity REITs-8.66% | | | | | | | | |
American Homes 4 Rent | | | | | | | | |
Series F, Pfd., 5.88%(b) | | | 488,832 | | | | 13,076,256 | |
Series G, Pfd., 5.88% | | | 180,720 | | | | 4,805,345 | |
Series H, Pfd., 6.25%(b) | | | 179,525 | | | | 5,003,362 | |
Series E, Pfd., 6.35% | | | 261,199 | | | | 6,830,354 | |
Series D, Pfd., 6.50% | | | 320,650 | | | | 8,320,868 | |
Boston Properties, Inc., Series B, Pfd., 5.25%(b) | | | 220,986 | | | | 5,613,044 | |
Digital Realty Trust, Inc. | | | | | | | | |
Series L, Pfd., 5.20%(b) | | | 600,402 | | | | 16,511,055 | |
Series J, Pfd., 5.25%(b) | | | 458,279 | | | | 12,295,626 | |
Series K, Pfd., 5.85% | | | 351,808 | | | | 9,713,419 | |
Series G, Pfd., 5.88% | | | 424,198 | | | | 10,923,098 | |
Series I, Pfd., 6.35% | | | 440,294 | | | | 11,143,841 | |
Series C, Pfd., 6.63%(b) | | | 306,947 | | | | 8,078,845 | |
Diversified Healthcare Trust | | | | | | | | |
Pfd., 5.63% | | | 634,599 | | | | 12,203,339 | |
Pfd., 6.25% | | | 434,770 | | | | 8,438,886 | |
EPR Properties, Series G, Pfd., 5.75% | | | 298,993 | | | | 5,540,340 | |
Federal Realty Investment Trust, Series C, Pfd., 5.00%(b) | | | 275,423 | | | | 7,262,905 | |
Kimco Realty Corp. | | | | | | | | |
Series L, Pfd., 5.13%(b) | | | 396,947 | | | | 10,463,523 | |
Class M, Pfd., 5.25%(b) | | | 450,660 | | | | 11,942,490 | |
National Retail Properties, Inc., Series F, Pfd., 5.20%(b) | | | 628,437 | | | | 16,219,959 | |
Office Properties Income Trust | | | | | | | | |
Pfd., 5.88%(b) | | | 554,695 | | | | 14,061,518 | |
Pfd., 6.38% | | | 67,246 | | | | 1,785,381 | |
PS Business Parks, Inc. | | | | | | | | |
Series Z, Pfd., 4.88% | | | 542,765 | | | | 14,524,391 | |
Series W, Pfd., 5.20% | | | 336,751 | | | | 8,738,688 | |
Series Y, Pfd., 5.20%(b) | | | 343,974 | | | | 9,166,907 | |
Series X, Pfd., 5.25%(b) | | | 408,760 | | | | 10,836,228 | |
| | | | | | | | |
| | | Shares | | | Value | |
Equity REITs-(continued) | | | | | | | | |
Public Storage | | | | | | | | |
Series M, Pfd., 4.13% | | | 237,524 | | | $ | 6,299,136 | |
Series L, Pfd., 4.63%(b) | | | 409,919 | | | | 11,223,582 | |
Series J, Pfd., 4.70%(b) | | | 25,852 | | | | 712,223 | |
Series K, Pfd., 4.75%(b) | | | 284,574 | | | | 7,854,242 | |
Series I, Pfd., 4.88%(b) | | | 233,030 | | | | 6,364,049 | |
Series E, Pfd., 4.90% | | | 1,133,956 | | | | 29,256,065 | |
Series D, Pfd., 4.95% | | | 911,772 | | | | 23,432,540 | |
Series G, Pfd., 5.05% | | | 866,082 | | | | 22,821,261 | |
Series C, Pfd., 5.13%(b) | | | 522,559 | | | | 13,482,022 | |
Series F, Pfd., 5.15%(b) | | | 528,007 | | | | 14,008,026 | |
Series W, Pfd., 5.20%(b) | | | 841,010 | | | | 21,277,553 | |
Series B, Pfd., 5.40%(b) | | | 981,047 | | | | 25,389,496 | |
Series H, Pfd., 5.60%(b) | | | 464,302 | | | | 13,186,177 | |
QTS Realty Trust, Inc., Series A, Pfd., 7.13%(b) | | | 53,108 | | | | 1,466,843 | |
SITE Centers Corp. | | | | | | | | |
Series K, Pfd., 6.25% | | | 345,608 | | | | 8,654,024 | |
Series A, Pfd., 6.38%(b) | | | 241,166 | | | | 6,005,033 | |
SL Green Realty Corp., Series I, Pfd., 6.50% | | | 397,505 | | | | 10,414,631 | |
Spirit Realty Capital, Inc., Series A, Pfd., 6.00% | | | 333,862 | | | | 8,657,042 | |
VEREIT, Inc., Series F, Pfd., 6.70% | | | 1,079,899 | | | | 27,159,460 | |
Vornado Realty Trust | | | | | | | | |
Series M, Pfd., 5.25%(b) | | | 596,110 | | | | 15,129,272 | |
Series L, Pfd., 5.40%(b) | | | 399,907 | | | | 10,097,652 | |
Series K, Pfd., 5.70% | | | 628,362 | | | | 15,910,126 | |
| | | | | | | | |
| | | | | | | 542,300,123 | |
| | | | | | | | |
Gas Utilities-0.34% | | | | | | | | |
South Jersey Industries, Inc., Pfd., 5.63% | | | 347,823 | | | | 8,907,747 | |
Spire, Inc., Series A, Pfd., 5.90% | | | 439,547 | | | | 12,171,056 | |
| | | | | | | | |
| | | | | | | 21,078,803 | |
| | | | | | | | |
Independent Power and Renewable Electricity Producers-0.14% | |
Brookfield Renewable Partners L.P., Series 17, Pfd., 5.25% (Canada) | | | 333,059 | | | | 9,039,221 | |
| | | | | | | | |
Insurance-14.90% | | | | | | | | |
AEGON Funding Co. LLC, Pfd., 5.10% (Netherlands) | | | 1,584,326 | | | | 40,637,962 | |
Allstate Corp. (The) | | | | | | | | |
Series I, Pfd., 4.75%(b) | | | 514,350 | | | | 13,928,598 | |
Pfd., 5.10%(c) | | | 857,831 | | | | 23,075,654 | |
Series H, Pfd., 5.10% | | | 1,946,565 | | | | 52,518,324 | |
Series G, Pfd., 5.63% | | | 1,057,687 | | | | 29,668,120 | |
American Equity Investment Life Holding Co. | | | | | | | | |
Series A, Pfd., 5.95%(b)(c) | | | 677,337 | | | | 16,195,128 | |
Series B, Pfd., 6.63%(c) | | | 281,892 | | | | 7,185,427 | |
American Financial Group, Inc. | | | | | | | | |
Pfd., 5.13%(b) | | | 373,990 | | | | 10,004,233 | |
Pfd., 5.63% | | | 149,219 | | | | 4,063,233 | |
Pfd., 5.88% | | | 74,751 | | | | 2,066,865 | |
Pfd., 6.00% | | | 214,260 | | | | 5,446,489 | |
American International Group, Inc., | | | | | | | | |
Series A, Pfd., 5.85%(b) | | | 867,638 | | | | 23,729,899 | |
Arch Capital Group Ltd. | | | | | | | | |
Series E, Pfd., 5.25% | | | 820,654 | | | | 20,918,470 | |
Series F, Pfd., 5.45% | | | 572,754 | | | | 15,069,158 | |
See accompanying Notes to Financial Statements which are an integral part of the financial statements.
Invesco Preferred ETF (PGX)—(continued)
August 31, 2020
| | | | | | | | |
| | | Shares | | | Value | |
Insurance-(continued) | | | | | | | | |
Argo Group International Holdings Ltd., Pfd., 7.00%(c) | | | 184,855 | | | $ | 4,711,954 | |
Argo Group U.S., Inc., Pfd., 6.50%(b) | | | 224,789 | | | | 5,736,615 | |
Aspen Insurance Holdings Ltd. | | | | | | | | |
Pfd., 5.63% (Bermuda)(b) | | | 454,660 | | | | 11,252,835 | |
Pfd., 5.63% (Bermuda)(b) | | | 443,229 | | | | 10,730,574 | |
Pfd., 5.95% (Bermuda)(b)(c) | | | 452,564 | | | | 11,223,587 | |
Assured Guaranty Municipal Holdings, Inc., Pfd., 6.25%(b) | | | 635,341 | | | | 17,046,199 | |
Athene Holding Ltd. | | | | | | | | |
Series B, Pfd., 5.63% | | | 564,062 | | | | 14,518,956 | |
Series A, Pfd., 6.35%(c) | | | 1,524,366 | | | | 40,654,841 | |
Series C, Pfd., 6.38%(c) | | | 1,007,086 | | | | 27,261,818 | |
AXIS Capital Holdings Ltd., Series E, Pfd., 5.50%(b) | | | 1,007,668 | | | | 25,645,151 | |
Brighthouse Financial, Inc. | | | | | | | | |
Pfd., 6.25%(b) | | | 724,562 | | | | 19,592,156 | |
Series A, Pfd., 6.60% | | | 734,700 | | | | 19,991,187 | |
Series B, Pfd., 6.75% | | | 584,505 | | | | 16,237,549 | |
Enstar Group Ltd. | | | | | | | | |
Series D, Pfd., 7.00% (Bermuda)(c) | | | 746,447 | | | | 19,922,670 | |
Series E, Pfd., 7.00% (Bermuda)(b) | | | 176,842 | | | | 4,739,366 | |
Globe Life, Inc., Pfd., 6.13% | | | 610,096 | | | | 16,954,568 | |
Hanover Insurance Group, Inc. (The), Pfd., 6.35% | | | 328,615 | | | | 8,330,390 | |
Hartford Financial Services Group, Inc. (The) | | | | | | | | |
Series G, Pfd., 6.00%(b) | | | 578,169 | | | | 15,986,373 | |
Pfd., 7.88%(c) | | | 1,091,375 | | | | 30,733,120 | |
MetLife, Inc. | | | | | | | | |
Series F, Pfd., 4.75%(b) | | | 1,604,306 | | | | 42,498,066 | |
Series E, Pfd., 5.63%(b) | | | 1,497,916 | | | | 41,552,190 | |
Prudential Financial, Inc. | | | | | | | | |
Pfd., 4.13% | | | 389,000 | | | | 9,870,875 | |
Pfd., 5.63% | | | 1,043,256 | | | | 29,065,112 | |
Pfd., 5.70% | | | 1,212,245 | | | | 30,306,125 | |
Pfd., 5.75%(b) | | | 1,023,867 | | | | 25,658,107 | |
Prudential PLC, Pfd., 6.50% (United Kingdom) | | | 969,778 | | | | 26,853,153 | |
Reinsurance Group of America, Inc. | | | | | | | | |
Pfd., 5.75%(c) | | | 704,243 | | | | 19,254,004 | |
Pfd., 6.20%(c) | | | 700,832 | | | | 18,859,389 | |
RenaissanceRe Holdings Ltd. | | | | | | | | |
Series E, Pfd., 5.38% (Bermuda)(b) | | | 737,361 | | | | 18,581,497 | |
Series F, Pfd., 5.75% (Bermuda)(b) | | | 430,499 | | | | 11,804,283 | |
Unum Group, Pfd., 6.25% | | | 563,015 | | | | 14,925,528 | |
W.R. Berkley Corp. | | | | | | | | |
Pfd., 5.10%(b) | | | 526,849 | | | | 13,761,296 | |
Pfd., 5.63% | | | 660,732 | | | | 16,835,451 | |
Pfd., 5.70%(b) | | | 315,484 | | | | 8,423,423 | |
Pfd., 5.75%(b) | | | 606,587 | | | | 15,583,220 | |
Pfd., 5.90%(b) | | | 124,317 | | | | 3,237,215 | |
| | | | | | | | |
| | | | | | | 932,846,403 | |
| | | | | | | | |
Internet & Direct Marketing Retail-1.05% | |
eBay, Inc., Pfd., 6.00% | | | 1,344,942 | | | | 35,008,840 | |
QVC, Inc. | | | | | | | | |
Pfd., 6.25%(b) | | | 876,801 | | | | 21,122,136 | |
Pfd., 6.38% | | | 385,803 | | | | 9,664,365 | |
| | | | | | | | |
| | | | | | | 65,795,341 | |
| | | | | | | | |
| | | | | | | | |
| | | Shares | | | Value | |
Leisure Products-0.40% | | | | | | | | |
Brunswick Corp. | | | | | | | | |
Pfd., 6.38%(b) | | | 390,351 | | | $ | 10,609,740 | |
Pfd., 6.50%(b) | | | 309,710 | | | | 8,352,879 | |
Pfd., 6.63%(b) | | | 217,202 | | | | 5,968,711 | |
| | | | | | | | |
| | | | | | | 24,931,330 | |
| | | | | | | | |
Multi-Utilities-4.08% | | | | | | | | |
Algonquin Power & Utilities Corp. | | | | | | | | |
Series 19-A, Pfd., 6.20% (Canada)(c) | | | 614,336 | | | | 16,857,380 | |
Pfd., 6.88% (Canada)(c) | | | 520,858 | | | | 14,412,141 | |
CMS Energy Corp. | | | | | | | | |
Pfd., 5.63%(b) | | | 371,675 | | | | 10,035,225 | |
Pfd., 5.88%(b) | | | 484,614 | | | | 13,292,962 | |
Pfd., 5.88% | | | 1,177,765 | | | | 32,470,981 | |
Dominion Energy, Inc., Series A, Investment Units, 5.25% | | | 1,474,938 | | | | 38,127,147 | |
DTE Energy Co. | | | | | | | | |
Series E, Investment Units, 5.25% | | | 703,411 | | | | 18,689,630 | |
Series B, Investment Units, 5.38% | | | 590,813 | | | | 15,130,721 | |
Series F, Investment Units, 6.00% | | | 731,618 | | | | 19,102,546 | |
Integrys Holding, Inc., Pfd., 6.00%(b)(c) | | | 624,421 | | | | 16,965,519 | |
NiSource, Inc., Series B, Pfd., 6.50%(c) | | | 889,957 | | | | 24,260,228 | |
Sempra Energy, Pfd., 5.75% | | | 1,324,023 | | | | 35,947,224 | |
| | | | | | | | |
| | | | | | | 255,291,704 | |
| | | | | | | | |
Oil, Gas & Consumable Fuels-1.95% | | | | | | | | |
DCP Midstream L.P. | | | | | | | | |
Series B, Pfd., 7.88%(c) | | | 289,266 | | | | 5,365,884 | |
Series C, Pfd., 7.95%(c) | | | 200,201 | | | | 3,783,799 | |
Enbridge, Inc., Series B, Pfd., 6.38% (Canada)(c) | | | 1,026,999 | | | | 26,517,114 | |
Energy Transfer Operating L.P. | | | | | | | | |
Series C, Pfd., 7.38%(c) | | | 842,888 | | | | 17,068,482 | |
Series E, Pfd., 7.60%(c) | | | 1,394,720 | | | | 29,777,272 | |
Series D, Pfd., 7.63%(c) | | | 761,849 | | | | 15,404,587 | |
NuStar Energy L.P. | | | | | | | | |
Series B, Pfd., 7.63%(c) | | | 654,228 | | | | 11,161,130 | |
Series A, Pfd., 8.50%(c) | | | 386,439 | | | | 7,299,833 | |
Series C, Pfd., 9.00%(c) | | | 296,195 | | | | 5,965,367 | |
| | | | | | | | |
| | | | | | | 122,343,468 | |
| | | | | | | | |
Real Estate Management & Development-0.43% | |
Brookfield Property Partners L.P. | | | | | | | | |
Series A, Pfd., 5.75% | | | 432,328 | | | | 8,568,741 | |
Series A2, Pfd., 6.38%(b) | | | 551,811 | | | | 12,195,023 | |
Series A-1, Pfd., 6.50%(b) | | | 272,635 | | | | 6,066,129 | |
| | | | | | | | |
| | | | | | | 26,829,893 | |
| | | | | | | | |
Thrifts & Mortgage Finance-0.37% | | | | | | | | |
New York Community Bancorp, Inc., | | | | | | | | |
Series A, Pfd., 6.38%(c) | | | 860,546 | | | | 23,303,586 | |
| | | | | | | | |
Trading Companies & Distributors-0.74% | |
Air Lease Corp., Series A, Pfd.,
6.15%(b)(c) | | | 463,068 | | | | 10,854,314 | |
GATX Corp., Pfd., 5.63%(b) | | | 295,807 | | | | 8,096,238 | |
Triton International Ltd. | | | | | | | | |
Pfd., 6.88% (Bermuda) | | | 217,698 | | | | 5,294,415 | |
Pfd., 7.38% (Bermuda) | | | 320,089 | | | | 8,098,252 | |
Pfd., 8.00% (Bermuda) | | | 248,086 | | | | 6,499,853 | |
WESCO International, Inc., Series A, Pfd., 10.63%(c) | | | 261,068 | | | | 7,249,858 | |
| | | | | | | | |
| | | | | | | 46,092,930 | |
| | | | | | | | |
See accompanying Notes to Financial Statements which are an integral part of the financial statements.
Invesco Preferred ETF (PGX)—(continued)
August 31, 2020
| | | | | | | | |
| | | Shares | | | Value | |
Wireless Telecommunication Services-1.55% | |
Telephone & Data Systems, Inc. | | | | | | | | |
Pfd., 5.88% | | | 485,648 | | | $ | 12,078,066 | |
Pfd., 6.63% | | | 923,365 | | | | 24,025,957 | |
United States Cellular Corp. | | | | | | | | |
Pfd., 6.25% | | | 796,929 | | | | 20,863,601 | |
Pfd., 6.95%(b) | | | 603,634 | | | | 15,368,522 | |
Pfd., 7.25%(b) | | | 543,698 | | | | 13,755,559 | |
Pfd., 7.25%(b) | | | 429,785 | | | | 10,813,391 | |
| | | | | | | | |
| | | | | | | 96,905,096 | |
| | | | | | | | |
TOTAL INVESTMENTS IN SECURITIES
(excluding investments purchased with cash collateral from securities on loan)-99.59%
(Cost $6,142,728,213) | | | | 6,235,097,928 | |
| | | | | | | | |
| | | | | | | | |
| | | Shares | | | Value | |
| Investments Purchased with Cash Collateral from Securities on Loan | |
| Money Market Funds-0.99% | |
Invesco Private Government Fund, 0.03%(d)(e)(f) | | | 46,761,620 | | | $ | 46,761,620 | |
Invesco Private Prime Fund,
0.14%(d)(e)(f) | | | 15,586,574 | | | | 15,589,691 | |
| | | | | | | | |
Total Investments Purchased with Cash Collateral from Securities on Loan
(Cost $62,351,312) | | | | 62,351,311 | |
| | | | | | | | |
TOTAL INVESTMENTS IN SECURITIES-100.58%
(Cost $6,205,079,525) | | | | 6,297,449,239 | |
OTHER ASSETS LESS LIABILITIES-(0.58)% | | | | (36,492,909 | ) |
| | | | | | | | |
NET ASSETS-100.00% | | | | | | $ | 6,260,956,330 | |
| | | | | | | | |
| | |
| Investment Abbreviations: |
| Pfd. | | -Preferred |
| REIT | | -Real Estate Investment Trust |
Notes to Schedule of Investments:
| (a) | Industry and/or sector classifications used in this report are generally according to the Global Industry Classification Standard, which was developed by and is the exclusive property and a service mark of MSCI Inc. and Standard & Poor’s. |
| (b) | All or a portion of this security was out on loan at August 31, 2020. |
| (c) | Security issued at a fixed rate for a specific period of time, after which it will convert to a variable rate. |
| (d) | Affiliated issuer. The issuer and/or the Fund is a wholly-owned subsidiary of Invesco Ltd., or is affiliated by having an investment adviser that is under common control of Invesco Ltd. The table below shows the Fund’s transactions in, and earnings from, its investments in affiliates for the fiscal year ended August 31, 2020. |
| | | | | | | | | | | | | | | | | | | | | | | | | | | | | | | | | | | |
| | | Value
August 31, 2019 | | Purchases
at Cost | | Proceeds
from Sales | | Change in
Unrealized
Appreciation
(Depreciation) | | Realized
Gain
(Loss) | | Value
August 31, 2020 | | Dividend
Income |
| Investments in Affiliated Money Market Funds: | | | | | | | | | | | | | | | | | | | | | | | | | | | | | | | | | | | |
| Invesco Premier U.S. Government Money Portfolio, Institutional Class | | | $ | - | | | | $ | 864,891,653 | | | | $ | (864,891,653 | ) | | | $ | - | | | | $ | - | | | | $ | - | | | | $ | 400,656 | |
| Investments Purchased with Cash Collateral from Securities on Loan: | | | | | | | | | | | | | | | | | | | | | | | | | | | | | | | | | | | |
| Invesco Government & Agency Portfolio, Institutional Class | | | | 20,242,227 | | | | | 331,450,994 | | | | | (351,693,221 | ) | | | | - | | | | | - | | | | | - | | | | | 259,646 | * |
| Invesco Liquid Assets Portfolio, Institutional Class | | | | 6,758,331 | | | | | 94,681,678 | | | | | (101,436,584 | ) | | | | - | | | | | (3,425 | ) | | | | - | | | | | 98,221 | * |
| Invesco Private Government Fund | | | | - | | | | | 216,365,901 | | | | | (169,604,281 | ) | | | | - | | | | | - | | | | | 46,761,620 | | | | | 5,022 | * |
| Invesco Private Prime Fund | | | | - | | | | | 31,412,262 | | | | | (15,823,349 | ) | | | | (1 | ) | | | | 779 | | | | | 15,589,691 | | | | | 3,506 | * |
| | | | | | | | | | | | | | | | | | | | | | | | | | | | | | | | | | | |
| Total | | | $ | 27,000,558 | | | | $ | 1,538,802,488 | | | | $ | (1,503,449,088 | ) | | | $ | (1 | ) | | | $ | (2,646 | ) | | | $ | 62,351,311 | | | | $ | 767,051 | |
| | | | | | | | | | | | | | | | | | | | | | | | | | | | | | | | | | | |
| * | Represents the income earned on the investment of cash collateral, which is included in securities lending income on the Statements of Operations. Does not include rebates and fees paid to lending agent or premiums received from borrowers, if any. |
| (e) | The rate shown is the 7-day SEC standardized yield as of August 31, 2020. |
| (f) | The security has been segregated to satisfy the commitment to return the cash collateral received in securities lending transactions upon the borrower’s return of the securities loaned. See Note 2J. |
See accompanying Notes to Financial Statements which are an integral part of the financial statements.
Invesco Taxable Municipal Bond ETF (BAB)
August 31, 2020
Schedule of Investments
| | | | | | | | | | | | | | | | |
| | | Interest
Rate | | | Maturity
Date | | | Principal
Amount
(000) | | | Value | |
Municipal Obligations-93.81% | | | | | | | | | | | | | | | | |
Alabama-0.88% | | | | | | | | | | | | | | | | |
Auburn University, Series 2020 C, RB | | | 2.53% | | | | 06/01/2040 | | | $ | 7,500 | | | $ | 7,555,275 | |
Auburn University, Series 2020 C, RB | | | 2.68% | | | | 06/01/2050 | | | | 10,000 | | | | 10,036,900 | |
| | | | | | | | | | | | | | | | |
| | | | | | | | | | | | | | | 17,592,175 | |
| | | | | | | | | | | | | | | | |
Arizona-0.47% | | | | | | | | | | | | | | | | |
Arizona (State of) Department of Transportation, Series 2020, Ref. RB | | | 2.46% | | | | 07/01/2030 | | | | 2,560 | | | | 2,735,283 | |
Flagstaff (City of), AZ, Series 2020 A, COP | | | 3.01% | | | | 05/01/2040 | | | | 5,000 | | | | 5,069,250 | |
Tucson (City of), AZ, Series 2010, RB | | | 5.79% | | | | 07/01/2026 | | | | 1,275 | | | | 1,567,791 | |
| | | | | | | | | | | | | | | | |
| | | | | | | | | | | | | | | 9,372,324 | |
| | | | | | | | | | | | | | | | |
California-22.36% | | | | | | | | | | | | | | | | |
Bay Area Toll Authority (San Francisco Bay Area), Series 2010 S-1, RB | | | 7.04% | | | | 04/01/2050 | | | | 3,605 | | | | 6,544,481 | |
Bay Area Toll Authority (San Francisco Bay Area), Series 2010 S-3, RB | | | 6.91% | | | | 10/01/2050 | | | | 3,025 | | | | 5,552,509 | |
California (State of), Series 2009 B, GO Bonds | | | 6.51% | | | | 04/01/2039 | | | | 14,890 | | | | 15,790,249 | |
California (State of), Series 2009, GO Bonds | | | 7.50% | | | | 04/01/2034 | | | | 11,460 | | | | 19,194,239 | |
California (State of), Series 2009, GO Bonds | | | 7.55% | | | | 04/01/2039 | | | | 18,860 | | | | 33,414,828 | |
California (State of), Series 2009, GO Bonds | | | 7.30% | | | | 10/01/2039 | | | | 14,160 | | | | 23,552,328 | |
California (State of), Series 2009, GO Bonds | | | 7.35% | | | | 11/01/2039 | | | | 8,505 | | | | 14,218,999 | |
California (State of), Series 2010, GO Bonds | | | 5.70% | | | | 11/01/2021 | | | | 7,500 | | | | 7,981,500 | |
California (State of), Series 2010, GO Bonds | | | 7.95% | | | | 03/01/2036 | | | | 1 | | | | 1,265 | |
California (State of), Series 2010, GO Bonds | | | 7.63% | | | | 03/01/2040 | | | | 4,500 | | | | 7,865,865 | |
California (State of), Series 2018, Ref. GO Bonds | | | 4.50% | | | | 04/01/2033 | | | | 9,850 | | | | 12,018,280 | |
California (State of) Department of Water Resources (Central Valley), Series 2020, Ref. RB | | | 1.77% | | | | 12/01/2034 | | | | 7,510 | | | | 7,609,357 | |
California (State of) Department of Water Resources (Central Valley), Series 2020, Ref. RB | | | 1.79% | | | | 12/01/2035 | | | | 12,325 | | | | 12,436,048 | |
California (State of) Infrastructure & Economic Development Bank (UCSF Neurosciences Building 19A), Series 2010 A, RB | | | 6.49% | | | | 05/15/2049 | | | | 1,000 | | | | 1,519,910 | |
California (State of) Public Works Board (California State University), Series 2010 B-2, RB | | | 7.80% | | | | 03/01/2035 | | | | 800 | | | | 1,224,816 | |
California (State of) Statewide Communities Development Authority (Marin General Hospital), Series 2018 B, RB | | | 4.82% | | | | 08/01/2045 | | | | 2,000 | | | | 2,239,600 | |
California State University, Series 2010 B, RB | | | 6.48% | | | | 11/01/2041 | | | | 900 | | | | 1,347,858 | |
California State University, Series 2020 B, Ref. RB | | | 2.98% | | | | 11/01/2051 | | | | 5,000 | | | | 5,289,250 | |
Carson (City of), CA (Carson Pension Obligation), Series 2020, RB | | | 3.70% | | | | 01/15/2044 | | | | 3,000 | | | | 3,101,100 | |
East Bay Municipal Utility District Wastewater System Revenue, Series 2010, RB | | | 5.03% | | | | 06/01/2032 | | | | 3,000 | | | | 3,955,740 | |
East Bay Municipal Utility District Water System Revenue, Series 2010, RB | | | 5.87% | | | | 06/01/2040 | | | | 3,000 | | | | 4,678,350 | |
El Monte (City of), CA, Series 2020, RB, (INS - AGM)(a) | | | 3.92% | | | | 08/01/2050 | | | | 10,000 | | | | 10,188,000 | |
Fresno (City of), CA, Series 2010 A2, Ref. RB | | | 6.50% | | | | 06/01/2030 | | | | 2,000 | | | | 2,635,020 | |
Hayward Unified School District, Series 2020, Ref. GO Bonds, (INS - AGM)(a) | | | 2.87% | | | | 08/01/2040 | | | | 4,000 | | | | 4,060,680 | |
Hesperia Unified School District, Series 2020, Ref. COP, (INS - AGM)(a) | | | 3.05% | | | | 02/01/2041 | | | | 3,000 | | | | 3,067,170 | |
Inglewood (City of), CA, Series 2020, RB, (INS - AGM)(a) | | | 3.92% | | | | 09/01/2050 | | | | 6,000 | | | | 6,421,980 | |
Jurupa Community Services District, Series 2010 B, COP | | | 6.35% | | | | 09/01/2025 | | | | 1,030 | | | | 1,295,472 | |
Jurupa Community Services District, Series 2010 B, COP | | | 6.50% | | | | 09/01/2026 | | | | 1,070 | | | | 1,389,877 | |
Jurupa Community Services District, Series 2010 B, COP | | | 6.60% | | | | 09/01/2027 | | | | 1,125 | | | | 1,509,548 | |
Jurupa Community Services District, Series 2010 B, COP | | | 6.70% | | | | 09/01/2028 | | | | 1,170 | | | | 1,618,777 | |
Jurupa Community Services District, Series 2010 B, COP | | | 7.19% | | | | 09/01/2040 | | | | 2,000 | | | | 3,294,200 | |
Long Beach (City of), CA, Series 2009 C, RB | | | 7.77% | | | | 06/01/2039 | | | | 250 | | | | 251,110 | |
Los Angeles (City of), CA Department of Water, Series 2009 C, RB | | | 5.38% | | | | 07/01/2024 | | | | 500 | | | | 586,275 | |
Los Angeles (City of), CA Department of Water, Series 2009 C, RB | | | 6.01% | | | | 07/01/2039 | | | | 2,270 | | | | 3,146,447 | |
Los Angeles (City of), CA Department of Water & Power, Series 2010, RB | | | 7.00% | | | | 07/01/2041 | | | | 1,500 | | | | 1,570,410 | |
Los Angeles (City of), CA Department of Water & Power, Series 2010, RB | | | 6.57% | | | | 07/01/2045 | | | | 10,000 | | | | 17,503,700 | |
Los Angeles (City of), CA Department of Water & Power, Series 2010, RB | | | 6.60% | | | | 07/01/2050 | | | | 1,715 | | | | 3,118,402 | |
Los Angeles Community College District, Series 2010, GO Bonds | | | 6.60% | | | | 08/01/2042 | | | | 3,000 | | | | 5,163,660 | |
Los Angeles Unified School District, Series 2010 J-05, GO Bonds | | | 5.98% | | | | 05/01/2027 | | | | 500 | | | | 641,690 | |
Montebello (City of), CA, Series 2020, RB, (INS - AGM)(a) | | | 4.06% | | | | 06/01/2039 | | | | 6,000 | | | | 6,552,000 | |
Montebello (City of), CA, Series 2020, RB, (INS - AGM)(a) | | | 4.26% | | | | 06/01/2045 | | | | 3,000 | | | | 3,201,630 | |
See accompanying Notes to Financial Statements which are an integral part of the financial statements.
Invesco Taxable Municipal Bond ETF (BAB)—(continued)
August 31, 2020
| | | | | | | | | | | | | | | | |
| | | Interest
Rate | | | Maturity
Date | | | Principal
Amount
(000) | | | Value | |
California-(continued) | | | | | | | | | | | | | | | | |
Napa Valley Unified School District, Series 2010 B, GO Bonds | | | 6.51% | | | | 08/01/2043 | | | $ | 3,000 | | | $ | 4,557,300 | |
Northern California Power Agency, Series 2010, RB | | | 7.31% | | | | 06/01/2040 | | | | 1,000 | | | | 1,552,730 | |
Oak Valley Hospital District, Series 2010, RB | | | 9.00% | | | | 11/01/2039 | | | | 1,000 | | | | 1,013,670 | |
Oxnard School District, Series 2020, Ref. GO Bonds, (INS - BAM)(a) | | | 2.63% | | | | 08/01/2041 | | | | 5,000 | | | | 5,055,400 | |
Pasadena (City of), CA, Series 2020 A, Ref. RB | | | 3.24% | | | | 05/01/2045 | | | | 5,000 | | | | 5,237,250 | |
Pomona (City of), CA, Series 2020 BJ, RB | | | 3.72% | | | | 08/01/2040 | | | | 3,250 | | | | 3,335,150 | |
Pomona (City of), CA, Series 2020 BJ, RB | | | 3.82% | | | | 08/01/2046 | | | | 1,500 | | | | 1,542,870 | |
Rancho Santiago Community College District, Series 2020 A-1, Ref. GO Bonds | | | 0.96% | | | | 09/01/2026 | | | | 5,500 | | | | 5,505,335 | |
Regents of the University of California Medical Center, Series 2009 F, RB | | | 6.46% | | | | 05/15/2029 | | | | 500 | | | | 633,920 | |
Regents of the University of California Medical Center, Series 2009 F, RB | | | 6.58% | | | | 05/15/2049 | | | | 5,335 | | | | 8,592,071 | |
Riverside (City of), CA, Series 2009 B, RB | | | 6.35% | | | | 10/01/2039 | | | | 500 | | | | 772,410 | |
Riverside (City of), CA (Riverside Pension Obligation), Series 2020 A, RB | | | 3.86% | | | | 06/01/2045 | | | | 2,000 | | | | 2,154,720 | |
San Diego (City of), CA Public Facilities Financing Authority, Series 2018 A, Ref. RB | | | 4.23% | | | | 10/15/2038 | | | | 2,000 | | | | 2,232,400 | |
San Diego (County of), CA Water Authority (Green Bonds), Series 2020 A, Ref. RB | | | 0.59% | | | | 05/01/2024 | | | | 2,000 | | | | 2,006,040 | |
San Diego (County of), CA Water Authority (Green Bonds), Series 2020 A, Ref. RB | | | 0.74% | | | | 05/01/2025 | | | | 2,000 | | | | 2,000,120 | |
San Francisco (City & County of), CA (525 Golden Gate Avenue - San Francisco Public Utilities Commission Office), Series 2009 D, COP | | | 6.49% | | | | 11/01/2041 | | | | 3,000 | | | | 4,593,330 | |
San Francisco (City & County of), CA (Clean & Safe Neighborhood Parks), Series 2010 D, GO Bonds | | | 6.26% | | | | 06/15/2030 | | | | 3,850 | | | | 5,227,376 | |
San Francisco (City & County of), CA (San Francisco General Hospital), Series 2010 C, GO Bonds | | | 6.26% | | | | 06/15/2030 | | | | 1,500 | | | | 2,087,955 | |
San Francisco (City of), CA Public Utilities Commission, Series 2010 B, RB | | | 6.00% | | | | 11/01/2040 | | | | 2,245 | | | | 3,284,031 | |
San Francisco (City of), CA Public Utilities Commission, Series 2010, RB | | | 5.70% | | | | 11/01/2027 | | | | 3,000 | | | | 3,892,830 | |
San Francisco (City of), CA Public Utilities Commission, Series 2010, RB | | | 6.00% | | | | 11/01/2040 | | | | 2,480 | | | | 3,685,503 | |
San Francisco (City of), CA Public Utilities Commission, Series 2010, RB | | | 6.95% | | | | 11/01/2050 | | | | 4,600 | | | | 8,067,664 | |
San Jose (City of), CA Successor Agency to the Redevelopment Agency, Series 2017 A, Ref. RB | | | 3.08% | | | | 08/01/2025 | | | | 2,000 | | | | 2,218,600 | |
San Luis Unit/Westlands Water District Financing Authority, Series 2020 A, RB, (INS - AGM)(a) | | | 3.74% | | | | 09/01/2050 | | | | 2,500 | | | | 2,643,325 | |
San Mateo Union High School District, Series 2010 B, GO Bonds(b) | | | 6.73% | | | | 09/01/2020 | | | | 1,000 | | | | 1,000,000 | |
Santa Clara Valley Transportation Authority, Series 2010, RB | | | 5.88% | | | | 04/01/2032 | | | | 1,025 | | | | 1,314,993 | |
Santa Clara Valley Water District, Series 2016 B, Ref. RB | | | 4.35% | | | | 06/01/2046 | | | | 3,000 | | | | 3,398,160 | |
Southern California Public Power Authority, Series 2010, RB | | | 5.92% | | | | 07/01/2035 | | | | 2,000 | | | | 2,846,620 | |
Tulare (County of), CA, Series 2018, RB | | | 4.45% | | | | 06/01/2037 | | | | 2,000 | | | | 2,227,120 | |
University of California, Series 2010 F, RB | | | 5.95% | | | | 05/15/2045 | | | | 8,745 | | | | 13,072,288 | |
University of California, Series 2015 AQ, RB | | | 4.77% | | | | 05/15/2115 | | | | 1,577 | | | | 2,247,919 | |
University of California, Series 2015 J, Ref. RB | | | 4.13% | | | | 05/15/2045 | | | | 24,670 | | | | 30,730,185 | |
University of California, Series 2016 AS, Ref. RB | | | 3.55% | | | | 05/15/2039 | | | | 1,500 | | | | 1,792,455 | |
University of California, Series 2019 BD, RB | | | 3.35% | | | | 07/01/2029 | | | | 15,000 | | | | 17,417,400 | |
University of California, Series 2020 BG, RB | | | 0.88% | | | | 05/15/2025 | | | | 10,000 | | | | 10,135,600 | |
University of California, Series 2020 BG, RB | | | 1.32% | | | | 05/15/2027 | | | | 6,000 | | | | 6,107,700 | |
University of California, Series 2020 BG, RB | | | 1.61% | | | | 05/15/2030 | | | | 7,500 | | | | 7,644,900 | |
| | | | | | | | | | | | | | | | |
| | | | | | | | | | | | | | | 448,579,960 | |
| | | | | | | | | | | | | | | | |
Colorado-0.75% | | | | | | | | | | | | | | | | |
Brighton (City of), CO, Series 2010 B, COP, (INS - AGM)(a) | | | 6.55% | | | | 12/01/2030 | | | | 2,000 | | | | 2,027,920 | |
Colorado (State of) Health Facilities Authority (Sanford Health), Series 2019 B, Ref. RB | | | 3.70% | | | | 11/01/2039 | | | | 1,200 | | | | 1,323,540 | |
Colorado (State of) State University System Board of Governors, Series 2010 B, RB | | | 5.96% | | | | 03/01/2033 | | | | 1,000 | | | | 1,335,870 | |
Colorado Mesa University, Series 2009 B, RB | | | 5.80% | | | | 05/15/2040 | | | | 1,215 | | | | 1,756,744 | |
Colorado Springs (City of), CO, Series 2010 B-2, RB | | | 5.74% | | | | 11/15/2050 | | | | 810 | | | | 818,862 | |
Denver (City & County of), CO, Series 2016 B, Ref. RB | | | 3.82% | | | | 08/01/2032 | | | | 1,000 | | | | 1,114,730 | |
Denver City & County School District No. 1, Series 2009 C, GO Bonds | | | 5.66% | | | | 12/01/2033 | | | | 500 | | | | 686,435 | |
Regional Transportation District, Series 2010, COP | | | 7.67% | | | | 06/01/2040 | | | | 3,000 | | | | 4,672,320 | |
Upper Eagle Regional Water Authority, Series 2010, RB | | | 6.52% | | | | 12/01/2039 | | | | 1,250 | | | | 1,263,025 | |
| | | | | | | | | | | | | | | | |
| | | | | | | | | | | | | | | 14,999,446 | |
| | | | | | | | | | | | | | | | |
Connecticut-1.01% | | | | | | | | | | | | | | | | |
Metropolitan District (The) (Clean Water), Series 2020, Ref. RB | | | 2.56% | | | | 04/01/2039 | | | | 6,000 | | | | 6,054,780 | |
New Britain (City of), CT, Series 2018, Ref. GO Bonds, (INS - BAM)(a) | | | 4.35% | | | | 03/01/2039 | | | | 4,835 | | | | 5,192,887 | |
New Britain (City of), CT, Series 2020 B, Ref. GO Bonds, (INS - AGM)(a) | | | 3.25% | | | | 09/01/2042 | | | | 4,000 | | | | 3,955,560 | |
See accompanying Notes to Financial Statements which are an integral part of the financial statements.
Invesco Taxable Municipal Bond ETF (BAB)—(continued)
August 31, 2020
| | | | | | | | | | | | | | | | |
| | | Interest
Rate | | | Maturity
Date | | | Principal
Amount
(000) | | | Value | |
Connecticut-(continued) | | | | | | | | | | | | | | | | |
South Central Connecticut Regional Water Authority, Series 2010 A, RB | | | 6.24% | | | | 08/01/2030 | | | $ | 2,000 | | | $ | 2,542,660 | |
South Central Connecticut Regional Water Authority, Series 2010 A, RB | | | 6.39% | | | | 08/01/2040 | | | | 1,645 | | | | 2,499,034 | |
| | | | | | | | | | | | | | | | |
| | | | | | | | | | | | | | | 20,244,921 | |
| | | | | | | | | | | | | | | | |
Delaware-0.36% | | | | | | | | | | | | | | | | |
University of Delaware, Series 2018, RB | | | 4.07% | | | | 11/01/2050 | | | | 5,770 | | | | 7,305,455 | |
| | | | | | | | | | | | | | | | |
District of Columbia-0.47% | | | | | | | | | | | | | | | | |
District of Columbia, Series 2010 F, RB | | | 4.91% | | | | 12/01/2023 | | | | 4,500 | | | | 5,078,790 | |
Metropolitan Washington Airports Authority, Series 2009, RB | | | 7.46% | | | | 10/01/2046 | | | | 2,480 | | | | 4,396,693 | |
| | | | | | | | | | | | | | | | |
| | | | | | | | | | | | | | | 9,475,483 | |
| | | | | | | | | | | | | | | | |
Florida-3.17% | | | | | | | | | | | | | | | | |
Davie (Town of), FL, Series 2010 B, RB(c)(d) | | | 6.60% | | | | 10/01/2020 | | | | 200 | | | | 200,998 | |
Escambia (County of), FL Health Facilities Authority, Series 2020, Ref. RB, (INS - AGM)(a) | | | 3.61% | | | | 08/15/2040 | | | | 5,750 | | | | 6,049,000 | |
Fort Lauderdale (City of), FL, Series 2020, Ref. RB | | | 0.75% | | | | 01/01/2024 | | | | 22,600 | | | | 22,677,744 | |
JEA Electric System Revenue, Series 2009 F, RB | | | 6.41% | | | | 10/01/2034 | | | | 500 | | | | 667,745 | |
JEA Water & Sewer System Revenue, Series 2010 A, RB | | | 6.21% | | | | 10/01/2033 | | | | 1,250 | | | | 1,654,800 | |
Lee Memorial Health System, Series 2010 A, RB | | | 7.28% | | | | 04/01/2027 | | | | 2,500 | | | | 3,137,450 | |
Miami-Dade (County of), FL, Series 2010 B, RB | | | 5.53% | | | | 07/01/2032 | | | | 2,500 | | | | 3,067,600 | |
Miami-Dade (County of), FL, Series 2019 B, Ref. RB | | | 3.14% | | | | 10/01/2027 | | | | 5,000 | | | | 5,207,450 | |
Miami-Dade (County of), FL, Series 2019 B, Ref. RB | | | 3.18% | | | | 10/01/2028 | | | | 3,600 | | | | 3,757,932 | |
Miami-Dade (County of), FL, Series 2019 B, Ref. RB | | | 3.28% | | | | 10/01/2029 | | | | 2,700 | | | | 2,831,355 | |
Reedy Creek Improvement District, Series 2020 A, Ref. GO Bonds | | | 2.73% | | | | 06/01/2038 | | | | 2,500 | | | | 2,570,175 | |
Sarasota (City of), FL, Series 2010, RB(c)(d) | | | 5.43% | | | | 10/01/2020 | | | | 200 | | | | 200,808 | |
Seminole (County of), FL, Series 2010 B, RB(c)(d) | | | 6.44% | | | | 10/01/2020 | | | | 2,000 | | | | 2,009,720 | |
St. Johns (County of), FL Industrial Development Authority (Flagler Health), Series 2020 A, Ref. RB, (INS - AGM)(a) | | | 3.80% | | | | 10/01/2050 | | | | 6,000 | | | | 6,056,220 | |
St. Johns (County of), FL Industrial Development Authority (Flagler Health), Series 2020 B, Ref. RB, (INS - AGM)(a) | | | 2.54% | | | | 10/01/2030 | | | | 2,000 | | | | 2,034,260 | |
Sunrise (City of), FL, Series 2010 B, RB(c)(d) | | | 5.81% | | | | 10/01/2020 | | | | 1,500 | | | | 1,506,615 | |
| | | | | | | | | | | | | | | | |
| | | | | | | | | | | | | | | 63,629,872 | |
| | | | | | | | | | | | | | | | |
Georgia-1.67% | | | | | | | | | | | | | | | | |
Fulton (County of), GA Development Authority (Georgia Tech Foundation), Series 2019, Ref. RB | | | 3.13% | | | | 11/01/2049 | | | | 8,500 | | | | 9,717,625 | |
Georgia (State of) Municipal Electric Authority, Series 2010, RB | | | 7.06% | | | | 04/01/2057 | | | | 9,761 | | | | 14,157,159 | |
Georgia (State of) Municipal Electric Authority (Plant Vogtle Units 3 & 4 Project M), Series 2010 A, RB | | | 6.66% | | | | 04/01/2057 | | | | 6,566 | | | | 9,696,538 | |
| | | | | | | | | | | | | | | | |
| | | | | | | | | | | | | | | 33,571,322 | |
| | | | | | | | | | | | | | | | |
Hawaii-3.15% | | | | | | | | | | | | | | | | |
Hawaii (State of), Series 2010, GO Bonds | | | 5.53% | | | | 02/01/2030 | | | | 1,000 | | | | 1,357,980 | |
Hawaii (State of), Series 2017 A, RB | | | 3.89% | | | | 07/01/2037 | | | | 1,250 | | | | 1,303,762 | |
Hawaii (State of), Series 2020 FZ, GO Bonds | | | 0.89% | | | | 08/01/2026 | | | | 6,910 | | | | 6,903,505 | |
Hawaii (State of), Series 2020 FZ, GO Bonds | | | 2.00% | | | | 08/01/2027 | | | | 5,000 | | | | 5,280,150 | |
Hawaii (State of), Series 2020 FZ, GO Bonds | | | 1.60% | | | | 08/01/2031 | | | | 3,000 | | | | 3,021,630 | |
Hawaii (State of), Series 2020 FZ, GO Bonds | | | 1.70% | | | | 08/01/2032 | | | | 5,000 | | | | 5,035,950 | |
Hawaii (State of), Series 2020 FZ, GO Bonds | | | 1.87% | | | | 08/01/2033 | | | | 8,000 | | | | 8,101,040 | |
Hawaii (State of), Series 2020 FZ, GO Bonds | | | 1.98% | | | | 08/01/2034 | | | | 6,000 | | | | 6,086,820 | |
Hawaii (State of), Series 2020 FZ, GO Bonds | | | 2.07% | | | | 08/01/2035 | | | | 15,000 | | | | 15,192,000 | |
Kauai (County of), HI, Series 2010 A, GO Bonds | | | 5.76% | | | | 08/01/2033 | | | | 2,000 | | | | 2,859,580 | |
University of Hawaii, Series 2010 A-1, RB | | | 5.83% | | | | 10/01/2030 | | | | 3,000 | | | | 3,012,330 | |
University of Hawaii, Series 2010 A-1, RB | | | 6.03% | | | | 10/01/2040 | | | | 5,000 | | | | 5,019,850 | |
| | | | | | | | | | | | | | | | |
| | | | | | | | | | | | | | | 63,174,597 | |
| | | | | | | | | | | | | | | | |
Idaho-0.04% | | | | | | | | | | | | | | | | |
Idaho (State of) Housing & Finance Association, Series 2010 A-2, RB | | | 6.35% | | | | 07/15/2028 | | | | 595 | | | | 754,347 | |
| | | | | | | | | | | | | | | | |
Illinois-5.38% | | | | | | | | | | | | | | | | |
Chicago (City of), IL, Series 2009 C, GO Bonds | | | 6.21% | | | | 01/01/2036 | | | | 6,205 | | | | 6,727,647 | |
Chicago (City of), IL, Series 2009 D, GO Bonds | | | 6.26% | | | | 01/01/2040 | | | | 2,000 | | | | 2,137,900 | |
See accompanying Notes to Financial Statements which are an integral part of the financial statements.
Invesco Taxable Municipal Bond ETF (BAB)—(continued)
August 31, 2020
| | | | | | | | | | | | | | | | |
| | | Interest
Rate | | | Maturity
Date | | | Principal
Amount
(000) | | | Value | |
Illinois-(continued) | | | | | | | | | | | | | | | | |
Chicago (City of), IL, Series 2010 B, GO Bonds | | | 7.52% | | | | 01/01/2040 | | | $ | 2,000 | | | $ | 2,349,540 | |
Chicago (City of), IL (O’Hare International Airport), Series 2010 B, RB | | | 6.85% | | | | 01/01/2038 | | | | 3,190 | | | | 3,194,689 | |
Chicago (City of), IL (O’Hare International Airport), Series 2010 B, RB | | | 6.40% | | | | 01/01/2040 | | | | 5,750 | | | | 8,962,180 | |
Chicago (City of), IL (O’Hare International Airport), Series 2018 C, RB | | | 4.47% | | | | 01/01/2049 | | | | 10,000 | | | | 13,336,300 | |
Chicago (City of), IL (O’Hare International Airport), Series 2018 C, RB | | | 4.57% | | | | 01/01/2054 | | | | 9,580 | | | | 13,069,419 | |
Chicago (City of), IL Board of Education, Series 2009 E, GO Bonds | | | 6.14% | | | | 12/01/2039 | | | | 8,700 | | | | 9,045,738 | |
Chicago (City of), IL Transit Authority, Series 2020 B, Ref. RB | | | 3.60% | | | | 12/01/2035 | | | | 10,000 | | | | 10,554,100 | |
Chicago (City of), IL Transit Authority, Series 2020 B, Ref. RB | | | 3.91% | | | | 12/01/2040 | | | | 3,000 | | | | 3,172,170 | |
Illinois (State of), Series 2010 1, GO Bonds | | | 5.56% | | | | 02/01/2021 | | | | 14,795 | | | | 14,931,706 | |
Illinois (State of), Series 2010 2, GO Bonds | | | 6.90% | | | | 03/01/2035 | | | | 9,300 | | | | 10,929,174 | |
Itasca (Village of), IL, Series 2009 A, GO Bonds | | | 6.10% | | | | 02/01/2034 | | | | 200 | | | | 200,716 | |
Itasca (Village of), IL, Series 2009 A, GO Bonds | | | 6.20% | | | | 02/01/2039 | | | | 320 | | | | 321,114 | |
Northern Illinois Municipal Power Agency, Series 2010, RB | | | 7.62% | | | | 01/01/2030 | | | | 225 | | | | 283,464 | |
Sales Tax Securitization Corp., Series 2020 B, Ref. RB | | | 2.96% | | | | 01/01/2032 | | | | 2,500 | | | | 2,547,250 | |
Sales Tax Securitization Corp., Series 2020 B, Ref. RB, (INS - BAM)(a) | | | 3.41% | | | | 01/01/2043 | | | | 6,000 | | | | 6,240,900 | |
| | | | | | | | | | | | | | | | |
| | | | | | | | | | | | | | | 108,004,007 | |
| | | | | | | | | | | | | | | | |
Indiana-0.28% | | | | | | | | | | | | | | | | |
Indianapolis (State of) Local Public Improvement Bond Bank (The), Series 2010 A-2, RB | | | 5.85% | | | | 01/15/2030 | | | | 1,000 | | | | 1,268,750 | |
Indianapolis (State of) Local Public Improvement Bond Bank (The), Series 2010 B-2, RB | | | 5.97% | | | | 01/15/2030 | | | | 3,500 | | | | 4,450,075 | |
| | | | | | | | | | | | | | | | |
| | | | | | | | | | | | | | | 5,718,825 | |
| | | | | | | | | | | | | | | | |
Kansas-0.03% | | | | | | | | | | | | | | | | |
Kansas (State of) Development Finance Authority, Series 2010 E2, RB | | | 6.12% | | | | 11/01/2029 | | | | 500 | | | | 504,295 | |
| | | | | | | | | | | | | | | | |
Kentucky-0.07% | | | | | | | | | | | | | | | | |
Kenton (County of), KY Airport Board, Series 2019, RB | | | 4.69% | | | | 01/01/2049 | | | | 1,000 | | | | 1,069,150 | |
Louisville/Jefferson (County of), KY Metropolitan Government, Series 2009, GO Bonds | | | 5.45% | | | | 11/15/2027 | | | | 200 | | | | 252,580 | |
| | | | | | | | | | | | | | | | |
| | | | | | | | | | | | | | | 1,321,730 | |
| | | | | | | | | | | | | | | | |
Louisiana-1.73% | | | | | | | | | | | | | | | | |
Louisiana (State of), Series 2020 A-2, Ref. RB | | | 2.23% | | | | 05/01/2036 | | | | 2,000 | | | | 2,011,920 | |
Louisiana (State of), Series 2020 A-2, Ref. RB | | | 2.53% | | | | 05/01/2041 | | | | 3,000 | | | | 2,981,730 | |
Louisiana (State of) Local Government Environmental Facilities & Community Development Authority, Series 2020, Ref. RB, (INS - AGM)(a) | | | 2.59% | | | | 02/01/2043 | | | | 9,225 | | | | 9,132,473 | |
Louisiana (State of) Local Government Environmental Facilities & Community Development Authority, Series 2020, Ref. RB, (INS - AGM)(a) | | | 2.64% | | | | 02/01/2048 | | | | 9,000 | | | | 8,876,430 | |
Louisiana (State of) Public Facilities Authority (LA Children’s Medical Center), Series 2020, RB, (INS - AGM)(a) | | | 2.28% | | | | 06/01/2030 | | | | 10,000 | | | | 10,214,900 | |
Tangipahoa (Parish of), LA Hospital Service District No. 1, Series 2009, RB, (INS - AGC)(a) | | | 7.20% | | | | 02/01/2042 | | | | 1,500 | | | | 1,511,100 | |
| | | | | | | | | | | | | | | | |
| | | | | | | | | | | | | | | 34,728,553 | |
| | | | | | | | | | | | | | | | |
Maryland-0.16% | | | | | | | | | | | | | | | | |
Maryland (State of) Transportation Authority, Series 2010 B, RB | | | 5.60% | | | | 07/01/2030 | | | | 1,200 | | | | 1,516,896 | |
Maryland Economic Development Corp. (Seagirt Marine Terminal), Series 2019, RB | | | 4.75% | | | | 06/01/2042 | | | | 1,500 | | | | 1,614,615 | |
| | | | | | | | | | | | | | | | |
| | | | | | | | | | | | | | | 3,131,511 | |
| | | | | | | | | | | | | | | | |
Massachusetts-3.11% | | | | | | | | | | | | | | | | |
Massachusetts (Commonwealth of), Series 2010 A, GO Bonds | | | 4.48% | | | | 05/01/2024 | | | | 4,300 | | | | 4,902,043 | |
Massachusetts (Commonwealth of), Series 2010 A, GO Bonds | | | 4.91% | | | | 05/01/2029 | | | | 7,765 | | | | 10,034,477 | |
Massachusetts (Commonwealth of), Series 2020 C, Ref. GO Bonds | | | 0.39% | | | | 07/01/2022 | | | | 4,000 | | | | 4,000,680 | |
Massachusetts (Commonwealth of), Series 2020 C, Ref. GO Bonds | | | 0.51% | | | | 07/01/2023 | | | | 2,000 | | | | 2,000,580 | |
Massachusetts (Commonwealth of) (Green Bonds), Series 2016 F, GO Bonds | | | 3.28% | | | | 06/01/2046 | | | | 1,500 | | | | 1,724,070 | |
Massachusetts (State of) Bay Transportation Authority, Series 2010, RB | | | 5.87% | | | | 07/01/2040 | | | | 2,000 | | | | 2,812,260 | |
Massachusetts (State of) Clean Water Trust (The), Series 2010, RB | | | 5.19% | | | | 08/01/2040 | | | | 1,125 | | | | 1,377,394 | |
Massachusetts (State of) College Building Authority, Series 2009 C, RB | | | 5.83% | | | | 05/01/2030 | | | | 5,000 | | | | 6,390,600 | |
Massachusetts (State of) Development Finance Agency (Wellforce, Inc.), Series 2020 D, RB, (INS - AGM)(a) | | | 3.52% | | | | 10/01/2046 | | | | 5,000 | | | | 5,063,450 | |
Massachusetts (State of) School Building Authority, Series 2009, RB | | | 5.72% | | | | 08/15/2039 | | | | 450 | | | | 667,318 | |
Massachusetts (State of) School Building Authority, Series 2020 B, Ref. RB | | | 0.35% | | | | 08/15/2021 | | | | 8,335 | | | | 8,348,253 | |
See accompanying Notes to Financial Statements which are an integral part of the financial statements.
Invesco Taxable Municipal Bond ETF (BAB) - (continued)
August 31, 2020
| | | | | | | | | | | | | | | | |
| | | Interest
Rate | | | Maturity
Date | | | Principal
Amount
(000) | | | Value | |
Massachusetts-(continued) | | | | | | | | | | | | | | | | |
Massachusetts (State of) School Building Authority, Series 2020 B, Ref. RB | | | 0.40% | | | | 08/15/2022 | | | $ | 13,285 | | | $ | 13,329,903 | |
University of Massachusetts Building Authority, Series 2010 2, RB | | | 4.55% | | | | 11/01/2025 | | | | 1,500 | | | | 1,771,740 | |
| | | | | | | | | | | | | | | | |
| | | | | | | | | | | | | | | 62,422,768 | |
| | | | | | | | | | | | | | | | |
Michigan-0.48% | | | | | | | | | | | | | | | | |
Great Lakes Water Authority, Series 2020 B, Ref. RB, (INS - AGM)(a) | | | 2.62% | | | | 07/01/2036 | | | | 8,800 | | | | 9,289,192 | |
University of Michigan, Series 2010 A, RB | | | 5.51% | | | | 04/01/2030 | | | | 250 | | | | 319,115 | |
| | | | | | | | | | | | | | | | |
| | | | | | | | | | | | | | | 9,608,307 | |
| | | | | | | | | | | | | | | | |
Minnesota-0.17% | | | | | | | | | | | | | | | | |
Western Minnesota Municipal Power Agency, Series 2019 A, Ref. RB | | | 3.23% | | | | 01/01/2046 | | | | 3,000 | | | | 3,344,730 | |
| | | | | | | | | | | | | | | | |
Mississippi-1.35% | | | | | | | | | | | | | | | | |
Mississippi (State of), Series 2009 D, GO Bonds | | | 5.54% | | | | 10/01/2029 | | | | 3,000 | | | | 3,801,900 | |
Mississippi (State of), Series 2010, GO Bonds | | | 5.25% | | | | 11/01/2034 | | | | 1,000 | | | | 1,342,460 | |
Mississippi (State of), Series 2020 A, Ref. GO Bonds | | | 1.04% | | | | 11/01/2027 | | | | 5,000 | | | | 5,047,600 | |
Mississippi (State of), Series 2020 A, Ref. GO Bonds | | | 1.63% | | | | 11/01/2031 | | | | 7,500 | | | | 7,656,150 | |
Mississippi (State of), Series 2020 A, Ref. GO Bonds | | | 1.73% | | | | 11/01/2032 | | | | 7,000 | | | | 7,151,760 | |
Mississippi (State of), Series 2020 A, Ref. GO Bonds | | | 1.78% | | | | 11/01/2033 | | | | 2,000 | | | | 2,033,880 | |
| | | | | | | | | | | | | | | | |
| | | | | | | | | | | | | | | 27,033,750 | |
| | | | | | | | | | | | | | | | |
Missouri-1.64% | | | | | | | | | | | | | | | | |
Missouri (State of) Health & Educational Facilities Authority (St. Louis University), Series 2019 B, RB | | | 4.20% | | | | 10/01/2049 | | | | 5,000 | | | | 5,946,000 | |
Missouri (State of) Highway & Transportation Commission, Series 2009 C, RB | | | 4.96% | | | | 05/01/2023 | | | | 2,250 | | | | 2,466,765 | |
Missouri (State of) Highway & Transportation Commission, Series 2009 C, RB | | | 5.06% | | | | 05/01/2024 | | | | 6,000 | | | | 6,789,120 | |
Missouri (State of) Highway & Transportation Commission, Series 2010 B, RB | | | 5.02% | | | | 05/01/2025 | | | | 1,000 | | | | 1,162,780 | |
Missouri (State of) Joint Municipal Electric Utility Commission (Prairie State), Series 2009 A, RB | | | 6.89% | | | | 01/01/2042 | | | | 10,000 | | | | 15,105,500 | |
Missouri (State of) Joint Municipal Electric Utility Commission (Prairie State), Series 2010 A, RB | | | 7.60% | | | | 01/01/2032 | | | | 1,000 | | | | 1,364,280 | |
| | | | | | | | | | | | | | | | |
| | | | | | | | | | | | | | | 32,834,445 | |
| | | | | | | | | | | | | | | | |
Nebraska-0.34% | | | | | | | | | | | | | | | | |
University of Nebraska Facilities Corp., Series 2019 A, Ref. RB | | | 3.04% | | | | 10/01/2049 | | | | 6,000 | | | | 6,795,420 | |
| | | | | | | | | | | | | | | | |
Nevada-0.54% | | | | | | | | | | | | | | | | |
Clark (County of), NV, Series 2010 A, GO Bonds | | | 6.55% | | | | 07/01/2030 | | | | 1,500 | | | | 1,916,400 | |
Clark (County of), NV, Series 2010 A, GO Bonds | | | 6.75% | | | | 07/01/2038 | | | | 1,620 | | | | 2,426,711 | |
Nye (County of), NV, Series 2010 B, GO Bonds, (INS - AGM)(a) | | | 6.30% | | | | 08/01/2035 | | | | 1,000 | | | | 1,003,010 | |
Nye (County of), NV, Series 2010 B, GO Bonds, (INS - AGM)(a) | | | 6.40% | | | | 08/01/2040 | | | | 1,000 | | | | 1,002,910 | |
Washoe (County of), NV (Streets & Highways), Series 2010 H, RB | | | 7.45% | | | | 02/01/2040 | | | | 3,000 | | | | 4,530,510 | |
| | | | | | | | | | | | | | | | |
| | | | | | | | | | | | | | | 10,879,541 | |
| | | | | | | | | | | | | | | | |
New Hampshire-0.02% | | | | | | | | | | | | | | | | |
New Hampshire (State of) Turnpike System, Series 2009, RB | | | 6.01% | | | | 11/01/2039 | | | | 250 | | | | 349,848 | |
| | | | | | | | | | | | | | | | |
New Jersey-2.97% | | | | | | | | | | | | | | | | |
Camden (County of), NJ Improvement Authority (The) (County Capital Program), Series 2009 A, RB | | | 6.18% | | | | 01/15/2027 | | | | 500 | | | | 589,500 | |
New Jersey (State of) Educational Facilities Authority (New Jersey City University), Series 2010 G, RB | | | 6.19% | | | | 07/01/2040 | | | | 3,000 | | | | 3,008,850 | |
New Jersey (State of) Educational Facilities Authority (Seton Hall University), Series 2020 D, RB, (INS - AGM)(a) | | | 3.96% | | | | 07/01/2048 | | | | 1,400 | | | | 1,466,304 | |
New Jersey (State of) Educational Facilities Authority (The College of New Jersey), Series 2020, Ref. RB, (INS - AGM)(a) | | | 3.61% | | | | 07/01/2050 | | | | 10,000 | | | | 10,128,300 | |
New Jersey (State of) Transportation Trust Fund Authority, Series 2010 B, RB | | | 6.56% | | | | 12/15/2040 | | | | 7,455 | | | | 9,664,513 | |
New Jersey (State of) Transportation Trust Fund Authority, Series 2010 C, RB | | | 5.75% | | | | 12/15/2028 | | | | 1,990 | | | | 2,248,302 | |
New Jersey Institute of Technology, Series 2020 B, Ref. RB | | | 3.42% | | | | 07/01/2042 | | | | 6,955 | | | | 7,212,544 | |
Passaic (County of), NJ Improvement Authority, Series 2010, RB | | | 6.54% | | | | 08/01/2031 | | | | 1,000 | | | | 1,003,910 | |
Passaic (County of), NJ Valley Water Commission, Series 2009, RB | | | 7.57% | | | | 12/15/2029 | | | | 500 | | | | 683,585 | |
Passaic (County of), NJ Valley Water Commission, Series 2009, RB | | | 7.82% | | | | 12/15/2039 | | | | 500 | | | | 809,160 | |
Rutgers The State University of New Jersey, Series 2010, RB | | | 5.55% | | | | 05/01/2029 | | | | 905 | | | | 1,094,190 | |
Rutgers The State University of New Jersey, Series 2019 R, Ref. RB | | | 3.27% | | | | 05/01/2043 | | | | 3,500 | | | | 3,890,845 | |
See accompanying Notes to Financial Statements which are an integral part of the financial statements.
Invesco Taxable Municipal Bond ETF (BAB)—(continued)
August 31, 2020
| | | | | | | | | | | | | | | | |
| | | Interest
Rate | | | Maturity
Date | | | Principal
Amount
(000) | | | Value | |
New Jersey-(continued) | | | | | | | | | | | | | | | | |
Rutgers The State University of New Jersey, Series 2020 S, Ref. RB | | | 2.56% | | | | 05/01/2040 | | | $ | 6,000 | | | $ | 5,935,740 | |
Rutgers The State University of New Jersey, Series 2020 S, Ref. RB | | | 2.68% | | | | 05/01/2046 | | | | 5,000 | | | | 4,900,900 | |
South Jersey Port Corp., Series 2009, RB | | | 7.37% | | | | 01/01/2040 | | | | 5,000 | | | | 6,893,700 | |
| | | | | | | | | | | | | | | | |
| | | | | | | | | | | | | | | 59,530,343 | |
| | | | | | | | | | | | | | | | |
New York-15.90% | | | | | | | | | | | | | | | | |
Long Island (City of), NY Power Authority, Series 2020 C, Ref. RB | | | 0.66% | | | | 03/01/2022 | | | | 1,600 | | | | 1,600,544 | |
Long Island (City of), NY Power Authority, Series 2020 C, Ref. RB | | | 0.76% | | | | 03/01/2023 | | | | 5,250 | | | | 5,254,095 | |
Metropolitan Transportation Authority, Series 2009, RB | | | 5.87% | | | | 11/15/2039 | | | | 335 | | | | 400,318 | |
Metropolitan Transportation Authority, Series 2009, RB | | | 7.34% | | | | 11/15/2039 | | | | 2,015 | | | | 3,267,302 | |
Metropolitan Transportation Authority, Series 2010 A2, RB | | | 6.09% | | | | 11/15/2040 | | | | 2,500 | | | | 3,574,950 | |
Metropolitan Transportation Authority, Series 2010 E, RB | | | 6.81% | | | | 11/15/2040 | | | | 6,525 | | | | 8,392,064 | |
Metropolitan Transportation Authority, Series 2010, RB | | | 6.65% | | | | 11/15/2039 | | | | 1,800 | | | | 2,313,792 | |
Metropolitan Transportation Authority, Series 2010, RB | | | 6.67% | | | | 11/15/2039 | | | | 7,250 | | | | 9,451,462 | |
Metropolitan Transportation Authority, Series 2010, RB | | | 6.69% | | | | 11/15/2040 | | | | 3,745 | | | | 4,856,891 | |
Monroe County Industrial Development Corp. (University of Rochester), Series 2020, RB | | | 2.85% | | | | 07/01/2050 | | | | 10,000 | | | | 10,056,900 | |
New York & New Jersey (States of) Port Authority, Series 2011, RB | | | 4.93% | | | | 10/01/2051 | | | | 11,485 | | | | 15,818,405 | |
New York & New Jersey (States of) Port Authority, Series 2012, RB | | | 4.46% | | | | 10/01/2062 | | | | 13,200 | | | | 17,312,724 | |
New York & New Jersey (States of) Port Authority, Series 2020 AAA, RB | | | 1.09% | | | | 07/01/2023 | | | | 22,500 | | | | 22,814,325 | |
New York (City of), NY, Series 2010 D-1, GO Bonds | | | 5.99% | | | | 12/01/2036 | | | | 1,500 | | | | 2,126,340 | |
New York (City of), NY, Series 2010 G-1, GO Bonds | | | 5.97% | | | | 03/01/2036 | | | | 8,495 | | | | 12,389,533 | |
New York (City of), NY, Series 2010 H-1, GO Bonds | | | 5.65% | | | | 06/01/2027 | | | | 1,000 | | | | 1,191,740 | |
New York (City of), NY, Series 2010 H-1, GO Bonds | | | 6.25% | | | | 06/01/2035 | | | | 3,920 | | | | 3,938,542 | |
New York (City of), NY, Series 2010 H-1, GO Bonds | | | 5.85% | | | | 06/01/2040 | | | | 5,000 | | | | 7,394,450 | |
New York (City of), NY, Series 2011 C-1, GO Bonds | | | 5.82% | | | | 10/01/2031 | | | | 2,710 | | | | 2,722,114 | |
New York (City of), NY, Series 2011 F-1, GO Bonds | | | 6.27% | | | | 12/01/2037 | | | | 7,920 | | | | 12,025,807 | |
New York (City of), NY, Series 2019 A-2, GO Bonds | | | 2.13% | | | | 08/01/2024 | | | | 15,000 | | | | 15,831,150 | |
New York (City of), NY, Series 2019 A-2, GO Bonds | | | 2.63% | | | | 08/01/2028 | | | | 10,000 | | | | 10,975,700 | |
New York (City of), NY, Series 2020 D-3, GO Bonds | | | 2.22% | | | | 03/01/2035 | | | | 6,930 | | | | 7,008,101 | |
New York (City of), NY Educational Construction Fund, Series 2010 A, RB | | | 6.00% | | | | 04/01/2035 | | | | 2,000 | | | | 2,912,280 | |
New York (City of), NY Municipal Water Finance Authority, Series 2010 GG, RB | | | 5.72% | | | | 06/15/2042 | | | | 4,460 | | | | 7,200,715 | |
New York (City of), NY Transitional Finance Authority, Series 2010, RB. | | | 5.51% | | | | 08/01/2037 | | | | 1,575 | | | | 2,224,215 | |
New York (City of), NY Transitional Finance Authority, Series 2011 B-1, RB | | | 5.93% | | | | 11/01/2036 | | | | 6,475 | | | | 6,530,361 | |
New York (City of), NY Transitional Finance Authority, Series 2011 S-1B, RB | | | 6.83% | | | | 07/15/2040 | | | | 3,785 | | | | 5,847,787 | |
New York (City of), NY Transitional Finance Authority, Series 2019 B-2, RB | | | 2.11% | | | | 11/01/2024 | | | | 5,000 | | | | 5,329,800 | |
New York (State of) Dormitory Authority, Series 2009 F, RB | | | 5.29% | | | | 03/15/2025 | | | | 200 | | | | 237,758 | |
New York (State of) Dormitory Authority, Series 2010 C, RB | | | 4.90% | | | | 02/15/2023 | | | | 1,400 | | | | 1,544,746 | |
New York (State of) Dormitory Authority, Series 2010 D, RB | | | 5.50% | | | | 03/15/2030 | | | | 2,760 | | | | 3,451,518 | |
New York (State of) Dormitory Authority, Series 2010 H, RB | | | 5.29% | | | | 03/15/2033 | | | | 1,345 | | | | 1,722,084 | |
New York (State of) Dormitory Authority, Series 2010 H, RB | | | 5.39% | | | | 03/15/2040 | | | | 1,800 | | | | 2,533,698 | |
New York (State of) Dormitory Authority, Series 2019 B, Ref. RB | | | 3.14% | | | | 07/01/2043 | | | | 2,000 | | | | 2,108,100 | |
New York (State of) Dormitory Authority, Series 2020 F, Ref. RB | | | 3.19% | | | | 02/15/2043 | | | | 5,000 | | | | 5,587,100 | |
New York (State of) Dormitory Authority (General Purpose), Series 2020 F, Ref. RB | | | 2.03% | | | | 02/15/2023 | | | | 1,245 | | | | 1,283,931 | |
New York (State of) Dormitory Authority (General Purpose), Series 2020 F, Ref. RB | | | 3.03% | | | | 02/15/2033 | | | | 6,970 | | | | 7,707,984 | |
New York (State of) Dormitory Authority (New York University), Series 2018 B, RB | | | 4.85% | | | | 07/01/2048 | | | | 5,000 | | | | 5,902,000 | |
New York (State of) Dormitory Authority (New York University), Series 2020 B, Ref. RB | | | 2.77% | | | | 07/01/2043 | | | | 5,000 | | | | 4,970,950 | |
New York (State of) Dormitory Authority (New York University; Green Bonds), Series 2019, RB | | | 4.01% | | | | 07/01/2049 | | | | 3,000 | | | | 3,569,070 | |
New York (State of) Housing Finance Agency, Series 2019 A, Ref. VRD RB(e) | | | 0.17% | | | | 11/01/2045 | | | | 9,985 | | | | 9,985,000 | |
New York (State of) Housing Finance Agency, Series 2019 B, Ref. VRD RB(e) | | | 0.14% | | | | 11/01/2045 | | | | 14,100 | | | | 14,100,000 | |
New York (State of) Thruway Authority, Series 2019 M, Ref. RB | | | 2.90% | | | | 01/01/2035 | | | | 5,000 | | | | 5,429,100 | |
New York State Environmental Facilities Corp., Series 2010, RB | | | 5.71% | | | | 06/15/2030 | | | | 1,000 | | | | 1,321,770 | |
New York State Urban Development Corp., Series 2010 B, RB | | | 5.84% | | | | 03/15/2040 | | | | 2,000 | | | | 2,703,220 | |
New York Transportation Development Corp. (LaGuardia Airport Terminal B Redevelopment), Series 2016 B, RB | | | 3.02% | | | | 07/01/2024 | | | | 2,000 | | | | 2,018,380 | |
New York Transportation Development Corp. (LaGuardia Airport Terminal B Redevelopment), Series 2016 B, RB | | | 3.12% | | | | 01/01/2025 | | | | 2,750 | | | | 2,787,290 | |
New York Transportation Development Corp. (LaGuardia Airport Terminal B Redevelopment), Series 2016 B, RB | | | 3.22% | | | | 07/01/2025 | | | | 2,500 | | | | 2,545,650 | |
See accompanying Notes to Financial Statements which are an integral part of the financial statements.
Invesco Taxable Municipal Bond ETF (BAB)—(continued)
August 31, 2020
| | | | | | | | | | | | | | | | |
| | | Interest
Rate | | | Maturity
Date | | | Principal
Amount
(000) | | | Value | |
New York-(continued) | | | | | | | | | | | | | | | | |
New York Transportation Development Corp. (LaGuardia Airport Terminal B Redevelopment), Series 2016 B, RB | | | 3.27% | | | | 01/01/2026 | | | $ | 2,000 | | | $ | 2,033,180 | |
New York Transportation Development Corp. (LaGuardia Airport Terminal B Redevelopment), Series 2016 B, RB | | | 3.32% | | | | 07/01/2026 | | | | 1,000 | | | | 1,020,390 | |
New York Transportation Development Corp. (LaGuardia Airport Terminal B Redevelopment), Series 2016 B, RB | | | 3.42% | | | | 07/01/2027 | | | | 2,000 | | | | 2,050,780 | |
New York Transportation Development Corp. (LaGuardia Airport Terminal B Redevelopment), Series 2016 B, RB | | | 3.47% | | | | 07/01/2028 | | | | 3,000 | | | | 3,066,900 | |
New York Transportation Development Corp. (LaGuardia Airport Terminal B Redevelopment), Series 2016 B, RB | | | 3.57% | | | | 07/01/2029 | | | | 2,000 | | | | 2,050,740 | |
New York Transportation Development Corp. (LaGuardia Airport Terminal B Redevelopment), Series 2016 B, RB | | | 3.67% | | | | 07/01/2030 | | | | 1,000 | | | | 1,029,990 | |
Triborough Bridge & Tunnel Authority, Series 2009 B, RB | | | 5.50% | | | | 11/15/2039 | | | | 2,715 | | | | 3,764,646 | |
Triborough Bridge & Tunnel Authority, Series 2010, RB | | | 5.45% | | | | 11/15/2032 | | | | 2,280 | | | | 3,008,300 | |
Westchester County Local Development Corp. (Westchester Medical), Series 2020, Ref. RB, (INS - AGM)(a) | | | 3.85% | | | | 11/01/2050 | | | | 7,750 | | | | 7,846,410 | |
Western Nassau County Water Authority, Series 2010 B, RB | | | 6.70% | | | | 04/01/2040 | | | | 500 | | | | 733,645 | |
| | | | | | | | | | | | | | | | |
| | | | | | | | | | | | | | | 318,876,737 | |
| | | | | | | | | | | | | | | | |
North Carolina-0.07% | | | | | | | | | | | | | | | | |
North Carolina State University at Raleigh, Series 2010 B, RB | | | 5.93% | | | | 10/01/2030 | | | | 1,000 | | | | 1,004,500 | |
University of North Carolina at Chapel Hill, Series 2009, RB | | | 5.76% | | | | 12/01/2039 | | | | 500 | | | | 501,855 | |
| | | | | | | | | | | | | | | | |
| | | | | | | | | | | | | | | 1,506,355 | |
| | | | | | | | | | | | | | | | |
Ohio-3.23% | | | | | | | | | | | | | | | | |
American Municipal Power, Inc., Series 2009 B, RB | | | 6.45% | | | | 02/15/2044 | | | | 2,000 | | | | 3,024,500 | |
American Municipal Power, Inc. (Combined Hydroelectric), Series 2010 B, RB | | | 8.08% | | | | 02/15/2050 | | | | 9,930 | | | | 18,803,845 | |
American Municipal Power, Inc. (Meldahl Hydroelectric), Series 2010 B, RB | | | 7.50% | | | | 02/15/2050 | | | | 3,395 | | | | 5,714,226 | |
American Municipal Power, Inc. (Meldahl Hydroelectric), Series 2010 E, RB | | | 6.27% | | | | 02/15/2050 | | | | 2,090 | | | | 3,027,783 | |
American Municipal Power, Inc. (Prairie State Energy Campus), Series 2009 C, RB | | | 6.05% | | | | 02/15/2043 | | | | 8,005 | | | | 11,793,046 | |
Columbus (City of), OH Regional Airport Authority, Series 2019, RB | | | 4.20% | | | | 12/15/2048 | | | | 1,000 | | | | 1,042,480 | |
Cuyahoga (County of), OH, Series 2010, RB | | | 8.22% | | | | 02/15/2040 | | | | 1,000 | | | | 1,408,450 | |
Franklin (County of), OH (Nationwide Childrens Hospital), Series 2019 B, RB | | | 3.38% | | | | 11/01/2050 | | | | 8,000 | | | | 8,860,160 | |
Franklin (County of), OH Convention Facilities Authority, Series 2010, RB | | | 6.39% | | | | 12/01/2030 | | | | 1,000 | | | | 1,322,520 | |
Franklin (County of), OH Convention Facilities Authority, Series 2010, RB | | | 6.54% | | | | 12/01/2036 | | | | 1,070 | | | | 1,590,245 | |
JobsOhio Beverage System, Series 2020 A, Ref. RB | | | 2.83% | | | | 01/01/2038 | | | | 2,000 | | | | 2,163,240 | |
Ohio (State of) (Cleveland Clinic Health), Series 2017, Ref. RB | | | 3.70% | | | | 01/01/2043 | | | | 1,000 | | | | 1,186,650 | |
Ohio State University (The), Series 2020, Ref. RB | | | 3.02% | | | | 12/01/2050 | | | | 5,000 | | | | 4,780,600 | |
| | | | | | | | | | | | | | | | |
| | | | | | | | | | | | | | | 64,717,745 | |
| | | | | | | | | | | | | | | | |
Oregon-1.38% | | | | | | | | | | | | | | | | |
Metro, Series 2019, GO Bonds | | | 3.25% | | | | 06/01/2028 | | | | 10,000 | | | | 11,646,100 | |
Morrow (Port of), OR (Bonneville Cooperation Project No. 4), Series 2016, RB | | | 2.99% | | | | 09/01/2036 | | | | 4,000 | | | | 4,505,000 | |
Oregon (State of), Series 2003, GO Bonds | | | 5.89% | | | | 06/01/2027 | | | | 2,000 | | | | 2,534,240 | |
Oregon (State of) Department of Transportation, Series 2010, RB | | | 5.83% | | | | 11/15/2034 | | | | 1,000 | | | | 1,447,800 | |
Oregon State University, Series 2019, RB | | | 4.05% | | | | 04/01/2052 | | | | 6,000 | | | | 6,466,020 | |
Portland (Port of), OR (Portland International Airport), Series 2019, RB | | | 4.24% | | | | 07/01/2049 | | | | 1,000 | | | | 1,027,670 | |
| | | | | | | | | | | | | | | | |
| | | | | | | | | | | | | | | 27,626,830 | |
| | | | | | | | | | | | | | | | |
Pennsylvania-5.98% | | | | | | | | | | | | | | | | |
Allegheny (County of), PA, Series 2020 C-79, Ref. GO Bonds | | | 2.09% | | | | 11/01/2033 | | | | 18,000 | | | | 18,441,180 | |
Allegheny (County of), PA, Series 2020 C-79, Ref. GO Bonds | | | 2.34% | | | | 11/01/2037 | | | | 38,000 | | | | 38,484,500 | |
Commonwealth Financing Authority, Series 2010 C2, RB | | | 5.59% | | | | 06/01/2030 | | | | 2,000 | | | | 2,509,000 | |
Commonwealth Financing Authority, Series 2019 A, RB | | | 3.81% | | | | 06/01/2041 | | | | 5,000 | | | | 5,732,500 | |
Commonwealth Financing Authority, Series 2019 A, RB, (INS - AGM)(a) | | | 3.66% | | | | 06/01/2038 | | | | 20,000 | | | | 22,653,600 | |
Kiski Area School District, Series 2010, GO Bonds(c)(d) | | | 6.53% | | | | 09/01/2020 | | | | 2,000 | | | | 2,000,000 | |
Pennsylvania (Commonwealth of), Series 2010 B, GO Bonds | | | 4.65% | | | | 02/15/2026 | | | | 4,955 | | | | 5,568,974 | |
Pennsylvania (State of) Higher Educational Facilities Authority, Series 2010, RB | | | 6.14% | | | | 04/01/2030 | | | | 1,000 | | | | 1,262,100 | |
Pennsylvania (State of) Higher Educational Facilities Authority, Series 2019 B, Ref. RB | | | 2.97% | | | | 08/15/2045 | | | | 7,000 | | | | 7,383,320 | |
See accompanying Notes to Financial Statements which are an integral part of the financial statements.
Invesco Taxable Municipal Bond ETF (BAB)—(continued)
August 31, 2020
| | | | | | | | | | | | | | | | |
| | | Interest
Rate | | | Maturity
Date | | | Principal
Amount
(000) | | | Value | |
Pennsylvania-(continued) | | | | | | | | | | | | | | | | |
Pennsylvania (State of) Turnpike Commission, Series 2009, RB | | | 6.11% | | | | 12/01/2039 | | | $ | 1,443 | | | $ | 2,169,146 | |
Pennsylvania (State of) Turnpike Commission, Series 2020 A, Ref. RB | | | 3.42% | | | | 12/01/2041 | | | | 5,000 | | | | 5,328,400 | |
Pennsylvania (State of) Turnpike Commission, Series 2020 A, Ref. RB | | | 3.44% | | | | 12/01/2043 | | | | 3,000 | | | | 3,192,000 | |
Quaker Valley School District, Series 2010, GO Bonds(c)(d) | | | 5.96% | | | | 10/01/2020 | | | | 1,000 | | | | 1,004,470 | |
School District of Philadelphia (The), Series 2010, GO Bonds | | | 6.62% | | | | 06/01/2030 | | | | 1,000 | | | | 1,253,210 | |
University of Pittsburgh-of the Commonwealth System of Higher Education, Series 2017 C, Ref. RB | | | 3.01% | | | | 09/15/2041 | | | | 2,750 | | | | 3,017,163 | |
| | | | | | | | | | | | | | | | |
| | | | | | | | | | | | | | | 119,999,563 | |
| | | | | | | | | | | | | | | | |
South Carolina-1.15% | | | | | | | | | | | | | | | | |
South Carolina (State of) Public Service Authority, Series 2010 C, RB | | | 6.45% | | | | 01/01/2050 | | | | 9,050 | | | | 14,389,228 | |
South Carolina (State of) Public Service Authority, Series 2016 D, RB, (INS - AGM)(a) | | | 2.39% | | | | 12/01/2023 | | | | 1,355 | | | | 1,404,701 | |
South Carolina Student Loan Corp., Series 2020, RB | | | 3.59% | | | | 12/01/2039 | | | | 5,000 | | | | 4,942,100 | |
Williamsburg County Public Facilities Corp. (Williamsburg County), Series 2010, RB | | | 6.53% | | | | 12/01/2030 | | | | 2,250 | | | | 2,272,163 | |
| | | | | | | | | | | | | | | | |
| | | | | | | | | | | | | | | 23,008,192 | |
| | | | | | | | | | | | | | | | |
Tennessee-0.05% | | | | | | | | | | | | | | | | |
Metropolitan Government Nashville & Davidson County Health & Educational Facs Board (Vanderbilt University), Seris 2016 B, RB | | | 4.05% | | | | 07/01/2026 | | | | 1,000 | | | | 1,093,530 | |
| | | | | | | | | | | | | | | | |
Texas-9.03% | | | | | | | | | | | | | | | | |
Beaumont (City of), TX, Series 2010 B, RB | | | 6.01% | | | | 09/01/2030 | | | | 1,500 | | | | 1,506,165 | |
Board of Regents of The University of Texas System, Series 2010 C, RB | | | 4.64% | | | | 08/15/2030 | | | | 10,000 | | | | 12,560,900 | |
Channelview Independent School District, Series 2010 B, GO Bonds, (CEP -Texas Permanent School Fund) | | | 5.93% | | | | 08/15/2035 | | | | 2,000 | | | | 2,006,800 | |
Dallas Convention Center Hotel Development Corp., Series 2009, RB | | | 7.09% | | | | 01/01/2042 | | | | 2,780 | | | | 3,726,117 | |
Dallas Independent School District, Series 2010 C, GO Bonds, (CEP -Texas Permanent School Fund) | | | 6.45% | | | | 02/15/2035 | | | | 5,170 | | | | 5,299,664 | |
Dallas-Fort Worth (Cities of), TX International Airport, Series 2019 A, Ref. RB | | | 1.89% | | | | 11/01/2021 | | | | 11,820 | | | | 11,981,579 | |
Dallas-Fort Worth (Cities of), TX International Airport, Series 2019 A, Ref. RB | | | 1.88% | | | | 11/01/2022 | | | | 5,690 | | | | 5,822,349 | |
Dallas-Fort Worth (Cities of), TX International Airport, Series 2019 A, Ref. RB | | | 1.94% | | | | 11/01/2023 | | | | 5,800 | | | | 5,982,178 | |
Dallas-Fort Worth (Cities of), TX International Airport, Series 2020 C, Ref. RB | | | 1.33% | | | | 11/01/2025 | | | | 3,250 | | | | 3,264,918 | |
Dallas-Fort Worth (Cities of), TX International Airport, Series 2020 C, Ref. RB | | | 1.65% | | | | 11/01/2026 | | | | 2,400 | | | | 2,414,040 | |
Dallas-Fort Worth (Cities of), TX International Airport, Series 2020 C, Ref. RB | | | 2.92% | | | | 11/01/2050 | | | | 20,000 | | | | 20,004,600 | |
Denison Independent School District, Series 2020, Ref. GO Bonds, (CEP -Texas Permanent School Fund) | | | 2.74% | | | | 08/01/2041 | | | | 10,000 | | | | 10,640,200 | |
Hallettsville Independent School District, Series 2010, GO Bonds, (CEP -Texas Permanent School Fund) | | | 6.27% | | | | 08/15/2030 | | | | 605 | | | | 607,287 | |
Hallettsville Independent School District, Series 2010, GO Bonds, (CEP -Texas Permanent School Fund) | | | 6.47% | | | | 08/15/2035 | | | | 1,000 | | | | 1,003,910 | |
North Texas Tollway Authority, Series 2009, RB | | | 6.72% | | | | 01/01/2049 | | | | 1,700 | | | | 3,065,916 | |
San Antonio (City of), TX, Series 2020, Ref. GO Bonds | | | 0.36% | | | | 02/01/2022 | | | | 5,000 | | | | 5,001,400 | |
San Antonio (City of), TX, Series 2020, Ref. GO Bonds | | | 0.48% | | | | 02/01/2023 | | | | 13,000 | | | | 13,028,340 | |
San Antonio (City of), TX, Series 2020, Ref. GO Bonds | | | 0.84% | | | | 02/01/2025 | | | | 10,000 | | | | 10,021,400 | |
San Antonio Education Facilities Corp. (Trinity University), Series 2020, Ref. RB | | | 3.24% | | | | 06/01/2050 | | | | 10,000 | | | | 10,020,000 | |
Texas (State of), Series 2009, GO Bonds | | | 5.52% | | | | 04/01/2039 | | | | 9,680 | | | | 14,654,843 | |
Texas (State of) Transportation Commission (Central Texas Turnpike System), Series 2020 C, Ref. RB | | | 3.03% | | | | 08/15/2041 | | | | 2,000 | | | | 2,004,700 | |
Texas (State of) Transportation Commission State Highway Fund, Series 2010 B, RB | | | 5.03% | | | | 04/01/2026 | | | | 2,000 | | | | 2,359,960 | |
Texas (State of) Transportation Commission State Highway Fund, Series 2010 B, RB | | | 5.18% | | | | 04/01/2030 | | | | 11,715 | | | | 15,205,250 | |
Texas A&M University, Series 2019 A, RB | | | 4.20% | | | | 05/15/2048 | | | | 2,500 | | | | 2,862,500 | |
Texas A&M University System Board of Regents, Series 2019 B, Ref. RB | | | 2.62% | | | | 05/15/2029 | | | | 3,000 | | | | 3,290,370 | |
University of Texas System (The), Series 2020 B, Ref. RB | | | 2.44% | | | | 08/15/2049 | | | | 7,500 | | | | 7,771,575 | |
Waco Educational Finance Corp. (Baylor University), Series 2020, Ref. RB | | | 2.84% | | | | 03/01/2040 | | | | 5,000 | | | | 5,062,100 | |
| | | | | | | | | | | | | | | | |
| | | | | | | | | | | | | | | 181,169,061 | |
| | | | | | | | | | | | | | | | |
Utah-0.32% | | | | | | | | | | | | | | | | |
Salt Lake (County of), UT Municipal Building Authority, Series 2009, RB | | | 5.82% | | | | 12/01/2029 | | | | 500 | | | | 631,105 | |
Utah (State of), Series 2009 D, GO Bonds | | | 4.55% | | | | 07/01/2024 | | | | 575 | | | | 629,171 | |
See accompanying Notes to Financial Statements which are an integral part of the financial statements.
Invesco Taxable Municipal Bond ETF (BAB)—(continued)
August 31, 2020
| | | | | | | | | | | | | | | | |
| | | Interest
Rate | | | Maturity
Date | | | Principal
Amount
(000) | | | Value | |
Utah-(continued) | | | | | | | | | | | | | | | | |
Utah (State of), Series 2010 B, GO Bonds | | | 3.54% | | | | 07/01/2025 | | | $ | 2,355 | | | $ | 2,583,411 | |
Utah (State of) Transit Authority, Series 2009 B, RB | | | 5.94% | | | | 06/15/2039 | | | | 1,815 | | | | 2,620,189 | |
| | | | | | | | | | | | | | | | |
| | | | | | | | | | | | | | | 6,463,876 | |
| | | | | | | | | | | | | | | | |
Virgin Islands-0.36% | | | | | | | | | | | | | | | | |
Virgin Islands (Government of) Water & Power Authority, Series 2010, RB, (INS - AGM)(a) | | | 6.85% | | | | 07/01/2035 | | | | 5,795 | | | | 7,165,460 | |
| | | | | | | | | | | | | | | | |
Washington-2.76% | | | | | | | | | | | | | | | | |
Benton (County of), WA Public Utility District No. 1, Series 2010, RB | | | 6.55% | | | | 11/01/2030 | | | | 750 | | | | 1,045,320 | |
Central Puget Sound Regional Transit Authority, Series 2009 S-2T, RB | | | 5.49% | | | | 11/01/2039 | | | | 1,855 | | | | 2,720,246 | |
Cowlitz (County of), WA Public Utility District No. 1, Series 2010, RB | | | 6.88% | | | | 09/01/2032 | | | | 6,500 | | | | 9,189,050 | |
Douglas (County of), WA Public Utility District No. 1, Series 2010 1-B, RB | | | 5.25% | | | | 09/01/2030 | | | | 2,000 | | | | 2,390,320 | |
Grant (County of), WA Public Utility District No. 2, Series 2010, Ref. RB | | | 5.73% | | | | 01/01/2030 | | | | 2,500 | | | | 3,315,200 | |
Grant (County of), WA Public Utility District No. 2, Series 2010, Ref. RB | | | 5.83% | | | | 01/01/2040 | | | | 2,750 | | | | 3,964,015 | |
King (County of), WA, Series 2020 B, Ref. RB | | | 1.30% | | | | 01/01/2028 | | | | 15,990 | | | | 16,027,257 | |
King (County of), WA, Series 2020 B, Ref. RB | | | 1.46% | | | | 01/01/2029 | | | | 5,915 | | | | 5,943,451 | |
Seattle (Port of), WA, Series 2017, Ref. RB | | | 3.76% | | | | 05/01/2036 | | | | 500 | | | | 527,435 | |
Snohomish (County of), WA Public Hospital District No. 3, Series 2010, GO Bonds | | | 6.33% | | | | 12/01/2035 | | | | 1,000 | | | | 1,009,860 | |
Tacoma (City of), WA, Series 2010 B, RB | | | 5.37% | | | | 12/01/2030 | | | | 1,000 | | | | 1,277,270 | |
Tacoma (City of), WA, Series 2010 B, RB, (INS - AGM)(a) | | | 5.79% | | | | 01/01/2032 | | | | 2,570 | | | | 3,434,394 | |
Washington (State of), Series 2010, GO Bonds | | | 5.09% | | | | 08/01/2033 | | | | 2,000 | | | | 2,662,520 | |
Washington (State of) Biomedical Research Facilities 3, Series 2010 B, RB | | | 6.42% | | | | 07/01/2030 | | | | 1,435 | | | | 1,874,382 | |
| | | | | | | | | | | | | | | | |
| | | | | | | | | | | | | | | 55,380,720 | |
| | | | | | | | | | | | | | | | |
Wisconsin-0.98% | | | | | | | | | | | | | | | | |
Wisconsin (State of), Series 2017 A, Ref. RB | | | 3.95% | | | | 05/01/2036 | | | | 3,000 | | | | 3,355,080 | |
Wisconsin (State of), Series 2019 1, Ref. GO Bonds | | | 2.38% | | | | 05/01/2030 | | | | 7,500 | | | | 8,303,925 | |
Wisconsin (State of), Series 2020 2, Ref. GO Bonds | | | 1.88% | | | | 05/01/2025 | | | | 2,500 | | | | 2,642,625 | |
Wisconsin (State of), Series 2020 2, Ref. GO Bonds | | | 2.35% | | | | 05/01/2031 | | | | 1,000 | | | | 1,103,780 | |
Wisconsin (State of), Series 2020 A, Ref. RB | | | 2.50% | | | | 05/01/2032 | | | | 2,000 | | | | 2,168,160 | |
Wisconsin (State of) Center District, Series 2020 B, Ref. RB, (INS - AGM)(a) | | | 4.17% | | | | 12/15/2050 | | | | 2,000 | | | | 2,146,180 | |
| | | | | | | | | | | | | | | | |
| | | | | | | | | | | | | | | 19,719,750 | |
| | | | | | | | | | | | | | | | |
| | | | |
Total Municipal Obligations
(Cost $1,710,495,834) | | | | | | | | | | | | | | | 1,881,635,794 | |
| | | | | | | | | | | | | | | | |
| | | |
U.S. Dollar Denominated Bonds & Notes-2.75% | | | | | | | | | | | | | |
California-0.79% | | | | | | | | | | | | | | | | |
Claremont Mckenna College, Series 2019 | | | 3.38% | | | | 01/01/2050 | | | | 7,500 | | | | 8,388,495 | |
Pepperdine University | | | 3.30% | | | | 12/01/2059 | | | | 5,000 | | | | 5,434,973 | |
University of Southern California, Series A | | | 3.23% | | | | 10/01/2120 | | | | 2,000 | | | | 2,104,425 | |
| | | | | | | | | | | | | | | | |
| | | | | | | | | | | | | | | 15,927,893 | |
| | | | | | | | | | | | | | | | |
Connecticut-0.19% | | | | | | | | | | | | | | | | |
Wesleyan University | | | 3.37% | | | | 07/01/2050 | | | | 4,000 | | | | 3,861,948 | |
| | | | | | | | | | | | | | | | |
District of Columbia-0.15% | | | | | | | | | | | | | | | | |
Association of American Medical Colleges | | | 3.32% | | | | 10/01/2041 | | | | 3,000 | | | | 3,079,130 | |
| | | | | | | | | | | | | | | | |
Maine-0.10% | | | | | | | | | | | | | | | | |
Colby College | | | 3.20% | | | | 07/01/2054 | | | | 2,000 | | | | 2,014,878 | |
| | | | | | | | | | | | | | | | |
Massachusetts-0.22% | | | | | | | | | | | | | | | | |
Whitehead Institute for Biomedical Research | | | 3.28% | | | | 12/01/2050 | | | | 4,000 | | | | 4,336,782 | |
| | | | | | | | | | | | | | | | |
Minnesota-0.13% | | | | | | | | | | | | | | | | |
Mayo Clinic, Series 2016 | | | 4.13% | | | | 11/15/2052 | | | | 2,000 | | | | 2,630,748 | |
| | | | | | | | | | | | | | | | |
New Hampshire-0.12% | | | | | | | | | | | | | | | | |
Trustees of Dartmouth College | | | 3.47% | | | | 06/01/2046 | | | | 2,000 | | | | 2,308,190 | |
| | | | | | | | | | | | | | | | |
New York-0.87% | | | | | | | | | | | | | | | | |
Ford Foundation (The) | | | 2.42% | | | | 06/01/2050 | | | | 3,000 | | | | 3,102,065 | |
Ford Foundation (The) | | | 2.82% | | | | 06/01/2070 | | | | 5,000 | | | | 5,327,877 | |
See accompanying Notes to Financial Statements which are an integral part of the financial statements.
Invesco Taxable Municipal Bond ETF (BAB)—(continued)
August 31, 2020
| | | | | | | | | | | | | | | | |
| | | Interest
Rate | | | Maturity
Date | | | Principal
Amount
(000) | | | Value | |
New York-(continued) | | | | | | | | | | | | | | | | |
Montefiore Medical Center | | | 2.90% | | | | 04/20/2032 | | | $ | 1,170 | | | $ | 1,271,032 | |
Montefiore Obligated Group, (INS - AGM)(a) | | | 3.79% | | | | 09/01/2050 | | | | 7,000 | | | | 7,775,893 | |
| | | | | | | | | | | | | | | | |
| | | | | | | | | | | | | | | 17,476,867 | |
| | | | | | | | | | | | | | | | |
Texas-0.18% | | | | | | | | | | | | | | | | |
Baylor Scott & White Holdings | | | 3.97% | | | | 11/15/2046 | | | | 3,000 | | | | 3,614,854 | |
| | | | | | | | | | | | | | | | |
Total U.S. Dollar Denominated Bonds & Notes
(Cost $50,669,900) | | | | | | | | | | | | | | | 55,251,290 | |
| | | | | | | | | | | | | | | | |
| | | | |
| | | | | | | | | Shares | | | | |
Money Market Funds-4.50% | | | | | | | | | | | | | | | | |
Invesco Premier U.S. Government Money Portfolio, Institutional Class, 0.01%(f)(g)
(Cost $90,139,484) | | | | | | | | | | | 90,139,484 | | | | 90,139,484 | |
| | | | | | | | | | | | | | | | |
TOTAL INVESTMENTS IN SECURITIES(h)-101.06%
(Cost $1,851,305,218) | | | | | | | | | | | | | | | 2,027,026,568 | |
OTHER ASSETS LESS LIABILITIES-(1.06%) | | | | | | | | | | | | | | | (21,165,809 | ) |
| | | | | | | | | | | | | | | | |
| | | | |
NET ASSETS-100.00% | | | | | | | | | | | | | | $ | 2,005,860,759 | |
| | | | | | | | | | | | | | | | |
| | |
| Investment Abbreviations: |
| AGC | | -Assured Guaranty Corp. |
| AGM | | -Assured Guaranty Municipal Corp. |
| BAM | | -Build America Mutual Assurance Co. |
| CEP | | -Credit Enhancement Provider |
| COP | | -Certificates of Participation |
| GO | | -General Obligation |
| INS | | -Insurer |
| RB | | -Revenue Bonds |
| Ref. | | -Refunding |
| VRD | | -Variable Rate Demand |
Notes to Schedule of Investments:
| (a) | Principal and/or interest payments are secured by the bond insurance company listed. |
| (b) | Security subject to crossover refunding. |
| (c) | Advance refunded; secured by an escrow fund of U.S. Government obligations or other highly rated collateral. |
| (d) | Security has an irrevocable call by the issuer or mandatory put by the holder. Maturity date reflects such call or put. |
| (e) | Demand security payable upon demand by the Fund at specified time intervals no greater than thirteen months. Interest rate is redetermined periodically by the issuer or agent based on current market conditions. Rate shown is the rate in effect on August 31, 2020. |
| (f) | Affiliated issuer. The issuer and/or the Fund is a wholly-owned subsidiary of Invesco Ltd., or is affiliated by having an investment adviser that is under common control of Invesco Ltd. The table below shows the Fund’s transactions in, and earnings from, its investments in affiliates for the fiscal year ended August 31, 2020. |
| | | | | | | | | | | | | | | | | | | | | | | | | | | | | | | | | | | |
| | | Value
August 31, 2019 | | Purchases
at Cost | | Proceeds
from Sales | | Change in
Unrealized
Appreciation | | Realized
Gain | | Value
August 31, 2020 | | Dividend
Income |
| Investments in Affiliated Money Market Funds: | | | | | | | | | | | | | | | | | | | | | | | | | | | | | | | | | | | |
| Invesco Premier U.S. Government Money Portfolio, Institutional Class | | | $ | 21,268,011 | | | | $ | 829,375,166 | | | | $ | (760,503,693 | ) | | | $ | - | | | | $ | - | | | | $ | 90,139,484 | | | | $ | 342,090 | |
| (g) | The rate shown is the 7-day SEC standardized yield as of August 31, 2020. |
| (h) | This table provides a listing of those entities that have either issued, guaranteed, backed or otherwise enhanced the credit quality of more than 5% of the securities held in the portfolio. In instances where the entity has guaranteed, backed or otherwise enhanced the credit quality of a security, it is not primarily responsible for the issuer’s obligations but may be called upon to satisfy the issuer’s obligations. |
| | | | |
| Entities | | Percentage | |
Assured Guaranty Municipal Corp | | | 8.13% | |
See accompanying Notes to Financial Statements which are an integral part of the financial statements.
Invesco Treasury Collateral ETF (CLTL)
August 31, 2020
Schedule of Investments
| | | | | | | | |
| | | Principal
Amount | | | Value | |
U.S. Treasury Securities-99.97% | |
U.S. Treasury Bills-60.87%(a) | |
0.08%, 09/01/2020 | | $ | 1,782,000 | | | $ | 1,782,000 | |
0.09%–0.17%, 10/01/2020 | | | 26,481,000 | | | | 26,478,959 | |
0.08%, 10/06/2020 | | | 9,654,000 | | | | 9,653,179 | |
0.01%–1.49%, 10/08/2020 | | | 33,669,900 | | | | 33,666,915 | |
0.08%, 10/13/2020 | | | 9,654,000 | | | | 9,652,986 | |
0.09%–0.15%, 10/15/2020 | | | 28,134,000 | | | | 28,130,905 | |
0.09%–0.16%, 10/22/2020 | | | 29,712,800 | | | | 29,708,801 | |
0.09%–0.16%, 10/29/2020 | | | 24,684,000 | | | | 24,680,321 | |
0.04%–1.48%, 11/05/2020 | | | 33,563,000 | | | | 33,557,395 | |
0.09%–0.16%, 11/12/2020 | | | 29,789,000 | | | | 29,783,340 | |
0.10%–0.16%, 11/19/2020 | | | 24,002,000 | | | | 23,996,865 | |
0.10%–0.16%, 11/27/2020 | | | 23,291,000 | | | | 23,285,301 | |
0.09%–0.16%, 12/03/2020 | | | 27,675,000 | | | | 27,667,136 | |
0.10%–0.15%, 12/10/2020 | | | 14,903,000 | | | | 14,898,757 | |
0.10%–0.14%, 12/17/2020 | | | 13,610,000 | | | | 13,605,854 | |
0.10%–0.15%, 12/24/2020 | | | 19,868,000 | | | | 19,861,079 | |
0.10%–0.16%, 12/31/2020 | | | 29,571,000 | | | | 29,560,067 | |
0.09%–0.11%, 01/07/2021 | | | 13,811,100 | | | | 13,805,453 | |
0.09%, 01/14/2021 | | | 14,068,000 | | | | 14,061,933 | |
0.10%–0.13%, 01/21/2021 | | | 14,868,400 | | | | 14,862,242 | |
0.10%–0.17%, 01/28/2021 | | | 14,884,000 | | | | 14,877,840 | |
0.10%, 02/04/2021 | | | 14,067,000 | | | | 14,060,447 | |
0.10%, 02/11/2021 | | | 14,067,000 | | | | 14,060,312 | |
0.11%, 02/18/2021 | | | 14,067,000 | | | | 14,059,693 | |
0.11%–0.39%, 02/25/2021 | | | 19,560,000 | | | | 19,548,941 | |
0.12%, 03/04/2021 | | | 14,067,000 | | | | 14,058,821 | |
0.12%–0.17%, 03/25/2021 | | | 25,098,000 | | | | 25,081,207 | |
0.12%–0.17%, 04/22/2021 | | | 16,737,000 | | | | 16,724,001 | |
0.12%–0.16%, 06/17/2021 | | | 15,874,000 | | | | 15,858,708 | |
| | | | | | | | |
| | | | | | | 571,029,458 | |
| | | | | | | | |
| | | | | | | | |
| | | Principal
Amount | | | Value | |
U.S. Treasury Notes-39.10% | |
2.75%, 09/30/2020 | | $ | 2,924,000 | | | $ | 2,930,136 | |
1.63%, 10/15/2020 | | | 19,941,000 | | | | 19,977,298 | |
1.38% - 2.88%, 10/31/2020 | | | 70,295,000 | | | | 70,503,751 | |
1.75% - 2.63%, 11/15/2020 | | | 20,558,000 | | | | 20,646,016 | |
1.63% - 2.75%, 11/30/2020 | | | 44,539,000 | | | | 44,757,538 | |
1.88%, 12/15/2020 | | | 11,783,000 | | | | 11,842,256 | |
1.75% - 2.50%, 12/31/2020 | | | 28,820,000 | | | | 29,009,799 | |
2.00%, 01/15/2021 | | | 6,477,000 | | | | 6,521,771 | |
1.38% - 2.13%, 01/31/2021 | | | 23,566,000 | | | | 23,722,553 | |
2.25% - 3.63%, 02/15/2021 | | | 24,065,000 | | | | 24,351,421 | |
1.13% - 2.50%, 02/28/2021 | | | 38,898,000 | | | | 39,261,822 | |
2.25%, 03/31/2021 | | | 12,872,000 | | | | 13,025,609 | |
2.25%, 04/30/2021 | | | 13,357,000 | | | | 13,545,208 | |
2.63%, 05/15/2021 | | | 4,320,000 | | | | 4,395,234 | |
2.00%, 05/31/2021 | | | 14,903,000 | | | | 15,106,712 | |
1.13% - 2.13%, 06/30/2021 | | | 26,911,000 | | | | 27,227,834 | |
| | | | | | | | |
| | | | | | | 366,824,958 | |
| | | | | | | | |
Total U.S. Treasury Securities
(Cost $937,203,997) | | | | | | | 937,854,416 | |
| | | | | | | | |
| | |
| | | Shares | | | | |
Money Market Funds-0.02% | |
Invesco Premier U.S. Government Money Portfolio, Institutional Class, 0.01%(b)(c)
(Cost $221,238) | | | 221,238 | | | | 221,238 | |
| | | | | | | | |
TOTAL INVESTMENTS IN SECURITIES-99.99%
(Cost $937,425,235) | | | | | | | 938,075,654 | |
OTHER ASSETS LESS LIABILITIES-0.01% | | | | 93,853 | |
| | | | | | | | |
| | |
NET ASSETS-100.00% | | | | | | $ | 938,169,507 | |
| | | | | | | | |
Notes to Schedule of Investments:
| (a) | Security traded on a discount basis. The interest rate shown represents the discount rate at the time of purchase by the Fund. |
| (b) | Affiliated issuer. The issuer and/or the Fund is a wholly-owned subsidiary of Invesco Ltd., or is affiliated by having an investment adviser that is under common control of Invesco Ltd. The table below shows the Fund’s transactions in, and earnings from, its investments in affiliates for the fiscal year ended August 31, 2020. |
| | | | | | | | | | | | | | | | | | | | | | | | | | | | | | | | | | | |
| | | Value
August 31, 2019 | | Purchases
at Cost | | Proceeds
from Sales | | Change in
Unrealized
Appreciation | | Realized
Gain | | Value
August 31, 2020 | | Dividend
Income |
| Investments in Affiliated Money Market Funds: | | | | | | | | | | | | | | | | | | | | | | | | | | | | | | | | | | | |
| Invesco Premier U.S. Government Money Portfolio, Institutional Class | | | $ | - | | | | $ | 64,329,631 | | | | $ | (64,108,393 | ) | | | $ | - | | | | $ | - | | | | $ | 221,238 | | | | $ | 8,878 | |
| (c) | The rate shown is the 7-day SEC standardized yield as of August 31, 2020. |
See accompanying Notes to Financial Statements which are an integral part of the financial statements.
Invesco Variable Rate Preferred ETF (VRP)
August 31, 2020
Schedule of Investments(a)
| | | | | | | | |
| | | Principal
Amount | | | Value | |
U.S. Dollar Denominated Bonds & Notes-72.66% | |
Automobiles-0.72% | | | | | | | | |
General Motors Financial Co., Inc. | | | | | | | | |
Series A, 5.75%(b)(c)(d) | | $ | 7,140,000 | | | $ | 6,984,332 | |
Series B, 6.50%(b)(c)(d) | | | 3,515,000 | | | | 3,561,569 | |
| | | | | | | | |
| | | | | | | 10,545,901 | |
| | | | | | | | |
Banks-35.53% | | | | | | | | |
Bank of America Corp. | | | | | | | | |
Series AA, 6.10%(c)(d) | | | 13,180,000 | | | | 14,797,779 | |
Series DD, 6.30%(c)(d) | | | 7,095,000 | | | | 8,208,420 | |
Series FF, 5.88%(c)(d) | | | 16,355,000 | | | | 17,994,019 | |
Series JJ, 5.13%(c)(d) | | | 7,225,000 | | | | 7,620,099 | |
Series MM, 4.30%(c)(d) | | | 7,775,000 | | | | 7,701,215 | |
Series U, 5.20%(b)(c)(d) | | | 7,191,000 | | | | 7,429,863 | |
Series X, 6.25%(c)(d) | | | 13,865,000 | | | | 15,100,892 | |
Series Z, 6.50%(c)(d) | | | 9,738,000 | | | | 11,005,546 | |
Citigroup, Inc. | | | | | | | | |
5.90%(c)(d) | | | 5,325,000 | | | | 5,644,287 | |
Series A, 5.95%(c)(d) | | | 10,616,000 | | | | 11,125,249 | |
Series D, 5.35%(b)(c)(d) | | | 8,585,000 | | | | 8,803,832 | |
Series M, 6.30%(c)(d) | | | 12,335,000 | | | | 13,221,270 | |
Series P, 5.95%(c)(d) | | | 13,912,000 | | | | 15,028,358 | |
Series Q, 4.38% (3 mo. USD LIBOR + 4.10%)(d)(e) | | | 8,783,000 | | | | 8,742,291 | |
Series R, 6.13%(c)(d) | | | 10,413,000 | | | | 10,477,544 | |
Series T, 6.25%(c)(d) | | | 10,702,000 | | | | 12,155,706 | |
Series U, 5.00%(c)(d) | | | 10,650,000 | | | | 10,778,291 | |
Series V, 4.70%(c)(d) | | | 10,600,000 | | | | 10,566,875 | |
Citizens Financial Group, Inc., Series F, 5.65%(c)(d) | | | 2,880,000 | | | | 3,096,000 | |
Comerica, Inc., 5.63%(b)(c)(d) | | | 2,900,000 | | | | 3,168,279 | |
Fifth Third Bancorp | | | | | | | | |
5.10%(c)(d) | | | 4,225,000 | | | | 4,031,036 | |
Series L, 4.50%(c)(d) | | | 2,390,000 | | | | 2,453,335 | |
Huntington Bancshares, Inc. | | | | | | | | |
Series E, 5.70%(c)(d) | | | 3,629,000 | | | | 3,458,283 | |
Series F, 5.63%(c)(d) | | | 3,680,000 | | | | 4,121,600 | |
Series G, 4.45%(c)(d) | | | 3,485,000 | | | | 3,511,068 | |
| | | | | | | | |
| | | Principal
Amount | | | Value | |
Banks-(continued) | | | | | | | | |
JPMorgan Chase & Co. | | | | | | | | |
Series CC, 4.63%(b)(c)(d) | | $ | 8,975,000 | | | $ | 8,845,227 | |
Series FF, 5.00%(c)(d) | | | 15,871,000 | | | | 16,310,826 | |
Series HH, 4.60%(c)(d) | | | 21,375,000 | | | | 21,481,875 | |
Series I, 3.74% (3 mo. USD LIBOR + 3.47%)(d)(e) | | | 20,741,000 | | | | 20,119,035 | |
Series II, 4.00%(c)(d) | | | 10,350,000 | | | | 9,826,031 | |
Series Q, 5.15%(c)(d) | | | 10,495,000 | | | | 10,671,640 | |
Series R, 6.00%(c)(d) | | | 10,590,000 | | | | 11,175,214 | |
Series S, 6.75%(c)(d) | | | 14,130,000 | | | | 15,795,137 | |
Series U, 1.20% (3 mo. USD LIBOR + 0.95%), 02/02/2037(e) | | | 2,340,000 | | | | 1,911,311 | |
Series U, 6.13%(c)(d) | | | 7,190,000 | | | | 7,691,709 | |
Series V, 3.62% (3 mo. USD LIBOR + 3.32%)(d)(e) | | | 17,519,000 | | | | 16,655,540 | |
Series W, 1.28% (3 mo. USD LIBOR + 1.00%), 05/15/2047(e) | | | 4,274,000 | | | | 3,294,450 | |
Series X, 6.10%(c)(d) | | | 11,003,000 | | | | 11,822,925 | |
Series Z, 4.05% (3 mo. USD LIBOR + 3.80%)(d)(e) | | | 14,240,000 | | | | 14,193,222 | |
KeyCorp, Series D, 5.00%(c)(d) | | | 3,815,000 | | | | 3,902,878 | |
M&T Bank Corp. | | | | | | | | |
Series E, 6.45%(c)(d) | | | 2,490,000 | | | | 2,703,381 | |
Series F, 5.13%(c)(d) | | | 3,620,000 | | | | 3,816,512 | |
Series G, 5.00%(c)(d) | | | 2,825,000 | | | | 2,934,469 | |
PNC Financial Services Group, Inc. (The) | | | | | | | | |
Series O, 6.75%(c)(d) | | | 7,005,000 | | | | 7,243,156 | |
Series R, 4.85%(c)(d) | | | 3,595,000 | | | | 3,701,430 | |
Series S, 5.00%(c)(d) | | | 3,750,000 | | | | 4,002,429 | |
Regions Financial Corp., Series D, 5.75%(b)(c)(d) | | | 2,530,000 | | | | 2,751,375 | |
Truist Financial Corp. | | | | | | | | |
Series L, 5.05%(c)(d) | | | 5,250,000 | | | | 5,246,066 | |
Series M, 5.13%(c)(d) | | | 3,480,000 | | | | 3,617,861 | |
Series N, 4.80%(c)(d) | | | 12,100,000 | | | | 12,565,330 | |
Series P, 4.95%(c)(d) | | | 7,200,000 | | | | 7,811,064 | |
Series Q, 5.10%(c)(d) | | | 7,100,000 | | | | 7,810,000 | |
U.S. Bancorp | | | | | | | | |
Series I, 5.13%(b)(c)(d) | | | 5,290,000 | | | | 5,307,721 | |
Series J, 5.30%(c)(d) | | | 7,040,000 | | | | 7,642,986 | |
USB Capital IX, 3.50% (3 mo. USD LIBOR + 1.02%)(d)(e) | | | 4,780,000 | | | | 4,268,516 | |
Wachovia Capital Trust III, 5.57% (3 mo. USD LIBOR + 0.93%)(d)(e) | | | 17,599,000 | | | | 17,718,145 | |
Wells Fargo & Co. | | | | | | | | |
Series S, 5.90%(c)(d) | | | 13,964,000 | | | | 14,673,242 | |
Series U, 5.88%(c)(d) | | | 14,096,000 | | | | 15,565,138 | |
| | | | | | | | |
| | | | | | | 523,316,978 | |
| | | | | | | | |
Capital Markets-9.69% | | | | | | | | |
Bank of New York Mellon Corp. (The) | | | | | | | | |
Series D, 4.50%(b)(c)(d) | | | 3,595,000 | | | | 3,543,574 | |
Series E, 3.73% (3 mo. USD LIBOR + 3.42%)(d)(e) | | | 7,240,000 | | | | 7,220,927 | |
Series F, 4.63%(c)(d) | | | 7,111,000 | | | | 7,441,374 | |
Series G, 4.70%(c)(d) | | | 7,190,000 | | | | 7,826,315 | |
See accompanying Notes to Financial Statements which are an integral part of the financial statements.
Invesco Variable Rate Preferred ETF (VRP)—(continued)
August 31, 2020
| | | | | | | | |
| | | Principal
Amount | | | Value | |
Capital Markets-(continued) | |
Charles Schwab Corp. (The) | | | | | | | | |
7.00%(c)(d) | | $ | 2,810,000 | | | $ | 3,000,799 | |
Series E, 4.63%(c)(d) | | | 4,235,000 | | | | 4,278,663 | |
Series F, 5.00%(b)(c)(d) | | | 3,615,000 | | | | 3,744,927 | |
Series G, 5.38%(c)(d) | | | 17,400,000 | | | | 19,140,000 | |
E*TRADE Financial Corp. | | | | | | | | |
Series A, 5.88%(b)(c)(d) | | | 2,885,000 | | | | 3,135,634 | |
Series B, 5.30%(b)(c)(d) | | | 2,050,000 | | | | 2,053,136 | |
Goldman Sachs Capital II, 4.00% (3 mo. USD LIBOR + 0.77%)(b)(d)(e) | | | 5,607,000 | | | | 5,162,673 | |
Goldman Sachs Group, Inc. (The) | | | | | | | | |
Series M, 4.17% (3 mo. USD LIBOR + 3.92%)(d)(e) | | | 14,405,000 | | | | 14,260,950 | |
Series O, 5.30%(c)(d) | | | 4,455,000 | | | | 4,806,019 | |
Series P, 5.00%(b)(c)(d) | | | 10,410,000 | | | | 10,052,150 | |
Series Q, 5.50%(c)(d) | | | 3,550,000 | | | | 3,845,580 | |
Series R, 4.95%(c)(d) | | | 4,300,000 | | | | 4,455,051 | |
Mellon Capital IV, Series 1, 4.00% (3 mo. USD LIBOR + 0.57%)(d)(e) | | | 3,580,000 | | | | 3,562,100 | |
Morgan Stanley | | | | | | | | |
Series H, 3.89% (3 mo. USD LIBOR + 3.61%)(d)(e) | | | 9,274,000 | | | | 8,875,279 | |
Series J, 4.09% (3 mo. USD LIBOR + 3.81%)(d)(e) | | | 10,590,000 | | | | 10,496,803 | |
Northern Trust Corp., Series D, 4.60%(c)(d) | | | 3,620,000 | | | | 3,747,460 | |
State Street Corp. | | | | | | | | |
1.31% (3 mo. USD LIBOR + 1.00%), 06/15/2047(e) | | | 3,636,000 | | | | 2,986,987 | |
Series F, 5.25%(c)(d) | | | 5,350,000 | | | | 5,379,425 | |
Series H, 5.63%(c)(d) | | | 3,540,000 | | | | 3,647,220 | |
| | | | | | | | |
| | | | | | | 142,663,046 | |
| | | | | | | | |
Consumer Finance-1.74% | |
American Express Co. | | | | | | | | |
Series B, 3.71% (3 mo. USD LIBOR + 3.43%)(b)(d)(e) | | | 5,455,000 | | | | 5,194,524 | |
Series C, 3.60% (3 mo. USD LIBOR + 3.29%)(d)(e) | | | 6,133,000 | | | | 5,697,680 | |
Capital One Financial Corp., Series E, 4.05% (3 mo. USD LIBOR + 3.80%)(d)(e) | | | 7,388,000 | | | | 6,701,382 | |
Discover Financial Services | | | | | | | | |
Class C, 5.50%(c)(d) | | | 4,130,000 | | | | 4,054,179 | |
Series D, 6.13%(c)(d) | | | 3,695,000 | | | | 3,993,925 | |
| | | | | | | | |
| | | | | | | 25,641,690 | |
| | | | | | | | |
Diversified Financial Services-0.63% | |
Equitable Holdings, Inc., Series B, 4.95%(c)(d) | | | 3,580,000 | | | | 3,689,011 | |
National Rural Utilities Cooperative Finance Corp. | | | | | | | | |
4.75%, 04/30/2043(c) | | | 2,864,000 | | | | 2,956,748 | |
5.25%, 04/20/2046(c) | | | 2,470,000 | | | | 2,694,940 | |
| | | | | | | | |
| | | | | | | 9,340,699 | |
| | | | | | | | |
Electric Utilities-1.50% | | | | | | | | |
Duke Energy Corp., 4.88%(c)(d) | | | 7,175,000 | | | | 7,579,337 | |
| | | | | | | | |
| | | Principal
Amount | | | Value | |
Electric Utilities-(continued) | |
NextEra Energy Capital Holdings, Inc. 2.36% (3 mo. USD LIBOR + 2.07%), 10/01/2066(e) | | $ | 2,497,000 | | | $ | 2,051,898 | |
4.80%, 12/01/2077(c) | | | 3,970,000 | | | | 4,288,048 | |
5.65%, 05/01/2079(c) | | | 3,550,000 | | | | 4,058,915 | |
Southern Co. (The), Series B, 5.50%, 03/15/2057(c) | | | 3,921,000 | | | | 4,046,375 | |
| | | | | | | | |
| | | | | | | 22,024,573 | |
| | | | | | | | |
Industrial Conglomerates-2.12% | |
General Electric Co., Series D, 5.00%(c)(d) | | | 39,964,000 | | | | 31,215,585 | |
| | | | | | | | |
Insurance-7.41% | | | | | | | | |
Aegon N.V. (Netherlands), 5.50%, 04/11/2048(c) | | | 5,475,000 | | | | 6,108,678 | |
Allstate Corp. (The), Series B, 5.75%, 08/15/2053(c) | | | 5,654,000 | | | | 6,065,626 | |
American International Group, Inc., Series A-9, 5.75%, 04/01/2048(c) | | | 5,329,000 | | | | 5,889,896 | |
AXIS Specialty Finance LLC, 4.90%, 01/15/2040(c) | | | 2,909,000 | | | | 2,858,842 | |
Enstar Finance LLC, 5.75%, 09/01/2040(c) | | | 2,390,000 | | | | 2,451,200 | |
Everest Reinsurance Holdings, Inc., 2.67% (3 mo. USD LIBOR + 2.38%), 05/15/2037(e) | | | 1,724,000 | | | | 1,469,226 | |
Lincoln National Corp. 2.64% (3 mo. USD LIBOR + 2.36%),
05/17/2066(e) | | | 5,205,000 | | | | 3,913,874 | |
2.31% (3 mo. USD LIBOR + 2.04%), 04/20/2067(e) | | | 3,560,000 | | | | 2,532,164 | |
Markel Corp., 6.00%(c)(d) | | | 4,320,000 | | | | 4,638,600 | |
MetLife, Inc. | | | | | | | | |
Series C, 3.89% (3 mo. USD LIBOR + 3.58%)(d)(e) | | | 10,775,000 | | | | 10,647,047 | |
Series D, 5.88%(c)(d) | | | 3,515,000 | | | | 3,900,246 | |
Principal Financial Group, Inc., 3.32% (3 mo. USD LIBOR + 3.04%), 05/15/2055(e) | | | 2,843,000 | | | | 2,600,620 | |
Progressive Corp. (The), Series B, 5.38%(c)(d) | | | 3,540,000 | | | | 3,577,135 | |
Prudential Financial, Inc. | | | | | | | | |
5.88%, 09/15/2042(c) | | | 7,072,000 | | | | 7,564,422 | |
5.63%, 06/15/2043(c) | | | 10,728,000 | | | | 11,535,149 | |
5.20%, 03/15/2044(c) | | | 3,560,000 | | | | 3,772,857 | |
5.38%, 05/15/2045(c) | | | 7,222,000 | | | | 7,944,586 | |
4.50%, 09/15/2047(c) | | | 5,250,000 | | | | 5,671,911 | |
5.70%, 09/15/2048(b)(c) | | | 7,140,000 | | | | 8,250,349 | |
3.70%, 10/01/2050(c) | | | 5,700,000 | | | | 5,886,846 | |
Reinsurance Group of America, Inc., 2.98% (3 mo. USD LIBOR + 2.67%), 12/15/2065(e) | | | 2,230,000 | | | | 1,840,854 | |
| | | | | | | | |
| | | | | | | 109,120,128 | |
| | | | | | | | |
Machinery-0.38% | | | | | | | | |
Stanley Black & Decker, Inc., 4.00%, 03/15/2060(c) | | | 5,325,000 | | | | 5,592,364 | |
| | | | | | | | |
See accompanying Notes to Financial Statements which are an integral part of the financial statements.
Invesco Variable Rate Preferred ETF (VRP)—(continued)
August 31, 2020
| | | | | | | | |
| | | Principal
Amount | | | Value | |
Media-0.61% | | | | | | | | |
ViacomCBS, Inc. | | | | | | | | |
5.88%, 02/28/2057(c) | | $ | 3,655,000 | | | $ | 3,799,007 | |
6.25%, 02/28/2057(c) | | | 4,671,000 | | | | 5,218,535 | |
| | | | | | | | |
| | | | | | | 9,017,542 | |
| | | | | | | | |
Multi-Utilities-2.09% | | | | | |
CenterPoint Energy, Inc., Series A, 6.13%(c)(d) | | | 5,712,000 | | | | 5,815,113 | |
CMS Energy Corp., 4.75%, 06/01/2050(c) | | | 3,600,000 | | | | 3,913,182 | |
Dominion Energy, Inc. | | | | | | | | |
Series A, 5.75%, 10/01/2054(c) | | | 4,875,000 | | | | 5,223,421 | |
Series B, 4.65%(b)(c)(d) | | | 5,890,000 | | | | 5,985,998 | |
Sempra Energy, 4.88%(c)(d) | | | 6,500,000 | | | | 6,809,400 | |
WEC Energy Group, Inc., 2.39% (3 mo. USD LIBOR + 2.11%), 05/15/2067(e) | | | 3,616,000 | | | | 2,994,537 | |
| | | | | | | | |
| | | | | | | 30,741,651 | |
| | | | | | | | |
Oil, Gas & Consumable Fuels-8.79% | |
BP Capital Markets PLC (United Kingdom) | | | | | | | | |
4.38%(c)(d) | | | 17,625,000 | | | | 18,550,312 | |
4.88%(c)(d) | | | 17,725,000 | | | | 19,403,557 | |
Enbridge, Inc. (Canada) | | | | | | | | |
5.50%, 07/15/2077(c) | | | 7,240,000 | | | | 7,092,580 | |
6.25%, 03/01/2078(c) | | | 6,020,000 | | | | 6,194,249 | |
Series 20-A, 5.75%, 07/15/2080(c) | | | 7,100,000 | | | | 7,486,147 | |
Energy Transfer Operating L.P. | | | | | | | | |
Series A, 6.25%(c)(d) | | | 6,745,000 | | | | 4,926,852 | |
Series G, 7.13%(c)(d) | | | 7,900,000 | | | | 6,905,785 | |
Enterprise Products Operating LLC | | | | | | | | |
5.38%, 02/15/2078(c) | | | 4,951,000 | | | | 4,521,525 | |
Series D, 4.88%, 08/16/2077(c) | | | 4,985,000 | | | | 4,409,257 | |
Series E, 5.25%, 08/16/2077(c) | | | 7,089,000 | | | | 6,817,810 | |
Plains All American Pipeline L.P., Series B, 6.13%(c)(d) | | | 5,628,000 | | | | 3,945,273 | |
TransCanada PipeLines Ltd. (Canada), 2.49% (3 mo. USD LIBOR + 2.21%), 05/15/2067(e) | | | 7,358,000 | | | | 5,270,704 | |
Transcanada Trust (Canada) | | | | | | | | |
5.63%, 05/20/2075(c) | | | 5,450,000 | | | | 5,661,603 | |
5.30%, 03/15/2077(c) | | | 10,605,000 | | | | 10,858,937 | |
5.50%, 09/15/2079(c) | | | 7,675,000 | | | | 8,187,268 | |
Series 16-A, 5.88%, 08/15/2076(c) | | | 8,472,000 | | | | 9,265,775 | |
| | | | | | | | |
| | | | | | | 129,497,634 | |
| | | | | | | | |
Trading Companies & Distributors-0.29% | |
AerCap Holdings N.V. (Ireland), 5.88%, 10/10/2079(c) | | | 5,218,000 | | | | 4,222,953 | |
| | | | | | | | |
Wireless Telecommunication Services-1.16% | |
Vodafone Group PLC (United Kingdom), 7.00%,
04/04/2079(c) | | | 14,215,000 | | | | 17,114,117 | |
| | | | | | | | |
Total U.S. Dollar Denominated Bonds & Notes
(Cost $1,072,588,206) | | | | 1,070,054,861 | |
| | | | | | | | |
| | |
| | | Shares | | | | |
Preferred Stocks-26.34% | |
Banks-8.14% | | | | | | | | |
Banco Santander S.A., Series 6, Pfd., (3 mo. USD LIBOR + 0.52%), 4.00% (Spain)(b)(e) | | | 101,525 | | | | 2,341,166 | |
| | | | | | | | |
| | | Shares | | | Value | |
Banks-(continued) | | | | | | | | |
Bank of America Corp. | | | | | | | | |
Series 2, Pfd., (3 mo. USD LIBOR + 0.65%), 3.00%(e) | | | 85,783 | | | $ | 1,831,467 | |
Series 4, Pfd., (3 mo. USD LIBOR + 0.75%), 4.00%(b)(e) | | | 61,004 | | | | 1,510,459 | |
Series 5, Pfd., (3 mo. USD LIBOR + 0.50%), 4.00%(e) | | | 120,682 | | | | 2,937,400 | |
Series E, Pfd., (3 mo. USD LIBOR + 0.35%), 4.00%(b)(e) | | | 91,104 | | | | 2,259,379 | |
Series K, Pfd., 6.45%(b)(c) | | | 302,269 | | | | 8,067,560 | |
Citigroup, Inc. | | | | | | | | |
Series K, Pfd., 6.88%(b)(c) | | | 430,166 | | | | 12,165,094 | |
Series J, Pfd., 7.13%(c) | | | 273,813 | | | | 7,825,576 | |
Citizens Financial Group, Inc., Series D, Pfd., 6.35%(b)(c) | | | 86,601 | | | | 2,333,031 | |
F.N.B. Corp., Pfd., 7.25%(c) | | | 32,056 | | | | 923,213 | |
Fifth Third Bancorp, Series I, Pfd., 6.63%(b)(c) | | | 128,977 | | | | 3,630,703 | |
First Horizon National Corp., Series D, Pfd., 6.10%(c) | | | 29,206 | | | | 778,340 | |
Heartland Financial USA, Inc., Series E, Pfd., 7.00%(b)(c) | | | 33,112 | | | | 888,726 | |
KeyCorp, Series E, Pfd., 6.13%(c) | | | 144,307 | | | | 4,291,690 | |
People’s United Financial, Inc., Series A, Pfd., 5.63%(c) | | | 70,797 | | | | 1,883,200 | |
PNC Financial Services Group, Inc. (The), Series P, Pfd., 6.13%(c) | | | 431,593 | | | | 11,454,478 | |
Regions Financial Corp. | | | | | | | | |
Series C, Pfd., 5.70%(c) | | | 143,154 | | | | 3,886,631 | |
Series B, Pfd., 6.38%(b)(c) | | | 144,394 | | | | 3,978,055 | |
Synovus Financial Corp. | | | | | | | | |
Series E, Pfd., 5.88%(c) | | | 100,485 | | | | 2,509,110 | |
Series D, Pfd., 6.30%(c) | | | 57,656 | | | | 1,500,786 | |
Truist Financial Corp., Series I, Pfd., (3 mo. USD LIBOR + 0.53%), 4.00%(b)(e) | | | 47,903 | | | | 1,207,156 | |
U.S. Bancorp | | | | | | | | |
Series B, Pfd., (3 mo. USD LIBOR + 0.60%), 3.50%(e) | | | 291,210 | | | | 6,429,917 | |
Series F, Pfd., 6.50%(c) | | | 322,881 | | | | 8,695,185 | |
Valley National Bancorp | | | | | | | | |
Series B, Pfd., 5.50%(c) | | | 29,300 | | | | 715,213 | |
Series A, Pfd., 6.25%(c) | | | 32,567 | | | | 908,294 | |
Wells Fargo & Co. | | | | | | | | |
Series Q, Pfd., 5.85%(c) | | | 496,767 | | | | 12,960,651 | |
Series R, Pfd., 6.63%(c) | | | 242,482 | | | | 6,685,229 | |
WesBanco, Inc., Series A, Pfd., 6.75%(b)(c) | | | 40,000 | | | | 1,052,000 | |
Wintrust Financial Corp. | | | | | | | | |
Series D, Pfd., 6.50%(c) | | | 35,808 | | | | 932,440 | |
Series E, Pfd., 6.88%(c) | | | 82,214 | | | | 2,186,070 | |
Zions Bancorporation N.A., Series G, Pfd., 6.30%(c) | | | 39,722 | | | | 1,074,480 | |
| | | | | | | | |
| | | | | | | 119,842,699 | |
| | | | | | | | |
See accompanying Notes to Financial Statements which are an integral part of the financial statements.
Invesco Variable Rate Preferred ETF (VRP)—(continued)
August 31, 2020
| | | | | | | | |
| | | Shares | | | Value | |
Capital Markets-5.19% | | | | | |
Goldman Sachs Group, Inc. (The) | | | | | | | | |
Series A, Pfd., (3 mo. USD LIBOR + 0.75%), 3.75%(e) | | | 216,295 | | | $ | 4,827,704 | |
Series C, Pfd., (3 mo. USD LIBOR + 0.75%), 4.00%(b)(e) | | | 57,307 | | | | 1,366,772 | |
Series D, Pfd., (3 mo. USD LIBOR + 0.67%), 4.00%(e) | | | 389,738 | | | | 9,065,306 | |
Series J, Pfd., 5.50%(c) | | | 287,005 | | | | 7,772,095 | |
Series K, Pfd., 6.38%(c) | | | 203,001 | | | | 5,659,668 | |
Morgan Stanley | | | | | | | | |
Series A, Pfd., (3 mo. USD LIBOR + 0.70%), 4.00%(e) | | | 317,292 | | | | 7,402,422 | |
Series K, Pfd., 5.85%(c) | | | 289,441 | | | | 8,173,814 | |
Series I, Pfd., 6.38%(b)(c) | | | 287,584 | | | | 8,112,745 | |
Series F, Pfd., 6.88%(c) | | | 245,701 | | | | 6,931,225 | |
Series E, Pfd., 7.13%(b)(c) | | | 248,867 | | | | 7,177,324 | |
State Street Corp. | | | | | | | | |
Series G, Pfd., 5.35%(c) | | | 143,974 | | | | 3,999,598 | |
Series D, Pfd., 5.90%(c) | | | 214,548 | | | | 5,908,652 | |
| | | | | | | | |
| | | | | | | 76,397,325 | |
| | | | | | | | |
Consumer Finance-1.28% | |
GMAC Capital Trust I, Series 2, Pfd., (3 mo. USD LIBOR + 5.79%), 6.07%(e) | | | 769,177 | | | | 18,867,912 | |
| | | | | | | | |
Diversified Financial Services-1.40% | |
Citigroup Capital XIII, Pfd., (3 mo. USD LIBOR + 6.37%), 6.64%(e) | | | 647,840 | | | | 17,459,288 | |
Compass Diversified Holdings, Series B, Pfd., 7.88%(c) | | | 28,669 | | | | 671,715 | |
Voya Financial, Inc., Series B, Pfd., 5.35%(c) | | | 86,883 | | | | 2,446,625 | |
| | | | | | | | |
| | | | | | | 20,577,628 | |
| | | | | | | | |
Electric Utilities-0.41% | | | | | | | | |
SCE Trust III, Series H, Pfd.,
5.75%(c) | | | 79,713 | | | | 1,831,805 | |
SCE Trust IV, Series J, Pfd.,
5.38%(b)(c) | | | 94,477 | | | | 2,174,860 | |
SCE Trust V, Series K, Pfd.,
5.45%(c) | | | 86,720 | | | | 2,012,771 | |
| | | | | | | | |
| | | | | | | 6,019,436 | |
| | | | | | | | |
Food Products-0.47% | | | | | | | | |
CHS, Inc. | | | | | | | | |
Series 3, Pfd., 6.75%(c) | | | 142,264 | | | | 3,748,656 | |
Series 2, Pfd., 7.10%(c) | | | 121,125 | | | | 3,249,784 | |
| | | | | | | | |
| | | | | | | 6,998,440 | |
| | | | | | | | |
Insurance-2.94% | | | | | | | | |
Aegon N.V., Series 1, Pfd., (3 mo. USD LIBOR + 0.88%), 4.00% (Netherlands)(b)(e) | | | 72,144 | | | | 1,792,057 | |
Allstate Corp. (The), Pfd., 5.10%(c) | | | 144,705 | | | | 3,892,565 | |
American Equity Investment Life Holding Co. | �� | | | | | | | |
Series A, Pfd., 5.95%(b)(c) | | | 114,718 | | | | 2,742,907 | |
Series B, Pfd., 6.63%(c) | | | 82,920 | | | | 2,113,631 | |
Argo Group International Holdings Ltd., Pfd., 7.00%(c) | | | 43,146 | | | | 1,099,792 | |
Aspen Insurance Holdings Ltd., Pfd., 5.95% (Bermuda)(c) | | | 78,877 | | | | 1,956,150 | |
Athene Holding Ltd. | | | | | | | | |
Series A, Pfd., 6.35%(c) | | | 249,450 | | | | 6,652,831 | |
Series C, Pfd., 6.38%(c) | | | 171,988 | | | | 4,655,715 | |
| | | | | | | | |
| | | Shares | | | Value | |
Insurance-(continued) | |
Enstar Group Ltd., Series D, Pfd., 7.00% (Bermuda)(c) | | | 114,819 | | | $ | 3,064,519 | |
Hartford Financial Services Group, Inc. (The), Pfd., 7.88%(c) | | | 172,204 | | | | 4,849,265 | |
MetLife, Inc., Series A, Pfd., (3 mo. USD LIBOR + 1.00%), 4.00%(b)(e) | | | 171,962 | | | | 4,266,377 | |
Reinsurance Group of America, Inc. | | | | | | | | |
Pfd., 5.75%(c) | | | 115,263 | | | | 3,151,290 | |
Pfd., 6.20%(c) | | | 115,311 | | | | 3,103,019 | |
| | | | | | | | |
| | | | | | | 43,340,118 | |
| | | | | | | | |
Marine-0.07% | | | | | | | | |
Atlas Corp., Series I, Pfd., 8.00% (Canada)(c) | | | 42,698 | | | | 981,627 | |
| | | | | | | | |
Mortgage REITs-2.83% | |
AG Mortgage Investment Trust, Inc., Series C, Pfd., 8.00%(c) | | | 32,872 | | | | 478,288 | |
AGNC Investment Corp. | | | | | | | | |
Series F, Pfd., 6.13%(c) | | | 164,753 | | | | 3,711,885 | |
Series E, Pfd., 6.50%(c) | | | 115,443 | | | | 2,689,822 | |
Series D, Pfd., 6.88%(c) | | | 67,063 | | | | 1,591,405 | |
Series C, Pfd., 7.00%(b)(c) | | | 93,124 | | | | 2,279,676 | |
Annaly Capital Management, Inc. | | | | | | | | |
Series G, Pfd., 6.50%(c) | | | 121,998 | | | | 2,642,477 | |
Series I, Pfd., 6.75%(b)(c) | | | 126,566 | | | | 2,971,770 | |
Series F, Pfd., 6.95%(b)(c) | | | 206,362 | | | | 4,760,771 | |
Chimera Investment Corp. | | | | | | | | |
Series C, Pfd., 7.75%(c) | | | 74,512 | | | | 1,534,947 | |
Series B, Pfd., 8.00%(c) | | | 93,319 | | | | 2,021,290 | |
Series D, Pfd., 8.00%(c) | | | 57,828 | | | | 1,237,519 | |
Dynex Capital, Inc., Series C, Pfd., 6.90%(c) | | | 32,012 | | | | 727,953 | |
Ellington Financial, Inc., Pfd., 6.75%(c) | | | 32,302 | | | | 700,630 | |
Exantas Capital Corp., Pfd., 8.63%(c) | | | 33,234 | | | | 500,836 | |
MFA Financial, Inc., Series C, Pfd., 6.50%(c) | | | 11,820 | | | | 227,062 | |
New Residential Investment Corp. | | | | | | | | |
Series C, Pfd., 6.38%(b)(c) | | | 116,031 | | | | 2,296,254 | |
Series B, Pfd., 7.13%(b)(c) | | | 80,097 | | | | 1,749,318 | |
Series A, Pfd., 7.50%(c) | | | 44,448 | | | | 1,033,860 | |
New York Mortgage Trust, Inc. | | | | | | | | |
Series E, Pfd., 7.88%(c) | | | 49,603 | | | | 1,028,766 | |
Series D, Pfd., 8.00%(c) | | | 38,487 | | | | 812,076 | |
PennyMac Mortgage Investment Trust | | | | | | | | |
Series B, Pfd., 8.00%(c) | | | 55,823 | | | | 1,380,503 | |
Series A, Pfd., 8.13%(c) | | | 32,774 | | | | 817,711 | |
Two Harbors Investment Corp. | | | | | | | | |
Series C, Pfd., 7.25%(c) | | | 84,716 | | | | 1,780,730 | |
Series B, Pfd., 7.63%(b)(c) | | | 82,073 | | | | 1,809,710 | |
Series A, Pfd., 8.13%(c) | | | 41,317 | | | | 946,986 | |
| | | | | | | | |
| | | | | | | 41,732,245 | |
| | | | | | | | |
Multi-Utilities-0.81% | |
Algonquin Power & Utilities Corp. | | | | | | | | |
Series 19-A, Pfd., 6.20%
(Canada)(c) | | | 100,397 | | | | 2,754,894 | |
Pfd., 6.88% (Canada)(c) | | | 82,809 | | | | 2,291,325 | |
Integrys Holding, Inc., Pfd., 6.00%(c) | | | 112,550 | | | | 3,057,984 | |
NiSource, Inc., Series B, Pfd.,
6.50%(c) | | | 143,459 | | | | 3,910,692 | |
| | | | | | | | |
| | | | | | | 12,014,895 | |
| | | | | | | | |
See accompanying Notes to Financial Statements which are an integral part of the financial statements.
Invesco Variable Rate Preferred ETF (VRP)—(continued)
August 31, 2020
| | | | | | | | |
| | | Shares | | | Value | |
Oil, Gas & Consumable Fuels-2.01% | |
Altera Infrastructure L.P., Series E, Pfd., 8.88%(c) | | | 33,927 | | | $ | 573,366 | |
DCP Midstream L.P. | | | | | | | | |
Series B, Pfd., 7.88%(c) | | | 45,941 | | | | 852,206 | |
Series C, Pfd., 7.95%(c) | | | 31,283 | | | | 591,249 | |
Enbridge, Inc., Series B, Pfd., 6.38% (Canada)(c) | | | 172,864 | | | | 4,463,348 | |
Energy Transfer Operating L.P. | | | | | | | | |
Series C, Pfd., 7.38%(c) | | | 129,244 | | | | 2,617,191 | |
Series E, Pfd., 7.60%(c) | | | 228,045 | | | | 4,868,761 | |
Series D, Pfd., 7.63%(c) | | | 127,288 | | | | 2,573,763 | |
GasLog Partners L.P. | | | | | | | | |
Series B, Pfd., 8.20% (Greece)(c) | | | 32,734 | | | | 518,834 | |
Series C, Pfd., 8.50% (Greece)(c) | | | 28,464 | | | | 468,233 | |
Series A, Pfd., 8.63% (Greece)(c) | | | 40,811 | | | | 701,945 | |
NGL Energy Partners L.P., Series B, Pfd., 9.00%(c) | | | 94,247 | | | | 1,314,746 | |
NuStar Energy L.P. | | | | | | | | |
Series B, Pfd., 7.63%(c) | | | 109,077 | | | | 1,860,854 | |
Series A, Pfd., 8.50%(c) | | | 63,568 | | | | 1,200,799 | |
Series C, Pfd., 9.00%(c) | | | 49,405 | | | | 995,017 | |
NuStar Logistics L.P., Pfd., (3 mo. USD LIBOR + 6.73%), 7.01%(b)(e) | | | 114,567 | | | | 2,354,352 | |
Targa Resources Partners L.P., Series A, Pfd., 9.00%(c) | | | 35,398 | | | | 865,481 | |
Teekay LNG Partners L.P., Series B, Pfd., 8.50% (Bermuda)(c) | | | 49,836 | | | | 1,186,097 | |
Tsakos Energy Navigation Ltd. | | | | | | | | |
Series E, Pfd., 9.25% (Greece)(c) | | | 33,351 | | | | 667,020 | |
Series F, Pfd., 9.50% (Greece)(c) | | | 43,445 | | | | 874,982 | |
| | | | | | | | |
| | | | | | | 29,548,244 | |
| | | | | | | | |
Thrifts & Mortgage Finance-0.33% | |
Merchants Bancorp, Series B, Pfd., 6.00%(b)(c) | | | 35,742 | | | | 891,763 | |
New York Community Bancorp, Inc., Series A, Pfd., 6.38%(c) | | | 148,493 | | | | 4,021,190 | |
| | | | | | | | |
| | | | | | | 4,912,953 | |
| | | | | | | | |
| | | | | | | | |
| | | Shares | | | Value | |
Trading Companies & Distributors-0.46% | |
Air Lease Corp., Series A, Pfd.,
6.15%(b)(c) | | | 71,919 | | | $ | 1,685,781 | |
Fortress Transportation & Infrastructure Investors LLC, Series B, Pfd.,
8.00%(c) | | | 32,924 | | | | 617,654 | |
WESCO International, Inc., Series A, Pfd., 10.63%(c) | | | 159,998 | | | | 4,443,145 | |
| | | | | | | | |
| | | | | | | 6,746,580 | |
| | | | | | | | |
Total Preferred Stocks
(Cost $407,840,178) | | | | | | | 387,980,102 | |
| | | | | | | | |
TOTAL INVESTMENTS IN SECURITIES
(excluding investments purchased with cash collateral from securities on loan)-99.00%
(Cost $1,480,428,384) | | | | 1,458,034,963 | |
| | | | | | | | |
| |
| Investments Purchased with Cash Collateral from Securities on Loan | | | | | |
|
Money Market Funds-2.36% | |
Invesco Private Government Fund, 0.03%(f)(g)(h) | | | 26,063,360 | | | | 26,063,360 | |
Invesco Private Prime Fund,
0.14%(f)(g)(h) | | | 8,686,264 | | | | 8,688,001 | |
| | | | | | | | |
Total Investments Purchased with Cash Collateral from Securities on Loan
(Cost $34,751,362) | | | | 34,751,361 | |
| | | | | | | | |
TOTAL INVESTMENTS IN SECURITIES-101.36%
(Cost $1,515,179,746) | | | | 1,492,786,324 | |
OTHER ASSETS LESS LIABILITIES-(1.36)% | | | | (19,978,880 | ) |
| | | | | | | | |
| | |
NET ASSETS-100.00% | | | | | | $ | 1,472,807,444 | |
| | | | | | | | |
| | |
| Investment Abbreviations: |
| LIBOR | | -London Interbank Offered Rate |
| Pfd. | | -Preferred |
| REIT | | -Real Estate Investment Trust |
| USD | | -U.S. Dollar |
See accompanying Notes to Financial Statements which are an integral part of the financial statements.
Invesco Variable Rate Preferred ETF (VRP)—(continued)
August 31, 2020
Notes to Schedule of Investments:
| (a) | Industry and/or sector classifications used in this report are generally according to the Global Industry Classification Standard, which was developed by and is the exclusive property and a service mark of MSCI Inc. and Standard & Poor’s. |
| (b) | All or a portion of this security was out on loan at August 31, 2020. |
| (c) | Security issued at a fixed rate for a specific period of time, after which it will convert to a variable rate. |
| (d) | Perpetual bond with no specified maturity date. |
| (e) | Interest or dividend rate is redetermined periodically. Rate shown is the rate in effect on August 31, 2020. |
| (f) | Affiliated issuer. The issuer and/or the Fund is a wholly-owned subsidiary of Invesco Ltd., or is affiliated by having an investment adviser that is under common control of Invesco Ltd. The table below shows the Fund’s transactions in, and earnings from, its investments in affiliates for the fiscal year ended August 31, 2020. |
| | | | | | | | | | | | | | | | | | | | | | | | | | | | | | | | | | | |
| | | Value
August 31, 2019 | | Purchases
at Cost | | Proceeds
from Sales | | Change in
Unrealized
Appreciation
(Depreciation) | | Realized
Gain
(Loss) | | Value
August 31, 2020 | | Dividend
Income |
| Investments in Affiliated Money Market Funds: | | | | | | | | | | | | | | | | | | | | | | | | | | | | | | | | | | | |
| Invesco Premier U.S. Government Money Portfolio, Institutional Class | | | $ | - | | | | $ | 166,680,518 | | | | $ | (166,680,518 | ) | | | $ | - | | | | $ | - | | | | $ | - | | | | $ | 50,785 | |
| Investments Purchased with Cash Collateral from Securities on Loan: | | | | | | | | | | | | | | | | | | | | | | | | | | | | | | | | | | | |
| Invesco Government & Agency Portfolio, Institutional Class | | | | 31,744,202 | | | | | 189,278,585 | | | | | (221,022,787 | ) | | | | - | | | | | - | | | | | - | | | | | 335,128 | * |
| Invesco Liquid Assets Portfolio, Institutional Class | | | | 10,598,241 | | | | | 54,944,895 | | | | | (65,536,582 | ) | | | | (47 | ) | | | | (6,507 | ) | | | | - | | | | | 126,096 | * |
| Invesco Private Government Fund | | | | - | | | | | 194,632,600 | | | | | (168,569,240 | ) | | | | - | | | | | - | | | | | 26,063,360 | | | | | 4,251 | * |
| Invesco Private Prime Fund | | | | - | | | | | 26,954,603 | | | | | (18,267,576 | ) | | | | (1 | ) | | | | 975 | | | | | 8,688,001 | | | | | 2,724 | * |
| | | | | | | | | | | | | | | | | | | | | | | | | | | | | | | | | | | |
Total | | | $ | 42,342,443 | | | | $ | 632,491,201 | | | | $ | (640,076,703 | ) | | | $ | (48 | ) | | | $ | (5,532 | ) | | | $ | 34,751,361 | | | | $ | 518,984 | |
| | | | | | | | | | | | | | | | | | | | | | | | | | | | | | | | | | | |
| * | Represents the income earned on the investment of cash collateral, which is included in securities lending income on the Statements of Operations. Does not include rebates and fees paid to lending agent or premiums received from borrowers, if any. |
| (g) | The rate shown is the 7-day SEC standardized yield as of August 31, 2020. |
| (h) | The security has been segregated to satisfy the commitment to return the cash collateral received in securities lending transactions upon the borrower’s return of the securities loaned. See Note 2J. |
See accompanying Notes to Financial Statements which are an integral part of the financial statements.
Invesco VRDO Tax-Free Weekly ETF (PVI)
August 31, 2020
Schedule of Investments
| | | | | | | | | | | | | | | | |
| | | Interest
Rate | | | Maturity
Date | | | Principal
Amount
(000) | | | Value | |
Municipal Obligations-96.81% | | | | | | | | | | | | | | | | |
Arizona-5.32% | | | | | | | | | | | | | | | | |
Arizona (State of) Health Facilities Authority (Banner Health), Series 2008 F, VRD RB, (LOC - JPMorgan Chase Bank, N.A.)(a)(b) | | | 0.07 | % | | | 01/01/2029 | | | $ | 150 | | | $ | 150,000 | |
Arizona (State of) Health Facilities Authority (Catholic Healthcare West Loan Program), Series 2005 B, VRD RB, (LOC - JPMorgan Chase Bank, N.A.)(a)(b) | | | 0.10 | % | | | 07/01/2035 | | | | 2,500 | | | | 2,500,000 | |
| | | | | | | | | | | | | | | | |
| | | | | | | | | | | | | | | 2,650,000 | |
| | | | | | | | | | | | | | | | |
California-5.01% | | | | | | | | | | | | | | | | |
Bay Area Toll Authority, Series 2007 G1, VRD RB, (LOC - Bank of America
N.A.)(a)(b) | | | 0.04 | % | | | 04/01/2047 | | | | 1,000 | | | | 1,000,000 | |
Los Angeles (City of), CA Department of Water, Series 2001 B-1, VRD RB(a) | | | 0.03 | % | | | 07/01/2035 | | | | 1,500 | | | | 1,500,000 | |
| | | | | | | | | | | | | | | | |
| | | | | | | | | | | | | | | 2,500,000 | |
| | | | | | | | | | | | | | | | |
Colorado-4.61% | | | | | | | | | | | | | | | | |
Colorado Springs (City of), CO, Series 2006 B, VRD RB(a) | | | 0.11 | % | | | 11/01/2036 | | | | 2,300 | | | | 2,300,000 | |
| | | | | | | | | | | | | | | | |
Florida-6.02% | | | | | | | | | | | | | | | | |
Florida Keys Aqueduct Authority, Series 2008, Ref. VRD RB, (LOC - TD Bank,
N.A.)(a)(b) | | | 0.09 | % | | | 09/01/2035 | | | | 1,500 | | | | 1,500,000 | |
West Palm Beach (City of), FL, Series 2008 C, VRD RB, (INS - AGC)(a)(c) | | | 0.11 | % | | | 10/01/2038 | | | | 1,500 | | | | 1,500,000 | |
| | | | | | | | | | | | | | | | |
| | | | | | | | | | | | | | | 3,000,000 | |
| | | | | | | | | | | | | | | | |
Indiana-5.01% | | | | | | | | | | | | | | | | |
Indianapolis (City of), IN, Series 2008, VRD RB, (LOC - Fannie Mae)(a)(b) | | | 0.06 | % | | | 05/15/2038 | | | | 2,500 | | | | 2,500,000 | |
| | | | | | | | | | | | | | | | |
Louisiana-4.61% | | | | | | | | | | | | | | | | |
Louisiana (State of) Offshore Terminal Authority Deepwater Port (Loop LLC), Series 2013 B, Ref. VRD RB, (LOC - JPMorgan Chase Bank, N.A.)(a)(b) | | | 0.10 | % | | | 09/01/2033 | | | | 2,000 | | | | 2,000,000 | |
Louisiana (State of) Public Facilities Authority (CHRISTUS Health), Series 2009 B2, Ref. VRD RB, (LOC - Bank of New York Mellon)(a)(b) | | | 0.08 | % | | | 07/01/2047 | | | | 300 | | | | 300,000 | |
| | | | | | | | | | | | | | | | |
| | | | | | | | | | | | | | | 2,300,000 | |
| | | | | | | | | | | | | | | | |
Maryland-4.41% | | | | | | | | | | | | | | | | |
Washington (State of) Suburban Sanitary District, Series 2015 A-2, VRD GO BAN(a) | | | 0.09 | % | | | 06/01/2023 | | | | 2,200 | | | | 2,200,000 | |
| | | | | | | | | | | | | | | | |
Massachusetts-9.63% | | | | | | | | | | | | | | | | |
Massachusetts (State of) Health & Educational Facilities Authority (Partners Healthcare), Series 1997 P1, VRD RB(a) | | | 0.09 | % | | | 07/01/2027 | | | | 2,500 | | | | 2,500,000 | |
University of Massachusetts Building Authority, Series 2008 1, VRD RB(a) | | | 0.08 | % | | | 05/01/2038 | | | | 2,300 | | | | 2,300,000 | |
| | | | | | | | | | | | | | | | |
| | | | | | | | | | | | | | | 4,800,000 | |
| | | | | | | | | | | | | | | | |
Michigan-3.01% | | | | | | | | | | | | | | | | |
Michigan (State of) Building Authority (Facilities Program), Series 2007, Ref. VRD RB, (LOC - Citibank N.A.)(a)(b) | | | 0.10 | % | | | 10/15/2042 | | | | 1,500 | | | | 1,500,000 | |
| | | | | | | | | | | | | | | | |
Missouri-5.42% | | | | | | | | | | | | | | | | |
Kansas City (City of), MO (H Roe Bartle), Series 2008 F, Ref. VRD RB, (LOC - Sumitomo Mitsui Banking)(a)(b) | | | 0.09 | % | | | 04/15/2025 | | | | 300 | | | | 300,000 | |
Missouri (State of) Health & Educational Facilities Authority (BJC Health System), Series 2008 C, VRD RB(a) | | | 0.07 | % | | | 05/15/2038 | | | | 2,400 | | | | 2,400,000 | |
| | | | | | | | | | | | | | | | |
| | | | | | | | | | | | | | | 2,700,000 | |
| | | | | | | | | | | | | | | | |
Nevada-5.01% | | | | | | | | | | | | | | | | |
Clark (County of), NV Department of Aviation, Series 2008 D-3, VRD RB, (LOC - Bank of America N.A.)(a)(b) | | | 0.09 | % | | | 07/01/2029 | | | | 2,500 | | | | 2,500,000 | |
| | | | | | | | | | | | | | | | |
New York-16.95% | | | | | | | | | | | | | | | | |
Battery Park (City of), NY Authority, Series 2019 D-1, Ref. VRD RB(a) | | | 0.07 | % | | | 11/01/2038 | | | | 1,500 | | | | 1,500,000 | |
Build NYC Resource Corp., Series 2015, Ref. VRD RB, (LOC - TD Bank, N.A.)(a)(b) | | | 0.09 | % | | | 04/01/2045 | | | | 2,500 | | | | 2,500,000 | |
Nassau (County of), NY Interim Finance Authority, Series 2008 B, VRD RB(a) | | | 0.07 | % | | | 11/15/2021 | | | | 1,600 | | | | 1,600,000 | |
See accompanying Notes to Financial Statements which are an integral part of the financial statements.
Invesco VRDO Tax-Free Weekly ETF (PVI)–(continued)
August 31, 2020
| | | | | | | | | | | | | | | | |
| | | Interest
Rate | | | Maturity
Date | | | Principal
Amount
(000) | | | Value | |
New York-(continued) | | | | | | | | | | | | | | | | |
New York (State of) Housing Finance Agency (222 East 44th Street Housing), Series 2015 A, VRD RB, (LOC - Bank of China Ltd.)(a)(b) | | | 0.10 | % | | | 05/01/2050 | | | $ | 1,450 | | | $ | 1,450,000 | |
New York State Urban Development Corp., Series 2008 A-1, Ref. VRD RB, (LOC - Wells Fargo Bank N.A.)(a)(b) | | | 0.08 | % | | | 01/01/2030 | | | | 1,400 | | | | 1,400,000 | |
| | | | | | | | | | | | | | | | |
| | | | | | | | | | | | | | | 8,450,000 | |
| | | | | | | | | | | | | | | | |
North Carolina-0.20% | | | | | | | | | | | | | | | | |
Charlotte (City of), NC, Series 2006 B, VRD RB(a) | | | 0.08 | % | | | 07/01/2036 | | | | 100 | | | | 100,000 | |
| | | | | | | | | | | | | | | | |
Ohio-5.02% | | | | | | | | | | | | | | | | |
Franklin (County of), OH (OhioHealth Corp.), Series 2009 A, Ref. VRD RB(a) | | | 0.08 | % | | | 11/15/2041 | | | | 2,500 | | | | 2,500,000 | |
| | | | | | | | | | | | | | | | |
Pennsylvania-4.01% | | | | | | | | | | | | | | | | |
General Authority of Southcentral Pennsylvania (WellSpan Health Obligated Group), Series 2019 D, Ref. VRD RB(a) | | | 0.14 | % | | | 06/01/2037 | | | | 2,000 | | | | 2,000,000 | |
| | | | | | | | | | | | | | | | |
Tennessee-2.34% | | | | | | | | | | | | | | | | |
Sevier (County of), TN Public Building Authority, Series 2010 D-1, VRD RB, (LOC - Bank of America N.A.)(a)(b) | | | 0.11 | % | | | 06/01/2026 | | | | 1,165 | | | | 1,165,000 | |
| | | | | | | | | | | | | | | | |
Texas-6.42% | | | | | | | | | | | | | | | | |
Houston (City of), TX, Series 2010, Ref. VRD RB, (LOC - Barclays Bank PLC)(a)(b) | | | 0.10 | % | | | 07/01/2030 | | | | 2,500 | | | | 2,500,000 | |
University of Texas System Board of Regents, Series 2008 B, VRD RB(a) | | | 0.06 | % | | | 08/01/2025 | | | | 700 | | | | 700,000 | |
| | | | | | | | | | | | | | | | |
| | | | | | | | | | | | | | | 3,200,000 | |
| | | | | | | | | | | | | | | | |
Washington-3.81% | | | | | | | | | | | | | | | | |
Washington (State of) Higher Education Facilities Authority (Whitman College), Series 2004, VRD Ref. RB(a) | | | 0.10 | % | | | 10/01/2029 | | | | 1,900 | | | | 1,900,000 | |
| | | | | | | | | | | | | | | | |
TOTAL INVESTMENTS IN SECURITIES(d)-96.81%
(Cost $48,265,000) | | | | | | | | | | | | | | | 48,265,000 | |
OTHER ASSETS LESS LIABILITIES-3.19% | | | | | | | | | | | | | | | 1,590,428 | |
| | | | | | | | | | | | | | | | |
NET ASSETS-100.00% | | | | | | | | | | | | | | $ | 49,855,428 | |
| | | | | | | | | | | | | | | | |
Investment Abbreviations:
AGC -Assured Guaranty Corp.
BAN -Bond Anticipation Notes
GO -General Obligation
INS -Insurer
LOC -Letter of Credit
RB -Revenue Bonds
Ref. -Refunding
VRD -Variable Rate Demand
Notes to Schedule of Investments:
| (a) | Demand security payable upon demand by the Fund at specified time intervals no greater than thirteen months. Interest rate is redetermined periodically by the issuer or agent based on current market conditions. Rate shown is the rate in effect on August 31, 2020. |
| (b) | Principal and interest payments are fully enhanced by a letter of credit from the bank listed or a predecessor bank, branch or subsidiary. |
| (c) | Principal and/or interest payments are secured by the bond insurance company listed. |
| (d) | This table provides a listing of those entities that have either issued, guaranteed, backed or otherwise enhanced the credit quality of more than 5% of the securities held in the portfolio. In instances where the entity has guaranteed, backed or otherwise enhanced the credit quality of a security, it is not primarily responsible for the issuer’s obligations but may be called upon to satisfy the issuer’s obligations. |
| | | | |
| Entities | | Percentage | |
Bank of America N.A | | | 9.67% | |
JPMorgan Chase Bank, N.A | | | 9.63% | |
TD Bank, N.A | | | 8.29% | |
Barclays Bank PLC | | | 5.18% | |
Fannie Mae | | | 5.18% | |
See accompanying Notes to Financial Statements which are an integral part of the financial statements.
Statements of Assets and Liabilities
August 31, 2020
| | | | | | | | | | | | | | | | | | | | | | | | | |
| | | Invesco
1-30 Laddered
Treasury
ETF (PLW) | | Invesco
California
AMT-Free
Municipal
Bond ETF
(PWZ) | | Invesco
CEF Income
Composite
ETF (PCEF) | | Invesco
Fundamental
High Yield®
Corporate Bond
ETF (PHB) | | Invesco
Fundamental
Investment
Grade Corporate
Bond ETF (PFIG) |
Assets: | | | | | | | | | | | | | | | | | | | | | | | | | |
Unaffiliated investments in securities, at value(a) | | | $ | 203,557,214 | | | | $ | 442,797,052 | | | | $ | 751,473,222 | | | | $ | 746,327,688 | | | | $ | 62,932,177 | |
Affiliated investments in securities, at value | | | | 115,706 | | | | | - | | | | | 17,685,863 | | | | | 26,362,944 | | | | | 824,220 | |
Cash | | | | - | | | | | 5,604,410 | | | | | - | | | | | - | | | | | - | |
Deposits with brokers: | | | | | | | | | | | | | | | | | | | | | | | | | |
Cash segregated as collateral | | | | 1,102,297 | | | | | - | | | | | - | | | | | - | | | | | - | |
Receivable for: | | | | | | | | | | | | | | | | | | | | | | | | | |
Dividends and interest | | | | 273,690 | | | | | 3,622,749 | | | | | 1,016,875 | | | | | 10,201,900 | | | | | 567,396 | |
Securities lending | | | | - | | | | | - | | | | | 122,812 | | | | | 5,714 | | | | | 198 | |
Investments sold. | | | | - | | | | | - | | | | | 4,176,897 | | | | | 2,573,438 | | | | | 2,229,091 | |
Fund shares sold. | | | | - | | | | | - | | | | | - | | | | | 7,560,284 | | | | | - | |
| | | | | | | | | | | | | | | | | | | | | | | | | |
Total assets | | | | 205,048,907 | | | | | 452,024,211 | | | | | 774,475,669 | | | | | 793,031,968 | | | | | 66,553,082 | |
| | | | | | | | | | | | | | | | | | | | | | | | | |
| | | | | |
Liabilities: | | | | | | | | | | | | | | | | | | | | | | | | | |
Due to custodian. | | | | - | | | | | - | | | | | 1,233,370 | | | | | 59,275 | | | | | - | |
Payable for: | | | | | | | | | | | | | | | | | | | | | | | | | |
Investments purchased | | | | - | | | | | - | | | | | - | | | | | 12,568,562 | | | | | 1,549,869 | |
Collateral upon return of securities loaned | | | | - | | | | | - | | | | | 12,630,770 | | | | | 22,277,047 | | | | | 591,372 | |
Collateral upon receipt of securities in-kind | | | | 1,102,297 | | | | | - | | | | | - | | | | | - | | | | | - | |
Fund shares repurchased | | | | - | | | | | - | | | | | 4,183,161 | | | | | - | | | | | 1,370,194 | |
Accrued unitary management fees | | | | 43,515 | | | | | 106,656 | | | | | 321,922 | | | | | 315,701 | | | | | 11,974 | |
Accrued expenses. | | | | - | | | | | - | | | | | - | | | | | 642 | | | | | - | |
| | | | | | | | | | | | | | | | | | | | | | | | | |
Total liabilities | | | | 1,145,812 | | | | | 106,656 | | | | | 18,369,223 | | | | | 35,221,227 | | | | | 3,523,409 | |
| | | | | | | | | | | | | | | | | | | | | | | | | |
Net Assets | | | $ | 203,903,095 | | | | $ | 451,917,555 | | | | $ | 756,106,446 | | | | $ | 757,810,741 | | | | $ | 63,029,673 | |
| | | | | | | | | | | | | | | | | | | | | | | | | |
| | | | | |
Net assets consist of: | | | | | | | | | | | | | | | | | | | | | | | | | |
Shares of beneficial interest | | | $ | 204,949,783 | | | | $ | 423,253,489 | | | | $ | 829,192,749 | | | | $ | 781,569,665 | | | | $ | 58,879,865 | |
Distributable earnings (loss) | | | | (1,046,688 | ) | | | | 28,664,066 | | | | | (73,086,303 | ) | | | | (23,758,924 | ) | | | | 4,149,808 | |
| | | | | | | | | | | | | | | | | | | | | | | | | |
Net Assets | | | $ | 203,903,095 | | | | $ | 451,917,555 | | | | $ | 756,106,446 | | | | $ | 757,810,741 | | | | $ | 63,029,673 | |
| | | | | | | | | | | | | | | | | | | | | | | | | |
Shares outstanding (unlimited amount authorized, $0.01 par value) | | | | 5,200,000 | | | | | 16,350,000 | | | | | 36,150,000 | | | | | 40,100,000 | | | | | 2,300,000 | |
Net asset value | | | $ | 39.21 | | | | $ | 27.64 | | | | $ | 20.92 | | | | $ | 18.90 | | | | $ | 27.40 | |
| | | | | | | | | | | | | | | | | | | | | | | | | |
Market price | | | $ | 39.14 | | | | $ | 27.58 | | | | $ | 20.91 | | | | $ | 18.89 | | | | $ | 27.39 | |
| | | | | | | | | | | | | | | | | | | | | | | | | |
Unaffiliated investments in securities, at cost | | | $ | 204,326,806 | | | | $ | 413,488,723 | | | | $ | 772,905,418 | | | | $ | 726,035,843 | | | | $ | 58,900,839 | |
| | | | | | | | | | | | | | | | | | | | | | | | | |
Affiliated investments in securities, at cost | | | $ | 115,706 | | | | $ | - | | | | $ | 17,676,748 | | | | $ | 26,362,944 | | | | $ | 824,220 | |
| | | | | | | | | | | | | | | | | | | | | | | | | |
(a) Includes securities on loan with an aggregate value of: | | | $ | - | | | | $ | - | | | | $ | 12,319,458 | | | | $ | 21,441,760 | | | | $ | 575,829 | |
| | | | | | | | | | | | | | | | | | | | | | | | | |
See accompanying Notes to Financial Statements which are an integral part of the financial statements.
| | | | | | | | | | | | | | | | | | | | | | | | | | | | | | | | | |
Invesco
National
AMT-Free
Municipal Bond
ETF (PZA) | | Invesco
New York
AMT-Free
Municipal Bond
ETF (PZT) | | Invesco
Preferred
ETF (PGX) | | Invesco
Taxable
Municipal
Bond ETF
(BAB) | | Invesco
Treasury
Collateral
ETF (CLTL) | | Invesco
Variable Rate
Preferred ETF
(VRP) | | Invesco
VRDO Tax-
Free Weekly
ETF (PVI) |
| | | | | | |
| | $ | 2,641,602,361 | | | | $ | 95,529,883 | | | | $ | 6,235,097,928 | | | | $ | 1,936,887,084 | | | | $ | 937,854,416 | | | | $ | 1,458,034,963 | | | | $ | 48,265,000 | |
| | | - | | | | | - | | | | | 62,351,311 | | | | | 90,139,484 | | | | | 221,238 | | | | | 34,751,361 | | | | | - | |
| | | | | | |
| | | 45,634,108 | | | | | 2,328,506 | | | | | - | | | | | - | | | | | - | | | | | - | | | | | 1,495,908 | |
| | | | | | |
| | | - | | | | | - | | | | | 6,639 | | | | | - | | | | | - | | | | | - | | | | | - | |
| | | 23,771,283 | | | | | 993,757 | | | | | 37,071,199 | | | | | 15,742,824 | | | | | 1,629,086 | | | | | 15,003,366 | | | | | 5,078 | |
| | | - | | | | | - | | | | | 257,203 | | | | | - | | | | | - | | | | | 70,271 | | | | | - | |
| | | - | | | | | - | | | | | 3,128,710 | | | | | - | | | | | 172,153,801 | | | | | 11,116,633 | | | | | 100,000 | |
| | | - | | | | | - | | | | | 60,194,673 | | | | | 11,679,286 | | | | | - | | | | | 2,498,170 | | | | | - | |
| | | | | | | | | | | | | | | | | | | | | | | | | | | | | | | | | | |
| | | 2,711,007,752 | | | | | 98,852,146 | | | | | 6,398,107,663 | | | | | 2,054,448,678 | | | | | 1,111,858,541 | | | | | 1,521,474,764 | | | | | 49,865,986 | |
| | | | | | | | | | | | | | | | | | | | | | | | | | | | | | | | | | |
| | | | | | |
| | | - | | | | | - | | | | | 6,668,422 | | | | | - | | | | | 2,204 | | | | | 3,391,391 | | | | | - | |
| | | 33,228,895 | | | | | - | | | | | 63,335,458 | | | | | 48,148,300 | | | | | 173,621,298 | | | | | 9,903,925 | | | | | - | |
| | | - | | | | | - | | | | | 62,351,312 | | | | | - | | | | | - | | | | | 34,751,362 | | | | | - | |
| | | - | | | | | - | | | | | 6,639 | | | | | - | | | | | - | | | | | - | | | | | - | |
| | | - | | | | | - | | | | | 2,232,331 | | | | | - | | | | | - | | | | | - | | | | | - | |
| | | 625,583 | | | | | 23,385 | | | | | 2,557,171 | | | | | 439,619 | | | | | 65,532 | | | | | 616,503 | | | | | 10,558 | |
| | | - | | | | | - | | | | | - | | | | | - | | | | | - | | | | | 4,139 | | | | | - | |
| | | | | | | | | | | | | | | | | | | | | | | | | | | | | | | | | | |
| | | 33,854,478 | | | | | 23,385 | | | | | 137,151,333 | | | | | 48,587,919 | | | | | 173,689,034 | | | | | 48,667,320 | | | | | 10,558 | |
| | | | | | | | | | | | | | | | | | | | | | | | | | | | | | | | | | |
| | $ | 2,677,153,274 | | | | $ | 98,828,761 | | | | $ | 6,260,956,330 | | | | $ | 2,005,860,759 | | | | $ | 938,169,507 | | | | $ | 1,472,807,444 | | | | $ | 49,855,428 | |
| | | | | | | | | | | | | | | | | | | | | | | | | | | | | | | | | | |
| | | | | | |
| | $ | 2,558,648,379 | | | | $ | 93,907,365 | | | | $ | 6,329,878,431 | | | | $ | 1,833,546,775 | | | | $ | 937,176,544 | | | | $ | 1,524,248,478 | | | | $ | 49,855,429 | |
| | | 118,504,895 | | | | | 4,921,396 | | | | | (68,922,101 | ) | | | | 172,313,984 | | | | | 992,963 | | | | | (51,441,034 | ) | | | | (1 | ) |
| | | | | | | | | | | | | | | | | | | | | | | | | | | | | | | | | | |
| | $ | 2,677,153,274 | | | | $ | 98,828,761 | | | | $ | 6,260,956,330 | | | | $ | 2,005,860,759 | | | | $ | 938,169,507 | | | | $ | 1,472,807,444 | | | | $ | 49,855,428 | |
| | | | | | | | | | | | | | | | | | | | | | | | | | | | | | | | | | |
| | | 100,100,000 | | | | | 3,850,000 | | | | | 421,300,000 | | | | | 60,050,000 | | | | | 8,870,001 | | | | | 59,000,000 | | | | | 2,000,000 | |
| | $ | 26.74 | | | | $ | 25.67 | | | | $ | 14.86 | | | | $ | 33.40 | | | | $ | 105.77 | | | | $ | 24.96 | | | | $ | 24.93 | |
| | | | | | | | | | | | | | | | | | | | | | | | | | | | | | | | | | |
| | $ | 26.73 | | | | $ | 25.73 | | | | $ | 14.91 | | | | $ | 33.41 | | | | $ | 105.78 | | | | $ | 25.01 | | | | $ | 24.93 | |
| | | | | | | | | | | | | | | | | | | | | | | | | | | | | | | | | | |
| | $ | 2,513,048,877 | | | | $ | 90,174,567 | | | | $ | 6,142,728,213 | | | | $ | 1,761,165,734 | | | | $ | 937,203,997 | | | | $ | 1,480,428,384 | | | | $ | 48,265,000 | |
| | | | | | | | | | | | | | | | | | | | | | | | | | | | | | | | | | |
| | $ | - | | | | $ | - | | | | $ | 62,351,312 | | | | $ | 90,139,484 | | | | $ | 221,238 | | | | $ | 34,751,362 | | | | $ | - | |
| | | | | | | | | | | | | | | | | | | | | | | | | | | | | | | | | | |
| | $ | - | | | | $ | - | | | | $ | 60,708,104 | | | | $ | - | | | | $ | - | | | | $ | 33,536,950 | | | | $ | - | |
| | | | | | | | | | | | | | | | | | | | | | | | | | | | | | | | | | |
Statements of Operations
For the year ended August 31, 2020
| | | | | | | | | | | | | | | | | | | | | | | | | |
| | | Invesco
1-30 Laddered
Treasury
ETF (PLW) | | Invesco
California
AMT-Free
Municipal
Bond ETF
(PWZ) | | Invesco
CEF Income
Composite
ETF (PCEF) | | Invesco
Fundamental
High Yield®
Corporate Bond
ETF (PHB) | | Invesco
Fundamental
Investment
Grade Corporate
Bond ETF (PFIG) |
| | | | | |
Investment income: | | | | | | | | | | | | | | | | | | | | | | | | | |
Unaffiliated interest income | | | $ | 2,753,043 | | | | $ | 10,845,348 | | | | $ | - | | | | $ | 31,010,723 | | | | $ | 2,140,161 | |
Unaffiliated dividend income | | | | - | | | | | - | | | | | 48,761,102 | | | | | - | | | | | - | |
Affiliated dividend income. | | | | 1,108 | | | | | - | | | | | 688,746 | | | | | 43,994 | | | | | 3,315 | |
Securities lending income | | | | 11,103 | | | | | - | | | | | 2,260,698 | | | | | 265,045 | | | | | 3,038 | |
Foreign withholding tax | | | | - | | | | | - | | | | | - | | | | | - | | | | | - | |
| | | | | | | | | | | | | | | | | | | | | | | | | |
Total investment income. | | | | 2,765,254 | | | | | 10,845,348 | | | | | 51,710,546 | | | | | 31,319,762 | | | | | 2,146,514 | |
| | | | | | | | | | | | | | | | | | | | | | | | | |
| | | | | |
Expenses: | | | | | | | | | | | | | | | | | | | | | | | | | |
Unitary management fees | | | | 460,000 | | | | | 1,108,068 | | | | | 3,766,737 | | | | | 3,409,316 | | | | | 162,995 | |
Tax expenses | | | | - | | | | | - | | | | | - | | | | | 2,142 | | | | | - | |
| | | | | | | | | | | | | | | | | | | | | | | | | |
Total expenses | | | | 460,000 | | | | | 1,108,068 | | | | | 3,766,737 | | | | | 3,411,458 | | | | | 162,995 | |
| | | | | | | | | | | | | | | | | | | | | | | | | |
Less: Waivers | | | | (226 | ) | | | | - | | | | | (1,179 | ) | | | | (8,527 | ) | | | | (617 | ) |
| | | | | | | | | | | | | | | | | | | | | | | | | |
Net expenses | | | | 459,774 | | | | | 1,108,068 | | | | | 3,765,558 | | | | | 3,402,931 | | | | | 162,378 | |
| | | | | | | | | | | | | | | | | | | | | | | | | |
Net investment income | | | | 2,305,480 | | | | | 9,737,280 | | | | | 47,944,988 | | | | | 27,916,831 | | | | | 1,984,136 | |
| | | | | | | | | | | | | | | | | | | | | | | | | |
| | | | | |
Realized and unrealized gain (loss) from: | | | | | | | | | | | | | | | | | | | | | | | | | |
Net realized gain (loss) from: | | | | | | | | | | | | | | | | | | | | | | | | | |
Unaffiliated investment securities | | | | 207,047 | | | | | 101,589 | | | | | (22,721,452 | ) | | | | (16,761,297 | ) | | | | 563,019 | |
Affiliated investment securities | | | | (126 | ) | | | | - | | | | | (2,768,763 | ) | | | | (2,431 | ) | | | | (13 | ) |
Unaffiliated in-kind redemptions | | | | 13,590,853 | | | | | 1,363,230 | | | | | 6,065,943 | | | | | (5,594,961 | ) | | | | 1,569,275 | |
Affiliated in-kind redemptions. | | | | - | | | | | - | | | | | 9,997 | | | | | - | | | | | - | |
Distributions of underlying fund shares | | | | - | | | | | - | | | | | 75,681 | | | | | - | | | | | - | |
| | | | | | | | | | | | | | | | | | | | | | | | | |
Net realized gain (loss) | | | | 13,797,774 | | | | | 1,464,819 | | | | | (19,338,594 | ) | | | | (22,358,689 | ) | | | | 2,132,281 | |
| | | | | | | | | | | | | | | | | | | | | | | | | |
Change in net unrealized appreciation (depreciation) of: | | | | | | | | | | | | | | | | | | | | | | | | | |
Unaffiliated investment securities | | | | (10,100,653 | ) | | | | 5,525,914 | | | | | (24,926,453 | ) | | | | 13,193,794 | | | | | 334,648 | |
Affiliated investment securities | | | | - | | | | | - | | | | | 256,957 | | | | | (285 | ) | | | | - | |
| | | | | | | | | | | | | | | | | | | | | | | | | |
Change in net unrealized appreciation (depreciation) | | | | (10,100,653 | ) | | | | 5,525,914 | | | | | (24,669,496 | ) | | | | 13,193,509 | | | | | 334,648 | |
| | | | | | | | | | | | | | | | | | | | | | | | | |
Net realized and unrealized gain (loss) | | | | 3,697,121 | | | | | 6,990,733 | | | | | (44,008,090 | ) | | | | (9,165,180 | ) | | | | 2,466,929 | |
| | | | | | | | | | | | | | | | | | | | | | | | | |
Net increase in net assets resulting from operations | | | $ | 6,002,601 | | | | $ | 16,728,013 | | | | $ | 3,936,898 | | | | $ | 18,751,651 | | | | $ | 4,451,065 | |
| | | | | | | | | | | | | | | | | | | | | | | | | |
See accompanying Notes to Financial Statements which are an integral part of the financial statements.
| | | | | | | | | | | | | | | | | | | | | | | | | | | | | | | | | |
Invesco
National
AMT-Free
Municipal Bond
ETF (PZA) | | Invesco
New York
AMT-Free
Municipal Bond
ETF (PZT) | | Invesco
Preferred
ETF (PGX) | | Invesco
Taxable
Municipal
Bond ETF
(BAB) | | Invesco
Treasury
Collateral
ETF (CLTL) | | Invesco
Variable Rate
Preferred
ETF (VRP) | | Invesco
VRDO Tax-
Free Weekly
ETF (PVI) |
| | | | | | |
| | $ | 62,154,361 | | | | $ | 2,639,638 | | | | $ | - | | | | $ | 51,332,868 | | | | $ | 9,009,122 | | | | $ | 50,994,283 | | | | $ | 502,157 | |
| | | - | | | | | - | | | | | 318,339,609 | | | | | - | | | | | - | | | | | 27,001,972 | | | | | - | |
| | | - | | | | | - | | | | | 400,656 | | | | | 342,090 | | | | | 8,878 | | | | | 50,785 | | | | | - | |
| | | - | | | | | - | | | | | 3,334,375 | | | | | - | | | | | - | | | | | 824,861 | | | | | - | |
| | | - | | | | | - | | | | | - | | | | | - | | | | | - | | | | | (2,908 | ) | | | | - | |
| | | | | | | | | | | | | | | | | | | | | | | | | | | | | | | | | | |
| | | 62,154,361 | | | | | 2,639,638 | | | | | 322,074,640 | | | | | 51,674,958 | | | | | 9,018,000 | | | | | 78,868,993 | | | | | 502,157 | |
| | | | | | | | | | | | | | | | | | | | | | | | | | | | | | | | | | |
| | | | | | |
| | | 6,070,762 | | | | | 253,141 | | | | | 28,244,166 | | | | | 4,021,787 | | | | | 562,012 | | | | | 7,717,214 | | | | | 132,400 | |
| | | - | | | | | - | | | | | - | | | | | - | | | | | - | | | | | 5,639 | | | | | - | |
| | | | | | | | | | | | | | | | | | | | | | | | | | | | | | | | | | |
| | | 6,070,762 | | | | | 253,141 | | | | | 28,244,166 | | | | | 4,021,787 | | | | | 562,012 | | | | | 7,722,853 | | | | | 132,400 | |
| | | | | | | | | | | | | | | | | | | | | | | | | | | | | | | | | | |
| | | - | | | | | - | | | | | (73,024 | ) | | | | (97,438 | ) | | | | (1,103 | ) | | | | (7,997 | ) | | | | - | |
| | | | | | | | | | | | | | | | | | | | | | | | | | | | | | | | | | |
| | | 6,070,762 | | | | | 253,141 | | | | | 28,171,142 | | | | | 3,924,349 | | | | | 560,909 | | | | | 7,714,856 | | | | | 132,400 | |
| | | | | | | | | | | | | | | | | | | | | | | | | | | | | | | | | | |
| | | 56,083,599 | | | | | 2,386,497 | | | | | 293,903,498 | | | | | 47,750,609 | | | | | 8,457,091 | | | | | 71,154,137 | | | | | 369,757 | |
| | | | | | | | | | | | | | | | | | | | | | | | | | | | | | | | | | |
| | | | | | |
| | | (5,225,584 | ) | | | | (300,744 | ) | | | | (43,462,717 | ) | | | | 1,954,698 | | | | | 455,447 | | | | | (18,707,593 | ) | | | | (1 | ) |
| | | - | | | | | - | | | | | (2,646 | ) | | | | - | | | | | - | | | | | (5,532 | ) | | | | - | |
| | | 983,504 | | | | | - | | | | | (44,178,638 | ) | | | | 5,666,063 | | | | | 503,159 | | | | | (14,694,734 | ) | | | | - | |
| | | - | | | | | - | | | | | - | | | | | - | | | | | - | | | | | - | | | | | - | |
| | | - | | | | | - | | | | | - | | | | | - | | | | | - | | | | | - | | | | | - | |
| | | | | | | | | | | | | | | | | | | | | | | | | | | | | | | | | | |
| | | (4,242,080 | ) | | | | (300,744 | ) | | | | (87,644,001 | ) | | | | 7,620,761 | | | | | 958,606 | | | | | (33,407,859 | ) | | | | (1 | ) |
| | | | | | | | | | | | | | | | | | | | | | | | | | | | | | | | | | |
| | | | | | |
| | | (10,782,082 | ) | | | | 459,153 | | | | | (16,793,392 | ) | | | | 26,074,006 | | | | | (22,171 | ) | | | | (8,783,980 | ) | | | | - | |
| | | - | | | | | - | | | | | (1 | ) | | | | - | | | | | - | | | | | (48 | ) | | | | - | |
| | | | | | | | | | | | | | | | | | | | | | | | | | | | | | | | | | |
| | | (10,782,082 | ) | | | | 459,153 | | | | | (16,793,393 | ) | | | | 26,074,006 | | | | | (22,171 | ) | | | | (8,784,028 | ) | | | | - | |
| | | | | | | | | | | | | | | | | | | | | | | | | | | | | | | | | | |
| | | (15,024,162 | ) | | | | 158,409 | | | | | (104,437,394 | ) | | | | 33,694,767 | | | | | 936,435 | | | | | (42,191,887 | ) | | | | (1 | ) |
| | | | | | | | | | | | | | | | | | | | | | | | | | | | | | | | | | |
| | $ | 41,059,437 | | | | $ | 2,544,906 | | | | $ | 189,466,104 | | | | $ | 81,445,376 | | | | $ | 9,393,526 | | | | $ | 28,962,250 | | | | $ | 369,756 | |
| | | | | | | | | | | | | | | | | | | | | | | | | | | | | | | | | | |
Statements of Changes in Net Assets
For the years ended August 31, 2020 and 2019
| | | | | | | | | | | | | | | | | | | | |
| | | Invesco 1-30 Laddered Treasury
ETF (PLW) | | | | | | Invesco California AMT-Free
Municipal Bond ETF (PWZ) | |
| | | 2020 | | | 2019 | | | | | | 2020 | | | 2019 | |
Operations: | | | | | | | | | | | | | | | | | | | | |
Net investment income | | $ | 2,305,480 | | | $ | 3,029,766 | | | | | | | $ | 9,737,280 | | | $ | 7,845,729 | |
Net realized gain (loss) | | | 13,797,774 | | | | (69,879 | ) | | | | | | | 1,464,819 | | | | 365,893 | |
Change in net unrealized appreciation (depreciation) | | | (10,100,653 | ) | | | 17,339,708 | | | | | | | | 5,525,914 | | | | 22,970,917 | |
| | | | | | | | | | | | | | | | | | | | |
Net increase in net assets resulting from operations | | | 6,002,601 | | | | 20,299,595 | | | | | | | | 16,728,013 | | | | 31,182,539 | |
| | | | | | | | | | | | | | | | | | | | |
| | | | | |
Distributions to Shareholders from: | | | | | | | | | | | | | | | | | | | | |
Distributable earnings | | | (2,310,988 | ) | | | (3,060,263 | ) | | | | | | | (9,796,658 | ) | | | (7,911,793 | ) |
| | | | | | | | | | | | | | | | | | | | |
| | | | | |
Shareholder Transactions: | | | | | | | | | | | | | | | | | | | | |
Proceeds from shares sold | | | 304,604,241 | | | | 149,797,777 | | | | | | | | 179,954,052 | | | | 89,210,474 | |
Value of shares repurchased | | | (283,516,270 | ) | | | (141,548,086 | ) | | | | | | | (81,617,562 | ) | | | (16,681,213 | ) |
Transaction fees | | | - | | | | - | | | | | | | | 47,470 | | | | 6,370 | |
| | | | | | | | | | | | | | | | | | | | |
Net increase (decrease) in net assets resulting from share transactions | | | 21,087,971 | | | | 8,249,691 | | | | | | | | 98,383,960 | | | | 72,535,631 | |
| | | | | | | | | | | | | | | | | | | | |
Net increase (decrease) in net assets | | | 24,779,584 | | | | 25,489,023 | | | | | | | | 105,315,315 | | | | 95,806,377 | |
| | | | | | | | | | | | | | | | | | | | |
| | | | | |
Net assets: | | | | | | | | | | | | | | | | | | | | |
Beginning of year | | | 179,123,511 | | | | 153,634,488 | | | | | | | | 346,602,240 | | | | 250,795,863 | |
| | | | | | | | | | | | | | | | | | | | |
End of year | | $ | 203,903,095 | | | $ | 179,123,511 | | | | | | | $ | 451,917,555 | | | $ | 346,602,240 | |
| | | | | | | | | | | | | | | | | | | | |
Changes in Shares Outstanding: | | | | | | | | | | | | | | | | | | | | |
Shares sold | | | 7,900,000 | | | | 4,400,000 | | | | | | | | 6,900,000 | | | | 3,500,000 | |
Shares repurchased | | | (7,650,000 | ) | | | (4,300,000 | ) | | | | | | | (3,100,000 | ) | | | (650,000 | ) |
Shares outstanding, beginning of year | | | 4,950,000 | | | | 4,850,000 | | | | | | | | 12,550,000 | | | | 9,700,000 | |
| | | | | | | | | | | | | | | | | | | | |
Shares outstanding, end of year | | | 5,200,000 | | | | 4,950,000 | | | | | | | | 16,350,000 | | | | 12,550,000 | |
| | | | | | | | | | | | | | | | | | | | |
See accompanying Notes to Financial Statements which are an integral part of the financial statements.
| | | | | | | | | | | | | | | | | | | | | | | | | | | | | | | | | | | | | | | | | | | | | | | | | | | | | | | | | | | | | | | | | | | |
Invesco CEF Income Composite
ETF (PCEF) | | | | Invesco Fundamental High Yield®
Corporate Bond (PHB) | | | | Invesco Fundamental Investment Grade
Corporate Bond ETF (PFIG) | | | | Invesco National AMT-Free
Municipal Bond ETF (PZA) |
| | | | | | | | | | | | | | |
| 2020 | | | | 2019 | | | | 2020 | | | | 2019 | | | | 2020 | | | | 2019 | | | | 2020 | | | | 2019 |
| | | | | | | | | | | | | | |
| | $ | 47,944,988 | | | | | | | | | $ | 38,910,835 | | | | | | $ | 27,916,831 | | | | | | | | | $ | 32,770,827 | | | | | | $ | 1,984,136 | | | | | | | | | $ | 3,904,391 | | | | | | | | | $ | 56,083,599 | | | | | | | | | $ | 50,423,341 | |
| | | (19,338,594 | ) | | | | | | | | | 5,728,368 | | | | | | | (22,358,689 | ) | | | | | | | | | (13,209,716 | ) | | | | | | 2,132,281 | | | | | | | | | | 2,845,166 | | | | | | | | | | (4,242,080 | ) | | | | | | | | | 276,646 | |
| | | (24,669,496 | ) | | | | | | | | | (9,759,032 | ) | | | | | | 13,193,509 | | | | | | | | | | 23,020,540 | | | | | | | 334,648 | | | | | | | | | | 5,576,458 | | | | | | | | | | (10,782,082 | ) | | | | | | | | | 112,734,517 | |
| | | | | | | | | | | | | | | | | | | | | | | | | | | | | | | | | | | | | | | | | | | | | | | | | | | | | | | | | | | | | | | | | | | | |
| | | 3,936,898 | | | | | | | | | | 34,880,171 | | | | | | | 18,751,651 | | | | | | | | | | 42,581,651 | | | | | | | 4,451,065 | | | | | | | | | | 12,326,015 | | | | | | | | | | 41,059,437 | | | | | | | | | | 163,434,504 | |
| | | | | | | | | | | | | | | | | | | | | | | | | | | | | | | | | | | | | | | | | | | | | | | | | | | | | | | | | | | | | | | | | | | | |
| | | | | | | | | | | | | | |
| | | (61,569,372 | ) | | | | | | | | | (53,905,613 | ) | | | | | | (28,061,635 | ) | | | | | | | | | (33,010,295 | ) | | | | | | (1,990,881 | ) | | | | | | | | | (3,906,123 | ) | | | | | | | | | (56,650,368 | ) | | | | | | | | | (50,635,683 | ) |
| | | | | | | | | | | | | | | | | | | | | | | | | | | | | | | | | | | | | | | | | | | | | | | | | | | | | | | | | | | | | | | | | | | | |
| | | | | | | | | | | | | | |
| | | 142,234,540 | | | | | | | | | | 153,858,756 | | | | | | | 453,998,450 | | | | | | | | | | 367,872,568 | | | | | | | 5,409,386 | | | | | | | | | | 53,554,180 | | | | | | | | | | 1,113,812,258 | | | | | | | | | | 393,969,271 | |
| | | (89,454,197 | ) | | | | | | | | | (97,051,457 | ) | | | | | | (447,423,697 | ) | | | | | | | | | (565,427,798 | ) | | | | | | (37,011,091 | ) | | | | | | | | | (76,423,003 | ) | | | | | | | | | (427,602,641 | ) | | | | | | | | | (160,884,192 | ) |
| | | - | | | | | | | | | | - | | | | | | | - | | | | | | | | | | - | | | | | | | - | | | | | | | | | | - | | | | | | | | | | 536,331 | | | | | | | | | | 133,834 | |
| | | | | | | | | | | | | | | | | | | | | | | | | | | | | | | | | | | | | | | | | | | | | | | | | | | | | | | | | | | | | | | | | | | | |
| | | 52,780,343 | | | | | | | | | | 56,807,299 | | | | | | | 6,574,753 | | | | | | | | | | (197,555,230 | ) | | | | | | (31,601,705 | ) | | | | | | | | | (22,868,823 | ) | | | | | | | | | 686,745,948 | | | | | | | | | | 233,218,913 | |
| | | | | | | | | | | | | | | | | | | | | | | | | | | | | | | | | | | | | | | | | | | | | | | | | | | | | | | | | | | | | | | | | | | | |
| | | (4,852,131 | ) | | | | | | | | | 37,781,857 | | | | | | | (2,735,231 | ) | | | | | | | | | (187,983,874 | ) | | | | | | (29,141,521 | ) | | | | | | | | | (14,448,931 | ) | | | | | | | | | 671,155,017 | | | | | | | | | | 346,017,734 | |
| | | | | | | | | | | | | | | | | | | | | | | | | | | | | | | | | | | | | | | | | | | | | | | | | | | | | | | | | | | | | | | | | | | | |
| | | | | | | | | | | | | | |
| | | 760,958,577 | | | | | | | | | | 723,176,720 | | | | | | | 760,545,972 | | | | | | | | | | 948,529,846 | | | | | | | 92,171,194 | | | | | | | | | | 106,620,125 | | | | | | | | | | 2,005,998,257 | | | | | | | | | | 1,659,980,523 | |
| | | | | | | | | | | | | | | | | | | | | | | | | | | | | | | | | | | | | | | | | | | | | | | | | | | | | | | | | | | | | | | | | | | | |
| | $ | 756,106,446 | | | | | | | | | $ | 760,958,577 | | | | | | $ | 757,810,741 | | | | | | | | | $ | 760,545,972 | | | | | | $ | 63,029,673 | | | | | | | | | $ | 92,171,194 | | | | | | | | | $ | 2,677,153,274 | | | | | | | | | $ | 2,005,998,257 | |
| | | | | | | | | | | | | | | | | | | | | | | | | | | | | | | | | | | | | | | | | | | | | | | | | | | | | | | | | | | | | | | | | | | | |
| | | | | | | | | | | | | | |
| | | 6,650,000 | | | | | | | | | | 7,050,000 | | | | | | | 24,600,000 | | | | | | | | | | 19,800,000 | | | | | | | 200,000 | | | | | | | | | | 2,150,000 | | | | | | | | | | 41,900,000 | | | | | | | | | | 15,350,000 | |
| | | (4,550,000 | ) | | | | | | | | | (4,450,000 | ) | | | | | | (24,400,000 | ) | | | | | | | | | (31,000,000 | ) | | | | | | (1,400,000 | ) | | | | | | | | | (2,950,000 | ) | | | | | | | | | (16,750,000 | ) | | | | | | | | | (6,500,000 | ) |
| | | 34,050,000 | | | | | | | | | | 31,450,000 | | | | | | | 39,900,000 | | | | | | | | | | 51,100,000 | | | | | | | 3,500,000 | | | | | | | | | | 4,300,000 | | | | | | | | | | 74,950,000 | | | | | | | | | | 66,100,000 | |
| | | | | | | | | | | | | | | | | | | | | | | | | | | | | | | | | | | | | | | | | | | | | | | | | | | | | | | | | | | | | | | | | | | | |
| | | 36,150,000 | | | | | | | | | | 34,050,000 | | | | | | | 40,100,000 | | | | | | | | | | 39,900,000 | | | | | | | 2,300,000 | | | | | | | | | | 3,500,000 | | | | | | | | | | 100,100,000 | | | | | | | | | | 74,950,000 | |
| | | | | | | | | | | | | | | | | | | | | | | | | | | | | | | | | | | | | | | | | | | | | | | | | | | | | | | | | | | | | | | | | | | | |
Statements of Changes in Net Assets—(continued)
For the years ended August 31, 2020 and 2019
| | | | | | | | | | | | | | | | | | | | | | | | | | | | |
| | | Invesco New York AMT-Free
Municipal Bond ETF (PZT) | | | | | | Invesco Preferred
ETF (PGX) | |
| | | | | | | |
| | | 2020 | | | | | | 2019 | | | | | | 2020 | | | | | | 2019 | |
Operations: | | | | | | | | | | | | | | | | | | | | | | | | | | | | |
Net investment income | | $ | 2,386,497 | | | | | | | $ | 1,871,847 | | | | | | | $ | 293,903,498 | | | | | | | $ | 266,239,505 | |
Net realized gain (loss) | | | (300,744 | ) | | | | | | | (90,801 | ) | | | | | | | (87,644,001 | ) | | | | | | | (31,425,066 | ) |
Change in net unrealized appreciation (depreciation) | | | 459,153 | | | | | | | | 4,774,119 | | | | | | | | (16,793,393 | ) | | | | | | | 123,557,606 | |
| | | | | | | | | | | | | | | | | | | | | | | | | | | | |
Net increase in net assets resulting from operations | | | 2,544,906 | | | | | | | | 6,555,165 | | | | | | | | 189,466,104 | | | | | | | | 358,372,045 | |
| | | | | | | | | | | | | | | | | | | | | | | | | | | | |
| | | | | | | |
Distributions to Shareholders from: | | | | | | | | | | | | | | | | | | | | | | | | | | | | |
Distributable earnings | | | (2,399,843 | ) | | | | | | | (1,892,274 | ) | | | | | | | (296,096,193 | ) | | | | | | | (276,045,216 | ) |
| | | | | | | | | | | | | | | | | | | | | | | | | | | | |
| | | | | | | |
Shareholder Transactions: | | | | | | | | | | | | | | | | | | | | | | | | | | | | |
Proceeds from shares sold | | | 22,896,565 | | | | | | | | 16,067,054 | | | | | | | | 1,590,156,558 | | | | | | | | 723,488,704 | |
Value of shares repurchased | | | (3,813,813 | ) | | | | | | | (4,705,635 | ) | | | | | | | (575,184,908 | ) | | | | | | | (831,211,672 | ) |
Transaction fees | | | - | | | | | | | | - | | | | | | | | - | | | | | | | | - | |
| | | | | | | | | | | | | | | | | | | | | | | | | | | | |
Net increase (decrease) in net assets resulting from share transactions | | | 19,082,752 | | | | | | | | 11,361,419 | | | | | | | | 1,014,971,650 | | | | | | | | (107,722,968 | ) |
| | | | | | | | | | | | | | | | | | | | | | | | | | | | |
Net increase (decrease) in net assets | | | 19,227,815 | | | | | | | | 16,024,310 | | | | | | | | 908,341,561 | | | | | | | | (25,396,139 | ) |
| | | | | | | | | | | | | | | | | | | | | | | | | | | | |
| | | | | | | |
Net assets: | | | | | | | | | | | | | | | | | | | | | | | | | | | | |
Beginning of year | | | 79,600,946 | | | | | | | | 63,576,636 | | | | | | | | 5,352,614,769 | | | | | | | | 5,378,010,908 | |
| | | | | | | | | | | | | | | | | | | | | | | | | | | | |
End of year | | $ | 98,828,761 | | | | | | | $ | 79,600,946 | | | | | | | $ | 6,260,956,330 | | | | | | | $ | 5,352,614,769 | |
| | | | | | | | | | | | | | | | | | | | | | | | | | | | |
Changes in Shares Outstanding: | | | | | | | | | | | | | | | | | | | | | | | | | | | | |
Shares sold | | | 900,000 | | | | | | | | 650,000 | | | | | | | | 107,200,000 | | | | | | | | 49,650,000 | |
Shares repurchased | | | (150,000 | ) | | | | | | | (200,000 | ) | | | | | | | (44,350,000 | ) | | | | | | | (59,450,000 | ) |
Shares outstanding, beginning of year | | | 3,100,000 | | | | | | | | 2,650,000 | | | | | | | | 358,450,000 | | | | | | | | 368,250,000 | |
| | | | | | | | | | | | | | | | | | | | | | | | | | | | |
Shares outstanding, end of year | | | 3,850,000 | | | | | | | | 3,100,000 | | | | | | | | 421,300,000 | | | | | | | | 358,450,000 | |
| | | | | | | | | | | | | | | | | | | | | | | | | | | | |
See accompanying Notes to Financial Statements which are an integral part of the financial statements.
| | | | | | | | | | | | | | | | | | | | | | | | | | | | | | |
Invesco Taxable Municipal Bond
ETF (BAB) | | | Invesco Treasury Collateral
ETF (CLTL) | | | Invesco Variable Rate Preferred
ETF (VRP) | | | Invesco VRDO Tax-Free Weekly
ETF (PVI) | |
| | | | | | | |
| 2020 | | | 2019 | | | 2020 | | | 2019 | | | 2020 | | | 2019 | | | 2020 | | | 2019 | |
| | | | | | | |
| $ | 47,750,609 | | | $ | 39,604,740 | | | $ | 8,457,091 | | | $ | 11,988,992 | | | $ | 71,154,137 | | | $ | 77,010,084 | | | $ | 369,757 | | | $ | 746,731 | |
| | 7,620,761 | | | | 4,015,522 | | | | 958,606 | | | | 175,715 | | | | (33,407,859 | ) | | | (43,259,104 | ) | | | (1 | ) | | | - | |
| | 26,074,006 | | | | 107,823,051 | | | | (22,171 | ) | | | 745,410 | | | | (8,784,028 | ) | | | 32,252,471 | | | | - | | | | - | |
| | | | | | | | | | | | | | | �� | | | | | | | | | | | | | | | |
| | 81,445,376 | | | | 151,443,313 | | | | 9,393,526 | | | | 12,910,117 | | | | 28,962,250 | | | | 66,003,451 | | | | 369,756 | | | | 746,731 | |
| | | | | | | | | | | | | | | | | | | | | | | | | | | | | | |
| | | | | | | |
| | (48,233,360 | ) | | | (39,734,954 | ) | | | (8,689,595 | ) | | | (12,311,025 | ) | | | (71,331,749 | ) | | | (89,362,622 | ) | | | (372,291 | ) | | | (746,949 | ) |
| | | | | | | | | | | | | | | | | | | | | | | | | | | | | | |
| | | | | | | |
| | 820,344,063 | | | | 341,027,100 | | | | 623,230,093 | | | | 163,576,734 | | | | 224,131,741 | | | | 50,163,388 | | | | 2,492,708 | | | | 8,725,062 | |
| | (156,954,488 | ) | | | (84,322,683 | ) | | | (232,782,080 | ) | | | (85,480,901 | ) | | | (238,556,105 | ) | | | (689,317,241 | ) | | | (9,972,306 | ) | | | (13,714,226 | ) |
| | 1,035,983 | | | | 939,411 | | | | - | | | | - | | | | - | | | | - | | | | - | | | | - | |
| | | | | | | | | | | | | | | | | | | | | | | | | | | | | | |
| | 664,425,558 | | | | 257,643,828 | | | | 390,448,013 | | | | 78,095,833 | | | | (14,424,364 | ) | | | (639,153,853 | ) | | | (7,479,598 | ) | | | (4,989,164 | ) |
| | | | | | | | | | | | | | | | | | | | | | | | | | | | | | |
| | 697,637,574 | | | | 369,352,187 | | | | 391,151,944 | | | | 78,694,925 | | | | (56,793,863 | ) | | | (662,513,024 | ) | | | (7,482,133 | ) | | | (4,989,382 | ) |
| | | | | | | | | | | | | | | | | | | | | | | | | | | | | | |
| | | | | | | |
| | 1,308,223,185 | | | | 938,870,998 | | | | 547,017,563 | | | | 468,322,638 | | | | 1,529,601,307 | | | | 2,192,114,331 | | | | 57,337,561 | | | | 62,326,943 | |
| | | | | | | | | | | | | | | | | | | | | | | | | | | | | | |
| $ | 2,005,860,759 | | | $ | 1,308,223,185 | | | $ | 938,169,507 | | | $ | 547,017,563 | | | $ | 1,472,807,444 | | | $ | 1,529,601,307 | | | $ | 49,855,428 | | | $ | 57,337,561 | |
| | | | | | | | | | | | | | | | | | | | | | | | | | | | | | |
| | | | | | | |
| | 24,950,000 | | | | 11,100,000 | | | | 5,890,000 | | | | 1,550,000 | | | | 8,800,000 | | | | 2,000,000 | | | | 100,000 | | | | 350,000 | |
| | (4,750,000 | ) | | | (2,900,000 | ) | | | (2,200,000 | ) | | | (810,000 | ) | | | (10,300,000 | ) | | | (28,700,000 | ) | | | (400,000 | ) | | | (550,000 | ) |
| | 39,850,000 | | | | 31,650,000 | | | | 5,180,001 | | | | 4,440,001 | | | | 60,500,000 | | | | 87,200,000 | | | | 2,300,000 | | | | 2,500,000 | |
| | | | | | | | | | | | | | | | | | | | | | | | | | | | | | |
| | 60,050,000 | | | | 39,850,000 | | | | 8,870,001 | | | | 5,180,001 | | | | 59,000,000 | | | | 60,500,000 | | | | 2,000,000 | | | | 2,300,000 | |
| | | | | | | | | | | | | | | | | | | | | | | | | | | | | | |
Financial Highlights
Invesco 1-30 Laddered Treasury ETF (PLW)
| | | | | | | | | | | | | | | | | | | | | | | | | | | | | | | | | | | | | | |
| | | Years Ended August 31, | | | Ten Months Ended August 31, | | | | | | Years Ended October 31, | |
| | | | | | | | |
| | | 2020 | | | 2019 | | | 2018 | | | | | | 2017 | | | 2016 | | | | | 2015 | |
Per Share Operating Performance: | | | | | | | | | | | | | | | | | | | | | | | | | | | | | | | | | | | | | | |
Net asset value at beginning of period | | $ | 36.19 | | | $ | 31.68 | | | | | | | $ | 32.59 | | | | | | | | | | | $ | 33.81 | | | $ | 32.59 | | | | | $ | 31.96 | |
| | | | | | | | | | | | | | | | | | | | | | | | | | | | | | | | | | | | | | |
Net investment income(a) | | | 0.47 | | | | 0.69 | | | | | | | | 0.57 | | | | | | | | | | | | 0.66 | | | | 0.65 | | | | | | 0.70 | |
Net realized and unrealized gain (loss) on investments | | | 3.04 | | | | 4.51 | | | | | | | | (0.91 | ) | | | | | | | | | | | (1.22 | ) | | | 1.22 | | | | | | 0.63 | |
| | | | | | | | | | | | | | | | | | | | | | | | | | | | | | | | | | | | | | |
Total from investment operations | | | 3.51 | | | | 5.20 | | | | | | | | (0.34 | ) | | | | | | | | | | | (0.56 | ) | | | 1.87 | | | | | | 1.33 | |
| | | | | | | | | | | | | | | | | | | | | | | | | | | | | | | | | | | | | | |
Distributions to shareholders from: | | | | | | | | | | | | | | | | | | | | | | | | | | | | | | | | | | | | | | |
Net investment income | | | (0.49 | ) | | | (0.69 | ) | | | | | | | (0.57 | ) | | | | | | | | | | | (0.66 | ) | | | (0.65 | ) | | | | | (0.70 | ) |
| | | | | | | | | | | | | | | | | | | | | | | | | | | | | | | | | | | | | | |
Net asset value at end of period | | $ | 39.21 | | | $ | 36.19 | | | | | | | $ | 31.68 | | | | | | | | | | | $ | 32.59 | | | $ | 33.81 | | | | | $ | 32.59 | |
| | | | | | | | | | | | | | | | | | | | | | | | | | | | | | | | | | | | | | |
Market price at end of period(b) | | $ | 39.14 | | | $ | 36.23 | | | | | | | $ | 31.64 | | | | | | | | | | | $ | 32.59 | | | $ | 33.84 | | | | | $ | 32.60 | |
| | | | | | | | | | | | | | | | | | | | | | | | | | | | | | | | | | | | | | |
Net Asset Value Total Return(c) | | | 9.82 | % | | | 16.71 | % | | | | | | | (1.04 | )% | | | | | | | | | | | (1.63 | )% | | | 5.76 | % | | | | | 4.18 | % |
Market Price Total Return(c) | | | 9.50 | % | | | 16.98 | % | | | | | | | (1.17 | )% | | | | | | | | | | | (1.72 | )% | | | 5.82 | % | | | | | 4.18 | % |
Ratios/Supplemental Data: | | | | | | | | | | | | | | | | | | | | | | | | | | | | | | | | | | | | | | |
Net assets at end of period (000’s omitted) | | $ | 203,903 | | | $ | 179,124 | | | | | | | $ | 153,634 | | | | | | | | | | | $ | 187,393 | | | $ | 221,472 | | | | | $ | 267,278 | |
Ratio to average net assets of: | | | | | | | | | | | | | | | | | | | | | | | | | | | | | | | | | | | | | | |
Expenses | | | 0.25 | % | | | 0.26 | %(d) | | | | | | | 0.25 | %(e) | | | | | | | | | | | 0.25 | % | | | 0.25 | % | | | | | 0.25 | % |
Net investment income | | | 1.25 | % | | | 2.13 | %(d) | | | | | | | 2.13 | %(e) | | | | | | | | | | | 2.02 | % | | | 1.94 | % | | | | | 2.14 | % |
Portfolio turnover rate(f) | | | 9 | % | | | 5 | % | | | | | | | 5 | % | | | | | | | | | | | 5 | % | | | 6 | % | | | | | 7 | % |
| (a) | Based on average shares outstanding. |
| (b) | The mean between the last bid and ask prices. |
| (c) | Net asset value total return is calculated assuming an initial investment made at the net asset value at the beginning of the period, reinvestment of all dividends and distributions at net asset value during the period, and redemption at net asset value on the last day of the period. Net asset value total return includes adjustments in accordance with accounting principles generally accepted in the United States of America and as such, the net asset value for financial reporting purposes and the returns based upon those net asset values may differ from the net asset value and returns for shareholder transactions. Market price total return is calculated assuming an initial investment made at the market price at the beginning of the period, reinvestment of all dividends and distributions at market price during the period, and sale at the market price on the last day of the period. Total investment returns calculated for a period of less than one year are not annualized. |
| (d) | Ratios include non-recurring costs associated with a proxy statement of 0.01%. |
| (f) | Portfolio turnover rate is not annualized for periods less than one year, if applicable, and does not include securities received or delivered from processing creations or redemptions. |
See accompanying Notes to Financial Statements which are an integral part of the financial statements.
Financial Highlights—(continued)
Invesco California AMT-Free Municipal Bond ETF (PWZ)
| | | | | | | | | | | | | | | | | | | | | | | | | | | | | | | | | | | | |
| | | Years Ended August 31, | | | Ten Months Ended August 31, | | | | | | Years Ended October 31, | |
| | | 2020 | | | 2019 | | | 2018 | | | | | | 2017 | | | 2016 | | | 2015 | |
Per Share Operating Performance: | | | | | | | | | | | | | | | | | | | | | | | | | | | | | | | | | | | | |
Net asset value at beginning of period | | $ | 27.62 | | | $ | 25.86 | | | | | | | $ | 26.09 | | | | | | | | | | | $ | 26.15 | | | $ | 25.43 | | | $ | 25.45 | |
| | | | | | | | | | | | | | | | | | | | | | | | | | | | | | | | | | | | |
Net investment income(a) | | | 0.67 | | | | 0.67 | | | | | | | | 0.54 | | | | | | | | | | | | 0.65 | | | | 0.74 | | | | 0.82 | |
Net realized and unrealized gain (loss) on investments | | | 0.02 | | | | 1.76 | | | | | | | | (0.23 | ) | | | | | | | | | | | (0.07 | ) | | | 0.70 | | | | (0.06 | ) |
| | | | | | | | | | | | | | | | | | | | | | | | | | | | | | | | | | | | |
Total from investment operations | | | 0.69 | | | | 2.43 | | | | | | | | 0.31 | | | | | | | | | | | | 0.58 | | | | 1.44 | | | | 0.76 | |
| | | | | | | | | | | | | | | | | | | | | | | | | | | | | | | | | | | | |
Distributions to shareholders from: | | | | | | | | | | | | | | | | | | | | | | | | | | | | | | | | | | | | |
Net investment income | | | (0.67 | ) | | | (0.67 | ) | | | | | | | (0.53 | ) | | | | | | | | | | | (0.65 | ) | | | (0.75 | ) | | | (0.83 | ) |
Return of capital | | | - | | | | - | | | | | | | | (0.01 | ) | | | | | | | | | | | (0.01 | ) | | | (0.01 | ) | | | (0.00 | )(b) |
| | | | | | | | | | | | | | | | | | | | | | | | | | | | | | | | | | | | |
Total distributions | | | (0.67 | ) | | | (0.67 | ) | | | | | | | (0.54 | ) | | | | | | | | | | | (0.66 | ) | | | (0.76 | ) | | | (0.83 | ) |
| | | | | | | | | | | | | | | | | | | | | | | | | | | | | | | | | | | | |
Transaction fees(a) | | | 0.00 | (b) | | | 0.00 | (b) | | | | | | | 0.00 | (b) | | | | | | | | | | | 0.02 | | | | 0.04 | | | | 0.05 | |
| | | | | | | | | | | | | | | | | | | | | | | | | | | | | | | | | | | | |
Net asset value at end of period. | | $ | 27.64 | | | $ | 27.62 | | | | | | | $ | 25.86 | | | | | | | | | | | $ | 26.09 | | | $ | 26.15 | | | $ | 25.43 | |
| | | | | | | | | | | | | | | | | | | | | | | | | | | | | | | | | | | | |
Market price at end of period(c) | | $ | 27.58 | | | $ | 27.62 | | | | | | | $ | 25.83 | | | | | | | | | | | $ | 26.08 | | | $ | 26.21 | | | $ | 25.50 | |
| | | | | | | | | | | | | | | | | | | | | | | | | | | | | | | | | | | | |
Net Asset Value Total Return(d) | | | 2.56 | % | | | 9.58 | % | | | | | | | 1.22 | % | | | | | | | | | | | 2.36 | % | | | 5.84 | % | | | 3.25 | % |
Market Price Total Return(d) | | | 2.34 | % | | | 9.70 | % | | | | | | | 1.15 | % | | | | | | | | | | | 2.08 | % | | | 5.79 | % | | | 2.87 | % |
Ratios/Supplemental Data: | | | | | | | | | | | | | | | | | | | | | | | | | | | | | | | | | | | | |
Net assets at end of period (000’s omitted) | | $ | 451,918 | | | $ | 346,602 | | | | | | | $ | 250,796 | | | | | | | | | | | $ | 237,413 | | | $ | 189,620 | | | $ | 109,369 | |
Ratio to average net assets of: | | | | | | | | | | | | | | | | | | | | | | | | | | | | | | | | | | | | |
Expenses | | | 0.28 | % | | | 0.28 | % | | | | | | | 0.28 | %(e) | | | | | | | | | | | 0.28 | % | | | 0.28 | % | | | 0.28 | % |
Net investment income | | | 2.46 | % | | | 2.55 | % | | | | | | | 2.49 | %(e) | | | | | | | | | | | 2.52 | % | | | 2.81 | % | | | 3.23 | % |
Portfolio turnover rate(f) | | | 12 | % | | | 13 | % | | | | | | | 6 | % | | | | | | | | | | | 24 | % | | | 6 | % | | | 3 | % |
| (a) | Based on average shares outstanding. |
| (b) | Amount represents less than $0.005. |
| (c) | The mean between the last bid and ask prices. |
| (d) | Net asset value total return is calculated assuming an initial investment made at the net asset value at the beginning of the period, reinvestment of all dividends and distributions at net asset value during the period, and redemption at net asset value on the last day of the period. Net asset value total return includes adjustments in accordance with accounting principles generally accepted in the United States of America and as such, the net asset value for financial reporting purposes and the returns based upon those net asset values may differ from the net asset value and returns for shareholder transactions. Market price total return is calculated assuming an initial investment made at the market price at the beginning of the period, reinvestment of all dividends and distributions at market price during the period, and sale at the market price on the last day of the period. Total investment returns calculated for a period of less than one year are not annualized. |
| (f) | Portfolio turnover rate is not annualized for periods less than one year, if applicable, and does not include securities received or delivered from processing creations or redemptions. |
See accompanying Notes to Financial Statements which are an integral part of the financial statements.
Financial Highlights—(continued)
Invesco CEF Income Composite ETF (PCEF)
| | | | | | | | | | | | | | | | | | | | | | | | | | | | | | | | | | | | |
| | | Years Ended August 31, | | | Ten Months Ended August 31, | | | | | | Years Ended October 31, | |
| | | 2020 | | | 2019 | | | 2018 | | | | | | 2017 | | | 2016 | | | 2015 | |
Per Share Operating Performance: | | | | | | | | | | | | | | | | | | | | | | | | | | | | | | | | | | | | |
Net asset value at beginning of period | | $ | 22.35 | | | $ | 22.99 | | | | | | | $ | 23.96 | | | | | | | | | | | $ | 22.23 | | | $ | 21.91 | | | $ | 24.41 | |
| | | | | | | | | | | | | | | | | | | | | | | | | | | | | | | | | | | | |
Net investment income(a)(b) | | | 1.35 | | | | 1.18 | | | | | | | | 1.26 | | | | | | | | | | | | 1.13 | | | | 1.30 | | | | 1.53 | |
Net realized and unrealized gain (loss) on investments | | | (1.05 | ) | | | (0.19 | ) | | | | | | | (0.84 | ) | | | | | | | | | | | 2.28 | | | | 0.77 | | | | (2.07 | ) |
| | | | | | | | | | | | | | | | | | | | | | | | | | | | | | | | | | | | |
Total from investment operations | | | 0.30 | | | | 0.99 | | | | | | | | 0.42 | | | | | | | | | | | | 3.41 | | | | 2.07 | | | | (0.54 | ) |
| | | | | | | | | | | | | | | | | | | | | | | | | | | | | | | | | | | | |
Distributions to shareholders from: | | | | | | | | | | | | | | | | | | | | | | | | | | | | | | | | | | | | |
Net investment income | | | (1.73 | ) | | | (1.63 | ) | | | | | | | (1.39 | ) | | | | | | | | | | | (1.13 | ) | | | (1.34 | ) | | | (1.49 | ) |
Return of capital | | | - | | | | - | | | | | | | | - | | | | | | | | | | | | (0.55 | ) | | | (0.41 | ) | | | (0.47 | ) |
| | | | | | | | | | | | | | | | | | | | | | | | | | | | | | | | | | | | |
Total distributions | | | (1.73 | ) | | | (1.63 | ) | | | | | | | (1.39 | ) | | | | | | | | | | | (1.68 | ) | | | (1.75 | ) | | | (1.96 | ) |
| | | | | | | | | | | | | | | | | | | | | | | | | | | | | | | | | | | | |
Net asset value at end of period. | | $ | 20.92 | | | $ | 22.35 | | | | | | | $ | 22.99 | | | | | | | | | | | $ | 23.96 | | | $ | 22.23 | | | $ | 21.91 | |
| | | | | | | | | | | | | | | | | | | | | | | | | | | | | | | | | | | | |
Market price at end of period(c) | | $ | 20.91 | | | $ | 22.35 | | | | | | | $ | 23.01 | | | | | | | | | | | $ | 23.96 | | | $ | 22.23 | | | $ | 21.85 | |
| | | | | | | | | | | | | | | | | | | | | | | | | | | | | | | | | | | | |
Net Asset Value Total Return(d) | | | 1.84 | % | | | 4.72 | % | | | | | | | 1.85 | % | | | | | | | | | | | 15.86 | % | | | 10.11 | % | | | (2.31 | )% |
Market Price Total Return(d) | | | 1.80 | % | | | 4.62 | % | | | | | | | 1.94 | % | | | | | | | | | | | 15.86 | % | | | 10.41 | % | | | (2.62 | )% |
Ratios/Supplemental Data: | | | | | | | | | | | | | | | | | | | | | | | | | | | | | | | | | | | | |
Net assets at end of period (000’s omitted) | | $ | 756,106 | | | $ | 760,959 | | | | | | | $ | 723,177 | | | | | | | | | | | $ | 703,177 | | | $ | 642,473 | | | $ | 628,684 | |
Ratio to average net assets of: | | | | | | | | | | | | | | | | | | | | | | | | | | | | | | | | | | | | |
Expenses(e) | | | 0.50 | % | | | 0.50 | % | | | | | | | 0.50 | %(f) | | | | | | | | | | | 0.50 | % | | | 0.50 | % | | | 0.50 | % |
Net investment income(b) | | | 6.36 | % | | | 5.35 | % | | | | | | | 6.53 | %(f) | | | | | | | | | | | 4.85 | % | | | 5.99 | % | | | 6.61 | % |
Portfolio turnover rate(g) | | | 21 | % | | | 20 | % | | | | | | | 12 | % | | | | | | | | | | | 15 | % | | | 20 | % | | | 20 | % |
| (a) | Based on average shares outstanding. |
| (b) | Net investment income (loss) is affected by the timing of the declaration of dividends by the underlying funds in which the Fund invests. Ratio of net investment income (loss) does not include net investment income of the underlying funds in which the Fund invests. |
| (c) | The mean between the last bid and ask prices. |
| (d) | Net asset value total return is calculated assuming an initial investment made at the net asset value at the beginning of the period, reinvestment of all dividends and distributions at net asset value during the period, and redemption at net asset value on the last day of the period. Net asset value total return includes adjustments in accordance with accounting principles generally accepted in the United States of America and as such, the net asset value for financial reporting purposes and the returns based upon those net asset values may differ from the net asset value and returns for shareholder transactions. Market price total return is calculated assuming an initial investment made at the market price at the beginning of the period, reinvestment of all dividends and distributions at market price during the period, and sale at the market price on the last day of the period. Total investment returns calculated for a period of less than one year are not annualized. |
| (e)�� | In addition to the fees and expenses which the Fund bears directly, the Fund indirectly bears a pro rata share of the fees and expenses of the investment companies in which the Fund invests. Estimated investment companies’ expenses are not expenses that are incurred directly by the Fund. They are expenses that are incurred directly by the investment companies and are deducted from the value of the investment companies the Fund invests in. The effect of the estimated investment companies’ expenses that the Fund bears indirectly is included in the Fund’s total return. |
| (g) | Portfolio turnover rate is not annualized for periods less than one year, if applicable, and does not include securities received or delivered from processing creations or redemptions. |
See accompanying Notes to Financial Statements which are an integral part of the financial statements.
Financial Highlights—(continued)
Invesco Fundamental High Yield® Corporate Bond ETF (PHB)
| | | | | | | | | | | | | | | | | | | | | | | | | | | | | | | | | | | | |
| | | Years Ended August 31, | | | Ten Months Ended August 31, | | | | | | Years Ended October 31, | |
| | | 2020 | | | 2019 | | | 2018 | | | | | | 2017 | | | 2016 | | | 2015 | |
Per Share Operating Performance: | | | | | | | | | | | | | | | | | | | | | | | | | | | | | | | | | | | | |
Net asset value at beginning of period | | $ | 19.06 | | | $ | 18.56 | | | | | | | $ | 19.08 | | | | | | | | | | | $ | 18.79 | | | $ | 18.25 | | | $ | 19.24 | |
| | | | | | | | | | | | | | | | | | | | | | | | | | | | | | | | | | | | |
Net investment income(a) | | | 0.76 | | | | 0.77 | | | | | | | | 0.64 | | | | | | | | | | | | 0.80 | | | | 0.85 | | | | 0.81 | |
Net realized and unrealized gain (loss) on investments | | | (0.15 | ) | | | 0.51 | | | | | | | | (0.52 | ) | | | | | | | | | | | 0.29 | | | | 0.54 | | | | (0.98 | ) |
| | | | | | | | | | | | | | | | | | | | | | | | | | | | | | | | | | | | |
Total from investment operations | | | 0.61 | | | | 1.28 | | | | | | | | 0.12 | | | | | | | | | | | | 1.09 | | | | 1.39 | | | | (0.17 | ) |
| | | | | | | | | | | | | | | | | | | | | | | | | | | | | | | | | | | | |
Distributions to shareholders from: | | | | | | | | | | | | | | | | | | | | | | | | | | | | | | | | | | | | |
Net investment income | | | (0.77 | ) | | | (0.78 | ) | | | | | | | (0.64 | ) | | | | | | | | | | | (0.80 | ) | | | (0.85 | ) | | | (0.82 | ) |
| | | | | | | | | | | | | | | | | | | | | | | | | | | | | | | | | | | | |
Net asset value at end of period | | $ | 18.90 | | | $ | 19.06 | | | | | | | $ | 18.56 | | | | | | | | | | | $ | 19.08 | | | $ | 18.79 | | | $ | 18.25 | |
| | | | | | | | �� | | | | | | | | | | | | | | | | | | | | | | | | | | | | |
Market price at end of period(b) | | $ | 18.89 | | | $ | 19.07 | | | | | | | $ | 18.55 | | | | | | | | | | | $ | 19.07 | | | $ | 18.70 | | | $ | 18.23 | |
| | | | | | | | | | | | | | | | | | | | | | | | | | | | | | | | | | | | |
Net Asset Value Total Return(c) | | | 3.38 | % | | | 7.12 | % | | | | | | | 0.70 | % | | | | | | | | | | | 5.96 | % | | | 7.97 | % | | | (0.90 | )% |
Market Price Total Return(c) | | | 3.28 | % | | | 7.25 | % | | | | | | | 0.70 | % | | | | | | | | | | | 6.42 | % | | | 7.56 | % | | | (0.75 | )% |
Ratios/Supplemental Data: | | | | | | | | | | | | | | | | | | | | | | | | | | | | | | | | | | | | |
Net assets at end of period (000’s omitted) | | $ | 757,811 | | | $ | 760,546 | | | | | | | $ | 948,530 | | | | | | | | | | | $ | 1,197,922 | | | $ | 1,088,137 | | | $ | 666,301 | |
Ratio to average net assets of: | | | | | | | | | | | | | | | | | | | | | | | | | | | | | | | | | | | | |
Expenses | | | 0.50 | % | | | 0.50 | % | | | | | | | 0.50 | %(d) | | | | | | | | | | | 0.50 | % | | | 0.50 | % | | | 0.50 | % |
Net investment income | | | 4.09 | % | | | 4.18 | % | | | | | | | 4.12 | %(d) | | | | | | | | | | | 4.23 | % | | | 4.69 | % | | | 4.34 | % |
Portfolio turnover rate(e) | | | 35 | % | | | 17 | % | | | | | | | 12 | % | | | | | | | | | | | 9 | % | | | 14 | % | | | 16 | % |
| (a) | Based on average shares outstanding. |
| (b) | The mean between the last bid and ask prices. |
| (c) | Net asset value total return is calculated assuming an initial investment made at the net asset value at the beginning of the period, reinvestment of all dividends and distributions at net asset value during the period, and redemption at net asset value on the last day of the period. Net asset value total return includes adjustments in accordance with accounting principles generally accepted in the United States of America and as such, the net asset value for financial reporting purposes and the returns based upon those net asset values may differ from the net asset value and returns for shareholder transactions. Market price total return is calculated assuming an initial investment made at the market price at the beginning of the period, reinvestment of all dividends and distributions at market price during the period, and sale at the market price on the last day of the period. Total investment returns calculated for a period of less than one year are not annualized. |
| (e) | Portfolio turnover rate is not annualized for periods less than one year, if applicable, and does not include securities received or delivered from processing creations or redemptions. |
See accompanying Notes to Financial Statements which are an integral part of the financial statements.
Financial Highlights—(continued)
Invesco Fundamental Investment Grade Corporate Bond ETF (PFIG)
| | | | | | | | | | | | | | | | | | | | | | | | | | | | | | | | | | | | |
| | | Years Ended August 31, | | | Ten Months Ended August 31, | | | | | | Years Ended October 31, | |
| | | 2020 | | | 2019 | | | 2018 | | | | | | 2017 | | | 2016 | | | 2015 | |
Per Share Operating Performance: | | | | | | | | | | | | | | | | | �� | | | | | | | | | | | | | | | | | | | |
Net asset value at beginning of period | | $ | 26.33 | | | $ | 24.80 | | | | | | | $ | 25.63 | | | | | | | | | | | $ | 25.85 | | | $ | 25.24 | | | $ | 25.45 | |
| | | | | | | | | | | | | | | | | | | | | | | | | | | | | | | | | | | | |
Net investment income(a) | | | 0.71 | | | | 0.76 | | | | | | | | 0.57 | | | | | | | | | | | | 0.65 | | | | 0.65 | | | | 0.62 | |
Net realized and unrealized gain (loss) on investments | | | 1.07 | | | | 1.53 | | | | | | | | (0.83 | ) | | | | | | | | | | | (0.22 | ) | | | 0.62 | | | | (0.19 | ) |
| | | | | | | | | | | | | | | | | | | | | | | | | | | | | | | | | | | | |
Total from investment operations | | | 1.78 | | | | 2.29 | | | | | | | | (0.26 | ) | | | | | | | | | | | 0.43 | | | | 1.27 | | | | 0.43 | |
| | | | | | | | | | | | | | | | | | | | | | | | | | | | | | | | | | | | |
Distributions to shareholders from: | | | | | | | | | | | | | | | | | | | | | | | | | | | | | | | | | | | | |
Net investment income | | | (0.71 | ) | | | (0.76 | ) | | | | | | | (0.57 | ) | | | | | | | | | | | (0.65 | ) | | | (0.66 | ) | | | (0.64 | ) |
Return of capital | | | - | | | | - | | | | | | | | (0.00 | )(b) | | | | | | | | | | | - | | | | (0.00 | )(b) | | | - | |
| | | | | | | | | | | | | | | | | | | | | | | | | | | | | | | | | | | | |
Total distributions | | | (0.71 | ) | | | (0.76 | ) | | | | | | | (0.57 | ) | | | | | | | | | | | (0.65 | ) | | | (0.66 | ) | | | (0.64 | ) |
| | | | | | | | | | | | | | | | | | | | | | | | | | | | | | | | | | | | |
Net asset value at end of period | | $ | 27.40 | | | $ | 26.33 | | | | | | | $ | 24.80 | | | | | | | | | | | $ | 25.63 | | | $ | 25.85 | | | $ | 25.24 | |
| | | | | | | | | | | | | | | | | | | | | | | | | | | | | | | | | | | | |
Market price at end of period(c) | | $ | 27.39 | | | $ | 26.31 | | | | | | | $ | 24.80 | | | | | | | | | | | $ | 25.62 | | | $ | 25.87 | | | $ | 25.27 | |
| | | | | | | | | | | | | | | | | | | | | | | | | | | | | | | | | | | | |
Net Asset Value Total Return(d) | | | 6.91 | % | | | 9.45 | % | | | | | | | (1.01 | )% | | | | | | | | | | | 1.73 | % | | | 5.08 | % | | | 1.69 | % |
Market Price Total Return(d) | | | 6.95 | % | | | 9.36 | % | | | | | | | (0.98 | )% | | | | | | | | | | | 1.61 | % | | | 5.03 | % | | | 1.72 | % |
Ratios/Supplemental Data: | | | | | | | | | | | | | | | | | | | | | | | | | | | | | | | | | | | | |
Net assets at end of period (000’s omitted) | | $ | 63,030 | | | $ | 92,171 | | | | | | | $ | 106,620 | | | | | | | | | | | $ | 49,970 | | | $ | 58,154 | | | $ | 34,067 | |
Ratio to average net assets of: | | | | | | | | | | | | | | | | | | | | | | | | | | | | | | | | | | | | |
Expenses | | | 0.22 | % | | | 0.23 | %(e) | | | | | | | 0.22 | %(f) | | | | | | | | | | | 0.22 | % | | | 0.22 | % | | | 0.22 | % |
Net investment income | | | 2.68 | % | | | 3.03 | %(e) | | | | | | | 2.77 | %(f) | | | | | | | | | | | 2.53 | % | | | 2.55 | % | | | 2.45 | % |
Portfolio turnover rate(g) | | | 36 | % | | | 28 | % | | | | | | | 24 | % | | | | | | | | | | | 42 | % | | | 20 | % | | | 16 | % |
| (a) | Based on average shares outstanding. |
| (b) | Amount represents less than $0.005. |
| (c) | The mean between the last bid and ask prices. |
| (d) | Net asset value total return is calculated assuming an initial investment made at the net asset value at the beginning of the period, reinvestment of all dividends and distributions at net asset value during the period, and redemption at net asset value on the last day of the period. Net asset value total return includes adjustments in accordance with accounting principles generally accepted in the United States of America and as such, the net asset value for financial reporting purposes and the returns based upon those net asset values may differ from the net asset value and returns for shareholder transactions. Market price total return is calculated assuming an initial investment made at the market price at the beginning of the period, reinvestment of all dividends and distributions at market price during the period, and sale at the market price on the last day of the period. Total investment returns calculated for a period of less than one year are not annualized. |
| (e) | Ratios include non-recurring costs associated with a proxy statement of 0.01%. |
| (g) | Portfolio turnover rate is not annualized for periods less than one year, if applicable, and does not include securities received or delivered from processing creations or redemptions. |
See accompanying Notes to Financial Statements which are an integral part of the financial statements.
Financial Highlights—(continued)
Invesco National AMT-Free Municipal Bond ETF (PZA)
| | | | | | | | | | | | | | | | | | | | | | | | | | | | | | | | |
| | | Years Ended August 31, | | | Ten Months Ended August 31, | | | | | Years Ended October 31, | |
| | | 2020 | | | 2019 | | | 2018 | | | | | 2017 | | | 2016 | | | 2015 | |
Per Share Operating Performance: | | | | | | | | | | | | | | | | | | | | | | | | | | | | | | | | |
Net asset value at beginning of period | | $ | 26.76 | | | $ | 25.11 | | | | | $ | 25.58 | | | | | | | | | $ | 25.69 | | | $ | 25.10 | | | $ | 25.17 | |
| | | | | | | | | | | | | | | | | | | | | | | | | | | | | | | | |
Net investment income(a) | | | 0.68 | | | | 0.76 | | | | | | 0.65 | | | | | | | | | | 0.77 | | | | 0.82 | | | | 0.92 | |
Net realized and unrealized gain (loss) on investments | | | (0.02 | ) | | | 1.65 | | | | | | (0.46 | ) | | | | | | | | | (0.11 | ) | | | 0.57 | | | | (0.09 | ) |
| | | | | | | | | | | | | | | | | | | | | | | | | | | | | | | | |
Total from investment operations | | | 0.66 | | | | 2.41 | | | | | | 0.19 | | | | | | | | | | 0.66 | | | | 1.39 | | | | 0.83 | |
| | | | | | | | | | | | | | | | | | | | | | | | | | | | | | | | |
Distributions to shareholders from: | | | | | | | | | | | | | | | | | | | | | | | | | | | | | | | | |
Net investment income | | | (0.69 | ) | | | (0.76 | ) | | | | | (0.66 | ) | | | | | | | | | (0.78 | ) | | | (0.83 | ) | | | (0.92 | ) |
Return of capital | | | - | | | | - | | | | | | - | | | | | | | | | | - | | | | (0.00 | )(b) | | | (0.00 | )(b) |
| | | | | | | | | | | | | | | | | | | | | | | | | | | | | | | | |
Total distributions | | | (0.69 | ) | | | (0.76 | ) | | | | | (0.66 | ) | | | | | | | | | (0.78 | ) | | | (0.83 | ) | | | (0.92 | ) |
| | | | | | | | | | | | | | | | | | | | | | | | | | | | | | | | |
Transaction fees(a) | | | 0.01 | | | | 0.00 | (b) | | | | | 0.00 | (b) | | | | | | | | | 0.01 | | | | 0.03 | | | | 0.02 | |
| | | | | | | | | | | | | | | | | | | | | | | | | | | | | | | | |
Net asset value at end of period | | $ | 26.74 | | | $ | 26.76 | | | | | $ | 25.11 | | | | | | | | | $ | 25.58 | | | $ | 25.69 | | | $ | 25.10 | |
| | | | | | | | | | | | | | | | | | | | | | | | | | | | | | | | |
Market price at end of period(c) | | $ | 26.73 | | | $ | 26.80 | | | | | $ | 25.12 | | | | | | | | | $ | 25.55 | | | $ | 25.77 | | | $ | 25.15 | |
| | | | | | | | | | | | | | | | | | | | | | | | | | | | | | | | |
Net Asset Value Total Return(d) | | | 2.60 | % | | | 9.83 | % | | | | | 0.77 | % | | | | | | | | | 2.70 | % | | | 5.71 | % | | | 3.45 | % |
Market Price Total Return(d) | | | 2.42 | % | | | 9.96 | % | | | | | 0.93 | % | | | | | | | | | 2.25 | % | | | 5.82 | % | | | 3.32 | % |
Ratios/Supplemental Data: | | | | | | | | | | | | | | | | | | | | | | | | | | | | | | | | |
Net assets at end of period (000’s omitted) | | $ | 2,677,153 | | | $ | 2,005,998 | | | | | $ | 1,659,981 | | | | | | | | | $ | 1,611,258 | | | $ | 1,379,633 | | | $ | 897,395 | |
Ratio to average net assets of: | | | | | | | | | | | | | | | | | | | | | | | | | | | | | | | | |
Expenses | | | 0.28 | % | | | 0.28 | % | | | | | 0.28 | %(e) | | | | | | | | | 0.28 | % | | | 0.28 | % | | | 0.28 | % |
Net investment income | | | 2.59 | % | | | 2.99 | % | | | | | 3.10 | %(e) | | | | | | | | | 3.06 | % | | | 3.17 | % | | | 3.64 | % |
Portfolio turnover rate(f) | | | 15 | % | | | 11 | % | | | | | 8 | % | | | | | | | | | 23 | % | | | 6 | % | | | 4 | % |
| (a) | Based on average shares outstanding. |
| (b) | Amount represents less than $0.005. |
| (c) | The mean between the last bid and ask prices. |
| (d) | Net asset value total return is calculated assuming an initial investment made at the net asset value at the beginning of the period, reinvestment of all dividends and distributions at net asset value during the period, and redemption at net asset value on the last day of the period. Net asset value total return includes adjustments in accordance with accounting principles generally accepted in the United States of America and as such, the net asset value for financial reporting purposes and the returns based upon those net asset values may differ from the net asset value and returns for shareholder transactions. Market price total return is calculated assuming an initial investment made at the market price at the beginning of the period, reinvestment of all dividends and distributions at market price during the period, and sale at the market price on the last day of the period. Total investment returns calculated for a period of less than one year are not annualized. |
| (f) | Portfolio turnover rate is not annualized for periods less than one year, if applicable, and does not include securities received or delivered from processing creations or redemptions. |
See accompanying Notes to Financial Statements which are an integral part of the financial statements.
Financial Highlights—(continued)
Invesco New York AMT-Free Municipal Bond ETF (PZT)
| | | | | | | | | | | | | | | | | | | | | | | | | | | | | | | | |
| | | Years Ended August 31, | | | Ten Months Ended August 31, | | | | | Years Ended October 31, | |
| | | 2020 | | | 2019 | | | 2018 | | | | | 2017 | | | 2016 | | | 2015 | |
Per Share Operating Performance: | | | | | | | | | | | | | | | | | | | | | | | | | | | | | | | | |
Net asset value at beginning of period | | $ | 25.68 | | | $ | 23.99 | | | | | $ | 24.47 | | | | | | | | | $ | 24.64 | | | $ | 24.14 | | | $ | 24.33 | |
| | | | | | | | | | | | | | | | | | | | | | | | | | | | | | | | |
Net investment income(a) | | | 0.67 | | | | 0.69 | | | | | | 0.58 | | | | | | | | | | 0.73 | | | | 0.81 | | | | 0.83 | |
Net realized and unrealized gain (loss) on investments | | | (0.01 | ) | | | 1.70 | | | | | | (0.47 | ) | | | | | | | | | (0.17 | ) | | | 0.51 | | | | (0.19 | ) |
| | | | | | | | | | | | | | | | | | | | | | | | | | | | | | | | |
Total from investment operations | | | 0.66 | | | | 2.39 | | | | | | 0.11 | | | | | | | | | | 0.56 | | | | 1.32 | | | | 0.64 | |
| | | | | | | | | | | | | | | | | | | | | | | | | | | | | | | | |
Distributions to shareholders from: | | | | | | | | | | | | | | | | | | | | | | | | | | | | | | | | |
Net investment income | | | (0.67 | ) | | | (0.70 | ) | | | | | (0.59 | ) | | | | | | | | | (0.73 | ) | | | (0.81 | ) | | | (0.83 | ) |
Return of capital | | | - | | | | - | | | | | | - | | | | | | | | | | - | | | | (0.01 | ) | | | (0.00 | )(b) |
| | | | | | | | | | | | | | | | | | | | | | | | | | | | | | | | |
Total distributions | | | (0.67 | ) | | | (0.70 | ) | | | | | (0.59 | ) | | | | | | | | | (0.73 | ) | | | (0.82 | ) | | | (0.83 | ) |
| | | | | | | | | | | | | | | | | | | | | | | | | | | | | | | | |
Net asset value at end of period | | $ | 25.67 | | | $ | 25.68 | | | | | $ | 23.99 | | | | | | | | | $ | 24.47 | | | $ | 24.64 | | | $ | 24.14 | |
| | | | | | | | | | | | | | | | | | | | | | | | | | | | | | | | |
Market price at end of period(c) | | $ | 25.73 | | | $ | 25.70 | | | | | $ | 23.92 | | | | | | | | | $ | 24.53 | | | $ | 24.67 | | | $ | 24.05 | |
| | | | | | | | | | | | | | | | | | | | | | | | | | | | | | | | |
Net Asset Value Total Return(d) | | | 2.66 | % | | | 10.17 | % | | | | | 0.46 | % | | | | | | | | | 2.37 | % | | | 5.50 | % | | | 2.68 | % |
Market Price Total Return(d) | | | 2.83 | % | | | 10.58 | % | | | | | (0.08 | )% | | | | | | | | | 2.49 | % | | | 6.02 | % | | | 2.77 | % |
Ratios/Supplemental Data: | | | | | | | | | | | | | | | | | | | | | | | | | | | | | | | | |
Net assets at end of period (000’s omitted) | | $ | 98,829 | | | $ | 79,601 | | | | | $ | 63,577 | | | | | | | | | $ | 66,061 | | | $ | 64,063 | | | $ | 50,692 | |
Ratio to average net assets of: | | | | | | | | | | | | | | | | | | | | | | | | | | | | | | | | |
Expenses | | | 0.28 | % | | | 0.29 | %(e) | | | | | 0.28 | %(f) | | | | | | | | | 0.28 | % | | | 0.28 | % | | | 0.28 | % |
Net investment income | | | 2.64 | % | | | 2.84 | %(e) | | | | | 2.89 | %(f) | | | | | | | | | 3.01 | % | | | 3.26 | % | | | 3.42 | % |
Portfolio turnover rate(g) | | | 12 | % | | | 11 | % | | | | | 7 | % | | | | | | | | | 22 | % | | | 21 | % | | | 18 | % |
| (a) | Based on average shares outstanding. |
| (b) | Amount represents less than $0.005. |
| (c) | The mean between the last bid and ask prices. |
| (d) | Net asset value total return is calculated assuming an initial investment made at the net asset value at the beginning of the period, reinvestment of all dividends and distributions at net asset value during the period, and redemption at net asset value on the last day of the period. Net asset value total return includes adjustments in accordance with accounting principles generally accepted in the United States of America and as such, the net asset value for financial reporting purposes and the returns based upon those net asset values may differ from the net asset value and returns for shareholder transactions. Market price total return is calculated assuming an initial investment made at the market price at the beginning of the period, reinvestment of all dividends and distributions at market price during the period, and sale at the market price on the last day of the period. Total investment returns calculated for a period of less than one year are not annualized. |
| (e) | Ratios include non-recurring costs associated with a proxy statement of 0.01%. |
| (g) | Portfolio turnover rate is not annualized for periods less than one year, if applicable, and does not include securities received or delivered from processing creations or redemptions. |
See accompanying Notes to Financial Statements which are an integral part of the financial statements.
Financial Highlights—(continued)
Invesco Preferred ETF (PGX)
| | | | | | | | | | | | | | | | | | | | | | | | | | | | | | | | |
| | | Years Ended August 31, | | | Ten Months Ended August 31, | | | | | Years Ended October 31, | |
| | | 2020 | | | 2019 | | | 2018 | | | | | 2017 | | | 2016 | | | 2015 | |
Per Share Operating Performance: | | | | | | | | | | | | | | | | | | | | | | | | | | | | | | | | |
Net asset value at beginning of period | | $ | 14.93 | | | $ | 14.60 | | | | | $ | 14.97 | | | | | | | | | $ | 14.96 | | | $ | 14.78 | | | $ | 14.57 | |
| | | | | | | | | | | | | | | | | | | | | | | | | | | | | | | | |
Net investment income(a) | | | 0.75 | | | | 0.78 | | | | | | 0.71 | | | | | | | | | | 0.84 | | | | 0.84 | | | | 0.87 | |
Net realized and unrealized gain (loss) on investments | | | (0.06 | ) | | | 0.36 | | | | | | (0.40 | ) | | | | | | | | | 0.02 | | | | 0.20 | | | | 0.21 | |
| | | | | | | | | | | | | | | | | | | | | | | | | | | | | | | | |
Total from investment operations | | | 0.69 | | | | 1.14 | | | | | | 0.31 | | | | | | | | | | 0.86 | | | | 1.04 | | | | 1.08 | |
| | | | | | | | | | | | | | | | | | | | | | | | | | | | | | | | |
Distributions to shareholders from: | | | | | | | | | | | | | | | | | | | | | | | | | | | | | | | | |
Net investment income | | | (0.76 | ) | | | (0.81 | ) | | | | | (0.68 | ) | | | | | | | | | (0.85 | ) | | | (0.86 | ) | | | (0.87 | ) |
| | | | | | | | | | | | | | | | | | | | | | | | | | | | | | | | |
Net asset value at end of period | | $ | 14.86 | | | $ | 14.93 | | | | | $ | 14.60 | | | | | | | | | $ | 14.97 | | | $ | 14.96 | | | $ | 14.78 | |
| | | | | | | | | | | | | | | | | | | | | | | | | | | | | | | | |
Market price at end of period(b) | | $ | 14.91 | | | $ | 14.97 | | | | | $ | 14.62 | | | | | | | | | $ | 14.96 | | | $ | 15.00 | | | $ | 14.80 | |
| | | | | | | | | | | | | | | | | | | | | | | | | | | | | | | | |
Net Asset Value Total Return(c) | | | 4.98 | % | | | 8.23 | % | | | | | 2.18 | % | | | | | | | | | 5.97 | % | | | 7.22 | % | | | 7.66 | % |
Market Price Total Return(c) | | | 5.04 | % | | | 8.37 | % | | | | | 2.39 | % | | | | | | | | | 5.60 | % | | | 7.36 | % | | | 7.43 | % |
Ratios/Supplemental Data: | | | | | | | | | | | | | | | | | | | | | | | | | | | | | | | | |
Net assets at end of period (000’s omitted) | | $ | 6,260,956 | | | $ | 5,352,615 | | | | | $ | 5,378,011 | | | | | | | | | $ | 5,333,535 | | | $ | 4,730,845 | | | $ | 3,117,091 | |
Ratio to average net assets of: | | | | | | | | | | | | | | | | | | | | | | | | | | | | | | | | |
Expenses | | | 0.50 | %(d) | | | 0.50 | %(d) | | | | | 0.50 | %(d)(e) | | | | | | | | | 0.50 | % | | | 0.50 | % | | | 0.50 | % |
Net investment income | | | 5.20 | %(d) | | | 5.45 | %(d) | | | | | 5.83 | %(d)(e) | | | | | | | | | 5.66 | % | | | 5.63 | % | | | 5.95 | % |
Portfolio turnover rate(f) | | | 18 | % | | | 15 | % | | | | | 16 | % | | | | | | | | | 10 | % | | | 14 | % | | | 12 | % |
| (a) | Based on average shares outstanding. |
| (b) | The mean between the last bid and ask prices. |
| (c) | Net asset value total return is calculated assuming an initial investment made at the net asset value at the beginning of the period, reinvestment of all dividends and distributions at net asset value during the period, and redemption at net asset value on the last day of the period. Net asset value total return includes adjustments in accordance with accounting principles generally accepted in the United States of America and as such, the net asset value for financial reporting purposes and the returns based upon those net asset values may differ from the net asset value and returns for shareholder transactions. Market price total return is calculated assuming an initial investment made at the market price at the beginning of the period, reinvestment of all dividends and distributions at market price during the period, and sale at the market price on the last day of the period. Total investment returns calculated for a period of less than one year are not annualized. |
| (d) | In addition to the fees and expenses which the Fund bears directly, the Fund indirectly bears a pro rata share of the fees and expenses of the investment companies in which the Fund invests. Estimated investment companies’ expenses are not expenses that are incurred directly by the Fund. They are expenses that are incurred directly by the investment companies and are deducted from the value of the investment companies the Fund invests in. The effect of the estimated investment companies’ expenses that the Fund bears indirectly is included in the Fund’s total return. |
| (f) | Portfolio turnover rate is not annualized for periods less than one year, if applicable, and does not include securities received or delivered from processing creations or redemptions. |
See accompanying Notes to Financial Statements which are an integral part of the financial statements.
Financial Highlights—(continued)
Invesco Taxable Municipal Bond ETF (BAB)
| | | | | | | | | | | | | | | | | | | | | | | | | | | | | | | | |
| | | Years Ended August 31, | | | Ten Months Ended August 31, | | | | | Years Ended October 31, | |
| | | 2020 | | | 2019 | | | 2018 | | | | | 2017 | | | 2016 | | | 2015 | |
| | | | | | | | | |
Per Share Operating Performance: | | | | | | | | | | | | | | | | | | | | | | | | | | | | | | | | |
Net asset value at beginning of period | | $ | 32.83 | | | $ | 29.66 | | | | | $ | 30.38 | | | | | | | | | $ | 30.68 | | | $ | 29.11 | | | $ | 29.77 | |
| | | | | | | | | | | | | | | | | | | | | | | | | | | | | | | | |
Net investment income(a) | | | 1.07 | | | | 1.23 | | | | | | 1.01 | | | | | | | | | | 1.21 | | | | 1.26 | | | | 1.37 | |
Net realized and unrealized gain (loss) on investments | | | 0.58 | | | | 3.14 | | | | | | (0.72 | ) | | | | | | | | | (0.32 | ) | | | 1.54 | | | | (0.71 | ) |
| | | | | | | | | | | | | | | | | | | | | | | | | | | | | | | | |
Total from investment operations | | | 1.65 | | | | 4.37 | | | | | | 0.29 | | | | | | | | | | 0.89 | | | | 2.80 | | | | 0.66 | |
| | | | | | | | | | | | | | | | | | | | | | | | | | | | | | | | |
Distributions to shareholders from: | | | | | | | | | | | | | | | | | | | | | | | | | | | | | | | | |
Net investment income | | | (1.10 | ) | | | (1.23 | ) | | | | | (1.02 | ) | | | | | | | | | (1.21 | ) | | | (1.27 | ) | | | (1.37 | ) |
| | | | | | | | | | | | | | | | | | | | | | | | | | | | | | | | |
Transaction fees(a) | | | 0.02 | | | | 0.03 | | | | | | 0.01 | | | | | | | | | | 0.02 | | | | 0.04 | | | | 0.05 | |
| | | | | | | | | | | | | | | | | | | | | | | | | | | | | | | | |
Net asset value at end of period | | $ | 33.40 | | | $ | 32.83 | | | | | $ | 29.66 | | | | | | | | | $ | 30.38 | | | $ | 30.68 | | | $ | 29.11 | |
| | | | | | | | | | | | | | | | | | | | | | | | | | | | | | | | |
Market price at end of period(b) | | $ | 33.41 | | | $ | 32.97 | | | | | $ | 29.51 | | | | | | | | | $ | 30.45 | | | $ | 30.74 | | | $ | 29.17 | |
| | | | | | | | | | | | | | | | | | | | | | | | | | | | | | | | |
Net Asset Value Total Return(c) | | | 5.28 | % | | | 15.31 | % | | | | | 1.02 | % | | | | | | | | | 3.14 | % | | | 9.93 | % | | | 2.40 | % |
Market Price Total Return(c) | | | 4.88 | % | | | 16.39 | % | | | | | 0.29 | % | | | | | | | | | 3.19 | % | | | 9.90 | % | | | 2.65 | % |
Ratios/Supplemental Data: | | | | | | | | | | | | | | | | | | | | | | | | | | | | | | | | |
Net assets at end of period (000’s omitted) | | $ | 2,005,861 | | | $ | 1,308,223 | | | | | $ | 938,871 | | | | | | | | | $ | 972,235 | | | $ | 1,070,679 | | | $ | 676,840 | |
Ratio to average net assets of: | | | | | | | | | | | | | | | | | | | | | | | | | | | | | | | | |
Expenses, after Waivers | | | 0.27 | % | | | 0.28 | % | | | | | 0.28 | %(d) | | | | | | | | | 0.28 | %(e) | | | 0.27 | % | | | 0.28 | % |
Expenses, prior to Waivers | | | 0.28 | % | | | 0.28 | % | | | | | 0.28 | %(d) | | | | | | | | | 0.28 | %(e) | | | 0.27 | % | | | 0.28 | % |
Net investment income | | | 3.32 | % | | | 4.06 | % | | | | | 4.06 | %(d) | | | | | | | | | 4.05 | %(e) | | | 4.14 | % | | | 4.59 | % |
Portfolio turnover rate(f) | | | 18 | % | | | 7 | % | | | | | 4 | % | | | | | | | | | 6 | % | | | 0 | %(g) | | | 9 | % |
| (a) | Based on average shares outstanding. |
| (b) | The mean between the last bid and ask prices. |
| (c) | Net asset value total return is calculated assuming an initial investment made at the net asset value at the beginning of the period, reinvestment of all dividends and distributions at net asset value during the period, and redemption at net asset value on the last day of the period. Net asset value total return includes adjustments in accordance with accounting principles generally accepted in the United States of America and as such, the net asset value for financial reporting purposes and the returns based upon those net asset values may differ from the net asset value and returns for shareholder transactions. Market price total return is calculated assuming an initial investment made at the market price at the beginning of the period, reinvestment of all dividends and distributions at market price during the period, and sale at the market price on the last day of the period. Total investment returns calculated for a period of less than one year are not annualized. |
| (e) | In addition to the fees and expenses which the Fund bears directly, the Fund indirectly bears a pro rata share of the fees and expenses of the investment companies in which the Fund invests. Estimated investment companies’ expenses are not expenses that are incurred directly by the Fund. They are expenses that are incurred directly by the investment companies and are deducted from the value of the investment companies the Fund invests in. The effect of the estimated investment companies’ expenses that the Fund bears indirectly is included in the Fund’s total return. |
| (f) | Portfolio turnover rate is not annualized for periods less than one year, if applicable, and does not include securities received or delivered from processing creations or redemptions. For the year ended October 31, 2017, the portfolio turnover calculation includes the value of securities purchased and sold in the effort to realign the Fund’s portfolio holdings due to the underlying index change. |
| (g) | Amount represents less than 0.5%. |
See accompanying Notes to Financial Statements which are an integral part of the financial statements.
Financial Highlights—(continued)
Invesco Treasury Collateral ETF (CLTL)
| | | | | | | | | | | | | | | | | | | | | | | | | | | | | | | | |
| | | Years Ended August 31, | | | Ten Months Ended August 31, | | | | | For the Period January 10, 2017(a) Through October 31, | |
| | | 2020 | | | 2019 | | | 2018 | | | | | 2017 | |
Per Share Operating Performance: | | | | | | | | | | | | | | | | | | | | | | | | | | | | | | | | |
Net asset value at beginning of period | | $ | 105.60 | | | $ | 105.48 | | | | | $ | 105.93 | | | | | | | | | | | | | $ | 105.35 | | | | | |
| | | | | | | | | | | | | | | | | | | | | | | | | | | | | | | | |
Net investment income(b) | | | 1.27 | | | | 2.39 | | | | | | 1.28 | | | | | | | | | | | | | | 0.66 | | | | | |
Net realized and unrealized gain (loss) on investments | | | 0.37 | | | | 0.16 | | | | | | 0.00 | (c) | | | | | | | | | | | | | (0.08 | ) | | | | |
| | | | | | | | | | | | | | | | | | | | | | | | | | | | | | | | |
Total from investment operations | | | 1.64 | | | | 2.55 | | | | | | 1.28 | | | | | | | | | | | | | | 0.58 | | | | | |
| | | | | | | | | | | | | | | | | | | | | | | | | | | | | | | | |
Distributions to shareholders from: | | | | | | | | | | | | | | | | | | | | | | | | | | | | | | | | |
Net investment income | | | (1.45 | ) | | | (2.43 | ) | | | | | (1.73 | ) | | | | | | | | | | | | | - | | | | | |
Net realized gains | | | (0.02 | ) | | | - | | | | | | - | | | | | | | | | | | | | | - | | | | | |
| | | | | | | | | | | | | | | | | | | | | | | | | | | | | | | | |
Total distributions | | | (1.47 | ) | | | (2.43 | ) | | | | | (1.73 | ) | | | | | | | | | | | | | - | | | | | |
| | | | | | | | | | | | | | | | | | | | | | | | | | | | | | | | |
Net asset value at end of period | | $ | 105.77 | | | $ | 105.60 | | | | | $ | 105.48 | | | | | | | | | | | | | $ | 105.93 | | | | | |
| | | | | | | | | | | | | | | | | | | | | | | | | | | | | | | | |
Market price at end of period(d) | | $ | 105.78 | | | $ | 105.62 | | | | | $ | 105.54 | | | | | | | | | | | | | $ | 105.94 | | | | | |
| | | | | | | | | | | | | | | | | | | | | | | | | | | | | | | | |
Net Asset Value Total Return(e) | | | 1.56 | % | | | 2.44 | % | | | | | 1.22 | % | | | | | | | | | | | | | 0.55 | %(f) | | | | |
Market Price Total Return(e) | | | 1.55 | % | | | 2.41 | % | | | | | 1.27 | % | | | | | | | | | | | | | 0.56 | %(f) | | | | |
Ratios/Supplemental Data: | | | | | | | | | | | | | | | | | | | | | | | | | | | | | | | | |
Net assets at end of period (000’s omitted) | | $ | 938,170 | | | $ | 547,018 | | | | | $ | 468,323 | | | | | | | | | | | | | $ | 454,429 | | | | | |
Ratio to average net assets of: | | | | | | | | | | | | | | | | | | | | | | | | | | | | | | | | |
Expenses | | | 0.08 | % | | | 0.08 | % | | | | | 0.08 | %(g) | | | | | | | | | | | | | 0.08 | %(g) | | | | |
Net investment income | | | 1.20 | % | | | 2.27 | % | | | | | 1.45 | %(g) | | | | | | | | | | | | | 0.77 | %(g) | | | | |
| (a) | Commencement of investment operations. |
| (b) | Based on average shares outstanding. |
| (c) | Amount represents less than $0.005. |
| (d) | The mean between the last bid and ask prices. |
| (e) | Net asset value total return is calculated assuming an initial investment made at the net asset value at the beginning of the period, reinvestment of all dividends and distributions at net asset value during the period, and redemption at net asset value on the last day of the period. Net asset value total return includes adjustments in accordance with accounting principles generally accepted in the United States of America and as such, the net asset value for financial reporting purposes and the returns based upon those net asset values may differ from the net asset value and returns for shareholder transactions. Market price total return is calculated assuming an initial investment made at the market price at the beginning of the period, reinvestment of all dividends and distributions at market price during the period, and sale at the market price on the last day of the period. Total investment returns calculated for a period of less than one year are not annualized. |
| (f) | The net asset value total return from Fund Inception (January 12, 2017, the first day of trading on the Exchange) to October 31, 2017 was 0.55%. The market price total return from Fund Inception to October 31, 2017 was 0.54%. |
See accompanying Notes to Financial Statements which are an integral part of the financial statements.
Financial Highlights—(continued)
Invesco Variable Rate Preferred ETF (VRP)
| | | | | | | | | | | | | | | | | | | | | | | | | | | | | | | | |
| | | | | | | | | | Ten Months Ended | | | | | | | | | | |
| | | Years Ended August 31, | | | | August 31, | | | Years Ended October 31, | |
| | | 2020 | | | 2019 | | | | 2018 | | | 2017 | | | 2016 | | | 2015 | |
Per Share Operating Performance: | | | | | | | | | | | | | | | | | | | | | | | | | | | | | | | | |
Net asset value at beginning of period | | $ | 25.28 | | | $25.14 | | | | | | $ | 25.87 | | | | | | | | | $ | 25.33 | | | $ | 24.36 | | | $ | 24.85 | |
| | | | | | | | | | | | | | | | | | | | | | | | | | | | | | | | |
Net investment income(a) | | | 1.13 | | | 1.14 | | | | | | | 0.91 | | | | | | | | | | 1.21 | | | | 1.23 | | | | 1.20 | |
Net realized and unrealized gain (loss) on investments | | | (0.31 | ) | | 0.33 | | | | | | | (0.66 | ) | | | | | | | | | 0.56 | | | | 0.98 | | | | (0.47 | ) |
| | | | | | | | | | | | | | | | | | | | | | | | | | | | | | | | |
Total from investment operations | | | 0.82 | | | 1.47 | | | | | | | 0.25 | | | | | | | | | | 1.77 | | | | 2.21 | | | | 0.73 | |
| | | | | | | | | | | | | | | | | | | | | | | | | | | | | | | | |
Distributions to shareholders from: | | | | | | | | | | | | | | | | | | | | | | | | | | | | | | | | |
Net investment income | | | (1.14 | ) | | (1.33) | | | | | | | (0.98 | ) | | | | | | | | | (1.23 | ) | | | (1.24 | ) | | | (1.20 | ) |
Return of capital | | | - | | | - | | | | | | | - | | | | | | | | | | - | | | | - | | | | (0.02 | ) |
| | | | | | | | | | | | | | | | | | | | | | | | | | | | | | | | |
Total distributions | | | (1.14 | ) | | (1.33) | | | | | | | (0.98 | ) | | | | | | | | | (1.23 | ) | | | (1.24 | ) | | | (1.22 | ) |
| | | | | | | | | | | | | | | | | | | | | | | | | | | | | | | | |
Net asset value at end of period | | $ | 24.96 | | | $25.28 | | | | | | $ | 25.14 | | | | | | | | | $ | 25.87 | | | $ | 25.33 | | | $ | 24.36 | |
| | | | | | | | | | | | | | | | | | | | | | | | | | | | | | | | |
Market price at end of period(b) | | $ | 25.01 | | | $25.33 | | | | | | $ | 25.11 | | | | | | | | | $ | 25.94 | | | $ | 25.42 | | | $ | 24.40 | |
| | | | | | | | | | | | | | | | | | | | | | | | | | | | | | | | |
Net Asset Value Total Return(c) | | | 3.48 | % | | 6.17% | | | | | | | 1.01 | % | | | | | | | | | 7.18 | % | | | 9.43 | % | | | 2.99 | % |
Market Price Total Return(c) | | | 3.51 | % | | 6.52% | | | | | | | 0.62 | % | | | | | | | | | 7.08 | % | | | 9.63 | % | | | 2.85 | % |
Ratios/Supplemental Data: | | | | | | | | | | | | | | | | | | | | | | | | | | | | | | | | |
Net assets at end of period (000’s omitted) | | $ | 1,472,807 | | | $1,529,601 | | | | | | $ | 2,192,114 | | | | | | | | | $ | 1,890,954 | | | $ | 899,060 | | | $ | 397,065 | |
Ratio to average net assets of: | | | | | | | | | | | | | | | | | | | | | | | | | | | | | | | | |
Expenses | | | 0.50 | % | | 0.50% | | | | | | | 0.50 | %(d) | | | | | | | | | 0.50 | % | | | 0.50 | % | | | 0.50 | % |
Net investment income | | | 4.61 | % | | 4.63% | | | | | | | 4.31 | %(d) | | | | | | | | | 4.72 | % | | | 5.03 | % | | | 4.88 | % |
Portfolio turnover rate(e) | | | 22 | % | | 13% | | | | | | | 7 | % | | | | | | | | | 4 | % | | | 17 | % | | | 5 | % |
| (a) | Based on average shares outstanding. |
| (b) | The mean between the last bid and ask prices. |
| (c) | Net asset value total return is calculated assuming an initial investment made at the net asset value at the beginning of the period, reinvestment of all dividends and distributions at net asset value during the period, and redemption at net asset value on the last day of the period. Net asset value total return includes adjustments in accordance with accounting principles generally accepted in the United States of America and as such, the net asset value for financial reporting purposes and the returns based upon those net asset values may differ from the net asset value and returns for shareholder transactions. Market price total return is calculated assuming an initial investment made at the market price at the beginning of the period, reinvestment of all dividends and distributions at market price during the period, and sale at the market price on the last day of the period. Total investment returns calculated for a period of less than one year are not annualized. |
| (e) | Portfolio turnover rate is not annualized for periods less than one year, if applicable, and does not include securities received or delivered from processing creations or redemptions. |
See accompanying Notes to Financial Statements which are an integral part of the financial statements.
Financial Highlights—(continued)
Invesco VRDO Tax-Free Weekly ETF (PVI)
| | | | | | | | | | | | | | | | | | | | | | | | | | | | | | | | |
| | | | | | | | | Ten Months Ended | | | | | | | | | | | | |
| | | Years Ended August 31, | | | August 31, | | | | | Years Ended October 31, | |
| | | 2020 | | | 2019 | | | 2018 | | | | | 2017 | | | 2016 | | | 2015 | |
| | | | | | | | | |
Per Share Operating Performance: | | | | | | | | | | | | | | | | | | | | | | | | | | | | | | | | |
Net asset value at beginning of period | | $ | 24.93 | | | $ | 24.93 | | | | | $ | 24.93 | | | | | | | | | $ | 24.93 | | | $ | 24.93 | | | $ | 24.96 | |
| | | | | | | | | | | | | | | | | | | | | | | | | | | | | | | | |
Net investment income (loss)(a) | | | 0.17 | | | | 0.31 | | | | | | 0.20 | | | | | | | | | | 0.13 | | | | 0.02 | | | | (0.03 | ) |
Net realized and unrealized gain on investments | | | (0.00 | )(b) | | | - | | | | | | - | | | | | | | | | | (0.00 | )(b) | | | - | | | | . | |
| | | | | | | | | | | | | | | | | | | | | | | | | | | | | | | | |
Total from investment operations | | | 0.17 | | | | 0.31 | | | | | | 0.20 | | | | | | | | | | 0.13 | | | | 0.02 | | | | (0.03 | ) |
| | | | | | | | | | | | | | | | | | | | | | | | | | | | | | | | |
Distributions to shareholders from: | | | | | | | | | | | | | | | | | | | | | | | | | | | | | | | | |
Net investment income | | | (0.17 | ) | | | (0.31 | ) | | | | | (0.20 | ) | | | | | | | | | (0.13 | ) | | | (0.02 | ) | | | - | |
Return of capital | | | - | | | | - | | | | | | - | | | | | | | | | | (0.00 | )(b) | | | (0.00 | )(b) | | | (0.00 | )(b) |
| | | | | | | | | | | | | | | | | | | | | | | | | | | | | | | | |
Total distributions | | | (0.17 | ) | | | (0.31 | ) | | | | | (0.20 | ) | | | | | | | | | (0.13 | ) | | | (0.02 | ) | | | (0.00 | )(b) |
| | | | | | | | | | | | | | | | | | | | | | | | | | | | | | | | |
Net asset value at end of period | | $ | 24.93 | | | $ | 24.93 | | | | | $ | 24.93 | | | | | | | | | $ | 24.93 | | | $ | 24.93 | | | $ | 24.93 | |
| | | | | | | | | | | | | | | | | | | | | | | | | | | | | | | | |
Market price at end of period(c) | | $ | 24.93 | | | $ | 24.96 | | | | | $ | 24.93 | | | | | | | | | $ | 24.93 | | | $ | 24.91 | | | $ | 24.93 | |
| | | | | | | | | | | | | | | | | | | | | | | | | | | | | | | | |
Net Asset Value Total Return(d) | | | 0.69 | % | | | 1.26 | % | | | | | 0.82 | % | | | | | | | | | 0.51 | % | | | 0.07 | % | | | (0.12 | )% |
Market Price Total Return(d) | | | 0.58 | % | | | 1.38 | % | | | | | 0.82 | % | | | | | | | | | 0.59 | % | | | (0.01 | )% | | | (0.16 | )% |
Ratios/Supplemental Data: | | | | | | | | | | | | | | | | | | | | | | | | | | | | | | | | |
Net assets at end of period (000’s omitted) | | $ | 49,855 | | | $ | 57,338 | | | | | $ | 62,327 | | | | | | | | | $ | 83,512 | | | $ | 59,831 | | | $ | 81,010 | |
Ratio to average net assets of: | | | | | | | | | | | | | | | | | | | | | | | | | | | | | | | | |
Expenses | | | 0.25 | % | | | 0.26 | %(e) | | | | | 0.25 | %(f) | | | | | | | | | 0.25 | % | | | 0.25 | % | | | 0.25 | % |
Net investment income (loss) | | | 0.70 | % | | | 1.25 | %(e) | | | | | 0.98 | %(f) | | | | | | | | | 0.51 | % | | | 0.06 | % | | | (0.15 | )% |
| (a) | Based on average shares outstanding. |
| (b) | Amount represents less than $0.005. |
| (c) | The mean between the last bid and ask prices. |
| (d) | Net asset value total return is calculated assuming an initial investment made at the net asset value at the beginning of the period, reinvestment of all dividends and distributions at net asset value during the period, and redemption at net asset value on the last day of the period. Net asset value total return includes adjustments in accordance with accounting principles generally accepted in the United States of America and as such, the net asset value for financial reporting purposes and the returns based upon those net asset values may differ from the net asset value and returns for shareholder transactions. Market price total return is calculated assuming an initial investment made at the market price at the beginning of the period, reinvestment of all dividends and distributions at market price during the period, and sale at the market price on the last day of the period. Total investment returns calculated for a period of less than one year are not annualized. |
| (e) | Ratios include non-recurring costs associated with a proxy statement of 0.01%. |
See accompanying Notes to Financial Statements which are an integral part of the financial statements.
Notes to Financial Statements
Invesco Exchange-Traded Fund Trust II
August 31, 2020
NOTE 1–Organization
Invesco Exchange-Traded Fund Trust II (the “Trust”) was organized as a Massachusetts business trust on October 10, 2006 and is authorized to have multiple series of portfolios. The Trust is an open-end management investment company registered under the Investment Company Act of 1940, as amended (the “1940 Act”). This report includes the following portfolios:
| | |
| Full Name | | Short Name |
| |
Invesco 1-30 Laddered Treasury ETF (PLW) | | “1-30 Laddered Treasury ETF” |
| |
Invesco California AMT-Free Municipal Bond ETF (PWZ) | | “California AMT-Free Municipal Bond ETF” |
| |
Invesco CEF Income Composite ETF (PCEF) | | “CEF Income Composite ETF” |
| |
Invesco Fundamental High Yield® Corporate Bond ETF (PHB) | | “Fundamental High Yield® Corporate Bond ETF” |
| |
Invesco Fundamental Investment Grade Corporate Bond ETF (PFIG) | | “Fundamental Investment Grade Corporate Bond ETF” |
| |
Invesco National AMT-Free Municipal Bond ETF (PZA) | | “National AMT-Free Municipal Bond ETF” |
| |
Invesco New York AMT-Free Municipal Bond ETF (PZT) | | “New York AMT-Free Municipal Bond ETF” |
| |
Invesco Preferred ETF (PGX) | | “Preferred ETF” |
| |
Invesco Taxable Municipal Bond ETF (BAB) | | “Taxable Municipal Bond ETF” |
| |
Invesco Treasury Collateral ETF (CLTL) | | “Treasury Collateral ETF” |
| |
Invesco Variable Rate Preferred ETF (VRP) | | “Variable Rate Preferred ETF” |
| |
Invesco VRDO Tax-Free Weekly ETF (PVI) | | “VRDO Tax-Free Weekly ETF” |
Each portfolio (each, a “Fund”, and collectively, the “Funds”) represents a separate series of the Trust. The shares of the Funds are referred to herein as “Shares” or “Fund’s Shares.” Each Fund’s Shares are listed and traded on NYSE Arca, Inc., except for Shares of 1-30 Laddered Treasury ETF, which are listed and traded on The Nasdaq Stock Market.
The market price of each Share may differ to some degree from a Fund’s net asset value (“NAV”). Unlike conventional mutual funds, each Fund issues and redeems Shares on a continuous basis, at NAV, only in a large specified number of Shares, each called a “Creation Unit.” Creation Units of 1-30 Laddered Treasury ETF, CEF Income Composite ETF, Fundamental High Yield® Corporate Bond ETF, Fundamental Investment Grade Corporate Bond ETF, Preferred ETF, Treasury Collateral ETF and Variable Rate Preferred ETF are issued and redeemed principally in exchange for the deposit or delivery of a basket of securities (“Deposit Securities”). Creation Units of California AMT-Free Municipal Bond ETF, National AMT-Free Municipal Bond ETF, New York AMT-Free Municipal Bond ETF, Taxable Municipal Bond ETF and VRDO Tax-Free Weekly ETF are issued and redeemed principally in exchange for the deposit or delivery of cash. Except when aggregated in Creation Units by Authorized Participants, the Shares are not individually redeemable securities of the Funds.
To provide enhanced daily liquidity, Treasury Collateral ETF determines its NAV twice each day, at 12:00 p.m. ET and 4:00 p.m. ET. The Fund provides same-day settlement for creation/redemption trades in the primary market for any trades placed before the initial daily NAV strike.
CEF Income Composite ETF is a “fund of funds,” in that it invests in other funds (“Underlying Funds”). Each Underlying Fund’s accounting policies are outlined in that Underlying Fund’s financial statements and are publicly available.
The investment objective of each Fund is to seek to track the investment results (before fees and expenses) of its respective index listed below (each, an “Underlying Index”):
| | |
| Fund | | Underlying Index |
| |
1-30 Laddered Treasury ETF | | Ryan/NASDAQ U.S. 1-30 Year Treasury Laddered Index |
| |
California AMT-Free Municipal Bond ETF | | ICE BofAML California Long-Term Core Plus Municipal Securities Index |
| |
CEF Income Composite ETF | | S-Network Composite Closed-End Fund IndexSM |
| |
Fundamental High Yield® Corporate Bond ETF | | RAFI® Bonds U.S. High Yield 1-10 Index |
| |
Fundamental Investment Grade Corporate Bond ETF | | RAFI® Bonds U.S. Investment Grade 1-10 Index |
| |
National AMT-Free Municipal Bond ETF | | ICE BofAML National Long-Term Core Plus Municipal Securities Index |
| |
New York AMT-Free Municipal Bond ETF | | ICE BofAML New York Long-Term Core Plus Municipal Securities Index |
| |
Preferred ETF | | ICE BofAML Core Plus Fixed Rate Preferred Securities Index |
| |
Taxable Municipal Bond ETF | | ICE BofAML US Taxable Municipal Securities Plus Index |
| |
Treasury Collateral ETF | | ICE U.S. Treasury Short Bond Index |
| |
Variable Rate Preferred ETF | | Wells Fargo® Hybrid and Preferred Securities Floating and Variable Rate Index |
| |
VRDO Tax-Free Weekly ETF | | Bloomberg U.S. Municipal AMT-Free Weekly VRDO Index |
NOTE 2–Significant Accounting Policies
The following is a summary of the significant accounting policies followed by the Funds in preparation of their financial statements.
Each Fund is an investment company and accordingly follows the investment company accounting and reporting guidance in accordance with Financial Accounting Standards Board Accounting Standards Codification Topic 946, Financial Services–Investment Companies.
A. Security Valuation - Securities, including restricted securities, are valued according to the following policies:
A security listed or traded on an exchange (except convertible securities) is generally valued at its last sales price or official closing price as of the close of the customary trading session on the exchange where the security is principally traded or, lacking any sales or official closing price on a particular day, the security may be valued at the closing bid price on that day. Securities traded in the over-the-counter market are valued based on prices furnished by independent pricing services or market makers. When such securities are valued by an independent pricing service they may be considered fair valued. Futures contracts are valued at the final settlement price set by an exchange on which they are principally traded. Listed options are valued at the mean between the last bid and asked prices from the exchange on which they are principally traded, or at the final settlement price set by such exchange. Swaps and options not listed on an exchange are valued by an independent source. For purposes of determining NAV per Share, futures and option contracts generally are valued 15 minutes after the close of the customary trading session of the New York Stock Exchange (“NYSE”).
Investment companies are valued using such company’s NAV per share, unless the shares are exchange-traded, in which case they are valued at the last sales price or official closing price as of the close of the customary trading session on the exchange where the security is principally traded.
Debt obligations (including convertible securities) and unlisted equities are fair valued using an evaluated quote provided by an independent pricing service. Evaluated quotes provided by the pricing service may be determined without exclusive reliance on quoted prices, and may reflect appropriate factors such as institution-size trading in similar groups of securities, developments related to specific securities, dividend rate (for unlisted equities), yield (for debt obligations), quality, type of issue, coupon rate (for debt obligations), maturity (for debt obligations), individual trading characteristics and other market data. Securities with a demand feature exercisable within one to seven days are valued at par. Pricing services generally value debt obligations assuming orderly transactions of institutional round lot size, but a Fund may hold or transact in the same securities in smaller, odd lot sizes. Odd lots often trade at lower prices than institutional round lots. Debt obligations are subject to interest rate and credit risks. In addition, all debt obligations involve some risk of default with respect to interest and/or principal payments.
Foreign securities’ (including foreign exchange contracts’) prices are converted into U.S. dollar amounts using the applicable exchange rates as of the close of the London world markets. If market quotations are available and reliable for foreign exchange-traded equity securities, the securities will be valued at the market quotations. Because trading hours for certain foreign securities end before the close of the NYSE, closing market quotations may become unreliable. If between the time trading ends on a particular security and the close of the customary trading session on the NYSE, events occur that Invesco Capital Management LLC (the “Adviser”) determines are significant and make the closing price unreliable, a Fund may fair value the security. If the event is likely to have affected the closing price of the security, the security will be valued at fair value in good faith using procedures approved by the Board of Trustees. Adjustments to closing prices to reflect fair value may also be based on a screening process of an independent pricing service to indicate the degree of certainty, based on historical data, that the closing price in the principal market where a foreign security trades is not the current value as of the close of the NYSE. Foreign securities’ prices meeting the approved degree of certainty that the price is not reflective of current value will be priced at the indication of fair value from the independent pricing service. Multiple factors may be considered by the independent pricing service in determining adjustments to reflect fair value and may include information relating to sector indices, American Depositary Receipts and domestic and foreign index futures. Foreign securities may have additional risks including exchange rate changes, the potential for sharply devalued currencies and high inflation, political and economic upheaval, the relative lack of issuer information, relatively low market liquidity and the potential lack of strict financial and accounting controls and standards.
Securities for which market prices are not provided by any of the above methods may be valued based upon quotes furnished by independent sources. The last bid price may be used to value exchange-traded equity securities. The mean between the last bid and asked prices may be used to value debt obligations, including corporate loans, and unlisted equity securities.
Securities for which market quotations are not readily available or became unreliable are valued at fair value as determined in good faith following procedures approved by the Board of Trustees. Issuer-specific events, market trends, bid/asked quotes of brokers and information providers and other market data may be reviewed in the course of making a good faith determination of a security’s fair value.
Each Fund may invest in securities that are subject to interest rate risk, meaning the risk that the prices will generally fall as interest rates rise and, conversely, the prices will generally rise as interest rates fall. Specific securities differ in their sensitivity
to changes in interest rates depending on their individual characteristics. Changes in interest rates may result in increased market volatility, which may affect the value and/or liquidity of certain Fund investments.
Valuations change in response to many factors, including the historical and prospective earnings of the issuer, the value of the issuer’s assets, general market conditions which are not specifically related to the particular issuer, such as real or perceived adverse economic conditions, changes in the general outlook for revenues or corporate earnings, changes in interest or currency rates, regional or global instability, natural or environmental disasters, widespread disease or other public health issues, war, acts of terrorism or adverse investor sentiment generally and market liquidity. Because of the inherent uncertainties of valuation, the values reflected in the financial statements may materially differ from the value received upon actual sale of those investments.
ADR and GDR Risk. Certain Funds may invest in American Depositary Receipts (“ADRs”) and Global Depositary Receipts (“GDRs”). ADRs are certificates that evidence ownership of shares of a foreign issuer and are alternatives to purchasing the underlying foreign securities directly in their national markets and currencies. GDRs are certificates issued by an international bank that generally are traded and denominated in the currencies of countries other than the home country of the issuer of the underlying shares. ADRs and GDRs may be subject to certain of the risks associated with direct investments in the securities of foreign companies, such as currency, political, economic and market risks, because their values depend on the performance of the non-dollar denominated underlying foreign securities. Moreover, ADRs and GDRs may not track the price of the underlying foreign securities on which they are based, and their value may change materially at times when U.S. markets are not open for trading.
Authorized Participant Concentration Risk. Only authorized participants (“APs”) may engage in creation or redemption transactions directly with each Fund. Each Fund has a limited number of institutions that may act as APs, and such APs have no obligation to submit creation or redemption orders. Consequently, there is no assurance that APs will establish or maintain an active trading market for the Shares. This risk may be heightened to the extent that securities held by each Fund are traded outside a collateralized settlement system. In that case, APs may be required to post collateral on certain trades on an agency basis (i.e., on behalf of other market participants), which only a limited number of APs may be able to do. In addition, to the extent that APs exit the business or are unable to proceed with creation and/or redemption orders with respect to each Fund and no other AP is able to step forward to create or redeem Creation Units, this may result in a significantly diminished trading market for Fund Shares, and Shares may be more likely to trade at a premium or discount to a Fund’s NAV and to face trading halts and/or delisting. Investments in non-U.S. securities, which may have lower trading volumes, may increase this risk.
Call Risk. If interest rates fall, it is possible that issuers of callable securities with high interest coupons will “call” (or prepay) their bonds before their maturity date. If an issuer exercises such a call during a period of declining interest rates, a Fund may have to replace such called security with a lower yielding security. If that were to happen, such Fund’s net investment income could fall.
Cash Transaction Risk. Most exchange-traded funds (“ETFs”) generally make in-kind redemptions to avoid being taxed on gains on the distributed portfolio securities at the fund level. However, unlike most ETFs, certain Funds currently intend to effect creations and redemptions principally for cash, rather than principally in-kind, because of the nature of the Fund’s investments. As such, each Fund may be required to sell portfolio securities to obtain the cash needed to distribute redemption proceeds. Therefore, a Fund may recognize a capital gain on these sales that might not have been incurred if the Fund had made a redemption in-kind. This may decrease the tax efficiency of each Fund compared to ETFs that utilize an in-kind redemption process and there may be a substantial difference in the after-tax rate of return between each Fund and conventional ETFs.
Changing Global Fixed-Income Market Conditions Risk. The current historically low interest rate environment was created in part by the Federal Reserve Board (“FRB”) and certain foreign central banks keeping the federal funds rates at, near or below zero. In recent years, the FRB and other foreign central banks began “tapering” their quantitative easing programs, leading to fluctuations in the Federal Funds Rate and equivalent foreign rates. However, in response to the impact of the COVID-19 pandemic, in March 2020 the FRB announced cuts to the Federal Funds Rate and a new round of quantitative easing. Because there is little precedent for this situation, it is difficult to predict the impact of these rate changes or any future rate changes on various markets. Any additional changes to the monetary policy by the FRB or other regulatory actions may affect interest rates and/or reduce liquidity for fixed-income investments, particularly those with longer maturities. In addition, decreases in fixed-income dealer market-making capacity may also potentially lead to heightened volatility and reduced liquidity in the fixed-income markets. As a result, the value of a Fund’s investments and share price may decline. Changes in central bank policies could also result in higher than normal shareholder redemptions, which could potentially increase portfolio turnover rate and a Fund’s transaction costs.
Fixed-Income Securities Risk. Fixed-income securities are subject to interest rate risk and credit risk. Interest rate risk refers to fluctuations in the value of a fixed-income security resulting from changes in the general level of interest rates. When the general level of interest rates goes up, the prices of most fixed-income securities go down. When the general level of interest rates goes down, the prices of most fixed-income securities go up. Fixed-income securities with longer maturities typically are more sensitive to changes in interest rates, making them more volatile than securities with shorter maturities. Credit risk
refers to the possibility that the issuer of a security will be unable and/or unwilling to make timely interest payments and/or repay the principal on its debt. Debt instruments are subject to varying degrees of credit risk, which may be reflected in credit ratings. There is a possibility that the credit rating of a fixed-income security may be downgraded after purchase, which may adversely affect the value of the security.
Foreign Fixed-Income Investment Risk. For certain funds, investments in fixed-income securities of non-U.S. issuers are subject to the same risks as other debt securities, notably credit risk, market risk, interest rate risk and liquidity risk, while also facing risks beyond those associated with investments in U.S. securities. For example, foreign securities may have relatively low market liquidity, greater market volatility, decreased publicly available information, and less reliable financial information about issuers, and inconsistent and potentially less stringent accounting, auditing and financial reporting requirements and standards of practice comparable to those applicable to domestic issuers. Foreign securities also are subject to the risks of expropriation, nationalization, political instability or other adverse political or economic developments and the difficulty of enforcing obligations in other countries. Investments in foreign securities also may be subject to dividend withholding or confiscatory taxes, currency blockage and/or transfer restrictions and higher transactional costs.
Fund of Funds Risk. Because CEF Income Composite ETF invests primarily in other funds, its investment performance largely depends on the investment performance of the Underlying Funds in which it invests. An investment in the Fund is subject to the risks associated with the Underlying Funds that comprise its Underlying Index. In addition, at times, certain of the segments of the market represented by Underlying Funds in which the Fund invests may be out of favor and underperform other segments. The Fund will pay indirectly a proportional share of the fees and expenses of the Underlying Funds in which it invests, including their investment advisory and administration fees, while continuing to pay its own unitary management fee. As a result, shareholders will absorb duplicate levels of fees with respect to investments in the Underlying Funds. In addition, at times certain segments of the market represented by constituent Underlying Funds in its Underlying Index may be out of favor and underperform other segments.
High Dividend Paying Securities Risk. Certain Funds invest in securities that pay high dividends. As a group, these securities can fall out of favor with the market, causing such companies to underperform companies that do not pay high dividends. Also, changes in the dividend policies of the companies in which a Fund invests and the capital resources available for such companies’ dividend payments may adversely affect a Fund.
Index Risk. Unlike many investment companies, each Fund does not utilize an investing strategy that seeks returns in excess of its Underlying Index. Therefore, a Fund would not necessarily buy or sell a security unless that security is added or removed, respectively, from its Underlying Index, even if that security generally is underperforming. Additionally, each Fund rebalances its portfolio in accordance with its Underlying Index, and, therefore, any changes to the Underlying Index’s rebalance schedule will result in corresponding changes to each Fund’s rebalance schedule.
Industry Concentration Risk. In following its methodology, each Fund’s Underlying Index from time to time may be concentrated to a significant degree in securities of issuers located in a single industry or industry group. To the extent that each Underlying Index concentrates in the securities of issuers in a particular industry or industry group, the corresponding Fund will also concentrate its investments to approximately the same extent. By concentrating its investments in an industry or industry group, each Fund may face more risks than if it were diversified broadly over numerous industries or industry groups. Such industry-based risks, any of which may adversely affect the companies in which each Fund invests, may include, but are not limited to, the following: general economic conditions or cyclical market patterns that could negatively affect supply and demand in a particular industry; competition for resources, adverse labor relations, political or world events; obsolescence of technologies; and increased competition or new product introductions that may affect the profitability or viability of companies in an industry. In addition, at times, such industry or industry group may be out of favor and underperform other industries or the market as a whole.
Issuer-Specific Changes Risk. The value of an individual security or particular type of security may be more volatile than the market as a whole and may perform differently from the value of the market as a whole.
LIBOR Risk. Certain Funds may invest in instruments that use or may use a floating reference rate based on LIBOR. On July 27, 2017, the head of the United Kingdom’s Financial Conduct Authority announced a desire to phase out the use of LIBOR by the end of 2021. There remains uncertainty regarding the future utilization of LIBOR and the nature of any replacement rate. As a result, any impact of a transition away from LIBOR on the Fund or the instruments in which the Fund invests cannot yet be determined. Industry initiatives are underway to identify alternative reference rates; however, there is no assurance that the composition or characteristics of any such alternative reference rate will be similar to or produce the same value or economic equivalence as LIBOR or that instruments using an alternative rate will have the same volume or liquidity. As a result, the transition process might lead to increased volatility and reduced liquidity in markets that currently rely on LIBOR to determine interest rates; a reduction in the value of some LIBOR-based investments; and/or costs incurred in connection with closing out positions and entering into new agreements. These effects could occur prior to the end of 2021 as the utility of LIBOR as a reference rate could deteriorate during the transition period.
Liquidity Risk. Liquidity risk exists when a particular investment is difficult to purchase or sell. If a Fund invests in illiquid securities or current portfolio securities become illiquid, it may reduce the returns of the Fund because the Fund may be unable to sell the illiquid securities at an advantageous time or price.
Market Risk. Securities in the Underlying Index are subject to market fluctuations. You should anticipate that the value of the Shares will decline, more or less, in correlation with any decline in value of the securities in the Underlying Index. Additionally, natural or environmental disasters, widespread disease or other public health issues, war, acts of terrorism or other events could result in increased premiums or discounts to each Fund’s NAV.
Mortgage-Backed and Asset-Backed Securities Risk. For certain Funds, investments in mortgage- and asset-backed securities are subject to prepayment or call risk, which is the risk that payments from the borrower may be received earlier than expected due to changes in the rate at which the underlying loans are prepaid. Securities may be prepaid at a price less than the original purchase value. In addition, TBA transactions involve the risk that the securities received may be less favorable than what was anticipated by the Fund when entering into the TBA transaction and counterparty risk. Default or bankruptcy of a counterparty to a TBA transaction would expose the Fund to potential loss and could affect the Fund’s returns.
Municipal Insurance Risk. A portion of the municipal securities that certain Funds hold may be covered by insurance that guarantees the bond’s scheduled payment of interest and repayment of principal. Municipal security insurance does not insure against market fluctuations or fluctuations in a Fund’s Share price. In addition, a municipal security insurance policy will not cover: (i) repayment of a municipal security before maturity (redemption), (ii) prepayment or payment of an acceleration premium (except for a mandatory sinking fund redemption) or any other provision of a bond indenture that advances the maturity of the bond, or (iii) nonpayment of principal or interest caused by negligence or bankruptcy of the paying agent. A mandatory sinking fund redemption may be a provision of a municipal security issue whereby part of the municipal security issue may be retired before maturity.
Municipal Securities Risk. Certain Funds invest in municipal securities. Municipal securities are subject to the risk that litigation, legislation or other political events, local business or economic conditions or the bankruptcy of the issuer could have a significant effect on an issuer’s ability to make payments of principal and/or interest. Political changes and uncertainties in the municipal market related to taxation, legislative changes or the rights of municipal security holders can significantly affect municipal securities. Because many securities are issued to finance similar projects, especially those relating to education, health care, transportation and utilities, conditions in those sectors can affect the overall municipal market. In addition, changes in the financial condition of an individual municipal issuer can affect the overall municipal market. If the Internal Revenue Service (“IRS”) determines that an issuer of a municipal security has not complied with applicable tax requirements, interest from the security could become taxable and the security could decline significantly in value.
Non-Correlation Risk. Each Fund’s return may not match the return of its corresponding Underlying Index for a number of reasons. For example, each Fund incurs operating expenses not applicable to the Underlying Index, and incurs costs in buying and selling securities, especially when rebalancing the Fund’s securities holdings to reflect changes in the composition of its corresponding Underlying Index. In addition, the performance of each Fund and its corresponding Underlying Index may vary due to asset valuation differences and differences between each Fund’s portfolio and its corresponding Underlying Index resulting from legal restrictions, costs or liquidity constraints.
Non-Diversified Fund Risk. Because California AMT-Free Municipal Bond ETF, New York AMT-Free Municipal Bond ETF, Preferred ETF and Variable Rate Preferred ETF are non-diversified and can invest a greater portion of its assets in securities of individual issuers than diversified funds. As a result, changes in the market value of a single investment could cause greater fluctuations in Share price than would occur in a diversified fund. This may increase a Fund’s volatility and cause the performance of a relatively small number of issuers to have a greater impact on a Fund’s performance.
Not a Money Market Fund. Treasury Collateral ETF is not a money market fund and is not subject to the strict rules that govern the quality, maturity, liquidity and other features of securities that money market funds may purchase. Under normal circumstances, the Fund’s investments may be more susceptible than a money market fund’s investments to credit risk, interest rate risk, valuation risk and other risks relevant to the Fund’s investments. An investment in the Fund is not insured or guaranteed by the Federal Deposit Insurance Corporation or any other government agency, and it is possible for the Fund to lose money. The Fund does not seek to maintain a stable NAV of $1.00 per share.
Preferred Stock Risk. With respect to certain Funds, preferred stock is subject to issuer-specific and overall market risks that are generally applicable to equity securities as a whole; however, there are special risks associated with investing in preferred stock. Preferred stock may be less liquid than many other types of securities, such as common stock, and generally provides no voting rights with respect to the issuer. Preferred stock also may be subordinated to bonds or other debt instruments in an issuer’s capital structure, meaning that an issuer’s preferred stock generally pays dividends only after the issuer makes required payments to holders of its bonds and other debt. This subjects preferred stock to a greater risk of non-payment than more senior securities. Because of the subordinated position of preferred stock in an issuer’s capital structure, the ability to defer dividend or interest payments for extended periods of time without triggering an event of default for the issuer, and certain other features, its quality and value are heavily dependent on the profitability and cash flows of the issuer rather than on any legal claims to specific assets. Also, in certain circumstances, an issuer of a preferred stock may call or redeem it prior to a specified date or may convert it to common stock, all of which may negatively impact its return.
Risks of Investing in Closed-End Funds. For CEF Income Composite ETF, the shares of closed-end funds may trade at a discount or premium to, or at, their NAV. To the extent that the Fund invests a portion of its assets in closed-end funds, those assets will be subject to the risks of the closed-end fund’s portfolio securities, and a shareholder in the Fund will bear not only his or her proportionate share of the expenses of the Fund, but also, indirectly, the expenses of the closed-end fund. The
securities of closed-end funds in which the Fund may invest may be leveraged. As a result, the Fund may be exposed indirectly to leverage through an investment in such securities. An investment in securities of closed-end funds that use leverage may expose the Fund to higher volatility in the market value of such securities and the possibility that the Fund’s long-term returns on such securities (and, indirectly, the long-term returns of the Shares) will be diminished.
Sampling Risk. Certain Funds’ use of a representative sampling approach may result in the Fund holding a smaller number of securities than are in its respective Underlying Index. As a result, an adverse development with respect to an issuer of securities held by the Fund could result in a greater decline in NAV than would be the case if the Fund held all of the securities in its Underlying Index. To the extent the assets in the Fund are smaller, these risks will be greater.
Tax Risk. There is no guarantee that the income from certain Funds will be exempt from federal or state income taxes. Events occurring after the date of issuance of a municipal bond or after a Fund’s acquisition of a municipal bond may result in a determination that interest on that bond is includible in gross income for federal income tax purposes retroactively to its date of issuance. Such a determination may cause a portion of prior distributions by a Fund to its shareholders to be taxable to those shareholders in the year of receipt. Federal or state changes in income or alternative minimum tax rates or in the tax treatment of municipal bonds may make municipal bonds less attractive as investments and cause them to lose value.
U.S. Government Obligation Risk. Certain Funds may invest in U.S. government obligations issued or guaranteed by the U.S. Government, its agencies and instrumentalities, including bills, notes and bonds issued by the U.S. Treasury. U.S. Government securities include securities that are issued or guaranteed by the United States Treasury, by various agencies of the U.S. Government, or by various instrumentalities which have been established or sponsored by the U.S. Government. U.S. Treasury securities are backed by the “full faith and credit” of the United States. Securities issued or guaranteed by federal agencies and U.S. Government-sponsored instrumentalities may or may not be backed by the full faith and credit of the United States. In the case of those U.S. Government securities not backed by the full faith and credit of the United States, the investor must look principally to the agency or instrumentality issuing or guaranteeing the security for ultimate repayment, and may not be able to assert a claim against the United States itself in the event that the agency or instrumentality does not meet its commitment. The U.S. Government, its agencies and instrumentalities do not guarantee the market value of their securities, and consequently, the value of such securities may fluctuate.
Valuation Risk. Financial information related to securities of non-U.S. issuers may be less reliable than information related to securities of U.S. issuers, which may make it difficult to obtain a current price for a non-U.S. security held by a Fund. In certain circumstances, market quotations may not be readily available for some Fund securities, and those securities may be fair valued. The value established for a security through fair valuation may be different from what would be produced if the security had been valued using market quotations. Fund securities that are valued using techniques other than market quotations, including “fair valued” securities, may be subject to greater fluctuation in their value from one day to the next than would be the case if market quotations were used. In addition, there is no assurance that a Fund could sell a portfolio security for the value established for it at any time, and it is possible that a Fund would incur a loss because a security is sold at a discount to its established value.
| C. | Investment Transactions and Investment Income - Investment transactions are accounted for on a trade date basis. Realized gains and losses from the sale or disposition of securities are computed on the specific identified cost basis. Interest income is recorded on an accrual basis from settlement date. Pay-in-kind interest income and non-cash dividend income received in the form of securities in-lieu of cash are recorded at the fair value of the securities received. Dividend income (net of withholding tax, if any) is recorded on the ex-dividend date. Dividend income from REITs is recorded based on the income included in the distributions received from the REIT investments using published REIT classifications, including some management estimates when actual amounts are not available. Distributions received in excess of this estimated amount are recorded as a reduction of the cost of investments or reclassified to capital gains. The actual amounts of income, return of capital, and capital gains are only determined by each REIT after its fiscal year-end, and may differ from the estimated amounts. Realized gains, dividends and interest received by a Fund may give rise to withholding and other taxes imposed by foreign countries. Tax conventions between certain countries and the United States may reduce or eliminate such taxes. |
The Funds may periodically participate in litigation related to each Fund’s investments. As such, the Funds may receive proceeds from litigation settlements. Any proceeds received are included in the Statements of Operations as realized gain (loss) for investments no longer held and as unrealized gain (loss) for investments still held.
Brokerage commissions and mark ups are considered transaction costs and are recorded as an increase to the cost basis of securities purchased and/or a reduction of proceeds on a sale of securities. Such transaction costs are included in the determination of net realized and unrealized gain (loss) from investment securities reported in the Statements of Operations and the Statements of Changes in Net Assets and the net realized and unrealized gains (losses) on securities per share in the Financial Highlights. Transaction costs are included in the calculation of each Fund’s NAV and, accordingly, they reduce each Fund’s total returns. These transaction costs are not considered operating expenses and are not reflected in net investment income reported in the Statements of Operations and the Statements of Changes in Net Assets, or the net investment income per share and the ratios of expenses and net investment income reported in the Financial Highlights, nor are they limited by any expense limitation arrangements between each Fund and the Adviser.
| D. | Country Determination - For the purposes of presentation in the Schedules of Investments, the Adviser may determine the country in which an issuer is located and/or credit risk exposure based on various factors. These factors include whether each |
| | Fund’s Underlying Index has made a country determination and may include the laws of the country under which the issuer is organized, where the issuer maintains a principal office, the country in which the issuer derives 50% or more of its total revenues and the country that has the primary market for the issuer’s securities, as well as other criteria. Among the other criteria that may be evaluated for making this determination are the country in which the issuer maintains 50% or more of its assets, the type of security, financial guarantees and enhancements, the nature of the collateral and the sponsor organization. Country of issuer and/or credit risk exposure has been determined to be the United States of America, unless otherwise noted. |
| E. | Dividends and Distributions to Shareholders - Each Fund declares and pays dividends from net investment income, if any, to its shareholders monthly and records such dividends on the ex-dividend date. Generally, each Fund distributes net realized taxable capital gains, if any, annually in cash and records them on the ex-dividend date. Such distributions on a tax basis are determined in conformity with federal income tax regulations, which may differ from accounting principles generally accepted in the United States of America (“GAAP”). Distributions in excess of tax basis earnings and profits, if any, are reported in each Fund’s financial statements as a tax return of capital at fiscal year-end. |
| F. | Federal Income Taxes - Each Fund intends to comply with the provisions of the Internal Revenue Code of 1986, as amended (the “Internal Revenue Code”), applicable to regulated investment companies and to distribute substantially all of the Fund’s taxable earnings to its shareholders. As such, the Funds will not be subject to federal income taxes on otherwise taxable income (including net realized gains) that is distributed to the shareholders. Therefore, no provision for federal income taxes is recorded in the financial statements. |
Each Fund recognizes the tax benefits of uncertain tax positions only when the position is more likely than not to be sustained. Management has analyzed each Fund’s uncertain tax positions and concluded that no liability for unrecognized tax benefits should be recorded related to uncertain tax positions. Management is not aware of any tax positions for which it is reasonably possible that the total amounts of unrecognized tax benefits will change materially in the next 12 months.
Income and capital gain distributions are determined in accordance with federal income tax regulations, which may differ from GAAP. These differences are primarily due to differing book and tax treatments for in-kind transactions, losses deferred due to wash sales, and passive foreign investment company adjustments, if any.
The Funds file U.S. federal tax returns and tax returns in certain other jurisdictions. Generally, a Fund is subject to examinations by such taxing authorities for up to three years after the filing of the return for the tax period.
| G. | Expenses - Expenses of the Trust that are excluded from a Fund’s unitary management fee and are directly identifiable to a specific Fund are applied to that Fund. Expenses of the Trust that are excluded from a Fund’s unitary management fee and are not readily identifiable to a specific Fund are allocated in such a manner as deemed equitable, taking into consideration the nature and type of expense and the relative net assets of each Fund. |
Each Fund has agreed to pay an annual unitary management fee to the Adviser. Out of the unitary management fee, the Adviser has agreed to pay for substantially all expenses of the Funds, including payments to Invesco Advisers, Inc. (the “Sub-Adviser”) for Treasury Collateral ETF and, for each Fund, the cost of transfer agency, custody, fund administration, legal, audit and other services, except for advisory fees, distribution fees, if any, brokerage expenses, taxes, interest, litigation expenses, acquired fund fees and expenses, if any, and other extraordinary expenses.
To the extent a Fund invests in other investment companies, the expenses shown in the accompanying financial statements reflect the expenses of the Fund and do not include any expenses of the investment companies in which it invests. The effects of such investment companies’ expenses are included in the realized and unrealized gain or loss on the investments in the investment companies.
| H. | Accounting Estimates - The preparation of the financial statements in accordance with GAAP requires management to make estimates and assumptions that affect the reported amounts and disclosures in the financial statements, including estimates and assumptions related to taxation. Actual results could differ from these estimates. In addition, the Funds monitor for material events or transactions that may occur or become known after the period-end date and before the date the financial statements are released to print. |
| I. | Indemnifications - Under the Trust’s organizational documents, its Officers and Trustees are indemnified against certain liabilities arising out of the performance of their duties to the Trust. Each Board member who is not an “interested person” (as defined in the 1940 Act) of the Trust (each, an “Independent Trustee”) is also indemnified against certain liabilities arising out of the performance of their duties to the Trust pursuant to an Indemnification Agreement between such trustee and the Trust. Additionally, in the normal course of business, the Trust enters into contracts with service providers that contain general indemnification clauses. The Trust’s maximum exposure under these arrangements is unknown, as this would involve future claims that may be made against the Trust that have not yet occurred. However, based on experience, the Trust believes the risk of loss to be remote. |
| J. | Securities Lending - Each Fund may participate in securities lending and may loan portfolio securities having a market value up to one-third of the Fund’s total assets. Such loans are secured by cash collateral equal to no less than 102% (105% for international securities) of the market value of the loaned securities determined daily by the securities lending provider. Cash collateral received in connection with these loans is generally invested in an affiliated money market fund and is shown as such on the Schedules of Investments. Each Fund bears the risk of loss with respect to the investment of collateral. It is the policy of these Funds to obtain additional collateral from or return excess collateral to the borrower by the end of the next business day, following the valuation date of the securities loaned. Therefore, the value of the collateral held may be |
| | temporarily less than the value of the securities on loan. When loaning securities, each Fund retains certain benefits of owning the securities, including the economic equivalent of dividends or interest generated by the security. Lending securities entails a risk of loss to each Fund if, and to the extent that, the market value of the securities loaned were to increase, and the borrower did not increase the collateral accordingly, and the borrower failed to return the securities. The securities loaned are subject to termination at the option of the borrower or each Fund. Upon termination, the borrower will return to each Fund the securities loaned and each Fund will return the collateral. Upon the failure of the borrower to return the securities, collateral may be liquidated and the securities may be purchased on the open market to replace the loaned securities. Each Fund could experience delays and costs in gaining access to the collateral and the securities may lose value during the delay which could result in potential losses to each Fund. Some of these losses may be indemnified by the lending agent. Each Fund bears the risk of any deficiency in the amount of the collateral available for return to the borrower due to any loss on the collateral invested. For Funds that participated in securities lending, dividends received on cash collateral investments for securities lending transactions, which are net of compensation to counterparties, are included in Securities lending income on the Statements of Operations. The aggregate value of securities out on loan, if any, is shown on the Statements of Assets and Liabilities. |
| K. | Foreign Currency Translations - Foreign currency is valued at the close of the NYSE based on quotations posted by banks and major currency dealers. Portfolio securities and other assets and liabilities denominated in foreign currencies are translated into U.S. dollar amounts at the date of valuation. Purchases and sales of portfolio securities (net of foreign taxes withheld on disposition) and income items denominated in foreign currencies are translated into U.S. dollar amounts on the respective dates of such transactions. Each Fund does not separately account for the portion of the results of operations resulting from changes in foreign exchange rates on investments and the fluctuations arising from changes in market prices of securities held. The combined results of changes in foreign exchange rates and the fluctuation of market prices on investments (net of estimated foreign tax withholding) are included with the net realized and unrealized gain or loss from investments in the Statements of Operations. Reported net realized foreign currency gains or losses arise from (1) sales of foreign currencies, (2) currency gains or losses realized between the trade and settlement dates on securities transactions, and (3) the difference between the amounts of dividends, interest, and foreign withholding taxes recorded on each Fund’s books and the U.S. dollar equivalent of the amounts actually received or paid. Net unrealized foreign currency gains and losses arise from changes in the fair values of assets and liabilities, other than investments in securities at fiscal period-end, resulting from changes in exchange rates. |
Each Fund may invest in foreign securities, which may be subject to foreign taxes on income, gains on investments or currency repatriation, a portion of which may be recoverable. Foreign taxes, if any, are recorded based on the tax regulations and rates that exist in the foreign markets in which each Fund invests.
NOTE 3—Investment Advisory Agreement and Other Agreements
The Trust has entered into an Investment Advisory Agreement with the Adviser on behalf of each Fund, pursuant to which the Adviser has overall responsibility for the selection and ongoing monitoring of the Funds’ investments, managing the Funds’ business affairs and providing certain clerical, bookkeeping and other administrative services, and for Treasury Collateral ETF, the oversight of the Sub-Adviser.
Pursuant to the Investment Advisory Agreement, each Fund accrues daily and pays monthly to the Adviser an annual unitary management fee. Out of the unitary management fee, the Adviser has agreed to pay for substantially all expenses of the Funds, including the cost of transfer agency, custody, fund administration, legal, audit and other services, except for advisory fees, distribution fees, if any, brokerage expenses, taxes, interest, litigation expenses, acquired fund fees and expenses, if any, and other extraordinary expenses. The unitary management fee is paid by each Fund to the Adviser at the following annual rates:
| | |
| | | Unitary Management Fees
(as a % of average daily net assets) |
| |
1-30 Laddered Treasury ETF | | 0.25% |
| |
California AMT-Free Municipal Bond ETF | | 0.28% |
| |
CEF Income Composite ETF | | 0.50% |
| |
Fundamental High Yield® Corporate Bond ETF | | 0.50% |
| |
Fundamental Investment Grade Corporate Bond ETF | | 0.22% |
| |
National AMT-Free Municipal Bond ETF | | 0.28% |
| |
New York AMT-Free Municipal Bond ETF | | 0.28% |
| |
Preferred ETF | | 0.50% |
| |
Taxable Municipal Bond ETF | | 0.28% |
| |
Treasury Collateral ETF | | 0.08% |
| |
Variable Rate Preferred ETF | | 0.50% |
| |
VRDO Tax-Free Weekly ETF | | 0.25% |
Further, through at least August 31, 2022, the Adviser has contractually agreed to waive a portion of each Fund’s management fee in an amount equal to 100% of the net advisory fees an affiliate of the Adviser receives that are attributable to the Fund’s investments of otherwise uninvested cash in money market funds managed by that affiliate (excluding investments of cash collateral from securities lending). There is no guarantee that the Adviser will extend the waiver of these fees past that date.
For the fiscal year ended August 31, 2020, the Adviser waived fees for each Fund in the following amounts:
| | | | |
| |
1-30 Laddered Treasury ETF | | $ | 226 | |
| |
California AMT-Free Municipal Bond ETF | | | - | |
| |
CEF Income Composite ETF | | | 1,179 | |
| |
Fundamental High Yield® Corporate Bond ETF | | | 8,527 | |
| |
Fundamental Investment Grade Corporate Bond ETF | | | 617 | |
| |
National AMT-Free Municipal Bond ETF | | | - | |
| |
New York AMT-Free Municipal Bond ETF | | | - | |
| |
Preferred ETF | | | 73,024 | |
| |
Taxable Municipal Bond ETF | | | 97,438 | |
| |
Treasury Collateral ETF | | | 1,103 | |
| |
Variable Rate Preferred ETF | | | 7,997 | |
| |
VRDO Tax-Free Weekly ETF | | | - | |
For Treasury Collateral ETF, the Adviser has entered into a sub-advisory agreement with the Sub-Adviser. The sub-advisory fee is paid by the Adviser to the Sub-Adviser at the annual rate of 40% of compensation paid to the Adviser from the Fund.
The Trust has entered into a Distribution Agreement with Invesco Distributors, Inc. (the “Distributor”), which serves as the distributor of Creation Units for each Fund. The Distributor does not maintain a secondary market in the Shares. The Funds are not charged any fees pursuant to the Distribution Agreement. The Distributor is an affiliate of the Adviser.
The Adviser has entered into a licensing agreement for each Fund with the following entities (each, a “Licensor”):
| | |
| Fund | | Licensor |
| |
1-30 Laddered Treasury ETF | | Nasdaq, Inc. |
| |
California AMT-Free Municipal Bond ETF | | Merrill Lynch, Pierce, Fenner & Smith Inc. |
| |
CEF Income Composite ETF | | S-Network Global Indexes, LLC |
| |
Fundamental High Yield® Corporate Bond ETF | | Research Affiliates® |
| |
Fundamental Investment Grade Corporate Bond ETF | | Research Affiliates® |
| |
National AMT-Free Municipal Bond ETF | | Merrill Lynch, Pierce, Fenner & Smith Inc. |
| |
New York AMT-Free Municipal Bond ETF | | Merrill Lynch, Pierce, Fenner & Smith Inc. |
| |
Preferred ETF | | Merrill Lynch, Pierce, Fenner & Smith Inc. |
| |
Taxable Municipal Bond ETF | | Merrill Lynch, Pierce, Fenner & Smith Inc. |
| |
Treasury Collateral ETF | | Interactive Data Pricing and Reference Data LLC |
| |
Variable Rate Preferred ETF | | Wells Fargo & Company |
| |
VRDO Tax-Free Weekly ETF | | Bloomberg Finance L.P. |
Each Underlying Index name trademark is owned by its respective Licensor. These trademarks have been licensed to the Adviser for use by the Funds. Each Fund is entitled to use its Underlying Index pursuant to the Trust’s sub-licensing agreement with the Adviser. The Funds are not sponsored, endorsed, sold or promoted by the Licensors, and the Licensors make no representation regarding the advisability of investing in any of the Funds.
The Trust has entered into service agreements whereby The Bank of New York Mellon, a wholly-owned subsidiary of The Bank of New York Mellon Corporation, serves as the administrator, custodian, fund accountant and transfer agent for each Fund.
For fiscal year ended August 31, 2020, the following Fund incurred brokerage commissions with Invesco Capital Markets, Inc. (“ICMI”), an affiliate of the Adviser and Distributor, for portfolio transactions executed on behalf of the Fund, as listed below:
| | | | |
| |
CEF Income Composite ETF | | $ | 6,648 | |
Portfolio transactions with ICMI that have not settled at period-end, if any, are shown in the Statements of Assets and Liabilities under the receivable caption Investments sold - affiliated broker and/or payable caption Investments purchased - affiliated broker.
NOTE 4—Additional Valuation Information
GAAP defines fair value as the price that would be received to sell an asset or paid to transfer a liability in an orderly transaction between market participants at the measurement date, under current market conditions. GAAP establishes a hierarchy that prioritizes the inputs to valuation methods, giving the highest priority to readily available unadjusted quoted prices in an active
market for identical assets (Level 1) and the lowest priority to significant unobservable inputs (Level 3), generally when market prices are not readily available or are unreliable. Based on the valuation inputs, the securities or other investments are tiered into one of three levels. Changes in valuation methods may result in transfers in or out of an investment’s assigned level:
| | |
Level 1 – | | Prices are determined using quoted prices in an active market for identical assets. |
| |
Level 2 – | | Prices are determined using other significant observable inputs. Observable inputs are inputs that other market participants may use in pricing a security. These may include quoted prices for similar securities, interest rates, prepayment speeds, credit risk, yield curves, loss severities, default rates, discount rates, volatilities and others. |
| |
Level 3 – | | Prices are determined using significant unobservable inputs. In situations where quoted prices or observable inputs are unavailable (for example, when there is little or no market activity for an investment at the end of the period), unobservable inputs may be used. Unobservable inputs reflect a Fund’s own assumptions about the factors market participants would use in determining fair value of the securities or instruments and would be based on the best available information. |
Except for the Funds listed below, as of August 31, 2020, all of the securities in each Fund were valued based on Level 2 inputs (see the Schedules of Investments for security categories). The level assigned to the securities valuations may not be an indication of the risk or liquidity associated with investing in those securities. Because of the inherent uncertainties of valuation, the values reflected in the financial statements may materially differ from the value received upon actual sale of those investments.
| | | | | | | | | | | | | | | | | | | | |
| | | Level 1 | | Level 2 | | Level 3 | | Total |
| | | | |
1-30 Laddered Treasury ETF | | | | | | | | | | | | | | | | | | | | |
| | | | |
Investments in Securities | | | | | | | | | | | | | | | | | | | | |
| | | | |
U.S. Treasury Securities | | | $ | - | | | | $ | 203,557,214 | | | | $ | - | | | | $ | 203,557,214 | |
| | | | |
Money Market Funds | | | | 115,706 | | | | | - | | | | | - | | | | | 115,706 | |
| | | | | | | | | | | | | | | | | | | | |
| | | | |
Total Investments | | | $ | 115,706 | | | | $ | 203,557,214 | | | | $ | - | | | | $ | 203,672,920 | |
| | | | | | | | | | | | | | | | | | | | |
| | | | |
CEF Income Composite ETF | | | | | | | | | | | | | | | | | | | | |
| | | | |
Investments in Securities | | | | | | | | | | | | | | | | | | | | |
| | | | |
Closed-End Funds | | | $ | 756,528,315 | | | | $ | - | | | | $ | - | | | | $ | 756,528,315 | |
| | | | |
Money Market Funds | | | | - | | | | | 12,630,770 | | | | | - | | | | | 12,630,770 | |
| | | | | | | | | | | | | | | | | | | | |
| | | | |
Total Investments | | | $ | 756,528,315 | | | | $ | 12,630,770 | | | | $ | - | | | | $ | 769,159,085 | |
| | | | | | | | | | | | | | | | | | | | |
| | | | |
Fundamental High Yield® Corporate Bond ETF | | | | | | | | | | | | | | | | | | | | |
| | | | |
Investments in Securities | | | | | | | | | | | | | | | | | | | | |
| | | | |
U.S. Dollar Denominated Bonds & Notes | | | $ | - | | | | $ | 746,327,688 | | | | $ | - | | | | $ | 746,327,688 | |
| | | | |
Money Market Funds | | | | 4,085,897 | | | | | 22,277,047 | | | | | - | | | | | 26,362,944 | |
| | | | | | | | | | | | | | | | | | | | |
| | | | |
Total Investments | | | $ | 4,085,897 | | | | $ | 768,604,735 | | | | $ | - | | | | $ | 772,690,632 | |
| | | | | | | | | | | | | | | | | | | | |
| | | | |
Fundamental Investment Grade Corporate Bond ETF | | | | | | | | | | | | | | | | | | | | |
| | | | |
Investments in Securities | | | | | | | | | | | | | | | | | | | | |
| | | | |
U.S. Dollar Denominated Bonds & Notes | | | $ | - | | | | $ | 62,932,177 | | | | $ | - | | | | $ | 62,932,177 | |
| | | | |
Money Market Funds | | | | 232,848 | | | | | 591,372 | | | | | - | | | | | 824,220 | |
| | | | | | | | | | | | | | | | | | | | |
| | | | |
Total Investments | | | $ | 232,848 | | | | $ | 63,523,549 | | | | $ | - | | | | $ | 63,756,397 | |
| | | | | | | | | | | | | | | | | | | | |
| | | | |
Preferred ETF | | | | | | | | | | | | | | | | | | | | |
| | | | |
Investments in Securities | | | | | | | | | | | | | | | | | | | | |
| | | | |
Preferred Stocks | | | $ | 6,235,097,928 | | | | $ | - | | | | $ | - | | | | $ | 6,235,097,928 | |
| | | | |
Money Market Funds | | | | - | | | | | 62,351,311 | | | | | - | | | | | 62,351,311 | |
| | | | | | | | | | | | | | | | | | | | |
| | | | |
Total Investments | | | $ | 6,235,097,928 | | | | $ | 62,351,311 | | | | $ | - | | | | $ | 6,297,449,239 | |
| | | | | | | | | | | | | | | | | | | | |
| | | | |
Taxable Municipal Bond ETF | | | | | | | | | | | | | | | | | | | | |
| | | | |
Investments in Securities | | | | | | | | | | | | | | | | | | | | |
| | | | |
Municipal Obligations | | | $ | - | | | | $ | 1,881,635,794 | | | | $ | - | | | | $ | 1,881,635,794 | |
| | | | |
U.S. Dollar Denominated Bonds & Notes | | | | - | | | | | 55,251,290 | | | | | - | | | | | 55,251,290 | |
| | | | |
Money Market Funds | | | | 90,139,484 | | | | | - | | | | | - | | | | | 90,139,484 | |
| | | | | | | | | | | | | | | | | | | | |
| | | | |
Total Investments | | | $ | 90,139,484 | | | | $ | 1,936,887,084 | | | | $ | - | | | | $ | 2,027,026,568 | |
| | | | | | | | | | | | | | | | | | | | |
| | | | |
Treasury Collateral ETF | | | | | | | | | | | | | | | | | | | | |
| | | | |
Investments in Securities | | | | | | | | | | | | | | | | | | | | |
| | | | |
U.S. Treasury Securities | | | $ | - | | | | $ | 937,854,416 | | | | $ | - | | | | $ | 937,854,416 | |
| | | | |
Money Market Funds | | | | 221,238 | | | | | - | | | | | - | | | | | 221,238 | |
| | | | | | | | | | | | | | | | | | | | |
| | | | |
Total Investments | | | $ | 221,238 | | | | $ | 937,854,416 | | | | $ | - | | | | $ | 938,075,654 | |
| | | | | | | | | | | | | | | | | | | | |
| | | | | | | | | | | | | | | | | | | | |
| | | Level 1 | | Level 2 | | Level 3 | | Total |
| | | | |
Variable Rate Preferred ETF | | | | | | | | | | | | | | | | | | | | |
| | | | |
Investments in Securities | | | | | | | | | | | | | | | | | | | | |
| | | | |
U.S. Dollar Denominated Bonds & Notes | | | $ | - | | | | $ | 1,070,054,861 | | | | $ | - | | | | $ | 1,070,054,861 | |
| | | | |
Preferred Stocks | | | | 387,980,102 | | | | | - | | | | | - | | | | | 387,980,102 | |
| | | | |
Money Market Funds | | | | - | | | | | 34,751,361 | | | | | - | | | | | 34,751,361 | |
| | | | | | | | | | | | | | | | �� | | | | |
| | | | |
Total Investments | | | $ | 387,980,102 | | | | $ | 1,104,806,222 | | | | $ | - | | | | $ | 1,492,786,324 | |
| | | | | | | | | | | | | | | | | | | | |
NOTE 5–Distributions to Shareholders and Tax Components of Net Assets
Tax Character of Distributions to Shareholders Paid During the Fiscal Years Ended August 31, 2020 and 2019:
| | | | | | | | | | | | | | | | | | | | | | | | | | | | | | |
| | | 2020 | | 2019 |
| | | | | Ordinary | | | | | | Ordinary | | |
| | | Ordinary | | Income-Tax- | | Long-Term | | Ordinary | | Income-Tax- | | Long-Term |
| | | Income* | | Exempt | | Capital Gains | | Income* | | Exempt | | Capital Gains |
| | | | | | |
1-30 Laddered Treasury ETF | | | $ | 2,310,988 | | | | $ | - | | | | $ | - | | | | $ | 3,060,263 | | | | $ | - | | | | $ | - | |
| | | | | | |
California AMT-Free Municipal Bond ETF | | | | 59,378 | | | | | 9,737,280 | | | | | - | | | | | 66,064 | | | | | 7,845,729 | | | | | - | |
| | | | | | |
CEF Income Composite ETF | | | | 61,569,372 | | | | | - | | | | | - | | | | | 53,905,613 | | | | | - | | | | | - | |
| | | | | | |
Fundamental High Yield® Corporate Bond ETF | | | | 28,061,635 | | | | | - | | | | | - | | | | | 33,010,295 | | | | | - | | | | | - | |
| | | | | | |
Fundamental Investment Grade Corporate Bond ETF | | | | 1,984,493 | | | | | - | | | | | 6,388 | | | | | 3,906,123 | | | | | - | | | | | - | |
| | | | | | |
National AMT-Free Municipal Bond ETF | | | | 566,769 | | | | | 56,083,599 | | | | | - | | | | | 212,341 | | | | | 50,423,342 | | | | | - | |
| | | | | | |
New York AMT-Free Municipal Bond ETF | | | | 13,346 | | | | | 2,386,497 | | | | | - | | | | | - | | | | | 1,892,274 | | | | | - | |
| | | | | | |
Preferred ETF | | | | 296,096,193 | | | | | - | | | | | - | | | | | 276,045,216 | | | | | - | | | | | - | |
| | | | | | |
Taxable Municipal Bond ETF | | | | 48,233,360 | | | | | - | | | | | - | | | | | 39,734,954 | | | | | - | | | | | - | |
| | | | | | |
Treasury Collateral ETF | | | | 8,688,360 | | | | | - | | | | | 1,235 | | | | | 12,311,025 | | | | | - | | | | | - | |
| | | | | | |
Variable Rate Preferred ETF | | | | 71,331,749 | | | | | - | | | | | - | | | | | 89,362,622 | | | | | - | | | | | - | |
VRDO Tax-Free Weekly ETF | | | | 2,374 | | | | | 369,917 | | | | | - | | | | | 340 | | | | | 746,609 | | | | | - | |
| * | Includes short-term capital gain distributions, if any. |
Tax Components of Net Assets at Fiscal Year-End:
| | | | | | | | | | | | | | | | | | | | | | | | | | | | | | | | | | | |
| | | | | | | | | Net | | | | | | |
| | | | | | | | | Unrealized | | | | | | |
| | | Undistributed | | Undistributed | | Temporary | | Appreciation | | | | Shares of | | |
| | | Ordinary | | Long-Term | | Book/Tax | | (Depreciation)- | | Capital Loss | | Beneficial | | Total |
| | | Income | | Capital Gains | | Differences | | Investments | | Carryforwards | | Interest | | Net Assets |
| | | | | | | |
1-30 Laddered Treasury ETF | | | $ | - | | | | $ | - | | | | $ | - | | | | $ | (790,961 | ) | | | $ | (255,727 | ) | | | $ | 204,949,783 | | | | $ | 203,903,095 | |
| | | | | | | |
California AMT-Free Municipal Bond ETF | | | | - | | | | | - | | | | | - | | | | | 29,224,562 | | | | | (560,496 | ) | | | | 423,253,489 | | | | | 451,917,555 | |
| | | | | | | |
CEF Income Composite ETF | | | | - | | | | | - | | | | | - | | | | | (39,969,570 | ) | | | | (33,116,733 | ) | | | | 829,192,749 | | | | | 756,106,446 | |
| | | | | | | |
Fundamental High Yield® Corporate Bond ETF | | | | - | | | | | - | | | | | - | | | | | 20,249,785 | | | | | (44,008,709 | ) | | | | 781,569,665 | | | | | 757,810,741 | |
| | | | | | | |
Fundamental Investment Grade Corporate Bond ETF | | | | - | | | | | 128,335 | | | | | - | | | | | 4,021,473 | | | | | - | | | | | 58,879,865 | | | | | 63,029,673 | |
| | | | | | | |
National AMT-Free Municipal Bond ETF | | | | - | | | | | - | | | | | - | | | | | 128,553,484 | | | | | (10,048,589 | ) | | | | 2,558,648,379 | | | | | 2,677,153,274 | |
| | | | | | | |
New York AMT-Free Municipal Bond ETF | | | | -
| | | | | - | | | | | - | | | | | 5,355,316 | | | | | (433,920 | ) | | | | 93,907,365 | | | | | 98,828,761 | |
| | | | | | | |
Preferred ETF | | | | 2,020,274 | | | | | - | | | | | (3,169,790 | ) | | | | 78,122,112 | | | | | (145,894,697 | ) | | | | 6,329,878,431 | | | | | 6,260,956,330 | |
| | | | | | | |
Taxable Municipal Bond ETF | | | | - | | | | | - | | | | | - | | | | | 175,721,350 | | | | | (3,407,366 | ) | | | | 1,833,546,775 | | | | | 2,005,860,759 | |
| | | | | | | |
Treasury Collateral ETF | | | | 345,772 | | | | | - | | | | | - | | | | | 647,191 | | | | | - | | | | | 937,176,544 | | | | | 938,169,507 | |
| | | | | | | |
Variable Rate Preferred ETF | | | | 8,484,043 | | | | | - | | | | | (1,802,013 | ) | | | | (29,520,484 | ) | | | | (28,602,580 | ) | | | | 1,524,248,478 | | | | | 1,472,807,444 | |
| | | | | | | |
VRDO Tax-Free Weekly ETF | | | | - | | | | | - | | | | | - | | | | | - | | | | | (1 | ) | | | | 49,855,429 | | | | | 49,855,428 | |
Capital loss carryforwards are calculated and reported as of a specific date. Results of transactions and other activity after that date may affect the amount of capital loss carryforwards actually available for the Funds to utilize. The ability to utilize capital loss carryforwards in the future may be limited under the Internal Revenue Code and related regulations based on the results of future transactions.
The following table presents available capital loss carryforwards for each Fund as of August 31, 2020:
| | | | | | | | | | | | |
| | | No expiration | | | | |
| | | |
| | | Short-Term | | | Long-Term | | | Total* | |
| | | |
1-30 Laddered Treasury ETF | | $ | 255,727 | | | $ | - | | | $ | 255,727 | |
| | | |
California AMT-Free Municipal Bond ETF | | | 249,270 | | | | 311,226 | | | | 560,496 | |
| | | |
CEF Income Composite ETF | | | 5,755,745 | | | | 27,360,988 | | | | 33,116,733 | |
| | | |
Fundamental High Yield® Corporate Bond ETF | | | 18,137,887 | | | | 25,870,822 | | | | 44,008,709 | |
| | | |
Fundamental Investment Grade Corporate Bond ETF | | | - | | | | - | | | | - | |
| | | |
National AMT-Free Municipal Bond ETF | | | 7,456,076 | | | | 2,592,513 | | | | 10,048,589 | |
| | | |
New York AMT-Free Municipal Bond ETF | | | 292,856 | | | | 141,064 | | | | 433,920 | |
| | | |
Preferred ETF | | | 24,366,783 | | | | 121,527,914 | | | | 145,894,697 | |
| | | |
Taxable Municipal Bond ETF | | | 1,759,440 | | | | 1,647,926 | | | | 3,407,366 | |
| | | |
Treasury Collateral ETF | | | - | | | | - | | | | - | |
| | | |
Variable Rate Preferred ETF | | | 6,828,588 | | | | 21,773,992 | | | | 28,602,580 | |
| | | |
VRDO Tax-Free Weekly ETF | | | 1 | | | | - | | | | 1 | |
| * | Capital loss carryforwards are reduced for limitations, if any, to the extent required by the Internal Revenue Code and may be further limited depending upon a variety of factors, including the realization of net unrealized gains or losses as of the date of any reorganization. |
NOTE 6–Investment Transactions
For the fiscal year ended August 31, 2020, the cost of securities purchased and the proceeds from sales of securities (other than short-term securities, U.S. Treasury obligations, money market funds and in-kind transactions, if any) were as follows:
| | | | | | | | |
| | | Purchases | | | Sales | |
| | |
1-30 Laddered Treasury ETF | | $ | - | | | $ | - | |
| | |
California AMT-Free Municipal Bond ETF | | | 208,669,771 | | | | 46,455,891 | |
| | |
CEF Income Composite ETF | | | 155,845,124 | | | | 154,968,943 | |
| | |
Fundamental High Yield® Corporate Bond ETF | | | 233,169,910 | | | | 253,001,428 | |
| | |
Fundamental Investment Grade Corporate Bond ETF | | | 29,207,338 | | | | 26,956,931 | |
| | |
National AMT-Free Municipal Bond ETF | | | 1,228,436,677 | | | | 318,979,092 | |
| | |
New York AMT-Free Municipal Bond ETF | | | 30,221,183 | | | | 10,842,662 | |
| | |
Preferred ETF | | | 1,158,437,383 | | | | 1,034,911,712 | |
| | |
Taxable Municipal Bond ETF | | | 951,530,148 | | | | 251,066,082 | |
| | |
Treasury Collateral ETF | | | - | | | | - | |
| | |
Variable Rate Preferred ETF | | | 344,948,655 | | | | 341,188,513 | |
| | |
VRDO Tax-Free Weekly ETF | | | - | | | | - | |
For the fiscal year ended August 31, 2020, the cost of securities purchased and proceeds from sales of U.S. Treasury obligations (other than short-term securities, money market funds and in-kind transactions), for the 1-30 Laddered Treasury ETF amounted to $19,433,834 and $16,764,041, respectively and for the Treasury Collateral ETF amounted to $0 and $0, respectively.
For the fiscal year ended August 31, 2020, in-kind transactions associated with creations and redemptions were as follows:
| | | | | | | | |
| | | Cost of | | | Value of | |
| | | Securities | | | Securities | |
| | | Received | | | Delivered | |
| | |
1-30 Laddered Treasury ETF | | $ | 293,938,793 | | | $ | 272,999,783 | |
| | |
California AMT-Free Municipal Bond ETF | | | - | | | | 62,243,111 | |
| | |
CEF Income Composite ETF | | | 139,938,332 | | | | 88,220,177 | |
| | |
Fundamental High Yield® Corporate Bond ETF | | | 408,810,098 | | | | 385,489,585 | |
| | |
Fundamental Investment Grade Corporate Bond ETF | | | 2,320,396 | | | | 35,310,511 | |
| | |
National AMT-Free Municipal Bond ETF | | | - | | | | 223,472,828 | |
| | |
New York AMT-Free Municipal Bond ETF | | | - | | | | - | |
| | |
Preferred ETF | | | 1,382,461,266 | | | | 507,833,571 | |
| | |
Taxable Municipal Bond ETF | | | - | | | | 57,727,646 | |
| | |
Treasury Collateral ETF | | | - | | | | - | |
| | | | | | | | |
| | | Cost of | | | Value of | |
| | | Securities | | | Securities | |
| | | Received | | | Delivered | |
| | |
Variable Rate Preferred ETF | | $ | 203,401,904 | | | $ | 212,207,079 | |
| | |
VRDO Tax-Free Weekly ETF | | | - | | | | - | |
Gains (losses) on in-kind transactions are generally not considered taxable gains (losses) for federal income tax purposes. At August 31, 2020, the aggregate cost of investments, including any derivatives, on a tax basis includes adjustments for financial reporting purposes as of the most recently completed federal income tax reporting period-end:
| | | | | | | | | | | | | | | | | | | | | | | | | | | | | | | | | | | |
| | | | | | | | | | | Net | | | | |
| | | Gross | | | | Gross | | | | Unrealized | | | | |
| | | Unrealized | | | | Unrealized | | | | Appreciation | | | | |
| | | Appreciation | | | | (Depreciation) | | | | (Depreciation) | | | | Cost |
| | | | | | | |
1-30 Laddered Treasury ETF | | | $ | 1,206,065 | | | | | | | | | $ | (1,997,026 | ) | | | | | | | | $ | (790,961 | ) | | | | | | | | $ | 204,463,881 | |
| | | | | | | |
California AMT-Free Municipal Bond ETF | | | | 29,717,806 | | | | | | | | | | (493,244 | ) | | | | | | | | | 29,224,562 | | | | | | | | | | 413,572,490 | |
| | | | | | | |
CEF Income Composite ETF | | | | 34,562,155 | | | | | | | | | | (74,531,725 | ) | | | | | | | | | (39,969,570 | ) | | | | | | | | | 809,128,655 | |
| | | | | | | |
Fundamental High Yield® Corporate Bond ETF | | | | 25,542,774 | | | | | | | | | | (5,292,989 | ) | | | | | | | | | 20,249,785 | | | | | | | | | | 752,440,847 | |
| | | | | | | |
Fundamental Investment Grade Corporate Bond ETF | | | | 4,071,843 | | | | | | | | | | (50,370 | ) | | | | | | | | | 4,021,473 | | | | | | | | | | 59,734,924 | |
| | | | | | | |
National AMT-Free Municipal Bond ETF | | | | 134,144,184 | | | | | | | | | | (5,590,700 | ) | | | | | | | | | 128,553,484 | | | | | | | | | | 2,513,048,877 | |
| | | | | | | |
New York AMT-Free Municipal Bond ETF | | | | 5,493,248 | | | | | | | | | | (137,932 | ) | | | | | | | | | 5,355,316 | | | | | | | | | | 90,174,567 | |
| | | | | | | |
Preferred ETF | | | | 176,184,379 | | | | | | | | | | (98,062,267 | ) | | | | | | | | | 78,122,112 | | | | | | | | | | 6,219,327,127 | |
| | | | | | | |
Taxable Municipal Bond ETF | | | | 176,909,882 | | | | | | | | | | (1,188,532 | ) | | | | | | | | | 175,721,350 | | | | | | | | | | 1,851,305,218 | |
| | | | | | | |
Treasury Collateral ETF | | | | 662,322 | | | | | | | | | | (15,131 | ) | | | | | | | | | 647,191 | | | | | | | | | | 937,428,464 | |
| | | | | | | |
Variable Rate Preferred ETF | | | | 30,468,992 | | | | | | | | | | (59,989,476 | ) | | | | | | | | | (29,520,484 | ) | | | | | | | | | 1,522,306,808 | |
| | | | | | | |
VRDO Tax-Free Weekly ETF | | | | - | | | | | | | | | | - | | | | | | | | | | - | | | | | | | | | | 48,265,000 | |
NOTE 7–Reclassification of Permanent Differences
Primarily as a result of differing book/tax treatment of in-kind transactions, distributions, taxable overdistributions, partnerships, and hybrid securities, amounts were reclassified between undistributed net investment income (loss), undistributed net realized gain (loss) and Shares of beneficial interest. These reclassifications had no effect on the net assets of each Fund. For the fiscal year ended August 31, 2020, the reclassifications were as follows:
| | | | | | | | | | | | | | | | | | | | | | | | | |
| | | Undistributed Net | | | | Undistributed Net | | | | Shares of |
| | | Investment Income (Loss) | | | | Realized Gain (Loss) | | | | Beneficial Interest |
| | | | | |
1-30 Laddered Treasury ETF | | | $ | 5,508 | | | | | | | | | $ | (13,498,108 | ) | | | | | | | | $ | 13,492,600 | |
| | | | | |
California AMT-Free Municipal Bond ETF | | | | 59,378 | | | | | | | | | | (1,363,231 | ) | | | | | | | | | 1,303,853 | |
| | | | | |
CEF Income Composite ETF | | | | 13,624,385 | | | | | | | | | | (2,404,257 | ) | | | | | | | | | (11,220,128 | ) |
| | | | | |
Fundamental High Yield® Corporate Bond ETF | | | | 144,804 | | | | | | | | | | 5,685,743 | | | | | | | | | | (5,830,547 | ) |
| | | | | |
Fundamental Investment Grade Corporate Bond ETF | | | | 6,745 | | | | | | | | | | (1,568,299 | ) | | | | | | | | | 1,561,554 | |
| | | | | |
National AMT-Free Municipal Bond ETF | | | | 566,769 | | | | | | | | | | (983,505 | ) | | | | | | | | | 416,736 | |
| | | | | |
New York AMT-Free Municipal Bond ETF | | | | 13,346 | | | | | | | | | | - | | | | | | | | | | (13,346 | ) |
| | | | | |
Preferred ETF | | | | (2,941,239 | ) | | | | | | | | | 48,086,758 | | | | | | | | | | (45,145,519 | ) |
| | | | | |
Taxable Municipal Bond ETF | | | | 482,751 | | | | | | | | | | (5,666,064 | ) | | | | | | | | | 5,183,313 | |
| | | | | |
Treasury Collateral ETF | | | | 80,708 | | | | | | | | | | (583,734 | ) | | | | | | | | | 503,026 | |
| | | | | |
Variable Rate Preferred ETF | | | | 3,993,503 | | | | | | | | | | 13,334,207 | | | | | | | | | | (17,327,710 | ) |
| | | | | |
VRDO Tax-Free Weekly ETF | | | | 2,374 | | | | | | | | | | - | | | | | | | | | | (2,374 | ) |
NOTE 8–Trustees’ and Officer’s Fees
Trustees’ and Officer’s Fees include amounts accrued by the Funds to pay remuneration to the Independent Trustees and an Officer of the Trust. The Adviser, as a result of each Fund’s unitary management fee, pays for such compensation for the Funds. The Trustee who is an “interested person” of the Trust does not receive any Trustees’ fees.
The Trust has adopted a deferred compensation plan (the “Plan”). Under the Plan, each Independent Trustee who has executed a Deferred Fee Agreement (a “Participating Trustee”) may defer receipt of all or a portion of their compensation (“Deferral Fees”). Such Deferral Fees are deemed to be invested in select Invesco ETFs. The Deferral Fees payable to a Participating Trustee are valued as of the date such Deferral Fees would have been paid to a Participating Trustee. The value increases with contributions or with increases in the value of the Shares selected, and the value decreases with distributions or with declines in the value of the Shares selected. Obligations under the Plan represent unsecured claims against the general assets of the Funds.
NOTE 9—Capital
Shares are issued and redeemed by each Fund only in Creation Units consisting of a specified number of Shares as set forth in the Funds’ prospectus. Only Authorized Participants are permitted to purchase or redeem Creation Units from the Funds. For 1-30 Laddered Treasury ETF, CEF Income Composite ETF, Fundamental High Yield® Corporate Bond ETF, Fundamental Investment Grade Corporate Bond ETF, Preferred ETF, Treasury Collateral ETF and Variable Rate Preferred ETF, such transactions are generally in exchange for Deposit Securities. However, for such Funds, cash in an amount equivalent to the value of certain securities may be substituted, generally when the securities are not available in sufficient quantity for delivery, not eligible for trading by the Authorized Participant or as a result of other market circumstances. For California AMT-Free Municipal Bond ETF, National AMT-Free Municipal Bond ETF, New York AMT-Free Municipal Bond ETF, Taxable Municipal Bond ETF and VRDO Tax-Free Weekly ETF, such transactions are principally in exchange for the deposit or delivery of cash.
To the extent that the Funds permit transactions in exchange for Deposit Securities, each Fund may issue Shares in advance of receipt of Deposit Securities subject to various conditions, including a requirement to maintain on deposit with the Trust cash at least equal to 105% of the market value of the missing Deposit Securities. In accordance with the Trust’s Participant Agreement, Creation Units will be issued to an Authorized Participant, notwithstanding the fact that the corresponding Deposit Securities have not been received in part or in whole, in reliance on the undertaking of the Authorized Participant to deliver the missing Deposit Securities as soon as possible, which undertaking shall be secured by the Authorized Participant’s delivery and maintenance of collateral consisting of cash in the form of U.S. dollars in immediately available funds having a value (marked-to-market daily) at least equal to 105%, which the Adviser may change from time to time, of the value of the missing Deposit Securities.
Certain transaction fees may be charged by the Funds for creations and redemptions, which are treated as increases in capital. Transactions in each Fund’s Shares are disclosed in detail in the Statements of Changes in Net Assets.
NOTE 10—Coronavirus (COVID-19) Pandemic
During the first quarter of 2020, the World Health Organization declared COVID-19 to be a public health emergency. COVID-19 has led to increased short-term market volatility and may have adverse long-term effects on U.S. and world economies and markets in general. COVID-19 may adversely impact the value of the Funds’ investments. Because of the uncertainties on valuation, the global economy and business operations, values reflected in these financial statements may materially differ from the value received upon actual sales of those investments.
The extent of the impact on the performance of the Funds and their investments will depend on future developments, including the duration and spread of the COVID-19 outbreak, related restrictions and advisories, and the effects on the financial markets and economy overall, all of which are highly uncertain and cannot be predicted.
Report of Independent Registered Public Accounting Firm
To the Board of Trustees of Invesco Exchange-Traded Fund Trust II and Shareholders of Invesco 1-30 Laddered Treasury ETF, Invesco California AMT-Free Municipal Bond ETF, Invesco CEF Income Composite ETF, Invesco Fundamental High Yield® Corporate Bond ETF, Invesco Fundamental Investment Grade Corporate Bond ETF, Invesco National AMT-Free Municipal Bond ETF, Invesco New York AMT-Free Municipal Bond ETF, Invesco Preferred ETF, Invesco Taxable Municipal Bond ETF, Invesco Treasury Collateral ETF, Invesco Variable Rate Preferred ETF and Invesco VRDO Tax-Free Weekly ETF
Opinions on the Financial Statements
We have audited the accompanying statements of assets and liabilities, including the schedules of investments, of Invesco 1-30 Laddered Treasury ETF, Invesco California AMT-Free Municipal Bond ETF, Invesco CEF Income Composite ETF, Invesco Fundamental High Yield® Corporate Bond ETF, Invesco Fundamental Investment Grade Corporate Bond ETF, Invesco National AMT-Free Municipal Bond ETF, Invesco New York AMT-Free Municipal Bond ETF, Invesco Preferred ETF, Invesco Taxable Municipal Bond ETF, Invesco Treasury Collateral ETF, Invesco Variable Rate Preferred ETF and Invesco VRDO Tax-Free Weekly ETF (twelve of the funds constituting Invesco Exchange-Traded Fund Trust II, hereafter collectively referred to as the “Funds”) as of August 31, 2020, the related statements of operations for the year ended August 31, 2020, the statements of changes in net assets for each of the two years in the period ended August 31, 2020, including the related notes, and the financial highlights for each of the periods indicated therein (collectively referred to as the “financial statements”). In our opinion, the financial statements present fairly, in all material respects, the financial position of each of the Funds as of August 31, 2020, the results of each of their operations for the year ended August 31, 2020, the changes in each of their net assets for each of the two years in the period ended August 31, 2020 and each of the financial highlights for each of the periods indicated therein, in conformity with accounting principles generally accepted in the United States of America.
Basis for Opinions
These financial statements are the responsibility of the Funds’ management. Our responsibility is to express an opinion on the Funds’ financial statements based on our audits. We are a public accounting firm registered with the Public Company Accounting Oversight Board (United States) (“PCAOB”) and are required to be independent with respect to the Funds in accordance with the U.S. federal securities laws and the applicable rules and regulations of the Securities and Exchange Commission and the PCAOB.
We conducted our audits of these financial statements in accordance with the standards of the PCAOB. Those standards require that we plan and perform the audit to obtain reasonable assurance about whether the financial statements are free of material misstatement, whether due to error or fraud.
Our audits included performing procedures to assess the risks of material misstatement of the financial statements, whether due to error or fraud, and performing procedures that respond to those risks. Such procedures included examining, on a test basis, evidence regarding the amounts and disclosures in the financial statements. Our audits also included evaluating the accounting principles used and significant estimates made by management, as well as evaluating the overall presentation of the financial statements. Our procedures included confirmation of securities owned as of August 31, 2020 by correspondence with the custodian, transfer agent, and brokers; when replies were not received from brokers, we performed other auditing procedures. We believe that our audits provide a reasonable basis for our opinions.
/s/ PricewaterhouseCoopers LLP
Chicago, Illinois
October 28, 2020
We have served as the auditor of one or more of the investment companies in the Invesco group of investment companies since at least 1995. We have not been able to determine the specific year we began serving as auditor.
Calculating your ongoing Fund expenses
Example
As a shareholder of a Fund of the Invesco Exchange-Traded Fund Trust II, you incur a unitary management fee. In addition to the unitary management fee, a shareholder may pay distribution fees, if any, brokerage expenses, taxes, interest, litigation expenses, acquired fund fees and expenses, if any, and other extraordinary expenses. The expense examples below are intended to help you understand your ongoing costs (in dollars) of investing in the Funds and to compare these costs with the ongoing costs of investing in other funds.
The example is based on an investment of $1,000 invested at the beginning of the period and held through the six-month period ended August 31, 2020.
In addition to the fees and expenses which the Invesco CEF Income Composite ETF and Invesco Preferred ETF (collectively the “Portfolios”) bear directly, the Portfolios indirectly bear a pro rata share of the fees and expenses of the investment companies in which the Portfolios invest. The amount of fees and expenses incurred indirectly by the Portfolios will vary because the investment companies have varied expenses and fee levels and the Portfolios may own different proportions of the investment companies at different times. Estimated investment companies’ expenses are not expenses that are incurred directly by the Portfolios. They are expenses that are incurred directly by the investment companies and are deducted from the value of the investment companies the Portfolios invest in. The effect of the estimated investment companies’ expenses that the Portfolios bear indirectly is included in each Portfolio’s total return.
Actual Expenses
The first line in the following table provides information about actual account values and actual expenses. You may use the information in this line, together with the amount you invested, to estimate the expenses that you paid over the period. Simply divide your account value by $1,000 (for example, an $8,600 account value divided by $1,000 = 8.6), then multiply the result by the number in the first line under the heading “Expenses Paid During the Six-Month Period” to estimate the expenses you paid on your account during this period.
Hypothetical Example for Comparison Purposes
The second line in the following table provides information about hypothetical account values and hypothetical expenses based on the Fund’s actual expense ratio and an assumed annualized rate of return of 5% per year before expenses, which is not the Fund’s actual return. The hypothetical account values and expenses may not be used to estimate the actual ending account balance or expenses you paid for the period. You may use this information to compare the ongoing costs of investing in the Fund and other funds. To do so, compare this 5% hypothetical example with the 5% hypothetical examples that appear in the shareholder reports of the other funds.
Please note that the expenses shown in the table are meant to highlight your ongoing costs only and do not reflect any transactional costs, such as sales charges and brokerage commissions. Therefore, the second line in the table is useful in comparing ongoing costs only, and will not help you determine the relative total costs of owning different funds. In addition, expenses shown in the table do not include the expenses of the underlying funds, which are borne indirectly by a Fund. If transaction costs and indirect expenses were included, your costs would have been higher.
| | | | | | | | | | | | | | | | | | | | |
| | | Beginning
Account Value
March 1, 2020 | | Ending
Account Value
August 31, 2020 | | Annualized
Expense Ratio
Based on the
Six-Month Period | | Expenses Paid
During the
Six-Month Period(1) |
| | | | |
Invesco 1-30 Laddered Treasury ETF (PLW) | | | | | | | | | | | | | | | | | | | | |
| | | | |
Actual | | | $ | 1,000.00 | | | | $ | 1,047.00 | | | | | 0.25 | % | | | $ | 1.29 | |
| | | | |
Hypothetical (5% return before expenses) | | | | 1,000.00 | | | | | 1,023.88 | | | | | 0.25 | | | | | 1.27 | |
| | | | |
Invesco California AMT-Free Municipal Bond ETF (PWZ) | | | | | | | | | | | | | | | | | | | | |
| | | | |
Actual | | | | 1,000.00 | | | | | 990.10 | | | | | 0.28 | | | | | 1.40 | |
| | | | |
Hypothetical (5% return before expenses) | | | | 1,000.00 | | | | | 1,023.73 | | | | | 0.28 | | | | | 1.42 | |
| | | | |
Invesco CEF Income Composite ETF (PCEF) | | | | | | | | | | | | | | | | | | | | |
| | | | |
Actual | | | | 1,000.00 | | | | | 1,022.40 | | | | | 0.50 | | | | | 2.54 | |
| | | | |
Hypothetical (5% return before expenses) | | | | 1,000.00 | | | | | 1,022.62 | | | | | 0.50 | | | | | 2.54 | |
Calculating your ongoing Fund expenses–(continued)
| | | | | | | | | | | | | | | | | | | | |
| | | | | | | Annualized | | |
| | | Beginning | | Ending | | Expense Ratio | | Expenses Paid |
| | | Account Value | | Account Value | | Based on the | | During the |
| | | March 1, 2020 | | August 31, 2020 | | Six-Month Period | | Six-Month Period(1) |
| | | | |
Invesco Fundamental High Yield® Corporate Bond ETF (PHB) | | | | | | | | | | | | | | | | | | | | |
| | | | |
Actual | | | $ | 1,000.00 | | | | $ | 1,024.20 | | | | | 0.50 | % | | | $ | 2.54 | |
| | | | |
Hypothetical (5% return before expenses) | | | | 1,000.00 | | | | | 1,022.62 | | | | | 0.50 | | | | | 2.54 | |
| | | | |
Invesco Fundamental Investment Grade Corporate Bond ETF (PFIG) | | | | | | | | | | | | | | | | | | | | |
| | | | |
Actual | | | | 1,000.00 | | | | | 1,035.00 | | | | | 0.22 | | | | | 1.13 | |
| | | | |
Hypothetical (5% return before expenses) | | | | 1,000.00 | | | | | 1,024.03 | | | | | 0.22 | | | | | 1.12 | |
| | | | |
Invesco National AMT-Free Municipal Bond ETF (PZA) | | | | | | | | | | | | | | | | | | | | |
| | | | |
Actual | | | | 1,000.00 | | | | | 989.50 | | | | | 0.28 | | | | | 1.40 | |
| | | | |
Hypothetical (5% return before expenses) | | | | 1,000.00 | | | | | 1,023.73 | | | | | 0.28 | | | | | 1.42 | |
| | | | |
Invesco New York AMT-Free Municipal Bond ETF (PZT) | | | | | | | | | | | | | | | | | | | | |
| | | | |
Actual | | | | 1,000.00 | | | | | 991.80 | | | | | 0.28 | | | | | 1.40 | |
| | | | |
Hypothetical (5% return before expenses) | | | | 1,000.00 | | | | | 1,023.73 | | | | | 0.28 | | | | | 1.42 | |
| | | | |
Invesco Preferred ETF (PGX) | | | | | | | | | | | | | | | | | | | | |
| | | | |
Actual | | | | 1,000.00 | | | | | 1,058.00 | | | | | 0.50 | | | | | 2.59 | |
| | | | |
Hypothetical (5% return before expenses) | | | | 1,000.00 | | | | | 1,022.62 | | | | | 0.50 | | | | | 2.54 | |
| | | | |
Invesco Taxable Municipal Bond ETF (BAB) | | | | | | | | | | | | | | | | | | | | |
| | | | |
Actual | | | | 1,000.00 | | | | | 1,001.90 | | | | | 0.27 | | | | | 1.36 | |
| | | | |
Hypothetical (5% return before expenses) | | | | 1,000.00 | | | | | 1,023.78 | | | | | 0.27 | | | | | 1.37 | |
| | | | |
Invesco Treasury Collateral ETF (CLTL) | | | | | | | | | | | | | | | | | | | | |
| | | | |
Actual | | | | 1,000.00 | | | | | 1,005.30 | | | | | 0.08 | | | | | 0.40 | |
| | | | |
Hypothetical (5% return before expenses) | | | | 1,000.00 | | | | | 1,024.73 | | | | | 0.08 | | | | | 0.41 | |
| | | | |
Invesco Variable Rate Preferred ETF (VRP) | | | | | | | | | | | | | | | | | | | | |
| | | | |
Actual | | | | 1,000.00 | | | | | 1,011.60 | | | | | 0.50 | | | | | 2.53 | |
| | | | |
Hypothetical (5% return before expenses) | | | | 1,000.00 | | | | | 1,022.62 | | | | | 0.50 | | | | | 2.54 | |
| | | | |
Invesco VRDO Tax-Free Weekly ETF (PVI) | | | | | | | | | | | | | | | | | | | | |
| | | | |
Actual | | | | 1,000.00 | | | | | 1,002.20 | | | | | 0.25 | | | | | 1.26 | |
| | | | |
Hypothetical (5% return before expenses) | | | | 1,000.00 | | | | | 1,023.88 | | | | | 0.25 | | | | | 1.27 | |
| (1) | Expenses are calculated using the annualized expense ratio, which represents the ongoing expenses as a percentage of net assets for the six-month period ended August 31, 2020. Expenses are calculated by multiplying the Fund’s annualized expense ratio by the average account value for the period, then multiplying the result by 184/366. Expense ratios for the most recent six-month period may differ from expense ratios based on the annualized data in the Financial Highlights. |
Tax Information
Form 1099-DIV, Form 1042-S and other year-end tax information provide shareholders with actual calendar year amounts that should be included in their tax returns. Shareholders should consult their tax advisors.
The following distribution information is being provided as required by the Internal Revenue Code or to meet a specific state’s requirement.
The Funds designate the following amounts or, if subsequently determined to be different, the maximum amount allowable for their fiscal year ended August 31, 2020:
| | | | | | | | | | | | | | | | | | | | | | | | | | | | | | | | | | | | | | | | |
| | | Qualified | | Qualified | | | | | | Business | | Qualified | | | | |
| | | Business | | Dividend | | Dividends-Received | | U.S. Treasury | | Interest | | Interest | | Tax-Exempt | | Long Term |
| | | Income* | | Income* | | Deduction* | | Obligations* | | Income* | | Income* | | Income* | | Capital Gains |
Invesco 1-30 Laddered Treasury ETF | | | | 0 | % | | | | 0 | % | | | | 0 | % | | | | 100 | % | | | | 99 | % | | | | 100 | % | | | | 0 | % | | | $ | - | |
Invesco California AMT-Free Municipal Bond ETF | | | | 0 | % | | | | 0 | % | | | | 0 | % | | | | 0 | % | | | | 0 | % | | | | 0 | % | | | | 99 | % | | | $ | - | |
Invesco CEF Income Composite ETF | | | | 0 | % | | | | 5 | % | | | | 5 | % | | | | 0 | % | | | | 0 | % | | | | 0 | % | | | | 0 | % | | | $ | - | |
Invesco Fundamental High Yield® Corporate Bond ETF | | | | 0 | % | | | | 0 | % | | | | 0 | % | | | | 0 | % | | | | 98 | % | | | | 96 | % | | | | 0 | % | | | $ | - | |
Invesco Fundamental Investment Grade Corporate Bond ETF | | | | 0 | % | | | | 0 | % | | | | 0 | % | | | | 0 | % | | | | 100 | % | | | | 97 | % | | | | 0 | % | | | $ | 6,388 | |
Invesco National AMT-Free Municipal Bond ETF | | | | 0 | % | | | | 0 | % | | | | 0 | % | | | | 0 | % | | | | 0 | % | | | | 0 | % | | | | 99 | % | | | $ | - | |
Invesco New York AMT-Free Municipal Bond ETF | | | | 0 | % | | | | 0 | % | | | | 0 | % | | | | 0 | % | | | | 0 | % | | | | 0 | % | | | | 99 | % | | | $ | - | |
Invesco Preferred ETF | | | | 7 | % | | | | 60 | % | | | | 58 | % | | | | 0 | % | | | | 29 | % | | | | 29 | % | | | | 0 | % | | | $ | - | |
Invesco Taxable Municipal Bond ETF | | | | 0 | % | | | | 0 | % | | | | 0 | % | | | | 0 | % | | | | 100 | % | | | | 100 | % | | | | 0 | % | | | $ | - | |
Invesco Treasury Collateral ETF | | | | 0 | % | | | | 0 | % | | | | 0 | % | | | | 100 | % | | | | 94 | % | | | | 96 | % | | | | 0 | % | | | $ | 1,235 | |
Invesco Variable Rate Preferred ETF | | | | 0 | % | | | | 74 | % | | | | 70 | % | | | | 0 | % | | | | 10 | % | | | | 15 | % | | | | 0 | % | | | $ | - | |
Invesco VRDO Tax-Free Weekly ETF | | | | 0 | % | | | | 0 | % | | | | 0 | % | | | | 0 | % | | | | 0 | % | | | | 0 | % | | | | 99 | % | | | $ | - | |
| * | The above percentages are based on ordinary income dividends paid to shareholders during the Trust’s fiscal year. |
Trustees and Officers
The Independent Trustees of the Trust, their term of office and length of time served, their principal business occupations during at least the past five years, the number of portfolios in the Fund Complex (as defined below) overseen by each Independent Trustee and the other directorships, if any, held by each Independent Trustee are shown below.
As of August 31, 2020
| | | | | | | | | | |
| | | | | | | | | Number of | | |
| | | | | Term of | | | | Portfolios | | Other |
| | | | | Office | | | | in Fund | | Directorships |
| | | | | and | | | | Complex** | | Held by |
| | | Position(s) | | Length of | | Principal | | Overseen by | | Independent |
| Name, Address and Year of | | Held | | Time | | Occupation(s) During | | Independent | | Trustees During |
| Birth of Independent Trustees | | with Trust | | Served* | | Past 5 Years | | Trustees | | the Past 5 Years |
|
Ronn R. Bagge—1958 c/o Invesco Capital Management LLC 3500 Lacey Road, Suite 700 Downers Grove, IL 60515 | | Vice Chairman of the Board; Chairman of the Nominating and Governance Committee and Trustee | | Vice Chairman since 2018; Chairman of the Nominating and Governance Committee and Trustee since 2007 | | Founder and Principal, YQA Capital Management LLC (1998-Present); formerly, Owner/CEO of Electronic Dynamic Balancing Co., Inc. (high-speed rotating equipment service provider). | | 214 | | Trustee
and
Investment
Oversight
Committee
member,
Mission
Aviation
Fellowship
(2017-
Present). |
| | | | | |
Todd J. Barre—1957 c/o Invesco Capital Management LLC 3500 Lacey Road, Suite 700 Downers Grove, IL 60515 | | Trustee | | Since 2010 | | Assistant Professor of Business, Trinity Christian College (2010-2016); formerly, Vice President and Senior Investment Strategist (2001-2008), Director of Open Architecture and Trading (2007-2008), Head of Fundamental Research (2004-2007) and Vice President and Senior Fixed Income Strategist (1994-2001), BMO Financial Group/Harris Private Bank. | | 214 | | None. |
| * | This is the date the Independent Trustee began serving the Trust. Each Independent Trustee serves an indefinite term, until his or her successor is elected. |
| ** | Fund Complex includes all open- and closed-end funds (including all of their portfolios) advised by the Adviser and any affiliated person of the Adviser. |
Trustees and Officers—(continued)
| | | | | | | | | | |
| | | | | | | | | Number of | | |
| | | | | Term of | | | | Portfolios | | Other |
| | | | | Office | | | | in Fund | | Directorships |
| | | | | and | | | | Complex** | | Held by |
| | | Position(s) | | Length of | | Principal | | Overseen by | | Independent |
| Name, Address and Year of | | Held | | Time | | Occupation(s) During | | Independent | | Trustees During |
| Birth of Independent Trustees | | with Trust | | Served* | | Past 5 Years | | Trustees | | the Past 5 Years |
|
Edmund P. Giambastiani, Jr.—1948 c/o Invesco Capital Management LLC 3500 Lacey Road, Suite 700 Downers Grove, IL 60515 | | Trustee | | Since 2019 | | President, Giambastiani Group LLC (national security and energy consulting) (2007-Present); Director, The Boeing Company (2009-Present); Trustee, MITRE Corporation (federally-funded research development) (2008-Present); Director, THL Credit, Inc. (alternative credit investment manager) (2016-Present); Trustee, U.S. Naval Academy Foundation Athletic & Scholarship Program (2010-Present); Advisory Board Member, Massachusetts Institute of Technology Lincoln Laboratory (federally-funded research development) (2010- Present); Defense Advisory Board Member, Lawrence Livermore National Laboratory (2013-Present); formerly, Chairman (2015-2016), Lead Director (2011-2015) and Director (2008-2011), Monster Worldwide, Inc. (career services); Advisory Board Member, Maxwell School of Citizenship and Public Affairs of Syracuse University (2012-2016); United States Navy, career nuclear submarine officer (1970-2007); Seventh Vice Chairman of the Joint Chiefs of Staff (2005-2007); first NATO Supreme Allied Commander Transformation (2003-2005); Commander, U.S. Joint Forces Command (2002-2005). | | 214 | | Formerly,
Trustee,
certain funds
of the
Oppenheimer
Funds
complex
(2013- 2019);
Director,
Mercury
Defense
Systems Inc.
(information
technology)
(2011-2013);
Independent
Director,
QinetiQ
Group Plc
(defense
technology
and security)
(2008-2011);
Chairman,
Alenia North
America, Inc.
(military and
defense
products)
(2008-2009);
Director,
SRA
International,
Inc.
(information
technology
and services)
(2008- 2011). |
| * | This is the date the Independent Trustee began serving the Trust. Each Independent Trustee serves an indefinite term, until his or her successor is elected. |
| ** | Fund Complex includes all open- and closed-end funds (including all of their portfolios) advised by the Adviser and any affiliated person of the Adviser. |
Trustees and Officers—(continued)
| | | | | | | | | | |
| | | | | | | | | Number of | | |
| | | | | Term of | | | | Portfolios | | Other |
| | | | | Office | | | | in Fund | | Directorships |
| | | | | and | | | | Complex** | | Held by |
| | | Position(s) | | Length of | | Principal | | Overseen by | | Independent |
| Name, Address and Year of | | Held | | Time | | Occupation(s) During | | Independent | | Trustees During |
| Birth of Independent Trustees | | with Trust | | Served* | | Past 5 Years | | Trustees | | the Past 5 Years |
|
Victoria J. Herget—1951 c/o Invesco Capital Management LLC 3500 Lacey Road, Suite 700 Downers Grove, IL 60515 | | Trustee | | Since 2019 | | Formerly, Managing Director (1993-2001), Principal (1985-1993), Vice President (1978-1985) and Assistant Vice President (1973- 1978), Zurich Scudder Investments (investment adviser) (and its predecessor firms). | | 214 | | Trustee (2000- Present) and Chair (2010-2017), Newberry Library; Trustee, Mather LifeWays (2001-Present); Trustee, Chikaming Open Lands (2014-Present); formerly, Trustee, certain funds in the Oppenheimer Funds complex (2012- 2019); Board Chair (2008-2015) and Director (2004- 2018), United Educators Insurance Company; Independent Director, First American Funds (2003-2011); Trustee (1992-2007), Chair of the Board of Trustees (1999-2007), Investment Committee Chair (1994-1999) and Investment Committee member (2007-2010), Wellesley College; Trustee, BoardSource (2006-2009); Trustee, Chicago City Day School (1994-2005). |
| * | This is the date the Independent Trustee began serving the Trust. Each Independent Trustee serves an indefinite term, until his or her successor is elected. |
| ** | Fund Complex includes all open- and closed-end funds (including all of their portfolios) advised by the Adviser and any affiliated person of the Adviser. |
Trustees and Officers—(continued)
| | | | | | | | | | |
| | | | | | | | | Number of | | |
| | | | | Term of | | | | Portfolios | | Other |
| | | | | Office | | | | in Fund | | Directorships |
| | | | | and | | | | Complex** | | Held by |
| | | Position(s) | | Length of | | Principal | | Overseen by | | Independent |
| Name, Address and Year of | | Held | | Time | | Occupation(s) During | | Independent | | Trustees During |
| Birth of Independent Trustees | | with Trust | | Served* | | Past 5 Years | | Trustees | | the Past 5 Years |
|
Marc M. Kole—1960 c/o Invesco Capital Management LLC 3500 Lacey Road, Suite 700 Downers Grove, IL 60515 | | Chairman of the Audit Committee and Trustee | | Chairman of the Audit Committee since 2008; Trustee since 2007 | | Senior Director of Finance, By The Hand Club for Kids (not-for-profit) (2015-Present); formerly, Chief Financial Officer, Hope Network (social services) (2008-2012); Assistant Vice President and Controller, Priority Health (health insurance) (2005-2008); Regional Chief Financial Officer, United Healthcare (2005); Chief Accounting Officer, Senior Vice President of Finance, Oxford Health Plans (2000-2004); Audit Partner, Arthur Andersen LLP (1996-2000). | | 214 | | Treasurer (2018-Present), Finance Committee Member (2015- Present) and Audit Committee Member (2015), Thornapple Evangelical Covenant Church; formerly, Board and Finance Committee Member (2009-2017) and Treasurer (2010-2015, 2017), NorthPointe Christian Schools. |
| | | | | |
Yung Bong Lim—1964 c/o Invesco Capital Management LLC 3500 Lacey Road, Suite 700 Downers Grove, IL 60515 | | Chairman of the Investment Oversight Committee and Trustee | | Chairman of the Investment Oversight Committee since 2014; Trustee since 2013 | | Managing Partner, RDG Funds LLC (real estate) (2008-Present); formerly, Managing Director, Citadel LLC (1999-2007). | | 214 | | Advisory Board Member, Performance Trust Capital Partners, LLC (2008-Present); Board Director, Beacon Power Services, Corp. (2019-Present). |
| * | This is the date the Independent Trustee began serving the Trust. Each Independent Trustee serves an indefinite term, until his or her successor is elected. |
| ** | Fund Complex includes all open- and closed-end funds (including all of their portfolios) advised by the Adviser and any affiliated person of the Adviser. |
Trustees and Officers—(continued)
| | | | | | | | | | |
| | | | | | | | | Number of | | |
| | | | | Term of | | | | Portfolios | | Other |
| | | | | Office | | | | in Fund | | Directorships |
| | | | | and | | | | Complex** | | Held by |
| | | Position(s) | | Length of | | Principal | | Overseen by | | Independent |
| Name, Address and Year of | | Held | | Time | | Occupation(s) During | | Independent | | Trustees During |
| Birth of Independent Trustees | | with Trust | | Served* | | Past 5 Years | | Trustees | | the Past 5 Years |
|
Joanne Pace—1958 c/o Invesco Capital Management LLC 3500 Lacey Road, Suite 700 Downers Grove, IL 60515 | | Trustee | | Since 2019 | | Formerly, Senior Advisor, SECOR Asset Management, LP (2010-2011); Managing Director and Chief Operating Officer, Morgan Stanley Investment Management (2006- 2010); Partner and Chief Operating Officer, FrontPoint Partners, LLC (alternative investments) (2005- 2006); Managing Director (2003-2005), Global Head of Human Resources and member of Executive Board and Operating Committee (2004-2005), Global Head of Operations and Product Control (2003-2004), Credit Suisse (investment banking); Managing Director (1997-2003), Controller and Principal Accounting Officer (1999-2003), Chief Financial Officer (temporary assignment) for the Oversight Committee, Long Term Capital Management (1998-1999). | | 214 | | Board Director, Horizon Blue Cross Blue Shield of New Jersey (2012- Present); Advisory Board Director, The Alberleen Group LLC (2012-Present); Governing Council Member (2016- Present) and Chair of Education Committee (2017-Present), Independent Directors Council (IDC); Board Member, 100 Women in Finance (2015-Present); Council Member, NewYork-Presbyterian Hospital’s Leadership Council on Children’s and Women’s Health (2012-Present); formerly, Trustee, certain funds in the Oppenheimer Funds complex (2012- 2019); Lead Independent Director and Chair of the Audit and Nominating Committee of The Global Chartist Fund, LLC, Oppenheimer Asset Management (2011-2012); Board Director, Managed Funds Association (2008-2010); Board Director (2007-2010) and Investment Committee Chair (2008-2010), Morgan Stanley Foundation. |
| * | This is the date the Independent Trustee began serving the Trust. Each Independent Trustee serves an indefinite term, until his or her successor is elected. |
| ** | Fund Complex includes all open- and closed-end funds (including all of their portfolios) advised by the Adviser and any affiliated person of the Adviser. |
Trustees and Officers—(continued)
| | | | | | | | | | |
| | | | | | | | | Number of | | |
| | | | | Term of | | | | Portfolios | | Other |
| | | | | Office | | | | in Fund | | Directorships |
| | | | | and | | | | Complex** | | Held by |
| | | Position(s) | | Length of | | Principal | | Overseen by | | Independent |
| Name, Address and Year of | | Held | | Time | | Occupation(s) During | | Independent | | Trustees During |
| Birth of Independent Trustees | | with Trust | | Served* | | Past 5 Years | | Trustees | | the Past 5 Years |
|
Gary R. Wicker - 1961 c/o Invesco Capital Management LLC 3500 Lacey Road, Suite 700 Downers Grove, IL 60515 | | Trustee | | Since 2013 | | Senior Vice President of Global Finance and Chief Financial Officer, RBC Ministries (publishing company) (2013-Present); formerly, Executive Vice President and Chief Financial Officer, Zondervan Publishing (a division of Harper Collins/NewsCorp) (2007-2012); Senior Vice President and Group Controller (2005- 2006), Senior Vice President and Chief Financial Officer (2003-2004), Chief Financial Officer (2001-2003), Vice President, Finance and Controller (1999-2001) and Assistant Controller (1997-1999), divisions of The Thomson Corporation (information services provider); Senior Audit Manager (1994-1997), PricewaterhouseCoopers LLP. | | 214 | | Board Member and Treasurer, Our Daily Bread Ministries Canada (2015- Present); Board and Finance Committee Member, West Michigan Youth For Christ (2010- Present). |
| | | | | |
Donald H. Wilson - 1959 c/o Invesco Capital Management LLC 3500 Lacey Road, Suite 700 Downers Grove, IL 60515 | | Chairman of the Board and Trustee | | Chairman since 2012; Trustee since 2007 | | Chairman, President and Chief Executive Officer, McHenry Bancorp Inc. and McHenry Savings Bank (subsidiary) (2018-Present); formerly, Chairman and Chief Executive Officer, Stone Pillar Advisors, Ltd. (2010-2017); President and Chief Executive Officer, Stone Pillar Investments, Ltd. (advisory services to the financial sector) (2016- 2018); Chairman, President and Chief Executive Officer, Community Financial Shares, Inc. and Community Bank—Wheaton/Glen Ellyn (subsidiary) (2013-2015); Chief Operating Officer, AMCORE Financial, Inc. (bank holding company) (2007-2009); Executive Vice President and Chief Financial Officer, AMCORE Financial, Inc. (2006-2007); Senior Vice President and Treasurer, Marshall & Ilsley Corp. (bank holding company) (1995-2006). | | 214 | | Director, Penfield Children’s Center (2004-Present); Board Chairman, Gracebridge Alliance, Inc. (2015-Present). |
| * | This is the date the Independent Trustee began serving the Trust. Each Independent Trustee serves an indefinite term, until his or her successor is elected. |
| ** | Fund Complex includes all open- and closed-end funds (including all of their portfolios) advised by the Adviser and any affiliated person of the Adviser. |
Trustees and Officers—(continued)
The Interested Trustee and the executive officers of the Trust, their term of office and length of time served, their principal business occupations during at least the past five years, the number of portfolios in the Fund Complex (as defined below) overseen by the Interested Trustee and the other directorships, if any, held by the Interested Trustee are shown below.
| | | | | | | | | | |
| | | | | | | | | Number of | | |
| | | | | Term of | | | | Portfolios | | Other |
| | | | | Office | | | | in Fund | | Directorships |
| | | | | and | | | | Complex** | | Held by |
| | | Position(s) | | Length of | | Principal | | Overseen by | | Interested |
| Name, Address and Year of Birth | | Held | | Time | | Occupation(s) During | | Interested | | Trustee During |
| of Interested Trustee | | with Trust | | Served* | | Past 5 Years | | Trustee | | the Past 5 Years |
|
Kevin M. Carome—1956 Invesco Ltd. Two Peachtree Pointe 1555 Peachtree St., N.E., Suite 1800 Atlanta, GA 30309 | | Trustee | | Since 2010 | | Senior Managing Director, Secretary and General Counsel, Invesco Ltd. (2007-Present); Director, Invesco Advisers, Inc. (2009-Present); Director (2006-Present) and Executive Vice President (2008-Present), Invesco North American Holdings, Inc.; Executive Vice President (2008-Present), Invesco Investments (Bermuda) Ltd.; Manager, Horizon Flight Works LLC; and Executive Vice President (2014-Present), INVESCO Asset Management (Bermuda) Ltd.; formerly, Director and Secretary (2012-2020), Invesco Services (Bahamas) Private Limited; Director, Invesco Finance PLC (2011-2019); Director, INVESCO Asset | | 214 | | None |
| | | | | | Management (Bermuda) Ltd. (2014-2019); Director and Executive Vice President, Invesco Finance, Inc. (2011-2018); Director (2006-2018) and Executive Vice President (2008-2018), Invesco Group Services, Inc., Invesco Holding Company (US), Inc.; Director, Invesco Holding Company Limited (2007- 2019); Director and Chairman, INVESCO Funds Group, Inc., Senior Vice President, Secretary and General Counsel, Invesco Advisers, Inc. (2003-2006); Director, Invesco Investments (Bermuda) Ltd. (2008- 2016); Senior Vice President and General Counsel, Liberty Financial Companies, Inc. (2000-2001); General Counsel of certain investment management subsidiaries of Liberty Financial Companies, Inc. (1998-2000); Associate General Counsel, Liberty Financial Companies, Inc. (1993-1998); Associate, Ropes & Gray LLP. | | | | |
| * | This is the date the Interested Trustee began serving the Trust. The Interested Trustee serves an indefinite term, until his successor is elected. |
| ** | Fund Complex includes all open- and closed-end funds (including all of their portfolios) advised by the Adviser and any affiliated person of the Adviser. |
Trustees and Officers—(continued)
| | | | | | |
| | | Position(s) | | Length of | | Principal |
| Name, Address and Year of Birth | | Held | | Time | | Occupation(s) During |
| of Executive Officers | | with Trust | | Served* | | Past 5 Years |
|
Anna Paglia—1974 Invesco Capital Management LLC 3500 Lacey Road, Suite 700 Downers Grove, IL 60515 | | President and Principal Executive Officer | | Since 2020 | | President and Principal Executive Officer, Invesco Exchange-Traded Fund Trust, Invesco Exchange-Traded Fund Trust II, Invesco India Exchange-Traded Fund Trust, Invesco Actively Managed Exchange-Traded Fund Trust, Invesco Actively Managed Exchange-Traded Commodity Fund Trust and Invesco Exchange- Traded Self-Indexed Fund Trust (2020-Present); Managing Director and Global Head of ETFs and Indexed Strategies, Chief Executive Officer and Principal Executive Officer, Invesco Capital Management LLC (2020-Present); Chief Executive Officer, Manager and Principal Executive Officer, Invesco Specialized Products, LLC (2020-Present); Vice President, Invesco Indexing LLC (2020-Present);formerly, Secretary, Invesco Exchange-Traded Fund Trust, Invesco Exchange-Traded Fund Trust II, Invesco India Exchange-Traded Fund Trust and Invesco Actively Managed Exchange-Traded Fund Trust (2011-2020), Invesco Actively Managed Exchange-Traded Commodity Fund Trust (2014-2020) and Invesco Exchange-Traded Self-Indexed Fund Trust (2015-2020); Head of Legal (2010-2020) and Secretary (2015-2020), Invesco Capital Management LLC; Manager and Assistant Secretary, Invesco Indexing LLC (2017-2020); Head of Legal and Secretary, Invesco Specialized Products, LLC (2018-2020); Partner, K&L Gates LLP (formerly, Bell Boyd & Lloyd LLP) (2007-2010); and Associate Counsel at Barclays Global Investors Ltd. (2004-2006). |
| | | |
Kelli Gallegos—1970 Invesco Capital Management LLC 11 Greenway Plaza, Suite 1000 Houston, TX 77046 | | Vice President and Treasurer | | Since 2018 | | Vice President, Invesco Advisers, Inc. (2020-Present); Principal Financial and Accounting Officer- Pooled Investments, Invesco Specialized Products, LLC (2018-Present); Vice President and Treasurer, Invesco Exchange-Traded Fund Trust, Invesco Exchange-Traded Fund Trust II, Invesco India Exchange-Traded Fund Trust, Invesco Actively Managed Exchange-Traded Fund Trust, Invesco Actively Managed Exchange-Traded Commodity Fund Trust and Invesco Exchange-Traded Self-Indexed Fund Trust (2018-Present); Principal Financial and Accounting Officer-Pooled Investments, Invesco Capital Management LLC (2018-Present); Vice President, Principal Financial Officer (2016-Present) and Assistant Treasurer (2008-Present), The Invesco Funds; formerly, Assistant Treasurer, Invesco Specialized Products, LLC (2018); Assistant Treasurer, Invesco Exchange-Traded Fund Trust, Invesco Exchange-Traded Fund Trust II, Invesco India Exchange-Traded Fund Trust and Invesco Actively Managed Exchange-Traded Fund Trust (2012-2018), Invesco Actively Managed Exchange-Traded Commodity Fund Trust (2014-2018) and Invesco Exchange-Traded Self-Indexed Fund Trust (2016-2018); Assistant Treasurer, Invesco Capital Management LLC (2013-2018); and Assistant Vice President, The Invesco Funds (2008-2016). |
| * | This is the date each Officer began serving the Trust in their current position. Each Officer serves an indefinite term, until his or her successor is elected. |
Trustees and Officers—(continued)
| | | | | | |
| | Position(s) | | Length of | | Principal |
| Name, Address and Year of Birth | | Held | | Time | | Occupation(s) During |
| of Executive Officers | | with Trust | | Served* | | Past 5 Years |
|
Adam Henkel—1980 Invesco Capital Management LLC 3500 Lacey Road, Suite 700 Downers Grove, IL 60515 | | Secretary | | Since 2020 | | Head of Legal – US ETFs and Secretary, Invesco Capital Management LLC (2020-Present); Head of Legal and Secretary, Invesco Specialized Products, LLC (2020-Present); Secretary, Invesco Exchange-Traded Fund Trust, Invesco Exchange-Traded Fund Trust II, Invesco India Exchange-Traded Fund Trust, Invesco Actively Managed Exchange-Traded Fund Trust, Invesco Actively Managed Exchange-Traded Commodity Fund Trust and Invesco Exchange- Traded Self-Indexed Fund Trust (2020-Present); Manager and Assistant Secretary, Invesco Indexing LLC (2020-Present); Assistant Secretary (2020-Present), Invesco Capital Markets, Inc. and Invesco Investment Advisers LLC; Assistant Secretary, The Invesco Funds (2014-Present); formerly, Assistant Secretary, Invesco Capital Management LLC (2015-2020) and Invesco Specialized Products, LLC (2018-2020); Assistant Secretary (2014-2020) and Chief Compliance Officer (2017-2017), Invesco Exchange- Traded Fund Trust, Invesco Exchange-Traded Fund Trust II, Invesco India Exchange-Traded Fund Trust and Invesco Actively Managed Exchange-Traded Fund Trust, Invesco Actively Managed Exchange-Traded Commodity Fund Trust and Invesco Exchange-Traded Self-Indexed Fund Trust. |
| | | |
Peter Hubbard—1981 Invesco Capital Management LLC 3500 Lacey Road, Suite 700 Downers Grove, IL 60515 | | Vice President | | Since 2009 | | Vice President, Invesco Specialized Products, LLC (2018-Present); Vice President, Invesco Exchange-Traded Fund Trust, Invesco Exchange-Traded Fund Trust II, Invesco India Exchange-Traded Fund Trust, Invesco Actively Managed Exchange-Traded Fund Trust (2009-Present), Invesco Actively Managed Exchange-Traded Commodity Fund Trust (2014-Present) and Invesco Exchange-Traded Self-Indexed Fund Trust (2016-Present); Vice President and Director of Portfolio Management, Invesco Capital Management LLC (2010-Present); formerly, Vice President of Portfolio Management, Invesco Capital Management LLC (2008-2010); Portfolio Manager, Invesco Capital Management LLC (2007-2008); Research Analyst, Invesco Capital Management LLC (2005-2007); Research Analyst and Trader, Ritchie Capital, a hedge fund operator (2003-2005). |
| | | |
Sheri Morris—1964 Invesco Capital Management LLC 11 Greenway Plaza, Suite 1000 Houston, TX 77046 | | Vice President | | Since 2012 | | Head of Global Fund Services, Invesco Ltd. (2019-Present); Vice President, OppenheimerFunds, Inc. (2019-Present); President and Principal Executive Officer, The Invesco Funds (2016-Present); Treasurer, The Invesco Funds (2008-Present); Vice President, Invesco Advisers, Inc. (formerly known as Invesco Institutional (N.A.), Inc.) (registered investment adviser) (2009-Present) and Vice President, Invesco Exchange-Traded Fund Trust, Invesco Exchange- Traded Fund Trust II, Invesco India Exchange-Traded Fund Trust, Invesco Actively Managed Exchange-Traded Fund Trust (2012-Present), Invesco Actively Managed Exchange-Traded Commodity Fund Trust (2014-Present) and Invesco Exchange-Traded Self-Indexed Fund Trust (2016-Present); formerly, Vice President and Principal Financial Officer, The Invesco Funds (2008-2016); Treasurer, Invesco Exchange-Traded Fund Trust, Invesco Exchange-Traded Fund Trust II, Invesco India Exchange-Traded Fund Trust and Invesco Actively Managed Exchange-Traded Fund Trust (2011-2013); Vice President, Invesco Aim Advisers, Inc., Invesco Aim Capital Management, Inc. and Invesco Aim Private Asset Management, Inc.; Assistant Vice President and Assistant Treasurer, The Invesco Funds and Assistant Vice President, Invesco Advisers, Inc., Invesco Aim Capital Management, Inc. and Invesco Aim Private Asset Management, Inc. |
| * | This is the date each Officer began serving the Trust in their current position. Each Officer serves an indefinite term, until his or her successor is elected. |
Trustees and Officers—(continued)
| | | | | | |
| | Position(s) | | Length of | | Principal |
| Name, Address and Year of Birth | | Held | | Time | | Occupation(s) During |
| of Executive Officers | | with Trust | | Served* | | Past 5 Years |
|
Rudolf E. Reitmann—1971 Invesco Capital Management LLC 3500 Lacey Road, Suite 700 Downers Grove, IL 60515 | | Vice President | | Since 2013 | | Head of Global Exchange Traded Funds Services, Invesco Specialized Products, LLC (2018-Present); Vice President, Invesco Exchange-Traded Fund Trust, Invesco Exchange-Traded Fund Trust II, Invesco India Exchange-Traded Fund Trust, Invesco Actively Managed Exchange-Traded Fund Trust (2013-Present), Invesco Actively Managed Exchange-Traded Commodity Fund Trust (2014-Present) and Invesco Exchange-Traded Self-Indexed Fund Trust (2016-Present); Head of Global Exchange Traded Funds Services, Invesco Capital Management LLC (2013-Present); Vice President, Invesco Capital Markets, Inc. (2018-Present). |
| | | |
Melanie Zimdars—1976 Invesco Capital Management LLC 3500 Lacey Road, Suite 700 Downers Grove, IL 60515 | | Chief Compliance Officer | | Since 2017 | | Chief Compliance Officer, Invesco Specialized Products, LLC (2018-Present); Chief Compliance Officer, Invesco Capital Management LLC (2017-Present); Chief Compliance Officer, Invesco Exchange-Traded Fund Trust, Invesco Exchange-Traded Fund Trust II, Invesco India Exchange-Traded Fund Trust, Invesco Actively Managed Exchange-Traded Fund Trust, Invesco Actively Managed Exchange-Traded Commodity Fund Trust and Invesco Exchange- Traded Self-Indexed Fund Trust (2017-Present); formerly, Vice President and Deputy Chief Compliance Officer, ALPS Holding, Inc. (2009-2017); Mutual Fund Treasurer/ Chief Financial Officer, Wasatch Advisors, Inc. (2005-2008); Compliance Officer, U.S. Bancorp Fund Services, LLC (2001-2005). |
| * | This is the date each Officer began serving the Trust in their current position. Each Officer serves an indefinite term, until his or her successor is elected. |
Availability of Additional Information About the Trustees
The Statement of Additional Information includes additional information about the Trustees and is available, without charge, upon request at (800) 983-0903.
Approval of Investment Advisory and Sub-Advisory Contracts
At a meeting held on April 14, 2020, the Board of Trustees of the Invesco Exchange-Traded Fund Trust II (the “Trust”), including the Independent Trustees, approved the continuation of the Investment Advisory Agreement between Invesco Capital Management LLC (the “Adviser”) and the Trust for the following 71 series (each, a “Fund” and collectively, the “Funds”):
| | |
Invesco 1-30 Laddered Treasury ETF | | Invesco S&P 500 Enhanced Value ETF |
Invesco California AMT-Free Municipal Bond ETF | | Invesco S&P 500® ex-Rate Sensitive Low Volatility ETF |
Invesco CEF Income Composite ETF | | Invesco S&P 500® High Beta ETF |
Invesco China Technology ETF | | Invesco S&P 500® High Dividend Low Volatility ETF |
Invesco DWA Developed Markets Momentum ETF | | Invesco S&P 500® Low Volatility ETF |
Invesco DWA Emerging Markets Momentum ETF | | Invesco S&P 500 Minimum Variance ETF |
Invesco DWA SmallCap Momentum ETF | | Invesco S&P 500 Momentum ETF |
Invesco Emerging Markets Sovereign Debt ETF | | Invesco S&P 500 Revenue ETF |
Invesco FTSE International Low Beta Equal Weight ETF | | Invesco S&P Emerging Markets Low Volatility ETF |
Invesco FTSE RAFI Developed Markets ex-U.S. ETF | | Invesco S&P Emerging Markets Momentum ETF |
Invesco FTSE RAFI Developed Markets ex-U.S. Small-Mid ETF | | Invesco S&P International Developed High Dividend Low Volatility ETF |
Invesco FTSE RAFI Emerging Markets ETF | | Invesco S&P International Developed Low Volatility ETF |
Invesco Fundamental High Yield® Corporate Bond ETF | | Invesco S&P International Developed Momentum ETF |
Invesco Fundamental Investment Grade Corporate Bond ETF | | Invesco S&P International Developed Quality ETF |
Invesco Global Clean Energy ETF | | Invesco S&P MidCap 400 Revenue ETF |
Invesco Global Short Term High Yield Bond ETF | | Invesco S&P MidCap Low Volatility ETF |
Invesco Global Water ETF | | Invesco S&P SmallCap 600 Revenue ETF |
Invesco International BuyBack Achievers™ ETF | | Invesco S&P SmallCap Consumer Discretionary ETF |
Invesco International Corporate Bond ETF | | Invesco S&P SmallCap Consumer Staples ETF |
Invesco KBW Bank ETF | | Invesco S&P SmallCap Energy ETF |
Invesco KBW High Dividend Yield Financial ETF | | Invesco S&P SmallCap Financials ETF |
Invesco KBW Premium Yield Equity REIT ETF | | Invesco S&P SmallCap Health Care ETF |
Invesco KBW Property & Casualty Insurance ETF | | Invesco S&P SmallCap High Dividend Low Volatility ETF |
Invesco KBW Regional Banking ETF | | Invesco S&P SmallCap Industrials ETF |
Invesco National AMT-Free Municipal Bond ETF | | Invesco S&P SmallCap Information Technology ETF |
Invesco New York AMT-Free Municipal Bond ETF | | Invesco S&P SmallCap Low Volatility ETF |
Invesco Preferred ETF | | Invesco S&P SmallCap Materials ETF |
Invesco PureBetaSM 0-5 Yr US TIPS ETF | | Invesco S&P SmallCap Quality ETF |
Invesco PureBetaSM FTSE Developed ex-North America ETF | | Invesco S&P SmallCap Utilities & Communication Services ETF |
Invesco PureBetaSM FTSE Emerging Markets ETF | | Invesco S&P Ultra Dividend Revenue ETF |
Invesco PureBetaSM MSCI USA ETF | | Invesco Senior Loan ETF |
Invesco PureBetaSM MSCI USA Small Cap ETF | | Invesco Taxable Municipal Bond ETF |
Invesco PureBetaSM US Aggregate Bond ETF | | Invesco Treasury Collateral ETF |
Invesco Russell 1000 Enhanced Equal Weight ETF | | Invesco Variable Rate Preferred ETF |
Invesco Russell 1000 Equal Weight ETF | | Invesco VRDO Tax-Free Weekly ETF |
Invesco Russell 1000 Low Beta Equal Weight ETF | | |
Also at the April 14, 2020 meeting, the Board of Trustees of the Trust, including the Independent Trustees, approved the continuation of the Investment Sub-Advisory Agreement between the Adviser and the following seven affiliated sub-advisers for each of Invesco Senior Loan ETF and Invesco Treasury Collateral ETF (the “Sub-Advisory Agreement”): Invesco Advisers, Inc.; Invesco Asset Management Deutschland, GmbH; Invesco Asset Management Limited; Invesco Asset Management (Japan) Limited; Invesco Hong Kong Limited; Invesco Senior Secured Management, Inc.; and Invesco Canada Ltd. (each, a “Sub-Adviser” and collectively, the “Sub-Advisers”).
Investment Advisory Agreement
The Trustees reviewed information from the Adviser describing: (i) the nature, extent and quality of services provided, (ii) the investment performance of each Fund and the Adviser, (iii) the fees paid by the Funds and comparisons to amounts paid by other comparable registered investment companies, (iv) the costs of services provided and estimated profits realized by the Adviser, (v) the extent to which economies of scale may be realized as a Fund grows and whether fee levels reflect any possible economies of
Approval of Investment Advisory and Sub-Advisory Contracts—(continued)
scale for the benefit of Fund shareholders, and (vi) any further benefits realized by the Adviser or its affiliates from the Adviser’s relationship with the Funds.
Nature, Extent and Quality of Services. In evaluating the nature, extent and quality of the Adviser’s services, the Trustees reviewed information concerning the functions performed by the Adviser for the Funds, information describing the Adviser’s current organization and staffing, including operational support provided by the Adviser’s parent organization, Invesco Ltd. (“Invesco”), and the background and experience of the persons responsible for the day-to-day management of the Funds. The Trustees reviewed matters related to the Adviser’s execution and/or oversight of execution of portfolio transactions on behalf of the Funds. The Trustees also reviewed information on the performance of the Funds and their underlying indexes for the one-year, three-year, five-year, ten-year and since-inception periods ended December 31, 2019, as applicable, including reports for each of those periods on the correlation and tracking error between each Fund’s performance and the performance of its underlying index, as well as the Adviser’s analysis of the tracking error and correlation between certain Funds and their underlying indexes. In reviewing the tracking error reports, the Trustees considered information provided by Invesco’s independent performance and risk management group with respect to general expected tracking error ranges. The Trustees also considered that certain Funds were created in connection with the purchases by Invesco of the exchange-traded funds businesses of Guggenheim Capital LLC on April 6, 2018 and Massachusetts Mutual Life Insurance Company (“Oppenheimer”) on May 24, 2019 (each, a “Transaction”), and that each such Fund’s performance prior to the closing of the applicable Transaction is that of its predecessor Guggenheim ETF or Oppenheimer ETF. The Trustees noted that, for each applicable period, the correlation for each Fund, other than the five-year and since-inception periods for Invesco Global Short Term High Yield Bond ETF and the one-year and ten-year periods for Invesco VRDO Tax-Free Weekly ETF, was within the targeted range set forth in the Trust’s registration statement. The Trustees reviewed the reasons provided by the Adviser for Invesco Global Short Term High Yield Bond ETF’s and Invesco VRDO Tax-Free Weekly ETF’s level of correlation to its underlying index, as well as the Adviser’s expectations for each Fund’s correlation going forward. The Trustees noted that, for each applicable period, the tracking error for all Funds was within the targeted range set forth in the Trust’s registration statement and concluded that each Fund’s correlation to its underlying index and the tracking error for each Fund were within an acceptable range given that Fund’s particular circumstances.
The Trustees considered the services provided by the Adviser in its oversight of the Funds’ administrator, custodian and transfer agent. They noted the significant amount of time, effort and resources that had been devoted to this oversight function.
Based on their review, the Trustees concluded that the nature, extent and quality of services provided by the Adviser to the Funds under the Investment Advisory Agreement were appropriate and reasonable.
Fees, Expenses and Profitability. The Trustees reviewed and discussed the information provided by the Adviser on each Fund’s net expense ratio and unitary advisory fee. The Trustees noted that the annual advisory fee charged to each Fund, as set forth below, is a unitary advisory fee and that the Adviser pays all other operating expenses of each Fund, including the fees payable to the Sub-Advisers for Invesco Senior Loan ETF and Invesco Treasury Collateral ETF, except that each Fund pays its brokerage expenses, taxes, interest (including, for Invesco Senior Loan ETF, interest expenses associated with its line of credit), litigation expenses and other extraordinary expenses (including acquired fund fees and expenses, if any).
| | · | | 0.04%: Invesco PureBetaSM MSCI USA ETF |
| | · | | 0.05%: Invesco PureBetaSM US Aggregate Bond ETF |
| | · | | 0.06%: Invesco PureBetaSM MSCI USA Small Cap ETF |
| | · | | 0.07%: Invesco PureBetaSM 0-5 Yr US TIPS ETF, Invesco PureBetaSM FTSE Developed ex-North America ETF |
| | · | | 0.08%: Invesco Treasury Collateral ETF |
| | · | | 0.10%: Invesco S&P 500 Minimum Variance ETF |
| | · | | 0.13%: Invesco S&P 500 Enhanced Value ETF, Invesco S&P 500 Momentum ETF |
| | · | | 0.14%: Invesco PureBetaSM FTSE Emerging Markets ETF |
| | · | | 0.20%: Invesco Russell 1000 Equal Weight ETF |
| | · | | 0.22%: Invesco Fundamental Investment Grade Corporate Bond ETF |
Approval of Investment Advisory and Sub-Advisory Contracts—(continued)
| | · | | 0.25%: Invesco 1-30 Laddered Treasury ETF, Invesco S&P 500® ex-Rate Sensitive Low Volatility ETF, Invesco S&P 500® High Beta ETF, Invesco S&P 500® Low Volatility ETF, Invesco S&P MidCap Low Volatility ETF, Invesco S&P SmallCap Low Volatility ETF, Invesco VRDO Tax-Free Weekly ETF |
| | · | | 0.28%: Invesco California AMT-Free Municipal Bond ETF, Invesco National AMT-Free Municipal Bond ETF, Invesco New York AMT-Free Municipal Bond ETF, Invesco Taxable Municipal Bond ETF |
| | · | | 0.29%: Invesco Russell 1000 Enhanced Equal Weight ETF, Invesco S&P International Developed Quality ETF, Invesco S&P SmallCap Consumer Discretionary ETF, Invesco S&P SmallCap Consumer Staples ETF, Invesco S&P SmallCap Energy ETF, Invesco S&P SmallCap Financials ETF, Invesco S&P SmallCap Health Care ETF, Invesco S&P SmallCap Industrials ETF, Invesco S&P SmallCap Information Technology ETF, Invesco S&P SmallCap Materials ETF, Invesco S&P SmallCap Quality ETF, Invesco S&P SmallCap Utilities & Communication Services ETF |
| | · | | 0.30%: Invesco S&P 500® High Dividend Low Volatility ETF, Invesco S&P International Developed High Dividend Low Volatility ETF, Invesco S&P SmallCap High Dividend Low Volatility ETF |
| | · | | 0.35%: Invesco Global Short Term High Yield Bond ETF, Invesco KBW Bank ETF, Invesco KBW High Dividend Yield Financial ETF, Invesco KBW Premium Yield Equity REIT ETF, Invesco KBW Property & Casualty Insurance ETF, Invesco KBW Regional Banking ETF, Invesco Russell 1000 Low Beta Equal Weight ETF, Invesco S&P International Developed Low Volatility ETF, Invesco S&P International Developed Momentum ETF |
| | · | | 0.39%: Invesco S&P 500 Revenue ETF, Invesco S&P MidCap 400 Revenue ETF, Invesco S&P SmallCap 600 Revenue ETF, Invesco S&P Ultra Dividend Revenue ETF |
| | · | | 0.45%: Invesco FTSE International Low Beta Equal Weight ETF, Invesco FTSE RAFI Developed Markets ex-U.S. ETF, Invesco S&P Emerging Markets Low Volatility ETF, Invesco S&P Emerging Markets Momentum ETF |
| | · | | 0.49%: Invesco FTSE RAFI Developed Markets ex-U.S. Small-Mid ETF, Invesco FTSE RAFI Emerging Markets ETF |
| | · | | 0.50%: Invesco CEF Income Composite ETF, Invesco Emerging Markets Sovereign Debt ETF, Invesco Fundamental High Yield® Corporate Bond ETF, Invesco International Corporate Bond ETF, Invesco Preferred ETF, Invesco Variable Rate Preferred ETF |
| | · | | 0.55%: Invesco International BuyBack AchieversTM ETF |
| | · | | 0.60%: Invesco DWA SmallCap Momentum ETF |
| | · | | 0.65%: Invesco Senior Loan ETF |
| | · | | 0.70%: Invesco China Technology ETF |
| | · | | 0.75%: Invesco Global Clean Energy ETF, Invesco Global Water ETF |
| | · | | 0.80%: Invesco DWA Developed Markets Momentum ETF |
| | · | | 0.90%: Invesco DWA Emerging Markets Momentum ETF |
The Trustees considered that, effective May 1, 2020, the Adviser had agreed to reduce the unitary advisory fee for Invesco S&P Emerging Markets Low Volatility ETF and Invesco S&P Emerging Markets Momentum ETF from 0.45% to 0.29% of average daily net assets, and to reduce the unitary advisory fee for Invesco S&P International Developed Low Volatility ETF and Invesco S&P International Developed Momentum ETF from 0.35% to 0.25% of average daily net assets.
The Trustees compared each Fund’s net expense ratio to information compiled by the Adviser from Lipper Inc. databases on the net expense ratios of comparable exchange-traded funds (“ETFs”), open-end (non-ETF) index funds and open-end (non-ETF) actively-managed funds, as applicable. The Trustees noted that the net expense ratios for certain Funds were equal to or lower than the median net expense ratios of their ETF and open-end index peer funds as illustrated in the table below. The Trustees also noted that the net expense ratios for all of the Funds were lower than the median net expense ratios of their open-end
Approval of Investment Advisory and Sub-Advisory Contracts—(continued)
actively-managed peer funds. The Trustees noted that a portion of each Fund’s operating expenses was attributable to a sub-license fee payable out of the unitary advisory fee charged to that Fund.
| | | | | | | | | | | | | | | |
| | | Equal | | Equal to/Lower | | |
| | | to/Lower | | than Open-End | | Lower than |
| | | than ETF | | Index Fund | | Open-Active Fund |
| Invesco Fund | | Peer Median | | Peer Median* | | Peer Median |
| | | |
Invesco 1-30 Laddered Treasury ETF | | | | | | | | | | | | | | X | |
| | | |
Invesco California AMT-Free Municipal Bond ETF | | | | | | | | | N/A | | | | | X | |
| | | |
Invesco CEF Income Composite ETF | | | | X | | | | | N/A | | | | | X | |
| | | |
Invesco China Technology ETF | | | | | | | | | N/A | | | | | X | |
| | | |
Invesco DWA Developed Markets Momentum ETF | | | | | | | | | | | | | | X | |
| | | |
Invesco DWA Emerging Markets Momentum ETF | | | | | | | | | | | | | | X | |
| | | |
Invesco DWA SmallCap Momentum ETF | | | | | | | | | | | | | | X | |
| | | |
Invesco Emerging Markets Sovereign Debt ETF | | | | | | | | | | | | | | X | |
| | | |
Invesco FTSE International Low Beta Equal Weight ETF | | | | X | | | | | X | | | | | X | |
| | | |
Invesco FTSE RAFI Developed Markets ex-U.S. ETF | | | | | | | | | X | | | | | X | |
| | | |
Invesco FTSE RAFI Developed Markets ex-U.S. Small-Mid ETF | | | | X | | | | | X | | | | | X | |
| | | |
Invesco FTSE RAFI Emerging Markets ETF | | | | X | | | | | | | | | | X | |
| | | |
Invesco Fundamental High Yield® Corporate Bond ETF | | | | | | | | | X | | | | | X | |
| | | |
Invesco Fundamental Investment Grade Corporate Bond ETF | | | | | | | | | | | | | | X | |
| | | |
Invesco Global Clean Energy ETF | | | | | | | | | N/A | | | | | X | |
| | | |
Invesco Global Short Term High Yield Bond ETF | | | | X | | | | | N/A | | | | | X | |
| | | |
Invesco Global Water ETF | | | | | | | | | N/A | | | | | X | |
| | | |
Invesco International BuyBack AchieversTM ETF | | | | X | | | | | X | | | | | X | |
| | | |
Invesco International Corporate Bond ETF | | | | | | | | | | | | | | X | |
| | | |
Invesco KBW Bank ETF | | | | X | | | | | | | | | | X | |
| | | |
Invesco KBW High Dividend Yield Financial ETF | | | | X | | | | | | | | | | X | |
| | | |
Invesco KBW Premium Yield Equity REIT ETF | | | | X | | | | | | | | | | X | |
| | | |
Invesco KBW Property & Casualty Insurance ETF | | | | X | | | | | | | | | | X | |
| | | |
Invesco KBW Regional Banking ETF | | | | X | | | | | | | | | | X | |
| | | |
Invesco National AMT-Free Municipal Bond ETF | | | | | | | | | | | | | | X | |
| | | |
Invesco New York AMT-Free Municipal Bond ETF | | | | | | | | | N/A | | | | | X | |
| | | |
Invesco Preferred ETF | | | | | | | | | N/A | | | | | X | |
| | | |
Invesco PureBetaTM 0-5 Yr US TIPS ETF | | | | | | | | | | | | | | X | |
| | | |
Invesco PureBetaTM FTSE Developed ex-North America ETF | | | | | | | | | | | | | | X | |
| | | |
Invesco PureBetaTM FTSE Emerging Markets ETF | | | | X | | | | | | | | | | X | |
| | | |
Invesco PureBetaTM MSCI USA ETF | | | | X | | | | | X | | | | | X | |
| | | |
Invesco PureBetaTM MSCI USA Small Cap ETF | | | | X | | | | | X | | | | | X | |
| | | |
Invesco PureBetaTM US Aggregate Bond ETF | | | | X | | | | | X | | | | | X | |
| | | |
Invesco Russell 1000 Enhanced Equal Weight ETF | | | | X | | | | | X | | | | | X | |
| | | |
Invesco Russell 1000 Equal Weight ETF | | | | X | | | | | X | | | | | X | |
| | | |
Invesco Russell 1000 Low Beta Equal Weight ETF | | | | | | | | | X | | | | | X | |
| | | |
Invesco S&P 500 Enhanced Value ETF | | | | X | | | | | X | | | | | X | |
| | | |
Invesco S&P 500® ex-Rate Sensitive Low Volatility ETF | | | | X | | | | | X | | | | | X | |
| | | |
Invesco S&P 500® High Beta ETF | | | | X | | | | | X | | | | | X | |
| | | |
Invesco S&P 500® High Dividend Low Volatility ETF | | | | X | | | | | X | | | | | X | |
| | | |
Invesco S&P 500® Low Volatility ETF | | | | X | | | | | | | | | | X | |
| | | |
Invesco S&P 500 Minimum Variance ETF | | | | X | | | | | X | | | | | X | |
| | | |
Invesco S&P 500 Momentum ETF | | | | | | | | | X | | | | | X | |
Approval of Investment Advisory and Sub-Advisory Contracts—(continued)
| | | | | | | | | | | | | | | |
| | | Equal | | Equal to/Lower | | |
| | | to/Lower | | than Open-End | | Lower than |
| | | than ETF | | Index Fund | | Open-Active Fund |
| Invesco Fund | | Peer Median | | Peer Median* | | Peer Median |
| | | |
Invesco S&P 500 Revenue ETF | | | | | | | | | X | | | | | X | |
| | | |
Invesco S&P Emerging Markets Low Volatility ETF | | | | X | | | | | X | | | | | X | |
| | | |
Invesco S&P Emerging Markets Momentum ETF | | | | X | | | | | | | | | | X | |
| | | |
Invesco S&P International Developed High Dividend Low Volatility ETF | | | | X | | | | | | | | | | X | |
| | | |
Invesco S&P International Developed Low Volatility ETF | | | | X | | | | | | | | | | X | |
| | | |
Invesco S&P International Developed Momentum ETF | | | | | | | | | | | | | | X | |
| | | |
Invesco S&P International Developed Quality ETF | | | | X | | | | | | | | | | X | |
| | | |
Invesco S&P MidCap 400 Revenue ETF | | | | | | | | | | | | | | X | |
| | | |
Invesco S&P MidCap Low Volatility ETF | | | | | | | | | | | | | | X | |
| | | |
Invesco S&P SmallCap 600 Revenue ETF | | | | | | | | | X | | | | | X | |
| | | |
Invesco S&P SmallCap Consumer Discretionary ETF | | | | X | | | | | | | | | | X | |
| | | |
Invesco S&P SmallCap Consumer Staples ETF | | | | X | | | | | | | | | | X | |
| | | |
Invesco S&P SmallCap Energy ETF | | | | X | | | | | | | | | | X | |
| | | |
Invesco S&P SmallCap Financials ETF | | | | X | | | | | | | | | | X | |
| | | |
Invesco S&P SmallCap Health Care ETF | | | | X | | | | | | | | | | X | |
| | | |
Invesco S&P SmallCap High Dividend Low Volatility ETF | | | | X | | | | | X | | | | | X | |
| | | |
Invesco S&P SmallCap Industrials ETF | | | | X | | | | | | | | | | X | |
| | | |
Invesco S&P SmallCap Information Technology ETF | | | | X | | | | | X | | | | | X | |
| | | |
Invesco S&P SmallCap Low Volatility ETF | | | | X | | | | | X | | | | | X | |
| | | |
Invesco S&P SmallCap Materials ETF | | | | X | | | | | | | | | | X | |
| | | |
Invesco S&P SmallCap Quality ETF | | | | X | | | | | | | | | | X | |
| | | |
Invesco S&P SmallCap Utilities & Communication Services ETF | | | | X | | | | | X | | | | | X | |
| | | |
Invesco S&P Ultra Dividend Revenue ETF | | | | | | | | | X | | | | | X | |
| | | |
Invesco Senior Loan ETF | | | | | | | | | X | | | | | X | |
| | | |
Invesco Taxable Municipal Bond ETF | | | | | | | | | N/A | | | | | X | |
| | | |
Invesco Treasury Collateral ETF | | | | X | | | | | | | | | | X | |
| | | |
Invesco Variable Rate Preferred ETF | | | | | | | | | X | | | | | X | |
| | | |
Invesco VRDO Tax-Free Weekly ETF | | | | | | | | | N/A | | | | | X | |
| * | The information provided by the Adviser indicated that certain Funds did not have any comparable open-end index fund peers. Those Funds have been designated in this column with an “N/A” for not available. |
In response to questions from the Independent Trustees, the Adviser provided supplemental information regarding each of Invesco 1-30 Laddered Treasury ETF, Invesco California AMT-Free Municipal Bond ETF, Invesco DWA Developed Markets Momentum ETF, Invesco Emerging Markets Sovereign Debt ETF, Invesco Global Clean Energy ETF, Invesco Global Water ETF, Invesco International Corporate Bond ETF, Invesco National AMT-Free Municipal Bond ETF, Invesco New York AMT-Free Municipal Bond ETF, Invesco Senior Loan ETF and Invesco VRDO Tax-Free Weekly ETF’s advisory fees and total expenses and the Lipper peer data. The Adviser explained its view that the advisory fees and total expenses for these Funds are competitive and generally in line with other comparable funds in the marketplace, particularly in light of the level and nature of services provided and the investment management style of the Adviser. The Trustees also considered the Adviser’s statements regarding its pricing philosophy and the differing pricing philosophy of certain of the peers.
The Trustees noted information, including fee information, provided by the Adviser regarding other investment products to which it provides investment advisory services, including products that have investment strategies comparable to certain of the Funds. The Trustees considered the Adviser’s explanation of the differences between the services provided to the Funds and to the other investment products it advises, noting the Adviser’s statement that the management and oversight of the Funds requires substantially more labor and expense.
Approval of Investment Advisory and Sub-Advisory Contracts—(continued)
Based on all the information provided, the Board concluded that each Fund’s unitary advisory fee was reasonable and appropriate in light of the services provided, the nature of the indexes, the distinguishing factors of the Funds, and the administrative, operational and management oversight costs for the Adviser.
In conjunction with their review of the unitary advisory fees, the Trustees considered information provided by the Adviser on the revenues received by the Adviser under the Investment Advisory Agreement for the Funds. The Trustees reviewed information provided by the Adviser on its overall profitability, as well as the estimated profitability to the Adviser from its relationship to each Fund. The Trustees concluded that the overall and estimated profitability to the Adviser was not unreasonable.
Economies of Scale and Whether Fee Levels Reflect These Economies of Scale. The Trustees reviewed the information provided by the Adviser as to the extent to which economies of scale may be realized as each Fund grows and whether fee levels reflect economies of scale for the benefit of shareholders. The Trustees reviewed each Fund’s asset size and unitary advisory fee. The Trustees noted that any reduction in fixed costs associated with the management of the Funds would be enjoyed by the Adviser, but a unitary advisory fee provides a level of certainty in expenses for the Funds. The Trustees considered whether the unitary advisory fee rate for each Fund was reasonable in relation to the asset size of that Fund, and concluded that the unitary advisory fee was reasonable and appropriate.
Fall-out Benefits. The Trustees considered that the Adviser identified no additional benefits it receives from its relationship with the Funds, and noted that the Adviser does not have any soft-dollar arrangements. The Trustees also considered benefits received by affiliates of the Adviser that may be directly or indirectly attributed to the Adviser’s relationship with the Funds, including brokerage fees and advisory fees for money market cash management vehicles. The Board concluded that the advisory fee was reasonable, taking into account any ancillary benefits received by affiliates of the Adviser.
Based on all of the information considered and the conclusions reached, the Board, including the Independent Trustees, determined to approve the continuation of the Investment Advisory Agreement for each Fund. No single factor was determinative in the Board’s analysis.
Investment Sub-Advisory Agreement
As noted above, the Board of Trustees of the Trust, including the Independent Trustees, approved the continuation of the Sub-Advisory Agreement for each of Invesco Senior Loan ETF and Invesco Treasury Collateral ETF at a meeting held on April 14, 2020. The review process followed by the Board is described in detail above. In connection with the review of the Sub-Advisory Agreement, the Board considered the factors described below, among others.
Nature, Extent and Quality of Services. The Trustees considered the nature, extent and quality of services provided under the Sub-Advisory Agreement. The Board reviewed the qualifications and background of each Sub-Adviser, the services provided or to be provided by each Sub-Adviser, the investment approach of the Sub-Adviser whose investment personnel manage Invesco Senior Loan ETF’s and Invesco Treasury Collateral ETF’s assets, the experience and skills of the investment personnel responsible for the day-to-day management of the Funds, and the resources made available to such personnel.
Based on their review, the Trustees concluded that the nature, extent and quality of services provided by the Sub-Advisers to Invesco Senior Loan ETF and Invesco Treasury Collateral ETF under the Sub-Advisory Agreement were appropriate and reasonable.
Fees, Expenses and Profitability. The Trustees reviewed and discussed the information provided by the Adviser and the Sub-Advisers on the sub-advisory fee rates under the Sub-Advisory Agreement. The Trustees noted that the sub-advisory fees charged by the Sub-Advisers under the Sub-Advisory Agreement are consistent with the compensation structure used throughout Invesco when Invesco’s affiliates provide sub-advisory services for funds managed by other Invesco affiliates. The Board considered how the sub-advisory fees relate to the overall advisory fee for each of Invesco Senior Loan ETF and Invesco Treasury Collateral ETF and noted that the Adviser compensates the Sub-Advisers from its fee.
The Trustees also reviewed the financial statements provided by Invesco Senior Secured Management, Inc., in connection with the March 12, 2020 Board meeting, and Invesco Advisers, Inc., in connection with the April 14, 2020 meeting, and noted the net income generated by each firm. The Trustees noted that the Adviser compensates the Sub-Advisers from its fee and that the Adviser provided profitability information with respect to Invesco Senior Loan ETF and Invesco Treasury Collateral ETF.
Approval of Investment Advisory and Sub-Advisory Contracts—(continued)
Economies of Scale and Whether Fee Levels Reflect These Economies of Scale. As part of their review of the Investment Advisory Agreement for Invesco Senior Loan ETF and Invesco Treasury Collateral ETF, the Trustees considered the extent to which economies of scale may be realized as the Funds grow and whether fee levels reflect economies of scale for the benefit of shareholders. The Trustees considered whether the sub-advisory fee rates for Invesco Senior Loan ETF and Invesco Treasury Collateral ETF were reasonable in relation to the asset size of the Funds, and concluded that the flat sub-advisory fee rates were reasonable and appropriate.
Fall-out Benefits. The Trustees noted that Invesco Advisers, Inc. receives management fees from money market funds into which the Funds’ and other Invesco ETFs’ excess cash and securities lending collateral may be invested, and that the Adviser waives its fees on the excess cash invested under such arrangement in amounts equal to fees received by Invesco Advisers, Inc. on the Funds’ and other Invesco ETFs’ excess cash invested in the money market funds. The Trustees noted that the Sub-Advisers had not identified any further benefits that they derived from their relationships with Invesco Senior Loan ETF and Invesco Treasury Collateral ETF and that the Sub-Advisers do not have any soft-dollar arrangements with respect to the Funds. The Board concluded that the sub-advisory fee with respect to each Fund was reasonable, taking into account any ancillary benefits received by the Sub-Advisers.
Based on all of the information considered and the conclusions reached, the Board, including the Independent Trustees, determined to approve the continuation of the Sub-Advisory Agreement for Invesco Senior Loan ETF and Invesco Treasury Collateral ETF. No single factor was determinative in the Board’s analysis.
Proxy Voting Policies and Procedures
A description of the Trust’s proxy voting policies and procedures that the Funds use to determine how to vote proxies relating to portfolio securities is available, without charge and upon request, by calling (800) 983-0903. This information is also available on the Securities and Exchange Commission’s (the “Commission”) website at www.sec.gov.
Information regarding how each Fund voted proxies for portfolio securities, if applicable, during the most recent 12-month period ended June 30, is available, without charge and upon request, by (i) calling (800) 983-0903; or (ii) accessing the Trust’s Form N-PX on the Commission’s website at www.sec.gov.
Quarterly Portfolios
The Trust files its complete schedule of portfolio holdings for the Funds with the Commission for the first and third quarters of each fiscal year as an exhibit to its reports on Form N-PORT. The Forms N-PORT are available on the Commission’s website at www.sec.gov.
Frequency Distribution of Discounts and Premiums
A table showing the number of days the market price of each Fund’s shares was greater than the Fund’s net asset value, and the number of days it was less than the Fund’s net asset value (i.e., premium or discount) for the most recently completed calendar year, and the calendar quarters since that year end (or the life of the Fund, if shorter) may be found at the Fund’s website at www.invesco.com/ETFs.
| | | | |
©2020 Invesco Capital Management LLC 3500 Lacey Road, Suite 700 | | | | |
| Downers Grove, IL 60515 | | P-TRST2-FINC-AR-1 | | invesco.com/ETFs |
| | | | |
| | |
 | | | | |
| |
| | Invesco Annual Report to Shareholders August 31, 2020 |
| | |
| | USEQ | | Invesco Russell 1000 Enhanced Equal Weight ETF |
| | |
| | EQAL | | Invesco Russell 1000 Equal Weight ETF |
| | |
| | USLB | | Invesco Russell 1000 Low Beta Equal Weight ETF |
| | |
| | SPVU | | Invesco S&P 500 Enhanced Value ETF |
| | |
| | XRLV | | Invesco S&P 500® ex-Rate Sensitive Low Volatility ETF |
| | |
| | SPHB | | Invesco S&P 500® High Beta ETF |
| | |
| | SPHD | | Invesco S&P 500® High Dividend Low Volatility ETF |
| | |
| | SPLV | | Invesco S&P 500® Low Volatility ETF |
| | |
| | SPMV | | Invesco S&P 500 Minimum Variance ETF |
| | |
| | SPMO | | Invesco S&P 500 Momentum ETF |
| | |
| | XMLV | | Invesco S&P MidCap Low Volatility ETF |
| | |
| | XSHD | | Invesco S&P SmallCap High Dividend Low Volatility ETF |
| | |
| | XSLV | | Invesco S&P SmallCap Low Volatility ETF |
| | |
| | XSHQ | | Invesco S&P SmallCap Quality ETF |
Beginning on January 1, 2021, as permitted by regulations adopted by the Securities and Exchange Commission, paper copies of the Funds’ shareholder reports will no longer be sent by mail, unless you specifically request paper copies of the reports from your financial intermediary, such as a broker-dealer or bank. Instead, the reports will be made available on a website, and you will be notified by mail each time a report is posted and provided with a website link to access the report.
If you already elected to receive shareholder reports electronically, you will not be affected by this change and you need not take any action. If you hold accounts through a financial intermediary, you may contact your financial intermediary to enroll in electronic delivery. Please note that not all financial intermediaries may offer this service.
You may elect to receive all future reports in paper free of charge. If you hold accounts through a financial intermediary, you can follow the instructions included with this disclosure, if applicable, or contact your financial intermediary to request that you continue to receive paper copies of your shareholder reports. Please note that not all financial intermediaries may offer this service. Your election to receive reports in paper will apply to all funds held with your financial intermediary.

Table of Contents
The Market Environment
Domestic Equity
Macroeconomic issues that concerned investors in the third quarter of 2019 mostly abated during the fourth quarter, providing the backdrop for strong equity market returns. During its September and October meetings, the US Federal Reserve (“the Fed”) cut interest rates by 0.25% each time, based on business investment and exports remaining weak.1 Investors were also encouraged by a resilient US economy and corporate earnings, putting the US equity market on track for its largest annual rise since 2013.
During the first quarter of 2020, as the spread of the new coronavirus (COVID-19) disrupted travel and suppressed consumer activity, investors became increasingly concerned about the global economy. At the same time, oil prices fell sharply as a price war between Saudi Arabia and Russia threatened to boost supply even as demand was falling. Beginning in late February, equity markets declined sharply and quickly, ushering in the first bear market since the financial crisis of 2008. Though the equity market stabilized somewhat toward the end of March, all sectors declined during the downturn. In response to the major collapse in demand and to help facilitate liquidity, the Fed cut interest rates two times in March by 0.50% and 1.00%, ending with a target range of 0.00% to 0.25%.1
In April, US unemployment numbers continued to climb and the initial gross domestic product (GDP) estimates for the first quarter of 2020 saw the economy shrink by 5%, the sharpest drop since the 2008 financial crisis.2 However, during the second and into the third quarter of 2020, US stocks largely shrugged off economic uncertainty, social unrest and a resurgence in coronavirus infections to rally from the market bottom. The rally followed a sharp economic decline caused by global shutdowns to slow the spread of COVID-19. Investor sentiment improved in response to trillions of dollars in economic stimulus, progress on a coronavirus vaccine and reopenings in many US regions. After oil futures contracts turned negative in early April, oil prices doubled in June, which supported struggling energy companies and millions of energy sector employees. In July, the Fed extended its emergency stimulus programs, originally scheduled to end in September, to year-end, which provided support to equities. Additionally, optimism about a vaccine, and better than anticipated US economic data and corporate earnings also boosted stocks. Most economists believe the US economy hit a low in April; however, in late August revised second quarter GDP fell by 31.7%, a record decline.2 Despite the extreme drop in the economy, the S&P 500 Index not only erased all of its losses from the first quarter but ended the fiscal year with record highs.
| 1 | Source: US Federal Reserve |
| 2 | Source: US Bureau of Economic Analysis |
| | |
 | | Management’s Discussion of Fund Performance |
| | Invesco Russell 1000 Enhanced Equal Weight ETF (USEQ) |
As an index fund, the Invesco Russell 1000 Enhanced Equal Weight ETF (the “Fund”) is passively managed and seeks to track the investment results (before fees and expenses) of the Russell 1000® Enhanced Value Equal Weight Index (the “Index”). The Fund generally will invest at least 90% of its total assets in the securities that comprise the Index.
Strictly in accordance with its guidelines and mandated procedures, Frank Russell Company (“Russell” or the “Index Provider”) compiles, maintains and calculates the Index, which is comprised of securities in the Russell 1000® Index (the “Russell 1000” or “Benchmark Index”) that exhibit upward price momentum and good relative valuation. The Index is a subset of the Russell 1000, which is designed to measure the performance of the large-cap segment of the U.S. equity market and consists of the stocks of the largest 1,000 U.S. companies, by capitalization.
The Index Provider selects constituent securities for the Index using a three-step screening process (based on a security’s earnings, valuation and momentum) to all securities in the Russell 1000. First, the Index Provider excludes securities with zero or negative earnings over the past 12 months. Second, the Index Provider screens for value stocks. Those securities with value scores in the bottom 10% are excluded. Third, the Index Provider screens for securities with greater positive price “momentum.” Stocks are ranked from highest returns to lowest returns over that period within each of 10 industries (as defined using the Industry Classification Benchmark) and stocks with returns ranking in the bottom 10% of each industry are excluded. The remaining securities are included in the Index. Constituent securities in the Index are equally weighted. The Fund generally invests in all of the securities comprising of the Index in proportion to their weightings in the Index.
For the fiscal year ended August 31, 2020, on a market price basis, the Fund returned 1.88%. On a net asset value (“NAV”) basis, the Fund returned 1.72%. During the same time period, the Index returned 1.87%. During the fiscal year, the Fund fully replicated the components of the Index; therefore, the Fund’s performance, on a NAV basis, differed from the return of the Index primarily due to fees and operating expenses that the Fund incurred during the period.
During this same time period, the Benchmark Index returned 22.50%. The Benchmark Index is an unmanaged index weighted by market capitalization based on the average performance of approximately 1,000 securities. The Benchmark Index was selected for its recognition in the marketplace, and its performance comparison is a useful measure for investors as a broad representation of the overall U.S. stock market.
The performance of the Fund differed from the Benchmark Index in part because the Fund seeks to track an Index that employs an equal weighted methodology, whereas the Benchmark Index weights stocks based on market capitalization.
Relative to the Benchmark Index, the Fund was most overweight in the industrials sector and most underweight in the information technology sector during the fiscal year ended August 31, 2020. The majority of the Fund’s underperformance relative to the Benchmark Index during the year can be primarily attributed to its allocation to the information technology sector and stock selection within the consumer discretionary sector.
For the fiscal year ended August 31, 2020, the information technology sector contributed most significantly to the Fund’s return, followed by the health care and industrials sectors, respectively. The financial sector detracted most significantly from the Fund’s return, followed by the real estate and energy sectors, respectively.
Positions that contributed most significantly to the Fund’s return for the fiscal year ended August 31, 2020, included Etsy, Inc., a consumer discretionary company (no longer held at fiscal year-end) and Apple, Inc., an information technology company (portfolio average weight of 0.19%). Positions that detracted most significantly from the Fund’s return included MFA Financial, Inc., a financial company (no longer held at fiscal year-end), and Howard Hughes Corp., a real estate company (no longer held at fiscal year-end).
| | | | |
Sector Breakdown (% of the Fund’s Net Assets) as of August 31, 2020 | |
| |
Financials | | | 16.83 | |
| |
Industrials | | | 15.99 | |
| |
Consumer Discretionary | | | 13.01 | |
| |
Information Technology | | | 12.79 | |
| |
Health Care | | | 9.75 | |
| |
Real Estate | | | 7.99 | |
| |
Materials | | | 6.29 | |
| |
Consumer Staples | | | 6.14 | |
| |
Communication Services | | | 4.65 | |
| |
Utilities | | | 4.51 | |
| |
Energy | | | 1.90 | |
| |
Money Market Funds Plus Other Assets Less Liabilities | | | 0.15 | |
Invesco Russell 1000 Enhanced Equal Weight ETF (USEQ) (continued)
| | | | |
|
Top Ten Fund Holdings* (% of the Fund’s Net Assets)
as of August 31, 2020 | |
Security | | | | |
| |
Amazon.com, Inc. | | | 0.25 | |
| |
Generac Holdings, Inc. | | | 0.25 | |
| |
United Parcel Service, Inc., Class B | | | 0.23 | |
| |
First Solar, Inc. | | | 0.23 | |
| |
Horizon Therapeutics PLC | | | 0.23 | |
| |
Apple, Inc. | | | 0.23 | |
| |
SolarEdge Technologies, Inc. | | | 0.22 | |
| |
Dick’s Sporting Goods, Inc. | | | 0.22 | |
| |
EPAM Systems, Inc. | | | 0.21 | |
| |
Gap, Inc. (The) | | | 0.21 | |
Total | | | 2.28 | |
* Excluding money market fund holdings. | | | | |
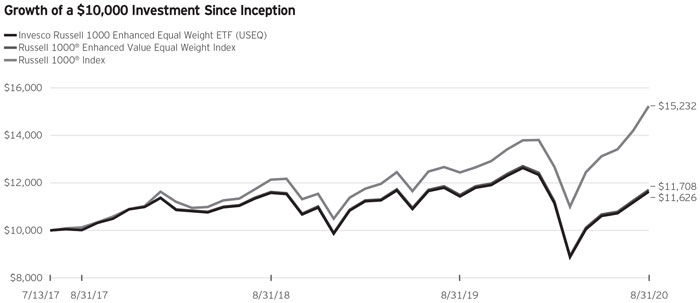
Fund Performance History as of August 31, 2020
| | | | | | | | | | | | |
| | | 1 Year | | 3 Years Average Annualized | | 3 Years Cumulative | | | | Fund Inception |
| | Average Annualized | | Cumulative |
| Index |
| Russell 1000® Enhanced Value Equal Weight Index | | 1.87% | | 5.36% | | 16.96% | | | | 5.16% | | 17.08% |
| | | | | | |
Russell 1000® Index | | 22.50 | | 14.58 | | 50.43 | | | | 14.38 | | 52.32 |
| | | | | | |
| Fund | | | | | | | | | | | | |
NAV Return | | 1.72 | | 5.12 | | 16.18 | | | | 4.93 | | 16.26 |
Market Price Return | | 1.88 | | 5.13 | | 16.21 | | | | 4.94 | | 16.30 |
Invesco Russell 1000 Enhanced Equal Weight ETF (USEQ) (continued)
Fund Inception: July 13, 2017
Performance quoted above represents past performance. Past performance is not a guarantee of future results and current performance may be higher or lower than performance quoted. Investment returns and principal value will fluctuate, and shares of the Fund (“Fund Shares”), when redeemed or sold, may be worth more or less than their original cost. Fund performance reflects any applicable fee waivers and/or expense reimbursements. Had the adviser not waived fees and/or reimbursed expenses currently or in the past, returns would have been lower. See the current prospectus for more information. According to the Fund’s current prospectus, the Fund’s expense ratio of 0.29% is expressed as a unitary management fee to cover operating expenses and expenses incurred in connection with managing the portfolio. NAV and Market Price returns assume that dividends and capital gain distributions have been reinvested in the Fund at NAV and Market Price, respectively. The returns shown in the table above do not reflect the deduction of taxes that a shareholder would pay on Fund
distributions or the redemption or sale of Fund Shares. See invesco.com/ ETFs to find the most recent month-end performance numbers.
Index and Benchmark Index performance results are based upon a hypothetical investment in their respective constituent securities. Index and Benchmark Index returns do not represent Fund returns. An investor cannot invest directly in an index. The Index and Benchmark Index do not charge management fees or brokerage expenses, and no such fees or expenses were deducted from the hypothetical performance shown. In addition, the results actual investors might have achieved would have differed from those shown because of differences in the timing, amounts of their investments, and fees and expenses associated with an investment in the Fund.
Notes Regarding Indexes and Fund Performance History:
| - | Average Annualized and Cumulative Inception returns for the Fund, Index and Benchmark Index are based on the inception date of the Fund. |
| | |
 | | Management’s Discussion of Fund Performance |
| | Invesco Russell 1000 Equal Weight ETF (EQAL) |
As an index fund, the Invesco Russell 1000 Equal Weight ETF (the “Fund”) is passively managed and seeks to track the investment results (before fees and expenses) of the Russell 1000® Equal Weight Index (the “Index”). The Fund generally will invest at least 90% of its total assets in the securities that comprise the Index.
Strictly in accordance with its guidelines and mandated procedures, Frank Russell Company (“Russell” or the “Index Provider”) compiles, maintains and calculates the Index which is designed to measure the performance of approximately 1000 equally-weighted securities. The Index is comprised of all of the securities in the Russell 1000® Index (the “Russell 1000” or “Benchmark Index”), which is composed of approximately 1,000 of the largest securities within the Russell 3000® Index. The Index is constructed by applying a two-step process. First, the Index Provider assigns each component security of the Russell 1000 to a sector based on the Russell Global Sectors (the “RGS”) classification system. There are nine economic sectors within the RGS classification system. Next, once the component securities are assigned to a sector, the Index Provider allocates an equal weight to each sector and then assigns an equal weight to each constituent security within each sector. The Fund generally invests in all of the securities comprising the Index in proportion to their weightings in the Index.
For the fiscal year ended August 31, 2020, on a market price basis, the Fund returned 8.87%. On a net asset value (“NAV”) basis, the Fund returned 8.71%. During the same time period, the Index returned 8.77%. During the fiscal year, the Fund fully replicated the components of the Index; therefore, the Fund’s performance, on a NAV basis, differed from the return of the Index primarily due to fees and operating expenses that the Fund incurred during the period, which were partially offset by revenue generated from the securities lending program in which the Fund participates.
During this same time period, the Benchmark Index returned 22.50%. The Benchmark Index is an unmanaged index weighted by market capitalization based on the average performance of approximately 1,000 securities. The Benchmark Index was selected for its recognition in the marketplace, and its performance comparison is a useful measure for investors as a broad representation of the overall U.S. stock market.
The performance of the Fund differed from the Benchmark Index in part because the Fund seeks to track an Index that employs an equal weighted methodology, whereas the Benchmark Index weights stocks based on market capitalization.
Relative to the Benchmark Index, the Fund was most overweight in the energy sector and most underweight in the information technology sector during the fiscal year ended August 31, 2020. The majority of the Fund’s underperformance relative to the Benchmark Index during the year can be attributed to the Fund’s underweight allocation to the information technology sector.
For the fiscal year ended August 31, 2020, the information technology sector contributed most significantly to the Fund’s return, followed by the health care and consumer discretionary sectors, respectively. The utilities sector detracted most significantly from the Fund’s return, followed by the real estate and financial sectors, respectively.
Positions that contributed most significantly to the Fund’s return for the fiscal year ended August 31, 2020, included Wayfair, Inc., Class A, a consumer discretionary company (portfolio average weight of 0.11%) and Moderna, Inc., a health care company (portfolio average weight of 0.14%). Positions that detracted most significantly from the Fund’s return included Chesapeake Energy Corp., an energy company (no longer held at fiscal year-end), and Centennial Resources Development, Inc., an energy company (no longer held at fiscal year-end).
| | | | | | |
| Sector Breakdown (% of the Fund’s Net Assets) |
as of August 31, 2020 | | | | | |
| | | |
Industrials | | | 13.70 | | | |
| | |
Information Technology | | | 13.53 | | | |
| | |
Health Care | | | 11.97 | | | |
| | |
Consumer Staples | | | 10.88 | | | |
| | |
Materials | | | 9.09 | | | |
| | |
Utilities | | | 8.97 | | | |
| | |
Consumer Discretionary | | | 8.66 | | | |
| | |
Energy | | | 8.61 | | | |
| | |
Financials | | | 6.37 | | | |
| | |
Communication Services | | | 4.77 | | | |
| | |
Real Estate | | | 3.32 | | | |
| | |
Money Market Funds Plus Other Assets Less Liabilities | | | 0.13 | | | |
| | | | | | |
|
Top Ten Fund Holdings* (% of the Fund’s Net Assets) as of August 31, 2020 |
| | | |
Security | | | | | | |
| | |
Enphase Energy, Inc. | | | 0.44 | | | |
| | |
First Solar, Inc. | | | 0.39 | | | |
| | |
SolarEdge Technologies, Inc. | | | 0.38 | | | |
| | |
Boston Beer Co., Inc. (The), Class A | | | 0.33 | | | |
| | |
Halliburton Co. | | | 0.32 | | | |
| | |
AES Corp. (The) | | | 0.31 | | | |
| | |
EQT Corp. | | | 0.30 | | | |
| | |
Antero Midstream Corp. | | | 0.30 | | | |
| | |
Pioneer Natural Resources Co. | | | 0.28 | | | |
| | |
Cheniere Energy, Inc. | | | 0.28 | | | |
| | |
Total | | | 3.33 | | | |
| | |
* Excluding money market fund holdings. | | | | | | |
Invesco Russell 1000 Equal Weight ETF (EQAL) (continued)
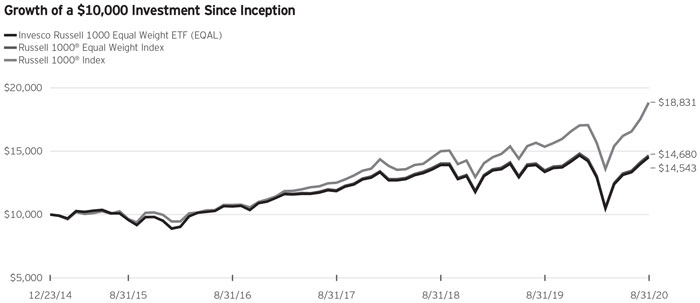
Fund Performance History as of August 31, 2020
| | | | | | | | | | | | | | | | |
| | | | | 3 Years | | | | 5 Years | | | | | | Fund Inception |
| | | | | Average | | 3 Years | | Average | | 5 Years | | | | Average | | |
| Index | | 1 Year | | Annualized | | Cumulative | | Annualized | | Cumulative | | | | Annualized | | Cumulative |
Russell 1000® Equal Weight Index | | 8.77% | | 7.17% | | 23.10% | | 8.86% | | 52.87% | | | | 6.98% | | 46.80% |
Russell 1000® Index | | 22.50 | | 14.58 | | 50.43 | | 14.31 | | 95.18 | | | | 11.77 | | 88.31 |
Fund | | | | | | | | | | | | | | | | |
NAV Return | | 8.71 | | 7.04 | | 22.63 | | 8.68 | | 51.64 | | | | 6.81 | | 45.43 |
Market Price Return | | 8.87 | | 7.10 | | 22.86 | | 8.71 | | 51.81 | | | | 6.82 | | 45.53 |
Fund Inception: December 23, 2014
Performance quoted above represents past performance. Past performance is not a guarantee of future results and current performance may be higher or lower than performance quoted. Investment returns and principal value will fluctuate, and shares of the Fund (“Fund Shares”), when redeemed or sold, may be worth more or less than their original cost. Fund performance reflects any applicable fee waivers and/or expense reimbursements. Had the adviser not waived fees and/or reimbursed expenses currently or in the past, returns would have been lower. See the current prospectus for more information. According to the Fund’s current prospectus, the Fund’s expense ratio of 0.20% is expressed as a unitary management fee to cover operating expenses and expenses incurred in connection with managing the portfolio. NAV and Market Price returns assume that dividends and capital gain distributions have been reinvested in the Fund at NAV and Market Price, respectively. The returns shown in the table above do not reflect the deduction of taxes that a shareholder would pay on Fund
distributions or the redemption or sale of Fund Shares. See invesco.com/ ETFs to find the most recent month-end performance numbers.
Index and Benchmark Index performance results are based upon a hypothetical investment in their respective constituent securities. Index and Benchmark Index returns do not represent Fund returns. An investor cannot invest directly in an index. The Index and Benchmark Index do not charge management fees or brokerage expenses, and no such fees or expenses were deducted from the hypothetical performance shown. In addition, the results actual investors might have achieved would have differed from those shown because of differences in the timing, amounts of their investments, and fees and expenses associated with an investment in the Fund.
Notes Regarding Indexes and Fund Performance History:
| - | Average Annualized and Cumulative Inception returns for the Fund, Index and Benchmark Index are based on the inception date of the Fund. |
| | |
 | | Management’s Discussion of Fund Performance |
| | Invesco Russell 1000 Low Beta Equal Weight ETF (USLB) |
As an index fund, the Invesco Russell 1000 Low Beta Equal Weight ETF (the “Fund”) is passively managed and seeks to track the investment results (before fees and expenses) of the Russell 1000® Low Beta Equal Weight Index (the “Index”). The Fund generally will invest at least 90% of its total assets in the securities that comprise the Index.
Strictly in accordance with its guidelines and mandated procedures, Frank Russell Company (“Russell” or the “Index Provider”) compiles, maintains and calculates the Index which is comprised of securities in the Russell 1000® Index (the “Russell 1000” or “Benchmark Index”) that exhibit low beta characteristics. The Index is a subset of the Russell 1000, which is designed to measure the performance of the large-cap segment of the U.S. equity market and consists of the stocks of the largest 1,000 U.S. companies, by capitalization.
The Index Provider selects constituent securities for the Index by calculating the beta score for each security in the Russell 1000. Beta is a measure of a security’s price sensitivity (i.e., volatility); it reflects the rate of change in a security’s price that results from overall market movements. To calculate the beta score, the Index Provider analyzes the security’s monthly returns over the past eighteen months to see the extent to which they correlate to overall market movements. Securities with a beta score of less than that of the overall U.S. equity market average (that is, securities whose price changes exhibit less volatility than the average amount of volatility in the market) are eligible for inclusion in the Index. The Index is equally weighted. The Fund generally invests in all of the securities comprising the Index in proportion to their weightings in the Index.
For the fiscal year ended August 31, 2020, on a market price basis, the Fund returned 2.30%. On a net asset value (“NAV”) basis, the Fund returned 2.08%. During the same time period, the Index returned 2.27%. During the fiscal year, the Fund fully replicated the components of the Index; therefore, the Fund’s performance, on a NAV basis, differed from the return of the Index primarily due to fees and operating expenses that the Fund incurred during the period, which were partially offset by the Fund holding cash to pay distributions in March, which coincided with overall market declines, along with revenue generated from the securities lending program in which the Fund participates.
The performance of the Fund differed from the Benchmark Index in part because the Fund seeks to track an Index that is a subset of the Benchmark Index, consisting of securities within the Benchmark Index that exhibit low beta characteristics.
During this same time period, the Benchmark Index returned 22.50%. The Benchmark Index is an unmanaged index weighted by market capitalization based on the average performance of approximately 1,000 securities. The Benchmark Index was selected for its recognition in the marketplace, and its
performance comparison is a useful measure for investors as a broad representation of the overall U.S. stock market.
Relative to the Benchmark Index, the Fund was most overweight in the real estate and utilities sectors and most underweight in the information technology and communication services sectors during the fiscal year ended August 31, 2020. The majority of the Fund’s underperformance relative to the Benchmark Index during the period can be attributed to the Fund’s underweight position and security selection in the information technology sector as well as its overweight position and security selection in the real estate sector.
For the fiscal year ended August 31, 2020, the health care sector contributed most significantly to the Fund’s return, followed by the information technology and industrials sectors, respectively. The real estate sector detracted most significantly from the Fund’s return, followed by the financials and utilities sectors, respectively.
Positions that contributed most significantly to the Fund’s return for the fiscal year ended August 31, 2020, included Newmont Corp., a materials company (portfolio average weight of 0.32%), and Advanced Micro Devices, Inc., an information technology company (portfolio average weight of 0.07%). Positions that detracted most significantly from the Fund’s return included MFA Financial, Inc., a financials company (no longer held at fiscal year-end), and Service Properties Trust, a real estate company (no longer held at fiscal year-end).
| | | | |
Sector Breakdown (% of the Fund’s Net Assets) as of August 31, 2020 | |
| |
Health Care | | | 16.76 | |
| |
Information Technology | | | 13.54 | |
| |
Industrials | | | 12.32 | |
| |
Financials | | | 11.51 | |
| |
Real Estate | | | 11.26 | |
| |
Consumer Staples | | | 8.92 | |
| |
Utilities | | | 8.29 | |
| |
Consumer Discretionary | | | 6.75 | |
| |
Communication Services | | | 5.50 | |
| |
Materials | | | 4.81 | |
| |
Energy | | | 0.25 | |
| |
Money Market Funds Plus Other Assets Less Liabilities | | | 0.09 | |
Invesco Russell 1000 Low Beta Equal Weight ETF (USLB) (continued)
Top Ten Fund Holdings* (% of the Fund’s Net Assets)
as of August 31, 2020
| | | | |
| | |
Security | | | | |
| |
Advanced Micro Devices, Inc. | | | 0.46 | |
| |
United Parcel Service, Inc., Class B | | | 0.43 | |
| |
Amazon.com, Inc. | | | 0.38 | |
| |
Watsco, Inc. | | | 0.37 | |
| |
West Pharmaceutical Services, Inc. | | | 0.36 | |
| |
Dell Technologies, Inc., Class C | | | 0.36 | |
| |
Adobe, Inc. | | | 0.36 | |
| |
Take-Two Interactive Software, Inc. | | | 0.36 | |
| |
Deere & Co. | | | 0.35 | |
| |
Veeva Systems, Inc., Class A | | | 0.35 | |
| |
Total | | | 3.78 | |
| * | Excluding money market fund holdings. |
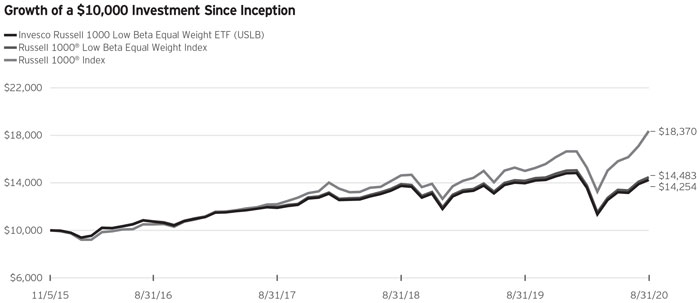
Fund Performance History as of August 31, 2020
| | | | | | | | | | | | | | | | | | | | | | | | | | | | | | |
| | | 1 Year | | 3 Years Average
Annualized | | 3 Years
Cumulative | | | | Fund Inception |
| Index | | | | Average
Annualized | | Cumulative |
| Russell 1000® Low Beta Equal Weight Index | | 2.27% | | 6.53% | | 20.90% | | | | 7.99% | | 44.83% |
Russell 1000® Index | | 22.50 | | 14.58 | | 50.43 | | | | 13.45 | | 83.70 |
Fund | | | | | | | | | | | | |
| NAV Return | | 2.08 | | 6.20 | | 19.79 | | | | 7.63 | | 42.54 |
Market Price Return | | 2.30 | | 6.28 | | 20.05 | | | | 7.65 | | 42.68 |
Invesco Russell 1000 Low Beta Equal Weight ETF (USLB) (continued)
Fund Inception: November 5, 2015
Performance quoted above represents past performance. Past performance is not a guarantee of future results and current performance may be higher or lower than performance quoted. Investment returns and principal value will fluctuate, and shares of the Fund (“Fund Shares”), when redeemed or sold, may be worth more or less than their original cost. Fund performance reflects any applicable fee waivers and/or expense reimbursements. Had the adviser not waived fees and/or reimbursed expenses currently or in the past, returns would have been lower. See the current prospectus for more information. According to the Fund’s current prospectus, the Fund’s expense ratio of 0.35% is expressed as a unitary management fee to cover operating expenses and expenses incurred in connection with managing the portfolio. NAV and Market Price returns assume that dividends and capital gain distributions have been reinvested in the Fund at NAV and Market Price, respectively. The returns shown in the table above do not reflect the deduction of taxes that a shareholder would pay on Fund
distributions or the redemption or sale of Fund Shares. See invesco.com/ETFs to find the most recent month-end performance numbers.
Index and Benchmark Index performance results are based upon a hypothetical investment in their respective constituent securities. Index and Benchmark Index returns do not represent Fund returns. An investor cannot invest directly in an index. The Index and Benchmark Index do not charge management fees or brokerage expenses, and no such fees or expenses were deducted from the hypothetical performance shown. In addition, the results actual investors might have achieved would have differed from those shown because of differences in the timing, amounts of their investments, and fees and expenses associated with an investment in the Fund.
Notes Regarding Indexes and Fund Performance History:
| - | Average Annualized and Cumulative Inception returns for the Fund, Index and Benchmark Index are based on the inception date of the Fund. |
| | |
 | | Management’s Discussion of Fund Performance |
| | Invesco S&P 500 Enhanced Value ETF (SPVU) |
As an index fund, the Invesco S&P 500 Enhanced Value ETF (the “Fund”) is passively managed and seeks to track the investment results (before fees and expenses) of the S&P 500 Enhanced Value Index (the “Index”). The Fund generally will invest at least 90% of its total assets in the securities that comprise the Index.
Strictly in accordance with its guidelines and mandated procedures, S&P Dow Jones Indices LLC (“S&P DJI” or the “Index Provider”) compiles, maintains and calculates the Index, which is designed to track the performance of approximately 100 stocks in the S&P 500® Index (the “Parent Index”) that have the highest “value score,” which the Index Provider calculates based on fundamental ratios of a company’s stock.
In selecting constituent securities for the Index, the Index Provider first calculates the value score of each stock in the Parent Index by evaluating each stock’s: (i) book value-to-price ratio, calculated using the company’s latest book value per share divided by its price; (ii) earnings-to-price ratio, calculated using the company’s trailing 12-month earnings per share divided by its price; and (iii) sales-to-price ratio, calculated using the company’s trailing 12-month sales per share divided by its price. The Index Provider then calculates the value score of each security based on a composite of those three factors and selects the 100 stocks with the highest value score for inclusion in the Index. The Index uses a modified market capitalization-weighted strategy, weighting securities by multiplying their market capitalization and their value score. The Fund generally invests in all of the securities comprising the Index in proportion to their weightings in the Index.
For the fiscal year ended August 31, 2020, on a market price basis, the Fund returned (10.97)%. On a net asset value (“NAV”) basis, the Fund returned (11.04)%. During the same time period, the Index returned (11.11)%. During the fiscal year, the Fund fully replicated the components of the Index; therefore, the Fund’s performance, on a NAV basis, differed from the return of the Index primarily due to fees and operating expenses that the Fund incurred which were partially offset by the Fund holding cash to pay distributions in March, which coincided with overall market declines. During the same time period, the Parent Index returned 21.94%.
Positions that contributed most significantly to the Fund’s return for the fiscal year ended August 31, 2020, included Morgan Stanley, a financial company (portfolio average weight of 2.25%), and Newmont Corp., a materials company (no longer held at fiscal year-end). Positions that detracted most significantly from the Fund’s return included Wells Fargo & Co., a financials company (portfolio average weight of 4.38%), and AT&T, Inc. a communication services company (portfolio average weight of 5.39%).
| | | | |
Sector Breakdown (% of the
Fund’s Net Assets)
as of August 31, 2020 | |
| |
Financials | | | 39.37 | |
| |
Health Care | | | 13.52 | |
| |
Consumer Discretionary | | | 9.75 | |
| |
Energy | | | 8.86 | |
| |
Industrials | | | 8.20 | |
| |
Communication Services | | | 6.78 | |
| |
Consumer Staples | | | 6.45 | |
| |
Sector Types Each Less Than 3% | | | 6.58 | |
| |
Money Market Funds Plus Other Assets Less Liabilities | | | 0.49 | |
|
Top Ten Fund Holdings* (% of the
Fund’s Net Assets)
as of August 31, 2020 | |
| |
Security | | | | |
| |
Bank of America Corp. | | | 5.11 | |
| |
AT&T, Inc. | | | 4.90 | |
| |
Citigroup, Inc. | | | 4.83 | |
| |
CVS Health Corp. | | | 4.48 | |
| |
Exxon Mobil Corp. | | | 4.17 | |
| |
Wells Fargo & Co. | | | 3.96 | |
| |
Raytheon Technologies Corp. | | | 3.28 | |
| |
Cigna Corp. | | | 2.70 | |
| |
General Motors Co. | | | 2.46 | |
| |
Anthem, Inc. | | | 2.42 | |
| |
Total | | | 38.31 | |
| * | Excluding money market fund holdings. |
Invesco S&P 500 Enhanced Value ETF (SPVU) (continued)
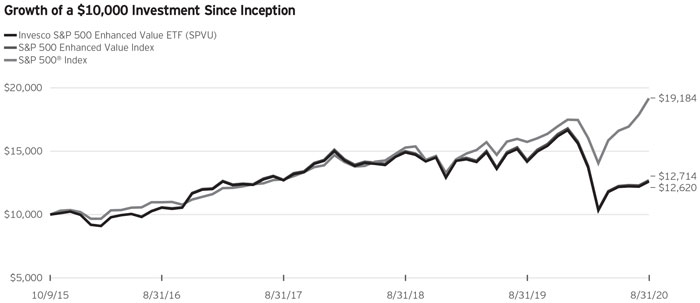
Fund Performance History as of August 31, 2020
| | | | | | | | | | | | |
| | | 1 Year | | 3 Years
Average Annualized | | 3 Years Cumulative | | | | Fund Inception |
| Index | | | | Average Annualized | | Cumulative |
| | | | | | |
| S&P 500 Enhanced Value Index | | (11.11)% | | (0.13)% | | (0.38)% | | | | 5.03% | | 27.14% |
| | | | | | |
S&P 500® Index | | 21.94 | | 14.52 | | 50.17 | | | | 14.24 | | 91.84 |
| | | | | | |
Fund | | | | | | | | | | | | |
| | | | | | |
NAV Return | | (11.04) | | (0.21) | | (0.61) | | | | 4.87 | | 26.20 |
| | | | | | |
Market Price Return | | (10.97) | | (0.14) | | (0.41) | | | | 4.88 | | 26.26 |
Fund Inception: October 9, 2015
Performance quoted above represents past performance. Past performance is not a guarantee of future results and current performance may be higher or lower than performance quoted. Investment returns and principal value will fluctuate, and shares of the Fund (“Fund Shares”), when redeemed or sold, may be worth more or less than their original cost. Fund performance reflects any applicable fee waivers and/or expense reimbursements. Had the adviser not waived fees and/or reimbursed expenses currently or in the past, returns would have been lower. See the current prospectus for more information. According to the Fund’s current prospectus, the Fund’s expense ratio of 0.13% is expressed as a unitary management fee to cover operating expenses and expenses incurred in connection with managing the portfolio. NAV and Market Price returns assume that dividends and capital gain distributions have been reinvested in the Fund at NAV and Market Price, respectively. The returns shown in the table above do not reflect the deduction of taxes that a shareholder would pay on Fund distributions or the redemption or sale of Fund Shares. See invesco.com/ ETFs to find the most recent month-end performance numbers.
Performance results for the indexes stated above are based upon a hypothetical investment in their respective constituent securities. The returns of an index do not represent Fund returns. An investor cannot invest directly in an index. The indexes do not charge management fees or brokerage expenses, and no such fees or expenses were deducted from the hypothetical performance shown. In addition, the results actual investors might have achieved would have differed from those shown because of differences in the timing, amounts of their investments, and fees and expenses associated with an investment in the Fund.
Notes Regarding Indexes and Fund Performance History:
| - | Average Annualized and Cumulative Inception returns for the Fund and the indexes are based on the inception date of the Fund. |
| - | Effective June 26, 2020, the Fund changed its designated broad-based securities market benchmark index from the Parent Index to the Index, as the Index more closely reflects the performance of the types of securities in which the Fund invests. |
| | |
 | | Management’s Discussion of Fund Performance |
| | Invesco S&P 500® ex-Rate Sensitive Low Volatility ETF (XRLV) |
As an index fund, the Invesco S&P 500® ex-Rate Sensitive Low Volatility ETF (the “Fund”) is passively managed and seeks to track the investment results (before fees and expenses) of the S&P 500® Low Volatility Rate Response Index (the “Index”). The Fund generally will invest at least 90% of its total assets in the securities that comprise the Index.
Strictly in accordance with its guidelines and mandated procedures, S&P Dow Jones Indices LLC (“S&P DJI” or the “Index Provider”) compiles, maintains and calculates the Index, which is designed to provide exposure to the 100 constituents of the S&P 500® Index (the “Parent Index”) that exhibit both low volatility and low interest rate risk. The Index is designed to include stocks exhibiting low volatility characteristics, after removing stocks that historically have performed poorly in rising interest rate environments. Volatility is a statistical measurement of the magnitude of up and down asset price fluctuations (increases or decreases in a stock’s price) over time. The Index Provider determines a stock’s “rate sensitivity” by performing a regression of the stock’s returns over a five-year period to changes in interest rates over that same period. The Fund generally invests in all of the securities comprising the Index in proportion to their weightings in the Index.
For the fiscal year ended August 31, 2020, on a market price basis, the Fund returned 3.99%. On a net asset value (“NAV”) basis, the Fund returned 3.86%. During the same time period, the Index returned 4.13%. During the fiscal year, the Fund fully replicated the components of the Index; therefore, the Fund’s performance, on a NAV basis, differed from the return of the Index primarily due to fees and operating expenses that the Fund incurred during the period. During the same time period, the Parent Index returned 21.94%.
For the fiscal year ended August 31, 2020, the health care sector contributed most significantly to the Fund’s return, followed by the industrials and information technology sectors, respectively. The financials sector detracted most significantly from the Fund’s return, followed by the real estate and energy sectors, respectively.
Positions that contributed most significantly to the Fund’s return for the fiscal year ended August 31, 2020, included Citrix Systems, Inc., an information technology company (no longer held at fiscal year-end), and United Parcel Service, Inc., Class B, an industrials company (portfolio average weight of 0.34%). Positions that detracted most significantly from the Fund’s return included Simon Property Group, Inc., a real estate company (no longer held at fiscal year-end), and Boston Properties, Inc., a real estate company (no longer held at fiscal year-end).
| | | | |
Sector Breakdown
(% of the Fund’s Net Assets)
as of August 31, 2020 | |
| |
Health Care | | | 29.60 | |
| |
Industrials | | | 21.45 | |
| |
Information Technology | | | 13.92 | |
| |
Financials | | | 8.89 | |
| |
Communication Services | | | 8.41 | |
| |
Consumer Discretionary | | | 7.03 | |
| |
Consumer Staples | | | 6.08 | |
| |
Materials | | | 3.68 | |
| |
Real Estate | | | 0.90 | |
| |
Money Market Funds Plus Other Assets Less Liabilities | | | 0.04 | |
|
Top Ten Fund Holdings*
(% of the Fund’s Net Assets)
as of August 31, 2020 | |
| |
Security | | | | |
| |
Bristol-Myers Squibb Co. | | | 1.32 | |
| |
Johnson & Johnson | | | 1.27 | |
| |
salesforce.com, inc. | | | 1.25 | |
| |
Amazon.com, Inc. | | | 1.20 | |
| |
Merck & Co., Inc. | | | 1.20 | |
| |
Expeditors International of Washington, Inc. | | | 1.18 | |
| |
Tyler Technologies, Inc. | | | 1.16 | |
| |
Charter Communications, Inc., Class A | | | 1.16 | |
| |
Berkshire Hathaway, Inc., Class B | | | 1.14 | |
| |
Danaher Corp. | | | 1.14 | |
| |
Total | | | 12.02 | |
| * | Excluding money market fund holdings. |
Invesco S&P 500® ex-Rate Sensitive Low Volatility ETF (XRLV) (continued)
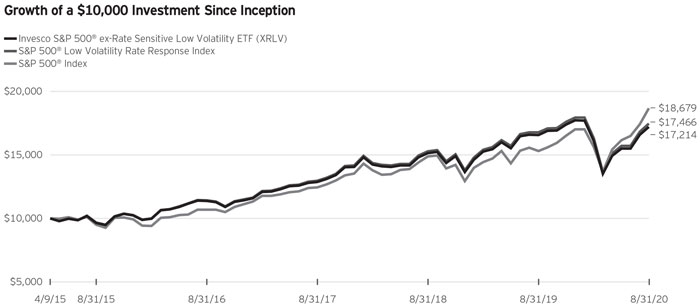
Fund Performance History as of August 31, 2020
| | | | | | | | | | | | | | | | |
| | | 1 Year | | 3 Years Average Annualized | | 3 Years Cumulative | | 5 Years Average Annualized | | 5 Years Cumulative | | | | Fund Inception |
| Index | | | | Average
Annualized | | Cumulative |
| S&P 500® Low Volatility Rate Response Index | | 4.13% | | 10.43% | | 34.68% | | 12.56% | | 80.69% | | | | 10.90% | | 74.66% |
S&P 500® Index | | 21.94 | | 14.52 | | 50.17 | | 14.46 | | 96.47 | | | | 12.29 | | 86.79 |
Fund | | | | | | | | | | | | | | | | |
| NAV Return | | 3.86 | | 10.14 | | 33.62 | | 12.26 | | 78.28 | | | | 10.60 | | 72.14 |
Market Price Return | | 3.99 | | 10.20 | | 33.82 | | 12.25 | | 78.25 | | | | 10.61 | | 72.27 |
Fund Inception: April 9, 2015
Performance quoted above represents past performance. Past performance is not a guarantee of future results and current performance may be higher or lower than performance quoted. Investment returns and principal value will fluctuate, and shares of the Fund (“Fund Shares”), when redeemed or sold, may be worth more or less than their original cost. Fund performance reflects any applicable fee waivers and/or expense reimbursements. Had the adviser not waived fees and/or reimbursed expenses currently or in the past, returns would have been lower. See the current prospectus for more information. According to the Fund’s current prospectus, the Fund’s expense ratio of 0.25% is expressed as a unitary management fee to cover operating expenses and expenses incurred in connection with managing the portfolio. NAV and Market Price returns assume that dividends and capital gain distributions have been reinvested in the Fund at NAV and Market Price, respectively. The returns shown in the table above do not reflect the deduction of taxes that a shareholder would pay on Fund distributions or the redemption or sale of Fund Shares. See invesco.com/ ETFs to find the most recent month-end performance numbers.
Performance results for the indexes stated above are based upon a hypothetical investment in their respective constituent securities. The returns of an index do not represent Fund returns. An investor cannot invest directly in an index. The indexes do not charge management fees or brokerage expenses, and no such fees or expenses were deducted from the hypothetical performance shown. In addition, the results actual investors might have achieved would have differed from those shown because of differences in the timing, amounts of their investments, and fees and expenses associated with an investment in the Fund.
Notes Regarding Indexes and Fund Performance History:
| - | Average Annualized and Cumulative Inception returns for the Fund and the indexes are based on the inception date of the Fund. |
| - | Effective June 26, 2020, the Fund changed its designated broad-based securities market benchmark index from the Parent Index to the Index, as the Index more closely reflects the performance of the types of securities in which the Fund invests. |
| | |
 | | Management’s Discussion of Fund Performance |
| | Invesco S&P 500® High Beta ETF (SPHB) |
As an index fund, the Invesco S&P 500® High Beta ETF (the “Fund”) is passively managed and seeks to track the investment results (before fees and expenses) of the S&P 500® High Beta Index (the “Index”). The Fund generally will invest at least 90% of its total assets in the securities that comprise the Index.
S&P Dow Jones Indices LLC (“S&P DJI” or the “Index Provider”) compiles, maintains and calculates the Index. Strictly in accordance with its guidelines and mandated procedures, S&P DJI selects 100 securities from the S&P 500® Index (the “Parent Index”) for inclusion in the Index that have the highest sensitivity to market movements, or “beta,” over the past 12 months as determined by the Index Provider. Beta is a measure of relative risk and is the rate of change of a security’s price. The Fund generally invests in all of the securities comprising the Index in proportion to their weightings in the Index.
For the fiscal year ended August 31, 2020, on a market price basis, the Fund returned 11.59%. On a net asset value (“NAV”) basis, the Fund returned 11.38%. During the same time period, the Index returned 11.53%. During the fiscal year, the Fund fully replicated the components of the Index; therefore, the Fund’s performance, on a NAV basis, differed from the return of the Index primarily due to fees and operating expenses that the Fund incurred during the period, which were partially offset by the Fund holding cash to pay distributions in March, which coincided with overall market declines. During the same time period, the Parent Index returned 21.94%.
For the fiscal year ended August 31, 2020, the information technology sector contributed most significantly to the Fund’s return, followed by the real estate and consumer discretionary sectors, respectively. The energy sector detracted most significantly from the Fund’s return, followed by the materials and consumer staples sectors, respectively.
Positions that contributed most significantly to the Fund’s return for the fiscal year ended August 31, 2020, included NVIDIA Corp., an information technology company (portfolio average weight of 1.53%), and Advanced Micro Devices, Inc., an information technology company (no longer held at fiscal year-end). Positions that detracted most significantly from the Fund’s return included American Airlines Group, Inc., an industrials company (portfolio average weight of 0.63%), and Capri Holdings Ltd., a consumer discretionary company (no longer held at fiscal year-end).
| | | | |
Sector Breakdown (% of the Fund’s Net Assets)
as of August 31, 2020 | |
| |
Financials | | | 28.47 | |
| |
Consumer Discretionary | | | 17.55 | |
| |
Energy | | | 17.25 | |
| |
Information Technology | | | 11.68 | |
| |
Industrials | | | 9.69 | |
| |
Real Estate | | | 5.91 | |
| |
Materials | | | 4.89 | |
| |
Sector Types Each Less Than 3% | | | 4.38 | |
| |
Money Market Funds Plus Other Assets Less Liabilities | | | 0.18 | |
|
Top Ten Fund Holdings* (% of the
Fund’s Net Assets)
as of August 31, 2020 | |
| |
Security | | | | |
| |
Norwegian Cruise Line Holdings Ltd. | | | 1.46 | |
| |
Lincoln National Corp. | | | 1.40 | |
| |
Royal Caribbean Cruises Ltd. | | | 1.37 | |
| |
Carnival Corp. | | | 1.37 | |
| |
DXC Technology Co. | | | 1.26 | |
| |
MGM Resorts International | | | 1.22 | |
| |
Discover Financial Services | | | 1.22 | |
| |
Weyerhaeuser Co. | | | 1.20 | |
| |
Freeport-McMoRan, Inc. | | | 1.20 | |
| |
Ameriprise Financial, Inc. | | | 1.20 | |
| |
Total | | | 12.90 | |
| * | Excluding money market fund holdings. |
Invesco S&P 500® High Beta ETF (SPHB) (continued)
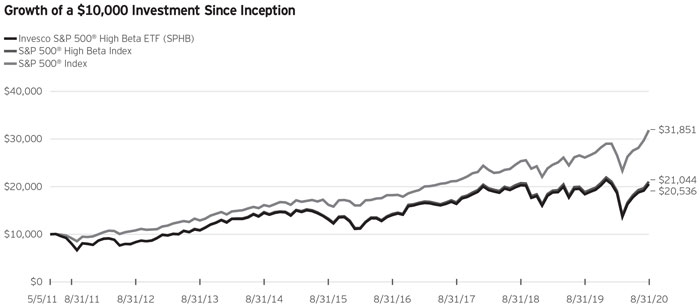
Fund Performance History as of August 31, 2020
| | | | | | | | | | | | | | | | |
| | | 1 Year | | 3 Years
Average Annualized | | 3 Years Cumulative | | 5 Years
Average Annualized | | 5 Years Cumulative | | | | Fund Inception |
| Index | | | | Average
Annualized | | Cumulative |
| | | | | | | | |
| S&P 500® High Beta Index | | 11.53% | | 8.02% | | 26.06% | | 9.63% | | 58.38% | | | | 8.31% | | 110.44% |
| | | | | | | | |
S&P 500® Index | | 21.94 | | 14.52 | | 50.17 | | 14.46 | | 96.47 | | | | 13.24 | | 218.51 |
| | | | | | | | |
| Fund | | | | | | | | | | | | | | | | |
| | | | | | | | |
| NAV Return | | 11.38 | | 7.79 | | 25.25 | | 9.37 | | 56.46 | | | | 8.03 | | 105.36 |
| | | | | | | | |
Market Price Return | | 11.59 | | 7.91 | | 25.67 | | 9.40 | | 56.72 | | | | 8.06 | | 105.92 |
Fund Inception: May 5, 2011
Performance quoted above represents past performance. Past performance is not a guarantee of future results and current performance may be higher or lower than performance quoted. Investment returns and principal value will fluctuate, and shares of the Fund (“Fund Shares”), when redeemed or sold, may be worth more or less than their original cost. Fund performance reflects any applicable fee waivers and/or expense reimbursements. Had the adviser not waived fees and/or reimbursed expenses currently or in the past, returns would have been lower. See the current prospectus for more information. According to the Fund’s current prospectus, the Fund’s expense ratio of 0.25% is expressed as a unitary management fee to cover operating expenses and expenses incurred in connection with managing the portfolio. NAV and Market Price returns assume that dividends and capital gain distributions have been reinvested in the Fund at NAV and Market Price, respectively. The returns shown in the table above do not reflect the deduction of taxes that a shareholder would pay on Fund distributions or the redemption or sale of Fund Shares. See invesco.com/ ETFs to find the most recent month-end performance numbers.
Performance results for the indexes stated above are based upon a hypothetical investment in their respective constituent securities. The returns of an index do not represent Fund returns. An investor cannot invest directly in an index. The indexes do not charge management fees or brokerage expenses, and no such fees or expenses were deducted from the hypothetical performance shown. In addition, the results actual investors might have achieved would have differed from those shown because of differences in the timing, amounts of their investments, and fees and expenses associated with an investment in the Fund.
Notes Regarding Indexes and Fund Performance History:
| - | Average Annualized and Cumulative Inception returns for the Fund and the indexes are based on the inception date of the Fund. |
| - | Effective June 26, 2020, the Fund changed its designated broad-based securities market benchmark index from the Parent Index to the Index, as the Index more closely reflects the performance of the types of securities in which the Fund invests. |
| | |
 | | Management’s Discussion of Fund Performance |
| | Invesco S&P 500® High Dividend Low Volatility ETF (SPHD) |
As an index fund, the Invesco S&P 500® High Dividend Low Volatility ETF (the “Fund”) is passively managed and seeks to track the investment results (before fees and expenses) of the S&P 500® Low Volatility High Dividend Index (the “Index”). The Fund generally will invest at least 90% of its total assets in the securities that comprise the Index.
S&P Dow Jones Indices LLC (“S&P DJI” or the “Index Provider”) compiles, maintains and calculates the Index, which is composed of 50 securities in the S&P 500® Index (the “Parent Index”) that historically have provided high dividend yields with lower volatility. Strictly in accordance with its guidelines and mandated procedures, S&P DJI identifies from the Parent Index the 75 securities with the highest dividend yields over the past 12 months, with no one sector within the Parent Index allowed to contribute more than 10 securities. From those securities, S&P DJI selects for inclusion in the Index the 50 securities with the lowest realized volatility over the past 12 months. Volatility is a statistical measurement of the magnitude of up and down asset price fluctuations (increases or decreases in a stock’s price) over time. The Index weights each constituent security by its dividend yield, with the highest dividend-yielding securities receiving the highest weights. The Fund generally invests in all of the securities comprising the Index in proportion to their weightings in the Index.
For the fiscal year ended August 31, 2020, on a market price basis, the Fund returned (11.37)%. On a net asset value (“NAV”) basis, the Fund returned (11.46)%. During the same time period, the Index returned (11.24)%. During the fiscal year, the Fund fully replicated the components of the Index; therefore, the Fund’s performance, on a NAV basis, differed from the return of the Index primarily due to fees and operating expenses that the Fund incurred during the period, which were partially offset by the Fund holding cash to pay distributions in March, which coincided with overall market declines. During the same time period, the Parent Index returned 21.94%.
For the fiscal year ended August 31, 2020, the materials sector contributed most significantly to the Fund’s return, followed by the information technology and consumer staples sectors, respectively. The real estate sector detracted most significantly from the Fund’s return, followed by the energy and financials sectors, respectively.
Positions that contributed most significantly to the Fund’s return for the fiscal year ended August 31, 2020, included United Parcel Service, Inc., Class B, an industrials company (no longer held at fiscal year-end), and General Mills, Inc., a consumer staples company (no longer held at fiscal year-end). Positions that detracted most significantly from the Fund’s return included Simon Property Group, Inc., a real estate company (no longer held at fiscal year-end), and ONEOK, Inc., an energy company (no longer held at fiscal year-end).
| | | | |
Sector Breakdown (% of the Fund’s Net Assets)
as of August 31, 2020 | |
| Utilities | | | 16.75 | |
| Real Estate | | | 13.96 | |
| Information Technology | | | 12.58 | |
| Materials | | | 11.34 | |
| Communication Services | | | 11.32 | |
| Consumer Staples | | | 9.19 | |
| Energy | | | 7.12 | |
| Consumer Discretionary | | | 6.97 | |
| Health Care | | | 4.69 | |
| Financials | | | 4.52 | |
| Industrials | | | 1.44 | |
| Money Market Funds Plus Other Assets Less Liabilities | | | 0.12 | |
|
Top Ten Fund Holdings* (% of the Fund’s Net Assets)
as of August 31, 2020 | |
| |
| Security | | | | |
| Iron Mountain, Inc. | | | 3.29 | |
| CenturyLink, Inc. | | | 3.18 | |
| Altria Group, Inc. | | | 3.11 | |
| Dow, Inc. | | | 2.75 | |
| H&R Block, Inc. | | | 2.73 | |
| Exxon Mobil Corp. | | | 2.71 | |
| Vornado Realty Trust | | | 2.68 | |
| Philip Morris International, Inc. | | | 2.63 | |
| PPL Corp. | | | 2.60 | |
| AT&T, Inc. | | | 2.60 | |
| Total | | | 28.28 | |
| * | Excluding money market fund holdings. |
Invesco S&P 500® High Dividend Low Volatility ETF (SPHD) (continued)
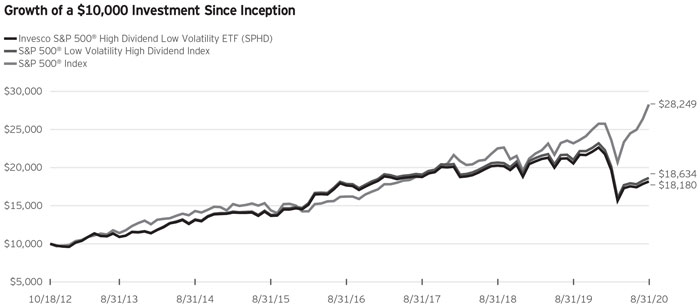
Fund Performance History as of August 31, 2020
| | | | | | | | | | | | | | | | |
| | | 1 Year | | 3 Years Average Annualized | | 3 Years Cumulative | | 5 Years Average Annualized | | 5 Years Cumulative | | | | Fund Inception |
| Index | | | | Average Annualized | | Cumulative |
| S&P 500® Low Volatility High Dividend Index | | (11.24)% | | (0.78)% | | (2.31)% | | 6.20% | | 35.10% | | | | 8.23% | | 86.34% |
S&P 500® Index | | 21.94 | | 14.52 | | 50.17 | | 14.46 | | 96.47 | | | | 14.11 | | 182.49 |
Fund | | | | | | | | | | | | | | | | |
| NAV Return | | (11.46) | | (1.07) | | (3.16) | | 5.87 | | 33.03 | | | | 7.89 | | 81.80 |
Market Price Return | | (11.37) | | (0.99) | | (2.94) | | 5.90 | | 33.19 | | | | 7.91 | | 82.05 |
Fund Inception: October 18, 2012
Performance quoted above represents past performance. Past performance is not a guarantee of future results and current performance may be higher or lower than performance quoted. Investment returns and principal value will fluctuate, and shares of the Fund (“Fund Shares”), when redeemed or sold, may be worth more or less than their original cost. Fund performance reflects any applicable fee waivers and/or expense reimbursements. Had the adviser not waived fees and/or reimbursed expenses currently or in the past, returns would have been lower. See the current prospectus for more information. According to the Fund’s current prospectus, the Fund’s expense ratio of 0.30% is expressed as a unitary management fee to cover operating expenses and expenses incurred in connection with managing the portfolio. NAV and Market Price returns assume that dividends and capital gain distributions have been reinvested in the Fund at NAV and Market Price, respectively. The returns shown in the table above do not reflect the deduction of taxes that a shareholder would pay on Fund distributions or the redemption or sale of Fund Shares. See invesco.com/ETFs to find the most recent month-end performance numbers.
Performance results for the indexes stated above are based upon a hypothetical investment in their respective constituent securities. The returns of an index do not represent Fund returns. An investor cannot invest directly in an index. The indexes do not charge management fees or brokerage expenses, and no such fees or expenses were deducted from the hypothetical performance shown. In addition, the results actual investors might have achieved would have differed from those shown because of differences in the timing, amounts of their investments, and fees and expenses associated with an investment in the Fund.
Notes Regarding Indexes and Fund Performance History:
| - | Average Annualized and Cumulative Inception returns for the Fund and the indexes are based on the inception date of the Fund. |
| - | Effective June 26, 2020, the Fund changed its designated broad-based securities market benchmark index from the Parent Index to the Index, as the Index more closely reflects the performance of the types of securities in which the Fund invests. |
| | |
 | | Management’s Discussion of Fund Performance |
| | Invesco S&P 500® Low Volatility ETF (SPLV) |
As an index fund, the Invesco S&P 500® Low Volatility ETF (the “Fund”) is passively managed and seeks to track the investment results (before fees and expenses) of the S&P 500® Low Volatility Index (the “Index”). The Fund generally will invest at least 90% of its total assets in the securities that comprise the Index.
S&P Dow Jones Indices LLC (“S&P DJI” or the “Index Provider”) compiles, maintains and calculates the Index. Strictly in accordance with its guidelines and mandated procedures, S&P DJI selects 100 securities from the S&P 500® Index (the “Parent Index”) for inclusion in the Index that have the lowest realized volatility over the past 12 months as determined by the Index Provider. Volatility is a statistical measurement of the magnitude of up and down asset price fluctuations (increases or decreases in a stock’s price) over time. The Fund generally invests in all of the securities comprising the Index in proportion to their weightings in the Index.
For the fiscal year ended August 31, 2020, on a market price basis, the Fund returned (1.08)%. On a net asset value (“NAV”) basis, the Fund returned (1.19)%. During the same time period, the Index returned (0.93)%. During the fiscal year, the Fund fully replicated the components of the Index; therefore, the Fund’s performance, on a NAV basis, differed from the return of the Index primarily due to fees and operating expenses that the Fund incurred during the period. During the same time period, the Parent Index returned 21.94%.
For the fiscal year ended August 31, 2020, the industrials sector contributed most significantly to the Fund’s return, followed by the health care and consumer staples sectors, respectively. The real estate sector detracted most significantly from the Fund’s return, followed by the utilities and financials sectors, respectively.
Positions that contributed most significantly to the Fund’s return for the fiscal year ended August 31, 2020, included United Parcel Service, Inc., Class B, an industrials company (portfolio average weight of 0.32%), and Citrix Systems, Inc., an information technology company (portfolio average weight of 1.10%). Positions that detracted most significantly from the Fund’s return included Cincinnati Financial Corp., a financials company (no longer held at fiscal year-end), and Federal Realty Investment Trust, a real estate company (no longer held at fiscal year-end).
| | | | |
Sector Breakdown
(% of the Fund’s Net Assets)
as of August 31, 2020 | |
Health Care | | | 24.77 | |
Consumer Staples | | | 24.63 | |
Industrials | | | 14.31 | |
Communication Services | | | 8.37 | |
Information Technology | | | 6.81 | |
Utilities | | | 6.23 | |
Financials | | | 5.82 | |
Consumer Discretionary | | | 5.09 | |
Sector Types Each Less Than 3% | | | 3.85 | |
Other Assets Less Liabilities | | | 0.12 | |
|
Top Ten Fund Holdings
(% of the Fund’s Net Assets)
as of August 31, 2020 | |
Security | | | | |
Verizon Communications, Inc. | | | 1.43 | |
Costco Wholesale Corp. | | | 1.27 | |
Bristol-Myers Squibb Co. | | | 1.23 | |
Walmart, Inc. | | | 1.21 | |
Clorox Co. (The) | | | 1.21 | |
Johnson & Johnson | | | 1.19 | |
General Mills, Inc. | | | 1.18 | |
Campbell Soup Co. | | | 1.15 | |
Kellogg Co. | | | 1.15 | |
Cerner Corp. | | | 1.14 | |
Total | | | 12.16 | |
Invesco S&P 500® Low Volatility ETF (SPLV) (continued)
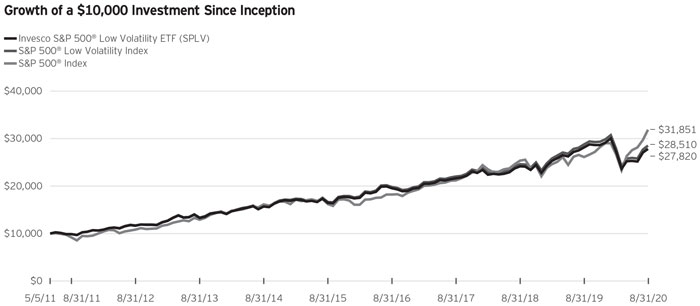
Fund Performance History as of August 31, 2020
| | | | | | | | | | | | | | | | |
| | | 1 Year | | 3 Years Average Annualized | | 3 Years Cumulative | | 5 Years Average Annualized | | 5 Years Cumulative | | | | Fund Inception |
| Index | | | | Average Annualized | | Cumulative |
| S&P 500® Low Volatility Index | | (0.93)% | | 9.04% | | 29.64% | | 11.34% | | 71.11% | | | | 11.90% | | 185.10% |
S&P 500® Index | | 21.94 | | 14.52 | | 50.17 | | 14.46 | | 96.47 | | | | 13.24 | | 218.51 |
Fund | | | | | | | | | | | | | | | | |
| NAV Return | | (1.19) | | 8.75 | | 28.61 | | 11.05 | | 68.87 | | | | 11.60 | | 178.20 |
Market Price Return | | (1.08) | | 8.82 | | 28.86 | | 11.07 | | 69.04 | | | | 11.62 | | 178.59 |
Fund Inception: May 5, 2011
Performance quoted above represents past performance. Past performance is not a guarantee of future results and current performance may be higher or lower than performance quoted. Investment returns and principal value will fluctuate, and shares of the Fund (“Fund Shares”), when redeemed or sold, may be worth more or less than their original cost. Fund performance reflects any applicable fee waivers and/or expense reimbursements. Had the adviser not waived fees and/or reimbursed expenses currently or in the past, returns would have been lower. See the current prospectus for more information. According to the Fund’s current prospectus, the Fund’s expense ratio of 0.25% is expressed as a unitary management fee to cover operating expenses and expenses incurred in connection with managing the portfolio. NAV and Market Price returns assume that dividends and capital gain distributions have been reinvested in the Fund at NAV and Market Price, respectively. The returns shown in the table above do not reflect the deduction of taxes that a shareholder would pay on Fund distributions or the redemption or sale of Fund Shares. See invesco.com/ETFs to find the most recent month-end performance numbers.
Performance results for the indexes stated above are based upon a hypothetical investment in their respective constituent securities. The returns of an index do not represent Fund returns. An investor cannot invest directly in an index. The indexes do not charge management fees or brokerage expenses, and no such fees or expenses were deducted from the hypothetical performance shown. In addition, the results actual investors might have achieved would have differed from those shown because of differences in the timing, amounts of their investments, and fees and expenses associated with an investment in the Fund.
Notes Regarding Indexes and Fund Performance History:
| - | Average Annualized and Cumulative Inception returns for the Fund and the Indexes are based on the inception date of the Fund. |
| - | Effective June 26, 2020, the Fund changed its designated broad-based securities market benchmark index from the Parent Index to the Index, as the Index more closely reflects the performance of the types of securities in which the Fund invests. |
| | |
 | | Management’s Discussion of Fund Performance |
| | Invesco S&P 500 Minimum Variance ETF (SPMV) |
As an index fund, the Invesco S&P 500 Minimum Variance ETF (the “Fund”) is passively managed and seeks to track the investment results (before fees and expenses) of the S&P 500® Minimum Volatility Index (the “Index”). The Fund generally will invest at least 90% of its total assets in the securities that comprise the Index.
S&P Dow Jones Indices LLC (“S&P DJI” or the “Index Provider”) compiles, maintains and calculates the Index, which is composed of a subset of constituent securities in the S&P 500® Index (the “Parent Index”). The Index measures the performance of a portfolio of equity securities using a managed volatility strategy that seeks to achieve lower total risk than the Parent Index, while maintaining other similar characteristics of the Parent Index. Volatility is a statistical measurement of the magnitude of up and down asset price fluctuations (increases or decreases in a stock’s price) over time. Unlike the Parent Index, which is a traditional market capitalization-weighted index (meaning that companies with larger market capitalizations receive proportionally greater weight in the index, without regard to the volatility of those stocks), the Index weights its constituents using a managed volatility methodology that is designed to minimize the overall forecasted volatility (i.e., to reduce the magnitude of price fluctuations) of the Index. The Fund generally invests in all of the securities comprising the Index in proportion to their weightings in the Index.
For the fiscal year ended August 31, 2020, on a market price basis, the Fund returned 11.22%. On a net asset value (“NAV”) basis, the Fund returned 11.02%. During the same time period, the Index returned 11.15%. During the fiscal year, the Fund fully replicated the components of the Index; therefore, the Fund’s performance, on a NAV basis, differed from the return of the Index primarily due to fees and operating expenses that the Fund incurred. During the same time period, the Parent Index returned 21.94%.
For the fiscal year ended August 31, 2020, the information technology sector contributed most significantly to the Fund’s return, followed by the health care and consumer staples sectors, respectively. The energy sector detracted most significantly from the Fund’s return, followed by the industrials and utilities sectors, respectively.
Positions that contributed most significantly to the Fund’s return for the fiscal year ended August 31, 2020, included Amazon.com, Inc., a consumer discretionary company (portfolio average weight of 2.26%), and Adobe Inc., an information technology company (portfolio average weight of 2.32%). Positions that detracted most significantly from the Fund’s return included ONEOK, Inc., an energy company (portfolio average weight of 0.48%), and V.F. Corp., a consumer discretionary company (portfolio average weight of 1.28%).
| | | | |
Sector Breakdown
(% of the Fund’s Net Assets)
as of August 31, 2020 | |
| |
Information Technology | | | 23.19 | |
| |
Consumer Discretionary | | | 14.64 | |
| |
Health Care | | | 13.12 | |
| |
Consumer Staples | | | 12.39 | |
| |
Financials | | | 9.75 | |
| |
Utilities | | | 7.43 | |
| |
Real Estate | | | 4.97 | |
| |
Industrials | | | 4.81 | |
| |
Communication Services | | | 4.35 | |
| |
Sector Types Each Less Than 3% | | | 5.16 | |
| |
Money Market Funds Plus Other Assets Less Liabilities | | | 0.19 | |
|
Top Ten Fund Holdings*
(% of the Fund’s Net Assets)
as of August 31, 2020 | |
| |
Security | | | | |
| |
Adobe, Inc. | | | 3.22 | |
| |
Amazon.com, Inc. | | | 3.13 | |
| |
Microsoft Corp. | | | 2.73 | |
| |
Accenture PLC, Class A | | | 2.60 | |
| |
QUALCOMM, Inc. | | | 2.52 | |
| |
McDonald’s Corp. | | | 2.48 | |
| |
Berkshire Hathaway, Inc., Class B | | | 2.46 | |
| |
Newmont Corp. | | | 2.46 | |
| |
UnitedHealth Group, Inc. | | | 2.32 | |
| |
NIKE, Inc., Class B | | | 2.23 | |
| |
Total | | | 26.15 | |
| * | Excluding money market fund holdings. |
Invesco S&P 500 Minimum Variance ETF (SPMV) (continued)
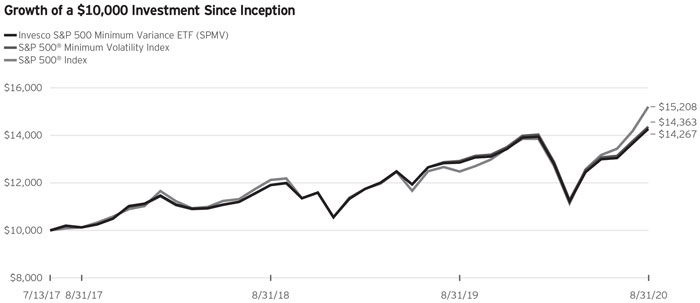
Fund Performance History as of August 31, 2020
| | | | | | | | | | | | | | |
| | | 1 Year | | 3 Years | | | | | | | | Fund Inception |
| Index | | Average
Annualized | | 3 Years
Cumulative | | | | Average
Annualized | | Cumulative |
S&P 500® Minimum Volatility Index | | 11.15% | | 12.33% | | 41.73% | | | | | | 12.26% | | 43.63% |
S&P 500® Index | | 21.94 | | 14.52 | | 50.17 | | | | | | 14.32 | | 52.08 |
| Fund | | | | | | | | | | | | | | |
NAV Return | | 11.02 | | 12.09 | | 40.82 | | | | | | 12.02 | | 42.67 |
�� Market Price Return | | 11.22 | | 12.15 | | 41.07 | | | | | | 12.08 | | 42.91 |
Fund Inception: July 13, 2017
Performance quoted above represents past performance. Past performance is not a guarantee of future results and current performance may be higher or lower than performance quoted. Investment returns and principal value will fluctuate, and shares of the Fund (“Fund Shares”), when redeemed or sold, may be worth more or less than their original cost. Fund performance reflects any applicable fee waivers and/or expense reimbursements. Had the adviser not waived fees and/or reimbursed expenses currently or in the past, returns would have been lower. See the current prospectus for more information. According to the Fund’s current prospectus, the Fund’s expense ratio of 0.10% is expressed as a unitary management fee to cover operating expenses and expenses incurred in connection with managing the portfolio. NAV and Market Price returns assume that dividends and capital gain distributions have been reinvested in the Fund at NAV and Market Price, respectively. The returns shown in the table above do not reflect the deduction of taxes that a shareholder would pay on Fund distributions or the redemption or sale of Fund Shares. See invesco.com/ETFs to find the most recent month-end performance numbers.
Performance results for the indexes stated above are based upon a hypothetical investment in their respective constituent securities. The returns of an index do not represent Fund returns. An investor cannot invest directly in an index. The indexes do not charge management fees or brokerage expenses, and no such fees or expenses were deducted from the hypothetical performance shown. In addition, the results actual investors might have achieved would have differed from those shown because of differences in the timing, amounts of their investments, and fees and expenses associated with an investment in the Fund.
Notes Regarding Indexes and Fund Performance History:
| - | Average Annualized and Cumulative Inception returns for the Fund and the indexes are based on the inception date of the Fund. |
| - | Effective June 26, 2020, the Fund changed its designated broad-based securities market benchmark index from the Parent Index to the Index, as the Index more closely reflects the performance of the types of securities in which the Fund invests. |
| | |
 | | Management’s Discussion of Fund Performance |
| | Invesco S&P 500 Momentum ETF (SPMO) |
As an index fund, the Invesco S&P 500 Momentum ETF (the “Fund”) is passively managed and seeks to track the investment results (before fees and expenses) of the S&P 500® Momentum Index (the “Index”). The Fund generally will invest at least 90% of its total assets in the securities that comprise the Index.
Strictly in accordance with its guidelines and mandated procedures, S&P Dow Jones Indices LLC (“S&P DJI” or the “Index Provider”) compiles, maintains and calculates the Index, which is designed to track the performance of approximately 100 stocks in the S&P 500® Index (the “Parent Index”) that have the highest “momentum score.” In general, momentum is the tendency of an investment to exhibit persistence in its relative performance; a “momentum style” of investing emphasizes investing in securities that have had better recent performance compared to other securities. The momentum score for each security included in the Index is based on upward price movements of the security as compared to other eligible securities within the Parent Index.
In selecting constituent securities for the Index, the Index Provider calculates the momentum score of each stock in the Parent Index by evaluating the percentage change in the stock’s price over the last 12 months, excluding the most recent month, and applying an adjustment based on the security’s volatility over that period. The Index Provider then selects the 100 stocks with the highest momentum score for inclusion in the Index using a modified market capitalization-weighted strategy, as the Index Provider weights securities by multiplying their market capitalization and their momentum score. The Fund generally invests in all of the securities comprising the Index in proportion to their weightings in the Index.
For the fiscal year ended August 31, 2020, on a market price basis, the Fund returned 28.08%. On a net asset value (“NAV”) basis, the Fund returned 27.77%. During the same time period, the Index returned 27.92%. During the fiscal year, the Fund fully replicated the components of the Index; therefore, the Fund’s performance, on a NAV basis, differed from the return of the Index primarily due to fees and operating expenses that the Fund incurred during the period. During the same time period, the Parent Index returned 21.94%.
Positions that contributed most significantly to the Fund’s return for the fiscal year ended August 31, 2020, included Apple, Inc., an information technology company (portfolio average weight of 3.74%), and Microsoft Corp., an information technology company (portfolio average weight of 9.33%). Positions that detracted most significantly from the Fund’s return included Walt Disney Co. (The), a communication services company (no longer held at fiscal year-end) and Starbucks Corp., a consumer discretionary company (no longer held at fiscal year-end).
| | | | |
Sector Breakdown (% of the Fund’s Net Assets) as of August 31, 2020 | |
| |
Information Technology | | | 49.58 | |
| |
Consumer Staples | | | 12.04 | |
| |
Utilities | | | 7.07 | |
| |
Consumer Discretionary | | | 6.55 | |
| |
Communication Services | | | 5.52 | |
| |
Real Estate | | | 4.98 | |
| |
Industrials | | | 4.90 | |
| |
Financials | | | 4.37 | |
| |
Health Care | | | 3.00 | |
| |
Materials | | | 1.93 | |
| |
Other Assets Less Liabilities | | | 0.06 | |
Top Ten Fund Holdings (% of the Fund’s Net Assets) as of August 31, 2020 | |
| |
Security | | | | |
| |
Apple, Inc. | | | 12.93 | |
| |
Microsoft Corp. | | | 9.11 | |
| |
NVIDIA Corp. | | | 5.30 | |
| |
Visa, Inc., Class A | | | 4.18 | |
| |
Mastercard, Inc., Class A | | | 3.88 | |
| |
Procter & Gamble Co. (The) | | | 3.67 | |
| |
Home Depot, Inc. (The) | | | 3.44 | |
| |
Adobe, Inc. | | | 3.04 | |
| |
NextEra Energy, Inc. | | | 2.74 | |
| |
Coca-Cola Co. (The) | | | 2.42 | |
| |
Total | | | 50.71 | |
Invesco S&P 500 Momentum ETF (SPMO) (continued)
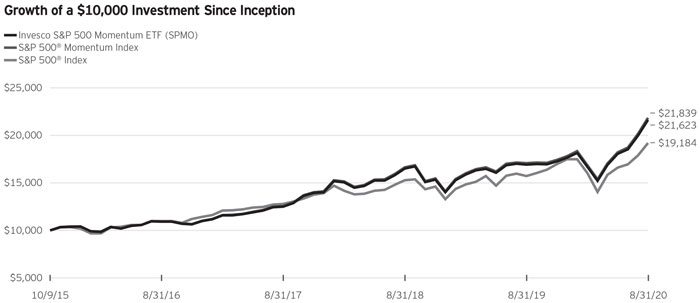
Fund Performance History as of August 31, 2020
| | | | | | | | | | | | |
| | | 1 Year | | 3 Years Average Annualized | | 3 Years Cumulative | | | | Fund Inception |
| Index | | Average Annualized | | Cumulative |
|
S&P 500® Momentum Index | | 27.92% | | 20.20% | | 73.67% | | | | 17.31% | | 118.39% |
S&P 500® Index | | 21.94 | | 14.52 | | 50.17 | | | | 14.24 | | 91.84 |
Fund | | | | | | | | | | | | |
NAV Return | | 27.77 | | 20.01 | | 72.86 | | | | 17.07 | | 116.23 |
Market Price Return | | 28.08 | | 20.20 | | 73.65 | | | | 17.12 | | 116.70 |
Fund Inception: October 9, 2015
Performance quoted above represents past performance. Past performance is not a guarantee of future results and current performance may be higher or lower than performance quoted. Investment returns and principal value will fluctuate, and shares of the Fund (“Fund Shares”), when redeemed or sold, may be worth more or less than their original cost. Fund performance reflects any applicable fee waivers and/or expense reimbursements. Had the adviser not waived fees and/or reimbursed expenses currently or in the past, returns would have been lower. See the current prospectus for more information. According to the Fund’s current prospectus, the Fund’s expense ratio of 0.13% is expressed as a unitary management fee to cover operating expenses and expenses incurred in connection with managing the portfolio. NAV and Market Price returns assume that dividends and capital gain distributions have been reinvested in the Fund at NAV and Market Price, respectively. The returns shown in the table above do not reflect the deduction of taxes that a shareholder would pay on Fund distributions or the redemption or sale of Fund Shares. See invesco.com/ETFs to find the most recent month-end performance numbers.
Performance results for the indexes stated above are based upon a hypothetical investment in their respective constituent securities. The returns of an index do not represent Fund returns. An investor cannot invest directly in an index. The indexes do not charge management fees or brokerage expenses, and no such fees or expenses were deducted from the hypothetical performance shown. In addition, the results actual investors might have achieved would have differed from those shown because of differences in the timing, amounts of their investments, and fees and expenses associated with an investment in the Fund.
Notes Regarding Indexes and Fund Performance History:
| - | Average Annualized and Cumulative Inception returns for the Fund and the indexes are based on the inception date of the Fund. |
| - | Effective June 26, 2020, the Fund changed its designated broad-based securities market benchmark index from the Parent Index to the Index, as the Index more closely reflects the performance of the types of securities in which the Fund invests. |
| | |
 | | Management’s Discussion of Fund Performance |
| | Invesco S&P MidCap Low Volatility ETF (XMLV) |
As an index fund, the Invesco S&P MidCap Low Volatility ETF (the “Fund”) is passively managed and seeks to track the investment results (before fees and expenses) of the S&P MidCap 400® Low Volatility Index (the “Index”). The Fund generally will invest at least 90% of its total assets in the securities that comprise the Index.
S&P Dow Jones Indices LLC (“S&P DJI” or the “Index Provider”) compiles, maintains and calculates the Index. Strictly in accordance with its guidelines and mandated procedures, S&P DJI selects for inclusion in the Index the 80 securities that it has determined have the lowest volatility over the past 12 months out of the 400 medium capitalization securities that are contained in the S&P MidCap 400® Index (the “Parent Index”). Volatility is a statistical measurement of the magnitude of up and down asset price fluctuations (increases or decreases in a stock’s price) over time. The Index weights the 80 securities based upon the inverse of each security’s volatility, with the least volatile securities receiving the highest weights in the Index. The Fund generally invests in all of the securities comprising the Index in proportion to their weightings in the Index.
For the fiscal year ended August 31, 2020, on a market price basis, the Fund returned (13.17)%. On a net asset value (“NAV”) basis, the Fund returned (13.26)%. During the same time period, the Index returned (13.15)%. During the fiscal year, the Fund fully replicated the components of the Index; therefore, the Fund’s performance, on a NAV basis, differed from the return of the Index primarily due to fees and operating expenses that the Fund incurred, which were partially offset by the Fund holding cash to pay distributions in March, which coincided with overall market declines. During the same time period, the Parent Index returned 4.22%.
For the fiscal year ended August 31, 2020, the industrials sector contributed most significantly to the Fund’s return, followed by the materials and information technology sectors, respectively. The real estate sector detracted most significantly from the Fund’s return, followed by the utilities and financials sectors, respectively.
Positions that contributed most significantly to the Fund’s return for the fiscal year ended August 31, 2020, included Watsco, Inc., an industrials company (portfolio average weight of 1.35%), and Lennox International Inc., an industrials company (portfolio average weight of 0.96%). Positions that detracted most significantly from the Fund’s return included Service Properties Trust, a real estate company (no longer held at fiscal year-end), and EPR Properties, a real estate company (no longer held at fiscal year-end).
| | | | |
Sector Breakdown (% of the Fund’s Net Assets) as of August 31, 2020 | |
| |
Industrials | | | 18.88 | |
| |
Consumer Staples | | | 13.01 | |
| |
Health Care | | | 11.51 | |
| |
Real Estate | | | 11.00 | |
| |
Materials | | | 10.64 | |
| |
Financials | | | 9.37 | |
| |
Information Technology | | | 8.79 | |
| |
Utilities | | | 7.06 | |
| |
Consumer Discretionary | | | 6.16 | |
| |
Communication Services | | | 3.50 | |
| |
Money Market Funds Plus Other Assets Less Liabilities | | | 0.08 | |
Top Ten Fund Holdings* (% of the Fund’s Net Assets) as of August 31, 2020 | |
| |
Security | | | | |
| |
Silgan Holdings, Inc. | | | 1.81 | |
| |
Tootsie Roll Industries, Inc. | | | 1.75 | |
| |
AptarGroup, Inc. | | | 1.55 | |
| |
Post Holdings, Inc. | | | 1.54 | |
| |
Masimo Corp. | | | 1.51 | |
| |
Flowers Foods, Inc. | | | 1.51 | |
| |
NewMarket Corp. | | | 1.51 | |
| |
Watsco, Inc. | | | 1.49 | |
| |
Qualys, Inc. | | | 1.45 | |
| |
CoreSite Realty Corp. | | | 1.45 | |
| |
Total | | | 15.57 | |
| * | Excluding money market fund holdings. |
Invesco S&P MidCap Low Volatility ETF (XMLV) (continued)
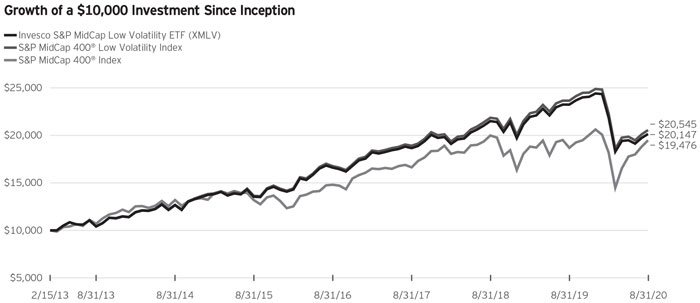
Fund Performance History as of August 31, 2020
| | | | | | | | | | | | | | | | | | | | | | | | | | | | | | | | |
| | | 1 Year | | | 3 Years Average Annualized | | 3 Years Cumulative | | 5 Years Average Annualized | | 5 Years Cumulative | | | | | Fund Inception |
Index | | Average Annualized | | Cumulative | |
|
S&P MidCap 400® Low Volatility Index | | | (13.15 | )% | | | 2.81 | % | | | 8.65 | % | | | 8.53 | % | | | 50.59 | % | | | | | | | 10.02 | % | | | 105.45 | % |
S&P MidCap 400® Index | | | 4.22 | | | | 5.38 | | | | 17.02 | | | | 8.11 | | | | 47.71 | | | | | | | | 9.25 | | | | 94.76 | |
Fund | | | | | | | | | | | | | | | | | | | | | | | | | | | | | | | | |
NAV Return | | | (13.26 | ) | | | 2.58 | | | | 7.95 | | | | 8.27 | | | | 48.76 | | | | | | | | 9.74 | | | | 101.47 | |
Market Price Return | | | (13.17 | ) | | | 2.63 | | | | 8.11 | | | | 8.29 | | | | 48.93 | | | | | | | | 9.75 | | | | 101.71 | |
Fund Inception: February 15, 2013
Performance quoted above represents past performance. Past performance is not a guarantee of future results and current performance may be higher or lower than performance quoted. Investment returns and principal value will fluctuate, and shares of the Fund (“Fund Shares”), when redeemed or sold, may be worth more or less than their original cost. Fund performance reflects any applicable fee waivers and/or expense reimbursements. Had the adviser not waived fees and/or reimbursed expenses currently or in the past, returns would have been lower. See the current prospectus for more information. According to the Fund’s current prospectus, the Fund’s expense ratio of 0.25% is expressed as a unitary management fee to cover operating expenses and expenses incurred in connection with managing the portfolio. NAV and Market Price returns assume that dividends and capital gain distributions have been reinvested in the Fund at NAV and Market Price, respectively. The returns shown in the table above do not reflect the deduction of taxes that a shareholder would pay on Fund distributions or the redemption or sale of Fund Shares. See invesco.com/ETFs to find the most recent month-end performance numbers.
Performance results for the indexes stated above are based upon a hypothetical investment in their respective constituent securities. The returns of an index do not represent Fund returns. An investor cannot invest directly in an index. The indexes do not charge management fees or brokerage expenses, and no such fees or expenses were deducted from the hypothetical performance shown. In addition, the results actual investors might have achieved would have differed from those shown because of differences in the timing, amounts of their investments, and fees and expenses associated with an investment in the Fund.
Notes Regarding Indexes and Fund Performance History:
| - | Average Annualized and Cumulative Inception returns for the Fund and the indexes are based on the inception date of the Fund. |
| - | Effective June 26, 2020, the Fund changed its designated broad-based securities market benchmark index from the Parent Index to the Index, as the Index more closely reflects the performance of the types of securities in which the Fund invests. |
| | |
 | | Management’s Discussion of Fund Performance |
| | Invesco S&P SmallCap High Dividend Low Volatility ETF (XSHD) |
As an index fund, the Invesco S&P SmallCap High Dividend Low Volatility ETF (the “Fund”) is passively managed and seeks to track the investment results (before fees and expenses) of the S&P SmallCap 600® Low Volatility High Dividend Index (the “Index”). The Fund generally will invest at least 90% of its total assets in the securities that comprise the Index.
Strictly in accordance with its guidelines and mandated procedures, S&P Dow Jones Indices LLC (“S&P DJI” or the “Index Provider”) compiles, maintains and calculates the Index, which is composed of 60 securities in the S&P SmallCap 600® Index (the “Parent Index”) that historically have provided high dividend yields with lower volatility. The Parent Index is designed to measure the small-capitalization segment of the U.S. equity market. S&P DJI identifies from the Parent Index the 90 securities with the highest dividend yields over the past 12 months, with no one sector within the Parent Index allowed to contribute more than 10 securities. From those securities, S&P DJI selects for inclusion in the Index the 60 securities with the lowest realized volatility over the past 12 months. Volatility is a statistical measurement of the magnitude of up and down asset price fluctuations (increases or decreases in a stock’s price) over time. The Index Provider weights each of the constituent securities in the Index by its dividend yield, with the highest dividend-yielding securities receiving the highest weights. The Fund generally invests in all of the securities comprising the Index in proportion to their weightings in the Index.
For the fiscal year ended August 31, 2020, on a market price basis, the Fund returned (20.01)%. On a net asset value (“NAV”) basis, the Fund returned (20.38)%. During the same time period, the Index returned (20.28)%. During the fiscal year, the Fund fully replicated the components of the Index; therefore, the Fund’s performance, on a NAV basis, differed from the return of the Index primarily due to fees and operating expenses that the Fund incurred, which were partially offset by the Fund holding cash to pay distributions in March, which coincided with overall market declines. During the same time period, the Parent Index returned (0.55)%.
For the fiscal year ended August 31, 2020, the consumer staples sector contributed most significantly to the Fund’s return, followed by the health care and industrials sectors, respectively. The financials sector detracted most significantly from the Fund’s return, followed by the real estate and consumer discretionary sectors, respectively.
Positions that contributed most significantly to the Fund’s return for the fiscal year ended August 31, 2020, included B&G Foods, Inc., a consumer staples company (portfolio average weight of 4.28%), and Meridian Bioscience, Inc., a health care company (no longer held at fiscal year-end). Positions that detracted most significantly from the Fund’s return included Invesco Mortgage
Capital Inc., a financials company (no longer held at fiscal year-end) and New York Mortgage Trust, Inc., a financials company (no longer held at fiscal year-end).
| | | | |
Sector Breakdown (% of the Fund’s Net Assets) as of August 31, 2020 | |
| |
Consumer Staples | | | 17.87 | |
| |
Industrials | | | 14.74 | |
| |
Materials | | | 14.24 | |
| |
Real Estate | | | 11.85 | |
| |
Information Technology | | | 11.35 | |
| |
Consumer Discretionary | | | 9.62 | |
| |
Utilities | | | 6.82 | |
| |
Financials | | | 5.73 | |
| |
Communication Services | | | 4.88 | |
| |
Health Care | | | 2.84 | |
| |
Money Market Funds Plus Other Assets Less Liabilities | | | 0.06 | |
Top Ten Fund Holdings* (% of the Fund’s Net Assets) as of August 31, 2020 | |
| |
Security | | | | |
| |
B&G Foods, Inc. | | | 3.49 | |
| |
Vector Group Ltd. | | | 3.49 | |
| |
KKR Real Estate Finance Trust, Inc. | | | 3.24 | |
| |
Global Net Lease, Inc. | | | 3.20 | |
| |
Brandywine Realty Trust | | | 3.07 | |
| |
Trinseo S.A. | | | 3.06 | |
| |
Universal Corp. | | | 3.04 | |
| |
Office Properties Income Trust | | | 2.89 | |
| |
Spok Holdings, Inc. | | | 2.86 | |
| |
Franklin Street Properties Corp. | | | 2.69 | |
| |
Total | | | 31.03 | |
| * | Excluding money market fund holdings. |
Invesco S&P SmallCap High Dividend Low Volatility ETF (XSHD) (continued)
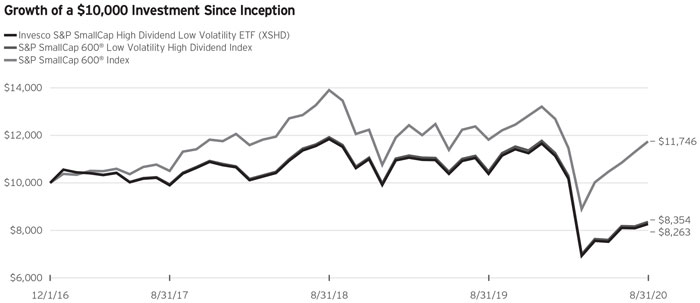
Fund Performance History as of August 31, 2020
| | | | | | | | | | | | |
| | | | | 3 Years
Average
Annualized | | | | | | Fund Inception |
| Index | | 1 Year | | 3 Years
Cumulative | | | | Average
Annualized | | Cumulative |
S&P SmallCap 600® Low Volatility High Dividend Index | | (20.28)% | | (5.61)% | | (15.89)% | | | | (4.69)% | | (16.46)% |
S&P SmallCap 600® Index | | (0.55) | | 3.82 | | 11.90 | | | | 4.39 | | 17.46 |
Fund | | | | | | | | | | | | |
NAV Return | | (20.38) | | (5.85) | | (16.55) | | | | (4.97) | | (17.37) |
Market Price Return | | (20.01) | | (5.79) | | (16.39) | | | | (4.92) | | (17.22) |
Fund Inception: December 1, 2016
Performance quoted above represents past performance. Past performance is not a guarantee of future results and current performance may be higher or lower than performance quoted. Investment returns and principal value will fluctuate, and shares of the Fund (“Fund Shares”), when redeemed or sold, may be worth more or less than their original cost. Fund performance reflects any applicable fee waivers and/or expense reimbursements. Had the adviser not waived fees and/or reimbursed expenses currently or in the past, returns would have been lower. See the current prospectus for more information. According to the Fund’s current prospectus, the Fund’s expense ratio of 0.30% is expressed as a unitary management fee to cover operating expenses and expenses incurred in connection with managing the portfolio. NAV and Market Price returns assume that dividends and capital gain distributions have been reinvested in the Fund at NAV and Market Price, respectively. The returns shown in the table above do not reflect the deduction of taxes that a shareholder would pay on Fund distributions or the redemption or sale of Fund Shares. See invesco.com/ETFs to find the most recent month-end performance numbers.
Performance results for the indexes stated above are based upon a hypothetical investment in their respective constituent securities. The returns of an index do not represent Fund returns. An investor cannot invest directly in an index. The indexes do not charge management fees or brokerage expenses, and no such fees or expenses were deducted from the hypothetical performance shown. In addition, the results actual investors might have achieved would have differed from those shown because of differences in the timing, amounts of their investments, and fees and expenses associated with an investment in the Fund.
Notes Regarding Indexes and Fund Performance History:
| - | Average Annualized and Cumulative Inception returns for the Fund and the indexes are based on the inception date of the Fund. |
| - | Effective June 26, 2020, the Fund changed its designated broad-based securities market benchmark index from the Parent Index to the Index, as the Index more closely reflects the performance of the types of securities in which the Fund invests. |
| | |
 | | Management’s Discussion of Fund Performance |
| | Invesco S&P SmallCap Low Volatility ETF (XSLV) |
As an index fund, the Invesco S&P SmallCap Low Volatility ETF (the “Fund”) is passively managed and seeks to track the investment results (before fees and expenses) of the S&P SmallCap 600® Low Volatility Index (the “Index”). The Fund generally will invest at least 90% of its total assets in the securities that comprise the Index.
S&P Dow Jones Indices LLC (“S&P DJI” or the “Index Provider”) compiles, maintains and calculates the Index. Strictly in accordance with its guidelines and mandated procedures, the Index Provider selects for inclusion in the Index the 120 securities that it has determined have the lowest volatility over the past 12 months out of the 600 small-capitalization securities that are contained in the S&P SmallCap 600® Index (the “Parent Index”). Volatility is a statistical measurement of the magnitude of up and down asset price fluctuations over time. S&P DJI weights the 120 securities within the Index based upon the inverse of each security’s volatility, with the least volatile securities receiving the highest weights in the Index. The Fund generally invests in all of the securities comprising the Index in proportion to their weightings in the Index.
For the fiscal year ended August 31, 2020, on a market price basis, the Fund returned (23.12)%. On a net asset value (“NAV”) basis, the Fund returned (23.22)%. During the same time period, the Index returned (23.08)%. During the fiscal year, the Fund fully replicated the components of the Index; therefore, the Fund’s performance, on a NAV basis, differed from the return of the Index primarily due to fees and operating expenses that the Fund incurred, which were partially offset by the Fund holding cash to pay distributions in March, which coincided with overall market declines. During the same time period, the Parent Index returned (0.55)%.
For the fiscal year ended August 31, 2020, the industrials sector contributed most significantly to the Fund’s return, followed by the information technology and consumer discretionary sectors, respectively. The financials sector detracted most significantly from the Fund’s return, followed by the real estate and utilities sectors, respectively.
Positions that contributed most significantly to the Fund’s return for the fiscal year ended August 31, 2020, included Wabash National Corp., an industrials company (no longer held at fiscal year-end) and Matson, Inc., an industrials company (no longer held at fiscal year-end). Positions that detracted most significantly from the Fund’s return included Granite Point Mortgage Trust Inc., a financials company (no longer held at fiscal year-end), and Redwood Trust, Inc., a financials company (no longer held at fiscal year-end).
| | | | |
Sector Breakdown (% of the Fund’s Net Assets) as of August 31, 2020 | |
| |
Industrials | | | 21.47 | |
| |
Financials | | | 18.02 | |
| |
Information Technology | | | 17.72 | |
| |
Health Care | | | 11.25 | |
| |
Consumer Staples | | | 9.81 | |
| |
Real Estate | | | 7.20 | |
| |
Materials | | | 4.47 | |
| |
Consumer Discretionary | | | 4.46 | |
| |
Utilities | | | 3.08 | |
| |
Communication Services | | | 2.46 | |
| |
Money Market Funds Plus Other Assets Less Liabilities | | | 0.06 | |
Top Ten Fund Holdings* (% of the Fund’s Net Assets) as of August 31, 2020 | |
| |
Security | | | | |
| |
WD-40 Co. | | | 1.11 | |
| |
Heartland Express, Inc. | | | 1.10 | |
| |
Progress Software Corp. | | | 1.07 | |
| |
CSG Systems International, Inc. | | | 1.04 | |
| |
Easterly Government Properties, Inc. | | | 1.04 | |
| |
National Beverage Corp. | | | 1.02 | |
| |
Universal Corp. | | | 1.01 | |
| |
MicroStrategy, Inc., Class A | | | 1.01 | |
| |
Exponent, Inc. | | | 0.99 | |
| |
HCI Group, Inc. | | | 0.99 | |
| |
Total | | | 10.38 | |
| * | Excluding money market fund holdings. |
Invesco S&P SmallCap Low Volatility ETF (XSLV) (continued)
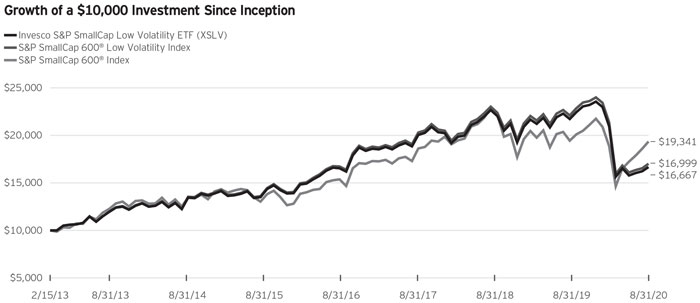
Fund Performance History as of August 31, 2020
| | | | | | | | | | | | | | | | | | | | | | | | | | | | | | |
| | | 1 Year | | | 3 Years
Average
Annualized | | 3 Years
Cumulative | | | | | | Fund Inception |
| Index | | 5 Years
Average
Annualized | | 5 Years
Cumulative | | | | Average
Annualized | | Cumulative |
S&P SmallCap 600® Low Volatility Index | | | (23.08 | )% | | | (3.76 | )% | | | (10.87 | )% | | | 4.70 | % | | | 25.80 | % | | | | | 7.29 | % | | | 69.99 | % |
S&P SmallCap 600® Index | | | (0.55 | ) | | | 3.82 | | | | 11.90 | | | | 7.47 | | | | 43.35 | | | | | | 9.14 | | | | 93.41 | |
Fund | | | | | | | | | | | | | | | | | | | | | | | | | | | | | | |
NAV Return | | | (23.22 | ) | | | (3.99 | ) | | | (11.50 | ) | | | 4.45 | | | | 24.31 | | | | | | 7.01 | | | | 66.67 | |
Market Price Return | | | (23.12 | ) | | | (3.91 | ) | | | (11.29 | ) | | | 4.48 | | | | 24.53 | | | | | | 7.02 | | | | 66.73 | |
Fund Inception: February 15, 2013
Performance quoted above represents past performance. Past performance is not a guarantee of future results and current performance may be higher or lower than performance quoted. Investment returns and principal value will fluctuate, and shares of the Fund (“Fund Shares”), when redeemed or sold, may be worth more or less than their original cost. Fund performance reflects any applicable fee waivers and/or expense reimbursements. Had the adviser not waived fees and/or reimbursed expenses currently or in the past, returns would have been lower. See the current prospectus for more information. According to the Fund’s current prospectus, the Fund’s expense ratio of 0.25% is expressed as a unitary management fee to cover operating expenses and expenses incurred in connection with managing the portfolio. NAV and Market Price returns assume that dividends and capital gain distributions have been reinvested in the Fund at NAV and Market Price, respectively. The returns shown in the table above do not reflect the deduction of taxes that a shareholder would pay on Fund distributions or the redemption or sale of Fund Shares. See invesco.com/ETFs to find the most recent month-end performance numbers.
Performance results for the indexes stated above are based upon a hypothetical investment in their respective constituent securities. The returns of an index do not represent Fund returns. An investor cannot invest directly in an index. The indexes do not charge management fees or brokerage expenses, and no such fees or expenses were deducted from the hypothetical performance shown. In addition, the results actual investors might have achieved would have differed from those shown because of differences in the timing, amounts of their investments, and fees and expenses associated with an investment in the Fund.
Notes Regarding Indexes and Fund Performance History:
| - | Average Annualized and Cumulative Inception returns for the Fund and the indexes are based on the inception date of the Fund. |
| - | Effective June 26, 2020, the Fund changed its designated broad-based securities market benchmark index from the Parent Index to the Index, as the Index more closely reflects the performance of the types of securities in which the Fund invests. |
| | |
 | | Management’s Discussion of Fund Performance |
| | Invesco S&P SmallCap Quality ETF (XSHQ) |
As an index fund, the Invesco S&P SmallCap Quality ETF (the “Fund”) is passively managed and seeks to track the investment results (before fees and expenses) of the S&P SmallCap 600® Quality Index (the “Index”). The Fund generally will invest at least 90% of its total assets in the securities that comprise the Index.
Strictly in accordance with its guidelines and mandated procedures, S&P Dow Jones Indices LLC (“S&P DJI”) compiles, maintains and calculates the Index, which is composed of 120 securities in the S&P SmallCap 600® Index (the “Parent Index”) that are of the highest quality–that is, stocks of companies that seek to generate higher revenue and cash flow than their counterparts through prudent use of assets and finances.
S&P DJI first calculates the quality score of each security in the Parent Index. Each component stock’s quality-score is based on a composite of the following three equally-weighted factors: (1) return-on-equity (calculated as the company’s trailing 12-month earnings per share divided by the company’s latest book value per share); (2) accruals ratio (computed using the change of the company’s net operating assets over the last year divided by the company’s average net operating assets over the last two years); and (3) financial leverage ratio (calculated as the company’s latest total debt divided by the company’s book value). Based on its criteria, S&P DJI selects the 120 stocks with the highest quality score for inclusion in the Index. S&P DJI weights each component stock of the Index by the total of its quality score multiplied by its market capitalization; stocks with higher scores receive relatively greater weights. The Fund generally invests in all of the securities comprising the Index in proportion to their weightings in the Index.
For the fiscal year ended August 31, 2020, on a market price basis, the Fund returned 3.80%. On a net asset value (“NAV”) basis, the Fund returned 3.61%. During the same time period, the Index returned 3.95%. During the fiscal year, the Fund fully replicated the components of the Index; therefore, the Fund’s performance, on a NAV basis, differed from the return of the Index primarily due to fees and operating expenses that the Fund incurred during the period. During the same time period, the Parent Index returned (0.55)%.
For the fiscal year ended August 31, 2020, the information technology sector contributed most significantly to the Fund’s return, followed by the industrials and consumer discretionary sectors, respectively. The financials sector detracted most significantly from the Fund’s return, followed by the real estate and energy sectors, respectively.
Positions that contributed most significantly to the Fund’s return for the fiscal year ended August 31, 2020, included Proto Labs, Inc., an industrials company (portfolio average weight of 1.70%), and Medpace Holdings, Inc., a health care company (portfolio average weight of 1.59%). Positions that detracted most significantly from the Fund’s return included ProAssurance Corp.,
a financials company (no longer held at fiscal year-end), and Steven Madden, Ltd., a consumer discretionary company (no longer held at fiscal year-end).
| | | | |
Sector Breakdown (% of the Fund’s Net Assets) as of August 31, 2020 | |
| |
Industrials | | | 32.09 | |
| |
Financials | | | 18.44 | |
| |
Information Technology | | | 16.21 | |
| |
Consumer Discretionary | | | 10.59 | |
| |
Consumer Staples | | | 8.89 | |
| |
Health Care | | | 6.53 | |
| |
Materials | | | 4.74 | |
| |
Sector Types Each Less Than 3% | | | 2.50 | |
| |
Money Market Funds Plus Other Assets Less Liabilities | | | 0.01 | |
Top Ten Fund Holdings* (% of the Fund’s Net Assets) as of August 31, 2020 | |
| |
Security | | | | |
| |
Exponent, Inc. | | | 2.75 | |
| |
Stamps.com, Inc. | | | 2.70 | |
| |
Proto Labs, Inc. | | | 2.63 | |
| |
Medpace Holdings, Inc. | | | 2.51 | |
| |
Simpson Manufacturing Co., Inc. | | | 2.40 | |
| |
Brooks Automation, Inc. | | | 2.30 | |
| |
UFP Industries, Inc. | | | 2.18 | |
| |
Green Dot Corp., Class A | | | 1.91 | |
| |
WD-40 Co. | | | 1.91 | |
| |
Meritage Homes Corp. | | | 1.89 | |
| |
Total | | | 23.18 | |
| * | Excluding money market fund holdings. |
Invesco S&P SmallCap Quality ETF (XSHQ) (continued)
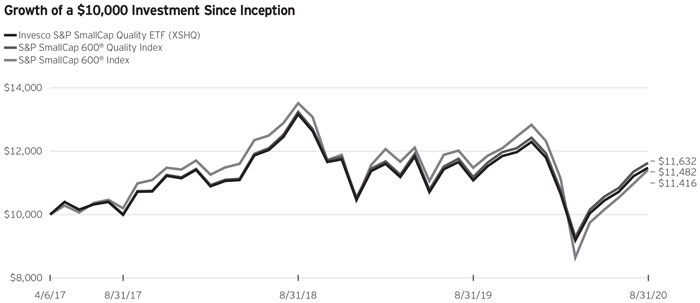
Fund Performance History as of August 31, 2020
| | | | | | | | | | | | | | | | | | | | | | |
| Index | | 1 Year | | | 3 Years
Average Annualized | | 3 Years Cumulative | | | | Fund Inception |
| | Average
Annualized | | Cumulative |
S&P SmallCap 600® Quality Index | | | 3.95 | % | | | 5.12 | % | | | 16.16 | % | | | | | 4.55 | % | | | 16.32 | % |
S&P SmallCap 600® Index | | | (0.55 | ) | | | 3.82 | | | | 11.90 | | | | | | 3.97 | | | | 14.16 | |
Fund | | | | | | | | | | | | | | | | | | | | | | |
NAV Return | | | 3.61 | | | | 4.72 | | | | 14.83 | | | | | | 4.15 | | | | 14.82 | |
Market Price Return | | | 3.80 | | | | 4.79 | | | | 15.05 | | | | | | 4.22 | | | | 15.09 | |
Fund Inception: April 6, 2017
Performance quoted above represents past performance. Past performance is not a guarantee of future results and current performance may be higher or lower than performance quoted. Investment returns and principal value will fluctuate, and shares of the Fund (“Fund Shares”), when redeemed or sold, may be worth more or less than their original cost. Fund performance reflects any applicable fee waivers and/or expense reimbursements. Had the adviser not waived fees and/or reimbursed expenses currently or in the past, returns would have been lower. See the current prospectus for more information. According to the Fund’s current prospectus, the Fund’s expense ratio of 0.29% is expressed as a unitary management fee to cover operating expenses and expenses incurred in connection with managing the portfolio. NAV and Market Price returns assume that dividends and capital gain distributions have been reinvested in the Fund at NAV and Market Price, respectively. The returns shown in the table above do not reflect the deduction of taxes that a shareholder would pay on Fund distributions or the redemption or sale of Fund Shares. See invesco.com/ETFs to find the most recent month-end performance numbers.
Performance results for the indexes stated above are based upon a hypothetical investment in their respective constituent securities. The returns of an index do not represent Fund returns. An investor cannot invest directly in an index. The indexes do not charge management fees or brokerage expenses, and no such fees or expenses were deducted from the hypothetical performance shown. In addition, the results actual investors might have achieved would have differed from those shown because of differences in the timing, amounts of their investments, and fees and expenses associated with an investment in the Fund.
Notes Regarding Indexes and Fund Performance History:
| - | Average Annualized and Cumulative Inception returns for the Fund and the indexes are based on the inception date of the Fund. |
| - | Effective June 26, 2020, the Fund changed its designated broad-based securities market benchmark index from the Parent Index to the Index, as the Index more closely reflects the performance of the types of securities in which the Fund invests. |
Liquidity Risk Management Program
The Securities and Exchange Commission (“SEC”) has adopted Rule 22e-4 under the Investment Company Act of 1940 (the “Liquidity Rule”) in order to promote effective liquidity risk management throughout the open-end investment company industry, thereby reducing the risk that funds will be unable to meet their redemption obligations and mitigating dilution of the interests of fund shareholders. The Funds have adopted and implemented a liquidity risk management program in accordance with the Liquidity Rule (the “Program”). The Program is reasonably designed to assess and manage the Funds’ liquidity risk, which is the risk that the Funds could not meet redemption requests without significant dilution of remaining investors’ interests in the Funds. The Board of Trustees of the Funds (the “Board”) has appointed Invesco Capital Management LLC (“Invesco”), the Funds’ investment adviser, as the Program’s administrator, and Invesco has delegated oversight of the Program to the Liquidity Risk Management Committee (the “Committee”), which is composed of senior representatives from relevant business groups at Invesco and its affiliates.
As required by the Liquidity Rule, the Program includes policies and procedures providing for an assessment, no less frequently than annually, of the Funds’ liquidity risk that takes into account, as relevant to the Funds’ liquidity risk: (1) each Fund’s investment strategy and liquidity of portfolio investments during both normal and reasonably foreseeable stressed conditions; (2) short-term and long-term cash flow projections for the Funds during both normal and reasonably foreseeable stressed conditions; (3) each Fund’s holdings of cash and cash equivalents and any borrowing arrangements; (4) the relationship between the Funds’ portfolio liquidity and the way in which, and the prices and spreads at which, Fund shares trade, including the efficiency of the arbitrage function and the level of active participation by market participants, including authorized participants; and (5) the effect of the composition of baskets on the overall liquidity of each Fund’s portfolio. The Liquidity Rule also requires the classification of each Fund’s investments into categories that reflect the assessment of their relative liquidity under current market conditions. Each Fund classifies its investments into one of four of the following categories defined in the Liquidity Rule: “Highly Liquid,” “Moderately Liquid,” “Less Liquid” and “Illiquid.” Funds that are not invested primarily in “Highly Liquid Investments” that are assets (cash or investments that are reasonably expected to be convertible into cash within three business days without significantly changing the market value of the investment) are required to establish a “Highly Liquid Investment Minimum” (“HLIM”), which is the minimum percentage of net assets that must be invested in Highly Liquid Investments. Funds with HLIMs have procedures for addressing HLIM shortfalls, including reporting to the Board and the SEC (on a non-public basis) as required by the Program and the Liquidity Rule. In addition, a Fund may not acquire an investment if, immediately after the acquisition, over 15% of such Fund’s net assets would consist of “Illiquid Investments” that are assets (an investment that cannot reasonably be expected to be sold or disposed of in current market conditions in seven calendar days or less without the sale or disposition significantly changing the market value of the investment). The Liquidity Rule and the Program also require reporting to the Board and the SEC (on a non-public basis) if a Fund’s holdings of Illiquid Investments exceed 15% of such Fund’s assets.
At a meeting held on March 12, 2020, the Committee presented a report to the Board that addressed the operation of the Program and assessed the Program’s adequacy and effectiveness of implementation (the “Report”). The Report covered the period from December 1, 2018 through December 31, 2019 (the “Program Reporting Period”).
The Report stated, in relevant part, that during the Program Reporting Period:
| | ● | | The Program, as adopted and implemented, remained reasonably designed to assess and manage the Funds’ liquidity risk and was operated effectively to achieve that goal; |
| | ● | | Each Fund’s investment strategy remained appropriate for an open-end fund; |
| | ● | | Each Fund was able to meet requests for redemption without significant dilution of remaining investors’ interests in the Fund; |
| | ● | | The Funds did not breach the 15% limit on Illiquid Investments; and |
| | ● | | The Funds primarily held Highly Liquid Investments and therefore have not adopted an HLIM. |
Invesco Russell 1000 Enhanced Equal Weight ETF (USEQ)
August 31, 2020
Schedule of Investments(a)
| | | | | | | | |
| | | Shares | | | Value | |
| Common Stocks & Other Equity Interests-99.85% | |
| Communication Services-4.65% | | | | | | | | |
Activision Blizzard, Inc. | | | 58 | | | $ | 4,844 | |
Alphabet, Inc., Class A(b) | | | 1 | | | | 1,630 | |
Alphabet, Inc., Class C(b) | | | 1 | | | | 1,634 | |
Altice USA, Inc., Class A(b) | | | 154 | | | | 4,247 | |
AT&T, Inc. | | | 128 | | | | 3,816 | |
Cable One, Inc. | | | 2 | | | | 3,681 | |
CenturyLink, Inc. | | | 380 | | | | 4,085 | |
Charter Communications, Inc., Class A(b) | | | 7 | | | | 4,309 | |
Comcast Corp., Class A | | | 98 | | | | 4,391 | |
Discovery, Inc., Class A(b)(c) | | | 63 | | | | 1,390 | |
Discovery, Inc., Class C(b) | | | 130 | | | | 2,596 | |
DISH Network Corp., Class A(b) | | | 119 | | | | 4,227 | |
Electronic Arts, Inc.(b) | | | 34 | | | | 4,742 | |
Facebook, Inc., Class A(b) | | | 18 | | | | 5,278 | |
Fox Corp., Class A | | | 131 | | | | 3,650 | |
Fox Corp., Class B | | | 133 | | | | 3,697 | |
GCI Liberty, Inc., Class A(b) | | | 56 | | | | 4,524 | |
IAC/InterActiveCorp.(b) | | | 14 | | | | 1,862 | |
Interpublic Group of Cos., Inc. (The) | | | 220 | | | | 3,907 | |
John Wiley & Sons, Inc., Class A | | | 98 | | | | 3,102 | |
Liberty Media Corp.-Liberty SiriusXM, Class A(b) | | | 34 | | | | 1,235 | |
Liberty Media Corp.-Liberty SiriusXM, Class C(b) | | | 71 | | | | 2,556 | |
New York Times Co. (The), Class A | | | 98 | | | | 4,246 | |
Nexstar Media Group, Inc., Class A | | | 44 | | | | 4,224 | |
Omnicom Group, Inc. | | | 71 | | | | 3,840 | |
Sirius XM Holdings, Inc. | | | 645 | | | | 3,786 | |
Take-Two Interactive Software, Inc.(b) | | | 31 | | | | 5,307 | |
Telephone & Data Systems, Inc. | | | 191 | | | | 4,418 | |
T-Mobile US, Inc.(b) | | | 40 | | | | 4,667 | |
Twitter, Inc.(b) | | | 116 | | | | 4,707 | |
United States Cellular Corp.(b) | | | 123 | | | | 4,475 | |
Verizon Communications, Inc. | | | 71 | | | | 4,208 | |
Walt Disney Co. (The) | | | 33 | | | | 4,352 | |
World Wrestling Entertainment, Inc., Class A(c) | | | 84 | | | | 3,702 | |
| | | | | | | | |
| | | | | | | 127,335 | |
| | | | | | | | |
Consumer Discretionary-13.01% | | | | | | | | |
Advance Auto Parts, Inc. | | | 29 | | | | 4,533 | |
Amazon.com, Inc.(b) | | | 2 | | | | 6,902 | |
Aptiv PLC | | | 49 | | | | 4,220 | |
Aramark | | | 145 | | | | 3,996 | |
AutoNation, Inc.(b) | | | 95 | | | | 5,402 | |
AutoZone, Inc.(b) | | | 4 | | | | 4,785 | |
Best Buy Co., Inc. | | | 49 | | | | 5,435 | |
Booking Holdings, Inc.(b) | | | 2 | | | | 3,821 | |
BorgWarner, Inc. | | | 117 | | | | 4,749 | |
Bright Horizons Family Solutions, Inc.(b) | | | 32 | | | | 4,256 | |
Burlington Stores, Inc.(b) | | | 19 | | | | 3,742 | |
CarMax, Inc.(b) | | | 43 | | | | 4,598 | |
Carter’s, Inc. | | | 45 | | | | 3,583 | |
Choice Hotels International, Inc. | | | 46 | | | | 4,567 | |
Columbia Sportswear Co. | | | 50 | | | | 4,278 | |
D.R. Horton, Inc. | | | 71 | | | | 5,067 | |
Darden Restaurants, Inc. | | | 47 | | | | 4,073 | |
Dick’s Sporting Goods, Inc. | | | 110 | | | | 5,953 | |
Dollar General Corp. | | | 21 | | | | 4,239 | |
Dollar Tree, Inc.(b) | | | 43 | | | | 4,140 | |
| | | | | | | | |
| | | Shares | | | Value | |
Consumer Discretionary-(continued) | |
Domino’s Pizza, Inc. | | | 10 | | | $ | 4,090 | |
Dunkin’ Brands Group, Inc. | | | 59 | | | | 4,489 | |
eBay, Inc. | | | 87 | | | | 4,766 | |
Extended Stay America, Inc. | | | 330 | | | | 4,122 | |
Five Below, Inc.(b) | | | 38 | | | | 4,159 | |
Floor & Decor Holdings, Inc., Class A(b) | | | 73 | | | | 5,347 | |
Foot Locker, Inc. | | | 130 | | | | 3,943 | |
Frontdoor, Inc.(b) | | | 88 | | | | 3,834 | |
Gap, Inc. (The) | | | 337 | | | | 5,860 | |
Garmin Ltd. | | | 42 | | | | 4,352 | |
General Motors Co. | | | 139 | | | | 4,119 | |
Gentex Corp. | | | 147 | | | | 3,976 | |
Genuine Parts Co. | | | 45 | | | | 4,250 | |
Graham Holdings Co., Class B | | | 11 | | | | 4,707 | |
Grand Canyon Education, Inc.(b) | | | 40 | | | | 3,762 | |
H&R Block, Inc. | | | 223 | | | | 3,234 | |
Hasbro, Inc. | | | 52 | | | | 4,105 | |
Hilton Worldwide Holdings, Inc. | | | 47 | | | | 4,247 | |
Home Depot, Inc. (The) | | | 16 | | | | 4,561 | |
Hyatt Hotels Corp., Class A(c) | | | 67 | | | | 3,785 | |
Las Vegas Sands Corp. | | | 78 | | | | 3,955 | |
Lear Corp. | | | 35 | | | | 3,988 | |
Leggett & Platt, Inc. | | | 115 | | | | 4,715 | |
Lennar Corp., Class A | | | 61 | | | | 4,564 | |
Lennar Corp., Class B | | | 4 | | | | 237 | |
LKQ Corp.(b) | | | 134 | | | | 4,253 | |
Lowe’s Cos., Inc. | | | 31 | | | | 5,105 | |
Marriott International, Inc., Class A | | | 41 | | | | 4,219 | |
McDonald’s Corp. | | | 21 | | | | 4,484 | |
MGM Resorts International | | | 199 | | | | 4,477 | |
NIKE, Inc., Class B | | | 39 | | | | 4,364 | |
Nordstrom, Inc.(c) | | | 207 | | | | 3,312 | |
NVR, Inc.(b) | | | 1 | | | | 4,168 | |
Ollie’s Bargain Outlet Holdings, Inc.(b) | | | 44 | | | | 4,204 | |
O’Reilly Automotive, Inc.(b) | | | 10 | | | | 4,656 | |
Penske Automotive Group, Inc. | | | 102 | | | | 4,811 | |
Planet Fitness, Inc., Class A(b) | | | 52 | | | | 3,161 | |
Polaris, Inc. | | | 44 | | | | 4,446 | |
Pool Corp. | | | 15 | | | | 4,918 | |
PulteGroup, Inc. | | | 112 | | | | 4,994 | |
Ross Stores, Inc. | | | 40 | | | | 3,643 | |
Service Corp. International | | | 101 | | | | 4,611 | |
ServiceMaster Global Holdings, Inc.(b) | | | 120 | | | | 4,788 | |
Skechers U.S.A., Inc., Class A(b) | | | 116 | | | | 3,463 | |
Starbucks Corp. | | | 51 | | | | 4,308 | |
Target Corp. | | | 33 | | | | 4,990 | |
Tempur Sealy International, Inc.(b) | | | 59 | | | | 5,047 | |
Thor Industries, Inc. | | | 43 | | | | 4,060 | |
Tiffany & Co. | | | 36 | | | | 4,410 | |
TJX Cos., Inc. (The) | | | 73 | | | | 4,000 | |
Toll Brothers, Inc. | | | 113 | | | | 4,771 | |
Tractor Supply Co. | | | 33 | | | | 4,911 | |
Ulta Beauty, Inc.(b) | | | 16 | | | | 3,715 | |
Vail Resorts, Inc. | | | 20 | | | | 4,353 | |
VF Corp. | | | 63 | | | | 4,142 | |
Wendy’s Co. (The) | | | 182 | | | | 3,811 | |
Whirlpool Corp. | | | 31 | | | | 5,509 | |
Williams-Sonoma, Inc.(c) | | | 47 | | | | 4,125 | |
See accompanying Notes to Financial Statements which are an integral part of the financial statements.
Invesco Russell 1000 Enhanced Equal Weight ETF (USEQ)–(continued)
August 31, 2020
| | | | | | | | |
| | | Shares | | | Value | |
Consumer Discretionary-(continued) | | | | | |
Wyndham Destinations, Inc. | | | 114 | | | $ | 3,305 | |
Wyndham Hotels & Resorts, Inc. | | | 81 | | | | 4,241 | |
Yum China Holdings, Inc. (China) | | | 82 | | | | 4,732 | |
Yum! Brands, Inc. | | | 43 | | | | 4,122 | |
| | | | | | | | |
| | | | | | | 356,135 | |
| | | | | | | | |
Consumer Staples-6.14% | | | | | | | | |
Archer-Daniels-Midland Co. | | | 100 | | | | 4,476 | |
Brown-Forman Corp., Class A | | | 12 | | | | 798 | |
Brown-Forman Corp., Class B | | | 50 | | | | 3,658 | |
Campbell Soup Co. | | | 83 | | | | 4,367 | |
Casey’s General Stores, Inc. | | | 24 | | | | 4,268 | |
Church & Dwight Co., Inc. | | | 54 | | | | 5,175 | |
Clorox Co. (The) | | | 20 | | | | 4,470 | |
Coca-Cola Co. (The) | | | 84 | | | | 4,160 | |
Colgate-Palmolive Co. | | | 56 | | | | 4,439 | |
Conagra Brands, Inc. | | | 120 | | | | 4,603 | |
Costco Wholesale Corp. | | | 13 | | | | 4,520 | |
Estee Lauder Cos., Inc. (The), Class A | | | 20 | | | | 4,434 | |
Flowers Foods, Inc. | | | 176 | | | | 4,305 | |
General Mills, Inc. | | | 66 | | | | 4,221 | |
Grocery Outlet Holding Corp.(b) | | | 111 | | | | 4,565 | |
Herbalife Nutrition Ltd.(b) | | | 90 | | | | 4,423 | |
Hershey Co. (The) | | | 30 | | | | 4,459 | |
Hormel Foods Corp. | | | 85 | | | | 4,333 | |
Ingredion, Inc. | | | 47 | | | | 3,781 | |
JM Smucker Co. (The) | | | 35 | | | | 4,206 | |
Kellogg Co. | | | 62 | | | | 4,396 | |
Keurig Dr Pepper, Inc. | | | 142 | | | | 4,236 | |
Kimberly-Clark Corp. | | | 29 | | | | 4,575 | |
Kraft Heinz Co. (The) | | | 129 | | | | 4,520 | |
Kroger Co. (The) | | | 123 | | | | 4,389 | |
Lamb Weston Holdings, Inc. | | | 62 | | | | 3,897 | |
McCormick & Co., Inc. | | | 23 | | | | 4,743 | |
Mondelez International, Inc., Class A | | | 77 | | | | 4,498 | |
Monster Beverage Corp.(b) | | | 56 | | | | 4,696 | |
Nu Skin Enterprises, Inc., Class A | | | 104 | | | | 4,916 | |
PepsiCo, Inc. | | | 31 | | | | 4,342 | |
Philip Morris International, Inc. | | | 54 | | | | 4,309 | |
Pilgrim’s Pride Corp.(b)(c) | | | 220 | | | | 3,520 | |
Procter & Gamble Co. (The) | | | 34 | | | | 4,703 | |
Seaboard Corp. | | | 1 | | | | 2,683 | |
Sprouts Farmers Market, Inc.(b) | | | 157 | | | | 3,666 | |
Sysco Corp. | | | 68 | | | | 4,090 | |
Tyson Foods, Inc., Class A | | | 67 | | | | 4,208 | |
Walgreens Boots Alliance, Inc. | | | 92 | | | | 3,498 | |
Walmart, Inc. | | | 33 | | | | 4,582 | |
| | | | | | | | |
| | | | | | | 168,128 | |
| | | | | | | | |
Energy-1.90% | | | | | | | | |
Cabot Oil & Gas Corp. | | | 198 | | | | 3,756 | |
Cheniere Energy, Inc.(b) | | | 81 | | | | 4,216 | |
Chevron Corp. | | | 42 | | | | 3,525 | |
ConocoPhillips | | | 89 | | | | 3,372 | |
EOG Resources, Inc. | | | 73 | | | | 3,310 | |
Exxon Mobil Corp. | | | 82 | | | | 3,275 | |
HollyFrontier Corp. | | | 120 | | | | 2,864 | |
Kinder Morgan, Inc. | | | 250 | | | | 3,455 | |
Marathon Oil Corp. | | | 678 | | | | 3,580 | |
Murphy Oil Corp.(c) | | | 285 | | | | 3,916 | |
ONEOK, Inc. | | | 99 | | | | 2,720 | |
| | | | | | | | |
| | | Shares | | | Value | |
Energy-(continued) | | | | | | | | |
Phillips 66 | | | 48 | | | $ | 2,807 | |
Pioneer Natural Resources Co. | | | 40 | | | | 4,157 | |
Valero Energy Corp. | | | 57 | | | | 2,998 | |
Williams Cos., Inc. (The) | | | 195 | | | | 4,048 | |
| | | | | | | | |
| | | | | | | 51,999 | |
| | | | | | | | |
Financials-16.83% | | | | | | | | |
Affiliated Managers Group, Inc. | | | 54 | | | | 3,707 | |
Aflac, Inc. | | | 106 | | | | 3,850 | |
Alleghany Corp. | | | 7 | | | | 3,882 | |
Allstate Corp. (The) | | | 40 | | | | 3,720 | |
Ally Financial, Inc. | | | 199 | | | | 4,553 | |
American Express Co. | | | 38 | | | | 3,860 | |
American Financial Group, Inc. | | | 62 | | | | 4,145 | |
American National Group, Inc. | | | 50 | | | | 3,751 | |
Ameriprise Financial, Inc. | | | 27 | | | | 4,234 | |
Aon PLC, Class A | | | 20 | | | | 4,000 | |
Arch Capital Group Ltd.(b) | | | 125 | | | | 3,943 | |
Arthur J. Gallagher & Co. | | | 41 | | | | 4,317 | |
Associated Banc-Corp. | | | 270 | | | | 3,629 | |
Assurant, Inc. | | | 37 | | | | 4,498 | |
Assured Guaranty Ltd. | | | 143 | | | | 3,067 | |
Athene Holding Ltd., Class A(b) | | | 126 | | | | 4,607 | |
AXIS Capital Holdings Ltd. | | | 103 | | | | 4,919 | |
Bank of America Corp. | | | 155 | | | | 3,990 | |
Bank of Hawaii Corp.(c) | | | 62 | | | | 3,412 | |
Bank of New York Mellon Corp. (The) | | | 102 | | | | 3,772 | |
Bank OZK | | | 165 | | | | 3,802 | |
Berkshire Hathaway, Inc., Class B(b) | | | 21 | | | | 4,579 | |
BlackRock, Inc. | | | 7 | | | | 4,159 | |
BOK Financial Corp. | | | 73 | | | | 4,098 | |
Brighthouse Financial, Inc.(b) | | | 125 | | | | 3,795 | |
Brown & Brown, Inc. | | | 95 | | | | 4,408 | |
Capital One Financial Corp. | | | 54 | | | | 3,728 | |
Cboe Global Markets, Inc. | | | 39 | | | | 3,580 | |
Charles Schwab Corp. (The) | | | 102 | | | | 3,624 | |
Chubb Ltd. | | | 32 | | | | 4,000 | |
Citigroup, Inc. | | | 76 | | | | 3,885 | |
Citizens Financial Group, Inc. | | | 150 | | | | 3,881 | |
CME Group, Inc., Class A | | | 22 | | | | 3,869 | |
CNA Financial Corp. | | | 127 | | | | 4,086 | |
Commerce Bancshares, Inc. | | | 62 | | | | 3,693 | |
Credit Acceptance Corp.(b)(c) | | | 10 | | | | 3,868 | |
Cullen/Frost Bankers, Inc. | | | 52 | | | | 3,612 | |
E*TRADE Financial Corp. | | | 83 | | | | 4,490 | |
East West Bancorp, Inc. | | | 106 | | | | 3,899 | |
Eaton Vance Corp. | | | 99 | | | | 4,061 | |
Erie Indemnity Co., Class A | | | 22 | | | | 4,696 | |
Evercore, Inc., Class A | | | 65 | | | | 4,022 | |
Everest Re Group Ltd. | | | 19 | | | | 4,182 | |
F.N.B. Corp. | | | 498 | | | | 3,735 | |
FactSet Research Systems, Inc. | | | 13 | | | | 4,555 | |
Fidelity National Financial, Inc. | | | 121 | | | | 3,972 | |
Fifth Third Bancorp | | | 189 | | | | 3,905 | |
First American Financial Corp. | | | 76 | | | | 3,995 | |
First Citizens BancShares, Inc., Class A | | | 10 | | | | 3,932 | |
First Hawaiian, Inc. | | | 224 | | | | 3,703 | |
First Horizon National Corp. | | | 387 | | | | 3,696 | |
First Republic Bank | | | 35 | | | | 3,952 | |
Franklin Resources, Inc. | | | 191 | | | | 4,022 | |
See accompanying Notes to Financial Statements which are an integral part of the financial statements.
Invesco Russell 1000 Enhanced Equal Weight ETF (USEQ)–(continued)
August 31, 2020
| | | | | | | | |
| | | Shares | | | Value | |
Financials-(continued) | |
Globe Life, Inc. | | | 50 | | | $ | 4,124 | |
Goldman Sachs Group, Inc. (The) | | | 19 | | | | 3,893 | |
Hanover Insurance Group, Inc. (The) | | | 38 | | | | 3,895 | |
Hartford Financial Services Group, Inc. (The) | | | 96 | | | | 3,883 | |
Huntington Bancshares, Inc. | | | 407 | | | | 3,830 | |
Interactive Brokers Group, Inc., Class A | | | 92 | | | | 4,878 | |
Intercontinental Exchange, Inc. | | | 41 | | | | 4,355 | |
Jefferies Financial Group, Inc. | | | 260 | | | | 4,560 | |
JPMorgan Chase & Co. | | | 39 | | | | 3,907 | |
Kemper Corp. | | | 59 | | | | 4,582 | |
KeyCorp. | | | 320 | | | | 3,942 | |
Lazard Ltd., Class A | | | 131 | | | | 4,149 | |
LendingTree, Inc.(b)(c) | | | 15 | | | | 4,634 | |
Lincoln National Corp. | | | 99 | | | | 3,569 | |
LPL Financial Holdings, Inc. | | | 51 | | | | 4,190 | |
M&T Bank Corp. | | | 36 | | | | 3,717 | |
Marsh & McLennan Cos., Inc. | | | 37 | | | | 4,252 | |
Mercury General Corp. | | | 95 | | | | 4,249 | |
MetLife, Inc. | | | 106 | | | | 4,077 | |
MGIC Investment Corp. | | | 449 | | | | 4,117 | |
Moody’s Corp. | | | 14 | | | | 4,125 | |
Morgan Stanley | | | 86 | | | | 4,494 | |
Morningstar, Inc. | | | 27 | | | | 4,324 | |
Nasdaq, Inc. | | | 34 | | | | 4,570 | |
New York Community Bancorp, Inc. | | | 390 | | | | 3,530 | |
Northern Trust Corp. | | | 47 | | | | 3,849 | |
Old Republic International Corp. | | | 238 | | | | 3,834 | |
OneMain Holdings, Inc. | | | 147 | | | | 4,275 | |
People’s United Financial, Inc. | | | 331 | | | | 3,502 | |
Pinnacle Financial Partners, Inc. | | | 94 | | | | 3,755 | |
PNC Financial Services Group, Inc. (The) | | | 34 | | | | 3,781 | |
Popular, Inc. | | | 97 | | | | 3,593 | |
Primerica, Inc. | | | 34 | | | | 4,245 | |
Principal Financial Group, Inc. | | | 94 | | | | 3,958 | |
Progressive Corp. (The) | | | 51 | | | | 4,847 | |
Prosperity Bancshares, Inc. | | | 61 | | | | 3,326 | |
Prudential Financial, Inc. | | | 63 | | | | 4,270 | |
Raymond James Financial, Inc. | | | 52 | | | | 3,937 | |
Regions Financial Corp. | | | 327 | | | | 3,780 | |
Reinsurance Group of America, Inc. | | | 47 | | | | 4,309 | |
RenaissanceRe Holdings Ltd. (Bermuda) | | | 22 | | | | 4,042 | |
S&P Global, Inc. | | | 12 | | | | 4,397 | |
Santander Consumer USA Holdings, Inc.(c) | | | 216 | | | | 3,717 | |
SEI Investments Co. | | | 70 | | | | 3,665 | |
Signature Bank | | | 37 | | | | 3,590 | |
SLM Corp. | | | 514 | | | | 3,927 | |
Starwood Property Trust, Inc. | | | 257 | | | | 4,009 | |
State Street Corp. | | | 61 | | | | 4,153 | |
SVB Financial Group(b) | | | 18 | | | | 4,597 | |
T. Rowe Price Group, Inc. | | | 32 | | | | 4,455 | |
TCF Financial Corp. | | | 124 | | | | 3,333 | |
TD Ameritrade Holding Corp. | | | 97 | | | | 3,723 | |
Tradeweb Markets, Inc., Class A | | | 63 | | | | 3,609 | |
Travelers Cos., Inc. (The) | | | 35 | | | | 4,061 | |
Truist Financial Corp. | | | 101 | | | | 3,920 | |
U.S. Bancorp | | | 104 | | | | 3,786 | |
W.R. Berkley Corp. | | | 67 | | | | 4,157 | |
Wells Fargo & Co. | | | 140 | | | | 3,381 | |
Western Alliance Bancorporation | | | 100 | | | | 3,530 | |
White Mountains Insurance Group Ltd. | | | 5 | | | | 4,457 | |
| | | | | | | | |
| | | Shares | | | Value | |
Financials-(continued) | |
Willis Towers Watson PLC | | | 20 | | | $ | 4,111 | |
Zions Bancorporation N.A. | | | 114 | | | | 3,666 | |
| | | | | | | | |
| | | | | | | 460,733 | |
| | | | | | | | |
Health Care-9.75% | | | | | | | | |
Abbott Laboratories | | | 44 | | | | 4,817 | |
AbbVie, Inc. | | | 45 | | | | 4,310 | |
Agilent Technologies, Inc. | | | 45 | | | | 4,519 | |
Alexion Pharmaceuticals, Inc.(b) | | | 36 | | | | 4,112 | |
Amedisys, Inc.(b) | | | 22 | | | | 5,322 | |
AmerisourceBergen Corp. | | | 41 | | | | 3,978 | |
Amgen, Inc. | | | 18 | | | | 4,560 | |
Anthem, Inc. | | | 14 | | | | 3,941 | |
Baxter International, Inc. | | | 45 | | | | 3,918 | |
Becton, Dickinson and Co. | | | 17 | | | | 4,127 | |
Biogen, Inc.(b) | | | 13 | | | | 3,739 | |
Bio-Rad Laboratories, Inc., Class A(b) | | | 9 | | | | 4,577 | |
Boston Scientific Corp.(b) | | | 106 | | | | 4,348 | |
Bristol-Myers Squibb Co. | | | 67 | | | | 4,167 | |
Bruker Corp. | | | 91 | | | | 3,824 | |
Centene Corp.(b) | | | 62 | | | | 3,802 | |
Cerner Corp. | | | 55 | | | | 4,035 | |
Charles River Laboratories International,
Inc.(b) | | | 21 | | | | 4,598 | |
Chemed Corp. | | | 9 | | | | 4,654 | |
Cigna Corp. | | | 20 | | | | 3,547 | |
Cooper Cos., Inc. (The) | | | 13 | | | | 4,087 | |
CVS Health Corp. | | | 60 | | | | 3,727 | |
Danaher Corp. | | | 24 | | | | 4,955 | |
DaVita, Inc.(b) | | | 51 | | | | 4,425 | |
Eli Lilly and Co. | | | 27 | | | | 4,007 | |
Encompass Health Corp. | | | 55 | | | | 3,588 | |
Exelixis, Inc.(b) | | | 174 | | | | 3,866 | |
Gilead Sciences, Inc. | | | 54 | | | | 3,605 | |
Globus Medical, Inc., Class A(b) | | | 74 | | | | 4,183 | |
Haemonetics Corp.(b) | | | 39 | | | | 3,497 | |
HCA Healthcare, Inc. | | | 38 | | | | 5,157 | |
Hill-Rom Holdings, Inc. | | | 40 | | | | 3,752 | |
Horizon Therapeutics PLC(b) | | | 83 | | | | 6,235 | |
Humana, Inc. | | | 10 | | | | 4,152 | |
Integra LifeSciences Holdings Corp.(b) | | | 75 | | | | 3,584 | |
Ionis Pharmaceuticals, Inc.(b) | | | 71 | | | | 3,870 | |
IQVIA Holdings, Inc.(b) | | | 27 | | | | 4,421 | |
Jazz Pharmaceuticals PLC(b) | | | 34 | | | | 4,569 | |
Johnson & Johnson | | | 27 | | | | 4,142 | |
Laboratory Corp. of America Holdings(b) | | | 23 | | | | 4,042 | |
McKesson Corp. | | | 25 | | | | 3,836 | |
Medtronic PLC | | | 42 | | | | 4,514 | |
Merck & Co., Inc. | | | 49 | | | | 4,178 | |
Mettler-Toledo International, Inc.(b) | | | 5 | | | | 4,854 | |
Molina Healthcare, Inc.(b) | | | 23 | | | | 4,254 | |
Mylan N.V.(b) | | | 230 | | | | 3,767 | |
PerkinElmer, Inc. | | | 39 | | | | 4,591 | |
Perrigo Co. PLC | | | 73 | | | | 3,818 | |
Pfizer, Inc. | | | 111 | | | | 4,195 | |
PRA Health Sciences, Inc.(b) | | | 37 | | | | 3,956 | |
Premier, Inc., Class A | | | 118 | | | | 3,865 | |
Quest Diagnostics, Inc. | | | 34 | | | | 3,782 | |
Regeneron Pharmaceuticals, Inc.(b) | | | 7 | | | | 4,340 | |
STERIS PLC | | | 25 | | | | 3,991 | |
Stryker Corp. | | | 20 | | | | 3,963 | |
See accompanying Notes to Financial Statements which are an integral part of the financial statements.
Invesco Russell 1000 Enhanced Equal Weight ETF (USEQ)–(continued)
August 31, 2020
| | | | | | | | |
| | | Shares | | | Value | |
Health Care-(continued) | |
Syneos Health, Inc.(b) | | | 65 | | | $ | 4,102 | |
Teleflex, Inc. | | | 11 | | | | 4,322 | |
Thermo Fisher Scientific, Inc. | | | 12 | | | | 5,148 | |
UnitedHealth Group, Inc. | | | 13 | | | | 4,063 | |
Varian Medical Systems, Inc.(b) | | | 32 | | | | 5,557 | |
Waters Corp.(b) | | | 20 | | | | 4,325 | |
Zimmer Biomet Holdings, Inc. | | | 31 | | | | 4,367 | |
Zoetis, Inc. | | | 28 | | | | 4,483 | |
| | | | | | | | |
| | | | | | | 267,030 | |
| | | | | | | | |
Industrials-15.99% | | | | | | | | |
3M Co. | | | 25 | | | | 4,076 | |
A.O. Smith Corp. | | | 81 | | | | 3,967 | |
AGCO Corp. | | | 68 | | | | 4,835 | |
Alaska Air Group, Inc. | | | 103 | | | | 4,012 | |
Allegion PLC | | | 39 | | | | 4,032 | |
Allison Transmission Holdings, Inc. | | | 103 | | | | 3,695 | |
AMERCO | | | 13 | | | | 4,614 | |
AMETEK, Inc. | | | 43 | | | | 4,330 | |
BWX Technologies, Inc. | | | 65 | | | | 3,615 | |
C.H. Robinson Worldwide, Inc. | | | 48 | | | | 4,718 | |
Carlisle Cos., Inc. | | | 31 | | | | 4,059 | |
Caterpillar, Inc. | | | 32 | | | | 4,554 | |
Cintas Corp. | | | 15 | | | | 4,999 | |
Clean Harbors, Inc.(b) | | | 62 | | | | 3,788 | |
Copart, Inc.(b) | | | 45 | | | | 4,649 | |
CoreLogic, Inc. | | | 79 | | | | 5,246 | |
CSX Corp. | | | 54 | | | | 4,129 | |
Cummins, Inc. | | | 23 | | | | 4,767 | |
Curtiss-Wright Corp. | | | 38 | | | | 3,888 | |
Deere & Co. | | | 26 | | | | 5,462 | |
Donaldson Co., Inc. | | | 81 | | | | 4,079 | |
Dover Corp. | | | 39 | | | | 4,284 | |
Eaton Corp. PLC | | | 45 | | | | 4,594 | |
Emerson Electric Co. | | | 64 | | | | 4,446 | |
Expeditors International of Washington, Inc. | | | 52 | | | | 4,596 | |
Fastenal Co. | | | 96 | | | | 4,691 | |
Fortive Corp. | | | 60 | | | | 4,327 | |
Fortune Brands Home & Security, Inc. | | | 64 | | | | 5,381 | |
FTI Consulting, Inc.(b)(c) | | | 32 | | | | 3,672 | |
Gates Industrial Corp. PLC(b) | | | 380 | | | | 4,290 | |
Generac Holdings, Inc.(b) | | | 36 | | | | 6,839 | |
General Dynamics Corp. | | | 26 | | | | 3,883 | |
Graco, Inc. | | | 81 | | | | 4,700 | |
HD Supply Holdings, Inc.(b) | | | 118 | | | | 4,680 | |
HEICO Corp. | | | 15 | | | | 1,649 | |
HEICO Corp., Class A | | | 26 | | | | 2,324 | |
Honeywell International, Inc. | | | 27 | | | | 4,470 | |
Hubbell, Inc. | | | 31 | | | | 4,493 | |
Huntington Ingalls Industries, Inc. | | | 20 | | | | 3,030 | |
IAA, Inc.(b) | | | 89 | | | | 4,656 | |
IDEX Corp. | | | 25 | | | | 4,506 | |
IHS Markit Ltd. | | | 57 | | | | 4,555 | |
Illinois Tool Works, Inc. | | | 23 | | | | 4,544 | |
Ingersoll Rand, Inc.(b) | | | 131 | | | | 4,593 | |
ITT, Inc. | | | 67 | | | | 4,208 | |
J.B. Hunt Transport Services, Inc. | | | 35 | | | | 4,919 | |
Jacobs Engineering Group, Inc. | | | 46 | | | | 4,152 | |
JetBlue Airways Corp.(b) | | | 358 | | | | 4,124 | |
Johnson Controls International PLC | | | 120 | | | | 4,888 | |
| | | | | | | | |
| | | Shares | | | Value | |
Industrials-(continued) | |
Kansas City Southern | | | 26 | | | $ | 4,733 | |
Knight-Swift Transportation Holdings, Inc. | | | 101 | | | | 4,591 | |
L3Harris Technologies, Inc. | | | 20 | | | | 3,615 | |
Landstar System, Inc. | | | 35 | | | | 4,658 | |
Lennox International, Inc. | | | 18 | | | | 5,046 | |
Lincoln Electric Holdings, Inc. | | | 47 | | | | 4,545 | |
Lockheed Martin Corp. | | | 10 | | | | 3,903 | |
Macquarie Infrastructure Corp. | | | 132 | | | | 3,699 | |
ManpowerGroup, Inc. | | | 54 | | | | 3,959 | |
Masco Corp. | | | 83 | | | | 4,839 | |
MSA Safety, Inc. | | | 33 | | | | 4,156 | |
MSC Industrial Direct Co., Inc., Class A | | | 56 | | | | 3,690 | |
Nordson Corp. | | | 21 | | | | 3,916 | |
Norfolk Southern Corp. | | | 21 | | | | 4,463 | |
Northrop Grumman Corp. | | | 12 | | | | 4,111 | |
nVent Electric PLC | | | 206 | | | | 3,939 | |
Old Dominion Freight Line, Inc. | | | 25 | | | | 5,054 | |
Oshkosh Corp. | | | 53 | | | | 4,082 | |
PACCAR, Inc. | | | 54 | | | | 4,635 | |
Parker-Hannifin Corp. | | | 21 | | | | 4,326 | |
Pentair PLC | | | 100 | | | | 4,514 | |
Quanta Services, Inc. | | | 100 | | | | 5,125 | |
Raytheon Technologies Corp. | | | 60 | | | | 3,660 | |
Regal Beloit Corp. | | | 48 | | | | 4,745 | |
Republic Services, Inc. | | | 46 | | | | 4,265 | |
Robert Half International, Inc. | | | 73 | | | | 3,884 | |
Rockwell Automation, Inc. | | | 18 | | | | 4,150 | |
Roper Technologies, Inc. | | | 10 | | | | 4,272 | |
Schneider National, Inc., Class B | | | 174 | | | | 4,708 | |
Sensata Technologies Holding PLC(b) | | | 100 | | | | 4,164 | |
Snap-on, Inc. | | | 29 | | | | 4,300 | |
Southwest Airlines Co. | | | 111 | | | | 4,171 | |
Stanley Black & Decker, Inc. | | | 30 | | | | 4,839 | |
Teledyne Technologies, Inc.(b) | | | 11 | | | | 3,450 | |
Timken Co. (The) | | | 91 | | | | 4,931 | |
Toro Co. (The) | | | 58 | | | | 4,366 | |
Trane Technologies PLC | | | 43 | | | | 5,091 | |
TransDigm Group, Inc. | | | 9 | | | | 4,497 | |
TransUnion | | | 44 | | | | 3,816 | |
Trinity Industries, Inc. | | | 186 | | | | 3,807 | |
Union Pacific Corp. | | | 23 | | | | 4,426 | |
United Parcel Service, Inc., Class B | | | 39 | | | | 6,381 | |
United Rentals, Inc.(b) | | | 27 | | | | 4,780 | |
Univar Solutions, Inc.(b) | | | 237 | | | | 4,311 | |
Valmont Industries, Inc. | | | 34 | | | | 4,320 | |
W.W. Grainger, Inc. | | | 13 | | | | 4,751 | |
Wabtec Corp. | | | 63 | | | | 4,193 | |
Waste Management, Inc. | | | 37 | | | | 4,218 | |
Watsco, Inc. | | | 23 | | | | 5,635 | |
XPO Logistics, Inc.(b) | | | 50 | | | | 4,413 | |
Xylem, Inc. | | | 58 | | | | 4,650 | |
| | | | | | | | |
| | | | | | | 437,801 | |
| | | | | | | | |
Information Technology-12.79% | | | | | | | | |
Accenture PLC, Class A | | | 20 | | | | 4,799 | |
Akamai Technologies, Inc.(b) | | | 39 | | | | 4,541 | |
Amdocs Ltd. | | | 63 | | | | 3,857 | |
Amphenol Corp., Class A | | | 39 | | | | 4,282 | |
Analog Devices, Inc. | | | 33 | | | | 3,857 | |
Apple, Inc. | | | 48 | | | | 6,194 | |
See accompanying Notes to Financial Statements which are an integral part of the financial statements.
Invesco Russell 1000 Enhanced Equal Weight ETF (USEQ)–(continued)
August 31, 2020
| | | | | | | | |
| | | Shares | | | Value | |
Information Technology-(continued) | |
Applied Materials, Inc. | | | 70 | | | $ | 4,312 | |
Arista Networks, Inc.(b) | | | 18 | | | | 4,022 | |
Aspen Technology, Inc.(b) | | | 36 | | | | 4,573 | |
Automatic Data Processing, Inc. | | | 27 | | | | 3,755 | |
Booz Allen Hamilton Holding Corp. | | | 50 | | | | 4,403 | |
Broadcom, Inc. | | | 13 | | | | 4,513 | |
Broadridge Financial Solutions, Inc. | | | 33 | | | | 4,534 | |
CACI International, Inc., Class A(b) | | | 16 | | | | 3,747 | |
Cadence Design Systems, Inc.(b) | | | 44 | | | | 4,880 | |
CDK Global, Inc. | | | 96 | | | | 4,476 | |
CDW Corp. | | | 35 | | | | 3,978 | |
Ciena Corp.(b) | | | 72 | | | | 4,087 | |
Cirrus Logic, Inc.(b) | | | 56 | | | | 3,393 | |
Cisco Systems, Inc. | | | 86 | | | | 3,631 | |
Citrix Systems, Inc. | | | 29 | | | | 4,211 | |
Cognizant Technology Solutions Corp., Class A | | | 73 | | | | 4,881 | |
Corning, Inc. | | | 160 | | | | 5,194 | |
Dell Technologies, Inc., Class C(b) | | | 83 | | | | 5,485 | |
Dolby Laboratories, Inc., Class A | | | 64 | | | | 4,470 | |
Entegris, Inc. | | | 65 | | | | 4,348 | |
EPAM Systems, Inc.(b) | | | 18 | | | | 5,888 | |
F5 Networks, Inc.(b) | | | 28 | | | | 3,705 | |
First Solar, Inc.(b) | | | 83 | | | | 6,357 | |
Fiserv, Inc.(b) | | | 37 | | | | 3,684 | |
FleetCor Technologies, Inc.(b) | | | 16 | | | | 4,023 | |
FLIR Systems, Inc. | | | 85 | | | | 3,136 | |
Genpact Ltd. | | | 108 | | | | 4,555 | |
GoDaddy, Inc., Class A(b) | | | 51 | | | | 4,268 | |
Intel Corp. | | | 65 | | | | 3,312 | |
International Business Machines Corp. | | | 31 | | | | 3,823 | |
Intuit, Inc. | | | 14 | | | | 4,835 | |
IPG Photonics Corp.(b) | | | 25 | | | | 4,043 | |
Jabil, Inc. | | | 125 | | | | 4,269 | |
Jack Henry & Associates, Inc. | | | 23 | | | | 3,805 | |
Juniper Networks, Inc. | | | 165 | | | | 4,125 | |
KLA Corp. | | | 22 | | | | 4,513 | |
Lam Research Corp. | | | 14 | | | | 4,709 | |
Leidos Holdings, Inc. | | | 38 | | | | 3,439 | |
Littelfuse, Inc. | | | 23 | | | | 4,159 | |
Lumentum Holdings, Inc.(b) | | | 52 | | | | 4,472 | |
Marvell Technology Group Ltd. | | | 112 | | | | 4,343 | |
Mastercard, Inc., Class A | | | 13 | | | | 4,656 | |
Maxim Integrated Products, Inc. | | | 67 | | | | 4,585 | |
Microchip Technology, Inc. | | | 37 | | | | 4,059 | |
Micron Technology, Inc.(b) | | | 82 | | | | 3,732 | |
Microsoft Corp. | | | 22 | | | | 4,962 | |
MKS Instruments, Inc. | | | 37 | | | | 4,423 | |
Motorola Solutions, Inc. | | | 28 | | | | 4,333 | |
National Instruments Corp. | | | 97 | | | | 3,481 | |
NortonLifeLock, Inc. | | | 195 | | | | 4,586 | |
Nuance Communications, Inc.(b) | | | 176 | | | | 5,273 | |
Oracle Corp. | | | 75 | | | | 4,291 | |
Paychex, Inc. | | | 54 | | | | 4,129 | |
Qorvo, Inc.(b) | | | 36 | | | | 4,618 | |
QUALCOMM, Inc. | | | 48 | | | | 5,717 | |
RealPage, Inc.(b) | | | 59 | | | | 3,695 | |
Science Applications International Corp. | | | 45 | | | | 3,756 | |
Skyworks Solutions, Inc. | | | 32 | | | | 4,635 | |
SolarEdge Technologies, Inc.(b) | | | 27 | | | | 5,971 | |
SolarWinds Corp.(b) | | | 208 | | | | 4,374 | |
| | | | | | | | |
| | | Shares | | | Value | |
Information Technology-(continued) | |
SS&C Technologies Holdings, Inc. | | | 66 | | | $ | 4,206 | |
Switch, Inc., Class A | | | 218 | | | | 3,750 | |
SYNNEX Corp. | | | 36 | | | | 4,577 | |
Synopsys, Inc.(b) | | | 22 | | | | 4,869 | |
Teradyne, Inc. | | | 56 | | | | 4,758 | |
Texas Instruments, Inc. | | | 32 | | | | 4,549 | |
Trimble, Inc.(b) | | | 95 | | | | 4,979 | |
Ubiquiti, Inc.(c) | | | 22 | | | | 3,998 | |
VeriSign, Inc.(b) | | | 19 | | | | 4,081 | |
Visa, Inc., Class A | | | 21 | | | | 4,452 | |
VMware, Inc., Class A(b)(c) | | | 27 | | | | 3,900 | |
Western Union Co. (The) | | | 176 | | | | 4,152 | |
Xilinx, Inc. | | | 42 | | | | 4,375 | |
Zebra Technologies Corp., Class A(b) | | | 15 | | | | 4,298 | |
| | | | | | | | |
| | | | | | | 350,106 | |
| | | | | | | | |
Materials-6.29% | | | | | | | | |
Air Products and Chemicals, Inc. | | | 16 | | | | 4,676 | |
Albemarle Corp. | | | 51 | | | | 4,642 | |
Amcor PLC | | | 384 | | | | 4,247 | |
AptarGroup, Inc. | | | 36 | | | | 4,262 | |
Ardagh Group S.A | | | 307 | | | | 4,673 | |
Avery Dennison Corp. | | | 34 | | | | 3,923 | |
Axalta Coating Systems Ltd.(b) | | | 165 | | | | 3,935 | |
Ball Corp. | | | 55 | | | | 4,420 | |
Berry Global Group, Inc.(b) | | | 88 | | | | 4,536 | |
Cabot Corp. | | | 103 | | | | 3,812 | |
Celanese Corp. | | | 42 | | | | 4,248 | |
Crown Holdings, Inc.(b) | | | 59 | | | | 4,534 | |
Eastman Chemical Co. | | | 56 | | | | 4,094 | |
Ecolab, Inc. | | | 18 | | | | 3,548 | |
Element Solutions, Inc.(b) | | | 358 | | | | 3,849 | |
FMC Corp. | | | 40 | | | | 4,274 | |
Graphic Packaging Holding Co. | | | 271 | | | | 3,789 | |
Huntsman Corp. | | | 213 | | | | 4,605 | |
International Flavors & Fragrances, Inc.(c) | | | 30 | | | | 3,714 | |
International Paper Co. | | | 109 | | | | 3,953 | |
Linde PLC (United Kingdom) | | | 19 | | | | 4,745 | |
LyondellBasell Industries N.V., Class A | | | 57 | | | | 3,732 | |
Martin Marietta Materials, Inc. | | | 19 | | | | 3,855 | |
NewMarket Corp. | | | 9 | | | | 3,352 | |
Newmont Corp. | | | 72 | | | | 4,844 | |
Nucor Corp. | | | 91 | | | | 4,137 | |
Packaging Corp. of America | | | 38 | | | | 3,847 | |
PPG Industries, Inc. | | | 36 | | | | 4,334 | |
Reliance Steel & Aluminum Co. | | | 40 | | | | 4,195 | |
RPM International, Inc. | | | 52 | | | | 4,408 | |
Sealed Air Corp. | | | 120 | | | | 4,716 | |
Sherwin-Williams Co. (The) | | | 7 | | | | 4,697 | |
Silgan Holdings, Inc. | | | 122 | | | | 4,643 | |
Sonoco Products Co. | | | 74 | | | | 3,924 | |
Southern Copper Corp. (Peru) | | | 105 | | | | 5,051 | |
Steel Dynamics, Inc. | | | 145 | | | | 4,280 | |
Valvoline, Inc. | | | 207 | | | | 4,223 | |
Vulcan Materials Co. | | | 34 | | | | 4,080 | |
W.R. Grace & Co. | | | 71 | | | | 2,890 | |
Westlake Chemical Corp. | | | 77 | | | | 4,568 | |
Westrock Co. | | | 135 | | | | 4,095 | |
| | | | | | | | |
| | | | | | | 172,350 | |
| | | | | | | | |
See accompanying Notes to Financial Statements which are an integral part of the financial statements.
Invesco Russell 1000 Enhanced Equal Weight ETF (USEQ)–(continued)
August 31, 2020
| | | | | | | | |
| | | Shares | | | Value | |
| Real Estate-7.99% | | | | | | | | |
| American Campus Communities, Inc. | | | 107 | | | $ | 3,627 | |
| American Homes 4 Rent, Class A | | | 147 | | | | 4,210 | |
| Americold Realty Trust | | | 112 | | | | 4,295 | |
| Apartment Investment & Management Co., Class A | | | 100 | | | | 3,603 | |
| Apple Hospitality REIT, Inc. | | | 352 | | | | 3,580 | |
| AvalonBay Communities, Inc. | | | 25 | | | | 3,952 | |
| Boston Properties, Inc. | | | 42 | | | | 3,649 | |
| Brandywine Realty Trust | | | 367 | | | | 4,085 | |
| Brixmor Property Group, Inc. | | | 294 | | | | 3,469 | |
| Camden Property Trust | | | 42 | | | | 3,820 | |
| CBRE Group, Inc., Class A(b) | | | 81 | | | | 3,810 | |
| CoreSite Realty Corp. | | | 34 | | | | 4,163 | |
| Corporate Office Properties Trust | | | 149 | | | | 3,671 | |
| Cousins Properties, Inc. | | | 114 | | | | 3,403 | |
| CubeSmart | | | 137 | | | | 4,332 | |
| Douglas Emmett, Inc. | | | 124 | | | | 3,462 | |
| Duke Realty Corp. | | | 110 | | | | 4,241 | |
| Equity Commonwealth | | | 121 | | | | 3,798 | |
| Equity LifeStyle Properties, Inc. | | | 63 | | | | 4,176 | |
| Equity Residential | | | 65 | | | | 3,669 | |
| Essex Property Trust, Inc. | | | 16 | | | | 3,464 | |
| Extra Space Storage, Inc. | | | 40 | | | | 4,262 | |
| Federal Realty Investment Trust | | | 43 | | | | 3,407 | |
| First Industrial Realty Trust, Inc. | | | 102 | | | | 4,350 | |
| Gaming and Leisure Properties, Inc. | | | 106 | | | | 3,853 | |
| Healthcare Trust of America, Inc., Class A | | | 147 | | | | 3,879 | |
| Healthpeak Properties, Inc. | | | 146 | | | | 4,036 | |
| Highwoods Properties, Inc. | | | 96 | | | | 3,577 | |
| Host Hotels & Resorts, Inc. | | | 320 | | | | 3,594 | |
| Hudson Pacific Properties, Inc. | | | 143 | | | | 3,358 | |
| Invitation Homes, Inc. | | | 145 | | | | 4,151 | |
| Iron Mountain, Inc.(c) | | | 142 | | | | 4,273 | |
| JBG SMITH Properties | | | 126 | | | | 3,486 | |
| Jones Lang LaSalle, Inc. | | | 35 | | | | 3,606 | |
| Kilroy Realty Corp. | | | 64 | | | | 3,745 | |
| Kimco Realty Corp. | | | 290 | | | | 3,477 | |
| Lamar Advertising Co., Class A | | | 58 | | | | 4,015 | |
| Life Storage, Inc. | | | 40 | | | | 4,217 | |
| Medical Properties Trust, Inc. | | | 206 | | | | 3,828 | |
| Mid-America Apartment Communities, Inc. | | | 33 | | | | 3,865 | |
| National Retail Properties, Inc. | | | 110 | | | | 3,898 | |
| Omega Healthcare Investors, Inc. | | | 122 | | | | 3,778 | |
| Prologis, Inc. | | | 42 | | | | 4,278 | |
| Public Storage | | | 20 | | | | 4,248 | |
| Rayonier, Inc. | | | 164 | | | | 4,802 | |
| Realty Income Corp. | | | 67 | | | | 4,156 | |
| Regency Centers Corp. | | | 82 | | | | 3,256 | |
| Spirit Realty Capital, Inc. | | | 119 | | | | 4,226 | |
| STORE Capital Corp. | | | 177 | | | | 4,786 | |
| Taubman Centers, Inc. | | | 95 | | | | 3,639 | |
| UDR, Inc. | | | 103 | | | | 3,586 | |
| VICI Properties, Inc. | | | 184 | | | | 4,111 | |
| Vornado Realty Trust | | | 98 | | | | 3,511 | |
| Weingarten Realty Investors | | | 191 | | | | 3,337 | |
| Weyerhaeuser Co. | | | 182 | | | | 5,516 | |
| WP Carey, Inc. | | | 62 | | | | 4,301 | |
| | | | | | | | |
| | | | | | | 218,887 | |
| | | | | | | | |
| | | | | | | | |
| | | Shares | | | Value | |
| Utilities-4.51% | | | | | | | | |
| Alliant Energy Corp. | | | 79 | | | $ | 4,278 | |
| Ameren Corp. | | | 53 | | | | 4,193 | |
| American Electric Power Co., Inc. | | | 46 | | | | 3,626 | |
| American Water Works Co., Inc. | | | 31 | | | | 4,382 | |
| Atmos Energy Corp. | | | 39 | | | | 3,893 | |
| Avangrid, Inc. | | | 87 | | | | 4,179 | |
| CMS Energy Corp. | | | 67 | | | | 4,053 | |
| Consolidated Edison, Inc. | | | 53 | | | | 3,781 | |
| Dominion Energy, Inc. | | | 47 | | | | 3,687 | |
| DTE Energy Co. | | | 36 | | | | 4,272 | |
| Duke Energy Corp. | | | 45 | | | | 3,615 | |
| Edison International | | | 66 | | | | 3,464 | |
| Entergy Corp. | | | 39 | | | | 3,866 | |
| Essential Utilities, Inc. | | | 89 | | | | 3,783 | |
| Evergy, Inc. | | | 64 | | | | 3,406 | |
| Eversource Energy | | | 46 | | | | 3,943 | |
| FirstEnergy Corp. | | | 93 | | | | 2,659 | |
| Hawaiian Electric Industries, Inc. | | | 102 | | | | 3,530 | |
| IDACORP, Inc. | | | 42 | | | | 3,776 | |
| MDU Resources Group, Inc. | | | 178 | | | | 4,204 | |
| National Fuel Gas Co. | | | 94 | | | | 4,290 | |
| NextEra Energy, Inc. | | | 16 | | | | 4,467 | |
| NiSource, Inc. | | | 159 | | | | 3,523 | |
| NRG Energy, Inc. | | | 111 | | | | 3,820 | |
| Pinnacle West Capital Corp. | | | 51 | | | | 3,741 | |
| PPL Corp. | | | 135 | | | | 3,730 | |
| Public Service Enterprise Group, Inc. | | | 76 | | | | 3,970 | |
| Sempra Energy | | | 31 | | | | 3,833 | |
| Southern Co. (The) | | | 69 | | | | 3,600 | |
| Vistra Corp. | | | 194 | | | | 3,731 | |
| WEC Energy Group, Inc. | | | 43 | | | | 4,045 | |
| Xcel Energy, Inc. | | | 60 | | | | 4,169 | |
| | | | | | | | |
| | | | | | | 123,509 | |
| | | | | | | | |
Total Common Stocks & Other Equity Interests
(Cost $2,669,558) | | | | 2,734,013 | |
| | | | | | | | |
| | |
| Money Market Funds-0.01% | | | | | | | | |
Invesco Premier U.S. Government Money Portfolio, Institutional Class, 0.01%(d)(e)
(Cost $210) | | | 210 | | | | 210 | |
| | | | | | | | |
TOTAL INVESTMENTS IN SECURITIES
(excluding investments purchased with cash collateral from securities on loan)-99.86%
(Cost $2,669,768) | | | | 2,734,223 | |
| | | | | | | | |
| |
| Investments Purchased with Cash Collateral from Securities on Loan | | | | | |
| | |
| Money Market Funds-2.04% | | | | | | | | |
Invesco Private Government Fund,
0.03%(d)(e)(f) | | | 42,741 | | | | 42,741 | |
See accompanying Notes to Financial Statements which are an integral part of the financial statements.
Invesco Russell 1000 Enhanced Equal Weight ETF (USEQ)–(continued)
August 31, 2020
| | | | | | | | |
| | | Shares | | | Value | |
| |
| Money Market Funds-(continued) | | | | | |
Invesco Private Prime Fund, 0.14%(d)(e)(f) | | | 13,090 | | | $ | 13,093 | |
| | | | | | | | |
Total Investments Purchased with Cash Collateral from Securities on Loan
(Cost $55,834) | | | | 55,834 | |
| | | | | | | | |
TOTAL INVESTMENTS IN SECURITIES-101.90%
(Cost $2,725,602) | | | | 2,790,057 | |
| OTHER ASSETS LESS LIABILITIES-(1.90)% | | | | (52,131 | ) |
| | | | | | | | |
| NET ASSETS-100.00% | | | | | | $ | 2,737,926 | |
| | | | | | | | |
Investment Abbreviations:
REIT-Real Estate Investment Trust
Notes to Schedule of Investments:
| (a) | Industry and/or sector classifications used in this report are generally according to the Global Industry Classification Standard, which was developed by and is the exclusive property and a service mark of MSCI Inc. and Standard & Poor’s. |
| (b) | Non-income producing security. |
| (c) | All or a portion of this security was out on loan at August 31, 2020. |
| (d) | Affiliated issuer. The issuer and/or the Fund is a wholly-owned subsidiary of Invesco Ltd., or is affiliated by having an investment adviser that is under common control of Invesco Ltd. The table below shows the Fund’s transactions in, and earnings from, its investments in affiliates for the fiscal year ended August 31, 2020. |
| | | | | | | | | | | | | | | | | | | | | | | | | | | | | | | | | | | |
| | | | | | | | | Change in | | Realized | | | | |
| | | Value | | Purchases | | Proceeds | | Unrealized | | Gain | | Value | | Dividend |
| | | August 31, 2019 | | at Cost | | from Sales | | Appreciation | | (Loss) | | August 31, 2020 | | Income |
| Invesco Ltd. | | | $ | 19,295 | | | | $ | 5,882 | | | | $ | (19,176 | ) | | | $ | 5,863 | | | | $ | (11,864 | ) | | | $ | - | | | | $ | 785 | |
Investments in Affiliated Money Market Funds: | | | | | | | | | | | | | | | | | | | | | | | | | | | | | | | | | | | |
| Invesco Premier U.S. Government Money Portfolio, Institutional Class | | | | - | | | | | 365,920 | | | | | (365,710 | ) | | | | - | | | | | - | | | | | 210 | | | | | 145 | |
| Investments Purchased with Cash Collateral from Securities on Loan: | | | | | | | | | | | | | | | | | | | | | | | | | | | | | | | | | | | |
| Invesco Government & Agency Portfolio, Institutional Class | | | | 164,481 | | | | | 1,400,057 | | | | | (1,564,538 | ) | | | | - | | | | | - | | | | | - | | | | | 1,666 | * |
| Invesco Liquid Assets Portfolio, Institutional Class | | | | 53,557 | | | | | 414,546 | | | | | (468,085 | ) | | | | - | | | | | (18 | ) | | | | - | | | | | 623 | * |
| Invesco Private Government Fund | | | | - | | | | | 276,798 | | | | | (234,057 | ) | | | | - | | | | | - | | | | | 42,741 | | | | | 5 | * |
| Invesco Private Prime Fund | | | | - | | | | | 32,631 | | | | | (19,539 | ) | | | | - | | | | | 1 | | | | | 13,093 | | | | | 3 | * |
| | | | | | | | | | | | | | | | | | | | | | | | | | | | | | | | | | | |
| Total | | | $ | 237,333 | | | | $ | 2,495,834 | | | | $ | (2,671,105 | ) | | | $ | 5,863 | | | | $ | (11,881 | ) | | | $ | 56,044 | | | | $ | 3,227 | |
| | | | | | | | | | | | | | | | | | | | | | | | | | | | | | | | | | | |
| * | Represents the income earned on the investment of cash collateral, which is included in securities lending income on the Statements of Operations. Does not include rebates and fees paid to lending agent or premiums received from borrowers, if any. |
| (e) | The rate shown is the 7-day SEC standardized yield as of August 31, 2020. |
| (f) | The security has been segregated to satisfy the commitment to return the cash collateral received in securities lending transactions upon the borrower’s return of the securities loaned. See Note 2J. |
See accompanying Notes to Financial Statements which are an integral part of the financial statements.
Invesco Russell 1000 Equal Weight ETF (EQAL)
August 31, 2020
Schedule of Investments(a)
| | | | | | | | |
| | | Shares | | | Value | |
| Common Stocks & Other Equity Interests-99.87% | |
Communication Services-4.77% | | | | | | | | |
Activision Blizzard, Inc. | | | 4,245 | | | $ | 354,542 | |
Alphabet, Inc., Class A(b) | | | 242 | | | | 394,346 | |
Altice USA, Inc., Class A(b) | | | 13,193 | | | | 363,863 | |
AT&T, Inc. | | | 36,952 | | | | 1,101,539 | |
Cable One, Inc. | | | 186 | | | | 342,301 | |
CenturyLink, Inc. | | | 110,497 | | | | 1,187,843 | |
Charter Communications, Inc., Class A(b) | | | 604 | | | | 371,828 | |
Comcast Corp., Class A | | | 8,232 | | | | 368,876 | |
Discovery, Inc., Class A(b)(c) | | | 14,422 | | | | 318,221 | |
DISH Network Corp., Class A(b) | | | 8,801 | | | | 312,612 | |
Electronic Arts, Inc.(b) | | | 2,498 | | | | 348,396 | |
Facebook, Inc., Class A(b) | | | 1,371 | �� | | | 401,977 | |
Fox Corp., Class A | | | 11,186 | | | | 311,642 | |
GCI Liberty, Inc., Class A(b) | | | 16,219 | | | | 1,310,171 | |
IAC/InterActiveCorp.(b) | | | 1,066 | | | | 141,767 | |
Interpublic Group of Cos., Inc. (The) | | | 18,496 | | | | 328,489 | |
John Wiley & Sons, Inc., Class A | | | 7,923 | | | | 250,763 | |
Liberty Broadband Corp., Class C(b) | | | 2,491 | | | | 348,964 | |
Liberty Media Corp.-Liberty Formula One, Class C(b) | | | 9,559 | | | | 372,610 | |
Liberty Media Corp.-Liberty SiriusXM, Class C(b) | | | 8,911 | | | | 320,752 | |
Lions Gate Entertainment Corp., Class A(b)(c) | | | 42,783 | | | | 416,706 | |
Live Nation Entertainment, Inc.(b) | | | 6,726 | | | | 382,037 | |
Madison Square Garden Entertainment Corp.(b) | | | 4,105 | | | | 308,573 | |
Madison Square Garden Sports Corp., Class A(b) | | | 2,004 | | | | 328,656 | |
Match Group, Inc.(b) | | | 5,682 | | | | 634,566 | |
Netflix, Inc.(b) | | | 731 | | | | 387,108 | |
New York Times Co. (The), Class A | | | 7,633 | | | | 330,738 | |
News Corp., Class A | | | 27,218 | | | | 411,536 | |
Nexstar Media Group, Inc., Class A | | | 3,675 | | | | 352,837 | |
Omnicom Group, Inc. | | | 5,866 | | | | 317,292 | |
Pinterest, Inc., Class A(b) | | | 13,982 | | | | 514,398 | |
Roku, Inc.(b) | | | 2,542 | | | | 440,986 | |
Sirius XM Holdings, Inc. | | | 53,582 | | | | 314,526 | |
Spotify Technology S.A.(b) | | | 1,440 | | | | 406,310 | |
Take-Two Interactive Software, Inc.(b) | | | 2,283 | | | | 390,827 | |
Telephone & Data Systems, Inc. | | | 56,068 | | | | 1,296,853 | |
T-Mobile US, Inc.(b) | | | 10,539 | | | | 1,229,691 | |
TripAdvisor, Inc. | | | 17,117 | | | | 400,024 | |
Twitter, Inc.(b) | | | 9,470 | | | | 384,293 | |
United States Cellular Corp.(b) | | | 35,871 | | | | 1,304,987 | |
Verizon Communications, Inc. | | | 19,706 | | | | 1,167,975 | |
ViacomCBS, Inc., Class B | | | 13,259 | | | | 369,263 | |
Walt Disney Co. (The) | | | 2,750 | | | | 362,643 | |
World Wrestling Entertainment, Inc., Class A | | | 7,169 | | | | 315,938 | |
Zillow Group, Inc., Class C(b) | | | 3,662 | | | | 314,053 | |
Zynga, Inc., Class A(b) | | | 34,979 | | | | 316,910 | |
| | | | | | | | |
| | | | | | | 22,651,228 | |
| | | | | | | | |
Consumer Discretionary-8.66% | | | | | |
Advance Auto Parts, Inc. | | | 2,203 | | | | 344,351 | |
Amazon.com, Inc.(b) | | | 128 | | | | 441,723 | |
Aptiv PLC | | | 4,240 | | | | 365,149 | |
Aramark | | | 12,843 | | | | 353,953 | |
| | | | | | | | |
| | | Shares | | | Value | |
Consumer Discretionary-(continued) | | | | | |
AutoNation, Inc.(b) | | | 8,253 | | | $ | 469,266 | |
AutoZone, Inc.(b) | | | 285 | | | | 340,948 | |
Best Buy Co., Inc. | | | 3,947 | | | | 437,762 | |
Booking Holdings, Inc.(b) | | | 206 | | | | 393,553 | |
BorgWarner, Inc. | | | 9,756 | | | | 395,996 | |
Bright Horizons Family Solutions, Inc.(b) | | | 2,685 | | | | 357,132 | |
Brunswick Corp. | | | 6,482 | | | | 401,171 | |
Burlington Stores, Inc.(b) | | | 1,543 | | | | 303,863 | |
Capri Holdings Ltd.(b) | | | 19,637 | | | | 311,050 | |
CarMax, Inc.(b) | | | 3,323 | | | | 355,328 | |
Carnival Corp. | | | 17,256 | | | | 284,379 | |
Carter’s, Inc. | | | 3,787 | | | | 301,521 | |
Carvana Co.(b) | | | 2,634 | | | | 568,839 | |
Chegg, Inc.(b) | | | 5,142 | | | | 379,171 | |
Chipotle Mexican Grill, Inc.(b) | | | 313 | | | | 410,118 | |
Choice Hotels International, Inc. | | | 3,800 | | | | 377,302 | |
Columbia Sportswear Co. | | | 4,098 | | | | 350,666 | |
D.R. Horton, Inc. | | | 5,666 | | | | 404,382 | |
Darden Restaurants, Inc. | | | 4,371 | | | | 378,835 | |
Dick’s Sporting Goods, Inc. | | | 7,917 | | | | 428,468 | |
Dollar General Corp. | | | 1,697 | | | | 342,590 | |
Dollar Tree, Inc.(b) | | | 3,588 | | | | 345,417 | |
Domino’s Pizza, Inc. | | | 864 | | | | 353,341 | |
Dunkin’ Brands Group, Inc. | | | 5,039 | | | | 383,367 | |
eBay, Inc. | | | 6,711 | | | | 367,629 | |
Etsy, Inc.(b) | | | 3,729 | | | | 446,361 | |
Expedia Group, Inc. | | | 3,856 | | | | 378,466 | |
Extended Stay America, Inc. | | | 27,260 | | | | 340,477 | |
Five Below, Inc.(b) | | | 2,912 | | | | 318,718 | |
Floor & Decor Holdings, Inc., Class A(b) | | | 5,576 | | | | 408,386 | |
Foot Locker, Inc. | | | 11,098 | | | | 336,602 | |
Ford Motor Co. | | | 51,298 | | | | 349,852 | |
Frontdoor, Inc.(b) | | | 7,162 | | | | 312,048 | |
Gap, Inc. (The) | | | 29,763 | | | | 517,579 | |
Garmin Ltd. | | | 3,411 | | | | 353,414 | |
General Motors Co. | | | 11,980 | | | | 354,967 | |
Gentex Corp. | | | 12,142 | | | | 328,441 | |
Genuine Parts Co. | | | 3,680 | | | | 347,539 | |
Graham Holdings Co., Class B | | | 963 | | | | 412,116 | |
Grand Canyon Education, Inc.(b) | | | 3,405 | | | | 320,206 | |
Grubhub, Inc.(b) | | | 5,062 | | | | 366,236 | |
H&R Block, Inc. | | | 19,836 | | | | 287,622 | |
Hanesbrands, Inc. | | | 27,495 | | | | 420,399 | |
Harley-Davidson, Inc. | | | 13,055 | | | | 361,754 | |
Hasbro, Inc. | | | 4,315 | | | | 340,626 | |
Hilton Worldwide Holdings, Inc. | | | 4,162 | | | | 376,078 | |
Home Depot, Inc. (The) | | | 1,311 | | | | 373,687 | |
Hyatt Hotels Corp., Class A | | | 5,850 | | | | 330,467 | |
Kohl’s Corp. | | | 13,900 | | | | 296,904 | |
L Brands, Inc. | | | 20,781 | | | | 610,961 | |
Las Vegas Sands Corp. | | | 6,742 | | | | 341,887 | |
Lear Corp. | | | 3,022 | | | | 344,296 | |
Leggett & Platt, Inc. | | | 9,380 | | | | 384,580 | |
Lennar Corp., Class A | | | 5,235 | | | | 391,683 | |
LKQ Corp.(b) | | | 12,497 | | | | 396,655 | |
Lowe’s Cos., Inc. | | | 2,401 | | | | 395,421 | |
lululemon athletica, inc.(b) | | | 1,076 | | | | 404,221 | |
Marriott International, Inc., Class A | | | 3,494 | | | | 359,568 | |
See accompanying Notes to Financial Statements which are an integral part of the financial statements.
Invesco Russell 1000 Equal Weight ETF (EQAL)–(continued)
August 31, 2020
| | | | | | | | |
| | | Shares | | Value | |
Consumer Discretionary-(continued) | |
Mattel, Inc.(b) | | | 32,692 | | | $ | 351,276 | |
McDonald’s Corp. | | | 1,713 | | | | 365,760 | |
MGM Resorts International | | | 17,484 | | | | 393,390 | |
Mohawk Industries, Inc.(b) | | | 3,420 | | | | 315,769 | |
Newell Brands, Inc. | | | 21,014 | | | | 335,804 | |
NIKE, Inc., Class B | | | 3,306 | | | | 369,908 | |
Nordstrom, Inc.(c) | | | 17,824 | | | | 285,184 | |
Norwegian Cruise Line Holdings
Ltd.(b)(c) | | | 16,809 | | | | 287,602 | |
NVR, Inc.(b) | | | 101 | | | | 421,002 | |
Ollie’s Bargain Outlet Holdings,
Inc.(b) | | | 3,162 | | | | 302,098 | |
O’Reilly Automotive, Inc.(b) | | | 769 | | | | 358,069 | |
Peloton Interactive, Inc., Class A(b) | | | 6,348 | | | | 486,701 | |
Penske Automotive Group, Inc. | | | 8,048 | | | | 379,624 | |
Planet Fitness, Inc., Class A(b) | | | 4,888 | | | | 297,142 | |
Polaris, Inc. | | | 3,446 | | | | 348,184 | |
Pool Corp. | | | 1,218 | | | | 399,309 | |
PulteGroup, Inc. | | | 9,115 | | | | 406,438 | |
PVH Corp. | | | 6,530 | | | | 364,113 | |
Qurate Retail, Inc., Class A(b) | | | 34,547 | | | | 381,744 | |
Ralph Lauren Corp. | | | 4,381 | | | | 301,544 | |
Ross Stores, Inc. | | | 3,507 | | | | 319,418 | |
Royal Caribbean Cruises Ltd. | | | 5,465 | | | | 376,211 | |
Service Corp. International | | | 8,203 | | | | 374,467 | |
ServiceMaster Global Holdings,
Inc.(b) | | | 9,089 | | | | 362,651 | |
Six Flags Entertainment Corp. | | | 13,877 | | | | 301,547 | |
Skechers U.S.A., Inc., Class A(b) | | | 9,977 | | | | 297,813 | |
Starbucks Corp. | | | 4,255 | | | | 359,420 | |
Tapestry, Inc. | | | 23,228 | | | | 342,148 | |
Target Corp. | | | 2,773 | | | | 419,305 | |
Tempur Sealy International, Inc.(b) | | | 4,438 | | | | 379,627 | |
Tesla, Inc.(b) | | | 1,605 | | | | 799,804 | |
Thor Industries, Inc. | | | 2,830 | | | | 267,237 | |
Tiffany & Co. | | | 2,676 | | | | 327,810 | |
TJX Cos., Inc. (The) | | | 6,066 | | | | 332,356 | |
Toll Brothers, Inc. | | | 10,043 | | | | 424,015 | |
Tractor Supply Co. | | | 2,582 | | | | 384,279 | |
Ulta Beauty, Inc.(b) | | | 1,478 | | | | 343,162 | |
Under Armour, Inc., Class A(b)(c) | | | 33,199 | | | | 325,682 | |
Vail Resorts, Inc. | | | 1,763 | | | | 383,752 | |
VF Corp. | | | 5,113 | | | | 336,180 | |
Wayfair, Inc., Class A(b)(c) | | | 1,624 | | | | 481,613 | |
Wendy’s Co. (The) | | | 14,727 | | | | 308,383 | |
Whirlpool Corp. | | | 2,563 | | | | 455,496 | |
Williams-Sonoma, Inc. | | | 3,763 | | | | 330,241 | |
Wyndham Destinations, Inc. | | | 10,672 | | | | 309,381 | |
Wyndham Hotels & Resorts, Inc. | | | 6,939 | | | | 363,326 | |
Wynn Resorts Ltd. | | | 3,675 | | | | 321,379 | |
Yum China Holdings, Inc. (China) | | | 6,450 | | | | 372,230 | |
Yum! Brands, Inc. | | | 3,609 | | | | 345,923 | |
| | | | | | | | |
| | | | | | | 41,151,004 | |
| | | | | | | | |
Consumer Staples-10.88% | | | | | | | | |
Altria Group, Inc. | | | 23,330 | | | | 1,020,454 | |
Archer-Daniels-Midland Co. | | | 23,846 | | | | 1,067,347 | |
Beyond Meat, Inc.(b)(c) | | | 6,126 | | | | 832,217 | |
Boston Beer Co., Inc. (The), Class A(b) | | | 1,804 | | | | 1,591,092 | |
Brown-Forman Corp., Class B | | | 14,493 | | | | 1,060,453 | |
Bunge Ltd. | | | 23,487 | | | | 1,071,477 | |
Campbell Soup Co. | | | 19,718 | | | | 1,037,364 | |
Casey’s General Stores, Inc. | | | 6,278 | | | | 1,116,542 | |
| | | | | | | | |
| | | Shares | | Value | |
Consumer Staples-(continued) | | | | | | | | |
Church & Dwight Co., Inc. | | | 12,439 | | | $ | 1,192,029 | |
Clorox Co. (The) | | | 4,512 | | | | 1,008,432 | |
Coca-Cola Co. (The) | | | 20,577 | | | | 1,019,179 | |
Colgate-Palmolive Co. | | | 13,139 | | | | 1,041,397 | |
Conagra Brands, Inc. | | | 28,245 | | | | 1,083,478 | |
Constellation Brands, Inc., Class A | | | 5,241 | | | | 966,860 | |
Costco Wholesale Corp. | | | 1,088 | | | | 378,254 | |
Coty, Inc., Class A | | | 69,072 | | | | 247,278 | |
Energizer Holdings, Inc. | | | 20,704 | | | | 958,388 | |
Estee Lauder Cos., Inc. (The), Class A | | | 1,659 | | | | 367,833 | |
Flowers Foods, Inc. | | | 42,276 | | | | 1,034,071 | |
General Mills, Inc. | | | 15,664 | | | | 1,001,713 | |
Grocery Outlet Holding Corp.(b) | | | 27,800 | | | | 1,143,414 | |
Hain Celestial Group, Inc. (The)(b) | | | 31,206 | | | | 1,023,245 | |
Herbalife Nutrition Ltd.(b) | | | 21,812 | | | | 1,072,060 | |
Hershey Co. (The) | | | 7,307 | | | | 1,086,112 | |
Hormel Foods Corp. | | | 20,101 | | | | 1,024,749 | |
Ingredion, Inc. | | | 11,238 | | | | 903,985 | |
JM Smucker Co. (The) | | | 8,903 | | | | 1,069,962 | |
Kellogg Co. | | | 14,276 | | | | 1,012,311 | |
Keurig Dr Pepper, Inc. | | | 33,292 | | | | 993,100 | |
Kimberly-Clark Corp. | | | 6,796 | | | | 1,072,137 | |
Kraft Heinz Co. (The) | | | 29,169 | | | | 1,022,082 | |
Kroger Co. (The) | | | 30,416 | | | | 1,085,243 | |
Lamb Weston Holdings, Inc. | | | 14,268 | | | | 896,744 | |
McCormick & Co., Inc. | | | 5,573 | | | | 1,149,153 | |
Molson Coors Beverage Co., Class B | | | 24,756 | | | | 931,816 | |
Mondelez International, Inc., Class A | | | 18,222 | | | | 1,064,529 | |
Monster Beverage Corp.(b) | | | 13,883 | | | | 1,164,228 | |
Nu Skin Enterprises, Inc., Class A | | | 25,465 | | | | 1,203,731 | |
PepsiCo, Inc. | | | 7,295 | | | | 1,021,738 | |
Philip Morris International, Inc. | | | 12,978 | | | | 1,035,515 | |
Pilgrim’s Pride Corp.(b) | | | 53,216 | | | | 851,456 | |
Post Holdings, Inc.(b) | | | 10,870 | | | | 956,777 | |
Procter & Gamble Co. (The) | | | 8,121 | | | | 1,123,378 | |
Reynolds Consumer Products, Inc. | | | 9,570 | | | | 318,011 | |
Seaboard Corp. | | | 312 | | | | 837,096 | |
Spectrum Brands Holdings, Inc. | | | 20,845 | | | | 1,242,362 | |
Sprouts Farmers Market, Inc.(b) | | | 43,395 | | | | 1,013,273 | |
Sysco Corp. | | | 17,302 | | | | 1,040,542 | |
TreeHouse Foods, Inc.(b) | | | 19,938 | | | | 853,546 | |
Tyson Foods, Inc., Class A | | | 15,110 | | | | 948,908 | |
US Foods Holding Corp.(b) | | | 48,396 | | | | 1,178,443 | |
Walgreens Boots Alliance, Inc. | | | 23,046 | | | | 876,209 | |
Walmart, Inc. | | | 2,758 | | | | 382,948 | |
| | | | | | | | |
| | | | | | | 51,694,661 | |
| | | | | | | | |
Energy-8.61% | |
Antero Midstream Corp.(c) | | | 208,402 | | | | 1,410,882 | |
Apache Corp. | | | 86,749 | | | | 1,283,885 | |
Baker Hughes Co., Class A | | | 76,588 | | | | 1,093,677 | |
Cabot Oil & Gas Corp. | | | 65,719 | | | | 1,246,689 | |
Cheniere Energy, Inc.(b) | | | 25,490 | | | | 1,326,755 | |
Chevron Corp. | | | 13,413 | | | | 1,125,753 | |
Cimarex Energy Co. | | | 42,492 | | | | 1,180,428 | |
Concho Resources, Inc. | | | 21,643 | | | | 1,125,003 | |
ConocoPhillips | | | 27,761 | | | | 1,051,864 | |
Continental Resources, Inc.(c) | | | 71,737 | | | | 1,232,442 | |
Devon Energy Corp. | | | 95,258 | | | | 1,035,454 | |
Diamondback Energy, Inc. | | | 26,475 | | | | 1,031,466 | |
See accompanying Notes to Financial Statements which are an integral part of the financial statements.
Invesco Russell 1000 Equal Weight ETF (EQAL)–(continued)
August 31, 2020
| | | | | | | | |
| | | Shares | | Value | |
Energy-(continued) | | | | | | | | |
EOG Resources, Inc. | | | 23,307 | | | $ | 1,056,739 | |
EQT Corp. | | | 90,193 | | | | 1,431,363 | |
Equitrans Midstream Corp. | | | 128,109 | | | | 1,316,961 | |
Exxon Mobil Corp. | | | 26,303 | | | | 1,050,542 | |
Halliburton Co. | | | 93,527 | | | | 1,513,267 | |
Helmerich & Payne, Inc. | | | 57,065 | | | | 940,431 | |
Hess Corp. | | | 23,884 | | | | 1,099,619 | |
HollyFrontier Corp. | | | 37,882 | | | | 904,243 | |
Kinder Morgan, Inc. | | | 78,222 | | | | 1,081,028 | |
Marathon Oil Corp. | | | 190,087 | | | | 1,003,659 | |
Marathon Petroleum Corp. | | | 32,071 | | | | 1,137,238 | |
Murphy Oil Corp.(c) | | | 82,737 | | | | 1,136,806 | |
National Oilwell Varco, Inc. | | | 100,546 | | | | 1,206,552 | |
Noble Energy, Inc. | | | 120,605 | | | | 1,200,020 | |
Occidental Petroleum Corp. | | | 62,724 | | | | 799,104 | |
ONEOK, Inc. | | | 33,925 | | | | 932,259 | |
Parsley Energy, Inc., Class A | | | 110,839 | | | | 1,191,519 | |
Phillips 66 | | | 16,182 | | | | 946,162 | |
Pioneer Natural Resources Co. | | | 13,051 | | | | 1,356,390 | |
Schlumberger Ltd. | | | 61,130 | | | | 1,162,081 | |
Targa Resources Corp. | | | 56,801 | | | | 966,185 | |
Valero Energy Corp. | | | 19,084 | | | | 1,003,628 | |
Williams Cos., Inc. (The) | | | 63,423 | | | | 1,316,661 | |
WPX Energy, Inc.(b) | | | 182,510 | | | | 1,014,756 | |
| | | | | | | | |
| | | | | | | 40,911,511 | |
| | | | | | | | |
Financials-6.37% | | | | | | | | |
Affiliated Managers Group, Inc. | | | 2,769 | | | | 190,092 | |
Aflac, Inc. | | | 5,573 | | | | 202,411 | |
AGNC Investment Corp. | | | 15,652 | | | | 220,850 | |
Alleghany Corp. | | | 456 | | | | 252,879 | |
Allstate Corp. (The) | | | 2,083 | | | | 193,719 | |
Ally Financial, Inc. | | | 10,353 | | | | 236,877 | |
American Express Co. | | | 2,019 | | | | 205,110 | |
American Financial Group, Inc. | | | 3,466 | | | | 231,702 | |
American International Group, Inc. | | | 6,351 | | | | 185,068 | |
American National Group, Inc. | | | 2,761 | | | | 207,103 | |
Ameriprise Financial, Inc. | | | 1,375 | | | | 215,600 | |
Annaly Capital Management, Inc. | | | 29,657 | | | | 217,979 | |
Aon PLC, Class A | | | 1,085 | | | | 216,989 | |
Apollo Global Management, Inc. | | | 4,179 | | | | 195,870 | |
Arch Capital Group Ltd.(b) | | | 6,763 | | | | 213,305 | |
Ares Management Corp., Class A | | | 5,241 | | | | 211,998 | |
Arthur J. Gallagher & Co. | | | 2,075 | | | | 218,498 | |
Associated Banc-Corp. | | | 15,661 | | | | 210,484 | |
Assurant, Inc. | | | 1,934 | | | | 235,097 | |
Assured Guaranty Ltd. | | | 8,063 | | | | 172,951 | |
Athene Holding Ltd., Class A(b) | | | 6,598 | | | | 241,223 | |
AXIS Capital Holdings Ltd. | | | 4,889 | | | | 233,499 | |
Bank of America Corp. | | | 8,245 | | | | 212,226 | |
Bank of Hawaii Corp. | | | 3,241 | | | | 178,385 | |
Bank of New York Mellon Corp. (The) | | | 5,349 | | | | 197,806 | |
Bank OZK | | | 8,435 | | | | 194,342 | |
Berkshire Hathaway, Inc., Class B(b) | | | 1,142 | | | | 249,002 | |
BlackRock, Inc. | | | 402 | | | | 238,864 | |
BOK Financial Corp. | | | 3,391 | | | | 190,371 | |
Brighthouse Financial, Inc.(b) | | | 7,132 | | | | 216,528 | |
Brown & Brown, Inc. | | | 4,925 | | | | 228,520 | |
Capital One Financial Corp. | | | 3,268 | | | | 225,590 | |
Carlyle Group, Inc. (The)(c) | | | 6,050 | | | | 156,151 | |
| | | | | | | | |
| | | Shares | | Value | |
Financials-(continued) | | | | | | | | |
Cboe Global Markets, Inc. | | | 1,889 | | | $ | 173,391 | |
Charles Schwab Corp. (The) | | | 6,071 | | | | 215,703 | |
Chubb Ltd. | | | 1,601 | | | | 200,125 | |
Cincinnati Financial Corp. | | | 3,281 | | | | 260,544 | |
Citigroup, Inc. | | | 3,899 | | | | 199,317 | |
Citizens Financial Group, Inc. | | | 8,725 | | | | 225,716 | |
CME Group, Inc., Class A | | | 1,075 | | | | 189,060 | |
CNA Financial Corp. | | | 6,285 | | | | 202,188 | |
Comerica, Inc. | | | 5,590 | | | | 220,973 | |
Commerce Bancshares, Inc. | | | 3,370 | | | | 200,751 | |
Credit Acceptance Corp.(b)(c) | | | 487 | | | | 188,372 | |
Cullen/Frost Bankers, Inc. | | | 2,377 | | | | 165,106 | |
Discover Financial Services | | | 3,821 | | | | 202,819 | |
E*TRADE Financial Corp. | | | 4,215 | | | | 228,032 | |
East West Bancorp, Inc. | | | 5,913 | | | | 217,480 | |
Eaton Vance Corp. | | | 5,113 | | | | 209,735 | |
Equitable Holdings, Inc. | | | 10,312 | | | | 218,511 | |
Erie Indemnity Co., Class A | | | 1,143 | | | | 243,962 | |
Evercore, Inc., Class A | | | 3,491 | | | | 216,023 | |
Everest Re Group Ltd. | | | 1,040 | | | | 228,883 | |
F.N.B. Corp. | | | 26,742 | | | | 200,565 | |
FactSet Research Systems, Inc. | | | 745 | | | | 261,048 | |
Fidelity National Financial, Inc. | | | 6,432 | | | | 211,163 | |
Fifth Third Bancorp | | | 9,571 | | | | 197,737 | |
First American Financial Corp. | | | 4,419 | | | | 232,307 | |
First Citizens BancShares, Inc., Class A | | | 553 | | | | 217,412 | |
First Hawaiian, Inc. | | | 11,567 | | | | 191,203 | |
First Horizon National Corp. | | | 19,998 | | | | 190,981 | |
First Republic Bank | | | 1,873 | | | | 211,480 | |
Franklin Resources, Inc. | | | 9,148 | | | | 192,657 | |
Globe Life, Inc. | | | 2,684 | | | | 221,376 | |
Goldman Sachs Group, Inc. (The) | | | 1,022 | | | | 209,377 | |
Hanover Insurance Group, Inc. (The) | | | 2,024 | | | | 207,440 | |
Hartford Financial Services Group, Inc. (The) | | | 5,018 | | | | 202,978 | |
Huntington Bancshares, Inc. | | | 22,377 | | | | 210,568 | |
Interactive Brokers Group, Inc., Class A | | | 4,875 | | | | 258,473 | |
Intercontinental Exchange, Inc. | | | 2,194 | | | | 233,069 | |
Invesco Ltd.(d) | | | 18,221 | | | | 185,854 | |
Jefferies Financial Group, Inc. | | | 13,411 | | | | 235,229 | |
JPMorgan Chase & Co. | | | 2,080 | | | | 208,395 | |
Kemper Corp. | | | 2,897 | | | | 224,981 | |
KeyCorp | | | 13,825 | | | | 170,324 | |
KKR & Co., Inc., Class A | | | 6,513 | | | | 233,296 | |
Lazard Ltd., Class A | | | 6,813 | | | | 215,768 | |
LendingTree, Inc.(b)(c) | | | 760 | | | | 234,794 | |
Lincoln National Corp. | | | 5,567 | | | | 200,690 | |
Loews Corp. | | | 6,085 | | | | 218,208 | |
LPL Financial Holdings, Inc. | | | 2,533 | | | | 208,111 | |
M&T Bank Corp. | | | 1,707 | | | | 176,265 | |
Markel Corp.(b) | | | 223 | | | | 242,363 | |
MarketAxess Holdings, Inc. | | | 403 | | | | 195,834 | |
Marsh & McLennan Cos., Inc. | | | 1,911 | | | | 219,593 | |
Mercury General Corp. | | | 4,917 | | | | 219,937 | |
MetLife, Inc. | | | 5,416 | | | | 208,299 | |
MGIC Investment Corp. | | | 24,123 | | | | 221,208 | |
Moody’s Corp. | | | 759 | | | | 223,632 | |
Morgan Stanley | | | 4,334 | | | | 226,495 | |
Morningstar, Inc. | | | 1,490 | | | | 238,624 | |
MSCI, Inc. | | | 665 | | | | 248,225 | |
Nasdaq, Inc. | | | 1,729 | | | | 232,412 | |
See accompanying Notes to Financial Statements which are an integral part of the financial statements.
Invesco Russell 1000 Equal Weight ETF (EQAL)–(continued)
August 31, 2020
| | | | | | | | |
| | | Shares | | Value | |
Financials-(continued) | | | | | | | | |
New Residential Investment Corp. | | | 27,055 | | | $ | 209,406 | |
New York Community Bancorp, Inc. | | | 19,660 | | | | 177,923 | |
Northern Trust Corp. | | | 2,732 | | | | 223,723 | |
Old Republic International Corp. | | | 12,520 | | | | 201,697 | |
OneMain Holdings, Inc. | | | 7,928 | | | | 230,546 | |
PacWest Bancorp | | | 11,268 | | | | 214,993 | |
People’s United Financial, Inc. | | | 17,255 | | | | 182,558 | |
Pinnacle Financial Partners, Inc. | | | 4,769 | | | | 190,522 | |
PNC Financial Services Group, Inc. (The) | | | 1,874 | | | | 208,389 | |
Popular, Inc. | | | 5,308 | | | | 196,608 | |
Primerica, Inc. | | | 1,919 | | | | 239,587 | |
Principal Financial Group, Inc. | | | 4,883 | | | | 205,623 | |
Progressive Corp. (The) | | | 2,553 | | | | 242,637 | |
Prosperity Bancshares, Inc. | | | 3,320 | | | | 181,006 | |
Prudential Financial, Inc. | | | 3,217 | | | | 218,016 | |
Raymond James Financial, Inc. | | | 2,857 | | | | 216,332 | |
Regions Financial Corp. | | | 18,345 | | | | 212,068 | |
Reinsurance Group of America, Inc. | | | 2,442 | | | | 223,883 | |
RenaissanceRe Holdings Ltd. (Bermuda) | | | 1,240 | | | | 227,838 | |
S&P Global, Inc. | | | 627 | | | | 229,745 | |
Santander Consumer USA Holdings, Inc. | | | 10,804 | | | | 185,937 | |
SEI Investments Co. | | | 3,704 | | | | 193,941 | |
Signature Bank | | | 1,931 | | | | 187,365 | |
SLM Corp. | | | 29,654 | | | | 226,557 | |
Starwood Property Trust, Inc. | | | 13,244 | | | | 206,606 | |
State Street Corp. | | | 3,247 | | | | 221,088 | |
Sterling Bancorp | | | 16,978 | | | | 198,133 | |
SVB Financial Group(b) | | | 930 | | | | 237,503 | |
Synchrony Financial | | | 9,290 | | | | 230,485 | |
Synovus Financial Corp. | | | 10,228 | | | | 223,686 | |
T. Rowe Price Group, Inc. | | | 1,649 | | | | 229,557 | |
TCF Financial Corp. | | | 5,895 | | | | 158,458 | |
TD Ameritrade Holding Corp. | | | 5,190 | | | | 199,192 | |
TFS Financial Corp. | | | 14,019 | | | | 216,594 | |
Tradeweb Markets, Inc., Class A | | | 3,235 | | | | 185,333 | |
Travelers Cos., Inc. (The) | | | 1,774 | | | | 205,855 | |
Truist Financial Corp. | | | 5,547 | | | | 215,279 | |
U.S. Bancorp | | | 5,357 | | | | 194,995 | |
Umpqua Holdings Corp. | | | 19,399 | | | | 218,821 | |
Unum Group | | | 12,038 | | | | 222,462 | |
Virtu Financial, Inc., Class A | | | 8,865 | | | | 228,983 | |
Voya Financial, Inc. | | | 4,389 | | | | 227,833 | |
W.R. Berkley Corp. | | | 3,527 | | | | 218,850 | |
Webster Financial Corp. | | | 7,598 | | | | 208,945 | |
Wells Fargo & Co. | | | 7,487 | | | | 180,811 | |
Western Alliance Bancorporation | | | 5,229 | | | | 184,584 | |
White Mountains Insurance Group Ltd. | | | 243 | | | | 216,610 | |
Willis Towers Watson PLC | | | 1,059 | | | | 217,656 | |
Wintrust Financial Corp. | | | 4,856 | | | | 211,333 | |
Zions Bancorporation N.A | | | 5,202 | | | | 167,296 | |
| | | | | | | | |
| | | | | | | 30,295,999 | |
| | | | | | | | |
Health Care-11.97% | | | | | | | | |
10X Genomics, Inc., Class A(b) | | | 4,754 | | | | 544,904 | |
Abbott Laboratories | | | 4,663 | | | | 510,459 | |
AbbVie, Inc. | | | 4,374 | | | | 418,898 | |
ABIOMED, Inc.(b) | | | 1,668 | | | | 513,110 | |
Acadia Healthcare Co., Inc.(b) | | | 15,915 | | | | 491,933 | |
ACADIA Pharmaceuticals, Inc.(b) | | | 8,550 | | | | 338,495 | |
Acceleron Pharma, Inc.(b) | | | 4,246 | | | | 413,858 | |
| | | | | | | | |
| | | Shares | | Value | |
Health Care-(continued) | | | | | | | | |
Adaptive Biotechnologies Corp.(b) | | | 9,457 | | | $ | 393,506 | |
Agilent Technologies, Inc. | | | 4,785 | | | | 480,510 | |
Agios Pharmaceuticals, Inc.(b) | | | 8,788 | | | | 360,396 | |
Alexion Pharmaceuticals, Inc.(b) | | | 3,631 | | | | 414,733 | |
Align Technology, Inc.(b) | | | 1,602 | | | | 475,762 | |
Alkermes PLC(b) | | | 23,769 | | | | 393,139 | |
Alnylam Pharmaceuticals, Inc.(b) | | | 2,961 | | | | 392,747 | |
Amedisys, Inc.(b) | | | 2,228 | | | | 538,953 | |
AmerisourceBergen Corp. | | | 4,211 | | | | 408,593 | |
Amgen, Inc. | | | 1,822 | | | | 461,549 | |
Anthem, Inc. | | | 1,597 | | | | 449,587 | |
Avantor, Inc.(b) | | | 24,130 | | | | 544,614 | |
Baxter International, Inc. | | | 5,036 | | | | 438,485 | |
Becton, Dickinson and Co. | | | 1,779 | | | | 431,888 | |
Biogen, Inc.(b) | | | 1,627 | | | | 467,990 | |
BioMarin Pharmaceutical, Inc.(b) | | | 3,704 | | | | 289,023 | |
Bio-Rad Laboratories, Inc., Class A(b) | | | 923 | | | | 469,429 | |
Bio-Techne Corp. | | | 1,664 | | | | 425,085 | |
Bluebird Bio, Inc.(b) | | | 6,577 | | | | 390,016 | |
Boston Scientific Corp.(b) | | | 11,489 | | | | 471,279 | |
Bristol-Myers Squibb Co. | | | 7,546 | | | | 469,361 | |
Bruker Corp. | | | 10,262 | | | | 431,209 | |
Cardinal Health, Inc. | | | 7,942 | | | | 403,136 | |
Catalent, Inc.(b) | | | 5,959 | | | | 551,208 | |
Centene Corp.(b) | | | 6,591 | | | | 404,160 | |
Cerner Corp. | | | 6,043 | | | | 443,375 | |
Change Healthcare, Inc.(b) | | | 35,051 | | | | 495,972 | |
Charles River Laboratories International, Inc.(b) | | | 2,355 | | | | 515,627 | |
Chemed Corp. | | | 931 | | | | 481,429 | |
Cigna Corp. | | | 2,224 | | | | 394,471 | |
Cooper Cos., Inc. (The) | | | 1,399 | | | | 439,818 | |
CVS Health Corp. | | | 15,008 | | | | 932,297 | |
Danaher Corp. | | | 2,387 | | | | 492,844 | |
DaVita, Inc.(b) | | | 5,398 | | | | 468,331 | |
DENTSPLY SIRONA, Inc. | | | 9,557 | | | | 428,823 | |
DexCom, Inc.(b) | | | 1,056 | | | | 449,233 | |
Edwards Lifesciences Corp.(b) | | | 6,023 | | | | 517,014 | |
Elanco Animal Health, Inc.(b) | | | 19,280 | | | | 560,277 | |
Eli Lilly and Co. | | | 2,614 | | | | 387,891 | |
Encompass Health Corp. | | | 6,471 | | | | 422,168 | |
Envista Holdings Corp.(b) | | | 20,198 | | | | 484,550 | |
Exact Sciences Corp.(b) | | | 4,894 | | | | 368,469 | |
Exelixis, Inc.(b) | | | 18,769 | | | | 417,047 | |
Gilead Sciences, Inc. | | | 5,695 | | | | 380,141 | |
Global Blood Therapeutics, Inc.(b) | | | 6,571 | | | | 412,527 | |
Globus Medical, Inc., Class A(b) | | | 8,879 | | | | 501,841 | |
Guardant Health, Inc.(b) | | | 5,309 | | | | 507,010 | |
Haemonetics Corp.(b) | | | 4,910 | | | | 440,231 | |
HCA Healthcare, Inc. | | | 4,217 | | | | 572,331 | |
Henry Schein, Inc.(b) | | | 7,104 | | | | 471,990 | |
Hill-Rom Holdings, Inc. | | | 4,463 | | | | 418,585 | |
Hologic, Inc.(b) | | | 7,948 | | | | 474,655 | |
Horizon Therapeutics PLC(b) | | | 8,716 | | | | 654,746 | |
Humana, Inc. | | | 1,114 | | | | 462,499 | |
ICU Medical, Inc.(b) | | | 2,351 | | | | 470,764 | |
IDEXX Laboratories, Inc.(b) | | | 1,353 | | | | 529,104 | |
Illumina, Inc.(b) | | | 1,160 | | | | 414,375 | |
Immunomedics, Inc.(b) | | | 12,542 | | | | 558,872 | |
Incyte Corp.(b) | | | 4,327 | | | | 416,906 | |
See accompanying Notes to Financial Statements which are an integral part of the financial statements.
Invesco Russell 1000 Equal Weight ETF (EQAL)–(continued)
August 31, 2020
| | | | | | | | |
| | | Shares | | | Value | |
Health Care-(continued) | | | | | | | | |
Insulet Corp.(b) | | | 2,229 | | | $ | 486,479 | |
Integra LifeSciences Holdings
Corp.(b) | | | 8,792 | | | | 420,170 | |
Intuitive Surgical, Inc.(b) | | | 730 | | | | 533,513 | |
Ionis Pharmaceuticals, Inc.(b) | | | 7,258 | | | | 395,561 | |
Iovance Biotherapeutics, Inc.(b) | | | 14,094 | | | | 469,753 | |
IQVIA Holdings, Inc.(b) | | | 3,059 | | | | 500,911 | |
Jazz Pharmaceuticals PLC(b) | | | 3,797 | | | | 510,279 | |
Johnson & Johnson | | | 2,934 | | | | 450,105 | |
Laboratory Corp. of America Holdings(b) | | | 2,508 | | | | 440,781 | |
Livongo Health, Inc.(b) | | | 6,011 | | | | 825,310 | |
Masimo Corp.(b) | | | 1,911 | | | | 428,064 | |
McKesson Corp. | | | 6,303 | | | | 967,132 | |
Medtronic PLC | | | 4,472 | | | | 480,606 | |
Merck & Co., Inc. | | | 5,524 | | | | 471,032 | |
Mettler-Toledo International, Inc.(b) | | | 502 | | | | 487,332 | |
Moderna, Inc.(b)(c) | | | 6,497 | | | | 421,590 | |
Molina Healthcare, Inc.(b) | | | 2,471 | | | | 457,061 | |
Mylan N.V.(b) | | | 25,830 | | | | 423,095 | |
Nektar Therapeutics(b) | | | 19,202 | | | | 371,367 | |
Neurocrine Biosciences, Inc.(b) | | | 3,479 | | | | 405,025 | |
Novocure Ltd.(b) | | | 6,752 | | | | 558,728 | |
Penumbra, Inc.(b) | | | 2,446 | | | | 511,581 | |
PerkinElmer, Inc. | | | 4,301 | | | | 506,314 | |
Perrigo Co. PLC | | | 7,725 | | | | 404,018 | |
Pfizer, Inc. | | | 12,696 | | | | 479,782 | |
PPD, Inc.(b) | | | 15,441 | | | | 530,244 | |
PRA Health Sciences, Inc.(b) | | | 4,328 | | | | 462,706 | |
Premier, Inc., Class A | | | 12,159 | | | | 398,207 | |
QIAGEN N.V.(b) | | | 9,938 | | | | 506,441 | |
Quest Diagnostics, Inc. | | | 3,789 | | | | 421,488 | |
Quidel Corp.(b) | | | 2,024 | | | | 356,143 | |
Reata Pharmaceuticals, Inc., Class A(b) | | | 2,623 | | | | 275,284 | |
Regeneron Pharmaceuticals, Inc.(b) | | | 696 | | | | 431,471 | |
Repligen Corp.(b) | | | 3,698 | | | | 572,857 | |
ResMed, Inc. | | | 2,437 | | | | 440,561 | |
Sage Therapeutics, Inc.(b) | | | 10,510 | | | | 551,144 | |
Sarepta Therapeutics, Inc.(b) | | | 2,553 | | | | 373,810 | |
Seattle Genetics, Inc.(b) | | | 2,630 | | | | 416,434 | |
STERIS PLC | | | 2,757 | | | | 440,127 | |
Stryker Corp. | | | 2,224 | | | | 440,708 | |
Syneos Health, Inc.(b) | | | 7,794 | | | | 491,801 | |
Tandem Diabetes Care, Inc.(b) | | | 4,806 | | | | 541,732 | |
Teladoc Health, Inc.(b)(c) | | | 2,203 | | | | 475,165 | |
Teleflex, Inc. | | | 1,152 | | | | 452,678 | |
Thermo Fisher Scientific, Inc. | | | 1,208 | | | | 518,208 | |
United Therapeutics Corp.(b) | | | 3,650 | | | | 390,404 | |
UnitedHealth Group, Inc. | | | 1,445 | | | | 451,635 | |
Universal Health Services, Inc., Class B | | | 4,310 | | | | 475,609 | |
Varian Medical Systems, Inc.(b) | | | 3,521 | | | | 611,492 | |
Veeva Systems, Inc., Class A(b) | | | 1,860 | | | | 525,022 | |
Vertex Pharmaceuticals, Inc.(b) | | | 1,504 | | | | 419,796 | |
Waters Corp.(b) | | | 2,006 | | | | 433,818 | |
West Pharmaceutical Services, Inc. | | | 1,984 | | | | 563,377 | |
Zimmer Biomet Holdings, Inc. | | | 3,317 | | | | 467,299 | |
Zoetis, Inc. | | | 3,074 | | | | 492,147 | |
| | | | | | | | |
| | | | | | | 56,907,625 | |
| | | | | | | | |
Industrials-13.70% | | | | | | | | |
3M Co. | | | 2,449 | | | | 399,236 | |
A.O. Smith Corp. | | | 15,135 | | | | 741,161 | |
| | | | | | | | |
| | | Shares | | | Value | |
Industrials-(continued) | | | | | | | | |
Acuity Brands, Inc. | | | 7,929 | | | $ | 866,560 | |
ADT, Inc.(c) | | | 46,642 | | | | 496,737 | |
AECOM(b) | | | 9,985 | | | | 394,507 | |
AGCO Corp. | | | 7,168 | | | | 509,645 | |
Air Lease Corp. | | | 12,701 | | | | 394,747 | |
Alaska Air Group, Inc. | | | 10,386 | | | | 404,535 | |
Allegion PLC | | | 3,767 | | | | 389,470 | |
Allison Transmission Holdings, Inc. | | | 10,523 | | | | 377,460 | |
AMERCO | | | 1,048 | | | | 371,925 | |
American Airlines Group, Inc.(c) | | | 23,565 | | | | 307,523 | |
AMETEK, Inc. | | | 4,349 | | | | 437,944 | |
Armstrong World Industries, Inc. | | | 9,568 | | | | 705,544 | |
Axon Enterprise, Inc.(b) | | | 4,234 | | | | 362,769 | |
Boeing Co. (The) | | | 2,018 | | | | 346,733 | |
BWX Technologies, Inc. | | | 6,589 | | | | 366,414 | |
C.H. Robinson Worldwide, Inc. | | | 5,000 | | | | 491,500 | |
Carlisle Cos., Inc. | | | 3,227 | | | | 422,576 | |
Carrier Global Corp. | | | 34,146 | | | | 1,019,258 | |
Caterpillar, Inc. | | | 3,051 | | | | 434,188 | |
Cintas Corp. | | | 1,410 | | | | 469,868 | |
Clean Harbors, Inc.(b) | | | 6,500 | | | | 397,150 | |
Colfax Corp.(b) | | | 13,807 | | | | 459,497 | |
Copa Holdings S.A., Class A (Panama) | | | 7,875 | | | | 419,344 | |
Copart, Inc.(b) | | | 4,499 | | | | 464,837 | |
CoreLogic, Inc. | | | 7,790 | | | | 517,256 | |
CoStar Group, Inc.(b) | | | 555 | | | | 470,973 | |
Crane Co. | | | 6,993 | | | | 395,384 | |
CSX Corp. | | | 5,600 | | | | 428,176 | |
Cummins, Inc. | | | 2,269 | | | | 470,250 | |
Curtiss-Wright Corp. | | | 4,229 | | | | 432,711 | |
Deere & Co. | | | 2,512 | | | | 527,671 | |
Delta Air Lines, Inc. | | | 12,611 | | | | 389,049 | |
Donaldson Co., Inc. | | | 8,635 | | | | 434,859 | |
Dover Corp. | | | 3,990 | | | | 438,262 | |
Eaton Corp. PLC | | | 4,447 | | | | 454,039 | |
Emerson Electric Co. | | | 6,324 | | | | 439,328 | |
Equifax, Inc. | | | 2,274 | | | | 382,646 | |
Expeditors International of Washington, Inc. | | | 5,287 | | | | 467,318 | |
Fastenal Co. | | | 17,286 | | | | 844,594 | |
FedEx Corp. | | | 2,810 | | | | 617,750 | |
Flowserve Corp. | | | 13,940 | | | | 413,739 | |
Fortive Corp. | | | 5,698 | | | | 410,883 | |
Fortune Brands Home & Security, Inc. | | | 5,185 | | | | 435,955 | |
FTI Consulting, Inc.(b) | | | 3,640 | | | | 417,726 | |
Gates Industrial Corp. PLC(b) | | | 36,412 | | | | 411,091 | |
Generac Holdings, Inc.(b) | | | 3,502 | | | | 665,310 | |
General Dynamics Corp. | | | 2,451 | | | | 366,057 | |
General Electric Co. | | | 53,376 | | | | 338,404 | |
Graco, Inc. | | | 8,026 | | | | 465,669 | |
GrafTech International Ltd. | | | 91,276 | | | | 607,898 | |
HD Supply Holdings, Inc.(b) | | | 11,048 | | | | 438,164 | |
HEICO Corp. | | | 3,498 | | | | 384,500 | |
Hexcel Corp. | | | 15,920 | | | | 627,089 | |
Honeywell International, Inc. | | | 2,617 | | | | 433,244 | |
Howmet Aerospace, Inc. | | | 49,769 | | | | 871,953 | |
Hubbell, Inc. | | | 3,069 | | | | 444,759 | |
Huntington Ingalls Industries, Inc. | | | 2,151 | | | | 325,920 | |
IAA, Inc.(b) | | | 7,681 | | | | 401,870 | |
IDEX Corp. | | | 2,539 | | | | 457,604 | |
IHS Markit Ltd. | | | 4,504 | | | | 359,960 | |
See accompanying Notes to Financial Statements which are an integral part of the financial statements.
Invesco Russell 1000 Equal Weight ETF (EQAL)–(continued)
August 31, 2020
| | | | | | | | |
| | | Shares | | | Value | |
Industrials-(continued) | | | | | | | | |
Illinois Tool Works, Inc. | | | 2,279 | | | $ | 450,216 | |
Ingersoll Rand, Inc.(b) | | | 13,235 | | | | 464,019 | |
ITT, Inc. | | | 6,907 | | | | 433,829 | |
J.B. Hunt Transport Services, Inc. | | | 3,247 | | | | 456,333 | |
Jacobs Engineering Group, Inc. | | | 4,562 | | | | 411,812 | |
JetBlue Airways Corp.(b) | | | 32,281 | | | | 371,877 | |
Johnson Controls International PLC | | | 11,186 | | | | 455,606 | |
Kansas City Southern | | | 2,670 | | | | 486,047 | |
Kirby Corp.(b) | | | 7,128 | | | | 302,512 | |
Knight-Swift Transportation Holdings, Inc. | | | 9,161 | | | | 416,459 | |
L3Harris Technologies, Inc. | | | 1,713 | | | | 309,608 | |
Landstar System, Inc. | | | 3,497 | | | | 465,416 | |
Lennox International, Inc. | | | 3,217 | | | | 901,822 | |
Lincoln Electric Holdings, Inc. | | | 4,640 | | | | 448,734 | |
Lockheed Martin Corp. | | | 1,035 | | | | 403,919 | |
Lyft, Inc., Class A(b) | | | 9,063 | | | | 268,899 | |
Macquarie Infrastructure Corp. | | | 12,254 | | | | 343,357 | |
ManpowerGroup, Inc. | | | 5,584 | | | | 409,363 | |
Masco Corp. | | | 15,039 | | | | 876,774 | |
Mercury Systems, Inc.(b) | | | 4,136 | | | | 313,261 | |
Middleby Corp. (The)(b) | | | 4,876 | | | | 477,360 | |
MSA Safety, Inc. | | | 3,601 | | | | 453,546 | |
MSC Industrial Direct Co., Inc., Class A | | | 5,373 | | | | 354,081 | |
Nielsen Holdings PLC | | | 21,520 | | | | 328,826 | |
Nordson Corp. | | | 1,999 | | | | 372,794 | |
Norfolk Southern Corp. | | | 2,232 | | | | 474,367 | |
Northrop Grumman Corp. | | | 1,216 | | | | 416,614 | |
nVent Electric PLC | | | 20,352 | | | | 389,130 | |
Old Dominion Freight Line, Inc. | | | 2,353 | | | | 475,730 | |
Oshkosh Corp. | | | 5,276 | | | | 406,305 | |
Otis Worldwide Corp. | | | 6,763 | | | | 425,393 | |
Owens Corning | | | 13,012 | | | | 880,132 | |
PACCAR, Inc. | | | 5,210 | | | | 447,226 | |
Parker-Hannifin Corp. | | | 2,089 | | | | 430,355 | |
Pentair PLC | | | 10,245 | | | | 462,459 | |
Quanta Services, Inc. | | | 10,137 | | | | 519,521 | |
Raytheon Technologies Corp. | | | 5,800 | | | | 353,800 | |
Regal Beloit Corp. | | | 4,668 | | | | 461,478 | |
Republic Services, Inc. | | | 4,718 | | | | 437,453 | |
Robert Half International, Inc. | | | 7,509 | | | | 399,479 | |
Rockwell Automation, Inc. | | | 1,863 | | | | 429,477 | |
Rollins, Inc. | | | 7,665 | | | | 422,648 | |
Roper Technologies, Inc. | | | 958 | | | | 409,248 | |
Ryder System, Inc. | | | 10,065 | | | | 411,658 | |
Schneider National, Inc., Class B | | | 16,072 | | | | 434,908 | |
Sensata Technologies Holding PLC(b) | | | 10,474 | | | | 436,137 | |
Snap-on, Inc. | | | 2,864 | | | | 424,645 | |
Southwest Airlines Co. | | | 10,835 | | | | 407,179 | |
Spirit AeroSystems Holdings, Inc., Class A | | | 13,954 | | | | 286,894 | |
Stanley Black & Decker, Inc. | | | 2,841 | | | | 458,253 | |
Stericycle, Inc.(b) | | | 6,806 | | | | 436,333 | |
Teledyne Technologies, Inc.(b) | | | 1,182 | | | | 370,687 | |
Textron, Inc. | | | 11,097 | | | | 437,555 | |
Timken Co. (The) | | | 16,447 | | | | 891,263 | |
Toro Co. (The) | | | 5,915 | | | | 445,281 | |
Trane Technologies PLC | | | 8,049 | | | | 952,921 | |
TransDigm Group, Inc. | | | 836 | | | | 417,724 | |
TransUnion | | | 2,307 | | | | 200,063 | |
Trex Co., Inc.(b) | | | 6,043 | | | | 903,368 | |
Trinity Industries, Inc. | | | 17,410 | | | | 356,383 | |
| | | | | | | | |
| | | Shares | | | Value | |
Industrials-(continued) | | | | | | | | |
Uber Technologies, Inc.(b) | | | 9,716 | | | $ | 326,749 | |
Union Pacific Corp. | | | 2,274 | | | | 437,609 | |
United Airlines Holdings, Inc.(b) | | | 9,882 | | | | 355,752 | |
United Parcel Service, Inc., Class B | | | 3,618 | | | | 591,977 | |
United Rentals, Inc.(b) | | | 2,529 | | | | 447,759 | |
Univar Solutions, Inc.(b) | | | 40,780 | | | | 741,788 | |
Valmont Industries, Inc. | | | 3,449 | | | | 438,195 | |
Verisk Analytics, Inc. | | | 2,325 | | | | 434,008 | |
Vertiv Holdings Co.(b) | | | 22,611 | | | | 366,977 | |
Virgin Galactic Holdings, Inc.(b)(c) | | | 25,564 | | | | 457,596 | |
W.W. Grainger, Inc. | | | 1,265 | | | | 462,269 | |
Wabtec Corp. | | | 6,346 | | | | 422,326 | |
Waste Management, Inc. | | | 3,712 | | | | 423,168 | |
Watsco, Inc. | | | 4,047 | | | | 991,475 | |
Woodward, Inc. | | | 4,887 | | | | 418,767 | |
XPO Logistics, Inc.(b) | | | 4,828 | | | | 426,168 | |
Xylem, Inc. | | | 5,859 | | | | 469,775 | �� |
| | | | | | | | |
| | | | | | | 65,140,084 | |
| | | | | | | | |
Information Technology-13.53% | | | | | | | | |
2U, Inc.(b) | | | 9,163 | | | | 379,257 | |
Accenture PLC, Class A | | | 1,920 | | | | 460,666 | |
Adobe, Inc.(b) | | | 773 | | | | 396,850 | |
Advanced Micro Devices, Inc.(b) | | | 5,968 | | | | 542,014 | |
Akamai Technologies, Inc.(b) | | | 3,197 | | | | 372,227 | |
Alliance Data Systems Corp. | | | 4,235 | | | | 191,041 | |
Alteryx, Inc., Class A(b) | | | 2,005 | | | | 242,264 | |
Amdocs Ltd. | | | 5,208 | | | | 318,886 | |
Amphenol Corp., Class A | | | 3,301 | | | | 362,450 | |
Analog Devices, Inc. | | | 2,621 | | | | 306,342 | |
Anaplan, Inc.(b) | | | 6,774 | | | | 414,907 | |
ANSYS, Inc.(b) | | | 1,116 | | | | 378,335 | |
Apple, Inc. | | | 3,648 | | | | 470,738 | |
Applied Materials, Inc. | | | 5,346 | | | | 329,314 | |
Arista Networks, Inc.(b) | | | 1,466 | | | | 327,578 | |
Arrow Electronics, Inc.(b) | | | 4,897 | | | | 384,708 | |
Aspen Technology, Inc.(b) | | | 3,184 | | | | 404,464 | |
Atlassian Corp. PLC, Class A(b) | | | 1,808 | | | | 346,702 | |
Autodesk, Inc.(b) | | | 1,360 | | | | 334,152 | |
Automatic Data Processing, Inc. | | | 2,561 | | | | 356,209 | |
Avalara, Inc.(b) | | | 2,598 | | | | 344,001 | |
Avnet, Inc. | | | 11,932 | | | | 328,249 | |
Bill.Com Holdings, Inc.(b) | | | 2,525 | | | | 249,925 | |
Black Knight, Inc.(b) | | | 4,387 | | | | 368,947 | |
Booz Allen Hamilton Holding Corp. | | | 4,839 | | | | 426,122 | |
Broadcom, Inc. | | | 1,021 | | | | 354,440 | |
Broadridge Financial Solutions, Inc. | | | 1,644 | | | | 225,886 | |
CACI International, Inc., Class A(b) | | | 1,336 | | | | 312,878 | |
Cadence Design Systems, Inc.(b) | | | 3,439 | | | | 381,419 | |
CDK Global, Inc. | | | 7,834 | | | | 365,221 | |
CDW Corp. | | | 2,758 | | | | 313,447 | |
Ceridian HCM Holding, Inc.(b) | | | 4,104 | | | | 326,350 | |
Ciena Corp.(b) | | | 6,039 | | | | 342,834 | |
Cirrus Logic, Inc.(b) | | | 4,988 | | | | 302,223 | |
Cisco Systems, Inc. | | | 7,042 | | | | 297,313 | |
Citrix Systems, Inc. | | | 2,204 | | | | 320,021 | |
Cloudflare, Inc., Class A(b) | | | 8,783 | | | | 336,038 | |
Cognex Corp. | | | 5,754 | | | | 398,119 | |
Cognizant Technology Solutions Corp., Class A | | | 5,883 | | | | 393,337 | |
See accompanying Notes to Financial Statements which are an integral part of the financial statements.
Invesco Russell 1000 Equal Weight ETF (EQAL)–(continued)
August 31, 2020
| | | | | | | | |
| | | Shares | | | Value | |
Information Technology-(continued) | | | | | | | | |
Coherent, Inc.(b) | | | 2,284 | | | $ | 257,315 | |
CommScope Holding Co., Inc.(b) | | | 32,883 | | | | 338,695 | |
Corning, Inc. | | | 11,803 | | | | 383,125 | |
Coupa Software, Inc.(b)(c) | | | 1,234 | | | | 404,431 | |
Cree, Inc.(b) | | | 5,391 | | | | 340,172 | |
Crowdstrike Holdings, Inc., Class A(b) | | | 3,171 | | | | 398,690 | |
Datadog, Inc., Class A(b) | | | 3,720 | | | | 310,806 | |
Dell Technologies, Inc., Class C(b) | | | 6,803 | | | | 449,542 | |
DocuSign, Inc.(b) | | | 1,987 | | | | 443,101 | |
Dolby Laboratories, Inc., Class A | | | 4,878 | | | | 340,728 | |
Dropbox, Inc., Class A(b) | | | 14,015 | | | | 296,698 | |
DXC Technology Co. | | | 20,606 | | | | 411,708 | |
Dynatrace, Inc.(b) | | | 7,979 | | | | 352,911 | |
EchoStar Corp., Class A(b) | | | 10,692 | | | | 314,131 | |
Elastic N.V.(b) | | | 3,610 | | | | 391,974 | |
Enphase Energy, Inc.(b) | | | 26,984 | | | | 2,083,974 | |
Entegris, Inc. | | | 5,197 | | | | 347,627 | |
EPAM Systems, Inc.(b) | | | 1,338 | | | | 437,660 | |
Euronet Worldwide, Inc.(b) | | | 2,042 | | | | 211,102 | |
Everbridge, Inc.(b) | | | 2,367 | | | | 351,760 | |
F5 Networks, Inc.(b) | | | 2,323 | | | | 307,403 | |
Fair Isaac Corp.(b) | | | 493 | | | | 207,449 | |
Fastly, Inc., Class A(b)(c) | | | 5,185 | | | | 481,375 | |
Fidelity National Information Services, Inc. | | | 1,620 | | | | 244,377 | |
FireEye, Inc.(b) | | | 25,883 | | | | 379,962 | |
First Solar, Inc.(b) | | | 24,443 | | | | 1,872,089 | |
Fiserv, Inc.(b) | | | 1,985 | | | | 197,666 | |
Five9, Inc.(b) | | | 3,129 | | | | 398,760 | |
FleetCor Technologies, Inc.(b) | | | 795 | | | | 199,903 | |
FLIR Systems, Inc. | | | 9,659 | | | | 356,417 | |
Fortinet, Inc.(b) | | | 2,370 | | | | 312,852 | |
Gartner, Inc.(b) | | | 2,640 | | | | 342,725 | |
Genpact Ltd. | | | 10,861 | | | | 458,117 | |
Global Payments, Inc. | | | 1,144 | | | | 202,053 | |
Globant S.A. (Argentina)(b) | | | 2,221 | | | | 394,405 | |
GoDaddy, Inc., Class A(b) | | | 4,021 | | | | 336,477 | |
Guidewire Software, Inc.(b) | | | 3,021 | | | | 339,289 | |
Hewlett Packard Enterprise Co. | | | 31,809 | | | | 307,593 | |
HP, Inc. | | | 19,060 | | | | 372,623 | |
HubSpot, Inc.(b) | | | 1,508 | | | | 451,917 | |
Inphi Corp.(b) | | | 2,860 | | | | 325,983 | |
Intel Corp. | | | 5,370 | | | | 273,602 | |
International Business Machines Corp. | | | 2,595 | | | | 319,989 | |
Intuit, Inc. | | | 1,124 | | | | 388,218 | |
IPG Photonics Corp.(b) | | | 1,985 | | | | 321,034 | |
Jabil, Inc. | | | 9,844 | | | | 336,173 | |
Jack Henry & Associates, Inc. | | | 1,062 | | | | 175,676 | |
Juniper Networks, Inc. | | | 13,563 | | | | 339,075 | |
Keysight Technologies, Inc.(b) | | | 3,781 | | | | 372,504 | |
KLA Corp. | | | 1,668 | | | | 342,174 | |
Lam Research Corp. | | | 1,033 | | | | 347,439 | |
Leidos Holdings, Inc. | | | 3,238 | | | | 293,007 | |
Littelfuse, Inc. | | | 2,366 | | | | 427,867 | |
Lumentum Holdings, Inc.(b) | | | 4,364 | | | | 375,304 | |
Manhattan Associates, Inc.(b) | | | 3,657 | | | | 355,643 | |
Marvell Technology Group Ltd. | | | 9,353 | | | | 362,709 | |
Mastercard, Inc., Class A | | | 749 | | | | 268,284 | |
Maxim Integrated Products, Inc. | | | 5,331 | | | | 364,854 | |
Medallia, Inc.(b) | | | 12,221 | | | | 442,278 | |
Microchip Technology, Inc. | | | 3,095 | | | | 339,522 | |
| | | | | | | | |
| | | Shares | | | Value | |
Information Technology-(continued) | | | | | | | | |
Micron Technology, Inc.(b) | | | 6,377 | | | $ | 290,217 | |
Microsoft Corp. | | | 1,647 | | | | 371,448 | |
MKS Instruments, Inc. | | | 2,951 | | | | 352,733 | |
MongoDB, Inc.(b) | | | 1,534 | | | | 358,649 | |
Monolithic Power Systems, Inc. | | | 1,444 | | | | 385,736 | |
Motorola Solutions, Inc. | | | 2,281 | | | | 352,985 | |
National Instruments Corp. | | | 8,280 | | | | 297,169 | |
NCR Corp.(b) | | | 17,954 | | | | 366,980 | |
NetApp, Inc. | | | 7,547 | | | | 357,652 | |
New Relic, Inc.(b) | | | 4,763 | | | | 292,591 | |
NortonLifeLock, Inc. | | | 16,087 | | | | 378,366 | |
Nuance Communications, Inc.(b) | | | 13,632 | | | | 408,415 | |
Nutanix, Inc., Class A(b) | | | 14,076 | | | | 404,122 | |
NVIDIA Corp. | | | 873 | | | | 467,038 | |
Okta, Inc.(b) | | | 1,648 | | | | 354,930 | |
ON Semiconductor Corp.(b) | | | 16,442 | | | | 351,366 | |
Oracle Corp. | | | 6,004 | | | | 343,549 | |
PagerDuty, Inc.(b)(c) | | | 10,412 | | | | 340,160 | |
Palo Alto Networks, Inc.(b) | | | 1,402 | | | | 360,889 | |
Paychex, Inc. | | | 5,142 | | | | 393,209 | |
Paycom Software, Inc.(b) | | | 1,028 | | | | 307,845 | |
Paylocity Holding Corp.(b) | | | 2,685 | | | | 395,366 | |
PayPal Holdings, Inc.(b) | | | 1,222 | | | | 249,459 | |
Pegasystems, Inc. | | | 3,347 | | | | 429,989 | |
Pluralsight, Inc., Class A(b) | | | 22,459 | | | | 429,865 | |
Proofpoint, Inc.(b) | | | 3,024 | | | | 331,642 | |
PTC, Inc.(b) | | | 4,072 | | | | 372,222 | |
Pure Storage, Inc., Class A(b) | | | 18,641 | | | | 284,462 | |
Qorvo, Inc.(b) | | | 2,895 | | | | 371,342 | |
QUALCOMM, Inc. | | | 3,595 | | | | 428,164 | |
RealPage, Inc.(b) | | | 4,786 | | | | 299,699 | |
RingCentral, Inc., Class A(b) | | | 1,132 | | | | 329,152 | |
Sabre Corp. | | | 38,058 | | | | 266,025 | |
salesforce.com, inc.(b) | | | 1,718 | | | | 468,413 | |
Science Applications International Corp. | | | 3,930 | | | | 327,998 | |
ServiceNow, Inc.(b) | | | 808 | | | | 389,472 | |
Skyworks Solutions, Inc. | | | 2,503 | | | | 362,560 | |
Slack Technologies, Inc., Class A(b) | | | 9,422 | | | | 309,418 | |
Smartsheet, Inc., Class A(b) | | | 6,331 | | | | 345,229 | |
SolarEdge Technologies, Inc.(b) | | | 8,175 | | | | 1,807,901 | |
SolarWinds Corp.(b) | | | 16,853 | | | | 354,419 | |
Splunk, Inc.(b) | | | 1,730 | | | | 379,441 | |
Square, Inc., Class A(b) | | | 2,093 | | | | 333,959 | |
SS&C Technologies Holdings, Inc. | | | 5,446 | | | | 347,019 | |
StoneCo Ltd., Class A (Brazil)(b) | | | 8,353 | | | | 426,003 | |
Switch, Inc., Class A | | | 17,714 | | | | 304,681 | |
SYNNEX Corp. | | | 3,203 | | | | 407,261 | |
Synopsys, Inc.(b) | | | 1,699 | | | | 375,989 | |
Teradata Corp.(b) | | | 15,697 | | | | 382,222 | |
Teradyne, Inc. | | | 4,046 | | | | 343,789 | |
Texas Instruments, Inc. | | | 2,560 | | | | 363,904 | |
Trade Desk, Inc. (The), Class A(b) | | | 825 | | | | 397,073 | |
Trimble, Inc.(b) | | | 9,040 | | | | 473,786 | |
Twilio, Inc., Class A(b) | | | 1,492 | | | | 402,482 | |
Tyler Technologies, Inc.(b) | | | 935 | | | | 322,865 | |
Ubiquiti, Inc.(c) | | | 1,833 | | | | 333,148 | |
Universal Display Corp. | | | 2,082 | | | | 365,391 | |
VeriSign, Inc.(b) | | | 1,546 | | | | 332,081 | |
ViaSat, Inc.(b) | | | 7,870 | | | | 312,911 | |
Visa, Inc., Class A | | | 1,070 | | | | 226,829 | |
See accompanying Notes to Financial Statements which are an integral part of the financial statements.
Invesco Russell 1000 Equal Weight ETF (EQAL)–(continued)
August 31, 2020
| | | | | | | | |
| | | Shares | | | Value | |
Information Technology-(continued) | | | | | | | | |
VMware, Inc., Class A(b)(c) | | | 2,250 | | | $ | 324,990 | |
Western Digital Corp. | | | 7,542 | | | | 289,764 | |
Western Union Co. (The) | | | 9,534 | | | | 224,907 | |
WEX, Inc.(b) | | | 1,199 | | | | 191,492 | |
Workday, Inc., Class A(b) | | | 1,716 | | | | 411,342 | |
Xerox Holdings Corp. | | | 23,472 | | | | 442,682 | |
Xilinx, Inc. | | | 3,448 | | | | 359,144 | |
Zebra Technologies Corp., Class A(b) | | | 1,477 | | | | 423,205 | |
Zendesk, Inc.(b) | | | 3,905 | | | | 376,364 | |
Zoom Video Communications, Inc., Class A(b) | | | 1,341 | | | | 435,959 | |
Zscaler, Inc.(b) | | | 2,852 | | | | 408,806 | |
| | | | | | | | |
| | | | | | | 64,315,146 | |
| | | | | | | | |
Materials-9.09% | | | | | | | | |
Air Products and Chemicals, Inc. | | | 3,053 | | | | 892,270 | |
Albemarle Corp. | | | 9,199 | | | | 837,201 | |
Amcor PLC | | | 70,604 | | | | 780,880 | |
AptarGroup, Inc. | | | 6,785 | | | | 803,276 | |
Ardagh Group S.A. | | | 56,704 | | | | 863,035 | |
Ashland Global Holdings, Inc. | | | 10,503 | | | | 773,966 | |
Avery Dennison Corp. | | | 6,232 | | | | 719,110 | |
Axalta Coating Systems Ltd.(b) | | | 32,552 | | | | 776,365 | |
Ball Corp. | | | 10,293 | | | | 827,248 | |
Berry Global Group, Inc.(b) | | | 16,583 | | | | 854,688 | |
Cabot Corp. | | | 19,441 | | | | 719,511 | |
Celanese Corp. | | | 8,234 | | | | 832,869 | |
CF Industries Holdings, Inc. | | | 24,194 | | | | 789,450 | |
Chemours Co. (The) | | | 46,283 | | | | 956,207 | |
Corteva, Inc. | | | 35,212 | | | | 1,005,303 | |
Crown Holdings, Inc.(b) | | | 11,070 | | | | 850,730 | |
Dow, Inc. | | | 17,444 | | | | 787,073 | |
DuPont de Nemours, Inc. | | | 13,811 | | | | 770,101 | |
Eagle Materials, Inc. | | | 9,939 | | | | 812,712 | |
Eastman Chemical Co. | | | 10,297 | | | | 752,814 | |
Ecolab, Inc. | | | 3,526 | | | | 694,904 | |
Element Solutions, Inc.(b) | | | 66,704 | | | | 717,068 | |
FMC Corp. | | | 7,335 | | | | 783,818 | |
Freeport-McMoRan, Inc. | | | 68,723 | | | | 1,072,766 | |
Graphic Packaging Holding Co. | | | 51,881 | | | | 725,296 | |
Huntsman Corp. | | | 39,684 | | | | 857,968 | |
International Flavors & Fragrances, Inc.(c) | | | 5,649 | | | | 699,290 | |
International Paper Co. | | | 20,691 | | | | 750,463 | |
Linde PLC (United Kingdom) | | | 3,481 | | | | 869,345 | |
LyondellBasell Industries N.V., Class A | | | 10,838 | | | | 709,672 | |
Martin Marietta Materials, Inc. | | | 3,422 | | | | 694,221 | |
Mosaic Co. (The) | | | 55,436 | | | | 1,010,598 | |
NewMarket Corp. | | | 1,765 | | | | 657,445 | |
Newmont Corp. | | | 13,069 | | | | 879,282 | |
Nucor Corp. | | | 16,681 | | | | 758,318 | |
Olin Corp. | | | 57,369 | | | | 645,401 | |
Packaging Corp. of America | | | 7,430 | | | | 752,213 | |
PPG Industries, Inc. | | | 6,940 | | | | 835,576 | |
Reliance Steel & Aluminum Co. | | | 7,606 | | | | 797,641 | |
Royal Gold, Inc. | | | 6,465 | | | | 881,309 | |
RPM International, Inc. | | | 9,624 | | | | 815,827 | |
Scotts Miracle-Gro Co. (The) | | | 5,596 | | | | 943,094 | |
Sealed Air Corp. | | | 22,935 | | | | 901,346 | |
Sherwin-Williams Co. (The) | | | 1,239 | | | | 831,431 | |
Silgan Holdings, Inc. | | | 23,180 | | | | 882,231 | |
Sonoco Products Co. | | | 14,135 | | | | 749,579 | |
| | | | | | | | |
| | | Shares | | | Value | |
Materials-(continued) | | | | | | | | |
Southern Copper Corp. (Peru) | | | 19,672 | | | $ | 946,223 | |
Steel Dynamics, Inc. | | | 27,100 | | | | 799,992 | |
Valvoline, Inc. | | | 61,404 | | | | 1,252,642 | |
Vulcan Materials Co. | | | 5,994 | | | | 719,280 | |
W.R. Grace & Co. | | | 14,604 | | | | 594,529 | |
Westlake Chemical Corp. | | | 13,474 | | | | 799,278 | |
Westrock Co. | | | 25,596 | | | | 776,327 | |
| | | | | | | | |
| | | | | | | 43,209,182 | |
| | | | | | | | |
Real Estate-3.32% | | | | | | | | |
Alexandria Real Estate Equities, Inc. | | | 1,207 | | | | 203,235 | |
American Campus Communities, Inc. | | | 5,568 | | | | 188,755 | |
American Homes 4 Rent, Class A | | | 7,602 | | | | 217,721 | |
American Tower Corp. | | | 877 | | | | 218,505 | |
Americold Realty Trust | | | 5,723 | | | | 219,477 | |
Apartment Investment & Management Co., Class A | | | 5,306 | | | | 191,175 | |
Apple Hospitality REIT, Inc. | | | 19,625 | | | | 199,586 | |
AvalonBay Communities, Inc. | | | 1,298 | | | | 205,162 | |
Boston Properties, Inc. | | | 1,990 | | | | 172,871 | |
Brandywine Realty Trust | | | 19,694 | | | | 219,194 | |
Brixmor Property Group, Inc. | | | 15,907 | | | | 187,703 | |
Brookfield Property REIT, Inc., Class A(c) | | | 20,377 | | | | 234,947 | |
Camden Property Trust | | | 2,195 | | | | 199,613 | |
CBRE Group, Inc., Class A(b) | | | 4,342 | | | �� | 204,204 | |
CoreSite Realty Corp. | | | 1,721 | | | | 210,736 | |
Corporate Office Properties Trust | | | 8,019 | | | | 197,588 | |
Cousins Properties, Inc. | | | 6,571 | | | | 196,144 | |
Crown Castle International Corp. | | | 1,241 | | | | 202,593 | |
CubeSmart | | | 7,399 | | | | 233,956 | |
CyrusOne, Inc. | | | 2,763 | | | | 230,793 | |
Digital Realty Trust, Inc. | | | 1,441 | | | | 224,292 | |
Douglas Emmett, Inc. | | | 6,708 | | | | 187,287 | |
Duke Realty Corp. | | | 5,649 | | | | 217,769 | |
Empire State Realty Trust, Inc., Class A | | | 29,837 | | | | 187,973 | |
EPR Properties | | | 4,994 | | | | 161,356 | |
Equinix, Inc. | | | 319 | | | | 251,940 | |
Equity Commonwealth | | | 6,451 | | | | 202,497 | |
Equity LifeStyle Properties, Inc. | | | 3,196 | | | | 211,863 | |
Equity Residential | | | 3,339 | | | | 188,487 | |
Essex Property Trust, Inc. | | | 783 | | | | 169,527 | |
Extra Space Storage, Inc. | | | 2,170 | | | | 231,214 | |
Federal Realty Investment Trust | | | 2,337 | | | | 185,184 | |
First Industrial Realty Trust, Inc. | | | 5,327 | | | | 227,197 | |
Gaming and Leisure Properties, Inc. | | | 5,525 | | | | 200,834 | |
Healthcare Trust of America, Inc., Class A | | | 7,286 | | | | 192,278 | |
Healthpeak Properties, Inc. | | | 7,375 | | | | 203,845 | |
Highwoods Properties, Inc. | | | 5,277 | | | | 196,621 | |
Host Hotels & Resorts, Inc. | | | 15,401 | | | | 172,953 | |
Howard Hughes Corp. (The)(b) | | | 3,893 | | | | 230,115 | |
Hudson Pacific Properties, Inc. | | | 7,920 | | | | 185,962 | |
Invitation Homes, Inc. | | | 7,291 | | | | 208,741 | |
Iron Mountain, Inc.(c) | | | 7,654 | | | | 230,309 | |
JBG SMITH Properties | | | 6,777 | | | | 187,520 | |
Jones Lang LaSalle, Inc. | | | 2,168 | | | | 223,391 | |
Kilroy Realty Corp. | | | 2,899 | | | | 169,649 | |
Kimco Realty Corp. | | | 15,499 | | | | 185,833 | |
Lamar Advertising Co., Class A | | | 2,821 | | | | 195,298 | |
Life Storage, Inc. | | | 2,164 | | | | 228,151 | |
Medical Properties Trust, Inc. | | | 10,518 | | | | 195,424 | |
See accompanying Notes to Financial Statements which are an integral part of the financial statements.
Invesco Russell 1000 Equal Weight ETF (EQAL)–(continued)
August 31, 2020
| | | | | | | | |
| | | Shares | | | Value | |
Real Estate-(continued) | | | | |
Mid-America Apartment Communities, Inc. | | | 1,759 | | | $ | 206,014 | |
National Retail Properties, Inc. | | | 5,571 | | | | 197,436 | |
Omega Healthcare Investors, Inc. | | | 6,377 | | | | 197,496 | |
Outfront Media, Inc. | | | 13,436 | | | | 227,471 | |
Paramount Group, Inc. | | | 25,496 | | | | 188,670 | |
Park Hotels & Resorts, Inc. | | | 17,053 | | | | 161,833 | |
Prologis, Inc. | | | 2,179 | | | | 221,953 | |
Public Storage | | | 1,058 | | | | 224,719 | |
Rayonier, Inc. | | | 8,649 | | | | 253,243 | |
Realty Income Corp. | | | 3,589 | | | | 222,626 | |
Regency Centers Corp. | | | 4,452 | | | | 176,789 | |
Rexford Industrial Realty, Inc. | | | 4,928 | | | | 236,445 | |
SBA Communications Corp., Class A | | | 724 | | | | 221,595 | |
Simon Property Group, Inc. | | | 2,905 | | | | 197,104 | |
SL Green Realty Corp. | | | 3,501 | | | | 163,707 | |
Spirit Realty Capital, Inc. | | | 5,560 | | | | 197,436 | |
STORE Capital Corp. | | | 8,239 | | | | 222,783 | |
Sun Communities, Inc. | | | 1,534 | | | | 228,689 | |
Taubman Centers, Inc. | | | 5,518 | | | | 211,339 | |
UDR, Inc. | | | 5,440 | | | | 189,366 | |
Ventas, Inc. | | | 5,237 | | | | 215,817 | |
VEREIT, Inc. | | | 29,578 | | | | 198,764 | |
VICI Properties, Inc. | | | 9,133 | | | | 204,031 | |
Vornado Realty Trust | | | 4,720 | | | | 169,118 | |
Weingarten Realty Investors | | | 10,721 | | | | 187,296 | |
Welltower, Inc. | | | 3,699 | | | | 212,766 | |
Weyerhaeuser Co. | | | 9,204 | | | | 278,973 | |
WP Carey, Inc. | | | 2,899 | | | | 201,104 | |
| | | | | | | | |
| | | | | | | 15,802,051 | |
| | | | | | | | |
Utilities-8.97% | | | | |
AES Corp. (The) | | | 83,453 | | | | 1,481,291 | |
Alliant Energy Corp. | | | 22,884 | | | | 1,239,169 | |
Ameren Corp. | | | 15,465 | | | | 1,223,436 | |
American Electric Power Co., Inc. | | | 13,710 | | | | 1,080,759 | |
American Water Works Co., Inc. | | | 8,692 | | | | 1,228,527 | |
Atmos Energy Corp. | | | 11,057 | | | | 1,103,710 | |
Avangrid, Inc. | | | 26,884 | | | | 1,291,507 | |
CenterPoint Energy, Inc. | | | 61,116 | | | | 1,226,598 | |
CMS Energy Corp. | | | 19,002 | | | | 1,149,431 | |
Consolidated Edison, Inc. | | | 14,985 | | | | 1,069,030 | |
Dominion Energy, Inc. | | | 13,274 | | | | 1,041,213 | |
DTE Energy Co. | | | 10,418 | | | | 1,236,304 | |
Duke Energy Corp. | | | 13,075 | | | | 1,050,446 | |
Edison International | | | 19,059 | | | | 1,000,216 | |
Entergy Corp. | | | 11,489 | | | | 1,139,019 | |
| | | | | | | | |
| | | Shares | | | Value | |
Utilities-(continued) | | | | |
Essential Utilities, Inc. | | | 25,733 | | | $ | 1,093,652 | |
Evergy, Inc. | | | 18,515 | | | | 985,368 | |
Eversource Energy | | | 13,246 | | | | 1,135,315 | |
Exelon Corp. | | | 29,352 | | | | 1,083,382 | |
FirstEnergy Corp. | | | 27,676 | | | | 791,257 | |
Hawaiian Electric Industries, Inc. | | | 31,036 | | | | 1,074,156 | |
IDACORP, Inc. | | | 12,807 | | | | 1,151,349 | |
MDU Resources Group, Inc. | | | 33,830 | | | | 799,065 | |
National Fuel Gas Co. | | | 27,022 | | | | 1,233,284 | |
NextEra Energy, Inc. | | | 4,508 | | | | 1,258,498 | |
NiSource, Inc. | | | 47,254 | | | | 1,047,149 | |
NRG Energy, Inc. | | | 33,341 | | | | 1,147,264 | |
OGE Energy Corp. | | | 36,193 | | | | 1,153,109 | |
PG&E Corp.(b) | | | 103,855 | | | | 961,697 | |
Pinnacle West Capital Corp. | | | 14,642 | | | | 1,073,991 | |
PPL Corp. | | | 41,726 | | | | 1,152,889 | |
Public Service Enterprise Group, Inc. | | | 22,258 | | | | 1,162,758 | |
Sempra Energy | | | 9,010 | | | | 1,114,086 | |
Southern Co. (The) | | | 19,981 | | | | 1,042,609 | |
UGI Corp. | | | 34,520 | | | | 1,191,976 | |
Vistra Corp. | | | 55,284 | | | | 1,063,111 | |
WEC Energy Group, Inc. | | | 12,482 | | | | 1,174,307 | |
Xcel Energy, Inc. | | | 17,381 | | | | 1,207,545 | |
| | | | | | | | |
| | | | | | | 42,658,473 | |
| | | | | | | | |
TOTAL INVESTMENTS IN SECURITIES
(excluding investments purchased with cash collateral from securities on loan)-99.87%
(Cost $456,677,050) | | | | 474,736,964 | |
| | | | | | | | |
| |
Investments Purchased with Cash Collateral from Securities on Loan | | | | | |
| |
Money Market Funds-2.01% | | | | |
Invesco Private Government Fund, 0.03%(d)(e)(f) | | | 7,244,822 | | | | 7,244,822 | |
Invesco Private Prime Fund, 0.14%(d)(e)(f) | | | 2,301,276 | | | | 2,301,736 | |
| | | | | | | | |
Total Investments Purchased with Cash Collateral from Securities on Loan
(Cost $9,546,558) | | | | 9,546,558 | |
| | | | | | | | |
TOTAL INVESTMENTS IN SECURITIES-101.88%
(Cost $466,223,608) | | | | 484,283,522 | |
OTHER ASSETS LESS LIABILITIES-(1.88)% | | | | (8,944,312 | ) |
| | | | | | | | |
NET ASSETS-100.00% | | | | | | $ | 475,339,210 | |
| | | | | | | | |
Investment Abbreviations:
REIT -Real Estate Investment Trust
See accompanying Notes to Financial Statements which are an integral part of the financial statements.
Invesco Russell 1000 Equal Weight ETF (EQAL)–(continued)
August 31, 2020
Notes to Schedule of Investments:
| (a) | Industry and/or sector classifications used in this report are generally according to the Global Industry Classification Standard, which was developed by and is the exclusive property and a service mark of MSCI Inc. and Standard & Poor’s. |
| (b) | Non-income producing security. |
| (c) | All or a portion of this security was out on loan at August 31, 2020. |
| (d) | Affiliated issuer. The issuer and/or the Fund is a wholly-owned subsidiary of Invesco Ltd., or is affiliated by having an investment adviser that is under common control of Invesco Ltd. The table below shows the Fund’s transactions in, and earnings from, its investments in affiliates for the fiscal year ended August 31, 2020. |
| | | | | | | | | | | | | | | | | | | | | | | | | | | | | | | | | | | |
| | | | | | | | | Change in
Unrealized | | Realized | | | | |
| | | Value | | Purchases | | Proceeds | | Appreciation | | Gain | | Value | | Dividend |
| | | August 31, 2019 | | at Cost | | from Sales | | (Depreciation) | | (Loss) | | August 31, 2020 | | Income |
Invesco Ltd. | | | | $ 192,215 | | | | $ | 130,818 | | | | | $(56,927) | | | | | $(64,421) | | | | $ | (15,831 | ) | | | | $ 185,854 | | | | $ | 13,920 | |
Investments in Affiliated Money Market Funds: | | | | | | | | | | | | | | | | | | | | | | | | | | | | | | | | | | | |
Invesco Premier U.S. Government Money Portfolio, Institutional Class | | | | - | | | | | 13,259,839 | | | | | (13,259,839 | ) | | | | - | | | | | - | | | | | - | | | | | 2,622 | |
Investments Purchased with Cash Collateral from Securities on Loan: | | | | | | | | | | | | | | | | | | | | | | | | | | | | | | | | | | | |
Invesco Government & Agency Portfolio, Institutional Class | | | | 9,793,835 | | | | | 68,810,438 | | | | | (78,604,273 | ) | | | | - | | | | | - | | | | | - | | | | | 104,484 | * |
Invesco Liquid Assets Portfolio, Institutional Class | | | | 3,517,256 | | | | | 18,320,645 | | | | | (21,836,667 | ) | | | | - | | | | | (1,234 | ) | | | | - | | | | | 39,027 | * |
Invesco Private Government Fund | | | | - | | | | | 64,209,846 | | | | | (56,965,024 | ) | | | | - | | | | | - | | | | | 7,244,822 | | | | | 1,083 | * |
Invesco Private Prime Fund | | | | - | | | | | 6,881,130 | | | | | (4,579,607 | ) | | | | - | | | | | 213 | | | | | 2,301,736 | | | | | 603 | * |
| | | | | | | | | | | | | | | | | | | | | | | | | | | | | | | | | | | |
Total | | | | $13,503,306 | | | | $ | 171,612,716 | | | | $ | (175,302,337 | ) | | | | $(64,421) | | | | $ | (16,852 | ) | | | | $9,732,412 | | | | $ | 161,739 | |
| | | | | | | | | | | | | | | | | | | | | | | | | | | | | | | | | | | |
| * | Represents the income earned on the investment of cash collateral, which is included in securities lending income on the Statements of Operations. Does not include rebates and fees paid to lending agent or premiums received from borrowers, if any. |
| (e) | The rate shown is the 7-day SEC standardized yield as of August 31, 2020. |
| (f) | The security has been segregated to satisfy the commitment to return the cash collateral received in securities lending transactions upon the borrower’s return of the securities loaned. See Note 2J. |
See accompanying Notes to Financial Statements which are an integral part of the financial statements.
Invesco Russell 1000 Low Beta Equal Weight ETF (USLB)
August 31, 2020
Schedule of Investments(a)
| | | | | | | | |
| | | Shares | | | Value | |
| Common Stocks & Other Equity Interests-99.91% | |
Communication Services-5.50% | | | | | | | | |
Activision Blizzard, Inc. | | | 379 | | | $ | 31,654 | |
Alphabet, Inc., Class A(b) | | | 9 | | | | 14,666 | |
Alphabet, Inc., Class C(b) | | | 9 | | | | 14,708 | |
Altice USA, Inc., Class A(b) | | | 1,014 | | | | 27,966 | |
AT&T, Inc. | | | 841 | | | | 25,070 | |
Cable One, Inc. | | | 14 | | | | 25,765 | |
Charter Communications, Inc., Class A(b) | | | 48 | | | | 29,549 | |
Comcast Corp., Class A | | | 642 | | | | 28,768 | |
Electronic Arts, Inc.(b) | | | 227 | | | | 31,660 | |
John Wiley & Sons, Inc., Class A | | | 642 | | | | 20,319 | |
Liberty Broadband Corp.,
Class C(b) | | | 194 | | | | 27,177 | |
Match Group, Inc.(b) | | | 288 | | | | 32,164 | |
Netflix, Inc.(b) | | | 62 | | | | 32,833 | |
New York Times Co. (The), Class A | | | 646 | | | | 27,991 | |
Omnicom Group, Inc. | | | 464 | | | | 25,098 | |
Take-Two Interactive Software, Inc.(b) | | | 206 | | | | 35,265 | |
T-Mobile US, Inc.(b) | | | 264 | | | | 30,803 | |
United States Cellular Corp.(b) | | | 807 | | | | 29,359 | |
Verizon Communications, Inc. | | | 466 | | | | 27,620 | |
Zynga, Inc., Class A(b) | | | 2,853 | | | | 25,848 | |
| | | | | | | | |
| | | | | | | 544,283 | |
| | | | | | | | |
Consumer Discretionary-6.75% | | | | | | | | |
Amazon.com, Inc.(b) | | | 11 | | | | 37,961 | |
AutoZone, Inc.(b) | | | 23 | | | | 27,515 | |
Columbia Sportswear Co. | | | 332 | | | | 28,409 | |
Dollar General Corp. | | | 138 | | | | 27,860 | |
Dollar Tree, Inc.(b) | | | 280 | | | | 26,956 | |
Domino’s Pizza, Inc. | | | 67 | | | | 27,400 | |
Frontdoor, Inc.(b) | | | 581 | | | | 25,314 | |
Garmin Ltd. | | | 277 | | | | 28,700 | |
Grand Canyon Education, Inc.(b) | | | 265 | | | | 24,921 | |
Hasbro, Inc. | | | 343 | | | | 27,076 | |
Home Depot, Inc. (The) | | | 107 | | | | 30,499 | |
McDonald’s Corp. | | | 137 | | | | 29,252 | |
NIKE, Inc., Class B | | | 257 | | | | 28,756 | |
Pool Corp. | | | 98 | | | | 32,128 | |
Ross Stores, Inc. | | | 265 | | | | 24,136 | |
Service Corp. International | | | 667 | | | | 30,449 | |
ServiceMaster Global Holdings, Inc.(b) | | | 787 | | | | 31,401 | |
Starbucks Corp. | | | 333 | | | | 28,129 | |
Target Corp. | | | 219 | | | | 33,115 | |
Tiffany & Co. | | | 232 | | | | 28,420 | |
TJX Cos., Inc. (The) | | | 480 | | | | 26,299 | |
Tractor Supply Co. | | | 217 | | | | 32,296 | |
Yum China Holdings, Inc. (China) | | | 541 | | | | 31,221 | |
| | | | | | | | |
| | | | | | | 668,213 | |
| | | | | | | | |
Consumer Staples-8.92% | | | | | | | | |
Archer-Daniels-Midland Co. | | | 654 | | | | 29,273 | |
Brown-Forman Corp., Class A | | | 82 | | | | 5,451 | |
Brown-Forman Corp., Class B | | | 328 | | | | 24,000 | |
Campbell Soup Co. | | | 543 | | | | 28,567 | |
Casey’s General Stores, Inc. | | | 157 | | | | 27,922 | |
Church & Dwight Co., Inc. | | | 355 | | | | 34,020 | |
Clorox Co. (The) | | | 127 | | | | 28,385 | |
Coca-Cola Co. (The) | | | 553 | | | | 27,390 | |
Colgate-Palmolive Co. | | | 370 | | | | 29,326 | |
| | | | | | | | |
| | | Shares | | | Value | |
Consumer Staples-(continued) | | | | | | | | |
Costco Wholesale Corp. | | | 86 | | | $ | 29,899 | |
Estee Lauder Cos., Inc. (The), Class A | | | 130 | | | | 28,824 | |
Flowers Foods, Inc. | | | 1,159 | | | | 28,349 | |
General Mills, Inc. | | | 431 | | | | 27,562 | |
Hershey Co. (The) | | | 197 | | | | 29,282 | |
Hormel Foods Corp. | | | 556 | | | | 28,345 | |
Ingredion, Inc. | | | 309 | | | | 24,856 | |
JM Smucker Co. (The) | | | 231 | | | | 27,762 | |
Kellogg Co. | | | 405 | | | | 28,719 | |
Keurig Dr Pepper, Inc. | | | 931 | | | | 27,772 | |
Kimberly-Clark Corp. | | | 187 | | | | 29,501 | |
Kroger Co. (The) | | | 811 | | | | 28,936 | |
McCormick & Co., Inc. | | | 152 | | | | 31,342 | |
Mondelez International, Inc., Class A | | | 509 | | | | 29,736 | |
Monster Beverage Corp.(b) | | | 365 | | | | 30,609 | |
PepsiCo, Inc. | | | 201 | | | | 28,152 | |
Philip Morris International, Inc. | | | 357 | | | | 28,485 | |
Procter & Gamble Co. (The) | | | 225 | | | | 31,124 | |
Seaboard Corp. | | | 9 | | | | 24,147 | |
Sprouts Farmers Market, Inc.(b) | | | 1,034 | | | | 24,144 | |
Tyson Foods, Inc., Class A | | | 441 | | | | 27,695 | |
Walgreens Boots Alliance, Inc. | | | 608 | | | | 23,116 | |
Walmart, Inc. | | | 216 | | | | 29,992 | |
| | | | | | | | |
| | | | | | | 882,683 | |
| | | | | | | | |
Energy-0.25% | | | | | | | | |
Cabot Oil & Gas Corp. | | | 1,302 | | | | 24,699 | |
| | | | | | | | |
Financials-11.51% | | | | | | | | |
Aflac, Inc. | | | 694 | | | | 25,206 | |
Alleghany Corp. | | | 48 | | | | 26,619 | |
Allstate Corp. (The) | | | 264 | | | | 24,552 | |
American Financial Group, Inc. | | | 408 | | | | 27,275 | |
American National Group, Inc. | | | 327 | | | | 24,528 | |
Aon PLC, Class A | | | 133 | | | | 26,599 | |
Arch Capital Group Ltd.(b) | | | 819 | | | | 25,831 | |
Arthur J. Gallagher & Co. | | | 272 | | | | 28,642 | |
Assurant, Inc. | | | 247 | | | | 30,025 | |
AXIS Capital Holdings Ltd. | | | 679 | | | | 32,429 | |
Berkshire Hathaway, Inc., Class B(b) | | | 139 | | | | 30,308 | |
Brown & Brown, Inc. | | | 631 | | | | 29,278 | |
Cboe Global Markets, Inc. | | | 255 | | | | 23,406 | |
Chubb Ltd. | | | 211 | | | | 26,375 | |
Cincinnati Financial Corp. | | | 415 | | | | 32,955 | |
CME Group, Inc., Class A | | | 142 | | | | 24,974 | |
CNA Financial Corp. | | | 838 | | | | 26,959 | |
Erie Indemnity Co., Class A | | | 143 | | | | 30,522 | |
Everest Re Group Ltd. | | | 124 | | | | 27,290 | |
FactSet Research Systems, Inc. | | | 85 | | | | 29,784 | |
Hanover Insurance Group, Inc. (The) | | | 254 | | | | 26,032 | |
Hartford Financial Services Group, Inc. (The) | | | 630 | | | | 25,484 | |
Interactive Brokers Group, Inc., Class A | | | 603 | | | | 31,971 | |
Intercontinental Exchange, Inc. | | | 273 | | | | 29,001 | |
Kemper Corp. | | | 392 | | | | 30,443 | |
MarketAxess Holdings, Inc. | | | 50 | | | | 24,297 | |
Marsh & McLennan Cos., Inc. | | | 239 | | | | 27,464 | |
Mercury General Corp. | | | 623 | | | | 27,867 | |
MSCI, Inc. | | | 83 | | | | 30,981 | |
Nasdaq, Inc. | | | 222 | | | | 29,841 | |
See accompanying Notes to Financial Statements which are an integral part of the financial statements.
Invesco Russell 1000 Low Beta Equal Weight ETF (USLB)–(continued)
August 31, 2020
| | | | | | | | |
| | | Shares | | | Value | |
Financials-(continued) | | | | |
Northern Trust Corp. | | | 311 | | | $ | 25,468 | |
Old Republic International Corp. | | | 1,564 | | | | 25,196 | |
Progressive Corp. (The) | | | 335 | | | | 31,838 | |
RenaissanceRe Holdings Ltd. (Bermuda) | | | 142 | | | | 26,091 | |
S&P Global, Inc. | | | 79 | | | | 28,947 | |
TFS Financial Corp. | | | 1,703 | | | | 26,311 | |
Travelers Cos., Inc. (The) | | | 228 | | | | 26,457 | |
Virtu Financial, Inc., Class A | | | 1,210 | | | | 31,254 | |
W.R. Berkley Corp. | | | 440 | | | | 27,302 | |
White Mountains Insurance Group Ltd. | | | 30 | | | | 26,742 | |
Willis Towers Watson PLC | | | 129 | | | | 26,513 | |
| | | | | | | | |
| | | | | | | 1,139,057 | |
| | | | | | | | |
Health Care-16.76% | | | | |
Abbott Laboratories | | | 290 | | | | 31,746 | |
AbbVie, Inc. | | | 294 | | | | 28,156 | |
Agilent Technologies, Inc. | | | 293 | | | | 29,423 | |
AmerisourceBergen Corp. | | | 266 | | | | 25,810 | |
Amgen, Inc. | | | 121 | | | | 30,652 | |
Anthem, Inc. | | | 93 | | | | 26,181 | |
Baxter International, Inc. | | | 293 | | | | 25,512 | |
Becton, Dickinson and Co. | | | 109 | | | | 26,462 | |
Biogen, Inc.(b) | | | 89 | | | | 25,600 | |
BioMarin Pharmaceutical, Inc.(b) | | | 238 | | | | 18,571 | |
Bio-Rad Laboratories, Inc., Class A(b) | | | 56 | | | | 28,481 | |
Boston Scientific Corp.(b) | | | 699 | | | | 28,673 | |
Bristol-Myers Squibb Co. | | | 440 | | | | 27,368 | |
Centene Corp.(b) | | | 405 | | | | 24,835 | |
Cerner Corp. | | | 364 | | | | 26,707 | |
Chemed Corp. | | | 56 | | | | 28,958 | |
Cigna Corp. | | | 130 | | | | 23,058 | |
Cooper Cos., Inc. (The) | | | 83 | | | | 26,094 | |
CVS Health Corp. | | | 396 | | | | 24,600 | |
Danaher Corp. | | | 156 | | | | 32,209 | |
DENTSPLY SIRONA, Inc. | | | 554 | | | | 24,858 | |
DexCom, Inc.(b) | | | 72 | | | | 30,630 | |
Edwards Lifesciences Corp.(b) | | | 358 | | | | 30,731 | |
Eli Lilly and Co. | | | 171 | | | | 25,375 | |
Encompass Health Corp. | | | 360 | | | | 23,486 | |
Exelixis, Inc.(b) | | | 1,144 | | | | 25,420 | |
Gilead Sciences, Inc. | | | 356 | | | | 23,763 | |
Henry Schein, Inc.(b) | | | 419 | | | | 27,838 | |
Hill-Rom Holdings, Inc. | | | 257 | | | | 24,104 | |
Humana, Inc. | | | 67 | | | | 27,816 | |
ICU Medical, Inc.(b) | | | 134 | | | | 26,832 | |
IDEXX Laboratories, Inc.(b) | | | 83 | | | | 32,458 | |
Illumina, Inc.(b) | | | 73 | | | | 26,077 | |
Insulet Corp.(b) | | | 146 | | | | 31,864 | |
Intuitive Surgical, Inc.(b) | | | 46 | | | | 33,619 | |
Ionis Pharmaceuticals, Inc.(b) | | | 466 | | | | 25,397 | |
Johnson & Johnson | | | 178 | | | | 27,307 | |
Masimo Corp.(b) | | | 115 | | | | 25,760 | |
McKesson Corp. | | | 164 | | | | 25,164 | |
Medtronic PLC | | | 273 | | | | 29,339 | |
Merck & Co., Inc. | | | 323 | | | | 27,542 | |
Mettler-Toledo International, Inc.(b) | | | 32 | | | | 31,065 | |
Molina Healthcare, Inc.(b) | | | 148 | | | | 27,376 | |
Neurocrine Biosciences, Inc.(b) | | | 219 | | | | 25,496 | |
Penumbra, Inc.(b) | | | 150 | | | | 31,372 | |
Pfizer, Inc. | | | 733 | | | | 27,700 | |
| | | | | | | | |
| | | Shares | | | Value | |
Health Care-(continued) | | | | |
Premier, Inc., Class A | | | 778 | | | $ | 25,480 | |
Regeneron Pharmaceuticals, Inc.(b) | | | 44 | | | | 27,277 | |
ResMed, Inc. | | | 162 | | | | 29,286 | |
STERIS PLC | | | 162 | | | | 25,862 | |
Stryker Corp. | | | 132 | | | | 26,157 | |
Teleflex, Inc. | | | 71 | | | | 27,899 | |
Thermo Fisher Scientific, Inc. | | | 76 | | | | 32,602 | |
United Therapeutics Corp.(b) | | | 207 | | | | 22,141 | |
UnitedHealth Group, Inc. | | | 88 | | | | 27,504 | |
Veeva Systems, Inc., Class A(b) | | | 123 | | | | 34,719 | |
Vertex Pharmaceuticals, Inc.(b) | | | 97 | | | | 27,075 | |
Waters Corp.(b) | | | 133 | | | | 28,763 | |
West Pharmaceutical Services, Inc. | | | 127 | | | | 36,063 | |
Zoetis, Inc. | | | 186 | | | | 29,779 | |
| | | | | | | | |
| | | | | | | 1,658,092 | |
| | | | | | | | |
Industrials-12.32% | | | | |
3M Co. | | | 164 | | | | 26,735 | |
AMERCO | | | 83 | | | | 29,456 | |
C.H. Robinson Worldwide, Inc. | | | 316 | | | | 31,063 | |
Carlisle Cos., Inc. | | | 204 | | | | 26,714 | |
Caterpillar, Inc. | | | 210 | | | | 29,885 | |
CoStar Group, Inc.(b) | | | 40 | | | | 33,944 | |
Deere & Co. | | | 167 | | | | 35,080 | |
Eaton Corp. PLC | | | 299 | | | | 30,528 | |
Expeditors International of Washington, Inc. | | | 338 | | | | 29,876 | |
General Dynamics Corp. | | | 168 | | | | 25,091 | |
Graco, Inc. | | | 535 | | | | 31,041 | |
GrafTech International Ltd. | | | 3,346 | | | | 22,284 | |
HD Supply Holdings, Inc.(b) | | | 775 | | | | 30,736 | |
Honeywell International, Inc. | | | 174 | | | | 28,806 | |
Hubbell, Inc. | | | 202 | | | | 29,274 | |
IDEX Corp. | | | 161 | | | | 29,017 | |
IHS Markit Ltd. | | | 368 | | | | 29,410 | |
J.B. Hunt Transport Services, Inc. | | | 230 | | | | 32,324 | |
Jacobs Engineering Group, Inc. | | | 302 | | | | 27,261 | |
Kansas City Southern | | | 173 | | | | 31,493 | |
L3Harris Technologies, Inc. | | | 132 | | | | 23,858 | |
Landstar System, Inc. | | | 232 | | | | 30,877 | |
Lennox International, Inc. | | | 117 | | | | 32,799 | |
Lockheed Martin Corp. | | | 65 | | | | 25,367 | |
Northrop Grumman Corp. | | | 78 | | | | 26,724 | |
Old Dominion Freight Line, Inc. | | | 159 | | | | 32,147 | |
PACCAR, Inc. | | | 355 | | | | 30,473 | |
Republic Services, Inc. | | | 307 | | | | 28,465 | |
Rollins, Inc. | | | 594 | | | | 32,753 | |
Roper Technologies, Inc. | | | 66 | | | | 28,194 | |
Schneider National, Inc., Class B | | | 1,143 | | | | 30,930 | |
Southwest Airlines Co. | | | 728 | | | | 27,358 | |
Teledyne Technologies, Inc.(b) | | | 73 | | | | 22,893 | |
Toro Co. (The) | | | 371 | | | | 27,929 | |
Trane Technologies PLC | | | 281 | | | | 33,268 | |
United Parcel Service, Inc., Class B | | | 258 | | | | 42,214 | |
Verisk Analytics, Inc. | | | 155 | | | | 28,934 | |
W.W. Grainger, Inc. | | | 83 | | | | 30,331 | |
Waste Management, Inc. | | | 240 | | | | 27,360 | |
Watsco, Inc. | | | 148 | | | | 36,258 | |
Xylem, Inc. | | | 378 | | | | 30,308 | |
| | | | | | | | |
| | | | | | | 1,219,458 | |
| | | | | | | �� | |
See accompanying Notes to Financial Statements which are an integral part of the financial statements.
Invesco Russell 1000 Low Beta Equal Weight ETF (USLB)–(continued)
August 31, 2020
| | | | | | | | |
| | | Shares | | | Value | |
Information Technology-13.54% | | | | |
Accenture PLC, Class A | | | 126 | | | $ | 30,231 | |
Adobe, Inc.(b) | | | 69 | | | | 35,424 | |
Advanced Micro Devices, Inc.(b) | | | 503 | | | | 45,682 | |
Akamai Technologies, Inc.(b) | | | 257 | | | | 29,922 | |
Amdocs Ltd. | | | 416 | | | | 25,472 | |
Arista Networks, Inc.(b) | | | 113 | | | | 25,250 | |
Aspen Technology, Inc.(b) | | | 238 | | | | 30,233 | |
Automatic Data Processing, Inc. | | | 172 | | | | 23,923 | |
Black Knight, Inc.(b) | | | 351 | | | | 29,519 | |
Booz Allen Hamilton Holding Corp. | | | 333 | | | | 29,324 | |
Broadcom, Inc. | | | 86 | | | | 29,855 | |
Broadridge Financial Solutions, Inc. | | | 213 | | | | 29,266 | |
CACI International, Inc., Class A(b) | | | 100 | | | | 23,419 | |
Cadence Design Systems, Inc.(b) | | | 285 | | | | 31,609 | |
Ciena Corp.(b) | | | 475 | | | | 26,966 | |
Cisco Systems, Inc. | | | 555 | | | | 23,432 | |
Citrix Systems, Inc. | | | 187 | | | | 27,152 | |
Corning, Inc. | | | 1,054 | | | | 34,213 | |
Dell Technologies, Inc., Class C(b) | | | 543 | | | | 35,881 | |
Dolby Laboratories, Inc., Class A | | | 419 | | | | 29,267 | |
Fidelity National Information Services, Inc. | | | 190 | | | | 28,661 | |
Fiserv, Inc.(b) | | | 243 | | | | 24,198 | |
GoDaddy, Inc., Class A(b) | | | 325 | | | | 27,196 | |
HP, Inc. | | | 1,572 | | | | 30,733 | |
Intel Corp. | | | 428 | | | | 21,807 | |
Intuit, Inc. | | | 91 | | | | 31,430 | |
Jack Henry & Associates, Inc. | | | 150 | | | | 24,813 | |
Juniper Networks, Inc. | | | 1,083 | | | | 27,075 | |
Leidos Holdings, Inc. | | | 247 | | | | 22,351 | |
Marvell Technology Group Ltd. | | | 737 | | | | 28,581 | |
Mastercard, Inc., Class A | | | 86 | | | | 30,804 | |
Microsoft Corp. | | | 143 | | | | 32,251 | |
Motorola Solutions, Inc. | | | 179 | | | | 27,700 | |
NortonLifeLock, Inc. | | | 1,280 | | | | 30,106 | |
Oracle Corp. | | | 495 | | | | 28,324 | |
Paychex, Inc. | | | 354 | | | | 27,070 | |
PTC, Inc.(b) | | | 327 | | | | 29,891 | |
RealPage, Inc.(b) | | | 385 | | | | 24,109 | |
Switch, Inc., Class A | | | 1,433 | | | | 24,648 | |
Synopsys, Inc.(b) | | | 142 | | | | 31,425 | |
Teradata Corp.(b) | | | 1,220 | | | | 29,707 | |
Texas Instruments, Inc. | | | 208 | | | | 29,567 | |
Tyler Technologies, Inc.(b) | | | 70 | | | | 24,172 | |
VeriSign, Inc.(b) | | | 122 | | | | 26,206 | |
Visa, Inc., Class A | | | 133 | | | | 28,195 | |
VMware, Inc., Class A(b)(c) | | | 177 | | | | 25,566 | |
Western Union Co. (The) | | | 1,157 | | | | 27,294 | |
| | | | | | | | |
| | | | | | | 1,339,920 | |
| | | | | | | | |
Materials-4.81% | | | | |
Air Products and Chemicals, Inc. | | | 107 | | | | 31,272 | |
AptarGroup, Inc. | | | 234 | | | | 27,703 | |
Avery Dennison Corp. | | | 221 | | | | 25,501 | |
Ball Corp. | | | 358 | | | | 28,772 | |
CF Industries Holdings, Inc. | | | 831 | | | | 27,115 | |
FMC Corp. | | | 260 | | | | 27,784 | |
Linde PLC (United Kingdom) | | | 124 | | | | 30,968 | |
Martin Marietta Materials, Inc. | | | 126 | | | | 25,562 | |
NewMarket Corp. | | | 61 | | | | 22,722 | |
Newmont Corp. | | | 473 | | | | 31,823 | |
| | | | | | | | |
| | | Shares | | | Value | |
Materials-(continued) | | | | |
Packaging Corp. of America | | | 249 | | | $ | 25,209 | |
Royal Gold, Inc. | | | 212 | | | | 28,900 | |
RPM International, Inc. | | | 339 | | | | 28,737 | |
Sherwin-Williams Co. (The) | | | 45 | | | | 30,197 | |
Silgan Holdings, Inc. | | | 805 | | | | 30,638 | |
Sonoco Products Co. | | | 486 | | | | 25,773 | |
Vulcan Materials Co. | | | 224 | | | | 26,880 | |
| | | | | | | | |
| | | | | | | 475,556 | |
| | | | | | | | |
Real Estate-11.26% | | | | | | | | |
Alexandria Real Estate Equities, Inc. | | | 171 | | | | 28,793 | |
American Homes 4 Rent, Class A | | | 968 | | | | 27,723 | |
American Tower Corp. | | | 99 | | | | 24,666 | |
Americold Realty Trust | | | 736 | | | | 28,226 | |
Apartment Investment & Management Co., Class A | | | 660 | | | | 23,780 | |
AvalonBay Communities, Inc. | | | 161 | | | | 25,448 | |
Brandywine Realty Trust | | | 2,416 | | | | 26,890 | |
Camden Property Trust | | | 269 | | | | 24,463 | |
CoreSite Realty Corp. | | | 221 | | | | 27,061 | |
Corporate Office Properties Trust | | | 981 | | | | 24,172 | |
Cousins Properties, Inc. | | | 750 | | | | 22,387 | |
Crown Castle International Corp. | | | 153 | | | | 24,977 | |
CubeSmart | | | 898 | | | | 28,395 | |
Digital Realty Trust, Inc. | | | 190 | | | | 29,573 | |
Douglas Emmett, Inc. | | | 814 | | | | 22,727 | |
Duke Realty Corp. | | | 724 | | | | 27,910 | |
Empire State Realty Trust, Inc., Class A | | | 3,406 | | | | 21,458 | |
Equinix, Inc. | | | 38 | | | | 30,012 | |
Equity Commonwealth | | | 792 | | | | 24,861 | |
Equity LifeStyle Properties, Inc. | | | 413 | | | | 27,378 | |
Equity Residential | | | 430 | | | | 24,273 | |
Essex Property Trust, Inc. | | | 103 | | | | 22,300 | |
Extra Space Storage, Inc. | | | 259 | | | | 27,596 | |
Healthcare Trust of America, Inc., Class A | | | 964 | | | | 25,440 | |
Healthpeak Properties, Inc. | | | 960 | | | | 26,534 | |
Highwoods Properties, Inc. | | | 629 | | | | 23,437 | |
Hudson Pacific Properties, Inc. | | | 937 | | | | 22,001 | |
Invitation Homes, Inc. | | | 953 | | | | 27,284 | |
Iron Mountain, Inc.(c) | | | 933 | | | | 28,074 | |
JBG SMITH Properties | | | 827 | | | | 22,883 | |
Kilroy Realty Corp. | | | 418 | | | | 24,461 | |
Life Storage, Inc. | | | 260 | | | | 27,412 | |
Medical Properties Trust, Inc. | | | 1,351 | | | | 25,102 | |
Mid-America Apartment Communities, Inc. | | | 213 | | | | 24,947 | |
National Retail Properties, Inc. | | | 720 | | | | 25,517 | |
Prologis, Inc. | | | 272 | | | | 27,706 | |
Public Storage | | | 127 | | | | 26,975 | |
Rayonier, Inc. | | | 1,081 | | | | 31,652 | |
Realty Income Corp. | | | 444 | | | | 27,541 | |
Sun Communities, Inc. | | | 183 | | | | 27,282 | |
Taubman Centers, Inc. | | | 625 | | | | 23,937 | |
UDR, Inc. | | | 676 | | | | 23,532 | |
WP Carey, Inc. | | | 401 | | | | 27,817 | |
| | | | | | | | |
| | | | | | | 1,114,603 | |
| | | | | | | | |
Utilities-8.29% | | | | | | | | |
AES Corp. (The) | | | 1,944 | | | | 34,506 | |
Alliant Energy Corp. | | | 519 | | | | 28,104 | |
Ameren Corp. | | | 348 | | | | 27,530 | |
American Electric Power Co., Inc. | | | 308 | | | | 24,280 | |
See accompanying Notes to Financial Statements which are an integral part of the financial statements.
Invesco Russell 1000 Low Beta Equal Weight ETF (USLB)–(continued)
August 31, 2020
| | | | | | | | |
| | | Shares | | | Value | |
Utilities-(continued) | | | | |
American Water Works Co., Inc. | | | 200 | | | $ | 28,268 | |
Atmos Energy Corp. | | | 253 | | | | 25,254 | |
Avangrid, Inc. | | | 574 | | | | 27,575 | |
CMS Energy Corp. | | | 445 | | | | 26,918 | |
Consolidated Edison, Inc. | | | 350 | | | | 24,969 | |
Dominion Energy, Inc. | | | 306 | | | | 24,003 | |
DTE Energy Co. | | | 234 | | | | 27,769 | |
Duke Energy Corp. | | | 297 | | | | 23,861 | |
Edison International | | | 435 | | | | 22,829 | |
Entergy Corp. | | | 255 | | | | 25,281 | |
Essential Utilities, Inc. | | | 587 | | | | 24,947 | |
Evergy, Inc. | | | 418 | | | | 22,246 | |
Eversource Energy | | | 305 | | | | 26,142 | |
Exelon Corp. | | | 664 | | | | 24,508 | |
FirstEnergy Corp. | | | 609 | | | | 17,411 | |
Hawaiian Electric Industries, Inc. | | | 672 | | | | 23,258 | |
IDACORP, Inc. | | | 272 | | | | 24,453 | |
MDU Resources Group, Inc. | | | 1,171 | | | | 27,659 | |
National Fuel Gas Co. | | | 617 | | | | 28,160 | |
NextEra Energy, Inc. | | | 102 | | | | 28,475 | |
NiSource, Inc. | | | 1,047 | | | | 23,202 | |
Pinnacle West Capital Corp. | | | 338 | | | | 24,792 | |
PPL Corp. | | | 886 | | | | 24,480 | |
Public Service Enterprise Group, Inc. | | | 502 | | | | 26,224 | |
Sempra Energy | | | 201 | | | | 24,854 | |
| | | | | | | | |
| | | Shares | | | Value | |
Utilities-(continued) | | | | |
Southern Co. (The) | | | 451 | | | $ | 23,533 | |
WEC Energy Group, Inc. | | | 282 | | | | 26,531 | |
Xcel Energy, Inc. | | | 400 | | | | 27,790 | |
| | | | | | | | |
| | | | 819,812 | |
| | | | | | | | |
TOTAL INVESTMENTS IN SECURITIES
(excluding investments purchased with cash collateral from securities on loan)-99.91%
(Cost $9,056,784) | | | | 9,886,376 | |
| | | | | | | | |
|
| Investments Purchased with Cash Collateral from Securities on Loan | |
| |
| Money Market Funds-0.55% | | | | | |
Invesco Private Government Fund, 0.03%(d)(e)(f) | | | 41,433 | | | | 41,433 | |
Invesco Private Prime Fund,
0.14%(d)(e)(f) | | | 13,296 | | | | 13,298 | |
| | | | | | | | |
Total Investments Purchased with Cash Collateral from Securities on Loan
(Cost $54,731) | | | | 54,731 | |
| | | | | | | | |
TOTAL INVESTMENTS IN SECURITIES-100.46% (Cost $9,111,515) | | | | 9,941,107 | |
OTHER ASSETS LESS LIABILITIES-(0.46)% | | | | (45,304 | ) |
| | | | | | | | |
NET ASSETS-100.00% | | | $ | 9,895,803 | |
| | | | | | | | |
Notes to Schedule of Investments:
| (a) | Industry and/or sector classifications used in this report are generally according to the Global Industry Classification Standard, which was developed by and is the exclusive property and a service mark of MSCI Inc. and Standard & Poor’s. |
| (b) | Non-income producing security. |
| (c) | All or a portion of this security was out on loan at August 31, 2020. |
| (d) | Affiliated issuer. The issuer and/or the Fund is a wholly-owned subsidiary of Invesco Ltd., or is affiliated by having an investment adviser that is under common control of Invesco Ltd. The table below shows the Fund’s transactions in, and earnings from, its investments in affiliates for the fiscal year ended August 31, 2020. |
| | | | | | | | | | | | | | | | | | | | | | | | | | | | | | | | | | | |
| | | | | | | | | Change in | | Realized | | | | |
| | | Value | | Purchases | | Proceeds | | Unrealized | | Gain | | Value | | Dividend |
| | | August 31, 2019 | | at Cost | | from Sales | | Appreciation | | (Loss) | | August 31, 2020 | | Income |
| Investments in Affiliated Money Market Funds: | | | | | | | | | | | | | | | | | | | | | | | | | | | | | | | | | | | |
| Invesco Premier U.S. Government Money Portfolio, Institutional Class | | | $ | 58,684 | | | | $ | 1,833,838 | | | | $ | (1,892,522 | ) | | | $ | - | | | | $ | - | | | | $ | - | | | | $ | 736 | |
| Investments Purchased with Cash Collateral from Securities on Loan: | | | | | | | | | | | | | | | | | | | | | | | | | | | | | | | | | | | |
| Invesco Government & Agency Portfolio, Institutional Class | | | | 1,337,605 | | | | | 10,345,816 | | | | | (11,683,421 | ) | | | | - | | | | | - | | | | | - | | | | | 10,708 | * |
| Invesco Liquid Assets Portfolio, Institutional Class | | | | 445,868 | | | | | 2,756,233 | | | | | (3,201,931 | ) | | | | - | | | | | (170 | ) | | | | - | | | | | 3,968 | * |
| Invesco Private Government Fund | | | | - | | | | | 1,121,431 | | | | | (1,079,998 | ) | | | | - | | | | | - | | | | | 41,433 | | | | | 12 | * |
Invesco Private Prime Fund | | | | - | | | | | 111,387 | | | | | (98,094 | ) | | | | - | | | | | 5 | | | | | 13,298 | | | | | 6 | * |
| | | | | | | | | | | | | | | | | | | | | | | | | | | | | | | | | | | |
| Total | | | $ | 1,842,157 | | | | $ | 16,168,705 | | | | $ | (17,955,966 | ) | | | $ | - | | | | $ | (165 | ) | | | $ | 54,731 | | | | $ | 15,430 | |
| | | | | | | | | | | | | | | | | | | | | | | | | | | | | | | | | | | |
| * | Represents the income earned on the investment of cash collateral, which is included in securities lending income on the Statements of Operations. Does not include rebates and fees paid to lending agent or premiums received from borrowers, if any. |
| (e) | The rate shown is the 7-day SEC standardized yield as of August 31, 2020. |
| (f) | The security has been segregated to satisfy the commitment to return the cash collateral received in securities lending transactions upon the borrower’s return of the securities loaned. See Note 2J. |
See accompanying Notes to Financial Statements which are an integral part of the financial statements.
Invesco S&P 500 Enhanced Value ETF (SPVU)
August 31, 2020
Schedule of Investments(a)
| | | | | | | | |
| | | Shares | | | Value | |
| Common Stocks & Other Equity Interests-99.51% | |
Communication Services-6.78% | | | | | | | | |
AT&T, Inc. | | | 113,467 | | | $ | 3,382,451 | |
CenturyLink, Inc. | | | 36,751 | | | | 395,073 | |
Discovery, Inc., Class C(b) | | | 8,645 | | | | 172,641 | |
DISH Network Corp., Class A(b) | | | 5,383 | | | | 191,204 | |
ViacomCBS, Inc., Class B | | | 19,417 | | | | 540,764 | |
| | | | | | | | |
| | | | | | | 4,682,133 | |
| | | | | | | | |
Consumer Discretionary-9.75% | | | | | | | | |
Best Buy Co., Inc. | | | 5,360 | | | | 594,478 | |
BorgWarner, Inc. | | | 5,573 | | | | 226,208 | |
Carnival Corp. | | | 17,640 | | | | 290,707 | |
D.R. Horton, Inc. | | | 7,456 | | | | 532,135 | |
Ford Motor Co. | | | 110,623 | | | | 754,449 | |
Gap, Inc. (The) | | | 8,191 | | | | 142,441 | |
General Motors Co. | | | 57,321 | | | | 1,698,421 | |
Hanesbrands, Inc. | | | 8,314 | | | | 127,121 | |
Kohl’s Corp. | | | 6,247 | | | | 133,436 | |
Lennar Corp., Class A | | | 8,005 | | | | 598,934 | |
LKQ Corp.(b) | | | 7,796 | | | | 247,445 | |
MGM Resorts International | | | 15,077 | | | | 339,232 | |
Mohawk Industries, Inc.(b) | | | 1,857 | | | | 171,457 | |
PulteGroup, Inc. | | | 6,320 | | | | 281,809 | |
PVH Corp. | | | 3,030 | | | | 168,953 | |
Ralph Lauren Corp. | | | 1,196 | | | | 82,321 | |
Whirlpool Corp. | | | 1,924 | | | | 341,933 | |
| | | | | | | | |
| | | | | | | 6,731,480 | |
| | | | | | | | |
Consumer Staples-6.45% | | | | | | | | |
Archer-Daniels-Midland Co. | | | 20,422 | | | | 914,089 | |
Kraft Heinz Co. (The) | | | 16,676 | | | | 584,327 | |
Kroger Co. (The) | | | 29,393 | | | | 1,048,742 | |
Molson Coors Beverage Co., Class B | | | 5,479 | | | | 206,229 | |
Tyson Foods, Inc., Class A | | | 8,676 | | | | 544,853 | |
Walgreens Boots Alliance, Inc. | | | 30,383 | | | | 1,155,162 | |
| | | | | | | | |
| | | | | | | 4,453,402 | |
| | | | | | | | |
Energy-8.86% | | | | | | | | |
ConocoPhillips | | | 22,078 | | | | 836,535 | |
Diamondback Energy, Inc. | | | 3,929 | | | | 153,074 | |
Exxon Mobil Corp. | | | 72,005 | | | | 2,875,880 | |
HollyFrontier Corp. | | | 5,704 | | | | 136,154 | |
Marathon Oil Corp. | | | 22,567 | | | | 119,154 | |
Marathon Petroleum Corp. | | | 12,598 | | | | 446,725 | |
Phillips 66 | | | 13,133 | | | | 767,887 | |
Valero Energy Corp. | | | 14,876 | | | | 782,329 | |
| | | | | | | | |
| | | | | | | 6,117,738 | |
| | | | | | | | |
Financials-39.37% | | | | | | | | |
Aflac, Inc. | | | 19,269 | | | | 699,850 | |
Allstate Corp. (The) | | | 9,084 | | | | 844,812 | |
American International Group, Inc. | | | 35,718 | | | | 1,040,822 | |
Assurant, Inc. | | | 1,502 | | | | 182,583 | |
Bank of America Corp. | | | 137,091 | | | | 3,528,722 | |
Bank of New York Mellon Corp. (The) | | | 22,364 | | | | 827,021 | |
Capital One Financial Corp. | | | 14,184 | | | | 979,121 | |
Citigroup, Inc. | | | 65,289 | | | | 3,337,574 | |
Citizens Financial Group, Inc. | | | 14,065 | | | | 363,861 | |
Comerica, Inc. | | | 4,288 | | | | 169,505 | |
| | | | | | | | |
| | | Shares | | | Value | |
Financials-(continued) | | | | | | | | |
Everest Re Group Ltd. | | | 1,034 | | | $ | 227,563 | |
Fifth Third Bancorp | | | 19,818 | | | | 409,440 | |
Franklin Resources, Inc. | | | 6,269 | | | | 132,025 | |
Goldman Sachs Group, Inc. (The) | | | 7,790 | | | | 1,595,937 | |
Hartford Financial Services Group, Inc. (The) | | | 11,137 | | | | 450,492 | |
Huntington Bancshares, Inc. | | | 24,360 | | | | 229,228 | |
Invesco Ltd.(c) | | | 13,012 | | | | 132,722 | |
KeyCorp | | | 25,369 | | | | 312,546 | |
Lincoln National Corp. | | | 7,808 | | | | 281,478 | |
Loews Corp. | | | 7,780 | | | | 278,991 | |
M&T Bank Corp. | | | 3,189 | | | | 329,296 | |
MetLife, Inc. | | | 35,056 | | | | 1,348,254 | |
Morgan Stanley | | | 29,341 | | | | 1,533,361 | |
People’s United Financial, Inc. | | | 12,700 | | | | 134,366 | |
Principal Financial Group, Inc. | | | 8,079 | | | | 340,207 | |
Prudential Financial, Inc. | | | 17,926 | | | | 1,214,845 | |
Regions Financial Corp. | | | 27,199 | | | | 314,420 | |
State Street Corp. | | | 8,468 | | | | 576,586 | |
Synchrony Financial | | | 13,644 | | | | 338,508 | |
Travelers Cos., Inc. (The) | | | 6,342 | | | | 735,926 | |
Truist Financial Corp. | | | 31,986 | | | | 1,241,377 | |
Unum Group | | | 9,862 | | | | 182,250 | |
Wells Fargo & Co. | | | 113,056 | | | | 2,730,302 | |
Zions Bancorporation N.A. | | | 4,275 | | | | 137,484 | |
| | | | | | | | |
| | | | | | | 27,181,475 | |
| | | | | | | | |
Health Care-13.52% | | | | | | | | |
AmerisourceBergen Corp. | | | 5,345 | | | | 518,625 | |
Anthem, Inc. | | | 5,928 | | | | 1,668,850 | |
Centene Corp.(b) | | | 18,366 | | | | 1,126,203 | |
Cigna Corp. | | | 10,510 | | | | 1,864,159 | |
CVS Health Corp. | | | 49,723 | | | | 3,088,793 | |
McKesson Corp. | | | 5,411 | | | | 830,264 | |
Mylan N.V.(b) | | | 14,360 | | | | 235,217 | |
| | | | | | | | |
| | | | | | | 9,332,111 | |
| | | | | | | | |
Industrials-8.20% | | | | | | | | |
Alaska Air Group, Inc. | | | 3,835 | | | | 149,373 | |
Delta Air Lines, Inc. | | | 20,310 | | | | 626,563 | |
Howmet Aerospace, Inc. | | | 12,133 | | | | 212,570 | |
Johnson Controls International PLC | | | 21,435 | | | | 873,048 | |
Quanta Services, Inc. | | | 4,200 | | | | 215,250 | |
Raytheon Technologies Corp. | | | 37,173 | | | | 2,267,553 | |
Southwest Airlines Co. | | | 12,165 | | | | 457,161 | |
Textron, Inc. | | | 6,478 | | | | 255,428 | |
United Airlines Holdings, Inc.(b) | | | 9,640 | | | | 347,040 | |
United Rentals, Inc.(b) | | | 1,461 | | | | 258,670 | |
| | | | | | | | |
| | | | | | | 5,662,656 | |
| | | | | | | | |
Information Technology-2.09% | | | | | | | | |
DXC Technology Co. | | | 6,600 | | | | 131,868 | |
Hewlett Packard Enterprise Co. | | | 39,638 | | | | 383,299 | |
HP, Inc. | | | 39,434 | | | | 770,935 | |
Xerox Holdings Corp. | | | 8,427 | | | | 158,933 | |
| | | | | | | | |
| | | | | | | 1,445,035 | |
| | | | | | | | |
Materials-2.40% | | | | | | | | |
Eastman Chemical Co. | | | 2,969 | | | | 217,064 | |
International Paper Co. | | | 8,761 | | | | 317,761 | |
See accompanying Notes to Financial Statements which are an integral part of the financial statements.
Invesco S&P 500 Enhanced Value ETF (SPVU)–(continued)
August 31, 2020
| | | | | | | | |
| | | Shares | | | Value | |
Materials-(continued) | | | | | | | | |
LyondellBasell Industries N.V., Class A | | | 5,952 | | | $ | 389,737 | |
Nucor Corp. | | | 8,428 | | | | 383,137 | |
Westrock Co. | | | 11,427 | | | | 346,581 | |
| | | | | | | | |
| | | | | | | 1,654,280 | |
| | | | | | | | |
Real Estate-0.83% | | | | | | | | |
CBRE Group, Inc., Class A(b) | | | 7,448 | | | | 350,279 | |
SL Green Realty Corp. | | | 2,048 | | | | 95,765 | |
Vornado Realty Trust | | | 3,635 | | | | 130,242 | |
| | | | | | | | |
| | | | | | | 576,286 | |
| | | | | | | | |
Utilities-1.26% | | | | | | | | |
Exelon Corp. | | | 23,475 | | | | 866,462 | |
| | | | | | | | |
Total Common Stocks & Other Equity Interests
(Cost $82,245,427) | | | | 68,703,058 | |
| | | | | | | | |
| | | | | | | | |
| | | Shares | | | Value | |
| Money Market Funds-0.06% | | | | | |
Invesco Premier U.S. Government Money Portfolio, Institutional Class, 0.01%(c)(d) (Cost $38,540) | | | 38,540 | | | $ | 38,540 | |
| | | | | | | | |
TOTAL INVESTMENTS IN SECURITIES-99.57%
(Cost $82,283,967) | | | | 68,741,598 | |
OTHER ASSETS LESS LIABILITIES-0.43% | | | | 299,952 | |
| | | | | | | | |
NET ASSETS-100.00% | | | | | | $ | 69,041,550 | |
| | | | | | | | |
Notes to Schedule of Investments:
| (a) | Industry and/or sector classifications used in this report are generally according to the Global Industry Classification Standard, which was developed by and is the exclusive property and a service mark of MSCI Inc. and Standard & Poor’s. |
| (b) | Non-income producing security. |
| (c) | Affiliated issuer. The issuer and/or the Fund is a wholly-owned subsidiary of Invesco Ltd., or is affiliated by having an investment adviser that is under common control of Invesco Ltd. The table below shows the Fund’s transactions in, and earnings from, its investments in affiliates for the fiscal year ended August 31, 2020. |
| | | | | | | | | | | | | | | | | | | | | | | | | | | | | | | | | | | |
| | | | | | | | | Change in | | | | | | |
| | | | | | | | | Unrealized | | Realized | | | | |
| | | Value | | Purchases | | Proceeds | | Appreciation | | Gain | | Value | | Dividend |
| | | August 31, 2019 | | at Cost | | from Sales | | (Depreciation) | | (Loss) | | August 31, 2020 | | Income |
Invesco Ltd. | | | $ | 142,116 | | | | $ | 145,070 | | | | $ | (70,009 | ) | | | $ | (70,879 | ) | | | $ | (13,576 | ) | | | $ | 132,722 | | | | $ | 11,390 | |
Investments in Affiliated Money
Market Funds: | | | | | | | | | | | | | | | | | | | | | | | | | | | | | | | |
Invesco Premier U.S. Government
Money Portfolio, Institutional Class | | | | - | | | | | 3,547,458 | | | | | (3,508,918 | ) | | | | - | | | | | - | | | | | 38,540 | | | | | 613 | |
Investments Purchased with Cash
Collateral from Securities on Loan: | | | | | | | | | | | | | | | | | | | | | | | | | | | | | | | |
Invesco Government & Agency
Portfolio, Institutional Class | | | | 235,178 | | | | | 3,333,195 | | | | | (3,568,373 | ) | | | | - | | | | | - | | | | | - | | | | | 2,145 | * |
Invesco Liquid Assets Portfolio,
Institutional Class | | | | 78,393 | | | | | 962,142 | | | | | (1,040,440 | ) | | | | - | | | | | (95 | ) | | | | - | | | | | 826 | * |
Invesco Private Government Fund | | | | - | | | | | 1,549,073 | | | | | (1,549,073 | ) | | | | - | | | | | - | | | | | - | | | | | 13 | * |
Invesco Private Prime Fund | | | | - | | | | | 195,814 | | | | | (195,821 | ) | | | | - | | | | | 7 | | | | | - | | | | | 4 | * |
| | | | | | | | | | | | | | | | | | | | | | | | | | | | | | | | | | | |
Total | | | $ | 455,687 | | | | $ | 9,732,752 | | | | $ | (9,932,634 | ) | | | $ | (70,879 | ) | | | $ | (13,664 | ) | | | $ | 171,262 | | | | $ | 14,991 | |
| | | | | | | | | | | | | | | | | | | | | | | | | | | | | | | | | | | |
| * | Represents the income earned on the investment of cash collateral, which is included in securities lending income on the Statements of Operations. Does not include rebates and fees paid to lending agent or premiums received from borrowers, if any. |
| (d) | The rate shown is the 7-day SEC standardized yield as of August 31, 2020. |
See accompanying Notes to Financial Statements which are an integral part of the financial statements.
Invesco S&P 500® ex-Rate Sensitive Low Volatility ETF (XRLV)
August 31, 2020
Schedule of Investments(a)
| | | | | | | | |
| | | Shares | | | Value | |
| Common Stocks & Other Equity Interests-99.96% | |
Communication Services-8.41% | | | | | | | | |
Activision Blizzard, Inc. | | | 8,230 | | | $ | 687,370 | |
Alphabet, Inc., Class C(b) | | | 479 | | | | 782,772 | |
AT&T, Inc. | | | 24,105 | | | | 718,570 | |
Charter Communications, Inc., Class A(b) | | | 1,299 | | | | 799,677 | |
Comcast Corp., Class A | | | 15,819 | | | | 708,849 | |
Electronic Arts, Inc.(b) | | | 5,327 | | | | 742,957 | |
Facebook, Inc., Class A(b) | | | 2,385 | | | | 699,282 | |
T-Mobile US, Inc.(b) | | | 5,679 | | | | 662,626 | |
| | | | | | | | |
| | | | | | | 5,802,103 | |
| | | | | | | | |
Consumer Discretionary-7.03% | | | | | | | | |
Amazon.com, Inc.(b) | | | 241 | | | | 831,681 | |
AutoZone, Inc.(b) | | | 517 | | | | 618,492 | |
eBay, Inc. | | | 13,192 | | | | 722,658 | |
Garmin Ltd. | | | 6,609 | | | | 684,759 | |
McDonald’s Corp. | | | 3,055 | | | | 652,304 | |
NIKE, Inc., Class B | | | 5,970 | | | | 667,983 | |
Tractor Supply Co. | | | 4,517 | | | | 672,265 | |
| | | | | | | | |
| | | | | | | 4,850,142 | |
| | | | | | | | |
Consumer Staples-6.08% | | | | | | | | |
Altria Group, Inc. | | | 16,741 | | | | 732,251 | |
Archer-Daniels-Midland Co. | | | 14,577 | | | | 652,467 | |
Conagra Brands, Inc. | | | 17,387 | | | | 666,965 | |
Kroger Co. (The) | | | 21,162 | | | | 755,060 | |
Monster Beverage Corp.(b) | | | 8,730 | | | | 732,098 | |
Philip Morris International, Inc. | | | 8,244 | | | | 657,789 | |
| | | | | | | | |
| | | | | | | 4,196,630 | |
| | | | | | | | |
Financials-8.89% | | | | | | | | |
Allstate Corp. (The) | | | 6,315 | | | | 587,295 | |
Aon PLC, Class A | | | 3,368 | | | | 673,566 | |
Arthur J. Gallagher & Co. | | | 5,949 | | | | 626,430 | |
Berkshire Hathaway, Inc., Class B(b) | | | 3,623 | | | | 789,959 | |
Cboe Global Markets, Inc. | | | 7,001 | | | | 642,622 | |
Intercontinental Exchange, Inc. | | | 6,661 | | | | 707,598 | |
Marsh & McLennan Cos., Inc. | | | 6,136 | | | | 705,088 | |
Progressive Corp. (The) | | | 7,754 | | | | 736,940 | |
Willis Towers Watson PLC | | | 3,240 | | | | 665,917 | |
| | | | | | | | |
| | | | | | | 6,135,415 | |
| | | | | | | | |
Health Care-29.60% | | | | | | | | |
Abbott Laboratories | | | 6,811 | | | | 745,600 | |
AbbVie, Inc. | | | 8,142 | | | | 779,759 | |
Agilent Technologies, Inc. | | | 7,162 | | | | 719,208 | |
Amgen, Inc. | | | 2,906 | | | | 736,148 | |
Becton, Dickinson and Co. | | | 2,786 | | | | 676,357 | |
Bio-Rad Laboratories, Inc.,
Class A(b) | | | 1,293 | | | | 657,607 | |
Bristol-Myers Squibb Co. | | | 14,619 | | | | 909,302 | |
Cooper Cos., Inc. (The) | | | 2,192 | | | | 689,121 | |
CVS Health Corp. | | | 10,260 | | | | 637,351 | |
Danaher Corp. | | | 3,809 | | | | 786,444 | |
DaVita, Inc.(b)(c) | | | 7,447 | | | | 646,102 | |
DENTSPLY SIRONA, Inc. | | | 13,669 | | | | 613,328 | |
Gilead Sciences, Inc. | | | 9,920 | | | | 662,160 | |
Henry Schein, Inc.(b) | | | 9,252 | | | | 614,703 | |
IDEXX Laboratories, Inc.(b) | | | 1,703 | | | | 665,975 | |
Illumina, Inc.(b) | | | 1,791 | | | | 639,781 | |
| | | | | | | | |
| | | Shares | | | Value | |
Health Care-(continued) | | | | | | | | |
Incyte Corp.(b) | | | 6,875 | | | $ | 662,406 | |
Johnson & Johnson | | | 5,705 | | | | 875,204 | |
Merck & Co., Inc. | | | 9,692 | | | | 826,437 | |
Mettler-Toledo International, Inc.(b) | | | 657 | | | | 637,803 | |
PerkinElmer, Inc. | | | 6,252 | | | | 735,985 | |
Pfizer, Inc. | | | 20,332 | | | | 768,346 | |
Quest Diagnostics, Inc. | | | 5,491 | | | | 610,819 | |
STERIS PLC | | | 4,239 | | | | 676,714 | |
Thermo Fisher Scientific, Inc. | | | 1,727 | | | | 740,849 | |
Vertex Pharmaceuticals, Inc.(b) | | | 2,401 | | | | 670,167 | |
Waters Corp.(b) | | | 2,976 | | | | 643,590 | |
West Pharmaceutical Services, Inc. | | | 2,581 | | | | 732,901 | |
Zoetis, Inc. | | | 4,161 | | | | 666,176 | |
| | | | | | | | |
| | | | | | | 20,426,343 | |
| | | | | | | | |
Industrials-21.45% | | | | | | | | |
3M Co. | | | 4,041 | | | | 658,764 | |
A.O. Smith Corp. | | | 13,732 | | | | 672,456 | |
C.H. Robinson Worldwide, Inc. | | | 7,823 | | | | 769,001 | |
Expeditors International of Washington, Inc. | | | 9,218 | | | | 814,779 | |
Fastenal Co. | | | 12,734 | | | | 622,183 | |
General Dynamics Corp. | | | 4,243 | | | | 633,692 | |
IDEX Corp. | | | 3,904 | | | | 703,618 | |
J.B. Hunt Transport Services, Inc. | | | 4,662 | | | | 655,197 | |
Jacobs Engineering Group, Inc. | | | 6,928 | | | | 625,391 | |
Johnson Controls International PLC | | | 15,261 | | | | 621,581 | |
L3Harris Technologies, Inc. | | | 3,489 | | | | 630,602 | |
Lockheed Martin Corp. | | | 1,641 | | | | 640,417 | |
Masco Corp. | | | 10,844 | | | | 632,205 | |
Northrop Grumman Corp. | | | 1,910 | | | | 654,385 | |
Old Dominion Freight Line, Inc. | | | 3,240 | | | | 655,063 | |
PACCAR, Inc. | | | 7,902 | | | | 678,308 | |
Republic Services, Inc. | | | 8,418 | | | | 780,517 | |
Roper Technologies, Inc. | | | 1,459 | | | | 623,270 | |
Union Pacific Corp. | | | 3,189 | | | | 613,691 | |
United Parcel Service, Inc., Class B | | | 4,106 | | | | 671,824 | |
Verisk Analytics, Inc. | | | 3,599 | | | | 671,825 | |
Waste Management, Inc. | | | 6,732 | | | | 767,448 | |
| | | | | | | | |
| | | | | | | 14,796,217 | |
| | | | | | | | |
Information Technology-13.92% | | | | | | | | |
Accenture PLC, Class A | | | 2,776 | | | | 666,046 | |
Akamai Technologies, Inc.(b) | | | 6,539 | | | | 761,336 | |
Amphenol Corp., Class A | | | 5,764 | | | | 632,887 | |
Apple, Inc. | | | 5,292 | | | | 682,880 | |
Cisco Systems, Inc. | | | 14,380 | | | | 607,123 | |
F5 Networks, Inc.(b) | | | 4,674 | | | | 618,510 | |
International Business Machines Corp. | | | 5,168 | | | | 637,266 | |
Juniper Networks, Inc. | | | 28,840 | | | | 721,000 | |
Microsoft Corp. | | | 2,992 | | | | 674,786 | |
Oracle Corp. | | | 11,633 | | | | 665,640 | |
salesforce.com, inc.(b) | | | 3,152 | | | | 859,393 | |
Tyler Technologies, Inc.(b) | | | 2,320 | | | | 801,119 | |
Visa, Inc., Class A | | | 3,123 | | | | 662,045 | |
Western Union Co. (The) | | | 26,035 | | | | 614,166 | |
| | | | | | | | |
| | | | | | | 9,604,197 | |
| | | | | | | | |
Materials-3.68% | | | | | | | | |
Air Products and Chemicals, Inc. | | | 2,106 | | | | 615,499 | |
See accompanying Notes to Financial Statements which are an integral part of the financial statements.
Invesco S&P 500® ex-Rate Sensitive Low Volatility ETF (XRLV)–(continued)
August 31, 2020
| | | | | | | | |
| | | Shares | | | Value | |
Materials-(continued) | | | | | | | | |
Linde PLC (United Kingdom) | | | 2,768 | | | $ | 691,280 | |
PPG Industries, Inc. | | | 5,130 | | | | 617,652 | |
Sherwin-Williams Co. (The) | | | 915 | | | | 614,011 | |
| | | | | | | | |
| | | | | | | 2,538,442 | |
| | | | | | | | |
Real Estate-0.90% | | | | | | | | |
Alexandria Real Estate Equities, Inc. | | | 3,695 | | | | 622,164 | |
| | | | | | | | |
TOTAL INVESTMENTS IN SECURITIES
(excluding investments purchased with cash collateral from securities on loan)-99.96%
(Cost $61,473,585) | | | | 68,971,653 | |
| | | | | | | | |
|
| Investments Purchased with Cash Collateral from Securities on Loan | |
| |
| Money Market Funds-0.05% | | | | | |
Invesco Private Government Fund,
0.03%(d)(e)(f) | | | 25,621 | | | | 25,621 | |
| | | | | | | | |
| | | Shares | | | Value | |
| Money Market Funds-(continued) | | | | | |
Invesco Private Prime Fund,
0.14%(d)(e)(f) | | | 8,635 | | | $ | 8,637 | |
| | | | | | | | |
Total Investments Purchased with Cash Collateral from Securities on Loan
(Cost $34,258) | | | | 34,258 | |
| | | | | | | | |
TOTAL INVESTMENTS IN SECURITIES-100.01%
(Cost $61,507,843) | | | | 69,005,911 | |
OTHER ASSETS LESS LIABILITIES-(0.01)% | | | | (3,529 | ) |
| | | | | | | | |
NET ASSETS-100.00% | | | | | | $ | 69,002,382 | |
| | | | | | | | |
Notes to Schedule of Investments:
| (a) | Industry and/or sector classifications used in this report are generally according to the Global Industry Classification Standard, which was developed by and is the exclusive property and a service mark of MSCI Inc. and Standard & Poor’s. |
| (b) | Non-income producing security. |
| (c) | All or a portion of this security was out on loan at August 31, 2020. |
| (d) | Affiliated issuer. The issuer and/or the Fund is a wholly-owned subsidiary of Invesco Ltd., or is affiliated by having an investment adviser that is under common control of Invesco Ltd. The table below shows the Fund’s transactions in, and earnings from, its investments in affiliates for the fiscal year ended August 31, 2020. |
| | | | | | | | | | | | | | | | | | | | | | | | | | | | | | | | | | | |
| | | | | | | | | Change in | | Realized | | | | |
| | | Value | | Purchases | | Proceeds | | Unrealized | | Gain | | Value | | Dividend |
| | | August 31, 2019 | | at Cost | | from Sales | | Appreciation | | (Loss) | | August 31, 2020 | | Income |
Investments in Affiliated Money Market Funds: | | | | | | | | | | | | | | | | | | | | | | | | | | | | | | | | | | | |
Invesco Premier U.S. Government Money Portfolio, Institutional Class | | | $ | - | | | | $ | 2,600,645 | | | | $ | (2,600,645 | ) | | | $ | - | | | | $ | - | | | | $ | - | | | | $ | 742 | |
Investments Purchased with Cash Collateral from Securities on Loan: | | | | | | | | | | | | | | | | | | | | | | | | | | | | | | | | | | | |
Invesco Government & Agency Portfolio, Institutional Class | | | | 908,778 | | | | | 5,811,389 | | | | | (6,720,167 | ) | | | | - | | | | | - | | | | | - | | | | | 4,395 | * |
Invesco Liquid Assets Portfolio, Institutional Class | | | | 302,009 | | | | | 1,939,686 | | | | | (2,241,447 | ) | | | | - | | | | | (248 | ) | | | | - | | | | | 1,622 | * |
Invesco Private Government Fund | | | | - | | | | | 25,910 | | | | | (289 | ) | | | | - | | | | | - | | | | | 25,621 | | | | | - | |
Invesco Private Prime Fund | | | | - | | | | | 8,637 | | | | | - | | | | | - | | | | | - | | | | | 8,637 | | | | | - | |
| | | | | | | | | | | | | | | | | | | | | | | | | | | | | | | | | | | |
Total | | | $ | 1,210,787 | | | | $ | 10,386,267 | | | | $ | (11,562,548 | ) | | | $ | - | | | | $ | (248 | ) | | | $ | 34,258 | | | | $ | 6,759 | |
| | | | | | | | | | | | | | | | | | | | | | | | | | | | | | | | | | | |
| * | Represents the income earned on the investment of cash collateral, which is included in securities lending income on the Statements of Operations. Does not include rebates and fees paid to lending agent or premiums received from borrowers, if any. |
| (e) | The rate shown is the 7-day SEC standardized yield as of August 31, 2020. |
| (f) | The security has been segregated to satisfy the commitment to return the cash collateral received in securities lending transactions upon the borrower’s return of the securities loaned. See Note 2J. |
See accompanying Notes to Financial Statements which are an integral part of the financial statements.
Invesco S&P 500® High Beta ETF (SPHB)
August 31, 2020
Schedule of Investments(a)
| | | | | | | | |
| | | Shares | | | Value | |
| Common Stocks & Other Equity Interests-99.82% | |
Communication Services-1.85% | | | | | | | | |
DISH Network Corp., Class A(b) | | | 35,476 | | | $ | 1,260,108 | |
ViacomCBS, Inc., Class B | | | 41,797 | | | | 1,164,046 | |
| | | | | | | | |
| | | | | | | 2,424,154 | |
| | | | | | | | |
Consumer Discretionary-17.55% | | | | | |
Aptiv PLC | | | 14,142 | | | | 1,217,909 | |
Carnival Corp. | | | 108,870 | | | | 1,794,178 | |
Darden Restaurants, Inc. | | | 16,230 | | | | 1,406,654 | |
Gap, Inc. (The) | | | 88,831 | | | | 1,544,771 | |
Kohl’s Corp. | | | 55,132 | | | | 1,177,620 | |
L Brands, Inc. | | | 49,971 | | | | 1,469,147 | |
Leggett & Platt, Inc. | | | 32,113 | | | | 1,316,633 | |
LKQ Corp.(b) | | | 36,878 | | | | 1,170,508 | |
MGM Resorts International | | | 71,075 | | | | 1,599,188 | |
Norwegian Cruise Line Holdings
Ltd.(b)(c) | | | 111,959 | | | | 1,915,619 | |
PVH Corp. | | | 27,913 | | | | 1,556,429 | |
Royal Caribbean Cruises Ltd. | | | 26,191 | | | | 1,802,988 | |
Tapestry, Inc. | | | 96,990 | | | | 1,428,663 | |
Under Armour, Inc., Class A(b)(c) | | | 109,187 | | | | 1,071,124 | |
Whirlpool Corp. | | | 6,659 | | | | 1,183,437 | |
Wynn Resorts Ltd. | | | 15,556 | | | | 1,360,372 | |
| | | | | | | | |
| | | | | | | 23,015,240 | |
| | | | | | | | |
Consumer Staples-0.79% | | | | | |
Coty, Inc., Class A | | | 289,649 | | | | 1,036,943 | |
| | | | | | | | |
Energy-17.25% | | | | | |
Apache Corp. | | | 104,998 | | | | 1,553,970 | |
Baker Hughes Co., Class A | | | 74,540 | | | | 1,064,431 | |
Chevron Corp. | | | 12,871 | | | | 1,080,263 | |
ConocoPhillips | | | 30,675 | | | | 1,162,276 | |
Devon Energy Corp. | | | 119,259 | | | | 1,296,345 | |
Diamondback Energy, Inc. | | | 28,087 | | | | 1,094,269 | |
Halliburton Co. | | | 95,904 | | | | 1,551,727 | |
Hess Corp. | | | 23,230 | | | | 1,069,509 | |
Marathon Oil Corp. | | | 206,609 | | | | 1,090,896 | |
Marathon Petroleum Corp. | | | 36,870 | | | | 1,307,410 | |
National Oilwell Varco, Inc. | | | 108,870 | | | | 1,306,440 | |
Noble Energy, Inc. | | | 148,576 | | | | 1,478,331 | |
Occidental Petroleum Corp. | | | 106,281 | | | | 1,354,020 | |
ONEOK, Inc. | | | 47,068 | | | | 1,293,429 | |
Pioneer Natural Resources Co. | | | 11,603 | | | | 1,205,900 | |
Schlumberger Ltd. | | | 65,260 | | | | 1,240,593 | |
TechnipFMC PLC (United Kingdom) | | | 160,410 | | | | 1,235,157 | |
Valero Energy Corp. | | | 23,671 | | | | 1,244,858 | |
| | | | | | | | |
| | | | | | | 22,629,824 | |
| | | | | | | | |
Financials-28.47% | | | | | |
American Express Co. | | | 12,694 | | | | 1,289,583 | |
American International Group, Inc. | | | 42,832 | | | | 1,248,124 | |
Ameriprise Financial, Inc. | | | 10,034 | | | | 1,573,331 | |
Bank of America Corp. | | | 47,042 | | | | 1,210,861 | |
Capital One Financial Corp. | | | 20,311 | | | | 1,402,068 | |
Citigroup, Inc. | | | 26,721 | | | | 1,365,978 | |
Citizens Financial Group, Inc. | | | 54,425 | | | | 1,407,975 | |
Comerica, Inc. | | | 30,895 | | | | 1,221,279 | |
Discover Financial Services | | | 30,086 | | | | 1,596,965 | |
E*TRADE Financial Corp. | | | 25,010 | | | | 1,353,041 | |
Fifth Third Bancorp | | | 68,321 | | | | 1,411,512 | |
| | | | | | | | |
| | | Shares | | | Value | |
Financials-(continued) | |
Invesco Ltd.(d) | | | 134,116 | | | $ | 1,367,983 | |
KeyCorp | | | 112,521 | | | | 1,386,259 | |
Lincoln National Corp. | | | 50,772 | | | | 1,830,331 | |
Loews Corp. | | | 31,682 | | | | 1,136,117 | |
MetLife, Inc. | | | 32,376 | | | | 1,245,181 | |
Morgan Stanley | | | 24,108 | | | | 1,259,884 | |
PNC Financial Services Group, Inc. (The) | | | 10,793 | | | | 1,200,182 | |
Principal Financial Group, Inc. | | | 28,826 | | | | 1,213,863 | |
Prudential Financial, Inc. | | | 19,883 | | | | 1,347,471 | |
Raymond James Financial, Inc. | | | 15,269 | | | | 1,156,169 | |
Regions Financial Corp. | | | 111,994 | | | | 1,294,651 | |
State Street Corp. | | | 16,414 | | | | 1,117,629 | |
SVB Financial Group(b) | | | 5,297 | | | | 1,352,748 | |
Synchrony Financial | | | 58,875 | | | | 1,460,689 | |
Truist Financial Corp. | | | 32,279 | | | | 1,252,748 | |
Unum Group | | | 81,151 | | | | 1,499,670 | |
Wells Fargo & Co. | | | 47,250 | | | | 1,141,087 | |
| | | | | | | | |
| | | | | | | 37,343,379 | |
| | | | | | | | |
Health Care-1.74% | | | | | |
Align Technology, Inc.(b) | | | 3,929 | | | | 1,166,834 | |
Universal Health Services, Inc., Class B | | | 10,100 | | | | 1,114,535 | |
| | | | | | | | |
| | | | | | | 2,281,369 | |
| | | | | | | | |
Industrials-9.69% | | | | | |
Alaska Air Group, Inc. | | | 33,203 | | | | 1,293,257 | |
American Airlines Group, Inc.(c) | | | 87,676 | | | | 1,144,172 | |
Boeing Co. (The) | | | 8,061 | | | | 1,385,041 | |
Howmet Aerospace, Inc. | | | 69,569 | | | | 1,218,849 | |
Parker-Hannifin Corp. | | | 6,073 | | | | 1,251,099 | |
Stanley Black & Decker, Inc. | | | 8,319 | | | | 1,341,855 | |
Textron, Inc. | | | 32,484 | | | | 1,280,844 | |
TransDigm Group, Inc. | | | 2,308 | | | | 1,153,238 | |
United Airlines Holdings, Inc.(b) | | | 37,550 | | | | 1,351,800 | |
United Rentals, Inc.(b) | | | 7,291 | | | | 1,290,871 | |
| | | | | | | | |
| | | | | | | 12,711,026 | |
| | | | | | | | |
Information Technology-11.68% | | | | | |
Applied Materials, Inc. | | | 18,537 | | | | 1,141,879 | |
DXC Technology Co. | | | 82,683 | | | | 1,652,006 | |
Global Payments, Inc. | | | 6,890 | | | | 1,216,912 | |
KLA Corp. | | | 5,881 | | | | 1,206,428 | |
Lam Research Corp. | | | 3,523 | | | | 1,184,926 | |
Microchip Technology, Inc. | | | 12,745 | | | | 1,398,126 | |
Micron Technology, Inc.(b) | | | 25,956 | | | | 1,181,258 | |
NVIDIA Corp. | | | 2,506 | | | | 1,340,660 | |
Paycom Software, Inc.(b) | | | 4,181 | | | | 1,252,042 | |
Skyworks Solutions, Inc. | | | 7,867 | | | | 1,139,535 | |
Western Digital Corp. | | | 36,509 | | | | 1,402,676 | |
Xerox Holdings Corp. | | | 63,950 | | | | 1,206,097 | |
| | | | | | | | |
| | | | | | | 15,322,545 | |
| | | | | | | | |
Materials-4.89% | | | | | |
Dow, Inc. | | | 26,524 | | | | 1,196,763 | |
Freeport-McMoRan, Inc. | | | 100,845 | | | | 1,574,191 | |
LyondellBasell Industries N.V., Class A | | | 18,807 | | | | 1,231,482 | |
Mosaic Co. (The) | | | 65,771 | | | | 1,199,005 | |
Westrock Co. | | | 40,229 | | | | 1,220,146 | |
| | | | | | | | |
| | | | | | | 6,421,587 | |
| | | | | | | | |
See accompanying Notes to Financial Statements which are an integral part of the financial statements.
Invesco S&P 500® High Beta ETF (SPHB)–(continued)
August 31, 2020
| | | | | | | | |
| | | Shares | | | Value | |
Real Estate-5.91% | | | | | | | | |
CBRE Group, Inc., Class A(b) | | | 25,014 | | | $ | 1,176,409 | |
Simon Property Group, Inc. | | | 18,864 | | | | 1,279,922 | |
SL Green Realty Corp. | | | 26,130 | | | | 1,221,839 | |
Ventas, Inc. | | | 32,062 | | | | 1,321,275 | |
Welltower, Inc. | | | 20,364 | | | | 1,171,337 | |
Weyerhaeuser Co. | | | 52,152 | | | | 1,580,727 | |
| | | | | | | | |
| | | | | | | 7,751,509 | |
| | | | | | | | |
TOTAL INVESTMENTS IN SECURITIES
(excluding investments purchased with cash collateral from securities on loan)-99.82%
(Cost $138,351,912) | | | | 130,937,576 | |
| | | | | | | | |
|
| Investments Purchased with Cash Collateral from Securities on Loan | |
| |
| Money Market Funds-2.89% | | | | | |
Invesco Private Government Fund, 0.03%(d)(e)(f) | | | 2,842,878 | | | | 2,842,878 | |
| | | | | | | | |
| | | Shares | | | Value | |
| Money Market Funds-(continued) | |
Invesco Private Prime Fund,
0.14%(d)(e)(f) | | | 947,461 | | | $ | 947,650 | |
| | | | | | | | |
Total Investments Purchased with Cash Collateral from Securities on Loan
(Cost $3,790,528) | | | | 3,790,528 | |
| | | | | | | | |
TOTAL INVESTMENTS IN SECURITIES-102.71%
(Cost $142,142,440) | | | | 134,728,104 | |
OTHER ASSETS LESS LIABILITIES-(2.71)% | | | | (3,553,032 | ) |
| | | | | | | | |
NET ASSETS-100.00% | | | $ | 131,175,072 | |
| | | | | | | | |
Notes to Schedule of Investments:
| (a) | Industry and/or sector classifications used in this report are generally according to the Global Industry Classification Standard, which was developed by and is the exclusive property and a service mark of MSCI Inc. and Standard & Poor’s. |
| (b) | Non-income producing security. |
| (c) | All or a portion of this security was out on loan at August 31, 2020. |
| (d) | Affiliated issuer. The issuer and/or the Fund is a wholly-owned subsidiary of Invesco Ltd., or is affiliated by having an investment adviser that is under common control of Invesco Ltd. The table below shows the Fund’s transactions in, and earnings from, its investments in affiliates for the fiscal year ended August 31, 2020. |
| | | | | | | | | | | | | | | | | | | | | | | | | | | | | | | | | | | |
| | | | | | | | | Change in | | | | | | |
| | | | | | | | | Unrealized | | Realized | | | | |
| | | Value | | Purchases | | Proceeds | | Appreciation | | Gain | | Value | | Dividend |
| | | August 31, 2019 | | at Cost | | from Sales | | (Depreciation) | | (Loss) | | August 31, 2020 | | Income |
Invesco Ltd. | | | $ | - | | | | $ | 4,352,727 | | | | $ | (2,670,424 | ) | | | $ | (177,747 | ) | | | $ | (136,573 | ) | | | $ | 1,367,983 | | | | $ | 38,074 | |
Investments in Affiliated Money Market Funds: | | | | | | | | | | | | | | | | | | | | | | | | | | | | | | | | | | | |
Invesco Premier U.S. Government Money Portfolio, Institutional Class | | | | - | | | | | 4,865,026 | | | | | (4,865,026 | ) | | | | - | | | | | - | | | | | - | | | | | 921 | |
Investments Purchased with Cash Collateral from Securities on Loan: | | | | | | | | | | | | | | | | | | | | | | | | | | | | | | | | | | | |
Invesco Government & Agency Portfolio, Institutional Class | | | | 1,125,263 | | | | | 23,369,507 | | | | | (24,494,770 | ) | | | | - | | | | | - | | | | | - | | | | | 13,256 | * |
Invesco Liquid Assets Portfolio, Institutional Class | | | | 375,088 | | | | | 6,047,067 | | | | | (6,421,760 | ) | | | | (1 | ) | | | | (394 | ) | | | | - | | | | | 4,990 | * |
Invesco Private Government Fund | | | | - | | | | | 21,139,694 | | | | | (18,296,816 | ) | | | | - | | | | | - | | | | | 2,842,878 | | | | | 263 | * |
Invesco Private Prime Fund | | | | - | | | | | 3,195,770 | | | | | (2,248,208 | ) | | | | - | | | | | 88 | | | | | 947,650 | | | | | 172 | * |
| | | | | | | | | | | | | | | | | | | | | | | | | | | | | | | | | | | |
Total | | | $ | 1,500,351 | | | | $ | 62,969,791 | | | | $ | (58,997,004 | ) | | | $ | (177,748 | ) | | | $ | (136,879 | ) | | | $ | 5,158,511 | | | | $ | 57,676 | |
| | | | | | | | | | | | | | | | | | | | | | | | | | | | | | | | | | | |
| * | Represents the income earned on the investment of cash collateral, which is included in securities lending income on the Statements of Operations. Does not include rebates and fees paid to lending agent or premiums received from borrowers, if any. |
| (e) | The rate shown is the 7-day SEC standardized yield as of August 31, 2020. |
| (f) | The security has been segregated to satisfy the commitment to return the cash collateral received in securities lending transactions upon the borrower’s return of the securities loaned. See Note 2J. |
See accompanying Notes to Financial Statements which are an integral part of the financial statements.
Invesco S&P 500® High Dividend Low Volatility ETF (SPHD)
August 31, 2020
Schedule of Investments(a)
| | | | | | | | |
| | | Shares | | | Value | |
| Common Stocks & Other Equity Interests-99.88% | |
Communication Services-11.32% | | | | | | | | |
AT&T, Inc. | | | 2,134,231 | | | $ | 63,621,426 | |
CenturyLink, Inc. | | | 7,224,660 | | | | 77,665,095 | |
Interpublic Group of Cos., Inc. (The) | | | 2,851,191 | | | | 50,637,152 | |
Omnicom Group, Inc. | | | 779,722 | | | | 42,175,163 | |
Verizon Communications, Inc. | | | 723,212 | | | | 42,864,776 | |
| | | | | | | | |
| | | | | | | 276,963,612 | |
| | | | | | | | |
Consumer Discretionary-6.97% | | | | | | | | |
H&R Block, Inc. | | | 4,603,949 | | | | 66,757,261 | |
Hanesbrands, Inc. | | | 3,523,087 | | | | 53,868,000 | |
Newell Brands, Inc. | | | 3,130,332 | | | | 50,022,705 | |
| | | | | | | | |
| | | | | | | 170,647,966 | |
| | | | | | | | |
Consumer Staples-9.19% | | | | | | | | |
Altria Group, Inc. | | | 1,741,857 | | | | 76,188,825 | |
Kraft Heinz Co. (The) | | | 1,339,815 | | | | 46,947,118 | |
Philip Morris International, Inc. | | | 804,995 | | | | 64,230,551 | |
Walgreens Boots Alliance, Inc. | | | 986,924 | | | | 37,522,850 | |
| | | | | | | | |
| | | | | | | 224,889,344 | |
| | | | | | | | |
Energy-7.12% | | | | | | | | |
Chevron Corp. | | | 571,168 | | | | 47,938,130 | |
Exxon Mobil Corp. | | | 1,659,407 | | | | 66,276,716 | |
Kinder Morgan, Inc. | | | 4,337,663 | | | | 59,946,503 | |
| | | | | | | | |
| | | | | | | 174,161,349 | |
| | | | | | | | |
Financials-4.52% | | | | | | | | |
Huntington Bancshares, Inc. | | | 6,406,409 | | | | 60,284,309 | |
People’s United Financial, Inc. | | | 4,752,608 | | | | 50,282,592 | |
| | | | | | | | |
| | | | | | | 110,566,901 | |
| | | | | | | | |
| Health Care-4.69% | | | | | | | | |
AbbVie, Inc. | | | 437,094 | | | | 41,860,492 | |
Cardinal Health, Inc. | | | 605,911 | | | | 30,756,042 | |
Pfizer, Inc. | | | 1,112,988 | | | | 42,059,817 | |
| | | | | | | | |
| | | | | | | 114,676,351 | |
| | | | | | | | |
Industrials-1.44% | | | | | | | | |
3M Co. | | | 216,162 | | | | 35,238,729 | |
| | | | | | | | |
Information Technology-12.58% | | | | | | | | |
Broadcom, Inc. | | | 118,987 | | | | 41,306,337 | |
Hewlett Packard Enterprise Co. | | | 4,674,931 | | | | 45,206,583 | |
HP, Inc. | | | 2,091,328 | | | | 40,885,462 | |
International Business Machines Corp. | | | 395,632 | | | | 48,785,382 | |
NetApp, Inc. | | | 927,678 | | | | 43,962,660 | |
Seagate Technology PLC | | | 1,027,408 | | | | 49,305,310 | |
Western Union Co. (The) | | | 1,620,406 | | | | 38,225,378 | |
| | | | | | | | |
| | | | | | | 307,677,112 | |
| | | | | | | | |
Materials-11.34% | | | | | | | | |
Amcor PLC(b) | | | 3,910,478 | | | | 43,249,887 | |
| | | | | | | | |
| | | Shares | | | Value | |
Materials-(continued) | | | | | | | | |
CF Industries Holdings, Inc. | | | 1,291,461 | | | $ | 42,140,372 | |
Dow, Inc. | | | 1,493,065 | | | | 67,367,093 | |
Eastman Chemical Co. | | | 451,163 | | | | 32,984,527 | |
International Paper Co. | | | 1,475,537 | | | | 53,517,727 | |
Nucor Corp. | | | 838,979 | | | | 38,139,985 | |
| | | | | | | | |
| | | | | | | 277,399,591 | |
| | | | | | | | |
Real Estate-13.96% | | | | | | | | |
Federal Realty Investment Trust | | | 625,393 | | | | 49,556,141 | |
Healthpeak Properties, Inc. | | | 1,895,304 | | | | 52,386,203 | |
Iron Mountain, Inc.(b) | | | 2,676,095 | | | | 80,523,698 | |
Realty Income Corp. | | | 747,888 | | | | 46,391,493 | |
Regency Centers Corp. | | | 1,191,860 | | | | 47,328,761 | |
Vornado Realty Trust | | | 1,827,654 | | | | 65,484,843 | |
| | | | | | | | |
| | | | | | | 341,671,139 | |
| | | | | | | | |
Utilities-16.75% | | | | | | | | |
Consolidated Edison, Inc. | | | 512,768 | | | | 36,580,869 | |
Dominion Energy, Inc. | | | 527,072 | | | | 41,343,528 | |
Duke Energy Corp. | | | 529,272 | | | | 42,521,713 | |
Edison International | | | 761,000 | | | | 39,937,280 | |
Entergy Corp. | | | 355,804 | | | | 35,274,409 | |
Exelon Corp. | | | 1,005,934 | | | | 37,129,024 | |
FirstEnergy Corp. | | | 1,247,531 | | | | 35,666,911 | |
Pinnacle West Capital Corp. | | | 479,015 | | | | 35,135,750 | |
PPL Corp. | | | 2,307,086 | | | | 63,744,786 | |
Southern Co. (The) | | | 814,108 | | | | 42,480,155 | |
| | | | | | | | |
| | | | | | | 409,814,425 | |
| | | | | | | | |
TOTAL INVESTMENTS IN SECURITIES
(excluding investments purchased with cash collateral from securities on loan)-99.88%
(Cost $2,710,750,901) | | | | | | | 2,443,706,519 | |
| | | | | | | | |
| |
| Investments Purchased with Cash Collateral from Securities on Loan | | | | | |
| | |
| Money Market Funds-2.73% | | | | | | | | |
Invesco Private Government Fund, 0.03%(c)(d)(e) | | | 50,133,719 | | | | 50,133,719 | |
Invesco Private Prime Fund,
0.14%(c)(d)(e) | | | 16,707,935 | | | | 16,711,276 | |
| | | | | | | | |
Total Investments Purchased with Cash Collateral from Securities on Loan
(Cost $66,844,996) | | | | 66,844,995 | |
| | | | | | | | |
TOTAL INVESTMENTS IN SECURITIES-102.61%
(Cost $2,777,595,897) | | | | 2,510,551,514 | |
OTHER ASSETS LESS LIABILITIES-(2.61)% | | | | (63,812,627 | ) |
| | | | | | | | |
NET ASSETS-100.00% | | | | | | $ | 2,446,738,887 | |
| | | | | | | | |
See accompanying Notes to Financial Statements which are an integral part of the financial statements.
Invesco S&P 500® High Dividend Low Volatility ETF (SPHD)–(continued)
August 31, 2020
Notes to Schedule of Investments:
| (a) | Industry and/or sector classifications used in this report are generally according to the Global Industry Classification Standard, which was developed by and is the exclusive property and a service mark of MSCI Inc. and Standard & Poor’s. |
| (b) | All or a portion of this security was out on loan at August 31, 2020. |
| (c) | Affiliated issuer. The issuer and/or the Fund is a wholly-owned subsidiary of Invesco Ltd., or is affiliated by having an investment adviser that is under common control of Invesco Ltd. The table below shows the Fund’s transactions in, and earnings from, its investments in affiliates for the fiscal year ended August 31, 2020. |
| | | | | | | | | | | | | | | | | | | | | | | | | | | | | | | | | | | |
| | | | | | | | | Change in | | | | | | |
| | | | | | | | | Unrealized | | Realized | | | | |
| | | Value | | Purchases | | Proceeds | | Appreciation | | Gain | | Value | | Dividend |
| | | August 31, 2019 | | at Cost | | from Sales | | (Depreciation) | | (Loss) | | August 31, 2020 | | Income |
| Investments in Affiliated Money Market Funds: | | | | | | | | | | | | | | | | | | | | | | | | | | | | | | | | | | | |
| Invesco Premier U.S. Government Money Portfolio, Institutional Class | | | $ | - | | | | $ | 85,692,547 | | | | $ | (85,692,547 | ) | | | | $ - | | | | | $ - | | | | | $ - | | | | $ | 25,630 | |
| Investments Purchased with Cash Collateral from Securities on Loan: | | | | | | | | | | | | | | | | | | | | | | | | | | | | | | | | | | | |
| Invesco Government & Agency Portfolio, Institutional Class | | | | 19,206,190 | | | | | 141,905,464 | | | | | (161,111,654 | ) | | | | - | | | | | - | | | | | - | | | | | 107,470 | * |
| Invesco Liquid Assets Portfolio, Institutional Class | | | | 6,402,063 | | | | | 43,665,513 | | | | | (50,059,988 | ) | | | | - | | | | | (7,588) | | | | | - | | | | | 39,550 | * |
Invesco Private Government Fund | | | | - | | | | | 111,400,989 | | | | | (61,267,270 | ) | | | | - | | | | | - | | | | | 50,133,719 | | | | | 600 | * |
Invesco Private Prime Fund | | | | - | | | | | 31,471,777 | | | | | (14,760,883 | ) | | | | (1) | | | | | 383 | | | | | 16,711,276 | | | | | 524 | * |
| | | | | | | | | | | | | | | | | | | | | | | | | | | | | | | | | | | |
Total | | | $ | 25,608,253 | | | | $ | 414,136,290 | | | | $ | (372,892,342 | ) | | | | $(1) | | | | | $(7,205) | | | | | $66,844,995 | | | | $ | 173,774 | |
| | | | | | | | | | | | | | | | | | | | | | | | | | | | | | | | | | | |
| * | Represents the income earned on the investment of cash collateral, which is included in securities lending income on the Statements of Operations. Does not include rebates and fees paid to lending agent or premiums received from borrowers, if any. |
| (d) | The rate shown is the 7-day SEC standardized yield as of August 31, 2020. |
| (e) | The security has been segregated to satisfy the commitment to return the cash collateral received in securities lending transactions upon the borrower’s return of the securities loaned. See Note 2J. |
See accompanying Notes to Financial Statements which are an integral part of the financial statements.
Invesco S&P 500® Low Volatility ETF (SPLV)
August 31, 2020
Schedule of Investments(a)
| | | | | | | | |
| | | Shares | | | Value | |
| Common Stocks & Other Equity Interests-99.88% | |
Communication Services-8.37% | | | | | | | | |
Activision Blizzard, Inc. | | | 1,036,355 | | | $ | 86,556,370 | |
Alphabet, Inc., Class C(b) | | | 59,974 | | | | 98,008,311 | |
AT&T, Inc. | | | 3,035,382 | | | | 90,484,738 | |
Charter Communications, Inc., Class A(b) | | | 162,598 | | | | 100,096,955 | |
Comcast Corp., Class A | | | 1,992,035 | | | | 89,263,088 | |
Electronic Arts, Inc.(b) | | | 666,801 | | | | 92,998,736 | |
T-Mobile US, Inc.(b) | | | 714,993 | | | | 83,425,383 | |
Verizon Communications, Inc. | | | 2,231,294 | | | | 132,248,795 | |
| | | | | | | | |
| | | | | | | 773,082,376 | |
| | | | | | | | |
Consumer Discretionary-5.09% | | | | | | | | |
Amazon.com, Inc.(b) | | | 30,302 | | | | 104,570,990 | |
Dollar General Corp. | | | 516,321 | | | | 104,234,883 | |
eBay, Inc. | | | 1,660,915 | | | | 90,984,924 | |
Garmin Ltd. | | | 832,077 | | | | 86,211,498 | |
Tractor Supply Co. | | | 568,292 | | | | 84,578,898 | |
| | | | | | | | |
| | | | | | | 470,581,193 | |
| | | | | | | | |
Consumer Staples-24.63% | | | | | | | | |
Altria Group, Inc. | | | 2,108,061 | | | | 92,206,588 | |
Archer-Daniels-Midland Co. | | | 1,835,151 | | | | 82,141,359 | |
Brown-Forman Corp., Class B | | | 1,174,535 | | | | 85,940,726 | |
Campbell Soup Co. | | | 2,024,747 | | | | 106,521,940 | |
Church & Dwight Co., Inc. | | | 1,056,483 | | | | 101,242,766 | |
Clorox Co. (The) | | | 498,370 | | | | 111,385,695 | |
Coca-Cola Co. (The) | | | 2,030,251 | | | | 100,558,332 | |
Colgate-Palmolive Co. | | | 1,309,852 | | | | 103,818,869 | |
Conagra Brands, Inc. | | | 2,189,502 | | | | 83,989,297 | |
Costco Wholesale Corp. | | | 336,033 | | | | 116,825,233 | |
General Mills, Inc. | | | 1,698,595 | | | | 108,625,150 | |
Hershey Co. (The) | | | 590,175 | | | | 87,723,612 | |
Hormel Foods Corp. | | | 2,069,605 | | | | 105,508,463 | |
JM Smucker Co. (The) | | | 871,234 | | | | 104,704,902 | |
Kellogg Co. | | | 1,500,570 | | | | 106,405,419 | |
Kimberly-Clark Corp. | | | 643,262 | | | | 101,481,013 | |
Kroger Co. (The) | | | 2,648,901 | | | | 94,512,788 | |
McCormick & Co., Inc. | | | 424,894 | | | | 87,613,143 | |
Mondelez International, Inc., Class A | | | 1,695,490 | | | | 99,050,526 | |
Monster Beverage Corp.(b) | | | 1,092,655 | | | | 91,630,048 | |
PepsiCo, Inc. | | | 648,225 | | | | 90,790,393 | |
Procter & Gamble Co. (The) | | | 725,500 | | | | 100,358,415 | |
Walmart, Inc. | | | 804,049 | | | | 111,642,203 | |
| | | | | | | | |
| | | | | | | 2,274,676,880 | |
| | | | | | | | |
Financials-5.82% | | | | | | | | |
Aon PLC, Class A | | | 424,079 | | | | 84,811,559 | |
Berkshire Hathaway, Inc., Class B(b) | | | 453,567 | | | | 98,895,749 | |
Intercontinental Exchange, Inc. | | | 838,729 | | | | 89,098,182 | |
Marsh & McLennan Cos., Inc. | | | 767,695 | | | | 88,215,832 | |
Progressive Corp. (The) | | | 976,396 | | | | 92,796,676 | |
Willis Towers Watson PLC | | | 407,948 | | | | 83,845,552 | |
| | | | | | | | |
| | | | | | | 537,663,550 | |
| | | | | | | | |
Health Care-24.77% | | | | | | | | |
Abbott Laboratories | | | 857,631 | | | | 93,884,866 | |
AbbVie, Inc. | | | 1,019,422 | | | | 97,630,045 | |
Agilent Technologies, Inc. | | | 901,848 | | | | 90,563,576 | |
Amgen, Inc. | | | 365,926 | | | | 92,696,374 | |
| | | | | | | | |
| | | Shares | | | Value | |
Health Care-(continued) | | | | | | | | |
Baxter International, Inc. | | | 1,025,753 | | | $ | 89,312,314 | |
Becton, Dickinson and Co. | | | 348,729 | | | | 84,660,939 | |
Bio-Rad Laboratories, Inc., Class A(b) | | | 162,792 | | | | 82,794,383 | |
Bristol-Myers Squibb Co. | | | 1,830,777 | | | | 113,874,329 | |
Cerner Corp. | | | 1,438,908 | | | | 105,572,680 | |
Cooper Cos., Inc. (The) | | | 276,020 | | | | 86,775,168 | |
CVS Health Corp. | | | 1,292,012 | | | | 80,259,786 | |
Danaher Corp. | | | 476,645 | | | | 98,412,893 | |
Eli Lilly and Co. | | | 553,002 | | | | 82,059,967 | |
Gilead Sciences, Inc. | | | 1,249,173 | | | | 83,382,298 | |
Incyte Corp.(b) | | | 865,709 | | | | 83,411,062 | |
Johnson & Johnson | | | 714,263 | | | | 109,575,087 | |
Medtronic PLC | | | 825,649 | | | | 88,732,498 | |
Merck & Co., Inc. | | | 1,213,755 | | | | 103,496,889 | |
PerkinElmer, Inc. | | | 782,488 | | | | 92,114,487 | |
Pfizer, Inc. | | | 2,545,710 | | | | 96,202,381 | |
Quest Diagnostics, Inc. | | | 691,440 | | | | 76,915,786 | |
STERIS PLC | | | 533,789 | | | | 85,214,076 | |
Thermo Fisher Scientific, Inc. | | | 217,435 | | | | 93,275,266 | |
West Pharmaceutical Services, Inc. | | | 324,993 | | | | 92,285,012 | |
Zoetis, Inc. | | | 523,969 | | | | 83,887,437 | |
| | | | | | | | |
| | | | | | | 2,286,989,599 | |
| | | | | | | | |
Industrials-14.31% | | | | | | | | |
3M Co. | | | 508,912 | | | | 82,962,834 | |
A.O. Smith Corp. | | | 1,729,257 | | | | 84,681,715 | |
C.H. Robinson Worldwide, Inc. | | | 984,947 | | | | 96,820,290 | |
Equifax, Inc. | | | 498,216 | | | | 83,834,806 | |
Expeditors International of Washington, Inc. | | | 1,154,214 | | | | 102,020,976 | |
General Dynamics Corp. | | | 534,350 | | | | 79,805,173 | |
IDEX Corp. | | | 491,560 | | | | 88,593,859 | |
Northrop Grumman Corp. | | | 240,469 | | | | 82,387,084 | |
PACCAR, Inc. | | | 995,000 | | | | 85,410,800 | |
Republic Services, Inc. | | | 1,053,694 | | | | 97,698,508 | |
Rollins, Inc. | | | 1,689,979 | | | | 93,185,442 | |
Roper Technologies, Inc. | | | 183,697 | | | | 78,473,521 | |
United Parcel Service, Inc., Class B | | | 516,912 | | | | 84,577,142 | |
Verisk Analytics, Inc. | | | 453,154 | | | | 84,590,257 | |
Waste Management, Inc. | | | 842,749 | | | | 96,073,386 | |
| | | | | | | | |
| | | | | | | 1,321,115,793 | |
| | | | | | | | |
Information Technology-6.81% | | | | | | | | |
Akamai Technologies, Inc.(b) | | | 818,392 | | | | 95,285,381 | |
Broadridge Financial Solutions, Inc. | | | 645,080 | | | | 88,633,992 | |
Citrix Systems, Inc. | | | 627,011 | | | | 91,041,997 | |
Jack Henry & Associates, Inc. | | | 469,008 | | | | 77,583,303 | |
Juniper Networks, Inc. | | | 3,631,680 | | | | 90,792,000 | |
Tyler Technologies, Inc.(b) | | | 290,517 | | | | 100,318,425 | |
VeriSign, Inc.(b) | | | 396,265 | | | | 85,117,722 | |
| | | | | | | | |
| | | | | | | 628,772,820 | |
| | | | | | | | |
Materials-0.94% | | | | | | | | |
Linde PLC (United Kingdom) | | | 348,470 | | | | 87,026,898 | |
| | | | | | | | |
Real Estate-2.91% | | | | | | | | |
Equinix, Inc. | | | 107,911 | | | | 85,225,950 | |
Extra Space Storage, Inc. | | | 801,381 | | | | 85,387,145 | |
Public Storage | | | 460,522 | | | | 97,814,873 | |
| | | | | | | | |
| | | | | | | 268,427,968 | |
| | | | | | | | |
See accompanying Notes to Financial Statements which are an integral part of the financial statements.
Invesco S&P 500® Low Volatility ETF (SPLV)–(continued)
August 31, 2020
| | | | | | | | |
| | | Shares | | | Value | |
| | |
| Utilities-6.23% | | | | | | | | |
| Alliant Energy Corp. | | | 1,619,925 | | | $ | 87,718,939 | |
| American Electric Power Co., Inc. | | | 1,042,272 | | | | 82,162,302 | |
| Atmos Energy Corp. | | | 783,118 | | | | 78,170,839 | |
| CMS Energy Corp. | | | 1,404,115 | | | | 84,934,916 | |
| Consolidated Edison, Inc. | | | 1,112,560 | | | | 79,370,030 | |
| Public Service Enterprise Group, Inc. | | | 1,512,056 | | | | 78,989,806 | |
| Xcel Energy, Inc. | | | 1,204,112 | | | | 83,655,681 | |
| | | | | | | | |
| | | | | | | 575,002,513 | |
| | | | | | | | |
TOTAL INVESTMENTS IN SECURITIES-99.88%
(Cost $8,381,602,277) | | | | 9,223,339,590 | |
| OTHER ASSETS LESS LIABILITIES-0.12% | | | | 10,627,343 | |
| | | | | | | | |
| NET ASSETS-100.00% | | | | | | $ | 9,233,966,933 | |
| | | | | | | | |
Notes to Schedule of Investments:
| (a) | Industry and/or sector classifications used in this report are generally according to the Global Industry Classification Standard, which was developed by and is the exclusive property and a service mark of MSCI Inc. and Standard & Poor’s. |
| (b) | Non-income producing security. |
Affiliated issuer. The issuer and/or the Fund is a wholly-owned subsidiary of Invesco Ltd., or is affiliated by having an investment adviser that is under common control of Invesco Ltd. The table below shows the Fund’s transactions in, and earnings from, its investments in affiliates for the fiscal year ended August 31, 2020.
| | | | | | | | | | | | | | | | | | | | | | | | | | | | | | | | | | | |
| | | Value
August 31, 2019 | | Purchases
at Cost | | Proceeds
from Sales | | Change in
Unrealized
Appreciation | | Realized
Gain
(Loss) | | Value
August 31, 2020 | | Dividend
Income |
Investments in Affiliated Money Market Funds: | | | | | | | | | | | | | | | | | | | | | | | | | | | | | | | | | | | |
Invesco Premier U.S. Government Money Portfolio, Institutional Class | | | $ | - | | | | $ | 173,495,582 | | | | $ | (173,495,582 | ) | | | $ | - | | | | $ | - | | | | $ | - | | | | $ | 41,571 | |
Investments Purchased with Cash Collateral from Securities on Loan: | | | | | | | | | | | | | | | | | | | | | | | | | | | | | | | | | | | |
Invesco Government & Agency Portfolio, Institutional Class | | | | - | | | | | 69,095,340 | | | | | (69,095,340 | ) | | | | - | | | | | - | | | | | - | | | | | 12,616 | * |
Invesco Liquid Assets Portfolio, Institutional Class | | | | - | | | | | 23,000,691 | | | | | (23,000,527 | ) | | | | - | | | | | (164 | ) | | | | - | | | | | 4,736 | * |
Invesco Private Government Fund | | | | - | | | | | 5,117,897 | | | | | (5,117,897 | ) | | | | - | | | | | - | | | | | - | | | | | 8 | * |
Invesco Private Prime Fund | | | | - | | | | | 1,704,243 | | | | | (1,704,243 | ) | | | | - | | | | | - | | | | | - | | | | | 6 | * |
| | | | | | | | | | | | | | | | | | | | | | | | | | | | | | | | | | | |
Total | | | $ | - | | | | $ | 272,413,753 | | | | $ | (272,413,589 | ) | | | $ | - | | | | $ | (164 | ) | | | $ | - | | | | $ | 58,937 | |
| | | | | | | | | | | | | | | | | | | | | | | | | | | | | | | | | | | |
| * | Represents the income earned on the investment of cash collateral, which is included in securities lending income on the Statements of Operations. Does not include rebates and fees paid to lending agent or premiums received from borrowers, if any. |
See accompanying Notes to Financial Statements which are an integral part of the financial statements.
Invesco S&P 500 Minimum Variance ETF (SPMV)
August 31, 2020
Schedule of Investments(a)
| | | | | | | | |
| | | Shares | | | Value | |
| Common Stocks & Other Equity Interests-99.81% | |
| Communication Services-4.35% | | | | | | | | |
| AT&T, Inc. | | | 3,350 | | | $ | 99,863 | |
| CenturyLink, Inc. | | | 678 | | | | 7,289 | |
| Verizon Communications, Inc. | | | 1,748 | | | | 103,604 | |
| | | | | | | | |
| | | | | | | 210,756 | |
| | | | | | | | |
| Consumer Discretionary-14.64% | | | | | | | | |
| Amazon.com, Inc.(b) | | | 44 | | | | 151,842 | |
| Expedia Group, Inc. | | | 287 | | | | 28,169 | |
| H&R Block, Inc. | | | 765 | | | | 11,093 | |
| Home Depot, Inc. (The) | | | 256 | | | | 72,970 | |
| McDonald’s Corp. | | | 564 | | | | 120,425 | |
| NIKE, Inc., Class B | | | 968 | | | | 108,310 | |
| Ralph Lauren Corp. | | | 136 | | | | 9,361 | |
| Starbucks Corp. | | | 342 | | | | 28,889 | |
| Tapestry, Inc. | | | 832 | | | | 12,255 | |
| TJX Cos., Inc. (The) | | | 1,460 | | | | 79,993 | |
| VF Corp. | | | 522 | | | | 34,322 | |
| Yum! Brands, Inc. | | | 544 | | | | 52,142 | |
| | | | | | | | |
| | | | | | | 709,771 | |
| | | | | | | | |
| Consumer Staples-12.39% | | | | | | | | |
| Campbell Soup Co. | | | 235 | | | | 12,363 | |
| Clorox Co. (The) | | | 193 | | | | 43,136 | |
| Coca-Cola Co. (The) | | | 1,009 | | | | 49,976 | |
| Colgate-Palmolive Co. | | | 926 | | | | 73,395 | |
| Conagra Brands, Inc. | | | 1,234 | | | | 47,336 | |
| General Mills, Inc. | | | 1,317 | | | | 84,222 | |
| Hershey Co. (The) | | | 66 | | | | 9,810 | |
| Hormel Foods Corp. | | | 894 | | | | 45,576 | |
| JM Smucker Co. (The) | | | 387 | | | | 46,510 | |
| Kellogg Co. | | | 325 | | | | 23,046 | |
| Kimberly-Clark Corp. | | | 133 | | | | 20,982 | |
| McCormick & Co., Inc. | | | 382 | | | | 78,768 | |
| Monster Beverage Corp.(b) | | | 135 | | | | 11,321 | |
| Procter & Gamble Co. (The) | | | 372 | | | | 51,459 | |
| Walgreens Boots Alliance, Inc. | | | 64 | | | | 2,433 | |
| | | | | | | | |
| | | | | | | 600,333 | |
| | | | | | | | |
| Energy-2.23% | | | | | | | | |
| Chevron Corp. | | | 178 | | | | 14,939 | |
| Diamondback Energy, Inc. | | | 175 | | | | 6,818 | |
| Exxon Mobil Corp. | | | 1,077 | | | | 43,015 | |
| Occidental Petroleum Corp. | | | 523 | | | | 6,663 | |
| ONEOK, Inc. | | | 393 | | | | 10,800 | |
| Williams Cos., Inc. (The) | | | 1,239 | | | | 25,722 | |
| | | | | | | | |
| | | | | | | 107,957 | |
| | | | | | | | |
| Financials-9.75% | | | | | | | | |
| American International Group, Inc. | | | 112 | | | | 3,264 | |
| Aon PLC, Class A | | | 154 | | | | 30,798 | |
| Bank of America Corp. | | | 1,105 | | | | 28,443 | |
| Berkshire Hathaway, Inc., Class B(b) | | | 547 | | | | 119,268 | |
| Chubb Ltd. | | | 764 | | | | 95,500 | |
| Citigroup, Inc. | | | 372 | | | | 19,017 | |
| JPMorgan Chase & Co. | | | 58 | | | | 5,811 | |
| Marsh & McLennan Cos., Inc. | | | 860 | | | | 98,822 | |
| | | | | | | | |
| | | Shares | | | Value | |
| Financials-(continued) | | | | | | | | |
| Progressive Corp. (The) | | | 635 | | | $ | 60,350 | |
| Travelers Cos., Inc. (The) | | | 99 | | | | 11,488 | |
| | | | | | | | |
| | | | | | | 472,761 | |
| | | | | | | | |
| Health Care-13.12% | | | | | | | | |
| Becton, Dickinson and Co. | | | 27 | | | | 6,555 | |
| Cerner Corp. | | | 613 | | | | 44,976 | |
| Cigna Corp. | | | 300 | | | | 53,211 | |
| CVS Health Corp. | | | 1,656 | | | | 102,871 | |
| HCA Healthcare, Inc. | | | 168 | | | | 22,801 | |
| Humana, Inc. | | | 25 | | | | 10,379 | |
| Intuitive Surgical, Inc.(b) | | | 20 | | | | 14,617 | |
| Johnson & Johnson | | | 568 | | | | 87,137 | |
| Laboratory Corp. of America Holdings(b) | | | 181 | | | | 31,811 | |
| Medtronic PLC | | | 749 | | | | 80,495 | |
| Quest Diagnostics, Inc. | | | 247 | | | | 27,476 | |
| Stryker Corp. | | | 174 | | | | 34,480 | |
| UnitedHealth Group, Inc. | | | 360 | | | | 112,518 | |
| Universal Health Services, Inc., Class B | | | 58 | | | | 6,400 | |
| | | | | | | | |
| | | | | | | 635,727 | |
| | | | | | | | |
| Industrials-4.81% | | | | | | | | |
| Cintas Corp. | | | 108 | | | | 35,990 | |
| Republic Services, Inc. | | | 785 | | | | 72,785 | |
| Rollins, Inc. | | | 522 | | | | 28,783 | |
| Waste Management, Inc. | | | 837 | | | | 95,418 | |
| | | | | | | | |
| | | | | | | 232,976 | |
| | | | | | | | |
| Information Technology-23.19% | | | | | | | | |
| Accenture PLC, Class A | | | 526 | | | | 126,203 | |
| Adobe, Inc.(b) | | | 304 | | | | 156,071 | |
| Analog Devices, Inc. | | | 132 | | | | 15,428 | |
| Apple, Inc. | | | 636 | | | | 82,070 | |
| Applied Materials, Inc. | | | 67 | | | | 4,127 | |
| Automatic Data Processing, Inc. | | | 194 | | | | 26,984 | |
| Cisco Systems, Inc. | | | 517 | | | | 21,828 | |
| Citrix Systems, Inc. | | | 271 | | | | 39,349 | |
| Cognizant Technology Solutions Corp., Class A | | | 847 | | | | 56,630 | |
| Global Payments, Inc. | | | 250 | | | | 44,155 | |
| Intel Corp. | | | 1,423 | | | | 72,502 | |
| Intuit, Inc. | | | 207 | | | | 71,496 | |
| Micron Technology, Inc.(b) | | | 189 | | | | 8,601 | |
| Microsoft Corp. | | | 587 | | | | 132,386 | |
| NVIDIA Corp. | | | 39 | | | | 20,864 | |
| Oracle Corp. | | | 252 | | | | 14,419 | |
| QUALCOMM, Inc. | | | 1,026 | | | | 122,197 | |
| salesforce.com, inc.(b) | | | 39 | | | | 10,633 | |
| Texas Instruments, Inc. | | | 690 | | | | 98,084 | |
| | | | | | | | |
| | | | | | | 1,124,027 | |
| | | | | | | | |
| Materials-2.93% | | | | | | | | |
| Corteva, Inc. | | | 799 | | | | 22,811 | |
| Newmont Corp. | | | 1,771 | | | | 119,153 | |
| | | | | | | | |
| | | | | | | 141,964 | |
| | | | | | | | |
| Real Estate-4.97% | | | | | | | | |
| American Tower Corp. | | | 295 | | | | 73,499 | |
| Crown Castle International Corp. | | | 469 | | | | 76,564 | |
| Host Hotels & Resorts, Inc. | | | 2,781 | | | | 31,231 | |
See accompanying Notes to Financial Statements which are an integral part of the financial statements.
Invesco S&P 500 Minimum Variance ETF (SPMV)–(continued)
August 31, 2020
| | | | | | | | |
| | | Shares | | | Value | |
| Real Estate-(continued) | | | | | | | | |
| Prologis, Inc. | | | 331 | | | $ | 33,716 | |
| Public Storage | | | 123 | | | | 26,125 | |
| | | | | | | | |
| | | | | | | 241,135 | |
| | | | | | | | |
| Utilities-7.43% | | | | | | | | |
| Ameren Corp. | | | 184 | | | | 14,556 | |
| American Electric Power Co., Inc. | | | 106 | | | | 8,356 | |
| CenterPoint Energy, Inc. | | | 300 | | | | 6,021 | |
| Consolidated Edison, Inc. | | | 64 | | | | 4,566 | |
| Dominion Energy, Inc. | | | 545 | | | | 42,750 | |
| DTE Energy Co. | | | 40 | | | | 4,747 | |
| Duke Energy Corp. | | | 173 | | | | 13,899 | |
| Eversource Energy | | | 252 | | | | 21,599 | |
| NextEra Energy, Inc. | | | 325 | | | | 90,730 | |
| Public Service Enterprise Group, Inc. | | | 1,262 | | | | 65,927 | |
| Sempra Energy | | | 48 | | | | 5,935 | |
| Southern Co. (The) | | | 1,404 | | | | 73,260 | |
| WEC Energy Group, Inc. | | | 85 | | | | 7,997 | |
| | | | | | | | |
| | | | | | | 360,343 | |
| | | | | | | | |
Total Common Stocks & Other Equity Interests
(Cost $4,483,833) | | | | 4,837,750 | |
| | | | | | | | |
| | | | | | | | |
| | | Shares | | | Value | |
| Money Market Funds-0.06% | | | | | | | | |
Invesco Premier U.S. Government Money
Portfolio, Institutional Class, 0.01%(c)(d)
(Cost $3,000) | | | 3,000 | | | $ | 3,000 | |
| | | | | | | | |
TOTAL INVESTMENTS IN SECURITIES-99.87%
(Cost $4,486,833) | | | | 4,840,750 | |
| OTHER ASSETS LESS LIABILITIES-0.13% | | | | | | | 6,384 | |
| | | | | | | | |
| NET ASSETS-100.00% | | | | | | $ | 4,847,134 | |
| | | | | | | | |
Notes to Schedule of Investments:
| (a) | Industry and/or sector classifications used in this report are generally according to the Global Industry Classification Standard, which was developed by and is the exclusive property and a service mark of MSCI Inc. and Standard & Poor’s. |
| (b) | Non-income producing security. |
| (c) | Affiliated issuer. The issuer and/or the Fund is a wholly-owned subsidiary of Invesco Ltd., or is affiliated by having an investment adviser that is under common control of Invesco Ltd. The table below shows the Fund’s transactions in, and earnings from, its investments in affiliates for the fiscal year ended August 31, 2020. |
| | | | | | | | | | | | | | | | | | | | | | | | | | | | | | | | | | | |
| | | Value
August 31, 2019 | | Purchases
at Cost | | Proceeds
from Sales | | Change in
Unrealized
Appreciation | | Realized
Gain | | Value
August 31, 2020 | | Dividend
Income |
Investments in Affiliated Money Market Funds: | | | | | | | | | | | | | | | | | | | | | | | | | | | | | | | | | | | |
Invesco Premier U.S. Government Money Portfolio, Institutional Class | | | $ | 4,664 | | | | $ | 116,153 | | | | $ | (117,817 | ) | | | $ | - | | | | $ | - | | | | $ | 3,000 | | | | $ | 66 | |
Investments Purchased with Cash Collateral from Securities on Loan: | | | | | | | | | | | | | | | | | | | | | | | | | | | | | | | | | | | |
Invesco Government & Agency Portfolio, Institutional Class | | | | 870 | | | | | 76,432 | | | | | (77,302 | ) | | | | - | | | | | - | | | | | - | | | | | 9 | * |
Invesco Liquid Assets Portfolio, Institutional Class | | | | - | | | | | 23,558 | | | | | (23,558 | ) | | | | - | | | | | - | | | | | - | | | | | 3 | * |
Invesco Private Government Fund | | | | - | | | | | 15,622 | | | | | (15,622 | ) | | | | - | | | | | - | | | | | - | | | | | - | |
| | | | | | | | | | | | | | | | | | | | | | | | | | | | | | | | | | | |
Total | | | $ | 5,534 | | | | $ | 231,765 | | | | $ | (234,299 | ) | | | $ | - | | | | $ | - | | | | $ | 3,000 | | | | $ | 78 | |
| | | | | | | | | | | | | | | | | | | | | | | | | | | | | | | | | | | |
| * | Represents the income earned on the investment of cash collateral, which is included in securities lending income on the Statements of Operations. Does not include rebates and fees paid to lending agent or premiums received from borrowers, if any. |
| (d) | The rate shown is the 7-day SEC standardized yield as of August 31, 2020. |
See accompanying Notes to Financial Statements which are an integral part of the financial statements.
Invesco S&P 500 Momentum ETF (SPMO)
August 31, 2020
Schedule of Investments(a)
| | | | | | | | |
| | | Shares | | | Value | |
| Common Stocks & Other Equity Interests-99.94% | |
Communication Services-5.52% | | | | | | | | |
Activision Blizzard, Inc. | | | 6,948 | | | $ | 580,297 | |
AT&T, Inc. | | | 59,185 | | | | 1,764,305 | |
Charter Communications, Inc., Class A(b) | | | 2,253 | | | | 1,386,969 | |
T-Mobile US, Inc.(b) | | | 2,979 | | | | 347,590 | |
| | | | | | | | |
| | | | | | | 4,079,161 | |
| | | | | | | | |
| | |
Consumer Discretionary-6.55% | | | | | | | | |
CarMax, Inc.(b) | | | 1,674 | | | | 179,001 | |
Chipotle Mexican Grill, Inc.(b) | | | 200 | | | | 262,056 | |
D.R. Horton, Inc. | | | 3,484 | | | | 248,653 | |
Dollar General Corp. | | | 2,236 | | | | 451,404 | |
Home Depot, Inc. (The) | | | 8,924 | | | | 2,543,697 | |
Lennar Corp., Class A | | | 2,205 | | | | 164,978 | |
NVR, Inc.(b) | | | 36 | | | | 150,060 | |
PulteGroup, Inc. | | | 3,153 | | | | 140,592 | |
Target Corp. | | | 4,629 | | | | 699,951 | |
| | | | | | | | |
| | | | | | | 4,840,392 | |
| | | | | | | | |
| | |
Consumer Staples-12.04% | | | | | | | | |
Brown-Forman Corp., Class B | | | 1,597 | | | | 116,852 | |
Campbell Soup Co. | | | 1,619 | | | | 85,176 | |
Coca-Cola Co. (The) | | | 36,084 | | | | 1,787,240 | |
Costco Wholesale Corp. | | | 4,777 | | | | 1,660,772 | |
Hershey Co. (The) | | | 1,682 | | | | 250,012 | |
Lamb Weston Holdings, Inc. | | | 1,163 | | | | 73,095 | |
Mondelez International, Inc., Class A | | | 9,956 | | | | 581,630 | |
PepsiCo, Inc. | | | 11,598 | | | | 1,624,416 | |
Procter & Gamble Co. (The) | | | 19,611 | | | | 2,712,790 | |
| | | | | | | | |
| | | | | | | 8,891,983 | |
| | | | | | | | |
| | |
Financials-4.37% | | | | | | | | |
Aon PLC, Class A | | | 1,941 | | | | 388,180 | |
Arthur J. Gallagher & Co. | | | 1,772 | | | | 186,592 | |
Cboe Global Markets, Inc. | | | 847 | | | | 77,746 | |
Intercontinental Exchange, Inc. | | | 4,023 | | | | 427,363 | |
MarketAxess Holdings, Inc. | | | 298 | | | | 144,810 | |
Moody’s Corp. | | | 1,853 | | | | 545,968 | |
MSCI, Inc. | | | 1,158 | | | | 432,247 | |
S&P Global, Inc. | | | 2,581 | | | | 945,730 | |
W.R. Berkley Corp. | | | 1,300 | | | | 80,665 | |
| | | | | | | | |
| | | | | | | 3,229,301 | |
| | | | | | | | |
| | |
Health Care-3.00% | | | | | | | | |
Cerner Corp. | | | 2,636 | | | | 193,403 | |
DaVita, Inc.(b) | | | 728 | | | | 63,161 | |
Edwards Lifesciences Corp.(b) | | | 4,149 | | | | 356,150 | |
Quest Diagnostics, Inc. | | | 1,239 | | | | 137,827 | |
ResMed, Inc. | | | 2,007 | | | | 362,826 | |
STERIS PLC | | | 877 | | | | 140,004 | |
Zoetis, Inc. | | | 6,030 | | | | 965,403 | |
| | | | | | | | |
| | | | | | | 2,218,774 | |
| | | | | | | | |
Industrials-4.90% | | | | | | | | |
Allegion PLC | | | 877 | | | | 90,673 | |
Cintas Corp. | | | 787 | | | | 262,260 | |
Copart, Inc.(b) | | | 2,522 | | | | 260,573 | |
Equifax, Inc. | | | 1,210 | | | | 203,607 | |
Fortune Brands Home & Security, Inc. | | | 1,254 | | | | 105,436 | |
IHS Markit Ltd. | | | 4,872 | | | | 389,370 | |
| | | | | | | | |
| | | Shares | | | Value | |
| | |
Industrials-(continued) | | | | | | | | |
Jacobs Engineering Group, Inc. | | | 1,190 | | | $ | 107,421 | |
Kansas City Southern | | | 1,071 | | | | 194,965 | |
Lockheed Martin Corp. | | | 2,196 | | | | 857,011 | |
Old Dominion Freight Line, Inc. | | | 804 | | | | 162,553 | |
Republic Services, Inc. | | | 1,823 | | | | 169,029 | |
Trane Technologies PLC | | | 2,080 | | | | 246,251 | |
TransDigm Group, Inc. | | | 549 | | | | 274,319 | |
Verisk Analytics, Inc. | | | 1,600 | | | | 298,672 | |
| | | | | | | | |
| | | | | | | 3,622,140 | |
| | | | | | | | |
| | |
Information Technology-49.58% | | | | | | | | |
Adobe, Inc.(b) | | | 4,378 | | | | 2,247,621 | |
Advanced Micro Devices, Inc.(b) | | | 13,825 | | | | 1,255,587 | |
Akamai Technologies, Inc.(b) | | | 1,297 | | | | 151,010 | |
ANSYS, Inc.(b) | | | 814 | | | | 275,954 | |
Apple, Inc. | | | 73,996 | | | | 9,548,444 | |
Applied Materials, Inc. | | | 9,417 | | | | 580,087 | |
Fidelity National Information Services, Inc. | | | 6,111 | | | | 921,844 | |
Fiserv, Inc.(b) | | | 5,110 | | | | 508,854 | |
Global Payments, Inc. | | | 3,531 | | | | 623,645 | |
KLA Corp. | | | 1,281 | | | | 262,784 | |
Lam Research Corp. | | | 1,759 | | | | 591,622 | |
Leidos Holdings, Inc. | | | 1,914 | | | | 173,198 | |
Mastercard, Inc., Class A | | | 8,001 | | | | 2,865,878 | |
Microsoft Corp. | | | 29,831 | | | | 6,727,785 | |
Motorola Solutions, Inc. | | | 1,189 | | | | 183,998 | |
NortonLifeLock, Inc. | | | 5,272 | | | | 123,998 | |
NVIDIA Corp. | | | 7,314 | | | | 3,912,844 | |
Paycom Software, Inc.(b) | | | 489 | | | | 146,436 | |
Qorvo, Inc.(b) | | | 961 | | | | 123,268 | |
QUALCOMM, Inc. | | | 9,997 | | | | 1,190,643 | |
ServiceNow, Inc.(b) | | | 1,498 | | | | 722,066 | |
Synopsys, Inc.(b) | | | 1,391 | | | | 307,828 | |
Visa, Inc., Class A | | | 14,566 | | | | 3,087,846 | |
Western Union Co. (The) | | | 3,885 | | | | 91,647 | |
| | | | | | | | |
| | | | | | | 36,624,887 | |
| | | | | | | | |
| | |
Materials-1.93% | | | | | | | | |
Air Products and Chemicals, Inc. | | | 1,831 | | | | 535,128 | |
Ball Corp. | | | 2,877 | | | | 231,225 | |
Martin Marietta Materials, Inc. | | | 468 | | | | 94,943 | |
Newmont Corp. | | | 8,326 | | | | 560,173 | |
| | | | | | | | |
| | | | | | | 1,421,469 | |
| | | | | | | | |
| | |
Real Estate-4.98% | | | | | | | | |
American Tower Corp. | | | 4,502 | | | | 1,121,673 | |
Crown Castle International Corp. | | | 3,490 | | | | 569,743 | |
Equinix, Inc. | | | 977 | | | | 771,615 | |
Mid-America Apartment Communities, Inc. | | | 1,278 | | | | 149,679 | |
Prologis, Inc. | | | 6,240 | | | | 635,606 | |
SBA Communications Corp., Class A | | | 1,394 | | | | 426,662 | |
| | | | | | | | |
| | | | | | | 3,674,978 | |
| | | | | | | | |
| | |
Utilities-7.07% | | | | | | | | |
Alliant Energy Corp. | | | 1,970 | | | | 106,676 | |
Ameren Corp. | | | 1,825 | | | | 144,376 | |
American Electric Power Co., Inc. | | | 3,516 | | | | 277,166 | |
American Water Works Co., Inc. | | | 1,796 | | | | 253,847 | |
CMS Energy Corp. | | | 2,024 | | | | 122,432 | |
See accompanying Notes to Financial Statements which are an integral part of the financial statements.
Invesco S&P 500 Momentum ETF (SPMO)–(continued)
August 31, 2020
| | | | | | | | |
| | | Shares | | | Value | |
Utilities-(continued) | | | | | | | | |
Entergy Corp. | | | 2,431 | | | $ | 241,009 | |
Evergy, Inc. | | | 2,283 | | | | 121,501 | |
Eversource Energy | | | 3,833 | | | | 328,526 | |
FirstEnergy Corp. | | | 3,675 | | | | 105,068 | |
NextEra Energy, Inc. | | | 7,242 | | | | 2,021,749 | |
Sempra Energy | | | 2,492 | | | | 308,136 | |
Southern Co. (The) | | | 11,332 | | | | 591,304 | |
WEC Energy Group, Inc. | | | 3,284 | | | | 308,959 | |
Xcel Energy, Inc. | | | 4,180 | | | | 290,405 | |
| | | | | | | | |
| | | | | | | 5,221,154 | |
| | | | | | | | |
TOTAL INVESTMENTS IN SECURITIES-99.94%
(Cost $58,338,530) | | | | 73,824,239 | |
OTHER ASSETS LESS LIABILITIES-0.06% | | | | 47,815 | |
| | | | | | | | |
NET ASSETS-100.00% | | | | | | $ | 73,872,054 | |
| | | | | | | | |
Notes to Schedule of Investments:
| (a) | Industry and/or sector classifications used in this report are generally according to the Global Industry Classification Standard, which was developed by and is the exclusive property and a service mark of MSCI Inc. and Standard & Poor’s. |
| (b) | Non-income producing security. |
Affiliated issuer. The issuer and/or the Fund is a wholly-owned subsidiary of Invesco Ltd., or is affiliated by having an investment adviser that is under common control of Invesco Ltd. The table below shows the Fund’s transactions in, and earnings from, its investments in affiliates for the fiscal year ended August 31, 2020.
| | | | | | | | | | | | | | | | | | | | | | | | | | | | | | | | | | | |
| | | | | | | | | Change in | | Realized | | | | |
| | | Value | | Purchases | | Proceeds | | Unrealized | | Gain | | Value | | Dividend |
| | | August 31, 2019 | | at Cost | | from Sales | | Appreciation | | (Loss) | | August 31, 2020 | | Income |
| Investments in Affiliated Money Market Funds: | | | | | | | | | | | | | | | | | | | | | | | | | | | | | | | | | | | |
| Invesco Premier U.S. Government Money Portfolio, Institutional Class | | | $ | 11,512 | | | | $ | 1,253,017 | | | | $ | (1,264,529 | ) | | | $ | - | | | | $ | - | | | | $ | - | | | | $ | 481 | |
| Investments Purchased with Cash Collateral from Securities on Loan: | | | | | | | | | | | | | | | | | | | | | | | | | | | | | | | | | | | |
| Invesco Government & Agency Portfolio, Institutional Class | | | | 35,166 | | | | | 1,639,525 | | | | | (1,674,691 | ) | | | | - | | | | | - | | | | | - | | | | | 235 | * |
| Invesco Liquid Assets Portfolio, Institutional Class | | | | 11,722 | | | | | 543,703 | | | | | (555,395 | ) | | | | - | | | | | (30 | ) | | | | - | | | | | 98 | * |
| | | | | | | | | | | | | | | | | | | | | | | | | | | | | | | | | | | |
| Total | | | $ | 58,400 | | | | $ | 3,436,245 | | | | $ | (3,494,615 | ) | | | $ | - | | | | $ | (30 | ) | | | $ | - | | | | $ | 814 | |
| | | | | | | | | | | | | | | | | | | | | | | | | | | | | | | | | | | |
| * | Represents the income earned on the investment of cash collateral, which is included in securities lending income on the Statements of Operations. Does not include rebates and fees paid to lending agent or premiums received from borrowers, if any. |
See accompanying Notes to Financial Statements which are an integral part of the financial statements.
Invesco S&P MidCap Low Volatility ETF (XMLV)
August 31, 2020
Schedule of Investments(a)
| | | | | | | | |
| | | Shares | | | Value | |
| Common Stocks & Other Equity Interests-99.92% | |
Communication Services-3.50% | | | | | | | | |
Cable One, Inc. | | | 13,069 | | | $ | 24,051,273 | |
John Wiley & Sons, Inc., Class A | | | 713,109 | | | | 22,569,900 | |
New York Times Co. (The), Class A | | | 572,927 | | | | 24,824,927 | |
| | | | | | | | |
| | | | | | | 71,446,100 | |
| | | | | | | | |
| | |
Consumer Discretionary-6.16% | | | | | | | | |
Columbia Sportswear Co. | | | 284,177 | | | | 24,317,026 | |
Gentex Corp. | | | 997,619 | | | | 26,985,594 | |
Grand Canyon Education, Inc.(b) | | | 261,130 | | | | 24,556,665 | |
Pool Corp. | | | 77,044 | | | | 25,258,105 | |
Service Corp. International | | | 539,500 | | | | 24,628,175 | |
| | | | | | | | |
| | | | | | | 125,745,565 | |
| | | | | | | | |
| | |
Consumer Staples-13.01% | | | | | | | | |
Casey’s General Stores, Inc. | | | 140,166 | | | | 24,928,523 | |
Flowers Foods, Inc. | | | 1,263,374 | | | | 30,902,128 | |
Grocery Outlet Holding Corp.(b) | | | 545,300 | | | | 22,428,189 | |
Hain Celestial Group, Inc. (The)(b) | | | 720,528 | | | | 23,626,113 | |
Ingredion, Inc. | | | 304,491 | | | | 24,493,256 | |
Lancaster Colony Corp. | | | 137,513 | | | | 24,438,810 | |
Post Holdings, Inc.(b) | | | 358,126 | | | | 31,522,251 | |
Sprouts Farmers Market, Inc.(b) | | | 928,907 | | | | 21,689,978 | |
Tootsie Roll Industries, Inc.(c) | | | 1,118,711 | | | | 35,787,565 | |
TreeHouse Foods, Inc.(b) | | | 605,029 | | | | 25,901,292 | |
| | | | | | | | |
| | | | | | | 265,718,105 | |
| | | | | | | | |
| | |
Financials-9.37% | | | | | | | | |
Brown & Brown, Inc. | | | 609,940 | | | | 28,301,216 | |
Commerce Bancshares, Inc. | | | 369,648 | | | | 22,019,931 | |
FactSet Research Systems, Inc | | | 65,901 | | | | 23,091,710 | |
Hanover Insurance Group, Inc. (The) | | | 240,436 | | | | 24,642,286 | |
Mercury General Corp. | | | 530,996 | | | | 23,751,451 | |
New York Community Bancorp, Inc. | | | 2,216,916 | | | | 20,063,090 | |
RenaissanceRe Holdings Ltd. (Bermuda) | | | 141,172 | | | | 25,938,943 | |
SEI Investments Co. | | | 449,424 | | | | 23,531,841 | |
| | | | | | | | |
| | | | | | | 191,340,468 | |
| | | | | | | | |
| | |
Health Care-11.51% | | | | | | | | |
Bio-Techne Corp. | | | 111,285 | | | | 28,428,866 | |
Chemed Corp. | | | 50,732 | | | | 26,234,025 | |
Encompass Health Corp. | | | 390,231 | | | | 25,458,670 | |
Globus Medical, Inc., Class A(b) | | | 428,383 | | | | 24,212,207 | |
Hill-Rom Holdings, Inc. | | | 252,396 | | | | 23,672,221 | |
Integra LifeSciences Holdings
Corp.(b) | | | 528,677 | | | | 25,265,474 | |
Masimo Corp.(b) | | | 138,162 | | | | 30,948,288 | |
Prestige Consumer Healthcare,
Inc.(b) | | | 673,517 | | | | 24,536,224 | |
United Therapeutics Corp.(b) | | | 246,648 | | | | 26,381,470 | |
| | | | | | | | |
| | | | | | | 235,137,445 | |
| | | | | | | | |
| | |
Industrials-18.88% | | | | | | | | |
Carlisle Cos., Inc. | | | 183,150 | | | | 23,983,492 | |
Donaldson Co., Inc. | | | 472,032 | | | | 23,771,531 | |
FTI Consulting, Inc.(b)(c) | | | 202,743 | | | | 23,266,787 | |
Graco, Inc. | | | 451,207 | | | | 26,179,030 | |
Hubbell, Inc. | | | 160,468 | | | | 23,255,023 | |
Knight-Swift Transportation Holdings, Inc. | | | 584,177 | | | | 26,556,686 | |
Landstar System, Inc. | | | 203,955 | | | | 27,144,371 | |
Lennox International, Inc. | | | 98,367 | | | | 27,575,221 | |
Lincoln Electric Holdings, Inc. | | | 256,743 | | | | 24,829,616 | |
| | | | | | | | |
| | | Shares | | | Value | |
Industrials-(continued) | | | | | | | | |
MSC Industrial Direct Co., Inc., Class A | | | 395,716 | | | $ | 26,077,684 | |
Tetra Tech, Inc. | | | 238,869 | | | | 22,049,997 | |
Toro Co. (The) | | | 389,817 | | | | 29,345,424 | |
Valmont Industries, Inc. | | | 179,711 | | | | 22,832,283 | |
Watsco, Inc. | | | 124,602 | | | | 30,526,244 | |
Werner Enterprises, Inc. | | | 616,804 | | | | 28,379,152 | |
| | | | | | | | |
| | | | | | | 385,772,541 | |
| | | | | | | | |
| | |
Information Technology-8.79% | | | | | | | | |
CACI International, Inc., Class A(b) | | | 106,660 | | | | 24,978,705 | |
CDK Global, Inc. | | | 538,336 | | | | 25,097,224 | |
CommVault Systems, Inc.(b) | | | 539,974 | | | | 23,343,076 | |
j2 Global, Inc.(b) | | | 362,079 | | | | 25,341,909 | |
MAXIMUS, Inc. | | | 335,645 | | | | 26,029,270 | |
PTC, Inc.(b) | | | 276,409 | | | | 25,266,547 | |
Qualys, Inc.(b) | | | 278,339 | | | | 29,542,902 | |
| | | | | | | | |
| | | | | | | 179,599,633 | |
| | | | | | | | |
| | |
Materials-10.64% | | | | | | | | |
AptarGroup, Inc. | | | 268,298 | | | | 31,763,800 | |
Ashland Global Holdings, Inc. | | | 307,707 | | | | 22,674,929 | |
NewMarket Corp. | | | 82,734 | | | | 30,817,588 | |
Reliance Steel & Aluminum Co. | | | 211,729 | | | | 22,204,020 | |
RPM International, Inc. | | | 287,819 | | | | 24,398,417 | |
Sensient Technologies Corp. | | | 464,627 | | | | 25,656,703 | |
Silgan Holdings, Inc. | | | 972,436 | | | | 37,010,914 | |
Sonoco Products Co. | | | 430,880 | | | | 22,849,566 | |
| | | | | | | | |
| | | | | | | 217,375,937 | |
| | | | | | | | |
| | |
Real Estate-11.00% | | | | | | | | |
Camden Property Trust | | | 268,599 | | | | 24,426,393 | |
CoreSite Realty Corp. | | | 241,222 | | | | 29,537,634 | |
CyrusOne, Inc. | | | 279,694 | | | | 23,362,840 | |
First Industrial Realty Trust, Inc. | | | 570,466 | | | | 24,330,375 | |
Healthcare Realty Trust, Inc. | | | 936,783 | | | | 27,026,190 | |
JBG SMITH Properties | | | 822,357 | | | | 22,754,618 | |
Life Storage, Inc. | | | 250,496 | | | | 26,409,793 | |
PS Business Parks, Inc. | | | 172,286 | | | | 21,742,493 | |
Rexford Industrial Realty, Inc. | | | 521,747 | | | | 25,033,421 | |
| | | | | | | | |
| | | | | | | 224,623,757 | |
| | | | | | | | |
| | |
Utilities-7.06% | | | | | | | | |
Essential Utilities, Inc. | | | 496,691 | | | | 21,109,367 | |
Hawaiian Electric Industries, Inc. | | | 664,964 | | | | 23,014,404 | |
IDACORP, Inc. | | | 296,986 | | | | 26,699,041 | |
National Fuel Gas Co. | | | 587,943 | | | | 26,833,719 | |
OGE Energy Corp. | | | 783,710 | | | | 24,969,001 | |
Spire, Inc. | | | 371,743 | | | | 21,639,160 | |
| | | | | | | | |
| | | | | | | 144,264,692 | |
| | | | | | | | |
Total Common Stocks & Other Equity Interests
(Cost $1,946,745,403) | | | | 2,041,024,243 | |
| | | | | | | | |
See accompanying Notes to Financial Statements which are an integral part of the financial statements.
Invesco S&P MidCap Low Volatility ETF (XMLV)–(continued)
August 31, 2020
| | | | | | | | |
| | | Shares | | | Value | |
| Money Market Funds-0.02% | | | | | | | | |
Invesco Premier U.S. Government Money Portfolio, Institutional Class, 0.01%(d)(e)
(Cost $485,395) | | | 485,395 | | | $ | 485,395 | |
| | | | | | | | |
TOTAL INVESTMENTS IN SECURITIES
(excluding investments purchased with cash collateral from securities on loan)-99.94%
(Cost $1,947,230,798) | | | | 2,041,509,638 | |
| | | | | | | | |
|
| Investments Purchased with Cash Collateral from Securities on Loan | |
| | |
| Money Market Funds-1.88% | | | | | | | | |
Invesco Private Government Fund, 0.03%(d)(e)(f) | | | 28,769,050 | | | | 28,769,050 | |
| | | | | | | | |
| | | Shares | | | Value | |
| Money Market Funds-(continued) | | | | | |
Invesco Private Prime Fund, 0.14%(d)(e)(f) | | | 9,588,035 | | | $ | 9,589,952 | |
| | | | | | | | |
Total Investments Purchased with Cash Collateral from Securities on Loan
(Cost $38,359,003) | | | | 38,359,002 | |
| | | | | | | | |
TOTAL INVESTMENTS IN SECURITIES-101.82%
(Cost $1,985,589,801) | | | | 2,079,868,640 | |
OTHER ASSETS LESS LIABILITIES-(1.82)% | | | | (37,166,433 | ) |
| | | | | | | | |
NET ASSETS-100.00% | | | | | | $ | 2,042,702,207 | |
| | | | | | | | |
Notes to Schedule of Investments:
| (a) | Industry and/or sector classifications used in this report are generally according to the Global Industry Classification Standard, which was developed by and is the exclusive property and a service mark of MSCI Inc. and Standard & Poor’s. |
| (b) | Non-income producing security. |
| (c) | All or a portion of this security was out on loan at August 31, 2020. |
| (d) | Affiliated issuer. The issuer and/or the Fund is a wholly-owned subsidiary of Invesco Ltd., or is affiliated by having an investment adviser that is under common control of Invesco Ltd. The table below shows the Fund’s transactions in, and earnings from, its investments in affiliates for the fiscal year ended August 31, 2020. |
| | | | | | | | | | | | | | | | | | | | | | | | | | | | | | | | | | | |
| | | | | | | | | Change in | | | | | | |
| | | | | | | | | Unrealized | | Realized | | | | |
| | | Value | | Purchases | | Proceeds | | Appreciation | | Gain | | Value | | Dividend |
| | | August 31, 2019 | | at Cost | | from Sales | | (Depreciation) | | (Loss) | | August 31, 2020 | | Income |
Investments in Affiliated Money Market Funds: | | | | | | | | | | | | | | | | | | | | | | | | | | | | | | | | | | | |
Invesco Premier U.S. Government Money Portfolio, Institutional Class | | | $ | - | | | | $ | 115,332,383 | | | | $ | (114,846,988 | ) | | | $ | - | | | | $ | - | | | | $ | 485,395 | | | | $ | 28,401 | |
Investments Purchased with Cash Collateral from Securities on Loan: | | | | | | | | | | | | | | | | | | | | | | | | | | | | | | | | | | | |
Invesco Government & Agency Portfolio, Institutional Class | | | | 39,847,925 | | | | | 130,685,403 | | | | | (170,533,328 | ) | | | | - | | | | | - | | | | | - | | | | | 388,623 | * |
Invesco Liquid Assets Portfolio, Institutional Class | | | | 13,282,642 | | | | | 39,948,868 | | | | | (53,227,199 | ) | | | | - | | | | | (4,311 | ) | | | | - | | | | | 144,964 | * |
Invesco Private Government Fund | | | | - | | | | | 121,181,363 | | | | | (92,412,313 | ) | | | | - | | | | | - | | | | | 28,769,050 | | | | | 3,633 | * |
Invesco Private Prime Fund | | | | - | | | | | 21,750,247 | | | | | (12,161,133 | ) | | | | (1 | ) | | | | 839 | | | | | 9,589,952 | | | | | 2,394 | * |
| | | | | | | | | | | | | | | | | | | | | | | | | | | | | | | | | | | |
Total | | | $ | 53,130,567 | | | | $ | 428,898,264 | | | | $ | (443,180,961 | ) | | | $ | (1 | ) | | | $ | (3,472 | ) | | | $ | 38,844,397 | | | | $ | 568,015 | |
| | | | | | | | | | | | | | | | | | | | | | | | | | | | | | | | | | | |
| * | Represents the income earned on the investment of cash collateral, which is included in securities lending income on the Statements of Operations. Does not include rebates and fees paid to lending agent or premiums received from borrowers, if any. |
| (e) | The rate shown is the 7-day SEC standardized yield as of August 31, 2020. |
| (f) | The security has been segregated to satisfy the commitment to return the cash collateral received in securities lending transactions upon the borrower’s return of the securities loaned. See Note 2J. |
See accompanying Notes to Financial Statements which are an integral part of the financial statements.
Invesco S&P SmallCap High Dividend Low Volatility ETF (XSHD)
August 31, 2020
Schedule of Investments(a)
| | | | | | | | |
| | | Shares | | | Value | |
| Common Stocks & Other Equity Interests-99.94% | |
Communication Services-4.88% | | | | |
Cogent Communications Holdings, Inc. | | | 3,812 | | | $ | 256,395 | |
Scholastic Corp. | | | 7,276 | | | | 163,710 | |
Spok Holdings, Inc. | | | 54,924 | | | | 595,376 | |
| | | | | | | | |
| | | | | | | 1,015,481 | |
| | | | | | | | |
Consumer Discretionary-9.62% | | | | |
Haverty Furniture Cos., Inc. | | | 25,708 | | | | 542,953 | |
LCI Industries | | | 1,839 | | | | 208,965 | |
M.D.C. Holdings, Inc. | | | 8,295 | | | | 359,837 | |
Oxford Industries, Inc. | | | 4,988 | | | | 247,056 | |
PetMed Express, Inc. | | | 9,421 | | | | 327,474 | |
Rent-A-Center, Inc. | | | 10,337 | | | | 317,346 | |
| | | | | | | | |
| | | | | | | 2,003,631 | |
| | | | | | | | |
Consumer Staples-17.87% | | | | |
Andersons, Inc. (The) | | | 25,368 | | | | 449,775 | |
B&G Foods, Inc.(b) | | | 23,374 | | | | 727,866 | |
Calavo Growers, Inc. | | | 2,744 | | | | 174,162 | |
J&J Snack Foods Corp. | | | 1,296 | | | | 176,191 | |
Medifast, Inc. | | | 1,751 | | | | 284,923 | |
MGP Ingredients, Inc. | | | 2,937 | | | | 104,410 | |
SpartanNash Co. | | | 15,465 | | | | 308,991 | |
Universal Corp. | | | 14,594 | | | | 633,525 | |
Vector Group Ltd. | | | 72,224 | | | | 727,296 | |
WD-40 Co. | | | 663 | | | | 135,504 | |
| | | | | | | | |
| | | | | | | 3,722,643 | |
| | | | | | | | |
Financials-5.73% | | | | |
Berkshire Hills Bancorp, Inc. | | | 56,542 | | | | 519,056 | |
KKR Real Estate Finance Trust, Inc. | | | 37,055 | | | | 674,401 | |
| | | | | | | | |
| | | | | | | 1,193,457 | |
| | | | | | | | |
Health Care-2.84% | | | | |
Computer Programs & Systems, Inc. | | | 6,723 | | | | 183,941 | |
LeMaitre Vascular, Inc. | | | 4,066 | | | | 131,251 | |
Phibro Animal Health Corp., Class A | | | 7,408 | | | | 158,976 | |
US Physical Therapy, Inc. | | | 1,318 | | | | 117,170 | |
| | | | | | | | |
| | | | | | | 591,338 | |
| | | | | | | | |
Industrials-14.74% | | | | |
Greenbrier Cos., Inc. (The) | | | 16,407 | | | | 446,106 | |
Hillenbrand, Inc. | | | 10,532 | | | | 333,970 | |
Matson, Inc. | | | 8,152 | | | | 326,651 | |
Matthews International Corp., Class A | | | 21,027 | | | | 460,491 | |
Park Aerospace Corp. | | | 30,716 | | | | 340,640 | |
Powell Industries, Inc. | | | 13,525 | | | | 365,040 | |
Resources Connection, Inc. | | | 40,246 | | | | 494,623 | |
Wabash National Corp. | | | 24,738 | | | | 302,051 | |
| | | | | | | | |
| | | | | | | 3,069,572 | |
| | | | | | | | |
Information Technology-11.35% | | | | |
ADTRAN, Inc. | | | 24,874 | | | | 275,853 | |
Benchmark Electronics, Inc. | | | 13,822 | | | | 271,050 | |
Comtech Telecommunications Corp. | | | 13,902 | | | | 230,773 | |
| | | | | | | | |
| | | Shares | | | Value | |
Information Technology-(continued) | | | | | | | | |
CSG Systems International, Inc. | | | 5,241 | | | $ | 223,109 | |
Daktronics, Inc. | | | 78,124 | | | | 345,308 | |
Kulicke & Soffa Industries, Inc. (Singapore) | | | 9,359 | | | | 224,429 | |
ManTech International Corp., Class A | | | 2,488 | | | | 186,227 | |
Progress Software Corp. | | | 4,617 | | | | 174,938 | |
Xperi Holding Corp. | | | 34,442 | | | | 431,558 | |
| | | | | | | | |
| | | | | | | 2,363,245 | |
| | | | | | | | |
Materials-14.24% | | | | |
Haynes International, Inc. | | | 16,258 | | | | 304,675 | |
Kaiser Aluminum Corp. | | | 4,961 | | | | 318,893 | |
Mercer International, Inc. (Germany) | | | 38,137 | | | | 319,588 | |
Neenah, Inc. | | | 7,375 | | | | 326,565 | |
PH Glatfelter Co. | | | 18,764 | | | | 281,272 | |
Schweitzer-Mauduit International, Inc., Class A | | | 15,144 | | | | 459,318 | |
Tredegar Corp. | | | 18,785 | | | | 318,030 | |
Trinseo S.A. | | | 25,546 | | | | 636,351 | |
| | | | | | | | |
| | | | | | | 2,964,692 | |
| | | | | | | | |
Real Estate-11.85% | | | | |
Brandywine Realty Trust | | | 57,453 | | | | 639,452 | |
Franklin Street Properties Corp. | | | 126,320 | | | | 559,598 | |
Global Net Lease, Inc. | | | 38,143 | | | | 667,502 | |
Office Properties Income Trust | | | 25,246 | | | | 601,865 | |
| | | | | | | | |
| | | | | | | 2,468,417 | |
| | | | | | | | |
Utilities-6.82% | | | | |
American States Water Co. | | | 1,841 | | | | 140,063 | |
Avista Corp. | | | 11,032 | | | | 406,639 | |
California Water Service Group | | | 3,290 | | | | 149,169 | |
Northwest Natural Holding Co. | | | 6,077 | | | | 310,595 | |
South Jersey Industries, Inc. | | | 18,731 | | | | 414,892 | |
| | | | | | | | |
| | | | | | | 1,421,358 | |
| | | | | | | | |
TOTAL INVESTMENTS IN SECURITIES
(excluding investments purchased with cash collateral from securities on loan)-99.94%
(Cost $21,427,559) | | | | 20,813,834 | |
| | | | | |
|
| Investments Purchased with Cash Collateral from Securities on Loan | |
| |
| Money Market Funds-3.54% | | | | | |
Invesco Private Government Fund, 0.03%(c)(d)(e) | | | 553,367 | | | | 553,367 | |
Invesco Private Prime Fund,
0.14%(c)(d)(e) | | | 184,428 | | | | 184,465 | |
| | | | | | | | |
Total Investments Purchased with Cash Collateral from Securities on Loan
(Cost $737,832) | | | | 737,832 | |
| | | | | | | | |
TOTAL INVESTMENTS IN SECURITIES-103.48%
(Cost $22,165,391) | | | | 21,551,666 | |
OTHER ASSETS LESS LIABILITIES-(3.48)% | | | | (724,691 | ) |
| | | | | | | | |
NET ASSETS-100.00% | | | $ | 20,826,975 | |
| | | | | |
See accompanying Notes to Financial Statements which are an integral part of the financial statements.
Invesco S&P SmallCap High Dividend Low Volatility ETF
(XSHD)–(continued)
August 31, 2020
Notes to Schedule of Investments:
| (a) | Industry and/or sector classifications used in this report are generally according to the Global Industry Classification Standard, which was developed by and is the exclusive property and a service mark of MSCI Inc. and Standard & Poor’s. |
| (b) | All or a portion of this security was out on loan at August 31, 2020. |
| (c) | Affiliated issuer. The issuer and/or the Fund is a wholly-owned subsidiary of Invesco Ltd., or is affiliated by having an investment adviser that is under common control of Invesco Ltd. The table below shows the Fund’s transactions in, and earnings from, its investments in affiliates for the fiscal year ended August 31, 2020. |
| | | | | | | | | | | | | | | | | | | | | | | | | | | | | | | | | | | |
| | | | | | | | | Change in | | Realized | | | | |
| | | Value | | Purchases | | Proceeds | | Unrealized | | Gain | | Value | | Dividend |
| | | August 31, 2019 | | at Cost | | from Sales | | Appreciation | | (Loss) | | August 31, 2020 | | Income |
Invesco Mortgage Capital, Inc. | | | $ | 679,191 | | | | $ | 467,498 | | | | $ | (684,910 | ) | | | $ | 31,316 | | | | $ | (493,095 | ) | | | $ | - | | | | $ | 71,843 | |
Investments in Affiliated Money Market Funds: | | | | | | | | | | | | | | | | | | | | | | | | | | | | | | | | | | | |
Invesco Premier U.S. Government Money Portfolio, Institutional Class | | | | - | | | | | 1,842,084 | | | | | (1,842,084 | ) | | | | - | | | | | - | | | | | - | | | | | 172 | |
Investments Purchased with Cash Collateral from Securities on Loan: | | | | | | | | | | | | | | | | | | | | | | | | | | | | | | | | | | | |
Invesco Government & Agency Portfolio, Institutional Class | | | | 964,427 | | | | | 13,511,252 | | | | | (14,475,679 | ) | | | | - | | | | | - | | | | | - | | | | | 9,780 | * |
Invesco Liquid Assets Portfolio, Institutional Class | | | | 324,524 | | | | | 3,538,442 | | | | | (3,862,879 | ) | | | | - | | | | | (87 | ) | | | | - | | | | | 3,639 | * |
Invesco Private Government Fund | | | | - | | | | | 6,594,042 | | | | | (6,040,675 | ) | | | | - | | | | | - | | | | | 553,367 | | | | | 188 | * |
Invesco Private Prime Fund | | | | - | | | | | 1,356,757 | | | | | (1,172,345 | ) | | | | - | | | | | 53 | | | | | 184,465 | | | | | 118 | * |
| | | | | | | | | | | | | | | | | | | | | | | | | | | | | | | | | | | |
Total | | | $ | 1,968,142 | | | | $ | 27,310,075 | | | | $ | (28,078,572 | ) | | | $ | 31,316 | | | | $ | (493,129 | ) | | | $ | 737,832 | | | | $ | 85,740 | |
| | | | | | | | | | | | | | | | | | | | | | | | | | | | | | | | | | | |
| * | Represents the income earned on the investment of cash collateral, which is included in securities lending income on the Statements of Operations. Does not include rebates and fees paid to lending agent or premiums received from borrowers, if any. |
| (d) | The rate shown is the 7-day SEC standardized yield as of August 31, 2020. |
| (e) | The security has been segregated to satisfy the commitment to return the cash collateral received in securities lending transactions upon the borrower’s return of the securities loaned. See Note 2J. |
See accompanying Notes to Financial Statements which are an integral part of the financial statements.
Invesco S&P SmallCap Low Volatility ETF (XSLV)
August 31, 2020
Schedule of Investments(a)
| | | | | | | | |
| | | Shares | | | Value | |
| Common Stocks & Other Equity Interests-99.94% | |
Communication Services-2.46% | | | | | | | | |
Cogent Communications Holdings, Inc. | | | 214,340 | | | $ | 14,416,508 | |
Scholastic Corp. | | | 517,191 | | | | 11,636,798 | |
TechTarget, Inc.(b) | | | 346,211 | | | | 13,737,652 | |
| | | | | | | | |
| | | | | | | 39,790,958 | |
| | | | | | | | |
Consumer Discretionary-4.46% | | | | | | | | |
Dorman Products, Inc.(b) | | | 160,677 | | | | 13,607,735 | |
Gentherm, Inc.(b) | | | 326,482 | | | | 14,766,781 | |
Shutterstock, Inc. | | | 276,332 | | | | 13,905,026 | |
Standard Motor Products, Inc. | | | 305,625 | | | | 13,887,600 | |
Sturm Ruger & Co., Inc. | | | 222,595 | | | | 15,773,082 | |
| | | | | | | | |
| | | | | | | 71,940,224 | |
| | | | | | | | |
Consumer Staples-9.81% | | | | | | | | |
Calavo Growers, Inc. | | | 217,107 | | | | 13,779,781 | |
Cal-Maine Foods, Inc.(b) | | | 351,357 | | | | 13,558,867 | |
Central Garden & Pet Co., Class A(b) | | | 337,153 | | | | 12,528,606 | |
Coca-Cola Consolidated, Inc. | | | 48,396 | | | | 13,226,627 | |
J&J Snack Foods Corp. | | | 95,719 | | | | 13,012,998 | |
John B. Sanfilippo & Son, Inc. | | | 186,208 | | | | 14,829,605 | |
National Beverage Corp.(b)(c) | | | 201,973 | | | | 16,424,444 | |
PriceSmart, Inc. | | | 211,139 | | | | 13,882,389 | |
Universal Corp. | | | 376,747 | | | | 16,354,587 | |
Vector Group Ltd. | | | 1,281,840 | | | | 12,908,129 | |
WD-40 Co. | | | 87,449 | | | | 17,872,827 | |
| | | | | | | | |
| | | | | | | 158,378,860 | |
| | | | | | | | |
Financials-18.02% | | | | | | | | |
AMERISAFE, Inc. | | | 214,704 | | | | 14,327,198 | |
Brookline Bancorp, Inc. | | | 1,245,496 | | | | 11,956,762 | |
City Holding Co. | | | 221,210 | | | | 14,153,016 | |
Community Bank System, Inc. | | | 232,286 | | | | 13,976,649 | |
CVB Financial Corp. | | | 714,883 | | | | 13,018,019 | |
Employers Holdings, Inc. | | | 452,813 | | | | 14,752,647 | |
First Hawaiian, Inc. | | | 680,798 | | | | 11,253,591 | |
HCI Group, Inc. | | | 290,879 | | | | 15,916,899 | |
Horace Mann Educators Corp. | | | 340,385 | | | | 13,295,438 | |
Independent Bank Corp. | | | 180,967 | | | | 11,373,776 | |
National Bank Holdings Corp., Class A | | | 431,872 | | | | 12,282,440 | |
NBT Bancorp, Inc. | | | 437,398 | | | | 13,327,517 | |
Northwest Bancshares, Inc. | | | 1,395,371 | | | | 14,107,201 | |
Old National Bancorp | | | 908,172 | | | | 12,696,245 | |
S&T Bancorp, Inc. | | | 568,176 | | | | 11,474,314 | |
Safety Insurance Group, Inc. | | | 204,013 | | | | 14,770,541 | |
Southside Bancshares, Inc. | | | 459,987 | | | | 12,674,942 | |
Third Point Reinsurance Ltd. (Bermuda)(b) | | | 1,501,972 | | | | 12,856,880 | |
Tompkins Financial Corp. | | | 177,978 | | | | 11,778,584 | |
Universal Insurance Holdings, Inc. | | | 622,441 | | | | 11,546,280 | |
Waddell & Reed Financial, Inc., Class A | | | 927,073 | | | | 14,601,400 | |
Westamerica Bancorporation | | | 241,592 | | | | 14,703,289 | |
| | | | | | | | |
| | | | | | | 290,843,628 | |
| | | | | | | | |
Health Care-11.25% | | | | | | | | |
Amphastar Pharmaceuticals, Inc.(b) | | | 732,701 | | | | 14,932,446 | |
Corcept Therapeutics, Inc.(b) | | | 908,850 | | | | 11,542,395 | |
Eagle Pharmaceuticals, Inc.(b) | | | 323,344 | | | | 12,830,290 | |
Enanta Pharmaceuticals, Inc.(b) | | | 255,219 | | | | 13,319,880 | |
HealthStream, Inc.(b) | | | 652,456 | | | | 13,515,626 | |
| | | | | | | | |
| | | Shares | | | Value | |
Health Care-(continued) | |
HMS Holdings Corp.(b) | | | 503,506 | | | $ | 14,042,782 | |
Innoviva, Inc.(b) | | | 940,237 | | | | 11,010,175 | |
Luminex Corp. | | | 426,521 | | | | 11,383,846 | |
Mesa Laboratories, Inc. | | | 59,858 | | | | 14,720,279 | |
Natus Medical, Inc.(b) | | | 715,640 | | | | 12,996,022 | |
Neogen Corp.(b) | | | 177,797 | | | | 13,548,132 | |
Omnicell, Inc.(b) | | | 190,670 | | | | 12,713,876 | |
Orthofix Medical, Inc.(b) | | | 395,244 | | | | 11,991,703 | |
Pacira BioSciences, Inc.(b) | | | 208,569 | | | | 13,039,734 | |
| | | | | | | | |
| | | | | | | 181,587,186 | |
| | | | | | | | |
Industrials-21.47% | | | | | | | | |
Aerojet Rocketdyne Holdings, Inc.(b) | | | 289,636 | | | | 11,982,241 | |
AeroVironment, Inc.(b) | | | 150,418 | | | | 11,490,431 | |
Alamo Group, Inc. | | | 110,376 | | | | 12,240,698 | |
Astec Industries, Inc. | | | 247,612 | | | | 13,054,105 | |
Brady Corp., Class A | | | 277,242 | | | | 12,999,877 | |
Encore Wire Corp. | | | 255,787 | | | | 13,201,167 | |
ESCO Technologies, Inc. | | | 150,850 | | | | 13,564,432 | |
Exponent, Inc. | | | 197,891 | | | | 15,921,321 | |
Federal Signal Corp. | | | 444,470 | | | | 14,276,376 | |
Forward Air Corp. | | | 242,170 | | | | 14,285,608 | |
Franklin Electric Co., Inc. | | | 207,759 | | | | 12,332,574 | |
Gibraltar Industries, Inc.(b) | | | 180,029 | | | | 11,241,911 | |
Heartland Express, Inc. | | | 854,981 | | | | 17,685,282 | |
Heidrick & Struggles International, Inc. | | | 591,764 | | | | 12,799,855 | |
Hub Group, Inc., Class A(b) | | | 276,957 | | | | 14,911,365 | |
Lindsay Corp. | | | 126,981 | | | | 12,689,211 | |
Marten Transport Ltd. | | | 658,213 | | | | 11,953,148 | |
National Presto Industries, Inc. | | | 166,261 | | | | 14,951,852 | |
Park Aerospace Corp.(d) | | | 1,253,799 | | | | 13,904,631 | |
Resources Connection, Inc. | | | 1,077,785 | | | | 13,245,978 | |
Simpson Manufacturing Co., Inc. | | | 121,508 | | | | 11,949,097 | |
Tennant Co. | | | 174,744 | | | | 11,615,234 | |
TrueBlue, Inc.(b) | | | 792,134 | | | | 13,402,907 | |
UniFirst Corp. | | | 72,879 | | | | 14,037,953 | |
US Ecology, Inc. | | | 328,408 | | | | 12,193,789 | |
Watts Water Technologies, Inc., Class A | | | 153,290 | | | | 14,677,518 | |
| | | | | | | | |
| | | | | | | 346,608,561 | |
| | | | | | | | |
Information Technology-17.72% | | | | | | | | |
Alarm.com Holdings, Inc.(b) | | | 236,989 | | | | 14,188,531 | |
Badger Meter, Inc. | | | 189,259 | | | | 11,675,388 | |
Bottomline Technologies (DE), Inc.(b) | | | 242,398 | | | | 11,545,417 | |
CSG Systems International, Inc. | | | 395,915 | | | | 16,854,102 | |
Diodes, Inc.(b) | | | 238,861 | | | | 11,670,748 | |
DSP Group, Inc.(b) | | | 1,056,087 | | | | 15,144,288 | |
EVERTEC, Inc. | | | 433,355 | | | | 15,176,092 | |
Fabrinet (Thailand)(b) | | | 183,785 | | | | 12,824,517 | |
FARO Technologies, Inc.(b) | | | 207,257 | | | | 11,710,020 | |
Harmonic, Inc.(b) | | | 1,827,265 | | | | 10,780,864 | |
Knowles Corp.(b) | | | 925,961 | | | | 13,944,973 | |
Methode Electronics, Inc. | | | 400,806 | | | | 11,346,818 | |
MicroStrategy, Inc., Class A(b) | | | 112,326 | | | | 16,224,367 | |
NIC, Inc. | | | 723,218 | | | | 15,462,401 | |
OSI Systems, Inc.(b) | | | 199,662 | | | | 15,723,382 | |
Progress Software Corp. | | | 454,131 | | | | 17,207,024 | |
Rambus, Inc.(b) | | | 853,240 | | | | 11,459,013 | |
SPS Commerce, Inc.(b) | | | 184,097 | | | | 14,705,668 | |
See accompanying Notes to Financial Statements which are an integral part of the financial statements.
Invesco S&P SmallCap Low Volatility ETF (XSLV)–(continued)
August 31, 2020
| | | | | | | | |
| | | Shares | | | Value | |
Information Technology-(continued) | |
Sykes Enterprises, Inc.(b) | | | 386,201 | | | $ | 12,785,184 | |
TTEC Holdings, Inc. | | | 216,522 | | | | 12,274,632 | |
Viavi Solutions, Inc.(b) | | | 994,498 | | | | 13,261,631 | |
| | | | | | | | |
| | | | | | | 285,965,060 | |
| | | | | | | | |
Materials-4.47% | | | | | | | | |
Balchem Corp. | | | 147,397 | | | | 14,400,687 | |
H.B. Fuller Co. | | | 251,000 | | | | 12,090,670 | |
Hawkins, Inc. | | | 214,772 | | | | 10,785,850 | |
Haynes International, Inc. | | | 589,147 | | | | 11,040,615 | |
Neenah, Inc. | | | 253,618 | | | | 11,230,205 | |
Stepan Co. | | | 108,708 | | | | 12,532,945 | |
| | | | | | | | |
| | | | | | | 72,080,972 | |
| | | | | | | | |
Real Estate-7.20% | | | | | | | | |
Agree Realty Corp. | | | 209,148 | | | | 13,996,184 | |
Easterly Government Properties, Inc. | | | 691,272 | | | | 16,721,870 | |
Industrial Logistics Properties Trust | | | 655,438 | | | | 14,137,798 | |
Investors Real Estate Trust | | | 188,546 | | | | 13,405,621 | |
Lexington Realty Trust | | | 1,307,952 | | | | 14,871,414 | |
National Storage Affiliates Trust | | | 407,038 | | | | 13,965,474 | |
St. Joe Co. (The)(b) | | | 667,482 | | | | 15,492,257 | |
Washington REIT | | | 617,759 | | | | 13,553,632 | |
| | | | | | | | |
| | | | | | | 116,144,250 | |
| | | | | | | | |
Utilities-3.08% | | | | | | | | |
American States Water Co. | | | 166,712 | | | | 12,683,449 | |
| | | | | | | | |
| | | Shares | | | Value | |
Utilities-(continued) | |
Avista Corp. | | | 353,004 | | | $ | 13,011,728 | |
California Water Service Group | | | 270,117 | | | | 12,247,105 | |
South Jersey Industries, Inc. | | | 531,596 | | | | 11,774,851 | |
| | | | | | | | |
| | | | | | | 49,717,133 | |
| | | | | | | | |
TOTAL INVESTMENTS IN SECURITIES
(excluding investments purchased with cash collateral from securities on loan)-99.94%
(Cost $1,591,019,268) | | | | 1,613,056,832 | |
| | | | | | | | |
| Investments Purchased with Cash Collateral from Securities on Loan | | | | | |
Money Market Funds-0.86% | | | | | |
Invesco Private Government Fund, 0.03%(d)(e)(f) | | | 10,435,290 | | | | 10,435,290 | |
Invesco Private Prime Fund, 0.14%(d)(e)(f) | | | 3,477,863 | | | | 3,478,558 | |
| | | | | | | | |
Total Investments Purchased with Cash Collateral from Securities on Loan
(Cost $13,913,848) | | | | 13,913,848 | |
| | | | | | | | |
TOTAL INVESTMENTS IN SECURITIES-100.80%
(Cost $1,604,933,116) | | | | 1,626,970,680 | |
OTHER ASSETS LESS LIABILITIES-(0.80)% | | | | | | | (12,865,547 | ) |
| | | | | | | | |
NET ASSETS-100.00% | | | | | | $ | 1,614,105,133 | |
| | | | | | | | |
Investment Abbreviations:
REIT-Real Estate Investment Trust
Notes to Schedule of Investments:
| (a) | Industry and/or sector classifications used in this report are generally according to the Global Industry Classification Standard, which was developed by and is the exclusive property and a service mark of MSCI Inc. and Standard & Poor’s. |
| (b) | Non-income producing security. |
| (c) | All or a portion of this security was out on loan at August 31, 2020. |
| (d) | Affiliated issuer. The issuer is affiliated by having an investment adviser that is under common control of Invesco Ltd. and/or the Investment Company Act of 1940, as amended (the “1940 Act”), defines “affiliated person” to include an issuer of which a fund holds 5% or more of the outstanding voting securities. The Fund has not owned enough of the outstanding voting securities of the issuer to have control (as defined in the 1940 Act) of that issuer. The table below shows the Fund’s transactions in, and earnings from, its investments in affiliates for the fiscal year ended August 31, 2020. |
| | | | | | | | | | | | | | | | | | | | | | | | | | | | | | | | | | | |
| | | | | | | | | Change in | | | | | | |
| | | | | | | | | Unrealized | | Realized | | | | |
| | | Value | | Purchases | | Proceeds | | Appreciation | | Gain | | Value | | Dividend |
| | | August 31, 2019 | | at Cost | | from Sales | | (Depreciation) | | (Loss) | | August 31, 2020 | | Income |
| Invesco Mortgage Capital, Inc. | | | $ | 22,332,386 | | | | $ | 8,995,419 | | | | $ | (8,717,328 | ) | | | $ | 1,658,726 | | | | $ | (24,269,203 | ) | | | $ | - | | | | $ | 1,568,755 | |
| Investments in Affiliated Money Market Funds: | | | | | | | | | | | | | | | | | | | | | | | | | | | | | | | | | | | |
| Invesco Premier U.S. Government Money Portfolio, Institutional Class | | | | 2,928,891 | | | | | 114,337,335 | | | | | (117,266,226 | ) | | | | - | | | | | - | | | | | - | | | | | 19,158 | |
See accompanying Notes to Financial Statements which are an integral part of the financial statements.
Invesco S&P SmallCap Low Volatility ETF (XSLV)–(continued)
August 31, 2020
| | | | | | | | | | | | | | | | | | | | | | | | | | | | | | | | | | | |
| | | | | | | | | Change in | | | | | | |
| | | | | | | | | Unrealized | | Realized | | | | |
| | | Value | | Purchases | | Proceeds | | Appreciation | | Gain | | Value | | Dividend |
| | | August 31, 2019 | | at Cost | | from Sales | | (Depreciation) | | (Loss) | | August 31, 2020 | | Income |
Investments Purchased with Cash Collateral from Securities on Loan: | | | | | | | | | | | | | | | | | | | | | | | | | | | | | | | | | | | |
| Invesco Government & Agency Portfolio, Institutional Class | | | $ | 10,506,667 | | | | $ | 112,352,453 | | | | $ | (122,859,120 | ) | | | $ | - | | | | $ | - | | | | $ | - | | | | $ | 78,095 | * |
| Invesco Liquid Assets Portfolio, Institutional Class | | | | 3,502,223 | | | | | 32,279,537 | | | | | (35,779,143 | ) | | | | (1 | ) | | | | (2,616 | ) | | | | - | | | | | 29,681 | * |
| Invesco Private Government Fund | | | | - | | | | | 68,644,623 | | | | | (58,209,333 | ) | | | | - | | | | | - | | | | | 10,435,290 | | | | | 1,574 | * |
| Invesco Private Prime Fund | | | | - | | | | | 16,096,480 | | | | | (12,618,375 | ) | | | | - | | | | | 453 | | | | | 3,478,558 | | | | | 1,186 | * |
| Investments in Other Affiliates: | | | | | | | | | | | | | | | | | | | | | | | | | | | | | | | | | | | |
Park Aerospace Corp. | | | | - | | | | | 17,192,508 | | | | | (2,621,565 | ) | | | | (646,475 | ) | | | | (19,837 | ) | | | | 13,904,631 | | | | | 79,537 | |
| | | | | | | | | | | | | | | | | | | | | | | | | | | | | | | | | | | |
Total | | | $ | 39,270,167 | | | | $ | 369,898,355 | | | | $ | (358,071,090 | ) | | | $ | 1,012,250 | | | | $ | (24,291,203 | ) | | | $ | 27,818,479 | | | | $ | 1,777,986 | |
| | | | | | | | | | | | | | | | | | | | | | | | | | | | | | | | | | | |
| * | Represents the income earned on the investment of cash collateral, which is included in securities lending income on the Statements of Operations. Does not include rebates and fees paid to lending agent or premiums received from borrowers, if any. |
| (e) | The rate shown is the 7-day SEC standardized yield as of August 31, 2020. |
| (f) | The security has been segregated to satisfy the commitment to return the cash collateral received in securities lending transactions upon the borrower’s return of the securities loaned. See Note 2J. |
See accompanying Notes to Financial Statements which are an integral part of the financial statements.
Invesco S&P SmallCap Quality ETF (XSHQ)
August 31, 2020
Schedule of Investments(a)
| | | | | | | | |
| | | Shares | | | Value | |
| Common Stocks & Other Equity Interests-99.99% | |
| Consumer Discretionary-10.59% | |
American Public Education, Inc.(b) | | | 365 | | | $ | 11,475 | |
Cavco Industries, Inc.(b) | | | 192 | | | | 36,655 | |
Dorman Products, Inc.(b) | | | 662 | | | | 56,065 | |
Ethan Allen Interiors, Inc. | | | 499 | | | | 7,106 | |
Gentherm, Inc.(b) | | | 795 | | | | 35,958 | |
Meritage Homes Corp.(b) | | | 796 | | | | 76,440 | |
PetMed Express, Inc.(c) | | | 641 | | | | 22,281 | |
Stamps.com, Inc.(b) | | | 437 | | | | 108,961 | |
Sturm Ruger & Co., Inc. | | | 356 | | | | 25,226 | |
Universal Electronics, Inc.(b) | | | 323 | | | | 13,269 | |
Winnebago Industries, Inc. | | | 640 | | | | 34,547 | |
| | | | | | | | |
| | | | | | | 427,983 | |
| | | | | | | | |
| Consumer Staples-8.89% | | | | | | | | |
Calavo Growers, Inc. | | | 395 | | | | 25,071 | |
Inter Parfums, Inc. | | | 416 | | | | 18,583 | |
J&J Snack Foods Corp. | | | 364 | | | | 49,486 | |
John B. Sanfilippo & Son, Inc. | | | 264 | | | | 21,025 | |
Medifast, Inc. | | | 260 | | | | 42,307 | |
National Beverage Corp.(b)(c) | | | 290 | | | | 23,583 | |
PriceSmart, Inc. | | | 503 | | | | 33,072 | |
Seneca Foods Corp., Class A(b) | | | 185 | | | | 8,761 | |
Universal Corp. | | | 595 | | | | 25,829 | |
USANA Health Sciences, Inc.(b) | | | 440 | | | | 34,500 | |
WD-40 Co. | | | 378 | | | | 77,256 | |
| | | | | | | | |
| | | | | | | 359,473 | |
| | | | | | | | |
| Energy-0.73% | | | | | | | | |
Bonanza Creek Energy, Inc.(b) | | | 360 | | | | 7,214 | |
Bristow Group, Inc.(b) | | | 128 | | | | 2,420 | |
DMC Global, Inc. | | | 302 | | | | 10,700 | |
Penn Virginia Corp.(b)(c) | | | 244 | | | | 2,787 | |
QEP Resources, Inc. | | | 2,736 | | | | 3,557 | |
Talos Energy, Inc.(b) | | | 398 | | | | 2,989 | |
| | | | | | | | |
| | | | | | | 29,667 | |
| | | | | | | | |
| Financials-18.44% | | | | | | | | |
Allegiance Bancshares, Inc. | | | 511 | | | | 12,990 | |
American Equity Investment Life Holding Co. | | | 2,018 | | | | 48,250 | |
AMERISAFE, Inc. | | | 494 | | | | 32,965 | |
Banner Corp. | | | 755 | | | | 27,271 | |
Berkshire Hills Bancorp, Inc. | | | 1,007 | | | | 9,244 | |
Boston Private Financial Holdings, Inc. | | | 1,886 | | | | 11,203 | |
City Holding Co. | | | 392 | | | | 25,080 | |
Community Bank System, Inc. | | | 1,195 | | | | 71,903 | |
CVB Financial Corp. | | | 3,377 | | | | 61,495 | |
Employers Holdings, Inc. | | | 701 | | | | 22,839 | |
First Commonwealth Financial Corp. | | | 2,429 | | | | 19,918 | |
Green Dot Corp., Class A(b) | | | 1,487 | | | | 77,413 | |
HCI Group, Inc. | | | 176 | | | | 9,631 | |
Heritage Financial Corp. | | | 890 | | | | 17,747 | |
HomeStreet, Inc. | | | 570 | | | | 15,601 | |
Hope Bancorp, Inc. | | | 2,966 | | | | 25,092 | |
OFG Bancorp. | | | 1,397 | | | | 17,937 | |
| Pacific Premier Bancorp, Inc. | | | 1,802 | | | | 40,707 | |
| Preferred Bank | | | 398 | | | | 14,885 | |
| Seacoast Banking Corp. of Florida(b) | | | 1,199 | | | | 24,268 | |
| Stewart Information Services Corp. | | | 497 | | | | 21,207 | |
| | | | | | | | |
| | | Shares | | | Value | |
| Financials-(continued) | | | | | | | | |
Third Point Reinsurance Ltd. (Bermuda)(b) | | | 1,989 | | | $ | 17,026 | |
Tompkins Financial Corp. | | | 326 | | | | 21,575 | |
United Community Banks, Inc. | | | 2,044 | | | | 37,037 | |
United Insurance Holdings Corp. | | | 485 | | | | 3,671 | |
Universal Insurance Holdings, Inc. | | | 758 | | | | 14,061 | |
Virtus Investment Partners, Inc. | | | 152 | | | | 21,569 | |
Waddell & Reed Financial, Inc., Class A | | | 1,454 | | | | 22,900 | |
| | | | | | | | |
| | | | | | | 745,485 | |
| | | | | | | | |
| Health Care-6.53% | | | | | | | | |
AngioDynamics, Inc.(b) | | | 932 | | | | 8,728 | |
Anika Therapeutics, Inc.(b) | | | 363 | | | | 13,914 | |
CorVel Corp.(b) | | | 266 | | | | 22,083 | |
Eagle Pharmaceuticals, Inc.(b) | | | 245 | | | | 9,722 | |
Innoviva, Inc.(b) | | | 1,972 | | | | 23,092 | |
Medpace Holdings, Inc.(b) | | | 781 | | | | 101,366 | |
Mesa Laboratories, Inc.(c) | | | 114 | | | | 28,035 | |
Natus Medical, Inc.(b) | | | 742 | | | | 13,475 | |
Providence Service Corp. (The)(b) | | | 269 | | | | 24,907 | |
Simulations Plus, Inc. | | | 311 | | | | 18,529 | |
| | | | | | | | |
| | | | | | | 263,851 | |
| | | | | | | | |
| Industrials-32.09% | | | | | | | | |
AAON, Inc. | | | 1,059 | | | | 60,289 | |
AAR Corp. | | | 656 | | | | 13,238 | |
ABM Industries, Inc. | | | 1,404 | | | | 53,549 | |
Albany International Corp., Class A | | | 679 | | | | 35,240 | |
Arcosa, Inc. | | | 1,090 | | | | 50,456 | |
Astec Industries, Inc. | | | 545 | | | | 28,732 | |
AZZ, Inc. | | | 565 | | | | 19,622 | |
Barnes Group, Inc. | | | 997 | | | | 39,481 | |
Brady Corp., Class A | | | 1,295 | | | | 60,723 | |
Encore Wire Corp. | | | 497 | | | | 25,650 | |
ESCO Technologies, Inc. | | | 584 | | | | 52,513 | |
Exponent, Inc. | | | 1,383 | | | | 111,269 | |
Franklin Electric Co., Inc. | | | 926 | | | | 54,967 | |
Gibraltar Industries, Inc.(b) | | | 749 | | | | 46,771 | |
Hub Group, Inc., Class A(b) | | | 776 | | | | 41,780 | |
Kaman Corp. | | | 866 | | | | 40,053 | |
Korn Ferry | | | 1,376 | | | | 41,968 | |
Marten Transport Ltd. | | | 1,391 | | | | 25,261 | |
Mueller Industries, Inc. | | | 1,421 | | | | 42,204 | |
National Presto Industries, Inc. | | | 137 | | | | 12,320 | |
Powell Industries, Inc. | | | 254 | | | | 6,856 | |
Proto Labs, Inc.(b) | | | 722 | | | | 106,134 | |
Resources Connection, Inc. | | | 676 | | | | 8,308 | |
Simpson Manufacturing Co., Inc. | | | 988 | | | | 97,160 | |
UFP Industries, Inc. | | | 1,484 | | | | 88,075 | |
UniFirst Corp. | | | 382 | | | | 73,581 | |
Watts Water Technologies, Inc., Class A | | | 638 | | | | 61,089 | |
| | | | | | | | |
| | | | | | | 1,297,289 | |
| | | | | | | | |
| Information Technology-16.21% | | | | | | | | |
Badger Meter, Inc. | | | 744 | | | | 45,897 | |
Brooks Automation, Inc. | | | 1,802 | | | | 93,037 | |
Daktronics, Inc. | | | 747 | | | | 3,302 | |
Digi International, Inc.(b) | | | 641 | | | | 8,731 | |
Diodes, Inc.(b) | | | 955 | | | | 46,661 | |
Fabrinet (Thailand)(b) | | | 832 | | | | 58,057 | |
See accompanying Notes to Financial Statements which are an integral part of the financial statements.
Invesco S&P SmallCap Quality ETF (XSHQ)–(continued)
August 31, 2020
| | | | | | | | |
| | | Shares | | | Value | |
Information Technology-(continued) | | | | | |
Kulicke & Soffa Industries, Inc. (Singapore) | | | 1,610 | | | $ | 38,608 | |
MicroStrategy, Inc., Class A(b) | | | 259 | | | | 37,410 | |
Power Integrations, Inc. | | | 1,258 | | | | 70,410 | |
Rogers Corp.(b) | | | 404 | | | | 45,777 | |
Sanmina Corp.(b) | | | 1,567 | | | | 44,346 | |
SPS Commerce, Inc.(b) | | | 821 | | | | 65,582 | |
Viavi Solutions, Inc.(b) | | | 4,826 | | | | 64,355 | |
Xperi Holding Corp. | | | 2,666 | | | | 33,405 | |
| | | | | | | | |
| | | | | | | 655,578 | |
| | | | | | | | |
| Materials-4.74% | | | | | | | | |
FutureFuel Corp. | | | 640 | | | | 7,744 | |
Hawkins, Inc. | | | 248 | | | | 12,455 | |
Haynes International, Inc. | | | 320 | | | | 5,997 | |
Innospec, Inc. | | | 593 | | | | 44,291 | |
Kraton Corp.(b) | | | 692 | | | | 9,716 | |
Myers Industries, Inc. | | | 863 | | | | 13,204 | |
Neenah, Inc. | | | 380 | | | | 16,826 | |
Stepan Co. | | | 464 | | | | 53,494 | |
Tredegar Corp. | | | 543 | | | | 9,193 | |
Warrior Met Coal, Inc. | | | 1,201 | | | | 18,579 | |
| | | | | | | | |
| | | | | | | 191,499 | |
| | | | | | | | |
| Real Estate-1.77% | | | | | | | | |
LTC Properties, Inc. | | | 863 | | | | 31,491 | |
Washington REIT | | | 1,835 | | | | 40,260 | |
| | | | | | | | |
| | | | | | | 71,751 | |
| | | | | | | | |
Total Common Stocks & Other Equity Interests
(Cost $3,951,558) | | | | 4,042,576 | |
| | | | | | | | |
| | |
Investment Abbreviations: | | | | | | | | |
REIT -Real Estate Investment Trust | | | | | | | | |
| | | | | | | | |
| | | Shares | | | Value | |
| Money Market Funds-0.01% | | | | | | | | |
Invesco Premier U.S. Government Money Portfolio, Institutional Class, 0.01%(d)(e)
(Cost $445) | | | 445 | | | $ | 445 | |
| | | | | | | | |
TOTAL INVESTMENTS IN SECURITIES
(excluding investments purchased with cash collateral from securities on loan)-100.00%
(Cost $3,952,003) | | | | 4,043,021 | |
| | | | | | | | |
|
| Investments Purchased with Cash Collateral from Securities on Loan | |
| | |
| Money Market Funds-1.61% | | | | | | | | |
Invesco Private Government Fund,
0.03%(d)(e)(f) | | | 49,421 | | | | 49,421 | |
Invesco Private Prime Fund,
0.14%(d)(e)(f) | | | 15,833 | | | | 15,836 | |
| | | | | | | | |
Total Investments Purchased with Cash Collateral from Securities on Loan
(Cost $65,257) | | | | | | | 65,257 | |
| | | | | | | | |
TOTAL INVESTMENTS IN SECURITIES-101.61%
(Cost $4,017,260) | | | | 4,108,278 | |
OTHER ASSETS LESS LIABILITIES-(1.61)% | | | | (65,229 | ) |
| | | | | | | | |
NET ASSETS-100.00% | | | | | | $ | 4,043,049 | |
| | | | | | | | |
Notes to Schedule of Investments:
| (a) | Industry and/or sector classifications used in this report are generally according to the Global Industry Classification Standard, which was developed by and is the exclusive property and a service mark of MSCI Inc. and Standard & Poor’s. |
| (b) | Non-income producing security. |
| (c) | All or a portion of this security was out on loan at August 31, 2020. |
| (d) | Affiliated issuer. The issuer and/or the Fund is a wholly-owned subsidiary of Invesco Ltd., or is affiliated by having an investment adviser that is under common control of Invesco Ltd. The table below shows the Fund’s transactions in, and earnings from, its investments in affiliates for the fiscal year ended August 31, 2020. |
| | | | | | | | | | | | | | | | | | | | | | | | | | | | | | | | | | | |
| | | Value
August 31, 2019 | | Purchases
at Cost | | Proceeds
from Sales | | Change in
Unrealized
Appreciation | | Realized
Gain | | Value
August 31, 2020 | | Dividend
Income |
| Investments in Affiliated Money Market Funds: | | | | | | | | | | | | | | | | | | | | | | | | | | | | | | | | | | | |
| Invesco Premier U.S. Government Money Portfolio, Institutional Class | | | $ | 5,387 | | | | $ | 187,450 | | | | $ | (192,392 | ) | | | $ | - | | | | $ | - | | | | $ | 445 | | | | $ | 80 | |
| Investments Purchased with Cash Collateral from Securities on Loan: | | | | | | | | | | | | | | | | | | | | | | | | | | | | | | | | | | | |
| Invesco Government & Agency Portfolio, Institutional Class | | | | 94,278 | | | | | 997,751 | | | | | (1,092,029 | ) | | | | - | | | | | - | | | | | - | | | | | 588 | * |
| Invesco Liquid Assets Portfolio, Institutional Class | | | | 31,426 | | | | | 236,642 | | | | | (268,074 | ) | | | | - | | | | | 6 | | | | | - | | | | | 217 | * |
| Invesco Private Government Fund | | | | - | | | | | 1,213,273 | | | | | (1,163,852 | ) | | | | - | | | | | - | | | | | 49,421 | | | | | 22 | * |
| Invesco Private Prime Fund | | | | - | | | | | 326,596 | | | | | (310,768 | ) | | | | - | | | | | 8 | | | | | 15,836 | | | | | 14 | * |
| | | | | | | | | | | | | | | | | | | | | | | | | | | | | | | | | | | |
| Total | | | $ | 131,091 | | | | $ | 2,961,712 | | | | $ | (3,027,115 | ) | | | $ | - | | | | $ | 14 | | | | $ | 65,702 | | | | $ | 921 | |
| | | | | | | | | | | | | | | | | | | | | | | | | | | | | | | | | | | |
See accompanying Notes to Financial Statements which are an integral part of the financial statements.
Invesco S&P SmallCap Quality ETF (XSHQ)–(continued)
August 31, 2020
| * | Represents the income earned on the investment of cash collateral, which is included in securities lending income on the Statements of Operations. Does not include rebates and fees paid to lending agent or premiums received from borrowers, if any. |
| (e) | The rate shown is the 7-day SEC standardized yield as of August 31, 2020. |
| (f) | The security has been segregated to satisfy the commitment to return the cash collateral received in securities lending transactions upon the borrower’s return of the securities loaned. See Note 2J. |
See accompanying Notes to Financial Statements which are an integral part of the financial statements.
Statements of Assets and Liabilities
August 31, 2020
| | | | | | | | | | | | | | | | | | | | | | | | | | | | | | |
| | | Invesco Russell
1000 Enhanced
Equal Weight
ETF (USEQ) | | Invesco Russell
1000 Equal
Weight ETF
(EQAL) | | Invesco Russell
1000 Low Beta
Equal Weight
ETF (USLB) | | Invesco S&P
500 Enhanced
Value ETF
(SPVU) | | Invesco S&P
500® ex-Rate
Sensitive Low
Volatility
ETF (XRLV) | | Invesco S&P
500® High
Beta ETF
(SPHB) |
| Assets: | | | | | | | | | | | | | | | | | | | | | | | | | | | | | | |
Unaffiliated investments in securities, at value(a) | | | | $ 2,734,013 | | | | | $474,551,110 | | | | | $ 9,886,376 | | | | | $ 68,570,336 | | | | | $ 68,971,653 | | | | | $129,569,593 | |
Affiliated investments in securities, at value | | | | 56,044 | | | | | 9,732,412 | | | | | 54,731 | | | | | 171,262 | | | | | 34,258 | | | | | 5,158,511 | |
Cash | | | | 47 | | | | | - | | | | | - | | | | | - | | | | | - | | | | | - | |
Receivable for: | | | | | | | | | | | | | | | | | | | | | | | | | | | | | | |
Dividends | | | | 4,313 | | | | | 841,805 | | | | | 12,445 | | | | | 307,675 | | | | | 95,844 | | | | | 330,028 | |
Securities lending | | | | 8 | | | | | 4,687 | | | | | 8 | | | | | - | | | | | 1 | | | | | 490 | |
Investments sold | | | | - | | | | | - | | | | | - | | | | | - | | | | | - | | | | | - | |
Fund shares sold | | | | - | | | | | - | | | | | - | | | | | - | | | | | - | | | | | - | |
Foreign tax reclaims | | | | - | | | | | 118 | | | | | - | | | | | - | | | | | - | | | | | - | |
| | | | | | | | | | | | | | | | | | | | | | | | | | | | | | |
Total assets | | | | 2,794,425 | | | | | 485,130,132 | | | | | 9,953,560 | | | | | 69,049,273 | | | | | 69,101,756 | | | | | 135,058,622 | |
| | | | | | | | | | | | | | | | | | | | | | | | | | | | | | |
| | | | | | |
| Liabilities: | | | | | | | | | | | | | | | | | | | | | | | | | | | | | | |
Due to custodian | | | | - | | | | | 168,645 | | | | | 128 | | | | | - | | | | | 50,342 | | | | | 62,491 | |
Payable for: | | | | | | | | | | | | | | | | | | | | | | | | | | | | | | |
Investments purchased | | | | - | | | | | - | | | | | - | | | | | - | | | | | - | | | | | - | |
Collateral upon return of securities loaned | | | | 55,834 | | | | | 9,546,558 | | | | | 54,731 | | | | | - | | | | | 34,258 | | | | | 3,790,528 | |
Fund shares repurchased | | | | - | | | | | - | | | | | - | | | | | - | | | | | - | | | | | - | |
Accrued unitary management fees | | | | 665 | | | | | 75,719 | | | | | 2,898 | | | | | 7,723 | | | | | 14,774 | | | | | 30,531 | |
| | | | | | | | | | | | | | | | | | | | | | | | | | | | | | |
Total liabilities | | | | 56,499 | | | | | 9,790,922 | | | | | 57,757 | | | | | 7,723 | | | | | 99,374 | | | | | 3,883,550 | |
| | | | | | | | | | | | | | | | | | | | | | | | | | | | | | |
| Net Assets | | | | $ 2,737,926 | | | | | $475,339,210 | | | | | $ 9,895,803 | | | | | $ 69,041,550 | | | | | $ 69,002,382 | | | | | $131,175,072 | |
| | | | | | | | | | | | | | | | | | | | | | | | | | | | | | |
| | | | | | |
| Net assets consist of: | | | | | | | | | | | | | | | | | | | | | | | | | | | | | | |
Shares of beneficial interest | | | | $ 8,330,313 | | | | | $529,149,404 | | | | | $ 38,159,818 | | | | | $ 89,472,301 | | | | | $ 86,343,048 | | | | | $217,555,747 | |
Distributable earnings (loss) | | | | (5,592,387 | ) | | | | (53,810,194 | ) | | | | (28,264,015 | ) | | | | (20,430,751 | ) | | | | (17,340,666 | ) | | | | (86,380,675 | ) |
| | | | | | | | | | | | | | | | | | | | | | | | | | | | | | |
| Net Assets | | | | $ 2,737,926 | | | | | $475,339,210 | | | | | $ 9,895,803 | | | | | $ 69,041,550 | | | | | $ 69,002,382 | | | | | $131,175,072 | |
| | | | | | | | | | | | | | | | | | | | | | | | | | | | | | |
Shares outstanding (unlimited amount authorized, $0.01 par value) | | | | 100,001 | | | | | 14,200,001 | | | | | 300,001 | | | | | 2,400,001 | | | | | 1,750,001 | | | | | 3,000,000 | |
Net asset value. | | | | $ 27.38 | | | | | $ 33.47 | | | | | $ 32.99 | | | | | $ 28.77 | | | | | $ 39.43 | | | | | $ 43.73 | |
| | | | | | | | | | | | | | | | | | | | | | | | | | | | | | |
Market price | | | | $ 27.40 | | | | | $ 33.52 | | | | | $ 33.06 | | | | | $ 28.82 | | | | | $ 39.49 | | | | | $ 43.83 | |
| | | | | | | | | | | | | | | | | | | | | | | | | | | | | | |
Unaffiliated investments in securities, at cost | | | | $ 2,669,558 | | | | | $456,316,757 | | | | | $ 9,056,784 | | | | | $ 82,004,701 | | | | | $ 61,473,585 | | | | | $136,806,182 | |
| | | | | | | | | | | | | | | | | | | | | | | | | | | | | | |
Affiliated investments in securities, at cost | | | | $ 56,044 | | | | | $ 9,906,851 | | | | | $ 54,731 | | | | | $ 279,266 | | | | | $ 34,258 | | | | | $ 5,336,258 | |
| | | | | | | | | | | | | | | | | | | | | | | | | | | | | | |
(a) Includes securities on loan with an aggregate value of: | | | | $ 53,093 | | | | | $ 9,205,361 | | | | | $ 53,050 | | | | | $ - | | | | | $ 33,489 | | | | | $ 3,543,513 | |
| | | | | | | | | | | | | | | | | | | | | | | | | | | | | | |
See accompanying Notes to Financial Statements which are an integral part of the financial statements.
| | | | | | | | | | | | | | | | | | | | | | | | | | | | | | | | | | | | | | |
Invesco S&P
500® High
Dividend Low
Volatility
ETF (SPHD) | | Invesco S&P
500® Low
Volatility
ETF (SPLV) | | Invesco
S&P 500
Minimum
Variance
ETF (SPMV) | | Invesco
S&P 500
Momentum
ETF (SPMO) | | Invesco S&P
MidCap Low
Volatility
ETF (XMLV) | | Invesco S&P
SmallCap High
Dividend Low
Volatility ETF
(XSHD) | | Invesco S&P
SmallCap Low
Volatility ETF
(XSLV) | | Invesco S&P
SmallCap
Quality
ETF (XSHQ) |
| | | | | | | | | | | | | | | | | | | | | | | | | | | | | | | | | | | | | | | |
| | | | | | | |
| | $ | 2,443,706,519 | | | | $ | 9,223,339,590 | | | | | $4,837,750 | | | | $ | 73,824,239 | | | | $ | 2,041,024,243 | | | | | $20,813,834 | | | | $ | 1,599,152,201 | | | | | $ 4,042,576 | |
| | | | | | | |
| | | 66,844,995 | | | | | - | | | | | 3,000 | | | | | - | | | | | 38,844,397 | | | | | 737,832 | | | | | 27,818,479 | | | | | 65,702 | |
| | | - | | | | | - | | | | | - | | | | | - | | | | | 5,323 | | | | | - | | | | | - | | | | | - | |
| | | | | | | | | | | | | | | | | | | | | | | | | | | | | | | | | | | | | | | |
| | | 13,544,811 | | | | | 13,449,084 | | | | | 6,738 | | | | | 71,451 | | | | | 1,632,172 | | | | | 51,296 | | | | | 2,311,373 | | | | | 1,754 | |
| | | 1,091 | | | | | - | | | | | - | | | | | - | | | | | 4,600 | | | | | 455 | | | | | 10,575 | | | | | 39 | |
| | | - | | | | | 10,893,008 | | | | | - | | | | | - | | | | | 8,759,293 | | | | | - | | | | | - | | | | | - | |
| | | - | | | | | 73,784,889 | | | | | - | | | | | - | | | | | - | | | | | - | | | | | - | | | | | - | |
| | | - | | | | | - | | | | | - | | | | | - | | | | | - | | | | | - | | | | | - | | | | | - | |
| | | | | | | | | | | | | | | | | | | | | | | | | | | | | | | | | | | | | | | |
| | | 2,524,097,416 | | | | | 9,321,466,571 | | | | | 4,847,488 | | | | | 73,895,690 | | | | | 2,090,270,028 | | | | | 21,603,417 | | | | | 1,629,292,628 | | | | | 4,110,071 | |
| | | | | | | | | | | | | | | | | | | | | | | | | | | | | | | | | | | | | | | |
| | | | | | | |
| | | | | | | | | | | | | | | | | | | | | | | | | | | | | | | | | | | | | | | |
| | | 9,882,696 | | | | | 956,017 | | | | | - | | | | | 15,869 | | | | | - | | | | | 33,232 | | | | | 929,410 | | | | | - | |
| | | | | | | | | | | | | | | | | | | | | | | | | | | | | | | | | | | | | | | |
| | | - | | | | | 73,705,615 | | | | | - | | | | | - | | | | | - | | | | | - | | | | | - | | | | | - | |
| | | | | | | |
| | | 66,844,996 | | | | | - | | | | | - | | | | | - | | | | | 38,359,003 | | | | | 737,832 | | | | | 13,913,848 | | | | | 65,257 | |
| | | - | | | | | 10,903,005 | | | | | - | | | | | - | | | | | 8,765,786 | | | | | - | | | | | - | | | | | - | |
| | | 630,837 | | | | | 1,935,001 | | | | | 354 | | | | | 7,767 | | | | | 443,032 | | | | | 5,378 | | | | | 344,237 | | | | | 1,765 | |
| | | | | | | | | | | | | | | | | | | | | | | | | | | | | | | | | | | | | | | |
| | | 77,358,529 | | | | | 87,499,638 | | | | | 354 | | | | | 23,636 | | | | | 47,567,821 | | | | | 776,442 | | | | | 15,187,495 | | | | | 67,022 | |
| | | | | | | | | | | | | | | | | | | | | | | | | | | | | | | | | | | | | | | |
| | $ | 2,446,738,887 | | | | $ | 9,233,966,933 | | | | | $4,847,134 | | | | $ | 73,872,054 | | | | $ | 2,042,702,207 | | | | | $20,826,975 | | | | $ | 1,614,105,133 | | | | | $ 4,043,049 | |
| | | | | | | | | | | | | | | | | | | | | | | | | | | | | | | | | | | | | | | |
| | | | | | | | | | | | | | | | | | | | | | | | | | | | | | | | | | | | | | | |
| | | | | | | |
| | $ | 3,379,624,514 | | | | $ | 10,300,369,241 | | | | | $4,544,698 | | | | $ | 62,968,968 | | | | $ | 2,590,675,244 | | | | | $29,102,978 | | | | $ | 2,247,158,390 | | | | | $ 6,118,209 | |
| | | (932,885,627 | ) | | | | (1,066,402,308 | ) | | | | 302,436 | | | | | 10,903,086 | | | | | (547,973,037 | ) | | | | (8,276,003 | ) | | | | (633,053,257 | ) | | | | (2,075,160 | ) |
| | | | | | | | | | | | | | | | | | | | | | | | | | | | | | | | | | | | | | | |
| | $ | 2,446,738,887 | | | | $ | 9,233,966,933 | | | | | $4,847,134 | | | | $ | 73,872,054 | | | | $ | 2,042,702,207 | | | | | $20,826,975 | | | | $ | 1,614,105,133 | | | | | $ 4,043,049 | |
| | | | | | | | | | | | | | | | | | | | | | | | | | | | | | | | | | | | | | | |
| | | 71,750,000 | | | | | 168,850,000 | | | | | 150,001 | | | | | 1,450,001 | | | | | 46,800,000 | | | | | 1,250,001 | | | | | 45,800,000 | | | | | 150,001 | |
| | $ | 34.10 | | | | $ | 54.69 | | | | | $ 32.31 | | | | $ | 50.95 | | | | $ | 43.65 | | | | | $16.66 | | | | $ | 35.24 | | | | | $ 26.95 | |
| | | | | | | | | | | | | | | | | | | | | | | | | | | | | | | | | | | | | | | |
| | $ | 34.16 | | | | $ | 54.77 | | | | | $ 32.39 | | | | $ | 51.10 | | | | $ | 43.70 | | | | | $16.69 | | | | $ | 35.30 | | | | | $ 26.99 | |
| | | | | | | | | | | | | | | | | | | | | | | | | | | | | | | | | | | | | | | |
| | | | | | | |
| | $ | 2,710,750,901 | | | | $ | 8,381,602,277 | | | | | $4,483,833 | | | | $ | 58,338,530 | | | | $ | 1,946,745,403 | | | | | $21,427,559 | | | | $ | 1,576,468,162 | | | | | $ 3,951,558 | |
| | | | | | | | | | | | | | | | | | | | | | | | | | | | | | | | | | | | | | | |
| | | | | | | |
| | $ | 66,844,996 | | | | $ | - | | | | | $ 3,000 | | | | $ | - | | | | $ | 38,844,398 | | | | | $ 737,832 | | | | $ | 28,464,954 | | | | | $ 65,702 | |
| | | | | | | | | | | | | | | | | | | | | | | | | | | | | | | | | | | | | | | |
| | | | | | | |
| | $ | 64,882,117 | | | | $ | - | | | | | $ - | | | | $ | - | | | | $ | 37,202,358 | | | | | $ 717,995 | | | | $ | 13,470,739 | | | | | $ 63,621 | |
| | | | | | | | | | | | | | | | | | | | | | | | | | | | | | | | | | | | | | | |
Statements of Operations
For the year ended August 31, 2020
| | | | | | | | | | | | | | | | | | | | | | | | | | | | | | |
| | | Invesco Russell
1000 Enhanced
Equal Weight
ETF (USEQ) | | Invesco Russell
1000 Equal
Weight ETF
(EQAL) | | Invesco Russell
1000 Low Beta
Equal Weight
ETF (USLB) | | Invesco S&P
500 Enhanced
Value ETF
(SPVU) | | Invesco S&P
500® ex-Rate
Sensitive Low
Volatility
ETF (XRLV) | | Invesco
S&P 500®
High Beta
ETF (SPHB) |
| Investment income: | | | | | | | | | | | | | | | | | | | | | | | | | | | | | | |
Unaffiliated dividend income | | | $ | 202,593 | | | | $ | 10,243,090 | | | | $ | 1,104,535 | | | | $ | 2,343,608 | | | | $ | 2,520,106 | | | | $ | 3,228,513 | |
Affiliated dividend income | | | | 930 | | | | | 16,542 | | | | | 736 | | | | | 12,003 | | | | | 742 | | | | | 38,995 | |
Securities lending income | | | | 752 | | | | | 349,443 | | | | | 4,761 | | | | | 3,235 | | | | | 3,410 | | | | | 22,685 | |
Foreign withholding tax | | | | (31 | ) | | | | (3,720 | ) | | | | - | | | | | - | | | | | - | | | | | - | |
| | | | | | | | | | | | | | | | | | | | | | | | | | | | | | |
Total investment income | | | | 204,244 | | | | | 10,605,355 | | | | | 1,110,032 | | | | | 2,358,846 | | | | | 2,524,258 | | | | | 3,290,193 | |
| | | | | | | | | | | | | | | | | | | | | | | | | | | | | | |
| | | | | | |
| Expenses: | | | | | | | | | | | | | | | | | | | | | | | | | | | | | | |
Unitary management fees | | | | 27,637 | | | | | 984,949 | | | | | 183,717 | | | | | 93,786 | | | | | 297,009 | | | | | 311,752 | |
| | | | | | | | | | | | | | | | | | | | | | | | | | | | | | |
Less: Waivers | | | | (18 | ) | | | | (475 | ) | | | | (89 | ) | | | | (109 | ) | | | | (107 | ) | | | | (179 | ) |
| | | | | | | | | | | | | | | | | | | | | | | | | | | | | | |
Net expenses | | | | 27,619 | | | | | 984,474 | | | | | 183,628 | | | | | 93,677 | | | | | 296,902 | | | | | 311,573 | |
| | | | | | | | | | | | | | | | | | | | | | | | | | | | | | |
Net investment income | | | | 176,625 | | | | | 9,620,881 | | | | | 926,404 | | | | | 2,265,169 | | | | | 2,227,356 | | | | | 2,978,620 | |
| | | | | | | | | | | | | | | | | | | | | | | | | | | | | | |
| | | | | | |
| Realized and unrealized gain (loss) from: | | | | | | | | | | | | | | | | | | | | | | | | | | | | | | |
Net realized gain (loss) from: | | | | | | | | | | | | | | | | | | | | | | | | | | | | | | |
Unaffiliated investment securities | | | | (540,283 | ) | | | | (46,183,214 | ) | | | | (2,334,160 | ) | | | | (6,008,551 | ) | | | | (14,336,170 | ) | | | | (24,755,920 | ) |
Affiliated investment securities | | | | (2,680 | ) | | | | (5,735 | ) | | | | (165 | ) | | | | (10,338 | ) | | | | (248 | ) | | | | (238,228 | ) |
Unaffiliated in-kind redemptions | | | | (1,160,391 | ) | | | | 15,654,384 | | | | | 4,100,682 | | | | | 4,519,144 | | | | | 13,471,366 | | | | | 23,079,386 | |
Affiliated in-kind redemptions | | | | (9,201 | ) | | | | (11,117 | ) | | | | - | | | | | (3,326 | ) | | | | - | | | | | 101,349 | |
| | | | | | | | | | | | | | | | | | | | | | | | | | | | | | |
Net realized gain (loss) | | | | (1,712,555 | ) | | | | (30,545,682 | ) | | | | 1,766,357 | | | | | (1,503,071 | ) | | | | (865,052 | ) | | | | (1,813,413 | ) |
| | | | | | | | | | | | | | | | | | | | | | | | | | | | | | |
Change in net unrealized appreciation (depreciation) of: | | | | | | | | | | | | | | | | | | | | | | | | | | | | | | |
Unaffiliated investment securities | | | | 378,865 | | | | | 29,222,606 | | | | | (7,091,515 | ) | | | | (10,991,632 | ) | | | | (5,089,290 | ) | | | | 8,709,454 | |
Affiliated investment securities | | | | 5,863 | | | | | (64,421 | ) | | | | - | | | | | (70,879 | ) | | | | - | | | | | (177,748 | ) |
| | | | | | | | | | | | | | | | | | | | | | | | | | | | | | |
Change in net unrealized appreciation (depreciation) | | | | 384,728 | | | | | 29,158,185 | | | | | (7,091,515 | ) | | | | (11,062,511 | ) | | | | (5,089,290 | ) | | | | 8,531,706 | |
| | | | | | | | | | | | | | | | | | | | | | | | | | | | | | |
Net realized and unrealized gain (loss) | | | | (1,327,827 | ) | | | | (1,387,497 | ) | | | | (5,325,158 | ) | | | | (12,565,582 | ) | | | | (5,954,342 | ) | | | | 6,718,293 | |
| | | | | | | | | | | | | | | | | | | | | | | | | | | | | | |
Net increase (decrease) in net assets resulting from operations | | | $ | (1,151,202 | ) | | | $ | 8,233,384 | | | | $ | (4,398,754 | ) | | | $ | (10,300,413 | ) | | | $ | (3,726,986 | ) | | | $ | 9,696,913 | |
| | | | | | | | | | | | | | | | | | | | | | | | | | | | | | |
See accompanying Notes to Financial Statements which are an integral part of the financial statements.
| | | | | | | | | | | | | | | | | | | | | | | | | | | | | | | | | | | | | | |
| Invesco S&P | | | | Invesco | | | | | | Invesco S&P | | | | |
| 500® High | | Invesco S&P | | S&P 500 | | Invesco S&P | | Invesco S&P | | SmallCap High | | Invesco S&P | | Invesco S&P |
| Dividend Low | | 500® Low | | Minimum | | 500 | | MidCap Low | | Dividend Low | | SmallCap Low | | SmallCap |
| Volatility | | Volatility | | Variance | | Momentum | | Volatility | | Volatility ETF | | Volatility | | Quality |
| ETF (SPHD) | | ETF (SPLV) | | ETF (SPMV) | | ETF (SPMO) | | ETF (XMLV) | | (XSHD) | | ETF (XSLV) | | ETF (XSHQ) |
| | | | | | | | | | | | | | | | | | | | | | | | | | | | | | | | | | | | | | | |
| | $ | 132,921,384 | | | | $ | 279,471,532 | | | | $ | 53,132 | | | | $ | 964,032 | | | | $ | 71,158,739 | | | | $ | 853,141 | | | | $ | 51,241,319 | | | | $ | 82,811 | |
| | | 25,630 | | | | | 41,571 | | | | | 66 | | | | | 481 | | | | | 28,401 | | | | | 72,015 | | | | | 1,667,450 | | | | | 80 | |
| | | 20,184 | | | | | 1,145 | | | | | 3 | | | | | 1,876 | | | | | 105,759 | | | | | 28,881 | | | | | 52,254 | | | | | 638 | |
| | | - | | | | | - | | | | | - | | | | | - | | | | | - | | | | | - | | | | | (11,005 | ) | | | | (16 | ) |
| | | | | | | | | | | | | | | | | | | | | | | | | | | | | | | | | | | | | | | |
| | | 132,967,198 | | | | | 279,514,248 | | | | | 53,201 | | | | | 966,389 | | | | | 71,292,899 | | | | | 954,037 | | | | | 52,950,018 | | | | | 83,513 | |
| | | | | | | | | | | | | | | | | | | | | | | | | | | | | | | | | | | | | | | |
| | | | | | | |
| | | | | | | | | | | | | | | | | | | | | | | | | | | | | | | | | | | | | | | |
| | | | | | | |
| | | 9,237,538 | | | | | 27,081,977 | | | | | 2,405 | | | | | 78,216 | | | | | 7,485,690 | | | | | 64,256 | | | | | 4,729,998 | | | | | 14,574 | |
| | | | | | | | | | | | | | | | | | | | | | | | | | | | | | | | | | | | | | | |
| | | (4,433 | ) | | | | (7,130 | ) | | | | (10 | ) | | | | (72 | ) | | | | (4,625 | ) | | | | (40 | ) | | | | (3,038 | ) | | | | (12 | ) |
| | | | | | | | | | | | | | | | | | | | | | | | | | | | | | | | | | | | | | | |
| | | 9,233,105 | | | | | 27,074,847 | | | | | 2,395 | | | | | 78,144 | | | | | 7,481,065 | | | | | 64,216 | | | | | 4,726,960 | | | | | 14,562 | |
| | | | | | | | | | | | | | | | | | | | | | | | | | | | | | | | | | | | | | | |
| | | 123,734,093 | | | | | 252,439,401 | | | | | 50,806 | | | | | 888,245 | | | | | 63,811,834 | | | | | 889,821 | | | | | 48,223,058 | | | | | 68,951 | |
| | | | | | | | | | | | | | | | | | | | | | | | | | | | | | | | | | | | | | | |
| | | | | | | |
| | | | | | | | | | | | | | | | | | | | | | | | | | | | | | | | | | | | | | | |
| | | | | | | | | | | | | | | | | | | | | | | | | | | | | | | | | | | | | | | |
| | | (466,509,556 | ) | | | | (1,453,783,796 | ) | | | | (34,850 | ) | | | | (3,259,399 | ) | | | | (571,632,213 | ) | | | | (5,642,119 | ) | | | | (571,310,643 | ) | | | | (316,034 | ) |
| | | (7,205 | ) | | | | (164 | ) | | | | - | | | | | (30 | ) | | | | (3,472 | ) | | | | (518,734 | ) | | | | (21,078,320 | ) | | | | 14 | |
| | | 24,398,377 | | | | | 1,065,228,773 | | | | | 533,992 | | | | | 2,601,217 | | | | | 89,815,727 | | | | | 1,280,311 | | | | | (197,675 | ) | | | | 952,284 | |
| | | - | | | | | - | | | | | - | | | | | - | | | | | - | | | | | 25,605 | | | | | (3,212,883 | ) | | | | - | |
| | | | | | | | | | | | | | | | | | | | | | | | | | | | | | | | | | | | | | | |
| | | (442,118,384 | ) | | | | (388,555,187 | ) | | | | 499,142 | | | | | (658,212 | ) | | | | (481,819,958 | ) | | | | (4,854,937 | ) | | | | (595,799,521 | ) | | | | 636,264 | |
| | | | | | | | | | | | | | | | | | | | | | | | | | | | | | | | | | | | | | | |
| | | | | | | |
| | | (130,835,551 | ) | | | | (409,441,163 | ) | | | | 129,404 | | | | | 12,697,783 | | | | | (138,578,399 | ) | | | | 954,774 | | | | | (45,554,929 | ) | | | | 380,456 | |
| | | (1 | ) | | | | - | | | | | - | | | | | - | | | | | (1 | ) | | | | 31,316 | | | | | 1,012,250 | | | | | - | |
| | | | | | | | | | | | | | | | | | | | | | | | | | | | | | | | | | | | | | | |
| | | | | | | |
| | | (130,835,552 | ) | | | | (409,441,163 | ) | | | | 129,404 | | | | | 12,697,783 | | | | | (138,578,400 | ) | | | | 986,090 | | | | | (44,542,679 | ) | | | | 380,456 | |
| | | | | | | | | | | | | | | | | | | | | | | | | | | | | | | | | | | | | | | |
| | | | | | | |
| | | (572,953,936 | ) | | | | (797,996,350 | ) | | | | 628,546 | | | | | 12,039,571 | | | | | (620,398,358 | ) | | | | (3,868,847 | ) | | | | (640,342,200 | ) | | | | 1,016,720 | |
| | | | | | | | | | | | | | | | | | | | | | | | | | | | | | | | | | | | | | | |
| | | | | | | |
| | $ | (449,219,843 | ) | | | $ | (545,556,949 | ) | | | $ | 679,352 | | | | $ | 12,927,816 | | | | $ | (556,586,524 | ) | | | $ | (2,979,026 | ) | | | $ | (592,119,142 | ) | | | $ | 1,085,671 | |
| | | | | | | | | | | | | | | | | | | | | | | | | | | | | | | | | | | | | | | |
Statements of Changes in Net Assets
For the years ended August 31, 2020 and 2019
| | | | | | | | | | | | | | | | |
| | | Invesco Russell 1000 Enhanced Equal
Weight ETF (USEQ) | | | Invesco Russell 1000 Equal
Weight ETF (EQAL) | |
| | | 2020 | | | 2019 | | | 2020 | | | 2019 | |
| Operations: | | | | | | | | | | | | | | | | |
Net investment income | | $ | 176,625 | | | $ | 1,110,244 | | | $ | 9,620,881 | | | $ | 8,349,649 | |
Net realized gain (loss) | | | (1,712,555 | ) | | | (5,167,794 | ) | | | (30,545,682 | ) | | | 12,702,382 | |
Change in net unrealized appreciation (depreciation) | | | 384,728 | | | | (10,714,361 | ) | | | 29,158,185 | | | | (49,208,648 | ) |
| | | | | | | | | | | | | | | | |
Net increase (decrease) in net assets resulting from operations | | | (1,151,202 | ) | | | (14,771,911 | ) | | | 8,233,384 | | | | (28,156,617 | ) |
| | | | | | | | | | | | | | | | |
| | | | |
| Distributions to Shareholders from: | | | | | | | | | | | | | | | | |
Distributable earnings. | | | (210,847 | ) | | | (1,520,785 | ) | | | (10,587,171 | ) | | | (7,723,638 | ) |
| | | | | | | | | | | | | | | | |
| | | | |
| Shareholder Transactions: | | | | | | | | | | | | | | | | |
Proceeds from shares sold | | | 1,512,476 | | | | 11,278,350 | | | | 91,719,158 | | | | 337,112,809 | |
Value of shares repurchased. | | | (15,435,876 | ) | | | (122,461,818 | ) | | | (174,958,378 | ) | | | (214,854,299 | ) |
| | | | | | | | | | | | | | | | |
Net increase (decrease) in net assets resulting from share transactions | | | (13,923,400 | ) | | | (111,183,468 | ) | | | (83,239,220 | ) | | | 122,258,510 | |
| | | | | | | | | | | | | | | | |
Net increase (decrease) in net assets | | | (15,285,449 | ) | | | (127,476,164 | ) | | | (85,593,007 | ) | | | 86,378,255 | |
| | | | | | | | | | | | | | | | |
| | | | |
| Net assets: | | | | | | | | | | | | | | | | |
Beginning of year | | | 18,023,375 | | | | 145,499,539 | | | | 560,932,217 | | | | 474,553,962 | |
| | | | | | | | | | | | | | | | |
End of year | | $ | 2,737,926 | | | $ | 18,023,375 | | | $ | 475,339,210 | | | $ | 560,932,217 | |
| | | | | | | | | | | | | | | | |
| | | | |
| Changes in Shares Outstanding: | | | | | | | | | | | | | | | | |
Shares sold | | | 50,000 | | | | 450,000 | | | | 2,800,000 | | | | 10,900,000 | |
Shares repurchased | | | (600,000 | ) | | | (4,850,000 | ) | | | (6,400,000 | ) | | | (7,350,000 | ) |
Shares outstanding, beginning of year | | | 650,001 | | | | 5,050,001 | | | | 17,800,001 | | | | 14,250,001 | |
| | | | | | | | | | | | | | | | |
Shares outstanding, end of year | | | 100,001 | | | | 650,001 | | | | 14,200,001 | | | | 17,800,001 | |
| | | | | | | | | | | | | | | | |
See accompanying Notes to Financial Statements which are an integral part of the financial statements.
| | | | | | | | | | | | | | | | | | | | | | | | | | | | | | | | | | | | | | |
Invesco Russell 1000 Low Beta
Equal Weight ETF (USLB) | | Invesco S&P 500 Enhanced
Value ETF (SPVU) | | Invesco S&P 500® ex-Rate
Sensitive Low Volatility ETF
(XRLV) | | Invesco S&P 500® High Beta
ETF (SPHB) |
| 2020 | | 2019 | | 2020 | | 2019 | | 2020 | | 2019 | | 2020 | | 2019 |
| | | | | | | | | | | | | | | | | | | | | | | | | | | | | | | | | | | | | | | |
| | $ | 926,404 | | | | $ | 2,760,307 | | | | $ | 2,265,169 | | | | $ | 974,615 | | | | $ | 2,227,356 | | | | $ | 2,532,358 | | | | $ | 2,978,620 | | | | $ | 1,820,802 | |
| | | 1,766,357 | | | | | 6,108,250 | | | | | (1,503,071 | ) | | | | (178,528 | ) | | | | (865,052 | ) | | | | 11,136,372 | | | | | (1,813,413 | ) | | | | (5,696,249 | ) |
| | | (7,091,515 | ) | | | | (5,831,764 | ) | | | | (11,062,511 | ) | | | | (3,705,995 | ) | | | | (5,089,290 | ) | | | | (478,006 | ) | | | | 8,531,706 | | | | | (14,981,810 | ) |
| | | | | | | | | | | | | | | | | | | | | | | | | | | | | | | | | | | | | | | |
| | | (4,398,754 | ) | | | | 3,036,793 | | | | | (10,300,413 | ) | | | | (2,909,908 | ) | | | | (3,726,986 | ) | | | | 13,190,724 | | | | | 9,696,913 | | | | | (18,857,257 | ) |
| | | | | | | | | | | | | | | | | | | | | | | | | | | | | | | | | | | | | | | |
| | | | | | | | | | | | | | | | | | | | | | | | | | | | | | | | | | | | | | | |
| | | (1,429,929 | ) | | | | (2,991,612 | ) | | | | (2,147,572 | ) | | | | (780,361 | ) | | | | (2,309,005 | ) | | | | (2,615,963 | ) | | | | (2,778,271 | ) | | | | (1,882,965 | ) |
| | | | | | | | | | | | | | | | | | | | | | | | | | | | | | | | | | | | | | | |
| | | | | | | |
| | | | | | | | | | | | | | | | | | | | | | | | | | | | | | | | | | | | | | | |
| | | 10,405,627 | | | | | 68,942,101 | | | | | 61,215,380 | | | | | 58,629,846 | | | | | 73,762,467 | | | | | 118,524,306 | | | | | 449,772,568 | | | | | 511,841,105 | |
| | | (105,866,613 | ) | | | | (122,579,609 | ) | | | | (39,885,462 | ) | | | | (21,775,533 | ) | | | | (165,381,578 | ) | | | | (108,630,536 | ) | | | | (416,509,169 | ) | | | | (572,041,756 | ) |
| | | | | | | | | | | | | | | | | | | | | | | | | | | | | | | | | | | | | | | |
| | | (95,460,986 | ) | | | | (53,637,508 | ) | | | | 21,329,918 | | | | | 36,854,313 | | | | | (91,619,111 | ) | | | | 9,893,770 | | | | | 33,263,399 | | | | | (60,200,651 | ) |
| | | | | | | | | | | | | | | | | | | | | | | | | | | | | | | | | | | | | | | |
| | | (101,289,669 | ) | | | | (53,592,327 | ) | | | | 8,881,933 | | | | | 33,164,044 | | | | | (97,655,102 | ) | | | | 20,468,531 | | | | | 40,182,041 | | | | | (80,940,873 | ) |
| | | | | | | | | | | | | | | | | | | | | | | | | | | | | | | | | | | | | | | |
| | | | | | | |
| | | | | | | | | | | | | | | | | | | | | | | | | | | | | | | | | | | | | | | |
| | | 111,185,472 | | | | | 164,777,799 | | | | | 60,159,617 | | | | | 26,995,573 | | | | | 166,657,484 | | | | | 146,188,953 | | | | | 90,993,031 | | | | | 171,933,904 | |
| | | | | | | | | | | | | | | | | | | | | | | | | | | | | | | | | | | | | | | |
| | $ | 9,895,803 | | | | $ | 111,185,472 | | | | $ | 69,041,550 | | | | $ | 60,159,617 | | | | $ | 69,002,382 | | | | $ | 166,657,484 | | | | $ | 131,175,072 | | | | $ | 90,993,031 | |
| | | | | | | | | | | | | | | | | | | | | | | | | | | | | | | | | | | | | | | |
| | | | | | | |
| | | | | | | | | | | | | | | | | | | | | | | | | | | | | | | | | | | | | | | |
| | | 300,000 | | | | | 2,250,000 | | | | | 1,900,000 | | | | | 1,700,000 | | | | | 1,900,000 | | | | | 3,250,000 | | | | | 11,250,000 | | | | | 12,350,000 | |
| | | (3,350,000 | ) | | | | (3,850,000 | ) | | | | (1,300,000 | ) | | | | (650,000 | ) | | | | (4,450,000 | ) | | | | (3,000,000 | ) | | | | (10,500,000 | ) | | | | (13,900,000 | ) |
| | | 3,350,001 | | | | | 4,950,001 | | | | | 1,800,001 | | | | | 750,001 | | | | | 4,300,001 | | | | | 4,050,001 | | | | | 2,250,000 | | | | | 3,800,000 | |
| | | | | | | | | | | | | | | | | | | | | | | | | | | | | | | | | | | | | | | |
| | | 300,001 | | | | | 3,350,001 | | | | | 2,400,001 | | | | | 1,800,001 | | | | | 1,750,001 | | | | | 4,300,001 | | | | | 3,000,000 | | | | | 2,250,000 | |
| | | | | | | | | | | | | | | | | | | | | | | | | | | | | | | | | | | | | | | |
Statements of Changes in Net Assets–(continued)
For the years ended August 31, 2020 and 2019
| | | | | | | | | | | | | | | | | | | | | | |
| | | Invesco S&P 500® High Dividend Low Volatility
ETF (SPHD) | | | | Invesco S&P 500® Low Volatility
ETF (SPLV) |
| | | 2020 | | 2019 | | | | 2020 | | 2019 |
| Operations: | | | | | | | | | | | | | | | | | | | | | | |
Net investment income | | | $ | 123,734,093 | | | | $ | 117,254,030 | | | | | | $ | 252,439,401 | | | | $ | 214,746,320 | |
Net realized gain (loss) | | | | (442,118,384 | ) | | | | 24,150,196 | | | | | | | (388,555,187 | ) | | | | 671,511,722 | |
Change in net unrealized appreciation (depreciation) | | | | (130,835,552 | ) | | | | (102,384,419 | ) | | | | | | (409,441,163 | ) | | | | 741,634,019 | |
| | | | | | | | | | | | | | | | | | | | | | |
Net increase (decrease) in net assets resulting from operations | | | | (449,219,843 | ) | | | | 39,019,807 | | | | | | | (545,556,949 | ) | | | | 1,627,892,061 | |
| | | | | | | | | | | | | | | | | | | | | | |
| | | | | |
| Distributions to Shareholders from: | | | | | | | | | | | | | | | | | | | | | | |
Distributable earnings | | | | (148,884,394 | ) | | | | (125,050,260 | ) | | | | | | (261,808,889 | ) | | | | (212,616,965 | ) |
| | | | | | | | | | | | | | | | | | | | | | |
| | | | | |
| Shareholder Transactions: | | | | | | | | | | | | | | | | | | | | | | |
Proceeds from shares sold | | | | 1,047,961,731 | | | | | 1,743,813,300 | | | | | | | 6,809,880,526 | | | | | 8,792,834,411 | |
Value of shares repurchased | | | | (1,307,303,319 | ) | | | | (1,010,466,400 | ) | | | | | | (9,117,426,455 | ) | | | | (5,240,593,236 | ) |
| | | | | | | | | | | | | | | | | | | | | | |
Net increase (decrease) in net assets resulting from share transactions | | | | (259,341,588 | ) | | | | 733,346,900 | | | | | | | (2,307,545,929 | ) | | | | 3,552,241,175 | |
| | | | | | | | | | | | | | | | | | | | | | |
Net increase (decrease) in net assets | | | | (857,445,825 | ) | | | | 647,316,447 | | | | | | | (3,114,911,767 | ) | | | | 4,967,516,271 | |
| | | | | | | | | | | | | | | | | | | | | | |
| | | | | |
| Net assets: | | | | | | | | | | | | | | | | | | | | | | |
Beginning of year | | | | 3,304,184,712 | | | | | 2,656,868,265 | | | | | | | 12,348,878,700 | | | | | 7,381,362,429 | |
| | | | | | | | | | | | | | | | | | | | | | |
End of year | | | $ | 2,446,738,887 | | | | $ | 3,304,184,712 | | | | | | $ | 9,233,966,933 | | | | $ | 12,348,878,700 | |
| | | | | | | | | | | | | | | | | | | | | | |
| | | | | |
| Changes in Shares Outstanding: | | | | | | | | | | | | | | | | | | | | | | |
Shares sold | | | | 25,500,000 | | | | | 42,100,000 | | | | | | | 119,950,000 | | | | | 170,200,000 | |
Shares repurchased | | | | (35,300,000 | ) | | | | (24,300,000 | ) | | | | | | (168,700,000 | ) | | | | (100,900,000 | ) |
Shares outstanding, beginning of year | | | | 81,550,000 | | | | | 63,750,000 | | | | | | | 217,600,000 | | | | | 148,300,000 | |
| | | | | | | | | | | | | | | | | | | | | | |
Shares outstanding, end of year | | | | 71,750,000 | | | | | 81,550,000 | | | | | | | 168,850,000 | | | | | 217,600,000 | |
| | | | | | | | | | | | | | | | | | | | | | |
See accompanying Notes to Financial Statements which are an integral part of the financial statements.
| | | | | | | | | | | | | | | | | | | | | | | | | | | | | | | | | | | | | | |
Invesco S&P 500 Minimum
Variance ETF (SPMV) | | Invesco S&P 500 Momentum
ETF (SPMO) | | Invesco S&P MidCap Low
Volatility ETF (XMLV) | | Invesco S&P SmallCap High Dividend
Low Volatility ETF (XSHD) |
| 2020 | | 2019 | | 2020 | | 2019 | | 2020 | | 2019 | | 2020 | | 2019 |
| | | | | | | | | | | | | | | | | | | | | | | | | | | | | | | | | | | | | | | |
| | $ | 50,806 | | | | $ | 23,008 | | | | $ | 888,245 | | | | $ | 738,478 | | | | $ | 63,811,834 | | | | $ | 50,428,045 | | | | $ | 889,821 | | | | $ | 798,528 | |
| | | 499,142 | | | | | 38,936 | | | | | (658,212 | ) | | | | 3,031,208 | | | | | (481,819,958 | ) | | | | 79,422,534 | | | | | (4,854,937 | ) | | | | (113,041 | ) |
| | | 129,404 | | | | | 43,428 | | | | | 12,697,783 | | | | | (546,724 | ) | | | | (138,578,400 | ) | | | | 109,821,075 | | | | | 986,090 | | | | | (2,057,901 | ) |
| | | | | | | | | | | | | | | | | | | | | | | | | | | | | | | | | | | | | | | |
| | | 679,352 | | | | | 105,372 | | | | | 12,927,816 | | | | | 3,222,962 | | | | | (556,586,524 | ) | | | | 239,671,654 | | | | | (2,979,026 | ) | | | | (1,372,414 | ) |
| | | | | | | | | | | | | | | | | | | | | | | | | | | | | | | | | | | | | | | |
| | | | | | | | | | | | | | | | | | | | | | | | | | | | | | | | | | | | | | | |
| | | (76,277 | ) | | | | (53,840 | ) | | | | (931,171 | ) | | | | (623,934 | ) | | | | (83,397,290 | ) | | | | (42,226,033 | ) | | | | (1,357,406 | ) | | | | (927,458 | ) |
| | | | | | | | | | | | | | | | | | | | | | | | | | | | | | | | | | | | | | | |
| | | | | | | |
| | | | | | | | | | | | | | | | | | | | | | | | | | | | | | | | | | | | | | | |
| | | 5,819,406 | | | | | - | | | | | 52,017,847 | | | | | 97,162,753 | | | | | 1,173,463,453 | | | | | 2,258,903,703 | | | | | 15,374,655 | | | | | 25,912,303 | |
| | | (3,086,540 | ) | | | | - | | | | | (65,195,002 | ) | | | | (74,791,195 | ) | | | | (1,722,512,968 | ) | | | | (668,254,758 | ) | | | | (13,747,174 | ) | | | | (12,162,724 | ) |
| | | | | | | | | | | | | | | | | | | | | | | | | | | | | | | | | | | | | | | |
| | | 2,732,866 | | | | | - | | | | | (13,177,155 | ) | | | | 22,371,558 | | | | | (549,049,515 | ) | | | | 1,590,648,945 | | | | | 1,627,481 | | | | | 13,749,579 | |
| | | | | | | | | | | | | | | | | | | | | | | | | | | | | | | | | | | | | | | |
| | | 3,335,941 | | | | | 51,532 | | | | | (1,180,510 | ) | | | | 24,970,586 | | | | | (1,189,033,329 | ) | | | | 1,788,094,566 | | | | | (2,708,951 | ) | | | | 11,449,707 | |
| | | | | | | | | | | | | | | | | | | | | | | | | | | | | | | | | | | | | | | |
| | | | | | | |
| | | | | | | | | | | | | | | | | | | | | | | | | | | | | | | | | | | | | | | |
| | | 1,511,193 | | | | | 1,459,661 | | | | | 75,052,564 | | | | | 50,081,978 | | | | | 3,231,735,536 | | | | | 1,443,640,970 | | | | | 23,535,926 | | | | | 12,086,219 | |
| | | | | | | | | | | | | | | | | | | | | | | | | | | | | | | | | | | | | | | |
| | $ | 4,847,134 | | | | $ | 1,511,193 | | | | $ | 73,872,054 | | | | $ | 75,052,564 | | | | $ | 2,042,702,207 | | | | $ | 3,231,735,536 | | | | $ | 20,826,975 | | | | $ | 23,535,926 | |
| | | | | | | | | | | | | | | | | | | | | | | | | | | | | | | | | | | | | | | |
| | | | | | | |
| | | | | | | | | | | | | | | | | | | | | | | | | | | | | | | | | | | | | | | |
| | | 200,000 | | | | | - | | | | | 1,250,000 | | | | | 2,550,000 | | | | | 22,200,000 | | | | | 46,300,000 | | | | | 800,000 | | | | | 1,100,000 | |
| | | (100,000 | ) | | | | - | | | | | (1,650,000 | ) | | | | (1,950,000 | ) | | | | (37,700,000 | ) | | | | (13,450,000 | ) | | | | (600,000 | ) | | | | (500,000 | ) |
| | | 50,001 | | | | | 50,001 | | | | | 1,850,001 | | | | | 1,250,001 | | | | | 62,300,000 | | | | | 29,450,000 | | | | | 1,050,001 | | | | | 450,001 | |
| | | | | | | | | | | | | | | | | | | | | | | | | | | | | | | | | | | | | | | |
| | | 150,001 | | | | | 50,001 | | | | | 1,450,001 | | | | | 1,850,001 | | | | | 46,800,000 | | | | | 62,300,000 | | | | | 1,250,001 | | | | | 1,050,001 | |
| | | | | | | | | | | | | | | | | | | | | | | | | | | | | | | | | | | | | | | |
Statements of Changes in Net Assets–(continued)
For the years ended August 31, 2020 and 2019
| | | | | | | | | | | | | | | | | | | | | | |
| | | Invesco S&P SmallCap Low Volatility
ETF (XSLV) | | | | Invesco S&P SmallCap Quality
ETF (XSHQ) |
| | | 2020 | | 2019 | | | | 2020 | | 2019 |
| Operations: | | | | | | | | | | | | | | | | | | | | | | |
Net investment income | | | $ | 48,223,058 | | | | $ | 43,430,842 | | | | | | $ | 68,951 | | | | $ | 176,663 | |
Net realized gain (loss) | | | | (595,799,521 | ) | | | | 1,513,917 | | | | | | | 636,264 | | | | | (4,399,622 | ) |
Change in net unrealized appreciation (depreciation) | | | | (44,542,679 | ) | | | | (89,022,647 | ) | | | | | | 380,456 | | | | | (3,277,772 | ) |
| | | | | | | | | | | | | | | | | | | | | | |
Net increase (decrease) in net assets resulting from operations | | | | (592,119,142 | ) | | | | (44,077,888 | ) | | | | | | 1,085,671 | | | | | (7,500,731 | ) |
| | | | | | | | | | | | | | | | | | | | | | |
| | | | | |
| Distributions to Shareholders from: | | | | | | | | | | | | | | | | | | | | | | |
Distributable earnings | | | | (61,636,699 | ) | | | | (43,490,857 | ) | | | | | | (57,762 | ) | | | | (246,833 | ) |
| | | | | | | | | | | | | | | | | | | | | | |
| | | | | |
| Shareholder Transactions: | | | | | | | | | | | | | | | | | | | | | | |
Proceeds from shares sold | | | | 1,151,033,302 | | | | | 1,001,558,929 | | | | | | | 7,300,521 | | | | | 10,090,242 | |
Value of shares repurchased | | | | (928,774,382 | ) | | | | (301,743,868 | ) | | | | | | (8,245,185 | ) | | | | (41,307,141 | ) |
| | | | | | | | | | | | | | | | | | | | | | |
Net increase (decrease) in net assets resulting from share transactions | | | | 222,258,920 | | | | | 699,815,061 | | | | | | | (944,664 | ) | | | | (31,216,899 | ) |
| | | | | | | | | | | | | | | | | | | | | | |
Net increase (decrease) in net assets | | | | (431,496,921 | ) | | | | 612,246,316 | | | | | | | 83,245 | | | | | (38,964,463 | ) |
| | | | | | | | | | | | | | | | | | | | | | |
| | | | | |
| Net assets: | | | | | | | | | | | | | | | | | | | | | | |
Beginning of year | | | | 2,045,602,054 | | | | | 1,433,355,738 | | | | | | | 3,959,804 | | | | | 42,924,267 | |
| | | | | | | | | | | | | | | | | | | | | | |
End of year | | | $ | 1,614,105,133 | | | | $ | 2,045,602,054 | | | | | | $ | 4,043,049 | | | | $ | 3,959,804 | |
| | | | | | | | | | | | | | | | | | | | | | |
| | | | | |
| Changes in Shares Outstanding: | | | | | | | | | | | | | | | | | | | | | | |
Shares sold | | | | 27,800,000 | | | | | 21,300,000 | | | | | | | 300,000 | | | | | 350,000 | |
Shares repurchased | | | | (25,000,000 | ) | | | | (6,350,000 | ) | | | | | | (300,000 | ) | | | | (1,550,000 | ) |
Shares outstanding, beginning of year | | | | 43,000,000 | | | | | 28,050,000 | | | | | | | 150,001 | | | | | 1,350,001 | |
| | | | | | | | | | | | | | | | | | | | | | |
Shares outstanding, end of year | | | | 45,800,000 | | | | | 43,000,000 | | | | | | | 150,001 | | | | | 150,001 | |
| | | | | | | | | | | | | | | | | | | | | | |
See accompanying Notes to Financial Statements which are an integral part of the financial statements.
Financial Highlights
Invesco Russell 1000 Enhanced Equal Weight ETF (USEQ)
| | | | | | | | | | | | | | | | | | | | |
| | | Years Ended August 31, | | Ten Months Ended
August 31, | | For the Period
July 11, 2017(a)
Through
October 31, |
| | | 2020 | | 2019 | | 2018 | | 2017 |
| | | | |
Per Share Operating Performance: | | | | | | | | | | | | | | | | | | | | |
Net asset value at beginning of period | | | $ | 27.73 | | | | $ | 28.81 | | | | $ | 26.39 | | | | $ | 24.98 | |
| | | | | | | | | | | | | | | | | | | | |
Net investment income(b) | | | | 0.53 | | | | | 0.45 | | | | | 0.39 | | | | | 0.11 | |
Net realized and unrealized gain (loss) on investments | | | | (0.15 | ) | | | | (0.91 | ) | | | | 2.34 | | | | | 1.35 | |
| | | | | | | | | | | | | | | | | | | | |
Total from investment operations | | | | 0.38 | | | | | (0.46 | ) | | | | 2.73 | | | | | 1.46 | |
| | | | | | | | | | | | | | | | | | | | |
Distributions to shareholders from: | | | | | | | | | | | | | | | | | | | | |
Net investment income | | | | (0.73 | ) | | | | (0.62 | ) | | | | (0.31 | ) | | | | (0.05 | ) |
| | | | | | | | | | | | | | | | | | | | |
Net asset value at end of period | | | $ | 27.38 | | | | $ | 27.73 | | | | $ | 28.81 | | | | $ | 26.39 | |
| | | | | | | | | | | | | | | | | | | | |
Market price at end of period(c) | | | $ | 27.40 | | | | $ | 27.71 | | | | $ | 28.83 | | | | $ | 26.43 | |
| | | | | | | | | | | | | | | | | | | | |
Net Asset Value Total Return(d) | | | | 1.72 | % | | | | (1.34 | )% | | | | 10.38 | % | | | | 5.84 | %(e) |
Market Price Total Return(d) | | | | 1.88 | % | | | | (1.49 | )% | | | | 10.29 | % | | | | 6.00 | %(e) |
Ratios/Supplemental Data: | | | | | | | | | | | | | | | | | | | | |
Net assets at end of period (000’s omitted) | | | $ | 2,738 | | | | $ | 18,023 | | | | $ | 145,500 | | | | $ | 67,301 | |
Ratio to average net assets of: | | | | | | | | | | | | | | | | | | | | |
Expenses | | | | 0.29 | % | | | | 0.30 | %(f) | | | | 0.29 | %(g) | | | | 0.29 | %(g) |
Net investment income | | | | 1.85 | % | | | | 1.63 | %(f) | | | | 1.69 | %(g) | | | | 1.35 | %(g) |
Portfolio turnover rate(h) | | | | 28 | % | | | | 23 | % | | | | 34 | % | | | | 2 | % |
| (a) | Commencement of investment operations. |
| (b) | Based on average shares outstanding. |
| (c) | The mean between the last bid and ask prices. |
| (d) | Net asset value total return is calculated assuming an initial investment made at the net asset value at the beginning of the period, reinvestment of all dividends and distributions at net asset value during the period, and redemption at net asset value on the last day of the period. Net asset value total return includes adjustments in accordance with accounting principles generally accepted in the United States of America and as such, the net asset value for financial reporting purposes and the returns based upon those net asset values may differ from the net asset value and returns for shareholder transactions. Market price total return is calculated assuming an initial investment made at the market price at the beginning of the period, reinvestment of all dividends and distributions at market price during the period, and sale at the market price on the last day of the period. Total investment returns calculated for a period of less than one year are not annualized. |
| (e) | The net asset value total return from Fund Inception (July 13, 2017, the first day of trading on the Exchange) to October 31, 2017 was 4.96%. The market price total return from Fund Inception to October 31, 2017 was 5.08%. |
| (f) | Ratios include non-recurring costs associated with a proxy statement of 0.01%. |
| (h) | Portfolio turnover rate is not annualized for periods less than one year, if applicable, and does not include securities received or delivered from processing creations or redemptions. |
See accompanying Notes to Financial Statements which are an integral part of the financial statements.
Financial Highlights–(continued)
Invesco Russell 1000 Equal Weight ETF (EQAL)
| | | | | | | | | | | | | | | | | | | | | | | | | | | | | | |
| | | | | | | | | | | | | For the Period December 22, 2014(a) Through October 31, |
| | | | | | | | | | | |
| | | | | | | Ten Months Ended August 31, | | | | |
| | | Years Ended August 31, | | Years Ended October 31, |
| | | 2020 | | 2019 | | 2018 | | 2017 | | 2016 | | 2015 |
Per Share Operating Performance: | | | | | | | | | | | | | | | | | | | | | | | | | | | | | | |
Net asset value at beginning of period | | | $ | 31.51 | | | | $ | 33.30 | | | | $ | 29.90 | | | | $ | 25.38 | | | | $ | 24.44 | | | | $ | 25.05 | |
| | | | | | | | | | | | | | | | | | | | | | | | | | | | | | |
Net investment income(b) | | | | 0.61 | | | | | 0.53 | | | | | 0.41 | | | | | 0.42 | | | | | 0.41 | | | | | 0.32 | |
Net realized and unrealized gain (loss) on investments | | | | 2.01 | | | | | (1.84 | ) | | | | 3.31 | | | | | 4.50 | | | | | 0.95 | | | | | (0.71 | ) |
| | | | | | | | | | | | | | | | | | | | | | | | | | | | | | |
Total from investment operations | | | | 2.62 | | | | | (1.31 | ) | | | | 3.72 | | | | | 4.92 | | | | | 1.36 | | | | | (0.39 | ) |
| | | | | | | | | | | | | | | | | | | | | | | | | | | | | | |
Distributions to shareholders from: | | | | | | | | | | | | | | | | | | | | | | | | | | | | | | |
Net investment income | | | | (0.66 | ) | | | | (0.48 | ) | | | | (0.32 | ) | | | | (0.40 | ) | | | | (0.42 | ) | | | | (0.22 | ) |
| | | | | | | | | | | | | | | | | | | | | | | | | | | | | | |
Net asset value at end of period | | | $ | 33.47 | | | | $ | 31.51 | | | | $ | 33.30 | | | | $ | 29.90 | | | | $ | 25.38 | | | | $ | 24.44 | |
| | | | | | | | | | | | | | | | | | | | | | | | | | | | | | |
Market price at end of period(c) | | | $ | 33.52 | | | | $ | 31.51 | | | | $ | 33.31 | | | | $ | 29.91 | | | | $ | 25.41 | | | | $ | 24.48 | |
| | | | | | | | | | | | | | | | | | | | | | | | | | | | | | |
Net Asset Value Total Return(d) | | | | 8.71 | % | | | | (3.88 | )% | | | | 12.50 | % | | | | 19.48 | % | | | | 5.67 | % | | | | (1.58 | )%(e) |
Market Price Total Return(d) | | | | 8.87 | % | | | | (3.91 | )% | | | | 12.49 | % | | | | 19.38 | % | | | | 5.62 | % | | | | (1.42 | )%(e) |
Ratios/Supplemental Data: | | | | | | | | | | | | | | | | | | | | | | | | | | | | | | |
Net assets at end of period (000’s omitted) | | | $ | 475,339 | | | | $ | 560,932 | | | | $ | 474,554 | | | | $ | 315,495 | | | | $ | 115,484 | | | | $ | 149,084 | |
Ratio to average net assets of: | | | | | | | | | | | | | | | | | | | | | | | | | | | | | | |
Expenses | | | | 0.20 | % | | | | 0.20 | % | | | | 0.20 | %(f) | | | | 0.20 | % | | | | 0.20 | % | | | | 0.20 | %(f) |
Net investment income | | | | 1.95 | % | | | | 1.67 | % | | | | 1.57 | %(f) | | | | 1.48 | % | | | | 1.70 | % | | | | 1.49 | %(f) |
Portfolio turnover rate(g) | | | | 29 | % | | | | 27 | % | | | | 19 | % | | | | 29 | % | | | | 31 | % | | | | 24 | % |
| (a) | Commencement of investment operations. |
| (b) | Based on average shares outstanding. |
| (c) | The mean between the last bid and ask prices. |
| (d) | Net asset value total return is calculated assuming an initial investment made at the net asset value at the beginning of the period, reinvestment of all dividends and distributions at net asset value during the period, and redemption at net asset value on the last day of the period. Net asset value total return includes adjustments in accordance with accounting principles generally accepted in the United States of America and as such, the net asset value for financial reporting purposes and the returns based upon those net asset values may differ from the net asset value and returns for shareholder transactions. Market price total return is calculated assuming an initial investment made at the market price at the beginning of the period, reinvestment of all dividends and distributions at market price during the period, and sale at the market price on the last day of the period. Total investment returns calculated for a period of less than one year are not annualized. |
| (e) | The net asset value total return from Fund Inception (December 23, 2014, the first day of trading on the Exchange) to October 31, 2015 was (2.01)%. The market price total return from Fund Inception to October 31, 2015 was (1.93)%. |
| (g) | Portfolio turnover rate is not annualized for periods less than one year, if applicable, and does not include securities received or delivered from processing creations or redemptions. |
See accompanying Notes to Financial Statements which are an integral part of the financial statements.
Financial Highlights–(continued)
Invesco Russell 1000 Low Beta Equal Weight ETF (USLB)
| | | | | | | | | | | | | | | | | | | | | | | | | |
| | | | | | | | | | | For the Period November 2, 2015(a) Through October 31, |
| | | | | | | | | |
| | | | | | | Ten Months Ended August 31, | | |
| | | Years Ended August 31, | | Years Ended October 31, |
| | | 2020 | | 2019 | | 2018 | | 2017 | | 2016 |
Per Share Operating Performance: | | | | | | | | | | | | | | | | | | | | | | | | | |
Net asset value at beginning of period | | | $ | 33.19 | | | | $ | 33.29 | | | | $ | 29.81 | | | | $ | 25.93 | | | | $ | 25.31 | |
| | | | | | | | | | | | | | | | | | | | | | | | | |
Net investment income(b) | | | | 0.59 | | | | | 0.58 | | | | | 0.42 | | | | | 0.45 | | | | | 0.42 | |
Net realized and unrealized gain (loss) on investments | | | | 0.01 | | | | | (0.07 | ) | | | | 3.44 | | | | | 3.83 | | | | | 0.53 | |
| | | | | | | | | | | | | | | | | | | | | | | | | |
Total from investment operations | | | | 0.60 | | | | | 0.51 | | | | | 3.86 | | | | | 4.28 | | | | | 0.95 | |
| | | | | | | | | | | | | | | | | | | | | | | | | |
Distributions to shareholders from: | | | | | | | | | | | | | | | | | | | | | | | | | |
Net investment income | | | | (0.80 | ) | | | | (0.61 | ) | | | | (0.38 | ) | | | | (0.40 | ) | | | | (0.33 | ) |
| | | | | | | | | | | | | | | | | | | | | | | | | |
Net asset value at end of period | | | $ | 32.99 | | | | $ | 33.19 | | | | $ | 33.29 | | | | $ | 29.81 | | | | $ | 25.93 | |
| | | | | | | | | | | | | | | | | | | | | | | | | |
Market price at end of period(c) | | | $ | 33.06 | | | | $ | 33.19 | | | | $ | 33.29 | | | | $ | 29.81 | | | | $ | 25.95 | |
| | | | | | | | | | | | | | | | | | | | | | | | | |
Net Asset Value Total Return(d) | | | | 2.08 | % | | | | 1.69 | % | | | | 13.04 | % | | | | 16.60 | % | | | | 3.78 | %(e) |
Market Price Total Return(d) | | | | 2.30 | % | | | | 1.69 | % | | | | 13.04 | % | | | | 16.51 | % | | | | 3.86 | %(e) |
Ratios/Supplemental Data: | | | | | | | | | | | | | | | | | | | | | | | | | |
Net assets at end of period (000’s omitted) | | | $ | 9,896 | | | | $ | 111,185 | | | | $ | 164,778 | | | | $ | 153,515 | | | | $ | 138,704 | |
Ratio to average net assets of: | | | | | | | | | | | | | | | | | | | | | | | | | |
Expenses | | | | 0.35 | % | | | | 0.36 | %(f) | | | | 0.35 | %(g) | | | | 0.35 | % | | | | 0.35 | %(g) |
Net investment income | | | | 1.76 | % | | | | 1.82 | %(f) | | | | 1.63 | %(g) | | | | 1.60 | % | | | | 1.66 | %(g) |
Portfolio turnover rate(h) | | | | 33 | % | | | | 53 | % | | | | 91 | % | | | | 40 | % | | | | 118 | % |
| (a) | Commencement of investment operations. |
| (b) | Based on average shares outstanding. |
| (c) | The mean between the last bid and ask prices. |
| (d) | Net asset value total return is calculated assuming an initial investment made at the net asset value at the beginning of the period, reinvestment of all dividends and distributions at net asset value during the period, and redemption at net asset value on the last day of the period. Net asset value total return includes adjustments in accordance with accounting principles generally accepted in the United States of America and as such, the net asset value for financial reporting purposes and the returns based upon those net asset values may differ from the net asset value and returns for shareholder transactions. Market price total return is calculated assuming an initial investment made at the market price at the beginning of the period, reinvestment of all dividends and distributions at market price during the period, and sale at the market price on the last day of the period. Total investment returns calculated for a period of less than one year are not annualized. |
| (e) | The net asset value total return from Fund Inception (November 5, 2015, the first day of trading on the Exchange) to October 31, 2016 was 4.19%. The market price total return from Fund Inception to October 31, 2016 was 4.15%. |
| (f) | Ratios include non-recurring costs associated with a proxy statement of 0.01%. |
| (h) | Portfolio turnover rate is not annualized for periods less than one year, if applicable, and does not include securities received or delivered from processing creations or redemptions. |
See accompanying Notes to Financial Statements which are an integral part of the financial statements.
Financial Highlights–(continued)
Invesco S&P 500 Enhanced Value ETF (SPVU)
| | | | | | | | | | | | | | | | | | | | | | | | | | | | | | |
| | | Years Ended August 31, | | Ten Months Ended
August 31, | | Years Ended October 31, | | For the Period
October 6, 2015(a)
Through
October 31, |
| | | 2020 | | 2019 | | 2018 | | 2017 | | 2016 | | 2015 |
Per Share Operating Performance: | | | | | | | | | | | | | | | | | | | | | | | | | | | | | | |
Net asset value at beginning of period | | | $ | 33.42 | | | | $ | 35.99 | | | | $ | 33.08 | | | | $ | 26.44 | | | | $ | 25.78 | | | | $ | 25.04 | |
| | | | | | | | | | | | | | | | | | | | | | | | | | | | | | |
Net investment income(b) | | | | 0.99 | | | | | 0.93 | | | | | 0.68 | | | | | 0.57 | | | | | 0.63 | | | | | 0.01 | |
Net realized and unrealized gain (loss) on investments | | | | (4.69 | ) | | | | (2.67 | ) | | | | 3.12 | | | | | 6.44 | | | | | 0.38 | | | | | 0.73 | |
| | | | | | | | | | | | | | | | | | | | | | | | | | | | | | |
Total from investment operations | | | | (3.70 | ) | | | | (1.74 | ) | | | | 3.80 | | | | | 7.01 | | | | | 1.01 | | | | | 0.74 | |
| | | | | | | | | | | | | | | | | | | | | | | | | | | | | | |
Distributions to shareholders from: | | | | | | | | | | | | | | | | | | | | | | | | | | | | | | |
Net investment income | | | | (0.95 | ) | | | | (0.83 | ) | | | | (0.89 | ) | | | | (0.37 | ) | | | | (0.35 | ) | | | | - | |
| | | | | | | | | | | | | | | | | | | | | | | | | | | | | | |
Net asset value at end of period | | | $ | 28.77 | | | | $ | 33.42 | | | | $ | 35.99 | | | | $ | 33.08 | | | | $ | 26.44 | | | | $ | 25.78 | |
| | | | | | | | | | | | | | | | | | | | | | | | | | | | | | |
Market price at end of period(c) | | | $ | 28.82 | | | | $ | 33.45 | | | | $ | 36.01 | | | | $ | 33.10 | | | | $ | 26.45 | | | | $ | 25.83 | |
| | | | | | | | | | | | | | | | | | | | | | | | | | | | | | |
Net Asset Value Total Return(d) | | | | (11.04 | )% | | | | (4.79 | )% | | | | 11.61 | % | | | | 26.58 | % | | | | 4.03 | % | | | | 2.96 | %(e) |
Market Price Total Return(d) | | | | (10.97 | )% | | | | (4.76 | )% | | | | 11.60 | % | | | | 26.61 | % | | | | 3.86 | % | | | | 3.15 | %(e) |
Ratios/Supplemental Data: | | | | | | | | | | | | | | | | | | | | | | | | | | | | | | |
Net assets at end of period (000’s omitted) | | | $ | 69,042 | | | | $ | 60,160 | | | | $ | 26,996 | | | | $ | 51,275 | | | | $ | 1,322 | | | | $ | 2,578 | |
Ratio to average net assets of: | | | | | | | | | | | | | | | | | | | | | | | | | | | | | | |
Expenses | | | | 0.13 | % | | | | 0.15 | %(f) | | | | 0.16 | %(g) | | | | 0.25 | % | | | | 0.25 | % | | | | 0.25 | %(g) |
Net investment income | | | | 3.14 | % | | | | 2.72 | %(f) | | | | 2.35 | %(g) | | | | 1.81 | % | | | | 2.53 | % | | | | 0.63 | %(g) |
Portfolio turnover rate(h) | | | | 39 | % | | | | 54 | % | | | | 34 | % | | | | 36 | % | | | | 42 | % | | | | 0 | %(i) |
| (a) | Commencement of investment operations. |
| (b) | Based on average shares outstanding. |
| (c) | The mean between the last bid and ask prices. |
| (d) | Net asset value total return is calculated assuming an initial investment made at the net asset value at the beginning of the period, reinvestment of all dividends and distributions at net asset value during the period, and redemption at net asset value on the last day of the period. Net asset value total return includes adjustments in accordance with accounting principles generally accepted in the United States of America and as such, the net asset value for financial reporting purposes and the returns based upon those net asset values may differ from the net asset value and returns for shareholder transactions. Market price total return is calculated assuming an initial investment made at the market price at the beginning of the period, reinvestment of all dividends and distributions at market price during the period, and sale at the market price on the last day of the period. Total investment returns calculated for a period of less than one year are not annualized. |
| (e) | The net asset value total return from Fund Inception (October 9, 2015, the first day of trading on the Exchange) to October 31, 2015 was 1.38%. The market price total return from Fund Inception to October 31, 2015 was 1.45%. |
| (f) | Ratios include non-recurring costs associated with a proxy statement of 0.02%. |
| (h) | Portfolio turnover rate is not annualized for periods less than one year, if applicable, and does not include securities received or delivered from processing creations or redemptions. |
| (i) | Amount represents less than 0.5%. |
See accompanying Notes to Financial Statements which are an integral part of the financial statements.
Financial Highlights–(continued)
Invesco S&P 500® ex-Rate Sensitive Low Volatility ETF (XRLV)
| | | | | | | | | | | | | | | | | | | | | | | | | | | | | | |
| | | Years Ended August 31, | | Ten Months Ended
August 31, | | Years Ended October 31, | | For the Period
April 6, 2015(a)
Through
October 31, |
| | | 2020 | | 2019 | | 2018 | | 2017 | | 2016 | | 2015 |
Per Share Operating Performance: | | | | | | | | | | | | | | | | | | | | | | | | | | | | | | |
Net asset value at beginning of period | | | $ | 38.76 | | | | $ | 36.10 | | | | $ | 32.38 | | | | $ | 26.74 | | | | $ | 25.36 | | | | $ | 25.14 | |
| | | | | | | | | | | | | | | | | | | | | | | | | | | | | | |
Net investment income(b) | | | | 0.72 | | | | | 0.63 | | | | | 0.43 | | | | | 0.51 | | | | | 0.44 | | | | | 0.23 | |
Net realized and unrealized gain on investments | | | | 0.71 | | | | | 2.68 | | | | | 3.73 | | | | | 5.62 | | | | | 1.39 | | | | | 0.18 | |
| | | | | | | | | | | | | | | | | | | | | | | | | | | | | | |
Total from investment operations | | | | 1.43 | | | | | 3.31 | | | | | 4.16 | | | | | 6.13 | | | | | 1.83 | | | | | 0.41 | |
| | | | | | | | | | | | | | | | | | | | | | | | | | | | | | |
Distributions to shareholders from: | | | | | | | | | | | | | | | | | | | | | | | | | | | | | | |
Net investment income | | | | (0.76 | ) | | | | (0.65 | ) | | | | (0.44 | ) | | | | (0.49 | ) | | | | (0.45 | ) | | | | (0.19 | ) |
Return of capital | | | | - | | | | | - | | | | | - | | | | | - | | | | | - | | | | | (0.00 | )(c) |
| | | | | | | | | | | | | | | | | | | | | | | | | | | | | | |
Total distributions | | | | (0.76 | ) | | | | (0.65 | ) | | | | (0.44 | ) | | | | (0.49 | ) | | | | (0.45 | ) | | | | (0.19 | ) |
| | | | | | | | | | | | | | | | | | | | | | | | | | | | | | |
Net asset value at end of period | | | $ | 39.43 | | | | $ | 38.76 | | | | $ | 36.10 | | | | $ | 32.38 | | | | $ | 26.74 | | | | $ | 25.36 | |
| | | | | | | | | | | | | | | | | | | | | | | | | | | | | | |
Market price at end of period(d) | | | $ | 39.49 | | | | $ | 38.77 | | | | $ | 36.11 | | | | $ | 32.38 | | | | $ | 26.75 | | | | $ | 25.42 | |
| | | | | | | | | | | | | | | | | | | | | | | | | | | | | | |
Net Asset Value Total Return(e) | | | | 3.86 | % | | | | 9.35 | % | | | | 12.92 | % | | | | 23.11 | % | | | | 7.29 | % | | | | 1.62 | %(f) |
Market Price Total Return(e) | | | | 3.99 | % | | | | 9.35 | % | | | | 12.96 | % | | | | 23.06 | % | | | | 7.08 | % | | | | 1.86 | %(f) |
Ratios/Supplemental Data: | | | | | | | | | | | | | | | | | | | | | | | | | | | | | | |
Net assets at end of period (000’s omitted) | | | $ | 69,002 | | | | $ | 166,657 | | | | $ | 146,189 | | | | $ | 131,153 | | | | $ | 164,423 | | | | $ | 107,785 | |
Ratio to average net assets of: | | | | | | | | | | | | | | | | | | | | | | | | | | | | | | |
Expenses | | | | 0.25 | % | | | | 0.26 | %(g) | | | | 0.25 | %(h) | | | | 0.25 | % | | | | 0.25 | % | | | | 0.25 | %(h) |
Net investment income | | | | 1.87 | % | | | | 1.74 | %(g) | | | | 1.52 | %(h) | | | | 1.75 | % | | | | 1.65 | % | | | | 1.65 | %(h) |
Portfolio turnover rate(i) | | | | 84 | % | | | | 62 | % | | | | 68 | % | | | | 61 | % | | | | 52 | % | | | | 32 | % |
| (a) | Commencement of investment operations. |
| (b) | Based on average shares outstanding. |
| (c) | Amount represents less than $(0.005). |
| (d) | The mean between the last bid and ask prices. |
| (e) | Net asset value total return is calculated assuming an initial investment made at the net asset value at the beginning of the period, reinvestment of all dividends and distributions at net asset value during the period, and redemption at net asset value on the last day of the period. Net asset value total return includes adjustments in accordance with accounting principles generally accepted in the United States of America and as such, the net asset value for financial reporting purposes and the returns based upon those net asset values may differ from the net asset value and returns for shareholder transactions. Market price total return is calculated assuming an initial investment made at the market price at the beginning of the period, reinvestment of all dividends and distributions at market price during the period, and sale at the market price on the last day of the period. Total investment returns calculated for a period of less than one year are not annualized. |
| (f) | The net asset value total return from Fund Inception (April 9, 2015, the first day of trading on the Exchange) to October 31, 2015 was 1.62%. The market price total return from Fund Inception to October 31, 2015 was 1.78%. |
| (g) | Ratios include non-recurring costs associated with a proxy statement of 0.01%. |
| (i) | Portfolio turnover rate is not annualized for periods less than one year, if applicable, and does not include securities received or delivered from processing creations or redemptions. |
See accompanying Notes to Financial Statements which are an integral part of the financial statements.
Financial Highlights–(continued)
Invesco S&P 500® High Beta ETF (SPHB)
| | | | | | | | | | | | | | | | | | | | | | | | | | | | | | |
| | | Years Ended August 31, | | Ten Months Ended
August 31,
2018 | | Years Ended October 31, |
| | | 2020 | | 2019 | | 2017 | | 2016 | | 2015 |
Per Share Operating Performance: | | | | | | | | | | | | | | | | | | | | | | | | | | | | | | |
Net asset value at beginning of period | | | $ | 40.44 | | | | $ | 45.25 | | | | $ | 40.12 | | | | $ | 32.29 | | | | $ | 31.38 | | | | $ | 34.04 | |
| | | | | | | | | | | | | | | | | | | | | | | | | | | | | | |
Net investment income(a) | | | | 0.99 | (b) | | | | 0.44 | | | | | 0.51 | | | | | 0.44 | | | | | 0.39 | | | | | 0.37 | |
Net realized and unrealized gain (loss) on investments | | | | 3.25 | | | | | (4.67 | ) | | | | 5.15 | | | | | 8.01 | | | | | 0.84 | | | | | (2.58 | ) |
| | | | | | | | | | | | | | | | | | | | | | | | | | | | | | |
Total from investment operations. | | | | 4.24 | | | | | (4.23 | ) | | | | 5.66 | | | | | 8.45 | | | | | 1.23 | | | | | (2.21 | ) |
| | | | | | | | | | | | | | | | | | | | | | | | | | | | | | |
Distributions to shareholders from: | | | | | | | | | | | | | | | | | | | | | | | | | | | | | | |
Net investment income | | | | (0.95 | ) | | | | (0.58 | ) | | | | (0.53 | ) | | | | (0.62 | ) | | | | (0.32 | ) | | | | (0.45 | ) |
| | | | | | | | | | | | | | | | | | | | | | | | | | | | | | |
Net asset value at end of period | | | $ | 43.73 | | | | $ | 40.44 | | | | $ | 45.25 | | | | $ | 40.12 | | | | $ | 32.29 | | | | $ | 31.38 | |
| | | | | | | | | | | | | | | | | | | | | | | | | | | | | | |
Market price at end of period(c) | | | $ | 43.83 | | | | $ | 40.46 | | | | $ | 45.28 | | | | $ | 40.12 | | | | $ | 32.32 | | | | $ | 31.42 | |
| | | | | | | | | | | | | | | | | | | | | | | | | | | | | | |
Net Asset Value Total Return(d) | | | | 11.38 | % | | | | (9.32 | )% | | | | 14.14 | % | | | | 26.32 | % | | | | 4.02 | % | | | | (6.56 | )% |
Market Price Total Return(d) | | | | 11.59 | % | | | | (9.33 | )% | | | | 14.22 | % | | | | 26.20 | % | | | | 3.98 | % | | | | (6.47 | )% |
Ratios/Supplemental Data: | | | | | | | | | | | | | | | | | | | | | | | | | | | | | | |
Net assets at end of period (000’s omitted) | | | $ | 131,175 | | | | $ | 90,993 | | | | $ | 171,934 | | | | $ | 359,072 | | | | $ | 489,204 | | | | $ | 80,025 | |
Ratio to average net assets of: | | | | | | | | | | | | | | | | | | | | | | | | | | | | | | |
Expenses | | | | 0.25 | % | | | | 0.25 | % | | | | 0.25 | %(e) | | | | 0.25 | % | | | | 0.25 | % | | | | 0.25 | % |
Net investment income | | | | 2.39 | %(b) | | | | 1.07 | % | | | | 1.42 | %(e) | | | | 1.18 | % | | | | 1.28 | % | | | | 1.09 | % |
Portfolio turnover rate(f) | | | | 113 | % | | | | 69 | % | | | | 76 | % | | | | 80 | % | | | | 55 | % | | | | 90 | % |
| (a) | Based on average shares outstanding. |
| (b) | Net investment income per share and the ratio of net investment income to average net assets include a significant dividend received during the period.Net investment income per share and the ratio of net investment income to average net assets excluding the significant dividend are $0.79 and 1.91%, respectively. |
| (c) | The mean between the last bid and ask prices. |
| (d) | Net asset value total return is calculated assuming an initial investment made at the net asset value at the beginning of the period, reinvestment of all dividends and distributions at net asset value during the period, and redemption at net asset value on the last day of the period. Net asset value total return includes adjustments in accordance with accounting principles generally accepted in the United States of America and as such, the net asset value for financial reporting purposes and the returns based upon those net asset values may differ from the net asset value and returns for shareholder transactions. Market price total return is calculated assuming an initial investment made at the market price at the beginning of the period, reinvestment of all dividends and distributions at market price during the period, and sale at the market price on the last day of the period. Total investment returns calculated for a period of less than one year are not annualized. |
| (f) | Portfolio turnover rate is not annualized for periods less than one year, if applicable, and does not include securities received or delivered from processing creations or redemptions. |
See accompanying Notes to Financial Statements which are an integral part of the financial statements.
Financial Highlights–(continued)
Invesco S&P 500® High Dividend Low Volatility ETF (SPHD)
| | | | | | | | | | | | | | | | | | | | | | | | | | | | | | |
| | | Years Ended August 31, | | Ten Months Ended August 31, | | Years Ended October 31, |
| | | 2020 | | 2019 | | 2018 | | 2017 | | 2016 | | 2015 |
Per Share Operating Performance: | | | | | | | | | | | | | | | | | | | | | | | | | | | | | | |
Net asset value at beginning of period | | | $ | 40.52 | | | | $ | 41.68 | | | | $ | 41.24 | | | | $ | 37.69 | | | | $ | 33.22 | | | | $ | 32.14 | |
| | | | | | | | | | | | | | | | | | | | | | | | | | | | | | |
Net investment income(a) | | | | 1.53 | | | | | 1.64 | | | | | 1.35 | | | | | 1.33 | | | | | 1.29 | | | | | 1.10 | |
Net realized and unrealized gain (loss) on investments | | | | (6.10 | ) | | | | (1.06 | ) | | | | 0.45 | | | | | 3.68 | | | | | 4.51 | | | | | 1.13 | |
| | | | | | | | | | | | | | | | | | | | | | | | | | | | | | |
Total from investment operations | | | | (4.57 | ) | | | | 0.58 | | | | | 1.80 | | | | | 5.01 | | | | | 5.80 | | | | | 2.23 | |
| | | | | | | | | | | | | | | | | | | | | | | | | | | | | | |
Distributions to shareholders from: | | | | | | | | | | | | | | | | | | | | | | | | | | | | | | |
Net investment income | | | | (1.85 | ) | | | | (1.74 | ) | | | | (1.36 | ) | | | | (1.46 | ) | | | | (1.33 | ) | | | | (1.15 | ) |
| | | | | | | | | | | | | | | | | | | | | | | | | | | | | | |
Net asset value at end of period | | | $ | 34.10 | | | | $ | 40.52 | | | | $ | 41.68 | | | | $ | 41.24 | | | | $ | 37.69 | | | | $ | 33.22 | |
| | | | | | | | | | | | | | | | | | | | | | | | | | | | | | |
Market price at end of period(b) | | | $ | 34.16 | | | | $ | 40.55 | | | | $ | 41.68 | | | | $ | 41.25 | | | | $ | 37.72 | | | | $ | 33.27 | |
| | | | | | | | | | | | | | | | | | | | | | | | | | | | | | |
Net Asset Value Total Return(c) | | | | (11.46 | )% | | | | 1.42 | % | | | | 4.48 | % | | | | 13.48 | % | | | | 17.75 | % | | | | 7.07 | % |
Market Price Total Return(c) | | | | (11.37 | )% | | | | 1.49 | % | | | | 4.45 | % | | | | 13.42 | % | | | | 17.66 | % | | | | 7.20 | % |
Ratios/Supplemental Data: | | | | | | | | | | | | | | | | | | | | | | | | | | | | | | |
Net assets at end of period (000’s omitted) | | | $ | 2,446,739 | | | | $ | 3,304,185 | | | | $ | 2,656,868 | | | | $ | 2,973,601 | | | | $ | 2,623,431 | | | | $ | 538,180 | |
Ratio to average net assets of: | | | | | | | | | | | | | | | | | | | | | | | | | | | | | | |
Expenses | | | | 0.30 | % | | | | 0.30 | % | | | | 0.30 | %(d) | | | | 0.30 | % | | | | 0.30 | % | | | | 0.30 | % |
Net investment income | | | | 4.02 | % | | | | 3.97 | % | | | | 3.95 | %(d) | | | | 3.31 | % | | | | 3.48 | % | | | | 3.38 | % |
Portfolio turnover rate(e) | | | | 76 | % | | | | 43 | % | | | | 46 | % | | | | 56 | % | | | | 50 | % | | | | 48 | % |
| (a) | Based on average shares outstanding. |
| (b) | The mean between the last bid and ask prices. |
| (c) | Net asset value total return is calculated assuming an initial investment made at the net asset value at the beginning of the period, reinvestment of all dividends and distributions at net asset value during the period, and redemption at net asset value on the last day of the period. Net asset value total return includes adjustments in accordance with accounting principles generally accepted in the United States of America and as such, the net asset value for financial reporting purposes and the returns based upon those net asset values may differ from the net asset value and returns for shareholder transactions. Market price total return is calculated assuming an initial investment made at the market price at the beginning of the period, reinvestment of all dividends and distributions at market price during the period, and sale at the market price on the last day of the period. Total investment returns calculated for a period of less than one year are not annualized. |
| (e) | Portfolio turnover rate is not annualized for periods less than one year, if applicable, and does not include securities received or delivered from processing creations or redemptions. |
See accompanying Notes to Financial Statements which are an integral part of the financial statements.
Financial Highlights–(continued)
Invesco S&P 500® Low Volatility ETF (SPLV)
| | | | | | | | | | | | | | | | | | | | | | | | | | | | | | |
| | | Years Ended August 31, | | Ten Months Ended August 31, | | Years Ended October 31, |
| | | 2020 | | 2019 | | 2018 | | 2017 | | 2016 | | 2015 |
Per Share Operating Performance: | | | | | | | | | | | | | | | | | | | | | | | | | | | | | | |
Net asset value at beginning of period | | | $ | 56.75 | | | | $ | 49.77 | | | | $ | 46.56 | | | | $ | 40.47 | | | | $ | 38.34 | | | | $ | 36.60 | |
| | | | | | | | | | | | | | | | | | | | | | | | | | | | | | |
Net investment income(a) | | | | 1.27 | | | | | 1.16 | | | | | 0.81 | | | | | 0.95 | | | | | 0.81 | | | | | 0.85 | |
Net realized and unrealized gain (loss) on investments | | | | (2.01 | ) | | | | 6.96 | | | | | 3.23 | | | | | 6.09 | | | | | 2.16 | | | | | 1.78 | |
| | | | | | | | | | | | | | | | | | | | | | | | | | | | | | |
Total from investment operations | | | | (0.74 | ) | | | | 8.12 | | | | | 4.04 | | | | | 7.04 | | | | | 2.97 | | | | | 2.63 | |
| | | | | | | | | | | | | | | | | | | | | | | | | | | | | | |
Distributions to shareholders from: | | | | | | | | | | | | | | | | | | | | | | | | | | | | | | |
Net investment income | | | | (1.32 | ) | | | | (1.14 | ) | | | | (0.83 | ) | | | | (0.95 | ) | | | | (0.84 | ) | | | | (0.89 | ) |
| | | | | | | | | | | | | | | | | | | | | | | | | | | | | | |
Net asset value at end of period | | | $ | 54.69 | | | | $ | 56.75 | | | | $ | 49.77 | | | | $ | 46.56 | | | | $ | 40.47 | | | | $ | 38.34 | |
| | | | | | | | | | | | | | | | | | | | | | | | | | | | | | |
Market price at end of period(b) | | | $ | 54.77 | | | | $ | 56.77 | | | | $ | 49.78 | | | | $ | 46.57 | | | | $ | 40.50 | | | | $ | 38.40 | |
| | | | | | | | | | | | | | | | | | | | | | | | | | | | | | |
Net Asset Value Total Return(c) | | | | (1.19 | )% | | | | 16.57 | % | | | | 8.77 | % | | | | 17.57 | % | | | | 7.80 | % | | | | 7.28 | % |
Market Price Total Return(c) | | | | (1.08 | )% | | | | 16.59 | % | | | | 8.76 | % | | | | 17.51 | % | | | | 7.72 | % | | | | 7.39 | % |
Ratios/Supplemental Data: | | | | | | | | | | | | | | | | | | | | | | | | | | | | | | |
Net assets at end of period (000’s omitted) | | | $ | 9,233,967 | | | | $ | 12,348,879 | | | | $ | 7,381,362 | | | | $ | 7,140,364 | | | | $ | 6,451,015 | | | | $ | 5,051,233 | |
Ratio to average net assets of: | | | | | | | | | | | | | | | | | | | | | | | | | | | | | | |
Expenses | | | | 0.25 | % | | | | 0.25 | % | | | | 0.25 | %(d) | | | | 0.25 | % | | | | 0.25 | % | | | | 0.25 | % |
Net investment income | | | | 2.33 | % | | | | 2.24 | % | | | | 2.06 | %(d) | | | | 2.18 | % | | | | 2.02 | % | | | | 2.26 | % |
Portfolio turnover rate(e) | | | | 86 | % | | | | 51 | % | | | | 68 | % | | | | 49 | % | | | | 53 | % | | | | 65 | % |
| (a) | Based on average shares outstanding. |
| (b) | The mean between the last bid and ask prices. |
| (c) | Net asset value total return is calculated assuming an initial investment made at the net asset value at the beginning of the period, reinvestment of all dividends and distributions at net asset value during the period, and redemption at net asset value on the last day of the period. Net asset value total return includes adjustments in accordance with accounting principles generally accepted in the United States of America and as such, the net asset value for financial reporting purposes and the returns based upon those net asset values may differ from the net asset value and returns for shareholder transactions. Market price total return is calculated assuming an initial investment made at the market price at the beginning of the period, reinvestment of all dividends and distributions at market price during the period, and sale at the market price on the last day of the period. Total investment returns calculated for a period of less than one year are not annualized. |
| (e) | Portfolio turnover rate is not annualized for periods less than one year, if applicable, and does not include securities received or delivered from processing creations or redemptions. |
See accompanying Notes to Financial Statements which are an integral part of the financial statements.
Financial Highlights–(continued)
Invesco S&P 500 Minimum Variance ETF (SPMV)
| | | | | | | | | | | | | | | | | | | | |
| | | | | | | | | For the Period |
| | | | | | | | | July 11, 2017(a) |
| | | | | | | Ten Months Ended | | Through |
| | | Years Ended August 31, | | August 31, | | October 31, |
| | | 2020 | | 2019 | | 2018 | | 2017 |
Per Share Operating Performance: | | | | | | | | | | | | | | | | | | | | |
Net asset value at beginning of period | | | | $30.22 | | | | | $29.19 | | | | | $26.29 | | | | | $24.92 | |
| | | | | | | | | | | | | | | | | | | | |
Net investment income(b) | | | | 0.63 | | | | | 0.46 | | | | | 0.47 | | | | | 0.15 | |
Net realized and unrealized gain on investments | | | | 2.57 | | | | | 1.65 | | | | | 3.04 | | | | | 1.30 | |
| | | | | | | | | | | | | | | | | | | | |
Total from investment operations | | | | 3.20 | | | | | 2.11 | | | | | 3.51 | | | | | 1.45 | |
| | | | | | | | | | | | | | | | | | | | |
Distributions to shareholders from: | | | | | | | | | | | | | | | | | | | | |
Net investment income | | | | (0.58 | ) | | | | (0.55 | ) | | | | (0.61 | ) | | | | (0.08 | ) |
Net realized gains | | | | (0.53 | ) | | | | (0.53 | ) | | | | - | | | | | - | |
| | | | | | | | | | | | | | | | | | | | |
Total distributions | | | | (1.11 | ) | | | | (1.08 | ) | | | | (0.61 | ) | | | | (0.08 | ) |
| | | | | | | | | | | | | | | | | | | | |
Net asset value at end of period | | | | $32.31 | | | | | $30.22 | | | | | $29.19 | | | | | $26.29 | |
| | | | | | | | | | | | | | | | | | | | |
Market price at end of period(c) | | | | $32.39 | | | | | $30.24 | | | | | $29.19 | | | | | $26.30 | |
| | | | | | | | | | | | | | | | | | | | |
Net Asset Value Total Return(d) | | | | 11.02 | % | | | | 7.86 | % | | | | 13.50 | % | | | | 5.81 | %(e) |
Market Price Total Return(d) | | | | 11.22 | % | | | | 7.94 | % | | | | 13.45 | % | | | | 5.85 | %(e) |
Ratios/Supplemental Data: | | | | | | | | | | | | | | | | | | | | |
Net assets at end of period (000’s omitted) | | | | $4,847 | | | | | $1,511 | | | | | $1,460 | | | | | $2,629 | |
Ratio to average net assets of: | | | | | | | | | | | | | | | | | | | | |
Expenses | | | | 0.10 | % | | | | 0.58 | %(f) | | | | 0.13 | %(g) | | | | 0.13 | %(g) |
Net investment income | | | | 2.11 | % | | | | 1.62 | %(f) | | | | 2.08 | %(g) | | | | 1.97 | %(g) |
Portfolio turnover rate(h) | | | | 20 | % | | | | 34 | % | | | | 30 | % | | | | 14 | % |
| (a) | Commencement of investment operations. |
| (b) | Based on average shares outstanding. |
| (c) | The mean between the last bid and ask prices. |
| (d) | Net asset value total return is calculated assuming an initial investment made at the net asset value at the beginning of the period, reinvestment of all dividends and distributions at net asset value during the period, and redemption at net asset value on the last day of the period. Net asset value total return includes adjustments in accordance with accounting principles generally accepted in the United States of America and as such, the net asset value for financial reporting purposes and the returns based upon those net asset values may differ from the net asset value and returns for shareholder transactions. Market price total return is calculated assuming an initial investment made at the market price at the beginning of the period, reinvestment of all dividends and distributions at market price during the period, and sale at the market price on the last day of the period. Total investment returns calculated for a period of less than one year are not annualized. |
| (e) | The net asset value total return from Fund Inception (July 13, 2017, the first day of trading on the Exchange) to October 31, 2017 was 4.97%. The market price total return from Fund Inception to October 31, 2017 was 4.93%. |
| (f) | Ratios include non-recurring costs associated with a proxy statement of 0.48%. |
| (h) | Portfolio turnover rate is not annualized for periods less than one year, if applicable, and does not include securities received or delivered from processing creations or redemptions. |
See accompanying Notes to Financial Statements which are an integral part of the financial statements.
Financial Highlights–(continued)
Invesco S&P 500 Momentum ETF (SPMO)
| | | | | | | | | | | | | | | | | | | | | | | | | | | | | | |
| | | Years Ended August 31, | | Ten Months Ended
August 31,
2018 | | Years Ended October 31, | | For the Period
October 6, 2015(a)
Through October 31, |
| | | 2020 | | 2019 | | 2017 | | 2016 | | 2015 |
Per Share Operating Performance: | | | | | | | | | | | | | | | | | | | | | | | | | | | | | | |
Net asset value at beginning of period | | | $ | 40.57 | | | | $ | 40.07 | | | | $ | 33.26 | | | | $ | 26.56 | | | | $ | 26.06 | | | | $ | 24.65 | |
| | | | | | | | | | | | | | | | | | | | | | | | | | | | | | |
Net investment income(b) | | | | 0.62 | | | | | 0.51 | | | | | 0.34 | | | | | 0.46 | | | | | 0.41 | | | | | 0.01 | |
Net realized and unrealized gain on investments | | | | 10.42 | | | | | 0.46 | | | | | 6.67 | | | | | 6.72 | | | | | 0.44 | | | | | 1.40 | |
| | | | | | | | | | | | | | | | | | | | | | | | | | | | | | |
Total from investment operations | | | | 11.04 | | | | | 0.97 | | | | | 7.01 | | | | | 7.18 | | | | | 0.85 | | | | | 1.41 | |
| | | | | | | | | | | | | | | | | | | | | | | | | | | | | | |
Distributions to shareholders from: | | | | | | | | | | | | | | | | | | | | | | | | | | | | | | |
Net investment income | | | | (0.66 | ) | | | | (0.47 | ) | | | | (0.20 | ) | | | | (0.48 | ) | | | | (0.35 | ) | | | | - | |
| | | | | | | | | | | | | | | | | | | | | | | | | | | | | | |
Net asset value at end of period | | | $ | 50.95 | | | | $ | 40.57 | | | | $ | 40.07 | | | | $ | 33.26 | | | | $ | 26.56 | | | | $ | 26.06 | |
| | | | | | | | | | | | | | | | | | | | | | | | | | | | | | |
Market price at end of period(c) | | | $ | 51.10 | | | | $ | 40.59 | | | | $ | 40.08 | | | | $ | 33.23 | | | | $ | 26.58 | | | | $ | 26.12 | |
| | | | | | | | | | | | | | | | | | | | | | | | | | | | | | |
Net Asset Value Total Return(d) | | | | 27.77 | % | | | | 2.52 | % | | | | 21.12 | % | | | | 27.35 | % | | | | 3.28 | % | | | | 5.72 | %(e) |
Market Price Total Return(d) | | | | 28.08 | % | | | | 2.55 | % | | | | 21.26 | % | | | | 27.14 | % | | | | 3.12 | % | | | | 5.96 | %(e) |
Ratios/Supplemental Data: | | | | | | | | | | | | | | | | | | | | | | | | | | | | | | |
Net assets at end of period (000’s omitted) | | | $ | 73,872 | | | | $ | 75,053 | | | | $ | 50,082 | | | | $ | 1,663 | | | | $ | 1,328 | | | | $ | 2,606 | |
Ratio to average net assets of: | | | | | | | | | | | | | | | | | | | | | | | | | | | | | | |
Expenses | | | | 0.13 | % | | | | 0.14 | %(f) | | | | 0.13 | %(g) | | | | 0.25 | % | | | | 0.25 | % | | | | 0.25 | %(g) |
Net investment income | | | | 1.48 | % | | | | 1.32 | %(f) | | | | 1.10 | %(g) | | | | 1.61 | % | | | | 1.60 | % | | | | 0.69 | %(g) |
Portfolio turnover rate(h) | | | | 90 | % | | | | 83 | % | | | | 41 | % | | | | 140 | % | | | | 105 | % | | | | 1 | % |
| (a) | Commencement of investment operations. |
| (b) | Based on average shares outstanding. |
| (c) | The mean between the last bid and ask prices. |
| (d) | Net asset value total return is calculated assuming an initial investment made at the net asset value at the beginning of the period, reinvestment of all dividends and distributions at net asset value during the period, and redemption at net asset value on the last day of the period. Net asset value total return includes adjustments in accordance with accounting principles generally accepted in the United States of America and as such, the net asset value for financial reporting purposes and the returns based upon those net asset values may differ from the net asset value and returns for shareholder transactions. Market price total return is calculated assuming an initial investment made at the market price at the beginning of the period, reinvestment of all dividends and distributions at market price during the period, and sale at the market price on the last day of the period. Total investment returns calculated for a period of less than one year are not annualized. |
| (e) | The net asset value total return from Fund Inception (October 9, 2015, the first day of trading on the Exchange) to October 31, 2015 was 3.62%. The market price total return from Fund Inception to October 31, 2015 was 3.77%. |
| (f) | Ratios include non-recurring costs associated with a proxy statement of 0.01%. |
| (h) | Portfolio turnover rate is not annualized for periods less than one year, if applicable, and does not include securities received or delivered from processing creations or redemptions. |
See accompanying Notes to Financial Statements which are an integral part of the financial statements.
Financial Highlights–(continued)
Invesco S&P MidCap Low Volatility ETF (XMLV)
| | | | | | | | | | | | | | | | | | | | | | | | | | | | | | |
| | | Years Ended August 31, | | Ten Months Ended
August 31, | | Years Ended October 31, |
| | | 2020 | | 2019 | | 2018 | | 2017 | | 2016 | | 2015 |
Per Share Operating Performance: | | | | | | | | | | | | | | | | | | | | | | | | | | | | | | |
Net asset value at beginning of period | | | $ | 51.87 | | | | $ | 49.02 | | | | $ | 45.02 | | | | $ | 38.21 | | | | $ | 34.38 | | | | $ | 31.82 | |
| | | | | | | | | | | | | | | | | | | | | | | | | | | | | | |
Net investment income(a) | | | | 1.02 | | | | | 1.09 | | | | | 0.96 | | | | | 0.69 | | | | | 0.69 | | | | | 0.66 | |
Net realized and unrealized gain (loss) on investments | | | | (7.93 | ) | | | | 2.72 | | | | | 3.92 | | | | | 6.80 | | | | | 3.72 | | | | | 2.55 | |
| | | | | | | | | | | | | | | | | | | | | | | | | | | | | | |
Total from investment operations | | | | (6.91 | ) | | | | 3.81 | | | | | 4.88 | | | | | 7.49 | | | | | 4.41 | | | | | 3.21 | |
| | | | | | | | | | | | | | | | | | | | | | | | | | | | | | |
Distributions to shareholders from: | | | | | | | | | | | | | | | | | | | | | | | | | | | | | | |
Net investment income | | | | (1.31 | ) | | | | (0.96 | ) | | | | (0.88 | ) | | | | (0.68 | ) | | | | (0.58 | ) | | | | (0.65 | ) |
| | | | | | | | | | | | | | | | | | | | | | | | | | | | | | |
Net asset value at end of period | | | $ | 43.65 | | | | $ | 51.87 | | | | $ | 49.02 | | | | $ | 45.02 | | | | $ | 38.21 | | | | $ | 34.38 | |
| | | | | | | | | | | | | | | | | | | | | | | | | | | | | | |
Market price at end of period(b) | | | $ | 43.70 | | | | $ | 51.88 | | | | $ | 49.04 | | | | $ | 45.02 | | | | $ | 38.23 | | | | $ | 34.42 | |
| | | | | | | | | | | | | | | | | | | | | | | | | | | | | | |
Net Asset Value Total Return(c) | | | | (13.26 | )% | | | | 7.99 | % | | | | 11.00 | % | | | | 19.76 | % | | | | 12.96 | % | | | | 10.18 | % |
Market Price Total Return(c) | | | | (13.17 | )% | | | | 7.97 | % | | | | 11.04 | % | | | | 19.69 | % | | | | 12.89 | % | | | | 10.30 | % |
Ratios/Supplemental Data: | | | | | | | | | | | | | | | | | | | | | | | | | | | | | | |
Net assets at end of period (000’s omitted) | | | $ | 2,042,702 | | | | $ | 3,231,736 | | | | $ | 1,443,641 | | | | $ | 1,195,218 | | | | $ | 682,094 | | | | $ | 106,565 | |
Ratio to average net assets of: | | | | | | | | | | | | | | | | | | | | | | | | | | | | | | |
Expenses | | | | 0.25 | % | | | | 0.25 | % | | | | 0.25 | %(d) | | | | 0.25 | % | | | | 0.25 | % | | | | 0.25 | % |
Net investment income | | | | 2.13 | % | | | | 2.21 | % | | | | 2.52 | %(d) | | | | 1.64 | % | | | | 1.86 | % | | | | 1.97 | % |
Portfolio turnover rate(e) | | | | 84 | % | | | | 61 | % | | | | 50 | % | | | | 57 | % | | | | 51 | % | | | | 57 | % |
| (a) | Based on average shares outstanding. |
| (b) | The mean between the last bid and ask prices. |
| (c) | Net asset value total return is calculated assuming an initial investment made at the net asset value at the beginning of the period, reinvestment of all dividends and distributions at net asset value during the period, and redemption at net asset value on the last day of the period. Net asset value total return includes adjustments in accordance with accounting principles generally accepted in the United States of America and as such, the net asset value for financial reporting purposes and the returns based upon those net asset values may differ from the net asset value and returns for shareholder transactions. Market price total return is calculated assuming an initial investment made at the market price at the beginning of the period, reinvestment of all dividends and distributions at market price during the period, and sale at the market price on the last day of the period. Total investment returns calculated for a period of less than one year are not annualized. |
| (e) | Portfolio turnover rate is not annualized for periods less than one year, if applicable, and does not include securities received or delivered from processing creations or redemptions. |
See accompanying Notes to Financial Statements which are an integral part of the financial statements.
Financial Highlights–(continued)
Invesco S&P SmallCap High Dividend Low Volatility ETF (XSHD)
| | | | | | | | | | | | | | | | | | | | |
| | | Years Ended August 31, | | Ten Months Ended
August 31, | | For the Period
November 29, 2016(a)
Through October 31, |
| | | 2020 | | 2019 | | 2018 | | 2017 |
Per Share Operating Performance: | | | | | | | | | | | | | | | | | | | | |
Net asset value at beginning of period | | | $ | 22.42 | | | | $ | 26.86 | | | | $ | 25.13 | | | | $ | 25.02 | |
| | | | | | | | | | | | | | | | | | | | |
Net investment income(b) | | | | 0.82 | | | | | 1.02 | | | | | 0.78 | | | | | 0.81 | |
Net realized and unrealized gain (loss) on investments | | | | (5.31 | ) | | | | (4.28 | ) | | | | 1.98 | | | | | 0.24 | |
| | | | | | | | | | | | | | | | | | | | |
Total from investment operations | | | | (4.49 | ) | | | | (3.26 | ) | | | | 2.76 | | | | | 1.05 | |
| | | | | | | | | | | | | | | | | | | | |
Distributions to shareholders from: | | | | | | | | | | | | | | | | | | | | |
Net investment income | | | | (1.27 | ) | | | | (1.18 | ) | | | | (1.03 | ) | | | | (0.94 | ) |
| | | | | | | | | | | | | | | | | | | | |
Net asset value at end of period | | | $ | 16.66 | | | | $ | 22.42 | | | | $ | 26.86 | | | | $ | 25.13 | |
| | | | | | | | | | | | | | | | | | | | |
Market price at end of period(c) | | | $ | 16.69 | | | | $ | 22.35 | | | | $ | 26.85 | | | | $ | 25.15 | |
| | | | | | | | | | | | | | | | | | | | |
Net Asset Value Total Return(d) | | | | (20.41 | )% | | | | (12.29 | )% | | | | 11.39 | % | | | | 4.31 | %(e) |
Market Price Total Return(d) | | | | (20.01 | )% | | | | (12.52 | )% | | | | 11.26 | % | | | | 4.39 | %(e) |
Ratios/Supplemental Data: | | | | | | | | | | | | | | | | | | | | |
Net assets at end of period (000’s omitted) | | | $ | 20,827 | | | | $ | 23,536 | | | | $ | 12,086 | | | | $ | 7,538 | |
Ratio to average net assets of: | | | | | | | | | | | | | | | | | | | | |
Expenses | | | | 0.30 | % | | | | 0.34 | %(f) | | | | 0.30 | %(g) | | | | 0.30 | %(g) |
Net investment income | | | | 4.15 | % | | | | 4.29 | %(f) | | | | 3.74 | %(g) | | | | 3.58 | %(g) |
Portfolio turnover rate(h) | | | | 83 | % | | | | 67 | % | | | | 61 | % | | | | 86 | % |
| (a) | Commencement of investment operations. |
| (b) | Based on average shares outstanding. |
| (c) | The mean between the last bid and ask prices. |
| (d) | Net asset value total return is calculated assuming an initial investment made at the net asset value at the beginning of the period, reinvestment of all dividends and distributions at net asset value during the period, and redemption at net asset value on the last day of the period. Net asset value total return includes adjustments in accordance with accounting principles generally accepted in the United States of America and as such, the net asset value for financial reporting purposes and the returns based upon those net asset values may differ from the net asset value and returns for shareholder transactions. Market price total return is calculated assuming an initial investment made at the market price at the beginning of the period, reinvestment of all dividends and distributions at market price during the period, and sale at the market price on the last day of the period. Total investment returns calculated for a period of less than one year are not annualized. |
| (e) | The net asset value total return from Fund Inception (December 1, 2016, the first day of trading on the Exchange) to October 31, 2017 was 6.26%. The market price total return from Fund Inception to October 31, 2017 was 6.34%. |
| (f) | Ratios include non-recurring costs associated with a proxy statement of 0.04%. |
| (h) | Portfolio turnover rate is not annualized for periods less than one year, if applicable, and does not include securities received or delivered from processing creations or redemptions. |
See accompanying Notes to Financial Statements which are an integral part of the financial statements.
Financial Highlights–(continued)
Invesco S&P SmallCap Low Volatility ETF (XSLV)
| | | | | | | | | | | | | | | | | | | | | | | | | | | | | | |
| | | Years Ended August 31, | | Ten Months Ended
August 31, | | Years Ended October 31, |
| | | 2020 | | 2019 | | 2018 | | 2017 | | 2016 | | 2015 |
| Per Share Operating Performance: | | | | | | | | | | | | | | | | | | | | | | | | | | | | | | |
Net asset value at beginning of period | | | $ | 47.57 | | | | $ | 51.10 | | | | $ | 46.43 | | | | $ | 37.90 | | | | $ | 34.30 | | | | $ | 32.93 | |
| | | | | | | | | | | | | | | | | | | | | | | | | | | | | | |
Net investment income(a) | | | | 1.08 | | | | | 1.24 | | | | | 0.87 | | | | | 0.97 | | | | | 0.78 | | | | | 0.77 | |
Net realized and unrealized gain (loss) on investments | | | | (12.05 | ) | | | | (3.46 | ) | | | | 4.55 | | | | | 8.46 | | | | | 3.58 | | | | | 1.38 | |
| | | | | | | | | | | | | | | | | | | | | | | | | | | | | | |
Total from investment operations | | | | (10.97 | ) | | | | (2.22 | ) | | | | 5.42 | | | | | 9.43 | | | | | 4.36 | | | | | 2.15 | |
| | | | | | | | | | | | | | | | | | | | | | | | | | | | | | |
Distributions to shareholders from: | | | | | | | | | | | | | | | | | | | | | | | | | | | | | | |
Net investment income | | | | (1.36 | ) | | | | (1.31 | ) | | | | (0.75 | ) | | | | (0.90 | ) | | | | (0.76 | ) | | | | (0.78 | ) |
| | | | | | | | | | | | | | | | | | | | | | | | | | | | | | |
Net asset value at end of period | | | $ | 35.24 | | | | $ | 47.57 | | | | $ | 51.10 | | | | $ | 46.43 | | | | $ | 37.90 | | | | $ | 34.30 | |
| | | | | | | | | | | | | | | | | | | | | | | | | | | | | | |
Market price at end of period(b) | | | $ | 35.30 | | | | $ | 47.59 | | | | $ | 51.10 | | | | $ | 46.47 | | | | $ | 37.93 | | | | $ | 34.30 | |
| | | | | | | | | | | | | | | | | | | | | | | | | | | | | | |
| Net Asset Value Total Return(c) | | | | (23.22 | )% | | | | (4.17 | )% | | | | 11.81 | % | | | | 25.05 | % | | | | 12.90 | % | | | | 6.63 | % |
| Market Price Total Return(c) | | | | (23.12 | )% | | | | (4.14 | )% | | | | 11.71 | % | | | | 25.06 | % | | | | 12.99 | % | | | | 6.70 | % |
| Ratios/Supplemental Data: | | | | | | | | | | | | | | | | | | | | | | | | | | | | | | |
Net assets at end of period (000’s omitted) | | | $ | 1,614,105 | | | | $ | 2,045,602 | | | | $ | 1,433,356 | | | | $ | 1,079,472 | | | | $ | 651,821 | | | | $ | 126,926 | |
Ratio to average net assets of: | | | | | | | | | | | | | | | | | | | | | | | | | | | | | | |
Expenses. | | | | 0.25 | % | | | | 0.25 | % | | | | 0.25 | %(d) | | | | 0.25 | % | | | | 0.25 | % | | | | 0.25 | %(e) |
Net investment income | | | | 2.55 | % | | | | 2.62 | % | | | | 2.24 | %(d) | | | | 2.25 | % | | | | 2.15 | % | | | | 2.33 | % |
Portfolio turnover rate(f) | | | | 103 | % | | | | 56 | % | | | | 66 | % | | | | 59 | % | | | | 48 | % | | | | 57 | % |
| (a) | Based on average shares outstanding. |
| (b) | The mean between the last bid and ask prices. |
| (c) | Net asset value total return is calculated assuming an initial investment made at the net asset value at the beginning of the period, reinvestment of all dividends and distributions at net asset value during the period, and redemption at net asset value on the last day of the period. Net asset value total return includes adjustments in accordance with accounting principles generally accepted in the United States of America and as such, the net asset value for financial reporting purposes and the returns based upon those net asset values may differ from the net asset value and returns for shareholder transactions. Market price total return is calculated assuming an initial investment made at the market price at the beginning of the period, reinvestment of all dividends and distributions at market price during the period, and sale at the market price on the last day of the period. Total investment returns calculated for a period of less than one year are not annualized. |
| (e) | In addition to the fees and expenses which the Fund bears directly, the Fund indirectly bears a pro rata share of the fees and expenses of the investment companies in which the Fund invests. Estimated investment companies’ expenses are not expenses that are incurred directly by the Fund. They are expenses that are incurred directly by the investment companies and are deducted from the value of the investment companies the Fund invests in. The effect of the estimated investment companies’ expenses that the Fund bears indirectly is included in the Fund’s total return. |
| (f) | Portfolio turnover rate is not annualized for periods less than one year, if applicable, and does not include securities received or delivered from processing creations or redemptions. |
See accompanying Notes to Financial Statements which are an integral part of the financial statements.
Financial Highlights–(continued)
Invesco S&P SmallCap Quality ETF (XSHQ)
| | | | | | | | | | | | | | | | | | | | |
| | | | | | | | | For the Period
April 3, 2017(a) |
| | | Years Ended August 31, | | Ten Months Ended
August 31, | | Through
October 31, |
| | | 2020 | | 2019 | | 2018 | | 2017 |
| Per Share Operating Performance: | | | | | | | | | | | | | | | | | | | | |
Net asset value at beginning of period | | | | $26.40 | | | | | $31.80 | | | | $ | 26.11 | | | | | $24.54 | |
| | | | | | | | | | | | | | | | | | | | |
Net investment income(b) | | | | 0.36 | | | | | 0.35 | | | | | 0.26 | | | | | 0.16 | |
Net realized and unrealized gain (loss) on investments. | | | | 0.54 | | | | | (5.41 | ) | | | | 5.65 | | | | | 1.51 | |
| | | | | | | | | | | | | | | | | | | | |
Total from investment operations | | | | 0.90 | | | | | (5.06 | ) | | | | 5.91 | | | | | 1.67 | |
| | | | | | | | | | | | | | | | | | | | |
Distributions to shareholders from: | | | | | | | | | | | | | | | | | | | | |
Net investment income | | | | (0.35 | ) | | | | (0.34 | ) | | | | (0.22 | ) | | | | (0.10 | ) |
Net realized gains | | | | - | | | | | (0.00 | )(c) | | | | - | | | | | - | |
| | | | | | | | | | | | | | | | | | | | |
Total distributions | | | | (0.35 | ) | | | | (0.34 | ) | | | | (0.22 | ) | | | | (0.10 | ) |
| | | | | | | | | | | | | | | | | | | | |
Net asset value at end of period | | | | $26.95 | | | | | $26.40 | | | | $ | 31.80 | | | | | $26.11 | |
| | | | | | | | | | | | | | | | | | | | |
Market price at end of period(d) | | | | $26.99 | | | | | $26.39 | | | | $ | 31.81 | | | | | $26.14 | |
| | | | | | | | | | | | | | | | | | | | |
| Net Asset Value Total Return(e) | | | | 3.61 | % | | | | (15.88 | )% | | | | 22.75 | % | | | | 6.81 | %(f) |
| Market Price Total Return(e) | | | | 3.80 | % | | | | (15.94 | )% | | | | 22.65 | % | | | | 6.93 | %(f) |
| Ratios/Supplemental Data: | | | | | | | | | | | | | | | | | | | | |
Net assets at end of period (000’s omitted) | | | | $4,043 | | | | | $3,960 | | | | $ | 42,924 | | | | | $1,305 | |
Ratio to average net assets of: | | | | | | | | | | | | | | | | | | | | |
Expenses | | | | 0.29 | % | | | | 0.34 | %(g) | | | | 0.29 | %(h) | | | | 0.29 | %(h) |
Net investment income | | | | 1.37 | % | | | | 1.23 | %(g) | | | | 1.06 | %(h) | | | | 1.11 | %(h) |
Portfolio turnover rate(i) | | | | 107 | % | | | | 52 | % | | | | 23 | % | | | | 65 | % |
| (a) | Commencement of investment operations. |
| (b) | Based on average shares outstanding. |
| (c) | Amount represents less than $(0.005). |
| (d) | The mean between the last bid and ask prices. |
| (e) | Net asset value total return is calculated assuming an initial investment made at the net asset value at the beginning of the period, reinvestment of all dividends and distributions at net asset value during the period, and redemption at net asset value on the last day of the period. Net asset value total return includes adjustments in accordance with accounting principles generally accepted in the United States of America and as such, the net asset value for financial reporting purposes and the returns based upon those net asset values may differ from the net asset value and returns for shareholder transactions. Market price total return is calculated assuming an initial investment made at the market price at the beginning of the period, reinvestment of all dividends and distributions at market price during the period, and sale at the market price on the last day of the period. Total investment returns calculated for a period of less than one year are not annualized. |
| (f) | The net asset value total return from Fund Inception (April 6, 2017, the first day of trading on the Exchange) to October 31, 2017 was 7.33%. The market price total return from Fund Inception to October 31, 2017 was 7.54%. |
| (g) | Ratios include non-recurring costs associated with a proxy statement of 0.05%. |
| (i) | Portfolio turnover rate is not annualized for periods less than one year, if applicable, and does not include securities received or delivered from processing creations or redemptions. |
See accompanying Notes to Financial Statements which are an integral part of the financial statements.
Notes to Financial Statements
Invesco Exchange-Traded Fund Trust II
August 31, 2020
NOTE 1—Organization
Invesco Exchange-Traded Fund Trust II (the “Trust”) was organized as a Massachusetts business trust on October 10, 2006 and is authorized to have multiple series of portfolios. The Trust is an open-end management investment company registered under the Investment Company Act of 1940, as amended (the “1940 Act”). This report includes the following portfolios:
| | | | |
| | | Full Name | | Short Name |
| | |
| | Invesco Russell 1000 Enhanced Equal Weight ETF (USEQ) | | “Russell 1000 Enhanced Equal Weight ETF” |
| | |
| | | Invesco Russell 1000 Equal Weight ETF (EQAL) | | “Russell 1000 Equal Weight ETF” |
| | |
| | Invesco Russell 1000 Low Beta Equal Weight ETF (USLB) | | “Russell 1000 Low Beta Equal Weight ETF” |
| | |
| | Invesco S&P 500 Enhanced Value ETF (SPVU) | | “S&P 500 Enhanced Value ETF” |
| | |
| | Invesco S&P 500® ex-Rate Sensitive Low Volatility ETF (XRLV) | | “S&P 500® ex-Rate Sensitive Low Volatility ETF” |
| | |
| | Invesco S&P 500® High Beta ETF (SPHB) | | “S&P 500® High Beta ETF” |
| | |
| | Invesco S&P 500® High Dividend Low Volatility ETF (SPHD) | | “S&P 500® High Dividend Low Volatility ETF” |
| | |
| | Invesco S&P 500® Low Volatility ETF (SPLV) | | “S&P 500® Low Volatility ETF” |
| | |
| | Invesco S&P 500 Minimum Variance ETF (SPMV) | | “S&P 500 Minimum Variance ETF” |
| | |
| | Invesco S&P 500 Momentum ETF (SPMO) | | “S&P 500 Momentum ETF” |
| | |
| | Invesco S&P MidCap Low Volatility ETF (XMLV) | | “S&P MidCap Low Volatility ETF” |
| | |
| | Invesco S&P SmallCap High Dividend Low Volatility ETF (XSHD) | | “S&P SmallCap High Dividend Low Volatility ETF” |
| | |
| | Invesco S&P SmallCap Low Volatility ETF (XSLV) | | “S&P SmallCap Low Volatility ETF” |
| | |
| | Invesco S&P SmallCap Quality ETF (XSHQ) | | “S&P SmallCap Quality ETF” |
Each portfolio (each, a “Fund”, and collectively, the “Funds”) represents a separate series of the Trust. The shares of the Funds are referred to herein as “Shares” or “Fund’s Shares.” Each Fund’s Shares are listed and traded on NYSE Arca, Inc., except for Shares of Russell 1000 Low Beta Equal Weight ETF, which is listed and traded on The Nasdaq Stock Market and Shares of Russell 1000 Enhanced Equal Weight ETF, S&P 500 Minimum Variance ETF, S&P SmallCap High Dividend Low Volatility ETF and S&P SmallCap Quality ETF, which are listed and traded on Cboe BZX Exchange, Inc.
The market price of each Share may differ to some degree from a Fund’s net asset value (“NAV”). Unlike conventional mutual funds, each Fund issues and redeems Shares on a continuous basis, at NAV, only in a large specified number of Shares, each called a “Creation Unit.” Creation Units are issued and redeemed principally in exchange for the deposit or delivery of a basket of securities (“Deposit Securities”). Except when aggregated in Creation Units by Authorized Participants, the Shares are not individually redeemable securities of the Funds.
The investment objective of each Fund is to seek to track the investment results (before fees and expenses) of its respective index listed below (each, an “Underlying Index”):
| | | | |
| | | Fund | | Underlying Index |
| | |
| | | Russell 1000 Enhanced Equal Weight ETF | | Russell 1000® Enhanced Value Equal Weight Index |
| | |
| | Russell 1000 Equal Weight ETF | | Russell 1000® Equal Weight Index |
| | |
| | Russell 1000 Low Beta Equal Weight ETF | | Russell 1000® Low Beta Equal Weight Index |
| | |
| | S&P 500 Enhanced Value ETF | | S&P 500 Enhanced Value Index |
| | |
| | S&P 500® ex-Rate Sensitive Low Volatility ETF | | S&P 500® Low Volatility Rate Response Index |
| | |
| | S&P 500® High Beta ETF | | S&P 500® High Beta Index |
| | |
| | S&P 500® High Dividend Low Volatility ETF | | S&P 500® Low Volatility High Dividend Index |
| | |
| | S&P 500® Low Volatility ETF | | S&P 500® Low Volatility Index |
| | |
| | S&P 500 Minimum Variance ETF | | S&P 500® Minimum Volatility Index |
| | |
| | S&P 500 Momentum ETF | | S&P 500® Momentum Index |
| | |
| | S&P MidCap Low Volatility ETF | | S&P MidCap 400® Low Volatility Index |
| | |
| | S&P SmallCap High Dividend Low Volatility ETF | | S&P SmallCap 600® Low Volatility High Dividend Index |
| | |
| | S&P SmallCap Low Volatility ETF | | S&P SmallCap 600® Low Volatility Index |
| | |
| | S&P SmallCap Quality ETF | | S&P SmallCap 600® Quality Index |
NOTE 2–Significant Accounting Policies
The following is a summary of the significant accounting policies followed by the Funds in preparation of their financial statements.
Each Fund is an investment company and accordingly follows the investment company accounting and reporting guidance in accordance with Financial Accounting Standards Board Accounting Standards Codification Topic 946, Financial Services–Investment Companies.
A. Security Valuation - Securities, including restricted securities, are valued according to the following policies:
A security listed or traded on an exchange (except convertible securities) is generally valued at its last sales price or official closing price as of the close of the customary trading session on the exchange where the security is principally traded or, lacking any sales or official closing price on a particular day, the security may be valued at the closing bid price on that day. Securities traded in the over-the-counter market are valued based on prices furnished by independent pricing services or market makers. When such securities are valued by an independent pricing service they may be considered fair valued. Futures contracts are valued at the final settlement price set by an exchange on which they are principally traded. Listed options are valued at the mean between the last bid and asked prices from the exchange on which they are principally traded, or at the final settlement price set by such exchange. Swaps and options not listed on an exchange are valued by an independent source. For purposes of determining NAV per Share, futures and option contracts generally are valued 15 minutes after the close of the customary trading session of the New York Stock Exchange (“NYSE”).
Investment companies are valued using such company’s NAV per share, unless the shares are exchange-traded, in which case they are valued at the last sales price or official closing price as of the close of the customary trading session on the exchange where the security is principally traded.
Debt obligations (including convertible securities) and unlisted equities are fair valued using an evaluated quote provided by an independent pricing service. Evaluated quotes provided by the pricing service may be determined without exclusive reliance on quoted prices, and may reflect appropriate factors such as institution-size trading in similar groups of securities, developments related to specific securities, dividend rate (for unlisted equities), yield (for debt obligations), quality, type of issue, coupon rate (for debt obligations), maturity (for debt obligations), individual trading characteristics and other market data. Securities with a demand feature exercisable within one to seven days are valued at par. Pricing services generally value debt obligations assuming orderly transactions of institutional round lot size, but a Fund may hold or transact in the same securities in smaller, odd lot sizes. Odd lots often trade at lower prices than institutional round lots. Debt obligations are subject to interest rate and credit risks. In addition, all debt obligations involve some risk of default with respect to interest and/or principal payments.
Foreign securities’ (including foreign exchange contracts’) prices are converted into U.S. dollar amounts using the applicable exchange rates as of the close of the London world markets. If market quotations are available and reliable for foreign exchange-traded equity securities, the securities will be valued at the market quotations. Because trading hours for certain foreign securities end before the close of the NYSE, closing market quotations may become unreliable. If between the time trading ends on a particular security and the close of the customary trading session on the NYSE, events occur that Invesco Capital Management LLC (the “Adviser”) determines are significant and make the closing price unreliable, a Fund may fair value the security. If the event is likely to have affected the closing price of the security, the security will be valued at fair value in good faith using procedures approved by the Board of Trustees. Adjustments to closing prices to reflect fair value may also be based on a screening process of an independent pricing service to indicate the degree of certainty, based on historical data, that the closing price in the principal market where a foreign security trades is not the current value as of the close of the NYSE. Foreign securities’ prices meeting the approved degree of certainty that the price is not reflective of current value will be priced at the indication of fair value from the independent pricing service. Multiple factors may be considered by the independent pricing service in determining adjustments to reflect fair value and may include information relating to sector indices, American Depositary Receipts and domestic and foreign index futures. Foreign securities may have additional risks including exchange rate changes, the potential for sharply devalued currencies and high inflation, political and economic upheaval, the relative lack of issuer information, relatively low market liquidity and the potential lack of strict financial and accounting controls and standards.
Securities for which market prices are not provided by any of the above methods may be valued based upon quotes furnished by independent sources. The last bid price may be used to value exchange-traded equity securities. The mean between the last bid and asked prices may be used to value debt obligations, including corporate loans, and unlisted equity securities.
Securities for which market quotations are not readily available or became unreliable are valued at fair value as determined in good faith following procedures approved by the Board of Trustees. Issuer-specific events, market trends, bid/asked quotes of brokers and information providers and other market data may be reviewed in the course of making a good faith determination of a security’s fair value.
Each Fund may invest in securities that are subject to interest rate risk, meaning the risk that the prices will generally fall as interest rates rise and, conversely, the prices will generally rise as interest rates fall. Specific securities differ in their sensitivity
to changes in interest rates depending on their individual characteristics. Changes in interest rates may result in increased market volatility, which may affect the value and/or liquidity of certain Fund investments.
Valuations change in response to many factors, including the historical and prospective earnings of the issuer, the value of the issuer’s assets, general market conditions which are not specifically related to the particular issuer, such as real or perceived adverse economic conditions, changes in the general outlook for revenues or corporate earnings, changes in interest or currency rates, regional or global instability, natural or environmental disasters, widespread disease or other public health issues, war, acts of terrorism or adverse investor sentiment generally and market liquidity. Because of the inherent uncertainties of valuation, the values reflected in the financial statements may materially differ from the value received upon actual sale of those investments.
B. Other Risks
Authorized Participant Concentration Risk. Only authorized participants (“APs”) may engage in creation or redemption transactions directly with each Fund. Each Fund has a limited number of institutions that may act as APs, and such APs have no obligation to submit creation or redemption orders. Consequently, there is no assurance that APs will establish or maintain an active trading market for the Shares. This risk may be heightened to the extent that securities held by each Fund are traded outside a collateralized settlement system. In that case, APs may be required to post collateral on certain trades on an agency basis (i.e., on behalf of other market participants), which only a limited number of APs may be able to do. In addition, to the extent that APs exit the business or are unable to proceed with creation and/or redemption orders with respect to each Fund and no other AP is able to step forward to create or redeem Creation Units, this may result in a significantly diminished trading market for Fund Shares, and Shares may be more likely to trade at a premium or discount to a Fund’s NAV and to face trading halts and/or delisting. Investments in non-U.S. securities, which may have lower trading volumes, may increase this risk.
Equity Risk. Equity risk is the risk that the value of equity securities, including common stocks, may fall due to both changes in general economic conditions that impact the market as a whole, as well as factors that directly relate to a specific company or its industry. Such general economic conditions include changes in interest rates, periods of market turbulence or instability, or general and prolonged periods of economic decline and cyclical change. It is possible that a drop in the stock market may depress the price of most or all of the common stocks that each Fund holds. In addition, equity risk includes the risk that investor sentiment toward one or more industries will become negative, resulting in those investors exiting their investments in those industries, which could cause a reduction in the value of companies in those industries more broadly. The value of a company’s common stock may fall solely because of factors, such as an increase in production costs that negatively impact other companies in the same region, industry or sector of the market. A company’s common stock also may decline significantly in price over a short period of time due to factors specific to that company, including decisions made by its management or lower demand for the company’s products or services. For example, an adverse event, such as an unfavorable earnings report or the failure to make anticipated dividend payments, may depress the value of common stock.
High Dividend Paying Securities Risk. Certain Funds invest in securities that pay high dividends. As a group, these securities can fall out of favor with the market, causing such companies to underperform companies that do not pay high dividends. Also, changes in the dividend policies of the companies in which a Fund invests and the capital resources available for such companies’ dividend payments may adversely affect a Fund.
Index Risk. Unlike many investment companies, each Fund does not utilize an investing strategy that seeks returns in excess of its Underlying Index. Therefore, a Fund would not necessarily buy or sell a security unless that security is added or removed, respectively, from its Underlying Index, even if that security generally is underperforming. Additionally, each Fund rebalances its portfolio in accordance with its Underlying Index, and, therefore, any changes to the Underlying Index’s rebalance schedule will result in corresponding changes to each Fund’s rebalance schedule.
Industry Concentration Risk. In following its methodology, each Fund’s Underlying Index from time to time may be concentrated to a significant degree in securities of issuers located in a single industry or industry group. To the extent that each Underlying Index concentrates in the securities of issuers in a particular industry or industry group, the corresponding Fund will also concentrate its investments to approximately the same extent. By concentrating its investments in an industry or industry group, each Fund may face more risks than if it were diversified broadly over numerous industries or industry groups. Such industry-based risks, any of which may adversely affect the companies in which each Fund invests, may include, but are not limited to, the following: general economic conditions or cyclical market patterns that could negatively affect supply and demand in a particular industry; competition for resources, adverse labor relations, political or world events; obsolescence of technologies; and increased competition or new product introductions that may affect the profitability or viability of companies in an industry. In addition, at times, such industry or industry group may be out of favor and underperform other industries or the market as a whole.
Market Risk. Securities in the Underlying Index are subject to market fluctuations. You should anticipate that the value of the Shares will decline, more or less, in correlation with any decline in value of the securities in the Underlying Index. Additionally, natural or environmental disasters, widespread disease or other public health issues, war, acts of terrorism or other events could result in increased premiums or discounts to each Fund’s NAV.
Momentum Investing Risk. For certain Funds, the momentum style of investing is subject to the risk that the securities may be more volatile than the market as a whole, or that the returns on securities that previously have exhibited price momentum
are less than returns on other styles of investing. Momentum can turn quickly, and stocks that previously have exhibited high positive momentum may not experience continued positive momentum. In addition, there may be periods when the momentum style of investing is out of favor and therefore, the investment performance of a Fund may suffer.
Non-Correlation Risk. Each Fund’s return may not match the return of its corresponding Underlying Index for a number of reasons. For example, each Fund incurs operating expenses not applicable to the Underlying Index, and incurs costs in buying and selling securities, especially when rebalancing the Fund’s securities holdings to reflect changes in the composition of its corresponding Underlying Index. In addition, the performance of each Fund and its corresponding Underlying Index may vary due to asset valuation differences and differences between each Fund’s portfolio and its corresponding Underlying Index resulting from legal restrictions, costs or liquidity constraints.
Non-Diversified Fund Risk. S&P 500 Momentum ETF is non-diversified and can invest a greater portion of its assets in securities of individual issuers than diversified funds. As a result, changes in the market value of a single investment could cause greater fluctuations in Share price than would occur in a diversified fund. This may increase the Fund’s volatility and cause the performance of a relatively small number of issuers to have a greater impact on the Fund’s performance.
Portfolio Turnover Risk. Certain Funds may engage in frequent trading of its portfolio securities in connection with the rebalancing or adjustment of its Underlying Index. A portfolio turnover rate of 200%, for example, is equivalent to a Fund buying and selling all of its securities two times during the course of a year. A high portfolio turnover rate (such as 100% or more) could result in high brokerage costs for a Fund. While a high portfolio turnover rate can result in an increase in taxable capital gains distributions to a Fund’s shareholders, a Fund will seek to utilize the in-kind creation and redemption mechanism to minimize realization of capital gains to the extent possible.
Real Estate Securities Risk. Investing in securities of real estate companies includes risks such as: fluctuations in the value of the underlying properties; defaults by borrowers or tenants; market saturation; changes in general and local economic conditions; decreases in market rates for rents; changes in the availability, cost and terms of mortgage funds; increased competition, property taxes, capital expenditures, or operating expenses; and other economic, political or regulatory occurrences, including the impact of changes in environmental laws, that may affect the real estate industry.
Small-and Mid-Capitalization Company Risk. Investing in securities of small- and mid-capitalization companies involves greater risk than customarily is associated with investing in larger, more established companies. These companies’ securities may be more volatile and less liquid than those of more established companies. These securities may have returns that vary, sometimes significantly, from the overall securities market. Often small- and mid-capitalization companies and the industries in which they focus are still evolving and, as a result, they may be more sensitive to changing market conditions.
| C. | Investment Transactions and Investment Income - Investment transactions are accounted for on a trade date basis. Realized gains and losses from the sale or disposition of securities are computed on the specific identified cost basis. Interest income is recorded on an accrual basis from settlement date. Pay-in-kind interest income and non-cash dividend income received in the form of securities in-lieu of cash are recorded at the fair value of the securities received. Dividend income (net of withholding tax, if any) is recorded on the ex-dividend date. Dividend income from REITs is recorded based on the income included in the distributions received from the REIT investments using published REIT classifications, including some management estimates when actual amounts are not available. Distributions received in excess of this estimated amount are recorded as a reduction of the cost of investments or reclassified to capital gains. The actual amounts of income, return of capital, and capital gains are only determined by each REIT after its fiscal year-end, and may differ from the estimated amounts. Realized gains, dividends and interest received by a Fund may give rise to withholding and other taxes imposed by foreign countries. Tax conventions between certain countries and the United States may reduce or eliminate such taxes. |
The Funds may periodically participate in litigation related to each Fund’s investments. As such, the Funds may receive proceeds from litigation settlements. Any proceeds received are included in the Statements of Operations as realized gain (loss) for investments no longer held and as unrealized gain (loss) for investments still held.
Brokerage commissions and mark ups are considered transaction costs and are recorded as an increase to the cost basis of securities purchased and/or a reduction of proceeds on a sale of securities. Such transaction costs are included in the determination of net realized and unrealized gain (loss) from investment securities reported in the Statements of Operations and the Statements of Changes in Net Assets and the net realized and unrealized gains (losses) on securities per share in the Financial Highlights. Transaction costs are included in the calculation of each Fund’s NAV and, accordingly, they reduce each Fund’s total returns. These transaction costs are not considered operating expenses and are not reflected in net investment income reported in the Statements of Operations and the Statements of Changes in Net Assets, or the net investment income per share and the ratios of expenses and net investment income reported in the Financial Highlights, nor are they limited by any expense limitation arrangements between each Fund and the Adviser.
| D. | Country Determination - For the purposes of presentation in the Schedules of Investments, the Adviser may determine the country in which an issuer is located and/or credit risk exposure based on various factors. These factors include whether each Fund’s Underlying Index has made a country determination and may include the laws of the country under which the issuer is organized, where the issuer maintains a principal office, the country in which the issuer derives 50% or more of its total revenues and the country that has the primary market for the issuer’s securities, as well as other criteria. Among the other |
criteria that may be evaluated for making this determination are the country in which the issuer maintains 50% or more of its assets, the type of security, financial guarantees and enhancements, the nature of the collateral and the sponsor organization. Country of issuer and/or credit risk exposure has been determined to be the United States of America, unless otherwise noted.
| E. | Dividends and Distributions to Shareholders - Each Fund (except for S&P 500® ex-Rate Sensitive Low Volatility ETF, S&P 500® High Dividend Low Volatility ETF, S&P 500® Low Volatility ETF and S&P SmallCap High Dividend Low Volatility ETF) declares and pays dividends from net investment income, if any, to its shareholders quarterly and records such dividends on the ex-dividend date. S&P 500® ex-Rate Sensitive Low Volatility ETF, S&P 500® High Dividend Low Volatility ETF, S&P 500® Low Volatility ETF and S&P SmallCap High Dividend Low Volatility ETF each declares and pays dividends from net investment income, if any, to its shareholders monthly and records such dividends on the ex-dividend date. Generally, each Fund distributes net realized taxable capital gains, if any, annually in cash and records them on ex-dividend date. Such distributions on a tax basis are determined in conformity with federal income tax regulations, which may differ from accounting principles generally accepted in the United States of America (“GAAP”). Distributions in excess of tax basis earnings and profits, if any, are reported in such Fund’s financial statements as a tax return of capital at fiscal year-end. |
| F. | Federal Income Taxes - Each Fund intends to comply with the provisions of the Internal Revenue Code of 1986, as amended (the “Internal Revenue Code”), applicable to regulated investment companies and to distribute substantially all of the Fund’s taxable earnings to its shareholders. As such, the Funds will not be subject to federal income taxes on otherwise taxable income (including net realized gains) that is distributed to the shareholders. Therefore, no provision for federal income taxes is recorded in the financial statements. |
Each Fund recognizes the tax benefits of uncertain tax positions only when the position is more likely than not to be sustained. Management has analyzed each Fund’s uncertain tax positions and concluded that no liability for unrecognized tax benefits should be recorded related to uncertain tax positions. Management is not aware of any tax positions for which it is reasonably possible that the total amounts of unrecognized tax benefits will change materially in the next 12 months.
Income and capital gain distributions are determined in accordance with federal income tax regulations, which may differ from GAAP. These differences are primarily due to differing book and tax treatments for in-kind transactions, losses deferred due to wash sales, and passive foreign investment company adjustments, if any.
The Funds file U.S. federal tax returns and tax returns in certain other jurisdictions. Generally, a Fund is subject to examinations by such taxing authorities for up to three years after the filing of the return for the tax period.
| G. | Expenses - Expenses of the Trust that are excluded from a Fund’s unitary management fee and are directly identifiable to a specific Fund are applied to that Fund. Expenses of the Trust that are excluded from a Fund’s unitary management fee and are not readily identifiable to a specific Fund are allocated in such a manner as deemed equitable, taking into consideration the nature and type of expense and the relative net assets of each Fund. |
Each Fund has agreed to pay an annual unitary management fee to the Adviser. Out of the unitary management fee, the Adviser has agreed to pay for substantially all expenses of the Funds, including the costs of transfer agency, custody, fund administration, legal, audit and other services, except for advisory fees, distribution fees, if any, brokerage expenses, taxes, interest, litigation expenses, acquired fund fees and expenses, if any, and other extraordinary expenses.
To the extent a Fund invests in other investment companies, the expenses shown in the accompanying financial statements reflect the expenses of the Fund and do not include any expenses of the investment companies in which it invests. The effects of such investment companies’ expenses are included in the realized and unrealized gain or loss on the investments in the investment companies.
| H. | Accounting Estimates - The preparation of the financial statements in accordance with GAAP requires management to make estimates and assumptions that affect the reported amounts and disclosures in the financial statements, including estimates and assumptions related to taxation. Actual results could differ from these estimates. In addition, the Funds monitor for material events or transactions that may occur or become known after the period-end date and before the date the financial statements are released to print. |
| I. | Indemnifications - Under the Trust’s organizational documents, its Officers and Trustees are indemnified against certain liabilities arising out of the performance of their duties to the Trust. Each Board member who is not an “interested person” (as defined in the 1940 Act) of the Trust (each, an “Independent Trustee”) is also indemnified against certain liabilities arising out of the performance of their duties to the Trust pursuant to an Indemnification Agreement between such trustee and the Trust. Additionally, in the normal course of business, the Trust enters into contracts with service providers that contain general indemnification clauses. The Trust’s maximum exposure under these arrangements is unknown, as this would involve future claims that may be made against the Trust that have not yet occurred. However, based on experience, the Trust believes the risk of loss to be remote. |
| J. | Securities Lending - Each Fund may participate in securities lending and may loan portfolio securities having a market value up to one-third of the Fund’s total assets. Such loans are secured by cash collateral equal to no less than 102% (105% for international securities) of the market value of the loaned securities determined daily by the securities lending provider. Cash collateral received in connection with these loans is generally invested in an affiliated money market fund and is shown as such on the Schedules of Investments. Each Fund bears the risk of loss with respect to the investment of collateral. It is the policy of these Funds to obtain additional collateral from or return excess collateral to the borrower by the end of the next business day, following the valuation date of the securities loaned. Therefore, the value of the collateral held may be |
temporarily less than the value of the securities on loan. When loaning securities, each Fund retains certain benefits of owning the securities, including the economic equivalent of dividends or interest generated by the security. Lending securities entails a risk of loss to each Fund if, and to the extent that, the market value of the securities loaned were to increase, and the borrower did not increase the collateral accordingly, and the borrower failed to return the securities. The securities loaned are subject to termination at the option of the borrower or each Fund. Upon termination, the borrower will return to each Fund the securities loaned and each Fund will return the collateral. Upon the failure of the borrower to return the securities, collateral may be liquidated and the securities may be purchased on the open market to replace the loaned securities. Each Fund could experience delays and costs in gaining access to the collateral and the securities may lose value during the delay which could result in potential losses to each Fund. Some of these losses may be indemnified by the lending agent. Each Fund bears the risk of any deficiency in the amount of the collateral available for return to the borrower due to any loss on the collateral invested. For Funds that participated in securities lending, dividends received on cash collateral investments for securities lending transactions, which are net of compensation to counterparties, are included in Securities lending income on the Statements of Operations. The aggregate value of securities out on loan, if any, is shown on the Statements of Assets and Liabilities.
| K. | Foreign Currency Translations - Foreign currency is valued at the close of the NYSE based on quotations posted by banks and major currency dealers. Portfolio securities and other assets and liabilities denominated in foreign currencies are translated into U.S. dollar amounts at the date of valuation. Purchases and sales of portfolio securities (net of foreign taxes withheld on disposition) and income items denominated in foreign currencies are translated into U.S. dollar amounts on the respective dates of such transactions. Each Fund does not separately account for the portion of the results of operations resulting from changes in foreign exchange rates on investments and the fluctuations arising from changes in market prices of securities held. The combined results of changes in foreign exchange rates and the fluctuation of market prices on investments (net of estimated foreign tax withholding) are included with the net realized and unrealized gain or loss from investments in the Statements of Operations. Reported net realized foreign currency gains or losses arise from (1) sales of foreign currencies, (2) currency gains or losses realized between the trade and settlement dates on securities transactions, and (3) the difference between the amounts of dividends, interest, and foreign withholding taxes recorded on each Fund’s books and the U.S. dollar equivalent of the amounts actually received or paid. Net unrealized foreign currency gains and losses arise from changes in the fair values of assets and liabilities, other than investments in securities at fiscal period-end, resulting from changes in exchange rates. |
Each Fund may invest in foreign securities, which may be subject to foreign taxes on income, gains on investments or currency repatriation, a portion of which may be recoverable. Foreign taxes, if any, are recorded based on the tax regulations and rates that exist in the foreign markets in which each Fund invests.
NOTE 3–Investment Advisory Agreement and Other Agreements
The Trust has entered into an Investment Advisory Agreement with the Adviser on behalf of each Fund, pursuant to which the Adviser has overall responsibility for the selection and ongoing monitoring of the Funds’ investments, managing the Funds’ business affairs and providing certain clerical, bookkeeping and other administrative services.
Pursuant to the Investment Advisory Agreement, each Fund accrues daily and pays monthly to the Adviser an annual unitary management fee. Out of the unitary management fee, the Adviser has agreed to pay for substantially all expenses of the Funds, including the cost of transfer agency, custody, fund administration, legal, audit and other services, except for advisory fees, distribution fees, if any, brokerage expenses, taxes, interest, litigation expenses, acquired fund fees and expenses, if any, and other extraordinary expenses. The unitary management fee is paid by each Fund to the Adviser at the following annual rates:
| | |
| | | Unitary Management Fees
(as a % of average daily net assets) |
| |
| Russell 1000 Enhanced Equal Weight ETF | | 0.29% |
| |
| Russell 1000 Equal Weight ETF | | 0.20% |
| |
| Russell 1000 Low Beta Equal Weight ETF | | 0.35% |
| |
| S&P 500 Enhanced Value ETF | | 0.13% |
| |
| S&P 500® ex-Rate Sensitive Low Volatility ETF | | 0.25% |
| |
| S&P 500® High Beta ETF | | 0.25% |
| |
| S&P 500® High Dividend Low Volatility ETF | | 0.30% |
| |
| S&P 500® Low Volatility ETF | | 0.25% |
| |
| S&P 500 Minimum Variance ETF | | 0.10% |
| |
| S&P 500 Momentum ETF | | 0.13% |
| |
| S&P MidCap Low Volatility ETF | | 0.25% |
| |
| S&P SmallCap High Dividend Low Volatility ETF | | 0.30% |
| |
| S&P SmallCap Low Volatility ETF | | 0.25% |
| |
| S&P SmallCap Quality ETF | | 0.29% |
Further, through at least August 31, 2022, the Adviser has contractually agreed to waive a portion of each Fund’s management fee in an amount equal to 100% of the net advisory fees an affiliate of the Adviser receives that are attributable to the Fund’s investments of otherwise uninvested cash in money market funds managed by that affiliate (excluding investments of cash collateral from securities lending). There is no guarantee that the Adviser will extend the waiver of these fees past that date.
For the fiscal year ended August 31, 2020, the Adviser waived fees for each Fund in the following amounts:
| | | | |
Russell 1000 Enhanced Equal Weight ETF | | $ | 18 | |
| |
Russell 1000 Equal Weight ETF | | | 475 | |
| |
Russell 1000 Low Beta Equal Weight ETF | | | 89 | |
| |
S&P 500 Enhanced Value ETF | | | 109 | |
| |
S&P 500® ex-Rate Sensitive Low Volatility ETF | | | 107 | |
| |
S&P 500® High Beta ETF | | | 179 | |
S&P 500® High Dividend Low Volatility ETF | | | 4,433 | |
| |
S&P 500® Low Volatility ETF | | | 7,130 | |
| |
S&P 500 Minimum Variance ETF | | | 10 | |
| |
S&P 500 Momentum ETF | | | 72 | |
| |
S&P MidCap Low Volatility ETF | | | 4,625 | |
| |
S&P SmallCap High Dividend Low Volatility ETF | | | 40 | |
| |
S&P SmallCap Low Volatility ETF | | | 3,038 | |
| |
S&P SmallCap Quality ETF | | | 12 | |
The Trust has entered into a Distribution Agreement with Invesco Distributors, Inc. (the “Distributor”), which serves as the distributor of Creation Units for each Fund. The Distributor does not maintain a secondary market in the Shares. The Funds are not charged any fees pursuant to the Distribution Agreement. The Distributor is an affiliate of the Adviser.
The Adviser has entered into a licensing agreement for each Fund with the following entities (each, a “Licensor”):
| | |
Fund | | Licensor |
| |
| Russell 1000 Enhanced Equal Weight ETF | | Frank Russell Company |
| |
| Russell 1000 Equal Weight ETF | | Frank Russell Company |
| |
| Russell 1000 Low Beta Equal Weight ETF | | Frank Russell Company |
| |
| S&P 500 Enhanced Value ETF | | S&P Dow Jones Indices LLC |
| |
| S&P 500® ex-Rate Sensitive Low Volatility ETF | | S&P Dow Jones Indices LLC |
| |
| S&P 500® High Beta ETF | | S&P Dow Jones Indices LLC |
| |
| S&P 500® High Dividend Low Volatility ETF | | S&P Dow Jones Indices LLC |
| |
| S&P 500® Low Volatility ETF | | S&P Dow Jones Indices LLC |
| |
| S&P 500 Minimum Variance ETF | | S&P Dow Jones Indices LLC |
| |
| S&P 500 Momentum ETF | | S&P Dow Jones Indices LLC |
| |
| S&P MidCap Low Volatility ETF | | S&P Dow Jones Indices LLC |
| |
| S&P SmallCap High Dividend Low Volatility ETF | | S&P Dow Jones Indices LLC |
| |
| S&P SmallCap Low Volatility ETF | | S&P Dow Jones Indices LLC |
| |
| S&P SmallCap Quality ETF | | S&P Dow Jones Indices LLC |
Each Underlying Index name trademark is owned by its respective Licensor. These trademarks have been licensed to the Adviser for use by the Funds. Each Fund is entitled to use its Underlying Index pursuant to the Trust’s sub-licensing agreement with the Adviser. The Funds are not sponsored, endorsed, sold or promoted by the Licensors, and the Licensors make no representation regarding the advisability of investing in any of the Funds.
The Trust has entered into service agreements whereby The Bank of New York Mellon, a wholly-owned subsidiary of The Bank of New York Mellon Corporation, serves as the administrator, custodian, fund accountant and transfer agent for each Fund.
For fiscal year ended August 31, 2020, the following Funds incurred brokerage commissions with Invesco Capital Markets, Inc. (“ICMI”), an affiliate of the Adviser and Distributor, for portfolio transactions executed on behalf of the Fund, as listed below:
| | | | |
| Russell 1000 Enhanced Equal Weight ETF | | $ | 248 | |
| Russell 1000 Equal Weight ETF | | | 25,410 | |
| Russell 1000 Low Beta Equal Weight ETF | | | 5,877 | |
| S&P 500 Enhanced Value ETF | | | 6,860 | |
| S&P 500® ex-Rate Sensitive Low Volatility ETF | | | 15,716 | |
| S&P 500® High Beta ETF | | | 30,345 | |
| S&P 500® High Dividend Low Volatility ETF | | | 50,486 | |
| S&P 500® Low Volatility ETF | | | 90,772 | |
| S&P 500 Minimum Variance ETF | | | 17 | |
| S&P 500 Momentum ETF | | | 5,306 | |
| S&P MidCap Low Volatility ETF | | | 11,221 | |
| S&P SmallCap High Dividend Low Volatility ETF | | | 2,521 | |
| S&P SmallCap Low Volatility ETF | | | 27,864 | |
| S&P SmallCap Quality ETF | | | 1,826 | |
Portfolio transactions with ICMI that have not settled at period-end, if any, are shown in the Statements of Assets and Liabilities under the receivable caption Investments sold - affiliated broker and/or payable caption Investments purchased - affiliated broker.
NOTE 4–Security Transactions with Affiliated Funds
Each Fund is permitted to purchase or sell securities from or to certain other affiliated funds under specified conditions outlined in procedures adopted by the Board of Trustees of the Trust. The procedures have been designed to ensure that any purchase or sale of securities by each Fund from or to another fund or portfolio that is or could be considered an affiliate by virtue of having a common investment adviser (or affiliated investment advisers), common Trustees and/or common officers complies with Rule 17a-7 of the 1940 Act. Further, as defined under the procedures, each transaction is effected at the current market price.
For the fiscal year ended August 31, 2020, the following Funds engaged in transactions with affiliates as listed below:
| | | | | | | | | | | | |
| | | Securities Purchases | | | Securities Sales | | | Net Realized Gains (Losses)* | |
| S&P 500 Enhanced Value ETF | | $ | - | | | $ | 11,158 | | | $ | (44,341) | |
| S&P 500® ex-Rate Sensitive Low Volatility ETF | | | 2,836,262 | | | | 1,825,268 | | | | 15,664 | |
| S&P 500® High Beta ETF | | | 297,424 | | | | 98,479 | | | | (21,703) | |
| S&P 500® High Dividend Low Volatility ETF | | | 119,787,157 | | | | 19,418,033 | | | | (3,764,930) | |
| S&P 500® Low Volatility ETF | | | 1,290,356 | | | | 2,836,262 | | | | (590,929) | |
| S&P MidCap Low Volatility ETF | | | 37,381 | | | | 33,424,513 | | | | (507,095) | |
| S&P SmallCap High Dividend Low Volatility ETF | | | 33,129 | | | | 17,808 | | | | (535) | |
| S&P SmallCap Low Volatility ETF | | | 208,736 | | | | 157,385 | | | | (11,138) | |
| S&P SmallCap Quality ETF | | | - | | | | 21,553 | | | | 9,483 | |
| * | Net realized gains (losses) from securities sold to affiliates are included in net realized gain (loss) from investment securities in the Statements of Operations. |
NOTE 5–Additional Valuation Information
GAAP defines fair value as the price that would be received to sell an asset or paid to transfer a liability in an orderly transaction between market participants at the measurement date, under current market conditions. GAAP establishes a hierarchy that prioritizes the inputs to valuation methods, giving the highest priority to readily available unadjusted quoted prices in an active market for identical assets (Level 1) and the lowest priority to significant unobservable inputs (Level 3), generally when market prices are not readily available or are unreliable. Based on the valuation inputs, the securities or other investments are tiered into one of three levels. Changes in valuation methods may result in transfers in or out of an investment’s assigned level:
| | | | |
| | | Level 1 – | | Prices are determined using quoted prices in an active market for identical assets. |
| | |
| | Level 2 – | | Prices are determined using other significant observable inputs. Observable inputs are inputs that other market participants may use in pricing a security. These may include quoted prices for similar securities, interest rates, prepayment speeds, credit risk, yield curves, loss severities, default rates, discount rates, volatilities and others. |
| | | | |
| | | Level 3 – | | Prices are determined using significant unobservable inputs. In situations where quoted prices or observable inputs are unavailable (for example, when there is little or no market activity for an investment at the end of the period), unobservable inputs may be used. Unobservable inputs reflect a Fund’s own assumptions about the factors market participants would use in determining fair value of the securities or instruments and would be based on the best available information. |
Except for the Funds listed below, as of August 31, 2020, all of the securities in each Fund were valued based on Level 1 inputs (see the Schedules of Investments for security categories). The level assigned to the securities valuations may not be an indication of the risk or liquidity associated with investing in those securities. Because of the inherent uncertainties of valuation, the values reflected in the financial statements may materially differ from the value received upon actual sale of those investments.
| | | | | | | | | | | | | | | | | | | | |
| | | Level 1 | | Level 2 | | Level 3 | | Total |
| Russell 1000 Enhanced Equal Weight ETF | | | | | | | | | | | | | | | | | | | | |
| Investments in Securities | | | | | | | | | | | | | | | | | | | | |
Common Stocks & Other Equity Interests | | | $ | 2,734,013 | | | | $ | - | | | | | $- | | | | $ | 2,734,013 | |
Money Market Funds | | | | 210 | | | | | 55,834 | | | | | - | | | | | 56,044 | |
Total Investments | | | $ | 2,734,223 | | | | $ | 55,834 | | | | | $- | | | | $ | 2,790,057 | |
| Russell 1000 Equal Weight ETF | | | | | | | | | | | | | | | | | | | | |
| Investments in Securities | | | | | | | | | | | | | | | | | | | | |
Common Stocks & Other Equity Interests | | | $ | 474,736,964 | | | | $ | - | | | | | $- | | | | $ | 474,736,964 | |
Money Market Funds | | | | - | | | | | 9,546,558 | | | | | - | | | | | 9,546,558 | |
Total Investments | | | $ | 474,736,964 | | | | $ | 9,546,558 | | | | | $- | | | | $ | 484,283,522 | |
| Russell 1000 Low Beta Equal Weight ETF | | | | | | | | | | | | | | | | | | | | |
| Investments in Securities | | | | | | | | | | | | | | | | | | | | |
Common Stocks & Other Equity Interests | | | $ | 9,886,376 | | | | $ | - | | | | | $- | | | | $ | 9,886,376 | |
Money Market Funds | | | | - | | | | | 54,731 | | | | | - | | | | | 54,731 | |
Total Investments | | | $ | 9,886,376 | | | | $ | 54,731 | | | | | $- | | | | $ | 9,941,107 | |
| S&P 500® ex-Rate Sensitive Low Volatility ETF | | | | | | | | | | | | | | | | | | | | |
| Investments in Securities | | | | | | | | | | | | | | | | | | | | |
Common Stocks & Other Equity Interests | | | $ | 68,971,653 | | | | $ | - | | | | | $- | | | | $ | 68,971,653 | |
Money Market Funds | | | | - | | | | | 34,258 | | | | | - | | | | | 34,258 | |
Total Investments | | | $ | 68,971,653 | | | | $ | 34,258 | | | | | $- | | | | $ | 69,005,911 | |
| S&P 500® High Beta ETF | | | | | | | | | | | | | | | | | | | | |
| Investments in Securities | | | | | | | | | | | | | | | | | | | | |
Common Stocks & Other Equity Interests | | | $ | 130,937,576 | | | | $ | - | | | | | $- | | | | $ | 130,937,576 | |
Money Market Funds | | | | - | | | | | 3,790,528 | | | | | - | | | | | 3,790,528 | |
Total Investments | | | $ | 130,937,576 | | | | $ | 3,790,528 | | | | | $- | | | | $ | 134,728,104 | |
| S&P 500® High Dividend Low Volatility ETF | | | | | | | | | | | | | | | | | | | | |
| Investments in Securities | | | | | | | | | | | | | | | | | | | | |
Common Stocks & Other Equity Interests | | | $ | 2,443,706,519 | | | | $ | - | | | | | $- | | | | $ | 2,443,706,519 | |
Money Market Funds | | | | - | | | | | 66,844,995 | | | | | - | | | | | 66,844,995 | |
Total Investments | | | $ | 2,443,706,519 | | | | $ | 66,844,995 | | | | | $- | | | | $ | 2,510,551,514 | |
| S&P MidCap Low Volatility ETF | | | | | | | | | | | | | | | | | | | | |
| Investments in Securities | | | | | | | | | | | | | | | | | | | | |
Common Stocks & Other Equity Interests | | | $ | 2,041,024,243 | | | | $ | - | | | | | $- | | | | $ | 2,041,024,243 | |
Money Market Funds | | | | 485,395 | | | | | 38,359,002 | | | | | - | | | | | 38,844,397 | |
Total Investments | | | $ | 2,041,509,638 | | | | $ | 38,359,002 | | | | | $- | | | | $ | 2,079,868,640 | |
| S&P SmallCap High Dividend Low Volatility ETF | | | | | | | | | | | | | | | | | | | | |
| Investments in Securities | | | | | | | | | | | | | | | | | | | | |
Common Stocks & Other Equity Interests | | | $ | 20,813,834 | | | | $ | - | | | | | $- | | | | $ | 20,813,834 | |
Money Market Funds | | | | - | | | | | 737,832 | | | | | - | | | | | 737,832 | |
Total Investments | | | $ | 20,813,834 | | | | $ | 737,832 | | | | | $- | | | | $ | 21,551,666 | |
| | | | | | | | | | | | | | | | | | | | |
| | | Level 1 | | Level 2 | | Level 3 | | Total |
| S&P SmallCap Low Volatility ETF | | | | | | | | | | | | | | | | | | | | |
| Investments in Securities | | | | | | | | | | | | | | | | | | | | |
Common Stocks & Other Equity Interests | | | $ | 1,613,056,832 | | | | $ | - | | | | | $- | | | | $ | 1,613,056,832 | |
Money Market Funds | | | | - | | | | | 13,913,848 | | | | | - | | | | | 13,913,848 | |
Total Investments | | | $ | 1,613,056,832 | | | | $ | 13,913,848 | | | | | $- | | | | $ | 1,626,970,680 | |
| S&P SmallCap Quality ETF | | | | | | | | | | | | | | | | | | | | |
| Investments in Securities | | | | | | | | | | | | | | | | | | | | |
Common Stocks & Other Equity Interests | | | $ | 4,042,576 | | | | $ | - | | | | | $- | | | | $ | 4,042,576 | |
Money Market Funds | | | | 445 | | | | | 65,257 | | | | | - | | | | | 65,702 | |
Total Investments | | | $ | 4,043,021 | | | | $ | 65,257 | | | | | $- | | | | $ | 4,108,278 | |
NOTE 6–Distributions to Shareholders and Tax Components of Net Assets
Tax Character of Distributions to Shareholders Paid During the Fiscal Years Ended August 31, 2020 and 2019:
| | | | | | | | | | | | | | | | |
| | | 2020 | | | 2019 | |
| | | Ordinary
Income* | | | Long-Term
Capital Gains | | | Ordinary
Income* | | | Long-Term
Capital Gains | |
| Russell 1000 Enhanced Equal Weight ETF | | $ | 210,847 | | | | $ - | | | $ | 1,520,785 | | | | $ - | |
| Russell 1000 Equal Weight ETF | | | 10,587,171 | | | | - | | | | 7,723,638 | | | | - | |
| Russell 1000 Low Beta Equal Weight ETF | | | 1,429,929 | | | | - | | | | 2,991,612 | | | | - | |
| S&P 500 Enhanced Value ETF | | | 2,147,572 | | | | - | | | | 780,361 | | | | - | |
| S&P 500® ex-Rate Sensitive Low Volatility ETF | | | 2,309,005 | | | | - | | | | 2,615,963 | | | | - | |
| S&P 500® High Beta ETF | | | 2,778,271 | | | | - | | | | 1,882,965 | | | | - | |
| S&P 500® High Dividend Low Volatility ETF | | | 148,884,394 | | | | - | | | | 125,050,260 | | | | - | |
| S&P 500® Low Volatility ETF | | | 261,808,889 | | | | - | | | | 212,616,965 | | | | - | |
| S&P 500 Minimum Variance ETF | | | 53,897 | | | | 22,380 | | | | 30,598 | | | | 23,242 | |
| S&P 500 Momentum ETF | | | 931,171 | | | | - | | | | 623,934 | | | | - | |
| S&P MidCap Low Volatility ETF | | | 83,397,290 | | | | - | | | | 42,226,033 | | | | - | |
| S&P SmallCap High Dividend Low Volatility ETF | | | 1,357,406 | | | | - | | | | 927,458 | | | | - | |
| S&P SmallCap Low Volatility ETF | | | 61,636,699 | | | | - | | | | 43,490,857 | | | | - | |
| S&P SmallCap Quality ETF | | | 57,762 | | | | - | | | | 246,833 | | | | - | |
| * | Includes short-term capital gain distributions, if any. |
Tax Components of Net Assets at Fiscal Year-End:
| | | | | | | | | | | | | | | | | | | | | | | | |
| | | Undistributed
Ordinary
Income | | | Net
Unrealized
Appreciation
(Depreciation)-
Investments | | | Capital Loss
Carryforwards | | | Post-October
Capital
Losses
Deferrals | | | Shares of
Beneficial
Interest | | | Total
Net Assets | |
| Russell 1000 Enhanced Equal Weight ETF | | $ | 29,281 | | | $ | 51,047 | | | $ | (5,672,715 | ) | | $ | - | | | $ | 8,330,313 | | | $ | 2,737,926 | |
| Russell 1000 Equal Weight ETF | | | 1,416,401 | | | | 7,962,305 | | | | (63,188,900 | ) | | | - | | | | 529,149,404 | | | | 475,339,210 | |
| Russell 1000 Low Beta Equal Weight ETF | | | - | | | | 787,578 | | | | (29,051,593 | ) | | | - | | | | 38,159,818 | | | | 9,895,803 | |
| S&P 500 Enhanced Value ETF | | | 455,276 | | | | (15,599,044 | ) | | | (5,286,983 | ) | | | - | | | | 89,472,301 | | | | 69,041,550 | |
| S&P 500® ex-Rate Sensitive Low Volatility ETF | | | - | | | | 7,248,234 | | | | (24,588,900 | ) | | | - | | | | 86,343,048 | | | | 69,002,382 | |
| S&P 500® High Beta ETF | | | 545,658 | | | | (11,268,755 | ) | | | (75,657,578 | ) | | | - | | | | 217,555,747 | | | | 131,175,072 | |
| S&P 500® High Dividend Low Volatility ETF | | | - | | | | (300,066,260 | ) | | | (632,819,367 | ) | | | - | | | | 3,379,624,514 | | | | 2,446,738,887 | |
| S&P 500® Low Volatility ETF | | | - | | | | 822,938,398 | | | | (1,889,340,706 | ) | | | - | | | | 10,300,369,241 | | | | 9,233,966,933 | |
| S&P 500 Minimum Variance ETF | | | 152 | | | | 351,056 | | | | - | | | | (48,772 | ) | | | 4,544,698 | | | | 4,847,134 | |
| S&P 500 Momentum ETF | | | 161,532 | | | | 15,478,147 | | | | (4,736,593 | ) | | | - | | | | 62,968,968 | | | | 73,872,054 | |
| S&P MidCap Low Volatility ETF | | | - | | | | 90,166,205 | | | | (638,139,242 | ) | | | - | | | | 2,590,675,244 | | | | 2,042,702,207 | |
| S&P SmallCap High Dividend Low Volatility ETF | | | - | | | | (939,520 | ) | | | (7,336,483 | ) | | | - | | | | 29,102,978 | | | | 20,826,975 | |
| S&P SmallCap Low Volatility ETF | | | - | | | | 13,672,498 | | | | (646,725,755 | ) | | | - | | | | 2,247,158,390 | | | | 1,614,105,133 | |
| S&P SmallCap Quality ETF | | | 15,244 | | | | 52,797 | | | | (2,143,201 | ) | | | - | | | | 6,118,209 | | | | 4,043,049 | |
Capital loss carryforwards are calculated and reported as of a specific date. Results of transactions and other activity after that date may affect the amount of capital loss carryforwards actually available for the Funds to utilize. The ability to utilize capital loss carryforwards in the future may be limited under the Internal Revenue Code and related regulations based on the results of future transactions.
The following table presents available capital loss carryforwards for each Fund as of August 31, 2020:
| | | | | | | | | | | | |
| | | No expiration | | | | |
| | | Short-Term | | | Long-Term | | | Total* | |
Russell 1000 Enhanced Equal Weight ETF | | $ | 3,377,267 | | | $ | 2,295,448 | | | $ | 5,672,715 | |
| | | |
Russell 1000 Equal Weight ETF | | | 12,923,414 | | | | 50,265,486 | | | | 63,188,900 | |
Russell 1000 Low Beta Equal Weight ETF | | | 18,166,817 | | | | 10,884,776 | | | | 29,051,593 | |
| | | |
S&P 500 Enhanced Value ETF | | | 3,514,684 | | | | 1,772,299 | | | | 5,286,983 | |
S&P 500® ex-Rate Sensitive Low Volatility ETF | | | 17,823,632 | | | | 6,765,268 | | | | 24,588,900 | |
| | | |
S&P 500® High Beta ETF | | | 56,229,197 | | | | 19,428,381 | | | | 75,657,578 | |
S&P 500® High Dividend Low Volatility ETF | | | 328,586,450 | | | | 304,232,917 | | | | 632,819,367 | |
| | | |
S&P 500® Low Volatility ETF | | | 1,482,621,950 | | | | 406,718,756 | | | | 1,889,340,706 | |
S&P 500 Minimum Variance ETF | | | - | | | | - | | | | - | |
| | | |
S&P 500 Momentum ETF | | | 4,210,972 | | | | 525,621 | | | | 4,736,593 | |
S&P MidCap Low Volatility ETF | | | 404,341,313 | | | | 233,797,929 | | | | 638,139,242 | |
| | | |
S&P SmallCap High Dividend Low Volatility ETF | | | 3,976,213 | | | | 3,360,270 | | | | 7,336,483 | |
S&P SmallCap Low Volatility ETF | | | 372,278,070 | | | | 274,447,685 | | | | 646,725,755 | |
| | | |
S&P SmallCap Quality ETF | | | 1,812,819 | | | | 330,382 | | | | 2,143,201 | |
| * | Capital loss carryforwards are reduced for limitations, if any, to the extent required by the Internal Revenue Code and may be further limited depending upon a variety of factors, including the realization of net unrealized gains or losses as of the date of any reorganization. |
NOTE 7–Investment Transactions
For the fiscal year ended August 31, 2020, the cost of securities purchased and the proceeds from sales of securities (other than short-term securities, U.S. Treasury obligations, money market funds and in-kind transactions, if any) were as follows:
| | | | | | | | |
| | | Purchases | | | Sales | |
Russell 1000 Enhanced Equal Weight ETF | | $ | 2,646,714 | | | $ | 2,913,769 | |
| | |
Russell 1000 Equal Weight ETF | | | 142,487,898 | | | | 144,161,625 | |
Russell 1000 Low Beta Equal Weight ETF | | | 17,405,896 | | | | 17,412,211 | |
| | |
S&P 500 Enhanced Value ETF | | | 28,361,546 | | | | 27,591,930 | |
S&P 500® ex-Rate Sensitive Low Volatility ETF | | | 99,514,740 | | | | 99,132,251 | |
| | |
S&P 500® High Beta ETF | | | 138,778,342 | | | | 137,150,049 | |
S&P 500® High Dividend Low Volatility ETF | | | 2,359,329,112 | | | | 2,358,684,417 | |
| | |
S&P 500® Low Volatility ETF | | | 9,253,916,688 | | | | 9,269,264,280 | |
S&P 500 Minimum Variance ETF | | | 533,944 | | | | 548,641 | |
| | |
S&P 500 Momentum ETF | | | 55,293,716 | | | | 54,813,486 | |
S&P MidCap Low Volatility ETF | | | 2,503,588,200 | | | | 2,513,317,635 | |
| | |
S&P SmallCap High Dividend Low Volatility ETF | | | 18,648,611 | | | | 18,158,344 | |
S&P SmallCap Low Volatility ETF | | | 1,945,018,637 | | | | 1,938,313,609 | |
| | |
S&P SmallCap Quality ETF | | | 5,580,842 | | | | 5,564,745 | |
For the fiscal year ended August 31, 2020, in-kind transactions associated with creations and redemptions were as follows:
| | | | | | | | |
| | | Cost of | | | Value of | |
| | | Securities | | | Securities | |
| | | Received | | | Delivered | |
Russell 1000 Enhanced Equal Weight ETF | | $ | 1,490,641 | | | $ | 15,151,371 | |
| | |
Russell 1000 Equal Weight ETF | | | 91,602,290 | | | | 173,645,532 | |
Russell 1000 Low Beta Equal Weight ETF | | | 10,351,361 | | | | 106,005,128 | |
| | |
S&P 500 Enhanced Value ETF | | | 61,112,386 | | | | 40,579,157 | |
S&P 500® ex-Rate Sensitive Low Volatility ETF | | | 73,201,588 | | | | 165,167,035 | |
| | |
S&P 500® High Beta ETF | | | 448,344,233 | | | | 416,777,319 | |
S&P 500® High Dividend Low Volatility ETF | | | 1,046,507,295 | | | | 1,307,020,405 | |
| | | | | | | | |
| | | Cost of | | | Value of | |
| | | Securities | | | Securities | |
| | | Received | | | Delivered | |
S&P 500® Low Volatility ETF | | $ | 6,761,610,806 | | | $ | 9,069,561,681 | |
S&P 500 Minimum Variance ETF | | | 5,795,823 | | | | 3,082,269 | |
S&P 500 Momentum ETF | | | 51,957,817 | | | | 65,582,427 | |
S&P MidCap Low Volatility ETF | | | 1,169,565,956 | | | | 1,713,976,298 | |
S&P SmallCap High Dividend Low Volatility ETF | | | 15,361,248 | | | | 14,279,825 | |
S&P SmallCap Low Volatility ETF | | | 1,145,255,359 | | | | 925,478,881 | |
S&P SmallCap Quality ETF | | | 7,281,720 | | | | 8,231,233 | |
Gains (losses) on in-kind transactions are generally not considered taxable gains (losses) for federal income tax purposes. At August 31, 2020, the aggregate cost of investments, including any derivatives, on a tax basis includes adjustments for financial reporting purposes as of the most recently completed federal income tax reporting period-end:
| | | | | | | | | | | | | | | | |
| | | | | | | | | Net | | | | |
| | | Gross | | | Gross | | | Unrealized | | | | |
| | | Unrealized | | | Unrealized | | | Appreciation | | | | |
| | | Appreciation | | | (Depreciation) | | | (Depreciation) | | | Cost | |
Russell 1000 Enhanced Equal Weight ETF | | $ | 331,423 | | | $ | (280,376 | ) | | $ | 51,047 | | | $ | 2,739,010 | |
Russell 1000 Equal Weight ETF | | | 65,020,097 | | | | (57,057,792 | ) | | | 7,962,305 | | | | 476,321,217 | |
Russell 1000 Low Beta Equal Weight ETF | | | 1,278,553 | | | | (490,975 | ) | | | 787,578 | | | | 9,153,529 | |
S&P 500 Enhanced Value ETF | | | 1,713,294 | | | | (17,312,338 | ) | | | (15,599,044 | ) | | | 84,340,642 | |
S&P 500® ex-Rate Sensitive Low Volatility ETF | | | 8,113,024 | | | | (864,790 | ) | | | 7,248,234 | | | | 61,757,677 | |
S&P 500® High Beta ETF | | | 4,987,579 | | | | (16,256,334 | ) | | | (11,268,755 | ) | | | 145,996,859 | |
S&P 500® High Dividend Low Volatility ETF | | | 50,124,413 | | | | (350,190,673 | ) | | | (300,066,260 | ) | | | 2,810,617,774 | |
S&P 500® Low Volatility ETF | | | 922,418,898 | | | | (99,480,500 | ) | | | 822,938,398 | | | | 8,400,401,192 | |
S&P 500 Minimum Variance ETF | | | 471,397 | | | | (120,341 | ) | | | 351,056 | | | | 4,489,694 | |
S&P 500 Momentum ETF | | | 15,720,541 | | | | (242,394 | ) | | | 15,478,147 | | | | 58,346,092 | |
S&P MidCap Low Volatility ETF | | | 177,334,514 | | | | (87,168,309 | ) | | | 90,166,205 | | | | 1,989,702,435 | |
S&P SmallCap High Dividend Low Volatility ETF | | | 1,120,904 | | | | (2,060,424 | ) | | | (939,520 | ) | | | 22,491,186 | |
S&P SmallCap Low Volatility ETF | | | 106,559,017 | | | | (92,886,519 | ) | | | 13,672,498 | | | | 1,613,298,182 | |
S&P SmallCap Quality ETF | | | 284,439 | | | | (231,642 | ) | | | 52,797 | | | | 4,055,481 | |
NOTE 8–Reclassification of Permanent Differences
Primarily as a result of differing book/tax treatment of in-kind transactions, taxable overdistributions and investment in REITs, amounts were reclassified between undistributed net investment income (loss), undistributed net realized gain (loss) and Shares of beneficial interest. These reclassifications had no effect on the net assets of each Fund. For the fiscal year ended August 31, 2020, the reclassifications were as follows:
| | | | | | | | | | | | |
| | | Undistributed Net
Investment Income (Loss) | | | Undistributed Net
Realized Gain (Loss) | | | Shares of
Beneficial Interest | |
| | | |
Russell 1000 Enhanced Equal Weight ETF | | $ | 2,122 | | | $ | 1,318,978 | | | $ | (1,321,100 | ) |
| | | |
Russell 1000 Equal Weight ETF | | | 5,052 | | | | (11,635,982 | ) | | | 11,630,930 | |
| | | |
Russell 1000 Low Beta Equal Weight ETF | | | 84,062 | | | | (3,384,766 | ) | | | 3,300,704 | |
| | | |
S&P 500 Enhanced Value ETF | | | - | | | | (3,398,704 | ) | | | 3,398,704 | |
| | | |
S&P 500® ex-Rate Sensitive Low Volatility ETF | | | 81,649 | | | | (11,691,936 | ) | | | 11,610,287 | |
| | | |
S&P 500® High Beta ETF | | | - | | | | (13,181,794 | ) | | | 13,181,794 | |
| | | |
S&P 500® High Dividend Low Volatility ETF | | | 26,834,448 | | | | 9,212,278 | | | | (36,046,726 | ) |
| | | |
S&P 500® Low Volatility ETF | | | 7,403,477 | | | | (1,011,252,426 | ) | | | 1,003,848,949 | |
| | | |
S&P 500 Minimum Variance ETF | | | (877 | ) | | | (514,181 | ) | | | 515,058 | |
| | | |
S&P 500 Momentum ETF | | | - | | | | (2,375,337 | ) | | | 2,375,337 | |
| | | |
S&P MidCap Low Volatility ETF | | | 5,637,633 | | | | (68,441,381 | ) | | | 62,803,748 | |
| | | |
S&P SmallCap High Dividend Low Volatility ETF | | | 467,585 | | | | (1,066,203 | ) | | | 598,618 | |
| | | |
S&P SmallCap Low Volatility ETF | | | 6,750,803 | | | | 21,001,360 | | | | (27,752,163 | ) |
| | | |
S&P SmallCap Quality ETF | | | 661 | | | | (904,409 | ) | | | 903,748 | |
NOTE 9–Trustees’ and Officer’s Fees
Trustees’ and Officer’s Fees include amounts accrued by the Funds to pay remuneration to the Independent Trustees and an Officer of the Trust. The Adviser, as a result of each Fund’s unitary management fee, pays for such compensation for the Funds. The Trustee who is an “interested person” of the Trust does not receive any Trustees’ fees.
The Trust has adopted a deferred compensation plan (the “Plan”). Under the Plan, each Independent Trustee who has executed a Deferred Fee Agreement (a “Participating Trustee”) may defer receipt of all or a portion of their compensation (“Deferral Fees”). Such Deferral Fees are deemed to be invested in select Invesco ETFs. The Deferral Fees payable to a Participating Trustee are valued as of the date such Deferral Fees would have been paid to a Participating Trustee. The value increases with contributions or with increases in the value of the Shares selected, and the value decreases with distributions or with declines in the value of the Shares selected. Obligations under the Plan represent unsecured claims against the general assets of the Funds.
NOTE 10–Capital
Shares are issued and redeemed by each Fund only in Creation Units consisting of a specified number of Shares as set forth in the Funds’ prospectus. Only Authorized Participants are permitted to purchase or redeem Creation Units from the Funds. Such transactions are principally permitted in exchange for Deposit Securities, with a balancing cash component to equate the transaction to the NAV per Share of a Fund of the Trust on the transaction date. However, for all Funds, cash in an amount equivalent to the value of certain securities may be substituted, generally when the securities are not available in sufficient quantity for delivery, not eligible for trading by the Authorized Participant or as a result of other market circumstances.
To the extent that the Funds permit transactions in exchange for Deposit Securities, each Fund may issue Shares in advance of receipt of Deposit Securities subject to various conditions, including a requirement to maintain on deposit with the Trust cash at least equal to 105% of the market value of the missing Deposit Securities. In accordance with the Trust’s Participant Agreement, Creation Units will be issued to an Authorized Participant, notwithstanding the fact that the corresponding Deposit Securities have not been received in part or in whole, in reliance on the undertaking of the Authorized Participant to deliver the missing Deposit Securities as soon as possible, which undertaking shall be secured by the Authorized Participant’s delivery and maintenance of collateral consisting of cash in the form of U.S. dollars in immediately available funds having a value (marked-to-market daily) at least equal to 105%, which the Adviser may change from time to time, of the value of the missing Deposit Securities.
Certain transaction fees may be charged by the Funds for creations and redemptions, which are treated as increases in capital. Transactions in each Fund’s Shares are disclosed in detail in the Statements of Changes in Net Assets.
NOTE 11–Coronavirus (COVID-19) Pandemic
During the first quarter of 2020, the World Health Organization declared COVID-19 to be a public health emergency. COVID-19 has led to increased short-term market volatility and may have adverse long-term effects on U.S. and world economies and markets in general. COVID-19 may adversely impact the value of the Funds’ investments. Because of the uncertainties on valuation, the global economy and business operations, values reflected in these financial statements may materially differ from the value received upon actual sales of those investments.
The extent of the impact on the performance of the Funds and their investments will depend on future developments, including the duration and spread of the COVID-19 outbreak, related restrictions and advisories, and the effects on the financial markets and economy overall, all of which are highly uncertain and cannot be predicted.
Report of Independent Registered Public Accounting Firm
To the Board of Trustees of Invesco Exchange-Traded Fund Trust II and Shareholders of Invesco Russell 1000 Enhanced Equal Weight ETF, Invesco Russell 1000 Equal Weight ETF, Invesco Russell 1000 Low Beta Equal Weight ETF, Invesco S&P 500 Enhanced Value ETF, Invesco S&P 500® ex-Rate Sensitive Low Volatility ETF, Invesco S&P 500® High Beta ETF, Invesco S&P 500® High Dividend Low Volatility ETF, Invesco S&P 500® Low Volatility ETF, Invesco S&P 500 Minimum Variance ETF, Invesco S&P 500 Momentum ETF, Invesco S&P MidCap Low Volatility ETF, Invesco S&P SmallCap High Dividend Low Volatility ETF, Invesco S&P SmallCap Low Volatility ETF and Invesco S&P SmallCap Quality ETF
Opinions on the Financial Statements
We have audited the accompanying statements of assets and liabilities, including the schedules of investments, of Invesco Russell 1000 Enhanced Equal Weight ETF, Invesco Russell 1000 Equal Weight ETF, Invesco Russell 1000 Low Beta Equal Weight ETF, Invesco S&P 500 Enhanced Value ETF, Invesco S&P 500® ex-Rate Sensitive Low Volatility ETF, Invesco S&P 500® High Beta ETF, Invesco S&P 500® High Dividend Low Volatility ETF, Invesco S&P 500® Low Volatility ETF, Invesco S&P 500 Minimum Variance ETF, Invesco S&P 500 Momentum ETF, Invesco S&P MidCap Low Volatility ETF, Invesco S&P SmallCap High Dividend Low Volatility ETF, Invesco S&P SmallCap Low Volatility ETF and Invesco S&P SmallCap Quality ETF (fourteen of the funds constituting Invesco Exchange-Traded Fund Trust II, hereafter collectively referred to as the “Funds”) as of August 31, 2020, the related statements of operations for the year ended August 31, 2020, the statements of changes in net assets for each of the two years in the period ended August 31, 2020, including the related notes, and the financial highlights for each of the periods indicated therein (collectively referred to as the “financial statements”). In our opinion, the financial statements present fairly, in all material respects, the financial position of each of the Funds as of August 31, 2020, the results of each of their operations for the year ended August 31, 2020, the changes in each of their net assets for each of the two years in the period ended August 31, 2020, and each of the financial highlights for each of the periods indicated therein, in conformity with accounting principles generally accepted in the United States of America.
Basis for Opinions
These financial statements are the responsibility of the Funds’ management. Our responsibility is to express an opinion on the Funds’ financial statements based on our audits. We are a public accounting firm registered with the Public Company Accounting Oversight Board (United States) (“PCAOB”) and are required to be independent with respect to the Funds in accordance with the U.S. federal securities laws and the applicable rules and regulations of the Securities and Exchange Commission and the PCAOB.
We conducted our audits of these financial statements in accordance with the standards of the PCAOB. Those standards require that we plan and perform the audit to obtain reasonable assurance about whether the financial statements are free of material misstatement, whether due to error or fraud.
Our audits included performing procedures to assess the risks of material misstatement of the financial statements, whether due to error or fraud, and performing procedures that respond to those risks. Such procedures included examining, on a test basis, evidence regarding the amounts and disclosures in the financial statements. Our audits also included evaluating the accounting principles used and significant estimates made by management, as well as evaluating the overall presentation of the financial statements. Our procedures included confirmation of securities owned as of August 31, 2020 by correspondence with the custodian, transfer agent, and brokers; when replies were not received from brokers, we performed other auditing procedures. We believe that our audits provide a reasonable basis for our opinions.
/s/PricewaterhouseCoopers LLP
Chicago, Illinois
October 28, 2020
We have served as the auditor of one or more of the investment companies in the Invesco group of investment companies since at least 1995. We have not been able to determine the specific year we began serving as auditor.
Calculating your ongoing Fund expenses
Example
As a shareholder of a Fund of the Invesco Exchange-Traded Fund Trust II, you incur a unitary management fee. In addition to the unitary management fee, a shareholder may pay distribution fees, if any, brokerage expenses, taxes, interest, litigation expenses, acquired fund fees and expenses, if any, and other extraordinary expenses. The expense examples below are intended to help you understand your ongoing costs (in dollars) of investing in the Funds and to compare these costs with the ongoing costs of investing in other funds.
The example is based on an investment of $1,000 invested at the beginning of the period and held through the six-month period ended August 31, 2020.
Actual Expenses
The first line in the following table provides information about actual account values and actual expenses. You may use the information in this line, together with the amount you invested, to estimate the expenses that you paid over the period. Simply divide your account value by $1,000 (for example, an $8,600 account value divided by $1,000 = 8.6), then multiply the result by the number in the first line under the heading “Expenses Paid During the Six-Month Period” to estimate the expenses you paid on your account during this period.
Hypothetical Example for Comparison Purposes
The second line in the following table provides information about hypothetical account values and hypothetical expenses based on the Fund’s actual expense ratio and an assumed annualized rate of return of 5% per year before expenses, which is not the Fund’s actual return. The hypothetical account values and expenses may not be used to estimate the actual ending account balance or expenses you paid for the period. You may use this information to compare the ongoing costs of investing in the Fund and other funds. To do so, compare this 5% hypothetical example with the 5% hypothetical examples that appear in the shareholder reports of the other funds.
Please note that the expenses shown in the table are meant to highlight your ongoing costs only and do not reflect any transactional costs, such as sales charges and brokerage commissions. Therefore, the second line in the table is useful in comparing ongoing costs only, and will not help you determine the relative total costs of owning different funds. In addition, expenses shown in the table do not include the expenses of the underlying funds, which are borne indirectly by a Fund. If transaction costs and indirect expenses were included, your costs would have been higher.
| | | | | | | | | | | | | | | | | | | | |
| | | | | | | Annualized | | |
| | | Beginning | | Ending | | Expense Ratio | | Expenses Paid |
| | | Account Value | | Account Value | | Based on the | | During the |
| | | March 1, 2020 | | August 31, 2020 | | Six-Month Period | | Six-Month Period(1) |
Invesco Russell 1000 Enhanced Equal Weight ETF (USEQ) | | | | | | | | | | | | | | | | | | | | |
Actual | | | $ | 1,000.00 | | | | $ | 1,042.80 | | | | | 0.29 | % | | | $ | 1.49 | |
Hypothetical (5% return before expenses) | | | | 1,000.00 | | | | | 1,023.68 | | | | | 0.29 | | | | | 1.48 | |
Invesco Russell 1000 Equal Weight ETF (EQAL) | | | | | | | | | | | | | | | | | | | | |
Actual | | | | 1,000.00 | | | | | 1,123.30 | | | | | 0.20 | | | | | 1.07 | |
Hypothetical (5% return before expenses) | | | | 1,000.00 | | | | | 1,024.13 | | | | | 0.20 | | | | | 1.02 | |
Invesco Russell 1000 Low Beta Equal Weight ETF (USLB) | | | | | | | | | | | | | | | | | | | | |
Actual | | | | 1,000.00 | | | | | 1,049.50 | | | | | 0.35 | | | | | 1.80 | |
Hypothetical (5% return before expenses) | | | | 1,000.00 | | | | | 1,023.38 | | | | | 0.35 | | | | | 1.78 | |
Invesco S&P 500 Enhanced Value ETF (SPVU) | | | | | | | | | | | | | | | | | | | | |
Actual | | | | 1,000.00 | | | | | 919.70 | | | | | 0.13 | | | | | 0.63 | |
Hypothetical (5% return before expenses) | | | | 1,000.00 | | | | | 1,024.48 | | | | | 0.13 | | | | | 0.66 | |
Invesco S&P 500® ex-Rate Sensitive Low Volatility ETF (XRLV) | | | | | | | | | | | | | | | | | | | | |
Actual | | | | 1,000.00 | | | | | 1,069.50 | | | | | 0.25 | | | | | 1.30 | |
Hypothetical (5% return before expenses) | | | | 1,000.00 | | | | | 1,023.88 | | | | | 0.25 | | | | | 1.27 | |
Calculating your ongoing Fund expenses–(continued)
| | | | | | | | | | | | | | | | | | | | |
| | | | | | | Annualized | | |
| | | Beginning | | Ending | | Expense Ratio | | Expenses Paid |
| | | Account Value | | Account Value | | Based on the | | During the |
| | | March 1, 2020 | | August 31, 2020 | | Six-Month Period | | Six-Month Period(1) |
Invesco S&P 500® High Beta ETF (SPHB) | | | | | | | | | | | | | | | | | | | | |
Actual | | | $ | 1,000.00 | | | | $ | 1,100.80 | | | | | 0.25 | % | | | $ | 1.32 | |
Hypothetical (5% return before expenses) | | | | 1,000.00 | | | | | 1,023.88 | | | | | 0.25 | | | | | 1.27 | |
Invesco S&P 500® High Dividend Low Volatility ETF (SPHD) | | | | | | | | | | | | | | | | | | | | |
Actual | | | | 1,000.00 | | | | | 924.50 | | | | | 0.30 | | | | | 1.45 | |
Hypothetical (5% return before expenses) | | | | 1,000.00 | | | | | 1,023.63 | | | | | 0.30 | | | | | 1.53 | |
Invesco S&P 500® Low Volatility ETF (SPLV) | | | | | | | | | | | | | | | | | | | | |
Actual | | | | 1,000.00 | | | | | 1,023.90 | | | | | 0.25 | | | | | 1.27 | |
Hypothetical (5% return before expenses) | | | | 1,000.00 | | | | | 1,023.88 | | | | | 0.25 | | | | | 1.27 | |
Invesco S&P 500 Minimum Variance ETF (SPMV) | | | | | | | | | | | | | | | | | | | | |
Actual | | | | 1,000.00 | | | | | 1,114.30 | | | | | 0.10 | | | | | 0.53 | |
Hypothetical (5% return before expenses) | | | | 1,000.00 | | | | | 1,024.63 | | | | | 0.10 | | | | | 0.51 | |
Invesco S&P 500 Momentum ETF (SPMO) | | | | | | | | | | | | | | | | | | | | |
Actual | | | | 1,000.00 | | | | | 1,294.40 | | | | | 0.13 | | | | | 0.75 | |
Hypothetical (5% return before expenses) | | | | 1,000.00 | | | | | 1,024.48 | | | | | 0.13 | | | | | 0.66 | |
Invesco S&P MidCap Low Volatility ETF (XMLV) | | | | | | | | | | | | | | | | | | | | |
Actual | | | | 1,000.00 | | | | | 922.00 | | | | | 0.25 | | | | | 1.21 | |
Hypothetical (5% return before expenses) | | | | 1,000.00 | | | | | 1,023.88 | | | | | 0.25 | | | | | 1.27 | |
Invesco S&P SmallCap High Dividend Low Volatility ETF (XSHD) | | | | | | | | | | | | | | | | | | | | |
Actual | | | | 1,000.00 | | | | | 811.70 | | | | | 0.30 | | | | | 1.37 | |
Hypothetical (5% return before expenses) | | | | 1,000.00 | | | | | 1,023.63 | | | | | 0.30 | | | | | 1.53 | |
Invesco S&P SmallCap Low Volatility ETF (XSLV) | | | | | | | | | | | | | | | | | | | | |
Actual | | | | 1,000.00 | | | | | 795.50 | | | | | 0.25 | | | | | 1.13 | |
Hypothetical (5% return before expenses) | | | | 1,000.00 | | | | | 1,023.88 | | | | | 0.25 | | | | | 1.27 | |
Invesco S&P SmallCap Quality ETF (XSHQ) | | | | | | | | | | | | | | | | | | | | |
Actual | | | | 1,000.00 | | | | | 1,077.80 | | | | | 0.29 | | | | | 1.51 | |
Hypothetical (5% return before expenses) | | | | 1,000.00 | | | | | 1,023.68 | | | | | 0.29 | | | | | 1.48 | |
| (1) | Expenses are calculated using the annualized expense ratio, which represents the ongoing expenses as a percentage of net assets for the six-month period ended August 31, 2020. Expenses are calculated by multiplying the Fund’s annualized expense ratio by the average account value for the period, then multiplying the result by 184/366. Expense ratios for the most recent six-month period may differ from expense ratios based on the annualized data in the Financial Highlights. |
Tax Information
Form 1099-DIV, Form 1042-S and other year-end tax information provide shareholders with actual calendar year amounts that should be included in their tax returns. Shareholders should consult their tax advisers.
The following distribution information is being provided as required by the Internal Revenue Code or to meet a specific state’s requirement.
Each Fund designates the following amounts or, if subsequently determined to be different, the maximum amount allowable for its fiscal year ended August 31, 2020:
| | | | | | | | | | |
| | | Qualified
Business
Income* | | Qualified
Dividend
Income* | | Dividends-Received
Deduction* | | Qualified
Interest
Income* | | Long Term
Capital Gains |
| Invesco Russell 1000 Enhanced Equal Weight ETF | | 8% | | 92% | | 89% | | 0% | | $ - |
| Invesco Russell 1000 Equal Weight ETF | | 0% | | 90% | | 87% | | 0% | | $ - |
| Invesco Russell 1000 Low Beta Equal Weight ETF | | 23% | | 76% | | 74% | | 0% | | $ - |
| Invesco S&P 500 Enhanced Value ETF | | 0% | | 100% | | 99% | | 0% | | $ - |
| Invesco S&P 500® ex-Rate Sensitive Low Volatility ETF | | 0% | | 97% | | 90% | | 0% | | $ - |
| Invesco S&P 500® High Beta ETF | | 1% | | 87% | | 87% | | 0% | | $ - |
| Invesco S&P 500® High Dividend Low Volatility ETF | | 13% | | 67% | | 65% | | 0% | | $ - |
| Invesco S&P 500® Low Volatility ETF | | 0% | | 82% | | 79% | | 0% | | $ - |
| Invesco S&P 500 Minimum Variance ETF | | 0% | | 86% | | 82% | | 0% | | $22,380 |
| Invesco S&P 500 Momentum ETF | | 2% | | 95% | | 94% | | 0% | | $ - |
| Invesco S&P MidCap Low Volatility ETF | | 30% | | 67% | | 66% | | 0% | | $ - |
| Invesco S&P SmallCap High Dividend Low Volatility ETF | | 25% | | 30% | | 30% | | 0% | | $ - |
| Invesco S&P SmallCap Low Volatility ETF | | 36% | | 51% | | 51% | | 1% | | $ - |
| Invesco S&P SmallCap Quality ETF | | 0% | | 85% | | 93% | | 0% | | $ - |
* The above percentages are based on ordinary income dividends paid to shareholders during the Trust’s fiscal year.
Trustees and Officers
The Independent Trustees of the Trust, their term of office and length of time served, their principal business occupations during at least the past five years, the number of portfolios in the Fund Complex (as defined below) overseen by each Independent Trustee and the other directorships, if any, held by each Independent Trustee are shown below.
As of August 31, 2020
| | | | | | | | | | |
Name, Address and Year of
Birth of Independent Trustees | | Position(s)
Held
with Trust | | Term of
Office
and
Length of
Time
Served* | | Principal
Occupation(s) During
Past 5 Years | | Number of
Portfolios
in Fund
Complex**
Overseen by
Independent
Trustees | | Other
Directorships
Held by
Independent
Trustees During
the Past 5
Years |
| | | | | |
Ronn R. Bagge–1958 c/o Invesco Capital Management LLC 3500 Lacey Road, Suite 700 Downers Grove, IL 60515 | | Vice Chairman of the Board; Chairman of the Nominating and Governance Committee and Trustee | | Vice
Chairman
since 2018;
Chairman of
the
Nominating
and
Governance
Committee
and Trustee
since 2007 | | Founder and Principal, YQA Capital Management LLC (1998-Present); formerly, Owner/CEO of Electronic Dynamic Balancing Co., Inc. (high-speed rotating equipment service provider). | | 214 | | Trustee
and
Investment
Oversight
Committee
member,
Mission
Aviation
Fellowship
(2017-
Present). |
| | | | | |
Todd J. Barre–1957 c/o Invesco Capital Management LLC 3500 Lacey Road, Suite 700 Downers Grove, IL 60515 | | Trustee | | Since 2010 | | Assistant Professor of Business, Trinity Christian College (2010-2016); formerly, Vice President and Senior Investment Strategist (2001-2008), Director of Open Architecture and Trading (2007-2008), Head of Fundamental Research (2004-2007)and Vice President and Senior Fixed Income Strategist (1994-2001), BMO Financial Group/Harris Private Bank. | | 214 | | None. |
| * | This is the date the Independent Trustee began serving the Trust. Each Independent Trustee serves an indefinite term, until his or her successor is elected. |
| ** | Fund Complex includes all open- and closed-end funds (including all of their portfolios) advised by the Adviser and any affiliated person of the Adviser. |
Trustees and Officers–(continued)
| | | | | | | | | | |
Name, Address and Year of
Birth of Independent Trustees | | Position(s)
Held
with Trust | | Term of
Office
and
Length of
Time
Served* | | Principal
Occupation(s) During
Past 5 Years | | Number of
Portfolios
in Fund
Complex**
Overseen by
Independent
Trustees | | Other
Directorships
Held by
Independent
Trustees During
the Past 5 Years |
| | | | | |
| Edmund P. Giambastiani, Jr.—1948 c/o Invesco Capital Management LLC 3500 Lacey Road, Suite 700 Downers Grove, IL 60515 | | Trustee | | Since 2019 | | President, Giambastiani Group LLC (national security and energy consulting) (2007-Present); Director, The Boeing Company (2009-Present); Trustee, MITRE Corporation (federally-funded research development) (2008-Present); Director, THL Credit, Inc. (alternative credit investment manager) (2016-Present); Trustee, U.S. Naval Academy Foundation Athletic & Scholarship Program (2010-Present); Advisory Board Member, Massachusetts Institute of Technology Lincoln Laboratory (federally-funded research development) (2010- Present); Defense Advisory Board Member, Lawrence Livermore National Laboratory (2013-Present); formerly, Chairman (2015-2016), Lead Director (2011-2015) and Director (2008-2011), Monster Worldwide, Inc. (career services); Advisory Board Member, Maxwell School of Citizenship and Public Affairs of Syracuse University (2012-2016); United States Navy, career nuclear submarine officer (1970-2007); Seventh Vice Chairman of the Joint Chiefs of Staff (2005-2007); first NATO Supreme Allied Commander Transformation (2003-2005); Commander, U.S. Joint Forces Command (2002-2005). | | 214 | | Formerly,
Trustee,
certain funds
of the
Oppenheimer
Funds
complex
(2013- 2019);
Director,
Mercury
Defense
Systems Inc.
(information
technology)
(2011-2013);
Independent
Director,
QinetiQ
Group Plc
(defense
technology
and security)
(2008-2011);
Chairman,
Alenia North
America, Inc.
(military and
defense
products)
(2008-2009);
Director,
SRA
International,
Inc.
(information
technology
and services)
(2008- 2011). |
| * | This is the date the Independent Trustee began serving the Trust. Each Independent Trustee serves an indefinite term, until his or her successor is elected. |
| ** | Fund Complex includes all open- and closed-end funds (including all of their portfolios) advised by the Adviser and any affiliated person of the Adviser. |
Trustees and Officers–(continued)
| | | | | | | | | | |
Name, Address and Year of
Birth of Independent Trustees | | Position(s) Held
with Trust | | Term of
Office
and
Length of
Time
Served* | | Principal
Occupation(s) During
Past 5 Years | | Number of
Portfolios
in Fund
Complex**
Overseen by
Independent
Trustees | | Other
Directorships
Held by
Independent
Trustees During
the Past 5 Years |
Victoria J. Herget–1951
c/o Invesco Capital Management LLC 3500 Lacey Road, Suite 700 Downers Grove, IL 60515 | | Trustee | | Since 2019 | | Formerly, Managing Director (1993-2001), Principal (1985-1993), Vice President (1978-1985) and Assistant Vice President (1973- 1978), Zurich Scudder Investments (investment adviser) (and its predecessor firms). | | 214 | | Trustee (2000- Present) and Chair (2010-2017), Newberry Library; Trustee, Mather LifeWays (2001-Present); Trustee, Chikaming Open Lands (2014-Present); formerly, Trustee, certain funds in the Oppenheimer Funds complex (2012- 2019); Board Chair (2008-2015) and Director (2004- 2018), United Educators Insurance Company; Independent Director, First American Funds (2003-2011); Trustee (1992-2007), Chair of the Board of Trustees (1999-2007), Investment Committee Chair (1994-1999) and Investment Committee member (2007-2010), Wellesley College; Trustee, BoardSource (2006-2009); Trustee, Chicago City Day School (1994-2005). |
| * | This is the date the Independent Trustee began serving the Trust. Each Independent Trustee serves an indefinite term, until his or her successor is elected. |
| ** | Fund Complex includes all open- and closed-end funds (including all of their portfolios) advised by the Adviser and any affiliated person of the Adviser. |
Trustees and Officers–(continued)
| | | | | | | | | | |
Name, Address and Year of
Birth of Independent Trustees | | Position(s) Held
with Trust | | Term of
Office
and
Length of
Time
Served* | | Principal
Occupation(s) During
Past 5 Years | | Number of
Portfolios
in Fund
Complex**
Overseen by
Independent
Trustees | | Other
Directorships
Held by
Independent
Trustees During
the Past 5 Years |
Marc M. Kole—1960
c/o Invesco Capital Management LLC 3500 Lacey Road, Suite 700 Downers Grove, IL 60515 | | Chairman of the Audit Committee and Trustee | | Chairman of the Audit Committee since 2008; Trustee since 2007 | | Senior Director of Finance, By The Hand Club for Kids (not-for-profit) (2015-Present); formerly, Chief Financial Officer, Hope Network (social services) (2008-2012); Assistant Vice President and Controller, Priority Health (health insurance) (2005-2008); Regional Chief Financial Officer, United Healthcare (2005); Chief Accounting Officer, Senior Vice President of Finance, Oxford Health Plans (2000-2004); Audit Partner, Arthur Andersen LLP (1996-2000). | | 214 | | Treasurer (2018-Present), Finance Committee Member (2015- Present) and Audit Committee Member (2015), Thornapple Evangelical Covenant Church; formerly, Board and Finance Committee Member (2009-2017) and Treasurer (2010-2015, 2017), NorthPointe Christian Schools. |
| Yung Bong Lim—1964 c/o Invesco Capital Management LLC 3500 Lacey Road, Suite 700 Downers Grove, IL 60515 | | Chairman of the Investment Oversight Committee and Trustee | | Chairman of the Investment Oversight Committee since 2014; Trustee since 2013 | | Managing Partner, RDG Funds LLC (real estate) (2008-Present); formerly, Managing Director, Citadel LLC (1999-2007). | | 214 | | Advisory Board Member, Performance Trust Capital Partners, LLC (2008-Present); Board Director, Beacon Power Services, Corp. (2019-Present). |
| * | This is the date the Independent Trustee began serving the Trust. Each Independent Trustee serves an indefinite term, until his or her successor is elected. |
| ** | Fund Complex includes all open- and closed-end funds (including all of their portfolios) advised by the Adviser and any affiliated person of the Adviser. |
Trustees and Officers–(continued)
| | | | | | | | | | |
Name, Address and Year of
Birth of Independent Trustees | | Position(s)
Held
with Trust | | Term of
Office
and
Length
of
Time
Served* | | Principal Occupation(s) During Past 5
Years | | Number of Portfolios in Fund Complex** Overseen by
Independent
Trustees | | Other
Directorships
Held by
Independent
Trustees
During the Past
5 Years |
| Joanne Pace—1958 c/o Invesco Capital Management LLC 3500 Lacey Road, Suite 700 Downers Grove, IL 60515 | | Trustee | | Since 2019 | | Formerly, Senior Advisor, SECOR Asset Management, LP (2010-2011); Managing Director and Chief Operating Officer, Morgan Stanley Investment Management (2006- 2010); Partner and Chief Operating Officer, FrontPoint Partners, LLC (alternative investments) (2005- 2006); Managing Director (2003-2005), Global Head of Human Resources and member of Executive Board and Operating Committee (2004-2005), Global Head of Operations and Product Control (2003-2004), Credit Suisse (investment banking); Managing Director (1997-2003), Controller and Principal Accounting Officer (1999-2003), Chief Financial Officer (temporary assignment) for the Oversight Committee, Long Term Capital Management (1998-1999). | | 214 | | Board Director, Horizon Blue Cross Blue Shield of New Jersey (2012- Present); Advisory Board Director, The Alberleen Group LLC (2012-Present); Governing Council Member (2016- Present) and Chair of |
| | | | | | | | | | Education Committee (2017-Present), Independent Directors Council (IDC); Board Member, 100 Women in Finance (2015-Present); Council Member, NewYork-Presbyterian Hospital’s Leadership Council on |
| | | | | | | | | | Children’s and Women’s Health (2012-Present); formerly, Trustee, certain funds in the Oppenheimer Funds complex (2012- 2019); |
| | | | | | | | | | Lead Independent Director and Chair of the Audit and Nominating Committee of The Global Chartist Fund, LLC, Oppenheimer Asset Management (2011-2012); Board Director, Managed Funds Association (2008-2010); Board Director (2007-2010) and Investment Committee Chair (2008-2010), Morgan Stanley Foundation. |
| * | This is the date the Independent Trustee began serving the Trust. Each Independent Trustee serves an indefinite term, until his or her successor is elected. |
| ** | Fund Complex includes all open- and closed-end funds (including all of their portfolios) advised by the Adviser and any affiliated person of the Adviser. |
Trustees and Officers–(continued)
| | | | | | | | | | |
Name, Address and Year of
Birth of Independent Trustees | | Position(s)
Held
with Trust | | Term of
Office
and
Length of
Time
Served* | | Principal
Occupation(s) During
Past 5 Years | | Number of
Portfolios
in Fund
Complex**
Overseen by
Independent
Trustees | | Other
Directorships
Held by
Independent
Trustees During
the Past 5 Years |
Gary R. Wicker - 1961
c/o Invesco Capital Management LLC
3500 Lacey Road, Suite 700 Downers Grove, IL 60515 | | Trustee | | Since 2013 | | Senior Vice President of Global Finance and Chief Financial Officer, RBC Ministries (publishing company) (2013-Present); formerly, Executive Vice President and Chief Financial Officer, Zondervan Publishing (a division of Harper Collins/NewsCorp) (2007-2012); Senior Vice President and Group Controller (2005- 2006), Senior Vice President and Chief Financial Officer (2003-2004), Chief Financial Officer (2001-2003), Vice President, Finance and Controller (1999-2001) and Assistant Controller (1997-1999), divisions of The Thomson Corporation (information services provider); Senior Audit Manager (1994-1997), PricewaterhouseCoopers LLP. | | 214 | | Board Member and Treasurer, Our Daily Bread Ministries Canada (2015-Present); Board and Finance Committee Member, West Michigan Youth For Christ (2010-Present). |
| | | | | |
Donald H. Wilson - 1959
c/o Invesco Capital Management LLC
3500 Lacey Road, Suite 700 Downers Grove, IL 60515 | | Chairman of the Board and Trustee | | Chairman since 2012; Trustee since 2007 | | Chairman, President and Chief Executive Officer, McHenry Bancorp Inc. and McHenry Savings Bank (subsidiary) (2018-Present); formerly, Chairman and Chief Executive Officer, Stone Pillar Advisors, Ltd. (2010-2017); President and Chief Executive Officer, Stone Pillar Investments, Ltd. (advisory services to the financial sector) (2016- 2018); Chairman, President and Chief Executive Officer, Community Financial Shares, Inc. and Community Bank—Wheaton/Glen Ellyn (subsidiary) (2013-2015); Chief Operating Officer, AMCORE Financial, Inc. (bank holding company) (2007-2009); Executive Vice President and Chief Financial Officer, AMCORE Financial, Inc. (2006-2007); Senior Vice President and Treasurer, Marshall & Ilsley Corp. (bank holding company) (1995-2006). | | 214 | | Director, Penfield Children’s Center (2004-Present); Board Chairman, Gracebridge Alliance, Inc. (2015-Present). |
| * | This is the date the Independent Trustee began serving the Trust. Each Independent Trustee serves an indefinite term, until his or her successor is elected. |
| ** | Fund Complex includes all open- and closed-end funds (including all of their portfolios) advised by the Adviser and any affiliated person of the Adviser. |
Trustees and Officers–(continued)
The Interested Trustee and the executive officers of the Trust, their term of office and length of time served, their principal business occupations during at least the past five years, the number of portfolios in the Fund Complex (as defined below) overseen by the Interested Trustee and the other directorships, if any, held by the Interested Trustee are shown below.
| | | | | | | | | | |
Name, Address and Year of
Birth of Interested Trustee | | Position(s)
Held
with Trust | | Term of
Office
and
Length of
Time
Served* | | Principal
Occupation(s) During
Past 5 Years | | Number of
Portfolios
in Fund
Complex**
Overseen by
Interested
Trustee | | Other
Directorships
Held by
Interested
Trustee During
the Past 5 Years |
Kevin M. Carome –1956 Invesco Ltd.
Two Peachtree Pointe
1555 Peachtree St., N.E., Suite 1800
Atlanta, GA 30309 | | Trustee | | Since 2010 | | Senior Managing Director, Secretary and General Counsel, Invesco Ltd. (2007-Present); Director, Invesco Advisers, Inc. (2009-Present); Director (2006-Present) and Executive Vice President (2008-Present), Invesco North American Holdings, Inc.; Executive Vice President (2008-Present), Invesco Investments (Bermuda) Ltd.; Manager, Horizon Flight Works LLC; and Executive Vice President (2014-Present), INVESCO Asset Management (Bermuda) Ltd.; formerly, Director and Secretary (2012-2020), Invesco Services (Bahamas) Private Limited; Director, Invesco Finance PLC (2011-2019); Director, INVESCO Asset Management (Bermuda) Ltd. (2014-2019); Director and Executive Vice President, Invesco Finance, Inc. (2011-2018); Director (2006-2018) and Executive Vice President (2008-2018), Invesco Group Services, Inc., Invesco Holding Company (US), Inc.; Director, Invesco Holding Company Limited (2007- 2019); Director and Chairman, INVESCO Funds Group, Inc., Senior Vice President, Secretary and General Counsel, Invesco Advisers, Inc. (2003-2006); Director, Invesco Investments (Bermuda) Ltd. (2008- 2016); Senior Vice President and General Counsel, Liberty Financial Companies, Inc. (2000-2001); General Counsel of certain investment management subsidiaries of Liberty Financial Companies, Inc. (1998-2000); Associate General Counsel, Liberty Financial Companies, Inc. (1993-1998); Associate, Ropes & Gray LLP. | | 214 | | None |
| * | This is the date the Interested Trustee began serving the Trust. The Interested Trustee serves an indefinite term, until his successor is elected. |
| ** | Fund Complex includes all open- and closed-end funds (including all of their portfolios) advised by the Adviser and any affiliated person of the Adviser. |
Trustees and Officers–(continued)
| | | | | | |
Name, Address and Year of
Birth of Executive Officers | | Position(s)
Held
with Trust | | Length of
Time
Served* | | Principal
Occupation(s) During
Past 5 Years |
Anna Paglia–1974
Invesco Capital
Management LLC
3500 Lacey Road, Suite 700 Downers Grove, IL 60515 | | President and Principal Executive Officer | | Since 2020 | | President and Principal Executive Officer, Invesco Exchange-Traded Fund Trust, Invesco Exchange-Traded Fund Trust II, Invesco India Exchange-Traded Fund Trust, Invesco Actively Managed Exchange-Traded Fund Trust, Invesco Actively Managed Exchange-Traded Commodity Fund Trust and Invesco Exchange- Traded Self-Indexed Fund Trust (2020-Present); Managing Director and Global Head of ETFs and Indexed Strategies, Chief Executive Officer and Principal Executive Officer, Invesco Capital Management LLC (2020-Present); Chief Executive Officer, Manager and Principal Executive Officer, Invesco Specialized Products, LLC (2020-Present); Vice President, Invesco Indexing LLC (2020-Present);formerly, Secretary, Invesco Exchange-Traded Fund Trust, Invesco Exchange-Traded Fund Trust II, Invesco India Exchange-Traded Fund Trust and Invesco Actively Managed Exchange-Traded Fund Trust (2011-2020), Invesco Actively Managed Exchange-Traded Commodity Fund Trust (2014-2020) and Invesco Exchange-Traded Self-Indexed Fund Trust (2015-2020); Head of Legal (2010-2020) and Secretary (2015-2020), Invesco Capital Management LLC; Manager and Assistant Secretary, Invesco Indexing LLC (2017-2020); Head of Legal and Secretary, Invesco Specialized Products, LLC (2018-2020); Partner, K&L Gates LLP (formerly, Bell Boyd & Lloyd LLP) (2007-2010); and Associate Counsel at Barclays Global Investors Ltd. (2004-2006). |
| | | |
Kelli Gallegos–1970
Invesco Capital
Management LLC
11 Greenway Plaza, Suite 1000 Houston, TX 77046 | | Vice President and Treasurer | | Since 2018 | | Vice President, Invesco Advisers, Inc. (2020-Present); Principal Financial and Accounting Officer- Pooled Investments, Invesco Specialized Products, LLC (2018-Present); Vice President and Treasurer, Invesco Exchange-Traded Fund Trust, Invesco Exchange-Traded Fund Trust II, Invesco India Exchange-Traded Fund Trust, Invesco Actively Managed Exchange-Traded Fund Trust, Invesco Actively Managed Exchange-Traded Commodity Fund Trust and Invesco Exchange-Traded Self-Indexed Fund Trust (2018-Present); Principal Financial and Accounting Officer-Pooled Investments, Invesco Capital Management LLC (2018-Present); Vice President, Principal Financial Officer (2016-Present) and Assistant Treasurer (2008-Present), The Invesco Funds; formerly, Assistant Treasurer, Invesco Specialized Products, LLC (2018); Assistant Treasurer, Invesco Exchange-Traded Fund Trust, Invesco Exchange-Traded Fund Trust II, Invesco India Exchange-Traded Fund Trust and Invesco Actively Managed Exchange-Traded Fund Trust (2012-2018), Invesco Actively Managed Exchange-Traded Commodity Fund Trust (2014-2018) and Invesco Exchange-Traded Self-Indexed Fund Trust (2016-2018); Assistant Treasurer, Invesco Capital Management LLC (2013-2018); and Assistant Vice President, The Invesco Funds (2008-2016). |
| * | This is the date each Officer began serving the Trust in their current position. Each Officer serves an indefinite term, until his or her successor is elected. |
Trustees and Officers–(continued)
| | | | | | |
Name, Address and Year of Birth
of Executive Officers | | Position(s)
Held
with Trust | | Length of
Time
Served* | | Principal
Occupation(s) During
Past 5 Years |
Adam Henkel—1980
Invesco Capital
Management LLC 3500 Lacey Road, Suite 700 Downers Grove, IL 60515 | | Secretary | | Since 2020 | | Head of Legal – US ETFs and Secretary, Invesco Capital Management LLC (2020-Present); Head of Legal and Secretary, Invesco Specialized Products, LLC (2020-Present); Secretary, Invesco Exchange-Traded Fund Trust, Invesco Exchange-Traded Fund Trust II, Invesco India Exchange-Traded Fund Trust, Invesco Actively Managed Exchange-Traded Fund Trust, Invesco Actively Managed Exchange-Traded Commodity Fund Trust and Invesco Exchange- Traded Self-Indexed Fund Trust (2020-Present); Manager and Assistant Secretary, Invesco Indexing LLC (2020-Present); Assistant Secretary (2020-Present), Invesco Capital Markets, Inc. and Invesco Investment Advisers LLC; Assistant Secretary, The Invesco Funds (2014-Present); formerly, Assistant Secretary, Invesco Capital Management LLC (2015-2020) and Invesco Specialized Products, LLC (2018-2020); Assistant Secretary (2014-2020) and Chief Compliance Officer (2017-2017), Invesco Exchange- Traded Fund Trust, Invesco Exchange-Traded Fund Trust II, Invesco India Exchange-Traded Fund Trust and Invesco Actively Managed Exchange-Traded Fund Trust, Invesco Actively Managed Exchange-Traded Commodity Fund Trust and Invesco Exchange-Traded Self-Indexed Fund Trust. |
| | | |
Peter Hubbard—1981
Invesco Capital
Management LLC 3500 Lacey Road, Suite 700 Downers Grove, IL 60515 | | Vice President | | Since 2009 | | Vice President, Invesco Specialized Products, LLC (2018-Present); Vice President, Invesco Exchange-Traded Fund Trust, Invesco Exchange-Traded Fund Trust II, Invesco India Exchange-Traded Fund Trust, Invesco Actively Managed Exchange-Traded Fund Trust (2009-Present), Invesco Actively Managed Exchange-Traded Commodity Fund Trust (2014-Present) and Invesco Exchange-Traded Self-Indexed Fund Trust (2016-Present); Vice President and Director of Portfolio Management, Invesco Capital Management LLC (2010-Present); formerly, Vice President of Portfolio Management, Invesco Capital Management LLC (2008-2010); Portfolio Manager, Invesco Capital Management LLC (2007-2008); Research Analyst, Invesco Capital Management LLC (2005-2007); Research Analyst and Trader, Ritchie Capital, a hedge fund operator (2003-2005). |
| | | |
Sheri Morris—1964
Invesco Capital
Management LLC 11 Greenway Plaza, Suite 1000 Houston, TX 77046 | | Vice President | | Since 2012 | | Head of Global Fund Services, Invesco Ltd. (2019-Present); Vice President, OppenheimerFunds, Inc. (2019-Present); President and Principal Executive Officer, The Invesco Funds (2016-Present); Treasurer, The Invesco Funds (2008-Present); Vice President, Invesco Advisers, Inc. (formerly known as Invesco Institutional (N.A.), Inc.) (registered investment adviser) (2009-Present) and Vice President, Invesco Exchange-Traded Fund Trust, Invesco Exchange- Traded Fund Trust II, Invesco India Exchange-Traded Fund Trust, Invesco Actively Managed Exchange-Traded Fund Trust (2012-Present), Invesco Actively Managed Exchange-Traded Commodity Fund Trust (2014-Present) and Invesco Exchange-Traded Self-Indexed Fund Trust (2016-Present); formerly, Vice President and Principal Financial Officer, The Invesco Funds (2008-2016); Treasurer, Invesco Exchange-Traded Fund Trust, Invesco Exchange-Traded Fund Trust II, Invesco India Exchange-Traded Fund Trust and Invesco Actively Managed Exchange-Traded Fund Trust (2011-2013); Vice President, Invesco Aim Advisers, Inc., Invesco Aim Capital Management, Inc. and Invesco Aim Private Asset Management, Inc.; Assistant Vice President and Assistant Treasurer, The Invesco Funds and Assistant Vice President, Invesco Advisers, Inc., Invesco Aim Capital Management, Inc. and Invesco Aim Private Asset Management, Inc. |
| * | This is the date each Officer began serving the Trust in their current position. Each Officer serves an indefinite term, until his or her successor is elected. |
Trustees and Officers–(continued)
| | | | | | |
Name, Address and Year of Birth
of Executive Officers | | Position(s)
Held
with Trust | | Length of
Time
Served* | | Principal
Occupation(s) During
Past 5 Years |
Rudolf E. Reitmann–1971
Invesco Capital Management LLC
3500 Lacey Road, Suite 700 Downers Grove, IL 60515 | | Vice President | | Since 2013 | | Head of Global Exchange Traded Funds Services, Invesco Specialized Products, LLC (2018-Present); Vice President, Invesco Exchange-Traded Fund Trust, Invesco Exchange-Traded Fund Trust II, Invesco India Exchange-Traded Fund Trust, Invesco Actively Managed Exchange-Traded Fund Trust (2013-Present), Invesco Actively Managed Exchange-Traded Commodity Fund Trust (2014-Present) and Invesco Exchange-Traded Self-Indexed Fund Trust (2016-Present); Head of Global Exchange Traded Funds Services, Invesco Capital Management LLC (2013-Present); Vice President, Invesco Capital Markets, Inc. (2018-Present). |
| | | |
Melanie Zimdars–1976
Invesco Capital Management LLC
3500 Lacey Road, Suite 700 Downers Grove, IL 60515 | | Chief Compliance Officer | | Since 2017 | | Chief Compliance Officer, Invesco Specialized Products, LLC (2018-Present); Chief Compliance Officer, Invesco Capital Management LLC (2017-Present); Chief Compliance Officer, Invesco Exchange-Traded Fund Trust, Invesco Exchange-Traded Fund Trust II, Invesco India Exchange-Traded Fund Trust, Invesco Actively Managed Exchange-Traded Fund Trust, Invesco Actively Managed Exchange-Traded Commodity Fund Trust and Invesco Exchange- Traded Self-Indexed Fund Trust (2017-Present); formerly, Vice President and Deputy Chief Compliance Officer, ALPS Holding, Inc. (2009-2017); Mutual Fund Treasurer/ Chief Financial Officer, Wasatch Advisors, Inc. (2005-2008); Compliance Officer, U.S. Bancorp Fund Services, LLC (2001-2005). |
| * | This is the date each Officer began serving the Trust in their current position. Each Officer serves an indefinite term, until his or her successor is elected. |
Availability of Additional Information About the Trustees
The Statement of Additional Information includes additional information about the Trustees and is available, without charge, upon request at (800) 983-0903.
Approval of Investment Advisory and Sub-Advisory Contracts
At a meeting held on April 14, 2020, the Board of Trustees of the Invesco Exchange-Traded Fund Trust II (the “Trust”), including the Independent Trustees, approved the continuation of the Investment Advisory Agreement between Invesco Capital Management LLC (the “Adviser”) and the Trust for the following 71 series (each, a “Fund” and collectively, the “Funds”):
Invesco 1-30 Laddered Treasury ETF
Invesco California AMT-Free Municipal Bond ETF
Invesco CEF Income Composite ETF
Invesco China Technology ETF
Invesco DWA Developed Markets Momentum ETF
Invesco DWA Emerging Markets Momentum ETF
Invesco DWA SmallCap Momentum ETF
Invesco Emerging Markets Sovereign Debt ETF
Invesco FTSE International Low Beta Equal Weight ETF
Invesco FTSE RAFI Developed Markets ex-U.S. ETF
Invesco FTSE RAFI Developed Markets ex-U.S. Small-Mid ETF
Invesco FTSE RAFI Emerging Markets ETF
Invesco Fundamental High Yield® Corporate Bond ETF
Invesco Fundamental Investment Grade Corporate Bond ETF
Invesco Global Clean Energy ETF
Invesco Global Short Term High Yield Bond ETF
Invesco Global Water ETF
Invesco International BuyBack Achievers™ ETF
Invesco International Corporate Bond ETF
Invesco KBW Bank ETF
Invesco KBW High Dividend Yield Financial ETF
Invesco KBW Premium Yield Equity REIT ETF
Invesco KBW Property & Casualty Insurance ETF
Invesco KBW Regional Banking ETF
Invesco National AMT-Free Municipal Bond ETF
Invesco New York AMT-Free Municipal Bond ETF
Invesco Preferred ETF
Invesco PureBetaSM 0-5 Yr US TIPS ETF
Invesco PureBetaSM FTSE Developed ex-North America ETF
Invesco PureBetaSM FTSE Emerging Markets ETF
Invesco PureBetaSM MSCI USA ETF
Invesco PureBetaSM MSCI USA Small Cap ETF
Invesco PureBetaSM US Aggregate Bond ETF
Invesco Russell 1000 Enhanced Equal Weight ETF
Invesco Russell 1000 Equal Weight ETF
Invesco Russell 1000 Low Beta Equal Weight ETF
Invesco S&P 500 Enhanced Value ETF
Invesco S&P 500® ex-Rate Sensitive Low Volatility ETF
Invesco S&P 500® High Beta ETF
Invesco S&P 500® High Dividend Low Volatility ETF
Invesco S&P 500® Low Volatility ETF
Invesco S&P 500 Minimum Variance ETF
Invesco S&P 500 Momentum ETF
Invesco S&P 500 Revenue ETF
Invesco S&P Emerging Markets Low Volatility ETF
Invesco S&P Emerging Markets Momentum ETF
Invesco S&P International Developed High Dividend Low Volatility ETF
Invesco S&P International Developed Low Volatility ETF
Invesco S&P International Developed Momentum ETF
Invesco S&P International Developed Quality ETF
Invesco S&P MidCap 400 Revenue ETF
Invesco S&P MidCap Low Volatility ETF
Invesco S&P SmallCap 600 Revenue ETF
Invesco S&P SmallCap Consumer Discretionary ETF
Invesco S&P SmallCap Consumer Staples ETF
Invesco S&P SmallCap Energy ETF
Invesco S&P SmallCap Financials ETF
Invesco S&P SmallCap Health Care ETF
Invesco S&P SmallCap High Dividend Low Volatility ETF
Invesco S&P SmallCap Industrials ETF
Invesco S&P SmallCap Information Technology ETF
Invesco S&P SmallCap Low Volatility ETF
Invesco S&P SmallCap Materials ETF
Invesco S&P SmallCap Quality ETF
Invesco S&P SmallCap Utilities & Communication Services ETF
Invesco S&P Ultra Dividend Revenue ETF
Invesco Senior Loan ETF
Invesco Taxable Municipal Bond ETF
Invesco Treasury Collateral ETF
Invesco Variable Rate Preferred ETF
Invesco VRDO Tax-Free Weekly ETF
Also at the April 14, 2020 meeting, the Board of Trustees of the Trust, including the Independent Trustees, approved the continuation of the Investment Sub-Advisory Agreement between the Adviser and the following seven affiliated sub-advisers for each of Invesco Senior Loan ETF and Invesco Treasury Collateral ETF (the “Sub-Advisory Agreement”): Invesco Advisers, Inc.; Invesco Asset Management Deutschland, GmbH; Invesco Asset Management Limited; Invesco Asset Management (Japan) Limited; Invesco Hong Kong Limited; Invesco Senior Secured Management, Inc.; and Invesco Canada Ltd. (each, a “Sub-Adviser” and collectively, the “Sub-Advisers”).
Investment Advisory Agreement
The Trustees reviewed information from the Adviser describing: (i) the nature, extent and quality of services provided, (ii) the investment performance of each Fund and the Adviser, (iii) the fees paid by the Funds and comparisons to amounts paid by other comparable registered investment companies, (iv) the costs of services provided and estimated profits realized by the Adviser, (v) the extent to which economies of scale may be realized as a Fund grows and whether fee levels reflect any possible economies of
Approval of Investment Advisory and Sub-Advisory Contracts–(continued)
scale for the benefit of Fund shareholders, and (vi) any further benefits realized by the Adviser or its affiliates from the Adviser’s relationship with the Funds.
Nature, Extent and Quality of Services. In evaluating the nature, extent and quality of the Adviser’s services, the Trustees reviewed information concerning the functions performed by the Adviser for the Funds, information describing the Adviser’s current organization and staffing, including operational support provided by the Adviser’s parent organization, Invesco Ltd. (“Invesco”), and the background and experience of the persons responsible for the day-to-day management of the Funds. The Trustees reviewed matters related to the Adviser’s execution and/or oversight of execution of portfolio transactions on behalf of the Funds. The Trustees also reviewed information on the performance of the Funds and their underlying indexes for the one-year, three-year, five-year, ten-year and since-inception periods ended December 31, 2019, as applicable, including reports for each of those periods on the correlation and tracking error between each Fund’s performance and the performance of its underlying index, as well as the Adviser’s analysis of the tracking error and correlation between certain Funds and their underlying indexes. In reviewing the tracking error reports, the Trustees considered information provided by Invesco’s independent performance and risk management group with respect to general expected tracking error ranges. The Trustees also considered that certain Funds were created in connection with the purchases by Invesco of the exchange-traded funds businesses of Guggenheim Capital LLC on April 6, 2018 and Massachusetts Mutual Life Insurance Company (“Oppenheimer”) on May 24, 2019 (each, a “Transaction”), and that each such Fund’s performance prior to the closing of the applicable Transaction is that of its predecessor Guggenheim ETF or Oppenheimer ETF. The Trustees noted that, for each applicable period, the correlation for each Fund, other than the five-year and since-inception periods for Invesco Global Short Term High Yield Bond ETF and the one-year and ten-year periods for Invesco VRDO Tax-Free Weekly ETF, was within the targeted range set forth in the Trust’s registration statement. The Trustees reviewed the reasons provided by the Adviser for Invesco Global Short Term High Yield Bond ETF’s and Invesco VRDO Tax-Free Weekly ETF’s level of correlation to its underlying index, as well as the Adviser’s expectations for each Fund’s correlation going forward. The Trustees noted that, for each applicable period, the tracking error for all Funds was within the targeted range set forth in the Trust’s registration statement and concluded that each Fund’s correlation to its underlying index and the tracking error for each Fund were within an acceptable range given that Fund’s particular circumstances.
The Trustees considered the services provided by the Adviser in its oversight of the Funds’ administrator, custodian and transfer agent. They noted the significant amount of time, effort and resources that had been devoted to this oversight function.
Based on their review, the Trustees concluded that the nature, extent and quality of services provided by the Adviser to the Funds under the Investment Advisory Agreement were appropriate and reasonable.
Fees, Expenses and Profitability. The Trustees reviewed and discussed the information provided by the Adviser on each Fund’s net expense ratio and unitary advisory fee. The Trustees noted that the annual advisory fee charged to each Fund, as set forth below, is a unitary advisory fee and that the Adviser pays all other operating expenses of each Fund, including the fees payable to the Sub-Advisers for Invesco Senior Loan ETF and Invesco Treasury Collateral ETF, except that each Fund pays its brokerage expenses, taxes, interest (including, for Invesco Senior Loan ETF, interest expenses associated with its line of credit), litigation expenses and other extraordinary expenses (including acquired fund fees and expenses, if any).
| | ● | | 0.04%: Invesco PureBetaSM MSCI USA ETF |
| | ● | | 0.05%: Invesco PureBetaSM US Aggregate Bond ETF |
| | ● | | 0.06%: Invesco PureBetaSM MSCI USA Small Cap ETF |
| | ● | | 0.07%: Invesco PureBetaSM 0-5 Yr US TIPS ETF, Invesco PureBetaSM FTSE Developed ex-North America ETF |
| | ● | | 0.08%: Invesco Treasury Collateral ETF |
| | ● | | 0.10%: Invesco S&P 500 Minimum Variance ETF |
| | ● | | 0.13%: Invesco S&P 500 Enhanced Value ETF, Invesco S&P 500 Momentum ETF |
| | ● | | 0.14%: Invesco PureBetaSM FTSE Emerging Markets ETF |
| | ● | | 0.20%: Invesco Russell 1000 Equal Weight ETF |
| | ● | | 0.22%: Invesco Fundamental Investment Grade Corporate Bond ETF |
Approval of Investment Advisory and Sub-Advisory Contracts–(continued)
| | ● | | 0.25%: Invesco 1-30 Laddered Treasury ETF, Invesco S&P 500® ex-Rate Sensitive Low Volatility ETF, Invesco S&P 500® High Beta ETF, Invesco S&P 500® Low Volatility ETF, Invesco S&P MidCap Low Volatility ETF, Invesco S&P SmallCap Low Volatility ETF, Invesco VRDO Tax-Free Weekly ETF |
| | ● | | 0.28%: Invesco California AMT-Free Municipal Bond ETF, Invesco National AMT-Free Municipal Bond ETF, Invesco New York AMT-Free Municipal Bond ETF, Invesco Taxable Municipal Bond ETF |
| | ● | | 0.29%: Invesco Russell 1000 Enhanced Equal Weight ETF, Invesco S&P International Developed Quality ETF, Invesco S&P SmallCap Consumer Discretionary ETF, Invesco S&P SmallCap Consumer Staples ETF, Invesco S&P SmallCap Energy ETF, Invesco S&P SmallCap Financials ETF, Invesco S&P SmallCap Health Care ETF, Invesco S&P SmallCap Industrials ETF, Invesco S&P SmallCap Information Technology ETF, Invesco S&P SmallCap Materials ETF, Invesco S&P SmallCap Quality ETF, Invesco S&P SmallCap Utilities & Communication Services ETF |
| | ● | | 0.30%: Invesco S&P 500® High Dividend Low Volatility ETF, Invesco S&P International Developed High Dividend Low Volatility ETF, Invesco S&P SmallCap High Dividend Low Volatility ETF |
| | ● | | 0.35%: Invesco Global Short Term High Yield Bond ETF, Invesco KBW Bank ETF, Invesco KBW High Dividend Yield Financial ETF, Invesco KBW Premium Yield Equity REIT ETF, Invesco KBW Property & Casualty Insurance ETF, Invesco KBW Regional Banking ETF, Invesco Russell 1000 Low Beta Equal Weight ETF, Invesco S&P International Developed Low Volatility ETF, Invesco S&P International Developed Momentum ETF |
| | ● | | 0.39%: Invesco S&P 500 Revenue ETF, Invesco S&P MidCap 400 Revenue ETF, Invesco S&P SmallCap 600 Revenue ETF, Invesco S&P Ultra Dividend Revenue ETF |
| | ● | | 0.45%: Invesco FTSE International Low Beta Equal Weight ETF, Invesco FTSE RAFI Developed Markets ex-U.S. ETF, Invesco S&P Emerging Markets Low Volatility ETF, Invesco S&P Emerging Markets Momentum ETF |
| | ● | | 0.49%: Invesco FTSE RAFI Developed Markets ex-U.S. Small-Mid ETF, Invesco FTSE RAFI Emerging Markets ETF |
| | ● | | 0.50%: Invesco CEF Income Composite ETF, Invesco Emerging Markets Sovereign Debt ETF, Invesco Fundamental High Yield® Corporate Bond ETF, Invesco International Corporate Bond ETF, Invesco Preferred ETF, Invesco Variable Rate Preferred ETF |
| | ● | | 0.55%: Invesco International BuyBack AchieversTM ETF |
| | ● | | 0.60%: Invesco DWA SmallCap Momentum ETF |
| | ● | | 0.65%: Invesco Senior Loan ETF |
| | ● | | 0.70%: Invesco China Technology ETF |
| | ● | | 0.75%: Invesco Global Clean Energy ETF, Invesco Global Water ETF |
| | ● | | 0.80%: Invesco DWA Developed Markets Momentum ETF |
| | ● | | 0.90%: Invesco DWA Emerging Markets Momentum ETF |
The Trustees considered that, effective May 1, 2020, the Adviser had agreed to reduce the unitary advisory fee for Invesco S&P Emerging Markets Low Volatility ETF and Invesco S&P Emerging Markets Momentum ETF from 0.45% to 0.29% of average daily net assets, and to reduce the unitary advisory fee for Invesco S&P International Developed Low Volatility ETF and Invesco S&P International Developed Momentum ETF from 0.35% to 0.25% of average daily net assets.
The Trustees compared each Fund’s net expense ratio to information compiled by the Adviser from Lipper Inc. databases on the net expense ratios of comparable exchange-traded funds (“ETFs”), open-end (non-ETF) index funds and open-end (non-ETF) actively-managed funds, as applicable. The Trustees noted that the net expense ratios for certain Funds were equal to or lower than the median net expense ratios of their ETF and open-end index peer funds as illustrated in the table below. The Trustees also noted that the net expense ratios for all of the Funds were lower than the median net expense ratios of their open-end
Approval of Investment Advisory and Sub-Advisory Contracts–(continued)
actively-managed peer funds. The Trustees noted that a portion of each Fund’s operating expenses was attributable to a sub-license fee payable out of the unitary advisory fee charged to that Fund.
| | | | | | |
| Invesco Fund | | Equal
to/Lower
than ETF
Peer Median | | Equal to/Lower
than Open-End
Index Fund
Peer Median* | | Lower than
Open-Active Fund
Peer Median |
Invesco 1-30 Laddered Treasury ETF | | | | | | X |
Invesco California AMT-Free Municipal Bond ETF | | | | N/A | | X |
Invesco CEF Income Composite ETF | | X | | N/A | | X |
Invesco China Technology ETF | | | | N/A | | X |
Invesco DWA Developed Markets Momentum ETF | | | | | | X |
Invesco DWA Emerging Markets Momentum ETF | | | | | | X |
Invesco DWA SmallCap Momentum ETF | | | | | | X |
Invesco Emerging Markets Sovereign Debt ETF | | | | | | X |
Invesco FTSE International Low Beta Equal Weight ETF | | X | | X | | X |
Invesco FTSE RAFI Developed Markets ex-U.S. ETF | | | | X | | X |
Invesco FTSE RAFI Developed Markets ex-U.S. Small-Mid ETF | | X | | X | | X |
Invesco FTSE RAFI Emerging Markets ETF | | X | | | | X |
Invesco Fundamental High Yield® Corporate Bond ETF | | | | X | | X |
Invesco Fundamental Investment Grade Corporate Bond ETF | | | | | | X |
Invesco Global Clean Energy ETF | | | | N/A | | X |
Invesco Global Short Term High Yield Bond ETF | | X | | N/A | | X |
Invesco Global Water ETF | | | | N/A | | X |
Invesco International BuyBack AchieversTM ETF | | X | | X | | X |
Invesco International Corporate Bond ETF | | | | | | X |
Invesco KBW Bank ETF | | X | | | | X |
Invesco KBW High Dividend Yield Financial ETF | | X | | | | X |
Invesco KBW Premium Yield Equity REIT ETF | | X | | | | X |
Invesco KBW Property & Casualty Insurance ETF | | X | | | | X |
Invesco KBW Regional Banking ETF | | X | | | | X |
Invesco National AMT-Free Municipal Bond ETF | | | | | | X |
Invesco New York AMT-Free Municipal Bond ETF | | | | N/A | | X |
Invesco Preferred ETF | | | | N/A | | X |
Invesco PureBetaTM 0-5 Yr US TIPS ETF | | | | | | X |
Invesco PureBetaTM FTSE Developed ex-North America ETF | | | | | | X |
Invesco PureBetaTM FTSE Emerging Markets ETF | | X | | | | X |
Invesco PureBetaTM MSCI USA ETF | | X | | X | | X |
Invesco PureBetaTM MSCI USA Small Cap ETF | | X | | X | | X |
Invesco PureBetaTM US Aggregate Bond ETF | | X | | X | | X |
Invesco Russell 1000 Enhanced Equal Weight ETF | | X | | X | | X |
Invesco Russell 1000 Equal Weight ETF | | X | | X | | X |
Invesco Russell 1000 Low Beta Equal Weight ETF | | | | X | | X |
Invesco S&P 500 Enhanced Value ETF | | X | | X | | X |
Invesco S&P 500® ex-Rate Sensitive Low Volatility ETF | | X | | X | | X |
Invesco S&P 500® High Beta ETF | | X | | X | | X |
Invesco S&P 500® High Dividend Low Volatility ETF | | X | | X | | X |
Invesco S&P 500® Low Volatility ETF | | X | | | | X |
Invesco S&P 500 Minimum Variance ETF | | X | | X | | X |
Invesco S&P 500 Momentum ETF | | | | X | | X |
Approval of Investment Advisory and Sub-Advisory Contracts–(continued)
| | | | | | |
| Invesco Fund | | Equal
to/Lower
than ETF
Peer Median | | Equal to/Lower
than Open-End
Index Fund
Peer Median* | | Lower than
Open-Active Fund
Peer Median |
Invesco S&P 500 Revenue ETF | | | | X | | X |
Invesco S&P Emerging Markets Low Volatility ETF | | X | | X | | X |
Invesco S&P Emerging Markets Momentum ETF | | X | | | | X |
Invesco S&P International Developed High Dividend Low Volatility ETF | | X | | | | X |
Invesco S&P International Developed Low Volatility ETF | | X | | | | X |
Invesco S&P International Developed Momentum ETF | | | | | | X |
Invesco S&P International Developed Quality ETF | | X | | | | X |
Invesco S&P MidCap 400 Revenue ETF | | | | | | X |
Invesco S&P MidCap Low Volatility ETF | | | | | | X |
Invesco S&P SmallCap 600 Revenue ETF | | | | X | | X |
Invesco S&P SmallCap Consumer Discretionary ETF | | X | | | | X |
Invesco S&P SmallCap Consumer Staples ETF | | X | | | | X |
Invesco S&P SmallCap Energy ETF | | X | | | | X |
Invesco S&P SmallCap Financials ETF | | X | | | | X |
Invesco S&P SmallCap Health Care ETF | | X | | | | X |
Invesco S&P SmallCap High Dividend Low Volatility ETF | | X | | X | | X |
Invesco S&P SmallCap Industrials ETF | | X | | | | X |
Invesco S&P SmallCap Information Technology ETF | | X | | X | | X |
Invesco S&P SmallCap Low Volatility ETF | | X | | X | | X |
Invesco S&P SmallCap Materials ETF | | X | | | | X |
Invesco S&P SmallCap Quality ETF | | X | | | | X |
Invesco S&P SmallCap Utilities & Communication Services ETF | | X | | X | | X |
Invesco S&P Ultra Dividend Revenue ETF | | | | X | | X |
Invesco Senior Loan ETF | | | | X | | X |
Invesco Taxable Municipal Bond ETF | | | | N/A | | X |
Invesco Treasury Collateral ETF | | X | | | | X |
Invesco Variable Rate Preferred ETF | | | | X | | X |
Invesco VRDO Tax-Free Weekly ETF | | | | N/A | | X |
| * | The information provided by the Adviser indicated that certain Funds did not have any comparable open-end index fund peers. Those Funds have been designated in this column with an “N/A” for not available. |
In response to questions from the Independent Trustees, the Adviser provided supplemental information regarding each of Invesco 1-30 Laddered Treasury ETF, Invesco California AMT-Free Municipal Bond ETF, Invesco DWA Developed Markets Momentum ETF, Invesco Emerging Markets Sovereign Debt ETF, Invesco Global Clean Energy ETF, Invesco Global Water ETF, Invesco International Corporate Bond ETF, Invesco National AMT-Free Municipal Bond ETF, Invesco New York AMT-Free Municipal Bond ETF, Invesco Senior Loan ETF and Invesco VRDO Tax-Free Weekly ETF’s advisory fees and total expenses and the Lipper peer data. The Adviser explained its view that the advisory fees and total expenses for these Funds are competitive and generally in line with other comparable funds in the marketplace, particularly in light of the level and nature of services provided and the investment management style of the Adviser. The Trustees also considered the Adviser’s statements regarding its pricing philosophy and the differing pricing philosophy of certain of the peers.
The Trustees noted information, including fee information, provided by the Adviser regarding other investment products to which it provides investment advisory services, including products that have investment strategies comparable to certain of the Funds. The Trustees considered the Adviser’s explanation of the differences between the services provided to the Funds and to the other investment products it advises, noting the Adviser’s statement that the management and oversight of the Funds requires substantially more labor and expense.
Approval of Investment Advisory and Sub-Advisory Contracts–(continued)
Based on all the information provided, the Board concluded that each Fund’s unitary advisory fee was reasonable and appropriate in light of the services provided, the nature of the indexes, the distinguishing factors of the Funds, and the administrative, operational and management oversight costs for the Adviser.
In conjunction with their review of the unitary advisory fees, the Trustees considered information provided by the Adviser on the revenues received by the Adviser under the Investment Advisory Agreement for the Funds. The Trustees reviewed information provided by the Adviser on its overall profitability, as well as the estimated profitability to the Adviser from its relationship to each Fund. The Trustees concluded that the overall and estimated profitability to the Adviser was not unreasonable.
Economies of Scale and Whether Fee Levels Reflect These Economies of Scale. The Trustees reviewed the information provided by the Adviser as to the extent to which economies of scale may be realized as each Fund grows and whether fee levels reflect economies of scale for the benefit of shareholders. The Trustees reviewed each Fund’s asset size and unitary advisory fee. The Trustees noted that any reduction in fixed costs associated with the management of the Funds would be enjoyed by the Adviser, but a unitary advisory fee provides a level of certainty in expenses for the Funds. The Trustees considered whether the unitary advisory fee rate for each Fund was reasonable in relation to the asset size of that Fund, and concluded that the unitary advisory fee was reasonable and appropriate.
Fall-out Benefits. The Trustees considered that the Adviser identified no additional benefits it receives from its relationship with the Funds, and noted that the Adviser does not have any soft-dollar arrangements. The Trustees also considered benefits received by affiliates of the Adviser that may be directly or indirectly attributed to the Adviser’s relationship with the Funds, including brokerage fees and advisory fees for money market cash management vehicles. The Board concluded that the advisory fee was reasonable, taking into account any ancillary benefits received by affiliates of the Adviser.
Based on all of the information considered and the conclusions reached, the Board, including the Independent Trustees, determined to approve the continuation of the Investment Advisory Agreement for each Fund. No single factor was determinative in the Board’s analysis.
Investment Sub-Advisory Agreement
As noted above, the Board of Trustees of the Trust, including the Independent Trustees, approved the continuation of the Sub-Advisory Agreement for each of Invesco Senior Loan ETF and Invesco Treasury Collateral ETF at a meeting held on April 14, 2020. The review process followed by the Board is described in detail above. In connection with the review of the Sub-Advisory Agreement, the Board considered the factors described below, among others.
Nature, Extent and Quality of Services. The Trustees considered the nature, extent and quality of services provided under the Sub-Advisory Agreement. The Board reviewed the qualifications and background of each Sub-Adviser, the services provided or to be provided by each Sub-Adviser, the investment approach of the Sub-Adviser whose investment personnel manage Invesco Senior Loan ETF’s and Invesco Treasury Collateral ETF’s assets, the experience and skills of the investment personnel responsible for the day-to-day management of the Funds, and the resources made available to such personnel.
Based on their review, the Trustees concluded that the nature, extent and quality of services provided by the Sub-Advisers to Invesco Senior Loan ETF and Invesco Treasury Collateral ETF under the Sub-Advisory Agreement were appropriate and reasonable.
Fees, Expenses and Profitability. The Trustees reviewed and discussed the information provided by the Adviser and the Sub-Advisers on the sub-advisory fee rates under the Sub-Advisory Agreement. The Trustees noted that the sub-advisory fees charged by the Sub-Advisers under the Sub-Advisory Agreement are consistent with the compensation structure used throughout Invesco when Invesco’s affiliates provide sub-advisory services for funds managed by other Invesco affiliates. The Board considered how the sub-advisory fees relate to the overall advisory fee for each of Invesco Senior Loan ETF and Invesco Treasury Collateral ETF and noted that the Adviser compensates the Sub-Advisers from its fee.
The Trustees also reviewed the financial statements provided by Invesco Senior Secured Management, Inc., in connection with the March 12, 2020 Board meeting, and Invesco Advisers, Inc., in connection with the April 14, 2020 meeting, and noted the net income generated by each firm. The Trustees noted that the Adviser compensates the Sub-Advisers from its fee and that the Adviser provided profitability information with respect to Invesco Senior Loan ETF and Invesco Treasury Collateral ETF.
Approval of Investment Advisory and Sub-Advisory Contracts–(continued)
Economies of Scale and Whether Fee Levels Reflect These Economies of Scale. As part of their review of the Investment Advisory Agreement for Invesco Senior Loan ETF and Invesco Treasury Collateral ETF, the Trustees considered the extent to which economies of scale may be realized as the Funds grow and whether fee levels reflect economies of scale for the benefit of shareholders. The Trustees considered whether the sub-advisory fee rates for Invesco Senior Loan ETF and Invesco Treasury Collateral ETF were reasonable in relation to the asset size of the Funds, and concluded that the flat sub-advisory fee rates were reasonable and appropriate.
Fall-out Benefits. The Trustees noted that Invesco Advisers, Inc. receives management fees from money market funds into which the Funds’ and other Invesco ETFs’ excess cash and securities lending collateral may be invested, and that the Adviser waives its fees on the excess cash invested under such arrangement in amounts equal to fees received by Invesco Advisers, Inc. on the Funds’ and other Invesco ETFs’ excess cash invested in the money market funds. The Trustees noted that the Sub-Advisers had not identified any further benefits that they derived from their relationships with Invesco Senior Loan ETF and Invesco Treasury Collateral ETF and that the Sub-Advisers do not have any soft-dollar arrangements with respect to the Funds. The Board concluded that the sub-advisory fee with respect to each Fund was reasonable, taking into account any ancillary benefits received by the Sub-Advisers.
Based on all of the information considered and the conclusions reached, the Board, including the Independent Trustees, determined to approve the continuation of the Sub-Advisory Agreement for Invesco Senior Loan ETF and Invesco Treasury Collateral ETF. No single factor was determinative in the Board’s analysis.
(This Page Intentionally Left Blank)
(This Page Intentionally Left Blank)
Proxy Voting Policies and Procedures
A description of the Trust’s proxy voting policies and procedures that the Funds use to determine how to vote proxies relating to portfolio securities is available, without charge and upon request, by calling (800) 983-0903. This information is also available on the Securities and Exchange Commission’s (the “Commission”) website at www.sec.gov.
Information regarding how each Fund voted proxies for portfolio securities, if applicable, during the most recent 12-month period ended June 30, is available, without charge and upon request, by (i) calling (800) 983-0903; or (ii) accessing the Trust’s Form N-PX on the Commission’s website at www.sec.gov.
Quarterly Portfolios
The Trust files its complete schedule of portfolio holdings for the Funds with the Commission for the first and third quarters of each fiscal year as an exhibit to its reports on Form N-PORT. The Forms N-PORT are available on the Commission’s website at www.sec.gov.
Frequency Distribution of Discounts and Premiums
A table showing the number of days the market price of each Fund’s shares was greater than the Fund’s net asset value, and the number of days it was less than the Fund’s net asset value (i.e., premium or discount) for the most recently completed calendar year, and the calendar quarters since that year end (or the life of the Fund, if shorter) may be found at the Fund’s website at www.invesco.com/ETFs.
©2020 Invesco Capital Management LLC
3500 Lacey Road, Suite 700
Downers Grove, IL 60515 P-TRST2-HBLV-AR- 1 invesco.com/ETFs

| | |
| Invesco Annual Report to Shareholders |
| August 31, 2020 |
| |
| RWL | | Invesco S&P 500 Revenue ETF |
| |
| RWK | | Invesco S&P MidCap 400 Revenue ETF |
| |
| RWJ | | Invesco S&P SmallCap 600 Revenue ETF |
| |
| RDIV | | Invesco S&P Ultra Dividend Revenue ETF |
Beginning on January 1, 2021, as permitted by regulations adopted by the Securities and Exchange Commission, paper copies of the Funds’ shareholder reports will no longer be sent by mail, unless you specifically request paper copies of the reports from your financial intermediary, such as a broker-dealer or bank. Instead, the reports will be made available on a website, and you will be notified by mail each time a report is posted and provided with a website link to access the report.
If you already elected to receive shareholder reports electronically, you will not be affected by this change and you need not take any action. If you hold accounts through a financial intermediary, you may contact your financial intermediary to enroll in electronic delivery. Please note that not all financial intermediaries may offer this service.
You may elect to receive all future reports in paper free of charge. If you hold accounts through a financial intermediary, you can follow the instructions included with this disclosure, if applicable, or contact your financial intermediary to request that you continue to receive paper copies of your shareholder reports. Please note that not all financial intermediaries may offer this service. Your election to receive reports in paper will apply to all funds held with your financial intermediary

Table of Contents
The Market Environment
Global Equity
At the start of the fiscal year, global equity markets faced volatility, hampered by US and China trade issues, potential for new tariffs and weakening global economic growth. Disagreement within the UK regarding its withdrawal from the European Union increased uncertainty for the UK and eurozone economies.
Macroeconomic and geopolitical issues mostly abated during the fourth quarter of 2019, providing a favorable backdrop for global equity returns. In response to third quarter economic weakness, central banks maintained accommodative policies. Better economic data and signs of progress in US and China trade talks also supported global equities. The UK’s general election in December delivered a decisive victory to the conservative party, reaffirming the original Brexit vote and the UK’s eventual exit from the European Union.
Global equity markets started 2020 buoyed by positive economic data and the signing of the phase one US-China trade deal. However, initial optimism was dampened by the outbreak of the new coronavirus (COVID-19) that swiftly spread from China to other global regions. Global equity markets fell sharply as the human and economic cost of the COVID-19 pandemic mounted. At the same time, oil prices fell sharply as a price war between Saudi Arabia and Russia threatened to boost supply even as demand was falling. The US bull market came to an abrupt end, while global equity markets also fell sharply. As fear of a worldwide recession increased, central banks around the world took aggressive action to support both local markets and the global economy.
Despite the continuing global spread of COVID-19, many countries achieved some success in controlling the spread and were able to slowly re-open their economies. Global equity markets benefited from government policy responses to the crisis, which were swift and encouraging. Many economies received fiscal stimulus and very significant monetary stimulus. The massive monetary policy response created an environment in which investors embraced risk, and stocks rose globally after a deep rout in the first quarter. In this environment, global equity markets, both developed and emerging, ended the fiscal year in positive territory.
| | |
 | | Management’s Discussion of Fund Performance Invesco S&P 500 Revenue ETF (RWL) |
As an index fund, the Invesco S&P 500® Revenue ETF (the “Fund”) seeks to track the investment results (before fees and expenses) of the S&P 500® Revenue-Weighted Index (the “Index”). The Fund generally will invest at least 90% of its total assets in the securities that comprise the Index.
Strictly in accordance with its guidelines and mandated procedures, S&P Dow Jones Indices (“S&P DJI” or the “Index Provider”) compiles, maintains, and calculates the Index, which includes positive revenue producing constituent securities of the S&P 500® Index (the “Parent Index”). Unlike the Parent Index, which employs a market-capitalization weighted methodology, the Index weights each constituent security based on the sum of the company’s revenues for the trailing four quarters, subject to a maximum 5% per company weighting. The Fund generally invests in all of the securities comprising the Index in proportion to their weightings in the Index.
For the fiscal year ended August 31, 2020, on a market price basis, the Fund returned 9.26%. On a net asset value (“NAV”) basis, the Fund returned 9.09%. During the same time period, the Index returned 9.41%. During the fiscal year, the Fund fully replicated the components of the Index; therefore, the Fund’s performance, on a NAV basis, differed from the return of the Index primarily due to fees and operating expenses incurred by the Fund during the period, which were partially offset by the Fund holding cash to pay distributions in March, which coincided with the overall market decline. During the same time period, the Parent Index returned 21.94%.
For the fiscal year ended August 31, 2020, the information technology sector contributed most significantly to the Fund’s return, followed by the health care and consumer discretionary sectors, respectively. The energy sector detracted most significantly from the Fund’s return, followed by the financials and utilities sectors, respectively.
Positions that contributed most significantly to the Fund’s return for the fiscal year ended August 31, 2020, included Apple, Inc., an information technology company (portfolio average weight of
2.47%) and Amazon.com, Inc., a consumer discretionary company (portfolio average weight of 2.57%). Positions that detracted most significantly from the Fund’s return during the period included Exxon Mobil Corp., an energy company (portfolio average weight of 1.83%) and Boeing Co. (The), an industrials company (portfolio average weight of 0.57%).
Sector Breakdown (% of the Fund’s Net Assets)
as of August 31, 2020
| | | | | | |
Health Care | | | 16.97 | | | |
Consumer Discretionary | | | 13.72 | | | |
Financials | | | 12.97 | | | |
Consumer Staples | | | 12.91 | | | |
Industrials | | | 11.38 | | | |
Information Technology | | | 11.25 | | | |
Communication Services | | | 8.09 | | | |
Energy | | | 6.26 | | | |
Materials | | | 3.07 | | | |
Sector Types Each Less Than 3% | | | 3.10 | | | |
Money Market Funds Plus Other Assets Less Liabilities | | | 0.28 | | | |
Top Ten Fund Holdings* (% of the Fund’s Net Assets)
as of August 31, 2020
| | | | | | |
Security | | | | | | |
Walmart, Inc. | | | 4.60 | | | |
Apple, Inc. | | | 2.97 | | | |
Amazon.com, Inc. | | | 2.93 | | | |
Berkshire Hathaway, Inc., Class B | | | 2.24 | | | |
UnitedHealth Group, Inc. | | | 1.97 | | | |
CVS Health Corp. | | | 1.85 | | | |
McKesson Corp. | | | 1.74 | | | |
Exxon Mobil Corp. | | | 1.53 | | | |
AmerisourceBergen Corp. | | | 1.39 | | | |
Costco Wholesale Corp. | | | 1.36 | | | |
Total | | | 22.58 | | | |
| * | Excluding money market fund holdings. |
Invesco S&P 500 Revenue ETF (RWL) (continued)
Growth of a $10,000 Investment
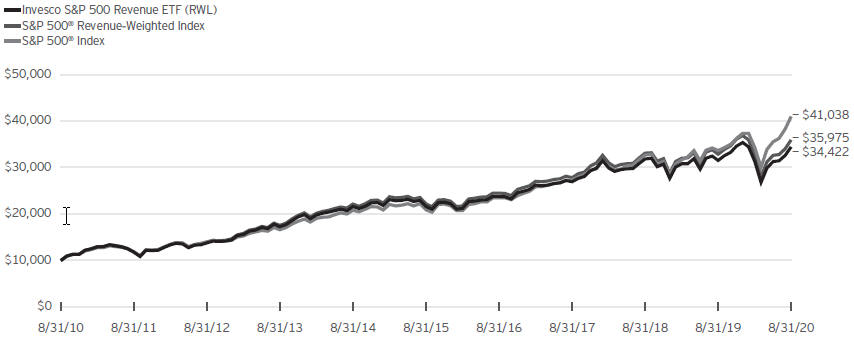
Fund Performance History as of August 31, 2020
| | | | | | | | | | | | | | | | | | | | | | | | | | | | | | | | | | | | | | | | |
| | | | | | | | | | | | | | | | | | | | | | | | | | | Fund Inception | |
| Index | | 1 Year | | | 3 Years
Average
Annualized | | | 3 Years
Cumulative | | | 5 Years
Average
Annualized | | | 5 Years
Cumulative | | | 10 Years
Average
Annualized | | | 10 Years
Cumulative | | | | | | Average
Annualized | | | Cumulative | |
| | | | | | | | | | |
S&P 500® Revenue-Weighted Index | | | 9.41 | % | | | 8.90% | | | | 29.14% | | | | 10.21% | | | | 62.56% | | | | 13.66% | | | | 259.75% | | | | | | | | 9.01% | | | | 194.66% | |
| | | | | | | | | | |
S&P 500® Index | | | 21.94 | | | | 14.5 2 | | | | 50.17 | | | | 14.46 | | | | 96.47 | | | | 15.16 | | | | 310.38 | | | | | | | | 10.22 | | | | 238.59 | |
| | | | | | | | | | |
| Fund | | | | | | | | | | | | | | | | | | | | | | | | | | | | | | |
| | | | | | | | | | |
NAV Return | | | 9.09 | | | | 8.52 | | | | 27.79 | | | | 9.80 | | | | 59.63 | | | | 13.16 | | | | 244.22 | | | | | | | | 8.51 | | | | 178.15 | |
| | | | | | | | | | |
Market Price Return | | | 9.26 | | | | 8.56 | | | | 27.95 | | | | 9.83 | | | | 59.78 | | | | 13.18 5 | | | | 244.99 | | | | | | | | 8.52 | | | | 178.65 | |
Oppenheimer S&P 500 Revenue ETF (the “Predecessor Fund”) Predecessor Fund Inception: February 19, 2008
Performance quoted above represents past performance. Past performance is not a guarantee of future results and current performance may be higher or lower than performance quoted. Investment returns and principal value will fluctuate, and shares of the Fund (“Fund Shares”), when redeemed or sold, may be worth more or less than their original cost. Fund performance reflects any applicable fee waivers and/or expense reimbursements. Had the adviser not waived fees and/or reimbursed expenses currently or in the past, returns would have been lower. See the current prospectus for more information. According to the Fund’s current prospectus, the Fund’s expense ratio of 0.39% is expressed as a unitary management fee to cover operating expenses and expenses incurred in connection with managing the portfolio. NAV and Market Price returns assume that dividends and capital gain distributions have been reinvested in the Fund at NAV and Market Price, respectively. The returns shown in the table above do not reflect the deduction of taxes that a shareholder would pay on Fund distributions or the redemption or sale of Fund Shares. See invesco.com/ETFs to find the most recent month-end performance numbers.
Performance results for the indexes stated above are based upon a hypothetical investment in their respective constituent securities. The returns of an index do not represent Fund returns. An investor cannot invest directly in an index. The indexes do not charge management fees or brokerage expenses, and no such fees or expenses were deducted from the hypothetical performance shown. In addition, the results actual investors might have achieved would have differed from those shown because of differences in the timing, amounts of their investments, and fees and expenses associated with an investment in the Fund.
| Notes | Regarding Indexes and Fund Performance History: |
| - | Average Annualized and Cumulative Inception returns for the Fund and the indexes are based on the inception date of the Predecessor Fund. |
| - | Effective after the close of business on May 24, 2019, the Predecessor Fund was reorganized into the Fund. Fund returns shown are blended returns of the Predecessor Fund and the Fund. |
| - | Effective June 26, 2020, the Fund changed its designated broad-based securities market benchmark index from the Parent Index to the Index, as the Index more closely reflects the performance of the types of securities in which the Fund invests. |
| | |
 | | Management’s Discussion of Fund Performance Invesco S&P MidCap 400 Revenue ETF (RWK) |
As an index fund, the Invesco S&P MidCap 400 Revenue ETF (the “Fund”) seeks to track the investment results (before fees and expenses) of the S&P MidCap 400® Revenue-Weighted Index (the “Index”). The Fund generally will invest at least 90% of its total assets in the securities that comprise the Index.
Strictly in accordance with its guidelines and mandated procedures, S&P Dow Jones Indices (“S&P DJI” or the “Index Provider”) compiles, maintains, and calculates the Index, which includes positive revenue producing constituent securities of the S&P MidCap 400® Index (the “Parent Index”), an index comprised of common stocks of 400 mid-cap companies that generally represents the mid-cap universe of the U.S. equity market. Unlike the Parent Index, which employs a market-capitalization weighted methodology, the Index weights each constituent security based on the sum of the company’s revenues for the trailing four quarters, subject to a maximum 5% per company weighting. The Fund generally invests in all of the securities comprising the Index in proportion to their weightings in the Index.
For the fiscal year ended August 31, 2020, on a market price basis, the Fund returned 2.03%. On a net asset value (“NAV”) basis, the Fund returned 1.89%. During the same time period, the Index returned 2.16%. During the fiscal year, the Fund fully replicated the components of the Index; therefore, the Fund’s performance, on a NAV basis, differed from the return of the Index primarily due to fees and operating expenses incurred by the Fund during the period, which were partially offset by the Fund holding cash to pay distributions in March, which coincided with the overall market decline. During the same time period, the Parent Index returned 4.22%.
For the fiscal year ended August 31, 2020, the consumer discretionary sector contributed most significantly to the Fund’s return, followed by the information technology and health care sectors, respectively. The energy sector detracted most significantly from the Fund’s return, followed by the financials and real estate sectors, respectively.
Positions that contributed most significantly to the Fund’s return for the fiscal year ended August 31, 2020, included Tech Data Corp., an information technology company (no longer held at fiscal year-end) and BJ’s Wholesale Club Holdings, Inc., a consumer staples company (portfolio average weight of 0.83%). Positions that detracted most significantly from the Fund’s return during the period included PBF Energy, Inc., Class A, an energy company (portfolio average weight of 1.42%) and World Fuel Services Corp., an energy company (portfolio average weight of 2.39%).
Sector Breakdown (% of the Fund’s Net Assets)
as of August 31, 2020
| | | | | | |
Industrials | | | 20.85 | | | |
Consumer Discretionary | | | 20.73 | | | |
Information Technology | | | 13.86 | | | |
Financials | | | 11.39 | | | |
Materials | | | 8.51 | | | |
Health Care | | | 7.14 | | | |
Consumer Staples | | | 5.76 | | | |
Energy | | | 4.72 | | | |
Real Estate | | | 3.12 | | | |
Sector Types Each Less Than 3% | | | 3.77 | | | |
Money Market Funds Plus Other Assets Less Liabilities | | | 0.15 | | | |
Top Ten Fund Holdings* (%of the Fund’s Net Assets)
as of August 31, 2020
| | | | | | |
Security | | | | | | |
World Fuel Services Corp. | | | 2.44 | | | |
Arrow Electronics, Inc. | | | 2.16 | | | |
AutoNation, Inc. | | | 1.96 | | | |
SYNNEX Corp. | | | 1.96 | | | |
Jabil, Inc. | | | 1.89 | | | |
Tenet Healthcare Corp. | | | 1.70 | | | |
ManpowerGroup, Inc. | | | 1.41 | | | |
Lear Corp. | | | 1.28 | | | |
XPO Logistics, Inc. | | | 1.25 | | | |
Molina Healthcare, Inc. | | | 1.22 | | | |
Total | | | 17.27 | | | |
| * | Excluding money market fund holdings. |
Invesco S&P MidCap 400 Revenue ETF (RWK) (continued)
Growth of a $10,000 Investment
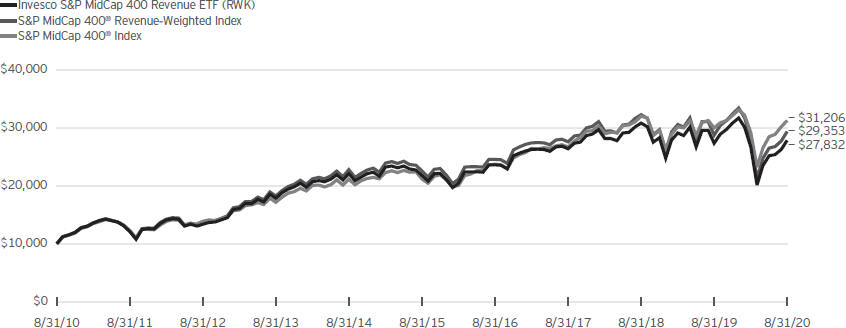
Fund Performance History as of August 31, 2020
| | | | | | | | | | | | | | | | | | | | | | | | | | | | | | | | | | | | | | | | |
| | | | | | | | | | | | | | | | | | | | | | | | | | | Fund Inception | |
| Index | | 1 Year | | | 3 Years
Average
Annualized | | | 3 Years
Cumulative | | | 5 Years
Average
Annualized | | | 5 Years
Cumulative | | | 10 Years
Average
Annualized | | | 10 Years
Cumulative | | | | | | Average
Annualized | | | Cumulative | |
S&P MidCap 400® Revenue-Weighted Index | | | 2.16 | % | | | 2.14% | | | | 6.56% | | | | 5.44% | | | | 30.34% | | | | 11.37% | | | | 193.53% | | | | | | | | 8.55% | | | | 179.43% | |
S&P MidCap 400® Index | | | 4.22 | | | | 5.38 | | | | 17.02 | | | | 8.11 | | | | 47.71 | | | | 12.05 | | | | 212.06 | | | | | | | | 8.90 | | | | 190.80 | |
Fund | | | | | | | | | | | | | | | | | | | | | | | | | | | | | | | | | | | | | | | | |
NAV Return | | | 1.89 | | | | 1.83 | | | | 5.59 | | | | 5.03 | | | | 27.84 | | | | 10.78 | | | | 178.32 | | | | | | | | 7.93 | | | | 160.03 | |
Market Price Return | | | 2.03 | | | | 1.86 | | | | 5.70 | | | | 5.06 | | | | 27.97 | | | | 10.78 | | | | 178.33 | | | | | | | | 7.94 | | | | 160.30 | |
Oppenheimer S&P MidCap 400 ETF (the “Predecessor Fund”) Predecessor Fund Inception: February 20, 2008
Performance quoted above represents past performance. Past performance is not a guarantee of future results and current performance may be higher or lower than performance quoted. Investment returns and principal value will fluctuate, and shares of the Fund (“Fund Shares”), when redeemed or sold, may be worth more or less than their original cost. Fund performance reflects any applicable fee waivers and/or expense reimbursements. Had the adviser not waived fees and/or reimbursed expenses currently or in the past, returns would have been lower. See the current prospectus for more information. According to the Fund’s current prospectus, the Fund’s expense ratio of 0.39% is expressed as a unitary management fee to cover operating expenses and expenses incurred in connection with managing the portfolio. NAV and Market Price returns assume that dividends and capital gain distributions have been reinvested in the Fund at NAV and Market Price, respectively. The returns shown in the table above do not reflect the deduction of taxes that a shareholder would pay on Fund distributions or the redemption or sale of Fund Shares. See invesco.com/ETFs to find the most recent month-end performance numbers.
Performance results for the indexes stated above are based upon a hypothetical investment in their respective constituent securities. The returns of an index do not represent Fund returns. An investor cannot invest directly in an index. The indexes do not charge management fees or brokerage expenses, and no such fees or expenses were deducted from the hypothetical performance shown. In addition, the results actual investors might have achieved would have differed from those shown because of differences in the timing, amounts of their investments, and fees and expenses associated with an investment in the Fund.
Notes Regarding Indexes and Fund Performance History:
| - | Average Annualized and Cumulative Inception returns for the Fund and the indexes are based on the inception date of the Predecessor Fund. |
| - | Effective after the close of business on May 24, 2019, the Predecessor Fund was reorganized into the Fund. Fund returns shown are blended returns of the Predecessor Fund and the Fund. |
| - | Effective June 26, 2020, the Fund changed its designated broad- based securities market benchmark index from the Parent Index to the Index, as the Index more closely reflects the performance of the types of securities in which the Fund invests. |
| | |
 | | Management’s Discussion of Fund Performance Invesco S&P SmallCap 600 Revenue ETF (RWJ) |
As an index fund, the Invesco S&P SmallCap 600 Revenue ETF (the “Fund”) seeks to track the investment results (before fees and expenses) of the S&P SmallCap 600® Revenue-Weighted Index (the “Index”). The Fund generally will invest at least 90% of its total assets in the securities that comprise the Index.
Strictly in accordance with its guidelines and mandated procedures, S&P Dow Jones Indices (“S&P DJI” or the “Index Provider”) compiles, maintains, and calculates the Index, which includes positive revenue producing constituent securities of the S&P SmallCap 600® Index (the “Parent Index”), an index comprised of common stocks of 600 small-cap companies that generally represents the small-cap universe of the U.S. equity market. Unlike the Parent Index, which employs a market- capitalization weighted methodology, the Index weights each constituent security based on the sum of the company’s revenues for the trailing four quarters, subject to a maximum 5% per company weighting. The Fund generally invests in all of the securities comprising the Index in proportion to their weightings in the Index.
For the fiscal year ended August 31, 2020, on a market price basis, the Fund returned 9.70%. On a net asset value (“NAV”) basis, the Fund returned 9.63%. During the same time period, the Index returned 9.42%. During the fiscal year, the Fund fully replicated the components of the Index; therefore, the Fund’s performance, on a NAV basis, differed from the return of the
Index primarily due to the Fund holding cash to pay distributions in March, which coincided with the overall market decline. During the same time period, the Parent Index returned (0.55)%.
For the fiscal year ended August 31, 2020, the consumer staples sector contributed most significantly to the Fund’s return, followed by the health care and consumer discretionary sectors, respectively. The energy sector detracted most significantly from the Fund’s return, followed by the financials and real estate sectors, respectively.
Positions that contributed most significantly to the Fund’s return for the fiscal year ended August 31, 2020, included United Natural Foods, Inc., a consumer staples company (portfolio average weight of 3.64%) and Owens & Minor, Inc., a health care company (portfolio average weight of 1.63%). Positions that detracted most significantly from the Fund’s return during the period included McDermott International, Inc., an energy company (no longer held at fiscal year-end) and J. C. Penney Co., Inc., a consumer discretionary company (no longer held at fiscal year-end).
Sector Breakdown (% of the Fund’s Net Assets)
as of August 31, 2020
| | | | | | |
Consumer Discretionary | | | 29.75 | | | |
Industrials | | | 20.12 | | | |
Health Care | | | 10.50 | | | |
Information Technology | | | 9.47 | | | |
Consumer Staples | | | 8.41 | | | |
Materials | | | 6.34 | | | |
Financials | | | 6.13 | | | |
Energy | | | 4.68 | | | |
Sector Types Each Less Than 3% | | | 4.51 | | | |
Money Market Funds Plus Other Assets Less Liabilities | | | 0.09 | | | |
Top Ten Fund Holdings* (% of the Fund’s Net Assets)
as of August 31, 2020
| | | | | | |
| Security | | | | | |
United Natural Foods, Inc. | | | 2.86 | | | |
Macy’s, Inc. | | | 2.41 | | | |
Core-Mark Holding Co., Inc. | | | 2.19 | | | |
Community Health Systems, Inc. | | | 2.18 | | | |
Owens & Minor, Inc. | | | 2.08 | | | |
Bed Bath & Beyond, Inc. | | | 1.67 | | | |
Group 1 Automotive, Inc. | | | 1.56 | | | |
Sonic Automotive, Inc., Class A | | | 1.52 | | | |
Andersons, Inc. (The) | | | 1.03 | | | |
Asbury Automotive Group, Inc. | | | 0.99 | | | |
Total | | | 18.49 | | | |
| * | Excluding money market fund holdings. |
Invesco S&P SmallCap 600 Revenue ETF (RWJ) (continued)
Growth of a $10,000 Investment
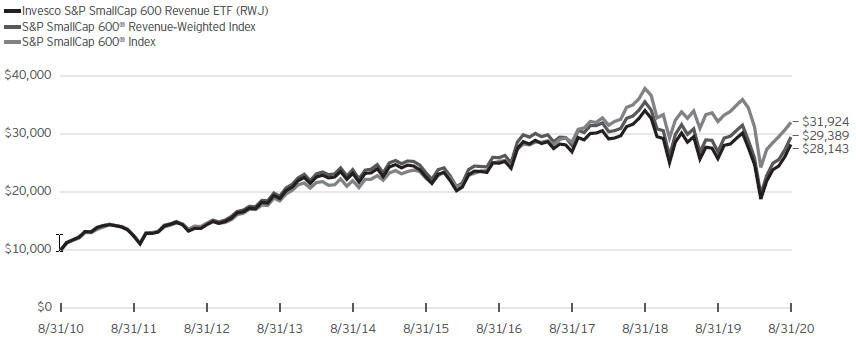
Fund Performance History as of August 31, 2020
| | | | | | | | | | | | | | | | | | | | | | | | | | | | | | | | | | | | | | | | |
| | | | | | | | | | | | | | | | | | | | | | | | | | | Fund Inception | |
| Index | | 1 Year | | | 3 Years
Average
Annualized | | | 3 Years
Cumulative | | | 5 Years
Average
Annualized | | | 5 Years
Cumulative | | | 10 Years
Average
Annualized | | | 10 Years
Cumulative | | | | | | Average
Annualized | | | Cumulative | |
S&P SmallCap 600® Revenue-Weighted Index | | | 9.42 | % | | | 1.61% | | | | 4.91% | | | | 4.77% | | | | 26.25% | | | | 11.38% | | | | 193.89% | | | | | | | | 9.23% | | | | 202.27% | |
S&P SmallCap 600® Index | | | (0.55 | ) | | | 3.82 | | | | 11.90 | | | | 7.47 | | | | 43.35 | | | | 12.31 | | | | 219.24 | | | | | | | | 8.78 | | | | 187.04 | |
Fund | | | | | | | | | | | | | | | | | | | | | | | | | | | | | | | | | | | | | | | | |
NAV Return | | | 9.63 | | | | 1.56 | | | | 4.77 | | | | 4.52 | | | | 24.73 | | | | 10.90 | | | | 181.43 | | | | | | | | 8.62 | | | | 181.64 | |
Market Price Return | | | 9.70 | | | | 1.59 | | | | 4.84 | | | | 4.53 | | | | 24.77 | | | | 10.91 | | | | 181.75 | | | | | | | | 8.62 | | | | 181.75 | |
Oppenheimer S&P SmallCap 600 Revenue ETF (the ‘‘Predecessor Fund’’)
Predecessor Fund Inception: February 19, 2008
Performance quoted above represents past performance. Past performance is not a guarantee of future results and current performance may be higher or lower than performance quoted. Investment returns and principal value will fluctuate, and shares of the Fund (“Fund Shares”), when redeemed or sold, may be worth more or less than their original cost. Fund performance reflects any applicable fee waivers and/or expense reimbursements. Had the adviser not waived fees and/or reimbursed expenses currently or in the past, returns would have been lower. See the current prospectus for more information. According to the Fund’s current prospectus, the Fund’s expense ratio of 0.39% is expressed as a unitary management fee to cover operating expenses and expenses incurred in connection with managing the portfolio. NAV and Market Price returns assume that dividends and capital gain distributions have been reinvested in the Fund at NAV and Market Price, respectively. The returns shown in the table above do not reflect the deduction of taxes that a shareholder would pay on Fund distributions or the redemption or sale of Fund Shares. See invesco.com/ETFs to find the most recent month-end performance numbers.
Performance results for the indexes stated above are based upon a hypothetical investment in their respective constituent securities. The returns of an index do not represent Fund returns. An investor cannot invest directly in an index. The indexes do not charge management fees or brokerage expenses, and no such fees or expenses were deducted from the hypothetical performance shown. In addition, the results actual investors might have achieved would have differed from those shown because of differences in the timing, amounts of their investments, and fees and expenses associated with an investment in the Fund.
Notes Regarding Indexes and Fund Performance History:
| - | Average Annualized and Cumulative Inception returns for the Fund and the indexes are based on the inception date of the Predecessor Fund. |
| - | Effective after the close of business on May 24, 2019, the Predecessor Fund was reorganized into the Fund. Fund returns shown are blended returns of the Predecessor Fund and the Fund. |
| - | Effective June 26, 2020, the Fund changed its designated broad- based securities market benchmark index from the Parent Index to the Index, as the Index more closely reflects the performance of the types of securities in which the Fund invests. |
| | |
 | | Management’s Discussion of Fund Performance Invesco S&P Ultra Dividend Revenue ETF (RDIV) |
As an index fund, the Invesco S&P Ultra Dividend Revenue ETF (the “Fund”) seeks to track the investment results (before fees and expenses) of the S&P 900® Dividend Revenue-Weighted Index (the “Index”). The Fund generally will invest at least 90% of its total assets in the securities that comprise the Index.
Strictly in accordance with its guidelines and mandated procedures, S&P Dow Jones Indices (“S&P DJI” or the “Index Provider”) compiles, maintains, and calculates the Index, which includes positive revenue producing constituent securities of the S&P 900® Index (the “Parent Index” or “Benchmark Index”), an index that combines the S&P 500® Index and S&P MidCap® 400 Index to form an investable benchmark for the large- and mid-cap universe of the U.S. equity market. From a universe of components of the Parent Index, the Index (1) excludes the top 5% of securities by dividend yield, (2) excludes the top 5% of securities within each sector by dividend payout ratio and (3) then includes the top 60 securities by dividend yield. Unlike the Parent Index, which employs a market-capitalization weighted methodology, the Index weights each constituent security based on the sum of the company’s revenues for the trailing four quarters, subject to a maximum 5% per company weighting. The Fund generally invests in all of the securities comprising the Index in proportion to their weightings in the Index.
For the fiscal year ended August 31, 2020, on a market price basis, the Fund returned (16.17)%. On a net asset value (“NAV”) basis, the Fund returned (16.26)%. During the same time period, the Index returned (16.36)%. During the fiscal year, the Fund fully replicated the components of the Index; therefore, the Fund’s performance, on a NAV basis, differed from the return of the Index primarily due to fees and operating expenses that the Fund incurred during the period that was offset by the Fund holding cash to pay distributions in March, which coincided with the overall market decline.
During this same time period, the Benchmark Index returned 20.79%. The Benchmark Index is an unmanaged index weighted by market capitalization based on the average performance of approximately 900 equity securities. The Benchmark Index was selected for its recognition in the marketplace, and because its performance comparison is a useful measure for investors as a broad representation of the U.S. large- and mid-cap stock market.
The performance of the Fund differed from the Benchmark Index in part because the Fund seeks to track an Index that employs a revenue weighted methodology, whereas the Benchmark Index weights stocks based primarily on market capitalization.
Relative to the Benchmark Index, the Fund was most overweight in the energy and materials sectors and most underweight in the information technology and industrials sectors during the fiscal year ended August 31, 2020. The majority of the Fund’s underperformance relative to the Benchmark Index during the
period can be attributed to the Fund being overweight and security selection in the consumer discretionary and energy sectors.
For the fiscal year ended August 31, 2020, the health care sector contributed most significantly to the Fund’s return, followed by the materials and information technology sectors, respectively. The consumer discretionary sector detracted most significantly from the Fund’s return, followed by the energy and real estate sectors, respectively.
Positions that contributed most significantly to the Fund’s return for the fiscal year ended August 31, 2020, included AbbVie, Inc., a health care company (no longer held at fiscal year-end) and Halliburton Co., an energy company (portfolio average weight of 1.22%). Positions that detracted most significantly from the Fund’s return during the period included PBF Energy, Inc., Class A, an energy company (no longer held at fiscal year-end) and Kohl’s Corp., a consumer discretionary company (no longer held at fiscal year-end).
Sector Breakdown (% of the Fund’s Net Assets) as of August 31, 2020
| | | | | | |
Financials | | | 28.80 | | | |
Energy | | | 26.90 | | | |
Materials | | | 17.74 | | | |
Information Technology | | | 8.07 | | | |
Consumer Staples | | | 4.20 | | | |
Real Estate | | | 3.04 | | | |
Sector Types Each Less Than 3% | | | 10.46 | | | |
Other Assets Less Liabilities | | | 0.79 | | | |
Top Ten Fund Holdings* (% of the Fund’s Net Assets)
as of August 31, 2020
| | | | | | |
Security | | | | | | |
Dow, Inc. | | | 5.31 | | | |
Prudential Financial, Inc. | | | 5.24 | | | |
MetLife, Inc. | | | 5.05 | | | |
International Business Machines Corp. | | | 4.92 | | | |
LyondellBasell Industries N.V., Class A | | | 4.80 | | | |
Chevron Corp. | | | 4.68 | | | |
Wells Fargo & Co. | | | 4.62 | | | |
Marathon Petroleum Corp. | | | 4.60 | | | |
Valero Energy Corp. | | | 4.56 | | | |
Phillips 66 | | | 4.51 | | | |
Total | | | 48.29 | | | |
| * | Excluding money market fund holdings. |
Invesco S&P Ultra Dividend Revenue ETF (RDIV) (continued)
Growth of a $10,000 Investment Since Inception
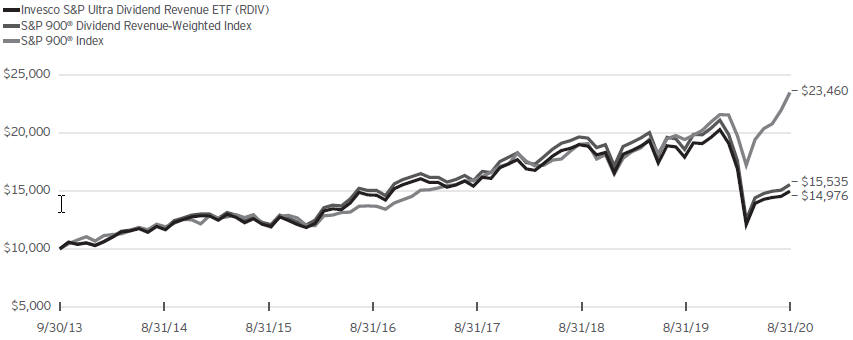
Fund Performance History as of August 31, 2020
| | | | | | | | | | | | | | | | | | | | | | | | | | | | | | | | |
| | | | | | | | | | | | | | | | | | | | | Fund Inception | |
Index | | | 1 Year | | |
| 3 Years
Average
Annualized |
| |
| 3 Years
Cumulative |
| |
| 5 Years
Average
Annualized |
| |
| 5 Years
Cumulative |
| | | | | |
| Average
Annualized |
| | | Cumulative | |
S&P 900® Dividend Revenue-Weighted Index | | | (16.36 | )% | | | (0.72)% | | | | (2.15)% | | | | 4.82% | | | | 26.52% | | | | | | | | 6.58% | | | | 55.35% | |
S&P 900® Index | | | 20.79 | | | | 13.92 | | | | 47.86 | | | | 14.04 | | | | 92.92 | | | | | | | | 13.12 | | | | 134.60 | |
Fund | | | | | | | | | | | | | | | | | | | | | | | | | | | | | | | | |
NAV Return | | | (16.26 | ) | | | (0.94) | | | | (2.80) | | | | 4.32 | | | | 23.54 | | | | | | | | 6.01 | | | | 49.76 | |
Market Price Return | | | (16.17 | ) | | | (0.87) | | | | (2.58) | | | | 4.34 | | | | 23.67 | | | | | | | | 6.04 | | | | 50.02 | |
Oppenheimer S&P Ultra Dividend Revenue ETF (the “Predecessor Fund’’)
Predecessor Fund Inception: September 30, 2013
Performance quoted above represents past performance. Past performance is not a guarantee of future results and current performance may be higher or lower than performance quoted. Investment returns and principal value will fluctuate, and shares of the Fund (“Fund Shares”), when redeemed or sold, may be worth more or less than their original cost. Fund performance reflects any applicable fee waivers and/or expense reimbursements. Had the adviser not waived fees and/or reimbursed expenses currently or in the past, returns would have been lower. See the current prospectus for more information. According to the Fund’s current prospectus, the Fund’s expense ratio of 0.39% is expressed as a unitary management fee to cover operating expenses and expenses incurred in connection with managing the portfolio. NAV and Market Price returns assume that dividends and capital gain distributions have been reinvested in the Fund at NAV and Market Price, respectively. The returns shown in the table above do not reflect the deduction of taxes that a shareholder would pay on Fund distributions or the redemption or sale of Fund Shares. See invesco.com/ETFs to find the most recent month-end performance numbers.
Index and Benchmark Index performance results are based upon a hypothetical investment in their respective constituent securities. Index and Benchmark Index returns do not represent Fund returns. An investor cannot invest directly in an index. The Index and Benchmark Index do not charge management fees or brokerage expenses, and no such fees or expenses were deducted from the hypothetical performance shown. In addition, the results actual investors might have achieved would have differed from those shown because of differences in the timing, amounts of their investments, and fees and expenses associated with an investment in the Fund.
Notes Regarding Indexes and Fund Performance History:
| - | Average Annualized and Cumulative Inception returns for the Fund, Index and Benchmark Index are based on the inception date of the Predecessor Fund. |
| - | Effective after the close of business on May 24, 2019, the Predecessor Fund was reorganized into the Fund. Fund returns shown are blended returns of the Predecessor Fund and the Fund. |
Liquidity Risk Management Program
The Securities and Exchange Commission (“SEC”) has adopted Rule 22e-4 under the Investment Company Act of 1940 (the “Liquidity Rule”) in order to promote effective liquidity risk management throughout the open-end investment company industry, thereby reducing the risk that funds will be unable to meet their redemption obligations and mitigating dilution of the interests of fund shareholders. The Funds have adopted and implemented a liquidity risk management program in accordance with the Liquidity Rule (the “Program”). The Program is reasonably designed to assess and manage the Funds’ liquidity risk, which is the risk that the Funds could not meet redemption requests without significant dilution of remaining investors’ interests in the Funds. The Board of Trustees of the Funds (the “Board”) has appointed Invesco Capital Management LLC (“Invesco”), the Funds’ investment adviser, as the Program’s administrator, and Invesco has delegated oversight of the Program to the Liquidity Risk Management Committee (the “Committee”), which is composed of senior representatives from relevant business groups at Invesco and its affiliates.
As required by the Liquidity Rule, the Program includes policies and procedures providing for an assessment, no less frequently than annually, of the Funds’ liquidity risk that takes into account, as relevant to the Funds’ liquidity risk: (1) each Fund’s investment strategy and liquidity of portfolio investments during both normal and reasonably foreseeable stressed conditions; (2) short-term and long-term cash flow projections for the Funds during both normal and reasonably foreseeable stressed conditions; (3) each Fund’s holdings of cash and cash equivalents and any borrowing arrangements; (4) the relationship between the Funds’ portfolio liquidity and the way in which, and the prices and spreads at which, Fund shares trade, including the efficiency of the arbitrage function and the level of active participation by market participants, including authorized participants; and (5) the effect of the composition of baskets on the overall liquidity of each Fund’s portfolio. The Liquidity Rule also requires the classification of each Fund’s investments into categories that reflect the assessment of their relative liquidity under current market conditions. Each Fund classifies its investments into one of four of the following categories defined in the Liquidity Rule: “Highly Liquid,” “Moderately Liquid,” “Less Liquid” and “Illiquid.” Funds that are not invested primarily in “Highly Liquid Investments” that are assets (cash or investments that are reasonably expected to be convertible into cash within three business days without significantly changing the market value of the investment) are required to establish a “Highly Liquid Investment Minimum” (“HLIM”), which is the minimum percentage of net assets that must be invested in Highly Liquid Investments. Funds with HLIMs have procedures for addressing HLIM shortfalls, including reporting to the Board and the SEC (on a non-public basis) as required by the Program and the Liquidity Rule. In addition, a Fund may not acquire an investment if, immediately after the acquisition, over 15% of such Fund’s net assets would consist of “Illiquid Investments” that are assets (an investment that cannot reasonably be expected to be sold or disposed of in current market conditions in seven calendar days or less without the sale or disposition significantly changing the market value of the investment). The Liquidity Rule and the Program also require reporting to the Board and the SEC (on a non-public basis) if a Fund’s holdings of Illiquid Investments exceed 15% of such Fund’s assets.
At a meeting held on March 12, 2020, the Committee presented a report to the Board that addressed the operation of the Program and assessed the Program’s adequacy and effectiveness of implementation (the “Report”). The Report covered the period from December 1, 2018 through December 31, 2019 (the “Program Reporting Period”).
The Report stated, in relevant part, that during the Program Reporting Period:
| | • | | The Program, as adopted and implemented, remained reasonably designed to assess and manage the Funds’ liquidity risk and was operated effectively to achieve that goal; |
| | • | | Each Fund’s investment strategy remained appropriate for an open-end fund; |
| | • | | Each Fund was able to meet requests for redemption without significant dilution of remaining investors’ interests in the Fund; |
| | • | | The Funds did not breach the 15% limit on Illiquid Investments; and |
| | • | | The Funds primarily held Highly Liquid Investments and therefore have not adopted an HLIM. |
Invesco S&P 500 Revenue ETF (RWL)
August 31, 2020
Schedule of Investments(a)
| | | | | | | | |
| | | Shares | | | Value | |
Common Stocks & Other Equity Interests-99.72% | |
Communication Services-8.09% | | | | | | | | |
Activision Blizzard, Inc. | | | 5,090 | | | $ | 425,117 | |
Alphabet, Inc., Class A(b) | | | 3,353 | | | | 5,463,814 | |
Alphabet, Inc., Class C(b) | | | 3,348 | | | | 5,471,235 | |
AT&T, Inc. | | | 334,825 | | | | 9,981,133 | |
CenturyLink, Inc. | | | 123,898 | | | | 1,331,903 | |
Charter Communications, Inc., Class A(b) | | | 5,038 | | | | 3,101,443 | |
Comcast Corp., Class A | | | 157,134 | | | | 7,041,175 | |
Discovery, Inc., Class A(b)(c) | | | 14,294 | | | | 315,397 | |
Discovery, Inc., Class C(b) | | | 16,014 | | | | 319,800 | |
DISH Network Corp., Class A(b) | | | 22,305 | | | | 792,274 | |
Electronic Arts, Inc.(b) | | | 2,564 | | | | 357,601 | |
Facebook, Inc., Class A(b) | | | 18,253 | | | | 5,351,780 | |
Fox Corp., Class A | | | 12,448 | | | | 346,801 | |
Fox Corp., Class B | | | 12,601 | | | | 350,308 | |
Interpublic Group of Cos., Inc. (The) | | | 33,603 | | | | 596,789 | |
Live Nation Entertainment, Inc.(b) | | | 12,939 | | | | 734,935 | |
Netflix, Inc.(b) | | | 2,931 | | | | 1,552,140 | |
News Corp., Class A | | | 23,150 | | | | 350,028 | |
News Corp., Class B | | | 23,090 | | | | 347,966 | |
Omnicom Group, Inc | | | 15,375 | | | | 831,634 | |
Take-Two Interactive Software, Inc.(b) | | | 1,310 | | | | 224,259 | |
T-Mobile US, Inc.(b) | | | 25,021 | | | | 2,919,450 | |
Twitter, Inc.(b) | | | 5,920 | | | | 240,234 | |
Verizon Communications, Inc. | | | 132,539 | | | | 7,855,586 | |
ViacomCBS, Inc., Class B | | | 68,063 | | | | 1,895,555 | |
Walt Disney Co. (The) | | | 38,635 | | | | 5,094,797 | |
| | | | | | | | |
| | | | | | | 63,293,154 | |
| | | | | | | | |
Consumer Discretionary-13.72% | | | | | | | | |
Advance Auto Parts, Inc. | | | 3,958 | | | | 618,675 | |
Amazon.com, Inc.(b) | | | 6,631 | | | | 22,883,316 | |
Aptiv PLC | | | 10,518 | | | | 905,810 | |
AutoZone, Inc.(b) | | | 627 | | | | 750,086 | |
Best Buy Co., Inc. | | | 31,466 | | | | 3,489,894 | |
Booking Holdings, Inc.(b) | | | 507 | | | | 968,598 | |
BorgWarner, Inc. | | | 16,739 | | | | 679,436 | |
CarMax, Inc.(b) | | | 12,830 | | | | 1,371,912 | |
Carnival Corp. | | | 59,548 | | | | 981,351 | |
Chipotle Mexican Grill, Inc.(b) | | | 336 | | | | 440,254 | |
D.R. Horton, Inc. | | | 19,428 | | | | 1,386,576 | |
Darden Restaurants, Inc. | | | 6,559 | | | | 568,469 | |
Dollar General Corp. | | | 9,143 | | | | 1,845,789 | |
Dollar Tree, Inc.(b) | | | 15,593 | | | | 1,501,138 | |
Domino’s Pizza, Inc. | | | 553 | | | | 226,155 | |
eBay, Inc. | | | 12,495 | | | | 684,476 | |
Expedia Group, Inc. | | | 8,032 | | | | 788,341 | |
Ford Motor Co. | | | 1,322,956 | | | | 9,022,560 | |
Gap, Inc. (The) | | | 88,311 | | | | 1,535,728 | |
Garmin Ltd. | | | 2,383 | | | | 246,903 | |
General Motors Co. | | | 275,582 | | | | 8,165,495 | |
Genuine Parts Co. | | | 12,754 | | | | 1,204,488 | |
H&R Block, Inc. | | | 10,056 | | | | 145,812 | |
Hanesbrands, Inc. | | | 32,457 | | | | 496,268 | |
Hasbro, Inc. | | | 3,891 | | | | 307,156 | |
Hilton Worldwide Holdings, Inc. | | | 6,743 | | | | 609,297 | |
Home Depot, Inc. (The) | | | 26,456 | | | | 7,541,018 | |
Kohl’s Corp. | | | 44,811 | | | | 957,163 | |
| | | | | | | | |
| | | Shares | | | Value | |
Consumer Discretionary-(continued) | | | | | | | | |
L Brands, Inc. | | | 43,347 | | | $ | 1,274,402 | |
Las Vegas Sands Corp. | | | 13,530 | | | | 686,106 | |
Leggett & Platt, Inc. | | | 8,042 | | | | 329,722 | |
Lennar Corp., Class A | | | 21,952 | | | | 1,642,449 | |
LKQ Corp.(b) | | | 27,230 | | | | 864,280 | |
Lowe’s Cos., Inc. | | | 33,710 | | | | 5,551,700 | |
Marriott International, Inc., Class A | | | 12,709 | | | | 1,307,883 | |
McDonald’s Corp. | | | 6,259 | | | | 1,336,422 | |
MGM Resorts International(c) | | | 35,493 | | | | 798,592 | |
Mohawk Industries, Inc.(b) | | | 5,706 | | | | 526,835 | |
Newell Brands, Inc. | | | 33,705 | | | | 538,606 | |
NIKE, Inc., Class B | | | 24,345 | | | | 2,723,962 | |
Norwegian Cruise Line Holdings Ltd.(b)(c) | | | 17,474 | | | | 298,980 | |
NVR, Inc.(b) | | | 130 | | | | 541,884 | |
O’Reilly Automotive, Inc.(b) | | | 1,430 | | | | 665,851 | |
PulteGroup, Inc. | | | 17,622 | | | | 785,765 | |
PVH Corp. | | | 11,347 | | | | 632,709 | |
Ralph Lauren Corp. | | | 4,680 | | | | 322,124 | |
Ross Stores, Inc. | | | 8,653 | | | | 788,115 | |
Royal Caribbean Cruises Ltd. | | | 9,791 | | | | 674,012 | |
Starbucks Corp. | | | 19,828 | | | | 1,674,871 | |
Tapestry, Inc. | | | 22,601 | | | | 332,913 | |
Target Corp. | | | 39,256 | | | | 5,935,900 | |
Tiffany & Co. | | | 2,109 | | | | 258,353 | |
TJX Cos., Inc. (The) | | | 39,912 | | | | 2,186,778 | |
Tractor Supply Co. | | | 4,080 | | | | 607,226 | |
Ulta Beauty, Inc.(b) | | | 1,712 | | | | 397,492 | |
Under Armour, Inc., Class A(b)(c) | | | 14,573 | | | | 142,961 | |
Under Armour, Inc., Class C(b) | | | 16,286 | | | | 144,131 | |
VF Corp. | | | 10,462 | | | | 687,877 | |
Whirlpool Corp. | | | 9,301 | | | | 1,652,974 | |
Wynn Resorts Ltd. | | | 3,640 | | | | 318,318 | |
Yum! Brands, Inc. | | | 3,486 | | | | 334,133 | |
| | | | | | | | |
| | | | | | | 107,286,490 | |
| | | | | | | | |
Consumer Staples-12.91% | | | | | | | | |
Altria Group, Inc. | | | 29,698 | | | | 1,298,991 | |
Archer-Daniels-Midland Co. | | | 93,636 | | | | 4,191,147 | |
Brown-Forman Corp., Class B | | | 2,955 | | | | 216,217 | |
Campbell Soup Co. | | | 10,111 | | | | 531,940 | |
Church & Dwight Co., Inc. | | | 3,494 | | | | 334,830 | |
Clorox Co. (The) | | | 1,773 | | | | 396,265 | |
Coca-Cola Co. (The) | | | 46,292 | | | | 2,292,843 | |
Colgate-Palmolive Co. | | | 12,418 | | | | 984,251 | |
Conagra Brands, Inc. | | | 18,196 | | | | 697,999 | |
Constellation Brands, Inc., Class A | | | 2,784 | | | | 513,592 | |
Costco Wholesale Corp. | | | 30,698 | | | | 10,672,467 | |
Coty, Inc., Class A | | | 92,525 | | | | 331,240 | |
Estee Lauder Cos., Inc. (The), Class A | | | 4,592 | | | | 1,018,138 | |
General Mills, Inc. | | | 15,841 | | | | 1,013,032 | |
Hershey Co. (The) | | | 3,522 | | | | 523,510 | |
Hormel Foods Corp. | | | 11,703 | | | | 596,619 | |
JM Smucker Co. (The) | | | 4,234 | | | | 508,842 | |
Kellogg Co. | | | 12,033 | | | | 853,260 | |
Kimberly-Clark Corp. | | | 7,882 | | | | 1,243,464 | |
Kraft Heinz Co. (The) | | | 44,975 | | | | 1,575,924 | |
Kroger Co. (The) | | | 216,139 | | | | 7,711,840 | |
Lamb Weston Holdings, Inc. | | | 3,454 | | | | 217,084 | |
See accompanying Notes to Financial Statements which are an integral part of the financial statements.
Invesco S&P 500 Revenue ETF (RWL)–(continued)
August 31, 2020
| | | | | | | | |
| | | Shares | | | Value | |
Consumer Staples-(continued) | | | | | | | | |
McCormick & Co., Inc. | | | 1,831 | | | $ | 377,552 | |
Molson Coors Beverage Co., Class B | | | 15,496 | | | | 583,269 | |
Mondelez International, Inc., Class A | | | 29,160 | | | | 1,703,527 | |
Monster Beverage Corp.(b) | | | 3,603 | | | | 302,148 | |
PepsiCo, Inc. | | | 28,762 | | | | 4,028,406 | |
Philip Morris International, Inc. | | | 24,359 | | | | 1,943,605 | |
Procter & Gamble Co. (The) | | | 34,872 | | | | 4,823,844 | |
Sysco Corp. | | | 62,303 | | | | 3,746,902 | |
Tyson Foods, Inc., Class A | | | 39,743 | | | | 2,495,860 | |
Walgreens Boots Alliance, Inc. | | | 191,033 | | | | 7,263,075 | |
Walmart, Inc. | | | 258,944 | | | | 35,954,374 | |
| | | | | | | | |
| | | | | | | 100,946,057 | |
| | | | | | | | |
Energy-6.26% | | | | | | | | |
Apache Corp. | | | 24,776 | | | | 366,685 | |
Baker Hughes Co., Class A | | | 84,287 | | | | 1,203,618 | |
Cabot Oil & Gas Corp. | | | 4,877 | | | | 92,517 | |
Chevron Corp. | | | 83,319 | | | | 6,992,964 | |
Concho Resources, Inc. | | | 4,321 | | | | 224,606 | |
ConocoPhillips | | | 38,204 | | | | 1,447,550 | |
Devon Energy Corp. | | | 28,726 | | | | 312,252 | |
Diamondback Energy, Inc. | | | 4,839 | | | | 188,527 | |
EOG Resources, Inc | | | 18,384 | | | | 833,531 | |
Exxon Mobil Corp. | | | 299,534 | | | | 11,963,388 | |
Halliburton Co. | | | 96,503 | | | | 1,561,418 | |
Hess Corp. | | | 7,278 | | | | 335,079 | |
HollyFrontier Corp. | | | 30,751 | | | | 734,026 | |
Kinder Morgan, Inc. | | | 46,736 | | | | 645,891 | |
Marathon Oil Corp. | | | 42,197 | | | | 222,800 | |
Marathon Petroleum Corp. | | | 187,235 | | | | 6,639,353 | |
National Oilwell Varco, Inc. | | | 37,466 | | | | 449,592 | |
Noble Energy, Inc. | | | 24,367 | | | | 242,452 | |
Occidental Petroleum Corp. | | | 68,218 | | | | 869,097 | |
ONEOK, Inc. | | | 15,741 | | | | 432,563 | |
Phillips 66 | | | 77,460 | | | | 4,529,086 | |
Pioneer Natural Resources Co. | | | 5,456 | | | | 567,042 | |
Schlumberger Ltd. | | | 97,162 | | | | 1,847,050 | |
TechnipFMC PLC (United Kingdom) | | | 97,644 | | | | 751,859 | |
Valero Energy Corp. | | | 94,930 | | | | 4,992,369 | |
Williams Cos., Inc. (The) | | | 25,119 | | | | 521,470 | |
| | | | | | | | |
| | | | | | | 48,966,785 | |
| | | | | | | | |
Financials-12.97% | | | | | | | | |
Aflac, Inc. | | | 34,467 | | | | 1,251,841 | |
Allstate Corp. (The) | | | 25,885 | | | | 2,407,305 | |
American Express Co. | | | 26,141 | | | | 2,655,664 | |
American International Group, Inc. | | | 83,154 | | | | 2,423,108 | |
Ameriprise Financial, Inc. | | | 5,531 | | | | 867,261 | |
Aon PLC, Class A | | | 3,463 | | | | 692,565 | |
Arthur J. Gallagher & Co. | | | 4,117 | | | | 433,520 | |
Assurant, Inc. | | | 5,423 | | | | 659,220 | |
Bank of America Corp. | | | 272,911 | | | | 7,024,729 | |
Bank of New York Mellon Corp. (The) | | | 30,625 | | | | 1,132,513 | |
Berkshire Hathaway, Inc., Class B(b) | | | 80,232 | | | | 17,493,785 | |
BlackRock, Inc. | | | 1,629 | | | | 967,936 | |
Capital One Financial Corp. | | | 25,011 | | | | 1,726,509 | |
Cboe Global Markets, Inc. | | | 1,601 | | | | 146,956 | |
Charles Schwab Corp. (The) | | | 17,868 | | | | 634,850 | |
Chubb Ltd. | | | 15,364 | | | | 1,920,500 | |
Cincinnati Financial Corp. | | | 6,301 | | | | 500,362 | |
Citigroup, Inc. | | | 114,020 | | | | 5,828,702 | |
| | | | | | | | |
| | | Shares | | | Value | |
Financials-(continued) | | | | | | | | |
Citizens Financial Group, Inc. | | | 16,497 | | | $ | 426,777 | |
CME Group, Inc., Class A | | | 1,695 | | | | 298,100 | |
Comerica, Inc. | | | 5,276 | | | | 208,560 | |
Discover Financial Services | | | 15,081 | | | | 800,500 | |
E*TRADE Financial Corp. | | | 3,667 | | | | 198,385 | |
Everest Re Group Ltd. | | | 2,191 | | | | 482,195 | |
Fifth Third Bancorp | | | 23,789 | | | | 491,481 | |
First Republic Bank | | | 2,289 | | | | 258,451 | |
Franklin Resources, Inc. | | | 14,450 | | | | 304,317 | |
Globe Life, Inc. | | | 3,400 | | | | 280,432 | |
Goldman Sachs Group, Inc. (The) | | | 14,781 | | | | 3,028,183 | |
Hartford Financial Services Group, Inc. (The) | | | 29,129 | | | | 1,178,268 | |
Huntington Bancshares, Inc. | | | 30,375 | | | | 285,829 | |
Intercontinental Exchange, Inc. | | | 4,041 | | | | 429,275 | |
Invesco Ltd.(d) | | | 35,610 | | | | 363,222 | |
JPMorgan Chase & Co. | | | 78,289 | | | | 7,843,775 | |
KeyCorp | | | 32,989 | | | | 406,425 | |
Lincoln National Corp. | | | 24,650 | | | | 888,633 | |
Loews Corp. | | | 24,731 | | | | 886,854 | |
M&T Bank Corp. | | | 3,534 | | | | 364,921 | |
MarketAxess Holdings, Inc. | | | 82 | | | | 39,847 | |
Marsh & McLennan Cos., Inc. | | | 9,403 | | | | 1,080,499 | |
MetLife, Inc. | | | 102,544 | | | | 3,943,842 | |
Moody’s Corp. | | | 1,061 | | | | 312,613 | |
Morgan Stanley | | | 63,850 | | | | 3,336,801 | |
MSCI, Inc. | | | 297 | | | | 110,861 | |
Nasdaq, Inc. | | | 2,266 | | | | 304,596 | |
Northern Trust Corp. | | | 4,680 | | | | 383,245 | |
People’s United Financial, Inc. | | | 11,020 | | | | 116,592 | |
PNC Financial Services Group, Inc. (The) | | | 10,890 | | | | 1,210,968 | |
Principal Financial Group, Inc. | | | 23,175 | | | | 975,899 | |
Progressive Corp. (The) | | | 28,973 | | | | 2,753,594 | |
Prudential Financial, Inc. | | | 57,083 | | | | 3,868,515 | |
Raymond James Financial, Inc. | | | 6,542 | | | | 495,360 | |
Regions Financial Corp. | | | 30,742 | | | | 355,378 | |
S&P Global, Inc. | | | 1,250 | | | | 458,025 | |
State Street Corp. | | | 11,079 | | | | 754,369 | |
SVB Financial Group(b) | | | 975 | | | | 248,996 | |
Synchrony Financial | | | 36,466 | | | | 904,721 | |
T. Rowe Price Group, Inc. | | | 2,702 | | | | 376,145 | |
Travelers Cos., Inc. (The) | | | 15,961 | | | | 1,852,114 | |
Truist Financial Corp. | | | 32,363 | | | | 1,256,008 | |
U.S. Bancorp | | | 38,802 | | | | 1,412,393 | |
Unum Group | | | 39,613 | | | | 732,048 | |
W.R. Berkley Corp. | | | 7,891 | | | | 489,637 | |
Wells Fargo & Co. | | | 195,336 | | | | 4,717,364 | |
Willis Towers Watson PLC | | | 2,796 | | | | 574,662 | |
Zions Bancorporation N.A. | | | 5,201 | | | | 167,264 | |
| | | | | | | | |
| | | | | | | 101,424,265 | |
| | | | | | | | |
Health Care-16.97% | | | | | | | | |
Abbott Laboratories | | | 20,502 | | | | 2,244,354 | |
AbbVie, Inc. | | | 20,937 | | | | 2,005,137 | |
ABIOMED, Inc.(b) | | | 197 | | | | 60,601 | |
Agilent Technologies, Inc. | | | 3,472 | | | | 348,658 | |
Alexion Pharmaceuticals, Inc.(b) | | | 2,731 | | | | 311,935 | |
Align Technology, Inc.(b) | | | 544 | | | | 161,557 | |
AmerisourceBergen Corp. | | | 111,794 | | | | 10,847,372 | |
Amgen, Inc. | | | 6,219 | | | | 1,575,397 | |
Anthem, Inc. | | | 23,454 | | | | 6,602,770 | |
See accompanying Notes to Financial Statements which are an integral part of the financial statements.
Invesco S&P 500 Revenue ETF (RWL)–(continued)
August 31, 2020
| | | | | | | | |
| | | Shares | | | Value | |
Health Care-(continued) | | | | | | | | |
Baxter International, Inc. | | | 7,802 | | | $ | 679,320 | |
Becton, Dickinson and Co. | | | 4,286 | | | | 1,040,512 | |
Biogen, Inc.(b) | | | 2,603 | | | | 748,727 | |
Bio-Rad Laboratories, Inc., Class A(b) | | | 295 | | | | 150,034 | |
Boston Scientific Corp.(b) | | | 17,335 | | | | 711,082 | |
Bristol-Myers Squibb Co. | | | 31,363 | | | | 1,950,779 | |
Cardinal Health, Inc. | | | 165,540 | | | | 8,402,810 | |
Centene Corp.(b) | | | 76,060 | | | | 4,663,999 | |
Cerner Corp. | | | 4,850 | | | | 355,845 | |
Cigna Corp. | | | 46,290 | | | | 8,210,457 | |
Cooper Cos., Inc. (The) | | | 526 | | | | 165,364 | |
CVS Health Corp. | | | 232,573 | | | | 14,447,435 | |
Danaher Corp. | | | 6,555 | | | | 1,353,411 | |
DaVita, Inc.(b) | | | 8,342 | | | | 723,752 | |
DENTSPLY SIRONA, Inc. | | | 5,182 | | | | 232,516 | |
DexCom, Inc.(b) | | | 245 | | | | 104,225 | |
Edwards Lifesciences Corp.(b) | | | 3,749 | | | | 321,814 | |
Eli Lilly and Co. | | | 9,152 | | | | 1,358,065 | |
Gilead Sciences, Inc. | | | 17,533 | | | | 1,170,328 | |
HCA Healthcare, Inc. | | | 29,200 | | | | 3,963,024 | |
Henry Schein, Inc.(b) | | | 10,088 | | | | 670,247 | |
Hologic, Inc.(b) | | | 3,776 | | | | 225,503 | |
Humana, Inc. | | | 10,176 | | | | 4,224,770 | |
IDEXX Laboratories, Inc.(b) | | | 474 | | | | 185,362 | |
Illumina, Inc.(b) | | | 596 | | | | 212,903 | |
Incyte Corp.(b) | | | 1,376 | | | | 132,578 | |
Intuitive Surgical, Inc.(b) | | | 467 | | | | 341,302 | |
IQVIA Holdings, Inc.(b) | | | 4,570 | | | | 748,338 | |
Johnson & Johnson | | | 33,365 | | | | 5,118,525 | |
Laboratory Corp. of America Holdings(b) | | | 3,925 | | | | 689,819 | |
McKesson Corp. | | | 88,786 | | | | 13,623,324 | |
Medtronic PLC | | | 17,624 | | | | 1,894,051 | |
Merck & Co., Inc. | | | 35,598 | | | | 3,035,442 | |
Mettler-Toledo International, Inc.(b) | | | 221 | | | | 214,542 | |
Mylan N.V.(b) | | | 41,437 | | | | 678,738 | |
PerkinElmer, Inc. | | | 1,705 | | | | 200,713 | |
Perrigo Co. PLC | | | 5,521 | | | | 288,748 | |
Pfizer, Inc. | | | 85,279 | | | | 3,222,693 | |
Quest Diagnostics, Inc. | | | 3,934 | | | | 437,618 | |
Regeneron Pharmaceuticals, Inc.(b) | | | 781 | | | | 484,165 | |
ResMed, Inc. | | | 1,021 | | | | 184,576 | |
STERIS PLC | | | 1,151 | | | | 183,746 | |
Stryker Corp. | | | 4,525 | | | | 896,674 | |
Teleflex, Inc. | | | 421 | | | | 165,432 | |
Thermo Fisher Scientific, Inc. | | | 4,291 | | | | 1,840,753 | |
UnitedHealth Group, Inc. | | | 49,199 | | | | 15,377,147 | |
Universal Health Services, Inc., Class B | | | 6,779 | | | | 748,063 | |
Varian Medical Systems, Inc.(b) | | | 1,639 | | | | 284,645 | |
Vertex Pharmaceuticals, Inc.(b) | | | 1,028 | | | | 286,935 | |
Waters Corp.(b) | | | 721 | | | | 155,923 | |
West Pharmaceutical Services, Inc. | | | 535 | | | | 151,919 | |
Zimmer Biomet Holdings, Inc. | | | 3,535 | | | | 498,011 | |
Zoetis, Inc. | | | 2,689 | | | | 430,509 | |
| | | | | | | | |
| | | | | | | 132,744,994 | |
| | | | | | | | |
Industrials-11.38% | | | | | | | | |
3M Co. | | | 11,865 | | | | 1,934,232 | |
A.O. Smith Corp. | | | 3,486 | | | | 170,710 | |
Alaska Air Group, Inc. | | | 12,614 | | | | 491,315 | |
Allegion PLC | | | 1,593 | | | | 164,700 | |
| | | | | | | | |
| | | Shares | | | Value | |
Industrials-(continued) | | | | | | | | |
American Airlines Group, Inc.(c) | | | 148,309 | | | $ | 1,935,433 | |
AMETEK, Inc. | | | 3,301 | | | | 332,411 | |
Boeing Co. (The) | | | 21,387 | | | | 3,674,714 | |
C.H. Robinson Worldwide, Inc. | | | 11,230 | | | | 1,103,909 | |
Carrier Global Corp. | | | 41,020 | | | | 1,224,447 | |
Caterpillar, Inc. | | | 23,508 | | | | 3,345,424 | |
Cintas Corp. | | | 1,558 | | | | 519,188 | |
Copart, Inc.(b) | | | 1,489 | | | | 153,844 | |
CSX Corp. | | | 9,621 | | | | 735,622 | |
Cummins, Inc. | | | 7,685 | | | | 1,592,716 | |
Deere & Co. | | | 13,510 | | | | 2,837,911 | |
Delta Air Lines, Inc. | | | 84,252 | | | | 2,599,174 | |
Dover Corp. | | | 4,156 | | | | 456,495 | |
Eaton Corp. PLC | | | 13,806 | | | | 1,409,593 | |
Emerson Electric Co. | | | 16,639 | | | | 1,155,911 | |
Equifax, Inc. | | | 1,229 | | | | 206,804 | |
Expeditors International of Washington, Inc. | | | 6,223 | | | | 550,051 | |
Fastenal Co. | | | 7,651 | | | | 373,828 | |
FedEx Corp. | | | 30,080 | | | | 6,612,787 | |
Flowserve Corp. | | | 8,012 | | | | 237,796 | |
Fortive Corp. | | | 6,641 | | | | 478,883 | |
Fortune Brands Home & Security, Inc. | | | 5,682 | | | | 477,743 | |
General Dynamics Corp. | | | 14,789 | | | | 2,208,737 | |
General Electric Co. | | | 789,943 | | | | 5,008,239 | |
Honeywell International, Inc. | | | 14,266 | | | | 2,361,736 | |
Howmet Aerospace, Inc. | | | 56,245 | | | | 985,412 | |
Huntington Ingalls Industries, Inc. | | | 2,831 | | | | 428,953 | |
IDEX Corp. | | | 919 | | | | 165,631 | |
IHS Markit Ltd. | | | 3,628 | | | | 289,950 | |
Illinois Tool Works, Inc. | | | 4,765 | | | | 941,326 | |
Ingersoll Rand, Inc.(b) | | | 4,840 | | | | 169,690 | |
J.B. Hunt Transport Services, Inc. | | | 4,669 | | | | 656,181 | |
Jacobs Engineering Group, Inc. | | | 9,380 | | | | 846,733 | |
Johnson Controls International PLC | | | 39,161 | | | | 1,595,028 | |
Kansas City Southern | | | 1,129 | | | | 205,523 | |
L3Harris Technologies, Inc. | | | 6,301 | | | | 1,138,843 | |
Lockheed Martin Corp. | | | 9,093 | | | | 3,548,634 | |
Masco Corp. | | | 9,248 | | | | 539,158 | |
Nielsen Holdings PLC | | | 24,403 | | | | 372,878 | |
Norfolk Southern Corp. | | | 3,532 | | | | 750,656 | |
Northrop Grumman Corp. | | | 6,129 | | | | 2,099,857 | |
Old Dominion Freight Line, Inc. | | | 1,487 | | | | 300,642 | |
Otis Worldwide Corp. | | | 12,028 | | | | 756,561 | |
PACCAR, Inc. | | | 18,867 | | | | 1,619,543 | |
Parker-Hannifin Corp. | | | 4,483 | | | | 923,543 | |
Pentair PLC | | | 4,513 | | | | 203,717 | |
Quanta Services, Inc. | | | 18,508 | | | | 948,535 | |
Raytheon Technologies Corp. | | | 67,575 | | | | 4,122,075 | |
Republic Services, Inc. | | | 7,217 | | | | 669,160 | |
Robert Half International, Inc. | | | 6,772 | | | | 360,270 | |
Rockwell Automation, Inc. | | | 1,862 | | | | 429,247 | |
Rollins, Inc. | | | 2,853 | | | | 157,314 | |
Roper Technologies, Inc. | | | 801 | | | | 342,179 | |
Snap-on, Inc. | | | 1,683 | | | | 249,538 | |
Southwest Airlines Co. | | | 34,071 | | | | 1,280,388 | |
Stanley Black & Decker, Inc.(b) | | | 6,171 | | | | 995,382 | |
Teledyne Technologies, Inc. | | | 545 | | | | 170,918 | |
Textron, Inc. | | | 22,124 | | | | 872,349 | |
Trane Technologies PLC | | | 9,847 | | | | 1,165,786 | |
TransDigm Group, Inc. | | | 775 | | | | 387,244 | |
See accompanying Notes to Financial Statements which are an integral part of the financial statements.
Invesco S&P 500 Revenue ETF (RWL)–(continued)
August 31, 2020
| | | | | | | | |
| | | Shares | | | Value | |
Industrials-(continued) | | | | | | | | |
Union Pacific Corp. | | | 7,371 | | | $ | 1,418,475 | |
United Airlines Holdings, Inc.(b) | | | 59,663 | | | | 2,147,868 | |
United Parcel Service, Inc., Class B | | | 42,230 | | | | 6,909,673 | |
United Rentals, Inc.(b) | | | 3,706 | | | | 656,147 | |
Verisk Analytics, Inc. | | | 946 | | | | 176,590 | |
W.W. Grainger, Inc. | | | 2,186 | | | | 798,830 | |
Wabtec Corp. | | | 7,964 | | | | 530,004 | |
Waste Management, Inc. | | | 8,471 | | | | 965,694 | |
Xylem, Inc. | | | 4,555 | | | | 365,220 | |
| | | | | | | | |
| | | | | | | 89,011,698 | |
| | | | | | | | |
Information Technology-11.25% | | | | | | | | |
Accenture PLC, Class A | | | 12,589 | | | | 3,020,479 | |
Adobe, Inc.(b) | | | 1,640 | | | | 841,960 | |
Advanced Micro Devices, Inc.(b) | | | 7,703 | | | | 699,586 | |
Akamai Technologies, Inc.(b) | | | 1,675 | | | | 195,020 | |
Amphenol Corp., Class A | | | 4,862 | | | | 533,848 | |
Analog Devices, Inc. | | | 2,668 | | | | 311,836 | |
ANSYS, Inc.(b) | | | 325 | | | | 110,178 | |
Apple, Inc. | | | 180,056 | | | | 23,234,426 | |
Applied Materials, Inc. | | | 15,500 | | | | 954,800 | |
Arista Networks, Inc.(b) | | | 597 | | | | 133,400 | |
Autodesk, Inc.(b) | | | 871 | | | | 214,005 | |
Automatic Data Processing, Inc. | | | 5,687 | | | | 791,005 | |
Broadcom, Inc. | | | 4,293 | | | | 1,490,315 | |
Broadridge Financial Solutions, Inc. | | | 2,026 | | | | 278,372 | |
Cadence Design Systems, Inc.(b) | | | 1,528 | | | | 169,470 | |
CDW Corp. | | | 9,194 | | | | 1,044,898 | |
Cisco Systems, Inc. | | | 63,756 | | | | 2,691,778 | |
Citrix Systems, Inc. | | | 1,277 | | | | 185,420 | |
Cognizant Technology Solutions Corp. Class A ., | | | 17,518 | | | | 1,171,253 | |
Corning, Inc. | | | 23,377 | | | | 758,817 | |
DXC Technology Co. | | | 68,362 | | | | 1,365,873 | |
F5 Networks, Inc.(b) | | | 935 | | | | 123,729 | |
Fidelity National Information Services, Inc. | | | 4,705 | | | | 709,749 | |
Fiserv, Inc.(b) | | | 7,052 | | | | 702,238 | |
FleetCor Technologies, Inc.(b) | | | 590 | | | | 148,356 | |
FLIR Systems, Inc. | | | 2,608 | | | | 96,235 | |
Fortinet, Inc.(b) | | | 986 | | | | 130,157 | |
Gartner, Inc.(b) | | | 2,056 | | | | 266,910 | |
Global Payments, Inc. | | | 1,887 | | | | 333,282 | |
Hewlett Packard Enterprise Co. | | | 152,295 | | | | 1,472,693 | |
HP, Inc. | | | 198,229 | | | | 3,875,377 | |
Intel Corp. | | | 72,538 | | | | 3,695,811 | |
International Business Machines Corp. | | | 35,985 | | | | 4,437,310 | |
Intuit, Inc. | | | 1,388 | | | | 479,401 | |
IPG Photonics Corp.(b) | | | 453 | | | | 73,264 | |
Jack Henry & Associates, Inc. | | | 559 | | | | 92,470 | |
Juniper Networks, Inc. | | | 10,563 | | | | 264,075 | |
Keysight Technologies, Inc.(b) | | | 2,497 | | | | 246,004 | |
KLA Corp. | | | 1,730 | | | | 354,892 | |
Lam Research Corp. | | | 1,926 | | | | 647,791 | |
Leidos Holdings, Inc. | | | 6,563 | | | | 593,886 | |
Mastercard, Inc., Class A | | | 3,246 | | | | 1,162,685 | |
Maxim Integrated Products, Inc. | | | 2,195 | | | | 150,226 | |
Microchip Technology, Inc. | | | 3,008 | | | | 329,978 | |
Micron Technology, Inc.(b) | | | 22,879 | | | | 1,041,223 | |
Microsoft Corp. | | | 42,082 | | | | 9,490,753 | |
Motorola Solutions, Inc. | | | 3,188 | | | | 493,343 | |
| | | | | | | | |
| | | Shares | | | Value | |
Information Technology-(continued) | | | | | | | | |
NetApp, Inc. | | | 7,241 | | | $ | 343,151 | |
NortonLifeLock, Inc. | | | 8,835 | | | | 207,799 | |
NVIDIA Corp. | | | 1,890 | | | | 1,011,112 | |
Oracle Corp. | | | 43,564 | | | | 2,492,732 | |
Paychex, Inc. | | | 3,164 | | | | 241,951 | |
Paycom Software, Inc.(b) | | | 145 | | | | 43,422 | |
PayPal Holdings, Inc.(b) | | | 6,613 | | | | 1,349,978 | |
Qorvo, Inc.(b) | | | 1,694 | | | | 217,289 | |
QUALCOMM, Inc. | | | 16,502 | | | | 1,965,388 | |
salesforce.com, inc.(b) | | | 5,929 | | | | 1,616,542 | |
Seagate Technology PLC | | | 11,632 | | | | 558,220 | |
ServiceNow, Inc.(b) | | | 562 | | | | 270,895 | |
Skyworks Solutions, Inc. | | | 1,459 | | | | 211,336 | |
Synopsys, Inc.(b) | | | 1,082 | | | | 239,447 | |
TE Connectivity Ltd. | | | 9,435 | | | | 911,421 | |
Texas Instruments, Inc. | | | 6,471 | | | | 919,853 | |
Tyler Technologies, Inc.(b) | | | 184 | | | | 63,537 | |
VeriSign, Inc.(b) | | | 355 | | | | 76,254 | |
Visa, Inc., Class A | | | 7,074 | | | | 1,499,617 | |
Western Digital Corp. | | | 21,275 | | | | 817,386 | |
Western Union Co. (The) | | | 12,945 | | | | 305,373 | |
Xerox Holdings Corp. | | | 29,283 | | | | 552,277 | |
Xilinx, Inc. | | | 1,981 | | | | 206,341 | |
Zebra Technologies Corp., Class A(b) | | | 975 | | | | 279,367 | |
| | | | | | | | |
| | | | | | | 88,009,265 | |
| | | | | | | | |
Materials-3.07% | | | | | | | | |
Air Products and Chemicals, Inc. | | | 2,182 | | | | 637,711 | |
Albemarle Corp. | | | 2,570 | | | | 233,896 | |
Amcor PLC | | | 67,390 | | | | 745,333 | |
Avery Dennison Corp. | | | 3,529 | | | | 407,211 | |
Ball Corp. | | | 9,527 | | | | 765,685 | |
Celanese Corp. | | | 3,896 | | | | 394,080 | |
CF Industries Holdings, Inc. | | | 8,811 | | | | 287,503 | |
Corteva, Inc. | | | 29,718 | | | | 848,449 | |
Dow, Inc. | | | 57,534 | | | | 2,595,934 | |
DuPont de Nemours, Inc. | | | 23,745 | | | | 1,324,021 | |
Eastman Chemical Co. | | | 7,431 | | | | 543,280 | |
Ecolab, Inc. | | | 4,171 | | | | 822,021 | |
FMC Corp. | | | 2,729 | | | | 291,621 | |
Freeport-McMoRan, Inc. | | | 74,331 | | | | 1,160,307 | |
International Flavors & Fragrances, Inc.(c) | | | 2,326 | | | | 287,936 | |
International Paper Co. | | | 35,931 | | | | 1,303,217 | |
Linde PLC (United Kingdom) | | | 7,885 | | | | 1,969,200 | |
LyondellBasell Industries N.V., Class A | | | 28,550 | | | | 1,869,454 | |
Martin Marietta Materials, Inc. | | | 1,372 | | | | 278,338 | |
Mosaic Co. (The) | | | 37,668 | | | | 686,688 | |
Newmont Corp. | | | 10,791 | | | | 726,018 | |
Nucor Corp. | | | 30,499 | | | | 1,386,484 | |
Packaging Corp. of America | | | 3,986 | | | | 403,543 | |
PPG Industries, Inc. | | | 8,329 | | | | 1,002,812 | |
Sealed Air Corp. | | | 9,016 | | | | 354,329 | |
Sherwin-Williams Co. (The) | | | 1,881 | | | | 1,262,245 | |
Vulcan Materials Co. | | | 2,525 | | | | 303,000 | |
Westrock Co. | | | 36,681 | | | | 1,112,535 | |
| | | | | | | | |
| | | | | | | 24,002,851 | |
| | | | | | | | |
Real Estate-0.86% | | | | | | | | |
Alexandria Real Estate Equities, Inc. | | | 576 | | | | 96,987 | |
American Tower Corp. | | | 1,716 | | | | 427,541 | |
See accompanying Notes to Financial Statements which are an integral part of the financial statements.
Invesco S&P 500 Revenue ETF (RWL)–(continued)
August 31, 2020
| | | | | | | | |
| | | Shares | | | Value | |
Real Estate-(continued) | | | | | | | | |
Apartment Investment & Management Co., Class A | | | 1,308 | | | $ | 47,127 | |
AvalonBay Communities, Inc. | | | 817 | | | | 129,135 | |
Boston Properties, Inc. | | | 1,758 | | | | 152,718 | |
CBRE Group, Inc., Class A(b) | | | 29,436 | | | | 1,384,375 | |
Crown Castle International Corp. | | | 2,038 | | | | 332,704 | |
Digital Realty Trust, Inc. | | | 1,342 | | | | 208,882 | |
Duke Realty Corp. | | | 1,510 | | | | 58,211 | |
Equinix, Inc. | | | 476 | | | | 375,935 | |
Equity Residential | | | 2,411 | | | | 136,101 | |
Essex Property Trust, Inc. | | | 345 | | | | 74,696 | |
Extra Space Storage, Inc. | | | 785 | | | | 83,642 | |
Federal Realty Investment Trust | | | 588 | | | | 46,593 | |
Healthpeak Properties, Inc. | | | 4,437 | | | | 122,639 | |
Host Hotels & Resorts, Inc. | | | 23,062 | | | | 258,986 | |
Iron Mountain, Inc.(c) | | | 8,736 | | | | 262,866 | |
Kimco Realty Corp. | | | 4,763 | | | | 57,108 | |
Mid-America Apartment Communities, Inc. | | | 791 | | | | 92,642 | |
Prologis, Inc. | | | 2,126 | | | | 216,554 | |
Public Storage | | | 831 | | | | 176,504 | |
Realty Income Corp. | | | 1,475 | | | | 91,494 | |
Regency Centers Corp. | | | 1,297 | | | | 51,504 | |
SBA Communications Corp., Class A | | | 392 | | | | 119,980 | |
Simon Property Group, Inc. | | | 4,224 | | | | 286,598 | |
SL Green Realty Corp. | | | 1,416 | | | | 66,212 | |
UDR, Inc. | | | 1,759 | | | | 61,231 | |
Ventas, Inc. | | | 5,684 | | | | 234,238 | |
Vornado Realty Trust | | | 7,187 | | | | 257,510 | |
Welltower, Inc. | | | 5,252 | | | | 302,095 | |
Weyerhaeuser Co. | | | 17,334 | | | | 525,394 | |
| | | | | | | | |
| | | | | | | 6,738,202 | |
| | | | | | | | |
Utilities-2.24% | | | | | | | | |
AES Corp. (The) | | | 44,294 | | | | 786,218 | |
Alliant Energy Corp. | | | 4,185 | | | | 226,618 | |
Ameren Corp. | | | 4,589 | | | | 363,036 | |
American Electric Power Co., Inc. | | | 10,584 | | | | 834,337 | |
American Water Works Co., Inc. | | | 1,634 | | | | 230,950 | |
Atmos Energy Corp. | | | 1,573 | | | | 157,017 | |
CenterPoint Energy, Inc. | | | 33,843 | | | | 679,229 | |
CMS Energy Corp. | | | 6,483 | | | | 392,157 | |
Consolidated Edison, Inc. | | | 9,250 | | | | 659,895 | |
Dominion Energy, Inc. | | | 11,698 | | | | 917,591 | |
DTE Energy Co. | | | 6,510 | | | | 772,542 | |
Duke Energy Corp. | | | 16,287 | | | | 1,308,498 | |
Edison International | | | 12,150 | | | | 637,632 | |
| | | | | | | | |
| | | Shares | | | Value | |
Utilities-(continued) | | | | | | | | |
Entergy Corp. | | | 6,217 | | | $ | 616,353 | |
Evergy, Inc. | | | 4,774 | | | | 254,072 | |
Eversource Energy | | | 5,723 | | | | 490,518 | |
Exelon Corp. | | | 48,413 | | | | 1,786,924 | |
FirstEnergy Corp. | | | 15,261 | | | | 436,312 | |
NextEra Energy, Inc. | | | 3,955 | | | | 1,104,117 | |
NiSource, Inc. | | | 12,078 | | | | 267,648 | |
NRG Energy, Inc. | | | 16,143 | | | | 555,481 | |
Pinnacle West Capital Corp. | | | 2,550 | | | | 187,043 | |
PPL Corp. | | | 16,572 | | | | 457,884 | |
Public Service Enterprise Group, Inc. | | | 10,516 | | | | 549,356 | |
Sempra Energy | | | 4,986 | | | | 616,519 | |
Southern Co. (The) | | | 21,002 | | | | 1,095,884 | |
WEC Energy Group, Inc. | | | 4,565 | | | | 429,475 | |
Xcel Energy, Inc. | | | 10,005 | | | | 695,097 | |
| | | | | | | | |
| | | | | | | 17,508,403 | |
| | | | | | | | |
Total Common Stocks & Other Equity Interests
(Cost $731,276,500) | | | | | | | 779,932,164 | |
| | | | | | | | |
| | |
Money Market Funds-0.04% | | | | | | | | |
Invesco Premier U.S. Government Money Portfolio, Institutional Class, 0.01%(d)(e)
(Cost $319,347) | | | 319,347 | | | | 319,347 | |
| | | | | | | | |
TOTAL INVESTMENTS IN SECURITIES (excluding investments purchased with cash collateral from securities on loan)-99.76%
(Cost $731,595,847) | | | | | | | 780,251,511 | |
| | | | | | | | |
|
Investments Purchased with Cash Collateral from Securities on Loan | |
| | |
Money Market Funds-0.41% | | | | | | | | |
Invesco Private Government Fund,
0.03%(d)(e)(f) | | | 2,397,010 | | | | 2,397,010 | |
Invesco Private Prime Fund, 0.14%(d)(e)(f) | | | 798,864 | | | | 799,024 | |
| | | | | | | | |
Total Investments Purchased with Cash Collateral from Securities on Loan
(Cost $3,196,034) | | | | 3,196,034 | |
| | | | | | | | |
TOTAL INVESTMENTS IN SECURITIES-100.17%
(Cost $734,791,881) | | | | 783,447,545 | |
OTHER ASSETS LESS LIABILITIES-(0.17)% | | | | (1,364,711 | ) |
| | | | | | | | |
NET ASSETS-100.00% | | | | | | $ | 782,082,834 | |
| | | | | | | | |
See accompanying Notes to Financial Statements which are an integralpart of the financial statements.
Invesco S&P 500 Revenue ETF (RWL)–(continued)
August 31, 2020
Notes to Schedule of Investments:
| (a) | Industry and/or sector classifications used in this report are generally according to the Global Industry Classification Standard, which was developed by and is the exclusive property and a service mark of MSCI Inc. and Standard & Poor’s. |
| (b) | Non-income producing security. |
| (c) | All or a portion of this security was out on loan at August 31, 2020. |
| (d) | Affiliated issuer. The issuer and/or the Fund is a wholly-owned subsidiary of Invesco Ltd., or is affiliated by having an investment adviser that is under common control of Invesco Ltd. The table below shows the Fund’s transactions in, and earnings from, its investments in affiliates for the fiscal year ended August 31, 2020. |
| | | | | | | | | | | | | | | | | | | | | | | | | | | | |
| | | Value
August 31, 2019 | | | Purchases
at Cost | | | Proceeds
from Sales | | | Change in
Unrealized
Appreciation
(Depreciation) | | | Realized
Gain
(Loss) | | | Value
August 31, 2020 | | | Dividend
Income | |
Invesco Ltd. | | $ | 293,747 | | | $ | 298,438 | | | $ | (68,332 | ) | | $ | (133,255 | ) | | $ | (27,376 | ) | | $ | 363,222 | | | $ | 23,845 | |
Investments in Affiliated Money Market Funds: | | | | | | | | | | | | | | | | | | | | | | | | | | | | |
Invesco Premier | | | | | | | | | | | | | | | | | | | | | | | | | | | | |
U.S. Government Money Portfolio, Institutional Class | | | - | | �� | | 25,266,436 | | | | (24,947,089 | ) | | | - | | | | - | | | | 319,347 | | | | 5,693 | |
Investments Purchased with Cash Collateral from Securities on Loan: | | | | | | | | | | | | | | | | | | | | | | | | | | | | |
Invesco Government & Agency Portfolio, Institutional Class | | | 2,475,627 | | | | 51,778,205 | | | | (54,253,832 | ) | | | - | | | | - | | | | - | | | | 30,326 | * |
Invesco Liquid Assets Portfolio, Institutional Class | | | 825,209 | | | | 15,424,722 | | | | (16,246,331 | ) | | | - | | | | (3,600 | ) | | | - | | | | 11,668 | * |
Invesco Private Government Fund | | | - | | | | 17,011,737 | | | | (14,614,727 | ) | | | - | | | | - | | | | 2,397,010 | | | | 312 | * |
Invesco Private Prime Fund | | | - | | | | 2,263,746 | | | | (1,464,800 | ) | | | - | | | | 78 | | | | 799,024 | | | | 201 | * |
| | | | | | | | | | | | | | | | | | | | | | | | | | | | |
Total | | $ | 3,594,583 | | | $ | 112,043,284 | | | $ | (111,595,111 | ) | | $ | (133,255 | ) | | $ | (30,898 | ) | | $ | 3,878,603 | | | $ | 72,045 | |
| | | | | | | | | | | | | | | | | | | | | | | | | | | | |
| * | Represents the income earned on the investment of cash collateral, which is included in securities lending income on the Statements of Operations. Does not include rebates and fees paid to lending agent or premiums received from borrowers, if any. |
| (e) | The rate shown is the 7-day SEC standardized yield as of August 31, 2020. |
| (f) | The security has been segregated to satisfy the commitment to return the cash collateral received in securities lending transactions upon the borrower’s return of the securities loaned. See Note 2J. |
See accompanying Notes to Financial Statements which are an integral part of the financial statements.
Invesco S&P MidCap 400 Revenue ETF (RWK)
August 31, 2020
Schedule of Investments(a)
| | | | | | | | |
| | | Shares | | | Value | |
Common Stocks & Other Equity Interests-99.85% | |
Communication Services-1.46% | | | | | | | | |
AMC Networks, Inc., Class A(b) | | | 14,920 | | | $ | 362,407 | |
Cable One, Inc. | | | 94 | | | | 172,991 | |
Cinemark Holdings, Inc. | | | 26,389 | | | | 386,599 | |
John Wiley & Sons, Inc., Class A | | | 6,766 | | | | 214,144 | |
New York Times Co. (The), Class A | | | 5,941 | | | | 257,423 | |
TEGNA, Inc. | | | 28,505 | | | | 356,883 | |
Telephone & Data Systems, Inc. | | | 34,682 | | | | 802,195 | |
TripAdvisor, Inc. | | | 9,507 | | | | 222,178 | |
World Wrestling Entertainment, Inc.,
Class A(c) | | | 3,188 | | | | 140,495 | |
Yelp, Inc.(b) | | | 5,803 | | | | 134,165 | |
| | | | | | | | |
| | | | | | | 3,049,480 | |
| | | | | | | | |
Consumer Discretionary-20.73% | | | | | | | | |
Aaron’s, Inc. | | | 12,548 | | | | 701,308 | |
Adient PLC(b) | | | 115,824 | | | | 2,008,388 | |
Adtalem Global Education, Inc.(b) | | | 4,414 | | | | 146,545 | |
American Eagle Outfitters, Inc.(c) | | | 45,451 | | | | 573,137 | |
AutoNation, Inc.(b) | | | 72,313 | | | | 4,111,717 | |
Boyd Gaming Corp. | | | 20,668 | | | | 553,489 | |
Brunswick Corp. | | | 9,543 | | | | 590,616 | |
Caesars Entertainment, Inc.(b) | | | 8,530 | | | | 390,674 | |
Carter’s, Inc. | | | 5,570 | | | | 443,483 | |
Choice Hotels International, Inc. | | | 1,781 | | | | 176,835 | |
Churchill Downs, Inc. | | | 1,298 | | | | 226,838 | |
Columbia Sportswear Co. | | | 5,086 | | | | 435,209 | |
Cracker Barrel Old Country Store, Inc. | | | 3,387 | | | | 452,876 | |
Dana, Inc. | | | 92,005 | | | | 1,283,470 | |
Deckers Outdoor Corp.(b) | | | 1,443 | | | | 294,184 | |
Delphi Technologies PLC(b) | | | 41,793 | | | | 725,944 | |
Dick’s Sporting Goods, Inc. | | | 28,113 | | | | 1,521,476 | |
Dunkin’ Brands Group, Inc. | | | 2,819 | | | | 214,470 | |
Etsy, Inc.(b) | | | 1,457 | | | | 174,403 | |
Five Below, Inc.(b) | | | 2,217 | | | | 242,651 | |
Foot Locker, Inc. | | | 32,295 | | | | 979,507 | |
Gentex Corp. | | | 9,156 | | | | 247,670 | |
Goodyear Tire & Rubber Co. (The) | | | 203,435 | | | | 1,951,959 | |
Graham Holdings Co., Class B | | | 1,168 | | | | 499,846 | |
Grand Canyon Education, Inc.(b) | | | 1,099 | | | | 103,350 | |
Grubhub, Inc.(b) | | | 2,968 | | | | 214,735 | |
Harley-Davidson, Inc. | | | 28,378 | | | | 786,354 | |
Helen of Troy Ltd.(b) | | | 1,296 | | | | 268,039 | |
Jack in the Box, Inc. | | | 1,809 | | | | 149,044 | |
KB Home | | | 20,419 | | | | 730,183 | |
Lear Corp. | | | 23,462 | | | | 2,673,026 | |
Marriott Vacations Worldwide Corp. | | | 6,566 | | | | 621,603 | |
Mattel, Inc.(b) | | | 61,991 | | | | 666,093 | |
Murphy USA, Inc.(b) | | | 17,465 | | | | 2,355,330 | |
Nordstrom, Inc.(c) | | | 108,758 | | | | 1,740,128 | |
Ollie’s Bargain Outlet Holdings, Inc.(b) | | | 2,083 | | | | 199,010 | |
Papa John’s International, Inc. | | | 2,736 | | | | 268,921 | |
Penn National Gaming, Inc.(b) | | | 23,568 | | | | 1,204,325 | |
Polaris, Inc. | | | 9,623 | | | | 972,308 | |
Pool Corp. | | | 1,767 | | | | 579,293 | |
RH(b) | | | 1,544 | | | | 510,369 | |
Sally Beauty Holdings, Inc.(b) | | | 38,427 | | | | 428,845 | |
Scientific Games Corp.(b) | | | 29,535 | | | | 610,931 | |
Service Corp. International | | | 11,622 | | | | 530,544 | |
| | | | | | | | |
| | | Shares | | | Value | |
Consumer Discretionary-(continued) | | | | | | | | |
Six Flags Entertainment Corp. | | | 8,526 | | | $ | 185,270 | |
Skechers U.S.A., Inc., Class A(b) | | | 22,030 | | | | 657,596 | |
Strategic Education, Inc. | | | 834 | | | | 85,543 | |
Taylor Morrison Home Corp., Class A(b) | | | 37,093 | | | | 872,798 | |
Tempur Sealy International, Inc.(b) | | | 6,768 | | | | 578,935 | |
Texas Roadhouse, Inc. | | | 7,204 | | | | 453,780 | |
Thor Industries, Inc. | | | 11,408 | | | | 1,077,257 | |
Toll Brothers, Inc. | | | 30,056 | | | | 1,268,964 | |
TRI Pointe Group, Inc.(b) | | | 31,528 | | | | 532,193 | |
Urban Outfitters, Inc.(b)(c) | | | 29,127 | | | | 685,650 | |
Visteon Corp.(b) | | | 5,441 | | | | 410,415 | |
Wendy’s Co. (The) | | | 10,402 | | | | 217,818 | |
Williams-Sonoma, Inc.(b) | | | 9,888 | | | | 867,771 | |
WW International, Inc. | | | 7,766 | | | | 182,346 | |
Wyndham Destinations, Inc. | | | 15,562 | | | | 451,142 | |
Wyndham Hotels & Resorts, Inc. | | | 5,896 | | | | 308,715 | |
| | | | | | | | |
| | | | | | | 43,395,319 | |
| | | | | | | | |
Consumer Staples-5.76% | | | | | | | | |
BJ’s Wholesale Club Holdings, Inc.(b) | | | 56,189 | | | | 2,495,353 | |
Boston Beer Co., Inc. (The), Class A(b) | | | 343 | | | | 302,519 | |
Casey’s General Stores, Inc. | | | 8,523 | | | | 1,515,816 | |
Darling Ingredients, Inc.(b) | | | 20,012 | | | | 639,784 | |
Edgewell Personal Care Co.(b) | | | 10,321 | | | | 296,316 | |
Energizer Holdings, Inc. | | | 8,166 | | | | 378,004 | |
Flowers Foods, Inc. | | | 25,631 | | | | 626,934 | |
Hain Celestial Group, Inc. (The)(b) | | | 9,213 | | | | 302,094 | |
Ingredion, Inc. | | | 9,797 | | | | 788,071 | |
Lancaster Colony Corp. | | | 1,146 | | | | 203,667 | |
Nu Skin Enterprises, Inc., Class A | | | 8,618 | | | | 407,373 | |
Pilgrim’s Pride Corp.(b) | | | 87,521 | | | | 1,400,336 | |
Post Holdings, Inc.(b) | | | 9,129 | | | | 803,535 | |
Sanderson Farms, Inc. | | | 3,977 | | | | 465,150 | |
Sprouts Farmers Market, Inc.(b) | | | 34,314 | | | | 801,232 | |
Tootsie Roll Industries, Inc.(c) | | | 2,048 | | | | 65,515 | |
TreeHouse Foods, Inc.(b) | | | 13,122 | | | | 561,753 | |
| | | | | | | | |
| | | | | | | 12,053,452 | |
| | | | | | | | |
Energy-4.72% | | | | | | | | |
Antero Midstream Corp.(c) | | | 26,285 | | | | 177,949 | |
ChampionX Corp.(b) | | | 13,919 | | | | 142,531 | |
Cimarex Energy Co. | | | 9,861 | | | | 273,939 | |
CNX Resources Corp.(b) | | | 13,187 | | | | 144,529 | |
EQT Corp. | | | 30,153 | | | | 478,528 | |
Equitrans Midstream Corp.(c) | | | 27,867 | | | | 286,473 | |
Murphy Oil Corp.(c) | | | 25,960 | | | | 356,690 | |
PBF Energy, Inc., Class A | | | 283,100 | | | | 2,423,336 | |
Transocean Ltd.(b)(c) | | | 196,080 | | | | 239,218 | |
World Fuel Services Corp. | | | 193,188 | | | | 5,100,163 | |
WPX Energy, Inc.(b) | | | 47,451 | | | | 263,828 | |
| | | | | | | | |
| | | | | | | 9,887,184 | |
| | | | | | | | |
Financials-11.39% | | | | | | | | |
Affiliated Managers Group, Inc. | | | 4,016 | | | | 275,698 | |
Alleghany Corp | | | 2,295 | | | | 1,272,715 | |
American Financial Group, Inc. | | | 15,850 | | | | 1,059,573 | |
Associated Banc-Corp. | | | 13,689 | | | | 183,980 | |
BancorpSouth Bank | | | 6,735 | | | | 145,341 | |
Bank of Hawaii Corp. | | | 1,586 | | | | 87,293 | |
See accompanying Notes to Financial Statements which are an integral part of the financial statements.
Invesco S&P MidCap 400 Revenue ETF (RWK)–(continued)
August 31, 2020
| | | | | | | | |
| | | Shares | | | Value | |
Financials-(continued) | | | | | | | | |
Bank OZK | | | 6,950 | | | $ | 160,128 | |
Brighthouse Financial, Inc.(b) | | | 35,273 | | | | 1,070,888 | |
Brown & Brown, Inc. | | | 8,363 | | | | 388,043 | |
Cathay General Bancorp | | | 4,253 | | | | 105,007 | |
CIT Group, Inc. | | | 18,557 | | | | 365,016 | |
CNO Financial Group, Inc. | | | 35,549 | | | | 579,449 | |
Commerce Bancshares, Inc. | | | 3,118 | | | | 185,739 | |
Cullen/Frost Bankers, Inc. | | | 2,809 | | | | 195,113 | |
East West Bancorp, Inc. | | | 7,467 | | | | 274,636 | |
Eaton Vance Corp. | | | 5,681 | | | | 233,035 | |
Essent Group Ltd. | | | 3,165 | | | | 112,991 | |
Evercore, Inc., Class A | | | 4,660 | | | | 288,361 | |
F.N.B. Corp. | | | 26,422 | | | | 198,165 | |
FactSet Research Systems, Inc. | | | 678 | | | | 237,571 | |
Federated Hermes, Inc., Class B | | | 7,808 | | | | 186,689 | |
First American Financial Corp. | | | 17,012 | | | | 894,321 | |
First Financial Bankshares, Inc. | | | 1,976 | | | | 59,823 | |
First Horizon National Corp. | | | 30,168 | | | | 288,104 | |
FirstCash, Inc. | | | 3,418 | | | | 204,226 | |
Fulton Financial Corp. | | | 13,005 | | | | 127,189 | |
Genworth Financial, Inc., Class A(b) | | | 351,620 | | | | 1,061,892 | |
Glacier Bancorp, Inc. | | | 2,312 | | | | 81,117 | |
Hancock Whitney Corp. | | | 7,724 | | | | 154,557 | |
Hanover Insurance Group, Inc. (The) | | | 6,479 | | | | 664,033 | |
Home BancShares, Inc. | | | 7,287 | | | | 118,122 | |
Interactive Brokers Group, Inc., Class A | | | 8,600 | | | | 455,972 | |
International Bancshares Corp. | | | 2,884 | | | | 91,077 | |
Janus Henderson Group PLC (United Kingdom) | | | 12,907 | | | | 267,433 | |
Jefferies Financial Group, Inc. | | | 50,180 | | | | 880,157 | |
Kemper Corp. | | | 10,238 | | | | 795,083 | |
LendingTree, Inc.(b)(c) | | | 551 | | | | 170,226 | |
Mercury General Corp. | | | 12,797 | | | | 572,410 | |
Navient Corp. | | | 86,860 | | | | 789,557 | |
New York Community Bancorp, Inc. | | | 23,259 | | | | 210,494 | |
Old Republic International Corp. | | | 55,392 | | | | 892,365 | |
PacWest Bancorp | | | 9,291 | | | | 177,272 | |
Pinnacle Financial Partners, Inc. | | | 4,030 | | | | 160,999 | |
Primerica, Inc. | | | 2,592 | | | | 323,611 | |
Prosperity Bancshares, Inc. | | | 2,310 | | | | 125,941 | |
Reinsurance Group of America, Inc. | | | 22,037 | | | | 2,020,352 | |
RenaissanceRe Holdings Ltd. (Bermuda) | | | 3,170 | | | | 582,456 | |
RLI Corp. | | | 1,571 | | | | 147,344 | |
SEI Investments Co. | | | 3,919 | | | | 205,199 | |
Selective Insurance Group, Inc. | | | 7,865 | | | | 470,406 | |
Signature Bank | | | 2,444 | | | | 237,141 | |
SLM Corp. | | | 44,221 | | | | 337,848 | |
Sterling Bancorp | | | 14,457 | | | | 168,713 | |
Stifel Financial Corp. | | | 10,315 | | | | 523,074 | |
Synovus Financial Corp. | | | 14,492 | | | | 316,940 | |
TCF Financial Corp. | | | 8,961 | | | | 240,872 | |
Texas Capital Bancshares,
Inc.(b) | | | 5,793 | | | | 187,635 | |
Trustmark Corp | | | 3,507 | | | | 82,344 | |
UMB Financial Corp. | | | 3,226 | | | | 173,301 | |
Umpqua Holdings Corp. | | | 15,802 | | | | 178,247 | |
United Bankshares, Inc. | | | 4,498 | | | | 117,578 | |
Valley National Bancorp | | | 24,918 | | | | 187,134 | |
Washington Federal, Inc. | | | 3,879 | | | | 90,963 | |
| | | | | | | | |
| | | Shares | | | Value | |
Financials-(continued) | | | | | | | | |
Webster Financial Corp. | | | 6,329 | | | $ | 174,048 | |
Wintrust Financial Corp. | | | 5,309 | | | | 231,048 | |
| | | | | | | | |
| | | | | | | 23,844,055 | |
| | | | | | | | |
Health Care-7.14% | | | | | | | | |
Acadia Healthcare Co., Inc.(b) | | | 16,372 | | | | 506,058 | |
Amedisys, Inc.(b) | | | 1,602 | | | | 387,524 | |
Arrowhead Pharmaceuticals, Inc.(b) | | | 562 | | | | 23,739 | |
Avanos Medical, Inc.(b) | | | 3,315 | | | | 107,406 | |
Bio-Techne Corp. | | | 407 | | | | 103,972 | |
Cantel Medical Corp. | | | 3,266 | | | | 171,400 | |
Catalent, Inc.(b) | | | 5,645 | | | | 522,162 | |
Charles River Laboratories International, Inc.(b) | | | 2,089 | | | | 457,386 | |
Chemed Corp. | | | 608 | | | | 314,403 | |
Encompass Health Corp. | | | 9,560 | | | | 623,694 | |
Exelixis, Inc.(b) | | | 5,801 | | | | 128,898 | |
Globus Medical, Inc.,
Class A(b) | | | 2,198 | | | | 124,231 | |
Haemonetics Corp.(b) | | | 1,471 | | | | 131,890 | |
HealthEquity, Inc.(b) | | | 1,455 | | | | 83,633 | |
Hill-Rom Holdings, Inc. | | | 4,168 | | | | 390,917 | |
ICU Medical, Inc.(b) | | | 940 | | | | 188,226 | |
Integra LifeSciences Holdings Corp.(b) | | | 4,147 | | | | 198,185 | |
LHC Group, Inc.(b) | | | 1,852 | | | | 386,031 | |
Ligand Pharmaceuticals,
Inc.(b)(c) | | | 133 | | | | 13,566 | |
LivaNova PLC(b) | | | 2,998 | | | | 140,606 | |
Masimo Corp.(b) | | | 596 | | | | 133,504 | |
MEDNAX, Inc.(b) | | | 28,837 | | | | 535,791 | |
Molina Healthcare, Inc.(b) | | | 13,778 | | | | 2,548,517 | |
Nektar Therapeutics(b) | | | 887 | | | | 17,154 | |
NuVasive, Inc.(b) | | | 2,636 | | | | 137,415 | |
Patterson Cos., Inc. | | | 43,213 | | | | 1,253,609 | |
Penumbra, Inc.(b) | | | 440 | | | | 92,026 | |
PRA Health Sciences, Inc.(b) | | | 4,523 | | | | 483,554 | |
Prestige Consumer Healthcare, Inc.(b) | | | 3,169 | | | | 115,447 | |
Quidel Corp.(b) | | | 433 | | | | 76,191 | |
Repligen Corp.(b) | | | 325 | | | | 50,346 | |
Syneos Health, Inc.(b) | | | 12,066 | | | | 761,365 | |
Tenet Healthcare Corp.(b) | | | 126,409 | | | | 3,562,206 | |
United Therapeutics Corp.(b) | | | 1,659 | | | | 177,447 | |
| | | | | | | | |
| | | | | | | 14,948,499 | |
| | | | | | | | |
Industrials-20.85% | | | | | | | | |
Acuity Brands, Inc. | | | 4,952 | | | | 541,204 | |
AECOM(b) | | | 56,086 | | | | 2,215,958 | |
AGCO Corp. | | | 21,960 | | | | 1,561,356 | |
ASGN, Inc.(b) | | | 9,142 | | | | 656,121 | |
Avis Budget Group, Inc.(b)(c) | | | 46,729 | | | | 1,593,926 | |
Axon Enterprise, Inc.(b) | | | 791 | | | | 67,773 | |
Brink’s Co. (The) | | | 10,550 | | | | 510,198 | |
Carlisle Cos., Inc. | | | 5,204 | | | | 681,464 | |
Clean Harbors, Inc.(b) | | | 8,134 | | | | 496,987 | |
Colfax Corp.(b) | | | 16,608 | | | | 552,714 | |
CoreLogic, Inc. | | | 5,323 | | | | 353,447 | |
Crane Co. | | | 8,070 | | | | 456,278 | |
Curtiss-Wright Corp. | | | 3,606 | | | | 368,966 | |
Donaldson Co., Inc. | | | 8,140 | | | | 409,930 | |
Dycom Industries, Inc.(b) | | | 11,732 | | | | 721,635 | |
EMCOR Group, Inc. | | | 20,134 | | | | 1,510,251 | |
EnerSys | | | 6,621 | | | | 476,580 | |
Fluor Corp. | | | 177,670 | | | | 1,691,418 | |
See accompanying Notes to Financial Statements which are an integral part of the financial statements.
Invesco S&P MidCap 400 Revenue ETF (RWK)–(continued)
August 31, 2020
| | | | | | | | |
| | | Shares | | | Value | |
Industrials-(continued) | | | | | | | | |
FTI Consulting, Inc.(b) | | | 3,130 | | | $ | 359,199 | |
GATX Corp. | | | 3,003 | | | | 200,841 | |
Generac Holdings, Inc.(b) | | | 2,881 | | | | 547,332 | |
Graco, Inc. | | | 4,403 | | | | 255,462 | |
Healthcare Services Group, Inc. | | | 9,928 | | | | 206,502 | |
Herman Miller, Inc. | | | 15,458 | | | | 368,364 | |
Hexcel Corp. | | | 7,147 | | | | 281,520 | |
HNI Corp. | | | 11,156 | | | | 355,319 | |
Hubbell, Inc. | | | 4,979 | | | | 721,557 | |
Insperity, Inc. | | | 10,547 | | | | 710,551 | |
ITT, Inc. | | | 7,055 | | | | 443,125 | |
JetBlue Airways Corp.(b) | | | 85,916 | | | | 989,752 | |
KAR Auction Services, Inc. | | | 25,534 | | | | 442,760 | |
Kennametal, Inc. | | | 10,067 | | | | 292,144 | |
Kirby Corp.(b) | | | 7,038 | | | | 298,693 | |
Knight-Swift Transportation Holdings, Inc. | | | 16,454 | | | | 747,999 | |
Landstar System, Inc. | | | 5,052 | | | | 672,371 | |
Lennox International, Inc. | | | 2,316 | | | | 649,244 | |
Lincoln Electric Holdings, Inc. | | | 4,951 | | | | 478,811 | |
ManpowerGroup, Inc. | | | 40,132 | | | | 2,942,077 | |
MasTec, Inc.(b) | | | 24,750 | | | | 1,143,697 | |
Mercury Systems, Inc.(b) | | | 1,289 | | | | 97,629 | |
Middleby Corp. (The)(b) | | | 5,502 | | | | 538,646 | |
MSA Safety, Inc. | | | 1,668 | | | | 210,085 | |
MSC Industrial Direct Co., Inc., Class A | | | 6,542 | | | | 431,118 | |
Nordson Corp. | | | 1,549 | | | | 288,873 | |
nVent Electric PLC | | | 15,376 | | | | 293,989 | |
Oshkosh Corp. | | | 15,326 | | | | 1,180,255 | |
Owens Corning | | | 18,322 | | | | 1,239,300 | |
Regal Beloit Corp. | | | 5,237 | | | | 517,730 | |
Ryder System, Inc. | | | 32,358 | | | | 1,323,442 | |
Stericycle, Inc.(b) | | | 7,865 | | | | 504,225 | |
Terex Corp. | | | 30,865 | | | | 604,028 | |
Tetra Tech, Inc. | | | 5,868 | | | | 541,675 | |
Timken Co. (The) | | | 11,669 | | | | 632,343 | |
Toro Co. (The) | | | 6,689 | | | | 503,548 | |
Trex Co., Inc.(b) | | | 902 | | | | 134,840 | |
Trinity Industries, Inc.(c) | | | 18,951 | | | | 387,927 | |
Univar Solutions, Inc.(b) | | | 77,472 | | | | 1,409,216 | |
Valmont Industries, Inc. | | | 3,514 | | | | 446,454 | |
Watsco, Inc. | | | 3,799 | | | | 930,717 | |
Werner Enterprises, Inc. | | | 8,493 | | | | 390,763 | |
Woodward, Inc. | | | 5,253 | | | | 450,130 | |
XPO Logistics, Inc.(b) | | | 29,721 | | | | 2,623,473 | |
| | | | | | | | |
| | | | | | | 43,653,932 | |
| | | | | | | | |
Information Technology-13.86% | | | | | | | | |
ACI Worldwide, Inc.(b) | | | 6,731 | | | | 197,757 | |
Alliance Data Systems Corp. | | | 14,589 | | | | 658,110 | |
Arrow Electronics, Inc.(b) | | | 57,499 | | | | 4,517,121 | |
Avnet, Inc. | | | 90,147 | | | | 2,479,944 | |
Belden, Inc. | | | 8,887 | | | | 299,314 | |
Blackbaud, Inc. | | | 2,125 | | | | 135,681 | |
Cabot Microelectronics Corp. | | | 1,075 | | | | 163,712 | |
CACI International, Inc., Class A(b) | | | 3,127 | | | | 732,312 | |
CDK Global, Inc. | | | 6,394 | | | | 298,088 | |
Ceridian HCM Holding, Inc.(b) | | | 1,539 | | | | 122,381 | |
Ciena Corp.(b) | | | 9,449 | | | | 536,420 | |
Cirrus Logic, Inc.(b) | | | 2,565 | | | | 155,413 | |
Cognex Corp. | | | 1,731 | | | | 119,768 | |
| | | | | | | | |
| | | Shares | | | Value | |
Information Technology-(continued) | | | | | | | | |
Coherent, Inc.(b) | | | 1,211 | | | $ | 136,431 | |
CommVault Systems, Inc.(b) | | | 2,294 | | | | 99,170 | |
Cree, Inc.(b) | | | 2,063 | | | | 130,175 | |
Enphase Energy, Inc.(b) | | | 1,989 | | | | 153,610 | |
Fair Isaac Corp.(b) | | | 394 | | | | 165,791 | |
First Solar, Inc.(b) | | | 8,453 | | | | 647,415 | |
II-VI, Inc.(b) | | | 5,717 | | | | 254,407 | |
InterDigital, Inc. | | | 785 | | | | 48,003 | |
j2 Global, Inc.(b) | | | 2,485 | | | | 173,925 | |
Jabil, Inc. | | | 115,661 | | | | 3,949,823 | |
KBR, Inc. | | | 31,698 | | | | 792,133 | |
Littelfuse, Inc. | | | 1,163 | | | | 210,317 | |
LiveRamp Holdings, Inc.(b) | | | 1,219 | | | | 68,069 | |
Lumentum Holdings, Inc.(b) | | | 3,065 | | | | 263,590 | |
Manhattan Associates, Inc.(b) | | | 983 | | | | 95,597 | |
MAXIMUS, Inc. | | | 6,272 | | | | 486,394 | |
MKS Instruments, Inc. | | | 2,622 | | | | 313,408 | |
Monolithic Power Systems, Inc. | | | 405 | | | | 108,188 | |
National Instruments Corp. | | | 4,598 | | | | 165,022 | |
NCR Corp.(b) | | | 49,891 | | | | 1,019,772 | |
NetScout Systems, Inc.(b) | | | 4,676 | | | | 108,203 | |
Paylocity Holding Corp.(b) | | | 570 | | | | 83,933 | |
Perspecta, Inc. | | | 24,234 | | | | 503,340 | |
PTC, Inc.(b) | | | 2,375 | | | | 217,099 | |
Qualys, Inc.(b) | | | 427 | | | | 45,322 | |
Sabre Corp. | | | 57,939 | | | | 404,994 | |
Science Applications International Corp. | | | 10,164 | | | | 848,287 | |
Semtech Corp.(b) | | | 1,440 | | | | 84,456 | |
Silicon Laboratories, Inc.(b) | | | 1,191 | | | | 121,970 | |
SolarEdge Technologies, Inc.(b) | | | 1,550 | | | | 342,783 | |
Synaptics, Inc.(b) | | | 2,862 | | | | 244,214 | |
SYNNEX Corp. | | | 32,209 | | | | 4,095,374 | |
Teradata Corp.(b) | | | 11,694 | | | | 284,749 | |
Teradyne, Inc. | | | 4,808 | | | | 408,536 | |
Trimble, Inc.(b) | | | 10,819 | | | | 567,024 | |
Universal Display Corp. | | | 370 | | | | 64,935 | |
ViaSat, Inc.(b) | | | 7,642 | | | | 303,846 | |
Vishay Intertechnology, Inc. | | | 22,574 | | | | 360,958 | |
WEX, Inc.(b) | | | 1,482 | | | | 236,690 | |
| | | | | | | | |
| | | | | | | 29,023,974 | |
| | | | | | | | |
Materials-8.51% | | | | | | | | |
Allegheny Technologies, Inc.(b) | | | 56,546 | | | | 471,028 | |
AptarGroup, Inc. | | | 3,706 | | | | 438,753 | |
Ashland Global Holdings, Inc. | | | 4,950 | | | | 364,766 | |
Avient Corp. | | | 15,836 | | | | 404,135 | |
Cabot Corp. | | | 11,783 | | | | 436,089 | |
Chemours Co. (The) | | | 48,984 | | | | 1,012,009 | |
Commercial Metals Co. | | | 43,195 | | | | 901,480 | |
Compass Minerals International, Inc. | | | 3,943 | | | | 224,475 | |
Domtar Corp. | | | 32,230 | | | | 919,200 | |
Eagle Materials, Inc. | | | 2,892 | | | | 236,479 | |
Greif, Inc., Class A | | | 18,419 | | | | 678,740 | |
Ingevity Corp.(b) | | | 3,442 | | | | 193,337 | |
Louisiana-Pacific Corp. | | | 13,814 | | | | 455,033 | |
Minerals Technologies, Inc. | | | 4,940 | | | | 250,705 | |
NewMarket Corp. | | | 744 | | | | 277,133 | |
O-I Glass, Inc. | | | 104,305 | | | | 1,134,838 | |
Olin Corp. | | | 61,256 | | | | 689,130 | |
Reliance Steel & Aluminum Co. | | | 15,343 | | | | 1,609,020 | |
See accompanying Notes to Financial Statements which are an integral part of the financial statements.
Invesco S&P MidCap 400 Revenue ETF (RWK)–(continued)
August 31, 2020
| | | | | | | | |
| | | Shares | | | Value | |
Materials-(continued) | | | | | | | | |
Royal Gold, Inc. | | | 546 | | | $ | 74,431 | |
RPM International, Inc. | | | 10,348 | | | | 877,200 | |
Scotts Miracle-Gro Co. (The) | | | 3,503 | | | | 590,361 | |
Sensient Technologies Corp. | | | 3,521 | | | | 194,430 | |
Silgan Holdings, Inc. | | | 19,284 | | | | 733,949 | |
Sonoco Products Co. | | | 14,431 | | | | 765,276 | |
Steel Dynamics, Inc. | | | 52,349 | | | | 1,545,342 | |
United States Steel Corp.(c) | | | 178,371 | | | | 1,396,645 | |
Valvoline, Inc. | | | 17,931 | | | | 365,792 | |
Worthington Industries, Inc. | | | 13,910 | | | | 577,682 | |
| | | | | | | | |
| | | | | | | 17,817,458 | |
| | | | | | | | |
Real Estate-3.12% | | | | | | | | |
American Campus Communities, Inc. | | | 3,471 | | | | 117,667 | |
Brixmor Property Group, Inc. | | | 11,124 | | | | 131,263 | |
Camden Property Trust | | | 1,466 | | | | 133,318 | |
CoreSite Realty Corp. | | | 646 | | | | 79,103 | |
Corporate Office Properties Trust | | | 3,288 | | | | 81,016 | |
Cousins Properties, Inc. | | | 2,973 | | | | 88,744 | |
CyrusOne, Inc. | | | 1,826 | | | | 152,526 | |
Douglas Emmett, Inc. | | | 4,116 | | | | 114,919 | |
EastGroup Properties, Inc. | | | 378 | | | | 50,334 | |
EPR Properties | | | 2,458 | | | | 79,418 | |
First Industrial Realty Trust, Inc. | | | 1,477 | | | | 62,994 | |
GEO Group, Inc. (The) | | | 25,816 | | | | 288,107 | |
Healthcare Realty Trust, Inc. | | | 2,064 | | | | 59,546 | |
Highwoods Properties, Inc. | | | 2,558 | | | | 95,311 | |
Hudson Pacific Properties, Inc. | | | 4,162 | | | | 97,724 | |
JBG SMITH Properties | | | 2,800 | | | | 77,476 | |
Jones Lang LaSalle, Inc. | | | 22,788 | | | | 2,348,075 | |
Kilroy Realty Corp. | | | 1,786 | | | | 104,517 | |
Lamar Advertising Co., Class A | | | 3,320 | | | | 229,844 | |
Life Storage, Inc. | | | 803 | | | | 84,660 | |
Macerich Co. (The)(c) | | | 12,531 | | | | 99,371 | |
Mack-Cali Realty Corp. | | | 3,492 | | | | 44,104 | |
Medical Properties Trust, Inc. | | | 6,624 | | | | 123,074 | |
National Retail Properties, Inc. | | | 2,529 | | | | 89,628 | |
Omega Healthcare Investors, Inc. | | | 4,173 | | | | 129,238 | |
Park Hotels & Resorts, Inc. | | | 31,571 | | | | 299,609 | |
Pebblebrook Hotel Trust | | | 13,554 | | | | 171,051 | |
Physicians Realty Trust | | | 3,169 | | | | 57,517 | |
PotlatchDeltic Corp. | | | 3,220 | | | | 148,249 | |
PS Business Parks, Inc. | | | 430 | | | | 54,266 | |
Rayonier, Inc. | | | 4,398 | | | | 128,773 | |
Sabra Health Care REIT, Inc. | | | 6,084 | | | | 90,226 | |
Service Properties Trust | | | 30,819 | | | | 253,024 | |
Spirit Realty Capital, Inc. | | | 1,941 | | | | 68,925 | |
STORE Capital Corp. | | | 3,884 | | | | 105,023 | |
Taubman Centers, Inc. | | | 2,349 | | | | 89,967 | |
Urban Edge Properties | | | 4,298 | | | | 45,387 | |
Weingarten Realty Investors | | | 3,093 | | | | 54,035 | |
| | | | | | | | |
| | | | | | | 6,528,029 | |
| | | | | | | | |
Investment Abbreviations: | | | | | | | | |
REIT -Real Estate Investment Trust | | | | | | | | |
| | | | | | | | |
| | | Shares | | | Value | |
Utilities-2.31% | | | | | | | | |
ALLETE, Inc. | | | 2,745 | | | $ | 148,120 | |
Black Hills Corp. | | | 3,907 | | | | 219,105 | |
Essential Utilities, Inc. | | | 2,849 | | | | 121,083 | |
Hawaiian Electric Industries, Inc. | | | 10,727 | | | | 371,261 | |
IDACORP, Inc. | | | 1,956 | | | | 175,844 | |
MDU Resources Group, Inc. | | | 35,044 | | | | 827,739 | |
National Fuel Gas Co. | | | 4,905 | | | | 223,864 | |
New Jersey Resources Corp. | | | 9,025 | | | | 272,014 | |
NorthWestern Corp. | | | 2,885 | | | | 148,981 | |
OGE Energy Corp. | | | 9,338 | | | | 297,509 | |
ONE Gas, Inc. | | | 2,622 | | | | 194,343 | |
PNM Resources, Inc. | | | 4,935 | | | | 215,561 | |
Southwest Gas Holdings, Inc. | | | 6,403 | | | | 402,557 | |
Spire, Inc. | | | 3,588 | | | | 208,857 | |
UGI Corp. | | | 29,610 | | | | 1,022,433 | |
| | | | | | | | |
| | | | | | | 4,849,271 | |
| | | | | | | | |
Total Common Stocks & Other Equity Interests
(Cost $220,679,459) | | | | 209,050,653 | |
| | | | | | | | |
| | |
Money Market Funds-0.08% | | | | | | | | |
Invesco Premier U.S. Government Money Portfolio, Institutional Class, 0.01%(d)(e)
(Cost $159,490) 159,490 | | | | 159,490 | |
| | | | | | | | |
TOTAL INVESTMENTS IN SECURITIES
(excluding investments purchased with cash collateral from securities on loan)-99.93%
(Cost $220,838,949) | | | | 209,210,143 | |
| | | | | | | | |
|
Investments Purchased with Cash Collateral from Securities on Loan | |
| | |
Money Market Funds-3.56% | | | | | | | | |
Invesco Private Government Fund, 0.03%(d)(e)(f) | | | 5,595,005 | | | | 5,595,005 | |
|
Invesco Private Prime Fund, 0.14%(d)(e)(f) | | | 1,864,660 | | | | 1,865,033 | |
| | | | | | | | |
Total Investments Purchased with Cash Collateral from Securities on Loan
(Cost $7,460,038) | | | | 7,460,038 | |
| | | | | | | | |
TOTAL INVESTMENTS IN SECURITIES-103.49%
(Cost $228,298,987) 216,670,181 | |
OTHER ASSETS LESS LIABILITIES-(3.49)% | | | | (7,305,134 | ) |
| | | | | | | | |
NET ASSETS-100.00% | | | | | | $ | 209,365,047 | |
| | | | | | | | |
See accompanying Notes to Financial Statements which are an integral part of the financial statements.
Invesco S&P MidCap 400 Revenue ETF (RWK)–(continued)
August 31, 2020
Notes to Schedule of Investments:
| (a) | Industry and/or sector classifications used in this report are generally according to the Global Industry Classification Standard, which was developed by and is the exclusive property and a service mark of MSCI Inc. and Standard & Poor’s. |
| (b) | Non-income producing security. |
| (c) | All or a portion of this security was out on loan at August 31, 2020. |
| (d) | Affiliated issuer. The issuer and/or the Fund is a wholly-owned subsidiary of Invesco Ltd., or is affiliated by having an investment adviser that is under common control of Invesco Ltd. The table below shows the Fund’s transactions in, and earnings from, its investments in affiliates for the fiscal year ended August 31, 2020. |
| | | | | | | | | | | | | | | | | | | | | | | | | | | | |
| | | Value
August 31, 2019 | | | Purchases
at Cost | | | Proceeds
from Sales | | | Change in
Unrealized
Appreciation | | | Realized
Gain | | | Value
August 31, 2020 | | | Dividend
Income | |
Investments in Affiliated Money Market Funds: | | | | | | | | | | | | | | | | | | | | | | | | | | | | |
Invesco Premier U.S. Government Money Portfolio, Institutional Class | | $ | 85,398 | | | $ | 14,269,650 | | | $ | (14,195,558 | ) | | $ | - | | | $ | - | | | $ | 159,490 | | | $ | 1,756 | |
Investments Purchased with Cash Collateral from Securities on Loan: | | | | | | | | | | | | | | | | | | | | | | | | | | | | |
Invesco Government & Agency Portfolio, Institutional Class | | | 11,267,314 | | | | 66,974,003 | | | | (78,241.317 | ) | | | - | | | | - | | | | - | | | | 99,138 | * |
Invesco Liquid Assets Portfolio, Institutional Class | | | 3,903,406 | | | | 15,950,721 | | | | (19,854,486 | ) | | | - | | | | 359 | | | | - | | | | 36,844 | * |
Invesco Private Government Fund | | | - | | | | 48,489,928 | | | | (42,894,923 | ) | | | - | | | | - | | | | 5,595,005 | | | | 798 | * |
Invesco Private Prime Fund | | | - | | | | 6,526,621 | | | | (4,661,716 | ) | | | - | | | | 128 | | | | 1,865,033 | | | | 494 | * |
| | | | | | | | | | | | | | | | | | | | | | | | | | | | |
Total | | $ | 15,256,118 | | | $ | 152,210,923 | | | $ | (159,848,000 | ) | | $ | - | | | $ | 487 | | | $ | 7,619,528 | | | $ | 139,030 | |
| | | | | | | | | | | | | | | | | | | | | | | | | | | | |
| * | Represents the income earned on the investment of cash collateral, which is included in securities lending income on the Statements of Operations. Does not include rebates and fees paid to lending agent or premiums received from borrowers, if any. |
| (e) | The rate shown is the 7-day SEC standardized yield as of August 31, 2020. |
| (f) | The security has been segregated to satisfy the commitment to return the cash collateral received in securities lending transactions upon the borrower’s return of the securities loaned. See Note 2J. |
See accompanying Notes to Financial Statements which are an integral part of the financial statements.
Invesco S&P SmallCap 600 Revenue ETF (RWJ)
August 31, 2020
Schedule of Investments(a)
| | | | | | | | |
| | | Shares | | | Value | |
Common Stocks & Other Equity Interests-99.91% | |
Communication Services-1.70% | | | | | | | | |
ATN International, Inc | | | 1,689 | | | $ | 97,962 | |
Cincinnati Bell, Inc.(b) | | | 23,616 | | | | 355,657 | |
Cogent Communications Holdings, Inc | | | 1,680 | | | | 112,997 | |
Consolidated Communications Holdings, Inc.(b) | | | 47,384 | | | | 368,648 | |
E.W. Scripps Co. (The), Class A | | | 41,128 | | | | 457,343 | |
Gannett Co., Inc.(c) | | | 272,503 | | | | 471,430 | |
Glu Mobile, Inc.(b) | | | 11,338 | | | | 90,024 | |
Iridium Communications, Inc.(b) | | | 5,046 | | | | 141,338 | |
Marcus Corp. (The) | | | 11,955 | | | | 187,335 | |
Meredith Corp. | | | 42,105 | | | | 589,470 | |
QuinStreet, Inc.(b) | | | 10,610 | | | | 139,521 | |
Scholastic Corp. | | | 12,919 | | | | 290,677 | |
Shenandoah Telecommunications Co. | | | 2,772 | | | | 153,292 | |
Spok Holdings, Inc. | | | 3,610 | | | | 39,132 | |
TechTarget, Inc.(b) | | | 1,042 | | | | 41,347 | |
Vonage Holdings Corp.(b) | | | 28,573 | | | | 327,161 | |
| | | | | | | | |
| | | | | | | 3,863,334 | |
| | | | | | | | |
Consumer Discretionary-29.75% | | | | | | | | |
Abercrombie & Fitch Co., Class A(c) | | | 68,646 | | | | 893,084 | |
American Axle & Manufacturing Holdings, Inc.(b) | | | 179,291 | | | | 1,394,884 | |
American Public Education, Inc.(b) | | | 2,174 | | | | 68,351 | |
America’s Car-Mart, Inc.(b) | | | 1,921 | | | | 193,061 | |
Asbury Automotive Group, Inc.(b) | | | 21,291 | | | | 2,252,375 | |
Barnes & Noble Education, Inc.(b) | | | 260,148 | | | | 593,137 | |
Bed Bath & Beyond, Inc.(c) | | | 312,191 | | | | 3,802,486 | |
Big Lots, Inc. | | | 36,925 | | | | 1,741,014 | |
BJ’s Restaurants, Inc. | | | 11,246 | | | | 354,474 | |
Bloomin’ Brands, Inc. | | | 77,856 | | | | 1,116,455 | |
Boot Barn Holdings, Inc.(b) | | | 8,328 | | | | 235,099 | |
Buckle, Inc. (The) | | | 11,710 | | | | 219,445 | |
Caleres, Inc. | | | 85,651 | | | | 668,934 | |
Callaway Golf Co. | | | 23,323 | | | | 486,518 | |
Capri Holdings Ltd.(b) | | | 75,092 | | | | 1,189,457 | |
Cato Corp. (The), Class A | | | 18,143 | | | | 145,144 | |
Cavco Industries, Inc.(b) | | | 1,295 | | | | 247,228 | |
Century Communities, Inc.(b) | | | 19,708 | | | | 703,181 | |
Cheesecake Factory, Inc. (The)(c) | | | 23,366 | | | | 689,998 | |
Chico’s FAS, Inc. | | | 309,947 | | | | 396,732 | |
Children’s Place, Inc. (The)(c) | | | 9,003 | | | | 179,745 | |
Chuy’s Holdings, Inc.(b) | | | 6,040 | | | | 134,330 | |
Conn’s, Inc.(b)(c) | | | 41,012 | | | | 524,133 | |
Cooper Tire & Rubber Co. | | | 23,072 | | | | 797,599 | |
Cooper-Standard Holdings, Inc.(b) | | | 41,183 | | | | 746,236 | |
Core-Mark Holding Co., Inc. | | | 149,212 | | | | 4,986,665 | |
Crocs, Inc.(b) | | | 8,986 | | | | 358,631 | |
Dave & Buster’s Entertainment, Inc.(c) | | | 18,494 | | | | 307,555 | |
Designer Brands, Inc., Class A | | | 113,783 | | | | 802,170 | |
Dine Brands Global, Inc. | | | 4,046 | | | | 240,980 | |
Dorman Products, Inc.(b) | | | 3,340 | | | | 282,865 | |
El Pollo Loco Holdings, Inc.(b) | | | 6,887 | | | | 123,071 | |
Ethan Allen Interiors, Inc. | | | 12,734 | | | | 181,332 | |
Express, Inc.(b) | | | 206,653 | | | | 229,385 | |
Fiesta Restaurant Group, Inc.(b) | | | 20,659 | | | | 207,003 | |
Fossil Group, Inc.(b) | | | 102,250 | | | | 657,979 | |
| | | | | | | | |
| | | Shares | | | Value | |
Consumer Discretionary-(continued) | | | | | | | | |
Fox Factory Holding Corp.(b) | | | 2,131 | | | $ | 214,826 | |
GameStop Corp., Class A(b)(c) | | | 310,449 | | | | 2,073,799 | |
Garrett Motion, Inc. (Switzerland)(b) | | | 123,178 | | | | 338,740 | |
Genesco, Inc.(b) | | | 22,529 | | | | 439,316 | |
Gentherm, Inc.(b) | | | 5,326 | | | | 240,895 | |
G-III Apparel Group Ltd.(b) | | | 46,159 | | | | 510,519 | |
Group 1 Automotive, Inc. | | | 40,956 | | | | 3,540,237 | |
Guess?, Inc.(c) | | | 62,056 | | | | 713,644 | |
Haverty Furniture Cos., Inc. | | | 10,672 | | | | 225,393 | |
Hibbett Sports, Inc.(b) | | | 12,406 | | | | 413,988 | |
Installed Building Products, Inc.(b) | | | 5,260 | | | | 456,673 | |
iRobot Corp.(b)(c) | | | 3,510 | | | | 259,845 | |
Kontoor Brands, Inc. | | | 28,788 | | | | 636,215 | |
La-Z-Boy, Inc. | | | 15,000 | | | | 487,500 | |
LCI Industries | | | 4,968 | | | | 564,514 | |
LGI Homes, Inc.(b) | | | 5,343 | | | | 597,668 | |
Liquidity Services, Inc.(b) | | | 8,607 | | | | 62,056 | |
Lithia Motors, Inc., Class A | | | 1 | | | | 249 | |
Lumber Liquidators Holdings, Inc.(b) | | | 22,371 | | | | 536,680 | |
M.D.C. Holdings, Inc. | | | 22,537 | | | | 977,655 | |
M/I Homes, Inc.(c) | | | 17,191 | | | | 731,649 | |
Macy’s, Inc.(b) | | | 786,336 | | | | 5,480,762 | |
MarineMax, Inc.(b) | | | 14,532 | | | | 427,386 | |
Meritage Homes Corp.(b) | | | 12,461 | | | | 1,196,630 | |
Michaels Cos., Inc. (The)(b)(c) | | | 195,457 | | | | 2,198,891 | |
Monarch Casino & Resort, Inc.(b) | | | 1,520 | | | | 69,935 | |
Monro, Inc. | | | 5,018 | | | | 231,280 | |
Motorcar Parts of America, Inc.(b) | | | 7,161 | | | | 124,673 | |
Movado Group, Inc. | | | 12,401 | | | | 135,295 | |
ODP Corp. (The) | | | 95,351 | | | | 2,229,306 | |
Oxford Industries, Inc. | | | 5,530 | | | | 273,901 | |
Perdoceo Education Corp.(b) | | | 9,163 | | | | 131,672 | |
PetMed Express, Inc.(c) | | | 1,902 | | | | 66,114 | |
Red Robin Gourmet Burgers, Inc.(b)(c) | | | 24,228 | | | | 268,931 | |
Regis Corp.(b) | | | 23,860 | | | | 176,325 | |
Rent-A-Center, Inc. | | | 24,346 | | | | 747,422 | |
Ruth’s Hospitality Group, Inc. | | | 10,750 | | | | 110,456 | |
Shake Shack, Inc., Class A(b)(c) | | | 2,511 | | | | 171,376 | |
Shoe Carnival, Inc.(c) | | | 8,225 | | | | 270,438 | |
Shutterstock, Inc. | | | 4,152 | | | | 208,929 | |
Signet Jewelers Ltd. | | | 122,861 | | | | 2,121,809 | |
Sleep Number Corp.(b) | | | 10,335 | | | | 496,080 | |
Sonic Automotive, Inc., Class A | | | 81,624 | | | | 3,449,430 | |
Stamps.com, Inc.(b) | | | 779 | | | | 194,236 | |
Standard Motor Products, Inc. | | | 6,229 | | | | 283,046 | |
Steven Madden Ltd. | | | 16,585 | | | | 350,939 | |
Sturm Ruger & Co., Inc. | | | 1,388 | | | | 98,354 | |
Tupperware Brands Corp. | | | 79,623 | | | | 1,297,059 | |
Unifi, Inc.(b) | | | 11,732 | | | | 143,482 | |
Universal Electronics, Inc.(b) | | | 3,669 | | | | 150,723 | |
Vera Bradley, Inc.(b) | | | 19,581 | | | | 103,192 | |
Vista Outdoor, Inc.(b) | | | 36,372 | | | | 705,981 | |
Wingstop, Inc. | | | 400 | | | | 65,360 | |
Winnebago Industries, Inc. | | | 8,035 | | | | 433,729 | |
Wolverine World Wide, Inc. | | | 21,602 | | | | 539,618 | |
See accompanying Notes to Financial Statements which are an integral part of the financial statements.
Invesco S&P SmallCap 600 Revenue ETF (RWJ)–(continued)
August 31, 2020
| | | | | | | | |
| | | Shares | | | Value | |
Consumer Discretionary-(continued) | | | | | | | | |
YETI Holdings, Inc.(b) | | | 5,926 | | | $ | 304,478 | |
Zumiez, Inc.(b) | | | 8,911 | | | | 228,834 | |
| | | | | | | | |
| | | | | | | 67,658,869 | |
| | | | | | | | |
Consumer Staples-8.41% | | | | | | | | |
Andersons, Inc. (The) | | | 132,425 | | | | 2,347,895 | |
B&G Foods, Inc.(c) | | | 16,548 | | | | 515,305 | |
Calavo Growers, Inc. | | | 4,767 | | | | 302,561 | |
Cal-Maine Foods, Inc.(b) | | | 6,368 | | | | 245,741 | |
Central Garden & Pet Co.(b) | | | 8,165 | | | | 332,234 | |
Central Garden & Pet Co., Class A(b) | | | 8,679 | | | | 322,512 | |
Chefs’ Warehouse, Inc. (The)(b) | | | 22,693 | | | | 336,083 | |
Coca-Cola Consolidated, Inc. | | | 4,787 | | | | 1,308,287 | |
Fresh Del Monte Produce, Inc. | | | 42,498 | | | | 985,529 | |
Inter Parfums, Inc. | | | 3,381 | | | | 151,029 | |
J&J Snack Foods Corp. | | | 2,134 | | | | 290,117 | |
John B. Sanfilippo & Son, Inc. | | | 2,457 | | | | 195,675 | |
Medifast, Inc. | | | 1,527 | | | | 248,473 | |
MGP Ingredients, Inc. | | | 2,430 | | | | 86,387 | |
National Beverage Corp.(b)(c) | | | 3,886 | | | | 316,010 | |
PriceSmart, Inc. | | | 13,509 | | | | 888,217 | |
Seneca Foods Corp., Class A(b) | | | 9,226 | | | | 436,943 | |
SpartanNash Co. | | | 108,294 | | | | 2,163,714 | |
United Natural Foods, Inc.(b)(c) | | | 359,991 | | | | 6,497,838 | |
Universal Corp. | | | 10,141 | | | | 440,221 | |
USANA Health Sciences, Inc.(b) | | | 3,011 | | | | 236,093 | |
Vector Group Ltd | | | 38,343 | | | | 386,114 | |
WD-40 Co. | | | 500 | | | | 102,190 | |
| | | | | | | | |
| | | | | | | 19,135,168 | |
| | | | | | | | |
Energy-4.68% | | | | | | | | |
Archrock, Inc. | | | 36,551 | | | | 239,775 | |
Bonanza Creek Energy, Inc.(b) | | | 3,511 | | | | 70,361 | |
Bristow Group, Inc.(b) | | | 3,279 | | | | 62,006 | |
Callon Petroleum Co.(b) | | | 12,133 | | | | 80,442 | |
CONSOL Energy, Inc.(b) | | | 43,196 | | | | 223,323 | |
Core Laboratories N.V | | | 6,184 | | | | 129,431 | |
DMC Global, Inc. | | | 2,760 | | | | 97,787 | |
Dorian LPG Ltd.(b) | | | 9,387 | | | | 79,226 | |
Dril-Quip, Inc.(b) | | | 3,027 | | | | 100,285 | |
Exterran Corp.(b) | | | 42,722 | | | | 196,521 | |
Geospace Technologies Corp.(b) | | | 3,228 | | | | 21,144 | |
Green Plains, Inc.(b) | | | 69,940 | | | | 935,797 | |
Gulfport Energy Corp.(b) | | | 117,747 | | | | 83,094 | |
Helix Energy Solutions Group, Inc.(b) | | | 42,037 | | | | 150,493 | |
Helmerich & Payne, Inc. | | | 26,086 | | | | 429,897 | |
Laredo Petroleum, Inc.(b) | | | 10,137 | | | | 165,740 | |
Matador Resources Co.(b)(c) | | | 24,529 | | | | 238,667 | |
Matrix Service Co.(b) | | | 29,312 | | | | 270,843 | |
Nabors Industries Ltd.(c) | | | 12,835 | | | | 513,143 | |
Newpark Resources, Inc.(b) | | | 75,853 | | | | 147,913 | |
Oasis Petroleum, Inc.(b)(c) | | | 361,785 | | | | 200,935 | |
Oceaneering International, Inc.(b) | | | 67,788 | | | | 365,377 | |
Oil States International, Inc.(b) | | | 42,499 | | | | 186,571 | |
Par Pacific Holdings, Inc.(b) | | | 135,577 | | | | 1,176,808 | |
Patterson-UTI Energy, Inc. | | | 112,417 | | | | 432,806 | |
PDC Energy, Inc.(b) | | | 19,414 | | | | 293,928 | |
Penn Virginia Corp.(b)(c) | | | 8,089 | | | | 92,376 | |
ProPetro Holding Corp.(b) | | | 72,169 | | | | 453,221 | |
QEP Resources, Inc. | | | 153,488 | | | | 199,535 | |
Range Resources Corp. | | | 78,872 | | | | 588,385 | |
| | | | | | | | |
| | | Shares | | | Value | |
Energy-(continued) | | | | | | | | |
Renewable Energy Group, Inc.(b) | | | 21,821 | | | $ | 729,476 | |
REX American Resources Corp.(b) | | | 1,344 | | | | 83,032 | |
RPC, Inc.(b) | | | 73,056 | | | | 228,665 | |
SEACOR Holdings, Inc.(b) | | | 5,950 | | | | 188,080 | |
SM Energy Co. | | | 78,514 | | | | 190,789 | |
Southwestern Energy Co.(b) | | | 180,203 | | | | 500,964 | |
Talos Energy, Inc.(b) | | | 16,532 | | | | 124,155 | |
US Silica Holdings, Inc. | | | 85,709 | | | | 382,262 | |
| | | | | | | | |
| | | | | | | 10,653,253 | |
| | | | | | | | |
Financials-6.13% | | | | | | | | |
Allegiance Bancshares, Inc. | | | 2,228 | | | | 56,636 | |
Ambac Financial Group, Inc.(b) | | | 5,859 | | | | 73,999 | |
American Equity Investment Life Holding Co. | | | 26,018 | | | | 622,090 | |
Ameris Bancorp | | | 8,638 | | | | 211,804 | |
AMERISAFE, Inc. | | | 1,335 | | | | 89,085 | |
Apollo Commercial Real Estate Finance, Inc. | | | 11,183 | | | | 99,976 | |
Axos Financial, Inc.(b) | | | 7,556 | | | | 187,238 | |
Banc of California, Inc. | | | 7,804 | | | | 85,766 | |
Banner Corp. | | | 3,712 | | | | 134,077 | |
Berkshire Hills Bancorp, Inc. | | | 11,526 | | | | 105,809 | |
Blucora, Inc.(b) | | | 13,185 | | | | 157,297 | |
Boston Private Financial Holdings, Inc. | | | 13,570 | | | | 80,606 | |
Brightsphere Investment Group, Inc. | | | 19,414 | | | | 269,078 | |
Brookline Bancorp, Inc. | | | 8,856 | | | | 85,018 | |
Cadence BanCorp | | | 24,835 | | | | 235,932 | |
Capstead Mortgage Corp. | | | 529 | | | | 3,264 | |
Central Pacific Financial Corp. | | | 3,448 | | | | 53,409 | |
City Holding Co. | | | 1,033 | | | | 66,091 | |
Columbia Banking System, Inc. | | | 5,353 | | | | 149,402 | |
Community Bank System, Inc. | | | 2,504 | | | | 150,666 | |
Customers Bancorp, Inc.(b) | | | 11,134 | | | | 142,181 | |
CVB Financial Corp. | | | 6,155 | | | | 112,082 | |
Dime Community Bancshares, Inc. | | | 4,070 | | | | 52,503 | |
Donnelley Financial Solutions, Inc.(b) | | | 23,029 | | | | 251,016 | |
Eagle Bancorp, Inc. | | | 3,198 | | | | 92,038 | |
eHealth, Inc.(b) | | | 1,169 | | | | 73,787 | |
Employers Holdings, Inc. | | | 6,239 | | | | 203,267 | |
Encore Capital Group, Inc.(b)(c) | | | 8,470 | | | | 389,112 | |
Enova International, Inc.(b) | | | 19,389 | | | | 331,164 | |
EZCORP, Inc., Class A(b) | | | 30,928 | | | | 166,393 | |
First Bancorp | | | 31,267 | | | | 179,160 | |
First Commonwealth Financial Corp. | | | 11,551 | | | | 94,718 | |
First Financial Bancorp | | | 12,120 | | | | 166,286 | |
First Midwest Bancorp, Inc. | | | 14,871 | | | | 185,293 | |
Flagstar Bancorp, Inc. | | | 11,724 | | | | 368,368 | |
Granite Point Mortgage Trust, Inc. | | | 8,206 | | | | 54,488 | |
Great Western Bancorp, Inc. | | | 7,844 | | | | 109,267 | |
Green Dot Corp., Class A(b) | | | 6,964 | | | | 362,546 | |
Greenhill & Co., Inc. | | | 6,801 | | | | 76,307 | |
Hanmi Financial Corp. | | | 6,237 | | | | 59,439 | |
HCI Group, Inc. | | | 1,219 | | | | 66,704 | |
Heritage Financial Corp. | | | 3,172 | | | | 63,250 | |
HomeStreet, Inc. | | | 3,607 | | | | 98,724 | |
Hope Bancorp, Inc. | | | 17,917 | | | | 151,578 | |
Horace Mann Educators Corp. | | | 9,046 | | | | 353,337 | |
Independent Bank Corp. | | | 1,969 | | | | 123,752 | |
Invesco Mortgage Capital, Inc.(d) | | | 11,291 | | | | 33,873 | |
James River Group Holdings Ltd | | | 4,638 | | | | 225,917 | |
Kinsale Capital Group, Inc. | | | 498 | | | | 103,200 | |
See accompanying Notes to Financial Statements which are an integral part of the financial statements.
Invesco S&P SmallCap 600 Revenue ETF (RWJ)–(continued)
August 31, 2020
| | | | | | | | |
| | | Shares | | | Value | |
Financials-(continued) | | | | | | | | |
KKR Real Estate Finance Trust, Inc. | | | 3,803 | | | $ | 69,215 | |
Meta Financial Group, Inc. | | | 6,596 | | | | 127,171 | |
National Bank Holdings Corp., Class A | | | 2,862 | | | | 81,395 | |
NBT Bancorp, Inc. | | | 3,823 | | | | 116,487 | |
New York Mortgage Trust, Inc. | | | 50,255 | | | | 132,673 | |
NMI Holdings, Inc., Class A(b) | | | 5,393 | | | | 92,490 | |
Northfield Bancorp, Inc. | | | 3,811 | | | | 36,814 | |
Northwest Bancshares, Inc. | | | 11,723 | | | | 118,519 | |
OFG Bancorp | | | 8,830 | | | | 113,377 | |
Old National Bancorp | | | 15,236 | | | | 212,999 | |
Pacific Premier Bancorp, Inc. | | | 6,180 | | | | 139,606 | |
Palomar Holdings, Inc.(b) | | | 372 | | | | 41,794 | |
PennyMac Mortgage Investment Trust | | | 4,913 | | | | 84,209 | |
Piper Sandler Cos. | | | 3,213 | | | | 242,421 | |
PRA Group, Inc.(b) | | | 6,324 | | | | 295,173 | |
Preferred Bank | | | 1,345 | | | | 50,303 | |
ProAssurance Corp. | | | 15,716 | | | | 240,769 | |
Provident Financial Services, Inc. | | | 7,428 | | | | 97,901 | |
Ready Capital Corp. | | | 11,834 | | | | 121,062 | |
Redwood Trust, Inc. | | | 16,567 | | | | 114,809 | |
S&T Bancorp, Inc. | | | 3,756 | | | | 75,852 | |
Safety Insurance Group, Inc. | | | 2,563 | | | | 185,561 | |
Seacoast Banking Corp. of Florida(b) | | | 3,789 | | | | 76,689 | |
ServisFirst Bancshares, Inc. | | | 2,769 | | | | 101,484 | |
Simmons First National Corp., Class A | | | 14,108 | | | | 240,824 | |
Southside Bancshares, Inc. | | | 2,382 | | | | 65,636 | |
Stewart Information Services Corp. | | | 14,218 | | | | 606,682 | |
StoneX Group, Inc.(b) | | | 4,332 | | | | 245,624 | |
Third Point Reinsurance Ltd. (Bermuda)(b) | | | 18,273 | | | | 156,417 | |
Tompkins Financial Corp. | | | 1,201 | | | | 79,482 | |
Triumph Bancorp, Inc.(b) | | | 3,301 | | | | 94,277 | |
TrustCo Bank Corp. | | | 7,554 | | | | 45,022 | |
United Community Banks, Inc. | | | 7,605 | | | | 137,803 | |
United Fire Group, Inc. | | | 9,374 | | | | 236,037 | |
United Insurance Holdings Corp. | | | 24,055 | | | | 182,096 | |
Universal Insurance Holdings, Inc. | | | 11,669 | | | | 216,460 | |
Veritex Holdings, Inc. | | | 5,203 | | | | 93,550 | |
Virtus Investment Partners, Inc. | | | 1,174 | | | | 166,591 | |
Waddell & Reed Financial, Inc., Class A | | | 16,461 | | | | 259,261 | |
Walker & Dunlop, Inc. | | | 4,314 | | | | 236,321 | |
Westamerica Bancorporation | | | 857 | | | | 52,157 | |
WisdomTree Investments, Inc. | | | 17,627 | | | | 65,925 | |
World Acceptance Corp.(b)(c) | | | 1,965 | | | | 178,795 | |
| | | | | | | | |
| | | | | | | 13,934,726 | |
| | | | | | | | |
Health Care-10.50% | | | | | | | | |
Addus HomeCare Corp.(b) | | | 1,522 | | | | 142,550 | |
Allscripts Healthcare Solutions, Inc.(b) | | | 65,464 | | | | 584,593 | |
AMAG Pharmaceuticals, Inc.(b)(c) | | | 10,233 | | | | 106,014 | |
AMN Healthcare Services, Inc.(b) | | | 11,212 | | | | 603,654 | |
Amphastar Pharmaceuticals, Inc.(b) | | | 3,788 | | | | 77,199 | |
AngioDynamics, Inc.(b) | | | 6,986 | | | | 65,424 | |
ANI Pharmaceuticals, Inc.(b) | | | 1,472 | | | | 46,162 | |
Anika Therapeutics, Inc.(b) | | | 857 | | | | 32,849 | |
BioTelemetry, Inc.(b) | | | 2,192 | | | | 86,759 | |
Cardiovascular Systems, Inc.(b) | | | 1,819 | | | | 59,427 | |
Coherus Biosciences, Inc.(b)(c) | | | 6,133 | | | | 116,343 | |
Community Health Systems, Inc.(b) | | | 958,583 | | | | 4,955,874 | |
Computer Programs & Systems, Inc. | | | 2,788 | | | | 76,280 | |
CONMED Corp. | | | 3,036 | | | | 262,037 | |
| | | | | | | | |
| | | Shares | | | Value | |
Health Care-(continued) | | | | | | | | |
Corcept Therapeutics, Inc.(b) | | | 5,198 | | | $ | 66,015 | |
CorVel Corp.(b) | | | 1,991 | | | | 165,293 | |
Covetrus, Inc.(b) | | | 55,905 | | | | 1,280,784 | |
Cross Country Healthcare, Inc.(b) | | | 33,282 | | | | 212,672 | |
CryoLife, Inc.(b) | | | 2,753 | | | | 55,666 | |
Cutera, Inc.(b) | | | 3,027 | | | | 49,552 | |
Cytokinetics, Inc.(b)(c) | | | 236 | | | | 5,655 | |
Eagle Pharmaceuticals, Inc.(b) | | | 1,002 | | | | 39,759 | |
Enanta Pharmaceuticals, Inc.(b) | | | 821 | | | | 42,848 | |
Endo International PLC(b) | | | 199,158 | | | | 599,466 | |
Ensign Group, Inc. (The) | | | 12,553 | | | | 734,853 | |
Glaukos Corp.(b)(c) | | | 1,398 | | | | 66,866 | |
Hanger, Inc.(b) | | | 15,026 | | | | 296,914 | |
HealthStream, Inc.(b) | | | 2,629 | | | | 54,460 | |
Heska Corp.(b) | | | 321 | | | | 33,256 | |
HMS Holdings Corp.(b) | | | 4,777 | | | | 133,230 | |
Innoviva, Inc.(b) | | | 5,124 | | | | 60,002 | |
Inogen, Inc.(b) | | | 2,485 | | | | 75,122 | |
Integer Holdings Corp.(b) | | | 3,969 | | | | 274,893 | |
Invacare Corp. | | | 30,314 | | | | 205,529 | |
Lannett Co., Inc.(b) | | | 16,908 | | | | 88,936 | |
Lantheus Holdings, Inc.(b) | | | 6,123 | | | | 82,171 | |
LeMaitre Vascular, Inc. | | | 1,100 | | | | 35,508 | |
Luminex Corp. | | | 2,628 | | | | 70,141 | |
Magellan Health, Inc.(b) | | | 23,636 | | | | 1,783,573 | |
Medpace Holdings, Inc.(b) | | | 2,388 | | | | 309,938 | |
Meridian Bioscience, Inc.(b) | | | 2,739 | | | | 38,729 | |
Merit Medical Systems, Inc.(b) | | | 5,408 | | | | 265,533 | |
Mesa Laboratories, Inc. | | | 118 | | | | 29,019 | |
Momenta Pharmaceuticals, Inc.(b) | | | 209 | | | | 10,904 | |
Myriad Genetics, Inc.(b) | | | 14,356 | | | | 191,940 | |
Natus Medical, Inc.(b) | | | 5,053 | | | | 91,762 | |
Neogen Corp.(b) | | | 1,384 | | | | 105,461 | |
NeoGenomics, Inc.(b) | | | 3,517 | | | | 136,987 | |
NextGen Healthcare, Inc.(b) | | | 12,050 | | | | 159,783 | |
Omnicell, Inc.(b) | | | 3,261 | | | | 217,443 | |
OraSure Technologies, Inc.(b) | | | 3,414 | | | | 40,012 | |
Orthofix Medical, Inc.(b) | | | 2,982 | | | | 90,474 | |
Owens & Minor, Inc. | | | 285,886 | | | | 4,739,990 | |
Pacira BioSciences, Inc.(b) | | | 2,318 | | | | 144,921 | |
Pennant Group, Inc. (The)(b) | | | 3,237 | | | | 119,898 | |
Phibro Animal Health Corp., Class A | | | 7,256 | | | | 155,714 | |
Providence Service Corp. (The)(b) | | | 4,464 | | | | 413,322 | |
RadNet, Inc.(b) | | | 16,479 | | | | 237,627 | |
REGENXBIO, Inc.(b) | | | 335 | | | | 10,224 | |
Select Medical Holdings Corp.(b) | | | 79,972 | | | | 1,605,038 | |
Simulations Plus, Inc. | | | 175 | | | | 10,426 | |
Supernus Pharmaceuticals, Inc.(b) | | | 3,993 | | | | 87,806 | |
SurModics, Inc.(b) | | | 577 | | | | 26,109 | |
Tabula Rasa HealthCare, Inc.(b)(c) | | | 1,264 | | | | 63,958 | |
Tactile Systems Technology, Inc.(b) | | | 1,087 | | | | 41,773 | |
Tivity Health, Inc.(b) | | | 27,986 | | | | 457,851 | |
US Physical Therapy, Inc. | | | 1,472 | | | | 130,861 | |
Vanda Pharmaceuticals, Inc.(b) | | | 5,044 | | | | 51,903 | |
Varex Imaging Corp.(b) | | | 11,298 | | | | 125,295 | |
Xencor, Inc.(b) | | | 615 | | | | 21,986 | |
Zynex, Inc.(b)(C) | | | 526 | | | | 7,785 | |
| | | | | | | | |
| | | | | | | 23,868,801 | |
| | | | | | | | |
See accompanying Notes to Financial Statements which are an integral part of the financial statements.
Invesco S&P SmallCap 600 Revenue ETF (RWJ)–(continued)
August 31, 2020
| | | | | | | | |
| | | Shares | | | Value | |
Industrials-20.12% | | | | | | | | |
AAON, Inc. | | | 2,150 | | | $ | 122,400 | |
AAR Corp. | | | 21,593 | | | | 435,747 | |
ABM Industries, Inc. | | | 46,610 | | | | 1,777,705 | |
Aegion Corp.(b) | | | 18,876 | | | | 305,508 | |
Aerojet Rocketdyne Holdings, Inc.(b) | | | 10,895 | | | | 450,726 | |
AeroVironment, Inc.(b) | | | 1,042 | | | | 79,598 | |
Alamo Group, Inc. | | | 2,627 | | | | 291,334 | |
Albany International Corp., Class A | | | 4,085 | | | | 212,012 | |
Allegiant Travel Co. | | | 3,607 | | | | 463,860 | |
American Woodmark Corp.(b) | | | 5,727 | | | | 501,112 | |
Apogee Enterprises, Inc. | | | 14,112 | | | | 295,364 | |
Applied Industrial Technologies, Inc. | | | 12,980 | | | | 781,526 | |
ArcBest Corp. | | | 29,088 | | | | 983,756 | |
Arcosa, Inc. | | | 10,385 | | | | 480,722 | |
Astec Industries, Inc. | | | 5,923 | | | | 312,261 | |
Atlas Air Worldwide Holdings, Inc.(b) | | | 15,535 | | | | 876,019 | |
AZZ, Inc. | | | 7,447 | | | | 258,634 | |
Barnes Group, Inc. | | | 8,295 | | | | 328,482 | |
Brady Corp., Class A | | | 5,324 | | | | 249,642 | |
Chart Industries, Inc.(b) | | | 7,193 | | | | 472,724 | |
CIRCOR International, Inc.(b) | | | 10,055 | | | | 298,131 | |
Comfort Systems USA, Inc. | | | 16,679 | | | | 845,125 | |
Cubic Corp. | | | 7,523 | | | | 354,183 | |
DXP Enterprises, Inc.(b) | | | 14,728 | | | | 283,367 | |
Echo Global Logistics, Inc.(b) | | | 24,156 | | | | 659,942 | |
Encore Wire Corp. | | | 6,089 | | | | 314,253 | |
Enerpac Tool Group Corp. | | | 9,616 | | | | 200,013 | |
EnPro Industries, Inc. | | | 6,672 | | | | 390,445 | |
ESCO Technologies, Inc. | | | 2,190 | | | | 196,925 | |
Exponent, Inc. | | | 1,332 | | | | 107,166 | |
Federal Signal Corp. | | | 9,584 | | | | 307,838 | |
Forrester Research, Inc.(b) | | | 3,315 | | | | 117,550 | |
Forward Air Corp. | | | 6,741 | | | | 397,652 | |
Foundation Building Materials, Inc.(b) | | | 33,565 | | | | 544,760 | |
Franklin Electric Co., Inc. | | | 5,787 | | | | 343,516 | |
Gibraltar Industries, Inc.(b) | | | 5,478 | | | | 342,074 | |
GMS, Inc.(b) | | | 33,227 | | | | 880,183 | |
Granite Construction, Inc. | | | 43,394 | | | | 806,694 | |
Greenbrier Cos., Inc. (The) | | | 31,326 | | | | 851,754 | |
Griffon Corp. | | | 29,933 | | | | 650,444 | |
Harsco Corp.(b) | | | 29,099 | | | | 411,751 | |
Hawaiian Holdings, Inc. | | | 38,186 | | | | 513,220 | |
Heartland Express, Inc. | | | 7,101 | | | | 146,884 | |
Heidrick & Struggles International, Inc. | | | 7,856 | | | | 169,925 | |
Hillenbrand, Inc. | | | 18,572 | | | | 588,918 | |
Hub Group, Inc., Class A(b) | | | 17,546 | | | | 944,677 | |
Insteel Industries, Inc. | | | 6,062 | | | | 111,783 | |
Interface, Inc. | | | 36,148 | | | | 273,279 | |
John Bean Technologies Corp. | | | 5,863 | | | | 601,016 | |
Kaman Corp. | | | 4,399 | | | | 203,454 | |
Kelly Services, Inc., Class A | | | 81,803 | | | | 1,553,439 | |
Korn Ferry | | | 15,591 | | | | 475,526 | |
Lindsay Corp. | | | 1,132 | | | | 113,121 | |
Lydall, Inc.(b) | | | 13,215 | | | | 248,178 | |
Marten Transport Ltd. | | | 12,299 | | | | 223,350 | |
Matson, Inc. | | | 16,663 | | | | 667,686 | |
Matthews International Corp., Class A | | | 17,701 | | | | 387,652 | |
Meritor, Inc.(b) | | | 44,961 | | | | 1,023,312 | |
Moog, Inc., Class A | | | 12,495 | | | | 753,324 | |
Mueller Industries, Inc. | | | 22,273 | | | | 661,508 | |
| | | | | | | | |
| | | Shares | | | Value | |
Industrials-(continued) | | | | | | | | |
MYR Group, Inc.(b) | | | 17,001 | | | $ | 659,809 | |
National Presto Industries, Inc. | | | 809 | | | | 72,753 | |
NOW, Inc.(b) | | | 74,641 | | | | 542,640 | |
Park Aerospace Corp. | | | 1,188 | | | | 13,175 | |
Patrick Industries, Inc. | | | 9,541 | | | | 536,300 | |
PGT Innovations, Inc.(b) | | | 12,284 | | | | 222,709 | |
Pitney Bowes, Inc. | | | 269,191 | | | | 1,477,859 | |
Powell Industries, Inc. | | | 4,873 | | | | 131,522 | |
Proto Labs, Inc.(b) | | | 943 | | | | 138,621 | |
Quanex Building Products Corp. | | | 15,711 | | | | 264,102 | |
Raven Industries, Inc. | | | 4,142 | | | | 102,929 | |
Resideo Technologies, Inc.(b) | | | 118,104 | | | | 1,577,869 | |
Resources Connection, Inc. | | | 14,266 | | | | 175,329 | |
RR Donnelley & Sons Co. | | | 1,091,276 | | | | 1,440,484 | |
Saia, Inc.(b) | | | 3,937 | | | | 528,345 | |
Simpson Manufacturing Co., Inc. | | | 3,322 | | | | 326,685 | |
SkyWest, Inc. | | | 19,529 | | | | 657,151 | |
SPX Corp.(b) | | | 8,985 | | | | 375,843 | |
SPX FLOW, Inc.(b) | | | 9,567 | | | | 415,973 | |
Standex International Corp. | | | 3,121 | | | | 180,519 | |
Team, Inc.(b) | | | 45,928 | | | | 292,561 | |
Tennant Co. | | | 4,068 | | | | 270,400 | |
Titan International, Inc. | | | 197,903 | | | | 471,009 | |
Triumph Group, Inc. | | | 60,240 | | | | 435,535 | |
TrueBlue, Inc.(b) | | | 34,933 | | | | 591,066 | |
UFP Industries, Inc. | | | 22,334 | | | | 1,325,523 | |
UniFirst Corp. | | | 2,495 | | | | 480,587 | |
US Ecology, Inc. | | | 5,386 | | | | 199,982 | |
Veritiv Corp.(b) | | | 102,854 | | | | 1,787,603 | |
Viad Corp. | | | 15,008 | | | | 321,621 | |
Vicor Corp.(b) | | | 906 | | | | 78,849 | |
Wabash National Corp. | | | 49,000 | | | | 598,290 | |
Watts Water Technologies, Inc., Class A | | | 4,506 | | | | 431,450 | |
| | | | | | | | |
| | | | | | | 45,768,243 | |
| | | | | | | | |
Information Technology-9.47% | | | | | | | | |
3D Systems Corp.(b)(c) | | | 19,124 | | | | 104,991 | |
8x8, Inc.(b) | | | 7,087 | | | | 119,629 | |
ADTRAN, Inc. | | | 10,788 | | | | 119,639 | |
Advanced Energy Industries, Inc.(b) | | | 3,387 | | | | 251,044 | |
Agilysys, Inc.(b) | | | 1,796 | | | | 45,564 | |
Alarm.com Holdings, Inc.(b) | | | 2,117 | | | | 126,745 | |
Applied Optoelectronics, Inc.(b)(c) | | | 4,595 | | | | 53,440 | |
Arlo Technologies, Inc.(b) | | | 37,834 | | | | 216,789 | |
Axcelis Technologies, Inc.(b) | | | 3,264 | | | | 77,128 | |
Badger Meter, Inc. | | | 1,578 | | | | 97,347 | |
Bel Fuse, Inc., Class B | | | 11,188 | | | | 134,480 | |
Benchmark Electronics, Inc. | | | 23,383 | | | | 458,541 | |
Bottomline Technologies (DE), Inc.(b) | | | 2,009 | | | | 95,689 | |
Brooks Automation, Inc. | | | 4,762 | | | | 245,862 | |
CalAmp Corp.(b) | | | 10,803 | | | | 88,260 | |
Cardtronics PLC, Class A(b) | | | 12,824 | | | | 278,409 | |
CEVA, Inc.(b) | | | 647 | | | | 27,336 | |
Cohu, Inc. | | | 8,334 | | | | 143,345 | |
Comtech Telecommunications Corp. | | | 8,618 | | | | 143,059 | |
CSG Systems International, Inc. | | | 5,076 | | | | 216,085 | |
CTS Corp. | | | 5,103 | | | | 106,653 | |
Daktronics, Inc. | | | 30,212 | | | | 133,537 | |
Diebold Nixdorf, Inc.(b) | | | 178,078 | | | | 1,485,170 | |
Digi International, Inc.(b) | | | 5,445 | | | | 74,161 | |
See accompanying Notes to Financial Statements which are an integral part of the financial statements.
Invesco S&P SmallCap 600 Revenue ETF (RWJ)–(continued)
August 31, 2020
| | | | | | | | |
| | | Shares | | | Value | |
Information Technology-(continued) | | | | | | | | |
Diodes, Inc.(b) | | | 5,847 | | | $ | 285,684 | |
DSP Group, Inc.(b) | | | 1,598 | | | | 22,915 | |
Ebix, Inc.(c) | | | 5,399 | | | | 124,555 | |
ePlus, Inc.(b) | | | 5,063 | | | | 388,433 | |
EVERTEC, Inc. | | | 3,847 | | | | 134,722 | |
ExlService Holdings, Inc.(b) | | | 3,816 | | | | 243,041 | |
Extreme Networks, Inc.(b) | | | 49,597 | | | | 216,739 | |
Fabrinet (Thailand)(b) | | | 6,116 | | | | 426,774 | |
FARO Technologies, Inc.(b) | | | 1,534 | | | | 86,671 | |
FormFactor, Inc.(b) | | | 5,562 | | | | 145,335 | |
Harmonic, Inc.(b) | | | 18,183 | | | | 107,280 | |
Ichor Holdings Ltd.(b) | | | 7,068 | | | | 177,831 | |
Insight Enterprises, Inc.(b) | | | 37,646 | | | | 2,251,419 | |
Itron, Inc.(b) | | | 8,573 | | | | 510,694 | |
Knowles Corp.(b) | | | 12,214 | | | | 183,943 | |
Kulicke & Soffa Industries, Inc. (Singapore) | | | 5,698 | | | | 136,638 | |
LivePerson, Inc.(b) | | | 2,085 | | | | 124,391 | |
ManTech International Corp., Class A | | | 7,523 | | | | 563,097 | |
MaxLinear, Inc.(b) | | | 3,532 | | | | 86,004 | |
Methode Electronics, Inc. | | | 7,475 | | | | 211,617 | |
MicroStrategy, Inc., Class A(b) | | | 926 | | | | 133,751 | |
MTS Systems Corp. | | | 10,629 | | | | 259,348 | |
NETGEAR, Inc.(b) | | | 9,233 | | | | 307,921 | |
NIC, Inc. | | | 3,451 | | | | 73,782 | |
OneSpan, Inc.(b) | | | 2,702 | | | | 58,228 | |
Onto Innovation, Inc.(b) | | | 2,711 | | | | 84,692 | |
OSI Systems, Inc.(b) | | | 3,687 | | | | 290,351 | |
PC Connection, Inc. | | | 14,934 | | | | 661,427 | |
PDF Solutions, Inc.(b) | | | 1,170 | | | | 24,219 | |
Perficient, Inc.(b) | | | 3,808 | | | | 163,401 | |
Photronics, Inc.(b) | | | 11,997 | | | | 120,330 | |
Plantronics, Inc. | | | 28,970 | | | | 358,069 | |
Plexus Corp.(b) | | | 11,772 | | | | 895,496 | |
Power Integrations, Inc. | | | 1,791 | | | | 100,242 | |
Progress Software Corp. | | | 2,554 | | | | 96,771 | |
Rambus, Inc.(b) | | | 3,674 | | | | 49,342 | |
Rogers Corp.(b) | | | 1,805 | | | | 204,525 | |
Sanmina Corp.(b) | | | 65,242 | | | | 1,846,349 | |
ScanSource, Inc.(b) | | | 36,298 | | | | 896,198 | |
SMART Global Holdings, Inc.(b) | | | 9,198 | | | | 231,790 | |
SPS Commerce, Inc.(b) | | | 959 | | | | 76,605 | |
Sykes Enterprises, Inc.(b) | | | 13,597 | | | | 450,129 | |
TTEC Holdings, Inc. | | | 8,889 | | | | 503,917 | |
TTM Technologies, Inc.(b) | | | 51,567 | | | | 590,958 | |
Ultra Clean Holdings, Inc.(b) | | | 12,314 | | | | 301,939 | |
Unisys Corp.(b) | | | 56,214 | | | | 655,455 | |
Veeco Instruments, Inc.(b) | | | 7,628 | | | | 90,697 | |
Viavi Solutions, Inc.(b) | | | 20,656 | | | | 275,448 | |
Virtusa Corp.(b) | | | 9,749 | | | | 385,475 | |
Xperi Holding Corp. | | | 6,225 | | | | 77,999 | |
| | | | | | | | |
| | | | | | | 21,535,540 | |
| | | | | | | | |
Materials-6.34% | | | | | | | | |
AdvanSix, Inc.(b) | | | 22,595 | | | | 287,634 | |
American Vanguard Corp. | | | 8,530 | | | | 120,700 | |
Arconic Corp.(b) | | | 91,280 | | | | 2,030,980 | |
Balchem Corp. | | | 1,647 | | | | 160,912 | |
Boise Cascade Co. | | | 33,070 | | | | 1,514,606 | |
Century Aluminum Co.(b) | | | 59,794 | | | | 590,167 | |
Clearwater Paper Corp.(b) | | | 12,008 | | | | 404,189 | |
| | | | | | | | |
| | | Shares | | | Value | |
Materials-(continued) | | | | | | | | |
Cleveland-Cliffs, Inc.(c) | | | 79,632 | | | $ | 523,979 | |
Ferro Corp.(b) | | | 24,075 | | | | 300,215 | |
FutureFuel Corp. | | | 3,884 | | | | 46,996 | |
GCP Applied Technologies, Inc.(b) | | | 12,544 | | | | 326,897 | |
H.B. Fuller Co. | | | 16,259 | | | | 783,196 | |
Hawkins, Inc. | | | 3,131 | | | | 157,239 | |
Haynes International, Inc. | | | 4,755 | | | | 89,109 | |
Innospec, Inc. | | | 4,499 | | | | 336,030 | |
Kaiser Aluminum Corp. | | | 4,595 | | | | 295,367 | |
Koppers Holdings, Inc.(b) | | | 22,830 | | | | 549,290 | |
Kraton Corp.(b) | | | 25,160 | | | | 353,246 | |
Livent Corp.(b) | | | 10,554 | | | | 89,498 | |
Materion Corp. | | | 4,783 | | | | 261,104 | |
Mercer International, Inc. (Germany) | | | 40,131 | | | | 336,298 | |
Myers Industries, Inc. | | | 8,282 | | | | 126,715 | |
Neenah, Inc. | | | 4,151 | | | | 183,806 | |
Olympic Steel, Inc. | | | 29,858 | | | | 328,438 | |
PH Glatfelter Co. | | | 13,555 | | | | 203,189 | |
Quaker Chemical Corp. | | | 1,692 | | | | 321,480 | |
Rayonier Advanced Materials, Inc.(b) | | | 157,726 | | | | 498,414 | |
Schweitzer-Mauduit International, Inc., Class A | | | 7,652 | | | | 232,085 | |
Stepan Co. | | | 4,353 | | | | 501,857 | |
SunCoke Energy, Inc. | | | 114,148 | | | | 408,650 | |
TimkenSteel Corp.(b) | | | 64,938 | | | | 244,816 | |
Tredegar Corp. | | | 14,049 | | | | 237,850 | |
Trinseo S.A | | | 37,835 | | | | 942,470 | |
US Concrete, Inc.(b) | | | 14,576 | | | | 389,033 | |
Warrior Met Coal, Inc. | | | 16,181 | | | | 250,320 | |
| | | | | | | | |
| | | | | | | 14,426,775 | |
| | | | | | | | |
Real Estate-2.36% | | | | | | | | |
Acadia Realty Trust | | | 4,692 | | | | 53,207 | |
Agree Realty Corp. | | | 741 | | | | 49,588 | |
Alexander & Baldwin, Inc. | | | 7,193 | | | | 87,107 | |
American Assets Trust, Inc. | | | 2,823 | | | | 72,128 | |
Armada Hoffler Properties, Inc. | | | 7,093 | | | | 71,639 | |
CareTrust REIT, Inc. | | | 2,029 | | | | 39,302 | |
Chatham Lodging Trust | | | 9,220 | | | | 63,802 | |
Community Healthcare Trust, Inc. | | | 371 | | | | 17,326 | |
DiamondRock Hospitality Co. | | | 31,921 | | | | 169,181 | |
Diversified Healthcare Trust | | | 60,827 | | | | 231,143 | |
Easterly Government Properties, Inc. | | | 2,112 | | | | 51,089 | |
Essential Properties Realty Trust, Inc. | | | 1,999 | | | | 33,923 | |
Four Corners Property Trust, Inc. | | | 1,614 | | | | 40,754 | |
Franklin Street Properties Corp. | | | 11,406 | | | | 50,529 | |
Getty Realty Corp. | | | 1,090 | | | | 31,926 | |
Global Net Lease, Inc. | | | 4,566 | | | | 79,905 | |
Hersha Hospitality Trust | | | 15,629 | | | | 100,494 | |
Independence Realty Trust, Inc. | | | 4,127 | | | | 48,327 | |
Industrial Logistics Properties Trust(c) | | | 2,799 | | | | 60,374 | |
Innovative Industrial Properties, Inc. | | | 148 | | | | 18,217 | |
Investors Real Estate Trust | | | 580 | | | | 41,238 | |
iStar, Inc. | | | 12,589 | | | | 155,852 | |
Kite Realty Group Trust | | | 5,722 | | | | 64,315 | |
Lexington Realty Trust | | | 7,224 | | | | 82,137 | |
LTC Properties, Inc. | | | 1,124 | | | | 41,015 | |
Marcus & Millichap, Inc.(b) | | | 6,523 | | | | 184,014 | |
National Storage Affiliates Trust | | | 3,027 | | | | 103,856 | |
NexPoint Residential Trust, Inc. | | | 1,289 | | | | 53,365 | |
See accompanying Notes to Financial Statements which are an integral part of the financial statements.
Invesco S&P SmallCap 600 Revenue ETF (RWJ)–(continued)
August 31, 2020
| | | | | | | | |
| | | Shares | | | Value | |
Real Estate-(continued) | | | | | | | | |
Office Properties Income Trust | | | 5,299 | | | $ | 126,328 | |
Pennsylvania REIT(c) | | | 48,645 | | | | 53,509 | |
RE/MAX Holdings, Inc., Class A | | | 2,002 | | | | 70,350 | |
Realogy Holdings Corp. | | | 175,320 | | | | 1,942,546 | |
Retail Opportunity Investments Corp. | | | 5,489 | | | | 61,093 | |
RPT Realty | | | 6,993 | | | | 40,979 | |
Safehold, Inc. | | | 427 | | | | 23,686 | |
Saul Centers, Inc. | | | 1,511 | | | | 42,338 | |
St. Joe Co. (The)(b) | | | 1,488 | | | | 34,536 | |
Summit Hotel Properties, Inc. | | | 16,122 | | | | 94,959 | |
Tanger Factory Outlet Centers, Inc.(c) | | | 13,665 | | | | 77,754 | |
Uniti Group, Inc. | | | 28,673 | | | | 281,569 | |
Universal Health Realty Income Trust | | | 192 | | | | 12,810 | |
Urstadt Biddle Properties, Inc., Class A | | | 2,414 | | | | 22,450 | |
Washington Prime Group, Inc.(c) | | | 136,850 | | | | 93,058 | |
Washington REIT | | | 3,088 | | | | 67,751 | |
Whitestone REIT | | | 3,813 | | | | 24,518 | |
Xenia Hotels & Resorts, Inc. | | | 21,052 | | | | 189,047 | |
| | | | | | | | |
| | | | | | | 5,355,034 | |
| | | | | | | | |
Utilities-0.45% | | | | | | | | |
American States Water Co. | | | 1,426 | | | | 108,490 | |
Avista Corp. | | | 8,320 | | | | 306,675 | |
California Water Service Group | | | 3,521 | | | | 159,642 | |
Northwest Natural Holding Co. | | | 2,981 | | | | 152,359 | |
South Jersey Industries, Inc. | | | 13,511 | | | | 299,269 | |
| | | | | | | | |
| | | | | | | 1,026,435 | |
| | | | | | | | |
Total Common Stocks & Other Equity Interests
(Cost $240,868,476) | | | | | | | 227,226,178 | |
| | | | | | | | |
| | | | | | | | |
| | | Shares | | | Value | |
Money Market Funds-0.05% | | | | | | | | |
Invesco Premier U.S. Government Money
Portfolio, Institutional Class, 0.01%(d)(e)
(Cost $122,767) | | | 122,767 | | | $ | 122,767 | |
| | | | | | | | |
TOTAL INVESTMENTS IN SECURITIES
(excluding investments purchased with cash collateral
from securities on loan)-99.96%
(Cost $240,991,243) | | | | 227,348,945 | |
| | | | | |
| | | | | |
| Investments Purchased with Cash Collateral from Securities on Loan | |
| | | | | | | | |
Money Market Funds-8.86% | | | | | | | | |
Invesco Private Government Fund, 0.03%(d)(e)(f) | | | 15,106,711 | | | | 15,106,711 | |
Invesco Private Prime Fund, 0.14%(d)(e)(f) | | | 5,034,639 | | | | 5,035,646 | |
| | | | | | | | |
Total Investments Purchased with Cash Collateral from Securities on Loan
(Cost $20,142,357) | | | | 20,142,357 | |
| | | | | | | | |
TOTAL INVESTMENTS IN SECURITIES-108.82%
(Cost $261,133,600) | | | | 247,491,302 | |
OTHER ASSETS LESS LIABILITIES-(8.82)% | | | | (20,066,699 | ) |
| | | | | | | | |
NET ASSETS-100.00% | | | $ | 227,424,603 | |
| | | | | | | | |
Investment Abbreviations:
REIT-RealEstate Investment Trust
Notes to Schedule of Investments:
| (a) | Industry and/or sector classifications used in this report are generally according to the Global Industry Classification Standard, which was developed by and is the exclusive property and a service mark of MSCI Inc. and Standard & Poor’s. |
| (b) | Non-income producing security. |
| (c) | All or a portion of this security was out on loan at August 31, 2020. |
| (d) | Affiliated issuer. The issuer and/or the Fund is a wholly-owned subsidiary of Invesco Ltd., or is affiliated by having an investment adviser that is under common control of Invesco Ltd. The table below shows the Fund’s transactions in, and earnings from, its investments in affiliates for the fiscal year ended August 31, 2020. |
| | | | | | | | | | | | | | | | | | | | | | | | | | | | | | | | | | | |
| | | Value
August 31, 2019 | | Purchases
at Cost | | Proceeds
from Sales | | Change in
Unrealized
Appreciation
(Depreciation) | | Realized
Gain
(Loss) | | Value
August 31, 2020 | | Dividend
Income |
Invesco Mortgage Capital, Inc. | | | $ | 48,352 | | | | $ | 51,061 | | | | $ | (60,415 | ) | | | $ | (3,591 | ) | | | $ | (1,534 | ) | | | $ | 33,873 | | | | $ | (7,783 | ) |
Investments in Affiliated Money Market Funds: | | | | | | | | | | | | | | | | | | | | | | | | | | | | | | | | | | | |
Invesco Premier U.S. Government Money Portfolio, Institutional Class | | | | 268,377 | | | | | 11,539,864 | | | | | (11,685,474 | ) | | | | - | | | | | - | | | | | 122,767 | | | | | 1,784 | |
Investments Purchased with Cash Collateral from Securities on Loan: | | | | | | | | | | | | | | | | | | | | | | | | | | | | | | | | | | | |
Invesco Government & Agency Portfolio, Institutional Class | | | | 23,823,718 | | | | | 79,803,492 | | | | | (103,627,210 | ) | | | | | | | | | - | | | | | - | | | | | 197,230 | * |
See accompanying Notes to Financial Statements which are an integral part of the financial statements.
Invesco S&P SmallCap 600 Revenue ETF (RWJ)–(continued)
August 31, 2020
| | | | | | | | | | | | | | | | | | | | | | | | | | | | | | | | | | | |
| | | Value
August 31, 2019 | | Purchases
at Cost | | Proceeds
from Sales | | Change in
Unrealized
Appreciation
(Depreciation) | | Realized
Gain
(Loss) | | Value
August 31, 2020 | | Dividend
Income |
Invesco Liquid Assets Portfolio, Institutional Class | | | $ | 7,950,340 | | | | $ | 22,616,153 | | | | $ | (30,564,009 | ) | | | $ | (72 | ) | | | $ | (2,412 | ) | | | $ | - | | | | $ | 73,344 | * |
Invesco Private Government Fund | | | | - | | | | | 69,880,299 | | | | | (54,773,588 | ) | | | | - | | | | | - | | | | | 15,106,711 | | | | | 2,028 | * |
Invesco Private Prime Fund | | | | - | | | | | 10,881,047 | | | | | (5,845,805 | ) | | | | - | | | | | 404 | | | | | 5,035,646 | | | | | 1,428 | * |
| | | | | | | | | | | | | | | | | | | | | | | | | | | | | | | | | | | |
Total | | | $ | 32,090,787 | | | | $ | 194,771,916 | | | | $ | (206,556,501 | ) | | | $ | (3,663 | ) | | | $ | (3,542 | ) | | | $ | 20,298,997 | | | | $ | 268,031 | |
| | | | | | | | | | | | | | | | | | | | | | | | | | | | | | | | | | | |
| * | Represents the income earned on the investment of cash collateral, which is included in securities lending income on the Statements of Operations. Does not include rebates and fees paid to lending agent or premiums received from borrowers, if any. |
| (e) | The rate shown is the 7-day SEC standardized yield as of August 31, 2020. |
| (f) | The security has been segregated to satisfy the commitment to return the cash collateral received in securities lending transactions upon the borrower’s return of the securities loaned. See Note 2J. |
See accompanying Notes to Financial Statements which are an integral part of the financial statements.
Invesco S&P Ultra Dividend Revenue ETF (RDIV)
August 31, 2020
Schedule of Investments(a)
| | | | | | | | |
| | | Shares | | | Value | |
Common Stocks & Other Equity Interests-99.21% | |
Communication Services-1.47% | | | | | | | | |
Interpublic Group of Cos., Inc. (The) | | | 500,890 | | | $ | 8,895,806 | |
| | | | | | | | |
Consumer Discretionary-2.84% | | | | | | | | |
H&R Block, Inc. | | | 163,822 | | | | 2,375,419 | |
Hanesbrands, Inc. | | | 435,730 | | | | 6,662,312 | |
Leggett & Platt, Inc. | | | 117,554 | | | | 4,819,714 | |
Wyndham Destinations, Inc. | | | 114,308 | | | | 3,313,789 | |
| | | | | | | | |
| | | | | | | 17,171,234 | |
| | | | | | | | |
Consumer Staples-4.20% | | | | | | | | |
Kraft Heinz Co. (The) | | | 659,926 | | | | 23,123,807 | |
Nu Skin Enterprises, Inc., Class A | | | 48,132 | | | | 2,275,200 | |
| | | | | | | | |
| | | | | | | 25,399,007 | |
| | | | | | | | |
Energy-26.90% | | | | | | | | |
Baker Hughes Co., Class A | | | 1,313,357 | | | | 18,754,738 | |
Chevron Corp. | | | 336,709 | | | | 28,259,986 | |
Halliburton Co. | | | 1,341,663 | | | | 21,708,107 | |
Kinder Morgan, Inc. | | | 813,522 | | | | 11,242,874 | |
Marathon Petroleum Corp. | | | 784,172 | | | | 27,806,739 | |
Phillips 66 | | | 466,450 | | | | 27,273,332 | |
Valero Energy Corp. | | | 523,421 | | | | 27,526,711 | |
| | | | | | | | |
| | | | | | | 162,572,487 | |
| | | | | | | | |
Financials-28.80% | | | | | | | | |
CIT Group, Inc. | | | 153,323 | | | | 3,015,863 | |
Citizens Financial Group, Inc. | | | 266,455 | | | | 6,893,191 | |
Comerica, Inc. | | | 88,313 | | | | 3,491,013 | |
F.N.B. Corp. | | | 181,365 | | | | 1,360,238 | |
Fifth Third Bancorp | | | 409,397 | | | | 8,458,142 | |
First Horizon National Corp. | | | 216,308 | | | | 2,065,741 | |
Franklin Resources, Inc. | | | 244,602 | | | | 5,151,318 | |
Huntington Bancshares, Inc. | | | 505,332 | | | | 4,755,174 | |
KeyCorp | | | 571,021 | | | | 7,034,979 | |
Mercury General Corp. | | | 83,219 | | | | 3,722,386 | |
MetLife, Inc. | | | 794,026 | | | | 30,538,240 | |
Principal Financial Group, Inc. | | | 346,919 | | | | 14,608,759 | |
Prudential Financial, Inc. | | | 467,539 | | | | 31,685,118 | |
Regions Financial Corp. | | | 536,091 | | | | 6,197,212 | |
Synovus Financial Corp. | | | 104,897 | | | | 2,294,097 | |
Umpqua Holdings Corp. | | | 112,283 | | | | 1,266,552 | |
Unum Group | | | 597,186 | | | | 11,035,997 | |
Valley National Bancorp. | | | 175,666 | | | | 1,319,252 | |
Webster Financial Corp. | | | 47,472 | | | | 1,305,480 | |
Wells Fargo & Co. | | | 1,155,659 | | | | 27,909,165 | |
| | | | | | | | |
| | | | | | | 174,107,917 | |
| | | | | | | | |
| | | | | | | | |
| | | Shares | | | Value | |
Health Care-0.96% | | | | | | | | |
Patterson Cos., Inc. | | | 199,336 | | | $ | 5,782,737 | |
| | | | | | | | |
Industrials-2.30% | | | | | | | | |
Nielsen Holdings PLC | | | 395,448 | | | | 6,042,446 | |
Ryder System, Inc. | | | 191,926 | | | | 7,849,773 | |
| | | | | | | | |
| | | | | | | 13,892,219 | |
| | | | | | | | |
Information Technology-8.07% | | | | | | | | |
International Business Machines Corp. | | | 241,261 | | | | 29,749,894 | |
Seagate Technology PLC | | | 196,114 | | | | 9,411,511 | |
Xerox Holdings Corp. | | | 510,803 | | | | 9,633,744 | |
| | | | | | | | |
| | | | | | | 48,795,149 | |
| | | | | | | | |
Materials-17.74% | | | | | | | | |
Dow, Inc. | | | 712,213 | | | | 32,135,050 | |
Greif, Inc., Class A | | | 115,109 | | | | 4,241,767 | |
International Paper Co. | | | 552,825 | | | | 20,050,963 | |
LyondellBasell Industries N.V., Class A | | | 443,036 | | | | 29,009,997 | |
Olin Corp. | | | 462,051 | | | | 5,198,074 | |
Westrock Co. | | | 548,095 | | | | 16,623,721 | |
| | | | | | | | |
| | | | | | | 107,259,572 | |
| | | | | | | | |
Real Estate-3.04% | | | | | | | | |
American Campus Communities, Inc. | | | 25,098 | | | | 850,822 | |
Highwoods Properties, Inc. | | | 18,814 | | | | 701,010 | |
Lamar Advertising Co., Class A | | | 24,912 | | | | 1,724,658 | |
Mack-Cali Realty Corp. | | | 27,355 | | | | 345,494 | |
Medical Properties Trust, Inc. | | | 46,507 | | | | 864,100 | |
National Retail Properties, Inc. | | | 17,973 | | | | 636,963 | |
Physicians Realty Trust | | | 21,989 | | | | 399,101 | |
Regency Centers Corp. | | | 24,892 | | | | 988,461 | |
SL Green Realty Corp. | | | 25,466 | | | | 1,190,790 | |
STORE Capital Corp. | | | 27,682 | | | | 748,521 | |
Vornado Realty Trust | | | 131,970 | | | | 4,728,485 | |
Welltower, Inc. | | | 90,306 | | | | 5,194,401 | |
| | | | | | | | |
| | | | | | | 18,372,806 | |
| | | | | | | | |
Utilities-2.89% | | | | | | | | |
CenterPoint Energy, Inc. | | | 493,825 | | | | 9,911,068 | |
PPL Corp. | | | 273,849 | | | | 7,566,448 | |
| | | | | | | | |
| | | | | | | 17,477,516 | |
| | | | | | | | |
TOTAL INVESTMENTS IN SECURITIES-99.21% (Cost $645,153,727) | | | | 599,726,450 | |
OTHER ASSETS LESS LIABILITIES-0.79% | | | | | | | 4,775,700 | |
| | | | | | | | |
NET ASSETS-100.00% | | | | | | $ | 604,502,150 | |
| | | | | | | | |
See accompanying Notes to Financial Statements which are an integral part of the financial statements.
Invesco S&P Ultra Dividend Revenue ETF (RDIV)–(continued)
August 31, 2020
Notes to Schedule of Investments:
| (a) | Industry and/or sector classifications used in this report are generally according to the Global Industry Classification Standard, which was developed by and is the exclusive property and a service mark of MSCI Inc. and Standard & Poor’s. |
Affiliated issuer. The issuer and/or the Fund is a wholly-owned subsidiary of Invesco Ltd., or is affiliated by having an investment adviser that is under common control of Invesco Ltd. The table below shows the Fund’s transactions in, and earnings from, its investments in affiliates for the fiscal year ended August 31, 2020.
| | | | | | | | | | | | | | | | | | | | | | | | | | | | | | | | | | | |
| | | Value
August 31, 2019 | | Purchases
at Cost | | Proceeds
from Sales | | Change in
Unrealized
Appreciation
(Depreciation) | | Realized
Gain
(Loss) | | Value
August 31, 2020 | | Dividend
Income |
| Investments in Affiliated Money Market Funds: | | | | | | | | | | | | | | | | | | | | | | | | | | | | | | | | | | | |
Invesco Premier
U.S. Government Money Portfolio, Institutional Class | | | $ | - | | | | $ | 65,764,464 | | | | $ | (65,764,464 | ) | | | $ | - | | | | $ | - | | | | $ | - | | | | $ | 25,644 | |
| Investments Purchased with Cash Collateral from Securities on Loan: | | | | | | | | | | | | | | | | | | | | | | | | | | | | | | | | | | | |
| Invesco Government & Agency Portfolio, Institutional Class | | | | 21,255,533 | | | | | 188,108,636 | | | | | (209,364,169 | ) | | | | - | | | | | - | | | | | - | | | | | 185,186 | * |
| Invesco Liquid Assets Portfolio, Institutional Class | | | | 7,098,369 | | | | | 52,942,043 | | | | | (60,038,916 | ) | | | | (144 | ) | | | | (1,352 | ) | | | | - | | | | | 69,969 | * |
| Invesco Private Government Fund | | | | - | | | | | 42,825,153 | | | | | (42,825,153 | ) | | | | - | | | | | - | | | | | - | | | | | 38 | * |
| | | | | | | | | | | | | | | | | | | | | | | | | | | | | | | | | | | |
| Total | | | $ | 28,353,902 | | | | $ | 349,640,296 | | | | $ | (377,992,702 | ) | | | $ | (144 | ) | | | $ | (1,352 | ) | | | $ | - | | | | $ | 280,837 | |
| | | | | | | | | | | | | | | | | | | | | | | | | | | | | | | | | | | |
| * | Represents the income earned on the investment of cash collateral, which is included in securities lending income on the Statements of Operations. Does not include rebates and fees paid to lending agent or premiums received from borrowers, if any. |
See accompanying Notes to Financial Statements which are an integral part of the financial statements.
Statements of Assets and Liabilities
August 31, 2020
| | | | | | | | | | | | | | | | | | | | |
| | | Invesco S&P 500
Revenue ETF (RWL) | | Invesco S&P
MidCap 400
Revenue
ETF (RWK) | | Invesco S&P
SmallCap 600
Revenue ETF (RWJ) | | Invesco S&P
Ultra Dividend
Revenue ETF (RDIV) |
Assets: | | | | | | | | | | | | | | | | | | | | |
Unaffiliated investments in securities, at value(a) | | | $ | 779,568,942 | | | | $ | 209,050,653 | | | | $ | 227,192,305 | | | | $ | 599,726,450 | |
Affiliated investments in securities, at value | | | | 3,878,603 | | | | | 7,619,528 | | | | | 20,298,997 | | | | | - | |
Cash | | | | 815 | | | | | - | | | | | - | | | | | - | |
Receivable for: | | | | | | | | | | | | | | | | | | | | |
Dividends | | | | 2,081,993 | | | | | 222,666 | | | | | 110,182 | | | | | 5,566,124 | |
Securities lending | | | | 1,544 | | | | | 2,337 | | | | | 41,093 | | | | | - | |
Investments sold | | | | - | | | | | - | | | | | 7,038,314 | | | | | 1,453,766 | |
| | | | | | | | | | | | | | | | | | | | |
Total assets | | | | 785,531,897 | | | | | 216,895,184 | | | | | 254,680,891 | | | | | 606,746,340 | |
| | | | | | | | | | | | | | | | | | | | |
Liabilities: | | | | | | | | | | | | | | | | | | | | |
Due to custodian | | | | - | | | | | - | | | | | - | | | | | 574,892 | |
Payable for: | | | | | | | | | | | | | | | | | | | | |
Investments purchased | | | | - | | | | | - | | | | | 723,162 | | | | | - | |
Collateral upon return of securities loaned | | | | 3,196,034 | | | | | 7,460,038 | | | | | 20,142,357 | | | | | - | |
Fund shares repurchased | | | | - | | | | | - | | | | | 6,314,979 | | | | | 1,464,215 | |
Accrued unitary management fees | | | | 253,029 | | | | | 70,099 | | | | | 75,790 | | | | | 205,083 | |
| | | | | | | | | | | | | | | | | | | | |
Total liabilities | | | | 3,449,063 | | | | | 7,530,137 | | | | | 27,256,288 | | | | | 2,244,190 | |
| | | | | | | | | | | | | | | | | | | | |
Net Assets | | | $ | 782,082,834 | | | | $ | 209,365,047 | | | | $ | 227,424,603 | | | | $ | 604,502,150 | |
| | | | | | | | | | | | | | | | | | | | |
| | | | |
Net assets consist of: | | | | | | | | | | | | | | | | | | | | |
Shares of beneficial interest | | | $ | 778,816,637 | | | | $ | 262,017,671 | | | | $ | 369,763,909 | | | | $ | 1,088,086,355 | |
Distributable earnings (loss) | | | | 3,266,197 | | | | | (52,652,624 | ) | | | | (142,339,306 | ) | | | | (483,584,205 | ) |
| | | | | | | | | | | | | | | | | | | | |
Net Assets | | | $ | 782,082,834 | | | | $ | 209,365,047 | | | | $ | 227,424,603 | | | | $ | 604,502,150 | |
| | | | | | | | | | | | | | | | | | | | |
Shares outstanding (unlimited amount authorized, $0.01 par value) | | | | 13,951,400 | | | | | 3,701,400 | | | | | 3,601,400 | | | | | 21,150,000 | |
Net asset value | | | $ | 56.06 | | | | $ | 56.56 | | | | $ | 63.15 | | | | $ | 28.58 | |
| | | | | | | | | | | | | | | | | | | | |
Market price | | | $ | 56.16 | | | | $ | 56.62 | | | | $ | 63.17 | | | | $ | 28.63 | |
| | | | | | | | | | | | | | | | | | | | |
Unaffiliated investments in securities, at cost | | | $ | 730,584,309 | | | | $ | 220,679,459 | | | | $ | 240,828,032 | | | | $ | 645,153,727 | |
| | | | | | | | | | | | | | | | | | | | |
Affiliated investments in securities, at cost | | | $ | 4,207,572 | | | | $ | 7,619,528 | | | | $ | 20,305,568 | | | | $ | - | |
| | | | | | | | | | | | | | | | | | | | |
(a) Includes securities on loan with an aggregate value of: | | | $ | 2,999,820 | | | | $ | 7,160,169 | | | | $ | 19,755,778 | | | | $ | - | |
| | | | | | | | | | | | | | | | | | | | |
See accompanying Notes to Financial Statements which are an integral part of the financial statements.
Statements of Operations
For the year ended August 31, 2020
| | | | | | | | | | | | | | | | | | | | |
| | | Invesco S&P 500
Revenue ETF (RWL) | | Invesco S&P
MidCap 400
Revenue
ETF (RWK) | | Invesco S&P
SmallCap 600
Revenue ETF (RWJ) | | Invesco S&P
Ultra Dividend
Revenue ETF (RDIV) |
Investment income: | | | | | | | | | | | | | | | | | | | | |
Unaffiliated dividend income | | | $ | 20,390,279 | | | | $ | 4,511,026 | | | | $ | 3,606,663 | | | | $ | 59,343,317 | |
Affiliated dividend income | | | | 29,538 | | | | | 1,756 | | | | | (5,999 | ) | | | | 25,644 | |
Securities lending income | | | | 139,370 | | | | | 169,824 | | | | | 1,682,756 | | | | | 292,243 | |
Foreign withholding tax | | | | (4,507 | ) | | | | (412 | ) | | | | (5,224 | ) | | | | (63,255 | ) |
| | | | | | | | | | | | | | | | | | | | |
Total investment income | | | | 20,554,680 | | | | | 4,682,194 | | | | | 5,278,196 | | | | | 59,597,949 | |
| | | | | | | | | | | | | | | | | | | | |
| | | | |
Expenses: | | | | | | | | | | | | | | | | | | | | |
Unitary management fees | | | | 3,342,447 | | | | | 1,078,381 | | | | | 1,086,897 | | | | | 4,505,553 | |
| | | | | | | | | | | | | | | | | | | | |
Less: Waivers | | | | (851 | ) | | | | (440 | ) | | | | (313 | ) | | | | (3,297 | ) |
| | | | | | | | | | | | | | | | | | | | |
Net expenses | | | | 3,341,596 | | | | | 1,077,941 | | | | | 1,086,584 | | | | | 4,502,256 | |
| | | | | | | | | | | | | | | | | | | | |
Net investment income | | | | 17,213,084 | | | | | 3,604,253 | | | | | 4,191,612 | | | | | 55,095,693 | |
| | | | | | | | | | | | | | | | | | | | |
| | | | |
Realized and unrealized gain (loss) from: | | | | | | | | | | | | | | | | | | | | |
Net realized gain (loss) from: | | | | | | | | | | | | | | | | | | | | |
Unaffiliated investment securities | | | | (18,665,341 | ) | | | | (14,578,819 | ) | | | | (81,135,826 | ) | | | | (311,967,028 | ) |
Affiliated investment securities | | | | (3,522 | ) | | | | 487 | | | | | (2,995 | ) | | | | (1,352 | ) |
Unaffiliated in-kind redemptions | | | | 73,314,431 | | | | | 16,246,325 | | | | | 27,283,146 | | | | | (52,476,218 | ) |
Affiliated in-kind redemptions | | | | (27,376 | ) | | | | - | | | | | (547 | ) | | | | - | |
| | | | | | | | | | | | | | | | | | | | |
Net realized gain (loss) | | | | 54,618,192 | | | | | 1,667,993 | | | | | (53,856,222 | ) | | | | (364,444,598 | ) |
| | | | | | | | | | | | | | | | | | | | |
Change in net unrealized appreciation (depreciation) of: | | | | | | | | | | | | | | | | | | | | |
Unaffiliated investment securities | | | | (19,647,313 | ) | | | | (10,502,165 | ) | | | | 63,733,211 | | | | | 60,150,878 | |
Affiliated investment securities | | | | (133,255 | ) | | | | - | | | | | (3,663 | ) | | | | (144 | ) |
| | | | | | | | | | | | | | | | | | | | |
Change in net unrealized appreciation (depreciation) | | | | (19,780,568 | ) | | | | (10,502,165 | ) | | | | 63,729,548 | | | | | 60,150,734 | |
| | | | | | | | | | | | | | | | | | | | |
Net realized and unrealized gain (loss) | | | | 34,837,624 | | | | | (8,834,172 | ) | | | | 9,873,326 | | | | | (304,293,864 | ) |
| | | | | | | | | | | | | | | | | | | | |
Net increase (decrease) in net assets resulting from operations | | | $ | 52,050,708 | | | | $ | (5,229,919 | ) | | | $ | 14,064,938 | | | | $ | (249,198,171 | ) |
| | | | | | | | | | | | | | | | | | | | |
See accompanying Notes to Financial Statements which are an integral part of the financial statements.
(This Page Intentionally Left Blank)
Statements of Changes in Net Assets
For the year ended August 31, 2020, period July 1, 2019 through August 31, 2019 and the year ended June 30, 2019
| | | | | | | | | | | | | | | |
| | | Invesco S&P 500
Revenue ETF (RWL) |
| | | Year Ended
August 31, 2020 | | Two Months Ended
August 31, 2019 | | Year Ended
June 30, 2019 |
Operations: | | | | | | | | | | | | | | | |
Net investment income | | | $ | 17,213,084 | | | | $ | 3,589,765 | | | | $ | 19,436,838 | |
Net realized gain (loss) | | | | 54,618,192 | | | | | 6,787,060 | | | | | 52,483,739 | |
Change in net unrealized appreciation (depreciation) | | | | (19,780,568 | ) | | | | (24,495,492 | ) | | | | (6,607,324 | ) |
| | | | | | | | | | | | | | | |
Net increase (decrease) in net assets resulting from operations | | | | 52,050,708 | | | | | (14,118,667 | ) | | | | 65,313,253 | |
| | | | | | | | | | | | | | | |
| | | |
Distributions to Shareholders from: | | | | | | | | | | | | | | | |
Distributable earnings | | | | (18,858,596 | ) | | | | - | | | | | (19,138,436 | ) |
| | | | | | | | | | | | | | | |
| | | |
Shareholder Transactions: | | | | | | | | | | | | | | | |
Proceeds from shares sold | | | | 122,131,917 | | | | | 2,604,990 | | | | | 243,025,931 | |
Value of shares repurchased | | | | (291,418,745 | ) | | | | (26,857,380 | ) | | | | (250,146,076 | ) |
| | | | | | | | | | | | | | | |
Net increase (decrease) in net assets resulting from share transactions | | | | (169,286,828 | ) | | | | (24,252,390 | ) | | | | (7,120,145 | ) |
| | | | | | | | | | | | | | | |
Net increase (decrease) in net assets | | | | (136,094,716 | ) | | | | (38,371,057 | ) | | | | 39,054,672 | |
| | | | | | | | | | | | | | | |
| | | |
Net assets: | | | | | | | | | | | | | | | |
Beginning of period | | | | 918,177,550 | | | | | 956,548,607 | | | | | 917,493,935 | |
| | | | | | | | | | | | | | | |
End of period | | | $ | 782,082,834 | | | | $ | 918,177,550 | | | | $ | 956,548,607 | |
| | | | | | | | | | | | | | | |
| | | |
Changes in Shares Outstanding: | | | | | | | | | | | | | | | |
Shares sold | | | | 2,250,000 | | | | | 50,000 | | | | | 4,750,000 | |
Shares repurchased | | | | (5,750,000 | ) | | | | (500,000 | ) | | | | (4,950,000 | ) |
Shares outstanding, beginning of period | | | | 17,451,400 | | | | | 17,901,400 | | | | | 18,101,400 | |
| | | | | | | | | | | | | | | |
Shares outstanding, end of period | | | | 13,951,400 | | | | | 17,451,400 | | | | | 17,901,400 | |
| | | | | | | | | | | | | | | |
See accompanying Notes to Financial Statements which are an integral part of the financial statements.
| | | | | | | | | | | | | | | | | | | | | | | | | | | | | | |
Invesco S&P
MidCap 400
Revenue ETF (RWK) | | Invesco S&P
SmallCap 600
Revenue ETF (RWJ) | | |
Year Ended
August 31, 2020 | | Two Months Ended
August 31, 2019 | | Year Ended
June 30, 2019 | | Year Ended
August 31, 2020 | | Two Months Ended
August 31, 2019 | | Year Ended
June 30, 2019 | | |
| | | | | | | | | | | | | | | | | | | | | | | | | | | | | | | |
| | $ | 3,604,253 | | | | $ | 604,617 | | | | $ | 3,935,107 | | | | $ | 4,191,612 | | | | $ | 697,074 | | | | $ | 5,409,022 | | | |
| | | 1,667,993 | | | | | 1,652,025 | | | | | 18,678,879 | | | | | (53,856,222 | ) | | | | 4,584,037 | | | | | 25,406,976 | | | |
| | | (10,502,165 | ) | | | | (28,795,505 | ) | | | | (20,423,615 | ) | | | | 63,729,548 | | | | | (33,894,064 | ) | | | | (98,675,989 | ) | | |
| | | | | | | | | | | | | | | | | | | | | | | | | | | | | | | |
| | | (5,229,919 | ) | | | | (26,538,863 | ) | | | | 2,190,371 | | | | | 14,064,938 | | | | | (28,612,953 | ) | | | | (67,859,991 | ) | | |
| | | | | | | | | | | | | | | | | | | | | | | | | | | | | | | |
| | | | | | |
| | | | | | | | | | | | | | | | | | | | | | | | | | | | | | | |
| | | (4,187,523 | ) | | | | - | | | | | (3,846,048 | ) | | | | (5,070,798 | ) | | | | - | | | | | (5,443,557 | ) | | |
| | | | | | | | | | | | | | | | | | | | | | | | | | | | | | | |
| | | | | | |
| | | | | | | | | | | | | | | | | | | | | | | | | | | | | | | |
| | | 31,016,971 | | | | | 2,857,012 | | | | | 80,869,707 | | | | | 53,812,575 | | | | | 3,109,660 | | | | | 175,782,312 | | | |
| | | (139,652,137 | ) | | | | (5,896,536 | ) | | | | (100,828,754 | ) | | | | (184,776,912 | ) | | | | (30,301,088 | ) | | | | (206,177,006 | ) | | |
| | | | | | | | | | | | | | | | | | | | | | | | | | | | | | | |
| | | (108,635,166 | ) | | | | (3,039,524 | ) | | | | (19,959,047 | ) | | | | (130,964,337 | ) | | | | (27,191,428 | ) | | | | (30,394,694 | ) | | |
| | | | | | | | | | | | | | | | | | | | | | | | | | | | | | | |
| | | (118,052,608 | ) | | | | (29,578,387 | ) | | | | (21,614,724 | ) | | | | (121,970,197 | ) | | | | (55,804,381 | ) | | | | (103,698,242 | ) | | |
| | | | | | | | | | | | | | | | | | | | | | | | | | | | | | | |
| | | | | | |
| | | | | | | | | | | | | | | | | | | | | | | | | | | | | | | |
| | | 327,417,655 | | | | | 356,996,042 | | | | | 378,610,766 | | | | | 349,394,800 | | | | | 405,199,181 | | | | | 508,897,423 | | | |
| | | | | | | | | | | | | | | | | | | | | | | | | | | | | | | |
| | $ | 209,365,047 | | | | $ | 327,417,655 | | | | $ | 356,996,042 | | | | $ | 227,424,603 | | | | $ | 349,394,800 | | | | $ | 405,199,181 | | | |
| | | | | | | | | | | | | | | | | | | | | | | | | | | | | | | |
| | | | | | |
| | | | | | | | | | | | | | | | | | | | | | | | | | | | | | | |
| | | 600,000 | | | | | 50,000 | | | | | 1,400,000 | | | | | 800,000 | | | | | 50,000 | | | | | 2,600,000 | | | |
| | | (2,700,000 | ) | | | | (100,000 | ) | | | | (1,750,000 | ) | | | | (3,150,000 | ) | | | | (500,000 | ) | | | | (3,150,000 | ) | | |
| | | 5,801,400 | | | | | 5,851,400 | | | | | 6,201,400 | | | | | 5,951,400 | | | | | 6,401,400 | | | | | 6,951,400 | | | |
| | | | | | | | | | | | | | | | | | | | | | | | | | | | | | | |
| | | 3,701,400 | | | | | 5,801,400 | | | | | 5,851,400 | | | | | 3,601,400 | | | | | 5,951,400 | | | | | 6,401,400 | | | |
| | | | | | | | | | | | | | | | | | | | | | | | | | | | | | | |
Statements of Changes in Net Assets–(continued)
For the year ended August 31, 2020, period July 1, 2019 through August 31, 2019 and the year ended June 30, 2019
| | | | | | | | | | | | |
| | | Invesco S&P
Ultra Dividend
Revenue ETF (RDIV) | |
| | | Year Ended
August 31, 2020 | | | Two Months Ended
August 31, 2019 | | | Year Ended
June 30, 2019 | |
Operations: | | | | | | | | | | | | |
Net investment income | | $ | 55,095,693 | | | $ | 9,813,984 | | | $ | 50,776,810 | |
Net realized gain (loss) | | | (364,444,598 | ) | | | 8,577,823 | | | | 7,071,471 | |
Change in net unrealized appreciation (depreciation) | | | 60,150,734 | | | | (114,555,720 | ) | | | (9,146,713 | ) |
| | | | | | | | | | | | |
Net increase (decrease) in net assets resulting from operations | | | (249,198,171 | ) | | | (96,163,913 | ) | | | 48,701,568 | |
| | | | | | | | | | | | |
| | | |
Distributions to Shareholders from: | | | | | | | | | | | | |
Distributable earnings | | | (51,573,798 | ) | | | - | | | | (48,980,283 | ) |
| | | | | | | | | | | | |
| | | |
Shareholder Transactions: | | | | | | | | | | | | |
Proceeds from shares sold | | | 470,839,096 | | | | 186,494,329 | | | | 2,425,047,339 | |
Value of shares repurchased | | | (1,137,864,895 | ) | | | (300,629,591 | ) | | | (1,253,156,914 | ) |
| | | | | | | | | | | | |
Net increase (decrease) in net assets resulting from share transactions | | | (667,025,799 | ) | | | (114,135,262 | ) | | | 1,171,890,425 | |
| | | | | | | | | | | | |
Net increase (decrease) in net assets | | | (967,797,768 | ) | | | (210,299,175 | ) | | | 1,171,611,710 | |
| | | | | | | | | | | | |
| | | |
Net assets: | | | | | | | | | | | | |
Beginning of period | | | 1,572,299,918 | | | | 1,782,599,093 | | | | 610,987,383 | |
| | | | | | | | | | | | |
End of period | | $ | 604,502,150 | | | $ | 1,572,299,918 | | | $ | 1,782,599,093 | |
| | | | | | | | | | | | |
| | | |
Changes in Shares Outstanding: | | | | | | | | | | | | |
Shares sold | | | 12,400,000 | | | | 4,950,000 | | | | 64,100,000 | |
Shares repurchased | | | (35,350,000 | ) | | | (8,200,000 | ) | | | (32,750,000 | ) |
Shares outstanding, beginning of period | | | 44,100,000 | | | | 47,350,000 | | | | 16,000,000 | |
| | | | | | | | | | | | |
Shares outstanding, end of period | | | 21,150,000 | | | | 44,100,000 | | | | 47,350,000 | |
| | | | | | | | | | | | |
See accompanying Notes to Financial Statements which are an integral part of the financial statements.
Financial Highlights
Invesco S&P 500 Revenue ETF (RWL)
| | | | | | | | | | | | | | | | | | | | | | | | | | | | | | |
| | | Year Ended August 31, | | Two Months Ended August 31, | | Years Ended June 30, |
| | | 2020 | | 2019 | | 2019 | | 2018 | | 2017 | | 2016 |
Per Share Operating Performance: | | | | | | | | | | | | | | | | | | | | | | | | | | | | | | |
Net asset value at beginning of period | | | $ | 52.61 | | | | $ | 53.43 | | | | $ | 50.69 | | | | $ | 46.43 | | | | $ | 40.74 | | | | $ | 40.91 | |
| | | | | | | | | | | | | | | | | | | | | | | | | | | | | | |
Net investment income(a) | | | | 1.08 | | | | | 0.20 | | | | | 1.03 | | | | | 0.90 | | | | | 0.83 | | | | | 0.76 | |
Net realized and unrealized gain (loss) on investments | | | | 3.53 | | | | | (1.02 | ) | | | | 2.72 | | | | | 4.41 | | | | | 5.60 | | | | | (0.14 | ) |
| | | | | | | | | | | | | | | | | | | | | | | | | | | | | | |
Total from investment operations | | | | 4.61 | | | | | (0.82 | ) | | | | 3.75 | | | | | 5.31 | | | | | 6.43 | | | | | 0.62 | |
| | | | | | | | | | | | | | | | | | | | | | | | | | | | | | |
Distributions to shareholders from: | | | | | | | | | | | | | | | | | | | | | | | | | | | | | | |
Net investment income | | | | (1.16 | ) | | | | - | | | | | (1.01 | ) | | | | (1.05 | ) | | | | (0.74 | ) | | | | (0.76 | ) |
Net realized gains | | | | - | | | | | - | | | | | - | | | | | - | | | | | - | | | | | (0.03 | ) |
| | | | | | | | | | | | | | | | | | | | | | | | | | | | | | |
Total distributions | | | | (1.16 | ) | | | | - | | | | | (1.01 | ) | | | | (1.05 | ) | | | | (0.74 | ) | | | | (0.79 | ) |
| | | | | | | | | | | | | | | | | | | | | | | | | | | | | | |
Net asset value at end of period | | | $ | 56.06 | | | | $ | 52.61 | | | | $ | 53.43 | | | | $ | 50.69 | | | | $ | 46.43 | | | | $ | 40.74 | |
| | | | | | | | | | | | | | | | | | | | | | | | | | | | | | |
Market price at end of period | | | $ | 56.16 | (b) | | | $ | 52.62 | (b) | | | $ | 53.41 | (b) | | | | | | | | | | | | | | | |
| | | | | | | | | | | | | | | | | | | | | | | | | | | | | | |
Net Asset Value Total Return(c) | | | | 9.09 | % | | | | (1.54 | )% | | | | 7.51 | % | | | | 11.49 | % | | | | 15.96 | % | | | | 1.55 | % |
Market Price Total Return(c) | | | | 9.26 | % | | | | (1.47 | )% | | | | 7.41 | % | | | | 11.46 | % | | | | 15.98 | % | | | | 1.61 | % |
Ratios/Supplemental Data: | | | | | | | | | | | | | | | | | | | | | | | | | | | | | | |
Net assets at end of period (000’s omitted) | | | $ | 782,083 | | | | $ | 918,178 | | | | $ | 956,549 | | | | $ | 917,494 | | | | $ | 689,504 | | | | $ | 366,679 | |
Ratio to average net assets of: | | | | | | | | | | | | | | | | | | | | | | | | | | | | | | |
Expenses, after Waivers | | | | 0.39 | % | | | | 0.39 | %(d) | | | | 0.39 | % | | | | 0.39 | % | | | | 0.42 | % | | | | 0.49 | % |
Expenses, prior to Waivers | | | | 0.39 | % | | | | 0.39 | %(d) | | | | 0.39 | % | | | | 0.41 | % | | | | 0.52 | % | | | | 0.62 | % |
Net investment income | | | | 2.01 | % | | | | 2.26 | %(d) | | | | 1.99 | % | | | | 1.81 | % | | | | 1.89 | % | | | | 1.92 | % |
Portfolio turnover rate(e) | | | | 14 | % | | | | 0 | %(f) | | | | 19 | % | | | | 15 | % | | | | 15 | % | | | | 14 | % |
| (a) | Based on average shares outstanding. |
| (b) | The mean between the last bid and ask prices. |
| (c) | Net asset value total return is calculated assuming an initial investment made at the net asset value at the beginning of the period, reinvestment of all dividends and distributions at net asset value during the period, and redemption at net asset value on the last day of the period. Net asset value total return includes adjustments in accordance with accounting principles generally accepted in the United States of America and as such, the net asset value for financial reporting purposes and the returns based upon those net asset values may differ from the net asset value and returns for shareholder transactions. Market price total return is calculated assuming an initial investment made at the market price at the beginning of the period, reinvestment of all dividends and distributions at market price during the period, and sale at the market price on the last day of the period. Total investment returns calculated for a period of less than one year are not annualized. |
| (d) | Ratios are annualized except for non-recurring costs associated with a proxy statement of less than 0.005%. |
| (e) | Portfolio turnover rate is not annualized and excludes the value of portfolio securities received or delivered as a result of in-kind creations or redemptions of the Fund’s capital shares. |
| (f) | Amount represents less than 0.5%. |
See accompanying Notes to Financial Statements which are an integral part of the financial statements.
Financial Highlights–(continued)
Invesco S&P MidCap 400 Revenue ETF (RWK)
| | | | | | | | | | | | | | | | | | | | | | | | | | | | | | |
| | | Year Ended August 31, | | Two Months Ended August 31, | | Years Ended June 30, |
| | | 2020 | | 2019 | | 2019 | | 2018 | | 2017 | | 2016 |
Per Share Operating Performance: | | | | | | | | | | | | | | | | | | | | | | | | | | | | | | |
Net asset value at beginning of period | | | $ | 56.44 | | | | $ | 61.01 | | | | $ | 61.05 | | | | $ | 56.31 | | | | $ | 47.74 | | | | $ | 49.39 | |
| | | | | | | | | | | | | | | | | | | | | | | | | | | | | | |
Net investment income(a) | | | | 0.74 | | | | | 0.10 | | | | | 0.65 | | | | | 0.63 | | | | | 0.56 | | | | | 0.44 | |
Net realized and unrealized gain (loss) on investments | | | | 0.21 | | | | | (4.67 | ) | | | | (0.06 | ) | | | | 4.70 | | | | | 8.68 | | | | | (1.63 | ) |
| | | | | | | | | | | | | | | | | | | | | | | | | | | | | | |
Total from investment operations | | | | 0.95 | | | | | (4.57 | ) | | | | 0.59 | | | | | 5.33 | | | | | 9.24 | | | | | (1.19 | ) |
| | | | | | | | | | | | | | | | | | | | | | | | | | | | | | |
Distributions to shareholders from: | | | | | | | | | | | | | | | | | | | | | | | | | | | | | | |
Net investment income | | | | (0.83 | ) | | | | - | | | | | (0.63 | ) | | | | (0.59 | ) | | | | (0.67 | ) | | | | (0.46 | ) |
| | | | | | | | | | | | | | | | | | | | | | | | | | | | | | |
Net asset value at end of period | | | $ | 56.56 | | | | $ | 56.44 | | | | $ | 61.01 | | | | $ | 61.05 | | | | $ | 56.31 | | | | $ | 47.74 | |
| | | | | | | | | | | | | | | | | | | | | | | | | | | | | | |
Market price at end of period | | | $ | 56.62 | (b) | | | $ | 56.42 | (b) | | | $ | 60.91 | (b) | | | | | | | | | | | | | | | |
| | | | | | | | | | | | | | | | | | | | | | | | | | | | | | |
Net Asset Value Total Return(c) | | | | 1.89 | % | | | | (7.49 | )% | | | | 1.05 | % | | | | 9.48 | % | | | | 19.46 | % | | | | (2.39 | )% |
Market Price Total Return(c) | | | | 2.03 | % | | | | (7.37 | )% | | | | 0.90 | % | | | | 9.40 | % | | | | 19.45 | % | | | | (2.38 | )% |
Ratios/Supplemental Data: | | | | | | | | | | | | | | | | | | | | | | | | | | | | | | |
Net assets at end of period (000’s omitted) | | | $ | 209,365 | | | | $ | 327,418 | | | | $ | 356,996 | | | | $ | 378,611 | | | | $ | 329,502 | | | | $ | 186,252 | |
Ratio to average net assets of: | | | | | | | | | | | | | | | | | | | | | | | | | | | | | | |
Expenses, after Waivers | | | | 0.39 | % | | | | 0.39 | %(d) | | | | 0.39 | % | | | | 0.39 | % | | | | 0.43 | % | | | | 0.54 | % |
Expenses, prior to Waivers | | | | 0.39 | % | | | | 0.39 | %(d) | | | | 0.39 | % | | | | 0.42 | % | | | | 0.56 | % | | | | 0.72 | % |
Net investment income | | | | 1.30 | % | | | | 1.06 | %(d) | | | | 1.09 | % | | | | 1.08 | % | | | | 1.05 | % | | | | 0.94 | % |
Portfolio turnover rate(e) | | | | 33 | % | | | | 0 | %(f) | | | | 33 | % | | | | 34 | % | | | | 46 | % | | | | 22 | % |
| (a) | Based on average shares outstanding. |
| (b) | The mean between the last bid and ask prices. |
| (c) | Net asset value total return is calculated assuming an initial investment made at the net asset value at the beginning of the period, reinvestment of all dividends and distributions at net asset value during the period, and redemption at net asset value on the last day of the period. Net asset value total return includes adjustments in accordance with accounting principles generally accepted in the United States of America and as such, the net asset value for financial reporting purposes and the returns based upon those net asset values may differ from the net asset value and returns for shareholder transactions. Market price total return is calculated assuming an initial investment made at the market price at the beginning of the period, reinvestment of all dividends and distributions at market price during the period, and sale at the market price on the last day of the period. Total investment returns calculated for a period of less than one year are not annualized. |
| (d) | Ratios are annualized except for non-recurring costs associated with a proxy statement of less than 0.005%. |
| (e) | Portfolio turnover rate is not annualized and excludes the value of portfolio securities received or delivered as a result of in-kind creations or redemptions of the Fund’s capital shares. |
| (f) | Amount represents less than 0.5%. |
See accompanying Notes to Financial Statements which are an integral part of the financial statements.
Financial Highlights–(continued)
Invesco S&P SmallCap 600 Revenue ETF (RWJ)
| | | | | | | | | | | | | | | | | | | | | | | | | | | | | | |
| | | Year Ended August 31, | | Two Months Ended August 31, | | Years Ended June 30, |
| | | 2020 | | 2019 | | 2019 | | 2018 | | 2017 | | 2016 |
Per Share Operating Performance: | | | | | | | | | | | | | | | | | | | | | | | | | | | | | | |
Net asset value at beginning of period | | | $ | 58.71 | | | | $ | 63.30 | | | | $ | 73.21 | | | | $ | 66.03 | | | | $ | 55.06 | | | | $ | 58.05 | |
| | | | | | | | | | | | | | | | | | | | | | | | | | | | | | |
Net investment income(a) | | | | 0.89 | | | | | 0.11 | | | | | 0.79 | | | | | 0.69 | | | | | 0.55 | | | | | 0.36 | |
Net realized and unrealized gain (loss) on investments | | | | 4.58 | | | | | (4.70 | ) | | | | (9.90 | ) | | | | 7.24 | | | | | 10.85 | | | | | (2.97 | ) |
| | | | | | | | | | | | | | | | | | | | | | | | | | | | | | |
Total from investment operations | | | | 5.47 | | | | | (4.59 | ) | | | | (9.11 | ) | | | | 7.93 | | | | | 11.40 | | | | | (2.61 | ) |
| | | | | | | | | | | | | | | | | | | | | | | | | | | | | | |
Distributions to shareholders from: | | | | | | | | | | | | | | | | | | | | | | | | | | | | | | |
Net investment income | | | | (1.03 | ) | | | | - | | | | | (0.80 | ) | | | | (0.75 | ) | | | | (0.43 | ) | | | | (0.38 | ) |
| | | | | | | | | | | | | | | | | | | | | | | | | | | | | | |
Net asset value at end of period | | | $ | 63.15 | | | | $ | 58.71 | | | | $ | 63.30 | | | | $ | 73.21 | | | | $ | 66.03 | | | | $ | 55.06 | |
| | | | | | | | | | | | | | | | | | | | | | | | | | | | | | |
Market price at end of period | | | $ | 63.17 | (b) | | | $ | 58.69 | (b) | | | $ | 63.23 | (b) | | | | | | | | | | | | | | | |
| | | | | | | | | | | | | | | | | | | | | | | | | | | | | | |
Net Asset Value Total Return(c) | | | | 9.63 | % | | | | (7.25 | )% | | | | (12.45 | )% | | | | 12.07 | %(d) | | | | 20.75 | % | | | | (4.46 | )% |
Market Price Total Return(c) | | | | 9.70 | % | | | | (7.18 | )% | | | | (12.57 | )% | | | | 12.10 | %(d) | | | | 20.76 | % | | | | (4.51 | )% |
Ratios/Supplemental Data: | | | | | | | | | | | | | | | | | | | | | | | | | | | | | | |
Net assets at end of period (000’s omitted) | | | $ | 227,425 | | | | $ | 349,395 | | | | $ | 405,199 | | | | $ | 508,897 | | | | $ | 554,751 | | | | $ | 297,421 | |
Ratio to average net assets of: | | | | | | | | | | | | | | | | | | | | | | | | | | | | | | |
Expenses, after Waivers | | | | 0.39 | % | | | | 0.39 | %(e) | | | | 0.39 | % | | | | 0.39 | % | | | | 0.43 | % | | | | 0.54 | % |
Expenses, prior to Waivers | | | | 0.39 | % | | | | 0.39 | %(e) | | | | 0.39 | % | | | | 0.42 | % | | | | 0.54 | % | | | | 0.68 | % |
Net investment income | | | | 1.50 | % | | | | 1.10 | %(e) | | | | 1.15 | % | | | | 1.01 | % | | | | 0.86 | % | | | | 0.68 | % |
Portfolio turnover rate(f) | | | | 49 | % | | | | 1 | % | | | | 39 | % | | | | 38 | % | | | | 46 | % | | | | 44 | % |
| (a) | Based on average shares outstanding. |
| (b) | The mean between the last bid and ask prices. |
| (c) | Net asset value total return is calculated assuming an initial investment made at the net asset value at the beginning of the period, reinvestment of all dividends and distributions at net asset value during the period, and redemption at net asset value on the last day of the period. Net asset value total return includes adjustments in accordance with accounting principles generally accepted in the United States of America and as such, the net asset value for financial reporting purposes and the returns based upon those net asset values may differ from the net asset value and returns for shareholder transactions. Market price total return is calculated assuming an initial investment made at the market price at the beginning of the period, reinvestment of all dividends and distributions at market price during the period, and sale at the market price on the last day of the period. Total investment returns calculated for a period of less than one year are not annualized. |
| (d) | Total Return at Net Asset Value and Total Return at Market Value include payments by affiliate, without which Total Return at Net Asset Value and Total Return at Market Value would have been lower. Such payments positively impacted Total Return at Net Asset Value by 0.10% and Total Return at Market Value by 0.09%. |
| (e) | Ratios are annualized except for non-recurring costs associated with a proxy statement of less than 0.005%. |
| (f) | Portfolio turnover rate is not annualized and excludes the value of portfolio securities received or delivered as a result of in-kind creations or redemptions of the Fund’s capital shares. |
See accompanying Notes to Financial Statements which are an integral part of the financial statements.
Financial Highlights–(continued)
Invesco S&P Ultra Dividend Revenue ETF (RDIV)
| | | | | | | | | | | | | | | | | | | | | | | | | | | | | | |
| | | Year Ended August 31, | | Two Months Ended August 31, | | Years Ended June 30, |
| | | 2020 | | 2019 | | 2019 | | 2018 | | 2017 | | 2016 |
Per Share Operating Performance: | | | | | | | | | | | | | | | | | | | | | | | | | | | | | | |
Net asset value at beginning of period | | | $ | 35.65 | | | | $ | 37.65 | | | | $ | 38.19 | | | | $ | 33.82 | | | | $ | 31.52 | | | | $ | 28.81 | |
| | | | | | | | | | | | | | | | | | | | | | | | | | | | | | |
Net investment income(a) | | | | 1.62 | | | | | 0.21 | | | | | 1.46 | | | | | 1.73 | | | | | 1.50 | | | | | 1.21 | |
Net realized and unrealized gain (loss) on investments | | | | (7.33 | ) | | | | (2.21 | ) | | | | (0.66 | ) | | | | 4.56 | | | | | 1.96 | | | | | 2.66 | |
| | | | | | | | | | | | | | | | | | | | | | | | | | | | | | |
Total from investment operations | | | | (5.71 | ) | | | | (2.00 | ) | | | | 0.80 | | | | | 6.29 | | | | | 3.46 | | | | | 3.87 | |
| | | | | | | | | | | | | | | | | | | | | | | | | | | | | | |
Distributions to shareholders from: | | | | | | | | | | | | | | | | | | | | | | | | | | | | | | |
Net investment income | | | | (1.36 | ) | | | | - | | | | | (1.34 | ) | | | | (1.92 | ) | | | | (1.14 | ) | | | | (1.16 | ) |
Net realized gains | | | | - | | | | | - | | | | | - | | | | | - | | | | | (0.02 | ) | | | | - | |
| | | | | | | | | | | | | | | | | | | | | | | | | | | | | | |
Total distributions | | | | (1.36 | ) | | | | - | | | | | (1.34 | ) | | | | (1.92 | ) | | | | (1.16 | ) | | | | (1.16 | ) |
| | | | | | | | | | | | | | | | | | | | | | | | | | | | | | |
Net asset value at end of period | | | $ | 28.58 | | | | $ | 35.65 | | | | $ | 37.65 | | | | $ | 38.19 | | | | $ | 33.82 | | | | $ | 31.52 | |
| | | | | | | | | | | | | | | | | | | | | | | | | | | | | | |
Market price at end of period | | | $ | 28.63 | (b) | | | $ | 35.67 | (b) | | | $ | 37.67 | (b) | | | | | | | | | | | | | | | |
| | | | | | | | | | | | | | | | | | | | | | | | | | | | | | |
Net Asset Value Total Return(c) | | | | (16.26 | )% | | | | (5.31 | )% | | | | 2.26 | % | | | | 19.13 | % | | | | 11.10 | % | | | | 13.91 | % |
Market Price Total Return(c) | | | | (16.17 | )% | | | | (5.31 | )% | | | | 2.26 | % | | | | 19.12 | % | | | | 11.18 | % | | | | 13.90 | % |
Ratios/Supplemental Data: | | | | | | | | | | | | | | | | | | | | | | | | | | | | | | |
Net assets at end of period (000’s omitted) | | | $ | 604,502 | | | | $ | 1,572,300 | | | | $ | 1,782,599 | | | | $ | 610,987 | | | | $ | 510,630 | | | | $ | 110,330 | |
Ratio to average net assets of: | | | | | | | | | | | | | | | | | | | | | | | | | | | | | | |
Expenses, after Waivers | | | | 0.39 | % | | | | 0.39 | %(d) | | | | 0.39 | % | | | | 0.39 | % | | | | 0.41 | % | | | | 0.49 | % |
Expenses, prior to Waivers | | | | 0.39 | % | | | | 0.39 | %(d) | | | | 0.39 | % | | | | 0.41 | % | | | | 0.52 | % | | | | 0.75 | % |
Net investment income | | | | 4.77 | % | | | | 3.36 | %(d) | | | | 3.93 | % | | | | 4.90 | % | | | | 4.48 | % | | | | 4.19 | % |
Portfolio turnover rate(e) | | | | 98 | % | | | | 12 | % | | | | 122 | % | | | | 74 | % | | | | 81 | % | | | | 208 | % |
| (a) | Based on average shares outstanding. |
| (b) | The mean between the last bid and ask prices. |
| (c) | Net asset value total return is calculated assuming an initial investment made at the net asset value at the beginning of the period, reinvestment of all dividends and distributions at net asset value during the period, and redemption at net asset value on the last day of the period. Net asset value total return includes adjustments in accordance with accounting principles generally accepted in the United States of America and as such, the net asset value for financial reporting purposes and the returns based upon those net asset values may differ from the net asset value and returns for shareholder transactions. Market price total return is calculated assuming an initial investment made at the market price at the beginning of the period, reinvestment of all dividends and distributions at market price during the period, and sale at the market price on the last day of the period. Total investment returns calculated for a period of less than one year are not annualized. |
| (d) | Ratios are annualized except for non-recurring costs associated with a proxy statement of less than 0.005%. |
| (e) | Portfolio turnover rate is not annualized and excludes the value of portfolio securities received or delivered as a result of in-kind creations or redemptions of the Fund’s capital shares. |
See accompanying Notes to Financial Statements which are an integral part of the financial statements.
Notes to Financial Statements
Invesco Exchange-Traded Fund Trust II
August 31, 2020
NOTE 1–Organization
Invesco Exchange-Traded Fund Trust II (the “Trust”) was organized as a Massachusetts business trust on October 10, 2006 and is authorized to have multiple series of portfolios. The Trust is an open-end management investment company registered under the Investment Company Act of 1940, as amended (the “1940 Act”). This report includes the following portfolios:
| | |
| Full Name | | Short Name |
| Invesco S&P 500 Revenue ETF (RWL) | | “S&P 500 Revenue ETF” |
| Invesco S&P MidCap 400 Revenue ETF (RWK) | | “S&P MidCap 400 Revenue ETF” |
| Invesco S&P SmallCap 600 Revenue ETF (RWJ) | | “S&P SmallCap 600 Revenue ETF” |
| Invesco S&P Ultra Dividend Revenue ETF (RDIV) | | “S&P Ultra Dividend Revenue ETF” |
Each portfolio (each, a “Fund”, and collectively, the “Funds”) represents a separate series of the Trust. The shares of the Funds are referred to herein as “Shares” or “Fund’s Shares.” Each Fund’s Shares are listed and traded on NYSE Arca, Inc.
The market price of each Share may differ to some degree from a Fund’s net asset value (“NAV”). Unlike conventional mutual funds, each Fund issues and redeems Shares on a continuous basis, at NAV, only in a large specified number of Shares, each called a “Creation Unit.” Creation Units are issued and redeemed principally in exchange for the deposit or delivery of a basket of securities (“Deposit Securities”). Except when aggregated in Creation Units by Authorized Participants, the Shares are not individually redeemable securities of the Funds.
The investment objective of each Fund is to seek to track the investment results (before fees and expenses) of its respective index listed below (each, an “Underlying Index”):
| | |
| Fund | | Underlying Index |
| S&P 500 Revenue ETF | | S&P 500 Revenue-Weighted Index |
| S&P MidCap 400 Revenue ETF | | S&P MidCap 400 Revenue-Weighted Index |
| S&P SmallCap 600 Revenue ETF | | S&P SmallCap 600 Revenue-Weighted Index |
| S&P Ultra Dividend Revenue ETF | | S&P 900 Dividend Revenue-Weighted Index |
NOTE 2–Significant Accounting Policies
The following is a summary of the significant accounting policies followed by the Funds in preparation of their financial statements.
Each Fund is an investment company and accordingly follows the investment company accounting and reporting guidance in accordance with Financial Accounting Standards Board Accounting Standards Codification Topic 946, Financial Services–Investment Companies.
| A. | Security Valuation - Securities, including restricted securities, are valued according to the following policies: |
A security listed or traded on an exchange (except convertible securities) is generally valued at its last sales price or official closing price as of the close of the customary trading session on the exchange where the security is principally traded or, lacking any sales or official closing price on a particular day, the security may be valued at the closing bid price on that day. Securities traded in the over-the-counter market are valued based on prices furnished by independent pricing services or market makers. When such securities are valued by an independent pricing service they may be considered fair valued. Futures contracts are valued at the final settlement price set by an exchange on which they are principally traded. Listed options are valued at the mean between the last bid and asked prices from the exchange on which they are principally traded, or at the final settlement price set by such exchange. Swaps and options not listed on an exchange are valued by an independent source. For purposes of determining NAV per Share, futures and option contracts generally are valued 15 minutes after the close of the customary trading session of the New York Stock Exchange (“NYSE”).
Investment companies are valued using such company’s NAV per share, unless the shares are exchange-traded, in which case they are valued at the last sales price or official closing price as of the close of the customary trading session on the exchange where the security is principally traded.
Debt obligations (including convertible securities) and unlisted equities are fair valued using an evaluated quote provided by an independent pricing service. Evaluated quotes provided by the pricing service may be determined without exclusive reliance on quoted prices, and may reflect appropriate factors such as institution-size trading in similar groups of securities, developments related to specific securities, dividend rate (for unlisted equities), yield (for debt obligations), quality, type of issue, coupon rate (for debt obligations), maturity (for debt obligations), individual trading characteristics and other market data. Securities with a demand feature exercisable within one to seven days are valued at par. Pricing services generally value
debt obligations assuming orderly transactions of institutional round lot size, but a Fund may hold or transact in the same securities in smaller, odd lot sizes. Odd lots often trade at lower prices than institutional round lots. Debt obligations are subject to interest rate and credit risks. In addition, all debt obligations involve some risk of default with respect to interest and/or principal payments.
Foreign securities’ (including foreign exchange contracts’) prices are converted into U.S. dollar amounts using the applicable exchange rates as of the close of the London world markets. If market quotations are available and reliable for foreign exchange-traded equity securities, the securities will be valued at the market quotations. Because trading hours for certain foreign securities end before the close of the NYSE, closing market quotations may become unreliable. If between the time trading ends on a particular security and the close of the customary trading session on the NYSE, events occur that Invesco Capital Management LLC (the “Adviser”) determines are significant and make the closing price unreliable, a Fund may fair value the security. If the event is likely to have affected the closing price of the security, the security will be valued at fair value in good faith using procedures approved by the Board of Trustees. Adjustments to closing prices to reflect fair value may also be based on a screening process of an independent pricing service to indicate the degree of certainty, based on historical data, that the closing price in the principal market where a foreign security trades is not the current value as of the close of the NYSE. Foreign securities’ prices meeting the approved degree of certainty that the price is not reflective of current value will be priced at the indication of fair value from the independent pricing service. Multiple factors may be considered by the independent pricing service in determining adjustments to reflect fair value and may include information relating to sector indices, American Depositary Receipts and domestic and foreign index futures. Foreign securities may have additional risks including exchange rate changes, the potential for sharply devalued currencies and high inflation, political and economic upheaval, the relative lack of issuer information, relatively low market liquidity and the potential lack of strict financial and accounting controls and standards.
Securities for which market prices are not provided by any of the above methods may be valued based upon quotes furnished by independent sources. The last bid price may be used to value exchange-traded equity securities. The mean between the last bid and asked prices may be used to value debt obligations, including corporate loans, and unlisted equity securities.
Securities for which market quotations are not readily available or became unreliable are valued at fair value as determined in good faith following procedures approved by the Board of Trustees. Issuer-specific events, market trends, bid/asked quotes of brokers and information providers and other market data may be reviewed in the course of making a good faith determination of a security’s fair value.
Each Fund may invest in securities that are subject to interest rate risk, meaning the risk that the prices will generally fall as interest rates rise and, conversely, the prices will generally rise as interest rates fall. Specific securities differ in their sensitivity to changes in interest rates depending on their individual characteristics. Changes in interest rates may result in increased market volatility, which may affect the value and/or liquidity of certain Fund investments.
Valuations change in response to many factors, including the historical and prospective earnings of the issuer, the value of the issuer’s assets, general market conditions which are not specifically related to the particular issuer, such as real or perceived adverse economic conditions, changes in the general outlook for revenues or corporate earnings, changes in interest or currency rates, regional or global instability, natural or environmental disasters, widespread disease or other public health issues, war, acts of terrorism or adverse investor sentiment generally and market liquidity. Because of the inherent uncertainties of valuation, the values reflected in the financial statements may materially differ from the value received upon actual sale of those investments.
Authorized Participant Concentration Risk. Only authorized participants (“APs”) may engage in creation or redemption transactions directly with each Fund. Each Fund has a limited number of institutions that may act as APs, and such APs have no obligation to submit creation or redemption orders. Consequently, there is no assurance that APs will establish or maintain an active trading market for the Shares. This risk may be heightened to the extent that securities held by each Fund are traded outside a collateralized settlement system. In that case, APs may be required to post collateral on certain trades on an agency basis (i.e., on behalf of other market participants), which only a limited number of APs may be able to do. In addition, to the extent that APs exit the business or are unable to proceed with creation and/or redemption orders with respect to each Fund and no other AP is able to step forward to create or redeem Creation Units, this may result in a significantly diminished trading market for Fund Shares, and Shares may be more likely to trade at a premium or discount to a Fund’s NAV and to face trading halts and/or delisting. Investments in non-U.S. securities, which may have lower trading volumes, may increase this risk.
Equity Risk. Equity risk is the risk that the value of equity securities, including common stocks, may fall due to both changes in general economic conditions that impact the market as a whole, as well as factors that directly relate to a specific company or its industry. Such general economic conditions include changes in interest rates, periods of market turbulence or instability, or general and prolonged periods of economic decline and cyclical change. It is possible that a drop in the stock market may depress the price of most or all of the common stocks that each Fund holds. In addition, equity risk includes the risk that investor sentiment toward one or more industries will become negative, resulting in those investors exiting their investments in those industries, which could cause a reduction in the value of companies in those industries more broadly. The value of a
company’s common stock may fall solely because of factors, such as an increase in production costs that negatively impact other companies in the same region, industry or sector of the market. A company’s common stock also may decline significantly in price over a short period of time due to factors specific to that company, including decisions made by its management or lower demand for the company’s products or services. For example, an adverse event, such as an unfavorable earnings report or the failure to make anticipated dividend payments, may depress the value of common stock.
Index Risk. Unlike many investment companies, each Fund does not utilize an investing strategy that seeks returns in excess of its Underlying Index. Therefore, a Fund would not necessarily buy or sell a security unless that security is added or removed, respectively, from its Underlying Index, even if that security generally is underperforming. Additionally, each Fund rebalances its portfolio in accordance with its Underlying Index, and, therefore, any changes to the Underlying Index’s rebalance schedule will result in corresponding changes to each Fund’s rebalance schedule.
Industry Concentration Risk. In following its methodology, each Fund’s Underlying Index from time to time may be concentrated to a significant degree in securities of issuers located in a single industry or industry group. To the extent that each Underlying Index concentrates in the securities of issuers in a particular industry or industry group, the corresponding Fund will also concentrate its investments to approximately the same extent. By concentrating its investments in an industry or industry group, each Fund may face more risks than if it were diversified broadly over numerous industries or industry groups. Such industry-based risks, any of which may adversely affect the companies in which each Fund invests, may include, but are not limited to, the following: general economic conditions or cyclical market patterns that could negatively affect supply and demand in a particular industry; competition for resources, adverse labor relations, political or world events; obsolescence of technologies; and increased competition or new product introductions that may affect the profitability or viability of companies in an industry. In addition, at times, such industry or industry group may be out of favor and underperform other industries or the market as a whole.
Market Risk. Securities in the Underlying Index are subject to market fluctuations. You should anticipate that the value of the Shares will decline, more or less, in correlation with any decline in value of the securities in the Underlying Index. Additionally, natural or environmental disasters, widespread disease or other public health issues, war, acts of terrorism or other events could result in increased premiums or discounts to each Fund’s NAV.
Non-Correlation Risk. Each Fund’s return may not match the return of its corresponding Underlying Index for a number of reasons. For example, each Fund incurs operating expenses not applicable to the Underlying Index, and incurs costs in buying and selling securities, especially when rebalancing the Fund’s securities holdings to reflect changes in the composition of its corresponding Underlying Index. In addition, the performance of each Fund and its corresponding Underlying Index may vary due to asset valuation differences and differences between each Fund’s portfolio and its corresponding Underlying Index resulting from legal restrictions, costs or liquidity constraints.
Non-Diversified Fund Risk. Because each Fund is non-diversified and can invest a greater portion of its assets in securities of individual issuers than a diversified fund, changes in the market value of a single investment could cause greater fluctuations in Share price than would occur in a diversified fund. This may increase a Fund’s volatility and cause the performance of a relatively small number of issuers to have a greater impact on a Fund’s performance.
Portfolio Turnover Risk. Certain Funds may engage in frequent trading of its portfolio securities in connection with the rebalancing or adjustment of its Underlying Index. A portfolio turnover rate of 200%, for example, is equivalent to a Fund buying and selling all of its securities two times during the course of a year. A high portfolio turnover rate (such as 100% or more) could result in high brokerage costs for a Fund. While a high portfolio turnover rate can result in an increase in taxable capital gains distributions to a Fund’s shareholders, a Fund will seek to utilize the in-kind creation and redemption mechanism to minimize realization of capital gains to the extent possible.
Small-and Mid-Capitalization Company Risk. Investing in securities of small- and mid-capitalization companies involves greater risk than customarily is associated with investing in larger, more established companies. These companies’ securities may be more volatile and less liquid than those of more established companies. These securities may have returns that vary, sometimes significantly, from the overall securities market. Often small- and mid-capitalization companies and the industries in which they focus are still evolving and, as a result, they may be more sensitive to changing market conditions.
| C. | Investment Transactions and Investment Income - Investment transactions are accounted for on a trade date basis. Realized gains and losses from the sale or disposition of securities are computed on the specific identified cost basis. Interest income is recorded on an accrual basis from settlement date. Pay-in-kind interest income and non-cash dividend income received in the form of securities in-lieu of cash are recorded at the fair value of the securities received. Dividend income (net of withholding tax, if any) is recorded on the ex-dividend date. Realized gains, dividends and interest received by a Fund may give rise to withholding and other taxes imposed by foreign countries. Tax conventions between certain countries and the United States may reduce or eliminate such taxes. |
The Funds may periodically participate in litigation related to each Fund’s investments. As such, the Funds may receive proceeds from litigation settlements. Any proceeds received are included in the Statements of Operations as realized gain (loss) for investments no longer held and as unrealized gain (loss) for investments still held.
Brokerage commissions and mark ups are considered transaction costs and are recorded as an increase to the cost basis of securities purchased and/or a reduction of proceeds on a sale of securities. Such transaction costs are included in the determination of net realized and unrealized gain (loss) from investment securities reported in the Statements of Operations
and the Statements of Changes in Net Assets and the net realized and unrealized gains (losses) on securities per share in the Financial Highlights. Transaction costs are included in the calculation of each Fund’s NAV and, accordingly, they reduce each Fund’s total returns. These transaction costs are not considered operating expenses and are not reflected in net investment income reported in the Statements of Operations and the Statements of Changes in Net Assets, or the net investment income per share and the ratios of expenses and net investment income reported in the Financial Highlights, nor are they limited by any expense limitation arrangements between each Fund and the Adviser.
| D. | Country Determination - For the purposes of presentation in the Schedules of Investments, the Adviser may determine the country in which an issuer is located and/or credit risk exposure based on various factors. These factors include whether each Fund’s Underlying Index has made a country determination and may include the laws of the country under which the issuer is organized, where the issuer maintains a principal office, the country in which the issuer derives 50% or more of its total revenues and the country that has the primary market for the issuer’s securities, as well as other criteria. Among the other criteria that may be evaluated for making this determination are the country in which the issuer maintains 50% or more of its assets, the type of security, financial guarantees and enhancements, the nature of the collateral and the sponsor organization. Country of issuer and/or credit risk exposure has been determined to be the United States of America, unless otherwise noted. |
| E. | Dividends and Distributions to Shareholders - Each Fund declares and pays dividends from net investment income, if any, to its shareholders quarterly and records such dividends on the ex-dividend date. Generally, each Fund distributes net realized taxable capital gains, if any, annually in cash and records them on the ex-dividend date. Such distributions on a tax basis are determined in conformity with federal income tax regulations, which may differ from accounting principles generally accepted in the United States of America (“GAAP”). Distributions in excess of tax basis earnings and profits, if any, are reported in such Fund’s financial statements as a tax return of capital at fiscal year-end. |
| F. | Federal Income Taxes - Each Fund intends to comply with the provisions of the Internal Revenue Code of 1986, as amended (the “Internal Revenue Code”), applicable to regulated investment companies and to distribute substantially all of the Fund’s taxable earnings to its shareholders. As such, the Funds will not be subject to federal income taxes on otherwise taxable income (including net realized gains) that is distributed to the shareholders. Therefore, no provision for federal income taxes is recorded in the financial statements. |
Each Fund recognizes the tax benefits of uncertain tax positions only when the position is more likely than not to be sustained. Management has analyzed each Fund’s uncertain tax positions and concluded that no liability for unrecognized tax benefits should be recorded related to uncertain tax positions. Management is not aware of any tax positions for which it is reasonably possible that the total amounts of unrecognized tax benefits will change materially in the next 12 months.
Income and capital gain distributions are determined in accordance with federal income tax regulations, which may differ from GAAP. These differences are primarily due to differing book and tax treatments for in-kind transactions, losses deferred due to wash sales, and passive foreign investment company adjustments, if any.
The Funds file U.S. federal tax returns and tax returns in certain other jurisdictions. Generally, a Fund is subject to examinations by such taxing authorities for up to three years after the filing of the return for the tax period.
| G. | Expenses - Expenses of the Trust that are excluded from a Fund’s unitary management fee and are directly identifiable to a specific Fund are applied to that Fund. Expenses of the Trust that are excluded from a Fund’s unitary management fee and are not readily identifiable to a specific Fund are allocated in such a manner as deemed equitable, taking into consideration the nature and type of expense and the relative net assets of each Fund. |
Each Fund has agreed to pay an annual unitary management fee to the Adviser. Out of the unitary management fee, the Adviser has agreed to pay for substantially all expenses of the Funds, including the costs of transfer agency, custody, fund administration, legal, audit and other services, except for advisory fees, distribution fees, if any, brokerage expenses, taxes, interest, litigation expenses, acquired fund fees and expenses, if any, and other extraordinary expenses.
To the extent a Fund invests in other investment companies, the expenses shown in the accompanying financial statements reflect the expenses of the Fund and do not include any expenses of the investment companies in which it invests. The effects of such investment companies’ expenses are included in the realized and unrealized gain or loss on the investments in the investment companies.
| H. | Accounting Estimates - The preparation of the financial statements in accordance with GAAP requires management to make estimates and assumptions that affect the reported amounts and disclosures in the financial statements, including estimates and assumptions related to taxation. Actual results could differ from these estimates. In addition, the Funds monitor for material events or transactions that may occur or become known after the period-end date and before the date the financial statements are released to print. |
| I. | Indemnifications - Under the Trust’s organizational documents, its Officers and Trustees are indemnified against certain liabilities arising out of the performance of their duties to the Trust. Each Board member who is not an “interested person” (as defined in the 1940 Act) of the Trust (each, an “Independent Trustee”) is also indemnified against certain liabilities arising out of the performance of their duties to the Trust pursuant to an Indemnification Agreement between such trustee and the Trust. Additionally, in the normal course of business, the Trust enters into contracts with service providers that contain general indemnification clauses. The Trust’s maximum exposure under these arrangements is unknown, as this would involve future claims that may be made against the Trust that have not yet occurred. However, based on experience, the Trust believes the risk of loss to be remote. |
| J. | Securities Lending - Each Fund may participate in securities lending and may loan portfolio securities having a market value up to one-third of the Fund’s total assets. Such loans are secured by cash collateral equal to no less than 102% (105% for international securities) of the market value of the loaned securities determined daily by the securities lending provider. Cash collateral received in connection with these loans is generally invested in an affiliated money market fund and is shown as such on the Schedules of Investments. Each Fund bears the risk of loss with respect to the investment of collateral. It is the policy of these Funds to obtain additional collateral from or return excess collateral to the borrower by the end of the next business day, following the valuation date of the securities loaned. Therefore, the value of the collateral held may be temporarily less than the value of the securities on loan. When loaning securities, each Fund retains certain benefits of owning the securities, including the economic equivalent of dividends or interest generated by the security. Lending securities entails a risk of loss to each Fund if, and to the extent that, the market value of the securities loaned were to increase, and the borrower did not increase the collateral accordingly, and the borrower failed to return the securities. The securities loaned are subject to termination at the option of the borrower or each Fund. Upon termination, the borrower will return to each Fund the securities loaned and each Fund will return the collateral. Upon the failure of the borrower to return the securities, collateral may be liquidated and the securities may be purchased on the open market to replace the loaned securities. Each Fund could experience delays and costs in gaining access to the collateral and the securities may lose value during the delay which could result in potential losses to each Fund. Some of these losses may be indemnified by the lending agent. Each Fund bears the risk of any deficiency in the amount of the collateral available for return to the borrower due to any loss on the collateral invested. For Funds that participated in securities lending, dividends received on cash collateral investments for securities lending transactions, which are net of compensation to counterparties, are included in Securities lending income on the Statements of Operations. The aggregate value of securities out on loan, if any, is shown on the Statements of Assets and Liabilities. |
| K. | Foreign Currency Translations - Foreign currency is valued at the close of the NYSE based on quotations posted by banks and major currency dealers. Portfolio securities and other assets and liabilities denominated in foreign currencies are translated into U.S. dollar amounts at the date of valuation. Purchases and sales of portfolio securities (net of foreign taxes withheld on disposition) and income items denominated in foreign currencies are translated into U.S. dollar amounts on the respective dates of such transactions. Each Fund does not separately account for the portion of the results of operations resulting from changes in foreign exchange rates on investments and the fluctuations arising from changes in market prices of securities held. The combined results of changes in foreign exchange rates and the fluctuation of market prices on investments (net of estimated foreign tax withholding) are included with the net realized and unrealized gain or loss from investments in the Statements of Operations. Reported net realized foreign currency gains or losses arise from (1) sales of foreign currencies, (2) currency gains or losses realized between the trade and settlement dates on securities transactions, and (3) the difference between the amounts of dividends, interest, and foreign withholding taxes recorded on each Fund’s books and the U.S. dollar equivalent of the amounts actually received or paid. Net unrealized foreign currency gains and losses arise from changes in the fair values of assets and liabilities, other than investments in securities at fiscal period-end, resulting from changes in exchange rates. |
Each Fund may invest in foreign securities, which may be subject to foreign taxes on income, gains on investments or currency repatriation, a portion of which may be recoverable. Foreign taxes, if any, are recorded based on the tax regulations and rates that exist in the foreign markets in which each Fund invests.
NOTE 3–Investment Advisory Agreement and Other Agreements
The Trust has entered into an Investment Advisory Agreement with the Adviser on behalf of each Fund, pursuant to which the Adviser has overall responsibility for the selection and ongoing monitoring of the Funds’ investments, managing the Funds’ business affairs and providing certain clerical, bookkeeping and other administrative services.
Pursuant to the Investment Advisory Agreement, each Fund accrues daily and pays monthly to the Adviser an annual unitary management fee. Out of the unitary management fee, the Adviser has agreed to pay for substantially all expenses of the Funds, including the cost of transfer agency, custody, fund administration, legal, audit and other services, except for advisory fees, distribution fees, if any, brokerage expenses, taxes, interest, litigation expenses, acquired fund fees and expenses, if any, and other extraordinary expenses. The unitary management fee is paid by each Fund to the Adviser at the following annual rates:
| | |
| | | Unitary Management Fees
(as a % of average daily net assets) |
S&P 500 Revenue ETF | | 0.39% |
S&P MidCap 400 Revenue ETF | | 0.39% |
S&P SmallCap 600 Revenue ETF | | 0.39% |
S&P Ultra Dividend Revenue ETF | | 0.39% |
The Adviser has agreed to waive a portion of each Fund’s unitary management fee to the extent necessary to prevent the operating expenses of each Fund (excluding distribution fees, if any, brokerage expenses, taxes, interest, litigation expenses,
acquired fund fees and expenses, if any, and other extraordinary expenses) from exceeding the Fund’s unitary management fee through at least May 24, 2021.
Further, through at least August 31, 2022, the Adviser has contractually agreed to waive a portion of each Fund’s management fee in an amount equal to 100% of the net advisory fees an affiliate of the Adviser receives that are attributable to the Fund’s investments of otherwise uninvested cash in money market funds managed by that affiliate (excluding investments of cash collateral from securities lending). There is no guarantee that the Adviser will extend the waiver of these fees past that date.
For the fiscal year ended August 31, 2020, the Adviser waived fees for each Fund in the following amounts:
| | | | |
S&P 500 Revenue ETF | | $ | 851 | |
S&P MidCap 400 Revenue ETF | | | 440 | |
S&P SmallCap 600 Revenue ETF | | | 313 | |
S&P Ultra Dividend Revenue ETF | | | 3,297 | |
The Trust has entered into a Distribution Agreement with Invesco Distributors, Inc. (the “Distributor”), which serves as the distributor of Creation Units for each Fund. The Distributor does not maintain a secondary market in the Shares. The Funds are not charged any fees pursuant to the Distribution Agreement. The Distributor is an affiliate of the Adviser.
The Adviser has entered into a licensing agreement for each Fund with S&P Dow Jones Indices LLC (the “Licensor”).
Each Underlying Index name trademark is owned by the Licensor. These trademarks have been licensed to the Adviser for use by the Funds. Each Fund is entitled to use its Underlying Index pursuant to the Trust’s sub-licensing agreement with the Adviser. The Funds are not sponsored, endorsed, sold or promoted by the Licensor, and the Licensor makes no representation regarding the advisability of investing in any of the Funds.
The Trust has entered into service agreements whereby The Bank of New York Mellon, a wholly-owned subsidiary of The Bank of New York Mellon Corporation, serves as the administrator, custodian, fund accountant and transfer agent for each Fund.
For fiscal year ended August 31, 2020, the following Funds incurred brokerage commissions with Invesco Capital Markets, Inc. (“ICMI”), an affiliate of the Adviser and Distributor, for portfolio transactions executed on behalf of the Fund, as listed below:
| | | | |
S&P 500 Revenue ETF | | $ | 20,618 | |
S&P MidCap 400 Revenue ETF | | | 10,739 | |
S&P SmallCap 600 Revenue ETF | | | 49,218 | |
S&P Ultra Dividend Revenue ETF | | | 29,370 | |
Portfolio transactions with ICMI that have not settled at period-end, if any, are shown in the Statements of Assets and Liabilities under the receivable caption Investments sold - affiliated broker and/or payable caption Investments purchased - affiliated broker.
NOTE 4–Security Transactions with Affiliated Funds
Each Fund is permitted to purchase or sell securities from or to certain other affiliated funds under specified conditions outlined in procedures adopted by the Board of Trustees of the Trust. The procedures have been designed to ensure that any purchase or sale of securities by each Fund from or to another fund or portfolio that is or could be considered an affiliate by virtue of having a common investment adviser (or affiliated investment advisers), common Trustees and/or common officers complies with Rule 17a-7 of the 1940 Act. Further, as defined under the procedures, each transaction is effected at the current market price.
For the fiscal year ended August 31, 2020, the following Funds engaged in transactions with affiliates as listed below:
| | | | | | | | | | | | | | | |
| | | Securities Purchases | | Securities Sales | | Net Realized Gains (Losses)* |
S&P 500 Revenue ETF | | | $ | - | | | | $ | 406,106 | | | | $ | (293,466 | ) |
S&P MidCap 400 Revenue ETF | | | | 35,744 | | | | | 2,435,223 | | | | | (693,646 | ) |
S&P SmallCap 600 Revenue ETF | | | | 274,454 | | | | | 202,267 | | | | | 125,245 | |
S&P Ultra Dividend Revenue ETF | | | | 9,679,047 | | | | | 113,737,618 | | | | | (26,685,871 | ) |
| * | Net realized gains (losses) from securities sold to affiliates are included in net realized gain (loss) from investment securities in the Statements of Operations. |
NOTE 5–Additional Valuation Information
GAAP defines fair value as the price that would be received to sell an asset or paid to transfer a liability in an orderly transaction between market participants at the measurement date, under current market conditions. GAAP establishes a hierarchy that prioritizes the inputs to valuation methods, giving the highest priority to readily available unadjusted quoted prices in an active market for identical assets (Level 1) and the lowest priority to significant unobservable inputs (Level 3), generally when market prices are not readily available or are unreliable. Based on the valuation inputs, the securities or other investments are tiered into one of three levels. Changes in valuation methods may result in transfers in or out of an investment’s assigned level:
| | |
| Level 1 – | | Prices are determined using quoted prices in an active market for identical assets. |
| | |
| |
| Level 2 – | | Prices are determined using other significant observable inputs. Observable inputs are inputs that other market participants may use in pricing a security. These may include quoted prices for similar securities, interest rates, prepayment speeds, credit risk, yield curves, loss severities, default rates, discount rates, volatilities and others. |
| |
| Level 3 – | | Prices are determined using significant unobservable inputs. In situations where quoted prices or observable inputs are unavailable (for example, when there is little or no market activity for an investment at the end of the period), unobservable inputs may be used. Unobservable inputs reflect a Fund’s own assumptions about the factors market participants would use in determining fair value of the securities or instruments and would be based on the best available information. |
The following is a summary of the tiered valuation input levels, as of August 31, 2020, for each of the Funds except for S&P Ultra Dividend Revenue ETF. All of the securities in S&P Ultra Dividend Revenue ETF were valued based on Level 1 inputs (see the Schedules of Investments for security categories). The level assigned to the securities valuations may not be an indication of the risk or liquidity associated with investing in those securities. Because of the inherent uncertainties of valuation, the values reflected in the financial statements may materially differ from the value received upon actual sale of those investments.
| | | | | | | | | | | | | | | | | | | | |
| | | Level 1 | | Level 2 | | Level 3 | | Total |
S&P 500 Revenue ETF | | | | | | | | | | | | | | | | | | | | |
Investments in Securities | | | | | | | | | | | | | | | | | | | | |
Common Stocks & Other Equity Interests | | | $ | 779,932,164 | | | | $ | - | | | | | $- | | | | $ | 779,932,164 | |
Money Market Funds | | | | 319,347 | | | | | 3,196,034 | | | | | - | | | | | 3,515,381 | |
| | | | | | | | | | | | | | | | | | | | |
Total Investments | | | $ | 780,251,511 | | | | $ | 3,196,034 | | | | | $- | | | | $ | 783,447,545 | |
| | | | | | | | | | | | | | | | | | | | |
S&P MidCap 400 Revenue ETF | | | | | | | | | | | | | | | | | | | | |
Investments in Securities | | | | | | | | | | | | | | | | | | | | |
Common Stocks & Other Equity Interests | | | $ | 209,050,653 | | | | $ | - | | | | | $- | | | | $ | 209,050,653 | |
Money Market Funds | | | | 159,490 | | | | | 7,460,038 | | | | | - | | | | | 7,619,528 | |
| | | | | | | | | | | | | | | | | | | | |
Total Investments | | | $ | 209,210,143 | | | | $ | 7,460,038 | | | | | $- | | | | $ | 216,670,181 | |
| | | | | | | | | | | | | | | | | | | | |
S&P SmallCap 600 Revenue ETF | | | | | | | | | | | | | | | | | | | | |
Investments in Securities | | | | | | | | | | | | | | | | | | | | |
Common Stocks & Other Equity Interests | | | $ | 227,226,178 | | | | $ | - | | | | | $- | | | | $ | 227,226,178 | |
Money Market Funds | | | | 122,767 | | | | | 20,142,357 | | | | | - | | | | | 20,265,124 | |
| | | | | | | | | | | | | | | | | | | | |
Total Investments | | | $ | 227,348,945 | | | | $ | 20,142,357 | | | | | $- | | | | $ | 247,491,302 | |
| | | | | | | | | | | | | | | | | | | | |
NOTE 6–Distributions to Shareholders and Tax Components of Net Assets
Tax Character of Distributions to Shareholders Paid During the Fiscal Year Ended August 31, 2020, the Period July 1, 2019 to August 31, 2019 and the Fiscal Year Ended June 30, 2019:
| | | | | | | | | | | | | | | |
| | | August 31, 2020 | | August 31, 2019 | | June 30, 2019 |
| | | Ordinary
Income* | | Ordinary
Income* | | Ordinary
Income* |
S&P 500 Revenue ETF | | | | $18,858,596 | | | | | $- | | | | | $19,138,436 | |
S&P MidCap 400 Revenue ETF | | | | 4,187,523 | | | | | - | | | | | 3,846,048 | |
S&P SmallCap 600 Revenue ETF | | | | 5,070,798 | | | | | - | | | | | 5,443,557 | |
S&P Ultra Dividend Revenue ETF | | | | 51,573,798 | | | | | - | | | | | 48,980,283 | |
| * | Includes short-term capital gain distributions, if any. |
Tax Components of Net Assets at Fiscal Year-End:
| | | | | | | | | | | | | | | | | | | | |
| | | Undistributed
Ordinary
Income | | | Net
Unrealized
Appreciation
(Depreciation)-
Investments | | | Capital Loss
Carryforwards | | | Shares of
Beneficial
Interest | | | Total
Net Assets | |
S&P 500 Revenue ETF | | $ | 2,888,046 | | | $ | 41,082,471 | | | $ | (40,704,320 | ) | | $ | 778,816,637 | | | $ | 782,082,834 | |
S&P MidCap 400 Revenue ETF | | | 330,479 | | | | (14,168,592 | ) | | | (38,814,511 | ) | | | 262,017,671 | | | | 209,365,047 | |
S&P SmallCap 600 Revenue ETF | | | 175,619 | | | | (18,723,957 | ) | | | (123,790,968 | ) | | | 369,763,909 | | | | 227,424,603 | |
S&P Ultra Dividend Revenue ETF | | | 16,594,372 | | | | (45,613,157 | ) | | | (454,565,420 | ) | | | 1,088,086,355 | | | | 604,502,150 | |
Capital loss carryforwards are calculated and reported as of a specific date. Results of transactions and other activity after that date may affect the amount of capital loss carryforwards actually available for the Funds to utilize. The ability to utilize capital loss carryforwards in the future may be limited under the Internal Revenue Code and related regulations based on the results of future transactions.
The following table presents available capital loss carryforwards for each Fund as of August 31, 2020:
| | | | | | | | | | | | |
| | | No expiration | | | | |
| | | Short-Term | | | Long-Term | | | Total* | |
S&P 500 Revenue ETF | | $ | 7,090,290 | | | $ | 33,614,030 | | | $ | 40,704,320 | |
S&P MidCap 400 Revenue ETF | | | 19,240,402 | | | | 19,574,109 | | | | 38,814,511 | |
S&P SmallCap 600 Revenue ETF | | | 31,882,109 | | | | 91,908,859 | | | | 123,790,968 | |
S&P Ultra Dividend Revenue ETF | | | 349,008,001 | | | | 105,557,419 | | | | 454,565,420 | |
| * | Capital loss carryforwards are reduced for limitations, if any, to the extent required by the Internal Revenue Code and may be further limited depending upon a variety of factors, including the realization of net unrealized gains or losses as of the date of any reorganization. |
NOTE 7–Investment Transactions
For the fiscal year ended August 31, 2020, the cost of securities purchased and the proceeds from sales of securities (other than short-term securities, U.S. Treasury obligations, money market funds and in-kind transactions, if any) were as follows:
| | | | | | | | |
| | | Purchases | | | Sales | |
S&P 500 Revenue ETF | | $ | 115,551,621 | | | $ | 116,895,738 | |
S&P MidCap 400 Revenue ETF | | | 89,945,473 | | | | 90,524,273 | |
S&P SmallCap 600 Revenue ETF | | | 136,895,119 | | | | 142,470,247 | |
S&P Ultra Dividend Revenue ETF | | | 1,147,526,422 | | | | 1,139,897,222 | |
For the fiscal year ended August 31, 2020, in-kind transactions associated with creations and redemptions were as follows:
| | | | | | | | |
| | | Cost of
Securities
Received | | | Value of
Securities
Delivered | |
S&P 500 Revenue ETF | | $ | 121,695,140 | | | $ | 291,684,295 | |
S&P MidCap 400 Revenue ETF | | | 30,985,506 | | | | 139,517,946 | |
S&P SmallCap 600 Revenue ETF | | | 53,636,450 | | | | 179,978,546 | |
S&P Ultra Dividend Revenue ETF | | | 470,164,582 | | | | 1,138,642,239 | |
Gains (losses) on in-kind transactions are generally not considered taxable gains (losses) for federal income tax purposes. At August 31, 2020, the aggregate cost of investments, including any derivatives, on a tax basis includes adjustments for financial reporting purposes as of the most recently completed federal income tax reporting period-end:
| | | | | | | | | | | | | | | | |
| | | Gross
Unrealized
Appreciation | | | Gross
Unrealized
(Depreciation) | | | Net
Unrealized
Appreciation
(Depreciation) | | | Cost | |
S&P 500 Revenue ETF | | $ | 144,447,340 | | | $ | (103,364,869 | ) | | $ | 41,082,471 | | | $ | 742,365,074 | |
S&P MidCap 400 Revenue ETF | | | 26,958,091 | | | | (41,126,683 | ) | | | (14,168,592 | ) | | | 230,838,773 | |
S&P SmallCap 600 Revenue ETF | | | 34,521,131 | | | | (53,245,088 | ) | | | (18,723,957 | ) | | | 266,215,259 | |
S&P Ultra Dividend Revenue ETF | | | 33,188,182 | | | | (78,801,339 | ) | | | (45,613,157 | ) | | | 645,339,607 | |
NOTE 8–Reclassification of Permanent Differences
Primarily as a result of differing book/tax treatment of in-kind transactions, amounts were reclassified between undistributed net investment income (loss), undistributed net realized gain (loss) and Shares of beneficial interest. These reclassifications had no effect on the net assets of each Fund. For the fiscal year ended August 31, 2020, the reclassifications were as follows:
| | | | | | | | | | | | | | | |
| | | Undistributed Net
Investment Income (Loss) | | Undistributed Net
Realized Gain (Loss) | | Shares of
Beneficial Interest |
S&P 500 Revenue ETF | | | $ | 285 | | | | $ | (70,524,593 | ) | | | $ | 70,524,308 | |
S&P MidCap 400 Revenue ETF | | | | (17,026 | ) | | | | (13,751,014 | ) | | | | 13,768,040 | |
S&P SmallCap 600 Revenue ETF | | | | (76,300 | ) | | | | (22,130,271 | ) | | | | 22,206,571 | |
S&P Ultra Dividend Revenue ETF | | | | (19,385 | ) | | | | 60,487,533 | | | | | (60,468,148 | ) |
NOTE 9–Trustees’ and Officer’s Fees
Trustees’ and Officer’s Fees include amounts accrued by the Funds to pay remuneration to the Independent Trustees and an Officer of the Trust. The Adviser, as a result of each Fund’s unitary management fee, pays for such compensation for the Funds. The Trustee who is an “interested person” of the Trust does not receive any Trustees’ fees.
The Trust has adopted a deferred compensation plan (the “Plan”). Under the Plan, each Independent Trustee who has executed a Deferred Fee Agreement (a “Participating Trustee”) may defer receipt of all or a portion of their compensation (“Deferral Fees”). Such Deferral Fees are deemed to be invested in select Invesco ETFs. The Deferral Fees payable to a Participating Trustee are valued as of the date such Deferral Fees would have been paid to a Participating Trustee. The value increases with contributions or with increases in the value of the Shares selected, and the value decreases with distributions or with declines in the value of the Shares selected. Obligations under the Plan represent unsecured claims against the general assets of the Funds.
NOTE 10–Capital
Shares are issued and redeemed by each Fund only in Creation Units consisting of a specified number of Shares as set forth in the Funds’ prospectus. Only Authorized Participants are permitted to purchase or redeem Creation Units from the Funds. Such transactions are principally permitted in exchange for Deposit Securities, with a balancing cash component to equate the transaction to the NAV per Share of a Fund of the Trust on the transaction date. However, for all Funds, cash in an amount equivalent to the value of certain securities may be substituted, generally when the securities are not available in sufficient quantity for delivery, not eligible for trading by the Authorized Participant or as a result of other market circumstances.
To the extent that the Funds permit transactions in exchange for Deposit Securities, each Fund may issue Shares in advance of receipt of Deposit Securities subject to various conditions, including a requirement to maintain on deposit with the Trust cash at least equal to 105% of the market value of the missing Deposit Securities. In accordance with the Trust’s Participant Agreement, Creation Units will be issued to an Authorized Participant, notwithstanding the fact that the corresponding Deposit Securities have not been received in part or in whole, in reliance on the undertaking of the Authorized Participant to deliver the missing Deposit Securities as soon as possible, which undertaking shall be secured by the Authorized Participant’s delivery and maintenance of collateral consisting of cash in the form of U.S. dollars in immediately available funds having a value (marked-to-market daily) at least equal to 105%, which the Adviser may change from time to time, of the value of the missing Deposit Securities.
Certain transaction fees may be charged by the Funds for creations and redemptions, which are treated as increases in capital.
Transactions in each Fund’s Shares are disclosed in detail in the Statements of Changes in Net Assets.
NOTE 11–Coronavirus (COVID-19) Pandemic
During the first quarter of 2020, the World Health Organization declared COVID-19 to be a public health emergency. COVID-19 has led to increased short-term market volatility and may have adverse long-term effects on U.S. and world economies and markets in general. COVID-19 may adversely impact the value of the Funds’ investments. Because of the uncertainties on valuation, the global economy and business operations, values reflected in these financial statements may materially differ from the value received upon actual sales of those investments.
The extent of the impact on the performance of the Funds and their investments will depend on future developments, including the duration and spread of the COVID-19 outbreak, related restrictions and advisories, and the effects on the financial markets and economy overall, all of which are highly uncertain and cannot be predicted.
Report of Independent Registered Public Accounting Firm
To the Board of Trustees of Invesco Exchange-Traded Fund Trust II and Shareholders of Invesco S&P 500 Revenue ETF, Invesco S&P MidCap 400 Revenue ETF, Invesco S&P SmallCap 600 Revenue ETF and Invesco S&P Ultra Dividend Revenue ETF
Opinions on the Financial Statements
We have audited the accompanying statements of assets and liabilities, including the schedules of investments, of each of the funds listed in the table below (four of the funds constituting Invesco Exchange-Traded Fund Trust II, hereafter collectively referred to as the “Funds”) as of August 31, 2020, the related statements of operations for the year ended August 31, 2020, the statements of changes in net assets for the year ended August 31, 2020, for the period July 1, 2019 through August 31, 2019 and for the year ended June 30, 2019, including the related notes, and the financial highlights for the year ended August 31, 2020, for the period July 1, 2019 through August 31, 2019 and for the year ended June 30, 2019 (collectively referred to as the “financial statements”). In our opinion, the financial statements present fairly, in all material respects, the financial position of each of the Funds as of August 31, 2020, the results of each of their operations for the year ended August 31, 2020, the changes in each of their net assets for the year ended August 31, 2020, for the period July 1, 2019 through August 31, 2019 and for the year ended June 30, 2019, and each of the financial highlights for the year ended August 31, 2020, for the period July 1, 2019 through August 31, 2019 and for the year ended June 30, 2019, in conformity with accounting principles generally accepted in the United States of America.
| | |
| Fund Name | | Predecessor Fund |
| Invesco S&P 500 Revenue ETF | | Oppenheimer S&P 500 Revenue ETF |
| Invesco S&P MidCap 400 Revenue ETF | | Oppenheimer S&P MidCap 400 Revenue ETF |
| Invesco S&P SmallCap 600 Revenue ETF | | Oppenheimer S&P SmallCap 600 Revenue ETF |
| Invesco S&P Ultra Dividend Revenue ETF | | Oppenheimer S&P Ultra Dividend Revenue ETF |
The financial statements of the Predecessor Funds as of and for the year ended June 30, 2018 and the financial highlights for each of the periods ended on or prior to June 30, 2018 (not presented herein, other than the financial highlights) were audited by other auditors whose report dated August 28, 2018 expressed an unqualified opinion on those financial statements and financial highlights.
Basis for Opinions
These financial statements are the responsibility of the Funds’ management. Our responsibility is to express an opinion on the Funds’ financial statements based on our audits. We are a public accounting firm registered with the Public Company Accounting Oversight Board (United States) (“PCAOB”) and are required to be independent with respect to the Funds in accordance with the U.S. federal securities laws and the applicable rules and regulations of the Securities and Exchange Commission and the PCAOB.
We conducted our audits of these financial statements in accordance with the standards of the PCAOB. Those standards require that we plan and perform the audit to obtain reasonable assurance about whether the financial statements are free of material misstatement, whether due to error or fraud.
Our audits included performing procedures to assess the risks of material misstatement of the financial statements, whether due to error or fraud, and performing procedures that respond to those risks. Such procedures included examining, on a test basis, evidence regarding the amounts and disclosures in the financial statements. Our audits also included evaluating the accounting principles used and significant estimates made by management, as well as evaluating the overall presentation of the financial statements.
Our procedures included confirmation of securities owned as of August 31, 2020 by correspondence with the custodian, transfer agent and brokers; when replies were not received from brokers, we performed other auditing procedures. We believe that our audits provide a reasonable basis for our opinions.
/s/ PricewaterhouseCoopers LLP
Chicago, Illinois
October 28, 2020
Report of Independent Registered Public Accounting Firm–(continued)
We have served as the auditor of one or more of the investment companies in the Invesco group of investment companies since at least 1995. We have not been able to determine the specific year we began serving as auditor.
Calculating your ongoing Fund expenses
Example
As a shareholder of a Fund of the Invesco Exchange-Traded Fund Trust II, you incur a unitary management fee. In addition to the unitary management fee, a shareholder may pay distribution fees, if any, brokerage expenses, taxes, interest, acquired fund fees and expenses, if any, litigation expenses and other extraordinary expenses. The expense examples below are intended to help you understand your ongoing costs (in dollars) of investing in the Funds and to compare these costs with the ongoing costs of investing in other funds.
The example is based on an investment of $1,000 invested at the beginning of the period and held through the six-month period ended August 31, 2020.
Actual Expenses
The first line in the following table provides information about actual account values and actual expenses. You may use the information in this line, together with the amount you invested, to estimate the expenses that you paid over the period. Simply divide your account value by $1,000 (for example, an $8,600 account value divided by $1,000 = 8.6), then multiply the result by the number in the first line under the heading “Expenses Paid During the Six-Month Period” to estimate the expenses you paid on your account during this period.
Hypothetical Example for Comparison Purposes
The second line in the following table provides information about hypothetical account values and hypothetical expenses based on each Fund’s actual expense ratio and an assumed annualized rate of return of 5% per year before expenses, which is not the Fund’s actual return. The hypothetical account values and expenses may not be used to estimate the actual ending account balance or expenses you paid for the period. You may use this information to compare the ongoing costs of investing in the Funds and other funds. To do so, compare this 5% hypothetical example with the 5% hypothetical examples that appear in the shareholder reports of the other funds.
Please note that the expenses shown in the table are meant to highlight your ongoing costs only, and do not reflect any transactional costs, such as sales charges and brokerage commissions. Therefore, the second line in the table is useful in comparing ongoing costs only, and will not help you determine the relative total costs of owning different funds. In addition, expenses shown in the table do not include the expenses of the underlying funds, which are borne indirectly by a Fund. If transaction costs and indirect expenses were included, your costs would have been higher.
| | | | | | | | | | | | | | | | |
| | | Beginning
Account Value
March 1, 2020 | | | Ending
Account Value
August 31, 2020 | | | Annualized
Expense Ratio
Based on the
Six-Month Period | | | Expenses Paid
During the
Six-Month Period(1) | |
Invesco S&P 500 Revenue ETF (RWL) | | | | | | | | | | | | | | | | |
Actual | | | $1,000.00 | | | | $1,099.40 | | | | 0.39% | | | | $2.06 | |
Hypothetical (5% return before expenses) | | | 1,000.00 | | | | 1,023.18 | | | | 0.39 | | | | 1.98 | |
Invesco S&P MidCap 400 Revenue ETF (RWK) | | | | | | | | | | | | | | | | |
Actual | | | 1,000.00 | | | | 1,042.40 | | | | 0.39 | | | | 2.00 | |
Hypothetical (5% return before expenses) | | | 1,000.00 | | | | 1,023.18 | | | | 0.39 | | | | 1.98 | |
Invesco S&P SmallCap 600 Revenue ETF (RWJ) | | | | | | | | | | | | | | | | |
Actual | | | 1,000.00 | | | | 1,140.60 | | | | 0.39 | | | | 2.10 | |
Hypothetical (5% return before expenses) | | | 1,000.00 | | | | 1,023.18 | | | | 0.39 | | | | 1.98 | |
Invesco S&P Ultra Dividend Revenue ETF (RDIV) | | | | | | | | | | | | | | | | |
Actual | | | 1,000.00 | | | | 886.90 | | | | 0.39 | | | | 1.85 | |
Hypothetical (5% return before expenses) | | | 1,000.00 | | | | 1,023.18 | | | | 0.39 | | | | 1.98 | |
| (1) | Expenses are calculated using the annualized expense ratio, which represents the ongoing expenses as a percentage of net assets for the six-month period ended August 31, 2020. Expenses are calculated by multiplying the Fund’s annualized expense ratio by the average account value for the period, then multiplying the result by 184/366. Expense ratios for the most recent six-month period may differ from expense ratios based on the annualized data in the Financial Highlights. |
Tax Information
Form 1099-DIV, Form 1042-S and other year–end tax information provide shareholders with actual calendar year amounts that should be included in their tax returns. Shareholders should consult their tax advisers.
The following distribution information is being provided as required by the Internal Revenue Code or to meet a specific state’s requirement.
Each Fund designates the following amounts or, if subsequently determined to be different, the maximum amount allowable for its fiscal year ended August 31, 2020:
| | | | | | | | | | | | | | | | | | | |
| | | Qualified
Dividend
Income* | | Dividends-Received
Deduction* | | Qualified
Interest
Income* |
Invesco S&P 500 Revenue ETF | | | | 100% | | | | | 100% | | | | | 0% | |
Invesco S&P MidCap 400 Revenue ETF | | | | 100% | | | | | 100% | | | | | 0% | |
Invesco S&P SmallCap 600 Revenue ETF | | | | 72% | | | | | 71% | | | | | 0% | |
Invesco S&P Ultra Dividend Revenue ETF | | | | 93% | | | | | 88% | | | | | 0% | |
| * | The above percentages are based on ordinary income dividends paid to shareholders during the Trust’s fiscal year. |
Trustees and Officers
The Independent Trustees of the Trust, their term of office and length of time served, their principal business occupations during at least the past five years, the number of portfolios in the Fund Complex (as defined below) overseen by each Independent Trustee and the other directorships, if any, held by each Independent Trustee are shown below.
As of August 31, 2020
| | | | | | | | | | |
Name, Address and Year of
Birth of Independent Trustees | | Position(s)
Held
with Trust | | Term of
Office and
Length of
Time
Served* | | Principal Occupation(s) During Past 5 Years | | Number of
Portfolios
in Fund
Complex**
Overseen by
Independent
Trustees | | Other Directorships Held by Independent Trustees During
the Past 5 Years |
Ronn R. Bagge–1958
c/o Invesco Capital
Management LLC
3500 Lacey Road, Suite 700
Downers Grove, IL 60515 | | Vice Chairman of the Board; Chairman of the Nominating and Governance Committee and Trustee | | Vice Chairman since 2018; Chairman of the Nominating and Governance Committee and Trustee since 2007 | | Founder and Principal, YQA Capital Management LLC (1998-Present); formerly, Owner/CEO of Electronic Dynamic Balancing Co., Inc. (high-speed rotating equipment service provider). | | 214 | | Trustee and Investment Oversight Committee member, Mission Aviation Fellowship (2017-Present). |
| | | | | |
Todd J. Barre–1957
c/o Invesco Capital
Management LLC
3500 Lacey Road, Suite 700
Downers Grove, IL 60515 | | Trustee | | Since 2010 | | Assistant Professor of Business, Trinity Christian College (2010-2016); formerly, Vice President and Senior Investment Strategist (2001-2008), Director of Open Architecture and Trading (2007-2008), Head of Fundamental Research (2004-2007) and Vice President and Senior Fixed Income Strategist (1994-2001), BMO Financial Group/Harris Private Bank. | | 214 | | None. |
| * | This is the date the Independent Trustee began serving the Trust. Each Independent Trustee serves an indefinite term, until his or her successor is elected. |
| ** | Fund Complex includes all open- and closed-end funds (including all of their portfolios) advised by the Adviser and any affiliated person of the Adviser. |
Trustees and Officers–(continued)
| | | | | | | | | | |
Name, Address and Year of
Birth of Independent Trustees | | Position(s)
Held
with Trust | | Term of
Office and
Length of
Time
Served* | | Principal Occupation(s) During Past 5 Years | | Number of
Portfolios
in Fund
Complex**
Overseen by
Independent
Trustees | | Other Directorships Held by Independent Trustees During
the Past 5 Years |
Edmund P. Giambastiani,
Jr.–1948
c/o Invesco Capital
Management LLC
3500 Lacey Road, Suite 700
Downers Grove, IL 60515 | | Trustee | | Since 2019 | | President, Giambastiani Group LLC (national security and energy consulting) (2007-Present); Director, The Boeing Company (2009-Present); Trustee, MITRE Corporation (federally-funded research development) (2008-Present); Director, THL Credit, Inc. (alternative credit investment manager) (2016-Present); Trustee, U.S. Naval Academy Foundation Athletic & Scholarship Program (2010-Present); Advisory Board Member, Massachusetts Institute of Technology Lincoln Laboratory (federally-funded research development) (2010- Present); Defense Advisory Board Member, Lawrence Livermore National Laboratory (2013-Present); formerly, Chairman (2015-2016), Lead Director (2011-2015) and Director (2008-2011), Monster Worldwide, Inc. (career services); Advisory Board Member, Maxwell School of Citizenship and Public Affairs of Syracuse University (2012-2016); United States Navy, career nuclear submarine officer (1970-2007); Seventh Vice Chairman of the Joint Chiefs of Staff (2005-2007); first NATO Supreme Allied Commander Transformation (2003-2005); Commander, U.S. Joint Forces Command (2002-2005). | | 214 | | Formerly, Trustee, certain funds of the Oppenheimer Funds complex (2013- 2019); Director, Mercury Defense Systems Inc. (information technology) (2011-2013); Independent Director, QinetiQ Group Plc (defense technology and security) (2008-2011); Chairman, Alenia North America, Inc. (military and defense products) (2008-2009); Director, SRA International, Inc. (information technology and services) (2008- 2011). |
| * | This is the date the Independent Trustee began serving the Trust. Each Independent Trustee serves an indefinite term, until his or her successor is elected. |
| ** | Fund Complex includes all open- and closed-end funds (including all of their portfolios) advised by the Adviser and any affiliated person of the Adviser. |
Trustees and Officers–(continued)
| | | | | | | | | | |
Name, Address and Year of
Birth of Independent Trustees | | Position(s)
Held
with Trust | | Term of
Office and
Length of
Time
Served* | | Principal Occupation(s) During Past 5 Years | | Number of
Portfolios
in Fund
Complex**
Overseen by
Independent
Trustees | | Other Directorships Held by Independent Trustees During
the Past 5 Years |
Victoria J. Herget–1951
c/o Invesco Capital
Management LLC
3500 Lacey Road, Suite 700
Downers Grove, IL 60515 | | Trustee | | Since 2019 | | Formerly, Managing Director (1993-2001), Principal (1985-1993), Vice President (1978-1985) and Assistant Vice President (1973- 1978), Zurich Scudder Investments (investment adviser) (and its predecessor firms). | | 214 | | Trustee (2000- Present) and Chair (2010-2017), Newberry Library; Trustee, Mather LifeWays (2001-Present); Trustee, Chikaming Open Lands (2014-Present); formerly, Trustee, certain funds in the Oppenheimer Funds complex (2012- 2019); Board Chair (2008-2015) and Director (2004- 2018), United Educators Insurance Company; Independent Director, First American Funds (2003-2011); Trustee (1992-2007), Chair of the Board of Trustees (1999-2007), Investment Committee Chair (1994-1999) and Investment Committee member (2007-2010), Wellesley College; Trustee, BoardSource (2006-2009); Trustee, Chicago City Day School (1994-2005). |
| * | This is the date the Independent Trustee began serving the Trust. Each Independent Trustee serves an indefinite term, until his or her successor is elected. |
| ** | Fund Complex includes all open- and closed-end funds (including all of their portfolios) advised by the Adviser and any affiliated person of the Adviser. |
Trustees and Officers–(continued)
| | | | | | | | | | |
Name, Address and Year of
Birth of Independent Trustees | | Position(s)
Held
with Trust | | Term of
Office and
Length of
Time
Served* | | Principal Occupation(s) During Past 5 Years | | Number of
Portfolios
in Fund
Complex**
Overseen by
Independent
Trustees | | Other Directorships Held by Independent Trustees During
the Past 5 Years |
Marc M. Kole–1960
c/o Invesco Capital
Management LLC
3500 Lacey Road, Suite 700
Downers Grove, IL 60515 | | Chairman of the Audit Committee and Trustee | | Chairman of the Audit Committee since 2008; Trustee since 2007 | | Senior Director of Finance, By The Hand Club for Kids (not-for-profit) (2015-Present); formerly, Chief Financial Officer, Hope Network (social services) (2008-2012); Assistant Vice President and Controller, Priority Health (health insurance) (2005-2008); Regional Chief Financial Officer, United Healthcare (2005); Chief Accounting Officer, Senior Vice President of Finance, Oxford Health Plans (2000-2004); Audit Partner, Arthur Andersen LLP (1996-2000). | | 214 | | Treasurer (2018-Present), Finance Committee Member (2015- Present) and Audit Committee Member (2015), Thornapple Evangelical Covenant Church; formerly, Board and Finance Committee Member (2009-2017) and Treasurer (2010-2015, 2017), NorthPointe Christian Schools. |
| | | | | |
Yung Bong Lim–1964
c/o Invesco Capital
Management LLC
3500 Lacey Road, Suite 700
Downers Grove, IL 60515 | | Chairman of the Investment Oversight Committee and Trustee | | Chairman of the Investment Oversight Committee since 2014; Trustee since 2013 | | Managing Partner, RDG Funds LLC (real estate) (2008-Present); formerly, Managing Director, Citadel LLC (1999-2007). | | 214 | | Advisory Board Member, Performance Trust Capital Partners, LLC (2008-Present); Board Director, Beacon Power Services, Corp. (2019-Present). |
| * | This is the date the Independent Trustee began serving the Trust. Each Independent Trustee serves an indefinite term, until his or her successor is elected. |
| ** | Fund Complex includes all open- and closed-end funds (including all of their portfolios) advised by the Adviser and any affiliated person of the Adviser. |
Trustees and Officers–(continued)
| | | | | | | | | | |
Name, Address and Year of
Birth of Independent Trustees | | Position(s)
Held
with Trust | | Term of
Office and
Length of
Time
Served* | | Principal Occupation(s) During Past 5 Years | | Number of
Portfolios
in Fund
Complex**
Overseen by
Independent
Trustees | | Other Directorships Held by Independent Trustees During
the Past 5 Years |
Joanne Pace–1958
c/o Invesco Capital
Management LLC
3500 Lacey Road, Suite 700
Downers Grove, IL 60515 | | Trustee | | Since 2019 | | Formerly, Senior Advisor, SECOR Asset Management, LP (2010-2011); Managing Director and Chief Operating Officer, Morgan Stanley Investment Management (2006- 2010); Partner and Chief Operating Officer, FrontPoint Partners, LLC (alternative investments) (2005- 2006); Managing Director (2003-2005), Global Head of Human Resources and member of Executive Board and Operating Committee (2004-2005), Global Head of Operations and Product Control (2003-2004), Credit Suisse (investment banking); Managing Director (1997-2003), Controller and Principal Accounting Officer (1999-2003), Chief Financial Officer (temporary assignment) for the Oversight Committee, Long Term Capital Management (1998-1999). | | 214 | | Board Director, Horizon Blue Cross Blue Shield of New Jersey (2012- Present); Advisory Board Director, The Alberleen Group LLC (2012-Present); Governing Council Member (2016- Present) and Chair of Education Committee (2017-Present), Independent Directors Council (IDC); Board Member, 100 Women in Finance (2015-Present); Council Member, NewYork-Presbyterian Hospital’s Leadership Council on Children’s and Women’s Health (2012-Present); formerly, Trustee, certain funds in the Oppenheimer Funds complex (2012- 2019); Lead Independent Director and Chair of the Audit and Nominating Committee of The Global Chartist Fund, LLC, Oppenheimer Asset Management (2011-2012); Board Director, Managed Funds Association (2008-2010); Board Director (2007-2010) and Investment Committee Chair (2008-2010), Morgan Stanley Foundation. |
| * | This is the date the Independent Trustee began serving the Trust. Each Independent Trustee serves an indefinite term, until his or her successor is elected. |
| ** | Fund Complex includes all open- and closed-end funds (including all of their portfolios) advised by the Adviser and any affiliated person of the Adviser. |
Trustees and Officers–(continued)
| | | | | | | | | | |
Name, Address and Year of
Birth of Independent Trustees | | Position(s)
Held with
Trust | | Term of Office and Length of
Time Served* | | Principal Occupation(s) During Past 5 Years | | Number of
Portfolios in Fund
Complex**
Overseen by
Independent
Trustees | | Other
Directorships
Held by
Independent
Trustees During
the Past 5 Years |
Gary R. Wicker—1961 c/o Invesco Capital Management LLC 3500 Lacey Road, Suite 700 Downers Grove, IL 60515 | | Trustee | | Since 2013 | | Senior Vice President of Global Finance and Chief Financial Officer, RBC Ministries (publishing company) (2013-Present); formerly, Executive Vice President and Chief Financial Officer, Zondervan Publishing (a division of Harper Collins/NewsCorp) (2007-2012); Senior Vice President and Group Controller (2005-2006), Senior Vice President and Chief Financial Officer (2003-2004), Chief Financial Officer (2001-2003), Vice President, Finance and Controller (1999-2001) and Assistant Controller (1997-1999), divisions of The Thomson Corporation (information services provider); Senior Audit Manager (1994-1997), PricewaterhouseCoopers LLP. | | 214 | | Board Member and Treasurer, Our Daily Bread Ministries Canada (2015- Present); Board and Finance Committee Member, West Michigan Youth For Christ (2010- Present). |
| | | | | |
Donald H. Wilson—1959 c/o Invesco Capital Management LLC 3500 Lacey Road, Suite 700 Downers Grove, IL 60515 | | Chairman of the Board and Trustee | | Chairman since 2012; Trustee since 2007 | | Chairman, President and Chief Executive Officer, McHenry Bancorp Inc. and McHenry Savings Bank (subsidiary) (2018-Present); formerly, Chairman and Chief Executive Officer, Stone Pillar Advisors, Ltd. (2010-2017); President and Chief Executive Officer, Stone Pillar Investments, Ltd. (advisory services to the financial sector) (2016- 2018); Chairman, President and Chief Executive Officer, Community Financial Shares, Inc. and Community Bank—Wheaton/Glen Ellyn (subsidiary) (2013-2015); Chief Operating Officer, AMCORE Financial, Inc. (bank holding company) (2007-2009); Executive Vice President and Chief Financial Officer, AMCORE Financial, Inc. (2006-2007); Senior Vice President and Treasurer, Marshall & Ilsley Corp. (bank holding company) (1995-2006). | | 214 | | Director, Penfield Children’s Center (2004-Present); Board Chairman, Gracebridge Alliance, Inc. (2015-Present). |
| * | This is the date the Independent Trustee began serving the Trust. Each Independent Trustee serves an indefinite term, until his or her successor is elected. |
| ** | Fund Complex includes all open- and closed-end funds (including all of their portfolios) advised by the Adviser and any affiliated person of the Adviser. |
Trustees and Officers–(continued)
The Interested Trustee and the executive officers of the Trust, their term of office and length of time served, their principal business occupations during at least the past five years, the number of portfolios in the Fund Complex (as defined below) overseen by the Interested Trustee and the other directorships, if any, held by the Interested Trustee are shown below.
| | | | | | | | | | |
Name, Address and Year of Birth of Interested Trustee | | Position(s) Held with Trust | | Term of Office and Length of Time Served* | | Principal Occupation(s) During Past 5 Years | | Number of Portfolios in Fund Complex** Overseen by Interested Trustee | | Other Directorships Held by Interested Trustee During the Past 5 Years |
Kevin M. Carome–1956
Invesco Ltd.
Two Peachtree Pointe
1555 Peachtree St., N.E.,
Suite 1800
Atlanta, GA 30309 | | Trustee | | Since 2010 | | Senior Managing Director, Secretary and General Counsel, Invesco Ltd. (2007-Present); Director, Invesco Advisers, Inc. (2009-Present); Director (2006-Present) and Executive Vice President (2008-Present), Invesco North American Holdings, Inc.; Executive Vice President (2008-Present), Invesco Investments (Bermuda) Ltd.; Manager, Horizon Flight Works LLC; and Executive Vice President (2014-Present), INVESCO Asset Management (Bermuda) Ltd.; formerly, Director and Secretary (2012-2020), Invesco Services (Bahamas) Private Limited; Director, Invesco Finance PLC (2011-2019); Director, INVESCO Asset Management (Bermuda) Ltd. (2014-2019); Director and Executive Vice President, Invesco Finance, Inc. (2011-2018); Director (2006-2018) and Executive Vice President (2008-2018), Invesco Group Services, Inc., Invesco Holding Company (US), Inc.; Director, Invesco Holding Company Limited (2007- 2019); Director and Chairman, INVESCO Funds Group, Inc., Senior Vice President, Secretary and General Counsel, Invesco Advisers, Inc. (2003-2006); Director, Invesco Investments (Bermuda) Ltd. (2008- 2016); Senior Vice President and General Counsel, Liberty Financial Companies, Inc. (2000-2001); General Counsel of certain investment management subsidiaries of Liberty Financial Companies, Inc. (1998-2000); Associate General Counsel, Liberty Financial Companies, Inc. (1993-1998); Associate, Ropes & Gray LLP. | | 214 | | None |
| * | This is the date the Interested Trustee began serving the Trust. The Interested Trustee serves an indefinite term, until his successor is elected. |
| ** | Fund Complex includes all open- and closed-end funds (including all of their portfolios) advised by the Adviser and any affiliated person of the Adviser. |
Trustees and Officers–(continued)
| | | | | | |
Name, Address and Year of Birth of Executive Officers | | Position(s) Held with Trust | | Length of Time Served* | | Principal Occupation(s) During Past 5 Years |
Anna Paglia–1974 Invesco Capital Management LLC 3500 Lacey Road, Suite 700 Downers Grove, IL 60515 | | President and Principal Executive Officer | | Since 2020 | | President and Principal Executive Officer, Invesco Exchange-Traded Fund Trust, Invesco Exchange-Traded Fund Trust II, Invesco India Exchange-Traded Fund Trust, Invesco Actively Managed Exchange-Traded Fund Trust, Invesco Actively Managed Exchange-Traded Commodity Fund Trust and Invesco Exchange- Traded Self-Indexed Fund Trust (2020-Present); Managing Director and Global Head of ETFs and Indexed Strategies, Chief Executive Officer and Principal Executive Officer, Invesco Capital Management LLC (2020-Present); Chief Executive Officer, Manager and Principal Executive Officer, Invesco Specialized Products, LLC (2020-Present); Vice President, Invesco Indexing LLC (2020-Present); formerly, Secretary, Invesco Exchange-Traded Fund Trust, Invesco Exchange-Traded Fund Trust II, Invesco India Exchange-Traded Fund Trust and Invesco Actively Managed Exchange-Traded Fund Trust (2011-2020), Invesco Actively Managed Exchange-Traded Commodity Fund Trust (2014-2020) and Invesco Exchange-Traded Self-Indexed Fund Trust (2015-2020); Head of Legal (2010-2020) and Secretary (2015-2020), Invesco Capital Management LLC; Manager and Assistant Secretary, Invesco Indexing LLC (2017-2020); Head of Legal and Secretary, Invesco Specialized Products, LLC (2018-2020); Partner, K&L Gates LLP (formerly, Bell Boyd & Lloyd LLP) (2007-2010); and Associate Counsel at Barclays Global Investors Ltd. (2004-2006). |
| | | |
Kelli Gallegos–1970 Invesco Capital Management LLC 11 Greenway Plaza, Suite 1000 Houston, TX 77046 | | Vice President and Treasurer | | Since 2018 | | Vice President, Invesco Advisers, Inc. (2020-Present); Principal Financial and Accounting Officer- Pooled Investments, Invesco Specialized Products, LLC (2018-Present); Vice President and Treasurer, Invesco Exchange-Traded Fund Trust, Invesco Exchange-Traded Fund Trust II, Invesco India Exchange-Traded Fund Trust, Invesco Actively Managed Exchange-Traded Fund Trust, Invesco Actively Managed Exchange-Traded Commodity Fund Trust and Invesco Exchange-Traded Self-Indexed Fund Trust (2018-Present); Principal Financial and Accounting Officer-Pooled Investments, Invesco Capital Management LLC (2018-Present); Vice President, Principal Financial Officer (2016-Present) and Assistant Treasurer (2008-Present), The Invesco Funds; formerly, Assistant Treasurer, Invesco Specialized Products, LLC (2018); Assistant Treasurer, Invesco Exchange-Traded Fund Trust, Invesco Exchange-Traded Fund Trust II, Invesco India Exchange-Traded Fund Trust and Invesco Actively Managed Exchange-Traded Fund Trust (2012-2018), Invesco Actively Managed Exchange-Traded Commodity Fund Trust (2014-2018) and Invesco Exchange-Traded Self-Indexed Fund Trust (2016-2018); Assistant Treasurer, Invesco Capital Management LLC (2013-2018); and Assistant Vice President, The Invesco Funds (2008-2016). |
* This is the date each Officer began serving the Trust in their current position. Each Officer serves an indefinite term, until his or her successor is elected.
Trustees and Officers–(continued)
| | | | | | |
Name, Address and Year of Birth of Executive Officers | | Position(s) Held with Trust | | Length of Time Served* | | Principal Occupation(s) During Past 5 Years |
Adam Henkel—1980 Invesco Capital Management LLC 3500 Lacey Road, Suite 700 Downers Grove, IL 60515 | | Secretary | | Since 2020 | | Head of Legal – US ETFs and Secretary, Invesco Capital Management LLC (2020-Present); Head of Legal and Secretary, Invesco Specialized Products, LLC (2020-Present); Secretary, Invesco Exchange-Traded Fund Trust, Invesco Exchange-Traded Fund Trust II, Invesco India Exchange-Traded Fund Trust, Invesco Actively Managed Exchange-Traded Fund Trust, Invesco Actively Managed Exchange-Traded Commodity Fund Trust and Invesco Exchange- Traded Self-Indexed Fund Trust (2020-Present); Manager and Assistant Secretary, Invesco Indexing LLC (2020-Present); Assistant Secretary (2020-Present), Invesco Capital Markets, Inc. and Invesco Investment Advisers LLC; Assistant Secretary, The Invesco Funds (2014-Present); formerly, Assistant Secretary, Invesco Capital Management LLC (2015-2020) and Invesco Specialized Products, LLC (2018-2020); Assistant Secretary (2014-2020) and Chief Compliance Officer (2017-2017), Invesco Exchange- Traded Fund Trust, Invesco Exchange-Traded Fund Trust II, Invesco India Exchange-Traded Fund Trust and Invesco Actively Managed Exchange-Traded Fund Trust, Invesco Actively Managed Exchange-Traded Commodity Fund Trust and Invesco Exchange-Traded Self-Indexed Fund Trust. |
| | | |
Peter Hubbard—1981 Invesco Capital Management LLC 3500 Lacey Road, Suite 700 Downers Grove, IL 60515 | | Vice President | | Since 2009 | | Vice President, Invesco Specialized Products, LLC (2018-Present); Vice President, Invesco Exchange-Traded Fund Trust, Invesco Exchange-Traded Fund Trust II, Invesco India Exchange-Traded Fund Trust, Invesco Actively Managed Exchange-Traded Fund Trust (2009-Present), Invesco Actively Managed Exchange-Traded Commodity Fund Trust (2014-Present) and Invesco Exchange-Traded Self-Indexed Fund Trust (2016-Present); Vice President and Director of Portfolio Management, Invesco Capital Management LLC (2010-Present); formerly, Vice President of Portfolio Management, Invesco Capital Management LLC (2008-2010); Portfolio Manager, Invesco Capital Management LLC (2007-2008); Research Analyst, Invesco Capital Management LLC (2005-2007); Research Analyst and Trader, Ritchie Capital, a hedge fund operator (2003-2005). |
| | | |
Sheri Morris—1964 Invesco Capital Management LLC 11 Greenway Plaza, Suite 1000 Houston, TX 77046 | | Vice President | | Since 2012 | | Head of Global Fund Services, Invesco Ltd. (2019-Present); Vice President, OppenheimerFunds, Inc. (2019-Present); President and Principal Executive Officer, The Invesco Funds (2016-Present); Treasurer, The Invesco Funds (2008-Present); Vice President, Invesco Advisers, Inc. (formerly known as Invesco Institutional (N.A.), Inc.) (registered investment adviser) (2009-Present) and Vice President, Invesco Exchange-Traded Fund Trust, Invesco Exchange- Traded Fund Trust II, Invesco India Exchange-Traded Fund Trust, Invesco Actively Managed Exchange-Traded Fund Trust (2012-Present), Invesco Actively Managed Exchange-Traded Commodity Fund Trust (2014-Present) and Invesco Exchange-Traded Self-Indexed Fund Trust (2016-Present); formerly, Vice President and Principal Financial Officer, The Invesco Funds (2008-2016); Treasurer, Invesco Exchange-Traded Fund Trust, Invesco Exchange-Traded Fund Trust II, Invesco India Exchange-Traded Fund Trust and Invesco Actively Managed Exchange-Traded Fund Trust (2011-2013); Vice President, Invesco Aim Advisers, Inc., Invesco Aim Capital Management, Inc. and Invesco Aim Private Asset Management, Inc.; Assistant Vice President and Assistant Treasurer, The Invesco Funds and Assistant Vice President, Invesco Advisers, Inc., Invesco Aim Capital Management, Inc. and Invesco Aim Private Asset Management, Inc. |
| * | This is the date each Officer began serving the Trust in their current position. Each Officer serves an indefinite term, until his or her successor is elected. |
Trustees and Officers–(continued)
| | | | | | |
Name, Address and Year of Birth of Executive Officers | | Position(s) Held with Trust | | Length of Time Served* | | Principal Occupation(s) During Past 5 Years |
Rudolf E. Reitmann–1971 Invesco Capital Management LLC 3500 Lacey Road, Suite 700 Downers Grove, IL 60515 | | Vice President | | Since 2013 | | Head of Global Exchange Traded Funds Services, Invesco Specialized Products, LLC (2018-Present); Vice President, Invesco Exchange-Traded Fund Trust, Invesco Exchange-Traded Fund Trust II, Invesco India Exchange-Traded Fund Trust, Invesco Actively Managed Exchange-Traded Fund Trust (2013-Present), Invesco Actively Managed Exchange-Traded Commodity Fund Trust (2014-Present) and Invesco Exchange-Traded Self-Indexed Fund Trust (2016-Present); Head of Global Exchange Traded Funds Services, Invesco Capital Management LLC (2013-Present); Vice President, Invesco Capital Markets, Inc. (2018-Present). |
| | | |
Melanie Zimdars–1976 Invesco Capital Management LLC 3500 Lacey Road, Suite 700 Downers Grove, IL 60515 | | Chief Compliance Officer | | Since 2017 | | Chief Compliance Officer, Invesco Specialized Products, LLC (2018-Present); Chief Compliance Officer, Invesco Capital Management LLC (2017-Present); Chief Compliance Officer, Invesco Exchange-Traded Fund Trust, Invesco Exchange-Traded Fund Trust II, Invesco India Exchange-Traded Fund Trust, Invesco Actively Managed Exchange-Traded Fund Trust, Invesco Actively Managed Exchange-Traded Commodity Fund Trust and Invesco Exchange- Traded Self-Indexed Fund Trust (2017-Present); formerly, Vice President and Deputy Chief Compliance Officer, ALPS Holding, Inc. (2009-2017); Mutual Fund Treasurer/ Chief Financial Officer, Wasatch Advisors, Inc. (2005-2008); Compliance Officer, U.S. Bancorp Fund Services, LLC (2001-2005). |
| * | This is the date each Officer began serving the Trust in their current position. Each Officer serves an indefinite term, until his or her successor is elected. |
Availability of Additional Information About the Trustees
The Statement of Additional Information includes additional information about the Trustees and is available, without charge, upon request at (800) 983-0903.
Approval of Investment Advisory and Sub-Advisory Contracts
At a meeting held on April 14, 2020, the Board of Trustees of the Invesco Exchange-Traded Fund Trust II (the “Trust”), including the Independent Trustees, approved the continuation of the Investment Advisory Agreement between Invesco Capital Management LLC (the “Adviser”) and the Trust for the following 71 series (each, a “Fund” and collectively, the “Funds”):
| | |
Invesco 1-30 Laddered Treasury ETF Invesco California AMT-Free Municipal Bond ETF Invesco CEF Income Composite ETF Invesco China Technology ETF Invesco DWA Developed Markets Momentum ETF Invesco DWA Emerging Markets Momentum ETF Invesco DWA SmallCap Momentum ETF Invesco Emerging Markets Sovereign Debt ETF Invesco FTSE International Low Beta Equal Weight ETF Invesco FTSE RAFI Developed Markets ex-U.S. ETF Invesco FTSE RAFI Developed Markets ex-U.S. Small-Mid ETF Invesco FTSE RAFI Emerging Markets ETF Invesco Fundamental High Yield® Corporate Bond ETF Invesco Fundamental Investment Grade Corporate Bond ETF Invesco Global Clean Energy ETF Invesco Global Short Term High Yield Bond ETF Invesco Global Water ETF Invesco International BuyBack Achievers™ ETF Invesco International Corporate Bond ETF Invesco KBW Bank ETF Invesco KBW High Dividend Yield Financial ETF Invesco KBW Premium Yield Equity REIT ETF Invesco KBW Property & Casualty Insurance ETF Invesco KBW Regional Banking ETF Invesco National AMT-Free Municipal Bond ETF Invesco New York AMT-Free Municipal Bond ETF Invesco Preferred ETF Invesco PureBetaSM 0-5YrUSTIPSETF Invesco PureBetaSM FTSE Developed ex-North America ETF Invesco PureBetaSM FTSE Emerging Markets ETF Invesco PureBetaSM MSCI USA ETF Invesco PureBetaSM MSCI USA Small Cap ETF Invesco PureBetaSM US Aggregate Bond ETF Invesco Russell 1000 Enhanced Equal Weight ETF Invesco Russell 1000 Equal Weight ETF Invesco Russell 1000 Low Beta Equal Weight ETF | | Invesco S&P 500 Enhanced Value ETF Invesco S&P 500® ex-Rate Sensitive Low Volatility ETF Invesco S&P 500® High Beta ETF Invesco S&P 500® High Dividend Low Volatility ETF Invesco S&P 500® Low Volatility ETF Invesco S&P 500 Minimum Variance ETF Invesco S&P 500 Momentum ETF Invesco S&P 500 Revenue ETF Invesco S&P Emerging Markets Low Volatility ETF Invesco S&P Emerging Markets Momentum ETF Invesco S&P International Developed High Dividend Low Volatility ETF Invesco S&P International Developed Low Volatility ETF Invesco S&P International Developed Momentum ETF Invesco S&P International Developed Quality ETF Invesco S&P MidCap 400 Revenue ETF Invesco S&P MidCap Low Volatility ETF Invesco S&P SmallCap 600 Revenue ETF Invesco S&P SmallCap Consumer Discretionary ETF Invesco S&P SmallCap Consumer Staples ETF Invesco S&P SmallCap Energy ETF Invesco S&P SmallCap Financials ETF Invesco S&P SmallCap Health Care ETF Invesco S&P SmallCap High Dividend Low Volatility ETF Invesco S&P SmallCap Industrials ETF Invesco S&P SmallCap Information Technology ETF Invesco S&P SmallCap Low Volatility ETF Invesco S&P SmallCap Materials ETF Invesco S&P SmallCap Quality ETF Invesco S&P SmallCap Utilities & Communication Services ETF Invesco S&P Ultra Dividend Revenue ETF Invesco Senior Loan ETF Invesco Taxable Municipal Bond ETF Invesco Treasury Collateral ETF Invesco Variable Rate Preferred ETF Invesco VRDO Tax-Free Weekly ETF |
Also at the April 14, 2020 meeting, the Board of Trustees of the Trust, including the Independent Trustees, approved the continuation of the Investment Sub-Advisory Agreement between the Adviser and the following seven affiliated sub-advisers for each of Invesco Senior Loan ETF and Invesco Treasury Collateral ETF (the “Sub-Advisory Agreement”): Invesco Advisers, Inc.; Invesco Asset Management Deutschland, GmbH; Invesco Asset Management Limited; Invesco Asset Management (Japan) Limited; Invesco Hong Kong Limited; Invesco Senior Secured Management, Inc.; and Invesco Canada Ltd. (each, a “Sub-Adviser” and collectively, the “Sub-Advisers”).
Investment Advisory Agreement
The Trustees reviewed information from the Adviser describing: (i) the nature, extent and quality of services provided, (ii) the investment performance of each Fund and the Adviser, (iii) the fees paid by the Funds and comparisons to amounts paid by other comparable registered investment companies, (iv) the costs of services provided and estimated profits realized by the Adviser, (v) the extent to which economies of scale may be realized as a Fund grows and whether fee levels reflect any possible economies of
Approval of Investment Advisory and Sub-Advisory Contracts–(continued)
scale for the benefit of Fund shareholders, and (vi) any further benefits realized by the Adviser or its affiliates from the Adviser’s relationship with the Funds.
Nature, Extent and Quality of Services. In evaluating the nature, extent and quality of the Adviser’s services, the Trustees reviewed information concerning the functions performed by the Adviser for the Funds, information describing the Adviser’s current organization and staffing, including operational support provided by the Adviser’s parent organization, Invesco Ltd. (“Invesco”), and the background and experience of the persons responsible for the day-to-day management of the Funds. The Trustees reviewed matters related to the Adviser’s execution and/or oversight of execution of portfolio transactions on behalf of the Funds. The Trustees also reviewed information on the performance of the Funds and their underlying indexes for the one-year, three-year, five-year, ten-year and since-inception periods ended December 31, 2019, as applicable, including reports for each of those periods on the correlation and tracking error between each Fund’s performance and the performance of its underlying index, as well as the Adviser’s analysis of the tracking error and correlation between certain Funds and their underlying indexes. In reviewing the tracking error reports, the Trustees considered information provided by Invesco’s independent performance and risk management group with respect to general expected tracking error ranges. The Trustees also considered that certain Funds were created in connection with the purchases by Invesco of the exchange-traded funds businesses of Guggenheim Capital LLC on April 6, 2018 and Massachusetts Mutual Life Insurance Company (“Oppenheimer”) on May 24, 2019 (each, a “Transaction”), and that each such Fund’s performance prior to the closing of the applicable Transaction is that of its predecessor Guggenheim ETF or Oppenheimer ETF. The Trustees noted that, for each applicable period, the correlation for each Fund, other than the five-year and since-inception periods for Invesco Global Short Term High Yield Bond ETF and the one-year and ten-year periods for Invesco VRDO Tax-Free Weekly ETF, was within the targeted range set forth in the Trust’s registration statement. The Trustees reviewed the reasons provided by the Adviser for Invesco Global Short Term High Yield Bond ETF’s and Invesco VRDO Tax-Free Weekly ETF’s level of correlation to its underlying index, as well as the Adviser’s expectations for each Fund’s correlation going forward. The Trustees noted that, for each applicable period, the tracking error for all Funds was within the targeted range set forth in the Trust’s registration statement and concluded that each Fund’s correlation to its underlying index and the tracking error for each Fund were within an acceptable range given that Fund’s particular circumstances.
The Trustees considered the services provided by the Adviser in its oversight of the Funds’ administrator, custodian and transfer agent. They noted the significant amount of time, effort and resources that had been devoted to this oversight function.
Based on their review, the Trustees concluded that the nature, extent and quality of services provided by the Adviser to the Funds under the Investment Advisory Agreement were appropriate and reasonable.
Fees, Expenses and Profitability. The Trustees reviewed and discussed the information provided by the Adviser on each Fund’s net expense ratio and unitary advisory fee. The Trustees noted that the annual advisory fee charged to each Fund, as set forth below, is a unitary advisory fee and that the Adviser pays all other operating expenses of each Fund, including the fees payable to the Sub-Advisers for Invesco Senior Loan ETF and Invesco Treasury Collateral ETF, except that each Fund pays its brokerage expenses, taxes, interest (including, for Invesco Senior Loan ETF, interest expenses associated with its line of credit), litigation expenses and other extraordinary expenses (including acquired fund fees and expenses, if any).
| | • | | 0.04%: Invesco PureBetaSM MSCI USA ETF |
| | • | | 0.05%: Invesco PureBetaSM US Aggregate Bond ETF |
| | • | | 0.06%: Invesco PureBetaSM MSCI USA Small Cap ETF |
| | • | | 0.07%: Invesco PureBetaSM 0-5 Yr US TIPS ETF, Invesco PureBetaSM FTSE Developed ex-North America ETF |
| | • | | 0.08%: Invesco Treasury Collateral ETF |
| | • | | 0.10%: Invesco S&P 500 Minimum Variance ETF |
| | • | | 0.13%: Invesco S&P 500 Enhanced Value ETF, Invesco S&P 500 Momentum ETF |
| | • | | 0.14%: Invesco PureBetaSM FTSE Emerging Markets ETF |
| | • | | 0.20%: Invesco Russell 1000 Equal Weight ETF |
| | • | | 0.22%: Invesco Fundamental Investment Grade Corporate Bond ETF |
Approval of Investment Advisory and Sub-Advisory Contracts–(continued)
| | • | | 0.25%: Invesco 1-30 Laddered Treasury ETF, Invesco S&P 500® ex-Rate Sensitive Low Volatility ETF, Invesco S&P 500® High Beta ETF, Invesco S&P 500® Low Volatility ETF, Invesco S&P MidCap Low Volatility ETF, Invesco S&P SmallCap Low Volatility ETF, Invesco VRDO Tax-Free Weekly ETF |
| | • | | 0.28%: Invesco California AMT-Free Municipal Bond ETF, Invesco National AMT-Free Municipal Bond ETF, Invesco New York AMT-Free Municipal Bond ETF, Invesco Taxable Municipal Bond ETF |
| | • | | 0.29%: Invesco Russell 1000 Enhanced Equal Weight ETF, Invesco S&P International Developed Quality ETF, Invesco S&P SmallCap Consumer Discretionary ETF, Invesco S&P SmallCap Consumer Staples ETF, Invesco S&P SmallCap Energy ETF, Invesco S&P SmallCap Financials ETF, Invesco S&P SmallCap Health Care ETF, Invesco S&P SmallCap Industrials ETF, Invesco S&P SmallCap Information Technology ETF, Invesco S&P SmallCap Materials ETF, Invesco S&P SmallCap Quality ETF, Invesco S&P SmallCap Utilities & Communication Services ETF |
| | • | | 0.30%: Invesco S&P 500® High Dividend Low Volatility ETF, Invesco S&P International Developed High Dividend Low Volatility ETF, Invesco S&P SmallCap High Dividend Low Volatility ETF |
| | • | | 0.35%: Invesco Global Short Term High Yield Bond ETF, Invesco KBW Bank ETF, Invesco KBW High Dividend Yield Financial ETF, Invesco KBW Premium Yield Equity REIT ETF, Invesco KBW Property & Casualty Insurance ETF, Invesco KBW Regional Banking ETF, Invesco Russell 1000 Low Beta Equal Weight ETF, Invesco S&P International Developed Low Volatility ETF, Invesco S&P International Developed Momentum ETF |
| | • | | 0.39%: Invesco S&P 500 Revenue ETF, Invesco S&P MidCap 400 Revenue ETF, Invesco S&P SmallCap 600 Revenue ETF, Invesco S&P Ultra Dividend Revenue ETF |
| | • | | 0.45%: Invesco FTSE International Low Beta Equal Weight ETF, Invesco FTSE RAFI Developed Markets ex-U.S. ETF, Invesco S&P Emerging Markets Low Volatility ETF, Invesco S&P Emerging Markets Momentum ETF |
| | • | | 0.49%: Invesco FTSE RAFI Developed Markets ex-U.S. Small-Mid ETF, Invesco FTSE RAFI Emerging Markets ETF |
| | • | | 0.50%: Invesco CEF Income Composite ETF, Invesco Emerging Markets Sovereign Debt ETF, Invesco Fundamental High Yield® Corporate Bond ETF, Invesco International Corporate Bond ETF, Invesco Preferred ETF, Invesco Variable Rate Preferred ETF |
| | • | | 0.55%: Invesco International BuyBack AchieversTM ETF |
| | • | | 0.60%: Invesco DWA SmallCap Momentum ETF |
| | • | | 0.65%: Invesco Senior Loan ETF |
| | • | | 0.70%: Invesco China Technology ETF |
| | • | | 0.75%: Invesco Global Clean Energy ETF, Invesco Global Water ETF |
| | • | | 0.80%: Invesco DWA Developed Markets Momentum ETF |
| | • | | 0.90%: Invesco DWA Emerging Markets Momentum ETF |
The Trustees considered that, effective May 1, 2020, the Adviser had agreed to reduce the unitary advisory fee for Invesco S&P Emerging Markets Low Volatility ETF and Invesco S&P Emerging Markets Momentum ETF from 0.45% to 0.29% of average daily net assets, and to reduce the unitary advisory fee for Invesco S&P International Developed Low Volatility ETF and Invesco S&P International Developed Momentum ETF from 0.35% to 0.25% of average daily net assets.
The Trustees compared each Fund’s net expense ratio to information compiled by the Adviser from Lipper Inc. databases on the net expense ratios of comparable exchange-traded funds (“ETFs”), open-end (non-ETF) index funds and open-end (non-ETF) actively-managed funds, as applicable. The Trustees noted that the net expense ratios for certain Funds were equal to or lower than the median net expense ratios of their ETF and open-end index peer funds as illustrated in the table below. The Trustees also noted that the net expense ratios for all of the Funds were lower than the median net expense ratios of their open-end
Approval of Investment Advisory and Sub-Advisory Contracts–(continued)
actively-managed peer funds. The Trustees noted that a portion of each Fund’s operating expenses was attributable to a sub-license fee payable out of the unitary advisory fee charged to that Fund.
| | | | | | |
| Invesco Fund | | Equal
to/Lower
than ETF
Peer Median | | Equal to/Lower than Open-End Index Fund Peer
Median* | | Lower than
Open-Active Fund
Peer Median |
Invesco 1-30 Laddered Treasury ETF | | | | | | X |
Invesco California AMT-Free Municipal Bond ETF | | | | N/A | | X |
Invesco CEF Income Composite ETF | | X | | N/A | | X |
Invesco China Technology ETF | | | | N/A | | X |
Invesco DWA Developed Markets Momentum ETF | | | | | | X |
Invesco DWA Emerging Markets Momentum ETF | | | | | | X |
Invesco DWA SmallCap Momentum ETF | | | | | | X |
Invesco Emerging Markets Sovereign Debt ETF | | | | | | X |
Invesco FTSE International Low Beta Equal Weight ETF | | X | | X | | X |
Invesco FTSE RAFI Developed Markets ex-U.S. ETF | | | | X | | X |
Invesco FTSE RAFI Developed Markets ex-U.S. Small-Mid ETF | | X | | X | | X |
Invesco FTSE RAFI Emerging Markets ETF | | X | | | | X |
Invesco Fundamental High Yield® Corporate Bond ETF | | | | X | | X |
Invesco Fundamental Investment Grade Corporate Bond ETF | | | | | | X |
Invesco Global Clean Energy ETF | | | | N/A | | X |
Invesco Global Short Term High Yield Bond ETF | | X | | N/A | | X |
Invesco Global Water ETF | | | | N/A | | X |
Invesco International BuyBack AchieversTM ETF | | X | | X | | X |
Invesco International Corporate Bond ETF | | | | | | X |
Invesco KBW Bank ETF | | X | | | | X |
Invesco KBW High Dividend Yield Financial ETF | | X | | | | X |
Invesco KBW Premium Yield Equity REIT ETF | | X | | | | X |
Invesco KBW Property & Casualty Insurance ETF | | X | | | | X |
Invesco KBW Regional Banking ETF | | X | | | | X |
Invesco National AMT-Free Municipal Bond ETF | | | | | | X |
Invesco New York AMT-Free Municipal Bond ETF | | | | N/A | | X |
Invesco Preferred ETF | | | | N/A | | X |
Invesco PureBetaTM 0-5Yr US TIPS ETF | | | | | | X |
Invesco PureBetaTM FTSE Developed ex-North America ETF | | | | | | X |
Invesco PureBetaTM FTSE Emerging Markets ETF | | X | | | | X |
Invesco PureBetaTM MSCI USA ETF | | X | | X | | X |
Invesco PureBetaTM MSCI USA Small Cap ETF | | X | | X | | X |
Invesco PureBetaTM US Aggregate Bond ETF | | X | | X | | X |
Invesco Russell 1000 Enhanced Equal Weight ETF | | X | | X | | X |
Invesco Russell 1000 Equal Weight ETF | | X | | X | | X |
Invesco Russell 1000 Low Beta Equal Weight ETF | | | | X | | X |
Invesco S&P 500 Enhanced Value ETF | | X | | X | | X |
Invesco S&P 500® ex-Rate Sensitive Low Volatility ETF | | X | | X | | X |
Invesco S&P 500® High Beta ETF | | X | | X | | X |
Invesco S&P 500® High Dividend Low Volatility ETF | | X | | X | | X |
Invesco S&P 500® Low Volatility ETF | | X | | | | X |
Invesco S&P 500 Minimum Variance ETF | | X | | X | | X |
Invesco S&P 500 Momentum ETF | | | | X | | X |
Approval of Investment Advisory and Sub-Advisory Contracts–(continued)
| | | | | | |
| Invesco Fund | | Equal
to/Lower
than ETF
Peer Median | | Equal to/Lower than Open-End Index Fund Peer
Median* | | Lower than
Open-Active Fund
Peer Median |
Invesco S&P 500 Revenue ETF | | | | X | | X |
Invesco S&P Emerging Markets Low Volatility ETF | | X | | X | | X |
Invesco S&P Emerging Markets Momentum ETF | | X | | | | X |
Invesco S&P International Developed High Dividend Low Volatility ETF | | X | | | | X |
Invesco S&P International Developed Low Volatility ETF | | X | | | | X |
Invesco S&P International Developed Momentum ETF | | | | | | X |
Invesco S&P International Developed Quality ETF | | X | | | | X |
Invesco S&P MidCap 400 Revenue ETF | | | | | | X |
Invesco S&P MidCap Low Volatility ETF | | | | | | X |
Invesco S&P SmallCap 600 Revenue ETF | | | | X | | X |
Invesco S&P SmallCap Consumer Discretionary ETF | | X | | | | X |
Invesco S&P SmallCap Consumer Staples ETF | | X | | | | X |
Invesco S&P SmallCap Energy ETF | | X | | | | X |
Invesco S&P SmallCap Financials ETF | | X | | | | X |
Invesco S&P SmallCap Health Care ETF | | X | | | | X |
Invesco S&P SmallCap High Dividend Low Volatility ETF | | X | | X | | X |
Invesco S&P SmallCap Industrials ETF | | X | | | | X |
Invesco S&P SmallCap Information Technology ETF | | X | | X | | X |
Invesco S&P SmallCap Low Volatility ETF | | X | | X | | X |
Invesco S&P SmallCap Materials ETF | | X | | | | X |
Invesco S&P SmallCap Quality ETF | | X | | | | X |
Invesco S&P SmallCap Utilities & Communication Services ETF | | X | | X | | X |
Invesco S&P Ultra Dividend Revenue ETF | | | | X | | X |
Invesco Senior Loan ETF | | | | X | | X |
Invesco Taxable Municipal Bond ETF | | | | N/A | | X |
Invesco Treasury Collateral ETF | | X | | | | X |
Invesco Variable Rate Preferred ETF | | | | X | | X |
Invesco VRDO Tax-Free Weekly ETF | | | | N/A | | X |
| * | The information provided by the Adviser indicated that certain Funds did not have any comparable open-end index fund peers. Those Funds have been designated in this column with an “N/A” for not available. |
In response to questions from the Independent Trustees, the Adviser provided supplemental information regarding each of Invesco 1-30 Laddered Treasury ETF, Invesco California AMT-Free Municipal Bond ETF, Invesco DWA Developed Markets Momentum ETF, Invesco Emerging Markets Sovereign Debt ETF, Invesco Global Clean Energy ETF, Invesco Global Water ETF, Invesco International Corporate Bond ETF, Invesco National AMT-Free Municipal Bond ETF, Invesco New York AMT-Free Municipal Bond ETF, Invesco Senior Loan ETF and Invesco VRDO Tax-Free Weekly ETF’s advisory fees and total expenses and the Lipper peer data. The Adviser explained its view that the advisory fees and total expenses for these Funds are competitive and generally in line with other comparable funds in the marketplace, particularly in light of the level and nature of services provided and the investment management style of the Adviser. The Trustees also considered the Adviser’s statements regarding its pricing philosophy and the differing pricing philosophy of certain of the peers.
The Trustees noted information, including fee information, provided by the Adviser regarding other investment products to which it provides investment advisory services, including products that have investment strategies comparable to certain of the Funds. The Trustees considered the Adviser’s explanation of the differences between the services provided to the Funds and to the other investment products it advises, noting the Adviser’s statement that the management and oversight of the Funds requires substantially more labor and expense.
Approval of Investment Advisory and Sub-Advisory Contracts–(continued)
Based on all the information provided, the Board concluded that each Fund’s unitary advisory fee was reasonable and appropriate in light of the services provided, the nature of the indexes, the distinguishing factors of the Funds, and the administrative, operational and management oversight costs for the Adviser.
In conjunction with their review of the unitary advisory fees, the Trustees considered information provided by the Adviser on the revenues received by the Adviser under the Investment Advisory Agreement for the Funds. The Trustees reviewed information provided by the Adviser on its overall profitability, as well as the estimated profitability to the Adviser from its relationship to each Fund. The Trustees concluded that the overall and estimated profitability to the Adviser was not unreasonable.
Economies of Scale and Whether Fee Levels Reflect These Economies of Scale. The Trustees reviewed the information provided by the Adviser as to the extent to which economies of scale may be realized as each Fund grows and whether fee levels reflect economies of scale for the benefit of shareholders. The Trustees reviewed each Fund’s asset size and unitary advisory fee. The Trustees noted that any reduction in fixed costs associated with the management of the Funds would be enjoyed by the Adviser, but a unitary advisory fee provides a level of certainty in expenses for the Funds. The Trustees considered whether the unitary advisory fee rate for each Fund was reasonable in relation to the asset size of that Fund, and concluded that the unitary advisory fee was reasonable and appropriate.
Fall-out Benefits. The Trustees considered that the Adviser identified no additional benefits it receives from its relationship with the Funds, and noted that the Adviser does not have any soft-dollar arrangements. The Trustees also considered benefits received by affiliates of the Adviser that may be directly or indirectly attributed to the Adviser’s relationship with the Funds, including brokerage fees and advisory fees for money market cash management vehicles. The Board concluded that the advisory fee was reasonable, taking into account any ancillary benefits received by affiliates of the Adviser.
Based on all of the information considered and the conclusions reached, the Board, including the Independent Trustees, determined to approve the continuation of the Investment Advisory Agreement for each Fund. No single factor was determinative in the Board’s analysis.
Investment Sub-Advisory Agreement
As noted above, the Board of Trustees of the Trust, including the Independent Trustees, approved the continuation of the Sub-Advisory Agreement for each of Invesco Senior Loan ETF and Invesco Treasury Collateral ETF at a meeting held on April 14, 2020. The review process followed by the Board is described in detail above. In connection with the review of the Sub-Advisory Agreement, the Board considered the factors described below, among others.
Nature, Extent and Quality of Services. The Trustees considered the nature, extent and quality of services provided under the Sub-Advisory Agreement. The Board reviewed the qualifications and background of each Sub-Adviser, the services provided or to be provided by each Sub-Adviser, the investment approach of the Sub-Adviser whose investment personnel manage Invesco Senior Loan ETF’s and Invesco Treasury Collateral ETF’s assets, the experience and skills of the investment personnel responsible for the day-to-day management of the Funds, and the resources made available to such personnel.
Based on their review, the Trustees concluded that the nature, extent and quality of services provided by the Sub-Advisers to Invesco Senior Loan ETF and Invesco Treasury Collateral ETF under the Sub-Advisory Agreement were appropriate and reasonable.
Fees, Expenses and Profitability. The Trustees reviewed and discussed the information provided by the Adviser and the Sub-Advisers on the sub-advisory fee rates under the Sub-Advisory Agreement. The Trustees noted that the sub-advisory fees charged by the Sub-Advisers under the Sub-Advisory Agreement are consistent with the compensation structure used throughout Invesco when Invesco’s affiliates provide sub-advisory services for funds managed by other Invesco affiliates. The Board considered how the sub-advisory fees relate to the overall advisory fee for each of Invesco Senior Loan ETF and Invesco Treasury Collateral ETF and noted that the Adviser compensates the Sub-Advisers from its fee.
The Trustees also reviewed the financial statements provided by Invesco Senior Secured Management, Inc., in connection with the March 12, 2020 Board meeting, and Invesco Advisers, Inc., in connection with the April 14, 2020 meeting, and noted the net income generated by each firm. The Trustees noted that the Adviser compensates the Sub-Advisers from its fee and that the Adviser provided profitability information with respect to Invesco Senior Loan ETF and Invesco Treasury Collateral ETF.
Approval of Investment Advisory and Sub-Advisory Contracts–(continued)
Economies of Scale and Whether Fee Levels Reflect These Economies of Scale. As part of their review of the Investment Advisory Agreement for Invesco Senior Loan ETF and Invesco Treasury Collateral ETF, the Trustees considered the extent to which economies of scale may be realized as the Funds grow and whether fee levels reflect economies of scale for the benefit of shareholders. The Trustees considered whether the sub-advisory fee rates for Invesco Senior Loan ETF and Invesco Treasury Collateral ETF were reasonable in relation to the asset size of the Funds, and concluded that the flat sub-advisory fee rates were reasonable and appropriate.
Fall-out Benefits. The Trustees noted that Invesco Advisers, Inc. receives management fees from money market funds into which the Funds’ and other Invesco ETFs’ excess cash and securities lending collateral may be invested, and that the Adviser waives its fees on the excess cash invested under such arrangement in amounts equal to fees received by Invesco Advisers, Inc. on the Funds’ and other Invesco ETFs’ excess cash invested in the money market funds. The Trustees noted that the Sub-Advisers had not identified any further benefits that they derived from their relationships with Invesco Senior Loan ETF and Invesco Treasury Collateral ETF and that the Sub-Advisers do not have any soft-dollar arrangements with respect to the Funds. The Board concluded that the sub-advisory fee with respect to each Fund was reasonable, taking into account any ancillary benefits received by the Sub-Advisers.
Based on all of the information considered and the conclusions reached, the Board, including the Independent Trustees, determined to approve the continuation of the Sub-Advisory Agreement for Invesco Senior Loan ETF and Invesco Treasury Collateral ETF. No single factor was determinative in the Board’s analysis.
(This Page Intentionally Left Blank)
(This Page Intentionally Left Blank)
Proxy Voting Policies and Procedures
A description of the Trust’s proxy voting policies and procedures that the Funds use to determine how to vote proxies relating to portfolio securities is available, without charge and upon request, by calling (800) 983-0903. This information is also available on the Securities and Exchange Commission’s (the “Commission”) website at www.sec.gov.
Information regarding how each Fund voted proxies for portfolio securities, if applicable, during the most recent 12-month period ended June 30, is available, without charge and upon request, by (i) calling (800) 983-0903; or (ii) accessing the Trust’s Form N-PX on the Commission’s website at www.sec.gov.
Quarterly Portfolios
The Trust files its complete schedule of portfolio holdings for the Funds with the Commission for the first and third quarters of each fiscal year as an exhibit to its reports on Form N-PORT. The Forms N-PORT are available on the Commission’s website at www.sec.gov.
Frequency Distribution of Discounts and Premiums
A table showing the number of days the market price of each Fund’s shares was greater than the Fund’s net asset value, and the number of days it was less than the Fund’s net asset value (i.e., premium or discount) for the most recently completed calendar year, and the calendar quarters since that year end (or the life of the Fund, if shorter) may be found at the Fund’s website at www.invesco.com/ETFs.
| | | | |
©2020 Invesco Capital Management LLC 3500 Lacey Road, Suite 700 Downers Grove, IL 60515 | | O-REV-AR-2 | | invesco.com/ETFs |
Item 2. Code of Ethics.
The Registrant has adopted a Code of Ethics that applies to the Registrant’s principal executive officer and principal financial officer. This Code is filed as an exhibit to this report on Form N-CSR under Item 13(a)(1). No substantive amendments to this Code were made during the reporting period. There were no waivers for the fiscal year ended August 31, 2020.
Item 3. Audit Committee Financial Expert.
The Registrant’s Board of Trustees (the “Board”) has determined that the Registrant has four “audit committee financial experts” serving on its audit committee: Mr. Marc M. Kole, Ms. Joanne Pace, Mr. Gary R. Wicker, and Mr. Donald H. Wilson. Each of these audit committee members is “independent,” meaning that he/she is not an “interested person” of the Registrant (as that term is defined in Section 2(a)(19) of the Investment Company Act of 1940, as amended) and he/she does not accept any consulting, advisory, or other compensatory fee from the Registrant (except in his/her capacity as a Board or committee member).
An “audit committee financial expert” is not an “expert” for any purpose, including for purposes of Section 11 of the Securities Act of 1933, as a result of being designated as an “audit committee financial expert.” Further, the designation of a person as an “audit committee financial expert” does not mean that a person has any greater duties, obligations, or liability than those imposed on a person without the “audit committee financial expert” designation. Similarly, the designation of a person as an “audit committee financial expert” does not affect the duties, obligations, or liability of any other member of the audit committee or Board.
Item 4. Principal Accountant Fees and Services.
(a) to (d)
Fees Billed by PwC to the Registrant
PricewaterhouseCoopers LLP (“PwC”), the Registrant’s independent registered public accounting firm, billed the Registrant aggregate fees for pre-approved services rendered to the Registrant for the last two fiscal years as shown in the following table. The Audit Committee pre-approved all audit and non-audit services provided to the Registrant.
| | | | |
| | | Fees Billed by PwC for Services Rendered to the
Registrant for Fiscal Year End 2020 | | Fees Billed by PwC for Services Rendered to the
Registrant for Fiscal Year End 2019 |
| Audit Fees | | $ 719,700 | | $742,770 |
Audit-Related Fees | | $ 0 | | $ 0 |
| Tax Fees(1) | | $ 672,950 | | $662,727 |
| All Other Fees | | $ 0 | | $ 0 |
Total Fees | | $1,392,650 | | $1,405,497 |
| (1) | Tax Fees for the fiscal years ended August 31, 2020 and 2019 include fees billed for preparation of U.S. Tax Returns and Taxable Income calculations, including excise and year-to-date estimates for various book-to-tax differences. |
Fees Billed by PwC Related to Invesco and Invesco Affiliates
PwC billed Invesco Capital Management LLC (“Invesco” or “Adviser”), the Registrant’s investment adviser, and any entity controlling, controlled by or under common control with Invesco that provides ongoing services to the Registrant (“Affiliates”), aggregate fees for pre-approved non-audit services rendered to Invesco and Affiliates for the last two fiscal years as shown in the following table. The Audit Committee pre-approved all non-audit services provided to Invesco and Affiliates that were required to be pre-approved.
| | | | |
| | | Fees Billed for Non-
Audit Services
Rendered to
Invesco and
Affiliates for Fiscal
Year End 2020 That
Were Required
to be Pre-Approved
by the Registrant’s Audit Committee | | Fees Billed for Non-
Audit Services
Rendered to
Invesco and
Affiliates for Fiscal
Year End 2019 That
Were Required
to be Pre-Approved
by the Registrant’s Audit Committee |
Audit-Related Fees(1) | | $701,000 | | $690,000 |
Tax Fees | | $ 0 | | $ 0 |
All Other Fees | | $ 0 | | $ 0 |
Total Fees | | $701,000 | | $690,000 |
| (1) | Audit-Related Fees for the fiscal years ended 2020 and 2019 include fees billed related to reviewing controls at a service organization. |
(e)(1) Audit Committee Pre-Approval Policies and Procedures
Pre-Approval of Audit and Non-Audit Services Policies and Procedures
As Adopted by the Audit Committee of the Invesco ETFs
| | |
| Applicable to | | Invesco Exchange-Traded Fund Trust, Invesco Exchange-Traded Fund Trust II, Invesco India Exchange-Traded Fund Trust, Invesco Actively Managed Exchange-Traded Fund Trust, Invesco Actively Managed Exchange-Traded Commodity Fund Trust and Invesco Exchange-Traded Self-Indexed Fund Trust (collectively the “Funds”) |
| Risk Addressed by Policy | | Approval of Audit and Non-Audit Services |
| Relevant Law and Other Sources | | Sarbanes-Oxley Act of 2002; Regulation S-X. |
| Last Reviewed by Compliance for Accuracy | | June 15, 2018 |
| Approved/Adopted Date | | June 2009 |
Statement of Principles
Under the Sarbanes-Oxley Act of 2002 and rules adopted by the Securities and Exchange Commission (“SEC”) (“Rules”), the Audit Committee of the Funds’ (the “Audit Committee”) Board of Trustees (the “Board”) is responsible for the appointment, compensation and oversight of the work of independent accountants (an “Auditor”). As part of this responsibility and to assure that the Auditor’s independence is not impaired, the Audit Committee pre-approves the audit and non-audit services provided to the Funds by each Auditor, as well as all non-audit services provided by the Auditor to the Funds’ investment adviser and to affiliates of the adviser that provide ongoing services to the Funds (“Service Affiliates”) if the services directly impact the Funds’ operations or financial reporting. The SEC Rules also specify the types of services that an Auditor may not provide to its audit client. The following policies and procedures comply with the requirements for pre-approval and provide a mechanism by which management of the Funds may request and secure pre-approval of audit and non-audit services in an orderly manner with minimal disruption to normal business operations.
Proposed services either may be pre-approved without consideration of specific case-by-case services by the Audit Committee (“general pre-approval”) or require the specific pre-approval of the Audit Committee (“specific pre-approval”). As set forth in these policies and procedures, unless a type of service has received general pre-approval, it will require specific pre-approval by the Audit Committee. Additionally, any fees exceeding 110% of estimated pre-approved fee levels provided at the time the service was pre-approved will also require specific approval by the Audit Committee before payment is made. The Audit Committee will also consider the impact of additional fees on the Auditor’s independence when determining whether to approve any additional fees for previously pre-approved services.
The Audit Committee will annually review and generally pre-approve the services that may be provided by each Auditor without obtaining specific pre-approval from the Audit Committee. The term of any general pre-approval runs from the date of such pre-approval through June 30th of the following year, unless the Audit Committee considers a different period and states otherwise. The Audit Committee will add to or subtract from the list of general pre-approved services from time to time, based on subsequent determinations.
The purpose of these policies and procedures is to set forth the guidelines to assist the Audit Committee in fulfilling its responsibilities.
Delegation
The Chairman of the Audit Committee (or, in his or her absence, any member of the Audit Committee) may grant specific pre-approval for non-prohibited services. All such delegated pre-approvals shall be presented to the Audit Committee no later than the next Audit Committee meeting.
Audit Services
The annual Audit services engagement terms will be subject to specific pre-approval of the Audit Committee. Audit services include the annual financial statement audit and other procedures such as tax provision work that is required to be performed by the independent auditor to be able to form an opinion on the Funds’ financial statements. The Audit Committee will obtain, review and consider sufficient information concerning the proposed Auditor to make a reasonable evaluation of the Auditor’s qualifications and independence.
In addition to the annual Audit services engagement, the Audit Committee may grant either general or specific pre-approval of other Audit services, which are those services that only the independent auditor reasonably can provide. Other Audit services may include services such as issuing consents for the inclusion of audited financial statements with SEC registration statements, periodic reports and other documents filed with the SEC or other documents issued in connection with securities offerings.
Non-Audit Services
The Audit Committee may provide either general or specific pre-approval of any non-audit services to the Funds and its Service Affiliates if the Audit Committee believes that the provision of the service will not impair the independence of the Auditor, is consistent with the SEC’s Rules on auditor independence, and otherwise conforms to the Audit Committee’s general principles and policies as set forth herein.
Audit-Related Services
“Audit-related services” are assurance and related services that are reasonably related to the performance of the audit or review of the Funds’ financial statements or that are traditionally performed by the independent auditor. Audit-related services include, among others, accounting consultations related to accounting, financial reporting or disclosure matters not classified as “Audit services”; and assistance with understanding and implementing new accounting and financial reporting guidance from rulemaking authorities.
Tax Services
“Tax services” include, but are not limited to, the review and signing of the Funds’ federal tax returns, the review of required distributions by the Funds and consultations regarding tax matters such as the tax treatment of new investments or the impact of new regulations. The Audit Committee will scrutinize carefully the retention of the Auditor in connection with a transaction initially recommended by the Auditor, the major business purpose of which may be tax avoidance or the tax treatment of which may not be supported in the Internal Revenue Code and related regulations. The Audit Committee will consult with the Funds’ Treasurer (or his or her designee) and may consult with outside counsel or advisors as necessary to ensure the consistency of Tax services rendered by the Auditor with the foregoing policy.
No Auditor shall represent any Fund or any Service Affiliate before a tax court, district court or federal court of claims.
Under rules adopted by the Public Company Accounting Oversight Board and approved by the SEC, in connection with seeking Audit Committee pre-approval of permissible Tax services, the Auditor shall:
| | 1. | Describe in writing to the Audit Committee, which writing may be in the form of the proposed engagement letter: |
| | a. | The scope of the service, the fee structure for the engagement, and any side letter or amendment to the engagement letter, or any other agreement between the Auditor and the Fund, relating to the service; and |
| | b. | Any compensation arrangement or other agreement, such as a referral agreement, a referral fee or |
fee-sharing arrangement, between the Auditor and any person (other than the Fund) with respect to the promoting, marketing, or recommending of a transaction covered by the service;
| | 2. | Discuss with the Audit Committee the potential effects of the services on the independence of the Auditor; and |
| | 3. | Document the substance of its discussion with the Audit Committee. |
All Other Auditor Services
The Audit Committee may pre-approve non-audit services classified as “All other services” that are not categorically prohibited by the SEC, as listed in Exhibit 1 to this policy.
Pre-Approval Fee Levels or Established Amounts
Pre-approval of estimated fees or established amounts for services to be provided by the Auditor under general or specific pre-approval policies will be set periodically by the Audit Committee. Any proposed fees exceeding 110% of the maximum estimated pre-approved fees or established amounts for pre-approved audit and non-audit services will be reported to the Audit Committee at the quarterly Audit Committee meeting and will require specific approval by the Audit Committee before payment is made. The Audit Committee will always factor in the overall relationship of fees for audit and non-audit services in determining whether to pre-approve any such services and in determining whether to approve any additional fees exceeding 110% of the maximum pre-approved fees or established amounts for previously pre-approved services.
Procedures
On an annual basis, the Auditor will submit to the Audit Committee for general pre-approval, a list of non-audit services that the Funds or Service Affiliates of the Funds may request from the Auditor. The list will describe the non-audit services in reasonable detail and will include an estimated range of fees and such other information as the Audit Committee may request.
Each request for services to be provided by the Auditor under the general pre-approval of the Audit Committee will be submitted to the Funds’ Treasurer (or his or her designee) and must include a detailed description of the services to be rendered. The Treasurer or his or her designee will ensure that such services are included within the list of services that have received the general pre-approval of the Audit Committee.
Each request to provide services that require specific approval by the Audit Committee shall be submitted to the Audit Committee jointly by the Funds’ Treasurer or his or her designee and the Auditor, and must include a joint statement that, in their view, such request is consistent with the pre-approval policies and procedures and the SEC Rules.
Each request to provide Tax services under either the general or specific pre-approval of the Audit Committee will describe in writing: (i) the scope of the service, the fee structure for the engagement, and any side letter or amendment to the engagement letter, or any other agreement between the Auditor and the audit client, relating to the service; and (ii) any compensation arrangement or other agreement between the Auditor and any person (other than the audit client) with respect to the promoting, marketing, or recommending of a transaction covered by the service. The Auditor will discuss with the Audit Committee
the potential effects of the services on the Auditor’s independence and will document the substance of the discussion.
Non-audit services pursuant to the de minimis exception provided by the SEC Rules will be promptly brought to the attention of the Audit Committee for approval, including documentation that each of the conditions for this exception, as set forth in the SEC Rules, has been satisfied.
On at least an annual basis, the Auditor will prepare a summary of all the services provided to any entity in the investment company complex as defined in section 2-01(f)(14) of Regulation S-X in sufficient detail as to the nature of the engagement and the fees associated with those services.
The Audit Committee has designated the Funds’ Treasurer to monitor the performance of all services provided by the Auditor and to ensure such services are in compliance with these policies and procedures. The Funds’ Treasurer will report to the Audit Committee on a periodic basis as to the results of such monitoring. Both the Funds’ Treasurer and management will immediately report to the Chairman of the Audit Committee any breach of these policies and procedures that comes to the attention of the Funds’ Treasurer or senior management.
| | |
| Adopted: | | June 26, 2009 |
| |
| Amended: | | June 15, 2018 |
Exhibit 1 to Pre-Approval of Audit and Non-Audit Services Policies and Procedures Conditionally Prohibited Non-Audit Services (not prohibited if the Fund can reasonably conclude that the results of the service would not be subject to audit procedures in connection with the audit of the Fund’s financial statements)
| | • | | Bookkeeping or other services related to the accounting records or financial statements of the audit client |
| | • | | Financial information systems design and implementation |
| | • | | Appraisal or valuation services, fairness opinions, or contribution-in-kind reports |
| | • | | Internal audit outsourcing services |
Categorically Prohibited Non-Audit Services
| | • | | Broker-dealer, investment adviser, or investment banking services |
| | • | | Expert services unrelated to the audit |
| | • | | Any service or product provided for a contingent fee or a commission |
| | • | | Services related to marketing, planning, or opining in favor of the tax treatment of confidential transactions or aggressive tax position transactions, a significant purpose of which is tax avoidance |
| | • | | Tax services for persons in financial reporting oversight roles at the Fund |
| | • | | Any other service that the Public Company Oversight Board determines by regulation is impermissible. |
(e)(2) There were no amounts that were pre-approved by the Audit Committee pursuant to the de minimus exception under Rule 2-01 of Regulation S-X.
| | (g) | In addition to the amounts shown in the tables above, PwC billed Invesco and Affiliates aggregate fees of $ 5,770,000 for the fiscal year ended August 31, 2020 and $ 3,213,000 for the fiscal year ended August 31, 2019 for non-audit services not required to be pre-approved by the Registrant’s Audit Committee. In total, PwC billed the Registrant, Invesco and Affiliates aggregate non-audit fees of $ 7,143,950 for the fiscal year ended August 31, 2020 and $ 4,565,727 for the fiscal year ended August 31, 2019. |
| | (h) | With respect to the non-audit services above billed to Invesco and Affiliates that were not required to be pre-approved by the Registrant’s Audit Committee, the Audit Committee received information from PwC about such services, including by way of comparison, that PwC provided audit services to entities within the Investment Company Complex, as defined by Rule 2-01(f)(14) of Regulation S-X, of approximately $32 million and non-audit services of approximately $20 million for the fiscal year ended 2020. The Audit Committee considered this information in evaluating PwC’s independence. |
Pursuant to PCAOB Rule 3526, PwC advised the Registrant’s Audit Committee of the following matters identified between September 1, 2019 and October 27, 2020 that may be reasonably thought to bear on PwC’s independence. PwC advised the Audit Committee that four PwC Managers and two PwC Associates each held financial interests in investment companies within the complex that includes the Funds as well as all registered investment companies advised by the Adviser and its affiliates, including other subsidiaries of the Adviser’s parent company, Invesco Ltd. (collectively, the “Invesco Fund Complex”) that were inconsistent with the requirements of Rule 2-01(c)(1) of Regulation S-X. In reporting the matters to the Audit Committee, PwC noted, among other things, that the impermissible holdings were disposed of by the individuals, the individuals were not in the chain of command of the audit or the audit partners of the Funds, the financial interests were not material to the net worth of each individual or their respective immediate family members and senior leadership of the Funds’ audit engagement team was unaware of the impermissible holdings until after the matters were confirmed to be independence exceptions or individuals ceased providing their non-audit services. In addition, PwC considered that audit work was performed by the PwC Associates, but such audit work was of a limited nature relating to administrative tasks and international tax. Based on the mitigating factors noted above, PwC advised the Audit Committee that it concluded that its objectivity and impartiality with respect to all issues encompassed within the audit engagement has not been impaired and that it believes it can continue to serve as the independent registered public accounting firm for the Funds in the Registrant.
Item 5. Audit Committee of Listed Registrants.
| | (a) | The Registrant has a separately designated Audit Committee established in accordance with Section 3(a)(58)(A) of the Securities Exchange Act of 1934, as amended, which consists solely of independent trustees. The Audit Committee members are Marc M. Kole, Joanne Pace, Gary R. Wicker, and Donald H. Wilson. |
Item 6. Schedule of Investments.
| (a) | The Schedules of Investments are included as a part of the report to shareholders filed under Item 1 of this Form N-CSR. |
Item 7. Disclosure of Proxy Voting Policies and Procedures for Closed-End Management Investment Companies.
Not applicable.
Item 8. Portfolio Managers of Closed-End Management Investment Companies.
Not applicable.
Item 9. Purchases of Equity Securities by Closed-End Management Investment Company and Affiliated Purchasers.
Not applicable.
Item 10. Submission of Matters to a Vote of Security Holders.
There have been no material changes to the procedures by which shareholders may recommend nominees to the Board that would require disclosure herein.
Item 11. Controls and Procedures.
| (a) | Based on their evaluation of the Registrant’s disclosure controls and procedures (as defined in Rule 30a-3(c) under the Investment Company Act of 1940) as of a date within 90 days of the filing date of this report, the Registrant’s President (principal executive officer) and Treasurer (principal financial officer) have concluded that such disclosure controls and procedures are |
effective.
| (b) | There were no changes in the registrant’s internal control over financial reporting (as defined in Rule 30a-3(d) under the Investment Company Act of 1940) that occurred during the period covered by this report that has materially affected, or is reasonably likely to materially affect, the registrant’s internal control over financial reporting. |
Item 12. Disclosure of Securities Lending Activities for Closed-End Management Investment Companies.
Not applicable.
Item 13. Exhibits.
SIGNATURES
Pursuant to the requirements of the Securities Exchange Act of 1934 and the Investment Company Act of 1940, the Registrant has duly caused this report to be signed on its behalf by the undersigned, thereunto duly authorized.
(Registrant) Invesco Exchange-Traded Fund Trust II
| | |
| By: | | /s/ Anna Paglia |
| |
| Name: | | Anna Paglia |
| Title: | | President |
| |
| Date: | | November 6, 2020 |
Pursuant to the requirements of the Securities Exchange Act of 1934 and the Investment Company Act of 1940, this report has been signed below by the following persons on behalf of the Registrant and in the capacities and on the dates indicated.
| | |
| By: | | /s/ Anna Paglia |
| |
| Name: | | Anna Paglia |
| Title: | | President |
| |
| Date: | | November 6, 2020 |
| | |
| By: | | /s/ Kelli Gallegos |
| |
| Name: | | Kelli Gallegos |
| Title: | | Treasurer |
| |
| Date: | | November 6, 2020 |