UNITED STATES
SECURITIES AND EXCHANGE COMMISSION
Washington, D.C. 20549
FORM N-CSR
CERTIFIED SHAREHOLDER REPORT OF REGISTERED
MANAGEMENT INVESTMENT COMPANIES
Investment Company Act file number 811-21977
Invesco Exchange-Traded Fund Trust II
(Exact name of registrant as specified in charter)
3500 Lacey Road
Downers Grove, IL 60515
(Address of principal executive offices) (Zip code)
Anna Paglia
President
3500 Lacey Road
Downers Grove, IL 60515
(Name and address of agent for service)
Registrant’s telephone number, including area code: 800-983-0903
Date of fiscal year end: October 31
Date of reporting period: October 31, 2022
Form N-CSR is to be used by management investment companies to file reports with the Commission not later than 10 days after the transmission to stockholders of any report that is required to be transmitted to stockholders under Rule 30e-1 under the Investment Company Act of 1940 (17 CFR 270.30e-1). The Commission may use the information provided on Form N-CSR in its regulatory, disclosure review, inspection, and policymaking roles.
A registrant is required to disclose the information specified by Form N-CSR, and the Commission will make this information public. A registrant is not required to respond to the collection of information contained in Form N-CSR unless the Form displays a currently valid Office of Management and Budget (“OMB”) control number. Please direct comments concerning the accuracy of the information collection burden estimate and any suggestions for reducing the burden to Secretary, Securities and Exchange Commission, 450 Fifth Street, NW, Washington, DC 20549-0609. The OMB has reviewed this collection of information under the clearance requirements of 44 U.S.C. § 3507.
Item 1. Reports to Stockholders.
| (a) | The Registrant’s annual report transmitted to shareholders pursuant to Rule 30e-1 under the Investment Company Act of 1940 is as follows: |
| (b) | Not applicable. |
 |
Invesco Annual Report to Shareholders | |||
| October 31, 2022 | ||||
| PBTP | Invesco PureBetaSM 0-5 Yr US TIPS ETF | |||
| PBDM | Invesco PureBetaSM FTSE Developed ex-North America ETF | |||
| PBEE | Invesco PureBetaSM FTSE Emerging Markets ETF | |||
| 2 |
|
Domestic Equity
The fiscal year ended October 31, 2022 began with continued volatility in equity markets in the fourth quarter of 2021 amid substantial inflation and the emergence of a new COVID-19 variant. Pandemic-related supply chain disruption and labor shortages intensified during the quarter, resulting in broadly higher input costs for companies and consumers alike. Additionally, the price of oil rose,1 causing higher gas prices for consumers, and the Consumer Price Index (CPI) reported for November 2021 increased 0.8%, resulting in a 6.8% increase over the prior 12 months, the highest since 1982.2 To combat inflation, the US Federal Reserve (the Fed) announced the potential for three or more interest rate increases in 2022. With solid corporate earnings and optimism about the COVID-19 Omicron variant reporting milder symptoms, stocks rallied at the 2021 year-end.
Equity markets declined in the first quarter of 2022 amid volatility sparked by Russia’s invasion of Ukraine, rising commodity prices, rampant global inflation and the Fed’s shift toward tighter monetary policy. Russia’s invasion exacerbated inflation pressures, disrupting already strained supply chains and increasing shortages of oil, gas and raw materials. The price of oil rose sharply, with crude prices reaching their highest price per barrel since 2008.1 Inflation continued to be a top concern for consumers, investors and the Fed. To combat inflation, the Fed raised the federal funds rate by one-quarter percentage point in March and the Fed indicated it would “taper” its asset purchase program quickly.3
As the war in Ukraine continued and corporate earnings in high-profile names like Netflix reported slowing growth and profits, the equity markets sold off for much of April 2022. The downward direction of the equity markets continued into the second quarter of 2022 amid record inflation, rising interest rates and an increasing likelihood of a US recession. Driven by higher food and energy prices, the CPI rose by yet another 40-year high to 8.6% for the 12 months ended May 2022.2 Oil prices peaked near $122 per barrel in early June, resulting in skyrocketing gasoline prices; the national average price reached a record high above $5 per gallon in early June.1 To tame inflation, the Fed raised the benchmark federal funds rate three more times, by 0.50% in May, by 0.75% in June and another 0.75% in July, which were the largest increases in nearly 30 years.3 US equity markets rose in July and much of August until Fed chairman Jerome Powell’s hawkish comments at an economic policy symposium held in Jackson Hole, Wyoming sparked a sharp selloff at month-end. The Fed reiterated that it would continue taking aggressive action to curb inflation, even though such measures could “bring pain to households and businesses,” and the Fed raised the benchmark federal funds rate by another 0.75% in September.3
After experiencing a sharp drop in September 2022, US equity markets rebounded in October with strong gains, despite mixed data on the economy and corporate earnings. Inflation data
reported in October came in higher than expected; however, the labor market remained strong, with payroll employment gains and a decline in the unemployment rate to a near record low of 3.5% in September.2 The initial estimate of third quarter real gross domestic product showed an increase of 2.6% (annualized) after falling in the prior two quarters, but the headline number masked a drop in demand and investment. Corporate earnings were generally in line with expectations, but many companies’ forward earnings guidance was weaker than expected.
In this environment, US stocks had negative double-digit returns for the fiscal year ended October 31, 2022 of -14.61%, as measured by the S&P 500 Index.4
| 1 | Source: Bloomberg LP |
| 2 | Source: US Bureau of Labor Statistics |
| 3 | Source: US Federal Reserve |
| 4 | Source: Lipper Inc. |
Global Equity
At the beginning of the fiscal year ended October 31, 2022, developed global equity markets were mostly positive, despite rising inflation and the emergence of Omicron, a new COVID-19 variant. Pandemic-related supply chain disruptions and labor shortages intensified at the end of 2021, resulting in broadly higher costs for companies and consumers. Emerging market equities declined due in part to COVID-19 concerns and China’s ongoing regulatory tightening in the private education and technology sectors and slowing economic growth.
Global equity markets declined in the first half of 2022 amid volatility sparked by Russia’s invasion of Ukraine, rising commodity prices, rampant global inflation and central banks shifting toward tighter monetary policy. Russia’s invasion exacerbated inflationary pressures, disrupting already strained supply chains, and increasing shortages of oil, gas and raw materials, with the price of oil rising sharply.
Inflation headwinds continued into the third quarter of 2022. The US Federal Reserve (the Fed), the European Central Bank and the Bank of England all raised interest rates. In contrast, the People’s Bank of China lowered its policy rate and the Bank of Japan kept rates the same. Emerging market equities, hampered by the strong US dollar, underperformed developed market equities.
During October 2022, developed market equities rebounded and were in positive territory. Developed market equities outperformed emerging market equities, which declined primarily driven by weakness in China as Chinese markets reacted to the reappointment of President Xi and his authority, with no signs of the country’s zero-COVID-19 policy being relaxed. Despite the rebound in October for developed market equities, at the end of the fiscal year, trailing one-year returns for developed market equities and emerging market equities were both in negative territory.
| 3 |
|
The Market Environment (continued)
Fixed Income
In the fourth quarter of 2021, concerns about inflation heightened as US inflation rose 7%,1 its highest level in nearly 40 years. Though the US Federal Reserve (the Fed) left policy rates unchanged during the quarter, the Fed indicated its accommodative policies were coming to an end in 2022 through a willingness to raise interest rates to combat inflation and the announced reduction of its monthly bond purchase program. Additionally, US interest rate moves and inflation risk significantly affected fixed income valuations during the quarter. The two-year Treasury yield rose moderately from 0.27% to 0.73%, while the 10-year increased slightly from 1.48% to 1.52% during the quarter.2 The yield curve, as measured by the yield differential between two- and 10-year Treasuries, flattened during the quarter.
At the beginning of 2022, geopolitical and economic tensions between Ukraine and Russia culminated with the latter invading Ukrainian territory. World leaders levied sanctions against Russia that had material effects on its fixed income markets, particularly sovereign debt and corporates, and levels of liquidity. The Russia-Ukraine war exacerbated inflationary pressures while also exerting downward pressure on economic growth through a surge in commodity/energy prices. Additionally, surges of COVID-19 in China exacerbated supply chain issues and aggravated inflation. During the second quarter of 2022, the two-year Treasury yield rose significantly from 0.78% to 2.28%, while the 10-year increased slightly from 1.63% to 2.32%.2
In the second quarter of 2022, the macro backdrop of tightening financial conditions and slowing economic growth was negative for credit asset classes. Inflation, as measured by the Consumer Price Index, increased further to 9.1% and fixed income markets experienced significant negative performance as all bond sectors felt the impact of rising interest rates with negative performance ranging from -0.9% (Bloomberg Asset-Backed Securities) to -9.8% (Bloomberg US Corporate High Yield).3 Credit spreads increased across all major credit-sensitive sectors, reflecting anticipation of an economic slowdown and increasing concerns about recession risk, with corporate spreads ending the second quarter above their long-term historical average. The Fed continued its rapid tightening of monetary policy in an effort to combat inflation via higher interest rates while simultaneously engineering a soft landing so as to not push the economy into a recession. The Fed aggressively raised its key Fed funds rate during the fiscal year, including a 0.50% hike in May, and three 0.75% hikes in June, July and November, the largest hikes since 1994, to a target Fed funds rate of 3.75-4.00%, the highest since 2008.4 At their November 2022 meeting, the Fed signaled that its hawkish policies would continue, though a slowing of the pace of rate increases was likely. While rates remained elevated across all maturities on the yield curve, the two-year Treasury rates increased from 2.92% to 4.51% during the fiscal year, while
10-year Treasury rates increased from 2.98% to 4.10%.2 At the end of the fiscal year, the yield curve remained inverted, which historically has been an indicator of a potential recession.
| 1 | Source: US Bureau of Labor Statistics |
| 2 | Source: US Department of the Treasury |
| 3 | Source: Bloomberg |
| 4 | Source: Federal Reserve of Economic Data |
| 4 |
|
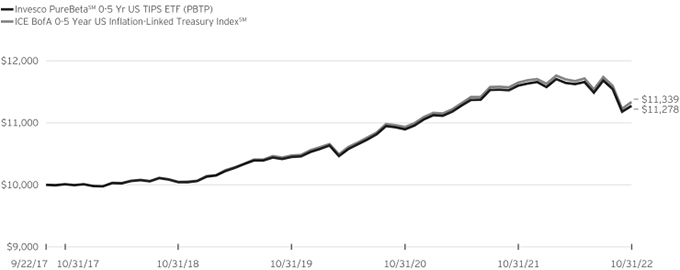
As an index fund, the Invesco PureBetaSM 0-5 Yr US TIPS ETF (the “Fund”) is passively managed and seeks to track the investment results (before fees and expenses) of the ICE BofA 0-5 Year US Inflation-Linked Treasury IndexSM (the “Index”). The Fund generally will invest at least 80% of its total assets in the components that comprise the Index.
Strictly in accordance with its guidelines and mandated procedures, ICE Data Indices, LLC (the “Index Provider”) compiles, maintains and calculates the Index, which is designed to measure the performance of the shorter maturity subset of the U.S. Treasury Inflation-Protected Securities (“TIPS”) market, represented by TIPS with a remaining maturity of at least one month and less than five years. TIPS are U.S. dollar-denominated, U.S. government debt securities that are publicly offered for sale in the United States. TIPS are “inflation-linked”, meaning that their principal and interest payments are tied to inflation (as measured by the Consumer Price Index). TIPS are issued by the U.S. Treasury, and their payments are supported by the full faith and credit of the United States.
To qualify for inclusion in the Index, securities must have: (i) at least one month but less than five years remaining term to final maturity; (ii) at least 18 months to maturity when issued; (iii) a minimum amount outstanding of $1 billion; and (iv) meet certain additional inclusion criteria detailed below. Original issue zero coupon bonds may be included in the Index, and the amounts outstanding of qualifying coupon securities are not reduced by any portions that have been stripped. Index constituents are market capitalization- weighted. The Fund generally invests in all of the securities comprising its Index in proportion to their weightings in the Index.
During the fiscal year ended October 31, 2022, on a market price basis, the Fund returned (2.78)%. On a net asset value (“NAV”) basis, the Fund returned (2.79)%. During the same time period, the Index returned (2.67)%. During the fiscal year, the Fund fully replicated the components of the Index; therefore, the Fund’s performance, on a NAV basis, differed from the return of the Index primarily due to fees and operating expenses as well as trading costs incurred by the Fund during the period.
For the fiscal year ended October 31, 2022, bonds with maturities of less than 1 year contributed most significantly to the Fund’s return, followed by bonds with maturities of 1 year. Bonds with maturities of 3 & 4 years detracted from the Fund’s return.
Positions that contributed most significantly to the Fund’s return for the fiscal year ended October 31, 2022, included Treasury CPI Note, 0.63% coupon, due 04/15/2023 (portfolio average weight of 6.00%) and Treasury CPI Note, 0.13% coupon, due 01/15/2023 (portfolio average weight of 5.60%). Positions that detracted from the Fund’s return included Treasury CPI Note, 0.38% coupon, due 01/15/2027 (portfolio average weight of
4.80%) and Treasury CPI Note, 0.13% coupon, due 10/15/2026 (portfolio average weight of 4.20%).
| Duration Breakdown (% of the Fund’s Net Assets) as of October 31, 2022 | ||||
| Maturing in 0-5 Years | 99.86 | |||
| Money Market Funds Plus Other Assets Less Liabilities | 0.14 | |||
| Top Ten Fund Holdings* (% of the Fund’s Net Assets) as of October 31, 2022 | ||||
| Security | ||||
| U.S. Treasury Inflation—Indexed Notes, 0.63%, 04/15/2023 | 5.97 | |||
| U.S. Treasury Inflation—Indexed Notes, 0.13%, 01/15/2023 | 5.59 | |||
| U.S. Treasury Inflation—Indexed Notes, 0.38%, 07/15/2023 | 5.55 | |||
| U.S. Treasury Inflation—Indexed Notes, 0.63%, 01/15/2024 | 5.45 | |||
| U.S. Treasury Inflation—Indexed Notes, 0.63%, 01/15/2026 | 5.43 | |||
| U.S. Treasury Inflation—Indexed Notes, 0.13%, 07/15/2024 | 5.35 | |||
| U.S. Treasury Inflation—Indexed Notes, 0.25%, 01/15/2025 | 5.28 | |||
| U.S. Treasury Inflation—Indexed Notes, 0.38%, 07/15/2025 | 5.28 | |||
| U.S. Treasury Inflation—Indexed Notes, 0.38%, 01/15/2027 | 4.79 | |||
| U.S. Treasury Inflation—Indexed Notes, 2.38%, 01/15/2025 | 4.77 | |||
| Total | 53.46 | |||
| * | Excluding money market fund holdings. |
| 5 |
|
Invesco PureBetaSM 0-5 Yr US TIPS ETF (PBTP) (continued)
Growth of a $10,000 Investment Since Inception
Fund Performance History as of October 31, 2022
| 1 Year | 3 Years Average | 3 Years Cumulative | 5 Years Average | 5 Years Cumulative | Fund Inception | |||||||||||||||||||||||||||
| Index | Average Annualized | Cumulative | ||||||||||||||||||||||||||||||
| ICE BofA 0-5 Year US Inflation-Linked Treasury IndexSM | (2.67 | )% | 2.69 | % | 8.27 | % | 2.53 | % | 13.29 | % | 2.49 | % | 13.39 | % | ||||||||||||||||||
| Fund | ||||||||||||||||||||||||||||||||
| NAV Return | (2.79 | ) | 2.58 | 7.93 | 2.41 | 12.66 | 2.38 | 12.78 | ||||||||||||||||||||||||
| Market Price Return | (2.78 | ) | 2.59 | 7.97 | 2.43 | 12.73 | 2.40 | 12.88 | ||||||||||||||||||||||||
Fund Inception: September 22, 2017
Performance quoted above represents past performance. Past performance is not a guarantee of future results and current performance may be higher or lower than performance quoted. Investment returns and principal value will fluctuate, and shares of the Fund (“Fund Shares”), when redeemed or sold, may be worth more or less than their original cost. Fund performance reflects any applicable fee waivers and/or expense reimbursements. Had the adviser not waived fees and/or reimbursed expenses currently or in the past, returns would have been lower. See the current prospectus for more information. According to the Fund’s current prospectus, the Fund’s expense ratio of 0.07% is expressed as a unitary management fee to cover operating expenses and expenses incurred in connection with managing the portfolio. NAV and Market Price returns assume that dividends and capital gain distributions have been reinvested in the Fund at NAV and Market Price, respectively. The returns shown in the table above do not reflect the deduction of
taxes that a shareholder would pay on Fund distributions or the redemption or sale of Fund Shares. See invesco.com/ETFs to find the most recent month-end performance numbers.
Performance results for the index stated above are based upon a hypothetical investment in their respective constituent securities. The returns of an index do not represent Fund returns. An investor cannot invest directly in an index. The index does not charge management fees or brokerage expenses, and no such fees or expenses were deducted from the hypothetical performance shown. In addition, the results actual investors might have achieved would have differed from those shown because of differences in the timing, amounts of their investments, and fees and expenses associated with an investment in the Fund.
Notes Regarding Index and Fund Performance History:
| - | Average Annualized and Cumulative Inception returns for the Fund and index are based on the inception date of the Fund. |
| 6 |
|
| PBDM | Management’s Discussion of Fund Performance | |
| Invesco PureBetaSM FTSE Developed ex-North America ETF (PBDM) |
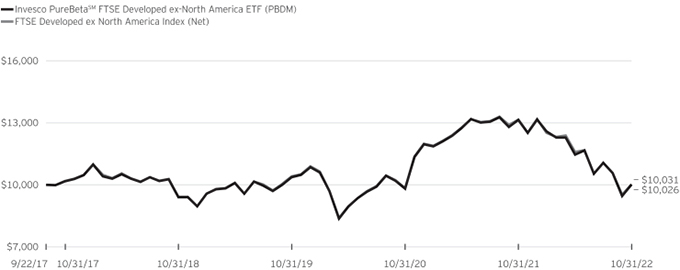
As an index fund, the Invesco PureBetaSM FTSE Developed ex-North America ETF (the “Fund”) is passively managed and seeks to track the investment results (before fees and expenses) of the FTSE Developed ex North America Index (the “Index”). The Fund generally will invest at least 90% of its total assets in securities that comprise the Index, as well as American depositary receipts (“ADRs”) and global depositary receipts (“GDRs”) that represent securities in the Index.
Strictly in accordance with its guidelines and mandated procedures, FTSE International Limited (the “Index Provider”) compiles, maintains and calculates the Index, which is designed to measure the performance of the large- and mid-capitalization segments of equity markets of countries around the world that are classified as developed markets within the country classification definition of the Index Provider, excluding the United States and Canada. The Index Provider defines the large- and mid-capitalization segments as approximately the top 90% of the eligible universe. The Fund generally invests in all of the securities comprising the Index in proportion to their weightings in the Index.
During the fiscal year ended October 31, 2022, on a market price basis, the Fund returned (23.80)%. On a net asset value (“NAV”) basis, the Fund returned (23.71)%. During the same time period, the Index returned (23.81)%. During the fiscal year, the Fund fully replicated the components of the Index; therefore, the Fund’s performance, on a NAV basis, differed from the return of the Index primarily due to the advantageous dividend tax treatment utilized by the Fund, which was partially offset by fees and operating expenses incurred during the period.
For the fiscal year ended October 31, 2022, the energy sector contributed most significantly to the Fund’s return. The industrials sector detracted most significantly from the Fund’s return, followed by the consumer discretionary and information technology sectors, respectively.
Positions that contributed most significantly to the Fund’s return for the fiscal year ended October 31, 2022, included Shell PLC, an energy company (portfolio average weight of 1.06%), and BP PLC, an energy company (portfolio average weight of 0.57%). Positions that detracted most significantly from the Fund’s return included ASML Holding N.V., an information technology company (portfolio average weight of 1.37%), and Samsung Electronics Co. Ltd., an information technology company (portfolio average weight of 1.46%).
| Sector Breakdown (% of the Fund’s Net Assets) as of October 31, 2022 | ||||
| Financials | 16.88 | |||
| Industrials | 15.59 | |||
| Health Care | 12.76 | |||
| Consumer Discretionary | 10.84 | |||
| Consumer Staples | 10.11 | |||
| Information Technology | 9.69 | |||
| Materials | 7.99 | |||
| Energy | 4.78 | |||
| Communication Services | 4.57 | |||
| Utilities | 3.27 | |||
| Real Estate | 3.06 | |||
| Money Market Funds Plus Other Assets Less Liabilities | 0.46 | |||
| Top Ten Fund Holdings* (% of the Fund’s Net Assets) as of October 31, 2022 | ||||
| Security | ||||
| Nestle S.A. | 2.02 | |||
| Roche Holding AG | 1.59 | |||
| Shell PLC | 1.39 | |||
| Samsung Electronics Co. Ltd. | 1.36 | |||
| ASML Holding N.V. | 1.31 | |||
| AstraZeneca PLC | 1.20 | |||
| Novo Nordisk A/S, Class B | 1.17 | |||
| Toyota Motor Corp. | 1.16 | |||
| Novartis AG | 1.14 | |||
| LVMH Moet Hennessy Louis Vuitton SE | 1.08 | |||
| Total | 13.42 | |||
| * | Excluding money market fund holdings. |
| 7 |
|
Invesco PureBetaSM FTSE Developed ex-North America ETF (PBDM) (continued)
Growth of a $10,000 Investment Since Inception
Fund Performance History as of October 31, 2022
1 Year | 3 Years Average | 3 Years Cumulative | 5 Years Average | 5 Years Cumulative | Fund Inception | |||||||||||||||||||||||||||
| Index | Average Annualized | Cumulative | ||||||||||||||||||||||||||||||
| FTSE Developed ex North America Index (Net) | (23.81 | )% | (1.24 | )% | (3.66 | )% | (0.31 | )% | (1.52 | )% | 0.06 | % | 0.31 | % | ||||||||||||||||||
| Fund | ||||||||||||||||||||||||||||||||
| NAV Return | (23.71 | ) | (1.14 | ) | (3.37 | ) | (0.31 | ) | (1.52 | ) | 0.05 | 0.26 | ||||||||||||||||||||
| Market Price Return | (23.80 | ) | (1.11 | ) | (3.30 | ) | (0.40 | ) | (1.97 | ) | 0.02 | 0.11 | ||||||||||||||||||||
Fund Inception: September 22, 2017
Performance quoted above represents past performance. Past performance is not a guarantee of future results and current performance may be higher or lower than performance quoted. Investment returns and principal value will fluctuate, and shares of the Fund (“Fund Shares”), when redeemed or sold, may be worth more or less than their original cost. Fund performance reflects any applicable fee waivers and/or expense reimbursements. Had the adviser not waived fees and/or reimbursed expenses currently or in the past, returns would have been lower. See the current prospectus for more information. According to the Fund’s current prospectus, the Fund’s expense ratio of 0.07% is expressed as a unitary management fee to cover operating expenses and expenses incurred in connection with managing the portfolio. NAV and Market Price returns assume that dividends and capital gain distributions have been reinvested in the Fund at NAV and Market Price, respectively. The returns shown in the table above do not reflect the deduction of taxes that a shareholder would pay on Fund distributions or the
redemption or sale of Fund Shares. See invesco.com/ ETFs to find the most recent month-end performance numbers.
Performance results for the index stated above are based upon a hypothetical investment in their respective constituent securities. The returns of an index do not represent Fund returns. An investor cannot invest directly in an index. The index does not charge management fees or brokerage expenses, and no such fees or expenses were deducted from the hypothetical performance shown. In addition, the results actual investors might have achieved would have differed from those shown because of differences in the timing, amounts of their investments, and fees and expenses associated with an investment in the Fund.
Notes Regarding Index and Fund Performance History:
| - | Average Annualized and Cumulative Inception returns for the Fund and index are based on the inception date of the Fund. |
| - | Net returns reflect reinvested dividends net of withholding taxes. |
| 8 |
|
| PBEE | Management’s Discussion of Fund Performance | |
| Invesco PureBetaSM FTSE Emerging Markets ETF (PBEE) |
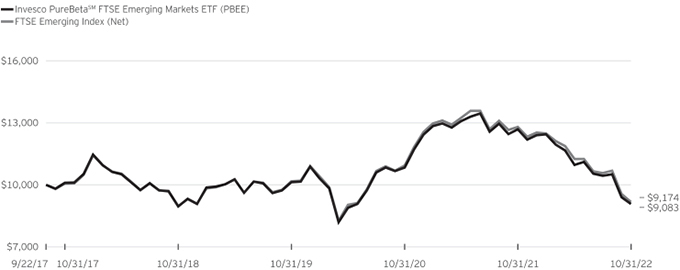
As an index fund, the Invesco PureBetaSM FTSE Emerging Markets ETF (the “Fund”) is passively managed and seeks to track the investment results (before fees and expenses) of the FTSE Emerging Index (the “Index”). The Fund generally will invest at least 90% of its total assets in securities that comprise the Index, as well as American depositary receipts (“ADRs”) and global depositary receipts (“GDRs”) that represent securities in the Index.
Strictly in accordance with its guidelines and mandated procedures, FTSE International Limited (the “Index Provider”) compiles, maintains and calculates the Index, which is designed to measure the performance of the large- and mid-capitalization segments of equity markets of countries around the world that are classified as emerging markets within the country classification definition of the Index Provider. The Index Provider defines the large- and mid-capitalization segments as approximately the top 90% of the eligible universe. The Fund does not purchase all of the securities in the Index; instead, the Fund utilizes a “sampling” methodology to seek to achieve its investment objective.
During the fiscal year ended October 31, 2022, on a market price basis, the Fund returned (28.09)%. On a net asset value (“NAV”) basis, the Fund returned (28.46)%. During the same time period, the Index returned (28.39)%. During the fiscal year, the Fund’s performance, on a NAV basis, differed from the return of the Index primarily due to the impact of the fees and expenses that the Fund incurred during the period.
For the fiscal year ended October 31, 2022, no sector contributed positively to the Fund’s return. The consumer discretionary sector detracted most significantly from the Fund’s return, followed by the information technology and communication services sectors, respectively.
Positions that contributed most significantly to the Fund’s return for the fiscal year ended October 31, 2022, included Petroleo Brasileiro S.A., Preference Shares, an energy company (portfolio average weight of 0.47%), and Petroleo Brasileiro S.A., an energy company (portfolio average weight of 0.43%). Positions that detracted most significantly from the Fund’s return included Taiwan Semiconductor Manufacturing Co. Ltd., an information technology company (portfolio average weight of 7.01%) and Tencent Holdings Ltd., a communication services company (portfolio average weight of 4.53%).
| Sector Breakdown (% of the Fund’s Net Assets) as of October 31, 2022 | ||||
| Financials | 22.14 | |||
| Information Technology | 13.61 | |||
| Consumer Discretionary | 11.48 | |||
| Exchange-Traded Funds | 9.42 | |||
| Communication Services | 8.25 | |||
| Materials | 8.12 | |||
| Industrials | 6.62 | |||
| Consumer Staples | 6.19 | |||
| Energy | 5.24 | |||
| Health Care | 3.82 | |||
| Sector Types Each Less Than 3% | 4.97 | |||
| Money Market Funds Plus Other Assets Less Liabilities | 0.14 | |||
| Top Ten Fund Holdings* (% of the Fund’s Net Assets) as of October 31, 2022 | ||||
| Security | ||||
| Taiwan Semiconductor Manufacturing Co. Ltd. | 5.48 | |||
| Invesco India ETF | 4.99 | |||
| iShares MSCI India ETF | 4.44 | |||
| Tencent Holdings Ltd. | 3.06 | |||
| Alibaba Group Holding Ltd. | 2.25 | |||
| Reliance Industries Ltd., GDR | 1.55 | |||
| Meituan, B Shares | 1.26 | |||
| Axis Bank Ltd., GDR | 1.16 | |||
| Larsen & Toubro Ltd., GDR | 1.07 | |||
| Infosys Ltd., ADR | 1.06 | |||
| Total | 26.32 | |||
| * | Excluding money market fund holdings. |
| 9 |
|
Invesco PureBetaSM FTSE Emerging Markets ETF (PBEE) (continued)
Growth of a $10,000 Investment Since Inception
Fund Performance History as of October 31, 2022
1 Year | 3 Years Average | 3 Years Cumulative | 5 Years Average | 5 Years Cumulative | Fund Inception | |||||||||||||||||||||||||||
| Index | Average Annualized | Cumulative | ||||||||||||||||||||||||||||||
| FTSE Emerging Index (Net) | (28.39 | )% | (3.40 | )% | (9.87 | )% | (1.82 | )% | (8.78 | )% | (1.67 | )% | (8.26 | )% | ||||||||||||||||||
| Fund | ||||||||||||||||||||||||||||||||
| NAV Return | (28.46 | ) | (3.56 | ) | (10.32 | ) | (2.11 | ) | (10.11 | ) | (1.87 | ) | (9.17 | ) | ||||||||||||||||||
| Market Price Return | (28.09 | ) | (3.43 | ) | (9.95 | ) | (2.16 | ) | (10.35 | ) | (2.19 | ) | (10.70 | ) | ||||||||||||||||||
Fund Inception: September 22, 2017
Performance quoted above represents past performance. Past performance is not a guarantee of future results and current performance may be higher or lower than performance quoted. Investment returns and principal value will fluctuate, and shares of the Fund (“Fund Shares”), when redeemed or sold, may be worth more or less than their original cost. Fund performance reflects any applicable fee waivers and/or expense reimbursements. Had the adviser not waived fees and/or reimbursed expenses currently or in the past, returns would have been lower. See the current prospectus for more information. The adviser has contractually agreed to waive a portion of its management fee through August 31, 2024. According to the Fund’s current prospectus, the Fund’s expense ratio of 0.20% (0.16% after fee waiver) includes the unitary management fee of 0.14% and acquired fund fees and expenses of 0.06%. NAV and Market Price returns assume that dividends and capital gain distributions have been reinvested in the Fund at NAV and Market Price, respectively. The returns shown in the table above do not reflect the deduction of taxes that a shareholder would pay
on Fund distributions or the redemption or sale of Fund Shares. See invesco.com/ETFs to find the most recent month-end performance numbers.
Performance results for the index stated above are based upon a hypothetical investment in their respective constituent securities. The returns of an index do not represent Fund returns. An investor cannot invest directly in an index. The index does not charge management fees or brokerage expenses, and no such fees or expenses were deducted from the hypothetical performance shown. In addition, the results actual investors might have achieved would have differed from those shown because of differences in the timing, amounts of their investments, and fees and expenses associated with an investment in the Fund.
Notes Regarding Index and Fund Performance History:
| - | Average Annualized and Cumulative Inception returns for the Fund and index are based on the inception date of the Fund. |
| - | Net returns reflect reinvested dividends net of withholding taxes. |
| 10 |
|
Invesco PureBetaSM 0-5 Yr US TIPS ETF (PBTP)
October 31, 2022
| Principal Amount | Value | |||||||
| U.S. Treasury Securities-99.86% |
| |||||||
| U.S. Treasury Inflation — Indexed Notes-99.86%(a) |
| |||||||
0.13%, 01/15/2023 | $ | 6,823,066 | $ | 6,803,215 | ||||
0.63%, 04/15/2023 | 7,304,397 | 7,258,215 | ||||||
0.38%, 07/15/2023 | 6,806,568 | 6,750,406 | ||||||
0.63%, 01/15/2024 | 6,747,197 | 6,636,170 | ||||||
0.50%, 04/15/2024 | 4,898,517 | 4,794,920 | ||||||
0.13%, 07/15/2024 | 6,682,143 | 6,509,663 | ||||||
0.13%, 10/15/2024 | 5,280,666 | 5,123,443 | ||||||
0.25% - 2.38%, 01/15/2025 | 12,386,032 | 12,221,264 | ||||||
0.13%, 04/15/2025 | 5,323,366 | 5,104,029 | ||||||
0.38%, 07/15/2025 | 6,644,451 | 6,419,709 | ||||||
0.13%, 10/15/2025 | 5,098,058 | 4,873,855 | ||||||
0.63% - 2.00%, 01/15/2026 | 10,715,004 | 10,489,562 | ||||||
0.13%, 04/15/2026 | 5,881,716 | 5,547,422 | ||||||
0.13%, 07/15/2026 | 5,946,352 | 5,619,447 | ||||||
0.13%, 10/15/2026 | 5,418,816 | 5,099,281 | ||||||
0.38% - 2.38%, 01/15/2027 | 9,288,331 | 9,026,676 | ||||||
0.13%, 04/15/2027(b) | 5,395,850 | 5,032,371 | ||||||
0.38%, 07/15/2027 | 5,789,564 | 5,465,639 | ||||||
1.63%, 10/15/2027 | 2,694,488 | 2,698,504 | ||||||
|
| |||||||
Total U.S. Treasury Securities | 121,473,791 | |||||||
|
| |||||||
| Shares | ||||||||
| Money Market Funds-0.05% | ||||||||
Invesco Government & Agency Portfolio, Institutional Class, 3.07%(c)(d) | 59,418 | 59,418 | ||||||
|
| |||||||
TOTAL INVESTMENTS IN SECURITIES |
| 121,533,209 | ||||||
|
| |||||||
| Shares | Value | |||||||
| Investments Purchased with Cash Collateral from Securities on Loan |
| |||||||
| Money Market Funds-3.03% |
| |||||||
Invesco Private Government Fund, | 1,031,059 | $ | 1,031,059 | |||||
Invesco Private Prime Fund, 3.28%(c)(d)(e) | 2,651,295 | 2,651,295 | ||||||
|
| |||||||
Total Investments Purchased with Cash Collateral from Securities on Loan | 3,682,354 | |||||||
|
| |||||||
TOTAL INVESTMENTS IN SECURITIES-102.94% |
| 125,215,563 | ||||||
OTHER ASSETS LESS LIABILITIES-(2.94)% |
| (3,580,140 | ) | |||||
|
| |||||||
NET ASSETS-100.00% |
| $ | 121,635,423 | |||||
|
| |||||||
Notes to Schedule of Investments:
| (a) | Principal amount of security and interest payments are adjusted for inflation. See Note 2I. |
| (b) | All or a portion of this security was out on loan at October 31, 2022. |
| (c) | Affiliated issuer. The issuer and/or the Fund is a wholly-owned subsidiary of Invesco Ltd., or is affiliated by having an investment adviser that is under common control of Invesco Ltd. The table below shows the Fund’s transactions in, and earnings from, its investments in affiliates for the fiscal year ended October 31, 2022. |
| Value October 31, 2021 | Purchases at Cost | Proceeds from Sales | Change in Unrealized Appreciation | Realized Gain (Loss) | Value October 31, 2022 | Dividend Income | |||||||||||||||||||||||||||||||||||||||||||||||||
| Investments in Affiliated Money Market Funds: | |||||||||||||||||||||||||||||||||||||||||||||||||||||||
| Invesco Government & Agency Portfolio, Institutional Class | $ | 60,551 | $ | 6,229,923 | $ | (6,231,056 | ) | $ | - | $ | - | $ | 59,418 | $ | 1,730 | ||||||||||||||||||||||||||||||||||||||||
| Investments Purchased with Cash Collateral from Securities on Loan: | |||||||||||||||||||||||||||||||||||||||||||||||||||||||
| Invesco Private Government Fund | 1,543,304 | 32,965,139 | (33,477,384 | ) | - | - | 1,031,059 | 5,592 | * | ||||||||||||||||||||||||||||||||||||||||||||||
| Invesco Private Prime Fund | 3,601,042 | 59,309,355 | (60,256,966 | ) | - | (2,136 | ) | 2,651,295 | 15,802 | * | |||||||||||||||||||||||||||||||||||||||||||||
|
|
|
|
|
|
|
|
|
|
|
|
|
| ||||||||||||||||||||||||||||||||||||||||||
Total | $ | 5,204,897 | $ | 98,504,417 | $ | (99,965,406 | ) | $ | - | $ | (2,136 | ) | $ | 3,741,772 | $ | 23,124 | |||||||||||||||||||||||||||||||||||||||
|
|
|
|
|
|
|
|
|
|
|
|
|
| ||||||||||||||||||||||||||||||||||||||||||
| * | Represents the income earned on the investment of cash collateral, which is included in securities lending income on the Statements of Operations. Does not include rebates and fees paid to lending agent or premiums received from borrowers, if any. |
See accompanying Notes to Financial Statements which are an integral part of the financial statements.
| 11 |
|
Invesco PureBetaSM 0-5 Yr US TIPS ETF (PBTP)–(continued)
October 31, 2022
| (d) | The rate shown is the 7-day SEC standardized yield as of October 31, 2022. |
| (e) | The security has been segregated to satisfy the commitment to return the cash collateral received in securities lending transactions upon the borrower’s return of the securities loaned. See Note 2J. |
See accompanying Notes to Financial Statements which are an integral part of the financial statements.
| 12 |
|
Invesco PureBetaSM FTSE Developed ex-North America ETF (PBDM)
October 31, 2022
Schedule of Investments
| Shares | Value | |||||||
| Common Stocks & Other Equity Interests-99.54% |
| |||||||
| Australia-8.73% | ||||||||
Adbri Ltd. | 2,452 | $ | 2,469 | |||||
AGL Energy Ltd. | 3,528 | 15,363 | ||||||
Allkem Ltd.(a) | 3,098 | 28,606 | ||||||
ALS Ltd. | 2,575 | 18,837 | ||||||
Altium Ltd. | 584 | 13,223 | ||||||
Alumina Ltd. | 13,530 | 11,680 | ||||||
AMP Ltd.(a) | 17,524 | 14,119 | ||||||
Ampol Ltd. | 1,278 | 22,253 | ||||||
Ansell Ltd. | 690 | 12,456 | ||||||
APA Group | 6,333 | 42,562 | ||||||
Aristocrat Leisure Ltd. | 3,590 | 85,099 | ||||||
ASX Ltd. | 1,039 | 44,979 | ||||||
Atlas Arteria Ltd. | 5,145 | 21,681 | ||||||
Aurizon Holdings Ltd. | 9,472 | 21,926 | ||||||
Australia & New Zealand Banking Group Ltd. | 16,545 | 270,417 | ||||||
Bank of Queensland Ltd.(b) | 3,432 | 16,152 | ||||||
Beach Energy Ltd. | 9,465 | 9,623 | ||||||
Bendigo & Adelaide Bank Ltd.(b) | 2,960 | 17,054 | ||||||
BHP Group Ltd. | 27,015 | 645,384 | ||||||
BlueScope Steel Ltd. | 2,527 | 25,418 | ||||||
Boral Ltd.(b) | 2,158 | 3,974 | ||||||
Brambles Ltd. | 7,451 | 55,650 | ||||||
carsales.com Ltd. | 1,796 | 23,337 | ||||||
Challenger Ltd. | 3,596 | 16,142 | ||||||
Charter Hall Group | 2,529 | 20,926 | ||||||
Cleanaway Waste Management Ltd. | 11,080 | 19,130 | ||||||
Cochlear Ltd. | 343 | 43,803 | ||||||
Coles Group Ltd. | 6,805 | 71,059 | ||||||
Commonwealth Bank of Australia | 9,169 | 613,751 | ||||||
CSL Ltd. | 2,583 | 463,269 | ||||||
CSR Ltd. | 2,603 | 7,707 | ||||||
Deterra Royalties Ltd. | 2,269 | 5,934 | ||||||
Dexus | 5,773 | 28,646 | ||||||
Domain Holdings Australia Ltd. | 1,241 | 2,650 | ||||||
Domino’s Pizza Enterprises Ltd. | 324 | 13,208 | ||||||
Downer EDI Ltd. | 3,696 | 10,612 | ||||||
EBOS Group Ltd. | 847 | 18,452 | ||||||
Endeavour Group Ltd. | 6,805 | 31,113 | ||||||
Evolution Mining Ltd. | 8,988 | 11,955 | ||||||
Flight Centre Travel Group Ltd.(a)(b) | 769 | 8,187 | ||||||
Fortescue Metals Group Ltd. | 8,531 | 80,191 | ||||||
Glencore PLC | 70,271 | 404,128 | ||||||
Goodman Group | 9,836 | 106,924 | ||||||
GPT Group (The) | 10,281 | 28,335 | ||||||
Harvey Norman Holdings Ltd. | 3,178 | 8,454 | ||||||
IDP Education Ltd.(b) | 972 | 18,391 | ||||||
IGO Ltd. | 3,333 | 32,587 | ||||||
Iluka Resources Ltd.(b) | 2,249 | 12,440 | ||||||
Incitec Pivot Ltd. | 10,407 | 24,955 | ||||||
Insignia Financial Ltd. | 3,412 | 6,873 | ||||||
Insurance Australia Group Ltd. | 13,039 | 40,855 | ||||||
James Hardie Industries PLC, CDI | 2,382 | 51,788 | ||||||
JB Hi-Fi Ltd.(b) | 606 | 16,628 | ||||||
Lendlease Corp. Ltd.(b) | 3,689 | 20,499 | ||||||
Lottery Corp. Ltd. (The)(a) | 11,920 | 32,699 | ||||||
Lynas Rare Earths Ltd.(a) | 4,821 | 25,680 | ||||||
Macquarie Group Ltd. | 1,868 | 202,467 | ||||||
| Shares | Value | |||||||
| Australia-(continued) | ||||||||
Magellan Financial Group Ltd.(b) | 748 | $ | 4,750 | |||||
Medibank Pvt. Ltd. | 14,782 | 26,561 | ||||||
Metcash Ltd.(b) | 5,181 | 13,583 | ||||||
Mineral Resources Ltd. | 897 | 41,946 | ||||||
Mirvac Group | 21,111 | 27,944 | ||||||
National Australia Bank Ltd. | 17,054 | 353,546 | ||||||
Newcrest Mining Ltd. | 4,788 | 53,120 | ||||||
NEXTDC Ltd.(a) | 2,430 | 12,928 | ||||||
Northern Star Resources Ltd. | 6,101 | 34,097 | ||||||
Nufarm Ltd. | 2,038 | 7,259 | ||||||
Orica Ltd. | 2,411 | 21,399 | ||||||
Origin Energy Ltd. | 9,424 | 33,566 | ||||||
Orora Ltd. | 4,652 | 9,013 | ||||||
OZ Minerals Ltd. | 1,742 | 26,923 | ||||||
Perpetual Ltd.(b) | 301 | 4,793 | ||||||
Pilbara Minerals Ltd.(a) | 14,101 | 45,896 | ||||||
Platinum Asset Management Ltd. | 2,813 | 3,220 | ||||||
Pro Medicus Ltd.(b) | 217 | 7,746 | ||||||
Qantas Airways Ltd.(a) | 4,460 | 16,655 | ||||||
QBE Insurance Group Ltd. | 7,906 | 61,879 | ||||||
Qube Holdings Ltd. | 8,928 | 15,528 | ||||||
Ramsay Health Care Ltd. | 937 | 35,093 | ||||||
REA Group Ltd. | 270 | 20,993 | ||||||
Reece Ltd. | 1,146 | 11,381 | ||||||
Rio Tinto Ltd. | 1,992 | 112,348 | ||||||
Rio Tinto PLC | 5,854 | 305,794 | ||||||
Santos Ltd. | 16,478 | 81,134 | ||||||
Scentre Group | 27,832 | 51,612 | ||||||
SEEK Ltd. | 1,870 | 25,817 | ||||||
Seven Group Holdings Ltd.(b) | 720 | 8,444 | ||||||
Shopping Centres Australasia Property Group | 5,951 | 10,351 | ||||||
Sierra Rutile Holdings Ltd.(a)(b) | 2,249 | 302 | ||||||
Sonic Healthcare Ltd. | 2,563 | 53,707 | ||||||
South32 Ltd. | 25,031 | 57,622 | ||||||
Star Entertainment Group Ltd. (The)(a) | 4,599 | 8,646 | ||||||
Stockland | 12,801 | 29,468 | ||||||
Suncorp Group Ltd. | 6,773 | 49,417 | ||||||
Tabcorp Holdings Ltd.(b) | 11,157 | 6,885 | ||||||
Telstra Group Ltd.(a) | 22,070 | 55,322 | ||||||
TPG Telecom Ltd.(b) | 1,968 | 6,166 | ||||||
Transurban Group | 16,522 | 140,092 | ||||||
Treasury Wine Estates Ltd. | 3,874 | 32,080 | ||||||
Vicinity Ltd. | 20,218 | 25,146 | ||||||
Washington H Soul Pattinson & Co. Ltd. | 1,428 | 25,513 | ||||||
Wesfarmers Ltd. | 6,080 | 176,742 | ||||||
Westpac Banking Corp. | 18,746 | 289,010 | ||||||
Whitehaven Coal Ltd. | 4,294 | 24,795 | ||||||
WiseTech Global Ltd. | 845 | 31,426 | ||||||
Woodside Energy Group Ltd. | 10,150 | 233,525 | ||||||
Woolworths Group Ltd. | 6,535 | 137,984 | ||||||
Worley Ltd. | 2,003 | 18,277 | ||||||
|
| |||||||
| 6,810,144 | ||||||||
|
| |||||||
| Austria-0.25% | ||||||||
ANDRITZ AG | 361 | 16,791 | ||||||
Erste Group Bank AG | 1,761 | 43,442 | ||||||
Mondi PLC | 2,599 | 43,763 | ||||||
OMV AG | 761 | 35,080 | ||||||
See accompanying Notes to Financial Statements which are an integral part of the financial statements.
| 13 |
|
Invesco PureBetaSM FTSE Developed ex-North America ETF (PBDM)–(continued)
October 31, 2022
| Shares | Value | |||||||
| Austria-(continued) | ||||||||
Raiffeisen Bank International AG | 693 | $ | 9,637 | |||||
Telekom Austria AG | 733 | 4,260 | ||||||
Verbund AG | 354 | 27,728 | ||||||
voestalpine AG | 616 | 13,382 | ||||||
|
| |||||||
| 194,083 | ||||||||
|
| |||||||
| Belgium-0.78% | ||||||||
Ackermans & van Haaren N.V. | 120 | 16,735 | ||||||
Ageas S.A./N.V. | 985 | 34,103 | ||||||
Anheuser-Busch InBev S.A./N.V.(b) | 4,651 | 232,599 | ||||||
D’Ieteren Group | 123 | 20,460 | ||||||
Elia Group S.A./N.V. | 202 | 25,535 | ||||||
Etablissements Franz Colruyt N.V. | 267 | 6,436 | ||||||
Groupe Bruxelles Lambert S.A. | 545 | 40,183 | ||||||
KBC Group N.V. | 1,473 | 73,811 | ||||||
Proximus SADP | 750 | 7,865 | ||||||
Sofina S.A.(b) | 82 | 16,006 | ||||||
Solvay S.A., Class A | 361 | 32,554 | ||||||
UCB S.A. | 648 | 48,879 | ||||||
Umicore S.A.(b) | 1,098 | 36,192 | ||||||
Warehouses De Pauw C.V.A. | 755 | 19,386 | ||||||
|
| |||||||
| 610,744 | ||||||||
|
| |||||||
| Brazil-0.05% | ||||||||
Yara International ASA | 872 | 38,916 | ||||||
|
| |||||||
| Burkina Faso-0.02% | ||||||||
Endeavour Mining PLC | 985 | 17,193 | ||||||
| Cambodia-0.01% | ||||||||
NagaCorp Ltd.(a) | 8,755 | 3,993 | ||||||
|
| |||||||
| Chile-0.03% | ||||||||
Antofagasta PLC(b) | 1,857 | 25,133 | ||||||
|
| |||||||
| China-0.59% | ||||||||
AAC Technologies Holdings, Inc.(a) | 3,807 | 6,974 | ||||||
BOC Hong Kong Holdings Ltd. | 19,114 | 59,413 | ||||||
Budweiser Brewing Co. APAC Ltd.(c) | 8,998 | 18,936 | ||||||
China Travel International Investment Hong Kong Ltd.(a) | 13,198 | 2,051 | ||||||
Chow Tai Fook Jewellery Group Ltd. | 9,309 | 15,938 | ||||||
ESR Group Ltd.(c) | 10,802 | 18,439 | ||||||
HUTCHMED China Ltd.(a) | 2,500 | 4,204 | ||||||
Kerry Logistics Network Ltd. | 1,263 | 2,005 | ||||||
Lenovo Group Ltd. | 39,428 | 31,543 | ||||||
MMG Ltd.(a) | 13,057 | 2,578 | ||||||
Nexteer Automotive Group Ltd.(b) | 4,389 | 2,376 | ||||||
Prosus N.V. | 4,574 | 199,092 | ||||||
Shangri-La Asia Ltd.(a) | 6,527 | 3,609 | ||||||
SITC International Holdings Co. Ltd. | 6,545 | 10,722 | ||||||
Want Want China Holdings Ltd. | 23,387 | 15,373 | ||||||
Wharf Holdings Ltd. (The) | 6,614 | 18,916 | ||||||
Wilmar International Ltd. | 11,302 | 30,989 | ||||||
Xinyi Glass Holdings Ltd. | 10,912 | 14,040 | ||||||
|
| |||||||
| 457,198 | ||||||||
|
| |||||||
| Denmark-2.41% | ||||||||
AP Moller - Maersk A/S, Class A | 15 | 30,030 | ||||||
AP Moller - Maersk A/S, Class B | 28 | 58,583 | ||||||
Carlsberg A/S, Class B | 498 | 58,708 | ||||||
Chr. Hansen Holding A/S | 551 | 30,606 | ||||||
Coloplast A/S, Class B(b) | 714 | 79,622 | ||||||
Danske Bank A/S(b) | 3,534 | 57,050 | ||||||
| Shares | Value | |||||||
| Denmark-(continued) | ||||||||
Demant A/S(a) | 544 | $ | 14,870 | |||||
DSV A/S | 1,005 | 136,089 | ||||||
Genmab A/S(a) | 352 | 135,705 | ||||||
GN Store Nord A/S | 686 | 14,590 | ||||||
H Lundbeck A/S | 1,280 | 4,787 | ||||||
H Lundbeck A/S, Class A(a) | 320 | 1,087 | ||||||
Novo Nordisk A/S, Class B | 8,396 | 912,993 | ||||||
Novozymes A/S, Class B | 1,064 | 55,894 | ||||||
Orsted A/S(c) | 1,010 | 83,320 | ||||||
Pandora A/S | 476 | 25,094 | ||||||
ROCKWOOL A/S, Class B(b) | 34 | 6,771 | ||||||
Royal Unibrew A/S | 253 | 14,453 | ||||||
SimCorp A/S | 213 | 12,725 | ||||||
Tryg A/S | 1,933 | 41,842 | ||||||
Vestas Wind Systems A/S | 5,411 | 106,603 | ||||||
|
| |||||||
| 1,881,422 | ||||||||
|
| |||||||
| Finland-1.25% | ||||||||
Elisa OYJ | 769 | 37,174 | ||||||
Fortum OYJ | 2,314 | 32,579 | ||||||
Huhtamaki OYJ | 498 | 17,891 | ||||||
Kesko OYJ, Class B | 1,445 | 28,135 | ||||||
Kojamo OYJ(b) | 1,045 | 13,602 | ||||||
Kone OYJ, Class B | 2,106 | 86,277 | ||||||
Metso Outotec OYJ(b) | 3,248 | 24,661 | ||||||
Neste OYJ | 2,231 | 97,770 | ||||||
Nokia OYJ(b) | 30,208 | 134,561 | ||||||
Nordea Bank Abp | 19,273 | 184,313 | ||||||
Orion OYJ, Class B | 556 | 25,580 | ||||||
Sampo OYJ, Class A | 2,636 | 120,573 | ||||||
Stora Enso OYJ, Class R | 3,079 | 40,139 | ||||||
UPM-Kymmene OYJ | 2,858 | 95,786 | ||||||
Valmet OYJ(b) | 940 | 21,396 | ||||||
Wartsila OYJ Abp | 2,613 | 17,820 | ||||||
|
| |||||||
| 978,257 | ||||||||
|
| |||||||
| France-9.89% | ||||||||
Accor S.A.(a) | 980 | 23,479 | ||||||
Adevinta ASA, Class B(a) | 1,488 | 10,190 | ||||||
Aeroports de Paris(a)(b) | 152 | 20,589 | ||||||
Air Liquide S.A. | 2,749 | 359,456 | ||||||
Airbus SE | 3,000 | 324,911 | ||||||
ALD S.A.(c) | 432 | 4,611 | ||||||
Alstom S.A.(b) | 1,582 | 32,616 | ||||||
Amundi S.A.(c) | 305 | 14,403 | ||||||
Arkema S.A. | 348 | 27,557 | ||||||
AXA S.A. | 9,946 | 245,754 | ||||||
BioMerieux | 231 | 20,443 | ||||||
BNP Paribas S.A. | 5,753 | 270,056 | ||||||
Bollore SE | 5,298 | 26,522 | ||||||
Bouygues S.A. | 1,141 | 32,568 | ||||||
Bureau Veritas S.A. | 1,521 | 37,687 | ||||||
Capgemini SE | 861 | 141,474 | ||||||
Carrefour S.A.(b) | 3,172 | 51,054 | ||||||
Cie de L’Odet SE | 2 | 2,392 | ||||||
Cie de Saint-Gobain | 2,462 | 100,739 | ||||||
Cie Generale des Etablissements Michelin S.C.A. | 3,752 | 95,711 | ||||||
Covivio | 268 | 14,356 | ||||||
Credit Agricole S.A. | 6,494 | 58,959 | ||||||
Danone S.A. | 3,273 | 162,844 | ||||||
Dassault Aviation S.A. | 124 | 18,432 | ||||||
See accompanying Notes to Financial Statements which are an integral part of the financial statements.
| 14 |
|
Invesco PureBetaSM FTSE Developed ex-North America ETF (PBDM)–(continued)
October 31, 2022
| Shares | Value | |||||||
| France-(continued) | ||||||||
Dassault Systemes SE | 3,569 | $ | 119,756 | |||||
Edenred | 1,337 | 68,661 | ||||||
Eiffage S.A. | 397 | 35,918 | ||||||
Electricite de France S.A. | 3,366 | 39,755 | ||||||
ENGIE S.A. | 8,894 | 115,629 | ||||||
EssilorLuxottica S.A. | 1,598 | 253,254 | ||||||
Eurazeo SE | 260 | 14,853 | ||||||
Euroapi S.A.(a) | 257 | 4,497 | ||||||
Faurecia SE(a) | 833 | 12,448 | ||||||
Gecina S.A. | 276 | 24,619 | ||||||
Getlink SE | 2,441 | 38,673 | ||||||
Hermes International | 166 | 215,009 | ||||||
ICADE | 174 | 6,477 | ||||||
Ipsen S.A. | 180 | 18,502 | ||||||
JCDecaux S.A.(a) | 389 | 4,910 | ||||||
Kering S.A. | 392 | 179,653 | ||||||
Klepierre S.A. | 972 | 19,550 | ||||||
La Francaise des Jeux SAEM(c) | 467 | 15,232 | ||||||
Legrand S.A. | 1,433 | 109,254 | ||||||
L’Oreal S.A. | 1,322 | 415,629 | ||||||
LVMH Moet Hennessy Louis Vuitton SE | 1,337 | 844,391 | ||||||
Neoen S.A.(c) | 234 | 8,169 | ||||||
Orange S.A. | 10,282 | 97,872 | ||||||
Pernod Ricard S.A.(b) | 1,099 | 193,017 | ||||||
Publicis Groupe S.A. | 1,226 | 68,753 | ||||||
Remy Cointreau S.A. | 131 | 20,081 | ||||||
Renault S.A.(a) | 1,030 | 31,731 | ||||||
Rexel S.A. | 1,288 | 23,048 | ||||||
Safran S.A. | 1,874 | 208,777 | ||||||
Sanofi | 5,847 | 504,670 | ||||||
Sartorius Stedim Biotech | 128 | 40,635 | ||||||
Schneider Electric SE | 2,859 | 362,424 | ||||||
SCOR SE | 839 | 12,625 | ||||||
SEB S.A.(b) | 161 | 10,486 | ||||||
Societe Generale S.A. | 4,086 | 93,792 | ||||||
Sodexo S.A. | 467 | 41,420 | ||||||
SOITEC(a) | 133 | 17,082 | ||||||
Somfy S.A. | 42 | 4,475 | ||||||
Teleperformance | 311 | 83,391 | ||||||
Thales S.A. | 538 | 68,407 | ||||||
TotalEnergies SE(b) | 12,698 | 691,509 | ||||||
Ubisoft Entertainment S.A.(a) | 504 | 13,833 | ||||||
Unibail-Rodamco-Westfield(a)(b) | 550 | 26,027 | ||||||
Valeo | 1,288 | 21,246 | ||||||
Veolia Environnement S.A. | 3,352 | 74,840 | ||||||
Vinci S.A. | 2,672 | 246,077 | ||||||
Vivendi SE | 3,762 | 30,801 | ||||||
Wendel SE | 144 | 11,286 | ||||||
Worldline S.A.(a)(c) | 1,303 | 57,076 | ||||||
|
| |||||||
| 7,717,023 | ||||||||
|
| |||||||
| Germany-7.08% | ||||||||
1&1 AG | 247 | 3,257 | ||||||
adidas AG | 901 | 88,142 | ||||||
Allianz SE | 2,191 | 394,550 | ||||||
Aroundtown S.A.(b) | 6,113 | 12,132 | ||||||
BASF SE | 4,925 | 221,161 | ||||||
Bayer AG | 5,291 | 278,307 | ||||||
Bayerische Motoren Werke AG | 1,722 | 135,338 | ||||||
| Shares | Value | |||||||
| Germany-(continued) | ||||||||
Bayerische Motoren Werke AG, Preference Shares | 309 | $ | 22,813 | |||||
Bechtle AG | 432 | 14,944 | ||||||
Beiersdorf AG | 535 | 51,386 | ||||||
Brenntag SE | 830 | 50,401 | ||||||
Carl Zeiss Meditec AG, BR | 196 | 23,740 | ||||||
Commerzbank AG(a) | 5,579 | 44,641 | ||||||
Continental AG | 580 | 30,084 | ||||||
Covestro AG(c) | 966 | 32,882 | ||||||
CTS Eventim AG& Co. KGaA(a) | 315 | 15,050 | ||||||
Daimler Truck Holding AG(a) | 2,250 | 60,042 | ||||||
Deutsche Bank AG | 10,959 | 104,631 | ||||||
Deutsche Boerse AG | 989 | 160,942 | ||||||
Deutsche Lufthansa AG(a) | 3,207 | 22,007 | ||||||
Deutsche Post AG | 5,206 | 184,770 | ||||||
Deutsche Telekom AG | 18,212 | 344,949 | ||||||
Deutsche Wohnen SE | 244 | 4,924 | ||||||
DWS Group GmbH & Co. KGaA(c) | 180 | 4,875 | ||||||
E.ON SE | 11,939 | 100,016 | ||||||
Evonik Industries AG | 1,024 | 18,880 | ||||||
Evotec SE(a) | 826 | 15,768 | ||||||
Fielmann AG | 130 | 4,145 | ||||||
Fraport AG Frankfurt Airport Services Worldwide(a) | 180 | 6,945 | ||||||
Fresenius Medical Care AG& Co. KGaA | 1,089 | 30,115 | ||||||
Fresenius SE & Co. KGaA | 2,188 | 50,387 | ||||||
Fuchs Petrolub SE | 180 | 4,341 | ||||||
Fuchs Petrolub SE, Preference Shares | 373 | 10,691 | ||||||
GEA Group AG | 888 | 31,069 | ||||||
Hannover Rueck SE | 322 | 52,447 | ||||||
HeidelbergCement AG | 776 | 35,779 | ||||||
Hella GmbH & Co. KGaA | 123 | 9,610 | ||||||
HelloFresh SE(a) | 877 | 17,561 | ||||||
Henkel AG& Co. KGaA(b) | 540 | 31,729 | ||||||
Henkel AG& Co. KGaA, Preference Shares | 907 | 57,175 | ||||||
HOCHTIEF AG | 103 | 5,477 | ||||||
Infineon Technologies AG | 6,994 | 170,325 | ||||||
KION Group AG | 420 | 9,327 | ||||||
Knorr-Bremse AG | 355 | 15,985 | ||||||
LANXESS AG | 457 | 15,470 | ||||||
LEG Immobilien SE | 391 | 25,552 | ||||||
Mercedes-Benz Group AG | 4,524 | 262,018 | ||||||
Merck KGaA | 693 | 113,013 | ||||||
METRO AG(a) | 702 | 5,363 | ||||||
MTU Aero Engines AG | 286 | 51,234 | ||||||
Muenchener Rueckversicherungs-Gesellschaft AG in Muenchen, Class R | 754 | 199,271 | ||||||
Nemetschek SE | 288 | 13,765 | ||||||
Puma SE | 534 | 23,650 | ||||||
Rational AG | 26 | 14,673 | ||||||
Rheinmetall AG | 231 | 37,557 | ||||||
RWE AG | 3,379 | 130,212 | ||||||
SAP SE | 5,955 | 574,849 | ||||||
Sartorius AG | 13 | 3,835 | ||||||
Sartorius AG, Preference Shares | 132 | 46,588 | ||||||
Scout24 SE(c) | 403 | 20,664 | ||||||
Siemens AG | 4,053 | 443,200 | ||||||
Siemens Energy AG(b) | 2,299 | 26,846 | ||||||
Siemens Healthineers AG(c) | 1,487 | 68,458 | ||||||
Sixt SE | 70 | 6,573 | ||||||
See accompanying Notes to Financial Statements which are an integral part of the financial statements.
| 15 |
|
Invesco PureBetaSM FTSE Developed ex-North America ETF (PBDM)–(continued)
October 31, 2022
| Shares | Value | |||||||
| Germany-(continued) | ||||||||
Sixt SE, Preference Shares | 88 | $ | 5,132 | |||||
SUSE S.A.(a) | 193 | 3,414 | ||||||
Symrise AG | 701 | 71,604 | ||||||
Talanx AG | 285 | 10,709 | ||||||
Telefonica Deutschland Holding AG | 4,822 | 10,513 | ||||||
thyssenkrupp AG(a) | 2,600 | 13,702 | ||||||
Traton SE | 268 | 3,345 | ||||||
TUI AG(a)(b) | 6,517 | 9,889 | ||||||
Uniper SE(b) | 469 | 1,405 | ||||||
United Internet AG | 576 | 10,774 | ||||||
Vantage Towers AG | 496 | 13,962 | ||||||
Varta AG(b) | 72 | 1,933 | ||||||
Volkswagen AG | 154 | 26,332 | ||||||
Volkswagen AG, Preference Shares | 1,081 | 138,188 | ||||||
Vonovia SE | 4,277 | 94,689 | ||||||
Wacker Chemie AG | 81 | 9,439 | ||||||
Zalando SE(a)(c) | 1,169 | 26,955 | ||||||
|
| |||||||
| 5,518,516 | ||||||||
|
| |||||||
| Hong Kong-2.22% | ||||||||
AIA Group Ltd. | 64,186 | 486,106 | ||||||
ASMPT Ltd. | 1,741 | 9,581 | ||||||
Bank of East Asia Ltd. (The) | 5,166 | 4,949 | ||||||
Cafe de Coral Holdings Ltd. | 2,159 | 2,519 | ||||||
Cathay Pacific Airways Ltd.(a) | 5,377 | 4,877 | ||||||
Champion REIT | 10,931 | 3,272 | ||||||
CK Asset Holdings Ltd. | 10,388 | 57,433 | ||||||
CK Hutchison Holdings Ltd. | 14,205 | 70,574 | ||||||
CK Infrastructure Holdings Ltd. | 3,296 | 15,662 | ||||||
CLP Holdings Ltd. | 8,739 | 58,669 | ||||||
Dah Sing Banking Group Ltd. | 2,174 | 1,296 | ||||||
Dah Sing Financial Holdings Ltd. | 869 | 1,720 | ||||||
DFI Retail Group Holdings Ltd. | 1,640 | 3,674 | ||||||
Guotai Junan International Holdings Ltd. | 14,111 | 1,007 | ||||||
Haitong International Securities Group | 15,475 | 1,124 | ||||||
Hang Lung Group Ltd. | 4,416 | 5,727 | ||||||
Hang Lung Properties Ltd. | 9,912 | 12,463 | ||||||
Hang Seng Bank Ltd. | 3,926 | 55,265 | ||||||
Henderson Land Development Co. Ltd. | 6,584 | 16,121 | ||||||
Hong Kong & China Gas Co. Ltd. (The) | 57,892 | 44,692 | ||||||
Hong Kong Exchanges & Clearing Ltd. | 6,826 | 181,740 | ||||||
Hongkong Land Holdings Ltd. | 5,954 | 22,923 | ||||||
Huabao International Holdings Ltd. | 5,425 | 2,502 | ||||||
Hutchison Port Holdings Trust, Class U | 27,069 | 4,412 | ||||||
Hutchison Telecommunications Hong Kong Holdings Ltd. | 6,614 | 876 | ||||||
Hysan Development Co. Ltd. | 3,296 | 7,188 | ||||||
Jardine Matheson Holdings Ltd. | 1,015 | 46,710 | ||||||
Johnson Electric Holdings Ltd., Class H | 1,662 | 1,713 | ||||||
Kerry Properties Ltd. | 3,284 | 5,196 | ||||||
Link REIT | 11,336 | 67,006 | ||||||
Man Wah Holdings Ltd. | 8,101 | 4,520 | ||||||
Melco International Development Ltd.(a) | 4,380 | 2,288 | ||||||
MTR Corp. Ltd. | 7,647 | 33,657 | ||||||
New World Development Co. Ltd. | 7,656 | 15,663 | ||||||
NWS Holdings Ltd. | 7,665 | 5,439 | ||||||
Orient Overseas International Ltd. | 700 | 10,228 | ||||||
PCCW Ltd. | 21,985 | 8,402 | ||||||
Power Assets Holdings Ltd. | 7,123 | 34,073 | ||||||
Prudential PLC | 14,790 | 138,067 | ||||||
| Shares | Value | |||||||
| Hong Kong-(continued) | ||||||||
Sino Land Co. Ltd. | 19,416 | $ | 20,752 | |||||
Sun Hung Kai Properties Ltd. | 7,598 | 81,741 | ||||||
Swire Pacific Ltd., Class A | 2,740 | 18,133 | ||||||
Swire Pacific Ltd., Class B | 5,440 | 5,606 | ||||||
Swire Properties Ltd. | 5,703 | 10,956 | ||||||
Techtronic Industries Co. Ltd. | 7,062 | 66,888 | ||||||
United Energy Group Ltd. | 39,446 | 3,819 | ||||||
Vitasoy International Holdings Ltd.(a)(b) | 4,362 | 7,446 | ||||||
VTech Holdings Ltd. | 875 | 4,654 | ||||||
WH Group Ltd. | 41,789 | 21,135 | ||||||
Wharf Real Estate Investment Co. Ltd. | 8,738 | 34,452 | ||||||
Yue Yuen Industrial Holdings Ltd. | 3,844 | 3,908 | ||||||
|
| |||||||
| 1,728,824 | ||||||||
|
| |||||||
| Indonesia-0.01% | ||||||||
First Pacific Co. Ltd. | 13,111 | 3,474 | ||||||
Golden Agri-Resources Ltd. | 34,090 | 6,986 | ||||||
|
| |||||||
| 10,460 | ||||||||
|
| |||||||
| Ireland-0.63% | ||||||||
AIB Group PLC | 4,878 | 14,126 | ||||||
Bank of Ireland Group PLC | 4,896 | 35,305 | ||||||
CRH PLC | 4,115 | 148,246 | ||||||
Flutter Entertainment PLC(a)(b) | 939 | 125,194 | ||||||
Glanbia PLC(b) | 1,008 | 11,646 | ||||||
Kerry Group PLC, Class A | 826 | 71,841 | ||||||
Kingspan Group PLC | 810 | 40,909 | ||||||
Smurfit Kappa Group PLC | 1,391 | 46,028 | ||||||
|
| |||||||
| 493,295 | ||||||||
|
| |||||||
| Israel-0.82% | ||||||||
AFI Properties Ltd. | 89 | 2,681 | ||||||
Airport City Ltd.(a) | 396 | 6,588 | ||||||
Alony Hetz Properties & Investments Ltd. | 576 | 6,792 | ||||||
Amot Investments Ltd. | 756 | 4,597 | ||||||
Ashtrom Group Ltd. | 215 | 4,701 | ||||||
Azrieli Group Ltd. | 216 | 16,086 | ||||||
Bank Hapoalim BM | 7,168 | 69,450 | ||||||
Bank Leumi Le-Israel BM | 8,295 | 79,544 | ||||||
Bezeq The Israeli Telecommunication Corp. Ltd. | 11,482 | 20,416 | ||||||
Big Shopping Centers Ltd. | 72 | 8,113 | ||||||
Delek Group Ltd.(a) | 42 | 6,451 | ||||||
Elbit Systems Ltd. | 143 | 29,059 | ||||||
Elco Ltd. | 51 | 2,956 | ||||||
Electra Ltd. | 10 | 5,846 | ||||||
Energix-Renewable Energies Ltd. | 1,008 | 3,540 | ||||||
Enlight Renewable Energy Ltd.(a) | 4,951 | 10,079 | ||||||
Fattal Holdings 1998 Ltd.(a) | 44 | 4,494 | ||||||
First International Bank of Israel Ltd. (The) | 288 | 12,495 | ||||||
Fox Wizel Ltd. | 37 | 4,531 | ||||||
Gav-Yam Lands Corp. Ltd. | 539 | 4,594 | ||||||
Harel Insurance Investments & Financial Services Ltd. | 612 | 5,919 | ||||||
ICL Group Ltd. | 3,895 | 35,326 | ||||||
Israel Corp. Ltd. (The) | 20 | 8,700 | ||||||
Israel Discount Bank Ltd., Class A | 6,567 | 37,542 | ||||||
Maytronics Ltd. | 251 | 2,720 | ||||||
Melisron Ltd. | 108 | 8,052 | ||||||
Mivne Real Estate KD Ltd. | 3,787 | 11,836 | ||||||
Mizrahi Tefahot Bank Ltd. | 720 | 27,352 | ||||||
Nice Ltd.(a) | 362 | 68,893 | ||||||
See accompanying Notes to Financial Statements which are an integral part of the financial statements.
| 16 |
|
Invesco PureBetaSM FTSE Developed ex-North America ETF (PBDM)–(continued)
October 31, 2022
| Shares | Value | |||||||
| Israel-(continued) | ||||||||
Nova Ltd.(a) | 145 | $ | 10,691 | |||||
OPC Energy Ltd.(a) | 396 | 4,894 | ||||||
Paz Oil Co. Ltd.(a) | 84 | 10,079 | ||||||
Phoenix Holdings Ltd. (The) | 684 | 7,445 | ||||||
Sapiens International Corp. N.V. | 144 | 2,843 | ||||||
Shapir Engineering and Industry Ltd. | 612 | 5,064 | ||||||
Shikun & Binui Ltd.(a)(b) | 1,149 | 4,582 | ||||||
Shufersal Ltd. | 612 | 4,196 | ||||||
Strauss Group Ltd. | 216 | 5,430 | ||||||
Teva Pharmaceutical Industries Ltd.(a)(b) | 5,417 | 48,668 | ||||||
Tower Semiconductor Ltd.(a) | 576 | 24,745 | ||||||
|
| |||||||
| 637,990 | ||||||||
|
| |||||||
| Italy-1.99% | ||||||||
A2A S.p.A. | 8,114 | 8,998 | ||||||
Amplifon S.p.A.(b) | 684 | 16,995 | ||||||
Assicurazioni Generali S.p.A.(b) | 7,402 | 111,126 | ||||||
Atlantia S.p.A. | 2,878 | 64,228 | ||||||
Banca Mediolanum S.p.A. | 1,289 | 9,657 | ||||||
Buzzi Unicem S.p.A. | 499 | 8,283 | ||||||
Coca-Cola HBC AG(a) | 1,046 | 22,912 | ||||||
Davide Campari-Milano N.V. | 2,650 | 23,818 | ||||||
De’ Longhi S.p.A.(b) | 378 | 6,527 | ||||||
DiaSorin S.p.A.(b) | 121 | 15,822 | ||||||
Enel S.p.A. | 41,815 | 186,761 | ||||||
Eni S.p.A.(b) | 13,085 | 171,408 | ||||||
Ferrari N.V. | 648 | 127,770 | ||||||
FinecoBank Banca Fineco S.p.A. | 3,272 | 44,110 | ||||||
Hera S.p.A. | 4,215 | 10,048 | ||||||
Infrastrutture Wireless Italiane S.p.A.(c) | 1,888 | 16,667 | ||||||
Interpump Group S.p.A. | 431 | 16,690 | ||||||
Intesa Sanpaolo S.p.A.(b) | 89,339 | 170,327 | ||||||
Italgas S.p.A. | 2,626 | 13,535 | ||||||
Leonardo S.p.A. | 2,145 | 17,240 | ||||||
Mediobanca Banca di Credito Finanziario S.p.A.(b) | 3,480 | 31,547 | ||||||
Moncler S.p.A. | 1,093 | 47,197 | ||||||
Nexi S.p.A.(a)(c) | 3,981 | 34,507 | ||||||
Pirelli & C. S.p.A.(c) | 2,624 | 9,902 | ||||||
Poste Italiane S.p.A.(c) | 2,447 | 21,331 | ||||||
PRADA S.p.A. | 2,743 | 12,492 | ||||||
Prysmian S.p.A. | 1,413 | 46,072 | ||||||
Recordati Industria Chimica e Farmaceutica S.p.A. | 519 | 19,508 | ||||||
Reply S.p.A. | 121 | 13,167 | ||||||
Snam S.p.A. | 11,949 | 53,168 | ||||||
Telecom Italia S.p.A.(a)(b) | 57,554 | 11,269 | ||||||
Telecom Italia S.p.A., RSP(a)(b) | 32,353 | 6,187 | ||||||
Terna Rete Elettrica Nazionale S.p.A. | 7,559 | 50,115 | ||||||
UniCredit S.p.A. | 10,530 | 130,591 | ||||||
UnipolSai Assicurazioni S.p.A. | 2,282 | 5,147 | ||||||
|
| |||||||
| 1,555,122 | ||||||||
|
| |||||||
| Japan-22.87% | ||||||||
ABC-Mart, Inc. | 144 | 6,423 | ||||||
Acom Co. Ltd. | 2,010 | 4,395 | ||||||
Activia Properties, Inc. | 4 | 11,855 | ||||||
Advance Residence Investment Corp. | 7 | 16,295 | ||||||
Advantest Corp. | 1,052 | 55,631 | ||||||
Aeon Co. Ltd. | 3,761 | 70,255 | ||||||
AEON Financial Service Co. Ltd. | 648 | 6,348 | ||||||
| Shares | Value | |||||||
| Japan-(continued) | ||||||||
Aeon Mall Co. Ltd. | 684 | $ | 7,441 | |||||
AEON REIT Investment Corp. | 9 | 9,688 | ||||||
AGC, Inc. | 1,008 | 31,637 | ||||||
Aica Kogyo Co. Ltd. | 288 | 6,200 | ||||||
Ain Holdings, Inc. | 144 | 6,055 | ||||||
Air Water, Inc. | 964 | 10,786 | ||||||
Aisin Corp. | 936 | 24,024 | ||||||
Ajinomoto Co., Inc. | 2,576 | 70,988 | ||||||
Alfresa Holdings Corp. | 910 | 10,475 | ||||||
Alps Alpine Co. Ltd. | 1,079 | 9,292 | ||||||
Amada Co. Ltd. | 1,702 | 11,989 | ||||||
Amano Corp. | 360 | 6,169 | ||||||
ANA Holdings, Inc.(a) | 842 | 16,377 | ||||||
Anritsu Corp.(b) | 756 | 7,624 | ||||||
Aozora Bank Ltd. | 648 | 11,148 | ||||||
Ariake Japan Co. Ltd. | 108 | 3,742 | ||||||
As One Corp. | 144 | 6,162 | ||||||
Asahi Group Holdings Ltd. | 2,575 | 72,138 | ||||||
Asahi Intecc Co. Ltd. | 1,044 | 17,799 | ||||||
Asahi Kasei Corp. | 6,588 | 42,307 | ||||||
Asics Corp. | 935 | 14,368 | ||||||
ASKUL Corp. | 216 | 2,260 | ||||||
Astellas Pharma, Inc. | 9,858 | 135,731 | ||||||
Azbil Corp. | 720 | 19,594 | ||||||
AZ-COM MARUWA Holdings, Inc. | 251 | 2,390 | ||||||
Bandai Namco Holdings, Inc. | 1,078 | 71,381 | ||||||
Bank of Kyoto Ltd. (The) | 396 | 14,280 | ||||||
BayCurrent Consulting, Inc. | 720 | 20,297 | ||||||
Benefit One, Inc. | 324 | 4,499 | ||||||
Benesse Holdings, Inc. | 396 | 5,845 | ||||||
Bic Camera, Inc. | 766 | 5,963 | ||||||
BIPROGY, Inc. | 360 | 7,787 | ||||||
Bridgestone Corp. | 3,118 | 112,482 | ||||||
Brother Industries Ltd. | 1,293 | 22,018 | ||||||
Calbee, Inc. | 432 | 8,676 | ||||||
Canon Marketing Japan, Inc. | 252 | 5,324 | ||||||
Canon, Inc.(b) | 5,257 | 111,552 | ||||||
Capcom Co. Ltd. | 1,008 | 28,110 | ||||||
Casio Computer Co. Ltd. | 1,151 | 10,020 | ||||||
Central Japan Railway Co. | 1,006 | 116,854 | ||||||
Chiba Bank Ltd. (The) | 3,224 | 17,635 | ||||||
Chubu Electric Power Co., Inc. | 3,726 | 30,357 | ||||||
Chugai Pharmaceutical Co. Ltd. | 3,473 | 80,613 | ||||||
Chugin Financial Group, Inc. | 874 | 5,269 | ||||||
Chugoku Electric Power Co., Inc. (The) | 1,604 | 7,532 | ||||||
Coca-Cola Bottlers Japan Holdings, Inc. | 730 | 6,601 | ||||||
COMSYS Holdings Corp. | 611 | 10,030 | ||||||
Concordia Financial Group Ltd. | 5,988 | 18,250 | ||||||
Cosmo Energy Holdings Co. Ltd. | 400 | 10,294 | ||||||
Cosmos Pharmaceutical Corp. | 113 | 10,948 | ||||||
Credit Saison Co. Ltd. | 802 | 8,579 | ||||||
CyberAgent, Inc. | 2,099 | 17,285 | ||||||
Dai Nippon Printing Co. Ltd.(b) | 1,389 | 27,876 | ||||||
Daicel Corp. | 1,416 | 8,079 | ||||||
Daido Steel Co. Ltd. | 216 | 5,609 | ||||||
Daifuku Co. Ltd. | 538 | 24,686 | ||||||
Dai-ichi Life Holdings, Inc. | 5,217 | 82,747 | ||||||
Daiichi Sankyo Co. Ltd. | 10,104 | 324,054 | ||||||
Daiichikosho Co. Ltd. | 216 | 6,205 | ||||||
Daikin Industries Ltd. | 1,451 | 218,526 | ||||||
See accompanying Notes to Financial Statements which are an integral part of the financial statements.
| 17 |
|
Invesco PureBetaSM FTSE Developed ex-North America ETF (PBDM)–(continued)
October 31, 2022
| Shares | Value | |||||||
| Japan-(continued) | ||||||||
Daio Paper Corp. | 431 | $ | 3,184 | |||||
Daito Trust Construction Co. Ltd. | 359 | 35,529 | ||||||
Daiwa House Industry Co. Ltd. | 3,403 | 68,960 | ||||||
Daiwa House REIT Investment Corp. | 11 | 22,202 | ||||||
Daiwa Office Investment Corp. | 1 | 4,723 | ||||||
Daiwa Securities Group, Inc. | 7,810 | 30,476 | ||||||
Daiwa Securities Living Investments Corp. | 11 | 8,540 | ||||||
DeNA Co. Ltd. | 469 | 6,125 | ||||||
Denka Co. Ltd. | 468 | 10,847 | ||||||
Denso Corp. | 2,394 | 119,028 | ||||||
Dentsu Group, Inc. | 1,085 | 33,834 | ||||||
Descente Ltd. | 195 | 4,697 | ||||||
DIC Corp. | 468 | 7,865 | ||||||
Disco Corp. | 144 | 34,587 | ||||||
DMG Mori Co. Ltd. | 576 | 6,685 | ||||||
Dowa Holdings Co. Ltd. | 252 | 8,028 | ||||||
East Japan Railway Co | 1,983 | 107,265 | ||||||
Ebara Corp. | 504 | 16,429 | ||||||
Eisai Co. Ltd. | 1,451 | 87,606 | ||||||
Electric Power Development Co. Ltd. | 838 | 11,659 | ||||||
ENEOS Holdings, Inc. | 15,606 | 51,427 | ||||||
EXEO Group, Inc. | 504 | 7,389 | ||||||
Ezaki Glico Co. Ltd. | 288 | 6,481 | ||||||
Fancl Corp. | 360 | 6,833 | ||||||
FANUC Corp. | 1,043 | 137,747 | ||||||
Fast Retailing Co. Ltd. | 276 | 154,104 | ||||||
Food & Life Cos. Ltd. | 576 | 9,723 | ||||||
FP Corp. | 251 | 5,986 | ||||||
Frontier Real Estate Investment Corp. | 3 | 10,596 | ||||||
Fuji Electric Co. Ltd. | 648 | 25,112 | ||||||
Fuji Kyuko Co. Ltd. | 98 | 3,033 | ||||||
Fuji Media Holdings, Inc. | 252 | 1,755 | ||||||
Fuji Oil Holdings, Inc. | 252 | 3,969 | ||||||
FUJIFILM Holdings Corp. | 1,944 | 89,186 | ||||||
Fujitsu General Ltd. | 324 | 7,411 | ||||||
Fujitsu Ltd. | 992 | 114,293 | ||||||
Fukuoka Financial Group, Inc. | 828 | 14,060 | ||||||
Furukawa Electric Co. Ltd. | 360 | 5,561 | ||||||
Fuyo General Lease Co. Ltd. | 108 | 6,002 | ||||||
GLP J-Reit | 23 | 23,846 | ||||||
GMO Internet Group, Inc. | 324 | 5,604 | ||||||
GMO Payment Gateway, Inc. | 216 | 15,593 | ||||||
GOLDWIN, Inc. | 181 | 9,474 | ||||||
GS Yuasa Corp. | 432 | 6,589 | ||||||
GungHo Online Entertainment, Inc. | 180 | 2,668 | ||||||
H.U. Group Holdings, Inc. | 288 | 5,367 | ||||||
Hachijuni Bank Ltd. (The) | 2,385 | 7,606 | ||||||
Hakuhodo DY Holdings, Inc. | 1,294 | 10,935 | ||||||
Hamamatsu Photonics K.K. | 684 | 31,017 | ||||||
Hankyu Hanshin Holdings, Inc. | 1,186 | 35,229 | ||||||
Haseko Corp. | 1,415 | 14,585 | ||||||
Heiwa Corp. | 288 | 4,650 | ||||||
Hikari Tsushin, Inc. | 108 | 13,057 | ||||||
Hino Motors Ltd. | 1,460 | 6,070 | ||||||
Hirogin Holdings, Inc. | 1,604 | 6,615 | ||||||
Hirose Electric Co. Ltd. | 180 | 23,385 | ||||||
Hisamitsu Pharmaceutical Co., Inc. | 396 | 9,778 | ||||||
Hitachi Construction Machinery Co. Ltd. | 612 | 11,998 | ||||||
Hitachi Ltd. | 4,959 | 225,538 | ||||||
Hitachi Metals Ltd.(a) | 1,041 | 15,212 | ||||||
| Shares | Value | |||||||
| Japan-(continued) | ||||||||
Hitachi Transport System Ltd. | 179 | $ | 10,706 | |||||
Honda Motor Co. Ltd. | 9,080 | 206,054 | ||||||
Horiba Ltd. | 216 | 8,894 | ||||||
Hoshizaki Corp. | 576 | 16,528 | ||||||
House Foods Group, Inc. | 396 | 7,415 | ||||||
Hoya Corp. | 1,905 | 177,831 | ||||||
Hulic Co. Ltd. | 2,261 | 16,429 | ||||||
Ibiden Co. Ltd. | 576 | 19,493 | ||||||
Idemitsu Kosan Co. Ltd. | 1,272 | 27,813 | ||||||
IHI Corp. | 684 | 15,278 | ||||||
Iida Group Holdings Co. Ltd. | 792 | 11,009 | ||||||
Industrial & Infrastructure Fund Investment Corp. | 10 | 10,563 | ||||||
Information Services International-Dentsu Ltd. | 109 | 3,340 | ||||||
INFRONEER Holdings, Inc. | 1,339 | 9,297 | ||||||
Inpex Corp. | 5,298 | 54,108 | ||||||
Internet Initiative Japan, Inc. | 576 | 9,060 | ||||||
Isetan Mitsukoshi Holdings Ltd. | 1,821 | 16,172 | ||||||
Isuzu Motors Ltd. | 2,791 | 32,748 | ||||||
Ito En Ltd. | 289 | 10,208 | ||||||
ITOCHU Corp.(b) | 7,140 | 184,895 | ||||||
Itochu Techno-Solutions Corp. | 538 | 12,488 | ||||||
Itoham Yonekyu Holdings, Inc. | 756 | 3,382 | ||||||
Iwatani Corp. | 253 | 9,328 | ||||||
Iyogin Holdings, Inc. | 1,496 | 7,015 | ||||||
Izumi Co. Ltd. | 216 | 4,358 | ||||||
J. Front Retailing Co. Ltd. | 1,319 | 10,667 | ||||||
Japan Airlines Co. Ltd.(a) | 794 | 14,824 | ||||||
Japan Airport Terminal Co. Ltd.(a) | 252 | 10,817 | ||||||
Japan Aviation Electronics Industry Ltd. | 252 | 3,932 | ||||||
Japan Exchange Group, Inc. | 2,792 | 36,695 | ||||||
Japan Hotel REIT Investment Corp. | 25 | 13,170 | ||||||
Japan Logistics Fund, Inc. | 5 | 10,714 | ||||||
Japan Metropolitan Fund Investment Corp. | 36 | 26,521 | ||||||
Japan Post Bank Co. Ltd. | 2,143 | 14,274 | ||||||
Japan Post Holdings Co. Ltd. | 11,604 | 78,039 | ||||||
Japan Post Insurance Co. Ltd.(b) | 1,079 | 15,949 | ||||||
Japan Prime Realty Investment Corp. | 5 | 13,574 | ||||||
Japan Real Estate Investment Corp. | 7 | 29,340 | ||||||
Japan Steel Works Ltd. (The) | 292 | 6,041 | ||||||
Japan Tobacco, Inc. | 6,390 | 105,930 | ||||||
JCR Pharmaceuticals Co. Ltd. | 288 | 4,292 | ||||||
Jeol Ltd. | 217 | 7,971 | ||||||
JFE Holdings, Inc. | 2,719 | 24,934 | ||||||
JGC Holdings Corp. | 1,139 | 13,732 | ||||||
JMDC, Inc. | 100 | 3,559 | ||||||
JSR Corp. | 972 | 18,533 | ||||||
JTEKT Corp. | 1,211 | 8,555 | ||||||
JustSystems Corp. | 180 | 3,803 | ||||||
Kadokawa Corp. | 531 | 9,546 | ||||||
Kagome Co. Ltd. | 432 | 8,644 | ||||||
Kajima Corp. | 2,323 | 21,896 | ||||||
Kakaku.com, Inc. | 718 | 12,178 | ||||||
Kaken Pharmaceutical Co. Ltd. | 180 | 4,608 | ||||||
Kamigumi Co. Ltd. | 476 | 9,057 | ||||||
Kandenko Co. Ltd. | 576 | 3,240 | ||||||
Kaneka Corp. | 324 | 8,044 | ||||||
Kansai Electric Power Co., Inc. (The) | 3,883 | 29,442 | ||||||
Kansai Paint Co. Ltd. | 944 | 12,321 | ||||||
Kao Corp. | 2,429 | 91,352 | ||||||
See accompanying Notes to Financial Statements which are an integral part of the financial statements.
| 18 |
|
Invesco PureBetaSM FTSE Developed ex-North America ETF (PBDM)–(continued)
October 31, 2022
| Shares | Value | |||||||
| Japan-(continued) | ||||||||
Katitas Co. Ltd. | 292 | $ | 6,552 | |||||
Kawasaki Heavy Industries Ltd. | 828 | 14,072 | ||||||
Kawasaki Kisen Kaisha Ltd.(b) | 1,299 | 19,760 | ||||||
KDDI Corp. | 8,810 | 260,504 | ||||||
Keihan Holdings Co. Ltd. | 540 | 13,896 | ||||||
Keikyu Corp. | 1,319 | 13,551 | ||||||
Keio Corp. | 646 | 22,687 | ||||||
Keisei Electric Railway Co. Ltd.(b) | 755 | 20,064 | ||||||
Kenedix Office Investment Corp. | 4 | 9,110 | ||||||
Kewpie Corp. | 575 | 9,087 | ||||||
Keyence Corp. | 1,072 | 406,197 | ||||||
Kikkoman Corp. | 1,006 | 54,688 | ||||||
Kinden Corp. | 682 | 6,947 | ||||||
Kintetsu Group Holdings Co. Ltd. | 1,008 | 34,112 | ||||||
Kirin Holdings Co. Ltd. | 3,998 | 58,893 | ||||||
Kobayashi Pharmaceutical Co. Ltd.(b) | 324 | 17,221 | ||||||
Kobe Bussan Co. Ltd.(b) | 737 | 16,041 | ||||||
Kobe Steel Ltd. | 1,737 | 7,129 | ||||||
Koei Tecmo Holdings Co. Ltd. | 862 | 13,037 | ||||||
Koito Manufacturing Co. Ltd. | 1,224 | 17,409 | ||||||
Kokuyo Co. Ltd. | 468 | 5,812 | ||||||
Komatsu Ltd. | 4,925 | 94,368 | ||||||
Konami Group Corp. | 504 | 22,142 | ||||||
Konica Minolta, Inc. | 2,442 | 7,443 | ||||||
Kose Corp. | 144 | 14,406 | ||||||
Kotobuki Spirits Co. Ltd. | 108 | 5,544 | ||||||
K’s Holdings Corp. | 838 | 6,574 | ||||||
Kubota Corp. | 5,760 | 80,470 | ||||||
Kuraray Co. Ltd. | 1,883 | 12,960 | ||||||
Kurita Water Industries Ltd. | 610 | 22,408 | ||||||
Kusuri no Aoki Holdings Co. Ltd. | 72 | 3,478 | ||||||
Kyocera Corp. | 1,601 | 80,150 | ||||||
Kyowa Kirin Co. Ltd. | 1,365 | 32,188 | ||||||
Kyudenko Corp. | 216 | 4,592 | ||||||
Kyushu Electric Power Co., Inc. | 2,478 | 12,287 | ||||||
Kyushu Financial Group, Inc. | 1,949 | 4,930 | ||||||
Kyushu Railway Co. | 802 | 16,781 | ||||||
LaSalle Logiport REIT | 10 | 10,677 | ||||||
Lasertec Corp. | 431 | 61,735 | ||||||
Lawson, Inc. | 252 | 8,053 | ||||||
Lintec Corp. | 288 | 4,325 | ||||||
Lion Corp. | 1,279 | 12,942 | ||||||
Lixil Corp. | 1,350 | 20,445 | ||||||
M3, Inc. | 2,275 | 68,050 | ||||||
Mabuchi Motor Co. Ltd. | 288 | 7,828 | ||||||
Makita Corp. | 1,343 | 24,577 | ||||||
Mani, Inc. | 324 | 4,730 | ||||||
Marubeni Corp. | 8,398 | 73,621 | ||||||
Marui Group Co. Ltd. | 1,016 | 16,774 | ||||||
Maruichi Steel Tube Ltd. | 360 | 6,808 | ||||||
Matsui Securities Co. Ltd. | 576 | 3,069 | ||||||
MatsukiyoCocokara & Co. | 626 | 22,827 | ||||||
Mazda Motor Corp. | 3,042 | 20,528 | ||||||
Mebuki Financial Group, Inc. | 5,007 | 9,735 | ||||||
Medipal Holdings Corp. | 791 | 9,819 | ||||||
MEIJI Holdings Co. Ltd. | 720 | 29,646 | ||||||
Menicon Co. Ltd. | 253 | 4,335 | ||||||
MINEBEA MITSUMI, Inc. | 2,143 | 31,777 | ||||||
MISUMI Group, Inc. | 1,523 | 32,584 | ||||||
Mitsubishi Chemical Group Corp. | 6,782 | 30,667 | ||||||
| Shares | Value | |||||||
| Japan-(continued) | ||||||||
Mitsubishi Corp. | 6,321 | $ | 171,426 | |||||
Mitsubishi Electric Corp. | 10,445 | 92,057 | ||||||
Mitsubishi Estate Co. Ltd. | 6,046 | 76,188 | ||||||
Mitsubishi Gas Chemical Co., Inc. | 972 | 12,373 | ||||||
Mitsubishi HC Capital, Inc. | 3,376 | 14,491 | ||||||
Mitsubishi Heavy Industries Ltd. | 1,496 | 51,532 | ||||||
Mitsubishi Logistics Corp. | 325 | 7,139 | ||||||
Mitsubishi Materials Corp. | 622 | 8,144 | ||||||
Mitsubishi Motors Corp.(a) | 3,351 | 11,273 | ||||||
Mitsubishi UFJ Financial Group, Inc.(b) | 64,460 | 303,359 | ||||||
Mitsui & Co. Ltd. | 8,343 | 184,839 | ||||||
Mitsui Chemicals, Inc. | 970 | 17,979 | ||||||
Mitsui Fudosan Co. Ltd. | 4,860 | 93,172 | ||||||
Mitsui Fudosan Logistics Park, Inc. | 3 | 9,951 | ||||||
Mitsui High-Tec, Inc. | 163 | 8,444 | ||||||
Mitsui Mining & Smelting Co. Ltd. | 324 | 6,561 | ||||||
Mitsui OSK Lines Ltd.(b) | 1,835 | 36,432 | ||||||
Miura Co. Ltd. | 539 | 11,006 | ||||||
Mizuho Financial Group, Inc. | 13,596 | 146,905 | ||||||
Money Forward, Inc.(a) | 224 | 6,390 | ||||||
MonotaRO Co. Ltd. | 1,211 | 18,478 | ||||||
Mori Hills REIT Investment Corp. | 8 | 8,757 | ||||||
Morinaga & Co. Ltd. | 216 | 5,406 | ||||||
Morinaga Milk Industry Co. Ltd. | 216 | 6,133 | ||||||
MS&AD Insurance Group Holdings, Inc. | 2,458 | 65,173 | ||||||
Murata Manufacturing Co. Ltd. | 3,089 | 151,712 | ||||||
Nabtesco Corp. | 612 | 13,032 | ||||||
Nagase & Co. Ltd. | 512 | 6,986 | ||||||
Nagoya Railroad Co. Ltd. | 1,044 | 16,000 | ||||||
Nankai Electric Railway Co. Ltd. | 612 | 12,394 | ||||||
NEC Corp. | 1,450 | 48,046 | ||||||
NEC Networks & System Integration Corp. | 396 | 4,247 | ||||||
NET One Systems Co. Ltd. | 468 | 9,635 | ||||||
Nexon Co. Ltd. | 2,143 | 36,001 | ||||||
NGK Insulators Ltd. | 1,401 | 16,373 | ||||||
NGK Spark Plug Co. Ltd. | 1,079 | 19,673 | ||||||
NH Foods Ltd. | 539 | 12,855 | ||||||
NHK Spring Co. Ltd. | 838 | 4,646 | ||||||
Nichirei Corp. | 514 | 8,002 | ||||||
Nidec Corp. | 2,429 | 134,626 | ||||||
Nifco, Inc. | 433 | 10,065 | ||||||
Nihon Kohden Corp. | 396 | 8,885 | ||||||
Nihon M&A Center Holdings, Inc. | 1,416 | 16,033 | ||||||
Nikon Corp. | 1,674 | 16,207 | ||||||
Nintendo Co. Ltd. | 5,760 | 235,229 | ||||||
Nippon Accommodations Fund, Inc. | 2 | 8,518 | ||||||
Nippon Building Fund, Inc. | 8 | 35,577 | ||||||
Nippon Electric Glass Co. Ltd. | 371 | 6,435 | ||||||
Nippon Express Holdings, Inc. | 361 | 18,143 | ||||||
Nippon Kayaku Co. Ltd. | 874 | 6,950 | ||||||
Nippon Paint Holdings Co. Ltd.(b) | 5,446 | 34,808 | ||||||
Nippon Prologis REIT, Inc. | 12 | 25,149 | ||||||
Nippon Sanso Holdings Corp. | 790 | 12,607 | ||||||
Nippon Shinyaku Co. Ltd. | 288 | 15,966 | ||||||
Nippon Shokubai Co. Ltd. | 180 | 6,467 | ||||||
Nippon Steel Corp. | 4,385 | 60,257 | ||||||
Nippon Telegraph & Telephone Corp. | 6,344 | 174,739 | ||||||
Nippon Television Holdings, Inc. | 144 | 1,075 | ||||||
Nippon Yusen K.K.(b) | 2,592 | 47,067 | ||||||
Nipro Corp. | 586 | 4,424 | ||||||
See accompanying Notes to Financial Statements which are an integral part of the financial statements.
| 19 |
|
Invesco PureBetaSM FTSE Developed ex-North America ETF (PBDM)–(continued)
October 31, 2022
| Shares | Value | |||||||
| Japan-(continued) | ||||||||
Nishi-Nippon Railroad Co. Ltd. | 432 | $ | 8,484 | |||||
Nissan Chemical Corp. | 720 | 32,455 | ||||||
Nissan Motor Co. Ltd. | 10,388 | 33,155 | ||||||
Nisshin Seifun Group, Inc. | 1,401 | 15,157 | ||||||
Nissin Foods Holdings Co. Ltd. | 361 | 23,389 | ||||||
Nitori Holdings Co. Ltd. | 396 | 36,061 | ||||||
Nitto Denko Corp. | 792 | 41,722 | ||||||
Noevir Holdings Co. Ltd. | 72 | 2,664 | ||||||
NOF Corp. | 360 | 12,401 | ||||||
NOK Corp. | 648 | 5,301 | ||||||
Nomura Holdings, Inc. | 16,038 | 51,987 | ||||||
Nomura Real Estate Holdings, Inc. | 611 | 13,833 | ||||||
Nomura Real Estate Master Fund, Inc. | 24 | 27,369 | ||||||
Nomura Research Institute Ltd. | 2,115 | 47,028 | ||||||
NS Solutions Corp. | 180 | 4,148 | ||||||
NSK Ltd. | 2,323 | 12,284 | ||||||
NTT Data Corp. | 3,365 | 48,833 | ||||||
Obayashi Corp.(b) | 3,582 | 23,015 | ||||||
OBIC Business Consultants Co. Ltd. | 169 | 4,866 | ||||||
Obic Co. Ltd. | 360 | 54,181 | ||||||
Odakyu Electric Railway Co. Ltd. | 1,604 | 19,090 | ||||||
Oji Holdings Corp. | 4,744 | 16,469 | ||||||
OKUMA Corp. | 145 | 4,868 | ||||||
Olympus Corp. | 6,690 | 141,330 | ||||||
Omron Corp. | 1,008 | 47,174 | ||||||
Ono Pharmaceutical Co. Ltd. | 2,252 | 52,969 | ||||||
Open House Group Co. Ltd. | 360 | 12,837 | ||||||
Orient Corp. | 302 | 2,448 | ||||||
Oriental Land Co. Ltd. | 1,008 | 135,295 | ||||||
ORIX Corp. | 6,382 | 93,818 | ||||||
ORIX JREIT, Inc. | 14 | 18,791 | ||||||
Osaka Gas Co. Ltd. | 2,071 | 30,681 | ||||||
OSG Corp. | 396 | 5,043 | ||||||
Otsuka Corp. | 574 | 18,131 | ||||||
Otsuka Holdings Co. Ltd. | 2,215 | 71,024 | ||||||
Paltac Corp. | 180 | 5,123 | ||||||
Pan Pacific International Holdings Corp. | 2,120 | 34,816 | ||||||
Panasonic Holdings Corp. | 11,405 | 81,681 | ||||||
Park24 Co. Ltd.(a) | 712 | 9,509 | ||||||
Penta-Ocean Construction Co. Ltd. | 1,532 | 7,627 | ||||||
PeptiDream, Inc.(a) | 468 | 5,142 | ||||||
Persol Holdings Co. Ltd. | 900 | 18,081 | ||||||
Pigeon Corp. | 612 | 8,021 | ||||||
Pola Orbis Holdings, Inc. | 432 | 4,781 | ||||||
Rakus Co. Ltd. | 538 | 6,019 | ||||||
Rakuten Group, Inc. | 4,349 | 19,487 | ||||||
Recruit Holdings Co. Ltd. | 7,375 | 227,747 | ||||||
Relo Group, Inc. | 576 | 8,146 | ||||||
Renesas Electronics Corp.(a) | 6,473 | 54,285 | ||||||
Rengo Co. Ltd. | 1,090 | 6,050 | ||||||
RENOVA, Inc.(a) | 251 | 5,522 | ||||||
Resona Holdings, Inc. | 11,622 | 43,764 | ||||||
Resorttrust, Inc. | 360 | 5,546 | ||||||
Ricoh Co. Ltd. | 3,243 | 23,782 | ||||||
Rinnai Corp. | 181 | 12,348 | ||||||
Rohm Co. Ltd. | 433 | 30,501 | ||||||
Rohto Pharmaceutical Co. Ltd. | 540 | 16,803 | ||||||
Ryohin Keikaku Co. Ltd. | 1,308 | 12,329 | ||||||
Sankyo Co. Ltd. | 251 | 8,300 | ||||||
Sankyu, Inc. | 288 | 8,613 | ||||||
| Shares | Value | |||||||
| Japan-(continued) | ||||||||
Sanrio Co. Ltd. | 300 | $ | 8,003 | |||||
Santen Pharmaceutical Co. Ltd. | 1,954 | 13,383 | ||||||
Sanwa Holdings Corp. | 1,018 | 8,780 | ||||||
Sapporo Holdings Ltd. | 360 | 7,944 | ||||||
Sawai Group Holdings Co. Ltd. | 216 | 6,227 | ||||||
SBI Holdings, Inc. | 1,308 | 23,655 | ||||||
SCREEN Holdings Co. Ltd. | 216 | 11,902 | ||||||
SCSK Corp. | 684 | 10,110 | ||||||
Secom Co. Ltd. | 1,044 | 59,640 | ||||||
Sega Sammy Holdings, Inc. | 818 | 10,484 | ||||||
Seibu Holdings, Inc. | 1,115 | 9,992 | ||||||
Seiko Epson Corp. | 1,487 | 20,269 | ||||||
Seino Holdings Co. Ltd. | 730 | 5,619 | ||||||
Sekisui Chemical Co. Ltd. | 1,785 | 22,337 | ||||||
Sekisui House Ltd. | 3,042 | 50,654 | ||||||
Sekisui House REIT, Inc. | 23 | 12,395 | ||||||
Seven & i Holdings Co. Ltd. | 4,133 | 154,437 | ||||||
Seven Bank Ltd. | 3,434 | 6,192 | ||||||
SG Holdings Co. Ltd. | 2,314 | 30,701 | ||||||
Sharp Corp.(b) | 1,045 | 6,264 | ||||||
SHIFT, Inc.(a) | 71 | 11,135 | ||||||
Shikoku Electric Power Co., Inc. | 864 | 4,162 | ||||||
Shimadzu Corp. | 1,411 | 37,260 | ||||||
Shimamura Co. Ltd. | 108 | 8,741 | ||||||
Shimano, Inc. | 431 | 66,911 | ||||||
Shimizu Corp. | 2,863 | 14,312 | ||||||
Shin-Etsu Chemical Co. Ltd. | 2,071 | 216,526 | ||||||
Shinko Electric Industries Co. Ltd. | 360 | 8,683 | ||||||
Shinsei Bank Ltd. | 352 | 5,234 | ||||||
Shionogi & Co. Ltd. | 1,487 | 68,930 | ||||||
Ship Healthcare Holdings, Inc. | 432 | 8,286 | ||||||
Shiseido Co. Ltd. | 2,043 | 70,856 | ||||||
Shizuoka Financial Group, Inc. | 2,647 | 16,705 | ||||||
SHO-BOND Holdings Co. Ltd. | 252 | 10,919 | ||||||
Shochiku Co. Ltd.(a) | 37 | 2,940 | ||||||
Showa Denko K.K. | 1,004 | 14,671 | ||||||
Skylark Holdings Co. Ltd.(a) | 1,179 | 12,588 | ||||||
SMC Corp. | 310 | 125,389 | ||||||
SMS Co. Ltd. | 252 | 5,798 | ||||||
SoftBank Corp. | 14,730 | 145,234 | ||||||
SoftBank Group Corp. | 5,602 | 241,214 | ||||||
Sohgo Security Services Co. Ltd. | 360 | 8,986 | ||||||
Sojitz Corp. | 1,287 | 18,997 | ||||||
Sompo Holdings, Inc. | 1,713 | 71,374 | ||||||
Sony Group Corp. | 6,596 | 443,239 | ||||||
Sotetsu Holdings, Inc. | 432 | 6,548 | ||||||
Square Enix Holdings Co. Ltd. | 432 | 19,299 | ||||||
Stanley Electric Co. Ltd. | 791 | 13,453 | ||||||
Subaru Corp. | 3,224 | 50,225 | ||||||
Sugi Holdings Co. Ltd. | 180 | 7,230 | ||||||
SUMCO Corp. | 1,828 | 23,232 | ||||||
Sumitomo Bakelite Co. Ltd. | 180 | 4,880 | ||||||
Sumitomo Chemical Co. Ltd. | 8,075 | 27,218 | ||||||
Sumitomo Corp. | 6,039 | 77,014 | ||||||
Sumitomo Electric Industries Ltd. | 4,026 | 42,092 | ||||||
Sumitomo Forestry Co. Ltd. | 756 | 11,851 | ||||||
Sumitomo Heavy Industries Ltd. | 648 | 12,307 | ||||||
Sumitomo Metal Mining Co. Ltd. | 1,293 | 36,380 | ||||||
Sumitomo Mitsui Financial Group, Inc. | 6,937 | 194,760 | ||||||
Sumitomo Mitsui Trust Holdings, Inc. | 1,891 | 54,414 | ||||||
See accompanying Notes to Financial Statements which are an integral part of the financial statements.
| 20 |
|
Invesco PureBetaSM FTSE Developed ex-North America ETF (PBDM)–(continued)
October 31, 2022
| Shares | Value | |||||||
| Japan-(continued) | ||||||||
Sumitomo Pharma Co. Ltd. | 936 | $ | 6,530 | |||||
Sumitomo Realty & Development Co. Ltd. | 2,072 | 47,606 | ||||||
Sumitomo Rubber Industries Ltd. | 1,008 | 8,653 | ||||||
Sundrug Co. Ltd. | 360 | 8,380 | ||||||
Suntory Beverage & Food Ltd. | 683 | 22,884 | ||||||
Suzuken Co. Ltd. | 432 | 9,620 | ||||||
Suzuki Motor Corp. | 2,421 | 81,767 | ||||||
Sysmex Corp. | 1,042 | 56,280 | ||||||
T&D Holdings, Inc. | 2,726 | 26,905 | ||||||
Taiheiyo Cement Corp. | 646 | 8,784 | ||||||
Taisei Corp. | 928 | 25,317 | ||||||
Taisho Pharmaceutical Holdings Co. Ltd. | 252 | 9,088 | ||||||
Taiyo Yuden Co. Ltd. | 648 | 17,678 | ||||||
Takara Bio, Inc. | 252 | 2,955 | ||||||
Takara Holdings, Inc. | 910 | 6,343 | ||||||
Takashimaya Co. Ltd. | 730 | 9,027 | ||||||
Takeda Pharmaceutical Co. Ltd. | 8,115 | 213,910 | ||||||
TBS Holdings, Inc. | 216 | 2,239 | ||||||
TDK Corp. | 1,892 | 59,254 | ||||||
TechnoPro Holdings, Inc. | 576 | 13,738 | ||||||
Teijin Ltd. | 1,008 | 9,155 | ||||||
Terumo Corp. | 3,510 | 106,834 | ||||||
THK Co. Ltd. | 650 | 11,361 | ||||||
TIS, Inc. | 1,208 | 32,631 | ||||||
Tobu Railway Co. Ltd. | 1,114 | 25,782 | ||||||
Toda Corp. | 1,247 | 6,234 | ||||||
Toho Co. Ltd. | 611 | 21,787 | ||||||
Toho Gas Co. Ltd. | 504 | 9,410 | ||||||
Tohoku Electric Power Co., Inc. | 2,502 | 10,521 | ||||||
Tokai Carbon Co. Ltd. | 1,018 | 6,650 | ||||||
Tokio Marine Holdings, Inc. | 10,014 | 181,301 | ||||||
Tokyo Century Corp. | 325 | 11,086 | ||||||
Tokyo Electric Power Co. Holdings, Inc.(a) | 8,328 | 27,174 | ||||||
Tokyo Electron Ltd. | 804 | 213,610 | ||||||
Tokyo Gas Co. Ltd. | 2,214 | 39,577 | ||||||
Tokyo Ohka Kogyo Co. Ltd. | 215 | 9,287 | ||||||
Tokyo Tatemono Co. Ltd. | 1,079 | 14,874 | ||||||
Tokyu Corp. | 2,573 | 29,705 | ||||||
Tokyu Fudosan Holdings Corp. | 3,269 | 16,605 | ||||||
Toppan, Inc. | 1,508 | 22,513 | ||||||
Toray Industries, Inc. | 8,111 | 39,536 | ||||||
Toshiba Corp. | 2,287 | 79,718 | ||||||
Toshiba TEC Corp. | 144 | 3,735 | ||||||
Tosoh Corp. | 1,523 | 16,589 | ||||||
TOTO Ltd. | 791 | 22,617 | ||||||
Toyo Seikan Group Holdings Ltd. | 792 | 9,064 | ||||||
Toyo Suisan Kaisha Ltd. | 504 | 18,921 | ||||||
Toyo Tire Corp. | 576 | 6,755 | ||||||
Toyoda Gosei Co. Ltd. | 432 | 6,906 | ||||||
Toyota Boshoku Corp. | 360 | 4,587 | ||||||
Toyota Industries Corp. | 864 | 44,527 | ||||||
Toyota Motor Corp. | 65,191 | 903,292 | ||||||
Toyota Tsusho Corp. | 1,221 | 41,074 | ||||||
Trend Micro, Inc. | 646 | 32,640 | ||||||
TS Tech Co. Ltd. | 576 | 6,026 | ||||||
Tsumura & Co. | 360 | 7,520 | ||||||
Tsuruha Holdings, Inc. | 181 | 10,534 | ||||||
UBE Corp. | 539 | 6,952 | ||||||
Ulvac, Inc. | 253 | 10,009 | ||||||
Unicharm Corp. | 2,034 | 62,018 | ||||||
| Shares | Value | |||||||
| Japan-(continued) | ||||||||
United Urban Investment Corp. | 16 | $ | 16,922 | |||||
Ushio, Inc. | 611 | 6,355 | ||||||
USS Co. Ltd. | 1,150 | 17,385 | ||||||
Welcia Holdings Co. Ltd. | 540 | 11,299 | ||||||
West Japan Railway Co. | 1,258 | 49,944 | ||||||
Yakult Honsha Co. Ltd. | 684 | 37,919 | ||||||
Yamada Holdings Co. Ltd. | 3,976 | 12,813 | ||||||
Yamaguchi Financial Group, Inc. | 1,211 | 6,371 | ||||||
Yamaha Corp. | 862 | 32,593 | ||||||
Yamaha Motor Co. Ltd. | 1,629 | 33,646 | ||||||
Yamato Holdings Co. Ltd. | 1,748 | 25,920 | ||||||
Yamato Kogyo Co. Ltd. | 180 | 5,232 | ||||||
Yamazaki Baking Co. Ltd. | 622 | 6,340 | ||||||
Yaoko Co. Ltd. | 108 | 4,701 | ||||||
Yaskawa Electric Corp. | 1,415 | 39,317 | ||||||
Yokogawa Electric Corp. | 1,283 | 21,502 | ||||||
Yokohama Rubber Co. Ltd. (The) | 714 | 11,183 | ||||||
Z Holdings Corp. | 13,941 | 36,073 | ||||||
Zenkoku Hosho Co. Ltd. | 288 | 9,514 | ||||||
Zensho Holdings Co. Ltd. | 540 | 13,479 | ||||||
Zeon Corp. | 730 | 6,159 | ||||||
ZOZO, Inc. | 610 | 12,989 | ||||||
|
| |||||||
| 17,838,723 | ||||||||
|
| |||||||
| Jordan-0.02% | ||||||||
Hikma Pharmaceuticals PLC | 905 | 13,014 | ||||||
|
| |||||||
| Luxembourg-0.15% | ||||||||
ArcelorMittal S.A.(b) | 2,802 | 62,740 | ||||||
Eurofins Scientific SE(b) | 651 | 41,680 | ||||||
L’Occitane International S.A. | 2,466 | 6,063 | ||||||
RTL Group S.A.(b) | 207 | 7,026 | ||||||
|
| |||||||
| 117,509 | ||||||||
|
| |||||||
| Macau-0.11% | ||||||||
Galaxy Entertainment Group Ltd. | 11,968 | 54,657 | ||||||
MGM China Holdings Ltd.(a) | 3,956 | 1,593 | ||||||
Sands China Ltd.(a) | 12,681 | 22,132 | ||||||
SJM Holdings Ltd.(a) | 12,365 | 3,859 | ||||||
Wynn Macau Ltd.(a)(b) | 7,495 | 2,988 | ||||||
|
| |||||||
| 85,229 | ||||||||
|
| |||||||
| Mexico-0.01% | ||||||||
Fresnillo PLC(b) | 989 | 8,301 | ||||||
|
| |||||||
| Netherlands-4.99% | ||||||||
Aalberts N.V. | 515 | 17,907 | ||||||
ABN AMRO Bank N.V., CVA(c) | 2,220 | 21,845 | ||||||
Adyen N.V.(a)(c) | 158 | 226,837 | ||||||
Aegon N.V. | 9,496 | 43,971 | ||||||
Akzo Nobel N.V. | 959 | 59,182 | ||||||
Argenx SE(a) | 296 | 115,500 | ||||||
ASM International N.V. | 247 | 54,879 | ||||||
ASML Holding N.V.(b) | 2,163 | 1,021,870 | ||||||
ASR Nederland N.V. | 701 | 30,893 | ||||||
BE Semiconductor Industries N.V. | 424 | 21,674 | ||||||
CTP N.V.(c) | 333 | 3,456 | ||||||
Euronext N.V.(c) | 433 | 27,518 | ||||||
EXOR N.V.(a) | 554 | 37,233 | ||||||
Heineken Holding N.V. | 567 | 38,723 | ||||||
Heineken N.V.(b) | 1,277 | 106,776 | ||||||
IMCD N.V. | 305 | 39,580 | ||||||
See accompanying Notes to Financial Statements which are an integral part of the financial statements.
| 21 |
|
Invesco PureBetaSM FTSE Developed ex-North America ETF (PBDM)–(continued)
October 31, 2022
| Shares | Value | |||||||
| Netherlands-(continued) | ||||||||
ING Groep N.V. | 20,349 | $ | 200,194 | |||||
JDE Peet’s N.V. | 447 | 12,803 | ||||||
Koninklijke Ahold Delhaize N.V. | 5,446 | 152,057 | ||||||
Koninklijke DSM N.V. | 934 | 110,128 | ||||||
Koninklijke KPN N.V. | 17,441 | 48,800 | ||||||
Koninklijke Philips N.V.(b) | 4,758 | 60,278 | ||||||
Koninklijke Vopak N.V. | 349 | 7,140 | ||||||
NN Group N.V. | 1,603 | 67,888 | ||||||
OCI N.V. | 518 | 19,823 | ||||||
Randstad N.V.(b) | 592 | 29,513 | ||||||
Shell PLC | 39,303 | 1,087,846 | ||||||
Universal Music Group N.V. | 4,004 | 78,561 | ||||||
Wolters Kluwer N.V. | 1,393 | 148,072 | ||||||
|
| |||||||
| 3,890,947 | ||||||||
|
| |||||||
| New Zealand-0.34% | ||||||||
a2 Milk Co. Ltd. (The)(a) | 3,950 | 13,309 | ||||||
Air New Zealand Ltd.(a) | 8,734 | 3,958 | ||||||
Auckland International Airport Ltd.(a) | 6,344 | 28,379 | ||||||
Contact Energy Ltd. | 4,039 | 17,716 | ||||||
Fisher & Paykel Healthcare Corp. Ltd. | 3,050 | 34,694 | ||||||
Fletcher Building Ltd. | 4,330 | 12,930 | ||||||
Infratil Ltd. | 3,884 | 19,721 | ||||||
Kiwi Property Group Ltd., (Acquired 12/07/2020 - 11/02/2021; Cost $6,935)(d) | 8,420 | 4,427 | ||||||
Mainfreight Ltd. | 432 | 19,084 | ||||||
Mercury NZ Ltd. | 3,619 | 12,236 | ||||||
Meridian Energy Ltd. | 6,600 | 18,711 | ||||||
Ryman Healthcare Ltd. | 2,201 | 10,715 | ||||||
SKYCITY Entertainment Group Ltd.(a) | 3,751 | 6,319 | ||||||
Spark New Zealand Ltd. | 10,002 | 29,751 | ||||||
Xero Ltd.(a) | 671 | 33,497 | ||||||
|
| |||||||
| 265,447 | ||||||||
|
| |||||||
| Nigeria-0.01% | ||||||||
Airtel Africa PLC(c) | 5,355 | 6,973 | ||||||
|
| |||||||
| Norway-0.75% | ||||||||
Aker ASA, Class A(b) | 128 | 9,018 | ||||||
Aker BP ASA | 1,642 | 52,339 | ||||||
AutoStore Holdings Ltd.(a)(c) | 3,128 | 5,906 | ||||||
DNB Bank ASA | 5,492 | 97,196 | ||||||
Equinor ASA | 5,025 | 183,831 | ||||||
Gjensidige Forsikring ASA | 891 | 16,274 | ||||||
Kongsberg Gruppen ASA | 403 | 14,443 | ||||||
Leroy Seafood Group ASA | 1,374 | 6,317 | ||||||
Mowi ASA | 2,371 | 35,359 | ||||||
Nordic Semiconductor ASA(a) | 838 | 11,840 | ||||||
Norsk Hydro ASA | 7,172 | 45,515 | ||||||
Orkla ASA | 4,079 | 27,526 | ||||||
Salmar ASA(b) | 288 | 9,756 | ||||||
Schibsted ASA, Class A | 414 | 6,375 | ||||||
Schibsted ASA, Class B | 516 | 7,658 | ||||||
Telenor ASA | 3,398 | 30,885 | ||||||
TOMRA Systems ASA | 1,255 | 20,282 | ||||||
Var Energi ASA | 2,171 | 7,402 | ||||||
|
| |||||||
| 587,922 | ||||||||
|
| |||||||
| Poland-0.20% | ||||||||
Allegro.eu S.A.(a)(b)(c) | 2,071 | 10,070 | ||||||
Bank Polska Kasa Opieki S.A. | 839 | 13,793 | ||||||
Dino Polska S.A.(a)(c) | 252 | 16,489 | ||||||
| Shares | Value | |||||||
| Poland-(continued) | ||||||||
InPost S.A.(a) | 1,006 | $ | 6,425 | |||||
KGHM Polska Miedz S.A. | 732 | 14,676 | ||||||
LPP S.A.(b) | 6 | 10,425 | ||||||
Polski Koncern Naftowy ORLEN S.A. | 3,118 | 35,889 | ||||||
Powszechna Kasa Oszczednosci Bank Polski S.A. | 4,569 | 24,964 | ||||||
Powszechny Zaklad Ubezpieczen S.A. | 3,003 | 16,868 | ||||||
Santander Bank Polska S.A. | 145 | 7,725 | ||||||
|
| |||||||
| 157,324 | ||||||||
|
| |||||||
| Portugal-0.16% | ||||||||
EDP - Energias de Portugal S.A. | 15,160 | 66,302 | ||||||
Galp Energia SGPS S.A.(b) | 2,759 | 28,018 | ||||||
Jeronimo Martins SGPS S.A. | 1,475 | 30,585 | ||||||
|
| |||||||
| 124,905 | ||||||||
|
| |||||||
| Russia-0.00% | ||||||||
Evraz PLC(e) | 3,267 | 0 | ||||||
|
| |||||||
| Singapore-1.47% | ||||||||
BOC Aviation Ltd.(c) | 1,199 | 8,027 | ||||||
CapitaLand Ascendas REIT | 18,287 | 33,858 | ||||||
CapitaLand Ascott Trust | 10,007 | 6,753 | ||||||
CapitaLand Integrated Commercial Trust | 27,412 | 36,418 | ||||||
CapitaLand Investment Ltd. | 13,650 | 29,034 | ||||||
City Developments Ltd. | 2,514 | 13,555 | ||||||
ComfortDelGro Corp. Ltd. | 11,039 | 9,907 | ||||||
DBS Group Holdings Ltd. | 9,761 | 235,903 | ||||||
Frasers Logistics & Commercial Trust(c) | 14,659 | 11,395 | ||||||
Genting Singapore Ltd. | 31,070 | 17,675 | ||||||
Jardine Cycle & Carriage Ltd. | 576 | 12,105 | ||||||
Kenon Holdings Ltd. | 73 | 2,810 | ||||||
Keppel Corp. Ltd. | 7,479 | 36,837 | ||||||
Keppel DC REIT | 6,640 | 8,258 | ||||||
Keppel REIT | 10,998 | 6,956 | ||||||
Mapletree Industrial Trust | 9,827 | 15,278 | ||||||
Mapletree Logistics Trust | 17,228 | 18,505 | ||||||
Mapletree Pan Asia Commercial Trust | 12,928 | 14,526 | ||||||
NetLink NBN Trust(c) | 14,659 | 8,857 | ||||||
Olam Group Ltd. | 3,499 | 3,313 | ||||||
Oversea-Chinese Banking Corp. Ltd. | 18,775 | 160,936 | ||||||
SATS Ltd.(a) | 3,387 | 6,534 | ||||||
Sembcorp Industries Ltd. | 4,886 | 10,048 | ||||||
Sembcorp Marine Ltd.(a) | 82,394 | 7,395 | ||||||
SIA Engineering Co. Ltd.(a)(b) | 1,247 | 1,903 | ||||||
Singapore Airlines Ltd.(a)(b) | 6,820 | 25,350 | ||||||
Singapore Exchange Ltd. | 4,420 | 26,300 | ||||||
Singapore Post Ltd. | 8,127 | 3,101 | ||||||
Singapore Technologies Engineering Ltd. | 8,182 | 19,080 | ||||||
Singapore Telecommunications Ltd. | 40,366 | 71,313 | ||||||
StarHub Ltd. | 3,063 | 2,316 | ||||||
STMicroelectronics N.V. | 3,393 | 105,970 | ||||||
Suntec REIT | 10,979 | 10,008 | ||||||
United Overseas Bank Ltd. | 6,886 | 135,083 | ||||||
UOL Group Ltd. | 2,647 | 11,579 | ||||||
Venture Corp. Ltd. | 1,455 | 16,379 | ||||||
|
| |||||||
| 1,143,265 | ||||||||
|
| |||||||
| South Africa-0.25% | ||||||||
Anglo American PLC | 6,494 | 195,034 | ||||||
|
| |||||||
See accompanying Notes to Financial Statements which are an integral part of the financial statements.
| 22 |
|
Invesco PureBetaSM FTSE Developed ex-North America ETF (PBDM)–(continued)
October 31, 2022
| Shares | Value | |||||||
| South Korea-4.78% | ||||||||
Alteogen, Inc.(a) | 174 | $ | 4,483 | |||||
Amorepacific Corp. | 167 | 10,868 | ||||||
Amorepacific Corp., Preference Shares | 56 | 1,447 | ||||||
Amorepacific Group | 144 | 2,497 | ||||||
BGF retail Co. Ltd. | 34 | 4,452 | ||||||
BNK Financial Group, Inc. | 1,550 | 6,975 | ||||||
Celltrion Healthcare Co. Ltd. | 511 | 24,932 | ||||||
Celltrion Pharm, Inc.(a) | 103 | 4,902 | ||||||
Celltrion, Inc. | 577 | 77,773 | ||||||
Cheil Worldwide, Inc. | 370 | 6,351 | ||||||
CJ CheilJedang Corp. | 42 | 12,207 | ||||||
CJ CheilJedang Corp., Preference Shares | 1 | 116 | ||||||
CJ Corp. | 69 | 3,478 | ||||||
CJ ENM Co. Ltd. | 54 | 2,783 | ||||||
CJ Logistics Corp.(a) | 36 | 2,221 | ||||||
Coway Co. Ltd. | 289 | 11,220 | ||||||
Daewoo Engineering & Construction Co. Ltd.(a) | 946 | 2,793 | ||||||
Daewoo Shipbuilding & Marine Engineering Co. Ltd.(a) | 252 | 3,237 | ||||||
DB Insurance Co. Ltd. | 238 | 9,407 | ||||||
Delivery Hero SE(a)(c) | 1,009 | 33,258 | ||||||
DGB Financial Group, Inc. | 820 | 3,909 | ||||||
DL E&C Co. Ltd. | 144 | 3,483 | ||||||
DL Holdings Co. Ltd. | 65 | 2,806 | ||||||
Dongsuh Cos., Inc. | 164 | 2,349 | ||||||
Doosan Bobcat, Inc. | 129 | 3,034 | ||||||
Doosan Enerbility Co. Ltd.(a) | 2,241 | 20,845 | ||||||
Ecopro BM Co. Ltd. | 211 | 17,049 | ||||||
E-MART, Inc. | 107 | 6,355 | ||||||
F&F Co. Ltd. | 83 | 8,478 | ||||||
Fila Holdings Corp. | 274 | 6,290 | ||||||
Green Cross Corp. | 30 | 2,685 | ||||||
GS Engineering & Construction Corp. | 324 | 4,936 | ||||||
GS Holdings Corp. | 272 | 8,784 | ||||||
GS Retail Co. Ltd. | 208 | 3,709 | ||||||
Hana Financial Group, Inc. | 1,539 | 44,567 | ||||||
Hanjin Kal Corp.(a) | 109 | 3,046 | ||||||
Hankook Tire & Technology Co. Ltd. | 393 | 10,084 | ||||||
Hanmi Pharm Co. Ltd. | 36 | 6,394 | ||||||
Hanmi Science Co. Ltd. | 73 | 1,642 | ||||||
Hanon Systems | 860 | 4,709 | ||||||
Hanssem Co. Ltd. | 36 | 946 | ||||||
Hanwha Aerospace Co. Ltd. | 180 | 8,378 | ||||||
Hanwha Corp. | 216 | 3,852 | ||||||
Hanwha Corp., 3rd Preference Shares | 108 | 1,061 | ||||||
Hanwha Life Insurance Co. Ltd.(a) | 1,469 | 2,253 | ||||||
Hanwha Solutions Corp.(a) | 614 | 20,345 | ||||||
HD Hyundai Co. Ltd. | 269 | 11,501 | ||||||
Hite Jinro Co. Ltd. | 162 | 2,917 | ||||||
HL Mando Co. Ltd. | 176 | 6,110 | ||||||
HLB, Inc.(a) | 475 | 13,505 | ||||||
HLB, Inc., Rts., expiring 12/02/2022(a) | 42 | 289 | ||||||
HMM Co. Ltd. | 1,559 | 20,904 | ||||||
Hotel Shilla Co. Ltd. | 165 | 7,529 | ||||||
HYBE Co. Ltd.(a) | 97 | 8,240 | ||||||
Hyundai Department Store Co. Ltd. | 72 | 2,735 | ||||||
Hyundai Doosan Infracore Co. Ltd.(a) | 719 | 2,801 | ||||||
Hyundai Engineering & Construction Co. Ltd. | 388 | 9,506 | ||||||
Hyundai Glovis Co. Ltd. | 98 | 11,971 | ||||||
Hyundai Heavy Industries Co. Ltd.(a) | 77 | 5,892 | ||||||
| Shares | Value | |||||||
| South Korea-(continued) | ||||||||
Hyundai Marine & Fire Insurance Co. Ltd. | 317 | $ | 7,411 | |||||
Hyundai Mipo Dockyard Co. Ltd.(a) | 108 | 6,960 | ||||||
Hyundai Mobis Co. Ltd. | 329 | 50,582 | ||||||
Hyundai Motor Co | 743 | 85,804 | ||||||
Hyundai Motor Co., First Pfd | 108 | 5,944 | ||||||
Hyundai Motor Co., Second Pfd | 180 | 10,084 | ||||||
Hyundai Steel Co. | 396 | 7,812 | ||||||
Hyundai Wia Corp. | 72 | 3,088 | ||||||
Iljin Materials Co. Ltd. | 90 | 3,829 | ||||||
Industrial Bank of Korea | 1,347 | 9,882 | ||||||
Kakao Corp. | 1,621 | 57,696 | ||||||
Kakao Games Corp.(a) | 145 | 4,026 | ||||||
KakaoBank Corp.(a) | 906 | 10,876 | ||||||
Kakaopay Corp.(a) | 113 | 2,804 | ||||||
Kangwon Land, Inc.(a) | 568 | 9,171 | ||||||
KB Financial Group, Inc. | 2,073 | 69,927 | ||||||
KCC Corp. | 24 | 4,111 | ||||||
KEPCO Plant Service & Engineering Co. Ltd. | 108 | 2,419 | ||||||
Kia Corp. | 1,375 | 63,998 | ||||||
Korea Aerospace Industries Ltd. | 376 | 12,499 | ||||||
Korea Electric Power Corp.(a) | 1,362 | 16,016 | ||||||
Korea Gas Corp. | 138 | 3,371 | ||||||
Korea Investment Holdings Co. Ltd. | 203 | 7,061 | ||||||
Korea Shipbuilding & Offshore Engineering Co. Ltd.(a) | 217 | 11,075 | ||||||
Korea Zinc Co. Ltd. | 53 | 23,813 | ||||||
Korean Air Lines Co. Ltd.(a) | 934 | 15,146 | ||||||
Krafton, Inc.(a) | 157 | 19,564 | ||||||
KT&G Corp. | 581 | 39,034 | ||||||
Kumho Petrochemical Co. Ltd. | 93 | 8,553 | ||||||
L&F Co. Ltd.(a) | 115 | 18,165 | ||||||
LG Chem Ltd. | 248 | 108,988 | ||||||
LG Chem Ltd., Preference Shares | 41 | 8,318 | ||||||
LG Corp. | 467 | 25,965 | ||||||
LG Display Co. Ltd. | 1,192 | 10,669 | ||||||
LG Electronics, Inc. | 576 | 32,996 | ||||||
LG Electronics, Inc., Preference Shares | 92 | 2,561 | ||||||
LG Energy Solution Ltd.(a) | 185 | 68,574 | ||||||
LG H&H Co. Ltd. | 47 | 16,828 | ||||||
LG H&H Co. Ltd., Preference Shares | 12 | 2,363 | ||||||
LG Innotek Co. Ltd. | 72 | 14,987 | ||||||
LG Uplus Corp. | 1,044 | 8,392 | ||||||
LOTTE Chemical Corp. | 73 | 7,585 | ||||||
LOTTE Chilsung Beverage Co. Ltd. | 19 | 1,874 | ||||||
LOTTE Corp. | 140 | 3,204 | ||||||
LOTTE Fine Chemical Co. Ltd. | 93 | 3,663 | ||||||
LOTTE Shopping Co. Ltd. | 60 | 3,681 | ||||||
LS Corp. | 92 | 4,295 | ||||||
Meritz Financial Group, Inc. | 145 | 2,209 | ||||||
Mirae Asset Securities Co. Ltd. | 1,414 | 6,303 | ||||||
Mirae Asset Securities Co. Ltd., Second Pfd | 752 | 1,911 | ||||||
NAVER Corp. | 775 | 92,220 | ||||||
NCSoft Corp. | 85 | 23,272 | ||||||
Netmarble Corp.(c) | 91 | 2,849 | ||||||
NH Investment & Securities Co. Ltd. | 720 | 4,534 | ||||||
NHN Corp.(a) | 72 | 1,160 | ||||||
NongShim Co. Ltd. | 18 | 3,816 | ||||||
OCI Co. Ltd. | 96 | 6,874 | ||||||
Orion Corp. | 108 | 7,696 | ||||||
Ottogi Corp. | 7 | 2,170 | ||||||
See accompanying Notes to Financial Statements which are an integral part of the financial statements.
| 23 |
|
Invesco PureBetaSM FTSE Developed ex-North America ETF (PBDM)–(continued)
October 31, 2022
| Shares | Value | |||||||
| South Korea-(continued) | ||||||||
Pan Ocean Co. Ltd. | 1,004 | $ | 3,031 | |||||
Paradise Co. Ltd.(a) | 243 | 2,422 | ||||||
Pearl Abyss Corp.(a) | 165 | 4,819 | ||||||
POSCO Chemical Co. Ltd. | 144 | 20,168 | ||||||
POSCO Holdings, Inc. | 401 | 70,097 | ||||||
Posco International Corp. | 263 | 3,813 | ||||||
S-1 Corp. | 101 | 4,424 | ||||||
Samsung Biologics Co. Ltd.(a)(c) | 98 | 60,336 | ||||||
Samsung C&T Corp. | 447 | 37,186 | ||||||
Samsung Card Co. Ltd. | 160 | 3,471 | ||||||
Samsung Electro-Mechanics Co. Ltd. | 288 | 24,464 | ||||||
Samsung Electronics Co. Ltd. | 25,412 | 1,059,688 | ||||||
Samsung Electronics Co. Ltd., Preference Shares | 4,431 | 165,799 | ||||||
Samsung Engineering Co. Ltd.(a) | 841 | 14,081 | ||||||
Samsung Fire & Marine Insurance Co. Ltd. | 175 | 24,571 | ||||||
Samsung Fire & Marine Insurance Co. Ltd., Preference Shares | 15 | 1,685 | ||||||
Samsung Heavy Industries Co. Ltd.(a) | 3,300 | 11,931 | ||||||
Samsung Life Insurance Co. Ltd. | 397 | 18,785 | ||||||
Samsung SDI Co. Ltd. | 281 | 145,387 | ||||||
Samsung SDI Co. Ltd., Preference Shares | 8 | 1,915 | ||||||
Samsung SDS Co. Ltd. | 195 | 17,112 | ||||||
Samsung Securities Co. Ltd. | 337 | 7,511 | ||||||
SD Biosensor, Inc. | 182 | 3,776 | ||||||
Seegene, Inc. | 153 | 3,083 | ||||||
Shin Poong Pharmaceutical Co. Ltd.(a) | 178 | 2,705 | ||||||
Shinhan Financial Group Co. Ltd. | 2,660 | 67,786 | ||||||
Shinsegae, Inc. | 36 | 5,370 | ||||||
SillaJen, Inc.(a) | 8 | 58 | ||||||
SK Biopharmaceuticals Co. Ltd.(a) | 130 | 5,302 | ||||||
SK Bioscience Co. Ltd.(a) | 106 | 5,626 | ||||||
SK Chemicals Co. Ltd. | 72 | 4,468 | ||||||
SK Hynix, Inc. | 2,897 | 168,193 | ||||||
SK IE Technology Co. Ltd.(a)(c) | 136 | 4,965 | ||||||
SK Innovation Co. Ltd.(a) | 277 | 33,642 | ||||||
SK Networks Co. Ltd. | 714 | 2,020 | ||||||
SK Square Co. Ltd.(a) | 527 | 13,670 | ||||||
SK Telecom Co. Ltd. | 184 | 6,472 | ||||||
SK, Inc. | 193 | 28,995 | ||||||
SKC Co. Ltd. | 101 | 7,339 | ||||||
S-Oil Corp. | 216 | 13,101 | ||||||
Solus Advanced Materials Co. Ltd. | 61 | 1,439 | ||||||
SSANGYONG C&E Co. Ltd. | 550 | 2,193 | ||||||
Wemade Co. Ltd. | 89 | 2,771 | ||||||
Woori Financial Group, Inc. | 3,382 | 27,897 | ||||||
Yuhan Corp. | 265 | 11,125 | ||||||
|
| |||||||
| 3,726,659 | ||||||||
|
| |||||||
| Spain-2.25% | ||||||||
Acciona S.A. | 123 | 22,137 | ||||||
ACS Actividades de Construccion y Servicios S.A. | 1,162 | 29,803 | ||||||
Aena SME S.A.(a)(c) | 377 | 44,396 | ||||||
Amadeus IT Group S.A.(a) | 2,282 | 118,951 | ||||||
Banco Bilbao Vizcaya Argentaria S.A.(b) | 32,798 | 168,855 | ||||||
Banco Santander S.A.(b) | 89,151 | 231,031 | ||||||
Bankinter S.A.(b) | 3,669 | 22,178 | ||||||
CaixaBank S.A. | 23,096 | 76,539 | ||||||
Cellnex Telecom S.A.(c) | 3,226 | 105,537 | ||||||
| Shares | Value | |||||||
| Spain-(continued) | ||||||||
Corp ACCIONA Energias Renovables S.A. | 306 | $ | 12,025 | |||||
EDP Renovaveis S.A. | 1,291 | 27,191 | ||||||
Enagas S.A. | 1,333 | 21,640 | ||||||
Endesa S.A. | 1,699 | 28,353 | ||||||
Ferrovial S.A. | 2,541 | 62,057 | ||||||
Fluidra S.A.(b) | 574 | 7,789 | ||||||
Grifols S.A.(a)(b) | 1,774 | 15,089 | ||||||
Grifols S.A., Class B, Preference Shares(a) | 1,387 | 8,650 | ||||||
Iberdrola S.A. | 32,002 | 324,990 | ||||||
Industria de Diseno Textil S.A.(b) | 5,637 | 127,806 | ||||||
Inmobiliaria Colonial SOCIMI S.A. | 1,841 | 9,707 | ||||||
Mapfre S.A.(b) | 5,293 | 9,076 | ||||||
Merlin Properties SOCIMI S.A. | 1,779 | 15,068 | ||||||
Naturgy Energy Group S.A. | 775 | 19,885 | ||||||
Red Electrica Corp. S.A. | 2,311 | 37,345 | ||||||
Repsol S.A. | 6,725 | 91,358 | ||||||
Siemens Gamesa Renewable Energy S.A., Class R(a) | 1,202 | 21,337 | ||||||
Telefonica S.A. | 27,334 | 94,149 | ||||||
|
| |||||||
| 1,752,942 | ||||||||
|
| |||||||
| Sweden-2.95% | ||||||||
Alfa Laval AB | 1,681 | 41,392 | ||||||
Alleima AB(a) | 1,154 | 3,929 | ||||||
Assa Abloy AB, Class B | 4,917 | 99,226 | ||||||
Atlas Copco AB, Class A | 13,545 | 144,687 | ||||||
Atlas Copco AB, Class B | 8,103 | 78,416 | ||||||
Axfood AB | 579 | 14,325 | ||||||
Beijer Ref AB(b) | 1,309 | 20,292 | ||||||
Boliden AB | 1,468 | 42,723 | ||||||
Castellum AB(b) | 1,451 | 16,584 | ||||||
Electrolux AB, Class B(b) | 1,234 | 15,216 | ||||||
Epiroc AB, Class A | 3,343 | 51,141 | ||||||
Epiroc AB, Class B | 2,024 | 27,172 | ||||||
EQT AB | 1,513 | 29,793 | ||||||
Essity AB, Class B | 3,267 | 69,003 | ||||||
Evolution AB(c) | 866 | 80,954 | ||||||
Fastighets AB Balder, Class B(a) | 3,238 | 12,159 | ||||||
Getinge AB, Class B | 1,197 | 24,296 | ||||||
H & M Hennes & Mauritz AB, Class B(b) | 4,699 | 47,286 | ||||||
Hexagon AB, Class B | 10,057 | 99,383 | ||||||
Holmen AB, Class B | 515 | 18,670 | ||||||
Husqvarna AB, Class A | 133 | 793 | ||||||
Husqvarna AB, Class B | 2,184 | 12,965 | ||||||
Industrivarden AB, Class A | 1,206 | 27,306 | ||||||
Industrivarden AB, Class C(b) | 918 | 20,611 | ||||||
Indutrade AB(b) | 1,503 | 26,298 | ||||||
Investment AB Latour, Class B | 768 | 12,979 | ||||||
Investor AB, Class A(b) | 2,847 | 48,410 | ||||||
Investor AB, Class B(b) | 9,783 | 159,673 | ||||||
Kinnevik AB, Class B(a) | 1,284 | 15,860 | ||||||
L E Lundbergforetagen AB, Class B | 396 | 15,631 | ||||||
Lifco AB, Class B | 1,217 | 17,571 | ||||||
Nibe Industrier AB, Class B | 7,804 | 62,218 | ||||||
Saab AB, Class B | 492 | 17,373 | ||||||
Sagax AB, Class B | 921 | 16,969 | ||||||
Sagax AB, Class D | 540 | 1,300 | ||||||
Sandvik AB | 5,774 | 90,186 | ||||||
Securitas AB, Class B | 2,602 | 21,272 | ||||||
Skandinaviska Enskilda Banken AB, Class A | 7,694 | 81,114 | ||||||
See accompanying Notes to Financial Statements which are an integral part of the financial statements.
| 24 |
|
Invesco PureBetaSM FTSE Developed ex-North America ETF (PBDM)–(continued)
October 31, 2022
| Shares | Value | |||||||
| Sweden-(continued) | ||||||||
Skandinaviska Enskilda Banken AB, Class C | 108 | $ | 1,231 | |||||
Skanska AB, Class B(b) | 1,921 | 29,866 | ||||||
SKF AB, Class B(b) | 2,059 | 29,775 | ||||||
Svenska Cellulosa AB S.C.A., Class A | 108 | 1,302 | ||||||
Svenska Cellulosa AB S.C.A., Class B | 3,184 | 37,544 | ||||||
Svenska Handelsbanken AB, Class A | 7,962 | 73,961 | ||||||
Svenska Handelsbanken AB, Class B(b) | 180 | 1,968 | ||||||
Sweco AB, Class B | 1,072 | 8,052 | ||||||
Swedbank AB, Class A | 5,384 | 80,221 | ||||||
Swedish Match AB | 7,933 | 81,552 | ||||||
Swedish Orphan Biovitrum AB, Class B(a) | 945 | 17,386 | ||||||
Tele2 AB, Class B | 2,963 | 24,271 | ||||||
Telefonaktiebolaget LM Ericsson, Class A | 195 | 1,158 | ||||||
Telefonaktiebolaget LM Ericsson, Class B | 16,131 | 89,629 | ||||||
Telia Co. AB(b) | 13,765 | 36,435 | ||||||
Trelleborg AB, Class B | 1,302 | 28,666 | ||||||
Vitrolife AB | 353 | 5,705 | ||||||
Volvo AB, Class A | 1,100 | 18,774 | ||||||
Volvo AB, Class B | 8,095 | 132,445 | ||||||
Volvo Car AB, Class B(a)(b) | 2,883 | 12,233 | ||||||
|
| |||||||
| 2,297,350 | ||||||||
|
| |||||||
| Switzerland-5.40% | ||||||||
ABB Ltd. | 8,165 | 227,143 | ||||||
Accelleron Industries AG(a) | 408 | 6,923 | ||||||
Adecco Group AG(b) | 852 | 26,682 | ||||||
Alcon, Inc. | 2,477 | 150,835 | ||||||
Bachem Holding AG | 165 | 11,846 | ||||||
Baloise Holding AG | 241 | 32,944 | ||||||
Banque Cantonale Vaudoise | 151 | 13,444 | ||||||
Barry Callebaut AG | 19 | 35,959 | ||||||
Belimo Holding AG | 50 | 20,385 | ||||||
BKW AG | 96 | 11,204 | ||||||
Chocoladefabriken Lindt & Spruengli AG, PC | 12 | 115,114 | ||||||
Cie Financiere Richemont S.A | 2,744 | 268,546 | ||||||
Clariant AG(a) | 1,212 | 19,511 | ||||||
Credit Suisse Group AG(b) | 14,022 | 57,867 | ||||||
DKSH Holding AG | 180 | 12,977 | ||||||
Emmi AG | 10 | 7,984 | ||||||
EMS-Chemie Holding AG | 38 | 23,903 | ||||||
Flughafen Zurich AG(a) | 101 | 15,684 | ||||||
Geberit AG | 188 | 83,654 | ||||||
Georg Fischer AG | 447 | 24,768 | ||||||
Givaudan S.A | 50 | 149,388 | ||||||
Helvetia Holding AG | 180 | 17,879 | ||||||
Holcim AG | 2,942 | 133,702 | ||||||
Julius Baer Group Ltd. | 1,145 | 54,885 | ||||||
Kuehne + Nagel International AG, Class R | 268 | 57,148 | ||||||
Logitech International S.A., Class R(b) | 784 | 39,053 | ||||||
Lonza Group AG | 398 | 204,975 | ||||||
Novartis AG | 11,008 | 889,880 | ||||||
Partners Group Holding AG | 121 | 108,746 | ||||||
PSP Swiss Property AG | 231 | 24,698 | ||||||
Schindler Holding AG | 102 | 16,063 | ||||||
Schindler Holding AG, PC | 219 | 35,725 | ||||||
SGS S.A. | 32 | 70,635 | ||||||
SIG Group AG(b) | 2,042 | 39,259 | ||||||
Sika AG | 821 | 185,243 | ||||||
Sonova Holding AG, Class A | 276 | 65,280 | ||||||
Straumann Holding AG | 572 | 54,516 | ||||||
| Shares | Value | |||||||
| Switzerland-(continued) | ||||||||
Swatch Group AG (The) | 237 | $ | 9,909 | |||||
Swatch Group AG (The), BR(b) | 155 | 34,911 | ||||||
Swiss Life Holding AG | 163 | 78,979 | ||||||
Swiss Prime Site AG | 396 | 31,973 | ||||||
Swisscom AG | 136 | 67,174 | ||||||
Tecan Group AG, Class R(b) | 67 | 24,597 | ||||||
Temenos AG | 324 | 19,328 | ||||||
UBS Group AG | 16,360 | 259,766 | ||||||
VAT Group AG(b)(c) | 138 | 31,551 | ||||||
Zurich Insurance Group AG | 798 | 340,730 | ||||||
|
| |||||||
| 4,213,366 | ||||||||
|
| |||||||
| Taiwan-0.00% | ||||||||
FIT Hon Teng Ltd.(a)(c) | 5,482 | 643 | ||||||
|
| |||||||
| United Kingdom-11.07% | ||||||||
3i Group PLC | 5,108 | 68,250 | ||||||
abrdn PLC(b) | 11,522 | 21,093 | ||||||
Admiral Group PLC | 1,530 | 35,531 | ||||||
Allfunds Group PLC | 1,307 | 8,248 | ||||||
Ashtead Group PLC | 2,370 | 124,156 | ||||||
Associated British Foods PLC | 1,864 | 28,962 | ||||||
AstraZeneca PLC | 7,934 | 936,684 | ||||||
Auto Trader Group PLC(c) | 4,991 | 29,973 | ||||||
AVEVA Group PLC(b) | 612 | 21,984 | ||||||
Aviva PLC | 15,008 | 72,245 | ||||||
B&M European Value Retail S.A. | 4,807 | 17,854 | ||||||
BAE Systems PLC | 16,975 | 159,168 | ||||||
Barclays PLC | 86,686 | 147,473 | ||||||
Barratt Developments PLC | 5,428 | 23,511 | ||||||
Bellway PLC | 662 | 14,139 | ||||||
Berkeley Group Holdings PLC | 559 | 22,340 | ||||||
BP PLC | 99,659 | 550,534 | ||||||
British American Tobacco PLC | 12,032 | 475,644 | ||||||
British Land Co. PLC (The) | 4,959 | 20,891 | ||||||
BT Group PLC(b) | 37,237 | 55,649 | ||||||
Bunzl PLC | 1,806 | 59,074 | ||||||
Burberry Group PLC | 2,125 | 44,406 | ||||||
Centrica PLC | 31,527 | 27,812 | ||||||
CNH Industrial N.V. | 5,277 | 68,349 | ||||||
Compass Group PLC | 9,590 | 202,776 | ||||||
ConvaTec Group PLC(c) | 8,580 | 21,535 | ||||||
Croda International PLC(b) | 723 | 56,272 | ||||||
DCC PLC | 529 | 29,479 | ||||||
Dechra Pharmaceuticals PLC | 592 | 17,858 | ||||||
Derwent London PLC | 541 | 13,479 | ||||||
Diageo PLC | 12,115 | 501,871 | ||||||
Direct Line Insurance Group PLC | 7,146 | 16,603 | ||||||
Dr. Martens PLC | 3,012 | 8,628 | ||||||
DS Smith PLC | 6,843 | 22,864 | ||||||
easyJet PLC(a) | 1,994 | 7,999 | ||||||
Entain PLC | 3,124 | 45,428 | ||||||
Experian PLC | 4,948 | 158,031 | ||||||
Haleon PLC(a) | 26,874 | 82,923 | ||||||
Halma PLC | 2,032 | 49,481 | ||||||
Hargreaves Lansdown PLC(b) | 2,025 | 17,794 | ||||||
Hiscox Ltd. | 1,798 | 18,615 | ||||||
HomeServe PLC | 1,480 | 20,209 | ||||||
Howden Joinery Group PLC | 2,859 | 16,919 | ||||||
HSBC Holdings PLC | 108,112 | 556,776 | ||||||
IMI PLC | 1,384 | 19,568 | ||||||
See accompanying Notes to Financial Statements which are an integral part of the financial statements.
| 25 |
|
Invesco PureBetaSM FTSE Developed ex-North America ETF (PBDM)–(continued)
October 31, 2022
| Shares | Value | |||||||
| United Kingdom-(continued) | ||||||||
Imperial Brands PLC | 5,053 | $ | 123,569 | |||||
Informa PLC | 7,730 | 49,448 | ||||||
InterContinental Hotels Group PLC | 982 | 53,094 | ||||||
Intermediate Capital Group PLC | 1,491 | 18,231 | ||||||
International Consolidated Airlines Group S.A.(a)(b) | 6,003 | 8,402 | ||||||
International Distributions Services PLC | 4,819 | 11,224 | ||||||
Intertek Group PLC | 866 | 36,433 | ||||||
ITV PLC | 19,979 | 15,412 | ||||||
J Sainsbury PLC | 9,060 | 20,278 | ||||||
JD Sports Fashion PLC | 13,212 | 14,822 | ||||||
Johnson Matthey PLC(b) | 1,000 | 22,273 | ||||||
Just Eat Takeaway.com N.V.(a)(b)(c) | 969 | 16,626 | ||||||
Kingfisher PLC | 10,634 | 26,801 | ||||||
Land Securities Group PLC | 3,821 | 25,094 | ||||||
Legal & General Group PLC | 31,783 | 85,226 | ||||||
Lloyds Banking Group PLC | 367,090 | 177,597 | ||||||
London Stock Exchange Group PLC | 1,970 | 171,609 | ||||||
M&G PLC | 13,940 | 28,119 | ||||||
Melrose Industries PLC | 21,559 | 29,017 | ||||||
National Grid PLC | 19,653 | 214,599 | ||||||
NatWest Group PLC | 27,348 | 73,932 | ||||||
Next PLC | 664 | 37,682 | ||||||
Ocado Group PLC(a)(b) | 3,109 | 16,910 | ||||||
Pearson PLC(b) | 3,942 | 43,589 | ||||||
Pennon Group PLC | 1,434 | 13,827 | ||||||
Pepco Group N.V.(a)(c) | 585 | 4,117 | ||||||
Persimmon PLC | 1,703 | 25,588 | ||||||
Phoenix Group Holdings PLC(b) | 3,934 | 24,568 | ||||||
Reckitt Benckiser Group PLC | 3,841 | 255,611 | ||||||
RELX PLC | 9,977 | 268,911 | ||||||
Renishaw PLC | 181 | 7,298 | ||||||
Rentokil Initial PLC | 13,556 | 84,968 | ||||||
Rightmove PLC(b) | 4,525 | 25,622 | ||||||
Rolls-Royce Holdings PLC(a)(b) | 44,904 | 40,404 | ||||||
RS GROUP PLC | 2,521 | 27,821 | ||||||
Sage Group PLC (The) | 5,502 | 46,041 | ||||||
Schroders PLC | 3,522 | 15,884 | ||||||
Segro PLC | 6,420 | 58,025 | ||||||
Severn Trent PLC | 1,345 | 38,761 | ||||||
Smith & Nephew PLC | 4,715 | 55,915 | ||||||
Smiths Group PLC | 1,944 | 34,927 | ||||||
Spirax-Sarco Engineering PLC | 394 | 48,765 | ||||||
SSE PLC | 5,717 | 102,420 | ||||||
St James’s Place PLC | 2,849 | 34,934 | ||||||
Standard Chartered PLC | 13,142 | 78,712 | ||||||
Tate & Lyle PLC | 2,151 | 17,361 | ||||||
Taylor Wimpey PLC | 19,406 | 20,953 | ||||||
Tesco PLC | 39,722 | 98,374 | ||||||
Unilever PLC | 13,630 | 623,714 | ||||||
UNITE Group PLC (The) | 1,713 | 17,573 | ||||||
United Utilities Group PLC | 3,659 | 39,575 | ||||||
Vodafone Group PLC | 134,779 | 157,723 | ||||||
| Shares | Value | |||||||
| United Kingdom-(continued) | ||||||||
Weir Group PLC (The) | 1,389 | $ | 24,348 | |||||
Whitbread PLC(b) | 1,082 | 32,041 | ||||||
Wise PLC, Class A(a) | 2,436 | 18,651 | ||||||
WPP PLC | 5,730 | 50,535 | ||||||
|
| |||||||
| 8,633,032 | ||||||||
|
| |||||||
| United States-5.00% | ||||||||
Amcor PLC, CDI | 8,093 | 93,617 | ||||||
Computershare Ltd. | 2,883 | 46,586 | ||||||
Ferguson PLC | 1,133 | 124,056 | ||||||
GSK PLC | 21,499 | 353,669 | ||||||
JS Global Lifestyle Co. Ltd.(c) | 6,774 | 5,454 | ||||||
Nestle S.A. | 14,481 | 1,577,825 | ||||||
Oracle Corp. | 180 | 9,616 | ||||||
QIAGEN N.V.(a) | 1,185 | 51,181 | ||||||
Roche Holding AG | 3,729 | 1,239,150 | ||||||
Roche Holding AG, BR(b) | 143 | 58,043 | ||||||
Samsonite International S.A.(a)(c) | 6,911 | 14,861 | ||||||
Signify N.V. | 674 | 18,692 | ||||||
Sims Ltd. | 872 | 6,814 | ||||||
Stellantis N.V. | 10,899 | 147,146 | ||||||
Swiss Re AG | 1,548 | 115,085 | ||||||
Tenaris S.A. | 2,506 | 38,898 | ||||||
|
| |||||||
| 3,900,693 | ||||||||
|
| |||||||
Total Common Stocks & Other Equity Interests |
| 77,637,591 | ||||||
|
| |||||||
| Money Market Funds-0.14% |
| |||||||
Invesco Government & Agency Portfolio, Institutional Class, 3.07%(f)(g) | 111,203 | 111,203 | ||||||
|
| |||||||
TOTAL INVESTMENTS IN SECURITIES |
| 77,748,794 | ||||||
|
| |||||||
| Investments Purchased with Cash Collateral from Securities on Loan |
| |||||||
| Money Market Funds-7.90% |
| |||||||
Invesco Private Government Fund, | 1,724,672 | 1,724,672 | ||||||
Invesco Private Prime Fund, 3.28%(f)(g)(h) | 4,432,079 | 4,432,079 | ||||||
|
| |||||||
Total Investments Purchased with Cash Collateral from Securities on Loan |
| 6,156,751 | ||||||
|
| |||||||
TOTAL INVESTMENTS IN SECURITIES-107.58% |
| 83,905,545 | ||||||
OTHER ASSETS LESS LIABILITIES-(7.58)% | (5,911,830 | ) | ||||||
|
| |||||||
NET ASSETS-100.00% | $ | 77,993,715 | ||||||
|
| |||||||
See accompanying Notes to Financial Statements which are an integral part of the financial statements.
| 26 |
|
Invesco PureBetaSM FTSE Developed ex-North America ETF (PBDM)–(continued)
October 31, 2022
Investment Abbreviations:
BR-Bearer Shares
CDI-CREST Depository Interest
CVA-Dutch Certificates
PC-Participation Certificate
Pfd.-Preferred
REIT-Real Estate Investment Trust
RSP-Registered Savings Plan Shares
Rts.-Rights
Notes to Schedule of Investments:
| (a) | Non-income producing security. |
| (b) | All or a portion of this security was out on loan at October 31, 2022. |
| (c) | Security purchased or received in a transaction exempt from registration under the Securities Act of 1933, as amended (the “1933 Act”). The security may be resold pursuant to an exemption from registration under the 1933 Act, typically to qualified institutional buyers. The aggregate value of these securities at October 31, 2022 was $1,260,855, which represented 1.62% of the Fund’s Net Assets. |
| (d) | Restricted security. The value of this security at October 31, 2022 represented less than 1% of the Fund’s Net Assets. |
| (e) | Security valued using significant unobservable inputs (Level 3). See Note 4. |
| (f) | Affiliated issuer. The issuer and/or the Fund is a wholly-owned subsidiary of Invesco Ltd., or is affiliated by having an investment adviser that is under common control of Invesco Ltd. The table below shows the Fund’s transactions in, and earnings from, its investments in affiliates for the fiscal year ended October 31, 2022. |
| Value October 31, 2021 | Purchases at Cost | Proceeds from Sales | Change in Unrealized Appreciation (Depreciation) | Realized Gain (Loss) | Value October 31, 2022 | Dividend Income | |||||||||||||||||||||||||||||||||||||||||||||||||
| Investments in Affiliated Money Market Funds: | |||||||||||||||||||||||||||||||||||||||||||||||||||||||
| Invesco Government & Agency Portfolio, Institutional Class | $ | 160,782 | $ | 6,855,780 | $ | (6,905,359 | ) | $ | - | $ | - | $ | 111,203 | $ | 905 | ||||||||||||||||||||||||||||||||||||||||
| Investments Purchased with Cash Collateral from Securities on Loan: | |||||||||||||||||||||||||||||||||||||||||||||||||||||||
| Invesco Private Government Fund | 335,481 | 11,797,840 | (10,408,649 | ) | - | - | 1,724,672 | 15,151 | * | ||||||||||||||||||||||||||||||||||||||||||||||
| Invesco Private Prime Fund | 783,705 | 23,502,498 | (19,853,781 | ) | (131 | ) | (212 | ) | 4,432,079 | 41,554 | * | ||||||||||||||||||||||||||||||||||||||||||||
|
|
|
|
|
|
|
|
|
|
|
|
|
| ||||||||||||||||||||||||||||||||||||||||||
Total | $ | 1,279,968 | $ | 42,156,118 | $ | (37,167,789 | ) | $ | (131 | ) | $ | (212 | ) | $ | 6,267,954 | $ | 57,610 | ||||||||||||||||||||||||||||||||||||||
|
|
|
|
|
|
|
|
|
|
|
|
|
| ||||||||||||||||||||||||||||||||||||||||||
| * | Represents the income earned on the investment of cash collateral, which is included in securities lending income on the Statements of Operations. Does not include rebates and fees paid to lending agent or premiums received from borrowers, if any. |
| (g) | The rate shown is the 7-day SEC standardized yield as of October 31, 2022. |
| (h) | The security has been segregated to satisfy the commitment to return the cash collateral received in securities lending transactions upon the borrower’s return of the securities loaned. See Note 2J. |
See accompanying Notes to Financial Statements which are an integral part of the financial statements.
| 27 |
|
Invesco PureBetaSM FTSE Emerging Markets ETF (PBEE)
October 31, 2022
Schedule of Investments
| Shares | Value | |||||||
| Common Stocks & Other Equity Interests-90.43% |
| |||||||
| Bahrain-0.12% | ||||||||
Ahli United Bank BSC(a) | 16,458 | $ | 16,206 | |||||
|
| |||||||
| Brazil-7.63% | ||||||||
Alpargatas S.A., Preference Shares | 684 | 2,863 | ||||||
Ambev S.A. | 12,329 | 37,594 | ||||||
Americanas S.A. | 2,071 | 6,133 | ||||||
Atacadao S.A. | 1,323 | 4,906 | ||||||
Auren Energia S.A. | 1,103 | 3,136 | ||||||
B3 S.A. - Brasil, Bolsa, Balcao | 18,148 | 52,017 | ||||||
Banco Bradesco S.A. | 3,025 | 9,593 | ||||||
Banco Bradesco S.A., Preference Shares | 13,907 | 52,636 | ||||||
Banco BTG Pactual S.A. | 2,671 | 14,731 | ||||||
Banco do Brasil S.A. | 1,672 | 11,796 | ||||||
Banco Santander Brasil S.A. | 671 | 3,808 | ||||||
BB Seguridade Participacoes S.A. | 1,931 | 10,926 | ||||||
BR Malls Participacoes S.A. | 2,753 | 5,325 | ||||||
Bradespar S.A., Preference Shares | 747 | 3,418 | ||||||
Braskem S.A., Class A, Preference Shares | 692 | 4,446 | ||||||
BRF S.A.(b) | 2,125 | 5,086 | ||||||
CCR S.A. | 3,449 | 8,519 | ||||||
Centrais Eletricas Brasileiras S.A. | 2,328 | 22,103 | ||||||
Centrais Eletricas Brasileiras S.A., Class B, Preference Shares | 696 | 7,072 | ||||||
Cia de Saneamento Basico do Estado de Sao Paulo | 1,140 | 13,057 | ||||||
Cia de Transmissao de Energia Eletrica Paulista, Preference Shares | 687 | 3,208 | ||||||
Cia Energetica de Minas Gerais | 489 | 1,611 | ||||||
Cia Energetica de Minas Gerais, Preference Shares | 4,158 | 9,010 | ||||||
Cia Paranaense de Energia | 1,100 | 1,470 | ||||||
Cia Paranaense de Energia, Class B, Preference Shares | 2,860 | 4,033 | ||||||
Cia Siderurgica Nacional S.A. | 1,473 | 3,447 | ||||||
Cosan S.A. | 1,868 | 6,002 | ||||||
CPFL Energia S.A. | 687 | 4,637 | ||||||
Dexco S.A. | 763 | 1,409 | ||||||
EDP - Energias do Brasil S.A. | 731 | 3,214 | ||||||
Embraer S.A.(b) | 2,078 | 5,445 | ||||||
Energisa S.A. | 676 | 6,247 | ||||||
Eneva S.A.(b) | 3,403 | 9,196 | ||||||
ENGIE Brasil Energia S.A. | 669 | 5,128 | ||||||
Equatorial Energia S.A. | 2,752 | 15,750 | ||||||
Gerdau S.A., Preference Shares | 2,717 | 13,333 | ||||||
GPS Participacoes e Empreendimentos S.A.(c) | 900 | 2,370 | ||||||
GRUPO DE MODA SOMA S.A. | 1,200 | 3,330 | ||||||
Grupo Mateus S.A.(b) | 2,700 | 3,756 | ||||||
Hapvida Participacoes e Investimentos S.A.(c) | 10,432 | 15,507 | ||||||
Hypera S.A. | 1,362 | 13,188 | ||||||
Itau Unibanco Holding S.A. | 1,113 | 5,392 | ||||||
Itau Unibanco Holding S.A., Preference Shares | 13,082 | 75,791 | ||||||
Itausa S.A., Preference Shares | 9,676 | 19,805 | ||||||
Klabin S.A. | 1,834 | 7,557 | ||||||
Localiza Rent a Car S.A. | 1,867 | 25,099 | ||||||
Lojas Renner S.A. | 2,975 | 17,519 | ||||||
Magazine Luiza S.A. | 8,128 | 6,924 | ||||||
Marfrig Global Foods S.A. | 1,979 | 4,035 | ||||||
| Shares | Value | |||||||
| Brazil-(continued) | ||||||||
Multiplan Empreendimentos Imobiliarios S.A. | 707 | $ | 3,552 | |||||
Natura & Co. Holding S.A. | 2,744 | 7,818 | ||||||
Neoenergia S.A. | 1,300 | 4,110 | ||||||
Odontoprev S.A. | 2,305 | 3,637 | ||||||
Petro Rio S.A.(b) | 1,682 | 11,344 | ||||||
Petroleo Brasileiro S.A. | 11,082 | 70,244 | ||||||
Petroleo Brasileiro S.A., Preference Shares | 13,351 | 75,848 | ||||||
Porto Seguro S.A. | 400 | 1,772 | ||||||
Raia Drogasil S.A. | 3,467 | 17,384 | ||||||
Rede D’Or Sao Luiz S.A.(c) | 989 | 6,063 | ||||||
Rumo S.A. | 3,708 | 15,645 | ||||||
Sao Martinho S.A. | 676 | 3,475 | ||||||
Sendas Distribuidora S.A. | 2,325 | 8,782 | ||||||
Sul America S.A. | 1,399 | 6,356 | ||||||
Suzano S.A. | 2,145 | 21,747 | ||||||
Telefonica Brasil S.A. | 1,370 | 10,786 | ||||||
TIM S.A. | 2,843 | 7,152 | ||||||
TOTVS S.A. | 1,392 | 8,797 | ||||||
Transmissora Alianca de Energia Eletrica S.A. | 200 | 1,532 | ||||||
Ultrapar Participacoes S.A. | 2,746 | 7,018 | ||||||
Usinas Siderurgicas de Minas Gerais S.A. Usiminas, Class A, Preference Shares | 1,420 | 1,957 | ||||||
Vale S.A. | 10,309 | 131,887 | ||||||
Vamos Locacao de Caminhoes Maquinas e Equipamentos S.A. | 400 | 1,229 | ||||||
Vibra Energia S.A. | 3,467 | 12,058 | ||||||
WEG S.A. | 4,281 | 32,863 | ||||||
|
| |||||||
| 1,045,634 | ||||||||
|
| |||||||
| Chile-0.70% | ||||||||
Banco de Chile | 150,083 | 13,722 | ||||||
Banco de Credito e Inversiones S.A. | 165 | 4,596 | ||||||
Banco Santander Chile | 187,261 | 6,706 | ||||||
Cencosud S.A. | 3,178 | 4,276 | ||||||
Cencosud Shopping S.A. | 2,096 | 2,292 | ||||||
Cia Cervecerias Unidas S.A. | 299 | 1,640 | ||||||
Colbun S.A. | 26,328 | 2,586 | ||||||
Embotelladora Andina S.A., Class B, Preference Shares | 720 | 1,259 | ||||||
Empresas CMPC S.A. | 3,749 | 5,946 | ||||||
Empresas COPEC S.A. | 1,164 | 8,019 | ||||||
Enel Americas S.A. | 52,806 | 5,230 | ||||||
Enel Chile S.A. | 88,771 | 3,123 | ||||||
Falabella S.A. | 2,262 | 4,421 | ||||||
Sociedad Quimica y Minera de Chile S.A., Class A | 18 | 1,468 | ||||||
Sociedad Quimica y Minera de Chile S.A., Class B, Preference Shares | 324 | 30,827 | ||||||
|
| |||||||
| 96,111 | ||||||||
|
| |||||||
| China-29.10% | ||||||||
360 DigiTech, Inc., ADR | 291 | 2,957 | ||||||
AECC Aero-Engine Control Co. Ltd., A Shares | 2,275 | 9,351 | ||||||
AECC Aviation Power Co. Ltd., A Shares | 700 | 4,665 | ||||||
Agricultural Bank of China Ltd., A Shares | 15,858 | 5,997 | ||||||
Agricultural Bank of China Ltd., H Shares | 67,298 | 19,204 | ||||||
Aier Eye Hospital Group Co. Ltd., A Shares | 1,900 | 6,430 | ||||||
Airtac International Group | 447 | 10,266 | ||||||
Akeso, Inc., B Shares(b)(c) | 1,809 | 7,259 | ||||||
See accompanying Notes to Financial Statements which are an integral part of the financial statements.
| 28 |
|
Invesco PureBetaSM FTSE Emerging Markets ETF (PBEE)–(continued)
October 31, 2022
| Shares | Value | |||||||
| China-(continued) | ||||||||
Alibaba Group Holding Ltd.(b) | 39,357 | $ | 308,093 | |||||
Alibaba Health Information Technology | 13,827 | 5,848 | ||||||
A-Living Smart City Services Co. Ltd., U Shares(c) | 2,398 | 1,359 | ||||||
Aluminum Corp. of China Ltd., A Shares | 12,761 | 6,749 | ||||||
Angelalign Technology, Inc.(c)(d) | 166 | 1,465 | ||||||
Anhui Conch Cement Co. Ltd., A Shares | 1,286 | 4,278 | ||||||
Anhui Conch Cement Co. Ltd., H Shares | 3,489 | 8,978 | ||||||
Anhui Expressway Co. Ltd., H Shares | 11,876 | 7,595 | ||||||
Anhui Gujing Distillery Co. Ltd., B Shares | 989 | 11,658 | ||||||
ANTA Sports Products Ltd. | 3,414 | 30,009 | ||||||
Autohome, Inc., ADR | 195 | 5,093 | ||||||
AviChina Industry & Technology Co. Ltd., H Shares | 12,947 | 5,674 | ||||||
Baidu, Inc., A Shares(b) | 5,544 | 53,040 | ||||||
Bank of China Ltd., A Shares | 9,541 | 3,935 | ||||||
Bank of China Ltd., H Shares | 181,639 | 58,542 | ||||||
Bank of Communications Co. Ltd., A Shares | 4,798 | 2,925 | ||||||
Bank of Communications Co. Ltd., H Shares | 19,268 | 9,401 | ||||||
Bank of Ningbo Co. Ltd., A Shares | 1,682 | 5,476 | ||||||
Bank of Shanghai Co. Ltd., A Shares | 2,961 | 2,264 | ||||||
BeiGene Ltd., (Acquired 06/17/2022 - 10/07/2022; Cost $18,023)(b)(e) | 1,684 | 21,238 | ||||||
Beijing Enterprises Water Group Ltd. | 14,423 | 3,032 | ||||||
Beijing Orient National Communication Science & Technology Co. Ltd., A Shares(b) | 1,900 | 2,273 | ||||||
Bengang Steel Plates Co. Ltd., A Shares | 9,783 | 3,793 | ||||||
Bilibili, Inc., Z Shares(b) | 603 | 5,216 | ||||||
BOE Technology Group Co. Ltd., A Shares | 9,856 | 4,510 | ||||||
Bosideng International Holdings Ltd.(d) | 8,000 | 3,455 | ||||||
BYD Co. Ltd., A Shares | 594 | 20,075 | ||||||
BYD Co. Ltd., H Shares | 2,024 | 45,302 | ||||||
BYD Electronic International Co. Ltd.(d) | 3,126 | 9,080 | ||||||
Central China Securities Co. Ltd., A Shares | 12,167 | 6,001 | ||||||
CGN Power Co. Ltd., H Shares(c) | 34,605 | 7,009 | ||||||
China Cinda Asset Management Co. Ltd., H Shares | 27,607 | 2,567 | ||||||
China CITIC Bank Corp. Ltd., H Shares | 27,328 | 10,305 | ||||||
China Coal Energy Co. Ltd., H Shares | 4,300 | 3,166 | ||||||
China Conch Environment Protection Holdings Ltd.(b) | 3,500 | 1,030 | ||||||
China Conch Venture Holdings Ltd. | 3,463 | 5,109 | ||||||
China Construction Bank Corp., H Shares | 236,160 | 125,453 | ||||||
China Everbright Bank Co. Ltd., H Shares | 16,203 | 4,190 | ||||||
China Everbright Environment Group Ltd. | 13,462 | 4,476 | ||||||
China Feihe Ltd.(c) | 9,738 | 5,607 | ||||||
China Galaxy Securities Co. Ltd., H Shares | 6,645 | 2,489 | ||||||
China Greatwall Technology Group Co. Ltd., A Shares | 2,700 | 4,125 | ||||||
China Green Electricity Investment of Tianjin Co. Ltd., A Shares | 1,600 | 2,889 | ||||||
China Hongqiao Group Ltd.(d) | 6,575 | 4,665 | ||||||
China International Capital Corp. Ltd., H Shares(c) | 5,235 | 7,282 | ||||||
China Jinmao Holdings Group Ltd. | 26,318 | 3,487 | ||||||
China Lesso Group Holdings Ltd. | 2,485 | 2,017 | ||||||
China Life Insurance Co. Ltd., H Shares | 14,598 | 15,900 | ||||||
China Literature Ltd.(b)(c) | 1,366 | 3,680 | ||||||
China Longyuan Power Group Corp. Ltd., H Shares | 9,784 | 11,180 | ||||||
| Shares | Value | |||||||
| China-(continued) | ||||||||
China Medical System Holdings Ltd. | 6,265 | $ | 6,840 | |||||
China Meidong Auto Holdings Ltd.(d) | 1,402 | 1,843 | ||||||
China Mengniu Dairy Co. Ltd. | 8,411 | 26,948 | ||||||
China Merchants Bank Co. Ltd., A Shares | 4,848 | 17,815 | ||||||
China Merchants Bank Co. Ltd., H Shares | 10,023 | 32,942 | ||||||
China Merchants Port Holdings Co. Ltd. | 4,667 | 5,470 | ||||||
China Merchants Securities Co. Ltd., H Shares(c) | 6,932 | 6,429 | ||||||
China Minsheng Banking Corp. Ltd., A Shares | 5,343 | 2,416 | ||||||
China Minsheng Banking Corp. Ltd., H Shares(d) | 21,113 | 6,132 | ||||||
China National Building Material Co. Ltd., H Shares | 13,576 | 7,886 | ||||||
China Northern Rare Earth Group High-Tech Co. Ltd., A Shares | 600 | 1,989 | ||||||
China Oilfield Services Ltd., H Shares | 5,817 | 6,551 | ||||||
China Overseas Land & Investment Ltd. | 10,694 | 20,408 | ||||||
China Pacific Insurance (Group) Co. Ltd., A Shares | 1,583 | 4,127 | ||||||
China Pacific Insurance (Group) Co. Ltd., H Shares | 8,328 | 13,431 | ||||||
China Petroleum & Chemical Corp., A Shares | 15,284 | 8,523 | ||||||
China Petroleum & Chemical Corp., H Shares | 53,605 | 21,169 | ||||||
China Power International Development Ltd. | 16,814 | 4,862 | ||||||
China Resources Beer Holdings Co. Ltd. | 4,996 | 23,548 | ||||||
China Resources Cement Holdings Ltd. | 12,175 | 4,405 | ||||||
China Resources Double Crane Pharmaceutical Co. Ltd., A Shares | 800 | 1,968 | ||||||
China Resources Land Ltd. | 8,127 | 25,469 | ||||||
China Resources Mixc Lifestyle Services | 1,978 | 5,796 | ||||||
China Resources Power Holdings Co. Ltd. | 5,094 | 7,411 | ||||||
China Shenhua Energy Co. Ltd., H Shares | 10,403 | 27,366 | ||||||
China Taiping Insurance Holdings Co. Ltd. | 5,587 | 3,872 | ||||||
China Three Gorges Renewables Group Co. Ltd., A Shares | 3,200 | 2,442 | ||||||
China Tourism Group Duty Free Corp. Ltd., A Shares | 450 | 9,887 | ||||||
China Tower Corp. Ltd., H Shares(c) | 155,152 | 14,033 | ||||||
China Traditional Chinese Medicine Holdings Co. Ltd. | 12,950 | 5,593 | ||||||
China Vanke Co. Ltd., A Shares | 1,979 | 3,666 | ||||||
China Vanke Co. Ltd., H Shares | 6,236 | 8,008 | ||||||
China Yangtze Power Co. Ltd., A Shares | 6,235 | 17,308 | ||||||
Chongqing Changan Automobile Co. Ltd., A Shares | 2,736 | 4,232 | ||||||
Chongqing Zhifei Biological Products Co. Ltd., A Shares | 400 | 4,680 | ||||||
CIFI Holdings Group Co. Ltd.(d) | 13,819 | 861 | ||||||
CITIC Ltd. | 14,037 | 12,571 | ||||||
CITIC Securities Co. Ltd., A Shares | 2,968 | 6,999 | ||||||
CITIC Securities Co. Ltd., H Shares | 6,487 | 9,702 | ||||||
CMOC Group Ltd., H Shares | 18,050 | 5,818 | ||||||
Contemporary Amperex Technology Co. Ltd., A Shares | 497 | 25,391 | ||||||
COSCO SHIPPING Energy Transportation Co. Ltd., A Shares(b) | 1,800 | 4,170 | ||||||
COSCO SHIPPING Holdings Co. Ltd., A Shares | 5,510 | 8,478 | ||||||
COSCO SHIPPING Holdings Co. Ltd., H Shares | 3,908 | 4,217 | ||||||
Country Garden Holdings Co. Ltd.(d) | 21,052 | 2,709 | ||||||
Country Garden Services Holdings Co. Ltd. | 5,245 | 4,584 | ||||||
See accompanying Notes to Financial Statements which are an integral part of the financial statements.
| 29 |
|
Invesco PureBetaSM FTSE Emerging Markets ETF (PBEE)–(continued)
October 31, 2022
| Shares | Value | |||||||
| China-(continued) | ||||||||
CSC Financial Co. Ltd., H Shares(c) | 2,390 | $ | 1,732 | |||||
CSG Holding Co. Ltd., B Shares | 34,721 | 13,314 | ||||||
CSPC Pharmaceutical Group Ltd. | 26,052 | 26,783 | ||||||
Dali Foods Group Co. Ltd.(c) | 7,416 | 3,051 | ||||||
Daqo New Energy Corp., ADR(b) | 100 | 4,399 | ||||||
Datang International Power Generation Co. Ltd., A Shares(b) | 29,509 | 11,442 | ||||||
Dongfang Electric Corp. Ltd., A Shares | 1,900 | 6,042 | ||||||
East Group Co. Ltd., A Shares | 3,500 | 3,333 | ||||||
East Money Information Co. Ltd., A Shares | 2,623 | 5,610 | ||||||
ENN Energy Holdings Ltd. | 1,602 | 15,928 | ||||||
Eternal Asia Supply Chain Management Ltd., A Shares | 7,222 | 5,165 | ||||||
Eve Energy Co. Ltd., A Shares | 594 | 6,758 | ||||||
Far East Horizon Ltd. | 7,852 | 6,062 | ||||||
Flat Glass Group Co. Ltd., H Shares | 1,486 | 3,479 | ||||||
Foshan Haitian Flavouring & Food Co. Ltd., A Shares | 736 | 6,018 | ||||||
Fosun International Ltd. | 6,926 | 4,235 | ||||||
Full Truck Alliance Co. Ltd., ADR(b)(d) | 1,540 | 7,330 | ||||||
Fuyao Glass Industry Group Co. Ltd., H Shares(c) | 2,509 | 8,997 | ||||||
Ganfeng Lithium Group Co. Ltd., A Shares | 791 | 8,564 | ||||||
GD Power Development Co. Ltd., A Shares(b) | 5,700 | 3,413 | ||||||
GDS Holdings Ltd., A Shares(b) | 2,047 | 2,477 | ||||||
Geely Automobile Holdings Ltd. | 14,401 | 15,484 | ||||||
Genscript Biotech Corp.(b) | 2,778 | 7,021 | ||||||
GF Securities Co. Ltd., H Shares | 6,421 | 6,536 | ||||||
Ginlong Technologies Co. Ltd., A Shares(b) | 100 | 2,559 | ||||||
Great Wall Motor Co. Ltd., H Shares | 10,095 | 11,021 | ||||||
GRG Banking Equipment Co. Ltd., A Shares | 5,442 | 7,024 | ||||||
Guangdong Haid Group Co. Ltd., A Shares | 890 | 7,042 | ||||||
Guangdong Investment Ltd. | 12,364 | 7,797 | ||||||
Guanghui Energy Co. Ltd., A Shares | 1,400 | 1,972 | ||||||
Guangshen Railway Co. Ltd., H Shares(b) | 27,862 | 3,620 | ||||||
Guangzhou Automobile Group Co. Ltd., H Shares | 9,289 | 5,656 | ||||||
Guangzhou Yuexiu Financial Holdings Group Co. Ltd., A Shares | 6,052 | 4,619 | ||||||
H World Group Ltd., ADR | 597 | 16,167 | ||||||
Haidilao International Holding Ltd.(b)(c) | 2,656 | 3,945 | ||||||
Haier Smart Home Co. Ltd., A Shares | 2,671 | 7,612 | ||||||
Haier Smart Home Co. Ltd., H Shares | 5,640 | 14,111 | ||||||
Haitian International Holdings Ltd. | 942 | 1,886 | ||||||
Haitong Securities Co. Ltd., A Shares | 5,442 | 6,293 | ||||||
Haitong Securities Co. Ltd., H Shares | 7,442 | 3,640 | ||||||
Hangzhou Binjiang Real Estate Group Co. Ltd., A Shares | 1,600 | 1,951 | ||||||
Hangzhou Tigermed Consulting Co. Ltd., A Shares | 594 | 6,783 | ||||||
Hansoh Pharmaceutical Group Co. Ltd.(c) | 1,903 | 2,938 | ||||||
Henan Shuanghui Investment & Development Co. Ltd., A Shares | 1,583 | 4,941 | ||||||
Hengan International Group Co. Ltd. | 3,074 | 11,924 | ||||||
Hengdian Group DMEGC Magnetics Co. Ltd., A Shares | 1,200 | 2,913 | ||||||
Hua Hong Semiconductor Ltd.(b)(c) | 1,488 | 3,484 | ||||||
Huadian Power International Corp. Ltd., A Shares | 4,200 | 3,125 | ||||||
| Shares | Value | |||||||
| China-(continued) | ||||||||
Huaneng Power International, Inc., H Shares(b)(d) | 15,713 | $ | 5,625 | |||||
Huatai Securities Co. Ltd., H Shares(c) | 6,497 | 6,365 | ||||||
Hubei Biocause Pharmaceutical Co. Ltd., A Shares | 24,480 | 9,626 | ||||||
Hygeia Healthcare Holdings Co. Ltd.(b)(c)(d) | 848 | 3,673 | ||||||
Industrial & Commercial Bank of China Ltd., A Shares | 11,871 | 6,750 | ||||||
Industrial & Commercial Bank of China Ltd., H Shares | 201,780 | 87,654 | ||||||
Industrial Bank Co. Ltd., A Shares | 4,848 | 9,983 | ||||||
Inner Mongolia Yili Industrial Group Co. Ltd., A Shares | 1,979 | 6,844 | ||||||
Inner Mongolia Yitai Coal Co. Ltd., B Shares | 1,300 | 1,838 | ||||||
Innovent Biologics, Inc.(b)(c) | 3,786 | 13,408 | ||||||
Inspur Electronic Information Industry Co. Ltd., A Shares | 1,682 | 5,305 | ||||||
iQIYI, Inc., ADR(b)(d) | 1,044 | 2,109 | ||||||
JA Solar Technology Co. Ltd., A Shares | 280 | 2,398 | ||||||
JD Health International, Inc.(b)(c) | 2,028 | 11,122 | ||||||
JD.com, Inc., A Shares | 6,086 | 112,496 | ||||||
Jiangsu Expressway Co. Ltd., H Shares | 5,338 | 3,760 | ||||||
Jiangsu Hengrui Medicine Co. Ltd., A Shares | 1,806 | 9,947 | ||||||
Jiangsu Yanghe Brewery Joint-Stock Co. Ltd., A Shares | 594 | 10,633 | ||||||
Jiangsu Zhongtian Technology Co. Ltd., A Shares | 1,300 | 3,913 | ||||||
Jiangxi Copper Co. Ltd., H Shares | 4,851 | 5,302 | ||||||
Jiangxi Special Electric Motor Co. Ltd., A Shares(b) | 600 | 1,569 | ||||||
Jinxin Fertility Group Ltd.(c) | 4,760 | 2,347 | ||||||
Jiumaojiu International Holdings Ltd.(c)(d) | 2,473 | 3,881 | ||||||
Joinn Laboratories China Co. Ltd., H Shares(c) | 682 | 2,211 | ||||||
Joyoung Co. Ltd., A Shares | 1,300 | 2,590 | ||||||
JOYY, Inc., ADR | 168 | 4,239 | ||||||
Juewei Food Co. Ltd., A Shares | 693 | 4,498 | ||||||
Kaishan Group Co. Ltd., A Shares(b) | 3,452 | 7,899 | ||||||
Kanzhun Ltd., ADR(b) | 464 | 5,072 | ||||||
KE Holdings, Inc., ADR(b)(d) | 1,542 | 15,698 | ||||||
Kingboard Holdings Ltd. | 3,036 | 7,488 | ||||||
KingClean Electric Co. Ltd., A Shares | 1,345 | 6,022 | ||||||
Kingdee International Software Group Co. Ltd.(b) | 7,208 | 11,790 | ||||||
Kingsoft Corp. Ltd. | 2,824 | 8,544 | ||||||
Kuaishou Technology(b)(c) | 5,022 | 20,664 | ||||||
Kweichow Moutai Co. Ltd., A Shares | 248 | 45,872 | ||||||
KWG Group Holdings Ltd.(b) | 12,500 | 1,210 | ||||||
Legend Holdings Corp., H Shares(c) | 1,681 | 1,411 | ||||||
Lens Technology Co. Ltd., A Shares | 2,000 | 2,729 | ||||||
Leyard Optoelectronic Co. Ltd., A Shares | 4,848 | 3,740 | ||||||
Li Auto, Inc., ADR(b)(d) | 1,238 | 16,862 | ||||||
Li Ning Co. Ltd. | 6,435 | 33,282 | ||||||
LianChuang Electronic Technology Co. Ltd., A Shares | 3,460 | 6,357 | ||||||
Longfor Group Holdings Ltd.(c) | 6,636 | 8,454 | ||||||
LONGi Green Energy Technology Co. Ltd., A Shares | 1,903 | 12,510 | ||||||
Longshine Technology Group Co. Ltd., A Shares | 800 | 2,824 | ||||||
Lufax Holding Ltd., ADR | 1,623 | 2,581 | ||||||
See accompanying Notes to Financial Statements which are an integral part of the financial statements.
| 30 |
|
Invesco PureBetaSM FTSE Emerging Markets ETF (PBEE)–(continued)
October 31, 2022
| Shares | Value | |||||||
| China-(continued) | ||||||||
Luxshare Precision Industry Co. Ltd., A Shares | 2,146 | $ | 8,380 | |||||
Luzhou Laojiao Co. Ltd., A Shares | 397 | 8,505 | ||||||
Mango Excellent Media Co. Ltd., A Shares | 890 | 2,674 | ||||||
Maxscend Microelectronics Co. Ltd., A Shares . | 416 | 5,264 | ||||||
Meituan, B Shares(b)(c) | 10,841 | 172,354 | ||||||
Ming Yuan Cloud Group Holdings Ltd. | 2,098 | 965 | ||||||
MINISO Group Holding Ltd., ADR(d) | 336 | 1,714 | ||||||
Muyuan Foods Co. Ltd., A Shares | 1,601 | 10,262 | ||||||
NARI Technology Co. Ltd., A Shares | 940 | 3,143 | ||||||
NAURA Technology Group Co. Ltd., A Shares | 198 | 7,208 | ||||||
NetEase, Inc. | 4,314 | 47,043 | ||||||
New China Life Insurance Co. Ltd., A Shares | 1,286 | 4,118 | ||||||
New China Life Insurance Co. Ltd., H Shares | 2,759 | 4,379 | ||||||
New Hope Liuhe Co. Ltd., A Shares(b) | 4,056 | 7,163 | ||||||
New Oriental Education & Technology Group, Inc.(b) | 3,500 | 8,570 | ||||||
Ninestar Corp., A Shares | 1,880 | 14,711 | ||||||
Ningbo Orient Wires & Cables Co. Ltd., A Shares | 400 | 4,220 | ||||||
NIO, Inc., ADR(b)(d) | 3,315 | 32,056 | ||||||
Nongfu Spring Co. Ltd., H Shares(c) | 1,764 | 8,865 | ||||||
People’s Insurance Co. Group of China Ltd. (The), H Shares | 20,463 | 5,657 | ||||||
PetroChina Co. Ltd., H Shares | 65,777 | 25,138 | ||||||
Pharmaron Beijing Co. Ltd., A Shares | 841 | 5,992 | ||||||
PICC Property & Casualty Co. Ltd., H Shares | 19,834 | 18,293 | ||||||
Pinduoduo, Inc., ADR(b) | 979 | 53,679 | ||||||
Ping An Bank Co. Ltd., A Shares | 5,442 | 7,710 | ||||||
Ping An Healthcare and Technology Co. | 1,360 | 2,509 | ||||||
Ping An Insurance (Group) Co. of China Ltd., A Shares | 1,483 | 7,345 | ||||||
Ping An Insurance (Group) Co. of China Ltd., H Shares | 17,526 | 70,105 | ||||||
Pingdingshan Tianan Coal Mining Co. Ltd., A Shares | 800 | 1,208 | ||||||
Poly Developments and Holdings Group Co. Ltd., A Shares | 4,750 | 8,981 | ||||||
Poly Property Services Co. Ltd., H Shares(c) | 1,187 | 4,393 | ||||||
Pop Mart International Group Ltd.(c)(d) | 1,956 | 2,532 | ||||||
Postal Savings Bank of China Co. Ltd., H Shares(c) | 28,476 | 13,204 | ||||||
Power Construction Corp. of China Ltd., A Shares | 2,200 | 2,122 | ||||||
Qingdao Hanhe Cable Co. Ltd., A Shares | 14,738 | 9,995 | ||||||
RLX Technology, Inc., ADR(b)(d) | 1,357 | 1,696 | ||||||
Sany Heavy Industry Co. Ltd., A Shares | 2,770 | 5,124 | ||||||
Seazen Group Ltd.(b) | 11,911 | 1,912 | ||||||
SF Holding Co. Ltd., A Shares | 890 | 5,885 | ||||||
Shaanxi Coal Industry Co. Ltd., A Shares | 700 | 1,905 | ||||||
Shandong Weigao Group Medical Polymer Co. Ltd., H Shares | 8,131 | 11,208 | ||||||
Shanghai Electric Power Co. Ltd., A Shares(b) | 2,000 | 2,513 | ||||||
Shanghai Flyco Electrical Appliance Co. Ltd., A Shares | 989 | 10,747 | ||||||
Shanghai Fosun Pharmaceutical Group Co. Ltd., H Shares(d) | 2,272 | 5,737 | ||||||
Shanghai Fudan Microelectronics Group Co. Ltd., A Shares | 233 | 2,995 | ||||||
| Shares | Value | |||||||
| China-(continued) | ||||||||
Shanghai International Airport Co. Ltd., A Shares(b) | 890 | $ | 6,509 | |||||
Shanghai Junshi Biosciences Co. Ltd., A Shares(b) | 344 | 3,349 | ||||||
Shanghai Pharmaceuticals Holding Co. Ltd., H Shares | 3,718 | 5,040 | ||||||
Shanghai Pudong Development Bank Co. Ltd., A Shares | 5,536 | 5,036 | ||||||
Shanghai Zhenhua Heavy Industries Co. Ltd., B Shares | 49,558 | 11,844 | ||||||
Shanxi Taigang Stainless Steel Co. Ltd., A Shares | 4,600 | 2,502 | ||||||
Shanxi Xinghuacun Fen Wine Factory Co. Ltd., A Shares | 435 | 13,850 | ||||||
Shenzhen Agricultural Products Group Co. Ltd., A Shares | 10,388 | 7,287 | ||||||
Shenzhen Huaqiang Industry Co. Ltd., A Shares | 3,660 | 5,446 | ||||||
Shenzhen Inovance Technology Co. Ltd., A Shares | 940 | 8,590 | ||||||
Shenzhen International Holdings Ltd. | 5,843 | 3,930 | ||||||
Shenzhen Kaifa Technology Co. Ltd., A Shares | 4,056 | 6,357 | ||||||
Shenzhen Kangtai Biological Products Co. Ltd., A Shares | 580 | 2,473 | ||||||
Shenzhen Mindray Bio-Medical Electronics Co. Ltd., A Shares | 252 | 11,237 | ||||||
Shenzhen MTC Co. Ltd., A Shares(b) | 7,800 | 3,687 | ||||||
Shenzhen Neptunus Bioengineering Co. Ltd., A Shares(b) | 20,774 | 9,364 | ||||||
Shenzhou International Group Holdings Ltd. | 2,138 | 14,816 | ||||||
Shijiazhuang Yiling Pharmaceutical Co. Ltd., A Shares | 700 | 2,923 | ||||||
Sieyuan Electric Co. Ltd., A Shares | 1,979 | 9,070 | ||||||
Silergy Corp. | 708 | 8,218 | ||||||
Sino Biopharmaceutical Ltd. | 27,960 | 13,571 | ||||||
Sinopec Oilfield Service Corp., A Shares(b) | 21,664 | 5,462 | ||||||
Sinopharm Group Co. Ltd., H Shares | 2,926 | 5,576 | ||||||
Sinotruk Hong Kong Ltd. | 3,465 | 3,090 | ||||||
Skyworth Digital Co. Ltd., A Shares | 1,100 | 2,246 | ||||||
Smoore International Holdings Ltd.(c)(d) | 4,911 | 5,224 | ||||||
Sun Art Retail Group Ltd. | 8,000 | 1,274 | ||||||
Sungrow Power Supply Co. Ltd., A Shares | 400 | 7,175 | ||||||
Sunny Optical Technology Group Co. Ltd. | 2,062 | 17,875 | ||||||
SuZhou TA&A Ultra Clean Technology Co. Ltd., A Shares | 200 | 1,695 | ||||||
TAL Education Group, ADR(b) | 1,239 | 5,836 | ||||||
Tencent Holdings Ltd. | 16,030 | 419,851 | ||||||
Tencent Music Entertainment Group, ADR(b) | 1,686 | 6,086 | ||||||
Tianqi Lithium Corp., A Shares(b) | 200 | 2,618 | ||||||
Titan Wind Energy Suzhou Co. Ltd., A Shares | 1,200 | 1,930 | ||||||
Tongcheng Travel Holdings Ltd.(b)(c) | 3,922 | 6,115 | ||||||
Tongwei Co. Ltd., A Shares | 1,385 | 8,255 | ||||||
Topsec Technologies Group, Inc., A Shares | 3,660 | 5,641 | ||||||
Topsports International Holdings Ltd.(c) | 6,926 | 3,494 | ||||||
TravelSky Technology Ltd., H Shares | 2,963 | 4,303 | ||||||
Trina Solar Co. Ltd., A Shares | 214 | 1,948 | ||||||
Trip.com Group Ltd., ADR(b)(d) | 1,437 | 32,519 | ||||||
Tsingtao Brewery Co. Ltd., H Shares | 1,399 | 9,802 | ||||||
Vipshop Holdings Ltd., ADR(b) | 1,233 | 8,594 | ||||||
Wanhua Chemical Group Co. Ltd., A Shares | 890 | 9,799 | ||||||
See accompanying Notes to Financial Statements which are an integral part of the financial statements.
| 31 |
|
Invesco PureBetaSM FTSE Emerging Markets ETF (PBEE)–(continued)
October 31, 2022
| Shares | Value | |||||||
| China-(continued) | ||||||||
Weibo Corp., ADR(b) | 183 | $ | 2,072 | |||||
Weichai Power Co. Ltd., H Shares | 7,267 | 6,962 | ||||||
Will Semiconductor Co. Ltd., A Shares | 270 | 2,714 | ||||||
Wingtech Technology Co. Ltd., A Shares | 594 | 3,897 | ||||||
Wuliangye Yibin Co. Ltd., A Shares | 693 | 12,676 | ||||||
WuXi AppTec Co. Ltd., A Shares | 400 | 4,187 | ||||||
WuXi AppTec Co. Ltd., H Shares(c) | 1,097 | 8,790 | ||||||
Wuxi Biologics Cayman, Inc.(b)(c) | 9,545 | 43,166 | ||||||
Xiaomi Corp., B Shares(b)(c) | 29,171 | 32,739 | ||||||
Xinhua Winshare Publishing and Media Co. Ltd., H Shares | 9,889 | 5,971 | ||||||
Xinjiang Goldwind Science & Technology Co. Ltd., A Shares | 4,750 | 6,801 | ||||||
Xinyi Solar Holdings Ltd. | 13,323 | 13,221 | ||||||
Xpeng, Inc.(b) | 1,629 | 5,271 | ||||||
Xtep International Holdings Ltd. | 2,500 | 2,293 | ||||||
Yadea Group Holdings Ltd.(c) | 1,604 | 2,448 | ||||||
Yangzijiang Shipbuilding Holdings Ltd. | 7,042 | 5,972 | ||||||
Yankuang Energy Group Co. Ltd., H Shares | 7,038 | 19,814 | ||||||
Yanlord Land Group Ltd. | 5,479 | 3,349 | ||||||
Yantai Eddie Precision Machinery Co. Ltd., A Shares | 1,420 | 2,767 | ||||||
Yihai International Holding Ltd. | 961 | 1,582 | ||||||
Yonyou Network Technology Co. Ltd., A Shares | 1,613 | 5,401 | ||||||
Youngy Co. Ltd., A Shares(b) | 100 | 1,510 | ||||||
Yum China Holdings, Inc. | 900 | 36,368 | ||||||
Yunnan Baiyao Group Co. Ltd., A Shares | 791 | 5,913 | ||||||
Yunnan Energy New Material Co. Ltd., A Shares | 198 | 4,016 | ||||||
Zai Lab Ltd., ADR, (Acquired 09/18/2020 - 10/07/2022; Cost $19,144)(b)(d)(e) | 214 | 4,768 | ||||||
Zhangzhou Pientzehuang Pharmaceutical Co. Ltd., A Shares | 198 | 6,185 | ||||||
Zhefu Holding Group Co. Ltd., A Shares | 12,761 | 6,836 | ||||||
Zhejiang Jingsheng Mechanical & Electrical Co. Ltd., A Shares | 889 | 8,680 | ||||||
Zhejiang Jiuzhou Pharmaceutical Co. Ltd., A Shares | 600 | 2,920 | ||||||
Zhengqi Holdings Co. Ltd., Rts., TBA(a)(b) | 15 | 0 | ||||||
ZhongAn Online P&C Insurance Co. Ltd., H Shares(b)(c)(d) | 1,350 | 2,514 | ||||||
Zhongsheng Group Holdings Ltd. | 2,343 | 8,895 | ||||||
Zhuzhou CRRC Times Electric Co. Ltd., H Shares | 2,003 | 8,688 | ||||||
Zijin Mining Group Co. Ltd., H Shares | 19,114 | 18,262 | ||||||
Zoomlion Heavy Industry Science and Technology Co. Ltd., H Shares | 7,186 | 2,316 | ||||||
ZTE Corp., H Shares | 2,906 | 5,183 | ||||||
ZTO Express (Cayman), Inc. | 800 | 13,442 | ||||||
|
| |||||||
| 3,987,643 | ||||||||
|
| |||||||
| Colombia-0.18% | ||||||||
Bancolombia S.A. | 544 | 3,955 | ||||||
Bancolombia S.A., Preference Shares | 830 | 5,311 | ||||||
Cementos Argos S.A. | 3,805 | 2,595 | ||||||
Grupo de Inversiones Suramericana S.A. | 837 | 6,824 | ||||||
Interconexion Electrica S.A. ESP | 1,688 | 6,661 | ||||||
|
| |||||||
| 25,346 | ||||||||
|
| |||||||
| Shares | Value | |||||||
| Cyprus-0.00% | ||||||||
Galaxy Cosmos Mezz PLC(b) | 196 | $ | 32 | |||||
Sunrisemezz PLC(b) | 147 | 12 | ||||||
|
| |||||||
| 44 | ||||||||
|
| |||||||
| Czech Republic-0.23% | ||||||||
CEZ A.S | 785 | 25,670 | ||||||
Komercni banka A.S. | 223 | 6,396 | ||||||
|
| |||||||
| 32,066 | ||||||||
|
| |||||||
| Egypt-0.13% | ||||||||
Commercial International Bank Egypt S.A.E. | 6,238 | 8,369 | ||||||
Eastern Co. S.A.E. | 3,018 | 1,486 | ||||||
Egypt Kuwait Holding Co. S.A.E. | 7,067 | 8,169 | ||||||
|
| |||||||
| 18,024 | ||||||||
|
| |||||||
| Greece-0.39% | ||||||||
Alpha Services and Holdings S.A.(b) | 5,301 | 4,914 | ||||||
Eurobank Ergasias Services and Holdings S.A.(b) | 4,337 | 4,287 | ||||||
Hellenic Telecommunications Organization S.A. | 715 | 11,236 | ||||||
Helleniq Energy Holdings S.A. | 243 | 1,660 | ||||||
JUMBO S.A. | 354 | 5,035 | ||||||
Motor Oil Hellas Corinth Refineries S.A. | 211 | 3,624 | ||||||
Mytilineos S.A. | 347 | 5,823 | ||||||
OPAP S.A. | 587 | 7,194 | ||||||
Piraeus Financial Holdings S.A.(b) | 1,030 | 1,271 | ||||||
Public Power Corp. S.A.(b) | 492 | 3,107 | ||||||
Terna Energy S.A. | 286 | 5,320 | ||||||
|
| |||||||
| 53,471 | ||||||||
|
| |||||||
| Hong Kong-0.07% | ||||||||
Alibaba Pictures Group Ltd.(b) | 75,019 | 2,772 | ||||||
Kingboard Laminates Holdings Ltd.(d) | 3,460 | 2,764 | ||||||
Nine Dragons Paper Holdings Ltd. | 6,630 | 3,927 | ||||||
|
| |||||||
| 9,463 | ||||||||
|
| |||||||
| Hungary-0.25% | ||||||||
Gedeon Richter PLC | 527 | 10,390 | ||||||
Magyar Telekom Telecommunications PLC | 4,528 | 3,241 | ||||||
MOL Hungarian Oil & Gas PLC | 1,246 | 7,460 | ||||||
OTP Bank Nyrt | 579 | 12,601 | ||||||
|
| |||||||
| 33,692 | ||||||||
|
| |||||||
| India-9.31% | ||||||||
Axis Bank Ltd., GDR(c) | 2,943 | 158,922 | ||||||
Dr. Reddy’s Laboratories Ltd., ADR(d) | 1,602 | 87,005 | ||||||
ICICI Bank Ltd., ADR(d) | 3,392 | 74,760 | ||||||
Infosys Ltd., ADR | 7,786 | 145,832 | ||||||
Larsen & Toubro Ltd., GDR(c) | 6,093 | 146,841 | ||||||
Mahindra & Mahindra Ltd., GDR(c) | 6,505 | 106,032 | ||||||
Reliance Industries Ltd., GDR(c) | 3,470 | 211,843 | ||||||
State Bank of India, GDR(c)(d) | 1,824 | 125,491 | ||||||
Tata Motors Ltd., ADR(b)(d) | 2,918 | 72,979 | ||||||
Tata Steel Ltd., GDR(c) | 4,874 | 62,387 | ||||||
Wipro Ltd., ADR(d) | 17,960 | 84,412 | ||||||
|
| |||||||
| 1,276,504 | ||||||||
|
| |||||||
| Indonesia-2.51% | ||||||||
PT Adaro Energy Indonesia Tbk | 29,426 | 7,509 | ||||||
PT Astra International Tbk | 50,443 | 21,506 | ||||||
PT Bank Central Asia Tbk | 102,955 | 58,087 | ||||||
PT Bank Mandiri (Persero) Tbk | 54,134 | 36,616 | ||||||
See accompanying Notes to Financial Statements which are an integral part of the financial statements.
| 32 |
|
Invesco PureBetaSM FTSE Emerging Markets ETF (PBEE)–(continued)
October 31, 2022
| Shares | Value | |||||||
| Indonesia-(continued) | ||||||||
PT Bank Negara Indonesia (Persero) Tbk | 23,537 | $ | 14,185 | |||||
PT Bank Rakyat Indonesia (Persero) Tbk | 172,572 | 51,448 | ||||||
PT Bank Syariah Indonesia Tbk | 7,822 | 702 | ||||||
PT Barito Pacific Tbk | 87,771 | 4,643 | ||||||
PT Bukit Asam Tbk | 13,904 | 3,485 | ||||||
PT Bumi Serpong Damai Tbk(b) | 18,038 | 1,076 | ||||||
PT Charoen Pokphand Indonesia Tbk | 22,603 | 8,079 | ||||||
PT Elang Mahkota Teknologi Tbk | 78,456 | 7,771 | ||||||
PT Gudang Garam Tbk | 1,596 | 2,466 | ||||||
PT Hanjaya Mandala Sampoerna Tbk | 34,894 | 2,248 | ||||||
PT Indah Kiat Pulp & Paper Corp. Tbk | 8,018 | 4,935 | ||||||
PT Indocement Tunggal Prakarsa Tbk | 4,702 | 2,796 | ||||||
PT Indofood CBP Sukses Makmur Tbk | 8,194 | 5,109 | ||||||
PT Indofood Sukses Makmur Tbk | 14,620 | 6,046 | ||||||
PT Jasa Marga (Persero) Tbk(b) | 9,281 | 2,029 | ||||||
PT Kalbe Farma Tbk | 65,188 | 8,568 | ||||||
PT Media Nusantara Citra Tbk(b) | 22,288 | 1,172 | ||||||
PT MNC Digital Entertainment Tbk(b) | 1,984 | 639 | ||||||
PT Perusahaan Gas Negara Tbk | 53,455 | 6,769 | ||||||
PT Sarana Menara Nusantara Tbk | 67,771 | 5,018 | ||||||
PT Semen Indonesia (Persero) Tbk | 9,639 | 4,913 | ||||||
PT Smartfren Telecom Tbk(b) | 468,029 | 2,341 | ||||||
PT Sumber Alfaria Trijaya Tbk | 41,887 | 7,573 | ||||||
PT Surya Citra Media Tbk | 117,741 | 1,766 | ||||||
PT Telkom Indonesia (Persero) Tbk | 138,712 | 39,041 | ||||||
PT Tower Bersama Infrastructure Tbk | 38,310 | 6,042 | ||||||
PT Unilever Indonesia Tbk | 18,499 | 5,503 | ||||||
PT United Tractors Tbk | 5,015 | 10,385 | ||||||
PT XL Axiata Tbk | 18,038 | 2,914 | ||||||
|
| |||||||
| 343,380 | ||||||||
|
| |||||||
| Kuwait-1.02% | ||||||||
Agility Public Warehousing Co. KSC | 5,310 | 13,440 | ||||||
Boubyan Bank KSCP | 3,051 | 8,116 | ||||||
Boubyan Petrochemicals Co. KSCP | 2,043 | 5,257 | ||||||
Gulf Bank KSCP | 5,623 | 6,226 | ||||||
Humansoft Holding Co. KSC | 270 | 2,930 | ||||||
Kuwait Finance House KSCP | 8,115 | 21,221 | ||||||
Mabanee Co. K.P.S.C. | 2,744 | 7,725 | ||||||
Mobile Telecommunications Co. KSCP | 2,407 | 4,655 | ||||||
National Bank of Kuwait SAKP | 20,134 | 70,071 | ||||||
|
| |||||||
| 139,641 | ||||||||
|
| |||||||
| Luxembourg-0.04% | ||||||||
Reinet Investments S.C.A. | 351 | 5,637 | ||||||
|
| |||||||
| Malaysia-2.05% | ||||||||
Alliance Bank Malaysia Bhd | 3,488 | 2,730 | ||||||
AMMB Holdings Bhd | 8,299 | 7,179 | ||||||
Axiata Group Bhd | 14,263 | 8,598 | ||||||
British American Tobacco Malaysia Bhd | 674 | 1,500 | ||||||
CIMB Group Holdings Bhd | 16,571 | 19,347 | ||||||
Dialog Group Bhd | 14,438 | 6,291 | ||||||
DiGi.Com Bhd | 14,429 | 11,566 | ||||||
FGV Holdings Bhd | 8,277 | 2,311 | ||||||
Fraser & Neave Holdings Bhd | 652 | 2,832 | ||||||
Genting Bhd | 7,600 | 7,137 | ||||||
Genting Malaysia Bhd | 8,881 | 5,147 | ||||||
Hartalega Holdings Bhd | 5,389 | 2,462 | ||||||
Hong Leong Bank Bhd | 2,039 | 9,125 | ||||||
Hong Leong Financial Group Bhd | 720 | 2,906 | ||||||
| Shares | Value | |||||||
| Malaysia-(continued) | ||||||||
IHH Healthcare Bhd | 8,589 | $ | 10,809 | |||||
IOI Corp. Bhd | 10,246 | 8,842 | ||||||
Kuala Lumpur Kepong Bhd | 706 | 3,237 | ||||||
Malayan Banking Bhd | 12,370 | 22,474 | ||||||
Malaysia Airports Holdings Bhd.(b) | 2,860 | 3,617 | ||||||
Maxis Bhd | 8,242 | 6,711 | ||||||
MISC Bhd | 2,970 | 4,542 | ||||||
Nestle Malaysia Bhd | 137 | 3,854 | ||||||
Petronas Chemicals Group Bhd | 6,829 | 12,595 | ||||||
Petronas Dagangan Bhd | 720 | 3,301 | ||||||
PPB Group Bhd | 2,061 | 7,280 | ||||||
Press Metal Aluminium Holdings Bhd | 10,482 | 9,644 | ||||||
Public Bank Bhd | 39,361 | 37,213 | ||||||
QL Resources Bhd | 4,105 | 4,445 | ||||||
RHB Bank Bhd | 5,415 | 6,551 | ||||||
Sime Darby Bhd | 12,049 | 5,734 | ||||||
Sime Darby Plantation Bhd | 10,334 | 9,617 | ||||||
Telekom Malaysia Bhd | 2,817 | 3,313 | ||||||
Tenaga Nasional Bhd | 11,450 | 20,391 | ||||||
Top Glove Corp. Bhd | 16,368 | 2,752 | ||||||
Westports Holdings Bhd | 4,255 | 3,024 | ||||||
YTL Corp. Bhd.(b) | 20,793 | 2,485 | ||||||
|
| |||||||
| 281,562 | ||||||||
|
| |||||||
| Mexico-3.39% | ||||||||
Alfa S.A.B. de C.V., Class A | 7,320 | 4,850 | ||||||
Alpek S.A.B. de C.V. | 817 | 1,143 | ||||||
America Movil S.A.B. de C.V., Series L | 82,583 | 78,011 | ||||||
Arca Continental S.A.B. de C.V. | 1,265 | 10,343 | ||||||
Banco del Bajio S.A.(c) | 2,103 | 5,921 | ||||||
Becle S.A.B. de C.V. | 2,022 | 4,269 | ||||||
Cemex S.A.B. de C.V., Series CPO(b)(d)(f) | 39,534 | 15,336 | ||||||
Coca-Cola FEMSA S.A.B. de C.V., Series L | 1,537 | 9,665 | ||||||
Concentradora Fibra Danhos S.A. de C.V. | 817 | 1,008 | ||||||
Controladora Vuela Cia de Aviacion S.A.B. de C.V., Class A(b) | 2,278 | 1,933 | ||||||
El Puerto de Liverpool S.A.B. de C.V., Series C-1 | 728 | 3,725 | ||||||
Fibra Uno Administracion S.A. de C.V. | 7,299 | 8,502 | ||||||
Fomento Economico Mexicano S.A.B. de C.V., Series CPO(g) | 5,157 | 36,953 | ||||||
Gruma S.A.B. de C.V., Class B | 698 | 8,082 | ||||||
Grupo Aeroportuario del Centro Norte S.A.B. de C.V.(d) | 117 | 930 | ||||||
Grupo Aeroportuario del Pacifico S.A.B. de C.V., Class B | 707 | 10,931 | ||||||
Grupo Aeroportuario del Sureste S.A.B. de C.V., Class B | 352 | 8,223 | ||||||
Grupo Bimbo S.A.B. de C.V., Series A | 7,770 | 30,029 | ||||||
Grupo Carso S.A.B. de C.V., Series A1 | 1,535 | 6,174 | ||||||
Grupo Comercial Chedraui S.A. de C.V.(d) | 2,996 | 12,054 | ||||||
Grupo Elektra S.A.B. de C.V.(d) | 42 | 2,104 | ||||||
Grupo Financiero Banorte S.A.B. de C.V., Class O | 8,160 | 66,208 | ||||||
Grupo Financiero Inbursa S.A.B. de C.V., Class O(b)(d) | 5,336 | 9,831 | ||||||
Grupo Mexico S.A.B. de C.V., Class B | 9,226 | 33,387 | ||||||
Grupo Televisa S.A.B., Series CPO(h) | 7,162 | 7,585 | ||||||
Industrias Penoles S.A.B. de C.V. | 400 | 4,529 | ||||||
See accompanying Notes to Financial Statements which are an integral part of the financial statements.
| 33 |
|
Invesco PureBetaSM FTSE Emerging Markets ETF (PBEE)–(continued)
October 31, 2022
| Shares | Value | |||||||
| Mexico-(continued) | ||||||||
Kimberly-Clark de Mexico S.A.B. de C.V., Class A(d) | 4,357 | $ | 6,862 | |||||
Megacable Holdings S.A.B. de C.V., Series CPO(i) | 728 | 1,526 | ||||||
Operadora de Sites Mexicanos S.A.B. de C.V., Class A-1 | 7,624 | 8,281 | ||||||
Orbia Advance Corp. S.A.B. de C.V. | 3,349 | 5,644 | ||||||
Prologis Property Mexico S.A. de C.V. | 1,750 | 4,486 | ||||||
Promotora y Operadora de Infraestructura S.A.B de C.V. | 320 | 2,403 | ||||||
Regional S.A.B. de C.V. | 117 | 816 | ||||||
Sitios Latinoamerica S.A.B. de C.V.(d) | 4,128 | 1,202 | ||||||
Wal-Mart de Mexico S.A.B. de C.V., Series V | 13,329 | 51,391 | ||||||
|
| |||||||
| 464,337 | ||||||||
|
| |||||||
| Pakistan-0.01% | ||||||||
Fauji Fertilizer Co. Ltd. | 1,947 | 911 | ||||||
|
| |||||||
Philippines-0.94% | ||||||||
Aboitiz Power Corp. | 6,427 | 3,510 | ||||||
ACEN Corp. | 17,173 | 1,852 | ||||||
Alliance Global Group, Inc. | 15,114 | 2,342 | ||||||
Ayala Corp. | 698 | 8,034 | ||||||
Ayala Land, Inc. | 21,624 | 9,515 | ||||||
Bank of the Philippine Islands | 5,867 | 9,719 | ||||||
BDO Unibank, Inc. | 6,295 | 13,828 | ||||||
Bloomberry Resorts Corp.(b) | 6,305 | 762 | ||||||
Converge Information and Communications Technology Solutions, Inc.(b) | 6,417 | 1,364 | ||||||
DMCI Holdings, Inc. | 7,997 | 1,310 | ||||||
Globe Telecom, Inc. | 70 | 2,805 | ||||||
GT Capital Holdings, Inc. | 364 | 2,593 | ||||||
International Container Terminal Services, Inc. | 3,192 | 9,529 | ||||||
JG Summit Holdings, Inc. | 8,858 | 6,596 | ||||||
Jollibee Foods Corp. | 1,111 | 4,448 | ||||||
LT Group, Inc. | 8,228 | 1,146 | ||||||
Manila Electric Co. | 768 | 3,994 | ||||||
Megaworld Corp. | 45,123 | 1,620 | ||||||
Metro Pacific Investments Corp. | 55,768 | 3,522 | ||||||
Metropolitan Bank & Trust Co. | 6,304 | 5,624 | ||||||
Monde Nissin Corp.(c) | 7,584 | 1,529 | ||||||
PLDT, Inc. | 362 | 10,207 | ||||||
San Miguel Corp. | 970 | 1,610 | ||||||
Semirara Mining & Power Corp | 2,453 | 1,479 | ||||||
SM Prime Holdings, Inc. | 28,128 | 15,290 | ||||||
Universal Robina Corp. | 2,300 | 4,842 | ||||||
|
| |||||||
| 129,070 | ||||||||
|
| |||||||
| Qatar-1.46% | ||||||||
Barwa Real Estate Co. | 5,881 | 5,491 | ||||||
Commercial Bank P.S.Q.C. (The) | 6,117 | 10,572 | ||||||
Doha Bank Q.P.S.C. | 4,689 | 2,840 | ||||||
Industries Qatar Q.S.C. | 4,681 | 20,270 | ||||||
Masraf Al Rayan Q.S.C. | 11,339 | 11,947 | ||||||
Mesaieed Petrochemical Holding Co. Q.P.S.C. | 13,375 | 8,337 | ||||||
Ooredoo Q.P.S.C. | 1,580 | 4,239 | ||||||
Qatar Aluminum Manufacturing Co. | 8,439 | 3,761 | ||||||
Qatar Electricity & Water Co. Q.S.C. | 1,552 | 7,884 | ||||||
Qatar Fuel Q.S.C. | 971 | 5,087 | ||||||
Qatar Gas Transport Co. Ltd. | 8,377 | 9,431 | ||||||
Qatar Insurance Co. (S.A.Q.) | 4,938 | 2,929 | ||||||
| Shares | Value | |||||||
| Qatar-(continued) | ||||||||
Qatar International Islamic Bank Q.S.C. | 2,292 | $ | 7,282 | |||||
Qatar Islamic Bank (S.A.Q.) | 3,603 | 24,130 | ||||||
Qatar National Bank Q.P.S.C. | 12,930 | 70,797 | ||||||
United Development Co. Q.S.C. | 5,356 | 2,108 | ||||||
Vodafone Qatar Q.S.C. | 5,084 | 2,337 | ||||||
|
| |||||||
| 199,442 | ||||||||
|
| |||||||
| Russia-0.00% | ||||||||
Alrosa PJSC(a) | 5,728 | 0 | ||||||
Gazprom PJSC(a) | 23,800 | 0 | ||||||
Inter RAO UES PJSC(a) | 91,895 | 0 | ||||||
Lukoil PJSC(a) | 959 | 0 | ||||||
Magnit PJSC(a) | 196 | 0 | ||||||
Magnitogorsk Iron & Steel Works PJSC(a) | 6,370 | 0 | ||||||
MMC Norilsk Nickel PJSC(a) | 119 | 0 | ||||||
Mobile TeleSystems PJSC(a) | 2,469 | 0 | ||||||
Moscow Exchange MICEX-RTS PJSC(a)(b) | 3,806 | 0 | ||||||
Novatek PJSC(a) | 2,626 | 0 | ||||||
Novolipetsk Steel PJSC(a) | 2,494 | 0 | ||||||
PhosAgro PJSC(a) | 127 | 0 | ||||||
Polyus PJSC(a)(b) | 72 | 0 | ||||||
Raspadskaya OJSC(a) | 586 | 0 | ||||||
Rosneft Oil Co. PJSC(a) | 2,287 | 0 | ||||||
Rostelecom PJSC(a) | 2,632 | 0 | ||||||
RusHydro PJSC(a) | 250,330 | 0 | ||||||
Sberbank of Russia PJSC(a)(b) | 21,738 | 0 | ||||||
Severstal PAO(a) | 487 | 0 | ||||||
Sistema PJSFC(a)(b) | 17,276 | 0 | ||||||
Surgutneftegas PJSC(a) | 18,011 | 0 | ||||||
Surgutneftegas PJSC, Preference Shares(a) | 16,402 | 0 | ||||||
Tatneft PJSC(a) | 4,111 | 0 | ||||||
Transneft PJSC, Preference Shares(a) | 1 | 0 | ||||||
United Co. RUSAL International PJSC(a) | 7,760 | 0 | ||||||
VTB Bank PJSC(a)(b) | 13,924,072 | 0 | ||||||
|
| |||||||
| 0 | ||||||||
|
| |||||||
| Saudi Arabia-6.17% | ||||||||
Abdullah Al Othaim Markets Co. | 188 | 5,684 | ||||||
ACWA Power Co. | 435 | 20,143 | ||||||
Advanced Petrochemical Co. | 1,094 | 12,898 | ||||||
Al Rajhi Bank(b) | 4,837 | 109,676 | ||||||
Alinma Bank | 1,812 | 18,084 | ||||||
Almarai Co. JSC | 271 | 4,060 | ||||||
Arab National Bank | 1,372 | 11,775 | ||||||
Arabian Centres Co. Ltd. | 1,281 | 6,648 | ||||||
Arabian Internet & Communications Services Co. | 22 | 1,452 | ||||||
Bank AlBilad(b) | 2,471 | 33,341 | ||||||
Bank Al-Jazira | 266 | 1,655 | ||||||
Banque Saudi Fransi | 1,698 | 19,522 | ||||||
Bupa Arabia for Cooperative Insurance Co. | 358 | 18,388 | ||||||
Company for Cooperative Insurance (The) | 441 | 9,941 | ||||||
Dallah Healthcare Co. | 266 | 11,355 | ||||||
Dr Sulaiman Al Habib Medical Services Group Co. | 181 | 10,915 | ||||||
Elm Co. | 35 | 3,083 | ||||||
Emaar Economic City(b) | 1,826 | 4,660 | ||||||
Etihad Etisalat Co. | 532 | 5,182 | ||||||
Jarir Marketing Co. | 233 | 10,169 | ||||||
Mobile Telecommunications Co.(b) | 1,749 | 6,042 | ||||||
Mouwasat Medical Services Co. | 167 | 9,733 | ||||||
See accompanying Notes to Financial Statements which are an integral part of the financial statements.
| 34 |
|
Invesco PureBetaSM FTSE Emerging Markets ETF (PBEE)–(continued)
October 31, 2022
| Shares | Value | |||||||
| Saudi Arabia-(continued) | ||||||||
National Industrialization Co.(b) | 1,708 | $ | 6,082 | |||||
Qassim Cement Co. (The) | 369 | 7,404 | ||||||
Rabigh Refining & Petrochemical Co.(b) | 454 | 1,648 | ||||||
Riyad Bank | 3,170 | 30,329 | ||||||
SABIC Agri-Nutrients Co. | 831 | 35,164 | ||||||
Sahara International Petrochemical Co. | 1,741 | 18,788 | ||||||
Saudi Airlines Catering Co.(b) | 581 | 11,983 | ||||||
Saudi Arabian Mining Co.(b) | 2,329 | 51,879 | ||||||
Saudi Arabian Oil Co.(c) | 5,454 | 50,657 | ||||||
Saudi Basic Industries Corp. | 1,979 | 46,558 | ||||||
Saudi British Bank (The) | 2,560 | 29,636 | ||||||
Saudi Cement Co. | 421 | 5,972 | ||||||
Saudi Electricity Co. | 1,197 | 8,601 | ||||||
Saudi Ground Services Co.(b) | 823 | 5,695 | ||||||
Saudi Industrial Investment Group | 2,759 | 16,506 | ||||||
Saudi Kayan Petrochemical Co.(b) | 2,992 | 10,479 | ||||||
Saudi National Bank (The) | 5,368 | 84,858 | ||||||
Saudi Research & Media Group(b) | 183 | 9,809 | ||||||
Saudi Tadawul Group Holding Co. | 27 | 1,561 | ||||||
Saudi Telecom Co. | 3,857 | 41,469 | ||||||
Saudia Dairy & Foodstuff Co. | 250 | 15,635 | ||||||
Savola Group (The) | 449 | 3,501 | ||||||
Southern Province Cement Co. | 610 | 8,896 | ||||||
United Electronics Co. | 49 | 998 | ||||||
Yamama Cement Co.(b) | 174 | 1,361 | ||||||
Yanbu National Petrochemical Co., Class A | 491 | 5,841 | ||||||
|
| |||||||
| 845,716 | ||||||||
|
| |||||||
| Singapore-0.01% | ||||||||
Yangzijiang Financial Holding Ltd.(b) | 7,130 | 1,562 | ||||||
|
| |||||||
| South Africa-3.90% | ||||||||
Absa Group Ltd. | 1,828 | 19,868 | ||||||
African Rainbow Minerals Ltd. | 347 | 4,884 | ||||||
Anglo American Platinum Ltd. | 158 | 12,562 | ||||||
Aspen Pharmacare Holdings Ltd. | 1,106 | 9,103 | ||||||
AVI Ltd. | 645 | 2,579 | ||||||
Bid Corp. Ltd. | 764 | 12,287 | ||||||
Bidvest Group Ltd. (The) | 1,043 | 12,059 | ||||||
Capitec Bank Holdings Ltd. | 184 | 19,029 | ||||||
Clicks Group Ltd. | 784 | 13,278 | ||||||
Dis-Chem Pharmacies Ltd.(c) | 2,211 | 4,047 | ||||||
Discovery Ltd.(b) | 1,271 | 8,314 | ||||||
Exxaro Resources Ltd. | 435 | 4,841 | ||||||
FirstRand Ltd. | 13,416 | 46,977 | ||||||
Foschini Group Ltd. (The) | 726 | 4,539 | ||||||
Gold Fields Ltd. | 2,511 | 20,289 | ||||||
Growthpoint Properties Ltd. | 8,055 | 5,676 | ||||||
Harmony Gold Mining Co. Ltd.(d) | 1,530 | 4,237 | ||||||
Impala Platinum Holdings Ltd. | 2,246 | 22,989 | ||||||
Investec Ltd. | 732 | 3,599 | ||||||
Kumba Iron Ore Ltd.(d) | 184 | 3,464 | ||||||
Life Healthcare Group Holdings Ltd. | 3,702 | 3,978 | ||||||
Momentum Metropolitan Holdings | 3,315 | 3,099 | ||||||
Mr Price Group Ltd. | 615 | 5,918 | ||||||
MTN Group Ltd. | 4,695 | 33,171 | ||||||
MultiChoice Group | 1,349 | 8,811 | ||||||
Naspers Ltd., Class N | 562 | 58,107 | ||||||
Nedbank Group Ltd. | 445 | 5,268 | ||||||
Netcare Ltd. | 4,935 | 4,184 | ||||||
Northam Platinum Holdings Ltd.(b) | 687 | 6,444 | ||||||
| Shares | Value | |||||||
| South Africa-(continued) | ||||||||
Pepkor Holdings Ltd.(c) | 4,008 | $ | 4,944 | |||||
Pick n Pay Stores Ltd. | 984 | 3,161 | ||||||
Rand Merchant Investment Holdings Ltd. | 2,591 | 4,021 | ||||||
Redefine Properties Ltd. | 14,358 | 3,188 | ||||||
Remgro Ltd. | 1,666 | 12,393 | ||||||
Resilient REIT Ltd. | 475 | 1,324 | ||||||
Royal Bafokeng Platinum Ltd. | 481 | 3,865 | ||||||
Sanlam Ltd. | 3,442 | 10,009 | ||||||
Santam Ltd. | 226 | 3,128 | ||||||
Sappi Ltd.(b) | 1,889 | 5,824 | ||||||
Sasol Ltd. | 1,234 | 20,751 | ||||||
Shoprite Holdings Ltd. | 1,531 | 19,486 | ||||||
Sibanye Stillwater Ltd. | 7,754 | 18,198 | ||||||
SPAR Group Ltd. (The) | 574 | 4,865 | ||||||
Standard Bank Group Ltd. | 2,931 | 27,376 | ||||||
Tiger Brands Ltd.(d) | 553 | 5,598 | ||||||
Transaction Capital Ltd.(d) | 383 | 856 | ||||||
Truworths International Ltd. | 1,510 | 4,294 | ||||||
Vodacom Group Ltd. | 1,254 | 8,551 | ||||||
Woolworths Holdings Ltd. | 2,470 | 8,479 | ||||||
|
| |||||||
| 533,912 | ||||||||
|
| |||||||
| Taiwan-14.71% | ||||||||
Accton Technology Corp. | 1,679 | 12,662 | ||||||
Acer, Inc. | 9,044 | 6,203 | ||||||
Advanced Energy Solution Holding Co. Ltd. | 45 | 788 | ||||||
Advantech Co. Ltd. | 1,269 | 11,539 | ||||||
ASE Technology Holding Co. Ltd. | 8,720 | 21,758 | ||||||
Asia Cement Corp. | 6,898 | 7,985 | ||||||
ASMedia Technology, Inc. | 107 | 1,933 | ||||||
ASPEED Technology, Inc. | 46 | 2,398 | ||||||
Asustek Computer, Inc. | 1,550 | 11,352 | ||||||
AUO Corp. | 22,137 | 11,610 | ||||||
Capital Securities Corp. | 7,241 | 2,247 | ||||||
Catcher Technology Co. Ltd. | 665 | 3,498 | ||||||
Cathay Financial Holding Co. Ltd. | 22,079 | 25,901 | ||||||
Chailease Holding Co. Ltd. | 3,377 | 15,616 | ||||||
Chang Hwa Commercial Bank Ltd. | 14,107 | 7,267 | ||||||
Cheng Shin Rubber Industry Co. Ltd. | 5,508 | 5,521 | ||||||
Chicony Electronics Co. Ltd. | 4,045 | 10,055 | ||||||
China Airlines Ltd. | 6,693 | 3,521 | ||||||
China Development Financial Holding Corp. | 34,866 | 12,714 | ||||||
China Steel Corp. | 35,324 | 29,434 | ||||||
Chunghwa Telecom Co. Ltd. | 10,361 | 35,692 | ||||||
Compal Electronics, Inc. | 13,543 | 8,868 | ||||||
CTBC Financial Holding Co. Ltd. | 44,440 | 28,135 | ||||||
Delta Electronics, Inc. | 6,343 | 50,689 | ||||||
E Ink Holdings, Inc. | 2,375 | 15,147 | ||||||
E.Sun Financial Holding Co. Ltd. | 22,553 | 16,238 | ||||||
Eclat Textile Co. Ltd. | 409 | 5,388 | ||||||
eMemory Technology, Inc. | 76 | 2,536 | ||||||
ENNOSTAR, Inc. | 2,343 | 2,989 | ||||||
Eva Airways Corp. | 7,049 | 5,119 | ||||||
Evergreen Marine Corp. Taiwan Ltd. | 2,831 | 12,080 | ||||||
Far Eastern International Bank | 8,112 | 2,669 | ||||||
Far Eastern New Century Corp. | 13,642 | 13,611 | ||||||
Far EasTone Telecommunications Co. Ltd. | 6,199 | 13,601 | ||||||
Feng TAY Enterprise Co. Ltd. | 1,194 | 5,947 | ||||||
First Financial Holding Co. Ltd. | 28,639 | 21,998 | ||||||
Formosa Chemicals & Fibre Corp. | 9,565 | 20,631 | ||||||
See accompanying Notes to Financial Statements which are an integral part of the financial statements.
| 35 |
|
Invesco PureBetaSM FTSE Emerging Markets ETF (PBEE)–(continued)
October 31, 2022
| Shares | Value | |||||||
| Taiwan-(continued) | ||||||||
Formosa Petrochemical Corp. | 2,119 | $ | 5,458 | |||||
Formosa Plastics Corp. | 11,195 | 28,871 | ||||||
Formosa Taffeta Co. Ltd. | 5,158 | 4,106 | ||||||
Foxconn Technology Co. Ltd. | 2,954 | 4,144 | ||||||
Fubon Financial Holding Co. Ltd. | 20,446 | 32,361 | ||||||
Giant Manufacturing Co. Ltd. | 530 | 3,380 | ||||||
Globalwafers Co. Ltd. | 540 | 6,008 | ||||||
Hiwin Technologies Corp. | 414 | 2,133 | ||||||
Hon Hai Precision Industry Co. Ltd. | 32,072 | 102,021 | ||||||
Hotai Motor Co. Ltd. | 719 | 13,031 | ||||||
HTC Corp.(b) | 4,904 | 7,686 | ||||||
Hua Nan Financial Holdings Co. Ltd. | 26,304 | 17,184 | ||||||
Innolux Corp. | 23,769 | 8,741 | ||||||
Inventec Corp. | 9,361 | 7,088 | ||||||
Largan Precision Co. Ltd. | 308 | 17,683 | ||||||
Lite-On Technology Corp. | 4,798 | 9,530 | ||||||
MediaTek, Inc. | 4,017 | 73,552 | ||||||
Mega Financial Holding Co. Ltd. | 28,958 | 26,871 | ||||||
Micro-Star International Co. Ltd. | 2,256 | 7,666 | ||||||
momo.com, Inc. | 148 | 2,216 | ||||||
Nan Ya Plastics Corp. | 14,001 | 29,677 | ||||||
Nan Ya Printed Circuit Board Corp. | 558 | 3,663 | ||||||
Nien Made Enterprise Co. Ltd. | 135 | 1,043 | ||||||
Novatek Microelectronics Corp. | 1,604 | 11,997 | ||||||
Oneness Biotech Co. Ltd.(b) | 526 | 3,722 | ||||||
Pegatron Corp. | 4,862 | 8,902 | ||||||
Pou Chen Corp. | 7,117 | 6,019 | ||||||
President Chain Store Corp. | 1,810 | 15,054 | ||||||
Quanta Computer, Inc. | 7,635 | 16,207 | ||||||
Realtek Semiconductor Corp. | 1,390 | 11,000 | ||||||
Ruentex Development Co. Ltd. | 1,500 | 1,843 | ||||||
Shanghai Commercial & Savings Bank Ltd. (The) | 9,474 | 13,642 | ||||||
Shanghai Commercial & Savings Bank Ltd. (The), Rts., expiring 12/08/2022(b) | 694 | 202 | ||||||
Shin Kong Financial Holding Co. Ltd. | 34,734 | 8,624 | ||||||
Sino-American Silicon Products, Inc. | 936 | 3,602 | ||||||
SinoPac Financial Holdings Co. Ltd. | 34,812 | 17,394 | ||||||
Synnex Technology International Corp. | 6,604 | 10,780 | ||||||
Taishin Financial Holding Co. Ltd. | 25,044 | 10,298 | ||||||
Taiwan Business Bank | 7,964 | 2,954 | ||||||
Taiwan Cement Corp. | 14,721 | 13,820 | ||||||
Taiwan Cooperative Financial Holding Co. Ltd. | 29,408 | 22,816 | ||||||
Taiwan Fertilizer Co. Ltd. | 4,508 | 7,317 | ||||||
Taiwan Glass Industry Corp. | 4,939 | 3,127 | ||||||
Taiwan Mobile Co. Ltd. | 3,118 | 9,202 | ||||||
Taiwan Semiconductor Manufacturing Co. Ltd. | 61,990 | 750,286 | ||||||
Teco Electric and Machinery Co. Ltd. | 7,581 | 6,705 | ||||||
Transcend Information, Inc. | 2,963 | 5,922 | ||||||
U-Ming Marine Transport Corp. | 2,000 | 2,185 | ||||||
Unimicron Technology Corp. | 4,048 | 15,640 | ||||||
Uni-President Enterprises Corp. | 13,470 | 27,381 | ||||||
United Microelectronics Corp. | 32,237 | 39,118 | ||||||
Vanguard International Semiconductor Corp. | 2,680 | 5,523 | ||||||
Voltronic Power Technology Corp. | 126 | 5,123 | ||||||
Walsin Lihwa Corp. | 9,044 | 10,034 | ||||||
Walsin Technology Corp. | 1,267 | 3,106 | ||||||
Wan Hai Lines Ltd. | 2,173 | 4,566 | ||||||
Win Semiconductors Corp. | 1,094 | 4,142 | ||||||
Winbond Electronics Corp. | 6,926 | 4,191 | ||||||
| Shares | Value | |||||||
| Taiwan-(continued) | ||||||||
Wistron Corp. | 7,111 | $ | 5,749 | |||||
Wiwynn Corp. | 258 | 5,797 | ||||||
Yageo Corp. | 951 | 10,831 | ||||||
Yang Ming Marine Transport Corp. | 4,461 | 8,334 | ||||||
Yuanta Financial Holding Co. Ltd. | 35,467 | 21,684 | ||||||
Zhen Ding Technology Holding Ltd. | 609 | 2,003 | ||||||
|
| |||||||
| 2,016,295 | ||||||||
|
| |||||||
| Thailand-2.84% | ||||||||
Advanced Info Service PCL, NVDR | 3,444 | 17,283 | ||||||
Airports of Thailand PCL, NVDR(b) | 13,052 | 25,377 | ||||||
Asset World Corp. PCL, NVDR | 23,334 | 3,740 | ||||||
B. Grimm Power PCL, NVDR | 2,372 | 2,103 | ||||||
Bangkok Dusit Medical Services PCL, NVDR | 26,813 | 20,782 | ||||||
Bangkok Expressway & Metro PCL, NVDR | 26,195 | 6,470 | ||||||
Banpu PCL, NVDR | 14,536 | 4,774 | ||||||
Berli Jucker PCL, NVDR | 3,370 | 3,033 | ||||||
BTS Group Holdings PCL, NVDR | 24,387 | 5,318 | ||||||
Bumrungrad Hospital PCL, NVDR | 1,065 | 6,352 | ||||||
Central Pattana PCL, NVDR | 7,722 | 13,949 | ||||||
Central Retail Corp. PCL, NVDR | 2,450 | 2,704 | ||||||
Charoen Pokphand Foods PCL, NVDR | 10,891 | 7,225 | ||||||
CP ALL PCL, NVDR | 15,006 | 23,656 | ||||||
Delta Electronics Thailand PCL, NVDR | 789 | 12,024 | ||||||
Electricity Generating PCL, NVDR | 882 | 3,951 | ||||||
Energy Absolute PCL, NVDR | 6,357 | 16,118 | ||||||
Global Power Synergy PCL, NVDR | 1,364 | 2,222 | ||||||
Gulf Energy Development PCL, NVDR | 13,285 | 17,627 | ||||||
Home Product Center PCL, NVDR | 18,909 | 7,254 | ||||||
Indorama Ventures PCL, NVDR | 6,527 | 7,203 | ||||||
Intouch Holdings PCL, NVDR | 7,499 | 14,186 | ||||||
IRPC PCL, NVDR | 7,485 | 617 | ||||||
Kasikornbank PCL, NVDR | 1,267 | 4,860 | ||||||
Krung Thai Bank PCL, NVDR | 16,222 | 7,459 | ||||||
Krungthai Card PCL, NVDR | 4,732 | 7,087 | ||||||
Land & Houses PCL, NVDR | 22,042 | 5,328 | ||||||
Minor International PCL, NVDR(b) | 11,934 | 8,858 | ||||||
Muangthai Capital PCL, NVDR | 2,468 | 2,351 | ||||||
Osotspa PCL, NVDR | 4,028 | 2,805 | ||||||
PTT Exploration & Production PCL, NVDR | 3,705 | 17,668 | ||||||
PTT Global Chemical PCL, NVDR | 3,695 | 4,223 | ||||||
PTT PCL, NVDR | 34,257 | 32,403 | ||||||
Ratch Group PCL, NVDR | 2,575 | 2,774 | ||||||
SCB X PCL, NVDR | 5,850 | 16,293 | ||||||
SCG Packaging PCL, NVDR | 583 | 796 | ||||||
Siam Cement PCL (The), NVDR | 2,566 | 21,844 | ||||||
Siam Makro PCL, NVDR | 4,987 | 4,717 | ||||||
Srisawad Corp. PCL, NVDR | 2,259 | 2,433 | ||||||
Thai Oil PCL, NVDR | 3,625 | 5,191 | ||||||
Thai Union Group PCL, NVDR | 9,671 | 4,574 | ||||||
Thai Union Group PCL, Rts., expiring 11/24/2022(a)(b) | 274 | 0 | ||||||
TMBThanachart Bank PCL, NVDR | 50,173 | 1,793 | ||||||
TMBThanachart Bank PCL, Wts., expiring 10/25/2025(b) | 1,044 | 14 | ||||||
Total Access Communication PCL, NVDR | 4,622 | 5,465 | ||||||
True Corp. PCL, NVDR | 46,501 | 6,060 | ||||||
|
| |||||||
| 388,964 | ||||||||
|
| |||||||
| Turkey-0.94% | ||||||||
Akbank T.A.S. | 7,231 | 5,683 | ||||||
See accompanying Notes to Financial Statements which are an integral part of the financial statements.
| 36 |
|
Invesco PureBetaSM FTSE Emerging Markets ETF (PBEE)–(continued)
October 31, 2022
| Shares | Value | |||||||
| Turkey-(continued) | ||||||||
Aksa Enerji Uretim A.S | 1,692 | $ | 3,765 | |||||
Arcelik A.S | 698 | 2,951 | ||||||
Aselsan Elektronik Sanayi Ve Ticaret A.S | 2,132 | 3,693 | ||||||
BIM Birlesik Magazalar A.S | 1,461 | 10,524 | ||||||
Can2 Termik A.S.(b) | 883 | 6,788 | ||||||
Coca-Cola Icecek A.S | 313 | 2,894 | ||||||
EIS Eczacibasi Ilac, Sinai ve Finansal Yatirimlar Sanayi ve Ticaret A.S | 1,896 | 2,031 | ||||||
Enka Insaat ve Sanayi A.S | 3,469 | 3,495 | ||||||
Eregli Demir ve Celik Fabrikalari TAS | 3,560 | 5,684 | ||||||
Ford Otomotiv Sanayi A.S | 198 | 3,864 | ||||||
Gubre Fabrikalari TAS(b) | 546 | 4,270 | ||||||
Haci Omer Sabanci Holding A.S | 3,524 | 6,354 | ||||||
Hektas Ticaret T.A.S.(b) | 750 | 1,154 | ||||||
Is Gayrimenkul Yatirim Ortakligi A.S.(b) | 2,825 | 1,157 | ||||||
Kizilbuk Gayrimenkul Yatirim Ortakligi A.S.(b) | 1,100 | 1,274 | ||||||
KOC Holding A.S | 2,579 | 7,708 | ||||||
Oyak Cimento Fabrikalari A.S.(b) | 2,325 | 2,100 | ||||||
Pegasus Hava Tasimaciligi A.S.(b) | 84 | 1,446 | ||||||
Penta Teknoloji Urunleri Dagitim Ticaret | 963 | 3,468 | ||||||
Petkim Petrokimya Holding A.S.(b) | 4,461 | 3,223 | ||||||
Sasa Polyester Sanayi A.S.(b) | 1,091 | 7,049 | ||||||
Turk Hava Yollari AO(b) | 3,375 | 18,378 | ||||||
Turkcell Iletisim Hizmetleri A.S | 3,128 | 4,311 | ||||||
Turkiye Garanti Bankasi A.S | 785 | 992 | ||||||
Turkiye Is Bankasi A.S., Class C | 9,887 | 4,953 | ||||||
Turkiye Petrol Rafinerileri A.S.(b) | 250 | 5,093 | ||||||
Turkiye Sise ve Cam Fabrikalari A.S | 2,493 | 4,452 | ||||||
|
| |||||||
| 128,754 | ||||||||
|
| |||||||
| United Arab Emirates-2.04% | ||||||||
Abu Dhabi Commercial Bank PJSC | 8,117 | 20,883 | ||||||
Abu Dhabi Islamic Bank PJSC | 3,649 | 9,438 | ||||||
Abu Dhabi National Oil Co. for Distribution PJSC | 1,188 | 1,459 | ||||||
Abu Dhabi Ports Co. PJSC(b) | 3,783 | 5,850 | ||||||
ADNOC Drilling Co. PJSC | 3,114 | 2,840 | ||||||
Air Arabia PJSC | 18,556 | 10,306 | ||||||
AL Seer Marine Supplies & Equipment Co. LLC(b) | 385 | 949 | ||||||
Aldar Properties PJSC | 11,465 | 13,484 | ||||||
Alpha Dhabi Holding PJSC(b) | 3,437 | 22,926 | ||||||
Apex Investment Co. PSC(b) | 1,266 | 1,324 | ||||||
Dana Gas PJSC | 34,626 | 8,861 | ||||||
Dubai Financial Market PJSC | 6,323 | 2,427 | ||||||
Dubai Investments PJSC | 22,340 | 13,259 | ||||||
Dubai Islamic Bank PJSC | 5,385 | 8,533 | ||||||
| Shares | Value | |||||||
| United Arab Emirates-(continued) | ||||||||
Emaar Development PJSC(b) | 5,974 | $ | 6,961 | |||||
Emaar Properties PJSC | 8,524 | 14,063 | ||||||
Emirates Telecommunications Group Co. PJSC | 9,471 | 66,526 | ||||||
Fertiglobe PLC | 3,350 | 4,642 | ||||||
First Abu Dhabi Bank PJSC | 12,132 | 59,123 | ||||||
Q Holding PJSC(b) | 4,718 | 5,087 | ||||||
|
| |||||||
| 278,941 | ||||||||
|
| |||||||
| United Republic of Tanzania-0.11% | ||||||||
AngloGold Ashanti Ltd. | 1,199 | 15,741 | ||||||
|
| |||||||
| United States-0.18% | ||||||||
GCC S.A.B. de C.V. | 865 | 5,361 | ||||||
JBS S.A. | 3,285 | 15,626 | ||||||
Parade Technologies Ltd. | 176 | 3,326 | ||||||
|
| |||||||
| 24,313 | ||||||||
|
| |||||||
Total Common Stocks & Other Equity Interests |
| 12,392,382 | ||||||
|
| |||||||
| Exchange-Traded Funds-9.43% | ||||||||
| India-9.43% | ||||||||
Invesco India ETF(j) | 27,958 | 683,293 | ||||||
iShares MSCI India ETF(d) | 14,410 | 608,102 | ||||||
|
| |||||||
Total Exchange-Traded Funds |
| 1,291,395 | ||||||
|
| |||||||
TOTAL INVESTMENTS IN SECURITIES |
| 13,683,777 | ||||||
|
| |||||||
| Investments Purchased with Cash Collateral from Securities on Loan |
| |||||||
| Money Market Funds-4.58% |
| |||||||
Invesco Private Government Fund, | 175,821 | 175,821 | ||||||
Invesco Private Prime Fund, 3.28%(j)(k)(l) | 451,899 | 451,899 | ||||||
|
| |||||||
Total Investments Purchased with Cash Collateral from Securities on Loan |
| 627,720 | ||||||
|
| |||||||
TOTAL INVESTMENTS IN SECURITIES-104.44% |
| 14,311,497 | ||||||
OTHER ASSETS LESS LIABILITIES-(4.44)% |
| (608,028 | ) | |||||
|
| |||||||
NET ASSETS-100.00% |
| $ | 13,703,469 | |||||
|
| |||||||
Investment Abbreviations:
ADR-American Depositary Receipt
CPO-Certificates of Ordinary Participation
ETF-Exchange-Traded Fund
GDR-Global Depositary Receipt
NVDR-Non-Voting Depositary Receipt
REIT-Real Estate Investment Trust
Rts.-Rights
TBA-To Be Announced
Wts.-Warrants
See accompanying Notes to Financial Statements which are an integral part of the financial statements.
| 37 |
|
Invesco PureBetaSM FTSE Emerging Markets ETF (PBEE)–(continued)
October 31, 2022
Notes to Schedule of Investments:
| (a) | Security valued using significant unobservable inputs (Level 3). See Note 4. |
| (b) | Non-income producing security. |
| (c) | Security purchased or received in a transaction exempt from registration under the Securities Act of 1933, as amended (the “1933 Act”). The security may be resold pursuant to an exemption from registration under the 1933 Act, typically to qualified institutional buyers. The aggregate value of these securities at October 31, 2022 was $1,368,503, which represented 9.99% of the Fund’s Net Assets. |
| (d) | All or a portion of this security was out on loan at October 31, 2022. |
| (e) | Restricted security. The aggregate value of these securities at October 31, 2022 was $26,006, which represented less than 1% of the Fund’s Net Assets. |
| (f) | Each CPO for Cemex S.A.B. de C.V. represents two Series A shares and one Series B share. |
| (g) | Each CPO for Fomento Economico Mexicano S.A.B. de C.V. represents one Series B share and four Series D shares. |
| (h) | Each CPO for Grupo Televisa S.A.B, Series CPO. represents twenty-five Series A shares, twenty-two Series B shares, thirty-five Series D shares and thirty-five Series L shares. |
| (i) | Each CPO for Megacable Holdings S.A.B. de C.V. represents two Series shares. |
| (j) | Affiliated issuer. The issuer and/or the Fund is a wholly-owned subsidiary of Invesco Ltd., or is affiliated by having an investment adviser that is under common control of Invesco Ltd. The table below shows the Fund’s transactions in, and earnings from, its investments in affiliates for the fiscal year ended October 31, 2022. |
| Value October 31, 2021 | Purchases at Cost | Proceeds from Sales | Change in Unrealized Appreciation (Depreciation) | Realized Gain (Loss) | Value October 31, 2022 | Dividend Income | |||||||||||||||||||||||||||||||||||||||||||||||||
| Invesco India ETF | $ | 518,180 | $ | 366,426 | $ | (124,682 | ) | $ | (66,837 | ) | $ | 16,577 | $ | 683,293 | $ | 1,979 | |||||||||||||||||||||||||||||||||||||||
| Investments in Affiliated Money Market Funds: | |||||||||||||||||||||||||||||||||||||||||||||||||||||||
| Invesco Government & Agency Portfolio, Institutional Class | 76,781 | 731,107 | (807,888 | ) | - | - | - | 118 | |||||||||||||||||||||||||||||||||||||||||||||||
| Investments Purchased with Cash Collateral from Securities on Loan: | |||||||||||||||||||||||||||||||||||||||||||||||||||||||
| Invesco Private Government Fund | 120,790 | 6,034,836 | (5,979,805 | ) | - | - | 175,821 | 3,070 | * | ||||||||||||||||||||||||||||||||||||||||||||||
Invesco Private Prime Fund | 281,842 | 12,198,619 | (12,028,387 | ) | 39 | (214 | ) | 451,899 | 8,297 | * | |||||||||||||||||||||||||||||||||||||||||||||
|
|
|
|
|
|
|
|
|
|
|
|
|
| ||||||||||||||||||||||||||||||||||||||||||
| Total | $ | 997,593 | $ | 19,330,988 | $ | (18,940,762 | ) | $ | (66,798 | ) | $ | 16,363 | ** | $ | 1,311,013 | $ | 13,464 | ||||||||||||||||||||||||||||||||||||||
|
|
|
|
|
|
|
|
|
|
|
|
|
| ||||||||||||||||||||||||||||||||||||||||||
| * | Represents the income earned on the investment of cash collateral, which is included in securities lending income on the Statements of Operations. Does not include rebates and fees paid to lending agent or premiums received from borrowers, if any. |
| ** | Includes capital gains distributions from affiliated underlying funds as follows: |
| Fund Name | Capital Gain | |
Invesco India ETF | $26,371 | |
| (k) | The rate shown is the 7-day SEC standardized yield as of October 31, 2022. |
| (l) | The security has been segregated to satisfy the commitment to return the cash collateral received in securities lending transactions upon the borrower’s return of the securities loaned. See Note 2J. |
See accompanying Notes to Financial Statements which are an integral part of the financial statements.
| 38 |
|
Statement of Assets and Liabilities
October 31, 2022
| Invesco PureBetaSM 0-5 Yr US TIPS ETF (PBTP) | Invesco PureBetaSM FTSE Developed ex-North America ETF (PBDM) | Invesco PureBetaSM FTSE Emerging Markets ETF (PBEE) | ||||||||||||||||||||||||||||||||
| Assets: | ||||||||||||||||||||||||||||||||||
Unaffiliated investments in securities, at value(a) | $ | 121,473,791 | $ | 77,637,591 | $ | 13,000,484 | ||||||||||||||||||||||||||||
Affiliated investments in securities, at value | 3,741,772 | 6,267,954 | 1,311,013 | |||||||||||||||||||||||||||||||
Foreign currencies, at value | - | - | 13,392 | |||||||||||||||||||||||||||||||
Deposits with brokers: | ||||||||||||||||||||||||||||||||||
Cash segregated as collateral | 1,810,339 | - | 38,131 | |||||||||||||||||||||||||||||||
Receivable for: | ||||||||||||||||||||||||||||||||||
Dividends and interest | 158,034 | 210,017 | 7,349 | |||||||||||||||||||||||||||||||
Securities lending | 1,886 | 1,361 | 910 | |||||||||||||||||||||||||||||||
Investments sold | 2,654,110 | 10,034 | 3 | |||||||||||||||||||||||||||||||
Fund shares sold | 2,215,602 | - | 36,122 | |||||||||||||||||||||||||||||||
Foreign tax reclaims | - | 50,837 | - | |||||||||||||||||||||||||||||||
|
|
|
|
|
| |||||||||||||||||||||||||||||
Total assets | 132,055,534 | 84,177,794 | 14,407,404 | |||||||||||||||||||||||||||||||
|
|
|
|
|
| |||||||||||||||||||||||||||||
| Liabilities: | ||||||||||||||||||||||||||||||||||
Due to custodian | - | - | 788 | |||||||||||||||||||||||||||||||
Due to foreign custodian | - | 12,804 | - | |||||||||||||||||||||||||||||||
Payable for: | ||||||||||||||||||||||||||||||||||
Investments purchased | 4,920,149 | 9,893 | 36,124 | |||||||||||||||||||||||||||||||
Collateral upon return of securities loaned | 3,682,354 | 6,156,882 | 627,681 | |||||||||||||||||||||||||||||||
Collateral upon receipt of securities in-kind | 1,810,339 | - | 38,131 | |||||||||||||||||||||||||||||||
Accrued unitary management fees | 7,269 | 4,500 | 1,180 | |||||||||||||||||||||||||||||||
Other payables | - | - | 31 | |||||||||||||||||||||||||||||||
|
|
|
|
|
| |||||||||||||||||||||||||||||
Total liabilities | 10,420,111 | 6,184,079 | 703,935 | |||||||||||||||||||||||||||||||
|
|
|
|
|
| |||||||||||||||||||||||||||||
| Net Assets | $ | 121,635,423 | $ | 77,993,715 | $ | 13,703,469 | ||||||||||||||||||||||||||||
|
|
|
|
|
| |||||||||||||||||||||||||||||
| Net assets consist of: | ||||||||||||||||||||||||||||||||||
Shares of beneficial interest | $ | 129,725,593 | $ | 106,264,397 | $ | 18,833,101 | ||||||||||||||||||||||||||||
Distributable earnings (loss) | (8,090,170 | ) | (28,270,682 | ) | (5,129,632 | ) | ||||||||||||||||||||||||||||
|
|
|
|
|
| |||||||||||||||||||||||||||||
| Net Assets | $ | 121,635,423 | $ | 77,993,715 | $ | 13,703,469 | ||||||||||||||||||||||||||||
|
|
|
|
|
| |||||||||||||||||||||||||||||
Shares outstanding (unlimited amount authorized, $0.01 par value) | 4,950,001 | 3,600,001 | 700,001 | |||||||||||||||||||||||||||||||
Net asset value | $ | 24.57 | $ | 21.66 | $ | 19.58 | ||||||||||||||||||||||||||||
|
|
|
|
|
| |||||||||||||||||||||||||||||
Market price | $ | 24.59 | $ | 21.72 | $ | 19.64 | ||||||||||||||||||||||||||||
|
|
|
|
|
| |||||||||||||||||||||||||||||
Unaffiliated investments in securities, at cost | $ | 129,779,238 | $ | 104,124,184 | $ | 17,355,789 | ||||||||||||||||||||||||||||
|
|
|
|
|
| |||||||||||||||||||||||||||||
Affiliated investments in securities, at cost | $ | 3,741,772 | $ | 6,268,085 | $ | 1,301,275 | ||||||||||||||||||||||||||||
|
|
|
|
|
| |||||||||||||||||||||||||||||
Foreign currencies (due to foreign custodian), at cost | $ | - | $ | (12,912 | ) | $ | 13,455 | |||||||||||||||||||||||||||
|
|
|
|
|
| |||||||||||||||||||||||||||||
(a)Includes securities on loan with an aggregate value of: | $ | 3,602,832 | $ | 5,826,147 | $ | 603,944 | ||||||||||||||||||||||||||||
| �� |
|
|
|
| |||||||||||||||||||||||||||||
See accompanying Notes to Financial Statements which are an integral part of the financial statements.
| 39 |
|
For the year ended October 31, 2022
| Invesco PureBetaSM 0-5 Yr US TIPS ETF (PBTP) | Invesco PureBetaSM FTSE Developed ex-North America ETF (PBDM) | Invesco PureBetaSM FTSE Emerging Markets ETF (PBEE) | |||||||||||||||||||||||||||||||||||||||||||
| Investment income: | |||||||||||||||||||||||||||||||||||||||||||||
Unaffiliated interest income | $ | 5,969,993 | $ | - | $ | 7 | |||||||||||||||||||||||||||||||||||||||
Unaffiliated dividend income | - | 2,992,641 | 511,305 | ||||||||||||||||||||||||||||||||||||||||||
Affiliated dividend income | 1,730 | 905 | 2,097 | ||||||||||||||||||||||||||||||||||||||||||
Non-cash dividend income | - | 41,228 | 13,970 | ||||||||||||||||||||||||||||||||||||||||||
Securities lending income, net | 4,070 | 21,087 | 6,149 | ||||||||||||||||||||||||||||||||||||||||||
Foreign withholding tax | - | (280,350 | ) | (43,582 | ) | ||||||||||||||||||||||||||||||||||||||||
|
|
|
|
|
| ||||||||||||||||||||||||||||||||||||||||
Total investment income | 5,975,793 | 2,775,511 | 489,946 | ||||||||||||||||||||||||||||||||||||||||||
|
|
|
|
|
| ||||||||||||||||||||||||||||||||||||||||
| Expenses: | |||||||||||||||||||||||||||||||||||||||||||||
Unitary management fees | 67,411 | 65,545 | 19,682 | ||||||||||||||||||||||||||||||||||||||||||
Tax expenses | - | - | 936 | ||||||||||||||||||||||||||||||||||||||||||
|
|
|
|
|
| ||||||||||||||||||||||||||||||||||||||||
Total expenses | 67,411 | 65,545 | 20,618 | ||||||||||||||||||||||||||||||||||||||||||
|
|
|
|
|
| ||||||||||||||||||||||||||||||||||||||||
Less: Waivers | (105 | ) | (59 | ) | (4,970 | ) | |||||||||||||||||||||||||||||||||||||||
|
|
|
|
|
| ||||||||||||||||||||||||||||||||||||||||
Net expenses | 67,306 | 65,486 | 15,648 | ||||||||||||||||||||||||||||||||||||||||||
|
|
|
|
|
| ||||||||||||||||||||||||||||||||||||||||
Net investment income | 5,908,487 | 2,710,025 | 474,298 | ||||||||||||||||||||||||||||||||||||||||||
|
|
|
|
|
| ||||||||||||||||||||||||||||||||||||||||
| Realized and unrealized gain (loss) from: | |||||||||||||||||||||||||||||||||||||||||||||
Net realized gain (loss) from: | |||||||||||||||||||||||||||||||||||||||||||||
Unaffiliated investment securities | (796,525 | ) | (1,429,722 | ) | (605,081 | ) | |||||||||||||||||||||||||||||||||||||||
Affiliated investment securities | (2,136 | ) | (212 | ) | 16,363 | ||||||||||||||||||||||||||||||||||||||||
In-kind redemptions | (124,130 | ) | 228,778 | - | |||||||||||||||||||||||||||||||||||||||||
Foreign currencies | - | (35,136 | ) | (5,281 | ) | ||||||||||||||||||||||||||||||||||||||||
Distributions of underlying fund shares | - | - | 26,371 | ||||||||||||||||||||||||||||||||||||||||||
|
|
|
|
|
| ||||||||||||||||||||||||||||||||||||||||
Net realized gain (loss) | (922,791 | ) | (1,236,292 | ) | (567,628 | ) | |||||||||||||||||||||||||||||||||||||||
|
|
|
|
|
| ||||||||||||||||||||||||||||||||||||||||
Change in net unrealized appreciation (depreciation) of: | |||||||||||||||||||||||||||||||||||||||||||||
Unaffiliated investment securities | (8,750,936 | ) | (27,145,708 | ) | (4,554,916 | ) | |||||||||||||||||||||||||||||||||||||||
Affiliated investment securities | - | (131 | ) | (66,798 | ) | ||||||||||||||||||||||||||||||||||||||||
Foreign currencies | - | (7,565 | ) | (125 | ) | ||||||||||||||||||||||||||||||||||||||||
|
|
|
|
|
| ||||||||||||||||||||||||||||||||||||||||
Change in net unrealized appreciation (depreciation) | (8,750,936 | ) | (27,153,404 | ) | (4,621,839 | ) | |||||||||||||||||||||||||||||||||||||||
|
|
|
|
|
| ||||||||||||||||||||||||||||||||||||||||
Net realized and unrealized gain (loss) | (9,673,727 | ) | (28,389,696 | ) | (5,189,467 | ) | |||||||||||||||||||||||||||||||||||||||
|
|
|
|
|
| ||||||||||||||||||||||||||||||||||||||||
Net increase (decrease) in net assets resulting from operations | $ | (3,765,240 | ) | $ | (25,679,671 | ) | $ | (4,715,169 | ) | ||||||||||||||||||||||||||||||||||||
|
|
|
|
|
| ||||||||||||||||||||||||||||||||||||||||
See accompanying Notes to Financial Statements which are an integral part of the financial statements.
| 40 |
|
Statements of Changes in Net Assets
For the years ended October 31, 2022 and 2021
| Invesco PureBetaSM 0-5 Yr US TIPS ETF (PBTP) | Invesco PureBetaSM FTSE Developed ex-North America ETF (PBDM) | Invesco PureBetaSM FTSE Emerging Markets ETF (PBEE) | ||||||||||||||||||||||||||||
| 2022 | 2021 | 2022 | 2021 | 2022 | 2021 | |||||||||||||||||||||||||
| Operations: | ||||||||||||||||||||||||||||||
Net investment income | $ | 5,908,487 | $ | 1,143,858 | $ | 2,710,025 | $ | 240,660 | $ | 474,298 | $ | 192,890 | ||||||||||||||||||
Net realized gain (loss) | (922,791 | ) | 151,996 | (1,236,292 | ) | (49,942 | ) | (567,628 | ) | (96,527 | ) | |||||||||||||||||||
Change in net unrealized appreciation (depreciation) | (8,750,936 | ) | 221,002 | (27,153,404 | ) | 877,821 | (4,621,839 | ) | 174,620 | |||||||||||||||||||||
|
|
|
|
|
|
|
|
|
|
|
| |||||||||||||||||||
Net increase (decrease) in net assets resulting from operations | (3,765,240 | ) | 1,516,856 | (25,679,671 | ) | 1,068,539 | (4,715,169 | ) | 270,983 | |||||||||||||||||||||
|
|
|
|
|
|
|
|
|
|
|
| |||||||||||||||||||
| Distributions to Shareholders from: | ||||||||||||||||||||||||||||||
Distributable earnings | (5,579,040 | ) | (872,608 | ) | (3,114,627 | ) | (176,508 | ) | (500,783 | ) | (157,773 | ) | ||||||||||||||||||
|
|
|
|
|
|
|
|
|
|
|
| |||||||||||||||||||
| Shareholder Transactions: | ||||||||||||||||||||||||||||||
Proceeds from shares sold | 112,102,622 | 42,247,747 | 38,575,699 | 67,426,085 | 7,537,315 | 8,781,479 | ||||||||||||||||||||||||
Value of shares repurchased | (33,948,435 | ) | (2,936,202 | ) | (2,348,895 | ) | - | - | - | |||||||||||||||||||||
Transaction fees | - | - | - | - | 15,230 | - | ||||||||||||||||||||||||
|
|
|
|
|
|
|
|
|
|
|
| |||||||||||||||||||
Net increase in net assets resulting from share transactions | 78,154,187 | 39,311,545 | 36,226,804 | 67,426,085 | 7,552,545 | 8,781,479 | ||||||||||||||||||||||||
|
|
|
|
|
|
|
|
|
|
|
| |||||||||||||||||||
Net increase in net assets | 68,809,907 | 39,955,793 | 7,432,506 | 68,318,116 | 2,336,593 | 8,894,689 | ||||||||||||||||||||||||
|
|
|
|
|
|
|
|
|
|
|
| |||||||||||||||||||
| Net assets: | ||||||||||||||||||||||||||||||
Beginning of year | 52,825,516 | 12,869,723 | 70,561,209 | 2,243,093 | 11,366,876 | 2,472,187 | ||||||||||||||||||||||||
|
|
|
|
|
|
|
|
|
|
|
| |||||||||||||||||||
End of year | $ | 121,635,423 | $ | 52,825,516 | $ | 77,993,715 | $ | 70,561,209 | $ | 13,703,469 | $ | 11,366,876 | ||||||||||||||||||
|
|
|
|
|
|
|
|
|
|
|
| |||||||||||||||||||
| Changes in Shares Outstanding: | ||||||||||||||||||||||||||||||
Shares sold | 4,290,000 | 1,590,000 | 1,300,000 | 2,300,000 | 300,000 | 300,000 | ||||||||||||||||||||||||
Shares repurchased | (1,320,000 | ) | (110,000 | ) | (100,000 | ) | - | - | - | |||||||||||||||||||||
Shares outstanding, beginning of year | 1,980,001 | 500,001 | 2,400,001 | 100,001 | 400,001 | 100,001 | ||||||||||||||||||||||||
|
|
|
|
|
|
|
|
|
|
|
| |||||||||||||||||||
Shares outstanding, end of year | 4,950,001 | 1,980,001 | 3,600,001 | 2,400,001 | 700,001 | 400,001 | ||||||||||||||||||||||||
|
|
|
|
|
|
|
|
|
|
|
| |||||||||||||||||||
See accompanying Notes to Financial Statements which are an integral part of the financial statements.
| 41 |
|
Invesco PureBetaSM 0-5 Yr US TIPS ETF (PBTP)
| Years Ended October 31, | ||||||||||||||||||||
| 2022 | 2021 | 2020 | 2019 | 2018 | ||||||||||||||||
| Per Share Operating Performance: | ||||||||||||||||||||
Net asset value at beginning of year | $ | 26.68 | $ | 25.74 | $ | 24.89 | $ | 24.40 | $ | 24.99 | ||||||||||
Net investment income(a) | 1.58 | 1.12 | 0.35 | 0.59 | 0.63 | |||||||||||||||
Net realized and unrealized gain (loss) on investments | (2.29 | ) | 0.53 | 0.71 | 0.39 | (0.55 | ) | |||||||||||||
Total from investment operations | (0.71 | ) | 1.65 | 1.06 | 0.98 | 0.08 | ||||||||||||||
Distributions to shareholders from: | ||||||||||||||||||||
Net investment income | (1.39 | ) | (0.69 | ) | (0.21 | ) | (0.49 | ) | (0.67 | ) | ||||||||||
Net realized gains | (0.01 | ) | (0.02 | ) | - | - | - | |||||||||||||
Total distributions | (1.40 | ) | (0.71 | ) | (0.21 | ) | (0.49 | ) | (0.67 | ) | ||||||||||
Net asset value at end of year | $ | 24.57 | $ | 26.68 | $ | 25.74 | $ | 24.89 | $ | 24.40 | ||||||||||
Market price at end of year(b) | $ | 24.59 | $ | 26.70 | $ | 25.75 | $ | 24.90 | $ | 24.40 | ||||||||||
| Net Asset Value Total Return(c) | (2.79 | )% | 6.46 | % | 4.28 | % | 4.04 | % | 0.33 | % | ||||||||||
| Market Price Total Return(c) | (2.78 | )% | 6.50 | % | 4.28 | % | 4.07 | % | 0.33 | % | ||||||||||
| Ratios/Supplemental Data: | ||||||||||||||||||||
Net assets at end of year (000’s omitted) | $ | 121,635 | $ | 52,826 | $ | 12,870 | $ | 7,467 | $ | 2,440 | ||||||||||
Ratio to average net assets of: | ||||||||||||||||||||
Expenses | 0.07 | % | 0.07 | % | 0.07 | % | 0.20 | %(d) | 0.07 | % | ||||||||||
Net investment income | 6.14 | % | 4.26 | % | 1.40 | % | 2.39 | %(d) | 2.53 | % | ||||||||||
Portfolio turnover rate(e) | 27 | % | 28 | % | 29 | % | 30 | % | 19 | % | ||||||||||
| (a) | Based on average shares outstanding. |
| (b) | The mean between the last bid and ask prices. |
| (c) | Net asset value total return is calculated assuming an initial investment made at the net asset value at the beginning of the period, reinvestment of all dividends and distributions at net asset value during the period, and redemption at net asset value on the last day of the period. Net asset value total return includes adjustments in accordance with accounting principles generally accepted in the United States of America and as such, the net asset value for financial reporting purposes and the returns based upon those net asset values may differ from the net asset value and returns for shareholder transactions. Market price total return is calculated assuming an initial investment made at the market price at the beginning of the period, reinvestment of all dividends and distributions at market price during the period, and sale at the market price on the last day of the period. Total investment returns calculated for a period of less than one year are not annualized. |
| (d) | Ratios include non-recurring costs associated with a proxy statement of 0.13%. |
| (e) | Portfolio turnover rate is not annualized for periods less than one year, if applicable, and does not include securities received or delivered from processing creations or redemptions. |
See accompanying Notes to Financial Statements which are an integral part of the financial statements.
| 42 |
|
Financial Highlights–(continued)
Invesco PureBetaSM FTSE Developed ex-North America ETF (PBDM)
| Years Ended October 31, | ||||||||||||||||||||
| 2022 | 2021 | 2020 | 2019 | 2018 | ||||||||||||||||
| Per Share Operating Performance: | ||||||||||||||||||||
Net asset value at beginning of year | $ | 29.40 | $ | 22.43 | $ | 24.31 | $ | 22.80 | $ | 25.37 | ||||||||||
Net investment income(a) | 0.74 | 0.78 | 0.53 | 0.69 | 0.73 | |||||||||||||||
Net realized and unrealized gain (loss) on investments | (7.62 | ) | 6.78 | (1.88 | ) | 1.61 | (2.60 | ) | ||||||||||||
Total from investment operations | (6.88 | ) | 7.56 | (1.35 | ) | 2.30 | (1.87 | ) | ||||||||||||
Distributions to shareholders from: | ||||||||||||||||||||
Net investment income | (0.86 | ) | (0.59 | ) | (0.53 | ) | (0.77 | ) | (0.70 | ) | ||||||||||
Net realized gains | - | - | - | (0.02 | ) | - | ||||||||||||||
Total distributions | (0.86 | ) | (0.59 | ) | (0.53 | ) | (0.79 | ) | (0.70 | ) | ||||||||||
Net asset value at end of year | $ | 21.66 | $ | 29.40 | $ | 22.43 | $ | 24.31 | $ | 22.80 | ||||||||||
Market price at end of year(b) | $ | 21.72 | $ | 29.51 | $ | 22.63 | $ | 24.35 | $ | 23.03 | ||||||||||
| Net Asset Value Total Return(c) | (23.71 | )% | 33.78 | % | (5.33 | )% | 10.31 | % | (7.60 | )% | ||||||||||
| Market Price Total Return(c) | (23.80 | )% | 33.09 | % | (4.66 | )% | 9.37 | % | (7.30 | )% | ||||||||||
| Ratios/Supplemental Data: | ||||||||||||||||||||
Net assets at end of year (000’s omitted) | $ | 77,994 | $ | 70,561 | $ | 2,243 | $ | 2,431 | $ | 2,280 | ||||||||||
Ratio to average net assets of: | ||||||||||||||||||||
Expenses | 0.07 | % | 0.07 | % | 0.07 | % | 0.37 | %(d) | 0.07 | % | ||||||||||
Net investment income | 2.89 | % | 2.77 | % | 2.30 | % | 2.99 | %(d) | 2.89 | % | ||||||||||
Portfolio turnover rate(e) | 6 | % | 7 | % | 3 | % | 4 | % | 7 | % | ||||||||||
| (a) | Based on average shares outstanding. |
| (b) | The mean between the last bid and ask prices. |
| (c) | Net asset value total return is calculated assuming an initial investment made at the net asset value at the beginning of the period, reinvestment of all dividends and distributions at net asset value during the period, and redemption at net asset value on the last day of the period. Net asset value total return includes adjustments in accordance with accounting principles generally accepted in the United States of America and as such, the net asset value for financial reporting purposes and the returns based upon those net asset values may differ from the net asset value and returns for shareholder transactions. Market price total return is calculated assuming an initial investment made at the market price at the beginning of the period, reinvestment of all dividends and distributions at market price during the period, and sale at the market price on the last day of the period. Total investment returns calculated for a period of less than one year are not annualized. |
| (d) | Ratios include non-recurring costs associated with a proxy statement of 0.30%. |
| (e) | Portfolio turnover rate is not annualized for periods less than one year, if applicable, and does not include securities received or delivered from processing creations or redemptions. |
See accompanying Notes to Financial Statements which are an integral part of the financial statements.
| 43 |
|
Financial Highlights–(continued)
Invesco PureBetaSM FTSE Emerging Markets ETF (PBEE)
| Years Ended October 31, | ||||||||||||||||||||
| 2022 | 2021 | 2020 | 2019 | 2018 | ||||||||||||||||
| Per Share Operating Performance: | ||||||||||||||||||||
Net asset value at beginning of year | $ | 28.42 | $ | 24.72 | $ | 23.86 | $ | 21.66 | $ | 25.07 | ||||||||||
Net investment income(a) | 0.83 | 0.76 | 0.55 | 0.74 | (b) | 0.66 | ||||||||||||||
Net realized and unrealized gain (loss) on investments | (8.81 | ) | 3.45 | 1.06 | 2.06 | (3.42 | ) | |||||||||||||
Total from investment operations | (7.98 | ) | 4.21 | 1.61 | 2.80 | (2.76 | ) | |||||||||||||
Distributions to shareholders from: | ||||||||||||||||||||
Net investment income | (0.89 | ) | (0.51 | ) | (0.75 | ) | (0.60 | ) | (0.65 | ) | ||||||||||
Transaction fees | 0.03 | - | - | - | - | |||||||||||||||
Net asset value at end of year | $ | 19.58 | $ | 28.42 | $ | 24.72 | $ | 23.86 | $ | 21.66 | ||||||||||
Market price at end of year(c) | $ | 19.64 | $ | 28.36 | $ | 24.97 | $ | 23.82 | $ | 21.75 | ||||||||||
| Net Asset Value Total Return(d) | (28.46 | )% | 17.02 | % | 7.08 | % | 13.02 | % | (11.28 | )% | ||||||||||
| Market Price Total Return(d) | (28.09 | )% | 15.61 | % | 8.33 | % | 12.34 | % | (11.38 | )% | ||||||||||
| Ratios/Supplemental Data: | ||||||||||||||||||||
Net assets at end of year (000’s omitted) | $ | 13,703 | $ | 11,367 | $ | 2,472 | $ | 2,386 | $ | 2,166 | ||||||||||
Ratio to average net assets of: | ||||||||||||||||||||
Expenses, after Waivers | 0.11 | %(e) | 0.10 | %(e) | 0.11 | %(e) | 0.39 | %(e)(f) | 0.11 | % | ||||||||||
Expenses, prior to Waivers | 0.15 | %(e) | 0.14 | %(e) | 0.14 | %(e) | 0.43 | %(e)(f) | 0.14 | % | ||||||||||
Net investment income | 3.37 | % | 2.63 | % | 2.35 | % | 3.16 | %(b)(f) | 2.64 | % | ||||||||||
Portfolio turnover rate(g) | 13 | % | 32 | % | 18 | % | 13 | % | 16 | % | ||||||||||
| (a) | Based on average shares outstanding. |
| (b) | Net Investment income per share and the ratio of net investment income to average net assets include a non-cash taxable distribution received during the year. Net investment income per share and the ratio of net investment income to average net assets excluding the non-cash taxable distribution are $0.56 and 2.39%, respectively. |
| (c) | The mean between the last bid and ask prices. |
| (d) | Net asset value total return is calculated assuming an initial investment made at the net asset value at the beginning of the period, reinvestment of all dividends and distributions at net asset value during the period, and redemption at net asset value on the last day of the period. Net asset value total return includes adjustments in accordance with accounting principles generally accepted in the United States of America and as such, the net asset value for financial reporting purposes and the returns based upon those net asset values may differ from the net asset value and returns for shareholder transactions. Market price total return is calculated assuming an initial investment made at the market price at the beginning of the period, reinvestment of all dividends and distributions at market price during the period, and sale at the market price on the last day of the period. Total investment returns calculated for a period of less than one year are not annualized. |
| (e) | In addition to the fees and expenses which the Fund bears directly, the Fund indirectly bears a pro rata share of the fees and expenses of the investment companies in which the Fund invests. Estimated investment companies’ expenses are not expenses that are incurred directly by the Fund. They are expenses that are incurred directly by the investment companies and are deducted from the value of the investment companies the Fund invests in. The effect of the estimated investment companies’ expenses that the Fund bears indirectly is included in the Fund’s total return. |
| (f) | Ratios include non-recurring costs associated with a proxy statement of 0.29%. |
| (g) | Portfolio turnover rate is not annualized for periods less than one year, if applicable, and does not include securities received or delivered from processing creations or redemptions. |
See accompanying Notes to Financial Statements which are an integral part of the financial statements.
| 44 |
|
Invesco Exchange-Traded Fund Trust II
October 31, 2022
NOTE 1–Organization
Invesco Exchange-Traded Fund Trust II (the “Trust”) was organized as a Massachusetts business trust and is authorized to have multiple series of portfolios. The Trust is an open-end management investment company registered under the Investment Company Act of 1940, as amended (the “1940 Act”). This report includes the following portfolios:
Full Name | Short Name | |
Invesco PureBetaSM 0-5 Yr US TIPS ETF (PBTP) | “PureBetaSM 0-5 Yr US TIPS ETF” | |
Invesco PureBetaSM FTSE Developed ex-North America ETF (PBDM) | “PureBetaSM FTSE Developed ex-North America ETF” | |
Invesco PureBetaSM FTSE Emerging Markets ETF (PBEE) | “PureBetaSM FTSE Emerging Markets ETF” | |
Each portfolio (each, a “Fund”, and collectively, the “Funds”) represents a separate series of the Trust. The shares of the Funds are referred to herein as “Shares” or “Fund’s Shares.” Each Fund’s Shares are listed and traded on Cboe BZX Exchange, Inc.
The market price of each Share may differ to some degree from a Fund’s net asset value (“NAV”). Unlike conventional mutual funds, each Fund issues and redeems Shares on a continuous basis, at NAV, only in a large specified number of Shares, each called a “Creation Unit.” Creation Units are issued and redeemed principally in exchange for the deposit or delivery of a basket of securities (“Deposit Securities”). Except when aggregated in Creation Units by authorized participants (“APs”), the Shares are not individually redeemable securities of the Funds.
The investment objective of each Fund is to seek to track the investment results (before fees and expenses) of its respective index listed below (each, an “Underlying Index”):
Fund | Underlying Index | |
PureBetaSM 0-5 Yr US TIPS ETF | ICE BofA 0-5 Year US Inflation-Linked Treasury IndexSM | |
PureBetaSM FTSE Developed ex-North America ETF | FTSE Developed ex North America Index | |
PureBetaSM FTSE Emerging Markets ETF | FTSE Emerging Index | |
NOTE 2–Significant Accounting Policies
The following is a summary of the significant accounting policies followed by the Funds in preparation of their financial statements.
Each Fund is an investment company and accordingly follows the investment company accounting and reporting guidance in accordance with Financial Accounting Standards Board Accounting Standards Codification Topic 946, Financial Services–Investment Companies.
| A. | Security Valuation - Securities, including restricted securities, are valued according to the following policies: |
A security listed or traded on an exchange is generally valued at its trade price or official closing price that day as of the close of the exchange where the security is principally traded or, lacking any trades or official closing price on a particular day, the security may be valued at the closing bid price on that day. Securities traded in the over-the-counter market are valued based on prices furnished by independent pricing services or market makers. When such securities are valued using prices provided by an independent pricing service they may be considered fair valued. Futures contracts are valued at the daily settlement price set by an exchange on which they are principally traded. U.S. exchange-traded options are valued at the mean between the last bid and asked prices from the exchange on which they are principally traded. Non-U.S. exchange-traded options are valued at the final settlement price set by the exchange on which they trade. Options not listed on an exchange and swaps generally are valued using pricing provided from independent pricing services.
Securities of investment companies that are not exchange-traded (e.g., open-end mutual funds) are valued using such company’s end-of-business-day NAV per share.
Deposits, other obligations of U.S. and non-U.S. banks and financial institutions are valued at their daily account value.
Fixed income securities (including convertible debt securities) generally are valued on the basis of prices provided by independent pricing services. Prices provided by the pricing service may be determined without exclusive reliance on quoted prices, and may reflect appropriate factors such as institution-size trading in similar groups of securities, developments related to specific securities, dividend rate (for unlisted equities), yield (for debt obligations), quality, type of issue, coupon rate (for debt obligations), maturity (for debt obligations), individual trading characteristics and other market data. Securities with a demand feature exercisable within one to seven days are valued at par. Pricing services generally value debt obligations assuming orderly transactions of institutional round lot size, but a Fund may hold or transact in the same securities in smaller, odd lot sizes. Odd lots often trade at lower prices than institutional round lots, and their value may be adjusted accordingly.
| 45 |
|
Debt obligations are subject to interest rate and credit risks. In addition, all debt obligations involve some risk of default with respect to interest and/or principal payments.
Foreign securities’ (including foreign exchange contracts’) prices are converted into U.S. dollar amounts using the applicable exchange rates as of the close of the London world markets. If market quotations are available and reliable for foreign exchange-traded equity securities, the securities will be valued at the market quotations. Invesco Capital Management LLC (the “Adviser”) may use various pricing services to obtain market quotations as well as fair value prices. Because trading hours for certain foreign securities end before the close of the New York Stock Exchange (“NYSE”), closing market quotations may become not representative of market value in the Adviser’s judgment (“unreliable”). If, between the time trading ends on a particular security and the close of the customary trading session on the NYSE, a significant event occurs that makes the closing price of the security unreliable, the Adviser may fair value the security. If the event is likely to have affected the closing price of the security, the security will be valued at fair value in good faith in accordance with Board-approved policies and related Adviser procedures (“Valuation Procedures”). Adjustments to closing prices to reflect fair value may also be based on a screening process of an independent pricing service to indicate the degree of certainty, based on historical data, that the closing price in the principal market where a foreign security trades is not the current value as of the close of the NYSE. Foreign securities’ prices meeting the degree of certainty that the price is not reflective of current value will be priced at the indication of fair value from the independent pricing service. Multiple factors may be considered by the independent pricing service in determining adjustments to reflect fair value and may include information relating to sector indices, American depositary receipts and domestic and foreign index futures. Foreign securities may have additional risks including exchange rate changes, the potential for sharply devalued currencies and high inflation, political and economic upheaval, the relative lack of issuer information, relatively low market liquidity and the potential lack of strict financial and accounting controls and standards.
Unlisted securities will be valued using prices provided by independent pricing services or by another method that the Adviser, in its judgment, believes better reflects the security’s fair value in accordance with the Valuation Procedures.
Securities for which market prices are not provided by any of the above methods may be valued based upon quotes furnished by independent sources. The last bid price may be used to value exchange-traded equity securities. The mean between the last bid and asked prices may be used to value debt obligations, including corporate loans, and unlisted equity securities.
Securities for which market quotations are not readily available are fair valued by the Adviser in accordance with the Valuation Procedures. If a fair value price provided by a pricing service is unreliable, the Adviser will fair value the security using the Valuation Procedures. Issuer-specific events, market trends, bid/asked quotes of brokers and information providers and other market data may be reviewed in the course of making a good faith determination of a security’s fair value.
Each Fund may invest in securities that are subject to interest rate risk, meaning the risk that the prices will generally fall as interest rates rise and, conversely, the prices will generally rise as interest rates fall. Specific securities differ in their sensitivity to changes in interest rates depending on their individual characteristics. Changes in interest rates may result in increased market volatility, which may affect the value and/or liquidity of certain Fund investments.
Valuations change in response to many factors, including the historical and prospective earnings of the issuer, the value of the issuer’s assets, general market conditions which are not specifically related to the particular issuer, such as real or perceived adverse economic conditions, changes in the general outlook for revenues or corporate earnings, changes in interest or currency rates, regional or global instability, natural or environmental disasters, widespread disease or other public health issues, war, acts of terrorism, significant governmental actions or adverse investor sentiment generally and market liquidity. Because of the inherent uncertainties of valuation, the values reflected in the financial statements may materially differ from the value received upon actual sale of those investments.
The price a Fund could receive upon the sale of any investment may differ from the Adviser’s valuation of the investment, particularly for securities that are valued using a fair valuation technique. When fair valuation techniques are applied, the Adviser uses available information, including both observable and unobservable inputs and assumptions, to determine a methodology that will result in a valuation that the Adviser believes approximates market value. Fund securities that are fair valued may be subject to greater fluctuation in their value from one day to the next than would be the case if market quotations were used. Because of the inherent uncertainties of valuation, and the degree of subjectivity in such decisions, a Fund could realize a greater or lesser than expected gain or loss upon the sale of the investment.
| B. | Investment Transactions and Investment Income - Investment transactions are accounted for on a trade date basis. Realized gains and losses from the sale or disposition of securities are computed on the specific identified cost basis. Interest income is recorded on an accrual basis from settlement date and includes coupon interest and amortization of premium and accretion of discount on debt securities as applicable. Pay-in-kind interest income and non-cash dividend income received in the form of securities in-lieu of cash are recorded at the fair value of the securities received. Dividend income (net of |
| 46 |
|
withholding tax, if any) is recorded on the ex-dividend date. Realized gains, dividends and interest received by a Fund may give rise to withholding and other taxes imposed by foreign countries. Tax conventions between certain countries and the United States may reduce or eliminate such taxes.
The Funds may periodically participate in litigation related to a Fund’s investments. As such, the Funds may receive proceeds from litigation settlements. Any proceeds received are included in the Statements of Operations as realized gain (loss) for investments no longer held and as unrealized gain (loss) for investments still held.
Brokerage commissions and mark ups are considered transaction costs and are recorded as an increase to the cost basis of securities purchased and/or a reduction of proceeds on a sale of securities. Such transaction costs are included in the determination of net realized and unrealized gain (loss) from investment securities reported in the Statements of Operations and the Statements of Changes in Net Assets and the net realized and unrealized gains (losses) on securities per share in the Financial Highlights. Transaction costs are included in the calculation of a Fund’s NAV and, accordingly, they reduce a Fund’s total returns. These transaction costs are not considered operating expenses and are not reflected in net investment income reported in the Statements of Operations and the Statements of Changes in Net Assets, or the net investment income per share and the ratios of expenses and net investment income reported in the Financial Highlights, nor are they limited by any expense limitation arrangements between each Fund and the Adviser.
| C. | Country Determination - For the purposes of presentation in the Schedules of Investments, the Adviser may determine the country in which an issuer is located and/or credit risk exposure based on various factors. These factors include whether each Fund’s Underlying Index has made a country determination and may include the laws of the country under which the issuer is organized, where the issuer maintains a principal office, the country in which the issuer derives 50% or more of its total revenues, the country that has the primary market for the issuer’s securities and its “country of risk” as determined by a third party service provider, as well as other criteria. Among the other criteria that may be evaluated for making this determination are the country in which the issuer maintains 50% or more of its assets, the type of security, financial guarantees and enhancements, the nature of the collateral and the sponsor organization. Country of issuer and/or credit risk exposure has been determined to be the United States of America, unless otherwise noted. |
| D. | Dividends and Distributions to Shareholders - Each Fund declares and pays dividends from net investment income, if any, to its shareholders quarterly and records such dividends on the ex-dividend date. Generally, each Fund distributes net realized taxable capital gains, if any, annually in cash and records them on the ex-dividend date. Such distributions on a tax basis are determined in conformity with federal income tax regulations, which may differ from accounting principles generally accepted in the United States of America (“GAAP”). Distributions in excess of tax basis earnings and profits, if any, are reported in such Fund’s financial statements as a tax return of capital at fiscal year-end. |
| E. | Federal Income Taxes - Each Fund intends to comply with the provisions of the Internal Revenue Code of 1986, as amended (the “Internal Revenue Code”), applicable to regulated investment companies and to distribute substantially all of the Fund’s taxable earnings to its shareholders. As such, the Funds will not be subject to federal income taxes on otherwise taxable income (including net realized gains) that is distributed to the shareholders. Therefore, no provision for federal income taxes is recorded in the financial statements. |
Each Fund recognizes the tax benefits of uncertain tax positions only when the position is more likely than not to be sustained. Management has analyzed each Fund’s uncertain tax positions and concluded that no liability for unrecognized tax benefits should be recorded related to uncertain tax positions. Management is not aware of any tax positions for which it is reasonably possible that the total amounts of unrecognized tax benefits will change materially in the next 12 months.
Income and capital gain distributions are determined in accordance with federal income tax regulations, which may differ from GAAP. These differences are primarily due to differing book and tax treatments for in-kind transactions, losses deferred due to wash sales, and passive foreign investment company adjustments, if any.
The Funds file U.S. federal tax returns and tax returns in certain other jurisdictions. Generally, a Fund is subject to examinations by such taxing authorities for up to three years after the filing of the return for the tax period.
| F. | Expenses - Each Fund has agreed to pay an annual unitary management fee to the Adviser. Out of the unitary management fee, the Adviser has agreed to pay for substantially all expenses of the Funds, including the costs of transfer agency, custody, fund administration, legal, audit and other services, except for distribution fees, if any, brokerage expenses, taxes, interest, acquired fund fees and expenses, if any, litigation expenses and other extraordinary expenses, including proxy expenses (except for such proxies related to: (i) changes to the Investment Advisory Agreement, (ii) the election of any Board member who is an “interested person” of the Trust, or (iii) any other matters that directly benefit the Adviser). |
Expenses of the Trust that are excluded from a Fund’s unitary management fee and are directly identifiable to a specific Fund are applied to that Fund. Expenses of the Trust that are excluded from a Fund’s unitary management fee and are not readily identifiable to a specific Fund are allocated in such a manner as deemed equitable, taking into consideration the nature and type of expense and the relative net assets of each Fund.
To the extent a Fund invests in other investment companies, the expenses shown in the accompanying financial statements reflect the expenses of the Fund and do not include any expenses of the investment companies in which it invests. The effects of such investment companies’ expenses are included in the realized and unrealized gain or loss on the investments in the investment companies.
| 47 |
|
| G. | Accounting Estimates - The preparation of the financial statements in accordance with GAAP requires management to make estimates and assumptions that affect the reported amounts and disclosures in the financial statements, including estimates and assumptions related to taxation. Actual results could differ from these estimates. In addition, the Funds monitor for material events or transactions that may occur or become known after the period-end date and before the date the financial statements are released to print. |
| H. | Indemnifications - Under the Trust’s organizational documents, its Officers and Trustees are indemnified against certain liabilities arising out of the performance of their duties to the Trust. Each Board member who is not an “interested person” (as defined in the 1940 Act) of the Trust (each, an “Independent Trustee”) is also indemnified against certain liabilities arising out of the performance of their duties to the Trust pursuant to an Indemnification Agreement between such trustee and the Trust. Additionally, in the normal course of business, the Trust enters into contracts with service providers that contain general indemnification clauses. The Trust’s maximum exposure under these arrangements is unknown, as this would involve future claims that may be made against the Trust that have not yet occurred. The risk of material loss as a result of such indemnification claims is considered remote. |
| I. | Treasury Inflation-Protected Securities - PureBetaSM 0-5 Yr US TIPS ETF may invest in Treasury Inflation-Protected Securities (“TIPS”). TIPS are fixed income securities whose principal value is periodically adjusted to the rate of inflation. The principal value of TIPS will be adjusted upward or downward, and any increase or decrease in the principal amount of TIPS will be included as Treasury Inflation-Protected Securities inflation adjustment in the Statements of Operations, even though investors do not receive their principal until maturity. |
| J. | Securities Lending - Each Fund may participate in securities lending and may loan portfolio securities having a market value up to one-third of each Fund’s total assets. Such loans are secured by cash collateral equal to no less than 102% (105% for international securities) of the market value of the loaned securities determined daily by the securities lending provider. Cash collateral received in connection with these loans is invested in short-term money market instruments or affiliated, unregistered investment companies that comply with Rule 2a-7 under the 1940 Act and money market funds (collectively, “affiliated money market funds”) and is shown as such on the Schedules of Investments. Each Fund bears the risk of loss with respect to the investment of collateral. It is the policy of these Funds to obtain additional collateral from or return excess collateral to the borrower by the end of the next business day, following the valuation date of the securities loaned. Therefore, the value of the collateral held may be temporarily less than the value of the securities on loan. When loaning securities, each Fund retains certain benefits of owning the securities, including the economic equivalent of dividends or interest generated by the security. Lending securities entails a risk of loss to each Fund if, and to the extent that, the market value of the securities loaned were to increase, and the borrower did not increase the collateral accordingly, and the borrower failed to return the securities. The securities loaned are subject to termination at the option of the borrower or each Fund. Upon termination, the borrower will return to each Fund the securities loaned and each Fund will return the collateral. Upon the failure of the borrower to return the securities, collateral may be liquidated and the securities may be purchased on the open market to replace the loaned securities. Each Fund could experience delays and costs in gaining access to the collateral and the securities may lose value during the delay which could result in potential losses to each Fund. Some of these losses may be indemnified by the lending agent. Each Fund bears the risk of any deficiency in the amount of the collateral available for return to the borrower due to any loss on the collateral invested. For Funds that participated in securities lending, dividends received on cash collateral investments for securities lending transactions, which are net of compensation to counterparties, are included in Securities lending income on the Statements of Operations. The aggregate value of securities out on loan, if any, is shown on the Statements of Assets and Liabilities. |
Invesco Advisers, Inc. (“Invesco”), an affiliate of the Adviser, serves as an affiliated securities lending agent for each Fund participating in the securities lending program. The Bank of New York Mellon (“BNYM”) also serves as a lending agent. To the extent a Fund utilizes Invesco as an affiliated securities lending agent, the Fund conducts its securities lending in accordance with, and in reliance upon, no-action letters issued by the SEC staff that provide guidance on how an affiliate may act as a direct agent lender and receive compensation for those services in a manner consistent with the federal securities laws. For the fiscal year ended October 31, 2022, PureBetaSM FTSE Emerging Markets ETF had affiliated securities lending transactions with Invesco. Fees paid to Invesco for securities lending agent services, which are included in Securities lending income on the Statements of Operations, were incurred by that Fund as listed below:
Amount | ||||
| PureBetaSM FTSE Emerging Markets ETF | $344 | |||
| K. | Foreign Currency Translations - Foreign currency is valued at the close of the NYSE based on quotations posted by banks and major currency dealers. Portfolio securities and other assets and liabilities denominated in foreign currencies are translated into U.S. dollar amounts at the date of valuation. Purchases and sales of portfolio securities (net of foreign taxes withheld on disposition) and income items denominated in foreign currencies are translated into U.S. dollar amounts on the respective dates of such transactions. Each Fund does not separately account for the portion of the results of operations resulting from changes in foreign exchange rates on investments and the fluctuations arising from changes in market prices of securities held. The combined results of changes in foreign exchange rates and the fluctuation of market prices on investments (net of estimated foreign tax withholding) are included with the net realized and unrealized gain or loss from |
| 48 |
|
investments in the Statements of Operations. Reported net realized foreign currency gains or losses arise from (1) sales of foreign currencies, (2) currency gains or losses realized between the trade and settlement dates on securities transactions, and (3) the difference between the amounts of dividends, interest, and foreign withholding taxes recorded on a Fund’s books and the U.S. dollar equivalent of the amounts actually received or paid. Net unrealized foreign currency gains and losses arise from changes in the fair values of assets and liabilities, other than investments in securities at fiscal period-end, resulting from changes in exchange rates.
Each Fund may invest in foreign securities, which may be subject to foreign taxes on income, gains on investments or currency repatriation, a portion of which may be recoverable. Foreign taxes, if any, are recorded based on the tax regulations and rates that exist in the foreign markets in which a Fund invests.
| L. | Other Risks |
AP Concentration Risk. Only APs may engage in creation or redemption transactions directly with each Fund. Each Fund has a limited number of institutions that may act as APs, and such APs have no obligation to submit creation or redemption orders. Consequently, there is no assurance that APs will establish or maintain an active trading market for the Shares. This risk may be heightened to the extent that securities held by each Fund are traded outside a collateralized settlement system. In that case, APs may be required to post collateral on certain trades on an agency basis (i.e., on behalf of other market participants), which only a limited number of APs may be able to do. In addition, to the extent that APs exit the business or are unable to proceed with creation and/or redemption orders with respect to each Fund and no other AP is able to step forward to create or redeem Creation Units, this may result in a significantly diminished trading market for Fund Shares, and Shares may be more likely to trade at a premium or discount to a Fund’s NAV and to face trading halts and/or delisting. Investments in non-U.S. securities, which may have lower trading volumes or could experience extended market closures or trading halts, may increase the risk that APs may not be able to effectively create or redeem Creation Units or the risk that the Shares may be halted and/or delisted.
Changing U.S. Fixed-Income Market Conditions Risk. The historically low interest rate environment observed over the past several years was created in part by the Federal Reserve Board (“FRB”) keeping the federal funds rates at, near or below zero. In recent years, the FRB began “tapering” its quantitative easing program, leading to fluctuations in the Federal Funds Rate. However, in response to the impact of the COVID-19 pandemic, in March 2020 the FRB announced cuts to the Federal Funds Rate and a new round of quantitative easing, before implementing several rounds of rate increases in 2022. Because there is little precedent for this situation, it is difficult to predict the impact of these rate changes and any future rate changes on various markets. Any additional changes to the monetary policy by the FRB or other regulatory actions may affect interest rates and/or reduce liquidity for fixed-income investments, particularly those with longer maturities. In addition, decreases in fixed-income dealer market-making capacity may also potentially lead to heightened volatility and reduced liquidity in the fixed-income markets. As a result, the value of a Fund’s investments and share price may decline. Changes in FRB policies could also result in higher than normal shareholder redemptions, which could potentially increase a Fund’s portfolio turnover rate and transaction costs.
China Investment Risk. Investments in companies located or operating in Greater China (normally considered to be the geographical area that includes mainland China, Hong Kong, Macau and Taiwan) involve risks and considerations not typically associated with investments in the U.S. and other Western nations, such as greater government control over the economy; political, legal and regulatory uncertainty; nationalization, expropriation, or confiscation of property; difficulty in obtaining information necessary for investigations into and/or litigation against Chinese companies, as well as in obtaining and/or enforcing judgments; limited legal remedies for shareholders; alteration or discontinuation of economic reforms; military conflicts, either internal or with other countries; inflation, currency fluctuations and fluctuations in inflation and interest rates that may have negative effects on the economy and securities markets of Greater China; and Greater China’s dependency on the economies of other Asian countries, many of which are developing countries. Events in any one country within Greater China may impact the other countries in the region or Greater China as a whole. Export growth continues to be a major driver of China’s rapid economic growth. As a result, a reduction in spending on Chinese products and services, the institution of additional tariffs or other trade barriers (or the threat thereof), including as a result of trade tensions between China and the United States, or a downturn in any of the economies of China’s key trading partners may have an adverse impact on the Chinese economy. In addition, actions by the U.S. government, such as delisting of certain Chinese companies from U.S. securities exchanges or otherwise restricting their operations in the U.S., may negatively impact the value of such securities held by a Fund. Further, health events, such as the recent coronavirus outbreak, may cause uncertainty and volatility in the Chinese economy, especially in the consumer discretionary (leisure, retail, gaming, tourism), industrials, and commodities sectors. Additionally, the inability of the Public Company Accounting Oversight Board (“PCAOB”) to inspect audit work papers and practices of PCAOB-registered accounting firms in China with respect to their audit work of U.S. reporting companies may impose significant additional risks associated with investments in China.
Currency Risk. Because each Fund’s NAV is determined in U.S. dollars, a Fund’s NAV could decline if the currency of a non-U.S. market in which the Fund invests depreciates against the U.S. dollar. Generally, an increase in the value of the U.S. dollar against a foreign currency will reduce the value of a security denominated in that foreign currency, thereby decreasing a Fund’s overall NAV. Exchange rates may be volatile and may change quickly and unpredictably in response to both global
| 49 |
|
economic developments and economic conditions, causing an adverse impact on a Fund. As a result, investors have the potential for losses regardless of the length of time they intend to hold Shares.
Emerging Markets Investment Risk. For certain Funds, investments in the securities of issuers in emerging market countries involve risks often not associated with investments in the securities of issuers in developed countries. Securities in emerging markets may be subject to greater price fluctuations than securities in more developed markets. Companies in emerging market countries generally may be subject to less stringent regulatory, disclosure, financial reporting, accounting, auditing and recordkeeping standards than companies in more developed countries. In addition, information about such companies may be less available and reliable. Emerging markets usually are subject to greater market volatility, political, social and economic instability, uncertainty regarding the existence of trading markets and more governmental limitations on foreign investment than are more developed markets. Securities law in many emerging market countries is relatively new and unsettled. Therefore, laws regarding foreign investment in emerging markets securities, securities regulation, title to securities, and shareholder rights may change quickly and unpredictably, and the ability to bring and enforce actions, or to obtain information needed to pursue or enforce such actions, may be limited. In addition, the enforcement of systems of taxation at federal, regional and local levels in emerging market countries may be inconsistent and subject to sudden change. Investments in emerging market securities may be subject to additional transaction costs, delays in settlement procedures, unexpected market closures, and lack of timely information. In addition, lack of relevant data and reliable public information, including financial information, about securities in emerging markets may contribute to incorrect weightings and data and computational errors when a Fund’s index provider selects securities for inclusion in the Fund’s Underlying Index or rebalances the Underlying Index.
Equity Risk. Equity risk is the risk that the value of equity securities, including common stocks, may fall due to both changes in general economic conditions that impact the market as a whole, as well as factors that directly relate to a specific company or its industry. Such general economic conditions include changes in interest rates, periods of market turbulence or instability, or general and prolonged periods of economic decline and cyclical change. It is possible that a drop in the stock market may depress the price of most or all of the common stocks that each Fund holds. In addition, equity risk includes the risk that investor sentiment toward one or more industries will become negative, resulting in those investors exiting their investments in those industries, which could cause a reduction in the value of companies in those industries more broadly. The value of a company’s common stock may fall solely because of factors, such as an increase in production costs that negatively impact other companies in the same region, industry or sector of the market. A company’s common stock also may decline significantly in price over a short period of time due to factors specific to that company, including decisions made by its management or lower demand for the company’s products or services. For example, an adverse event, such as an unfavorable earnings report or the failure to make anticipated dividend payments, may depress the value of common stock.
Fixed-Income Securities Risk. Fixed-income securities are subject to interest rate risk and credit risk. Interest rate risk refers to fluctuations in the value of a fixed-income security resulting from changes in the general level of interest rates. When the general level of interest rates goes up, the prices of most fixed-income securities go down. When the general level of interest rates goes down, the prices of most fixed-income securities go up. Fixed-income securities with longer maturities typically are more sensitive to changes in interest rates, making them more volatile than securities with shorter maturities. Credit risk refers to the possibility that the issuer of a security will be unable and/or unwilling to make timely interest payments and/or repay the principal on its debt. Debt instruments are subject to varying degrees of credit risk, which may be reflected in credit ratings. There is a possibility that the credit rating of a fixed-income security may be downgraded after purchase, which may occur quickly and without advance warning following sudden market downturns or unexpected developments involving an issuer, and which may adversely affect the liquidity and value of the security.
Foreign Investment Risk. Investments in the securities of non-U.S. issuers involve risks beyond those associated with investments in U.S. securities. Foreign securities may have relatively low market liquidity, greater market volatility, decreased publicly available information and less reliable financial information about issuers and inconsistent and potentially less stringent accounting, auditing and financial reporting requirements and standards of practice, including recordkeeping standards, comparable to those applicable to domestic issuers. Foreign securities are also subject to the risks of expropriation, nationalization, political instability or other adverse political or economic developments and the difficulty of enforcing obligations in other countries. Investments in foreign securities also may be subject to dividend withholding or confiscatory taxes, currency blockage and/or transfer restrictions and higher transactional costs. If a Fund invests in securities denominated in foreign currencies, fluctuations in the value of the U.S. dollar relative to the values of other currencies may adversely affect investments in foreign securities and may negatively impact the Fund’s returns.
Geographic Concentration Risk. A natural or other disaster could occur in a geographic region in which a Fund invests, which could affect the economy or particular business operations of companies in that specific geographic region and adversely impact the Fund’s investments in the affected region.
Index Risk. Unlike many investment companies, each Fund does not utilize an investing strategy that seeks returns in excess of its Underlying Index. Therefore, a Fund would not necessarily buy or sell a security unless that security is added or removed, respectively, from its Underlying Index, even if that security generally is underperforming. Additionally, each Fund rebalances its portfolio in accordance with its Underlying Index, and, therefore, any changes to the Underlying Index’s rebalance schedule will result in corresponding changes to each Fund’s rebalance schedule.
| 50 |
|
Industry Concentration Risk. In following its methodology, each Fund’s Underlying Index from time to time may be concentrated to a significant degree in securities of issuers operating in a single industry or industry group. To the extent that each Underlying Index concentrates in the securities of issuers in a particular industry or industry group, the corresponding Fund will also concentrate its investments to approximately the same extent. By concentrating its investments in an industry or industry group, each Fund may face more risks than if it were diversified broadly over numerous industries or industry groups. Such industry-based risks, any of which may adversely affect the companies in which each Fund invests, may include, but are not limited to, the following: general economic conditions or cyclical market patterns that could negatively affect supply and demand in a particular industry; competition for resources, adverse labor relations, political or world events; obsolescence of technologies; and increased competition or new product introductions that may affect the profitability or viability of companies in an industry. In addition, at times, such industry or industry group may be out of favor and underperform other industries or the market as a whole.
Inflation-Linked Security Risk. For certain Funds, the value of inflation-linked securities generally will fluctuate in response to changes in real interest rates, generally decreasing when real interest rates rise and increasing when real interest rates fall. Real interest rates represent nominal (or stated) interest rates reduced by the expected impact of inflation. In addition, interest payments on inflation -indexed securities will generally vary up or down along with the rate of inflation.
Liquidity Risk. Liquidity risk exists when a particular investment is difficult to purchase or sell. If a Fund invests in illiquid securities or current portfolio securities become illiquid, it may reduce the returns of the Fund because the Fund may be unable to sell the illiquid securities at an advantageous time or price.
Market Risk. Securities in each Underlying Index are subject to market fluctuations. You should anticipate that the value of the Shares will decline, more or less, in correlation with any decline in value of the securities in an Underlying Index.
Additionally, natural or environmental disasters, widespread disease or other public health issues, war, acts of terrorism or other events could result in increased premiums or discounts to each Fund’s NAV.
Non-Correlation Risk. Each Fund’s return may not match the return of its corresponding Underlying Index for a number of reasons. For example, each Fund incurs operating expenses not applicable to the Underlying Index, and incurs costs in buying and selling securities, especially when rebalancing the Fund’s securities holdings to reflect changes in the composition of its corresponding Underlying Index. Additionally, a Fund’s use of a representative sampling approach may cause the Fund not to be as well-correlated with the return of its corresponding Underlying Index as would be the case if the Fund purchased all of the securities in its corresponding Underlying Index in the proportions represented in the Underlying Index. In addition, the performance of each Fund and its corresponding Underlying Index may vary due to asset valuation differences and differences between each Fund’s portfolio and its corresponding Underlying Index resulting from legal restrictions, costs or liquidity constraints.
Non-Diversification Risk. To the extent certain Funds become non-diversified, such Funds can invest a greater portion of their respective assets in securities of individual issuers than can a diversified fund. As a result, changes in the market value of a single investment could cause greater fluctuations in Share price than would occur in a diversified fund. This may increase certain Funds’ volatility and cause the performance of a relatively small number of issuers to have a greater impact on such Funds’ performance.
Sampling Risk. Certain Funds’ use of a representative sampling approach may result in the Fund holding a smaller number of securities than are in its respective Underlying Index. As a result, an adverse development with respect to an issuer of securities held by the Fund could result in a greater decline in NAV than would be the case if the Fund held all of the securities in its Underlying Index. To the extent the assets in the Fund are smaller, these risks will be greater.
Small- and Mid-Capitalization Company Risk. Investing in securities of small- and mid-capitalization companies involves greater risk than customarily is associated with investing in larger, more established companies. These companies’ securities may be more volatile and less liquid than those of more established companies. These securities may have returns that vary, sometimes significantly, from the overall securities market. Often small- and mid-capitalization companies and the industries in which they focus are still evolving and, as a result, they may be more sensitive to changing market conditions.
U.S. Government Obligations Risk. Certain Funds may invest in U.S. government obligations issued or guaranteed by the U.S. Government, its agencies and instrumentalities, including bills, notes and bonds issued by the U.S. Treasury. U.S. Government securities include securities that are issued or guaranteed by the United States Treasury, by various agencies of the U.S. Government, or by various instrumentalities which have been established or sponsored by the U.S. Government. U.S. Treasury securities are backed by the “full faith and credit” of the United States. Securities issued or guaranteed by federal agencies and U.S. Government-sponsored instrumentalities may or may not be backed by the full faith and credit of the United States. In the case of those U.S. Government securities not backed by the full faith and credit of the United States, the investor must look principally to the agency or instrumentality issuing or guaranteeing the security for ultimate repayment, and may not be able to assert a claim against the United States itself in the event that the agency or instrumentality does not meet its commitment. The U.S. Government, its agencies and instrumentalities do not guarantee the market value of their securities, and consequently, the value of such securities may fluctuate. Additionally, from time to time, uncertainty regarding the status of negotiations in the U.S. Government to increase the statutory debt limit, commonly called the “debt ceiling”, could increase the risk that the U.S. Government may default on payments on certain U.S. Government securities, cause the credit rating of the U.S. Government to be downgraded, increase volatility in the stock and bond markets,
| 51 |
|
result in higher interest rates, reduce prices of U.S. Treasury securities, and/or increase the costs of various kinds of debt. If a U.S. Government-sponsored entity is negatively impacted by legislative or regulatory action, is unable to meet its obligations, or its creditworthiness declines, the performance of a Fund that holds securities of that entity will be adversely impacted.
Valuation Risk. Financial information related to securities of non-U.S. issuers may be less reliable than information related to securities of U.S. issuers, which may make it difficult to obtain a current price for a non-U.S. security held by a Fund. In certain circumstances, market quotations may not be readily available for some Fund securities, and those securities may be fair valued. The value established for a security through fair valuation may be different from what would be produced if the security had been valued using market quotations. Fund securities that are valued using techniques other than market quotations, including “fair valued” securities, may be subject to greater fluctuations in their value from one day to the next than would be the case if market quotations were used. In addition, there is no assurance that a Fund could sell a portfolio security for the value established for it at any time, and it is possible that a Fund would incur a loss because a security is sold at a discount to its established value.
COVID-19 Risk. The COVID-19 strain of coronavirus has resulted in instances of market closures and dislocations, extreme volatility, liquidity constraints and increased trading costs. Efforts to contain its spread have resulted in travel restrictions, disruptions of healthcare systems, business operations (including business closures) and supply chains, layoffs, lower consumer demand and employee availability, and defaults and credit downgrades, among other significant economic impacts that have disrupted global economic activity across many industries. Such economic impacts may exacerbate other pre-existing political, social and economic risks locally or globally and cause general concern and uncertainty. The full economic impact and ongoing effects of COVID-19 (or other future epidemics or pandemics) at the macro-level and on individual businesses are unpredictable and may result in significant and prolonged effects on the Funds’ performance.
NOTE 3–Investment Advisory Agreement and Other Agreements
The Trust has entered into an Investment Advisory Agreement with the Adviser on behalf of each Fund, pursuant to which the Adviser has overall responsibility for the selection and ongoing monitoring of the Funds’ investments, managing the Funds’ business affairs and providing certain clerical, bookkeeping and other administrative services.
Pursuant to the Investment Advisory Agreement, each Fund accrues daily and pays monthly to the Adviser an annual unitary management fee. Out of the unitary management fee, the Adviser has agreed to pay for substantially all expenses of the Funds, including the cost of transfer agency, custody, fund administration, legal, audit and other services, except for distribution fees, if any, brokerage expenses, taxes, interest, acquired fund fees and expenses, if any, litigation expenses and other extraordinary expenses, including proxy expenses (except for such proxies related to: (i) changes to the Investment Advisory Agreement, (ii) the election of any Board member who is an “interested person” of the Trust, or (iii) any other matters that directly benefit the Adviser). The unitary management fee is paid by each Fund to the Adviser at the following annual rates:
| Unitary Management Fees (as a % of average daily net assets) | ||
PureBetaSM 0-5 Yr US TIPS ETF | 0.07% | |
PureBetaSM FTSE Developed ex-North America ETF | 0.07% | |
PureBetaSM FTSE Emerging Markets ETF | 0.14% | |
Through at least August 31, 2024, the Adviser has contractually agreed to waive the management fee payable by each Fund in an amount equal to the lesser of: (i) 100% of the net advisory fees earned by the Adviser or an affiliate of the Adviser that are attributable to the Fund’s investments in money market funds that are managed by affiliates of the Adviser and other funds (including ETFs) managed by the Adviser or affiliates of the Adviser or (ii) the management fee available to be waived. This waiver does not apply to a Fund’s investment of cash collateral received for securities lending. There is no guarantee that the Adviser will extend the waiver of these fees past that date.
For the fiscal year ended October 31, 2022, the Adviser waived fees for each Fund in the following amounts:
PureBetaSM 0-5 Yr US TIPS ETF | $ | 105 | ||
PureBetaSM FTSE Developed ex-North America ETF | 59 | |||
PureBetaSM FTSE Emerging Markets ETF | 4,970 | |||
The Trust has entered into a Distribution Agreement with Invesco Distributors, Inc. (the “Distributor”), which serves as the distributor of Creation Units for each Fund. The Distributor does not maintain a secondary market in the Shares. The Funds are not charged any fees pursuant to the Distribution Agreement. The Distributor is an affiliate of the Adviser.
The Adviser has entered into a licensing agreement for each Fund with the following entities (each, a “Licensor”):
Fund | Licensor | |
PureBetaSM 0-5 Yr US TIPS ETF | ICE Data Indices, LLC | |
PureBetaSM FTSE Developed ex-North America ETF | FTSE International Ltd. | |
PureBetaSM FTSE Emerging Markets ETF | FTSE International Ltd. | |
| 52 |
|
Each Underlying Index name trademark is owned by its respective Licensor. These trademarks have been licensed to the Adviser for use by the Funds. Each Fund is entitled to use its Underlying Index pursuant to the Trust’s sub-licensing agreement with the Adviser. The Funds are not sponsored, endorsed, sold or promoted by the Licensors, and the Licensors make no representation regarding the advisability of investing in any of the Funds.
The Trust has entered into service agreements whereby BNYM, a wholly-owned subsidiary of The Bank of New York Mellon Corporation, serves as the administrator, custodian, fund accountant and transfer agent for each Fund.
For the fiscal year ended October 31, 2022, the following Fund incurred brokerage commissions with Invesco Capital Markets, Inc. (“ICMI”), an affiliate of the Adviser and Distributor, for portfolio transactions executed on behalf of the Fund, as listed below:
PureBetaSM FTSE Emerging Markets ETF | $143 | |
NOTE 4–Additional Valuation Information
GAAP defines fair value as the price that would be received to sell an asset or paid to transfer a liability in an orderly transaction between market participants at the measurement date, under current market conditions. GAAP establishes a hierarchy that prioritizes the inputs to valuation methods, giving the highest priority to readily available unadjusted quoted prices in an active market for identical assets (Level 1) and the lowest priority to significant unobservable inputs (Level 3), generally when market prices are not readily available. Based on the valuation inputs, the securities or other investments are tiered into one of three levels. Changes in valuation methods may result in transfers in or out of an investment’s assigned level:
| Level 1 – | Prices are determined using quoted prices in an active market for identical assets. |
| Level 2 – | Prices are determined using other significant observable inputs. Observable inputs are inputs that other market participants may use in pricing a security. These may include quoted prices for similar securities, interest rates, prepayment speeds, credit risk, yield curves, loss severities, default rates, discount rates, volatilities and others. |
| Level 3 – | Prices are determined using significant unobservable inputs. In situations where quoted prices or observable inputs are unavailable (for example, when there is little or no market activity for an investment at the end of the period), unobservable inputs may be used. Unobservable inputs reflect the Adviser’s assumptions about the factors market participants would use in determining fair value of the securities or instruments and would be based on the best available information. |
The following is a summary of the tiered valuation input levels, as of October 31, 2022. The level assigned to the securities valuations may not be an indication of the risk or liquidity associated with investing in those securities. Because of the inherent uncertainties of valuation, the values reflected in the financial statements may materially differ from the value received upon actual sale of those investments.
| Level 1 | Level 2 | Level 3 | Total | |||||||||||||
PureBetaSM 0-5 Yr US TIPS ETF | ||||||||||||||||
| Investments in Securities | ||||||||||||||||
U.S. Treasury Securities | $ | - | $ | 121,473,791 | $ | - | $ | 121,473,791 | ||||||||
Money Market Funds | 59,418 | 3,682,354 | - | 3,741,772 | ||||||||||||
|
|
|
|
|
|
|
| |||||||||
Total Investments | $ | 59,418 | $ | 125,156,145 | $ | - | $ | 125,215,563 | ||||||||
|
|
|
|
|
|
|
| |||||||||
PureBetaSM FTSE Developed ex-North America ETF | ||||||||||||||||
| Investments in Securities | ||||||||||||||||
Common Stocks & Other Equity Interests | $ | 77,637,302 | $ | 289 | $ | 0 | $ | 77,637,591 | ||||||||
Money Market Funds | 111,203 | 6,156,751 | - | 6,267,954 | ||||||||||||
|
|
|
|
|
|
|
| |||||||||
Total Investments | $ | 77,748,505 | $ | 6,157,040 | $ | 0 | $ | 83,905,545 | ||||||||
|
|
|
|
|
|
|
| |||||||||
PureBetaSM FTSE Emerging Markets ETF | ||||||||||||||||
| Investments in Securities | ||||||||||||||||
Common Stocks & Other Equity Interests | $ | 12,375,113 | $ | 1,063 | $ | 16,206 | $ | 12,392,382 | ||||||||
Exchange-Traded Funds | 1,291,395 | - | - | 1,291,395 | ||||||||||||
Money Market Funds | - | 627,720 | - | 627,720 | ||||||||||||
|
|
|
|
|
|
|
| |||||||||
Total Investments | $ | 13,666,508 | $ | 628,783 | $ | 16,206 | $ | 14,311,497 | ||||||||
|
|
|
|
|
|
|
| |||||||||
| 53 |
|
NOTE 5–Distributions to Shareholders and Tax Components of Net Assets
Tax Character of Distributions to Shareholders Paid During the Fiscal Years Ended October 31, 2022 and 2021:
| 2022 | 2021 | ||||||||||||||
| Ordinary Income* | Long-Term Capital Gains | Ordinary Income* | |||||||||||||
PureBetaSM 0-5 Yr US TIPS ETF | $ | 5,578,034 | $ | 1,006 | $ | 872,608 | |||||||||
PureBetaSM FTSE Developed ex-North America ETF | 3,114,627 | - | 176,508 | ||||||||||||
PureBetaSM FTSE Emerging Markets ETF | 500,783 | - | 157,773 | ||||||||||||
* Includes short-term capital gain distributions, if any.
Tax Components of Net Assets at Fiscal Year-End:
| Undistributed Ordinary Income | Undistributed Long-Term Capital Gains | Temporary Book/Tax Differences | Net Unrealized Appreciation (Depreciation)- Investments | Net Unrealized (Depreciation)- Foreign Currencies | Capital Loss Carryforwards | Shares of Beneficial Interest | Total Net Assets | |||||||||||||||||||||||||||||||||
| PureBetaSM 0-5 Yr US TIPS ETF | $ | 719,398 | $ | 5,364 | $ | - | $ | (8,814,932 | ) | $ | - | $ | - | $ | 129,725,593 | $ | 121,635,423 | |||||||||||||||||||||||
| PureBetaSM FTSE Developed ex-North America ETF | - | - | (973 | ) | (26,868,584 | ) | (7,951 | ) | (1,393,174 | ) | 106,264,397 | 77,993,715 | ||||||||||||||||||||||||||||
| PureBetaSM FTSE Emerging Markets ETF | 8,295 | - | - | (4,625,058 | ) | (148 | ) | (512,721 | ) | 18,833,101 | 13,703,469 | |||||||||||||||||||||||||||||
Capital loss carryforwards are calculated and reported as of a specific date. Results of transactions and other activity after that date may affect the amount of capital loss carryforwards actually available for the Funds to utilize. The ability to utilize capital loss carryforwards in the future may be limited under the Internal Revenue Code and related regulations based on the results of future transactions.
The Funds have capital loss carryforwards as of October 31, 2022, as follows:
| No expiration | ||||||
| Short-Term | Long-Term | Total* | ||||
PureBetaSM 0-5 Yr US TIPS ETF | $ - | $ - | $ - | |||
PureBetaSM FTSE Developed ex-North America ETF | 965,521 | 427,653 | 1,393,174 | |||
PureBetaSM FTSE Emerging Markets ETF | 194,310 | 318,411 | 512,721 | |||
| * | Capital loss carryforwards are reduced for limitations, if any, to the extent required by the Internal Revenue Code and may be further limited depending upon a variety of factors, including the realization of net unrealized gains or losses as of the date of any reorganization. |
NOTE 6–Investment Transactions
For the fiscal year ended October 31, 2022, the cost of securities purchased and the proceeds from sales of securities (other than short-term securities, U.S. Government obligations, money market funds and in-kind transactions, if any) were as follows:
| Purchases | Sales | |||||||
PureBetaSM FTSE Developed ex-North America ETF | $ | 8,206,176 | $ | 5,457,873 | ||||
PureBetaSM FTSE Emerging Markets ETF | 7,171,808 | 1,861,855 | ||||||
For the fiscal year ended October 31, 2022, in-kind transactions associated with creations and redemptions were as follows:
| In-kind Purchases | In-kind Sales | |||||||
PureBetaSM 0-5 Yr US TIPS ETF | $ | 93,981,761 | $ | 27,403,026 | ||||
PureBetaSM FTSE Developed ex-North America ETF | 35,274,449 | 2,148,440 | ||||||
PureBetaSM FTSE Emerging Markets ETF | 2,217,610 | - | ||||||
Gains (losses) on in-kind transactions are generally not considered taxable gains (losses) for federal income tax purposes.
| 54 |
|
As of October 31, 2022, the aggregate cost of investments, including any derivatives, on a tax basis includes adjustments for financial reporting purposes as of the most recently completed federal income tax reporting period-end:
| Gross Unrealized Appreciation | Gross Unrealized (Depreciation) | Net Unrealized Appreciation (Depreciation) | Cost | |||||||||||||||||
PureBetaSM 0-5 Yr US TIPS ETF | $ | - | $ | (8,814,932 | ) | $ | (8,814,932 | ) | $ | 134,030,495 | ||||||||||
PureBetaSM FTSE Developed ex-North America ETF | 983,279 | (27,851,863 | ) | (26,868,584 | ) | 110,774,129 | ||||||||||||||
PureBetaSM FTSE Emerging Markets ETF | 649,961 | (5,275,019 | ) | (4,625,058 | ) | 18,936,555 | ||||||||||||||
NOTE 7–Reclassification of Permanent Differences
Primarily as a result of differing book/tax treatment of distributions, in-kind transactions, passive foreign investment companies, foreign currency transactions, taxable spinoff and excise taxes, amounts were reclassified between undistributed net investment income (loss), undistributed net realized gain (loss) and Shares of beneficial interest. These reclassifications had no effect on the net assets of each Fund. For the fiscal year ended October 31, 2022, the reclassifications were as follows:
| Undistributed Net Investment Income (Loss) | Undistributed Net Realized Gain (Loss) | Shares of Beneficial Interest | |||||||||||||
PureBetaSM 0-5 Yr US TIPS ETF | $ | - | $ | 451,552 | $ | (451,552 | ) | ||||||||
PureBetaSM FTSE Developed ex-North America ETF | 324,888 | (436,371 | ) | 111,483 | |||||||||||
PureBetaSM FTSE Emerging Markets ETF | (461 | ) | 1,396 | (935 | ) | ||||||||||
NOTE 8–Trustees’ and Officer’s Fees
The Adviser, as a result of each Fund’s unitary management fee, pays remuneration to the Independent Trustees and an Officer of the Trust on behalf of the Funds. The Trustee who is an “interested person” of the Trust does not receive any Trustees’ fees.
The Trust has adopted a deferred compensation plan (the “Plan”). Under the Plan, each Independent Trustee who has executed a Deferred Fee Agreement (a “Participating Trustee”) may defer receipt of all or a portion of their compensation (“Deferral Fees”). Such Deferral Fees are deemed to be invested in select Invesco ETFs. The Deferral Fees payable to a Participating Trustee are valued as of the date such Deferral Fees would have been paid to a Participating Trustee. The value increases with contributions or with increases in the value of the Shares selected, and the value decreases with distributions or with declines in the value of the Shares selected. Obligations under the Plan represent unsecured claims against the general assets of the Funds.
NOTE 9–Capital
Shares are issued and redeemed by each Fund only in Creation Units consisting of a specified number of Shares as set forth in each Fund’s prospectus. Only APs are permitted to purchase or redeem Creation Units from the Funds. Such transactions are principally permitted in exchange for Deposit Securities, with a balancing cash component to equate the transaction to the NAV per Share of a Fund on the transaction date. However, for all Funds, cash in an amount equivalent to the value of certain securities may be substituted, generally when the securities are not available in sufficient quantity for delivery, not eligible for trading by the AP or as a result of other market circumstances.
To the extent that the Funds permit transactions in exchange for Deposit Securities, each Fund may issue Shares in advance of receipt of Deposit Securities subject to various conditions, including a requirement to maintain on deposit with the Trust cash at least equal to 105% of the market value of the missing Deposit Securities. In accordance with the Trust’s Participant Agreement, Creation Units will be issued to an AP, notwithstanding the fact that the corresponding Deposit Securities have not been received in part or in whole, in reliance on the undertaking of the AP to deliver the missing Deposit Securities as soon as possible, which undertaking shall be secured by the AP’s delivery and maintenance of collateral consisting of cash in the form of U.S. dollars in immediately available funds having a value (marked-to-market daily) at least equal to 105%, which the Adviser may change from time to time, of the value of the missing Deposit Securities.
Certain transaction fees may be charged by the Funds for creations and redemptions, which are treated as increases in capital.
Transactions in each Fund’s Shares are disclosed in detail in the Statements of Changes in Net Assets.
| 55 |
|
Report of Independent Registered Public Accounting Firm
To the Board of Trustees of Invesco Exchange-Traded Fund Trust II and Shareholders of Invesco PureBetaSM 0-5 Yr US TIPS ETF, Invesco PureBetaSM FTSE Developed ex-North America ETF and Invesco PureBetaSM FTSE Emerging Markets ETF
Opinions on the Financial Statements
We have audited the accompanying statements of assets and liabilities, including the schedules of investments, of Invesco PureBetaSM 0-5 Yr US TIPS ETF, Invesco PureBetaSM FTSE Developed ex-North America ETF and Invesco PureBetaSM FTSE Emerging Markets ETF (three of the funds constituting Invesco Exchange-Traded Fund Trust II, hereafter collectively referred to as the “Funds”) as of October 31, 2022, the related statements of operations for the year ended October 31, 2022, the statements of changes in net assets for each of the two years in the period ended October 31, 2022, including the related notes, and the financial highlights for each of the five years in the period ended October 31, 2022 (collectively referred to as the “financial statements”). In our opinion, the financial statements present fairly, in all material respects, the financial position of each of the Funds as of October 31, 2022, the results of each of their operations for the year then ended, the changes in each of their net assets for each of the two years in the period ended October 31, 2022 and each of the financial highlights for each of the five years in the period ended October 31, 2022 in conformity with accounting principles generally accepted in the United States of America.
Basis for Opinions
These financial statements are the responsibility of the Funds’ management. Our responsibility is to express an opinion on the Funds’ financial statements based on our audits. We are a public accounting firm registered with the Public Company Accounting Oversight Board (United States) (“PCAOB”) and are required to be independent with respect to the Funds in accordance with the U.S. federal securities laws and the applicable rules and regulations of the Securities and Exchange Commission and the PCAOB.
We conducted our audits of these financial statements in accordance with the standards of the PCAOB. Those standards require that we plan and perform the audit to obtain reasonable assurance about whether the financial statements are free of material misstatement, whether due to error or fraud.
Our audits included performing procedures to assess the risks of material misstatement of the financial statements, whether due to error or fraud, and performing procedures that respond to those risks. Such procedures included examining, on a test basis, evidence regarding the amounts and disclosures in the financial statements. Our audits also included evaluating the accounting principles used and significant estimates made by management, as well as evaluating the overall presentation of the financial statements. Our procedures included confirmation of securities owned as of October 31, 2022 by correspondence with the custodian, transfer agent, and brokers; when replies were not received from brokers, we performed other auditing procedures. We believe that our audits provide a reasonable basis for our opinions.
/s/ PricewaterhouseCoopers LLP
Chicago, Illinois
December 23, 2022
We have served as the auditor of one or more of the investment companies in the Invesco group of investment companies since at least 1995. We have not been able to determine the specific year we began serving as auditor.
| 56 |
|
Calculating your ongoing Fund expenses
Example
As a shareholder of a Fund of the Invesco Exchange-Traded Fund Trust II, you incur a unitary management fee. In addition to the unitary management fee, a shareholder may pay distribution fees, if any, brokerage expenses, taxes, interest, acquired fund fees and expenses, if any, litigation expenses and other extraordinary expenses, including proxy expenses (except for such proxies related to: (i) changes to the Investment Advisory Agreement, (ii) the election of any Board member who is an “interested person” of the Trust, or (iii) any other matters that directly benefit the Adviser). The expense examples below are intended to help you understand your ongoing costs (in dollars) of investing in the Funds and to compare these costs with the ongoing costs of investing in other funds.
The example is based on an investment of $1,000 invested at the beginning of the period and held for the entire period May 1, 2022 through October 31, 2022.
In addition to the fees and expenses which the Invesco PureBetaSM FTSE Emerging Markets ETF (the “Portfolio”) bears directly, the Portfolio indirectly bears a pro rata share of the fees and expenses of the investment companies in which the Portfolio invests. The amount of fees and expenses incurred indirectly by the Portfolio will vary because the investment companies have varied expenses and fee levels and the Portfolio may own different proportions of the investment companies at different times.
Estimated investment companies’ expenses are not expenses that are incurred directly by the Portfolio. They are expenses that are incurred directly by the investment companies and are deducted from the value of the investment companies the Portfolio invests in. The effect of the estimated investment companies’ expenses that the Portfolio bears indirectly is included in the Portfolio’s total return.
Actual Expenses
The first line in the following table provides information about actual account values and actual expenses. You may use the information in this line, together with the amount you invested, to estimate the expenses that you paid over the period. Simply divide your account value by $1,000 (for example, an $8,600 account value divided by $1,000 = 8.6), then multiply the result by the number in the first line under the heading “Expenses Paid During the Six-Month Period” to estimate the expenses you paid on your account during this period.
Hypothetical Example for Comparison Purposes
The second line in the following table provides information about hypothetical account values and hypothetical expenses based on each Fund’s actual expense ratio and an assumed annualized rate of return of 5% per year before expenses, which is not the Fund’s actual return. The hypothetical account values and expenses may not be used to estimate the actual ending account balance or expenses you paid for the period. You may use this information to compare the ongoing costs of investing in the Funds and other funds. To do so, compare this 5% hypothetical example with the 5% hypothetical examples that appear in the shareholder reports of the other funds.
Please note that the expenses shown in the table are meant to highlight your ongoing costs only, and do not reflect any transactional costs, such as sales charges and brokerage commissions. Therefore, the second line in the table is useful in comparing ongoing costs only, and will not help you determine the relative total costs of owning different funds. In addition, expenses shown in the table do not include the expenses of the underlying funds, which are borne indirectly by a Fund. If transaction costs and indirect expenses were included, your costs would have been higher.
| Beginning Account Value May 1, 2022 | Ending Account Value October 31, 2022 | Annualized Expense Ratio Based on the Six-Month Period | Expenses Paid During the Six-Month Period(1) | |||||||||||||||||
Invesco PureBetaSM 0-5 Yr US TIPS ETF (PBTP) | ||||||||||||||||||||
Actual | $ | 1,000.00 | $ | 970.30 | 0.07 | % | $ | 0.35 | ||||||||||||
Hypothetical (5% return before expenses) | 1,000.00 | 1,024.85 | 0.07 | 0.36 | ||||||||||||||||
Invesco PureBetaSM FTSE Developed ex-North America ETF (PBDM) | ||||||||||||||||||||
Actual | 1,000.00 | 874.20 | 0.07 | 0.33 | ||||||||||||||||
Hypothetical (5% return before expenses) | 1,000.00 | 1,024.85 | 0.07 | 0.36 | ||||||||||||||||
| 57 |
|
Calculating your ongoing Fund expenses–(continued)
| Beginning Account Value May 1, 2022 | Ending Account Value October 31, 2022 | Annualized Expense Ratio Based on the Six-Month Period | Expenses Paid During the Six-Month Period(1) | |||||||||||||||||
Invesco PureBetaSM FTSE Emerging Markets ETF (PBEE) | ||||||||||||||||||||
Actual | $ | 1,000.00 | $ | 827.50 | 0.10 | % | $ | 0.46 | ||||||||||||
Hypothetical (5% return before expenses) | 1,000.00 | 1,024.70 | 0.10 | 0.51 | ||||||||||||||||
| (1) | Expenses are calculated using the annualized expense ratio, which represents the ongoing expenses as a percentage of net assets for the six-month period ended October 31, 2022. Expenses are calculated by multiplying the Fund’s annualized expense ratio by the average account value for the period, then multiplying the result by 184/365. Expense ratios for the most recent six-month period may differ from expense ratios based on the annualized data in the Financial Highlights. |
| 58 |
|
Form 1099-DIV, Form 1042-S and other year–end tax information provide shareholders with actual calendar year amounts that should be included in their tax returns. Shareholders should consult their tax advisers.
The following distribution information is being provided as required by the Internal Revenue Code or to meet a specific state’s requirement.
Each Fund designates the following amounts or, if subsequently determined to be different, the maximum amount allowable for its fiscal year ended October 31, 2022:
| Qualified Business Income* | Qualified Dividend Income* | Corporate Dividends Received Deduction* | U.S. Treasury Obligations* | Business Interest Income* | Qualified Interest Income* | Long Term Capital Gains | Qualified Short Term Gains | |||||||||||||||||||||||||||||||||
Invesco PureBetaSM 0-5 Yr US TIPS ETF | 0 | % | 0 | % | 0 | % | 100 | % | 99 | % | 100 | % | $ | 1,006 | $ | 16,992 | ||||||||||||||||||||||||
| Invesco PureBetaSM FTSE Developed ex-North America ETF | 0 | % | 77 | % | 0 | % | 0 | % | 0 | % | 0 | % | - | - | ||||||||||||||||||||||||||
| Invesco PureBetaSM FTSE Emerging Markets ETF | 0 | % | 38 | % | 0 | % | 0 | % | 0 | % | 0 | % | - | - | ||||||||||||||||||||||||||
* The above percentages are based on ordinary income dividends paid to shareholders during the Fund’s fiscal year.
The Funds intend to elect to pass through to shareholders the credit for taxes paid to foreign countries. The foreign source income and foreign taxes paid per share are as follows:
| Foreign Taxes Per Share | Foreign Source Income Per Share | |||||||||
| Invesco PureBetaSM FTSE Developed ex-North America ETF | $ | 0.0565 | $ | 0.8967 | ||||||
| Invesco PureBetaSM FTSE Emerging Markets ETF | 0.0584 | 0.7217 | ||||||||
| 59 |
|
The Independent Trustees of the Trust, their term of office and length of time served, their principal business occupations during at least the past five years, the number of portfolios in the Fund Complex (as defined below) overseen by each Independent Trustee and the other directorships, if any, held by each Independent Trustee are shown below:
As of October 31, 2022
Name, Address and Year of Birth of Independent Trustees | Position(s) with Trust | Term of and Length of Served* | Principal Occupation(s) During the Past 5 Years | Number of Portfolios in Fund Complex** Overseen by Independent Trustees | Other Directorships Held by Independent Trustees During the Past 5 Years | |||||
Ronn R. Bagge–1958 c/o Invesco Capital Management LLC 3500 Lacey Road, Suite 700 Downers Grove, IL 60515 | Vice Chair of the Board; Chair of the Nominating and Governance Committee and Trustee | Vice Chair since 2018; Chair of the Nominating and Governance Committee and Trustee since 2007 | Founder and Principal, YQA Capital Management LLC (1998-Present); formerly, Owner/CEO of Electronic Dynamic Balancing Co., Inc. (high-speed rotating equipment service provider). | 234 | Chair (since 2021) and member (since 2017) of the Joint Investment Committee, Mission Aviation Fellowship and MAF Foundation; Trustee, Mission Aviation Fellowship (2017-Present). | |||||
Todd J. Barre–1957 c/o Invesco Capital Management LLC 3500 Lacey Road, Suite 700 Downers Grove, IL 60515 | Trustee | Since 2010 | Assistant Professor of Business, Trinity Christian College (2010-2016); formerly, Vice President and Senior Investment Strategist (2001-2008), Director of Open Architecture and Trading (2007-2008), Head of Fundamental Research (2004-2007) and Vice President and Senior Fixed Income Strategist (1994-2001), BMO Financial Group/Harris Private Bank. | 234 | None. | |||||
| * | This is the date the Independent Trustee began serving the Trust. Each Independent Trustee serves an indefinite term, until his or her successor is elected. |
| ** | Fund Complex includes all open- and closed-end funds (including all of their portfolios) advised by the Adviser and any affiliated person of the Adviser. |
| 60 |
|
Trustees and Officers–(continued)
Name, Address and Year of Birth of Independent Trustees | Position(s) with Trust | Term of and Length of Served* | Principal Occupation(s) During the Past 5 Years | Number of Portfolios in Fund Complex** Overseen by Independent Trustees | Other Directorships Held by Independent Trustees During the Past 5 Years | |||||
Edmund P. Giambastiani, Jr.–1948 c/o Invesco Capital Management LLC 3500 Lacey Road, Suite 700 Downers Grove, IL 60515 | Trustee | Since 2019 | President, Giambastiani Group LLC (national security and energy consulting) (2007-Present); Director, First Eagle Alternative Credit LLC (2020-Present); Advisory Board Member, Massachusetts Institute of Technology Lincoln Laboratory (federally-funded research development) (2010-Present); Defense Advisory Board Member, Lawrence Livermore National Laboratory (2013-Present); formerly, Director, The Boeing Company (2009-2021); Trustee, MITRE Corporation (federally funded research development) (2008-2020); Director, THL Credit, Inc. (alternative credit investment manager) (2016-2020); Chair (2015-2016), Lead Director (2011-2015) and Director (2008-2011), Monster Worldwide, Inc. (career services); United States Navy, career nuclear submarine officer (1970-2007); Seventh Vice Chair of the Joint Chiefs of Staff (2005-2007); first NATO Supreme Allied Commander Transformation (2003-2005); Commander, U.S. Joint Forces Command (2002-2005). | 234 | Trustee, U.S. Naval Academy Foundation Athletic & Scholarship Program (2010-Present); formerly, Trustee, certain funds of the Oppenheimer Funds complex (2013-2019); Advisory Board Member, Maxwell School of Citizenship and Public Affairs of Syracuse University (2012-2016). |
| * | This is the date the Independent Trustee began serving the Trust. Each Independent Trustee serves an indefinite term, until his or her successor is elected. |
| ** | Fund Complex includes all open- and closed-end funds (including all of their portfolios) advised by the Adviser and any affiliated person of the Adviser. |
| 61 |
|
Trustees and Officers–(continued)
Name, Address and Year of Birth of Independent Trustees | Position(s) with Trust | Term of and Length of Served* | Principal Occupation(s) During the Past 5 Years | Number of Portfolios in Fund Complex** Overseen by Independent Trustees | Other Directorships Held by Independent Trustees During the Past 5 Years | |||||
Victoria J. Herget–1951 c/o Invesco Capital Management LLC 3500 Lacey Road, Suite 700 Downers Grove, IL 60515 | Trustee | Since 2019 | Formerly, Managing Director (1993-2001), Principal (1985-1993), Vice President (1978-1985) and Assistant Vice President (1973-1978), Zurich Scudder Investments (investment adviser) (and its predecessor firms). | 234 | Trustee (2000- Present) and Chair (2010-2017), Newberry Library; Trustee, Chikaming Open Lands (2014-Present); formerly, Trustee, Mather LifeWays (2001-2021); Trustee, certain funds in the Oppenheimer Funds complex (2012-2019); Board Chair (2008-2015) and Director (2004-2018), United Educators Insurance Company; Independent Director, First American Funds (2003-2011); Trustee (1992-2007), Chair of the Board of Trustees (1999-2007), Investment Committee Chair (1994-1999) and Investment Committee member (2007-2010), Wellesley College; Trustee, BoardSource (2006-2009); Trustee, Chicago City Day School (1994-2005). |
| * | This is the date the Independent Trustee began serving the Trust. Each Independent Trustee serves an indefinite term, until his or her successor is elected. |
| ** | Fund Complex includes all open- and closed-end funds (including all of their portfolios) advised by the Adviser and any affiliated person of the Adviser. |
| 62 |
|
Trustees and Officers–(continued)
Name, Address and Year of Birth of Independent Trustees | Position(s) with Trust | Term of and Length of Served* | Principal Occupation(s) During the Past 5 Years | Number of Portfolios in Fund Complex** Overseen by Independent Trustees | Other Directorships Held by Independent Trustees During the Past 5 Years | |||||
Marc M. Kole–1960 c/o Invesco Capital Management LLC 3500 Lacey Road, Suite 700 Downers Grove, IL 60515 | Chair of the Audit Committee and Trustee | Chair of the Audit Committee since 2008; Trustee since 2007 | Formerly, Managing Director of Finance (2020-2021) and Senior Director of Finance (2015-2020), By The Hand Club for Kids (not-for-profit); Chief Financial Officer, Hope Network (social services) (2008-2012); Assistant Vice President and Controller, Priority Health (health insurance) (2005-2008); Regional Chief Financial Officer, United Healthcare (2005); Chief Accounting Officer, Senior Vice President of Finance, Oxford Health Plans (2000-2004); Audit Partner, Arthur Andersen LLP (1996-2000). | 234 | Formerly, Treasurer (2018-2021), Finance Committee Member (2015-2021) and Audit Committee Member (2015), Thornapple Evangelical Covenant Church; Board and Finance Committee Member (2009-2017) and Treasurer (2010-2015, 2017), NorthPointe Christian Schools. | |||||
Yung Bong Lim–1964 c/o Invesco Capital Management LLC 3500 Lacey Road, Suite 700 Downers Grove, IL 60515 | Chair of the Investment Oversight Committee and Trustee | Chair of the Investment Oversight Committee since 2014; Trustee since 2013 | Managing Partner, RDG Funds LLC (real estate) (2008-Present); formerly, Managing Director, Citadel LLC (1999-2007). | 234 | Board Director, Beacon Power Services, Corp. (2019-Present); formerly, Advisory Board Member, Performance Trust Capital Partners, LLC (2008-2020). | |||||
| * | This is the date the Independent Trustee began serving the Trust. Each Independent Trustee serves an indefinite term, until his or her successor is elected. |
| ** | Fund Complex includes all open- and closed-end funds (including all of their portfolios) advised by the Adviser and any affiliated person of the Adviser. |
| 63 |
|
Trustees and Officers–(continued)
Name, Address and Year of Birth of Independent Trustees | Position(s) with Trust | Term of and Length of Served* | Principal Occupation(s) During the Past 5 Years | Number of Portfolios in Fund Complex** Overseen by Independent Trustees | Other Directorships Held by Independent Trustees During the Past 5 Years | |||||
Joanne Pace–1958 c/o Invesco Capital Management LLC 3500 Lacey Road, Suite 700 Downers Grove, IL 60515 | Trustee | Since 2019 | Formerly, Senior Advisor, SECOR Asset Management, LP (2010-2011); Managing Director and Chief Operating Officer, Morgan Stanley Investment Management (2006-2010); Partner and Chief Operating Officer, FrontPoint Partners, LLC (alternative investments) (2005-2006); Managing Director (2003-2005), Global Head of Human Resources and member of Executive Board and Operating Committee (2004-2005), Global Head of Operations and Product Control (2003-2004), Credit Suisse (investment banking); Managing Director (1997-2003), Controller and Principal Accounting Officer (1999-2003), Chief Financial Officer (temporary assignment) for the Oversight Committee, Long Term Capital Management (1998-1999), Morgan Stanley. | 234 | Board Director, Horizon Blue Cross Blue Shield of New Jersey (2012-Present); Governing Council Member (2016-Present) and Chair of Education Committee (2017-2021), Independent Directors Council (IDC); Council Member, New York-Presbyterian Hospital’s Leadership Council on Children’s and Women’s Health (2012-Present); formerly, Advisory Board Director, The Alberleen Group LLC (2012-2021); Board Member, 100 Women in Finance (2015-2020); Trustee, certain funds in the Oppenheimer Funds complex (2012-2019); Lead Independent Director and Chair of the Audit and Nominating Committee of The Global Chartist Fund, LLC, Oppenheimer Asset Management (2011-2012); Board Director, Managed Funds Association (2008-2010); Board Director (2007-2010) and Investment Committee Chair (2008-2010), Morgan Stanley Foundation. |
| * | This is the date the Independent Trustee began serving the Trust. Each Independent Trustee serves an indefinite term, until his or her successor is elected. |
| ** | Fund Complex includes all open- and closed-end funds (including all of their portfolios) advised by the Adviser and any affiliated person of the Adviser. |
| 64 |
|
Trustees and Officers–(continued)
Name, Address and Year of Birth of Independent Trustees | Position(s) with Trust | Term of and Length of Served* | Principal Occupation(s) During the Past 5 Years | Number of Portfolios in Fund Complex** Overseen by Independent Trustees | Other Directorships Held by Independent Trustees During the Past 5 Years | |||||
Gary R. Wicker–1961 c/o Invesco Capital Management LLC 3500 Lacey Road, Suite 700 Downers Grove, IL 60515 | Trustee | Since 2013 | Senior Vice President of Global Finance and Chief Financial Officer, RBC Ministries (publishing company) (2013-Present); formerly, Executive Vice President and Chief Financial Officer, Zondervan Publishing (a division of Harper Collins/NewsCorp) (2007-2012); Senior Vice President and Group Controller (2005- 2006), Senior Vice President and Chief Financial Officer (2003-2004), Chief Financial Officer (2001-2003), Vice President, Finance and Controller (1999-2001) and Assistant Controller (1997-1999), divisions of The Thomson Corporation (information services provider); Senior Audit Manager (1994-1997), PricewaterhouseCoopers LLP. | 234 | Board Member and Treasurer, Our Daily Bread Ministries Canada (2015-Present); Board and Finance Committee Member, West Michigan Youth For Christ (2010-Present). | |||||
Donald H. Wilson–1959 c/o Invesco Capital Management LLC 3500 Lacey Road, Suite 700 Downers Grove, IL 60515 | Chair of the Board and Trustee | Chair since 2012; Trustee since 2007 | Chair, President and Chief Executive Officer, McHenry Bancorp Inc. and McHenry Savings Bank (subsidiary) (2018-Present); formerly, Chair and Chief Executive Officer, Stone Pillar Advisors, Ltd. (2010-2017); President and Chief Executive Officer, Stone Pillar Investments, Ltd. (advisory services to the financial sector) (2016-2018); Chair, President and Chief Executive Officer, Community Financial Shares, Inc. and Community Bank–Wheaton/Glen Ellyn (subsidiary) (2013-2015); Chief Operating Officer, AMCORE Financial, Inc. (bank holding company) (2007-2009); Executive Vice President and Chief Financial Officer, AMCORE Financial, Inc. (2006-2007); Senior Vice President and Treasurer, Marshall & Ilsley Corp. (bank holding company) (1995-2006). | 234 | Director, Penfield Children’s Center (2004-Present); Board Chair, Gracebridge Alliance, Inc. (2015-Present). | |||||
| * | This is the date the Independent Trustee began serving the Trust. Each Independent Trustee serves an indefinite term, until his or her successor is elected. |
| ** | Fund Complex includes all open- and closed-end funds (including all of their portfolios) advised by the Adviser and any affiliated person of the Adviser. |
| 65 |
|
Trustees and Officers–(continued)
The Interested Trustee and the executive officers of the Trust, their term of office and length of time served, their principal business occupations during at least the past five years, the number of portfolios in the Fund Complex overseen by the Interested Trustee and the other directorships, if any, held by the Interested Trustee are shown below:
Name, Address and Year of Birth of Interested Trustee | Position(s) with Trust | Term of and Length of Served* | Principal Occupation(s) During the Past 5 Years | Number of in Fund Complex** Overseen by Interested Trustee | Other Directorships Held by Interested Trustee During the Past 5 Years | |||||
Anna Paglia–1974 Invesco Capital Management LLC 3500 Lacey Road Suite 700 Downers Grove, IL 60515 | Trustee, President and Principal Executive Officer | Trustee since 2022, President and Principal Executive Officer since 2020 | President and Principal Executive Officer (2020-Present) and Trustee (2022-Present), Invesco Exchange- Traded Fund Trust, Invesco Exchange-Traded Fund Trust II, Invesco India Exchange-Traded Fund Trust, Invesco Actively Managed Exchange-Traded Fund Trust, Invesco Actively Managed Exchange-Traded Commodity Fund Trust and Invesco Exchange-Traded Self-Indexed Fund Trust; Managing Director and Global Head of ETFs and Indexed Strategies, Chief Executive Officer and Principal Executive Officer, Invesco Capital Management LLC (2020-Present); Chief Executive Officer, Manager and Principal Executive Officer, Invesco Specialized Products, LLC (2020-Present); Vice President, Invesco Indexing LLC (2020-Present); formerly, Secretary, Invesco Exchange-Traded Fund Trust, Invesco Exchange-Traded Fund Trust II, Invesco India Exchange-Traded Fund Trust and Invesco Actively Managed Exchange-Traded Fund Trust (2011-2020), Invesco Actively Managed Exchange-Traded Commodity Fund Trust (2014-2020) and Invesco Exchange-Traded Self-Indexed Fund Trust (2015- 2020); Head of Legal (2010-2020) and Secretary (2015-2020), Invesco Capital Management LLC; Manager and Assistant Secretary, Invesco Indexing LLC (2017-2020); Head of Legal and Secretary, Invesco Specialized Products, LLC (2018-2020); Partner, K&L Gates LLP (formerly, Bell Boyd & Lloyd LLP) (2007-2010); and Associate Counsel at Barclays Global Investors Ltd. (2004-2006). | 234 | None |
| * | This is the date the Interested Trustee began serving the Trust. The Interested Trustee serves an indefinite term, until his successor is elected. |
| ** | Fund Complex includes all open- and closed-end funds (including all of their portfolios) advised by the Adviser and any affiliated person of the Adviser. |
| 66 |
|
Trustees and Officers–(continued)
Name, Address and Year of Birth of Executive Officers | Position(s) Held with Trust | Length of Time Served* | Principal Occupation(s) During the Past 5 Years | |||
Adrien Deberghes–1967 Invesco Capital Management LLC 11 Greenway Plaza, Suite 1000 Houston, TX 77046 | Vice President | Since 2020 | Vice President, Invesco Exchange-Traded Fund Trust, Invesco Exchange-Traded Fund Trust II, Invesco India Exchange-Traded Fund Trust, Invesco Actively Managed Exchange-Traded Fund Trust, Invesco Actively Managed Exchange-Traded Commodity Fund Trust and Invesco Exchange-Traded Self-Indexed Fund Trust (2020-Present); Head of the Fund Office of the CFO, Fund Administration and Vice President, Invesco Advisers, Inc. (2020-Present); Principal Financial Officer, Treasurer and Vice President, The Invesco Funds (2020-Present); formerly, Senior Vice President and Treasurer, Fidelity Investments (2008-2020). | |||
Kelli Gallegos–1970 Invesco Capital Management LLC 11 Greenway Plaza, Suite 1000 Houston, TX 77046 | Vice President and Treasurer | Since 2018 | Vice President, Invesco Advisers, Inc. (2020-Present); Principal Financial and Accounting Officer- Pooled Investments, Invesco Specialized Products, LLC (2018-Present); Vice President and Treasurer, Invesco Exchange-Traded Fund Trust, Invesco Exchange-Traded Fund Trust II, Invesco India Exchange-Traded Fund Trust, Invesco Actively Managed Exchange-Traded Fund Trust, Invesco Actively Managed Exchange-Traded Commodity Fund Trust and Invesco Exchange-Traded Self-Indexed Fund Trust (2018-Present); Principal Financial and Accounting Officer-Pooled Investments, Invesco Capital Management LLC (2018-Present); Vice President and Assistant Treasurer (2008-Present), The Invesco Funds; formerly, Principal Financial Officer (2016-2020) and Assistant Vice President (2008-2016), The Invesco Funds; Assistant Treasurer, Invesco Specialized Products, LLC (2018); Assistant Treasurer, Invesco Exchange-Traded Fund Trust, Invesco Exchange-Traded Fund Trust II, Invesco India Exchange-Traded Fund Trust and Invesco Actively Managed Exchange-Traded Fund Trust (2012-2018), Invesco Actively Managed Exchange-Traded Commodity Fund Trust (2014-2018) and Invesco Exchange-Traded Self-Indexed Fund Trust (2016-2018); and Assistant Treasurer, Invesco Capital Management LLC (2013-2018). | |||
Adam Henkel–1980 Invesco Capital Management LLC 3500 Lacey Road, Suite 700 Downers Grove, IL 60515 | Secretary | Since 2020 | Head of Legal and Secretary, Invesco Capital Management LLC and Invesco Specialized Products, LLC (2020-present); Secretary, Invesco Exchange-Traded Fund Trust, Invesco Exchange-Traded Fund Trust II, Invesco India Exchange-Traded Fund Trust, Invesco Actively Managed Exchange-Traded Fund Trust, Invesco Actively Managed Exchange-Traded Commodity Fund Trust and Invesco Exchange-Traded Self-Indexed Fund Trust (2020-Present); Assistant Secretary, Invesco Capital Markets, Inc. (2020-Present); Assistant Secretary, The Invesco Funds (2014-Present); Manager and Assistant Secretary, Invesco Indexing LLC (2020-Present); Assistant Secretary, Invesco Investment Advisers LLC (2020-Present); formerly, Assistant Secretary of Invesco Exchange-Traded Fund Trust, Invesco Exchange-Traded Fund Trust II, Invesco India Exchange-Traded Fund Trust, Invesco Actively Managed Exchange-Traded Fund Trust and Invesco Actively Managed Exchange-Traded Commodity Fund Trust (2014-2020); Chief Compliance Officer of Invesco Capital Management LLC (2017); Chief Compliance Officer of Invesco Exchange-Traded Fund Trust, Invesco Exchange-Traded Fund Trust II, Invesco India Exchange-Traded Fund Trust, Invesco Actively Managed Exchange-Traded Fund Trust and Invesco Actively Managed Exchange-Traded Commodity Fund Trust (2017); Senior Counsel, Invesco, Ltd. (2013-2020); Assistant Secretary, Invesco Specialized Products, LLC (2018-2020). | |||
| * | This is the date each Officer began serving the Trust in their current position. Each Officer serves an indefinite term, until his or her successor is elected. |
| 67 |
|
Trustees and Officers–(continued)
Name, Address and Year of Birth of Executive Officers | Position(s) Held with Trust | Length of Time Served* | Principal Occupation(s) During the Past 5 Years | |||
Peter Hubbard–1981 Invesco Capital Management LLC 3500 Lacey Road, Suite 700 Downers Grove, IL 60515 | Vice President | Since 2009 | Vice President, Invesco Specialized Products, LLC (2018-Present); Vice President, Invesco Exchange-Traded Fund Trust, Invesco Exchange-Traded Fund Trust II, Invesco India Exchange-Traded Fund Trust, Invesco Actively Managed Exchange-Traded Fund Trust (2009-Present), Invesco Actively Managed Exchange-Traded Commodity Fund Trust (2014-Present) and Invesco Exchange-Traded Self-Indexed Fund Trust (2016-Present); Vice President and Director of Portfolio Management, Invesco Capital Management LLC (2010-Present); and Vice President, Invesco Advisers, Inc. (2020-Present); formerly, Vice President of Portfolio Management, Invesco Capital Management LLC (2008-2010); Portfolio Manager, Invesco Capital Management LLC (2007-2008); Research Analyst, Invesco Capital Management LLC (2005-2007); Research Analyst and Trader, Ritchie Capital, a hedge fund operator (2003-2005). | |||
Sheri Morris–1964 Invesco Capital Management LLC 11 Greenway Plaza, Suite 1000 Houston, TX 77046 | Vice President | Since 2012 | Head of Global Fund Services, Invesco Ltd. (2019-Present); Vice President, OppenheimerFunds, Inc. (2019-Present); President and Principal Executive Officer, The Invesco Funds (2016-Present); Senior Vice President, Invesco Advisers, Inc. (formerly known as Invesco Institutional (N.A.), Inc.) (registered investment adviser) (2020-Present); Director, Invesco Trust Company (2022-Present) and Vice President, Invesco Exchange-Traded Fund Trust, Invesco Exchange-Traded Fund Trust II, Invesco India Exchange-Traded Fund Trust, Invesco Actively Managed Exchange-Traded Fund Trust (2012-Present), Invesco Actively Managed Exchange-Traded Commodity Fund Trust (2014-Present) and Invesco Exchange-Traded Self-Indexed Fund Trust (2016-Present); formerly, Treasurer (2008-2020), Vice President and Principal Financial Officer, The Invesco Funds (2008-2016); Treasurer, Invesco Exchange-Traded Fund Trust, Invesco Exchange-Traded Fund Trust II, Invesco India Exchange-Traded Fund Trust and Invesco Actively Managed Exchange- Traded Fund Trust (2011-2013); Vice President, Invesco Aim Advisers, Inc., Invesco Aim Capital Management, Inc. and Invesco Aim Private Asset Management, Inc.; Treasurer, Assistant Vice President and Assistant Treasurer, The Invesco Funds and Assistant Vice President, Invesco Advisers, Inc., Invesco Aim Capital Management, Inc. and Invesco Aim Private Asset Management, Inc.; Vice President, Invesco Advisers, Inc. (2009-2020). | |||
Rudolf E. Reitmann–1971 Invesco Capital Management LLC 3500 Lacey Road, Suite 700 Downers Grove, IL 60515 | Vice President | Since 2013 | Head of Global Exchange Traded Funds Services, Invesco Specialized Products, LLC (2018-Present); Vice President, Invesco Exchange-Traded Fund Trust, Invesco Exchange-Traded Fund Trust II, Invesco India Exchange-Traded Fund Trust, Invesco Actively Managed Exchange-Traded Fund Trust (2013-Present), Invesco Actively Managed Exchange-Traded Commodity Fund Trust (2014-Present) and Invesco Exchange-Traded Self-Indexed Fund Trust (2016-Present); Head of Global Exchange Traded Funds Services, Invesco Capital Management LLC (2013-Present); Vice President, Invesco Capital Markets, Inc. (2018-Present). | |||
| * | This is the date each Officer began serving the Trust in their current position. Each Officer serves an indefinite term, until his or her successor is elected. |
| 68 |
|
Trustees and Officers–(continued)
Name, Address and Year of Birth of Executive Officers | Position(s) Held with Trust | Length of Time Served* | Principal Occupation(s) During the Past 5 Years | |||
Melanie Zimdars–1976 Invesco Capital Management LLC 3500 Lacey Road, Suite 700 Downers Grove, IL 60515 | Chief Compliance Officer | Since 2017 | Chief Compliance Officer, Invesco Specialized Products, LLC (2018-Present); Chief Compliance Officer, Invesco Capital Management LLC (2017-Present); Chief Compliance Officer, Invesco Exchange-Traded Fund Trust, Invesco Exchange-Traded Fund Trust II, Invesco India Exchange-Traded Fund Trust, Invesco Actively Managed Exchange-Traded Fund Trust, Invesco Actively Managed Exchange-Traded Commodity Fund Trust and Invesco Exchange-Traded Self-Indexed Fund Trust (2017-Present); formerly, Vice President and Deputy Chief Compliance Officer, ALPS Holding, Inc. (2009-2017); Mutual Fund Treasurer/ Chief Financial Officer, Wasatch Advisors, Inc. (2005-2008); Compliance Officer, U.S. Bancorp Fund Services, LLC (2001-2005). |
| * | This is the date each Officer began serving the Trust in their current position. Each Officer serves an indefinite term, until his or her successor is elected. |
Availability of Additional Information About the Trustees
The Statement of Additional Information includes additional information about the Trustees and is available, without charge, upon request at (800) 983-0903.
| 69 |
|
(This Page Intentionally Left Blank)
Proxy Voting Policies and Procedures
A description of the Trust’s proxy voting policies and procedures that the Funds use to determine how to vote proxies relating to portfolio securities is available, without charge and upon request, by calling (800) 983-0903. This information is also available on the Securities and Exchange Commission’s (the “Commission”) website at www.sec.gov.
Information regarding how each Fund voted proxies for portfolio securities, if applicable, during the most recent 12-month period ended June 30, is available, without charge and upon request, by (i) calling (800) 983-0903; or (ii) accessing the Trust’s Form N-PX on the Commission’s website at www.sec.gov.
Quarterly Portfolios
The Trust files its complete schedule of portfolio holdings for the Funds with the Commission for the first and third quarters of each fiscal year as an exhibit to its reports on Form N-PORT. The Forms N-PORT are available on the Commission’s website at www.sec.gov.
Frequency Distribution of Discounts and Premiums
A table showing the number of days the market price of each Fund’s shares was greater than the Fund’s net asset value, and the number of days it was less than the Fund’s net asset value (i.e., premium or discount) for the most recently completed calendar year, and the calendar quarters since that year end (or the life of the Fund, if shorter) may be found at the Fund’s website at www.invesco.com/ETFs.
| ©2022 Invesco Capital Management LLC | ||||||
| 3500 Lacey Road, Suite 700 | ||||||
| Downers Grove, IL 60515 | P-PBETA-AR-1 | invesco.com/ETFs |
 | Invesco Annual Report to Shareholders
| |||
October 31, 2022
| ||||
| IDLB | Invesco FTSE International Low Beta Equal Weight ETF | |||
| EELV | Invesco S&P Emerging Markets Low Volatility ETF | |||
| EEMO | Invesco S&P Emerging Markets Momentum ETF | |||
| IDHD | Invesco S&P International Developed High Dividend Low Volatility ETF | |||
| IDLV | Invesco S&P International Developed Low Volatility ETF | |||
| IDMO | Invesco S&P International Developed Momentum ETF | |||
| 2 |
|
Domestic Equity
The fiscal year ended October 31, 2022 began with continued volatility in equity markets in the fourth quarter of 2021 amid substantial inflation and the emergence of a new COVID-19 variant. Pandemic-related supply chain disruption and labor shortages intensified during the quarter, resulting in broadly higher input costs for companies and consumers alike. Additionally, the price of oil rose,1 causing higher gas prices for consumers, and the Consumer Price Index (CPI) reported for November 2021 increased 0.8%, resulting in a 6.8% increase over the prior 12 months, the highest since 1982.2 To combat inflation, the US Federal Reserve (the Fed) announced the potential for three or more interest rate increases in 2022. With solid corporate earnings and optimism about the COVID-19 Omicron variant reporting milder symptoms, stocks rallied at the 2021 year-end.
Equity markets declined in the first quarter of 2022 amid volatility sparked by Russia’s invasion of Ukraine, rising commodity prices, rampant global inflation and the Fed’s shift toward tighter monetary policy. Russia’s invasion exacerbated inflation pressures, disrupting already strained supply chains and increasing shortages of oil, gas and raw materials. The price of oil rose sharply, with crude prices reaching their highest price per barrel since 2008.1 Inflation continued to be a top concern for consumers, investors and the Fed. To combat inflation, the Fed raised the federal funds rate by one-quarter percentage point in March and the Fed indicated it would “taper” its asset purchase program quickly.3
As the war in Ukraine continued and corporate earnings in high-profile names like Netflix reported slowing growth and profits, the equity markets sold off for much of April 2022. The downward direction of the equity markets continued into the second quarter of 2022 amid record inflation, rising interest rates and an increasing likelihood of a US recession. Driven by higher food and energy prices, the CPI rose by yet another 40-year high to 8.6% for the 12 months ended May 2022.2 Oil prices peaked near $122 per barrel in early June, resulting in skyrocketing gasoline prices; the national average price reached a record high above $5 per gallon in early June.1 To tame inflation, the Fed raised the benchmark federal funds rate three more times, by 0.50% in May, by 0.75% in June and another 0.75% in July, which were the largest increases in nearly 30 years.3 US equity markets rose in July and much of August until Fed chairman Jerome Powell’s hawkish comments at an economic policy symposium held in Jackson Hole, Wyoming sparked a sharp selloff at month-end. The Fed reiterated that it would continue taking aggressive action to curb inflation, even though such measures could “bring pain to households and businesses,” and the Fed raised the benchmark federal funds rate by another 0.75% in September.3
After experiencing a sharp drop in September 2022, US equity markets rebounded in October with strong gains, despite mixed data on the economy and corporate earnings. Inflation data
reported in October came in higher than expected; however, the labor market remained strong, with payroll employment gains and a decline in the unemployment rate to a near record low of 3.5% in September.2 The initial estimate of third quarter real gross domestic product showed an increase of 2.6% (annualized) after falling in the prior two quarters, but the headline number masked a drop in demand and investment. Corporate earnings were generally in line with expectations, but many companies’ forward earnings guidance was weaker than expected.
In this environment, US stocks had negative double-digit returns for the fiscal year ended October 31, 2022 of (14.61)%, as measured by the S&P 500 Index.4
| 1 | Source: Bloomberg LP |
| 2 | Source: US Bureau of Labor Statistics |
| 3 | Source: US Federal Reserve |
| 4 | Source: Lipper Inc. |
Global Equity
At the beginning of the fiscal year ended October 31, 2022, developed global equity markets were mostly positive, despite rising inflation and the emergence of Omicron, a new COVID-19 variant. Pandemic-related supply chain disruptions and labor shortages intensified at the end of 2021, resulting in broadly higher costs for companies and consumers. Emerging market equities declined due in part to COVID-19 concerns and China’s ongoing regulatory tightening in the private education and technology sectors and slowing economic growth.
Global equity markets declined in the first half of 2022 amid volatility sparked by Russia’s invasion of Ukraine, rising commodity prices, rampant global inflation and central banks shifting toward tighter monetary policy. Russia’s invasion exacerbated inflationary pressures, disrupting already strained supply chains, and increasing shortages of oil, gas and raw materials, with the price of oil rising sharply.
Inflation headwinds continued into the third quarter of 2022. The US Federal Reserve (the Fed), the European Central Bank and the Bank of England all raised interest rates. In contrast, the People’s Bank of China lowered its policy rate and the Bank of Japan kept rates the same. Emerging market equities, hampered by the strong US dollar, underperformed developed market equities.
During October 2022, developed market equities rebounded and were in positive territory. Developed market equities outperformed emerging market equities, which declined primarily driven by weakness in China as Chinese markets reacted to the reappointment of President Xi and his authority, with no signs of the country’s zero-COVID-19 policy being relaxed. Despite the rebound in October for developed market equities, at the end of the fiscal year, trailing one-year returns for developed market equities and emerging market equities were both in negative territory.
| 3 |
|
| IDLB | Management’s Discussion of Fund Performance | |
| Invesco FTSE International Low Beta Equal Weight ETF (IDLB) |
As an index fund, the Invesco FTSE International Low Beta Equal Weight ETF (the “Fund”) is passively managed and seeks to track the investment results (before fees and expenses) of the FTSE Developed ex-U.S. Low Beta Equal Weight Index (the “Index”). The Fund generally will invest at least 90% of its total assets in the securities that comprise the Index.
Strictly in accordance with its guidelines and mandated procedures, FTSE International Limited (the “Index Provider”) compiles, maintains and calculates the Index, which is designed to provide exposure to constituents of the FTSE Developed ex US Index (the “Developed ex US Index”) that exhibit low beta characteristics. The Developed ex US Index is designed to measure the performance of the international equity markets and consists of large and mid-capitalization companies from developed markets throughout the world, excluding the United States. Beta is a measure of relative risk and is the rate of change of a security’s price. The Index is equally weighted, meaning that the Index Provider assigns each component security the same weight in the Index. The Fund generally invests in all of the securities comprising the Index in proportion to their weightings in the Index.
For the fiscal year ended October 31, 2022, on a market price basis, the Fund returned (26.68)%. On a net asset value (“NAV”) basis, the Fund returned (26.15)%. During the same time period, the Index returned (26.03)%. During the fiscal year, the Fund’s performance, on a NAV basis, differed from the return of the Index primarily due to fees and operating expenses that the Fund incurred during the period as well as residual cash holdings due to the Fund’s small size.
During this same time period, the MSCI World ex USA Index (Net) (the “Benchmark Index”) returned (22.04)%. The Benchmark Index is an unmanaged index weighted by market capitalization based on the average performance of approximately 935 securities. The Benchmark Index was selected for its recognition in the marketplace, and its performance comparison is a useful measure for investors as a broad representation of the overall international equity market.
The performance of the Fund differed from the Benchmark Index in part because the Fund employs a beta driven stock selection and equal weighting methodology, whereas the Benchmark Index selects and weights stocks based on market capitalization.
Relative to the Benchmark Index, the Fund was most overweight in the real estate sector and most underweight in the financials sector during the fiscal year ended October 31, 2022. The majority of the Fund’s underperformance relative to the Benchmark Index during the period can be attributed to its underweight allocation to and stock selection within the health care and energy sectors.
For the fiscal year ended October 31, 2022, no sector contributed positively to the Fund’s return. The industrials sector detracted
most significantly from the Fund’s return, followed by the consumer staples and consumer discretionary sectors, respectively.
Positions that contributed most significantly to the Fund’s return for the fiscal year ended October 31, 2022 included Kenon Holdings, Ltd., a utilities company (portfolio average weight of 0.14%), and Hitachi Transport System Ltd., an industrials company (portfolio average weight of 0.15%). Positions that detracted most significantly from the Fund’s return included Varta AG, an industrials company (portfolio average weight of 0.10%), and Koninklijke Philips N.V., a health care company (portfolio average weight of 0.10%).
| Sector Breakdown (% of the Fund’s Net Assets) as of October 31, 2022 | ||||
| Industrials | 18.03 | |||
| Financials | 15.12 | |||
| Consumer Staples | 12.42 | |||
| Consumer Discretionary | 10.13 | |||
| Materials | 8.26 | |||
| Real Estate | 7.58 | |||
| Communication Services | 7.48 | |||
| Health Care | 6.76 | |||
| Information Technology | 5.40 | |||
| Utilities | 4.20 | |||
| Energy | 3.26 | |||
| Money Market Funds Plus Other Assets Less Liabilities | 1.36 | |||
| Top Ten Fund Holdings* (% of the Fund’s Net Assets) as of October 31, 2022 | ||||
| Security | ||||
| Polski Koncern Naftowy ORLEN S.A. | 0.23 | |||
| Eisai Co. Ltd. | 0.18 | |||
| AIB Group PLC | 0.16 | |||
| FinecoBank Banca Fineco S.p.A. | 0.16 | |||
| Danske Bank A/S | 0.15 | |||
| Commerzbank AG | 0.15 | |||
| Bankinter S.A. | 0.15 | |||
| Santander Bank Polska S.A. | 0.15 | |||
| Bank of Ireland Group PLC | 0.15 | |||
| Sodexo S.A. | 0.15 | |||
| Total | 1.63 | |||
| * | Excluding money market fund holdings. |
| 4 |
|
Invesco FTSE International Low Beta Equal Weight ETF (IDLB) (continued)
Growth of a $10,000 Investment Since Inception
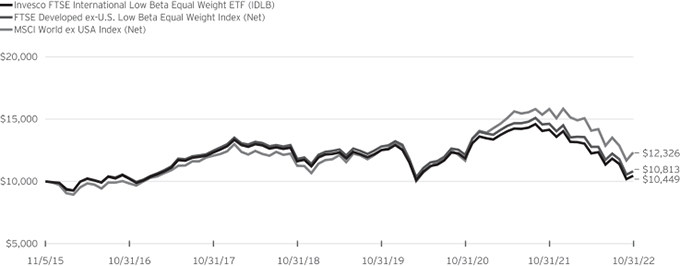
Fund Performance History as of October 31, 2022
| 1 Year | 3 Years Average | 3 Years Cumulative | 5 Years Average | 5 Years Cumulative | Fund Inception | |||||||||||||||||||||||||||
Index | Average Annualized | Cumulative | ||||||||||||||||||||||||||||||
| FTSE Developed ex-U.S. Low Beta Equal Weight Index (Net) | (26.03 | )% | (5.50 | )% | (15.61 | )% | (2.80 | )% | (13.25 | )% | 1.12 | % | 8.13 | % | ||||||||||||||||||
| MSCI World ex USA Index (Net) | (22.04 | ) | (0.49 | ) | (1.46 | ) | 0.41 | 2.05 | 3.04 | 23.26 | ||||||||||||||||||||||
| Fund | ||||||||||||||||||||||||||||||||
| NAV Return | (26.15 | ) | (5.87 | ) | (16.60 | ) | (3.25 | ) | (15.21 | ) | 0.63 | 4.49 | ||||||||||||||||||||
| Market Price Return | (26.68 | ) | (5.84 | ) | (16.51 | ) | (3.34 | ) | (15.63 | ) | 0.48 | 3.40 | ||||||||||||||||||||
Fund Inception: November 5, 2015
Performance quoted above represents past performance. Past performance is not a guarantee of future results and current performance may be higher or lower than performance quoted. Investment returns and principal value will fluctuate, and shares of the Fund (“Fund Shares”), when redeemed or sold, may be worth more or less than their original cost. Fund performance reflects any applicable fee waivers and/or expense reimbursements. Had the adviser not waived fees and/or reimbursed expenses currently or in the past, returns would have been lower. See the current prospectus for more information. According to the Fund’s current prospectus, the Fund’s expense ratio of 0.45% is expressed as a unitary management fee to cover operating expenses and expenses incurred in connection with managing the portfolio. NAV and Market Price returns assume that dividends and capital gain distributions have been reinvested in the Fund at NAV and Market Price, respectively. The returns shown in the table above do not reflect the deduction of taxes that a shareholder would pay on Fund distributions or the redemption or sale of Fund Shares. See invesco.com/ ETFs to find the most recent month-end performance numbers.
Performance results for the indexes stated above are based upon a hypothetical investment in their respective constituent securities. The returns of an index do not represent Fund returns. An investor cannot invest directly in an index. The indexes do not charge management fees or brokerage expenses, and no such fees or expenses were deducted from the hypothetical performance shown. In addition, the results actual investors might have achieved would have differed from those shown because of differences in the timing, amounts of their investments, and fees and expenses associated with an investment in the Fund.
Notes Regarding Indexes and Fund Performance History:
| - | Average Annualized and Cumulative Inception returns for the Fund and the indexes are based on the inception date of the Fund. |
| - | Net returns reflect reinvested dividends net of withholding taxes. |
| 5 |
|
| EELV | Management’s Discussion of Fund Performance | |
| Invesco S&P Emerging Markets Low Volatility ETF (EELV) |
As an index fund, the Invesco S&P Emerging Markets Low Volatility ETF (the “Fund”) is passively managed and seeks to track the investment results (before fees and expenses) of the S&P BMI Emerging Markets Low Volatility IndexTM (the “Index”). The Fund generally will invest at least 90% of its total assets in the securities that comprise the Index.
Strictly in accordance with its guidelines and mandated procedures, S&P Dow Jones Indices LLC (“S&P DJI” or the “Index Provider”) compiles, maintains and calculates the Index, which is designed to measure the performance of the 200 least volatile stocks (over the trailing 12 months) included in the S&P Emerging Plus LargeMidCap Index. Volatility is a statistical measurement of the magnitude of up and down asset price fluctuations (increases or decreases in a stock’s price) over time. S&P DJI measures the realized volatility of the Index’s 200 constituents over the trailing 12 months and weights constituents so that the least volatile stocks receive the highest weights. The Fund generally invests in all of the securities comprising the Index in proportion to their weightings in the Index.
For the fiscal year ended October 31, 2022, on a market price basis, the Fund returned (10.40)%. On a net asset value (“NAV”) basis, the Fund returned (10.68)%. During the same time period, the Index returned (9.91)%. During the fiscal year, the Fund’s performance, on a NAV basis, differed from the return of the Index primarily due to fees and operating expenses that the Fund incurred, as well as trading costs around quarterly rebalances during the period that were higher than average given the relatively less liquid nature of many emerging markets securities.
During this same time period, the MSCI Emerging Markets IndexSM (Net) (the “Benchmark Index”) returned (31.03)%. The Benchmark Index is an unmanaged index weighted by market capitalization based on the average performance of approximately 1400 securities. The Benchmark Index was selected for its recognition in the marketplace, and its performance comparison is a useful measure for investors as a broad representation of emerging equity markets overall.
The performance of the Fund differed from the Benchmark Index in part because the Fund employs a beta driven stock selection and an inverse volatility weighting methodology, whereas the Benchmark Index selects and weights stocks based on market capitalization.
Relative to the Benchmark Index, the Fund was most overweight in the financials sector and most underweight in the information technology sector during the fiscal year ended October 31, 2022. The majority of the Fund’s outperformance relative to the Benchmark Index during the period can be attributed to its overweight allocation to and stock selection within the financials sector as well as its underweight allocation to and stock selection within the communication services and consumer discretionary sectors, respectively.
For the fiscal year ended October 31, 2022, the health care sector contributed most significantly to the Fund’s return, followed by the energy sector. The financials sector detracted most significantly from the Fund’s return, followed by the materials and information technology sectors, respectively.
Positions that contributed most significantly to the Fund’s return for the fiscal year ended October 31, 2022 included Ooredoo Q.P.S.C., a communication services company (portfolio average weight of 0.57%), and Alinma Bank, a financials company (no longer held at fiscal year-end). Positions that detracted most significantly from the Fund’s return included Mobile TeleSystems PJSC, a communication services company (portfolio average weight of 0.14%), and X5 Retail Group N.V., a consumer staples company (portfolio average weight of 0.11%).
| Sector Breakdown (% of the Fund’s Net Assets) as of October 31, 2022 | ||||
| Financials | 31.75 | |||
| Consumer Staples | 10.90 | |||
| Communication Services | 9.59 | |||
| Information Technology | 9.34 | |||
| Consumer Discretionary | 7.82 | |||
| Materials | 7.17 | |||
| Industrials | 7.10 | |||
| Utilities | 5.14 | |||
| Real Estate | 3.96 | |||
| Energy | 3.60 | |||
| Health Care | 3.48 | |||
| Money Market Funds Plus Other Assets Less Liabilities | 0.15 | |||
| Top Ten Fund Holdings* (% of the Fund’s Net Assets) as of October 31, 2022 | ||||
| Security | ||||
| KT&G Corp. | 1.09 | |||
| National Bank of Kuwait SAKP | 0.91 | |||
| Malayan Banking Bhd. | 0.90 | |||
| Taiwan Mobile Co. Ltd. | 0.83 | |||
| Tisco Financial Group PCL, NVDR | 0.80 | |||
| Taiwan High Speed Rail Corp. | 0.76 | |||
| Hong Leong Bank Bhd. | 0.75 | |||
| Mobile Telecommunications Co. KSCP | 0.75 | |||
| Chunghwa Telecom Co. Ltd. | 0.74 | |||
| Abu Dhabi National Oil Co. for Distribution PJSC | 0.72 | |||
| Total | 8.25 | |||
| * | Excluding money market fund holdings. |
| 6 |
|
Invesco S&P Emerging Markets Low Volatility ETF (EELV) (continued)
Growth of a $10,000 Investment
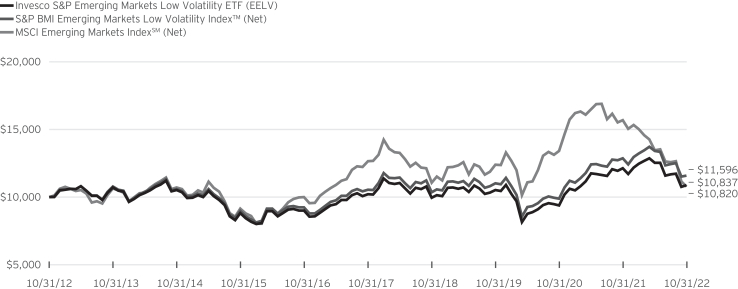
Fund Performance History as of October 31, 2022
| 1 Year | 3 Years Average | 3 Years Cumulative | 5 Years Average | 5 Years Cumulative | 10 Years Average | 10 Years Cumulative | Fund Inception | |||||||||||||||||||||||||||||||||
Index | Average Annualized | Cumulative | ||||||||||||||||||||||||||||||||||||||
| S&P BMI Emerging Markets Low Volatility Index™ (Net) | (9.91 | )% | 1.69 | % | 5.14 | % | 1.91 | % | 9.90 | % | 1.49 | % | 15.96 | % | 2.55 | % | 31.21 | % | ||||||||||||||||||||||
| MSCI Emerging Markets IndexSM (Net) | (31.03 | ) | (4.42 | ) | (12.67 | ) | (3.09 | ) | (14.54 | ) | 0.79 | 8.20 | 1.36 | 15.76 | ||||||||||||||||||||||||||
| Fund | ||||||||||||||||||||||||||||||||||||||||
| NAV Return | (10.68 | ) | 0.93 | 2.80 | 1.19 | 6.08 | 0.81 | 8.37 | 1.74 | 20.50 | ||||||||||||||||||||||||||||||
| Market Price Return | (10.40 | ) | 1.24 | 3.77 | 1.26 | 6.45 | 0.90 | 9.39 | 1.72 | 20.16 | ||||||||||||||||||||||||||||||
Fund Inception: January 13, 2012
Performance quoted above represents past performance. Past performance is not a guarantee of future results and current performance may be higher or lower than performance quoted. Investment returns and principal value will fluctuate, and shares of the Fund (“Fund Shares”), when redeemed or sold, may be worth more or less than their original cost. Fund performance reflects any applicable fee waivers and/or expense reimbursements. Had the adviser not waived fees and/or reimbursed expenses currently or in the past, returns would have been lower. See the current prospectus for more information. According to the Fund’s current prospectus, the Fund’s expense ratio of 0.29% is expressed as a unitary management fee to cover operating expenses and expenses incurred in connection with managing the portfolio. NAV and Market Price returns assume that dividends and capital gain distributions have been reinvested in the Fund at NAV and Market Price, respectively. The returns shown in the table above do not reflect the deduction of taxes that a shareholder would pay on Fund distributions or the redemption or sale of Fund Shares. See invesco.com/ETFs to find the most recent month-end performance numbers.
Performance results for the indexes stated above are based upon a hypothetical investment in their respective constituent securities. The returns of an index do not represent Fund returns. An investor cannot invest directly in an index. The indexes do not charge management fees or brokerage expenses, and no such fees or expenses were deducted from the hypothetical performance shown. In addition, the results actual investors might have achieved would have differed from those shown because of differences in the timing, amounts of their investments, and fees and expenses associated with an investment in the Fund.
Notes Regarding Indexes and Fund Performance History:
| - | Average Annualized and Cumulative Inception returns for the Fund and the indexes are based on the inception date of the Fund. |
| - | Net returns reflect reinvested dividends net of withholding taxes. |
| 7 |
|
| EEMO | Management’s Discussion of Fund Performance | |
| Invesco S&P Emerging Markets Momentum ETF (EEMO) |
As an index fund, the Invesco S&P Emerging Markets Momentum ETF (the “Fund”) is passively managed and seeks to track the investment results (before fees and expenses) of the S&P Momentum Emerging Plus LargeMidCap Index (the “Index”). The Fund generally will invest at least 90% of its total assets in the securities that comprise the Index, as well as American depositary receipts (“ADRs”) and global depositary receipts (“GDRs”) that represent securities in the Index.
Strictly in accordance with its guidelines and mandated procedures, S&P Dow Jones Indices LLC (“S&P DJI” or the “Index Provider”) compiles, maintains and calculates the Index, which is composed of constituents of the S&P Emerging Plus LargeMidCap (the “Emerging LargeMidCap Index”) that have the highest “momentum score.” In general, momentum is the tendency of an investment to exhibit persistence in its relative performance; a “momentum style” of investing emphasizes investing in securities that have had better recent performance compared to other securities. The momentum score for each security included in the Index is based on upward price movements of the security as compared to other eligible securities within the Emerging LargeMidCap Index, which is designed to measure publicly listed equity securities of companies with float-adjusted market values of at least $100 million in emerging market countries.
In selecting constituent securities for the Index, the Index Provider first calculates the momentum score of each stock in the Emerging LargeMidCap Index by evaluating the percentage change in the stock’s price over the last 12 months, excluding the most recent month, and applying an adjustment based on the security’s volatility over that period. The Index Provider then ranks all the stocks in descending order by momentum score, selects the top 20% for inclusion in the Index and weights the selected securities based on a modified market capitalization-weighted strategy. While the Fund generally seeks to invest in all of the securities comprising the Index in proportion to their weightings in the Index, at times the composition of the Index may make such “full replication” impracticable. In such circumstances, the Fund will utilize a “sampling” methodology to seek to achieve its investment objective.
For the fiscal year ended October 31, 2022, on a market price basis, the Fund returned (18.28)%. On a net asset value (“NAV”) basis, the Fund returned (18.82)%. During the same time period, the Index returned (18.18)%. During the fiscal year, the Fund’s performance, on a NAV basis, differed from the return of the Index primarily due to fees and expenses that the Fund incurred during the period as well as trading costs around quarterly rebalances during the period.
During this same time period, the MSCI Emerging Markets IndexSM (Net) (the “Benchmark Index”) returned (31.03)%. The Benchmark Index is an unmanaged index weighted by market capitalization based on the average performance of approximately
1400 securities. The Benchmark Index was selected for its recognition in the marketplace, and its performance comparison is a useful measure for investors as a broad representation of emerging equity markets overall.
The performance of the Fund differed from the Benchmark Index in part because the Fund employs a beta driven stock selection and a momentum weighting methodology, whereas the Benchmark Index selects and weights stocks based on market capitalization.
Relative to the Benchmark Index, the Fund was most overweight in the financials sector and most underweight in the information technology sector during the fiscal year ended October 31, 2022. The majority of the Fund’s outperformance relative to the Benchmark Index during the period can be attributed to its overweight allocation to and security selection within the financials and materials sectors, respectively.
For the fiscal year ended October 31, 2022, the utilities sector contributed most significantly to the Fund’s return, followed by the industrials and materials sectors, respectively. The financials sector detracted most significantly from the Fund’s return, followed by the consumer discretionary sector.
Positions that contributed most significantly to the Fund’s return for the fiscal year ended October 31, 2022 included Vale S.A., a materials company (no longer held at fiscal year-end), and Saudi Arabian Mining Co., a materials company (portfolio average weight of 1.17%). Positions that detracted most significantly from the Fund’s return included Gazprom PJSC, an energy company (portfolio average weight of 1.03%), and NIO Inc., Class A, a consumer discretionary company (no longer held at fiscal year-end).
| Sector Breakdown (% of the Fund’s Net Assets) as of October 31, 2022 | ||||
| Financials | 46.26 | |||
| Energy | 11.73 | |||
| Utilities | 10.10 | |||
| Industrials | 7.41 | |||
| Materials | 6.27 | |||
| Consumer Discretionary | 5.37 | |||
| Communication Services | 4.20 | |||
| Consumer Staples | 3.24 | |||
| Sector Types Each Less Than 3% | 5.47 | |||
| Money Market Funds Plus Other Assets Less Liabilities | (0.05) | |||
| 8 |
|
Invesco S&P Emerging Markets Momentum ETF (EEMO) (continued)
| Top Ten Fund Holdings* (% of the Fund’s Net Assets) as of October 31, 2022 | ||||
| Security | ||||
| ICICI Bank Ltd. | 3.28 | |||
| Petroleo Brasileiro S.A., Preference Shares | 2.92 | |||
| Al Rajhi Bank | 2.90 | |||
| Petroleo Brasileiro S.A. | 2.73 | |||
| Saudi National Bank (The) | 2.64 | |||
| National Bank of Kuwait SAKP | 2.52 | |||
| PT Bank Central Asia Tbk | 2.20 | |||
| Sociedad Quimica y Minera de Chile S.A., Class B, Preference Shares | 1.98 | |||
| Adani Total Gas Ltd. | 1.75 | |||
| Saudi Arabian Oil Co. | 1.70 | |||
| Total | 24.62 | |||
| * | Excluding money market fund holdings. |
Growth of a $10,000 Investment
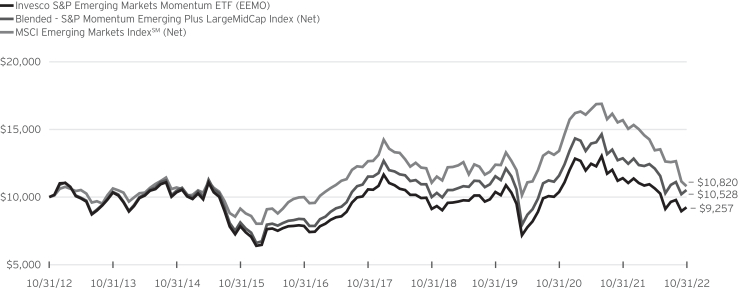
Fund Performance History as of October 31, 2022
| 1 Year | 3 Years Average | 3 Years Cumulative | 5 Years Average | 5 Years Cumulative | 10 Years Average | 10 Years Cumulative | Fund Inception | |||||||||||||||||||||||||||||||||
Index | Average Annualized | Cumulative | ||||||||||||||||||||||||||||||||||||||
| Blended—S&P Momentum Emerging Plus LargeMidCap Index (Net) | (18.18 | )% | (3.00 | )% | (8.73 | )% | (1.80 | )% | (8.67 | )% | 0.52 | % | 5.28 | % | (0.71 | )% | (7.32 | )% | ||||||||||||||||||||||
| MSCI Emerging Markets IndexSM (Net) | (31.03 | ) | (4.42 | ) | (12.67 | ) | (3.09 | ) | (14.54 | ) | 0.79 | 8.20 | 0.29 | 3.19 | ||||||||||||||||||||||||||
| Fund | ||||||||||||||||||||||||||||||||||||||||
| NAV Return | (18.82 | ) | (3.74 | ) | (10.80 | ) | (2.64 | ) | (12.50 | ) | (0.77 | ) | (7.43 | ) | (1.95 | ) | (18.97 | ) | ||||||||||||||||||||||
| Market Price Return | (18.28 | ) | (3.76 | ) | (10.86 | ) | (2.80 | ) | (13.23 | ) | (0.82 | ) | (7.86 | ) | (2.05 | ) | (19.87 | ) | ||||||||||||||||||||||
| 9 |
|
Invesco S&P Emerging Markets Momentum ETF (EEMO) (continued)
Fund Inception: February 24, 2012
Performance quoted above represents past performance. Past performance is not a guarantee of future results and current performance may be higher or lower than performance quoted. Investment returns and principal value will fluctuate, and shares of the Fund (“Fund Shares”), when redeemed or sold, may be worth more or less than their original cost. Fund performance reflects any applicable fee waivers and/or expense reimbursements. Had the adviser not waived fees and/or reimbursed expenses currently, or in the past, returns would have been lower. See the current prospectus for more information. According to the Fund’s current prospectus, the Fund’s expense ratio of 0.29% is expressed as a unitary management fee to cover operating expenses and expenses incurred in connection with managing the portfolio. NAV and Market Price returns assume that dividends and capital gain distributions have been reinvested in the Fund at NAV and Market Price, respectively. The returns shown in the table above do not reflect the deduction of taxes that a shareholder would pay on Fund distributions or the redemption or sale of Fund Shares. See invesco.com/ETFs to find the most recent month-end performance numbers.
Performance results for the indexes stated above are based upon a hypothetical investment in their respective constituent securities. The returns of an index do not represent Fund returns. An investor cannot invest directly in an index. The indexes do not charge management fees or brokerage expenses, and no such fees or expenses were deducted from the hypothetical performance shown. In addition, the results actual investors might have achieved would have differed from those shown because of differences in the timing, amounts of their investments, and fees and expenses associated with an investment in the Fund.
Notes Regarding Indexes and Fund Performance History:
| - | Average Annualized and Cumulative Inception returns for the Fund and the indexes are based on the inception date of the Fund. |
| - | The Blended-S&P Momentum Emerging Plus LargeMidCap Index is comprised of the performance of the S&P BMI Emerging Markets High Beta IndexTM, the Fund’s underlying index from Fund inception through the conversion date, March 21, 2016, followed by the performance of the Index for the period March 21, 2016 through October 31, 2022. |
| - | Net returns reflect reinvested dividends net of withholding taxes. |
| 10 |
|
| IDHD | Management’s Discussion of Fund Performance | |
| Invesco S&P International Developed High Dividend Low Volatility ETF (IDHD) |
As an index fund, the Invesco S&P International Developed High Dividend Low Volatility ETF (the “Fund”) is passively managed and seeks to track the investment results (before fees and expenses) of the S&P EPAC Ex-Korea Low Volatility High Dividend Index (the “Index”). The Fund generally will invest at least 90% of its total assets in the securities that comprise the Index.
Strictly in accordance with its guidelines and mandated procedures, S&P Dow Jones Indices LLC (“S&P DJI” or the “Index Provider”) compiles, maintains and calculates the Index, which is composed of 100 securities in the S&P EPAC Ex-Korea LargeMidCap Index (which is comprised of large and mid-cap equity securities and is designed to measure the performance of developed equity markets within the Europe and Asia Pacific regions, excluding South Korea) that historically have provided high dividend yields with lower volatility. Volatility is a statistical measurement of the magnitude of up and down asset price fluctuations (increases or decreases in a stock’s price) over time.
The Index Provider begins by identifying the 300 securities with the highest dividend yields over the trailing 12 months, with no one country except the U.S. and no one sector allowed to contribute more than 20 securities and 25 securities, respectively. For the U.S., the maximum number of stocks allowed is 40. From those 300 securities, the 100 securities with the lowest volatility over the trailing 12 months are included in the Index.
The Index Provider weights each of the 100 constituent securities in the Index by its dividend yield, with the highest dividend-yielding securities receiving the highest weights. Each constituent security comprises between 0.05% and 3.0% of the weight of the Index, and no sector comprises more than 25% of the Index. The Fund generally invests in all of the securities comprising the Index in proportion to their weightings in the Index.
During the fiscal year ended October 31, 2022, on a market price basis, the Fund returned (18.34)%. On a net asset value (“NAV”) basis, the Fund returned (17.57)%. During the same time period, the Index returned (17.52)%. During the fiscal year, the Fund fully replicated the components of the Index; therefore, the Fund’s performance, on a NAV basis, differed from the return of the Index primarily due to fees and operating expenses incurred by the Fund, which were partially offset by benefits to the Fund related to dividend tax treatment relative to the Index.
During this same time period, the MSCI EAFE® Index (Net) (the “Benchmark Index”) returned (23.00)%. The Benchmark Index is an unmanaged index weighted by market capitalization based on the average performance of approximately 850 securities. The Benchmark Index was selected for its recognition in the marketplace, and its performance comparison is a useful measure for investors as a broad representation of the markets of economically developed countries outside the U.S.
The performance of the Fund differed from the Benchmark Index in part because the Fund employs a dividend driven stock selection and an inverse volatility weighting methodology, whereas the Benchmark Index selects and weights stocks based on market capitalization.
Relative to the Benchmark Index, the Fund was most overweight in the health care sector and most underweight in the real estate sector during the fiscal year ended October 31, 2022. The majority of the Fund’s outperformance relative to the Benchmark Index during the period can be attributed to its overweight allocation to and security selection within the financials sector and its underweight allocation and selection within the information technology sector.
For the fiscal year ended October 31, 2022, the health care sector was the only sector that contributed positively to the Fund’s return. The real estate sector detracted most significantly from the Fund’s return, followed by the utilities and financials sectors, respectively.
Positions that contributed most significantly to the Fund’s return for the fiscal year ended October 31, 2022 included BOC Hong Kong Holdings Ltd., a financials company (no longer held at fiscal year-end), and Imperial Brands PLC, a consumer staples company (portfolio average weight of 0.41%). Positions that detracted most significantly from the Fund’s return included New World Development Co. Ltd., a real estate company (portfolio average weight of 0.35%), and Telenor ASA, a communication services company (portfolio average weight of 1.26%).
| Sector Breakdown (% of the Fund’s Net Assets) as of October 31, 2022 | ||||
| Financials | 27.47 | |||
| Real Estate | 20.46 | |||
| Utilities | 13.91 | |||
| Communication Services | 12.35 | |||
| Industrials | 10.16 | |||
| Consumer Staples | 9.11 | |||
| Sector Types Each Less Than 3% | 6.17 | |||
| Money Market Funds Plus Other Assets Less Liabilities | 0.37 | |||
| 11 |
|
Invesco S&P International Developed High Dividend Low Volatility ETF (IDHD) (continued)
| Top Ten Fund Holdings* (% of the Fund’s Net Assets) as of October 31, 2022 | ||||
| Security | ||||
| Assicurazioni Generali S.p.A. | 2.04 | |||
| Imperial Brands PLC | 1.81 | |||
| First International Bank of Israel Ltd. (The) | 1.73 | |||
| UnipolSai Assicurazioni S.p.A. | 1.68 | |||
| Oesterreichische Post AG | 1.55 | |||
| Fletcher Building Ltd. | 1.54 | |||
| Phoenix Group Holdings PLC | 1.42 | |||
| Australia & New Zealand Banking Group Ltd. | 1.42 | |||
| Stockland | 1.40 | |||
| Proximus SADP | 1.40 | |||
| Total | 15.99 | |||
| * | Excluding money market fund holdings. |
Growth of a $10,000 Investment Since Inception
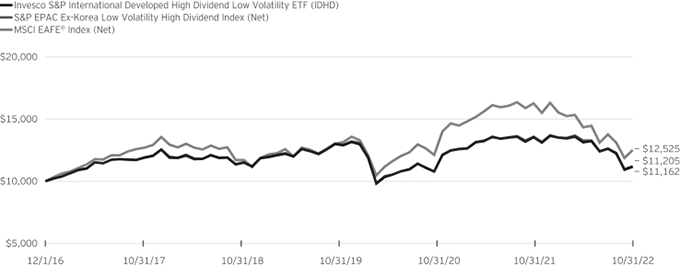
Fund Performance History as of October 31, 2022
| 1 Year | 3 Years Average | 3 Years Cumulative | 5 Years Average | 5 Years Cumulative | Fund Inception | |||||||||||||||||||||||||||
Index | Average Annualized | Cumulative | ||||||||||||||||||||||||||||||
| S&P EPAC Ex-Korea Low Volatility High Dividend Index (Net) | (17.52 | )% | (4.92 | )% | (14.04 | )% | (0.94 | )% | (4.59 | )% | 1.94 | % | 12.05 | % | ||||||||||||||||||
| MSCI EAFE® Index (Net) | (23.00 | ) | (1.27 | ) | (3.77 | ) | (0.09 | ) | (0.47 | ) | 3.88 | 25.25 | ||||||||||||||||||||
| Fund | ||||||||||||||||||||||||||||||||
| NAV Return | (17.57 | ) | (4.91 | ) | (14.01 | ) | (0.97 | ) | (4.78 | ) | 1.88 | 11.62 | ||||||||||||||||||||
| Market Price Return | (18.34 | ) | (5.08 | ) | (14.49 | ) | (1.24 | ) | (6.04 | ) | 1.78 | 11.03 | ||||||||||||||||||||
| 12 |
|
Invesco S&P International Developed High Dividend Low Volatility ETF (IDHD) (continued)
Fund Inception: December 1, 2016
Performance quoted above represents past performance. Past performance is not a guarantee of future results and current performance may be higher or lower than performance quoted. Investment returns and principal value will fluctuate, and shares of the Fund (“Fund Shares”), when redeemed or sold, may be worth more or less than their original cost. Fund performance reflects any applicable fee waivers and/or expense reimbursements. Had the adviser not waived fees and/or reimbursed expenses currently or in the past, returns would have been lower. See the current prospectus for more information. According to the Fund’s current prospectus, the Fund’s expense ratio of 0.30% is expressed as a unitary management fee to cover operating expenses and expenses incurred in connection with managing the portfolio. NAV and Market Price returns assume that dividends and capital gain distributions have been reinvested in the Fund at NAV and Market Price, respectively. The returns shown in the table above do not reflect the deduction of taxes that a shareholder would pay on Fund distributions or the redemption or sale of Fund Shares. See invesco.com/ ETFs to find the most recent month-end performance numbers.
Performance results for the indexes stated above are based upon a hypothetical investment in their respective constituent securities. The returns of an index do not represent Fund returns. An investor cannot invest directly in an index. The indexes do not charge management fees or brokerage expenses, and no such fees or expenses were deducted from the hypothetical performance shown. In addition, the results actual investors might have achieved would have differed from those shown because of differences in the timing, amounts of their investments, and fees and expenses associated with an investment in the Fund.
Notes Regarding Indexes and Fund Performance History:
| - | Average Annualized and Cumulative Inception returns for the Fund and the indexes are based on the inception date of the Fund. |
| - | Net returns reflect reinvested dividends net of withholding taxes. |
| 13 |
|
| IDLV | Management’s Discussion of Fund Performance | |
| Invesco S&P International Developed Low Volatility ETF (IDLV) |
As an index fund, the Invesco S&P International Developed Low Volatility ETF (the “Fund”) is passively managed and seeks to track the investment results (before fees and expenses) of the S&P BMI International Developed Low VolatilityTM Index (the “Index”). The Fund generally will invest at least 90% of its total assets in the securities that comprise the Index.
Strictly in accordance with its guidelines and mandated procedures, S&P Dow Jones Indices LLC (“S&P DJI” or the “Index Provider”) compiles, maintains and calculates the Index, which is designed to measure the performance of the 200 least volatile stocks of the S&P Developed ex-U.S. & South Korea LargeMidCap Index (which is designed to measure the performance of large- and mid-cap securities in developed markets throughout the world, excluding the United States and South Korea). Volatility is a statistical measurement of the magnitude of up and down asset price fluctuations (increases or decreases in a stock’s price) over time. S&P DJI measures the realized volatility of the Index’s 200 constituents over the trailing 12 months and weights constituents so that the least volatile stocks receive the highest weights. The Fund generally invests in all of the securities comprising the Index in proportion to their weightings in the Index.
For the fiscal year ended October 31, 2022, on a market price basis, the Fund returned (17.50)%. On a net asset value (“NAV”) basis, the Fund returned (17.33)%. During the same time period, the Index returned (17.32)%. During the fiscal year, the Fund fully replicated the components of the Index; therefore, the Fund’s performance, on a NAV basis, differed from the return of the Index primarily due to the fees and operating expenses incurred by the Fund, which were partially offset by benefits to the Fund related to dividend tax treatment relative to the Index.
During this same time period, the MSCI EAFE® Index (Net) (the “Benchmark Index”) returned (23.00)%. The Benchmark Index is an unmanaged index weighted by market capitalization based on the average performance of approximately 850 securities. The Benchmark Index was selected for its recognition in the marketplace, and its performance comparison is a useful measure for investors as a broad representation of the markets of economically developed countries outside the U.S.
The performance of the Fund differed from the Benchmark Index in part because the Fund employs a beta driven stock selection and an inverse volatility weighting methodology, whereas the Benchmark Index selects and weights stocks based on market capitalization.
Relative to the Benchmark Index, the Fund was most overweight in the real estate sector and most underweight in the health care sector during the fiscal year ended October 31, 2022. The majority of the Fund’s outperformance relative to the Benchmark Index during the period can be attributed to its underweight
allocation to and security selection within the consumer discretionary and industrials sectors, respectively.
For the fiscal year ended October 31, 2022, the consumer discretionary sector was the only sector that contributed positively to the Fund’s return. The real estate sector detracted most significantly from the Fund’s return, followed by the financials and utilities sectors, respectively.
Positions that contributed most significantly to the Fund’s return for the fiscal year ended October 31, 2022 included Thales S.A., an industrials company (no longer held at fiscal year-end), and BAE Systems PLC, an industrials company (no longer held at fiscal year-end). Positions that detracted most significantly from the Fund’s return included HK Electric Investments & HK Electric Investments Ltd., a utilities company (portfolio average weight of 0.74%), and Hong Kong & China Gas Co. Ltd., a utilities company (portfolio average weight of 0.48%).
| Sector Breakdown (% of the Fund’s Net Assets) as of October 31, 2022 | ||||
| Financials | 19.62 | |||
| Real Estate | 16.32 | |||
| Consumer Staples | 14.02 | |||
| Utilities | 12.98 | |||
| Industrials | 12.22 | |||
| Communication Services | 10.90 | |||
| Consumer Discretionary | 4.72 | |||
| Health Care | 3.52 | |||
| Sector Types Each Less Than 3% | 5.15 | |||
| Money Market Funds Plus Other Assets Less Liabilities | 0.55 | |||
| Top Ten Fund Holdings* (% of the Fund’s Net Assets) as of October 31, 2022 | ||||
| Security | ||||
| McDonald’s Holdings Co. Japan Ltd. | 0.92 | |||
| HK Electric Investments & HK Electric Investments Ltd. | 0.80 | |||
| HKT Trust & HKT Ltd. | 0.76 | |||
| Hydro One Ltd. | 0.75 | |||
| BCE, Inc. | 0.72 | |||
| MTR Corp. Ltd. | 0.70 | |||
| Canadian Utilities Ltd., Class A | 0.69 | |||
| CapitaLand Ascendas REIT | 0.68 | |||
| Fortis, Inc. | 0.67 | |||
| Orange S.A. | 0.66 | |||
| Total | 7.35 | |||
| * | Excluding money market fund holdings. |
| 14 |
|
Invesco S&P International Developed Low Volatility ETF (IDLV) (continued)
Growth of a $10,000 Investment
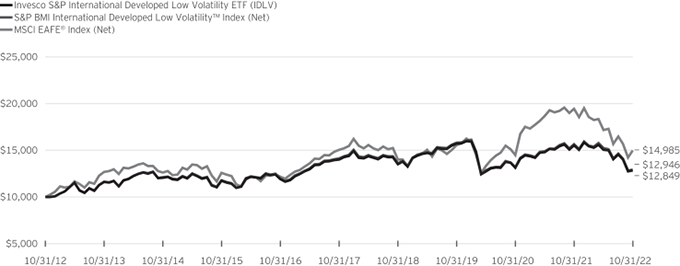
Fund Performance History as of October 31, 2022
| 1 Year | 3 Years Average | 3 Years Cumulative | 5 Years Average | 5 Years Cumulative | 10 Years Average | 10 Years Cumulative | Fund Inception | |||||||||||||||||||||||||||||||||
Index | Average Annualized | Cumulative | ||||||||||||||||||||||||||||||||||||||
| S&P BMI International Developed Low Volatility™ Index (Net) | (17.32 | )% | (6.48 | )% | (18.21 | )% | (1.75 | )% | (8.43 | )% | 2.62 | % | 29.46 | % | 3.69 | % | 47.92 | % | ||||||||||||||||||||||
| MSCI EAFE® Index (Net) | (23.00 | ) | (1.27 | ) | (3.77 | ) | (0.09 | ) | (0.47 | ) | 4.13 | 49.85 | 4.80 | 65.98 | ||||||||||||||||||||||||||
| Fund | ||||||||||||||||||||||||||||||||||||||||
| NAV Return | (17.33 | ) | (6.52 | ) | (18.30 | ) | (1.74 | ) | (8.41 | ) | 2.54 | 28.49 | 3.62 | 46.75 | ||||||||||||||||||||||||||
| Market Price Return | (17.50 | ) | (6.51 | ) | (18.29 | ) | (1.75 | ) | (8.44 | ) | 2.55 | 28.65 | 3.57 | 46.03 | ||||||||||||||||||||||||||
Fund Inception: January 13, 2012
Performance quoted above represents past performance. Past performance is not a guarantee of future results and current performance may be higher or lower than performance quoted. Investment returns and principal value will fluctuate, and shares of the Fund (“Fund Shares”), when redeemed or sold, may be worth more or less than their original cost. Fund performance reflects any applicable fee waivers and/or expense reimbursements. Had the adviser not waived fees and/or reimbursed expenses currently or in the past, returns would have been lower. See the current prospectus for more information. According to the Fund’s current prospectus, the Fund’s expense ratio of 0.25% is expressed as a unitary management fee to cover operating expenses and expenses incurred in connection with managing the portfolio. NAV and Market Price returns assume that dividends and capital gain distributions have been reinvested in the Fund at NAV and Market Price, respectively. The returns shown in the table above do not reflect the deduction of taxes that a shareholder would pay on Fund distributions or the redemption or sale of Fund Shares. See invesco.com/ ETFs to find the most recent month-end performance numbers.
Performance results for the indexes stated above are based upon a hypothetical investment in their respective constituent securities. The returns of an index do not represent Fund returns. An investor cannot invest directly in an index. The indexes do not charge management fees or brokerage expenses, and no such fees or expenses were deducted from the hypothetical performance shown. In addition, the results actual investors might have achieved would have differed from those shown because of differences in the timing, amounts of their investments, and fees and expenses associated with an investment in the Fund.
Notes Regarding Indexes and Fund Performance History:
| - | Average Annualized and Cumulative Inception returns for the Fund and the indexes are based on the inception date of the Fund. |
| - | Net returns reflect reinvested dividends net of withholding taxes. |
| 15 |
|
| IDMO | Management’s Discussion of Fund Performance | |
| Invesco S&P International Developed Momentum ETF (IDMO) |
As an index fund, Invesco S&P International Developed Momentum ETF (the “Fund”) is passively managed and seeks to track the investment results (before fees and expenses) of the S&P Momentum Developed ex-U.S. & South Korea LargeMidCap (the “Index”). The Fund generally will invest at least 90% of its total assets in the securities that comprise the Index.
Strictly in accordance with its guidelines and mandated procedures, S&P Dow Jones Indices LLC (“S&P DJI” or the “Index Provider”) compiles, maintains and calculates the Index, which is composed of constituents of the S&P Developed ex-U.S. & South Korea LargeMidCap (the “Developed ex-U.S. & South Korea Index”) that have the highest “momentum score.” In general, momentum is the tendency of an investment to exhibit persistence in its relative performance; a “momentum style” of investing emphasizes investing in securities that have had better recent performance compared to other securities. The momentum score for each security included in the Index is based on upward price movements of the security as compared to other eligible securities within the Developed ex-U.S. & South Korea Index, which is designed to measure the performance of large- and mid-cap securities in developed markets throughout the world, excluding the United States and South Korea.
In selecting constituent securities for the Index, the Index Provider first calculates the momentum score of each stock in the Developed ex-U.S. & South Korea Index by evaluating the percentage change in the stock’s price over the last 12 months, excluding the most recent month, and applying an adjustment based on the security’s volatility over that period. The Index Provider then ranks all the stocks in descending order by momentum score, selects the top 20% for inclusion in the Index and weights the selected securities based on a modified market capitalization-weighted strategy. The Fund generally invests in all of the securities comprising the Index in proportion to their weighting in the Index.
For the fiscal year ended October 31, 2022, on a market price basis, the Fund returned (18.21)%. On a net asset value (“NAV”) basis, the Fund returned (18.73)%. During the same time period, the Index returned (18.50)%. During the fiscal year, the Fund’s performance, on a NAV basis, differed from the return of the Index primarily due to fees and expenses that the Fund incurred during the period.
During this same time period, the MSCI EAFE® Index (Net) (the “Benchmark Index”) returned (23.00)%. The Benchmark Index is an unmanaged index weighted by market capitalization based on the average performance of approximately 850 securities. The Benchmark Index was selected for its recognition in the marketplace, and its performance comparison is a useful measure for investors as a broad representation of the markets of economically developed countries outside the U.S.
The performance of the Fund differed from the Benchmark Index in part because the Fund employs a momentum driven stock selection and weighting methodology, whereas the Benchmark Index selects and weights stocks based on market capitalization.
Relative to the Benchmark Index, the Fund was most overweight in the financials sector and most underweight in the health care sector during the fiscal year ended October 31, 2022. The majority of the Fund’s outperformance relative to the Benchmark Index during the period can be attributed to the Fund’s overweight allocation to and stock selection within the financials sector and the Fund’s overweight allocation to the energy sector.
For the fiscal year ended October 31, 2022, the energy sector was the only sector to contribute positively to the Fund’s return. The financials sector detracted most significantly from the Fund’s return, followed by the consumer discretionary and industrials sectors, respectively.
Positions that contributed most significantly to the Fund’s return for the fiscal year ended October 31, 2022 included Shell PLC, an energy company (portfolio average weight of 2.26%), and TotalEnergies SE, an energy company (portfolio average weight of 1.59%). Positions that detracted most significantly from the Fund’s return included ASML Holdings N.V., an information technology company (no longer held at fiscal year-end), and Toyota Motor Corp., a consumer discretionary company (no longer held at fiscal year-end).
| Sector Breakdown (% of the Fund’s Net Assets) as of October 31, 2022 | ||||
| Energy | 28.76 | |||
| Financials | 16.43 | |||
| Health Care | 14.97 | |||
| Industrials | 11.54 | |||
| Consumer Staples | 7.48 | |||
| Communication Services | 5.68 | |||
| Utilities | 5.00 | |||
| Materials | 4.39 | |||
| Consumer Discretionary | 3.13 | |||
| Sector Types Each Less Than 3% | 2.46 | |||
| Money Market Funds Plus Other Assets Less Liabilities | 0.16 | |||
| 16 |
|
Invesco S&P International Developed Momentum ETF (IDMO) (continued)
| Top Ten Fund Holdings* (% of the Fund’s Net Assets) as of October 31, 2022 | ||||
| Security | ||||
| Shell PLC | 6.54 | |||
| Novo Nordisk A/S, Class B | 5.25 | |||
| AstraZeneca PLC | 4.75 | |||
| TotalEnergies SE | 3.69 | |||
| BP PLC | 2.89 | |||
| HSBC Holdings PLC | 2.51 | |||
| Canadian Natural Resources Ltd. | 2.51 | |||
| Enbridge, Inc. | 2.36 | |||
| British American Tobacco PLC | 2.34 | |||
| Daiichi Sankyo Co. Ltd. | 1.96 | |||
| Total | 34.80 | |||
| * | Excluding money market fund holdings. |
Growth of a $10,000 Investment
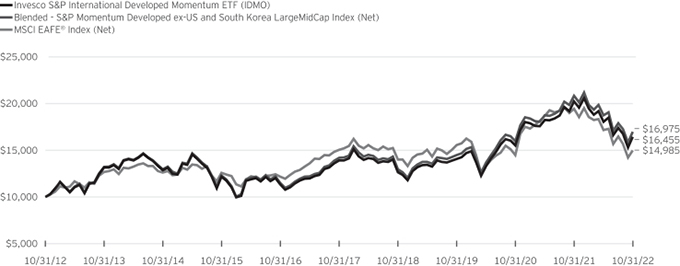
Fund Performance History as of October 31, 2022
| 1 Year | 3 Years Average | 3 Years Cumulative | 5 Years Average | 5 Years Cumulative | 10 Years Average | 10 Years Cumulative | Fund Inception | |||||||||||||||||||||||||||||||||
Index | Average Annualized | Cumulative | ||||||||||||||||||||||||||||||||||||||
| Blended—S&P Momentum Developed ex-US and South Korea LargeMidCap Index (Net) | (18.50 | )% | 5.40 | % | 17.08 | % | 3.64 | % | 19.58 | % | 5.43 | % | 69.75 | % | 4.15 | % | 54.40 | % | ||||||||||||||||||||||
| MSCI EAFE® Index (Net) | (23.00 | ) | (1.27 | ) | (3.77 | ) | (0.09 | ) | (0.47 | ) | 4.13 | 49.85 | 3.80 | 48.93 | ||||||||||||||||||||||||||
| Fund | ||||||||||||||||||||||||||||||||||||||||
| NAV Return | (18.73 | ) | 5.30 | 16.75 | 3.42 | 18.32 | 5.11 | 64.55 | 3.81 | 49.02 | ||||||||||||||||||||||||||||||
| Market Price Return | (18.21 | ) | 5.65 | 17.93 | 3.71 | 19.96 | 5.13 | 64.84 | 3.81 | 49.04 | ||||||||||||||||||||||||||||||
| 17 |
|
Invesco S&P International Developed Momentum ETF (IDMO) (continued)
Fund Inception: February 24, 2012
Performance quoted above represents past performance. Past performance is not a guarantee of future results and current performance may be higher or lower than performance quoted. Investment returns and principal value will fluctuate, and shares of the Fund (“Fund Shares”), when redeemed or sold, may be worth more or less than their original cost. Fund performance reflects any applicable fee waivers and/or expense reimbursements. Had the adviser not waived fees and/or reimbursed expenses currently, or in the past, returns would have been lower. See the current prospectus for more information. According to the Fund’s current prospectus, the Fund’s expense ratio of 0.25% is expressed as a unitary management fee to cover operating expenses and expenses incurred in connection with managing the portfolio. NAV and Market Price returns assume that dividends and capital gain distributions have been reinvested in the Fund at NAV and Market Price, respectively. The returns shown in the table above do not reflect the deduction of taxes that a shareholder would pay on Fund distributions or the redemption or sale of Fund Shares. See invesco.com/ ETFs to find the most recent month-end performance numbers.
Performance results for the indexes stated above are based upon a hypothetical investment in their respective constituent securities. The returns of an index do not represent Fund returns. An investor cannot invest directly in an index. The indexes do not charge management fees or brokerage expenses, and no such fees or expenses were deducted from the hypothetical performance shown. In addition, the results actual investors might have achieved would have differed from those shown because of differences in the timing, amounts of their investments, and fees and expenses associated with an investment in the Fund.
Notes Regarding Indexes and Fund Performance History:
| - | Average Annualized and Cumulative Inception returns for the Fund and the indexes are based on the inception date of the Fund. |
| - | The Blended-S&P Momentum Developed ex-U.S. & South Korea LargeMidCap Index is comprised of the performance of the S&P BMI International Developed High Beta IndexTM, the Fund’s underlying index from Fund inception through the conversion date, March 21, 2016, followed by the performance of the Index for the period March 21, 2016 through October 31, 2022. |
| - | Net returns reflect reinvested dividends net of withholding taxes. |
| 18 |
|
Invesco FTSE International Low Beta Equal Weight ETF (IDLB)
October 31, 2022
| Shares | Value | |||||||
| Common Stocks & Other Equity Interests-98.64% |
| |||||||
| Australia-5.11% | ||||||||
Adbri Ltd. | 3,583 | $ | 3,609 | |||||
AGL Energy Ltd. | 1,031 | 4,490 | ||||||
Alumina Ltd.(a) | 5,227 | 4,512 | ||||||
Ampol Ltd. | 229 | 3,987 | ||||||
APA Group | 714 | 4,799 | ||||||
Aristocrat Leisure Ltd. | 222 | 5,262 | ||||||
ASX Ltd. | 101 | 4,372 | ||||||
Atlas Arteria Ltd. | 1,050 | 4,425 | ||||||
Aurizon Holdings Ltd. | 2,123 | 4,914 | ||||||
Australia & New Zealand Banking Group Ltd. | 347 | 5,671 | ||||||
Beach Energy Ltd. | 4,631 | 4,708 | ||||||
BHP Group Ltd. | 195 | 4,659 | ||||||
Brambles Ltd. | 640 | 4,780 | ||||||
Challenger Ltd. | 1,237 | 5,553 | ||||||
Coles Group Ltd. | 451 | 4,709 | ||||||
CSL Ltd. | 27 | 4,843 | ||||||
Deterra Royalties Ltd. | 1,890 | 4,943 | ||||||
EBOS Group Ltd. | 229 | 4,989 | ||||||
Incitec Pivot Ltd. | 2,020 | 4,844 | ||||||
Insurance Australia Group Ltd. | 1,703 | 5,336 | ||||||
Lynas Rare Earths Ltd.(b) | 892 | 4,751 | ||||||
Magellan Financial Group Ltd.(a) | 608 | 3,861 | ||||||
Medibank Pvt. Ltd. | 2,134 | 3,834 | ||||||
Metcash Ltd.(a) | 1,922 | 5,039 | ||||||
Orora Ltd. | 2,385 | 4,621 | ||||||
Platinum Asset Management Ltd. | 4,436 | 5,077 | ||||||
QBE Insurance Group Ltd. | 656 | 5,134 | ||||||
Qube Holdings Ltd. | 2,740 | 4,766 | ||||||
Ramsay Health Care Ltd. | 110 | 4,120 | ||||||
REA Group Ltd. | 62 | 4,821 | ||||||
Rio Tinto Ltd. | 84 | 4,738 | ||||||
Santos Ltd. | 1,004 | 4,943 | ||||||
Scentre Group | 2,693 | 4,994 | ||||||
Seven Group Holdings Ltd.(a) | 426 | 4,996 | ||||||
Shopping Centres Australasia Property Group | 2,901 | 5,046 | ||||||
Stockland | 2,188 | 5,037 | ||||||
Suncorp Group Ltd. | 727 | 5,304 | ||||||
Tabcorp Holdings Ltd.(a) | 8,249 | 5,090 | ||||||
Telstra Group Ltd.(b) | 1,995 | 5,001 | ||||||
TPG Telecom Ltd.(a) | 1,480 | 4,637 | ||||||
Transurban Group | 567 | 4,808 | ||||||
Treasury Wine Estates Ltd. | 600 | 4,969 | ||||||
Vicinity Ltd. | 4,092 | 5,089 | ||||||
Woodside Energy Group Ltd. | 231 | 5,315 | ||||||
Woolworths Group Ltd. | 219 | 4,624 | ||||||
Worley Ltd. | 545 | 4,973 | ||||||
|
| |||||||
| 220,993 | ||||||||
|
| |||||||
| Austria-0.62% | ||||||||
ANDRITZ AG | 117 | 5,442 | ||||||
OMV AG | 134 | 6,177 | ||||||
Telekom Austria AG | 868 | 5,044 | ||||||
Verbund AG | 57 | 4,465 | ||||||
voestalpine AG | 268 | 5,822 | ||||||
|
| |||||||
| 26,950 | ||||||||
|
| |||||||
| Belgium-0.95% | ||||||||
Ackermans & van Haaren N.V. | 37 | 5,160 | ||||||
| Shares | Value | |||||||
| Belgium-(continued) | ||||||||
Ageas S.A./N.V. | 133 | $ | 4,605 | |||||
Elia Group S.A./N.V. | 37 | 4,677 | ||||||
Etablissements Franz Colruyt N.V.(a) | 195 | 4,701 | ||||||
KBC Group N.V. | 114 | 5,712 | ||||||
Proximus SADP(a) | 426 | 4,467 | ||||||
Solvay S.A., Class A | 67 | 6,042 | ||||||
Umicore S.A.(a) | 170 | 5,603 | ||||||
|
| |||||||
| 40,967 | ||||||||
|
| |||||||
| Brazil-0.13% | ||||||||
Yara International ASA | 128 | 5,713 | ||||||
|
| |||||||
| Canada-4.21% | ||||||||
Barrick Gold Corp. | 380 | 5,708 | ||||||
BCE, Inc. | 117 | 5,271 | ||||||
Canadian National Railway Co. | 48 | 5,680 | ||||||
Canadian Tire Corp. Ltd., Class A(a) | 48 | 5,373 | ||||||
Canadian Utilities Ltd., Class A | 186 | 4,943 | ||||||
Cenovus Energy, Inc. | 302 | 6,097 | ||||||
CGI, Inc., Class A(b) | 72 | 5,793 | ||||||
Constellation Software, Inc. | 4 | 5,777 | ||||||
Dollarama, Inc. | 93 | 5,519 | ||||||
Enbridge, Inc. | 137 | 5,331 | ||||||
Fairfax Financial Holdings Ltd. | 11 | 5,396 | ||||||
Fortis, Inc. | 128 | 4,988 | ||||||
George Weston Ltd. | 50 | 5,496 | ||||||
Great-West Lifeco, Inc. | 241 | 5,572 | ||||||
Hydro One Ltd.(c) | 209 | 5,234 | ||||||
Imperial Oil Ltd. | 115 | 6,248 | ||||||
Intact Financial Corp. | 39 | 5,919 | ||||||
Loblaw Cos. Ltd. | 64 | 5,237 | ||||||
Manulife Financial Corp. | 327 | 5,413 | ||||||
Metro, Inc. | 107 | 5,598 | ||||||
Pembina Pipeline Corp. | 160 | 5,276 | ||||||
Power Corp. of Canada | 220 | 5,456 | ||||||
Restaurant Brands International, Inc. | 97 | 5,756 | ||||||
Royal Bank of Canada | 61 | 5,637 | ||||||
Saputo, Inc. | 223 | 5,421 | ||||||
Shaw Communications, Inc., Class B | 220 | 5,643 | ||||||
Sun Life Financial, Inc. | 129 | 5,472 | ||||||
Suncor Energy, Inc. | 174 | 5,978 | ||||||
TC Energy Corp. | 117 | 5,133 | ||||||
TELUS Corp. | 251 | 5,235 | ||||||
Thomson Reuters Corp. | 51 | 5,417 | ||||||
Toronto-Dominion Bank (The) | 88 | 5,625 | ||||||
Tourmaline Oil Corp. | 97 | 5,459 | ||||||
|
| |||||||
| 182,101 | ||||||||
|
| |||||||
| China-0.91% | ||||||||
AAC Technologies Holdings, Inc.(b) | 2,914 | 5,338 | ||||||
ESR Group Ltd.(c) | 1,932 | 3,298 | ||||||
Kerry Logistics Network Ltd. | 2,466 | 3,914 | ||||||
Lenovo Group Ltd. | 6,555 | 5,244 | ||||||
Nexteer Automotive Group Ltd.(a) | 7,271 | 3,937 | ||||||
Prosus N.V | 88 | 3,830 | ||||||
SITC International Holdings Co. Ltd. | 2,130 | 3,489 | ||||||
Want Want China Holdings Ltd. | 7,691 | 5,056 | ||||||
Wilmar International Ltd. | 1,875 | 5,141 | ||||||
|
| |||||||
| 39,247 | ||||||||
|
| |||||||
See accompanying Notes to Financial Statements which are an integral part of the financial statements.
| 19 | ||||
|
| |||
Invesco FTSE International Low Beta Equal Weight ETF (IDLB)–(continued)
October 31, 2022
| Shares | Value | |||||||
| Denmark-0.80% | ||||||||
Chr. Hansen Holding A/S(a) | 93 | $ | 5,166 | |||||
Coloplast A/S, Class B(a) | 47 | 5,241 | ||||||
Danske Bank A/S | 405 | 6,538 | ||||||
GN Store Nord A/S(a) | 191 | 4,062 | ||||||
Royal Unibrew A/S | 72 | 4,113 | ||||||
SimCorp A/S | 74 | 4,421 | ||||||
Tryg A/S(a) | 240 | 5,195 | ||||||
|
| |||||||
| 34,736 | ||||||||
|
| |||||||
| Finland-1.08% | ||||||||
Elisa OYJ | 101 | 4,882 | ||||||
Huhtamaki OYJ | 155 | 5,569 | ||||||
Kojamo OYJ(a) | 323 | 4,204 | ||||||
Kone OYJ, Class B | 135 | 5,531 | ||||||
Nordea Bank Abp | 583 | 5,575 | ||||||
Orion OYJ, Class B | 120 | 5,521 | ||||||
Sampo OYJ, Class A | 120 | 5,489 | ||||||
Stora Enso OYJ, Class R | 363 | 4,732 | ||||||
UPM-Kymmene OYJ | 159 | 5,329 | ||||||
|
| |||||||
| 46,832 | ||||||||
|
| |||||||
| France-4.54% | ||||||||
Accor S.A.(b) | 226 | 5,414 | ||||||
Adevinta ASA, Class B(b) | 664 | 4,547 | ||||||
Aeroports de Paris(b) | 39 | 5,283 | ||||||
Air Liquide S.A. | 43 | 5,623 | ||||||
ALD S.A.(c) | 497 | 5,305 | ||||||
Amundi S.A.(c) | 106 | 5,006 | ||||||
AXA S.A. | 229 | 5,658 | ||||||
BioMerieux | 59 | 5,221 | ||||||
BNP Paribas S.A. | 116 | 5,445 | ||||||
Bollore SE | 1,130 | 5,657 | ||||||
Bouygues S.A. | 184 | 5,252 | ||||||
Carrefour S.A.(a) | 324 | 5,215 | ||||||
Credit Agricole S.A. | 587 | 5,329 | ||||||
Danone S.A. | 103 | 5,125 | ||||||
Dassault Aviation S.A. | 39 | 5,797 | ||||||
Edenred | 107 | 5,495 | ||||||
Eiffage S.A. | 61 | 5,519 | ||||||
ENGIE S.A. | 455 | 5,915 | ||||||
EssilorLuxottica S.A. | 36 | 5,705 | ||||||
Ipsen S.A. | 57 | 5,859 | ||||||
JCDecaux S.A.(b) | 390 | 4,922 | ||||||
La Francaise des Jeux SAEM(c) | 167 | 5,447 | ||||||
Neoen S.A.(c) | 131 | 4,573 | ||||||
Orange S.A. | 535 | 5,093 | ||||||
Pernod Ricard S.A. | 29 | 5,093 | ||||||
Publicis Groupe S.A. | 111 | 6,225 | ||||||
Remy Cointreau S.A. | 29 | 4,445 | ||||||
Sanofi | 66 | 5,697 | ||||||
SEB S.A.(a) | 73 | 4,755 | ||||||
Sodexo S.A. | 71 | 6,297 | ||||||
Somfy S.A. | 49 | 5,221 | ||||||
Thales S.A. | 45 | 5,722 | ||||||
TotalEnergies SE | 107 | 5,827 | ||||||
Ubisoft Entertainment S.A.(b) | 117 | 3,211 | ||||||
Unibail-Rodamco-Westfield(a)(b) | 105 | 4,969 | ||||||
Vinci S.A. | 59 | 5,434 | ||||||
Vivendi SE | 596 | 4,880 | ||||||
|
| |||||||
| 196,181 | ||||||||
|
| |||||||
| Shares | Value | |||||||
| Germany-4.69% | ||||||||
1&1 AG | 337 | $ | 4,443 | |||||
adidas AG | 36 | 3,522 | ||||||
Allianz SE | 32 | 5,763 | ||||||
Bayer AG | 103 | 5,418 | ||||||
Bechtle AG | 141 | 4,878 | ||||||
Beiersdorf AG | 54 | 5,187 | ||||||
Commerzbank AG(b) | 814 | 6,513 | ||||||
Continental AG | 94 | 4,876 | ||||||
Covestro AG(c) | 179 | 6,093 | ||||||
CTS Eventim AG& Co. KGaA(b) | 101 | 4,826 | ||||||
Deutsche Bank AG | 649 | 6,196 | ||||||
Deutsche Boerse AG | 32 | 5,208 | ||||||
Deutsche Telekom AG | 287 | 5,436 | ||||||
Deutsche Wohnen SE | 238 | 4,803 | ||||||
Fielmann AG | 146 | 4,655 | ||||||
Fraport AG Frankfurt Airport Services | ||||||||
Worldwide(b) | 125 | 4,823 | ||||||
Fresenius Medical Care AG& Co. KGaA | 158 | 4,369 | ||||||
Fresenius SE & Co. KGaA | 219 | 5,043 | ||||||
Fuchs Petrolub SE | 68 | 1,640 | ||||||
Fuchs Petrolub SE, Preference Shares | 141 | 4,041 | ||||||
Hannover Rueck SE | 37 | 6,027 | ||||||
Hella GmbH & Co. KGaA | 77 | 6,016 | ||||||
HelloFresh SE(b) | 226 | 4,525 | ||||||
Henkel AG& Co. KGaA | 32 | 1,880 | ||||||
Henkel AG& Co. KGaA, Preference Shares | 53 | 3,341 | ||||||
Mercedes-Benz Group AG | 96 | 5,560 | ||||||
MTU Aero Engines AG | 31 | 5,553 | ||||||
Muenchener Rueckversicherungs-Gesellschaft AG in Muenchen, Class R | 23 | 6,079 | ||||||
Nemetschek SE | 92 | 4,397 | ||||||
Puma SE | 88 | 3,897 | ||||||
Rheinmetall AG | 34 | 5,528 | ||||||
RWE AG | 142 | 5,472 | ||||||
Sartorius AG | 14 | 4,130 | ||||||
Scout24 SE(c) | 94 | 4,820 | ||||||
Siemens Healthineers AG(c) | 111 | 5,110 | ||||||
Symrise AG | 52 | 5,312 | ||||||
Talanx AG | 153 | 5,749 | ||||||
Telefonica Deutschland Holding AG | 2,089 | 4,555 | ||||||
United Internet AG | 239 | 4,470 | ||||||
Vantage Towers AG | 209 | 5,883 | ||||||
Varta AG(a) | 77 | 2,068 | ||||||
Wacker Chemie AG | 38 | 4,428 | ||||||
|
| |||||||
| 202,533 | ||||||||
|
| |||||||
| Hong Kong-2.77% | ||||||||
AIA Group Ltd. | 561 | 4,249 | ||||||
ASMPT Ltd. | 698 | 3,841 | ||||||
Bank of East Asia Ltd. (The) | 4,304 | 4,123 | ||||||
Cafe de Coral Holdings Ltd. | 3,784 | 4,416 | ||||||
Champion REIT | 12,606 | 3,774 | ||||||
CK Hutchison Holdings Ltd. | 840 | 4,173 | ||||||
CK Infrastructure Holdings Ltd. | 891 | 4,234 | ||||||
Dah Sing Banking Group Ltd. | 6,974 | 4,158 | ||||||
DFI Retail Group Holdings Ltd. | 1,996 | 4,471 | ||||||
Guotai Junan International Holdings Ltd. | 56,065 | 4,000 | ||||||
Hang Lung Group Ltd. | 3,204 | 4,155 | ||||||
Hang Lung Properties Ltd. | 3,258 | 4,096 | ||||||
Hong Kong & China Gas Co. Ltd. (The) | 5,498 | 4,244 | ||||||
See accompanying Notes to Financial Statements which are an integral part of the financial statements.
| 20 | ||||
|
| |||
Invesco FTSE International Low Beta Equal Weight ETF (IDLB)–(continued)
October 31, 2022
| Shares | Value | |||||||
| Hong Kong-(continued) | ||||||||
Hongkong Land Holdings Ltd. | 1,122 | $ | 4,320 | |||||
Hutchison Port Holdings Trust, Class U | 25,250 | 4,116 | ||||||
Hysan Development Co. Ltd. | 1,924 | 4,196 | ||||||
Jardine Matheson Holdings Ltd. | 102 | 4,694 | ||||||
Johnson Electric Holdings Ltd., Class H | 4,587 | 4,727 | ||||||
Link REIT | 700 | 4,138 | ||||||
MTR Corp. Ltd. | 1,059 | 4,661 | ||||||
NWS Holdings Ltd. | 5,636 | 3,999 | ||||||
PCCW Ltd. | 10,842 | 4,143 | ||||||
Power Assets Holdings Ltd. | 907 | 4,339 | ||||||
Sun Hung Kai Properties Ltd. | 462 | 4,970 | ||||||
Swire Pacific Ltd., Class B | 4,672 | 4,815 | ||||||
Swire Properties Ltd. | 2,349 | 4,513 | ||||||
Techtronic Industries Co. Ltd. | 457 | 4,328 | ||||||
Yue Yuen Industrial Holdings Ltd. | 3,636 | 3,696 | ||||||
|
| |||||||
| 119,589 | ||||||||
|
| |||||||
| Indonesia-0.09% | ||||||||
First Pacific Co. Ltd. | 14,063 | 3,726 | ||||||
|
| |||||||
| Ireland-0.53% | ||||||||
AIB Group PLC | 2,383 | 6,901 | ||||||
Bank of Ireland Group PLC | 876 | 6,317 | ||||||
Glanbia PLC(a) | 426 | 4,922 | ||||||
Kerry Group PLC, Class A(a) | 52 | 4,522 | ||||||
|
| |||||||
| 22,662 | ||||||||
|
| |||||||
| Israel-1.58% | ||||||||
Bezeq The Israeli Telecommunication Corp. Ltd. | 3,216 | 5,718 | ||||||
Big Shopping Centers Ltd. | 38 | 4,282 | ||||||
Delek Group Ltd.(b) | 31 | 4,762 | ||||||
Elbit Systems Ltd. | 25 | 5,080 | ||||||
Elco Ltd. | 77 | 4,463 | ||||||
Electra Ltd. | 9 | 5,261 | ||||||
Maytronics Ltd. | 377 | 4,085 | ||||||
Nice Ltd.(b) | 25 | 4,758 | ||||||
Paz Oil Co. Ltd.(b) | 41 | 4,920 | ||||||
Sapiens International Corp. N.V | 240 | 4,738 | ||||||
Shapir Engineering and Industry Ltd. | 568 | 4,700 | ||||||
Shufersal Ltd. | 793 | 5,437 | ||||||
Strauss Group Ltd. | 207 | 5,204 | ||||||
Tower Semiconductor Ltd.(b) | 116 | 4,983 | ||||||
|
| |||||||
| 68,391 | ||||||||
|
| |||||||
| Italy-2.62% | ||||||||
Amplifon S.p.A.(a) | 207 | 5,143 | ||||||
Assicurazioni Generali S.p.A.(a) | 369 | 5,540 | ||||||
Atlantia S.p.A. | 236 | 5,267 | ||||||
Davide Campari-Milano N.V.(a) | 550 | 4,943 | ||||||
DiaSorin S.p.A.(a) | 41 | 5,361 | ||||||
Enel S.p.A. | 1,150 | 5,136 | ||||||
Ferrari N.V. | 28 | 5,521 | ||||||
FinecoBank Banca Fineco S.p.A. | 499 | 6,727 | ||||||
Infrastrutture Wireless Italiane S.p.A.(c) | 583 | 5,147 | ||||||
Italgas S.p.A. | 1,051 | 5,417 | ||||||
Leonardo S.p.A. | 661 | 5,313 | ||||||
Mediobanca Banca di Credito Finanziario S.p.A. | 683 | 6,192 | ||||||
Moncler S.p.A.(a) | 121 | 5,225 | ||||||
Nexi S.p.A.(a)(b)(c) | 658 | 5,703 | ||||||
Poste Italiane S.p.A.(c) | 676 | 5,893 | ||||||
PRADA S.p.A. | 1,000 | 4,554 | ||||||
Prysmian S.p.A. | 176 | 5,739 | ||||||
| Shares | Value | |||||||
| Italy-(continued) | ||||||||
Recordati Industria Chimica e Farmaceutica S.p.A. | 133 | $ | 4,999 | |||||
Snam S.p.A. | 1,140 | 5,072 | ||||||
Terna Rete Elettrica Nazionale S.p.A.(a) | 760 | 5,039 | ||||||
UnipolSai Assicurazioni S.p.A. | 2,436 | 5,494 | ||||||
|
| |||||||
| 113,425 | ||||||||
|
| |||||||
| Japan-37.72% | ||||||||
ABC-Mart, Inc. | 134 | 5,977 | ||||||
Acom Co. Ltd. | 2,267 | 4,957 | ||||||
Activia Properties, Inc. | 2 | 5,927 | ||||||
Advance Residence Investment Corp. | 2 | 4,656 | ||||||
Aeon Co. Ltd. | 276 | 5,156 | ||||||
Aeon Mall Co. Ltd. | 452 | 4,917 | ||||||
AEON REIT Investment Corp. | 5 | 5,382 | ||||||
AGC, Inc. | 158 | 4,959 | ||||||
Aica Kogyo Co. Ltd. | 244 | 5,253 | ||||||
Ain Holdings, Inc. | 94 | 3,953 | ||||||
Alfresa Holdings Corp. | 451 | 5,192 | ||||||
Alps Alpine Co. Ltd. | 601 | 5,176 | ||||||
Ariake Japan Co. Ltd. | 159 | 5,509 | ||||||
Asahi Group Holdings Ltd. | 161 | 4,510 | ||||||
Asahi Intecc Co. Ltd. | 300 | 5,115 | ||||||
Asahi Kasei Corp. | 736 | 4,726 | ||||||
ASKUL Corp. | 407 | 4,258 | ||||||
Astellas Pharma, Inc. | 379 | 5,218 | ||||||
AZ-COM MARUWA Holdings, Inc. | 448 | 4,265 | ||||||
Bank of Kyoto Ltd. (The) | 138 | 4,976 | ||||||
Benesse Holdings, Inc. | 343 | 5,063 | ||||||
Bic Camera, Inc. | 660 | 5,138 | ||||||
BIPROGY, Inc. | 243 | 5,256 | ||||||
Calbee, Inc. | 273 | 5,483 | ||||||
Canon Marketing Japan, Inc. | 238 | 5,028 | ||||||
Capcom Co. Ltd. | 198 | 5,522 | ||||||
Casio Computer Co. Ltd. | 569 | 4,954 | ||||||
Central Japan Railway Co. | 46 | 5,343 | ||||||
Chiba Bank Ltd. (The) | 1,001 | 5,475 | ||||||
Chugai Pharmaceutical Co. Ltd. | 209 | 4,851 | ||||||
Chugin Financial Group, Inc. | 806 | 4,859 | ||||||
COMSYS Holdings Corp. | 290 | 4,761 | ||||||
Concordia Financial Group Ltd. | 1,703 | 5,190 | ||||||
Cosmo Energy Holdings Co. Ltd. | 182 | 4,684 | ||||||
Cosmos Pharmaceutical Corp. | 51 | 4,941 | ||||||
Daicel Corp. | 857 | 4,889 | ||||||
Daido Steel Co. Ltd. | 192 | 4,986 | ||||||
Dai-ichi Life Holdings, Inc. | 313 | 4,964 | ||||||
Daiichikosho Co. Ltd. | 185 | 5,315 | ||||||
Daio Paper Corp. | 576 | 4,255 | ||||||
Daiwa House Industry Co. Ltd. | 240 | 4,863 | ||||||
Daiwa House REIT Investment Corp. | 2 | 4,037 | ||||||
Daiwa Office Investment Corp. | 1 | �� | 4,723 | |||||
Daiwa Securities Group, Inc. | 1,237 | 4,827 | ||||||
Daiwa Securities Living Investments Corp. | 6 | 4,658 | ||||||
DeNA Co. Ltd. | 394 | 5,145 | ||||||
Denka Co. Ltd. | 225 | 5,215 | ||||||
Descente Ltd. | 219 | 5,275 | ||||||
DIC Corp. | 300 | 5,042 | ||||||
Disco Corp. | 22 | 5,284 | ||||||
East Japan Railway Co. | 104 | 5,626 | ||||||
Eisai Co. Ltd. | 132 | 7,970 | ||||||
Electric Power Development Co. Ltd. | 351 | 4,884 | ||||||
See accompanying Notes to Financial Statements which are an integral part of the financial statements.
| 21 | ||||
|
| |||
Invesco FTSE International Low Beta Equal Weight ETF (IDLB)–(continued)
October 31, 2022
| Shares | Value | |||||||
| Japan-(continued) | ||||||||
ENEOS Holdings, Inc. | 1,437 | $ | 4,735 | |||||
EXEO Group, Inc. | 351 | 5,146 | ||||||
Ezaki Glico Co. Ltd. | 208 | 4,681 | ||||||
Fancl Corp. | 266 | 5,049 | ||||||
Fast Retailing Co. Ltd. | 9 | 5,025 | ||||||
FP Corp. | 229 | 5,462 | ||||||
Frontier Real Estate Investment Corp. | 1 | 3,532 | ||||||
Fuji Electric Co. Ltd. | 124 | 4,805 | ||||||
Fuji Kyuko Co. Ltd. | 183 | 5,664 | ||||||
Fuji Media Holdings, Inc. | 681 | 4,742 | ||||||
Fuji Oil Holdings, Inc. | 317 | 4,993 | ||||||
Fujitsu General Ltd. | 254 | 5,810 | ||||||
Fukuoka Financial Group, Inc. | 303 | 5,145 | ||||||
Furukawa Electric Co. Ltd. | 307 | 4,742 | ||||||
Fuyo General Lease Co. Ltd. | 91 | 5,057 | ||||||
GLP J-Reit | 4 | 4,147 | ||||||
GMO Internet Group, Inc. | 290 | 5,016 | ||||||
GOLDWIN, Inc. | 90 | 4,711 | ||||||
GS Yuasa Corp. | 296 | 4,515 | ||||||
GungHo Online Entertainment, Inc. | 325 | 4,817 | ||||||
H.U. Group Holdings, Inc. | 265 | 4,939 | ||||||
Hachijuni Bank Ltd. (The)(a) | 1,574 | 5,020 | ||||||
Hankyu Hanshin Holdings, Inc. | 180 | 5,347 | ||||||
Haseko Corp. | 470 | 4,844 | ||||||
Heiwa Corp. | 355 | 5,732 | ||||||
Hirogin Holdings, Inc. | 1,228 | 5,065 | ||||||
Hirose Electric Co. Ltd. | 38 | 4,937 | ||||||
Hisamitsu Pharmaceutical Co., Inc. | 222 | 5,481 | ||||||
Hitachi Ltd. | 108 | 4,912 | ||||||
Hitachi Metals Ltd.(b) | 82 | 1,198 | ||||||
Hitachi Transport System Ltd. | 86 | 5,144 | ||||||
Honda Motor Co. Ltd. | 202 | 4,584 | ||||||
Hoshizaki Corp. | 181 | 5,194 | ||||||
House Foods Group, Inc. | 254 | 4,756 | ||||||
Hulic Co. Ltd. | 710 | 5,159 | ||||||
Industrial & Infrastructure Fund Investment Corp. | 4 | 4,225 | ||||||
Information Services International-Dentsu Ltd. | 165 | 5,057 | ||||||
Inpex Corp. | 469 | 4,790 | ||||||
Isetan Mitsukoshi Holdings Ltd. | 683 | 6,066 | ||||||
Isuzu Motors Ltd. | 435 | 5,104 | ||||||
Ito En Ltd.(a) | 123 | 4,345 | ||||||
ITOCHU Corp.(a) | 196 | 5,076 | ||||||
Itoham Yonekyu Holdings, Inc. | 1,117 | 4,998 | ||||||
Iyogin Holdings, Inc. | 1,161 | 5,444 | ||||||
Izumi Co. Ltd. | 250 | 5,044 | ||||||
Japan Hotel REIT Investment Corp. | 11 | 5,795 | ||||||
Japan Logistics Fund, Inc. | 2 | 4,286 | ||||||
Japan Metropolitan Fund Investment Corp. | 7 | 5,157 | ||||||
Japan Post Bank Co. Ltd. | 742 | 4,942 | ||||||
Japan Post Holdings Co. Ltd. | 783 | 5,266 | ||||||
Japan Post Insurance Co. Ltd.(a) | 353 | 5,218 | ||||||
Japan Prime Realty Investment Corp. | 2 | 5,429 | ||||||
Japan Real Estate Investment Corp. | 1 | 4,191 | ||||||
Japan Steel Works Ltd. (The) | 251 | 5,193 | ||||||
Japan Tobacco, Inc. | 319 | 5,288 | ||||||
JCR Pharmaceuticals Co. Ltd. | 346 | 5,156 | ||||||
Jeol Ltd. | 133 | 4,886 | ||||||
JGC Holdings Corp. | 399 | 4,811 | ||||||
JSR Corp.(a) | 240 | 4,576 | ||||||
JTEKT Corp. | 764 | 5,397 | ||||||
| Shares | Value | |||||||
| Japan-(continued) | ||||||||
JustSystems Corp. | 213 | $ | 4,500 | |||||
Kagome Co. Ltd. | 245 | 4,902 | ||||||
Kajima Corp. | 512 | 4,826 | ||||||
Kaken Pharmaceutical Co. Ltd. | 194 | 4,966 | ||||||
Kamigumi Co. Ltd. | 276 | 5,251 | ||||||
Kandenko Co. Ltd. | 897 | 5,045 | ||||||
Kansai Electric Power Co., Inc. (The) | 559 | 4,239 | ||||||
Kansai Paint Co. Ltd. | 350 | 4,568 | ||||||
Kao Corp. | 124 | 4,664 | ||||||
KDDI Corp. | 176 | 5,204 | ||||||
Keihan Holdings Co. Ltd. | 213 | 5,481 | ||||||
Keikyu Corp. | 525 | 5,394 | ||||||
Keio Corp. | 141 | 4,952 | ||||||
Keisei Electric Railway Co. Ltd. | 193 | 5,129 | ||||||
Kenedix Office Investment Corp. | 2 | 4,555 | ||||||
Kewpie Corp. | 328 | 5,184 | ||||||
Kinden Corp. | 511 | 5,205 | ||||||
Kintetsu Group Holdings Co. Ltd. | 159 | 5,381 | ||||||
Kirin Holdings Co. Ltd. | 328 | 4,832 | ||||||
Kobayashi Pharmaceutical Co. Ltd. | 95 | 5,049 | ||||||
Kobe Bussan Co. Ltd. | 211 | 4,592 | ||||||
Kobe Steel Ltd. | 1,183 | 4,855 | ||||||
Koito Manufacturing Co. Ltd. | 314 | 4,466 | ||||||
Kokuyo Co. Ltd. | 418 | 5,191 | ||||||
Komatsu Ltd. | 257 | 4,924 | ||||||
Konami Group Corp. | 106 | 4,657 | ||||||
Kose Corp. | 57 | 5,702 | ||||||
K’s Holdings Corp. | 586 | 4,597 | ||||||
Kuraray Co. Ltd. | 709 | 4,880 | ||||||
Kurita Water Industries Ltd. | 138 | 5,069 | ||||||
Kusuri no Aoki Holdings Co. Ltd. | 122 | 5,893 | ||||||
Kyocera Corp. | 97 | 4,856 | ||||||
Kyushu Financial Group, Inc. | 1,975 | 4,996 | ||||||
Kyushu Railway Co. | 256 | 5,356 | ||||||
LaSalle Logiport REIT(b) | 4 | 4,271 | ||||||
Lawson, Inc. | 163 | 5,209 | ||||||
Lintec Corp. | 323 | 4,850 | ||||||
Lion Corp. | 462 | 4,675 | ||||||
Lixil Corp. | 309 | 4,680 | ||||||
Mabuchi Motor Co. Ltd. | 190 | 5,164 | ||||||
Makita Corp. | 228 | 4,172 | ||||||
Mani, Inc. | 429 | 6,263 | ||||||
Marui Group Co. Ltd. | 300 | 4,953 | ||||||
Maruichi Steel Tube Ltd. | 253 | 4,785 | ||||||
Matsui Securities Co. Ltd.(a) | 948 | 5,051 | ||||||
MatsukiyoCocokara & Co. | 136 | 4,959 | ||||||
Mazda Motor Corp. | 611 | 4,123 | ||||||
Mebuki Financial Group, Inc. | 2,819 | 5,481 | ||||||
Medipal Holdings Corp. | 395 | 4,903 | ||||||
MEIJI Holdings Co. Ltd. | 114 | 4,694 | ||||||
Menicon Co. Ltd. | 223 | 3,821 | ||||||
Mitsubishi Chemical Group Corp. | 1,027 | 4,644 | ||||||
Mitsubishi Electric Corp. | 531 | 4,680 | ||||||
Mitsubishi Estate Co. Ltd. | 400 | 5,041 | ||||||
Mitsubishi HC Capital, Inc. | 1,113 | 4,777 | ||||||
Mitsubishi Heavy Industries Ltd. | 140 | 4,823 | ||||||
Mitsubishi Materials Corp. | 362 | 4,739 | ||||||
Mitsubishi Motors Corp.(b) | 1,346 | 4,528 | ||||||
Mitsubishi UFJ Financial Group, Inc. | 1,044 | 4,913 | ||||||
Mitsui & Co. Ltd. | 230 | 5,096 | ||||||
See accompanying Notes to Financial Statements which are an integral part of the financial statements.
| 22 | ||||
|
| |||
Invesco FTSE International Low Beta Equal Weight ETF (IDLB)–(continued)
October 31, 2022
| Shares | Value | |||||||
| Japan-(continued) | ||||||||
Mitsui Fudosan Co. Ltd. | 267 | $ | 5,119 | |||||
Mitsui Fudosan Logistics Park, Inc. | 1 | 3,317 | ||||||
Mitsui Mining & Smelting Co. Ltd. | 228 | 4,617 | ||||||
Mizuho Financial Group, Inc. | 472 | 5,100 | ||||||
Mori Hills REIT Investment Corp. | 5 | 5,473 | ||||||
Morinaga & Co. Ltd. | 189 | 4,730 | ||||||
Morinaga Milk Industry Co. Ltd. | 176 | 4,997 | ||||||
MS&AD Insurance Group Holdings, Inc. | 181 | 4,799 | ||||||
Nagase & Co. Ltd. | 375 | 5,117 | ||||||
Nagoya Railroad Co. Ltd. | 349 | 5,349 | ||||||
Nankai Electric Railway Co. Ltd. | 271 | 5,488 | ||||||
NEC Networks & System Integration Corp. | 432 | 4,633 | ||||||
NET One Systems Co. Ltd. | 243 | 5,003 | ||||||
Nexon Co. Ltd. | 270 | 4,536 | ||||||
NGK Spark Plug Co. Ltd. | 263 | 4,795 | ||||||
NH Foods Ltd. | 189 | 4,508 | ||||||
NHK Spring Co. Ltd. | 796 | 4,413 | ||||||
Nichirei Corp. | 302 | 4,702 | ||||||
Nihon Kohden Corp. | 236 | 5,295 | ||||||
Nintendo Co. Ltd. | 130 | 5,309 | ||||||
Nippon Accommodations Fund, Inc. | 1 | 4,259 | ||||||
Nippon Building Fund, Inc. | 1 | 4,447 | ||||||
Nippon Electric Glass Co. Ltd. | 286 | 4,961 | ||||||
Nippon Kayaku Co. Ltd. | 619 | 4,923 | ||||||
Nippon Paint Holdings Co. Ltd. | 693 | 4,429 | ||||||
Nippon Prologis REIT, Inc. | 2 | 4,191 | ||||||
Nippon Shokubai Co. Ltd. | 136 | 4,886 | ||||||
Nippon Telegraph & Telephone Corp. | 200 | 5,509 | ||||||
Nippon Television Holdings, Inc. | 635 | 4,742 | ||||||
Nipro Corp. | 662 | 4,997 | ||||||
Nishi-Nippon Railroad Co. Ltd. | 260 | 5,106 | ||||||
Nissan Motor Co. Ltd. | 1,369 | 4,369 | ||||||
Nisshin Seifun Group, Inc. | 479 | 5,182 | ||||||
Nissin Foods Holdings Co. Ltd. | 76 | 4,924 | ||||||
Nitori Holdings Co. Ltd. | 56 | 5,099 | ||||||
Nitto Denko Corp. | 87 | 4,583 | ||||||
Noevir Holdings Co. Ltd. | 130 | 4,810 | ||||||
NOK Corp. | 605 | 4,950 | ||||||
Nomura Holdings, Inc. | 1,494 | 4,843 | ||||||
Nomura Real Estate Holdings, Inc. | 220 | 4,981 | ||||||
Nomura Real Estate Master Fund, Inc. | 4 | 4,562 | ||||||
NSK Ltd. | 993 | 5,251 | ||||||
Obayashi Corp. | 779 | 5,005 | ||||||
OBIC Business Consultants Co. Ltd. | 149 | 4,291 | ||||||
Odakyu Electric Railway Co. Ltd. | 394 | 4,689 | ||||||
Oji Holdings Corp. | 1,351 | 4,690 | ||||||
Olympus Corp. | 250 | 5,281 | ||||||
Ono Pharmaceutical Co. Ltd. | 226 | 5,316 | ||||||
ORIX JREIT, Inc. | 4 | 5,369 | ||||||
Osaka Gas Co. Ltd. | 321 | 4,756 | ||||||
OSG Corp. | 390 | 4,967 | ||||||
Pan Pacific International Holdings Corp. | 300 | 4,927 | ||||||
Panasonic Holdings Corp. | 664 | 4,755 | ||||||
Penta-Ocean Construction Co. Ltd. | 1,021 | 5,083 | ||||||
Pigeon Corp. | 361 | 4,731 | ||||||
Pola Orbis Holdings, Inc. | 486 | 5,379 | ||||||
Relo Group, Inc. | 334 | 4,723 | ||||||
Renesas Electronics Corp.(b) | 568 | 4,763 | ||||||
Rengo Co. Ltd. | 916 | 5,084 | ||||||
RENOVA, Inc.(a)(b) | 247 | 5,434 | ||||||
| Shares | Value | |||||||
| Japan-(continued) | ||||||||
Resona Holdings, Inc. | 1,469 | $ 5,532 | ||||||
Resorttrust, Inc. | 336 | 5,177 | ||||||
Rohm Co. Ltd. | 72 | 5,072 | ||||||
Rohto Pharmaceutical Co. Ltd. | 179 | 5,570 | ||||||
Sankyo Co. Ltd. | 184 | 6,084 | ||||||
Sanrio Co. Ltd. | 205 | 5,469 | ||||||
Santen Pharmaceutical Co. Ltd. | 748 | 5,123 | ||||||
Sanwa Holdings Corp. | 543 | 4,683 | ||||||
SBI Holdings, Inc. | 274 | 4,955 | ||||||
Secom Co. Ltd. | 84 | 4,799 | ||||||
Sega Sammy Holdings, Inc. | 363 | 4,652 | ||||||
Seibu Holdings, Inc. | 532 | 4,768 | ||||||
Seino Holdings Co. Ltd. | 678 | 5,218 | ||||||
Sekisui Chemical Co. Ltd. | 395 | 4,943 | ||||||
Sekisui House REIT, Inc.(a) | 9 | 4,850 | ||||||
Seven & i Holdings Co. Ltd. | 136 | 5,082 | ||||||
Seven Bank Ltd.(a) | 2,851 | 5,141 | ||||||
Sharp Corp.(a) | 750 | 4,496 | ||||||
SHIFT, Inc.(b) | 37 | 5,803 | ||||||
Shimamura Co. Ltd. | 60 | 4,856 | ||||||
Shimizu Corp. | 982 | 4,909 | ||||||
Shinsei Bank Ltd.(a) | 384 | 5,710 | ||||||
Ship Healthcare Holdings, Inc. | 287 | 5,505 | ||||||
Shiseido Co. Ltd. | 142 | 4,925 | ||||||
Shizuoka Financial Group, Inc. | 934 | 5,894 | ||||||
SHO-BOND Holdings Co. Ltd. | 125 | 5,416 | ||||||
Shochiku Co. Ltd.(b) | 61 | 4,847 | ||||||
Skylark Holdings Co. Ltd.(b) | 491 | 5,242 | ||||||
SoftBank Corp.(a) | 492 | 4,851 | ||||||
Sohgo Security Services Co. Ltd. | 208 | 5,192 | ||||||
Sompo Holdings, Inc. | 126 | 5,250 | ||||||
Sotetsu Holdings, Inc. | 313 | 4,744 | ||||||
Square Enix Holdings Co. Ltd. | 124 | 5,539 | ||||||
Stanley Electric Co. Ltd. | 291 | 4,949 | ||||||
Subaru Corp. | 297 | 4,627 | ||||||
Sugi Holdings Co. Ltd. | 127 | 5,101 | ||||||
SUMCO Corp. | 394 | 5,007 | ||||||
Sumitomo Chemical Co. Ltd. | 1,368 | 4,611 | ||||||
Sumitomo Corp. | 383 | 4,884 | ||||||
Sumitomo Electric Industries Ltd. | 470 | 4,914 | ||||||
Sumitomo Forestry Co. Ltd. | 317 | 4,969 | ||||||
Sumitomo Heavy Industries Ltd. | 256 | 4,862 | ||||||
Sumitomo Metal Mining Co. Ltd. | 171 | 4,811 | ||||||
Sumitomo Mitsui Financial Group, Inc. | 179 | 5,026 | ||||||
Sumitomo Mitsui Trust Holdings, Inc. | 174 | 5,007 | ||||||
Sumitomo Realty & Development Co. Ltd. | 220 | 5,055 | ||||||
Sumitomo Rubber Industries Ltd. | 627 | 5,383 | ||||||
Sundrug Co. Ltd. | 221 | 5,145 | ||||||
Suntory Beverage & Food Ltd. | 148 | 4,959 | ||||||
Suzuken Co. Ltd. | 226 | 5,033 | ||||||
Suzuki Motor Corp. | 154 | 5,201 | ||||||
Taiheiyo Cement Corp. | 360 | 4,895 | ||||||
Taisei Corp. | 178 | 4,856 | ||||||
Taisho Pharmaceutical Holdings Co. Ltd. | 145 | 5,229 | ||||||
Takeda Pharmaceutical Co. Ltd. | 195 | 5,140 | ||||||
TBS Holdings, Inc. | 465 | 4,821 | ||||||
TDK Corp. | 153 | 4,792 | ||||||
Teijin Ltd. | 510 | 4,632 | ||||||
THK Co. Ltd. | 264 | 4,614 | ||||||
TIS, Inc. | 189 | 5,105 | ||||||
See accompanying Notes to Financial Statements which are an integral part of the financial statements.
| 23 | ||||
|
| |||
Invesco FTSE International Low Beta Equal Weight ETF (IDLB)–(continued)
October 31, 2022
| Shares | Value | |||||||
| Japan-(continued) | ||||||||
Tobu Railway Co. Ltd. | 228 | $ | 5,277 | |||||
Toda Corp.(a) | 1,094 | 5,469 | ||||||
Toho Co. Ltd. | 142 | 5,063 | ||||||
Toho Gas Co. Ltd. | 241 | 4,499 | ||||||
Tokio Marine Holdings, Inc. | 291 | 5,268 | ||||||
Tokyo Century Corp. | 151 | 5,151 | ||||||
Tokyo Gas Co. Ltd. | 288 | 5,148 | ||||||
Tokyo Ohka Kogyo Co. Ltd. | 109 | 4,708 | ||||||
Tokyo Tatemono Co. Ltd. | 359 | 4,949 | ||||||
Tokyu Corp. | 454 | 5,241 | ||||||
Toppan, Inc. | 343 | 5,121 | ||||||
Toray Industries, Inc. | 942 | 4,592 | ||||||
Toshiba Corp. | 146 | 5,089 | ||||||
Toshiba TEC Corp. | 181 | 4,694 | ||||||
Toyo Seikan Group Holdings Ltd. | 454 | 5,196 | ||||||
Toyo Suisan Kaisha Ltd. | 132 | 4,956 | ||||||
Toyoda Gosei Co. Ltd. | 310 | 4,956 | ||||||
Toyota Boshoku Corp. | 370 | 4,715 | ||||||
Toyota Industries Corp. | 96 | 4,947 | ||||||
Toyota Motor Corp. | 358 | 4,960 | ||||||
TS Tech Co. Ltd. | 481 | 5,032 | ||||||
Tsumura & Co. | 236 | 4,930 | ||||||
Tsuruha Holdings, Inc. | 97 | 5,645 | ||||||
UBE Corp. | 366 | 4,720 | ||||||
United Urban Investment Corp. | 5 | 5,288 | ||||||
Ushio, Inc. | 442 | 4,597 | ||||||
Yakult Honsha Co. Ltd. | 91 | 5,045 | ||||||
Yamada Holdings Co. Ltd. | 1,561 | 5,031 | ||||||
Yamato Holdings Co. Ltd. | 345 | 5,116 | ||||||
Yamato Kogyo Co. Ltd. | 152 | 4,418 | ||||||
Yamazaki Baking Co. Ltd. | 459 | 4,678 | ||||||
Yaoko Co. Ltd. | 116 | 5,049 | ||||||
Z Holdings Corp. | 1,813 | 4,691 | ||||||
Zenkoku Hosho Co. Ltd.(a) | 163 | 5,385 | ||||||
Zensho Holdings Co. Ltd. | 206 | 5,142 | ||||||
|
| |||||||
| 1,630,328 | ||||||||
|
| |||||||
| Luxembourg-0.33% | ||||||||
Eurofins Scientific SE(a) | 78 | 4,994 | ||||||
L’Occitane International S.A. | 1,722 | 4,234 | ||||||
RTL Group S.A.(a) | 146 | 4,955 | ||||||
|
| |||||||
| 14,183 | ||||||||
|
| |||||||
| Mexico-0.13% | ||||||||
Fresnillo PLC(a) | 678 | 5,691 | ||||||
|
| |||||||
| Netherlands-2.32% | ||||||||
Aalberts N.V. | 148 | 5,146 | ||||||
ABN AMRO Bank N.V., CVA(a)(c) | 564 | 5,550 | ||||||
Aegon N.V. | 1,208 | 5,594 | ||||||
Akzo Nobel N.V. | 86 | 5,307 | ||||||
ASR Nederland N.V. | 133 | 5,861 | ||||||
CTP N.V.(c) | 398 | 4,130 | ||||||
Euronext N.V.(c) | 73 | 4,639 | ||||||
Heineken Holding N.V. | 76 | 5,191 | ||||||
Heineken N.V. | 60 | 5,017 | ||||||
ING Groep N.V. | 616 | 6,060 | ||||||
JDE Peet’s N.V. | 176 | 5,041 | ||||||
Koninklijke Ahold Delhaize N.V. | 197 | 5,501 | ||||||
Koninklijke KPN N.V. | 1,703 | 4,765 | ||||||
Koninklijke Philips N.V.(a) | 324 | 4,105 | ||||||
| Shares | Value | |||||||
| Netherlands-(continued) | ||||||||
NN Group N.V. | 132 | $ | 5,590 | |||||
OCI N.V. | 144 | 5,511 | ||||||
Randstad N.V.(a) | 116 | 5,783 | ||||||
Shell PLC | 204 | 5,646 | ||||||
Wolters Kluwer N.V. | 55 | 5,846 | ||||||
|
| |||||||
| 100,283 | ||||||||
|
| |||||||
| New Zealand-1.15% | ||||||||
a2 Milk Co. Ltd. (The)(b) | 1,421 | 4,788 | ||||||
Auckland International Airport Ltd.(b) | 1,171 | 5,238 | ||||||
Contact Energy Ltd. | 1,124 | 4,930 | ||||||
Fletcher Building Ltd. | 1,581 | 4,721 | ||||||
Infratil Ltd. | 978 | 4,966 | ||||||
Kiwi Property Group Ltd., (Acquired 03/18/2022; | 8,681 | 4,564 | ||||||
Mainfreight Ltd. | 119 | 5,257 | ||||||
Mercury NZ Ltd. | 1,527 | 5,163 | ||||||
Meridian Energy Ltd. | 1,769 | 5,015 | ||||||
Spark New Zealand Ltd. | 1,634 | 4,861 | ||||||
|
| |||||||
| 49,503 | ||||||||
|
| |||||||
| Norway-0.92% | ||||||||
DNB Bank ASA | 284 | 5,026 | ||||||
Gjensidige Forsikring ASA | 267 | 4,877 | ||||||
Kongsberg Gruppen ASA | 158 | 5,662 | ||||||
Leroy Seafood Group ASA | 809 | 3,720 | ||||||
Mowi ASA | 264 | 3,937 | ||||||
Nordic Semiconductor ASA(b) | 352 | 4,974 | ||||||
Orkla ASA | 646 | 4,359 | ||||||
Salmar ASA | 82 | 2,778 | ||||||
Telenor ASA | 494 | 4,490 | ||||||
|
| |||||||
| 39,823 | ||||||||
|
| |||||||
| Poland-0.85% | ||||||||
Allegro.eu S.A.(a)(b)(c) | 1,027 | 4,994 | ||||||
Dino Polska S.A.(b)(c) | 74 | 4,842 | ||||||
KGHM Polska Miedz S.A. | 288 | 5,774 | ||||||
Polski Koncern Naftowy ORLEN S.A. | 852 | 9,807 | ||||||
Powszechny Zaklad Ubezpieczen S.A. | 905 | 5,083 | ||||||
Santander Bank Polska S.A.(a) | 119 | 6,340 | ||||||
|
| |||||||
| 36,840 | ||||||||
|
| |||||||
| Portugal-0.35% | ||||||||
EDP-Energias de Portugal S.A. | 1,134 | 4,959 | ||||||
Galp Energia SGPS S.A.(a) | 500 | 5,078 | ||||||
Jeronimo Martins SGPS S.A. | 244 | 5,060 | ||||||
|
| |||||||
| 15,097 | ||||||||
|
| |||||||
| Singapore-2.89% | ||||||||
CapitaLand Ascendas REIT | 2,686 | 4,973 | ||||||
CapitaLand Ascott Trust | 6,948 | 4,689 | ||||||
CapitaLand Integrated Commercial Trust | 3,659 | 4,861 | ||||||
CapitaLand Investment Ltd. | 2,052 | 4,365 | ||||||
City Developments Ltd. | 932 | 5,025 | ||||||
ComfortDelGro Corp. Ltd. | 5,371 | 4,820 | ||||||
Frasers Logistics & Commercial Trust(c) | 5,569 | 4,329 | ||||||
Genting Singapore Ltd. | 9,773 | 5,560 | ||||||
Jardine Cycle & Carriage Ltd. | 230 | 4,834 | ||||||
Kenon Holdings Ltd. | 133 | 5,120 | ||||||
Keppel Corp. Ltd. | 1,042 | 5,132 | ||||||
Keppel DC REIT | 3,904 | 4,856 | ||||||
Keppel REIT | 7,013 | 4,435 | ||||||
See accompanying Notes to Financial Statements which are an integral part of the financial statements.
| 24 | ||||
|
| |||
Invesco FTSE International Low Beta Equal Weight ETF (IDLB)–(continued)
October 31, 2022
| Shares | Value | |||||||
| Singapore-(continued) | ||||||||
Mapletree Industrial Trust | 2,994 | $ | 4,655 | |||||
Mapletree Logistics Trust(a) | 4,535 | 4,871 | ||||||
Mapletree Pan Asia Commercial Trust | 4,116 | 4,625 | ||||||
NetLink NBN Trust(c) | 8,100 | 4,894 | ||||||
SIA Engineering Co. Ltd.(a)(b) | 3,054 | 4,662 | ||||||
Singapore Exchange Ltd. | 798 | 4,748 | ||||||
Singapore Post Ltd. | 13,058 | 4,983 | ||||||
Singapore Technologies Engineering Ltd. | 2,030 | 4,734 | ||||||
Singapore Telecommunications Ltd. | 2,891 | 5,107 | ||||||
StarHub Ltd. | 6,157 | 4,656 | ||||||
Suntec REIT | 4,793 | 4,369 | ||||||
UOL Group Ltd. | 1,094 | 4,785 | ||||||
Venture Corp. Ltd. | 414 | 4,660 | ||||||
|
| |||||||
| 124,748 | ||||||||
|
| |||||||
| South Korea-9.08% | ||||||||
Amorepacific Group | 208 | 3,607 | ||||||
BGF retail Co. Ltd. | 45 | 5,892 | ||||||
BNK Financial Group, Inc. | 1,082 | 4,869 | ||||||
Celltrion Healthcare Co. Ltd. | 101 | 4,928 | ||||||
Celltrion, Inc. | 38 | 5,122 | ||||||
Cheil Worldwide, Inc. | 332 | 5,699 | ||||||
CJ CheilJedang Corp. | 17 | 4,941 | ||||||
CJ CheilJedang Corp., Preference Shares | 3 | 348 | ||||||
CJ Corp. | 93 | 4,688 | ||||||
CJ Logistics Corp.(b) | 61 | 3,764 | ||||||
Coway Co. Ltd. | 114 | 4,426 | ||||||
Daewoo Engineering & Construction Co. Ltd.(b) | 1,396 | 4,121 | ||||||
DB Insurance Co. Ltd. | 122 | 4,822 | ||||||
DGB Financial Group, Inc. | 975 | 4,648 | ||||||
DL Holdings Co. Ltd. | 109 | 4,706 | ||||||
Dongsuh Cos., Inc. | 297 | 4,253 | ||||||
Ecopro BM Co. Ltd. | 65 | 5,252 | ||||||
E-MART, Inc. | 74 | 4,395 | ||||||
GS Holdings Corp. | 158 | 5,102 | ||||||
GS Retail Co. Ltd. | 286 | 5,100 | ||||||
Hana Financial Group, Inc. | 185 | 5,357 | ||||||
Hanjin Kal Corp.(b) | 138 | 3,856 | ||||||
Hankook Tire & Technology Co. Ltd. | 191 | 4,901 | ||||||
Hanmi Pharm Co. Ltd. | 24 | 4,263 | ||||||
Hanssem Co. Ltd. | 135 | 3,549 | ||||||
Hanwha Corp. | 179 | 3,192 | ||||||
Hanwha Corp., 3rd Preference Shares | 98 | 963 | ||||||
Hanwha Life Insurance Co. Ltd. | 3,143 | 4,821 | ||||||
HD Hyundai Co. Ltd. | 115 | 4,917 | ||||||
Hite Jinro Co. Ltd. | 238 | 4,286 | ||||||
Hotel Shilla Co. Ltd. | 98 | 4,472 | ||||||
Hyundai Department Store Co. Ltd. | 117 | 4,444 | ||||||
Hyundai Engineering & Construction Co. Ltd. | 151 | 3,700 | ||||||
Hyundai Marine & Fire Insurance Co. Ltd. | 231 | 5,400 | ||||||
Hyundai Motor Co. | 31 | 3,580 | ||||||
Hyundai Motor Co., First Pfd. | 5 | 275 | ||||||
Hyundai Motor Co., Second Pfd. | 8 | 448 | ||||||
Industrial Bank of Korea | 759 | 5,568 | ||||||
Kakao Games Corp.(b) | 138 | 3,832 | ||||||
Kangwon Land, Inc.(b) | 273 | 4,408 | ||||||
KB Financial Group, Inc. | 147 | 4,959 | ||||||
KEPCO Plant Service & Engineering Co. Ltd. | 176 | 3,941 | ||||||
Kia Corp. | 90 | 4,189 | ||||||
Korea Aerospace Industries Ltd. | 119 | 3,956 | ||||||
| Shares | Value | |||||||
| South Korea-(continued) | ||||||||
Korea Gas Corp. | 167 | $ | 4,080 | |||||
Korea Zinc Co. Ltd. | 11 | 4,942 | ||||||
Korean Air Lines Co. Ltd.(b) | 270 | 4,378 | ||||||
KT&G Corp. | 87 | 5,845 | ||||||
Kumho Petrochemical Co. Ltd. | 56 | 5,150 | ||||||
L&F Co. Ltd.(b) | 32 | 5,054 | ||||||
LG Chem Ltd. | 11 | 4,834 | ||||||
LG Chem Ltd., Preference Shares | 2 | 406 | ||||||
LG Corp. | 89 | 4,948 | ||||||
LG Innotek Co. Ltd. | 21 | 4,371 | ||||||
LG Uplus Corp. | 631 | 5,072 | ||||||
LOTTE Chemical Corp. | 41 | 4,260 | ||||||
LOTTE Chilsung Beverage Co. Ltd. | 47 | 4,636 | ||||||
LOTTE Corp. | 175 | 4,005 | ||||||
LOTTE Fine Chemical Co. Ltd. | 103 | 4,056 | ||||||
LS Corp. | 108 | 5,042 | ||||||
Mirae Asset Securities Co. Ltd. | 847 | 3,776 | ||||||
Mirae Asset Securities Co. Ltd., Second Pfd. | 442 | 1,123 | ||||||
NCSoft Corp. | 19 | 5,202 | ||||||
NHN Corp.(b) | 286 | 4,608 | ||||||
NongShim Co. Ltd. | 24 | 5,088 | ||||||
OCI Co. Ltd. | 62 | 4,440 | ||||||
Orion Corp. | 74 | 5,273 | ||||||
Ottogi Corp. | 15 | 4,649 | ||||||
S-1 Corp. | 125 | 5,476 | ||||||
Samsung Biologics Co. Ltd.(b)(c) | 9 | 5,541 | ||||||
Samsung C&T Corp. | 60 | 4,991 | ||||||
Samsung Card Co. Ltd. | 232 | 5,033 | ||||||
Samsung Electronics Co. Ltd. | 122 | 5,087 | ||||||
Samsung Fire & Marine Insurance Co. Ltd. | 35 | 4,914 | ||||||
Samsung Fire & Marine Insurance Co. Ltd., Preference Shares | 3 | 337 | ||||||
Samsung Life Insurance Co. Ltd. | 117 | 5,536 | ||||||
Samsung SDI Co. Ltd. | 12 | 6,209 | ||||||
Samsung SDI Co. Ltd., Preference Shares | 1 | 239 | ||||||
Samsung SDS Co. Ltd. | 57 | 5,002 | ||||||
Seegene, Inc. | 230 | 4,634 | ||||||
Shinhan Financial Group Co. Ltd. | 198 | 5,046 | ||||||
SK Networks Co. Ltd. | 1,599 | 4,524 | ||||||
SK Telecom Co. Ltd. | 139 | 4,889 | ||||||
SK, Inc. | 31 | 4,657 | ||||||
SKC Co. Ltd. | 60 | 4,360 | ||||||
S-Oil Corp. | 72 | 4,367 | ||||||
Solus Advanced Materials Co. Ltd. | 174 | 4,104 | ||||||
SSANGYONG C&E Co. Ltd. | 1,063 | 4,239 | ||||||
Wemade Co. Ltd. | 117 | 3,643 | ||||||
Woori Financial Group, Inc. | 595 | 4,908 | ||||||
Yuhan Corp. | 128 | 5,373 | ||||||
|
| |||||||
| 392,307 | ||||||||
|
| |||||||
| Spain-1.95% | ||||||||
Acciona S.A. | 28 | 5,040 | ||||||
ACS Actividades de Construccion y Servicios S.A.(a) | 243 | 6,232 | ||||||
Aena SME S.A.(b)(c) | 44 | 5,182 | ||||||
Amadeus IT Group S.A.(b) | 103 | 5,369 | ||||||
Bankinter S.A. | 1,058 | 6,395 | ||||||
CaixaBank S.A. | 1,797 | 5,955 | ||||||
Enagas S.A. | 297 | 4,821 | ||||||
Endesa S.A. | 316 | 5,274 | ||||||
See accompanying Notes to Financial Statements which are an integral part of the financial statements.
| 25 | ||||
|
| |||
Invesco FTSE International Low Beta Equal Weight ETF (IDLB)–(continued)
October 31, 2022
| Shares | Value | |||||||
| Spain-(continued) | ||||||||
Ferrovial S.A. | 216 | $ | 5,275 | |||||
Grifols S.A., Class B, Preference Shares(b) | 688 | 4,291 | ||||||
Mapfre S.A.(a) | 3,266 | 5,601 | ||||||
Merlin Properties SOCIMI S.A. | 592 | 5,014 | ||||||
Naturgy Energy Group S.A. | 196 | 5,029 | ||||||
Red Electrica Corp. S.A. | 296 | 4,783 | ||||||
Repsol S.A. | 416 | 5,651 | ||||||
Telefonica S.A. | 1,312 | 4,519 | ||||||
|
| |||||||
| 84,431 | ||||||||
|
| |||||||
| Sweden-2.73% | ||||||||
Assa Abloy AB, Class B | 266 | 5,368 | ||||||
Atlas Copco AB, Class A | 531 | 5,672 | ||||||
Axfood AB | 180 | 4,453 | ||||||
Boliden AB | 168 | 4,889 | ||||||
Electrolux AB, Class B(a) | 427 | 5,265 | ||||||
Essity AB, Class B | 243 | 5,132 | ||||||
H & M Hennes & Mauritz AB, Class B(a) | 520 | 5,233 | ||||||
Holmen AB, Class B | 126 | 4,568 | ||||||
Saab AB, Class B | 162 | 5,720 | ||||||
Securitas AB, Class B(a) | 753 | 6,156 | ||||||
Skandinaviska Enskilda Banken AB, Class A | 533 | 5,619 | ||||||
Skandinaviska Enskilda Banken AB, Class C | 8 | 91 | ||||||
Skanska AB, Class B | 365 | 5,675 | ||||||
SKF AB, Class B(a) | 360 | 5,206 | ||||||
Svenska Cellulosa AB S.C.A., Class A | 13 | 157 | ||||||
Svenska Cellulosa AB S.C.A., Class B | 347 | 4,092 | ||||||
Svenska Handelsbanken AB, Class A | 642 | 5,964 | ||||||
Svenska Handelsbanken AB, Class B | 15 | 164 | ||||||
Sweco AB, Class B | 573 | 4,304 | ||||||
Swedbank AB, Class A | 417 | 6,213 | ||||||
Swedish Match AB | 539 | 5,541 | ||||||
Swedish Orphan Biovitrum AB, Class B(b) | 245 | 4,507 | ||||||
Tele2 AB, Class B | 508 | 4,161 | ||||||
Telefonaktiebolaget LM Ericsson, Class A | 9 | 53 | ||||||
Telefonaktiebolaget LM Ericsson, Class B | 713 | 3,962 | ||||||
Telia Co. AB(a) | 1,536 | 4,066 | ||||||
Volvo AB, Class A | 41 | 700 | ||||||
Volvo AB, Class B | 298 | 4,876 | ||||||
|
| |||||||
| 117,807 | ||||||||
|
| |||||||
| Switzerland-2.85% | ||||||||
Adecco Group AG(a) | 179 | 5,606 | ||||||
Alcon, Inc. | 86 | 5,237 | ||||||
Baloise Holding AG | 39 | 5,331 | ||||||
Banque Cantonale Vaudoise | 59 | 5,253 | ||||||
Barry Callebaut AG | 3 | 5,678 | ||||||
BKW AG | 47 | 5,485 | ||||||
Cie Financiere Richemont S.A. | 50 | 4,893 | ||||||
Clariant AG(b) | 315 | 5,071 | ||||||
DKSH Holding AG | 76 | 5,479 | ||||||
Emmi AG | 6 | 4,790 | ||||||
Flughafen Zurich AG(b) | 33 | 5,124 | ||||||
Helvetia Holding AG | 51 | 5,066 | ||||||
Holcim AG | 128 | 5,817 | ||||||
Julius Baer Group Ltd. | 117 | 5,608 | ||||||
Logitech International S.A., Class R(a) | 114 | 5,679 | ||||||
Novartis AG | 70 | 5,659 | ||||||
PSP Swiss Property AG | 50 | 5,346 | ||||||
Swatch Group AG (The) | 32 | 1,338 | ||||||
Swatch Group AG (The), BR(a) | 18 | 4,054 | ||||||
| Shares | Value | |||||||
| Switzerland-(continued) | ||||||||
Swiss Life Holding AG | 11 | $ | 5,330 | |||||
Swiss Prime Site AG | 66 | 5,329 | ||||||
Swisscom AG | 11 | 5,433 | ||||||
UBS Group AG | 355 | 5,637 | ||||||
Zurich Insurance Group AG | 12 | 5,124 | ||||||
|
| |||||||
| 123,367 | ||||||||
|
| |||||||
| Taiwan-0.10% | ||||||||
FIT Hon Teng Ltd.(b)(c) | 36,419 | 4,268 | ||||||
|
| |||||||
| United Kingdom-3.08% | ||||||||
Admiral Group PLC | 226 | 5,248 | ||||||
Associated British Foods PLC | 306 | 4,755 | ||||||
Auto Trader Group PLC(c) | 716 | 4,300 | ||||||
BAE Systems PLC | 601 | 5,635 | ||||||
British American Tobacco PLC | 135 | 5,337 | ||||||
BT Group PLC | 3,096 | 4,627 | ||||||
Bunzl PLC | 163 | 5,332 | ||||||
ConvaTec Group PLC(c) | 2,144 | 5,381 | ||||||
Diageo PLC | 124 | 5,137 | ||||||
Direct Line Insurance Group PLC | 2,266 | 5,265 | ||||||
Dr. Martens PLC | 1,972 | 5,649 | ||||||
HomeServe PLC | 393 | 5,366 | ||||||
HSBC Holdings PLC | 882 | 4,542 | ||||||
Imperial Brands PLC | 246 | 6,016 | ||||||
London Stock Exchange Group PLC | 58 | 5,053 | ||||||
Melrose Industries PLC | 3,418 | 4,600 | ||||||
Pearson PLC | 541 | 5,982 | ||||||
Pennon Group PLC | 500 | 4,821 | ||||||
Reckitt Benckiser Group PLC | 70 | 4,658 | ||||||
RELX PLC | 206 | 5,552 | ||||||
Rentokil Initial PLC | 895 | 5,610 | ||||||
Rightmove PLC | 768 | 4,349 | ||||||
Tate & Lyle PLC | 611 | 4,931 | ||||||
Tesco PLC | 1,876 | 4,646 | ||||||
Unilever PLC | 119 | 5,446 | ||||||
Vodafone Group PLC | 4,033 | 4,720 | ||||||
|
| |||||||
| 132,958 | ||||||||
|
| |||||||
| United States-1.56% | ||||||||
Amcor PLC, CDI | 444 | 5,136 | ||||||
Computershare Ltd. | 321 | 5,187 | ||||||
GSK PLC | 338 | 5,560 | ||||||
JS Global Lifestyle Co. Ltd.(c) | 4,567 | 3,677 | ||||||
Nestle S.A | 48 | 5,230 | ||||||
Oracle Corp. | 90 | 4,808 | ||||||
QIAGEN N.V.(b) | 119 | 5,140 | ||||||
Roche Holding AG | 18 | 5,982 | ||||||
Samsonite International S.A.(b)(c) | 2,215 | 4,763 | ||||||
Signify N.V. | 190 | 5,269 | ||||||
Swiss Re AG | 73 | 5,427 | ||||||
Tenaris S.A. | 393 | 6,100 | ||||||
Waste Connections, Inc. | 40 | 5,273 | ||||||
|
| |||||||
| 67,552 | ||||||||
|
| |||||||
Total Common Stocks & Other Equity Interests |
| 4,263,232 | ||||||
|
| |||||||
See accompanying Notes to Financial Statements which are an integral part of the financial statements.
| 26 | ||||
|
| |||
Invesco FTSE International Low Beta Equal Weight ETF (IDLB)–(continued)
October 31, 2022
| Shares | Value | |||||||
| Money Market Funds-0.11% | ||||||||
Invesco Government & Agency Portfolio, Institutional Class, 3.07%(e)(f) | 4,856 | $ | 4,856 | |||||
|
| |||||||
TOTAL INVESTMENTS IN SECURITIES |
| 4,268,088 | ||||||
|
| |||||||
Investments Purchased with Cash Collateral from Securities on Loan
|
| |||||||
| Money Market Funds-7.04% |
| |||||||
Invesco Private Government Fund, | 85,186 | 85,186 | ||||||
| Shares | Value | |||||||
| Money Market Funds-(continued) | ||||||||
Invesco Private Prime Fund, 3.28%(e)(f)(g) | 218,993 | $ | 218,993 | |||||
|
| |||||||
Total Investments Purchased with Cash Collateral from Securities on Loan |
| 304,179 | ||||||
|
| |||||||
TOTAL INVESTMENTS IN SECURITIES-105.79% |
| 4,572,267 | ||||||
OTHER ASSETS LESS LIABILITIES-(5.79)% |
| (250,047 | ) | |||||
|
| |||||||
NET ASSETS-100.00% | $ | 4,322,220 | ||||||
|
| |||||||
Investment Abbreviations:
BR-Bearer Shares
CDI-CREST Depository Interest
CVA-Dutch Certificates
Pfd.-Preferred
REIT-Real Estate Investment Trust
Notes to Schedule of Investments:
| (a) | All or a portion of this security was out on loan at October 31, 2022. |
| (b) | Non-income producing security. |
| (c) | Security purchased or received in a transaction exempt from registration under the Securities Act of 1933, as amended (the “1933 Act”). The security may be resold pursuant to an exemption from registration under the 1933 Act, typically to qualified institutional buyers. The aggregate value of these securities at October 31, 2022 was $128,119, which represented 2.96% of the Fund’s Net Assets. |
| (d) | Restricted security. The value of this security at October 31, 2022 represented less than 1% of the Fund’s Net Assets. |
| (e) | Affiliated issuer. The issuer and/or the Fund is a wholly-owned subsidiary of Invesco Ltd., or is affiliated by having an investment adviser that is under common control of Invesco Ltd. The table below shows the Fund’s transactions in, and earnings from, its investments in affiliates for the fiscal year ended October 31, 2022. |
| Value October 31, 2021 | Purchases at Cost | Proceeds from Sales | Change in Unrealized Appreciation (Depreciation) | Realized Gain (Loss) | Value October 31, 2022 | Dividend Income | |||||||||||||||||||||||||||||
| Investments in Affiliated Money Market Funds: | |||||||||||||||||||||||||||||||||||
Invesco Government & Agency Portfolio, Institutional Class | $ | - | $ | 479,985 | $ | (475,129 | ) | $ | - | $ | - | $ | 4,856 | $ | 85 | ||||||||||||||||||||
| Investments Purchased with Cash Collateral from Securities on Loan: | |||||||||||||||||||||||||||||||||||
Invesco Private Government Fund | 112,402 | 935,723 | (962,939 | ) | - | - | 85,186 | 1,223 | * | ||||||||||||||||||||||||||
Invesco Private Prime Fund | 262,272 | 2,020,847 | (2,063,949 | ) | (4 | ) | (173 | ) | 218,993 | 3,349 | * | ||||||||||||||||||||||||
|
|
|
|
|
|
|
|
|
|
|
|
|
| ||||||||||||||||||||||
Total | $ | 374,674 | $ | 3,436,555 | $ | (3,502,017 | ) | $ | (4 | ) | $ | (173 | ) | $ | 309,035 | $ | 4,657 | ||||||||||||||||||
|
|
|
|
|
|
|
|
|
|
|
|
|
| ||||||||||||||||||||||
| * | Represents the income earned on the investment of cash collateral, which is included in securities lending income on the Statements of Operations. Does not include rebates and fees paid to lending agent or premiums received from borrowers, if any. |
| (f) | The rate shown is the 7-day SEC standardized yield as of October 31, 2022. |
| (g) | The security has been segregated to satisfy the commitment to return the cash collateral received in securities lending transactions upon the borrower’s return of the securities loaned. See Note 2J. |
See accompanying Notes to Financial Statements which are an integral part of the financial statements.
| 27 | ||||
|
| |||
Invesco S&P Emerging Markets Low Volatility ETF (EELV)
October 31, 2022
Schedule of Investments
| Shares | Value | |||||||
| Common Stocks & Other Equity Interests-99.85% |
| |||||||
| Brazil-4.54% | ||||||||
BB Seguridade Participacoes S.A. | 710,400 | $ | 4,019,587 | |||||
Energisa S.A. | 456,200 | 4,215,758 | ||||||
ENGIE Brasil Energia S.A. | 757,900 | 5,809,279 | ||||||
Equatorial Energia S.A. | 892,600 | 5,108,348 | ||||||
Itau Unibanco Holding S.A., Preference Shares | 750,400 | 4,347,451 | ||||||
Itausa S.A., Preference Shares | 2,455,900 | 5,026,703 | ||||||
Neoenergia S.A. | 1,206,100 | 3,813,273 | ||||||
Telefonica Brasil S.A. | 565,500 | 4,452,009 | ||||||
TIM S.A. | 1,686,500 | 4,242,565 | ||||||
|
| |||||||
| 41,034,973 | ||||||||
|
| |||||||
| Chile-0.36% | ||||||||
Enel Americas S.A. | 33,194,129 | 3,287,707 | ||||||
|
| |||||||
| China-5.43% | ||||||||
Agricultural Bank of China Ltd., H Shares | 17,602,897 | 5,023,088 | ||||||
Bank of China Ltd., H Shares | 17,801,184 | 5,737,306 | ||||||
Bank of Communications Co. Ltd., H Shares | 8,130,608 | 3,966,984 | ||||||
China CITIC Bank Corp. Ltd., H Shares | 11,543,246 | 4,352,696 | ||||||
China Construction Bank Corp., H Shares | 8,787,027 | 4,667,847 | ||||||
China Life Insurance Co. Ltd., H Shares | 2,739,813 | 2,984,185 | ||||||
China Petroleum & Chemical Corp., H Shares | 8,437,735 | 3,332,163 | ||||||
China Tower Corp. Ltd., H Shares(a) | 32,256,471 | 2,917,520 | ||||||
Haitong Securities Co. Ltd., H Shares | 6,326,145 | 3,094,632 | ||||||
Hengan International Group Co. Ltd. | 897,795 | 3,482,596 | ||||||
Industrial & Commercial Bank of China Ltd., H Shares | 11,612,092 | 5,044,330 | ||||||
People’s Insurance Co. Group of China Ltd. (The), H Shares | 16,467,538 | 4,552,260 | ||||||
|
| |||||||
| 49,155,607 | ||||||||
|
| |||||||
| Greece-0.40% | ||||||||
OPAP S.A | 296,864 | 3,638,231 | ||||||
|
| |||||||
| India-0.45% | ||||||||
Dr. Reddy’s Laboratories Ltd., ADR(b) | 73,563 | 4,062,116 | ||||||
|
| |||||||
| Indonesia-2.75% | ||||||||
PT Bank Central Asia Tbk | 7,694,601 | 4,341,240 | ||||||
PT Bank Rakyat Indonesia (Persero) Tbk | 13,089,091 | 3,902,181 | ||||||
PT Indofood CBP Sukses Makmur Tbk | 6,797,845 | 4,238,438 | ||||||
PT Indofood Sukses Makmur Tbk | 10,441,384 | 4,317,803 | ||||||
PT Kalbe Farma Tbk | 34,094,290 | 4,481,058 | ||||||
PT Telkom Indonesia (Persero) Tbk | 12,661,901 | 3,563,760 | ||||||
|
| |||||||
| 24,844,480 | ||||||||
|
| |||||||
| Kuwait-3.69% | ||||||||
Agility Public Warehousing Co. KSC | 1,541,729 | 3,902,229 | ||||||
Boubyan Bank KSCP | 1,902,062 | 5,059,884 | ||||||
Gulf Bank KSCP | 3,982,757 | 4,410,285 | ||||||
Kuwait Finance House KSCP | 1,908,785 | 4,991,496 | ||||||
Mobile Telecommunications Co. KSCP | 3,514,090 | 6,795,609 | ||||||
National Bank of Kuwait SAKP | 2,356,995 | 8,202,875 | ||||||
|
| |||||||
| 33,362,378 | ||||||||
|
| |||||||
| Malaysia-8.34% | ||||||||
AMMB Holdings Bhd. | 4,524,400 | 3,913,874 | ||||||
CIMB Group Holdings Bhd. | 3,988,000 | 4,656,041 | ||||||
| Shares | Value | |||||||
| Malaysia-(continued) | ||||||||
Genting Bhd. | 4,188,800 | $ | 3,933,645 | |||||
Genting Malaysia Bhd. | 7,104,600 | 4,117,302 | ||||||
Hong Leong Bank Bhd. | 1,520,400 | 6,804,497 | ||||||
IHH Healthcare Bhd. | 3,900,247 | 4,908,306 | ||||||
Malayan Banking Bhd. | 4,482,692 | 8,144,316 | ||||||
MISC Bhd. | 3,151,800 | 4,819,694 | ||||||
MR DIY Group M Bhd.(a) | 9,234,800 | 3,945,494 | ||||||
Petronas Chemicals Group Bhd. | 2,487,200 | 4,587,222 | ||||||
Public Bank Bhd. | 6,687,200 | 6,322,289 | ||||||
RHB Bank Bhd. | 4,357,300 | 5,271,522 | ||||||
Sime Darby Bhd. | 9,414,900 | 4,480,441 | ||||||
Telekom Malaysia Bhd. | 3,068,700 | 3,608,708 | ||||||
Tenaga Nasional Bhd. | 3,300,772 | 5,878,278 | ||||||
|
| |||||||
| 75,391,629 | ||||||||
|
| |||||||
| Mexico-3.43% | ||||||||
America Movil S.A.B. de C.V., Series L | 4,724,573 | 4,537,968 | ||||||
Arca Continental S.A.B. de C.V. | 621,257 | 5,164,933 | ||||||
Fomento Economico Mexicano S.A.B. de C.V., Series CPO(c) | 642,443 | 4,680,835 | ||||||
Grupo Aeroportuario del Sureste S.A.B. de C.V., Class B | 181,742 | 4,317,042 | ||||||
Grupo Elektra S.A.B. de C.V.(b) | 91,214 | 4,644,896 | ||||||
Orbia Advance Corp. S.A.B. de C.V. | 2,051,928 | 3,457,957 | ||||||
Sitios Latinoamerica S.A.B. de C.V.(b)(d) | 20 | 6 | ||||||
Wal-Mart de Mexico S.A.B. de C.V., Series V | 1,104,046 | 4,256,771 | ||||||
|
| |||||||
| 31,060,408 | ||||||||
|
| |||||||
| Qatar-4.50% | ||||||||
Barwa Real Estate Co. | 5,145,380 | 4,803,815 | ||||||
Commercial Bank P.S.Q.C. (The) | 2,079,927 | 3,594,717 | ||||||
Industries Qatar Q.S.C. | 773,130 | 3,347,912 | ||||||
Masraf Al Rayan Q.S.C. | 3,235,673 | 3,409,151 | ||||||
Ooredoo Q.P.S.C. | 2,136,061 | 5,730,574 | ||||||
Qatar Fuel Q.S.C. | 1,128,636 | 5,913,194 | ||||||
Qatar Gas Transport Co. Ltd. | 4,789,498 | 5,392,172 | ||||||
Qatar Islamic Bank (S.A.Q) | 653,070 | 4,373,825 | ||||||
Qatar National Bank Q.P.S.C. | 752,061 | 4,117,827 | ||||||
|
| |||||||
| 40,683,187 | ||||||||
|
| |||||||
| Romania-0.51% | ||||||||
NEPI Rockcastle N.V. | 913,622 | 4,598,560 | ||||||
|
| |||||||
| Russia-0.00% | ||||||||
Mobile TeleSystems PJSC, ADR(d)(e) | 206,291 | 0 | ||||||
X5 Retail Group N.V., GDR(a)(e) | 51,546 | 0 | ||||||
|
| |||||||
| — | ||||||||
|
| |||||||
| Saudi Arabia-4.68% | ||||||||
Advanced Petrochemical Co. | 323,812 | 3,817,613 | ||||||
Almarai Co. JSC | 329,075 | 4,930,586 | ||||||
Dr Sulaiman Al Habib Medical Services Group Co. | 76,083 | 4,588,204 | ||||||
Jarir Marketing Co. | 101,938 | 4,449,131 | ||||||
Saudi Arabian Oil Co.(a) | 474,008 | 4,402,570 | ||||||
Saudi Basic Industries Corp. | 163,285 | 3,841,438 | ||||||
Saudi National Bank (The) | 228,374 | 3,610,176 | ||||||
Saudi Telecom Co. | 487,142 | 5,237,598 | ||||||
See accompanying Notes to Financial Statements which are an integral part of the financial statements.
| 28 | ||||
|
| |||
Invesco S&P Emerging Markets Low Volatility ETF (EELV)–(continued)
October 31, 2022
| Shares | Value | |||||||
| Saudi Arabia-(continued) | ||||||||
Savola Group (The) | 498,716 | $ | 3,888,805 | |||||
Yanbu National Petrochemical Co., Class A | 301,865 | 3,591,001 | ||||||
|
| |||||||
| 42,357,122 | ||||||||
|
| |||||||
| South Africa-3.42% | ||||||||
Bidvest Group Ltd. (The) | 300,174 | 3,528,874 | ||||||
Capitec Bank Holdings Ltd. | 34,205 | 3,537,423 | ||||||
Clicks Group Ltd. | 229,722 | 3,956,123 | ||||||
Growthpoint Properties Ltd.(b) | 5,334,869 | 3,759,301 | ||||||
MultiChoice Group | 644,056 | 4,206,559 | ||||||
Remgro Ltd. | 511,696 | 3,806,500 | ||||||
Shoprite Holdings Ltd. | 305,629 | 3,889,899 | ||||||
Vodacom Group Ltd. | 619,508 | 4,224,217 | ||||||
|
| |||||||
| 30,908,896 | ||||||||
|
| |||||||
| South Korea-8.89% | ||||||||
BNK Financial Group, Inc. | 921,877 | 4,148,430 | ||||||
Cheil Worldwide, Inc. | 236,409 | 4,057,847 | ||||||
GS Holdings Corp. | 117,621 | 3,798,354 | ||||||
GS Retail Co. Ltd.(b) | 212,963 | 3,797,438 | ||||||
Hyundai Motor Co. | 27,348 | 3,158,234 | ||||||
Industrial Bank of Korea | 717,143 | 5,261,079 | ||||||
Kangwon Land, Inc.(d) | 211,169 | 3,409,658 | ||||||
KT&G Corp. | 146,862 | 9,866,751 | ||||||
LG Uplus Corp. | 581,654 | 4,675,445 | ||||||
LOTTE Corp. | 137,766 | 3,152,916 | ||||||
Mirae Asset Securities Co. Ltd. | 854,260 | 3,808,172 | ||||||
NH Investment & Securities Co. Ltd. | 712,926 | 4,489,414 | ||||||
Samsung Electronics Co. Ltd. | 119,718 | 4,992,277 | ||||||
Samsung Life Insurance Co. Ltd. | 91,213 | 4,315,881 | ||||||
Samsung Securities Co. Ltd. | 178,040 | 3,968,388 | ||||||
Shinhan Financial Group Co. Ltd. | 179,659 | 4,578,344 | ||||||
SSANGYONG C&E Co. Ltd.(b) | 1,035,932 | 4,130,783 | ||||||
Yuhan Corp. | 114,026 | 4,786,939 | ||||||
|
| |||||||
| 80,396,350 | ||||||||
|
| |||||||
| Taiwan-26.95% | ||||||||
Asia Cement Corp. | 4,134,000 | 4,785,420 | ||||||
Asustek Computer, Inc. | 524,000 | 3,837,815 | ||||||
Catcher Technology Co. Ltd. | 787,000 | 4,139,856 | ||||||
Cathay Financial Holding Co. Ltd. | 3,065,000 | 3,595,531 | ||||||
Chang Hwa Commercial Bank Ltd. | 11,928,009 | 6,144,928 | ||||||
Cheng Shin Rubber Industry Co. Ltd. | 4,495,000 | 4,505,811 | ||||||
Chicony Electronics Co. Ltd. | 2,007,000 | 4,989,082 | ||||||
China Steel Corp. | 4,203,000 | 3,502,228 | ||||||
Chunghwa Telecom Co. Ltd. | 1,938,222 | 6,676,783 | ||||||
Compal Electronics, Inc. | 7,369,000 | 4,825,383 | ||||||
CTBC Financial Holding Co. Ltd. | 5,939,053 | 3,760,003 | ||||||
E.Sun Financial Holding Co. Ltd. | 5,781,937 | 4,162,959 | ||||||
Far Eastern New Century Corp. | 5,950,000 | 5,936,613 | ||||||
Far EasTone Telecommunications Co. Ltd. | 2,587,993 | 5,678,365 | ||||||
First Financial Holding Co. Ltd. | 6,991,737 | 5,370,331 | ||||||
Formosa Chemicals & Fibre Corp. | 2,788,095 | 6,013,581 | ||||||
Formosa Petrochemical Corp. | 1,942,000 | 5,002,281 | ||||||
Formosa Plastics Corp. | 1,469,000 | 3,788,468 | ||||||
Foxconn Technology Co. Ltd. | 2,792,000 | 3,916,468 | ||||||
Fubon Financial Holding Co. Ltd. | 2,397,950 | 3,795,343 | ||||||
Highwealth Construction Corp. | 3,827,545 | 4,923,632 | ||||||
Hon Hai Precision Industry Co. Ltd. | 1,463,000 | 4,653,813 | ||||||
Hotai Motor Co. Ltd. | 217,000 | 3,932,904 | ||||||
Hua Nan Financial Holdings Co. Ltd. | 7,647,167 | 4,995,667 | ||||||
| Shares | Value | |||||||
| Taiwan-(continued) | ||||||||
Inventec Corp. | 7,979,000 | $ | 6,041,977 | |||||
King Yuan Electronics Co. Ltd. | 3,386,000 | 3,436,177 | ||||||
Lite-On Technology Corp. | 1,974,000 | 3,920,739 | ||||||
Mega Financial Holding Co. Ltd. | 4,969,271 | 4,611,101 | ||||||
Nan Ya Plastics Corp. | 1,875,930 | 3,976,290 | ||||||
Pegatron Corp. | 2,223,000 | 4,070,355 | ||||||
Pou Chen Corp. | 5,050,000 | 4,270,696 | ||||||
Powertech Technology, Inc. | 1,759,000 | 4,072,353 | ||||||
President Chain Store Corp. | 631,000 | 5,248,134 | ||||||
Qisda Corp. | 4,454,000 | 3,393,458 | ||||||
Quanta Computer, Inc. | 1,802,000 | 3,825,178 | ||||||
Radiant Opto-Electronics Corp. | 1,548,000 | 4,727,231 | ||||||
Shanghai Commercial & Savings Bank Ltd. (The) | 3,009,000 | 4,332,923 | ||||||
Shanghai Commercial & Savings Bank Ltd. (The), Rts., expiring 12/08/2022(d) | 218,233 | 63,663 | ||||||
Shin Kong Financial Holding Co. Ltd. | 14,223,000 | 3,531,197 | ||||||
SinoPac Financial Holdings Co. Ltd. | 8,777,475 | 4,385,673 | ||||||
Synnex Technology International Corp. | 2,213,264 | 3,612,932 | ||||||
Taishin Financial Holding Co. Ltd. | 9,871,806 | 4,059,320 | ||||||
Taiwan Business Bank | 10,794,746 | 4,003,327 | ||||||
Taiwan Cement Corp. | 5,229,974 | 4,909,821 | ||||||
Taiwan Cooperative Financial Holding Co. Ltd. | 6,478,080 | 5,026,053 | ||||||
Taiwan High Speed Rail Corp. | 7,892,000 | 6,882,309 | ||||||
Taiwan Mobile Co. Ltd. | 2,535,162 | 7,482,160 | ||||||
Taiwan Semiconductor Manufacturing Co. Ltd. | 263,397 | 3,187,984 | ||||||
Teco Electric and Machinery Co. Ltd. | 5,161,000 | 4,564,776 | ||||||
Tripod Technology Corp. | 1,380,000 | 3,820,188 | ||||||
Uni-President Enterprises Corp. | 2,952,181 | 6,001,020 | ||||||
Wistron Corp. | 5,627,000 | 4,549,099 | ||||||
WPG Holdings Ltd. | 3,287,937 | 4,484,594 | ||||||
Yuanta Financial Holding Co. Ltd. | 7,028,930 | 4,297,305 | ||||||
|
| |||||||
| 243,721,298 | ||||||||
|
| |||||||
| Thailand-19.82% | ||||||||
Advanced Info Service PCL, NVDR | 843,371 | 4,232,366 | ||||||
Airports of Thailand PCL, NVDR(d) | 2,701,688 | 5,252,888 | ||||||
Asset World Corp. PCL, NVDR | 26,174,083 | 4,195,005 | ||||||
Bangkok Bank PCL, NVDR | 1,326,324 | 5,070,419 | ||||||
Bangkok Commercial Asset Management PCL, NVDR | 7,969,266 | 3,203,620 | ||||||
Bangkok Dusit Medical Services PCL, NVDR | 5,784,260 | 4,483,333 | ||||||
Bangkok Expressway & Metro PCL, NVDR | 21,588,102 | 5,331,796 | ||||||
Berli Jucker PCL, NVDR | 4,433,017 | 3,989,249 | ||||||
BTS Group Holdings PCL, NVDR | 22,399,625 | 4,884,837 | ||||||
Bumrungrad Hospital PCL, NVDR | 691,796 | 4,126,056 | ||||||
Carabao Group PCL, NVDR | 1,479,326 | 3,507,861 | ||||||
Central Pattana PCL, NVDR | 2,179,142 | 3,936,311 | ||||||
Central Retail Corp. PCL, NVDR | 3,704,988 | 4,088,531 | ||||||
Charoen Pokphand Foods PCL, NVDR | 7,248,141 | 4,808,606 | ||||||
CP ALL PCL, NVDR | 3,215,938 | 5,069,792 | ||||||
Electricity Generating PCL, NVDR | 1,296,704 | 5,808,934 | ||||||
Global Power Synergy PCL, NVDR | 2,346,960 | 3,823,214 | ||||||
Gulf Energy Development PCL, NVDR | 2,775,965 | 3,683,296 | ||||||
Home Product Center PCL, NVDR | 12,544,063 | 4,811,963 | ||||||
Intouch Holdings PCL, NVDR | 2,326,874 | 4,401,864 | ||||||
IRPC PCL, NVDR | 46,660,957 | 3,849,590 | ||||||
Kasikornbank PCL, NVDR | 1,019,157 | 3,909,536 | ||||||
See accompanying Notes to Financial Statements which are an integral part of the financial statements.
| 29 | ||||
|
| |||
Invesco S&P Emerging Markets Low Volatility ETF (EELV)–(continued)
October 31, 2022
| Shares | Value | |||||||
| Thailand-(continued) | ||||||||
Krung Thai Bank PCL, NVDR | 9,263,125 | $ | 4,259,188 | |||||
Krungthai Card PCL, NVDR | 2,766,311 | 4,142,925 | ||||||
Land & Houses PCL, NVDR | 23,356,877 | 5,645,908 | ||||||
Minor International PCL, NVDR(d) | 4,646,775 | 3,449,065 | ||||||
Ngern Tid Lor PCL, NVDR | 4,937,465 | 3,372,940 | ||||||
Osotspa PCL, NVDR | 5,843,020 | 4,068,314 | ||||||
PTT Global Chemical PCL, NVDR | 3,719,669 | 4,251,330 | ||||||
PTT Oil & Retail Business PCL, NVDR | 6,512,231 | 4,123,615 | ||||||
PTT PCL, NVDR | 4,989,641 | 4,719,576 | ||||||
Ratch Group PCL, NVDR | 4,716,235 | 5,080,547 | ||||||
SCG Packaging PCL, NVDR | 2,915,416 | 3,983,227 | ||||||
Siam Cement PCL (The), NVDR | 732,966 | 6,239,648 | ||||||
Siam Global House PCL, NVDR | 7,955,451 | 4,201,381 | ||||||
Thai Beverage PCL | 12,382,341 | 5,031,338 | ||||||
Thai Union Group PCL, NVDR | 9,206,687 | 4,354,187 | ||||||
Thai Union Group PCL, Rts., expiring 11/24/2022(d)(e) | 258,289 | 0 | ||||||
Tisco Financial Group PCL, NVDR | 2,882,863 | 7,271,541 | ||||||
TMBThanachart Bank PCL, NVDR | 115,827,799 | 4,138,881 | ||||||
WHA Corp. PCL, NVDR | 43,197,377 | 4,471,825 | ||||||
|
| |||||||
| 179,274,503 | ||||||||
|
| |||||||
| United Arab Emirates-1.69% | ||||||||
Abu Dhabi National Oil Co. for Distribution PJSC | 5,294,343 | 6,500,725 | ||||||
| Shares | Value | |||||||
| United Arab Emirates-(continued) | ||||||||
Aldar Properties PJSC | 3,103,765 | $ | 3,650,444 | |||||
Dubai Islamic Bank PJSC | 3,225,512 | 5,110,870 | ||||||
|
| |||||||
| 15,262,039 | ||||||||
|
| |||||||
TOTAL INVESTMENTS IN SECURITIES (excluding investments purchased with cash collateral from securities on loan)-99.85% | 903,039,484 | |||||||
|
| |||||||
| Investments Purchased with Cash Collateral from Securities on Loan |
| |||||||
| Money Market Funds-1.30% | ||||||||
Invesco Private Government Fund, 3.18%(f)(g)(h) | 3,288,267 | 3,288,267 | ||||||
Invesco Private Prime Fund, 3.28%(f)(g)(h) | 8,453,393 | 8,453,393 | ||||||
|
| |||||||
Total Investments Purchased with Cash Collateral from Securities on Loan |
| 11,741,660 | ||||||
|
| |||||||
TOTAL INVESTMENTS IN SECURITIES-101.15% |
| 914,781,144 | ||||||
OTHER ASSETS LESS LIABILITIES-(1.15)% |
| (10,384,205 | ) | |||||
|
| |||||||
NET ASSETS-100.00%. | $ | 904,396,939 | ||||||
|
| |||||||
Investment Abbreviations:
ADR-American Depositary Receipt
CPO-Certificates of Ordinary Participation
GDR-Global Depositary Receipt
NVDR-Non-Voting Depositary Receipt
Rts.-Rights
Notes to Schedule of Investments:
| (a) | Security purchased or received in a transaction exempt from registration under the Securities Act of 1933, as amended (the “1933 Act”). The security may be resold pursuant to an exemption from registration under the 1933 Act, typically to qualified institutional buyers. The aggregate value of these securities at October 31, 2022 was $11,265,584, which represented 1.25% of the Fund’s Net Assets. |
| (b) | All or a portion of this security was out on loan at October 31, 2022. |
| (c) | Each CPO for Fomento Economico Mexicano S.A.B. de C.V. represents one Series B share and four Series D shares. |
| (d) | Non-income producing security. |
| (e) | Security valued using significant unobservable inputs (Level 3). See Note 4. |
| (f) | Affiliated issuer. The issuer and/or the Fund is a wholly-owned subsidiary of Invesco Ltd., or is affiliated by having an investment adviser that is under common control of Invesco Ltd. The table below shows the Fund’s transactions in, and earnings from, its investments in affiliates for the fiscal year ended October 31, 2022. |
| Value October 31, 2021 | Purchases at Cost | Proceeds from Sales | Change in Unrealized Appreciation (Depreciation) | Realized Gain (Loss) | Value October 31, 2022 | Dividend Income | |||||||||||||||||||||||||||||
| Investments in Affiliated Money Market Funds: | |||||||||||||||||||||||||||||||||||
| Invesco Government & Agency Portfolio, Institutional Class | $ | 9,266,939 | $ | 270,393,250 | $ | (279,660,189 | ) | $ | – | $ | – | $ | – | $ | 12,750 | ||||||||||||||||||||
See accompanying Notes to Financial Statements which are an integral part of the financial statements.
| 30 | ||||
|
| |||
Invesco S&P Emerging Markets Low Volatility ETF (EELV)–(continued)
October 31, 2022
| Value October 31, 2021 | Purchases at Cost | Proceeds from Sales | Change in Unrealized Appreciation (Depreciation) | Realized Gain (Loss) | Value October 31, 2022 | Dividend Income | |||||||||||||||||||||||||||||
| Investments Purchased with Cash Collateral from Securities on Loan: | |||||||||||||||||||||||||||||||||||
| Invesco Private Government Fund | $ | 1,823,421 | $ | 28,602,113 | $ | (27,137,267 | ) | $ | – | $ | – | $ | 3,288,267 | $ | 25,628 | * | |||||||||||||||||||
| Invesco Private Prime Fund | 4,254,649 | 57,459,266 | (53,259,460 | ) | (12 | ) | (1,050 | ) | 8,453,393 | 67,942 | * | ||||||||||||||||||||||||
|
|
|
|
|
|
|
|
|
|
|
|
|
| ||||||||||||||||||||||
| Total | $ | 15,345,009 | $ | 356,454,629 | $ | (360,056,916 | ) | $ | (12 | ) | $ | (1,050 | ) | $ | 11,741,660 | $ | 106,320 | ||||||||||||||||||
|
|
|
|
|
|
|
|
|
|
|
|
|
| ||||||||||||||||||||||
| * | Represents the income earned on the investment of cash collateral, which is included in securities lending income on the Statements of Operations. Does not include rebates and fees paid to lending agent or premiums received from borrowers, if any. |
| (g) | The rate shown is the 7-day SEC standardized yield as of October 31, 2022. |
| (h) | The security has been segregated to satisfy the commitment to return the cash collateral received in securities lending transactions upon the borrower’s return of the securities loaned. See Note 2J. |
See accompanying Notes to Financial Statements which are an integral part of the financial statements.
| 31 | ||||
|
| |||
Invesco S&P Emerging Markets Momentum ETF (EEMO)
October 31, 2022
Schedule of Investments
| Shares | Value | |||||||
| Common Stocks & Other Equity Interests-100.06% |
| |||||||
| Brazil-6.78% | ||||||||
BB Seguridade Participacoes S.A. | 3,100 | $ | 17,541 | |||||
Cia de Saneamento Basico do Estado de Sao Paulo | 1,100 | 12,599 | ||||||
Cia Energetica de Minas Gerais, Preference Shares | 5,600 | 12,134 | ||||||
CPFL Energia S.A. | 900 | 6,075 | ||||||
ENGIE Brasil Energia S.A. | 1,000 | 7,665 | ||||||
Petroleo Brasileiro S.A. | 21,300 | 135,011 | ||||||
Petroleo Brasileiro S.A., Preference Shares | 25,400 | 144,299 | ||||||
|
| |||||||
| 335,324 | ||||||||
|
| |||||||
| Chile-2.51% | ||||||||
Banco de Chile | 147,343 | 13,471 | ||||||
Cia Sud Americana de Vapores S.A. | 103,399 | 7,176 | ||||||
Quinenco S.A. | 2,015 | 5,357 | ||||||
Sociedad Quimica y Minera de Chile S.A., Class B, Preference Shares | 1,030 | 98,000 | ||||||
|
| |||||||
| 124,004 | ||||||||
|
| |||||||
| China-3.94% | ||||||||
Bank of China Ltd., H Shares | 238,948 | 77,013 | ||||||
China Overseas Land & Investment Ltd. | 12,000 | 22,900 | ||||||
China Railway Group Ltd., H Shares | 15,132 | 6,573 | ||||||
China Shenhua Energy Co. Ltd., H Shares | 15,200 | 39,986 | ||||||
PICC Property & Casualty Co. Ltd., H Shares | 26,000 | 23,980 | ||||||
Shanghai Baosight Software Co. Ltd., B Shares | 1,554 | 4,682 | ||||||
Yankuang Energy Group Co. Ltd., H Shares | 6,883 | 19,378 | ||||||
|
| |||||||
| 194,512 | ||||||||
|
| |||||||
| Czech Republic-0.73% | ||||||||
CEZ A.S. | 1,100 | 35,970 | ||||||
|
| |||||||
| Greece-0.30% | ||||||||
Motor Oil Hellas Corinth Refineries S.A. | 223 | 3,831 | ||||||
OPAP S.A. | 577 | 7,071 | ||||||
Star Bulk Carriers Corp. | 242 | 4,216 | ||||||
|
| |||||||
| 15,118 | ||||||||
|
| |||||||
| Hungary-0.22% | ||||||||
MOL Hungarian Oil & Gas PLC | 1,833 | 10,974 | ||||||
|
| |||||||
| India-21.81% | ||||||||
ABB India Ltd. | 238 | 8,769 | ||||||
Adani Enterprises Ltd. | 1,431 | 57,868 | ||||||
Adani Green Energy Ltd.(a) | 2,213 | 56,220 | ||||||
Adani Total Gas Ltd. | 1,983 | 86,309 | ||||||
Adani Transmission Ltd.(a) | 2,011 | 81,353 | ||||||
Bajaj Holdings & Investment Ltd. | 88 | 7,081 | ||||||
Bank of Baroda | 3,762 | 6,713 | ||||||
Bharat Electronics Ltd. | 15,307 | 19,758 | ||||||
Canara Bank | 1,286 | 4,512 | ||||||
Cholamandalam Investment and Finance Co. Ltd. | 1,366 | 11,706 | ||||||
Coal India Ltd. | 9,575 | 28,449 | ||||||
Cummins India Ltd. | 584 | 9,509 | ||||||
Hindustan Aeronautics Ltd.(b) | 490 | 14,977 | ||||||
ICICI Bank Ltd. | 14,766 | 162,096 | ||||||
Indian Railway Catering & Tourism Corp. Ltd. | 743 | 6,653 | ||||||
ITC Ltd. | 15,844 | 66,743 | ||||||
Mahindra & Mahindra Ltd. | 4,747 | 77,337 | ||||||
NHPC Ltd. | 9,224 | 4,747 | ||||||
NTPC Ltd. | 18,269 | 38,203 | ||||||
| Shares | Value | |||||||
| India-(continued) | ||||||||
Page Industries Ltd. | 27 | $ | 16,233 | |||||
Polycab India Ltd. | 122 | 4,093 | ||||||
Power Grid Corp. of India Ltd. | 12,999 | 35,828 | ||||||
Siemens Ltd. | 341 | 12,052 | ||||||
SRF Ltd. | 494 | 15,269 | ||||||
State Bank of India | 5,466 | 37,889 | ||||||
Sun Pharmaceutical Industries Ltd. | 3,481 | 42,763 | ||||||
Tata Elxsi Ltd. | 200 | 16,903 | ||||||
Tata Motors Ltd.(a) | 6,306 | 31,443 | ||||||
Tata Motors Ltd., Class A(a) | 1,590 | 4,518 | ||||||
Tata Power Co. Ltd. (The) | 7,458 | 20,362 | ||||||
Titan Co. Ltd. | 1,494 | 49,841 | ||||||
Trent Ltd. | 613 | 11,315 | ||||||
TVS Motor Co. Ltd. | 1,089 | 15,077 | ||||||
Varun Beverages Ltd. | 1,202 | 15,233 | ||||||
|
| |||||||
| 1,077,822 | ||||||||
|
| |||||||
| Indonesia-8.39% | ||||||||
PT Adaro Energy Indonesia Tbk | 101,076 | 25,791 | ||||||
PT Astra International Tbk | 72,400 | 30,868 | ||||||
PT Bank Central Asia Tbk | 192,700 | 108,720 | ||||||
PT Bank Mandiri (Persero) Tbk | 108,200 | 73,185 | ||||||
PT Bank Negara Indonesia (Persero) Tbk | 39,000 | 23,504 | ||||||
PT Bank Rakyat Indonesia (Persero) Tbk | 228,600 | 68,151 | ||||||
PT Kalbe Farma Tbk | 69,300 | 9,108 | ||||||
PT Perusahaan Gas Negara Tbk | 56,600 | 7,167 | ||||||
PT Telkom Indonesia (Persero) Tbk | 189,500 | 53,336 | ||||||
PT United Tractors Tbk | 7,100 | 14,703 | ||||||
|
| |||||||
| 414,533 | ||||||||
|
| |||||||
| Kuwait-4.16% | ||||||||
Boubyan Bank KSCP | 3,639 | 9,681 | ||||||
Gulf Bank KSCP | 12,458 | 13,795 | ||||||
Kuwait Finance House KSCP | 22,022 | 57,588 | ||||||
National Bank of Kuwait SAKP | 35,738 | 124,376 | ||||||
|
| |||||||
| 205,440 | ||||||||
|
| |||||||
| Malaysia-3.97% | ||||||||
AMMB Holdings Bhd. | 9,400 | 8,132 | ||||||
CIMB Group Holdings Bhd. | 24,000 | 28,020 | ||||||
Hong Leong Bank Bhd. | 3,100 | 13,874 | ||||||
Malayan Banking Bhd. | 30,400 | 55,232 | ||||||
Petronas Chemicals Group Bhd. | 8,812 | 16,252 | ||||||
Public Bank Bhd. | 59,800 | 56,537 | ||||||
RHB Bank Bhd. | 14,900 | 18,026 | ||||||
|
| |||||||
| 196,073 | ||||||||
|
| |||||||
| Mexico-2.58% | ||||||||
America Movil S.A.B. de C.V., Series L | 54,221 | 51,219 | ||||||
Arca Continental S.A.B. de C.V. | 1,535 | 12,551 | ||||||
Grupo Aeroportuario del Pacifico S.A.B. de C.V., | 1,146 | 17,719 | ||||||
Grupo Bimbo S.A.B. de C.V., Series A | 5,658 | 21,866 | ||||||
Grupo Financiero Inbursa S.A.B. de C.V., Class O(a)(c) | 13,096 | 24,128 | ||||||
|
| |||||||
| 127,483 | ||||||||
|
| |||||||
See accompanying Notes to Financial Statements which are an integral part of the financial statements.
| 32 | ||||
|
| |||
Invesco S&P Emerging Markets Momentum ETF (EEMO)–(continued)
October 31, 2022
| Shares | Value | |||||||
| Philippines-0.33% | ||||||||
International Container Terminal Services, Inc. | 2,313 | $ | 6,905 | |||||
PLDT, Inc. | 330 | 9,305 | ||||||
|
| |||||||
| 16,210 | ||||||||
|
| |||||||
| Qatar-2.98% | ||||||||
Commercial Bank P.S.Q.C. (The) | 12,788 | 22,101 | ||||||
Industries Qatar Q.S.C. | 7,703 | 33,357 | ||||||
Mesaieed Petrochemical Holding Co. Q.P.S.C. | 18,709 | 11,662 | ||||||
Qatar Gas Transport Co. Ltd. | 14,042 | 15,809 | ||||||
Qatar Islamic Bank (S.A.Q) | 9,601 | 64,301 | ||||||
|
| |||||||
| 147,230 | ||||||||
|
| |||||||
| Russia-0.00% | ||||||||
Alrosa PJSC(d) | 11,439 | 0 | ||||||
Gazprom PJSC(d) | 43,562 | 0 | ||||||
Severstal PAO(d) | 1,045 | 0 | ||||||
|
| |||||||
| - | ||||||||
|
| |||||||
| Saudi Arabia-14.53% | ||||||||
ACWA Power Co. | 892 | 41,306 | ||||||
Al Rajhi Bank(a) | 6,316 | 143,211 | ||||||
Alinma Bank | 6,043 | 60,308 | ||||||
Arab National Bank | 552 | 4,738 | ||||||
Bank AlBilad(a) | 2,786 | 37,591 | ||||||
Bank Al-Jazira | 1,422 | 8,848 | ||||||
Banque Saudi Fransi | 2,121 | 24,385 | ||||||
Dr Sulaiman Al Habib Medical Services Group Co. | 256 | 15,438 | ||||||
Mouwasat Medical Services Co. | 159 | 9,267 | ||||||
Riyad Bank | 5,503 | 52,649 | ||||||
Sahara International Petrochemical Co. | 1,302 | 14,051 | ||||||
Saudi Arabian Mining Co.(a) | 3,354 | 74,711 | ||||||
Saudi Arabian Oil Co.(b) | 9,064 | 84,186 | ||||||
Saudi British Bank (The) | 1,467 | 16,983 | ||||||
Saudi National Bank (The) | 8,256 | 130,512 | ||||||
|
| |||||||
| 718,184 | ||||||||
|
| |||||||
| South Africa-6.10% | ||||||||
Absa Group Ltd. | 2,655 | 28,857 | ||||||
Capitec Bank Holdings Ltd. | 321 | 33,197 | ||||||
FirstRand Ltd. | 17,488 | 61,236 | ||||||
Investec Ltd. | 1,698 | 8,348 | ||||||
MTN Group Ltd. | 2,656 | 18,765 | ||||||
Nedbank Group Ltd. | 1,748 | 20,694 | ||||||
Rand Merchant Investment Holdings Ltd. | 4,820 | 7,480 | ||||||
Remgro Ltd. | 1,654 | 12,304 | ||||||
Sasol Ltd. | 2,066 | 34,742 | ||||||
Shoprite Holdings Ltd. | 2,186 | 27,822 | ||||||
Standard Bank Group Ltd. | 5,147 | 48,074 | ||||||
|
| |||||||
| 301,519 | ||||||||
|
| |||||||
| South Korea-1.26% | ||||||||
Ecopro BM Co. Ltd. | 187 | 15,110 | ||||||
Hyundai Marine & Fire Insurance Co. Ltd. | 189 | 4,419 | ||||||
Korea Aerospace Industries Ltd. | 354 | 11,767 | ||||||
L&F Co. Ltd.(a) | 109 | 17,217 | ||||||
LG Innotek Co. Ltd. | 53 | 11,032 | ||||||
Meritz Fire & Marine Insurance Co. Ltd. | 118 | 2,605 | ||||||
|
| |||||||
| 62,150 | ||||||||
|
| |||||||
| Taiwan-7.03% | ||||||||
China Airlines Ltd. | 8,000 | 4,208 | ||||||
Chunghwa Telecom Co. Ltd. | 14,000 | 48,227 | ||||||
| Shares | Value | |||||||
| Taiwan-(continued) | ||||||||
Compal Electronics, Inc. | 13,000 | $ | 8,513 | |||||
E Ink Holdings, Inc. | 5,388 | 34,362 | ||||||
E.Sun Financial Holding Co. Ltd. | 51,267 | 36,912 | ||||||
Eva Airways Corp. | 11,000 | 7,988 | ||||||
Far EasTone Telecommunications Co. Ltd. | 8,000 | 17,553 | ||||||
First Financial Holding Co. Ltd. | 47,020 | 36,116 | ||||||
Hua Nan Financial Holdings Co. Ltd. | 40,586 | 26,514 | ||||||
Mega Financial Holding Co. Ltd. | 30,075 | 27,907 | ||||||
Shanghai Commercial & Savings Bank Ltd. (The) | 16,000 | 23,040 | ||||||
Shanghai Commercial & Savings Bank Ltd. (The), Rts., expiring 12/08/2022(a) | 1,172 | 342 | ||||||
SinoPac Financial Holdings Co. Ltd. | 44,126 | 22,048 | ||||||
Taiwan Business Bank | 27,000 | 10,013 | ||||||
Taiwan Cooperative Financial Holding Co. Ltd. | 48,876 | 37,921 | ||||||
Yulon Finance Corp. | 1,318 | 5,583 | ||||||
|
| |||||||
| 347,247 | ||||||||
|
| |||||||
| Thailand-4.25% | ||||||||
Airports of Thailand PCL, NVDR(a) | 15,500 | 30,137 | ||||||
Asset World Corp. PCL, NVDR | 32,500 | 5,209 | ||||||
Bangkok Bank PCL, NVDR | 2,300 | 8,793 | ||||||
Bangkok Dusit Medical Services PCL, NVDR | 13,300 | 10,309 | ||||||
Bumrungrad Hospital PCL, NVDR | 2,300 | 13,718 | ||||||
Central Pattana PCL, NVDR | 5,400 | 9,754 | ||||||
Energy Absolute PCL, NVDR | 6,400 | 16,227 | ||||||
Gulf Energy Development PCL, NVDR | 24,010 | 31,858 | ||||||
Kasikornbank PCL, NVDR | 5,100 | 19,564 | ||||||
Krung Thai Bank PCL, NVDR | 20,300 | 9,334 | ||||||
Land & Houses PCL, NVDR | 10,895 | 2,633 | ||||||
PTT Exploration & Production PCL, NVDR | 8,100 | 38,627 | ||||||
TMBThanachart Bank PCL, NVDR | 159,000 | 5,681 | ||||||
True Corp. PCL, NVDR | 61,900 | 8,067 | ||||||
|
| |||||||
| 209,911 | ||||||||
|
| |||||||
| Turkey-4.68% | ||||||||
Akbank T.A.S. | 14,299 | 11,238 | ||||||
Aksa Enerji Uretim A.S. | 1,849 | 4,115 | ||||||
Anadolu Efes Biracilik ve Malt Sanayii A.S. | 969 | 2,498 | ||||||
Arcelik A.S. | 1,149 | 4,858 | ||||||
Aselsan Elektronik Sanayi Ve Ticaret A.S. | 1,940 | 3,360 | ||||||
BIM Birlesik Magazalar A.S. | 1,889 | 13,607 | ||||||
Emlak Konut Gayrimenkul Yatirim Ortakligi A.S. | 9,333 | 2,212 | ||||||
Enerjisa Enerji A.S.(b) | 1,055 | 1,163 | ||||||
Enka Insaat ve Sanayi A.S. | 11,670 | 11,756 | ||||||
Eregli Demir ve Celik Fabrikalari TAS | 5,154 | 8,229 | ||||||
Ford Otomotiv Sanayi A.S. | 326 | 6,361 | ||||||
Gubre Fabrikalari TAS(a) | 232 | 1,815 | ||||||
Haci Omer Sabanci Holding A.S. | 8,868 | 15,989 | ||||||
Iskenderun Demir ve Celik A.S. | 915 | 1,252 | ||||||
KOC Holding A.S. | 5,468 | 16,343 | ||||||
Koza Altin Isletmeleri A.S. | 200 | 2,089 | ||||||
Oyak Cimento Fabrikalari A.S.(a) | 1,712 | 1,546 | ||||||
Petkim Petrokimya Holding A.S.(a) | 4,917 | 3,552 | ||||||
Sasa Polyester Sanayi A.S.(a) | 3,057 | 19,752 | ||||||
TAV Havalimanlari Holding A.S.(a) | 1,242 | 5,234 | ||||||
Tofas Turk Otomobil Fabrikasi A.S. | 842 | 4,454 | ||||||
Turk Hava Yollari AO(a) | 5,055 | 27,526 | ||||||
Turk Telekomunikasyon A.S. | 1,814 | 1,208 | ||||||
Turk Traktor ve Ziraat Makineleri A.S. | 51 | 1,044 | ||||||
Turkiye Garanti Bankasi A.S. | 3,146 | 3,974 | ||||||
Turkiye Is Bankasi A.S., Class C | 24,803 | 12,426 | ||||||
See accompanying Notes to Financial Statements which are an integral part of the financial statements.
| 33 | ||||
|
| |||
Invesco S&P Emerging Markets Momentum ETF (EEMO)–(continued)
October 31, 2022
| Shares | Value | |||||||
| Turkey-(continued) | ||||||||
Turkiye Petrol Rafinerileri A.S.(a) | 906 | $ | 18,458 | |||||
Turkiye Sise ve Cam Fabrikalari A.S. | 9,460 | 16,893 | ||||||
Vestel Beyaz Esya Sanayi ve Ticaret A.S. | 1,235 | 623 | ||||||
Yapi ve Kredi Bankasi A.S. | 15,588 | 7,717 | ||||||
|
| |||||||
| 231,292 | ||||||||
|
| |||||||
| United Arab Emirates-3.51% | ||||||||
Abu Dhabi Commercial Bank PJSC | 10,261 | 26,399 | ||||||
Abu Dhabi Islamic Bank PJSC | 7,854 | 20,314 | ||||||
Aldar Properties PJSC | 11,552 | 13,587 | ||||||
Dubai Islamic Bank PJSC | 10,715 | 16,978 | ||||||
Emaar Properties PJSC | 15,511 | 25,591 | ||||||
Fertiglobe PLC | 5,180 | 7,178 | ||||||
First Abu Dhabi Bank PJSC | 13,049 | 63,592 | ||||||
|
| |||||||
| 173,639 | ||||||||
|
| |||||||
Total Common Stocks & Other Equity Interests |
| 4,944,635 | ||||||
|
| |||||||
| Money Market Funds-0.08% | ||||||||
Invesco Government & Agency Portfolio, Institutional Class, | 4,220 | 4,220 | ||||||
|
| |||||||
TOTAL INVESTMENTS IN SECURITIES |
| 4,948,855 | ||||||
|
| |||||||
| Shares | Value | |||||||
| Investments Purchased with Cash Collateral from Securities on Loan |
| |||||||
| Money Market Funds-0.50% | ||||||||
Invesco Private Government Fund, 3.18%(e)(f)(g) | 6,971 | $ | 6,971 | |||||
Invesco Private Prime Fund, 3.28%(e)(f)(g) | 17,921 | 17,921 | ||||||
|
| |||||||
Total Investments Purchased with Cash Collateral from Securities on Loan |
| 24,892 | ||||||
|
| |||||||
TOTAL INVESTMENTS IN SECURITIES-100.64% | 4,973,747 | |||||||
OTHER ASSETS LESS LIABILITIES-(0.64)% |
| (31,865 | ) | |||||
|
| |||||||
NET ASSETS-100.00% | $ | 4,941,882 | ||||||
|
| |||||||
Investment Abbreviations:
NVDR-Non-Voting Depositary Receipt
Rts.-Rights
| Notes to Schedule of Investments: |
(a) Non-income producing security. |
(b) Security purchased or received in a transaction exempt from registration under the Securities Act of 1933, as amended (the “1933 Act”). The security may be resold pursuant to an exemption from registration under the 1933 Act, typically to qualified institutional buyers. The aggregate value of these securities at October 31, 2022 was $100,326, which represented 2.03% of the Fund’s Net Assets. |
(c) All or a portion of this security was out on loan at October 31, 2022. |
(d) Security valued using significant unobservable inputs (Level 3). See Note 4. |
(e) Affiliated issuer. The issuer and/or the Fund is a wholly-owned subsidiary of Invesco Ltd., or is affiliated by having an investment adviser that is under common control of Invesco Ltd. The table below shows the Fund’s transactions in, and earnings from, its investments in affiliates for the fiscal year ended October 31, 2022. |
| Value October 31, 2021 | Purchases at Cost | Proceeds from Sales | Change in Unrealized Appreciation | Realized Gain (Loss) | Value October 31, 2022 | Dividend Income | |||||||||||||||||||||||||||||
| Investments in Affiliated Money Market Funds: | |||||||||||||||||||||||||||||||||||
| Invesco Government & Agency Portfolio, Institutional Class | $ | 11,208 | $ | 956,847 | $(963,835) | $ | - | $ | - | $ | 4,220 | $ | 69 | ||||||||||||||||||||||
| Investments Purchased with Cash Collateral from Securities on Loan: | |||||||||||||||||||||||||||||||||||
| Invesco Private Government Fund | 4,674 | 665,718 | (663,421 | ) | - | - | 6,971 | 47 | * | ||||||||||||||||||||||||||
| Invesco Private Prime Fund | 10,905 | 1,130,508 | (1,123,454 | ) | - | (38 | ) | 17,921 | 136 | * | |||||||||||||||||||||||||
|
|
|
|
|
|
|
|
|
|
|
|
|
| ||||||||||||||||||||||
| Total | $ | 26,787 | $ | 2,753,073 | $ | (2,750,710 | ) | $ | - | $ | (38 | ) | $ | 29,112 | $ | 252 | |||||||||||||||||||
|
|
|
|
|
|
|
|
|
|
|
|
|
| ||||||||||||||||||||||
| * | Represents the income earned on the investment of cash collateral, which is included in securities lending income on the Statements of Operations. Does not include rebates and fees paid to lending agent or premiums received from borrowers, if any. |
See accompanying Notes to Financial Statements which are an integral part of the financial statements.
| 34 | ||||
|
| |||
Invesco S&P Emerging Markets Momentum ETF (EEMO)–(continued)
October 31, 2022
| (f) | The rate shown is the 7-day SEC standardized yield as of October 31, 2022. |
| (g) | The security has been segregated to satisfy the commitment to return the cash collateral received in securities lending transactions upon the borrower’s return of the securities loaned. See Note 2J. |
See accompanying Notes to Financial Statements which are an integral part of the financial statements.
| 35 | ||||
|
| |||
Invesco S&P International Developed High Dividend Low Volatility ETF (IDHD)
October 31, 2022
Schedule of Investments
| Shares | Value | |||||||
| Common Stocks & Other Equity Interests-99.63% |
| |||||||
| Australia-13.71% | ||||||||
APA Group | 21,770 | $ | 146,308 | |||||
Aurizon Holdings Ltd. | 93,528 | 216,499 | ||||||
Australia & New Zealand Banking Group Ltd. | 15,475 | 252,929 | ||||||
Bank of Queensland Ltd.(a) | 46,227 | 217,561 | ||||||
Commonwealth Bank of Australia | 2,183 | 146,125 | ||||||
Dexus | 35,524 | 176,275 | ||||||
GPT Group (The) | 68,449 | 188,647 | ||||||
Medibank Pvt. Ltd. | 58,913 | 105,858 | ||||||
National Australia Bank Ltd. | 8,709 | 180,546 | ||||||
Stockland | 108,964 | 250,837 | ||||||
Suncorp Group Ltd. | 25,628 | 186,985 | ||||||
Wesfarmers Ltd. | 4,867 | 141,481 | ||||||
Westpac Banking Corp. | 15,371 | 236,977 | ||||||
|
| |||||||
| 2,447,028 | ||||||||
|
| |||||||
| Austria-1.55% | ||||||||
Oesterreichische Post AG(a) | 9,732 | 277,498 | ||||||
|
| |||||||
| Belgium-1.40% | ||||||||
Proximus SADP | 23,796 | 249,534 | ||||||
|
| |||||||
| China-0.79% | ||||||||
Wilmar International Ltd. | 51,228 | 140,460 | ||||||
|
| |||||||
| Finland-0.74% | ||||||||
Elisa OYJ | 2,749 | 132,887 | ||||||
|
| |||||||
| France-2.52% | ||||||||
Bouygues S.A. | 8,158 | 232,859 | ||||||
Orange S.A. | 22,857 | 217,571 | ||||||
|
| |||||||
| 450,430 | ||||||||
|
| |||||||
| Germany-1.30% | ||||||||
E.ON SE | 27,745 | 232,427 | ||||||
|
| |||||||
| Hong Kong-11.04% | ||||||||
CK Asset Holdings Ltd. | 21,640 | 119,642 | ||||||
CK Hutchison Holdings Ltd. | 28,820 | 143,185 | ||||||
CK Infrastructure Holdings Ltd. | 32,482 | 154,344 | ||||||
CLP Holdings Ltd. | 21,984 | 147,590 | ||||||
HK Electric Investments & HK Electric Investments Ltd. | 192,592 | 122,427 | ||||||
HKT Trust & HKT Ltd. | 192,177 | 217,152 | ||||||
Hong Kong & China Gas Co. Ltd. (The) | 152,616 | 117,818 | ||||||
Link REIT | 22,606 | 133,623 | ||||||
New World Development Co. Ltd. | 84,488 | 172,854 | ||||||
Power Assets Holdings Ltd. | 34,235 | 163,764 | ||||||
Sino Land Co. Ltd. | 124,941 | 133,538 | ||||||
Sun Hung Kai Properties Ltd. | 17,769 | 191,162 | ||||||
Swire Properties Ltd. | 79,884 | 153,462 | ||||||
|
| |||||||
| 1,970,561 | ||||||||
|
| |||||||
| Israel-3.95% | ||||||||
Amot Investments Ltd. | 38,716 | 235,409 | ||||||
First International Bank of Israel Ltd. (The) | 7,114 | 308,654 | ||||||
Plus500 Ltd. | 7,774 | 161,558 | ||||||
|
| |||||||
| 705,621 | ||||||||
| �� | |||||||
| Italy-5.53% | ||||||||
Assicurazioni Generali S.p.A.(a) | 24,219 | 363,708 | ||||||
Snam S.p.A. | 41,687 | 185,489 | ||||||
| Shares | Value | |||||||
| Italy-(continued) | ||||||||
Terna Rete Elettrica Nazionale S.p.A.(a) | 20,810 | $ | 137,967 | |||||
UnipolSai Assicurazioni S.p.A.(a) | 132,681 | 299,251 | ||||||
|
| |||||||
| 986,415 | ||||||||
|
| |||||||
| Japan-18.01% | ||||||||
Activia Properties, Inc. | 61 | 180,782 | ||||||
Aozora Bank Ltd.(a) | 10,288 | 176,987 | ||||||
Chugoku Electric Power Co., Inc. (The)(a) | 27,624 | 129,724 | ||||||
Daiwa Office Investment Corp. | 31 | 146,412 | ||||||
EXEO Group, Inc. | 10,949 | 160,513 | ||||||
Japan Post Holdings Co. Ltd. | 25,492 | 171,439 | ||||||
Japan Prime Realty Investment Corp. | 52 | 141,164 | ||||||
Japan Tobacco, Inc. | 14,411 | 238,899 | ||||||
Kenedix Office Investment Corp.(a) | 64 | 145,753 | ||||||
Kyushu Electric Power Co., Inc. | 27,531 | 136,511 | ||||||
Mitsubishi HC Capital, Inc. | 34,141 | 146,547 | ||||||
Mizuho Financial Group, Inc. | 15,805 | 170,773 | ||||||
ORIX JREIT, Inc. | 111 | 148,986 | ||||||
Sekisui House Ltd. | 8,502 | 141,571 | ||||||
Sekisui House REIT, Inc.(a) | 293 | 157,899 | ||||||
Seven Bank Ltd. | 78,374 | 141,314 | ||||||
SoftBank Corp.(a) | 19,854 | 195,755 | ||||||
Sumitomo Mitsui Financial Group, Inc. | 6,089 | 170,952 | ||||||
Takeda Pharmaceutical Co. Ltd. | 6,247 | 164,670 | ||||||
Tohoku Electric Power Co., Inc. | 35,067 | 147,454 | ||||||
|
| |||||||
| 3,214,105 | ||||||||
|
| |||||||
| Netherlands-1.58% | ||||||||
Koninklijke Ahold Delhaize N.V. | 5,554 | 155,073 | ||||||
Koninklijke KPN N.V. | 45,061 | 126,081 | ||||||
|
| |||||||
| 281,154 | ||||||||
|
| |||||||
| New Zealand-3.92% | ||||||||
Contact Energy Ltd. | 45,090 | 197,773 | ||||||
Fletcher Building Ltd. | 92,373 | 275,833 | ||||||
Spark New Zealand Ltd. | 76,226 | 226,732 | ||||||
|
| |||||||
| 700,338 | ||||||||
|
| |||||||
| Norway-2.47% | ||||||||
Gjensidige Forsikring ASA | 6,715 | 122,651 | ||||||
Orkla ASA | 17,943 | 121,083 | ||||||
Telenor ASA | 21,628 | 196,583 | ||||||
|
| |||||||
| 440,317 | ||||||||
|
| |||||||
| Portugal-0.79% | ||||||||
Jeronimo Martins SGPS S.A. | 6,823 | 141,479 | ||||||
|
| |||||||
| Singapore-12.03% | ||||||||
CapitaLand Integrated Commercial Trust | 123,699 | 164,338 | ||||||
DBS Group Holdings Ltd. | 7,314 | 176,764 | ||||||
Jardine Cycle & Carriage Ltd. | 7,485 | 157,306 | ||||||
Keppel Corp. Ltd. | 41,917 | 206,460 | ||||||
Keppel REIT | 225,709 | 142,753 | ||||||
Mapletree Industrial Trust. | 92,486 | 143,784 | ||||||
Mapletree Logistics Trust | 173,582 | 186,449 | ||||||
Mapletree Pan Asia Commercial Trust | 145,270 | 163,225 | ||||||
Oversea-Chinese Banking Corp. Ltd. | 19,552 | 167,596 | ||||||
Singapore Technologies Engineering Ltd. | 61,420 | 143,231 | ||||||
Suntec REIT | 191,432 | 174,509 | ||||||
See accompanying Notes to Financial Statements which are an integral part of the financial statements.
| 36 | ||||
|
| |||
Invesco S&P International Developed High Dividend Low Volatility ETF (IDHD)–(continued)
October 31, 2022
| Shares | Value | |||||||
| Singapore-(continued) | ||||||||
United Overseas Bank Ltd. | 8,106 | $ | 159,015 | |||||
Venture Corp. Ltd. | 14,344 | 161,473 | ||||||
|
| |||||||
| 2,146,903 | ||||||||
|
| |||||||
| Spain-0.98% | ||||||||
Telefonica S.A. | 50,597 | 174,276 | ||||||
|
| |||||||
| Sweden-2.01% | ||||||||
Svenska Handelsbanken AB, Class A | 23,166 | 215,194 | ||||||
Telia Co. AB(a) | 54,429 | 144,071 | ||||||
|
| |||||||
| 359,265 | ||||||||
|
| |||||||
| Switzerland-4.94% | ||||||||
Holcim AG | 4,861 | 220,913 | ||||||
Novartis AG | 1,753 | 141,711 | ||||||
Swiss Life Holding AG | 378 | 183,155 | ||||||
Swisscom AG | 301 | 148,673 | ||||||
Zurich Insurance Group AG | 439 | 187,444 | ||||||
|
| |||||||
| 881,896 | ||||||||
|
| |||||||
| United Kingdom-9.65% | ||||||||
British American Tobacco PLC | 5,769 | 228,058 | ||||||
Imperial Brands PLC | 13,198 | 322,646 | ||||||
National Grid PLC | 14,222 | 155,296 | ||||||
Phoenix Group Holdings PLC(a) | 40,705 | 254,199 | ||||||
SSE PLC | 9,311 | 166,807 | ||||||
Tesco PLC | 53,070 | 131,431 | ||||||
Unilever PLC | 3,231 | 147,852 | ||||||
United Utilities Group PLC | 13,064 | 141,297 | ||||||
Vodafone Group PLC | 150,009 | 175,545 | ||||||
|
| |||||||
| 1,723,131 | ||||||||
|
| |||||||
| Shares | Value | |||||||
| United States-0.72% | ||||||||
GSK PLC | 7,820 | $ | 128,643 | |||||
|
| |||||||
TOTAL INVESTMENTS IN SECURITIES |
| 17,784,368 | ||||||
|
| |||||||
| Investments Purchased with Cash Collateral from Securities on Loan |
| |||||||
| Money Market Funds-12.55% | ||||||||
Invesco Private Government Fund, | 627,209 | 627,209 | ||||||
Invesco Private Prime Fund, 3.28%(b)(c)(d) | 1,612,389 | 1,612,389 | ||||||
|
| |||||||
Total Investments Purchased with Cash Collateral from Securities on Loan |
| 2,239,598 | ||||||
|
| |||||||
TOTAL INVESTMENTS IN SECURITIES-112.18% |
| 20,023,966 | ||||||
OTHER ASSETS LESS LIABILITIES-(12.18)% |
| (2,173,744 | ) | |||||
|
| |||||||
NET ASSETS-100.00% | $ | 17,850,222 | ||||||
|
| |||||||
Investment Abbreviations:
REIT-Real Estate Investment Trust
Notes to Schedule of Investments:
| (a) | All or a portion of this security was out on loan at October 31, 2022. |
| (b) | Affiliated issuer. The issuer and/or the Fund is a wholly-owned subsidiary of Invesco Ltd., or is affiliated by having an investment adviser that is under common control of Invesco Ltd. The table below shows the Fund’s transactions in, and earnings from, its investments in affiliates for the fiscal year ended October 31, 2022. |
| Value October 31, 2021 | Purchases at Cost | Proceeds from Sales | Change in Unrealized Appreciation | Realized Gain (Loss) | Value October 31, 2022 | Dividend Income | |||||||||||||||||||||||||||||
| Investments in Affiliated Money Market Funds: | |||||||||||||||||||||||||||||||||||
| Invesco Government & Agency Portfolio, Institutional Class | $ | - | $ | 2,034,679 | $ | (2,034,679 | ) | $ | - | $ | - | $ | - | $ | 176 | ||||||||||||||||||||
| Investments Purchased with Cash Collateral from Securities on Loan: | |||||||||||||||||||||||||||||||||||
| Invesco Private Government Fund | 419,898 | 4,141,395 | (3,934,084 | ) | - | - | 627,209 | 4,286 | * | ||||||||||||||||||||||||||
| Invesco Private Prime Fund | 979,762 | 9,857,281 | (9,224,336 | ) | 16 | (334 | ) | 1,612,389 | 11,629 | * | |||||||||||||||||||||||||
|
|
|
|
|
|
|
|
|
|
|
|
|
| ||||||||||||||||||||||
Total | $ | 1,399,660 | $ | 16,033,355 | $ | (15,193,099 | ) | $ | 16 | $ | (334 | ) | $ | 2,239,598 | $ | 16,091 | |||||||||||||||||||
|
|
|
|
|
|
|
|
|
|
|
|
|
| ||||||||||||||||||||||
| * | Represents the income earned on the investment of cash collateral, which is included in securities lending income on the Statements of Operations. Does not include rebates and fees paid to lending agent or premiums received from borrowers, if any. |
| (c) | The rate shown is the 7-day SEC standardized yield as of October 31, 2022. |
| (d) | The security has been segregated to satisfy the commitment to return the cash collateral received in securities lending transactions upon the borrower’s return of the securities loaned. See Note 2J. |
See accompanying Notes to Financial Statements which are an integral part of the financial statements.
| 37 | ||||
|
| |||
Invesco S&P International Developed Low Volatility ETF (IDLV)
October 31, 2022
Schedule of Investments
| Shares | Value | |||||||
| Common Stocks & Other Equity Interests-99.45% |
| |||||||
| Australia-7.02% | ||||||||
APA Group | 279,886 | $ | 1,881,008 | |||||
ASX Ltd. | 43,053 | 1,863,798 | ||||||
Aurizon Holdings Ltd. | 852,661 | 1,973,748 | ||||||
Australia & New Zealand Banking Group Ltd. | 149,195 | 2,438,495 | ||||||
Coles Group Ltd. | 203,238 | 2,122,256 | ||||||
Commonwealth Bank of Australia(a) | 31,152 | 2,085,241 | ||||||
Dexus | 352,606 | 1,749,678 | ||||||
Lendlease Corp. Ltd. | 289,557 | 1,609,017 | ||||||
Medibank Pvt. Ltd. | 915,996 | 1,645,912 | ||||||
National Australia Bank Ltd. | 109,778 | 2,275,805 | ||||||
Telstra Group Ltd.(b) | 1,002,198 | 2,512,154 | ||||||
Transurban Group. | 266,907 | 2,263,134 | ||||||
Wesfarmers Ltd. | 61,976 | 1,801,605 | ||||||
Westpac Banking Corp.(a) | 144,112 | 2,221,795 | ||||||
Woolworths Group Ltd. | 86,894 | 1,834,736 | ||||||
|
| |||||||
| 30,278,382 | ||||||||
|
| |||||||
| Belgium-0.95% | ||||||||
Ackermans & van Haaren N.V | 14,034 | 1,957,130 | ||||||
Groupe Bruxelles Lambert S.A. | 28,989 | 2,137,387 | ||||||
|
| |||||||
| 4,094,517 | ||||||||
|
| |||||||
| Canada-20.66% | ||||||||
Algonquin Power & Utilities Corp. | 213,701 | 2,362,531 | ||||||
AltaGas Ltd. | 104,246 | 1,877,735 | ||||||
Bank of Montreal(a) | 26,174 | 2,407,958 | ||||||
Bank of Nova Scotia (The)(a) | 47,325 | 2,284,631 | ||||||
BCE, Inc. | 68,763 | 3,097,750 | ||||||
Canadian Apartment Properties REIT | 62,258 | 1,925,637 | ||||||
Canadian Imperial Bank of Commerce | 51,004 | 2,313,418 | ||||||
Canadian National Railway Co. | 15,867 | 1,877,449 | ||||||
Canadian Utilities Ltd., Class A | 111,501 | 2,963,169 | ||||||
CCL Industries, Inc., Class B(a) | 40,006 | 1,877,046 | ||||||
CGI,Inc.,ClassA(b) | 26,687 | 2,147,012 | ||||||
Choice Properties REIT(a) | 248,866 | 2,388,223 | ||||||
Dollarama, Inc. | 32,297 | 1,916,676 | ||||||
Emera, Inc.(a) | 72,846 | 2,696,378 | ||||||
Empire Co. Ltd., Class A | 74,795 | 1,919,156 | ||||||
Enbridge, Inc. | 65,749 | 2,558,526 | ||||||
Fortis, Inc. | 74,281 | 2,894,348 | ||||||
George Weston Ltd. | 18,985 | 2,087,021 | ||||||
Great-West Lifeco, Inc. | 116,730 | 2,699,068 | ||||||
Hydro One Ltd.(c) | 128,636 | 3,221,440 | ||||||
IGM Financial, Inc. | 73,364 | 1,961,501 | ||||||
Intact Financial Corp. | 18,521 | 2,810,771 | ||||||
Loblaw Cos. Ltd. | 23,842 | 1,950,987 | ||||||
Metro, Inc. | 47,682 | 2,494,824 | ||||||
National Bank of Canada | 36,022 | 2,449,617 | ||||||
Northland Power, Inc.(a) | 65,402 | 1,900,616 | ||||||
Pembina Pipeline Corp. | 61,738 | 2,035,831 | ||||||
Power Corp. of Canada | 105,973 | 2,628,252 | ||||||
Restaurant Brands International, Inc. | 32,529 | 1,930,444 | ||||||
Rogers Communications, Inc., Class B | 52,436 | 2,180,012 | ||||||
Royal Bank of Canada | 29,778 | 2,751,744 | ||||||
Sun Life Financial, Inc. | 59,985 | 2,544,432 | ||||||
TC Energy Corp. | 46,337 | 2,032,775 | ||||||
TELUS Corp. | 134,582 | 2,806,978 | ||||||
Thomson Reuters Corp. | 22,079 | 2,345,241 | ||||||
| Shares | Value | |||||||
| Canada-(continued) | ||||||||
TMX Group Ltd. | 25,635 | $ | 2,461,546 | |||||
Toromont Industries Ltd. | 24,437 | 1,875,704 | ||||||
Toronto-Dominion Bank (The) | 37,378 | 2,389,200 | ||||||
|
| |||||||
| 89,065,647 | ||||||||
|
| |||||||
| China-0.48% | ||||||||
Wilmar International Ltd. | 760,844 | 2,086,124 | ||||||
|
| |||||||
| Denmark-0.47% | ||||||||
Tryg A/S(a) | 94,532 | 2,046,245 | ||||||
|
| |||||||
| Finland-0.57% | ||||||||
Elisa OYJ | 50,978 | 2,464,289 | ||||||
|
| |||||||
| France-2.53% | ||||||||
Air Liquide S.A. | 16,520 | 2,160,136 | ||||||
Bureau Veritas S.A. | 79,706 | 1,974,952 | ||||||
Danone S.A. | 38,286 | 1,904,865 | ||||||
Orange S.A. | 298,218 | 2,838,679 | ||||||
Sanofi | 23,426 | 2,021,961 | ||||||
|
| |||||||
| 10,900,593 | ||||||||
|
| |||||||
| Germany-1.33% | ||||||||
Beiersdorf AG | 18,648 | 1,791,102 | ||||||
Deutsche Boerse AG | 12,175 | 1,981,262 | ||||||
Deutsche Telekom AG | 103,077 | 1,952,356 | ||||||
|
| |||||||
| 5,724,720 | ||||||||
|
| |||||||
| Hong Kong-6.77% | ||||||||
CK Asset Holdings Ltd. | 278,070 | 1,537,385 | ||||||
CK Hutchison Holdings Ltd. | 369,597 | 1,836,249 | ||||||
CK Infrastructure Holdings Ltd. | 402,478 | 1,912,448 | ||||||
CLP Holdings Ltd. | 407,539 | 2,736,015 | ||||||
Hang Seng Bank Ltd. | 129,874 | 1,828,198 | ||||||
HK Electric Investments & HK Electric Investments Ltd. | 5,405,875 | 3,436,412 | ||||||
HKT Trust & HKT Ltd. | 2,902,331 | 3,279,512 | ||||||
Hong Kong & China Gas Co. Ltd. (The) | 2,192,355 | 1,692,475 | ||||||
Link REIT | 327,284 | 1,934,556 | ||||||
MTR Corp. Ltd. | 684,922 | 3,014,587 | ||||||
Power Assets Holdings Ltd. | 539,702 | 2,581,681 | ||||||
Sino Land Co. Ltd. | 1,389,858 | 1,485,494 | ||||||
Sun Hung Kai Properties Ltd. | 178,051 | 1,915,502 | ||||||
|
| |||||||
| 29,190,514 | ||||||||
|
| |||||||
| Ireland-0.38% | ||||||||
Kerry Group PLC, Class A | 18,682 | 1,624,865 | ||||||
|
| |||||||
| Israel-0.46% | ||||||||
First International Bank of Israel Ltd. (The) | 45,601 | 1,978,483 | ||||||
|
| |||||||
| Italy-1.87% | ||||||||
Infrastrutture Wireless Italiane S.p.A.(a)(c) | 206,881 | 1,826,335 | ||||||
Snam S.p.A | 493,697 | 2,196,732 | ||||||
Terna Rete Elettrica Nazionale S.p.A.(a) | 267,841 | 1,775,747 | ||||||
UnipolSai Assicurazioni S.p.A.(a) | 999,269 | 2,253,768 | ||||||
|
| |||||||
| 8,052,582 | ||||||||
|
| |||||||
| Japan-29.77% | ||||||||
Activia Properties, Inc. | 719 | 2,130,854 | ||||||
Advance Residence Investment Corp. | 868 | 2,020,574 | ||||||
Aeon Mall Co. Ltd. | 194,195 | 2,112,647 | ||||||
Canon, Inc. | 85,337 | 1,810,831 | ||||||
See accompanying Notes to Financial Statements which are an integral part of the financial statements.
| 38 | ||||
|
| |||
Invesco S&P International Developed Low Volatility ETF (IDLV)–(continued)
October 31, 2022
| Shares | Value | |||||||
| Japan-(continued) | ||||||||
Central Japan Railway Co. | 17,045 | $ | 1,979,897 | |||||
Chubu Electric Power Co., Inc. | 193,889 | 1,579,706 | ||||||
Chugoku Electric Power Co., Inc. (The)(a) | 337,378 | 1,584,350 | ||||||
COMSYS Holdings Corp. | 120,304 | 1,974,917 | ||||||
Dai Nippon Printing Co. Ltd. | 91,690 | 1,840,154 | ||||||
Daiwa House Industry Co. Ltd. | 91,375 | 1,851,660 | ||||||
Daiwa House REIT Investment Corp. | 956 | 1,929,559 | ||||||
Daiwa Office Investment Corp. | 432 | 2,040,327 | ||||||
Daiwa Securities Group, Inc. | 468,911 | 1,829,773 | ||||||
GLP J-Reit | 1,806 | 1,872,403 | ||||||
Hankyu Hanshin Holdings, Inc. | 66,735 | 1,982,272 | ||||||
Haseko Corp. | 184,821 | 1,904,974 | ||||||
Industrial & Infrastructure Fund Investment Corp. | 1,632 | 1,723,847 | ||||||
Japan Metropolitan Fund Investment Corp. | 2,719 | 2,003,098 | ||||||
Japan Post Bank Co. Ltd.(a) | 270,471 | 1,801,502 | ||||||
Japan Post Holdings Co. Ltd. | 324,141 | 2,179,913 | ||||||
Japan Prime Realty Investment Corp. | 838 | 2,274,922 | ||||||
Japan Real Estate Investment Corp. | 554 | 2,322,078 | ||||||
Japan Tobacco, Inc. | 149,455 | 2,477,594 | ||||||
Kansai Electric Power Co., Inc. (The) | 216,530 | 1,641,802 | ||||||
Kao Corp. | 48,016 | 1,805,829 | ||||||
KDDI Corp. | 73,617 | 2,176,787 | ||||||
Kewpie Corp. | 145,056 | 2,292,438 | ||||||
Kirin Holdings Co. Ltd. | 136,791 | 2,015,029 | ||||||
Kuraray Co. Ltd. | 261,428 | 1,799,313 | ||||||
Kyocera Corp. | 37,421 | 1,873,379 | ||||||
Kyushu Electric Power Co., Inc. | 383,487 | 1,901,503 | ||||||
Kyushu Railway Co. | 95,120 | 1,990,266 | ||||||
McDonald’s Holdings Co. Japan Ltd. | 113,710 | 3,947,547 | ||||||
MEIJI Holdings Co. Ltd. | 51,213 | 2,108,679 | ||||||
Mitsubishi Estate Co. Ltd. | 151,829 | 1,913,249 | ||||||
Mitsubishi HC Capital, Inc. | 455,467 | 1,955,044 | ||||||
Mizuho Financial Group, Inc. | 204,717 | 2,211,966 | ||||||
NH Foods Ltd. | 73,490 | 1,752,764 | ||||||
Nichirei Corp. | 134,409 | 2,092,525 | ||||||
Nippon Building Fund, Inc. | 499 | 2,219,121 | ||||||
Nippon Prologis REIT, Inc. | 844 | 1,768,803 | ||||||
Nippon Telegraph & Telephone Corp. | 92,103 | 2,536,883 | ||||||
Nisshin Seifun Group, Inc. | 200,685 | 2,171,100 | ||||||
Nissin Foods Holdings Co. Ltd. | 29,504 | 1,911,552 | ||||||
Nomura Real Estate Master Fund, Inc. | 1,889 | 2,154,173 | ||||||
Oji Holdings Corp. | 496,251 | 1,722,781 | ||||||
Ono Pharmaceutical Co. Ltd. | 81,669 | 1,920,912 | ||||||
ORIX JREIT, Inc. | 1,574 | 2,112,645 | ||||||
Osaka Gas Co. Ltd. | 118,459 | 1,754,948 | ||||||
Otsuka Holdings Co. Ltd. | 65,402 | 2,097,123 | ||||||
Secom Co. Ltd. | 35,381 | 2,021,193 | ||||||
Sekisui House Ltd. | 131,505 | 2,189,759 | ||||||
Sekisui House REIT, Inc.(a) | 4,019 | 2,165,855 | ||||||
Skylark Holdings Co. Ltd.(a)(b) | 196,261 | 2,095,511 | ||||||
SoftBank Corp.(a) | 249,564 | 2,460,632 | ||||||
Sohgo Security Services Co. Ltd. | 75,778 | 1,891,455 | ||||||
Sumitomo Mitsui Financial Group, Inc. | 68,918 | 1,934,906 | ||||||
Sumitomo Mitsui Trust Holdings, Inc. | 63,922 | 1,839,368 | ||||||
Suntory Beverage & Food Ltd. | 57,062 | 1,911,856 | ||||||
Takeda Pharmaceutical Co. Ltd. | 88,916 | 2,343,815 | ||||||
Tobu Railway Co. Ltd. | 89,920 | 2,081,103 | ||||||
| Shares | Value | |||||||
| Japan-(continued) | ||||||||
United Urban Investment Corp. | 1,904 | $ | 2,013,717 | |||||
Zensho Holdings Co. Ltd. | 94,296 | 2,353,673 | ||||||
|
| |||||||
| 128,378,856 | ||||||||
|
| |||||||
| Netherlands-1.48% | ||||||||
Koninklijke Ahold Delhaize N.V. | 70,945 | 1,980,849 | ||||||
Koninklijke KPN N.V. | 827,590 | 2,315,614 | ||||||
Wolters Kluwer N.V. | 19,560 | 2,079,172 | ||||||
|
| |||||||
| 6,375,635 | ||||||||
|
| |||||||
| New Zealand-1.39% | ||||||||
Contact Energy Ltd. | 421,760 | 1,849,912 | ||||||
Infratil Ltd. | 377,636 | 1,917,448 | ||||||
Spark New Zealand Ltd. | 746,394 | 2,220,122 | ||||||
|
| |||||||
| 5,987,482 | ||||||||
|
| |||||||
| Norway-1.40% | ||||||||
Gjensidige Forsikring ASA | 103,219 | 1,885,310 | ||||||
Orkla ASA | 315,962 | 2,132,174 | ||||||
Telenor ASA | 221,507 | 2,013,342 | ||||||
|
| |||||||
| 6,030,826 | ||||||||
|
| |||||||
| Singapore-10.15% | ||||||||
CapitaLand Ascendas REIT | 1,588,394 | 2,940,847 | ||||||
CapitaLand Integrated Commercial Trust | 1,706,219 | 2,266,760 | ||||||
City Developments Ltd. | 371,206 | 2,001,485 | ||||||
DBS Group Holdings Ltd. | 104,075 | 2,515,275 | ||||||
Genting Singapore Ltd. | 3,870,948 | 2,202,044 | ||||||
Keppel Corp. Ltd. | 493,118 | 2,428,827 | ||||||
Mapletree Industrial Trust | 1,760,192 | 2,736,501 | ||||||
Mapletree Logistics Trust(a) | 2,037,072 | 2,188,078 | ||||||
Mapletree Pan Asia Commercial Trust | 1,876,677 | 2,108,626 | ||||||
Oversea-Chinese Banking Corp. Ltd. | 318,144 | 2,727,077 | ||||||
Singapore Airlines Ltd.(a)(b) | 578,861 | 2,151,656 | ||||||
Singapore Exchange Ltd. | 455,279 | 2,708,960 | ||||||
Singapore Technologies Engineering Ltd. | 1,161,807 | 2,709,323 | ||||||
Singapore Telecommunications Ltd. | 1,369,975 | 2,420,279 | ||||||
Suntec REIT | 2,485,713 | 2,265,967 | ||||||
United Overseas Bank Ltd. | 127,094 | 2,493,201 | ||||||
UOL Group Ltd. | 614,790 | 2,689,245 | ||||||
Venture Corp. Ltd. | 196,099 | 2,207,517 | ||||||
|
| |||||||
| 43,761,668 | ||||||||
|
| |||||||
| Spain-0.79% | ||||||||
Red Electrica Corp. S.A. | 112,764 | 1,822,214 | ||||||
Telefonica S.A. | 464,342 | 1,599,381 | ||||||
|
| |||||||
| 3,421,595 | ||||||||
|
| |||||||
| Sweden-0.89% | ||||||||
AAK AB(a) | 130,874 | 1,906,774 | ||||||
Telia Co. AB(a) | 735,455 | 1,946,714 | ||||||
|
| |||||||
| 3,853,488 | ||||||||
|
| |||||||
| Switzerland-2.64% | ||||||||
Novartis AG | 32,110 | 2,595,752 | ||||||
SGS S.A. | 963 | 2,125,673 | ||||||
Swiss Life Holding AG | 3,697 | 1,791,332 | ||||||
Swisscom AG | 5,317 | 2,626,223 | ||||||
Zurich Insurance Group AG(a) | 5,278 | 2,253,599 | ||||||
|
| |||||||
| 11,392,579 | ||||||||
|
| |||||||
| United Kingdom-5.43% | ||||||||
British American Tobacco PLC | 51,067 | 2,018,761 | ||||||
See accompanying Notes to Financial Statements which are an integral part of the financial statements.
| 39 | ||||
|
| |||
Invesco S&P International Developed Low Volatility ETF (IDLV)–(continued)
October 31, 2022
| Shares | Value | |||||||
| United Kingdom-(continued) | ||||||||
Bunzl PLC | 59,894 | $ | 1,959,124 | |||||
Diageo PLC | 45,688 | 1,892,652 | ||||||
Imperial Brands PLC | 89,328 | 2,184,487 | ||||||
J Sainsbury PLC | 798,299 | 1,786,773 | ||||||
National Grid PLC | 179,267 | 1,957,489 | ||||||
Reckitt Benckiser Group PLC | 26,738 | 1,779,361 | ||||||
RELX PLC | 84,287 | 2,271,797 | ||||||
Severn Trent PLC(a) | 67,210 | 1,936,878 | ||||||
Tesco PLC | 800,015 | 1,981,280 | ||||||
United Utilities Group PLC | 176,473 | 1,908,694 | ||||||
Vodafone Group PLC | 1,471,351 | 1,721,822 | ||||||
|
| |||||||
| 23,399,118 | ||||||||
|
| |||||||
| United States-2.02% | ||||||||
GSK PLC | 124,886 | 2,054,436 | ||||||
Nestle S.A. | 22,205 | 2,419,419 | ||||||
Roche Holding AG | 6,457 | 2,145,666 | ||||||
Waste Connections, Inc. | 15,782 | 2,080,394 | ||||||
|
| |||||||
| 8,699,915 | ||||||||
|
| |||||||
Total Common Stocks & Other Equity Interests | 428,808,123 | |||||||
|
| |||||||
| Money Market Funds-0.01% | ||||||||
Invesco Government & Agency Portfolio, Institutional Class, 3.07%(d)(e) | 49,451 | 49,451 | ||||||
|
| |||||||
TOTAL INVESTMENTS IN SECURITIES | 428,857,574 | |||||||
|
| |||||||
| Shares | Value | |||||||
| Investments Purchased with Cash Collateral from Securities on Loan |
| |||||||
| Money Market Funds-7.38% | ||||||||
Invesco Private Government Fund, | 8,908,375 | $ | 8,908,375 | |||||
Invesco Private Prime Fund, | 22,901,210 | 22,901,210 | ||||||
|
| |||||||
Total Investments Purchased with Cash Collateral from Securities on Loan |
| 31,809,585 | ||||||
|
| |||||||
TOTAL INVESTMENTS IN SECURITIES-106.84% |
| 460,667,159 | ||||||
OTHER ASSETS LESS LIABILITIES-(6.84)% |
| (29,507,717 | ) | |||||
|
| |||||||
NET ASSETS-100.00%. | $ | 431,159,442 | ||||||
|
| |||||||
Investment Abbreviations:
REIT-Real Estate Investment Trust
Notes to Schedule of Investments:
| (a) | All or a portion of this security was out on loan at October 31, 2022. |
| (b) | Non-income producing security. |
| (c) | Security purchased or received in a transaction exempt from registration under the Securities Act of 1933, as amended (the “1933 Act”). The security may be resold pursuant to an exemption from registration under the 1933 Act, typically to qualified institutional buyers. The aggregate value of these securities at October 31, 2022 was $5,047,775, which represented 1.17% of the Fund’s Net Assets. |
| (d) | Affiliated issuer. The issuer and/or the Fund is a wholly-owned subsidiary of Invesco Ltd., or is affiliated by having an investment adviser that is under common control of Invesco Ltd. The table below shows the Fund’s transactions in, and earnings from, its investments in affiliates for the fiscal year ended October 31, 2022. |
| Value October 31, 2021 | Purchases at Cost | Proceeds from Sales | Change in Unrealized Appreciation | Realized Gain (Loss) | Value October 31, 2022 | Dividend Income | |||||||||||||||||||||||||||||
| Investments in Affiliated Money Market Funds: | |||||||||||||||||||||||||||||||||||
| Invesco Government & Agency Portfolio, Institutional Class | $ | – | $ | 85,144,131 | $ | (85,094,680 | ) | $ | – | $ | – | $ | 49,451 | $ | 6,447 | ||||||||||||||||||||
See accompanying Notes to Financial Statements which are an integral part of the financial statements.
| 40 | ||||
|
| |||
Invesco S&P International Developed Low Volatility ETF (IDLV)–(continued)
October 31, 2022
| Value October 31, 2021 | Purchases at Cost | Proceeds from Sales | Change in Unrealized Appreciation | Realized Gain (Loss) | Value October 31, 2022 | Dividend Income | |||||||||||||||||||||||||||||
Investments Purchased with Cash Collateral from Securities on Loan: | |||||||||||||||||||||||||||||||||||
| Invesco Private Government Fund | $ | 16,037,629 | $ | 144,742,322 | $ | (151,871,576 | ) | $ | - | $ | - | $ | 8,908,375 | $ | 119,547 | * | |||||||||||||||||||
Invesco Private Prime Fund | 37,421,121 | 284,712,356 | (299,223,038 | ) | 73 | (9,302 | ) | 22,901,210 | 330,078 | * | |||||||||||||||||||||||||
|
|
|
|
|
|
|
|
|
|
|
|
|
| ||||||||||||||||||||||
Total | $ | 53,458,750 | $ | 514,598,809 | $ | (536,189,294 | ) | $ | 73 | $ | (9,302 | ) | $ | 31,859,036 | $ | 456,072 | |||||||||||||||||||
|
|
|
|
|
|
|
|
|
|
|
|
|
| ||||||||||||||||||||||
| * | Represents the income earned on the investment of cash collateral, which is included in securities lending income on the Statements of Operations. Does not include rebates and fees paid to lending agent or premiums received from borrowers, if any. |
| (e) | The rate shown is the 7-day SEC standardized yield as of October 31, 2022. |
| (f) | The security has been segregated to satisfy the commitment to return the cash collateral received in securities lending transactions upon the borrower’s return of the securities loaned. See Note 2J. |
See accompanying Notes to Financial Statements which are an integral part of the financial statements.
| 41 | ||||
|
| |||
Invesco S&P International Developed Momentum ETF (IDMO)
October 31, 2022
Schedule of Investments
| Shares | Value | |||||||
| Common Stocks & Other Equity Interests-99.84% |
| |||||||
| Australia-7.12% | ||||||||
Ampol Ltd. | 419 | $ | 7,296 | |||||
APA Group | 2,610 | 17,541 | ||||||
ASX Ltd. | 350 | 15,152 | ||||||
Endeavour Group Ltd. | 2,286 | 10,452 | ||||||
Glencore PLC | 27,028 | 155,438 | ||||||
Incitec Pivot Ltd. | 4,604 | 11,040 | ||||||
Macquarie Group Ltd. | 579 | 62,756 | ||||||
National Australia Bank Ltd. | 6,739 | 139,706 | ||||||
Orica Ltd. | 1,014 | 9,000 | ||||||
Origin Energy Ltd. | 4,325 | 15,404 | ||||||
Pilbara Minerals Ltd.(a) | 4,079 | 13,276 | ||||||
South32 Ltd. | 8,366 | 19,259 | ||||||
Vicinity Ltd. | 8,639 | 10,744 | ||||||
WiseTech Global Ltd. | 357 | 13,277 | ||||||
Woodside Energy Group Ltd. | 4,889 | 112,483 | ||||||
Worley Ltd. | 729 | 6,652 | ||||||
|
| |||||||
| 619,476 | ||||||||
|
| |||||||
| Austria-0.05% | ||||||||
Verbund AG | 58 | 4,543 | ||||||
|
| |||||||
| Belgium-0.16% | ||||||||
Elia Group S.A./N.V | 107 | 13,526 | ||||||
|
| |||||||
| Canada-17.47% | ||||||||
AltaGas Ltd. | 415 | 7,475 | ||||||
BCE, Inc. | 498 | 22,435 | ||||||
Cameco Corp. | 695 | 16,462 | ||||||
Canadian National Railway Co. | 1,071 | 126,725 | ||||||
Canadian Natural Resources Ltd. | 3,640 | 218,045 | ||||||
Canadian Utilities Ltd., Class A(b) | 303 | 8,052 | ||||||
Cenovus Energy, Inc. | 4,800 | 96,911 | ||||||
Dollarama, Inc. | 691 | 41,008 | ||||||
Emera, Inc.(b) | 426 | 15,768 | ||||||
Enbridge, Inc. | 5,264 | 204,841 | ||||||
Fairfax Financial Holdings Ltd. | 54 | 26,488 | ||||||
Fortis, Inc. | 829 | 32,302 | ||||||
George Weston Ltd. | 132 | 14,511 | ||||||
Hydro One Ltd.(c) | 825 | 20,661 | ||||||
Imperial Oil Ltd. | 676 | 36,728 | ||||||
Intact Financial Corp. | 319 | 48,412 | ||||||
Loblaw Cos. Ltd. | 451 | 36,905 | ||||||
Metro, Inc. | 366 | 19,150 | ||||||
Nutrien Ltd. | 1,270 | 107,173 | ||||||
Pembina Pipeline Corp. | 1,219 | 40,197 | ||||||
Ritchie Bros. Auctioneers, Inc. | 184 | 12,005 | ||||||
Suncor Energy, Inc. | 4,377 | 150,366 | ||||||
TC Energy Corp. | 1,921 | 84,273 | ||||||
Teck Resources Ltd., Class B | 736 | 22,376 | ||||||
TELUS Corp. | 769 | 16,039 | ||||||
Thomson Reuters Corp. | 227 | 24,112 | ||||||
Tourmaline Oil Corp. | 1,090 | 61,338 | ||||||
West Fraser Timber Co. Ltd. | 112 | 8,399 | ||||||
|
| |||||||
| 1,519,157 | ||||||||
|
| |||||||
| China-0.21% | ||||||||
BOC Hong Kong Holdings Ltd. | 5,831 | 18,125 | ||||||
|
| |||||||
| Denmark-5.56% | ||||||||
AP Moller - Maersk A/S, Class A | 5 | 10,010 | ||||||
| Shares | Value | |||||||
| Denmark-(continued) | ||||||||
AP Moller-Maersk A/S, Class B | 8 | $ | 16,738 | |||||
Novo Nordisk A/S, Class B | 4,198 | 456,496 | ||||||
|
| |||||||
| 483,244 | ||||||||
|
| |||||||
| Finland-0.49% | ||||||||
Orion OYJ, Class B | 202 | 9,294 | ||||||
Sampo OYJ, Class A | 728 | 33,299 | ||||||
|
| |||||||
| 42,593 | ||||||||
|
| |||||||
| France-6.45% | ||||||||
Aeroports de Paris(a) | 51 | 6,908 | ||||||
Orange S.A. | 3,618 | 34,439 | ||||||
Sanofi | 1,929 | 166,497 | ||||||
Thales S.A. | 255 | 32,424 | ||||||
TotalEnergies SE | 5,886 | 320,541 | ||||||
|
| |||||||
| 560,809 | ||||||||
|
| |||||||
| Germany-1.38% | ||||||||
Deutsche Boerse AG | 388 | 63,140 | ||||||
Hapag-Lloyd AG(b)(c) | 18 | 3,254 | ||||||
RWE AG | 1,396 | 53,796 | ||||||
|
| |||||||
| 120,190 | ||||||||
|
| |||||||
| Hong Kong-0.20% | ||||||||
HKT Trust & HKT Ltd. | 7,452 | 8,420 | ||||||
Power Assets Holdings Ltd. | 1,928 | 9,223 | ||||||
|
| |||||||
| 17,643 | ||||||||
|
| |||||||
| Israel-1.82% | ||||||||
Airport City Ltd.(a) | 96 | 1,597 | ||||||
Bank Hapoalim BM | 2,359 | 22,856 | ||||||
Bank Leumi Le-Israel BM | 3,841 | 36,833 | ||||||
Bezeq The Israeli Telecommunication Corp. Ltd. | 7,054 | 12,543 | ||||||
Elbit Systems Ltd. | 86 | 17,476 | ||||||
Fattal Holdings 1998 Ltd.(a) | 11 | 1,124 | ||||||
First International Bank of Israel Ltd. (The) | 179 | 7,766 | ||||||
ICL Group Ltd. | 1,357 | 12,307 | ||||||
Israel Corp. Ltd. (The) | 10 | 4,350 | ||||||
Israel Discount Bank Ltd., Class A | 2,368 | 13,537 | ||||||
Mivne Real Estate KD Ltd.(b) | 987 | 3,085 | ||||||
Mizrahi Tefahot Bank Ltd. | 337 | 12,802 | ||||||
Phoenix Holdings Ltd. (The) | 281 | 3,059 | ||||||
Plus500 Ltd. | 213 | 4,427 | ||||||
ZIM Integrated Shipping Services Ltd.(b) | 182 | 4,275 | ||||||
|
| |||||||
| 158,037 | ||||||||
|
| |||||||
| Italy-0.68% | ||||||||
Eni S.p.A.(b) | 4,483 | 58,726 | ||||||
|
| |||||||
| Japan-24.74% | ||||||||
Ajinomoto Co., Inc. | 1,033 | 28,467 | ||||||
Astellas Pharma, Inc. | 3,237 | 44,569 | ||||||
Bandai Namco Holdings, Inc. | 591 | 39,134 | ||||||
Canon Marketing Japan, Inc. | 119 | 2,514 | ||||||
Canon, Inc. | 2,376 | 50,418 | ||||||
Chiba Bank Ltd. (The) | 1,218 | 6,662 | ||||||
Dai Nippon Printing Co. Ltd. | 425 | 8,529 | ||||||
Dai-ichi Life Holdings, Inc. | 1,505 | 23,871 | ||||||
Daiichi Sankyo Co. Ltd. | 5,323 | 170,718 | ||||||
Dentsu Group, Inc. | 399 | 12,442 | ||||||
Electric Power Development Co. Ltd. | 392 | 5,454 | ||||||
See accompanying Notes to Financial Statements which are an integral part of the financial statements.
| 42 | ||||
|
| |||
Invesco S&P International Developed Momentum ETF (IDMO)–(continued)
October 31, 2022
| Shares | Value | |||||||
| Japan-(continued) | ||||||||
Fuji Electric Co. Ltd. | 242 | $ | 9,378 | |||||
Fukuoka Financial Group, Inc. | 400 | 6,792 | ||||||
GOLDWIN, Inc. | 61 | 3,193 | ||||||
Hankyu Hanshin Holdings, Inc. | 434 | 12,891 | ||||||
Hitachi Transport System Ltd. | 145 | 8,673 | ||||||
Idemitsu Kosan Co. Ltd. | 472 | 10,321 | ||||||
IHI Corp. | 307 | 6,857 | ||||||
Inpex Corp. | 3,482 | 35,561 | ||||||
Isetan Mitsukoshi Holdings Ltd. | 919 | 8,161 | ||||||
ITOCHU Corp. | 2,748 | 71,161 | ||||||
Japan Post Bank Co. Ltd.(b) | 724 | 4,822 | ||||||
Japan Tobacco, Inc. | 2,154 | 35,708 | ||||||
JFE Holdings, Inc. | 810 | 7,428 | ||||||
Kansai Electric Power Co., Inc. (The) | 2,170 | 16,454 | ||||||
Kawasaki Kisen Kaisha Ltd.(b) | 816 | 12,413 | ||||||
KDDI Corp. | 4,167 | 123,214 | ||||||
Kintetsu Group Holdings Co. Ltd. | 316 | 10,694 | ||||||
Konami Group Corp. | 177 | 7,776 | ||||||
Marubeni Corp. | 3,864 | 33,874 | ||||||
Marui Group Co. Ltd. | 403 | 6,654 | ||||||
Mitsubishi Corp. | 3,121 | 84,642 | ||||||
Mitsubishi Estate Co. Ltd. | 2,240 | 28,227 | ||||||
Mitsubishi Heavy Industries Ltd. | 1,004 | 34,585 | ||||||
Mitsubishi Motors Corp.(a) | 1,400 | 4,710 | ||||||
Mitsubishi UFJ Financial Group, Inc. | 29,567 | 139,147 | ||||||
Mitsui & Co. Ltd. | 2,543 | 56,340 | ||||||
Mitsui OSK Lines Ltd.(b) | 1,185 | 23,527 | ||||||
MS&AD Insurance Group Holdings, Inc. | 1,065 | 28,238 | ||||||
Nexon Co. Ltd. | 810 | 13,608 | ||||||
NGK Spark Plug Co. Ltd. | 573 | 10,447 | ||||||
Nikon Corp. | 840 | 8,132 | ||||||
Nippon Telegraph & Telephone Corp. | 3,863 | 106,402 | ||||||
Nippon Yusen K.K.(b) | 1,485 | 26,966 | ||||||
Nissan Chemical Corp. | 261 | 11,765 | ||||||
Nissin Foods Holdings Co. Ltd. | 172 | 11,144 | ||||||
Nomura Real Estate Holdings, Inc. | 200 | 4,528 | ||||||
NTT Data Corp. | 945 | 13,714 | ||||||
Ono Pharmaceutical Co. Ltd. | 1,644 | 38,668 | ||||||
Oriental Land Co. Ltd. | 475 | 63,755 | ||||||
ORIX Corp. | 2,262 | 33,252 | ||||||
Osaka Gas Co. Ltd. | 718 | 10,637 | ||||||
Resona Holdings, Inc. | 5,065 | 19,073 | ||||||
Rohto Pharmaceutical Co. Ltd. | 276 | 8,588 | ||||||
Sega Sammy Holdings, Inc. | 558 | 7,152 | ||||||
Seven & i Holdings Co. Ltd. | 1,133 | 42,336 | ||||||
Shimamura Co. Ltd. | 41 | 3,318 | ||||||
Shinsei Bank Ltd.(b) | 112 | 1,665 | ||||||
SoftBank Corp.(b) | 4,851 | 47,830 | ||||||
Sojitz Corp. | 387 | 5,713 | ||||||
Sompo Holdings, Inc. | 810 | 33,749 | ||||||
Sumitomo Corp. | 2,853 | 36,384 | ||||||
Sumitomo Mitsui Financial Group, Inc. | 2,287 | 64,209 | ||||||
Sumitomo Mitsui Trust Holdings, Inc. | 771 | 22,186 | ||||||
Suntory Beverage & Food Ltd. | 321 | 10,755 | ||||||
Suzuken Co. Ltd. | 127 | 2,828 | ||||||
Taisei Corp. | 328 | 8,948 | ||||||
TIS, Inc. | 447 | 12,075 | ||||||
Tokio Marine Holdings, Inc. | 6,444 | 116,667 | ||||||
Tokyo Electric Power Co. Holdings, Inc.(a)(b) | 2,033 | 6,634 | ||||||
Tokyo Gas Co. Ltd. | 835 | 14,926 | ||||||
| Shares | Value | |||||||
| Japan-(continued) | ||||||||
Tokyo Tatemono Co. Ltd. | 385 | $ | 5,307 | |||||
Toppan, Inc. | 634 | 9,465 | ||||||
Toshiba Corp. | 731 | 25,481 | ||||||
Toyo Suisan Kaisha Ltd. | 239 | 8,972 | ||||||
Trend Micro, Inc. | 372 | 18,796 | ||||||
USS Co. Ltd. | 609 | 9,207 | ||||||
Yakult Honsha Co. Ltd. | 319 | 17,685 | ||||||
Yokogawa Electric Corp. | 534 | 8,949 | ||||||
Zensho Holdings Co. Ltd. | 213 | 5,317 | ||||||
|
| |||||||
| 2,151,452 | ||||||||
|
| |||||||
| Netherlands-7.23% | ||||||||
Koninklijke KPN N.V. | 7,254 | 20,297 | ||||||
Shell PLC | 20,559 | 569,041 | ||||||
Wolters Kluwer N.V. | 373 | 39,649 | ||||||
|
| |||||||
| 628,987 | ||||||||
|
| |||||||
| New Zealand-0.11% | ||||||||
Spark New Zealand Ltd. | 3,219 | 9,575 | ||||||
|
| |||||||
| Norway-2.10% | ||||||||
Aker BP ASA | 595 | 18,965 | ||||||
DNB Bank ASA | 1,347 | 23,839 | ||||||
Equinor ASA | 3,618 | 132,358 | ||||||
Kongsberg Gruppen ASA | 204 | 7,311 | ||||||
|
| |||||||
| 182,473 | ||||||||
|
| |||||||
| Portugal-0.25% | ||||||||
Galp Energia SGPS S.A.(b) | 804 | 8,165 | ||||||
Jeronimo Martins SGPS S.A. | 664 | 13,768 | ||||||
|
| |||||||
| 21,933 | ||||||||
|
| |||||||
| Singapore-0.71% | ||||||||
City Developments Ltd. | 904 | 4,874 | ||||||
Jardine Cycle & Carriage Ltd. | 265 | 5,569 | ||||||
Kenon Holdings Ltd. | 71 | 2,733 | ||||||
Keppel Corp. Ltd. | 3,829 | 18,860 | ||||||
Singapore Telecommunications Ltd. | 14,456 | 25,539 | ||||||
Suntec REIT | 4,153 | 3,786 | ||||||
|
| |||||||
| 61,361 | ||||||||
|
| |||||||
| Spain-1.29% | ||||||||
Corp.ACCIONA Energias Renovables S.A | 135 | 5,305 | ||||||
EDP Renovaveis S.A. | 346 | 7,287 | ||||||
Naturgy Energy Group S.A. | 417 | 10,699 | ||||||
Red Electrica Corp. S.A. | 807 | 13,041 | ||||||
Repsol S.A. | 3,129 | 42,507 | ||||||
Telefonica S.A. | 9,650 | 33,239 | ||||||
|
| |||||||
| 112,078 | ||||||||
|
| |||||||
| Sweden-0.09% | ||||||||
Axfood AB | 299 | 7,398 | ||||||
|
| |||||||
| Switzerland-1.38% | ||||||||
Zurich Insurance Group AG | 282 | 120,408 | ||||||
|
| |||||||
| United Kingdom-19.78% | ||||||||
AstraZeneca PLC | 3,496 | 412,736 | ||||||
BAE Systems PLC | 8,348 | 78,276 | ||||||
BP PLC | 45,533 | 251,532 | ||||||
British American Tobacco PLC | 5,153 | 203,706 | ||||||
Bunzl PLC | 579 | 18,939 | ||||||
Compass Group PLC | 3,189 | 67,430 | ||||||
HSBC Holdings PLC | 42,462 | 218,679 | ||||||
See accompanying Notes to Financial Statements which are an integral part of the financial statements.
| 43 | ||||
|
| |||
Invesco S&P International Developed Momentum ETF (IDMO)–(continued)
October 31, 2022
| Shares | Value | |||||||
| United Kingdom-(continued) | ||||||||
Imperial Brands PLC | 2,011 | $ | 49,178 | |||||
National Grid PLC | 9,603 | 104,859 | ||||||
NatWest Group PLC | 9,194 | 24,855 | ||||||
Reckitt Benckiser Group PLC | 1,476 | 98,225 | ||||||
RELX PLC | 3,494 | 94,174 | ||||||
SSE PLC | 2,150 | 38,517 | ||||||
Standard Chartered PLC | 4,224 | 25,299 | ||||||
Tesco PLC | 13,624 | 33,741 | ||||||
|
| |||||||
| 1,720,146 | ||||||||
|
| |||||||
| United States-0.57% | ||||||||
Computershare Ltd. | 1,976 | 31,930 | ||||||
Tenaris S.A. | 1,140 | 17,695 | ||||||
|
| |||||||
| 49,625 | ||||||||
|
| |||||||
TOTAL INVESTMENTS IN SECURITIES |
| 8,681,505 | ||||||
|
| |||||||
| Shares | Value | |||||||
Investments Purchased with Cash Collateral from Securities on Loan |
| |||||||
| Money Market Funds-2.73% | ||||||||
Invesco Private Government Fund, 3.18%(d)(e)(f) | 66,406 | $ | 66,406 | |||||
Invesco Private Prime Fund, 3.28%(d)(e)(f) | 170,719 | 170,719 | ||||||
|
| |||||||
Total Investments Purchased with Cash Collateral |
| 237,125 | ||||||
|
| |||||||
TOTAL INVESTMENTS IN SECURITIES-102.57% |
| 8,918,630 | ||||||
OTHER ASSETS LESS LIABILITIES-(2.57)% | (223,772 | ) | ||||||
|
| |||||||
NET ASSETS-100.00% | $ | 8,694,858 | ||||||
|
| |||||||
Investment Abbreviations:
REIT-Real Estate Investment Trust
| Notes to Schedule of Investments: |
(a) Non-income producing security. |
(b) All or a portion of this security was out on loan at October 31, 2022. |
(c) Security purchased or received in a transaction exempt from registration under the Securities Act of 1933, as amended (the “1933 Act”). The security may be resold pursuant to an exemption from registration under the 1933 Act, typically to qualified institutional buyers. The aggregate value of these securities at October 31, 2022 was $23,915, which represented less than 1% of the Fund’s Net Assets. |
(d) Affiliated issuer. The issuer and/or the Fund is a wholly-owned subsidiary of Invesco Ltd., or is affiliated by having an investment adviser that is under common control of Invesco Ltd. The table below shows the Fund’s transactions in, and earnings from, its investments in affiliates for the fiscal year ended October 31, 2022. |
| Value October 31, 2021 | Purchases at Cost | Proceeds from Sales | Change in Unrealized Appreciation (Depreciation) | Realized Gain (Loss) | Value October 31, 2022 | Dividend Income | |||||||||||||||||||||||||||||
| Investments in Affiliated Money Market Funds: | |||||||||||||||||||||||||||||||||||
| Invesco Government & Agency Portfolio, Institutional Class | $ | - | $ | 2,656,647 | $ | (2,656,647 | ) | $ | - | $ | - | $ | - | $ | 202 | ||||||||||||||||||||
| Investments Purchased with Cash Collateral from Securities on Loan: | |||||||||||||||||||||||||||||||||||
| Invesco Private Government Fund | 325,717 | 2,539,776 | (2,799,087 | ) | - | - | 66,406 | 1,598 | * | ||||||||||||||||||||||||||
Invesco Private Prime Fund | 760,007 | 4,365,481 | (4,954,697 | ) | (4 | ) | (68 | ) | 170,719 | 4,323 | * | ||||||||||||||||||||||||
|
|
|
|
|
|
|
|
|
|
|
|
|
| ||||||||||||||||||||||
Total | $ | 1,085,724 | $ | 9,561,904 | $ | (10,410,431 | ) | $ | (4 | ) | $ | (68 | ) | $ | 237,125 | $ | 6,123 | ||||||||||||||||||
|
|
|
|
|
|
|
|
|
|
|
|
|
| ||||||||||||||||||||||
| * | Represents the income earned on the investment of cash collateral, which is included in securities lending income on the Statements of Operations. Does not include rebates and fees paid to lending agent or premiums received from borrowers, if any. |
| (e) | The rate shown is the 7-day SEC standardized yield as of October 31, 2022. |
| (f) | The security has been segregated to satisfy the commitment to return the cash collateral received in securities lending transactions upon the borrower’s return of the securities loaned. See Note 2J. |
See accompanying Notes to Financial Statements which are an integral part of the financial statements.
| 44 | ||||
|
| |||
(This Page Intentionally Left Blank)
| 45 | ||||
|
| |||
Statements of Assets and Liabilities
October 31, 2022
| Invesco FTSE International Low Beta Equal Weight ETF (IDLB) | Invesco S&P Emerging Markets Low Volatility ETF (EELV) | Invesco S&P Emerging Markets Momentum ETF (EEMO) | Invesco S&P International Developed High Dividend Low Volatility ETF (IDHD) | |||||||||||||||||
| Assets: | ||||||||||||||||||||
Unaffiliated investments in securities, at value(a) | $ | 4,263,232 | $ | 903,039,484 | $ | 4,944,635 | $ | 17,784,368 | ||||||||||||
Affiliated investments in securities, at value | 309,035 | 11,741,660 | 29,112 | 2,239,598 | ||||||||||||||||
Foreign currencies, at value | - | 1,593,880 | 5,420 | 204 | ||||||||||||||||
Deposits with brokers: | ||||||||||||||||||||
Cash segregated as collateral | - | 488,571 | - | - | ||||||||||||||||
Receivable for: | ||||||||||||||||||||
Dividends | 15,397 | 824,776 | 2,866 | 63,007 | ||||||||||||||||
Securities lending | 142 | 9,685 | 4 | 1,116 | ||||||||||||||||
Investments sold | 9,735 | 6,138 | - | - | ||||||||||||||||
Fund shares sold | - | 9,786,382 | - | - | ||||||||||||||||
Foreign tax reclaims | 39,583 | 9,310 | - | 18,062 | ||||||||||||||||
|
|
|
|
|
|
|
| |||||||||||||
Total assets | 4,637,124 | 927,499,886 | 4,982,037 | 20,106,355 | ||||||||||||||||
|
|
|
|
|
|
|
| |||||||||||||
| Liabilities: | ||||||||||||||||||||
Due to custodian | 1,385 | 692,013 | 3,177 | 12,082 | ||||||||||||||||
Due to foreign custodian | 2,653 | - | - | - | ||||||||||||||||
Payable for: | ||||||||||||||||||||
Investments purchased | 5,057 | 9,946,396 | 2 | 2 | ||||||||||||||||
Collateral upon return of securities loaned. | 304,183 | 11,741,671 | 24,892 | 2,239,582 | ||||||||||||||||
Collateral upon receipt of securities in-kind | - | 488,570 | - | - | ||||||||||||||||
Accrued unitary management fees | 1,626 | 234,297 | 1,407 | 4,467 | ||||||||||||||||
Accrued tax expenses | - | - | 10,677 | - | ||||||||||||||||
|
|
|
|
|
|
|
| |||||||||||||
Total liabilities | 314,904 | 23,102,947 | 40,155 | 2,256,133 | ||||||||||||||||
|
|
|
|
|
|
|
| |||||||||||||
| Net Assets | $ | 4,322,220 | $ | 904,396,939 | $ | 4,941,882 | $ | 17,850,222 | ||||||||||||
|
|
|
|
|
|
|
| |||||||||||||
| Net assets consist of: | ||||||||||||||||||||
Shares of beneficial interest | $ | 21,575,348 | $ | 1,161,261,111 | $ | 7,365,158 | $ | 25,484,405 | ||||||||||||
Distributable earnings (loss) | (17,253,128 | ) | (256,864,172 | ) | (2,423,276 | ) | (7,634,183 | ) | ||||||||||||
|
|
|
|
|
|
|
| |||||||||||||
| Net Assets | $ | 4,322,220 | $ | 904,396,939 | $ | 4,941,882 | $ | 17,850,222 | ||||||||||||
|
|
|
|
|
|
|
| |||||||||||||
Shares outstanding (unlimited amount authorized, $0.01 par value) | 200,001 | 42,450,000 | 350,000 | 850,001 | ||||||||||||||||
Net asset value | $ | 21.61 | $ | 21.30 | $ | 14.12 | $ | 21.00 | ||||||||||||
|
|
|
|
|
|
|
| |||||||||||||
Market price | $ | 21.48 | $ | 21.40 | $ | 14.07 | $ | 20.90 | ||||||||||||
|
|
|
|
|
|
|
| |||||||||||||
Unaffiliated investments in securities, at cost | $ | 5,163,489 | $ | 983,740,517 | $ | 5,089,323 | $ | 21,139,258 | ||||||||||||
|
|
|
|
|
|
|
| |||||||||||||
Affiliated investments in securities, at cost | $ | 309,039 | $ | 11,741,671 | $ | 29,112 | $ | 2,239,582 | ||||||||||||
|
|
|
|
|
|
|
| |||||||||||||
Foreign currencies (due to foreign custodian), at cost | $ | (2,651 | ) | $ | 1,592,649 | $ | 5,424 | $ | 221 | |||||||||||
|
|
|
|
|
|
|
| |||||||||||||
(a) Includes securities on loan with an aggregate value of: | $ | 287,976 | $ | 11,070,165 | $ | 23,887 | $ | 2,038,909 | ||||||||||||
|
|
|
|
|
|
|
| |||||||||||||
See accompanying Notes to Financial Statements which are an integral part of the financial statements.
| 46 | ||||
|
| |||
| Invesco S&P International Developed Low Volatility ETF (IDLV) | Invesco S&P International Developed Momentum ETF (IDMO) | |||||||||
| $ | 428,808,123 | $ | 8,681,505 | |||||||
| 31,859,036 | 237,125 | |||||||||
| - | 781 | |||||||||
| - | - | |||||||||
| 1,451,738 | 35,431 | |||||||||
| 12,396 | 196 | |||||||||
| 53 | 2,017 | |||||||||
| 6,231,491 | - | |||||||||
| 940,877 | 6,147 | |||||||||
|
|
|
| |||||||
| 469,303,714 | 8,963,202 | |||||||||
|
|
|
| |||||||
| 568 | 29,326 | |||||||||
| 420 | - | |||||||||
| 6,230,235 | - | |||||||||
| 31,809,512 | 237,129 | |||||||||
| - | - | |||||||||
| 103,537 | 1,889 | |||||||||
| - | - | |||||||||
|
|
|
| |||||||
| 38,144,272 | 268,344 | |||||||||
|
|
|
| |||||||
| $ | 431,159,442 | $ | 8,694,858 | |||||||
|
|
|
| |||||||
| $ | 716,335,371 | $ | 12,896,484 | |||||||
| (285,175,929 | ) | (4,201,626 | ) | |||||||
|
|
|
| |||||||
| $ | 431,159,442 | $ | 8,694,858 | |||||||
|
|
|
| |||||||
| 17,300,000 | 300,000 | |||||||||
| $ | 24.92 | $ | 28.98 | |||||||
|
|
|
| |||||||
| $ | 24.92 | $ | 29.21 | |||||||
|
|
|
| |||||||
| $ | 493,392,800 | $ | 8,961,298 | |||||||
|
|
|
| |||||||
| $ | 31,858,963 | $ | 237,129 | |||||||
|
|
|
| |||||||
| $ | (515 | ) | $ | 782 | ||||||
|
|
|
| |||||||
| $ | 29,030,973 | $ | 217,092 | |||||||
|
|
|
| |||||||
| 47 | ||||
|
| |||
For the year ended October 31, 2022
| Invesco FTSE International Low Beta Equal Weight ETF (IDLB) | Invesco S&P Emerging Markets Low Volatility ETF (EELV) | Invesco S&P Emerging Markets Momentum ETF (EEMO) | Invesco S&P International Developed High Dividend Low Volatility ETF (IDHD) | |||||||||||||||||
| Investment income: | ||||||||||||||||||||
Unaffiliated interest income | $ | - | $ | - | $ | 12 | $ | - | ||||||||||||
Unaffiliated dividend income | 195,821 | 39,546,190 | 181,095 | 957,374 | ||||||||||||||||
Affiliated dividend income | 85 | 12,750 | 69 | 176 | ||||||||||||||||
Non-cash dividend income | 1,664 | 591,759 | 926 | 3,287 | ||||||||||||||||
Securities lending income, net | 2,281 | 65,346 | 158 | 11,184 | ||||||||||||||||
Foreign withholding tax | (23,967 | ) | (5,141,395 | ) | (23,190 | ) | (95,609 | ) | ||||||||||||
|
|
|
|
|
|
|
| |||||||||||||
Total investment income | 175,884 | 35,074,650 | 159,070 | 876,412 | ||||||||||||||||
|
|
|
|
|
|
|
| |||||||||||||
| Expenses: | ||||||||||||||||||||
Unitary management fees | 27,868 | 2,160,076 | 15,752 | 57,513 | ||||||||||||||||
|
|
|
|
|
|
|
| |||||||||||||
Less: Waivers | (4 | ) | (860 | ) | (5 | ) | (13 | ) | ||||||||||||
|
|
|
|
|
|
|
| |||||||||||||
Net expenses | 27,864 | 2,159,216 | 15,747 | 57,500 | ||||||||||||||||
|
|
|
|
|
|
|
| |||||||||||||
Net investment income | 148,020 | 32,915,434 | 143,323 | 818,912 | ||||||||||||||||
|
|
|
|
|
|
|
| |||||||||||||
| Realized and unrealized gain (loss) from: | ||||||||||||||||||||
Net realized gain (loss) from: | ||||||||||||||||||||
Unaffiliated investment securities | (537,475 | ) | (70,302,933 | ) | (777,392 | )(a) | (1,276,393 | ) | ||||||||||||
Affiliated investment securities | (173 | ) | (1,050 | ) | (38 | ) | (334 | ) | ||||||||||||
In-kind redemptions | (144,401 | ) | (1,661,311 | ) | (8,386 | ) | 738,793 | |||||||||||||
Foreign currencies | (6,191 | ) | (2,875,451 | ) | (9,627 | ) | (13,681 | ) | ||||||||||||
|
|
|
|
|
|
|
| |||||||||||||
Net realized gain (loss) | (688,240 | ) | (74,840,745 | ) | (795,443 | ) | (551,615 | ) | ||||||||||||
|
|
|
|
|
|
|
| |||||||||||||
Change in net unrealized appreciation (depreciation) of: | ||||||||||||||||||||
Unaffiliated investment securities | (1,328,820 | ) | (114,822,450 | ) | (507,032 | )(b) | (3,794,520 | ) | ||||||||||||
Affiliated investment securities | (4 | ) | (12 | ) | - | 16 | ||||||||||||||
Foreign currencies | (12,151 | ) | (1,220 | ) | (7 | ) | (1,832 | ) | ||||||||||||
|
|
|
|
|
|
|
| |||||||||||||
Change in net unrealized appreciation (depreciation) | (1,340,975 | ) | (114,823,682 | ) | (507,039 | ) | (3,796,336 | ) | ||||||||||||
|
|
|
|
|
|
|
| |||||||||||||
Net realized and unrealized gain (loss) | (2,029,215 | ) | (189,664,427 | ) | (1,302,482 | ) | (4,347,951 | ) | ||||||||||||
|
|
|
|
|
|
|
| |||||||||||||
Net increase (decrease) in net assets resulting from operations | $ | (1,881,195 | ) | $ | (156,748,993 | ) | $ | (1,159,159 | ) | $ | (3,529,039 | ) | ||||||||
|
|
|
|
|
|
|
| |||||||||||||
| (a) | Net of foreign taxes of $230. |
| (b) | Net of change of deferred foreign taxes of $5,256. |
See accompanying Notes to Financial Statements which are an integral part of the financial statements.
| 48 | ||||
|
| |||
Invesco S&P ETF (IDLV) | Invesco S&P International Developed Momentum ETF (IDMO) | |||||||
| $ | - | $ | - | |||||
| 22,958,553 | 303,873 | |||||||
| 6,447 | 202 | |||||||
| 95,141 | - | |||||||
| 249,438 | 2,862 | |||||||
| (2,465,370 | ) | (39,318 | ) | |||||
|
|
|
| |||||
| 20,844,209 | 267,619 | |||||||
|
|
|
| |||||
| 1,471,387 | 21,045 | |||||||
|
|
|
| |||||
| (402 | ) | (9 | ) | |||||
|
|
|
| |||||
| 1,470,985 | 21,036 | |||||||
|
|
|
| |||||
| 19,373,224 | 246,583 | |||||||
|
|
|
| |||||
| (25,013,657 | ) | (1,380,407 | ) | |||||
| (9,302 | ) | (68 | ) | |||||
| 12,173,059 | 713,508 | |||||||
| 101,686 | (7,857 | ) | ||||||
|
|
|
| |||||
| (12,748,214 | ) | (674,824 | ) | |||||
|
|
|
| |||||
| (100,956,399 | ) | (1,305,968 | ) | |||||
| 73 | (4 | ) | ||||||
| (146,267 | ) | (1,301 | ) | |||||
|
|
|
| |||||
| (101,102,593 | ) | (1,307,273 | ) | |||||
|
|
|
| |||||
| (113,850,807 | ) | (1,982,097 | ) | |||||
|
|
|
| |||||
| $ | (94,477,583 | ) | $ | (1,735,514 | ) | |||
|
|
|
| |||||
| 49 | ||||
|
| |||
Statements of Changes in Net Assets
For the years ended October 31, 2022 and 2021
| Invesco FTSE International Low Beta Equal Weight ETF (IDLB) | Invesco S&P Emerging Markets Low Volatility ETF (EELV) | |||||||||||||||
| 2022 | 2021 | 2022 | 2021 | |||||||||||||
| Operations: | ||||||||||||||||
Net investment income | $ | 148,020 | $ | 194,278 | $ | 32,915,434 | $ | 9,747,834 | ||||||||
Net realized gain (loss) | (688,240 | ) | 961,992 | (74,840,745 | ) | 29,466,019 | ||||||||||
Change in net unrealized appreciation (depreciation) | (1,340,975 | ) | 550,351 | (114,823,682 | ) | 36,093,653 | ||||||||||
|
|
|
|
|
|
|
| |||||||||
Net increase (decrease) in net assets resulting from operations | (1,881,195 | ) | 1,706,621 | (156,748,993 | ) | 75,307,506 | ||||||||||
|
|
|
|
|
|
|
| |||||||||
| Distributions to Shareholders from: | ||||||||||||||||
Distributable earnings | (269,340 | ) | (179,259 | ) | (35,911,398 | ) | (8,893,471 | ) | ||||||||
|
|
|
|
|
|
|
| |||||||||
| Shareholder Transactions: | ||||||||||||||||
Proceeds from shares sold | - | - | 1,130,799,843 | 91,924,916 | ||||||||||||
Value of shares repurchased | (1,156,772 | ) | (3,036,730 | ) | (396,266,066 | ) | (67,022,264 | ) | ||||||||
Transaction fees | 437 | 797 | 1,825,266 | 174,854 | ||||||||||||
|
|
|
|
|
|
|
| |||||||||
Net increase (decrease) in net assets resulting from share transactions | (1,156,335 | ) | (3,035,933 | ) | 736,359,043 | 25,077,506 | ||||||||||
|
|
|
|
|
|
|
| |||||||||
Net increase (decrease) in net assets | (3,306,870 | ) | (1,508,571 | ) | 543,698,652 | 91,491,541 | ||||||||||
|
|
|
|
|
|
|
| |||||||||
| Net assets: | ||||||||||||||||
Beginning of year | 7,629,090 | 9,137,661 | 360,698,287 | 269,206,746 | ||||||||||||
|
|
|
|
|
|
|
| |||||||||
End of year | $ | 4,322,220 | $ | 7,629,090 | $ | 904,396,939 | $ | 360,698,287 | ||||||||
|
|
|
|
|
|
|
| |||||||||
| Changes in Shares Outstanding: | ||||||||||||||||
Shares sold | - | - | 45,650,000 | 3,800,000 | ||||||||||||
Shares repurchased | (50,000 | ) | (100,000 | ) | (17,600,000 | ) | (2,900,000 | ) | ||||||||
Shares outstanding, beginning of year | 250,001 | 350,001 | 14,400,000 | 13,500,000 | ||||||||||||
|
|
|
|
|
|
|
| |||||||||
Shares outstanding, end of year | 200,001 | 250,001 | 42,450,000 | 14,400,000 | ||||||||||||
|
|
|
|
|
|
|
| |||||||||
See accompanying Notes to Financial Statements which are an integral part of the financial statements.
| 50 | ||||
|
| |||
| Invesco S&P Emerging Markets Momentum ETF (EEMO) | Invesco S&P International Developed High Dividend Low Volatility ETF (IDHD) | Invesco S&P International Developed Low Volatility ETF (IDLV) | Invesco S&P International Developed Momentum ETF (IDMO) | |||||||||||||||||||||||||||||||||||
| 2022 | 2021 | 2022 | 2021 | 2022 | 2021 | 2022 | 2021 | |||||||||||||||||||||||||||||||
| $ | 143,323 | $ | 124,900 | $ | 818,912 | $ | 861,750 | $ | 19,373,224 | $ | 20,562,798 | $ | 246,583 | $ | 168,830 | |||||||||||||||||||||||
| (795,443 | ) | 1,652,108 | (551,615 | ) | 1,474,075 | (12,748,214 | ) | 53,277,588 | (674,824 | ) | (1,550,235 | ) | ||||||||||||||||||||||||||
| (507,039 | ) | (810,634 | ) | (3,796,336 | ) | 1,545,952 | (101,102,593 | ) | 55,625,445 | (1,307,273 | ) | 11,574,198 | ||||||||||||||||||||||||||
|
|
|
|
|
|
|
|
|
|
|
|
|
|
|
| |||||||||||||||||||||||
| (1,159,159 | ) | 966,374 | (3,529,039 | ) | 3,881,777 | (94,477,583 | ) | 129,465,831 | (1,735,514 | ) | 10,192,793 | |||||||||||||||||||||||||||
|
|
|
|
|
|
|
|
|
|
|
|
|
|
|
| |||||||||||||||||||||||
| (147,705 | ) | (88,036 | ) | (1,043,050 | ) | (759,011 | ) | (26,853,850 | ) | (17,849,945 | ) | (320,959 | ) | (142,128 | ) | |||||||||||||||||||||||
|
|
|
|
|
|
|
|
|
|
|
|
|
|
|
| |||||||||||||||||||||||
| 773,925 | 11,284,355 | 9,960,609 | 13,362,729 | 99,707,399 | 217,888,889 | 3,128,960 | 14,379,315 | |||||||||||||||||||||||||||||||
| (791,495 | ) | (11,675,073 | ) | (6,391,731 | ) | (13,272,460 | ) | (247,910,310 | ) | (403,375,226 | ) | (9,078,999 | ) | (305,965,211 | ) | |||||||||||||||||||||||
| 2,831 | 5,550 | - | - | - | - | - | - | |||||||||||||||||||||||||||||||
|
|
|
|
|
|
|
|
|
|
|
|
|
|
|
| |||||||||||||||||||||||
| (14,739 | ) | (385,168 | ) | 3,568,878 | 90,269 | (148,202,911 | ) | (185,486,337 | ) | (5,950,039 | ) | (291,585,896 | ) | |||||||||||||||||||||||||
|
|
|
|
|
|
|
|
|
|
|
|
|
|
|
| |||||||||||||||||||||||
| (1,321,603 | ) | 493,170 | (1,003,211 | ) | 3,213,035 | (269,534,344 | ) | (73,870,451 | ) | (8,006,512 | ) | (281,535,231 | ) | |||||||||||||||||||||||||
|
|
|
|
|
|
|
|
|
|
|
|
|
|
|
| |||||||||||||||||||||||
|
| 6,263,485
|
| 5,770,315 | 18,853,433 | 15,640,398 | 700,693,786 | 774,564,237 | 16,701,370 | 298,236,601 | |||||||||||||||||||||||||||||
| $ | 4,941,882 | $ | 6,263,485 | $ | 17,850,222 | $ | 18,853,433 | $ | 431,159,442 | $ | 700,693,786 | $ | 8,694,858 | $ | 16,701,370 | |||||||||||||||||||||||
|
|
|
|
|
|
|
|
|
|
|
|
|
|
|
| |||||||||||||||||||||||
| 50,000 | 600,000 | 400,000 | 500,000 | 3,450,000 | 6,950,000 | 100,000 | 400,000 | |||||||||||||||||||||||||||||||
| (50,000 | ) | (600,000 | ) | (250,000 | ) | (500,000 | ) | (8,300,000 | ) | (13,100,000 | ) | (250,000 | ) | (10,250,000 | ) | |||||||||||||||||||||||
|
| 350,000
|
| 350,000 | 700,001 | 700,001 | 22,150,000 | 28,300,000 | 450,000 | 10,300,000 | |||||||||||||||||||||||||||||
| 350,000 | 350,000 | 850,001 | 700,001 | 17,300,000 | 22,150,000 | 300,000 | 450,000 | |||||||||||||||||||||||||||||||
|
|
|
|
|
|
|
|
|
|
|
|
|
|
|
| |||||||||||||||||||||||
| 51 | ||||
|
| |||
Invesco FTSE International Low Beta Equal Weight ETF (IDLB)
| Years Ended October 31, | ||||||||||||||||||||
| 2022 | 2021 | 2020 | 2019 | 2018 | ||||||||||||||||
| Per Share Operating Performance: | ||||||||||||||||||||
Net asset value at beginning of year | $ | 30.52 | $ | 26.11 | $ | 28.22 | $ | 26.98 | $ | 29.47 | ||||||||||
|
|
|
|
|
|
|
|
|
| |||||||||||
Net investment income(a) | 0.63 | 0.72 | 0.47 | 0.68 | 0.67 | |||||||||||||||
Net realized and unrealized gain (loss) on investments | (8.42 | ) | 4.35 | (2.05 | ) | 1.43 | (2.30 | ) | ||||||||||||
|
|
|
|
|
|
|
|
|
| |||||||||||
Total from investment operations | (7.79 | ) | 5.07 | (1.58 | ) | 2.11 | (1.63 | ) | ||||||||||||
|
|
|
|
|
|
|
|
|
| |||||||||||
Distributions to shareholders from: | ||||||||||||||||||||
Net investment income | (1.12 | ) | (0.66 | ) | (0.55 | ) | (0.87 | ) | (0.86 | ) | ||||||||||
|
|
|
|
|
|
|
|
|
| |||||||||||
Transaction fees(a) | 0.00 | (b) | 0.00 | (b) | 0.02 | - | - | |||||||||||||
|
|
|
|
|
|
|
|
|
| |||||||||||
Net asset value at end of year | $ | 21.61 | $ | 30.52 | $ | 26.11 | $ | 28.22 | $ | 26.98 | ||||||||||
|
|
|
|
|
|
|
|
|
| |||||||||||
Market price at end of year(c) | $ | 21.48 | $ | 30.55 | $ | 26.04 | $ | 28.02 | $ | 26.86 | ||||||||||
|
|
|
|
|
|
|
|
|
| |||||||||||
| Net Asset Value Total Return(d) | (26.15 | )% | 19.43 | % | (5.44 | )% | 7.94 | % | (5.81 | )% | ||||||||||
| Market Price Total Return(d) | (26.68 | )% | 19.87 | % | (5.02 | )% | 7.65 | % | (6.12 | )% | ||||||||||
| Ratios/Supplemental Data: | ||||||||||||||||||||
Net assets at end of year (000’s omitted) | $ | 4,322 | $ | 7,629 | $ | 9,138 | $ | 53,615 | $ | 109,258 | ||||||||||
Ratio to average net assets of: | ||||||||||||||||||||
Expenses | 0.45 | % | 0.45 | % | 0.45 | % | 0.46 | %(e) | 0.45 | % | ||||||||||
Net investment income | 2.39 | % | 2.36 | % | 1.75 | % | 2.48 | %(e) | 2.23 | % | ||||||||||
Portfolio turnover rate(f) | 66 | % | 43 | % | 38 | % | 53 | % | 50 | % | ||||||||||
| (a) | Based on average shares outstanding. |
| (b) | Amount represents less than $0.005. |
| (c) | The mean between the last bid and ask prices. |
| (d) | Net asset value total return is calculated assuming an initial investment made at the net asset value at the beginning of the period, reinvestment of all dividends and distributions at net asset value during the period, and redemption at net asset value on the last day of the period. Net asset value total return includes adjustments in accordance with accounting principles generally accepted in the United States of America and as such, the net asset value for financial reporting purposes and the returns based upon those net asset values may differ from the net asset value and returns for shareholder transactions. Market price total return is calculated assuming an initial investment made at the market price at the beginning of the period, reinvestment of all dividends and distributions at market price during the period, and sale at the market price on the last day of the period. Total investment returns calculated for a period of less than one year are not annualized. |
| (e) | Ratios include non-recurring costs associated with a proxy statement of 0.01%. |
| (f) | Portfolio turnover rate is not annualized for periods less than one year, if applicable, and does not include securities received or delivered from processing creations or redemptions. |
See accompanying Notes to Financial Statements which are an integral part of the financial statements.
| 52 | ||||
|
| |||
Financial Highlights–(continued)
Invesco S&P Emerging Markets Low Volatility ETF (EELV)
| Years Ended October 31, | ||||||||||||||||||||
| 2022 | 2021 | 2020 | 2019 | 2018 | ||||||||||||||||
| Per Share Operating Performance: | ||||||||||||||||||||
Net asset value at beginning of year | $ | 25.05 | $ | 19.94 | $ | 23.23 | $ | 23.02 | $ | 24.59 | ||||||||||
|
|
|
|
|
|
|
|
|
| |||||||||||
Net investment income(a) | 1.05 | 0.74 | 0.72 | 0.74 | 1.04 | |||||||||||||||
Net realized and unrealized gain (loss) on investments | (3.69 | ) | 5.03 | (3.33 | ) | 0.58 | (1.68 | ) | ||||||||||||
|
|
|
|
|
|
|
|
|
| |||||||||||
Total from investment operations | (2.64 | ) | 5.77 | (2.61 | ) | 1.32 | (0.64 | ) | ||||||||||||
|
|
|
|
|
|
|
|
|
| |||||||||||
Distributions to shareholders from: | ||||||||||||||||||||
Net investment income | (1.17 | ) | (0.67 | ) | (0.72 | ) | (1.12 | ) | (1.01 | ) | ||||||||||
|
|
|
|
|
|
|
|
|
| |||||||||||
Transaction fees(a) | 0.06 | 0.01 | 0.04 | 0.01 | 0.08 | |||||||||||||||
|
|
|
|
|
|
|
|
|
| |||||||||||
Net asset value at end of year | $ | 21.30 | $ | 25.05 | $ | 19.94 | $ | 23.23 | $ | 23.02 | ||||||||||
|
|
|
|
|
|
|
|
|
| |||||||||||
Market price at end of year(b) | $ | 21.40 | $ | 25.08 | $ | 19.82 | $ | 23.12 | $ | 23.03 | ||||||||||
|
|
|
|
|
|
|
|
|
| |||||||||||
| Net Asset Value Total Return(c) | (10.68 | )% | 29.21 | % | (10.92 | )% | 5.87 | % | (2.54 | )% | ||||||||||
| Market Price Total Return(c) | (10.40 | )% | 30.16 | % | (11.03 | )% | 5.32 | % | (2.60 | )% | ||||||||||
| Ratios/Supplemental Data: | ||||||||||||||||||||
Net assets at end of year (000’s omitted) | $ | 904,397 | $ | 360,698 | $ | 269,207 | $ | 335,632 | $ | 246,270 | ||||||||||
Ratio to average net assets of: | ||||||||||||||||||||
Expenses, after Waivers | 0.29 | % | 0.29 | % | 0.29 | % | 0.29 | % | 0.29 | % | ||||||||||
Expenses, prior to Waivers | 0.29 | % | 0.29 | % | 0.38 | % | 0.45 | % | 0.45 | % | ||||||||||
Net investment income | 4.42 | % | 3.13 | % | 3.42 | % | 3.14 | % | 4.12 | % | ||||||||||
Portfolio turnover rate(d) | 136 | % | 92 | % | 114 | % | 67 | % | 125 | % | ||||||||||
| (a) | Based on average shares outstanding. |
| (b) | The mean between the last bid and ask prices. |
| (c) | Net asset value total return is calculated assuming an initial investment made at the net asset value at the beginning of the period, reinvestment of all dividends and distributions at net asset value during the period, and redemption at net asset value on the last day of the period. Net asset value total return includes adjustments in accordance with accounting principles generally accepted in the United States of America and as such, the net asset value for financial reporting purposes and the returns based upon those net asset values may differ from the net asset value and returns for shareholder transactions. Market price total return is calculated assuming an initial investment made at the market price at the beginning of the period, reinvestment of all dividends and distributions at market price during the period, and sale at the market price on the last day of the period. Total investment returns calculated for a period of less than one year are not annualized. |
| (d) | Portfolio turnover rate is not annualized for periods less than one year, if applicable, and does not include securities received or delivered from processing creations or redemptions. |
See accompanying Notes to Financial Statements which are an integral part of the financial statements.
| 53 | ||||
|
| |||
Financial Highlights–(continued)
Invesco S&P Emerging Markets Momentum ETF (EEMO)
| Years Ended October 31, | ||||||||||||||||||||
| 2022 | 2021 | 2020 | 2019 | 2018 | ||||||||||||||||
| Per Share Operating Performance: | ||||||||||||||||||||
Net asset value at beginning of year | $ | 17.90 | $ | 16.49 | $ | 16.97 | $ | 17.23 | $ | 20.85 | ||||||||||
|
|
|
|
|
|
|
|
|
| |||||||||||
Net investment income(a) | 0.43 | (b) | 0.27 | (c) | 0.32 | 0.40 | 0.27 | (d) | ||||||||||||
Net realized and unrealized gain (loss) on investments | (3.78 | ) | 1.32 | (0.46 | ) | 1.61 | (3.03 | ) | ||||||||||||
|
|
|
|
|
|
|
|
|
| |||||||||||
Total from investment operations | (3.35 | ) | 1.59 | (0.14 | ) | 2.01 | (2.76 | ) | ||||||||||||
|
|
|
|
|
|
|
|
|
| |||||||||||
Distributions to shareholders from: | ||||||||||||||||||||
Net investment income | (0.44 | ) | (0.19 | ) | (0.34 | ) | (0.43 | ) | (0.14 | ) | ||||||||||
Net realized gains | - | - | - | (1.85 | ) | (0.76 | ) | |||||||||||||
|
|
|
|
|
|
|
|
|
| |||||||||||
Total distributions | (0.44 | ) | (0.19 | ) | (0.34 | ) | (2.28 | ) | (0.90 | ) | ||||||||||
|
|
|
|
|
|
|
|
|
| |||||||||||
Transaction fees(a) | 0.01 | 0.01 | 0.00 | (e) | 0.01 | 0.04 | ||||||||||||||
|
|
|
|
|
|
|
|
|
| |||||||||||
Net asset value at end of year | $ | 14.12 | $ | 17.90 | $ | 16.49 | $ | 16.97 | $ | 17.23 | ||||||||||
|
|
|
|
|
|
|
|
|
| |||||||||||
Market price at end of year(f) | $ | 14.07 | $ | 17.72 | $ | 16.51 | $ | 16.92 | $ | 17.18 | ||||||||||
|
|
|
|
|
|
|
|
|
| |||||||||||
| Net Asset Value Total Return(g) | (18.82 | )% | 9.66 | % | 0.20 | % | 13.60 | % | (13.66 | )% | ||||||||||
| Market Price Total Return(g) | (18.28 | )% | 8.44 | % | 0.59 | % | 13.66 | % | (14.35 | )% | ||||||||||
| Ratios/Supplemental Data: | ||||||||||||||||||||
Net assets at end of year (000’s omitted) | $ | 4,942 | $ | 6,263 | $ | 5,770 | $ | 5,941 | $ | 12,924 | ||||||||||
Ratio to average net assets of: | ||||||||||||||||||||
Expenses, after Waivers | 0.29 | % | 0.29 | % | 0.29 | % | 0.36 | %(h)(i) | 0.27 | %(h) | ||||||||||
Expenses, prior to Waivers | 0.29 | % | 0.29 | % | 0.37 | % | 0.53 | %(h)(i) | 0.45 | %(h) | ||||||||||
Net investment income | 2.64 | %(b) | 1.43 | %(c) | 2.10 | % | 2.42 | %(i) | 1.26 | %(d) | ||||||||||
Portfolio turnover rate(j) | 114 | % | 166 | % | 172 | % | 114 | % | 140 | % | ||||||||||
| (a) | Based on average shares outstanding. |
| (b) | Net investment income per share and the ratio of net investment income to average net assets include a significant dividend received during the period. Net investment income per share and the ratio of net investment income to average net assets excluding the significant dividend are $0.32 and 1.98%, respectively. |
| (c) | Net investment income per share and the ratio of net investment income to average net assets include a significant dividend received during the period. Net investment income per share and the ratio of net investment income to average net assets excluding the significant dividend are $0.22 and 1.14%, respectively. |
| (d) | Net Investment income per share and the ratio of net investment income to average net assets include a non-cash taxable distribution received during the year. Net investment income per share and the ratio of net investment income to average net assets excluding the non-cash taxable distribution are $0.17 and 0.83%, respectively. |
| (e) | Amount represents less than $0.005. |
| (f) | The mean between the last bid and ask prices. |
| (g) | Net asset value total return is calculated assuming an initial investment made at the net asset value at the beginning of the period, reinvestment of all dividends and distributions at net asset value during the period, and redemption at net asset value on the last day of the period. Net asset value total return includes adjustments in accordance with accounting principles generally accepted in the United States of America and as such, the net asset value for financial reporting purposes and the returns based upon those net asset values may differ from the net asset value and returns for shareholder transactions. Market price total return is calculated assuming an initial investment made at the market price at the beginning of the period, reinvestment of all dividends and distributions at market price during the period, and sale at the market price on the last day of the period. Total investment returns calculated for a period of less than one year are not annualized. |
| (h) | In addition to the fees and expenses which the Fund bears directly, the Fund indirectly bears a pro rata share of the fees and expenses of the investment companies in which the Fund invests. Estimated investment companies’ expenses are not expenses that are incurred directly by the Fund. They are expenses that are incurred directly by the investment companies and are deducted from the value of the investment companies the Fund invests in. The effect of the estimated investment companies’ expenses that the Fund bears indirectly is included in the Fund’s total return. |
| (i) | Ratios include non-recurring costs associated with a proxy statement of 0.08%. |
| (j) | Portfolio turnover rate is not annualized for periods less than one year, if applicable, and does not include securities received or delivered from processing creations or redemptions. |
See accompanying Notes to Financial Statements which are an integral part of the financial statements.
| 54 | ||||
|
| |||
Financial Highlights–(continued)
Invesco S&P International Developed High Dividend Low Volatility ETF (IDHD)
| Years Ended October 31, | ||||||||||||||||||||
| 2022 | 2021 | 2020 | 2019 | 2018 | ||||||||||||||||
| Per Share Operating Performance: | ||||||||||||||||||||
Net asset value at beginning of year | $ | 26.93 | $ | 22.34 | $ | 28.60 | $ | 26.19 | $ | 28.39 | ||||||||||
|
|
|
|
|
|
|
|
|
| |||||||||||
Net investment income(a) | 1.06 | 1.23 | 1.07 | 1.25 | 1.27 | |||||||||||||||
Net realized and unrealized gain (loss) on investments | (5.62 | ) | 4.44 | (5.83 | ) | 2.41 | (2.09 | ) | ||||||||||||
|
|
|
|
|
|
|
|
|
| |||||||||||
Total from investment operations | (4.56 | ) | 5.67 | (4.76 | ) | 3.66 | (0.82 | ) | ||||||||||||
|
|
|
|
|
|
|
|
|
| |||||||||||
Distributions to shareholders from: | ||||||||||||||||||||
Net investment income | (1.37 | ) | (1.08 | ) | (1.50 | ) | (1.25 | ) | (1.38 | ) | ||||||||||
|
|
|
|
|
|
|
|
|
| |||||||||||
Net asset value at end of year | $ | 21.00 | $ | 26.93 | $ | 22.34 | $ | 28.60 | $ | 26.19 | ||||||||||
|
|
|
|
|
|
|
|
|
| |||||||||||
Market price at end of year(b) | $ | 20.90 | $ | 27.05 | $ | 22.49 | $ | 28.61 | $ | 26.41 | ||||||||||
|
|
|
|
|
|
|
|
|
| |||||||||||
| Net Asset Value Total Return(c) | (17.57 | )% | 25.55 | % | (16.91 | )% | 14.30 | % | (3.11 | )% | ||||||||||
| Market Price Total Return(c) | (18.34 | )% | 25.23 | % | (16.38 | )% | 13.34 | % | (3.06 | )% | ||||||||||
| Ratios/Supplemental Data: | ||||||||||||||||||||
Net assets at end of year (000’s omitted) | $ | 17,850 | $ | 18,853 | $ | 15,640 | $ | 14,300 | $ | 5,238 | ||||||||||
Ratio to average net assets of: | ||||||||||||||||||||
Expenses | 0.30 | % | 0.30 | % | 0.30 | % | 0.37 | %(d) | 0.30 | % | ||||||||||
Net investment income | 4.27 | % | 4.61 | % | 4.39 | % | 4.60 | %(d) | 4.51 | % | ||||||||||
Portfolio turnover rate(e) | 86 | % | 71 | % | 88 | % | 58 | % | 65 | % | ||||||||||
| (a) | Based on average shares outstanding. |
| (b) | The mean between the last bid and ask prices. |
| (c) | Net asset value total return is calculated assuming an initial investment made at the net asset value at the beginning of the period, reinvestment of all dividends and distributions at net asset value during the period, and redemption at net asset value on the last day of the period. Net asset value total return includes adjustments in accordance with accounting principles generally accepted in the United States of America and as such, the net asset value for financial reporting purposes and the returns based upon those net asset values may differ from the net asset value and returns for shareholder transactions. Market price total return is calculated assuming an initial investment made at the market price at the beginning of the period, reinvestment of all dividends and distributions at market price during the period, and sale at the market price on the last day of the period. Total investment returns calculated for a period of less than one year are not annualized. |
| (d) | Ratios include non-recurring costs associated with a proxy statement of 0.07%. |
| (e) | Portfolio turnover rate is not annualized for periods less than one year, if applicable, and does not include securities received or delivered from processing creations or redemptions. |
Invesco S&P International Developed Low Volatility ETF (IDLV)
| Years Ended October 31, | ||||||||||||||||||||
| 2022 | 2021 | 2020 | 2019 | 2018 | ||||||||||||||||
| Per Share Operating Performance: | ||||||||||||||||||||
Net asset value at beginning of year | $ | 31.63 | $ | 27.37 | $ | 34.58 | $ | 30.83 | $ | 33.28 | ||||||||||
|
|
|
|
|
|
|
|
|
| |||||||||||
Net investment income(a) | 0.98 | 0.83 | 0.83 | 1.15 | 1.08 | |||||||||||||||
Net realized and unrealized gain (loss) on investments | (6.32 | ) | 4.17 | (6.40 | ) | 3.79 | (2.22 | ) | ||||||||||||
|
|
|
|
|
|
|
|
|
| |||||||||||
Total from investment operations | (5.34 | ) | 5.00 | (5.57 | ) | 4.94 | (1.14 | ) | ||||||||||||
|
|
|
|
|
|
|
|
|
| |||||||||||
Distributions to shareholders from: | ||||||||||||||||||||
Net investment income | (1.37 | ) | (0.74 | ) | (1.64 | ) | (1.19 | ) | (1.31 | ) | ||||||||||
|
|
|
|
|
|
|
|
|
| |||||||||||
Net asset value at end of year | $ | 24.92 | $ | 31.63 | $ | 27.37 | $ | 34.58 | $ | 30.83 | ||||||||||
|
|
|
|
|
|
|
|
|
| |||||||||||
Market price at end of year(b) | $ | 24.92 | $ | 31.69 | $ | 27.43 | $ | 34.57 | $ | 30.76 | ||||||||||
|
|
|
|
|
|
|
|
|
| |||||||||||
| Net Asset Value Total Return(c) | (17.33 | )% | 18.34 | % | (16.49 | )% | 16.33 | % | (3.62 | )% | ||||||||||
| Market Price Total Return(c) | (17.50 | )% | 18.31 | % | (16.28 | )% | 16.56 | % | (3.87 | )% | ||||||||||
| Ratios/Supplemental Data: | ||||||||||||||||||||
Net assets at end of year (000’s omitted) | $ | 431,159 | $ | 700,694 | $ | 774,564 | $ | 989,052 | $ | 537,929 | ||||||||||
Ratio to average net assets of: | ||||||||||||||||||||
Expenses, after Waivers | 0.25 | % | 0.25 | % | 0.25 | % | 0.25 | % | 0.25 | % | ||||||||||
Expenses, prior to Waivers | 0.25 | % | 0.25 | % | 0.30 | % | 0.35 | % | 0.35 | % | ||||||||||
Net investment income | 3.29 | % | 2.69 | % | 2.77 | % | 3.51 | % | 3.26 | % | ||||||||||
Portfolio turnover rate(d) | 78 | % | 81 | % | 99 | % | 59 | % | 65 | % | ||||||||||
| (a) | Based on average shares outstanding. |
| (b) | The mean between the last bid and ask prices. |
| (c) | Net asset value total return is calculated assuming an initial investment made at the net asset value at the beginning of the period, reinvestment of all dividends and distributions at net asset value during the period, and redemption at net asset value on the last day of the period. Net asset value total return includes adjustments in accordance with accounting principles generally accepted in the United States of America and as such, the net asset value for financial reporting purposes and the returns based upon those net asset values may differ from the net asset value and returns for shareholder transactions. Market price total return is calculated assuming an initial investment made at the market price at the beginning of the period, reinvestment of all dividends and distributions at market price during the period, and sale at the market price on the last day of the period. Total investment returns calculated for a period of less than one year are not annualized. |
| (d) | Portfolio turnover rate is not annualized for periods less than one year, if applicable, and does not include securities received or delivered from processing creations or redemptions. |
See accompanying Notes to Financial Statements which are an integral part of the financial statements.
| 55 | ||||
|
| |||
Financial Highlights–(continued)
Invesco S&P International Developed Momentum ETF (IDMO)
| Years Ended October 31, | ||||||||||||||||||||
| 2022 | 2021 | 2020 | 2019 | 2018 | ||||||||||||||||
| Per Share Operating Performance: | ||||||||||||||||||||
Net asset value at beginning of year | $ | 37.11 | $ | 28.96 | $ | 26.85 | $ | 24.86 | $ | 27.96 | ||||||||||
|
|
|
|
|
|
|
|
|
| |||||||||||
Net investment income(a) | 0.97 | 0.50 | 0.04 | 0.61 | 0.61 | |||||||||||||||
Net realized and unrealized gain (loss) on investments | (7.84 | ) | 8.25 | 2.58 | 2.12 | (3.04 | ) | |||||||||||||
|
|
|
|
|
|
|
|
|
| |||||||||||
Total from investment operations | (6.87 | ) | 8.75 | 2.62 | 2.73 | (2.43 | ) | |||||||||||||
|
|
|
|
|
|
|
|
|
| |||||||||||
Distributions to shareholders from: | ||||||||||||||||||||
Net investment income | (1.26 | ) | (0.60 | ) | (0.51 | ) | (0.74 | ) | (0.67 | ) | ||||||||||
|
|
|
|
|
|
|
|
|
| |||||||||||
Net asset value at end of year | $ | 28.98 | $ | 37.11 | $ | 28.96 | $ | 26.85 | $ | 24.86 | ||||||||||
|
|
|
|
|
|
|
|
|
| |||||||||||
Market price at end of year(b) | $ | 29.21 | $ | 37.16 | $ | 28.92 | $ | 26.79 | $ | 24.78 | ||||||||||
|
|
|
|
|
|
|
|
|
| |||||||||||
| Net Asset Value Total Return(c) | (18.73 | )% | 30.43 | % | 10.14 | % | 11.30 | % | (8.95 | )% | ||||||||||
| Market Price Total Return(c) | (18.21 | )% | 30.80 | % | 10.24 | % | 11.42 | % | (8.70 | )% | ||||||||||
| Ratios/Supplemental Data: | ||||||||||||||||||||
Net assets at end of year (000’s omitted) | $ | 8,695 | $ | 16,701 | $ | 298,237 | $ | 2,685 | $ | 2,486 | ||||||||||
Ratio to average net assets of: | ||||||||||||||||||||
Expenses, after Waivers | 0.25 | % | 0.25 | % | 0.25 | % | 0.53 | %(d) | 0.25 | % | ||||||||||
Expenses, prior to Waivers | 0.25 | % | 0.25 | % | 0.26 | % | 0.63 | %(d) | 0.35 | % | ||||||||||
Net investment income | 2.93 | % | 1.42 | % | 0.13 | % | 2.39 | %(d) | 2.21 | % | ||||||||||
Portfolio turnover rate(e) | 106 | % | 29 | % | 15 | % | 104 | % | 123 | % | ||||||||||
| (a) | Based on average shares outstanding. |
| (b) | The mean between the last bid and ask prices. |
| (c) | Net asset value total return is calculated assuming an initial investment made at the net asset value at the beginning of the period, reinvestment of all dividends and distributions at net asset value during the period, and redemption at net asset value on the last day of the period. Net asset value total return includes adjustments in accordance with accounting principles generally accepted in the United States of America and as such, the net asset value for financial reporting purposes and the returns based upon those net asset values may differ from the net asset value and returns for shareholder transactions. Market price total return is calculated assuming an initial investment made at the market price at the beginning of the period, reinvestment of all dividends and distributions at market price during the period, and sale at the market price on the last day of the period. Total investment returns calculated for a period of less than one year are not annualized. |
| (d) | Ratios include non-recurring costs associated with a proxy statement of 0.27%. |
| (e) | Portfolio turnover rate is not annualized for periods less than one year, if applicable, and does not include securities received or delivered from processing creations or redemptions. |
See accompanying Notes to Financial Statements which are an integral part of the financial statements.
| 56 | ||||
|
| |||
Invesco Exchange-Traded Fund Trust II
October 31, 2022
NOTE 1–Organization
Invesco Exchange-Traded Fund Trust II (the “Trust”) was organized as a Massachusetts business trust and is authorized to have multiple series of portfolios. The Trust is an open-end management investment company registered under the Investment Company Act of 1940, as amended (the “1940 Act”). This report includes the following portfolios:
Full Name | Short Name | |
Invesco FTSE International Low Beta Equal Weight ETF (IDLB) | “FTSE International Low Beta Equal Weight ETF” | |
Invesco S&P Emerging Markets Low Volatility ETF (EELV) | “S&P Emerging Markets Low Volatility ETF” | |
Invesco S&P Emerging Markets Momentum ETF (EEMO) | “S&P Emerging Markets Momentum ETF” | |
Invesco S&P International Developed High Dividend Low Volatility ETF (IDHD) | “S&P International Developed High Dividend Low Volatility ETF” | |
Invesco S&P International Developed Low Volatility ETF (IDLV) | “S&P International Developed Low Volatility ETF” | |
Invesco S&P International Developed Momentum ETF (IDMO) | “S&P International Developed Momentum ETF” | |
Each portfolio (each, a “Fund”, and collectively, the “Funds”) represents a separate series of the Trust. The shares of the Funds are referred to herein as “Shares” or “Fund’s Shares.” Each Fund’s Shares are listed and traded on NYSE Arca, Inc., except for Shares of FTSE International Low Beta Equal Weight ETF which are listed and traded on The Nasdaq Stock Market and Shares of S&P International Developed High Dividend Low Volatility ETF, which are listed and traded on Cboe BZX Exchange, Inc.
The market price of each Share may differ to some degree from a Fund’s net asset value (“NAV”). Unlike conventional mutual funds, each Fund issues and redeems Shares on a continuous basis, at NAV, only in a large specified number of Shares, each called a “Creation Unit.” Creation Units are issued and redeemed principally in exchange for the deposit or delivery of a basket of securities (“Deposit Securities”). Except when aggregated in Creation Units by authorized participants (“APs”), the Shares are not individually redeemable securities of the Funds.
The investment objective of each Fund is to seek to track the investment results (before fees and expenses) of its respective index listed below (each, an “Underlying Index”).
Fund | Underlying Index | |
FTSE International Low Beta Equal Weight ETF | FTSE Developed ex-U.S. Low Beta Equal Weight Index | |
S&P Emerging Markets Low Volatility ETF | S&P BMI Emerging Markets Low Volatility IndexTM | |
S&P Emerging Markets Momentum ETF | S&P Momentum Emerging Plus LargeMidCap Index | |
S&P International Developed High Dividend Low Volatility ETF | S&P EPAC Ex-Korea Low Volatility High Dividend Index | |
S&P International Developed Low Volatility ETF | S&P BMI International Developed Low VolatilityTM Index | |
S&P International Developed Momentum ETF | S&P Momentum Developed ex-U.S. & South Korea LargeMidCap Index | |
NOTE 2–Significant Accounting Policies
The following is a summary of the significant accounting policies followed by the Funds in preparation of their financial statements.
Each Fund is an investment company and accordingly follows the investment company accounting and reporting guidance in accordance with Financial Accounting Standards Board Accounting Standards Codification Topic 946, Financial Services–Investment Companies.
| A. | Security Valuation - Securities, including restricted securities, are valued according to the following policies: |
Securities, including restricted securities in a fund that are held as investments (the “Underlying Fund”), if any, of a Fund, are valued in accordance with the Underlying Fund’s valuation policy. The policies of Underlying Funds affiliated with the Funds as a result of having the same investment adviser are the same as those set forth below.
A security listed or traded on an exchange is generally valued at its trade price or official closing price that day as of the close of the exchange where the security is principally traded or, lacking any trades or official closing price on a particular day, the security may be valued at the closing bid price on that day. Securities traded in the over-the-counter market are valued based on prices furnished by independent pricing services or market makers. When such securities are valued using prices provided by an independent pricing service they may be considered fair valued. Futures contracts are valued at the daily settlement price set by an exchange on which they are principally traded. U.S. exchange-traded options are valued at the mean between the last bid and asked prices from the exchange on which they are principally traded. Non-U.S. exchange-traded options are valued at the final settlement price set by the exchange on which they trade. Options not listed on an exchange and swaps generally are valued using pricing provided from independent pricing services.
| 57 | ||||
|
| |||
Securities of investment companies that are not exchange-traded (e.g., open-end mutual funds) are valued using such company’s end-of-business-day NAV per share.
Deposits, other obligations of U.S. and non-U.S. banks and financial institutions are valued at their daily account value.
Fixed income securities (including convertible debt securities) generally are valued on the basis of prices provided by independent pricing services. Prices provided by the pricing service may be determined without exclusive reliance on quoted prices, and may reflect appropriate factors such as institution-size trading in similar groups of securities, developments related to specific securities, dividend rate (for unlisted equities), yield (for debt obligations), quality, type of issue, coupon rate (for debt obligations), maturity (for debt obligations), individual trading characteristics and other market data. Securities with a demand feature exercisable within one to seven days are valued at par. Pricing services generally value debt obligations assuming orderly transactions of institutional round lot size, but a Fund may hold or transact in the same securities in smaller, odd lot sizes. Odd lots often trade at lower prices than institutional round lots, and their value may be adjusted accordingly. Debt obligations are subject to interest rate and credit risks. In addition, all debt obligations involve some risk of default with respect to interest and/or principal payments.
Foreign securities’ (including foreign exchange contracts’) prices are converted into U.S. dollar amounts using the applicable exchange rates as of the close of the London world markets. If market quotations are available and reliable for foreign exchange-traded equity securities, the securities will be valued at the market quotations. Invesco Capital Management LLC (the “Adviser”) may use various pricing services to obtain market quotations as well as fair value prices. Because trading hours for certain foreign securities end before the close of the New York Stock Exchange (“NYSE”), closing market quotations may become not representative of market value in the Adviser’s judgment (“unreliable”). If, between the time trading ends on a particular security and the close of the customary trading session on the NYSE, a significant event occurs that makes the closing price of the security unreliable, the Adviser may fair value the security. If the event is likely to have affected the closing price of the security, the security will be valued at fair value in good faith in accordance with Board-approved policies and related Adviser procedures (“Valuation Procedures”). Adjustments to closing prices to reflect fair value may also be based on a screening process of an independent pricing service to indicate the degree of certainty, based on historical data, that the closing price in the principal market where a foreign security trades is not the current value as of the close of the NYSE. Foreign securities’ prices meeting the degree of certainty that the price is not reflective of current value will be priced at the indication of fair value from the independent pricing service. Multiple factors may be considered by the independent pricing service in determining adjustments to reflect fair value and may include information relating to sector indices, American depositary receipts and domestic and foreign index futures. Foreign securities may have additional risks including exchange rate changes, the potential for sharply devalued currencies and high inflation, political and economic upheaval, the relative lack of issuer information, relatively low market liquidity and the potential lack of strict financial and accounting controls and standards.
Unlisted securities will be valued using prices provided by independent pricing services or by another method that the Adviser, in its judgment, believes better reflects the security’s fair value in accordance with the Valuation Procedures.
Securities for which market prices are not provided by any of the above methods may be valued based upon quotes furnished by independent sources. The last bid price may be used to value exchange-traded equity securities. The mean between the last bid and asked prices may be used to value debt obligations, including corporate loans, and unlisted equity securities.
Securities for which market quotations are not readily available are fair valued by the Adviser in accordance with the Valuation Procedures. If a fair value price provided by a pricing service is unreliable, the Adviser will fair value the security using the Valuation Procedures. Issuer-specific events, market trends, bid/asked quotes of brokers and information providers and other market data may be reviewed in the course of making a good faith determination of a security’s fair value.
Each Fund may invest in securities that are subject to interest rate risk, meaning the risk that the prices will generally fall as interest rates rise and, conversely, the prices will generally rise as interest rates fall. Specific securities differ in their sensitivity to changes in interest rates depending on their individual characteristics. Changes in interest rates may result in increased market volatility, which may affect the value and/or liquidity of certain Fund investments.
Valuations change in response to many factors, including the historical and prospective earnings of the issuer, the value of the issuer’s assets, general market conditions which are not specifically related to the particular issuer, such as real or perceived adverse economic conditions, changes in the general outlook for revenues or corporate earnings, changes in interest or currency rates, regional or global instability, natural or environmental disasters, widespread disease or other public health issues, war, acts of terrorism, significant governmental actions or adverse investor sentiment generally and market liquidity. Because of the inherent uncertainties of valuation, the values reflected in the financial statements may materially differ from the value received upon actual sale of those investments.
The price a Fund could receive upon the sale of any investment may differ from the Adviser’s valuation of the investment, particularly for securities that are valued using a fair valuation technique. When fair valuation techniques are applied, the Adviser uses available information, including both observable and unobservable inputs and assumptions, to determine a methodology that will result in a valuation that the Adviser believes approximates market value. Fund securities that are fair valued may be subject to greater fluctuation in their value from one day to the next than would be the case if market
| 58 | ||||
|
| |||
quotations were used. Because of the inherent uncertainties of valuation, and the degree of subjectivity in such decisions, a Fund could realize a greater or lesser than expected gain or loss upon the sale of the investment.
| B. | Investment Transactions and Investment Income - Investment transactions are accounted for on a trade date basis. Realized gains and losses from the sale or disposition of securities are computed on the specific identified cost basis. Interest income is recorded on an accrual basis from settlement date and includes coupon interest and amortization of premium and accretion of discount on debt securities as applicable. Pay-in-kind interest income and non-cash dividend income received in the form of securities in-lieu of cash are recorded at the fair value of the securities received. Dividend income (net of withholding tax, if any) is recorded on the ex-dividend date. Realized gains, dividends and interest received by a Fund may give rise to withholding and other taxes imposed by foreign countries. Tax conventions between certain countries and the United States may reduce or eliminate such taxes. |
The Funds may periodically participate in litigation related to a Fund’s investments. As such, the Funds may receive proceeds from litigation settlements. Any proceeds received are included in the Statements of Operations as realized gain (loss) for investments no longer held and as unrealized gain (loss) for investments still held.
Brokerage commissions and mark ups are considered transaction costs and are recorded as an increase to the cost basis of securities purchased and/or a reduction of proceeds on a sale of securities. Such transaction costs are included in the determination of net realized and unrealized gain (loss) from investment securities reported in the Statements of Operations and the Statements of Changes in Net Assets and the net realized and unrealized gains (losses) on securities per share in the Financial Highlights. Transaction costs are included in the calculation of a Fund’s NAV and, accordingly, they reduce a Fund’s total returns. These transaction costs are not considered operating expenses and are not reflected in net investment income reported in the Statements of Operations and the Statements of Changes in Net Assets, or the net investment income per share and the ratios of expenses and net investment income reported in the Financial Highlights, nor are they limited by any expense limitation arrangements between each Fund and the Adviser.
| C. | Country Determination - For the purposes of presentation in the Schedules of Investments, the Adviser may determine the country in which an issuer is located and/or credit risk exposure based on various factors. These factors include whether each Fund’s Underlying Index has made a country determination and may include the laws of the country under which the issuer is organized, where the issuer maintains a principal office, the country in which the issuer derives 50% or more of its total revenues, the country that has the primary market for the issuer’s securities and its “country of risk” as determined by a third party service provider, as well as other criteria. Among the other criteria that may be evaluated for making this determination are the country in which the issuer maintains 50% or more of its assets, the type of security, financial guarantees and enhancements, the nature of the collateral and the sponsor organization. Country of issuer and/or credit risk exposure has been determined to be the United States of America, unless otherwise noted. |
| D. | Dividends and Distributions to Shareholders - Each Fund declares and pays dividends from net investment income, if any, to its shareholders quarterly and records such dividends on the ex-dividend date. Generally, each Fund distributes net realized taxable capital gains, if any, annually in cash and records them on the ex-dividend date. Such distributions on a tax basis are determined in conformity with federal income tax regulations, which may differ from accounting principles generally accepted in the United States of America (“GAAP”). Distributions in excess of tax basis earnings and profits, if any, are reported in such Fund’s financial statements as a tax return of capital at fiscal year-end. |
| E. | Federal Income Taxes - Each Fund intends to comply with the provisions of the Internal Revenue Code of 1986, as amended (the “Internal Revenue Code”), applicable to regulated investment companies and to distribute substantially all of the Fund’s taxable earnings to its shareholders. As such, the Funds will not be subject to federal income taxes on otherwise taxable income (including net realized gains) that is distributed to the shareholders. Therefore, no provision for federal income taxes is recorded in the financial statements. |
Each Fund recognizes the tax benefits of uncertain tax positions only when the position is more likely than not to be sustained. Management has analyzed each Fund’s uncertain tax positions and concluded that no liability for unrecognized tax benefits should be recorded related to uncertain tax positions. Management is not aware of any tax positions for which it is reasonably possible that the total amounts of unrecognized tax benefits will change materially in the next 12 months.
Income and capital gain distributions are determined in accordance with federal income tax regulations, which may differ from GAAP. These differences are primarily due to differing book and tax treatments for in-kind transactions, losses deferred due to wash sales, and passive foreign investment company adjustments, if any.
The Funds file U.S. federal tax returns and tax returns in certain other jurisdictions. Generally, a Fund is subject to examinations by such taxing authorities for up to three years after the filing of the return for the tax period.
| F. | Foreign Withholding Taxes - Each Fund is subject to foreign withholding tax imposed by certain foreign countries in which the Fund may invest. Withholding taxes are incurred on certain foreign dividends and are accrued at the time the dividend is recognized based on applicable foreign tax laws. Each Fund may file withholding tax refunds in certain jurisdictions to recover a portion of amounts previously withheld. Each Fund will record a receivable for such tax refunds based on several factors including; an assessment of a jurisdiction’s legal obligation to pay reclaims, administrative practices and payment history. Any receivables recorded will be shown under receivables for Foreign tax reclaims on the Statements of Assets and Liabilities. |
As a result of recent court rulings in certain countries across the European Union, tax refunds for previously withheld taxes on dividends earned in those countries have been received. These tax refund payments are reflected as Foreign withholding
| 59 | ||||
|
| |||
tax claims in the Statements of Operations, and any related interest is included in Unaffiliated interest income. Each Fund may incur fees paid to third party providers that assist in the recovery of the tax reclaims. These fees are excluded from the unitary management fee and are reflected on the Statements of Operations as Professional fees, if any. In the event tax refunds received by a Fund during the fiscal year exceed the foreign withholding taxes paid by a Fund for the year, and the Fund previously passed foreign tax credits on to its shareholders, the Fund intends to enter into a closing agreement with the Internal Revenue Service in order to pay the associated liability on behalf of the Funds’ shareholders. For the fiscal year ended October 31, 2022, the Funds did not enter into any closing agreements.
| G. | Expenses - Each Fund has agreed to pay an annual unitary management fee to the Adviser. Out of the unitary management fee, the Adviser has agreed to pay for substantially all expenses of the Funds, including the costs of transfer agency, custody, fund administration, legal, audit and other services, except for distribution fees, if any, brokerage expenses, taxes, interest, acquired fund fees and expenses, if any, litigation expenses and other extraordinary expenses, including proxy expenses (except for such proxies related to: (i) changes to the Investment Advisory Agreement, (ii) the election of any Board member who is an “interested person” of the Trust, or (iii) any other matters that directly benefit the Adviser). |
Expenses of the Trust that are excluded from a Fund’s unitary management fee and are directly identifiable to a specific Fund are applied to that Fund. Expenses of the Trust that are excluded from a Fund’s unitary management fee and are not readily identifiable to a specific Fund are allocated in such a manner as deemed equitable, taking into consideration the nature and type of expense and the relative net assets of each Fund.
To the extent a Fund invests in other investment companies, the expenses shown in the accompanying financial statements reflect the expenses of the Fund and do not include any expenses of the investment companies in which it invests. The effects of such investment companies’ expenses are included in the realized and unrealized gain or loss on the investments in the investment companies.
| H. | Accounting Estimates - The preparation of the financial statements in accordance with GAAP requires management to make estimates and assumptions that affect the reported amounts and disclosures in the financial statements, including estimates and assumptions related to taxation. Actual results could differ from these estimates. In addition, the Funds monitor for material events or transactions that may occur or become known after the period-end date and before the date the financial statements are released to print. |
| I. | Indemnifications - Under the Trust’s organizational documents, its Officers and Trustees are indemnified against certain liabilities arising out of the performance of their duties to the Trust. Each Board member who is not an “interested person” (as defined in the 1940 Act) of the Trust (each, an “Independent Trustee”) is also indemnified against certain liabilities arising out of the performance of their duties to the Trust pursuant to an Indemnification Agreement between such trustee and the Trust. Additionally, in the normal course of business, the Trust enters into contracts with service providers that contain general indemnification clauses. The Trust’s maximum exposure under these arrangements is unknown, as this would involve future claims that may be made against the Trust that have not yet occurred. The risk of material loss as a result of such indemnification claims is considered remote. |
| J. | Securities Lending - Each Fund may participate in securities lending and may loan portfolio securities having a market value up to one-third of each Fund’s total assets. Such loans are secured by cash collateral equal to no less than 102% (105% for international securities) of the market value of the loaned securities determined daily by the securities lending provider. Cash collateral received in connection with these loans is invested in short-term money market instruments or affiliated, unregistered investment companies that comply with Rule 2a-7 under the 1940 Act and money market funds (collectively, “affiliated money market funds”) and is shown as such on the Schedules of Investments. Each Fund bears the risk of loss with respect to the investment of collateral. It is the policy of these Funds to obtain additional collateral from or return excess collateral to the borrower by the end of the next business day, following the valuation date of the securities loaned. Therefore, the value of the collateral held may be temporarily less than the value of the securities on loan. When loaning securities, each Fund retains certain benefits of owning the securities, including the economic equivalent of dividends or interest generated by the security. Lending securities entails a risk of loss to each Fund if, and to the extent that, the market value of the securities loaned were to increase, and the borrower did not increase the collateral accordingly, and the borrower failed to return the securities. The securities loaned are subject to termination at the option of the borrower or each Fund. Upon termination, the borrower will return to each Fund the securities loaned and each Fund will return the collateral. Upon the failure of the borrower to return the securities, collateral may be liquidated and the securities may be purchased on the open market to replace the loaned securities. Each Fund could experience delays and costs in gaining access to the collateral and the securities may lose value during the delay which could result in potential losses to each Fund. Some of these losses may be indemnified by the lending agent. Each Fund bears the risk of any deficiency in the amount of the collateral available for return to the borrower due to any loss on the collateral invested. For Funds that participated in securities lending, dividends received on cash collateral investments for securities lending transactions, which are net of compensation to counterparties, are included in Securities lending income on the Statements of Operations. The aggregate value of securities out on loan, if any, is shown on the Statements of Assets and Liabilities. |
Invesco Advisers, Inc. (“Invesco”), an affiliate of the Adviser, serves as an affiliated securities lending agent for each Fund participating in the securities lending program. The Bank of New York Mellon (“BNYM”) also serves as a lending agent. To the extent a Fund utilizes Invesco as an affiliated securities lending agent, the Fund conducts its securities lending in accordance
| 60 | ||||
|
| |||
with, and in reliance upon, no-action letters issued by the SEC staff that provide guidance on how an affiliate may act as a direct agent lender and receive compensation for those services in a manner consistent with the federal securities laws. For the fiscal year ended October 31, 2022, each Fund (except for FTSE International Low Beta Equal Weight ETF, S&P International Developed High Dividend Low Volatility ETF and S&P International Developed Low Volatility ETF) had affiliated securities lending transactions with Invesco. Fees paid to Invesco for securities lending agent services, which are included in Securities lending income on the Statements of Operations, were incurred by each applicable Fund as listed below:
Amount | ||||
S&P Emerging Markets Low Volatility ETF | $190 | |||
S&P Emerging Markets Momentum ETF | 2 | |||
S&P International Developed Momentum ETF | 1 | |||
| K. | Foreign Currency Translations - Foreign currency is valued at the close of the NYSE based on quotations posted by banks and major currency dealers. Portfolio securities and other assets and liabilities denominated in foreign currencies are translated into U.S. dollar amounts at the date of valuation. Purchases and sales of portfolio securities (net of foreign taxes withheld on disposition) and income items denominated in foreign currencies are translated into U.S. dollar amounts on the respective dates of such transactions. Each Fund does not separately account for the portion of the results of operations resulting from changes in foreign exchange rates on investments and the fluctuations arising from changes in market prices of securities held. The combined results of changes in foreign exchange rates and the fluctuation of market prices on investments (net of estimated foreign tax withholding) are included with the net realized and unrealized gain or loss from investments in the Statements of Operations. Reported net realized foreign currency gains or losses arise from (1) sales of foreign currencies, (2) currency gains or losses realized between the trade and settlement dates on securities transactions, and (3) the difference between the amounts of dividends, interest, and foreign withholding taxes recorded on a Fund’s books and the U.S. dollar equivalent of the amounts actually received or paid. Net unrealized foreign currency gains and losses arise from changes in the fair values of assets and liabilities, other than investments in securities at fiscal period-end, resulting from changes in exchange rates. |
Each Fund may invest in foreign securities, which may be subject to foreign taxes on income, gains on investments or currency repatriation, a portion of which may be recoverable. Foreign taxes, if any, are recorded based on the tax regulations and rates that exist in the foreign markets in which a Fund invests.
| L. | Other Risks |
AP Concentration Risk. Only APs may engage in creation or redemption transactions directly with each Fund. Each Fund has a limited number of institutions that may act as APs, and such APs have no obligation to submit creation or redemption orders. Consequently, there is no assurance that APs will establish or maintain an active trading market for the Shares. This risk may be heightened to the extent that securities held by each Fund are traded outside a collateralized settlement system. In that case, APs may be required to post collateral on certain trades on an agency basis (i.e., on behalf of other market participants), which only a limited number of APs may be able to do. In addition, to the extent that APs exit the business or are unable to proceed with creation and/or redemption orders with respect to each Fund and no other AP is able to step forward to create or redeem Creation Units, this may result in a significantly diminished trading market for Fund Shares, and Shares may be more likely to trade at a premium or discount to a Fund’s NAV and to face trading halts and/or delisting. Investments in non-U.S. securities, which may have lower trading volumes or could experience extended market closures or trading halts, may increase the risk that APs may not be able to effectively create or redeem Creation Units or the risk that the Shares may be halted and/or delisted.
Emerging Markets Investment Risk. For certain Funds, investments in the securities of issuers in emerging market countries involve risks often not associated with investments in the securities of issuers in developed countries. Securities in emerging markets may be subject to greater price fluctuations than securities in more developed markets. Companies in emerging market countries generally may be subject to less stringent regulatory, disclosure, financial reporting, accounting, auditing and recordkeeping standards than companies in more developed countries. In addition, information about such companies may be less available and reliable. Emerging markets usually are subject to greater market volatility, political, social and economic instability, uncertainty regarding the existence of trading markets and more governmental limitations on foreign investment than are more developed markets. Securities law in many emerging market countries is relatively new and unsettled. Therefore, laws regarding foreign investment in emerging markets securities, securities regulation, title to securities, and shareholder rights may change quickly and unpredictably, and the ability to bring and enforce actions, or to obtain information needed to pursue or enforce such actions, may be limited. In addition, the enforcement of systems of taxation at federal, regional and local levels in emerging market countries may be inconsistent and subject to sudden change. Investments in emerging market securities may be subject to additional transaction costs, delays in settlement procedures, unexpected market closures, and lack of timely information. In addition, lack of relevant data and reliable public information, including financial information, about securities in emerging markets may contribute to incorrect weightings and data and
| 61 | ||||
|
| |||
computational errors when a Fund’s index provider selects securities for inclusion in the Fund’s Underlying Index or rebalances the Underlying Index.
Equity Risk. Equity risk is the risk that the value of equity securities, including common stocks, may fall due to both changes in general economic conditions that impact the market as a whole, as well as factors that directly relate to a specific company or its industry. Such general economic conditions include changes in interest rates, periods of market turbulence or instability, or general and prolonged periods of economic decline and cyclical change. It is possible that a drop in the stock market may depress the price of most or all of the common stocks that each Fund holds. In addition, equity risk includes the risk that investor sentiment toward one or more industries will become negative, resulting in those investors exiting their investments in those industries, which could cause a reduction in the value of companies in those industries more broadly. The value of a company’s common stock may fall solely because of factors, such as an increase in production costs that negatively impact other companies in the same region, industry or sector of the market. A company’s common stock also may decline significantly in price over a short period of time due to factors specific to that company, including decisions made by its management or lower demand for the company’s products or services. For example, an adverse event, such as an unfavorable earnings report or the failure to make anticipated dividend payments, may depress the value of common stock.
Foreign Investment Risk. Investments in the securities of non-U.S. issuers involve risks beyond those associated with investments in U.S. securities. Foreign securities may have relatively low market liquidity, greater market volatility, decreased publicly available information and less reliable financial information about issuers and inconsistent and potentially less stringent accounting, auditing and financial reporting requirements and standards of practice, including recordkeeping standards, comparable to those applicable to domestic issuers. Foreign securities are also subject to the risks of expropriation, nationalization, political instability or other adverse political or economic developments and the difficulty of enforcing obligations in other countries. Investments in foreign securities also may be subject to dividend withholding or confiscatory taxes, currency blockage and/or transfer restrictions and higher transactional costs. If a Fund invests in securities denominated in foreign currencies, fluctuations in the value of the U.S. dollar relative to the values of other currencies may adversely affect investments in foreign securities and may negatively impact the Fund’s returns.
Geographic Concentration Risk. A natural or other disaster could occur in a geographic region in which a Fund invests, which could affect the economy or particular business operations of companies in that specific geographic region and adversely impact the Fund’s investments in the affected region.
High Dividend Paying Securities Risk. Certain Funds invest in securities that pay high dividends. As a group, these securities can fall out of favor with the market, causing such companies to underperform companies that do not pay high dividends. Also, changes in the dividend policies of the companies in which a Fund invests and the capital resources available for such companies’ dividend payments may adversely affect a Fund. In addition, the value of dividend-paying stocks can decline when interest rates rise, as fixed-income investments become more attractive to investors.
Index Risk. Unlike many investment companies, each Fund does not utilize an investing strategy that seeks returns in excess of its Underlying Index. Therefore, a Fund would not necessarily buy or sell a security unless that security is added or removed, respectively, from its Underlying Index, even if that security generally is underperforming. Additionally, each Fund rebalances its portfolio in accordance with its Underlying Index, and, therefore, any changes to the Underlying Index’s rebalance schedule will result in corresponding changes to each Fund’s rebalance schedule.
Industry Concentration Risk. In following its methodology, each Fund’s Underlying Index from time to time may be concentrated to a significant degree in securities of issuers operating in a single industry or industry group. To the extent that each Underlying Index concentrates in the securities of issuers in a particular industry or industry group, the corresponding Fund will also concentrate its investments to approximately the same extent. By concentrating its investments in an industry or industry group, each Fund may face more risks than if it were diversified broadly over numerous industries or industry groups. Such industry-based risks, any of which may adversely affect the companies in which each Fund invests, may include, but are not limited to, the following: general economic conditions or cyclical market patterns that could negatively affect supply and demand in a particular industry; competition for resources, adverse labor relations, political or world events; obsolescence of technologies; and increased competition or new product introductions that may affect the profitability or viability of companies in an industry. In addition, at times, such industry or industry group may be out of favor and underperform other industries or the market as a whole.
Market Risk. Securities in each Underlying Index are subject to market fluctuations. You should anticipate that the value of the Shares will decline, more or less, in correlation with any decline in value of the securities in an Underlying Index. Additionally, natural or environmental disasters, widespread disease or other public health issues, war, acts of terrorism or other events could result in increased premiums or discounts to each Fund’s NAV.
Mid-Capitalization Company Risk. Investing in securities of mid-capitalization companies involves greater risk than customarily is associated with investing in larger, more established companies and securities may be more volatile and less liquid than those of more established companies. These securities may have returns that vary, sometimes significantly, from the overall securities market. Mid-capitalization companies tend to have less experienced management as well as limited product and market diversification and financial resources compared to larger capitalization companies. Often mid-capitalization companies and the industries in which they focus are still evolving and, as a result, they may be more sensitive to changing market conditions.
| 62 | ||||
|
| |||
Momentum Investing Risk. For certain Funds, the momentum style of investing is subject to the risk that the securities may be more volatile than the market as a whole, or that the returns on securities that previously have exhibited price momentum are less than returns on other styles of investing. Momentum can turn quickly, and stocks that previously have exhibited high momentum may not experience continued positive momentum. In addition, there may be periods when the momentum style of investing is out of favor and therefore, the investment performance of a Fund may suffer.
Non-Correlation Risk. Each Fund’s return may not match the return of its corresponding Underlying Index for a number of reasons. For example, each Fund incurs operating expenses not applicable to the Underlying Index, and incurs costs in buying and selling securities, especially when rebalancing the Fund’s securities holdings to reflect changes in the composition of its corresponding Underlying Index. Additionally, a Fund’s use of a representative sampling approach may cause the Fund not to be as well-correlated with the return of its corresponding Underlying Index as would be the case if the Fund purchased all of the securities in its corresponding Underlying Index in the proportions represented in the Underlying Index. In addition, the performance of each Fund and its corresponding Underlying Index may vary due to asset valuation differences and differences between each Fund’s portfolio and its corresponding Underlying Index resulting from legal restrictions, costs or liquidity constraints.
Non-Diversification Risk. To the extent certain Funds become non-diversified, such Funds may invest a greater portion of their respective assets in securities of individual issuers than can a diversified fund. As a result, changes in the market value of a single investment could cause greater fluctuations in Share price than would occur in a diversified fund. This may increase certain Funds’ volatility and cause the performance of a relatively small number of issuers to have a greater impact on such Funds’ performance.
Portfolio Turnover Risk. Certain Funds may engage in frequent trading of their portfolio securities in connection with the rebalancing or adjustment of their respective Underlying Index. A portfolio turnover rate of 200%, for example, is equivalent to a Fund buying and selling all of its securities two times during the course of a year. A high portfolio turnover rate (such as 100% or more) could result in high brokerage costs for a Fund. While a high portfolio turnover rate can result in an increase in taxable capital gains distributions to a Fund’s shareholders, a Fund will seek to utilize the in-kind creation and redemption mechanism to minimize the realization of capital gains to the extent possible.
Sampling Risk. Certain Funds’ use of a representative sampling approach may result in the Fund holding a smaller number of securities than are in its respective Underlying Index. As a result, an adverse development with respect to an issuer of securities held by the Fund could result in a greater decline in NAV than would be the case if the Fund held all of the securities in its Underlying Index. To the extent the assets in the Fund are smaller, these risks will be greater.
COVID-19 Risk. The COVID-19 strain of coronavirus has resulted in instances of market closures and dislocations, extreme volatility, liquidity constraints and increased trading costs. Efforts to contain its spread have resulted in travel restrictions, disruptions of healthcare systems, business operations (including business closures) and supply chains, layoffs, lower consumer demand and employee availability, and defaults and credit downgrades, among other significant economic impacts that have disrupted global economic activity across many industries. Such economic impacts may exacerbate other pre-existing political, social and economic risks locally or globally and cause general concern and uncertainty. The full economic impact and ongoing effects of COVID-19 (or other future epidemics or pandemics) at the macro-level and on individual businesses are unpredictable and may result in significant and prolonged effects on the Funds’ performance.
NOTE 3–Investment Advisory Agreement and Other Agreements
The Trust has entered into an Investment Advisory Agreement with the Adviser on behalf of each Fund, pursuant to which the Adviser has overall responsibility for the selection and ongoing monitoring of the Funds’ investments, managing the Funds’ business affairs and providing certain clerical, bookkeeping and other administrative services.
Pursuant to the Investment Advisory Agreement, each Fund accrues daily and pays monthly to the Adviser an annual unitary management fee. Out of the unitary management fee, the Adviser has agreed to pay for substantially all expenses of the Funds, including the cost of transfer agency, custody, fund administration, legal, audit and other services, except for distribution fees, if any, brokerage expenses, taxes, interest, acquired fund fees and expenses, if any, litigation expenses and other extraordinary expenses, including proxy expenses (except for such proxies related to: (i) changes to the Investment Advisory Agreement, (ii) the election of any Board member who is an “interested person” of the Trust, or (iii) any other matters that directly benefit the Adviser). The unitary management fee is paid by each Fund to the Adviser at the following annual rates:
| Unitary Management Fees (as a % of average daily net assets) | |||||
FTSE International Low Beta Equal Weight ETF | 0.45 | % | |||
S&P Emerging Markets Low Volatility ETF | 0.29 | % | |||
S&P Emerging Markets Momentum ETF | 0.29 | % | |||
S&P International Developed High Dividend Low Volatility ETF | 0.30 | % | |||
S&P International Developed Low Volatility ETF | 0.25 | % | |||
S&P International Developed Momentum ETF | 0.25 | % | |||
| 63 | ||||
|
| |||
Through at least August 31, 2024, the Adviser has contractually agreed to waive the management fee payable by each Fund in an amount equal to the lesser of: (i) 100% of the net advisory fees earned by the Adviser or an affiliate of the Adviser that are attributable to the Fund’s investments in money market funds that are managed by affiliates of the Adviser and other funds (including ETFs) managed by the Adviser or affiliates of the Adviser or (ii) the management fee available to be waived. This waiver does not apply to a Fund’s investment of cash collateral received for securities lending. There is no guarantee that the Adviser will extend the waiver of these fees past that date.
For the fiscal year ended October 31, 2022, the Adviser waived fees for each Fund in the following amounts:
FTSE International Low Beta Equal Weight ETF | $ | 4 | ||
S&P Emerging Markets Low Volatility ETF | 860 | |||
S&P Emerging Markets Momentum ETF | 5 | |||
S&P International Developed High Dividend Low Volatility ETF | 13 | |||
S&P International Developed Low Volatility ETF | 402 | |||
S&P International Developed Momentum ETF | 9 | |||
The Trust has entered into a Distribution Agreement with Invesco Distributors, Inc. (the “Distributor”), which serves as the distributor of Creation Units for each Fund. The Distributor does not maintain a secondary market in the Shares. The Funds are not charged any fees pursuant to the Distribution Agreement. The Distributor is an affiliate of the Adviser.
The Adviser has entered into a licensing agreement for each Fund with the following entities (each, a “Licensor”):
Fund | Licensor | |
FTSE International Low Beta Equal Weight ETF | FTSE International Ltd. | |
S&P Emerging Markets Low Volatility ETF | S&P Dow Jones Indices LLC | |
S&P Emerging Markets Momentum ETF | S&P Dow Jones Indices LLC | |
S&P International Developed High Dividend Low Volatility ETF | S&P Dow Jones Indices LLC | |
S&P International Developed Low Volatility ETF | S&P Dow Jones Indices LLC | |
S&P International Developed Momentum ETF | S&P Dow Jones Indices LLC | |
Each Underlying Index name trademark is owned by its respective Licensor. These trademarks have been licensed to the Adviser for use by the Funds. Each Fund is entitled to use its Underlying Index pursuant to the Trust’s sub-licensing agreement with the Adviser. The Funds are not sponsored, endorsed, sold or promoted by the Licensors, and the Licensors make no representation regarding the advisability of investing in any of the Funds.
The Trust has entered into service agreements whereby BNYM, a wholly-owned subsidiary of The Bank of New York Mellon Corporation, serves as the administrator, custodian, fund accountant and transfer agent for each Fund.
For the fiscal year ended October 31, 2022, the following Funds incurred brokerage commissions with Invesco Capital Markets, Inc. (“ICMI”), an affiliate of the Adviser and Distributor, for portfolio transactions executed on behalf of the Funds, as listed below:
S&P Emerging Markets Low Volatility ETF | $ | 1,158 | ||
S&P Emerging Markets Momentum ETF | 38 | |||
S&P International Developed High Dividend Low Volatility ETF | 2 | |||
NOTE 4–Additional Valuation Information
GAAP defines fair value as the price that would be received to sell an asset or paid to transfer a liability in an orderly transaction between market participants at the measurement date, under current market conditions. GAAP establishes a hierarchy that prioritizes the inputs to valuation methods, giving the highest priority to readily available unadjusted quoted prices in an active market for identical assets (Level 1) and the lowest priority to significant unobservable inputs (Level 3), generally when market prices are not readily available. Based on the valuation inputs, the securities or other investments are tiered into one of three levels. Changes in valuation methods may result in transfers in or out of an investment’s assigned level:
| Level 1 | – | Prices are determined using quoted prices in an active market for identical assets. | ||
| Level 2 | – | Prices are determined using other significant observable inputs. Observable inputs are inputs that other market participants may use in pricing a security. These may include quoted prices for similar securities, interest rates, prepayment speeds, credit risk, yield curves, loss severities, default rates, discount rates, volatilities and others. | ||
| Level 3 | – | Prices are determined using significant unobservable inputs. In situations where quoted prices or observable inputs are unavailable (for example, when there is little or no market activity for an investment at the end of the period), unobservable inputs may be used. Unobservable inputs reflect the Adviser’s assumptions about the factors market participants would use in determining fair value of the securities or instruments and would be based on the best available information. | ||
| 64 | ||||
|
| |||
The following is a summary of the tiered valuation input levels, as of October 31, 2022. The level assigned to the securities valuations may not be an indication of the risk or liquidity associated with investing in those securities. Because of the inherent uncertainties of valuation, the values reflected in the financial statements may materially differ from the value received upon actual sale of those investments.
| Level 1 | Level 2 | Level 3 | Total | |||||||||||||||||
FTSE International Low Beta Equal Weight ETF | ||||||||||||||||||||
| Investments in Securities | ||||||||||||||||||||
Common Stocks & Other Equity Interests | $ | 4,263,232 | $ | - | $ | - | $ | 4,263,232 | ||||||||||||
Money Market Funds | 4,856 | 304,179 | - | 309,035 | ||||||||||||||||
|
|
|
|
|
|
|
| |||||||||||||
Total Investments | $ | 4,268,088 | $ | 304,179 | $ | - | $ | 4,572,267 | ||||||||||||
|
|
|
|
|
|
|
| |||||||||||||
S&P Emerging Markets Low Volatility ETF | ||||||||||||||||||||
| Investments in Securities | ||||||||||||||||||||
Common Stocks & Other Equity Interests | $ | 903,039,484 | $ | - | $ | 0 | $ | 903,039,484 | ||||||||||||
Money Market Funds | - | 11,741,660 | - | 11,741,660 | ||||||||||||||||
|
|
|
|
|
|
|
| |||||||||||||
Total Investments | $ | 903,039,484 | $ | 11,741,660 | $ | 0 | $ | 914,781,144 | ||||||||||||
|
|
|
|
|
|
|
| |||||||||||||
S&P Emerging Markets Momentum ETF | ||||||||||||||||||||
| Investments in Securities | ||||||||||||||||||||
Common Stocks & Other Equity Interests | $ | 4,944,293 | $ | 342 | $ | 0 | $ | 4,944,635 | ||||||||||||
Money Market Funds | 4,220 | 24,892 | - | 29,112 | ||||||||||||||||
|
|
|
|
|
|
|
| |||||||||||||
Total Investments | $ | 4,948,513 | $ | 25,234 | $ | 0 | $ | 4,973,747 | ||||||||||||
|
|
|
|
|
|
|
| |||||||||||||
S&P International Developed High Dividend Low Volatility ETF | ||||||||||||||||||||
| Investments in Securities | ||||||||||||||||||||
Common Stocks & Other Equity Interests | $ | 17,784,368 | $ | - | $ | - | $ | 17,784,368 | ||||||||||||
Money Market Funds | - | 2,239,598 | - | 2,239,598 | ||||||||||||||||
|
|
|
|
|
|
|
| |||||||||||||
Total Investments | $ | 17,784,368 | $ | 2,239,598 | $ | - | $ | 20,023,966 | ||||||||||||
|
|
|
|
|
|
|
| |||||||||||||
S&P International Developed Low Volatility ETF | ||||||||||||||||||||
| Investments in Securities | ||||||||||||||||||||
Common Stocks & Other Equity Interests | $ | 428,808,123 | $ | - | $ | - | $ | 428,808,123 | ||||||||||||
Money Market Funds | 49,451 | 31,809,585 | - | 31,859,036 | ||||||||||||||||
|
|
|
|
|
|
|
| |||||||||||||
Total Investments | $ | 428,857,574 | $ | 31,809,585 | $ | - | $ | 460,667,159 | ||||||||||||
|
|
|
|
|
|
|
| |||||||||||||
S&P International Developed Momentum ETF | ||||||||||||||||||||
| Investments in Securities | ||||||||||||||||||||
Common Stocks & Other Equity Interests | $ | 8,681,505 | $ | - | $ | - | $ | 8,681,505 | ||||||||||||
Money Market Funds | - | 237,125 | - | 237,125 | ||||||||||||||||
|
|
|
|
|
|
|
| |||||||||||||
Total Investments | $ | 8,681,505 | $ | 237,125 | $ | - | $ | 8,918,630 | ||||||||||||
|
|
|
|
|
|
|
| |||||||||||||
NOTE 5–Distributions to Shareholders and Tax Components of Net Assets
Tax Character of Distributions to Shareholders Paid During the Fiscal Years Ended October 31, 2022 and 2021:
| 2022 | 2021 | |||||||
| Ordinary Income* | Ordinary Income* | |||||||
FTSE International Low Beta Equal Weight ETF | $ | 269,340 | $ | 179,259 | ||||
S&P Emerging Markets Low Volatility ETF | 35,911,398 | 8,893,471 | ||||||
S&P Emerging Markets Momentum ETF | 147,705 | 88,036 | ||||||
S&P International Developed High Dividend Low Volatility ETF | 1,043,050 | 759,011 | ||||||
S&P International Developed Low Volatility ETF | 26,853,850 | 17,849,945 | ||||||
S&P International Developed Momentum ETF | 320,959 | 142,128 | ||||||
| * | Includes short-term capital gain distributions, if any. |
| 65 | ||||
|
| |||
Tax Components of Net Assets at Fiscal Year-End:
| Undistributed Ordinary Income | Temporary Book/Tax Differences | Net Unrealized Appreciation (Depreciation)- Investments | Net Unrealized (Depreciation)- Foreign Currencies | Capital Loss Carryforwards | Shares of Beneficial Interest | Total Net Assets | |||||||||||||||||||||||||||||
| FTSE International Low Beta Equal Weight ETF | $ | - | $ | (44 | ) | $ | (964,886) | $ | (6,175) | $ | (16,282,023 | ) | $ | 21,575,348 | $ | 4,322,220 | |||||||||||||||||||
| S&P Emerging Markets Low Volatility ETF | - | - | (106,329,818 | ) | (8,359 | ) | (150,525,995 | ) | 1,161,261,111 | 904,396,939 | |||||||||||||||||||||||||
| S&P Emerging Markets Momentum ETF | 31,742 | - | (153,464) | (10,849 | ) | (2,290,705 | ) | 7,365,158 | 4,941,882 | ||||||||||||||||||||||||||
| S&P International Developed High Dividend Low Volatility ETF | - | - | (3,641,804 | ) | (2,661 | ) | (3,989,718 | ) | 25,484,405 | 17,850,222 | |||||||||||||||||||||||||
| S&P International Developed Low Volatility ETF | 789,646 | - | (67,421,629) | (116,414 | ) | (218,427,532 | ) | 716,335,371 | 431,159,442 | ||||||||||||||||||||||||||
| S&P International Developed Momentum ETF | 4,012 | - | (293,293 | ) | (1,436 | ) | (3,910,909 | ) | 12,896,484 | 8,694,858 | |||||||||||||||||||||||||
Capital loss carryforwards are calculated and reported as of a specific date. Results of transactions and other activity after that date may affect the amount of capital loss carryforwards actually available for the Funds to utilize. The ability to utilize capital loss carryforwards in the future may be limited under the Internal Revenue Code and related regulations based on the results of future transactions.
The Funds have capital loss carryforwards as of October 31, 2022, as follows:
| No expiration | ||||||||||||
| Short-Term | Long-Term | Total* | ||||||||||
FTSE International Low Beta Equal Weight ETF | $ | 7,323,789 | $ | 8,958,234 | $ | 16,282,023 | ||||||
S&P Emerging Markets Low Volatility ETF | 108,432,456 | 42,093,539 | 150,525,995 | |||||||||
S&P Emerging Markets Momentum ETF | 2,290,705 | - | 2,290,705 | |||||||||
S&P International Developed High Dividend Low Volatility ETF | 2,352,352 | 1,637,366 | 3,989,718 | |||||||||
S&P International Developed Low Volatility ETF | 131,913,982 | 86,513,550 | 218,427,532 | |||||||||
S&P International Developed Momentum ETF | 3,433,068 | 477,841 | 3,910,909 | |||||||||
| * | Capital loss carryforwards are reduced for limitations, if any, to the extent required by the Internal Revenue Code and may be further limited depending upon a variety of factors, including the realization of net unrealized gains or losses as of the date of any reorganization. |
NOTE 6–Investment Transactions
For the fiscal year ended October 31, 2022, the cost of securities purchased and the proceeds from sales of securities (other than short-term securities, U.S. Government obligations, money market funds and in-kind transactions, if any) were as follows:
| Purchases | Sales | |||||||
FTSE International Low Beta Equal Weight ETF | $ | 3,980,123 | $ | 4,188,721 | ||||
S&P Emerging Markets Low Volatility ETF | 1,492,376,556 | 993,134,472 | ||||||
S&P Emerging Markets Momentum ETF | 6,218,338 | 6,184,131 | ||||||
S&P International Developed High Dividend Low Volatility ETF | 16,873,936 | 16,342,313 | ||||||
S&P International Developed Low Volatility ETF | 457,328,681 | 471,221,104 | ||||||
S&P International Developed Momentum ETF | 9,221,986 | 9,317,055 | ||||||
For the fiscal year ended October 31, 2022, in-kind transactions associated with creations and redemptions were as follows:
| In-kind Purchases | In-kind Sales | |||||||
FTSE International Low Beta Equal Weight ETF | $ | - | $ | 969,068 | ||||
S&P Emerging Markets Low Volatility ETF | 320,453,313 | 90,900,022 | ||||||
S&P Emerging Markets Momentum ETF | 98,326 | 138,527 | ||||||
S&P International Developed High Dividend Low Volatility ETF | 9,299,886 | 6,539,166 | ||||||
S&P International Developed Low Volatility ETF | 96,111,602 | 236,125,937 | ||||||
S&P International Developed Momentum ETF | 3,119,309 | 9,030,673 | ||||||
Gains (losses) on in-kind transactions are generally not considered taxable gains (losses) for federal income tax purposes.
| 66 | ||||
|
| |||
As of October 31, 2022, the aggregate cost of investments, including any derivatives, on a tax basis includes adjustments for financial reporting purposes as of the most recently completed federal income tax reporting period-end:
| Gross Unrealized Appreciation | Gross Unrealized (Depreciation) | Net Unrealized Appreciation (Depreciation) | Cost | |||||||||||||
FTSE International Low Beta Equal Weight ETF | $ | 133,388 | $ | (1,098,274) | $ | (964,886) | $ | 5,537,153 | ||||||||
S&P Emerging Markets Low Volatility ETF | 20,757,914 | (127,087,732) | (106,329,818) | 1,021,110,962 | ||||||||||||
S&P Emerging Markets Momentum ETF | 367,371 | (520,835) | (153,464) | 5,127,211 | ||||||||||||
S&P International Developed High Dividend Low Volatility ETF | 169,363 | (3,811,167) | (3,641,804) | 23,665,770 | ||||||||||||
S&P International Developed Low Volatility ETF | 6,851,527 | (74,273,156) | (67,421,629) | 528,088,788 | ||||||||||||
S&P International Developed Momentum ETF | 199,398 | (492,691) | (293,293) | 9,211,923 | ||||||||||||
NOTE 7–Reclassification of Permanent Differences
Primarily as a result of differing book/tax treatment of in-kind transactions, passive foreign investment companies, distributions, wash sales, foreign currency transactions, foreign capital gains taxes, taxable spinoff and inverse floaters, amounts were reclassified between undistributed net investment income, undistributed net realized gain (loss) and Shares of beneficial interest. These reclassifications had no effect on the net assets of each Fund. For the fiscal year ended October 31, 2022, the reclassifications were as follows:
| Undistributed Net Investment Income (Loss) | Undistributed Net Realized Gain (Loss) | Shares of Beneficial Interest | |||||||||||||
FTSE International Low Beta Equal Weight ETF | $ | 52,717 | $ | 123,310 | $ | (176,027 | ) | ||||||||
S&P Emerging Markets Low Volatility ETF | (30,689 | ) | 2,657,640 | (2,626,951 | ) | ||||||||||
S&P Emerging Markets Momentum ETF | 19,877 | (11,491 | ) | (8,386 | ) | ||||||||||
S&P International Developed High Dividend Low Volatility ETF | 43,239 | (697,929 | ) | 654,690 | |||||||||||
S&P International Developed Low Volatility ETF | 5,835,405 | (15,306,696 | ) | 9,471,291 | |||||||||||
S&P International Developed Momentum ETF | 50,239 | (741,081 | ) | 690,842 | |||||||||||
NOTE 8–Trustees’ and Officer’s Fees
The Adviser, as a result of each Fund’s unitary management fee, pays remuneration to the Independent Trustees and an Officer of the Trust on behalf of the Funds. The Trustee who is an “interested person” of the Trust does not receive any Trustees’ fees.
The Trust has adopted a deferred compensation plan (the “Plan”). Under the Plan, each Independent Trustee who has executed a Deferred Fee Agreement (a “Participating Trustee”) may defer receipt of all or a portion of their compensation (“Deferral Fees”). Such Deferral Fees are deemed to be invested in select Invesco ETFs. The Deferral Fees payable to a Participating Trustee are valued as of the date such Deferral Fees would have been paid to a Participating Trustee. The value increases with contributions or with increases in the value of the Shares selected, and the value decreases with distributions or with declines in the value of the Shares selected. Obligations under the Plan represent unsecured claims against the general assets of the Funds.
NOTE 9–Capital
Shares are issued and redeemed by each Fund only in Creation Units consisting of a specified number of Shares as set forth in each Fund’s prospectus. Only APs are permitted to purchase or redeem Creation Units from the Funds. Such transactions are principally permitted in exchange for Deposit Securities, with a balancing cash component to equate the transaction to the NAV per Share of a Fund on the transaction date. However, for all Funds, cash in an amount equivalent to the value of certain securities may be substituted, generally when the securities are not available in sufficient quantity for delivery, not eligible for trading by the AP or as a result of other market circumstances.
To the extent that the Funds permit transactions in exchange for Deposit Securities, each Fund may issue Shares in advance of receipt of Deposit Securities subject to various conditions, including a requirement to maintain on deposit with the Trust cash at least equal to 105% of the market value of the missing Deposit Securities. In accordance with the Trust’s Participant Agreement, Creation Units will be issued to an AP, notwithstanding the fact that the corresponding Deposit Securities have not been received in part or in whole, in reliance on the undertaking of the AP to deliver the missing Deposit Securities as soon as possible, which undertaking shall be secured by the AP’s delivery and maintenance of collateral consisting of cash in the form of U.S. dollars in immediately available funds having a value (marked-to-market daily) at least equal to 105%, which the Adviser may change from time to time, of the value of the missing Deposit Securities.
Certain transaction fees may be charged by the Funds for creations and redemptions, which are treated as increases in capital.
Transactions in each Fund’s Shares are disclosed in detail in the Statements of Changes in Net Assets.
| 67 | ||||
|
| |||
Report of Independent Registered Public Accounting Firm
To the Board of Trustees of Invesco Exchange-Traded Fund Trust II and Shareholders of Invesco FTSE International Low Beta Equal Weight ETF, Invesco S&P Emerging Markets Low Volatility ETF, Invesco S&P Emerging Markets Momentum ETF, Invesco S&P International Developed High Dividend Low Volatility ETF, Invesco S&P International Developed Low Volatility ETF and Invesco S&P International Developed Momentum ETF
Opinions on the Financial Statements
We have audited the accompanying statements of assets and liabilities, including the schedules of investments, of Invesco FTSE International Low Beta Equal Weight ETF, Invesco S&P Emerging Markets Low Volatility ETF, Invesco S&P Emerging Markets Momentum ETF, Invesco S&P International Developed High Dividend Low Volatility ETF, Invesco S&P International Developed Low Volatility ETF and Invesco S&P International Developed Momentum ETF (six of the funds constituting Invesco Exchange-Traded Fund Trust II, hereafter collectively referred to as the “Funds”) as of October 31, 2022, the related statements of operations for the year ended October 31, 2022, the statements of changes in net assets for each of the two years in the period ended October 31, 2022, including the related notes, and the financial highlights for each of the five years in the period ended October 31, 2022 (collectively referred to as the “financial statements”). In our opinion, the financial statements present fairly, in all material respects, the financial position of each of the Funds as of October 31, 2022, the results of each of their operations for the year then ended, the changes in each of their net assets for each of the two years in the period ended October 31, 2022 and each of the financial highlights for each of the five years in the period ended October 31, 2022 in conformity with accounting principles generally accepted in the United States of America.
Basis for Opinions
These financial statements are the responsibility of the Funds’ management. Our responsibility is to express an opinion on the Funds’ financial statements based on our audits. We are a public accounting firm registered with the Public Company Accounting Oversight Board (United States) (“PCAOB”) and are required to be independent with respect to the Funds in accordance with the U.S. federal securities laws and the applicable rules and regulations of the Securities and Exchange Commission and the PCAOB.
We conducted our audits of these financial statements in accordance with the standards of the PCAOB. Those standards require that we plan and perform the audit to obtain reasonable assurance about whether the financial statements are free of material misstatement, whether due to error or fraud.
Our audits included performing procedures to assess the risks of material misstatement of the financial statements, whether due to error or fraud, and performing procedures that respond to those risks. Such procedures included examining, on a test basis, evidence regarding the amounts and disclosures in the financial statements. Our audits also included evaluating the accounting principles used and significant estimates made by management, as well as evaluating the overall presentation of the financial statements. Our procedures included confirmation of securities owned as of October 31, 2022 by correspondence with the custodian, transfer agent and brokers; when replies were not received from brokers, we performed other auditing procedures. We believe that our audits provide a reasonable basis for our opinions.
/s/ PricewaterhouseCoopers LLP
Chicago, Illinois
December 23, 2022
We have served as the auditor of one or more of the investment companies in the Invesco group of investment companies since at least 1995. We have not been able to determine the specific year we began serving as auditor.
| 68 | ||||
|
| |||
Calculating your ongoing Fund expenses
Example
As a shareholder of a Fund of the Invesco Exchange-Traded Fund Trust II, you incur a unitary management fee. In addition to the unitary management fee, a shareholder may pay distribution fees, if any, brokerage expenses, taxes, interest, acquired fund fees and expenses, if any, litigation expenses and other extraordinary expenses, including proxy expenses (except for such proxies related to: (i) changes to the Investment Advisory Agreement, (ii) the election of any Board member who is an “interested person” of the Trust, or (iii) any other matters that directly benefit the Adviser). The expense examples below are intended to help you understand your ongoing costs (in dollars) of investing in the Funds and to compare these costs with the ongoing costs of investing in other funds.
The example is based on an investment of $1,000 invested at the beginning of the period and held for the entire period May 1, 2022 through October 31, 2022.
Actual Expenses
The first line in the following table provides information about actual account values and actual expenses. You may use the information in this line, together with the amount you invested, to estimate the expenses that you paid over the period. Simply divide your account value by $1,000 (for example, an $8,600 account value divided by $1,000 = 8.6), then multiply the result by the number in the first line under the heading “Expenses Paid During the Six-Month Period” to estimate the expenses you paid on your account during this period.
Hypothetical Example for Comparison Purposes
The second line in the following table provides information about hypothetical account values and hypothetical expenses based on each Fund’s actual expense ratio and an assumed annualized rate of return of 5% per year before expenses, which is not the Fund’s actual return. The hypothetical account values and expenses may not be used to estimate the actual ending account balance or expenses you paid for the period. You may use this information to compare the ongoing costs of investing in the Funds and other funds. To do so, compare this 5% hypothetical example with the 5% hypothetical examples that appear in the shareholder reports of the other funds.
Please note that the expenses shown in the table are meant to highlight your ongoing costs only, and do not reflect any transactional costs, such as sales charges and brokerage commissions. Therefore, the second line in the table is useful in comparing ongoing costs only, and will not help you determine the relative total costs of owning different funds. In addition, if these transactional costs were included, your costs would have been higher.
| Beginning Account Value May 1, 2022 | Ending Account Value October 31, 2022 | Annualized Expense Ratio Based on the Six-Month Period | Expenses Paid During the Six-Month Period(1) | |||||||||||||||||
| Invesco FTSE International Low Beta Equal Weight ETF (IDLB) | ||||||||||||||||||||
Actual | $1,000.00 | $ | 852.30 | 0.45 | % | $2.10 | ||||||||||||||
Hypothetical (5% return before expenses) | 1,000.00 | 1,022.94 | 0.45 | 2.29 | ||||||||||||||||
| Invesco S&P Emerging Markets Low Volatility ETF (EELV) | ||||||||||||||||||||
Actual | 1,000.00 | 863.80 | 0.29 | 1.36 | ||||||||||||||||
Hypothetical (5% return before expenses) | 1,000.00 | 1,023.74 | 0.29 | 1.48 | ||||||||||||||||
| Invesco S&P Emerging Markets Momentum ETF (EEMO) | ||||||||||||||||||||
Actual | 1,000.00 | 869.50 | 0.29 | 1.37 | ||||||||||||||||
Hypothetical (5% return before expenses) | 1,000.00 | 1,023.74 | 0.29 | 1.48 | ||||||||||||||||
| Invesco S&P International Developed High Dividend Low Volatility ETF (IDHD) | ||||||||||||||||||||
Actual | 1,000.00 | 849.30 | 0.30 | 1.40 | ||||||||||||||||
Hypothetical (5% return before expenses) | 1,000.00 | 1,023.69 | 0.30 | 1.53 | ||||||||||||||||
| Invesco S&P International Developed Low Volatility ETF (IDLV) | ||||||||||||||||||||
Actual | 1,000.00 | 853.40 | 0.25 | 1.17 | ||||||||||||||||
Hypothetical (5% return before expenses) | 1,000.00 | 1,023.95 | 0.25 | 1.28 | ||||||||||||||||
| 69 | ||||
|
| |||
Calculating your ongoing Fund expenses–(continued)
| Beginning Account Value May 1, 2022 | Ending Account Value October 31, 2022 | Annualized Expense Ratio Based on the Six-Month Period | Expenses Paid During the Six-Month Period(1) | |||||||||||||||||
| Invesco S&P International Developed Momentum ETF (IDMO) | ||||||||||||||||||||
Actual | $ | 1,000.00 | $ | 911.30 | 0.25% | $ | 1.20 | |||||||||||||
Hypothetical (5% return before expenses) | 1,000.00 | 1,023.95 | 0.25 | 1.28 | ||||||||||||||||
| (1) | Expenses are calculated using the annualized expense ratio, which represents the ongoing expenses as a percentage of net assets for the six-month period ended October 31, 2022. Expenses are calculated by multiplying the Fund’s annualized expense ratio by the average account value for the period, then multiplying the result by 184/365. Expense ratios for the most recent six-month period may differ from expense ratios based on the annualized data in the Financial Highlights. |
| 70 | ||||
|
| |||
Form 1099-DIV, Form 1042-S and other year–end tax information provide shareholders with actual calendar year amounts that should be included in their tax returns. Shareholders should consult their tax advisers.
The following distribution information is being provided as required by the Internal Revenue Code or to meet a specific state’s requirement.
Each Fund designates the following amounts or, if subsequently determined to be different, the maximum amount allowable for its fiscal year ended October 31, 2022:
| Qualified Business Income* | Qualified Dividend Income* | Corporate Dividends Received Deduction* | U.S. Treasury Obligations* | Business Interest Income* | Qualified Short Term Gains | |||||||||
| Invesco FTSE International Low Beta Equal Weight ETF | 0% | 69% | 0% | 0% | 0% | $ | - | |||||||
| Invesco S&P Emerging Markets Low Volatility ETF | 0% | 35% | 0% | 0% | 0% | 295,551 | ||||||||
| Invesco S&P Emerging Markets Momentum ETF | 0% | 41% | 0% | 0% | 0% | - | ||||||||
Invesco S&P International Developed High Dividend Low Volatility ETF | 0% | 54% | 0% | 0% | 0% | - | ||||||||
| Invesco S&P International Developed Low Volatility ETF | 0% | 57% | 0% | 0% | 0% | - | ||||||||
| Invesco S&P International Developed Momentum ETF | 0% | 66% | 0% | 0% | 0% | - | ||||||||
| * | The above percentages are based on ordinary income dividends paid to shareholders during the Fund’s fiscal year. |
The Funds intend to elect to pass through to shareholders the credit for taxes paid to foreign countries. The foreign source income and foreign taxes paid per share are as follows:
| Foreign Taxes Per Share | Foreign Source Income Per Share | |||
Invesco FTSE International Low Beta Equal Weight ETF | $0.0875 | $1.0441 | ||
Invesco S&P Emerging Markets Low Volatility ETF | 0.1182 | 0.9443 | ||
Invesco S&P Emerging Markets Momentum ETF | 0.0659 | 0.5553 | ||
Invesco S&P International Developed High Dividend Low Volatility ETF | 0.0575 | 1.1299 | ||
Invesco S&P International Developed Low Volatility ETF | 0.0826 | 1.4457 | ||
Invesco S&P International Developed Momentum ETF | 0.0823 | 1.1127 | ||
| 71 | ||||
|
| |||
The Independent Trustees of the Trust, their term of office and length of time served, their principal business occupations during at least the past five years, the number of portfolios in the Fund Complex (as defined below) overseen by each Independent Trustee and the other directorships, if any, held by each Independent Trustee are shown below:
As of October 31, 2022
Name, Address and Year of Birth of Independent Trustees | Position(s) Held with Trust | Term of Office and Length of Time Served* | Principal Occupation(s) During the Past 5 Years | Number of Portfolios in Fund Complex** Overseen by Trustees | Other Directorships Held by Independent Trustees During the Past 5 Years | |||||
Ronn R. Bagge–1958 c/o Invesco Capital Management LLC 3500 Lacey Road, Suite 700 Downers Grove, IL 60515 | Vice Chair of the Board; Chair of the Nominating and Governance Committee and Trustee | Vice Chair since 2018; Chair of the Nominating and Governance Committee and Trustee since 2007 | Founder and Principal, YQA Capital Management LLC (1998-Present); formerly, Owner/CEO of Electronic Dynamic Balancing Co., Inc. (high-speed rotating equipment service provider). | 234 | Chair (since 2021) and member (since 2017) of the Joint Investment Committee, Mission Aviation Fellowship and MAF Foundation; Trustee, Mission Aviation Fellowship (2017-Present). | |||||
Todd J. Barre–1957 c/o Invesco Capital Management LLC 3500 Lacey Road, Suite 700 Downers Grove, IL 60515 | Trustee | Since 2010 | Assistant Professor of Business, Trinity Christian College (2010-2016); formerly, Vice President and Senior Investment Strategist (2001-2008), Director of Open Architecture and Trading (2007-2008), Head of Fundamental Research (2004-2007) and Vice President and Senior Fixed Income Strategist (1994-2001), BMO Financial Group/Harris Private Bank. | 234 | None. | |||||
| * | This is the date the Independent Trustee began serving the Trust. Each Independent Trustee serves an indefinite term, until his or her successor is elected. |
| ** | Fund Complex includes all open- and closed-end funds (including all of their portfolios) advised by the Adviser and any affiliated person of the Adviser. |
| 72 | ||||
|
| |||
Trustees and Officers–(continued)
Name, Address and Year of Birth of Independent Trustees | Position(s) Held with Trust | Term of Office and Length of Time Served* | Principal Occupation(s) During the Past 5 Years | Number of Portfolios in Fund Complex** Overseen by | Other Directorships Held by Independent the Past 5 Years | |||||
Edmund P. Giambastiani, Jr.–1948 c/o Invesco Capital Management LLC 3500 Lacey Road, Suite 700 Downers Grove, IL 60515 | Trustee | Since 2019 | President, Giambastiani Group LLC (national security and energy consulting) (2007-Present); Director, First Eagle Alternative Credit LLC (2020-Present); Advisory Board Member, Massachusetts Institute of Technology Lincoln Laboratory (federally-funded research development) (2010-Present); Defense Advisory Board Member, Lawrence Livermore National Laboratory (2013-Present); formerly, Director, The Boeing Company (2009-2021); Trustee, MITRE Corporation (federally funded research development) (2008-2020); Director, THL Credit, Inc. (alternative credit investment manager) (2016-2020); Chair (2015-2016), Lead Director (2011-2015) and Director (2008-2011), Monster Worldwide, Inc. (career services); United States Navy, career nuclear submarine officer (1970-2007); Seventh Vice Chair of the Joint Chiefs of Staff (2005-2007); first NATO Supreme Allied Commander Transformation (2003-2005); Commander, U.S. Joint Forces Command (2002-2005). | 234 | Trustee, U.S. Naval Academy Foundation Athletic & Scholarship Program (2010- Present); formerly, Trustee, certain funds of the Oppenheimer Funds complex (2013-2019); Advisory Board Member, Maxwell School of Citizenship and Public Affairs of Syracuse University (2012-2016). |
| * | This is the date the Independent Trustee began serving the Trust. Each Independent Trustee serves an indefinite term, until his or her successor is elected. |
| ** | Fund Complex includes all open- and closed-end funds (including all of their portfolios) advised by the Adviser and any affiliated person of the Adviser. |
| 73 | ||||
|
| |||
Trustees and Officers–(continued)
Name, Address and Year of Birth of Independent Trustees | Position(s) with Trust | Term of and Length of Served* | Principal Occupation(s) During the Past 5 Years | Number of in Fund Complex** Overseen by | Other Directorships Held by Independent Trustees During the Past 5 Years | |||||
Victoria J. Herget–1951 c/o Invesco Capital Management LLC 3500 Lacey Road, Suite 700 Downers Grove, IL 60515 | Trustee | Since 2019 | Formerly, Managing Director (1993-2001), Principal (1985-1993), Vice President (1978-1985) and Assistant Vice President (1973-1978), Zurich Scudder Investments (investment adviser) (and its predecessor firms). | 234 | Trustee (2000- Present) and Chair (2010-2017), Newberry Library; Trustee, Chikaming Open Lands (2014-Present); formerly, Trustee, Mather LifeWays (2001-2021); Trustee, certain funds in the Oppenheimer Funds complex (2012-2019); Board Chair (2008-2015) and Director (2004-2018), United Educators Insurance Company; Independent Director, First American Funds (2003-2011); Trustee (1992-2007), Chair of the Board of Trustees (1999-2007), Investment Committee Chair (1994-1999) and Investment Committee member (2007-2010), Wellesley College; Trustee, BoardSource (2006-2009); Trustee, Chicago City Day School (1994-2005). |
| * | This is the date the Independent Trustee began serving the Trust. Each Independent Trustee serves an indefinite term, until his or her successor is elected. |
| ** | Fund Complex includes all open- and closed-end funds (including all of their portfolios) advised by the Adviser and any affiliated person of the Adviser. |
| 74 | ||||
|
| |||
Trustees and Officers–(continued)
Name, Address and Year of Birth of Independent Trustees | Position(s) with Trust | Term of and Length of Served* | Principal Occupation(s) During the Past 5 Years | Number of in Fund Complex** | Other Directorships Held by Independent Trustees During the Past 5 Years | |||||
Marc M. Kole–1960 c/o Invesco Capital Management LLC 3500 Lacey Road, Suite 700 Downers Grove, IL 60515 | Chair of the Audit Committee and Trustee | Chair of the Audit Committee since 2008; Trustee since 2007 | Formerly, Managing Director of Finance (2020-2021) and Senior Director of Finance (2015-2020), By The Hand Club for Kids (not-for-profit); Chief Financial Officer, Hope Network (social services) (2008-2012); Assistant Vice President and Controller, Priority Health (health insurance) (2005-2008); Regional Chief Financial Officer, United Healthcare (2005); Chief Accounting Officer, Senior Vice President of Finance, Oxford Health Plans (2000-2004); Audit Partner, Arthur Andersen LLP (1996-2000). | 234 | Formerly, Treasurer (2018-2021), Finance Committee Member (2015-2021) and Audit Committee Member (2015), Thornapple Evangelical Covenant Church; Board and Finance Committee Member (2009-2017) and Treasurer (2010-2015, 2017), NorthPointe Christian Schools. | |||||
Yung Bong Lim–1964 c/o Invesco Capital Management LLC 3500 Lacey Road, Suite 700 Downers Grove, IL 60515 | Chair of the Investment Oversight Committee and Trustee | Chair of the Investment Oversight Committee since 2014; Trustee since 2013 | Managing Partner, RDG Funds LLC (real estate) (2008-Present); formerly, Managing Director, Citadel LLC (1999-2007). | 234 | Board Director, Beacon Power Services, Corp. (2019-Present); formerly, Advisory Board Member, Performance Trust Capital Partners, LLC (2008-2020). | |||||
| * | This is the date the Independent Trustee began serving the Trust. Each Independent Trustee serves an indefinite term, until his or her successor is elected. |
| ** | Fund Complex includes all open- and closed-end funds (including all of their portfolios) advised by the Adviser and any affiliated person of the Adviser. |
| 75 | ||||
|
| |||
Trustees and Officers–(continued)
Name, Address and Year of Birth of Independent Trustees | Position(s) with Trust | Term of and Length of Served* | Principal Occupation(s) During the Past 5 Years | Number of in Fund Complex** | Other Directorships Held by Independent Trustees During the Past 5 Years | |||||
Joanne Pace–1958 c/o Invesco Capital Management LLC 3500 Lacey Road, Suite 700 Downers Grove, IL 60515 | Trustee | Since 2019 | Formerly, Senior Advisor, SECOR Asset Management, LP (2010-2011); Managing Director and Chief Operating Officer, Morgan Stanley Investment Management (2006-2010); Partner and Chief Operating Officer, FrontPoint Partners, LLC (alternative investments) (2005-2006); Managing Director (2003-2005), Global Head of Human Resources and member of Executive Board and Operating Committee (2004-2005), Global Head of Operations and Product Control (2003-2004), Credit Suisse (investment banking); Managing Director (1997-2003), Controller and Principal Accounting Officer (1999-2003), Chief Financial Officer (temporary assignment) for the Oversight Committee, Long Term Capital Management (1998-1999), Morgan Stanley. | 234 | Board Director, Horizon Blue Cross Blue Shield of New Jersey (2012- Present); Governing Council Member (2016-Present) and Chair of Education Committee (2017-2021), Independent Directors Council (IDC); Council Member, New York-Presbyterian Hospital’s Leadership Council on Children’s and Women’s Health (2012-Present); formerly, Advisory Board Director, The Alberleen Group LLC (2012-2021); Board Member, 100 Women in Finance (2015-2020); Trustee, certain funds in the Oppenheimer Funds complex (2012-2019); Lead Independent Director and Chair of the Audit and Nominating Committee of The Global Chartist Fund, LLC, Oppenheimer Asset Management (2011-2012); Board Director, Managed Funds Association (2008-2010); Board Director (2007-2010) and Investment Committee Chair (2008-2010), Morgan Stanley Foundation. |
| * | This is the date the Independent Trustee began serving the Trust. Each Independent Trustee serves an indefinite term, until his or her successor is elected. |
| ** | Fund Complex includes all open- and closed-end funds (including all of their portfolios) advised by the Adviser and any affiliated person of the Adviser. |
| 76 | ||||
|
| |||
Trustees and Officers–(continued)
Name, Address and Year of Birth of Independent Trustees | Position(s) with Trust | Term of and Length of Served* | Principal Occupation(s) During the Past 5 Years | Number of in Fund Complex** | Other Directorships Held by Independent Trustees During the Past 5 Years | |||||
Gary R. Wicker–1961 c/o Invesco Capital Management LLC 3500 Lacey Road, Suite 700 Downers Grove, IL 60515 | Trustee | Since 2013 | Senior Vice President of Global Finance and Chief Financial Officer, RBC Ministries (publishing company) (2013-Present); formerly, Executive Vice President and Chief Financial Officer, Zondervan Publishing (a division of Harper Collins/NewsCorp) (2007-2012); Senior Vice President and Group Controller (2005- 2006), Senior Vice President and Chief Financial Officer (2003-2004), Chief Financial Officer (2001-2003), Vice President, Finance and Controller (1999-2001) and Assistant Controller (1997-1999), divisions of The Thomson Corporation (information services provider); Senior Audit Manager (1994-1997), PricewaterhouseCoopers LLP. | 234 | Board Member and Treasurer, Our Daily Bread Ministries Canada (2015- Present); Board and Finance Committee Member, West Michigan Youth For Christ (2010- Present). | |||||
Donald H. Wilson–1959 c/o Invesco Capital Management LLC 3500 Lacey Road, Suite 700 Downers Grove, IL 60515 | Chair of the Board and Trustee | Chair since 2012; Trustee since 2007 | Chair, President and Chief Executive Officer, McHenry Bancorp Inc. and McHenry Savings Bank (subsidiary) (2018-Present); formerly, Chair and Chief Executive Officer, Stone Pillar Advisors, Ltd. (2010-2017); President and Chief Executive Officer, Stone Pillar Investments, Ltd. (advisory services to the financial sector) (2016-2018); Chair, President and Chief Executive Officer, Community Financial Shares, Inc. and Community Bank—Wheaton/Glen Ellyn (subsidiary) (2013-2015); Chief Operating Officer, AMCORE Financial, Inc. (bank holding company) (2007-2009); Executive Vice President and Chief Financial Officer, AMCORE Financial, Inc. (2006-2007); Senior Vice President and Treasurer, Marshall & Ilsley Corp. (bank holding company) (1995-2006). | 234 | Director, Penfield Children’s Center (2004-Present); Board Chair, Gracebridge Alliance, Inc. (2015-Present). | |||||
| * | This is the date the Independent Trustee began serving the Trust. Each Independent Trustee serves an indefinite term, until his or her successor is elected. |
| ** | Fund Complex includes all open- and closed-end funds (including all of their portfolios) advised by the Adviser and any affiliated person of the Adviser. |
| 77 | ||||
|
| |||
Trustees and Officers–(continued)
The Interested Trustee and the executive officers of the Trust, their term of office and length of time served, their principal business occupations during at least the past five years, the number of portfolios in the Fund Complex overseen by the Interested Trustee and the other directorships, if any, held by the Interested Trustee are shown below:
Name, Address and Year of Birth of Interested Trustee | Position(s) with Trust | Term of Office and Length of Time Served* | Principal Occupation(s) During the Past 5 Years | Number of Portfolios in Fund Complex** Overseen by Interested Trustee | Other Directorships Held by Interested Trustee During the Past 5 Years | |||||
Anna Paglia–1974 Invesco Capital Management LLC 3500 Lacey Road Suite 700 Downers Grove, IL 60515 | Trustee, President and Principal Executive Officer | Trustee since 2022, President and Principal Executive Officer since 2020 | President and Principal Executive Officer (2020-Present) and Trustee (2022-Present), Invesco Exchange- Traded Fund Trust, Invesco Exchange-Traded Fund Trust II, Invesco India Exchange-Traded Fund Trust, Invesco Actively Managed Exchange-Traded Fund Trust, Invesco Actively Managed Exchange-Traded Commodity Fund Trust and Invesco Exchange-Traded Self-Indexed Fund Trust; Managing Director and Global Head of ETFs and Indexed Strategies, Chief Executive Officer and Principal Executive Officer, Invesco Capital Management LLC (2020-Present); Chief Executive Officer, Manager and Principal Executive Officer, Invesco Specialized Products, LLC (2020-Present); Vice President, Invesco Indexing LLC (2020-Present); formerly, Secretary, Invesco Exchange-Traded Fund Trust, Invesco Exchange-Traded Fund Trust II, Invesco India Exchange-Traded Fund Trust and Invesco Actively Managed Exchange-Traded Fund Trust (2011-2020), Invesco Actively Managed Exchange-Traded Commodity Fund Trust (2014-2020) and Invesco Exchange-Traded Self-Indexed Fund Trust (2015- 2020); Head of Legal (2010-2020) and Secretary (2015-2020), Invesco Capital Management LLC; Manager and Assistant Secretary, Invesco Indexing LLC (2017-2020); Head of Legal and Secretary, Invesco Specialized Products, LLC (2018-2020); Partner, K&L Gates LLP (formerly, Bell Boyd & Lloyd LLP) (2007-2010); and Associate Counsel at Barclays Global Investors Ltd. (2004-2006). | 234 | None |
| * | This is the date the Interested Trustee began serving the Trust. The Interested Trustee serves an indefinite term, until his successor is elected. |
| ** | Fund Complex includes all open- and closed-end funds (including all of their portfolios) advised by the Adviser and any affiliated person of the Adviser. |
| 78 | ||||
|
| |||
Trustees and Officers–(continued)
Name, Address and Year of Birth of Executive Officers | Position(s) with Trust | Length of Served* | Principal Occupation(s) During the Past 5 Years | |||
Adrien Deberghes–1967 Invesco Capital Management LLC 11 Greenway Plaza, Suite 1000 Houston, TX 77046 | Vice President | Since 2020 | Vice President, Invesco Exchange-Traded Fund Trust, Invesco Exchange-Traded Fund Trust II, Invesco India Exchange-Traded Fund Trust, Invesco Actively Managed Exchange-Traded Fund Trust, Invesco Actively Managed Exchange- Traded Commodity Fund Trust and Invesco Exchange-Traded Self-Indexed Fund Trust (2020-Present); Head of the Fund Office of the CFO, Fund Administration and Vice President, Invesco Advisers, Inc. (2020-Present); Principal Financial Officer, Treasurer and Vice President, The Invesco Funds (2020-Present); formerly, Senior Vice President and Treasurer, Fidelity Investments (2008-2020). | |||
Kelli Gallegos–1970 Invesco Capital Management LLC 11 Greenway Plaza, Suite 1000 Houston, TX 77046 | Vice President and Treasurer | Since 2018 | Vice President, Invesco Advisers, Inc. (2020-Present); Principal Financial and Accounting Officer- Pooled Investments, Invesco Specialized Products, LLC (2018-Present); Vice President and Treasurer, Invesco Exchange-Traded Fund Trust, Invesco Exchange-Traded Fund Trust II, Invesco India Exchange-Traded Fund Trust, Invesco Actively Managed Exchange-Traded Fund Trust, Invesco Actively Managed Exchange-Traded Commodity Fund Trust and Invesco Exchange-Traded Self-Indexed Fund Trust (2018-Present); Principal Financial and Accounting Officer-Pooled Investments, Invesco Capital Management LLC (2018-Present); Vice President and Assistant Treasurer (2008-Present), The Invesco Funds; formerly, Principal Financial Officer (2016-2020) and Assistant Vice President (2008-2016), The Invesco Funds; Assistant Treasurer, Invesco Specialized Products, LLC (2018); Assistant Treasurer, Invesco Exchange- Traded Fund Trust, Invesco Exchange-Traded Fund Trust II, Invesco India Exchange-Traded Fund Trust and Invesco Actively Managed Exchange-Traded Fund Trust (2012-2018), Invesco Actively Managed Exchange-Traded Commodity Fund Trust (2014-2018) and Invesco Exchange-Traded Self-Indexed Fund Trust (2016-2018); and Assistant Treasurer, Invesco Capital Management LLC (2013-2018). | |||
Adam Henkel–1980 Invesco Capital Management LLC 3500 Lacey Road, Suite 700 Downers Grove, IL 60515 | Secretary | Since 2020 | Head of Legal and Secretary, Invesco Capital Management LLC and Invesco Specialized Products, LLC (2020-present); Secretary, Invesco Exchange-Traded Fund Trust, Invesco Exchange-Traded Fund Trust II, Invesco India Exchange- Traded Fund Trust, Invesco Actively Managed Exchange-Traded Fund Trust, Invesco Actively Managed Exchange-Traded Commodity Fund Trust and Invesco Exchange-Traded Self-Indexed Fund Trust (2020-Present); Assistant Secretary, Invesco Capital Markets, Inc. (2020-Present); Assistant Secretary, The Invesco Funds (2014-Present); Manager and Assistant Secretary, Invesco Indexing LLC (2020-Present); Assistant Secretary, Invesco Investment Advisers LLC (2020-Present); formerly, Assistant Secretary of Invesco Exchange-Traded Fund Trust, Invesco Exchange-Traded Fund Trust II, Invesco India Exchange- Traded Fund Trust, Invesco Actively Managed Exchange-Traded Fund Trust and Invesco Actively Managed Exchange-Traded Commodity Fund Trust (2014-2020); Chief Compliance Officer of Invesco Capital Management LLC (2017); Chief Compliance Officer of Invesco Exchange-Traded Fund Trust, Invesco Exchange-Traded Fund Trust II, Invesco India Exchange-Traded Fund Trust, Invesco Actively Managed Exchange-Traded Fund Trust and Invesco Actively Managed Exchange-Traded Commodity Fund Trust (2017); Senior Counsel, Invesco, Ltd. (2013-2020); Assistant Secretary, Invesco Specialized Products, LLC (2018-2020). | |||
| * | This is the date each Officer began serving the Trust in their current position. Each Officer serves an indefinite term, until his or her successor is elected. |
| 79 | ||||
|
| |||
Trustees and Officers–(continued)
Name, Address and Year of Birth of Executive Officers | Position(s) with Trust | Length of Served* | Principal Occupation(s) During the Past 5 Years | |||
Peter Hubbard–1981 Invesco Capital Management LLC 3500 Lacey Road, Suite 700 Downers Grove, IL 60515 | Vice President | Since 2009 | Vice President, Invesco Specialized Products, LLC (2018-Present); Vice President, Invesco Exchange-Traded Fund Trust, Invesco Exchange-Traded Fund Trust II, Invesco India Exchange-Traded Fund Trust, Invesco Actively Managed Exchange-Traded Fund Trust (2009-Present), Invesco Actively Managed Exchange-Traded Commodity Fund Trust (2014-Present) and Invesco Exchange-Traded Self-Indexed Fund Trust (2016-Present); Vice President and Director of Portfolio Management, Invesco Capital Management LLC (2010-Present); and Vice President, Invesco Advisers, Inc. (2020-Present); formerly, Vice President of Portfolio Management, Invesco Capital Management LLC (2008-2010); Portfolio Manager, Invesco Capital Management LLC (2007-2008); Research Analyst, Invesco Capital Management LLC (2005-2007); Research Analyst and Trader, Ritchie Capital, a hedge fund operator (2003-2005). | |||
Sheri Morris–1964 Invesco Capital Management LLC 11 Greenway Plaza, Suite 1000 Houston, TX 77046 | Vice President | Since 2012 | Head of Global Fund Services, Invesco Ltd. (2019-Present); Vice President, OppenheimerFunds, Inc. (2019-Present); President and Principal Executive Officer, The Invesco Funds (2016-Present); Senior Vice President, Invesco Advisers, Inc. (formerly known as Invesco Institutional (N.A.), Inc.) (registered investment adviser) (2020-Present); Director, Invesco Trust Company (2022-Present) and Vice President, Invesco Exchange-Traded Fund Trust, Invesco Exchange-Traded Fund Trust II, Invesco India Exchange-Traded Fund Trust, Invesco Actively Managed Exchange-Traded Fund Trust (2012-Present), Invesco Actively Managed Exchange-Traded Commodity Fund Trust (2014-Present) and Invesco Exchange-Traded Self-Indexed Fund Trust (2016-Present); formerly, Treasurer (2008-2020), Vice President and Principal Financial Officer, The Invesco Funds (2008-2016); Treasurer, Invesco Exchange-Traded Fund Trust, Invesco Exchange-Traded Fund Trust II, Invesco India Exchange-Traded Fund Trust and Invesco Actively Managed Exchange- Traded Fund Trust (2011-2013); Vice President, Invesco Aim Advisers, Inc., Invesco Aim Capital Management, Inc. and Invesco Aim Private Asset Management, Inc.; Treasurer, Assistant Vice President and Assistant Treasurer, The Invesco Funds and Assistant Vice President, Invesco Advisers, Inc., Invesco Aim Capital Management, Inc. and Invesco Aim Private Asset Management, Inc.; Vice President, Invesco Advisers, Inc. (2009-2020). | |||
Rudolf E. Reitmann–1971 Invesco Capital Management LLC 3500 Lacey Road, Suite 700 Downers Grove, IL 60515 | Vice President | Since 2013 | Head of Global Exchange Traded Funds Services, Invesco Specialized Products, LLC (2018-Present); Vice President, Invesco Exchange-Traded Fund Trust, Invesco Exchange-Traded Fund Trust II, Invesco India Exchange-Traded Fund Trust, Invesco Actively Managed Exchange-Traded Fund Trust (2013-Present), Invesco Actively Managed Exchange-Traded Commodity Fund Trust (2014-Present) and Invesco Exchange-Traded Self-Indexed Fund Trust (2016-Present); Head of Global Exchange Traded Funds Services, Invesco Capital Management LLC (2013-Present); Vice President, Invesco Capital Markets, Inc. (2018-Present). | |||
| * | This is the date each Officer began serving the Trust in their current position. Each Officer serves an indefinite term, until his or her successor is elected. |
| 80 | ||||
|
| |||
Trustees and Officers–(continued)
Name, Address and Year of Birth of Executive Officers | Position(s) with Trust | Length of Served* | Principal Occupation(s) During the Past 5 Years | |||
Melanie Zimdars–1976 Invesco Capital Management LLC 3500 Lacey Road, Suite 700 Downers Grove, IL 60515 | Chief Compliance Officer | Since 2017 | Chief Compliance Officer, Invesco Specialized Products, LLC (2018-Present); Chief Compliance Officer, Invesco Capital Management LLC (2017-Present); Chief Compliance Officer, Invesco Exchange-Traded Fund Trust, Invesco Exchange-Traded Fund Trust II, Invesco India Exchange-Traded Fund Trust, Invesco Actively Managed Exchange-Traded Fund Trust, Invesco Actively Managed Exchange-Traded Commodity Fund Trust and Invesco Exchange- Traded Self-Indexed Fund Trust (2017-Present); formerly, Vice President and Deputy Chief Compliance Officer, ALPS Holding, Inc. (2009-2017); Mutual Fund Treasurer/ Chief Financial Officer, Wasatch Advisors, Inc. (2005-2008); Compliance Officer, U.S. Bancorp Fund Services, LLC (2001-2005). |
| * | This is the date each Officer began serving the Trust in their current position. Each Officer serves an indefinite term, until his or her successor is elected. |
Availability of Additional Information About the Trustees
The Statement of Additional Information includes additional information about the Trustees and is available, without charge, upon request at (800) 983-0903.
| 81 | ||||
|
| |||
(This Page Intentionally Left Blank)
Proxy Voting Policies and Procedures
A description of the Trust’s proxy voting policies and procedures that the Funds use to determine how to vote proxies relating to portfolio securities is available, without charge and upon request, by calling (800) 983-0903. This information is also available on the Securities and Exchange Commission’s (the “Commission”) website at www.sec.gov.
Information regarding how each Fund voted proxies for portfolio securities, if applicable, during the most recent 12-month period ended June 30, is available, without charge and upon request, by (i) calling (800) 983-0903; or (ii) accessing the Trust’s Form N-PX on the Commission’s website at www.sec.gov.
Quarterly Portfolios
The Trust files its complete schedule of portfolio holdings for the Funds with the Commission for the first and third quarters of each fiscal year as an exhibit to its reports on Form N-PORT. The Forms N-PORT are available on the Commission’s website at www.sec.gov.
Frequency Distribution of Discounts and Premiums
A table showing the number of days the market price of each Fund’s shares was greater than the Fund’s net asset value, and the number of days it was less than the Fund’s net asset value (i.e., premium or discount) for the most recently completed calendar year, and the calendar quarters since that year end (or the life of the Fund, if shorter) may be found at the Fund’s website at www.invesco.com/ETFs.
| ©2022 Invesco Capital Management LLC | ||||||
| 3500 Lacey Road, Suite 700 | ||||||
| Downers Grove, IL 60515 | P-TRST2-HBLV-AR-2 | invesco.com/ETFs |
 |
Invesco Annual Report to Shareholders
October 31, 2022
| |||
| PCY | Invesco Emerging Markets Sovereign Debt ETF | |||
| PGHY | Invesco Global Short Term High Yield Bond ETF | |||
| PICB | Invesco International Corporate Bond ETF | |||
| 2 |
|
Domestic Equity
The fiscal year ended October 31, 2022 began with continued volatility in equity markets in the fourth quarter of 2021 amid substantial inflation and the emergence of a new COVID-19 variant. Pandemic-related supply chain disruption and labor shortages intensified during the quarter, resulting in broadly higher input costs for companies and consumers alike. Additionally, the price of oil rose,1 causing higher gas prices for consumers, and the Consumer Price Index (CPI) reported for November 2021 increased 0.8%, resulting in a 6.8% increase over the prior 12 months, the highest since 1982.2 To combat inflation, the US Federal Reserve (the Fed) announced the potential for three or more interest rate increases in 2022. With solid corporate earnings and optimism about the COVID-19 Omicron variant reporting milder symptoms, stocks rallied at the 2021 year-end.
Equity markets declined in the first quarter of 2022 amid volatility sparked by Russia’s invasion of Ukraine, rising commodity prices, rampant global inflation and the Fed’s shift toward tighter monetary policy. Russia’s invasion exacerbated inflation pressures, disrupting already strained supply chains and increasing shortages of oil, gas and raw materials. The price of oil rose sharply, with crude prices reaching their highest price per barrel since 2008.1 Inflation continued to be a top concern for consumers, investors and the Fed. To combat inflation, the Fed raised the federal funds rate by one-quarter percentage point in March and the Fed indicated it would “taper” its asset purchase program quickly.3
As the war in Ukraine continued and corporate earnings in high-profile names like Netflix reported slowing growth and profits, the equity markets sold off for much of April 2022. The downward direction of the equity markets continued into the second quarter of 2022 amid record inflation, rising interest rates and an increasing likelihood of a US recession. Driven by higher food and energy prices, the CPI rose by yet another 40-year high to 8.6% for the 12 months ended May 2022.2 Oil prices peaked near $122 per barrel in early June, resulting in skyrocketing gasoline prices; the national average price reached a record high above $5 per gallon in early June.1 To tame inflation, the Fed raised the benchmark federal funds rate three more times, by 0.50% in May, by 0.75% in June and another 0.75% in July, which were the largest increases in nearly 30 years.3 US equity markets rose in July and much of August until Fed chairman Jerome Powell’s hawkish comments at an economic policy symposium held in Jackson Hole, Wyoming sparked a sharp selloff at month-end. The Fed reiterated that it would continue taking aggressive action to curb inflation, even though such measures could “bring pain to households and businesses,” and the Fed raised the benchmark federal funds rate by another 0.75% in September.3
After experiencing a sharp drop in September 2022, US equity markets rebounded in October with strong gains, despite mixed data on the economy and corporate earnings. Inflation data
reported in October came in higher than expected; however, the
labor market remained strong, with payroll employment gains and a decline in the unemployment rate to a near record low of 3.5% in September.2 The initial estimate of third quarter real gross domestic product showed an increase of 2.6% (annualized) after falling in the prior two quarters, but the headline number masked a drop in demand and investment. Corporate earnings were generally in line with expectations, but many companies’ forward earnings guidance was weaker than expected.
In this environment, US stocks had negative double-digit returns for the fiscal year ended October 31, 2022 of -14.61%, as measured by the S&P 500 Index.4
| 1 | Source: Bloomberg LP |
| 2 | Source: US Bureau of Labor Statistics |
| 3 | Source: US Federal Reserve |
| 4 | Source: Lipper Inc. |
Fixed Income
In the fourth quarter of 2021, concerns about inflation heightened as US inflation rose 7%,1 its highest level in nearly 40 years. Though the US Federal Reserve (the Fed) left policy rates unchanged during the quarter, the Fed indicated its accommodative policies were coming to an end in 2022 through a willingness to raise interest rates to combat inflation and the announced reduction of its monthly bond purchase program. Additionally, US interest rate moves and inflation risk significantly affected fixed income valuations during the quarter. The two-year Treasury yield rose moderately from 0.27% to 0.73%, while the 10-year increased slightly from 1.48% to 1.52% during the quarter.2 The yield curve, as measured by the yield differential between two- and 10-year Treasuries, flattened during the quarter.
At the beginning of 2022, geopolitical and economic tensions between Ukraine and Russia culminated with the latter invading Ukrainian territory. World leaders levied sanctions against Russia that had material effects on its fixed income markets, particularly sovereign debt and corporates, and levels of liquidity. The Russia-Ukraine war exacerbated inflationary pressures while also exerting downward pressure on economic growth through a surge in commodity/energy prices. Additionally, surges of COVID-19 in China exacerbated supply chain issues and aggravated inflation. During the second quarter of 2022, the two-year Treasury yield rose significantly from 0.78% to 2.28%, while the 10-year increased slightly from 1.63% to 2.32%.2
In the second quarter of 2022, the macro backdrop of tightening financial conditions and slowing economic growth was negative for credit asset classes. Inflation, as measured by the Consumer Price Index, increased further to 9.1% and fixed income markets experienced significant negative performance as all bond sectors felt the impact of rising interest rates with negative performance ranging from -0.9% (Bloomberg Asset-Backed Securities) to -9.8% (Bloomberg US Corporate High Yield).3 Credit spreads increased across all major credit-sensitive sectors, reflecting
| 3 |
|
The Market Environment (continued)
anticipation of an economic slowdown and increasing concerns about recession risk, with corporate spreads ending the second quarter above their long-term historical average. The Fed continued its rapid tightening of monetary policy in an effort to combat inflation via higher interest rates while simultaneously engineering a soft landing so as to not push the economy into a recession. The Fed aggressively raised its key Fed funds rate during the fiscal year, including a 0.50% hike in May, and three 0.75% hikes in June, July and November, the largest hikes since 1994, to a target Fed funds rate of 3.75-4.00%, the highest since 2008.4 At their November 2022 meeting, the Fed signaled that its hawkish policies would continue, though a slowing of the pace of rate increases was likely. While rates remained elevated across all maturities on the yield curve, the two-year Treasury rates increased from 2.92% to 4.51% during the fiscal year, while 10-year Treasury rates increased from 2.98% to 4.10%.2 At the end of the fiscal year, the yield curve remained inverted, which historically has been an indicator of a potential recession.
| 1 | Source: US Bureau of Labor Statistics |
| 2 | Source: US Department of the Treasury |
| 3 | Source: Bloomberg |
| 4 | Source: Federal Reserve of Economic Data |
| 4 |
|
As an index fund, the Invesco Emerging Markets Sovereign Debt ETF (the “Fund”) is passively managed and seeks to track the investment results (before fees and expenses) of the DBIQ Emerging Market USD Liquid Balanced Index (the “Index”). The Fund generally will invest at least 80% of its total assets in components that comprise the Index.
Strictly in accordance with its guidelines and mandated procedures, Deutsche Bank Securities Inc. (“DB” or the “Index Provider”) compiles and maintains the Index, which measures potential returns of a theoretical portfolio of liquid U.S. dollar- denominated government bonds from emerging market countries. The Index is composed of one to three securities from each of the eligible emerging market countries set forth in the prospectus that (i) are denominated in U.S. dollars, (ii) are sovereign or quasi-sovereign bonds, (iii) generally have at least three years to maturity at the time of rebalancing, (iv) have an outstanding amount of at least $500 million or greater, and (v) have a fixed coupon. The Fund does not purchase all of the securities in the Index; instead, the Fund utilizes a “sampling” methodology to seek to achieve its investment objective.
For the fiscal year ended October 31, 2022, on a market price basis, the Fund returned (32.83)%. On a net asset value (“NAV”) basis, the Fund returned (31.97)%. During the same time period, the Index returned (34.28)%. During the fiscal year, the Fund’s performance, on a NAV basis, differed from the return of the Index primarily due the positive effects of the Fund’s sampling methodology, which offset the fees and operating expenses that the Fund incurred during the period.
During this same time period, the JP Morgan Emerging Market Bond Global Index (the “Benchmark Index”) returned (22.21)%. The Benchmark Index is an unmanaged index weighted by country, which limits weights of countries with higher debt outstanding, reallocating this excess to countries with lower debt outstanding, based on the average performance of approximately 800 securities. The Benchmark Index was selected for its recognition in the marketplace, and its performance comparison is a useful measure for investors as a broad representation of the U.S. dollar-denominated bond market in emerging market countries.
Relative to the Benchmark Index, the Fund was most overweight in Jordan bonds and most underweight in China bonds during the fiscal year ended October 31, 2022. The majority of the Fund’s underperformance relative to the Benchmark Index during the period can be attributed to the Fund’s higher allocation to Pakistan bonds, followed by Romania bonds.
For the fiscal year ended October 31, 2022, United States bonds contributed most significantly to the Fund’s return. Ukraine bonds detracted most significantly from the Fund’s return, followed by Russia bonds and Belarus bonds, respectively.
The position that contributed most significantly to the Fund’s return for the fiscal year ended October 31, 2022, was Turkey Government International Bond, 5.95% coupon, due 01/15/2031 (portfolio average weight of 1.20%). Positions that detracted most significantly from the Fund’s return during this period included Pakistan Government International Bond, 6.88% coupon, due 12/05/2027 (portfolio average weight of 0.50%) and Republic of Kenya Government International Bond, 8.25% coupon, due 02/28/2048 (portfolio average weight of 1.50%).
| 5 |
|
Invesco Emerging Markets Sovereign Debt ETF (PCY) (continued)
Country Breakdown | ||||
| Jordan | 3.38 | |||
| Costa Rica | 3.35 | |||
| Turkey | 3.35 | |||
| Oman | 3.35 | |||
| Guatemala | 3.29 | |||
| Paraguay | 3.22 | |||
| Bahrain | 3.21 | |||
| Brazil | 3.16 | |||
| Panama | 3.15 | |||
| Angola | 3.15 | |||
| Kazakhstan | 3.08 | |||
| Dominican Republic | 3.06 | |||
| Morocco | 3.03 | |||
| Philippines | 3.01 | |||
| Kenya | 3.00 | |||
| South Africa | 2.99 | |||
| Mexico | 2.99 | |||
| Indonesia | 2.95 | |||
| Egypt | 2.91 | |||
| Chile | 2.89 | |||
| Mongolia | 2.87 | |||
| Qatar | 2.86 | |||
| Colombia | 2.85 | |||
| Saudi Arabia | 2.82 | |||
| El Salvador | 2.81 | |||
| United Arab Emirates | 2.80 | |||
| Peru | 2.78 | |||
| China | 2.71 | |||
| Nigeria | 2.70 | |||
| Romania | 2.70 | |||
| Hungary | 2.69 | |||
| Poland | 1.76 | |||
| Kuwait | 1.73 | |||
| Pakistan | 1.32 | |||
| Money Market Funds Plus Other Assets Less Liabilities | 2.08 | |||
| Top Ten Fund Holdings* (% of the Fund’s Net Assets) as of October 31, 2022 | ||||
| Security | ||||
| Republic of Poland Government International Bond, 3.25%, 04/06/2026 | 1.76 | |||
| Kuwait International Government Bond, 3.50%, 03/20/2027 | 1.73 | |||
| Republic of Kenya Government International Bond, 7.25%, 02/28/2028 | 1.55 | |||
| Kazakhstan Government International Bond, 6.50%, 07/21/2045 | 1.54 | |||
| Kazakhstan Government International Bond, 4.88%, 10/14/2044 | 1.54 | |||
| Republic of Kenya Government International Bond, 8.25%, 02/28/2048 | 1.44 | |||
| Jordan Government International Bond, 5.75%, 01/31/2027 | 1.19 | |||
| Guatemala Government Bond, 4.88%, 02/13/2028 | 1.19 | |||
| Paraguay Government International Bond, 4.70%, 03/27/2027 | 1.17 | |||
| Turkey Government International Bond, 8.00%, 02/14/2034 | 1.15 | |||
| Total | 14.26 | |||
| * | Excluding money market fund holdings. |
| 6 |
|
Invesco Emerging Markets Sovereign Debt ETF (PCY) (continued)
Growth of a $10,000 Investment
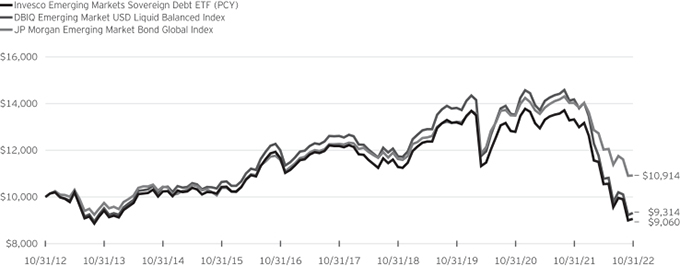
Fund Performance History as of October 31, 2022
3 Years Average | 3 Years Cumulative | 5 Years Average | 5 Years Cumulative | 10 Years Average | 10 Years Cumulative | Fund Inception | ||||||||||||||||||||||||||||||||||
Index | 1 Year | Average Annualized | Cumulative | |||||||||||||||||||||||||||||||||||||
| DBIQ Emerging Market USD Liquid Balanced Index | (34.28 | )% | (12.31 | )% | (32.56 | )% | (5.89 | )% | (26.16 | )% | (0.71 | )% | (6.86 | )% | 3.31 | % | 63.36 | % | ||||||||||||||||||||||
| JP Morgan Emerging Market Bond Global Index | (22.21 | ) | (6.20 | ) | (17.46 | ) | (2.33 | ) | (11.11 | ) | 0.88 | 9.14 | 3.91 | 78.03 | ||||||||||||||||||||||||||
| Fund | ||||||||||||||||||||||||||||||||||||||||
| NAV Return | (31.97 | ) | (11.77 | ) | (31.31 | ) | (5.76 | ) | (25.66 | ) | (0.98 | ) | (9.40 | ) | 2.68 | 48.82 | ||||||||||||||||||||||||
| Market Price Return | (32.83 | ) | (12.18 | ) | (32.27 | ) | (6.01 | ) | (26.64 | ) | (1.15 | ) | (10.90 | ) | 2.54 | 45.84 | ||||||||||||||||||||||||
Fund Inception: October 11, 2007
Performance quoted above represents past performance. Past performance is not a guarantee of future results and current performance may be higher or lower than performance quoted. Investment returns and principal value will fluctuate, and shares of the Fund (“Fund Shares”), when redeemed or sold, may be worth more or less than their original cost. Fund performance reflects any applicable fee waivers and/or expense reimbursements. Had the adviser not waived fees and/or reimbursed expenses currently or in the past, returns would have been lower. See the current prospectus for more information. According to the Fund’s current prospectus, the Fund’s expense ratio of 0.50% is expressed as a unitary management fee to cover operating expenses and expenses incurred in connection with managing the portfolio. NAV and Market Price returns assume that dividends and capital gain distributions have been reinvested in the Fund at NAV and Market Price, respectively. The returns shown in the table above do not reflect the deduction of taxes that a shareholder would pay on Fund distributions or the redemption or sale of Fund Shares. See invesco.com/ETFs to find the most recent month-end performance numbers.
Performance results for the indexes are based upon a hypothetical investment in their respective constituent securities. The returns for an index do not represent Fund returns. An investor cannot invest directly in an index. The indexes do not charge management fees or brokerage expenses, and no such fees or expenses were deducted from the hypothetical performance shown. In addition, the results actual investors might have achieved would have differed from those shown because of differences in the timing, amounts of their investments, and fees and expenses associated with an investment in the Fund.
Notes Regarding Indexes and Fund Performance History:
| - | Average Annualized and Cumulative Inception returns for the Fund and the indexes are based on the inception date of the Fund. |
| 7 |
|
| PGHY | Management’s Discussion of Fund Performance | |
| Invesco Global Short Term High Yield Bond ETF (PGHY) |
As an index fund, the Invesco Global Short Term High Yield Bond ETF (the “Fund”) is passively managed and seeks to track the investment results (before fees and expenses) of the DB Global Short Maturity High Yield Bond Index (the “Index”). The Fund generally will invest at least 80% of its total assets in components that comprise the Index.
Strictly in accordance with its guidelines and mandated procedures, Deutsche Bank Securities Inc. (“DB” or the “Index Provider”) compiles and maintains the Index, which is composed of U.S. dollar denominated, publicly issued, institutionally traded short-term bonds that are rated below investment grade. The Index is composed of bonds issued by corporations, as well as sovereign or quasi-government entities, that (i) are denominated in U.S. dollars; (ii) are rated below “investment grade” (i.e., have a “composite rating” from DB of between “C” and “BB+” (both inclusive)); (iii) have not been marked as defaulted by any rating agency; (iv) have generally three years or less to maturity; (v) have a minimum amount outstanding of at least $250 million; and (vi) have a fixed coupon.
Eligible bonds must be rated by at least one of S&P Global Ratings, Moody’s Investors Service, Inc., or Fitch Ratings Inc. DB converts all available ratings for each bond into a numerical score, and then calculates an average score for each bond from those available ratings that corresponds to DB’s “composite rating” system. The Fund does not purchase all of the securities in the Index; instead, the Fund utilizes a “sampling” methodology to seek to achieve its investment objective.
For the fiscal year ended October 31, 2022, on a market price basis, the Fund returned (7.87)%. On a net asset value (“NAV”) basis, the Fund returned (7.45)%. During the same time period, the Index returned (9.74)%. The Fund’s performance, on a NAV basis, differed from the return of the Index primarily due to the positive effects of the Fund’s sampling methodology, which offset the fees and operating expenses that the Fund incurred during the period.
During this same time period, ICE BofA 0-5 Year U.S. High Yield Constrained Index (the “Benchmark Index”) returned (5.94)%. The Benchmark Index is an unmanaged index weighted by market capitalization and based on the average performance of approximately 950 securities. The Benchmark Index was selected for its recognition in the marketplace, and its performance comparison is a useful measure for investors as a broad representation of the U.S. dollar-denominated short-term high yield corporate bond market.
Relative to the Benchmark Index, the Fund was most overweight in the financial sector and most underweight in the communication services sector during the fiscal year ended October 31, 2022. The majority of the Fund’s underperformance relative to the Benchmark Index during the period can be attributed to the Fund’s overweight allocation to the materials sector.
For the fiscal year ended October 31, 2022, the utilities sector contributed most significantly to the Fund’s return. The financial sector detracted most significantly from the Fund’s return.
Positions that contributed most significantly to the Fund’s return for the fiscal year ended October 31, 2022, included Codere Finance 2 (Luxembourg) S.A., 13.63% coupon, due 11/30/2027, (portfolio average weight of 0.10%) and Mountain Province Diamonds, Inc., 8.00% coupon, due 12/15/2022, (portfolio average weight of 0.40%). Positions that detracted most significantly from the Fund’s return included Global Ports Finance PLC, 6.50% coupon, due 09/22/2023, (no longer held at fiscal year-end) and Celtic Resources Holdings DAC, 4.13% coupon, due 10/09/2024, (portfolio average weight of 0.00%).
| Sector Breakdown (% of the Fund’s Net Assets) as of October 31, 2022 | ||||
| Financials | 20.01 | |||
| Consumer Discretionary | 12.52 | |||
| Energy | 11.93 | |||
| Sovereign Debt | 10.32 | |||
| Industrials | 9.92 | |||
| Materials | 8.81 | |||
| Communication Services | 7.20 | |||
| Utilities | 4.86 | |||
| Real Estate | 3.88 | |||
| Sector Types Each Less Than 3% | 5.84 | |||
| Money Market Funds Plus Other Assets Less Liabilities | 4.71 | |||
| Top Ten Fund Holdings* (% of the Fund’s Net Assets) as of October 31, 2022 | ||||
| Security | ||||
| SoftBank Group Corp., 4.75%, 09/19/2024 | 0.45 | |||
| Rakuten Group, Inc., 3.55%, 11/27/2024 | 0.44 | |||
| Roenesans Gayrimenkul Yatirim A.S., 7.25%, 04/26/2023 | 0.39 | |||
| Mountain Province Diamonds, Inc., 8.00%, 12/15/2022 | 0.38 | |||
| Costa Rica Government International Bond, 4.25%, 01/26/2023 | 0.37 | |||
| Avient Corp., 5.25%, 03/15/2023 | 0.37 | |||
| KOC Holding A.S., 5.25%, 03/15/2023 | 0.37 | |||
| Oman Government International Bond, 4.13%, 01/17/2023 | 0.37 | |||
| Hazine Mustesarligi Varlik Kiralama A.S., 5.00%, 04/06/2023 | 0.37 | |||
| Arcelik A.S., 5.00%, 04/03/2023 | 0.37 | |||
| Total | 3.88 | |||
| * | Excluding money market fund holdings. |
| 8 |
|
Invesco Global Short Term High Yield Bond ETF (PGHY) (continued)
Growth of a $10,000 Investment Since Inception
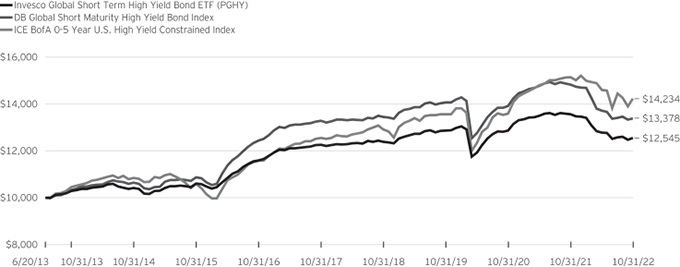
Fund Performance History as of October 31, 2022
| 1 Year | 3 Years Average | 3 Years Cumulative | 5 Years Average | 5 Years Cumulative | Fund Inception | |||||||||||||||||||||||||||
Index | Average Annualized | Cumulative | ||||||||||||||||||||||||||||||
| DB Global Short Maturity High Yield Bond Index | (9.74 | )% | (1.67 | )% | (4.92 | )% | 0.15 | % | 0.76 | % | 3.16 | % | 33.78 | % | ||||||||||||||||||
| ICE BofA 0-5 Year U.S. High Yield Constrained Index | (5.94 | ) | 1.63 | 4.97 | 2.56 | 13.45 | 3.84 | 42.34 | ||||||||||||||||||||||||
| Fund | ||||||||||||||||||||||||||||||||
| NAV Return | (7.45 | ) | (0.84 | ) | (2.50 | ) | 0.47 | 2.36 | 2.45 | 25.45 | ||||||||||||||||||||||
| Market Price Return | (7.87 | ) | (0.92 | ) | (2.74 | ) | 0.37 | 1.87 | 2.45 | 25.39 | ||||||||||||||||||||||
Fund Inception: June 20, 2013
Performance quoted above represents past performance. Past performance is not a guarantee of future results and current performance may be higher or lower than performance quoted. Investment returns and principal value will fluctuate, and shares of the Fund (“Fund Shares”), when redeemed or sold, may be worth more or less than their original cost. Fund performance reflects any applicable fee waivers and/or expense reimbursements. Had the adviser not waived fees and/or reimbursed expenses currently or in the past, returns would have been lower. See the current prospectus for more information. According to the Fund’s current prospectus, the Fund’s expense ratio of 0.35% is expressed as a unitary management fee to cover operating expenses and expenses incurred in connection with managing the portfolio. NAV and Market Price returns assume that dividends and capital gain distributions have been reinvested in the Fund at NAV and Market Price, respectively. The returns shown in the table above do not reflect the deduction of taxes that a shareholder would pay on Fund distributions or the redemption or sale of Fund Shares. See invesco.com/ETFs to find the most recent month-end performance numbers.
Performance results for the indexes are based upon a hypothetical investment in their respective constituent securities. The returns for an index do not represent Fund returns. An investor cannot invest directly in an index. The indexes do not charge management fees or brokerage expenses, and no such fees or expenses were deducted from the hypothetical performance shown. In addition, the results actual investors might have achieved would have differed from those shown because of differences in the timing, amounts of their investments, and fees and expenses associated with an investment in the Fund.
Notes Regarding Indexes and Fund Performance History:
| - | Average Annualized and Cumulative Inception returns for the Fund and the indexes are based on the inception date of the Fund. |
| 9 |
|
| PICB | Management’s Discussion of Fund Performance | |
| Invesco International Corporate Bond ETF (PICB) |
As an index fund, the Invesco International Corporate Bond ETF (the “Fund”) is passively managed and seeks to track the investment results (before fees and expenses) of the S&P International Corporate Bond Index® (the “Index”). The Fund generally will invest at least 80% of its total assets in components that comprise the Index.
S&P Dow Jones Indices LLC (“S&P DJI” or the “Index Provider”) constructs the Index, which is composed of investment grade corporate bonds issued by non-U.S. investment grade issuers, denominated in the following currencies of Group of Ten (“G10”) countries, excluding the U.S. Dollar (USD): Australian Dollar (AUD), British Pound (GBP), Canadian Dollar (CAD), Euro (EUR), Japanese Yen (JPY), New Zealand Dollar (NZD), Norwegian Krone (NOK), Swedish Krona (SEK) and Swiss Franc (SFR). The Fund does not purchase all of the securities in the Index; instead, the Fund utilizes a “sampling” methodology to seek to achieve its investment objective.
For the fiscal year ended October 31, 2022, on a market price basis, the Fund returned (29.09)%. On a net asset value (“NAV”) basis, the Fund returned (29.02)%. During the same time period, the Index returned (28.88)%. The Fund’s performance, on a NAV basis, differed from the return of the Index primarily due to fees and operating expenses that the Fund incurred during the period, which were partially offset by the positive effects of the Fund’s sampling methodology.
During this same time period, the Bloomberg Pan-European Aggregate Index (the “Benchmark Index”) returned (29.59)%. The Benchmark Index is an unmanaged index weighted by market capitalization based on the average performance of approximately 8,300 securities. The Benchmark Index was selected for its recognition in the marketplace, and its performance comparison is a useful measure for investors as a broad-based representation of the non-U.S. dollar corporate bond market.
Relative to the Benchmark Index, the Fund was most overweight in the financials sector and most underweight in the information technology sector during the fiscal year ended October 31, 2022. The majority of the Fund’s outperformance relative to the Benchmark Index during the period can be attributed the Fund’s security selection in the information technology sector.
For the fiscal year ended October 31, 2022, no sector contributed to the Fund’s return. The financials sector detracted most significantly from the Fund’s return.
Positions that contributed most significantly to the Fund’s return for the fiscal year ended October 31, 2022, included Orsted A/S, 5.38% coupon, due 09/13/2042, (portfolio average weight of 0.40 %), and BG Energy Capital PLC, 5.13% coupon, due 12/01/2025, (portfolio average weight of 0.30%). Positions that detracted most significantly from the Fund’s return included Enel Finance International N.V., 5.75% coupon, due 09/14/2040,
(portfolio average weight of 0.50%), and ENGIE S.A., 5.00% coupon, due 10/01/2060, (portfolio average weight of 0.30%).
| Sector Breakdown (% of the Fund’s Net Assets) as of October 31, 2022 | ||||
| Financials | 51.68 | |||
| Utilities | 13.79 | |||
| Communication Services | 8.78 | |||
| Industrials | 5.11 | |||
| Energy | 4.97 | |||
| Consumer Discretionary | 4.71 | |||
| Sector Types Each Less Than 3% | 9.48 | |||
| Money Market Funds Plus Other Assets Less Liabilities | 1.48 | |||
| Top Ten Fund Holdings* (% of the Fund’s Net Assets) as of October 31, 2022 | ||||
| Security | ||||
| Toronto-Dominion Bank (The), 2.67%, 09/09/2025 | 0.77 | |||
| Royal Bank of Canada, 3.37%, 09/29/2025 | 0.72 | |||
| NTT Finance Corp., Series 16, 0.18%, 12/19/2025 | 0.69 | |||
| NTT Finance Corp., Series 18, 0.38%, 09/20/2030 | 0.68 | |||
| Toronto-Dominion Bank (The), 4.21%, 06/01/2027 | 0.65 | |||
| Electricite de France S.A., 6.13%, 06/02/2034 | 0.59 | |||
| Bank of Montreal, 4.31%, 06/01/2027 | 0.58 | |||
| Bank of Nova Scotia (The), 1.95%, 01/10/2025 | 0.49 | |||
| Enel Finance International N.V., 5.75%, 09/14/2040 | 0.48 | |||
| Bank of Nova Scotia (The), 2.95%, 03/08/2027 | 0.48 | |||
| Total | 6.13 | |||
| * | Excluding money market fund holdings. |
| 10 |
|
Invesco International Corporate Bond ETF (PICB) (continued)
Growth of a $10,000 Investment
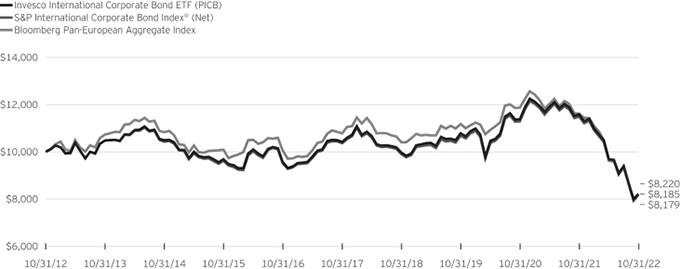
Fund Performance History as of October 31, 2022
| 1 Year | 3 Years Average | 3 Years Cumulative | 5 Years Average | 5 Years Cumulative | 10 Years Average | 10 Years Cumulative | Fund Inception | |||||||||||||||||||||||||||||||||
| Index | Average Annualized | Cumulative | ||||||||||||||||||||||||||||||||||||||
| S&P International Corporate Bond Index® (Net) | (28.88 | )% | (8.52 | )% | (23.43 | )% | (4.63 | )% | (21.12 | )% | (1.99 | )% | (18.21 | )% | 0.30 | % | 3.80 | % | ||||||||||||||||||||||
| Bloomberg Pan-European Aggregate Index | (29.59 | ) | (9.86 | ) | (26.76 | ) | (5.38 | ) | (24.15 | ) | (1.98 | ) | (18.15 | ) | 0.00 | (0.06 | ) | |||||||||||||||||||||||
| Fund | ||||||||||||||||||||||||||||||||||||||||
| NAV Return | (29.02 | ) | (8.65 | ) | (23.77 | ) | (4.64 | ) | (21.14 | ) | (1.94 | ) | (17.80 | ) | 0.34 | 4.36 | ||||||||||||||||||||||||
| Market Price Return | (29.09 | ) | (8.50 | ) | (23.40 | ) | (4.63 | ) | (21.12 | ) | (1.98 | ) | (18.14 | ) | 0.29 | 3.68 | ||||||||||||||||||||||||
Fund Inception: June 3, 2010
Performance quoted above represents past performance. Past performance is not a guarantee of future results and current performance may be higher or lower than performance quoted. Investment returns and principal value will fluctuate, and shares of the Fund (“Fund Shares”), when redeemed or sold, may be worth more or less than their original cost. Fund performance reflects any applicable fee waivers and/or expense reimbursements. Had the adviser not waived fees and/or reimbursed expenses currently or in the past, returns would have been lower. See the current prospectus for more information. According to the Fund’s current prospectus, the Fund’s expense ratio of 0.50% is expressed as a unitary management fee to cover operating expenses and expenses incurred in connection with managing the portfolio. NAV and Market Price returns assume that dividends and capital gain distributions have been reinvested in the Fund at NAV and Market Price, respectively. The returns shown in the table above do not reflect the deduction of taxes that a shareholder would pay on Fund distributions or the redemption or sale of Fund Shares. See invesco.com/ETFs to find the most recent month-end performance numbers.
Performance results for the indexes are based upon a hypothetical investment in their respective constituent securities. The returns for an index do not represent Fund returns. An investor cannot invest directly in an index. The indexes do not charge management fees or brokerage expenses, and no such fees or expenses were deducted from the hypothetical performance shown. In addition, the results actual investors might have achieved would have differed from those shown because of differences in the timing, amounts of their investments, and fees and expenses associated with an investment in the Fund.
Notes Regarding Indexes and Fund Performance History:
| - | Average Annualized and Cumulative Inception returns for the Fund and the indexes are based on the inception date of the Fund. |
| - | Net returns reflect reinvested dividends net of withholding taxes. |
| 11 |
|
Invesco Emerging Markets Sovereign Debt ETF (PCY)
October 31, 2022
| Principal Amount | Value | |||||||
U.S. Dollar Denominated Bonds & Notes-97.92% |
| |||||||
Angola-3.15% |
| |||||||
Angolan Government International Bond | ||||||||
8.25%, 05/09/2028(a) | $ | 18,311,000 | $ | 15,486,528 | ||||
9.38%, 05/08/2048(a) | 19,286,000 | 14,731,611 | ||||||
9.13%, 11/26/2049(a) | 19,515,000 | 14,790,419 | ||||||
|
| |||||||
| 45,008,558 | ||||||||
|
| |||||||
Bahrain-3.21% |
| |||||||
Bahrain Government International Bond | ||||||||
6.00%, 09/19/2044(a) | 21,408,000 | 15,099,812 | ||||||
7.50%, 09/20/2047(a) | 19,132,000 | 15,366,746 | ||||||
6.25%, 01/25/2051(a) | 21,680,000 | 15,347,315 | ||||||
|
| |||||||
| 45,813,873 | ||||||||
|
| |||||||
Brazil-3.16% |
| |||||||
Brazilian Government International Bond | ||||||||
5.63%, 01/07/2041 | 18,931,000 | 15,272,627 | ||||||
5.63%, 02/21/2047(b) | 19,673,000 | 15,004,536 | ||||||
4.75%, 01/14/2050 | 22,068,000 | 14,835,788 | ||||||
|
| |||||||
| 45,112,951 | ||||||||
|
| |||||||
Chile-2.89% |
| |||||||
Chile Government International Bond | ||||||||
4.34%, 03/07/2042 | 18,508,000 | 14,320,325 | ||||||
3.86%, 06/21/2047 | 18,864,000 | 13,582,365 | ||||||
4.00%, 01/31/2052 | 18,878,000 | 13,404,134 | ||||||
|
| |||||||
| 41,306,824 | ||||||||
|
| |||||||
China-2.71% |
| |||||||
China Government International Bond | ||||||||
4.00%, 10/19/2048(a)(b) | 15,200,000 | 13,454,722 | ||||||
2.25%, 10/21/2050(a) | 20,840,000 | 12,557,670 | ||||||
2.50%, 10/26/2051(a) | 19,980,000 | 12,684,561 | ||||||
|
| |||||||
| 38,696,953 | ||||||||
|
| |||||||
Colombia-2.85% |
| |||||||
Colombia Government International Bond | ||||||||
7.38%, 09/18/2037 | 16,227,000 | 13,729,804 | ||||||
6.13%, 01/18/2041 | 18,994,000 | 13,595,627 | ||||||
5.63%, 02/26/2044 | 20,609,000 | 13,455,829 | ||||||
|
| |||||||
| 40,781,260 | ||||||||
|
| |||||||
Costa Rica-3.35% |
| |||||||
Costa Rica Government International Bond |
| |||||||
5.63%, 04/30/2043(a) | 21,536,000 | 15,814,235 | ||||||
7.00%, 04/04/2044(a)(b) | 18,773,000 | 16,021,198 | ||||||
7.16%, 03/12/2045(a)(b) | 18,531,000 | 16,081,562 | ||||||
|
| |||||||
| 47,916,995 | ||||||||
|
| |||||||
Dominican Republic-3.06% |
| |||||||
Dominican Republic International Bond | ||||||||
7.45%, 04/30/2044(a) | 17,295,000 | 14,570,506 | ||||||
6.85%, 01/27/2045(a) | 18,806,000 | 14,634,575 | ||||||
6.50%, 02/15/2048(a) | 19,712,000 | 14,520,729 | ||||||
|
| |||||||
| 43,725,810 | ||||||||
|
| |||||||
Egypt-2.91% |
| |||||||
Egypt Government International Bond | ||||||||
8.50%, 01/31/2047(a) | 23,652,000 | 14,028,096 | ||||||
| Principal Amount | Value | |||||||
Egypt-(continued) | ||||||||
7.90%, 02/21/2048(a) | $ | 25,045,000 | $ | 14,199,513 | ||||
8.70%, 03/01/2049(a) | 22,452,000 | 13,431,729 | ||||||
|
| |||||||
| 41,659,338 | ||||||||
|
| |||||||
El Salvador-2.81% |
| |||||||
El Salvador Government International Bond | ||||||||
6.38%, 01/18/2027(a) | 33,182,000 | 13,229,652 | ||||||
8.63%, 02/28/2029(a) | 33,856,000 | 13,882,811 | ||||||
9.50%, 07/15/2052(a) | 33,840,000 | 12,995,870 | ||||||
|
| |||||||
| 40,108,333 | ||||||||
|
| |||||||
Guatemala-3.29% |
| |||||||
Guatemala Government Bond | ||||||||
4.88%, 02/13/2028(a) | 18,370,000 | 16,973,240 | ||||||
3.70%, 10/07/2033(a)(b) | 20,152,000 | 15,339,897 | ||||||
4.65%, 10/07/2041(a) | 19,890,000 | 14,719,239 | ||||||
|
| |||||||
| 47,032,376 | ||||||||
|
| |||||||
Hungary-2.69% |
| |||||||
Hungary Government International Bond | ||||||||
5.50%, 06/16/2034(a) | 15,897,000 | 13,734,786 | ||||||
7.63%, 03/29/2041 | 12,445,000 | 12,502,645 | ||||||
3.13%, 09/21/2051(a) | 22,150,000 | 12,243,922 | ||||||
|
| |||||||
| 38,481,353 | ||||||||
|
| |||||||
Indonesia-2.95% |
| |||||||
Indonesia Government International Bond | ||||||||
7.75%, 01/17/2038(a) | 13,293,000 | 14,788,462 | ||||||
6.75%, 01/15/2044(a) | 13,744,000 | 14,220,211 | ||||||
4.45%, 04/15/2070 | 17,554,000 | 13,207,249 | ||||||
|
| |||||||
| 42,215,922 | ||||||||
|
| |||||||
Jordan-3.38% |
| |||||||
Jordan Government International Bond | ||||||||
5.75%, 01/31/2027(a) | 18,455,000 | 16,990,503 | ||||||
5.85%, 07/07/2030(a) | 19,563,000 | 16,262,135 | ||||||
7.38%, 10/10/2047(a) | 19,901,000 | 14,992,100 | ||||||
|
| |||||||
| 48,244,738 | ||||||||
|
| |||||||
Kazakhstan-3.08% |
| |||||||
Kazakhstan Government International Bond |
| |||||||
4.88%, 10/14/2044(a) | 28,574,000 | 21,966,005 | ||||||
6.50%, 07/21/2045(a) | 24,758,000 | 22,029,867 | ||||||
|
| |||||||
| 43,995,872 | ||||||||
|
| |||||||
Kenya-3.00% |
| |||||||
Republic of Kenya Government International Bond | ||||||||
7.25%, 02/28/2028(a) | 29,163,000 | 22,175,079 | ||||||
8.25%, 02/28/2048(a) | 32,081,000 | 20,631,291 | ||||||
|
| |||||||
| 42,806,370 | ||||||||
|
| |||||||
Kuwait-1.73% |
| |||||||
Kuwait International Government Bond, | ||||||||
3.50%, 03/20/2027(a) | 25,937,000 | 24,784,826 | ||||||
|
| |||||||
Mexico-2.99% |
| |||||||
Mexico Government International Bond | ||||||||
4.60%, 01/23/2046 | 19,206,750 | 14,146,130 | ||||||
See accompanying Notes to Financial Statements which are an integral part of the financial statements.
| 12 | ||||
|
| |||
Invesco Emerging Markets Sovereign Debt ETF (PCY)–(continued)
October 31, 2022
| Principal Amount | Value | |||||||
Mexico-(continued) |
| |||||||
5.75%, 10/12/2110 | $ | 17,760,000 | $ | 13,699,562 | ||||
Series A, 6.05%, 01/11/2040 | 16,127,000 | 14,918,199 | ||||||
|
| |||||||
| 42,763,891 | ||||||||
|
| |||||||
Mongolia-2.87% |
| |||||||
Mongolia Government International Bond | ||||||||
5.13%, 04/07/2026(a) | 18,265,000 | 14,156,446 | ||||||
3.50%, 07/07/2027(a) | 20,054,000 | 13,838,320 | ||||||
4.45%, 07/07/2031(a)(b) | 20,293,000 | 13,079,867 | ||||||
|
| |||||||
| 41,074,633 | ||||||||
|
| |||||||
Morocco-3.03% |
| |||||||
Morocco Government International Bond | ||||||||
3.00%, 12/15/2032(a) | 21,274,000 | 15,417,055 | ||||||
5.50%, 12/11/2042(a) | 18,483,000 | 13,973,333 | ||||||
4.00%, 12/15/2050(a) | 23,330,000 | 13,880,930 | ||||||
|
| |||||||
| 43,271,318 | ||||||||
|
| |||||||
Nigeria-2.70% |
| |||||||
Nigeria Government International Bond | ||||||||
7.70%, 02/23/2038(a) | 21,956,000 | 12,954,040 | ||||||
7.63%, 11/28/2047(a) | 22,359,000 | 12,775,485 | ||||||
9.25%, 01/21/2049(a)(b) | 19,720,000 | 12,855,567 | ||||||
|
| |||||||
| 38,585,092 | ||||||||
|
| |||||||
Oman-3.35% |
| |||||||
Oman Government International Bond | ||||||||
6.50%, 03/08/2047(a) | 19,075,000 | 15,776,398 | ||||||
6.75%, 01/17/2048(a) | 19,157,000 | 16,150,328 | ||||||
7.00%, 01/25/2051(a) | 18,624,000 | 15,960,098 | ||||||
|
| |||||||
| 47,886,824 | ||||||||
|
| |||||||
Pakistan-1.32% |
| |||||||
Pakistan Government International Bond | ||||||||
8.25%, 09/30/2025(a) | 17,830,000 | 6,418,800 | ||||||
6.00%, 04/08/2026(a) | 18,530,000 | 6,161,225 | ||||||
6.88%, 12/05/2027(a) | 19,608,000 | 6,286,325 | ||||||
|
| |||||||
| 18,866,350 | ||||||||
|
| |||||||
Panama-3.15% |
| |||||||
Panama Government International Bond | ||||||||
3.16%, 01/23/2030 | 18,770,000 | 15,453,573 | ||||||
2.25%, 09/29/2032 | 20,806,000 | 14,635,118 | ||||||
3.30%, 01/19/2033(b) | 19,370,000 | 14,960,317 | ||||||
|
| |||||||
| 45,049,008 | ||||||||
|
| |||||||
Paraguay-3.22% |
| |||||||
Paraguay Government International Bond | ||||||||
4.70%, 03/27/2027(a) | 17,510,000 | 16,778,957 | ||||||
6.10%, 08/11/2044(a) | 17,252,000 | 15,010,130 | ||||||
5.60%, 03/13/2048(a) | 18,108,000 | 14,260,050 | ||||||
|
| |||||||
| 46,049,137 | ||||||||
|
| |||||||
Peru-2.78% |
| |||||||
Peruvian Government International Bond | ||||||||
5.63%, 11/18/2050 | 14,658,000 | 13,546,953 | ||||||
3.55%, 03/10/2051(b) | 20,045,000 | 13,282,745 | ||||||
3.60%, 01/15/2072(b) | 21,892,000 | 12,922,957 | ||||||
|
| |||||||
| 39,752,655 | ||||||||
|
| |||||||
| Principal Amount | Value | |||||||
Philippines-3.01% |
| |||||||
Philippine Government International Bond | ||||||||
3.70%, 03/01/2041 | $ | 19,192,000 | $ | 14,489,960 | ||||
3.20%, 07/06/2046 | 21,543,000 | 14,296,353 | ||||||
4.20%, 03/29/2047 | 18,234,000 | 14,208,433 | ||||||
|
| |||||||
| 42,994,746 | ||||||||
|
| |||||||
Poland-1.76% |
| |||||||
Republic of Poland Government International Bond, 3.25%, 04/06/2026 | 26,731,000 | 25,154,940 | ||||||
|
| |||||||
Qatar-2.86% |
| |||||||
Qatar Government International Bond | ||||||||
4.63%, 06/02/2046(a) | 15,740,000 | 13,920,299 | ||||||
5.10%, 04/23/2048(a) | 14,579,000 | 13,606,216 | ||||||
4.82%, 03/14/2049(a) | 15,009,000 | 13,407,149 | ||||||
|
| |||||||
| 40,933,664 | ||||||||
|
| |||||||
Romania-2.70% |
| |||||||
Romanian Government International Bond | ||||||||
6.13%, 01/22/2044(a) | 16,170,000 | 13,006,194 | ||||||
5.13%, 06/15/2048(a) | 18,082,000 | 12,682,245 | ||||||
4.00%, 02/14/2051(a) | 21,798,000 | 12,849,354 | ||||||
|
| |||||||
| 38,537,793 | ||||||||
|
| |||||||
Saudi Arabia-2.82% |
| |||||||
Saudi Government International Bond | ||||||||
4.50%, 10/26/2046(a) | 16,904,000 | 13,502,306 | ||||||
4.63%, 10/04/2047(a) | 16,587,000 | 13,385,228 | ||||||
5.00%, 04/17/2049(a) | 15,750,000 | 13,439,932 | ||||||
|
| |||||||
| 40,327,466 | ||||||||
|
| |||||||
South Africa-2.99% |
| |||||||
Republic of South Africa Government International Bond | ||||||||
6.30%, 06/22/2048 | 19,719,000 | 14,378,602 | ||||||
5.75%, 09/30/2049 | 20,987,000 | 14,017,805 | ||||||
7.30%, 04/20/2052 | 18,280,000 | 14,386,360 | ||||||
|
| |||||||
| 42,782,767 | ||||||||
|
| |||||||
Turkey-3.35% |
| |||||||
Turkey Government International Bond | ||||||||
5.95%, 01/15/2031 | 20,900,000 | 16,064,367 | ||||||
8.00%, 02/14/2034 | 18,547,000 | 16,405,823 | ||||||
6.88%, 03/17/2036 | 20,439,000 | 15,440,683 | ||||||
|
| |||||||
| 47,910,873 | ||||||||
|
| |||||||
United Arab Emirates-2.80% |
| |||||||
Emirate of Dubai Government International Bond, 5.25%, 01/30/2043(a) | 17,311,000 | 14,568,245 | ||||||
Finance Department Government of Sharjah | ||||||||
4.00%, 07/28/2050(a) | 22,411,000 | 13,017,430 | ||||||
4.38%, 03/10/2051(a) | 20,678,000 | 12,370,696 | ||||||
|
| |||||||
| 39,956,371 | ||||||||
|
| |||||||
Total U.S. Dollar Denominated Bonds & Notes |
| 1,399,589,880 | ||||||
|
| |||||||
See accompanying Notes to Financial Statements which are an integral part of the financial statements.
| 13 | ||||
|
| |||
Invesco Emerging Markets Sovereign Debt ETF (PCY)–(continued)
October 31, 2022
| Shares | Value | |||||||
Money Market Funds-0.55% |
| |||||||
Invesco Government & Agency Portfolio, Institutional Class, 3.07%(c)(d) | 7,905,005 | $ | 7,905,005 | |||||
|
| |||||||
TOTAL INVESTMENTS IN SECURITIES |
| 1,407,494,885 | ||||||
|
| |||||||
| Investments Purchased with Cash Collateral from Securities on Loan |
| |||||||
Money Market Funds-3.84% |
| |||||||
Invesco Private Government Fund, | 15,375,146 | 15,375,146 | ||||||
| Shares | Value | |||||
Money Market Funds-(continued) |
| |||||
Invesco Private Prime Fund, 3.28%(c)(d)(e) | 39,527,745 | $ | 39,527,745 | |||
|
| |||||
Total Investments Purchased with Cash Collateral from Securities on Loan | 54,902,891 | |||||
|
| |||||
TOTAL INVESTMENTS IN SECURITIES-102.31% | 1,462,397,776 | |||||
OTHER ASSETS LESS LIABILITIES-(2.31)% | (33,017,905 | ) | ||||
|
| |||||
NET ASSETS-100.00% | $ | 1,429,379,871 | ||||
|
| |||||
Notes to Schedule of Investments:
| (a) | Security purchased or received in a transaction exempt from registration under the Securities Act of 1933, as amended (the “1933 Act”). The security may be resold pursuant to an exemption from registration under the 1933 Act, typically to qualified institutional buyers. The aggregate value of these securities at October 31, 2022 was $960,270,071, which represented 67.18% of the Fund’s Net Assets. |
| (b) | All or a portion of this security was out on loan at October 31, 2022. |
| (c) | Affiliated issuer. The issuer and/or the Fund is a wholly-owned subsidiary of Invesco Ltd., or is affiliated by having an investment adviser that is under common control of Invesco Ltd. The table below shows the Fund’s transactions in, and earnings from, its investments in affiliates for the fiscal year ended October 31, 2022. |
| Value October 31, 2021 | Purchases at Cost | Proceeds from Sales | Change in Unrealized Appreciation (Depreciation) | Realized Gain (Loss) | Value October 31, 2022 | Dividend Income | |||||||||||||||||||||||||||||||||||||||||||||||||||||||||||
| Investments in Affiliated Money Market Funds: | |||||||||||||||||||||||||||||||||||||||||||||||||||||||||||||||||
| Invesco Government & Agency Portfolio, Institutional Class | $ | 1,814,291 | $ | 257,091,527 | $ | (251,000,813 | ) | $ | - | $ | - | $ | 7,905,005 | $ | 46,096 | ||||||||||||||||||||||||||||||||||||||||||||||||||
| Investments Purchased with Cash Collateral from Securities on Loan: | |||||||||||||||||||||||||||||||||||||||||||||||||||||||||||||||||
| Invesco Private Government Fund | 18,930,470 | 246,671,541 | (250,226,865 | ) | - | - | 15,375,146 | 240,581 | * | ||||||||||||||||||||||||||||||||||||||||||||||||||||||||
| Invesco Private Prime Fund | 44,171,098 | 422,644,909 | (427,279,476 | ) | (1,736 | ) | (7,050 | ) | 39,527,745 | 650,630 | * | ||||||||||||||||||||||||||||||||||||||||||||||||||||||
|
|
|
|
|
|
|
|
|
|
|
|
|
| ||||||||||||||||||||||||||||||||||||||||||||||||||||
| Total | $ | 64,915,859 | $ | 926,407,977 | $ | (928,507,154 | ) | $ | (1,736 | ) | $ | (7,050 | ) | $ | 62,807,896 | $ | 937,307 | ||||||||||||||||||||||||||||||||||||||||||||||||
|
|
|
|
|
|
|
|
|
|
|
|
|
| ||||||||||||||||||||||||||||||||||||||||||||||||||||
| * | Represents the income earned on the investment of cash collateral, which is included in securities lending income on the Statements of Operations. Does not include rebates and fees paid to lending agent or premiums received from borrowers, if any. |
| (d) | The rate shown is the 7-day SEC standardized yield as of October 31, 2022. |
| (e) | The security has been segregated to satisfy the commitment to return the cash collateral received in securities lending transactions upon the borrower’s return of the securities loaned. See Note 2I. |
See accompanying Notes to Financial Statements which are an integral part of the financial statements.
| 14 | ||||
|
| |||
Invesco Global Short Term High Yield Bond ETF (PGHY)
October 31, 2022
Schedule of Investments
| Principal Amount | Value | |||||||
U.S. Dollar Denominated Bonds & Notes-94.92% |
| |||||||
Argentina-1.71% |
| |||||||
AES Argentina Generacion S.A., 7.75%, 02/02/2024(a) | $ 850,000 | $ | 661,912 | |||||
Agua y Saneamientos Argentinos S.A., 6.63%, 02/01/2023(a) | 850,000 | 498,351 | ||||||
Arcor S.A.I.C., 6.00%, 07/06/2023(a) | 543,000 | 532,794 | ||||||
Capex S.A., 6.88%, 05/15/2024(a) | 500,000 | 485,220 | ||||||
MSU Energy S.A./UGEN S.A./UENSA S.A., 6.88%, 02/01/2025(a) | 600,000 | 382,317 | ||||||
Provincia de Cordoba, 6.88%, 12/10/2025(a)(b) | 221 | 169 | ||||||
Tecpetrol S.A., 4.88%, 12/12/2022(a) | 553,000 | 553,000 | ||||||
YPF S.A., 8.50%, 07/28/2025(a) | 100,000 | 72,223 | ||||||
|
| |||||||
| 3,185,986 | ||||||||
|
| |||||||
Armenia-0.32% |
| |||||||
Republic of Armenia International Bond, 7.15%, 03/26/2025(a) | 600,000 | 589,714 | ||||||
|
| |||||||
Australia-0.88% |
| |||||||
FMG Resources August 2006 Pty. Ltd., 5.13%, 05/15/2024(a) | 600,000 | 586,518 | ||||||
Infrabuild Australia Pty. Ltd., 12.00%, 10/01/2024(a) | 400,000 | 372,084 | ||||||
North Queensland Export Terminal Pty. Ltd., 4.45%, 12/15/2022(a) | 700,000 | 688,423 | ||||||
|
| |||||||
| 1,647,025 | ||||||||
|
| |||||||
Azerbaijan-0.81% |
| |||||||
International Bank of Azerbaijan OJSC, 3.50%, 09/01/2024(a) | 600,000 | 576,000 | ||||||
Republic of Azerbaijan International Bond, 4.75%, 03/18/2024(a) | 400,000 | 392,130 | ||||||
State Oil Co. of the Azerbaijan Republic, 4.75%, 03/13/2023(a) | 550,000 | 545,477 | ||||||
|
| |||||||
| 1,513,607 | ||||||||
|
| |||||||
Bahrain-0.72% |
| |||||||
Bahrain Government International Bond, 6.13%, 08/01/2023(a) | 400,000 | 401,399 | ||||||
BBK BSC, 5.50%, 07/09/2024(a) | 450,000 | 438,500 | ||||||
Oil and Gas Holding Co. BSCC (The), 7.63%, 11/07/2024(a) | 500,000 | 496,955 | ||||||
|
| |||||||
| 1,336,854 | ||||||||
|
| |||||||
Belgium-0.32% |
| |||||||
Barry Callebaut Services N.V., 5.50%, 06/15/2023(a) | 600,000 | 594,837 | ||||||
|
| |||||||
Bolivia-0.20% |
| |||||||
Bolivian Government International Bond, 5.95%, 08/22/2023(a) | 400,000 | 383,000 | ||||||
|
| |||||||
Brazil-5.99% |
| |||||||
Azul Investments L.L.P., 5.88%, 10/26/2024(a)(c) | 500,000 | 378,711 | ||||||
Banco Daycoval S.A., 4.25%, 12/13/2024(a) | 500,000 | 480,042 | ||||||
| Principal Amount | Value | |||||||
Brazil-(continued) |
| |||||||
Banco Nacional de Desenvolvimento Economico e Social | ||||||||
5.75%, 09/26/2023(a) | $ 595,000 | $ | 597,100 | |||||
4.75%, 05/09/2024(a) | 580,000 | 574,212 | ||||||
Banco Safra S.A., 4.13%, 02/08/2023(a) | 600,000 | 593,575 | ||||||
Banco Votorantim S.A., 4.50%, 09/24/2024(a) | 500,000 | 485,196 | ||||||
Brazilian Government International Bond | ||||||||
2.63%, 01/05/2023 | 500,000 | 498,480 | ||||||
8.88%, 04/15/2024 | 500,000 | 529,500 | ||||||
4.25%, 01/07/2025 | 600,000 | 585,147 | ||||||
8.75%, 02/04/2025 | 500,000 | 535,052 | ||||||
2.88%, 06/06/2025 | 200,000 | 187,594 | ||||||
BRF S.A., 4.75%, 05/22/2024(a) | 400,000 | 388,054 | ||||||
Caixa Economica Federal, 3.50%, 11/07/2022(a) | 610,000 | 609,695 | ||||||
Cemig Geracao e Transmissao S.A., 9.25%, 12/05/2024(a) | 500,000 | 514,037 | ||||||
Centrais Eletricas Brasileiras S.A., 3.63%, 02/04/2025(a) | 500,000 | 471,377 | ||||||
Cielo USA, Inc., 3.75%, 11/16/2022(a) | 512,000 | 511,514 | ||||||
Embraer Netherlands Finance B.V., 5.05%, 06/15/2025 | 100,000 | 94,349 | ||||||
Gol Finance S.A., 7.00%, 01/31/2025(a) | 500,000 | 216,098 | ||||||
InterCement Financial Operations B.V., 5.75%, 07/17/2024(a) | 400,000 | 278,440 | ||||||
Itau Unibanco Holding S.A. | ||||||||
2.90%, 01/24/2023(a) | 620,000 | 617,749 | ||||||
5.13%, 05/13/2023(a) | 600,000 | 596,676 | ||||||
3.25%, 01/24/2025(a) | 500,000 | 481,515 | ||||||
Petrobras Global Finance B.V. | ||||||||
6.25%, 03/17/2024 | 468,000 | 470,204 | ||||||
5.30%, 01/27/2025 | 497,000 | 491,429 | ||||||
|
| |||||||
| 11,185,746 | ||||||||
|
| |||||||
Canada-2.68% |
| |||||||
Bombardier, Inc. | ||||||||
7.50%, 12/01/2024(a) | 500,000 | 498,172 | ||||||
7.50%, 03/15/2025(a) | 100,000 | 99,401 | ||||||
Ensign Drilling, Inc., 9.25%, 04/15/2024(a) | 400,000 | 362,482 | ||||||
goeasy Ltd., 5.38%, 12/01/2024(a) | 500,000 | 467,318 | ||||||
Methanex Corp., 4.25%, 12/01/2024(c) | 600,000 | 580,878 | ||||||
Mountain Province Diamonds, Inc., 8.00%, 12/15/2022(a)(c) | 725,000 | 708,764 | ||||||
NOVA Chemicals Corp., 4.88%, 06/01/2024(a) | 603,000 | 587,777 | ||||||
Quebecor Media, Inc., 5.75%, 01/15/2023(c) | 500,000 | 500,835 | ||||||
TransAlta Corp., 4.50%, 11/15/2022 | 600,000 | 599,430 | ||||||
Videotron Ltd., 5.38%, 06/15/2024(a) | 600,000 | 597,435 | ||||||
|
| |||||||
| 5,002,492 | ||||||||
|
| |||||||
Cayman Islands-0.22% |
| |||||||
Industrial Senior Trust, 5.50%, 11/01/2022(a) | 415,000 | 415,000 | ||||||
|
| |||||||
See accompanying Notes to Financial Statements which are an integral part of the financial statements.
| 15 | ||||
|
| |||
Invesco Global Short Term High Yield Bond ETF (PGHY)–(continued)
October 31, 2022
| Principal Amount | Value | |||||||
Chile-0.24% |
| |||||||
Kenbourne Invest S.A., 6.88%, 11/26/2024(a) | $ 500,000 | $ | 445,857 | |||||
|
| |||||||
China-1.45% |
| |||||||
Greenland Global Investment Ltd., 5.88%, 07/03/2024(a) | 200,000 | 45,000 | ||||||
Huachen Energy Co. Ltd., 2.35% PIK Rate, 2.30% Cash Rate, 12/29/2026(a)(d) | 405,180 | 184,357 | ||||||
Lanzhou City Development Investment Co. Ltd., 4.15%, 11/15/2022(a) | 400,000 | 380,000 | ||||||
Yanlord Land HK Co. Ltd. | ||||||||
6.75%, 04/23/2023(a)(c) | 500,000 | 456,250 | ||||||
6.80%, 02/27/2024(a) | 300,000 | 178,500 | ||||||
Yinchuan Tonglian Capital Investment Operation Co. Ltd., 4.45%, 06/10/2023(a) | 200,000 | 175,993 | ||||||
Zhangzhou Transportation Development Group Co. Ltd., 4.98%, 06/01/2025(a) | 200,000 | 193,868 | ||||||
Zhongyuan Asset Management Co. Ltd., 4.20%, 11/29/2022(a) | 500,000 | 493,730 | ||||||
Zoomlion HK SPV Co. Ltd., 6.13%, 12/20/2022(a) | 607,000 | 607,704 | ||||||
|
| |||||||
| 2,715,402 | ||||||||
|
| |||||||
Colombia-1.33% |
| |||||||
Banco de Bogota S.A., 5.38%, 02/19/2023(a) | 407,000 | 406,380 | ||||||
Bancolombia S.A., 3.00%, 01/29/2025 | 500,000 | 449,390 | ||||||
Credivalores-Crediservicios S.A.S., 8.88%, 02/07/2025(a) | 500,000 | 196,243 | ||||||
Ecopetrol S.A. | ||||||||
5.88%, 09/18/2023 | 575,000 | 566,461 | ||||||
4.13%, 01/16/2025(c) | 500,000 | 461,559 | ||||||
Gilex Holding S.a.r.l., 8.50%, 05/02/2023(a) | 410,000 | 404,625 | ||||||
|
| |||||||
| 2,484,658 | ||||||||
|
| |||||||
Costa Rica-0.37% |
| |||||||
Costa Rica Government International Bond, 4.25%, 01/26/2023(a) | 700,000 | 700,327 | ||||||
|
| |||||||
Denmark-0.31% |
| |||||||
DKT Finance ApS, 9.38%, 06/17/2023(a) | 600,000 | 579,750 | ||||||
|
| |||||||
Dominican Republic-0.58% |
| |||||||
Banco de Reservas de la Republica Dominicana, 7.00%, 02/01/2023(a) | 550,000 | 551,438 | ||||||
Dominican Republic International Bond, 5.50%, 01/27/2025(a) | 550,000 | 539,772 | ||||||
|
| |||||||
| 1,091,210 | ||||||||
|
| |||||||
Egypt-1.39% |
| |||||||
Egypt Government International Bond | ||||||||
5.58%, 02/21/2023(a) | 600,000 | 597,600 | ||||||
4.55%, 11/20/2023(a) | 684,000 | 664,607 | ||||||
6.20%, 03/01/2024(a) | 550,000 | 528,599 | ||||||
5.75%, 05/29/2024(a) | 600,000 | 568,227 | ||||||
6.75%, 11/10/2024(a) | 250,000 | 229,563 | ||||||
|
| |||||||
| 2,588,596 | ||||||||
|
| |||||||
| Principal Amount | Value | |||||||
El Salvador-0.24% |
| |||||||
El Salvador Government International Bond, 5.88%, 01/30/2025(a) | $ 800,000 | $ | 452,000 | |||||
|
| |||||||
Ethiopia-0.06% |
| |||||||
Ethiopia International Bond, 6.63%, 12/11/2024(a) | 200,000 | 104,142 | ||||||
|
| |||||||
Georgia-0.25% |
| |||||||
Georgia Capital JSC, 6.13%, 03/09/2024(a) | 500,000 | 469,181 | ||||||
|
| |||||||
Germany-0.67% |
| |||||||
Commerzbank AG, 8.13%, 09/19/2023(a) | 509,000 | 507,311 | ||||||
Deutsche Bank AG, 4.50%, 04/01/2025(c) | 200,000 | 186,074 | ||||||
Norddeutsche Landesbank-Girozentrale, 6.25%, 04/10/2024(a) | 400,000 | 371,968 | ||||||
ZF North America Capital, Inc., 4.75%, 04/29/2025(a) | 200,000 | 187,417 | ||||||
|
| |||||||
| 1,252,770 | ||||||||
|
| |||||||
Ghana-0.16% |
| |||||||
Ghana Government International Bond, 7.88%, 08/07/2023(a) | 230,000 | 173,096 | ||||||
Tullow Oil PLC, 7.00%, 03/01/2025(a) | 200,000 | 130,446 | ||||||
|
| |||||||
| 303,542 | ||||||||
|
| |||||||
India-4.28% |
| |||||||
ABJA Investment Co. Pte. Ltd., 5.95%, 07/31/2024(a) | 500,000 | 491,092 | ||||||
Adani Green Energy UP Ltd./Prayatna Developers Pvt. Ltd./Parampujya Solar Energy Pvt. Ltd., 6.25%, 12/10/2024(a) | 300,000 | 272,895 | ||||||
Azure Power Solar Energy Pvt. Ltd., 5.65%, 12/24/2024(a) | 500,000 | 406,125 | ||||||
GMR Hyderabad International Airport Ltd., 5.38%, 04/10/2024(a) | 500,000 | 481,275 | ||||||
Greenko Investment Co., 4.88%, 08/16/2023(a) | 600,000 | 575,040 | ||||||
Greenko Solar Mauritius Ltd., 5.55%, 01/29/2025(a) | 500,000 | 438,125 | ||||||
Greenko Wind Projects Mauritius Ltd., 5.50%, 04/06/2025(a) | 350,000 | 299,721 | ||||||
IIFL Finance Ltd., 5.88%, 04/20/2023(a) | 612,000 | 599,791 | ||||||
India Green Energy Holdings, 5.38%, 04/29/2024(a) | 500,000 | 466,973 | ||||||
India Toll Roads, 5.50%, 08/19/2024(a) | 500,000 | 465,476 | ||||||
JSW Steel Ltd. | ||||||||
5.95%, 04/18/2024(a) | 500,000 | 468,250 | ||||||
5.38%, 04/04/2025(a) | 200,000 | 173,750 | ||||||
Manappuram Finance Ltd., 5.90%, 01/13/2023(a) | 500,000 | 496,425 | ||||||
Muthoot Finance Ltd., 4.40%, 09/02/2023(a) | 400,000 | 388,600 | ||||||
Shriram Transport Finance Co. Ltd. | ||||||||
5.10%, 07/16/2023(a) | 400,000 | 390,906 | ||||||
4.40%, 03/13/2024(a) | 478,000 | 446,113 | ||||||
4.15%, 07/18/2025(a) | 200,000 | 173,102 | ||||||
See accompanying Notes to Financial Statements which are an integral part of the financial statements.
| 16 | ||||
|
| |||
Invesco Global Short Term High Yield Bond ETF (PGHY)–(continued)
October 31, 2022
| Principal Amount | Value | |||||||
India-(continued) | ||||||||
Tata Motors Ltd., 5.75%, 10/30/2024(a) | $ 500,000 | $ | 482,623 | |||||
TML Holdings Pte. Ltd., 5.50%, 06/03/2024(a) | 500,000 | 473,775 | ||||||
|
| |||||||
| 7,990,057 | ||||||||
|
| |||||||
Indonesia-1.70% | ||||||||
APL Realty Holdings Pte. Ltd., 5.95%, 06/02/2024(a) | 600,000 | 252,000 | ||||||
Indika Energy Capital III Pte. Ltd., 5.88%, 11/09/2024(a) | 600,000 | 581,333 | ||||||
Jababeka International B.V., 6.50%, 10/05/2023(a) | 700,000 | 388,500 | ||||||
LMIRT Capital Pte. Ltd., 7.25%, 06/19/2024(a) | 400,000 | 250,000 | ||||||
Medco Platinum Road Pte. Ltd., 6.75%, 01/30/2025(a) | 500,000 | 479,825 | ||||||
Nickel Industries Ltd., 6.50%, 04/01/2024(a) | 500,000 | 455,000 | ||||||
PT Saka Energi Indonesia, 4.45%, 05/05/2024(a) | 450,000 | 419,786 | ||||||
Theta Capital Pte. Ltd., 8.13%, 01/22/2025(a) | 500,000 | 343,000 | ||||||
|
| |||||||
| 3,169,444 | ||||||||
|
| |||||||
Israel-1.75% | ||||||||
Energean Israel Finance Ltd., 4.50%, 03/30/2024(a)(c) | 450,000 | 431,025 | ||||||
Leviathan Bond Ltd. | ||||||||
5.75%, 06/30/2023(a) | 507,202 | 504,365 | ||||||
6.13%, 06/30/2025(a) | 200,000 | 190,873 | ||||||
Teva Pharmaceutical Finance Co. B.V., 2.95%, 12/18/2022 | 550,000 | 545,749 | ||||||
Teva Pharmaceutical Finance Netherlands III B.V. | ||||||||
2.80%, 07/21/2023 | 574,000 | 558,855 | ||||||
6.00%, 04/15/2024 | 450,000 | 446,137 | ||||||
7.13%, 01/31/2025 | 600,000 | 595,386 | ||||||
|
| |||||||
| 3,272,390 | ||||||||
|
| |||||||
Jamaica-0.23% | ||||||||
Digicel International Finance Ltd./Digicel international Holdings Ltd., 8.75%, 05/25/2024(a) | 500,000 | 427,822 | ||||||
|
| |||||||
Japan-1.24% | ||||||||
Rakuten Group, Inc., 3.55%, 11/27/2024(a) | 900,000 | 823,707 | ||||||
SoftBank Group Corp. | ||||||||
4.75%, 09/19/2024(a) | 900,000 | 848,250 | ||||||
3.13%, 01/06/2025(a) | 500,000 | 451,875 | ||||||
6.00%, 07/30/2025(a) | 200,000 | 188,128 | ||||||
|
| |||||||
| 2,311,960 | ||||||||
|
| |||||||
Kenya-0.23% | ||||||||
Republic of Kenya Government International Bond, 6.88%, 06/24/2024(a) | 500,000 | 438,265 | ||||||
|
| |||||||
Kuwait-0.36% | ||||||||
Kuwait Projects Co. SPC Ltd., 5.00%, 03/15/2023(a) | 700,000 | 676,843 | ||||||
|
| |||||||
| Principal Amount | Value | |||||||
Mexico-1.63% | ||||||||
Axtel S.A.B. de C.V., 6.38%, 11/14/2024(a) | $ 426,000 | $ | 285,795 | |||||
Credito Real S.A.B. de C.V., SOFOM, E.R., 7.25%, 07/20/2023, (Acquired 09/28/2020; Cost $297,011)(a)(c)(e) | 300,000 | 6,375 | ||||||
Operadora de Servicios Mega S.A. de C.V. SOFOM, E.R., 8.25%, 02/11/2025(a) | 500,000 | 210,103 | ||||||
Petroleos Mexicanos | ||||||||
3.50%, 01/30/2023 | 584,000 | 579,827 | ||||||
4.63%, 09/21/2023 | 585,000 | 572,569 | ||||||
4.88%, 01/18/2024(c) | 611,000 | 595,484 | ||||||
4.25%, 01/15/2025(c) | 600,000 | 559,626 | ||||||
SixSigma Networks Mexico S.A. de C.V., 7.50%, 05/02/2025(a) | 200,000 | 166,031 | ||||||
Unifin Financiera S.A.B. de C.V., 7.25%, 09/27/2023(a) | 700,000 | 71,750 | ||||||
|
| |||||||
| 3,047,560 | ||||||||
|
| |||||||
Mongolia-0.85% | ||||||||
Development Bank of Mongolia LLC, 7.25%, 10/23/2023(a) | 400,000 | 352,600 | ||||||
Mongolia Government International Bond | ||||||||
5.63%, 05/01/2023(a) | 600,000 | 571,500 | ||||||
8.75%, 03/09/2024(a) | 200,000 | 187,998 | ||||||
Mongolian Mortgage Corp. Hfc LLC, 8.85%, 02/08/2024(a) | 750,000 | 472,500 | ||||||
|
| |||||||
| 1,584,598 | ||||||||
|
| |||||||
Morocco-0.64% | ||||||||
Morocco Government International Bond, 4.25%, 12/11/2022(a) | 600,000 | 599,011 | ||||||
OCP S.A., 5.63%, 04/25/2024(a) | 600,000 | 595,814 | ||||||
|
| |||||||
| 1,194,825 | ||||||||
|
| |||||||
Netherlands-0.13% | ||||||||
InterGen N.V., 7.00%, 06/30/2023(a) | 250,000 | 245,010 | ||||||
|
| |||||||
Nigeria-0.31% | ||||||||
Nigeria Government International Bond, 6.38%, 07/12/2023(a) | 600,000 | 583,770 | ||||||
|
| |||||||
Oman-1.29% | ||||||||
Bank Muscat SAOG, 4.88%, 03/14/2023(a) | 600,000 | 597,214 | ||||||
Lamar Funding Ltd., 3.96%, 05/07/2025(a) | 200,000 | 184,857 | ||||||
Oman Government International Bond | ||||||||
4.13%, 01/17/2023(a) | 700,000 | 697,486 | ||||||
4.88%, 02/01/2025(a) | 530,000 | 516,379 | ||||||
Oztel Holdings SPC Ltd., 5.63%, 10/24/2023(a) | 408,000 | 406,002 | ||||||
|
| |||||||
| 2,401,938 | ||||||||
|
| |||||||
Pakistan-0.43% | ||||||||
Pakistan Government International Bond, 8.25%, 04/15/2024(a) | 400,000 | 171,360 | ||||||
Third Pakistan International Sukuk Co. Ltd. (The), 5.63%, 12/05/2022(a) | 700,000 | 639,072 | ||||||
|
| |||||||
| 810,432 | ||||||||
|
| |||||||
Panama-0.33% | ||||||||
Multibank, Inc., 4.38%, 11/09/2022(a) | 625,000 | 624,403 | ||||||
|
| |||||||
See accompanying Notes to Financial Statements which are an integral part of the financial statements.
| 17 | ||||
|
| |||
Invesco Global Short Term High Yield Bond ETF (PGHY)–(continued)
October 31, 2022
| Principal Amount | Value | |||||||
Puerto Rico-0.22% | ||||||||
Popular, Inc., 6.13%, 09/14/2023 | $ 400,000 | $ | 402,220 | |||||
|
| |||||||
Russia-0.15% | ||||||||
Chelyabinsk Pipe Plant Via Chelpipe Finance DAC, 4.50%, 09/19/2024(a)(f) | 300,000 | 82,500 | ||||||
O1 Properties Finance PLC, 0.50%, 12/31/2049(a) | 500,000 | 32,435 | ||||||
Petropavlovsk 2016 Ltd., 8.13%, 11/14/2022(a) | 300,000 | 162,000 | ||||||
|
| |||||||
| 276,935 | ||||||||
|
| |||||||
Singapore-0.25% | ||||||||
Puma International Financing S.A., 5.13%, 10/06/2024(a) | 500,000 | 469,720 | ||||||
|
| |||||||
South Africa-1.58% | ||||||||
Eskom Holdings SOC Ltd. | ||||||||
6.75%, 08/06/2023(a) | 420,000 | 412,224 | ||||||
7.13%, 02/11/2025(a) | 613,000 | 575,178 | ||||||
MTN (Mauritius) Investments Ltd., 4.76%, 11/11/2024(a) | 300,000 | 288,698 | ||||||
Republic of South Africa Government International Bond, 4.67%, 01/17/2024 | 600,000 | 591,420 | ||||||
Sasol Financing International Ltd., 4.50%, 11/14/2022 | 637,000 | 636,087 | ||||||
Sasol Financing USA LLC, 5.88%, 03/27/2024 | 450,000 | 440,446 | ||||||
|
| |||||||
| 2,944,053 | ||||||||
|
| |||||||
South Korea-0.21% | ||||||||
SK Innovation Co. Ltd., 4.13%, 07/13/2023(a) | 400,000 | 393,266 | ||||||
|
| |||||||
Spain-0.09% | ||||||||
Codere Finance 2 (Luxembourg) S.A., 11.63% PIK Rate, 2.00% Cash Rate, 11/30/2027, (Acquired 03/01/2019 - 04/30/2022; Cost $186,746)(a)(d)(e) | 198,128 | 165,833 | ||||||
|
| |||||||
Sweden-0.79% | ||||||||
Stena AB, 7.00%, 02/01/2024(a) | 600,000 | 568,944 | ||||||
Stena International S.A. | ||||||||
5.75%, 03/01/2024(a) | 575,000 | 540,825 | ||||||
6.13%, 02/01/2025(a) | 400,000 | 375,794 | ||||||
|
| |||||||
| 1,485,563 | ||||||||
|
| |||||||
Trinidad and Tobago-0.32% | ||||||||
Trinidad & Tobago Government International Bond, 4.38%, 01/16/2024(a) | 600,000 | 591,464 | ||||||
|
| |||||||
Turkey-10.00% | ||||||||
Arcelik A.S., 5.00%, 04/03/2023(a) | 700,000 | 696,319 | ||||||
Fibabanka A. S., 6.00%, 01/25/2023(a) | 600,000 | 596,569 | ||||||
Hazine Mustesarligi Varlik Kiralama A.S. | ||||||||
5.00%, 04/06/2023(a) | 700,000 | 697,235 | ||||||
4.49%, 11/25/2024(a) | 500,000 | 463,974 | ||||||
KOC Holding A.S. | ||||||||
5.25%, 03/15/2023(a) | 700,000 | 699,783 | ||||||
6.50%, 03/11/2025(a) | 200,000 | 190,162 | ||||||
Mersin Uluslararasi Liman Isletmeciligi A.S., 5.38%, 11/15/2024(a) | 500,000 | 462,467 | ||||||
| Principal Amount | Value | |||||||
Turkey-(continued) | ||||||||
Petkim Petrokimya Holding A.S., 5.88%, 01/26/2023(a) | $ 620,000 | $ | 620,028 | |||||
QNB Finansbank A.S., 6.88%, 09/07/2024(a) | 500,000 | 501,545 | ||||||
Roenesans Gayrimenkul Yatirim A.S., 7.25%, 04/26/2023(a) | 750,000 | 736,745 | ||||||
T.C. Ziraat Bankasi A.S., 5.13%, 09/29/2023(a) | 420,000 | 413,635 | ||||||
Turk Telekomunikasyon A.S. | ||||||||
4.88%, 06/19/2024(a) | 600,000 | 530,220 | ||||||
6.88%, 02/28/2025(a) | 613,000 | 536,363 | ||||||
Turkey Government International Bond | ||||||||
3.25%, 03/23/2023 | 600,000 | 598,362 | ||||||
7.25%, 12/23/2023 | 600,000 | 607,446 | ||||||
5.75%, 03/22/2024 | 600,000 | 592,350 | ||||||
6.35%, 08/10/2024 | 500,000 | 490,515 | ||||||
5.60%, 11/14/2024 | 500,000 | 479,365 | ||||||
7.38%, 02/05/2025 | 500,000 | 492,858 | ||||||
4.25%, 03/13/2025 | 200,000 | 181,727 | ||||||
Turkiye Garanti Bankasi A.S., 5.88%, 03/16/2023(a) | 500,000 | 501,372 | ||||||
Turkiye Ihracat Kredi Bankasi A.S. | ||||||||
5.38%, 10/24/2023(a) | 420,000 | 410,869 | ||||||
8.25%, 01/24/2024(a) | 600,000 | 591,884 | ||||||
6.13%, 05/03/2024(a) | 400,000 | 375,937 | ||||||
Turkiye Is Bankasi A.S. | ||||||||
7.85%, 12/10/2023(a) | 600,000 | 603,211 | ||||||
6.13%, 04/25/2024(a) | 500,000 | 486,400 | ||||||
Turkiye Petrol Rafinerileri A.S., 4.50%, 10/18/2024(a) | 550,000 | 510,141 | ||||||
Turkiye Sinai Kalkinma Bankasi A.S. | ||||||||
5.50%, 01/16/2023(a) | 500,000 | 500,193 | ||||||
6.00%, 01/23/2025(a) | 500,000 | 452,207 | ||||||
Turkiye Vakiflar Bankasi T.A.O. | ||||||||
6.00%, 11/01/2022(a) | 400,000 | 400,000 | ||||||
5.75%, 01/30/2023(a) | 420,000 | 420,109 | ||||||
8.13%, 03/28/2024(a) | 400,000 | 394,540 | ||||||
5.25%, 02/05/2025(a) | 500,000 | 445,000 | ||||||
Yapi ve Kredi Bankasi A.S. | ||||||||
5.50%, 12/06/2022(a) | 420,000 | 420,009 | ||||||
6.10%, 03/16/2023(a) | 600,000 | 600,943 | ||||||
5.85%, 06/21/2024(a) | 516,000 | 493,496 | ||||||
8.25%, 10/15/2024(a) | 500,000 | 492,825 | ||||||
|
| |||||||
| 18,686,804 | ||||||||
|
| |||||||
Ukraine-0.11% | ||||||||
MHP SE, 7.75%, 05/10/2024(a) | 350,000 | 168,595 | ||||||
Ukraine Railways Via Rail Capital Markets PLC, 8.25%, 07/09/2024(a)(f) | 200,000 | 38,000 | ||||||
|
| |||||||
| 206,595 | ||||||||
|
| |||||||
United Arab Emirates-0.24% | ||||||||
Alpha Star Holding V Ltd., 6.63%, 04/18/2023(a) | 454,000 | 451,812 | ||||||
|
| |||||||
United Kingdom-0.52% | ||||||||
Celtic Resources Holdings DAC, 4.13%, 10/09/2024(a)(g) | 300,000 | 0 | ||||||
Clear Channel International B.V., 6.63%, 08/01/2025(a) | 200,000 | 190,721 | ||||||
See accompanying Notes to Financial Statements which are an integral part of the financial statements.
| 18 | ||||
|
| |||
Invesco Global Short Term High Yield Bond ETF (PGHY)–(continued)
October 31, 2022
| Principal Amount | Value | |||||||
United Kingdom-(continued) | ||||||||
eG Global Finance PLC, 6.75%, 02/07/2025(a) | $ 50,000 | $ | 45,114 | |||||
Jaguar Land Rover Automotive PLC, 5.63%, 02/01/2023(a) | 550,000 | 539,807 | ||||||
Neptune Energy Bondco PLC, 6.63%, 05/15/2025(a) | 200,000 | 194,681 | ||||||
|
| |||||||
| 970,323 | ||||||||
|
| |||||||
United States-43.05% | ||||||||
ADT Security Corp. (The), 4.13%, 06/15/2023 | 510,000 | 506,135 | ||||||
Ahern Rentals, Inc., 7.38%, 05/15/2023(a) | 500,000 | 352,240 | ||||||
Albertson’s Cos., Inc./Safeway, Inc./New Albertson’s L.P./Albertson’s LLC, 3.50%, 02/15/2023(a) | 500,000 | 497,402 | ||||||
Alliance Resource Operating Partners L.P./Alliance Resource Finance Corp., 7.50%, 05/01/2025(a) | 200,000 | 196,481 | ||||||
Ally Financial, Inc., 5.13%, 09/30/2024(c) | 500,000 | 492,676 | ||||||
AMC Networks, Inc. | ||||||||
5.00%, 04/01/2024 | 500,000 | 486,092 | ||||||
4.75%, 08/01/2025(c) | 100,000 | 91,633 | ||||||
American Airlines, Inc., 11.75%, 07/15/2025(a) | 200,000 | 219,002 | ||||||
AmeriGas Partners L.P./AmeriGas Finance Corp. | ||||||||
5.63%, 05/20/2024 | 500,000 | 489,700 | ||||||
5.50%, 05/20/2025 | 200,000 | 192,007 | ||||||
Aramark Services, Inc. | ||||||||
5.00%, 04/01/2025(a) | 200,000 | 193,084 | ||||||
6.38%, 05/01/2025(a) | 200,000 | 198,378 | ||||||
Arconic Corp., 6.00%, 05/15/2025(a) | 100,000 | 99,269 | ||||||
Ardagh Packaging Finance PLC/Ardagh Holdings USA, Inc., 5.25%, 04/30/2025(a) | 50,000 | 47,261 | ||||||
Arrow Bidco LLC, 9.50%, 03/15/2024(a) | 500,000 | 503,080 | ||||||
Avient Corp. | ||||||||
5.25%, 03/15/2023 | 700,000 | 700,319 | ||||||
5.75%, 05/15/2025(a) | 100,000 | 97,797 | ||||||
B&G Foods, Inc., 5.25%, 04/01/2025 | 200,000 | 182,261 | ||||||
Ball Corp. | ||||||||
4.00%, 11/15/2023 | 600,000 | 589,425 | ||||||
5.25%, 07/01/2025 | 200,000 | 197,852 | ||||||
Brand Industrial Services, Inc., 8.50%, 07/15/2025(a) | 100,000 | 72,120 | ||||||
Brinker International, Inc. | ||||||||
3.88%, 05/15/2023 | 600,000 | 593,476 | ||||||
5.00%, 10/01/2024(a) | 500,000 | 485,704 | ||||||
Caesars Entertainment, Inc., 6.25%, 07/01/2025(a) | 200,000 | 194,431 | ||||||
Caesars Resort Collection LLC/CRC Finco, Inc., 5.75%, 07/01/2025(a) | 200,000 | 195,625 | ||||||
CCO Holdings LLC/CCO Holdings Capital Corp., 4.00%, 03/01/2023(a) | 500,000 | 496,855 | ||||||
CDW LLC/CDW Finance Corp., 5.50%, 12/01/2024 | 500,000 | 496,267 | ||||||
| Principal Amount | Value | |||||||
United States-(continued) | ||||||||
Cedar Fair L.P./Canada’s Wonderland Co./Magnum Management Corp., 5.50%, 05/01/2025(a) | $ 100,000 | $ | 99,375 | |||||
Cengage Learning, Inc., 9.50%, 06/15/2024(a) | 500,000 | 473,905 | ||||||
Cheniere Corpus Christi Holdings LLC | ||||||||
7.00%, 06/30/2024 | 500,000 | 506,163 | ||||||
5.88%, 03/31/2025 | 100,000 | 100,088 | ||||||
Citgo Holding, Inc., 9.25%, 08/01/2024(a) | 500,000 | 501,100 | ||||||
CITGO Petroleum Corp., 7.00%, 06/15/2025(a) | 100,000 | 98,867 | ||||||
Clearwater Paper Corp., 5.38%, 02/01/2025(a) | 500,000 | 486,011 | ||||||
CNG Holdings, Inc., 12.50%, 06/15/2024(a) | 500,000 | 426,920 | ||||||
Commercial Metals Co., 4.88%, 05/15/2023(c) | 574,000 | 573,320 | ||||||
CommScope Technologies LLC, 6.00%, 06/15/2025(a) | 200,000 | 186,972 | ||||||
Compass Minerals International, Inc., 4.88%, 07/15/2024(a) | 500,000 | 474,382 | ||||||
Continental Resources, Inc. | ||||||||
4.50%, 04/15/2023 | 500,000 | 498,457 | ||||||
3.80%, 06/01/2024(c) | 500,000 | 482,780 | ||||||
Cooper-Standard Automotive, Inc., 13.00%, 06/01/2024(a) | 500,000 | 512,761 | ||||||
Cornerstone Chemical Co., 6.75%, 08/15/2024(a) | 500,000 | 376,698 | ||||||
Crestwood Midstream Partners L.P./Crestwood Midstream Finance Corp., 5.75%, 04/01/2025 | 200,000 | 195,120 | ||||||
CSC Holdings LLC, 5.25%, 06/01/2024(c) | 500,000 | 485,528 | ||||||
CVR Energy, Inc., 5.25%, 02/15/2025(a) | 500,000 | 482,138 | ||||||
Dana Financing Luxembourg S.a.r.l., 5.75%, 04/15/2025(a) | 200,000 | 194,714 | ||||||
Delta Air Lines, Inc. | ||||||||
3.80%, 04/19/2023 | 600,000 | 594,447 | ||||||
2.90%, 10/28/2024 | 500,000 | 473,335 | ||||||
Diebold Nixdorf, Inc. | ||||||||
8.50%, 04/15/2024 | 430,000 | 216,373 | ||||||
9.38%, 07/15/2025(a) | 100,000 | 74,596 | ||||||
DISH DBS Corp. | ||||||||
5.00%, 03/15/2023 | 601,000 | 594,368 | ||||||
5.88%, 11/15/2024 | 500,000 | 462,500 | ||||||
Diversified Healthcare Trust, 4.75%, 05/01/2024 | 659,000 | 565,570 | ||||||
DPL, Inc., 4.13%, 07/01/2025 | 200,000 | 189,152 | ||||||
Enact Holdings, Inc., 6.50%, 08/15/2025(a) | 100,000 | 98,741 | ||||||
EnerSys, 5.00%, 04/30/2023(a) | 600,000 | 594,534 | ||||||
EnLink Midstream Partners L.P., 4.40%, 04/01/2024 | 600,000 | 577,305 | ||||||
Enova International, Inc., 8.50%, 09/01/2024(a) | 500,000 | 469,861 | ||||||
EQM Midstream Partners L.P., 4.00%, 08/01/2024 | 600,000 | 573,786 | ||||||
FirstEnergy Corp., 2.05%, 03/01/2025 | 200,000 | 184,194 | ||||||
Ford Motor Credit Co. LLC 3.35%, 11/01/2022 | 500,000 | 500,000 | ||||||
See accompanying Notes to Financial Statements which are an integral part of the financial statements.
| 19 | ||||
|
| |||
Invesco Global Short Term High Yield Bond ETF (PGHY)–(continued)
October 31, 2022
| Principal Amount | Value | |||||||
United States-(continued) | ||||||||
3.09%, 01/09/2023 | $ 450,000 | $ | 448,395 | |||||
4.14%, 02/15/2023 | 450,000 | 448,965 | ||||||
3.37%, 11/17/2023 | 528,000 | 510,878 | ||||||
5.58%, 03/18/2024 | 600,000 | 593,469 | ||||||
4.06%, 11/01/2024(c) | 500,000 | 479,217 | ||||||
2.30%, 02/10/2025(c) | 500,000 | 456,500 | ||||||
4.69%, 06/09/2025 | 200,000 | 190,506 | ||||||
5.13%, 06/16/2025 | 200,000 | 193,838 | ||||||
Freedom Mortgage Corp. | ||||||||
8.13%, 11/15/2024(a) | 500,000 | 440,565 | ||||||
8.25%, 04/15/2025(a) | 200,000 | 171,467 | ||||||
Freeport-McMoRan, Inc. | ||||||||
3.88%, 03/15/2023 | 530,000 | 526,905 | ||||||
4.55%, 11/14/2024 | 500,000 | 490,718 | ||||||
FS Energy and Power Fund, 7.50%, 08/15/2023(a) | 409,000 | 410,718 | ||||||
FXI Holdings, Inc., 7.88%, 11/01/2024(a) | 500,000 | 429,638 | ||||||
Genesis Energy L.P./Genesis Energy Finance Corp., 5.63%, 06/15/2024 | 600,000 | 587,226 | ||||||
Goodyear Tire & Rubber Co. (The), 9.50%, 05/31/2025 | 200,000 | 208,223 | ||||||
Graphic Packaging International LLC | ||||||||
4.88%, 11/15/2022 | 624,000 | 622,590 | ||||||
4.13%, 08/15/2024 | 500,000 | 487,862 | ||||||
Hanesbrands, Inc., 4.63%, 05/15/2024(a) | 500,000 | 487,475 | ||||||
HAT Holdings I LLC/HAT Holdings II LLC, 6.00%, 04/15/2025(a) | 200,000 | 190,940 | ||||||
HCA, Inc. | ||||||||
5.38%, 02/01/2025 | 500,000 | 493,804 | ||||||
5.25%, 04/15/2025 | 200,000 | 196,613 | ||||||
7.69%, 06/15/2025 | 200,000 | 206,342 | ||||||
Hillenbrand, Inc., 5.75%, 06/15/2025 | 200,000 | 198,758 | ||||||
Hilton Domestic Operating Co., Inc., 5.38%, 05/01/2025(a) | 200,000 | 197,500 | ||||||
Howmet Aerospace, Inc. | ||||||||
5.13%, 10/01/2024(c) | 500,000 | 495,387 | ||||||
6.88%, 05/01/2025(c) | 200,000 | 203,910 | ||||||
Hyatt Hotels Corp. | ||||||||
1.30%, 10/01/2023(c) | 500,000 | 480,398 | ||||||
1.80%, 10/01/2024(c) | 500,000 | 466,453 | ||||||
Icahn Enterprises L.P./Icahn Enterprises Finance Corp., 4.75%, 09/15/2024 | 500,000 | 487,255 | ||||||
International Game Technology PLC, 6.50%, 02/15/2025(a) | 400,000 | 400,432 | ||||||
iStar, Inc., 4.75%, 10/01/2024 | 500,000 | 494,722 | ||||||
KB Home, 7.63%, 05/15/2023 | 500,000 | 500,952 | ||||||
Koppers, Inc., 6.00%, 02/15/2025(a) | 500,000 | 448,150 | ||||||
Laredo Petroleum, Inc., 9.50%, 01/15/2025 | 600,000 | 601,125 | ||||||
Las Vegas Sands Corp. | ||||||||
3.20%, 08/08/2024 | 600,000 | 569,464 | ||||||
2.90%, 06/25/2025 | 200,000 | 181,317 | ||||||
Legacy LifePoint Health LLC, 6.75%, 04/15/2025(a) | 200,000 | 177,400 | ||||||
Live Nation Entertainment, Inc., 4.88%, 11/01/2024(a) | 500,000 | 486,695 | ||||||
Mallinckrodt International Finance S.A./Mallinckrodt CB LLC, 10.00%, 04/15/2025(a) | 200,000 | 136,000 | ||||||
| Principal Amount | Value | |||||||
United States-(continued) | ||||||||
Mattel, Inc., 3.15%, 03/15/2023 | $ 485,000 | $ | 479,772 | |||||
Mauser Packaging Solutions Holding Co. | ||||||||
5.50%, 04/15/2024(a) | 500,000 | 490,922 | ||||||
7.25%, 04/15/2025(a) | 200,000 | 180,316 | ||||||
Maxim Crane Works Holdings Capital LLC, 10.13%, 08/01/2024(a) | 596,000 | 574,464 | ||||||
MGM Resorts International | ||||||||
6.00%, 03/15/2023 | 536,000 | 536,329 | ||||||
6.75%, 05/01/2025(c) | 200,000 | 198,233 | ||||||
5.75%, 06/15/2025(c) | 200,000 | 195,079 | ||||||
Mohegan Gaming & Entertainment, 7.88%, 10/15/2024(a) | 500,000 | 504,420 | ||||||
Murphy Oil Corp., 5.75%, 08/15/2025 | 200,000 | 197,493 | ||||||
Navient Corp. | ||||||||
5.50%, 01/25/2023 | 410,000 | 409,853 | ||||||
7.25%, 09/25/2023 | 538,000 | 540,012 | ||||||
6.13%, 03/25/2024 | 400,000 | 393,362 | ||||||
5.88%, 10/25/2024(c) | 500,000 | 486,915 | ||||||
6.75%, 06/25/2025 | 200,000 | 191,709 | ||||||
Netflix, Inc. | ||||||||
5.75%, 03/01/2024(c) | 431,000 | 431,534 | ||||||
5.88%, 02/15/2025 | 500,000 | 503,605 | ||||||
Newmark Group, Inc., 6.13%, 11/15/2023 | 596,000 | 593,857 | ||||||
NextEra Energy Operating Partners L.P., 4.25%, 07/15/2024(a) | 500,000 | 485,873 | ||||||
NGL Energy Partners L.P./NGL Energy Finance Corp. | ||||||||
7.50%, 11/01/2023 | 526,000 | 513,623 | ||||||
6.13%, 03/01/2025 | 200,000 | 156,309 | ||||||
Nordstrom, Inc., 2.30%, 04/08/2024 | 500,000 | 469,885 | ||||||
Northwest Acquisitions ULC/Dominion Finco, Inc., 7.13%, 12/31/2049(a)(f) | 500,000 | 30 | ||||||
NortonLifeLock, Inc., 5.00%, 04/15/2025(a) | 200,000 | 194,536 | ||||||
Occidental Petroleum Corp. | ||||||||
6.95%, 07/01/2024 | 525,000 | 537,041 | ||||||
2.90%, 08/15/2024 | 600,000 | 578,658 | ||||||
8.00%, 07/15/2025(c) | 200,000 | 211,378 | ||||||
Oceaneering International, Inc., 4.65%, 11/15/2024 | 500,000 | 477,204 | ||||||
OneMain Finance Corp. | ||||||||
5.63%, 03/15/2023 | 500,000 | 500,607 | ||||||
8.25%, 10/01/2023 | 575,000 | 584,812 | ||||||
6.13%, 03/15/2024(c) | 550,000 | 538,164 | ||||||
6.88%, 03/15/2025(c) | 200,000 | 194,623 | ||||||
Owens-Brockway Glass Container, Inc. | ||||||||
5.88%, 08/15/2023(a) | 532,000 | 529,968 | ||||||
5.38%, 01/15/2025(a) | 500,000 | 473,120 | ||||||
PBF Holding Co. LLC/PBF Finance Corp., 7.25%, 06/15/2025(c) | 200,000 | 198,363 | ||||||
PBF Logistics L.P./PBF Logistics Finance Corp., 6.88%, 05/15/2023 | 600,000 | 601,011 | ||||||
Performance Food Group, Inc., 6.88%, 05/01/2025(a) | 200,000 | 199,806 | ||||||
Perrigo Finance Unlimited Co., 3.90%, 12/15/2024 | 500,000 | 479,143 | ||||||
See accompanying Notes to Financial Statements which are an integral part of the financial statements.
| 20 | ||||
|
| |||
Invesco Global Short Term High Yield Bond ETF (PGHY)–(continued)
October 31, 2022
| Principal Amount | Value | |||||||
United States-(continued) | ||||||||
Prime Security Services Borrower LLC/ Prime Finance, Inc., 5.25%, 04/15/2024(a) | $ | 500,000 | $ | 498,505 | ||||
PTC, Inc., 3.63%, 02/15/2025(a) | 500,000 | 474,736 | ||||||
Pyxus Holdings, Inc., 10.00%, 08/24/2024 | 510,625 | 401,693 | ||||||
QVC, Inc. | ||||||||
4.85%, 04/01/2024 | 500,000 | 483,214 | ||||||
4.45%, 02/15/2025 | 500,000 | 438,080 | ||||||
Radian Group, Inc. | ||||||||
4.50%, 10/01/2024 | 500,000 | 473,254 | ||||||
6.63%, 03/15/2025 | 200,000 | 197,102 | ||||||
Range Resources Corp. | ||||||||
5.00%, 03/15/2023 | 600,000 | 598,407 | ||||||
4.88%, 05/15/2025 | 200,000 | 193,364 | ||||||
Rayonier AM Products, Inc., 5.50%, 06/01/2024(a) | 500,000 | 492,500 | ||||||
Realogy Group LLC/Realogy Co-Issuer Corp., 4.88%, 06/01/2023(a) | 500,000 | 499,625 | ||||||
Sabre GLBL, Inc., 9.25%, 04/15/2025(a) | 100,000 | 97,014 | ||||||
Scientific Games International, Inc., 8.63%, 07/01/2025(a) | 200,000 | 205,847 | ||||||
Sealed Air Corp., 5.13%, 12/01/2024(a) | 500,000 | 493,155 | ||||||
Sensata Technologies B.V., 5.63%, 11/01/2024(a) | 600,000 | 596,118 | ||||||
Service Properties Trust | ||||||||
4.50%, 06/15/2023 | 635,000 | 627,180 | ||||||
4.65%, 03/15/2024 | 550,000 | 518,705 | ||||||
4.35%, 10/01/2024 | 500,000 | 459,410 | ||||||
4.50%, 03/15/2025 | 200,000 | 177,259 | ||||||
Six Flags Entertainment Corp., 4.88%, 07/31/2024(a) | 500,000 | 485,273 | ||||||
Six Flags Theme Parks, Inc., 7.00%, 07/01/2025(a) | 200,000 | 202,240 | ||||||
SM Energy Co., 5.63%, 06/01/2025 | 200,000 | 193,762 | ||||||
Southeast Supply Header LLC, 4.25%, 06/15/2024(a) | 500,000 | 452,385 | ||||||
Spectrum Brands, Inc., 5.75%, 07/15/2025 | 200,000 | 197,640 | ||||||
Spirit AeroSystems, Inc. | ||||||||
3.95%, 06/15/2023 | 421,000 | 410,147 | ||||||
5.50%, 01/15/2025(a) | 500,000 | 483,188 | ||||||
7.50%, 04/15/2025(a) | 200,000 | 194,779 | ||||||
Sprint Communications LLC, 6.00%, 11/15/2022 | 500,000 | 500,700 | ||||||
Sprint Corp. | ||||||||
7.88%, 09/15/2023 | 460,000 | 468,284 | ||||||
7.13%, 06/15/2024 | 500,000 | 505,833 | ||||||
7.63%, 02/15/2025 | 500,000 | 514,425 | ||||||
Starwood Property Trust, Inc. | ||||||||
5.50%, 11/01/2023(a) | 500,000 | 494,317 | ||||||
3.75%, 12/31/2024(a) | 500,000 | 468,083 | ||||||
4.75%, 03/15/2025 | 200,000 | 188,137 | ||||||
Stellantis N.V., 5.25%, 04/15/2023 | 615,000 | 613,549 | ||||||
Stericycle, Inc., 5.38%, 07/15/2024(a) | 500,000 | 493,607 | ||||||
Summit Midstream Holdings LLC/Summit Midstream Finance Corp., 5.75%, 04/15/2025 | 200,000 | 167,759 | ||||||
| Principal Amount | Value | |||||||
United States-(continued) | ||||||||
Taylor Morrison Communities, Inc./Taylor Morrison Holdings II, Inc., 5.63%, 03/01/2024(a) | $ | 500,000 | $ | 490,661 | ||||
Team Health Holdings, Inc., 6.38%, 02/01/2025(a) | 500,000 | 378,595 | ||||||
Tenet Healthcare Corp. | ||||||||
4.63%, 07/15/2024 | 500,000 | 485,443 | ||||||
4.63%, 09/01/2024(a) | 500,000 | 483,833 | ||||||
TMX Finance LLC/TitleMax Finance Corp., 11.13%, 04/01/2023(a) | 500,000 | 482,245 | ||||||
Toll Brothers Finance Corp., 4.38%, 04/15/2023 | 499,000 | 495,673 | ||||||
TPro Acquisition Corp., 11.00%, 10/15/2024(a) | 500,000 | 492,112 | ||||||
Travel + Leisure Co., 3.90%, 03/01/2023 | 620,000 | 614,527 | ||||||
Tri Pointe Group, Inc./Tri Pointe Homes, Inc., 5.88%, 06/15/2024 | 561,000 | 551,647 | ||||||
Trinity Industries, Inc., 4.55%, 10/01/2024 | 500,000 | 473,180 | ||||||
Triumph Group, Inc. | ||||||||
8.88%, 06/01/2024(a) | 484,000 | 489,813 | ||||||
6.25%, 09/15/2024(a) | 500,000 | 462,995 | ||||||
7.75%, 08/15/2025 | 200,000 | 151,773 | ||||||
Uber Technologies, Inc., 7.50%, 05/15/2025(a) | 100,000 | 100,179 | ||||||
United Airlines Holdings, Inc. | ||||||||
5.00%, 02/01/2024(c) | 526,000 | 513,531 | ||||||
4.88%, 01/15/2025(c) | 500,000 | 478,033 | ||||||
Uniti Group L.P./Uniti Fiber Holdings, Inc./CSL Capital LLC, 7.88%, 02/15/2025(a) | 500,000 | 496,772 | ||||||
Univision Communications, Inc., 5.13%, 02/15/2025(a) | 500,000 | 483,955 | ||||||
US Foods, Inc., 6.25%, 04/15/2025(a) | 100,000 | 99,657 | ||||||
USI, Inc., 6.88%, 05/01/2025(a) | 200,000 | 194,417 | ||||||
Vail Resorts, Inc., 6.25%, 05/15/2025(a) | 200,000 | 199,470 | ||||||
Venator Finance S.a.r.l./Venator Materials LLC, 5.75%, 07/15/2025(a) | 200,000 | 66,478 | ||||||
VeriSign, Inc., 5.25%, 04/01/2025 | 200,000 | 198,138 | ||||||
W&T Offshore, Inc., 9.75%, 11/01/2023(a) | 500,000 | 496,383 | ||||||
Werner FinCo L.P./Werner FinCo, Inc., 8.75%, 07/15/2025(a) | 200,000 | 169,792 | ||||||
Wesco Aircraft Holdings, Inc., 8.50%, 11/15/2024(a) | 300,000 | 157,500 | ||||||
WeWork Cos. LLC/WW Co-Obligor, Inc., 5.00%, 07/10/2025(a) | 200,000 | 100,259 | ||||||
WeWork Cos., Inc., 7.88%, 05/01/2025(a) | 100,000 | 54,750 | ||||||
WR Grace Holdings LLC, 5.63%, 10/01/2024(a) | 500,000 | 490,835 | ||||||
Wynn Las Vegas LLC/Wynn Las Vegas Capital Corp. | ||||||||
4.25%, 05/30/2023(a) | 570,000 | 562,125 | ||||||
5.50%, 03/01/2025(a) | 200,000 | 189,603 | ||||||
Xerox Corp., 3.80%, 05/15/2024 | 600,000 | 572,559 | ||||||
Xerox Holdings Corp., 5.00%, 08/15/2025(a) | 200,000 | 181,033 | ||||||
See accompanying Notes to Financial Statements which are an integral part of the financial statements.
| 21 | ||||
|
| |||
Invesco Global Short Term High Yield Bond ETF (PGHY)–(continued)
October 31, 2022
| Principal Amount | Value | |||||||
United States-(continued) | ||||||||
XPO Logistics, Inc., 6.25%, 05/01/2025(a) | $ 200,000 | $ | 202,302 | |||||
Yum! Brands, Inc., 3.88%, 11/01/2023 | 581,000 | 571,605 | ||||||
|
| |||||||
| 80,412,583 | ||||||||
|
| |||||||
Uzbekistan-0.54% | ||||||||
Republic of Uzbekistan International Bond, 4.75%, 02/20/2024(a) | 600,000 | 572,925 | ||||||
Uzbek Industrial and Construction Bank ATB, 5.75%, 12/02/2024(a) | 500,000 | 444,757 | ||||||
|
| |||||||
| 1,017,682 | ||||||||
|
| |||||||
Vietnam-0.26% | ||||||||
Vietnam Government International Bond, 4.80%, 11/19/2024(a) | 500,000 | 483,750 | ||||||
|
| |||||||
Zambia-0.29% | ||||||||
First Quantum Minerals Ltd., 6.50%, 03/01/2024(a) | 546,000 | 535,169 | ||||||
|
| |||||||
Total U.S. Dollar Denominated Bonds & Notes (Cost $189,343,488) | 177,314,785 | |||||||
|
| |||||||
| Shares | ||||||||
Preferred Stocks-0.14% | ||||||||
Guitar Center Holdings, Inc., Series A, Pfd., 0.00%(g)(h) | 2,000 | 262,000 | ||||||
Guitar Center Holdings, Inc., Series B, Pfd., 0.00%(g)(h) | 24 | 1,560 | ||||||
|
| |||||||
Total Preferred Stocks | 263,560 | |||||||
|
| |||||||
Common Stocks & Other Equity Interests-0.07% |
| |||||||
Spain-0.00% | ||||||||
Codere New Topco S.A.(g)(i) | 8,480 | 0 | ||||||
|
| |||||||
United States-0.07% | ||||||||
Hornbeck Offshore Services, Inc.(i)(j) | 323 | 9,044 | ||||||
Hornbeck Offshore Services, Inc., Wts.(i)(j) | 3,246 | 90,888 | ||||||
Hornbeck Offshore Services, Inc., | 2,673 | 9,355 | ||||||
PetroQuest Energy, Inc.(g)(i) | 28,971 | 12,313 | ||||||
Premier Brands Group Holdings Co.(k) | 3,222 | 3,169 | ||||||
Investment Abbreviations:
EUR-Euro
Pfd.-Preferred
PIK-Pay-in-Kind
Wts.-Warrants
| Shares | Value | |||||||
United States-(continued) | ||||||||
Premier Brands Group Holdings Co., Wts., expiring 03/21/2024(k) | 10,096 | $ | 2,044 | |||||
TRU Taj LLC/TRU Taj Finance, Inc.(i) | 2,156 | 11,454 | ||||||
|
| |||||||
| 138,267 | ||||||||
|
| |||||||
Total Common Stocks & Other Equity Interests |
| 138,267 | ||||||
|
| |||||||
| Principal Amount | ||||||||
Non-U.S. Dollar Denominated Bonds & Notes-0.07%(l) |
| |||||||
Spain-0.07% | ||||||||
Codere New Holdco S.A., 7.50% PIK Rate, 0.00% Cash Rate, 11/30/2027(a)(d) (Cost $403,687) | EUR 235,182 | 124,788 | ||||||
|
| |||||||
| Shares | ||||||||
Money Market Funds-2.47% | ||||||||
Invesco Government & Agency Portfolio, Institutional Class, 3.07%(m)(n) | 4,619,354 | 4,619,354 | ||||||
|
| |||||||
TOTAL INVESTMENTS IN SECURITIES |
| 182,460,754 | ||||||
|
| |||||||
| Investments Purchased with Cash Collateral from Securities on Loan |
| |||||||
Money Market Funds-5.09% | ||||||||
Invesco Private Government Fund, | 2,658,893 | 2,658,893 | ||||||
Invesco Private Prime Fund, 3.28%(m)(n)(o) | 6,845,033 | 6,845,033 | ||||||
|
| |||||||
Total Investments Purchased with Cash Collateral from Securities on Loan |
| 9,503,926 | ||||||
|
| |||||||
TOTAL INVESTMENTS IN SECURITIES-102.76% |
| 191,964,680 | ||||||
OTHER ASSETS LESS LIABILITIES-(2.76)% |
| (5,160,141 | ) | |||||
|
| |||||||
NET ASSETS-100.00%. | $ | 186,804,539 | ||||||
|
| |||||||
See accompanying Notes to Financial Statements which are an integral part of the financial statements.
| 22 | ||||
|
| |||
Invesco Global Short Term High Yield Bond ETF (PGHY)–(continued)
October 31, 2022
Notes to Schedule of Investments:
| (a) | Security purchased or received in a transaction exempt from registration under the Securities Act of 1933, as amended (the “1933 Act”). The security may be resold pursuant to an exemption from registration under the 1933 Act, typically to qualified institutional buyers. The aggregate value of these securities at October 31, 2022 was $111,492,054, which represented 59.68% of the Fund’s Net Assets. |
| (b) | Step coupon bond. The interest rate represents the coupon rate at which the bond will accrue at a specified future date. |
| (c) | All or a portion of this security was out on loan at October 31, 2022. |
| (d) | All or a portion of this security is Pay-in-Kind. Pay-in-Kind securities pay interest income in the form of securities. |
| (e) | Restricted security. The aggregate value of these securities at October 31, 2022 was $172,208, which represented less than 1% of the Fund’s Net Assets. |
| (f) | Defaulted security. Currently, the issuer is in default with respect to principal and/or interest payments. The aggregate value of these securities at October 31, 2022 was $120,530, which represented less than 1% of the Fund’s Net Assets. |
| (g) | Security valued using significant unobservable inputs (Level 3). See Note 4. |
| (h) | Acquired as part of the Guitar Center, Inc. reorganization. |
| (i) | Non-income producing security. |
| (j) | Acquired as part of the Hornbeck Offshore Services, Inc. reorganization. |
| (k) | Acquired as part of the Nine West Holding, Inc. reorganization. |
| (l) | Foreign denominated security. Principal amount is denominated in the currency indicated. |
| (m) | Affiliated issuer. The issuer and/or the Fund is a wholly-owned subsidiary of Invesco Ltd., or is affiliated by having an investment adviser that is under common control of Invesco Ltd. The table below shows the Fund’s transactions in, and earnings from, its investments in affiliates for the fiscal year ended October 31, 2022. |
| Value October 31, 2021 | Purchases at Cost | Proceeds from Sales | Change in Unrealized Appreciation (Depreciation) | Realized Gain (Loss) | Value October 31, 2022 | Dividend Income | ||||||||||||||||||||||||||||||||||||||||||||||||||||||
Investments in Affiliated Money Market Funds: | ||||||||||||||||||||||||||||||||||||||||||||||||||||||||||||
Invesco Government & Agency Portfolio, Institutional Class | $10,387,579 | $ 84,251,444 | $ (90,019,669 | ) | $ - | $ - | $ 4,619,354 | $ 28,650 | ||||||||||||||||||||||||||||||||||||||||||||||||||||
| Investments Purchased with Cash Collateral from Securities on Loan: | ||||||||||||||||||||||||||||||||||||||||||||||||||||||||||||
| Invesco Private Government Fund | 5,594,655 | 25,382,426 | (28,318,188 | ) | - | - | 2,658,893 | 36,293 | * | |||||||||||||||||||||||||||||||||||||||||||||||||||
| Invesco Private Prime Fund | 13,054,957 | 48,779,527 | (54,984,765 | ) | (53 | ) | (4,633 | ) | 6,845,033 | 101,232 | * | |||||||||||||||||||||||||||||||||||||||||||||||||
|
|
|
|
|
|
|
|
|
|
|
|
|
| |||||||||||||||||||||||||||||||||||||||||||||||
| Total | $29,037,191 | $158,413,397 | $(173,322,622 | ) | $(53 | ) | $(4,633 | ) | $14,123,280 | $166,175 | ||||||||||||||||||||||||||||||||||||||||||||||||||
|
|
|
|
|
|
|
|
|
|
|
|
|
| |||||||||||||||||||||||||||||||||||||||||||||||
| * | Represents the income earned on the investment of cash collateral, which is included in securities lending income on the Statements of Operations. Does not include rebates and fees paid to lending agent or premiums received from borrowers, if any. |
| (n) | The rate shown is the 7-day SEC standardized yield as of October 31, 2022. |
| (o) | The security has been segregated to satisfy the commitment to return the cash collateral received in securities lending transactions upon the borrower’s return of the securities loaned. See Note 2I. |
See accompanying Notes to Financial Statements which are an integral part of the financial statements.
| 23 | ||||
|
| |||
Invesco International Corporate Bond ETF (PICB)
October 31, 2022
Schedule of Investments
| Principal | ||||||||||||
| Amount | Value | |||||||||||
Non-U.S. Dollar Denominated Bonds & Notes-98.52%(a) |
| |||||||||||
Australia-2.11% |
| |||||||||||
APA Infrastructure Ltd., 3.50%, 03/22/2030(b) | GBP | 200,000 | $ | 189,657 | ||||||||
Australia & New Zealand Banking Group Ltd. | ||||||||||||
4.05%, 05/12/2025 | AUD | 200,000 | 125,750 | |||||||||
0.75%, 09/29/2026(b) | EUR | 100,000 | 89,427 | |||||||||
BHP Billiton Finance Ltd., Series 12, 4.30%, 09/25/2042 | GBP | 350,000 | 343,127 | |||||||||
Commonwealth Bank of Australia, 4.20%, 08/18/2025 | AUD | 350,000 | 220,493 | |||||||||
Glencore Finance (Europe) Ltd., 3.13%, 03/26/2026(b) | GBP | 146,000 | 150,811 | |||||||||
National Australia Bank Ltd. | ||||||||||||
3.90%, 05/30/2025 | AUD | 300,000 | 188,241 | |||||||||
2.90%, 02/25/2027 | AUD | 400,000 | 234,486 | |||||||||
2.13%, 05/24/2028(b) | EUR | 100,000 | 91,448 | |||||||||
1.38%, 08/30/2028(b) | EUR | 200,000 | 174,098 | |||||||||
NBN Co. Ltd., 1.00%, 12/03/2025(b) | AUD | 350,000 | 199,414 | |||||||||
Telstra Corp. Ltd., 2.50%, 09/15/2023 | EUR | 50,000 | 49,314 | |||||||||
|
| |||||||||||
| 2,056,266 | ||||||||||||
|
| |||||||||||
Belgium-0.10% |
| |||||||||||
KBC Group N.V., 1.13%, 01/25/2024(b) | EUR | 100,000 | 95,932 | |||||||||
|
| |||||||||||
Canada-20.86% |
| |||||||||||
Bank of Montreal | ||||||||||||
1.50%, 12/18/2024(b) | GBP | 200,000 | 213,461 | |||||||||
2.37%, 02/03/2025 | CAD | 400,000 | 275,956 | |||||||||
1.55%, 05/28/2026 | CAD | 350,000 | 226,776 | |||||||||
3.65%, 04/01/2027 | CAD | 570,000 | 392,590 | |||||||||
4.31%, 06/01/2027 | CAD | 800,000 | 566,111 | |||||||||
Bank of Nova Scotia (The) | ||||||||||||
2.49%, 09/23/2024 | CAD | 550,000 | 384,159 | |||||||||
1.95%, 01/10/2025 | CAD | 700,000 | 479,290 | |||||||||
2.16%, 02/03/2025 | CAD | 500,000 | 343,267 | |||||||||
1.85%, 11/02/2026 | CAD | 550,000 | 355,034 | |||||||||
2.95%, 03/08/2027 | CAD | 700,000 | 468,561 | |||||||||
1.40%, 11/01/2027 | CAD | 450,000 | 275,719 | |||||||||
Bell Canada | ||||||||||||
2.70%, 02/27/2024 | CAD | 300,000 | 213,010 | |||||||||
3.35%, 03/12/2025 | CAD | 550,000 | 387,077 | |||||||||
3.80%, 08/21/2028 | CAD | 250,000 | 170,757 | |||||||||
2.50%, 05/14/2030 | CAD | 250,000 | 151,806 | |||||||||
3.00%, 03/17/2031 | CAD | 300,000 | 185,354 | |||||||||
3.50%, 09/30/2050 | CAD | 350,000 | 176,068 | |||||||||
Canadian Imperial Bank of Commerce | ||||||||||||
3.29%, 01/15/2024 | CAD | 450,000 | 322,460 | |||||||||
2.35%, 08/28/2024 | CAD | 500,000 | 348,907 | |||||||||
2.75%, 03/07/2025 | CAD | 500,000 | 346,914 | |||||||||
2.00%, 04/17/2025 | CAD | 650,000 | 441,664 | |||||||||
1.10%, 01/19/2026 | CAD | 300,000 | 193,289 | |||||||||
1.70%, 07/15/2026 | CAD | 300,000 | 194,212 | |||||||||
4.95%, 06/29/2027 | CAD | 600,000 | 435,115 | |||||||||
Cenovus Energy, Inc., 3.50%, 02/07/2028 | CAD | 350,000 | 238,529 | |||||||||
CPPIB Capital, Inc., 4.45%, 09/01/2027(b) | AUD | 350,000 | 220,123 | |||||||||
| Principal | ||||||||||||
| Amount | Value | |||||||||||
Canada-(continued) |
| |||||||||||
Federation des caisses Desjardins du Quebec | ||||||||||||
2.42%, 10/04/2024 | CAD | 300,000 | $ | 208,980 | ||||||||
1.09%, 01/21/2026 | CAD | 400,000 | 257,401 | |||||||||
4.41%, 05/19/2027 | CAD | 150,000 | 106,103 | |||||||||
HSBC Bank Canada | ||||||||||||
3.40%, 03/24/2025 | CAD | 400,000 | 281,362 | |||||||||
1.78%, 05/20/2026 | CAD | 350,000 | 228,482 | |||||||||
National Bank of Canada | ||||||||||||
2.98%, 03/04/2024 | CAD | 300,000 | 213,748 | |||||||||
2.55%, 07/12/2024 | CAD | 350,000 | 245,774 | |||||||||
2.58%, 02/03/2025 | CAD | 600,000 | 415,421 | |||||||||
2.24%, 11/04/2026 | CAD | 225,000 | 147,399 | |||||||||
Ontario Teachers’ Finance Trust, 1.85%, 05/03/2032(b) | EUR | 200,000 | 172,264 | |||||||||
Rogers Communications, Inc. | ||||||||||||
3.10%, 04/15/2025 | CAD | 500,000 | 347,541 | |||||||||
3.65%, 03/31/2027 | CAD | 350,000 | 239,432 | |||||||||
3.25%, 05/01/2029 | CAD | 400,000 | 258,448 | |||||||||
4.25%, 04/15/2032 | CAD | 200,000 | 132,609 | |||||||||
Royal Bank of Canada | ||||||||||||
2.61%, 11/01/2024 | CAD | 600,000 | 418,859 | |||||||||
1.94%, 05/01/2025 | CAD | 500,000 | 339,264 | |||||||||
3.37%, 09/29/2025 | CAD | 1,000,000 | 697,959 | |||||||||
2.33%, 01/28/2027 | CAD | 700,000 | 457,975 | |||||||||
3.63%, 06/14/2027(b) | GBP | 100,000 | 105,310 | |||||||||
4.61%, 07/26/2027 | CAD | 650,000 | 465,607 | |||||||||
1.83%, 07/31/2028 | CAD | 300,000 | 184,017 | |||||||||
2.13%, 04/26/2029(b) | EUR | 100,000 | 87,285 | |||||||||
Shaw Communications, Inc., 6.75%, 11/09/2039 | CAD | 450,000 | 343,229 | |||||||||
TELUS Corp. | ||||||||||||
5.25%, 11/15/2032 | CAD | 400,000 | 287,330 | |||||||||
Series CY, 3.30%, 05/02/2029 | CAD | 300,000 | 196,364 | |||||||||
Thomson Reuters Corp., 2.24%, 05/14/2025 | CAD | 450,000 | 308,014 | |||||||||
Toronto-Dominion Bank (The) | ||||||||||||
2.50%, 12/02/2024 | CAD | 550,000 | 382,353 | |||||||||
1.94%, 03/13/2025 | CAD | 450,000 | 306,541 | |||||||||
2.67%, 09/09/2025 | CAD | 1,100,000 | 753,440 | |||||||||
1.13%, 12/09/2025 | CAD | 500,000 | 324,496 | |||||||||
2.26%, 01/07/2027 | CAD | 450,000 | 293,914 | |||||||||
0.50%, 01/18/2027(b) | EUR | 200,000 | 170,295 | |||||||||
2.88%, 04/05/2027(b) | GBP | 200,000 | 204,298 | |||||||||
4.21%, 06/01/2027 | CAD | 900,000 | 634,357 | |||||||||
2.55%, 08/03/2027(b) | EUR | 200,000 | 184,013 | |||||||||
5.38%, 10/21/2027 | CAD | 500,000 | 368,830 | |||||||||
1.89%, 03/08/2028 | CAD | 400,000 | 248,933 | |||||||||
1.90%, 09/11/2028 | CAD | 500,000 | 306,558 | |||||||||
1.95%, 04/08/2030(b) | EUR | 100,000 | 84,314 | |||||||||
3.13%, 08/03/2032(b) | EUR | 100,000 | 89,297 | |||||||||
TransCanada PipeLines Ltd. | ||||||||||||
3.80%, 04/05/2027 | CAD | 550,000 | 379,947 | |||||||||
4.18%, 07/03/2048(b) | CAD | 300,000 | 166,077 | |||||||||
4.34%, 10/15/2049 | CAD | 550,000 | 310,310 | |||||||||
|
| |||||||||||
| 20,360,359 | ||||||||||||
|
| |||||||||||
See accompanying Notes to Financial Statements which are an integral part of the financial statements.
| 24 | ||||
|
| |||
Invesco International Corporate Bond ETF (PICB)–(continued)
October 31, 2022
| Principal | ||||||||||||
| Amount | Value | |||||||||||
China-0.07% |
| |||||||||||
Prosus N.V., 1.29%, 07/13/2029(b) | EUR | 100,000 | $ | 68,697 | ||||||||
|
| |||||||||||
Denmark-0.85% |
| |||||||||||
Danske Bank A/S, 0.63%, 05/26/2025(b) | EUR | 100,000 | 91,858 | |||||||||
Orsted A/S | ||||||||||||
4.88%, 01/12/2032(b) | GBP | 200,000 | 223,187 | |||||||||
5.75%, 04/09/2040(b) | GBP | 150,000 | 176,877 | |||||||||
5.38%, 09/13/2042(b) | GBP | 300,000 | 343,172 | |||||||||
|
| |||||||||||
| 835,094 | ||||||||||||
|
| |||||||||||
Finland-1.11% |
| |||||||||||
Nordea Bank Abp | ||||||||||||
1.13%, 02/16/2027(b) | EUR | 130,000 | 114,882 | |||||||||
0.50%, 05/14/2027(b) | EUR | 200,000 | 173,343 | |||||||||
1.13%, 09/27/2027(b) | EUR | 100,000 | 88,869 | |||||||||
0.50%, 11/02/2028(b) | EUR | 200,000 | 160,248 | |||||||||
2.50%, 05/23/2029(b) | EUR | 200,000 | 179,465 | |||||||||
OP Corporate Bank PLC | ||||||||||||
0.50%, 08/12/2025(b) | EUR | 100,000 | 90,993 | |||||||||
2.88%, 12/15/2025(b) | EUR | 200,000 | 192,960 | |||||||||
0.10%, 11/16/2027(b) | EUR | 100,000 | 82,091 | |||||||||
|
| |||||||||||
| 1,082,851 | ||||||||||||
|
| |||||||||||
France-21.45% |
| |||||||||||
Aeroports de Paris | ||||||||||||
2.13%, 10/02/2026(b) | EUR | 100,000 | 94,178 | |||||||||
2.75%, 04/02/2030(b) | EUR | 200,000 | 181,477 | |||||||||
Airbus SE | ||||||||||||
1.63%, 06/09/2030(b) | EUR | 200,000 | 172,099 | |||||||||
2.38%, 04/07/2032(b) | EUR | 100,000 | 88,569 | |||||||||
2.38%, 06/09/2040(b) | EUR | 100,000 | 75,013 | |||||||||
Autoroutes du Sud de la France S.A. | ||||||||||||
1.38%, 01/22/2030(b) | EUR | 100,000 | 86,932 | |||||||||
1.38%, 02/21/2031(b) | EUR | 100,000 | 85,377 | |||||||||
Banque Federative du Credit Mutuel S.A. | ||||||||||||
3.00%, 05/21/2024(b) | EUR | 100,000 | 97,887 | |||||||||
1.75%, 12/19/2024(b) | GBP | 100,000 | 107,457 | |||||||||
1.25%, 01/14/2025(b) | EUR | 100,000 | 93,961 | |||||||||
0.01%, 03/07/2025(b) | EUR | 200,000 | 182,070 | |||||||||
1.00%, 05/23/2025(b) | EUR | 300,000 | 277,998 | |||||||||
0.75%, 07/17/2025(b) | EUR | 200,000 | 183,627 | |||||||||
3.00%, 09/11/2025(b) | EUR | 100,000 | 96,323 | |||||||||
1.25%, 12/05/2025(b) | GBP | 200,000 | 205,537 | |||||||||
1.63%, 01/19/2026(b) | EUR | 200,000 | 185,302 | |||||||||
2.38%, 03/24/2026(b) | EUR | 100,000 | 93,201 | |||||||||
0.01%, 05/11/2026(b) | EUR | 200,000 | 173,621 | |||||||||
0.75%, 06/08/2026(b) | EUR | 200,000 | 178,162 | |||||||||
1.00%, 07/16/2026(b) | GBP | 200,000 | 197,822 | |||||||||
1.25%, 05/26/2027(b) | EUR | 200,000 | 177,166 | |||||||||
3.13%, 09/14/2027(b) | EUR | 300,000 | 287,850 | |||||||||
0.25%, 07/19/2028(b) | EUR | 100,000 | 78,277 | |||||||||
0.63%, 11/03/2028(b) | EUR | 200,000 | 158,183 | |||||||||
1.75%, 03/15/2029(b) | EUR | 100,000 | 84,162 | |||||||||
1.88%, 06/18/2029(b) | EUR | 100,000 | 81,824 | |||||||||
0.75%, 01/17/2030(b) | EUR | 100,000 | 76,244 | |||||||||
1.25%, 06/03/2030(b) | EUR | 100,000 | 78,582 | |||||||||
0.63%, 02/21/2031(b) | EUR | 200,000 | 145,522 | |||||||||
BNP Paribas S.A. | ||||||||||||
2.38%, 02/17/2025(b) | EUR | 200,000 | 191,139 | |||||||||
1.50%, 11/17/2025(b) | EUR | 200,000 | 184,375 | |||||||||
| Principal | ||||||||||||
| Amount | Value | |||||||||||
France-(continued) |
| |||||||||||
3.38%, 01/23/2026(b) | GBP | 300,000 | $ | 320,019 | ||||||||
1.13%, 06/11/2026(b) | EUR | 200,000 | 178,184 | |||||||||
0.13%, 09/04/2026(b) | EUR | 100,000 | 84,968 | |||||||||
2.25%, 01/11/2027(b) | EUR | 100,000 | 90,656 | |||||||||
1.88%, 12/14/2027(b) | GBP | 300,000 | 282,091 | |||||||||
1.50%, 05/23/2028(b) | EUR | 100,000 | 84,242 | |||||||||
1.50%, 05/25/2028(b) | EUR | 100,000 | 89,247 | |||||||||
1.38%, 05/28/2029(b) | EUR | 200,000 | 161,622 | |||||||||
3.63%, 09/01/2029(b) | EUR | 100,000 | 92,812 | |||||||||
1.63%, 07/02/2031(b) | EUR | 100,000 | 74,886 | |||||||||
1.25%, 07/13/2031(b) | GBP | 300,000 | 237,988 | |||||||||
2.10%, 04/07/2032(b) | EUR | 200,000 | 158,112 | |||||||||
0.63%, 12/03/2032(b) | EUR | 300,000 | 201,031 | |||||||||
2.00%, 09/13/2036(b) | GBP | 100,000 | 72,883 | |||||||||
Bouygues S.A. | ||||||||||||
1.13%, 07/24/2028(b) | EUR | 100,000 | 86,704 | |||||||||
2.25%, 06/29/2029(b) | EUR | 200,000 | 178,160 | |||||||||
3.25%, 06/30/2037(b) | EUR | 100,000 | 82,813 | |||||||||
BPCE S.A. | ||||||||||||
0.63%, 09/26/2024(b) | EUR | 200,000 | 186,296 | |||||||||
1.00%, 04/01/2025(b) | EUR | 100,000 | 92,414 | |||||||||
0.63%, 04/28/2025(b) | EUR | 200,000 | 184,191 | |||||||||
0.25%, 01/15/2026(b) | EUR | 200,000 | 178,480 | |||||||||
0.38%, 02/02/2026(b) | EUR | 100,000 | 89,188 | |||||||||
0.50%, 02/24/2027(b) | EUR | 100,000 | 84,718 | |||||||||
1.75%, 04/26/2027(b) | EUR | 100,000 | 90,730 | |||||||||
1.00%, 10/05/2028(b) | EUR | 100,000 | 84,621 | |||||||||
5.25%, 04/16/2029(b) | GBP | 200,000 | 208,095 | |||||||||
0.25%, 01/14/2031(b) | EUR | 200,000 | 145,182 | |||||||||
0.75%, 03/03/2031(b) | EUR | 100,000 | 73,102 | |||||||||
1.00%, 01/14/2032(b) | EUR | 100,000 | 72,564 | |||||||||
Capgemini SE, 2.38%, 04/15/2032(b) | EUR | 200,000 | 173,189 | |||||||||
Carrefour S.A., 2.63%, 12/15/2027(b) | EUR | 100,000 | 92,697 | |||||||||
Cie de Saint-Gobain, 1.88%, 03/15/2031(b) | EUR | 100,000 | 83,827 | |||||||||
Cie Generale des Etablissements Michelin S.C.A., 1.75%, 09/03/2030(b) | EUR | 100,000 | 89,231 | |||||||||
Coentreprise de Transport d’Electricite S.A. | ||||||||||||
1.50%, 07/29/2028(b) | EUR | 200,000 | 172,324 | |||||||||
2.13%, 07/29/2032(b) | EUR | 100,000 | 80,961 | |||||||||
Credit Agricole Assurances S.A. | ||||||||||||
2.00%, 07/17/2030(b) | EUR | 200,000 | 152,631 | |||||||||
1.50%, 10/06/2031(b) | EUR | 100,000 | 70,261 | |||||||||
Credit Agricole S.A. | ||||||||||||
1.38%, 03/13/2025(b) | EUR | 200,000 | 188,017 | |||||||||
1.00%, 09/18/2025(b) | EUR | 300,000 | 277,759 | |||||||||
0.38%, 10/21/2025(b) | EUR | 200,000 | 180,925 | |||||||||
3.13%, 02/05/2026(b) | EUR | 200,000 | 193,522 | |||||||||
1.25%, 04/14/2026(b) | EUR | 200,000 | 183,412 | |||||||||
1.88%, 12/20/2026(b) | EUR | 200,000 | 181,136 | |||||||||
1.38%, 05/03/2027(b) | EUR | 200,000 | 179,432 | |||||||||
0.13%, 12/09/2027 | EUR | 200,000 | 161,277 | |||||||||
0.38%, 04/20/2028(b) | EUR | 200,000 | 159,983 | |||||||||
1.75%, 03/05/2029(b) | EUR | 200,000 | 169,746 | |||||||||
1.00%, 07/03/2029(b) | EUR | 200,000 | 166,088 | |||||||||
2.50%, 08/29/2029(b) | EUR | 100,000 | 91,090 | |||||||||
0.88%, 01/14/2032(b) | EUR | 200,000 | 144,733 | |||||||||
1.13%, 07/12/2032(b) | EUR | 200,000 | 146,984 | |||||||||
See accompanying Notes to Financial Statements which are an integral part of the financial statements.
| 25 | ||||
|
| |||
Invesco International Corporate Bond ETF (PICB)–(continued)
October 31, 2022
| Principal | ||||||||||||
| Amount | Value | |||||||||||
France-(continued) |
| |||||||||||
Credit Mutuel Arkea S.A., 3.38%, 09/19/2027(b) | EUR | 200,000 | $ | 192,668 | ||||||||
Danone S.A., 1.21%, 11/03/2028(b) | EUR | 200,000 | 174,698 | |||||||||
Dassault Systemes SE, 0.38%, 09/16/2029(b) | EUR | 100,000 | 80,985 | |||||||||
Electricite de France S.A. | ||||||||||||
1.00%, 10/13/2026(b) | EUR | 200,000 | 177,765 | |||||||||
4.13%, 03/25/2027(b) | EUR | 100,000 | 99,210 | |||||||||
6.25%, 05/30/2028(b) | GBP | 200,000 | 231,945 | |||||||||
4.38%, 10/12/2029(b) | EUR | 100,000 | 96,799 | |||||||||
4.63%, 04/26/2030(b) | EUR | 200,000 | 198,764 | |||||||||
2.00%, 10/02/2030(b) | EUR | 200,000 | 163,525 | |||||||||
5.88%, 07/18/2031 | GBP | 200,000 | 226,822 | |||||||||
1.00%, 11/29/2033(b) | EUR | 200,000 | 134,122 | |||||||||
6.13%, 06/02/2034(b) | GBP | 500,000 | 572,895 | |||||||||
4.75%, 10/12/2034(b) | EUR | 200,000 | 192,853 | |||||||||
5.50%, 03/27/2037(b) | GBP | 100,000 | 106,823 | |||||||||
5.50%, 10/17/2041(b) | GBP | 400,000 | 422,661 | |||||||||
5.13%, 09/22/2050(b) | GBP | 300,000 | 303,412 | |||||||||
6.00%, 01/23/2114(b)(c) | GBP | 400,000 | 428,028 | |||||||||
ELO SACA, 2.88%, 01/29/2026(b) | EUR | 100,000 | 92,196 | |||||||||
ENGIE S.A. | ||||||||||||
2.38%, 05/19/2026(b) | EUR | 200,000 | 189,478 | |||||||||
7.00%, 10/30/2028 | GBP | 200,000 | 243,428 | |||||||||
5.00%, 10/01/2060(b) | GBP | 300,000 | 316,067 | |||||||||
EssilorLuxottica S.A. | ||||||||||||
0.50%, 06/05/2028(b) | EUR | 100,000 | 85,272 | |||||||||
0.75%, 11/27/2031(b) | EUR | 100,000 | 78,633 | |||||||||
Holding d’Infrastructures de Transport S.A.S.U., 1.48%, 01/18/2031(b) | EUR | 100,000 | 74,792 | |||||||||
HSBC Continental Europe S.A., 0.10%, 09/03/2027(b) | EUR | 100,000 | 83,801 | |||||||||
Orange S.A. | ||||||||||||
1.38%, 03/20/2028(b) | EUR | 100,000 | 89,649 | |||||||||
8.13%, 11/20/2028(b) | GBP | 150,000 | 197,678 | |||||||||
2.00%, 01/15/2029(b) | EUR | 200,000 | 183,819 | |||||||||
1.38%, 01/16/2030(b) | EUR | 100,000 | 86,255 | |||||||||
1.88%, 09/12/2030(b) | EUR | 100,000 | 88,211 | |||||||||
0.50%, 09/04/2032(b) | EUR | 100,000 | 73,411 | |||||||||
8.13%, 01/28/2033 | EUR | 150,000 | 197,165 | |||||||||
0.63%, 12/16/2033(b) | EUR | 200,000 | 142,633 | |||||||||
5.38%, 11/22/2050(b) | GBP | 200,000 | 242,722 | |||||||||
Pernod Ricard S.A., 1.75%, 04/08/2030(b) | EUR | 200,000 | 175,271 | |||||||||
Sanofi | ||||||||||||
Series 12FX, 1.38%, 03/21/2030(b) | EUR | 200,000 | 173,991 | |||||||||
Series 20FX, 1.88%, 03/21/2038(b) | EUR | 100,000 | 79,815 | |||||||||
Societe Generale S.A. | ||||||||||||
1.25%, 02/15/2024(b) | EUR | 200,000 | 191,569 | |||||||||
1.13%, 01/23/2025(b) | EUR | 200,000 | 186,498 | |||||||||
2.63%, 02/27/2025(b) | EUR | 100,000 | 95,440 | |||||||||
0.13%, 02/24/2026(b) | EUR | 100,000 | 88,200 | |||||||||
0.75%, 01/25/2027(b) | EUR | 200,000 | 168,883 | |||||||||
0.25%, 07/08/2027(b) | EUR | 100,000 | 84,261 | |||||||||
0.13%, 02/18/2028(b) | EUR | 100,000 | 81,620 | |||||||||
2.13%, 09/27/2028(b) | EUR | 200,000 | 171,339 | |||||||||
1.75%, 03/22/2029(b) | EUR | 100,000 | 82,690 | |||||||||
2.63%, 05/30/2029(b) | EUR | 200,000 | 183,727 | |||||||||
1.25%, 06/12/2030(b) | EUR | 100,000 | 76,367 | |||||||||
| Principal | ||||||||||||
| Amount | Value | |||||||||||
France-(continued) |
| |||||||||||
Suez S.A.C.A., 2.88%, 05/24/2034(b) | EUR | 200,000 | $ | 162,038 | ||||||||
TotalEnergies Capital Canada Ltd., 2.13%, 09/18/2029(b) | EUR | 300,000 | 271,626 | |||||||||
TotalEnergies Capital International S.A. | ||||||||||||
0.75%, 07/12/2028(b) | EUR | 200,000 | 170,771 | |||||||||
1.38%, 10/04/2029(b) | EUR | 100,000 | 85,979 | |||||||||
1.99%, 04/08/2032(b) | EUR | 100,000 | 85,942 | |||||||||
1.62%, 05/18/2040(b) | EUR | 100,000 | 67,722 | |||||||||
Unibail-Rodamco-Westfield SE | ||||||||||||
0.63%, 05/04/2027(b) | EUR | 100,000 | 80,914 | |||||||||
1.38%, 12/04/2031(b) | EUR | 100,000 | 68,448 | |||||||||
Westfield America Management Ltd., 2.63%, 03/30/2029(b) | GBP | 150,000 | 127,769 | |||||||||
|
| |||||||||||
| 20,935,226 | ||||||||||||
|
| |||||||||||
Germany-11.48% |
| |||||||||||
Amprion GmbH, 3.97%, 09/22/2032(b) | EUR | 200,000 | 194,733 | |||||||||
Aroundtown S.A. | ||||||||||||
0.38%, 04/15/2027(b) | EUR | 100,000 | 71,719 | |||||||||
3.00%, 10/16/2029(b) | GBP | 100,000 | 81,912 | |||||||||
BASF SE | ||||||||||||
0.75%, 03/17/2026(b) | EUR | 100,000 | 90,974 | |||||||||
0.25%, 06/05/2027(b) | EUR | 100,000 | 86,087 | |||||||||
0.88%, 11/15/2027(b) | EUR | 100,000 | 87,304 | |||||||||
1.50%, 03/17/2031(b) | EUR | 200,000 | 163,277 | |||||||||
Bayer AG | ||||||||||||
0.05%, 01/12/2025(b) | EUR | 100,000 | 91,763 | |||||||||
0.75%, 01/06/2027(b) | EUR | 200,000 | 173,341 | |||||||||
0.38%, 01/12/2029(b) | EUR | 100,000 | 77,605 | |||||||||
1.13%, 01/06/2030(b) | EUR | 100,000 | 78,849 | |||||||||
0.63%, 07/12/2031(b) | EUR | 100,000 | 71,769 | |||||||||
1.38%, 07/06/2032(b) | EUR | 200,000 | 149,524 | |||||||||
Bayer Capital Corp. B.V. | ||||||||||||
1.50%, 06/26/2026(b) | EUR | 200,000 | 181,925 | |||||||||
2.13%, 12/15/2029(b) | EUR | 300,000 | 255,670 | |||||||||
BMW Finance N.V., 1.50%, 02/06/2029(b) | EUR | 200,000 | 178,961 | |||||||||
Commerzbank AG | ||||||||||||
0.63%, 08/28/2024(b) | EUR | 100,000 | 93,782 | |||||||||
1.00%, 03/04/2026(b) | EUR | 200,000 | 180,884 | |||||||||
0.50%, 12/04/2026(b) | EUR | 100,000 | 86,965 | |||||||||
Deutsche Bahn Finance GmbH | ||||||||||||
0.63%, 04/15/2036(b) | EUR | 200,000 | 134,186 | |||||||||
0.63%, 12/08/2050(b) | EUR | 100,000 | 49,019 | |||||||||
1.13%, 05/29/2051(b) | EUR | 180,000 | 100,103 | |||||||||
Deutsche Bank AG | ||||||||||||
3.88%, 02/12/2024(b) | GBP | 100,000 | 111,752 | |||||||||
2.63%, 12/16/2024(b) | GBP | 300,000 | 316,742 | |||||||||
1.63%, 01/20/2027(b) | EUR | 200,000 | 167,387 | |||||||||
Deutsche Telekom AG, 1.75%, 03/25/2031(b) | EUR | 100,000 | 87,379 | |||||||||
Deutsche Telekom International Finance B.V. | ||||||||||||
1.50%, 04/03/2028(b) | EUR | 157,000 | 141,876 | |||||||||
2.00%, 12/01/2029(b) | EUR | 200,000 | 181,916 | |||||||||
E.ON International Finance B.V. | ||||||||||||
1.50%, 07/31/2029(b) | EUR | 100,000 | 83,978 | |||||||||
6.25%, 06/03/2030(b) | GBP | 200,000 | 234,094 | |||||||||
6.38%, 06/07/2032 | GBP | 250,000 | 298,902 | |||||||||
See accompanying Notes to Financial Statements which are an integral part of the financial statements.
| 26 | ||||
|
| |||
Invesco International Corporate Bond ETF (PICB)–(continued)
October 31, 2022
| Principal | ||||||||||||
| Amount | Value | |||||||||||
Germany-(continued) | ||||||||||||
4.75%, 01/31/2034(b) | GBP | 300,000 | $ | 310,731 | ||||||||
5.88%, 10/30/2037(b) | GBP | 250,000 | 279,584 | |||||||||
6.75%, 01/27/2039(b) | GBP | 250,000 | 304,053 | |||||||||
6.13%, 07/06/2039(b) | GBP | 250,000 | 285,478 | |||||||||
E.ON SE, 0.38%, 09/29/2027(b) | EUR | 100,000 | 85,595 | |||||||||
Grand City Properties S.A., 0.13%, 01/11/2028(b) | EUR | 100,000 | 68,582 | |||||||||
HeidelbergCement Finance (Luxembourg) S.A., 1.63%, 04/07/2026(b) | EUR | 100,000 | 92,057 | |||||||||
Landesbank Baden-Wuerttemberg | ||||||||||||
1.50%, 02/03/2025(b) | GBP | 200,000 | 209,950 | |||||||||
0.38%, 02/18/2027(b) | EUR | 100,000 | 84,460 | |||||||||
Mercedes-Benz Group AG | ||||||||||||
1.00%, 11/15/2027(b) | EUR | 100,000 | 89,146 | |||||||||
1.38%, 05/11/2028(b) | EUR | 100,000 | 89,816 | |||||||||
1.50%, 07/03/2029(b) | EUR | 200,000 | 176,129 | |||||||||
0.75%, 09/10/2030(b) | EUR | 100,000 | 81,139 | |||||||||
1.13%, 11/06/2031(b) | EUR | 100,000 | 80,204 | |||||||||
0.75%, 03/11/2033(b) | EUR | 250,000 | 184,992 | |||||||||
2.13%, 07/03/2037(b)(c) | EUR | 150,000 | 122,747 | |||||||||
Mercedes-Benz International Finance B.V., 0.63%, 05/06/2027(b) | EUR | 175,000 | 155,049 | |||||||||
RWE AG | ||||||||||||
2.50%, 08/24/2025(b) | EUR | 200,000 | 191,862 | |||||||||
2.13%, 05/24/2026(b) | EUR | 100,000 | 93,504 | |||||||||
2.75%, 05/24/2030(b) | EUR | 100,000 | 89,000 | |||||||||
SAP SE, 1.63%, 03/10/2031(b) | EUR | 200,000 | 173,537 | |||||||||
Siemens Financieringsmaatschappij N.V. | ||||||||||||
0.25%, 02/20/2029(b) | EUR | 100,000 | 82,053 | |||||||||
0.13%, 09/05/2029(b) | EUR | 100,000 | 80,797 | |||||||||
1.38%, 09/06/2030(b) | EUR | 100,000 | 86,114 | |||||||||
3.00%, 09/08/2033(b) | EUR | 200,000 | 188,002 | |||||||||
0.50%, 09/05/2034(b) | EUR | 100,000 | 70,184 | |||||||||
Traton Finance Luxembourg S.A. | ||||||||||||
0.13%, 03/24/2025(b) | EUR | 100,000 | 89,970 | |||||||||
0.75%, 03/24/2029(b) | EUR | 300,000 | 235,839 | |||||||||
Volkswagen Financial Services AG | ||||||||||||
1.50%, 10/01/2024(b) | EUR | 100,000 | 95,112 | |||||||||
0.25%, 01/31/2025(b) | EUR | 100,000 | 91,498 | |||||||||
0.13%, 02/12/2027(b) | EUR | 100,000 | 83,781 | |||||||||
0.88%, 01/31/2028(b) | EUR | 130,000 | 108,668 | |||||||||
Volkswagen Financial Services N.V., | ||||||||||||
2.13%, 01/18/2028(b) | GBP | 200,000 | 187,344 | |||||||||
Volkswagen International Finance N.V. | ||||||||||||
0.88%, 09/22/2028(b) | EUR | 100,000 | 82,293 | |||||||||
1.63%, 01/16/2030(b) | EUR | 175,000 | 147,806 | |||||||||
3.25%, 11/18/2030(b) | EUR | 200,000 | 183,840 | |||||||||
4.13%, 11/16/2038(b) | EUR | 100,000 | 92,776 | |||||||||
Series 10Y, 1.88%, 03/30/2027(b) | EUR | 300,000 | 270,472 | |||||||||
Volkswagen Leasing GmbH | ||||||||||||
2.63%, 01/15/2024(b) | EUR | 200,000 | 195,916 | |||||||||
1.13%, 04/04/2024(b) | EUR | 100,000 | 95,487 | |||||||||
1.38%, 01/20/2025(b) | EUR | 100,000 | 94,225 | |||||||||
0.38%, 07/20/2026(b) | EUR | 100,000 | 86,887 | |||||||||
Vonovia Finance B.V. | ||||||||||||
2.25%, 12/15/2023(b) | EUR | 100,000 | 96,783 | |||||||||
1.25%, 12/06/2024(b) | EUR | 100,000 | 92,556 | |||||||||
Vonovia SE | ||||||||||||
0.38%, 06/16/2027(b) | EUR | 100,000 | 79,370 | |||||||||
| Principal | ||||||||||||
| Amount | Value | |||||||||||
Germany-(continued) | ||||||||||||
0.25%, 09/01/2028(b) | EUR | 200,000 | $ | 148,133 | ||||||||
0.63%, 12/14/2029(b) | EUR | 100,000 | 70,807 | |||||||||
0.75%, 09/01/2032(b) | EUR | 200,000 | 126,791 | |||||||||
1.00%, 06/16/2033(b) | EUR | 100,000 | 62,176 | |||||||||
Wintershall Dea Finance B.V. | ||||||||||||
0.84%, 09/25/2025(b) | EUR | 100,000 | 89,261 | |||||||||
1.33%, 09/25/2028(b) | EUR | 200,000 | 162,666 | |||||||||
1.82%, 09/25/2031(b) | EUR | 100,000 | 73,861 | |||||||||
|
| |||||||||||
| 11,203,461 | ||||||||||||
|
| |||||||||||
Ireland-0.27% | ||||||||||||
Ryanair DAC, 0.88%, 05/25/2026(b) | EUR | 200,000 | 174,435 | |||||||||
Smurfit Kappa Acquisitions ULC, 2.88%, 01/15/2026(b) | EUR | 100,000 | 95,094 | |||||||||
|
| |||||||||||
| 269,529 | ||||||||||||
|
| |||||||||||
Italy-5.15% | ||||||||||||
Assicurazioni Generali S.p.A., 4.13%, 05/04/2026(b) | EUR | 100,000 | 99,631 | |||||||||
ASTM S.p.A. | ||||||||||||
1.50%, 01/25/2030(b) | EUR | 125,000 | 94,057 | |||||||||
2.38%, 11/25/2033(b) | EUR | 100,000 | 69,691 | |||||||||
Enel Finance International N.V. | ||||||||||||
5.63%, 08/14/2024(b) | GBP | 200,000 | 229,439 | |||||||||
1.50%, 07/21/2025(b) | EUR | 100,000 | 93,324 | |||||||||
0.25%, 11/17/2025(b) | EUR | 100,000 | 88,279 | |||||||||
1.38%, 06/01/2026(b) | EUR | 50,000 | 45,086 | |||||||||
1.13%, 09/16/2026(b) | EUR | 150,000 | 133,292 | |||||||||
0.38%, 06/17/2027(b) | EUR | 100,000 | 82,927 | |||||||||
1.00%, 10/20/2027(b) | GBP | 125,000 | 112,048 | |||||||||
3.88%, 03/09/2029(b) | EUR | 200,000 | 188,362 | |||||||||
2.88%, 04/11/2029(b) | GBP | 200,000 | 185,974 | |||||||||
0.38%, 05/28/2029(b) | EUR | 100,000 | 74,714 | |||||||||
0.50%, 06/17/2030(b) | EUR | 120,000 | 86,088 | |||||||||
0.88%, 09/28/2034(b) | EUR | 220,000 | 135,547 | |||||||||
0.88%, 06/17/2036(b) | EUR | 100,000 | 58,046 | |||||||||
5.75%, 09/14/2040(b) | GBP | 450,000 | 469,628 | |||||||||
Enel S.p.A., 5.75%, 06/22/2037(b) | GBP | 180,000 | 190,506 | |||||||||
Eni S.p.A. | ||||||||||||
3.75%, 09/12/2025(b) | EUR | 100,000 | 99,138 | |||||||||
1.50%, 02/02/2026(b) | EUR | 150,000 | 139,459 | |||||||||
1.25%, 05/18/2026(b) | EUR | 200,000 | 183,091 | |||||||||
0.38%, 06/14/2028(b) | EUR | 100,000 | 81,673 | |||||||||
3.63%, 01/29/2029(b) | EUR | 100,000 | 95,490 | |||||||||
0.63%, 01/23/2030(b) | EUR | 100,000 | 76,919 | |||||||||
2.00%, 05/18/2031(b) | EUR | 150,000 | 124,437 | |||||||||
Intesa Sanpaolo S.p.A. | ||||||||||||
1.38%, 01/18/2024(b) | EUR | 100,000 | 96,343 | |||||||||
1.00%, 07/04/2024(b) | EUR | 150,000 | 141,788 | |||||||||
2.13%, 05/26/2025(b) | EUR | 125,000 | 117,943 | |||||||||
0.63%, 02/24/2026(b) | EUR | 250,000 | 216,205 | |||||||||
1.00%, 11/19/2026(b) | EUR | 100,000 | 86,761 | |||||||||
4.75%, 09/06/2027(b) | EUR | 150,000 | 146,930 | |||||||||
0.75%, 03/16/2028(b) | EUR | 100,000 | 80,865 | |||||||||
1.75%, 03/20/2028(b) | EUR | 150,000 | 127,790 | |||||||||
1.75%, 07/04/2029(b) | EUR | 100,000 | 81,942 | |||||||||
Snam S.p.A., 0.88%, 10/25/2026(b) | EUR | 200,000 | 175,139 | |||||||||
Terna Rete Elettrica Nazionale S.p.A., 1.38%, 07/26/2027(b) | EUR | 100,000 | 88,639 | |||||||||
See accompanying Notes to Financial Statements which are an integral part of the financial statements.
| 27 | ||||
|
| |||
Invesco International Corporate Bond ETF (PICB)–(continued)
October 31, 2022
| Principal | ||||||||||||
| Amount | Value | |||||||||||
Italy-(continued) | ||||||||||||
UniCredit S.p.A. | ||||||||||||
0.50%, 04/09/2025(b) | EUR | 100,000 | $ | 90,430 | ||||||||
0.33%, 01/19/2026(b) | EUR | 150,000 | 130,470 | |||||||||
2.13%, 10/24/2026(b) | EUR | 159,000 | 145,304 | |||||||||
0.85%, 01/19/2031(b) | EUR | 100,000 | 69,502 | |||||||||
|
| |||||||||||
| 5,032,897 | ||||||||||||
|
| |||||||||||
Japan-2.35% | ||||||||||||
Mizuho Financial Group, Inc., 0.69%, 10/07/2030(b) | EUR | 100,000 | 73,992 | |||||||||
NTT Finance Corp. | ||||||||||||
0.34%, 03/03/2030(b) | EUR | 100,000 | 78,612 | |||||||||
Series 16, 0.18%, 12/19/2025 | JPY100,000,000 | 671,965 | ||||||||||
Series 18, 0.38%, 09/20/2030 | JPY100,000,000 | 664,250 | ||||||||||
Sumitomo Mitsui Financial Group, Inc. | ||||||||||||
1.55%, 06/15/2026(b) | EUR | 200,000 | 181,059 | |||||||||
0.63%, 10/23/2029(b) | EUR | 125,000 | 95,482 | |||||||||
Takeda Pharmaceutical Co. Ltd. | ||||||||||||
2.25%, 11/21/2026(b) | EUR | 200,000 | 189,087 | |||||||||
3.00%, 11/21/2030(b) | EUR | 200,000 | 186,416 | |||||||||
1.38%, 07/09/2032 | EUR | 100,000 | 78,486 | |||||||||
2.00%, 07/09/2040 | EUR | 100,000 | 70,835 | |||||||||
|
| |||||||||||
| 2,290,184 | ||||||||||||
|
| |||||||||||
Luxembourg-0.08% | ||||||||||||
Logicor Financing S.a.r.l., 1.63%, 07/15/2027(b) | EUR | 100,000 | 77,257 | |||||||||
|
| |||||||||||
Netherlands-3.92% | ||||||||||||
ABN AMRO Bank N.V. | ||||||||||||
1.38%, 01/16/2025(b) | GBP | 200,000 | 213,440 | |||||||||
1.25%, 05/28/2025(b) | EUR | 200,000 | 186,348 | |||||||||
0.60%, 01/15/2027(b) | EUR | 100,000 | 86,257 | |||||||||
0.50%, 09/23/2029(b) | EUR | 100,000 | 77,053 | |||||||||
1.00%, 06/02/2033(b) | EUR | 100,000 | 71,197 | |||||||||
1.25%, 01/20/2034(b) | EUR | 100,000 | 70,047 | |||||||||
Cooperatieve Rabobank U.A. | ||||||||||||
1.25%, 01/14/2025(b) | GBP | 200,000 | 210,429 | |||||||||
5.25%, 09/14/2027(b) | GBP | 150,000 | 161,755 | |||||||||
4.63%, 05/23/2029(b) | GBP | 200,000 | 202,281 | |||||||||
1.13%, 05/07/2031(b) | EUR | 100,000 | 77,044 | |||||||||
ING Groep N.V. | ||||||||||||
1.13%, 02/14/2025(b) | EUR | 100,000 | 93,950 | |||||||||
2.13%, 01/10/2026(b) | EUR | 100,000 | 93,503 | |||||||||
3.00%, 02/18/2026(b) | GBP | 300,000 | 315,941 | |||||||||
1.38%, 01/11/2028(b) | EUR | 100,000 | 85,644 | |||||||||
2.00%, 09/20/2028(b) | EUR | 200,000 | 173,171 | |||||||||
2.50%, 11/15/2030(b) | EUR | 300,000 | 261,997 | |||||||||
Koninklijke KPN N.V., 5.75%, 09/17/2029(b) | GBP | 300,000 | 339,254 | |||||||||
LeasePlan Corp. N.V. | ||||||||||||
0.25%, 02/23/2026(b) | EUR | 100,000 | 84,847 | |||||||||
0.25%, 09/07/2026(b) | EUR | 200,000 | 164,927 | |||||||||
Shell International Finance B.V. | ||||||||||||
1.50%, 04/07/2028(b) | EUR | 100,000 | 90,427 | |||||||||
1.25%, 05/12/2028(b) | EUR | 200,000 | 177,282 | |||||||||
0.75%, 08/15/2028(b) | EUR | 150,000 | 128,437 | |||||||||
0.50%, 11/08/2031(b) | EUR | 100,000 | 76,272 | |||||||||
1.88%, 04/07/2032(b) | EUR | 100,000 | 85,804 | |||||||||
| Principal | ||||||||||||
| Amount | Value | |||||||||||
Netherlands-(continued) | ||||||||||||
1.25%, 11/11/2032(b) | EUR | 100,000 | $ | 79,808 | ||||||||
0.88%, 11/08/2039(b) | EUR | 100,000 | 60,478 | |||||||||
TenneT Holding B.V. | ||||||||||||
2.13%, 11/17/2029(b) | EUR | 100,000 | 89,085 | |||||||||
0.88%, 06/16/2035(b) | EUR | 100,000 | 67,632 | |||||||||
|
| |||||||||||
| 3,824,310 | ||||||||||||
|
| |||||||||||
Norway-0.43% | ||||||||||||
Equinor ASA | ||||||||||||
1.38%, 05/22/2032(b) | EUR | 100,000 | 82,242 | |||||||||
1.63%, 02/17/2035(b) | EUR | 100,000 | 79,063 | |||||||||
Telenor ASA | ||||||||||||
0.75%, 05/31/2026(b) | EUR | 100,000 | 90,104 | |||||||||
1.13%, 05/31/2029(b) | EUR | 200,000 | 169,691 | |||||||||
|
| |||||||||||
| 421,100 | ||||||||||||
|
| |||||||||||
Portugal-0.18% | ||||||||||||
EDP Finance B.V., 1.88%, 09/21/2029(b) | EUR | 200,000 | 173,375 | |||||||||
|
| |||||||||||
Spain-6.30% | ||||||||||||
Abertis Infraestructuras S.A. | ||||||||||||
2.38%, 09/27/2027(b) | EUR | 200,000 | 180,642 | |||||||||
3.00%, 03/27/2031(b) | EUR | 100,000 | 86,004 | |||||||||
Banco Bilbao Vizcaya Argentaria S.A. | ||||||||||||
0.38%, 10/02/2024(b) | EUR | 100,000 | 93,391 | |||||||||
1.38%, 05/14/2025(b) | EUR | 100,000 | 93,622 | |||||||||
0.75%, 06/04/2025(b) | EUR | 100,000 | 92,778 | |||||||||
1.75%, 11/26/2025(b) | EUR | 200,000 | 186,922 | |||||||||
1.00%, 06/21/2026(b) | EUR | 100,000 | 89,329 | |||||||||
0.38%, 11/15/2026(b) | EUR | 100,000 | 86,277 | |||||||||
0.50%, 01/14/2027(b) | EUR | 200,000 | 169,824 | |||||||||
3.50%, 02/10/2027(b) | EUR | 100,000 | 95,079 | |||||||||
3.38%, 09/20/2027(b) | EUR | 200,000 | 192,204 | |||||||||
Banco de Sabadell S.A., 0.88%, 07/22/2025(b) | EUR | 100,000 | 89,968 | |||||||||
Banco Santander S.A. | ||||||||||||
1.38%, 07/31/2024(b) | GBP | 200,000 | 216,101 | |||||||||
1.13%, 01/17/2025(b) | EUR | 100,000 | 93,458 | |||||||||
2.50%, 03/18/2025(b) | EUR | 200,000 | 190,175 | |||||||||
1.38%, 01/05/2026(b) | EUR | 300,000 | 271,658 | |||||||||
3.25%, 04/04/2026(b) | EUR | 300,000 | 284,600 | |||||||||
1.50%, 04/14/2026(b) | GBP | 200,000 | 196,580 | |||||||||
0.30%, 10/04/2026(b) | EUR | 100,000 | 86,992 | |||||||||
3.13%, 01/19/2027(b) | EUR | 100,000 | 93,041 | |||||||||
0.50%, 02/04/2027(b) | EUR | 100,000 | 84,205 | |||||||||
1.75%, 02/17/2027(b) | GBP | 200,000 | 189,606 | |||||||||
1.13%, 06/23/2027(b) | EUR | 100,000 | 86,295 | |||||||||
2.13%, 02/08/2028(b) | EUR | 100,000 | 86,552 | |||||||||
0.20%, 02/11/2028(b) | EUR | 200,000 | 163,413 | |||||||||
1.63%, 10/22/2030(b) | EUR | 100,000 | 75,146 | |||||||||
CaixaBank S.A. | ||||||||||||
2.38%, 02/01/2024(b) | EUR | 200,000 | 194,764 | |||||||||
1.13%, 05/17/2024(b) | EUR | 100,000 | 95,488 | |||||||||
0.38%, 02/03/2025(b) | EUR | 100,000 | 92,048 | |||||||||
1.13%, 03/27/2026(b) | EUR | 100,000 | 89,884 | |||||||||
1.38%, 06/19/2026(b) | EUR | 200,000 | 176,225 | |||||||||
3.75%, 09/07/2029(b) | EUR | 200,000 | 192,191 | |||||||||
Iberdrola Finanzas S.A., 1.38%, 03/11/2032(b) | EUR | 200,000 | 164,417 | |||||||||
See accompanying Notes to Financial Statements which are an integral part of the financial statements.
| 28 | ||||
|
| |||
Invesco International Corporate Bond ETF (PICB)–(continued)
October 31, 2022
| Principal | ||||||||||||
| Amount | Value | |||||||||||
Spain-(continued) | ||||||||||||
Naturgy Finance B.V., 1.38%, 01/19/2027(b) | EUR | 200,000 | $ | 177,045 | ||||||||
Santander Consumer Finance S.A. | ||||||||||||
1.00%, 02/27/2024(b) | EUR | 200,000 | 191,585 | |||||||||
0.38%, 06/27/2024(b) | EUR | 100,000 | 94,041 | |||||||||
0.38%, 01/17/2025(b) | EUR | 100,000 | 92,278 | |||||||||
Telefonica Emisiones S.A. | ||||||||||||
5.38%, 02/02/2026(b) | GBP | 200,000 | 226,059 | |||||||||
1.46%, 04/13/2026(b) | EUR | 100,000 | 92,647 | |||||||||
1.45%, 01/22/2027(b) | EUR | 100,000 | 90,937 | |||||||||
1.20%, 08/21/2027(b) | EUR | 200,000 | 176,996 | |||||||||
1.72%, 01/12/2028(b) | EUR | 200,000 | 179,773 | |||||||||
1.79%, 03/12/2029(b) | EUR | 100,000 | 88,124 | |||||||||
0.66%, 02/03/2030(b) | EUR | 200,000 | 158,906 | |||||||||
|
| |||||||||||
| 6,147,270 | ||||||||||||
|
| |||||||||||
Sweden-1.72% | ||||||||||||
Heimstaden Bostad Treasury B.V., 0.25%, 10/13/2024(b) | EUR | 125,000 | 108,553 | |||||||||
Skandinaviska Enskilda Banken AB | ||||||||||||
1.75%, 11/11/2026(b) | EUR | 200,000 | 185,074 | |||||||||
0.38%, 06/21/2028(b) | EUR | 200,000 | 161,204 | |||||||||
0.63%, 11/12/2029(b) | EUR | 200,000 | 155,285 | |||||||||
Svenska Handelsbanken AB | ||||||||||||
0.13%, 11/03/2026(b) | EUR | 100,000 | 86,570 | |||||||||
0.05%, 09/06/2028(b) | EUR | 100,000 | 80,437 | |||||||||
1.38%, 02/23/2029(b) | EUR | 130,000 | 108,515 | |||||||||
0.50%, 02/18/2030(b) | EUR | 100,000 | 75,758 | |||||||||
Swedbank AB | ||||||||||||
0.25%, 11/02/2026(b) | EUR | 100,000 | 86,566 | |||||||||
2.10%, 05/25/2027(b) | EUR | 200,000 | 184,802 | |||||||||
Telia Co. AB, 3.63%, 11/08/2023(b) | SEK | 2,000,000 | 180,666 | |||||||||
Vattenfall AB, 6.88%, 04/15/2039(b) | GBP | 200,000 | 262,424 | |||||||||
|
| |||||||||||
| 1,675,854 | ||||||||||||
|
| |||||||||||
Switzerland-2.41% | ||||||||||||
Credit Suisse AG | ||||||||||||
2.13%, 05/31/2024(b) | EUR | 100,000 | 93,733 | |||||||||
1.13%, 12/15/2025(b) | GBP | 200,000 | 198,328 | |||||||||
0.25%, 01/05/2026(b) | EUR | 225,000 | 193,819 | |||||||||
1.50%, 04/10/2026(b) | EUR | 150,000 | 133,031 | |||||||||
0.25%, 09/01/2028(b) | EUR | 120,000 | 91,720 | |||||||||
Credit Suisse Group AG | ||||||||||||
2.75%, 08/08/2025(b) | GBP | 150,000 | 152,541 | |||||||||
0.65%, 09/10/2029(b) | EUR | 100,000 | 69,865 | |||||||||
0.63%, 01/18/2033(b) | EUR | 248,000 | 147,544 | |||||||||
Holcim Finance (Luxembourg) S.A. | ||||||||||||
2.25%, 05/26/2028(b) | EUR | 200,000 | 176,914 | |||||||||
0.50%, 09/03/2030(b) | EUR | 100,000 | 71,469 | |||||||||
Richemont International Holding S.A. | ||||||||||||
1.50%, 03/26/2030(b) | EUR | 100,000 | 86,289 | |||||||||
2.00%, 03/26/2038(b) | EUR | 200,000 | 153,315 | |||||||||
UBS AG | ||||||||||||
0.01%, 03/31/2026(b) | EUR | 200,000 | 174,433 | |||||||||
0.50%, 03/31/2031(b) | EUR | 200,000 | 149,779 | |||||||||
UBS Group AG | ||||||||||||
1.25%, 09/01/2026(b) | EUR | 200,000 | 176,973 | |||||||||
| Principal | ||||||||||||
| Amount | Value | |||||||||||
Switzerland-(continued) | ||||||||||||
0.88%, 11/03/2031(b) | EUR | 200,000 | $ | 145,827 | ||||||||
0.63%, 02/24/2033(b) | EUR | 200,000 | 137,210 | |||||||||
|
| |||||||||||
| 2,352,790 | ||||||||||||
|
| |||||||||||
United Kingdom-15.74% | ||||||||||||
ABP Finance PLC, 6.25%, 12/14/2026(b) | GBP | 200,000 | 233,747 | |||||||||
Annington Funding PLC | ||||||||||||
3.18%, 07/12/2029(b) | GBP | 150,000 | 139,560 | |||||||||
3.69%, 07/12/2034(b) | GBP | 200,000 | 177,397 | |||||||||
3.94%, 07/12/2047(b) | GBP | 200,000 | 163,761 | |||||||||
B.A.T. International Finance PLC | ||||||||||||
7.25%, 03/12/2024 | GBP | 200,000 | 233,350 | |||||||||
4.00%, 09/04/2026(b) | GBP | 150,000 | 157,516 | |||||||||
2.25%, 06/26/2028(b) | GBP | 140,000 | 125,002 | |||||||||
2.25%, 01/16/2030(b) | EUR | 200,000 | 153,572 | |||||||||
6.00%, 11/24/2034(b) | GBP | 150,000 | 149,394 | |||||||||
2.25%, 09/09/2052(b) | GBP | 200,000 | 101,874 | |||||||||
Barclays PLC | ||||||||||||
3.13%, 01/17/2024(b) | GBP | 400,000 | 448,597 | |||||||||
3.00%, 05/08/2026(b) | GBP | 300,000 | 308,511 | |||||||||
3.25%, 02/12/2027(b) | GBP | 350,000 | 353,890 | |||||||||
BG Energy Capital PLC | ||||||||||||
5.13%, 12/01/2025(b) | GBP | 250,000 | 285,969 | |||||||||
5.00%, 11/04/2036(b) | GBP | 250,000 | 264,810 | |||||||||
Blend Funding PLC, 3.46%, 09/21/2047(b) | GBP | 200,000 | 172,138 | |||||||||
BP Capital Markets PLC | ||||||||||||
2.97%, 02/27/2026(b) | EUR | 100,000 | 96,822 | |||||||||
1.57%, 02/16/2027(b) | EUR | 100,000 | 90,868 | |||||||||
2.52%, 04/07/2028(b) | EUR | 100,000 | 92,781 | |||||||||
1.23%, 05/08/2031(b) | EUR | 100,000 | 79,504 | |||||||||
2.82%, 04/07/2032(b) | EUR | 200,000 | 179,184 | |||||||||
British Telecommunications PLC | ||||||||||||
1.00%, 11/21/2024(b) | EUR | 100,000 | 93,745 | |||||||||
1.75%, 03/10/2026(b) | EUR | 200,000 | 185,385 | |||||||||
1.50%, 06/23/2027(b) | EUR | 100,000 | 88,360 | |||||||||
5.75%, 12/07/2028(b) | GBP | 150,000 | 171,282 | |||||||||
3.13%, 11/21/2031(b) | GBP | 100,000 | 93,054 | |||||||||
6.38%, 06/23/2037(b) | GBP | 200,000 | 226,821 | |||||||||
Cadent Finance PLC | ||||||||||||
2.13%, 09/22/2028(b) | GBP | 250,000 | 234,271 | |||||||||
2.63%, 09/22/2038(b) | GBP | 200,000 | 150,913 | |||||||||
2.75%, 09/22/2046(b) | GBP | 200,000 | 138,539 | |||||||||
CCEP Finance Ireland DAC, 0.88%, 05/06/2033(b) | EUR | 100,000 | 72,049 | |||||||||
Centrica PLC | ||||||||||||
4.38%, 03/13/2029(b) | GBP | 150,000 | 155,384 | |||||||||
7.00%, 09/19/2033(b) | GBP | 272,000 | 328,107 | |||||||||
4.25%, 09/12/2044(b) | GBP | 150,000 | 130,053 | |||||||||
CK Hutchison Finance (16) (II) Ltd., 0.88%, 10/03/2024(b) | EUR | 100,000 | 93,865 | |||||||||
Clarion Funding PLC, 3.13%, 04/19/2048(b) | GBP | 130,000 | 101,510 | |||||||||
Diageo Finance PLC, 2.50%, 03/27/2032(b) | EUR | 100,000 | 90,451 | |||||||||
easyJet FinCo B.V., 1.88%, 03/03/2028(b) | EUR | 200,000 | 157,701 | |||||||||
See accompanying Notes to Financial Statements which are an integral part of the financial statements.
| 29 | ||||
|
| |||
Invesco International Corporate Bond ETF (PICB)–(continued)
October 31, 2022
| Principal | ||||||||||||
| Amount | Value | |||||||||||
United Kingdom-(continued) | ||||||||||||
GlaxoSmithKline Capital PLC, 3.38%, 12/20/2027(b) | GBP | 150,000 | $ | 159,278 | ||||||||
Heathrow Funding Ltd. | ||||||||||||
7.13%, 02/14/2024(b) | GBP | 200,000 | 229,745 | |||||||||
6.75%, 12/03/2026(b) | GBP | 200,000 | 232,543 | |||||||||
6.45%, 12/10/2031(b) | GBP | 250,000 | 289,986 | |||||||||
5.88%, 05/13/2041(b) | GBP | 200,000 | 217,295 | |||||||||
4.63%, 10/31/2046(b) | GBP | 200,000 | 184,878 | |||||||||
High Speed Rail Finance 1 PLC, 4.38%, 11/01/2038(b) | GBP | 150,000 | 156,023 | |||||||||
Housing & Care 21, 3.29%, 11/08/2049(b) | GBP | 200,000 | 163,570 | |||||||||
HSBC Bank PLC | ||||||||||||
5.38%, 08/22/2033(b) | GBP | 156,000 | 163,978 | |||||||||
4.75%, 03/24/2046 | GBP | 100,000 | 94,040 | |||||||||
HSBC Holdings PLC | ||||||||||||
6.50%, 05/20/2024(b) | GBP | 200,000 | 233,806 | |||||||||
0.88%, 09/06/2024(b) | EUR | 200,000 | 188,226 | |||||||||
2.50%, 03/15/2027(b) | EUR | 200,000 | 182,347 | |||||||||
2.63%, 08/16/2028(b) | GBP | 300,000 | 284,619 | |||||||||
0.64%, (3 mo. EURIBOR + 0.78%), 09/24/2029(b)(d) | EUR | 200,000 | 155,373 | |||||||||
Imperial Brands Finance Netherlands B.V., 1.75%, 03/18/2033(b) | EUR | 100,000 | 64,817 | |||||||||
Imperial Brands Finance PLC | ||||||||||||
8.13%, 03/15/2024(b) | GBP | 200,000 | 236,244 | |||||||||
5.50%, 09/28/2026(b) | GBP | 150,000 | 164,933 | |||||||||
4.88%, 06/07/2032(b) | GBP | 100,000 | 94,012 | |||||||||
Lloyds Bank Corporate Markets PLC | ||||||||||||
1.75%, 07/11/2024(b) | GBP | 100,000 | 108,965 | |||||||||
2.38%, 04/09/2026(b) | EUR | 200,000 | 187,790 | |||||||||
Lloyds Bank PLC, 7.50%, 04/15/2024(b) | GBP | 200,000 | 238,393 | |||||||||
Lloyds Banking Group PLC | ||||||||||||
2.25%, 10/16/2024(b) | GBP | 300,000 | 324,844 | |||||||||
1.50%, 09/12/2027(b) | EUR | 100,000 | 87,366 | |||||||||
National Grid Electricity Distribution (West Midlands) PLC, 5.75%, 04/16/2032(b) | GBP | 225,000 | 258,424 | |||||||||
Nationwide Building Society | ||||||||||||
0.25%, 07/22/2025(b) | EUR | 200,000 | 180,571 | |||||||||
3.25%, 01/20/2028(b) | GBP | 200,000 | 204,957 | |||||||||
NatWest Markets PLC | ||||||||||||
1.00%, 05/28/2024(b) | EUR | 200,000 | 189,339 | |||||||||
2.75%, 04/02/2025(b) | EUR | 100,000 | 95,986 | |||||||||
0.13%, 11/12/2025(b) | EUR | 100,000 | 87,728 | |||||||||
0.13%, 06/18/2026(b) | EUR | 200,000 | 170,134 | |||||||||
1.38%, 03/02/2027(b) | EUR | 100,000 | 87,318 | |||||||||
Sanctuary Capital PLC, 2.38%, 04/14/2050(b) | GBP | 200,000 | 132,858 | |||||||||
Santander UK Group Holdings PLC, 3.63%, 01/14/2026(b) | GBP | 150,000 | 158,832 | |||||||||
Scottish Widows Ltd., 7.00%, 06/16/2043(b) | GBP | 250,000 | 284,656 | |||||||||
Severn Trent Utilities Finance PLC, 3.63%, 01/16/2026(b) | GBP | 200,000 | 218,898 | |||||||||
Sky Ltd., 2.50%, 09/15/2026(b) | EUR | 100,000 | 95,255 | |||||||||
Society of Lloyd’s, 4.75%, 10/30/2024(b) | GBP | 100,000 | 110,927 | |||||||||
SSE PLC, 8.38%, 11/20/2028(b) | GBP | 183,000 | 236,886 | |||||||||
| Principal | ||||||||||||
| Amount | Value | |||||||||||
United Kingdom-(continued) | ||||||||||||
Standard Chartered PLC | ||||||||||||
5.13%, 06/06/2034(b) | GBP | 100,000 | $ | 101,209 | ||||||||
4.38%, 01/18/2038(b) | GBP | 200,000 | 205,162 | |||||||||
T.H.F.C. (Funding No.3) PLC, 5.20%, 10/11/2043(b) | GBP | 300,000 | 328,778 | |||||||||
Thames Water Utilities Finance PLC | ||||||||||||
4.00%, 06/19/2025(b) | GBP | 100,000 | 111,071 | |||||||||
5.13%, 09/28/2037(b) | GBP | 250,000 | 258,847 | |||||||||
5.50%, 02/11/2041(b) | GBP | 100,000 | 106,966 | |||||||||
Vodafone Group PLC | ||||||||||||
2.20%, 08/25/2026(b) | EUR | 200,000 | 189,785 | |||||||||
1.63%, 11/24/2030(b) | EUR | 100,000 | 84,718 | |||||||||
1.60%, 07/29/2031(b) | EUR | 151,000 | 125,134 | |||||||||
3.38%, 08/08/2049(b) | GBP | 200,000 | 161,715 | |||||||||
3.00%, 08/12/2056(b) | GBP | 300,000 | 217,694 | |||||||||
|
| |||||||||||
| 15,366,656 | ||||||||||||
|
| |||||||||||
United States-1.94% | ||||||||||||
Medtronic Global Holdings S.C.A. | ||||||||||||
0.38%, 10/15/2028 | EUR | 100,000 | 82,628 | |||||||||
3.00%, 10/15/2028 | EUR | 200,000 | 192,184 | |||||||||
1.63%, 03/07/2031 | EUR | 150,000 | 127,859 | |||||||||
0.75%, 10/15/2032 | EUR | 100,000 | 74,805 | |||||||||
1.38%, 10/15/2040 | EUR | 100,000 | 63,886 | |||||||||
1.63%, 10/15/2050 | EUR | 100,000 | 59,828 | |||||||||
Nestle Finance International Ltd., 0.38%, 05/12/2032(b) | EUR | 200,000 | 151,707 | |||||||||
Stellantis N.V. | ||||||||||||
3.75%, 03/29/2024(b) | EUR | 125,000 | 123,903 | |||||||||
3.88%, 01/05/2026(b) | EUR | 100,000 | 98,152 | |||||||||
2.75%, 05/15/2026(b) | EUR | 100,000 | 94,124 | |||||||||
0.63%, 03/30/2027(b) | EUR | 200,000 | 169,090 | |||||||||
4.50%, 07/07/2028(b) | EUR | 100,000 | 97,646 | |||||||||
0.75%, 01/18/2029(b) | EUR | 200,000 | 155,584 | |||||||||
2.75%, 04/01/2032(b) | EUR | 200,000 | 163,488 | |||||||||
1.25%, 06/20/2033(b) | EUR | 100,000 | 68,456 | |||||||||
Toyota Motor Credit Corp. | ||||||||||||
0.25%, 07/16/2026(b) | EUR | 100,000 | 88,293 | |||||||||
0.13%, 11/05/2027(b) | EUR | 100,000 | 83,160 | |||||||||
|
| |||||||||||
| 1,894,793 | ||||||||||||
|
| |||||||||||
Total Non-U.S. Dollar Denominated Bonds & Notes |
| 96,163,901 | ||||||||||
|
| |||||||||||
| Shares | ||||||||||||
Money Market Funds-0.30% | ||||||||||||
Invesco Government & Agency Portfolio, Institutional Class, 3.07%(e)(f) |
| 296,525 | 296,525 | |||||||||
|
| |||||||||||
TOTAL INVESTMENTS IN SECURITIES |
| 96,460,426 | ||||||||||
|
| |||||||||||
Investments Purchased with Cash Collateral from Securities on Loan |
| |||||||||||
Money Market Funds-0.69% | ||||||||||||
Invesco Private Government Fund, | 187,446 | 187,446 | ||||||||||
See accompanying Notes to Financial Statements which are an integral part of the financial statements.
| 30 | ||||
|
| |||
Invesco International Corporate Bond ETF (PICB)–(continued)
October 31, 2022
| Shares | Value | |||||||||||
Money Market Funds-(continued) | ||||||||||||
Invesco Private Prime Fund, 3.28%(e)(f)(g) | 484,184 | $ | 484,184 | |||||||||
|
| |||||||||||
Total Investments Purchased with Cash Collateral from Securities on Loan |
| 671,630 | ||||||||||
|
| |||||||||||
TOTAL INVESTMENTS IN SECURITIES-99.51% |
| 97,132,056 | ||||||||||
|
| |||||||||||
OTHER ASSETS LESS LIABILITIES-0.49% |
| 477,042 | ||||||||||
|
| |||||||||||
NET ASSETS-100.00% | $ | 97,609,098 | ||||||||||
|
| |||||||||||
Investment Abbreviations:
AUD-Australian Dollar
CAD-Canadian Dollar
EUR-Euro
EURIBOR-Euro Interbank Offered Rate
GBP-British Pound Sterling
JPY-Japanese Yen
SEK-Swedish Krona
Notes to Schedule of Investments:
| (a) | Foreign denominated security. Principal amount is denominated in the currency indicated. |
| (b) | Security purchased or received in a transaction exempt from registration under the Securities Act of 1933, as amended (the “1933 Act”). The security may be resold pursuant to an exemption from registration under the 1933 Act, typically to qualified institutional buyers. The aggregate value of these securities at October 31, 2022 was $72,797,158, which represented 74.58% of the Fund’s Net Assets. |
| (c) | All or a portion of this security was out on loan at October 31, 2022. |
| (d) | Security issued at a fixed rate for a specific period of time, after which it will convert to a variable rate. |
| (e) | Affiliated issuer. The issuer and/or the Fund is a wholly-owned subsidiary of Invesco Ltd., or is affiliated by having an investment adviser that is under common control of Invesco Ltd. The table below shows the Fund’s transactions in, and earnings from, its investments in affiliates for the fiscal year ended October 31, 2022. |
| Value October 31, 2021 | Purchases at Cost | Proceeds from Sales | Change in Unrealized Appreciation | Realized Gain (Loss) | Value October 31, 2022 | Dividend Income | |||||||||||||||||||||||||||||||||||||||||||||||||
| Investments in Affiliated Money Market Funds: | |||||||||||||||||||||||||||||||||||||||||||||||||||||||
| Invesco Government & Agency Portfolio, Institutional Class | $ | 516,859 | $ | 9,493,774 | $ | (9,714,108 | ) | $ | - | $ | - | $ | 296,525 | $ | 439 | ||||||||||||||||||||||||||||||||||||||||
| Investments Purchased with Cash Collateral from Securities on Loan: | |||||||||||||||||||||||||||||||||||||||||||||||||||||||
| Invesco Private Government Fund | 1,739,564 | 9,859,885 | (11,412,003 | ) | - | - | 187,446 | 14,921 | * | ||||||||||||||||||||||||||||||||||||||||||||||
Invesco Private Prime Fund | 4,058,983 | 21,281,834 | (24,853,742 | ) | 3 | (2,894 | ) | 484,184 | 41,231 | * | |||||||||||||||||||||||||||||||||||||||||||||
|
|
|
|
|
|
|
|
|
|
|
|
|
| ||||||||||||||||||||||||||||||||||||||||||
Total | $ | 6,315,406 | $ | 40,635,493 | $ | (45,979,853 | ) | $ | 3 | $ | (2,894 | ) | $ | 968,155 | $ | 56,591 | |||||||||||||||||||||||||||||||||||||||
|
|
|
|
|
|
|
|
|
|
|
|
|
| ||||||||||||||||||||||||||||||||||||||||||
| * | Represents the income earned on the investment of cash collateral, which is included in securities lending income on the Statements of Operations. Does not include rebates and fees paid to lending agent or premiums received from borrowers, if any. |
| (f) | The rate shown is the 7-day SEC standardized yield as of October 31, 2022. |
| (g) | The security has been segregated to satisfy the commitment to return the cash collateral received in securities lending transactions upon the borrower’s return of the securities loaned. See Note 2I. |
See accompanying Notes to Financial Statements which are an integral part of the financial statements.
| 31 | ||||
|
| |||
Statements of Assets and Liabilities
October 31, 2022
| Invesco Emerging Markets Sovereign Debt ETF (PCY) | Invesco Global Short Term High Yield Bond ETF (PGHY) | Invesco International Corporate Bond ETF (PICB) | ||||||||||||||||||||||||||||||||||||||||||
Assets: | ||||||||||||||||||||||||||||||||||||||||||||
Unaffiliated investments in securities, at value(a) | $ | 1,399,589,880 | $ | 177,841,400 | $ | 96,163,901 | ||||||||||||||||||||||||||||||||||||||
Affiliated investments in securities, at value | 62,807,896 | 14,123,280 | 968,155 | |||||||||||||||||||||||||||||||||||||||||
Cash | 134,576 | 1,132,148 | - | |||||||||||||||||||||||||||||||||||||||||
Foreign currencies, at value | 21,341 | 4,055 | 420,859 | |||||||||||||||||||||||||||||||||||||||||
Deposits with brokers: | ||||||||||||||||||||||||||||||||||||||||||||
Cash segregated as collateral | - | 1,942,302 | - | |||||||||||||||||||||||||||||||||||||||||
Receivable for: | ||||||||||||||||||||||||||||||||||||||||||||
Dividends and interest | 23,963,666 | 2,918,581 | 1,092,371 | |||||||||||||||||||||||||||||||||||||||||
Securities lending | 59,993 | 11,071 | 235 | |||||||||||||||||||||||||||||||||||||||||
Investments sold | 1,277,708 | 1,579,189 | 286,198 | |||||||||||||||||||||||||||||||||||||||||
Fund shares sold | 310,490 | 1,764,900 | - | |||||||||||||||||||||||||||||||||||||||||
Foreign tax reclaims | - | - | 50,853 | |||||||||||||||||||||||||||||||||||||||||
Investments matured, at value | - | 1,417,744 | - | |||||||||||||||||||||||||||||||||||||||||
|
|
|
|
|
| |||||||||||||||||||||||||||||||||||||||
Total assets | 1,488,165,550 | 202,734,670 | 98,982,572 | |||||||||||||||||||||||||||||||||||||||||
|
|
|
|
|
| |||||||||||||||||||||||||||||||||||||||
Liabilities: | ||||||||||||||||||||||||||||||||||||||||||||
Payable for: | ||||||||||||||||||||||||||||||||||||||||||||
Investments purchased | 310,490 | 4,428,918 | 661,364 | |||||||||||||||||||||||||||||||||||||||||
Collateral upon return of securities loaned | 54,904,626 | 9,503,979 | 671,627 | |||||||||||||||||||||||||||||||||||||||||
Collateral upon receipt of securities in-kind | - | 1,942,302 | - | |||||||||||||||||||||||||||||||||||||||||
Fund shares repurchased | 2,948,537 | - | - | |||||||||||||||||||||||||||||||||||||||||
Accrued unitary management fees | 622,026 | 54,932 | 40,483 | |||||||||||||||||||||||||||||||||||||||||
|
|
|
|
|
| |||||||||||||||||||||||||||||||||||||||
Total liabilities | 58,785,679 | 15,930,131 | 1,373,474 | |||||||||||||||||||||||||||||||||||||||||
|
|
|
|
|
| |||||||||||||||||||||||||||||||||||||||
Net Assets | $ | 1,429,379,871 | $ | 186,804,539 | $ | 97,609,098 | ||||||||||||||||||||||||||||||||||||||
|
|
|
|
|
| |||||||||||||||||||||||||||||||||||||||
Net assets consist of: | ||||||||||||||||||||||||||||||||||||||||||||
Shares of beneficial interest | $ | 2,903,630,793 | $ | 236,591,142 | $ | 131,335,757 | ||||||||||||||||||||||||||||||||||||||
Distributable earnings (loss) | (1,474,250,922 | ) | (49,786,603 | ) | (33,726,659 | ) | ||||||||||||||||||||||||||||||||||||||
|
|
|
|
|
| |||||||||||||||||||||||||||||||||||||||
Net Assets | $ | 1,429,379,871 | $ | 186,804,539 | $ | 97,609,098 | ||||||||||||||||||||||||||||||||||||||
|
|
|
|
|
| |||||||||||||||||||||||||||||||||||||||
Shares outstanding (unlimited amount authorized, $0.01 par value) | 83,500,000 | 9,800,000 | 4,950,000 | |||||||||||||||||||||||||||||||||||||||||
Net asset value | $ | 17.12 | $ | 19.06 | $ | 19.72 | ||||||||||||||||||||||||||||||||||||||
|
|
|
|
|
| |||||||||||||||||||||||||||||||||||||||
Market price | $ | 16.88 | $ | 18.96 | $ | 19.73 | ||||||||||||||||||||||||||||||||||||||
|
|
|
|
|
| |||||||||||||||||||||||||||||||||||||||
Unaffiliated investments in securities, at cost | $ | 2,007,579,585 | $ | 190,551,435 | $ | 123,908,183 | ||||||||||||||||||||||||||||||||||||||
|
|
|
|
|
| |||||||||||||||||||||||||||||||||||||||
Affiliated investments in securities, at cost | $ | 62,809,631 | $ | 14,123,333 | $ | 968,152 | ||||||||||||||||||||||||||||||||||||||
|
|
|
|
|
| |||||||||||||||||||||||||||||||||||||||
Foreign currencies, at cost | $ | 22,001 | $ | 4,185 | $ | 415,745 | ||||||||||||||||||||||||||||||||||||||
|
|
|
|
|
| |||||||||||||||||||||||||||||||||||||||
Investments matured, at cost | $ | - | $ | 9,394,020 | $ | - | ||||||||||||||||||||||||||||||||||||||
|
|
|
|
|
| |||||||||||||||||||||||||||||||||||||||
(a) Includes securities on loan with an aggregate value of: | $ | 51,965,167 | $ | 9,125,105 | $ | 335,124 | ||||||||||||||||||||||||||||||||||||||
|
|
|
|
|
| |||||||||||||||||||||||||||||||||||||||
See accompanying Notes to Financial Statements which are an integral part of the financial statements.
| 32 | ||||
|
| |||
For the year ended October 31, 2022
| Invesco Emerging Markets Sovereign Debt ETF (PCY) | Invesco Global Short Term High Yield Bond ETF (PGHY) | Invesco International Corporate Bond ETF (PICB) | |||||||||||||||||||||||||||||||||||||||||||||||||||||
Investment income: | |||||||||||||||||||||||||||||||||||||||||||||||||||||||
Unaffiliated interest income | $ | 127,750,448 | $ | 9,294,914 | $ | 1,975,856 | |||||||||||||||||||||||||||||||||||||||||||||||||
Unaffiliated dividend income | - | 7,619 | - | ||||||||||||||||||||||||||||||||||||||||||||||||||||
Affiliated dividend income | 46,096 | 28,650 | 439 | ||||||||||||||||||||||||||||||||||||||||||||||||||||
Securities lending income, net | 444,543 | 124,484 | 10,249 | ||||||||||||||||||||||||||||||||||||||||||||||||||||
Foreign withholding tax | - | - | (1,158 | ) | |||||||||||||||||||||||||||||||||||||||||||||||||||
|
|
|
|
|
| ||||||||||||||||||||||||||||||||||||||||||||||||||
Total investment income | 128,241,087 | 9,455,667 | 1,985,386 | ||||||||||||||||||||||||||||||||||||||||||||||||||||
|
|
|
|
|
| ||||||||||||||||||||||||||||||||||||||||||||||||||
Expenses: | |||||||||||||||||||||||||||||||||||||||||||||||||||||||
Unitary management fees | 10,295,190 | 713,749 | 628,648 | ||||||||||||||||||||||||||||||||||||||||||||||||||||
|
|
|
|
|
| ||||||||||||||||||||||||||||||||||||||||||||||||||
Less: Waivers | (3,068 | ) | (1,452 | ) | (22 | ) | |||||||||||||||||||||||||||||||||||||||||||||||||
|
|
|
|
|
| ||||||||||||||||||||||||||||||||||||||||||||||||||
Net expenses | 10,292,122 | 712,297 | 628,626 | ||||||||||||||||||||||||||||||||||||||||||||||||||||
|
|
|
|
|
| ||||||||||||||||||||||||||||||||||||||||||||||||||
Net investment income | 117,948,965 | 8,743,370 | 1,356,760 | ||||||||||||||||||||||||||||||||||||||||||||||||||||
|
|
|
|
|
| ||||||||||||||||||||||||||||||||||||||||||||||||||
Realized and unrealized gain (loss) from: | |||||||||||||||||||||||||||||||||||||||||||||||||||||||
Net realized gain (loss) from: | |||||||||||||||||||||||||||||||||||||||||||||||||||||||
Unaffiliated investment securities | (359,714,218 | ) | (15,924,728 | ) | (12,248,782 | ) | |||||||||||||||||||||||||||||||||||||||||||||||||
Affiliated investment securities | (7,050 | ) | (4,633 | ) | (2,894 | ) | |||||||||||||||||||||||||||||||||||||||||||||||||
In-kind redemptions | (48,269,923 | ) | (2,137,332 | ) | (1,561,276 | ) | |||||||||||||||||||||||||||||||||||||||||||||||||
Foreign currencies | (71 | ) | (683 | ) | (266,956 | ) | |||||||||||||||||||||||||||||||||||||||||||||||||
|
|
|
|
|
| ||||||||||||||||||||||||||||||||||||||||||||||||||
Net realized gain (loss) | (407,991,262 | ) | (18,067,376 | ) | (14,079,908 | ) | |||||||||||||||||||||||||||||||||||||||||||||||||
|
|
|
|
|
| ||||||||||||||||||||||||||||||||||||||||||||||||||
Change in net unrealized appreciation (depreciation) of: | |||||||||||||||||||||||||||||||||||||||||||||||||||||||
Unaffiliated investment securities. | (509,446,225 | ) | (6,998,054 | ) | (30,443,124 | ) | |||||||||||||||||||||||||||||||||||||||||||||||||
Affiliated investment securities | (1,736 | ) | (53 | ) | 3 | ||||||||||||||||||||||||||||||||||||||||||||||||||
Foreign currencies | (660 | ) | (123 | ) | (28,668 | ) | |||||||||||||||||||||||||||||||||||||||||||||||||
|
|
|
|
|
| ||||||||||||||||||||||||||||||||||||||||||||||||||
Change in net unrealized appreciation (depreciation) | (509,448,621 | ) | (6,998,230 | ) | (30,471,789 | ) | |||||||||||||||||||||||||||||||||||||||||||||||||
|
|
|
|
|
| ||||||||||||||||||||||||||||||||||||||||||||||||||
Net realized and unrealized gain (loss) | (917,439,883 | ) | (25,065,606 | ) | (44,551,697 | ) | |||||||||||||||||||||||||||||||||||||||||||||||||
|
|
|
|
|
| ||||||||||||||||||||||||||||||||||||||||||||||||||
Net increase (decrease) in net assets resulting from operations | $ | (799,490,918 | ) | $ | (16,322,236 | ) | $ | (43,194,937 | ) | ||||||||||||||||||||||||||||||||||||||||||||||
|
|
|
|
|
| ||||||||||||||||||||||||||||||||||||||||||||||||||
See accompanying Notes to Financial Statements which are an integral part of the financial statements.
| 33 | ||||
|
| |||
Statements of Changes in Net Assets
For the years ended October 31, 2022 and 2021
| Invesco Emerging | ||||||||||||||||||||
| Markets Sovereign | Invesco Global Short Term High | |||||||||||||||||||
| Debt ETF (PCY) | Yield Bond ETF (PGHY) | |||||||||||||||||||
| 2022 | 2021 | 2022 | 2021 | |||||||||||||||||
Operations: | ||||||||||||||||||||
Net investment income | $ | 117,948,965 | $ | 125,519,125 | $ | 8,743,370 | $ | 9,908,902 | ||||||||||||
Net realized gain (loss) | (407,991,262 | ) | 56,620,363 | (18,067,376 | ) | (820,726 | ) | |||||||||||||
Change in net unrealized appreciation (depreciation) | (509,448,621 | ) | (70,951,580 | ) | (6,998,230 | ) | 1,773,806 | |||||||||||||
|
|
|
|
|
|
|
| |||||||||||||
Net increase (decrease) in net assets resulting from operations | (799,490,918 | ) | 111,187,908 | (16,322,236 | ) | 10,861,982 | ||||||||||||||
|
|
|
|
|
|
|
| |||||||||||||
Distributions to Shareholders from: | ||||||||||||||||||||
Distributable earnings | (121,305,087 | ) | (128,603,511 | ) | (8,881,528 | ) | (9,921,771 | ) | ||||||||||||
Return of capital | - | - | (1,187,837 | ) | (1,754,213 | ) | ||||||||||||||
|
|
|
|
|
|
|
| |||||||||||||
Total distributions to shareholders | (121,305,087 | ) | (128,603,511 | ) | (10,069,365 | ) | (11,675,984 | ) | ||||||||||||
|
|
|
|
|
|
|
| |||||||||||||
Shareholder Transactions: | ||||||||||||||||||||
Proceeds from shares sold | 470,231,665 | 1,140,175,565 | 11,704,032 | 40,821,537 | ||||||||||||||||
Value of shares repurchased | (843,971,292 | ) | (1,074,290,505 | ) | (34,870,522 | ) | - | |||||||||||||
Transaction fees | - | - | - | - | ||||||||||||||||
|
|
|
|
|
|
|
| |||||||||||||
Net increase (decrease) in net assets resulting from share transactions | (373,739,627 | ) | 65,885,060 | (23,166,490 | ) | 40,821,537 | ||||||||||||||
|
|
|
|
|
|
|
| |||||||||||||
Net increase (decrease) in net assets | (1,294,535,632 | ) | 48,469,457 | (49,558,091 | ) | 40,007,535 | ||||||||||||||
|
|
|
|
|
|
|
| |||||||||||||
Net assets: | ||||||||||||||||||||
Beginning of year | 2,723,915,503 | 2,675,446,046 | 236,362,630 | 196,355,095 | ||||||||||||||||
|
|
|
|
|
|
|
| |||||||||||||
End of year | $ | 1,429,379,871 | $ | 2,723,915,503 | $ | 186,804,539 | $ | 236,362,630 | ||||||||||||
|
|
|
|
|
|
|
| |||||||||||||
Changes in Shares Outstanding: | ||||||||||||||||||||
Shares sold | 20,900,000 | 41,300,000 | 600,000 | 1,850,000 | ||||||||||||||||
Shares repurchased | (39,200,000 | ) | (39,000,000 | ) | (1,750,000 | ) | - | |||||||||||||
Shares outstanding, beginning of year | 101,800,000 | 99,500,000 | 10,950,000 | 9,100,000 | ||||||||||||||||
|
|
|
|
|
|
|
| |||||||||||||
Shares outstanding, end of year | 83,500,000 | 101,800,000 | 9,800,000 | 10,950,000 | ||||||||||||||||
|
|
|
|
|
|
|
| |||||||||||||
See accompanying Notes to Financial Statements which are an integral part of the financial statements.
| 34 | ||||
|
| |||
| Invesco International Corporate |
| |||||||
| Bond ETF (PICB) | ||||||||
| 2022 | 2021 | |||||||
| $ | 1,356,760 | $ | 1,139,209 | |||||
| (14,079,908 | ) | 4,831,221 | ||||||
| (30,471,789 | ) | (4,047,648 | ) | |||||
|
|
|
| |||||
| (43,194,937 | ) | 1,922,782 | ||||||
|
|
|
| |||||
| (1,125,779 | ) | (1,301,115 | ) | |||||
| (984,729 | ) | - | ||||||
|
|
|
| |||||
| (2,110,508 | ) | (1,301,115 | ) | |||||
|
|
|
| |||||
| 44,894,274 | 42,457,100 | |||||||
| (24,976,244 | ) | (38,131,756 | ) | |||||
| 17,214 | 7,455 | |||||||
|
|
|
| |||||
| 19,935,244 | 4,332,799 | |||||||
|
|
|
| |||||
| (25,370,201 | ) | 4,954,466 | ||||||
|
|
|
| |||||
| 122,979,299 | 118,024,833 | |||||||
|
|
|
| |||||
| $ | 97,609,098 | $ | 122,979,299 | |||||
|
|
|
| |||||
| 1,650,000 | 1,450,000 | |||||||
| (1,050,000 | ) | (1,300,000 | ) | |||||
| 4,350,000 | 4,200,000 | |||||||
|
|
|
| |||||
| 4,950,000 | 4,350,000 | |||||||
|
|
|
| |||||
| 35 | ||||
|
| |||
Invesco Emerging Markets Sovereign Debt ETF (PCY)
| Years Ended October 31, | ||||||||||||||||||||
| 2022 | 2021 | 2020 | 2019 | 2018 | ||||||||||||||||
Per Share Operating Performance: | ||||||||||||||||||||
Net asset value at beginning of year | $ | 26.76 | $ | 26.89 | $ | 29.12 | $ | 26.20 | $ | 29.62 | ||||||||||
|
|
|
|
|
|
|
|
|
| |||||||||||
Net investment income(a) | 1.25 | 1.23 | 1.28 | 1.41 | 1.26 | |||||||||||||||
Net realized and unrealized gain (loss) on investments | (9.61 | ) | (0.10 | ) | (2.20 | ) | 2.93 | (3.42 | ) | |||||||||||
|
|
|
|
|
|
|
|
|
| |||||||||||
Total from investment operations. | (8.36 | ) | 1.13 | (0.92 | ) | 4.34 | (2.16 | ) | ||||||||||||
|
|
|
|
|
|
|
|
|
| |||||||||||
Distributions to shareholders from: | ||||||||||||||||||||
Net investment income | (1.28 | ) | (1.26 | ) | (1.31 | ) | (1.42 | ) | (1.26 | ) | ||||||||||
|
|
|
|
|
|
|
|
|
| |||||||||||
Net asset value at end of year | $ | 17.12 | $ | 26.76 | $ | 26.89 | $ | 29.12 | $ | 26.20 | ||||||||||
|
|
|
|
|
|
|
|
|
| |||||||||||
Market price at end of year(b) | $ | 16.88 | $ | 26.73 | $ | 26.81 | $ | 29.13 | $ | 26.13 | ||||||||||
|
|
|
|
|
|
|
|
|
| |||||||||||
Net Asset Value Total Return(c) | (31.97 | )% | 4.17 | % | (3.07 | )% | 16.91 | % | (7.42 | )% | ||||||||||
Market Price Total Return(c) | (32.83 | )% | 4.38 | % | (3.38 | )% | 17.28 | % | (7.66 | )% | ||||||||||
Ratios/Supplemental Data: | ||||||||||||||||||||
Net assets at end of year (000’s omitted) | $ | 1,429,380 | $ | 2,723,916 | $ | 2,675,446 | $ | 3,535,387 | $ | 3,704,365 | ||||||||||
Ratio to average net assets of: | ||||||||||||||||||||
Expenses | 0.50 | % | 0.50 | % | 0.50 | % | 0.50 | % | 0.50 | % | ||||||||||
Net investment income | 5.73 | % | 4.47 | % | 4.63 | % | 5.03 | % | 4.51 | % | ||||||||||
Portfolio turnover rate(d) | 40 | % | 41 | % | 28 | % | 28 | % | 54 | % | ||||||||||
| (a) | Based on average shares outstanding. |
| (b) | The mean between the last bid and ask prices. |
| (c) | Net asset value total return is calculated assuming an initial investment made at the net asset value at the beginning of the period, reinvestment of all dividends and distributions at net asset value during the period, and redemption at net asset value on the last day of the period. Net asset value total return includes adjustments in accordance with accounting principles generally accepted in the United States of America and as such, the net asset value for financial reporting purposes and the returns based upon those net asset values may differ from the net asset value and returns for shareholder transactions. Market price total return is calculated assuming an initial investment made at the market price at the beginning of the period, reinvestment of all dividends and distributions at market price during the period, and sale at the market price on the last day of the period. Total investment returns calculated for a period of less than one year are not annualized. |
| (d) | Portfolio turnover rate is not annualized for periods less than one year, if applicable, and does not include securities received or delivered from processing creations or redemptions. |
Invesco Global Short Term High Yield Bond ETF (PGHY)
| Years Ended October 31, | ||||||||||||||||||||
| 2022 | 2021 | 2020 | 2019 | 2018 | ||||||||||||||||
Per Share Operating Performance: | ||||||||||||||||||||
Net asset value at beginning of year | $ | 21.59 | $ | 21.58 | $ | 22.82 | $ | 23.14 | $ | 24.14 | ||||||||||
|
|
|
|
|
|
|
|
|
| |||||||||||
Net investment income(a) | 0.86 | 0.96 | 1.18 | 1.20 | 1.24 | |||||||||||||||
Net realized and unrealized gain (loss) on investments | (2.40 | ) | 0.18 | (1.20 | ) | (0.32 | ) | (1.00 | ) | |||||||||||
|
|
|
|
|
|
|
|
|
| |||||||||||
Total from investment operations | (1.54 | ) | 1.14 | (0.02 | ) | 0.88 | 0.24 | |||||||||||||
|
|
|
|
|
|
|
|
|
| |||||||||||
Distributions to shareholders from: | ||||||||||||||||||||
Net investment income | (0.87 | ) | (0.96 | ) | (1.19 | ) | (1.20 | ) | (1.24 | ) | ||||||||||
Return of capital | (0.12 | ) | (0.17 | ) | (0.03 | ) | - | - | ||||||||||||
|
|
|
|
|
|
|
|
|
| |||||||||||
Total distributions | (0.99 | ) | (1.13 | ) | (1.22 | ) | (1.20 | ) | (1.24 | ) | ||||||||||
|
|
|
|
|
|
|
|
|
| |||||||||||
Net asset value at end of year | $ | 19.06 | $ | 21.59 | $ | 21.58 | $ | 22.82 | $ | 23.14 | ||||||||||
|
|
|
|
|
|
|
|
|
| |||||||||||
Market price at end of year(b) | $ | 18.96 | $ | 21.62 | $ | 21.59 | $ | 22.81 | $ | 23.03 | ||||||||||
|
|
|
|
|
|
|
|
|
| |||||||||||
Net Asset Value Total Return(c) | (7.26 | )% | 5.33 | % | 0.02 | % | 3.90 | % | 1.05 | % | ||||||||||
Market Price Total Return(c) | (7.87 | )% | 5.42 | % | 0.15 | % | 4.36 | % | 0.36 | % | ||||||||||
Ratios/Supplemental Data: | ||||||||||||||||||||
Net assets at end of year (000’s omitted) | $ | 186,805 | $ | 236,363 | $ | 196,355 | $ | 230,477 | $ | 216,400 | ||||||||||
Ratio to average net assets of: | ||||||||||||||||||||
Expenses | 0.35 | % | 0.35 | % | 0.35 | % | 0.35 | % | 0.35 | % | ||||||||||
Net investment income | 4.29 | % | 4.36 | % | 5.39 | % | 5.21 | % | 5.25 | % | ||||||||||
Portfolio turnover rate(d) | 58 | % | 59 | % | 54 | % | 57 | % | 42 | % | ||||||||||
| (a) | Based on average shares outstanding. |
| (b) | The mean between the last bid and ask prices. |
| (c) | Net asset value total return is calculated assuming an initial investment made at the net asset value at the beginning of the period, reinvestment of all dividends and distributions at net asset value during the period, and redemption at net asset value on the last day of the period. Net asset value total return includes adjustments in accordance with accounting principles generally accepted in the United States of America and as such, the net asset value for financial reporting purposes and the returns based upon those net asset values may differ from the net asset value and returns for shareholder transactions. Market price total return is calculated assuming an initial investment made at the market price at the beginning of the period, reinvestment of all dividends and distributions at market price during the period, and sale at the market price on the last day of the period. Total investment returns calculated for a period of less than one year are not annualized. |
| (d) | Portfolio turnover rate is not annualized for periods less than one year, if applicable, and does not include securities received or delivered from processing creations or redemptions. |
See accompanying Notes to Financial Statements which are an integral part of the financial statements.
| 36 | ||||
|
| |||
Financial Highlights–(continued)
Invesco International Corporate Bond ETF (PICB)
| Years Ended October 31, | ||||||||||||||||||||
| 2022 | 2021 | 2020 | 2019 | 2018 | ||||||||||||||||
Per Share Operating Performance: | ||||||||||||||||||||
Net asset value at beginning of year | $ | 28.27 | $ | 28.10 | $ | 26.96 | $ | 25.31 | $ | 26.88 | ||||||||||
|
|
|
|
|
|
|
|
|
| |||||||||||
Net investment income(a) | 0.26 | 0.29 | 0.34 | 0.39 | 0.43 | |||||||||||||||
Net realized and unrealized gain (loss) on investments | (8.39 | ) | 0.20 | 1.13 | 1.65 | (1.57 | ) | |||||||||||||
|
|
|
|
|
|
|
|
|
| |||||||||||
Total from investment operations | (8.13 | ) | 0.49 | 1.47 | 2.04 | (1.14 | ) | |||||||||||||
|
|
|
|
|
|
|
|
|
| |||||||||||
Distributions to shareholders from: | ||||||||||||||||||||
Net investment income | (0.14 | ) | (0.29 | ) | (0.34 | ) | (0.23 | ) | (0.43 | ) | ||||||||||
Net realized gains | (0.09 | ) | (0.03 | ) | - | - | - | |||||||||||||
Return of capital | (0.19 | ) | - | - | (0.16 | ) | - | |||||||||||||
|
|
|
|
|
|
|
|
|
| |||||||||||
Total distributions | (0.42 | ) | (0.32 | ) | (0.34 | ) | (0.39 | ) | (0.43 | ) | ||||||||||
|
|
|
|
|
|
|
|
|
| |||||||||||
Transaction fees(a) | 0.00 | (b) | 0.00 | (b) | 0.01 | 0.00 | (b) | - | ||||||||||||
|
|
|
|
|
|
|
|
|
| |||||||||||
Net asset value at end of year | $ | 19.72 | $ | 28.27 | $ | 28.10 | $ | 26.96 | $ | 25.31 | ||||||||||
|
|
|
|
|
|
|
|
|
| |||||||||||
Market price at end of year(c) | $ | 19.73 | $ | 28.31 | $ | 28.15 | $ | 26.84 | $ | 25.28 | ||||||||||
|
|
|
|
|
|
|
|
|
| |||||||||||
Net Asset Value Total Return(d) | (29.02 | )% | 1.73 | % | 5.57 | % | 8.12 | % | (4.31 | )% | ||||||||||
Market Price Total Return(d) | (29.09 | )% | 1.69 | % | 6.24 | % | 7.77 | % | (4.46 | )% | ||||||||||
Ratios/Supplemental Data: | ||||||||||||||||||||
Net assets at end of year (000’s omitted) | $ | 97,609 | $ | 122,979 | $ | 118,025 | $ | 111,878 | $ | 118,969 | ||||||||||
Ratio to average net assets of: | ||||||||||||||||||||
Expenses | 0.50 | % | 0.50 | % | 0.50 | % | 0.51 | %(e) | 0.50 | % | ||||||||||
Net investment income | 1.08 | % | 0.99 | % | 1.27 | % | 1.49 | %(e) | 1.58 | % | ||||||||||
Portfolio turnover rate(f) | 28 | % | 22 | % | 22 | % | 23 | % | 12 | % | ||||||||||
| (a) | Based on average shares outstanding. |
| (b) | Amount represents less than $0.005. |
| (c) | The mean between the last bid and ask prices. |
| (d) | Net asset value total return is calculated assuming an initial investment made at the net asset value at the beginning of the period, reinvestment of all dividends and distributions at net asset value during the period, and redemption at net asset value on the last day of the period. Net asset value total return includes adjustments in accordance with accounting principles generally accepted in the United States of America and as such, the net asset value for financial reporting purposes and the returns based upon those net asset values may differ from the net asset value and returns for shareholder transactions. Market price total return is calculated assuming an initial investment made at the market price at the beginning of the period, reinvestment of all dividends and distributions at market price during the period, and sale at the market price on the last day of the period. Total investment returns calculated for a period of less than one year are not annualized. |
| (e) | Ratios include non-recurring costs associated with a proxy statement of 0.01%. |
| (f) | Portfolio turnover rate is not annualized for periods less than one year, if applicable, and does not include securities received or delivered from processing creations or redemptions. |
See accompanying Notes to Financial Statements which are an integral part of the financial statements.
| 37 | ||||
|
| |||
Invesco Exchange-Traded Fund Trust II
October 31, 2022
NOTE 1–Organization
Invesco Exchange-Traded Fund Trust II (the “Trust”) was organized as a Massachusetts business trust and is authorized to have multiple series of portfolios. The Trust is an open-end management investment company registered under the Investment Company Act of 1940, as amended (the “1940 Act”). This report includes the following portfolios:
Full Name | Short Name | |
| Invesco Emerging Markets Sovereign Debt ETF (PCY) | “Emerging Markets Sovereign Debt ETF” | |
| Invesco Global Short Term High Yield Bond ETF (PGHY) | “Global Short Term High Yield Bond ETF” | |
| Invesco International Corporate Bond ETF (PICB) | “International Corporate Bond ETF” | |
Each portfolio (each, a “Fund”, and collectively, the “Funds”) represents a separate series of the Trust. The shares of the Funds are referred to herein as “Shares” or “Fund’s Shares.” Each Fund’s Shares are listed and traded on NYSE Arca, Inc.
The market price of each Share may differ to some degree from a Fund’s net asset value (“NAV”). Unlike conventional mutual funds, each Fund issues and redeems Shares on a continuous basis, at NAV, only in a large specified number of Shares, each called a “Creation Unit.” Creation Units of each Fund are issued and redeemed principally in exchange for the deposit or delivery of a basket of securities (“Deposit Securities”). Except when aggregated in Creation Units by authorized participants (“APs”), the Shares are not individually redeemable securities of the Funds.
The investment objective of each Fund is to seek to track the investment results (before fees and expenses) of its respective index listed below (each, an “Underlying Index”):
Fund | Underlying Index | |
| Emerging Markets Sovereign Debt ETF | DBIQ Emerging Market USD Liquid Balanced Index | |
| Global Short Term High Yield Bond ETF | DB Global Short Maturity High Yield Bond Index | |
| International Corporate Bond ETF | S&P International Corporate Bond Index® | |
NOTE 2–Significant Accounting Policies
The following is a summary of the significant accounting policies followed by the Funds in preparation of their financial statements.
Each Fund is an investment company and accordingly follows the investment company accounting and reporting guidance in accordance with Financial Accounting Standards Board Accounting Standards Codification Topic 946, Financial Services–Investment Companies.
| A. | Security Valuation - Securities, including restricted securities, are valued according to the following policies: |
A security listed or traded on an exchange is generally valued at its trade price or official closing price that day as of the close of the exchange where the security is principally traded or, lacking any trades or official closing price on a particular day, the security may be valued at the closing bid price on that day. Securities traded in the over-the-counter market are valued based on prices furnished by independent pricing services or market makers. When such securities are valued using prices provided by an independent pricing service they may be considered fair valued. Futures contracts are valued at the daily settlement price set by an exchange on which they are principally traded. U.S. exchange-traded options are valued at the mean between the last bid and asked prices from the exchange on which they are principally traded. Non-U.S. exchange-traded options are valued at the final settlement price set by the exchange on which they trade. Options not listed on an exchange and swaps generally are valued using pricing provided from independent pricing services.
Securities of investment companies that are not exchange-traded (e.g., open-end mutual funds) are valued using such company’s end-of-business-day NAV per share.
Deposits, other obligations of U.S. and non-U.S. banks and financial institutions are valued at their daily account value.
Fixed income securities (including convertible debt securities) generally are valued on the basis of prices provided by independent pricing services. Prices provided by the pricing service may be determined without exclusive reliance on quoted prices, and may reflect appropriate factors such as institution-size trading in similar groups of securities, developments related to specific securities, dividend rate (for unlisted equities), yield (for debt obligations), quality, type of issue, coupon rate (for debt obligations), maturity (for debt obligations), individual trading characteristics and other market data. Securities with a demand feature exercisable within one to seven days are valued at par. Pricing services generally value debt obligations assuming orderly transactions of institutional round lot size, but a Fund may hold or transact in the same securities in smaller, odd lot sizes. Odd lots often trade at lower prices than institutional round lots, and their value may be adjusted accordingly.
| 38 | ||||
|
| |||
Debt obligations are subject to interest rate and credit risks. In addition, all debt obligations involve some risk of default with respect to interest and/or principal payments.
Foreign securities’ (including foreign exchange contracts’) prices are converted into U.S. dollar amounts using the applicable exchange rates as of the close of the London world markets. If market quotations are available and reliable for foreign exchange-traded equity securities, the securities will be valued at the market quotations. Invesco Capital Management LLC (the “Adviser”) may use various pricing services to obtain market quotations as well as fair value prices. Because trading hours for certain foreign securities end before the close of the New York Stock Exchange (“NYSE”), closing market quotations may become not representative of market value in the Adviser’s judgment (“unreliable”). If, between the time trading ends on a particular security and the close of the customary trading session on the NYSE, a significant event occurs that makes the closing price of the security unreliable, the Adviser may fair value the security. If the event is likely to have affected the closing price of the security, the security will be valued at fair value in good faith in accordance with Board-approved policies and related Adviser procedures (“Valuation Procedures”). Adjustments to closing prices to reflect fair value may also be based on a screening process of an independent pricing service to indicate the degree of certainty, based on historical data, that the closing price in the principal market where a foreign security trades is not the current value as of the close of the NYSE. Foreign securities’ prices meeting the degree of certainty that the price is not reflective of current value will be priced at the indication of fair value from the independent pricing service. Multiple factors may be considered by the independent pricing service in determining adjustments to reflect fair value and may include information relating to sector indices, American depositary receipts and domestic and foreign index futures. Foreign securities may have additional risks including exchange rate changes, the potential for sharply devalued currencies and high inflation, political and economic upheaval, the relative lack of issuer information, relatively low market liquidity and the potential lack of strict financial and accounting controls and standards.
Unlisted securities will be valued using prices provided by independent pricing services or by another method that the Adviser, in its judgment, believes better reflects the security’s fair value in accordance with the Valuation Procedures.
Securities for which market prices are not provided by any of the above methods may be valued based upon quotes furnished by independent sources. The last bid price may be used to value exchange-traded equity securities. The mean between the last bid and asked prices may be used to value debt obligations, including corporate loans, and unlisted equity securities.
Securities for which market quotations are not readily available are fair valued by the Adviser in accordance with the Valuation Procedures. If a fair value price provided by a pricing service is unreliable, the Adviser will fair value the security using the Valuation Procedures. Issuer-specific events, market trends, bid/asked quotes of brokers and information providers and other market data may be reviewed in the course of making a good faith determination of a security’s fair value.
Each Fund may invest in securities that are subject to interest rate risk, meaning the risk that the prices will generally fall as interest rates rise and, conversely, the prices will generally rise as interest rates fall. Specific securities differ in their sensitivity to changes in interest rates depending on their individual characteristics. Changes in interest rates may result in increased market volatility, which may affect the value and/or liquidity of certain Fund investments.
Valuations change in response to many factors, including the historical and prospective earnings of the issuer, the value of the issuer’s assets, general market conditions which are not specifically related to the particular issuer, such as real or perceived adverse economic conditions, changes in the general outlook for revenues or corporate earnings, changes in interest or currency rates, regional or global instability, natural or environmental disasters, widespread disease or other public health issues, war, acts of terrorism, significant governmental actions or adverse investor sentiment generally and market liquidity. Because of the inherent uncertainties of valuation, the values reflected in the financial statements may materially differ from the value received upon actual sale of those investments.
The price a Fund could receive upon the sale of any investment may differ from the Adviser’s valuation of the investment, particularly for securities that are valued using a fair valuation technique. When fair valuation techniques are applied, the Adviser uses available information, including both observable and unobservable inputs and assumptions, to determine a methodology that will result in a valuation that the Adviser believes approximates market value. Fund securities that are fair valued may be subject to greater fluctuation in their value from one day to the next than would be the case if market quotations were used. Because of the inherent uncertainties of valuation, and the degree of subjectivity in such decisions, a Fund could realize a greater or lesser than expected gain or loss upon the sale of the investment.
| B. | Investment Transactions and Investment Income - Investment transactions are accounted for on a trade date basis. Realized gains and losses from the sale or disposition of securities are computed on the specific identified cost basis. Interest income is recorded on an accrual basis from settlement date and includes coupon interest and amortization of premium and accretion of discount on debt securities as applicable. Pay-in-kind interest income and non-cash dividend income received in the form of securities in-lieu of cash are recorded at the fair value of the securities received. Dividend income (net of |
| 39 | ||||
|
| |||
withholding tax, if any) is recorded on the ex-dividend date. Realized gains, dividends and interest received by a Fund may give rise to withholding and other taxes imposed by foreign countries. Tax conventions between certain countries and the United States may reduce or eliminate such taxes.
The Funds may periodically participate in litigation related to a Fund’s investments. As such, the Funds may receive proceeds from litigation settlements. Any proceeds received are included in the Statements of Operations as realized gain (loss) for investments no longer held and as unrealized gain (loss) for investments still held.
Brokerage commissions and mark ups are considered transaction costs and are recorded as an increase to the cost basis of securities purchased and/or a reduction of proceeds on a sale of securities. Such transaction costs are included in the determination of net realized and unrealized gain (loss) from investment securities reported in the Statements of Operations and the Statements of Changes in Net Assets and the net realized and unrealized gains (losses) on securities per share in the Financial Highlights. Transaction costs are included in the calculation of a Fund’s NAV and, accordingly, they reduce a Fund’s total returns. These transaction costs are not considered operating expenses and are not reflected in net investment income reported in the Statements of Operations and the Statements of Changes in Net Assets, or the net investment income per share and the ratios of expenses and net investment income reported in the Financial Highlights, nor are they limited by any expense limitation arrangements between each Fund and the Adviser.
| C. | Country Determination - For the purposes of presentation in the Schedules of Investments, the Adviser may determine the country in which an issuer is located and/or credit risk exposure based on various factors. These factors include whether each Fund’s Underlying Index has made a country determination and may include the laws of the country under which the issuer is organized, where the issuer maintains a principal office, the country in which the issuer derives 50% or more of its total revenues, the country that has the primary market for the issuer’s securities and its “country of risk” as determined by a third party service provider, as well as other criteria. Among the other criteria that may be evaluated for making this determination are the country in which the issuer maintains 50% or more of its assets, the type of security, financial guarantees and enhancements, the nature of the collateral and the sponsor organization. Country of issuer and/or credit risk exposure has been determined to be the United States of America, unless otherwise noted. |
| D. | Dividends and Distributions to Shareholders - Each Fund declares and pays dividends from net investment income, if any, to its shareholders monthly and records such dividends on the ex-dividend date. Generally, each Fund distributes net realized taxable capital gains, if any, annually in cash and records them on the ex-dividend date. Such distributions on a tax basis are determined in conformity with federal income tax regulations, which may differ from accounting principles generally accepted in the United States of America (“GAAP”). Distributions in excess of tax basis earnings and profits, if any, are reported in each Fund’s financial statements as a tax return of capital at fiscal year-end. |
| E. | Federal Income Taxes - Each Fund intends to comply with the provisions of the Internal Revenue Code of 1986, as amended (the “Internal Revenue Code”), applicable to regulated investment companies and to distribute substantially all of the Fund’s taxable earnings to its shareholders. As such, the Funds will not be subject to federal income taxes on otherwise taxable income (including net realized gains) that is distributed to the shareholders. Therefore, no provision for federal income taxes is recorded in the financial statements. |
Each Fund recognizes the tax benefits of uncertain tax positions only when the position is more likely than not to be sustained. Management has analyzed each Fund’s uncertain tax positions and concluded that no liability for unrecognized tax benefits should be recorded related to uncertain tax positions. Management is not aware of any tax positions for which it is reasonably possible that the total amounts of unrecognized tax benefits will change materially in the next 12 months.
Income and capital gain distributions are determined in accordance with federal income tax regulations, which may differ from GAAP. These differences are primarily due to differing book and tax treatments for in-kind transactions, losses deferred due to wash sales, and passive foreign investment company adjustments, if any.
The Funds file U.S. federal tax returns and tax returns in certain other jurisdictions. Generally, a Fund is subject to examinations by such taxing authorities for up to three years after the filing of the return for the tax period.
| F. | Expenses - Each Fund has agreed to pay an annual unitary management fee to the Adviser. Out of the unitary management fee, the Adviser has agreed to pay for substantially all expenses of the Funds, including the costs of transfer agency, custody, fund administration, legal, audit and other services, except for distribution fees, if any, brokerage expenses, taxes, interest, acquired fund fees and expenses, if any, litigation expenses and other extraordinary expenses, including proxy expenses (except for such proxies related to: (i) changes to the Investment Advisory Agreement, (ii) the election of any Board member who is an “interested person” of the Trust, or (iii) any other matters that directly benefit the Adviser). |
Expenses of the Trust that are excluded from a Fund’s unitary management fee and are directly identifiable to a specific Fund are applied to that Fund. Expenses of the Trust that are excluded from a Fund’s unitary management fee and are not readily identifiable to a specific Fund are allocated in such a manner as deemed equitable, taking into consideration the nature and type of expense and the relative net assets of each Fund.
To the extent a Fund invests in other investment companies, the expenses shown in the accompanying financial statements reflect the expenses of the Fund and do not include any expenses of the investment companies in which it invests. The effects of such investment companies’ expenses are included in the realized and unrealized gain or loss on the investments in the investment companies.
| 40 | ||||
|
| |||
| G. | Accounting Estimates - The preparation of the financial statements in accordance with GAAP requires management to make estimates and assumptions that affect the reported amounts and disclosures in the financial statements, including estimates and assumptions related to taxation. Actual results could differ from these estimates. In addition, the Funds monitor for material events or transactions that may occur or become known after the period-end date and before the date the financial statements are released to print. |
| H. | Indemnifications - Under the Trust’s organizational documents, its Officers and Trustees are indemnified against certain liabilities arising out of the performance of their duties to the Trust. Each Board member who is not an “interested person” (as defined in the 1940 Act) of the Trust (each, an “Independent Trustee”) is also indemnified against certain liabilities arising out of the performance of their duties to the Trust pursuant to an Indemnification Agreement between such trustee and the Trust. Additionally, in the normal course of business, the Trust enters into contracts with service providers that contain general indemnification clauses. The Trust’s maximum exposure under these arrangements is unknown, as this would involve future claims that may be made against the Trust that have not yet occurred. The risk of material loss as a result of such indemnification claims is considered remote. |
| I. | Securities Lending - Each Fund may participate in securities lending and may loan portfolio securities having a market value up to one-third of each Fund’s total assets. Such loans are secured by cash collateral equal to no less than 102% (105% for international securities) of the market value of the loaned securities determined daily by the securities lending provider. Cash collateral received in connection with these loans is invested in short-term money market instruments or affiliated, unregistered investment companies that comply with Rule 2a-7 under the 1940 Act and money market funds (collectively, “affiliated money market funds”) and is shown as such on the Schedules of Investments. Each Fund bears the risk of loss with respect to the investment of collateral. It is the policy of these Funds to obtain additional collateral from or return excess collateral to the borrower by the end of the next business day, following the valuation date of the securities loaned. Therefore, the value of the collateral held may be temporarily less than the value of the securities on loan. When loaning securities, each Fund retains certain benefits of owning the securities, including the economic equivalent of dividends or interest generated by the security. Lending securities entails a risk of loss to each Fund if, and to the extent that, the market value of the securities loaned were to increase, and the borrower did not increase the collateral accordingly, and the borrower failed to return the securities. The securities loaned are subject to termination at the option of the borrower or each Fund. Upon termination, the borrower will return to each Fund the securities loaned and each Fund will return the collateral. Upon the failure of the borrower to return the securities, collateral may be liquidated and the securities may be purchased on the open market to replace the loaned securities. Each Fund could experience delays and costs in gaining access to the collateral and the securities may lose value during the delay which could result in potential losses to each Fund. Some of these losses may be indemnified by the lending agent. Each Fund bears the risk of any deficiency in the amount of the collateral available for return to the borrower due to any loss on the collateral invested. For Funds that participated in securities lending, dividends received on cash collateral investments for securities lending transactions, which are net of compensation to counterparties, are included in Securities lending income on the Statements of Operations. The aggregate value of securities out on loan, if any, is shown on the Statements of Assets and Liabilities. |
Invesco Advisers, Inc. (“Invesco”), an affiliate of the Adviser, serves as an affiliated securities lending agent for each Fund participating in the securities lending program. The Bank of New York Mellon (“BNYM”) also serves as a lending agent. To the extent a Fund utilizes Invesco as an affiliated securities lending agent, the Fund conducts its securities lending in accordance with, and in reliance upon, no-action letters issued by the SEC staff that provide guidance on how an affiliate may act as a direct agent lender and receive compensation for those services in a manner consistent with the federal securities laws. For the fiscal year ended October 31, 2022, there were no affiliated transactions with Invesco.
| J. | Foreign Currency Translations - Foreign currency is valued at the close of the NYSE based on quotations posted by banks and major currency dealers. Portfolio securities and other assets and liabilities denominated in foreign currencies are translated into U.S. dollar amounts at the date of valuation. Purchases and sales of portfolio securities (net of foreign taxes withheld on disposition) and income items denominated in foreign currencies are translated into U.S. dollar amounts on the respective dates of such transactions. Each Fund does not separately account for the portion of the results of operations resulting from changes in foreign exchange rates on investments and the fluctuations arising from changes in market prices of securities held. The combined results of changes in foreign exchange rates and the fluctuation of market prices on investments (net of estimated foreign tax withholding) are included with the net realized and unrealized gain or loss from investments in the Statements of Operations. Reported net realized foreign currency gains or losses arise from (1) sales of foreign currencies, (2) currency gains or losses realized between the trade and settlement dates on securities transactions, and (3) the difference between the amounts of dividends, interest, and foreign withholding taxes recorded on a Fund’s books and the U.S. dollar equivalent of the amounts actually received or paid. Net unrealized foreign currency gains and losses arise from changes in the fair values of assets and liabilities, other than investments in securities at fiscal period-end, resulting from changes in exchange rates. |
Each Fund may invest in foreign securities, which may be subject to foreign taxes on income, gains on investments or currency repatriation, a portion of which may be recoverable. Foreign taxes, if any, are recorded based on the tax regulations and rates that exist in the foreign markets in which a Fund invests.
| 41 | ||||
|
| |||
| K. | Other Risks |
AP Concentration Risk. Only APs may engage in creation or redemption transactions directly with each Fund. Each Fund has a limited number of institutions that may act as APs, and such APs have no obligation to submit creation or redemption orders. Consequently, there is no assurance that APs will establish or maintain an active trading market for the Shares. This risk may be heightened to the extent that securities held by each Fund are traded outside a collateralized settlement system. In that case, APs may be required to post collateral on certain trades on an agency basis (i.e., on behalf of other market participants), which only a limited number of APs may be able to do. In addition, to the extent that APs exit the business or are unable to proceed with creation and/or redemption orders with respect to each Fund and no other AP is able to step forward to create or redeem Creation Units, this may result in a significantly diminished trading market for Fund Shares, and Shares may be more likely to trade at a premium or discount to a Fund’s NAV and to face trading halts and/or delisting. Investments in non-U.S. securities, which may have lower trading volumes or could experience extended market closures or trading halts, may increase the risk that APs may not be able to effectively create or redeem Creation Units or the risk that the Shares may be halted and/or delisted.
Call Risk. If interest rates fall, it is possible that issuers of callable securities with high interest coupons will “call” (or prepay) their bonds before their maturity date. If an issuer exercises such a call during a period of declining interest rates, a Fund may have to replace such called security with a lower yielding security. If that were to happen, such Fund’s net investment income could fall.
Changing Global Fixed-Income Market Conditions Risk. The historically low interest rate environment observed over the past several years was created in part by the Federal Reserve Board (“FRB”) and certain foreign central banks keeping the federal funds and equivalent foreign rates at, near or below zero. In recent years, the FRB and certain foreign central banks began “tapering” their quantitative easing programs, leading to fluctuations in the Federal Funds Rate and equivalent foreign rates. However, in response to the impact of the COVID-19 pandemic, in March 2020 the FRB announced cuts to the Federal Funds Rate and a new round of quantitative easing, before implementing several rounds of rate increases in 2022. Because there is little precedent for this situation, it is difficult to predict the impact of these rate changes and any future rate changes on various markets. Any additional changes to the monetary policy by the FRB and foreign central banks or other regulatory actions may affect interest rates and/or reduce liquidity for fixed-income investments, particularly those with longer maturities. In addition, decreases in fixed-income dealer market-making capacity may also potentially lead to heightened volatility and reduced liquidity in the fixed-income markets. As a result, the value of a Fund’s investments and share price may decline. Changes in FRB or foreign central bank policies could also result in higher than normal shareholder redemptions, which could potentially increase a Fund’s portfolio turnover rate and transaction costs.
Fixed-Income Securities Risk. Fixed-income securities are subject to interest rate risk and credit risk. Interest rate risk refers to fluctuations in the value of a fixed-income security resulting from changes in the general level of interest rates. When the general level of interest rates goes up, the prices of most fixed-income securities go down. When the general level of interest rates goes down, the prices of most fixed-income securities go up. Fixed-income securities with longer maturities typically are more sensitive to changes in interest rates, making them more volatile than securities with shorter maturities. Credit risk refers to the possibility that the issuer of a security will be unable and/or unwilling to make timely interest payments and/or repay the principal on its debt. Debt instruments are subject to varying degrees of credit risk, which may be reflected in credit ratings. There is a possibility that the credit rating of a fixed-income security may be downgraded after purchase, which may occur quickly and without advance warning following sudden market downturns or unexpected developments involving an issuer, and which may adversely affect the liquidity and value of the security. Additionally, from time to time, uncertainty regarding the status of negotiations in the U.S. Government to increase the statutory debt limit, commonly called the “debt ceiling”, could increase the risk that the U.S. Government may default on payments on certain U.S. Government securities, cause the credit rating of the U.S. Government to be downgraded, increase volatility in the stock and bond markets, result in higher interest rates, reduce prices of U.S. Treasury securities, and/or increase the costs of various kinds of debt. If a U.S. Government-sponsored entity is negatively impacted by legislative or regulatory action, is unable to meet its obligations, or its creditworthiness declines, the performance of a Fund that holds securities of that entity will be adversely impacted.
Foreign Fixed-Income Investment Risk. For certain Funds, investments in fixed-income securities of non-U.S. issuers are subject to the same risks as other debt securities, notably credit risk, market risk, interest rate risk and liquidity risk, while also facing risks beyond those associated with investments in U.S. securities. For example, foreign securities may have relatively low market liquidity, greater market volatility, decreased publicly available information, and less reliable financial information about issuers, and inconsistent and potentially less stringent accounting, auditing and financial reporting requirements and standards of practice, including recordkeeping standards, comparable to those applicable to domestic issuers. Foreign securities also are subject to the risks of expropriation, nationalization, political instability or other adverse political or economic developments and the difficulty of enforcing obligations in other countries. Investments in foreign securities also may be subject to dividend withholding or confiscatory taxes, currency blockage and/or transfer restrictions and higher transactional costs.
Geographic Concentration Risk. A natural or other disaster could occur in a geographic region in which a Fund invests, which could affect the economy or particular business operations of companies in that specific geographic region and adversely impact the Fund’s investments in the affected region.
| 42 | ||||
|
| |||
Index Risk. Unlike many investment companies, each Fund does not utilize an investing strategy that seeks returns in excess of its Underlying Index. Therefore, a Fund would not necessarily buy or sell a security unless that security is added or removed, respectively, from its Underlying Index, even if that security generally is underperforming. Additionally, each Fund rebalances its portfolio in accordance with its Underlying Index, and, therefore, any changes to the Underlying Index’s rebalance schedule will result in corresponding changes to each Fund’s rebalance schedule.
Industry Concentration Risk. In following its methodology, each Fund’s Underlying Index from time to time may be concentrated to a significant degree in securities of issuers operating in a single industry or industry group. To the extent that each Underlying Index concentrates in the securities of issuers in a particular industry or industry group, the corresponding Fund will also concentrate its investments to approximately the same extent. By concentrating its investments in an industry or industry group, each Fund may face more risks than if it were diversified broadly over numerous industries or industry groups. Such industry-based risks, any of which may adversely affect the companies in which each Fund invests, may include, but are not limited to, the following: general economic conditions or cyclical market patterns that could negatively affect supply and demand in a particular industry; competition for resources, adverse labor relations, political or world events; obsolescence of technologies; and increased competition or new product introductions that may affect the profitability or viability of companies in an industry. In addition, at times, such industry or industry group may be out of favor and underperform other industries or the market as a whole.
Liquidity Risk. Liquidity risk exists when a particular investment is difficult to purchase or sell. If a Fund invests in illiquid securities or current portfolio securities become illiquid, it may reduce the returns of the Fund because the Fund may be unable to sell the illiquid securities at an advantageous time or price.
Market Risk. Securities in each Underlying Index are subject to market fluctuations. You should anticipate that the value of the Shares will decline, more or less, in correlation with any decline in value of the securities in an Underlying Index. Additionally, natural or environmental disasters, widespread disease or other public health issues, war, acts of terrorism or other events could result in increased premiums or discounts to each Fund’s NAV.
Non-Correlation Risk. Each Fund’s return may not match the return of its corresponding Underlying Index for a number of reasons. For example, each Fund incurs operating expenses not applicable to the Underlying Index, and incurs costs in buying and selling securities, especially when rebalancing the Fund’s securities holdings to reflect changes in the composition of its corresponding Underlying Index. Additionally, a Fund’s use of a representative sampling approach may cause the Fund not to be as well-correlated with the return of its corresponding Underlying Index as would be the case if the Fund purchased all of the securities in its corresponding Underlying Index in the proportions represented in the Underlying Index. In addition, the performance of each Fund and its corresponding Underlying Index may vary due to asset valuation differences and differences between each Fund’s portfolio and its corresponding Underlying Index resulting from legal restrictions, costs or liquidity constraints.
Non-Investment Grade Securities Risk. Non-investment grade securities (commonly known as “junk bonds”) and unrated securities of comparable credit quality are considered speculative and are subject to the increased risk of an issuer’s inability to meet principal and interest payment obligations. These securities may be subject to greater price volatility due to such factors as specific corporate developments, interest rate sensitivity, negative perceptions of the non-investment grade securities markets generally, real or perceived adverse economic and competitive industry conditions and less secondary market liquidity. If the issuer of non-investment grade securities defaults, a Fund may incur additional expenses to seek recovery.
Sampling Risk. Certain Funds’ use of a representative sampling approach may result in the Fund holding a smaller number of securities than are in its respective Underlying Index. As a result, an adverse development with respect to an issuer of securities held by the Fund could result in a greater decline in NAV than would be the case if the Fund held all of the securities in its Underlying Index. To the extent the assets in the Fund are smaller, these risks will be greater.
Valuation Risk. Financial information related to securities of non-U.S. issuers may be less reliable than information related to securities of U.S. issuers, which may make it difficult to obtain a current price for a non-U.S. security held by a Fund. In certain circumstances, market quotations may not be readily available for some Fund securities, and those securities may be fair valued. The value established for a security through fair valuation may be different from what would be produced if the security had been valued using market quotations. Fund securities that are valued using techniques other than market quotations, including “fair valued” securities, may be subject to greater fluctuations in their value from one day to the next than would be the case if market quotations were used. In addition, there is no assurance that a Fund could sell a portfolio security for the value established for it at any time, and it is possible that a Fund would incur a loss because a security is sold at a discount to its established value.
COVID-19 Risk. The COVID-19 strain of coronavirus has resulted in instances of market closures and dislocations, extreme volatility, liquidity constraints and increased trading costs. Efforts to contain its spread have resulted in travel restrictions, disruptions of healthcare systems, business operations (including business closures) and supply chains, layoffs, lower consumer demand and employee availability, and defaults and credit downgrades, among other significant economic impacts that have disrupted global economic activity across many industries. Such economic impacts may exacerbate other pre-existing political, social and economic risks locally or globally and cause general concern and uncertainty. The full economic
| 43 | ||||
|
| |||
impact and ongoing effects of COVID-19 (or other future epidemics or pandemics) at the macro-level and on individual businesses are unpredictable and may result in significant and prolonged effects on the Funds’ performance.
NOTE 3–Investment Advisory Agreement and Other Agreements
The Trust has entered into an Investment Advisory Agreement with the Adviser on behalf of each Fund, pursuant to which the Adviser has overall responsibility for the selection and ongoing monitoring of the Funds’ investments, managing the Funds’ business affairs and providing certain clerical, bookkeeping and other administrative services.
Pursuant to the Investment Advisory Agreement, each Fund accrues daily and pays monthly to the Adviser an annual unitary management fee. Out of the unitary management fee, the Adviser has agreed to pay for substantially all expenses of the Funds, including the cost of transfer agency, custody, fund administration, legal, audit and other services, except for distribution fees, if any, brokerage expenses, taxes, interest, acquired fund fees and expenses, if any, litigation expenses and other extraordinary expenses, including proxy expenses (except for such proxies related to: (i) changes to the Investment Advisory Agreement, (ii) the election of any Board member who is an “interested person” of the Trust, or (iii) any other matters that directly benefit the Adviser). The unitary management fee is paid by each Fund to the Adviser at the following annual rates:
| Unitary Management Fees | ||
| (as a % of average daily net assets) | ||
| Emerging Markets Sovereign Debt ETF | 0.50% | |
| Global Short Term High Yield Bond ETF | 0.35% | |
| International Corporate Bond ETF | 0.50% | |
Through at least August 31, 2024, the Adviser has contractually agreed to waive the management fee payable by each Fund in an amount equal to the lesser of: (i) 100% of the net advisory fees earned by the Adviser or an affiliate of the Adviser that are attributable to the Fund’s investments in money market funds that are managed by affiliates of the Adviser and other funds (including ETFs) managed by the Adviser or affiliates of the Adviser or (ii) the management fee available to be waived. This waiver does not apply to a Fund’s investment of cash collateral received for securities lending. There is no guarantee that the Adviser will extend the waiver of these fees past that date.
For the fiscal year ended October 31, 2022, the Adviser waived fees for each Fund in the following amounts:
| Emerging Markets Sovereign Debt ETF | $ | 3,068 | ||
| Global Short Term High Yield Bond ETF | 1,452 | |||
| International Corporate Bond ETF | 22 | |||
The Trust has entered into a Distribution Agreement with Invesco Distributors, Inc. (the “Distributor”), which serves as the distributor of Creation Units for each Fund. The Distributor does not maintain a secondary market in the Shares. The Funds are not charged any fees pursuant to the Distribution Agreement. The Distributor is an affiliate of the Adviser.
The Adviser has entered into a licensing agreement for each Fund with the following entities (each, a “Licensor”):
Fund | Licensor | |
| Emerging Markets Sovereign Debt ETF | Deutsche Bank Securities Inc. | |
| Global Short Term High Yield Bond ETF | Deutsche Bank Securities Inc. | |
| International Corporate Bond ETF | S&P Dow Jones Indices LLC | |
Each Underlying Index name trademark is owned by its respective Licensor. These trademarks have been licensed to the Adviser for use by the Funds. Each Fund is entitled to use its Underlying Index pursuant to the Trust’s sub-licensing agreement with the Adviser. The Funds are not sponsored, endorsed, sold or promoted by the Licensors, and the Licensors make no representation regarding the advisability of investing in any of the Funds.
The Trust has entered into service agreements whereby BNYM, a wholly-owned subsidiary of The Bank of New York Mellon Corporation, serves as the administrator, custodian, fund accountant and transfer agent for each Fund.
NOTE 4–Additional Valuation Information
GAAP defines fair value as the price that would be received to sell an asset or paid to transfer a liability in an orderly transaction between market participants at the measurement date, under current market conditions. GAAP establishes a hierarchy that prioritizes the inputs to valuation methods, giving the highest priority to readily available unadjusted quoted prices in an active market for identical assets (Level 1) and the lowest priority to significant unobservable inputs (Level 3), generally when market prices are not readily available. Based on the valuation inputs, the securities or other investments are tiered into one of three levels. Changes in valuation methods may result in transfers in or out of an investment’s assigned level:
| Level 1 – | Prices are determined using quoted prices in an active market for identical assets. |
| 44 | ||||
|
| |||
| Level 2 – | Prices are determined using other significant observable inputs. Observable inputs are inputs that other market participants may use in pricing a security. These may include quoted prices for similar securities, interest rates, prepayment speeds, credit risk, yield curves, loss severities, default rates, discount rates, volatilities and others. | |
| Level 3 – | Prices are determined using significant unobservable inputs. In situations where quoted prices or observable inputs are unavailable (for example, when there is little or no market activity for an investment at the end of the period), unobservable inputs may be used. Unobservable inputs reflect the Adviser’s assumptions about the factors market participants would use in determining fair value of the securities or instruments and would be based on the best available information. | |
The following is a summary of the tiered valuation input levels, as of October 31, 2022. The level assigned to the securities valuations may not be an indication of the risk or liquidity associated with investing in those securities. Because of the inherent uncertainties of valuation, the values reflected in the financial statements may materially differ from the value received upon actual sale of those investments.
| Level 1 | Level 2 | Level 3 | Total | |||||||||||||||||
Emerging Markets Sovereign Debt ETF | ||||||||||||||||||||
Investments in Securities | ||||||||||||||||||||
U.S. Dollar Denominated Bonds & Notes | $ | - | $ | 1,399,589,880 | $ | - | $ | 1,399,589,880 | ||||||||||||
Money Market Funds | 7,905,005 | 54,902,891 | - | 62,807,896 | ||||||||||||||||
|
|
|
|
|
|
|
| |||||||||||||
Total Investments | $ | 7,905,005 | $ | 1,454,492,771 | $ | - | $ | 1,462,397,776 | ||||||||||||
|
|
|
|
|
|
|
| |||||||||||||
Global Short Term High Yield Bond ETF | ||||||||||||||||||||
Investments in Securities | ||||||||||||||||||||
U.S. Dollar Denominated Bonds & Notes | $ | - | $ | 177,314,785 | $ | 0 | $ | 177,314,785 | ||||||||||||
Preferred Stocks | - | - | 263,560 | 263,560 | ||||||||||||||||
Common Stocks & Other Equity Interests | - | 116,599 | 21,668 | 138,267 | ||||||||||||||||
Non-U.S. Dollar Denominated Bonds & Notes | - | 124,788 | - | 124,788 | ||||||||||||||||
Money Market Funds | 4,619,354 | 9,503,926 | - | 14,123,280 | ||||||||||||||||
|
|
|
|
|
|
|
| |||||||||||||
Total Investments in Securities | 4,619,354 | 187,060,098 | 285,228 | 191,964,680 | ||||||||||||||||
|
|
|
|
|
|
|
| |||||||||||||
Other Investments - Assets | ||||||||||||||||||||
Investments Matured | - | 1,197,518 | 220,226 | 1,417,744 | ||||||||||||||||
|
|
|
|
|
|
|
| |||||||||||||
Total Investments | $ | 4,619,354 | $ | 188,257,616 | $ | 505,454 | $ | 193,382,424 | ||||||||||||
|
|
|
|
|
|
|
| |||||||||||||
International Corporate Bond ETF | ||||||||||||||||||||
Investments in Securities | ||||||||||||||||||||
Non-U.S. Dollar Denominated Bonds & Notes | $ | - | $ | 96,163,901 | $ | - | $ | 96,163,901 | ||||||||||||
Money Market Funds | 296,525 | 671,630 | - | 968,155 | ||||||||||||||||
|
|
|
|
|
|
|
| |||||||||||||
Total Investments | $ | 296,525 | $ | 96,835,531 | $ | - | $ | 97,132,056 | ||||||||||||
|
|
|
|
|
|
|
| |||||||||||||
NOTE 5–Distributions to Shareholders and Tax Components of Net Assets
Tax Character of Distributions to Shareholders Paid During the Fiscal Years Ended October 31, 2022 and 2021:
| 2022 | 2021 | |||||||||||||||||||||||
| Ordinary | Long-Term | Return of | Ordinary | Long-Term | Return of | |||||||||||||||||||
| Income* | Capital Gains | Capital | Income* | Capital Gains | Capital | |||||||||||||||||||
Emerging Markets Sovereign Debt ETF | $ | 121,305,087 | $ | - | $ | - | $ | 128,603,511 | $ | - | $ | - | ||||||||||||
Global Short Term High Yield Bond ETF | 8,881,528 | - | 1,187,837 | 9,921,771 | - | 1,754,213 | ||||||||||||||||||
International Corporate Bond ETF | 748,498 | 377,281 | 984,729 | 1,151,105 | 150,010 | - | ||||||||||||||||||
| * | Includes short-term capital gain distributions, if any. |
| 45 | ||||
|
| |||
Tax Components of Net Assets at Fiscal Year-End:
| Net | Net | |||||||||||||||||||
| Unrealized | Unrealized | |||||||||||||||||||
| Appreciation | (Depreciation)- | Shares of | ||||||||||||||||||
| (Depreciation)- | Foreign | Capital Loss | Beneficial | Total | ||||||||||||||||
| Investments | Currencies | Carryforwards | Interest | Net Assets | ||||||||||||||||
Emerging Markets Sovereign Debt ETF | $ | (615,602,888 | ) | $ | (660 | ) | $ | (858,647,374 | ) | $ | 2,903,630,793 | $ | 1,429,379,871 | |||||||
Global Short Term High Yield Bond ETF | (20,785,371 | ) | (132 | ) | (29,001,100 | ) | 236,591,142 | 186,804,539 | ||||||||||||
International Corporate Bond ETF | (27,966,519 | ) | (35,413 | ) | (5,724,727 | ) | 131,335,757 | 97,609,098 | ||||||||||||
Capital loss carryforwards are calculated and reported as of a specific date. Results of transactions and other activity after that date may affect the amount of capital loss carryforwards actually available for the Funds to utilize. The ability to utilize capital loss carryforwards in the future may be limited under the Internal Revenue Code and related regulations based on the results of future transactions.
The Funds have capital loss carryforwards as of October 31, 2022, as follows:
| No expiration | ||||||||||||
| Short-Term | Long-Term | Total* | ||||||||||
Emerging Markets Sovereign Debt ETF | $ | 306,562,180 | $ | 552,085,194 | $ | 858,647,374 | ||||||
Global Short Term High Yield Bond ETF | 7,746,895 | 21,254,205 | 29,001,100 | |||||||||
International Corporate Bond ETF | 2,905,165 | 2,819,562 | 5,724,727 | |||||||||
| * | Capital loss carryforwards are reduced for limitations, if any, to the extent required by the Internal Revenue Code and may be further limited depending upon a variety of factors, including the realization of net unrealized gains or losses as of the date of any reorganization. |
NOTE 6–Investment Transactions
For the fiscal year ended October 31, 2022, the cost of securities purchased and the proceeds from sales of securities (other than short-term securities, U.S. Government obligations, money market funds and in-kind transactions, if any) were as follows:
| Purchases | Sales | |||||||||||
Emerging Markets Sovereign Debt ETF | $ | 809,304,117 | $ | 823,925,898 | ||||||||
Global Short Term High Yield Bond ETF | 110,448,907 | 114,080,745 | ||||||||||
International Corporate Bond ETF | 41,790,064 | 34,581,378 | ||||||||||
For the fiscal year ended October 31, 2022, in-kind transactions associated with creations and redemptions were as follows:
| In-kind | In-kind | |||||||||||
| Purchases | Sales | |||||||||||
Emerging Markets Sovereign Debt ETF | $ | 402,693,069 | $ | 758,040,182 | ||||||||
Global Short Term High Yield Bond ETF | 8,908,270 | 27,461,806 | ||||||||||
International Corporate Bond ETF | 37,376,164 | 24,687,225 | ||||||||||
Gains (losses) on in-kind transactions are generally not considered taxable gains (losses) for federal income tax purposes. As of October 31, 2022, the aggregate cost of investments, including any derivatives, on a tax basis includes adjustments for financial reporting purposes as of the most recently completed federal income tax reporting period-end:
| Net | ||||||||||||||||
| Gross | Gross | Unrealized | ||||||||||||||
| Unrealized | Unrealized | Appreciation | ||||||||||||||
| Appreciation | (Depreciation) | (Depreciation) | Cost | |||||||||||||
Emerging Markets Sovereign Debt ETF | $161,478 | $ | (615,764,366 | ) | $ | (615,602,888 | ) | $ | 2,078,000,664 | |||||||
Global Short Term High Yield Bond ETF | 189,312 | (20,974,683 | ) | (20,785,371 | ) | 214,167,795 | ||||||||||
International Corporate Bond ETF | 338,349 | (28,304,868 | ) | (27,966,519 | ) | 125,098,575 | ||||||||||
| 46 | ||||
|
| |||
NOTE 7–Reclassification of Permanent Differences
Primarily as a result of differing book/tax treatment of foreign currency transactions, net operating losses and in-kind transactions, amounts were reclassified between undistributed net investment income (loss), undistributed net realized gain (loss) and Shares of beneficial interest. These reclassifications had no effect on the net assets of each Fund. For the fiscal year ended October 31, 2022, the reclassifications were as follows:
| Undistributed Net Investment Income (Loss) | Undistributed Net Realized Gain | Shares of Beneficial Interest | |||||||||||||||||||||||||||||||||||||||||||||||||||||
Emerging Markets Sovereign Debt ETF | $ | 3,356,122 | $ | 69,435,582 | $ | (72,791,704 | ) | ||||||||||||||||||||||||||||||||||||||||||||||||
Global Short Term High Yield Bond ETF | 68,719 | 2,068,613 | (2,137,332 | ) | |||||||||||||||||||||||||||||||||||||||||||||||||||
International Corporate Bond ETF | (1,449,058 | ) | 8,240,796 | (6,791,738 | ) | ||||||||||||||||||||||||||||||||||||||||||||||||||
NOTE 8–Trustees’ and Officer’s Fees
The Adviser, as a result of each Fund’s unitary management fee, pays remuneration to the Independent Trustees and an Officer of the Trust on behalf of the Funds. The Trustee who is an “interested person” of the Trust does not receive any Trustees’ fees.
The Trust has adopted a deferred compensation plan (the “Plan”). Under the Plan, each Independent Trustee who has executed a Deferred Fee Agreement (a “Participating Trustee”) may defer receipt of all or a portion of their compensation (“Deferral Fees”). Such Deferral Fees are deemed to be invested in select Invesco ETFs. The Deferral Fees payable to a Participating Trustee are valued as of the date such Deferral Fees would have been paid to a Participating Trustee. The value increases with contributions or with increases in the value of the Shares selected, and the value decreases with distributions or with declines in the value of the Shares selected. Obligations under the Plan represent unsecured claims against the general assets of the Funds.
NOTE 9–Capital
Shares are issued and redeemed by each Fund only in Creation Units consisting of a specified number of Shares as set forth in each Fund’s prospectus. Only APs are permitted to purchase or redeem Creation Units from the Funds. Such transactions are principally permitted in exchange for Deposit Securities, with a balancing cash component to equate the transaction to the NAV per Share of a Fund on the transaction date. However, for such Funds, cash in an amount equivalent to the value of certain securities may be substituted, generally when the securities are not available in sufficient quantity for delivery, not eligible for trading by the AP or as a result of other market circumstances.
To the extent that the Funds permit transactions in exchange for Deposit Securities, each Fund may issue Shares in advance of receipt of Deposit Securities subject to various conditions, including a requirement to maintain on deposit with the Trust cash at least equal to 105% of the market value of the missing Deposit Securities. In accordance with the Trust’s Participant Agreement, Creation Units will be issued to an AP, notwithstanding the fact that the corresponding Deposit Securities have not been received in part or in whole, in reliance on the undertaking of the AP to deliver the missing Deposit Securities as soon as possible, which undertaking shall be secured by the AP’s delivery and maintenance of collateral consisting of cash in the form of U.S. dollars in immediately available funds having a value (marked-to-market daily) at least equal to 105%, which the Adviser may change from time to time, of the value of the missing Deposit Securities.
Certain transaction fees may be charged by the Funds for creations and redemptions, which are treated as increases in capital. Transactions in each Fund’s Shares are disclosed in detail in the Statements of Changes in Net Assets.
| 47 | ||||
|
| |||
Report of Independent Registered Public Accounting Firm
To the Board of Trustees of Invesco Exchange-Traded Fund Trust II and Shareholders of Invesco Emerging Markets Sovereign Debt ETF, Invesco Global Short Term High Yield Bond ETF and Invesco International Corporate Bond ETF
Opinions on the Financial Statements
We have audited the accompanying statements of assets and liabilities, including the schedules of investments, of Invesco Emerging Markets Sovereign Debt ETF, Invesco Global Short Term High Yield Bond ETF and Invesco International Corporate Bond ETF (three of the funds constituting Invesco Exchange-Traded Fund Trust II, hereafter collectively referred to as the “Funds”) as of October 31, 2022, the related statements of operations for the year ended October 31, 2022, the statements of changes in net assets for each of the two years in the period ended October 31, 2022, including the related notes, and the financial highlights for each of the five years in the period ended October 31, 2022 (collectively referred to as the “financial statements”). In our opinion, the financial statements present fairly, in all material respects, the financial position of each of the Funds as of October 31, 2022, the results of each of their operations for the year then ended, the changes in each of their net assets for each of the two years in the period ended October 31, 2022 and each of the financial highlights for each of the five years in the period ended October 31, 2022, in conformity with accounting principles generally accepted in the United States of America.
Basis for Opinions
These financial statements are the responsibility of the Funds’ management. Our responsibility is to express an opinion on the Funds’ financial statements based on our audits. We are a public accounting firm registered with the Public Company Accounting Oversight Board (United States) (“PCAOB”) and are required to be independent with respect to the Funds in accordance with the U.S. federal securities laws and the applicable rules and regulations of the Securities and Exchange Commission and the PCAOB.
We conducted our audits of these financial statements in accordance with the standards of the PCAOB. Those standards require that we plan and perform the audit to obtain reasonable assurance about whether the financial statements are free of material misstatement, whether due to error or fraud.
Our audits included performing procedures to assess the risks of material misstatement of the financial statements, whether due to error or fraud, and performing procedures that respond to those risks. Such procedures included examining, on a test basis, evidence regarding the amounts and disclosures in the financial statements. Our audits also included evaluating the accounting principles used and significant estimates made by management, as well as evaluating the overall presentation of the financial statements. Our procedures included confirmation of securities owned as of October 31, 2022 by correspondence with the custodian, transfer agent, and brokers; when replies were not received from brokers, we performed other auditing procedures. We believe that our audits provide a reasonable basis for our opinions.
/s/ PricewaterhouseCoopers LLP
Chicago, Illinois
December 23, 2022
We have served as the auditor of one or more of the investment companies in the Invesco group of investment companies since at least 1995. We have not been able to determine the specific year we began serving as auditor.
| 48 | ||||
|
| |||
Calculating your ongoing Fund expenses
Example
As a shareholder of a Fund of the Invesco Exchange-Traded Fund Trust II, you incur a unitary management fee. In addition to the unitary management fee, a shareholder may pay distribution fees, if any, brokerage expenses, taxes, interest, acquired fund fees and expenses, if any, litigation expenses and other extraordinary expenses, including proxy expenses (except for such proxies related to: (i) changes to the Investment Advisory Agreement, (ii) the election of any Board member who is an “interested person” of the Trust, or (iii) any other matters that directly benefit the Adviser). The expense examples below are intended to help you understand your ongoing costs (in dollars) of investing in the Funds and to compare these costs with the ongoing costs of investing in other funds.
The example is based on an investment of $1,000 invested at the beginning of the period and held for the entire period May 1, 2022 through October 31, 2022.
Actual Expenses
The first line in the following table provides information about actual account values and actual expenses. You may use the information in this line, together with the amount you invested, to estimate the expenses that you paid over the period. Simply divide your account value by $1,000 (for example, an $8,600 account value divided by $1,000 = 8.6), then multiply the result by the number in the first line under the heading “Expenses Paid During the Six-Month Period” to estimate the expenses you paid on your account during this period.
Hypothetical Example for Comparison Purposes
The second line in the following table provides information about hypothetical account values and hypothetical expenses based on each Fund’s actual expense ratio and an assumed annualized rate of return of 5% per year before expenses, which is not the Fund’s actual return. The hypothetical account values and expenses may not be used to estimate the actual ending account balance or expenses you paid for the period. You may use this information to compare the ongoing costs of investing in the Funds and other funds. To do so, compare this 5% hypothetical example with the 5% hypothetical examples that appear in the shareholder reports of the other funds.
Please note that the expenses shown in the table are meant to highlight your ongoing costs only, and do not reflect any transactional costs, such as sales charges and brokerage commissions. Therefore, the second line in the table is useful in comparing ongoing costs only, and will not help you determine the relative total costs of owning different funds. In addition, if these transactional costs were included, your costs would have been higher.
| Annualized | ||||||||||||||||
| Beginning | Ending | Expense Ratio | Expenses Paid | |||||||||||||
| Account Value | Account Value | Based on the | During the | |||||||||||||
| May 1, 2022 | October 31, 2022 | Six-Month Period | Six-Month Period(1) | |||||||||||||
Invesco Emerging Markets Sovereign Debt ETF (PCY) | ||||||||||||||||
Actual | $1,000.00 | $ 858.90 | 0.50% | $2.34 | ||||||||||||
Hypothetical (5% return before expenses) | 1,000.00 | 1,022.68 | 0.50 | 2.55 | ||||||||||||
Invesco Global Short Term High Yield Bond ETF (PGHY) | ||||||||||||||||
Actual | 1,000.00 | 982.10 | 0.35 | 1.75 | ||||||||||||
Hypothetical (5% return before expenses) | 1,000.00 | 1,023.44 | 0.35 | 1.79 | ||||||||||||
Invesco International Corporate Bond ETF (PICB) | ||||||||||||||||
Actual | 1,000.00 | 848.50 | 0.50 | 2.33 | ||||||||||||
Hypothetical (5% return before expenses) | 1,000.00 | 1,022.68 | 0.50 | 2.55 | ||||||||||||
| (1) | Expenses are calculated using the annualized expense ratio, which represents the ongoing expenses as a percentage of net assets for the six-month period ended October 31, 2022. Expenses are calculated by multiplying the Fund’s annualized expense ratio by the average account value for the period, then multiplying the result by 184/365. Expense ratios for the most recent six-month period may differ from expense ratios based on the annualized data in the Financial Highlights. |
| 49 | ||||
|
| |||
Form 1099-DIV, Form 1042-S and other year-end tax information provide shareholders with actual calendar year amounts that should be included in their tax returns. Shareholders should consult their tax advisers.
The following distribution information is being provided as required by the Internal Revenue Code or to meet a specific state’s requirement.
Each Fund designates the following amounts or, if subsequently determined to be different, the maximum amount allowable for its fiscal year ended October 31, 2022:
| Corporate | Qualified | |||||||||||||||||||||||||||||||||||||||
| Qualified | Qualified | Dividends | U.S. | Business | Qualified | Short | ||||||||||||||||||||||||||||||||||
| Business | Dividend | Received | Treasury | Interest | Interest | Long Term | Term | |||||||||||||||||||||||||||||||||
| Income* | Income* | Deduction* | Obligations* | Income* | Income* | Capital Gains | Gains | |||||||||||||||||||||||||||||||||
| Invesco Emerging Markets Sovereign Debt ETF | 0 | % | 0 | % | 0 | % | 0 | % | 99 | % | 0 | % | $ | - | $ | - | ||||||||||||||||||||||||
| Invesco Global Short Term High Yield Bond ETF | 0 | % | 0 | % | 0 | % | 0 | % | 100 | % | 34 | % | - | - | ||||||||||||||||||||||||||
| Invesco International Corporate Bond ETF | 0 | % | 0 | % | 0 | % | 0 | % | 69 | % | 0 | % | 377,281 | 34,198 | ||||||||||||||||||||||||||
| * | The above percentages are based on ordinary income dividends paid to shareholders during the Fund’s fiscal year. |
| 50 | ||||
|
| |||
The Independent Trustees of the Trust, their term of office and length of time served, their principal business occupations during at least the past five years, the number of portfolios in the Fund Complex (as defined below) overseen by each Independent Trustee and the other directorships, if any, held by each Independent Trustee are shown below:
As of October 31, 2022
| Name, Address and Year of Birth of Independent Trustees | Position(s) with Trust | Term of and Length of | Principal Occupation(s) During the Past 5 Years | Number of in Fund | Other Directorships Held by Independent Trustees During the Past 5 Years | |||||
Ronn R. Bagge–1958 c/o Invesco Capital Management LLC 3500 Lacey Road, Suite 700 Downers Grove, IL 60515 | Vice Chair of the Board; Chair of the Nominating and Governance Committee and Trustee | Vice Chair since 2018; Chair of the Nominating and Governance Committee and Trustee since 2007 | Founder and Principal, YQA Capital Management LLC (1998-Present); formerly, Owner/CEO of Electronic Dynamic Balancing Co., Inc. (high-speed rotating equipment service provider). | 234 | Chair (since 2021) and member (since 2017) of the Joint Investment Committee, Mission Aviation Fellowship and MAF Foundation; Trustee, Mission Aviation Fellowship (2017-Present). | |||||
Todd J. Barre–1957 c/o Invesco Capital Management LLC 3500 Lacey Road, Suite 700 Downers Grove, IL 60515 | Trustee | Since 2010 | Assistant Professor of Business, Trinity Christian College (2010-2016); formerly, Vice President and Senior Investment Strategist (2001-2008), Director of Open Architecture and Trading (2007-2008), Head of Fundamental Research (2004-2007) and Vice President and Senior Fixed Income Strategist (1994-2001), BMO Financial Group/Harris Private Bank. | 234 | None. | |||||
| * | This is the date the Independent Trustee began serving the Trust. Each Independent Trustee serves an indefinite term, until his or her successor is elected. |
| ** | Fund Complex includes all open- and closed-end funds (including all of their portfolios) advised by the Adviser and any affiliated person of the Adviser. |
| 51 | ||||
|
| |||
Trustees and Officers–(continued)
| Name, Address and Year of Birth of Independent Trustees | Position(s) with Trust | Term of and Length of | Principal Occupation(s) During the Past 5 Years | Number of in Fund | Other Directorships Held by Independent Trustees During the Past 5 Years | |||||
Edmund P. Giambastiani, Jr.–1948 c/o Invesco Capital Management LLC 3500 Lacey Road, Suite 700 Downers Grove, IL 60515 | Trustee | Since 2019 | President, Giambastiani Group LLC (national security and energy consulting) (2007-Present); Director, First Eagle Alternative Credit LLC (2020-Present); Advisory Board Member, Massachusetts Institute of Technology Lincoln Laboratory (federally-funded research development) (2010-Present); Defense Advisory Board Member, Lawrence Livermore National Laboratory (2013-Present); formerly, Director, The Boeing Company (2009-2021); Trustee, MITRE Corporation (federally funded research development) (2008-2020); Director, THL Credit, Inc. (alternative credit investment manager) (2016-2020); Chair (2015-2016), Lead Director (2011-2015) and Director (2008-2011), Monster Worldwide, Inc. (career services); United States Navy, career nuclear submarine officer (1970-2007); Seventh Vice Chair of the Joint Chiefs of Staff (2005-2007); first NATO Supreme Allied Commander Transformation (2003-2005); Commander, U.S. Joint Forces Command (2002-2005). | 234 | Trustee, U.S. Naval Academy Foundation Athletic & Scholarship Program (2010- Present); formerly, Trustee, certain funds of the Oppenheimer Funds complex (2013-2019); Advisory Board Member, Maxwell School of Citizenship and Public Affairs of Syracuse University (2012-2016). |
| * | This is the date the Independent Trustee began serving the Trust. Each Independent Trustee serves an indefinite term, until his or her successor is elected. |
| ** | Fund Complex includes all open- and closed-end funds (including all of their portfolios) advised by the Adviser and any affiliated person of the Adviser. |
| 52 | ||||
|
| |||
Trustees and Officers–(continued)
| Name, Address and Year of Birth of Independent Trustees | Position(s) with Trust | Term of and Length of | Principal Occupation(s) During the Past 5 Years | Number of in Fund | Other Directorships Held by Independent Trustees During the Past 5 Years | |||||
Victoria J. Herget–1951 c/o Invesco Capital Management LLC 3500 Lacey Road, Suite 700 Downers Grove, IL 60515 | Trustee | Since 2019 | Formerly, Managing Director (1993-2001), Principal (1985-1993), Vice President (1978-1985) and Assistant Vice President (1973-1978), Zurich Scudder Investments (investment adviser) (and its predecessor firms). | 234 | Trustee (2000- Present) and Chair (2010-2017), Newberry Library; Trustee, Chikaming Open Lands (2014-Present); formerly, Trustee, Mather LifeWays (2001-2021); Trustee, certain funds in the Oppenheimer Funds complex (2012-2019); Board Chair (2008-2015) and Director (2004-2018), United Educators Insurance Company; Independent Director, First American Funds (2003-2011); Trustee (1992-2007), Chair of the Board of Trustees (1999-2007), Investment Committee Chair (1994-1999) and Investment Committee member (2007-2010), Wellesley College; Trustee, BoardSource (2006-2009); Trustee, Chicago City Day School (1994-2005). |
| * | This is the date the Independent Trustee began serving the Trust. Each Independent Trustee serves an indefinite term, until his or her successor is elected. |
| ** | Fund Complex includes all open- and closed-end funds (including all of their portfolios) advised by the Adviser and any affiliated person of the Adviser. |
| 53 | ||||
|
| |||
Trustees and Officers–(continued)
| Name, Address and Year of Birth of Independent Trustees | Position(s) with Trust | Term of and Length of | Principal Occupation(s) During the Past 5 Years | Number of in Fund | Other Directorships Held by Independent Trustees During the Past 5 Years | |||||
Marc M. Kole–1960 c/o Invesco Capital Management LLC 3500 Lacey Road, Suite 700 Downers Grove, IL 60515 | Chair of the Audit Committee and Trustee | Chair of the Audit Committee since 2008; Trustee since 2007 | Formerly, Managing Director of Finance (2020-2021) and Senior Director of Finance (2015-2020), By The Hand Club for Kids (not-for-profit); Chief Financial Officer, Hope Network (social services) (2008-2012); Assistant Vice President and Controller, Priority Health (health insurance) (2005-2008); Regional Chief Financial Officer, United Healthcare (2005); Chief Accounting Officer, Senior Vice President of Finance, Oxford Health Plans (2000-2004); Audit Partner, Arthur Andersen LLP (1996-2000). | 234 | Formerly, Treasurer (2018-2021), Finance Committee Member (2015-2021) and Audit Committee Member (2015), Thornapple Evangelical Covenant Church; Board and Finance Committee Member (2009-2017) and Treasurer (2010-2015, 2017), NorthPointe Christian Schools. | |||||
Yung Bong Lim–1964 c/o Invesco Capital Management LLC 3500 Lacey Road, Suite 700 Downers Grove, IL 60515 | Chair of the Investment Oversight Committee and Trustee | Chair of the Investment Oversight Committee since 2014; Trustee since 2013 | Managing Partner, RDG Funds LLC (real estate) (2008-Present); formerly, Managing Director, Citadel LLC (1999-2007). | 234 | Board Director, Beacon Power Services, Corp. (2019-Present); formerly, Advisory Board Member, Performance Trust Capital Partners, LLC (2008-2020). | |||||
| * | This is the date the Independent Trustee began serving the Trust. Each Independent Trustee serves an indefinite term, until his or her successor is elected. |
| ** | Fund Complex includes all open- and closed-end funds (including all of their portfolios) advised by the Adviser and any affiliated person of the Adviser. |
| 54 | ||||
|
| |||
Trustees and Officers–(continued)
| Name, Address and Year of Birth of Independent Trustees | Position(s) with Trust | Term of and Length of | Principal Occupation(s) During the Past 5 Years | Number of in Fund | Other Directorships Held by Independent Trustees During the Past 5 Years | |||||
Joanne Pace–1958 c/o Invesco Capital Management LLC 3500 Lacey Road, Suite 700 Downers Grove, IL 60515 | Trustee | Since 2019 | Formerly, Senior Advisor, SECOR Asset Management, LP (2010-2011); Managing Director and Chief Operating Officer, Morgan Stanley Investment Management (2006-2010); Partner and Chief Operating Officer, FrontPoint Partners, LLC (alternative investments) (2005-2006); Managing Director (2003-2005), Global Head of Human Resources and member of Executive Board and Operating Committee (2004-2005), Global Head of Operations and Product Control (2003-2004), Credit Suisse (investment banking); Managing Director (1997-2003), Controller and Principal Accounting Officer (1999-2003), Chief Financial Officer (temporary assignment) for the Oversight Committee, Long Term Capital Management (1998-1999), Morgan Stanley. | 234 | Board Director, Horizon Blue Cross Blue Shield of New Jersey (2012- Present); Governing Council Member (2016-Present) and Chair of Education Committee (2017-2021), Independent Directors Council (IDC); Council Member, New York-Presbyterian Hospital’s Leadership Council on Children’s and Women’s Health (2012-Present); formerly, Advisory Board Director, The Alberleen Group LLC (2012-2021); Board Member, 100 Women in Finance (2015-2020); Trustee, certain funds in the Oppenheimer Funds complex (2012-2019); Lead Independent Director and Chair of the Audit and Nominating Committee of The Global Chartist Fund, LLC, Oppenheimer Asset Management (2011-2012); Board Director, Managed Funds Association (2008-2010); Board Director (2007-2010) and Investment Committee Chair (2008-2010), Morgan Stanley Foundation. |
| * | This is the date the Independent Trustee began serving the Trust. Each Independent Trustee serves an indefinite term, until his or her successor is elected. |
| ** | Fund Complex includes all open- and closed-end funds (including all of their portfolios) advised by the Adviser and any affiliated person of the Adviser. |
| 55 | ||||
|
| |||
Trustees and Officers–(continued)
| Name, Address and Year of Birth of Independent Trustees | Position(s) with Trust | Term of and Length of | Principal Occupation(s) During the Past 5 Years | Number of in Fund | Other Directorships Held by Independent Trustees During the Past 5 Years | |||||
Gary R. Wicker–1961 c/o Invesco Capital Management LLC 3500 Lacey Road, Suite 700 Downers Grove, IL 60515 | Trustee | Since 2013 | Senior Vice President of Global Finance and Chief Financial Officer, RBC Ministries (publishing company) (2013-Present); formerly, Executive Vice President and Chief Financial Officer, Zondervan Publishing (a division of Harper Collins/NewsCorp) (2007-2012); Senior Vice President and Group Controller (2005-2006), Senior Vice President and Chief Financial Officer (2003-2004), Chief Financial Officer (2001-2003), Vice President, Finance and Controller (1999-2001) and Assistant Controller (1997-1999), divisions of The Thomson Corporation (information services provider); Senior Audit Manager (1994-1997), PricewaterhouseCoopers LLP. | 234 | Board Member and Treasurer, Our Daily Bread Ministries Canada (2015-Present); Board and Finance Committee Member, West Michigan Youth For Christ (2010- Present). | |||||
Donald H. Wilson–1959 c/o Invesco Capital Management LLC 3500 Lacey Road, Suite 700 Downers Grove, IL 60515 | Chair of the Board and Trustee | Chair since 2012; Trustee since 2007 | Chair, President and Chief Executive Officer, McHenry Bancorp Inc. and McHenry Savings Bank (subsidiary) (2018-Present); formerly, Chair and Chief Executive Officer, Stone Pillar Advisors, Ltd. (2010-2017); President and Chief Executive Officer, Stone Pillar Investments, Ltd. (advisory services to the financial sector) (2016-2018); Chair, President and Chief Executive Officer, Community Financial Shares, Inc. and Community Bank–Wheaton/Glen Ellyn (subsidiary) (2013-2015); Chief Operating Officer, AMCORE Financial, Inc. (bank holding company) (2007-2009); Executive Vice President and Chief Financial Officer, AMCORE Financial, Inc. (2006-2007); Senior Vice President and Treasurer, Marshall & Ilsley Corp. (bank holding company) (1995-2006). | 234 | Director, Penfield Children’s Center (2004-Present); Board Chair, Gracebridge Alliance, Inc. (2015-Present). | |||||
| * | This is the date the Independent Trustee began serving the Trust. Each Independent Trustee serves an indefinite term, until his or her successor is elected. |
| ** | Fund Complex includes all open- and closed-end funds (including all of their portfolios) advised by the Adviser and any affiliated person of the Adviser. |
| 56 | ||||
|
| |||
Trustees and Officers–(continued)
The Interested Trustee and the executive officers of the Trust, their term of office and length of time served, their principal business occupations during at least the past five years, the number of portfolios in the Fund Complex overseen by the Interested Trustee and the other directorships, if any, held by the Interested Trustee are shown below:
| Name, Address and Year of Birth of Interested Trustee | Position(s) with Trust | Term of and Length of | Principal Occupation(s) During the Past 5 Years | Number of in Fund | Other Directorships Held by Interested Trustee During the Past 5 Years | |||||
Anna Paglia–1974 Invesco Capital Management LLC 3500 Lacey Road Suite 700 Downers Grove, IL 60515 | Trustee, President and Principal Executive Officer | Trustee since 2022, President and Principal Executive Officer since 2020 | President and Principal Executive Officer (2020-Present) and Trustee (2022-Present), Invesco Exchange- Traded Fund Trust, Invesco Exchange-Traded Fund Trust II, Invesco India Exchange-Traded Fund Trust, Invesco Actively Managed Exchange-Traded Fund Trust, Invesco Actively Managed Exchange-Traded Commodity Fund Trust and Invesco Exchange-Traded Self-Indexed Fund Trust; Managing Director and Global Head of ETFs and Indexed Strategies, Chief Executive Officer and Principal Executive Officer, Invesco Capital Management LLC (2020-Present); Chief Executive Officer, Manager and Principal Executive Officer, Invesco Specialized Products, LLC (2020-Present); Vice President, Invesco Indexing LLC (2020-Present); formerly, Secretary, Invesco Exchange-Traded Fund Trust, Invesco Exchange-Traded Fund Trust II, Invesco India Exchange-Traded Fund Trust and Invesco Actively Managed Exchange-Traded Fund Trust (2011-2020), Invesco Actively Managed Exchange-Traded Commodity Fund Trust (2014-2020) and Invesco Exchange-Traded Self-Indexed Fund Trust (2015-2020); Head of Legal (2010-2020) and Secretary (2015-2020), Invesco Capital Management LLC; Manager and Assistant Secretary, Invesco Indexing LLC (2017-2020); Head of Legal and Secretary, Invesco Specialized Products, LLC (2018-2020); Partner, K&L Gates LLP (formerly, Bell Boyd & Lloyd LLP) (2007-2010); and Associate Counsel at Barclays Global Investors Ltd. (2004-2006). | 234 | None |
| * | This is the date the Interested Trustee began serving the Trust. The Interested Trustee serves an indefinite term, until his successor is elected. |
| ** | Fund Complex includes all open- and closed-end funds (including all of their portfolios) advised by the Adviser and any affiliated person of the Adviser. |
| 57 | ||||
|
| |||
Trustees and Officers–(continued)
| Name, Address and Year of Birth of Executive Officers | Position(s) with Trust | Length of Time Served* | Principal Occupation(s) During the Past 5 Years | |||
Adrien Deberghes–1967 Invesco Capital Management LLC 11 Greenway Plaza, Suite 1000 Houston, TX 77046 | Vice President | Since 2020 | Vice President, Invesco Exchange-Traded Fund Trust, Invesco Exchange-Traded Fund Trust II, Invesco India Exchange-Traded Fund Trust, Invesco Actively Managed Exchange-Traded Fund Trust, Invesco Actively Managed Exchange-Traded Commodity Fund Trust and Invesco Exchange-Traded Self-Indexed Fund Trust (2020-Present); Head of the Fund Office of the CFO, Fund Administration and Vice President, Invesco Advisers, Inc. (2020-Present); Principal Financial Officer, Treasurer and Vice President, The Invesco Funds (2020-Present); formerly, Senior Vice President and Treasurer, Fidelity Investments (2008-2020). | |||
Kelli Gallegos–1970 Invesco Capital Management LLC 11 Greenway Plaza, Suite 1000 Houston, TX 77046 | Vice President and Treasurer | Since 2018 | Vice President, Invesco Advisers, Inc. (2020-Present); Principal Financial and Accounting Officer- Pooled Investments, Invesco Specialized Products, LLC (2018-Present); Vice President and Treasurer, Invesco Exchange-Traded Fund Trust, Invesco Exchange-Traded Fund Trust II, Invesco India Exchange-Traded Fund Trust, Invesco Actively Managed Exchange-Traded Fund Trust, Invesco Actively Managed Exchange-Traded Commodity Fund Trust and Invesco Exchange-Traded Self-Indexed Fund Trust (2018-Present); Principal Financial and Accounting Officer-Pooled Investments, Invesco Capital Management LLC (2018-Present); Vice President and Assistant Treasurer (2008-Present), The Invesco Funds; formerly, Principal Financial Officer (2016-2020) and Assistant Vice President (2008-2016), The Invesco Funds; Assistant Treasurer, Invesco Specialized Products, LLC (2018); Assistant Treasurer, Invesco Exchange- Traded Fund Trust, Invesco Exchange-Traded Fund Trust II, Invesco India Exchange-Traded Fund Trust and Invesco Actively Managed Exchange-Traded Fund Trust (2012-2018), Invesco Actively Managed Exchange-Traded Commodity Fund Trust (2014-2018) and Invesco Exchange-Traded Self-Indexed Fund Trust (2016-2018); and Assistant Treasurer, Invesco Capital Management LLC (2013-2018). | |||
Adam Henkel–1980 Invesco Capital Management LLC 3500 Lacey Road, Suite 700 Downers Grove, IL 60515 | Secretary | Since 2020 | Head of Legal and Secretary, Invesco Capital Management LLC and Invesco Specialized Products, LLC (2020-present); Secretary, Invesco Exchange-Traded Fund Trust, Invesco Exchange-Traded Fund Trust II, Invesco India Exchange-Traded Fund Trust, Invesco Actively Managed Exchange-Traded Fund Trust, Invesco Actively Managed Exchange-Traded Commodity Fund Trust and Invesco Exchange-Traded Self-Indexed Fund Trust (2020-Present); Assistant Secretary, Invesco Capital Markets, Inc. (2020-Present); Assistant Secretary, The Invesco Funds (2014-Present); Manager and Assistant Secretary, Invesco Indexing LLC (2020-Present); Assistant Secretary, Invesco Investment Advisers LLC (2020-Present); formerly, Assistant Secretary of Invesco Exchange-Traded Fund Trust, Invesco Exchange-Traded Fund Trust II, Invesco India Exchange- Traded Fund Trust, Invesco Actively Managed Exchange-Traded Fund Trust and Invesco Actively Managed Exchange-Traded Commodity Fund Trust (2014-2020); Chief Compliance Officer of Invesco Capital Management LLC (2017); Chief Compliance Officer of Invesco Exchange-Traded Fund Trust, Invesco Exchange-Traded Fund Trust II, Invesco India Exchange-Traded Fund Trust, Invesco Actively Managed Exchange-Traded Fund Trust and Invesco Actively Managed Exchange-Traded Commodity Fund Trust (2017); Senior Counsel, Invesco, Ltd. (2013-2020); Assistant Secretary, Invesco Specialized Products, LLC (2018-2020). | |||
| * | This is the date each Officer began serving the Trust in their current position. Each Officer serves an indefinite term, until his or her successor is elected. |
| 58 | ||||
|
| |||
Trustees and Officers–(continued)
| Name, Address and Year of Birth of Executive Officers | Position(s) with Trust | Length of Time Served* | Principal Occupation(s) During the Past 5 Years | |||
Peter Hubbard–1981 Invesco Capital Management LLC 3500 Lacey Road, Suite 700 Downers Grove, IL 60515 | Vice President | Since 2009 | Vice President, Invesco Specialized Products, LLC (2018-Present); Vice President, Invesco Exchange-Traded Fund Trust, Invesco Exchange-Traded Fund Trust II, Invesco India Exchange-Traded Fund Trust, Invesco Actively Managed Exchange-Traded Fund Trust (2009-Present), Invesco Actively Managed Exchange-Traded Commodity Fund Trust (2014-Present) and Invesco Exchange-Traded Self-Indexed Fund Trust (2016-Present); Vice President and Director of Portfolio Management, Invesco Capital Management LLC (2010-Present); and Vice President, Invesco Advisers, Inc. (2020-Present); formerly, Vice President of Portfolio Management, Invesco Capital Management LLC (2008-2010); Portfolio Manager, Invesco Capital Management LLC (2007-2008); Research Analyst, Invesco Capital Management LLC (2005-2007); Research Analyst and Trader, Ritchie Capital, a hedge fund operator (2003-2005). | |||
Sheri Morris–1964 Invesco Capital Management LLC 11 Greenway Plaza, Suite 1000 Houston, TX 77046 | Vice President | Since 2012 | Head of Global Fund Services, Invesco Ltd. (2019-Present); Vice President, OppenheimerFunds, Inc. (2019-Present); President and Principal Executive Officer, The Invesco Funds (2016-Present); Senior Vice President, Invesco Advisers, Inc. (formerly known as Invesco Institutional (N.A.), Inc.) (registered investment adviser) (2020-Present); Director, Invesco Trust Company (2022-Present) and Vice President, Invesco Exchange-Traded Fund Trust, Invesco Exchange-Traded Fund Trust II, Invesco India Exchange-Traded Fund Trust, Invesco Actively Managed Exchange-Traded Fund Trust (2012-Present), Invesco Actively Managed Exchange-Traded Commodity Fund Trust (2014-Present) and Invesco Exchange-Traded Self-Indexed Fund Trust (2016-Present); formerly, Treasurer (2008-2020), Vice President and Principal Financial Officer, The Invesco Funds (2008-2016); Treasurer, Invesco Exchange-Traded Fund Trust, Invesco Exchange-Traded Fund Trust II, Invesco India Exchange-Traded Fund Trust and Invesco Actively Managed Exchange- Traded Fund Trust (2011-2013); Vice President, Invesco Aim Advisers, Inc., Invesco Aim Capital Management, Inc. and Invesco Aim Private Asset Management, Inc.; Treasurer, Assistant Vice President and Assistant Treasurer, The Invesco Funds and Assistant Vice President, Invesco Advisers, Inc., Invesco Aim Capital Management, Inc. and Invesco Aim Private Asset Management, Inc.; Vice President, Invesco Advisers, Inc. (2009-2020). | |||
Rudolf E. Reitmann–1971 Invesco Capital Management LLC 3500 Lacey Road, Suite 700 Downers Grove, IL 60515 | Vice President | Since 2013 | Head of Global Exchange Traded Funds Services, Invesco Specialized Products, LLC (2018-Present); Vice President, Invesco Exchange-Traded Fund Trust, Invesco Exchange-Traded Fund Trust II, Invesco India Exchange-Traded Fund Trust, Invesco Actively Managed Exchange-Traded Fund Trust (2013-Present), Invesco Actively Managed Exchange-Traded Commodity Fund Trust (2014-Present) and Invesco Exchange-Traded Self-Indexed Fund Trust (2016-Present); Head of Global Exchange Traded Funds Services, Invesco Capital Management LLC (2013-Present); Vice President, Invesco Capital Markets, Inc. (2018-Present). | |||
| * | This is the date each Officer began serving the Trust in their current position. Each Officer serves an indefinite term, until his or her successor is elected. |
| 59 | ||||
|
| |||
Trustees and Officers–(continued)
| Name, Address and Year of Birth of Executive Officers | Position(s) with Trust | Length of Time Served* | Principal Occupation(s) During the Past 5 Years | |||
Melanie Zimdars–1976 Invesco Capital Management LLC 3500 Lacey Road, Suite 700 Downers Grove, IL 60515 | Chief Compliance Officer | Since 2017 | Chief Compliance Officer, Invesco Specialized Products, LLC (2018-Present); Chief Compliance Officer, Invesco Capital Management LLC (2017-Present); Chief Compliance Officer, Invesco Exchange-Traded Fund Trust, Invesco Exchange-Traded Fund Trust II, Invesco India Exchange-Traded Fund Trust, Invesco Actively Managed Exchange-Traded Fund Trust, Invesco Actively Managed Exchange-Traded Commodity Fund Trust and Invesco Exchange- Traded Self-Indexed Fund Trust (2017-Present); formerly, Vice President and Deputy Chief Compliance Officer, ALPS Holding, Inc. (2009-2017); Mutual Fund Treasurer/Chief Financial Officer, Wasatch Advisors, Inc. (2005-2008); Compliance Officer, U.S. Bancorp Fund Services, LLC (2001-2005). |
| * | This is the date each Officer began serving the Trust in their current position. Each Officer serves an indefinite term, until his or her successor is elected. |
Availability of Additional Information About the Trustees
The Statement of Additional Information includes additional information about the Trustees and is available, without charge, upon request at (800) 983-0903.
| 60 | ||||
|
| |||
(This Page Intentionally Left Blank)
(This Page Intentionally Left Blank)
Proxy Voting Policies and Procedures
A description of the Trust’s proxy voting policies and procedures that the Funds use to determine how to vote proxies relating to portfolio securities is available, without charge and upon request, by calling (800) 983-0903. This information is also available on the Securities and Exchange Commission’s (the “Commission”) website at www.sec.gov.
Information regarding how each Fund voted proxies for portfolio securities, if applicable, during the most recent 12-month period ended June 30, is available, without charge and upon request, by (i) calling (800) 983-0903; or (ii) accessing the Trust’s Form N-PX on the Commission’s website at www.sec.gov.
Quarterly Portfolios
The Trust files its complete schedule of portfolio holdings for the Funds with the Commission for the first and third quarters of each fiscal year as an exhibit to its reports on Form N-PORT. The Forms N-PORT are available on the Commission’s website at www.sec.gov.
Frequency Distribution of Discounts and Premiums
A table showing the number of days the market price of each Fund’s shares was greater than the Fund’s net asset value, and the number of days it was less than the Fund’s net asset value (i.e., premium or discount) for the most recently completed calendar year, and the calendar quarters since that year end (or the life of the Fund, if shorter) may be found at the Fund’s website at www.invesco.com/ETFs.
| ©2022 Invesco Capital Management LLC | ||||
| 3500 Lacey Road, Suite 700 | ||||
| Downers Grove, IL 60515 | P-TRST2-FINC-AR-2 | invesco.com/ETFs |
 |
Invesco Annual Report to Shareholders
October 31, 2022
| |||
| CQQQ | Invesco China Technology ETF | |||
| PIZ | Invesco DWA Developed Markets Momentum ETF | |||
| PIE | Invesco DWA Emerging Markets Momentum ETF | |||
| PXF | Invesco FTSE RAFI Developed Markets ex-U.S. ETF | |||
| PDN | Invesco FTSE RAFI Developed Markets ex-U.S. Small-Mid ETF | |||
| PXH | Invesco FTSE RAFI Emerging Markets ETF | |||
| PBD | Invesco Global Clean Energy ETF | |||
| PIO | Invesco Global Water ETF | |||
| IPKW | Invesco International BuyBack AchieversTM ETF | |||
| CUT | Invesco MSCI Global Timber ETF | |||
| GBLD | Invesco MSCI Green Building ETF | |||
| CGW | Invesco S&P Global Water Index ETF | |||
| IDHQ | Invesco S&P International Developed Quality ETF | |||
| 2 |
|
Domestic Equity
The fiscal year ended October 31, 2022 began with continued volatility in equity markets in the fourth quarter of 2021 amid substantial inflation and the emergence of a new COVID-19 variant. Pandemic-related supply chain disruption and labor shortages intensified during the quarter, resulting in broadly higher input costs for companies and consumers alike. Additionally, the price of oil rose,1 causing higher gas prices for consumers, and the Consumer Price Index (CPI) reported for November 2021 increased 0.8%, resulting in a 6.8% increase over the prior 12 months, the highest since 1982.2 To combat inflation, the US Federal Reserve (the Fed) announced the potential for three or more interest rate increases in 2022. With solid corporate earnings and optimism about the COVID-19 Omicron variant reporting milder symptoms, stocks rallied at the 2021 year-end.
Equity markets declined in the first quarter of 2022 amid volatility sparked by Russia’s invasion of Ukraine, rising commodity prices, rampant global inflation and the Fed’s shift toward tighter monetary policy. Russia’s invasion exacerbated inflation pressures, disrupting already strained supply chains and increasing shortages of oil, gas and raw materials. The price of oil rose sharply, with crude prices reaching their highest price per barrel since 2008.1 Inflation continued to be a top concern for consumers, investors and the Fed. To combat inflation, the Fed raised the federal funds rate by one-quarter percentage point in March and the Fed indicated it would “taper” its asset purchase program quickly.3
As the war in Ukraine continued and corporate earnings in high-profile names like Netflix reported slowing growth and profits, the equity markets sold off for much of April 2022. The downward direction of the equity markets continued into the second quarter of 2022 amid record inflation, rising interest rates and an increasing likelihood of a US recession. Driven by higher food and energy prices, the CPI rose by yet another 40-year high to 8.6% for the 12 months ended May 2022.2 Oil prices peaked near $122 per barrel in early June, resulting in skyrocketing gasoline prices; the national average price reached a record high above $5 per gallon in early June.1 To tame inflation, the Fed raised the benchmark federal funds rate three more times, by 0.50% in May, by 0.75% in June and another 0.75% in July, which were the largest increases in nearly 30 years.3 US equity markets rose in July and much of August until Fed chairman Jerome Powell’s hawkish comments at an economic policy symposium held in Jackson Hole, Wyoming, sparked a sharp selloff at month-end. The Fed reiterated that it would continue taking aggressive action to curb inflation, even though such measures could “bring pain to households and businesses,” and the Fed raised the benchmark federal funds rate by another 0.75% in September.3
After experiencing a sharp drop in September 2022, US equity markets rebounded in October with strong gains, despite mixed data on the economy and corporate earnings. Inflation data
reported in October came in higher than expected; however, the labor market remained strong, with payroll employment gains and a decline in the unemployment rate to a near record low of 3.5% in September.2 The initial estimate of third quarter real gross domestic product showed an increase of 2.6% (annualized) after falling in the prior two quarters, but the headline number masked a drop in demand and investment. Corporate earnings were generally in line with expectations, but many companies’ forward earnings guidance was weaker than expected.
In this environment, US stocks had negative double-digit returns for the fiscal year ended October 31, 2022 of -14.61%, as measured by the S&P 500 Index.4
| 1 | Source: Bloomberg LP |
| 2 | Source: US Bureau of Labor Statistics |
| 3 | Source: US Federal Reserve |
| 4 | Source: Lipper Inc. |
Global Equity
At the beginning of the fiscal year ended October 31, 2022, developed global equity markets were mostly positive, despite rising inflation and the emergence of Omicron, a new COVID-19 variant. Pandemic-related supply chain disruptions and labor shortages intensified at the end of 2021, resulting in broadly higher costs for companies and consumers. Emerging market equities declined due in part to COVID-19 concerns and China’s ongoing regulatory tightening in the private education and technology sectors and slowing economic growth.
Global equity markets declined in the first half of 2022 amid volatility sparked by Russia’s invasion of Ukraine, rising commodity prices, rampant global inflation and central banks shifting toward tighter monetary policy. Russia’s invasion exacerbated inflationary pressures, disrupting already strained supply chains, and increasing shortages of oil, gas and raw materials, with the price of oil rising sharply.
Inflation headwinds continued into the third quarter of 2022. The US Federal Reserve (the Fed), the European Central Bank and the Bank of England all raised interest rates. In contrast, the People’s Bank of China lowered its policy rate and the Bank of Japan kept rates the same. Emerging market equities, hampered by the strong US dollar, underperformed developed market equities.
During October 2022, developed market equities rebounded and were in positive territory. Developed market equities outperformed emerging market equities, which declined primarily driven by weakness in China as Chinese markets reacted to the reappointment of President Xi and his authority, with no signs of the country’s zero-COVID-19 policy being relaxed. Despite the rebound in October for developed market equities, at the end of the fiscal year, trailing one-year returns for developed market equities and emerging market equities were both in negative territory.
| 3 |
|
As an index fund, Invesco China Technology ETF’s (the “Fund”) is passively managed and seeks to track the investment results (before fees and expenses) of the FTSE China Incl A 25% Technology Capped Index (the “Index”). The Fund generally will invest at least 90% of its total assets in the securities that comprise the Index, as well as American depositary receipts (“ADRs”) and global depositary receipts (“GDRs”) that represent securities in the Index.
Strictly in accordance with its guidelines and mandated procedures, FTSE International Limited (the “Index Provider”) compiles, maintains, and calculates the Index. The Index is composed of securities of companies that the Index Provider, pursuant to the Index methodology, has classified as being in the technology industry and that are constituents of the FTSE China Index or FTSE China A Stock Connect CNH Index. The Index may include China A-shares (shares of Chinese incorporated companies that may trade on the Shanghai or Shenzhen stock exchanges via a Stock Connect program), B-shares, H-shares, N-shares, Red Chip shares, P-chip shares and S-chip shares. Index constituents are modified market capitalization weighted. The Fund generally invests in all of the securities comprising the Index in proportion to their weightings in the Index.
For the fiscal year ended October 31, 2022, on a market price basis, the Fund returned (53.17)%. On a net asset value (“NAV”) basis, the Fund returned (53.32)%. During the same time period, the Index returned (53.05)%. During the fiscal year, the Fund’s performance, on a NAV basis, differed from the return of the Index primarily due to fees and operating expenses that the Fund incurred during the period.
During this same time period, the MSCI China Index (Net) (the “Benchmark Index”) returned (47.90)%. The Benchmark Index is an unmanaged index weighted by market capitalization and based on the average performance of approximately 700 securities. The Benchmark Index was selected for its recognition in the marketplace, and its performance comparison is a useful measure for investors as a broad representation of Chinese stocks.
The performance of the Fund differed from the Benchmark Index because the Fund seeks to track an Index that employs a stock selection methodology within a specific sector whereas the Benchmark Index selects and weights stocks based on market capitalization.
Relative to the Benchmark Index, the Fund was most overweight in the semiconductors & semiconductor equipment industry and most underweight the internet & direct marketing retail industry during the fiscal year ended October 31, 2022. The majority of the Fund’s underperformance relative to the Benchmark Index during that period can be attributed to the Fund’s underweight allocation to the banks industry as well as the Fund’s overweight allocation to the interactive media & services industry.
For the fiscal year ended October 31, 2022, the trading companies & distributors industry contributed most significantly to the Fund’s return, followed by the communications equipment industry. The interactive media & services industry detracted most significantly from the Fund’s return, followed by the electronic equipment instruments & components and entertainment industries, respectively.
Positions that contributed most significantly to the Fund’s return for the fiscal year ended October 31, 2022 included China National Software & Service Co. Ltd., A Shares, a software company (portfolio average weight of 0.06%), and Beijing Kingsoft Office Software. Inc., A Shares, a software company (portfolio average weight of 0.82%). Positions that detracted most significantly from the Fund’s return included Tencent Holdings Ltd., an interactive media & services company (portfolio average weight of 10.61%), and Kuaishou Technology, an interactive media & services company (portfolio average weight of 6.92%).
| Industry Breakdown (% of the Fund’s Net Assets) as of October 31, 2022 | ||||
| Interactive Media & Services | 22.63 | |||
| Semiconductors & Semiconductor Equipment | 19.54 | |||
| Internet & Direct Marketing Retail | 15.89 | |||
| Software | 13.00 | |||
| Electronic Equipment, Instruments & Components | 12.36 | |||
| Entertainment | 5.06 | |||
| IT Services | 3.84 | |||
| Industry Types Each Less Than 3% | 7.70 | |||
| Money Market Funds Plus Other Assets Less Liabilities | (0.02) | |||
| Top Ten Fund Holdings* (% of the Fund’s Net Assets) as of October 31, 2022 | ||||
| Security | ||||
| Tencent Holdings Ltd. | 8.93 | |||
| Meituan, B Shares | 8.32 | |||
| Pinduoduo, Inc., ADR | 7.34 | |||
| Baidu, Inc., A Shares | 5.83 | |||
| Kingdee International Software Group Co. Ltd. | 4.39 | |||
| Kuaishou Technology | 4.01 | |||
| LONGi Green Energy Technology Co. Ltd., A Shares | 3.65 | |||
| Sunny Optical Technology Group Co. Ltd. | 3.56 | |||
| Tencent Music Entertainment Group, ADR | 2.32 | |||
| Bilibili, Inc., Z Shares | 2.28 | |||
| Total | 50.63 | |||
| * | Excluding money market fund holdings. |
| 4 |
|
Invesco China Technology ETF (CQQQ) (continued)
Growth of a $10,000 Investment
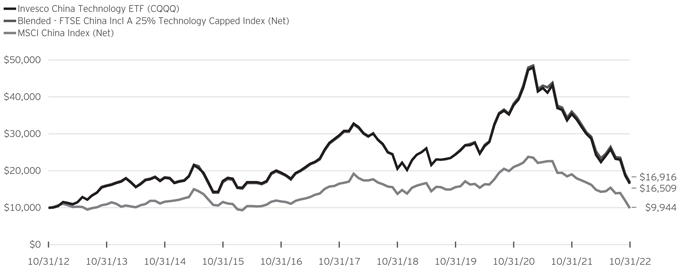
Fund Performance History as of October 31, 2022
1 Year | 3 Years | 3 Years | 5 Years | 5 Years | 10 Years | 10 Years | Fund Inception | |||||||||||||||||||||||||||||||||
| Index | Average Annualized | Cumulative | ||||||||||||||||||||||||||||||||||||||
Blended—FTSE China Incl A 25% Technology Capped Index (Net) | (53.05 | )% | (11.65 | )% | (31.04 | )% | (10.49 | )% | (42.54 | )% | 5.40 | % | 69.16 | % | 3.22 | % | 50.44 | % | ||||||||||||||||||||||
| MSCI China Index (Net) | (47.90 | ) | (13.85 | ) | (36.05 | ) | (9.68 | ) | (39.88 | ) | (0.06 | ) | (0.56 | ) | (0.32 | ) | (4.04 | ) | ||||||||||||||||||||||
| Fund | ||||||||||||||||||||||||||||||||||||||||
NAV Return | (53.32 | ) | (12.28 | ) | (32.50 | ) | (11.05 | ) | (44.33 | ) | 5.14 | 65.09 | 2.96 | 45.62 | ||||||||||||||||||||||||||
| Market Price Return | (53.17 | ) | (12.33 | ) | (32.62 | ) | (11.17 | ) | (44.69 | ) | 5.10 | 64.49 | 2.91 | 44.70 | ||||||||||||||||||||||||||
Guggenheim China Technology ETF (the “Predecessor Fund”) Fund Inception: December 08, 2009
Performance quoted above represents past performance. Past performance is not a guarantee of future results and current performance may be higher or lower than performance quoted. Investment returns and principal value will fluctuate, and shares of the Fund (“Fund Shares”), when redeemed or sold, may be worth more or less than their original cost. Fund performance reflects any applicable fee waivers and/or expense reimbursements. Had the adviser not waived fees and/or reimbursed expenses currently or in the past, returns would have been lower. See the current prospectus for more information. According to the Fund’s current prospectus, the Fund’s expense ratio of 0.70% is expressed as a unitary management fee to cover operating expenses and expenses incurred in connection with managing the portfolio. NAV and Market Price returns assume that dividends and capital gain distributions have been reinvested in the Fund at NAV and Market Price, respectively. The returns shown in the table above do not reflect the deduction of taxes that a shareholder would pay on Fund distributions or the redemption or sale of Fund Shares. See invesco.com/ETFs to find the most recent month-end performance numbers.
Performance results for the indexes stated above are based upon a hypothetical investment in their respective constituent securities. The
returns of an index do not represent Fund returns. An investor cannot invest directly in an index. The indexes do not charge management fees or brokerage expenses, and no such fees or expenses were deducted from the hypothetical performance shown. In addition, the results actual investors might have achieved would have differed from those shown because of differences in the timing, amounts of their investments, and fees and expenses associated with an investment in the Fund.
Notes Regarding Indexes and Fund Performance History:
| - | Effective after the close of business on May 18, 2018, the Predecessor Fund was reorganized into the Fund. Fund returns shown are blended returns of the Predecessor Fund and the Fund. |
| - | Average Annualized and Cumulative Inception returns for the Fund and the indexes are based on the inception date of the Fund. |
| - | Net returns reflect reinvested dividends net of withholding taxes. |
| - | The Blended-FTSE China Incl A 25% Technology Capped Index (Net) is comprised of the performance of the AlphaShares China Technology Index, the Fund’s previous underlying index from Fund inception to the conversion date, June 21, 2019, followed by the performance of the Index, starting from the conversion date through October 31, 2022. |
| 5 |
|
| PIZ | Management’s Discussion of Fund Performance | |
| Invesco DWA Developed Markets Momentum ETF (PIZ) |
As an index fund, the Invesco DWA Developed Markets Momentum ETF (the “Fund”) is passively managed and seeks to track the investment results (before fees and expenses) of the Dorsey Wright® Developed Markets Technical Leaders Index (the “Index”). The Fund generally will invest at least 90% of its total assets in the securities that comprise the Index.
Strictly in accordance with its guidelines and mandated procedures, Dorsey Wright & Associates, LLC (“Dorsey Wright” or the “Index Provider”) selects securities pursuant to its proprietary selection methodology for inclusion in the Index, which is designed to identify securities that demonstrate powerful relative strength characteristics. “Relative strength” is an investing technique that seeks to determine the strongest performing securities by measuring certain factors, such as a security’s relative performance against the overall market or a security’s relative strength value, which is derived by comparing the rate of increase of the security’s price over a set period as compared to that of a benchmark index. The Index is comprised of equity securities of large capitalization companies based in countries classified as developed markets, excluding the United States. Dorsey Wright selects securities for inclusion in the Index from an eligible universe of the largest 1,000 constituents by market capitalization within the Nasdaq Developed Markets Ex United States Index (except for U.S.-listed American depositary receipts of foreign listings). The Index Provider assigns a relative strength score to each eligible security and selects approximately 100 securities with the greatest scores for inclusion in the Index. Component security weights are based on relative scores, with securities with higher scores receiving larger weights. The Fund generally invests in all of the securities comprising the Index in proportion to their weightings in the Index.
For the fiscal year ended October 31, 2022, on a market price basis, the Fund returned (33.49)%. On a net asset value (“NAV”) basis, the Fund returned (33.25)%. During the same time period, the Index returned (32.68)%. During the fiscal year, the Fund fully replicated the components of the Index; therefore, the Fund’s performance, on a NAV basis, differed from the return of the Index primarily due to fees and operating expenses that the Fund incurred during the period.
During this same time period, the MSCI EAFE® Index (Net) (the “Benchmark Index”) returned (23.00)%. The Benchmark Index is an unmanaged index weighted by market capitalization based on the average performance of approximately 800 securities. The Benchmark Index was selected for its recognition in the marketplace, and its performance comparison is a useful measure for investors as a broad representation of the markets of economically developed countries outside of the U.S.
The performance of the Fund differed from the Benchmark Index because the Fund seeks to track an Index that employs a proprietary stock selection and weighting methodology, whereas
the Benchmark Index selects and weights stocks based on market capitalization.
Relative to the Benchmark Index, the Fund was most overweight in the industrials sector and most underweight in the consumer discretionary sector during the fiscal period ended October 31, 2022. The majority of the Fund’s underperformance relative to the Benchmark Index during that period can be attributed to the Fund being overweight in the information technology and industrials sectors, and security selection in the industrials sector.
For the fiscal year ended October 31, 2022, the industrials sector detracted most significantly from the Fund’s return, followed by the information technology and materials sectors, respectively. No sector contributed positively to the Fund’s return.
Positions that contributed most significantly to the Fund’s return for the fiscal year ended October 31, 2022 included Lasertec Corp., an information technology company (portfolio average weight of 1.30%), and Enerplus Corp., an Energy company (portfolio average weight of 0.12%). Positions that detracted most significantly from the Fund’s return included NIBE Industrier AB, Class B, an industrials company (portfolio average weight of 1.30%), and ASM International N.V., an information technology company (no longer held at fiscal year-end).
| Sector Breakdown (% of the Fund’s Net Assets) as of October 31, 2022 | ||||
| Information Technology | 16.78 | |||
| Financials | 16.77 | |||
| Industrials | 16.51 | |||
| Energy | 9.71 | |||
| Health Care | 9.53 | |||
| Materials | 7.81 | |||
| Consumer Discretionary | 7.26 | |||
| Consumer Staples | 6.83 | |||
| Utilities | 4.83 | |||
| Communication Services | 3.45 | |||
| Real Estate | 0.49 | |||
| Money Market Funds Plus Other Assets Less Liabilities | 0.03 | |||
| 6 |
|
Invesco DWA Developed Markets Momentum ETF (PIZ) (continued)
| Top Ten Fund Holdings* (% of the Fund’s Net Assets) as of October 31, 2022 | ||||
| Security | ||||
| Lasertec Corp. | 3.49 | |||
| Constellation Software, Inc. | 3.04 | |||
| Descartes Systems Group, Inc. (The) | 2.74 | |||
| CSL Ltd. | 2.65 | |||
| ASML Holding N.V. | 2.57 | |||
| Sampo OYJ, Class A | 2.50 | |||
| Metro, Inc. | 2.36 | |||
| Toromont Industries Ltd. | 2.21 | |||
| Canadian National Railway Co. | 2.07 | |||
| Flughafen Zurich AG | 2.04 | |||
| Total | 25.67 | |||
| * | Excluding money market fund holdings. |
Growth of a $10,000 Investment
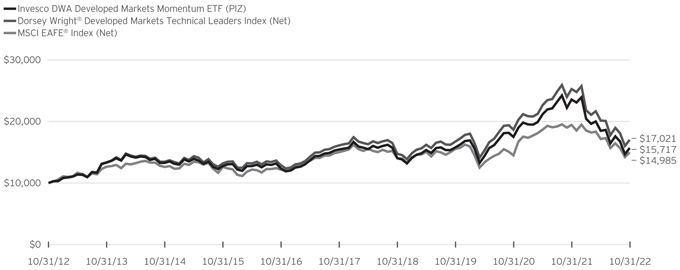
Fund Performance History as of October 31, 2022
| 1 Year | 3 Years Average | 3 Years Cumulative | 5 Years Average | 5 Years Cumulative | 10 Years Average | 10 Years Cumulative | Fund Inception | |||||||||||||||||||||||||||||||||
| Index | Average Annualized | Cumulative | ||||||||||||||||||||||||||||||||||||||
Dorsey Wright® Developed Markets Technical Leaders Index (Net) | (32.68 | )% | 0.60 | % | 1.81 | % | 1.09 | % | 5.56 | % | 5.46 | % | 70.21 | % | 2.77 | % | 49.98 | % | ||||||||||||||||||||||
| MSCI EAFE® Index (Net) | (23.00 | ) | (1.27 | ) | (3.77 | ) | (0.09 | ) | (0.47 | ) | 4.13 | 49.85 | 1.09 | 17.45 | ||||||||||||||||||||||||||
| Fund | ||||||||||||||||||||||||||||||||||||||||
NAV Return | (33.25 | ) | (0.12 | ) | (0.36 | ) | 0.34 | 1.73 | 4.63 | 57.17 | 1.88 | 31.75 | ||||||||||||||||||||||||||||
| Market Price Return | (33.49 | ) | (0.06 | ) | (0.18 | ) | 0.28 | 1.42 | 4.55 | 56.08 | 1.83 | 30.80 | ||||||||||||||||||||||||||||
| 7 |
|
Invesco DWA Developed Markets Momentum ETF (PIZ) (continued)
Fund Inception: December 28, 2007
Performance quoted above represents past performance. Past performance is not a guarantee of future results and current performance may be higher or lower than performance quoted. Investment returns and principal value will fluctuate, and shares of the Fund (“Fund Shares”), when redeemed or sold, may be worth more or less than their original cost. Fund performance reflects any applicable fee waivers and/or expense reimbursements. Had the adviser not waived fees and/or reimbursed expenses currently or in the past, returns would have been lower. See the current prospectus for more information. According to the Fund’s current prospectus, the Fund’s expense ratio of 0.80% is expressed as a unitary management fee to cover operating expenses and expenses incurred in connection with managing the portfolio. NAV and Market Price returns assume that dividends and capital gain distributions have been reinvested in the Fund at NAV and Market Price, respectively. The returns shown in the table above do not
reflect the deduction of taxes that a shareholder would pay on Fund distributions or the redemption or sale of Fund Shares. See invesco.com/ETFs to find the most recent month-end performance numbers.
Performance results for the indexes stated above are based upon a hypothetical investment in their respective constituent securities. The returns of an index do not represent Fund returns. An investor cannot invest directly in an index. The indexes do not charge management fees or brokerage expenses, and no such fees or expenses were deducted from the hypothetical performance shown. In addition, the results actual investors might have achieved would have differed from those shown because of differences in the timing, amounts of their investments, and fees and expenses associated with an investment in the Fund.
Notes Regarding Indexes and Fund Performance History:
| - | Average Annualized and Cumulative Inception returns for the Fund and the indexes are based on the inception date of the Fund. |
| - | Net returns reflect reinvested dividends net of withholding taxes. |
| 8 |
|
| PIE | Management’s Discussion of Fund Performance | |
| Invesco DWA Emerging Markets Momentum ETF (PIE) |
As an index fund, the Invesco DWA Emerging Markets Momentum ETF (the “Fund”) is passively managed and seeks to track the investment results (before fees and expenses) of the Dorsey Wright® Emerging Markets Technical Leaders Index (the “Index”). The Fund generally will invest at least 90% of its total assets in the securities that comprise the Index.
Strictly in accordance with its guidelines and mandated procedures, Dorsey Wright & Associates, LLC (“Dorsey Wright” or the “Index Provider”) selects securities pursuant to its proprietary selection methodology for inclusion in the Index, which is designed to identify securities that demonstrate powerful relative strength characteristics. “Relative strength” is an investing technique that seeks to determine the strongest performing securities by measuring certain factors, such as a security’s relative performance against the overall market or a security’s relative strength value, which is derived by comparing the rate of increase of the security’s price over a set period as compared to that of a benchmark index. The Index is comprised of equity securities of large capitalization companies based in countries classified as emerging markets. Dorsey Wright selects securities for inclusion in the Index from an eligible universe of the largest 1,000 constituents by market capitalization within the Nasdaq Emerging Markets Index (except for U.S.-listed American Depositary Receipts or foreign listings). The Index Provider assigns a relative strength score to each eligible security and selects approximately 100 securities with the greatest scores for inclusion in the Index. Component security weights are based on relative scores, with securities with higher scores receiving larger weights. The Fund generally invests in all of the securities comprising the Index in proportion to their weightings in the Index.
For the fiscal year ended October 31, 2022, on a market price basis, the Fund returned (33.79)%. On a net asset value (“NAV”) basis, the Fund returned (34.05)%. During the same time period, the Index returned (33.03)%. During the fiscal year, the Fund fully replicated the components of the Index; therefore, the Fund’s performance, on a NAV basis, differed from the return of the Index primarily due to fees and operating expenses that the Fund incurred during the period, as well as trading costs and slippage associated with quarterly rebalances.
During this same time period, the MSCI Emerging Markets Index (Net) (the “Benchmark Index”) returned (31.03)%. The Benchmark Index is an unmanaged index weighted by market capitalization and based on the average performance of approximately 1,400 securities. The Benchmark Index was selected for its recognition in the marketplace, and its performance comparison is a useful measure for investors as a broad representation of emerging market equities.
The performance of the Fund differed from the Benchmark Index because the Fund seeks to track an Index that employs a proprietary stock selection and weighting methodology, whereas
the Benchmark Index selects and weights stocks based on market capitalization.
Relative to the Benchmark Index, the Fund was most overweight in the electronic components sub-industry and most underweight in the diversified banks sub-industry during the fiscal year ended October 31, 2022. The majority of the Fund’s underperformance relative to the Benchmark Index during the period can be attributed to the Fund being underweight in the diversified banks sub-industry and security selection in the semiconductors and apparel accessories & luxury goods sub-industries.
For the fiscal year ended October 31, 2022, the coal & consumable fuels sub-industry contributed most significantly to the Fund’s return, followed by the oil & gas exploration & production and drug retail sub-industries, respectively. The semiconductors sub-industry detracted most significantly from the Fund’s return, followed by the technology hardware storage & peripherals and apparel accessories & luxury goods sub-industries, respectively.
Positions that contributed most significantly to the Fund’s return for the fiscal year ended October 31, 2022 included Turk Hava Yollari AO, an airlines company (portfolio average weight of 0.27%), and PT Indo Tambangraya Megah Tbk, a coal & consumable fuels company (portfolio average weight of 0.70%). Positions that detracted most significantly from the Fund’s return included Li Ning Co. Ltd., an apparel accessories & luxury goods company (portfolio average weight of 1.30%), and Frontken Corp. Bhd., a diversified support services company (portfolio average weight of 1.88%).
| Sector Breakdown (% of the Fund’s Net Assets) as of October 31, 2022 | ||||
| Information Technology | 17.22 | |||
| Energy | 16.08 | |||
| Financials | 15.83 | |||
| Industrials | 14.11 | |||
| Consumer Staples | 11.47 | |||
| Consumer Discretionary | 8.87 | |||
| Materials | 6.85 | |||
| Utilities | 4.69 | |||
| Sector Types Each Less Than 3% | 4.57 | |||
| Money Market Funds Plus Other Assets Less Liabilities | 0.31 | |||
| 9 |
|
Invesco DWA Emerging Markets Momentum ETF (PIE) (continued)
| Top Ten Fund Holdings* (% of the Fund’s Net Assets) as of October 31, 2022 | ||||
| Security | ||||
| Sinbon Electronics Co. Ltd. | 3.00 | |||
| Frontken Corp. Bhd. | 2.73 | |||
| Thungela Resources Ltd. | 2.64 | |||
| Petro Rio S.A. | 2.58 | |||
| Clicks Group Ltd. | 2.49 | |||
| Topco Scientific Co. Ltd. | 2.44 | |||
| Com7 PCL, NVDR | 2.38 | |||
| Micro-Star International Co. Ltd. | 2.29 | |||
| Impala Platinum Holdings Ltd. | 2.29 | |||
| Voltronic Power Technology Corp. | 2.20 | |||
| Total | 25.04 | |||
| * | Excluding money market fund holdings. |
Growth of a $10,000 Investment
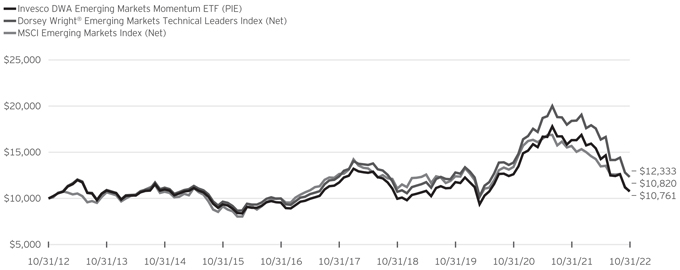
Fund Performance History as of October 31, 2022
| 1 Year | 3 Years Average | 3 Years Cumulative | 5 Years Average | 5 Years Cumulative | 10 Years Average | 10 Years Cumulative | Fund Inception | |||||||||||||||||||||||||||||||||
| Index | Average Annualized | Cumulative | ||||||||||||||||||||||||||||||||||||||
Dorsey Wright® Emerging Markets Technical Leaders Index (Net) | (33.03 | )% | (1.28 | )% | (3.79 | )% | (0.13 | )% | (0.66 | )% | 2.12 | % | 23.33 | % | 0.82 | % | 12.94 | % | ||||||||||||||||||||||
| MSCI Emerging Markets Index (Net) | (31.03 | ) | (4.42 | ) | (12.67 | ) | (3.09 | ) | (14.54 | ) | 0.79 | 8.20 | (0.19 | ) | (2.82 | ) | ||||||||||||||||||||||||
| Fund | ||||||||||||||||||||||||||||||||||||||||
NAV Return | (34.05 | ) | (2.97 | ) | (8.66 | ) | (1.72 | ) | (8.33 | ) | 0.73 | 7.60 | (1.74 | ) | (22.92 | ) | ||||||||||||||||||||||||
| Market Price Return | (33.79 | ) | (2.93 | ) | (8.55 | ) | (1.84 | ) | (8.87 | ) | 0.68 | 7.05 | (1.80 | ) | (23.67 | ) | ||||||||||||||||||||||||
| 10 |
|
Invesco DWA Emerging Markets Momentum ETF (PIE) (continued)
Fund Inception: December 28, 2007
Performance quoted above represents past performance. Past performance is not a guarantee of future results and current performance may be higher or lower than performance quoted. Investment returns and principal value will fluctuate, and shares of the Fund (“Fund Shares”), when redeemed or sold, may be worth more or less than their original cost. Fund performance reflects any applicable fee waivers and/or expense reimbursements. Had the adviser not waived fees and/or reimbursed expenses currently or in the past, returns would have been lower. See the current prospectus for more information. According to the Fund’s current prospectus, the Fund’s expense ratio of 0.90% is expressed as a unitary management fee to cover operating expenses and expenses incurred in connection with managing the portfolio. NAV and Market Price returns assume that dividends and capital gain distributions have been reinvested in the Fund at NAV and Market Price, respectively. The returns shown in the table above do not reflect the deduction of taxes that a shareholder would pay on Fund distributions or the redemption or sale of Fund Shares. See invesco.com/ETFs to find the most recent month-end performance numbers.
Performance results for the indexes stated above are based upon a hypothetical investment in their respective constituent securities. The returns of an index do not represent Fund returns. An investor cannot invest directly in an index. The indexes do not charge management fees or brokerage expenses, and no such fees or expenses were deducted from the hypothetical performance shown. In addition, the results actual investors might have achieved would have differed from those shown because of differences in the timing, amounts of their investments, and fees and expenses associated with an investment in the Fund.
Notes Regarding Indexes and Fund Performance History:
| - | Average Annualized and Cumulative Inception returns for the Fund and the indexes are based on the inception date of the Fund. |
| - | Net returns reflect reinvested dividends net of withholding taxes. |
| 11 |
|
| PXF | Management’s Discussion of Fund Performance | |
| Invesco FTSE RAFI Developed Markets ex-U.S. ETF (PXF) |
As an index fund, the Invesco FTSE RAFI Developed Markets ex-U.S. ETF (the “Fund”) is passively managed and seeks to track the investment results (before fees and expenses) of the FTSE RAFITM Developed ex U.S. 1000 Index (the “Index”). The Fund generally will invest at least 90% of its total assets in the securities that comprise the Index, as well as American depositary receipts (“ADRs”) and global depositary receipts (“GDRs”) that represent securities in the Index.
Strictly in accordance with its guidelines and mandated procedures, FTSE International Limited (“FTSE”) in conjunction with Research Affiliates (“RA”, and together with FTSE, the “Index Provider”), compiles, maintains and calculates the Index, which is comprised of companies located in countries that are classified as “developed” within the country classification definition of FTSE, excluding the United States. The Index is designed to track the performance of non-U.S.-listed companies domiciled in developed markets countries with the largest cumulative scores (“Fundamental Value”), selected from the constituents of the FTSE Developed ex US Total Cap Index as determined by the Index Provider. The Index selects and weights companies based on their Fundamental Values, which are derived from the following four fundamental measures of firm size: book value, cash flow, sales and dividends. The Fund generally invests in all of the securities comprising the Index in proportion to their weightings in the Index.
For the fiscal year ended October 31, 2022, on a market price basis, the Fund returned (17.81)%. On a net asset value (“NAV”) basis, the Fund returned (17.95)%. During the same time period, the Index returned (17.79)%. During the fiscal year, the Fund fully replicated the components of the Index; therefore, the Fund’s performance, on a NAV basis, differed from the return of the Index primarily due to fees and operating expenses that the Fund incurred during the period, which were significantly offset by benefits to the Fund related to dividend tax treatment relative to the Index.
During this same time period, the MSCI EAFE® Index (Net) (the “Benchmark Index”) returned (23.00)%. The Benchmark Index is an unmanaged index weighted by market capitalization based on the average performance of approximately 800 securities. The Benchmark Index was selected for its recognition in the marketplace, and its performance comparison is a useful measure for investors as a broad representation of the markets of economically developed countries outside of the U.S.
The performance of the Fund differed from the Benchmark Index in part because the Fund employs a fundamental weighting and stock selection methodology, whereas the Benchmark Index selects and weights stocks based on market capitalization.
Relative to the Benchmark Index, the Fund was most overweight in the financials sector and most underweight in the health care sector during the fiscal year ended October 31, 2022. The majority of the Fund’s outperformance relative to the Benchmark Index during the period can be attributed to the Fund’s overweight exposure to the energy sector, as well as the Fund’s underweight exposure to, and security selection in, the information technology and industrials sectors.
For the fiscal year ended October 31, 2022, the energy sector contributed most significantly to the Fund’s return. The financials sector detracted most significantly from the Fund’s return followed by the consumer discretionary and industrials sectors, respectively.
Positions that contributed most significantly to the Fund’s return for the fiscal year ended October 31, 2022, included Shell PLC, an energy company (portfolio average weight of 2.28%), and BP PLC, an energy company (portfolio average weight of 1.50%). Positions that detracted most significantly from the Fund’s return included Samsung Electronics Co. Ltd., an information technology company (portfolio average weight of 1.28%), and Saipem S.p.A., an energy company (portfolio average weight of 0.21%).
| Sector Breakdown (% of the Fund’s Net Assets) as of October 31, 2022 | ||||
| Financials | 23.87 | |||
| Industrials | 12.77 | |||
| Energy | 11.88 | |||
| Consumer Discretionary | 9.49 | |||
| Materials | 8.90 | |||
| Consumer Staples | 8.32 | |||
| Health Care | 7.17 | |||
| Communication Services | 5.47 | |||
| Information Technology | 5.23 | |||
| Utilities | 4.52 | |||
| Real Estate | 2.04 | |||
| Money Market Funds Plus Other Assets Less Liabilities | 0.34 | |||
| 12 |
|
Invesco FTSE RAFI Developed Markets ex-U.S. ETF (PXF) (continued)
| Top Ten Fund Holdings* (% of the Fund’s Net Assets) as of October 31, 2022 | ||||
| Security | ||||
| Shell PLC | 3.13 | |||
| BP PLC | 1.93 | |||
| Total Energies SE | 1.76 | |||
| Nestle S.A. | 1.20 | |||
| Samsung Electronics Co. Ltd. | 1.19 | |||
| Toyota Motor Corp. | 1.08 | |||
| HSBC Holdings PLC | 0.96 | |||
| Roche Holding AG | 0.95 | |||
| British American Tobacco PLC | 0.94 | |||
| Novartis AG | 0.84 | |||
| Total | 13.98 | |||
| * | Excluding money market fund holdings. |
Growth of a $10,000 Investment
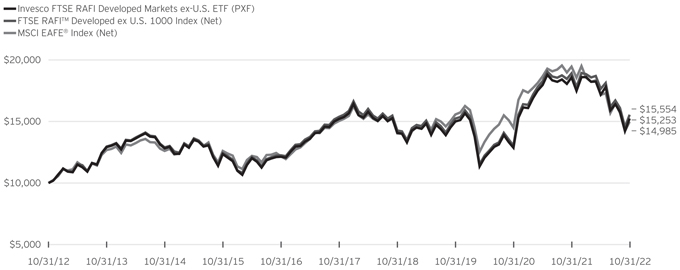
Fund Performance History as of October 31, 2022
| 1 Year | 3 Years Average | 3 Years Cumulative | 5 Years Average | 5 Years Cumulative | 10 Years Average | 10 Years Cumulative | Fund Inception | |||||||||||||||||||||||||||||||||
| Index | Average Annualized | Cumulative | ||||||||||||||||||||||||||||||||||||||
| FTSE RAFI™ Developed ex U.S. 1000 Index (Net) | (17.79 | )% | 0.70 | % | 2.11 | % | 0.21 | % | 1.04 | % | 4.52 | % | 55.54 | % | 1.50 | % | 25.74 | % | ||||||||||||||||||||||
| MSCI EAFE® Index (Net) | (23.00 | ) | (1.27 | ) | (3.77 | ) | (0.09 | ) | (0.47 | ) | 4.13 | 49.85 | 1.13 | 18.76 | ||||||||||||||||||||||||||
| Fund | ||||||||||||||||||||||||||||||||||||||||
| NAV Return | (17.95 | ) | 0.55 | 1.65 | 0.05 | 0.25 | 4.31 | 52.53 | 1.14 | 18.93 | ||||||||||||||||||||||||||||||
| Market Price Return | (17.81 | ) | 0.72 | 2.19 | 0.02 | 0.12 | 4.30 | 52.29 | 1.14 | 19.01 | ||||||||||||||||||||||||||||||
| 13 |
|
Invesco FTSE RAFI Developed Markets ex-U.S. ETF (PXF) (continued)
Fund Inception: June 25, 2007
Performance quoted above represents past performance. Past performance is not a guarantee of future results and current performance may be higher or lower than performance quoted. Investment returns and principal value will fluctuate, and shares of the Fund (“Fund Shares”), when redeemed or sold, may be worth more or less than their original cost. Fund performance reflects any applicable fee waivers and/or expense reimbursements. Had the adviser not waived fees and/or reimbursed expenses currently or in the past, returns would have been lower. See the current prospectus for more information.
According to the Fund’s current prospectus, the Fund’s expense ratio of 0.45% is expressed as a unitary management fee to cover operating expenses and expenses incurred in connection with managing the portfolio. NAV and Market Price returns assume that dividends and capital gain distributions have been reinvested in the Fund at NAV and Market Price, respectively. The returns shown in the table above do not reflect the deduction of taxes that a shareholder would pay on Fund distributions or the redemption or sale of Fund Shares. See invesco.com/ETFs to find the most recent month-end performance numbers.
Performance results for the indexes stated above are based upon a hypothetical investment in their respective constituent securities. The returns of an index do not represent Fund returns. An investor cannot invest directly in an index. The indexes do not charge management fees or brokerage expenses, and no such fees or expenses were deducted from the hypothetical performance shown. In addition, the results actual investors might have achieved would have differed from those shown because of differences in the timing, amounts of their investments, and fees and expenses associated with an investment in the Fund.
Notes Regarding Indexes and Fund Performance History:
| - | Average Annualized and Cumulative Inception returns for the Fund and the indexes are based on the inception date of the Fund. |
| - | Net returns reflect reinvested dividends net of withholding taxes. |
| 14 |
|
| PDN | Management’s Discussion of Fund Performance | |
| Invesco FTSE RAFI Developed Markets ex-U.S. Small-Mid ETF (PDN) |
As an index fund, the Invesco FTSE RAFI Developed Markets ex- U.S. Small-Mid ETF (the “Fund) is passively managed and seeks to track the investment results (before fees and expenses) of the FTSE RAFITM Developed ex U.S. Mid-Small 1500 Index (the “Index”). The Fund generally will invest at least 90% of its total assets in the securities that comprise the Index, as well as American depositary receipts (“ADRs”) and global depositary receipts (“GDRs”) that represent securities in the Index.
Strictly in accordance with its guidelines and mandated procedures, FTSE International Limited (“FTSE”) in conjunction with Research Affiliates LLC (“RA”, and together with FTSE, the “Index Provider”), compiles, maintains and calculates the Index, which is comprised of securities of small-and mid-capitalization companies that are classified as “developed” within the country classification definition of FTSE, excluding the United States. The Index is designed to track the performance of the small and mid- capitalization companies in developed markets based on their cumulative scores (“Fundamental Value”), selected from the constituents of the FTSE Developed ex US Total Cap Index, as determined by the Index Provider. The Index selects and weights companies based on their Fundamental Values, which are derived from the following four fundamental measures of firm size: book value, cash flow, sales and dividends. The Fund generally invests in all of the securities comprising the Index in proportion to their weightings in the Index.
For the fiscal year ended October 31, 2022, on a market price basis, the Fund returned (28.21)%. On a net asset value (“NAV”) basis, the Fund returned (27.72)%. During the same time period, the Index returned (27.55)%. During the fiscal year the Fund’s performance, on a NAV basis, differed from the return of the Index primarily due to fees and operating expenses that the Fund incurred during the period, which were significantly offset by benefits to the Fund related to dividend tax treatment relative to the Index.
During this same time period, the MSCI EAFE® Small Cap Index (Net) (the “Benchmark Index”) returned (30.28)%. The Benchmark Index is an unmanaged index weighted by market capitalization based on the average performance of approximately 2,300 securities. The Benchmark Index was selected for its recognition in the marketplace, and its performance comparison is a useful measure for investors as a broad representation of small capitalization companies located in markets of economically developed countries outside of the U.S.
The performance of the Fund differed from the Benchmark Index in part because the Fund employs a fundamental weighting and stock selection methodology, whereas the Benchmark Index selects and weights stocks based on market capitalization.
Relative to the Benchmark Index, the Fund was most overweight in the energy sector and most underweight in the information technology sector during the fiscal year ended October 31, 2022. The majority of the Fund’s outperformance relative to the Benchmark Index during the period can be attributed to the Fund’s overweight allocation to, and security selection in, the energy sector, as well as it’s underweight allocation to, and security selection in the information technology sector.
For the fiscal year ended October 31, 2022, the energy sector contributed most significantly to the Fund’s return. The industrials sector detracted most significantly from the Fund’s return followed by the consumer discretionary and real estate sectors, respectively.
Positions that contributed most significantly to the Fund’s return for the fiscal year ended October 31, 2022 included D/S Norden A/S, an industrials company (portfolio average weight of 0.10%), and Enerplus Corp., an energy company (portfolio average weight of 0.16%). Positions that detracted most significantly from the Fund’s return included Banca Monte dei Paschi di Sienna S.p.A., a financials company (no longer held at fiscal year-end), and ADLER Group SA, a real estate company (portfolio average weight of 0.06%).
| Sector Breakdown (% of the Fund’s Net Assets) as of October 31, 2022 | ||||
| Industrials | 22.35 | |||
| Consumer Discretionary | 12.95 | |||
| Materials | 10.84 | |||
| Real Estate | 10.24 | |||
| Financials | 9.77 | |||
| Information Technology | 7.50 | |||
| Consumer Staples | 7.04 | |||
| Health Care | 5.86 | |||
| Communication Services | 5.25 | |||
| Energy | 5.23 | |||
| Utilities | 2.60 | |||
| Money Market Funds Plus Other Assets Less Liabilities | 0.37 | |||
| 15 |
|
Invesco FTSE RAFI Developed Markets ex-U.S. Small-Mid ETF (PDN) (continued)
| Top Ten Fund Holdings* (% of the Fund’s Net Assets) as of October 31, 2022 | ||||
| Security | ||||
| Mineral Resources Ltd. | 0.23 | |||
| Saras S.p.A. | 0.22 | |||
| Vitesco Technologies Group AG | 0.22 | |||
| Ritchie Bros. Auctioneers, Inc. | 0.22 | |||
| Keppel Corp. Ltd. | 0.22 | |||
| Frontline Ltd. | 0.21 | |||
| ConvaTec Group PLC | 0.21 | |||
| AIB Group PLC | 0.21 | |||
| HomeServe PLC | 0.21 | |||
| Nexans S.A. | 0.21 | |||
| Total | 2.16 | |||
| * | Excluding money market fund holdings. |
Growth of a $10,000 Investment
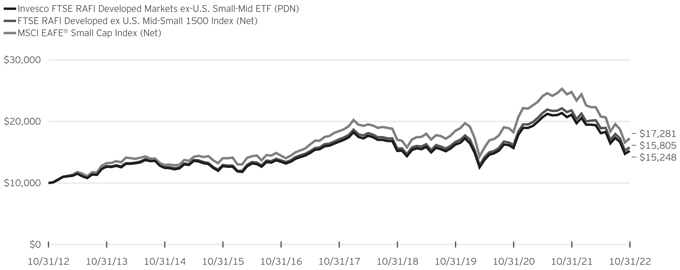
Fund Performance History as of October 31, 2022
1 Year | 3 Years Average | 3 Years Cumulative | 5 Years Average | 5 Years Cumulative | 10 Years Average | 10 Years Cumulative | Fund Inception | |||||||||||||||||||||||||||||||||
| Index | Average Annualized | Cumulative | ||||||||||||||||||||||||||||||||||||||
| FTSE RAFI Developed ex U.S. Mid-Small 1500 Index (Net) | (27.55 | )% | (1.82 | )% | (5.35 | )% | (1.56 | )% | (7.56 | )% | 4.68 | % | 58.05 | % | 3.17 | % | 60.05 | % | ||||||||||||||||||||||
| MSCI EAFE® Small Cap Index (Net) | (30.28 | ) | (2.26 | ) | (6.63 | ) | (1.30 | ) | (6.34 | ) | 5.62 | 72.81 | 2.71 | 49.71 | ||||||||||||||||||||||||||
| Fund | ||||||||||||||||||||||||||||||||||||||||
| NAV Return | (27.72 | ) | (2.10 | ) | (6.17 | ) | (1.85 | ) | (8.93 | ) | 4.31 | 52.48 | 2.69 | 49.20 | ||||||||||||||||||||||||||
| Market Price Return | (28.21 | ) | (1.81 | ) | (5.34 | ) | (1.91 | ) | (9.18 | ) | 4.25 | 51.65 | 2.60 | 47.34 | ||||||||||||||||||||||||||
| 16 |
|
Invesco FTSE RAFI Developed Markets ex-U.S. Small-Mid ETF (PDN) (continued)
Fund Inception: September 27, 2007
Performance quoted above represents past performance. Past performance is not a guarantee of future results and current performance may be higher or lower than performance quoted. Investment returns and principal value will fluctuate, and shares of the Fund (“Fund Shares”), when redeemed or sold, may be worth more or less than their original cost. Fund performance reflects any applicable fee waivers and/or expense reimbursements. Had the adviser not waived fees and/or reimbursed expenses currently or in the past, returns would have been lower. See the current prospectus for more information.
According to the Fund’s current prospectus, the Fund’s expense ratio of 0.49% is expressed as a unitary management fee to cover operating expenses and expenses incurred in connection with managing the portfolio. NAV and Market Price returns assume that dividends and capital gain distributions have been reinvested in the Fund at NAV and Market Price, respectively. The returns shown in the table above do not reflect the deduction of taxes that a shareholder would pay on Fund distributions or the redemption or sale of Fund Shares. See invesco.com/ETFs to find the most recent month-end performance numbers.
Performance results for the indexes stated above are based upon a hypothetical investment in their respective constituent securities. The returns of an index do not represent Fund returns. An investor cannot invest directly in an index. The indexes do not charge management fees or brokerage expenses, and no such fees or expenses were deducted from the hypothetical performance shown. In addition, the results actual investors might have achieved would have differed from those shown because of differences in the timing, amounts of their investments, and fees and expenses associated with an investment in the Fund.
Notes Regarding Indexes and Fund Performance History:
| - | Average Annualized and Cumulative Inception returns for the Fund and the indexes are based on the inception date of the Fund. |
| - | Net returns reflect reinvested dividends net of withholding taxes. |
| 17 |
|
| PXH | Management’s Discussion of Fund Performance | |
| Invesco FTSE RAFI Emerging Markets ETF (PXH) |
As an index fund, the Invesco FTSE RAFI Emerging Markets ETF (the “Fund) is passively managed and seeks to track the investment results (before fees and expenses) of the FTSE RAFITM Emerging Index (the “Index”). The Fund generally will invest at least 90% of its total assets in the securities that comprise the Index, as well as American depositary receipts (“ADRs”) and global depositary receipts (“GDRs”) that represent securities in the Index.
Strictly in accordance with its guidelines and mandated procedures, FTSE International Limited (“FTSE”) in conjunction with Research Affiliates LLC (“RA”, and together with FTSE, the “Index Provider”), compiles, maintains and calculates the Index, which is comprised of securities of companies located in countries that are classified as emerging markets within the country classification definition of FTSE. The Index includes securities of companies selected from the constituents of the FTSE Emerging Total Cap Index. The Index selects and weights its component securities based on their cumulative score (“Fundamental Value”), which is derived from the following four fundamental measures of firm size: book value, cash flows, sales and dividends. While the Fund generally seeks to invest in all of the securities comprising the Index in proportion to their weightings in the Index, at times the composition of the Index may make such “full replication” impracticable. In such circumstances, the Fund will utilize a “sampling” methodology to seek to achieve its investment objective.
For the fiscal year ended October 31, 2022, on a market price basis, the Fund returned (24.14)%. On a net asset value (“NAV”) basis, the Fund returned (24.47)%. During the same time period, the Index returned (24.20)%. During the fiscal year, the Fund’s performance, on a NAV basis, differed from the return of the Index during the period primarily due to Indian capital gains taxes incurred, as well as fees and expenses that the Fund incurred, which were significantly offset by benefits to the Fund related to dividend tax treatment and capital gains taxes in the Indian market relative to the Index.
During this same time period, the MSCI Emerging Markets Index (Net) (the “Benchmark Index”) returned (31.03)%. The Benchmark Index is an unmanaged index weighted by market capitalization and based on the average performance of approximately 1,400 securities. The Benchmark Index was selected for its recognition in the marketplace, and its performance comparison is a useful measure for investors as a broad representation of emerging market equities.
The performance of the Fund differed from the Benchmark Index in part because the Fund employs a fundamental weighting and stock selection methodology, whereas the Benchmark Index selects and weights stocks based on market capitalization.
Relative to the Benchmark Index, the Fund was most overweight in the financials sector and most underweight in the information technology sector during the fiscal year ended October 31, 2022. The majority of the Fund’s outperformance relative to the Benchmark Index during the period can be attributed to the Fund’s underweight exposure to and security selection in the consumer discretionary and communication services sectors, as well as the Fund’s overweight exposure to the financials sector.
For the fiscal year ended October 31, 2022, no sector contributed significantly to the Fund’s return. The financials sector detracted most significantly from the Fund’s return followed by the information technology and consumer discretionary sectors, respectively.
Positions that contributed most significantly to the Fund’s return for the fiscal year ended October 31, 2022 included Gazprom PJSC, an energy company (portfolio average weight of 2.40%), and Taiwan Semiconductor Manufacturing Co. Ltd., an information technology company (portfolio average weight of 4.69%). Positions that detracted most significantly from the Fund’s return included Sberbank Russia PJSC, a financials company (portfolio average weight of 0.69%), and Gazprom PJSC, an energy company (portfolio average weight of 0.96%),
As an emerging markets fund, the Fund had exposure to Russian securities with a weight of about 4.97% upon Russia’s invasion of the Ukraine (as of February 24, 2022). United States federal sanctions implemented as a response to the invasion have prohibited the buying and selling of all Russian securities. While Gazprom PJSC and LUKOIL PJSC, both Russian securities, are held within the portfolio, they have been marked down to a zero value as a result of the mentioned sanctions. In accordance with the federal law and sanctions, once the Fund is able to transact within the applicable market, the securities will be sold immediately at the prevailing market price.
| Sector Breakdown (% of the Fund’s Net Assets) as of October 31, 2022 | ||||
| Financials | 33.63 | |||
| Energy | 13.25 | |||
| Information Technology | 10.99 | |||
| Materials | 10.98 | |||
| Consumer Discretionary | 8.87 | |||
| Communication Services | 6.63 | |||
| Consumer Staples | 4.82 | |||
| Utilities | 4.40 | |||
| Industrials | 3.47 | |||
| Sector Types Each Less Than 3% | 2.74 | |||
| Money Market Funds Plus Other Assets Less Liabilities | 0.22 | |||
| 18 |
|
Invesco FTSE RAFI Emerging Markets ETF (PXH) (continued)
| Top Ten Fund Holdings* (% of the Fund’s Net Assets) as of October 31, 2022 | ||||
| Security | ||||
| Taiwan Semiconductor Manufacturing Co. Ltd. | 3.41 | |||
| Alibaba Group Holding Ltd. | 2.42 | |||
| Itau Unibanco Holding S.A., Preference Shares | 2.23 | |||
| Vale S.A. | 2.11 | |||
| China Construction Bank Corp., H Shares | 2.04 | |||
| Reliance Industries Ltd. | 2.02 | |||
| Petroleo Brasileiro S.A., Preference Shares | 1.98 | |||
| Industrial & Commercial Bank of China Ltd., H Shares | 1.80 | |||
| Banco Bradesco S.A., Preference Shares | 1.65 | |||
| Ping An Insurance (Group) Co. of China Ltd., H Shares | 1.50 | |||
| Total | 21.16 | |||
| * | Excluding money market fund holdings. |
Growth of a $10,000 Investment
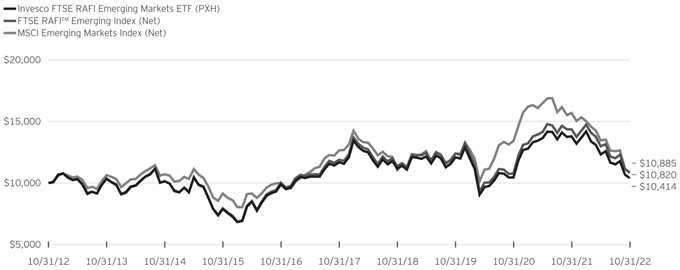
Fund Performance History as of October 31, 2022
1 Year | 3 Years Average | 3 Years Cumulative | 5 Years Average | 5 Years Cumulative | 10 Years Average | 10 Years Cumulative | Fund Inception | |||||||||||||||||||||||||||||||||
| Index | Average Annualized | Cumulative | ||||||||||||||||||||||||||||||||||||||
| FTSE RAFI™ Emerging Index (Net) | (24.20 | )% | (4.22 | )% | (12.14 | )% | (1.76 | )% | (8.51 | )% | 0.85 | % | 8.85 | % | 0.61 | % | 9.66 | % | ||||||||||||||||||||||
| MSCI Emerging Markets Index (Net) | (31.03 | ) | (4.42 | ) | (12.67 | ) | (3.09 | ) | (14.54 | ) | 0.79 | 8.20 | 0.07 | 0.99 | ||||||||||||||||||||||||||
| Fund | ||||||||||||||||||||||||||||||||||||||||
| NAV Return | (24.47 | ) | (4.85 | ) | (13.84 | ) | (2.27 | ) | (10.83 | ) | 0.41 | 4.14 | (0.37 | ) | (5.38 | ) | ||||||||||||||||||||||||
| Market Price Return | (24.14 | ) | (4.80 | ) | (13.72 | ) | (2.22 | ) | (10.63 | ) | 0.45 | 4.64 | (0.51 | ) | (7.39 | ) | ||||||||||||||||||||||||
| 19 |
|
Invesco FTSE RAFI Emerging Markets ETF (PXH) (continued)
Fund Inception: September 27, 2007
Performance quoted above represents past performance. Past performance is not a guarantee of future results and current performance may be higher or lower than performance quoted. Investment returns and principal value will fluctuate, and shares of the Fund (“Fund Shares”), when redeemed or sold, may be worth more or less than their original cost. Fund performance reflects any applicable fee waivers and/or expense reimbursements. Had the adviser not waived fees and/or reimbursed expenses currently or in the past, returns would have been lower. See the current prospectus for more information.
According to the Fund’s current prospectus, the Fund’s expense ratio of 0.49% is expressed as a unitary management fee to cover operating expenses and expenses incurred in connection with managing the portfolio. NAV and Market Price returns assume that dividends and capital gain distributions have been reinvested in the Fund at NAV and Market Price, respectively. The returns shown in the table above do not reflect the deduction of taxes that a shareholder would pay on Fund distributions or the redemption or sale of Fund Shares. See invesco.com/ETFs to find the most recent month-end performance numbers.
Performance results for the indexes stated above are based upon a hypothetical investment in their respective constituent securities. The returns of an index do not represent Fund returns. An investor cannot invest directly in an index. The indexes do not charge management fees or brokerage expenses, and no such fees or expenses were deducted from the hypothetical performance shown. In addition, the results actual investors might have achieved would have differed from those shown because of differences in the timing, amounts of their investments, and fees and expenses associated with an investment in the Fund.
Notes Regarding Indexes and Fund Performance History:
| - | Average Annualized and Cumulative Inception returns for the Fund and the indexes are based on the inception date of the Fund. |
| - | Net returns reflect reinvested dividends net of withholding taxes. |
| 20 |
|
| PBD | Management’s Discussion of Fund Performance | |
| Invesco Global Clean Energy ETF (PBD) |
As an index fund, the Invesco Global Clean Energy ETF (the “Fund”) is passively managed and seeks to track the investment results (before fees and expenses) of the WilderHill New Energy Global Innovation Index (the “Index”). The Fund generally will invest at least 90% of its total assets in the securities that comprise the Index, as well as American depositary receipts (“ADRs”) and global depositary receipts (“GDRs”) that represent securities in the Index.
Strictly in accordance with its guidelines and mandated procedures, WilderHill New Energy Finance LLC (the “Index Provider”) compiles and maintains the Index, which is comprised of securities of companies that are located in developed and emerging markets throughout the world and that are engaged in the business of the advancement of cleaner energy and conservation. The Index is comprised primarily of companies whose technologies focus on the generation and use of cleaner energy, conservation and efficiency, and the advancement of renewable energy in general, as determined by the Index Provider. The Index includes companies in wind, solar, biofuels, hydro, wave, tidal, geothermal and other relevant renewable energy businesses and those involved in energy conversion, storage, conservation, efficiency, materials relating to those activities, carbon and greenhouse gas reduction, pollution control, emerging hydrogen and fuel cells. The Fund generally invests in all of the securities comprising the Index in proportion to their weightings in the Index.
For the fiscal year ended October 31, 2022, on a market price basis, the Fund returned (38.83)%. On a net asset value (“NAV”) basis, the Fund returned (38.52)%. During the same time period, the Index returned (38.75)%. During the fiscal year, the Fund fully replicated the components of the Index; therefore, the Fund’s performance, on a NAV basis, differed from the return of the Index primarily due to income from the securities lending program in which the Fund participates, which were partially offset by fees and operating expenses that the Fund incurred during the period.
During this same time period, the MSCI EAFE® Index (Net) (the “Benchmark Index”) returned (23.00)%. The Benchmark Index is an unmanaged index weighted by market capitalization based on the average performance of approximately 800 securities. The Benchmark Index was selected for its recognition in the marketplace, and its performance comparison is a useful measure for investors as a broad representation of the markets of economically developed countries outside of the U.S.
The performance of the Fund differed from the Benchmark Index because the Fund seeks to track an Index that employs a proprietary stock selection and weighting methodology, whereas the Benchmark Index selects, and weights stocks based upon the market capitalization.
Relative to the Benchmark Index, the Fund was most overweight in the electrical components & equipment sub-industry and most underweight in the pharmaceuticals sub-industry during the fiscal year ended October 31, 2022. The majority of the Fund’s underperformance relative to the Benchmark Index during the period can be attributed to the Fund’s security selection in the electrical components & equipment and automobile manufacturers sub-industries. For the fiscal year ended October 31, 2022, the fertilizers & agricultural chemicals sub-industry contributed most significantly to the Fund’s return, followed by the motorcycle manufacturers sub-industry. The electrical components & equipment sub-industry detracted most significantly from the Fund’s return, followed by the automobile manufacturers sub-indsutry.
Positions that contributed most significantly to the Fund’s return for the fiscal year ended October 31, 2022 included Sociedad Quimica y Minera de Chile S.A., Sponsored ADR, Pfd., Class B, a fertilizers & agricultural chemicals company (portfolio average weight of 0.90%), and Infrastructure & Energy Alternatives, Inc., a construction & engineering company (no longer held at fiscal year-end). Positions that detracted most significantly from the Fund’s return included XPeng, Inc., Sponsored ADR, Class A, an automobile manufacturers company (portfolio average weight of 0.75%), and ITM Power PLC, a heavy electrical equipment company (portfolio average weight of 0.70%).
| Sub-Industry Breakdown (% of the Fund’s Net Assets) as of October 31, 2022 | ||||
| Electrical Components & Equipment | 18.08 | |||
| Renewable Electricity | 15.52 | |||
| Heavy Electrical Equipment | 9.83 | |||
| Semiconductors | 7.42 | |||
| Automobile Manufacturers | 5.64 | |||
| Semiconductor Equipment | 5.36 | |||
| Electric Utilities | 4.91 | |||
| Construction & Engineering | 4.88 | |||
| Diversified Metals & Mining | 3.27 | |||
| Specialty Chemicals | 3.02 | |||
| Sub-Industry Types Each Less than 3% | 22.08 | |||
| Money Market Funds Plus Other Assets Less Liabilities | (0.01) | |||
| 21 |
|
Invesco Global Clean Energy ETF (PBD) (continued)
| Top Ten Fund Holdings* (% of the Fund’s Net Assets) as of October 31, 2022 | ||||
| Security | ||||
| VERBIO Vereinigte BioEnergie AG | 1.17 | |||
| McPhy Energy S.A. | 1.14 | |||
| Samsung SDI Co. Ltd. | 1.07 | |||
| Arcosa, Inc. | 1.03 | |||
| PNE AG | 1.02 | |||
| First Solar, Inc. | 1.00 | |||
| Ecopro BM Co. Ltd. | 0.99 | |||
| Fugro N.V. | 0.97 | |||
| Proterra, Inc. | 0.96 | |||
| CropEnergies AG | 0.95 | |||
| Total | 10.3 | |||
| * | Excluding money market fund holdings. |
Growth of a $10,000 Investment
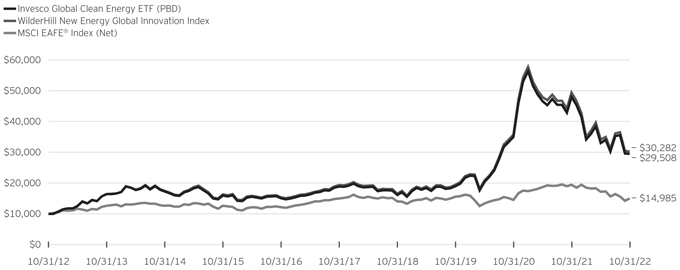
Fund Performance History as of October 31, 2022
1 Year | 3 Years Average Annualized | 3 Years | 5 Years Average Annualized | 5 Years | 10 Years Average Annualized | 10 Years Cumulative | Fund Inception | |||||||||||||||||||||||||||||||||
| Index | Average | Cumulative | ||||||||||||||||||||||||||||||||||||||
| WilderHill New Energy Global Innovation Index | (38.75 | )% | 15.96 | % | 55.93 | % | 9.38 | % | 56.58 | % | 11.72 | % | 202.82 | % | (0.08 | )% | (1.18 | )% | ||||||||||||||||||||||
| MSCI EAFE® Index (Net) | (23.00 | ) | (1.27 | ) | (3.77 | ) | (0.09 | ) | (0.47 | ) | 4.13 | 49.85 | 1.24 | 20.91 | ||||||||||||||||||||||||||
| Fund | ||||||||||||||||||||||||||||||||||||||||
| NAV Return | (38.52 | ) | 15.83 | 55.39 | 9.34 | 56.24 | 11.43 | 195.08 | (0.68 | ) | (9.91 | ) | ||||||||||||||||||||||||||||
| Market Price Return | (38.83 | ) | 15.97 | 55.97 | 9.26 | 55.73 | 11.48 | 196.34 | (0.75 | ) | (10.99 | ) | ||||||||||||||||||||||||||||
| 22 |
|
Invesco Global Clean Energy ETF (PBD) (continued)
Fund Inception: June 13, 2007
Performance quoted above represents past performance. Past performance is not a guarantee of future results and current performance may be higher or lower than performance quoted. Investment returns and principal value will fluctuate, and shares of the Fund (“Fund Shares”), when redeemed or sold, may be worth more or less than their original cost. Fund performance reflects any applicable fee waivers and/or expense reimbursements. Had the adviser not waived fees and/or reimbursed expenses currently or in the past, returns would have been lower. See the current prospectus for more information. According to the Fund’s current prospectus, the Fund’s expense ratio of 0.75% is expressed as a unitary management fee to cover operating expenses and expenses incurred in connection with managing the portfolio. NAV and Market Price returns assume that dividends and capital gain distributions have been reinvested in the Fund at NAV and Market Price, respectively. The returns shown in the table above do not reflect the deduction of taxes that a shareholder would pay on Fund distributions or the redemption or sale of Fund Shares. See invesco.com/ETFs to find the most recent month-end performance numbers.
Performance results for the indexes stated above are based upon a hypothetical investment in their respective constituent securities. The returns of an index do not represent Fund returns. An investor cannot invest directly in an index. The indexes do not charge management fees or brokerage expenses, and no such fees or expenses were deducted from the hypothetical performance shown. In addition, the results actual investors might have achieved would have differed from those shown because of differences in the timing, amounts of their investments, and fees and expenses associated with an investment in the Fund.
Notes Regarding Indexes and Fund Performance History:
| - | Average Annualized and Cumulative Inception returns for the Fund and the indexes are based on the inception date of the Fund. |
| - | Net returns reflect reinvested dividends net of withholding taxes. |
| 23 |
|
| PIO | Management’s Discussion of Fund Performance | |
| Invesco Global Water ETF (PIO) |
As an index fund, the Invesco Global Water ETF (the “Fund”) is passively managed and seeks to track the investment results (before fees and expenses) of the Nasdaq OMX Global Water IndexSM (the “Index”). The Fund generally will invest at least 90% of its total assets in the securities that comprise the Index, as well as American depositary receipts (“ADRs”) and global depositary receipts (“GDRs”) that are based on the securities in the Index.
Strictly in accordance with its guidelines and mandated procedures, Nasdaq, Inc. (“Nasdaq” or the “Index Provider”) compiles, maintains, and calculates the Index, which is comprised of securities of global exchange-listed companies located in the United States, as well as developed and emerging markets throughout the world, that create products designed to conserve and purify water for homes, businesses and industries. The Fund generally invests in all of the securities comprising the Index in proportion to their weightings in the Index.
For the fiscal year ended October 31, 2022, on a market price basis, the Fund returned (25.02)%. On a net asset value (“NAV”) basis, the Fund returned (25.14)%. During the same time period, the Index returned (24.89)%. During the fiscal year, the Fund fully replicated the components of the Index; therefore, the Fund’s performance, on a NAV basis, differed from the return of the Index primarily due to fees and operating expenses that the Fund incurred during the period, which were partially offset by the effects of compounding during a period of weak returns as well as benefits to the Fund related to dividend tax treatment relative to the Index.
During this same time period, the MSCI EAFE® Index (Net) (the “Benchmark Index”) returned (23.00)%. The Benchmark Index is an unmanaged index weighted by market capitalization based on the average performance of approximately 800 securities. The Benchmark Index was selected for its recognition in the marketplace, and its performance comparison is a useful measure for investors as a broad representation of the markets of economically developed countries outside of the U.S.
The performance of the Fund differed from the Benchmark Index because the Fund seeks to track an Index that employs a proprietary stock selection and weighting methodology, whereas the Benchmark Index selects and weights stocks based upon the market capitalization.
Relative to the Benchmark Index, the Fund was most overweight in the industrial machinery sub-industry and most underweight in the pharmaceuticals sub-industry during the fiscal year ended October 31, 2022. The majority of the Fund’s underperformance relative to the Benchmark Index during the period can be attributed to the Fund’s overweight allocation to the building materials and industrial machinery sub-industries, respectively.
For the fiscal year ended October 31, 2022, the environmental & facilities services sub-industry contributed most significantly to the
Fund’s return, followed by the diversified support services sub-industry. The industrial machinery sub-industry detracted most significantly from the Fund’s return, followed by the building materials sub-industry.
Positions that contributed most significantly to the Fund’s return for the fiscal year ended October 31, 2022 included Companhia de Saneamento Basico do Estado de Sao Paulo, a water utilities company (portfolio average weight of 2.55%), and Tetra Tech, Inc., an environmental & facilities services company (portfolio average weight of 0.69%). Positions that detracted most significantly from the Fund’s return included Pentair PLC, an industrial machinery company (portfolio average weight of 7.35%) and Geberit AG, a building products company (portfolio average weight of 6.19%).
| Sector Breakdown (% of the Fund’s Net Assets) as of October 31, 2022 | ||||
| Industrials | 45.54 | |||
| Utilities | 26.45 | |||
| Health Care | 11.82 | |||
| Information Technology | 11.45 | |||
| Materials | 3.95 | |||
| Consumer Discretionary | 0.60 | |||
| Money Market Funds Plus Other Assets Less Liabilities | 0.19 | |||
| Top Ten Fund Holdings* (% of the Fund’s Net Assets) as of October 31, 2022 | ||||
| Security | ||||
| Roper Technologies, Inc. | 8.49 | |||
| Ferguson PLC | 7.77 | |||
| Danaher Corp. | 7.69 | |||
| Pentair PLC | 6.98 | |||
| Geberit AG | 6.18 | |||
| Waters Corp. | 4.13 | |||
| Veolia Environnement S.A. | 4.11 | |||
| American Water Works Co., Inc. | 4.03 | |||
| Ecolab, Inc. | 3.95 | |||
| Xylem, Inc. | 3.63 | |||
| Total | 56.96 | |||
| * | Excluding money market fund holdings. |
| 24 |
|
Invesco Global Water ETF (PIO) (continued)
Growth of a $10,000 Investment
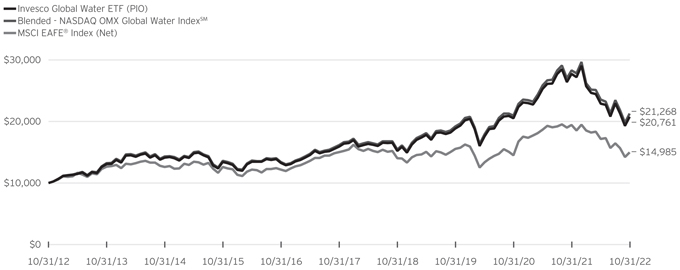
Fund Performance History as of October 31, 2022
| 3 Years Average Annualized | 3 Years Cumulative | 5 Years Average Annualized | 5 Years Cumulative | 10 Years Average Annualized | 10 Years Cumulative | Fund Inception | ||||||||||||||||||||||||||||||||||
| Index | 1 Year | Average | Cumulative | |||||||||||||||||||||||||||||||||||||
| Blended—NASDAQ OMX Global Water IndexSM | (24.89 | )% | 3.49 | % | 10.85 | % | 5.65 | % | 31.61 | % | 7.84 | % | 112.68 | % | 3.14 | % | 60.89 | % | ||||||||||||||||||||||
| MSCI EAFE® Index (Net) | (23.00 | ) | (1.27 | ) | (3.77 | ) | (0.09 | ) | (0.47 | ) | 4.13 | 49.85 | 1.24 | 20.91 | ||||||||||||||||||||||||||
| Fund | ||||||||||||||||||||||||||||||||||||||||
| NAV Return | (25.14 | ) | 3.24 | 10.05 | (5.43 | ) | 30.29 | 7.58 | 107.61 | 2.81 | 53.15 | |||||||||||||||||||||||||||||
| Market Price Return | (25.02 | ) | 3.45 | 10.71 | (5.51 | ) | 30.73 | 7.66 | 109.13 | 2.69 | 50.49 | |||||||||||||||||||||||||||||
Fund Inception: June 13, 2007
Performance quoted above represents past performance. Past performance is not a guarantee of future results and current performance may be higher or lower than performance quoted. Investment returns and principal value will fluctuate, and shares of the Fund (“Fund Shares”), when redeemed or sold, may be worth more or less than their original cost. Fund performance reflects any applicable fee waivers and/or expense reimbursements. Had the adviser not waived fees and/or reimbursed expenses currently or in the past, returns would have been lower. See the current prospectus for more information. According to the Fund’s current prospectus, the Fund’s expense ratio of 0.75% is expressed as a unitary management fee to cover operating expenses and expenses incurred in connection with managing the portfolio. NAV and Market Price returns assume that dividends and capital gain distributions have been reinvested in the Fund at NAV and Market Price, respectively. The returns shown in the table above do not reflect the deduction of taxes that a shareholder would pay on Fund distributions or the redemption or sale of Fund Shares. See invesco.com/ETFs to find the most recent month-end performance numbers.
Performance results for the indexes stated above are based upon a hypothetical investment in their respective constituent securities. The returns of an index do not represent Fund returns. An investor cannot invest directly in an index. The indexes do not charge management fees or brokerage expenses, and no such fees or expenses were deducted from the hypothetical performance shown. In addition, the results actual investors might have achieved would have differed from those shown because of differences in the timing, amounts of their investments, and fees and expenses associated with an investment in the Fund.
Notes Regarding Indexes and Fund Performance History:
| - | Average Annualized and Cumulative Inception returns for the Fund and the indexes are based on the inception date of the Fund. |
| - | The Blended-Nasdaq OMX Global Water IndexSM performance is comprised of the performance of the Palisades Global Water Index, the Fund’s previous underlying index prior to the conversion date, March 1, 2012, followed by the performance of the Index, starting from the conversion date through October 31, 2022. |
| - | Net returns reflect reinvested dividends net of withholding taxes. |
| 25 |
|
| IPKW | Management’s Discussion of Fund Performance | |
| Invesco International Buyback AchieversTM ETF (IPKW) |
As an index fund, the Invesco International BuyBack AchieversTM ETF (the “Fund”) is passively managed and seeks to track the investment results (before fees and expenses) of the Nasdaq International BuyBack AchieversTM Index (the “Index”). The Fund generally will invest at least 90% of its total assets in the securities that comprise the Index.
Strictly in accordance with its guidelines and mandated procedures, Nasdaq, Inc. (“Nasdaq” or the “Index Provider”) compiles, maintains, and calculates the Index, which is comprised of the securities of foreign companies that are classified as “International BuyBack AchieversTM” pursuant to the Index Provider’s proprietary selection methodology. To qualify as an “International BuyBack AchieverTM,” a company must have effected a net reduction of 5% or more of its outstanding shares in its latest fiscal year. Additionally, to be eligible for inclusion in the Index, a security must: (i) be included in the NASDAQ Global Ex-US Index (a broad-based index designed to track the performance of the global equity market and whose component securities are issued by companies located throughout the world, excluding the United States); (ii) have a minimum market capitalization of $250 million; and (iii) have a minimum three-month average daily dollar trading volume of $1 million. The Fund generally invests in all of the securities comprising the Index in proportion to their weightings in the Index.
For the fiscal year ended October 31, 2022, on a market price basis, the Fund returned (23.65)%. On a net asset value (“NAV”) basis, the Fund returned (23.55)%. During the same time period, the Index returned (23.29)%. During the fiscal year, the Fund’s performance, on a NAV basis, differed from the return of the Index primarily due to fees and operating expenses incurred by the Fund during the period, which were significantly offset by benefits to the Fund related to dividend tax treatment relative to the Index.
During this same time period, the MSCI ACWI ex USA® Index (Net) (the “Benchmark Index”) returned (24.73)%. The Benchmark Index is an unmanaged index weighted by market capitalization and based on the average performance of approximately 2,300 securities. The Benchmark Index was selected for its recognition in the marketplace, and its performance comparison is a useful measure for investors as a broad representation of the developed and emerging equity markets outside of the U.S.
The performance of the Fund differed from the Benchmark Index in part because the Fund employs a modified market capitalization weighting methodology and selects stocks based on constituent companies engaging in stock buybacks, whereas the Benchmark Index selects and weights stocks based on market capitalization.
Relative to the Benchmark Index, the Fund was most overweight in the communication services sector and most underweight in the
information technology sector during the fiscal year ended October 31, 2022. The majority of the Fund’s outperformance relative to the Benchmark Index during the period can be attributed to the Fund’s security selection in the consumer discretionary and industrials sectors. For the fiscal year ended October 31, 2022, the energy sector contributed most significantly to the Fund’s return. The financials sector detracted most significantly from Fund’s return followed by the real estate and communication services sectors, respectively.
Positions that contributed most significantly to the Fund’s return for the fiscal year ended October 31, 2022 included Hitachi Transport System, Ltd., an industrials company (no longer held at fiscal year-end) and Element Fleet Management Corp., a financials company (portfolio average weight of 0.81). Positions that detracted most significantly from the Fund’s return included Aroundtown SA, a real estate company (no longer held at fiscal year-end) and Abrdn PLC, a financials company (no longer held at fiscal year-end).
| Sector Breakdown (% of the Fund’s Net Assets) as of October 31, 2022 | ||||
| Financials | 27.52 | |||
| Materials | 13.46 | |||
| Energy | 12.45 | |||
| Communication Services | 11.72 | |||
| Consumer Discretionary | 7.93 | |||
| Consumer Staples | 7.73 | |||
| Information Technology | 6.69 | |||
| Health Care | 5.03 | |||
| Industrials | 3.47 | |||
| Sector Types Each Less Than 3% | 3.51 | |||
| Money Market Funds Plus Other Assets Less Liabilities | 0.49 | |||
| Top Ten Fund Holdings* (% of the Fund’s Net Assets) as of October 31, 2022 | ||||
| Security | ||||
| SoftBank Group Corp. | 5.99 | |||
| Suncor Energy, Inc. | 5.71 | |||
| CGI, Inc., Class A | 5.01 | |||
| Dollarama, Inc. | 4.84 | |||
| Japan Post Holdings Co. Ltd. | 4.79 | |||
| Roche Holding AG | 4.76 | |||
| Dai-ichi Life Holdings, Inc. | 4.72 | |||
| Vale S.A. | 4.52 | |||
| Imperial Oil Ltd. | 2.94 | |||
| Carrefour S.A. | 2.72 | |||
| Total | 46.00 | |||
| * | Excluding money market fund holdings. |
| 26 |
|
Invesco International Buyback AchieversTM ETF (IPKW) (continued)
Growth of a $10,000 Investment Since Inception
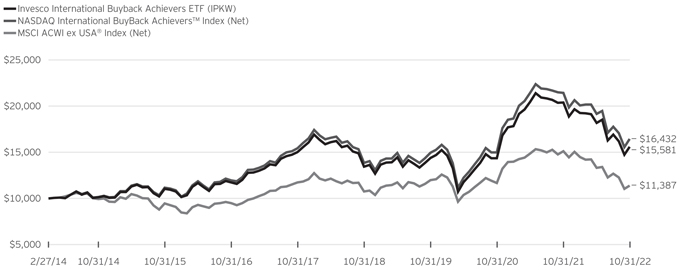
Fund Performance History as of October 31, 2022
| 3 Years Average Annualized | 3 Years Cumulative | 5 Years Average Annualized | 5 Years Cumulative | Fund Inception | ||||||||||||||||||||||||||||
| Index | 1 Year | Average | Cumulative | |||||||||||||||||||||||||||||
| NASDAQ International BuyBack Achievers™ Index (Net) | (23.29 | )% | 3.19 | % | 9.88 | % | 1.26 | % | 6.49 | % | 5.90 | % | 64.32 | % | ||||||||||||||||||
| MSCI ACWI ex USA® Index (Net) | (24.73 | ) | (1.68 | ) | (4.95 | ) | (0.60 | ) | (2.95 | ) | 1.51 | 13.87 | ||||||||||||||||||||
| Fund | ||||||||||||||||||||||||||||||||
| NAV Return | (23.55 | ) | 2.65 | 8.15 | 0.74 | 3.77 | 5.25 | 55.81 | ||||||||||||||||||||||||
| Market Price Return | (23.65 | ) | 2.79 | 8.61 | 0.64 | 3.23 | 5.17 | 54.80 | ||||||||||||||||||||||||
Fund Inception: February 27, 2014
Performance quoted above represents past performance. Past performance is not a guarantee of future results and current performance may be higher or lower than performance quoted. Investment returns and principal value will fluctuate, and shares of the Fund (“Fund Shares”), when redeemed or sold, may be worth more or less than their original cost. Fund performance reflects any applicable fee waivers and/or expense reimbursements. Had the adviser not waived fees and/or reimbursed expenses currently or in the past, returns would have been lower. See the current prospectus for more information. According to the Fund’s current prospectus, the Fund’s expense ratio of 0.55% is expressed as a unitary management fee to cover operating expenses and expenses incurred in connection with managing the portfolio. NAV and Market Price returns assume that dividends and capital gain distributions have been reinvested in the Fund at NAV and Market Price, respectively. The returns shown in the table above do not reflect the deduction of taxes that a shareholder would pay on Fund distributions or the redemption or sale of Fund Shares. See invesco.com/ETFs to find the most recent month-end performance numbers.
Performance results for the indexes stated above are based upon a hypothetical investment in their respective constituent securities. The returns of an index do not represent Fund returns. An investor cannot invest directly in an index. The indexes do not charge management fees or brokerage expenses, and no such fees or expenses were deducted from the hypothetical performance shown. In addition, the results actual investors might have achieved would have differed from those shown because of differences in the timing, amounts of their investments, and fees and expenses associated with an investment in the Fund.
Notes Regarding Indexes and Fund Performance History:
| - | Average Annualized and Cumulative Inception returns for the Fund and the indexes are based on the inception date of the Fund. |
| - | Net returns reflect reinvested dividends net of withholding taxes. |
| 27 |
|
| CUT | Management’s Discussion of Fund Performance | |
| Invesco MSCI Global Timber ETF (CUT) |
As an index fund, the Invesco MSCI Global Timber ETF (the “Fund”) is passively managed and seeks to track the investment results (before fees and expenses) of the MSCI ACWI IMI Timber Select Capped Index (the “Index”). The Fund generally will invest at least 90% of its total assets in the securities that comprise the Index, as well as American depositary receipts (“ADRs”) and global depositary receipts (“GDRs”) that represent securities in the Index.
Strictly in accordance with its guidelines and mandated procedures, MSCI, Inc. (“MSCI” or the “Index Provider”) compiles, maintains, and calculates the Index, which is comprised of equity securities of companies in both developed and emerging markets throughout the world that are primarily engaged in the ownership and management of forests and timberlands and the production of finished products that use timber as a raw material. The securities in the Index are selected from a universe of securities that are included in the MSCI ACWI Investable Market Index and classified by the Global Industry Classification Standard to be in the sub-industries of forest products, paper products, paper packaging or specialized real estate investment trusts (“REITs”) classified as “timber” REITs. The constituents of the Index are weighted based on their free-float-adjusted market capitalization. The Fund generally invests in all of the securities comprising the Index in proportion to their weightings in the Index.
For the fiscal year ended October 31, 2022, on a market price basis, the Fund returned (16.82)%. On a net asset value (“NAV”) basis, the Fund returned (16.65)%. During the same time period, the Index returned (16.68)%. During the fiscal year, the Fund’s performance, on a NAV basis, differed from the return of the Index primarily due to the effect of compounding during a period of weak returns and the significant benefits to the Fund related to dividend tax treatment relative to the Index. These were offset by fees and operating expenses incurred by the Fund during the period.
During this same time period, the MSCI World Index (Net) (the “Benchmark Index”) returned (18.48)%. The Benchmark Index is an unmanaged index weighted by market capitalization and based on the average performance of approximately 1,500 securities. The Benchmark Index was selected for its recognition in the marketplace, and its performance comparison is a useful measure for investors as a broad representation of equity markets in economically developed countries.
The performance of the Fund differed from the Benchmark Index because the Fund seeks to track an Index that employs a proprietary stock selection and weighting methodology, whereas the Benchmark Index selects and weights stocks based on market capitalization.
Relative to the Benchmark Index, the Fund was most overweight in the paper packaging sub-industry and most underweight in the
diversified banks sub-industry during the fiscal year ended October 31, 2022. The majority of the Fund’s outperformance relative to the Benchmark Index during the period can be attributed to the Fund’s underweight allocation to the interactive media & services sub-industry, followed by the Fund’s security selection in the specialized REITs sub-industry. For the fiscal year ended October 31, 2022, no sub-industry contributed positively to the Fund’s return. The paper packaging sub-industry detracted most significantly from the Fund’s return during the period, followed by the paper products sub-industry.
Positions that contributed most significantly to the Fund’s return for the fiscal year ended October 31, 2022 included Suzano S.A., a paper products company (portfolio average weight of 3.11%) and Graphic Packaging Holding Co., a paper packaging company (portfolio average weight of 2.64%). Positions that detracted most significantly from the Fund’s return included Smurfit Kappa Group PLC, a paper packaging company (portfolio average weight of 4.22%) and International Paper Co., a paper packaging company (portfolio average weight of 4.85%).
| Sector Breakdown (% of the Fund’s Net Assets) as of October 31, 2022 | ||||
| Materials | 90.08 | |||
| Real Estate | 8.93 | |||
| Exchange-Traded Fund | 0.63 | |||
| Money Market Funds Plus Other Assets Less Liabilities | 0.36 | |||
| Top Ten Fund Holdings* (% of the Fund’s Net Assets) as of October 31, 2022 | ||||
| Security | ||||
| UPM-Kymmene OYJ | 5.55 | |||
| Amcor PLC | 5.22 | |||
| Avery Dennison Corp. | 4.90 | |||
| Weyerhaeuser Co. | 4.77 | |||
| Packaging Corp. of America | 4.71 | |||
| WestRock Co. | 4.32 | |||
| International Paper Co. | 4.31 | |||
| Mondi PLC | 4.05 | |||
| Smurfit Kappa Group PLC | 4.04 | |||
| Suzano S.A. | 3.75 | |||
| Total | 45.62 | |||
| * | Excluding money market fund holdings. |
| 28 |
|
Invesco MSCI Global Timber ETF (CUT) (continued)
Growth of a $10,000 Investment
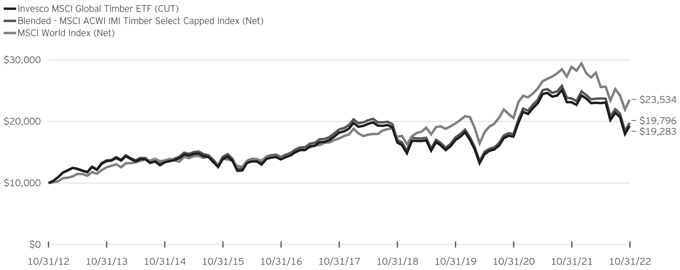
Fund Performance History as of October 31, 2022
1 Year | 3 Years Average | 3 Years Cumulative | 5 Years Average | 5 Years Cumulative | 10 Years Average | 10 Years Cumulative | Fund Inception | |||||||||||||||||||||||||||||||||
| Index | Average Annualized | Cumulative | ||||||||||||||||||||||||||||||||||||||
| Blended—MSCI ACWI IMI Timber Select Capped Index (Net) | (16.68 | )% | 4.40 | % | 13.78 | % | 1.09 | % | 5.58 | % | 7.07 | % | 97.96 | % | 3.89 | % | 77.05 | % | ||||||||||||||||||||||
| MSCI World Index (Net) | (18.48 | ) | 6.11 | 19.47 | 6.37 | 36.20 | 8.94 | 135.34 | 5.21 | 114.09 | ||||||||||||||||||||||||||||||
| Fund | ||||||||||||||||||||||||||||||||||||||||
| NAV Return | (16.65 | ) | 4.33 | 13.56 | 1.14 | 5.84 | 6.79 | 92.83 | 3.14 | 58.91 | ||||||||||||||||||||||||||||||
| Market Price Return | (16.82 | ) | 4.37 | 13.70 | 1.06 | 5.43 | 6.68 | 90.83 | 3.12 | 58.53 | ||||||||||||||||||||||||||||||
Guggenheim MSCI Global Timber ETF (the “Predecessor Fund”) Fund Inception: November 9, 2007
Performance quoted above represents past performance. Past performance is not a guarantee of future results and current performance may be higher or lower than performance quoted. Investment returns and principal value will fluctuate, and shares of the Fund (“Fund Shares”), when redeemed or sold, may be worth more or less than their original cost. Fund performance reflects any applicable fee waivers and/or expense reimbursements. Had the adviser not waived fees and/or reimbursed expenses currently or in the past, returns would have been lower. See the current prospectus for more information. The adviser has contractually agreed to waive fees and/or pay certain Fund expenses through August 31, 2024. According to the Fund’s current prospectus, the total gross annual operating expense ratio is indicated as 0.68% and the net annual operating expense ratio is indicated as 0.60%. The Financial Highlights section of the Shareholder Report presents the expense ratios based on expenses incurred during the period covered by this report. NAV and Market Price returns assume that dividends and capital gain distributions have been reinvested in the Fund at NAV and Market Price, respectively. The returns shown in the table above do not reflect the deduction of taxes that a shareholder would pay on Fund distributions or the redemption or sale of Fund Shares. See invesco.com/ETFs to find the most recent month-end performance numbers.
Performance results for the indexes stated above are based upon a hypothetical investment in their respective constituent securities. The returns of an index do not represent Fund returns. An investor cannot invest directly in an index. The indexes do not charge management fees or brokerage expenses, and no such fees or expenses were deducted from the hypothetical performance shown. In addition, the results actual investors might have achieved would have differed from those shown because of differences in the timing, amounts of their investments, and fees and expenses associated with an investment in the Fund.
Notes Regarding Indexes and Fund Performance History:
| - | Average Annualized and Cumulative Inception returns for the Fund and the indexes are based on the inception date of the Fund. |
| - | The Blended-MSCI ACWI IMI Timber Select Capped Index performance is comprised of the performance of the Beacon Global Timber Index, the Fund’s previous underlying index prior to the conversion date, May 20, 2016, followed by the performance of the Index, starting from the conversion date through October 31, 2022. |
| - | Effective after the close of business on April 6, 2018, the Predecessor Fund was reorganized into the Fund. Fund returns shown are blended returns of the Predecessor Fund and the Fund. |
| - | Net returns reflect reinvested dividends net of withholding taxes. |
| 29 |
|
| GBLD | Management’s Discussion of Fund Performance | |
| Invesco MSCI Green Building ETF (GBLD) |
As an index fund, the Invesco MSCI Green Building ETF (the “Fund”) is passively managed and seeks to track the investment results (before fees and expenses) of the MSCI Global Green Building Index (the “Index”). The Fund generally will invest at least 90% of its total assets in the securities that comprise the Index.
Strictly in accordance with its guidelines and mandated procedures, MSCI Inc. (the “Index Provider”) compiles, maintains and calculates the Index, which is comprised of companies that the index methodology has determined provide exposure to the environment impact theme of “green building.” The index methodology defines “green building” to include the design, construction, redevelopment, retrofitting, or acquisition of green- certified properties to promote mechanisms for raising capacity for effective climate change mitigation and adaptation. The Index is composed of securities that are also components of the MSCI ACWI Investable Market Index (the “Parent Index”), an equity index composed of more than 9,200 securities of large-, mid- and small-capitalization companies located in both developed and emerging market countries around the world. Companies that derive 50% or more of their revenue from green building are eligible for inclusion in the Index. Such companies are evaluated for their level of involvement in, and strategic commitment to green building, based on the Index Provider’s internal environmental, social and governance (“ESG”) rating and score data. Once included in the Index, securities will remain constituents as long as they continue to meet the eligibility criteria and the revenue they derive from green building does not fall below 40%. The Index weights its constituents by their free-float adjusted market capitalization. The Fund generally invests in all of the securities comprising the Index in proportion to their weightings in the Index.
For the fiscal year ended October 31, 2022, on a market price basis, the Fund returned (28.22)%. On a net asset value (“NAV”) basis, the Fund returned (28.05)%. During the same time period, the Index returned (28.24)%. During the fiscal year, the Fund’s performance, on a NAV basis, differed from the return of the Index primarily due to benefits to the Fund related to dividend tax treatment relative to the Index, which were partially offset by fees and operating expenses that the Fund incurred during the period.
During this same time period, the MSCI All Country World IMI Index (Net) (the “Benchmark Index”) returned (20.22)%. The Benchmark Index is an unmanaged index weighted by market capitalization based on the average performance of approximately 9,200 securities. The Benchmark Index was selected for its recognition in the marketplace, and its performance comparison is a useful measure for investors as a broad representation of the markets of economically developed countries outside of the U.S.
The performance of the Fund differed from the Benchmark Index because the Fund seeks to track an Index that employs a proprietary stock selection and weighting methodology, whereas
the Benchmark Index selects and weights stocks based on market capitalization.
Relative to the Benchmark Index, the Fund was most overweight in the office REITs sub-industry and most underweight in the diversified banks sub-industry during the fiscal year ended October 31, 2022. The majority of the Fund’s underperformance relative to the Benchmark Index during that period can be attributed to the Fund being overweight in the office REITs and real estate operating companies sub-industries.
For the fiscal year ended October 31, 2022, the department stores sub-industry contributed most significantly to the Fund’s return. The office REITs sub-industry detracted most significantly from the Fund’s return, followed by the diversified REITs and retail REITs sub-industries, respectively.
Positions that contributed most significantly to the Fund’s return for the fiscal year ended October 31, 2022 included Isetan Mitsukoshi Holdings Ltd., a department stores company (portfolio average weight of 0.98%), and Mapletree North Asia Commercial Trust, a diversified REITs company (no longer held at fiscal year-end). Positions that detracted most significantly from the Fund’s return included Alexandria Real Estate Equities, Inc., an office REITs company (portfolio average weight of 9.51%), and Boston Properties, Inc., an office REITs company (portfolio average weight of 5.63%).
| Sector Breakdown (% of the Fund’s Net Assets) as of October 31, 2022 | ||||
| Real Estate | 93.92 | |||
| Consumer Discretionary | 5.82 | |||
| Money Market Funds Plus Other Assets Less Liabilities | 0.26 | |||
| Top Ten Fund Holdings* (% of the Fund’s Net Assets) as of October 31, 2022 | ||||
| Security | ||||
| Alexandria Real Estate Equities, Inc. | 9.86 | |||
| Sun Hung Kai Properties Ltd. | 6.79 | |||
| Boston Properties, Inc. | 4.74 | |||
| CapitaLand Integrated Commercial Trust | 3.07 | |||
| Nippon Building Fund, Inc. | 2.98 | |||
| Unibail-Rodamco-Westfield | 2.43 | |||
| Japan Real Estate Investment Corp. | 2.30 | |||
| Japan Metropolitan Fund Investment Corp. | 2.24 | |||
| Nomura Real Estate Master Fund, Inc. | 2.11 | |||
| Vicinity Ltd. | 2.10 | |||
| Total | 38.62 | |||
| * | Excluding money market fund holdings. |
| 30 |
|
Invesco MSCI Green Building ETF (GBLD) (continued)
Growth of a $10,000 Investment Since Inception
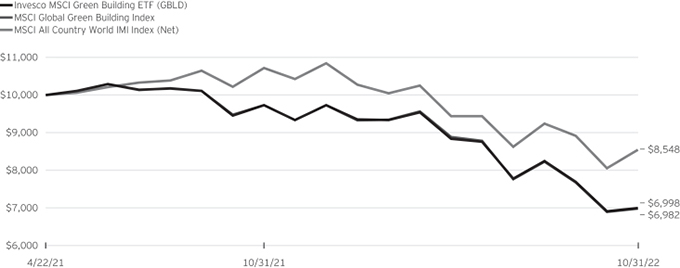
Fund Performance History as of October 31, 2022
| 1 Year | Fund Inception | |||||||||||||||
| Index | Average Annualized | Cumulative | ||||||||||||||
| MSCI Global Green Building Index | (28.24 | )% | (21.02 | )% | (30.18 | )% | ||||||||||
| MSCI All Country World IMI Index (Net) | (20.22 | ) | (9.79 | ) | (14.52 | ) | ||||||||||
| Fund | ||||||||||||||||
| NAV Return | (28.05 | ) | (20.90 | ) | (30.02 | ) | ||||||||||
| Market Price Return | (28.22 | ) | (20.79 | ) | (29.87 | ) | ||||||||||
Fund Inception: April 22, 2021
Performance quoted above represents past performance. Past performance is not a guarantee of future results and current performance may be higher or lower than performance quoted. Investment returns and principal value will fluctuate, and shares of the Fund (“Fund Shares”), when redeemed or sold, may be worth more or less than their original cost. Fund performance reflects any applicable fee waivers and/or expense reimbursements. Had the adviser not waived fees and/or reimbursed expenses currently or in the past, returns would have been lower. See the current prospectus for more information. According to the Fund’s current prospectus, the Fund’s expense ratio of 0.39% is expressed as a unitary management fee to cover operating expenses and expenses incurred in connection with managing the portfolio. NAV and Market Price returns assume that dividends and capital gain distributions have been reinvested in the Fund at NAV and Market Price, respectively. The returns shown in the table above do not reflect the deduction of taxes that a shareholder would pay on Fund distributions or the redemption or sale of Fund Shares. See invesco.com/ETFs to find the most recent month-end performance numbers.
Performance results for the indexes stated above are based upon a hypothetical investment in their respective constituent securities. The returns of an index do not represent Fund returns. An investor cannot invest directly in an index. The indexes do not charge management fees or brokerage expenses, and no such fees or expenses were deducted from the hypothetical performance shown. In addition, the results actual investors might have achieved would have differed from those shown because of differences in the timing, amounts of their investments, and fees and expenses associated with an investment in the Fund.
Notes Regarding Indexes and Fund Performance History:
| - | Average Annualized and Cumulative Inception returns for the Fund and the indexes are based on the inception date of the Fund. |
| - | Net returns reflect reinvested dividends net of withholding taxes. |
| 31 |
|
| CGW | Management’s Discussion of Fund Performance | |
| Invesco S&P Global Water Index ETF (CGW) |
As an index fund, the Invesco S&P Global Water Index ETF (the “Fund”) is passively managed and seeks to track the investment results (before fees and expenses) of the S&P Global Water Index (the “Index”). The Fund generally will invest at least 90% of its total assets in securities that comprise the Index, as well as American depositary receipts (“ADRs”) and global depositary receipts (“GDRs”) that represent securities in the Index.
Strictly in accordance with its guidelines and mandated procedures, S&P Dow Jones Indices LLC (“S&P DJI” or the “Index Provider”) compiles, maintains, and calculates the Index, which is designed to measure the performance of approximately 50 of the largest global companies in water-related businesses. To be eligible for inclusion in the Index, securities must be classified as being in either the water equipment and materials or water utilities and infrastructure segments pursuant to the Index methodology. Index constituents must have a minimum float-adjusted capitalization of $100 million and total market capitalization of $250 million. The Fund generally invests in all of the securities comprising the Index in proportion to their weightings in the Index.
Effective October 24, 2022, the Index methodology was revised by the Index Provider to (i) increase the target number of constituents to 100, (ii) update the eligibility criteria, and (iii) incorporate an analysis of environmental, social, and governance (“ESG”) factors as part of its constituent selection methodology.
For the fiscal year ended October 31, 2022, on a market price basis, the Fund returned (21.37)%. On a net asset value (“NAV”) basis, the Fund returned (21.21)%. During the same time period, the Index returned (20.97)%. During the fiscal year, the Fund’s performance, on a NAV basis, differed from the return of the Index primarily due to fees and operating expenses that the Fund incurred during the period, which were partially offset by the effects of compounding during a period of weak returns as well as benefits to the Fund related to dividend tax treatment relative to the Index.
During this same time period, the MSCI EAFE® Index (Net) (the “Benchmark Index”) returned (23.00)%. The Benchmark Index is an unmanaged index weighted by market capitalization based on the average performance of approximately 800 securities. The Benchmark Index was selected for its recognition in the marketplace, and its performance comparison is a useful measure for investors as a broad representation of the markets of economically developed countries outside of the U.S.
The performance of the Fund differed from the Benchmark Index because the Fund seeks to track an Index that employs a proprietary stock selection and weighting methodology, whereas the Benchmark Index selects and weights stocks based on market capitalization.
Relative to the Benchmark Index, the Fund was most overweight in the water utilities sub-industry and most underweight in the pharmaceuticals sub-industry during the fiscal year ended
October 31, 2022. The majority of the Fund’s outperformance relative to the Benchmark Index during that period can be attributed to the Fund’s security selection in and overweight allocation to the water utilities sub-industry, followed by Fund’s selection in the commodity chemicals sub-industries.
For the fiscal year ended October 31, 2022, the energy sector was the only positive contributor to the Fund’s return. The industrials sector detracted most significantly from the Fund’s return during the period, followed by the utilities sector.
Positions that contributed most significantly to the Fund’s return for the fiscal year ended October 31, 2022 included Cia de Saneamento Basico do Estado de Sao Paulo, ADR, a utilities company (portfolio average weight of 1.43%), and Badger Meter, Inc., an information technology company (portfolio average weight of 1.19%). Positions that detracted most significantly from the Fund’s return included Geberit AG, an industrials company (portfolio average weight of 4.76%), and Halma plc, an information technology company (no longer held at fiscal year-end).
| Industry Breakdown (% of the Fund’s Net Assets) as of October 31, 2022 | ||||
| Water Utilities | 40.66 | |||
| Machinery | 28.31 | |||
| Building Products | 10.38 | |||
| Multi-Utilities | 4.28 | |||
| Construction & Engineering | 4.01 | |||
| Chemicals | 3.98 | |||
| Commercial Services & Supplies | 3.36 | |||
| Industry Types Each Less Than 3% | 5.02 | |||
| Money Market Funds Plus Other Assets Less Liabilities | 0.00 | |||
| Top Ten Fund Holdings* (% of the Fund’s Net Assets) as of October 31, 2022 | ||||
| Security | ||||
| Xylem, Inc. | 8.36 | |||
| American Water Works Co., Inc. | 8.21 | |||
| United Utilities Group PLC | 6.67 | |||
| Severn Trent PLC | 6.34 | |||
| Essential Utilities, Inc. | 5.99 | |||
| Advanced Drainage Systems, Inc. | 4.54 | |||
| Veolia Environnement S.A. | 4.28 | |||
| Ecolab, Inc. | 3.98 | |||
| Geberit AG | 3.75 | |||
| Evoqua Water Technologies Corp. | 3.19 | |||
| Total | 55.31 | |||
| * | Excluding money market fund holdings. |
| 32 |
|
Invesco S&P Global Water Index ETF (CGW) (continued)
Growth of a $10,000 Investment
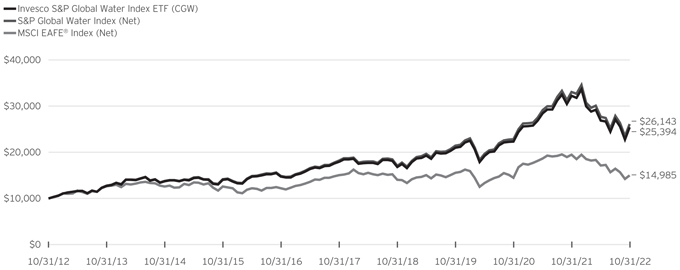
Fund Performance History as of October 31, 2022
| 1 Year | 3 Years Average | 3 Years Cumulative | 5 Years Average | 5 Years Cumulative | 10 Years Average | 10 Years Cumulative | Fund Inception | |||||||||||||||||||||||||||||||||
| Index | Average Annualized | Cumulative | ||||||||||||||||||||||||||||||||||||||
| S&P Global Water Index (Net) | (20.97 | )% | 6.86 | % | 22.03 | % | 7.50 | % | 43.55 | % | 10.09 | % | 161.43 | % | 6.58 | % | 167.80 | % | ||||||||||||||||||||||
| MSCI EAFE® Index (Net) | (23.00 | ) | (1.27 | ) | (3.77 | ) | (0.09 | ) | (0.47 | ) | 4.13 | 49.85 | 1.16 | 19.49 | ||||||||||||||||||||||||||
| Fund | ||||||||||||||||||||||||||||||||||||||||
| NAV Return | (21.21 | ) | 6.51 | 20.82 | 7.16 | 41.31 | 9.77 | 153.94 | 6.15 | 151.46 | ||||||||||||||||||||||||||||||
| Market Price Return | (21.37 | ) | 6.52 | 20.87 | 7.18 | 41.46 | 9.74 | 153.24 | 6.15 | 151.47 | ||||||||||||||||||||||||||||||
Guggenheim S&P Global Water Index ETF (the “Predecessor Fund”)
Fund Inception: May 14, 2007
Performance quoted above represents past performance. Past performance is not a guarantee of future results and current performance may be higher or lower than performance quoted. Investment returns and principal value will fluctuate, and shares of the Fund (“Fund Shares”), when redeemed or sold, may be worth more or less than their original cost. Fund performance reflects any applicable fee waivers and/or expense reimbursements. Had the adviser not waived fees and/or reimbursed expenses currently or in the past, returns would have been lower. See the current prospectus for more information. According to the Fund’s current prospectus, the total annual operating expense ratio was indicated as 0.57%. The Financial Highlights section of the Shareholder Report presents the expense ratios based on expenses incurred during the period covered by this report. NAV and Market Price returns assume that dividends and capital gain distributions have been reinvested in the Fund at NAV and Market Price, respectively. The returns shown in the table above do not reflect the deduction of taxes that a shareholder would pay on Fund distributions or the redemption or sale of Fund Shares. See invesco.com/ETFs to find the most recent month-end performance numbers.
Performance results for the indexes stated above are based upon a hypothetical investment in their respective constituent securities. The returns of an index do not represent Fund returns. An investor cannot invest directly in an index. The indexes do not charge management fees or brokerage expenses, and no such fees or expenses were deducted from the hypothetical performance shown. In addition, the results actual investors might have achieved would have differed from those shown because of differences in the timing, amounts of their investments, and fees and expenses associated with an investment in the Fund.
Notes Regarding Indexes and Fund Performance History:
| - | Average Annualized and Cumulative Inception returns for the Fund and the indexes are based on the inception date of the Fund. |
| - | Effective after the close of business on April 6, 2018, the Predecessor Fund was reorganized into the Fund. Fund returns shown are blended returns of the Predecessor Fund and the Fund. |
| - | Net returns reflect reinvested dividends net of withholding taxes. |
| 33 |
|
| IDHQ | Management’s Discussion of Fund Performance | |
| Invesco S&P International Developed Quality ETF (IDHQ) |
As an index fund, Invesco S&P International Developed Quality ETF (the “Fund) is passively managed and seeks to track the investment results (before fees and expenses) of the S&P Quality Developed ex-U.S. LargeMidCap Index (the “Index”). The Fund generally will invest at least 90% of its total assets in securities that comprise the Index.
Strictly in accordance with its guidelines and mandated procedures, S&P Dow Jones Indices (“S&P DJI” or the “Index Provider”) compiles, maintains and calculates the Index, which is constructed from constituents of the S&P Developed ex-U.S. LargeMidCap (the “Parent Index”) that the Index Provider identifies as being of the highest quality—that is, stocks of companies that seek to generate higher revenue and cash flow than their counterparts through prudent use of assets and finances. The Parent Index is designed to measure the top 85% of float-adjusted market cap in each developed country, excluding the United States. In selecting constituent securities for the Index, the Index Provider calculates the quality score of each security in the Parent Index and selects the top 20% of securities with the highest quality scores based on a composite of the following three equally- weighted factors: (i) return-on-equity, calculated as the company’s trailing 12-month earnings per share divided by the company’s latest book value per share; (ii) accruals ratio, computed using the change of the company’s net operating assets over the last year divided by the company’s average net operating assets over the last two years; and (iii) financial leverage, calculated as the company’s latest total debt divided by the company’s book value. The Index is modified market-capitalization weighted, weighting component securities by multiplying their market capitalization and their quality score; securities with higher scores receive relatively greater weights. The Fund generally invests all of the securities comprising the Index in proportion to their weightings in the Index.
For the fiscal year ended October 31, 2022, on a market price basis, the Fund returned (27.04)%. On a net asset value (“NAV”) basis, the Fund returned (26.69)%. During the same time period, the Index returned (26.58)%. During the fiscal year, the Fund fully replicated the components of the Index; therefore, the Fund’s performance, on a NAV basis, differed from the return of the Index primarily due to fees and operating expenses incurred by the Fund during the period, which were partially offset by income from securities lending.
During this same time period, the MSCI EAFE® Index (Net) (the “Benchmark Index”) returned (23.00)%. The Benchmark Index is an unmanaged index weighted by market capitalization based on the average performance of approximately 800 securities. The Benchmark Index was selected for its recognition in the marketplace, and its performance comparison is a useful measure for investors as a broad representation of the markets of economically developed countries outside of the U.S.
The performance of the Fund differed from the Benchmark Index in part because the Fund employs a quality metric weighting and stock selection methodology, whereas the Benchmark Index selects and weights stocks based on market capitalization.
Relative to the Benchmark Index, the Fund was most overweight in the health care sector and most underweight in the financials sector during the fiscal year ended October 31, 2022. The majority of the Fund’s underperformance relative to the Benchmark Index during the period can be attributed to the Fund’s underweight exposure to and security selection in the financials and energy sectors.
For the fiscal year ended October 31, 2022, the energy sector contributed most significantly to the Fund’s return. The information technology sector detracted most significantly from the Fund’s return followed by the industrials and consumer discretionary sectors, respectively.
Positions that contributed most significantly to the Fund’s return for the fiscal year ended October 31, 2022 included ABB Ltd., an industrials company (portfolio average weight of 0.68%) and Hermes International, a consumer discretionary company (portfolio average weight of 0.37%). Positions that detracted most significantly from the Fund’s return included ASML Holding NV, an information technology company (portfolio average weight of 4.76%), and Nestle S.A., a consumer staples company (portfolio average weight of 5.42%).
| Sector Breakdown (% of the Fund’s Net Assets) as of October 31, 2022 | ||||
| Health Care | 24.22 | |||
| Industrials | 15.17 | |||
| Consumer Staples | 12.55 | |||
| Information Technology | 10.50 | |||
| Materials | 9.83 | |||
| Consumer Discretionary | 8.51 | |||
| Financials | 7.64 | |||
| Communication Services | 4.85 | |||
| Energy | 4.66 | |||
| Sector Types Each Less Than 3% | 1.83 | |||
| Money Market Funds Plus Other Assets Less Liabilities | 0.24 | |||
| 34 |
|
Invesco S&P International Developed Quality ETF (IDHQ) (continued)
| Top Ten Fund Holdings* (% of the Fund’s Net Assets) as of October 31, 2022 | ||||
| Security | ||||
| Roche Holding AG | 6.10 | |||
| Nestle S.A. | 5.69 | |||
| Novartis AG | 5.52 | |||
| ASML Holding N.V. | 4.93 | |||
| Novo Nordisk A/S, Class B | 4.49 | |||
| BHP Group Ltd. | 3.26 | |||
| Diageo PLC | 2.48 | |||
| AIA Group Ltd. | 1.84 | |||
| Airbus SE | 1.78 | |||
| CSL Ltd. | 1.65 | |||
| Total | 37.74 | |||
| * | Excluding money market fund holdings. |
Growth of a $10,000 Investment
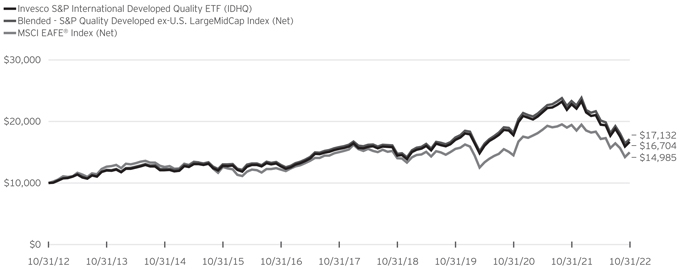
Fund Performance History as of October 31, 2022
1 Year | 3 Years Average | 3 Years Cumulative | 5 Years Average | 5 Years Cumulative | 10 Years Average | 10 Years Cumulative | Fund Inception | |||||||||||||||||||||||||||||||||
| Index | Average Annualized | Cumulative | ||||||||||||||||||||||||||||||||||||||
| Blended—S&P Quality Developed ex-U.S. LargeMidCap Index (Net) | (26.58 | )% | (0.49 | )% | (1.47 | )% | 1.57 | % | 8.09 | % | 5.53 | % | 71.32 | % | 2.10 | % | 37.67 | % | ||||||||||||||||||||||
| MSCI EAFE® Index (Net) | (23.00 | ) | (1.27 | ) | (3.77 | ) | (0.09 | ) | (0.47 | ) | 4.13 | 49.85 | 1.24 | 20.91 | ||||||||||||||||||||||||||
| Fund | ||||||||||||||||||||||||||||||||||||||||
| NAV Return | (26.69 | ) | (0.63 | ) | (1.87 | ) | 1.42 | 7.30 | 5.26 | 67.04 | 1.42 | 24.18 | ||||||||||||||||||||||||||||
| Market Price Return | (27.04 | ) | (0.72 | ) | (2.15 | ) | 1.23 | 6.29 | 5.16 | 65.32 | 1.31 | 22.25 | ||||||||||||||||||||||||||||
| 35 |
|
Invesco S&P International Developed Quality ETF (IDHQ) (continued)
Fund Inception: June 13, 2007
Performance quoted above represents past performance. Past performance is not a guarantee of future results and current performance may be higher or lower than performance quoted. Investment returns and principal value will fluctuate, and shares of the Fund (“Fund Shares”), when redeemed or sold, may be worth more or less than their original cost. Fund performance reflects any applicable fee waivers and/or expense reimbursements. Had the adviser not waived fees and/or reimbursed expenses currently or in the past, returns would have been lower. See the current prospectus for more information. According to the Fund’s current prospectus, the Fund’s expense ratio of 0.29% is expressed as a unitary management fee to cover operating expenses and expenses incurred in connection with managing the portfolio. NAV and Market Price returns assume that dividends and capital gain distributions have been reinvested in the Fund at NAV and Market Price, respectively. The returns shown in the table above do not reflect the deduction of taxes that a shareholder would pay on Fund distributions or the redemption or sale of Fund Shares. See invesco.com/ETFs to find the most recent month-end performance numbers.
Performance results for the indexes stated above are based upon a hypothetical investment in their respective constituent securities. The
returns of an index do not represent Fund returns. An investor cannot invest directly in an index. The indexes do not charge management fees or brokerage expenses, and no such fees or expenses were deducted from the hypothetical performance shown. In addition, the results actual investors might have achieved would have differed from those shown because of differences in the timing, amounts of their investments, and fees and expenses associated with an investment in the Fund.
Notes Regarding Indexes and Fund Performance History:
| - | Average Annualized and Cumulative Inception returns for the Fund and the indexes are based on the inception date of the Fund. |
| - | The Blended-S&P Quality Developed ex-U.S. LargeMidCap Index is comprised of the performance of the QSG Developed International Opportunities Index, the Fund’s previous underlying index from Fund inception through March 1, 2012, followed by the performance of S&P International Developed High Quality Rankings Index, the Fund’s underlying index for the period March 1, 2012 through the conversion date, March 18, 2016, followed by the performance of the Index, starting from the conversion date through October 31, 2022. |
| - | Net returns reflect reinvested dividends net of withholding taxes. |
| 36 |
|
Invesco China Technology ETF (CQQQ)
October 31, 2022
| Shares | Value | |||||||
Common Stocks & Other Equity Interests-100.02% |
| |||||||
Capital Markets-0.46% | ||||||||
Hithink RoyalFlush Information Network Co. Ltd., A Shares (China) | 276,600 | $ | 3,223,577 | |||||
|
| |||||||
Chemicals-0.22% | ||||||||
Jiangsu Cnano Technology Co. Ltd., A Shares (China) | 119,469 | 1,561,088 | ||||||
|
| |||||||
Diversified Financial Services-0.00% | ||||||||
Zhengqi Holdings Co. Ltd., Rts., TBA (China)(b)(c) | 122,862 | 0 | ||||||
|
| |||||||
Electrical Equipment-1.83% | ||||||||
East Group Co. Ltd., A Shares (China) | 1,066,000 | 1,015,085 | ||||||
Hongfa Technology Co. Ltd., A Shares (China) | 536,349 | 2,521,324 | ||||||
Qingdao TGOOD Electric Co. Ltd., A Shares (China) | 535,318 | 1,103,113 | ||||||
Sieyuan Electric Co. Ltd., A Shares (China) | 394,120 | 1,806,280 | ||||||
Suzhou Anjie Technology Co. Ltd., A Shares (China) | 351,500 | 623,190 | ||||||
Suzhou Maxwell Technologies Co. Ltd., A Shares (China) | 89,033 | 5,824,851 | ||||||
|
| |||||||
| 12,893,843 | ||||||||
|
| |||||||
Electronic Equipment, Instruments & Components-12.36% |
| |||||||
Avary Holding Shenzhen Co. Ltd., A Shares (China) | 426,356 | 1,737,880 | ||||||
Beijing Yuanliu Hongyuan Electronic Technology Co. Ltd., A Shares (China) | 106,786 | 1,679,934 | ||||||
BOE Technology Group Co. Ltd., A Shares (China) | 19,295,474 | 8,830,034 | ||||||
BOE Technology Group Co. Ltd., B Shares (China) | 6,879,279 | 2,970,854 | ||||||
Chaozhou Three-Circle Group Co. Ltd., A Shares (China) | 985,790 | 3,835,864 | ||||||
China Zhenhua Group Science & Technology Co. Ltd., A Shares (China) | 266,559 | 4,924,983 | ||||||
Guangzhou Shiyuan Electronic Technology Co. Ltd., A Shares (China) | 127,460 | 1,136,183 | ||||||
Hengdian Group DMEGC Magnetics Co. Ltd., A Shares (China) | 836,900 | 2,031,878 | ||||||
Lens Technology Co. Ltd., A Shares (China) | 2,558,400 | 3,491,308 | ||||||
Leyard Optoelectronic Co. Ltd., A Shares (China) | 1,308,000 | 1,008,966 | ||||||
Lingyi iTech Guangdong Co., A Shares (China)(b) | 3,637,500 | 2,357,353 | ||||||
Maxscend Microelectronics Co. Ltd., A Shares (China) | 245,146 | 3,102,195 | ||||||
OFILM Group Co. Ltd., A Shares (China)(b) | 1,676,073 | 1,074,730 | ||||||
Raytron Technology Co. Ltd., A Shares (China) | 229,442 | 1,494,803 | ||||||
Shanghai Friendess Electronic Technology Corp. Ltd., A Shares (China) | 68,753 | 1,940,337 | ||||||
Shengyi Technology Co. Ltd., A Shares (China) | 1,190,619 | 2,262,610 | ||||||
Shennan Circuits Co. Ltd., A Shares (China) | 95,364 | 980,870 | ||||||
Shenzhen Everwin Precision Technology Co. Ltd., A Shares (China)(b) | 617,880 | 998,110 | ||||||
| Shares | Value | |||||||
Electronic Equipment, Instruments & Components-(continued) |
| |||||||
Shenzhen Huaqiang Industry Co. Ltd., A Shares (China) | 499,675 | $ | 743,495 | |||||
Shenzhen Kaifa Technology Co. Ltd., A Shares (China) | 802,817 | 1,258,354 | ||||||
Shenzhen Kinwong Electronic Co. Ltd., A Shares (China) | 184,220 | 511,372 | ||||||
Sunny Optical Technology Group Co. Ltd. (China) | 2,889,349 | 25,047,638 | ||||||
Tianma Microelectronics Co. Ltd., A Shares (China) | 1,187,352 | 1,438,110 | ||||||
Unisplendour Corp. Ltd., A Shares (China) | 683,058 | 1,605,026 | ||||||
Universal Scientific Industrial Shanghai Co. Ltd., A Shares (China) | 428,700 | 1,023,791 | ||||||
Wuhan Guide Infrared Co. Ltd., A Shares (China) | 1,689,970 | 2,688,262 | ||||||
WUS Printed Circuit Kunshan Co. Ltd., A Shares (China) | 975,710 | 1,455,825 | ||||||
Xiamen Faratronic Co. Ltd., A Shares (China) | 115,600 | 2,805,184 | ||||||
Zhejiang Crystal-Optech Co. Ltd., A Shares (China) | 715,370 | 1,183,037 | ||||||
Zhuzhou Hongda Electronics Corp. Ltd., A Shares (China) | 205,100 | 1,246,292 | ||||||
|
| |||||||
| 86,865,278 | ||||||||
|
| |||||||
Entertainment-5.06% | ||||||||
Bilibili, Inc., Z Shares (China)(b)(d) | 1,853,085 | 16,028,901 | ||||||
China Ruyi Holdings Ltd. (China)(b)(d) | 17,258,365 | 2,704,229 | ||||||
Hangzhou Shunwang Technology Co. Ltd., A Shares (China) | 357,200 | 491,856 | ||||||
Tencent Music Entertainment Group, ADR (China)(b) | 4,522,032 | 16,324,536 | ||||||
|
| |||||||
| 35,549,522 | ||||||||
|
| |||||||
Health Care Technology-0.21% |
| |||||||
Winning Health Technology Group Co. Ltd., A Shares (China) | 1,104,829 | 1,465,315 | ||||||
|
| |||||||
Household Durables-0.55% | ||||||||
TCL Technology Group Corp., A Shares (China) | 7,217,700 | 3,866,660 | ||||||
|
| |||||||
Interactive Media & Services-22.63% |
| |||||||
Autohome, Inc., ADR (China)(d) | 447,377 | 11,685,487 | ||||||
Baidu, Inc., A Shares (China)(b) | 4,281,497 | 40,961,346 | ||||||
JOYY, Inc., ADR (China)(d) | 333,642 | 8,417,788 | ||||||
Kuaishou Technology (China)(b)(e) | 6,840,509 | 28,146,836 | ||||||
Tencent Holdings Ltd. (China) | 2,395,229 | 62,734,840 | ||||||
Weibo Corp., ADR (China)(b)(d) | 522,472 | 5,914,383 | ||||||
Zhihu, Inc., ADR (China)(b)(d) | 1,151,273 | 1,138,609 | ||||||
|
| |||||||
| 158,999,289 | ||||||||
|
| |||||||
Internet & Direct Marketing Retail-15.89% |
| |||||||
Dada Nexus Ltd., ADR (China)(b)(d) | 518,904 | 1,603,413 | ||||||
Meituan, B Shares (China)(b)(e) | 3,678,833 | 58,487,533 | ||||||
Pinduoduo, Inc., ADR (China)(b)(d) | 940,111 | 51,546,286 | ||||||
|
| |||||||
| 111,637,232 | ||||||||
|
| |||||||
IT Services-3.84% | ||||||||
Beijing Sinnet Technology Co. Ltd., A Shares (China) | 924,800 | 1,097,302 | ||||||
See accompanying Notes to Financial Statements which are an integral part of the financial statements.
| 37 | ||||
|
| |||
Invesco China Technology ETF (CQQQ)–(continued)
October 31, 2022
| Shares | Value | |||||||
IT Services-(continued) | ||||||||
Beijing Ultrapower Software Co. Ltd., A Shares (China) | 1,008,900 | $ | 604,074 | |||||
China TransInfo Technology Co. Ltd., A Shares (China)(b) | 522,771 | 640,338 | ||||||
DHC Software Co. Ltd., A Shares (China) | 1,648,900 | 1,393,927 | ||||||
Digital China Information Service Co. Ltd., A Shares (China) | 306,000 | 483,824 | ||||||
GDS Holdings Ltd., A Shares (China)(b)(d) | 6,742,249 | 8,159,565 | ||||||
Kingsoft Cloud Holdings Ltd., ADR | 735,002 | 1,859,555 | ||||||
Taiji Computer Corp. Ltd., A Shares (China) | 298,073 | 1,103,490 | ||||||
TravelSky Technology Ltd., H Shares (China) | 6,853,126 | 9,952,500 | ||||||
Wangsu Science & Technology Co. Ltd., A Shares (China) | 1,258,645 | 929,507 | ||||||
Wonders Information Co. Ltd., A Shares (China)(b) | 610,900 | 729,036 | ||||||
|
| |||||||
| 26,953,118 | ||||||||
|
| |||||||
Machinery-0.62% | ||||||||
Han’s Laser Technology Industry Group Co. Ltd., A Shares (China) | 386,400 | 1,339,953 | ||||||
Wuxi Shangji Automation Co. Ltd., A Shares (China) | 177,920 | 2,985,729 | ||||||
|
| |||||||
| 4,325,682 | ||||||||
|
| |||||||
Media-1.23% | ||||||||
China Literature Ltd. (China)(b)(d)(e) | 2,942,790 | 7,928,815 | ||||||
People.cn Co. Ltd., A Shares (China) | 568,800 | 741,920 | ||||||
|
| |||||||
| 8,670,735 | ||||||||
|
| |||||||
Semiconductors & Semiconductor Equipment-19.54% |
| |||||||
3Peak, Inc., A Shares (China) | 49,473 | 1,743,885 | ||||||
Advanced Micro-Fabrication Equipment, Inc., A Shares (China)(b) | 317,016 | 4,820,870 | ||||||
All Winner Technology Co. Ltd., A Shares (China) | 277,353 | 741,397 | ||||||
Amlogic Shanghai Co. Ltd., A Shares | 211,486 | 1,662,077 | ||||||
China Resources Microelectronics Ltd., A Shares (China) | 496,737 | 3,447,880 | ||||||
Gigadevice Semiconductor Beijing, Inc., A Shares (China) | 343,264 | 3,869,280 | ||||||
Goke Microelectronics Co. Ltd., A Shares (China) | 93,700 | 969,275 | ||||||
Hangzhou Chang Chuan Technology Co. Ltd., A Shares (China) | 311,002 | 2,560,080 | ||||||
Hangzhou Lion Electronics Co. Ltd., A Shares (China) | 348,112 | 2,042,331 | ||||||
Hangzhou Silan Microelectronics Co. Ltd., A Shares (China) | 728,400 | 3,133,719 | ||||||
Hua Hong Semiconductor Ltd. (China)(b)(d)(e) | 3,022,171 | 7,076,250 | ||||||
Ingenic Semiconductor Co. Ltd., A Shares (China) | 199,900 | 1,861,344 | ||||||
JCET Group Co. Ltd., A Shares (China) | 915,300 | 3,019,815 | ||||||
LONGi Green Energy Technology Co. Ltd., A Shares (China) | 3,898,605 | 25,628,897 | ||||||
Montage Technology Co. Ltd., A Shares (China) | 582,743 | 4,530,299 | ||||||
National Silicon Industry Group Co. Ltd., A Shares (China)(b) | 962,418 | 2,678,145 | ||||||
| Shares | Value | |||||||
Semiconductors & Semiconductor Equipment-(continued) |
| |||||||
NAURA Technology Group Co. Ltd., A Shares (China) | 271,357 | $ | 9,878,546 | |||||
Rockchip Electronics Co. Ltd., A Shares (China) | 78,008 | 698,893 | ||||||
SG Micro Corp., A Shares (China) | 182,362 | 3,739,388 | ||||||
Shanghai Fudan Microelectronics Group Co. Ltd., A Shares (China) | 146,501 | 1,883,401 | ||||||
Shanghai Fudan Microelectronics Group Co. Ltd., H Shares (China)(d) | 2,087,891 | 9,043,268 | ||||||
Shenzhen SC New Energy Technology Corp., A Shares (China) | 159,918 | 2,974,169 | ||||||
StarPower Semiconductor Ltd., A Shares (China) | 78,200 | 3,993,251 | ||||||
TCL Zhonghuan Renewable Energy Technology Co. Ltd., A Shares (China) | 1,662,525 | 8,997,580 | ||||||
Tianshui Huatian Technology Co. Ltd., A Shares (China) | 1,648,500 | 1,992,131 | ||||||
TongFu Microelectronics Co. Ltd., A Shares (China)(b) | 683,700 | 1,763,910 | ||||||
Unigroup Guoxin Microelectronics Co. Ltd., A Shares (China) | 437,059 | 9,827,330 | ||||||
Will Semiconductor Co. Ltd., A Shares (China) | 425,649 | 4,278,885 | ||||||
Yangzhou Yangjie Electronic Technology Co. Ltd., A Shares (China) | 263,645 | 1,855,983 | ||||||
Zhejiang Jingsheng Mechanical & Electrical Co. Ltd., A Shares (China) | 672,700 | 6,567,917 | ||||||
|
| |||||||
| 137,280,196 | ||||||||
|
| |||||||
Software-13.00% | ||||||||
Beijing E-Hualu Information Technology Co. Ltd., A Shares (China)(b) | 342,400 | 770,313 | ||||||
Beijing Kingsoft Office Software, Inc., A Shares (China) | 237,140 | 9,446,481 | ||||||
Beijing Orient National Communication Science & Technology Co. Ltd., A Shares (China)(b) | 592,900 | 709,179 | ||||||
Beijing Shiji Information Technology Co. Ltd., A Shares (China) | 1,080,012 | 1,870,407 | ||||||
China National Software & Service Co. Ltd., A Shares (China) | 339,400 | 3,375,585 | ||||||
Hundsun Technologies, Inc., A Shares (China) | 977,425 | 5,581,766 | ||||||
Iflytek Co. Ltd., A Shares (China) | 1,195,650 | 5,738,583 | ||||||
Kingdee International Software Group Co. Ltd. (China)(b)(d) | 18,841,212 | 30,818,571 | ||||||
Longshine Technology Group Co. Ltd., A Shares (China) | 538,167 | 1,899,430 | ||||||
Ming Yuan Cloud Group Holdings Ltd. | 4,131,797 | 1,900,137 | ||||||
Newland Digital Technology Co. Ltd., A Shares (China) | 531,000 | 1,000,363 | ||||||
NSFOCUS Technologies Group Co. Ltd., A Shares (China) | 381,600 | 589,764 | ||||||
Sangfor Technologies, Inc., A Shares (China) | 75,814 | 1,308,821 | ||||||
Shanghai 2345 Network Holding Group Co. Ltd., A Shares (China) | 1,710,200 | 485,040 | ||||||
Shanghai Baosight Software Co. Ltd., A Shares (China) | 465,053 | 2,696,550 | ||||||
See accompanying Notes to Financial Statements which are an integral part of the financial statements.
| 38 | ||||
|
| |||
Invesco China Technology ETF (CQQQ)–(continued)
October 31, 2022
| Shares | Value | |||||||
Software-(continued) |
| |||||||
Shanghai Baosight Software Co. Ltd., B Shares (China) | 3,693,979 | $ | ��11,129,959 | |||||
Shenzhen Infogem Technologies Co. Ltd., A Shares (China)(b) | 363,500 | 484,096 | ||||||
Shenzhen Kingdom Sci-Tech Co. Ltd., A Shares (China) | 484,100 | 790,627 | ||||||
Sinosoft Co. Ltd., A Shares (China) | 109,020 | 462,154 | ||||||
Thunder Software Technology Co. Ltd., A Shares (China) | 195,287 | 2,641,964 | ||||||
Topsec Technologies Group, Inc., A Shares (China) | 609,900 | 940,095 | ||||||
Tuya, Inc., ADR (China)(b)(d) | 887,471 | 793,044 | ||||||
Yonyou Network Technology Co. Ltd., A Shares (China) | 1,767,004 | 5,916,967 | ||||||
|
| |||||||
| 91,349,896 | ||||||||
|
| |||||||
Technology Hardware, Storage & Peripherals-1.96% |
| |||||||
China Greatwall Technology Group Co. Ltd., A Shares (China) | 1,659,346 | 2,534,967 | ||||||
Inspur Electronic Information Industry Co. Ltd., A Shares (China) | 747,958 | 2,359,082 | ||||||
Legend Holdings Corp., H Shares (China)(e) | 3,791,517 | 3,183,003 | ||||||
Ninestar Corp., A Shares (China) | 725,850 | 5,679,622 | ||||||
|
| |||||||
| 13,756,674 | ||||||||
|
| |||||||
Trading Companies & Distributors-0.62% |
| |||||||
Beijing United Information Technology Co. Ltd., A Shares (China) | 256,455 | 4,357,058 | ||||||
|
| |||||||
Total Common Stocks & Other Equity Interests |
| 702,755,163 | ||||||
|
| |||||||
| Shares | Value | |||||||
Money Market Funds-0.04% |
| |||||||
Invesco Government & Agency Portfolio, Institutional Class, 3.07%(f)(g) | 276,917 | $ | 276,917 | |||||
|
| |||||||
TOTAL INVESTMENTS IN SECURITIES (excluding investments purchased with cash collateral from securities on loan)-100.06% |
| 703,032,080 | ||||||
|
| |||||||
| Investments Purchased with Cash Collateral from Securities on Loan |
| |||||||
Money Market Funds-7.11% | ||||||||
Invesco Private Government Fund, | 13,979,864 | 13,979,864 | ||||||
Invesco Private Prime Fund, 3.28%(f)(g)(h) | 35,951,651 | 35,951,651 | ||||||
|
| |||||||
Total Investments Purchased with Cash Collateral from Securities on Loan |
| 49,931,515 | ||||||
|
| |||||||
TOTAL INVESTMENTS IN SECURITIES-107.17% |
| 752,963,595 | ||||||
OTHER ASSETS LESS LIABILITIES-(7.17)% |
| (50,353,944 | ) | |||||
|
| |||||||
NET ASSETS-100.00% |
| $ | 702,609,651 | |||||
|
| |||||||
Investment Abbreviations:
ADR-American Depositary Receipt
Rts. -Rights
TBA -To Be Announced
Notes to Schedule of Investments:
| (a) | Industry and/or sector classifications used in this report are generally according to the Global Industry Classification Standard, which was developed by and is the exclusive property and a service mark of MSCI Inc. and Standard & Poor’s. |
| (b) | Non-income producing security. |
| (c) | Security valued using significant unobservable inputs (Level 3). See Note 4. |
| (d) | All or a portion of this security was out on loan at October 31, 2022. |
| (e) | Security purchased or received in a transaction exempt from registration under the Securities Act of 1933, as amended (the “1933 Act”). The security may be resold pursuant to an exemption from registration under the 1933 Act, typically to qualified institutional buyers. The aggregate value of these securities at October 31, 2022 was $104,822,437, which represented 14.92% of the Fund’s Net Assets. |
| (f) | Affiliated issuer. The issuer and/or the Fund is a wholly-owned subsidiary of Invesco Ltd., or is affiliated by having an investment adviser that is under common control of Invesco Ltd. The table below shows the Fund’s transactions in, and earnings from, its investments in affiliates for the fiscal year ended October 31, 2022. |
| Value October 31, 2021 | Purchases | Proceeds | Change in | Realized | Value | Dividend Income | ||||||||||||||||||||||||||||||||||
| Investments in Affiliated Money Market Funds: | ||||||||||||||||||||||||||||||||||||||||
| Invesco Government & Agency Portfolio, Institutional Class | $ | - | $ | 200,427,991 | $ | (200,151,074 | ) | $ | - | $ | - | $ | 276,917 | $ | 36,486 | |||||||||||||||||||||||||
See accompanying Notes to Financial Statements which are an integral part of the financial statements.
| 39 | ||||
|
| |||
Invesco China Technology ETF (CQQQ)–(continued)
October 31, 2022
| Value October 31, 2021 | Purchases | Proceeds | Change in | Realized | Value | Dividend Income | ||||||||||||||||||||||||||||||||||
| Investments Purchased with Cash Collateral from Securities on Loan: | ||||||||||||||||||||||||||||||||||||||||
| Invesco Private Government Fund | $ | 86,683,578 | $ | 174,585,036 | $ | (247,288,750 | ) | $ - | $ | - | $13,979,864 | $ | 126,172 | * | ||||||||||||||||||||||||||
| Invesco Private Prime Fund | 202,261,685 | 340,282,276 | (506,528,833 | ) | 423 | (63,900 | ) | 35,951,651 | 372,319 | * | ||||||||||||||||||||||||||||||
|
|
|
|
|
|
|
|
|
| |||||||||||||||||||||||||||||||
| Total | $ | 288,945,263 | $ | 715,295,303 | $ | (953,968,657 | ) | $423 | $ | (63,900 | ) | $50,208,432 | $ | 534,977 | ||||||||||||||||||||||||||
|
|
|
|
|
|
|
|
|
| |||||||||||||||||||||||||||||||
| * | Represents the income earned on the investment of cash collateral, which is included in securities lending income on the Statements of Operations. Does not include rebates and fees paid to lending agent or premiums received from borrowers, if any. |
| (g) | The rate shown is the 7-day SEC standardized yield as of October 31, 2022. |
| (h) | The security has been segregated to satisfy the commitment to return the cash collateral received in securities lending transactions upon the borrower’s return of the securities loaned. See Note 2J. |
This Fund has holdings greater than 10% of net assets in the following country:
China | 100.02% |
See accompanying Notes to Financial Statements which are an integral part of the financial statements.
| 40 | ||||
|
| |||
Invesco DWA Developed Markets Momentum ETF (PIZ)
October 31, 2022
Schedule of Investments
| Shares | Value | |||||||
Common Stocks & Other Equity Interests-99.97% |
| |||||||
Australia-9.25% | ||||||||
CSL Ltd. | 15,022 | $ | 2,694,240 | |||||
EBOS Group Ltd. | 23,327 | 508,193 | ||||||
IGO Ltd. | 67,769 | 662,591 | ||||||
Lynas Rare Earths Ltd.(a) | 186,900 | 995,545 | ||||||
Macquarie Group Ltd. | 8,441 | 914,893 | ||||||
Mineral Resources Ltd. | 19,670 | 919,828 | ||||||
Steadfast Group Ltd. | 166,853 | 539,873 | ||||||
Whitehaven Coal Ltd. | 264,599 | 1,527,857 | ||||||
WiseTech Global Ltd. | 16,962 | 630,824 | ||||||
|
| |||||||
| 9,393,844 | ||||||||
|
| |||||||
Belgium-1.24% | ||||||||
D’Ieteren Group | 4,513 | 750,690 | ||||||
Elia Group S.A./N.V. | 4,048 | 511,708 | ||||||
|
| |||||||
| 1,262,398 | ||||||||
|
| |||||||
Canada-35.10% | ||||||||
ARC Resources Ltd.(b) | 59,145 | 831,642 | ||||||
Bank of Nova Scotia (The) | 20,808 | 1,004,514 | ||||||
Cameco Corp. | 20,577 | 487,404 | ||||||
Canadian National Railway Co. | 17,754 | 2,100,726 | ||||||
Canadian Pacific Railway Ltd. | 12,434 | 925,770 | ||||||
Capital Power Corp. | 15,320 | 512,145 | ||||||
Cenovus Energy, Inc. | 73,279 | 1,479,494 | ||||||
CGI, Inc., Class A(a) | 15,916 | 1,280,468 | ||||||
Constellation Software, Inc. | 2,140 | 3,090,477 | ||||||
Crescent Point Energy Corp. | 78,348 | 611,712 | ||||||
Descartes Systems Group, Inc. (The)(a) | 40,414 | 2,785,027 | ||||||
Dollarama, Inc. | 30,542 | 1,812,525 | ||||||
Element Fleet Management Corp. | 55,599 | 739,798 | ||||||
Emera, Inc.(b) | 12,881 | 476,787 | ||||||
Enerplus Corp. | 89,075 | 1,542,430 | ||||||
Fortis, Inc. | 36,395 | 1,418,126 | ||||||
Imperial Oil Ltd. | 14,808 | 804,531 | ||||||
Intact Financial Corp. | 4,648 | 705,386 | ||||||
Ivanhoe Mines Ltd., Class A(a) | 84,748 | 587,126 | ||||||
Metro, Inc. | 45,795 | 2,396,092 | ||||||
Northland Power, Inc. | 24,766 | 719,713 | ||||||
Nutrien Ltd. | 5,977 | 504,389 | ||||||
Quebecor, Inc., Class B | 27,664 | 520,810 | ||||||
Royal Bank of Canada | 17,445 | 1,612,069 | ||||||
Teck Resources Ltd., Class B | 19,358 | 588,524 | ||||||
TELUS Corp. | 25,129 | 524,116 | ||||||
Thomson Reuters Corp. | 5,154 | 547,460 | ||||||
TMX Group Ltd. | 5,849 | 561,638 | ||||||
Toromont Industries Ltd. | 29,184 | 2,240,068 | ||||||
Tourmaline Oil Corp. | 26,117 | 1,469,697 | ||||||
WSP Global, Inc. | 6,088 | 747,315 | ||||||
|
| |||||||
| 35,627,979 | ||||||||
|
| |||||||
Denmark-4.03% | ||||||||
Novo Nordisk A/S, Class B | 18,679 | 2,031,181 | ||||||
Novozymes A/S, Class B | 24,333 | 1,278,261 | ||||||
Ringkjoebing Landbobank A/S | 7,195 | 783,254 | ||||||
|
| |||||||
| 4,092,696 | ||||||||
|
| |||||||
Finland-5.08% | ||||||||
Elisa OYJ | 28,140 | 1,360,294 | ||||||
| Shares | Value | |||||||
Finland-(continued) | ||||||||
Huhtamaki OYJ | 19,201 | $ | 689,826 | |||||
Sampo OYJ, Class A | 55,520 | 2,539,533 | ||||||
UPM-Kymmene OYJ | 16,853 | 564,828 | ||||||
|
| |||||||
| 5,154,481 | ||||||||
|
| |||||||
France-4.04% | ||||||||
Hermes International | 820 | 1,062,092 | ||||||
LVMH Moet Hennessy Louis Vuitton SE | 2,667 | 1,684,360 | ||||||
Pernod Ricard S.A. | 7,725 | 1,356,741 | ||||||
|
| |||||||
| 4,103,193 | ||||||||
|
| |||||||
Germany-2.33% | ||||||||
Carl Zeiss Meditec AG, BR | 10,261 | 1,242,837 | ||||||
K+S AG | 25,786 | 569,858 | ||||||
Muenchener Rueckversicherungs-Gesellschaft AG in Muenchen, Class R | 2,108 | 557,113 | ||||||
|
| |||||||
| 2,369,808 | ||||||||
|
| |||||||
Ireland-0.61% | ||||||||
Bank of Ireland Group PLC | 86,596 | 624,444 | ||||||
|
| |||||||
Israel-5.30% | ||||||||
Bank Leumi Le-Israel BM | 57,731 | 553,607 | ||||||
Bezeq The Israeli Telecommunication Corp. Ltd. | 305,270 | 542,799 | ||||||
Israel Discount Bank Ltd., Class A | 105,705 | 604,286 | ||||||
Mizrahi Tefahot Bank Ltd. | 46,799 | 1,777,817 | ||||||
Nice Ltd.(a) | 9,968 | 1,897,021 | ||||||
|
| |||||||
| 5,375,530 | ||||||||
|
| |||||||
Italy-2.38% | ||||||||
Recordati Industria Chimica e Farmaceutica S.p.A. | 30,604 | 1,150,312 | ||||||
Snam S.p.A. | 163,574 | 727,832 | ||||||
Terna Rete Elettrica Nazionale S.p.A.(b) | 81,155 | 538,046 | ||||||
|
| |||||||
| 2,416,190 | ||||||||
|
| |||||||
Japan-7.25% | ||||||||
Bandai Namco Holdings, Inc. | 12,680 | 839,618 | ||||||
ITOCHU Corp.(b) | 24,618 | 637,499 | ||||||
Lasertec Corp. | 24,731 | 3,542,389 | ||||||
Mitsui OSK Lines Ltd.(b) | 27,969 | 555,297 | ||||||
Nippon Telegraph & Telephone Corp. | 20,042 | 552,036 | ||||||
Nippon Yusen K.K.(b) | 38,681 | 702,392 | ||||||
Nomura Research Institute Ltd. | 23,669 | 526,296 | ||||||
|
| |||||||
| 7,355,527 | ||||||||
|
| |||||||
Netherlands-3.86% | ||||||||
ASML Holding N.V.(b) | 5,520 | 2,607,823 | ||||||
OCI N.V.(b) | 14,804 | 566,533 | ||||||
Wolters Kluwer N.V. | 6,970 | 740,891 | ||||||
|
| |||||||
| 3,915,247 | ||||||||
|
| |||||||
Norway-1.08% | ||||||||
Aker BP ASA | 16,630 | 530,082 | ||||||
Equinor ASA | 15,580 | 569,966 | ||||||
|
| |||||||
| 1,100,048 | ||||||||
|
| |||||||
See accompanying Notes to Financial Statements which are an integral part of the financial statements.
| 41 | ||||
|
| |||
Invesco DWA Developed Markets Momentum ETF (PIZ)–(continued)
October 31, 2022
| Shares | Value | |||||||
Singapore-1.45% | ||||||||
Oversea-Chinese Banking Corp. Ltd. | 93,899 | $ | 804,886 | |||||
STMicroelectronics N.V. | 21,393 | 668,144 | ||||||
|
| |||||||
| 1,473,030 | ||||||||
|
| |||||||
Spain-0.56% | ||||||||
Ferrovial S.A. | 23,107 | 564,323 | ||||||
|
| |||||||
Sweden-2.49% | ||||||||
Axfood AB | 25,101 | 621,026 | ||||||
Nibe Industrier AB, Class B | 239,825 | 1,912,011 | ||||||
|
| |||||||
| 2,533,037 | ||||||||
|
| |||||||
Switzerland-6.72% | ||||||||
ABB Ltd. | 21,689 | 603,369 | ||||||
Accelleron Industries AG(a) | 1,084 | 18,393 | ||||||
Baloise Holding AG | 4,285 | 585,749 | ||||||
Banque Cantonale Vaudoise | 9,343 | 831,837 | ||||||
Chocoladefabriken Lindt & Spruengli AG | 6 | 583,363 | ||||||
Flughafen Zurich AG(a) | 13,305 | 2,066,047 | ||||||
Siegfried Holding AG(a) | 1,426 | 849,259 | ||||||
Swiss Life Holding AG | 1,426 | 690,949 | ||||||
VAT Group AG(b)(c) | 2,572 | 588,033 | ||||||
|
| |||||||
| 6,816,999 | ||||||||
|
| |||||||
United Kingdom-4.72% | ||||||||
3i Group PLC | 44,661 | 596,734 | ||||||
AstraZeneca PLC | 5,432 | 641,299 | ||||||
Diageo PLC | 24,462 | 1,013,352 | ||||||
InterContinental Hotels Group PLC | 14,729 | 796,359 | ||||||
RELX PLC | 20,854 | 562,080 | ||||||
RS GROUP PLC | 61,348 | 677,018 | ||||||
UNITE Group PLC (The) | 48,933 | 501,981 | ||||||
|
| |||||||
| 4,788,823 | ||||||||
|
| |||||||
| Shares | Value | |||||||
United States-2.48% | ||||||||
Nestle S.A. | 8,861 | $ | 965,480 | |||||
Roche Holding AG | 1,686 | 560,259 | ||||||
Samsonite International S.A.(a)(c) | 198,120 | 426,029 | ||||||
Waste Connections, Inc. | 4,295 | 566,170 | ||||||
|
| |||||||
| 2,517,938 | ||||||||
|
| |||||||
TOTAL INVESTMENTS IN SECURITIES | 101,485,535 | |||||||
|
| |||||||
| Investments Purchased with Cash Collateral from Securities on Loan |
| |||||||
Money Market Funds-6.69% | ||||||||
Invesco Private Government Fund, | 1,900,398 | 1,900,398 | ||||||
Invesco Private Prime Fund, | 4,885,456 | 4,885,456 | ||||||
|
| |||||||
Total Investments Purchased with Cash Collateral from Securities on Loan |
| 6,785,854 | ||||||
|
| |||||||
TOTAL INVESTMENTS IN SECURITIES-106.66% |
| 108,271,389 | ||||||
OTHER ASSETS LESS LIABILITIES-(6.66)% |
| (6,757,391 | ) | |||||
|
| |||||||
NET ASSETS-100.00% |
| $ | 101,513,998 | |||||
|
| |||||||
Investment Abbreviations:
BR-Bearer Shares
Notes to Schedule of Investments:
| (a) | Non-income producing security. |
| (b) | All or a portion of this security was out on loan at October 31, 2022. |
| (c) | Security purchased or received in a transaction exempt from registration under the Securities Act of 1933, as amended (the “1933 Act”). The security may be resold pursuant to an exemption from registration under the 1933 Act, typically to qualified institutional buyers. The aggregate value of these securities at October 31, 2022 was $1,014,062, which represented less than 1% of the Fund’s Net Assets. |
| (d) | Affiliated issuer. The issuer and/or the Fund is a wholly-owned subsidiary of Invesco Ltd., or is affiliated by having an investment adviser that is under common control of Invesco Ltd. The table below shows the Fund’s transactions in, and earnings from, its investments in affiliates for the fiscal year ended October 31, 2022. |
Value October 31, 2021 | Purchases at Cost | Proceeds from Sales | Change in Unrealized Appreciation | Realized Gain (Loss) | Value October 31, 2022 | Dividend Income | ||||||||
| Investments in Affiliated Money Market Funds: | ||||||||||||||
| Invesco Government & Agency Portfolio, Institutional Class | $ - | $ 10,073,742 | $ (10,073,742) | $ - | $ - | $ - | $ 473 | |||||||
See accompanying Notes to Financial Statements which are an integral part of the financial statements.
| 42 | ||||
|
| |||
Invesco DWA Developed Markets Momentum ETF (PIZ)–(continued)
October 31, 2022
Value October 31, 2021 | Purchases at Cost | Proceeds from Sales | Change in Unrealized Appreciation | Realized Gain (Loss) | Value October 31, 2022 | Dividend Income | |||||||||||||||||||||||||||||
| Investments Purchased with Cash Collateral from Securities on Loan: | |||||||||||||||||||||||||||||||||||
| Invesco Private Government Fund | $ | 2,574,626 | $ | 42,051,504 | $ | (42,725,732 | ) | $ | - | $ | - | $ | 1,900,398 | $ | 22,668 | * | |||||||||||||||||||
| Invesco Private Prime Fund | 6,007,460 | 71,785,701 | (72,905,977 | ) | 130 | (1,858 | ) | 4,885,456 | 63,990 | * | |||||||||||||||||||||||||
|
|
|
|
|
|
|
|
|
|
|
|
|
| ||||||||||||||||||||||
| Total | $ | 8,582,086 | $ | 123,910,947 | $ | (125,705,451 | ) | $ | 130 | $ | (1,858 | ) | $ | 6,785,854 | $ | 87,131 | |||||||||||||||||||
|
|
|
|
|
|
|
|
|
|
|
|
|
| ||||||||||||||||||||||
| * | Represents the income earned on the investment of cash collateral, which is included in securities lending income on the Statements of Operations. Does not include rebates and fees paid to lending agent or premiums received from borrowers, if any. |
| (e) | The rate shown is the 7-day SEC standardized yield as of October 31, 2022. |
| (f) | The security has been segregated to satisfy the commitment to return the cash collateral received in securities lending transactions upon the borrower’s return of the securities loaned. See Note 2J. |
See accompanying Notes to Financial Statements which are an integral part of the financial statements.
| 43 | ||||
|
| |||
Invesco DWA Emerging Markets Momentum ETF (PIE)
October 31, 2022
Schedule of Investments
| Shares | Value | |||||||
Common Stocks & Other Equity Interests-99.69% |
| |||||||
Brazil-9.52% |
| |||||||
Arezzo Industria e Comercio S.A. | 39,300 | $ | 782,667 | |||||
Banco do Brasil S.A. | 92,300 | 651,188 | ||||||
BB Seguridade Participacoes S.A. | 125,100 | 707,841 | ||||||
Centrais Eletricas Brasileiras S.A. | 85,500 | 811,780 | ||||||
Cia Energetica de Minas Gerais | 318,200 | 1,048,488 | ||||||
Cia Energetica de Minas Gerais, Preference Shares | 335,100 | 726,111 | ||||||
Gerdau S.A., Preference Shares | 156,300 | 767,016 | ||||||
Minerva S.A. | 276,400 | 720,597 | ||||||
Petro Rio S.A.(a) | 480,200 | 3,238,702 | ||||||
Petroleo Brasileiro S.A. | 137,000 | 868,382 | ||||||
Santos Brasil Participacoes S.A. | 500,200 | 867,468 | ||||||
SLC Agricola S.A. | 87,000 | 761,856 | ||||||
|
| |||||||
| 11,952,096 | ||||||||
|
| |||||||
China-11.51% |
| |||||||
ANTA Sports Products Ltd. | 125,612 | 1,104,126 | ||||||
C&D International Investment Group Ltd.(b) | 852,679 | 1,325,208 | ||||||
China Coal Energy Co. Ltd., H Shares | 1,618,235 | 1,191,538 | ||||||
China Overseas Property Holdings Ltd. | 1,728,805 | 1,087,957 | ||||||
China Power International Development Ltd. | 2,093,094 | 605,276 | ||||||
China Shenhua Energy Co. Ltd., H Shares | 362,849 | 954,519 | ||||||
China State Construction International Holdings Ltd. | 740,136 | 665,664 | ||||||
Greentown China Holdings Ltd. | 408,534 | 388,765 | ||||||
Li Ning Co. Ltd. | 441,981 | 2,285,958 | ||||||
PetroChina Co. Ltd., H Shares | 1,667,090 | 637,117 | ||||||
Sany Heavy Equipment International Holdings Co. Ltd. | 2,111,139 | 1,731,974 | ||||||
Tsingtao Brewery Co. Ltd., H Shares | 77,540 | 543,284 | ||||||
Yankuang Energy Group Co. Ltd., H Shares | 503,478 | 1,417,462 | ||||||
Yuexiu Property Co. Ltd. | 610,621 | 521,177 | ||||||
|
| |||||||
| 14,460,025 | ||||||||
|
| |||||||
Indonesia-10.10% |
| |||||||
PT Adaro Energy Indonesia Tbk | 4,951,281 | 1,263,414 | ||||||
PT Bank Negara Indonesia (Persero) Tbk | 1,301,506 | 784,366 | ||||||
PT BFI Finance Indonesia Tbk | 16,431,806 | 1,164,106 | ||||||
PT Bukit Asam Tbk | 3,482,632 | 873,030 | ||||||
PT Indah Kiat Pulp & Paper Corp. Tbk | 1,246,050 | 766,923 | ||||||
PT Indo Tambangraya Megah Tbk | 677,643 | 1,957,225 | ||||||
PT Merdeka Copper Gold Tbk(a) | 9,948,022 | 2,404,491 | ||||||
PT Sarana Menara Nusantara Tbk | 9,764,682 | 723,078 | ||||||
PT Tower Bersama Infrastructure Tbk | 6,514,608 | 1,027,468 | ||||||
PT United Tractors Tbk | 318,792 | 660,169 | ||||||
PT Vale Indonesia Tbk(a) | 2,535,285 | 1,056,538 | ||||||
|
| |||||||
| 12,680,808 | ||||||||
|
| |||||||
Malaysia-4.55% |
| |||||||
Frontken Corp. Bhd | 6,627,900 | 3,434,508 | ||||||
QL Resources Bhd | 1,499,000 | 1,623,283 | ||||||
Telekom Malaysia Bhd | 564,500 | 663,837 | ||||||
|
| |||||||
| 5,721,628 | ||||||||
|
| |||||||
Mexico-8.36% |
| |||||||
Alfa S.A.B. de C.V., Class A | 1,149,671 | 761,659 | ||||||
Arca Continental S.A.B. de C.V. | 103,952 | 849,936 | ||||||
Banco del Bajio S.A.(c) | 504,993 | 1,421,684 | ||||||
| Shares | Value | |||||||
Mexico-(continued) |
| |||||||
Gentera S.A.B. de C.V.(b) | 1,673,357 | $ | 1,716,437 | |||||
Grupo Aeroportuario del Pacifico S.A.B. de C.V., Class B | 55,998 | 865,826 | ||||||
Grupo Bimbo S.A.B. de C.V., Series A | 226,704 | 876,138 | ||||||
Grupo Comercial Chedraui S.A. de C.V.(b) | 291,373 | 1,172,303 | ||||||
Grupo Financiero Banorte S.A.B. de C.V., Class O | 111,617 | 905,633 | ||||||
Grupo Financiero Inbursa S.A.B. de C.V., Class O(a)(b) | 446,016 | 821,744 | ||||||
Regional S.A.B. de C.V. | 159,348 | 1,111,559 | ||||||
|
| |||||||
| 10,502,919 | ||||||||
|
| |||||||
Philippines-1.59% |
| |||||||
DMCI Holdings, Inc. | 4,918,559 | 805,473 | ||||||
Semirara Mining & Power Corp. | 1,975,689 | 1,191,550 | ||||||
|
| |||||||
| 1,997,023 | ||||||||
|
| |||||||
South Africa-10.47% |
| |||||||
Absa Group Ltd. | 76,837 | 835,120 | ||||||
Clicks Group Ltd. | 184,477 | 3,124,390 | ||||||
Exxaro Resources Ltd. | 70,822 | 788,166 | ||||||
Impala Platinum Holdings Ltd. | 280,533 | 2,871,351 | ||||||
Motus Holdings Ltd. | 224,373 | 1,417,478 | ||||||
Nedbank Group Ltd. | 67,372 | 797,576 | ||||||
Thungela Resources Ltd. | 211,193 | 3,316,687 | ||||||
|
| |||||||
| 13,150,768 | ||||||||
|
| |||||||
Taiwan-33.63% |
| |||||||
Asia Vital Components Co. Ltd. | 433,000 | 1,370,657 | ||||||
Bizlink Holding, Inc. | 75,000 | 573,745 | ||||||
Delta Electronics, Inc. | 101,000 | 807,122 | ||||||
E.Sun Financial Holding Co. Ltd. | 1,949,996 | 1,403,985 | ||||||
Eva Airways Corp. | 975,000 | 708,046 | ||||||
Evergreen International Storage & Transport Corp. | 793,000 | 639,863 | ||||||
First Financial Holding Co. Ltd. | 1,028,100 | 789,680 | ||||||
Formosa Plastics Corp. | 285,000 | 734,999 | ||||||
Global Unichip Corp. | 53,000 | 801,847 | ||||||
Gold Circuit Electronics Ltd. | 246,000 | 653,506 | ||||||
Great Wall Enterprise Co. Ltd. | 782,636 | 976,398 | ||||||
HTC Corp.(a) | 428,000 | 670,774 | ||||||
Hua Nan Financial Holdings Co. Ltd. | 1,032,718 | 674,644 | ||||||
Kings Town Bank Co. Ltd. | 1,242,000 | 1,183,316 | ||||||
Lien Hwa Industrial Holdings Corp. | 1,387,295 | 2,004,146 | ||||||
Lite-On Technology Corp. | 614,000 | 1,219,521 | ||||||
Lotes Co. Ltd. | 98,000 | 2,360,090 | ||||||
Mega Financial Holding Co. Ltd. | 981,100 | 910,385 | ||||||
Micro-Star International Co. Ltd. | 845,000 | 2,871,518 | ||||||
Powertech Technology, Inc. | 284,000 | 657,503 | ||||||
Sinbon Electronics Co. Ltd. | 484,000 | 3,762,650 | ||||||
SinoPac Financial Holdings Co. Ltd. | 1,706,060 | 852,434 | ||||||
Taichung Commercial Bank Co. Ltd. | 1,787,700 | 696,272 | ||||||
Taiwan Cooperative Financial Holding Co. Ltd. | 943,420 | 731,958 | ||||||
Tatung Co. Ltd.(a) | 710,000 | 689,673 | ||||||
Topco Scientific Co. Ltd. | 660,000 | 3,062,146 | ||||||
TXC Corp. | 353,000 | 835,872 | ||||||
Union Bank of Taiwan | 2,060,063 | 968,576 | ||||||
Uni-President Enterprises Corp. | 862,000 | 1,752,223 | ||||||
See accompanying Notes to Financial Statements which are an integral part of the financial statements.
| 44 | ||||
|
| |||
Invesco DWA Emerging Markets Momentum ETF (PIE)–(continued)
October 31, 2022
| Shares | Value | |||||||
Taiwan-(continued) |
| |||||||
Voltronic Power Technology Corp. | 68,000 | $ | 2,764,528 | |||||
Walsin Lihwa Corp. | 1,392,304 | 1,544,724 | ||||||
Wistron Corp. | 860,000 | 695,260 | ||||||
Wiwynn Corp. | 83,000 | 1,864,908 | ||||||
|
| |||||||
| 42,232,969 | ||||||||
|
| |||||||
Thailand-8.63% |
| |||||||
Banpu PCL, NVDR | 2,690,140 | 883,519 | ||||||
Central Plaza Hotel PCL, NVDR(a) | 585,290 | 780,438 | ||||||
Com7 PCL, NVDR | 3,759,750 | 2,988,241 | ||||||
Energy Absolute PCL, NVDR | 1,062,309 | 2,693,453 | ||||||
Kiatnakin Phatra Bank PCL, NVDR | 396,001 | 759,540 | ||||||
PTT Exploration & Production PCL, NVDR | 199,533 | 951,530 | ||||||
Singer Thailand PCL, NVDR | 1,871,302 | 1,782,309 | ||||||
Singer Thailand PCL, Rts., expiring 12/30/2022(d) | 1,306,227 | 0 | ||||||
|
| |||||||
| 10,839,030 | ||||||||
|
| |||||||
Turkey-1.33% |
| |||||||
Sasa Polyester Sanayi A.S.(a) | 1 | 5 | ||||||
Turk Hava Yollari AO(a) | 306,257 | 1,667,688 | ||||||
|
| |||||||
| 1,667,693 | ||||||||
|
| |||||||
TOTAL INVESTMENTS IN SECURITIES |
| 125,204,959 | ||||||
|
| |||||||
| Shares | Value | |||||||
| Investments Purchased with Cash Collateral from Securities on Loan |
| |||||||
Money Market Funds-1.13% |
| |||||||
Invesco Private Government Fund, | 386,986 | $ | 386,986 | |||||
Invesco Private Prime Fund, | 1,036,003 | 1,036,003 | ||||||
|
| |||||||
Total Investments Purchased with Cash Collateral from Securities on Loan |
| 1,422,989 | ||||||
|
| |||||||
TOTAL INVESTMENTS IN SECURITIES-100.82% |
| 126,627,948 | ||||||
OTHER ASSETS LESS LIABILITIES-(0.82)% |
| (1,034,911 | ) | |||||
|
| |||||||
NET ASSETS-100.00% |
| $ | 125,593,037 | |||||
|
| |||||||
Investment Abbreviations:
NVDR-Non-Voting Depositary Receipt
Rts.-Rights
Notes to Schedule of Investments:
| (a) | Non-income producing security. |
| (b) | All or a portion of this security was out on loan at October 31, 2022. |
| (c) | Security purchased or received in a transaction exempt from registration under the Securities Act of 1933, as amended (the “1933 Act”). The security may be resold pursuant to an exemption from registration under the 1933 Act, typically to qualified institutional buyers. The value of this security at October 31, 2022 represented 1.13% of the Fund’s Net Assets. |
| (d) | Security valued using significant unobservable inputs (Level 3). See Note 4. |
| (e) | Affiliated issuer. The issuer and/or the Fund is a wholly-owned subsidiary of Invesco Ltd., or is affiliated by having an investment adviser that is under common control of Invesco Ltd. The table below shows the Fund’s transactions in, and earnings from, its investments in affiliates for the fiscal year ended October 31, 2022. |
| Value October 31, 2021 | Purchases | Proceeds | Change in | Realized | Value | Dividend Income | ||||||||||||||||||||||||||||||||||
| Investments in Affiliated Money Market Funds: | ||||||||||||||||||||||||||||||||||||||||
| Invesco Government & Agency Portfolio, Institutional Class | $ | 121,401 | $ | 20,699,615 | $ | (20,821,016 | ) | $ | - | $ | - | $ | - | $ | 1,531 | |||||||||||||||||||||||||
| Investments Purchased with Cash Collateral from Securities on Loan: | ||||||||||||||||||||||||||||||||||||||||
| Invesco Private Government Fund | 3,409,998 | 31,168,866 | (34,191,878 | ) | - | - | 386,986 | 10,930 | * | |||||||||||||||||||||||||||||||
| Invesco Private Prime Fund | 7,956,662 | 63,439,384 | (70,356,003 | ) | 11 | (4,051 | ) | 1,036,003 | 30,431 | * | ||||||||||||||||||||||||||||||
|
|
|
|
|
|
|
|
|
|
|
|
|
| |||||||||||||||||||||||||||
| Total | $ | 11,488,061 | $ | 115,307,865 | $ | (125,368,897 | ) | $ | 11 | $ | (4,051 | ) | $ | 1,422,989 | $ | 42,892 | ||||||||||||||||||||||||
|
|
|
|
|
|
|
|
|
|
|
|
|
| |||||||||||||||||||||||||||
| * | Represents the income earned on the investment of cash collateral, which is included in securities lending income on the Statements of Operations. Does not include rebates and fees paid to lending agent or premiums received from borrowers, if any. |
See accompanying Notes to Financial Statements which are an integral part of the financial statements.
| 45 | ||||
|
| |||
Invesco DWA Emerging Markets Momentum ETF (PIE)–(continued)
October 31, 2022
| (f) | The rate shown is the 7-day SEC standardized yield as of October 31, 2022. |
| (g) | The security has been segregated to satisfy the commitment to return the cash collateral received in securities lending transactions upon the borrower’s return of the securities loaned. See Note 2J. |
See accompanying Notes to Financial Statements which are an integral part of the financial statements.
| 46 | ||||
|
| |||
Invesco FTSE RAFI Developed Markets ex-U.S. ETF (PXF)
October 31, 2022
Schedule of Investments
| Shares | Value | |||||||
Common Stocks & Other Equity Interests-99.66% |
| |||||||
Australia-6.07% | ||||||||
AGL Energy Ltd. | 133,052 | $ | 579,396 | |||||
AMP Ltd.(a) | 364,029 | 293,301 | ||||||
Ampol Ltd. | 17,271 | 300,727 | ||||||
APA Group | 67,194 | 451,585 | ||||||
Aristocrat Leisure Ltd. | 17,350 | 411,272 | ||||||
ASX Ltd. | 6,018 | 260,524 | ||||||
Aurizon Holdings Ltd. | 185,087 | 428,441 | ||||||
Australia & New Zealand Banking Group Ltd. | 136,373 | 2,228,928 | ||||||
Bank of Queensland Ltd.(b) | 59,344 | 279,294 | ||||||
Bendigo & Adelaide Bank Ltd.(b) | 38,837 | 223,757 | ||||||
BHP Group Ltd. | 377,478 | 9,017,896 | ||||||
BlueScope Steel Ltd. | 50,802 | 510,995 | ||||||
Brambles Ltd. | 120,832 | 902,467 | ||||||
Coles Group Ltd. | 72,523 | 757,301 | ||||||
Commonwealth Bank of Australia | 62,192 | 4,162,986 | ||||||
CSL Ltd. | 9,089 | 1,630,139 | ||||||
Dexus | 70,420 | 349,433 | ||||||
Endeavour Group Ltd. | 76,677 | 350,573 | ||||||
Evolution Mining Ltd.(b) | 92,529 | 123,069 | ||||||
Fortescue Metals Group Ltd. | 119,477 | 1,123,074 | ||||||
Glencore PLC | 1,450,636 | 8,342,599 | ||||||
Goodman Group | 45,813 | 498,017 | ||||||
GPT Group (The) | 132,274 | 364,551 | ||||||
GPT Group (The)(c) | 231,466 | 709 | ||||||
Incitec Pivot Ltd. | 182,801 | 438,346 | ||||||
Insurance Australia Group Ltd. | 186,207 | 583,443 | ||||||
James Hardie Industries PLC, CDI | 12,351 | 268,527 | ||||||
JB Hi-Fi Ltd.(b) | 8,879 | 243,629 | ||||||
Lendlease Corp. Ltd.(b) | 36,834 | 204,680 | ||||||
Lottery Corp. Ltd. (The)(a) | 135,683 | 372,211 | ||||||
Macquarie Group Ltd. | 17,265 | 1,871,298 | ||||||
Medibank Pvt. Ltd. | 181,859 | 326,774 | ||||||
Metcash Ltd.(b) | 94,272 | 247,157 | ||||||
Mirvac Group | 296,625 | 392,631 | ||||||
National Australia Bank Ltd. | 121,472 | 2,518,233 | ||||||
Newcrest Mining Ltd. | 54,660 | 606,423 | ||||||
Orica Ltd. | 26,647 | 236,507 | ||||||
Origin Energy Ltd. | 150,910 | 537,502 | ||||||
Qantas Airways Ltd.(a)(b) | 98,472 | 367,733 | ||||||
QBE Insurance Group Ltd. | 88,675 | 694,048 | ||||||
Ramsay Health Care Ltd. | 11,793 | 441,678 | ||||||
Rio Tinto Ltd. | 36,570 | 2,062,530 | ||||||
Rio Tinto PLC | 101,557 | 5,305,008 | ||||||
Santos Ltd. | 131,761 | 648,760 | ||||||
Scentre Group | 318,508 | 590,643 | ||||||
Sonic Healthcare Ltd. | 26,585 | 557,083 | ||||||
South32 Ltd. | 357,000 | 821,821 | ||||||
Stockland | 186,179 | 428,588 | ||||||
Suncorp Group Ltd. | 73,933 | 539,425 | ||||||
Tabcorp Holdings Ltd.(b) | 135,683 | 83,726 | ||||||
Telstra Group Ltd.(a) | 534,671 | 1,340,230 | ||||||
Transurban Group | 127,631 | 1,082,197 | ||||||
Treasury Wine Estates Ltd. | 36,481 | 302,095 | ||||||
Vicinity Ltd. | 303,174 | 377,067 | ||||||
Wesfarmers Ltd. | 54,628 | 1,588,003 | ||||||
Westpac Banking Corp. | 200,592 | 3,092,556 | ||||||
| Shares | Value | |||||||
Australia-(continued) |
| |||||||
Whitehaven Coal Ltd. | 127,438 | $ | 735,857 | |||||
Woodside Energy Group Ltd. | 146,374 | 3,367,688 | ||||||
Woolworths Group Ltd. | 68,325 | 1,442,658 | ||||||
Worley Ltd. | 38,026 | 346,986 | ||||||
|
| |||||||
| 68,654,775 | ||||||||
|
| |||||||
Austria-0.37% | ||||||||
ams-OSRAM AG(a)(b) | 16,642 | 94,389 | ||||||
ANDRITZ AG | 6,640 | 308,838 | ||||||
BAWAG Group AG(d) | 8,768 | 423,934 | ||||||
Erste Group Bank AG | 35,901 | 885,650 | ||||||
Mondi PLC(b) | 47,656 | 802,455 | ||||||
OMV AG | 19,160 | 883,213 | ||||||
Raiffeisen Bank International AG | 21,331 | 296,631 | ||||||
voestalpine AG(b) | 11,664 | 253,388 | ||||||
Wienerberger AG | 8,732 | 199,705 | ||||||
|
| |||||||
| 4,148,203 | ||||||||
|
| |||||||
Belgium-0.92% |
| |||||||
Ageas S.A./N.V. | 23,358 | 808,699 | ||||||
Anheuser-Busch InBev S.A./N.V.(b) | 88,255 | 4,413,681 | ||||||
Cofinimmo S.A.(b) | 1,948 | 161,629 | ||||||
Elia Group S.A./N.V. | 1,931 | 244,098 | ||||||
Etablissements Franz Colruyt N.V.(b) | 8,099 | 195,233 | ||||||
Euronav N.V. | 25,757 | 448,806 | ||||||
Groupe Bruxelles Lambert S.A. | 6,454 | 475,860 | ||||||
KBC Group N.V. | 24,845 | 1,244,968 | ||||||
Proximus SADP | 26,193 | 274,670 | ||||||
Sofina S.A.(b) | 784 | 153,036 | ||||||
Solvay S.A., Class A | 7,707 | 694,995 | ||||||
Telenet Group Holding N.V. | 7,587 | 115,704 | ||||||
UCB S.A. | 7,089 | 534,730 | ||||||
Umicore S.A. | 20,037 | 660,450 | ||||||
|
| |||||||
| 10,426,559 | ||||||||
|
| |||||||
Brazil-0.11% |
| |||||||
Wheaton Precious Metals Corp. | 11,399 | 372,459 | ||||||
Yara International ASA | 19,750 | 881,421 | ||||||
|
| |||||||
| 1,253,880 | ||||||||
|
| |||||||
Canada-10.18% |
| |||||||
Agnico Eagle Mines Ltd. | 18,661 | 819,877 | ||||||
Air Canada(a) | 23,127 | 332,481 | ||||||
Algonquin Power & Utilities Corp. | 41,794 | 462,046 | ||||||
Alimentation Couche-Tard, Inc. | 55,288 | 2,472,467 | ||||||
Allied Properties REIT | 10,131 | 196,002 | ||||||
AltaGas Ltd. | 28,417 | 511,862 | ||||||
ARC Resources Ltd.(b) | 29,549 | 415,491 | ||||||
Atco Ltd., Class I | 10,845 | 336,310 | ||||||
B2Gold Corp. | 61,413 | 187,294 | ||||||
Bank of Montreal(b) | 48,039 | 4,419,496 | ||||||
Bank of Nova Scotia (The) | 111,279 | 5,372,033 | ||||||
Barrick Gold Corp. | 104,032 | 1,562,711 | ||||||
BCE, Inc. | 28,525 | 1,285,042 | ||||||
Bombardier, Inc., Class B(a) | 14,500 | 425,311 | ||||||
Brookfield Asset Management, Inc., Class A | 89,856 | 3,553,925 | ||||||
CAE, Inc.(a) | 12,300 | 234,449 | ||||||
Cameco Corp. | 15,354 | 363,687 | ||||||
See accompanying Notes to Financial Statements which are an integral part of the financial statements.
| 47 | ||||
|
| |||
Invesco FTSE RAFI Developed Markets ex-U.S. ETF (PXF)–(continued)
October 31, 2022
| Shares | Value | |||||||
Canada-(continued) |
| |||||||
Canadian Apartment Properties REIT | 11,965 | $ | 370,077 | |||||
Canadian Imperial Bank of Commerce | 70,525 | 3,198,843 | ||||||
Canadian National Railway Co. | 19,957 | 2,361,394 | ||||||
Canadian Natural Resources Ltd. | 68,926 | 4,128,839 | ||||||
Canadian Pacific Railway Ltd. | 16,664 | 1,240,714 | ||||||
Canadian Tire Corp. Ltd., Class A(b) | 5,379 | 602,118 | ||||||
Canadian Utilities Ltd., Class A | 13,790 | 366,473 | ||||||
Capital Power Corp. | 10,698 | 357,633 | ||||||
CCL Industries, Inc., Class B | 7,318 | 343,354 | ||||||
Cenovus Energy, Inc. | 52,532 | 1,060,615 | ||||||
CGI, Inc., Class A(a) | 11,489 | 924,308 | ||||||
CI Financial Corp. | 22,507 | 225,062 | ||||||
Constellation Software, Inc. | 227 | 327,822 | ||||||
Crescent Point Energy Corp. | 50,546 | 394,645 | ||||||
Dollarama, Inc. | 5,309 | 315,064 | ||||||
Element Fleet Management Corp. | 28,817 | 383,438 | ||||||
Emera, Inc.(b) | 23,198 | 858,669 | ||||||
Empire Co. Ltd., Class A | 16,427 | 421,499 | ||||||
Enbridge, Inc. | 177,654 | 6,913,144 | ||||||
Fairfax Financial Holdings Ltd. | 2,929 | 1,436,725 | ||||||
Finning International, Inc. | 14,240 | 302,432 | ||||||
First Capital REIT | 20,751 | 241,123 | ||||||
Fortis, Inc. | 40,035 | 1,559,958 | ||||||
Franco-Nevada Corp. | 3,308 | 408,222 | ||||||
George Weston Ltd. | 6,783 | 745,655 | ||||||
Gibson Energy, Inc. | 13,855 | 236,156 | ||||||
Gildan Activewear, Inc. | 7,912 | 249,358 | ||||||
Great-West Lifeco, Inc. | 33,537 | 775,453 | ||||||
H&R REIT | 43,489 | 357,400 | ||||||
Hydro One Ltd.(d) | 26,411 | 661,413 | ||||||
iA Financial Corp., Inc. | 10,051 | 558,680 | ||||||
IAMGOLD Corp.(a) | 86,894 | 127,406 | ||||||
IGM Financial, Inc. | 7,647 | 204,454 | ||||||
Imperial Oil Ltd. | 15,407 | 837,075 | ||||||
Intact Financial Corp. | 5,568 | 845,007 | ||||||
Keyera Corp. | 22,631 | 484,458 | ||||||
Kinross Gold Corp. | 155,312 | 562,473 | ||||||
Linamar Corp. | 6,310 | 269,738 | ||||||
Loblaw Cos. Ltd. | 14,140 | 1,157,074 | ||||||
Magna International, Inc. | 34,049 | 1,895,092 | ||||||
Manulife Financial Corp. | 251,961 | 4,170,873 | ||||||
MEG Energy Corp.(a) | 25,557 | 381,655 | ||||||
Methanex Corp. | 5,864 | 204,416 | ||||||
Metro, Inc. | 15,555 | 813,871 | ||||||
National Bank of Canada | 22,023 | 1,497,638 | ||||||
Northland Power, Inc.(b) | 12,044 | 350,005 | ||||||
Nutrien Ltd. | 37,145 | 3,134,607 | ||||||
Onex Corp. | 6,298 | 316,597 | ||||||
Open Text Corp. | 12,988 | 375,724 | ||||||
Parkland Corp. | 18,542 | 374,361 | ||||||
Pembina Pipeline Corp. | 46,098 | 1,520,097 | ||||||
Power Corp. of Canada | 64,621 | 1,602,675 | ||||||
Quebecor, Inc., Class B | 13,860 | 260,932 | ||||||
Restaurant Brands International, Inc. | 11,834 | 702,293 | ||||||
RioCan REIT | 29,980 | 426,606 | ||||||
Rogers Communications, Inc., Class B | 29,595 | 1,230,404 | ||||||
Royal Bank of Canada | 96,288 | 8,897,843 | ||||||
Saputo, Inc. | 21,517 | 523,077 | ||||||
Shaw Communications, Inc., Class B | 32,068 | 822,594 | ||||||
Shopify, Inc., Class A(a) | 4,942 | 169,232 | ||||||
| Shares | Value | |||||||
Canada-(continued) |
| |||||||
SmartCentres REIT | 11,895 | $ | 232,833 | |||||
SNC-Lavalin Group, Inc. | 16,502 | 285,387 | ||||||
SSR Mining, Inc. | 14,360 | 197,495 | ||||||
Stantec, Inc. | 4,891 | 239,019 | ||||||
Sun Life Financial, Inc. | 55,001 | 2,333,021 | ||||||
Suncor Energy, Inc. | 168,333 | 5,782,841 | ||||||
TC Energy Corp. | 75,681 | 3,320,077 | ||||||
Teck Resources Ltd., Class B | 38,072 | 1,157,469 | ||||||
TELUS Corp. | 32,464 | 677,102 | ||||||
TFI International, Inc. | 3,322 | 302,013 | ||||||
Thomson Reuters Corp. | 6,506 | 691,070 | ||||||
TMX Group Ltd. | 2,890 | 277,506 | ||||||
Toronto-Dominion Bank (The) | 122,553 | 7,833,581 | ||||||
Tourmaline Oil Corp. | 11,888 | 668,981 | ||||||
Vermilion Energy, Inc. | 19,958 | 465,133 | ||||||
West Fraser Timber Co. Ltd. | 3,940 | 295,460 | ||||||
WSP Global, Inc. | 4,619 | 566,992 | ||||||
Yamana Gold, Inc. | 73,542 | 322,408 | ||||||
|
| |||||||
| 115,083,435 | ||||||||
|
| |||||||
Chile-0.05% |
| |||||||
Antofagasta PLC(b) | 23,525 | 318,390 | ||||||
Lundin Mining Corp. | 42,921 | 224,666 | ||||||
|
| |||||||
| 543,056 | ||||||||
|
| |||||||
China-0.26% |
| |||||||
AAC Technologies Holdings, Inc.(a) | 100,924 | 184,881 | ||||||
BOC Hong Kong Holdings Ltd. | 324,682 | 1,009,222 | ||||||
Lenovo Group Ltd. | 800,328 | 640,275 | ||||||
Prosus N.V. | 11,655 | 507,307 | ||||||
Tingyi Cayman Islands Holding Corp. | 104,626 | 163,673 | ||||||
Wilmar International Ltd. | 101,907 | 279,414 | ||||||
Xinyi Glass Holdings Ltd. | 112,491 | 144,736 | ||||||
|
| |||||||
| 2,929,508 | ||||||||
|
| |||||||
Denmark-1.10% |
| |||||||
AP Moller - Maersk A/S, Class A | 226 | 452,447 | ||||||
AP Moller - Maersk A/S, Class B | 307 | 642,322 | ||||||
Carlsberg A/S, Class B | 5,685 | 670,195 | ||||||
Chr. Hansen Holding A/S | 3,643 | 202,353 | ||||||
Coloplast A/S, Class B | 3,599 | 401,346 | ||||||
Danske Bank A/S | 91,952 | 1,484,406 | ||||||
DSV A/S | 4,727 | 640,094 | ||||||
Genmab A/S(a) | 795 | 306,494 | ||||||
ISS A/S(a)(b) | 23,703 | 435,195 | ||||||
Jyske Bank A/S(a) | 6,316 | 341,099 | ||||||
Novo Nordisk A/S, Class B | 39,083 | 4,249,940 | ||||||
Novozymes A/S, Class B | 6,009 | 315,665 | ||||||
Orsted A/S(d) | 9,192 | 758,297 | ||||||
Pandora A/S | 5,790 | 305,236 | ||||||
Tryg A/S(b) | 13,196 | 285,641 | ||||||
Vestas Wind Systems A/S(b) | 50,820 | 1,001,213 | ||||||
|
| |||||||
| 12,491,943 | ||||||||
|
| |||||||
Finland-1.37% |
| |||||||
Elisa OYJ | 8,990 | 434,579 | ||||||
Fortum OYJ | 51,647 | 727,141 | ||||||
Huhtamaki OYJ(b) | 7,278 | 261,473 | ||||||
Kesko OYJ, Class B | 21,952 | 427,417 | ||||||
Kone OYJ, Class B | 22,825 | 935,075 | ||||||
Neste OYJ | 24,415 | 1,069,950 | ||||||
See accompanying Notes to Financial Statements which are an integral part of the financial statements.
| 48 | ||||
|
| |||
Invesco FTSE RAFI Developed Markets ex-U.S. ETF (PXF)–(continued)
October 31, 2022
| Shares | Value | |||||||
Finland-(continued) |
| |||||||
Nokia OYJ(b) | 424,845 | $ | 1,892,471 | |||||
Nokian Renkaat OYJ | 15,843 | 178,663 | ||||||
Nordea Bank Abp | 461,097 | 4,409,601 | ||||||
Orion OYJ, Class B | 5,516 | 253,778 | ||||||
Outokumpu OYJ(b) | 59,279 | 238,045 | ||||||
Sampo OYJ, Class A | 41,608 | 1,903,186 | ||||||
Stora Enso OYJ, Class R | 50,912 | 663,706 | ||||||
UPM-Kymmene OYJ | 44,454 | 1,489,875 | ||||||
Valmet OYJ(b) | 9,112 | 207,405 | ||||||
Wartsila OYJ Abp(b) | 49,973 | 340,797 | ||||||
|
| |||||||
| 15,433,162 | ||||||||
|
| |||||||
France-9.98% |
| |||||||
Accor S.A.(a) | 10,204 | 244,464 | ||||||
Aeroports de Paris(a)(b) | 1,697 | 229,865 | ||||||
Air France-KLM(a)(b) | 319,970 | 421,077 | ||||||
Air Liquide S.A. | 27,113 | 3,545,264 | ||||||
Airbus SE | 24,361 | 2,638,381 | ||||||
Alstom S.A.(b) | 33,884 | 698,586 | ||||||
Amundi S.A.(d) | 5,140 | 242,728 | ||||||
Arkema S.A. | 6,406 | 507,270 | ||||||
Atos SE(b) | 25,752 | 251,466 | ||||||
AXA S.A. | 228,328 | 5,641,704 | ||||||
BNP Paribas S.A. | 149,608 | 7,022,857 | ||||||
Bollore SE | 50,111 | 250,855 | ||||||
Bouygues S.A. | 41,534 | 1,185,529 | ||||||
Bureau Veritas S.A. | 14,658 | 363,195 | ||||||
Capgemini SE | 6,781 | 1,114,209 | ||||||
Carrefour S.A.(b) | 127,476 | 2,051,764 | ||||||
CGG S.A.(a)(b) | 300,271 | 254,928 | ||||||
Cie de Saint-Gobain | 53,459 | 2,187,421 | ||||||
Cie Generale des Etablissements Michelin S.C.A. | 75,121 | 1,916,287 | ||||||
Covivio | 4,090 | 219,096 | ||||||
Credit Agricole S.A. | 213,632 | 1,939,563 | ||||||
Danone S.A. | 55,959 | 2,784,161 | ||||||
Dassault Systemes SE | 9,000 | 301,991 | ||||||
Edenred | 8,920 | 458,084 | ||||||
Eiffage S.A. | 10,248 | 927,174 | ||||||
Electricite de France S.A. | 189,850 | 2,242,279 | ||||||
Elis S.A. | 17,590 | 201,841 | ||||||
ENGIE S.A. | 232,920 | 3,028,138 | ||||||
EssilorLuxottica S.A. | 11,364 | 1,800,990 | ||||||
Eurazeo SE | 4,076 | 232,848 | ||||||
Euroapi S.A.(a) | 4,105 | 71,832 | ||||||
Eutelsat Communications S.A.(b) | 26,610 | 267,208 | ||||||
Faurecia SE(a) | 31,480 | 470,433 | ||||||
Gecina S.A | 4,695 | 418,788 | ||||||
Getlink SE | 20,064 | 317,879 | ||||||
Hermes International | 353 | 457,217 | ||||||
Kering S.A. | 2,343 | 1,073,793 | ||||||
Klepierre S.A. | 24,378 | 490,313 | ||||||
Legrand S.A. | 12,091 | 921,835 | ||||||
L’Oreal S.A. | 6,389 | 2,008,666 | ||||||
LVMH Moet Hennessy Louis Vuitton SE | 6,054 | 3,823,441 | ||||||
Orange S.A. | 339,853 | 3,234,995 | ||||||
Orpea S.A.(a)(b) | 9,039 | 73,364 | ||||||
Pernod Ricard S.A. | 7,929 | 1,392,570 | ||||||
Publicis Groupe S.A. | 20,555 | 1,152,704 | ||||||
Renault S.A.(a) | 63,772 | 1,964,617 | ||||||
| Shares | Value | |||||||
France-(continued) |
| |||||||
Rexel S.A.(b) | 35,921 | $ | 642,774 | |||||
Rubis S.C.A. | 11,781 | 267,806 | ||||||
Safran S.A. | 18,490 | 2,059,914 | ||||||
Sanofi | 94,537 | 8,159,741 | ||||||
Schneider Electric SE | 26,357 | 3,341,168 | ||||||
SCOR SE | 23,660 | 356,027 | ||||||
SEB S.A.(b) | 2,315 | 150,781 | ||||||
Societe Generale S.A. | 169,530 | 3,891,467 | ||||||
Sodexo S.A. | 10,328 | 916,038 | ||||||
SPIE S.A. | 12,691 | 297,022 | ||||||
Technip Energies N.V. | 23,403 | 302,198 | ||||||
Teleperformance | 1,665 | 446,452 | ||||||
Thales S.A. | 8,258 | 1,050,016 | ||||||
TotalEnergies SE(b) | 364,428 | 19,846,067 | ||||||
Ubisoft Entertainment S.A.(a) | 6,290 | 172,638 | ||||||
Unibail-Rodamco-Westfield(a)(b) | 17,976 | 850,664 | ||||||
Valeo | 45,920 | 757,477 | ||||||
Veolia Environnement S.A. | 62,244 | 1,389,712 | ||||||
Vinci S.A. | 42,703 | 3,932,713 | ||||||
Vivendi SE | 33,749 | 276,320 | ||||||
Worldline S.A.(a)(d) | 14,936 | 654,252 | ||||||
|
| |||||||
| 112,804,917 | ||||||||
|
| |||||||
Germany-8.57% |
| |||||||
Aareal Bank AG(a)(b) | 9,331 | 304,520 | ||||||
adidas AG | 8,339 | 815,779 | ||||||
Allianz SE | 46,565 | 8,385,310 | ||||||
Aroundtown S.A.(b) | 122,628 | 243,369 | ||||||
Aurubis AG | 4,474 | 282,647 | ||||||
BASF SE | 121,084 | 5,437,364 | ||||||
Bayer AG | 112,212 | 5,902,354 | ||||||
Bayerische Motoren Werke AG | 52,161 | 4,099,524 | ||||||
Bayerische Motoren Werke AG, Preference Shares | 9,092 | 671,261 | ||||||
Beiersdorf AG | 3,999 | 384,096 | ||||||
Brenntag SE | 11,669 | 708,592 | ||||||
Commerzbank AG(a) | 209,189 | 1,673,865 | ||||||
Continental AG | 20,085 | 1,041,782 | ||||||
Covestro AG(d) | 25,924 | 882,422 | ||||||
Daimler Truck Holding AG(a) | 52,722 | 1,406,911 | ||||||
Deutsche Bank AG | 337,041 | 3,217,888 | ||||||
Deutsche Boerse AG | 7,276 | 1,184,038 | ||||||
Deutsche Lufthansa AG(a) | 126,539 | 868,326 | ||||||
Deutsche Post AG | 87,618 | 3,109,710 | ||||||
Deutsche Telekom AG | 407,008 | 7,709,039 | ||||||
E.ON SE | 231,348 | 1,938,063 | ||||||
Evonik Industries AG | 24,354 | 449,031 | ||||||
Freenet AG | 16,974 | 334,015 | ||||||
Fresenius Medical Care AG& Co. KGaA | 24,217 | 669,698 | ||||||
Fresenius SE & Co. KGaA | 58,590 | 1,349,244 | ||||||
GEA Group AG | 10,648 | 372,548 | ||||||
Hannover Rueck SE | 4,324 | 704,294 | ||||||
HeidelbergCement AG | 24,201 | 1,115,825 | ||||||
Henkel AG& Co. KGaA(b) | 9,427 | 553,906 | ||||||
Henkel AG& Co. KGaA, Preference Shares | 16,203 | 1,021,389 | ||||||
HOCHTIEF AG | 4,380 | 232,899 | ||||||
HUGO BOSS AG | 4,166 | 192,039 | ||||||
Infineon Technologies AG | 42,162 | 1,026,770 | ||||||
K+S AG | 16,717 | 369,438 | ||||||
KION Group AG | 6,119 | 135,892 | ||||||
See accompanying Notes to Financial Statements which are an integral part of the financial statements.
| 49 | ||||
|
| |||
Invesco FTSE RAFI Developed Markets ex-U.S. ETF (PXF)–(continued)
October 31, 2022
| Shares | Value | |||||||
Germany-(continued) |
| |||||||
Knorr-Bremse AG | 4,303 | $ | 193,761 | |||||
LANXESS AG | 12,312 | 416,774 | ||||||
LEG Immobilien SE | 5,132 | 335,375 | ||||||
Mercedes-Benz Group AG | 123,064 | 7,127,542 | ||||||
Merck KGaA | 4,454 | 726,349 | ||||||
MTU Aero Engines AG | 2,360 | 422,767 | ||||||
Muenchener Rueckversicherungs- Gesellschaft AG in Muenchen, Class R | 14,380 | 3,800,418 | ||||||
Porsche Automobil Holding SE, Preference Shares | 9,695 | 542,345 | ||||||
ProSiebenSat.1 Media SE | 30,682 | 208,633 | ||||||
Puma SE | 2,745 | 121,571 | ||||||
Rheinmetall AG | 5,256 | 854,540 | ||||||
RWE AG | 56,737 | 2,186,406 | ||||||
Salzgitter AG(b) | 8,448 | 189,035 | ||||||
SAP SE | 49,027 | 4,732,685 | ||||||
Siemens AG | 53,468 | 5,846,786 | ||||||
Siemens Energy AG(b) | 80,486 | 939,864 | ||||||
Siemens Healthineers AG(d) | 9,291 | 427,733 | ||||||
Symrise AG | 4,175 | 426,460 | ||||||
TAG Immobilien AG | 11,127 | 69,778 | ||||||
Telefonica Deutschland Holding AG | 140,910 | 307,226 | ||||||
thyssenkrupp AG(a) | 126,221 | 665,170 | ||||||
TUI AG(a)(b) | 218,705 | 331,880 | ||||||
Uniper SE(b) | 11,107 | 33,284 | ||||||
United Internet AG | 9,990 | 186,858 | ||||||
Volkswagen AG | 6,436 | 1,100,457 | ||||||
Volkswagen AG, Preference Shares | 36,649 | 4,684,962 | ||||||
Vonovia SE | 47,140 | 1,043,635 | ||||||
Zalando SE(a)(d) | 6,573 | 151,562 | ||||||
|
| |||||||
| 96,867,704 | ||||||||
|
| |||||||
Hong Kong-1.07% |
| |||||||
AIA Group Ltd. | 471,346 | 3,569,689 | ||||||
CK Asset Holdings Ltd. | 106,143 | 586,840 | ||||||
CK Hutchison Holdings Ltd. | 102,152 | 507,516 | ||||||
CLP Holdings Ltd. | 60,837 | 408,429 | ||||||
Hang Seng Bank Ltd. | 30,667 | 431,690 | ||||||
Henderson Land Development Co. Ltd. | 61,666 | 150,986 | ||||||
Hong Kong & China Gas Co. Ltd. (The) | 323,491 | 249,732 | ||||||
Hong Kong Exchanges & Clearing Ltd. | 17,305 | 460,741 | ||||||
Hongkong Land Holdings Ltd. | 47,988 | 184,754 | ||||||
Jardine Matheson Holdings Ltd. | 5,416 | 249,244 | ||||||
Link REIT | 118,811 | 702,285 | ||||||
MTR Corp. Ltd. | 62,342 | 274,389 | ||||||
New World Development Co. Ltd. | 78,333 | 160,261 | ||||||
Power Assets Holdings Ltd. | 42,943 | 205,419 | ||||||
Prudential PLC | 237,548 | 2,217,546 | ||||||
Sun Hung Kai Properties Ltd. | 87,186 | 937,962 | ||||||
Techtronic Industries Co. Ltd. | 29,451 | 278,946 | ||||||
WH Group Ltd. | 631,922 | 319,590 | ||||||
Wharf Real Estate Investment Co. Ltd. | 63,705 | 251,173 | ||||||
|
| |||||||
| 12,147,192 | ||||||||
|
| |||||||
Ireland-0.49% |
| |||||||
Bank of Ireland Group PLC | 114,402 | 824,954 | ||||||
CRH PLC | 69,750 | 2,512,796 | ||||||
Flutter Entertainment PLC(a)(b) | 6,002 | 800,225 | ||||||
Kerry Group PLC, Class A(b) | 5,788 | 503,410 | ||||||
| Shares | Value | |||||||
Ireland-(continued) |
| |||||||
Kingspan Group PLC | 3,979 | $ | 200,958 | |||||
Smurfit Kappa Group PLC | 19,974 | 660,936 | ||||||
|
| |||||||
| 5,503,279 | ||||||||
|
| |||||||
Israel-0.39% |
| |||||||
Bank Hapoalim BM | 79,495 | 770,217 | ||||||
Bank Leumi Le-Israel BM | 89,561 | 858,839 | ||||||
Bezeq The Israeli Telecommunication Corp. Ltd. | 173,437 | 308,387 | ||||||
ICL Group Ltd. | 38,039 | 344,994 | ||||||
Israel Discount Bank Ltd., Class A | 70,206 | 401,348 | ||||||
Mizrahi Tefahot Bank Ltd. | 7,689 | 292,092 | ||||||
Teva Pharmaceutical Industries Ltd.(a)(b) | 154,569 | 1,388,684 | ||||||
|
| |||||||
| 4,364,561 | ||||||||
|
| |||||||
Italy-2.99% |
| |||||||
A2A S.p.A. | 248,487 | 275,554 | ||||||
Assicurazioni Generali S.p.A.(b) | 172,786 | 2,594,045 | ||||||
Atlantia S.p.A. | 55,894 | 1,247,384 | ||||||
Azimut Holding S.p.A. | 10,842 | 174,666 | ||||||
Banco BPM S.p.A.(b) | 271,473 | 821,298 | ||||||
BPER Banca | 209,459 | 387,643 | ||||||
Coca-Cola HBC AG(a) | 14,601 | 319,827 | ||||||
Enel S.p.A. | 1,153,430 | 5,151,630 | ||||||
Eni S.p.A.(b) | 458,376 | 6,004,543 | ||||||
Ferrari N.V. | 1,955 | 385,479 | ||||||
FinecoBank Banca Fineco S.p.A.(b) | 18,434 | 248,511 | ||||||
Hera S.p.A.(b) | 100,418 | 239,387 | ||||||
Intesa Sanpaolo S.p.A.(b) | 2,572,190 | 4,903,954 | ||||||
Italgas S.p.A.(b) | 51,953 | 267,779 | ||||||
Leonardo S.p.A. | 107,410 | 863,283 | ||||||
Mediobanca Banca di Credito Finanziario S.p.A.(b) | 76,721 | 695,488 | ||||||
Moncler S.p.A.(b) | 4,135 | 178,554 | ||||||
Pirelli & C. S.p.A.(d) | 53,837 | 203,155 | ||||||
Poste Italiane S.p.A.(b)(d) | 64,105 | 558,819 | ||||||
Prysmian S.p.A. | 22,759 | 742,073 | ||||||
Saipem S.p.A.(a) | 144,103 | 140,145 | ||||||
Snam S.p.A. | 194,556 | 865,688 | ||||||
Telecom Italia S.p.A.(a)(b) | 3,616,562 | 708,095 | ||||||
Telecom Italia S.p.A., RSP(a)(b) | 2,014,131 | 385,194 | ||||||
Terna Rete Elettrica Nazionale S.p.A.(b) | 100,311 | 665,048 | ||||||
UniCredit S.p.A. | 354,275 | 4,393,657 | ||||||
Unipol Gruppo S.p.A. | 78,986 | 340,055 | ||||||
|
| |||||||
| 33,760,954 | ||||||||
|
| |||||||
Japan-19.16% |
| |||||||
Advantest Corp. | 4,904 | 259,329 | ||||||
Aeon Co. Ltd. | 55,993 | 1,045,949 | ||||||
AGC, Inc. | 25,619 | 804,068 | ||||||
Aisin Corp. | 17,865 | 458,539 | ||||||
Ajinomoto Co., Inc. | 29,556 | 814,488 | ||||||
Alps Alpine Co. Ltd. | 49,522 | 426,469 | ||||||
Amada Co. Ltd. | 31,953 | 225,080 | ||||||
ANA Holdings, Inc.(a) | 19,184 | 373,135 | ||||||
Aozora Bank Ltd.(b) | 15,335 | 263,811 | ||||||
Asahi Group Holdings Ltd. | 36,216 | 1,014,589 | ||||||
Asahi Kasei Corp. | 85,286 | 547,687 | ||||||
Astellas Pharma, Inc. | 85,325 | 1,174,808 | ||||||
Bandai Namco Holdings, Inc. | 10,643 | 704,736 | ||||||
Bridgestone Corp. | 34,947 | 1,260,711 | ||||||
See accompanying Notes to Financial Statements which are an integral part of the financial statements.
| 50 | ||||
|
| |||
Invesco FTSE RAFI Developed Markets ex-U.S. ETF (PXF)–(continued)
October 31, 2022
| Shares | Value | |||||||
Japan-(continued) |
| |||||||
Brother Industries Ltd. | 16,098 | $ | 274,121 | |||||
Canon, Inc.(b) | 103,332 | 2,192,681 | ||||||
Casio Computer Co. Ltd. | 24,245 | 211,074 | ||||||
Central Japan Railway Co. | 14,213 | 1,650,940 | ||||||
Chiba Bank Ltd. (The) | 50,098 | 274,025 | ||||||
Chubu Electric Power Co., Inc. | 45,761 | 372,837 | ||||||
Chugai Pharmaceutical Co. Ltd. | 16,272 | 377,693 | ||||||
COMSYS Holdings Corp. | 12,281 | 201,606 | ||||||
Concordia Financial Group Ltd. | 77,860 | 237,297 | ||||||
Credit Saison Co. Ltd. | 21,764 | 232,817 | ||||||
Dai Nippon Printing Co. Ltd. | 15,597 | 313,021 | ||||||
Daifuku Co. Ltd. | 4,051 | 185,877 | ||||||
Dai-ichi Life Holdings, Inc. | 93,084 | 1,476,405 | ||||||
Daiichi Sankyo Co. Ltd. | 65,092 | 2,087,621 | ||||||
Daikin Industries Ltd. | 11,460 | 1,725,920 | ||||||
Daito Trust Construction Co. Ltd. | 5,447 | 539,075 | ||||||
Daiwa House Industry Co. Ltd. | 33,956 | 688,098 | ||||||
Daiwa House REIT Investment Corp. | 96 | 193,763 | ||||||
Daiwa Securities Group, Inc. | 141,686 | 552,884 | ||||||
Denso Corp. | 38,604 | 1,919,356 | ||||||
Dentsu Group, Inc. | 16,150 | 503,618 | ||||||
Disco Corp. | 918 | 220,490 | ||||||
Dowa Holdings Co. Ltd. | 6,801 | 216,656 | ||||||
East Japan Railway Co. | 33,155 | 1,793,428 | ||||||
Ebara Corp. | 8,228 | 268,205 | ||||||
Eisai Co. Ltd. | 19,004 | 1,147,387 | ||||||
Electric Power Development Co. Ltd. | 20,644 | 287,226 | ||||||
ENEOS Holdings, Inc. | 380,098 | 1,252,545 | ||||||
FANUC Corp. | 9,719 | 1,283,574 | ||||||
Fast Retailing Co. Ltd. | 1,681 | 938,582 | ||||||
Fuji Electric Co. Ltd. | 10,935 | 423,760 | ||||||
FUJIFILM Holdings Corp. | 24,438 | 1,121,154 | ||||||
Fujitsu Ltd. | 13,693 | 1,577,641 | ||||||
Fukuoka Financial Group, Inc. | 14,925 | 253,444 | ||||||
GLP J-Reit | 148 | 153,442 | ||||||
Hankyu Hanshin Holdings, Inc. | 11,901 | 353,503 | ||||||
Hino Motors Ltd. | 39,618 | 164,725 | ||||||
Hirose Electric Co. Ltd. | 1,785 | 231,899 | ||||||
Hitachi Construction Machinery Co. Ltd. | 13,692 | 268,433 | ||||||
Hitachi Ltd. | 86,994 | 3,956,534 | ||||||
Hitachi Metals Ltd.(a) | 3,957 | 57,824 | ||||||
Honda Motor Co. Ltd. | 119,067 | 2,702,008 | ||||||
Hoya Corp. | 7,376 | 688,546 | ||||||
Hulic Co. Ltd. | 35,063 | 254,772 | ||||||
Ibiden Co. Ltd. | 5,401 | 182,777 | ||||||
Idemitsu Kosan Co. Ltd. | 25,322 | 553,682 | ||||||
IHI Corp. | 26,895 | 600,743 | ||||||
Iida Group Holdings Co. Ltd. | 15,281 | 212,403 | ||||||
Inpex Corp. | 152,297 | 1,555,400 | ||||||
Isetan Mitsukoshi Holdings Ltd. | 55,092 | 489,262 | ||||||
Isuzu Motors Ltd. | 54,059 | 634,298 | ||||||
ITOCHU Corp.(b) | 66,260 | 1,715,846 | ||||||
J. Front Retailing Co. Ltd. | 41,730 | 337,467 | ||||||
Japan Airlines Co. Ltd.(a) | 20,490 | 382,546 | ||||||
Japan Exchange Group, Inc. | 29,499 | 387,703 | ||||||
Japan Metropolitan Fund Investment Corp. | 470 | 346,251 | ||||||
Japan Post Bank Co. Ltd.(b) | 84,084 | 560,051 | ||||||
Japan Post Holdings Co. Ltd. | 388,832 | 2,614,973 | ||||||
Japan Post Insurance Co. Ltd.(b) | 26,387 | 390,031 | ||||||
Japan Real Estate Investment Corp. | 74 | 310,169 | ||||||
| Shares | Value | |||||||
Japan-(continued) |
| |||||||
Japan Tobacco, Inc. | 128,833 | $ | 2,135,732 | |||||
JFE Holdings, Inc. | 132,317 | 1,213,362 | ||||||
JGC Holdings Corp. | 31,442 | 379,077 | ||||||
JSR Corp. | 11,912 | 227,124 | ||||||
JTEKT Corp. | 29,319 | 207,118 | ||||||
Kajima Corp. | 27,784 | 261,886 | ||||||
Kansai Electric Power Co., Inc. (The) | 49,756 | 377,266 | ||||||
Kansai Paint Co. Ltd. | 12,681 | 165,514 | ||||||
Kao Corp. | 37,594 | 1,413,869 | ||||||
Kawasaki Heavy Industries Ltd. | 41,092 | 698,344 | ||||||
Kawasaki Kisen Kaisha Ltd.(b) | 20,999 | 319,432 | ||||||
KDDI Corp. | 104,532 | 3,090,915 | ||||||
Keio Corp. | 7,206 | 253,072 | ||||||
Keisei Electric Railway Co. Ltd.(b) | 9,001 | 239,203 | ||||||
Keyence Corp. | 2,526 | 957,139 | ||||||
Kikkoman Corp. | 4,862 | 264,305 | ||||||
Kintetsu Group Holdings Co. Ltd. | 10,257 | 347,110 | ||||||
Kirin Holdings Co. Ltd. | 58,898 | 867,610 | ||||||
Kobe Steel Ltd. | 103,172 | 423,419 | ||||||
Koito Manufacturing Co. Ltd. | 20,004 | 284,512 | ||||||
Komatsu Ltd. | 81,673 | 1,564,939 | ||||||
Konica Minolta, Inc. | 134,334 | 409,414 | ||||||
Kubota Corp. | 74,772 | 1,044,600 | ||||||
Kuraray Co. Ltd. | 42,291 | 291,073 | ||||||
Kurita Water Industries Ltd. | 7,152 | 262,724 | ||||||
Kyocera Corp. | 24,991 | 1,251,105 | ||||||
Kyowa Kirin Co. Ltd. | 11,764 | 277,410 | ||||||
Kyushu Electric Power Co., Inc. | 40,495 | 200,793 | ||||||
Kyushu Railway Co. | 19,541 | 408,871 | ||||||
Lawson, Inc. | 6,989 | 223,351 | ||||||
Lion Corp. | 21,276 | 215,286 | ||||||
Lixil Corp. | 23,256 | 352,200 | ||||||
Makita Corp. | 16,566 | 303,155 | ||||||
Marubeni Corp. | 130,428 | 1,143,389 | ||||||
Marui Group Co. Ltd. | 16,545 | 273,162 | ||||||
MatsukiyoCocokara & Co. | 8,687 | 316,773 | ||||||
Mazda Motor Corp. | 104,724 | 706,685 | ||||||
Mebuki Financial Group, Inc. | 121,376 | 235,999 | ||||||
MEIJI Holdings Co. Ltd. | 11,086 | 456,463 | ||||||
MINEBEA MITSUMI, Inc. | 30,484 | 452,025 | ||||||
MISUMI Group, Inc. | 9,125 | 195,227 | ||||||
Mitsubishi Chemical Group Corp. | 142,981 | 646,534 | ||||||
Mitsubishi Corp. | 111,273 | 3,017,738 | ||||||
Mitsubishi Electric Corp. | 122,760 | 1,081,950 | ||||||
Mitsubishi Estate Co. Ltd. | 84,782 | 1,068,367 | ||||||
Mitsubishi Gas Chemical Co., Inc. | 28,903 | 367,911 | ||||||
Mitsubishi HC Capital, Inc. | 55,698 | 239,078 | ||||||
Mitsubishi Heavy Industries Ltd. | 44,374 | 1,528,542 | ||||||
Mitsubishi Materials Corp. | 20,260 | 265,254 | ||||||
Mitsubishi Motors Corp.(a) | 164,623 | 553,783 | ||||||
Mitsubishi UFJ Financial Group, Inc. | 1,470,159 | 6,918,803 | ||||||
Mitsui & Co. Ltd. | 96,788 | 2,144,333 | ||||||
Mitsui Chemicals, Inc. | 23,291 | 431,707 | ||||||
Mitsui Fudosan Co. Ltd. | 67,295 | 1,290,121 | ||||||
Mitsui Mining & Smelting Co. Ltd. | 12,214 | 247,345 | ||||||
Mitsui OSK Lines Ltd.(b) | 29,508 | 585,852 | ||||||
Mizuho Financial Group, Inc. | 226,652 | 2,448,973 | ||||||
MS&AD Insurance Group Holdings, Inc. | 31,260 | 828,847 | ||||||
Murata Manufacturing Co. Ltd. | 28,562 | 1,402,783 | ||||||
Nabtesco Corp. | 10,522 | 224,053 | ||||||
See accompanying Notes to Financial Statements which are an integral part of the financial statements.
| 51 | ||||
|
| |||
Invesco FTSE RAFI Developed Markets ex-U.S. ETF (PXF)–(continued)
October 31, 2022
| Shares | Value | |||||||
Japan-(continued) |
| |||||||
Nagoya Railroad Co. Ltd. | 14,436 | $ | 221,248 | |||||
NEC Corp. | 24,368 | 807,430 | ||||||
NGK Insulators Ltd. | 23,817 | 278,334 | ||||||
NGK Spark Plug Co. Ltd. | 20,879 | 380,678 | ||||||
NH Foods Ltd. | 11,618 | 277,094 | ||||||
Nichirei Corp. | 11,592 | 180,468 | ||||||
Nidec Corp. | 13,332 | 738,918 | ||||||
Nikon Corp. | 48,310 | 467,710 | ||||||
Nintendo Co. Ltd. | 42,776 | 1,746,899 | ||||||
Nippon Building Fund, Inc. | 82 | 364,665 | ||||||
Nippon Electric Glass Co. Ltd. | 14,053 | 243,742 | ||||||
Nippon Prologis REIT, Inc. | 74 | 155,085 | ||||||
Nippon Steel Corp. | 158,023 | 2,171,507 | ||||||
Nippon Telegraph & Telephone Corp. | 134,857 | 3,714,499 | ||||||
Nippon Yusen K.K.(b) | 35,096 | 637,293 | ||||||
Nissan Chemical Corp. | 5,357 | 241,477 | ||||||
Nissan Motor Co. Ltd. | 411,087 | 1,312,071 | ||||||
Nissin Foods Holdings Co. Ltd. | 3,965 | 256,891 | ||||||
Nitori Holdings Co. Ltd. | 3,436 | 312,889 | ||||||
Nitto Denko Corp. | 13,862 | 730,242 | ||||||
Nomura Holdings, Inc. | 285,156 | 924,332 | ||||||
Nomura Real Estate Holdings, Inc. | 13,268 | 300,379 | ||||||
Nomura Real Estate Master Fund, Inc. | 292 | 332,990 | ||||||
Nomura Research Institute Ltd. | 8,546 | 190,026 | ||||||
NSK Ltd. | 101,411 | 536,274 | ||||||
NTT Data Corp. | 43,524 | 631,623 | ||||||
Obayashi Corp. | 52,767 | 339,035 | ||||||
Odakyu Electric Railway Co. Ltd. | 17,694 | 210,588 | ||||||
Oji Holdings Corp. | 72,159 | 250,507 | ||||||
Olympus Corp. | 29,023 | 613,128 | ||||||
Omron Corp. | 10,278 | 481,002 | ||||||
Ono Pharmaceutical Co. Ltd. | 22,157 | 521,148 | ||||||
Oriental Land Co. Ltd. | 1,994 | 267,637 | ||||||
ORIX Corp. | 98,605 | 1,449,537 | ||||||
ORIX JREIT, Inc. | 166 | 222,808 | ||||||
Osaka Gas Co. Ltd. | 22,576 | 334,459 | ||||||
Otsuka Corp. | 8,641 | 272,947 | ||||||
Otsuka Holdings Co. Ltd. | 20,869 | 669,167 | ||||||
Pan Pacific International Holdings Corp. | 25,280 | 415,168 | ||||||
Panasonic Holdings Corp. | 152,309 | 1,090,813 | ||||||
Persol Holdings Co. Ltd. | 14,825 | 297,827 | ||||||
Rakuten Group, Inc.(b) | 55,934 | 250,628 | ||||||
Recruit Holdings Co. Ltd. | 39,004 | 1,204,483 | ||||||
Renesas Electronics Corp.(a) | 43,781 | 367,161 | ||||||
Resona Holdings, Inc. | 244,987 | 922,523 | ||||||
Ricoh Co. Ltd. | 67,390 | 494,198 | ||||||
Rohm Co. Ltd. | 6,961 | 490,340 | ||||||
Ryohin Keikaku Co. Ltd. | 19,293 | 181,851 | ||||||
Santen Pharmaceutical Co. Ltd. | 28,903 | 197,956 | ||||||
SBI Holdings, Inc. | 26,499 | 479,223 | ||||||
Secom Co. Ltd. | 12,936 | 738,989 | ||||||
Sega Sammy Holdings, Inc. | 14,255 | 182,701 | ||||||
Seibu Holdings, Inc. | 29,219 | 261,847 | ||||||
Seiko Epson Corp. | 30,154 | 411,020 | ||||||
Sekisui Chemical Co. Ltd. | 22,349 | 279,673 | ||||||
Sekisui House Ltd. | 48,142 | 801,638 | ||||||
Seven & i Holdings Co. Ltd. | 49,159 | 1,836,910 | ||||||
SG Holdings Co. Ltd. | 19,475 | 258,383 | ||||||
Sharp Corp.(b) | 36,398 | 218,190 | ||||||
Shimadzu Corp. | 10,689 | 282,264 | ||||||
| Shares | Value | |||||||
Japan-(continued) |
| |||||||
Shimamura Co. Ltd. | 3,073 | $ | 248,718 | |||||
Shimano, Inc. | 2,271 | 352,564 | ||||||
Shimizu Corp. | 55,208 | 275,975 | ||||||
Shin-Etsu Chemical Co. Ltd. | 19,010 | 1,987,522 | ||||||
Shionogi & Co. Ltd. | 12,544 | 581,479 | ||||||
Shiseido Co. Ltd. | 14,001 | 485,586 | ||||||
Shizuoka Financial Group, Inc. | 43,096 | 271,969 | ||||||
Showa Denko K.K | 37,695 | 550,836 | ||||||
Skylark Holdings Co. Ltd.(a)(b) | 20,419 | 218,017 | ||||||
SMC Corp. | 1,859 | 751,930 | ||||||
SoftBank Corp. | 262,091 | 2,584,145 | ||||||
SoftBank Group Corp. | 217,027 | 9,344,857 | ||||||
Sojitz Corp. | 28,892 | 426,475 | ||||||
Sompo Holdings, Inc. | 29,016 | 1,208,976 | ||||||
Sony Group Corp. | 68,177 | 4,581,370 | ||||||
Stanley Electric Co. Ltd. | 14,736 | 250,631 | ||||||
Subaru Corp. | 65,599 | 1,021,929 | ||||||
SUMCO Corp. | 20,316 | 258,196 | ||||||
Sumitomo Chemical Co. Ltd. | 183,686 | 619,145 | ||||||
Sumitomo Corp. | 71,114 | 906,897 | ||||||
Sumitomo Electric Industries Ltd. | 52,738 | 551,383 | ||||||
Sumitomo Forestry Co. Ltd. | 14,348 | 224,919 | ||||||
Sumitomo Heavy Industries Ltd. | 12,639 | 240,050 | ||||||
Sumitomo Metal Mining Co. Ltd. | 18,960 | 533,459 | ||||||
Sumitomo Mitsui Financial Group, Inc. | 177,154 | 4,973,685 | ||||||
Sumitomo Mitsui Trust Holdings, Inc. | 25,749 | 740,932 | ||||||
Sumitomo Realty & Development Co. Ltd. | 26,213 | 602,263 | ||||||
Sumitomo Rubber Industries Ltd. | 29,097 | 249,792 | ||||||
Suntory Beverage & Food Ltd. | 11,031 | 369,592 | ||||||
Suzuki Motor Corp. | 35,877 | 1,211,710 | ||||||
Sysmex Corp. | 5,760 | 311,106 | ||||||
T&D Holdings, Inc. | 78,948 | 779,202 | ||||||
Taisei Corp. | 17,729 | 483,675 | ||||||
Taiyo Yuden Co. Ltd. | 6,535 | 178,285 | ||||||
Takashimaya Co. Ltd.(b) | 26,905 | 332,703 | ||||||
Takeda Pharmaceutical Co. Ltd. | 183,730 | 4,843,100 | ||||||
TDK Corp. | 31,151 | 975,597 | ||||||
Teijin Ltd. | 22,528 | 204,614 | ||||||
Terumo Corp. | 25,609 | 779,460 | ||||||
THK Co. Ltd. | 11,475 | 200,572 | ||||||
TIS, Inc. | 15,462 | 417,667 | ||||||
Tobu Railway Co. Ltd. | 11,180 | 258,749 | ||||||
Toho Gas Co. Ltd. | 12,393 | 231,376 | ||||||
Tohoku Electric Power Co., Inc. | 75,956 | 319,390 | ||||||
Tokio Marine Holdings, Inc. | 123,774 | 2,240,898 | ||||||
Tokyo Electric Power Co. Holdings, Inc.(a)(b) | 295,543 | 964,365 | ||||||
Tokyo Electron Ltd. | 4,182 | 1,111,092 | ||||||
Tokyo Gas Co. Ltd. | 39,089 | 698,755 | ||||||
Tokyu Corp. | 25,422 | 293,498 | ||||||
Tokyu Fudosan Holdings Corp. | 54,087 | 274,738 | ||||||
Toppan, Inc. | 21,894 | 326,860 | ||||||
Toray Industries, Inc. | 145,515 | 709,292 | ||||||
Toshiba Corp. | 35,039 | 1,221,361 | ||||||
Tosoh Corp. | 21,256 | 231,530 | ||||||
TOTO Ltd. | 10,586 | 302,691 | ||||||
Toyo Suisan Kaisha Ltd. | 7,321 | 274,842 | ||||||
Toyota Industries Corp. | 8,904 | 458,873 | ||||||
Toyota Motor Corp. | 879,723 | 12,189,521 | ||||||
Toyota Tsusho Corp. | 16,872 | 567,565 | ||||||
See accompanying Notes to Financial Statements which are an integral part of the financial statements.
| 52 | ||||
|
| |||
Invesco FTSE RAFI Developed Markets ex-U.S. ETF (PXF)–(continued)
October 31, 2022
| Shares | Value | |||||||
Japan-(continued) |
| |||||||
Trend Micro, Inc. | 6,580 | $ | 332,464 | |||||
Tsuruha Holdings, Inc. | 4,273 | 248,673 | ||||||
Unicharm Corp. | 12,616 | 384,672 | ||||||
United Urban Investment Corp. | 220 | 232,677 | ||||||
West Japan Railway Co. | 30,982 | 1,230,025 | ||||||
Yakult Honsha Co. Ltd. | 6,523 | 361,621 | ||||||
Yamada Holdings Co. Ltd. | 188,247 | 606,656 | ||||||
Yamaha Corp. | 8,169 | 308,876 | ||||||
Yamaha Motor Co. Ltd. | 38,852 | 802,473 | ||||||
Yamato Holdings Co. Ltd. | 28,696 | 425,512 | ||||||
Yaskawa Electric Corp. | 9,682 | 269,026 | ||||||
Yokogawa Electric Corp. | 20,215 | 338,787 | ||||||
Z Holdings Corp. | 151,782 | 392,743 | ||||||
|
| |||||||
| 216,667,232 | ||||||||
|
| |||||||
Jordan-0.01% |
| |||||||
Hikma Pharmaceuticals PLC | 9,896 | 142,308 | ||||||
|
| |||||||
Luxembourg-0.25% |
| |||||||
Aperam S.A. | 5,403 | 141,245 | ||||||
ArcelorMittal S.A. | 110,788 | 2,480,664 | ||||||
Eurofins Scientific SE | 3,133 | 200,591 | ||||||
|
| |||||||
| 2,822,500 | ||||||||
|
| |||||||
Macau-0.07% |
| |||||||
Galaxy Entertainment Group Ltd. | 92,712 | 423,413 | ||||||
Sands China Ltd.(a) | 202,700 | 353,763 | ||||||
|
| |||||||
| 777,176 | ||||||||
|
| |||||||
Mongolia-0.04% |
| |||||||
Turquoise Hill Resources Ltd.(a) | 15,084 | 424,194 | ||||||
|
| |||||||
Netherlands-5.45% | ||||||||
Aalberts N.V. | 5,452 | 189,567 | ||||||
ABN AMRO Bank N.V., CVA(d) | 106,119 | 1,044,213 | ||||||
Aegon N.V. | 514,242 | 2,381,158 | ||||||
Akzo Nobel N.V. | 16,213 | 1,000,547 | ||||||
ASM International N.V.(b) | 771 | 171,302 | ||||||
ASML Holding N.V.(b) | 4,296 | 2,029,567 | ||||||
ASR Nederland N.V. | 19,023 | 838,354 | ||||||
EXOR N.V.(a) | 11,913 | 800,647 | ||||||
Heineken Holding N.V. | 6,063 | 414,073 | ||||||
Heineken N.V.(b) | 12,981 | 1,085,400 | ||||||
ING Groep N.V. | 602,334 | 5,925,788 | ||||||
Koninklijke Ahold Delhaize N.V. | 124,609 | 3,479,197 | ||||||
Koninklijke DSM N.V. | 7,474 | 881,261 | ||||||
Koninklijke KPN N.V. | 330,149 | 923,764 | ||||||
Koninklijke Philips N.V.(b) | 80,775 | 1,023,313 | ||||||
Koninklijke Vopak N.V. | 7,212 | 147,549 | ||||||
NN Group N.V. | 35,375 | 1,498,161 | ||||||
PostNL N.V.(b) | 72,138 | 113,149 | ||||||
Randstad N.V.(b) | 15,982 | 796,741 | ||||||
SBM Offshore N.V. | 19,776 | 267,775 | ||||||
Shell PLC | 1,276,468 | 35,330,666 | ||||||
Universal Music Group N.V.(b) | 13,258 | 260,132 | ||||||
Wolters Kluwer N.V. | 9,017 | 958,481 | ||||||
|
| |||||||
| 61,560,805 | ||||||||
|
| |||||||
Norway-0.69% |
| |||||||
Aker BP ASA | 21,154 | 674,285 | ||||||
DNB Bank ASA | 52,132 | 922,615 | ||||||
Equinor ASA | 91,901 | 3,362,032 | ||||||
Gjensidige Forsikring ASA | 12,518 | 228,643 | ||||||
| Shares | Value | |||||||
Norway-(continued) |
| |||||||
Mowi ASA | 36,792 | $ | 548,685 | |||||
Norsk Hydro ASA | 109,807 | 696,852 | ||||||
Orkla ASA | 53,195 | 358,970 | ||||||
Storebrand ASA | 50,713 | 394,120 | ||||||
Telenor ASA | 65,913 | 599,103 | ||||||
|
| |||||||
| 7,785,305 | ||||||||
|
| |||||||
Poland-0.13% |
| |||||||
Bank Polska Kasa Opieki S.A. | 18,178 | 298,843 | ||||||
KGHM Polska Miedz S.A. | 11,700 | 234,571 | ||||||
Polski Koncern Naftowy ORLEN S.A. | 26,673 | 307,016 | ||||||
Powszechna Kasa Oszczednosci Bank Polski S.A.(b) | 62,834 | 343,316 | ||||||
Powszechny Zaklad Ubezpieczen S.A.(b) | 49,427 | 277,625 | ||||||
|
| |||||||
| 1,461,371 | ||||||||
|
| |||||||
Portugal-0.29% |
| |||||||
Banco Comercial Portugues S.A., Class R(b) | 1,335,947 | 190,664 | ||||||
EDP - Energias de Portugal S.A. | 380,746 | 1,665,174 | ||||||
Galp Energia SGPS S.A. | 90,274 | 916,760 | ||||||
Jeronimo Martins SGPS S.A. | 25,020 | 518,805 | ||||||
|
| |||||||
| 3,291,403 | ||||||||
|
| |||||||
Russia-0.00% |
| |||||||
Evraz PLC(c) | 48,360 | 0 | ||||||
Raspadskaya OJSC(c) | 546 | 0 | ||||||
|
| |||||||
| 0 | ||||||||
|
| |||||||
Singapore-0.80% |
| |||||||
CapitaLand Ascendas REIT | 211,340 | 391,287 | ||||||
CapitaLand Integrated Commercial Trust | 290,840 | 386,389 | ||||||
CapitaLand Investment Ltd. | 123,005 | 261,639 | ||||||
ComfortDelGro Corp. Ltd. | 238,747 | 214,267 | ||||||
DBS Group Holdings Ltd. | 105,520 | 2,550,197 | ||||||
Genting Singapore Ltd. | 465,472 | 264,791 | ||||||
Oversea-Chinese Banking Corp. Ltd. | 132,478 | 1,135,579 | ||||||
Singapore Airlines Ltd.(a)(b) | 124,651 | 463,334 | ||||||
Singapore Technologies Engineering Ltd. | 95,506 | 222,719 | ||||||
Singapore Telecommunications Ltd. | 621,241 | 1,097,521 | ||||||
STMicroelectronics N.V. | 19,747 | 616,736 | ||||||
United Overseas Bank Ltd. | 60,921 | 1,195,087 | ||||||
Venture Corp. Ltd. | 21,639 | 243,594 | ||||||
|
| |||||||
| 9,043,140 | ||||||||
|
| |||||||
South Africa-0.22% |
| |||||||
Anglo American PLC | 81,653 | 2,452,282 | ||||||
|
| |||||||
South Korea-3.88% |
| |||||||
Amorepacific Corp. | 1,612 | 104,905 | ||||||
Amorepacific Corp., Preference Shares | 561 | 14,493 | ||||||
Celltrion, Inc. | 1,880 | 253,403 | ||||||
CJ CheilJedang Corp. | 764 | 222,048 | ||||||
CJ CheilJedang Corp., Preference Shares | 117 | 13,594 | ||||||
Doosan Enerbility Co. Ltd.(a) | 28,163 | 261,968 | ||||||
E-MART, Inc. | 2,566 | 152,398 | ||||||
GS Engineering & Construction Corp. | 12,392 | 188,779 | ||||||
Hana Financial Group, Inc. | 24,957 | 722,718 | ||||||
Hanwha Solutions Corp.(a) | 12,508 | 414,460 | ||||||
Hyundai Engineering & Construction Co. Ltd. | 17,665 | 432,805 | ||||||
Hyundai Glovis Co. Ltd. | 2,657 | 324,559 | ||||||
Hyundai Mobis Co. Ltd. | 7,088 | 1,089,734 | ||||||
See accompanying Notes to Financial Statements which are an integral part of the financial statements.
| 53 | ||||
|
| |||
Invesco FTSE RAFI Developed Markets ex-U.S. ETF (PXF)–(continued)
October 31, 2022
| Shares | Value | |||||||
South Korea-(continued) |
| |||||||
Hyundai Motor Co. | 13,875 | $ | 1,602,329 | |||||
Hyundai Motor Co., First Pfd | 2,241 | 123,342 | ||||||
Hyundai Motor Co., Second Pfd | 3,567 | 199,829 | ||||||
Hyundai Steel Co. | 14,174 | 279,609 | ||||||
Industrial Bank of Korea | 31,238 | 229,167 | ||||||
KB Financial Group, Inc. | 35,955 | 1,212,846 | ||||||
Kia Corp. | 34,605 | 1,610,665 | ||||||
Korea Electric Power Corp.(a)(b) | 31,575 | 371,288 | ||||||
Korea Gas Corp.(b) | 8,967 | 219,068 | ||||||
Korea Investment Holdings Co. Ltd. | 4,447 | 154,691 | ||||||
Korea Shipbuilding & Offshore Engineering Co. Ltd.(a) | 6,587 | 336,182 | ||||||
Korea Zinc Co. Ltd. | 940 | 422,338 | ||||||
Korean Air Lines Co. Ltd.(a)(b) | 17,193 | 278,815 | ||||||
KT&G Corp. | 9,500 | 638,246 | ||||||
LG Chem Ltd. | 2,854 | 1,254,241 | ||||||
LG Chem Ltd., Preference Shares | 391 | 79,328 | ||||||
LG Corp. | 8,794 | 488,950 | ||||||
LG Display Co. Ltd. | 72,194 | 646,196 | ||||||
LG Electronics, Inc. | 18,856 | 1,080,171 | ||||||
LG Electronics, Inc., Preference Shares | 3,022 | 84,118 | ||||||
LG H&H Co. Ltd. | 388 | 138,917 | ||||||
LG H&H Co. Ltd., Preference Shares | 94 | 18,510 | ||||||
LG Innotek Co. Ltd. | 1,018 | 211,897 | ||||||
LG Uplus Corp. | 26,502 | 213,028 | ||||||
LOTTE Chemical Corp. | 2,598 | 269,932 | ||||||
Meritz Fire & Marine Insurance Co. Ltd. | 9,502 | 209,792 | ||||||
NAVER Corp. | 2,120 | 252,266 | ||||||
NCSoft Corp. | 693 | 189,736 | ||||||
POSCO Holdings, Inc. | 9,053 | 1,582,503 | ||||||
Posco International Corp. | 21,939 | 318,046 | ||||||
Samsung C&T Corp. | 6,524 | 542,732 | ||||||
Samsung Electro-Mechanics Co. Ltd. | 3,896 | 330,946 | ||||||
Samsung Electronics Co. Ltd. | 323,615 | 13,494,844 | ||||||
Samsung Electronics Co. Ltd., Preference Shares | 55,726 | 2,085,153 | ||||||
Samsung Engineering Co. Ltd.(a)(b) | 15,522 | 259,890 | ||||||
Samsung Fire & Marine Insurance Co. Ltd. | 2,035 | 285,724 | ||||||
Samsung Fire & Marine Insurance Co. Ltd., Preference Shares | 151 | 16,961 | ||||||
Samsung Heavy Industries Co. Ltd.(a) | 72,219 | 261,103 | ||||||
Samsung Life Insurance Co. Ltd. | 6,483 | 306,753 | ||||||
Samsung SDI Co. Ltd. | 1,567 | 810,754 | ||||||
Samsung SDI Co. Ltd., Preference Shares | 36 | 8,618 | ||||||
Samsung SDS Co. Ltd. | 2,209 | 193,847 | ||||||
Samsung Securities Co. Ltd. | 8,348 | 186,071 | ||||||
Shinhan Financial Group Co. Ltd. | 32,395 | 825,539 | ||||||
Shinsegae, Inc. | 1,253 | 186,923 | ||||||
SK Hynix, Inc. | 39,002 | 2,264,359 | ||||||
SK Innovation Co. Ltd.(a) | 8,684 | 1,054,675 | ||||||
SK Telecom Co. Ltd. | 9,930 | 349,253 | ||||||
SK, Inc. | 3,962 | 595,225 | ||||||
S-Oil Corp. | 6,457 | 391,649 | ||||||
Woori Financial Group, Inc. | 66,267 | 546,623 | ||||||
|
| |||||||
| 43,909,552 | ||||||||
|
| |||||||
Spain-3.20% | ||||||||
Acciona S.A.(b) | 2,365 | 425,650 | ||||||
Acerinox S.A. | 26,823 | 234,936 | ||||||
| Shares | Value | |||||||
Spain-(continued) |
| |||||||
ACS Actividades de Construccion y Servicios S.A.(b) | 47,577 | $ | 1,220,241 | |||||
Aena SME S.A.(a)(d) | 3,680 | 433,364 | ||||||
Amadeus IT Group S.A.(a) | 13,795 | 719,073 | ||||||
Banco Bilbao Vizcaya Argentaria S.A.(b) | 1,008,721 | 5,193,218 | ||||||
Banco de Sabadell S.A. | 1,328,957 | 1,045,001 | ||||||
Banco Santander S.A.(b) | 2,223,966 | 5,763,310 | ||||||
Bankinter S.A. | 61,599 | 372,351 | ||||||
CaixaBank S.A. | 415,441 | 1,376,747 | ||||||
Cellnex Telecom S.A.(b)(d) | 11,692 | 382,497 | ||||||
Enagas S.A. | 29,555 | 479,786 | ||||||
Endesa S.A.(b) | 47,127 | 786,470 | ||||||
Ferrovial S.A. | 25,474 | 622,130 | ||||||
Grifols S.A.(a)(b) | 29,927 | 254,551 | ||||||
Grifols S.A., Class B, Preference Shares(a) | 22,456 | 140,047 | ||||||
Iberdrola S.A. | 639,493 | 6,494,246 | ||||||
Industria de Diseno Textil S.A.(b) | 58,486 | 1,326,039 | ||||||
Inmobiliaria Colonial SOCIMI S.A. | 30,915 | 163,010 | ||||||
Mapfre S.A.(b) | 131,979 | 226,316 | ||||||
Merlin Properties SOCIMI S.A. | 35,099 | 297,294 | ||||||
Naturgy Energy Group S.A.(b) | 38,234 | 980,992 | ||||||
Red Electrica Corp. S.A. | 40,170 | 649,129 | ||||||
Repsol S.A. | 292,115 | 3,968,348 | ||||||
Telefonica S.A. | 772,535 | 2,660,921 | ||||||
|
| |||||||
| 36,215,667 | ||||||||
|
| |||||||
Sweden-2.37% |
| |||||||
Alfa Laval AB | 15,258 | 375,704 | ||||||
Alleima AB(a) | 10,850 | 36,938 | ||||||
Assa Abloy AB, Class B | 38,402 | 774,959 | ||||||
Atlas Copco AB, Class A(b) | 88,009 | 940,105 | ||||||
Atlas Copco AB, Class B(b) | 51,754 | 500,846 | ||||||
Billerud AB(b) | 20,708 | 267,225 | ||||||
Boliden AB(b) | 21,867 | 636,393 | ||||||
Castellum AB(b) | 18,515 | 211,615 | ||||||
Dometic Group AB(b)(d) | 26,068 | 149,230 | ||||||
Electrolux AB, Class B(b) | 33,976 | 418,949 | ||||||
Epiroc AB, Class A | 18,660 | 285,461 | ||||||
Epiroc AB, Class B | 11,187 | 150,183 | ||||||
Essity AB, Class B | 47,394 | 1,001,023 | ||||||
Fabege AB | 17,800 | 129,153 | ||||||
Fastighets AB Balder, Class B(a)(b) | 27,661 | 103,868 | ||||||
Getinge AB, Class B | 7,541 | 153,066 | ||||||
H & M Hennes & Mauritz AB, Class B(b) | 89,027 | 895,873 | ||||||
Hexagon AB, Class B(b) | 51,657 | 510,472 | ||||||
Holmen AB, Class B | 5,984 | 216,931 | ||||||
Husqvarna AB, Class A | 1,676 | 9,995 | ||||||
Husqvarna AB, Class B(b) | 28,450 | 168,891 | ||||||
Industrivarden AB, Class A | 19,601 | 443,798 | ||||||
Industrivarden AB, Class C(b) | 14,743 | 331,004 | ||||||
Investor AB, Class A(b) | 37,160 | 631,862 | ||||||
Investor AB, Class B(b) | 129,303 | 2,110,420 | ||||||
Kinnevik AB, Class A(a) | 1,108 | 13,877 | ||||||
Kinnevik AB, Class B(a) | 17,946 | 221,677 | ||||||
Orron Energy AB | 11,156 | 23,159 | ||||||
Saab AB, Class B | 11,129 | 392,974 | ||||||
Sandvik AB(b) | 54,310 | 848,283 | ||||||
Securitas AB, Class B(b) | 61,570 | 503,349 | ||||||
Skandinaviska Enskilda Banken AB, Class A | 143,529 | 1,513,163 | ||||||
Skandinaviska Enskilda Banken AB, Class C | 2,170 | 24,743 | ||||||
See accompanying Notes to Financial Statements which are an integral part of the financial statements.
| 54 | ||||
|
| |||
Invesco FTSE RAFI Developed Markets ex-U.S. ETF (PXF)–(continued)
October 31, 2022
| Shares | Value | |||||||
Sweden-(continued) |
| |||||||
Skanska AB, Class B(b) | 28,386 | $ | 441,314 | |||||
SKF AB, Class B(b) | 42,415 | 613,361 | ||||||
SSAB AB, Class A | 32,115 | 154,436 | ||||||
SSAB AB, Class B(b) | 87,307 | 405,625 | ||||||
Svenska Cellulosa AB S.C.A., Class A | 1,213 | 14,621 | ||||||
Svenska Cellulosa AB S.C.A., Class B(b) | 33,665 | 396,957 | ||||||
Svenska Handelsbanken AB, Class A | 175,388 | 1,629,217 | ||||||
Svenska Handelsbanken AB, Class B(b) | 4,281 | 46,799 | ||||||
Swedbank AB, Class A | 118,780 | 1,769,804 | ||||||
Swedish Match AB | 64,478 | 662,842 | ||||||
Tele2 AB, Class B(b) | 42,017 | 344,183 | ||||||
Telefonaktiebolaget LM Ericsson, Class A | 2,020 | 11,992 | ||||||
Telefonaktiebolaget LM Ericsson, Class B | 174,421 | 969,142 | ||||||
Telia Co. AB(b) | 386,573 | 1,023,240 | ||||||
Trelleborg AB, Class B | 19,002 | 418,371 | ||||||
Volvo AB, Class A | 21,245 | 362,592 | ||||||
Volvo AB, Class B | 155,836 | 2,549,683 | ||||||
|
| |||||||
| 26,809,368 | ||||||||
|
| |||||||
Switzerland-3.90% |
| |||||||
ABB Ltd. | 94,123 | 2,618,421 | ||||||
Accelleron Industries AG(a) | 4,707 | 79,865 | ||||||
Adecco Group AG(b) | 23,998 | 751,534 | ||||||
Alcon, Inc. | 15,922 | 969,560 | ||||||
Baloise Holding AG | 3,980 | 544,056 | ||||||
Barry Callebaut AG | 173 | 327,416 | ||||||
Chocoladefabriken Lindt & Spruengli AG | 3 | 291,681 | ||||||
Chocoladefabriken Lindt & Spruengli AG, PC | 34 | 326,155 | ||||||
Cie Financiere Richemont S.A | 18,773 | 1,837,250 | ||||||
Clariant AG(a) | 19,067 | 306,939 | ||||||
Credit Suisse Group AG(b) | 468,394 | 1,933,018 | ||||||
Dufry AG(a)(b) | 7,507 | 247,620 | ||||||
Geberit AG | 1,160 | 516,161 | ||||||
Georg Fischer AG | 4,944 | 273,939 | ||||||
Givaudan S.A. | 272 | 812,671 | ||||||
Helvetia Holding AG | 3,165 | 314,365 | ||||||
Holcim AG | 67,550 | 3,069,872 | ||||||
Julius Baer Group Ltd. | 15,431 | 739,670 | ||||||
Kuehne + Nagel International AG, | 2,602 | 554,851 | ||||||
Logitech International S.A., Class R(b) | 4,786 | 238,403 | ||||||
Lonza Group AG | 1,367 | 704,024 | ||||||
Novartis AG | 117,765 | 9,520,049 | ||||||
Partners Group Holding AG(b) | 439 | 394,541 | ||||||
PSP Swiss Property AG | 2,596 | 277,564 | ||||||
Schindler Holding AG | 1,040 | 163,781 | ||||||
Schindler Holding AG, PC | 2,125 | 346,646 | ||||||
SGS S.A. | 285 | 629,093 | ||||||
SIG Group AG(b) | 17,666 | 339,639 | ||||||
Sika AG | 2,944 | 664,257 | ||||||
Sonova Holding AG, Class A | 1,279 | 302,512 | ||||||
Swatch Group AG (The) | 3,697 | 154,567 | ||||||
Swatch Group AG (The), BR(b) | 2,423 | 545,735 | ||||||
Swiss Life Holding AG | 3,793 | 1,837,847 | ||||||
Swiss Prime Site AG | 3,695 | 298,332 | ||||||
Swisscom AG | 2,322 | 1,146,904 | ||||||
UBS Group AG | 324,670 | 5,155,140 | ||||||
Zurich Insurance Group AG | 11,312 | 4,829,995 | ||||||
|
| |||||||
| 44,064,073 | ||||||||
|
| |||||||
| Shares | Value | |||||||
Turkey-0.01% |
| |||||||
Eldorado Gold Corp.(a) | 22,957 | $ | 128,077 | |||||
|
| |||||||
United Kingdom-11.48% |
| |||||||
3i Group PLC | 57,685 | 770,753 | ||||||
abrdn PLC(b) | 137,588 | 251,875 | ||||||
Admiral Group PLC | 13,044 | 302,917 | ||||||
Ashtead Group PLC | 17,222 | 902,199 | ||||||
Associated British Foods PLC | 32,208 | 500,431 | ||||||
AstraZeneca PLC | 51,583 | 6,089,860 | ||||||
Aviva PLC | 231,068 | 1,112,314 | ||||||
B&M European Value Retail S.A. | 57,468 | 213,451 | ||||||
BAE Systems PLC | 274,792 | 2,576,613 | ||||||
Barclays PLC | 2,158,381 | 3,671,913 | ||||||
Barratt Developments PLC | 101,675 | 440,393 | ||||||
Beazley PLC | 39,481 | 283,876 | ||||||
Bellway PLC | 8,461 | 180,706 | ||||||
Berkeley Group Holdings PLC | 11,429 | 456,741 | ||||||
BP PLC | 3,954,471 | 21,845,202 | ||||||
British American Tobacco PLC | 267,628 | 10,579,765 | ||||||
British Land Co. PLC (The) | 82,997 | 349,649 | ||||||
BT Group PLC(b) | 867,527 | 1,296,478 | ||||||
Bunzl PLC | 22,292 | 729,168 | ||||||
Burberry Group PLC | 20,683 | 432,213 | ||||||
Centrica PLC | 631,012 | 556,656 | ||||||
CNH Industrial N.V. | 83,443 | 1,080,782 | ||||||
Compass Group PLC | 118,995 | 2,516,095 | ||||||
Croda International PLC | 4,348 | 338,410 | ||||||
DCC PLC | 10,976 | 611,641 | ||||||
Derwent London PLC | 7,612 | 189,655 | ||||||
Diageo PLC | 76,886 | 3,185,047 | ||||||
Direct Line Insurance Group PLC | 182,338 | 423,649 | ||||||
Drax Group PLC | 37,058 | 222,294 | ||||||
DS Smith PLC | 122,105 | 407,979 | ||||||
easyJet PLC(a)(b) | 36,515 | 146,473 | ||||||
Entain PLC | 20,984 | 305,140 | ||||||
Experian PLC | 26,609 | 849,850 | ||||||
Haleon PLC(a) | 425,247 | 1,312,150 | ||||||
Halma PLC | 8,667 | 211,051 | ||||||
Hays PLC | 154,315 | 195,260 | ||||||
Hiscox Ltd. | 22,890 | 236,979 | ||||||
Howden Joinery Group PLC | 25,926 | 153,429 | ||||||
HSBC Holdings PLC | 2,116,190 | 10,898,356 | ||||||
IG Group Holdings PLC | 26,147 | 239,480 | ||||||
IMI PLC | 15,043 | 212,687 | ||||||
Imperial Brands PLC | 63,281 | 1,547,516 | ||||||
Inchcape PLC | 22,747 | 194,852 | ||||||
Informa PLC | 87,181 | 557,688 | ||||||
InterContinental Hotels Group PLC | 7,634 | 412,751 | ||||||
Intermediate Capital Group PLC | 12,936 | 158,173 | ||||||
International Consolidated Airlines Group S.A.(a)(b) | 200,895 | 281,169 | ||||||
International Distributions Services PLC | 128,979 | 300,415 | ||||||
Intertek Group PLC | 7,199 | 302,864 | ||||||
Investec PLC | 73,908 | 373,137 | ||||||
ITV PLC | 343,434 | 264,927 | ||||||
J Sainsbury PLC | 169,998 | 380,494 | ||||||
Johnson Matthey PLC(b) | 41,239 | 918,511 | ||||||
Just Eat Takeaway.com N.V.(a)(b)(d) | 12,863 | 220,700 | ||||||
Kingfisher PLC | 261,820 | 659,866 | ||||||
Land Securities Group PLC | 65,596 | 430,789 | ||||||
See accompanying Notes to Financial Statements which are an integral part of the financial statements.
| 55 | ||||
|
| |||
Invesco FTSE RAFI Developed Markets ex-U.S. ETF (PXF)–(continued)
October 31, 2022
| Shares | Value | |||||||
United Kingdom-(continued) |
| |||||||
Legal & General Group PLC | 464,016 | $ | 1,244,256 | |||||
Lloyds Banking Group PLC | 7,267,029 | 3,515,769 | ||||||
London Stock Exchange Group PLC | 5,990 | 521,796 | ||||||
M&G PLC(b) | 211,355 | 426,338 | ||||||
Man Group PLC | 115,206 | 287,436 | ||||||
Marks & Spencer Group PLC(a) | 313,274 | 380,526 | ||||||
Melrose Industries PLC | 278,017 | 374,191 | ||||||
Micro Focus International PLC | 61,625 | 368,808 | ||||||
National Grid PLC | 291,852 | 3,186,850 | ||||||
NatWest Group PLC | 603,558 | 1,631,641 | ||||||
Next PLC | 7,074 | 401,450 | ||||||
Pearson PLC | 80,812 | 893,584 | ||||||
Pennon Group PLC | 34,160 | 329,390 | ||||||
Persimmon PLC | 35,658 | 535,766 | ||||||
Phoenix Group Holdings PLC | 67,325 | 420,439 | ||||||
Quilter PLC(d) | 169,543 | 188,684 | ||||||
Reckitt Benckiser Group PLC | 31,267 | 2,080,758 | ||||||
RELX PLC | 67,821 | 1,827,987 | ||||||
Rentokil Initial PLC(b) | 61,274 | 384,062 | ||||||
Rolls-Royce Holdings PLC(a)(b) | 526,555 | 473,784 | ||||||
RS GROUP PLC | 18,725 | 206,643 | ||||||
Sage Group PLC (The) | 55,115 | 461,203 | ||||||
Schroders PLC(b) | 44,497 | 200,675 | ||||||
Segro PLC | 44,328 | 400,641 | ||||||
Severn Trent PLC | 16,814 | 484,551 | ||||||
Smith & Nephew PLC | 57,393 | 680,618 | ||||||
Smiths Group PLC | 29,295 | 526,338 | ||||||
Spectris PLC | 7,498 | 260,711 | ||||||
Spirax-Sarco Engineering PLC | 1,675 | 207,315 | ||||||
SSE PLC | 97,159 | 1,740,604 | ||||||
SSP Group PLC(a) | 72,006 | 167,715 | ||||||
St James’s Place PLC | 36,387 | 446,173 | ||||||
Standard Chartered PLC | 253,538 | 1,518,521 | ||||||
Subsea 7 S.A.(b) | 41,795 | 418,077 | ||||||
Tate & Lyle PLC | 38,526 | 310,942 | ||||||
Taylor Wimpey PLC | 526,872 | 568,883 | ||||||
Tesco PLC | 659,602 | 1,633,540 | ||||||
Travis Perkins PLC | 26,858 | 254,434 | ||||||
Unilever PLC | 177,130 | 8,105,542 | ||||||
United Utilities Group PLC | 49,781 | 538,421 | ||||||
Virgin Money UK PLC | 125,833 | 197,179 | ||||||
Vodafone Group PLC | 4,233,281 | 4,953,922 | ||||||
Weir Group PLC (The) | 15,481 | 271,371 | ||||||
Whitbread PLC(b) | 14,335 | 424,498 | ||||||
WPP PLC | 124,125 | 1,094,701 | ||||||
|
| |||||||
| 129,830,165 | ||||||||
|
| |||||||
Investment Abbreviations:
BR-Bearer Shares
CDI-CREST Depository Interest
CVA-Dutch Certificates
PC-Participation Certificate
Pfd.-Preferred
REIT-Real Estate Investment Trust
RSP-Registered Savings Plan Shares
| Shares | Value | |||||||
United States-3.75% |
| |||||||
Amcor PLC, CDI | 112,483 | $ | 1,301,165 | |||||
Bausch Health Cos., Inc.(a) | 34,350 | 223,116 | ||||||
Carnival PLC(b) | 15,189 | 121,751 | ||||||
Computershare Ltd. | 22,752 | 367,648 | ||||||
Ferguson PLC | 12,732 | 1,394,070 | ||||||
GSK PLC | 340,205 | 5,596,539 | ||||||
Nestle S.A. | 124,108 | 13,522,594 | ||||||
QIAGEN N.V.(a) | 6,397 | 276,292 | ||||||
Roche Holding AG | 32,433 | 10,777,511 | ||||||
Roche Holding AG, BR(b) | 1,203 | 488,292 | ||||||
Signify N.V. | 13,216 | 366,521 | ||||||
Stellantis N.V. | 267,228 | 3,607,811 | ||||||
Swiss Re AG | 38,625 | 2,871,546 | ||||||
Tenaris S.A. | 38,089 | 591,219 | ||||||
Waste Connections, Inc. | 6,919 | 912,067 | ||||||
|
| |||||||
| 42,418,142 | ||||||||
|
| |||||||
Zambia-0.04% |
| |||||||
First Quantum Minerals Ltd. | 23,199 | 408,689 | ||||||
|
| |||||||
TOTAL INVESTMENTS IN SECURITIES |
| 1,126,624,577 | ||||||
|
| |||||||
| Investments Purchased with Cash Collateral from Securities on Loan |
| |||||||
Money Market Funds-7.34% |
| |||||||
Invesco Private Government Fund, | 23,289,157 | 23,289,157 | ||||||
Invesco Private Prime Fund, 3.28%(e)(f)(g) | 59,722,272 | 59,722,272 | ||||||
|
| |||||||
Total Investments Purchased with Cash Collateral from Securities on Loan |
| 83,011,429 | ||||||
|
| |||||||
TOTAL INVESTMENTS IN SECURITIES-107.00% |
| 1,209,636,006 | ||||||
OTHER ASSETS LESS LIABILITIES-(7.00)% |
| (79,098,247 | ) | |||||
|
| |||||||
NET ASSETS-100.00% |
| $ | 1,130,537,759 | |||||
|
| |||||||
See accompanying Notes to Financial Statements which are an integral part of the financial statements.
| 56 | ||||
|
| |||
Invesco FTSE RAFI Developed Markets ex-U.S. ETF (PXF)–(continued)
October 31, 2022
Notes to Schedule of Investments:
| (a) | Non-income producing security. |
| (b) | All or a portion of this security was out on loan at October 31, 2022. |
| (c) | Security valued using significant unobservable inputs (Level 3). See Note 4. |
| (d) | Security purchased or received in a transaction exempt from registration under the Securities Act of 1933, as amended (the “1933 Act”). The security may be resold pursuant to an exemption from registration under the 1933 Act, typically to qualified institutional buyers. The aggregate value of these securities at October 31, 2022 was $7,383,003, which represented less than 1% of the Fund’s Net Assets. |
| (e) | Affiliated issuer. The issuer and/or the Fund is a wholly-owned subsidiary of Invesco Ltd., or is affiliated by having an investment adviser that is under common control of Invesco Ltd. The table below shows the Fund’s transactions in, and earnings from, its investments in affiliates for the fiscal year ended October 31, 2022. |
Value | Purchases at Cost | Proceeds from Sales | Change in | Realized Gain (Loss) | Value | Dividend Income | ||||||||||||||||||||||||||||||||||
| Investments in Affiliated Money Market Funds: | ||||||||||||||||||||||||||||||||||||||||
| Invesco Government & Agency Portfolio, Institutional Class | $ | - | $ | 99,834,166 | $ | (99,834,166 | ) | $ | - | $ | - | $ | - | $ | 7,994 | |||||||||||||||||||||||||
| Investments Purchased with Cash Collateral from Securities on Loan: | ||||||||||||||||||||||||||||||||||||||||
| Invesco Private Government Fund | 26,101,909 | 238,161,734 | (240,974,486 | ) | - | - | 23,289,157 | 290,797 | * | |||||||||||||||||||||||||||||||
| Invesco Private Prime Fund | 60,862,717 | 456,531,914 | (457,662,819 | ) | (1,019 | ) | (8,521 | ) | 59,722,272 | 793,060 | * | |||||||||||||||||||||||||||||
|
|
|
|
|
|
|
|
|
|
|
|
|
| |||||||||||||||||||||||||||
| Total | $ | 86,964,626 | $ | 794,527,814 | $ | (798,471,471 | ) | $ | (1,019 | ) | $ | (8,521 | ) | $ | 83,011,429 | $ | 1,091,851 | |||||||||||||||||||||||
|
|
|
|
|
|
|
|
|
|
|
|
|
| |||||||||||||||||||||||||||
| * | Represents the income earned on the investment of cash collateral, which is included in securities lending income on the Statements of Operations. Does not include rebates and fees paid to lending agent or premiums received from borrowers, if any. |
| (f) | The rate shown is the 7-day SEC standardized yield as of October 31, 2022. |
| (g) | The security has been segregated to satisfy the commitment to return the cash collateral received in securities lending transactions upon the borrower’s return of the securities loaned. See Note 2J. |
See accompanying Notes to Financial Statements which are an integral part of the financial statements.
| 57 | ||||
|
| |||
Invesco FTSE RAFI Developed Markets ex-U.S. Small-Mid ETF–(PDN)
October 31, 2022
Schedule of Investments
| Shares | Value | |||||||
Common Stocks & Other Equity Interests-99.63% |
| |||||||
Australia-6.82% | ||||||||
Abacus Property Group | 107,245 | $ | 192,018 | |||||
Adbri Ltd. | 142,619 | 143,636 | ||||||
ALS Ltd. | 86,720 | 634,384 | ||||||
Alumina Ltd. | 213,507 | 184,312 | ||||||
Ansell Ltd. | 47,394 | 855,541 | ||||||
ARB Corp. Ltd. | 5,818 | 107,927 | ||||||
Atlas Arteria Ltd. | 127,264 | 536,288 | ||||||
AUB Group Ltd. | 10,152 | 134,248 | ||||||
Austal Ltd. | 133,323 | 212,281 | ||||||
Bapcor Ltd.(a) | 85,052 | 360,039 | ||||||
Beach Energy Ltd. | 674,974 | 686,264 | ||||||
Bega Cheese Ltd. | 85,893 | 176,307 | ||||||
Blackmores Ltd. | 3,164 | 137,579 | ||||||
Boral Ltd.(a) | 222,552 | 409,855 | ||||||
Breville Group Ltd.(a) | 14,233 | 180,661 | ||||||
Brickworks Ltd. | 15,658 | 221,577 | ||||||
BWP Trust | 106,159 | 276,964 | ||||||
carsales.com Ltd. | 32,542 | 422,839 | ||||||
Centuria Industrial REIT | 72,845 | 141,140 | ||||||
Centuria Office REIT | 106,192 | 102,196 | ||||||
Challenger Ltd. | 96,705 | 434,103 | ||||||
Champion Iron Ltd. | 74,638 | 223,364 | ||||||
Charter Hall Group | 51,241 | 423,993 | ||||||
Charter Hall Long Wale REIT | 69,981 | 194,660 | ||||||
Charter Hall Retail REIT | 141,885 | 363,821 | ||||||
Charter Hall Social Infrastructure REIT | 66,074 | 146,611 | ||||||
Cleanaway Waste Management Ltd. | 258,413 | 446,154 | ||||||
Cochlear Ltd. | 6,347 | 810,541 | ||||||
Collins Foods Ltd. | 28,373 | 170,545 | ||||||
Coronado Global Resources, Inc.,CDI(b) | 297,626 | 353,990 | ||||||
Corporate Travel Management Ltd. | 10,318 | 115,264 | ||||||
Costa Group Holdings Ltd. | 140,009 | 227,403 | ||||||
Credit Corp. Group Ltd. | 8,620 | 102,414 | ||||||
Cromwell Property Group | 342,770 | 153,429 | ||||||
CSR Ltd. | 163,519 | 484,123 | ||||||
Domino’s Pizza Enterprises Ltd. | 5,312 | 216,543 | ||||||
Downer EDI Ltd. | 225,233 | 646,674 | ||||||
Eagers Automotive Ltd. | 41,634 | 329,857 | ||||||
EBOS Group Ltd. | 13,620 | 296,720 | ||||||
Elders Ltd. | 38,974 | 323,985 | ||||||
EVT Ltd.(c) | 17,720 | 169,286 | ||||||
Flight Centre Travel Group Ltd.(a)(c) | 43,881 | 467,194 | ||||||
Genworth Mortgage Insurance Australia Ltd. | 86,853 | 150,508 | ||||||
GrainCorp Ltd., Class A | 101,379 | 542,601 | ||||||
Growthpoint Properties Australia Ltd. | 76,020 | 161,389 | ||||||
GUD Holdings Ltd. | 24,063 | 123,712 | ||||||
Harvey Norman Holdings Ltd.(a) | 258,967 | 688,881 | ||||||
Healius Ltd. | 177,230 | 388,721 | ||||||
HomeCo Daily Needs REIT(b) | 243,616 | 199,399 | ||||||
IGO Ltd. | 49,958 | 488,449 | ||||||
Iluka Resources Ltd. | 50,547 | 279,588 | ||||||
Ingenia Communities Group | 49,940 | 125,182 | ||||||
Inghams Group Ltd.(a) | 104,919 | 169,739 | ||||||
Insignia Financial Ltd.(a) | 216,335 | 435,757 | ||||||
InvoCare Ltd.(a) | 24,163 | 157,910 | ||||||
IPH Ltd. | 28,191 | 179,186 | ||||||
IRESS Ltd. | 47,099 | 305,692 | ||||||
| Shares | Value | |||||||
Australia-(continued) | ||||||||
Link Administration Holdings Ltd. | 166,346 | $ | 364,849 | |||||
Magellan Financial Group Ltd.(a) | 34,981 | 222,120 | ||||||
Mineral Resources Ltd. | 23,855 | 1,115,531 | ||||||
Monadelphous Group Ltd. | 39,845 | 348,551 | ||||||
National Storage REIT | 193,001 | 322,112 | ||||||
NEXTDC Ltd.(c) | 43,561 | 231,754 | ||||||
nib holdings Ltd. | 55,198 | 235,427 | ||||||
Nine Entertainment Co. Holdings Ltd. | 326,153 | 429,631 | ||||||
Northern Star Resources Ltd. | 127,868 | 714,628 | ||||||
NRW Holdings Ltd. | 140,594 | 229,252 | ||||||
Nufarm Ltd. | 93,480 | 332,951 | ||||||
OceanaGold Corp.(c) | 246,243 | 357,436 | ||||||
oOh!media Ltd. | 166,507 | 134,688 | ||||||
Orora Ltd. | 253,486 | 491,138 | ||||||
OZ Minerals Ltd. | 53,869 | 832,573 | ||||||
Pendal Group Ltd. | 196,166 | 615,902 | ||||||
Perpetual Ltd.(a) | 14,856 | 236,542 | ||||||
Perseus Mining Ltd.(a) | 206,707 | 241,226 | ||||||
Platinum Asset Management Ltd. | 208,862 | 239,067 | ||||||
Premier Investments Ltd. | 13,997 | 224,028 | ||||||
Qube Holdings Ltd. | 383,864 | 667,656 | ||||||
Ramelius Resources Ltd. | 191,098 | 89,815 | ||||||
REA Group Ltd. | 2,954 | 229,676 | ||||||
Reece Ltd.(a) | 33,591 | 333,581 | ||||||
Regis Resources Ltd.(a) | 344,251 | 335,700 | ||||||
Sandfire Resources Ltd. | 72,196 | 160,657 | ||||||
SEEK Ltd. | 46,034 | 635,533 | ||||||
Seven Group Holdings Ltd. | 30,252 | 354,781 | ||||||
Shopping Centres Australasia Property Group | 264,778 | 460,530 | ||||||
Sierra Rutile Holdings Ltd.(a)(c) | 50,547 | 6,788 | ||||||
Silver Lake Resources Ltd.(c) | 170,499 | 121,018 | ||||||
SmartGroup Corp. Ltd. | 28,968 | 91,136 | ||||||
St Barbara Ltd.(a)(c) | 428,031 | 139,589 | ||||||
Star Entertainment Group Ltd. (The)(c) | 367,237 | 690,400 | ||||||
Steadfast Group Ltd. | 119,902 | 387,957 | ||||||
Super Retail Group Ltd.(a) | 64,686 | 425,217 | ||||||
TPG Telecom Ltd.(a) | 158,877 | 497,810 | ||||||
United Malt Grp Ltd. | 95,410 | 189,741 | ||||||
Viva Energy Group Ltd.(b) | 331,734 | 600,320 | ||||||
Washington H Soul Pattinson & Co. Ltd. | 46,303 | 827,260 | ||||||
Waypoint REIT Ltd. | 215,700 | 376,547 | ||||||
Webjet Ltd.(a)(c) | 58,595 | 197,834 | ||||||
|
| |||||||
| 33,352,396 | ||||||||
|
| |||||||
Austria-0.51% | ||||||||
AT&S Austria Technologie & Systemtechnik AG | 6,364 | 196,558 | ||||||
CA Immobilien Anlagen AG | 7,231 | 228,339 | ||||||
EVN AG | 9,364 | 155,853 | ||||||
IMMOFINANZ AG(a)(c) | 13,919 | 164,257 | ||||||
Kontron AG(a) | 15,468 | 223,966 | ||||||
Lenzing AG(a) | 3,935 | 188,235 | ||||||
Mayr Melnhof Karton AG | 920 | 130,937 | ||||||
Oesterreichische Post AG(a) | 10,546 | 300,708 | ||||||
S IMMO AG(a) | 1,951 | 43,868 | ||||||
UNIQA Insurance Group AG | 29,762 | 192,964 | ||||||
See accompanying Notes to Financial Statements which are an integral part of the financial statements.
| 58 | ||||
|
| |||
Invesco FTSE RAFI Developed Markets ex-U.S. Small-Mid ETF (PDN)–(continued)
October 31, 2022
| Shares | Value | |||||||
Austria-(continued) | ||||||||
Verbund AG | 6,676 | $ | 522,910 | |||||
Vienna Insurance Group AG Wiener Versicherung Gruppe(a) | 6,165 | 138,011 | ||||||
|
| |||||||
| 2,486,606 | ||||||||
|
| |||||||
Belgium-1.08% | ||||||||
Ackermans & van Haaren N.V. | 4,781 | 666,741 | ||||||
Aedifica S.A.(a) | 4,814 | 367,311 | ||||||
Barco N.V. | 17,357 | 375,004 | ||||||
Bekaert S.A. | 11,570 | 322,473 | ||||||
bpost S.A.(a) | 76,059 | 375,865 | ||||||
Cie d’Entreprises CFE(c) | 2,479 | 26,314 | ||||||
Deme Group N.V.(c) | 2,479 | 275,884 | ||||||
D’Ieteren Group(a) | 4,107 | 683,156 | ||||||
Fagron(a) | 11,260 | 140,223 | ||||||
Galapagos N.V.(a)(c) | 9,121 | 416,391 | ||||||
KBC Ancora(a) | 8,038 | 285,838 | ||||||
Melexis N.V.(a) | 3,545 | 244,558 | ||||||
Montea N.V. | 1,710 | 116,784 | ||||||
Ontex Group N.V.(a)(c) | 35,114 | 207,189 | ||||||
Recticel S.A.(a) | 11,262 | 155,609 | ||||||
Shurgard Self Storage S.A.(a) | 3,881 | 168,967 | ||||||
Warehouses De Pauw C.V.A. | 17,144 | 440,213 | ||||||
|
| |||||||
| 5,268,520 | ||||||||
|
| |||||||
Burkina Faso-0.09% | ||||||||
Endeavour Mining PLC | 25,720 | 448,929 | ||||||
|
| |||||||
Cambodia-0.02% | ||||||||
NagaCorp Ltd.(c) | 217,196 | 99,054 | ||||||
|
| |||||||
Canada-8.64% | ||||||||
Advantage Energy Ltd.(c) | 58,663 | 442,967 | ||||||
Aecon Group, Inc. | 43,077 | 305,065 | ||||||
Ag Growth International, Inc. | 9,053 | 231,626 | ||||||
Alamos Gold, Inc., Class A | 108,382 | 854,152 | ||||||
Altus Group Ltd. | 5,335 | 189,339 | ||||||
Aritzia, Inc.(c) | 5,083 | 196,903 | ||||||
Artis REIT | 53,243 | 372,765 | ||||||
ATS Automation Tooling Systems, Inc.(c) | 9,279 | 293,189 | ||||||
Aurora Cannabis, Inc.(c) | 86,858 | 124,806 | ||||||
AutoCanada, Inc.(c) | 16,166 | 251,962 | ||||||
Badger Infrastructure Solutions Ltd. | 8,606 | 181,577 | ||||||
Ballard Power Systems, Inc.(a)(c) | 18,743 | 106,078 | ||||||
Baytex Energy Corp.(c) | 60,846 | 330,091 | ||||||
Birchcliff Energy Ltd. | 94,182 | 731,196 | ||||||
BlackBerry Ltd.(c) | 68,414 | 317,481 | ||||||
Boardwalk REIT, Class E | 13,010 | 462,391 | ||||||
Boralex, Inc., Class A | 14,716 | 416,758 | ||||||
Boyd Group Services, Inc. | 3,556 | 505,382 | ||||||
Brookfield Infrastructure Corp., Class A | 13,649 | 588,166 | ||||||
BRP, Inc. | 5,871 | 392,060 | ||||||
Canaccord Genuity Group, Inc. | 34,570 | 176,899 | ||||||
Canadian Western Bank(a) | 34,050 | 591,610 | ||||||
Canfor Corp.(c) | 34,891 | 523,602 | ||||||
Canopy Growth Corp.(c) | 51,643 | 192,708 | ||||||
Capstone Copper Corp.(c) | 48,885 | 113,248 | ||||||
Cargojet, Inc. | 1,320 | 128,511 | ||||||
Cascades, Inc. | 38,353 | 248,554 | ||||||
Celestica, Inc.(c) | 81,796 | 896,485 | ||||||
Centerra Gold, Inc. | 77,672 | 360,444 | ||||||
CES Energy Solutions Corp. | 91,132 | 191,744 | ||||||
| Shares | Value | |||||||
Canada-(continued) | ||||||||
Chartwell Retirement Residences | 69,230 | $ | 400,951 | |||||
Chemtrade Logistics Income Fund | 53,504 | 289,084 | ||||||
Choice Properties REIT(a) | 60,872 | 584,153 | ||||||
Chorus Aviation, Inc.(a)(c) | 60,764 | 114,931 | ||||||
Cineplex, Inc.(c) | 47,995 | 325,819 | ||||||
Cogeco Communications, Inc. | 3,729 | 189,942 | ||||||
Cogeco, Inc. | 2,763 | 117,524 | ||||||
Colliers International Group, Inc. | 3,287 | 308,109 | ||||||
Corus Entertainment, Inc., Class B(a) | 162,677 | 256,410 | ||||||
Crew Energy, Inc.(c) | 80,749 | 356,372 | ||||||
Crombie REIT(a) | 26,993 | 295,052 | ||||||
Cronos Group, Inc.(c) | 55,499 | 185,126 | ||||||
CT REIT(a) | 18,207 | 206,890 | ||||||
Descartes Systems Group, Inc. (The)(c) | 5,004 | 344,838 | ||||||
Doman Building Materials Group Ltd.(a) | 42,968 | 174,197 | ||||||
Dorel Industries, Inc., Class B | 45,526 | 179,060 | ||||||
Dream Industrial REIT | 33,949 | 272,528 | ||||||
Dream Office REIT | 19,993 | 225,866 | ||||||
DREAM Unlimited Corp. | 5,444 | 99,178 | ||||||
Dundee Precious Metals, Inc. | 43,398 | 196,620 | ||||||
ECN Capital Corp. | 51,670 | 155,686 | ||||||
Enerflex Ltd. | 33,146 | 171,070 | ||||||
Enerplus Corp. | 42,308 | 732,609 | ||||||
Enghouse Systems Ltd. | 5,684 | 126,219 | ||||||
EQB, Inc. | 5,708 | 202,032 | ||||||
Equinox Gold Corp.(c) | 54,946 | 180,864 | ||||||
Exchange Income Corp. | 12,245 | 408,451 | ||||||
Extendicare, Inc.(a) | 37,080 | 190,558 | ||||||
Fiera Capital Corp. | 33,465 | 212,706 | ||||||
First Majestic Silver Corp. | 19,385 | 162,862 | ||||||
First National Financial Corp.(a) | 5,677 | 142,336 | ||||||
FirstService Corp. | 3,511 | 438,370 | ||||||
Fortuna Silver Mines, Inc.(c) | 84,487 | 234,746 | ||||||
Freehold Royalties Ltd.(a) | 16,797 | 208,723 | ||||||
GFL Environmental, Inc. | 17,450 | 470,391 | ||||||
goeasy Ltd. | 1,533 | 124,220 | ||||||
Granite REIT | 11,480 | 585,930 | ||||||
Home Capital Group, Inc. | 16,401 | 316,706 | ||||||
Hudbay Minerals, Inc. | 85,958 | 325,797 | ||||||
Innergex Renewable Energy, Inc. | 28,267 | 310,843 | ||||||
Interfor Corp.(c) | 21,583 | 382,910 | ||||||
International Petroleum Corp.(c) | 38,174 | 380,327 | ||||||
InterRent REIT | 29,950 | 251,843 | ||||||
Ivanhoe Mines Ltd., Class A(c) | 28,326 | 196,240 | ||||||
Kelt Exploration Ltd.(c) | 46,247 | 199,696 | ||||||
Killam Apartment REIT | 29,866 | 345,723 | ||||||
Labrador Iron Ore Royalty Corp. | 8,174 | 169,227 | ||||||
Laurentian Bank of Canada | 28,354 | 631,913 | ||||||
Lightspeed Commerce, Inc.(c) | 14,144 | 270,738 | ||||||
Maple Leaf Foods, Inc. | 24,632 | 364,591 | ||||||
Martinrea International, Inc. | 48,145 | 308,131 | ||||||
Mullen Group Ltd. | 45,929 | 460,957 | ||||||
New Gold, Inc.(c) | 136,546 | 123,127 | ||||||
NFI Group, Inc.(a) | 48,530 | 313,085 | ||||||
North West Co., Inc. (The) | 17,620 | 457,922 | ||||||
NorthWest Healthcare Properties REIT(a) | 53,323 | 419,845 | ||||||
Nuvei Corp.(b)(c) | 3,640 | 109,409 | ||||||
NuVista Energy Ltd.(c) | 59,283 | 587,158 | ||||||
Obsidian Energy Ltd.(c) | 23,708 | 215,346 | ||||||
Osisko Gold Royalties Ltd. | 26,582 | 284,713 | ||||||
See accompanying Notes to Financial Statements which are an integral part of the financial statements.
| 59 | ||||
|
| |||
Invesco FTSE RAFI Developed Markets ex-U.S. Small-Mid ETF (PDN)–(continued)
October 31, 2022
| Shares | Value | |||||||
Canada-(continued) | ||||||||
Pan American Silver Corp. | 38,868 | $ | 619,757 | |||||
Paramount Resources Ltd., Class A | 14,316 | 302,892 | ||||||
Pason Systems, Inc. | 25,052 | 265,754 | ||||||
Peyto Exploration & Development Corp. | 103,135 | 961,752 | ||||||
PrairieSky Royalty Ltd. | 40,370 | 626,245 | ||||||
Precision Drilling Corp.(c) | 12,148 | 895,036 | ||||||
Premium Brands Holdings Corp. | 7,227 | 425,816 | ||||||
Richelieu Hardware Ltd. | 6,552 | 175,658 | ||||||
Ritchie Bros. Auctioneers, Inc. | 16,402 | 1,070,179 | ||||||
Russel Metals, Inc. | 24,090 | 498,383 | ||||||
Sandstorm Gold Ltd. | 27,968 | 137,579 | ||||||
Secure Energy Services, Inc. | 85,222 | 446,712 | ||||||
ShawCor Ltd.(c) | 52,017 | 379,054 | ||||||
Sienna Senior Living, Inc. | 27,556 | 237,369 | ||||||
Sierra Wireless, Inc.(c) | 12,564 | 372,761 | ||||||
Silvercorp Metals, Inc. | 49,754 | 121,098 | ||||||
Slate Grocery REIT, Class U | 14,265 | 148,083 | ||||||
Sleep Country Canada Holdings, Inc.(b) | 9,826 | 161,504 | ||||||
Spin Master Corp.(b) | 5,749 | 177,437 | ||||||
Stelco Holdings, Inc. | 12,606 | 317,079 | ||||||
Stella-Jones, Inc. | 21,691 | 652,455 | ||||||
Summit Industrial Income REIT | 20,892 | 266,654 | ||||||
Superior Plus Corp. | 90,715 | 688,983 | ||||||
Torex Gold Resources, Inc.(c) | 40,592 | 276,158 | ||||||
Toromont Industries Ltd. | 11,957 | 917,780 | ||||||
TransAlta Corp. | 94,980 | 835,571 | ||||||
TransAlta Renewables, Inc. | 25,255 | 270,870 | ||||||
Transcontinental, Inc., Class A | 32,334 | 368,604 | ||||||
Tricon Residential, Inc. | 32,320 | 272,009 | ||||||
Uni-Select, Inc.(c) | 16,381 | 443,736 | ||||||
Western Forest Products, Inc. | 188,462 | 169,941 | ||||||
Westshore Terminals Investment Corp. | 10,497 | 187,538 | ||||||
Whitecap Resources, Inc. | 38,514 | 298,162 | ||||||
Winpak Ltd. | 9,054 | 275,593 | ||||||
|
| |||||||
| 42,278,631 | ||||||||
|
| |||||||
China-1.06% | ||||||||
BeiGene Ltd., (Acquired 03/18/2022 - 10/25/2022; Cost $338,902)(c)(d) | 24,000 | 302,681 | ||||||
Budweiser Brewing Co. APAC Ltd.(b) | 242,167 | 509,640 | ||||||
CapitaLand China Trust | 417,430 | 286,133 | ||||||
China Travel International Investment Hong Kong Ltd.(a)(c) | 844,000 | 131,172 | ||||||
Chow Tai Fook Jewellery Group Ltd. | 441,819 | 756,454 | ||||||
ESR Group Ltd.(b) | 136,289 | 232,651 | ||||||
FIH Mobile Ltd.(a)(c) | 1,417,774 | 115,591 | ||||||
Jinchuan Group International Resources Co. Ltd. | 1,977,000 | 130,963 | ||||||
Kerry Logistics Network Ltd. | 116,708 | 185,250 | ||||||
Lee & Man Paper Manufacturing Ltd. | 334,969 | 101,559 | ||||||
Minth Group Ltd. | 155,131 | 306,315 | ||||||
MMG Ltd.(a)(c) | 1,332,023 | 263,016 | ||||||
Nexteer Automotive Group Ltd.(a) | 477,788 | 258,680 | ||||||
Powerlong Real Estate Holdings Ltd.(a) | 351,000 | 28,617 | ||||||
SITC International Holdings Co. Ltd. | 140,123 | 229,556 | ||||||
TI Fluid Systems PLC(b) | 54,778 | 87,539 | ||||||
Towngas Smart Energy Co. Ltd.(c) | 559,000 | 195,832 | ||||||
Uni-President China Holdings Ltd. | 352,349 | 260,339 | ||||||
| Shares | Value | |||||||
China-(continued) | ||||||||
Want Want China Holdings Ltd. | 785,444 | $ | 516,302 | |||||
Wharf Holdings Ltd. (The) | 107,048 | 306,150 | ||||||
|
| |||||||
| 5,204,440 | ||||||||
|
| |||||||
Colombia-0.15% | ||||||||
Frontera Energy Corp.(c) | 19,200 | 160,463 | ||||||
Parex Resources, Inc. | 37,022 | 563,995 | ||||||
|
| |||||||
| 724,458 | ||||||||
|
| |||||||
Denmark-1.62% | ||||||||
Alm Brand A/S | 263,823 | 360,751 | ||||||
Bavarian Nordic A/S(c) | 9,441 | 300,806 | ||||||
D/S Norden A/S | 17,022 | 883,127 | ||||||
Demant A/S(c) | 11,797 | 322,467 | ||||||
Dfds A/S | 9,128 | 277,262 | ||||||
FLSmidth & Co. A/S(a) | 31,153 | 720,660 | ||||||
GN Store Nord A/S(a) | 14,145 | 300,832 | ||||||
H Lundbeck A/S | 109,597 | 409,867 | ||||||
H Lundbeck A/S, Class A(c) | 27,384 | 93,067 | ||||||
Matas A/S | 13,265 | 126,970 | ||||||
NKT A/S(c) | 13,650 | 682,088 | ||||||
Per Aarsleff Holding A/S | 4,951 | 138,358 | ||||||
Ringkjoebing Landbobank A/S | 4,048 | 440,669 | ||||||
ROCKWOOL A/S, Class B(a) | 1,181 | 235,179 | ||||||
Royal Unibrew A/S | 6,789 | 387,824 | ||||||
Scandinavian Tobacco Group A/S(b) | 15,727 | 263,698 | ||||||
Schouw & Co. A/S | 3,148 | 199,766 | ||||||
SimCorp A/S(a) | 4,327 | 258,498 | ||||||
Spar Nord Bank A/S | 15,924 | 192,799 | ||||||
Sydbank A/S | 23,203 | 707,252 | ||||||
Topdanmark A/S | 13,357 | 617,087 | ||||||
|
| |||||||
| 7,919,027 | ||||||||
|
| |||||||
Egypt-0.16% | ||||||||
Centamin PLC | 783,979 | 800,817 | ||||||
|
| |||||||
Faroe Islands-0.09% | ||||||||
Bakkafrost P/F(a) | 8,351 | 417,275 | ||||||
|
| |||||||
Finland-1.08% | ||||||||
Cargotec OYJ, Class B(a) | 23,210 | 873,541 | ||||||
Citycon OYJ(a) | 33,760 | 210,377 | ||||||
Finnair OYJ(a)(c) | 523,013 | 221,759 | ||||||
Kemira OYJ | 22,913 | 302,552 | ||||||
Kojamo OYJ(a) | 44,117 | 574,252 | ||||||
Konecranes OYJ | 27,480 | 691,491 | ||||||
Metsa Board OYJ | 47,989 | 360,942 | ||||||
Metso Outotec OYJ(a) | 79,725 | 605,313 | ||||||
Terveystalo OYJ(a)(b) | 15,712 | 97,211 | ||||||
TietoEVRY OYJ(a) | 34,420 | 821,220 | ||||||
Tokmanni Group Corp. | 18,092 | 218,866 | ||||||
Uponor OYJ(a) | 13,540 | 179,858 | ||||||
YIT OYJ(a) | 59,304 | 148,760 | ||||||
|
| |||||||
| 5,306,142 | ||||||||
|
| |||||||
France-3.01% | ||||||||
ALD S.A.(b) | 23,990 | 256,074 | ||||||
Alten S.A. | 4,898 | 572,684 | ||||||
BioMerieux | 5,041 | 446,113 | ||||||
Casino Guichard Perrachon S.A.(a)(c) | 42,253 | 406,750 | ||||||
Cie Plastic Omnium S.A. | 26,795 | 375,792 | ||||||
Coface S.A.(c) | 42,470 | 473,061 | ||||||
Dassault Aviation S.A. | 6,039 | 897,685 | ||||||
See accompanying Notes to Financial Statements which are an integral part of the financial statements.
| 60 | ||||
|
| |||
Invesco FTSE RAFI Developed Markets ex-U.S. Small-Mid ETF (PDN)–(continued)
October 31, 2022
| Shares | Value | |||||||
France-(continued) | ||||||||
Derichebourg S.A. | 36,740 | $ | 160,572 | |||||
Elior Group S.A.(a)(b)(c) | 93,293 | 207,464 | ||||||
Eramet S.A.(a) | 2,836 | 185,977 | ||||||
Fnac Darty S.A.(a) | 6,776 | 209,484 | ||||||
Gaztransport Et Technigaz S.A., (Acquired 03/15/2018 - 10/25/2022; | 4,339 | 504,751 | ||||||
ICADE | 12,309 | 458,157 | ||||||
Imerys S.A.(a) | 16,038 | 657,190 | ||||||
Ipsen S.A. | 6,083 | 625,262 | ||||||
Ipsos | 9,839 | 476,495 | ||||||
JCDecaux S.A.(c) | 14,311 | 180,623 | ||||||
Korian S.A. | 24,009 | 226,852 | ||||||
La Francaise des Jeux SAEM(b) | 14,523 | 473,676 | ||||||
Lagardere S.A. | 12,653 | 221,224 | ||||||
Maisons du Monde S.A.(a)(b) | 17,891 | 175,411 | ||||||
Mercialys S.A.(a) | 45,896 | 397,592 | ||||||
Metropole Television S.A.(a) | 12,555 | 129,920 | ||||||
Nexans S.A. | 10,880 | 1,017,258 | ||||||
Nexity S.A.(a) | 13,254 | 265,660 | ||||||
Remy Cointreau S.A.(a) | 2,515 | 385,532 | ||||||
Sartorius Stedim Biotech | 721 | 228,887 | ||||||
SMCP S.A.(b)(c) | 41,942 | 263,851 | ||||||
Societe BIC S.A. | 9,767 | 560,852 | ||||||
SOITEC(a)(c) | 1,565 | 201,003 | ||||||
Somfy S.A. | 1,020 | 108,675 | ||||||
Sopra Steria Group SACA | 3,859 | 511,082 | ||||||
Television Francaise 1(a) | 32,581 | 206,733 | ||||||
Trigano S.A.(a) | 1,914 | 195,981 | ||||||
Vallourec S.A.(c) | 62,282 | 663,271 | ||||||
Verallia S.A.(b) | 21,201 | 600,961 | ||||||
Virbac S.A. | 558 | 136,772 | ||||||
Wendel SE | 8,283 | 649,190 | ||||||
|
| |||||||
| 14,714,517 | ||||||||
|
| |||||||
Germany-4.26% | ||||||||
1&1 AG | 13,730 | 181,025 | ||||||
ADLER Group S.A.(a)(b)(c) | 77,316 | 114,776 | ||||||
ADVA Optical Networking SE(c) | 5,110 | 104,646 | ||||||
Amadeus Fire AG | 1,012 | 102,222 | ||||||
Auto1 Group SE(b)(c) | 17,568 | 118,331 | ||||||
Bechtle AG | 17,321 | 599,173 | ||||||
Bilfinger SE | 14,615 | 407,342 | ||||||
CANCOM SE | 8,258 | 204,371 | ||||||
Carl Zeiss Meditec AG, BR | 2,493 | 301,958 | ||||||
CECONOMY AG(a) | 126,147 | 205,593 | ||||||
CompuGroup Medical SE & Co. KGaA | 3,989 | 126,161 | ||||||
Corestate Capital Holding S.A.(a)(c) | 13,950 | 12,891 | ||||||
CTS Eventim AG& Co. KGaA(c) | 6,067 | 289,862 | ||||||
Deutsche EuroShop AG | 4,558 | 97,756 | ||||||
Deutsche Pfandbriefbank AG(b) | 61,388 | 457,777 | ||||||
Deutsche Wohnen SE | 14,630 | 295,264 | ||||||
Deutz AG | 64,287 | 242,970 | ||||||
DIC Asset AG | 11,740 | 80,991 | ||||||
Draegerwerk AG& Co. KGaA | 1,325 | 47,865 | ||||||
Draegerwerk AG& Co. KGaA, Preference Shares | 3,901 | 157,114 | ||||||
Duerr AG | 22,618 | 598,654 | ||||||
DWS Group GmbH & Co. KGaA(b) | 16,948 | 458,966 | ||||||
ElringKlinger AG | 21,890 | 156,746 | ||||||
| Shares | Value | |||||||
Germany-(continued) | ||||||||
Encavis AG | 18,556 | $ | 345,706 | |||||
Evotec SE(c) | 11,506 | 219,649 | ||||||
Fielmann AG | 5,594 | 178,360 | ||||||
Fraport AG Frankfurt Airport Services Worldwide(c) | 12,103 | 466,997 | ||||||
Fuchs Petrolub SE | 8,399 | 202,548 | ||||||
Fuchs Petrolub SE, Preference Shares | 17,625 | 505,171 | ||||||
Gerresheimer AG | 10,485 | 601,046 | ||||||
Grand City Properties S.A. | 44,938 | 437,483 | ||||||
GRENKE AG | 6,906 | 140,879 | ||||||
Heidelberger Druckmaschinen AG(a)(c) | 203,271 | 280,862 | ||||||
Hella GmbH & Co. KGaA | 7,810 | 610,188 | ||||||
HelloFresh SE(c) | 9,951 | 199,259 | ||||||
Hornbach Holding AG& Co. KGaA | 4,178 | 284,924 | ||||||
Instone Real Estate Group SE(b) | 14,449 | 105,249 | ||||||
Jenoptik AG | 11,407 | 250,511 | ||||||
Jungheinrich AG, Preference Shares | 13,339 | 331,963 | ||||||
Kloeckner & Co. SE(a) | 57,426 | 450,367 | ||||||
Krones AG | 4,758 | 440,866 | ||||||
Leoni AG(a)(c) | 22,571 | 159,168 | ||||||
METRO AG(c) | 62,258 | 475,648 | ||||||
MorphoSys AG(c) | 7,183 | 135,988 | ||||||
Nemetschek SE | 2,155 | 103,002 | ||||||
Nordex SE(a)(c) | 54,486 | 509,325 | ||||||
Norma Group SE | 8,514 | 135,058 | ||||||
Rational AG | 282 | 159,146 | ||||||
Sartorius AG | 61 | 17,996 | ||||||
Sartorius AG, Preference Shares | 768 | 271,058 | ||||||
Schaeffler AG, Preference Shares(a) | 87,700 | 451,161 | ||||||
Scout24 SE(b) | 17,903 | 917,988 | ||||||
Siltronic AG | 5,945 | 370,466 | ||||||
Sirius Real Estate Ltd. | 197,299 | 160,148 | ||||||
Sixt SE | 3,216 | 301,961 | ||||||
Sixt SE, Preference Shares | 4,158 | 242,464 | ||||||
Software AG | 15,351 | 336,519 | ||||||
Softwareone Holding AG(a)(c) | 36,063 | 406,125 | ||||||
Stabilus SE | 3,647 | 200,231 | ||||||
Stroeer SE & Co. KGaA | 6,226 | 253,892 | ||||||
Suedzucker AG | 40,544 | 516,925 | ||||||
Synlab AG | 15,424 | 198,633 | ||||||
Talanx AG | 15,681 | 589,246 | ||||||
TeamViewer AG(b)(c) | 13,142 | 126,434 | ||||||
Traton SE | 21,624 | 269,930 | ||||||
Vantage Towers AG | 12,695 | 357,342 | ||||||
Vitesco Technologies Group AG(c) | 20,172 | 1,080,586 | ||||||
Wacker Chemie AG | 4,545 | 529,613 | ||||||
Wacker Neuson SE | 9,107 | 143,745 | ||||||
|
| |||||||
| 20,834,280 | ||||||||
|
| |||||||
Ghana-0.05% | ||||||||
Tullow Oil PLC(a)(c) | 486,455 | 226,832 | ||||||
|
| |||||||
Hong Kong-1.42% | ||||||||
ASMPT Ltd. | 99,658 | 548,447 | ||||||
Bank of East Asia Ltd. (The) | 129,797 | 124,343 | ||||||
Cathay Pacific Airways Ltd.(c) | 369,307 | 334,970 | ||||||
CK Infrastructure Holdings Ltd. | 125,263 | 595,210 | ||||||
Cowell e Holdings, Inc.(c) | 311,550 | 381,011 | ||||||
DFI Retail Group Holdings Ltd. | 60,088 | 134,597 | ||||||
Hang Lung Properties Ltd. | 399,862 | 502,766 | ||||||
Huabao International Holdings Ltd. | 497,692 | 229,513 | ||||||
See accompanying Notes to Financial Statements which are an integral part of the financial statements.
| 61 | ||||
|
| |||
Invesco FTSE RAFI Developed Markets ex-U.S. Small-Mid ETF (PDN)–(continued)
October 31, 2022
| Shares | Value | |||||||
Hong Kong-(continued) | ||||||||
Hysan Development Co. Ltd. | 102,937 | $ | 224,499 | |||||
Kerry Properties Ltd. | 93,684 | 148,227 | ||||||
Man Wah Holdings Ltd. | 338,698 | 188,984 | ||||||
Melco International Development Ltd.(a)(c) | 189,406 | 98,927 | ||||||
Orient Overseas International Ltd.(a) | 30,500 | 445,658 | ||||||
Pacific Basin Shipping Ltd. | 957,375 | 231,726 | ||||||
PCCW Ltd. | 463,311 | 177,065 | ||||||
Singamas Container Holdings Ltd. | 1,184,000 | 90,499 | ||||||
Sino Land Co. Ltd. | 373,667 | 399,379 | ||||||
Swire Pacific Ltd., Class A | 81,000 | 536,055 | ||||||
Swire Pacific Ltd., Class B | 140,000 | 144,283 | ||||||
Swire Properties Ltd. | 213,050 | 409,281 | ||||||
Truly International Holdings Ltd. | 1,156,000 | 141,373 | ||||||
United Energy Group Ltd. | 2,224,000 | 215,321 | ||||||
Vinda International Holdings Ltd.(a) | 64,000 | 120,013 | ||||||
Vitasoy International Holdings Ltd.(a)(c) | 194,545 | 332,096 | ||||||
VTech Holdings Ltd. | 33,468 | 178,002 | ||||||
|
| |||||||
| 6,932,245 | ||||||||
|
| |||||||
Iraq-0.03% | ||||||||
Gulf Keystone Petroleum Ltd. | 70,364 | 169,319 | ||||||
|
| |||||||
Ireland-0.44% | ||||||||
AIB Group PLC | 354,218 | 1,025,768 | ||||||
C&C Group PLC(a)(c) | 107,410 | 202,195 | ||||||
Dalata Hotel Group PLC | 38,475 | 123,397 | ||||||
Glanbia PLC(a) | 52,720 | 609,117 | ||||||
Glenveagh Properties PLC(b)(c) | 136,186 | 133,254 | ||||||
Greencore Group PLC(a)(c) | 108,486 | 83,687 | ||||||
|
| |||||||
| 2,177,418 | ||||||||
|
| |||||||
Israel-2.39% | ||||||||
Airport City Ltd.(c) | 15,602 | 259,553 | ||||||
Alony Hetz Properties & Investments Ltd. | 22,858 | 269,529 | ||||||
Amot Investments Ltd. | 28,961 | 176,095 | ||||||
Ashtrom Group Ltd. | 7,130 | 155,890 | ||||||
Azrieli Group Ltd. | 6,045 | 450,176 | ||||||
Big Shopping Centers Ltd. | 1,086 | 122,378 | ||||||
Clal Insurance Enterprises Holdings Ltd.(c) | 15,499 | 268,673 | ||||||
Delek Group Ltd.(c) | 4,665 | 716,550 | ||||||
El Al Israel Airlines(a)(c) | 168,996 | 194,949 | ||||||
Elbit Systems Ltd. | 4,882 | 992,075 | ||||||
Elco Ltd. | 2,008 | 116,389 | ||||||
Electra Ltd. | 256 | 149,658 | ||||||
FIBI Holdings Ltd. | 3,733 | 176,812 | ||||||
First International Bank of Israel Ltd. (The) | 15,236 | 661,042 | ||||||
Formula Systems 1985 Ltd. | 2,125 | 173,285 | ||||||
G City Ltd. | 43,151 | 140,015 | ||||||
Harel Insurance Investments & Financial Services Ltd. | 35,484 | 343,195 | ||||||
Isracard Ltd. | 45,510 | 135,256 | ||||||
Israel Corp. Ltd. (The) | 864 | 375,844 | ||||||
Matrix IT Ltd. | 6,031 | 130,696 | ||||||
Melisron Ltd.(a) | 3,485 | 259,828 | ||||||
Migdal Insurance & Financial Holdings Ltd. | 108,918 | 131,184 | ||||||
Mivne Real Estate KD Ltd. | 97,177 | 303,721 | ||||||
Nice Ltd.(c) | 4,049 | 770,570 | ||||||
Norstar Holdings, Inc.(a) | 16,284 | 84,948 | ||||||
Nova Ltd.(c) | 1,499 | 110,524 | ||||||
Oil Refineries Ltd. | 1,116,859 | 418,247 | ||||||
Partner Communications Co. Ltd.(c) | 34,884 | 264,145 | ||||||
| Shares | Value | |||||||
Israel-(continued) | ||||||||
Paz Oil Co. Ltd.(c) | 2,516 | $ | 301,891 | |||||
Phoenix Holdings Ltd. (The) | 39,693 | 432,061 | ||||||
Plus500 Ltd. | 39,188 | 814,400 | ||||||
Reit 1 Ltd. | 30,408 | 160,270 | ||||||
Shikun & Binui Ltd.(c) | 49,187 | 196,078 | ||||||
Shufersal Ltd. | 52,352 | 358,930 | ||||||
Strauss Group Ltd. | 8,130 | 204,388 | ||||||
Tower Semiconductor Ltd.(c) | 20,095 | 863,294 | ||||||
|
| |||||||
| 11,682,539 | ||||||||
|
| |||||||
Italy-2.86% | ||||||||
ACEA S.p.A. | 16,575 | 208,869 | ||||||
Amplifon S.p.A.(a) | 10,434 | 259,255 | ||||||
Anima Holding S.p.A.(b) | 103,435 | 320,593 | ||||||
Autogrill S.p.A.(a)(c) | 83,760 | 524,024 | ||||||
Banca Generali S.p.A.(a) | 18,694 | 559,091 | ||||||
Banca IFIS S.p.A. | 19,104 | 225,633 | ||||||
Banca Mediolanum S.p.A. | 102,029 | 764,371 | ||||||
Banca Monte dei Paschi di Siena S.p.A.(a)(c) | 2,914 | 5,500 | ||||||
Banca Popolare di Sondrio S.p.A. | 102,793 | 368,792 | ||||||
BFF Bank S.p.A.(b) | 59,389 | 419,098 | ||||||
Brembo S.p.A.(a) | 45,327 | 473,973 | ||||||
Buzzi Unicem S.p.A.(a) | 42,728 | 709,257 | ||||||
Danieli & C. Officine Meccaniche S.p.A. | 3,986 | 81,352 | ||||||
Danieli & C. Officine Meccaniche S.p.A., RSP | 13,037 | 179,103 | ||||||
Davide Campari-Milano N.V.(a) | 48,962 | 440,074 | ||||||
De’ Longhi S.p.A.(a) | 17,804 | 307,413 | ||||||
DiaSorin S.p.A.(a) | 2,375 | 310,552 | ||||||
Enav S.p.A.(a)(b) | 72,183 | 278,948 | ||||||
ERG S.p.A. | 24,505 | 768,728 | ||||||
Esprinet S.p.A. | 34,378 | 229,178 | ||||||
Infrastrutture Wireless Italiane S.p.A.(b) | 68,151 | 601,634 | ||||||
Interpump Group S.p.A.(a) | 10,653 | 412,522 | ||||||
Iren S.p.A. | 260,914 | 387,843 | ||||||
Maire Tecnimont S.p.A.(a) | 94,762 | 294,274 | ||||||
MFE-MediaForEurope N.V., Class A(a) | 458,820 | 160,802 | ||||||
MFE-MediaForEurope N.V., Class B(a) | 265,355 | 132,443 | ||||||
Nexi S.p.A.(a)(b)(c) | 31,551 | 273,479 | ||||||
OVS S.p.A.(a)(b) | 164,489 | 307,263 | ||||||
Piaggio & C S.p.A. | 85,285 | 219,158 | ||||||
PRADA S.p.A. | 79,213 | 360,754 | ||||||
Recordati Industria Chimica e Farmaceutica S.p.A.(a) | 16,303 | 612,781 | ||||||
Reply S.p.A.(a) | 1,905 | 207,297 | ||||||
Salvatore Ferragamo S.p.A.(a) | 14,151 | 208,114 | ||||||
Saras S.p.A.(c) | 896,539 | 1,083,694 | ||||||
Sesa S.p.A.(a) | 1,209 | 131,082 | ||||||
Technogym S.p.A.(a)(b) | 28,399 | 195,355 | ||||||
Unieuro S.p.A.(a)(b) | 22,780 | 245,860 | ||||||
UnipolSai Assicurazioni S.p.A.(a) | 179,349 | 404,507 | ||||||
Webuild S.p.A.(a) | 216,748 | 294,985 | ||||||
Webuild S.p.A., Wts., expiring 08/02/2030(c) | 6,553 | 0 | ||||||
|
| |||||||
| 13,967,651 | ||||||||
|
| |||||||
Japan-30.36% | ||||||||
77 Bank Ltd. (The) | 20,340 | 246,458 | ||||||
ABC-Mart, Inc. | 10,428 | 465,150 | ||||||
Acom Co. Ltd. | 176,348 | 385,596 | ||||||
Activia Properties, Inc. | 217 | 643,109 | ||||||
Adastria Co. Ltd. | 19,325 | 262,893 | ||||||
ADEKA Corp. | 21,285 | 318,770 | ||||||
See accompanying Notes to Financial Statements which are an integral part of the financial statements.
| 62 | ||||
|
| |||
Invesco FTSE RAFI Developed Markets ex-U.S. Small-Mid ETF (PDN)–(continued)
October 31, 2022
| Shares | Value | |||||||
Japan-(continued) | ||||||||
Advance Residence Investment Corp. | 293 | $ | 682,060 | |||||
Aeon Delight Co. Ltd.(a) | 6,757 | 135,199 | ||||||
AEON Financial Service Co. Ltd. | 67,500 | 661,217 | ||||||
Aeon Mall Co. Ltd. | 63,883 | 694,983 | ||||||
AEON REIT Investment Corp. | 457 | 491,943 | ||||||
Aica Kogyo Co. Ltd. | 11,144 | 239,922 | ||||||
Aichi Financial Group, Inc. | 16,216 | 207,289 | ||||||
Aiful Corp. | 109,174 | 297,477 | ||||||
Ain Holdings, Inc. | 9,751 | 410,023 | ||||||
Air Water, Inc. | 58,511 | 654,649 | ||||||
Alconix Corp. | 23,290 | 214,512 | ||||||
Alfresa Holdings Corp. | 56,281 | 647,874 | ||||||
Alpen Co. Ltd.(a) | 11,152 | 151,935 | ||||||
Amano Corp. | 10,465 | 179,328 | ||||||
Anritsu Corp. | 36,755 | 370,678 | ||||||
Aoyama Trading Co. Ltd. | 52,032 | 363,368 | ||||||
Arclands Corp. | 14,708 | 145,957 | ||||||
Ariake Japan Co. Ltd. | 4,347 | 150,618 | ||||||
As One Corp. | 3,438 | 147,110 | ||||||
Asahi Holdings, Inc. | 28,504 | 364,175 | ||||||
Asahi Intecc Co. Ltd. | 12,969 | 221,102 | ||||||
Asanuma Corp. | 11,364 | 209,259 | ||||||
Asics Corp. | 48,882 | 751,145 | ||||||
ASKUL Corp. | 19,713 | 206,235 | ||||||
Autobacs Seven Co. Ltd. | 23,216 | 221,016 | ||||||
Avex, Inc. | 19,506 | 218,767 | ||||||
Azbil Corp. | 27,178 | 739,631 | ||||||
Bank of Kyoto Ltd. (The) | 19,605 | 706,986 | ||||||
Bell System24 Holdings, Inc. | 16,174 | 150,494 | ||||||
Benesse Holdings, Inc. | 20,235 | 298,689 | ||||||
Bic Camera, Inc.(a) | 56,779 | 441,977 | ||||||
BIPROGY, Inc. | 21,936 | 474,479 | ||||||
BML, Inc. | 7,417 | 167,916 | ||||||
Calbee, Inc. | 26,577 | 533,739 | ||||||
Canon Marketing Japan, Inc. | 12,318 | 260,225 | ||||||
Capcom Co. Ltd. | 17,199 | 479,630 | ||||||
Chiyoda Corp.(a)(c) | 102,360 | 254,118 | ||||||
Chugin Financial Group, Inc. | 27,217 | 164,069 | ||||||
Chugoku Electric Power Co., Inc. (The)(a) | 119,663 | 561,946 | ||||||
Citizen Watch Co. Ltd. | 171,502 | 721,154 | ||||||
CKD Corp. | 21,525 | 264,582 | ||||||
CMK Corp. | 33,014 | 119,053 | ||||||
Coca-Cola Bottlers Japan Holdings, Inc. | 47,721 | 431,507 | ||||||
Colowide Co. Ltd.(a) | 22,532 | 276,657 | ||||||
Comforia Residential REIT, Inc. | 147 | 312,029 | ||||||
Cosmo Energy Holdings Co. Ltd.(a) | 35,005 | 900,825 | ||||||
Cosmos Pharmaceutical Corp. | 4,530 | 438,874 | ||||||
CyberAgent, Inc. | 65,403 | 538,590 | ||||||
Daicel Corp. | 76,412 | 435,950 | ||||||
Daido Steel Co. Ltd. | 10,876 | 282,446 | ||||||
Daihen Corp.(a) | 5,335 | 138,010 | ||||||
Daiichikosho Co. Ltd. | 7,177 | 206,182 | ||||||
Daiki Aluminium Industry Co. Ltd. | 16,050 | 138,542 | ||||||
Daio Paper Corp. | 16,772 | 123,899 | ||||||
Daiseki Co. Ltd. | 8,108 | 250,929 | ||||||
Daiwa Office Investment Corp. | 76 | 358,946 | ||||||
Daiwa Securities Living Investments Corp. | 479 | 371,895 | ||||||
Daiwabo Holdings Co. Ltd. | 21,976 | 284,320 | ||||||
DCM Holdings Co. Ltd. | 28,002 | 218,349 | ||||||
DeNA Co. Ltd. | 35,800 | 467,506 | ||||||
| Shares | Value | �� | ||||||
Japan-(continued) | ||||||||
Denka Co. Ltd. | 33,446 | $ | 775,197 | |||||
Descente Ltd. | 7,597 | 182,980 | ||||||
Dexerials Corp.(a) | 9,725 | 227,365 | ||||||
DIC Corp. | 22,792 | 383,049 | ||||||
Digital Garage, Inc. | 4,998 | 120,045 | ||||||
DMG Mori Co. Ltd. | 63,847 | 740,983 | ||||||
Doutor Nichires Holdings Co. Ltd. | 14,471 | 161,616 | ||||||
DTS Corp. | 8,037 | 191,415 | ||||||
Duskin Co. Ltd. | 7,656 | 146,903 | ||||||
DyDo Group Holdings, Inc.(a) | 3,941 | 120,376 | ||||||
Earth Corp. | 3,867 | 133,986 | ||||||
EDION Corp. | 38,548 | 306,288 | ||||||
Elecom Co. Ltd.(a) | 15,187 | 141,004 | ||||||
en Japan, Inc. | 6,616 | 115,241 | ||||||
Exedy Corp. | 11,984 | 140,533 | ||||||
EXEO Group, Inc. | 28,160 | 412,828 | ||||||
Ezaki Glico Co. Ltd. | 14,416 | 324,429 | ||||||
Fancl Corp. | 8,770 | 166,449 | ||||||
FCC Co. Ltd. | 15,368 | 149,508 | ||||||
Financial Products Group Co. Ltd. | 23,341 | 182,475 | ||||||
Food & Life Cos. Ltd. | 12,944 | 218,498 | ||||||
FP Corp.(a) | 11,248 | 268,269 | ||||||
Frontier Real Estate Investment Corp. | 118 | 416,793 | ||||||
Fuji Corp. | 33,273 | 440,551 | ||||||
Fuji Media Holdings, Inc. | 40,994 | 285,456 | ||||||
Fuji Oil Holdings, Inc. | 18,579 | 292,619 | ||||||
Fuji Seal International, Inc. | 13,606 | 159,554 | ||||||
Fuji Soft, Inc. | 4,513 | 245,940 | ||||||
Fujikura Ltd. | 150,290 | 889,798 | ||||||
Fujimi, Inc. | 2,956 | 123,701 | ||||||
Fujitec Co. Ltd. | 13,036 | 259,431 | ||||||
Fujitsu General Ltd.(a) | 18,336 | 419,433 | ||||||
Fukuoka REIT Corp. | 134 | 156,507 | ||||||
Fukuyama Transporting Co. Ltd. | 4,784 | 104,444 | ||||||
Furukawa Electric Co. Ltd. | 48,651 | 751,523 | ||||||
Fuyo General Lease Co. Ltd. | 2,652 | 147,378 | ||||||
Gakken Holdings Co. Ltd. | 19,463 | 128,457 | ||||||
Global One Real Estate Investment Corp. | 244 | 188,456 | ||||||
GLOBERIDE, Inc. | 8,626 | 135,453 | ||||||
Glory Ltd. | 10,853 | 167,576 | ||||||
GMO Internet Group, Inc. | 15,077 | 260,793 | ||||||
GOLDWIN, Inc. | 5,095 | 266,688 | ||||||
GS Yuasa Corp.(a) | 40,687 | 620,563 | ||||||
GungHo Online Entertainment, Inc. | 9,119 | 135,158 | ||||||
Gunma Bank Ltd. (The) | 177,632 | 484,011 | ||||||
H.I.S. Co. Ltd.(a)(c) | 27,744 | 384,330 | ||||||
H.U. Group Holdings, Inc. | 32,278 | 601,541 | ||||||
H2O Retailing Corp. | 41,016 | 344,939 | ||||||
Hachijuni Bank Ltd. (The)(a) | 105,830 | 337,494 | ||||||
Hakuhodo DY Holdings, Inc. | 56,709 | 479,204 | ||||||
Hamamatsu Photonics K.K | 15,481 | 702,001 | ||||||
Hanwa Co. Ltd. | 8,026 | 194,393 | ||||||
Haseko Corp. | 62,963 | 648,968 | ||||||
Hazama Ando Corp.(a) | 55,350 | 321,371 | ||||||
Heiwa Corp.(a) | 13,253 | 213,995 | ||||||
Heiwa Real Estate Co. Ltd. | 8,169 | 226,985 | ||||||
Heiwa Real Estate REIT, Inc. | 180 | 186,618 | ||||||
Hikari Tsushin, Inc. | 7,316 | 884,506 | ||||||
Hirata Corp. | 4,092 | 120,033 | ||||||
Hirogin Holdings, Inc.(a) | 56,627 | 233,541 | ||||||
See accompanying Notes to Financial Statements which are an integral part of the financial statements.
| 63 | ||||
|
| |||
Invesco FTSE RAFI Developed Markets ex-U.S. Small-Mid ETF (PDN)–(continued)
October 31, 2022
| Shares | Value | |||||||
Japan-(continued) | ||||||||
Hisamitsu Pharmaceutical Co., Inc. | 28,086 | $ | 693,481 | |||||
Hitachi Transport System Ltd. | 12,627 | 755,233 | ||||||
Hitachi Zosen Corp. | 130,335 | 753,240 | ||||||
Hokkaido Electric Power Co., Inc.(a) | 63,617 | 193,888 | ||||||
Hokkoku Financial Holdings, Inc.(a) | 11,409 | 348,484 | ||||||
Hokuetsu Corp. | 36,014 | 187,054 | ||||||
Hokuhoku Financial Group, Inc. | 39,582 | 237,809 | ||||||
Hokuriku Electric Power Co.(a) | 47,717 | 159,875 | ||||||
Horiba Ltd. | 11,260 | 463,627 | ||||||
Hoshino Resorts REIT, Inc.(a) | 48 | 227,995 | ||||||
Hoshizaki Corp. | 20,912 | 600,058 | ||||||
Hosiden Corp. | 31,561 | 333,372 | ||||||
House Foods Group, Inc.(a) | 17,191 | 321,879 | ||||||
Hulic Reit, Inc. | 307 | 359,597 | ||||||
Ichigo Office REIT Investment Corp.(a) | 301 | 169,905 | ||||||
Idec Corp. | 8,925 | 191,548 | ||||||
IDOM, Inc. | 47,470 | 237,933 | ||||||
Iino Kaiun Kaisha Ltd. | 27,407 | 136,634 | ||||||
Inabata & Co. Ltd. | 10,338 | 170,892 | ||||||
Industrial & Infrastructure Fund Investment Corp. | 360 | 380,260 | ||||||
INFRONEER Holdings, Inc. | 52,846 | 366,919 | ||||||
Internet Initiative Japan, Inc. | 25,086 | 394,598 | ||||||
Invincible Investment Corp. | 1,712 | 537,898 | ||||||
IRISO Electronics Co. Ltd. | 5,741 | 166,859 | ||||||
Ishihara Sangyo Kaisha Ltd. | 25,889 | 178,707 | ||||||
Ito En Ltd.(a) | 12,055 | 425,800 | ||||||
Itochu Techno-Solutions Corp. | 28,827 | 669,110 | ||||||
Itoham Yonekyu Holdings, Inc. | 32,604 | 145,872 | ||||||
Iwatani Corp. | 16,592 | 611,728 | ||||||
Iyogin Holdings, Inc. | 47,994 | 225,060 | ||||||
Izumi Co. Ltd.(a) | 12,895 | 260,182 | ||||||
J Trust Co. Ltd. | 57,727 | 254,001 | ||||||
Jaccs Co. Ltd. | 7,597 | 184,514 | ||||||
JAFCO Group Co. Ltd. | 43,134 | 662,528 | ||||||
Japan Airport Terminal Co. Ltd.(c) | 9,213 | 395,458 | ||||||
Japan Aviation Electronics Industry Ltd. | 25,574 | 399,005 | ||||||
Japan Display, Inc.(a)(c) | 1,082,677 | 364,207 | ||||||
Japan Excellent, Inc. | 365 | 337,656 | ||||||
Japan Hotel REIT Investment Corp. | 1,399 | 736,985 | ||||||
Japan Lifeline Co. Ltd. | 22,053 | 148,964 | ||||||
Japan Logistics Fund, Inc. | 181 | 387,853 | ||||||
Japan Petroleum Exploration Co. Ltd. | 27,707 | 719,541 | ||||||
Japan Prime Realty Investment Corp. | 248 | 673,247 | ||||||
Japan Securities Finance Co. Ltd.(a) | 25,265 | 151,452 | ||||||
Japan Steel Works Ltd. (The) | 19,540 | 404,249 | ||||||
Jeol Ltd. | 4,365 | 160,345 | ||||||
Joyful Honda Co. Ltd.(a) | 15,194 | 185,434 | ||||||
Juki Corp. | 29,459 | 144,684 | ||||||
JVCKenwood Corp. | 187,875 | 273,025 | ||||||
Kadokawa Corp. | 16,374 | 294,354 | ||||||
Kagome Co. Ltd. | 18,014 | 360,438 | ||||||
Kakaku.com, Inc. | 16,542 | 280,569 | ||||||
Kaken Pharmaceutical Co. Ltd. | 7,287 | 186,544 | ||||||
Kamigumi Co. Ltd. | 27,214 | 517,786 | ||||||
Kanamoto Co. Ltd.(a) | 13,526 | 195,471 | ||||||
Kaneka Corp. | 14,026 | 348,208 | ||||||
Kanematsu Corp. | 21,172 | 209,533 | ||||||
Kanto Denka Kogyo Co. Ltd. | 16,168 | 103,338 | ||||||
Keihan Holdings Co. Ltd. | 34,024 | 875,580 | ||||||
| Shares | Value | |||||||
Japan-(continued) | ||||||||
Keikyu Corp. | 78,210 | $ | 803,490 | |||||
Kenedix Office Investment Corp.(a) | 236 | 537,464 | ||||||
Kenedix Residential Next Investment Corp. | 212 | 310,651 | ||||||
Kenedix Retail REIT Corp. | 161 | 289,537 | ||||||
Kewpie Corp. | 34,089 | 538,736 | ||||||
KH Neochem Co. Ltd. | 13,338 | 227,841 | ||||||
Kinden Corp. | 22,032 | 224,419 | ||||||
Kobayashi Pharmaceutical Co. Ltd.(a) | 7,328 | 389,486 | ||||||
Koei Tecmo Holdings Co. Ltd.(a) | 19,057 | 288,224 | ||||||
Kohnan Shoji Co. Ltd.(a) | 7,781 | 163,069 | ||||||
Kokuyo Co. Ltd. | 16,583 | 205,956 | ||||||
Komeri Co. Ltd. | 8,266 | 144,315 | ||||||
Konami Group Corp. | 17,221 | 756,572 | ||||||
Kose Corp. | 5,748 | 575,051 | ||||||
K’s Holdings Corp. | 79,864 | 626,511 | ||||||
Kumagai Gumi Co. Ltd. | 15,711 | 265,735 | ||||||
Kureha Corp. | 8,297 | 533,652 | ||||||
Kusuri no Aoki Holdings Co. Ltd. | 5,099 | 246,314 | ||||||
KYB Corp. | 11,422 | 250,134 | ||||||
Kyoritsu Maintenance Co. Ltd.(a) | 6,929 | 285,766 | ||||||
Kyudenko Corp. | 8,843 | 188,003 | ||||||
Kyushu Financial Group, Inc. | 71,094 | 179,846 | ||||||
LaSalle Logiport REIT | 251 | 267,997 | ||||||
Lasertec Corp. | 1,171 | 167,730 | ||||||
Leopalace21 Corp.(a)(c) | 98,389 | 187,332 | ||||||
Life Corp. | 8,850 | 132,064 | ||||||
Lintec Corp. | 13,604 | 204,287 | ||||||
M3, Inc. | 16,018 | 479,134 | ||||||
Mabuchi Motor Co. Ltd. | 19,073 | 518,417 | ||||||
Macnica Holdings, Inc. | 15,568 | 311,915 | ||||||
Makino Milling Machine Co. Ltd. | 10,832 | 334,868 | ||||||
Mandom Corp. | 16,854 | 170,882 | ||||||
Maruha Nichiro Corp., Class C | 9,774 | 150,784 | ||||||
Maruichi Steel Tube Ltd. | 12,120 | 229,215 | ||||||
Matsuda Sangyo Co. Ltd. | 8,758 | 131,044 | ||||||
Matsui Securities Co. Ltd.(a) | 31,966 | 170,330 | ||||||
Maxell Ltd. | 24,189 | 200,985 | ||||||
MCJ Co. Ltd. | 20,432 | 129,216 | ||||||
Medipal Holdings Corp. | 46,140 | 572,734 | ||||||
Megachips Corp. | 5,355 | 91,943 | ||||||
Megmilk Snow Brand Co. Ltd. | 10,734 | 116,992 | ||||||
Meidensha Corp.(a) | 9,697 | 129,241 | ||||||
Meiko Electronics Co. Ltd. | 6,973 | 123,993 | ||||||
Meitec Corp.(a) | 18,707 | 315,779 | ||||||
Menicon Co. Ltd. | 7,882 | 135,065 | ||||||
Mirai Corp.(a) | 492 | 158,555 | ||||||
MIRAIT ONE Corp. | 20,328 | 195,437 | ||||||
Mitsubishi Estate Logistics REIT Investment Corp.(a) | 55 | 162,815 | ||||||
Mitsubishi Logistics Corp. | 20,452 | 449,260 | ||||||
Mitsui E&S Holdings Co. Ltd.(c) | 137,080 | 384,582 | ||||||
Mitsui Fudosan Logistics Park, Inc. | 81 | 268,665 | ||||||
Mitsui Matsushima Holdings Co. Ltd.(a) | 12,136 | 195,878 | ||||||
Miura Co. Ltd. | 18,411 | 375,937 | ||||||
Mixi, Inc. | 28,414 | 445,800 | ||||||
Monex Group, Inc. | 59,653 | 207,894 | ||||||
MonotaRO Co. Ltd. | 10,810 | 164,948 | ||||||
Mori Hills REIT Investment Corp. | 363 | 397,350 | ||||||
Mori Trust Sogo Reit, Inc. | 205 | 204,538 | ||||||
Morinaga & Co. Ltd.(a) | 12,370 | 309,593 | ||||||
See accompanying Notes to Financial Statements which are an integral part of the financial statements.
| 64 | ||||
|
| |||
Invesco FTSE RAFI Developed Markets ex-U.S. Small-Mid ETF (PDN)–(continued)
October 31, 2022
| Shares | Value | |||||||
Japan-(continued) | ||||||||
Morinaga Milk Industry Co. Ltd. | 13,688 | $ | 388,626 | |||||
Musashi Seimitsu Industry Co. Ltd. | 20,490 | 236,696 | ||||||
Nachi-Fujikoshi Corp. | 5,645 | 148,118 | ||||||
Nagase & Co. Ltd. | 14,265 | 194,634 | ||||||
Namura Shipbuilding Co. Ltd.(a)(c) | 71,131 | 260,816 | ||||||
Nankai Electric Railway Co. Ltd. | 19,870 | 402,386 | ||||||
NEC Networks & System Integration Corp. | 24,027 | 257,672 | ||||||
NET One Systems Co. Ltd. | 22,977 | 473,035 | ||||||
Nexon Co. Ltd. | 46,751 | 785,395 | ||||||
NHK Spring Co. Ltd. | 75,225 | 417,031 | ||||||
Nichias Corp. | 13,892 | 214,593 | ||||||
Nichicon Corp.(a) | 27,721 | 261,292 | ||||||
Nichi-iko Pharmaceutical Co. Ltd.(a)(c) | 33,349 | 104,556 | ||||||
Nifco, Inc. | 23,969 | 557,156 | ||||||
Nihon Kohden Corp. | 22,221 | 498,584 | ||||||
Nihon M&A Center Holdings, Inc. | 17,722 | 200,667 | ||||||
Nikkiso Co. Ltd. | 30,021 | 200,362 | ||||||
Nippon Accommodations Fund, Inc. | 97 | 413,099 | ||||||
Nippon Carbon Co. Ltd. | 5,284 | 149,844 | ||||||
Nippon Chemi-Con Corp.(c) | 17,893 | 225,596 | ||||||
Nippon Denko Co. Ltd.(a) | 58,505 | 133,829 | ||||||
Nippon Gas Co. Ltd. | 30,973 | 450,316 | ||||||
Nippon Kayaku Co. Ltd. | 24,999 | 198,801 | ||||||
Nippon Light Metal Holdings Co. Ltd. | 28,792 | 281,072 | ||||||
Nippon Paint Holdings Co. Ltd.(a) | 109,147 | 697,613 | ||||||
Nippon Paper Industries Co. Ltd.(a) | 61,018 | 355,512 | ||||||
NIPPON REIT Investment Corp. | 131 | 323,457 | ||||||
Nippon Sanso Holdings Corp. | 51,415 | 820,509 | ||||||
Nippon Sheet Glass Co. Ltd.(a)(c) | 88,102 | 328,971 | ||||||
Nippon Shinyaku Co. Ltd. | 8,266 | 458,249 | ||||||
Nippon Shokubai Co. Ltd. | 6,240 | 224,184 | ||||||
Nippon Steel Trading Corp. | 4,806 | 165,551 | ||||||
Nippon Suisan Kaisha Ltd. | 145,183 | 517,691 | ||||||
Nippon Television Holdings, Inc. | 21,433 | 160,061 | ||||||
Nippon Yakin Kogyo Co. Ltd.(a) | 10,543 | 200,880 | ||||||
Nipro Corp. | 43,154 | 325,756 | ||||||
Nishimatsu Construction Co. Ltd.(a) | 16,074 | 391,482 | ||||||
Nishimatsuya Chain Co. Ltd.(a) | 20,707 | 190,164 | ||||||
Nishi-Nippon Financial Holdings, Inc. | 42,753 | 218,029 | ||||||
Nishi-Nippon Railroad Co. Ltd.(a) | 9,929 | 194,993 | ||||||
Nissha Co. Ltd. | 22,518 | 265,577 | ||||||
Nisshin Seifun Group, Inc. | 64,407 | 696,784 | ||||||
Nisshinbo Holdings, Inc. | 98,769 | 685,771 | ||||||
Nissin Electric Co. Ltd. | 19,027 | 176,912 | ||||||
Nitto Boseki Co. Ltd.(a) | 6,416 | 95,354 | ||||||
NOF Corp. | 18,558 | 639,264 | ||||||
Nojima Corp. | 17,992 | 150,100 | ||||||
NOK Corp. | 26,623 | 217,806 | ||||||
Nomura Co. Ltd. | 24,737 | 181,240 | ||||||
Noritz Corp. | 12,238 | 125,809 | ||||||
NS Solutions Corp. | 7,316 | 168,583 | ||||||
NS United Kaiun Kaisha Ltd. | 6,169 | 153,566 | ||||||
NSD Co. Ltd. | 9,783 | 167,443 | ||||||
NTN Corp.(a) | 486,202 | 866,845 | ||||||
NTT UD REIT Investment Corp.(a) | 369 | 361,465 | ||||||
Obic Co. Ltd. | 5,383 | 810,157 | ||||||
Okamura Corp. | 19,835 | 182,690 | ||||||
Oki Electric Industry Co. Ltd.(a) | 32,337 | 160,342 | ||||||
OKUMA Corp. | 12,288 | 412,535 | ||||||
Okumura Corp. | 8,013 | 151,597 | ||||||
| Shares | Value | |||||||
Japan-(continued) | ||||||||
One REIT, Inc. | 72 | $ | 120,085 | |||||
Onward Holdings Co. Ltd.(a) | 106,819 | 222,787 | ||||||
Open House Group Co. Ltd. | 19,337 | 689,515 | ||||||
Organo Corp. | 9,996 | 173,174 | ||||||
Orient Corp.(a) | 42,999 | 348,598 | ||||||
OSG Corp.(a) | 20,773 | 264,563 | ||||||
Outsourcing, Inc. | 45,126 | 353,697 | ||||||
Paltac Corp. | 7,299 | 207,722 | ||||||
Park24 Co. Ltd.(c) | 46,917 | 626,570 | ||||||
Pasona Group, Inc.(a) | 11,647 | 160,794 | ||||||
Penta-Ocean Construction Co. Ltd. | 102,279 | 509,210 | ||||||
Pigeon Corp. | 28,060 | 367,752 | ||||||
Pilot Corp. | 4,650 | 181,138 | ||||||
Pola Orbis Holdings, Inc. | 28,806 | 318,807 | ||||||
Press Kogyo Co. Ltd. | 77,304 | 216,359 | ||||||
Pressance Corp. | 11,052 | 113,617 | ||||||
Prima Meat Packers Ltd. | 8,126 | 107,538 | ||||||
Raito Kogyo Co. Ltd. | 13,200 | 180,192 | ||||||
Relo Group, Inc.(a) | 30,795 | 435,504 | ||||||
Rengo Co. Ltd. | 71,007 | 394,125 | ||||||
Resorttrust, Inc. | 25,585 | 394,185 | ||||||
Rinnai Corp. | 12,177 | 830,725 | ||||||
Rohto Pharmaceutical Co. Ltd. | 18,014 | 560,533 | ||||||
Round One Corp. | 63,477 | 270,333 | ||||||
Royal Holdings Co. Ltd.(a)(c) | 11,547 | 184,740 | ||||||
Saizeriya Co. Ltd.(a) | 8,027 | 149,917 | ||||||
Sakai Chemical Industry Co. Ltd. | 10,810 | 142,911 | ||||||
Sakata Seed Corp. | 6,796 | 224,041 | ||||||
SAMTY Co. Ltd. | 12,585 | 199,060 | ||||||
San-In Godo Bank Ltd. (The) | 29,906 | 142,453 | ||||||
Sanken Electric Co. Ltd. | 8,838 | 303,846 | ||||||
Sankyo Co. Ltd. | 20,185 | 667,469 | ||||||
Sankyu, Inc. | 15,747 | 470,921 | ||||||
Sanoh Industrial Co. Ltd.(a) | 29,887 | 136,531 | ||||||
Sanrio Co. Ltd.(a) | 8,355 | 222,879 | ||||||
Sanwa Holdings Corp. | 35,155 | 303,217 | ||||||
Sanyo Chemical Industries Ltd. | 4,982 | 141,280 | ||||||
Sanyo Denki Co. Ltd. | 4,369 | 160,198 | ||||||
Sanyo Special Steel Co. Ltd.(a) | 15,336 | 197,381 | ||||||
Sapporo Holdings Ltd.(a) | 23,013 | 507,839 | ||||||
Sawai Group Holdings Co. Ltd. | 8,339 | 240,405 | ||||||
SBS Holdings, Inc. | 7,590 | 148,088 | ||||||
SCREEN Holdings Co. Ltd. | 8,740 | 481,586 | ||||||
SCSK Corp. | 37,777 | 558,388 | ||||||
Seiko Holdings Corp. | 8,734 | 185,098 | ||||||
Seino Holdings Co. Ltd. | 33,483 | 257,709 | ||||||
Seiren Co. Ltd.(a) | 14,480 | 227,281 | ||||||
Sekisui House REIT, Inc.(a) | 969 | 522,198 | ||||||
Senko Group Holdings Co. Ltd. | 33,681 | 225,242 | ||||||
Senshu Ikeda Holdings, Inc. | 160,221 | 229,603 | ||||||
Seven Bank Ltd.(a) | 363,039 | 654,586 | ||||||
Shibaura Machine Co. Ltd. | 10,812 | 210,370 | ||||||
Shiga Bank Ltd. (The) | 10,543 | 178,536 | ||||||
Shikoku Electric Power Co., Inc. | 49,240 | 237,197 | ||||||
Shindengen Electric Manufacturing Co. Ltd.(a) | 7,854 | 194,454 | ||||||
Shinko Electric Industries Co. Ltd. | 8,388 | 202,314 | ||||||
Shinsei Bank Ltd.(a) | 41,682 | 619,755 | ||||||
Ship Healthcare Holdings, Inc.(a) | 22,757 | 436,507 | ||||||
SHO-BOND Holdings Co. Ltd. | 6,958 | 301,474 | ||||||
See accompanying Notes to Financial Statements which are an integral part of the financial statements.
| 65 | ||||
|
| |||
Invesco FTSE RAFI Developed Markets ex-U.S. Small-Mid ETF (PDN)–(continued)
October 31, 2022
| Shares | Value | |||||||
Japan-(continued) | ||||||||
Shochiku Co. Ltd.(c) | 2,168 | $ | 172,261 | |||||
Siix Corp. | 19,380 | 149,814 | ||||||
SKY Perfect JSAT Holdings, Inc.(a) | 61,088 | 214,128 | ||||||
Sodick Co. Ltd. | 31,958 | 166,203 | ||||||
Sohgo Security Services Co. Ltd. | 26,902 | 671,487 | ||||||
Sotetsu Holdings, Inc.(a) | 14,604 | 221,367 | ||||||
Square Enix Holdings Co. Ltd. | 17,150 | 766,145 | ||||||
Star Micronics Co. Ltd. | 16,011 | 183,663 | ||||||
Starts Corp., Inc. | 7,665 | 135,627 | ||||||
Sugi Holdings Co. Ltd. | 14,284 | 573,724 | ||||||
Sumitomo Bakelite Co. Ltd. | 13,237 | 358,900 | ||||||
Sumitomo Mitsui Construction Co. Ltd. | 54,231 | 159,444 | ||||||
Sumitomo Osaka Cement Co. Ltd. | 19,473 | 414,654 | ||||||
Sumitomo Pharma Co. Ltd. | 93,322 | 651,091 | ||||||
Sumitomo Warehouse Co. Ltd. (The)(a) | 14,487 | 196,786 | ||||||
Sundrug Co. Ltd. | 26,087 | 607,266 | ||||||
Suruga Bank Ltd. | 198,219 | 525,437 | ||||||
Suzuken Co. Ltd. | 18,433 | 410,490 | ||||||
SWCC Showa Holdings Co. Ltd.(a) | 15,674 | 188,655 | ||||||
Tadano Ltd. | 27,070 | 165,733 | ||||||
Taiheiyo Cement Corp. | 50,904 | 692,145 | ||||||
Taisho Pharmaceutical Holdings Co. Ltd. | 14,957 | 539,372 | ||||||
Taiyo Holdings Co. Ltd. | 9,942 | 175,516 | ||||||
Takara Holdings, Inc. | 44,236 | 308,329 | ||||||
Takasago Thermal Engineering Co. Ltd. | 12,921 | 157,345 | ||||||
Takeuchi Manufacturing Co. Ltd. | 13,955 | 281,663 | ||||||
Takuma Co. Ltd. | 16,527 | 137,433 | ||||||
Tama Home Co. Ltd.(a) | 8,758 | 137,585 | ||||||
Tamura Corp.(a) | 42,865 | 213,409 | ||||||
TBS Holdings, Inc. | 24,416 | 253,137 | ||||||
TechnoPro Holdings, Inc. | 16,143 | 385,017 | ||||||
Toagosei Co. Ltd. | 19,658 | 151,170 | ||||||
Tocalo Co. Ltd. | 17,833 | 142,774 | ||||||
Toda Corp.(a) | 30,036 | 150,145 | ||||||
Toei Co. Ltd.(a) | 1,341 | 165,195 | ||||||
Toho Co. Ltd. | 22,923 | 817,384 | ||||||
Toho Holdings Co. Ltd. | 12,260 | 166,783 | ||||||
Toho Zinc Co. Ltd.(a) | 12,308 | 176,710 | ||||||
Tokai Carbon Co. Ltd. | 95,111 | 621,339 | ||||||
Tokai Rika Co. Ltd. | 15,565 | 162,525 | ||||||
Tokai Tokyo Financial Holdings, Inc.(a) | 73,457 | 168,526 | ||||||
Token Corp. | 2,499 | 131,982 | ||||||
Tokuyama Corp. | 44,790 | 522,829 | ||||||
Tokyo Century Corp. | 12,238 | 417,443 | ||||||
Tokyo Ohka Kogyo Co. Ltd. | 9,104 | 393,230 | ||||||
Tokyo Seimitsu Co. Ltd. | 12,999 | 392,239 | ||||||
Tokyo Steel Manufacturing Co. Ltd.(a) | 29,185 | 250,547 | ||||||
Tokyo Tatemono Co. Ltd. | 51,792 | 713,976 | ||||||
Tokyu Construction Co. Ltd. | 27,674 | 116,181 | ||||||
Tokyu REIT, Inc. | 225 | 320,466 | ||||||
Tomy Co. Ltd. | 23,492 | 206,415 | ||||||
Topcon Corp. | 35,653 | 391,227 | ||||||
Towa Pharmaceutical Co. Ltd. | 7,471 | 112,340 | ||||||
Toyo Ink SC Holdings Co. Ltd. | 11,409 | 146,993 | ||||||
Toyo Seikan Group Holdings Ltd. | 56,283 | 644,111 | ||||||
Toyo Tire Corp. | 57,521 | 674,532 | ||||||
Toyobo Co. Ltd. | 29,176 | 204,145 | ||||||
Toyoda Gosei Co. Ltd. | 45,525 | 727,738 | ||||||
Toyota Boshoku Corp. | 49,823 | 634,876 | ||||||
Transcosmos, Inc. | 9,054 | 208,632 | ||||||
| Shares | Value | |||||||
Japan-(continued) | ||||||||
Trusco Nakayama Corp. | 8,143 | $ | 109,297 | |||||
TS Tech Co. Ltd. | 32,424 | 339,216 | ||||||
Tsubaki Nakashima Co. Ltd. | 28,129 | 233,533 | ||||||
Tsugami Corp. | 17,935 | 134,782 | ||||||
Tsumura & Co. | 10,178 | 212,619 | ||||||
TV Asahi Holdings Corp. | 17,389 | 163,086 | ||||||
UACJ Corp. | 20,324 | 290,021 | ||||||
UBE Corp. | 42,457 | 547,583 | ||||||
Ulvac, Inc. | 16,626 | 657,724 | ||||||
United Arrows Ltd.(a) | 19,339 | 263,214 | ||||||
Ushio, Inc. | 36,951 | 384,339 | ||||||
USS Co. Ltd. | 44,203 | 668,242 | ||||||
V Technology Co. Ltd.(a) | 6,765 | 127,440 | ||||||
Wacoal Holdings Corp. | 12,565 | 202,464 | ||||||
Wacom Co. Ltd. | 32,044 | 139,486 | ||||||
Welcia Holdings Co. Ltd. | 31,224 | 653,323 | ||||||
Yamaguchi Financial Group, Inc.(a) | 76,224 | 401,030 | ||||||
Yamato Kogyo Co. Ltd. | 12,486 | 362,899 | ||||||
Yamazaki Baking Co. Ltd. | 62,097 | 632,939 | ||||||
Yaoko Co. Ltd.(a) | 4,651 | 202,455 | ||||||
Yokohama Rubber Co. Ltd. (The) | 50,611 | 792,696 | ||||||
Yokowo Co. Ltd.(a) | 7,482 | 102,186 | ||||||
Yoshinoya Holdings Co. Ltd.(a) | 18,426 | 289,837 | ||||||
Zenkoku Hosho Co. Ltd.(a) | 11,721 | 387,191 | ||||||
Zensho Holdings Co. Ltd.(a) | 28,175 | 703,261 | ||||||
Zeon Corp. | 73,194 | 617,521 | ||||||
ZOZO, Inc. | 9,598 | 204,378 | ||||||
|
| |||||||
| 148,507,193 | ||||||||
|
| |||||||
Luxembourg-0.23% | ||||||||
Global Fashion Group S.A.(c) | 56,646 | 95,512 | ||||||
RTL Group S.A.(a) | 8,282 | 281,091 | ||||||
SES S.A., FDR | 107,458 | 762,348 | ||||||
|
| |||||||
| 1,138,951 | ||||||||
|
| |||||||
Macau-0.16% | ||||||||
MGM China Holdings Ltd.(c) | 243,089 | 97,857 | ||||||
SJM Holdings Ltd.(c) | 1,074,668 | 335,412 | ||||||
Wynn Macau Ltd.(a)(c) | 869,842 | 346,836 | ||||||
|
| |||||||
| 780,105 | ||||||||
|
| |||||||
Mexico-0.11% | ||||||||
Fresnillo PLC(a) | 64,036 | 537,476 | ||||||
|
| |||||||
Netherlands-1.99% | ||||||||
Adyen N.V.(a)(b)(c) | 444 | 637,441 | ||||||
AMG Advanced Metallurgical Group N.V. | 6,449 | 201,797 | ||||||
Arcadis N.V. | 19,246 | 653,970 | ||||||
Argenx SE(a)(c) | 1,362 | 531,454 | ||||||
Basic-Fit N.V.(a)(b)(c) | 6,112 | 154,040 | ||||||
BE Semiconductor Industries N.V. | 8,908 | 455,355 | ||||||
Corbion N.V.(a) | 13,421 | 357,615 | ||||||
Eurocommercial Properties N.V. | 12,169 | 267,726 | ||||||
Euronext N.V.(b) | 9,963 | 633,158 | ||||||
Flow Traders(a)(b) | 14,065 | 338,632 | ||||||
Fugro N.V.(c) | 62,650 | 814,250 | ||||||
Heijmans N.V., CVA | 11,462 | 116,230 | ||||||
IMCD N.V.(a) | 6,442 | 835,981 | ||||||
Intertrust N.V.(a)(b)(c) | 25,999 | 512,895 | ||||||
JDE Peet’s N.V. | 32,275 | 924,434 | ||||||
Koninklijke BAM Groep N.V.(c) | 232,509 | 507,859 | ||||||
OCI N.V.(a) | 25,027 | 957,757 | ||||||
See accompanying Notes to Financial Statements which are an integral part of the financial statements.
| 66 | ||||
|
| |||
Invesco FTSE RAFI Developed Markets ex-U.S. Small-Mid ETF (PDN)–(continued)
October 31, 2022
| Shares | Value | |||||||
Netherlands-(continued) | ||||||||
TKH Group N.V., CVA(a) | 9,084 | $ | 321,958 | |||||
TomTom N.V.(a)(c) | 22,592 | 176,956 | ||||||
Van Lanschot Kempen N.V., CVA | 8,196 | 176,996 | ||||||
Wereldhave N.V.(a) | 14,982 | 183,613 | ||||||
|
| |||||||
| 9,760,117 | ||||||||
|
| |||||||
New Zealand-1.11% | ||||||||
a2 Milk Co. Ltd. (The)(c) | 111,898 | 377,041 | ||||||
Auckland International Airport Ltd.(c) | 181,849 | 813,468 | ||||||
Chorus Ltd. | 57,346 | 276,849 | ||||||
Contact Energy Ltd. | 79,946 | 350,657 | ||||||
Fisher & Paykel Healthcare Corp. Ltd. | 50,656 | 576,212 | ||||||
Fletcher Building Ltd. | 165,159 | 493,179 | ||||||
Goodman Property Trust | 102,521 | 123,288 | ||||||
Infratil Ltd. | 37,756 | 191,706 | ||||||
Mainfreight Ltd. | 5,836 | 257,808 | ||||||
Mercury NZ Ltd. | 47,031 | 159,018 | ||||||
Meridian Energy Ltd. | 120,346 | 341,185 | ||||||
Ryman Healthcare Ltd. | 43,213 | 210,377 | ||||||
SKYCITY Entertainment Group Ltd.(c) | 92,554 | 155,931 | ||||||
Spark New Zealand Ltd. | 325,645 | 968,619 | ||||||
Xero Ltd.(c) | 2,789 | 139,232 | ||||||
|
| |||||||
| 5,434,570 | ||||||||
|
| |||||||
Nigeria-0.07% | ||||||||
Airtel Africa PLC(a)(b) | 259,904 | 338,441 | ||||||
|
| |||||||
Norway-1.66% | ||||||||
Aker ASA, Class A(a) | 7,191 | 506,635 | ||||||
Aker Solutions ASA, Class A | 136,423 | 522,239 | ||||||
Atea ASA | 14,266 | 158,620 | ||||||
Austevoll Seafood ASA | 24,424 | 180,651 | ||||||
Borregaard ASA | 10,829 | 145,611 | ||||||
BW Offshore Ltd. | 65,193 | 166,042 | ||||||
Crayon Group Holding ASA(a)(b)(c) | 10,862 | 90,004 | ||||||
DNO ASA | 315,984 | 412,119 | ||||||
Elkem ASA(b)(c) | 117,798 | 391,797 | ||||||
Entra ASA(b) | 17,099 | 155,500 | ||||||
Europris ASA(b) | 43,732 | 260,368 | ||||||
Frontline Ltd. | 83,559 | 1,044,000 | ||||||
Grieg Seafood ASA | 16,377 | 113,414 | ||||||
Kongsberg Gruppen ASA | 12,806 | 458,939 | ||||||
Leroy Seafood Group ASA | 69,299 | 318,605 | ||||||
Norske Skog ASA(b)(c) | 39,739 | 244,622 | ||||||
Norwegian Air Shuttle ASA(c) | 143,510 | 114,870 | ||||||
Salmar ASA(a) | 9,657 | 327,137 | ||||||
Schibsted ASA, Class A | 9,975 | 153,604 | ||||||
Schibsted ASA, Class B | 12,326 | 182,931 | ||||||
SpareBank 1 Nord Norge | 20,731 | 172,080 | ||||||
SpareBank 1 SMN | 28,486 | 307,413 | ||||||
SpareBank 1 SR-Bank ASA, Class B(a) | 28,122 | 286,174 | ||||||
TGS ASA | 61,356 | 837,999 | ||||||
TOMRA Systems ASA | 18,926 | 305,857 | ||||||
Wallenius Wilhelmsen ASA(a) | 40,293 | 286,593 | ||||||
|
| |||||||
| 8,143,824 | ||||||||
|
| |||||||
Peru-0.03% | ||||||||
Hochschild Mining PLC | 220,393 | 135,375 | ||||||
|
| |||||||
Poland-0.65% | ||||||||
Alior Bank S.A.(c) | 35,680 | 219,852 | ||||||
Allegro.eu S.A.(a)(b)(c) | 44,232 | 215,072 | ||||||
| Shares | Value | |||||||
Poland-(continued) | ||||||||
Bank Millennium S.A.(a)(c) | 91,866 | $ | 83,946 | |||||
CCC S.A.(a)(c) | 13,917 | 107,483 | ||||||
CD Projekt S.A.(a) | 4,458 | 118,753 | ||||||
Cyfrowy Polsat S.A. | 48,100 | 180,450 | ||||||
Dino Polska S.A.(b)(c) | 3,977 | 260,224 | ||||||
Jastrzebska Spolka Weglowa S.A.(a)(c) | 43,505 | 378,760 | ||||||
KRUK S.A. | 3,442 | 200,835 | ||||||
LPP S.A.(a) | 103 | 178,958 | ||||||
mBank S.A.(c) | 4,284 | 240,267 | ||||||
Orange Polska S.A.(a) | 156,615 | 197,995 | ||||||
PGE Polska Grupa Energetyczna S.A.(c) | 214,647 | 245,177 | ||||||
Santander Bank Polska S.A.(a) | 6,669 | 355,300 | ||||||
Tauron Polska Energia S.A.(a)(c) | 455,253 | 185,007 | ||||||
|
| |||||||
| 3,168,079 | ||||||||
|
| |||||||
Portugal-0.32% | ||||||||
CTT-Correios de Portugal S.A.(a) | 47,805 | 147,650 | ||||||
Navigator Co. S.A. (The) | 92,005 | 350,820 | ||||||
NOS, SGPS S.A. | 106,743 | 418,200 | ||||||
REN - Redes Energeticas Nacionais SGPS S.A. | 83,137 | 215,282 | ||||||
Sonae SGPS S.A. | 447,018 | 430,103 | ||||||
|
| |||||||
| 1,562,055 | ||||||||
|
| |||||||
Singapore-2.15% | ||||||||
AIMS APAC REIT | 166,740 | 144,930 | ||||||
BOC Aviation Ltd.(a)(b) | 47,782 | 319,872 | ||||||
BW LPG Ltd.(b) | 55,536 | 449,230 | ||||||
CapitaLand Ascott Trust | 451,136 | 304,455 | ||||||
City Developments Ltd. | 164,001 | 884,268 | ||||||
ESR-LOGOS REIT | 564,848 | 135,714 | ||||||
Frasers Centrepoint Trust | 197,116 | 289,733 | ||||||
Frasers Logistics & Commercial Trust(b) | 534,299 | 415,327 | ||||||
IGG, Inc.(c) | 262,311 | 68,169 | ||||||
Jardine Cycle & Carriage Ltd. | 20,549 | 431,862 | ||||||
Keppel Corp. Ltd. | 214,565 | 1,056,828 | ||||||
Keppel DC REIT | 211,728 | 263,332 | ||||||
Keppel REIT | 518,349 | 327,837 | ||||||
Mapletree Industrial Trust | 364,977 | 567,415 | ||||||
Mapletree Logistics Trust(a) | 630,784 | 677,543 | ||||||
Mapletree Pan Asia Commercial Trust | 618,588 | 695,043 | ||||||
NetLink NBN Trust(b) | 651,630 | 393,713 | ||||||
Olam Group Ltd. | 173,060 | 163,876 | ||||||
Raffles Medical Group Ltd. | 175,073 | 164,545 | ||||||
SATS Ltd.(c) | 114,373 | 220,647 | ||||||
Sembcorp Industries Ltd. | 255,764 | 525,951 | ||||||
Sembcorp Marine Ltd.(c) | 2,972,710 | 266,790 | ||||||
Singapore Exchange Ltd. | 138,845 | 826,143 | ||||||
Suntec REIT | 569,170 | 518,853 | ||||||
UOL Group Ltd. | 94,157 | 411,866 | ||||||
|
| |||||||
| 10,523,942 | ||||||||
|
| |||||||
South Africa-0.03% | ||||||||
Scatec ASA(b) | 17,900 | 126,715 | ||||||
|
| |||||||
South Korea-8.03% | ||||||||
Amorepacific Group | 11,105 | 192,561 | ||||||
Asiana Airlines, Inc.(a)(c) | 47,932 | 348,272 | ||||||
BGF retail Co. Ltd. | 3,021 | 395,533 | ||||||
BNK Financial Group, Inc. | 131,549 | 591,968 | ||||||
Celltrion Healthcare Co. Ltd. | 6,434 | 313,920 | ||||||
Cheil Worldwide, Inc. | 25,967 | 445,711 | ||||||
See accompanying Notes to Financial Statements which are an integral part of the financial statements.
| 67 | ||||
|
| |||
Invesco FTSE RAFI Developed Markets ex-U.S. Small-Mid ETF (PDN)–(continued)
October 31, 2022
| Shares | Value | |||||||
South Korea-(continued) | ||||||||
Chong Kun Dang Pharmaceutical Corp. | 2,276 | $ | 134,216 | |||||
CJ CGV Co. Ltd.(c) | 8,272 | 78,397 | ||||||
CJ Corp. | 6,721 | 338,775 | ||||||
CJ ENM Co. Ltd. | 6,151 | 316,953 | ||||||
CJ Logistics Corp.(c) | 3,446 | 212,646 | ||||||
Com2uSCorp. | 2,950 | 147,246 | ||||||
Cosmax, Inc. | 2,131 | 68,518 | ||||||
Coway Co. Ltd. | 14,968 | 581,088 | ||||||
Daewoo Engineering & Construction Co. | 158,846 | 468,916 | ||||||
Daewoo Shipbuilding & Marine Engineering Co. Ltd.(a)(c) | 37,039 | 475,842 | ||||||
Daishin Securities Co. Ltd. | 11,855 | 116,099 | ||||||
Daishin Securities Co. Ltd., Preference Shares | 11,294 | 104,658 | ||||||
DB HiTek Co. Ltd. | 5,810 | 180,485 | ||||||
DB Insurance Co. Ltd. | 15,377 | 607,761 | ||||||
Delivery Hero SE(b)(c) | 7,441 | 245,267 | ||||||
DGB Financial Group, Inc. | 48,358 | 230,511 | ||||||
DL Holdings Co. Ltd. | 7,580 | 327,263 | ||||||
Dongkuk Steel Mill Co. Ltd.(a) | 61,402 | 493,561 | ||||||
Dongsuh Cos., Inc. | 7,024 | 100,593 | ||||||
Doosan Bobcat, Inc. | 13,512 | 317,773 | ||||||
Doosan Co. Ltd.(a) | 7,691 | 417,904 | ||||||
Fila Holdings Corp.(a) | 24,964 | 573,079 | ||||||
Gradiant Corp. | 13,487 | 129,241 | ||||||
Green Cross Corp. | 1,174 | 105,083 | ||||||
GS Holdings Corp. | 19,434 | 627,585 | ||||||
GS Retail Co. Ltd. | 20,462 | 364,867 | ||||||
Handsome Co. Ltd. | 6,313 | 111,240 | ||||||
Hankook Tire & Technology Co. Ltd. | 20,310 | 521,135 | ||||||
Hanmi Pharm Co. Ltd. | 943 | 167,488 | ||||||
Hanon Systems | 66,566 | 364,502 | ||||||
Hansol Chemical Co. Ltd. | 1,325 | 172,549 | ||||||
Hanssem Co. Ltd. | 2,977 | 78,268 | ||||||
Hanwha Aerospace Co. Ltd. | 19,682 | 916,085 | ||||||
Hanwha Corp. | 26,449 | 471,624 | ||||||
Hanwha Corp., 3rd Preference Shares | 12,817 | 125,970 | ||||||
Hanwha Investment & Securities Co. Ltd. | 41,207 | 71,164 | ||||||
Hanwha Life Insurance Co. Ltd. | 251,287 | 385,455 | ||||||
HD Hyundai Co. Ltd. | 18,952 | 810,261 | ||||||
HDC Hyundai Development Co-Engineering & Construction, Class E(a) | 67,811 | 476,050 | ||||||
Hite Jinro Co. Ltd. | 11,759 | 211,744 | ||||||
HL Mando Co. Ltd. | 23,221 | 806,121 | ||||||
HMM Co. Ltd. | 35,996 | 482,659 | ||||||
Hotel Shilla Co. Ltd. | 9,250 | 422,093 | ||||||
Hyosung Advanced Materials Corp.(a) | 1,077 | 241,190 | ||||||
Hyosung Chemical Corp.(c) | 1,119 | 79,735 | ||||||
Hyosung Corp. | 5,490 | 264,007 | ||||||
Hyosung Heavy Industries Corp.(c) | 3,855 | 155,342 | ||||||
Hyosung TNC Corp. | 1,816 | 333,381 | ||||||
Hyundai Construction Equipment Co. Ltd. | 11,219 | 338,669 | ||||||
Hyundai Department Store Co. Ltd. | 8,054 | 305,887 | ||||||
Hyundai Doosan Infracore Co. Ltd.(c) | 103,609 | 403,686 | ||||||
Hyundai Electric & Energy System Co. Ltd.(c) | 16,521 | 398,397 | ||||||
Hyundai Elevator Co. Ltd.(a) | 11,578 | 204,827 | ||||||
Hyundai Heavy Industries Co. Ltd.(c) | 5,176 | 396,071 | ||||||
Hyundai Marine & Fire Insurance Co. Ltd. | 42,930 | 1,003,594 | ||||||
Hyundai Mipo Dockyard Co. Ltd.(c) | 6,881 | 443,452 | ||||||
| Shares | Value | |||||||
South Korea-(continued) | ||||||||
Hyundai Rotem Co. Ltd.(a)(c) | 30,284 | $ | 517,684 | |||||
Hyundai Wia Corp.(a) | 17,895 | 767,584 | ||||||
IS Dongseo Co. Ltd. | 6,629 | 146,825 | ||||||
JB Financial Group Co. Ltd. | 35,278 | 177,820 | ||||||
Kakao Corp. | 12,938 | 460,498 | ||||||
KakaoBank Corp.(c) | 4,229 | 50,768 | ||||||
Kangwon Land, Inc.(c) | 33,605 | 542,606 | ||||||
KCC Corp. | 2,895 | 495,897 | ||||||
KCC Glass Corp. | 6,137 | 166,732 | ||||||
KEPCO Plant Service & Engineering Co. | 11,227 | 251,424 | ||||||
KG Chemical Corp. | 9,403 | 151,826 | ||||||
KIWOOM Securities Co. Ltd. | 6,664 | 378,006 | ||||||
Kolmar Korea Co. Ltd. | 5,526 | 132,869 | ||||||
Kolon Industries, Inc. | 16,188 | 494,351 | ||||||
Korea Aerospace Industries Ltd. | 17,915 | 595,511 | ||||||
Korea Line Corp.(c) | 84,185 | 116,427 | ||||||
Korea Petrochemical Ind Co. Ltd. | 2,829 | 235,345 | ||||||
Korea Real Estate Investment & Trust Co. Ltd. | 94,301 | 90,365 | ||||||
Korean Reinsurance Co. | 25,297 | 130,530 | ||||||
Krafton, Inc.(c) | 2,465 | 307,162 | ||||||
Kumho Petrochemical Co. Ltd. | 7,119 | 654,701 | ||||||
Kyeryong Construction Industrial Co. Ltd. | 5,756 | 69,099 | ||||||
LIG Nex1 Co. Ltd. | 3,965 | 282,528 | ||||||
LOTTE Chilsung Beverage Co. Ltd. | 1,914 | 188,787 | ||||||
LOTTE Corp. | 12,151 | 278,088 | ||||||
LOTTE Fine Chemical Co. Ltd. | 7,063 | 278,167 | ||||||
LOTTE Shopping Co. Ltd. | 7,161 | 439,378 | ||||||
LS Corp. | 9,309 | 434,588 | ||||||
LS Electric Co. Ltd.(a) | 8,986 | 346,962 | ||||||
LX Hausys Ltd. | 6,561 | 148,313 | ||||||
LX International Corp. | 25,298 | 721,937 | ||||||
Meritz Financial Group, Inc.(a) | 19,718 | 300,383 | ||||||
Meritz Securities Co. Ltd. | 151,421 | 393,315 | ||||||
Mirae Asset Securities Co. Ltd. | 95,070 | 423,809 | ||||||
Mirae Asset Securities Co. Ltd., Second Pfd | 35,987 | 91,455 | ||||||
MK Electron Co. Ltd. | 12,436 | 88,177 | ||||||
Netmarble Corp.(b) | 3,221 | 100,851 | ||||||
NH Investment & Securities Co. Ltd. | 82,955 | 522,382 | ||||||
NHN Corp.(c) | 11,580 | 186,571 | ||||||
NongShim Co. Ltd. | 1,572 | 333,282 | ||||||
OCI Co. Ltd.(a) | 9,232 | 661,072 | ||||||
Orion Corp. | 6,192 | 441,214 | ||||||
Pan Ocean Co. Ltd. | 71,353 | 215,394 | ||||||
Paradise Co. Ltd.(a)(c) | 11,146 | 111,112 | ||||||
Partron Co. Ltd. | 17,382 | 100,061 | ||||||
Poongsan Corp. | 14,316 | 262,310 | ||||||
S-1 Corp. | 5,324 | 233,225 | ||||||
Samsung Biologics Co. Ltd.(b)(c) | 366 | 225,337 | ||||||
Samsung Card Co. Ltd. | 13,944 | 302,481 | ||||||
Seah Besteel Holdings Corp. | 18,558 | 218,222 | ||||||
Sebang Global Battery Co. Ltd. | 4,740 | 129,610 | ||||||
Seoul Semiconductor Co. Ltd. | 21,833 | 160,170 | ||||||
Seoyon Co. Ltd. | 19,526 | 71,554 | ||||||
SFA Engineering Corp. | 9,564 | 256,146 | ||||||
SK Chemicals Co. Ltd.(a) | 3,438 | 213,359 | ||||||
SKC Co. Ltd. | 4,174 | 303,281 | ||||||
SL Corp.(a) | 8,968 | 193,595 | ||||||
SSANGYONG C&E Co. Ltd. | 38,528 | 153,631 | ||||||
See accompanying Notes to Financial Statements which are an integral part of the financial statements.
| 68 | ||||
|
| |||
Invesco FTSE RAFI Developed Markets ex-U.S. Small-Mid ETF (PDN)–(continued)
October 31, 2022
| Shares | Value | |||||||
South Korea-(continued) | ||||||||
Sungwoo Hitech Co. Ltd.(a) | 39,522 | $ | 143,721 | |||||
TKG Huchems Co. Ltd. | 12,902 | 188,850 | ||||||
WONIK IPS Co. Ltd. | 6,487 | 125,236 | ||||||
Youngone Corp. | 14,000 | 464,881 | ||||||
Yuhan Corp. | 9,203 | 386,352 | ||||||
|
| |||||||
| 39,268,755 | ||||||||
|
| |||||||
Spain-1.76% | ||||||||
Almirall S.A. | 21,071 | 196,489 | ||||||
Applus Services S.A. | 40,215 | 238,082 | ||||||
Befesa S.A.(b) | 5,640 | 195,881 | ||||||
Cia de Distribucion Integral Logista Holdings S.A. | 36,571 | 756,876 | ||||||
CIE Automotive S.A.(a) | 18,168 | 462,197 | ||||||
Construcciones y Auxiliar de Ferrocarriles | 4,745 | 123,809 | ||||||
Corp.ACCIONA Energias Renovables S.A. | 7,881 | 309,698 | ||||||
Ebro Foods S.A.(a) | 9,353 | 145,871 | ||||||
EDP Renovaveis S.A.(a) | 35,523 | 748,177 | ||||||
Ence Energia y Celulosa S.A. | 80,804 | 276,644 | ||||||
Faes Farma S.A. | 57,200 | 215,676 | ||||||
Fluidra S.A.(a) | 12,911 | 175,203 | ||||||
Gestamp Automocion S.A.(b) | 106,908 | 375,736 | ||||||
Indra Sistemas S.A.(a) | 73,549 | 657,864 | ||||||
Linea Directa Aseguradora S.A. Cia de Seguros y Reaseguros(a) | 132,535 | 124,245 | ||||||
Mediaset Espana Comunicacion S.A.(a)(c) | 27,072 | 84,123 | ||||||
Melia Hotels International S.A.(c) | 39,804 | 184,899 | ||||||
Obrascon Huarte Lain S.A.(a)(c) | 422,505 | 179,394 | ||||||
Prosegur Cia de Seguridad S.A.(a) | 79,925 | 149,062 | ||||||
Sacyr S.A.(a) | 318,975 | 782,473 | ||||||
Siemens Gamesa Renewable Energy S.A., Class R(a)(c) | 52,613 | 933,922 | ||||||
Tecnicas Reunidas S.A.(a)(c) | 41,648 | 297,401 | ||||||
Unicaja Banco S.A.(b) | 451,294 | 399,649 | ||||||
Viscofan S.A. | 9,945 | 592,206 | ||||||
|
| |||||||
| 8,605,577 | ||||||||
|
| |||||||
Sweden-3.77% | ||||||||
AAK AB(a) | 36,236 | 527,942 | ||||||
AddTech AB, Class B | 18,982 | 229,493 | ||||||
AFRY AB | 27,200 | 365,031 | ||||||
Arjo AB, Class B | 45,578 | 181,727 | ||||||
Atrium Ljungberg AB, Class B | 10,561 | 141,158 | ||||||
Avanza Bank Holding AB(a) | 8,031 | 160,250 | ||||||
Axfood AB | 34,910 | 863,711 | ||||||
Beijer Alma AB, Class B(a) | 7,036 | 98,309 | ||||||
Beijer Ref AB(a) | 22,218 | 344,415 | ||||||
Betsson AB, Class B | 77,838 | 566,328 | ||||||
BHG Group AB(a)(c) | 19,512 | 32,701 | ||||||
Bilia AB, Class A(a) | 25,436 | 269,311 | ||||||
Bonava AB, Class B(a) | 45,203 | 132,208 | ||||||
Bravida Holding AB(b) | 23,586 | 220,910 | ||||||
Bure Equity AB | 9,834 | 189,909 | ||||||
Byggmax Group AB(a) | 30,848 | 128,970 | ||||||
Catena AB(a) | 4,027 | 136,803 | ||||||
Cibus Nordic Real Estate AB | 8,016 | 109,427 | ||||||
Clas Ohlson AB, Class B | 22,767 | 151,946 | ||||||
Cloetta AB, Class B | 104,766 | 191,321 | ||||||
Coor Service Management Holding AB(b) | 27,868 | 147,909 | ||||||
Corem Property Group AB, Class B | 55,309 | 34,435 | ||||||
| Shares | Value | |||||||
Sweden-(continued) | ||||||||
Corem Property Group AB, Preference Shares | 866 | $ | 16,927 | |||||
Dios Fastigheter AB | 24,819 | 162,945 | ||||||
Dustin Group AB(a)(b) | 27,314 | 113,701 | ||||||
Electrolux Professional AB, Class B(a) | 46,766 | 176,476 | ||||||
Elekta AB, Class B(a) | 92,948 | 471,871 | ||||||
EQT AB(a) | 9,266 | 182,462 | ||||||
Evolution AB(a)(b) | 7,642 | 714,377 | ||||||
Granges AB | 31,931 | 215,706 | ||||||
Hexpol AB | 72,320 | 713,354 | ||||||
Hufvudstaden AB, Class A(a) | 36,245 | 431,642 | ||||||
Indutrade AB(a) | 31,319 | 547,989 | ||||||
Intrum AB(a) | 36,349 | 457,551 | ||||||
Investment AB Latour, Class B(a) | 12,675 | 214,205 | ||||||
Inwido AB | 16,643 | 149,404 | ||||||
JM AB(a) | 25,721 | 387,312 | ||||||
L E Lundbergforetagen AB, Class B | 17,303 | 683,010 | ||||||
Lifco AB, Class B(a) | 17,139 | 247,458 | ||||||
Lindab International AB | 14,623 | 155,487 | ||||||
Loomis AB(a) | 17,920 | 500,442 | ||||||
MEKO AB | 19,328 | 182,428 | ||||||
Modern Times Group MTG AB, Class B(a)(c) | 17,488 | 130,894 | ||||||
Mycronic AB | 12,822 | 201,431 | ||||||
NCC AB, Class A(a) | 1,191 | 12,718 | ||||||
NCC AB, Class B(a) | 29,703 | 247,425 | ||||||
New Wave Group AB, Class B | 12,873 | 178,817 | ||||||
Nibe Industrier AB, Class B | 92,407 | 736,717 | ||||||
Nobia AB(a) | 57,343 | 95,533 | ||||||
Nolato AB, Class B | 28,021 | 118,165 | ||||||
Nordnet AB publ | 10,931 | 135,519 | ||||||
Nyfosa AB | 31,520 | 188,114 | ||||||
Pandox AB(a)(c) | 32,415 | 396,591 | ||||||
Peab AB, Class B | 38,671 | 200,521 | ||||||
Ratos AB, Class B(a) | 99,221 | 371,458 | ||||||
Resurs Holding AB, Class A(b) | 123,998 | 269,306 | ||||||
Sagax AB, Class B | 14,101 | 259,805 | ||||||
Sagax AB, Class D | 8,754 | 21,072 | ||||||
Samhallsbyggnadsbolaget i Norden AB, | 170,815 | 234,649 | ||||||
Samhallsbyggnadsbolaget i Norden AB, | 8,103 | 13,316 | ||||||
Scandic Hotels Group AB(b)(c) | 76,044 | 241,060 | ||||||
Stillfront Group AB(a)(c) | 73,310 | 142,700 | ||||||
Sweco AB, Class B(a) | 35,959 | 270,088 | ||||||
Swedish Orphan Biovitrum AB, Class B(c) | 36,663 | 674,505 | ||||||
Thule Group AB(a)(b) | 16,903 | 332,846 | ||||||
Viaplay Group AB, Class B(c) | 16,293 | 297,243 | ||||||
VNV Global AB(a)(c) | 33,511 | 71,871 | ||||||
Wallenstam AB, Class B(a) | 61,486 | 216,889 | ||||||
Wihlborgs Fastigheter AB(a) | 69,345 | 454,332 | ||||||
|
| |||||||
| 18,462,546 | ||||||||
|
| |||||||
Switzerland-3.37% | ||||||||
Allreal Holding AG | 2,806 | 402,079 | ||||||
ALSO Holding AG(a) | 1,598 | 251,337 | ||||||
Arbonia AG(a) | 12,421 | 151,423 | ||||||
Aryzta AG(a)(c) | 411,120 | 421,493 | ||||||
Autoneum Holding AG(a) | 1,647 | 157,500 | ||||||
Banque Cantonale Vaudoise | 9,699 | 863,533 | ||||||
Belimo Holding AG | 793 | 323,301 | ||||||
See accompanying Notes to Financial Statements which are an integral part of the financial statements.
| 69 | ||||
|
| |||
Invesco FTSE RAFI Developed Markets ex-U.S. Small-Mid ETF (PDN)–(continued)
October 31, 2022
| Shares | Value | |||||||
Switzerland-(continued) | ||||||||
BKW AG | 5,943 | $ | 693,622 | |||||
Bucher Industries AG | 1,668 | 562,361 | ||||||
Burckhardt Compression Holding AG | 580 | 250,952 | ||||||
Bystronic AG | 130 | 74,694 | ||||||
Cembra Money Bank AG | 11,891 | 862,640 | ||||||
Daetwyler Holding AG, BR | 724 | 128,631 | ||||||
DKSH Holding AG | 9,539 | 687,723 | ||||||
dormakaba Holding AG | 1,008 | 320,304 | ||||||
Emmi AG | 379 | 302,594 | ||||||
EMS-Chemie Holding AG | 866 | 544,738 | ||||||
Flughafen Zurich AG(c) | 4,446 | 690,391 | ||||||
Forbo Holding AG | 217 | 262,807 | ||||||
Galenica AG(a)(b) | 12,970 | 931,844 | ||||||
Huber + Suhner AG | 4,193 | 373,735 | ||||||
Inficon Holding AG | 211 | 167,830 | ||||||
Interroll Holding AG, Class R(a) | 38 | 80,120 | ||||||
IWG PLC(c) | 216,764 | 329,434 | ||||||
Komax Holding AG, Class R | 717 | 168,369 | ||||||
Kongsberg Automotive ASA(c) | 767,179 | 201,593 | ||||||
Landis+Gyr Group AG(a)(c) | 7,796 | 449,492 | ||||||
Mediclinic International PLC | 154,801 | 884,022 | ||||||
Mobilezone Holding AG | 16,265 | 258,095 | ||||||
Mobimo Holding AG | 1,017 | 237,291 | ||||||
OC Oerlikon Corp. AG | 72,365 | 467,489 | ||||||
Rieter Holding AG | 1,098 | 91,395 | ||||||
SFS Group AG | 3,149 | 284,771 | ||||||
Siegfried Holding AG(c) | 465 | 276,932 | ||||||
Stadler Rail AG(a) | 14,307 | 421,740 | ||||||
Straumann Holding AG | 4,077 | 388,573 | ||||||
Sulzer AG(a) | 5,516 | 367,917 | ||||||
Tecan Group AG, Class R(a) | 981 | 360,149 | ||||||
Temenos AG | 5,239 | 312,534 | ||||||
u-blox Holding AG(c) | 2,638 | 270,456 | ||||||
Valiant Holding AG | 2,000 | 196,053 | ||||||
VAT Group AG(a)(b) | 2,004 | 458,172 | ||||||
Vontobel Holding AG, Class R | 4,763 | 268,432 | ||||||
Wizz Air Holdings PLC(a)(b)(c) | 6,669 | 131,684 | ||||||
Zehnder Group AG | 2,445 | 131,931 | ||||||
Zur Rose Group AG(a)(c) | 1,019 | 27,553 | ||||||
|
| |||||||
| 16,489,729 | ||||||||
|
| |||||||
Ukraine-0.04% | ||||||||
Ferrexpo PLC | 177,672 | 208,859 | ||||||
|
| |||||||
United Arab Emirates-0.15% | ||||||||
Borr Drilling Ltd.(c) | 93,957 | 458,179 | ||||||
Network International Holdings PLC(a)(b)(c) | 73,964 | 276,765 | ||||||
|
| |||||||
| 734,944 | ||||||||
|
| |||||||
United Kingdom-7.01% | ||||||||
888 Holdings PLC | 78,418 | 83,786 | ||||||
Ascential PLC(c) | 62,197 | 137,492 | ||||||
Ashmore Group PLC(a) | 141,453 | 336,147 | ||||||
Assura PLC | 608,164 | 391,767 | ||||||
Aston Martin Lagonda Global Holdings PLC(a)(b)(c) | 61,328 | 74,564 | ||||||
Auto Trader Group PLC(b) | 66,367 | 398,563 | ||||||
AVEVA Group PLC(a) | 21,487 | 771,859 | ||||||
Babcock International Group PLC(c) | 121,436 | 385,331 | ||||||
Balanced Commercial Property Trust Ltd. | 134,680 | 129,478 | ||||||
Balfour Beatty PLC | 137,495 | 472,698 | ||||||
| Shares | Value | |||||||
United Kingdom-(continued) | ||||||||
Biffa PLC(b) | 63,663 | $ | 301,550 | |||||
Big Yellow Group PLC | 29,541 | 382,976 | ||||||
Bodycote PLC | 25,823 | 147,348 | ||||||
Britvic PLC(a) | 75,776 | 634,705 | ||||||
Capita PLC(c) | 497,700 | 139,246 | ||||||
Capital & Counties Properties PLC | 177,027 | 218,291 | ||||||
Capricorn Energy PLC(a)(c) | 123,948 | 353,344 | ||||||
Civitas Social Housing PLC(b) | 202,138 | 138,708 | ||||||
Clarkson PLC | 4,945 | 157,423 | ||||||
Close Brothers Group PLC(a) | 31,717 | 358,601 | ||||||
CMC Markets PLC(a)(b) | 56,073 | 158,494 | ||||||
Computacenter PLC | 15,228 | 317,343 | ||||||
ConvaTec Group PLC(b) | 412,635 | 1,035,690 | ||||||
Countryside Partnerships PLC(b)(c) | 169,575 | 415,081 | ||||||
Cranswick PLC | 9,376 | 321,045 | ||||||
Crest Nicholson Holdings PLC | 59,353 | 138,039 | ||||||
Currys PLC(a) | 439,224 | 329,717 | ||||||
Dechra Pharmaceuticals PLC | 7,302 | 220,268 | ||||||
Diploma PLC | 11,968 | 342,555 | ||||||
Domino’s Pizza Group PLC | 80,719 | 210,221 | ||||||
Dr. Martens PLC | 48,005 | 137,513 | ||||||
Dunelm Group PLC | 25,107 | 250,623 | ||||||
Elementis PLC(c) | 115,775 | 123,300 | ||||||
EnQuest PLC(a)(c) | 1,255,819 | 390,390 | ||||||
Essentra PLC(a) | 39,987 | 103,588 | ||||||
Euromoney Institutional Investor PLC | 15,944 | 265,811 | ||||||
Firstgroup PLC | 234,742 | 284,324 | ||||||
Frasers Group PLC(c) | 67,253 | 501,371 | ||||||
Games Workshop Group PLC | 4,345 | 320,167 | ||||||
Genuit Group PLC | 43,156 | 126,952 | ||||||
Genus PLC | 7,232 | 212,660 | ||||||
Grafton Group PLC | 61,882 | 491,610 | ||||||
Grainger PLC | 142,901 | 373,481 | ||||||
Great Portland Estates PLC | 53,082 | 314,136 | ||||||
Greggs PLC | 15,451 | 358,992 | ||||||
Halfords Group PLC | 78,137 | 158,605 | ||||||
Hammerson PLC(a) | 1,406,671 | 309,743 | ||||||
Harbour Energy PLC | 89,908 | 391,185 | ||||||
Hargreaves Lansdown PLC(a) | 51,443 | 452,035 | ||||||
Hill & Smith Holdings PLC | 13,327 | 151,599 | ||||||
HomeServe PLC | 74,829 | 1,021,791 | ||||||
Ibstock PLC(b) | 124,574 | 223,031 | ||||||
Indivior PLC(c) | 17,034 | 325,365 | ||||||
IP Group PLC | 300,284 | 203,982 | ||||||
J D Wetherspoon PLC(c) | 33,483 | 173,863 | ||||||
JD Sports Fashion PLC | 371,555 | 416,838 | ||||||
John Wood Group PLC(c) | 333,905 | 537,834 | ||||||
Jupiter Fund Management PLC | 147,342 | 176,089 | ||||||
Kier Group PLC(c) | 134,850 | 92,845 | ||||||
Lancashire Holdings Ltd. | 87,967 | 501,543 | ||||||
LondonMetric Property PLC | 155,660 | 334,961 | ||||||
LXI REIT PLC(b) | 134,073 | 188,017 | ||||||
Marshalls PLC | 23,565 | 68,480 | ||||||
Marston’s PLC | 222,401 | 89,775 | ||||||
Mitchells & Butlers PLC(c) | 94,874 | 126,929 | ||||||
Moneysupermarket.com Group PLC | 164,504 | 347,363 | ||||||
Morgan Sindall Group PLC | 6,418 | 113,796 | ||||||
National Express Group PLC(c) | 171,172 | 333,458 | ||||||
NCC Group PLC | 71,309 | 163,382 | ||||||
Ninety One PLC(a) | 60,112 | 140,911 | ||||||
See accompanying Notes to Financial Statements which are an integral part of the financial statements.
| 70 | ||||
|
| |||
Invesco FTSE RAFI Developed Markets ex-U.S. Small-Mid ETF (PDN)–(continued)
October 31, 2022
| Shares | Value | |||||||
United Kingdom-(continued) | ||||||||
Ocado Group PLC(a)(c) | 37,349 | $ | 203,140 | |||||
OSB Group PLC | 83,728 | 399,868 | ||||||
Oxford Instruments PLC | 6,835 | 150,622 | ||||||
PageGroup PLC | 81,175 | 394,592 | ||||||
Paragon Banking Group PLC | 67,925 | 334,719 | ||||||
Pepco Group N.V.(b)(c) | 21,404 | 150,638 | ||||||
Petrofac Ltd.(a)(c) | 458,805 | 568,920 | ||||||
Pets at Home Group PLC | 140,066 | 464,121 | ||||||
Playtech PLC(c) | 111,321 | 665,199 | ||||||
Premier Foods PLC(a) | 124,297 | 148,261 | ||||||
Primary Health Properties PLC | 292,266 | 373,852 | ||||||
Provident Financial PLC | 64,239 | 120,779 | ||||||
QinetiQ Group PLC | 157,021 | 649,745 | ||||||
Reach PLC | 109,285 | 115,571 | ||||||
Redde Northgate PLC | 48,156 | 184,630 | ||||||
Redrow PLC | 97,637 | 470,567 | ||||||
Renewi PLC(c) | 31,669 | 192,885 | ||||||
Renishaw PLC | 3,900 | 157,249 | ||||||
Restaurant Group PLC (The)(c) | 238,434 | 87,298 | ||||||
Rightmove PLC(a) | 56,029 | 317,255 | ||||||
Rotork PLC | 163,849 | 483,315 | ||||||
S4 Capital PLC(c) | 44,299 | 89,613 | ||||||
Safestore Holdings PLC | 28,595 | 297,458 | ||||||
Saga PLC(a)(c) | 56,405 | 55,785 | ||||||
Savills PLC | 23,303 | 221,481 | ||||||
Serco Group PLC | 331,048 | 622,803 | ||||||
Shaftesbury PLC | 59,978 | 253,849 | ||||||
Softcat PLC | 15,220 | 196,264 | ||||||
Spire Healthcare Group PLC(b)(c) | 77,194 | 192,864 | ||||||
Spirent Communications PLC | 99,034 | 296,459 | ||||||
SThree PLC | 58,418 | 250,206 | ||||||
Synthomer PLC | 143,482 | 185,848 | ||||||
Telecom Plus PLC | 13,134 | 321,339 | ||||||
THG PLC(a)(c) | 311,499 | 190,799 | ||||||
TP ICAP Group PLC | 172,947 | 366,386 | ||||||
Tritax Big Box REIT PLC | 315,846 | 510,200 | ||||||
Tritax EuroBox PLC(a)(b) | 135,716 | 92,191 | ||||||
Tyman PLC | 51,990 | 115,048 | ||||||
UK Commercial Property REIT Ltd. | 225,458 | 158,344 | ||||||
UNITE Group PLC (The) | 62,218 | 638,265 | ||||||
Vesuvius PLC | 38,623 | 150,838 | ||||||
Victrex PLC | 22,176 | 422,050 | ||||||
Vistry Group PLC | 55,673 | 386,518 | ||||||
Watches of Switzerland Group PLC(b)(c) | 19,426 | 173,226 | ||||||
WH Smith PLC(c) | 28,807 | 390,375 | ||||||
Wickes Group PLC | 87,364 | 127,544 | ||||||
Workspace Group PLC | 33,129 | 156,158 | ||||||
|
| |||||||
| 34,295,805 | ||||||||
|
| |||||||
Investment Abbreviations:
BR-Bearer Shares
CDI-CREST Depository Interest
CVA-Dutch Certificates
FDR-Fiduciary Depositary Receipt
Pfd.-Preferred
REIT-Real Estate Investment Trust
RSP-Registered Savings Plan Shares
Wts.-Warrants
| Shares | Value | |||||||
United Republic of Tanzania-0.03% | ||||||||
Helios Towers PLC(a)(c) | 87,601 | $ | 126,579 | |||||
|
| |||||||
United States-0.82% | ||||||||
Argonaut Gold, Inc.(c) | 131,993 | 38,706 | ||||||
Brookfield Renewable Corp., Class A | 12,814 | 397,652 | ||||||
Diversified Energy Co. PLC(a)(b) | 183,624 | 265,961 | ||||||
JS Global Lifestyle Co. Ltd.(b) | 268,074 | 215,829 | ||||||
Oracle Corp. | 9,362 | 500,113 | ||||||
Primo Water Corp. | 50,406 | 733,890 | ||||||
Reliance Worldwide Corp. Ltd. | 134,414 | 275,903 | ||||||
RHI Magnesita N.V. | 5,890 | 125,593 | ||||||
Samsonite International S.A.(b)(c) | 404,505 | 869,831 | ||||||
Sims Ltd. | 63,504 | 496,225 | ||||||
Sinch AB(a)(b)(c) | 33,782 | 79,469 | ||||||
|
| |||||||
| 3,999,172 | ||||||||
|
| |||||||
Total Common Stocks & Other Equity Interests |
| 487,359,905 | ||||||
|
| |||||||
Money Market Funds-0.12% |
| |||||||
Invesco Government & Agency Portfolio, Institutional Class, 3.07%(e)(f) | 599,917 | 599,917 | ||||||
|
| |||||||
TOTAL INVESTMENTS IN SECURITIES |
| 487,959,822 | ||||||
|
| |||||||
| Investments Purchased with Cash Collateral from Securities on Loan |
| |||||||
Money Market Funds-15.93% |
| |||||||
Invesco Private Government Fund, | 22,006,479 | 22,006,479 | ||||||
Invesco Private Prime Fund, | 55,915,444 | 55,915,444 | ||||||
|
| |||||||
Total Investments Purchased with Cash Collateral from Securities on Loan | 77,921,923 | |||||||
|
| |||||||
TOTAL INVESTMENTS IN SECURITIES-115.68% |
| 565,881,745 | ||||||
OTHER ASSETS LESS LIABILITIES-(15.68)% |
| (76,719,566 | ) | |||||
|
| |||||||
NET ASSETS-100.00% | $ | 489,162,179 | ||||||
|
| |||||||
See accompanying Notes to Financial Statements which are an integral part of the financial statements.
| 71 | ||||
|
| |||
Invesco FTSE RAFI Developed Markets ex-U.S. Small-Mid ETF (PDN)–(continued)
October 31, 2022
Notes to Schedule of Investments:
| (a) | All or a portion of this security was out on loan at October 31, 2022. |
| (b) | Security purchased or received in a transaction exempt from registration under the Securities Act of 1933, as amended (the “1933 Act”). The security may be resold pursuant to an exemption from registration under the 1933 Act, typically to qualified institutional buyers. The aggregate value of these securities at October 31, 2022 was $26,137,293, which represented 5.34% of the Fund’s Net Assets. |
| (c) | Non-income producing security. |
| (d) | Restricted security. The value of this security at October 31, 2022 represented less than 1% of the Fund’s Net Assets. |
| (e) | Affiliated issuer. The issuer and/or the Fund is a wholly-owned subsidiary of Invesco Ltd., or is affiliated by having an investment adviser that is under common control of Invesco Ltd. The table below shows the Fund’s transactions in, and earnings from, its investments in affiliates for the fiscal year ended October 31, 2022. |
Value | Purchases at Cost | Proceeds from Sales | Change in | Realized Gain (Loss) | Value | Dividend Income | ||||||||||||||||||||||||||||||||||||||||||||||
| Invesco Office J-Reit, Inc. | $ | 58,080 | $ | - | $ | (58,488 | ) | $ | (10,828 | ) | $ | 11,236 | $ | - | $ | - | ||||||||||||||||||||||||||||||||||||
| Investments in Affiliated Money Market Funds: | ||||||||||||||||||||||||||||||||||||||||||||||||||||
| Invesco Government & Agency Portfolio, Institutional Class | - | 38,122,360 | (37,522,443 | ) | - | - | 599,917 | 5,436 | ||||||||||||||||||||||||||||||||||||||||||||
| Investments Purchased with Cash Collateral from Securities on Loan: | ||||||||||||||||||||||||||||||||||||||||||||||||||||
| Invesco Private Government Fund | 12,012,523 | 74,010,518 | (64,016,562 | ) | - | - | 22,006,479 | 221,784 | * | |||||||||||||||||||||||||||||||||||||||||||
| Invesco Private Prime Fund | 28,084,570 | 165,160,340 | (137,314,145 | ) | (2,027 | ) | (13,294 | ) | 55,915,444 | 600,212 | * | |||||||||||||||||||||||||||||||||||||||||
|
|
|
|
|
|
|
|
|
|
|
|
|
| |||||||||||||||||||||||||||||||||||||||
| Total | $ | 40,155,173 | $ | 277,293,218 | $ | (238,911,638 | ) | $ | (12,855 | ) | $ | (2,058 | ) | $ | 78,521,840 | $ | 827,432 | |||||||||||||||||||||||||||||||||||
|
|
|
|
|
|
|
|
|
|
|
|
|
| |||||||||||||||||||||||||||||||||||||||
| * | Represents the income earned on the investment of cash collateral, which is included in securities lending income on the Statements of Operations. Does not include rebates and fees paid to lending agent or premiums received from borrowers, if any. |
| (f) | The rate shown is the 7-day SEC standardized yield as of October 31, 2022. |
| (g) | The security has been segregated to satisfy the commitment to return the cash collateral received in securities lending transactions upon the borrower’s return of the securities loaned. See Note 2J. |
See accompanying Notes to Financial Statements which are an integral part of the financial statements.
| 72 | ||||
|
| |||
Invesco FTSE RAFI Emerging Markets ETF (PXH)
October 31, 2022
Schedule of Investments
| Shares | Value | |||||||
Common Stocks & Other Equity Interests-99.78% |
| |||||||
Brazil-17.94% |
| |||||||
Ambev S.A. | 2,128,544 | $ | 6,490,391 | |||||
B3 S.A. - Brasil, Bolsa, Balcao | 1,538,955 | 4,411,050 | ||||||
Banco Bradesco S.A. | 1,537,016 | 4,874,162 | ||||||
Banco Bradesco S.A., Preference Shares | 5,243,706 | 19,846,587 | ||||||
Banco do Brasil S.A. | 1,423,458 | 10,042,673 | ||||||
Banco Santander Brasil S.A. | 454,700 | 2,580,583 | ||||||
Braskem S.A., Class A, Preference Shares | 183,809 | 1,180,847 | ||||||
BRF S.A.(a) | 893,600 | 2,138,952 | ||||||
CCR S.A. | 875,400 | 2,162,120 | ||||||
Centrais Eletricas Brasileiras S.A. | 623,450 | 5,919,344 | ||||||
Centrais Eletricas Brasileiras S.A., Class B, Preference Shares | 272,200 | 2,765,964 | ||||||
Cia de Saneamento Basico do Estado de Sao Paulo | 295,192 | 3,381,017 | ||||||
Cia Energetica de Minas Gerais | 302,505 | 996,772 | ||||||
Cia Energetica de Minas Gerais, Preference Shares | 1,109,268 | 2,403,617 | ||||||
Cia Paranaense de Energia | 292,000 | 390,094 | ||||||
Cia Paranaense de Energia, Class B, Preference Shares | 1,211,980 | 1,709,210 | ||||||
Cia Siderurgica Nacional S.A. | 339,082 | 793,545 | ||||||
Cielo S.A. | 3,346,722 | 3,794,939 | ||||||
Cogna Educacao(a) | 4,497,600 | 2,819,973 | ||||||
Cosan S.A. | 437,865 | 1,406,909 | ||||||
Embraer S.A.(a) | 539,667 | 1,414,154 | ||||||
Energisa S.A. | 161,700 | 1,494,275 | ||||||
Equatorial Energia S.A. | 459,500 | 2,629,717 | ||||||
Gerdau S.A., Preference Shares | 719,692 | 3,531,768 | ||||||
Hapvida Participacoes e Investimentos | 612,000 | 909,734 | ||||||
Itau Unibanco Holding S.A. | 433,400 | 2,099,581 | ||||||
Itau Unibanco Holding S.A., Preference Shares | 4,636,375 | 26,860,889 | ||||||
Itausa S.A., Preference Shares | 1,479,685 | 3,028,599 | ||||||
Klabin S.A. | 361,400 | 1,489,060 | ||||||
Lojas Renner S.A. | 304,710 | 1,794,376 | ||||||
Metalurgica Gerdau S.A., Preference Shares | 1,327,700 | 2,846,562 | ||||||
Natura & Co. Holding S.A. | 454,400 | 1,294,636 | ||||||
Petroleo Brasileiro S.A. | 2,776,262 | 17,597,498 | ||||||
Petroleo Brasileiro S.A., Preference Shares | 4,193,547 | 23,823,838 | ||||||
Rumo S.A. | 567,300 | 2,393,639 | ||||||
Sul America S.A. | 378,155 | 1,718,084 | ||||||
Suzano S.A. | 176,468 | 1,789,146 | ||||||
Telefonica Brasil S.A. | 379,343 | 2,986,452 | ||||||
TIM S.A. | 590,766 | 1,486,133 | ||||||
Ultrapar Participacoes S.A. | 1,232,292 | 3,149,275 | ||||||
Usinas Siderurgicas de Minas Gerais S.A. Usiminas | 121,800 | 171,538 | ||||||
Usinas Siderurgicas de Minas Gerais S.A. Usiminas, Class A, Preference Shares | 354,100 | 487,902 | ||||||
Vale S.A. | 1,990,438 | 25,464,406 | ||||||
| Shares | Value | |||||||
Brazil-(continued) |
| |||||||
Via S/A(a) | 2,499,900 | $ | 1,491,198 | |||||
Vibra Energia S.A. | 1,264,019 | 4,396,274 | ||||||
|
| |||||||
| 216,457,483 | ||||||||
|
| |||||||
Canada-0.14% |
| |||||||
Canadian Solar, Inc.(a)(c) | 48,803 | 1,654,422 | ||||||
|
| |||||||
Chile-0.82% |
| |||||||
Banco de Chile | 23,549,057 | 2,153,015 | ||||||
Banco Santander Chile | 48,863,397 | 1,749,901 | ||||||
Cencosud S.A. | 756,957 | 1,018,563 | ||||||
Enel Americas S.A. | 15,692,514 | 1,554,263 | ||||||
Falabella S.A. | 641,976 | 1,254,819 | ||||||
Sociedad Quimica y Minera de Chile S.A., Class A | 2,644 | 215,674 | ||||||
Sociedad Quimica y Minera de Chile S.A., Class B, Preference Shares | 20,639 | 1,963,714 | ||||||
|
| |||||||
| 9,909,949 | ||||||||
|
| |||||||
China-31.24% |
| |||||||
Agricultural Bank of China Ltd., A Shares | 12,102,700 | 4,576,693 | ||||||
Agricultural Bank of China Ltd., H Shares | 38,539,754 | 10,997,541 | ||||||
Alibaba Group Holding Ltd.(a) | 3,729,228 | 29,193,050 | ||||||
Aluminum Corp. of China Ltd., A Shares | 745,300 | 394,166 | ||||||
Aluminum Corp. of China Ltd., H Shares | 2,926,126 | 834,987 | ||||||
Anhui Conch Cement Co. Ltd., A Shares | 176,200 | 586,158 | ||||||
Anhui Conch Cement Co. Ltd., H Shares | 776,539 | 1,998,266 | ||||||
ANTA Sports Products Ltd. | 109,410 | 961,711 | ||||||
Baidu, Inc., A Shares(a) | 723,614 | 6,922,860 | ||||||
Bank of Beijing Co. Ltd., A Shares | 2,077,500 | 1,149,960 | ||||||
Bank of China Ltd., A Shares | 3,546,100 | 1,462,440 | ||||||
Bank of China Ltd., H Shares | 50,596,706 | 16,307,275 | ||||||
Bank of Communications Co. Ltd., A Shares | 4,136,093 | 2,521,801 | ||||||
Bank of Communications Co. Ltd., H Shares | 10,912,353 | 5,324,218 | ||||||
Baoshan Iron & Steel Co. Ltd., A Shares | 1,364,300 | 899,115 | ||||||
BYD Co. Ltd., A Shares | 10,700 | 361,627 | ||||||
BYD Co. Ltd., H Shares | 69,361 | 1,552,479 | ||||||
CGN Power Co. Ltd., A Shares | 282,400 | 102,148 | ||||||
CGN Power Co. Ltd., H Shares(b) | 6,229,128 | 1,261,720 | ||||||
China CITIC Bank Corp. Ltd., A Shares | 480,001 | 284,768 | ||||||
China CITIC Bank Corp. Ltd., H Shares | 6,616,564 | 2,494,956 | ||||||
China Coal Energy Co. Ltd., A Shares | 292,800 | 353,834 | ||||||
China Coal Energy Co. Ltd., H Shares | 1,683,540 | 1,239,624 | ||||||
China Conch Environment Protection Holdings Ltd.(a) | 430,702 | 126,744 | ||||||
China Conch Venture Holdings Ltd. | 426,320 | 628,902 | ||||||
China Construction Bank Corp., A Shares | 318,000 | 232,664 | ||||||
China Construction Bank Corp., H Shares | 46,418,241 | 24,658,314 | ||||||
See accompanying Notes to Financial Statements which are an integral part of the financial statements.
| 73 | ||||
|
| |||
Invesco FTSE RAFI Emerging Markets ETF (PXH)–(continued)
October 31, 2022
| Shares | Value | |||||||
China-(continued) |
| |||||||
China Everbright Bank Co. Ltd., A Shares | 4,389,600 | $ | 1,635,891 | |||||
China Everbright Bank Co. Ltd., H Shares | 4,701,740 | 1,215,887 | ||||||
China Everbright Environment Group Ltd. | 2,448,328 | 814,046 | ||||||
China Gas Holdings Ltd. | 1,539,929 | 1,365,364 | ||||||
China Hongqiao Group Ltd.(c) | 1,632,402 | 1,158,300 | ||||||
China Life Insurance Co. Ltd., H Shares . | 3,726,430 | 4,058,801 | ||||||
China Longyuan Power Group Corp. Ltd., H Shares | 680,967 | 778,139 | ||||||
China Mengniu Dairy Co. Ltd. | 539,120 | 1,727,277 | ||||||
China Merchants Bank Co. Ltd., A Shares | 573,500 | 2,107,427 | ||||||
China Merchants Bank Co. Ltd., H Shares | 1,489,705 | 4,896,194 | ||||||
China Minsheng Banking Corp. Ltd., A Shares | 4,802,645 | 2,171,475 | ||||||
China Minsheng Banking Corp. Ltd., H Shares(c) | 12,506,665 | 3,632,579 | ||||||
China National Building Material Co. Ltd., H Shares | 2,875,863 | 1,670,597 | ||||||
China Overseas Land & Investment Ltd. | 3,357,320 | 6,406,830 | ||||||
China Pacific Insurance (Group) Co. Ltd., A Shares | 369,600 | 963,676 | ||||||
China Pacific Insurance (Group) Co. Ltd., H Shares | 2,128,043 | 3,432,043 | ||||||
China Petroleum & Chemical Corp., A Shares | 3,184,900 | 1,776,031 | ||||||
China Petroleum & Chemical Corp., H Shares | 35,750,184 | 14,118,177 | ||||||
China Power International Development Ltd.(c) | 4,448,770 | 1,286,484 | ||||||
China Railway Group Ltd., A Shares | 2,320,400 | 1,586,441 | ||||||
China Railway Group Ltd., H Shares | 6,362,445 | 2,763,867 | ||||||
China Resources Cement Holdings Ltd. | 1,580,244 | 571,717 | ||||||
China Resources Gas Group Ltd. | 356,221 | 912,125 | ||||||
China Resources Land Ltd. | 1,860,060 | 5,829,089 | ||||||
China Resources Power Holdings Co. Ltd. | 1,977,494 | 2,876,868 | ||||||
China Shenhua Energy Co. Ltd., A Shares | 387,100 | 1,486,643 | ||||||
China Shenhua Energy Co. Ltd., H Shares | 2,634,723 | 6,930,964 | ||||||
China State Construction Engineering Corp. Ltd., A Shares | 5,377,237 | 3,499,558 | ||||||
China Tower Corp. Ltd., H Shares(b) | 17,541,867 | 1,586,620 | ||||||
China United Network Communications Ltd., A Shares | 2,794,400 | 1,286,436 | ||||||
China Vanke Co. Ltd., A Shares | 753,600 | 1,395,976 | ||||||
China Vanke Co. Ltd., H Shares | 2,098,132 | 2,694,213 | ||||||
Chongqing Rural Commercial Bank Co. Ltd., A Shares | 486,600 | 232,679 | ||||||
Chongqing Rural Commercial Bank Co. Ltd., H Shares | 3,365,727 | 1,020,457 | ||||||
CIFI Holdings Group Co. Ltd.(c) | 2,664,738 | 166,079 | ||||||
CITIC Ltd. | 1,786,868 | 1,600,245 | ||||||
CITIC Securities Co. Ltd., A Shares | 238,300 | 561,908 | ||||||
CITIC Securities Co. Ltd., H Shares | 782,031 | 1,169,582 | ||||||
| Shares | Value | |||||||
China-(continued) |
| |||||||
COSCO SHIPPING Holdings Co. Ltd., A Shares | 189,780 | $ | 292,005 | |||||
COSCO SHIPPING Holdings Co. Ltd., H Shares | 725,232 | 782,526 | ||||||
Country Garden Holdings Co. Ltd. | 4,825,035 | 620,813 | ||||||
CRRC Corp. Ltd., A Shares | 1,332,300 | 867,074 | ||||||
CRRC Corp. Ltd., H Shares | 3,164,420 | 959,422 | ||||||
CSPC Pharmaceutical Group Ltd. | 1,585,730 | 1,630,202 | ||||||
ENN Energy Holdings Ltd. | 222,698 | 2,214,256 | ||||||
Geely Automobile Holdings Ltd. | 2,158,332 | 2,320,595 | ||||||
GF Securities Co. Ltd., A Shares | 163,600 | 305,520 | ||||||
GF Securities Co. Ltd., H Shares | 609,133 | 620,008 | ||||||
Great Wall Motor Co. Ltd., A Shares | 44,900 | 179,388 | ||||||
Great Wall Motor Co. Ltd., H Shares | 633,388 | 691,495 | ||||||
Greentown China Holdings Ltd. | 844,048 | 803,205 | ||||||
Guangzhou Automobile Group Co. Ltd., A Shares | 95,300 | 147,939 | ||||||
Guangzhou Automobile Group Co. Ltd., H Shares | 1,253,088 | 763,041 | ||||||
Haier Smart Home Co. Ltd., A Shares | 137,500 | 391,856 | ||||||
Haier Smart Home Co. Ltd., H Shares | 756,807 | 1,893,500 | ||||||
Haitong Securities Co. Ltd., A Shares | 370,800 | 428,788 | ||||||
Haitong Securities Co. Ltd., H Shares | 1,929,515 | 943,883 | ||||||
Hengan International Group Co. Ltd. | 286,145 | 1,109,972 | ||||||
Huaneng Power International, Inc., A Shares(a) | 505,600 | 464,133 | ||||||
Huaneng Power International, Inc., H Shares(a)(c) | 4,784,481 | 1,712,694 | ||||||
Huatai Securities Co. Ltd., A Shares | 235,500 | 386,230 | ||||||
Huatai Securities Co. Ltd., H Shares(b) | 738,148 | 723,117 | ||||||
Huaxia Bank Co. Ltd., A Shares | 1,786,092 | 1,172,195 | ||||||
Industrial & Commercial Bank of China Ltd., A Shares | 3,372,012 | 1,917,333 | ||||||
Industrial & Commercial Bank of China Ltd., H Shares | 50,110,437 | 21,768,134 | ||||||
Industrial Bank Co. Ltd., A Shares | 1,169,200 | 2,407,732 | ||||||
JD.com, Inc., A Shares | 334,326 | 6,179,825 | ||||||
Jiangxi Copper Co. Ltd., A Shares | 149,300 | 315,022 | ||||||
Jiangxi Copper Co. Ltd., H Shares | 1,195,391 | 1,306,580 | ||||||
JinkoSolar Holding Co. Ltd., ADR(a)(c) | 33,345 | 1,583,221 | ||||||
JOYY, Inc., ADR(c) | 38,051 | 960,027 | ||||||
Kunlun Energy Co. Ltd. | 1,997,971 | 1,193,715 | ||||||
Kweichow Moutai Co. Ltd., A Shares | 6,700 | 1,239,279 | ||||||
Longfor Group Holdings Ltd.(b) | 936,823 | 1,193,428 | ||||||
Lufax Holding Ltd., ADR | 326,442 | 519,043 | ||||||
Meituan, B Shares(a)(b) | 198,143 | 3,150,155 | ||||||
Metallurgical Corp. of China Ltd., A Shares | 1,195,900 | 471,898 | ||||||
Metallurgical Corp. of China Ltd., H Shares | 3,005,839 | 478,646 | ||||||
NetEase, Inc. | 286,152 | 3,120,392 | ||||||
New China Life Insurance Co. Ltd., A Shares | 113,400 | 363,105 | ||||||
New China Life Insurance Co. Ltd., H Shares | 748,414 | 1,187,951 | ||||||
New Oriental Education & Technology Group, Inc.(a) | 1,533,342 | 3,754,318 | ||||||
People’s Insurance Co. Group of China Ltd. (The), H Shares | 7,933,707 | 2,193,181 | ||||||
PetroChina Co. Ltd., H Shares | 24,925,332 | 9,525,787 | ||||||
See accompanying Notes to Financial Statements which are an integral part of the financial statements.
| 74 | ||||
|
| |||
Invesco FTSE RAFI Emerging Markets ETF (PXH)–(continued)
October 31, 2022
| Shares | Value | |||||||
China-(continued) |
| |||||||
PICC Property & Casualty Co. Ltd., H Shares | 2,707,968 | $ | 2,497,588 | |||||
Ping An Bank Co. Ltd., A Shares | 883,800 | 1,252,088 | ||||||
Ping An Insurance (Group) Co. of China Ltd., A Shares | 578,900 | 2,867,294 | ||||||
Ping An Insurance (Group) Co. of China Ltd., H Shares | 4,521,187 | 18,085,094 | ||||||
Poly Developments and Holdings Group Co. Ltd., A Shares | 644,600 | 1,218,793 | ||||||
Postal Savings Bank of China Co. Ltd., A Shares | 1,040,300 | 553,033 | ||||||
Postal Savings Bank of China Co. Ltd., H Shares(b)(c) | 6,787,559 | 3,147,412 | ||||||
SAIC Motor Corp. Ltd., A Shares | 975,856 | 1,838,438 | ||||||
Shanghai Pharmaceuticals Holding Co. Ltd., A Shares | 143,900 | 346,609 | ||||||
Shanghai Pharmaceuticals Holding Co. Ltd., H Shares | 944,653 | 1,280,420 | ||||||
Shanghai Pudong Development Bank Co. Ltd., A Shares | 3,043,952 | 2,769,277 | ||||||
Shenzhou International Group Holdings Ltd. | 114,992 | 796,903 | ||||||
Sino Biopharmaceutical Ltd. | 2,086,147 | 1,012,532 | ||||||
Sinopharm Group Co. Ltd., H Shares | 580,848 | 1,106,962 | ||||||
Sunny Optical Technology Group Co. Ltd. | 66,390 | 575,532 | ||||||
TAL Education Group, ADR(a) | 525,561 | 2,475,392 | ||||||
Tencent Holdings Ltd. | 687,664 | 18,011,009 | ||||||
Trip.com Group Ltd., ADR(a) | 186,718 | 4,225,428 | ||||||
Vipshop Holdings Ltd., ADR(a)(c) | 346,570 | 2,415,593 | ||||||
Weichai Power Co. Ltd., A Shares | 262,400 | 326,445 | ||||||
Weichai Power Co. Ltd., H Shares | 1,104,992 | 1,058,560 | ||||||
Xiaomi Corp., B Shares(a)(b) | 3,728,398 | 4,184,435 | ||||||
Yangzijiang Shipbuilding Holdings Ltd. | 1,395,474 | 1,183,357 | ||||||
Yankuang Energy Group Co. Ltd., A Shares | 45,400 | 252,547 | ||||||
Yankuang Energy Group Co. Ltd., H Shares | 1,069,529 | 3,011,088 | ||||||
Zhongsheng Group Holdings Ltd. | 223,254 | 847,528 | ||||||
Zijin Mining Group Co. Ltd., A Shares | 298,000 | 323,372 | ||||||
Zijin Mining Group Co. Ltd., H Shares | 1,152,015 | 1,100,672 | ||||||
|
| |||||||
| 376,830,736 | ||||||||
|
| |||||||
India-14.48% |
| |||||||
Axis Bank Ltd. | 595,309 | 6,515,659 | ||||||
Bank of Baroda | 1,024,115 | 1,827,330 | ||||||
Bharat Petroleum Corp. Ltd. | 807,690 | 2,962,823 | ||||||
Bharti Airtel Ltd. | 467,267 | 4,696,519 | ||||||
Coal India Ltd. | 1,872,195 | 5,562,700 | ||||||
GAIL (India) Ltd. | 2,193,929 | 2,419,809 | ||||||
Grasim Industries Ltd. | 154,905 | 3,221,889 | ||||||
HCL Technologies Ltd. | 203,382 | 2,558,076 | ||||||
Hero MotoCorp Ltd. | 65,425 | 2,115,707 | ||||||
Hindalco Industries Ltd. | 744,599 | 3,648,897 | ||||||
Hindustan Petroleum Corp. Ltd. | 590,963 | 1,526,712 | ||||||
Hindustan Unilever Ltd. | 103,603 | 3,192,415 | ||||||
Housing Development Finance Corp. Ltd. | 396,434 | 11,828,247 | ||||||
ICICI Bank Ltd. | 302,479 | 3,320,500 | ||||||
Indiabulls Housing Finance Ltd.(a) | 886,180 | 1,384,765 | ||||||
| Shares | Value | |||||||
India-(continued) |
| |||||||
Indian Oil Corp. Ltd. | 2,467,533 | $ | 2,034,480 | |||||
Indus Towers Ltd. | 463,608 | 1,038,921 | ||||||
Infosys Ltd. | 567,862 | 10,548,434 | ||||||
ITC Ltd. | 1,026,637 | 4,324,706 | ||||||
Jindal Steel & Power Ltd. | 298,143 | 1,656,260 | ||||||
JSW Steel Ltd. | 339,131 | 2,761,105 | ||||||
Larsen & Toubro Ltd. | 213,980 | 5,229,717 | ||||||
Mahindra & Mahindra Ltd. | 410,635 | 6,690,011 | ||||||
Maruti Suzuki India Ltd. | 26,502 | 3,050,351 | ||||||
NTPC Ltd. | 2,066,023 | 4,320,360 | ||||||
Oil & Natural Gas Corp. Ltd. | 2,617,337 | 4,238,519 | ||||||
Piramal Enterprises Ltd. | 51,965 | 533,225 | ||||||
Power Grid Corp. of India Ltd. | 1,503,926 | 4,145,096 | ||||||
REC Ltd. | 1,088,844 | 1,348,929 | ||||||
Reliance Industries Ltd. | 790,690 | 24,353,758 | ||||||
Shriram Transport Finance Co. Ltd. | 101,572 | 1,508,227 | ||||||
State Bank of India | 849,471 | 5,888,393 | ||||||
Sun Pharmaceutical Industries Ltd. | 173,742 | 2,134,375 | ||||||
Tata Consultancy Services Ltd. | 152,911 | 5,898,556 | ||||||
Tata Motors Ltd.(a) | 1,475,979 | 7,359,613 | ||||||
Tata Motors Ltd., Class A(a) | 270,583 | 768,821 | ||||||
Tata Power Co. Ltd. (The) | 626,700 | 1,711,023 | ||||||
Tata Steel Ltd. | 4,809,207 | 5,899,852 | ||||||
Tech Mahindra Ltd. | 131,779 | 1,692,897 | ||||||
UltraTech Cement Ltd. | 17,803 | 1,444,188 | ||||||
UPL Ltd. | 193,060 | 1,703,028 | ||||||
Vedanta Ltd. | 897,788 | 3,045,500 | ||||||
Wipro Ltd. | 175,306 | 818,635 | ||||||
Yes Bank Ltd.(a) | 9,552,949 | 1,794,550 | ||||||
|
| |||||||
| 174,723,578 | ||||||||
|
| |||||||
Indonesia-1.97% |
| |||||||
PT Adaro Energy Indonesia Tbk | 9,541,205 | 2,434,621 | ||||||
PT Astra International Tbk | 5,429,097 | 2,314,698 | ||||||
PT Bank Central Asia Tbk | 7,896,455 | 4,455,124 | ||||||
PT Bank Mandiri (Persero) Tbk | 4,998,766 | 3,381,118 | ||||||
PT Bank Negara Indonesia (Persero) Tbk | 3,529,740 | 2,127,235 | ||||||
PT Bank Rakyat Indonesia (Persero) Tbk | 16,960,577 | 5,056,367 | ||||||
PT Telkom Indonesia (Persero) Tbk | 14,118,405 | 3,973,701 | ||||||
|
| |||||||
| 23,742,864 | ||||||||
|
| |||||||
Malaysia-0.53% |
| |||||||
CIMB Group Holdings Bhd | 1,224,100 | 1,429,152 | ||||||
Malayan Banking Bhd | 845,600 | 1,536,316 | ||||||
Petronas Chemicals Group Bhd | 912,800 | 1,683,506 | ||||||
Public Bank Bhd | 1,869,400 | 1,767,390 | ||||||
|
| |||||||
| 6,416,364 | ||||||||
|
| |||||||
Mexico-3.70% |
| |||||||
America Movil S.A.B. de C.V., Series L | 12,259,563 | 11,580,775 | ||||||
Arca Continental S.A.B. de C.V | 221,508 | 1,811,101 | ||||||
Cemex S.A.B. de C.V., Series CPO(a)(c)(d) | 12,782,093 | 4,958,543 | ||||||
Fomento Economico Mexicano S.A.B. de C.V., Series CPO(e) | 1,016,390 | 7,283,045 | ||||||
Grupo Financiero Banorte S.A.B. de C.V., Class O | 936,756 | 7,600,612 | ||||||
Grupo Mexico S.A.B. de C.V., Class B(c) . | 777,382 | 2,813,207 | ||||||
Grupo Televisa S.A.B., Series CPO(f) | 1,302,040 | 1,378,854 | ||||||
See accompanying Notes to Financial Statements which are an integral part of the financial statements.
| 75 | ||||
|
| |||
Invesco FTSE RAFI Emerging Markets ETF (PXH)–(continued)
October 31, 2022
| Shares | Value | |||||||
Mexico-(continued) |
| |||||||
Sitios Latinoamerica S.A.B. de C.V.(c) | 590,770 | $ | 172,032 | |||||
Wal-Mart de Mexico S.A.B. de C.V., Series V | 1,833,696 | 7,070,016 | ||||||
|
| |||||||
| 44,668,185 | ||||||||
|
| |||||||
Russia-0.00% |
| |||||||
Aeroflot PJSC(a)(g) | 1,684,800 | 0 | ||||||
Alrosa PJSC(g) | 1,976,600 | 0 | ||||||
Gazprom PJSC(g) | 9,643,940 | 0 | ||||||
Inter RAO UES PJSC(g) | 29,081,146 | 0 | ||||||
Lukoil PJSC(g) | 261,775 | 0 | ||||||
Magnit PJSC(g) | 55,179 | 0 | ||||||
MMC Norilsk Nickel PJSC(g) | 20,152 | 0 | ||||||
Mobile TeleSystems PJSC(g) | 921,186 | 0 | ||||||
Moscow Exchange MICEX-RTS | 550,555 | 0 | ||||||
Novatek PJSC(g) | 298,686 | 0 | ||||||
Novolipetsk Steel PJSC(g) | 795,328 | 0 | ||||||
Rosneft Oil Co. PJSC(g) | 1,054,960 | 0 | ||||||
Sberbank of Russia PJSC(a)(g) | 7,562,894 | 0 | ||||||
Severstal PAO(g) | 147,196 | 0 | ||||||
Sistema PJSFC(a)(g) | 3,408,447 | 0 | ||||||
Surgutneftegas PJSC(g) | 3,493,738 | 0 | ||||||
Surgutneftegas PJSC, Preference Shares(g) | 3,804,484 | 0 | ||||||
Tatneft PJSC(g) | 753,855 | 0 | ||||||
Tatneft PJSC, Preference Shares(g) | 74,068 | 0 | ||||||
VTB Bank PJSC(a)(g) | 3,563,458,267 | 0 | ||||||
|
| |||||||
| 0 | ||||||||
|
| |||||||
Saudi Arabia-3.59% |
| |||||||
Al Rajhi Bank(a) | 288,315 | 6,537,355 | ||||||
Alinma Bank | 210,556 | 2,101,329 | ||||||
Etihad Etisalat Co. | 161,530 | 1,573,365 | ||||||
Riyad Bank | 258,213 | 2,470,428 | ||||||
Saudi Arabian Mining Co.(a) | 148,680 | 3,311,870 | ||||||
Saudi Arabian Oil Co.(b) | 646,051 | 6,000,500 | ||||||
Saudi Basic Industries Corp. | 266,863 | 6,278,211 | ||||||
Saudi Electricity Co. | 425,338 | 3,056,280 | ||||||
Saudi Kayan Petrochemical Co.(a) | 308,023 | 1,078,784 | ||||||
Saudi National Bank (The) | 309,314 | 4,889,689 | ||||||
Saudi Telecom Co. | 473,289 | 5,088,655 | ||||||
Yanbu National Petrochemical Co., Class A | 81,046 | 964,127 | ||||||
|
| |||||||
| 43,350,593 | ||||||||
|
| |||||||
Singapore-0.03% |
| |||||||
Yangzijiang Financial Holding Ltd.(a) | 1,406,624 | 308,143 | ||||||
|
| |||||||
South Africa-4.31% |
| |||||||
Absa Group Ltd. | 265,770 | 2,888,581 | ||||||
Aspen Pharmacare Holdings Ltd. | 152,944 | 1,258,839 | ||||||
Bid Corp. Ltd. | 96,623 | 1,553,960 | ||||||
Bidvest Group Ltd. (The) | 99,677 | 1,152,462 | ||||||
Capitec Bank Holdings Ltd. | 12,337 | 1,275,872 | ||||||
Discovery Ltd.(a) | 137,209 | 897,579 | ||||||
Exxaro Resources Ltd. | 113,932 | 1,267,929 | ||||||
FirstRand Ltd.(c) | 1,318,216 | 4,615,818 | ||||||
Foschini Group Ltd. (The) | 160,421 | 1,003,073 | ||||||
Gold Fields Ltd. | 267,410 | 2,160,670 | ||||||
Impala Platinum Holdings Ltd. | 125,009 | 1,279,510 | ||||||
Kumba Iron Ore Ltd.(c) | 29,545 | 556,239 | ||||||
| Shares | Value | |||||||
South Africa-(continued) |
| |||||||
Mr Price Group Ltd. | 91,336 | $ | 878,893 | |||||
MTN Group Ltd. | 572,063 | 4,041,717 | ||||||
Naspers Ltd., Class N | 39,751 | 4,109,965 | ||||||
Nedbank Group Ltd. | 182,426 | 2,159,630 | ||||||
Old Mutual Ltd. | 1,769,861 | 1,005,433 | ||||||
Remgro Ltd. | 151,577 | 1,127,579 | ||||||
Sanlam Ltd. | 506,069 | 1,471,600 | ||||||
Sasol Ltd. | 340,022 | 5,717,883 | ||||||
Shoprite Holdings Ltd. | 172,409 | 2,194,339 | ||||||
Sibanye Stillwater Ltd. | 892,030 | 2,093,498 | ||||||
Standard Bank Group Ltd. | 346,323 | 3,234,735 | ||||||
Steinhoff International Holdings N.V.(a) | 10,820,434 | 1,112,808 | ||||||
Vodacom Group Ltd. | 171,899 | 1,172,122 | ||||||
Woolworths Holdings Ltd. | 507,771 | 1,743,179 | ||||||
|
| |||||||
| 51,973,913 | ||||||||
|
| |||||||
Taiwan-12.25% |
| |||||||
Acer, Inc. | 1,987,000 | 1,362,796 | ||||||
ASE Technology Holding Co. Ltd. | 1,830,362 | 4,567,029 | ||||||
Asustek Computer, Inc. | 311,641 | 2,282,482 | ||||||
AUO Corp. | 5,486,615 | 2,877,610 | ||||||
Catcher Technology Co. Ltd. | 320,000 | 1,683,296 | ||||||
Cathay Financial Holding Co. Ltd. | 3,049,339 | 3,577,159 | ||||||
Chailease Holding Co. Ltd. | 288,609 | 1,334,556 | ||||||
China Development Financial Holding Corp. | 6,532,000 | 2,381,907 | ||||||
China Steel Corp. | 5,230,653 | 4,358,539 | ||||||
Chunghwa Telecom Co. Ltd. | 1,086,599 | 3,743,114 | ||||||
Compal Electronics, Inc. | 1,956,000 | 1,280,832 | ||||||
CTBC Financial Holding Co. Ltd. | 4,750,838 | 3,007,746 | ||||||
Delta Electronics, Inc. | 582,506 | 4,654,986 | ||||||
E.Sun Financial Holding Co. Ltd. | 2,367,073 | 1,704,278 | ||||||
Evergreen Marine Corp. Taiwan Ltd. | 118,200 | 504,384 | ||||||
First Financial Holding Co. Ltd. | 1,941,466 | 1,491,234 | ||||||
Formosa Chemicals & Fibre Corp. | 461,920 | 996,305 | ||||||
Formosa Petrochemical Corp. | 417,000 | 1,074,125 | ||||||
Formosa Plastics Corp. | 1,265,280 | 3,263,085 | ||||||
Foxconn Technology Co. Ltd. | 699,000 | 980,520 | ||||||
Fubon Financial Holding Co. Ltd. | 2,588,762 | 4,097,350 | ||||||
Hon Hai Precision Industry Co. Ltd. | 3,237,064 | 10,297,124 | ||||||
Innolux Corp. | 6,732,705 | 2,475,989 | ||||||
Largan Precision Co. Ltd. | 44,000 | 2,526,185 | ||||||
Lite-On Technology Corp. | 609,313 | 1,210,211 | ||||||
MediaTek, Inc. | 240,091 | 4,396,111 | ||||||
Mega Financial Holding Co. Ltd. | 2,356,357 | 2,186,518 | ||||||
Micro-Star International Co. Ltd. | 292,000 | 992,288 | ||||||
Nan Ya Plastics Corp. | 1,024,940 | 2,172,501 | ||||||
Novatek Microelectronics Corp. | 116,000 | 867,593 | ||||||
Pegatron Corp. | 720,260 | 1,318,810 | ||||||
Powertech Technology, Inc. | 543,200 | 1,257,591 | ||||||
President Chain Store Corp. | 157,000 | 1,305,796 | ||||||
Quanta Computer, Inc. | 1,186,000 | 2,517,570 | ||||||
Realtek Semiconductor Corp. | 86,000 | 680,580 | ||||||
Shin Kong Financial Holding Co. Ltd. | 11,664,998 | 2,896,113 | ||||||
Sino-American Silicon Products, Inc. | 195,000 | 750,407 | ||||||
SinoPac Financial Holdings Co. Ltd. | 2,433,350 | 1,215,825 | ||||||
Synnex Technology International Corp. | 639,000 | 1,043,103 | ||||||
Taishin Financial Holding Co. Ltd. | 2,724,008 | 1,120,121 | ||||||
Taiwan Cement Corp. | 1,821,292 | 1,709,802 | ||||||
See accompanying Notes to Financial Statements which are an integral part of the financial statements.
| 76 | ||||
|
| |||
Invesco FTSE RAFI Emerging Markets ETF (PXH)–(continued)
October 31, 2022
| Shares | Value | |||||||
Taiwan-(continued) |
| |||||||
Taiwan Cooperative Financial Holding Co. Ltd. | 1,737,950 | $ | 1,348,398 | |||||
Taiwan Semiconductor Manufacturing Co. Ltd. | 3,394,000 | 41,078,749 | ||||||
Unimicron Technology Corp. | 157,000 | 606,610 | ||||||
Uni-President Enterprises Corp. | 730,941 | 1,485,814 | ||||||
United Microelectronics Corp. | 3,479,491 | 4,222,146 | ||||||
Walsin Technology Corp. | 271,000 | 664,412 | ||||||
Wistron Corp. | 1,539,875 | 1,244,899 | ||||||
Yageo Corp. | 124,347 | 1,416,257 | ||||||
Yuanta Financial Holding Co. Ltd. | 2,460,404 | 1,504,227 | ||||||
|
| |||||||
| 147,735,083 | ||||||||
|
| |||||||
Thailand-4.64% |
| |||||||
Advanced Info Service PCL, NVDR | 432,521 | 2,170,560 | ||||||
Bangkok Bank PCL, NVDR | 829,095 | 3,169,557 | ||||||
Bangkok Dusit Medical Services PCL, NVDR | 2,273,387 | 1,762,084 | ||||||
Banpu PCL, NVDR | 5,311,206 | 1,744,353 | ||||||
Charoen Pokphand Foods PCL, NVDR | 4,183,155 | 2,775,214 | ||||||
CP ALL PCL, NVDR | 1,922,963 | 3,031,471 | ||||||
Indorama Ventures PCL, NVDR | 1,080,643 | 1,192,512 | ||||||
IRPC PCL, NVDR | 12,217,340 | 1,007,947 | ||||||
Kasikornbank PCL, NVDR | 1,196,535 | 4,589,966 | ||||||
Krung Thai Bank PCL, NVDR | 7,776,638 | 3,575,701 | ||||||
Land & Houses PCL, NVDR | 5,104,383 | 1,233,850 | ||||||
PTT Exploration & Production PCL, NVDR | 867,815 | 4,138,424 | ||||||
PTT Global Chemical PCL, NVDR | 2,190,836 | 2,503,977 | ||||||
PTT PCL, NVDR | 10,493,372 | 9,925,417 | ||||||
SCB X PCL, NVDR | 1,758,024 | 4,896,231 | ||||||
Siam Cement PCL (The), NVDR | 565,855 | 4,817,052 | ||||||
Thai Oil PCL, NVDR | 1,528,414 | 2,188,612 | ||||||
TMBThanachart Bank PCL, NVDR | 33,954,253 | 1,213,289 | ||||||
TMBThanachart Bank PCL, Wts.,expiring 10/25/2025(a) | 351,453 | 4,709 | ||||||
|
| |||||||
| 55,940,926 | ||||||||
|
| |||||||
Turkey-3.62% |
| |||||||
Akbank T.A.S. | 6,468,541 | 5,083,620 | ||||||
BIM Birlesik Magazalar A.S. | 399,487 | 2,877,576 | ||||||
Eregli Demir ve Celik Fabrikalari TAS | 1,301,384 | 2,077,692 | ||||||
Haci Omer Sabanci Holding A.S. | 2,329,113 | 4,199,262 | ||||||
KOC Holding A.S. | 1,371,613 | 4,099,451 | ||||||
Investment Abbreviations:
ADR-American Depositary Receipt
CPO-Certificates of Ordinary Participation
NVDR-Non-Voting Depositary Receipt
Wts.-Warrants
| Shares | Value | |||||||
Turkey-(continued) | ||||||||
Turk Hava Yollari AO(a) | 1,363,419 | $ | 7,424,345 | |||||
Turkcell Iletisim Hizmetleri A.S. | 2,179,170 | 3,003,506 | ||||||
Turkiye Garanti Bankasi A.S. | 1,347,539 | 1,702,270 | ||||||
Turkiye Halk Bankasi A.S.(a) | 3,722,324 | 1,648,772 | ||||||
Turkiye Is Bankasi A.S., Class C | 9,065,227 | 4,541,653 | ||||||
Turkiye Petrol Rafinerileri A.S.(a) | 228,074 | 4,646,590 | ||||||
Yapi ve Kredi Bankasi A.S. | 4,684,220 | 2,319,083 | ||||||
|
| |||||||
| 43,623,820 | ||||||||
|
| |||||||
United Republic of Tanzania-0.17% |
| |||||||
AngloGold Ashanti Ltd. | 155,276 | 2,038,549 | ||||||
|
| |||||||
United States-0.35% |
| |||||||
JBS S.A. | 893,140 | 4,248,468 | ||||||
|
| |||||||
Total Common Stocks & Other Equity Interests |
| 1,203,623,076 | ||||||
|
| |||||||
Money Market Funds-0.71% |
| |||||||
Invesco Government & Agency Portfolio, Institutional Class, 3.07%(h)(i) | 8,531,729 | 8,531,729 | ||||||
|
| |||||||
TOTAL INVESTMENTS IN SECURITIES |
| 1,212,154,805 | ||||||
|
| |||||||
Investments Purchased with Cash Collateral from Securities on Loan |
| |||||||
Money Market Funds-1.00% |
| |||||||
Invesco Private Government Fund, | 3,383,737 | 3,383,737 | ||||||
Invesco Private Prime Fund, 3.28%(h)(i)(j) | 8,698,849 | 8,698,849 | ||||||
|
| |||||||
Total Investments Purchased with Cash Collateral from Securities on Loan |
| 12,082,586 | ||||||
|
| |||||||
TOTAL INVESTMENTS IN SECURITIES-101.49% |
| 1,224,237,391 | ||||||
OTHER ASSETS LESS LIABILITIES-(1.49)% |
| (17,996,804 | ) | |||||
|
| |||||||
NET ASSETS-100.00% | $ | 1,206,240,587 | ||||||
|
| |||||||
See accompanying Notes to Financial Statements which are an integral part of the financial statements.
| 77 | ||||
|
| |||
Invesco FTSE RAFI Emerging Markets ETF (PXH)–(continued)
October 31, 2022
Notes to Schedule of Investments:
| (a) | Non-income producing security. |
| (b) | Security purchased or received in a transaction exempt from registration under the Securities Act of 1933, as amended (the “1933 Act”). The security may be resold pursuant to an exemption from registration under the 1933 Act, typically to qualified institutional buyers. The aggregate value of these securities at October 31, 2022 was $22,157,121, which represented 1.84% of the Fund’s Net Assets. |
| (c) | All or a portion of this security was out on loan at October 31, 2022. |
| (d) | Each CPO for Cemex S.A.B. de C.V. represents two Series A shares and one Series B share. |
| (e) | Each CPO for Fomento Economico Mexicano S.A.B. de C.V. represents one Series B share and four Series D shares. |
| (f) | Each CPO for Grupo Televisa S.A.B, Series CPO. represents twenty-five Series A shares, twenty-two Series B shares, thirty-five Series D shares and thirty-five Series L shares. |
| (g) | Security valued using significant unobservable inputs (Level 3). See Note 4. |
| (h) | Affiliated issuer. The issuer and/or the Fund is a wholly-owned subsidiary of Invesco Ltd., or is affiliated by having an investment adviser that is under common control of Invesco Ltd. The table below shows the Fund’s transactions in, and earnings from, its investments in affiliates for the fiscal year ended October 31, 2022. |
Value | Purchases at Cost | Proceeds from Sales | Change in | Realized Gain (Loss) | Value October 31, 2022 | Dividend Income | |||||||||||||||||||||||||||||||||||||||||||||||||
| Investments in Affiliated Money Market Funds: | |||||||||||||||||||||||||||||||||||||||||||||||||||||||
| Invesco Government & Agency Portfolio, Institutional Class | $ | 2,123,231 | $ | 276,545,353 | $ | (270,136,855 | ) | $ | - | $ | - | $ | 8,531,729 | $ | 55,295 | ||||||||||||||||||||||||||||||||||||||||
| Investments Purchased with Cash Collateral from Securities on Loan: | |||||||||||||||||||||||||||||||||||||||||||||||||||||||
| Invesco Private Government Fund | 10,330,294 | 67,546,943 | (74,493,500 | ) | - | - | 3,383,737 | 65,024 | * | ||||||||||||||||||||||||||||||||||||||||||||||
| Invesco Private Prime Fund | 24,104,019 | 123,209,886 | (138,612,989 | ) | (232 | ) | (1,835 | ) | 8,698,849 | 175,622 | * | ||||||||||||||||||||||||||||||||||||||||||||
|
|
|
|
|
|
|
|
|
|
|
|
|
| ||||||||||||||||||||||||||||||||||||||||||
| Total | $ | 36,557,544 | $ | 467,302,182 | $ | (483,243,344 | ) | $ | (232 | ) | $ | (1,835 | ) | $ | 20,614,315 | $ | 295,941 | ||||||||||||||||||||||||||||||||||||||
|
|
|
|
|
|
|
|
|
|
|
|
|
| ||||||||||||||||||||||||||||||||||||||||||
| * | Represents the income earned on the investment of cash collateral, which is included in securities lending income on the Statements of Operations. Does not include rebates and fees paid to lending agent or premiums received from borrowers, if any. |
| (i) | The rate shown is the 7-day SEC standardized yield as of October 31, 2022. |
| (j) | The security has been segregated to satisfy the commitment to return the cash collateral received in securities lending transactions upon the borrower’s return of the securities loaned. See Note 2J. |
See accompanying Notes to Financial Statements which are an integral part of the financial statements.
| 78 | ||||
|
| |||
Invesco Global Clean Energy ETF (PBD)
October 31, 2022
Schedule of Investments
| Shares | Value | |||||||
Common Stocks & Other Equity Interests-100.01% |
| |||||||
Austria-0.77% |
| |||||||
Verbund AG | 21,434 | $ | 1,678,857 | |||||
|
| |||||||
Belgium-0.84% |
| |||||||
Elia Group S.A./N.V. | 14,422 | 1,823,086 | ||||||
|
| |||||||
Canada-4.99% |
| |||||||
Ballard Power Systems, Inc.(a)(b) | 264,925 | 1,499,374 | ||||||
Boralex, Inc., Class A | 55,034 | 1,558,567 | ||||||
Canadian Solar, Inc.(a)(b) | 48,838 | 1,655,608 | ||||||
Innergex Renewable Energy, Inc. | 127,908 | 1,406,562 | ||||||
Li-Cycle Holdings Corp.(a)(b) | 313,524 | 1,868,603 | ||||||
Lithium Americas Corp.(a)(b) | 64,956 | 1,616,105 | ||||||
NFI Group, Inc. | 186,950 | 1,206,085 | ||||||
|
| |||||||
| 10,810,904 | ||||||||
|
| |||||||
Chile-0.82% |
| |||||||
Sociedad Quimica y Minera de Chile S.A., ADR | 18,868 | 1,767,554 | ||||||
|
| |||||||
China-8.75% |
| |||||||
BYD Co. Ltd., H Shares | 71,093 | 1,591,246 | ||||||
China Datang Corp. Renewable Power Co. Ltd., H Shares(b) | 7,067,835 | 1,908,802 | ||||||
Flat Glass Group Co. Ltd., H Shares | 671,582 | 1,572,473 | ||||||
Ganfeng Lithium Group Co. Ltd., | 235,178 | 1,590,852 | ||||||
JinkoSolar Holding Co. Ltd., ADR(a)(b) | 33,954 | 1,612,136 | ||||||
JL Mag Rare-Earth Co. Ltd., H Shares(b)(c) | 516,800 | 1,501,053 | ||||||
NIO, Inc., ADR(a)(b) | 91,681 | 886,555 | ||||||
ReneSola Ltd., ADR(a)(b) | 324,353 | 1,466,076 | ||||||
Tianqi Lithium Corp.(a) | 181,400 | 1,478,958 | ||||||
Xinyi Energy Holdings Ltd. | 5,109,114 | 1,301,710 | ||||||
Xinyi Solar Holdings Ltd. | 1,575,053 | 1,563,044 | ||||||
XPeng, Inc., ADR(a)(b) | 127,148 | 841,720 | ||||||
Yadea Group Holdings Ltd.(c) | 1,086,652 | 1,658,387 | ||||||
|
| |||||||
| 18,973,012 | ||||||||
|
| |||||||
Denmark-3.32% |
| |||||||
NKT A/S(a) | 36,496 | 1,823,698 | ||||||
Novozymes A/S, Class B | 37,049 | 1,946,258 | ||||||
Orsted A/S(c) | 20,749 | 1,711,695 | ||||||
Vestas Wind Systems A/S | 87,081 | 1,715,597 | ||||||
|
| |||||||
| 7,197,248 | ||||||||
|
| |||||||
France-2.78% |
| |||||||
McPhy Energy S.A.(a)(b) | 216,475 | 2,460,462 | ||||||
Neoen S.A.(b)(c) | 47,438 | 1,655,992 | ||||||
Nexans S.A. | 20,435 | 1,910,631 | ||||||
|
| |||||||
| 6,027,085 | ||||||||
|
| |||||||
Germany-7.36% |
| |||||||
CropEnergies AG | 128,951 | 2,057,024 | ||||||
Encavis AG | 91,172 | 1,698,572 | ||||||
Energiekontor AG | 22,548 | 2,003,452 | ||||||
Nordex SE(a) | 212,420 | 1,985,664 | ||||||
PNE AG(b) | 116,056 | 2,209,200 | ||||||
SFC Energy AG, Class BR(a)(b) | 91,130 | 1,682,478 | ||||||
SMA Solar Technology AG(a)(b) | 36,809 | 1,784,085 | ||||||
VERBIO Vereinigte BioEnergie AG | 32,133 | 2,531,166 | ||||||
|
| |||||||
| 15,951,641 | ||||||||
|
| |||||||
| Shares | Value | |||||||
Hong Kong-0.51% |
| |||||||
Polestar Automotive Holding UK PLC, ADR(a)(b) | 246,817 | $ | 1,100,804 | |||||
|
| |||||||
India-0.76% |
| |||||||
ReNew Energy Global PLC, Class A(a)(b) | 283,751 | 1,648,593 | ||||||
|
| |||||||
Ireland-0.81% |
| |||||||
Kingspan Group PLC | 34,858 | 1,760,494 | ||||||
|
| |||||||
Israel-1.52% |
| |||||||
Energix-Renewable Energies Ltd. | 456,417 | 1,602,874 | ||||||
Enlight Renewable Energy Ltd.(a) | 831,788 | 1,693,354 | ||||||
|
| |||||||
| 3,296,228 | ||||||||
|
| |||||||
Italy-1.77% |
| |||||||
Prysmian S.p.A. | 61,559 | 2,007,174 | ||||||
Terna Rete Elettrica Nazionale S.p.A.(b) | 277,256 | 1,838,168 | ||||||
|
| |||||||
| 3,845,342 | ||||||||
|
| |||||||
Japan-3.33% |
| |||||||
Abalance Corp. | 140,300 | 2,001,117 | ||||||
GS Yuasa Corp.(b) | 113,564 | 1,732,093 | ||||||
RENOVA, Inc.(a)(b) | 74,644 | 1,642,183 | ||||||
West Holdings Corp. | 61,681 | 1,848,749 | ||||||
|
| |||||||
| 7,224,142 | ||||||||
|
| |||||||
Netherlands-1.88% |
| |||||||
Alfen Beheer B.V.(b)(c) | 18,517 | 1,968,304 | ||||||
Fugro N.V.(a) | 161,585 | 2,100,090 | ||||||
|
| |||||||
| 4,068,394 | ||||||||
|
| |||||||
New Zealand-0.85% |
| |||||||
Mercury NZ Ltd. | 548,394 | 1,854,191 | ||||||
|
| |||||||
Norway-2.47% |
| |||||||
Aker Horizons ASA(a) | 1,306,140 | 1,640,079 | ||||||
FREYR Battery S.A.(a) | 135,724 | 1,806,487 | ||||||
NEL ASA(a)(b) | 1,557,106 | 1,902,791 | ||||||
|
| |||||||
| 5,349,357 | ||||||||
|
| |||||||
South Africa-0.63% |
| |||||||
Scatec ASA(c) | 193,304 | 1,368,412 | ||||||
|
| |||||||
South Korea-12.23% |
| |||||||
Bumhan Fuel Cell Co. Ltd.(a) | 80,362 | 1,599,398 | ||||||
CS Wind Corp. | 44,400 | 1,832,792 | ||||||
DaeMyoung Energy Co. Ltd.(a) | 87,528 | 1,345,686 | ||||||
Dongkuk Structures & Construction Co. Ltd. | 406,564 | 1,487,029 | ||||||
Doosan Fuel Cell Co. Ltd.(a)(b) | 80,716 | 1,544,112 | ||||||
Ecopro BM Co. Ltd. | 26,529 | 2,143,626 | ||||||
Hyundai Energy Solutions Co. Ltd.(a) | 32,525 | 1,344,886 | ||||||
Iljin Hysolus Co. Ltd.(a)(b) | 71,201 | 1,524,540 | ||||||
Iljin Materials Co. Ltd. | 40,838 | 1,737,360 | ||||||
L&F Co. Ltd.(a) | 11,949 | 1,887,413 | ||||||
LG Energy Solution Ltd.(a) | 5,378 | 1,993,460 | ||||||
Samsung SDI Co. Ltd. | 4,469 | 2,312,228 | ||||||
Sebitchem Co. Ltd.(a) | 16,627 | 1,467,243 | ||||||
SK IE Technology Co. Ltd.(a)(c) | 34,702 | 1,266,807 | ||||||
Sungeel Hitech Co. Ltd.(a) | 16,447 | 1,548,347 | ||||||
Unison Co. Ltd.(a) | 1,120,323 | 1,462,881 | ||||||
|
| |||||||
| 26,497,808 | ||||||||
|
| |||||||
Spain-3.89% |
| |||||||
Acciona S.A. | 9,709 | 1,747,413 | ||||||
See accompanying Notes to Financial Statements which are an integral part of the financial statements.
| 79 | ||||
|
| |||
Invesco Global Clean Energy ETF (PBD)–(continued)
October 31, 2022
| Shares | Value | |||||||
Spain-(continued) |
| |||||||
Corp. ACCIONA Energias Renovables S.A. | 47,404 | $ | 1,862,827 | |||||
EDP Renovaveis S.A. | 81,125 | 1,708,635 | ||||||
Grenergy Renovables S.A. | 52,250 | 1,611,210 | ||||||
Solaria Energia y Medio Ambiente S.A.(a) | 94,854 | 1,499,984 | ||||||
|
| |||||||
| 8,430,069 | ||||||||
|
| |||||||
Sweden-2.20% |
| |||||||
Nibe Industrier AB, Class B | 189,650 | 1,511,989 | ||||||
OX2 AB(a) | 238,453 | 1,644,288 | ||||||
PowerCell Sweden AB(a)(b) | 145,804 | 1,603,119 | ||||||
|
| |||||||
| 4,759,396 | ||||||||
|
| |||||||
Switzerland-0.93% |
| |||||||
Landis+Gyr Group AG(a)(b) | 34,828 | 2,008,070 | ||||||
|
| |||||||
Taiwan-3.08% |
| |||||||
Motech Industries, Inc. | 2,177,684 | 1,598,331 | ||||||
Sino-American Silicon Products, Inc. | 374,000 | 1,439,243 | ||||||
Teco Electric and Machinery Co. Ltd. | 2,136,000 | 1,889,239 | ||||||
United Renewable Energy Co. Ltd.(a) | 2,675,141 | 1,743,439 | ||||||
|
| |||||||
| 6,670,252 | ||||||||
|
| |||||||
United Kingdom-1.25% |
| |||||||
Ceres Power Holdings PLC(a)(b) | 326,892 | 1,233,731 | ||||||
ITM Power PLC(a)(b) | 1,542,639 | 1,468,139 | ||||||
|
| |||||||
| 2,701,870 | ||||||||
|
| |||||||
United States-32.27% |
| |||||||
Altus Power, Inc.(a) | 159,038 | 1,584,019 | ||||||
Ameresco, Inc., Class A(a)(b) | 26,758 | 1,618,324 | ||||||
Archer Aviation, Inc., Class A(a)(b) | 622,104 | 1,772,996 | ||||||
Arcosa, Inc. | 34,610 | 2,221,962 | ||||||
Array Technologies, Inc.(a)(b) | 109,499 | 1,981,932 | ||||||
Bloom Energy Corp., Class A(a)(b) | 76,230 | 1,426,263 | ||||||
Brookfield Renewable Corp., Class A(b) | 48,838 | 1,515,443 | ||||||
Canoo, Inc.(a)(b) | 704,310 | 964,905 | ||||||
ChargePoint Holdings, Inc.(a)(b) | 102,445 | 1,432,181 | ||||||
Enphase Energy, Inc.(a) | 6,317 | 1,939,319 | ||||||
EVgo, Inc.(a)(b) | 194,484 | 1,441,126 | ||||||
First Solar, Inc.(a) | 14,938 | 2,174,525 | ||||||
Fisker, Inc.(a)(b) | 215,527 | 1,756,545 | ||||||
FTC Solar, Inc.(a)(b) | 523,095 | 1,082,807 | ||||||
FuelCell Energy, Inc.(a)(b) | 464,016 | 1,447,730 | ||||||
Gevo, Inc.(a)(b) | 788,828 | 1,774,863 | ||||||
Hannon Armstrong Sustainable Infrastructure Capital, Inc. | 51,490 | 1,399,498 | ||||||
Itron, Inc.(a)(b) | 40,246 | 1,967,627 | ||||||
Joby Aviation, Inc.(a)(b) | 342,373 | 1,650,238 | ||||||
Livent Corp.(a)(b) | 59,186 | 1,868,502 | ||||||
Investment Abbreviations:
ADR-American Depositary Receipt
BR-Bearer Shares
| Shares | Value | |||||||
United States-(continued) |
| |||||||
Lordstown Motors Corp., Class A(a)(b) | 908,788 | $ | 1,644,906 | |||||
Lucid Group, Inc.(a)(b) | 119,592 | 1,708,970 | ||||||
Maxeon Solar Technologies Ltd.(a)(b) | 79,776 | 1,378,529 | ||||||
MP Materials Corp.(a)(b) | 61,493 | 1,847,250 | ||||||
Navitas Semiconductor Corp.(a)(b) | 333,120 | 1,402,435 | ||||||
Ormat Technologies, Inc.(b) | 20,752 | 1,877,018 | ||||||
Piedmont Lithium, Inc.(a)(b) | 32,830 | 2,042,683 | ||||||
Plug Power, Inc.(a)(b) | 67,306 | 1,075,550 | ||||||
Proterra, Inc.(a)(b) | 333,683 | 2,082,182 | ||||||
QuantumScape Corp.(a)(b) | 165,859 | 1,381,605 | ||||||
REC Silicon ASA(a) | 983,617 | 1,890,252 | ||||||
Rivian Automotive, Inc., Class A(a)(b) | 49,687 | 1,737,554 | ||||||
Shoals Technologies Group, Inc., Class A(a)(b) | 79,583 | 1,839,163 | ||||||
Signify N.V.(c) | 66,251 | 1,837,347 | ||||||
SolarEdge Technologies, Inc.(a) | 6,296 | 1,448,269 | ||||||
Solid Power, Inc.(a)(b) | 315,027 | 1,767,301 | ||||||
Stem, Inc.(a)(b) | 116,141 | 1,579,518 | ||||||
Sunnova Energy International, Inc.(a)(b) | 71,245 | 1,320,882 | ||||||
SunPower Corp.(a)(b) | 74,390 | 1,375,471 | ||||||
Sunrun, Inc.(a)(b) | 52,786 | 1,188,213 | ||||||
TPI Composites, Inc.(a)(b) | 131,559 | 1,310,328 | ||||||
Universal Display Corp. | 19,435 | 1,850,601 | ||||||
Wolfspeed, Inc.(a)(b) | 16,860 | 1,327,725 | ||||||
|
| |||||||
| 69,934,557 | ||||||||
|
| |||||||
TOTAL INVESTMENTS IN SECURITIES |
| 216,747,366 | ||||||
|
| |||||||
| Investments Purchased with Cash Collateral from Securities on Loan |
| |||||||
Money Market Funds-32.89% |
| |||||||
Invesco Private Government Fund, | 19,922,611 | 19,922,611 | ||||||
Invesco Private Prime Fund, 3.28%(d)(e)(f) | 51,352,081 | 51,352,081 | ||||||
|
| |||||||
Total Investments Purchased with Cash Collateral from Securities on Loan |
| 71,274,692 | ||||||
|
| |||||||
TOTAL INVESTMENTS IN SECURITIES-132.90% |
| 288,022,058 | ||||||
OTHER ASSETS LESS LIABILITIES-(32.90)% |
| (71,294,087 | ) | |||||
|
| |||||||
NET ASSETS-100.00% |
| $ | 216,727,971 | |||||
|
| |||||||
See accompanying Notes to Financial Statements which are an integral part of the financial statements.
| 80 | ||||
|
| |||
Invesco Global Clean Energy ETF (PBD)–(continued)
October 31, 2022
Notes to Schedule of Investments:
| (a) | Non-income producing security. |
| (b) | All or a portion of this security was out on loan at October 31, 2022. |
| (c) | Security purchased or received in a transaction exempt from registration under the Securities Act of 1933, as amended (the “1933 Act”). The security may be resold pursuant to an exemption from registration under the 1933 Act, typically to qualified institutional buyers. The aggregate value of these securities at October 31, 2022 was $14,558,849, which represented 6.72% of the Fund’s Net Assets. |
| (d) | Affiliated issuer. The issuer and/or the Fund is a wholly-owned subsidiary of Invesco Ltd., or is affiliated by having an investment adviser that is under common control of Invesco Ltd. The table below shows the Fund’s transactions in, and earnings from, its investments in affiliates for the fiscal year ended October 31, 2022. |
Value | Purchases at Cost | Proceeds from Sales | Change in | Realized Gain (Loss) | Value October 31, 2022 | Dividend Income | |||||||||||||||||||||||||||||||||||||||||||||||||||||||||||
| Investments in Affiliated Money Market Funds: | |||||||||||||||||||||||||||||||||||||||||||||||||||||||||||||||||
| Invesco Government & Agency Portfolio, Institutional Class | $ | - | $ | 5,789,576 | $ | (5,789,576 | ) | $ | - | $ | - | $ | - | $ | 714 | ||||||||||||||||||||||||||||||||||||||||||||||||||
| Investments Purchased with Cash Collateral from Securities on Loan: | |||||||||||||||||||||||||||||||||||||||||||||||||||||||||||||||||
| Invesco Private Government Fund | 38,817,582 | 92,102,708 | (110,997,679 | ) | - | - | 19,922,611 | 220,057 | * | ||||||||||||||||||||||||||||||||||||||||||||||||||||||||
| Invesco Private Prime Fund | 90,917,942 | 170,990,176 | (210,528,439 | ) | (916 | ) | (26,682 | ) | 51,352,081 | 609,760 | * | ||||||||||||||||||||||||||||||||||||||||||||||||||||||
|
|
|
|
|
|
|
|
|
|
|
|
|
| ||||||||||||||||||||||||||||||||||||||||||||||||||||
| Total | $ | 129,735,524 | $ | 268,882,460 | $ | (327,315,694 | ) | $ | (916 | ) | $ | (26,682 | ) | $ | 71,274,692 | $ | 830,531 | ||||||||||||||||||||||||||||||||||||||||||||||||
|
|
|
|
|
|
|
|
|
|
|
|
|
| ||||||||||||||||||||||||||||||||||||||||||||||||||||
| * | Represents the income earned on the investment of cash collateral, which is included in securities lending income on the Statements of Operations. Does not include rebates and fees paid to lending agent or premiums received from borrowers, if any. |
| (e) | The rate shown is the 7-day SEC standardized yield as of October 31, 2022. |
| (f) | The security has been segregated to satisfy the commitment to return the cash collateral received in securities lending transactions upon the borrower’s return of the securities loaned. See Note 2J. |
See accompanying Notes to Financial Statements which are an integral part of the financial statements.
| 81 | ||||
|
| |||
Invesco Global Water ETF (PIO)
October 31, 2022
Schedule of Investments
| Shares | Value | |||||||
Common Stocks & Other Equity Interests-99.81% |
| |||||||
Brazil-3.50% |
| |||||||
Cia de Saneamento Basico do Estado de Sao Paulo | 785,541 | $ | 8,997,287 | |||||
|
| |||||||
Canada-1.01% |
| |||||||
Stantec, Inc. | 53,414 | 2,610,298 | ||||||
|
| |||||||
China-1.21% |
| |||||||
Beijing Enterprises Water Group Ltd. | 4,847,976 | 1,019,021 | ||||||
China Water Affairs Group Ltd. | 665,272 | 471,208 | ||||||
Guangdong Investment Ltd.(a) | 2,554,165 | 1,610,619 | ||||||
|
| |||||||
| 3,100,848 | ||||||||
|
| |||||||
France-4.11% |
| |||||||
Veolia Environnement S.A. | 473,339 | 10,568,166 | ||||||
|
| |||||||
India-0.01% | ||||||||
VA Tech Wabag Ltd.(b) | 7,830 | 24,953 | ||||||
|
| |||||||
Italy-1.25% |
| |||||||
ACEA S.p.A. | 40,555 | 511,053 | ||||||
Hera S.p.A.(a) | 1,135,315 | 2,706,480 | ||||||
|
| |||||||
| 3,217,533 | ||||||||
|
| |||||||
Japan-7.20% |
| |||||||
Ebara Corp. | 144,976 | 4,725,729 | ||||||
Ebara Jitsugyo Co. Ltd. | 6,116 | 89,579 | ||||||
Kurita Water Industries Ltd.(a) | 101,652 | 3,734,113 | ||||||
METAWATER Co. Ltd. | 24,241 | 310,851 | ||||||
Miura Co. Ltd. | 180,310 | 3,681,776 | ||||||
Nomura Micro Science Co. Ltd. | 18,190 | 457,091 | ||||||
Organo Corp. | 49,110 | 850,797 | ||||||
Torishima Pump Manufacturing Co. Ltd. | 22,065 | 191,353 | ||||||
TOTO Ltd. | 156,774 | 4,482,723 | ||||||
|
| |||||||
| 18,524,012 | ||||||||
|
| |||||||
Netherlands-1.61% |
| |||||||
Aalberts N.V. | 79,548 | 2,765,899 | ||||||
Arcadis N.V.(a) | 40,878 | 1,389,014 | ||||||
|
| |||||||
| 4,154,913 | ||||||||
|
| |||||||
South Korea-0.60% |
| |||||||
Coway Co. Ltd. | 39,785 | 1,544,533 | ||||||
|
| |||||||
Spain-2.84% |
| |||||||
Acciona S.A. | 40,609 | 7,308,754 | ||||||
|
| |||||||
Switzerland-6.94% |
| |||||||
Belimo Holding AG(a) | 4,816 | 1,963,455 | ||||||
Geberit AG | 35,715 | 15,891,971 | ||||||
|
| |||||||
| 17,855,426 | ||||||||
|
| |||||||
| Shares | Value | |||||||
United Kingdom-13.59% |
| |||||||
Genuit Group PLC | 176,674 | $ | 519,722 | |||||
Halma PLC | 312,631 | 7,612,895 | ||||||
Pennon Group PLC | 369,578 | 3,563,677 | ||||||
Severn Trent PLC | 264,512 | 7,622,785 | ||||||
Spirax-Sarco Engineering PLC | 54,121 | 6,698,564 | ||||||
United Utilities Group PLC | 826,496 | 8,939,201 | ||||||
|
| |||||||
| 34,956,844 | ||||||||
|
| |||||||
United States-55.94% |
| |||||||
A.O. Smith Corp. | 98,773 | 5,410,785 | ||||||
American Water Works Co., Inc. | 71,435 | 10,382,363 | ||||||
Danaher Corp. | 78,579 | 19,775,977 | ||||||
Ecolab, Inc. | 64,730 | 10,167,141 | ||||||
Essential Utilities, Inc. | 97,678 | 4,319,321 | ||||||
Ferguson PLC | 182,526 | 19,985,392 | ||||||
IDEX Corp. | 36,194 | 8,046,288 | ||||||
Pentair PLC | 417,917 | 17,949,535 | ||||||
Roper Technologies, Inc. | 52,682 | 21,838,796 | ||||||
Tetra Tech, Inc. | 43,036 | 6,080,126 | ||||||
Waters Corp.(b) | 35,514 | 10,624,724 | ||||||
Xylem, Inc. | 91,213 | 9,342,948 | ||||||
|
| |||||||
| 143,923,396 | ||||||||
|
| |||||||
TOTAL INVESTMENTS IN SECURITIES |
| 256,786,963 | ||||||
|
| |||||||
| Investments Purchased with Cash Collateral from Securities on Loan |
| |||||||
Money Market Funds-1.21% |
| |||||||
Invesco Private Government Fund, | 875,923 | 875,923 | ||||||
Invesco Private Prime Fund, 3.28%(c)(d)(e) | 2,251,823 | 2,251,823 | ||||||
|
| |||||||
Total Investments Purchased with Cash Collateral from Securities on Loan |
| 3,127,746 | ||||||
|
| |||||||
TOTAL INVESTMENTS IN SECURITIES-101.02% |
| 259,914,709 | ||||||
OTHER ASSETS LESS LIABILITIES-(1.02)% |
| (2,629,372 | ) | |||||
|
| |||||||
NET ASSETS-100.00% |
| $ | 257,285,337 | |||||
|
| |||||||
See accompanying Notes to Financial Statements which are an integral part of the financial statements.
| 82 | ||||
|
| |||
Invesco Global Water ETF (PIO)–(continued)
October 31, 2022
Notes to Schedule of Investments:
| (a) | All or a portion of this security was out on loan at October 31, 2022. |
| (b) | Non-income producing security. |
| (c) | Affiliated issuer. The issuer and/or the Fund is a wholly-owned subsidiary of Invesco Ltd., or is affiliated by having an investment adviser that is under common control of Invesco Ltd. The table below shows the Fund’s transactions in, and earnings from, its investments in affiliates for the fiscal year ended October 31, 2022. |
Value | Purchases at Cost | Proceeds from Sales | Change in Unrealized Appreciation | Realized Gain (Loss) | Value October 31, 2022 | Dividend Income | |||||||||||||||||||||||||||||||||||||||
| Investments in Affiliated Money Market Funds: | |||||||||||||||||||||||||||||||||||||||||||||
| Invesco Government & Agency Portfolio, Institutional Class | $ | 46,598 | $ | 10,014,967 | $ | (10,061,565 | ) | $ | - | $ | - | $ | - | $ | 2,413 | ||||||||||||||||||||||||||||||
| Investments Purchased with Cash Collateral from Securities on Loan: | |||||||||||||||||||||||||||||||||||||||||||||
| Invesco Private Government Fund | 2,705,012 | 29,677,719 | (31,506,808 | ) | - | - | 875,923 | 23,909 | * | ||||||||||||||||||||||||||||||||||||
| Invesco Private Prime Fund | 6,311,696 | 68,221,243 | (72,278,858 | ) | 5 | (2,263 | ) | 2,251,823 | 66,577 | * | |||||||||||||||||||||||||||||||||||
|
|
|
|
|
|
|
|
|
|
|
|
|
| ||||||||||||||||||||||||||||||||
| Total | $ | 9,063,306 | $ | 107,913,929 | $ | (113,847,231 | ) | $ | 5 | $ | (2,263 | ) | $ | 3,127,746 | $ | 92,899 | |||||||||||||||||||||||||||||
|
|
|
|
|
|
|
|
|
|
|
|
|
| ||||||||||||||||||||||||||||||||
| * | Represents the income earned on the investment of cash collateral, which is included in securities lending income on the Statements of Operations. Does not include rebates and fees paid to lending agent or premiums received from borrowers, if any. |
| (d) | The rate shown is the 7-day SEC standardized yield as of October 31, 2022. |
| (e) | The security has been segregated to satisfy the commitment to return the cash collateral received in securities lending transactions upon the borrower���s return of the securities loaned. See Note 2J. |
See accompanying Notes to Financial Statements which are an integral part of the financial statements.
| 83 | ||||
|
| |||
Invesco International BuyBack AchieversTM ETF (IPKW)
October 31, 2022
Schedule of Investments
| Shares | Value | |||||||
Common Stocks & Other Equity Interests-99.51% |
| |||||||
Australia-1.63% |
| |||||||
Boral Ltd.(a) | 153,780 | $ | 283,204 | |||||
Eclipx Group Ltd.(b) | 105,972 | 127,396 | ||||||
Orora Ltd. | 466,488 | 903,836 | ||||||
|
| |||||||
| 1,314,436 | ||||||||
|
| |||||||
Brazil-4.52% |
| |||||||
Vale S.A. | 285,700 | 3,655,065 | ||||||
|
| |||||||
Canada-28.02% | ||||||||
Artis REIT | 36,970 | 258,835 | ||||||
Canaccord Genuity Group, Inc. | 57,614 | 294,818 | ||||||
CGI, Inc., Class A(b) | 50,273 | 4,044,543 | ||||||
CI Financial Corp. | 104,248 | 1,042,442 | ||||||
Dollarama, Inc. | 65,925 | 3,912,341 | ||||||
Dream Office REIT | 16,308 | 184,235 | ||||||
Element Fleet Management Corp. | 160,367 | 2,133,838 | ||||||
Fairfax Financial Holdings Ltd. | 4,144 | 2,032,703 | ||||||
Home Capital Group, Inc. | 19,182 | 370,407 | ||||||
Imperial Oil Ltd. | 43,705 | 2,374,530 | ||||||
Interfor Corp.(b) | 31,827 | 564,652 | ||||||
Real Matters, Inc.(b) | 37,187 | 125,951 | ||||||
Stelco Holdings, Inc. | 27,066 | 680,792 | ||||||
Suncor Energy, Inc. | 134,395 | 4,616,949 | ||||||
|
| |||||||
| 22,637,036 | ||||||||
|
| |||||||
Colombia-1.23% |
| |||||||
Parex Resources, Inc. | 65,267 | 994,280 | ||||||
|
| |||||||
Denmark-1.98% | ||||||||
Jyske Bank A/S(b) | 29,659 | 1,601,753 | ||||||
|
| |||||||
Finland-0.26% | ||||||||
Citycon OYJ(a) | 34,157 | 212,851 | ||||||
|
| |||||||
France-2.72% | ||||||||
Carrefour S.A.(a) | 136,610 | 2,198,778 | ||||||
|
| |||||||
Germany-2.25% | ||||||||
Scout24 SE(c) | 35,405 | 1,815,414 | ||||||
|
| |||||||
Hong Kong-1.89% | ||||||||
WH Group Ltd. | 3,017,183 | 1,525,917 | ||||||
|
| |||||||
Ireland-0.39% | ||||||||
Glenveagh Properties PLC(b)(c) | 319,360 | 312,483 | ||||||
|
| |||||||
Japan-29.66% | ||||||||
Dai-ichi Life Holdings, Inc. | 240,319 | 3,811,700 | ||||||
Fukuyama Transporting Co. Ltd. | 15,201 | 331,868 | ||||||
Gree, Inc. | 22,480 | 126,590 | ||||||
GungHo Online Entertainment, Inc. | 24,610 | 364,758 | ||||||
Hazama Ando Corp.(a) | 54,099 | 314,108 | ||||||
Hogy Medical Co. Ltd. | 9,795 | 217,469 | ||||||
Inabata & Co. Ltd. | 14,451 | 238,881 | ||||||
Inpex Corp. | 202,645 | 2,069,601 | ||||||
JAFCO Group Co. Ltd. | 16,616 | 255,218 | ||||||
Japan Post Holdings Co. Ltd. | 575,166 | 3,868,106 | ||||||
Japan Post Insurance Co. Ltd.(a) | 68,314 | 1,009,761 | ||||||
K’s Holdings Corp. | 70,246 | 551,060 | ||||||
Marui Group Co. Ltd. | 63,065 | 1,041,219 | ||||||
Mebuki Financial Group, Inc. | 357,923 | 695,931 | ||||||
Megachips Corp. | 5,856 | 100,545 | ||||||
Mitsubishi Shokuhin Co. Ltd. | 7,174 | 145,280 | ||||||
| Shares | Value | |||||||
Japan-(continued) |
| |||||||
Morinaga Milk Industry Co. Ltd. | 14,990 | $ | 425,592 | |||||
Nishimatsu Construction Co. Ltd.(a) | 16,995 | 413,913 | ||||||
Nitto Kogyo Corp.(a) | 10,285 | 170,361 | ||||||
Ricoh Co. Ltd. | 171,859 | 1,260,311 | ||||||
Sega Sammy Holdings, Inc. | 63,450 | 813,215 | ||||||
SoftBank Group Corp. | 112,401 | 4,839,818 | ||||||
Starts Corp., Inc. | 12,552 | 222,100 | ||||||
Sumitomo Osaka Cement Co. Ltd. | 9,918 | 211,192 | ||||||
Suruga Bank Ltd. | 76,285 | 202,216 | ||||||
Tokushu Tokai Paper Co. Ltd.(a) | 4,926 | 96,939 | ||||||
Yamazen Corp. | 26,345 | 163,953 | ||||||
|
| |||||||
| 23,961,705 | ||||||||
|
| |||||||
Luxembourg-2.61% |
| |||||||
ArcelorMittal S.A. | 93,971 | 2,104,113 | ||||||
|
| |||||||
Netherlands-2.54% | ||||||||
Akzo Nobel N.V. | 33,297 | 2,054,845 | ||||||
|
| |||||||
Poland-0.40% | ||||||||
Cyfrowy Polsat S.A. | 85,528 | 320,863 | ||||||
|
| |||||||
South Korea-1.15% | ||||||||
Meritz Fire & Marine Insurance Co. Ltd. | 23,133 | 510,747 | ||||||
Meritz Securities Co. Ltd. | 159,783 | 415,035 | ||||||
|
| |||||||
| 925,782 | ||||||||
|
| |||||||
Switzerland-0.93% |
| |||||||
Forbo Holding AG | 621 | 752,088 | ||||||
|
| |||||||
Turkey-0.76% | ||||||||
Arcelik A.S | 145,229 | 614,004 | ||||||
|
| |||||||
United Kingdom-9.00% | ||||||||
Balanced Commercial Property Trust Ltd. | 383,058 | 368,263 | ||||||
Firstgroup PLC | 344,248 | 416,960 | ||||||
NatWest Group PLC | 754,399 | 2,039,420 | ||||||
Pennon Group PLC | 151,573 | 1,461,551 | ||||||
Quilter PLC(c) | 701,419 | 780,606 | ||||||
Victoria PLC(a)(b) | 34,872 | 202,356 | ||||||
WPP PLC | 227,226 | 2,003,984 | ||||||
|
| |||||||
| 7,273,140 | ||||||||
|
| |||||||
United States-7.57% |
| |||||||
JBS S.A. | 409,700 | 1,948,852 | ||||||
RHI Magnesita N.V. | 15,015 | 320,165 | ||||||
Roche Holding AG | 11,577 | 3,847,046 | ||||||
|
| |||||||
| 6,116,063 | ||||||||
|
| |||||||
TOTAL INVESTMENTS IN SECURITIES |
| 80,390,616 | ||||||
|
| |||||||
| Investments Purchased with Cash Collateral from Securities on Loan |
| |||||||
Money Market Funds-4.77% |
| |||||||
Invesco Private Government Fund, 3.18%(d)(e)(f) | 1,081,717 | 1,081,717 | ||||||
See accompanying Notes to Financial Statements which are an integral part of the financial statements.
| 84 | ||||
|
| |||
Invesco International BuyBack AchieversTM ETF (IPKW)–(continued)
October 31, 2022
| Shares | Value | |||||||
Money Market Funds-(continued) |
| |||||||
Invesco Private Prime Fund, 3.28%(d)(e)(f) | 2,768,002 | $ | 2,768,002 | |||||
|
| |||||||
Total Investments Purchased with Cash Collateral from Securities on Loan |
| 3,849,719 | ||||||
|
| |||||||
TOTAL INVESTMENTS IN SECURITIES-104.28% |
| 84,240,335 | ||||||
OTHER ASSETS LESS LIABILITIES-(4.28)% |
| (3,454,995 | ) | |||||
|
| |||||||
NET ASSETS-100.00% |
| $ | 80,785,340 | |||||
|
| |||||||
Investment Abbreviations:
REIT-Real Estate Investment Trust
Notes to Schedule of Investments:
| (a) | All or a portion of this security was out on loan at October 31, 2022. |
| (b) | Non-income producing security. |
| (c) | Security purchased or received in a transaction exempt from registration under the Securities Act of 1933, as amended (the “1933 Act”). The security may be resold pursuant to an exemption from registration under the 1933 Act, typically to qualified institutional buyers. The aggregate value of these securities at October 31, 2022 was $2,908,503, which represented 3.60% of the Fund’s Net Assets. |
| (d) | Affiliated issuer. The issuer and/or the Fund is a wholly-owned subsidiary of Invesco Ltd., or is affiliated by having an investment adviser that is under common control of Invesco Ltd. The table below shows the Fund’s transactions in, and earnings from, its investments in affiliates for the fiscal year ended October 31, 2022. |
Value | Purchases at Cost | Proceeds from Sales | Change in Unrealized Appreciation | Realized (Loss) | Value October 31, 2022 | Dividend Income | ||||||||||||||||||||||||||||||||||||||||||||||||||||||||||
| Investments in Affiliated Money Market Funds: | ||||||||||||||||||||||||||||||||||||||||||||||||||||||||||||||||
Invesco Government & Agency Portfolio, Institutional Class | $ | 354,727 | $ | 31,092,641 | $ | (31,447,368 | ) | $ | - | $ | - | $ | - | $ | 1,823 | |||||||||||||||||||||||||||||||||||||||||||||||||
| Investments Purchased with Cash Collateral from Securities on Loan: | ||||||||||||||||||||||||||||||||||||||||||||||||||||||||||||||||
Invesco Private Government Fund | 3,468,349 | 30,546,574 | (32,933,206 | ) | - | - | 1,081,717 | 19,942 | * | |||||||||||||||||||||||||||||||||||||||||||||||||||||||
Invesco Private Prime Fund | 8,092,804 | 60,235,892 | (65,559,501 | ) | 38 | (1,231 | ) | 2,768,002 | 54,887 | * | ||||||||||||||||||||||||||||||||||||||||||||||||||||||
|
|
|
|
|
|
|
|
|
|
|
|
|
| |||||||||||||||||||||||||||||||||||||||||||||||||||
Total | $ | 11,915,880 | $ | 121,875,107 | $ | (129,940,075 | ) | $ | 38 | $ | (1,231 | ) | $ | 3,849,719 | $ | 76,652 | ||||||||||||||||||||||||||||||||||||||||||||||||
|
|
|
|
|
|
|
|
|
|
|
|
|
| |||||||||||||||||||||||||||||||||||||||||||||||||||
| * | Represents the income earned on the investment of cash collateral, which is included in securities lending income on the Statements of Operations. Does not include rebates and fees paid to lending agent or premiums received from borrowers, if any. |
| (e) | The rate shown is the 7-day SEC standardized yield as of October 31, 2022. |
| (f) | The security has been segregated to satisfy the commitment to return the cash collateral received in securities lending transactions upon the borrower’s return of the securities loaned. See Note 2J. |
See accompanying Notes to Financial Statements which are an integral part of the financial statements.
| 85 | ||||
|
| |||
Invesco MSCI Global Timber ETF (CUT)
October 31, 2022
Schedule of Investments
| Shares | Value | |||||||
Common Stocks & Other Equity Interests-99.00% |
| |||||||
Austria-4.05% |
| |||||||
Mondi PLC | 146,027 | $ | 2,458,875 | |||||
|
| |||||||
Brazil-5.59% | ||||||||
Dexco S.A. | 102,796 | 189,832 | ||||||
Klabin S.A. | 224,834 | 926,373 | ||||||
Suzano S.A. | 224,553 | 2,276,663 | ||||||
|
| |||||||
| 3,392,868 | ||||||||
|
| |||||||
Canada-4.32% |
| |||||||
Canfor Corp.(a) | 18,910 | 283,778 | ||||||
Cascades, Inc. | 20,461 | 132,602 | ||||||
Interfor Corp.(a) | 17,160 | 304,440 | ||||||
Stella-Jones, Inc. | 17,321 | 521,008 | ||||||
West Fraser Timber Co. Ltd. | 18,421 | 1,381,389 | ||||||
|
| |||||||
| 2,623,217 | ||||||||
|
| |||||||
Chile-0.89% |
| |||||||
Empresas CMPC S.A. | 339,384 | 538,302 | ||||||
|
| |||||||
China-0.49% | ||||||||
Chengxin Lithium Group Co. Ltd., A Shares | 15,300 | 90,602 | ||||||
Greatview Aseptic Packaging Co. Ltd. | 183,243 | 25,678 | ||||||
Lee & Man Paper Manufacturing Ltd. | 385,042 | 116,741 | ||||||
Shandong Sun Paper Industry JSC Ltd., A Shares | 45,800 | 65,826 | ||||||
|
| |||||||
| 298,847 | ||||||||
|
| |||||||
Finland-11.48% |
| |||||||
Huhtamaki OYJ(b) | 28,793 | 1,034,433 | ||||||
Metsa Board OYJ | 53,762 | 404,363 | ||||||
Stora Enso OYJ, Class R | 165,470 | 2,157,124 | ||||||
UPM-Kymmene OYJ | 100,447 | 3,366,479 | ||||||
|
| |||||||
| 6,962,399 | ||||||||
|
| |||||||
Germany-0.30% |
| |||||||
Mercer International, Inc.(b) | 13,569 | 182,096 | ||||||
|
| |||||||
Hong Kong-0.48% | ||||||||
Nine Dragons Paper Holdings Ltd. | 492,716 | 291,869 | ||||||
|
| |||||||
Indonesia-1.20% | ||||||||
PT Indah Kiat Pulp & Paper Corp. Tbk | 828,337 | 509,827 | ||||||
PT Pabrik Kertas Tjiwi Kimia Tbk | 431,738 | 215,904 | ||||||
|
| |||||||
| 725,731 | ||||||||
|
| |||||||
Ireland-4.04% |
| |||||||
Smurfit Kappa Group PLC | 73,851 | 2,447,378 | ||||||
|
| |||||||
Japan-2.99% | ||||||||
Daiken Corp. | 3,491 | 46,786 | ||||||
Daio Paper Corp. | 25,130 | 185,641 | ||||||
Hokuetsu Corp. | 37,537 | 194,965 | ||||||
Nippon Paper Industries Co. Ltd.(b) | 29,375 | 171,149 | ||||||
Oji Holdings Corp. | 244,269 | 848,002 | ||||||
Rengo Co. Ltd. | 56,012 | 310,895 | ||||||
Tokushu Tokai Paper Co. Ltd.(b) | 2,732 | 53,764 | ||||||
|
| |||||||
| 1,811,202 | ||||||||
|
| |||||||
Malaysia-0.09% |
| |||||||
Ta Ann Holdings Bhd | 63,500 | 53,051 | ||||||
|
| |||||||
Norway-0.13% | ||||||||
Elopak ASA | 34,637 | 78,123 | ||||||
|
| |||||||
| Shares | Value | |||||||
Portugal-0.70% | ||||||||
Altri SGPS S.A. | 21,338 | $ | 118,839 | |||||
Navigator Co. S.A. (The) | 64,081 | 244,345 | ||||||
Semapa-Sociedade de Investimento e Gestao | 4,843 | 61,651 | ||||||
|
| |||||||
| 424,835 | ||||||||
|
| |||||||
Russia-0.00% |
| |||||||
Segezha Group PJSC(c)(d) | 1,310,077 | 0 | ||||||
|
| |||||||
Saudi Arabia-0.19% | ||||||||
Middle East Paper Co. | 8,313 | 115,263 | ||||||
|
| |||||||
South Africa-0.87% | ||||||||
Sappi Ltd.(a) | 171,808 | 529,704 | ||||||
|
| |||||||
South Korea-0.20% | ||||||||
Dongwha Enterprise Co. Ltd.(a) | 1,592 | 73,428 | ||||||
Kuk-il Paper Manufacturing Co. Ltd.(a) | 28,857 | 50,747 | ||||||
|
| |||||||
| 124,175 | ||||||||
|
| |||||||
Spain-0.32% |
| |||||||
Ence Energia y Celulosa S.A. | 41,974 | 143,704 | ||||||
Miquel y Costas & Miquel S.A. | 4,576 | 48,483 | ||||||
|
| |||||||
| 192,187 | ||||||||
|
| |||||||
Sweden-6.65% |
| |||||||
Billerud AB(b) | 66,634 | 859,875 | ||||||
Holmen AB, Class B | 28,279 | 1,025,168 | ||||||
Svenska Cellulosa AB S.C.A., Class B | 182,066 | 2,146,809 | ||||||
|
| |||||||
| 4,031,852 | ||||||||
|
| |||||||
Switzerland-2.89% |
| |||||||
SIG Group AG | 91,265 | 1,754,623 | ||||||
|
| |||||||
Taiwan-1.11% | ||||||||
Cheng Loong Corp. | 219,000 | 178,068 | ||||||
Chung Hwa Pulp Corp. | 121,000 | 62,523 | ||||||
Longchen Paper & Packaging Co. Ltd. | 217,000 | 100,006 | ||||||
Shihlin Paper Corp.(a) | 47,000 | 69,795 | ||||||
YFY, Inc. | 330,000 | 261,665 | ||||||
|
| |||||||
| 672,057 | ||||||||
|
| |||||||
Thailand-0.92% |
| |||||||
Polyplex Thailand PCL, NVDR | 61,211 | 37,956 | ||||||
SCG Packaging PCL, NVDR | 382,102 | 522,052 | ||||||
|
| |||||||
| 560,008 | ||||||||
|
| |||||||
United Kingdom-2.25% |
| |||||||
DS Smith PLC | 407,998 | 1,363,210 | ||||||
|
| |||||||
United States-46.85% | ||||||||
Amcor PLC | 273,501 | 3,167,142 | ||||||
Avery Dennison Corp. | 17,529 | 2,972,042 | ||||||
Clearwater Paper Corp.(a) | 5,165 | 229,739 | ||||||
Glatfelter Corp.(b) | 13,606 | 38,505 | ||||||
Graphic Packaging Holding Co. | 92,416 | 2,121,871 | ||||||
International Paper Co. | 77,881 | 2,617,581 | ||||||
Louisiana-Pacific Corp.(b) | 24,991 | 1,415,740 | ||||||
Packaging Corp. of America | 23,745 | 2,854,387 | ||||||
Pactiv Evergreen, Inc. | 13,134 | 143,292 | ||||||
PotlatchDeltic Corp.(b) | 23,830 | 1,060,197 | ||||||
Ranpak Holdings Corp.(a)(b) | 12,955 | 49,229 | ||||||
Rayonier, Inc. | 43,364 | 1,461,367 | ||||||
Resolute Forest Products, Inc.(a) | 13,962 | 290,182 | ||||||
Sealed Air Corp. | 43,981 | 2,094,375 | ||||||
See accompanying Notes to Financial Statements which are an integral part of the financial statements.
| 86 | ||||
|
| |||
Invesco MSCI Global Timber ETF (CUT)–(continued)
October 31, 2022
| Shares | Value | |||||||
United States-(continued) | ||||||||
Sonoco Products Co. | 29,091 | $ | 1,805,969 | |||||
Sylvamo Corp. | 12,072 | 581,508 | ||||||
WestRock Co. | 77,037 | 2,623,880 | ||||||
Weyerhaeuser Co. | 93,539 | 2,893,161 | ||||||
|
| |||||||
| 28,420,167 | ||||||||
|
| |||||||
Total Common Stocks & Other Equity Interests |
| 60,052,039 | ||||||
|
| |||||||
Exchange-Traded Funds-0.64% |
| |||||||
India-0.64% |
| |||||||
Invesco India ETF(e) | 15,752 | 384,979 | ||||||
|
| |||||||
Money Market Funds-0.11% |
| |||||||
Invesco Government & Agency Portfolio, Institutional Class, 3.07%(e)(f) | 67,536 | 67,536 | ||||||
|
| |||||||
TOTAL INVESTMENTS IN SECURITIES |
| 60,504,554 | ||||||
|
| |||||||
| Shares | Value | |||||||
Investments Purchased with Cash Collateral from Securities on Loan |
| |||||||
Money Market Funds-6.54% |
| |||||||
Invesco Private Government Fund, 3.18%(e)(f)(g) | 1,110,750 | $ | 1,110,750 | |||||
Invesco Private Prime Fund, 3.28%(e)(f)(g) | 2,855,522 | 2,855,522 | ||||||
|
| |||||||
Total Investments Purchased with Cash Collateral from Securities on Loan |
| 3,966,272 | ||||||
|
| |||||||
TOTAL INVESTMENTS IN SECURITIES-106.29% |
| 64,470,826 | ||||||
OTHER ASSETS LESS LIABILITIES-(6.29)% |
| (3,814,371 | ) | |||||
|
| |||||||
NET ASSETS-100.00% |
| $ | 60,656,455 | |||||
|
| |||||||
Investment Abbreviations:
ETF-Exchange-Traded Fund
NVDR-Non-Voting Depositary Receipt
Notes to Schedule of Investments:
(a) Non-income producing security.
| (b) | All or a portion of this security was out on loan at October 31, 2022. |
| (c) | Security purchased or received in a transaction exempt from registration under the Securities Act of 1933, as amended (the “1933 Act”). The security may be resold pursuant to an exemption from registration under the 1933 Act, typically to qualified institutional buyers. The value of this security at October 31, 2022 represented less than 1% of the Fund’s Net Assets. |
| (d) | Security valued using significant unobservable inputs (Level 3). See Note 4. |
| (e) | Affiliated issuer. The issuer and/or the Fund is a wholly-owned subsidiary of Invesco Ltd., or is affiliated by having an investment adviser that is under common control of Invesco Ltd. The table below shows the Fund’s transactions in, and earnings from, its investments in affiliates for the fiscal year ended October 31, 2022. |
| Value October 31, 2021 | Purchases at Cost | Proceeds from Sales | Change in Unrealized Appreciation (Depreciation) | Realized Gain (Loss) | Value October 31, 2022 | Dividend Income | ||||||||
| Invesco India ETF | $260,608 | $263,514 | $(96,265) | $(46,619) | $21,338 | $384,979 | $3,325 | |||||||
| Investments in Affiliated Money Market Funds: | ||||||||||||||
| Invesco Government & Agency Portfolio, Institutional Class | 223,357 | 4,051,573 | (4,207,394) | - | - | 67,536 | 473 | |||||||
See accompanying Notes to Financial Statements which are an integral part of the financial statements.
| 87 | ||||
|
| |||
Invesco MSCI Global Timber ETF (CUT)–(continued)
October 31, 2022
| Value October 31, 2021 | Purchases at Cost | Proceeds from Sales | Change in Unrealized Appreciation (Depreciation) | Realized Gain (Loss) | Value October 31, 2022 | Dividend Income | |||||||||||||||||||||||||||||
| Investments Purchased with Cash Collateral from Securities on Loan: | |||||||||||||||||||||||||||||||||||
| Invesco Private Government Fund | $ | 1,598,882 | $ | 28,002,957 | $ | (28,491,089 | ) | $ | - | $ | - | $ | 1,110,750 | $ | 13,727 | * | |||||||||||||||||||
| Invesco Private Prime Fund | 3,730,724 | 57,538,802 | (58,413,722 | ) | 12 | (294 | ) | 2,855,522 | 37,872 | * | |||||||||||||||||||||||||
|
|
|
|
|
|
|
|
|
|
|
|
|
| ||||||||||||||||||||||
| Total | $ | 5,813,571 | $ | 89,856,846 | $ | (91,208,470 | ) | $ | (46,607 | ) | $ | 21,044 | ** | $ | 4,418,787 | $ | 55,397 | ||||||||||||||||||
|
|
|
|
|
|
|
|
|
|
|
|
|
| ||||||||||||||||||||||
| * | Represents the income earned on the investment of cash collateral, which is included in securities lending income on the Statements of Operations. Does not include rebates and fees paid to lending agent or premiums received from borrowers, if any. |
| ** | Includes capital gains distributions from affiliated underlying funds as follows: |
| Fund Name | Capital Gain | ||||
Invesco India ETF | $ | 17,597 | |||
| (f) | The rate shown is the 7-day SEC standardized yield as of October 31, 2022. |
| (g) | The security has been segregated to satisfy the commitment to return the cash collateral received in securities lending transactions upon the borrower’s return of the securities loaned. See Note 2J. |
See accompanying Notes to Financial Statements which are an integral part of the financial statements.
| 88 | ||||
|
| |||
Invesco MSCI Green Building ETF (GBLD)
October 31, 2022
Schedule of Investments
| Shares | Value | |||||||
Common Stocks & Other Equity Interests-99.74% |
| |||||||
Australia-2.90% |
| |||||||
Centuria Office REIT | 8,345 | $ | 8,031 | |||||
Cromwell Property Group | 30,959 | 13,858 | ||||||
GDI Property Group | 10,409 | 5,258 | ||||||
Growthpoint Properties Australia Ltd. | 5,804 | 12,322 | ||||||
Vicinity Ltd. | 83,169 | 103,440 | ||||||
|
| |||||||
| 142,909 | ||||||||
|
| |||||||
Austria-0.59% |
| |||||||
CA Immobilien Anlagen AG | 916 | 28,925 | ||||||
|
| |||||||
Canada-1.50% | ||||||||
First Capital REIT | 2,329 | 27,063 | ||||||
RioCan REIT | 3,300 | 46,958 | ||||||
|
| |||||||
| 74,021 | ||||||||
|
| |||||||
China-0.26% |
| |||||||
Guangzhou R&F Properties Co. Ltd., H Shares(a) | 36,476 | 4,972 | ||||||
SOHO China Ltd. | 44,538 | 6,525 | ||||||
Yuzhou Group Holdings Co. Ltd.(a)(b) | 49,338 | 1,282 | ||||||
|
| |||||||
| 12,779 | ||||||||
|
| |||||||
Finland-0.23% |
| |||||||
Citycon OYJ(a) | 1,806 | 11,254 | ||||||
|
| |||||||
France-7.85% | ||||||||
Carmila S.A. | 1,234 | 17,270 | ||||||
Covivio | 1,018 | 54,533 | ||||||
Gecina S.A. | 988 | 88,128 | ||||||
Klepierre S.A. | 4,624 | 93,002 | ||||||
Mercialys S.A.(a) | 1,614 | 13,982 | ||||||
Unibail-Rodamco-Westfield(a)(b) | 2,535 | 119,962 | ||||||
|
| |||||||
| 386,877 | ||||||||
|
| |||||||
Germany-0.12% |
| |||||||
Deutsche EuroShop AG | 266 | 5,705 | ||||||
|
| |||||||
Hong Kong-9.84% | ||||||||
Champion REIT | 57,220 | 17,130 | ||||||
Henderson Land Development Co. Ltd. | 31,214 | 76,426 | ||||||
Sun Hung Kai Properties Ltd. | 31,101 | 334,590 | ||||||
Swire Properties Ltd. | 25,117 | 48,251 | ||||||
Yuexiu REIT | 49,978 | 8,595 | ||||||
|
| |||||||
| 484,992 | ||||||||
|
| |||||||
Israel-0.10% |
| |||||||
Property & Building Corp. Ltd.(b) | 64 | 4,766 | ||||||
|
| |||||||
Japan-27.31% | ||||||||
Activia Properties, Inc. | 15 | 44,455 | ||||||
AEON REIT Investment Corp. | 35 | 37,676 | ||||||
CRE Logistics REIT, Inc. | 12 | 16,518 | ||||||
Daiwa House REIT Investment Corp. | 47 | 94,863 | ||||||
Daiwa Office Investment Corp. | 7 | 33,061 | ||||||
Frontier Real Estate Investment Corp. | 10 | 35,321 | ||||||
Fukuoka REIT Corp. | 14 | 16,352 | ||||||
Global One Real Estate Investment Corp. | 20 | 15,447 | ||||||
GLP J-Reit | 92 | 95,383 | ||||||
Hulic Reit, Inc. | 28 | 32,797 | ||||||
Isetan Mitsukoshi Holdings Ltd. | 7,217 | 64,093 | ||||||
Itochu Advance Logistics Investment Corp. | 14 | 13,695 | ||||||
Japan Excellent, Inc. | 26 | 24,052 | ||||||
Japan Metropolitan Fund Investment Corp. | 150 | 110,506 | ||||||
| Shares | Value | |||||||
Japan-(continued) | ||||||||
Japan Real Estate Investment Corp. | 27 | $ | 113,170 | |||||
LaSalle Logiport REIT | 38 | 40,573 | ||||||
Mitsubishi Estate Logistics REIT Investment Corp. | 10 | 29,603 | ||||||
Mori Hills REIT Investment Corp. | 33 | 36,123 | ||||||
Nippon Building Fund, Inc. | 33 | 146,756 | ||||||
Nippon Prologis REIT, Inc. | 46 | 96,404 | ||||||
Nomura Real Estate Master Fund, Inc. | 91 | 103,774 | ||||||
One REIT, Inc. | 5 | 8,339 | ||||||
ORIX JREIT, Inc. | 56 | 75,164 | ||||||
Sekisui House REIT, Inc. | 90 | 48,501 | ||||||
SOSiLA Logistics REIT, Inc. | 14 | 13,422 | ||||||
|
| |||||||
| 1,346,048 | ||||||||
|
| |||||||
Netherlands-0.58% |
| |||||||
Eurocommercial Properties N.V. | 917 | 20,174 | ||||||
Wereldhave N.V.(a) | 692 | 8,481 | ||||||
|
| |||||||
| 28,655 | ||||||||
|
| |||||||
Singapore-10.08% |
| |||||||
CapitaLand India Trust | 19,952 | 15,791 | ||||||
CapitaLand Integrated Commercial Trust | 113,976 | 151,420 | ||||||
City Developments Ltd. | 8,775 | 47,314 | ||||||
Frasers Centrepoint Trust | 21,990 | 32,322 | ||||||
Frasers Logistics & Commercial Trust(c) | 63,444 | 49,317 | ||||||
Keppel REIT | 39,979 | 25,285 | ||||||
Lendlease Global Commercial REIT | 36,166 | 17,890 | ||||||
Manulife US REIT(c) | 36,064 | 13,163 | ||||||
Mapletree Pan Asia Commercial Trust | 50,614 | 56,870 | ||||||
OUE Commercial REIT, (Acquired 04/20/2021 - 08/18/2022; Cost $14,207)(d) | 46,875 | 10,766 | ||||||
Prime US REIT(c) | 13,904 | 6,535 | ||||||
SPH REIT | 24,014 | 13,830 | ||||||
Starhill Global REIT | 31,261 | 11,377 | ||||||
Suntec REIT | 49,347 | 44,985 | ||||||
|
| |||||||
| 496,865 | ||||||||
|
| |||||||
Spain-2.09% |
| |||||||
Inmobiliaria Colonial SOCIMI S.A. | 6,379 | 33,635 | ||||||
Lar Espana Real Estate SOCIMI S.A. | 1,169 | 4,558 | ||||||
Merlin Properties SOCIMI S.A. | 7,068 | 59,867 | ||||||
Neinor Homes S.A.(a)(c) | 602 | 4,802 | ||||||
|
| |||||||
| 102,862 | ||||||||
|
| |||||||
Sweden-1.26% |
| |||||||
Atrium Ljungberg AB, Class B | 972 | 12,992 | ||||||
Fabege AB | 5,688 | 41,271 | ||||||
Platzer Fastigheter Holding AB, Class B | 1,289 | 7,990 | ||||||
|
| |||||||
| 62,253 | ||||||||
|
| |||||||
United Kingdom-4.22% |
| |||||||
Berkeley Group Holdings PLC | 2,393 | 95,632 | ||||||
Crest Nicholson Holdings PLC | 5,522 | 12,843 | ||||||
Land Securities Group PLC | 15,141 | 99,436 | ||||||
|
| |||||||
| 207,911 | ||||||||
|
| |||||||
United States-30.81% |
| |||||||
Alexandria Real Estate Equities, Inc. | 3,344 | 485,883 | ||||||
Boston Properties, Inc. | 3,211 | 233,440 | ||||||
Brandywine Realty Trust | 3,684 | 24,167 | ||||||
Cousins Properties, Inc. | 3,197 | 75,961 | ||||||
See accompanying Notes to Financial Statements which are an integral part of the financial statements.
| 89 | ||||
|
| |||
Invesco MSCI Green Building ETF (GBLD)–(continued)
October 31, 2022
| Shares | Value | |||||||
United States-(continued) |
| |||||||
Douglas Emmett, Inc. | 3,778 | $ | 66,455 | |||||
Empire State Realty Trust, Inc., Class A, (Acquired 04/20/2021 - 08/18/2022; Cost $30,980)(a)(d) | 3,043 | 22,427 | ||||||
Equity Commonwealth | 2,422 | 63,360 | ||||||
Franklin Street Properties Corp. | 2,217 | 6,385 | ||||||
Highwoods Properties, Inc. | 2,260 | 63,800 | ||||||
Hudson Pacific Properties, Inc. | 3,109 | 34,323 | ||||||
JBG SMITH Properties | 2,390 | 47,035 | ||||||
KB Home | 1,714 | 49,397 | ||||||
Kilroy Realty Corp. | 2,258 | 96,507 | ||||||
Meritage Homes Corp.(b) | 789 | 60,090 | ||||||
Paramount Group, Inc.(a) | 3,767 | 24,372 | ||||||
Piedmont Office Realty Trust, Inc., Class A | 2,651 | 27,703 | ||||||
SL Green Realty Corp. | 1,378 | 54,679 | ||||||
Vornado Realty Trust | 3,503 | 82,636 | ||||||
|
| |||||||
| 1,518,620 | ||||||||
|
| |||||||
Total Common Stocks & Other Equity Interests |
| 4,915,442 | ||||||
|
| |||||||
Money Market Funds-0.66% |
| |||||||
Invesco Government & Agency Portfolio, Institutional Class, 3.07%(e)(f) | 32,365 | 32,365 | ||||||
|
| |||||||
TOTAL INVESTMENTS IN SECURITIES (excluding investments purchased with cash collateral from securities on loan)-100.40% | 4,947,807 | |||||||
|
| |||||||
| Shares | Value | |||||||
Investments Purchased with Cash Collateral from Securities on Loan |
| |||||||
Money Market Funds-2.34% |
| |||||||
Invesco Private Government Fund, 3.18%(e)(f)(g) | 32,360 | $ | 32,360 | |||||
Invesco Private Prime Fund, 3.28%(e)(f)(g) | 83,181 | 83,181 | ||||||
|
| |||||||
Total Investments Purchased with Cash Collateral from Securities on Loan | 115,541 | |||||||
|
| |||||||
TOTAL INVESTMENTS IN SECURITIES-102.74% |
| 5,063,348 | ||||||
OTHER ASSETS LESS LIABILITIES-(2.74)% |
| (135,219 | ) | |||||
|
| |||||||
NET ASSETS-100.00% |
| $ | 4,928,129 | |||||
|
| |||||||
Investment Abbreviations:
REIT-Real Estate Investment Trust
Notes to Schedule of Investments:
| (a) | All or a portion of this security was out on loan at October 31, 2022. |
| (b) | Non-income producing security. |
| (c) | Security purchased or received in a transaction exempt from registration under the Securities Act of 1933, as amended (the “1933 Act”). The security may be resold pursuant to an exemption from registration under the 1933 Act, typically to qualified institutional buyers. The aggregate value of these securities at October 31, 2022 was $73,817, which represented 1.50% of the Fund’s Net Assets. |
| (d) | Restricted security. The value of this security at October 31, 2022 represented less than 1% of the Fund’s Net Assets. |
| (e) | Affiliated issuer. The issuer and/or the Fund is a wholly-owned subsidiary of Invesco Ltd., or is affiliated by having an investment adviser that is under common control of Invesco Ltd. The table below shows the Fund’s transactions in, and earnings from, its investments in affiliates for the period ended October 31, 2022. |
| Value October 31, 2021 | Purchases at Cost | Proceeds from Sales | Change in Unrealized Appreciation | Realized Gain (Loss) | Value October 31, 2022 | Dividend Income | |||||||||||||||||||||||||||||
| Invesco Office J-Reit, Inc. | $ | 9,945 | $ | - | $ | (10,015 | ) | $ | 371 | $ | (301 | ) | $ | - | $ | - | |||||||||||||||||||
| Investments in Affiliated Money Market Funds: | |||||||||||||||||||||||||||||||||||
| Invesco Government & Agency Portfolio, Institutional Class | - | 409,299 | (376,934 | ) | - | - | 32,365 | 248 | |||||||||||||||||||||||||||
| Investments Purchased with Cash Collateral from Securities on Loan: | |||||||||||||||||||||||||||||||||||
| Invesco Private Government Fund | 57,646 | 859,534 | (884,820 | ) | - | - | 32,360 | 562 | * | ||||||||||||||||||||||||||
| Invesco Private Prime Fund | 134,510 | 1,982,306 | (2,033,610 | ) | 3 | (28 | ) | 83,181 | 1,523 | * | |||||||||||||||||||||||||
|
|
|
|
|
|
|
|
|
|
|
|
|
| ||||||||||||||||||||||
Total | $ | 202,101 | $ | 3,251,139 | $ | (3,305,379 | ) | $ | 374 | $ | (329 | ) | $ | 147,906 | $ | 2,333 | |||||||||||||||||||
|
|
|
|
|
|
|
|
|
|
|
|
|
| ||||||||||||||||||||||
| * | Represents the income earned on the investment of cash collateral, which is included in securities lending income on the Statements of Operations. Does not include rebates and fees paid to lending agent or premiums received from borrowers, if any. |
See accompanying Notes to Financial Statements which are an integral part of the financial statements.
| 90 | ||||
|
| |||
Invesco MSCI Green Building ETF (GBLD)–(continued)
October 31, 2022
| (f) | The rate shown is the 7-day SEC standardized yield as of October 31, 2022. |
| (g) | The security has been segregated to satisfy the commitment to return the cash collateral received in securities lending transactions upon the borrower’s return of the securities loaned. See Note 2J. |
See accompanying Notes to Financial Statements which are an integral part of the financial statements.
| 91 | ||||
|
| |||
Invesco S&P Global Water Index ETF (CGW)
October 31, 2022
Schedule of Investments
| Shares | Value | |||||||
Common Stocks & Other Equity Interests-100.00% |
| |||||||
Austria-0.90% |
| |||||||
Wienerberger AG | 366,867 | $ | 8,390,409 | |||||
|
| |||||||
Brazil-2.50% | ||||||||
Cia de Saneamento Basico do Estado de Sao Paulo, ADR(a) | 2,014,451 | 23,287,053 | ||||||
|
| |||||||
Canada-2.03% | ||||||||
Stantec, Inc. | 387,500 | 18,936,806 | ||||||
|
| |||||||
China-1.09% | ||||||||
Beijing Enterprises Water Group Ltd.(a) | 34,348,466 | 7,219,879 | ||||||
China Lesso Group Holdings Ltd. | 3,597,000 | 2,918,895 | ||||||
|
| |||||||
| 10,138,774 | ||||||||
|
| |||||||
France-4.28% |
| |||||||
Veolia Environnement S.A. | 1,789,236 | 39,947,994 | ||||||
|
| |||||||
Italy-1.01% | ||||||||
Interpump Group S.p.A.(a) | 242,761 | 9,400,576 | ||||||
|
| |||||||
Japan-3.85% | ||||||||
Ebara Corp. | 245,100 | 7,989,434 | ||||||
Kurita Water Industries Ltd.(a) | 680,791 | 25,008,368 | ||||||
Organo Corp. | 168,500 | 2,919,148 | ||||||
|
| |||||||
| 35,916,950 | ||||||||
|
| |||||||
Netherlands-1.17% |
| |||||||
Aalberts N.V. | 314,419 | 10,932,406 | ||||||
|
| |||||||
South Korea-0.70% | ||||||||
Coway Co. Ltd. | 168,587 | 6,544,885 | ||||||
|
| |||||||
Switzerland-6.82% | ||||||||
Belimo Holding AG | 28,252 | 11,518,177 | ||||||
Geberit AG(a) | 78,541 | 34,948,096 | ||||||
Georg Fischer AG | 250,792 | 13,895,995 | ||||||
Sulzer AG(a) | 49,256 | 3,285,374 | ||||||
|
| |||||||
| 63,647,642 | ||||||||
|
| |||||||
United Kingdom-15.28% |
| |||||||
Pennon Group PLC | 2,193,305 | 21,149,070 | ||||||
Severn Trent PLC(a) | 2,052,978 | 59,163,325 | ||||||
United Utilities Group PLC(a) | 5,754,415 | 62,238,506 | ||||||
|
| |||||||
| 142,550,901 | ||||||||
|
| |||||||
United States-60.37% |
| |||||||
Advanced Drainage Systems, Inc.(a) | 365,835 | 42,392,960 | ||||||
American States Water Co.(a) | 258,528 | 23,386,443 | ||||||
American Water Works Co., Inc.(a) | 526,997 | 76,593,744 | ||||||
| Shares | Value | |||||||
United States-(continued) | ||||||||
Badger Meter, Inc.(a) | 170,225 | $ | 19,146,908 | |||||
California Water Service Group | 397,413 | 24,663,451 | ||||||
Core & Main, Inc., Class A(a)(b) | 263,009 | 6,201,752 | ||||||
Ecolab, Inc.(a) | 236,269 | 37,110,772 | ||||||
Energy Recovery, Inc.(a)(b) | 374,133 | 9,626,442 | ||||||
Essential Utilities, Inc. | 1,263,661 | 55,879,089 | ||||||
Evoqua Water Technologies Corp.(b) | 759,537 | 29,758,660 | ||||||
Franklin Electric Co., Inc. | 164,098 | 13,446,190 | ||||||
Lindsay Corp. | 63,807 | 10,802,525 | ||||||
Middlesex Water Co.(a) | 136,138 | 12,180,267 | ||||||
Montrose Environmental Group, Inc.(a)(b) | 110,907 | 4,855,508 | ||||||
Mueller Water Products, Inc., Class A | 901,367 | 10,545,994 | ||||||
Pentair PLC | 490,822 | 21,080,805 | ||||||
Reliance Worldwide Corp. Ltd.(a) | 2,521,319 | 5,175,348 | ||||||
Select Energy Services, Inc., Class A(b) | 473,845 | 4,572,604 | ||||||
SJW Group(a) | 189,399 | 13,386,721 | ||||||
Tetra Tech, Inc. | 187,329 | 26,465,841 | ||||||
TETRA Technologies, Inc.(a)(b) | 424,355 | 2,096,314 | ||||||
Valmont Industries, Inc. | 57,871 | 18,473,580 | ||||||
Watts Water Technologies, Inc., Class A(a) | 119,225 | 17,449,771 | ||||||
Xylem, Inc.(a) | 761,341 | 77,984,159 | ||||||
|
| |||||||
| 563,275,848 | ||||||||
|
| |||||||
TOTAL INVESTMENTS IN SECURITIES |
| 932,970,244 | ||||||
|
| |||||||
Investments Purchased with Cash Collateral from Securities on Loan |
| |||||||
Money Market Funds-10.08% |
| |||||||
Invesco Private Government Fund, | 26,467,571 | 26,467,571 | ||||||
Invesco Private Prime Fund, 3.28%(c)(d)(e) | 67,629,085 | 67,629,085 | ||||||
|
| |||||||
Total Investments Purchased with Cash Collateral from Securities on Loan |
| 94,096,656 | ||||||
|
| |||||||
TOTAL INVESTMENTS IN SECURITIES-110.08% |
| 1,027,066,900 | ||||||
OTHER ASSETS LESS LIABILITIES-(10.08)% |
| (94,073,162 | ) | |||||
|
| |||||||
NET ASSETS-100.00% |
| $ | 932,993,738 | |||||
|
| |||||||
See accompanying Notes to Financial Statements which are an integral part of the financial statements.
| 92 | ||||
|
| |||
Invesco S&P Global Water Index ETF (CGW)–(continued)
October 31, 2022
Notes to Schedule of Investments:
| (a) | All or a portion of this security was out on loan at October 31, 2022. |
| (b) | Non-income producing security. |
| (c) | Affiliated issuer. The issuer and/or the Fund is a wholly-owned subsidiary of Invesco Ltd., or is affiliated by having an investment adviser that is under common control of Invesco Ltd. The table below shows the Fund’s transactions in, and earnings from, its investments in affiliates for the fiscal year ended October 31, 2022. |
| Value October 31, 2021 | Purchases at Cost | Proceeds from Sales | Change in Unrealized Appreciation | Realized Gain (Loss) | Value October 31, 2022 | Dividend Income | |||||||||||||||||||||||||||||
| Investments in Affiliated Money Market Funds: | |||||||||||||||||||||||||||||||||||
| Invesco Government & Agency Portfolio, Institutional Class | $ | 198,686 | $ | 29,391,900 | $ | (29,590,586 | ) | $ | - | $ | - | $ | - | $ | 1,104 | ||||||||||||||||||||
| Investments Purchased with Cash Collateral from Securities on Loan: | |||||||||||||||||||||||||||||||||||
| Invesco Private Government Fund | 9,367,167 | 132,981,516 | (115,881,112 | ) | - | - | 26,467,571 | 112,171 | * | ||||||||||||||||||||||||||
Invesco Private Prime Fund | 21,856,724 | 314,701,566 | (268,930,095 | ) | 1,594 | (704 | ) | 67,629,085 | 306,510 | * | |||||||||||||||||||||||||
|
|
|
|
|
|
|
|
|
|
|
|
|
| ||||||||||||||||||||||
Total | $ | 31,422,577 | $ | 477,074,982 | $ | (414,401,793 | ) | $ | 1,594 | $ | (704 | ) | $ | 94,096,656 | $ | 419,785 | |||||||||||||||||||
|
|
|
|
|
|
|
|
|
|
|
|
|
| ||||||||||||||||||||||
| * | Represents the income earned on the investment of cash collateral, which is included in securities lending income on the Statements of Operations. Does not include rebates and fees paid to lending agent or premiums received from borrowers, if any. |
| (d) | The rate shown is the 7-day SEC standardized yield as of October 31, 2022. |
| (e) | The security has been segregated to satisfy the commitment to return the cash collateral received in securities lending transactions upon the borrower’s return of the securities loaned. See Note 2J. |
See accompanying Notes to Financial Statements which are an integral part of the financial statements.
| 93 | ||||
|
| |||
Invesco S&P International Developed Quality ETF (IDHQ)
October 31, 2022
Schedule of Investments
| Shares | Value | |||||||
Common Stocks & Other Equity Interests-99.76% |
| |||||||
Australia-12.05% | ||||||||
AGL Energy Ltd. | 14,244 | $ | 62,028 | |||||
ALS Ltd. | 9,414 | 68,866 | ||||||
Aristocrat Leisure Ltd. | 12,457 | 295,286 | ||||||
ASX Ltd. | 5,522 | 239,052 | ||||||
Bendigo & Adelaide Bank Ltd.(a) | 13,827 | 79,663 | ||||||
BHP Group Ltd. | 125,958 | 3,009,119 | ||||||
BlueScope Steel Ltd. | 10,818 | 108,813 | ||||||
Charter Hall Group | 10,541 | 87,221 | ||||||
Cochlear Ltd. | 1,463 | 186,832 | ||||||
CSL Ltd. | 8,468 | 1,518,761 | ||||||
Domino’s Pizza Enterprises Ltd. | 1,311 | 53,443 | ||||||
Fortescue Metals Group Ltd. | 45,691 | 429,492 | ||||||
Goodman Group | 34,661 | 376,788 | ||||||
James Hardie Industries PLC, CDI | 9,497 | 206,477 | ||||||
JB Hi-Fi Ltd.(a) | 2,720 | 74,634 | ||||||
Lynas Rare Earths Ltd.(b) | 18,440 | 98,223 | ||||||
Rio Tinto PLC | 27,777 | 1,450,980 | ||||||
SEEK Ltd. | 9,679 | 133,626 | ||||||
Sonic Healthcare Ltd. | 10,436 | 218,684 | ||||||
South32 Ltd. | 83,171 | 191,461 | ||||||
Stockland | 49,266 | 113,411 | ||||||
Transurban Group | 66,961 | 567,770 | ||||||
Wesfarmers Ltd. | 22,564 | 655,922 | ||||||
WiseTech Global Ltd. | 3,136 | 116,629 | ||||||
Woolworths Group Ltd. | 36,571 | 772,184 | ||||||
|
| |||||||
| 11,115,365 | ||||||||
|
| |||||||
Belgium-0.49% | ||||||||
KBC Group N.V. | 6,496 | 325,510 | ||||||
Umicore S.A.(a) | 3,772 | 124,331 | ||||||
|
| |||||||
| 449,841 | ||||||||
|
| |||||||
Brazil-0.42% | ||||||||
Wheaton Precious Metals Corp. | 7,968 | 260,353 | ||||||
Yara International ASA | 2,977 | 132,860 | ||||||
|
| |||||||
| 393,213 | ||||||||
|
| |||||||
Canada-6.20% | ||||||||
Canadian National Railway Co. | 11,196 | 1,324,756 | ||||||
Canadian Natural Resources Ltd. | 24,027 | 1,439,277 | ||||||
CGI, Inc., Class A(b) | 4,557 | 366,618 | ||||||
Fairfax Financial Holdings Ltd. | 571 | 280,085 | ||||||
Gildan Activewear, Inc. | 4,277 | 134,796 | ||||||
Imperial Oil Ltd. | 4,007 | 217,704 | ||||||
Manulife Financial Corp. | 35,671 | 590,485 | ||||||
Suncor Energy, Inc. | 26,616 | 914,355 | ||||||
Toromont Industries Ltd. | 1,722 | 132,175 | ||||||
Tourmaline Oil Corp. | 5,668 | 318,959 | ||||||
|
| |||||||
| 5,719,210 | ||||||||
|
| |||||||
China-0.62% | ||||||||
BOC Hong Kong Holdings Ltd. | 93,525 | 290,708 | ||||||
Budweiser Brewing Co. APAC Ltd.(c) | 29,815 | 62,746 | ||||||
Chow Tai Fook Jewellery Group Ltd. | 47,618 | 81,528 | ||||||
ENN Energy Holdings Ltd. | 13,714 | 136,356 | ||||||
|
| |||||||
| 571,338 | ||||||||
|
| |||||||
Denmark-5.91% | ||||||||
AP Moller - Maersk A/S, Class B | 167 | 349,406 | ||||||
| Shares | Value | |||||||
Denmark-(continued) | ||||||||
Chr. Hansen Holding A/S | 2,907 | $ | 161,471 | |||||
Coloplast A/S, Class B | 2,169 | 241,878 | ||||||
Demant A/S(b) | 1,837 | 50,214 | ||||||
Novo Nordisk A/S, Class B | 38,104 | 4,143,482 | ||||||
Novozymes A/S, Class B | 4,067 | 213,648 | ||||||
Orsted A/S(c) | 3,550 | 292,859 | ||||||
|
| |||||||
| 5,452,958 | ||||||||
|
| |||||||
Finland-1.95% | ||||||||
Elisa OYJ | 2,975 | 143,812 | ||||||
Kesko OYJ, Class B | 5,327 | 103,719 | ||||||
Kone OYJ, Class B | 11,380 | 466,206 | ||||||
Metso Outotec OYJ(a) | 13,147 | 99,819 | ||||||
Neste OYJ | 7,862 | 344,540 | ||||||
Orion OYJ, Class B | 2,332 | 107,290 | ||||||
Sampo OYJ, Class A | 11,760 | 537,913 | ||||||
|
| |||||||
| 1,803,299 | ||||||||
|
| |||||||
France-5.50% | ||||||||
Airbus SE | 15,145 | 1,640,256 | ||||||
BioMerieux | 936 | 82,833 | ||||||
Bollore SE | 21,450 | 107,378 | ||||||
Hermes International | 790 | 1,023,235 | ||||||
Kering S.A. | 1,444 | 661,783 | ||||||
L’Oreal S.A. | 4,457 | 1,401,256 | ||||||
Sartorius Stedim Biotech | 495 | 157,142 | ||||||
|
| |||||||
| 5,073,883 | ||||||||
|
| |||||||
Germany-1.44% | ||||||||
adidas AG | 3,660 | 358,047 | ||||||
Hapag-Lloyd AG(c) | 216 | 39,046 | ||||||
Mercedes-Benz Group AG | 16,145 | 935,076 | ||||||
|
| |||||||
| 1,332,169 | ||||||||
|
| |||||||
Hong Kong-2.62% | ||||||||
AIA Group Ltd. | 224,059 | 1,696,887 | ||||||
Hong Kong Exchanges & Clearing Ltd. | 27,026 | 719,559 | ||||||
|
| |||||||
| 2,416,446 | ||||||||
|
| |||||||
Israel-0.78% | ||||||||
Check Point Software Technologies Ltd.(b) | 2,470 | 319,198 | ||||||
Clal Insurance Enterprises Holdings Ltd.(b) | 2,709 | 46,960 | ||||||
ICL Group Ltd. | 13,824 | 125,376 | ||||||
Israel Corp. Ltd. (The) | 121 | 52,636 | ||||||
Kornit Digital Ltd.(b) | 1,315 | 35,137 | ||||||
Maytronics Ltd.(a) | 2,952 | 31,990 | ||||||
Phoenix Holdings Ltd. (The) | 5,249 | 57,136 | ||||||
Strauss Group Ltd. | 2,136 | 53,699 | ||||||
|
| |||||||
| 722,132 | ||||||||
|
| |||||||
Italy-0.68% | ||||||||
Ferrari N.V. | 2,763 | 544,797 | ||||||
Recordati Industria Chimica e Farmaceutica S.p.A. | 2,115 | 79,497 | ||||||
|
| |||||||
| 624,294 | ||||||||
|
| |||||||
Japan-13.96% | ||||||||
Advantest Corp. | 4,559 | 241,085 | ||||||
Astellas Pharma, Inc. | 34,859 | 479,961 | ||||||
BayCurrent Consulting, Inc. | 5,250 | 147,997 | ||||||
Benefit One, Inc. | 3,914 | 54,351 | ||||||
See accompanying Notes to Financial Statements which are an integral part of the financial statements.
| 94 | ||||
|
| |||
Invesco S&P International Developed Quality ETF (IDHQ)–(continued)
October 31, 2022
| Shares | Value | |||||||
Japan-(continued) | ||||||||
BIPROGY, Inc. | 2,546 | $ | 55,070 | |||||
Casio Computer Co. Ltd. | 5,706 | 49,676 | ||||||
Chugai Pharmaceutical Co. Ltd. | 14,406 | 334,381 | ||||||
CyberAgent, Inc. | 11,715 | 96,472 | ||||||
Daito Trust Construction Co. Ltd. | 1,439 | 142,414 | ||||||
Disco Corp. | 729 | 175,095 | ||||||
Fast Retailing Co. Ltd. | 1,160 | 647,683 | ||||||
GMO Payment Gateway, Inc. | 1,294 | 93,414 | ||||||
Hoshizaki Corp. | 2,456 | 70,474 | ||||||
Hoya Corp. | 7,682 | 717,111 | ||||||
Iida Group Holdings Co. Ltd. | 3,899 | 54,195 | ||||||
Japan Exchange Group, Inc. | 11,048 | 145,203 | ||||||
Japan Tobacco, Inc. | 19,537 | 323,875 | ||||||
Kakaku.com, Inc. | 3,807 | 64,571 | ||||||
Kawasaki Kisen Kaisha Ltd.(a) | 6,855 | 104,277 | ||||||
Kewpie Corp. | 3,403 | 53,780 | ||||||
Kobayashi Pharmaceutical Co. Ltd. | 1,160 | 61,654 | ||||||
Konami Group Corp. | 2,063 | 90,634 | ||||||
Kyowa Kirin Co. Ltd. | 4,619 | 108,922 | ||||||
Lawson, Inc. | 1,685 | 53,848 | ||||||
M3, Inc. | 10,277 | 307,408 | ||||||
MISUMI Group, Inc. | 5,473 | 117,093 | ||||||
Mitsui OSK Lines Ltd.(a) | 10,501 | 208,487 | ||||||
Murata Manufacturing Co. Ltd. | 12,029 | 590,788 | ||||||
Nexon Co. Ltd. | 8,853 | 148,726 | ||||||
Nifco, Inc. | 2,307 | 53,626 | ||||||
Nihon M&A Center Holdings, Inc. | 10,351 | 117,205 | ||||||
Nintendo Co. Ltd. | 26,550 | 1,084,257 | ||||||
Nippon Shinyaku Co. Ltd. | 1,321 | 73,233 | ||||||
Nippon Yusen K.K.(a) | 15,837 | 287,577 | ||||||
Nissan Chemical Corp. | 2,934 | 132,256 | ||||||
NOF Corp. | 1,543 | 53,151 | ||||||
Obic Co. Ltd. | 1,335 | 200,921 | ||||||
Otsuka Corp. | 2,500 | 78,969 | ||||||
Persol Holdings Co. Ltd. | 3,772 | 75,778 | ||||||
Pola Orbis Holdings, Inc. | 4,539 | 50,235 | ||||||
Rakus Co. Ltd. | 4,769 | 53,358 | ||||||
Recruit Holdings Co. Ltd. | 36,323 | 1,121,691 | ||||||
Ryohin Keikaku Co. Ltd. | 5,087 | 47,949 | ||||||
SCREEN Holdings Co. Ltd. | 942 | 51,906 | ||||||
SCSK Corp. | 3,287 | 48,586 | ||||||
Sega Sammy Holdings, Inc. | 3,745 | 47,998 | ||||||
SG Holdings Co. Ltd. | 11,149 | 147,918 | ||||||
Shimadzu Corp. | 5,521 | 145,793 | ||||||
Shimano, Inc. | 1,549 | 240,476 | ||||||
Shinko Electric Industries Co. Ltd. | 1,523 | 36,734 | ||||||
Shiseido Co. Ltd. | 7,606 | 263,793 | ||||||
Square Enix Holdings Co. Ltd. | 2,099 | 93,769 | ||||||
Sumitomo Metal Mining Co. Ltd. | 5,193 | 146,110 | ||||||
Tokio Marine Holdings, Inc. | 39,435 | 713,961 | ||||||
Tokyo Electron Ltd. | 3,700 | 983,032 | ||||||
Tosoh Corp. | 6,456 | 70,322 | ||||||
Trend Micro, Inc. | 4,230 | 213,727 | ||||||
USS Co. Ltd. | 4,619 | 69,828 | ||||||
Workman Co. Ltd.(a) | 1,544 | 52,874 | ||||||
Yakult Honsha Co. Ltd. | 3,188 | 176,736 | ||||||
Yamato Holdings Co. Ltd. | 7,380 | 109,433 | ||||||
ZOZO, Inc. | 4,799 | 102,189 | ||||||
|
| |||||||
| 12,884,036 | ||||||||
|
| |||||||
| Shares | Value | |||||||
Luxembourg-0.34% | ||||||||
ArcelorMittal S.A. | 12,099 | $ | 270,910 | |||||
RTL Group S.A.(a) | 1,182 | 40,117 | ||||||
|
| |||||||
| 311,027 | ||||||||
|
| |||||||
Netherlands-6.97% | ||||||||
ASM International N.V. | 687 | 152,639 | ||||||
ASML Holding N.V.(a) | 9,635 | 4,551,879 | ||||||
Koninklijke DSM N.V. | 3,244 | 382,501 | ||||||
Koninklijke KPN N.V. | 65,953 | 184,538 | ||||||
Universal Music Group N.V. | 29,264 | 574,181 | ||||||
Wolters Kluwer N.V. | 5,496 | 584,209 | ||||||
|
| |||||||
| 6,429,947 | ||||||||
|
| |||||||
New Zealand-0.26% | ||||||||
Fisher & Paykel Healthcare Corp. Ltd. | 11,161 | 126,956 | ||||||
Spark New Zealand Ltd. | 39,667 | 117,988 | ||||||
|
| |||||||
| 244,944 | ||||||||
|
| |||||||
Norway-1.60% | ||||||||
Aker BP ASA | 3,991 | 127,213 | ||||||
Equinor ASA | 24,395 | 892,447 | ||||||
Gjensidige Forsikring ASA | 4,717 | 86,157 | ||||||
Kongsberg Gruppen ASA | 1,945 | 69,704 | ||||||
Nordic Semiconductor ASA(b) | 3,493 | 49,354 | ||||||
Norsk Hydro ASA | 26,727 | 169,614 | ||||||
TOMRA Systems ASA | 4,883 | 78,912 | ||||||
|
| |||||||
| 1,473,401 | ||||||||
|
| |||||||
Singapore-1.06% | ||||||||
Kenon Holdings Ltd. | 989 | 38,076 | ||||||
Singapore Exchange Ltd. | 15,978 | 95,071 | ||||||
Singapore Technologies Engineering Ltd. | 29,180 | 68,048 | ||||||
Singapore Telecommunications Ltd. | 196,343 | 346,871 | ||||||
STMicroelectronics N.V. | 13,857 | 432,780 | ||||||
|
| |||||||
| 980,846 | ||||||||
|
| |||||||
South Africa-1.01% | ||||||||
Anglo American PLC | 31,063 | 932,914 | ||||||
|
| |||||||
South Korea-0.58% | ||||||||
BGF retail Co. Ltd. | 377 | 49,360 | ||||||
Cheil Worldwide, Inc. | 2,786 | 47,820 | ||||||
Daewoo Engineering & Construction Co. | 10,661 | 31,471 | ||||||
F&F Co. Ltd. | 687 | 70,173 | ||||||
Kumho Petrochemical Co. Ltd. | 443 | 40,741 | ||||||
LEENO Industrial, Inc. | 473 | 45,426 | ||||||
Meritz Fire & Marine Insurance Co. Ltd. | 1,874 | 41,376 | ||||||
Samsung Electro-Mechanics Co. Ltd. | 1,051 | 89,277 | ||||||
Samsung Engineering Co. Ltd.(b) | 4,128 | 69,116 | ||||||
S-Oil Corp. | 842 | 51,072 | ||||||
|
| |||||||
| 535,832 | ||||||||
|
| |||||||
Spain-0.90% | ||||||||
Industria de Diseno Textil S.A.(a) | 20,065 | 454,929 | ||||||
Telefonica S.A. | 108,456 | 373,566 | ||||||
|
| |||||||
| 828,495 | ||||||||
|
| |||||||
Sweden-1.81% | ||||||||
Atlas Copco AB, Class A(a) | 51,314 | 548,132 | ||||||
Boliden AB | 5,434 | 158,145 | ||||||
Epiroc AB, Class A | 11,114 | 170,022 | ||||||
Evolution AB(c) | 3,555 | 332,323 | ||||||
Getinge AB, Class B | 3,922 | 79,608 | ||||||
See accompanying Notes to Financial Statements which are an integral part of the financial statements.
| 95 | ||||
|
| |||
Invesco S&P International Developed Quality ETF (IDHQ)–(continued)
October 31, 2022
| Shares | Value | |||||||
Sweden-(continued) | ||||||||
H & M Hennes & Mauritz AB, Class B(a) | 14,777 | $ | 148,700 | |||||
Kinnevik AB, Class B(b) | 5,814 | 71,817 | ||||||
SSAB AB, Class A | 9,009 | 43,323 | ||||||
Sweco AB, Class B | 4,620 | 34,701 | ||||||
Tele2 AB, Class B | 9,778 | 80,097 | ||||||
|
| |||||||
| 1,666,868 | ||||||||
|
| |||||||
Switzerland-10.05% | ||||||||
ABB Ltd. | 44,716 | 1,243,960 | ||||||
EMS-Chemie Holding AG | 164 | 103,161 | ||||||
Geberit AG | 958 | 426,278 | ||||||
Kuehne + Nagel International AG, Class R(a) | 1,681 | 358,456 | ||||||
Lonza Group AG | 1,747 | 899,729 | ||||||
Novartis AG | 63,054 | 5,097,246 | ||||||
Partners Group Holding AG | 568 | 510,476 | ||||||
Schindler Holding AG, PC | 821 | 133,928 | ||||||
Sonova Holding AG, Class A | 1,069 | 252,843 | ||||||
Straumann Holding AG | 2,600 | 247,802 | ||||||
|
| |||||||
| 9,273,879 | ||||||||
|
| |||||||
United Kingdom-8.49% | ||||||||
Admiral Group PLC | 7,005 | 162,675 | ||||||
Ashtead Group PLC | 9,178 | 480,803 | ||||||
Auto Trader Group PLC(c) | 29,390 | 176,500 | ||||||
Barratt Developments PLC | 20,809 | 90,132 | ||||||
Burberry Group PLC | 9,356 | 195,512 | ||||||
Diageo PLC | 55,275 | 2,289,798 | ||||||
Halma PLC | 8,427 | 205,206 | ||||||
Hargreaves Lansdown PLC(a) | 15,158 | 133,195 | ||||||
Imperial Brands PLC | 25,010 | 611,611 | ||||||
JD Sports Fashion PLC | 48,639 | 54,567 | ||||||
Melrose Industries PLC | 78,184 | 105,230 | ||||||
Next PLC | 3,358 | 190,567 | ||||||
Persimmon PLC | 6,794 | 102,081 | ||||||
RELX PLC | 47,869 | 1,290,218 | ||||||
Rightmove PLC | 29,013 | 164,281 | ||||||
Sage Group PLC (The) | 27,975 | 234,095 | ||||||
Schroders PLC | 21,379 | 96,416 | ||||||
| Shares | Value | |||||||
United Kingdom-(continued) | ||||||||
Smiths Group PLC | 10,863 | $ | 195,174 | |||||
Spirax-Sarco Engineering PLC | 1,484 | 183,675 | ||||||
SSE PLC | 24,363 | 436,463 | ||||||
St James’s Place PLC | 10,420 | 127,769 | ||||||
Wise PLC, Class A(b) | 13,627 | 104,335 | ||||||
WPP PLC | 22,979 | 202,660 | ||||||
|
| |||||||
| 7,832,963 | ||||||||
|
| |||||||
United States-14.07% | ||||||||
Ferguson PLC | 5,861 | 641,741 | ||||||
GSK PLC | 73,120 | 1,202,860 | ||||||
Nestle S.A. | 48,170 | 5,248,521 | ||||||
Oracle Corp. | 1,014 | 54,167 | ||||||
Roche Holding AG | 16,944 | 5,630,504 | ||||||
Spotify Technology S.A.(b) | 2,509 | 202,175 | ||||||
|
| |||||||
| 12,979,968 | ||||||||
|
| |||||||
TOTAL INVESTMENTS IN SECURITIES |
| 92,049,268 | ||||||
|
| |||||||
| Investments Purchased with Cash Collateral from Securities on Loan |
| |||||||
Money Market Funds-7.55% |
| |||||||
Invesco Private Government Fund, | 1,950,330 | 1,950,330 | ||||||
Invesco Private Prime Fund, | 5,013,788 | 5,013,788 | ||||||
|
| |||||||
Total Investments Purchased with Cash Collateral from Securities on Loan |
| 6,964,118 | ||||||
|
| |||||||
TOTAL INVESTMENTS IN SECURITIES-107.31% |
| 99,013,386 | ||||||
OTHER ASSETS LESS LIABILITIES-(7.31)% |
| (6,747,725 | ) | |||||
|
| |||||||
NET ASSETS-100.00% |
| $ | 92,265,661 | |||||
|
| |||||||
Investment Abbreviations:
CDI-CREST Depository Interest
PC-Participation Certificate
Notes to Schedule of Investments:
| (a) | All or a portion of this security was out on loan at October 31, 2022. |
| (b) | Non-income producing security. |
| (c) | Security purchased or received in a transaction exempt from registration under the Securities Act of 1933, as amended (the “1933 Act”). The security may be resold pursuant to an exemption from registration under the 1933 Act, typically to qualified institutional buyers. The aggregate value of these securities at October 31, 2022 was $903,474, which represented less than 1% of the Fund’s Net Assets. |
| (d) | Affiliated issuer. The issuer and/or the Fund is a wholly-owned subsidiary of Invesco Ltd., or is affiliated by having an investment adviser that is under common control of Invesco Ltd. The table below shows the Fund’s transactions in, and earnings from, its investments in affiliates for the fiscal year ended October 31, 2022. |
| Value October 31, 2021 | Purchases at Cost | Proceeds from Sales | Change in Unrealized Appreciation | Realized Gain (Loss) | Value October 31, 2022 | Dividend Income | ||||||||
| Investments in Affiliated Money Market Funds: | ||||||||||||||
| Invesco Government & Agency Portfolio, Institutional Class | $ - | $ 3,975,859 | $ (3,975,859) | $ - | $ - | $ - | $ 920 | |||||||
See accompanying Notes to Financial Statements which are an integral part of the financial statements.
| 96 | ||||
|
| |||
Invesco S&P International Developed Quality ETF (IDHQ)–(continued)
October 31, 2022
| Value October 31, 2021 | Purchases at Cost | Proceeds from Sales | Change in Unrealized Appreciation | Realized Gain (Loss) | Value October 31, 2022 | Dividend Income | |||||||||||||||||||||||||||||
| Investments Purchased with Cash Collateral from Securities on Loan: | |||||||||||||||||||||||||||||||||||
| Invesco Private Government Fund | $ | 1,212,403 | $ | 26,535,657 | $ | (25,797,730 | ) | $ | - | $ | - | $ | 1,950,330 | $ | 17,560 | * | |||||||||||||||||||
| Invesco Private Prime Fund | 2,828,941 | 48,737,501 | (46,551,283 | ) | 22 | (1,393 | ) | 5,013,788 | 49,217 | * | |||||||||||||||||||||||||
|
|
|
|
|
|
|
|
|
|
|
|
|
| ||||||||||||||||||||||
| Total | $ | 4,041,344 | $ | 79,249,017 | $ | (76,324,872 | ) | $ | 22 | $ | (1,393 | ) | $ | 6,964,118 | $ | 67,697 | |||||||||||||||||||
|
|
|
|
|
|
|
|
|
|
|
|
|
| ||||||||||||||||||||||
| * | Represents the income earned on the investment of cash collateral, which is included in securities lending income on the Statements of Operations. Does not include rebates and fees paid to lending agent or premiums received from borrowers, if any. |
| (e) | The rate shown is the 7-day SEC standardized yield as of October 31, 2022. |
| (f) | The security has been segregated to satisfy the commitment to return the cash collateral received in securities lending transactions upon the borrower’s return of the securities loaned. See Note 2J. |
See accompanying Notes to Financial Statements which are an integral part of the financial statements.
| 97 | ||||
|
| |||
Statements of Assets and Liabilities
October 31, 2022
| Invesco China Technology ETF (CQQQ) | Invesco DWA Developed Markets Momentum ETF (PIZ) | Invesco DWA ETF (PIE) | Invesco FTSE RAFI Developed Markets ex-U.S. ETF (PXF) | Invesco FTSE RAFI Developed Markets ex-U.S. Small-Mid ETF (PDN) | ||||||||||||||||||||||||||||||||||
Assets: | ||||||||||||||||||||||||||||||||||||||
Unaffiliated investments in securities, at value(a) | $ | 702,755,163 | $ | 101,485,535 | $ | 125,204,959 | $ | 1,126,624,577 | $ | 487,359,905 | ||||||||||||||||||||||||||||
Affiliated investments in securities, at value | 50,208,432 | 6,785,854 | 1,422,989 | 83,011,429 | 78,521,840 | |||||||||||||||||||||||||||||||||
Cash | - | - | - | - | - | |||||||||||||||||||||||||||||||||
Foreign currencies, at value | 344 | - | 760,453 | 100,741 | - | |||||||||||||||||||||||||||||||||
Deposits with brokers: | ||||||||||||||||||||||||||||||||||||||
Cash segregated as collateral | - | - | - | 143,031 | 330,085 | |||||||||||||||||||||||||||||||||
Receivable for: | ||||||||||||||||||||||||||||||||||||||
Dividends | 32,621 | 299,056 | 176,331 | 3,230,110 | 1,438,108 | |||||||||||||||||||||||||||||||||
Securities lending | 13,048 | 1,928 | 1,459 | 30,811 | 54,703 | |||||||||||||||||||||||||||||||||
Investments sold | - | 88,499 | 396,589 | 400,245 | 426,902 | |||||||||||||||||||||||||||||||||
Fund shares sold | - | - | - | 15,099,446 | 208,113 | |||||||||||||||||||||||||||||||||
Foreign tax reclaims | - | 404,593 | 3,266 | 2,142,747 | 372,026 | |||||||||||||||||||||||||||||||||
Other assets | - | - | - | - | - | |||||||||||||||||||||||||||||||||
|
|
|
|
|
|
|
|
|
| |||||||||||||||||||||||||||||
Total assets | 753,009,608 | 109,065,465 | 127,966,046 | 1,230,783,137 | 568,711,682 | |||||||||||||||||||||||||||||||||
|
|
|
|
|
|
|
|
|
| |||||||||||||||||||||||||||||
Liabilities: | ||||||||||||||||||||||||||||||||||||||
Due to custodian | - | 609,214 | 524,032 | 1,172,531 | 10,000 | |||||||||||||||||||||||||||||||||
Due to foreign custodian | - | 649 | - | - | 488,347 | |||||||||||||||||||||||||||||||||
Payable for: | ||||||||||||||||||||||||||||||||||||||
Investments purchased | - | - | - | 15,429,776 | 608,019 | |||||||||||||||||||||||||||||||||
Collateral upon return of securities loaned | 49,931,090 | 6,785,724 | 1,422,978 | 83,012,447 | 77,923,950 | |||||||||||||||||||||||||||||||||
Collateral upon receipt of securities in-kind | - | - | - | 143,031 | 330,085 | |||||||||||||||||||||||||||||||||
Fund shares repurchased | - | 86,965 | 322,235 | 78,933 | - | |||||||||||||||||||||||||||||||||
Accrued unitary management fees | 468,867 | 68,915 | 103,764 | 408,660 | 189,102 | |||||||||||||||||||||||||||||||||
Accrued advisory fees | - | - | - | - | - | |||||||||||||||||||||||||||||||||
Accrued trustees’ and officer’s fees | - | - | - | - | - | |||||||||||||||||||||||||||||||||
Accrued expenses | - | - | - | - | - | |||||||||||||||||||||||||||||||||
Accrued tax expenses | - | - | - | - | - | |||||||||||||||||||||||||||||||||
|
|
|
|
|
|
|
|
|
| |||||||||||||||||||||||||||||
Total liabilities | 50,399,957 | 7,551,467 | 2,373,009 | 100,245,378 | 79,549,503 | |||||||||||||||||||||||||||||||||
|
|
|
|
|
|
|
|
|
| |||||||||||||||||||||||||||||
Net Assets | $ | 702,609,651 | $ | 101,513,998 | $ | 125,593,037 | $ | 1,130,537,759 | $ | 489,162,179 | ||||||||||||||||||||||||||||
|
|
|
|
|
|
|
|
|
| |||||||||||||||||||||||||||||
Net assets consist of: | ||||||||||||||||||||||||||||||||||||||
Shares of beneficial interest | $ | 1,670,169,086 | $ | 273,346,291 | $ | 289,079,899 | $ | 1,417,184,134 | $ | 655,526,434 | ||||||||||||||||||||||||||||
Distributable earnings (loss) | (967,559,435 | ) | (171,832,293 | ) | (163,486,862 | ) | (286,646,375 | ) | (166,364,255 | ) | ||||||||||||||||||||||||||||
|
|
|
|
|
|
|
|
|
| |||||||||||||||||||||||||||||
Net Assets | $ | 702,609,651 | $ | 101,513,998 | $ | 125,593,037 | $ | 1,130,537,759 | $ | 489,162,179 | ||||||||||||||||||||||||||||
|
|
|
|
|
|
|
|
|
| |||||||||||||||||||||||||||||
Shares outstanding (unlimited amount authorized, $0.01 par value) | 21,850,000 | 3,900,000 | 7,900,000 | 30,050,000 | 18,350,000 | |||||||||||||||||||||||||||||||||
Net asset value | $ | 32.16 | $ | 26.03 | $ | 15.90 | $ | 37.62 | $ | 26.66 | ||||||||||||||||||||||||||||
|
|
|
|
|
|
|
|
|
| |||||||||||||||||||||||||||||
Market price | $ | 31.96 | $ | 26.00 | $ | 15.85 | $ | 37.71 | $ | 26.68 | ||||||||||||||||||||||||||||
|
|
|
|
|
|
|
|
|
| |||||||||||||||||||||||||||||
Unaffiliated investments in securities, at cost | $ | 1,084,595,653 | $ | 103,698,305 | $ | 131,309,627 | $ | 1,251,414,909 | $ | 583,663,688 | ||||||||||||||||||||||||||||
|
|
|
|
|
|
|
|
|
| |||||||||||||||||||||||||||||
Affiliated investments in securities, at cost | $ | 50,208,007 | $ | 6,785,724 | $ | 1,422,978 | $ | 83,012,447 | $ | 78,523,867 | ||||||||||||||||||||||||||||
|
|
|
|
|
|
|
|
|
| |||||||||||||||||||||||||||||
Foreign currencies (due to foreign custodian), at cost | $ | 341 | $ | (1,053 | ) | $ | 762,347 | $ | 102,724 | $ | (500,692 | ) | ||||||||||||||||||||||||||
|
|
|
|
|
|
|
|
|
| |||||||||||||||||||||||||||||
(a) Includes securities on loan with an aggregate value of: | $ | 49,340,453 | $ | 6,402,321 | $ | 1,350,747 | $ | 77,667,523 | $ | 70,094,584 | ||||||||||||||||||||||||||||
|
|
|
|
|
|
|
|
|
| |||||||||||||||||||||||||||||
See accompanying Notes to Financial Statements which are an integral part of the financial statements.
| 98 | ||||
|
| |||
| Invesco FTSE RAFI Emerging Markets ETF (PXH) | Invesco Global Clean Energy ETF (PBD) | Invesco Global Water ETF (PIO) | Invesco International BuyBack AchieversTM ETF (IPKW) | Invesco MSCI Global Timber ETF (CUT) | Invesco MSCI Green Building ETF (GBLD) | Invesco S&P Global Water Index ETF (CGW) | Invesco S&P International Developed Quality ETF (IDHQ) | |||||||||||||||||||||||||||||||||||||||||||||||
| $ | 1,203,623,076 | $ | 216,747,366 | $ | 256,786,963 | $ | 80,390,616 | $ | 60,052,039 | $ | 4,915,442 | $ | 932,970,244 | $ | 92,049,268 | |||||||||||||||||||||||||||||||||||||||
| 20,614,315 | 71,274,692 | 3,127,746 | 3,849,719 | 4,418,787 | 147,906 | 94,096,656 | 6,964,118 | |||||||||||||||||||||||||||||||||||||||||||||||
| - | - | - | - | 1,602 | - | - | - | |||||||||||||||||||||||||||||||||||||||||||||||
| 2,057,597 | 83,885 | 7,126 | - | 63,622 | - | - | 6,756 | |||||||||||||||||||||||||||||||||||||||||||||||
| - | - | 41,818 | 57,465 | - | - | - | 76,657 | |||||||||||||||||||||||||||||||||||||||||||||||
| 823,641 | 49,822 | 622,559 | 208,746 | 71,625 | 18,135 | 401,563 | 173,422 | |||||||||||||||||||||||||||||||||||||||||||||||
| 3,375 | 157,756 | 1,021 | 2,171 | 767 | 62 | 5,523 | 1,304 | |||||||||||||||||||||||||||||||||||||||||||||||
| 16,485,622 | - | - | 2,879,896 | 74,657 | - | - | 11,797 | |||||||||||||||||||||||||||||||||||||||||||||||
| - | - | 38,840 | 49,194 | 656 | - | - | 66,542 | |||||||||||||||||||||||||||||||||||||||||||||||
| - | 77,285 | 261,585 | 125,041 | 160,862 | - | 1,341,624 | 312,458 | |||||||||||||||||||||||||||||||||||||||||||||||
| 4,546 | - | - | - | 14,378 | - | 17,260 | - | |||||||||||||||||||||||||||||||||||||||||||||||
|
|
|
|
|
|
|
|
|
|
|
|
|
|
|
| |||||||||||||||||||||||||||||||||||||||
| 1,243,612,172 | 288,390,806 | 260,887,658 | 87,562,848 | 64,858,995 | 5,081,545 | 1,028,832,870 | 99,662,322 | |||||||||||||||||||||||||||||||||||||||||||||||
|
|
|
|
|
|
|
|
|
|
|
|
|
|
|
| |||||||||||||||||||||||||||||||||||||||
| - | 251,484 | 238,124 | 329,850 | - | - | 791,226 | 255,708 | |||||||||||||||||||||||||||||||||||||||||||||||
| - | - | - | 89,014 | - | 36,284 | 29 | - | |||||||||||||||||||||||||||||||||||||||||||||||
| 3,046,076 | - | 38,840 | 2,415,003 | 104 | - | - | 66,549 | |||||||||||||||||||||||||||||||||||||||||||||||
| 12,082,818 | 71,275,607 | 3,127,741 | 3,849,681 | 3,966,260 | 115,538 | 94,095,062 | 6,964,096 | |||||||||||||||||||||||||||||||||||||||||||||||
| - | - | 41,817 | 57,465 | - | - | - | 76,658 | |||||||||||||||||||||||||||||||||||||||||||||||
| 17,424,394 | - | - | - | 74,657 | - | - | 11,797 | |||||||||||||||||||||||||||||||||||||||||||||||
| 512,117 | 135,744 | 155,799 | 36,495 | - | 1,594 | - | 21,853 | |||||||||||||||||||||||||||||||||||||||||||||||
| - | - | - | - | 18,557 | - | 370,442 | - | |||||||||||||||||||||||||||||||||||||||||||||||
| - | - | - | - | 5,629 | - | 15,045 | - | |||||||||||||||||||||||||||||||||||||||||||||||
| - | - | - | - | 137,333 | - | 567,328 | - | |||||||||||||||||||||||||||||||||||||||||||||||
| 4,306,180 | - | - | - | - | - | - | - | |||||||||||||||||||||||||||||||||||||||||||||||
|
|
|
|
|
|
|
|
|
|
|
|
|
|
|
| |||||||||||||||||||||||||||||||||||||||
| 37,371,585 | 71,662,835 | 3,602,321 | 6,777,508 | 4,202,540 | 153,416 | 95,839,132 | 7,396,661 | |||||||||||||||||||||||||||||||||||||||||||||||
|
|
|
|
|
|
|
|
|
|
|
|
|
|
|
| |||||||||||||||||||||||||||||||||||||||
| $ | 1,206,240,587 | $ | 216,727,971 | $ | 257,285,337 | $ | 80,785,340 | $ | 60,656,455 | $ | 4,928,129 | $ | 932,993,738 | $ | 92,265,661 | |||||||||||||||||||||||||||||||||||||||
|
|
|
|
|
|
|
|
|
|
|
|
|
|
|
| |||||||||||||||||||||||||||||||||||||||
| $ | 1,724,731,854 | $ | 455,671,148 | $ | 325,253,601 | $ | 156,455,823 | $ | 79,712,589 | $ | 7,058,969 | $ | 850,758,176 | $ | 130,764,306 | |||||||||||||||||||||||||||||||||||||||
| (518,491,267 | ) | (238,943,177 | ) | (67,968,264 | ) | (75,670,483 | ) | (19,056,134 | ) | (2,130,840 | ) | 82,235,562 | (38,498,645 | ) | ||||||||||||||||||||||||||||||||||||||||
|
|
|
|
|
|
|
|
|
|
|
|
|
|
|
| |||||||||||||||||||||||||||||||||||||||
| $ | 1,206,240,587 | $ | 216,727,971 | $ | 257,285,337 | $ | 80,785,340 | $ | 60,656,455 | $ | 4,928,129 | $ | 932,993,738 | $ | 92,265,661 | |||||||||||||||||||||||||||||||||||||||
|
|
|
|
|
|
|
|
|
|
|
|
|
|
|
| |||||||||||||||||||||||||||||||||||||||
| 76,150,000 | 11,425,000 | 8,350,000 | 2,650,000 | 2,050,000 | 300,001 | 20,440,000 | 4,150,000 | |||||||||||||||||||||||||||||||||||||||||||||||
| $ | 15.84 | $ | 18.97 | $ | 30.81 | $ | 30.49 | $ | 29.59 | $ | 16.43 | $ | 45.65 | $ | 22.23 | |||||||||||||||||||||||||||||||||||||||
|
|
|
|
|
|
|
|
|
|
|
|
|
|
|
| |||||||||||||||||||||||||||||||||||||||
| $ | 15.85 | $ | 18.89 | $ | 30.89 | $ | 30.48 | $ | 29.53 | $ | 16.44 | $ | 45.66 | $ | 22.23 | |||||||||||||||||||||||||||||||||||||||
|
|
|
|
|
|
|
|
|
|
|
|
|
|
|
| |||||||||||||||||||||||||||||||||||||||
| $ | 1,425,588,990 | $ | 280,728,846 | $ | 256,199,110 | $ | 91,288,305 | $ | 60,017,662 | $ | 6,811,965 | $ | 809,680,309 | $ | 105,807,874 | |||||||||||||||||||||||||||||||||||||||
|
|
|
|
|
|
|
|
|
|
|
|
|
|
|
| |||||||||||||||||||||||||||||||||||||||
| $ | 20,614,547 | $ | 71,275,607 | $ | 3,127,741 | $ | 3,849,681 | $ | 4,437,292 | $ | 147,903 | $ | 94,095,062 | $ | 6,964,096 | |||||||||||||||||||||||||||||||||||||||
|
|
|
|
|
|
|
|
|
|
|
|
|
|
|
| |||||||||||||||||||||||||||||||||||||||
| $ | 2,057,493 | $ | 83,550 | $ | 6,765 | $ | (89,320 | ) | $ | 65,471 | $ | (37,074 | ) | $ | (39 | ) | $ | 6,772 | ||||||||||||||||||||||||||||||||||||
|
|
|
|
|
|
|
|
|
|
|
|
|
|
|
| |||||||||||||||||||||||||||||||||||||||
| $ | 11,420,585 | $ | 68,990,447 | $ | 2,856,988 | $ | 3,461,360 | $ | 3,731,075 | $ | 110,162 | $ | 92,297,929 | $ | 6,556,473 | |||||||||||||||||||||||||||||||||||||||
|
|
|
|
|
|
|
|
|
|
|
|
|
|
|
| |||||||||||||||||||||||||||||||||||||||
| 99 | ||||
|
| |||
For the year ended October 31, 2022
| Invesco China Technology ETF (CQQQ) | Invesco DWA Developed Markets Momentum ETF (PIZ) | Invesco DWA Emerging Markets Momentum ETF (PIE) | Invesco FTSE RAFI Developed Markets ex-U.S. ETF (PXF) | Invesco FTSE | ||||||||||||||||||||||||||||||||||||||
Investment income: | ||||||||||||||||||||||||||||||||||||||||||
Unaffiliated dividend income | $ | 6,395,518 | $ | 3,731,817 | $ | 8,163,218 | $ | 44,810,465 | $ | 15,349,806 | ||||||||||||||||||||||||||||||||
Affiliated dividend income | 36,486 | 473 | 1,531 | 7,994 | 5,436 | |||||||||||||||||||||||||||||||||||||
Non-cash dividend income | - | 103,576 | - | 694,309 | 552,708 | |||||||||||||||||||||||||||||||||||||
Securities lending income, net | 325,597 | 26,198 | 56,231 | 590,559 | 573,033 | |||||||||||||||||||||||||||||||||||||
Foreign withholding tax | (361,975 | ) | (416,327 | ) | (1,424,645 | ) | (4,545,836 | ) | (1,727,051 | ) | ||||||||||||||||||||||||||||||||
|
|
|
|
|
|
|
|
|
| |||||||||||||||||||||||||||||||||
Total investment income | 6,395,626 | 3,445,737 | 6,796,335 | 41,557,491 | 14,753,932 | |||||||||||||||||||||||||||||||||||||
|
|
|
|
|
|
|
|
|
| |||||||||||||||||||||||||||||||||
Expenses: | ||||||||||||||||||||||||||||||||||||||||||
Unitary management fees | 7,959,167 | 1,367,819 | 1,718,178 | 5,068,212 | 2,381,922 | |||||||||||||||||||||||||||||||||||||
Advisory fees | - | - | - | - | - | |||||||||||||||||||||||||||||||||||||
Sub-licensing fees | - | - | - | - | - | |||||||||||||||||||||||||||||||||||||
Accounting & administration fees | - | - | - | - | - | |||||||||||||||||||||||||||||||||||||
Professional fees | - | - | - | - | - | |||||||||||||||||||||||||||||||||||||
Custodian & transfer agent fees | - | - | - | - | - | |||||||||||||||||||||||||||||||||||||
Trustees’ and officer’s fees | - | - | - | - | - | |||||||||||||||||||||||||||||||||||||
Tax expenses | - | - | - | - | - | |||||||||||||||||||||||||||||||||||||
Other expenses | - | - | - | - | - | |||||||||||||||||||||||||||||||||||||
|
|
|
|
|
|
|
|
|
| |||||||||||||||||||||||||||||||||
Total expenses | 7,959,167 | 1,367,819 | 1,718,178 | 5,068,212 | 2,381,922 | |||||||||||||||||||||||||||||||||||||
|
|
|
|
|
|
|
|
|
| |||||||||||||||||||||||||||||||||
Less: Waivers | (1,468 | ) | (38 | ) | (75 | ) | (608 | ) | (271 | ) | ||||||||||||||||||||||||||||||||
|
|
|
|
|
|
|
|
|
| |||||||||||||||||||||||||||||||||
Net expenses | 7,957,699 | 1,367,781 | 1,718,103 | 5,067,604 | 2,381,651 | |||||||||||||||||||||||||||||||||||||
|
|
|
|
|
|
|
|
|
| |||||||||||||||||||||||||||||||||
Net investment income (loss) | (1,562,073 | ) | 2,077,956 | 5,078,232 | 36,489,887 | 12,372,281 | ||||||||||||||||||||||||||||||||||||
|
|
|
|
|
|
|
|
|
| |||||||||||||||||||||||||||||||||
| Realized and unrealized gain (loss) from: | ||||||||||||||||||||||||||||||||||||||||||
Net realized gain (loss) from: | ||||||||||||||||||||||||||||||||||||||||||
Unaffiliated investment securities | (463,852,058 | ) | (47,666,491 | ) | (44,489,154 | ) | (18,472,470 | ) | (17,923,053 | ) | ||||||||||||||||||||||||||||||||
Affiliated investment securities | (63,900 | ) | (1,858 | ) | (4,051 | ) | (8,521 | ) | (2,058 | ) | ||||||||||||||||||||||||||||||||
Unaffiliated in-kind redemptions | 1,238,557 | 4,526,592 | 479,739 | 30,608,247 | 19,915,699 | |||||||||||||||||||||||||||||||||||||
Affiliated in-kind redemptions | - | - | - | - | - | |||||||||||||||||||||||||||||||||||||
Foreign currencies | (289,163 | ) | (169,489 | ) | (714,584 | ) | (652,096 | ) | (437,054 | ) | ||||||||||||||||||||||||||||||||
Distributions of underlying fund shares | - | - | - | - | - | |||||||||||||||||||||||||||||||||||||
|
|
|
|
|
|
|
|
|
| |||||||||||||||||||||||||||||||||
Net realized gain (loss) | (462,966,564 | ) | (43,311,246 | ) | (44,728,050 | ) | 11,475,160 | 1,553,534 | ||||||||||||||||||||||||||||||||||
|
|
|
|
|
|
|
|
|
| |||||||||||||||||||||||||||||||||
Change in net unrealized appreciation (depreciation) of: | ||||||||||||||||||||||||||||||||||||||||||
Unaffiliated investment securities | (376,606,191 | ) | (33,202,269 | ) | (34,871,275 | ) | (265,275,944 | ) | (164,581,202 | ) | ||||||||||||||||||||||||||||||||
Affiliated investment securities | 423 | 130 | 11 | (1,019 | ) | (12,855 | ) | |||||||||||||||||||||||||||||||||||
Foreign currencies | 2 | (72,521 | ) | (215 | ) | (327,561 | ) | (43,747 | ) | |||||||||||||||||||||||||||||||||
|
|
|
|
|
|
|
|
|
| |||||||||||||||||||||||||||||||||
Change in net unrealized appreciation (depreciation) | (376,605,766 | ) | (33,274,660 | ) | (34,871,479 | ) | (265,604,524 | ) | (164,637,804 | ) | ||||||||||||||||||||||||||||||||
|
|
|
|
|
|
|
|
|
| |||||||||||||||||||||||||||||||||
Net realized and unrealized gain (loss) | (839,572,330 | ) | (76,585,906 | ) | (79,599,529 | ) | (254,129,364 | ) | (163,084,270 | ) | ||||||||||||||||||||||||||||||||
|
|
|
|
|
|
|
|
|
| |||||||||||||||||||||||||||||||||
Net increase (decrease) in net assets resulting from operations | $ | (841,134,403 | ) | $ | (74,507,950 | ) | $ | (74,521,297 | ) | $ | (217,639,477 | ) | $ | (150,711,989 | ) | |||||||||||||||||||||||||||
|
|
|
|
|
|
|
|
|
| |||||||||||||||||||||||||||||||||
| (a) | Net of foreign taxes of $2,010,910. |
| (b) | Net of change of deferred foreign taxes of $2,739,086. |
See accompanying Notes to Financial Statements which are an integral part of the financial statements.
| 100 | ||||
|
| |||
| Invesco FTSE RAFI Emerging Markets ETF (PXH) | Invesco Global Clean Energy ETF (PBD) | Invesco Global Water ETF (PIO) | Invesco International BuyBack AchieversTM ETF (IPKW) | Invesco MSCI Global Timber ETF (CUT) | Invesco MSCI Green Building ETF (GBLD) | Invesco S&P Global Water Index ETF (CGW) | Invesco S&P International Developed Quality ETF (IDHQ) | |||||||||||||||||||||||||||||||||||||||||||||||
| $ | 83,560,018 | $ | 1,782,911 | $ | 5,109,008 | $ | 3,847,174 | $ | 2,132,069 | $ | 196,679 | $ | 19,053,718 | $ | 3,900,641 | |||||||||||||||||||||||||||||||||||||||
| 55,295 | 714 | 2,413 | 1,823 | 3,798 | 248 | 1,104 | 920 | |||||||||||||||||||||||||||||||||||||||||||||||
| 2,490,594 | - | - | - | 40,890 | 1,204 | 116,685 | 50,734 | |||||||||||||||||||||||||||||||||||||||||||||||
| 105,462 | 3,479,425 | 19,798 | 219,125 | 12,231 | 1,518 | 68,506 | 31,471 | |||||||||||||||||||||||||||||||||||||||||||||||
| (6,609,693 | ) | (242,363 | ) | (276,065 | ) | (381,606 | ) | (92,243 | ) | (14,034 | ) | (795,009 | ) | (344,676 | ) | |||||||||||||||||||||||||||||||||||||||
|
|
|
|
|
|
|
|
|
|
|
|
|
|
|
| |||||||||||||||||||||||||||||||||||||||
| 79,601,676 | 5,020,687 | 4,855,154 | 3,686,516 | 2,096,745 | 185,615 | 18,445,004 | 3,639,090 | |||||||||||||||||||||||||||||||||||||||||||||||
|
|
|
|
|
|
|
|
|
|
|
|
|
|
|
| |||||||||||||||||||||||||||||||||||||||
| 6,633,814 | 2,048,041 | 2,196,437 | 558,907 | - | 19,106 | - | 335,922 | |||||||||||||||||||||||||||||||||||||||||||||||
| - | - | - | - | 403,416 | - | 5,220,552 | - | |||||||||||||||||||||||||||||||||||||||||||||||
| - | - | - | - | 48,409 | - | 459,417 | - | |||||||||||||||||||||||||||||||||||||||||||||||
| - | - | - | - | 20,833 | - | 64,782 | - | |||||||||||||||||||||||||||||||||||||||||||||||
| - | - | - | - | 30,792 | - | 34,427 | - | |||||||||||||||||||||||||||||||||||||||||||||||
| - | - | - | - | 24,218 | - | 37,325 | - | |||||||||||||||||||||||||||||||||||||||||||||||
| - | - | - | - | 3,482 | - | 10,044 | - | |||||||||||||||||||||||||||||||||||||||||||||||
| 2,729 | 1,288 | - | - | 1,091 | - | - | - | |||||||||||||||||||||||||||||||||||||||||||||||
| - | - | - | - | 23,041 | - | 73,822 | - | |||||||||||||||||||||||||||||||||||||||||||||||
|
|
|
|
|
|
|
|
|
|
|
|
|
|
|
| |||||||||||||||||||||||||||||||||||||||
| 6,636,543 | 2,049,329 | 2,196,437 | 558,907 | 555,282 | 19,106 | 5,900,369 | 335,922 | |||||||||||||||||||||||||||||||||||||||||||||||
|
|
|
|
|
|
|
|
|
|
|
|
|
|
|
| |||||||||||||||||||||||||||||||||||||||
| (2,552 | ) | (67 | ) | (133 | ) | (97 | ) | (65,125 | ) | (11 | ) | (58 | ) | (73 | ) | |||||||||||||||||||||||||||||||||||||||
|
|
|
|
|
|
|
|
|
|
|
|
|
|
|
| |||||||||||||||||||||||||||||||||||||||
| 6,633,991 | 2,049,262 | 2,196,304 | 558,810 | 490,157 | 19,095 | 5,900,311 | 335,849 | |||||||||||||||||||||||||||||||||||||||||||||||
|
|
|
|
|
|
|
|
|
|
|
|
|
|
|
| |||||||||||||||||||||||||||||||||||||||
| 72,967,685 | 2,971,425 | 2,658,850 | 3,127,706 | 1,606,588 | 166,520 | 12,544,693 | 3,303,241 | |||||||||||||||||||||||||||||||||||||||||||||||
|
|
|
|
|
|
|
|
|
|
|
|
|
|
|
| |||||||||||||||||||||||||||||||||||||||
| (79,494,358 | )(a) | (80,299,927 | ) | (18,298,262 | ) | (26,251,740 | ) | 999,073 | (232,261 | ) | (35,509,814 | ) | (17,271,513 | ) | ||||||||||||||||||||||||||||||||||||||||
| (1,835 | ) | (26,682 | ) | (2,263 | ) | (1,231 | ) | (294 | ) | (329 | ) | (704 | ) | (1,393 | ) | |||||||||||||||||||||||||||||||||||||||
| 5,597,848 | 3,644,886 | 2,227,312 | 68,421 | 5,258,046 | - | 18,467,894 | 3,082,437 | |||||||||||||||||||||||||||||||||||||||||||||||
| - | �� | - | - | - | 3,741 | - | - | - | ||||||||||||||||||||||||||||||||||||||||||||||
| (3,332,193 | ) | 16,633 | (52,366 | ) | (226,407 | ) | (21,179 | ) | (2,196 | ) | 216,283 | (57,079 | ) | |||||||||||||||||||||||||||||||||||||||||
| - | - | - | - | 17,597 | - | - | - | |||||||||||||||||||||||||||||||||||||||||||||||
|
|
|
|
|
|
|
|
|
|
|
|
|
|
|
| |||||||||||||||||||||||||||||||||||||||
| (77,230,538 | ) | (76,665,090 | ) | (16,125,579 | ) | (26,410,957 | ) | 6,256,984 | (234,786 | ) | (16,826,341 | ) | (14,247,548 | ) | ||||||||||||||||||||||||||||||||||||||||
|
|
|
|
|
|
|
|
|
|
|
|
|
|
|
| |||||||||||||||||||||||||||||||||||||||
| (368,899,788 | )(b) | (71,089,336 | ) | (72,792,470 | ) | (4,090,342 | ) | (22,024,979 | ) | (1,652,361 | ) | (254,424,658 | ) | (26,297,245 | ) | |||||||||||||||||||||||||||||||||||||||
| (232 | ) | (916 | ) | 5 | 38 | (46,607 | ) | 374 | 1,594 | 22 | ||||||||||||||||||||||||||||||||||||||||||||
| 15,609 | (12,258 | ) | (33,788 | ) | (17,142 | ) | (25,916 | ) | 339 | (123,015 | ) | (37,695 | ) | |||||||||||||||||||||||||||||||||||||||||
|
|
|
|
|
|
|
|
|
|
|
|
|
|
|
| |||||||||||||||||||||||||||||||||||||||
| (368,884,411 | ) | (71,102,510 | ) | (72,826,253 | ) | (4,107,446 | ) | (22,097,502 | ) | (1,651,648 | ) | (254,546,079 | ) | (26,334,918 | ) | |||||||||||||||||||||||||||||||||||||||
|
|
|
|
|
|
|
|
|
|
|
|
|
|
|
| |||||||||||||||||||||||||||||||||||||||
| (446,114,949 | ) | (147,767,600 | ) | (88,951,832 | ) | (30,518,403 | ) | (15,840,518 | ) | (1,886,434 | ) | (271,372,420 | ) | (40,582,466 | ) | |||||||||||||||||||||||||||||||||||||||
|
|
|
|
|
|
|
|
|
|
|
|
|
|
|
| |||||||||||||||||||||||||||||||||||||||
| $ | (373,147,264 | ) | $ | (144,796,175 | ) | $ | (86,292,982 | ) | $ | (27,390,697 | ) | $ | (14,233,930 | ) | $ | (1,719,914 | ) | $ | (258,827,727 | ) | $ | (37,279,225 | ) | |||||||||||||||||||||||||||||||
|
|
|
|
|
|
|
|
|
|
|
|
|
|
|
| |||||||||||||||||||||||||||||||||||||||
| 101 | ||||
|
| |||
Statements of Changes in Net Assets
For the years ended October 31, 2022 and 2021
| Invesco China Technology ETF (CQQQ) | Invesco DWA Developed Markets Momentum ETF (PIZ) | |||||||||||||||||||||||||||
| 2022 | 2021 | 2022 | 2021 | |||||||||||||||||||||||||
Operations: | ||||||||||||||||||||||||||||
Net investment income (loss) | $ | (1,562,073 | ) | $ | (3,007,211 | ) | $ | 2,077,956 | $ | 1,214,869 | ||||||||||||||||||
Net realized gain (loss) | (462,966,564 | ) | 31,255,498 | (43,311,246 | ) | 40,842,745 | ||||||||||||||||||||||
Change in net unrealized appreciation (depreciation) | (376,605,766 | ) | (228,330,434 | ) | (33,274,660 | ) | 12,793,382 | |||||||||||||||||||||
|
|
|
|
|
|
|
| |||||||||||||||||||||
Net increase (decrease) in net assets resulting from operations | (841,134,403 | ) | (200,082,147 | ) | (74,507,950 | ) | 54,850,996 | |||||||||||||||||||||
|
|
|
|
|
|
|
| |||||||||||||||||||||
Distributions to Shareholders from: | ||||||||||||||||||||||||||||
Distributable earnings | - | (6,502,078 | ) | (3,925,843 | ) | (964,301 | ) | |||||||||||||||||||||
|
|
|
|
|
|
|
| |||||||||||||||||||||
Shareholder Transactions: | ||||||||||||||||||||||||||||
Proceeds from shares sold | 172,945,075 | 934,478,610 | 28,274,301 | 171,884,702 | ||||||||||||||||||||||||
Value of shares repurchased | (149,431,932 | ) | (251,717,877 | ) | (100,277,950 | ) | (128,862,593 | ) | ||||||||||||||||||||
Transaction fees | 892,716 | - | - | - | ||||||||||||||||||||||||
|
|
|
|
|
|
|
| |||||||||||||||||||||
Net increase (decrease) in net assets resulting from share transactions | 24,405,859 | 682,760,733 | (72,003,649 | ) | 43,022,109 | |||||||||||||||||||||||
|
|
|
|
|
|
|
| |||||||||||||||||||||
Net increase (decrease) in net assets | (816,728,544 | ) | 476,176,508 | (150,437,442 | ) | 96,908,804 | ||||||||||||||||||||||
|
|
|
|
|
|
|
| |||||||||||||||||||||
Net assets: | ||||||||||||||||||||||||||||
Beginning of year | 1,519,338,195 | 1,043,161,687 | 251,951,440 | 155,042,636 | ||||||||||||||||||||||||
|
|
|
|
|
|
|
| |||||||||||||||||||||
End of year | $ | 702,609,651 | $ | 1,519,338,195 | $ | 101,513,998 | $ | 251,951,440 | ||||||||||||||||||||
|
|
|
|
|
|
|
| |||||||||||||||||||||
Changes in Shares Outstanding: | ||||||||||||||||||||||||||||
Shares sold | 3,000,000 | 11,100,000 | 750,000 | 4,550,000 | ||||||||||||||||||||||||
Shares repurchased | (3,200,000 | ) | (3,150,000 | ) | (3,150,000 | ) | (3,450,000 | ) | ||||||||||||||||||||
Shares outstanding, beginning of year | 22,050,000 | 14,100,000 | 6,300,000 | 5,200,000 | ||||||||||||||||||||||||
|
|
|
|
|
|
|
| |||||||||||||||||||||
Shares outstanding, end of year | 21,850,000 | 22,050,000 | 3,900,000 | 6,300,000 | ||||||||||||||||||||||||
|
|
|
|
|
|
|
| |||||||||||||||||||||
See accompanying Notes to Financial Statements which are an integral part of the financial statements.
| 102 | ||||
|
| |||
| Invesco DWA Emerging Markets Momentum ETF (PIE) | Invesco FTSE RAFI Developed Markets ex-U.S. ETF (PXF) | Invesco FTSE RAFI Developed Markets ex-U.S. Small-Mid ETF (PDN) | Invesco FTSE RAFI Emerging Markets ETF (PXH) | |||||||||||||||||||||||||||||||||||||||||||||||||||||||||||||||||||||||||||
| 2022 | 2021 | 2022 | 2021 | 2022 | 2021 | 2022 | 2021 | |||||||||||||||||||||||||||||||||||||||||||||||||||||||||||||||||||||||
| $ | 5,078,232 | $ | 1,722,180 | $ | 36,489,887 | $ | 35,112,659 | $ | 12,372,281 | $ | 7,065,857 | $ | 72,967,685 | $ | 55,658,353 | |||||||||||||||||||||||||||||||||||||||||||||||||||||||||||||||
| (44,728,050 | ) | 44,078,965 | 11,475,160 | 27,602,304 | 1,553,534 | 32,710,580 | (77,230,538 | ) | 33,864,949 | |||||||||||||||||||||||||||||||||||||||||||||||||||||||||||||||||||||
| (34,871,479 | ) | 1,750,161 | (265,604,524 | ) | 316,656,880 | (164,637,804 | ) | 65,895,115 | (368,884,411 | ) | 225,062,252 | |||||||||||||||||||||||||||||||||||||||||||||||||||||||||||||||||||
|
|
|
|
|
|
|
|
|
|
|
|
|
|
|
| |||||||||||||||||||||||||||||||||||||||||||||||||||||||||||||||
| (74,521,297 | ) | 47,551,306 | (217,639,477 | ) | 379,371,843 | (150,711,989 | ) | 105,671,552 | (373,147,264 | ) | 314,585,554 | |||||||||||||||||||||||||||||||||||||||||||||||||||||||||||||||||||
|
|
|
|
|
|
|
|
|
|
|
|
|
|
|
| |||||||||||||||||||||||||||||||||||||||||||||||||||||||||||||||
| (6,385,828 | ) | (2,586,314 | ) | (56,137,305 | ) | (27,603,102 | ) | (16,160,202 | ) | (7,594,401 | ) | (87,622,863 | ) | (40,406,081 | ) | |||||||||||||||||||||||||||||||||||||||||||||||||||||||||||||||
|
|
|
|
|
|
|
|
|
|
|
|
|
|
|
| |||||||||||||||||||||||||||||||||||||||||||||||||||||||||||||||
| 33,108,779 | 145,789,480 | 343,704,424 | 85,097,681 | 305,752,400 | 111,750,049 | 520,451,725 | 326,988,438 | |||||||||||||||||||||||||||||||||||||||||||||||||||||||||||||||||||||||
| (41,730,730 | ) | (131,467,700 | ) | (139,666,614 | ) | (108,096,381 | ) | (84,459,440 | ) | (83,278,298 | ) | (214,644,247 | ) | (210,835,982 | ) | |||||||||||||||||||||||||||||||||||||||||||||||||||||||||||||||
| 178,579 | 167,645 | 88,225 | 15,729 | 81,683 | 4,510 | 700,528 | 326,816 | |||||||||||||||||||||||||||||||||||||||||||||||||||||||||||||||||||||||
|
|
|
|
|
|
|
|
|
|
|
|
|
|
|
| |||||||||||||||||||||||||||||||||||||||||||||||||||||||||||||||
| (8,443,372 | ) | 14,489,425 | 204,126,035 | (22,982,971 | ) | 221,374,643 | 28,476,261 | 306,508,006 | 116,479,272 | |||||||||||||||||||||||||||||||||||||||||||||||||||||||||||||||||||||
|
|
|
|
|
|
|
|
|
|
|
|
|
|
|
| |||||||||||||||||||||||||||||||||||||||||||||||||||||||||||||||
| (89,350,497 | ) | 59,454,417 | (69,650,747 | ) | 328,785,770 | 54,502,452 | 126,553,412 | (154,262,121 | ) | 390,658,745 | ||||||||||||||||||||||||||||||||||||||||||||||||||||||||||||||||||||
|
|
|
|
|
|
|
|
|
|
|
|
|
|
|
| |||||||||||||||||||||||||||||||||||||||||||||||||||||||||||||||
| 214,943,534 | 155,489,117 | 1,200,188,506 | 871,402,736 | 434,659,727 | 308,106,315 | 1,360,502,708 | 969,843,963 | |||||||||||||||||||||||||||||||||||||||||||||||||||||||||||||||||||||||
|
|
|
|
|
|
|
|
|
|
|
|
|
|
|
| |||||||||||||||||||||||||||||||||||||||||||||||||||||||||||||||
| $ | 125,593,037 | $ | 214,943,534 | $ | 1,130,537,759 | $ | 1,200,188,506 | $ | 489,162,179 | $ | 434,659,727 | $ | 1,206,240,587 | $ | 1,360,502,708 | |||||||||||||||||||||||||||||||||||||||||||||||||||||||||||||||
|
|
|
|
|
|
|
|
|
|
|
|
|
|
|
| |||||||||||||||||||||||||||||||||||||||||||||||||||||||||||||||
| 1,450,000 | 6,100,000 | 8,300,000 | 1,800,000 | 9,500,000 | 3,000,000 | 27,050,000 | 14,650,000 | |||||||||||||||||||||||||||||||||||||||||||||||||||||||||||||||||||||||
| (2,150,000 | ) | (5,450,000 | ) | (3,150,000 | ) | (2,400,000 | ) | (2,550,000 | ) | (2,250,000 | ) | (11,550,000 | ) | (9,400,000 | ) | |||||||||||||||||||||||||||||||||||||||||||||||||||||||||||||||
| 8,600,000 | 7,950,000 | 24,900,000 | 25,500,000 | 11,400,000 | 10,650,000 | 60,650,000 | 55,400,000 | |||||||||||||||||||||||||||||||||||||||||||||||||||||||||||||||||||||||
|
|
|
|
|
|
|
|
|
|
|
|
|
|
|
| |||||||||||||||||||||||||||||||||||||||||||||||||||||||||||||||
| 7,900,000 | 8,600,000 | 30,050,000 | 24,900,000 | 18,350,000 | 11,400,000 | 76,150,000 | 60,650,000 | |||||||||||||||||||||||||||||||||||||||||||||||||||||||||||||||||||||||
|
|
|
|
|
|
|
|
|
|
|
|
|
|
|
| |||||||||||||||||||||||||||||||||||||||||||||||||||||||||||||||
| 103 | ||||
|
| |||
Statements of Changes in Net Assets–(continued)
For the years ended October 31, 2022 and 2021
| Invesco Global Clean Energy ETF (PBD) | Invesco Global Water ETF (PIO) | |||||||||||||||||||||||||||
| 2022 | 2021 | 2022 | 2021 | |||||||||||||||||||||||||
Operations: | ||||||||||||||||||||||||||||
Net investment income | $ | 2,971,425 | $ | 1,961,935 | $ | 2,658,850 | $ | 4,145,969 | ||||||||||||||||||||
Net realized gain (loss) | (76,665,090 | ) | 41,827,373 | (16,125,579 | ) | 46,218,048 | ||||||||||||||||||||||
Change in net unrealized appreciation (depreciation) | (71,102,510 | ) | (32,979,658 | ) | (72,826,253 | ) | 24,908,830 | |||||||||||||||||||||
|
|
|
|
|
|
|
| |||||||||||||||||||||
Net increase (decrease) in net assets resulting from operations | (144,796,175 | ) | 10,809,650 | (86,292,982 | ) | 75,272,847 | ||||||||||||||||||||||
|
|
|
|
|
|
|
| |||||||||||||||||||||
Distributions to Shareholders from: | ||||||||||||||||||||||||||||
Distributable earnings | (3,615,255 | ) | (1,855,153 | ) | (3,609,219 | ) | (3,106,732 | ) | ||||||||||||||||||||
Return of capital | - | - | - | - | ||||||||||||||||||||||||
|
|
|
|
|
|
|
| |||||||||||||||||||||
Total distributions to shareholders | (3,615,255 | ) | (1,855,153 | ) | (3,609,219 | ) | (3,106,732 | ) | ||||||||||||||||||||
|
|
|
|
|
|
|
| |||||||||||||||||||||
Shareholder Transactions: | ||||||||||||||||||||||||||||
Proceeds from shares sold | 7,715,450 | 424,488,613 | 31,091,667 | 155,139,410 | ||||||||||||||||||||||||
Value of shares repurchased | (42,210,220 | ) | (158,049,668 | ) | (6,934,994 | ) | (111,547,704 | ) | ||||||||||||||||||||
Transaction fees | 14,718 | 48,283 | 2,911 | 8,130 | ||||||||||||||||||||||||
|
|
|
|
|
|
|
| |||||||||||||||||||||
Net increase (decrease) in net assets resulting from share transactions | (34,480,052 | ) | 266,487,228 | 24,159,584 | 43,599,836 | |||||||||||||||||||||||
|
|
|
|
|
|
|
| |||||||||||||||||||||
Net increase (decrease) in net assets | (182,891,482 | ) | 275,441,725 | (65,742,617 | ) | 115,765,951 | ||||||||||||||||||||||
|
|
|
|
|
|
|
| |||||||||||||||||||||
Net assets: | ||||||||||||||||||||||||||||
Beginning of year | 399,619,453 | 124,177,728 | 323,027,954 | 207,262,003 | ||||||||||||||||||||||||
|
|
|
|
|
|
|
| |||||||||||||||||||||
End of year | $ | 216,727,971 | $ | 399,619,453 | $ | 257,285,337 | $ | 323,027,954 | ||||||||||||||||||||
|
|
|
|
|
|
|
| |||||||||||||||||||||
Changes in Shares Outstanding: | ||||||||||||||||||||||||||||
Shares sold | 350,000 | 12,400,000 | 800,000 | 3,950,000 | ||||||||||||||||||||||||
Shares repurchased | (1,700,000 | ) | (5,050,000 | ) | (200,000 | ) | (2,850,000 | ) | ||||||||||||||||||||
Shares outstanding, beginning of year | 12,775,000 | 5,425,000 | 7,750,000 | 6,650,000 | ||||||||||||||||||||||||
|
|
|
|
|
|
|
| |||||||||||||||||||||
Shares outstanding, end of year | 11,425,000 | 12,775,000 | 8,350,000 | 7,750,000 | ||||||||||||||||||||||||
|
|
|
|
|
|
|
| |||||||||||||||||||||
| (a) | For the period April 20, 2021 (commencement of investment operations) through October 31, 2021. |
See accompanying Notes to Financial Statements which are an integral part of the financial statements.
| 104 | ||||
|
| |||
| Invesco International BuyBack AchieversTM ETF (IPKW) | Invesco MSCI Global Timber ETF (CUT) | Invesco MSCI Green Building ETF (GBLD) | Invesco S&P Global Water Index ETF (CGW) | |||||||||||||||||||||||||||
| 2022 | 2021 | 2022 | 2021 | 2022 | 2021(a) | 2022 | 2021 | |||||||||||||||||||||||
| $ | 3,127,706 | $ | 7,296,457 | $ | 1,606,588 | $ | 1,518,965 | $ | 166,520 | $ | 87,786 | $ | 12,544,693 | $ | 19,796,650 | |||||||||||||||
| (26,410,957 | ) | 38,109,597 | 6,256,984 | 7,132,006 | (234,786 | ) | 3,150 | (16,826,341 | ) | 45,148,590 | ||||||||||||||||||||
| (4,107,446 | ) | (8,019,452 | ) | (22,097,502 | ) | 15,142,417 | (1,651,648 | ) | (244,921 | ) | (254,546,079 | ) | 258,398,968 | |||||||||||||||||
|
|
|
|
|
|
|
|
|
|
|
|
|
|
|
| |||||||||||||||
| (27,390,697 | ) | 37,386,602 | (14,233,930 | ) | 23,793,388 | (1,719,914 | ) | (153,985 | ) | (258,827,727 | ) | 323,344,208 | ||||||||||||||||||
|
|
|
|
|
|
|
|
|
|
|
|
|
|
|
| |||||||||||||||
| (9,566,307 | ) | (2,099,827 | ) | (1,454,000 | ) | (1,493,991 | ) | (174,785 | ) | (82,156 | ) | (20,088,093 | ) | (11,646,987 | ) | |||||||||||||||
| - | - | - | - | (26,115 | ) | - | - | - | ||||||||||||||||||||||
|
|
|
|
|
|
|
|
|
|
|
|
|
|
|
| |||||||||||||||
| (9,566,307 | ) | (2,099,827 | ) | (1,454,000 | ) | (1,493,991 | ) | (200,900 | ) | (82,156 | ) | (20,088,093 | ) | (11,646,987 | ) | |||||||||||||||
|
|
|
|
|
|
|
|
|
|
|
|
|
|
|
| |||||||||||||||
| 14,961,759 | 66,429,753 | 5,213,349 | 11,405,740 | 2,085,059 | 5,000,025 | 55,189,956 | 270,538,311 | |||||||||||||||||||||||
| (21,886,121 | ) | (69,533,806 | ) | (20,907,491 | ) | (16,774,336 | ) | - | - | (42,623,484 | ) | (93,778,162 | ) | |||||||||||||||||
| 6,640 | 6,881 | 3,660 | 3,017 | - | - | 1,588 | 13,469 | |||||||||||||||||||||||
|
|
|
|
|
|
|
|
|
|
|
|
|
|
|
| |||||||||||||||
| (6,917,722 | ) | (3,097,172 | ) | (15,690,482 | ) | (5,365,579 | ) | 2,085,059 | 5,000,025 | 12,568,060 | 176,773,618 | |||||||||||||||||||
|
|
|
|
|
|
|
|
|
|
|
|
|
|
|
| |||||||||||||||
| (43,874,726 | ) | 32,189,603 | (31,378,412 | ) | 16,933,818 | 164,245 | 4,763,884 | (266,347,760 | ) | 488,470,839 | ||||||||||||||||||||
|
|
|
|
|
|
|
|
|
|
|
|
|
|
|
| |||||||||||||||
| 124,660,066 | 92,470,463 | 92,034,867 | 75,101,049 | 4,763,884 | - | 1,199,341,498 | 710,870,659 | |||||||||||||||||||||||
|
|
|
|
|
|
|
|
|
|
|
|
|
|
|
| |||||||||||||||
| $ | 80,785,340 | $ | 124,660,066 | $ | 60,656,455 | $ | 92,034,867 | $ | 4,928,129 | $ | 4,763,884 | $ | 932,993,738 | $ | 1,199,341,498 | |||||||||||||||
|
|
|
|
|
|
|
|
|
|
|
|
|
|
|
| |||||||||||||||
| 400,000 | 1,500,000 | 150,000 | 300,000 | 100,000 | 200,001 | 960,000 | 5,040,000 | |||||||||||||||||||||||
| (600,000 | ) | (1,600,000 | ) | (650,000 | ) | (450,000 | ) | - | - | (880,000 | ) | (1,840,000 | ) | |||||||||||||||||
| 2,850,000 | 2,950,000 | 2,550,000 | 2,700,000 | 200,001 | - | 20,360,000 | 17,160,000 | |||||||||||||||||||||||
|
|
|
|
|
|
|
|
|
|
|
|
|
|
|
| |||||||||||||||
| 2,650,000 | 2,850,000 | 2,050,000 | 2,550,000 | 300,001 | 200,001 | 20,440,000 | 20,360,000 | |||||||||||||||||||||||
|
|
|
|
|
|
|
|
|
|
|
|
|
|
|
| |||||||||||||||
| 105 | ||||
|
| |||
Statements of Changes in Net Assets–(continued)
For the years ended October 31, 2022 and 2021
| Invesco S&P International Developed Quality ETF (IDHQ) | ||||||||
| 2022 | 2021 | |||||||
Operations: | ||||||||
Net investment income | $ | 3,303,241 | $ | 2,236,083 | ||||
Net realized gain (loss) | (14,247,548 | ) | 12,964,294 | |||||
Change in net unrealized appreciation (depreciation) | (26,334,918 | ) | 10,136,928 | |||||
|
|
|
| |||||
Net increase (decrease) in net assets resulting from operations | (37,279,225 | ) | 25,337,305 | |||||
|
|
|
| |||||
Distributions to Shareholders from: | ||||||||
Distributable earnings | (3,802,505 | ) | (2,252,111 | ) | ||||
|
|
|
| |||||
Shareholder Transactions: | ||||||||
Proceeds from shares sold | 49,580,715 | 67,242,044 | ||||||
Value of shares repurchased | (30,759,251 | ) | (75,829,640 | ) | ||||
Transaction fees | 3,973 | 3,343 | ||||||
|
|
|
| |||||
Net increase (decrease) in net assets resulting from share transactions | 18,825,437 | (8,584,253 | ) | |||||
|
|
|
| |||||
Net increase (decrease) in net assets | (22,256,293 | ) | 14,500,941 | |||||
|
|
|
| |||||
Net assets: | ||||||||
Beginning of year | 114,521,954 | 100,021,013 | ||||||
|
|
|
| |||||
End of year | $ | 92,265,661 | $ | 114,521,954 | ||||
|
|
|
| |||||
Changes in Shares Outstanding: | ||||||||
Shares sold | 1,650,000 | 2,200,000 | ||||||
Shares repurchased | (1,150,000 | ) | (2,550,000 | ) | ||||
Shares outstanding, beginning of year | 3,650,000 | 4,000,000 | ||||||
|
|
|
| |||||
Shares outstanding, end of year | 4,150,000 | 3,650,000 | ||||||
|
|
|
| |||||
See accompanying Notes to Financial Statements which are an integral part of the financial statements.
| 106 | ||||
|
| |||
Invesco China Technology ETF (CQQQ)
| Two Months Ended | Year Ended August 31, 2018 | |||||||||||||||||||||||||||
| Years Ended October 31, | October 31, | |||||||||||||||||||||||||||
| 2022 | 2021 | 2020 | 2019 | 2018 | ||||||||||||||||||||||||
Per Share Operating Performance: | ||||||||||||||||||||||||||||
Net asset value at beginning of period | $ | 68.90 | $ | 73.98 | $ | 47.88 | $ | 40.55 | $ | 49.32 | $ | 55.00 | ||||||||||||||||
|
|
|
|
|
|
|
|
|
|
|
| |||||||||||||||||
Net investment income (loss)(a) | (0.07 | ) | (0.15 | ) | (0.06 | ) | 0.04 | 0.03 | 0.31 | |||||||||||||||||||
Net realized and unrealized gain (loss) on investments | (36.71 | ) | (4.54 | ) | 26.17 | 7.46 | (8.80 | ) | (5.13 | ) | ||||||||||||||||||
|
|
|
|
|
|
|
|
|
|
|
| |||||||||||||||||
Total from investment operations | (36.78 | ) | (4.69 | ) | 26.11 | 7.50 | (8.77 | ) | (4.82 | ) | ||||||||||||||||||
|
|
|
|
|
|
|
|
|
|
|
| |||||||||||||||||
Distributions to shareholders from: | ||||||||||||||||||||||||||||
Net investment income | - | (0.39 | ) | (0.01 | ) | (0.17 | ) | - | (0.86 | ) | ||||||||||||||||||
|
|
|
|
|
|
|
|
|
|
|
| |||||||||||||||||
Transaction fees(a) | 0.04 | - | - | - | - | - | ||||||||||||||||||||||
|
|
|
|
|
|
|
|
|
|
|
| |||||||||||||||||
Net asset value at end of period | $ | 32.16 | $ | 68.90 | $ | 73.98 | $ | 47.88 | $ | 40.55 | $ | 49.32 | ||||||||||||||||
|
|
|
|
|
|
|
|
|
|
|
| |||||||||||||||||
Market price at end of period(b) | $ | 31.96 | $ | 68.25 | $ | 74.34 | $ | 47.67 | $ | 40.81 | $ | 49.36 | ||||||||||||||||
|
|
|
|
|
|
|
|
|
|
|
| |||||||||||||||||
Net Asset Value Total Return(c) | (53.32 | )% | (6.41 | )% | 54.53 | % | 18.59 | % | (17.78 | )% | (9.05 | )% | ||||||||||||||||
Market Price Total Return(c) | (53.17 | )% | (7.75 | )% | 55.97 | % | 17.32 | % | (17.32 | )% | (9.33 | )% | ||||||||||||||||
Ratios/Supplemental Data: | ||||||||||||||||||||||||||||
Net assets at end of period (000’s omitted) | $ | 702,610 | $ | 1,519,338 | $ | 1,043,162 | $ | 509,964 | $ | 405,541 | $ | 384,689 | ||||||||||||||||
Ratio to average net assets of: | ||||||||||||||||||||||||||||
Expenses | 0.70 | % | 0.70 | % | 0.70 | % | 0.70 | % | 0.70 | %(d) | 0.65 | % | ||||||||||||||||
Net investment income (loss) | (0.14 | )% | (0.19 | )% | (0.09 | )% | 0.09 | % | 0.39 | %(d) | 0.52 | % | ||||||||||||||||
Portfolio turnover rate(e) | 58 | % | 54 | % | 38 | % | 80 | % | 4 | % | 21 | % | ||||||||||||||||
| (a) | Based on average shares outstanding. |
| (b) | The mean between the last bid and ask prices. |
| (c) | Net asset value total return is calculated assuming an initial investment made at the net asset value at the beginning of the period, reinvestment of all dividends and distributions at net asset value during the period, and redemption at net asset value on the last day of the period. Net asset value total return includes adjustments in accordance with accounting principles generally accepted in the United States of America and as such, the net asset value for financial reporting purposes and the returns based upon those net asset values may differ from the net asset value and returns for shareholder transactions. Market price total return is calculated assuming an initial investment made at the market price at the beginning of the period, reinvestment of all dividends and distributions at market price during the period, and sale at the market price on the last day of the period. Total investment returns calculated for a period of less than one year are not annualized. |
| (d) | Annualized. |
| (e) | Portfolio turnover rate is not annualized for periods less than one year, if applicable, and does not include securities received or delivered from processing creations or redemptions. |
See accompanying Notes to Financial Statements which are an integral part of the financial statements.
| 107 | ||||
|
| |||
Financial Highlights–(continued)
Invesco DWA Developed Markets Momentum ETF (PIZ)
| Years Ended October 31, | ||||||||||||||||||||
| 2022 | 2021 | 2020 | 2019 | 2018 | ||||||||||||||||
Per Share Operating Performance: | ||||||||||||||||||||
Net asset value at beginning of year | $ | 39.99 | $ | 29.82 | $ | 27.18 | $ | 24.53 | $ | 27.30 | ||||||||||
|
|
|
|
|
|
|
|
|
| |||||||||||
Net investment income(a) | 0.40 | 0.22 | (b) | 0.13 | 0.30 | 0.24 | ||||||||||||||
Net realized and unrealized gain (loss) on investments | (13.59 | ) | 10.12 | 2.77 | 2.70 | (2.68 | ) | |||||||||||||
|
|
|
|
|
|
|
|
|
| |||||||||||
Total from investment operations | (13.19 | ) | 10.34 | 2.90 | 3.00 | (2.44 | ) | |||||||||||||
|
|
|
|
|
|
|
|
|
| |||||||||||
Distributions to shareholders from: | ||||||||||||||||||||
Net investment income | (0.77 | ) | (0.17 | ) | (0.26 | ) | (0.35 | ) | (0.33 | ) | ||||||||||
|
|
|
|
|
|
|
|
|
| |||||||||||
Net asset value at end of year | $ | 26.03 | $ | 39.99 | $ | 29.82 | $ | 27.18 | $ | 24.53 | ||||||||||
|
|
|
|
|
|
|
|
|
| |||||||||||
Market price at end of year(c) | $ | 26.00 | $ | 40.09 | $ | 29.77 | $ | 27.10 | $ | 24.47 | ||||||||||
|
|
|
|
|
|
|
|
|
| |||||||||||
Net Asset Value Total Return(d) | (33.25 | )% | 34.70 | % | 10.82 | % | 12.31 | % | (9.09 | )% | ||||||||||
Market Price Total Return(d) | (33.49 | )% | 35.26 | % | 10.96 | % | 12.25 | % | (9.48 | )% | ||||||||||
Ratios/Supplemental Data: | ||||||||||||||||||||
Net assets at end of year (000’s omitted) | $ | 101,514 | $ | 251,951 | $ | 155,043 | $ | 175,327 | $ | 223,182 | ||||||||||
Ratio to average net assets of: | ||||||||||||||||||||
Expenses | 0.80 | % | 0.80 | % | 0.80 | % | 0.81 | % | 0.80 | % | ||||||||||
Net investment income | 1.22 | % | 0.59 | %(b) | 0.47 | % | 1.18 | % | 0.88 | % | ||||||||||
Portfolio turnover rate(e) | 152 | % | 161 | % | 115 | % | 106 | % | 94 | % | ||||||||||
| (a) | Based on average shares outstanding. |
| (b) | Net investment income per share and the ratio of net investment income to average net assets includes income received from foreign withholding tax claims. Net investment income per share and the ratio of net investment income to average net assets excluding the foreign withholding tax claims are $0.16 and 0.44%, respectively. |
| (c) | The mean between the last bid and ask prices. |
| (d) | Net asset value total return is calculated assuming an initial investment made at the net asset value at the beginning of the period, reinvestment of all dividends and distributions at net asset value during the period, and redemption at net asset value on the last day of the period. Net asset value total return includes adjustments in accordance with accounting principles generally accepted in the United States of America and as such, the net asset value for financial reporting purposes and the returns based upon those net asset values may differ from the net asset value and returns for shareholder transactions. Market price total return is calculated assuming an initial investment made at the market price at the beginning of the period, reinvestment of all dividends and distributions at market price during the period, and sale at the market price on the last day of the period. Total investment returns calculated for a period of less than one year are not annualized. |
| (e) | Portfolio turnover rate is not annualized for periods less than one year, if applicable, and does not include securities received or delivered from processing creations or redemptions. |
See accompanying Notes to Financial Statements which are an integral part of the financial statements.
| 108 | ||||
|
| |||
Financial Highlights–(continued)
Invesco DWA Emerging Markets Momentum ETF (PIE)
| Years Ended October 31, | ||||||||||||||||||||
| 2022 | 2021 | 2020 | 2019 | 2018 | ||||||||||||||||
Per Share Operating Performance: | ||||||||||||||||||||
Net asset value at beginning of year | $ | 24.99 | $ | 19.56 | $ | 18.59 | $ | 16.12 | $ | 19.48 | ||||||||||
|
|
|
|
|
|
|
|
|
| |||||||||||
Net investment income(a) | 0.57 | (b) | 0.19 | 0.23 | 0.36 | (c) | 0.40 | |||||||||||||
Net realized and unrealized gain (loss) on investments | (8.97 | ) | 5.52 | 1.07 | 2.51 | (3.29 | ) | |||||||||||||
|
|
|
|
|
|
|
|
|
| |||||||||||
Total from investment operations | (8.40 | ) | 5.71 | 1.30 | 2.87 | (2.89 | ) | |||||||||||||
|
|
|
|
|
|
|
|
|
| |||||||||||
Distributions to shareholders from: | ||||||||||||||||||||
Net investment income | (0.71 | ) | (0.30 | ) | (0.34 | ) | (0.41 | ) | (0.49 | ) | ||||||||||
|
|
|
|
|
|
|
|
|
| |||||||||||
Transaction fees(a) | 0.02 | 0.02 | 0.01 | 0.01 | 0.02 | |||||||||||||||
|
|
|
|
|
|
|
|
|
| |||||||||||
Net asset value at end of year | $ | 15.90 | $ | 24.99 | $ | 19.56 | $ | 18.59 | $ | 16.12 | ||||||||||
|
|
|
|
|
|
|
|
|
| |||||||||||
Market price at end of year(d) | $ | 15.85 | $ | 24.81 | $ | 19.60 | $ | 18.51 | $ | 16.08 | ||||||||||
|
|
|
|
|
|
|
|
|
| |||||||||||
Net Asset Value Total Return(e) | (34.05 | )% | 29.35 | % | 7.08 | % | 18.23 | % | (15.11 | )% | ||||||||||
Market Price Total Return(e) | (33.79 | )% | 28.17 | % | 7.77 | % | 18.03 | % | (15.58 | )% | ||||||||||
Ratios/Supplemental Data: | ||||||||||||||||||||
Net assets at end of year (000’s omitted) | $ | 125,593 | $ | 214,944 | $ | 155,489 | $ | 168,210 | $ | 192,660 | ||||||||||
Ratio to average net assets of: | ||||||||||||||||||||
Expenses | 0.90 | % | 0.90 | % | 0.90 | % | 0.91 | %(f) | 0.90 | % | ||||||||||
Net investment income | 2.66 | %(b) | 0.79 | % | 1.25 | % | 2.13 | %(c)(f) | 2.01 | % | ||||||||||
Portfolio turnover rate(g) | 169 | % | 198 | % | 155 | % | 158 | % | 163 | % | ||||||||||
| (a) | Based on average shares outstanding. |
| (b) | Net investment income per share and the ratio of net investment income to average net assets include a significant dividend received during the period. Net investment income per share and the ratio of net investment income to average net assets excluding the significant dividend are $0.48 and 2.24%, respectively. |
| (c) | Net Investment income per share and the ratio of net investment income to average net assets include a non-cash taxable distribution received during the year. Net investment income per share and the ratio of net investment income to average net assets excluding the non-cash taxable distribution are $0.24 and 1.39%, respectively. |
| (d) | The mean between the last bid and ask prices. |
| (e) | Net asset value total return is calculated assuming an initial investment made at the net asset value at the beginning of the period, reinvestment of all dividends and distributions at net asset value during the period, and redemption at net asset value on the last day of the period. Net asset value total return includes adjustments in accordance with accounting principles generally accepted in the United States of America and as such, the net asset value for financial reporting purposes and the returns based upon those net asset values may differ from the net asset value and returns for shareholder transactions. Market price total return is calculated assuming an initial investment made at the market price at the beginning of the period, reinvestment of all dividends and distributions at market price during the period, and sale at the market price on the last day of the period. Total investment returns calculated for a period of less than one year are not annualized. |
| (f) | Ratios include non-recurring costs associated with a proxy statement of 0.01%. |
| (g) | Portfolio turnover rate is not annualized for periods less than one year, if applicable, and does not include securities received or delivered from processing creations or redemptions. |
See accompanying Notes to Financial Statements which are an integral part of the financial statements.
| 109 | ||||
|
| |||
Financial Highlights–(continued)
Invesco FTSE RAFI Developed Markets ex-U.S. ETF (PXF)
| Years Ended October 31, | ||||||||||||||||||||
| 2022 | 2021 | 2020 | 2019 | 2018 | ||||||||||||||||
Per Share Operating Performance: | ||||||||||||||||||||
Net asset value at beginning of year | $ | 48.20 | $ | 34.17 | $ | 40.99 | $ | 40.04 | $ | 44.66 | ||||||||||
|
|
|
|
|
|
|
|
|
| |||||||||||
Net investment income(a) | 1.40 | 1.42 | 0.94 | 1.45 | 1.34 | |||||||||||||||
Net realized and unrealized gain (loss) on investments | (9.83 | ) | 13.72 | (6.85 | ) | 1.10 | (4.56 | ) | ||||||||||||
|
|
|
|
|
|
|
|
|
| |||||||||||
Total from investment operations | (8.43 | ) | 15.14 | (5.91 | ) | 2.55 | (3.22 | ) | ||||||||||||
|
|
|
|
|
|
|
|
|
| |||||||||||
Distributions to shareholders from: | ||||||||||||||||||||
Net investment income | (2.15 | ) | (1.11 | ) | (0.92 | ) | (1.60 | ) | (1.40 | ) | ||||||||||
|
|
|
|
|
|
|
|
|
| |||||||||||
Transaction fees(a) | 0.00 | (b) | 0.00 | (b) | 0.01 | 0.00 | (b) | 0.00 | (b) | |||||||||||
|
|
|
|
|
|
|
|
|
| |||||||||||
Net asset value at end of year | $ | 37.62 | $ | 48.20 | $ | 34.17 | $ | 40.99 | $ | 40.04 | ||||||||||
|
|
|
|
|
|
|
|
|
| |||||||||||
Market price at end of year(c) | $ | 37.71 | $ | 48.22 | $ | 34.25 | $ | 40.86 | $ | 39.98 | ||||||||||
|
|
|
|
|
|
|
|
|
| |||||||||||
Net Asset Value Total Return(d) | (17.95 | )% | 44.49 | % | (14.26 | )% | 6.58 | % | (7.45 | )% | ||||||||||
Market Price Total Return(d) | (17.81 | )% | 44.22 | % | (13.80 | )% | 6.41 | % | (7.92 | )% | ||||||||||
Ratios/Supplemental Data: | ||||||||||||||||||||
Net assets at end of year (000’s omitted) | $ | 1,130,538 | $ | 1,200,189 | $ | 871,403 | $ | 1,246,076 | $ | 1,275,422 | ||||||||||
Ratio to average net assets of: | ||||||||||||||||||||
Expenses | 0.45 | % | 0.45 | % | 0.45 | % | 0.45 | % | 0.45 | % | ||||||||||
Net investment income | 3.24 | % | 3.09 | % | 2.57 | % | 3.64 | % | 3.02 | % | ||||||||||
Portfolio turnover rate(e) | 16 | % | 17 | % | 11 | % | 15 | % | 10 | % | ||||||||||
| (a) | Based on average shares outstanding. |
| (b) | Amount represents less than $0.005. |
| (c) | The mean between the last bid and ask prices. |
| (d) | Net asset value total return is calculated assuming an initial investment made at the net asset value at the beginning of the period, reinvestment of all dividends and distributions at net asset value during the period, and redemption at net asset value on the last day of the period. Net asset value total return includes adjustments in accordance with accounting principles generally accepted in the United States of America and as such, the net asset value for financial reporting purposes and the returns based upon those net asset values may differ from the net asset value and returns for shareholder transactions. Market price total return is calculated assuming an initial investment made at the market price at the beginning of the period, reinvestment of all dividends and distributions at market price during the period, and sale at the market price on the last day of the period. Total investment returns calculated for a period of less than one year are not annualized. |
| (e) | Portfolio turnover rate is not annualized for periods less than one year, if applicable, and does not include securities received or delivered from processing creations or redemptions. |
See accompanying Notes to Financial Statements which are an integral part of the financial statements.
| 110 | ||||
|
| |||
Financial Highlights–(continued)
Invesco FTSE RAFI Developed Markets ex-U.S. Small-Mid ETF (PDN)
| Years Ended October 31, | ||||||||||||||||||||
| 2022 | 2021 | 2020 | 2019 | 2018 | ||||||||||||||||
Per Share Operating Performance: | ||||||||||||||||||||
Net asset value at beginning of year | $ | 38.13 | $ | 28.93 | $ | 30.67 | $ | 29.48 | $ | 33.33 | ||||||||||
|
|
|
|
|
|
|
|
|
| |||||||||||
Net investment income(a) | 0.81 | 0.65 | 0.60 | 0.70 | 0.75 | |||||||||||||||
Net realized and unrealized gain (loss) on investments | (11.23 | ) | 9.25 | (1.70 | ) | 1.24 | (3.66 | ) | ||||||||||||
|
|
|
|
|
|
|
|
|
| |||||||||||
Total from investment operations | (10.42 | ) | 9.90 | (1.10 | ) | 1.94 | (2.91 | ) | ||||||||||||
|
|
|
|
|
|
|
|
|
| |||||||||||
Distributions to shareholders from: | ||||||||||||||||||||
Net investment income | (1.06 | ) | (0.70 | ) | (0.64 | ) | (0.75 | ) | (0.94 | ) | ||||||||||
|
|
|
|
|
|
|
|
|
| |||||||||||
Transaction fees(a) | 0.01 | 0.00 | (b) | 0.00 | (b) | 0.00 | (b) | 0.00 | (b) | |||||||||||
|
|
|
|
|
|
|
|
|
| |||||||||||
Net asset value at end of year | $ | 26.66 | $ | 38.13 | $ | 28.93 | $ | 30.67 | $ | 29.48 | ||||||||||
|
|
|
|
|
|
|
|
|
| |||||||||||
Market price at end of year(c) | $ | 26.68 | $ | 38.41 | $ | 28.94 | $ | 30.42 | $ | 29.48 | ||||||||||
|
|
|
|
|
|
|
|
|
| |||||||||||
Net Asset Value Total Return(d) | (27.72 | )% | 34.34 | % | (3.36 | )% | 6.72 | % | (9.05 | )% | ||||||||||
Market Price Total Return(d) | (28.21 | )% | 35.26 | % | (2.53 | )% | 5.85 | % | (9.36 | )% | ||||||||||
Ratios/Supplemental Data: | ||||||||||||||||||||
Net assets at end of year (000’s omitted) | $ | 489,162 | $ | 434,660 | $ | 308,106 | $ | 328,155 | $ | 291,863 | ||||||||||
Ratio to average net assets of: | ||||||||||||||||||||
Expenses | 0.49 | % | 0.49 | % | 0.49 | % | 0.49 | % | 0.49 | % | ||||||||||
Net investment income | 2.55 | % | 1.77 | % | 2.09 | % | 2.36 | % | 2.25 | % | ||||||||||
Portfolio turnover rate(e) | 32 | % | 31 | % | 26 | % | 27 | % | 21 | % | ||||||||||
| (a) | Based on average shares outstanding. |
| (b) | Amount represents less than $0.005. |
| (c) | The mean between the last bid and ask prices. |
| (d) | Net asset value total return is calculated assuming an initial investment made at the net asset value at the beginning of the period, reinvestment of all dividends and distributions at net asset value during the period, and redemption at net asset value on the last day of the period. Net asset value total return includes adjustments in accordance with accounting principles generally accepted in the United States of America and as such, the net asset value for financial reporting purposes and the returns based upon those net asset values may differ from the net asset value and returns for shareholder transactions. Market price total return is calculated assuming an initial investment made at the market price at the beginning of the period, reinvestment of all dividends and distributions at market price during the period, and sale at the market price on the last day of the period. Total investment returns calculated for a period of less than one year are not annualized. |
| (e) | Portfolio turnover rate is not annualized for periods less than one year, if applicable, and does not include securities received or delivered from processing creations or redemptions. |
See accompanying Notes to Financial Statements which are an integral part of the financial statements.
| 111 | ||||
|
| |||
Financial Highlights–(continued)
Invesco FTSE RAFI Emerging Markets ETF (PXH)
| Years Ended October 31, | ||||||||||||||||||||
| 2022 | 2021 | 2020 | 2019 | 2018 | ||||||||||||||||
Per Share Operating Performance: | ||||||||||||||||||||
Net asset value at beginning of year | $ | 22.43 | $ | 17.51 | $ | 20.95 | $ | 20.02 | $ | 21.66 | ||||||||||
|
|
|
|
|
|
|
|
|
| |||||||||||
Net investment income(a) | 1.06 | (b) | 0.92 | 0.59 | 0.72 | 0.73 | ||||||||||||||
Net realized and unrealized gain (loss) on investments | (6.37 | ) | 4.63 | (3.40 | ) | 0.92 | (1.66 | ) | ||||||||||||
|
|
|
|
|
|
|
|
|
| |||||||||||
Total from investment operations | (5.31 | ) | 5.55 | (2.81 | ) | 1.64 | (0.93 | ) | ||||||||||||
|
|
|
|
|
|
|
|
|
| |||||||||||
Distributions to shareholders from: | ||||||||||||||||||||
Net investment income | (1.29 | ) | (0.64 | ) | (0.63 | ) | (0.71 | ) | (0.71 | ) | ||||||||||
|
|
|
|
|
|
|
|
|
| |||||||||||
Transaction fees(a) | 0.01 | 0.01 | 0.00 | (c) | 0.00 | (c) | 0.00 | (c) | ||||||||||||
|
|
|
|
|
|
|
|
|
| |||||||||||
Net asset value at end of year | $ | 15.84 | $ | 22.43 | $ | 17.51 | $ | 20.95 | $ | 20.02 | ||||||||||
|
|
|
|
|
|
|
|
|
| |||||||||||
Market price at end of year(d) | $ | 15.85 | $ | 22.34 | $ | 17.51 | $ | 20.93 | $ | 20.03 | ||||||||||
|
|
|
|
|
|
|
|
|
| |||||||||||
Net Asset Value Total Return(e) | (24.47 | )% | 31.79 | % | (13.44 | )% | 8.31 | % | (4.44 | )% | ||||||||||
Market Price Total Return(e) | (24.14 | )% | 31.28 | % | (13.36 | )% | 8.14 | % | (4.22 | )% | ||||||||||
Ratios/Supplemental Data: | ||||||||||||||||||||
Net assets at end of year (000’s omitted) | $ | 1,206,241 | $ | 1,360,503 | $ | 969,844 | $ | 1,277,150 | $ | 1,129,333 | ||||||||||
Ratio to average net assets of: | ||||||||||||||||||||
Expenses, after Waivers | 0.49 | % | 0.49 | %(f) | 0.49 | %(f) | 0.49 | %(f) | 0.48 | % | ||||||||||
Expenses, prior to Waivers | 0.49 | % | 0.49 | %(f) | 0.49 | %(f) | 0.49 | %(f) | 0.49 | % | ||||||||||
Net investment income | 5.39 | %(b) | 4.11 | % | 3.14 | % | 3.48 | % | 3.30 | % | ||||||||||
Portfolio turnover rate(g) | 36 | % | 34 | % | 22 | % | 29 | % | 16 | % | ||||||||||
| (a) | Based on average shares outstanding. |
| (b) | Net investment income per share and the ratio of net investment income to average net assets include a significant dividend received during the period. Net investment income per share and the ratio of net investment income to average net assets excluding the significant dividend are $0.63 and 3.19%, respectively. |
| (c) | Amount represents less than $0.005. |
| (d) | The mean between the last bid and ask prices. |
| (e) | Net asset value total return is calculated assuming an initial investment made at the net asset value at the beginning of the period, reinvestment of all dividends and distributions at net asset value during the period, and redemption at net asset value on the last day of the period. Net asset value total return includes adjustments in accordance with accounting principles generally accepted in the United States of America and as such, the net asset value for financial reporting purposes and the returns based upon those net asset values may differ from the net asset value and returns for shareholder transactions. Market price total return is calculated assuming an initial investment made at the market price at the beginning of the period, reinvestment of all dividends and distributions at market price during the period, and sale at the market price on the last day of the period. Total investment returns calculated for a period of less than one year are not annualized. |
| (f) | In addition to the fees and expenses which the Fund bears directly, the Fund indirectly bears a pro rata share of the fees and expenses of the investment companies in which the Fund invests. Estimated investment companies’ expenses are not expenses that are incurred directly by the Fund. They are expenses that are incurred directly by the investment companies and are deducted from the value of the investment companies the Fund invests in. The effect of the estimated investment companies’ expenses that the Fund bears indirectly is included in the Fund’s total return. |
| (g) | Portfolio turnover rate is not annualized for periods less than one year, if applicable, and does not include securities received or delivered from processing creations or redemptions. |
See accompanying Notes to Financial Statements which are an integral part of the financial statements.
| 112 | ||||
|
| |||
Financial Highlights–(continued)
Invesco Global Clean Energy ETF (PBD)
| Years Ended October 31, | ||||||||||||||||||||
| 2022 | 2021 | 2020 | 2019 | 2018 | ||||||||||||||||
Per Share Operating Performance: | ||||||||||||||||||||
Net asset value at beginning of year | $ | 31.28 | $ | 22.89 | $ | 12.66 | $ | 10.97 | $ | 13.08 | ||||||||||
|
|
|
|
|
|
|
|
|
| |||||||||||
Net investment income(a) | 0.25 | 0.16 | 0.19 | 0.21 | 0.18 | |||||||||||||||
Net realized and unrealized gain (loss) on investments | (12.25 | ) | 8.37 | 10.30 | 1.72 | (2.07 | ) | |||||||||||||
|
|
|
|
|
|
|
|
|
| |||||||||||
Total from investment operations | (12.00 | ) | 8.53 | 10.49 | 1.93 | (1.89 | ) | |||||||||||||
|
|
|
|
|
|
|
|
|
| |||||||||||
Distributions to shareholders from: | ||||||||||||||||||||
Net investment income | (0.31 | ) | (0.14 | ) | (0.26 | ) | (0.24 | ) | (0.22 | ) | ||||||||||
|
|
|
|
|
|
|
|
|
| |||||||||||
Transaction fees(a) | 0.00 | (b) | 0.00 | (b) | 0.00 | (b) | 0.00 | (b) | 0.00 | (b) | ||||||||||
|
|
|
|
|
|
|
|
|
| |||||||||||
Net asset value at end of year | $ | 18.97 | $ | 31.28 | $ | 22.89 | $ | 12.66 | $ | 10.97 | ||||||||||
|
|
|
|
|
|
|
|
|
| |||||||||||
Market price at end of year(c) | $ | 18.89 | $ | 31.31 | $ | 22.92 | $ | 12.56 | $ | 10.95 | ||||||||||
|
|
|
|
|
|
|
|
|
| |||||||||||
Net Asset Value Total Return(d) | (38.52 | )% | 37.31 | % | 84.06 | % | 17.86 | % | (14.69 | )% | ||||||||||
Market Price Total Return(d) | (38.83 | )% | 37.26 | % | 85.77 | % | 17.16 | % | (14.78 | )% | ||||||||||
Ratios/Supplemental Data: | ||||||||||||||||||||
Net assets at end of year (000’s omitted) | $ | 216,728 | $ | 399,619 | $ | 124,178 | $ | 49,675 | $ | 49,661 | ||||||||||
Ratio to average net assets of: | ||||||||||||||||||||
Expenses | 0.75 | % | 0.75 | % | 0.75 | % | 0.77 | %(e) | 0.75 | % | ||||||||||
Net investment income | 1.09 | % | 0.52 | % | 1.20 | % | 1.74 | %(e) | 1.43 | % | ||||||||||
Portfolio turnover rate(f) | 67 | % | 74 | % | 56 | % | 59 | % | 46 | % | ||||||||||
| (a) | Based on average shares outstanding. |
| (b) | Amount represents less than $0.005. |
| (c) | The mean between the last bid and ask prices. |
| (d) | Net asset value total return is calculated assuming an initial investment made at the net asset value at the beginning of the period, reinvestment of all dividends and distributions at net asset value during the period, and redemption at net asset value on the last day of the period. Net asset value total return includes adjustments in accordance with accounting principles generally accepted in the United States of America and as such, the net asset value for financial reporting purposes and the returns based upon those net asset values may differ from the net asset value and returns for shareholder transactions. Market price total return is calculated assuming an initial investment made at the market price at the beginning of the period, reinvestment of all dividends and distributions at market price during the period, and sale at the market price on the last day of the period. Total investment returns calculated for a period of less than one year are not annualized. |
| (e) | Ratios include non-recurring costs associated with a proxy statement of 0.02%. |
| (f) | Portfolio turnover rate is not annualized for periods less than one year, if applicable, and does not include securities received or delivered from processing creations or redemptions. |
See accompanying Notes to Financial Statements which are an integral part of the financial statements.
| 113 | ||||
|
| |||
Financial Highlights–(continued)
Invesco Global Water ETF (PIO)
| Years Ended October 31, | ||||||||||||||||||||
| 2022 | 2021 | 2020 | 2019 | 2018 | ||||||||||||||||
Per Share Operating Performance: | ||||||||||||||||||||
Net asset value at beginning of year | $ | 41.68 | $ | 31.17 | $ | 28.94 | $ | 23.73 | $ | 25.27 | ||||||||||
|
|
|
|
|
|
|
|
|
| |||||||||||
Net investment income(a) | 0.32 | 0.58 | (b) | 0.25 | 0.38 | 0.45 | ||||||||||||||
Net realized and unrealized gain (loss) on investments | (10.75 | ) | 10.35 | 2.27 | 5.25 | (1.54 | ) | |||||||||||||
|
|
|
|
|
|
|
|
|
| |||||||||||
Total from investment operations | (10.43 | ) | 10.93 | 2.52 | 5.63 | (1.09 | ) | |||||||||||||
|
|
|
|
|
|
|
|
|
| |||||||||||
Distributions to shareholders from: | ||||||||||||||||||||
Net investment income | (0.44 | ) | (0.42 | ) | (0.29 | ) | (0.42 | ) | (0.45 | ) | ||||||||||
|
|
|
|
|
|
|
|
|
| |||||||||||
Transaction fees(a) | 0.00 | (c) | 0.00 | (c) | 0.00 | (c) | 0.00 | (c) | 0.00 | (c) | ||||||||||
|
|
|
|
|
|
|
|
|
| |||||||||||
Net asset value at end of year | $ | 30.81 | $ | 41.68 | $ | 31.17 | $ | 28.94 | $ | 23.73 | ||||||||||
|
|
|
|
|
|
|
|
|
| |||||||||||
Market price at end of year(d) | $ | 30.89 | $ | 41.72 | $ | 31.18 | $ | 28.84 | $ | 23.69 | ||||||||||
|
|
|
|
|
|
|
|
|
| |||||||||||
Net Asset Value Total Return(e) | (25.14 | )% | 35.17 | % | 8.76 | % | 23.90 | % | (4.45 | )% | ||||||||||
Market Price Total Return(e) | (25.02 | )% | 35.26 | % | 9.16 | % | 23.68 | % | (4.53 | )% | ||||||||||
Ratios/Supplemental Data: | ||||||||||||||||||||
Net assets at end of year (000’s omitted) | $ | 257,285 | $ | 323,028 | $ | 207,262 | $ | 195,314 | $ | 164,916 | ||||||||||
Ratio to average net assets of: | ||||||||||||||||||||
Expenses | 0.75 | % | 0.75 | % | 0.75 | % | 0.76 | %(f) | 0.75 | % | ||||||||||
Net investment income | 0.91 | % | 1.52 | %(b) | 0.86 | % | 1.45 | %(f) | 1.77 | % | ||||||||||
Portfolio turnover rate(g) | 35 | % | 31 | % | 30 | % | 32 | % | 34 | % | ||||||||||
| (a) | Based on average shares outstanding. |
| (b) | Net investment income per share and the ratio of net investment income to average net assets include a significant dividend received during the period. Net investment income per share and the ratio of net investment income to average net assets excluding the significant dividend are $0.35 and 0.92%, respectively. |
| (c) | Amount represents less than $0.005. |
| (d) | The mean between the last bid and ask prices. |
| (e) | Net asset value total return is calculated assuming an initial investment made at the net asset value at the beginning of the period, reinvestment of all dividends and distributions at net asset value during the period, and redemption at net asset value on the last day of the period. Net asset value total return includes adjustments in accordance with accounting principles generally accepted in the United States of America and as such, the net asset value for financial reporting purposes and the returns based upon those net asset values may differ from the net asset value and returns for shareholder transactions. Market price total return is calculated assuming an initial investment made at the market price at the beginning of the period, reinvestment of all dividends and distributions at market price during the period, and sale at the market price on the last day of the period. Total investment returns calculated for a period of less than one year are not annualized. |
| (f) | Ratios include non-recurring costs associated with a proxy statement of 0.01%. |
| (g) | Portfolio turnover rate is not annualized for periods less than one year, if applicable, and does not include securities received or delivered from processing creations or redemptions. |
See accompanying Notes to Financial Statements which are an integral part of the financial statements.
| 114 | ||||
|
| |||
Financial Highlights–(continued)
Invesco International BuyBack AchieversTM ETF (IPKW)
| Years Ended October 31, | ||||||||||||||||||||
| 2022 | 2021 | 2020 | 2019 | 2018 | ||||||||||||||||
Per Share Operating Performance: | ||||||||||||||||||||
Net asset value at beginning of year | $ | 43.74 | $ | 31.35 | $ | 32.20 | $ | 31.00 | $ | 35.31 | ||||||||||
|
|
|
|
|
|
|
|
|
| |||||||||||
Net investment income(a) | 1.12 | 2.55 | (b) | 0.57 | 0.76 | 0.69 | ||||||||||||||
Net realized and unrealized gain (loss) on investments | (10.90 | ) | 10.57 | (0.82 | ) | 1.38 | (4.28 | ) | ||||||||||||
|
|
|
|
|
|
|
|
|
| |||||||||||
Total from investment operations | (9.78 | ) | 13.12 | (0.25 | ) | 2.14 | (3.59 | ) | ||||||||||||
|
|
|
|
|
|
|
|
|
| |||||||||||
Distributions to shareholders from: | ||||||||||||||||||||
Net investment income | (3.47 | ) | (0.73 | ) | (0.61 | ) | (0.94 | ) | (0.73 | ) | ||||||||||
|
|
|
|
|
|
|
|
|
| |||||||||||
Transaction fees(a) | 0.00 | (c) | 0.00 | (c) | 0.01 | 0.00 | (c) | 0.01 | ||||||||||||
|
|
|
|
|
|
|
|
|
| |||||||||||
Net asset value at end of year | $ | 30.49 | $ | 43.74 | $ | 31.35 | $ | 32.20 | $ | 31.00 | ||||||||||
|
|
|
|
|
|
|
|
|
| |||||||||||
Market price at end of year(d) | $ | 30.48 | $ | 43.78 | $ | 31.42 | $ | 32.05 | $ | 30.96 | ||||||||||
|
|
|
|
|
|
|
|
|
| |||||||||||
Net Asset Value Total Return(e) | (23.55 | )% | 41.90 | % | (0.30 | )% | 7.10 | % | (10.40 | )% | ||||||||||
Market Price Total Return(e) | (23.65 | )% | 41.72 | % | 0.37 | % | 6.74 | % | (10.96 | )% | ||||||||||
Ratios/Supplemental Data: | ||||||||||||||||||||
Net assets at end of year (000’s omitted) | $ | 80,785 | $ | 124,660 | $ | 92,470 | $ | 141,692 | $ | 243,373 | ||||||||||
Ratio to average net assets of: | ||||||||||||||||||||
Expenses | 0.55 | % | 0.55 | % | 0.55 | % | 0.55 | % | 0.55 | % | ||||||||||
Net investment income | 3.08 | % | 5.98 | %(b) | 1.86 | % | 2.44 | % | 1.90 | % | ||||||||||
Portfolio turnover rate(f) | 101 | % | 113 | % | 88 | % | 99 | % | 121 | % | ||||||||||
| (a) | Based on average shares outstanding. |
| (b) | Net investment income per share and the ratio of net investment income to average net assets include a significant dividend received during the period. Net investment income per share and the ratio of net investment income to average net assets excluding the significant dividend are $0.63 and 1.47%, respectively. |
| (c) | Amount represents less than $0.005. |
| (d) | The mean between the last bid and ask prices. |
| (e) | Net asset value total return is calculated assuming an initial investment made at the net asset value at the beginning of the period, reinvestment of all dividends and distributions at net asset value during the period, and redemption at net asset value on the last day of the period. Net asset value total return includes adjustments in accordance with accounting principles generally accepted in the United States of America and as such, the net asset value for financial reporting purposes and the returns based upon those net asset values may differ from the net asset value and returns for shareholder transactions. Market price total return is calculated assuming an initial investment made at the market price at the beginning of the period, reinvestment of all dividends and distributions at market price during the period, and sale at the market price on the last day of the period. Total investment returns calculated for a period of less than one year are not annualized. |
| (f) | Portfolio turnover rate is not annualized for periods less than one year, if applicable, and does not include securities received or delivered from processing creations or redemptions. |
See accompanying Notes to Financial Statements which are an integral part of the financial statements.
| 115 | ||||
|
| |||
Financial Highlights–(continued)
Invesco MSCI Global Timber ETF (CUT)
| Years Ended October 31, | Five Months Ended October 31, | Years Ended May 31, | ||||||||||||||||||||||||||||||
| 2022 | 2021 | 2020 | 2019 | 2018 | 2018 | |||||||||||||||||||||||||||
Per Share Operating Performance: | ||||||||||||||||||||||||||||||||
Net asset value at beginning of period | $ | 36.09 | $ | 27.82 | $ | 27.65 | $ | 27.98 | $ | 33.50 | $ | 27.57 | ||||||||||||||||||||
|
|
|
|
|
|
|
|
|
|
|
| |||||||||||||||||||||
Net investment income(a) | 0.68 | 0.55 | 0.53 | 0.72 | 0.20 | 0.63 | ||||||||||||||||||||||||||
Net realized and unrealized gain (loss) on investments | (6.60 | ) | 8.27 | 0.40 | (0.23 | ) | (5.72 | ) | 5.80 | |||||||||||||||||||||||
|
|
|
|
|
|
|
|
|
|
|
| |||||||||||||||||||||
Total from investment operations | (5.92 | ) | 8.82 | 0.93 | 0.49 | (5.52 | ) | 6.43 | ||||||||||||||||||||||||
|
|
|
|
|
|
|
|
|
|
|
| |||||||||||||||||||||
Distributions to shareholders from: | ||||||||||||||||||||||||||||||||
Net investment income | (0.58 | ) | (0.55 | ) | (0.77 | ) | (0.82 | ) | - | (0.50 | ) | |||||||||||||||||||||
|
|
|
|
|
|
|
|
|
|
|
| |||||||||||||||||||||
Transaction fees(a) | 0.00 | (b) | 0.00 | (b) | 0.01 | 0.00 | (b) | 0.00 | (b) | - | ||||||||||||||||||||||
|
|
|
|
|
|
|
|
|
|
|
| |||||||||||||||||||||
Net asset value at end of period | $ | 29.59 | $ | 36.09 | $ | 27.82 | $ | 27.65 | $ | 27.98 | $ | 33.50 | ||||||||||||||||||||
|
|
|
|
|
|
|
|
|
|
|
| |||||||||||||||||||||
Market price at end of period(c) | $ | 29.53 | $ | 36.09 | $ | 27.81 | $ | 27.56 | $ | 27.94 | $ | 33.54 | ||||||||||||||||||||
|
|
|
|
|
|
|
|
|
|
|
| |||||||||||||||||||||
Net Asset Value Total Return(d) | (16.65 | )% | 31.90 | % | 3.29 | % | 2.32 | % | (16.48 | )% | 23.42 | % | ||||||||||||||||||||
Market Price Total Return(d) | (16.82 | )% | 31.95 | % | 3.60 | % | 2.14 | % | (16.70 | )% | 23.79 | % | ||||||||||||||||||||
Ratios/Supplemental Data: | ||||||||||||||||||||||||||||||||
Net assets at end of period (000’s omitted) | $ | 60,656 | $ | 92,035 | $ | 75,101 | $ | 134,093 | $ | 173,463 | $ | 236,190 | ||||||||||||||||||||
Ratio to average net assets of: | ||||||||||||||||||||||||||||||||
Expenses, after Waivers | 0.61 | % | 0.60 | % | 0.55 | % | 0.56 | %(e) | 0.55 | %(f) | 0.55 | % | ||||||||||||||||||||
Expenses, prior to Waivers | 0.69 | % | 0.68 | % | 0.72 | % | 0.68 | %(e) | 0.64 | %(f) | 0.67 | % | ||||||||||||||||||||
Net investment income | 1.99 | % | 1.51 | % | 2.00 | % | 2.70 | %(e) | 1.50 | %(f) | 2.02 | % | ||||||||||||||||||||
Portfolio turnover rate(g) | 15 | % | 14 | % | 10 | % | 18 | % | 4 | % | 10 | % | ||||||||||||||||||||
| (a) | Based on average shares outstanding. |
| (b) | Amount represents less than $0.005. |
| (c) | The mean between the last bid and ask prices. |
| (d) | Net asset value total return is calculated assuming an initial investment made at the net asset value at the beginning of the period, reinvestment of all dividends and distributions at net asset value during the period, and redemption at net asset value on the last day of the period. Net asset value total return includes adjustments in accordance with accounting principles generally accepted in the United States of America and as such, the net asset value for financial reporting purposes and the returns based upon those net asset values may differ from the net asset value and returns for shareholder transactions. Market price total return is calculated assuming an initial investment made at the market price at the beginning of the period, reinvestment of all dividends and distributions at market price during the period, and sale at the market price on the last day of the period. Total investment returns calculated for a period of less than one year are not annualized. |
| (e) | Ratios include non-recurring costs associated with a proxy statement of 0.01%. |
| (f) | Annualized. |
| (g) | Portfolio turnover rate is not annualized for periods less than one year, if applicable, and does not include securities received or delivered from processing creations or redemptions. |
See accompanying Notes to Financial Statements which are an integral part of the financial statements.
| 116 | ||||
|
| |||
Financial Highlights–(continued)
Invesco MSCI Green Building ETF (GBLD)
| Years Ended October 31, 2022 | For the Period April 20, 2021(a) Through October 31, 2021 | |||||||||
Per Share Operating Performance: | ||||||||||
Net asset value at beginning of period | $ | 23.82 | $ | 25.00 | ||||||
|
|
|
| |||||||
Net investment income(b) | 0.69 | 0.44 | ||||||||
Net realized and unrealized gain (loss) on investments | (7.21 | ) | (1.21 | ) | ||||||
|
|
|
| |||||||
Total from investment operations | (6.52 | ) | (0.77 | ) | ||||||
|
|
|
| |||||||
Distributions to shareholders from: | ||||||||||
Net investment income | (0.76 | ) | (0.41 | ) | ||||||
Return of capital | (0.11 | ) | - | |||||||
|
|
|
| |||||||
Total distributions | (0.87 | ) | (0.41 | ) | ||||||
|
|
|
| |||||||
Net asset value at end of period | $ | 16.43 | $ | 23.82 | ||||||
|
|
|
| |||||||
Market price at end of period(c) | $ | 16.44 | $ | 23.89 | ||||||
|
|
|
| |||||||
Net Asset Value Total Return(d) | (28.05 | )% | (3.13 | )%(e) | ||||||
Market Price Total Return(d) | (28.22 | )% | (2.84 | )%(e) | ||||||
Ratios/Supplemental Data: | ||||||||||
Net assets at end of period (000’s omitted) | $ | 4,928 | $ | 4,764 | ||||||
Ratio to average net assets of: | ||||||||||
Expenses | 0.39 | % | 0.39 | % | ||||||
Net investment income | 3.40 | % | 3.34 | %(f) | ||||||
Portfolio turnover rate(g) | 17 | % | 25 | % | ||||||
| (a) | Commencement of investment operations. |
| (b) | Based on average shares outstanding. |
| (c) | The mean between the last bid and ask prices. |
| (d) | Net asset value total return is calculated assuming an initial investment made at the net asset value at the beginning of the period, reinvestment of all dividends and distributions at net asset value during the period, and redemption at net asset value on the last day of the period. Net asset value total return includes adjustments in accordance with accounting principles generally accepted in the United States of America and as such, the net asset value for financial reporting purposes and the returns based upon those net asset values may differ from the net asset value and returns for shareholder transactions. Market price total return is calculated assuming an initial investment made at the market price at the beginning of the period, reinvestment of all dividends and distributions at market price during the period, and sale at the market price on the last day of the period. Total investment returns calculated for a period of less than one year are not annualized. |
| (e) | The net asset value total return from Fund Inception (April 22, 2021, the first day of trading on the exchange) to October 31, 2021 was (2.74)%. The market price total return from Fund Inception to October 31, 2021 was (2.30)%. |
| (f) | Annualized. |
| (g) | Portfolio turnover rate is not annualized for periods less than one year, if applicable, and does not include securities received or delivered from processing creations or redemptions. |
See accompanying Notes to Financial Statements which are an integral part of the financial statements.
| 117 | ||||
|
| |||
Financial Highlights–(continued)
Invesco S&P Global Water Index ETF (CGW)
| Years Ended October 31, | Two Months Ended October 31, | Years Ended August 31, | ||||||||||||||||||||||||||||||
| 2022 | 2021 | 2020 | 2019 | 2018 | 2018 | |||||||||||||||||||||||||||
Per Share Operating Performance: | ||||||||||||||||||||||||||||||||
Net asset value at beginning of year | $ | 58.91 | $ | 41.43 | $ | 39.55 | $ | 32.32 | $ | 35.28 | $ | 33.38 | ||||||||||||||||||||
|
|
|
|
|
|
|
|
|
|
|
| |||||||||||||||||||||
Net investment income(a) | 0.61 | 1.08 | (b) | 0.63 | 0.64 | 0.04 | 0.59 | |||||||||||||||||||||||||
Net realized and unrealized gain (loss) on investments | (12.91 | ) | 17.06 | 1.86 | 7.26 | (3.00 | ) | 1.92 | ||||||||||||||||||||||||
|
|
|
|
|
|
|
|
|
|
|
| |||||||||||||||||||||
Total from investment operations | (12.30 | ) | 18.14 | 2.49 | 7.90 | (2.96 | ) | 2.51 | ||||||||||||||||||||||||
|
|
|
|
|
|
|
|
|
|
|
| |||||||||||||||||||||
Distributions to shareholders from: | ||||||||||||||||||||||||||||||||
Net investment income | (0.96 | ) | (0.66 | ) | (0.61 | ) | (0.67 | ) | - | (0.61 | ) | |||||||||||||||||||||
|
|
|
|
|
|
|
|
|
|
|
| |||||||||||||||||||||
Transaction fees(a) | 0.00 | (c) | 0.00 | (c) | 0.00 | (c) | 0.00 | (c) | 0.00 | (c) | - | |||||||||||||||||||||
|
|
|
|
|
|
|
|
|
|
|
| |||||||||||||||||||||
Net asset value at end of year | $ | 45.65 | $ | 58.91 | $ | 41.43 | $ | 39.55 | $ | 32.32 | $ | 35.28 | ||||||||||||||||||||
|
|
|
|
|
|
|
|
|
|
|
| |||||||||||||||||||||
Market price at end of year(d) | $ | 45.66 | $ | 59.04 | $ | 41.54 | $ | 39.54 | $ | 32.27 | $ | 35.23 | ||||||||||||||||||||
|
|
|
|
|
|
|
|
|
|
|
| |||||||||||||||||||||
Net Asset Value Total Return(e) | (21.21 | )% | 44.25 | % | 6.31 | % | 25.10 | % | (8.39 | )% | 7.51 | % | ||||||||||||||||||||
Market Price Total Return(e) | (21.37 | )% | 44.18 | % | 6.62 | % | 25.27 | % | (8.40 | )% | 7.09 | % | ||||||||||||||||||||
Ratios/Supplemental Data: | ||||||||||||||||||||||||||||||||
Net assets at end of year (000’s omitted) | $ | 932,994 | $ | 1,199,341 | $ | 710,871 | $ | 741,918 | $ | 531,298 | $ | 594,105 | ||||||||||||||||||||
Ratio to average net assets of: | ||||||||||||||||||||||||||||||||
Expenses | 0.57 | % | 0.57 | % | 0.57 | % | 0.59 | % | 0.60 | %(f) | 0.62 | % | ||||||||||||||||||||
Net investment income | 1.20 | % | 2.08 | %(b) | 1.61 | % | 1.82 | % | 0.67 | %(f) | 1.71 | % | ||||||||||||||||||||
Portfolio turnover rate(g) | 35 | % | 15 | % | 15 | % | 13 | % | 5 | % | 13 | % | ||||||||||||||||||||
| (a) | Based on average shares outstanding. |
| (b) | Net investment income per share and the ratio of net investment income to average net assets include a significant dividend received during the period. Net investment income per share and the ratio of net investment income to average net assets excluding the significant dividend are $0.62 and 1.18%, respectively. |
| (c) | Amount represents less than $0.005. |
| (d) | The mean between the last bid and ask prices. |
| (e) | Net asset value total return is calculated assuming an initial investment made at the net asset value at the beginning of the period, reinvestment of all dividends and distributions at net asset value during the period, and redemption at net asset value on the last day of the period. Net asset value total return includes adjustments in accordance with accounting principles generally accepted in the United States of America and as such, the net asset value for financial reporting purposes and the returns based upon those net asset values may differ from the net asset value and returns for shareholder transactions. Market price total return is calculated assuming an initial investment made at the market price at the beginning of the period, reinvestment of all dividends and distributions at market price during the period, and sale at the market price on the last day of the period. Total investment returns calculated for a period of less than one year are not annualized. |
| (f) | Annualized. |
| (g) | Portfolio turnover rate is not annualized for periods less than one year, if applicable, and does not include securities received or delivered from processing creations or redemptions. |
See accompanying Notes to Financial Statements which are an integral part of the financial statements.
| 118 | ||||
|
| |||
Financial Highlights–(continued)
Invesco S&P International Developed Quality ETF (IDHQ)
| Years Ended October 31, | ||||||||||||||||||||
| 2022 | 2021 | 2020 | 2019 | 2018 | ||||||||||||||||
Per Share Operating Performance: | ||||||||||||||||||||
Net asset value at beginning of year | $ | 31.38 | $ | 25.01 | $ | 24.47 | $ | 21.36 | $ | 23.50 | ||||||||||
|
|
|
|
|
|
|
|
|
| |||||||||||
Net investment income(a) | 0.76 | 0.63 | 0.46 | 0.54 | 0.58 | |||||||||||||||
Net realized and unrealized gain (loss) on investments | (9.05 | ) | 6.39 | 0.55 | 3.16 | (2.18 | ) | |||||||||||||
|
|
|
|
|
|
|
|
|
| |||||||||||
Total from investment operations | (8.29 | ) | 7.02 | 1.01 | 3.70 | (1.60 | ) | |||||||||||||
|
|
|
|
|
|
|
|
|
| |||||||||||
Distributions to shareholders from: | ||||||||||||||||||||
Net investment income | (0.86 | ) | (0.65 | ) | (0.47 | ) | (0.59 | ) | (0.54 | ) | ||||||||||
|
|
|
|
|
|
|
|
|
| |||||||||||
Transaction fees(a) | 0.00 | (b) | 0.00 | (b) | 0.00 | (b) | 0.00 | (b) | 0.00 | (b) | ||||||||||
|
|
|
|
|
|
|
|
|
| |||||||||||
Net asset value at end of year | $ | 22.23 | $ | 31.38 | $ | 25.01 | $ | 24.47 | $ | 21.36 | ||||||||||
|
|
|
|
|
|
|
|
|
| |||||||||||
Market price at end of year(c) | $ | 22.23 | $ | 31.53 | $ | 25.00 | $ | 24.53 | $ | 21.31 | ||||||||||
|
|
|
|
|
|
|
|
|
| |||||||||||
Net Asset Value Total Return(d) | (26.69 | )% | 28.19 | % | 4.42 | % | 17.58 | % | (7.00 | )% | ||||||||||
Market Price Total Return(d) | (27.04 | )% | 28.85 | % | 4.09 | % | 18.14 | % | (8.05 | )% | ||||||||||
Ratios/Supplemental Data: | ||||||||||||||||||||
Net assets at end of year (000’s omitted) | $ | 92,266 | $ | 114,522 | $ | 100,021 | $ | 47,726 | $ | 32,039 | ||||||||||
Ratio to average net assets of: | ||||||||||||||||||||
Expenses | 0.29 | % | 0.29 | % | 0.29 | % | 0.31 | %(e) | 0.29 | % | ||||||||||
Net investment income | 2.85 | % | 2.09 | % | 1.83 | % | 2.38 | %(e) | 2.47 | % | ||||||||||
Portfolio turnover rate(f) | 62 | % | 61 | % | 42 | % | 54 | % | 54 | % | ||||||||||
| (a) | Based on average shares outstanding. |
| (b) | Amount represents less than $0.005. |
| (c) | The mean between the last bid and ask prices. |
| (d) | Net asset value total return is calculated assuming an initial investment made at the net asset value at the beginning of the period, reinvestment of all dividends and distributions at net asset value during the period, and redemption at net asset value on the last day of the period. Net asset value total return includes adjustments in accordance with accounting principles generally accepted in the United States of America and as such, the net asset value for financial reporting purposes and the returns based upon those net asset values may differ from the net asset value and returns for shareholder transactions. Market price total return is calculated assuming an initial investment made at the market price at the beginning of the period, reinvestment of all dividends and distributions at market price during the period, and sale at the market price on the last day of the period. Total investment returns calculated for a period of less than one year are not annualized. |
| (e) | Ratios include non-recurring costs associated with a proxy statement of 0.02%. |
| (f) | Portfolio turnover rate is not annualized for periods less than one year, if applicable, and does not include securities received or delivered from processing creations or redemptions. |
See accompanying Notes to Financial Statements which are an integral part of the financial statements.
| 119 | ||||
|
| |||
Invesco Exchange-Traded Fund Trust II
October 31, 2022
NOTE 1–Organization
Invesco Exchange-Traded Fund Trust II (the “Trust”) was organized as a Massachusetts business trust and is authorized to have multiple series of portfolios. The Trust is an open-end management investment company registered under the Investment Company Act of 1940, as amended (the “1940 Act”). This report includes the following portfolios:
Full Name | Short Name | |
| Invesco China Technology ETF (CQQQ) | “China Technology ETF” | |
| Invesco DWA Developed Markets Momentum ETF (PIZ) | “DWA Developed Markets Momentum ETF” | |
| Invesco DWA Emerging Markets Momentum ETF (PIE) | “DWA Emerging Markets Momentum ETF” | |
| Invesco FTSE RAFI Developed Markets ex-U.S. ETF (PXF) | “FTSE RAFI Developed Markets ex-U.S. ETF” | |
| Invesco FTSE RAFI Developed Markets ex-U.S. Small-Mid ETF (PDN) | “FTSE RAFI Developed Markets ex-U.S. Small-Mid ETF” | |
| Invesco FTSE RAFI Emerging Markets ETF (PXH) | “FTSE RAFI Emerging Markets ETF” | |
| Invesco Global Clean Energy ETF (PBD) | “Global Clean Energy ETF” | |
| Invesco Global Water ETF (PIO) | “Global Water ETF” | |
| Invesco International BuyBack AchieversTM ETF (IPKW) | “International BuyBack AchieversTM ETF” | |
| Invesco MSCI Global Timber ETF (CUT) | “MSCI Global Timber ETF” | |
| Invesco MSCI Green Building ETF (GBLD) | “MSCI Green Building ETF” | |
| Invesco S&P Global Water Index ETF (CGW) | “S&P Global Water Index ETF” | |
| Invesco S&P International Developed Quality ETF (IDHQ) | “S&P International Developed Quality ETF” | |
Each portfolio (each, a “Fund”, and collectively, the “Funds”) represents a separate series of the Trust. The shares of the Funds are referred to herein as “Shares” or “Fund’s Shares.” Each Fund’s Shares are listed and traded on the following exchanges:
Fund | Exchange | |
| China Technology ETF | NYSE Arca, Inc. | |
| DWA Developed Markets Momentum ETF | The Nasdaq Stock Market | |
| DWA Emerging Markets Momentum ETF | The Nasdaq Stock Market | |
| FTSE RAFI Developed Markets ex-U.S. ETF | NYSE Arca, Inc. | |
| FTSE RAFI Developed Markets ex-U.S. Small-Mid ETF | NYSE Arca, Inc. | |
| FTSE RAFI Emerging Markets ETF | NYSE Arca, Inc. | |
| Global Clean Energy ETF | NYSE Arca, Inc. | |
| Global Water ETF | The Nasdaq Stock Market | |
| International BuyBack AchieversTM ETF | The Nasdaq Stock Market | |
| MSCI Global Timber ETF | NYSE Arca, Inc. | |
| MSCI Green Building ETF | NYSE Arca, Inc. | |
| S&P Global Water Index ETF | NYSE Arca, Inc. | |
| S&P International Developed Quality ETF | NYSE Arca, Inc. | |
The market price of each Share may differ to some degree from a Fund’s net asset value (“NAV”). Unlike conventional mutual funds, each Fund issues and redeems Shares on a continuous basis, at NAV, only in a large specified number of Shares, each called a “Creation Unit.” Creation Units are issued and redeemed principally in exchange for the deposit or delivery of a basket of securities (“Deposit Securities”). Except when aggregated in Creation Units by authorized participants (“APs”), the Shares are not individually redeemable securities of the Funds.
| 120 | ||||
|
| |||
The investment objective of each Fund is to seek to track the investment results (before fees and expenses) of its respective index listed below (each, an “Underlying Index”):
Fund | Underlying Index | |
| China Technology ETF | FTSE China Incl A 25% Technology Capped Index | |
| DWA Developed Markets Momentum ETF | Dorsey Wright® Developed Markets Technical Leaders Index | |
| DWA Emerging Markets Momentum ETF | Dorsey Wright® Emerging Markets Technical Leaders Index | |
| FTSE RAFI Developed Markets ex-U.S. ETF | FTSE RAFITM Developed ex U.S. 1000 Index | |
| FTSE RAFI Developed Markets ex-U.S. Small-Mid ETF | FTSE RAFITM Developed ex U.S. Mid-Small 1500 Index | |
| FTSE RAFI Emerging Markets ETF | FTSE RAFITM Emerging Index | |
| Global Clean Energy ETF | WilderHill New Energy Global Innovation Index | |
| Global Water ETF | Nasdaq OMX Global Water IndexSM | |
| International BuyBack AchieversTM ETF | Nasdaq International BuyBack AchieversTM Index | |
| MSCI Global Timber ETF | MSCI ACWI IMI Timber Select Capped Index | |
| MSCI Green Building ETF | MSCI Global Green Building Index | |
| S&P Global Water Index ETF | S&P Global Water Index | |
| S&P International Developed Quality ETF | S&P Quality Developed ex-U.S. LargeMidCap Index | |
NOTE 2–Significant Accounting Policies
The following is a summary of the significant accounting policies followed by the Funds in preparation of their financial statements.
Each Fund is an investment company and accordingly follows the investment company accounting and reporting guidance in accordance with Financial Accounting Standards Board Accounting Standards Codification Topic 946, Financial Services–Investment Companies.
| A. | Security Valuation - Securities, including restricted securities, are valued according to the following policies: |
A security listed or traded on an exchange is generally valued at its trade price or official closing price that day as of the close of the exchange where the security is principally traded or, lacking any trades or official closing price on a particular day, the security may be valued at the closing bid price on that day. Securities traded in the over-the-counter market are valued based on prices furnished by independent pricing services or market makers. When such securities are valued using prices provided by an independent pricing service they may be considered fair valued. Futures contracts are valued at the daily settlement price set by an exchange on which they are principally traded. U.S. exchange-traded options are valued at the mean between the last bid and asked prices from the exchange on which they are principally traded. Non-U.S. exchange-traded options are valued at the final settlement price set by the exchange on which they trade. Options not listed on an exchange and swaps generally are valued using pricing provided from independent pricing services.
Securities of investment companies that are not exchange-traded (e.g., open-end mutual funds) are valued using such company’s end-of-business-day NAV per share.
Deposits, other obligations of U.S. and non-U.S. banks and financial institutions are valued at their daily account value.
Fixed income securities (including convertible debt securities) generally are valued on the basis of prices provided by independent pricing services. Prices provided by the pricing service may be determined without exclusive reliance on quoted prices, and may reflect appropriate factors such as institution-size trading in similar groups of securities, developments related to specific securities, dividend rate (for unlisted equities), yield (for debt obligations), quality, type of issue, coupon rate (for debt obligations), maturity (for debt obligations), individual trading characteristics and other market data. Securities with a demand feature exercisable within one to seven days are valued at par. Pricing services generally value debt obligations assuming orderly transactions of institutional round lot size, but a Fund may hold or transact in the same securities in smaller, odd lot sizes. Odd lots often trade at lower prices than institutional round lots, and their value may be adjusted accordingly. Debt obligations are subject to interest rate and credit risks. In addition, all debt obligations involve some risk of default with respect to interest and/or principal payments.
Foreign securities’ (including foreign exchange contracts’) prices are converted into U.S. dollar amounts using the applicable exchange rates as of the close of the London world markets. If market quotations are available and reliable for foreign exchange-traded equity securities, the securities will be valued at the market quotations. Invesco Capital Management LLC (the “Adviser”) may use various pricing services to obtain market quotations as well as fair value prices. Because trading hours for certain foreign securities end before the close of the New York Stock Exchange (“NYSE”), closing market quotations may become not representative of market value in the Adviser’s judgment (“unreliable”). If, between the time trading ends on a particular security and the close of the customary trading session on the NYSE, a significant event occurs that makes the closing price of the security unreliable, the Adviser may fair value the security. If the event is likely to have affected the closing price of the security, the security will be valued at fair value in good faith in accordance with Board-approved policies and related Adviser procedures (“Valuation Procedures”). Adjustments to closing prices to reflect fair value may also be based on a screening process of an independent pricing service to indicate the degree of certainty, based on historical data, that the
| 121 | ||||
|
| |||
closing price in the principal market where a foreign security trades is not the current value as of the close of the NYSE. Foreign securities’ prices meeting the degree of certainty that the price is not reflective of current value will be priced at the indication of fair value from the independent pricing service. Multiple factors may be considered by the independent pricing service in determining adjustments to reflect fair value and may include information relating to sector indices, American depositary receipts and domestic and foreign index futures. Foreign securities may have additional risks including exchange rate changes, the potential for sharply devalued currencies and high inflation, political and economic upheaval, the relative lack of issuer information, relatively low market liquidity and the potential lack of strict financial and accounting controls and standards.
Unlisted securities will be valued using prices provided by independent pricing services or by another method that the Adviser, in its judgment, believes better reflects the security’s fair value in accordance with the Valuation Procedures.
Securities for which market prices are not provided by any of the above methods may be valued based upon quotes furnished by independent sources. The last bid price may be used to value exchange-traded equity securities. The mean between the last bid and asked prices may be used to value debt obligations, including corporate loans, and unlisted equity securities.
Securities for which market quotations are not readily available are fair valued by the Adviser in accordance with the Valuation Procedures. If a fair value price provided by a pricing service is unreliable, the Adviser will fair value the security using the Valuation Procedures. Issuer-specific events, market trends, bid/asked quotes of brokers and information providers and other market data may be reviewed in the course of making a good faith determination of a security’s fair value.
Each Fund may invest in securities that are subject to interest rate risk, meaning the risk that the prices will generally fall as interest rates rise and, conversely, the prices will generally rise as interest rates fall. Specific securities differ in their sensitivity to changes in interest rates depending on their individual characteristics. Changes in interest rates may result in increased market volatility, which may affect the value and/or liquidity of certain Fund investments.
Valuations change in response to many factors, including the historical and prospective earnings of the issuer, the value of the issuer’s assets, general market conditions which are not specifically related to the particular issuer, such as real or perceived adverse economic conditions, changes in the general outlook for revenues or corporate earnings, changes in interest or currency rates, regional or global instability, natural or environmental disasters, widespread disease or other public health issues, war, acts of terrorism, significant governmental actions or adverse investor sentiment generally and market liquidity. Because of the inherent uncertainties of valuation, the values reflected in the financial statements may materially differ from the value received upon actual sale of those investments.
The price a Fund could receive upon the sale of any investment may differ from the Adviser’s valuation of the investment, particularly for securities that are valued using a fair valuation technique. When fair valuation techniques are applied, the Adviser uses available information, including both observable and unobservable inputs and assumptions, to determine a methodology that will result in a valuation that the Adviser believes approximates market value. Fund securities that are fair valued may be subject to greater fluctuation in their value from one day to the next than would be the case if market quotations were used. Because of the inherent uncertainties of valuation, and the degree of subjectivity in such decisions, a Fund could realize a greater or lesser than expected gain or loss upon the sale of the investment.
| B. | Investment Transactions and Investment Income - Investment transactions are accounted for on a trade date basis. Realized gains and losses from the sale or disposition of securities are computed on the specific identified cost basis. Interest income is recorded on an accrual basis from settlement date and includes coupon interest and amortization of premium and accretion of discount on debt securities as applicable. Pay-in-kind interest income and non-cash dividend income received in the form of securities in-lieu of cash are recorded at the fair value of the securities received. Dividend income (net of withholding tax, if any) is recorded on the ex-dividend date. Dividend income from REITs is recorded based on the income included in the distributions received from the REIT investments using published REIT classifications, including some management estimates when actual amounts are not available. Distributions received in excess of this estimated amount are recorded as a reduction of the cost of investments or reclassified to capital gains. The actual amounts of income, return of capital, and capital gains are only determined by each REIT after its fiscal year-end, and may differ from the estimated amounts. Realized gains, dividends and interest received by a Fund may give rise to withholding and other taxes imposed by foreign countries. Tax conventions between certain countries and the United States may reduce or eliminate such taxes. |
The Funds may periodically participate in litigation related to a Fund’s investments. As such, the Funds may receive proceeds from litigation settlements. Any proceeds received are included in the Statements of Operations as realized gain (loss) for investments no longer held and as unrealized gain (loss) for investments still held.
Brokerage commissions and mark ups are considered transaction costs and are recorded as an increase to the cost basis of securities purchased and/or a reduction of proceeds on a sale of securities. Such transaction costs are included in the determination of net realized and unrealized gain (loss) from investment securities reported in the Statements of Operations and the Statements of Changes in Net Assets and the net realized and unrealized gains (losses) on securities per share in the Financial Highlights. Transaction costs are included in the calculation of a Fund’s NAV and, accordingly, they reduce a Fund’s total returns. These transaction costs are not considered operating expenses and are not reflected in net investment income reported in the Statements of Operations and the Statements of Changes in Net Assets, or the net investment income per
| 122 | ||||
|
| |||
share and the ratios of expenses and net investment income reported in the Financial Highlights, nor are they limited by any expense limitation arrangements between each Fund and the Adviser.
| C. | Country Determination - For the purposes of presentation in the Schedules of Investments, the Adviser may determine the country in which an issuer is located and/or credit risk exposure based on various factors. These factors include whether each Fund’s Underlying Index has made a country determination and may include the laws of the country under which the issuer is organized, where the issuer maintains a principal office, the country in which the issuer derives 50% or more of its total revenues, the country that has the primary market for the issuer’s securities and its “country of risk” as determined by a third party service provider, as well as other criteria. Among the other criteria that may be evaluated for making this determination are the country in which the issuer maintains 50% or more of its assets, the type of security, financial guarantees and enhancements, the nature of the collateral and the sponsor organization. Country of issuer and/or credit risk exposure has been determined to be the United States of America, unless otherwise noted. |
| D. | Dividends and Distributions to Shareholders |
Each Fund (except for China Technology ETF, MSCI Global Timber ETF and S&P Global Water Index ETF) declares and pays dividends from net investment income, if any, to its shareholders quarterly and records such dividends on the ex-dividend date. China Technology ETF, MSCI Global Timber ETF and S&P Global Water Index ETF each declares and pays dividends from net investment income, if any, to its shareholders annually and records such dividends on the ex-dividend date. Generally, each Fund distributes net realized taxable capital gains, if any, annually in cash and records them on the ex-dividend date. Such distributions on a tax basis are determined in conformity with federal income tax regulations, which may differ from accounting principles generally accepted in the United States of America (“GAAP”). Distributions in excess of tax basis earnings and profits, if any, are reported in such Fund’s financial statements as a tax return of capital at fiscal year-end.
| E. | Federal Income Taxes - Each Fund intends to comply with the provisions of the Internal Revenue Code of 1986, as amended (the “Internal Revenue Code”), applicable to regulated investment companies and to distribute substantially all of the Fund’s taxable earnings to its shareholders. As such, the Funds will not be subject to federal income taxes on otherwise taxable income (including net realized gains) that is distributed to the shareholders. Therefore, no provision for federal income taxes is recorded in the financial statements. |
Each Fund recognizes the tax benefits of uncertain tax positions only when the position is more likely than not to be sustained. Management has analyzed each Fund’s uncertain tax positions and concluded that no liability for unrecognized tax benefits should be recorded related to uncertain tax positions. Management is not aware of any tax positions for which it is reasonably possible that the total amounts of unrecognized tax benefits will change materially in the next 12 months.
Income and capital gain distributions are determined in accordance with federal income tax regulations, which may differ from GAAP. These differences are primarily due to differing book and tax treatments for in-kind transactions, losses deferred due to wash sales, and passive foreign investment company adjustments, if any.
The Funds file U.S. federal tax returns and tax returns in certain other jurisdictions. Generally, a Fund is subject to examinations by such taxing authorities for up to three years after the filing of the return for the tax period.
| F. | Foreign Withholding Taxes - Each Fund is subject to foreign withholding tax imposed by certain foreign countries in which the Fund may invest. Withholding taxes are incurred on certain foreign dividends and are accrued at the time the dividend is recognized based on applicable foreign tax laws. Each Fund may file withholding tax refunds in certain jurisdictions to recover a portion of amounts previously withheld. Each Fund will record a receivable for such tax refunds based on several factors including; an assessment of a jurisdiction’s legal obligation to pay reclaims, administrative practices and payment history. Any receivables recorded will be shown under receivables for Foreign tax reclaims on the Statements of Assets and Liabilities. |
As a result of recent court rulings in certain countries across the European Union, tax refunds for previously withheld taxes on dividends earned in those countries have been received. These tax refund payments are reflected as Foreign withholding tax claims in the Statements of Operations, and any related interest is included in Unaffiliated interest income. Each Fund may incur fees paid to third party providers that assist in the recovery of the tax reclaims. These fees are excluded from the unitary management fee and are reflected on the Statements of Operations as Professional fees, if any. In the event tax refunds received by a Fund during the fiscal year exceed the foreign withholding taxes paid by a Fund for the year, and the Fund previously passed foreign tax credits on to its shareholders, the Fund intends to enter into a closing agreement with the Internal Revenue Service in order to pay the associated liability on behalf of the Funds’ shareholders. For the fiscal year ended October 31, 2022, the Funds did not enter into any closing agreements.
| G. | Expenses - Each Fund (except for MSCI Global Timber ETF and S&P Global Water Index ETF) has agreed to pay an annual unitary management fee to the Adviser. Out of the unitary management fee, the Adviser has agreed to pay for substantially all expenses of the Funds, including the costs of transfer agency, custody, fund administration, legal, audit and other services, except for distribution fees, if any, brokerage expenses, taxes, interest, acquired fund fees and expenses, if any, litigation expenses and other extraordinary expenses, including proxy expenses (except for such proxies related to: (i) changes to the Investment Advisory Agreement, (ii) the election of any Board member who is an “interested person” of the Trust, or (iii) any other matters that directly benefit the Adviser). |
MSCI Global Timber ETF and S&P Global Water Index ETF are responsible for all of their expenses, including the investment advisory fees, costs of transfer agency, custody, fund administration, legal, audit and other services, interest, taxes, brokerage commissions and other expenses connected with executions of portfolio transactions, licensing fees related to its
| 123 | ||||
|
| |||
respective Underlying Index, any distribution fees or expenses, litigation expenses, fees payable to the Trust’s Board members and officers who are not “interested persons” (as defined in the 1940 Act) of the Trust (the “Independent Trustees”) or the Adviser, expenses incurred in connection with the Board members’ services, including travel expenses and legal fees of counsel for the Independent Trustees, acquired fund fees and expenses, if any, and extraordinary expenses, including proxy expenses (except for such proxies related to: (i) changes to the Investment Advisory Agreement, (ii) the election of any Board member who is an “interested person” of the Trust, or (iii) any other matters that directly benefit the Adviser).
Expenses of the Trust that are excluded from a Fund’s unitary management fee (if applicable) and are directly identifiable to a specific Fund are applied to that Fund. Expenses of the Trust that are excluded from each Fund’s unitary management fee (if applicable) and are not readily identifiable to a specific Fund are allocated in such a manner as deemed equitable, taking into consideration the nature and type of expense and the relative net assets of each Fund.
To the extent a Fund invests in other investment companies, the expenses shown in the accompanying financial statements reflect the expenses of the Fund and do not include any expenses of the investment companies in which it invests. The effects of such investment companies’ expenses are included in the realized and unrealized gain or loss on the investments in the investment companies.
| H. | Accounting Estimates - The preparation of the financial statements in accordance with GAAP requires management to make estimates and assumptions that affect the reported amounts and disclosures in the financial statements, including estimates and assumptions related to taxation. Actual results could differ from these estimates. In addition, the Funds monitor for material events or transactions that may occur or become known after the period-end date and before the date the financial statements are released to print. |
| I. | Indemnifications - Under the Trust’s organizational documents, its Officers and Trustees are indemnified against certain liabilities arising out of the performance of their duties to the Trust. Each Independent Trustee is also indemnified against certain liabilities arising out of the performance of their duties to the Trust pursuant to an Indemnification Agreement between such trustee and the Trust. Additionally, in the normal course of business, the Trust enters into contracts with service providers that contain general indemnification clauses. The Trust’s maximum exposure under these arrangements is unknown, as this would involve future claims that may be made against the Trust that have not yet occurred. The risk of material loss as a result of such indemnification claims is considered remote. |
| J. | Securities Lending - Each Fund may participate in securities lending and may loan portfolio securities having a market value up to one-third of each Fund’s total assets. Such loans are secured by cash collateral equal to no less than 102% (105% for international securities) of the market value of the loaned securities determined daily by the securities lending provider. Cash collateral received in connection with these loans is invested in short-term money market instruments or affiliated, unregistered investment companies that comply with Rule 2a-7 under the 1940 Act and money market funds (collectively, “affiliated money market funds”) and is shown as such on the Schedules of Investments. Each Fund bears the risk of loss with respect to the investment of collateral. It is the policy of these Funds to obtain additional collateral from or return excess collateral to the borrower by the end of the next business day, following the valuation date of the securities loaned. Therefore, the value of the collateral held may be temporarily less than the value of the securities on loan. When loaning securities, each Fund retains certain benefits of owning the securities, including the economic equivalent of dividends or interest generated by the security. Lending securities entails a risk of loss to each Fund if, and to the extent that, the market value of the securities loaned were to increase, and the borrower did not increase the collateral accordingly, and the borrower failed to return the securities. The securities loaned are subject to termination at the option of the borrower or each Fund. Upon termination, the borrower will return to each Fund the securities loaned and each Fund will return the collateral. Upon the failure of the borrower to return the securities, collateral may be liquidated and the securities may be purchased on the open market to replace the loaned securities. Each Fund could experience delays and costs in gaining access to the collateral and the securities may lose value during the delay which could result in potential losses to each Fund. Some of these losses may be indemnified by the lending agent. Each Fund bears the risk of any deficiency in the amount of the collateral available for return to the borrower due to any loss on the collateral invested. For Funds that participated in securities lending, dividends received on cash collateral investments for securities lending transactions, which are net of compensation to counterparties, are included in Securities lending income on the Statements of Operations. The aggregate value of securities out on loan, if any, is shown on the Statements of Assets and Liabilities. |
Invesco Advisers, Inc. (“Invesco”), an affiliate of the Adviser, serves as an affiliated securities lending agent for each Fund participating in the securities lending program. The Bank of New York Mellon (“BNYM”) also serves as a lending agent. To the extent a Fund utilizes Invesco as an affiliated securities lending agent, the Fund conducts its securities lending in accordance with, and in reliance upon, no-action letters issued by the SEC staff that provide guidance on how an affiliate may act as a direct agent lender and receive compensation for those services in a manner consistent with the federal securities laws. For the fiscal year ended October 31, 2022, each Fund (except for DWA Developed Markets Momentum ETF, FTSE RAFI Developed Markets ex-U.S. ETF, FTSE RAFI Developed Markets ex-U.S. Small-Mid ETF and International BuyBack AchieversTM ETF) had affiliated securities lending transactions with Invesco. Fees paid to Invesco for securities lending agent services,
| 124 | ||||
|
| |||
which are included in Securities lending income on the Statements of Operations, were incurred by each applicable Fund as listed below:
Amount | ||||
| China Technology ETF | $2,870 | |||
| DWA Emerging Markets Momentum ETF | 1,179 | |||
| FTSE RAFI Emerging Markets ETF | 343 | |||
| Global Clean Energy ETF | 114,013 | |||
| Global Water ETF | 59 | |||
| MSCI Global Timber ETF | 435 | |||
| MSCI Green Building ETF | 8 | |||
| S&P Global Water Index ETF | 1,026 | |||
| S&P International Developed Quality ETF | 24 | |||
| K. | Foreign Currency Translations - Foreign currency is valued at the close of the NYSE based on quotations posted by banks and major currency dealers. Portfolio securities and other assets and liabilities denominated in foreign currencies are translated into U.S. dollar amounts at the date of valuation. Purchases and sales of portfolio securities (net of foreign taxes withheld on disposition) and income items denominated in foreign currencies are translated into U.S. dollar amounts on the respective dates of such transactions. Each Fund does not separately account for the portion of the results of operations resulting from changes in foreign exchange rates on investments and the fluctuations arising from changes in market prices of securities held. The combined results of changes in foreign exchange rates and the fluctuation of market prices on investments (net of estimated foreign tax withholding) are included with the net realized and unrealized gain or loss from investments in the Statements of Operations. Reported net realized foreign currency gains or losses arise from (1) sales of foreign currencies, (2) currency gains or losses realized between the trade and settlement dates on securities transactions, and (3) the difference between the amounts of dividends, interest, and foreign withholding taxes recorded on a Fund’s books and the U.S. dollar equivalent of the amounts actually received or paid. Net unrealized foreign currency gains and losses arise from changes in the fair values of assets and liabilities, other than investments in securities at fiscal period-end, resulting from changes in exchange rates. |
Each Fund may invest in foreign securities, which may be subject to foreign taxes on income, gains on investments or currency repatriation, a portion of which may be recoverable. Foreign taxes, if any, are recorded based on the tax regulations and rates that exist in the foreign markets in which a Fund invests.
| L. | Other Risks |
ADR and GDR Risk. Certain Funds may invest in American depositary receipts (“ADRs”) and global depositary receipts (“GDRs”). ADRs are certificates that evidence ownership of shares of a foreign issuer and are alternatives to purchasing the underlying foreign securities directly in their national markets and currencies. GDRs are certificates issued by an international bank that generally are traded and denominated in the currencies of countries other than the home country of the issuer of the underlying shares. ADRs and GDRs may be subject to certain of the risks associated with direct investments in the securities of foreign companies, such as currency, political, economic and market risks, because their values depend on the performance of the non-dollar denominated underlying foreign securities. Moreover, ADRs and GDRs may not track the price of the underlying foreign securities on which they are based, and their value may change materially at times when U.S. markets are not open for trading.
AP Concentration Risk. Only APs may engage in creation or redemption transactions directly with each Fund. Each Fund has a limited number of institutions that may act as APs, and such APs have no obligation to submit creation or redemption orders. Consequently, there is no assurance that APs will establish or maintain an active trading market for the Shares. This risk may be heightened to the extent that securities held by each Fund are traded outside a collateralized settlement system. In that case, APs may be required to post collateral on certain trades on an agency basis (i.e., on behalf of other market participants), which only a limited number of APs may be able to do. In addition, to the extent that APs exit the business or are unable to proceed with creation and/or redemption orders with respect to each Fund and no other AP is able to step forward to create or redeem Creation Units, this may result in a significantly diminished trading market for Fund Shares, and Shares may be more likely to trade at a premium or discount to a Fund’s NAV and to face trading halts and/or delisting. Investments in non-U.S. securities, which may have lower trading volumes or could experience extended market closures or trading halts, may increase the risk that APs may not be able to effectively create or redeem Creation Units or the risk that the Shares may be halted and/or delisted.
China Investment Risk. Investments in companies located or operating in Greater China (normally considered to be the geographical area that includes mainland China, Hong Kong, Macau and Taiwan) involve risks and considerations not typically associated with investments in the U.S. and other Western nations, such as greater government control over the economy; political, legal and regulatory uncertainty; nationalization, expropriation, or confiscation of property; difficulty in obtaining information necessary for investigations into and/or litigation against Chinese companies, as well as in obtaining and/or enforcing judgments; limited legal remedies for shareholders; alteration or discontinuation of economic reforms; military
| 125 | ||||
|
| |||
conflicts, either internal or with other countries; inflation, currency fluctuations and fluctuations in inflation and interest rates that may have negative effects on the economy and securities markets of Greater China; and Greater China’s dependency on the economies of other Asian countries, many of which are developing countries. Events in any one country within Greater China may impact the other countries in the region or Greater China as a whole. Export growth continues to be a major driver of China’s rapid economic growth. As a result, a reduction in spending on Chinese products and services, the institution of additional tariffs or other trade barriers (or the threat thereof), including as a result of trade tensions between China and the United States, or a downturn in any of the economies of China’s key trading partners may have an adverse impact on the Chinese economy. In addition, actions by the U.S. government, such as delisting of certain Chinese companies from U.S. securities exchanges or otherwise restricting their operations in the U.S., may negatively impact the value of such securities held by a Fund. Further, health events, such as the recent coronavirus outbreak, may cause uncertainty and volatility in the Chinese economy, especially in the consumer discretionary (leisure, retail, gaming, tourism), industrials, and commodities sectors. Additionally, the inability of the Public Company Accounting Oversight Board (“PCAOB”) to inspect audit work papers and practices of PCAOB-registered accounting firms in China with respect to their audit work of U.S. reporting companies may impose significant additional risks associated with investments in China.
Currency Risk. Because each Fund’s NAV is determined in U.S. dollars, a Fund’s NAV could decline if the currency of a non-U.S. market in which the Fund invests depreciates against the U.S. dollar. Generally, an increase in the value of the U.S. dollar against a foreign currency will reduce the value of a security denominated in that foreign currency, thereby decreasing a Fund’s overall NAV. Exchange rates may be volatile and may change quickly and unpredictably in response to both global economic developments and economic conditions, causing an adverse impact on a Fund. As a result, investors have the potential for losses regardless of the length of time they intend to hold Shares.
Emerging Markets Investment Risk. For certain Funds, investments in the securities of issuers in emerging market countries involve risks often not associated with investments in the securities of issuers in developed countries. Securities in emerging markets may be subject to greater price fluctuations than securities in more developed markets. Companies in emerging market countries generally may be subject to less stringent regulatory, disclosure, financial reporting, accounting, auditing and recordkeeping standards than companies in more developed countries. In addition, information about such companies may be less available and reliable. Emerging markets usually are subject to greater market volatility, political, social and economic instability, uncertainty regarding the existence of trading markets and more governmental limitations on foreign investment than are more developed markets. Securities law in many emerging market countries is relatively new and unsettled. Therefore, laws regarding foreign investment in emerging markets securities, securities regulation, title to securities, and shareholder rights may change quickly and unpredictably, and the ability to bring and enforce actions, or to obtain information needed to pursue or enforce such actions, may be limited. In addition, the enforcement of systems of taxation at federal, regional and local levels in emerging market countries may be inconsistent and subject to sudden change. Investments in emerging market securities may be subject to additional transaction costs, delays in settlement procedures, unexpected market closures, and lack of timely information. In addition, lack of relevant data and reliable public information, including financial information, about securities in emerging markets may contribute to incorrect weightings and data and computational errors when a Fund’s index provider selects securities for inclusion in the Fund’s Underlying Index or rebalances the Underlying Index.
Equity Risk. Equity risk is the risk that the value of equity securities, including common stocks, may fall due to both changes in general economic conditions that impact the market as a whole, as well as factors that directly relate to a specific company or its industry. Such general economic conditions include changes in interest rates, periods of market turbulence or instability, or general and prolonged periods of economic decline and cyclical change. It is possible that a drop in the stock market may depress the price of most or all of the common stocks that each Fund holds. In addition, equity risk includes the risk that investor sentiment toward one or more industries will become negative, resulting in those investors exiting their investments in those industries, which could cause a reduction in the value of companies in those industries more broadly. The value of a company’s common stock may fall solely because of factors, such as an increase in production costs that negatively impact other companies in the same region, industry or sector of the market. A company’s common stock also may decline significantly in price over a short period of time due to factors specific to that company, including decisions made by its management or lower demand for the company’s products or services. For example, an adverse event, such as an unfavorable earnings report or the failure to make anticipated dividend payments, may depress the value of common stock.
Foreign Investment Risk. Investments in the securities of non-U.S. issuers involve risks beyond those associated with investments in U.S. securities. Foreign securities may have relatively low market liquidity, greater market volatility, decreased publicly available information and less reliable financial information about issuers and inconsistent and potentially less stringent accounting, auditing and financial reporting requirements and standards of practice, including recordkeeping standards, comparable to those applicable to domestic issuers. Foreign securities are also subject to the risks of expropriation, nationalization, political instability or other adverse political or economic developments and the difficulty of enforcing obligations in other countries. Investments in foreign securities also may be subject to dividend withholding or confiscatory taxes, currency blockage and/or transfer restrictions and higher transactional costs. If a Fund invests in securities denominated in foreign currencies, fluctuations in the value of the U.S. dollar relative to the values of other currencies may adversely affect investments in foreign securities and may negatively impact the Fund’s returns.
| 126 | ||||
|
| |||
Geographic Concentration Risk. A natural or other disaster could occur in a geographic region in which a Fund invests, which could affect the economy or particular business operations of companies in that specific geographic region and adversely impact the Fund’s investments in the affected region.
Green Building Investing Risk. Companies involved in “green building” face many of the risk factors associated generally with the building and construction industry, including that such companies maybe significantly affected by changes in government spending or regulation, zoning laws, economic conditions and world events, interest rates, taxation, real estate values and overbuilding. Such companies may be impacted by the supply and demand both for their specific products or services and for industrial sector products in general. In addition, such companies face risks specific to sustainable or “green” building, including: building costs may be more expensive for green buildings as compared to conventional buildings; green construction materials may not be readily available; the costs associated with obtaining third-party certification; and the failure to continue to meet certification standards. The technology and methods for green building are relatively new, and there is uncertainty surrounding the longevity and warranty of new products and/or the use of relatively untested materials. Moreover, there remains uncertainty about how the regulatory environment might evolve with respect to green building.
Index Risk. Unlike many investment companies, each Fund does not utilize an investing strategy that seeks returns in excess of its Underlying Index. Therefore, a Fund would not necessarily buy or sell a security unless that security is added or removed, respectively, from its Underlying Index, even if that security generally is underperforming. Additionally, each Fund rebalances its portfolio in accordance with its Underlying Index, and, therefore, any changes to the Underlying Index’s rebalance schedule will result in corresponding changes to each Fund’s rebalance schedule.
Industry Concentration Risk. In following its methodology, each Fund’s Underlying Index from time to time may be concentrated to a significant degree in securities of issuers operating in a single industry or industry group. To the extent that each Underlying Index concentrates in the securities of issuers in a particular industry or industry group, the corresponding Fund will also concentrate its investments to approximately the same extent. By concentrating its investments in an industry or industry group, each Fund may face more risks than if it were diversified broadly over numerous industries or industry groups. Such industry-based risks, any of which may adversely affect the companies in which each Fund invests, may include, but are not limited to, the following: general economic conditions or cyclical market patterns that could negatively affect supply and demand in a particular industry; competition for resources, adverse labor relations, political or world events; obsolescence of technologies; and increased competition or new product introductions that may affect the profitability or viability of companies in an industry. In addition, at times, such industry or industry group may be out of favor and underperform other industries or the market as a whole.
Market Disruption Risks Related to Russia-Ukraine Conflict. Following Russia’s invasion of Ukraine in late February 2022, various countries, including the United States, as well as NATO and the European Union, issued broad-ranging economic sanctions against Russia and Belarus. The resulting responses to the military actions (and potential further sanctions in response to continued military activity), the potential for military escalation and other corresponding events, have had, and could continue to have, severe negative effects on regional and global economic and financial markets, including increased volatility, reduced liquidity and overall uncertainty. The negative impacts may be particularly acute in certain sectors including, but not limited to, energy and financials. Russia may take additional counter measures or retaliatory actions (including cyberattacks), which could exacerbate negative consequences on global financial markets. The duration of ongoing hostilities and corresponding sanctions and related events cannot be predicted. The foregoing may result in a negative impact on Fund performance and the value of an investment in each Fund, even beyond any direct investment exposure each Fund may have to Russian issuers or the adjoining geographic regions.
Market Risk. Securities in each Underlying Index are subject to market fluctuations. You should anticipate that the value of the Shares will decline, more or less, in correlation with any decline in value of the securities in an Underlying Index. Additionally, natural or environmental disasters, widespread disease or other public health issues, war, acts of terrorism or other events could result in increased premiums or discounts to each Fund’s NAV.
Non-Correlation Risk. Each Fund’s return may not match the return of its corresponding Underlying Index for a number of reasons. For example, each Fund incurs operating expenses not applicable to the Underlying Index, and incurs costs in buying and selling securities, especially when rebalancing the Fund’s securities holdings to reflect changes in the composition of its corresponding Underlying Index. In addition, the performance of each Fund and its corresponding Underlying Index may vary due to asset valuation differences and differences between each Fund’s portfolio and its corresponding Underlying Index resulting from legal restrictions, costs or liquidity constraints.
Non-Diversified Fund Risk.Because China Technology ETF, Global Water ETF, International BuyBack AchieversTM ETF, MSCI Global Timber ETF, MSCI Green Building ETF and S&P Global Water Index ETF are non-diversified, and to the extent certain Funds become non-diversified, and can invest a greater portion of their respective assets in securities of individual issuers than can a diversified fund, changes in the market value of a single investment could cause greater fluctuations in Share price than would occur in a diversified fund. This may increase a Fund’s volatility and cause the performance of a relatively small number of issuers to have a greater impact on a Fund’s performance.
Portfolio Turnover Risk. Certain Funds may engage in frequent trading of their portfolio securities in connection with the rebalancing or adjustment of their respective Underlying Index. A portfolio turnover rate of 200%, for example, is equivalent to a Fund buying and selling all of its securities two times during the course of a year. A high portfolio turnover rate (such as
| 127 | ||||
|
| |||
100% or more) could result in high brokerage costs for a Fund. While a high portfolio turnover rate can result in an increase in taxable capital gains distributions to a Fund’s shareholders, a Fund will seek to utilize the in-kind creation and redemption mechanism to minimize the realization of capital gains to the extent possible.
REIT Risk. REITs are pooled investment vehicles that trade like stocks and invest substantially all of their assets in real estate and may qualify for special tax considerations. REITs are subject to certain risks inherent in the direct ownership of real estate, including without limitation, a possible lack of mortgage funds and associated interest rate risks, overbuilding, property vacancies, increases in property taxes and operating expenses, changes in zoning laws, losses due to environmental damages and changes in neighborhood values and appeal to purchasers. Further, failure of a company to qualify as a REIT under federal tax law may have adverse consequences to the REIT’s shareholders. In addition, REITs may have expenses, including advisory and administration expenses, and REIT shareholders will incur a proportionate share of the underlying expenses.
Sampling Risk. Certain Funds’ use of a representative sampling approach may result in the Fund holding a smaller number of securities than are in its respective Underlying Index. As a result, an adverse development with respect to an issuer of securities held by the Fund could result in a greater decline in NAV than would be the case if the Fund held all of the securities in its Underlying Index. To the extent the assets in the Fund are smaller, these risks will be greater.
Small- and Mid-Capitalization Company Risk. Investing in securities of small- and mid-capitalization companies involves greater risk than customarily is associated with investing in larger, more established companies. These companies’ securities may be more volatile and less liquid than those of more established companies. These securities may have returns that vary, sometimes significantly, from the overall securities market. Often small- and mid-capitalization companies and the industries in which they focus are still evolving and, as a result, they may be more sensitive to changing market conditions.
Thematic Investing Risk. Certain Funds rely on the index provider for their respective Underlying Index to identify securities that provide exposure to specific environmental themes, as set forth in the Underlying Index methodology. A Fund’s performance may suffer if such securities are not correctly identified. Performance may also suffer if the securities included in an Underlying Index do not benefit from the development of the applicable environmental theme. Further, to the extent that an index provider evaluates environmental, social and governance (“ESG”) factors as part of an Underlying Index’s methodology, there is a risk that information used by the index provider to evaluate these ESG factors may not be readily available, complete or accurate. This could negatively impact the index provider’s ability to apply its ESG standards when compiling the Underlying Index, and which may negatively impact a Fund’s performance. Performance may also be impacted by the inclusion of non-theme relevant exposures in an Underlying Index. There is no guarantee that an Underlying Index will reflect complete exposure to any particular environmental theme.
COVID-19 Risk. The COVID-19 strain of coronavirus has resulted in instances of market closures and dislocations, extreme volatility, liquidity constraints and increased trading costs. Efforts to contain its spread have resulted in travel restrictions, disruptions of healthcare systems, business operations (including business closures) and supply chains, layoffs, lower consumer demand and employee availability, and defaults and credit downgrades, among other significant economic impacts that have disrupted global economic activity across many industries. Such economic impacts may exacerbate other pre-existing political, social and economic risks locally or globally and cause general concern and uncertainty. The full economic impact and ongoing effects of COVID-19 (or other future epidemics or pandemics) at the macro-level and on individual businesses are unpredictable and may result in significant and prolonged effects on the Funds’ performance.
NOTE 3–Investment Advisory Agreements and Other Agreements
The Trust has entered into Investment Advisory Agreements with the Adviser on behalf of each Fund, pursuant to which the Adviser has overall responsibility for the selection and ongoing monitoring of the Funds’ investments, managing the Funds’ business affairs and providing certain clerical, bookkeeping and other administrative services.
Pursuant to an Investment Advisory Agreement, each Fund listed below accrues daily and pays monthly to the Adviser an annual unitary management fee. Out of the unitary management fee, the Adviser has agreed to pay for substantially all expenses of the Funds, including the cost of transfer agency, custody, fund administration, legal, audit and other services, except for distribution fees, if any, brokerage expenses, taxes, interest, acquired fund fees and expenses, if any, litigation expenses and other extraordinary expenses, including proxy expenses (except for such proxies related to: (i) changes to the Investment Advisory Agreement, (ii) the election of any Board member who is an “interested person” of the Trust, or (iii) any other matters that directly benefit the Adviser). The unitary management fee is paid by each Fund to the Adviser at the following annual rates:
| Unitary Management Fees (as a % of average daily net assets) | ||
| China Technology ETF | 0.70% | |
| DWA Developed Markets Momentum ETF | 0.80% | |
| DWA Emerging Markets Momentum ETF | 0.90% | |
| FTSE RAFI Developed Markets ex-U.S. ETF | 0.45% | |
| FTSE RAFI Developed Markets ex-U.S. Small-Mid ETF | 0.49% | |
| FTSE RAFI Emerging Markets ETF | 0.49% | |
| 128 | ||||
|
| |||
| Unitary Management Fees (as a % of average daily net assets) | ||
| Global Clean Energy ETF | 0.75% | |
| Global Water ETF | 0.75% | |
| International BuyBack AchieversTM ETF | 0.55% | |
| MSCI Green Building ETF | 0.39% | |
| S&P International Developed Quality ETF | 0.29% | |
Pursuant to another Investment Advisory Agreement, each of the following Funds accrues daily and pays monthly to the Adviser an annual fee equal to a percentage of its average daily net assets as follows:
| Management Fees (as a % of average daily net assets) | ||
| MSCI Global Timber ETF | 0.50% | |
| S&P Global Water Index ETF | 0.50% | |
The Trust also has entered into an Amended and Restated Excess Expense Agreement (the “Expense Agreement”) with the Adviser on behalf of each of MSCI Global Timber ETF and S&P Global Water Index ETF, pursuant to which the Adviser has contractually agreed to waive fees and/or pay Fund expenses to the extent necessary to prevent the operating expenses (excluding interest expenses, licensing fees, offering costs, brokerage commissions and other trading expenses, taxes, acquired fund fees and expenses, if any, and extraordinary expenses, including proxy expenses (except for such proxies related to: (i) changes to the Investment Advisory Agreement, (ii) the election of any Board member who is an “interested person” of the Trust, or (iii) any other matters that directly benefit the Adviser)) of each such Fund from exceeding the percentage of the Fund’s average daily net assets per year (the “Expense Cap”) shown in the table below through at least August 31, 2024. Unless the Adviser continues the Expense Agreement, it will terminate on August 31, 2024. During its term, the Expense Agreement cannot be terminated or amended to increase the Expense Cap without approval of the Board of Trustees. The Adviser did not waive fees and/or pay Fund expenses during the period under this Expense Cap for S&P Global Water Index ETF.
| Expense Cap | ||
| MSCI Global Timber ETF | 0.55% | |
| S&P Global Water Index ETF | 0.63% | |
Further, through at least August 31, 2024, the Adviser has contractually agreed to waive the management fee payable by each Fund in an amount equal to the lesser of: (i) 100% of the net advisory fees earned by the Adviser or an affiliate of the Adviser that are attributable to the Fund’s investments in money market funds that are managed by affiliates of the Adviser and other funds (including ETFs) managed by the Adviser or affiliates of the Adviser or (ii) the management fee available to be waived. This waiver does not apply to a Fund’s investment of cash collateral received for securities lending. There is no guarantee that the Adviser will extend the waiver of these fees past that date. This agreement is not subject to recapture by the Adviser.
For the fiscal year ended October 31, 2022, the Adviser waived fees for each Fund in the following amounts:
| China Technology ETF | $ | 1,468 | ||
| DWA Developed Markets Momentum ETF | 38 | |||
| DWA Emerging Markets Momentum ETF | 75 | |||
| FTSE RAFI Developed Markets ex-U.S. ETF | 608 | |||
| FTSE RAFI Developed Markets ex-U.S. Small-Mid ETF | 271 | |||
| FTSE RAFI Emerging Markets ETF | 2,552 | |||
| Global Clean Energy ETF | 67 | |||
| Global Water ETF | 133 | |||
| International BuyBack AchieversTM ETF | 97 | |||
| MSCI Global Timber ETF | 65,125 | |||
| MSCI Green Building ETF | 11 | |||
| S&P Global Water Index ETF | 58 | |||
| S&P International Developed Quality ETF | 73 | |||
The fees waived and/or expenses borne by the Adviser for MSCI Global Timber ETF and S&P Global Water Index ETF, pursuant to the Expense Cap, are subject to recapture by the Adviser up to three years from the date the fees were waived or the expense were incurred, but no recapture payment will be made by the Funds if it would result in the Funds exceeding (i) the Expense Cap or (ii) the expense cap in effect at the time the fees and/or expenses subject to recapture were waived and/or borne by the Adviser.
| 129 | ||||
|
| |||
For the following Fund, the amounts available for potential recapture by the Adviser and the expiration schedule as of October 31, 2022 are as follows:
| Total | ||||||||
| Potential | ||||||||
| Recapture | Potential Recapture Amounts Expiring | |||||||
| Amounts | 10/31/23 | 10/31/24 | 10/31/25 | |||||
MSCI Global Timber ETF | $303,574 | $159,364 | $81,775 | $62,435 | ||||
The Trust has entered into a Distribution Agreement with Invesco Distributors, Inc. (the “Distributor”), which serves as the distributor of Creation Units for each Fund. The Distributor does not maintain a secondary market in the Shares. The Funds are not charged any fees pursuant to the Distribution Agreement. The Distributor is an affiliate of the Adviser.
The Adviser has entered into a licensing agreement for each Fund with the following entities (each, a “Licensor”):
Fund | Licensor | |
| China Technology ETF | FTSE International Ltd. | |
| DWA Developed Markets Momentum ETF | Dorsey Wright & Associates, LLC | |
| DWA Emerging Markets Momentum ETF | Dorsey Wright & Associates, LLC | |
| FTSE RAFI Developed Markets ex-U.S. ETF | FTSE International Ltd. | |
| FTSE RAFI Developed Markets ex-U.S. Small-Mid ETF | FTSE International Ltd. | |
| FTSE RAFI Emerging Markets ETF | FTSE International Ltd. | |
| Global Clean Energy ETF | WilderHill New Energy Finance, LLC | |
| Global Water ETF | Nasdaq, Inc. | |
| International BuyBack AchieversTM ETF | Nasdaq, Inc. | |
| MSCI Global Timber ETF | MSCI, Inc. | |
| MSCI Green Building ETF | MSCI, Inc. | |
| S&P Global Water Index ETF | S&P Dow Jones Indices LLC | |
| S&P International Developed Quality ETF | S&P Dow Jones Indices LLC | |
Each Underlying Index name trademark is owned by its respective Licensor. These trademarks have been licensed to the Adviser for use by the Funds. Each Fund is entitled to use its Underlying Index pursuant to the Trust’s sub-licensing agreement with the Adviser. The Funds are not sponsored, endorsed, sold or promoted by the Licensors, and the Licensors make no representation regarding the advisability of investing in any of the Funds.
The Trust has entered into service agreements whereby BNYM, a wholly-owned subsidiary of The Bank of New York Mellon Corporation, serves as the administrator, custodian, fund accountant and transfer agent for each Fund.
For the fiscal year ended October 31, 2022, the following Funds incurred brokerage commissions with Invesco Capital Markets, Inc. (“ICMI”), an affiliate of the Adviser and Distributor, for portfolio transactions executed on behalf of the Funds, as listed below:
China Technology ETF | $ | 20,870 | ||
DWA Developed Markets Momentum ETF | 4 | |||
DWA Emerging Markets Momentum ETF | 4,339 | |||
FTSE RAFI Emerging Markets ETF | 17,930 | |||
Global Clean Energy ETF | 26,353 | |||
Global Water ETF | 868 | |||
MSCI Global Timber ETF | 1,789 | |||
MSCI Green Building ETF | 93 | |||
S&P Global Water Index ETF | 6,901 | |||
S&P International Developed Quality ETF | 2 | |||
Portfolio transactions with ICMI that have not settled at period-end, if any, are shown in the Statements of Assets and Liabilities under the receivable caption Investments sold - affiliated broker and/or payable caption Investments purchased - affiliated broker.
NOTE 4–Additional Valuation Information
GAAP defines fair value as the price that would be received to sell an asset or paid to transfer a liability in an orderly transaction between market participants at the measurement date, under current market conditions. GAAP establishes a hierarchy that prioritizes the inputs to valuation methods, giving the highest priority to readily available unadjusted quoted prices in an active market for identical assets (Level 1) and the lowest priority to significant unobservable inputs (Level 3), generally when market
| 130 | ||||
|
| |||
prices are not readily available. Based on the valuation inputs, the securities or other investments are tiered into one of three levels. Changes in valuation methods may result in transfers in or out of an investment’s assigned level:
| Level 1 - | Prices are determined using quoted prices in an active market for identical assets. | |
| Level 2 - | Prices are determined using other significant observable inputs. Observable inputs are inputs that other market participants may use in pricing a security. These may include quoted prices for similar securities, interest rates, prepayment speeds, credit risk, yield curves, loss severities, default rates, discount rates, volatilities and others. | |
| Level 3 - | Prices are determined using significant unobservable inputs. In situations where quoted prices or observable inputs are unavailable (for example, when there is little or no market activity for an investment at the end of the period), unobservable inputs may be used. Unobservable inputs reflect the Adviser’s assumptions about the factors market participants would use in determining fair value of the securities or instruments and would be based on the best available information. | |
The following is a summary of the tiered valuation input levels, as of October 31, 2022. The level assigned to the securities valuations may not be an indication of the risk or liquidity associated with investing in those securities. Because of the inherent uncertainties of valuation, the values reflected in the financial statements may materially differ from the value received upon actual sale of those investments.
| Level 1 | Level 2 | Level 3 | Total | |||||||||||||||||
China Technology ETF | ||||||||||||||||||||
Investments in Securities | ||||||||||||||||||||
Common Stocks & Other Equity Interests | $ | 702,755,163 | $ | - | $ | 0 | $ | 702,755,163 | ||||||||||||
Money Market Funds | 276,917 | 49,931,515 | - | 50,208,432 | ||||||||||||||||
|
|
|
|
|
|
|
| |||||||||||||
Total Investments | $ | 703,032,080 | $ | 49,931,515 | $ | 0 | $ | 752,963,595 | ||||||||||||
|
|
|
|
|
|
|
| |||||||||||||
DWA Developed Markets Momentum ETF | ||||||||||||||||||||
Investments in Securities | ||||||||||||||||||||
Common Stocks & Other Equity Interests | $ | 101,485,535 | $ | - | $ | - | $ | 101,485,535 | ||||||||||||
Money Market Funds | - | 6,785,854 | - | 6,785,854 | ||||||||||||||||
|
|
|
|
|
|
|
| |||||||||||||
Total Investments | $ | 101,485,535 | $ | 6,785,854 | $ | - | $ | 108,271,389 | ||||||||||||
|
|
|
|
|
| �� |
|
| ||||||||||||
DWA Emerging Markets Momentum ETF | ||||||||||||||||||||
Investments in Securities | ||||||||||||||||||||
Common Stocks & Other Equity Interests | $ | 125,204,959 | $ | - | $ | 0 | $ | 125,204,959 | ||||||||||||
Money Market Funds | - | 1,422,989 | - | 1,422,989 | ||||||||||||||||
|
|
|
|
|
|
|
| |||||||||||||
Total Investments | $ | 125,204,959 | $ | 1,422,989 | $ | 0 | $ | 126,627,948 | ||||||||||||
|
|
|
|
|
|
|
| |||||||||||||
FTSE RAFI Developed Markets ex-U.S. ETF | ||||||||||||||||||||
Investments in Securities | ||||||||||||||||||||
Common Stocks & Other Equity Interests | $ | 1,126,623,868 | $ | - | $ | 709 | $ | 1,126,624,577 | ||||||||||||
Money Market Funds | - | 83,011,429 | - | 83,011,429 | ||||||||||||||||
|
|
|
|
|
|
|
| |||||||||||||
Total Investments | $ | 1,126,623,868 | $ | 83,011,429 | $ | 709 | $ | 1,209,636,006 | ||||||||||||
|
|
|
|
|
|
|
| |||||||||||||
FTSE RAFI Developed Markets ex-U.S. Small-Mid ETF | ||||||||||||||||||||
Investments in Securities | ||||||||||||||||||||
Common Stocks & Other Equity Interests | $ | 487,359,905 | $ | 0 | $ | - | $ | 487,359,905 | ||||||||||||
Money Market Funds | 599,917 | 77,921,923 | - | 78,521,840 | ||||||||||||||||
|
|
|
|
|
|
|
| |||||||||||||
Total Investments | $ | 487,959,822 | $ | 77,921,923 | $ | - | $ | 565,881,745 | ||||||||||||
|
|
|
|
|
|
|
| |||||||||||||
FTSE RAFI Emerging Markets ETF | ||||||||||||||||||||
Investments in Securities | ||||||||||||||||||||
Common Stocks & Other Equity Interests | $ | 1,203,456,997 | $ | 166,079 | $ | 0 | $ | 1,203,623,076 | ||||||||||||
Money Market Funds | 8,531,729 | 12,082,586 | - | 20,614,315 | ||||||||||||||||
|
|
|
|
|
|
|
| |||||||||||||
Total Investments | $ | 1,211,988,726 | $ | 12,248,665 | $ | 0 | $ | 1,224,237,391 | ||||||||||||
|
|
|
|
|
|
|
| |||||||||||||
Global Clean Energy ETF | ||||||||||||||||||||
Investments in Securities | ||||||||||||||||||||
Common Stocks & Other Equity Interests | $ | 216,747,366 | $ | - | $ | - | $ | 216,747,366 | ||||||||||||
Money Market Funds | - | 71,274,692 | - | 71,274,692 | ||||||||||||||||
|
|
|
|
|
|
|
| |||||||||||||
Total Investments | $ | 216,747,366 | $ | 71,274,692 | $ | - | $ | 288,022,058 | ||||||||||||
|
|
|
|
|
|
|
| |||||||||||||
| 131 | ||||
|
| |||
| Level 1 | Level 2 | Level 3 | Total | |||||||||||||||||
Global Water ETF | ||||||||||||||||||||
Investments in Securities | ||||||||||||||||||||
Common Stocks & Other Equity Interests | $ | 256,786,963 | $ | - | $ | - | $ | 256,786,963 | ||||||||||||
Money Market Funds | - | 3,127,746 | - | 3,127,746 | ||||||||||||||||
|
|
|
|
|
|
|
| |||||||||||||
Total Investments | $ | 256,786,963 | $ | 3,127,746 | $ | - | $ | 259,914,709 | ||||||||||||
|
|
|
|
|
|
|
| |||||||||||||
International BuyBack AchieversTM ETF | ||||||||||||||||||||
Investments in Securities | ||||||||||||||||||||
Common Stocks & Other Equity Interests | $ | 80,390,616 | �� | $ | - | $ | - | $ | 80,390,616 | |||||||||||
Money Market Funds | - | 3,849,719 | - | 3,849,719 | ||||||||||||||||
|
|
|
|
|
|
|
| |||||||||||||
Total Investments | $ | 80,390,616 | $ | 3,849,719 | $ | - | $ | 84,240,335 | ||||||||||||
|
|
|
|
|
|
|
| |||||||||||||
MSCI Global Timber ETF | ||||||||||||||||||||
Investments in Securities | ||||||||||||||||||||
Common Stocks & Other Equity Interests | $ | 60,052,039 | $ | - | $ | 0 | $ | 60,052,039 | ||||||||||||
Exchange-Traded Funds | 384,979 | - | - | 384,979 | ||||||||||||||||
Money Market Funds | 67,536 | 3,966,272 | - | 4,033,808 | ||||||||||||||||
|
|
|
|
|
|
|
| |||||||||||||
Total Investments | $ | 60,504,554 | $ | 3,966,272 | $ | 0 | $ | 64,470,826 | ||||||||||||
|
|
|
|
|
|
|
| |||||||||||||
MSCI Green Building ETF | ||||||||||||||||||||
Investments in Securities | ||||||||||||||||||||
Common Stocks & Other Equity Interests | $ | 4,915,442 | $ | - | $ | - | $ | 4,915,442 | ||||||||||||
Money Market Funds | 32,365 | 115,541 | - | 147,906 | ||||||||||||||||
|
|
|
|
|
|
|
| |||||||||||||
Total Investments | $ | 4,947,807 | $ | 115,541 | $ | - | $ | 5,063,348 | ||||||||||||
|
|
|
|
|
|
|
| |||||||||||||
S&P Global Water Index ETF | ||||||||||||||||||||
Investments in Securities | ||||||||||||||||||||
Common Stocks & Other Equity Interests | $ | 932,970,244 | $ | - | $ | - | $ | 932,970,244 | ||||||||||||
Money Market Funds | - | 94,096,656 | - | 94,096,656 | ||||||||||||||||
|
|
|
|
|
|
|
| |||||||||||||
Total Investments | $ | 932,970,244 | $ | 94,096,656 | $ | - | $ | 1,027,066,900 | ||||||||||||
|
|
|
|
|
|
|
| |||||||||||||
S&P International Developed Quality ETF | ||||||||||||||||||||
Investments in Securities | ||||||||||||||||||||
Common Stocks & Other Equity Interests | $ | 92,049,268 | $ | - | $ | - | $ | 92,049,268 | ||||||||||||
Money Market Funds | - | 6,964,118 | - | 6,964,118 | ||||||||||||||||
|
|
|
|
|
|
|
| |||||||||||||
Total Investments | $ | 92,049,268 | $ | 6,964,118 | $ | - | $ | 99,013,386 | ||||||||||||
|
|
|
|
|
|
|
| |||||||||||||
NOTE 5–Distributions to Shareholders and Tax Components of Net Assets
Tax Character of Distributions to Shareholders Paid During the Fiscal Years Ended October 31, 2022 and 2021:
| 2022 | 2021 | |||||||||||
| Ordinary | Return of | Ordinary | ||||||||||
| Income* | Capital | Income* | ||||||||||
China Technology ETF | $ | - | $ | - | $ | 6,502,078 | ||||||
DWA Developed Markets Momentum ETF | 3,925,843 | - | 964,301 | |||||||||
DWA Emerging Markets Momentum ETF | 6,385,828 | - | 2,586,314 | |||||||||
FTSE RAFI Developed Markets ex-U.S. ETF | 56,137,305 | - | 27,603,102 | |||||||||
FTSE RAFI Developed Markets ex-U.S. Small-Mid ETF | 16,160,202 | - | 7,594,401 | |||||||||
FTSE RAFI Emerging Markets ETF | 87,622,863 | - | 40,406,081 | |||||||||
Global Clean Energy ETF | 3,615,255 | - | 1,855,153 | |||||||||
Global Water ETF | 3,609,219 | - | 3,106,732 | |||||||||
International BuyBack AchieversTM ETF | 9,566,307 | - | 2,099,827 | |||||||||
MSCI Global Timber ETF | 1,454,000 | - | 1,493,991 | |||||||||
MSCI Green Building ETF | 174,785 | 26,115 | 82,156 | |||||||||
S&P Global Water Index ETF | 20,088,093 | - | 11,646,987 | |||||||||
S&P International Developed Quality ETF | 3,802,505 | - | 2,252,111 | |||||||||
| * | Includes short-term capital gain distributions, if any. |
| 132 | ||||
|
| |||
Tax Components of Net Assets at Fiscal Year-End:
| Undistributed Ordinary Income | Temporary Book/Tax Differences | Net Unrealized Appreciation (Depreciation)- Investments | Net Unrealized Appreciation (Depreciation)- Foreign Currencies and Foreign Taxes | Capital Loss Carryforwards | Shares of Beneficial Interest | Total Net Assets | ||||||||||||||||||||||
| China Technology ETF | $ | 660,382 | $ | - | $ | (470,991,582 | ) | $ | 2 | $ | (497,228,237 | ) | $ | 1,670,169,086 | $ | 702,609,651 | ||||||||||||
| DWA Developed Markets Momentum ETF | - | - | (2,315,916 | ) | (50,612 | ) | (169,465,765 | ) | 273,346,291 | 101,513,998 | ||||||||||||||||||
| DWA Emerging Markets Momentum ETF | 189,068 | - | (6,774,908 | ) | (327 | ) | (156,900,695 | ) | 289,079,899 | 125,593,037 | ||||||||||||||||||
| FTSE RAFI Developed Markets ex-U.S. ETF | - | - | (170,147,140 | ) | (240,088 | ) | (116,259,147 | ) | 1,417,184,134 | 1,130,537,759 | ||||||||||||||||||
| FTSE RAFI Developed Markets ex-U.S. Small-Mid ETF | - | - | (115,065,987 | ) | (53,642 | ) | (51,244,626 | ) | 655,526,434 | 489,162,179 | ||||||||||||||||||
| FTSE RAFI Emerging Markets ETF | - | - | (310,483,101 | ) | (4,306,043 | ) | (203,702,123 | ) | 1,724,731,854 | 1,206,240,587 | ||||||||||||||||||
| Global Clean Energy ETF | 2,984,807 | - | (73,511,888 | ) | (14,566 | ) | (168,401,530 | ) | 455,671,148 | 216,727,971 | ||||||||||||||||||
| Global Water ETF | 365,078 | - | (3,451,830 | ) | (21,673 | ) | (64,859,839 | ) | 325,253,601 | 257,285,337 | ||||||||||||||||||
| International BuyBack AchieversTM ETF | - | - | (11,292,352 | ) | (19,703 | ) | (64,358,428 | ) | 156,455,823 | 80,785,340 | ||||||||||||||||||
| MSCI Global Timber ETF | 1,424,246 | (5,603 | ) | (1,232,818 | ) | (28,596 | ) | (19,213,363 | ) | 79,712,589 | 60,656,455 | |||||||||||||||||
| MSCI Green Building ETF | - | - | (1,926,500 | ) | (49 | ) | (204,291 | ) | 7,058,969 | 4,928,129 | ||||||||||||||||||
| S&P Global Water Index ETF | 10,580,908 | (9,778 | ) | 116,724,411 | (72,162 | ) | (44,987,817 | ) | 850,758,176 | 932,993,738 | ||||||||||||||||||
| S&P International Developed Quality ETF | - | - | (14,716,431 | ) | (31,493 | ) | (23,750,721 | ) | 130,764,306 | 92,265,661 | ||||||||||||||||||
Capital loss carryforwards are calculated and reported as of a specific date. Results of transactions and other activity after that date may affect the amount of capital loss carryforwards actually available for the Funds to utilize. The ability to utilize capital loss carryforwards in the future may be limited under the Internal Revenue Code and related regulations based on the results of future transactions.
The Funds have capital loss carryforwards as of October 31, 2022, as follows:
| No expiration | ||||||||||||
| Short-Term | Long-Term | Total* | ||||||||||
China Technology ETF | $ | 217,640,677 | $ | 279,587,560 | $ | 497,228,237 | ||||||
DWA Developed Markets Momentum ETF | 169,465,765 | - | 169,465,765 | |||||||||
DWA Emerging Markets Momentum ETF | 156,900,695 | - | 156,900,695 | |||||||||
FTSE RAFI Developed Markets ex-U.S. ETF | 1,017,717 | 115,241,430 | 116,259,147 | |||||||||
FTSE RAFI Developed Markets ex-U.S. Small-Mid ETF | 8,184,414 | 43,060,212 | 51,244,626 | |||||||||
FTSE RAFI Emerging Markets ETF | 16,665,721 | 187,036,402 | 203,702,123 | |||||||||
Global Clean Energy ETF | 66,912,051 | 101,489,479 | 168,401,530 | |||||||||
Global Water ETF | 50,900,586 | 13,959,253 | 64,859,839 | |||||||||
International BuyBack AchieversTM ETF | 56,476,910 | 7,881,518 | 64,358,428 | |||||||||
MSCI Global Timber ETF | 11,902,078 | 7,311,285 | 19,213,363 | |||||||||
MSCI Green Building ETF | 70,993 | 133,298 | 204,291 | |||||||||
S&P Global Water Index ETF | 34,455,780 | 10,532,037 | 44,987,817 | |||||||||
S&P International Developed Quality ETF | 19,447,843 | 4,302,878 | 23,750,721 | |||||||||
| * | Capital loss carryforwards are reduced for limitations, if any, to the extent required by the Internal Revenue Code and may be further limited depending upon a variety of factors, including the realization of net unrealized gains or losses as of the date of any reorganization. |
| 133 | ||||
|
| |||
NOTE 6–Investment Transactions
For the fiscal year ended October 31, 2022, the cost of securities purchased and the proceeds from sales of securities (other than short-term securities, U.S. Government obligations, money market funds and in-kind transactions, if any) were as follows:
| Purchases | Sales | |||||||
China Technology ETF | $ | 702,397,961 | $ | 667,632,669 | ||||
DWA Developed Markets Momentum ETF | 260,990,263 | 265,433,506 | ||||||
DWA Emerging Markets Momentum ETF | 322,264,409 | 326,282,883 | ||||||
FTSE RAFI Developed Markets ex-U.S. ETF | 182,177,509 | 186,038,112 | ||||||
FTSE RAFI Developed Markets ex-U.S. Small-Mid ETF | 184,960,767 | 156,151,152 | ||||||
FTSE RAFI Emerging Markets ETF | 729,115,313 | 489,678,250 | ||||||
Global Clean Energy ETF | 184,518,419 | 188,620,312 | ||||||
Global Water ETF | 102,918,543 | 102,310,775 | ||||||
International BuyBack AchieversTM ETF | 101,931,816 | 108,419,777 | ||||||
MSCI Global Timber ETF | 11,636,490 | 12,466,509 | ||||||
MSCI Green Building ETF | 949,606 | 858,417 | ||||||
S&P Global Water Index ETF | 361,507,926 | 367,751,505 | ||||||
S&P International Developed Quality ETF | 72,381,017 | 71,530,165 | ||||||
For the fiscal year ended October 31, 2022, in-kind transactions associated with creations and redemptions were as follows:
| In-kind | In-kind | |||||||
| Purchases | Sales | |||||||
China Technology ETF | $ | 38,380,987 | $ | 47,051,396 | ||||
DWA Developed Markets Momentum ETF | 27,530,867 | 96,715,350 | ||||||
DWA Emerging Markets Momentum ETF | 8,354,252 | 14,183,043 | ||||||
FTSE RAFI Developed Markets ex-U.S. ETF | 324,082,091 | 131,335,155 | ||||||
FTSE RAFI Developed Markets ex-U.S. Small-Mid ETF | 268,971,655 | 81,396,426 | ||||||
FTSE RAFI Emerging Markets ETF | 100,871,526 | 52,771,487 | ||||||
Global Clean Energy ETF | 6,718,749 | 37,849,888 | ||||||
Global Water ETF | 29,196,536 | 6,526,703 | ||||||
International BuyBack AchieversTM ETF | 13,170,468 | 19,426,286 | ||||||
MSCI Global Timber ETF | 4,832,965 | 19,222,332 | ||||||
MSCI Green Building ETF | 1,960,255 | - | ||||||
S&P Global Water Index ETF | 54,345,711 | 42,301,999 | ||||||
S&P International Developed Quality ETF | 47,746,082 | 30,122,861 | ||||||
Gains (losses) on in-kind transactions are generally not considered taxable gains (losses) for federal income tax purposes.
As of October 31, 2022, the aggregate cost of investments, including any derivatives, on a tax basis includes adjustments for financial reporting purposes as of the most recently completed federal income tax reporting period-end:
| Net | ||||||||||||||||
| Gross | Gross | Unrealized | ||||||||||||||
| Unrealized | Unrealized | Appreciation | ||||||||||||||
| Appreciation | (Depreciation) | (Depreciation) | Cost | |||||||||||||
China Technology ETF | $ | 67,365,495 | $ | (538,357,077 | ) | $ | (470,991,582 | ) | $ | 1,223,955,177 | ||||||
DWA Developed Markets Momentum ETF | 5,359,909 | (7,675,825 | ) | (2,315,916 | ) | 110,587,305 | ||||||||||
DWA Emerging Markets Momentum ETF | 8,942,637 | (15,717,545 | ) | (6,774,908 | ) | 133,402,856 | ||||||||||
FTSE RAFI Developed Markets ex-U.S. ETF | 70,882,819 | (241,029,959 | ) | (170,147,140 | ) | 1,379,783,146 | ||||||||||
FTSE RAFI Developed Markets ex-U.S. Small-Mid ETF | 21,416,951 | (136,482,938 | ) | (115,065,987 | ) | 680,947,732 | ||||||||||
FTSE RAFI Emerging Markets ETF | 144,294,218 | (454,777,319 | ) | (310,483,101 | ) | 1,534,720,492 | ||||||||||
Global Clean Energy ETF | 15,894,401 | (89,406,289 | ) | (73,511,888 | ) | 361,533,946 | ||||||||||
Global Water ETF | 28,615,792 | (32,067,622 | ) | (3,451,830 | ) | 263,366,539 | ||||||||||
International BuyBack AchieversTM ETF | 877,400 | (12,169,752 | ) | (11,292,352 | ) | 95,532,687 | ||||||||||
MSCI Global Timber ETF | 8,090,144 | (9,322,962 | ) | (1,232,818 | ) | 65,703,644 | ||||||||||
MSCI Green Building ETF | 16,187 | (1,942,687 | ) | (1,926,500 | ) | 6,989,848 | ||||||||||
| 134 | ||||
|
| |||
| Net | ||||||||||||||||
| Gross | Gross | Unrealized | ||||||||||||||
| Unrealized | Unrealized | Appreciation | ||||||||||||||
| Appreciation | (Depreciation) | (Depreciation) | Cost | |||||||||||||
S&P Global Water Index ETF | $ | 151,757,742 | $ | (35,033,331 | ) | $ | 116,724,411 | $ | 910,342,489 | |||||||
S&P International Developed Quality ETF | 2,876,359 | (17,592,790 | ) | (14,716,431 | ) | 113,729,817 | ||||||||||
NOTE 7–Reclassification of Permanent Differences
Primarily as a result of differing book/tax treatment of in-kind transactions, wash sales, passive foreign investment companies, foreign currency transactions, distributions, foreign capital gains taxes, REITs, return of capital, taxable spinoff and partnerships, amounts were reclassified between undistributed net investment income (loss), undistributed net realized gain (loss) and Shares of beneficial interest. These reclassifications had no effect on the net assets of each Fund. For the fiscal year ended October 31, 2022, the reclassifications were as follows:
| Undistributed Net | Undistributed Net | Shares of | ||||||||||
| Investment Income (Loss) | Realized Gain (Loss) | Beneficial Interest | ||||||||||
China Technology ETF | $ 4,089,261 | $ 19,224,537 | $(23,313,798) | |||||||||
DWA Developed Markets Momentum ETF | 998,240 | (4,100,854) | 3,102,614 | |||||||||
DWA Emerging Markets Momentum ETF | 481,227 | (910,995) | 429,768 | |||||||||
FTSE RAFI Developed Markets ex-U.S. ETF | 7,285,437 | (31,290,660) | 24,005,223 | |||||||||
FTSE RAFI Developed Markets ex-U.S. Small-Mid ETF | 2,352,888 | (18,423,447) | 16,070,559 | |||||||||
FTSE RAFI Emerging Markets ETF | (3,762,660) | 2,665,570 | 1,097,090 | |||||||||
Global Clean Energy ETF | 1,751,433 | (3,448,894) | 1,697,461 | |||||||||
Global Water ETF | (50,452) | (2,143,840) | 2,194,292 | |||||||||
International BuyBack AchieversTM ETF | 660,102 | 218,443 | (878,545) | |||||||||
MSCI Global Timber ETF | (22,096) | (4,928,306) | 4,950,402 | |||||||||
MSCI Green Building ETF | (4,440) | 4,439 | 1 | |||||||||
S&P Global Water Index ETF | 217,901 | (17,503,460) | 17,285,559 | |||||||||
S&P International Developed Quality ETF | 430,973 | (3,045,945) | 2,614,972 | |||||||||
NOTE 8–Trustees’ and Officer’s Fees
Trustees’ and Officer’s Fees include amounts accrued by the Funds to pay remuneration to the Independent Trustees and an Officer of the Trust. The Adviser, as a result of the unitary management fee, pays for such compensation for each Fund except MSCI Global Timber ETF and S&P Global Water Index ETF. The Trustee who is an “interested person” of the Trust does not receive any Trustees’ fees.
The Trust has adopted a deferred compensation plan (the “Plan”). Under the Plan, each Independent Trustee who has executed a Deferred Fee Agreement (a “Participating Trustee”) may defer receipt of all or a portion of their compensation (“Deferral Fees”). Such Deferral Fees are deemed to be invested in select Invesco ETFs. The Deferral Fees payable to a Participating Trustee are valued as of the date such Deferral Fees would have been paid to a Participating Trustee. The value increases with contributions or with increases in the value of the Shares selected, and the value decreases with distributions or with declines in the value of the Shares selected. Obligations under the Plan represent unsecured claims against the general assets of the Funds.
NOTE 9–Capital
Shares are issued and redeemed by each Fund only in Creation Units consisting of a specified number of Shares as set forth in each Fund’s prospectus. Only APs are permitted to purchase or redeem Creation Units from the Funds. Such transactions are principally permitted in exchange for Deposit Securities, with a balancing cash component to equate the transaction to the NAV per Share of a Fund on the transaction date. However, for all Funds, cash in an amount equivalent to the value of certain securities may be substituted, generally when the securities are not available in sufficient quantity for delivery, not eligible for trading by the AP or as a result of other market circumstances.
To the extent that the Funds permit transactions in exchange for Deposit Securities, each Fund may issue Shares in advance of receipt of Deposit Securities subject to various conditions, including a requirement to maintain on deposit with the Trust cash at least equal to 105% of the market value of the missing Deposit Securities. In accordance with the Trust’s Participant Agreement, Creation Units will be issued to an AP, notwithstanding the fact that the corresponding Deposit Securities have not been received in part or in whole, in reliance on the undertaking of the AP to deliver the missing Deposit Securities as soon as possible, which undertaking shall be secured by the AP’s delivery and maintenance of collateral consisting of cash in the form of U.S. dollars in immediately available funds having a value (marked-to-market daily) at least equal to 105%, which the Adviser may change from time to time, of the value of the missing Deposit Securities.
Certain transaction fees may be charged by the Funds for creations and redemptions, which are treated as increases in capital.
| 135 | ||||
|
| |||
Transactions in each Fund’s Shares are disclosed in detail in the Statements of Changes in Net Assets.
| 136 | ||||
|
| |||
Report of Independent Registered Public Accounting Firm
To the Board of Trustees of Invesco Exchange-Traded Fund Trust II and Shareholders of each of the thirteen Funds listed in the table below
Opinions on the Financial Statements
We have audited the accompanying statements of assets and liabilities, including the schedules of investments, of each of the funds listed in the table below (thirteen of the funds constituting Invesco Exchange-Traded Fund Trust II, hereafter collectively referred to as the “Funds”) as of October 31, 2022, the related statements of operations for the year ended October 31, 2022, the statements of changes in net assets for each of the periods indicated in the table below, including the related notes, and the financial highlights for each of the periods indicated in the table below (collectively referred to as the “financial statements”). In our opinion, the financial statements present fairly, in all material respects, the financial position of each of the Funds as of October 31, 2022, the results of each of their operations for the year then ended, and the changes in each of their net assets and each of the financial highlights for each of the periods indicated in the table below, in conformity with accounting principles generally accepted in the United States of America.
Fund Name | Fund Name | |
Invesco China Technology ETF (1) | Invesco Global Water ETF (2) | |
Invesco DWA Developed Markets Momentum ETF (2) | Invesco International BuyBack AchieversTM ETF (2) | |
Invesco DWA Emerging Markets Momentum ETF (2) | Invesco MSCI Global Timber ETF (3) | |
Invesco FTSE RAFI Developed Markets ex-U.S. ETF (2) | Invesco MSCI Green Building ETF (4) | |
Invesco FTSE RAFI Developed Markets ex-U.S. Small-Mid ETF (2) | Invesco S&P Global Water Index ETF (1) | |
Invesco FTSE RAFI Emerging Markets ETF (2) | Invesco S&P International Developed Quality ETF (2) | |
Invesco Global Clean Energy ETF (2) | ||
(1) Statement of changes in net assets for each of the two years in the period ended October 31, 2022 and the financial highlights for each of the four years in the period ended October 31, 2022, for the period September 1, 2018 through October 31, 2018 and for the year ended August 31, 2018
(2) Statement of changes in net assets for each of the two years in the period ended October 31, 2022 and the financial highlights for each of the five years in the period ended October 31, 2022
(3) Statement of changes in net assets for each of the two years in the period ended October 31, 2022 and the financial highlights for each of the four years in the period ended October 31, 2022, for the period June 1, 2018 through October 31, 2018 and for the year ended May 31, 2018
(4) Statement of changes in net assets and the financial highlights for the year ended October 31, 2022 and for the period April 20, 2021 (commencement of investment operations) through October 31, 2021
Basis for Opinions
These financial statements are the responsibility of the Funds’ management. Our responsibility is to express an opinion on the Funds’ financial statements based on our audits. We are a public accounting firm registered with the Public Company Accounting Oversight Board (United States) (“PCAOB”) and are required to be independent with respect to the Funds in accordance with the U.S. federal securities laws and the applicable rules and regulations of the Securities and Exchange Commission and the PCAOB.
We conducted our audits of these financial statements in accordance with the standards of the PCAOB. Those standards require that we plan and perform the audit to obtain reasonable assurance about whether the financial statements are free of material misstatement, whether due to error or fraud.
Our audits included performing procedures to assess the risks of material misstatement of the financial statements, whether due to error or fraud, and performing procedures that respond to those risks. Such procedures included examining, on a test basis, evidence regarding the amounts and disclosures in the financial statements. Our audits also included evaluating the accounting principles used and significant estimates made by management, as well as evaluating the overall presentation of the financial statements. Our procedures included confirmation of securities owned as of October 31, 2022 by correspondence with the
| 137 | ||||
|
| |||
Report of Independent Registered Public Accounting Firm–(continued)
custodian, transfer agent, and brokers; when replies were not received from brokers, we performed other auditing procedures. We believe that our audits provide a reasonable basis for our opinions.
/s/ PricewaterhouseCoopers LLP
Chicago, Illinois
December 23, 2022
We have served as the auditor of one or more of the investment companies in the Invesco group of investment companies since at least 1995. We have not been able to determine the specific year we began serving as auditor.
| 138 | ||||
|
| |||
Calculating your ongoing Fund expenses
Example
As a shareholder of Invesco MSCI Global Timber ETF and Invesco S&P Global Water Index ETF, you incur advisory fees and other Fund expenses. As a shareholder of the Invesco China Technology ETF, Invesco DWA Developed Markets Momentum ETF, Invesco DWA Emerging Markets Momentum ETF, Invesco FTSE RAFI Developed Markets ex-U.S. ETF, Invesco FTSE RAFI Developed Markets ex-U.S. Small-Mid ETF, Invesco FTSE RAFI Emerging Markets ETF, Invesco Global Clean Energy ETF, Invesco Global Water ETF, Invesco International BuyBack Achievers™ ETF, Invesco MSCI Green Building ETF and Invesco S&P International Developed Quality ETF, you incur a unitary management fee. In addition to the advisory fee or unitary management fee, a shareholder may pay distribution fees, if any, brokerage expenses, taxes, interest, acquired fund fees and expenses, if any, litigation expenses and other extraordinary expenses, including proxy expenses (except for such proxies related to: (i) changes to the Investment Advisory Agreement, (ii) the election of any Board member who is an “interested person” of the Trust, or (iii) any other matters that directly benefit the Adviser). The expense examples below are intended to help you understand your ongoing costs (in dollars) of investing in the Funds and to compare these costs with the ongoing costs of investing in other funds.
The example is based on an investment of $1,000 invested at the beginning of the period and held for the entire period May 1, 2022 through October 31, 2022.
Actual Expenses
The first line in the following table provides information about actual account values and actual expenses. You may use the information in this line, together with the amount you invested, to estimate the expenses that you paid over the period. Simply divide your account value by $1,000 (for example, an $8,600 account value divided by $1,000 = 8.6), then multiply the result by the number in the first line under the heading “Expenses Paid During the Six-Month Period” to estimate the expenses you paid on your account during this period.
Hypothetical Example for Comparison Purposes
The second line in the following table provides information about hypothetical account values and hypothetical expenses based on each Fund’s actual expense ratio and an assumed annualized rate of return of 5% per year before expenses, which is not the Fund’s actual return. The hypothetical account values and expenses may not be used to estimate the actual ending account balance or expenses you paid for the period. You may use this information to compare the ongoing costs of investing in the Funds and other funds. To do so, compare this 5% hypothetical example with the 5% hypothetical examples that appear in the shareholder reports of the other funds.
Please note that the expenses shown in the table are meant to highlight your ongoing costs only, and do not reflect any transactional costs, such as sales charges and brokerage commissions. Therefore, the second line in the table is useful in comparing ongoing costs only, and will not help you determine the relative total costs of owning different funds. In addition, if these transactional costs were included, your costs would have been higher.
| Beginning Account Value May 1, 2022 | Ending Account Value October 31, 2022 | Annualized Expense Ratio Based on the Six-Month Period | Expenses Paid During the Six-Month Period(1) | |||||||||||||
Invesco China Technology ETF (CQQQ) | ||||||||||||||||
Actual | $1,000.00 | $ 737.60 | 0.70% | $3.07 | ||||||||||||
Hypothetical (5% return before expenses) | 1,000.00 | 1,021.68 | 0.70 | 3.57 | ||||||||||||
Invesco DWA Developed Markets Momentum ETF (PIZ) | ||||||||||||||||
Actual | 1,000.00 | 849.50 | 0.80 | 3.73 | ||||||||||||
Hypothetical (5% return before expenses) | 1,000.00 | 1,021.17 | 0.80 | 4.08 | ||||||||||||
Invesco DWA Emerging Markets Momentum ETF (PIE) | ||||||||||||||||
Actual | 1,000.00 | 753.80 | 0.90 | 3.98 | ||||||||||||
Hypothetical (5% return before expenses) | 1,000.00 | 1,020.67 | 0.90 | 4.58 | ||||||||||||
Invesco FTSE RAFI Developed Markets ex-U.S. ETF (PXF) | ||||||||||||||||
Actual | 1,000.00 | 887.10 | 0.45 | 2.14 | ||||||||||||
Hypothetical (5% return before expenses) | 1,000.00 | 1,022.94 | 0.45 | 2.29 | ||||||||||||
| 139 | ||||
|
| |||
Calculating your ongoing Fund expense–(continued)
| Beginning Account Value May 1, 2022 | Ending Account Value October 31, 2022 | Annualized Expense Ratio Based on the Six-Month Period | Expenses Paid During the Six-Month Period(1) | |||||||||||||
Invesco FTSE RAFI Developed Markets ex-U.S. Small-Mid ETF (PDN) | ||||||||||||||||
Actual | $1,000.00 | $ 840.70 | 0.49% | $2.27 | ||||||||||||
Hypothetical (5% return before expenses) | 1,000.00 | 1,022.74 | 0.49 | 2.50 | ||||||||||||
Invesco FTSE RAFI Emerging Markets ETF (PXH) | ||||||||||||||||
Actual | 1,000.00 | 845.20 | 0.49 | 2.28 | ||||||||||||
Hypothetical (5% return before expenses) | 1,000.00 | 1,022.74 | 0.49 | 2.50 | ||||||||||||
Invesco Global Clean Energy ETF (PBD) | ||||||||||||||||
Actual | 1,000.00 | 894.40 | 0.75 | 3.58 | ||||||||||||
Hypothetical (5% return before expenses) | 1,000.00 | 1,021.42 | 0.75 | 3.82 | ||||||||||||
Invesco Global Water ETF (PIO) | ||||||||||||||||
Actual | 1,000.00 | 906.50 | 0.75 | 3.60 | ||||||||||||
Hypothetical (5% return before expenses) | 1,000.00 | 1,021.42 | 0.75 | 3.82 | ||||||||||||
Invesco International BuyBack AchieversTM ETF (IPKW) | ||||||||||||||||
Actual | 1,000.00 | 857.30 | 0.55 | 2.57 | ||||||||||||
Hypothetical (5% return before expenses) | 1,000.00 | 1,022.43 | 0.55 | 2.80 | ||||||||||||
Invesco MSCI Global Timber ETF (CUT) | ||||||||||||||||
Actual | 1,000.00 | 837.80 | 0.60 | 2.78 | ||||||||||||
Hypothetical (5% return before expenses) | 1,000.00 | 1,022.18 | 0.60 | 3.06 | ||||||||||||
Invesco MSCI Green Building ETF (GBLD) | ||||||||||||||||
Actual | 1,000.00 | 792.00 | 0.39 | 1.76 | ||||||||||||
Hypothetical (5% return before expenses) | 1,000.00 | 1,023.24 | 0.39 | 1.99 | ||||||||||||
Invesco S&P Global Water Index ETF (CGW) | ||||||||||||||||
Actual | 1,000.00 | 945.90 | 0.57 | 2.80 | ||||||||||||
Hypothetical (5% return before expenses) | 1,000.00 | 1,022.33 | 0.57 | 2.91 | ||||||||||||
Invesco S&P International Developed Quality ETF (IDHQ) | ||||||||||||||||
Actual | 1,000.00 | 858.00 | 0.29 | 1.36 | ||||||||||||
Hypothetical (5% return before expenses) | 1,000.00 | 1,023.74 | 0.29 | 1.48 | ||||||||||||
| (1) | Expenses are calculated using the annualized expense ratio, which represents the ongoing expenses as a percentage of net assets for the six-month period ended October 31, 2022. Expenses are calculated by multiplying the Fund’s annualized expense ratio by the average account value for the period, then multiplying the result by 184/365. Expense ratios for the most recent six-month period may differ from expense ratios based on the annualized data in the Financial Highlights. |
| 140 | ||||
|
| |||
Form 1099-DIV, Form 1042-S and other year–end tax information provide shareholders with actual calendar year amounts that should be included in their tax returns. Shareholders should consult their tax advisers.
The following distribution information is being provided as required by the Internal Revenue Code or to meet a specific state’s requirement.
Each Fund designates the following amounts or, if subsequently determined to be different, the maximum amount allowable for its fiscal year ended October 31, 2022:
| Qualified Business Income* | Qualified Dividend Income* | Corporate Dividends Received Deduction* | U.S. Treasury Obligations* | Business Interest Income* | |||||||||||||||||||||
Invesco China Technology ETF | 0 | % | 0 | % | 0 | % | 0 | % | 0 | % | |||||||||||||||
Invesco DWA Developed Markets Momentum ETF | 0 | % | 84 | % | 0 | % | 0 | % | 0 | % | |||||||||||||||
Invesco DWA Emerging Markets Momentum ETF | 0 | % | 32 | % | 0 | % | 0 | % | 0 | % | |||||||||||||||
Invesco FTSE RAFI Developed Markets ex-U.S. ETF | 0 | % | 78 | % | 0 | % | 0 | % | 0 | % | |||||||||||||||
Invesco FTSE RAFI Developed Markets ex-U.S. Small-Mid ETF | 0 | % | 71 | % | 0 | % | 0 | % | 0 | % | |||||||||||||||
Invesco FTSE RAFI Emerging Markets ETF | 0 | % | 52 | % | 0 | % | 0 | % | 0 | % | |||||||||||||||
Invesco Global Clean Energy ETF | 0 | % | 32 | % | 1 | % | 0 | % | 0 | % | |||||||||||||||
Invesco Global Water ETF | 0 | % | 100 | % | 44 | % | 0 | % | 0 | % | |||||||||||||||
Invesco International BuyBack AchieversTM ETF | 0 | % | 78 | % | 0 | % | 0 | % | 0 | % | |||||||||||||||
Invesco MSCI Global Timber ETF | 0 | % | 97 | % | 42 | % | 0 | % | 0 | % | |||||||||||||||
Invesco MSCI Green Building ETF | 16 | % | 28 | % | 1 | % | 0 | % | 0 | % | |||||||||||||||
Invesco S&P Global Water Index ETF | 0 | % | 100 | % | 28 | % | 0 | % | 0 | % | |||||||||||||||
Invesco S&P International Developed Quality ETF | 0 | % | 85 | % | 0 | % | 0 | % | 0 | % | |||||||||||||||
| * | The above percentages are based on ordinary income dividends paid to shareholders during the Fund’s fiscal year. |
The Funds intend to elect to pass through to shareholders the credit for taxes paid to foreign countries. The foreign source income and foreign taxes paid per share are as follows:
| Foreign Taxes Per Share | Foreign Source Income Per Share | |||
Invesco DWA Developed Markets Momentum ETF | $0.0857 | $0.9829 | ||
Invesco DWA Emerging Markets Momentum ETF | 0.1669 | 1.1526 | ||
Invesco FTSE RAFI Developed Markets ex-U.S. ETF | 0.0940 | 1.6406 | ||
Invesco FTSE RAFI Developed Markets ex-U.S. Small-Mid ETF | 0.0723 | 0.8623 | ||
Invesco FTSE RAFI Emerging Markets ETF | 0.0828 | 1.1276 | ||
Invesco Global Water ETF | 0.0214 | 0.4927 | ||
Invesco International BuyBack AchieversTM ETF | 0.1114 | 1.6153 | ||
Invesco MSCI Global Timber ETF | 0.0381 | 0.7484 | ||
Invesco MSCI Green Building ETF | 0.0272 | 0.4988 | ||
Invesco S&P International Developed Quality ETF | 0.0591 | 1.0132 | ||
| 141 | ||||
|
| |||
The Independent Trustees of the Trust, their term of office and length of time served, their principal business occupations during at least the past five years, the number of portfolios in the Fund Complex (as defined below) overseen by each Independent Trustee and the other directorships, if any, held by each Independent Trustee are shown below:
As of October 31, 2022
| Name, Address and Year of Birth of Independent Trustees | Position(s) with Trust | Term of and Length of | Principal Occupation(s) During the Past 5 Years | Number of in Fund | Other Directorships Held by Independent Trustees During the Past 5 Years | |||||
Ronn R. Bagge–1958 c/o Invesco Capital Management LLC 3500 Lacey Road, Suite 700 Downers Grove, IL 60515 | Vice Chair of the Board; Chair of the Nominating and Governance Committee and Trustee | Vice Chair since 2018; Chair of the Nominating and Governance Committee and Trustee since 2007 | Founder and Principal, YQA Capital Management LLC (1998-Present); formerly, Owner/CEO of Electronic Dynamic Balancing Co., Inc. (high-speed rotating equipment service provider). | 234 | Chair (since 2021) and member (since 2017) of the Joint Investment Committee, Mission Aviation Fellowship and MAF Foundation; Trustee, Mission Aviation Fellowship (2017-Present). | |||||
Todd J. Barre–1957 c/o Invesco Capital Management LLC 3500 Lacey Road, Suite 700 Downers Grove, IL 60515 | Trustee | Since 2010 | Assistant Professor of Business, Trinity Christian College (2010-2016); formerly, Vice President and Senior Investment Strategist (2001-2008), Director of Open Architecture and Trading (2007-2008), Head of Fundamental Research (2004-2007) and Vice President and Senior Fixed Income Strategist (1994-2001), BMO Financial Group/Harris Private Bank. | 234 | None. | |||||
| * | This is the date the Independent Trustee began serving the Trust. Each Independent Trustee serves an indefinite term, until his or her successor is elected. |
| ** | Fund Complex includes all open- and closed-end funds (including all of their portfolios) advised by the Adviser and any affiliated person of the Adviser. |
| 142 | ||||
|
| |||
Trustees and Officers–(continued)
| Name, Address and Year of Birth of Independent Trustees | Position(s) with Trust | Term of and Length of | Principal Occupation(s) During the Past 5 Years | Number of in Fund | Other Directorships Held by Independent Trustees During the Past 5 Years | |||||
Edmund P. Giambastiani, Jr.–1948 c/o Invesco Capital Management LLC 3500 Lacey Road, Suite 700 Downers Grove, IL 60515 | Trustee | Since 2019 | President, Giambastiani Group LLC (national security and energy consulting) (2007-Present); Director, First Eagle Alternative Credit LLC (2020-Present); Advisory Board Member, Massachusetts Institute of Technology Lincoln Laboratory (federally-funded research development) (2010-Present); Defense Advisory Board Member, Lawrence Livermore National Laboratory (2013-Present); formerly, Director, The Boeing Company (2009-2021); Trustee, MITRE Corporation (federally funded research development) (2008-2020); Director, THL Credit, Inc. (alternative credit investment manager) (2016-2020); Chair (2015-2016), Lead Director (2011-2015) and Director (2008-2011), Monster Worldwide, Inc. (career services); United States Navy, career nuclear submarine officer (1970-2007); Seventh Vice Chair of the Joint Chiefs of Staff (2005-2007); first NATO Supreme Allied Commander Transformation (2003-2005); Commander, U.S. Joint Forces Command (2002-2005). | 234 | Trustee, U.S. Naval Academy Foundation Athletic & Scholarship Program (2010-Present); formerly, Trustee, certain funds of the Oppenheimer Funds complex (2013-2019); Advisory Board Member, Maxwell School of Citizenship and Public Affairs of Syracuse University (2012-2016). |
| * | This is the date the Independent Trustee began serving the Trust. Each Independent Trustee serves an indefinite term, until his or her successor is elected. |
| ** | Fund Complex includes all open- and closed-end funds (including all of their portfolios) advised by the Adviser and any affiliated person of the Adviser. |
| 143 | ||||
|
| |||
Trustees and Officers–(continued)
| Name, Address and Year of Birth of Independent Trustees | Position(s) with Trust | Term of and Length of | Principal Occupation(s) During the Past 5 Years | Number of in Fund | Other Directorships Held by Independent Trustees During the Past 5 Years | |||||
Victoria J. Herget–1951 c/o Invesco Capital Management LLC 3500 Lacey Road, Suite 700 Downers Grove, IL 60515 | Trustee | Since 2019 | Formerly, Managing Director (1993-2001), Principal (1985-1993), Vice President (1978-1985) and Assistant Vice President (1973-1978), Zurich Scudder Investments (investment adviser) (and its predecessor firms). | 234 | Trustee (2000-Present) and Chair (2010-2017), Newberry Library; Trustee, Chikaming Open Lands (2014-Present); formerly, Trustee, Mather LifeWays (2001-2021); Trustee, certain funds in the Oppenheimer Funds complex (2012-2019); Board Chair (2008-2015) and Director (2004-2018), United Educators Insurance Company; Independent Director, First American Funds (2003-2011); Trustee (1992-2007), Chair of the Board of Trustees (1999-2007), Investment Committee Chair (1994-1999) and Investment Committee member (2007-2010), Wellesley College; Trustee, BoardSource (2006-2009); Trustee, Chicago City Day School (1994-2005). |
| * | This is the date the Independent Trustee began serving the Trust. Each Independent Trustee serves an indefinite term, until his or her successor is elected. |
| ** | Fund Complex includes all open- and closed-end funds (including all of their portfolios) advised by the Adviser and any affiliated person of the Adviser. |
| 144 | ||||
|
| |||
Trustees and Officers–(continued)
| Name, Address and Year of Birth of Independent Trustees | Position(s) with Trust | Term of and Length of | Principal Occupation(s) During the Past 5 Years | Number of in Fund | Other Directorships Held by Independent Trustees During the Past 5 Years | |||||
Marc M. Kole–1960 c/o Invesco Capital Management LLC 3500 Lacey Road, Suite 700 Downers Grove, IL 60515 | Chair of the Audit Committee and Trustee | Chair of the Audit Committee since 2008; Trustee since 2007 | Formerly, Managing Director of Finance (2020-2021) and Senior Director of Finance (2015-2020), By The Hand Club for Kids (not-for-profit); Chief Financial Officer, Hope Network (social services) (2008-2012); Assistant Vice President and Controller, Priority Health (health insurance) (2005-2008); Regional Chief Financial Officer, United Healthcare (2005); Chief Accounting Officer, Senior Vice President of Finance, Oxford Health Plans (2000-2004); Audit Partner, Arthur Andersen LLP (1996-2000). | 234 | Formerly, Treasurer (2018-2021), Finance Committee Member (2015-2021) and Audit Committee Member (2015), Thornapple Evangelical Covenant Church; Board and Finance Committee Member (2009-2017) and Treasurer (2010-2015, 2017), NorthPointe Christian Schools. | |||||
Yung Bong Lim–1964 c/o Invesco Capital Management LLC 3500 Lacey Road, Suite 700 Downers Grove, IL 60515 | Chair of the Investment Oversight Committee and Trustee | Chair of the Investment Oversight Committee since 2014; Trustee since 2013 | Managing Partner, RDG Funds LLC (real estate) (2008-Present); formerly, Managing Director, Citadel LLC (1999-2007). | 234 | Board Director, Beacon Power Services, Corp. (2019-Present); formerly, Advisory Board Member, Performance Trust Capital Partners, LLC (2008-2020). | |||||
| * | This is the date the Independent Trustee began serving the Trust. Each Independent Trustee serves an indefinite term, until his or her successor is elected. |
| ** | Fund Complex includes all open- and closed-end funds (including all of their portfolios) advised by the Adviser and any affiliated person of the Adviser. |
| 145 | ||||
|
| |||
Trustees and Officers–(continued)
| Name, Address and Year of Birth of Independent Trustees | Position(s) with Trust | Term of and Length of | Principal Occupation(s) During the Past 5 Years | Number of in Fund | Other Directorships Held by Independent Trustees During the Past 5 Years | |||||
Joanne Pace–1958 c/o Invesco Capital Management LLC 3500 Lacey Road, Suite 700 Downers Grove, IL 60515 | Trustee | Since 2019 | Formerly, Senior Advisor, SECOR Asset Management, LP (2010-2011); Managing Director and Chief Operating Officer, Morgan Stanley Investment Management (2006-2010); Partner and Chief Operating Officer, FrontPoint Partners, LLC (alternative investments) (2005-2006); Managing Director (2003-2005), Global Head of Human Resources and member of Executive Board and Operating Committee (2004-2005), Global Head of Operations and Product Control (2003-2004), Credit Suisse (investment banking); Managing Director (1997-2003), Controller and Principal Accounting Officer (1999-2003), Chief Financial Officer (temporary assignment) for the Oversight Committee, Long Term Capital Management (1998-1999), Morgan Stanley. | 234 | Board Director, Horizon Blue Cross Blue Shield of New Jersey (2012-Present); Governing Council Member (2016-Present) and Chair of Education Committee (2017-2021), Independent Directors Council (IDC); Council Member, New York-Presbyterian Hospital’s Leadership Council on Children’s and Women’s Health (2012-Present); formerly, Advisory Board Director, The Alberleen Group LLC (2012-2021); Board Member, 100 Women in Finance (2015-2020); Trustee, certain funds in the Oppenheimer Funds complex (2012-2019); Lead Independent Director and Chair of the Audit and Nominating Committee of The Global Chartist Fund, LLC, Oppenheimer Asset Management (2011-2012); Board Director, Managed Funds Association (2008-2010); Board Director (2007-2010) and Investment Committee Chair (2008-2010), Morgan Stanley Foundation. |
| * | This is the date the Independent Trustee began serving the Trust. Each Independent Trustee serves an indefinite term, until his or her successor is elected. |
| ** | Fund Complex includes all open- and closed-end funds (including all of their portfolios) advised by the Adviser and any affiliated person of the Adviser. |
| 146 | ||||
|
| |||
Trustees and Officers–(continued)
Name, Address and Year of Birth of Independent Trustees | Position(s) with Trust | Term of and Length of | Principal Occupation(s) During the Past 5 Years | Number of in Fund | Other Directorships Held by Independent Trustees During the Past 5 Years | |||||
Gary R. Wicker–1961 c/o Invesco Capital Management LLC 3500 Lacey Road, Suite 700 Downers Grove, IL 60515 | Trustee | Since 2013 | Senior Vice President of Global Finance and Chief Financial Officer, RBC Ministries (publishing company) (2013-Present); formerly, Executive Vice President and Chief Financial Officer, Zondervan Publishing (a division of Harper Collins/NewsCorp) (2007-2012); Senior Vice President and Group Controller (2005- 2006), Senior Vice President and Chief Financial Officer (2003-2004), Chief Financial Officer (2001-2003), Vice President, Finance and Controller (1999-2001) and Assistant Controller (1997-1999), divisions of The Thomson Corporation (information services provider); Senior Audit Manager (1994-1997), PricewaterhouseCoopers LLP. | 234 | Board Member and Treasurer, Our Daily Bread Ministries Canada (2015-Present); Board and Finance Committee Member, West Michigan Youth For Christ (2010-Present). | |||||
Donald H. Wilson–1959 c/o Invesco Capital Management LLC 3500 Lacey Road, Suite 700 Downers Grove, IL 60515 | Chair of the Board and Trustee | Chair since 2012; Trustee since 2007 | Chair, President and Chief Executive Officer, McHenry Bancorp Inc. and McHenry Savings Bank (subsidiary) (2018-Present); formerly, Chair and Chief Executive Officer, Stone Pillar Advisors, Ltd. (2010-2017); President and Chief Executive Officer, Stone Pillar Investments, Ltd. (advisory services to the financial sector) (2016-2018); Chair, President and Chief Executive Officer, Community Financial Shares, Inc. and Community Bank–Wheaton/Glen Ellyn (subsidiary) (2013-2015); Chief Operating Officer, AMCORE Financial, Inc. (bank holding company) (2007-2009); Executive Vice President and Chief Financial Officer, AMCORE Financial, Inc. (2006-2007); Senior Vice President and Treasurer, Marshall & Ilsley Corp. (bank holding company) (1995-2006). | 234 | Director, Penfield Children’s Center (2004-Present); Board Chair, Gracebridge Alliance, Inc. (2015-Present). | |||||
| * | This is the date the Independent Trustee began serving the Trust. Each Independent Trustee serves an indefinite term, until his or her successor is elected. |
| ** | Fund Complex includes all open- and closed-end funds (including all of their portfolios) advised by the Adviser and any affiliated person of the Adviser. |
| 147 | ||||
|
| |||
Trustees and Officers–(continued)
The Interested Trustee and the executive officers of the Trust, their term of office and length of time served, their principal business occupations during at least the past five years, the number of portfolios in the Fund Complex overseen by the Interested Trustee and the other directorships, if any, held by the Interested Trustee are shown below:
Name, Address and Year of Birth of Interested Trustee | Position(s) with Trust | Term of and Length of | Principal Occupation(s) During the Past 5 Years | Number of in Fund | Other Directorships Held by Interested Trustee During the Past 5 Years | |||||
Anna Paglia–1974 Invesco Capital Management LLC 3500 Lacey Road Suite 700 Downers Grove, IL 60515 | Trustee, President and Principal Executive Officer | Trustee since 2022, President and Principal Executive Officer since 2020 | President and Principal Executive Officer (2020-Present) and Trustee (2022-Present), Invesco Exchange- Traded Fund Trust, Invesco Exchange-Traded Fund Trust II, Invesco India Exchange-Traded Fund Trust, Invesco Actively Managed Exchange-Traded Fund Trust, Invesco Actively Managed Exchange-Traded Commodity Fund Trust and Invesco Exchange-Traded Self-Indexed Fund Trust; Managing Director and Global Head of ETFs and Indexed Strategies, Chief Executive Officer and Principal Executive Officer, Invesco Capital Management LLC (2020-Present); Chief Executive Officer, Manager and Principal Executive Officer, Invesco Specialized Products, LLC (2020-Present); Vice President, Invesco Indexing LLC (2020-Present); formerly, Secretary, Invesco Exchange-Traded Fund Trust, Invesco Exchange-Traded Fund Trust II, Invesco India Exchange-Traded Fund Trust and Invesco Actively Managed Exchange-Traded Fund Trust (2011-2020), Invesco Actively Managed Exchange-Traded Commodity Fund Trust (2014-2020) and Invesco Exchange-Traded Self-Indexed Fund Trust (2015-2020); Head of Legal (2010-2020) and Secretary (2015-2020), Invesco Capital Management LLC; Manager and Assistant Secretary, Invesco Indexing LLC (2017-2020); Head of Legal and Secretary, Invesco Specialized Products, LLC (2018-2020); Partner, K&L Gates LLP (formerly, Bell Boyd & Lloyd LLP) (2007-2010); and Associate Counsel at Barclays Global Investors Ltd. (2004-2006). | 234 | None |
| * | This is the date the Interested Trustee began serving the Trust. The Interested Trustee serves an indefinite term, until his successor is elected. |
| ** | Fund Complex includes all open- and closed-end funds (including all of their portfolios) advised by the Adviser and any affiliated person of the Adviser. |
| 148 | ||||
|
| |||
Trustees and Officers–(continued)
| Name, Address and Year of Birth of Executive Officers | Position(s) with Trust | Length of Time Served* | Principal Occupation(s) During the Past 5 Years | |||
Adrien Deberghes–1967 Invesco Capital Management LLC 11 Greenway Plaza, Suite 1000 Houston, TX 77046 | Vice President | Since 2020 | Vice President, Invesco Exchange-Traded Fund Trust, Invesco Exchange-Traded Fund Trust II, Invesco India Exchange-Traded Fund Trust, Invesco Actively Managed Exchange-Traded Fund Trust, Invesco Actively Managed Exchange-Traded Commodity Fund Trust and Invesco Exchange-Traded Self-Indexed Fund Trust (2020-Present); Head of the Fund Office of the CFO, Fund Administration and Vice President, Invesco Advisers, Inc. (2020-Present); Principal Financial Officer, Treasurer and Vice President, The Invesco Funds (2020-Present); formerly, Senior Vice President and Treasurer, Fidelity Investments (2008-2020). | |||
Kelli Gallegos–1970 Invesco Capital Management LLC 11 Greenway Plaza, Suite 1000 Houston, TX 77046 | Vice President and Treasurer | Since 2018 | Vice President, Invesco Advisers, Inc. (2020-Present); Principal Financial and Accounting Officer-Pooled Investments, Invesco Specialized Products, LLC (2018-Present); Vice President and Treasurer, Invesco Exchange-Traded Fund Trust, Invesco Exchange-Traded Fund Trust II, Invesco India Exchange-Traded Fund Trust, Invesco Actively Managed Exchange-Traded Fund Trust, Invesco Actively Managed Exchange-Traded Commodity Fund Trust and Invesco Exchange-Traded Self-Indexed Fund Trust (2018-Present); Principal Financial and Accounting Officer-Pooled Investments, Invesco Capital Management LLC (2018-Present); Vice President and Assistant Treasurer (2008-Present), The Invesco Funds; formerly, Principal Financial Officer (2016-2020) and Assistant Vice President (2008-2016), The Invesco Funds; Assistant Treasurer, Invesco Specialized Products, LLC (2018); Assistant Treasurer, Invesco Exchange- Traded Fund Trust, Invesco Exchange-Traded Fund Trust II, Invesco India Exchange-Traded Fund Trust and Invesco Actively Managed Exchange-Traded Fund Trust (2012-2018), Invesco Actively Managed Exchange-Traded Commodity Fund Trust (2014-2018) and Invesco Exchange-Traded Self-Indexed Fund Trust (2016-2018); and Assistant Treasurer, Invesco Capital Management LLC (2013-2018). | |||
Adam Henkel–1980 Invesco Capital Management LLC 3500 Lacey Road, Suite 700 Downers Grove, IL 60515 | Secretary | Since 2020 | Head of Legal and Secretary, Invesco Capital Management LLC and Invesco Specialized Products, LLC (2020-present); Secretary, Invesco Exchange-Traded Fund Trust, Invesco Exchange-Traded Fund Trust II, Invesco India Exchange-Traded Fund Trust, Invesco Actively Managed Exchange-Traded Fund Trust, Invesco Actively Managed Exchange-Traded Commodity Fund Trust and Invesco Exchange-Traded Self-Indexed Fund Trust (2020-Present); Assistant Secretary, Invesco Capital Markets, Inc. (2020-Present); Assistant Secretary, The Invesco Funds (2014-Present); Manager and Assistant Secretary, Invesco Indexing LLC (2020-Present); Assistant Secretary, Invesco Investment Advisers LLC (2020-Present); formerly, Assistant Secretary of Invesco Exchange-Traded Fund Trust, Invesco Exchange-Traded Fund Trust II, Invesco India Exchange-Traded Fund Trust, Invesco Actively Managed Exchange-Traded Fund Trust and Invesco Actively Managed Exchange-Traded Commodity Fund Trust (2014-2020); Chief Compliance Officer of Invesco Capital Management LLC (2017); Chief Compliance Officer of Invesco Exchange-Traded Fund Trust, Invesco Exchange-Traded Fund Trust II, Invesco India Exchange-Traded Fund Trust, Invesco Actively Managed Exchange-Traded Fund Trust and Invesco Actively Managed Exchange-Traded Commodity Fund Trust (2017); Senior Counsel, Invesco, Ltd. (2013-2020); Assistant Secretary, Invesco Specialized Products, LLC (2018-2020). | |||
| * | This is the date each Officer began serving the Trust in their current position. Each Officer serves an indefinite term, until his or her successor is elected. |
| 149 | ||||
|
| |||
Trustees and Officers–(continued)
| Name, Address and Year of Birth of Executive Officers | Position(s) with Trust | Length of Time Served* | Principal Occupation(s) During the Past 5 Years | |||
Peter Hubbard–1981 Invesco Capital Management LLC 3500 Lacey Road, Suite 700 Downers Grove, IL 60515 | Vice President | Since 2009 | Vice President, Invesco Specialized Products, LLC (2018-Present); Vice President, Invesco Exchange-Traded Fund Trust, Invesco Exchange-Traded Fund Trust II, Invesco India Exchange-Traded Fund Trust, Invesco Actively Managed Exchange-Traded Fund Trust (2009-Present), Invesco Actively Managed Exchange-Traded Commodity Fund Trust (2014-Present) and Invesco Exchange-Traded Self-Indexed Fund Trust (2016-Present); Vice President and Director of Portfolio Management, Invesco Capital Management LLC (2010-Present); and Vice President, Invesco Advisers, Inc. (2020-Present); formerly, Vice President of Portfolio Management, Invesco Capital Management LLC (2008-2010); Portfolio Manager, Invesco Capital Management LLC (2007-2008); Research Analyst, Invesco Capital Management LLC (2005-2007); Research Analyst and Trader, Ritchie Capital, a hedge fund operator (2003-2005). | |||
Sheri Morris–1964 Invesco Capital Management LLC 11 Greenway Plaza, Suite 1000 Houston, TX 77046 | Vice President | Since 2012 | Head of Global Fund Services, Invesco Ltd. (2019-Present); Vice President, OppenheimerFunds, Inc. (2019-Present); President and Principal Executive Officer, The Invesco Funds (2016-Present); Senior Vice President, Invesco Advisers, Inc. (formerly known as Invesco Institutional (N.A.), Inc.) (registered investment adviser) (2020-Present); Director, Invesco Trust Company (2022-Present) and Vice President, Invesco Exchange-Traded Fund Trust, Invesco Exchange-Traded Fund Trust II, Invesco India Exchange-Traded Fund Trust, Invesco Actively Managed Exchange-Traded Fund Trust (2012-Present), Invesco Actively Managed Exchange-Traded Commodity Fund Trust (2014-Present) and Invesco Exchange-Traded Self-Indexed Fund Trust (2016-Present); formerly, Treasurer (2008-2020), Vice President and Principal Financial Officer, The Invesco Funds (2008-2016); Treasurer, Invesco Exchange-Traded Fund Trust, Invesco Exchange-Traded Fund Trust II, Invesco India Exchange-Traded Fund Trust and Invesco Actively Managed Exchange-Traded Fund Trust (2011-2013); Vice President, Invesco Aim Advisers, Inc., Invesco Aim Capital Management, Inc. and Invesco Aim Private Asset Management, Inc.; Treasurer, Assistant Vice President and Assistant Treasurer, The Invesco Funds and Assistant Vice President, Invesco Advisers, Inc., Invesco Aim Capital Management, Inc. and Invesco Aim Private Asset Management, Inc.; Vice President, Invesco Advisers, Inc. (2009-2020). | |||
Rudolf E. Reitmann–1971 Invesco Capital Management LLC 3500 Lacey Road, Suite 700 Downers Grove, IL 60515 | Vice President | Since 2013 | Head of Global Exchange Traded Funds Services, Invesco Specialized Products, LLC (2018-Present); Vice President, Invesco Exchange-Traded Fund Trust, Invesco Exchange-Traded Fund Trust II, Invesco India Exchange-Traded Fund Trust, Invesco Actively Managed Exchange-Traded Fund Trust (2013-Present), Invesco Actively Managed Exchange-Traded Commodity Fund Trust (2014-Present) and Invesco Exchange-Traded Self-Indexed Fund Trust (2016-Present); Head of Global Exchange Traded Funds Services, Invesco Capital Management LLC (2013-Present); Vice President, Invesco Capital Markets, Inc. (2018-Present). | |||
| * | This is the date each Officer began serving the Trust in their current position. Each Officer serves an indefinite term, until his or her successor is elected. |
| 150 | ||||
|
| |||
Trustees and Officers–(continued)
| Name, Address and Year of Birth of Executive Officers | Position(s) with Trust | Length of Time Served* | Principal Occupation(s) During the Past 5 Years | |||
Melanie Zimdars–1976 Invesco Capital Management LLC 3500 Lacey Road, Suite 700 Downers Grove, IL 60515 | Chief Compliance Officer | Since 2017 | Chief Compliance Officer, Invesco Specialized Products, LLC (2018-Present); Chief Compliance Officer, Invesco Capital Management LLC (2017-Present); Chief Compliance Officer, Invesco Exchange-Traded Fund Trust, Invesco Exchange-Traded Fund Trust II, Invesco India Exchange-Traded Fund Trust, Invesco Actively Managed Exchange-Traded Fund Trust, Invesco Actively Managed Exchange-Traded Commodity Fund Trust and Invesco Exchange- Traded Self-Indexed Fund Trust (2017-Present); formerly, Vice President and Deputy Chief Compliance Officer, ALPS Holding, Inc. (2009-2017); Mutual Fund Treasurer/ Chief Financial Officer, Wasatch Advisors, Inc. (2005-2008); Compliance Officer, U.S. Bancorp Fund Services, LLC (2001-2005). |
| * | This is the date each Officer began serving the Trust in their current position. Each Officer serves an indefinite term, until his or her successor is elected. |
Availability of Additional Information About the Trustees
The Statement of Additional Information includes additional information about the Trustees and is available, without charge, upon request at (800) 983-0903.
| 151 | ||||
|
| |||
(This Page Intentionally Left Blank)
(This Page Intentionally Left Blank)
(This Page Intentionally Left Blank)
Proxy Voting Policies and Procedures
A description of the Trust’s proxy voting policies and procedures that the Funds use to determine how to vote proxies relating to portfolio securities is available, without charge and upon request, by calling (800) 983-0903. This information is also available on the Securities and Exchange Commission’s (the “Commission”) website at www.sec.gov.
Information regarding how each Fund voted proxies for portfolio securities, if applicable, during the most recent 12-month period ended June 30, is available, without charge and upon request, by (i) calling (800) 983-0903; or (ii) accessing the Trust’s Form N-PX on the Commission’s website at www.sec.gov.
Quarterly Portfolios
The Trust files its complete schedule of portfolio holdings for the Funds with the Commission for the first and third quarters of each fiscal year as an exhibit to its reports on Form N-PORT. The Forms N-PORT are available on the Commission’s website at www.sec.gov.
Frequency Distribution of Discounts and Premiums
A table showing the number of days the market price of each Fund’s shares was greater than the Fund’s net asset value, and the number of days it was less than the Fund’s net asset value (i.e., premium or discount) for the most recently completed calendar year, and the calendar quarters since that year end (or the life of the Fund, if shorter) may be found at the Fund’s website at www.invesco.com/ETFs.
| ©2022 Invesco Capital Management LLC | ||||
| 3500 Lacey Road, Suite 700 | ||||
| Downers Grove, IL 60515 | P-PS-AR-8 | invesco.com/ETFs |
 |
Invesco Annual Report to Shareholders
October 31, 2022
| |||
| BLKC | Invesco Alerian Galaxy Blockchain Users and Decentralized Commerce ETF | |||
| SATO | Invesco Alerian Galaxy Crypto Economy ETF | |||
| 2 |
|
Digital Assets
The digital asset market was extremely challenged during the fiscal year ended October 31, 2022, with the price of Bitcoin, for example, falling from over $60,000 in October 2021 to just over $20,000 in October 2022. While market pressure and tightening interest rates contributed to adverse returns across risk assets, digital assets had unique challenges, including the collapse of several prominent coins like UST and LUNA. Since many blockchain related companies are exposed to either digital asset prices directly or generate revenues from activity in the space, the challenges in the digital asset markets have contributed to related struggles for equity investments in companies in the industry.
Domestic Equity
The fiscal year ended October 31, 2022 began with continued volatility in equity markets in the fourth quarter of 2021 amid substantial inflation and the emergence of a new COVID-19 variant. Pandemic-related supply chain disruption and labor shortages intensified during the quarter, resulting in broadly higher input costs for companies and consumers alike. Additionally, the price of oil rose,1 causing higher gas prices for consumers, and the Consumer Price Index (CPI) reported for November 2021 increased 0.8%, resulting in a 6.8% increase over the prior 12 months, the highest since 1982.2 To combat inflation, the US Federal Reserve (the Fed) announced the potential for three or more interest rate increases in 2022. With solid corporate earnings and optimism about the COVID-19 Omicron variant reporting milder symptoms, stocks rallied at the 2021 year-end.
Equity markets declined in the first quarter of 2022 amid volatility sparked by Russia’s invasion of Ukraine, rising commodity prices, rampant global inflation and the Fed’s shift toward tighter monetary policy. Russia’s invasion exacerbated inflation pressures, disrupting already strained supply chains and increasing shortages of oil, gas and raw materials. The price of oil rose sharply, with crude prices reaching their highest price per barrel since 2008.1 Inflation continued to be a top concern for consumers, investors and the Fed. To combat inflation, the Fed raised the federal funds rate by one-quarter percentage point in March and the Fed indicated it would “taper” its asset purchase program quickly.3
As the war in Ukraine continued and corporate earnings in high-profile names like Netflix reported slowing growth and profits, the equity markets sold off for much of April 2022. The downward direction of the equity markets continued into the second quarter of 2022 amid record inflation, rising interest rates and an increasing likelihood of a US recession. Driven by higher food and energy prices, the CPI rose by yet another 40-year high to 8.6% for the 12 months ended May 2022.2 Oil prices peaked near $122 per barrel in early June, resulting in skyrocketing gasoline prices; the national average price reached a record high above $5 per
gallon in early June.1 To tame inflation, the Fed raised the benchmark federal funds rate three more times, by 0.50% in May, by 0.75% in June and another 0.75% in July, which were the largest increases in nearly 30 years.3 US equity markets rose in July and much of August until Fed chairman Jerome Powell’s hawkish comments at an economic policy symposium held in Jackson Hole, Wyoming sparked a sharp selloff at month-end. The Fed reiterated that it would continue taking aggressive action to curb inflation, even though such measures could “bring pain to households and businesses,” and the Fed raised the benchmark federal funds rate by another 0.75% in September.3
After experiencing a sharp drop in September 2022, US equity markets rebounded in October with strong gains, despite mixed data on the economy and corporate earnings. Inflation data reported in October came in higher than expected; however, the labor market remained strong, with payroll employment gains and a decline in the unemployment rate to a near record low of 3.5% in September.2 The initial estimate of third quarter real gross domestic product showed an increase of 2.6% (annualized) after falling in the prior two quarters, but the headline number masked a drop in demand and investment. Corporate earnings were generally in line with expectations, but many companies’ forward earnings guidance was weaker than expected.
In this environment, US stocks had negative double-digit returns for the fiscal year ended October 31, 2022 of -14.61%, as measured by the S&P 500 Index.4
| 1 | Source: Bloomberg LP |
| 2 | Source: US Bureau of Labor Statistics |
| 3 | Source: US Federal Reserve |
| 4 | Source: Lipper Inc. |
Global Equity
At the beginning of the fiscal year ended October 31, 2022, developed global equity markets were mostly positive, despite rising inflation and the emergence of Omicron, a new COVID-19 variant. Pandemic-related supply chain disruptions and labor shortages intensified at the end of 2021, resulting in broadly higher costs for companies and consumers. Emerging market equities declined due in part to COVID-19 concerns and China’s ongoing regulatory tightening in the private education and technology sectors and slowing economic growth.
Global equity markets declined in the first half of 2022 amid volatility sparked by Russia’s invasion of Ukraine, rising commodity prices, rampant global inflation and central banks shifting toward tighter monetary policy. Russia’s invasion exacerbated inflationary pressures, disrupting already strained supply chains, and increasing shortages of oil, gas and raw materials, with the price of oil rising sharply.
Inflation headwinds continued into the third quarter of 2022. The US Federal Reserve (the Fed), the European Central Bank and the
| 3 |
|
The Market Environment (continued)
Bank of England all raised interest rates. In contrast, the People’s Bank of China lowered its policy rate and the Bank of Japan kept rates the same. Emerging market equities, hampered by the strong US dollar, underperformed developed market equities.
During October 2022, developed market equities rebounded and were in positive territory. Developed market equities outperformed emerging market equities, which declined primarily driven by weakness in China as Chinese markets reacted to the reappointment of President Xi and his authority, with no signs of the country’s zero-COVID-19 policy being relaxed. Despite the rebound in October for developed market equities, at the end of the fiscal year, trailing one-year returns for developed market equities and emerging market equities were both in negative territory.
| 4 |
|
| BLKC | Management’s Discussion of Fund Performance | |
| Invesco Alerian Galaxy Blockchain Users and Decentralized Commerce ETF (BLKC) |
As an index fund, the Invesco Alerian Galaxy Blockchain Users and Decentralized Commerce ETF (the “Fund”) is passively managed and seeks to track the investment results (before fees and expenses) of the Alerian Galaxy Global Blockchain Equity, Trusts and ETPs Index (the “Index”). The Fund generally will invest at least 80% of its total assets in the securities that comprise the Index.
Strictly in accordance with its guidelines and mandated procedures, GKD Index Partners, LLC d/b/a Alerian (the “Index Provider or Alerian”) maintains the Index, which is comprised of two different components: (i) stocks of companies that are materially engaged in the development of blockchain technology, cryptocurrency mining, cryptocurrency buying, or enabling technologies (the “Equity Component”); and (ii) exchange-traded products (“ETPs”) and private investment trusts traded over-the-counter that invest at least 75% of their assets in Bitcoin (the “ETP and Trust Component”).
The Equity Component of the Index is primarily comprised of exchange-listed equity securities of companies that are principally or materially engaged in one of the following four business activities (each, a “Business Segment”): cryptocurrency miners, cryptocurrency enabling technologies, cryptocurrency buyers and blockchain users.
To be eligible for inclusion in the Equity Component, a company’s stock must be listed on an approved and globally recognized exchange and such company must have: (i) a minimum full market capitalization value of $50 million, (ii) a minimum free float factor of 20%, and (iii) a minimum average daily trading value (“ADTV”) for the previous three months of $1 million. Companies may be located in the U.S. or in foreign jurisdictions, including in emerging markets.
The ETP and Trust Component of the Index is represented by exchange-traded products and open-ended private investment trusts that trade on an approved U.S. exchange (in accordance with the Index Provider’s methodology) and invest at least 75% of their assets in Bitcoin. To be eligible for inclusion in the ETP and Trust Component, an ETP or private trust must also: (i) have a minimum full market capitalization of $1 billion ($500 million for current Index constituents), (ii) have a minimum ADTV for the previous three months of $15 million ($7.5 million for current Index constituents), and (iii) have an open-end structure. Currently, the only security in the ETP and Trust Component that the Fund will hold is the Grayscale Bitcoin Trust.
The Fund will not invest directly in cryptocurrencies or crypto assets. The Fund also will not invest in initial coin offerings or futures contracts on cryptocurrencies. Because the Fund will not invest directly in any cryptocurrency, it will not track price movements of any cryptocurrency. The Fund may, however, have indirect exposure to crypto assets by virtue of (i) its investments
in companies that use one or more crypto assets as part of their business activities or that hold crypto assets as proprietary investments and (ii) its investments in the ETP and Trust Component.
The Fund will allocate its assets in the same proportion as the Index (i.e., under normal circumstances, the Fund will invest approximately 85% of its assets in securities of the Equity Component and 15% in the ETP and Trust Component). The Fund generally invests in all of the securities comprising the Equity Component in proportion to their weightings in the Equity Component. However, due to the practical difficulties and expense of, or other restrictions on, purchasing all of the securities in the Index (particularly constituents of the ETP and Trust Components and otherwise where necessary), the Fund will also utilize a sampling methodology from time to time.
For the fiscal year ended October 31, 2022, on a market price basis, the Fund returned (63.66)%. On a net asset value (“NAV”) basis, the Fund returned (63.88)%. During the same time period, the Index returned (64.25)%. During the fiscal year, the Fund’s performance, on a NAV basis, differed from the return of the Index primarily due to income from securities lending, which were partially offset by fees and expenses incurred by the Fund during the period.
During this same time period, the MSCI All Country World Index (Net) (the “Benchmark Index”) returned (19.96)%. The Benchmark Index is an unmanaged index weighted by market capitalization and based on the average performance of approximately 3,000 securities. The Benchmark Index was selected for its recognition in the marketplace, and its performance comparison is a useful measure for investors as a broad representation of global stocks.
The performance of the Fund differed from the Benchmark Index because the Fund seeks to track an Index that employs a stock selection methodology within a specific sector whereas the Benchmark Index selects and weights stocks across all sectors based on market capitalization.
Relative to the Benchmark Index, the Fund was most overweight in the software industry and most underweight in the pharmaceuticals industry during the fiscal year ended October 31, 2022. The majority of the Fund’s underperformance relative to the Benchmark Index during that period can be attributed to the Fund’s stock selection in the software and IT services industries, respectively.
For the fiscal year ended October 31, 2022, the industrial conglomerates industry was the only contributing industry. The software industry detracted most significantly from the Fund’s return, followed by the IT services industry.
| 5 |
|
Invesco Alerian Galaxy Blockchain Users and Decentralized Commerce ETF (BLKC) (continued)
Positions that contributed most significantly to the Fund’s return for the fiscal year ended October 31, 2022 included Applied Blockchain, Inc., a software company (portfolio average weight of 0.52%), and Wells Fargo & Co., a banks company (portfolio average weight of 0.65%). Positions that detracted most significantly from the Fund’s return included Grayscale Bitcoin Trust BTC (portfolio average weight of 14.64%), and Greenidge Generation Holdings Inc., Class A, a software company (portfolio average weight of 1.21%).
| Sector Breakdown (% of the Fund’s Net Assets) as of October 31, 2022 | ||||
| Information Technology | 49.13 | |||
| Investment Companies | 15.11 | |||
| Financials | 14.80 | |||
| Communication Services | 6.44 | |||
| Industrials | 4.52 | |||
| Consumer Discretionary | 3.96 | |||
| Consumer Staples | 3.01 | |||
| Sector Types Each Less Than 3% | 2.90 | |||
| Money Market Funds Plus Other Assets Less Liabilities | 0.13 | |||
| Top Ten Fund Holdings* (% of the Fund’s Net Assets) as of October 31, 2022 | ||||
| Security | ||||
| Grayscale Bitcoin Trust BTC | 15.11 | |||
| MicroStrategy, Inc., Class A | 1.73 | |||
| Oracle Corp. | 1.71 | |||
| Hut 8 Mining Corp. | 1.68 | |||
| Applied Blockchain, Inc. | 1.66 | |||
| Marathon Digital Holdings, Inc. | 1.65 | |||
| JPMorgan Chase & Co. | 1.63 | |||
| Honeywell International, Inc. | 1.63 | |||
| Cleanspark, Inc. | 1.63 | |||
| International Business Machines Corp. | 1.61 | |||
| Total | 30.04 | |||
| * | Excluding money market fund holdings. |
| 6 |
|
Invesco Alerian Galaxy Blockchain Users and Decentralized Commerce ETF (BLKC) (continued)
Growth of a $10,000 Investment Since Inception
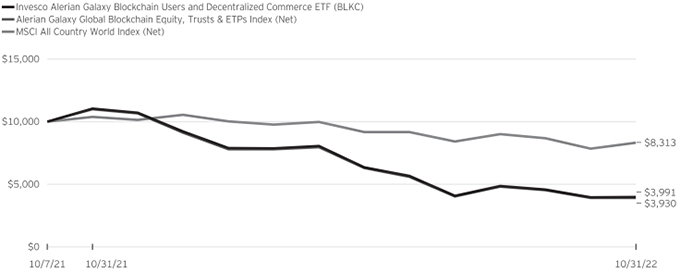
Fund Performance History as of October 31, 2022
| 1 Year | Fund Inception | |||||||||||||||
| Index | Average Annualized | Cumulative | ||||||||||||||
| Alerian Galaxy Global Blockchain Equity, Trusts & ETPs Index (Net) | (64.25 | )% | (58.41 | )% | (60.70 | )% | ||||||||||
| MSCI All Country World Index (Net) | (19.96 | ) | (15.93 | ) | (16.87 | ) | ||||||||||
| Fund | ||||||||||||||||
| NAV Return | (63.88 | ) | (57.81 | ) | (60.09 | ) | ||||||||||
| Market Price Return | (63.66 | ) | (57.97 | ) | (60.26 | ) | ||||||||||
Fund Inception: October 7, 2021
Performance quoted above represents past performance. Past performance is not a guarantee of future results and current performance may be higher or lower than performance quoted. Investment returns and principal value will fluctuate, and shares of the Fund (“Fund Shares”), when redeemed or sold, may be worth more or less than their original cost. Fund performance reflects any applicable fee waivers and/or expense reimbursements. Had the adviser not waived fees and/or reimbursed expenses currently or in the past, returns would have been lower. See the current prospectus for more information. According to the Fund’s current prospectus, the Fund’s expense ratio of 0.60% is expressed as a unitary management fee to cover operating expenses and expenses incurred in connection with managing the portfolio. NAV and Market Price returns assume that dividends and capital gain distributions have been reinvested in the Fund at NAV and Market Price, respectively. The returns shown in the table above do not reflect the deduction of taxes that a shareholder would pay on Fund distributions or the redemption or sale of Fund Shares. See invesco.com/ETFs to find the most recent month-end performance numbers.
Performance results for the indexes stated above are based upon a hypothetical investment in their respective constituent securities. The returns of an index do not represent Fund returns. An investor cannot invest directly in an index. The indexes do not charge management fees or brokerage expenses, and no such fees or expenses were deducted from the hypothetical performance shown. In addition, the results actual investors might have achieved would have differed from those shown because of differences in the timing, amounts of their investments, and fees and expenses associated with an investment in the Fund.
Notes Regarding Index and Fund Performance History:
| - | Average Annualized and Cumulative Inception returns for the Fund and the indexes are based on the inception date of the Fund. |
| - | Net returns reflect reinvested dividends net of withholding taxes. |
| 7 |
|
| SATO | Management’s Discussion of Fund Performance | |
| Invesco Alerian Galaxy Crypto Economy ETF (SATO) |
As an index fund, the Invesco Alerian Galaxy Crypto Economy ETF (the “Fund”) is passively managed and seeks to track the investment results (before fees and expenses) of the Alerian Galaxy Global Cryptocurrency-Focused Blockchain Equity, Trusts and ETPs Index (the “Index”). The Fund generally will invest at least 80% of its total assets in the securities that comprise the Index.
Strictly in accordance with its guidelines and mandated procedures, GKD Index Partners, LLC d/b/a Alerian (the “Index Provider” or “Alerian”) maintains the Index, which is comprised of two different components: (i) stocks of digital asset companies, which are companies that are materially engaged in cryptocurrency, cryptocurrency mining, cryptocurrency buying, or cryptocurrency enabling technologies (the “Equity Component”); and (ii) exchange-traded products (“ETPs”) and private investment trusts traded over-the-counter that invest at least 75% of their assets in Bitcoin (the “ETP and Trust Component”).
The Equity Component of the Index is primarily comprised of exchange-listed equity securities of companies that are principally engaged in one of the following three business activities (each, a “Business Segment”): cryptocurrency miners, cryptocurrency enabling technologies and cryptocurrency buyers.
To be eligible for inclusion in the Equity Component of the Index, a company’s stock must be listed on a globally recognized exchange and such company must have: (i) a minimum full market capitalization value of $50 million, (ii) a minimum free float factor of 20%, and (iii) a minimum average daily trading value (“ADTV”) for the previous three months of $1 million. Companies may be located in the U.S. or in foreign jurisdictions, including in emerging markets.
The ETP and Trust Component of the Index is represented by exchange-traded products (including exchange-traded notes (“ETNs”) and exchange-traded funds listed outside of the U.S.) and open-ended private investment trusts that trade on an approved U.S. exchange (in accordance with the Index Provider’s methodology) and invest at least 75% of their assets in Bitcoin. To be eligible for inclusion in the ETP and Trust Component, an ETP or private trust must: (i) have a minimum full market capitalization of $1 billion ($500 million for current constituents), (ii) have a minimum ADTV for the previous three months of $15 million ($7.5 million for current constituents), and (iii) have an open-end structure. Currently, the only security in the ETP and Trust Component that the Fund will hold is the Grayscale Bitcoin Trust.
The Fund will not invest directly in cryptocurrencies or crypto assets. The Fund also will not invest in initial coin offerings or futures contracts on cryptocurrencies. Because the Fund will not invest directly in any cryptocurrency, it will not track price movements of any cryptocurrency. The Fund may, however, have indirect exposure to crypto assets by virtue of (i) its investments
in companies that use one or more crypto assets as part of their business activities or that hold crypto assets as proprietary investments and (ii) its investments in the ETP and Trust Component.
The Fund will allocate its assets in the same proportion as the Index (i.e., under normal circumstances, the Fund will invest approximately 85% of its assets in securities of the Equity Component and 15% in the ETP and Trust Component). The Fund generally invests in all of the securities comprising the Equity Component in proportion to their weightings in the Equity Component. However, due to the practical difficulties and expense of, or other restrictions on, purchasing all of the securities in the Index (particularly constituents of the ETP and Trust Components and otherwise where necessary), the Fund will also utilize a sampling methodology from time to time.
For the fiscal year ended October 31, 2022, on a market price basis, the Fund returned (78.27)%. On a net asset value (“NAV”) basis, the Fund returned (78.47)%. During the same time period, the Index returned (78.20)%. During the fiscal year, the Fund’s performance, on a NAV basis, differed from the return of the Index primarily due to fees and expenses the Fund incurred during the period, partially offset by the Fund having a lower weight to the Grayscale Bitcoin Trust relative to the Index.
During this same time period, the MSCI All Country World Index (Net) (the “Benchmark Index”) returned (19.96)%. The Benchmark Index is an unmanaged index weighted by market capitalization and based on the average performance of approximately 3,000 securities. The Benchmark Index was selected for its recognition in the marketplace, and its performance comparison is a useful measure for investors as a broad representation of global stocks.
The performance of the Fund differed from the Benchmark Index because the Fund seeks to track an Index that employs a stock selection methodology within a specific sector whereas the Benchmark Index selects and weights stocks across all sectors based on market capitalization.
Relative to the Benchmark Index, the Fund was most overweight in the software industry and most underweight in the pharmaceuticals industry during the fiscal year ended October 31, 2022. The majority of the Fund’s underperformance relative to the Benchmark Index during that period can be attributed to the Fund’s security selection and overweight allocation in the software industry.
For the fiscal year ended October 31, 2022, no industry positively contributed to the Fund’s return. The software industry detracted most significantly from the Fund’s return during the period, followed by the IT services and capital markets industries, respectively.
| 8 |
|
Invesco Alerian Galaxy Crypto Economy ETF (SATO) (continued)
Positions that contributed most significantly to the Fund’s return for the fiscal year ended October 31, 2022 included Applied Blockchain, Inc., a software company (portfolio average weight of 1.21%), and Marathon Digital Holdings, Inc., a software company (portfolio average weight of 3.02%). Positions that detracted most significantly from the Fund’s return included Grayscale Bitcoin Trust BTC (portfolio average weight of 14.98%), and Core Scientific, Inc., an IT services company (portfolio average weight of 1.87%).
| Sector Breakdown (% of the Fund’s Net Assets) as of October 31, 2022 | ||||
| Information Technology | 60.69 | |||
| Financials | 17.96 | |||
| Investment Companies | 15.36 | |||
| Communication Services | 3.05 | |||
| Sector Types Each Less Than 3% | 2.68 | |||
| Money Market Funds Plus Other Assets Less Liabilities | 0.26 | |||
| Top Ten Fund Holdings* (% of the Fund’s Net Assets) as of October 31, 2022 | ||||
| Security | ||||
| Grayscale Bitcoin Trust BTC | 15.36 | |||
| MicroStrategy, Inc., Class A | 4.46 | |||
| Hut 8 Mining Corp. | 4.35 | |||
| Marathon Digital Holdings, Inc. | 4.29 | |||
| Applied Blockchain, Inc. | 4.29 | |||
| Cleanspark, Inc. | 4.21 | |||
| Riot Blockchain, Inc. | 3.97 | |||
| Galaxy Digital Holdings Ltd. | 3.94 | |||
| Block, Inc., Class A | 3.93 | |||
| Bit Digital, Inc. | 3.64 | |||
| Total | 52.44 | |||
| * | Excluding money market fund holdings. |
| 9 |
|
Invesco Alerian Galaxy Crypto Economy ETF (SATO) (continued)
Growth of a $10,000 Investment Since Inception
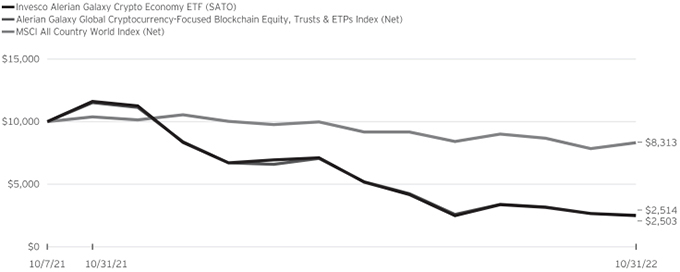
Fund Performance History as of October 31, 2022
| 1 Year | Fund Inception | |||||||||||||||
| Index | Average Annualized | Cumulative | ||||||||||||||
| Alerian Galaxy Global Cryptocurrency-Focused Blockchain Equity, Trusts & ETPs Index (Net) | (78.20 | )% | (72.67 | )% | (74.86 | )% | ||||||||||
| MSCI All Country World Index (Net) | (19.96 | ) | (15.93 | ) | (16.87 | ) | ||||||||||
| Fund | ||||||||||||||||
| NAV Return | (78.47 | ) | (72.78 | ) | (74.97 | ) | ||||||||||
| Market Price Return | (78.27 | ) | (73.12 | ) | (75.30 | ) | ||||||||||
Fund Inception: October 7, 2021
Performance quoted above represents past performance. Past performance is not a guarantee of future results and current performance may be higher or lower than performance quoted. Investment returns and principal value will fluctuate, and shares of the Fund (“Fund Shares”), when redeemed or sold, may be worth more or less than their original cost. Fund performance reflects any applicable fee waivers and/or expense reimbursements. Had the adviser not waived fees and/or reimbursed expenses currently or in the past, returns would have been lower. See the current prospectus for more information. According to the Fund’s current prospectus, the Fund’s expense ratio of 0.60% is expressed as a unitary management fee to cover operating expenses and expenses incurred in connection with managing the portfolio. NAV and Market Price returns assume that dividends and capital gain distributions have been reinvested in the Fund at NAV and Market Price, respectively. The returns shown in the table above do not reflect the deduction of taxes that a shareholder would pay on Fund distributions or the redemption or sale of Fund Shares. See invesco.com/ETFs to find the most recent month-end performance numbers.
Performance results for the indexes stated above are based upon a hypothetical investment in their respective constituent securities. The returns of an index do not represent Fund returns. An investor cannot invest directly in an index. The indexes do not charge management fees or brokerage expenses, and no such fees or expenses were deducted from the hypothetical performance shown. In addition, the results actual investors might have achieved would have differed from those shown because of differences in the timing, amounts of their investments, and fees and expenses associated with an investment in the Fund.
Notes Regarding Index and Fund Performance History:
| - | Average Annualized and Cumulative Inception returns for the Fund and the indexes are based on the inception date of the Fund. |
| - | Net returns reflect reinvested dividends net of withholding taxes. |
| 10 |
|
Invesco Alerian Galaxy Blockchain Users and Decentralized Commerce ETF (BLKC)
October 31, 2022
Consolidated Schedule of Investments(a)
| Shares | Value | |||||||
Common Stocks & Other Equity Interests-84.76% |
| |||||||
Australia-2.71% |
| |||||||
BHP Group Ltd. | 1,142 | $ | 27,282 | |||||
Iris Energy Ltd.(b)(c) | 7,663 | 25,939 | ||||||
|
| |||||||
| 53,221 | ||||||||
|
| |||||||
Canada-4.37% |
| |||||||
Bitfarms Ltd.(b)(c) | 27,965 | 26,816 | ||||||
Hive Blockchain Technologies Ltd.(b)(c) | 8,315 | 25,907 | ||||||
Hut 8 Mining Corp.(b)(c) | 14,761 | 33,114 | ||||||
|
| |||||||
| 85,837 | ||||||||
|
| |||||||
China-6.48% |
| |||||||
Alibaba Group Holding Ltd., ADR(b)(c) | 373 | 23,715 | ||||||
Bit Digital, Inc.(b)(c) | 26,138 | 27,706 | ||||||
Canaan, Inc., ADR(b)(c) | 8,502 | 24,656 | ||||||
Meitu, Inc.(b)(d) | 322,830 | 27,966 | ||||||
Tencent Holdings Ltd. | 894 | 23,415 | ||||||
|
| |||||||
| 127,458 | ||||||||
|
| |||||||
Netherlands-1.51% |
| |||||||
Shell PLC | 1,076 | 29,782 | ||||||
|
| |||||||
Norway-1.54% |
| |||||||
Aker ASA, Class A | 431 | 30,366 | ||||||
|
| |||||||
South Korea-1.54% |
| |||||||
Samsung Electronics Co. Ltd. | 727 | 30,316 | ||||||
|
| |||||||
Taiwan-1.32% |
| |||||||
Taiwan Semiconductor Manufacturing Co. Ltd., ADR | 420 | 25,851 | ||||||
|
| |||||||
United States-65.29% |
| |||||||
Accenture PLC, Class A | 108 | 30,661 | ||||||
Advanced Micro Devices, Inc.(b) | 475 | 28,529 | ||||||
Alphabet, Inc., Class A(b) | 282 | 26,652 | ||||||
Amazon.com, Inc.(b) | 248 | 25,405 | ||||||
Applied Blockchain, Inc.(b)(c) | 14,496 | 32,616 | ||||||
Bakkt Holdings, Inc.(b) | 13,007 | 27,705 | ||||||
Bank of America Corp. | 878 | 31,643 | ||||||
BitNile Holdings, Inc.(b) | 155,630 | 26,535 | ||||||
Block, Inc., Class A(b) | 498 | 29,915 | ||||||
Cisco Systems, Inc. | 686 | 31,165 | ||||||
Citigroup, Inc. | 648 | 29,717 | ||||||
Cleanspark, Inc.(b)(c) | 9,201 | 32,020 | ||||||
Coinbase Global, Inc., Class A(b)(c) | 404 | 26,765 | ||||||
Core Scientific, Inc.(b) | 22,552 | 4,510 | ||||||
Galaxy Digital Holdings Ltd., (Acquired 10/05/2021 - 10/21/2022; | 6,165 | 29,965 | ||||||
Goldman Sachs Group, Inc. (The) | 90 | 31,006 | ||||||
Greenidge Generation Holdings, Inc.(b)(c) | 22,933 | 22,296 | ||||||
Honeywell International, Inc. | 157 | 32,031 | ||||||
Intel Corp. | 1,060 | 30,136 | ||||||
International Business Machines Corp. | 229 | 31,668 | ||||||
Intuit, Inc. | 70 | 29,925 | ||||||
JPMorgan Chase & Co. | 255 | 32,099 | ||||||
Investment Abbreviations: |
| |||||||
ADR-American Depositary Receipt |
| |||||||
| Shares | Value | |||||||
United States-(continued) | ||||||||
Marathon Digital Holdings, Inc.(b)(c) | 2,480 | $ | 32,513 | |||||
Mastercard, Inc., Class A | 94 | 30,849 | ||||||
Meta Platforms, Inc., Class A(b) | 215 | 20,029 | ||||||
Micron Technology, Inc. | 511 | 27,645 | ||||||
Microsoft Corp. | 119 | 27,624 | ||||||
MicroStrategy, Inc., Class A(b)(c) | 127 | 33,974 | ||||||
Nestle S.A. | 267 | 29,092 | ||||||
NVIDIA Corp. | 234 | 31,583 | ||||||
Oracle Corp. | 430 | 33,570 | ||||||
PayPal Holdings, Inc.(b) | 331 | 27,665 | ||||||
Phunware, Inc.(b)(c) | 23,901 | 27,964 | ||||||
QUALCOMM, Inc. | 247 | 29,062 | ||||||
Riot Blockchain, Inc.(b)(c) | 4,380 | 30,178 | ||||||
SAI.TECH Global Corp., Class C(b)(c) | 7,814 | 17,972 | ||||||
salesforce.com, inc.(b) | 192 | 31,217 | ||||||
Signature Bank | 181 | 28,694 | ||||||
Silvergate Capital Corp., Class A(b)(c) | 408 | 23,158 | ||||||
Tesla, Inc.(b) | 126 | 28,670 | ||||||
Texas Instruments, Inc. | 180 | 28,913 | ||||||
Verizon Communications, Inc. | 765 | 28,588 | ||||||
Visa, Inc., Class A(c) | 151 | 31,281 | ||||||
Walmart, Inc. | 211 | 30,032 | ||||||
Wells Fargo & Co. | 657 | 30,216 | ||||||
|
| |||||||
| 1,283,453 | ||||||||
|
| |||||||
Total Common Stocks & Other Equity Interests |
| 1,666,284 | ||||||
|
| |||||||
Mutual Fund-15.11% | ||||||||
United States-15.11% | ||||||||
Grayscale Bitcoin Trust BTC | 24,752 | 297,024 | ||||||
|
| |||||||
TOTAL INVESTMENTS IN SECURITIES |
| 1,963,308 | ||||||
|
| |||||||
| Investments Purchased with Cash Collateral from Securities on Loan |
| |||||||
Money Market Funds-21.73% |
| |||||||
Invesco Private Government Fund, 3.18%(f)(g)(h) | 117,081 | 117,081 | ||||||
Invesco Private Prime Fund, 3.28%(f)(g)(h) | 310,156 | 310,156 | ||||||
|
| |||||||
Total Investments Purchased with Cash Collateral from Securities on Loan |
| 427,237 | ||||||
|
| |||||||
TOTAL INVESTMENTS IN SECURITIES-121.60% |
| 2,390,545 | ||||||
OTHER ASSETS LESS LIABILITIES-(21.60)% |
| (424,688 | ) | |||||
|
| |||||||
NET ASSETS-100.00% |
| $ | 1,965,857 | |||||
|
| |||||||
See accompanying Notes to Consolidated Financial Statements which are an integral part of the consolidated financial statements.
| 11 | ||||
|
| |||
Invesco Alerian Galaxy Blockchain Users and Decentralized Commerce ETF (BLKC)–(continued)
October 31, 2022
Notes to Consolidated Schedule of Investments:
| (a) | The Consolidated Schedule of Investments includes the accounts of the wholly-owned subsidiary. All inter-company accounts and transactions have been eliminated in consolidations. |
| (b) | Non-income producing security. |
| (c) | All or a portion of this security was out on loan at October 31, 2022. |
| (d) | Security purchased or received in a transaction exempt from registration under the Securities Act of 1933, as amended (the “1933 Act”). The security may be resold pursuant to an exemption from registration under the 1933 Act, typically to qualified institutional buyers. The value of this security at October 31, 2022 represented 1.42% of the Fund’s Net Assets. |
| (e) | Restricted security. The value of this security at October 31, 2022 represented 1.52% of the Fund’s Net Assets. |
| (f) | Affiliated issuer. The issuer and/or the Fund is a wholly-owned subsidiary of Invesco Ltd., or is affiliated by having an investment adviser that is under common control of Invesco Ltd. The table below shows the Fund’s transactions in, and earnings from, its investments in affiliates for the fiscal year ended October 31, 2022. |
| Value October 31, 2021 | Purchases at Cost | Proceeds from Sales | Change in Unrealized Appreciation | Realized Gain (Loss) | Value October 31, 2022 | Dividend Income | |||||||||||||||||||||||||||||
| Investments in Affiliated Money Market Funds: | |||||||||||||||||||||||||||||||||||
| Invesco Government & Agency Portfolio, Institutional Class | $ | - | $ | 398,568 | $ | (398,568 | ) | $ | - | $ | - | $ | - | $ | 41 | ||||||||||||||||||||
| Investments Purchased with Cash Collateral from Securities on Loan: | |||||||||||||||||||||||||||||||||||
| Invesco Private Government Fund | - | 2,688,047 | (2,570,966 | ) | - | - | 117,081 | 1,202 | * | ||||||||||||||||||||||||||
| Invesco Private Prime Fund | - | 4,382,494 | (4,072,262 | ) | 2 | (78 | ) | 310,156 | 3,401 | * | |||||||||||||||||||||||||
|
|
|
|
|
|
|
|
|
|
|
|
|
| ||||||||||||||||||||||
| Total | $ | - | $ | 7,469,109 | $ | (7,041,796 | ) | $ | 2 | $ | (78 | ) | $ | 427,237 | $ | 4,644 | |||||||||||||||||||
|
|
|
|
|
|
|
|
|
|
|
|
|
| ||||||||||||||||||||||
| * | Represents the income earned on the investment of cash collateral, which is included in securities lending income on the Consolidated Statement of Operations. Does not include rebates and fees paid to lending agent or premiums received from borrowers, if any. |
| (g) | The rate shown is the 7-day SEC standardized yield as of October 31, 2022. |
| (h) | The security has been segregated to satisfy the commitment to return the cash collateral received in securities lending transactions upon the borrower’s return of the securities loaned. See Note 2I. |
See accompanying Notes to Consolidated Financial Statements which are an integral part of the consolidated financial statements.
| 12 | ||||
|
| |||
Invesco Alerian Galaxy Crypto Economy ETF (SATO)
October 31, 2022
Consolidated Schedule of Investments(a)
| Shares | Value | |||||||
Common Stocks & Other Equity Interests-84.38% |
| |||||||
Australia-3.41% | ||||||||
Iris Energy Ltd.(b)(c) | 27,889 | $ | 94,404 | |||||
|
| |||||||
Canada-11.29% | ||||||||
Bitfarms Ltd.(b) | 101,795 | 97,611 | ||||||
Hive Blockchain Technologies Ltd.(b)(c) | 30,258 | 94,276 | ||||||
Hut 8 Mining Corp.(b)(c) | 53,728 | 120,529 | ||||||
|
| |||||||
| 312,416 | ||||||||
|
| |||||||
China-8.49% | ||||||||
Bit Digital, Inc.(b)(c) | 95,143 | 100,851 | ||||||
Canaan, Inc., ADR(b)(c) | 30,941 | 89,729 | ||||||
Meitu, Inc.(b)(d) | 279,097 | 24,177 | ||||||
Tencent Holdings Ltd. | 771 | 20,194 | ||||||
|
| |||||||
| 234,951 | ||||||||
|
| |||||||
Norway-0.95% | ||||||||
Aker ASA, Class A | 372 | 26,209 | ||||||
|
| |||||||
South Korea-0.95% | ||||||||
Samsung Electronics Co. Ltd. | 632 | 26,355 | ||||||
|
| |||||||
Taiwan-0.81% | ||||||||
Taiwan Semiconductor Manufacturing Co. Ltd., ADR | 363 | 22,343 | ||||||
|
| |||||||
United States-58.48% | ||||||||
Advanced Micro Devices, Inc.(b) | 410 | 24,625 | ||||||
Alphabet, Inc., Class A(b) | 242 | 22,871 | ||||||
Applied Blockchain, Inc.(b) | 52,744 | 118,674 | ||||||
Bakkt Holdings, Inc.(b) | 47,347 | 100,849 | ||||||
BitNile Holdings, Inc.(b) | 134,538 | 22,939 | ||||||
Block, Inc., Class A(b) | 1,810 | 108,727 | ||||||
Cleanspark, Inc.(b)(c) | 33,485 | 116,528 | ||||||
Coinbase Global, Inc., Class A(b)(c) | 1,470 | 97,388 | ||||||
Core Scientific, Inc.(b) | 82,097 | 16,419 | ||||||
Galaxy Digital Holdings Ltd., (Acquired 01/25/2022 - 10/21/2022; | 22,429 | 109,017 | ||||||
Goldman Sachs Group, Inc. (The) | 78 | 26,872 | ||||||
Greenidge Generation Holdings, Inc.(b)(c) | 83,439 | 81,119 | ||||||
JPMorgan Chase & Co. | 221 | 27,819 | ||||||
Marathon Digital Holdings, Inc.(b)(c) | 9,067 | 118,868 | ||||||
Meta Platforms, Inc., Class A(b) | 185 | 17,235 | ||||||
Micron Technology, Inc. | 441 | 23,858 | ||||||
Investment Abbreviations: | ||||||||
ADR-American Depositary Receipt | ||||||||
| Shares | Value | |||||||
United States-(continued) | ||||||||
Microsoft Corp. | 103 | $ | 23,909 | |||||
MicroStrategy, Inc., Class A(b)(c) | 461 | 123,322 | ||||||
NVIDIA Corp. | 202 | 27,264 | ||||||
PayPal Holdings, Inc.(b) | 288 | 24,071 | ||||||
Phunware, Inc.(b)(c) | 20,664 | 24,177 | ||||||
Riot Blockchain, Inc.(b)(c) | 15,931 | 109,765 | ||||||
SAI.TECH Global Corp., Class C(b)(c) | 28,404 | 65,329 | ||||||
Signature Bank | 157 | 24,889 | ||||||
Silvergate Capital Corp., Class A(b)(c) | 1,483 | 84,175 | ||||||
Tesla, Inc.(b) | 109 | 24,802 | ||||||
Visa, Inc., Class A | 131 | 27,138 | ||||||
Wells Fargo & Co. | 571 | 26,260 | ||||||
|
| |||||||
| 1,618,909 | ||||||||
|
| |||||||
Total Common Stocks & Other Equity Interests |
| 2,335,587 | ||||||
|
| |||||||
Mutual Fund-15.36% |
| |||||||
United States-15.36% | ||||||||
Grayscale Bitcoin Trust BTC | 35,435 | 425,220 | ||||||
|
| |||||||
TOTAL INVESTMENTS IN SECURITIES |
| 2,760,807 | ||||||
|
| |||||||
| Investments Purchased with Cash Collateral from Securities on Loan |
| |||||||
Money Market Funds-31.16% |
| |||||||
Invesco Private Government Fund, 3.18%(f)(g)(h) | 221,063 | 221,063 | ||||||
Invesco Private Prime Fund, 3.28%(f)(g)(h) | 641,624 | 641,624 | ||||||
|
| |||||||
Total Investments Purchased with Cash Collateral from Securities on Loan |
| 862,687 | ||||||
|
| |||||||
TOTAL INVESTMENTS IN SECURITIES-130.90% |
| 3,623,494 | ||||||
OTHER ASSETS LESS LIABILITIES-(30.90)% |
| (855,417 | ) | |||||
|
| |||||||
NET ASSETS-100.00% | $ | 2,768,077 | ||||||
|
| |||||||
See accompanying Notes to Consolidated Financial Statements which are an integral part of the consolidated financial statements.
| 13 | ||||
|
| |||
Invesco Alerian Galaxy Crypto Economy ETF (SATO)–(continued)
October 31, 2022
Notes to Consolidated Schedule of Investments:
| (a) | The Consolidated Schedule of Investments includes the accounts of the wholly-owned subsidiary. All inter-company accounts and transactions have been eliminated in consolidations. |
| (b) | Non-income producing security. |
| (c) | All or a portion of this security was out on loan at October 31, 2022. |
| (d) | Security purchased or received in a transaction exempt from registration under the Securities Act of 1933, as amended (the “1933 Act”). The security may be resold pursuant to an exemption from registration under the 1933 Act, typically to qualified institutional buyers. The value of this security at October 31, 2022 represented less than 1% of the Fund’s Net Assets. |
| (e) | Restricted security. The value of this security at October 31, 2022 represented 3.94% of the Fund’s Net Assets. |
| (f) | Affiliated issuer. The issuer and/or the Fund is a wholly-owned subsidiary of Invesco Ltd., or is affiliated by having an investment adviser that is under common control of Invesco Ltd. The table below shows the Fund’s transactions in, and earnings from, its investments in affiliates for the fiscal year ended October 31, 2022. |
| Value October 31, 2021 | Purchases at Cost | Proceeds from Sales | Change in Unrealized Appreciation (Depreciation) | Realized Gain (Loss) | Value October 31, 2022 | Dividend Income | |||||||||||||||||||||||||||||
| Investments in Affiliated Money Market Funds: | |||||||||||||||||||||||||||||||||||
| Invesco Government & Agency Portfolio, Institutional Class | $413,001 | $ | 312,912 | $ | (725,913 | ) | $ | - | $ | - | $ | - | $ | 28 | |||||||||||||||||||||
| Investments Purchased with Cash Collateral from Securities on Loan: | |||||||||||||||||||||||||||||||||||
| Invesco Private Government Fund | - | 7,512,908 | (7,291,845 | ) | - | - | 221,063 | 3,185 | * | ||||||||||||||||||||||||||
| Invesco Private Prime Fund | - | 11,892,213 | (11,250,289 | ) | (1 | ) | (299 | ) | 641,624 | 9,269 | * | ||||||||||||||||||||||||
|
|
|
|
|
|
|
|
|
|
|
|
|
| ||||||||||||||||||||||
| Total | $413,001 | $ | 19,718,033 | $ | (19,268,047 | ) | $ | (1 | ) | $ | (299 | ) | $ | 862,687 | $ | 12,482 | |||||||||||||||||||
|
|
|
|
|
|
|
|
|
|
|
|
|
| ||||||||||||||||||||||
| * | Represents the income earned on the investment of cash collateral, which is included in securities lending income on the Consolidated Statement of Operations. Does not include rebates and fees paid to lending agent or premiums received from borrowers, if any. |
| (g) | The rate shown is the 7-day SEC standardized yield as of October 31, 2022. |
| (h) | The security has been segregated to satisfy the commitment to return the cash collateral received in securities lending transactions upon the borrower’s return of the securities loaned. See Note 2I. |
See accompanying Notes to Consolidated Financial Statements which are an integral part of the consolidated financial statements.
| 14 | ||||
|
| |||
Consolidated Statements of Assets and Liabilities
October 31, 2022
| Invesco | ||||||||||
| Alerian Galaxy | Invesco | |||||||||
| Blockchain Users | Alerian Galaxy | |||||||||
| and Decentralized | Crypto Economy | |||||||||
Commerce ETF (BLKC) | ETF (SATO) | |||||||||
Assets: | ||||||||||
Unaffiliated investments in securities, at value(a) | $ | 1,963,308 | $ | 2,760,807 | ||||||
Affiliated investments in securities, at value | 427,237 | 862,687 | ||||||||
Receivable for: | ||||||||||
Dividends | 1,183 | 2,372 | ||||||||
Securities lending | 3,128 | 6,899 | ||||||||
Investments sold | - | 64,846 | ||||||||
|
|
|
| |||||||
Total assets | 2,394,856 | 3,697,611 | ||||||||
|
|
|
| |||||||
Liabilities: | ||||||||||
Due to custodian | 728 | 65,212 | ||||||||
Due to foreign custodian | 36 | 171 | ||||||||
Payable for: | ||||||||||
Collateral upon return of securities loaned | 427,235 | 862,688 | ||||||||
Accrued unitary management fees | 1,000 | 1,463 | ||||||||
|
|
|
| |||||||
Total liabilities | 428,999 | 929,534 | ||||||||
|
|
|
| |||||||
Net Assets | $ | 1,965,857 | $ | 2,768,077 | ||||||
|
|
|
| |||||||
Net assets consist of: | ||||||||||
Shares of beneficial interest | $ | 4,880,126 | $ | 10,677,914 | ||||||
Distributable earnings (loss) | (2,914,269 | ) | (7,909,837 | ) | ||||||
|
|
|
| |||||||
Net Assets | $ | 1,965,857 | $ | 2,768,077 | ||||||
|
|
|
| |||||||
Shares outstanding (unlimited amount authorized, $0.01 par value) | 200,001 | 450,001 | ||||||||
Net asset value | $ | 9.83 | $ | 6.15 | ||||||
|
|
|
| |||||||
Market price | $ | 9.82 | $ | 6.14 | ||||||
|
|
|
| |||||||
Unaffiliated investments in securities, at cost | $ | 3,093,959 | $ | 5,013,655 | ||||||
|
|
|
| |||||||
Affiliated investments in securities, at cost | $ | 427,235 | $ | 862,688 | ||||||
|
|
|
| |||||||
Foreign currencies (due to foreign custodian), at cost | $ | (36 | ) | $ | (178 | ) | ||||
|
|
|
| |||||||
(a)Includes securities on loan with an aggregate value of: | $ | 384,229 | $ | 744,880 | ||||||
|
|
|
| |||||||
See accompanying Notes to Consolidated Financial Statements which are an integral part of the consolidated financial statements.
| 15 | ||||
|
| |||
Consolidated Statements of Operations
For the year ended October 31, 2022
| Invesco | ||||||||||
| Alerian Galaxy | Invesco | |||||||||
| Blockchain Users | Alerian Galaxy | |||||||||
| and Decentralized | Crypto Economy | |||||||||
Commerce ETF (BLKC) | ETF (SATO) | |||||||||
Investment income: | ||||||||||
Unaffiliated dividend income | $ | 29,208 | $ | 8,901 | ||||||
Affiliated dividend income | 41 | 28 | ||||||||
Non-cash dividend income | - | 2,283 | ||||||||
Securities lending income, net | 57,920 | 191,334 | ||||||||
Foreign withholding tax | (1,343 | ) | (890 | ) | ||||||
|
|
|
| |||||||
Total investment income | 85,826 | 201,656 | ||||||||
|
|
|
| |||||||
Expenses: | ||||||||||
Unitary management fees | 20,226 | 38,066 | ||||||||
Tax expenses | 192 | 577 | ||||||||
|
|
|
| |||||||
Total expenses | 20,418 | 38,643 | ||||||||
|
|
|
| |||||||
Net investment income | 65,408 | 163,013 | ||||||||
|
|
|
| |||||||
Realized and unrealized gain (loss) from: | ||||||||||
Net realized gain (loss) from: | ||||||||||
Unaffiliated investment securities | (1,893,240 | ) | (6,978,216 | ) | ||||||
Affiliated investment securities | (78 | ) | (299 | ) | ||||||
In-kind redemptions | - | (112,682 | ) | |||||||
Foreign currencies | 444 | (772 | ) | |||||||
|
|
|
| |||||||
Net realized gain (loss) | (1,892,874 | ) | (7,091,969 | ) | ||||||
|
|
|
| |||||||
Change in net unrealized appreciation (depreciation) of: | ||||||||||
Unaffiliated investment securities | (1,711,143 | ) | (3,653,806 | ) | ||||||
Affiliated investment securities | 2 | (1 | ) | |||||||
Foreign currencies | 3 | 9 | ||||||||
|
|
|
| |||||||
Change in net unrealized appreciation (depreciation) | (1,711,138 | ) | (3,653,798 | ) | ||||||
|
|
|
| |||||||
Net realized and unrealized gain (loss) | (3,604,012 | ) | (10,745,767 | ) | ||||||
|
|
|
| |||||||
Net increase (decrease) in net assets resulting from operations | $ | (3,538,604 | ) | $ | (10,582,754 | ) | ||||
|
|
|
| |||||||
See accompanying Notes to Consolidated Financial Statements which are an integral part of the consolidated financial statements.
| 16 | ||||
|
| |||
Statements of Changes in Net Assets
For the years ended October 31, 2022 and 2021
| Invesco | ||||||||||||||||||||
| Alerian Galaxy | Invesco | |||||||||||||||||||
| Blockchain Users | Alerian Galaxy | |||||||||||||||||||
| and Decentralized | Crypto Economy | |||||||||||||||||||
| Commerce ETF (BLKC) | ETF (SATO) | |||||||||||||||||||
| 2022 | 2021(a) | 2022 | 2021(a) | |||||||||||||||||
Operations: | ||||||||||||||||||||
Net investment income (loss) | $ | 65,408 | $ | 981 | $ | 163,013 | $ | (3,186 | ) | |||||||||||
Net realized gain (loss) | (1,892,874 | ) | 4,712 | (7,091,969 | ) | 1,428 | ||||||||||||||
Change in net unrealized appreciation (depreciation) | (1,711,138 | ) | 580,491 | (3,653,798 | ) | 1,400,958 | ||||||||||||||
|
|
|
|
|
|
|
| |||||||||||||
Net increase (decrease) in net assets resulting from operations | (3,538,604 | ) | 586,184 | (10,582,754 | ) | 1,399,200 | ||||||||||||||
|
|
|
|
|
|
|
| |||||||||||||
Distributions to Shareholders from: | ||||||||||||||||||||
Distributable earnings | (81,748 | ) | - | (174,368 | ) | - | ||||||||||||||
|
|
|
|
|
|
|
| |||||||||||||
Shareholder Transactions: | ||||||||||||||||||||
Proceeds from shares sold | - | 5,000,025 | 2,453,318 | 10,363,314 | ||||||||||||||||
Value of shares repurchased | - | - | (690,633 | ) | - | |||||||||||||||
|
|
|
|
|
|
|
| |||||||||||||
Net increase in net assets resulting from share transactions | - | 5,000,025 | 1,762,685 | 10,363,314 | ||||||||||||||||
|
|
|
|
|
|
|
| |||||||||||||
Net increase (decrease) in net assets | (3,620,352 | ) | 5,586,209 | (8,994,437 | ) | 11,762,514 | ||||||||||||||
|
|
|
|
|
|
|
| |||||||||||||
Net assets: | ||||||||||||||||||||
Beginning of period | 5,586,209 | - | 11,762,514 | - | ||||||||||||||||
|
|
|
|
|
|
|
| |||||||||||||
End of period | $ | 1,965,857 | $ | 5,586,209 | $ | 2,768,077 | $ | 11,762,514 | ||||||||||||
|
|
|
|
|
|
|
| |||||||||||||
Changes in Shares Outstanding: | ||||||||||||||||||||
Shares sold | - | 200,001 | 150,000 | 400,001 | ||||||||||||||||
Shares repurchased | - | - | (100,000 | ) | - | |||||||||||||||
Shares outstanding, beginning of period | 200,001 | - | 400,001 | - | ||||||||||||||||
|
|
|
|
|
|
|
| |||||||||||||
Shares outstanding, end of period | 200,001 | 200,001 | 450,001 | 400,001 | ||||||||||||||||
|
|
|
|
|
|
|
| |||||||||||||
(a) For the period October 5, 2021 (commencement of investment operations) through October 31, 2021.
See accompanying Notes to Consolidated Financial Statements which are an integral part of the consolidated financial statements.
| 17 | ||||
|
| |||
Consolidated Financial Highlights
Invesco Alerian Galaxy Blockchain Users and Decentralized Commerce ETF (BLKC)
| For the Period | ||||||||||
| October 5, 2021(a) | ||||||||||
| Year Ended | Through | |||||||||
| October 31, | October 31, | |||||||||
2022 | 2021 | |||||||||
Per Share Operating Performance: | ||||||||||
Net asset value at beginning of period | $ | 27.93 | $ | 25.00 | ||||||
|
|
|
| |||||||
Net investment income(b) | 0.33 | 0.01 | ||||||||
Net realized and unrealized gain (loss) on investments | (18.02 | ) | 2.92 | |||||||
|
|
|
| |||||||
Total from investment operations | (17.69 | ) | 2.93 | |||||||
|
|
|
| |||||||
Distributions to shareholders from: | ||||||||||
Net investment income | (0.41 | ) | - | |||||||
|
|
|
| |||||||
Net asset value at end of period | $ | 9.83 | $ | 27.93 | ||||||
|
|
|
| |||||||
Market price at end of period(c) | $ | 9.82 | $ | 27.73 | ||||||
|
|
|
| |||||||
Net Asset Value Total Return(d) | (63.88 | )% | 11.72 | %(e) | ||||||
Market Price Total Return(d) | (63.66 | )% | 10.92 | %(e) | ||||||
Ratios/Supplemental Data: | ||||||||||
Net assets at end of period (000’s omitted) | $ | 1,966 | $ | 5,586 | ||||||
Ratio to average net assets of: | ||||||||||
Expenses | 0.61 | % | 0.60 | %(f) | ||||||
Net investment income | 1.94 | % | 0.27 | %(f) | ||||||
Portfolio turnover rate(g) | 124 | % | 12 | % | ||||||
| (a) | Commencement of investment operations. |
| (b) | Based on average shares outstanding. |
| (c) | The mean between the last bid and ask prices. |
| (d) | Net asset value total return is calculated assuming an initial investment made at the net asset value at the beginning of the period, reinvestment of all dividends and distributions at net asset value during the period, and redemption at net asset value on the last day of the period. Net asset value total return includes adjustments in accordance with accounting principles generally accepted in the United States of America and as such, the net asset value for financial reporting purposes and the returns based upon those net asset values may differ from the net asset value and returns for shareholder transactions. Market price total return is calculated assuming an initial investment made at the market price at the beginning of the period, reinvestment of all dividends and distributions at market price during the period, and sale at the market price on the last day of the period. Total investment returns calculated for a period of less than one year are not annualized. |
| (e) | The net asset value total return from Fund Inception (October 7, 2021, the first day of trading on the exchange) to October 31, 2021 was 10.48%. The market price total return from Fund Inception to October 31, 2021 was 9.34%. |
| (f) | Annualized. |
| (g) | Portfolio turnover rate is not annualized for periods less than one year, if applicable, and does not include securities received or delivered from processing creations or redemptions. |
See accompanying Notes to Consolidated Financial Statements which are an integral part of the consolidated financial statements.
| 18 | ||||
|
| |||
Consolidated Financial Highlights–(continued)
Invesco Alerian Galaxy Crypto Economy ETF (SATO)
| For the Period | ||||||||||
| October 5, 2021(a) | ||||||||||
| Year Ended | Through | |||||||||
| October 31, | October 31, | |||||||||
2022 | 2021 | |||||||||
Per Share Operating Performance: | ||||||||||
Net asset value at beginning of period | $ | 29.41 | $ | 25.00 | ||||||
|
|
|
| |||||||
Net investment income (loss)(b) | 0.36 | (0.01 | ) | |||||||
Net realized and unrealized gain (loss) on investments | (23.23 | ) | 4.42 | |||||||
|
|
|
| |||||||
Total from investment operations | (22.87 | ) | 4.41 | |||||||
|
|
|
| |||||||
Distributions to shareholders from: | ||||||||||
Net investment income | (0.36 | ) | - | |||||||
Net realized gains | (0.03 | ) | - | |||||||
|
|
|
| |||||||
Total distributions | (0.39 | ) | - | |||||||
|
|
|
| |||||||
Net asset value at end of period | $ | 6.15 | $ | 29.41 | ||||||
|
|
|
| |||||||
Market price at end of period(c) | $ | 6.14 | $ | 29.09 | ||||||
|
|
|
| |||||||
Net Asset Value Total Return(d) | (78.47 | )% | 17.64 | %(e) | ||||||
Market Price Total Return(d) | (78.27 | )% | 16.36 | %(e) | ||||||
Ratios/Supplemental Data: | ||||||||||
Net assets at end of period (000’s omitted) | $ | 2,768 | $ | 11,763 | ||||||
Ratio to average net assets of: | ||||||||||
Expenses | 0.61 | % | 0.60 | %(f) | ||||||
Net investment income (loss) | 2.57 | % | (0.60 | )%(f) | ||||||
Portfolio turnover rate(g) | 149 | % | 10 | % | ||||||
| (a) | Commencement of investment operations. |
| (b) | Based on average shares outstanding. |
| (c) | The mean between the last bid and ask prices. |
| (d) | Net asset value total return is calculated assuming an initial investment made at the net asset value at the beginning of the period, reinvestment of all dividends and distributions at net asset value during the period, and redemption at net asset value on the last day of the period. Net asset value total return includes adjustments in accordance with accounting principles generally accepted in the United States of America and as such, the net asset value for financial reporting purposes and the returns based upon those net asset values may differ from the net asset value and returns for shareholder transactions. Market price total return is calculated assuming an initial investment made at the market price at the beginning of the period, reinvestment of all dividends and distributions at market price during the period, and sale at the market price on the last day of the period. Total investment returns calculated for a period of less than one year are not annualized. |
| (e) | The net asset value total return from Fund Inception (October 7, 2021, the first day of trading on the exchange) to October 31, 2021 was 16.25%. The market price total return from Fund Inception to October 31, 2021 was 13.63%. |
| (f) | Annualized. |
| (g) | Portfolio turnover rate is not annualized for periods less than one year, if applicable, and does not include securities received or delivered from processing creations or redemptions. |
See accompanying Notes to Consolidated Financial Statements which are an integral part of the consolidated financial statements.
| 19 | ||||
|
| |||
Notes to Consolidated Financial Statements
Invesco Exchange-Traded Fund Trust II
October 31, 2022
NOTE 1–Organization
Invesco Exchange-Traded Fund Trust II (the “Trust”) was organized as a Massachusetts business trust and is authorized to have multiple series of portfolios. The Trust is an open-end management investment company registered under the Investment Company Act of 1940, as amended (the “1940 Act”). This report includes the following portfolios and their respective wholly-owned subsidiaries (each, a “Subsidiary”) organized under the laws of the Cayman Islands:
Full Name | Short Name | Subsidiary | ||
| Invesco Alerian Galaxy Blockchain Users and Decentralized Commerce ETF (BLKC) | “Alerian Galaxy Blockchain Users and Decentralized Commerce ETF” | Invesco GBE Cayman Ltd. | ||
| Invesco Alerian Galaxy Crypto Economy ETF (SATO) | “Alerian Galaxy Crypto Economy ETF” | Invesco GCE Cayman Ltd. | ||
Each portfolio (each, a “Fund”, and collectively, the “Funds”) represents a separate series of the Trust. The shares of the Funds are referred to herein as “Shares” or “Fund’s Shares.” Each Fund’s Shares are listed and traded on Cboe BZX Exchange, Inc.
The market price of each Share may differ to some degree from a Fund’s net asset value (“NAV”). Unlike conventional mutual funds, each Fund issues and redeems Shares on a continuous basis, at NAV, only in a large specified number of Shares, each called a “Creation Unit.” Creation Units are issued and redeemed principally in exchange for cash and/or the deposit or delivery of a basket of securities (“Deposit Securities”). Except when aggregated in Creation Units by authorized participants (“APs”), the Shares are not individually redeemable securities of the Funds.
The investment objective of each Fund is to seek to track the investment results (before fees and expenses) of its respective index listed below (each, an “Underlying Index”):
Fund | Underlying Index | |
| Alerian Galaxy Blockchain Users and Decentralized Commerce ETF | Alerian Galaxy Global Blockchain Equity, Trusts and ETPs Index | |
| Alerian Galaxy Crypto Economy ETF | Alerian Galaxy Global Cryptocurrency-Focused Blockchain Equity, Trusts and ETPs Index | |
Each Fund’s investment in its respective Subsidiary is expected to provide the Fund with exposure to exchange-traded products and private investment trusts traded over-the-counter that are linked to cryptocurrencies. Each Fund may invest up to 25% of its respective total assets in its Subsidiary.
NOTE 2–Significant Accounting Policies
The following is a summary of the significant accounting policies followed by the Funds in preparation of their consolidated financial statements.
Each Fund is an investment company and accordingly follows the investment company accounting and reporting guidance in accordance with Financial Accounting Standards Board Accounting Standards Codification Topic 946, Financial Services–Investment Companies.
A. Security Valuation - Securities, including restricted securities, are valued according to the following policies:
A security listed or traded on an exchange is generally valued at its trade price or official closing price that day as of the close of the exchange where the security is principally traded or, lacking any trades or official closing price on a particular day, the security may be valued at the closing bid price on that day. Securities traded in the over-the-counter market are valued based on prices furnished by independent pricing services or market makers. When such securities are valued using prices provided by an independent pricing service they may be considered fair valued. Futures contracts are valued at the daily settlement price set by an exchange on which they are principally traded. U.S. exchange-traded options are valued at the mean between the last bid and asked prices from the exchange on which they are principally traded. Non-U.S. exchange-traded options are valued at the final settlement price set by the exchange on which they trade. Options not listed on an exchange and swaps generally are valued using pricing provided from independent pricing services.
Securities of investment companies that are not exchange-traded (e.g., open-end mutual funds) are valued using such company’s end-of-business-day NAV per share.
Deposits, other obligations of U.S. and non-U.S. banks and financial institutions are valued at their daily account value.
Fixed income securities (including convertible debt securities) generally are valued on the basis of prices provided by independent pricing services. Prices provided by the pricing service may be determined without exclusive reliance on quoted prices, and may reflect appropriate factors such as institution-size trading in similar groups of securities, developments related to specific securities, dividend rate (for unlisted equities), yield (for debt obligations), quality, type of issue, coupon rate (for
| 20 | ||||
|
| |||
debt obligations), maturity (for debt obligations), individual trading characteristics and other market data. Securities with a demand feature exercisable within one to seven days are valued at par. Pricing services generally value debt obligations assuming orderly transactions of institutional round lot size, but a Fund may hold or transact in the same securities in smaller, odd lot sizes. Odd lots often trade at lower prices than institutional round lots, and their value may be adjusted accordingly. Debt obligations are subject to interest rate and credit risks. In addition, all debt obligations involve some risk of default with respect to interest and/or principal payments.
Foreign securities’ (including foreign exchange contracts’) prices are converted into U.S. dollar amounts using the applicable exchange rates as of the close of the London world markets. If market quotations are available and reliable for foreign exchange-traded equity securities, the securities will be valued at the market quotations. Invesco Capital Management LLC (the “Adviser”) may use various pricing services to obtain market quotations as well as fair value prices. Because trading hours for certain foreign securities end before the close of the New York Stock Exchange (“NYSE”), closing market quotations may become not representative of market value in the Adviser’s judgment (“unreliable”). If, between the time trading ends on a particular security and the close of the customary trading session on the NYSE, a significant event occurs that makes the closing price of the security unreliable, the Adviser may fair value the security. If the event is likely to have affected the closing price of the security, the security will be valued at fair value in good faith in accordance with Board-approved policies and related Adviser procedures (“Valuation Procedures”). Adjustments to closing prices to reflect fair value may also be based on a screening process of an independent pricing service to indicate the degree of certainty, based on historical data, that the closing price in the principal market where a foreign security trades is not the current value as of the close of the NYSE. Foreign securities’ prices meeting the degree of certainty that the price is not reflective of current value will be priced at the indication of fair value from the independent pricing service. Multiple factors may be considered by the independent pricing service in determining adjustments to reflect fair value and may include information relating to sector indices, American depositary receipts and domestic and foreign index futures. Foreign securities may have additional risks including exchange rate changes, the potential for sharply devalued currencies and high inflation, political and economic upheaval, the relative lack of issuer information, relatively low market liquidity and the potential lack of strict financial and accounting controls and standards.
Unlisted securities will be valued using prices provided by independent pricing services or by another method that the Adviser, in its judgment, believes better reflects the security’s fair value in accordance with the Valuation Procedures.
Securities for which market prices are not provided by any of the above methods may be valued based upon quotes furnished by independent sources. The last bid price may be used to value exchange-traded equity securities. The mean between the last bid and asked prices may be used to value debt obligations, including corporate loans, and unlisted equity securities.
Securities for which market quotations are not readily available are fair valued by the Adviser in accordance with the Valuation Procedures. If a fair value price provided by a pricing service is unreliable, the Adviser will fair value the security using the Valuation Procedures. Issuer-specific events, market trends, bid/asked quotes of brokers and information providers and other market data may be reviewed in the course of making a good faith determination of a security’s fair value.
Each Fund may invest in securities that are subject to interest rate risk, meaning the risk that the prices will generally fall as interest rates rise and, conversely, the prices will generally rise as interest rates fall. Specific securities differ in their sensitivity to changes in interest rates depending on their individual characteristics. Changes in interest rates may result in increased market volatility, which may affect the value and/or liquidity of certain Fund investments.
Valuations change in response to many factors, including the historical and prospective earnings of the issuer, the value of the issuer’s assets, general market conditions which are not specifically related to the particular issuer, such as real or perceived adverse economic conditions, changes in the general outlook for revenues or corporate earnings, changes in interest or currency rates, regional or global instability, natural or environmental disasters, widespread disease or other public health issues, war, acts of terrorism, significant governmental actions or adverse investor sentiment generally and market liquidity. Because of the inherent uncertainties of valuation, the values reflected in the consolidated financial statements may materially differ from the value received upon actual sale of those investments.
The price a Fund could receive upon the sale of any investment may differ from the Adviser’s valuation of the investment, particularly for securities that are valued using a fair valuation technique. When fair valuation techniques are applied, the Adviser uses available information, including both observable and unobservable inputs and assumptions, to determine a methodology that will result in a valuation that the Adviser believes approximates market value. Fund securities that are fair valued may be subject to greater fluctuation in their value from one day to the next than would be the case if market quotations were used. Because of the inherent uncertainties of valuation, and the degree of subjectivity in such decisions, a Fund could realize a greater or lesser than expected gain or loss upon the sale of the investment.
| B. | Investment Transactions and Investment Income - Investment transactions are accounted for on a trade date basis. Realized gains and losses from the sale or disposition of securities are computed on the specific identified cost basis. Interest income is recorded on an accrual basis from settlement date and includes coupon interest and amortization of premium and accretion of discount on debt securities as applicable. Pay-in-kind interest income and non-cash dividend income received in the form of securities in-lieu of cash are recorded at the fair value of the securities received. Dividend income (net of |
| 21 | ||||
|
| |||
withholding tax, if any) is recorded on the ex-dividend date. Realized gains, dividends and interest received by a Fund may give rise to withholding and other taxes imposed by foreign countries. Tax conventions between certain countries and the United States may reduce or eliminate such taxes.
The Funds may periodically participate in litigation related to a Fund’s investments. As such, the Funds may receive proceeds from litigation settlements. Any proceeds received are included in the Consolidated Statements of Operations as realized gain (loss) for investments no longer held and as unrealized gain (loss) for investments still held.
Brokerage commissions and mark ups are considered transaction costs and are recorded as an increase to the cost basis of securities purchased and/or a reduction of proceeds on a sale of securities. Such transaction costs are included in the determination of net realized and unrealized gain (loss) from investment securities reported in the Consolidated Statements of Operations and the Consolidated Statements of Changes in Net Assets and the net realized and unrealized gains (losses) on securities per share in the Consolidated Financial Highlights. Transaction costs are included in the calculation of a Fund’s NAV and, accordingly, they reduce a Fund���s total returns. These transaction costs are not considered operating expenses and are not reflected in net investment income reported in the Consolidated Statements of Operations and the Consolidated Statements of Changes in Net Assets, or the net investment income per share and the ratios of expenses and net investment income reported in the Consolidated Financial Highlights, nor are they limited by any expense limitation arrangements between each Fund and the Adviser.
| C. | Country Determination - For the purposes of presentation in the Consolidated Schedules of Investments, the Adviser may determine the country in which an issuer is located and/or credit risk exposure based on various factors. These factors include whether each Fund’s Underlying Index has made a country determination and may include the laws of the country under which the issuer is organized, where the issuer maintains a principal office, the country in which the issuer derives 50% or more of its total revenues, the country that has the primary market for the issuer’s securities and its “country of risk” as determined by a third party service provider, as well as other criteria. Among the other criteria that may be evaluated for making this determination are the country in which the issuer maintains 50% or more of its assets, the type of security, financial guarantees and enhancements, the nature of the collateral and the sponsor organization. Country of issuer and/or credit risk exposure has been determined to be the United States of America, unless otherwise noted. |
| D. | Dividends and Distributions to Shareholders - Each Fund declares and pays dividends from net investment income, if any, to its shareholders quarterly and records such dividends on the ex-dividend date. Generally, each Fund distributes net realized taxable capital gains, if any, annually in cash and records them on the ex-dividend date. Such distributions on a tax basis are determined in conformity with federal income tax regulations, which may differ from accounting principles generally accepted in the United States of America (“GAAP”). Distributions in excess of tax basis earnings and profits, if any, are reported in such Fund’s consolidated financial statements as a tax return of capital at fiscal year-end. |
| E. | Federal Income Taxes - Each Fund intends to comply with the provisions of the Internal Revenue Code of 1986, as amended (the “Internal Revenue Code”), applicable to regulated investment companies and to distribute substantially all of the Fund’s taxable earnings to its shareholders. As such, the Funds will not be subject to federal income taxes on otherwise taxable income (including net realized gains) that is distributed to the shareholders. Therefore, no provision for federal income taxes is recorded in the consolidated financial statements. |
Each Fund recognizes the tax benefits of uncertain tax positions only when the position is more likely than not to be sustained. Management has analyzed each Fund’s uncertain tax positions and concluded that no liability for unrecognized tax benefits should be recorded related to uncertain tax positions. Management is not aware of any tax positions for which it is reasonably possible that the total amounts of unrecognized tax benefits will change materially in the next 12 months.
Each Subsidiary is classified as a controlled foreign corporation under Subchapter N of the Internal Revenue Code. Therefore, each Fund is required to increase its taxable income by its share of its Subsidiary’s income. Net investment losses of each Subsidiary cannot be deducted by each Fund in the current period nor carried forward to offset taxable income in future periods.
Income and capital gain distributions are determined in accordance with federal income tax regulations, which may differ from GAAP. These differences are primarily due to differing book and tax treatments for in-kind transactions, losses deferred due to wash sales, and passive foreign investment company adjustments, if any.
The Funds file U.S. federal tax returns and tax returns in certain other jurisdictions. Generally, a Fund is subject to examinations by such taxing authorities for up to three years after the filing of the return for the tax period.
| F. | Expenses - Each Fund has agreed to pay an annual unitary management fee to the Adviser. Out of the unitary management fee, the Adviser has agreed to pay for substantially all expenses of the Funds, including the costs of transfer agency, custody, fund administration, legal, audit and other services, except for distribution fees, if any, brokerage expenses, taxes, interest, acquired fund fees and expenses, if any, litigation expenses and other extraordinary expenses, including proxy expenses (except for such proxies related to: (i) changes to the Investment Advisory Agreement, (ii) the election of any Board member who is an “interested person” of the Trust, or (iii) any other matters that directly benefit the Adviser). |
Expenses of the Trust that are excluded from a Fund’s unitary management fee and are directly identifiable to a specific Fund are applied to that Fund. Expenses of the Trust that are excluded from a Fund’s unitary management fee and are not readily identifiable to a specific Fund are allocated in such a manner as deemed equitable, taking into consideration the nature and type of expense and the relative net assets of each Fund.
| 22 | ||||
|
| |||
To the extent a Fund invests in other investment companies, the expenses shown in the accompanying consolidated financial statements reflect the expenses of the Fund and do not include any expenses of the investment companies in which it invests. The effects of such investment companies’ expenses are included in the realized and unrealized gain or loss on the investments in the investment companies.
| G. | Accounting Estimates - The preparation of the consolidated financial statements in accordance with GAAP requires management to make estimates and assumptions that affect the reported amounts and disclosures in the consolidated financial statements, including estimates and assumptions related to taxation. Actual results could differ from these estimates. All inter-company accounts and transactions have been eliminated in consolidation. In addition, the Funds monitor for material events or transactions that may occur or become known after the period-end date and before the date the consolidated financial statements are released to print. |
| H. | Indemnifications - Under the Trust’s organizational documents, its Officers and Trustees are indemnified against certain liabilities arising out of the performance of their duties to the Trust. Also, under each Subsidiary’s organizational documents, the directors and officers of the Subsidiary are indemnified against certain liabilities that may arise out of the performance of their duties to the Fund and/or the Subsidiary, respectively. Each Board member who is not an “interested person” (as defined in the 1940 Act) of the Trust (each, an “Independent Trustee”) is also indemnified against certain liabilities arising out of the performance of their duties to the Trust pursuant to an Indemnification Agreement between such trustee and the Trust. Additionally, in the normal course of business, the Trust enters into contracts with service providers that contain general indemnification clauses. The Trust’s maximum exposure under these arrangements is unknown, as this would involve future claims that may be made against the Trust that have not yet occurred. The risk of material loss as a result of such indemnification claims is considered remote. |
| I. | Securities Lending - Each Fund may participate in securities lending and may loan portfolio securities having a market value up to one-third of each Fund’s total assets. Such loans are secured by cash collateral equal to no less than 102% (105% for international securities) of the market value of the loaned securities determined daily by the securities lending provider. Cash collateral received in connection with these loans is invested in short-term money market instruments or affiliated, unregistered investment companies that comply with Rule 2a-7 under the 1940 Act and money market funds (collectively, “affiliated money market funds”) and is shown as such on the Consolidated Schedules of Investments. Each Fund bears the risk of loss with respect to the investment of collateral. It is the policy of these Funds to obtain additional collateral from or return excess collateral to the borrower by the end of the next business day, following the valuation date of the securities loaned. Therefore, the value of the collateral held may be temporarily less than the value of the securities on loan. When loaning securities, each Fund retains certain benefits of owning the securities, including the economic equivalent of dividends or interest generated by the security. Lending securities entails a risk of loss to each Fund if, and to the extent that, the market value of the securities loaned were to increase, and the borrower did not increase the collateral accordingly, and the borrower failed to return the securities. The securities loaned are subject to termination at the option of the borrower or each Fund. Upon termination, the borrower will return to each Fund the securities loaned and each Fund will return the collateral. Upon the failure of the borrower to return the securities, collateral may be liquidated and the securities may be purchased on the open market to replace the loaned securities. Each Fund could experience delays and costs in gaining access to the collateral and the securities may lose value during the delay which could result in potential losses to each Fund. Some of these losses may be indemnified by the lending agent. Each Fund bears the risk of any deficiency in the amount of the collateral available for return to the borrower due to any loss on the collateral invested. For Funds that participated in securities lending, dividends received on cash collateral investments for securities lending transactions, which are net of compensation to counterparties, are included in Securities lending income on the Consolidated Statements of Operations. The aggregate value of securities out on loan, if any, is shown on the Consolidated Statements of Assets and Liabilities. |
Invesco Advisers, Inc. (“Invesco”), an affiliate of the Adviser, serves as an affiliated securities lending agent for each Fund participating in the securities lending program. The Bank of New York Mellon (“BNYM”) also serves as a lending agent. To the extent a Fund utilizes Invesco as an affiliated securities lending agent, the Fund conducts its securities lending in accordance with, and in reliance upon, no-action letters issued by the SEC staff that provide guidance on how an affiliate may act as a direct agent lender and receive compensation for those services in a manner consistent with the federal securities laws. For the fiscal year ended October 31, 2022, each Fund had affiliated securities lending transactions with Invesco. Fees paid to Invesco for securities lending agent services, which are included in Securities lending income on the Consolidated Statements of Operations, were incurred by each Fund as listed below:
| Amount | ||||
Alerian Galaxy Blockchain Users and Decentralized Commerce ETF | $1,747 | |||
Alerian Galaxy Crypto Economy ETF | 6,967 | |||
| J. | Foreign Currency Translations - Foreign currency is valued at the close of the NYSE based on quotations posted by banks and major currency dealers. Portfolio securities and other assets and liabilities denominated in foreign currencies are translated into U.S. dollar amounts at the date of valuation. Purchases and sales of portfolio securities (net of foreign taxes withheld on disposition) and income items denominated in foreign currencies are translated into U.S. dollar amounts on the |
| 23 | ||||
|
| |||
respective dates of such transactions. Each Fund does not separately account for the portion of the results of operations resulting from changes in foreign exchange rates on investments and the fluctuations arising from changes in market prices of securities held. The combined results of changes in foreign exchange rates and the fluctuation of market prices on investments (net of estimated foreign tax withholding) are included with the net realized and unrealized gain or loss from investments in the Consolidated Statements of Operations. Reported net realized foreign currency gains or losses arise from (1) sales of foreign currencies, (2) currency gains or losses realized between the trade and settlement dates on securities transactions, and (3) the difference between the amounts of dividends, interest, and foreign withholding taxes recorded on a Fund’s books and the U.S. dollar equivalent of the amounts actually received or paid. Net unrealized foreign currency gains and losses arise from changes in the fair values of assets and liabilities, other than investments in securities at fiscal period-end, resulting from changes in exchange rates.
Each Fund may invest in foreign securities, which may be subject to foreign taxes on income, gains on investments or currency repatriation, a portion of which may be recoverable. Foreign taxes, if any, are recorded based on the tax regulations and rates that exist in the foreign markets in which a Fund invests.
| K. | Other Risks |
ADR and GDR Risk. Certain Funds may invest in American depositary receipts (“ADRs”) and global depositary receipts (“GDRs”). ADRs are certificates that evidence ownership of shares of a foreign issuer and are alternatives to purchasing the underlying foreign securities directly in their national markets and currencies. GDRs are certificates issued by an international bank that generally are traded and denominated in the currencies of countries other than the home country of the issuer of the underlying shares. ADRs and GDRs may be subject to certain of the risks associated with direct investments in the securities of foreign companies, such as currency, political, economic and market risks, because their values depend on the performance of the non-dollar denominated underlying foreign securities. Moreover, ADRs and GDRs may not track the price of the underlying foreign securities on which they are based, and their value may change materially at times when U.S. markets are not open for trading.
AP Concentration Risk. Only APs may engage in creation or redemption transactions directly with each Fund. Each Fund has a limited number of institutions that may act as APs, and such APs have no obligation to submit creation or redemption orders. Consequently, there is no assurance that APs will establish or maintain an active trading market for the Shares. This risk may be heightened to the extent that securities held by each Fund are traded outside a collateralized settlement system. In that case, APs may be required to post collateral on certain trades on an agency basis (i.e., on behalf of other market participants), which only a limited number of APs may be able to do. In addition, to the extent that APs exit the business or are unable to proceed with creation and/or redemption orders with respect to each Fund and no other AP is able to step forward to create or redeem Creation Units, this may result in a significantly diminished trading market for Fund Shares, and Shares may be more likely to trade at a premium or discount to a Fund’s NAV and to face trading halts and/or delisting. Investments in non-U.S. securities, which may have lower trading volumes or could experience extended market closures or trading halts, may increase the risk that APs may not be able to effectively create or redeem Creation Units or the risk that the Shares may be halted and/or delisted.
Blockchain Company Investments Risk. Companies engaged in the development, enablement and acquisition of blockchain technologies are subject to a number of risks. Blockchain technology is new and many of its uses may be untested. The mechanics of using distributed ledger technology to transact in other types of assets, such as securities or derivatives, is less clear. There is no assurance that widespread adoption will occur. Furthermore, the development and acceptance of competing platforms or technologies may cause consumers or investors to use an alternative to blockchains. A lack of expansion in the usage of blockchain technology could adversely affect the underlying holdings of the Funds. Moreover, the extent to which companies held by the Funds utilize blockchain technology may vary, and it is possible that even widespread adoption of blockchain technology may not result in a material impact on the stock price of such companies.
Furthermore, companies that are developing applications of blockchain technology applications may not in fact do so or may not be able to capitalize on those blockchain technologies. A proliferation of recent startups attempting to apply blockchain technology in different contexts means the possibility of conflicting intellectual property claims could be a risk to an issuer, its operations or its business. This could also pose a risk to blockchain platforms that permit transactions in digital securities. Regardless of the merit of any intellectual property or other legal action, any threatened action that reduces confidence in the viability of blockchain may adversely affect an investment in the Funds. Additionally, blockchain technology is new, and as such may be subject to future laws or regulations. Any such regulatory changes affecting blockchain technology may adversely impact an investment in companies utilizing this technology.
Transacting on a blockchain depends in part specifically on the use of cryptographic keys that are required to access a user’s account (or “wallet”). The theft, loss or destruction of these keys impairs the value of ownership claims users have over the relevant assets being represented by the ledger (whether “smart contracts,” securities, currency or other digital assets). The theft, loss or destruction of private or public keys needed to transact on a blockchain could also adversely affect a company’s business or operations if it were dependent on the ledger.
In addition, because blockchain functionality relies on the Internet, a significant disruption of Internet connectivity affecting large numbers of users or geographic areas could impede the functionality of blockchain technologies and adversely affect the
| 24 | ||||
|
| |||
Funds. In addition, certain features of blockchain technology, such as decentralization, open source protocol, and reliance on peer-to-peer connectivity, may increase the risk of fraud or cyber-attack by potentially reducing the likelihood of a coordinated response.
Cryptocurrency Risk. Cryptocurrencies (also referred to as “virtual currencies” and “digital currencies”) are digital assets designed to act as a medium of exchange. Although cryptocurrency is an emerging asset class, there are thousands of cryptocurrencies. While the Funds will not invest directly in cryptocurrencies, the value of the Funds’ investments in cryptocurrency-linked assets (including private trusts and ETPs) is subject to fluctuations in the value of the cryptocurrency, which have been and may in the future be highly volatile. The value of cryptocurrencies is determined by the supply and demand for cryptocurrency in the global market for the trading of cryptocurrency, which consists primarily of transactions on electronic exchanges. The price of a digital currency could drop precipitously (including to zero) for a variety of reasons, including, but not limited to, regulatory changes, a crisis of confidence, flaw or operational issue in a digital currency network or a change in user preference to competing cryptocurrencies. Cryptocurrency is a new technological innovation with a limited history; it is a highly speculative asset, and the Funds’ exposure to cryptocurrency-linked assets could result in substantial losses to the Funds.
Cryptocurrencies trade on exchanges, which are largely unregulated and, therefore, are more exposed to fraud and failure than established, regulated exchanges for securities, derivatives and other currencies. Cryptocurrency exchanges have in the past, and may in the future, cease operating temporarily or even permanently, resulting in the potential loss of users’ cryptocurrency or other market disruptions. Cryptocurrency exchanges are more exposed to the risk of market manipulation than exchanges for traditional assets. Cryptocurrency exchanges that are regulated typically must comply with minimum net capital, cybersecurity, and anti-money laundering requirements, but are not typically required to protect customers or their markets to the same extent that regulated securities exchanges or futures exchanges are required to do so. Furthermore, many cryptocurrency exchanges lack certain safeguards established by traditional exchanges to enhance the stability of trading on the exchange, such as measures designed to prevent sudden drops in value of items traded on the exchange (i.e., “flash crashes”). As a result, the prices of cryptocurrencies on exchanges may be subject to larger and more frequent sudden declines than assets traded on traditional exchanges. In addition, cryptocurrency exchanges are also subject to the risk of cybersecurity threats and have been breached, resulting in the theft and/or loss of cryptocurrencies. A cyber or other security breach or a business failure of a cryptocurrency exchange or custodian may affect the price of a particular cryptocurrency or cryptocurrencies generally. A risk also exists with respect to malicious actors or previously unknown vulnerabilities, which may adversely affect the value of a digital currency.
Currently, there is relatively limited use of cryptocurrency in the retail and commercial marketplace, which contributes to price volatility. A lack of expansion by cryptocurrencies into retail and commercial markets, or a contraction of such use, may result in increased volatility or a reduction in the value of cryptocurrencies, either of which could adversely impact a Fund’s investment in cryptocurrency. In addition, to the extent market participants develop a preference for one cryptocurrency over another, the value of the less preferred cryptocurrency would likely be adversely affected.
Currency Risk. Because each Fund’s NAV is determined in U.S. dollars, a Fund’s NAV could decline if the currency of a non-U.S. market in which the Fund invests depreciates against the U.S. dollar. Generally, an increase in the value of the U.S. dollar against a foreign currency will reduce the value of a security denominated in that foreign currency, thereby decreasing a Fund’s overall NAV. Exchange rates may be volatile and may change quickly and unpredictably in response to both global economic developments and economic conditions, causing an adverse impact on a Fund. As a result, investors have the potential for losses regardless of the length of time they intend to hold Shares.
Digital Asset Company Investments Risk. Companies engaged in the development, enablement and acquisition of digital assets and cryptocurrencies are subject to a number of risks. The technology relating to digital assets, including blockchain, is developing and the risks associated with digital assets may not fully emerge until the technology is widely used. Cryptocurrencies and blockchain technology are new and many of their uses may be untested. The mechanics of using distributed ledger technology to transact in other types of assets, such as securities or derivatives, is less clear. There is no assurance that widespread adoption will occur. Furthermore, the development and acceptance of competing platforms or technologies may cause consumers or investors to use an alternative to cryptocurrencies. A lack of expansion in the usage of cryptocurrencies could adversely affect an investment in the Funds.
Currently, there are relatively few companies for which digital assets represents an attributable and significant revenue stream. Therefore, the values of the companies included in an Underlying Index may not be a reflection of their connection to digital assets, but may be based on other business operations. Furthermore, companies that are developing applications of digital assets and cryptocurrencies may not in fact do so or may not be able to capitalize on those digital assets. Blockchain technology also may never be implemented to a scale that provides identifiable economic benefit to the companies included in an Underlying Index, which could adversely affect an investment in the Funds. A proliferation of recent startups attempting to apply blockchain technology in different contexts means the possibility of conflicting intellectual property claims could be a risk to an issuer, its operations or its business. This could also pose a risk to blockchain platforms that permit transactions in digital securities. Regardless of the merit of any intellectual property or other legal action, any threatened action that reduces confidence in the viability of blockchain and/or cryptocurrencies may adversely affect an investment in the Funds.
| 25 | ||||
|
| |||
There may be risks posed by the lack of regulation for digital assets and any future regulatory developments could affect the viability and expansion of the use of digital assets.
Emerging Markets Investment Risk. For certain Funds, investments in the securities of issuers in emerging market countries involve risks often not associated with investments in the securities of issuers in developed countries. Securities in emerging markets may be subject to greater price fluctuations than securities in more developed markets. Companies in emerging market countries generally may be subject to less stringent regulatory, disclosure, financial reporting, accounting, auditing and recordkeeping standards than companies in more developed countries. In addition, information about such companies may be less available and reliable. Emerging markets usually are subject to greater market volatility, political, social and economic instability, uncertainty regarding the existence of trading markets and more governmental limitations on foreign investment than are more developed markets. Securities law in many emerging market countries is relatively new and unsettled. Therefore, laws regarding foreign investment in emerging markets securities, securities regulation, title to securities, and shareholder rights may change quickly and unpredictably, and the ability to bring and enforce actions, or to obtain information needed to pursue or enforce such actions, may be limited. In addition, the enforcement of systems of taxation at federal, regional and local levels in emerging market countries may be inconsistent and subject to sudden change. Investments in emerging market securities may be subject to additional transaction costs, delays in settlement procedures, unexpected market closures, and lack of timely information. In addition, lack of relevant data and reliable public information, including financial information, about securities in emerging markets may contribute to incorrect weightings and data and computational errors when a Fund’s index provider selects securities for inclusion in the Fund’s Underlying Index or rebalances the Underlying Index.
Equity Risk. Equity risk is the risk that the value of equity securities, including common stocks, may fall due to both changes in general economic conditions that impact the market as a whole, as well as factors that directly relate to a specific company or its industry. Such general economic conditions include changes in interest rates, periods of market turbulence or instability, or general and prolonged periods of economic decline and cyclical change. It is possible that a drop in the stock market may depress the price of most or all of the common stocks that each Fund holds. In addition, equity risk includes the risk that investor sentiment toward one or more industries will become negative, resulting in those investors exiting their investments in those industries, which could cause a reduction in the value of companies in those industries more broadly. The value of a company’s common stock may fall solely because of factors, such as an increase in production costs that negatively impact other companies in the same region, industry or sector of the market. A company’s common stock also may decline significantly in price over a short period of time due to factors specific to that company, including decisions made by its management or lower demand for the company’s products or services. For example, an adverse event, such as an unfavorable earnings report or the failure to make anticipated dividend payments, may depress the value of common stock.
Foreign Investment Risk. Investments in the securities of non-U.S. issuers involve risks beyond those associated with investments in U.S. securities. Foreign securities may have relatively low market liquidity, greater market volatility, decreased publicly available information and less reliable financial information about issuers and inconsistent and potentially less stringent accounting, auditing and financial reporting requirements and standards of practice, including recordkeeping standards, comparable to those applicable to domestic issuers. Foreign securities are also subject to the risks of expropriation, nationalization, political instability or other adverse political or economic developments and the difficulty of enforcing obligations in other countries. Investments in foreign securities also may be subject to dividend withholding or confiscatory taxes, currency blockage and/or transfer restrictions and higher transactional costs. If a Fund invests in securities denominated in foreign currencies, fluctuations in the value of the U.S. dollar relative to the values of other currencies may adversely affect investments in foreign securities and may negatively impact the Fund’s returns.
Index Risk. Unlike many investment companies, each Fund does not utilize an investing strategy that seeks returns in excess of its Underlying Index. Therefore, a Fund would not necessarily buy or sell a security unless that security is added or removed, respectively, from its Underlying Index, even if that security generally is underperforming. Additionally, each Fund rebalances its portfolio in accordance with its Underlying Index, and, therefore, any changes to the Underlying Index’s rebalance schedule will result in corresponding changes to each Fund’s rebalance schedule.
Industry Concentration Risk. In following its methodology, each Fund’s Underlying Index from time to time may be concentrated to a significant degree in securities of issuers operating in a single industry or industry group. To the extent that each Underlying Index concentrates in the securities of issuers in a particular industry or industry group, the corresponding Fund will also concentrate its investments to approximately the same extent. By concentrating its investments in an industry or industry group, each Fund may face more risks than if it were diversified broadly over numerous industries or industry groups. Such industry-based risks, any of which may adversely affect the companies in which each Fund invests, may include, but are not limited to, the following: general economic conditions or cyclical market patterns that could negatively affect supply and demand in a particular industry; competition for resources, adverse labor relations, political or world events; obsolescence of technologies; and increased competition or new product introductions that may affect the profitability or viability of companies in an industry. In addition, at times, such industry or industry group may be out of favor and underperform other industries or the market as a whole.
Market Risk. Securities in each Underlying Index are subject to market fluctuations. You should anticipate that the value of the Shares will decline, more or less, in correlation with any decline in value of the securities in an Underlying Index.
| 26 | ||||
|
| |||
Additionally, natural or environmental disasters, widespread disease or other public health issues, war, acts of terrorism or other events could result in increased premiums or discounts to each Fund’s NAV.
Micro-Capitalization Company Risk. Investments in the securities of micro-capitalization companies involve substantially greater risks of loss and price fluctuations than other securities with larger capitalizations. Micro-capitalization companies carry additional risks because their earnings and revenues tend to be less predictable (and some companies may be experience significant losses), their share prices tend to be more volatile and their markets less liquid than companies with larger market capitalizations. Micro-capitalization companies may be newly formed or in the early stages of development, with limited product lines, markets or financial resources, and they may lack management depth or may be overly reliant on specific key individuals. In addition, less public information may be available about these companies. The shares of micro-capitalization companies tend to trade less frequently than those of larger, more established companies, which can adversely affect the pricing of these securities and the future ability to sell these securities.
Non-Correlation Risk. Each Fund’s return may not match the return of its corresponding Underlying Index for a number of reasons. For example, each Fund incurs operating expenses not applicable to the Underlying Index, and incurs costs in buying and selling securities, especially when rebalancing the Fund’s securities holdings to reflect changes in the composition of its corresponding Underlying Index. Because certain Funds issue and redeem Creation Units principally for cash, such Funds will incur higher costs in buying and selling securities than if they issued and redeemed Creation Units in-kind. Additionally, a Fund’s use of a representative sampling approach may cause the Fund not to be as well-correlated with the return of its corresponding Underlying Index as would be the case if the Fund purchased all of the securities in its corresponding Underlying Index in the proportions represented in the Underlying Index. In addition, the performance of each Fund and its corresponding Underlying Index may vary due to asset valuation differences and differences between each Fund’s portfolio and its corresponding Underlying Index resulting from legal restrictions, costs or liquidity constraints.
Non-Diversified Fund Risk. Because each Fund is non-diversified and can invest a greater portion of its assets in securities of individual issuers than can a diversified fund, changes in the market value of a single investment could cause greater fluctuations in Share price than would occur in a diversified fund. This may increase a Fund’s volatility and cause the performance of a relatively small number of issuers to have a greater impact on a Fund’s performance.
Portfolio Turnover Risk. Certain Funds may engage in frequent trading of their portfolio securities in connection with the rebalancing or adjustment of their respective Underlying Index. A portfolio turnover rate of 200%, for example, is equivalent to a Fund buying and selling all of its securities two times during the course of a year. A high portfolio turnover rate (such as 100% or more) could result in high brokerage costs for a Fund. While a high portfolio turnover rate can result in an increase in taxable capital gains distributions to a Fund’s shareholders, a Fund will seek to utilize the in-kind creation and redemption mechanism to minimize the realization of capital gains to the extent possible.
Sampling Risk. Certain Funds’ use of a representative sampling approach may result in the Fund holding a smaller number of securities than are in its respective Underlying Index. As a result, an adverse development with respect to an issuer of securities held by the Fund could result in a greater decline in NAV than would be the case if the Fund held all of the securities in its Underlying Index. To the extent the assets in the Fund are smaller, these risks will be greater.
Small- and Mid-Capitalization Company Risk. Investing in securities of small- and mid-capitalization companies involves greater risk than customarily is associated with investing in larger, more established companies. These companies’ securities may be more volatile and less liquid than those of more established companies. These securities may have returns that vary, sometimes significantly, from the overall securities market. Often small- and mid-capitalization companies and the industries in which they focus are still evolving and, as a result, they may be more sensitive to changing market conditions.
Subsidiary Investment Risk. By investing in its Subsidiary, each Fund is indirectly exposed to the risks associated with its respective Subsidiary’s investments. Each Subsidiary is not registered under the 1940 Act; therefore each Fund will not receive all of the protections offered to investors in registered investment companies. Changes in the laws of the United States and/or the Cayman Islands could result in the inability of a Fund and/or its Subsidiary to operate as intended, which may negatively affect the Fund and its shareholders.
Valuation Risk. Financial information related to securities of non-U.S. issuers may be less reliable than information related to securities of U.S. issuers, which may make it difficult to obtain a current price for a non-U.S. security held by a Fund. In certain circumstances, market quotations may not be readily available for some Fund securities, and those securities may be fair valued. The value established for a security through fair valuation may be different from what would be produced if the security had been valued using market quotations. Fund securities that are valued using techniques other than market quotations, including “fair valued” securities, may be subject to greater fluctuations in their value from one day to the next than would be the case if market quotations were used. In addition, there is no assurance that a Fund could sell a portfolio security for the value established for it at any time, and it is possible that a Fund would incur a loss because a security is sold at a discount to its established value.
COVID-19 Risk. The COVID-19 strain of coronavirus has resulted in instances of market closures and dislocations, extreme volatility, liquidity constraints and increased trading costs. Efforts to contain its spread have resulted in travel restrictions, disruptions of healthcare systems, business operations (including business closures) and supply chains, layoffs, lower consumer demand and employee availability, and defaults and credit downgrades, among other significant economic impacts that have disrupted global economic activity across many industries. Such economic impacts may exacerbate other
| 27 | ||||
|
| |||
pre-existing political, social and economic risks locally or globally and cause general concern and uncertainty. The full economic impact and ongoing effects of COVID-19 (or other future epidemics or pandemics) at the macro-level and on individual businesses are unpredictable and may result in significant and prolonged effects on the Funds’ performance.
NOTE 3–Investment Advisory Agreement and Other Agreements
The Trust has entered into an Investment Advisory Agreement with the Adviser on behalf of each Fund, pursuant to which the Adviser has overall responsibility for the selection and ongoing monitoring of the Funds’ investments, managing the Funds’ business affairs and providing certain clerical, bookkeeping and other administrative services.
Pursuant to the Investment Advisory Agreement, each Fund accrues daily and pays monthly to the Adviser an annual unitary management fee. Out of the unitary management fee, the Adviser has agreed to pay for substantially all expenses of the Funds, including the cost of transfer agency, custody, fund administration, legal, audit and other services, except for distribution fees, if any, brokerage expenses, taxes, interest, acquired fund fees and expenses, if any, litigation expenses and other extraordinary expenses, including proxy expenses (except for such proxies related to: (i) changes to the Investment Advisory Agreement, (ii) the election of any Board member who is an “interested person” of the Trust, or (iii) any other matters that directly benefit the Adviser). The unitary management fee is paid by each Fund to the Adviser at the following annual rates:
| Unitary Management Fees | ||
| (as a % of average daily net assets) | ||
Alerian Galaxy Blockchain Users and Decentralized Commerce ETF | 0.60% | |
Alerian Galaxy Crypto Economy ETF | 0.60% | |
Through at least August 31, 2024, the Adviser has contractually agreed to waive the management fee payable by each Fund in an amount equal to the lesser of: (i) 100% of the net advisory fees earned by the Adviser or an affiliate of the Adviser that are attributable to the Fund’s investments in money market funds that are managed by affiliates of the Adviser and other funds (including ETFs) managed by the Adviser or affiliates of the Adviser or (ii) the management fee available to be waived. This waiver does not apply to a Fund’s investment of cash collateral received for securities lending. There is no guarantee that the Adviser will extend the waiver of these fees past that date.
For the fiscal year ended October 31, 2022, no fees were waived.
The Trust has entered into a Distribution Agreement with Invesco Distributors, Inc. (the “Distributor”), which serves as the distributor of Creation Units for each Fund. The Distributor does not maintain a secondary market in the Shares. The Funds are not charged any fees pursuant to the Distribution Agreement. The Distributor is an affiliate of the Adviser.
The Adviser has entered into a licensing agreement for each Fund with GKD Index Partners, LLC d/b/a Alerian (the “Licensor”).
Each Underlying Index name trademark is owned by the Licensor. These trademarks have been licensed to the Adviser for use by the Funds. Each Fund is entitled to use its Underlying Index pursuant to the Trust’s sub-licensing agreement with the Adviser. The Funds are not sponsored, endorsed, sold or promoted by the Licensor, and the Licensor makes no representation regarding the advisability of investing in any of the Funds.
The Trust has entered into service agreements whereby BNYM, a wholly-owned subsidiary of The Bank of New York Mellon Corporation, serves as the administrator, custodian, fund accountant and transfer agent for each Fund.
For the fiscal year ended October 31, 2022, the following Funds incurred brokerage commissions with Invesco Capital Markets, Inc. (“ICMI”), an affiliate of the Adviser and Distributor, for portfolio transactions executed on behalf of the Funds, as listed below:
Alerian Galaxy Blockchain Users and Decentralized Commerce ETF | $ | 5,151 | ||
Alerian Galaxy Crypto Economy ETF | 11,395 | |||
Portfolio transactions with ICMI that have not settled at period-end, if any, are shown in the Consolidated Statements of Assets and Liabilities under the receivable caption Investments sold - affiliated broker and/or payable caption Investments purchased - affiliated broker.
NOTE 4–Additional Valuation Information
GAAP defines fair value as the price that would be received to sell an asset or paid to transfer a liability in an orderly transaction between market participants at the measurement date, under current market conditions. GAAP establishes a hierarchy that prioritizes the inputs to valuation methods, giving the highest priority to readily available unadjusted quoted prices in an active market for identical assets (Level 1) and the lowest priority to significant unobservable inputs (Level 3), generally when market prices are not readily available. Based on the valuation inputs, the securities or other investments are tiered into one of three levels. Changes in valuation methods may result in transfers in or out of an investment’s assigned level:
| Level 1 - | Prices are determined using quoted prices in an active market for identical assets. | |
| Level 2 - | Prices are determined using other significant observable inputs. Observable inputs are inputs that other market participants may use in pricing a security. These may include quoted prices for similar securities, interest rates, prepayment speeds, credit risk, yield curves, loss severities, default rates, discount rates, volatilities and others. | |
| 28 | ||||
|
| |||
| Level 3 – | Prices are determined using significant unobservable inputs. In situations where quoted prices or observable inputs are unavailable (for example, when there is little or no market activity for an investment at the end of the period), unobservable inputs may be used. Unobservable inputs reflect the Adviser’s assumptions about the factors market participants would use in determining fair value of the securities or instruments and would be based on the best available information. |
The following is a summary of the tiered valuation input levels, as of October 31, 2022. The level assigned to the securities valuations may not be an indication of the risk or liquidity associated with investing in those securities. Because of the inherent uncertainties of valuation, the values reflected in the consolidated financial statements may materially differ from the value received upon actual sale of those investments.
| Level 1 | Level 2 | Level 3 | Total | |||||||||||||||||
Alerian Galaxy Blockchain Users and Decentralized Commerce ETF | ||||||||||||||||||||
Investments in Securities | ||||||||||||||||||||
Common Stocks & Other Equity Interests | $ | 1,666,284 | $ | - | $ | - | $ | 1,666,284 | ||||||||||||
Mutual Fund | 297,024 | - | - | 297,024 | ||||||||||||||||
Money Market Funds | - | 427,237 | - | 427,237 | ||||||||||||||||
|
|
|
|
|
|
|
| |||||||||||||
Total Investments | $ | 1,963,308 | $ | 427,237 | $ | - | $ | 2,390,545 | ||||||||||||
|
|
|
|
|
|
|
| |||||||||||||
Alerian Galaxy Crypto Economy ETF | ||||||||||||||||||||
Investments in Securities | ||||||||||||||||||||
Common Stocks & Other Equity Interests | $ | 2,335,587 | $ | - | $ | - | $ | 2,335,587 | ||||||||||||
Mutual Fund | 425,220 | - | - | 425,220 | ||||||||||||||||
Money Market Funds | - | 862,687 | - | 862,687 | ||||||||||||||||
|
|
|
|
|
|
|
| |||||||||||||
Total Investments | $ | 2,760,807 | $ | 862,687 | $ | - | $ | 3,623,494 | ||||||||||||
|
|
|
|
|
|
|
| |||||||||||||
NOTE 5–Distributions to Shareholders and Tax Components of Net Assets
Tax Character of Distributions to Shareholders Paid During the Fiscal Years Ended October 31, 2022 and 2021:
| 2022 | 2021 | |||||||||
| Ordinary Income* | Ordinary Income* | |||||||||
| Alerian Galaxy Blockchain Users and Decentralized Commerce ETF | $ | 81,748 | $ | - | ||||||
Alerian Galaxy Crypto Economy ETF | 174,368 | - | ||||||||
| * | Includes short-term capital gain distributions, if any. |
Tax Components of Net Assets at Fiscal Year-End:
| Undistributed Ordinary Income | Net Unrealized Appreciation (Depreciation)- Investments | Net Unrealized Appreciation- Foreign Currencies | Capital Loss Carryforwards | Shares of Beneficial Interest | Total Net Assets | |||||||||||||||||||||||||
| Alerian Galaxy Blockchain Users and Decentralized Commerce ETF | $ | 22,138 | $ | (1,562,950 | ) | $ | 2 | $ | (1,373,459 | ) | $ | 4,880,126 | $ | 1,965,857 | ||||||||||||||||
Alerian Galaxy Crypto Economy ETF | 39,942 | (3,525,400 | ) | 9 | (4,424,388 | ) | 10,677,914 | 2,768,077 | ||||||||||||||||||||||
Capital loss carryforwards are calculated and reported as of a specific date. Results of transactions and other activity after that date may affect the amount of capital loss carryforwards actually available for the Funds to utilize. The ability to utilize capital loss carryforwards in the future may be limited under the Internal Revenue Code and related regulations based on the results of future transactions.
The Funds have capital loss carryforwards as of October 31, 2022, as follows:
| No expiration | |||||||||||||||
| Short-Term | Long-Term | Total | |||||||||||||
Alerian Galaxy Blockchain Users and Decentralized Commerce ETF | $ | 1,321,543 | $ | 51,916 | $ | 1,373,459 | |||||||||
Alerian Galaxy Crypto Economy ETF | 4,211,426 | 212,962 | 4,424,388 | ||||||||||||
| 29 | ||||
|
| |||
NOTE 6–Investment Transactions
For the fiscal year ended October 31, 2022, the cost of securities purchased and the proceeds from sales of securities (other than short-term securities, U.S. Government obligations, money market funds and in-kind transactions, if any) were as follows:
| Purchases | Sales | |||||||
| Alerian Galaxy Blockchain Users and Decentralized Commerce ETF | $ | 4,255,354 | $ | 4,265,170 | ||||
Alerian Galaxy Crypto Economy ETF | 10,199,445 | 9,820,364 | ||||||
For the fiscal year ended October 31, 2022, in-kind transactions associated with creations and redemptions were as follows:
| In-kind Purchases | In-kind Sales | |||||||
Alerian Galaxy Blockchain Users and Decentralized Commerce ETF | $ | - | $ | - | ||||
Alerian Galaxy Crypto Economy ETF | 2,032,214 | 585,050 | ||||||
Gains (losses) on in-kind transactions are generally not considered taxable gains (losses) for federal income tax purposes. As of October 31, 2022, the aggregate cost of investments, including any derivatives, on a tax basis includes adjustments for financial reporting purposes as of the most recently completed federal income tax reporting period-end:
| Net | ||||||||||||||||||||
| Gross | Gross | Unrealized | ||||||||||||||||||
| Unrealized | Unrealized | Appreciation | ||||||||||||||||||
Appreciation | (Depreciation) | (Depreciation) | Cost | |||||||||||||||||
| Alerian Galaxy Blockchain Users and Decentralized Commerce ETF | $ | 50,100 | $ | (1,613,050 | ) | $ | (1,562,950 | ) | $ | 3,953,495 | ||||||||||
Alerian Galaxy Crypto Economy ETF | 111,956 | (3,637,356 | ) | (3,525,400 | ) | 7,148,894 | ||||||||||||||
NOTE 7–Reclassification of Permanent Differences
Primarily as a result of differing book/tax treatment of in-kind transactions, passive foreign investment companies, income from the Subsidiary and wash sales, amounts were reclassified between undistributed net investment income (loss), undistributed net realized gain (loss) and Shares of beneficial interest. These reclassifications had no effect on the net assets of each Fund. For the fiscal year ended October 31, 2022, the reclassifications were as follows:
| Undistributed Net | Undistributed Net | Shares of | |||||||||||||
Investment Income | Realized Gain | Beneficial Interest | |||||||||||||
| Alerian Galaxy Blockchain Users and Decentralized Commerce ETF | $ | 26,007 | $ | 93,892 | $ | (119,899 | ) | ||||||||
Alerian Galaxy Crypto Economy ETF | 37,555 | 1,410,530 | (1,448,085 | ) | |||||||||||
NOTE 8–Trustees’ and Officer’s Fees
The Adviser, as a result of each Fund’s unitary management fee, pays remuneration to the Independent Trustees and an Officer of the Trust on behalf of the Funds. The Trustee who is an “interested person” of the Trust does not receive any Trustees’ fees.
The Trust has adopted a deferred compensation plan (the “Plan”). Under the Plan, each Independent Trustee who has executed a Deferred Fee Agreement (a “Participating Trustee”) may defer receipt of all or a portion of their compensation (“Deferral Fees”). Such Deferral Fees are deemed to be invested in select Invesco ETFs. The Deferral Fees payable to a Participating Trustee are valued as of the date such Deferral Fees would have been paid to a Participating Trustee. The value increases with contributions or with increases in the value of the Shares selected, and the value decreases with distributions or with declines in the value of the Shares selected. Obligations under the Plan represent unsecured claims against the general assets of the Funds.
NOTE 9–Capital
Shares are issued and redeemed by each Fund only in Creation Units consisting of a specified number of Shares as set forth in each Fund’s prospectus. Only APs are permitted to purchase or redeem Creation Units from the Funds. Such transactions are principally permitted in exchange for Deposit Securities, with a balancing cash component to equate the transaction to the NAV per Share of a Fund on the transaction date. However, for all Funds, cash in an amount equivalent to the value of certain securities may be substituted, generally when the securities are not available in sufficient quantity for delivery, not eligible for trading by the AP or as a result of other market circumstances.
To the extent that the Funds permit transactions in exchange for Deposit Securities, each Fund may issue Shares in advance of receipt of Deposit Securities subject to various conditions, including a requirement to maintain on deposit with the Trust cash at least equal to 105% of the market value of the missing Deposit Securities. In accordance with the Trust’s Participant Agreement, Creation Units will be issued to an AP, notwithstanding the fact that the corresponding Deposit Securities have not been received in part or in whole, in reliance on the undertaking of the AP to deliver the missing Deposit Securities as soon as possible, which
| 30 | ||||
|
| |||
undertaking shall be secured by the AP’s delivery and maintenance of collateral consisting of cash in the form of U.S. dollars in immediately available funds having a value (marked-to-market daily) at least equal to 105%, which the Adviser may change from time to time, of the value of the missing Deposit Securities.
Certain transaction fees may be charged by the Funds for creations and redemptions, which are treated as increases in capital. Transactions in each Fund’s Shares are disclosed in detail in the Consolidated Statements of Changes in Net Assets.
| 31 | ||||
|
| |||
Report of Independent Registered Public Accounting Firm
To the Board of Trustees of Invesco Exchange-Traded Fund Trust II and Shareholders of Invesco Alerian Galaxy Blockchain Users and Decentralized Commerce ETF and Invesco Alerian Galaxy Crypto Economy ETF
Opinions on the Consolidated Financial Statements
We have audited the accompanying consolidated statements of assets and liabilities, including the consolidated schedules of investments, of Invesco Alerian Galaxy Blockchain Users and Decentralized Commerce ETF and Invesco Alerian Galaxy Crypto Economy ETF and each of their subsidiaries (two of the funds constituting Invesco Exchange-Traded Fund Trust II, hereafter collectively referred to as the “Funds”) as of October 31, 2022, the related consolidated statements of operations for the year ended October 31, 2022, and the consolidated statements of changes in net assets and the consolidated financial highlights for the year ended October 31, 2022 and for the period October 5, 2021 (commencement of investment operations) through October 31, 2021, including the related notes (collectively referred to as the “consolidated financial statements”). In our opinion, the consolidated financial statements present fairly, in all material respects, the financial position of each of the Funds as of October 31, 2022, the results of each of their operations for the year then ended, and the changes in each of their net assets and each of the financial highlights for the year ended October 31, 2022 and for the period October 5, 2021 (commencement of investment operations) through October 31, 2021 in conformity with accounting principles generally accepted in the United States of America.
Basis for Opinions
These consolidated financial statements are the responsibility of the Funds’ management. Our responsibility is to express an opinion on the Funds’ consolidated financial statements based on our audits. We are a public accounting firm registered with the Public Company Accounting Oversight Board (United States) (“PCAOB”) and are required to be independent with respect to the Funds in accordance with the U.S. federal securities laws and the applicable rules and regulations of the Securities and Exchange Commission and the PCAOB.
We conducted our audits of these consolidated financial statements in accordance with the standards of the PCAOB. Those standards require that we plan and perform the audit to obtain reasonable assurance about whether the consolidated financial statements are free of material misstatement, whether due to error or fraud.
Our audits included performing procedures to assess the risks of material misstatement of the consolidated financial statements, whether due to error or fraud, and performing procedures that respond to those risks. Such procedures included examining, on a test basis, evidence regarding the amounts and disclosures in the consolidated financial statements. Our audits also included evaluating the accounting principles used and significant estimates made by management, as well as evaluating the overall presentation of the consolidated financial statements. Our procedures included confirmation of securities owned as of October 31, 2022 by correspondence with the custodian, transfer agent and brokers; when replies were not received from brokers, we performed other auditing procedures. We believe that our audits provide a reasonable basis for our opinions.
| /s/PricewaterhouseCoopers LLP |
| Chicago, Illinois |
| December 23, 2022 |
We have served as the auditor of one or more of the investment companies in the Invesco group of investment companies since at least 1995. We have not been able to determine the specific year we began serving as auditor.
| 32 | ||||
|
| |||
Calculating your ongoing Fund expenses
Example
As a shareholder of a Fund of the Invesco Exchange-Traded Fund Trust II, you incur a unitary management fee. In addition to the unitary management fee, a shareholder may pay distribution fees, if any, brokerage expenses, taxes, interest, acquired fund fees and expenses, if any, litigation expenses and other extraordinary expenses, including proxy expenses (except for such proxies related to: (i) changes to the Investment Advisory Agreement, (ii) the election of any Board member who is an “interested person” of the Trust, or (iii) any other matters that directly benefit the Adviser). The expense examples below are intended to help you understand your ongoing costs (in dollars) of investing in the Funds and to compare these costs with the ongoing costs of investing in other funds.
The example is based on an investment of $1,000 invested at the beginning of the period and held for the entire period May 1, 2022 through October 31, 2022.
Actual Expenses
The first line in the following table provides information about actual account values and actual expenses. You may use the information in this line, together with the amount you invested, to estimate the expenses that you paid over the period. Simply divide your account value by $1,000 (for example, an $8,600 account value divided by $1,000 = 8.6), then multiply the result by the number in the first line under the heading “Expenses Paid During the Six-Month Period” to estimate the expenses you paid on your account during this period.
Hypothetical Example for Comparison Purposes
The second line in the following table provides information about hypothetical account values and hypothetical expenses based on each Fund’s actual expense ratio and an assumed annualized rate of return of 5% per year before expenses, which is not the Fund’s actual return. The hypothetical account values and expenses may not be used to estimate the actual ending account balance or expenses you paid for the period. You may use this information to compare the ongoing costs of investing in the Funds and other funds. To do so, compare this 5% hypothetical example with the 5% hypothetical examples that appear in the shareholder reports of the other funds.
Please note that the expenses shown in the table are meant to highlight your ongoing costs only, and do not reflect any transactional costs, such as sales charges and brokerage commissions. Therefore, the second line in the table is useful in comparing ongoing costs only, and will not help you determine the relative total costs of owning different funds. In addition, if these transactional costs were included, your costs would have been higher.
Beginning Account Value May 1, 2022 | Ending Account Value October 31, 2022 | Annualized Expense Ratio Based on the Six-Month Period | Expenses Paid During the Six-Month Period(1) | |||||||||||||
Invesco Alerian Galaxy Blockchain Users and Decentralized Commerce ETF (BLKC) | ||||||||||||||||
Actual | $1,000.00 | $ 626.60 | 0.60% | $2.46 | ||||||||||||
Hypothetical (5% return before expenses) | 1,000.00 | 1,022.18 | 0.60 | 3.06 | ||||||||||||
Invesco Alerian Galaxy Crypto Economy ETF (SATO) | ||||||||||||||||
Actual | 1,000.00 | 483.50 | 0.60 | 2.24 | ||||||||||||
Hypothetical (5% return before expenses) | 1,000.00 | 1,022.18 | 0.60 | 3.06 | ||||||||||||
| (1) | Expenses are calculated using the annualized expense ratio, which represents the ongoing expenses as a percentage of net assets for the six-month period ended October 31, 2022. Expenses are calculated by multiplying the Fund’s annualized expense ratio by the average account value for the period, then multiplying the result by 184/365. Expense ratios for the most recent six-month period may differ from expense ratios based on the annualized data in the Consolidated Financial Highlights. |
| 33 | ||||
|
| |||
Form 1099-DIV, Form 1042-S and other year–end tax information provide shareholders with actual calendar year amounts that should be included in their tax returns. Shareholders should consult their tax advisers.
The following distribution information is being provided as required by the Internal Revenue Code or to meet a specific state’s requirement.
Each Fund designates the following amounts or, if subsequently determined to be different, the maximum amount allowable for its fiscal year ended October 31, 2022:
| Qualified Business Income* | Qualified Dividend Income* | Corporate Dividends Received Deduction* | U.S. Treasury Obligations* | Business Interest Income* | Qualified Short Term Gains | |||||||||||||||||||||||||
Invesco Alerian Galaxy Blockchain Users and Decentralized Commerce ETF | 0 | % | 29 | % | 16 | % | 0 | % | 0 | % | $ | - | ||||||||||||||||||
Invesco Alerian Galaxy Crypto Economy ETF | 0 | % | 3 | % | 1 | % | 0 | % | 0 | % | 11,130 | |||||||||||||||||||
| * | The above percentages are based on ordinary income dividends paid to shareholders during the Fund’s fiscal year. |
| 34 | ||||
|
| |||
The Independent Trustees of the Trust, their term of office and length of time served, their principal business occupations during at least the past five years, the number of portfolios in the Fund Complex (as defined below) overseen by each Independent Trustee and the other directorships, if any, held by each Independent Trustee are shown below:
As of October 31, 2022
Name, Address and Year of Birth of Independent Trustees | Position(s) Held with Trust | Term of Office and Length of | Principal Occupation(s) During the Past 5 Years | Number of Portfolios in Fund Complex** Overseen by Independent Trustees | Other Directorships Held by Independent Trustees During the Past 5 Years | |||||
Ronn R. Bagge–1958 c/o Invesco Capital Management LLC 3500 Lacey Road, Suite 700 Downers Grove, IL 60515 | Vice Chair of the Board; Chair of the Nominating and Governance Committee and Trustee | Vice Chair since 2018; Chair of the Nominating and Governance Committee and Trustee since 2007 | Founder and Principal, YQA Capital Management LLC (1998-Present); formerly, Owner/CEO of Electronic Dynamic Balancing Co., Inc. (high-speed rotating equipment service provider). | 234 | Chair (since 2021) and member (since 2017) of the Joint Investment Committee, Mission Aviation Fellowship and MAF Foundation; Trustee, Mission Aviation Fellowship (2017-Present). | |||||
Todd J. Barre–1957 c/o Invesco Capital Management LLC 3500 Lacey Road, Suite 700 Downers Grove, IL 60515 | Trustee | Since 2010 | Assistant Professor of Business, Trinity Christian College (2010-2016); formerly, Vice President and Senior Investment Strategist (2001-2008), Director of Open Architecture and Trading (2007-2008), Head of Fundamental Research (2004-2007) and Vice President and Senior Fixed Income Strategist (1994-2001), BMO Financial Group/Harris Private Bank. | 234 | None. | |||||
| * | This is the date the Independent Trustee began serving the Trust. Each Independent Trustee serves an indefinite term, until his or her successor is elected. |
| ** | Fund Complex includes all open- and closed-end funds (including all of their portfolios) advised by the Adviser and any affiliated person of the Adviser. |
| 35 | ||||
|
| |||
Trustees and Officers–(continued)
Name, Address and Year of Birth of Independent Trustees | Position(s) with Trust | Term of Office and Length of Time Served* | Principal Occupation(s) During the Past 5 Years | Number of Portfolios in Fund Complex** Overseen by Independent Trustees | Other Directorships Held by Independent Trustees During the Past 5 Years | |||||
Edmund P. Giambastiani, Jr.–1948 c/o Invesco Capital Management LLC 3500 Lacey Road, Suite 700 Downers Grove, IL 60515 | Trustee | Since 2019 | President, Giambastiani Group LLC (national security and energy consulting) (2007-Present); Director, First Eagle Alternative Credit LLC (2020-Present); Advisory Board Member, Massachusetts Institute of Technology Lincoln Laboratory (federally-funded research development) (2010-Present); Defense Advisory Board Member, Lawrence Livermore National Laboratory (2013-Present); formerly, Director, The Boeing Company (2009-2021); Trustee, MITRE Corporation (federally funded research development) (2008-2020); Director, THL Credit, Inc. (alternative credit investment manager) (2016-2020); Chair (2015-2016), Lead Director (2011-2015) and Director (2008-2011), Monster Worldwide, Inc. (career services); United States Navy, career nuclear submarine officer (1970-2007); Seventh Vice Chair of the Joint Chiefs of Staff (2005-2007); first NATO Supreme Allied Commander Transformation (2003-2005); Commander, U.S. Joint Forces Command (2002-2005). | 234 | Trustee, U.S. Naval Academy Foundation Athletic & Scholarship Program (2010- Present); formerly, Trustee, certain funds of the Oppenheimer Funds complex (2013-2019); Advisory Board Member, Maxwell School of Citizenship and Public Affairs of Syracuse University (2012-2016). |
| * | This is the date the Independent Trustee began serving the Trust. Each Independent Trustee serves an indefinite term, until his or her successor is elected. |
| ** | Fund Complex includes all open- and closed-end funds (including all of their portfolios) advised by the Adviser and any affiliated person of the Adviser. |
| 36 | ||||
|
| |||
Trustees and Officers–(continued)
Name, Address and Year of Birth of Independent Trustees | Position(s) Held with Trust | Term of Office and Length of Time Served* | Principal Occupation(s) During the Past 5 Years | Number of Portfolios in Fund Complex** Overseen by Independent Trustees | Other Directorships Held by Independent Trustees During the Past 5 Years | |||||
Victoria J. Herget–1951 c/o Invesco Capital Management LLC 3500 Lacey Road, Suite 700 Downers Grove, IL 60515 | Trustee | Since 2019 | Formerly, Managing Director (1993-2001), Principal (1985-1993), Vice President (1978-1985) and Assistant Vice President (1973-1978), Zurich Scudder Investments (investment adviser) (and its predecessor firms). | 234 | Trustee (2000- Present) and Chair (2010-2017), Newberry Library; Trustee, Chikaming Open Lands (2014-Present); formerly, Trustee, Mather LifeWays (2001-2021); Trustee, certain funds in the Oppenheimer Funds complex (2012-2019); Board Chair (2008-2015) and Director (2004-2018), United Educators Insurance Company; Independent Director, First American Funds (2003-2011); Trustee (1992-2007), Chair of the Board of Trustees (1999-2007), Investment Committee Chair (1994-1999) and Investment Committee member (2007-2010), Wellesley College; Trustee, Board Source (2006-2009); Trustee, Chicago City Day School (1994-2005). |
| * | This is the date the Independent Trustee began serving the Trust. Each Independent Trustee serves an indefinite term, until his or her successor is elected. |
| ** | Fund Complex includes all open- and closed-end funds (including all of their portfolios) advised by the Adviser and any affiliated person of the Adviser. |
| 37 | ||||
|
| |||
Trustees and Officers–(continued)
Name, Address and Year of Birth of Independent Trustees | Position(s) Held with Trust | Term of Office and Length of | Principal Occupation(s) During the Past 5 Years | Number of Portfolios in Fund Complex** Overseen by Independent Trustees | Other Directorships Held by Independent Trustees During the Past 5 Years | |||||
Marc M. Kole–1960 c/o Invesco Capital Management LLC 3500 Lacey Road, Suite 700 Downers Grove, IL 60515 | Chair of the Audit Committee and Trustee | Chair of the Audit Committee since 2008; Trustee since 2007 | Formerly, Managing Director of Finance (2020-2021) and Senior Director of Finance (2015-2020), By The Hand Club for Kids (not-for-profit); Chief Financial Officer, Hope Network (social services) (2008-2012); Assistant Vice President and Controller, Priority Health (health insurance) (2005-2008); Regional Chief Financial Officer, United Healthcare (2005); Chief Accounting Officer, Senior Vice President of Finance, Oxford Health Plans (2000-2004); Audit Partner, Arthur Andersen LLP (1996-2000). | 234 | Formerly, Treasurer (2018-2021), Finance Committee Member (2015-2021) and Audit Committee Member (2015), Thornapple Evangelical Covenant Church; Board and Finance Committee Member (2009-2017) and Treasurer (2010-2015, 2017), NorthPointe Christian Schools. | |||||
Yung Bong Lim–1964 c/o Invesco Capital Management LLC 3500 Lacey Road, Suite 700 Downers Grove, IL 60515 | Chair of the Investment Oversight Committee and Trustee | Chair of the Investment Oversight Committee since 2014; Trustee since 2013 | Managing Partner, RDG Funds LLC (real estate) (2008-Present); formerly, Managing Director, Citadel LLC (1999-2007). | 234 | Board Director, Beacon Power Services, Corp. (2019-Present); formerly, Advisory Board Member, Performance Trust Capital Partners, LLC (2008-2020). | |||||
| * | This is the date the Independent Trustee began serving the Trust. Each Independent Trustee serves an indefinite term, until his or her successor is elected. |
| ** | Fund Complex includes all open- and closed-end funds (including all of their portfolios) advised by the Adviser and any affiliated person of the Adviser. |
| 38 | ||||
|
| |||
Trustees and Officers–(continued)
Name, Address and Year of Birth of Independent Trustees | Position(s) Held with Trust | Term of Office and Length of Time Served* | Principal Occupation(s) During the Past 5 Years | Number of Portfolios in Fund Complex** Overseen by Independent Trustees | Other Directorships Held by Independent Trustees During the Past 5 Years | |||||
Joanne Pace–1958 c/o Invesco Capital Management LLC 3500 Lacey Road, Suite 700 Downers Grove, IL 60515 | Trustee | Since 2019 | Formerly, Senior Advisor, SECOR Asset Management, LP (2010-2011); Managing Director and Chief Operating Officer, Morgan Stanley Investment Management (2006-2010); Partner and Chief Operating Officer, FrontPoint Partners, LLC (alternative investments) (2005-2006); Managing Director (2003-2005), Global Head of Human Resources and member of Executive Board and Operating Committee (2004-2005), Global Head of Operations and Product Control (2003-2004), Credit Suisse (investment banking); Managing Director (1997-2003), Controller and Principal Accounting Officer (1999-2003), Chief Financial Officer (temporary assignment) for the Oversight Committee, Long Term Capital Management (1998-1999), Morgan Stanley. | 234 | Board Director, Horizon Blue Cross Blue Shield of New Jersey (2012- Present); Governing Council Member (2016-Present) and Chair of Education Committee (2017-2021), Independent Directors Council (IDC); Council Member, New York-Presbyterian Hospital’s Leadership Council on Children’s and Women’s Health (2012-Present); formerly, Advisory Board Director, The Alberleen Group LLC (2012-2021); Board Member, 100 Women in Finance (2015-2020); Trustee, certain funds in the Oppenheimer Funds complex (2012-2019); Lead Independent Director and Chair of the Audit and Nominating Committee of The Global Chartist Fund, LLC, Oppenheimer Asset Management (2011-2012); Board Director, Managed Funds Association (2008-2010); Board Director (2007-2010) and Investment Committee Chair (2008-2010), Morgan Stanley Foundation. |
| * | This is the date the Independent Trustee began serving the Trust. Each Independent Trustee serves an indefinite term, until his or her successor is elected. |
| ** | Fund Complex includes all open- and closed-end funds (including all of their portfolios) advised by the Adviser and any affiliated person of the Adviser. |
| 39 | ||||
|
| |||
Trustees and Officers–(continued)
| Name, Address and Year of Birth of Independent Trustees | Position(s) with Trust | Term of Office and Length of Time Served* | Principal Occupation(s) During the Past 5 Years | Number of Portfolios in Fund Complex** Overseen by Independent Trustees | Other Directorships Held by Independent Trustees During the Past 5 Years | |||||
Gary R. Wicker–1961 c/o Invesco Capital Management LLC 3500 Lacey Road, Suite 700 Downers Grove, IL 60515 | Trustee | Since 2013 | Senior Vice President of Global Finance and Chief Financial Officer, RBC Ministries (publishing company) (2013-Present); formerly, Executive Vice President and Chief Financial Officer, Zondervan Publishing (a division of Harper Collins/NewsCorp) (2007-2012); Senior Vice President and Group Controller (2005- 2006), Senior Vice President and Chief Financial Officer (2003-2004), Chief Financial Officer (2001-2003), Vice President, Finance and Controller (1999-2001) and Assistant Controller (1997-1999), divisions of The Thomson Corporation (information services provider); Senior Audit Manager (1994-1997), PricewaterhouseCoopers LLP. | 234 | Board Member and Treasurer, Our Daily Bread Ministries Canada (2015- Present); Board and Finance Committee Member, West Michigan Youth For Christ (2010- Present). | |||||
Donald H. Wilson–1959 c/o Invesco Capital Management LLC 3500 Lacey Road, Suite 700 Downers Grove, IL 60515 | Chair of the Board and Trustee | Chair since 2012; Trustee since 2007 | Chair, President and Chief Executive Officer, McHenry Bancorp Inc. and McHenry Savings Bank (subsidiary) (2018-Present); formerly, Chair and Chief Executive Officer, Stone Pillar Advisors, Ltd. (2010-2017); President and Chief Executive Officer, Stone Pillar Investments, Ltd. (advisory services to the financial sector) (2016-2018); Chair, President and Chief Executive Officer, Community Financial Shares, Inc. and Community Bank—Wheaton/Glen Ellyn (subsidiary) (2013-2015); Chief Operating Officer, AMCORE Financial, Inc. (bank holding company) (2007-2009); Executive Vice President and Chief Financial Officer, AMCORE Financial, Inc. (2006-2007); Senior Vice President and Treasurer, Marshall & Ilsley Corp. (bank holding company) (1995-2006). | 234 | Director, Penfield Children’s Center (2004-Present); Board Chair, Gracebridge Alliance, Inc. (2015-Present). | |||||
| * | This is the date the Independent Trustee began serving the Trust. Each Independent Trustee serves an indefinite term, until his or her successor is elected. |
| ** | Fund Complex includes all open- and closed-end funds (including all of their portfolios) advised by the Adviser and any affiliated person of the Adviser. |
| 40 | ||||
|
| |||
Trustees and Officers–(continued)
The Interested Trustee and the executive officers of the Trust, their term of office and length of time served, their principal business occupations during at least the past five years, the number of portfolios in the Fund Complex overseen by the Interested Trustee and the other directorships, if any, held by the Interested Trustee are shown below:
| Name, Address and Year of Birth of Interested Trustee | Position(s) with Trust | Term of Office and Length of Time Served* | Principal Occupation(s) During the Past 5 Years | Number of Portfolios in Fund Complex** Overseen by Interested Trustee | Other Directorships Held by Interested Trustee During the Past 5 Years | |||||
Anna Paglia–1974 Invesco Capital Management LLC 3500 Lacey Road Suite 700 Downers Grove, IL 60515 | Trustee, President and Principal Executive Officer | Trustee since 2022, President and Principal Executive Officer since 2020 | President and Principal Executive Officer (2020-Present) and Trustee (2022-Present), Invesco Exchange- Traded Fund Trust, Invesco Exchange-Traded Fund Trust II, Invesco India Exchange-Traded Fund Trust, Invesco Actively Managed Exchange-Traded Fund Trust, Invesco Actively Managed Exchange-Traded Commodity Fund Trust and Invesco Exchange-Traded Self-Indexed Fund Trust; Managing Director and Global Head of ETFs and Indexed Strategies, Chief Executive Officer and Principal Executive Officer, Invesco Capital Management LLC (2020-Present); Chief Executive Officer, Manager and Principal Executive Officer, Invesco Specialized Products, LLC (2020-Present); Vice President, Invesco Indexing LLC (2020-Present); formerly, Secretary, Invesco Exchange-Traded Fund Trust, Invesco Exchange-Traded Fund Trust II, Invesco India Exchange-Traded Fund Trust and Invesco Actively Managed Exchange-Traded Fund Trust (2011-2020), Invesco Actively Managed Exchange-Traded Commodity Fund Trust (2014-2020) and Invesco Exchange-Traded Self-Indexed Fund Trust (2015- 2020); Head of Legal (2010-2020) and Secretary (2015-2020), Invesco Capital Management LLC; Manager and Assistant Secretary, Invesco Indexing LLC (2017-2020); Head of Legal and Secretary, Invesco Specialized Products, LLC (2018-2020); Partner, K&L Gates LLP (formerly, Bell Boyd & Lloyd LLP) (2007-2010); and Associate Counsel at Barclays Global Investors Ltd. (2004-2006). | 234 | None |
| * | This is the date the Interested Trustee began serving the Trust. The Interested Trustee serves an indefinite term, until his successor is elected. |
| ** | Fund Complex includes all open- and closed-end funds (including all of their portfolios) advised by the Adviser and any affiliated person of the Adviser. |
| 41 | ||||
|
| |||
Trustees and Officers–(continued)
Name, Address and Year of Birth of Executive Officers | Position(s) Held with Trust | Length of Time Served* | Principal Occupation(s) During the Past 5 Years | |||
Adrien Deberghes–1967 Invesco Capital Management LLC 11 Greenway Plaza, Suite 1000 Houston, TX 77046 | Vice President | Since 2020 | Vice President, Invesco Exchange-Traded Fund Trust, Invesco Exchange-Traded Fund Trust II, Invesco India Exchange-Traded Fund Trust, Invesco Actively Managed Exchange-Traded Fund Trust, Invesco Actively Managed Exchange- Traded Commodity Fund Trust and Invesco Exchange-Traded Self-Indexed Fund Trust (2020-Present); Head of the Fund Office of the CFO, Fund Administration and Vice President, Invesco Advisers, Inc. (2020-Present); Principal Financial Officer, Treasurer and Vice President, The Invesco Funds (2020-Present); formerly, Senior Vice President and Treasurer, Fidelity Investments (2008-2020). | |||
Kelli Gallegos–1970 Invesco Capital Management LLC 11 Greenway Plaza, Suite 1000 Houston, TX 77046 | Vice President and Treasurer | Since 2018 | Vice President, Invesco Advisers, Inc. (2020-Present); Principal Financial and Accounting Officer- Pooled Investments, Invesco Specialized Products, LLC (2018-Present); Vice President and Treasurer, Invesco Exchange-Traded Fund Trust, Invesco Exchange-Traded Fund Trust II, Invesco India Exchange-Traded Fund Trust, Invesco Actively Managed Exchange-Traded Fund Trust, Invesco Actively Managed Exchange-Traded Commodity Fund Trust and Invesco Exchange-Traded Self-Indexed Fund Trust (2018-Present); Principal Financial and Accounting Officer-Pooled Investments, Invesco Capital Management LLC (2018-Present); Vice President and Assistant Treasurer (2008-Present), The Invesco Funds; formerly, Principal Financial Officer (2016-2020) and Assistant Vice President (2008-2016), The Invesco Funds; Assistant Treasurer, Invesco Specialized Products, LLC (2018); Assistant Treasurer, Invesco Exchange-Traded Fund Trust, Invesco Exchange-Traded Fund Trust II, Invesco India Exchange-Traded Fund Trust and Invesco Actively Managed Exchange-Traded Fund Trust (2012-2018), Invesco Actively Managed Exchange-Traded Commodity Fund Trust (2014-2018) and Invesco Exchange-Traded Self-Indexed Fund Trust (2016-2018); and Assistant Treasurer, Invesco Capital Management LLC (2013-2018). | |||
Adam Henkel–1980 Invesco Capital Management LLC 3500 Lacey Road, Suite 700 Downers Grove, IL 60515 | Secretary | Since 2020 | Head of Legal and Secretary, Invesco Capital Management LLC and Invesco Specialized Products, LLC (2020-present); Secretary, Invesco Exchange-Traded Fund Trust, Invesco Exchange-Traded Fund Trust II, Invesco India Exchange- Traded Fund Trust, Invesco Actively Managed Exchange-Traded Fund Trust, Invesco Actively Managed Exchange-Traded Commodity Fund Trust and Invesco Exchange-Traded Self-Indexed Fund Trust (2020-Present); Assistant Secretary, Invesco Capital Markets, Inc. (2020-Present); Assistant Secretary, The Invesco Funds (2014-Present); Manager and Assistant Secretary, Invesco Indexing LLC (2020-Present); Assistant Secretary, Invesco Investment Advisers LLC (2020-Present); formerly, Assistant Secretary of Invesco Exchange-Traded Fund Trust, Invesco Exchange-Traded Fund Trust II, Invesco India Exchange-Traded Fund Trust, Invesco Actively Managed Exchange-Traded Fund Trust and Invesco Actively Managed Exchange-Traded Commodity Fund Trust (2014-2020); Chief Compliance Officer of Invesco Capital Management LLC (2017); Chief Compliance Officer of Invesco Exchange-Traded Fund Trust, Invesco Exchange-Traded Fund Trust II, Invesco India Exchange-Traded Fund Trust, Invesco Actively Managed Exchange-Traded Fund Trust and Invesco Actively Managed Exchange-Traded Commodity Fund Trust (2017); Senior Counsel, Invesco, Ltd. (2013-2020); Assistant Secretary, Invesco Specialized Products, LLC (2018-2020). | |||
| * | This is the date each Officer began serving the Trust in their current position. Each Officer serves an indefinite term, until his or her successor is elected. |
| 42 | ||||
|
| |||
Trustees and Officers–(continued)
Name, Address and Year of Birth of Executive Officers | Position(s) with Trust | Length of Time Served* | Principal Occupation(s) During the Past 5 Years | |||
Peter Hubbard–1981 Invesco Capital Management LLC 3500 Lacey Road, Suite 700 Downers Grove, IL 60515 | Vice President | Since 2009 | Vice President, Invesco Specialized Products, LLC (2018-Present); Vice President, Invesco Exchange-Traded Fund Trust, Invesco Exchange-Traded Fund Trust II, Invesco India Exchange-Traded Fund Trust, Invesco Actively Managed Exchange-Traded Fund Trust (2009-Present), Invesco Actively Managed Exchange-Traded Commodity Fund Trust (2014-Present) and Invesco Exchange-Traded Self-Indexed Fund Trust (2016-Present); Vice President and Director of Portfolio Management, Invesco Capital Management LLC (2010-Present); and Vice President, Invesco Advisers, Inc. (2020-Present); formerly, Vice President of Portfolio Management, Invesco Capital Management LLC (2008-2010); Portfolio Manager, Invesco Capital Management LLC (2007-2008); Research Analyst, Invesco Capital Management LLC (2005-2007); Research Analyst and Trader, Ritchie Capital, a hedge fund operator (2003-2005). | |||
Sheri Morris–1964 Invesco Capital Management LLC 11 Greenway Plaza, Suite 1000 Houston, TX 77046 | Vice President | Since 2012 | Head of Global Fund Services, Invesco Ltd. (2019-Present); Vice President, OppenheimerFunds, Inc. (2019-Present); President and Principal Executive Officer, The Invesco Funds (2016-Present); Senior Vice President, Invesco Advisers, Inc. (formerly known as Invesco Institutional (N.A.), Inc.) (registered investment adviser) (2020-Present); Director, Invesco Trust Company (2022-Present) and Vice President, Invesco Exchange-Traded Fund Trust, Invesco Exchange-Traded Fund Trust II, Invesco India Exchange-Traded Fund Trust, Invesco Actively Managed Exchange-Traded Fund Trust (2012-Present), Invesco Actively Managed Exchange-Traded Commodity Fund Trust (2014-Present) and Invesco Exchange-Traded Self-Indexed Fund Trust (2016-Present); formerly, Treasurer (2008-2020), Vice President and Principal Financial Officer, The Invesco Funds (2008-2016); Treasurer, Invesco Exchange-Traded Fund Trust, Invesco Exchange-Traded Fund Trust II, Invesco India Exchange-Traded Fund Trust and Invesco Actively Managed Exchange- Traded Fund Trust (2011-2013); Vice President, Invesco Aim Advisers, Inc., Invesco Aim Capital Management, Inc. and Invesco Aim Private Asset Management, Inc.; Treasurer, Assistant Vice President and Assistant Treasurer, The Invesco Funds and Assistant Vice President, Invesco Advisers, Inc., Invesco Aim Capital Management, Inc. and Invesco Aim Private Asset Management, Inc.; Vice President, Invesco Advisers, Inc. (2009-2020). | |||
Rudolf E. Reitmann–1971 Invesco Capital Management LLC 3500 Lacey Road, Suite 700 Downers Grove, IL 60515 | Vice President | Since 2013 | Head of Global Exchange Traded Funds Services, Invesco Specialized Products, LLC (2018-Present); Vice President, Invesco Exchange-Traded Fund Trust, Invesco Exchange-Traded Fund Trust II, Invesco India Exchange-Traded Fund Trust, Invesco Actively Managed Exchange-Traded Fund Trust (2013-Present), Invesco Actively Managed Exchange-Traded Commodity Fund Trust (2014-Present) and Invesco Exchange-Traded Self-Indexed Fund Trust (2016-Present); Head of Global Exchange Traded Funds Services, Invesco Capital Management LLC (2013-Present); Vice President, Invesco Capital Markets, Inc. (2018-Present). | |||
| * | This is the date each Officer began serving the Trust in their current position. Each Officer serves an indefinite term, until his or her successor is elected. |
| 43 | ||||
|
| |||
Trustees and Officers–(continued)
| Name, Address and Year of Birth of Executive Officers | Position(s) Held with Trust | Length of Time Served* | Principal Occupation(s) During the Past 5 Years | |||
Melanie Zimdars–1976 Invesco Capital Management LLC 3500 Lacey Road, Suite 700 Downers Grove, IL 60515 | Chief Compliance Officer | Since 2017 | Chief Compliance Officer, Invesco Specialized Products, LLC (2018-Present); Chief Compliance Officer, Invesco Capital Management LLC (2017-Present); Chief Compliance Officer, Invesco Exchange-Traded Fund Trust, Invesco Exchange-Traded Fund Trust II, Invesco India Exchange-Traded Fund Trust, Invesco Actively Managed Exchange-Traded Fund Trust, Invesco Actively Managed Exchange-Traded Commodity Fund Trust and Invesco Exchange-Traded Self-Indexed Fund Trust (2017-Present); formerly, Vice President and Deputy Chief Compliance Officer, ALPS Holding, Inc. (2009-2017); Mutual Fund Treasurer/ Chief Financial Officer, Wasatch Advisors, Inc. (2005-2008); Compliance Officer, U.S. Bancorp Fund Services, LLC (2001-2005). |
| * | This is the date each Officer began serving the Trust in their current position. Each Officer serves an indefinite term, until his or her successor is elected. |
Availability of Additional Information About the Trustees
The Statement of Additional Information includes additional information about the Trustees and is available, without charge, upon request at (800) 983-0903.
| 44 | ||||
|
| |||
(This Page Intentionally Left Blank)
(This Page Intentionally Left Blank)
Proxy Voting Policies and Procedures
A description of the Trust’s proxy voting policies and procedures that the Funds use to determine how to vote proxies relating to portfolio securities is available, without charge and upon request, by calling (800) 983-0903. This information is also available on the Securities and Exchange Commission’s (the “Commission”) website at www.sec.gov.
Information regarding how each Fund voted proxies for portfolio securities, if applicable, during the most recent 12-month period ended June 30, is available, without charge and upon request, by (i) calling (800) 983-0903; or (ii) accessing the Trust’s Form N-PX on the Commission’s website at www.sec.gov.
Quarterly Portfolios
The Trust files its complete schedule of portfolio holdings for the Funds with the Commission for the first and third quarters of each fiscal year as an exhibit to its reports on Form N-PORT. The Forms N-PORT are available on the Commission’s website at www.sec.gov.
Frequency Distribution of Discounts and Premiums
A table showing the number of days the market price of each Fund’s shares was greater than the Fund’s net asset value, and the number of days it was less than the Fund’s net asset value (i.e., premium or discount) for the most recently completed calendar year, and the calendar quarters since that year end (or the life of the Fund, if shorter) may be found at the Fund’s website at www.invesco.com/ETFs.
| ©2022 Invesco Capital Management LLC | ||||
| 3500 Lacey Road, Suite 700 | ||||
| Downers Grove, IL 60515 | P-PS-AR-11 | invesco.com/ETFs |
Item 2. Code of Ethics.
The Registrant has adopted a Code of Ethics that applies to the Registrant’s principal executive officer and principal financial officer. This Code is filed as an exhibit to this report on Form N-CSR under Item 13(a)(1). No substantive amendments to this Code were made during the reporting period. There were no waivers for the fiscal year ended October 31, 2022.
Item 3. Audit Committee Financial Expert.
The Registrant’s Board of Trustees (the “Board”) has determined that the Registrant has four “audit committee financial experts” serving on its audit committee: Mr. Marc M. Kole, Ms. Joanne Pace, Mr. Gary R. Wicker and Mr. Donald H. Wilson. Each of these audit committee members is “independent,” meaning that he/she is not an “interested person” of the Registrant (as that term is defined in Section 2(a)(19) of the Investment Company Act of 1940, as amended) and he/she does not accept any consulting, advisory, or other compensatory fee from the Registrant (except in his/her capacity as a Board or committee member).
An “audit committee financial expert” is not an “expert” for any purpose, including for purposes of Section 11 of the Securities Act of 1933, as a result of being designated as an “audit committee financial expert.” Further, the designation of a person as an “audit committee financial expert” does not mean that a person has any greater duties, obligations, or liability than those imposed on a person without the “audit committee financial expert” designation. Similarly, the designation of a person as an “audit committee financial expert” does not affect the duties, obligations, or liability of any other member of the audit committee or Board.
Item 4. Principal Accountant Fees and Services.
(a) to (d)
Fees Billed by PwC to the Registrant
PricewaterhouseCoopers LLP (“PwC”), the Registrant’s independent registered public accounting firm, billed the Registrant aggregate fees for pre-approved services rendered to the Registrant for the last two fiscal years as shown in the following table. The Audit Committee pre-approved all audit and non-audit services provided to the Registrant.
| Fees Billed by PwC for Services Rendered to the Registrant for Fiscal Year End 2022 | Fees Billed by PwC for Services Rendered to the Registrant for Fiscal Year End 2021 | |||||||
Audit Fees | $ | 477,990 | $ | 453,660 | ||||
Audit-Related Fees | $ | 0 | $ | 0 | ||||
Tax Fees(1) | $ | 358,074 | $ | 363,393 | ||||
All Other Fees | $ | 0 | $ | 0 | ||||
Total Fees | $ | 1,761,90 | $ | 817,053 | ||||
| (1) | Tax Fees for the fiscal years ended October 31, 2022, and 2021 include fees billed for preparation of U.S. Tax Returns and Taxable Income calculations, including excise and year-to-date estimates for various book-to-tax differences. |
Fees Billed by PwC Related to Invesco and Invesco Affiliates
PwC billed Invesco Capital Management LLC (“Invesco” or “Adviser”), the Registrant’s investment adviser, and any entity controlling, controlled by or under common control with Invesco that provides ongoing services to the Registrant (“Affiliates”), aggregate fees for pre-approved non-audit services rendered to Invesco and Affiliates for the last two fiscal years as shown in the following table. The Audit Committee pre-approved all non-audit services provided to Invesco and Affiliates that were required to be pre-approved.
| Fees Billed for Non- Audit Services Rendered to Invesco and Affiliates for Fiscal Year End 2022 That Were Required to be Pre-Approved by the Registrant’s Audit Committee | Fees Billed for Non- Audit Services Rendered to Invesco and Affiliates for Fiscal Year End 2021 That Were Required to be Pre-Approved by the Registrant’s Audit Committee | |||||||
Audit-Related Fees(1) | $ | 760,000 | $ | 760,000 | ||||
Tax Fees | $ | 0 | $ | 0 | ||||
All Other Fees | $ | 0 | $ | 0 | ||||
Total Fees | $ | 760,000 | $ | 760,000 | ||||
| (1) | Audit-Related Fees for the fiscal years ended 2022 and 2021 include fees billed related to reviewing controls at a service organization. |
(e)(1) Audit Committee Pre-Approval Policies and Procedures
Pre-Approval of Audit and Non-Audit Services Policies and Procedures
As Adopted by the Audit Committee of the Invesco ETFs
| Applicable to | Invesco Exchange-Traded Fund Trust, Invesco Exchange-Traded Fund Trust II, Invesco India Exchange-Traded Fund Trust, Invesco Actively Managed Exchange-Traded Fund Trust, Invesco Actively Managed Exchange-Traded Commodity Fund Trust and Invesco Exchange-Traded Self-Indexed Fund Trust (collectively the “Funds”) | |
| Risk Addressed by Policy | Approval of Audit and Non-Audit Services | |
| Relevant Law and Other Sources | Sarbanes-Oxley Act of 2002; Regulation S-X. | |
| Last Reviewed by Compliance for Accuracy | June 15, 2018 | |
| Effective Date | June 26, 2009 | |
| Amended Dates | March 12, 2015 and June 15, 2018 | |
Statement of Principles
Under the Sarbanes-Oxley Act of 2002 and rules adopted by the Securities and Exchange Commission (“SEC”) (“Rules”), the Audit Committee of the Funds’ (the “Audit Committee”) Board of Trustees (the “Board”) is responsible for the appointment, compensation and oversight of the work of independent accountants (an “Auditor”). As part of this responsibility and to assure that the Auditor’s independence is not impaired, the Audit Committee pre-approves the audit and non-audit services provided to the Funds by each Auditor, as well as all non-audit services provided by the Auditor to the Funds’ investment adviser and to affiliates of the adviser that provide ongoing services to the Funds (“Service Affiliates”) if the services directly impact the Funds’ operations or financial reporting. The SEC Rules also specify the types of services that an Auditor may not provide to its audit client. The following policies and procedures comply with the requirements for pre-approval and provide a mechanism by which management of the Funds may request and secure pre-approval of audit and non-audit services in an orderly manner with minimal disruption to normal business operations.
Proposed services either may be pre-approved without consideration of specific case-by-case services by the Audit Committee (“general pre-approval”) or require the specific pre-approval of the Audit Committee (“specific pre-approval”). As set forth in these policies and procedures, unless a type of service has received general pre-approval, it will require specific pre-approval by the Audit Committee. Additionally, any fees exceeding 110% of estimated pre-approved fee levels provided at the time the service was pre-approved will also require specific approval by the Audit Committee before payment is made. The Audit Committee will also consider the impact of additional fees on the Auditor’s independence when determining whether to approve any additional fees for previously pre-approved services.
The Audit Committee will annually review and generally pre-approve the services that may be provided by each Auditor without obtaining specific pre-approval from the Audit Committee. The term of any general pre-approval runs from the date of such pre-approval through June 30th of the following year, unless the Audit Committee considers a different period and states otherwise. The Audit Committee will add to or subtract from the list of general pre-approved services from time to time, based on subsequent determinations.
The purpose of these policies and procedures is to set forth the guidelines to assist the Audit Committee in fulfilling its responsibilities.
Delegation
The Chairman of the Audit Committee (or, in his or her absence, any member of the Audit Committee) may grant specific pre-approval for non-prohibited services. All such delegated pre-approvals shall be presented to the Audit Committee no later than the next Audit Committee meeting.
Audit Services
The annual Audit services engagement terms will be subject to specific pre-approval of the Audit Committee. Audit services include the annual financial statement audit and other procedures such as tax provision work that is required to be performed by the independent auditor to be able to form an opinion on the Funds’ financial statements. The Audit Committee will obtain, review and consider sufficient information concerning the proposed Auditor to make a reasonable evaluation of the Auditor’s qualifications and independence.
In addition to the annual Audit services engagement, the Audit Committee may grant either general or specific pre-approval of other Audit services, which are those services that only the independent auditor reasonably can provide. Other Audit services may include services such as issuing consents for the inclusion of audited financial statements with SEC registration statements, periodic reports and other documents filed with the SEC or other documents issued in connection with securities offerings.
Non-Audit Services
The Audit Committee may provide either general or specific pre-approval of any non-audit services to the Funds and its Service Affiliates if the Audit Committee believes that the provision of the service will not impair the independence of the Auditor, is consistent with the SEC’s Rules on auditor independence, and otherwise conforms to the Audit Committee’s general principles and policies as set forth herein.
Audit-Related Services
“Audit-related services” are assurance and related services that are reasonably related to the performance of the audit or review of the Funds’ financial statements or that are traditionally performed by the independent auditor. Audit-related services include, among others, accounting consultations related to accounting, financial reporting or disclosure matters not classified as “Audit services”; and assistance with understanding and implementing new accounting and financial reporting guidance from rulemaking authorities.
Tax Services
“Tax services” include, but are not limited to, the review and signing of the Funds’ federal tax returns, the review of required distributions by the Funds and consultations regarding tax matters such as the tax treatment of new investments or the impact of new regulations. The Audit Committee will scrutinize carefully the retention of the Auditor in connection with a transaction initially recommended by the Auditor, the major business purpose of which may be tax avoidance or the tax treatment of which may not be supported in the Internal Revenue Code and related regulations. The Audit Committee will consult with the Funds’ Treasurer (or his or her designee) and may consult with outside counsel or advisors as necessary to ensure the consistency of Tax services rendered by the Auditor with the foregoing policy.
No Auditor shall represent any Fund or any Service Affiliate before a tax court, district court or federal court of claims.
Under rules adopted by the Public Company Accounting Oversight Board and approved by the SEC, in connection with seeking Audit Committee pre-approval of permissible Tax services, the Auditor shall:
| 1. | Describe in writing to the Audit Committee, which writing may be in the form of the proposed engagement letter: |
| a. | The scope of the service, the fee structure for the engagement, and any side letter or amendment to the engagement letter, or any other agreement between the Auditor and the Fund, relating to the service; and |
| b. | Any compensation arrangement or other agreement, such as a referral agreement, a referral fee or fee-sharing arrangement, between the Auditor and any person (other than the Fund) with respect to the promoting, marketing, or recommending of a transaction covered by the service; |
| 2. | Discuss with the Audit Committee the potential effects of the services on the independence of the Auditor; and |
| 3. | Document the substance of its discussion with the Audit Committee. |
All Other Auditor Services
The Audit Committee may pre-approve non-audit services classified as “All other services” that are not categorically prohibited by the SEC, as listed in Exhibit 1 to this policy.
Pre-Approval Fee Levels or Established Amounts
Pre-approval of estimated fees or established amounts for services to be provided by the Auditor under general or specific pre-approval policies will be set periodically by the Audit Committee. Any proposed fees exceeding 110% of the maximum estimated pre-approved fees or established amounts for pre-approved audit and non-audit services will be reported to the Audit Committee at the quarterly Audit Committee meeting and will require specific approval by the Audit Committee before payment is made. The Audit Committee will always factor in the overall relationship of fees for audit and non-audit services in determining whether to pre-approve any such services and in determining whether to approve any additional fees exceeding 110% of the maximum pre-approved fees or established amounts for previously pre-approved services.
Procedures
On an annual basis, the Auditor will submit to the Audit Committee for general pre-approval, a list of non-audit services that the Funds or Service Affiliates of the Funds may request from the Auditor. The list will describe the non-audit services in reasonable detail and will include an estimated range of fees and such other information as the Audit Committee may request.
Each request for services to be provided by the Auditor under the general pre-approval of the Audit Committee will be submitted to the Funds’ Treasurer (or his or her designee) and must include a detailed description of the services to be rendered. The Treasurer or his or her designee will ensure that such services are included within the list of services that have received the general pre-approval of the Audit Committee.
Each request to provide services that require specific approval by the Audit Committee shall be submitted to the Audit Committee jointly by the Funds’ Treasurer or his or her designee and the Auditor, and must include a joint statement that, in their view, such request is consistent with the pre-approval policies and procedures and the SEC Rules.
Each request to provide Tax services under either the general or specific pre-approval of the Audit Committee will describe in writing: (i) the scope of the service, the fee structure for the engagement, and any side letter or amendment to the engagement letter, or any other agreement between the Auditor and the audit client, relating to the service; and (ii) any compensation arrangement or other agreement between the Auditor and any person (other than the audit client) with respect to the promoting, marketing, or recommending of a transaction covered by the service. The Auditor will discuss with the Audit Committee the potential effects of the services on the Auditor’s independence and will document the substance of the discussion.
Non-audit services pursuant to the de minimis exception provided by the SEC Rules will be promptly brought to the attention of the Audit Committee for approval, including documentation that each of the conditions for this exception, as set forth in the SEC Rules, has been satisfied.
On at least an annual basis, the Auditor will prepare a summary of all the services provided to any entity in the investment company complex as defined in section 2-01(f)(14) of Regulation S-X in sufficient detail as to the nature of the engagement and the fees associated with those services.
The Audit Committee has designated the Funds’ Treasurer to monitor the performance of all services provided by the Auditor and to ensure such services are in compliance with these policies and procedures. The Funds’ Treasurer will report to the Audit Committee on a periodic basis as to the results of such monitoring. Both the Funds’ Treasurer and management will immediately report to the Chairman of the Audit Committee any breach of these policies and procedures that comes to the attention of the Funds’ Treasurer or senior management.
Exhibit 1 to Pre-Approval of Audit and Non-Audit Services Policies and Procedures Conditionally Prohibited Non-Audit Services (not prohibited if the Fund can reasonably conclude that the results of the service would not be subject to audit procedures in connection with the audit of the Fund’s financial statements)
| • | Bookkeeping or other services related to the accounting records or financial statements of the audit client |
| • | Financial information systems design and implementation |
| • | Appraisal or valuation services, fairness opinions, or contribution-in-kind reports |
| • | Actuarial services |
| • | Internal audit outsourcing services |
Categorically Prohibited Non-Audit Services
| • | Management functions |
| • | Human resources |
| • | Broker-dealer, investment adviser, or investment banking services |
| • | Legal services |
| • | Expert services unrelated to the audit |
| • | Any service or product provided for a contingent fee or a commission |
| • | Services related to marketing, planning, or opining in favor of the tax treatment of confidential transactions or aggressive tax position transactions, a significant purpose of which is tax avoidance |
| • | Tax services for persons in financial reporting oversight roles at the Fund |
| • | Any other service that the Public Company Oversight Board determines by regulation is impermissible. |
| (e)(2) | There were no amounts that were pre-approved by the Audit Committee pursuant to the de minimus exception under Rule 2-01 of Regulation S-X. |
| (f) | Not applicable. |
| (g) | In addition to the amounts shown in the tables above, PwC billed Invesco and Affiliates aggregate fees of $7,434,000 for the fiscal year ended October 31, 2022 and $5,910,000 for the fiscal year ended October 31, 2021 for non-audit services not required to be pre-approved by the Registrant’s Audit Committee. In total, PwC billed the Registrant, Invesco and Affiliates aggregate non-audit fees of $8,579,074 for the fiscal year ended October 31, 2022 and $7,033,393 for the fiscal year ended October 31, 2021. |
| (h) | With respect to the non-audit services above billed to Invesco and Affiliates that were not required to be pre-approved by the Registrant’s Audit Committee, the Audit Committee received information from PwC about such services, including by way of comparison, that PwC provided audit services to entities within the Investment Company Complex, as defined by Rule 2-01(f)(14) of Regulation S-X, of approximately $31 million and non-audit services of approximately $19 million for the fiscal year ended 2022. The Audit Committee considered this information in evaluating PwC’s independence. |
Pursuant to PCAOB Rule 3526, Communication with Audit Committees Concerning Independence, PwC advised the Registrant’s Audit Committee of the following matters identified since the previous annual Form N-CSR filing that may be reasonably thought to bear on PwC’s independence. PwC advised the Audit Committee that one PwC Partner held financial interests directly in investment companies within the complex that includes the Funds as well as all registered investment companies advised by the Adviser and its affiliates, including other subsidiaries of the Adviser’s parent company, Invesco Ltd. (collectively, the “Invesco Fund Complex”) that were inconsistent with the requirements of Rule 2-01(c)(1) of SEC Regulation S-X. In reporting the matter to the Audit Committee, PwC noted, among other things, that the impermissible holding was disposed of by the individual, the individual was not in the chain of command of the audit or the audit partners of the Funds, the financial interest was not material to the net worth of the individual or his or her respective immediate family members and the Funds’ audit engagement team was unaware of the impermissible holding until after the matter was confirmed to be an independence exception. In addition, PwC considered that the PwC Partner provided non-audit services that were not relied upon by the audit engagement team in the audits of the financial statements of the Funds. Based on the mitigating factors noted above, PwC advised the Audit Committee that it concluded that its objectivity and impartiality with respect to all issues encompassed within the audit engagement has not been impaired and it believes that a reasonable investor with knowledge of all relevant facts and circumstances for the violation would conclude that PwC is capable of exercising objective and impartial judgment on all issues encompassed within the audits of the financial statements of the Funds in the Registrant for the impacted periods.
Item 5. Audit Committee of Listed Registrants.
| (a) | The Registrant has a separately designated Audit Committee established in accordance with Section 3(a)(58)(A) of the Securities Exchange Act of 1934, as amended, which consists solely of independent trustees. The Audit Committee members are Marc M. Kole, Joanne Pace, Gary R. Wicker, and Donald H. Wilson. |
| (b) | Not applicable. |
Item 6. Schedule of Investments.
| (a) | The Schedules of Investments are included as a part of the report to shareholders filed under Item 1 of this Form N-CSR. |
| (b) | Not applicable. |
Item 7. Disclosure of Proxy Voting Policies and Procedures for Closed-End Management Investment Companies.
Not applicable.
Item 8. Portfolio Managers of Closed-End Management Investment Companies.
Not applicable.
Item 9. Purchases of Equity Securities by Closed-End Management Investment Company and Affiliated Purchasers.
Not applicable.
Item 10. Submission of Matters to a Vote of Security Holders.
There have been no material changes to the procedures by which shareholders may recommend nominees to the Board that would require disclosure herein.
Item 11. Controls and Procedures.
| (a) | Based on their evaluation of the Registrant’s disclosure controls and procedures (as defined in Rule 30a-3(c) under the Investment Company Act of 1940) as of a date within 90 days of the filing date of this report, the Registrant’s President (principal executive officer) and Treasurer (principal financial officer) have concluded that such disclosure controls and procedures are effective. |
| (b) | There were no changes in the Registrant’s internal control over financial reporting (as defined in Rule 30a-3(d) under the Investment Company Act of 1940) that occurred during the period covered by this report that has materially affected, or is reasonably likely to materially affect, the Registrant’s internal control over financial reporting. |
Item 12. Disclosure of Securities Lending Activities for Closed-End Management Investment Companies.
Not applicable.
Item 13. Exhibits.
SIGNATURES
Pursuant to the requirements of the Securities Exchange Act of 1934 and the Investment Company Act of 1940, the Registrant has duly caused this report to be signed on its behalf by the undersigned, thereunto duly authorized.
(Registrant): Invesco Exchange-Traded Fund Trust II
| By: | /s/ Anna Paglia | |
| Name: | Anna Paglia | |
| Title: | President |
Date: January 5, 2023
Pursuant to the requirements of the Securities Exchange Act of 1934 and the Investment Company Act of 1940, this report has been signed below by the following persons on behalf of the Registrant and in the capacities and on the dates indicated.
| By | /s/ Anna Paglia | |
| Name: | Anna Paglia | |
| Title: | President |
Date: January 5, 2023
| By | /s/ Kelli Gallegos | |
| Name: | Kelli Gallegos | |
| Title: | Treasurer |
Date: January 5, 2023