EXHIBIT 99.1
Updated Presentation Materials dated September 30, 2009
 Third Quarter 2009 Investor Presentation As of September 30, 2009 |
 1 Certain comments made in the course of this presentation by People's United Financial are forward- looking in nature. These include all statements about People's United Financial's operating results or financial position for periods ending or on dates occurring after September 30, 2009 and usually use words such as "expect", "anticipate", "believe", and similar expressions. These comments represent management's current beliefs, based upon information available to it at the time the statements are made, with regard to the matters addressed. All forward-looking statements are subject to risks and uncertainties that could cause People's United Financial's actual results or financial condition to differ materially from those expressed in or implied by such statements. Factors of particular importance to People’s United Financial include, but are not limited to: (1) changes in general, national or regional economic conditions; (2) changes in interest rates; (3) changes in loan default and charge-off rates; (4) changes in deposit levels; (5) changes in levels of income and expense in non-interest income and expense related activities; (6) residential mortgage and secondary market activity; (7) changes in accounting and regulatory guidance applicable to banks; (8) price levels and conditions in the public securities markets generally; (9) competition and its effect on pricing, spending, third-party relationships and revenues; and (10) the successful completion of the integration of Chittenden Corporation. People's United Financial does not undertake any obligation to update or revise any forward-looking statements, whether as a result of new information, future events or otherwise. Forward Looking Statement |
 2 People’s United Financial, Inc. NASDAQ: PBCT Market Capitalization (11/02/09): $ 5.5 billion, #14 Assets: $ 20.8 billion, #24 Loans: $ 14.1 billion, #24 Deposits: $ 15.1 billion, #25 Branches: ~ 300 ATMs: > 440 Employees (FTE): ~ 4,300 Founded: 1842 Snapshot, as of September 30, 2009 Corporate Overview |
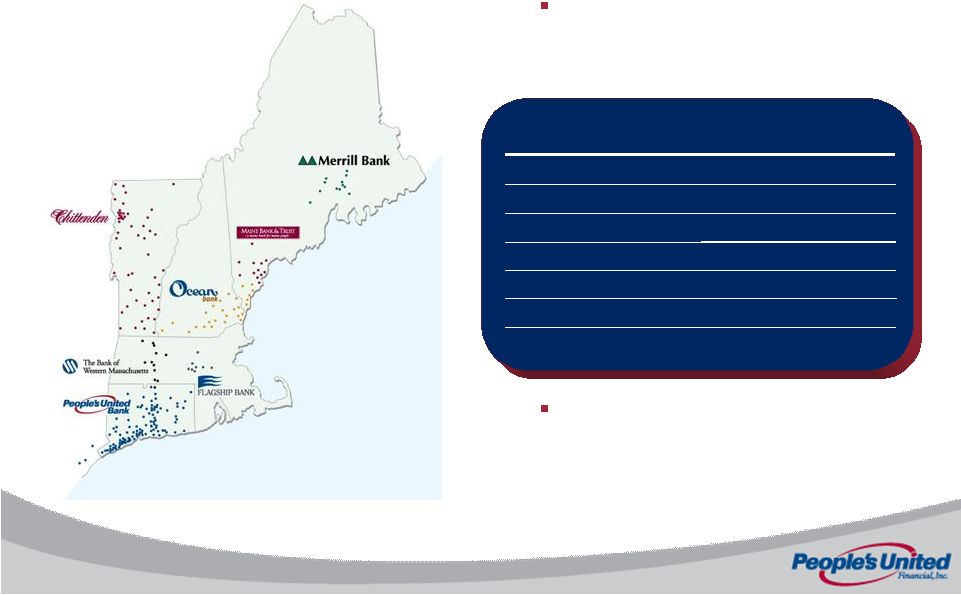 3 People’s United Footprint Diversified footprint with approx. 300 branches and $15 billion in deposits across six states Considerable scarcity value as the largest independent bank headquartered in New England VT NH Fairfield Ct. CT MA % of Deposits 17 9 35 62 6 Branches 46 31 63 160 19 ME 5 33 Market Share #1 #4 #1 #3 #24 #7 NY 1 4 N/A |
 4 Investment Thesis Strong Balance Sheet with Significant Capital Surplus Tangible Capital Ratio of 18.6% No Wholesale Borrowings Exceptional credit quality Low level of non-performing assets of 1.35% Combined net charge-off ratio of 0.44% annualized Significant and low cost deposit market share Cost of deposits continues to decline, at 1.13% for 3Q09 Deposits entirely fund loans Opportunities Abound! Drive organic growth Actively evaluating acquisition options Positioned to leverage earnings growth via our asset sensitive balance sheet We are excited about growth and confident in our position |
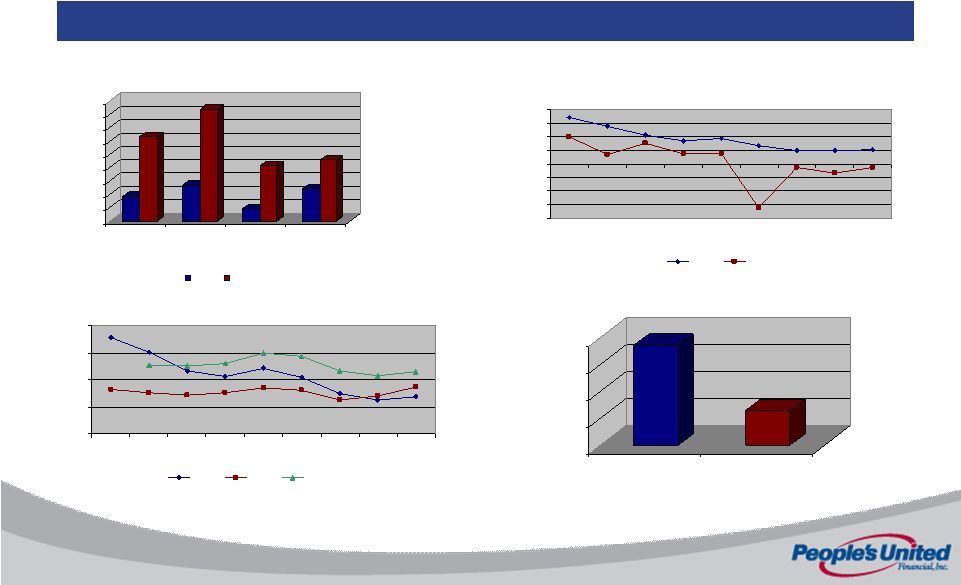 5 18.6% 6.5% 0.00% 5.00% 10.00% 15.00% 20.00% PBCT Peers 2.50 3.00 3.50 4.00 4.50 3Q07 4Q07 1Q08 2Q08 3Q08 4Q08 1Q09 2Q09 3Q09 PBCT Peers PBCT Core Peer Comparison As of September 30, 2009 On all important measures, People’s United remains stronger than peers Net Interest Margin Return on Average Assets Tang. Equity / Tang. Assets * See Appendix for peer group Asset Quality -2.00 -1.50 -1.00 -0.50 0.00 0.50 1.00 1.50 2.00 3Q07 4Q07 1Q08 2Q08 3Q08 4Q08 1Q09 2Q09 3Q09 PBCT Peers 0.93% 3.16% 1.35% 4.17% 0.44% 2.08% 1.21% 2.31% 0.00% 0.50% 1.00% 1.50% 2.00% 2.50% 3.00% 3.50% 4.00% 4.50% NPAs / Assets NPAs / Loans + REO NCOs / Loans Allowance / Loans PBCT Peers |
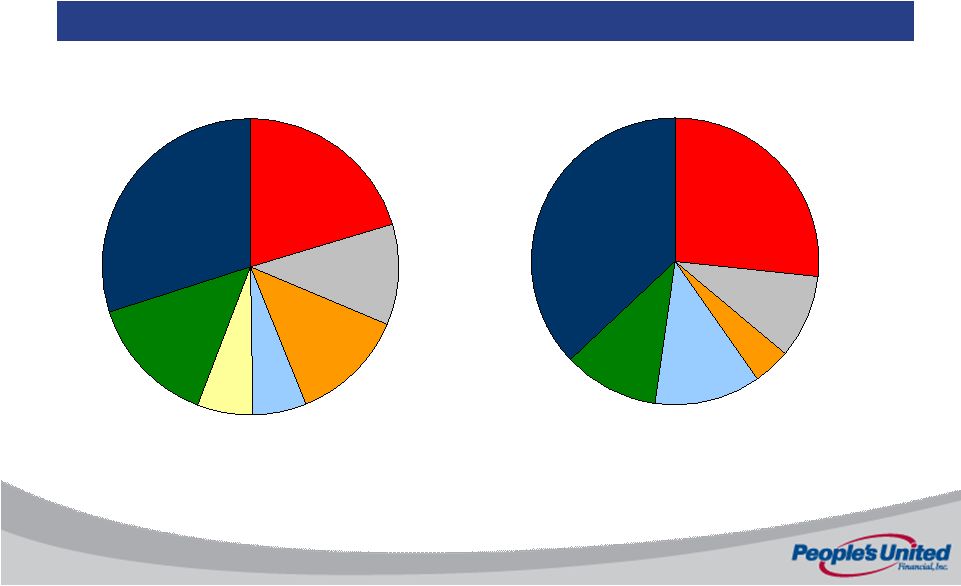
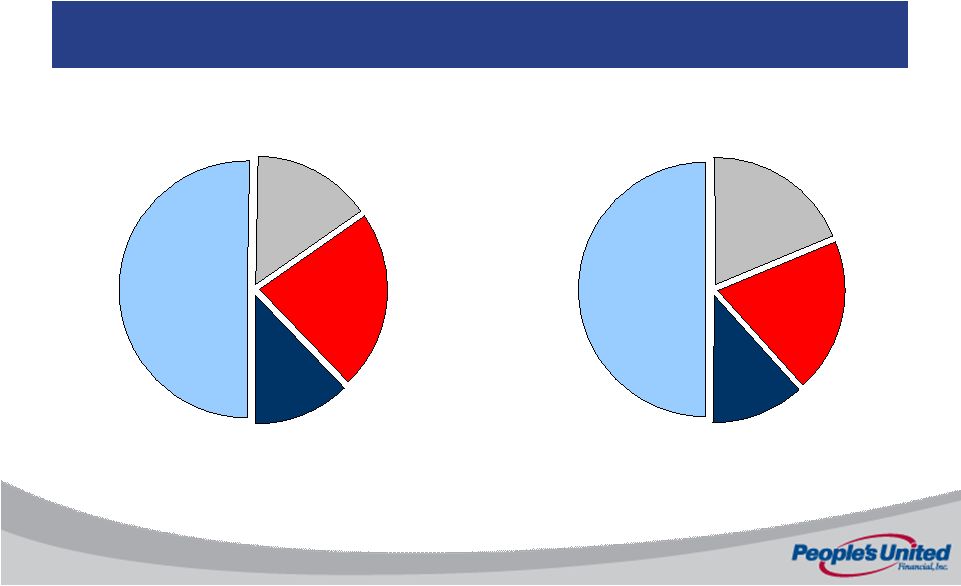 6 Average Earnings Asset Mix 3Q 08 Home Equity 12% Securities & Investments 19% Commercial Banking 50% Residential Mortgage 19% 3Q 09 Home Equity 12% Securities & Investments 23% Commercial Banking 50% Residential Mortgage 15% We remain focused on growing core commercial and consumer lending, while excess capital is safely held in liquid investments $9,375 $2,809 $4,218 $2,270 $8,872 $3,360 $3,459 $2,077 |
 7 Average Funding Mix Our assets are funded nearly entirely with deposits and equity, which reinforces our fortress balance sheet. 3Q 08 Interest- bearing Deposits 56% Demand Deposits 16% Stockholders’ Equity 26% 3Q 09 Interest- bearing Deposits 57% Stockholders’ Equity 25% Demand Deposits 16% Sub-debt / Other 2% Sub-debt / Other 2% Cost of Deposits = 1.13% Cost of Deposits = 1.63% |
 8 Commercial Banking Average core Commercial lending increased 3% annualized in 3Q09 Loan pricing has improved as competitors pull back Commercial loan yields increased 6bps during the quarter Fee income growth initiatives are underway Experienced management team provides local knowledge and decision making, successfully attracting talent and customers from competitors People’s United remains focused on growing core middle market commercial loans and deposits |
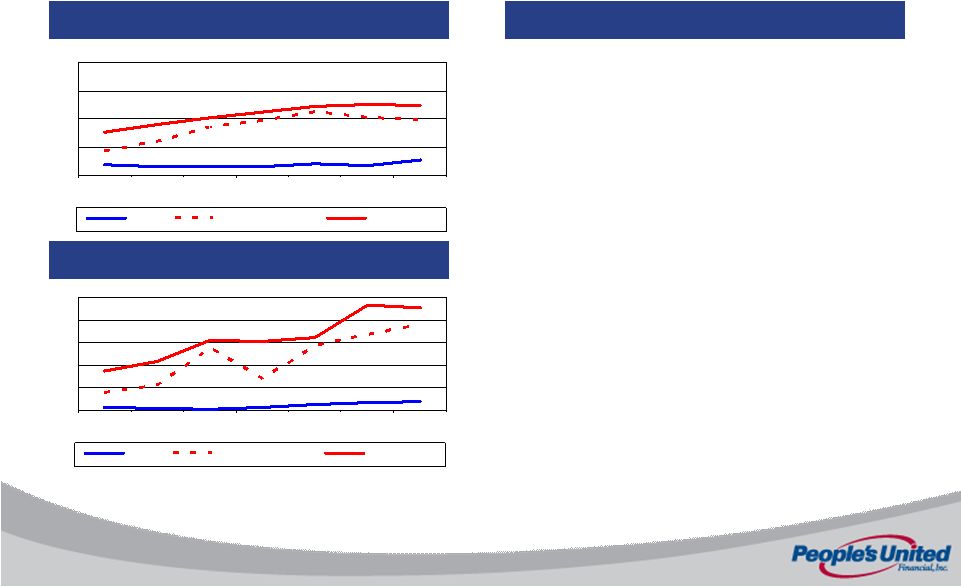
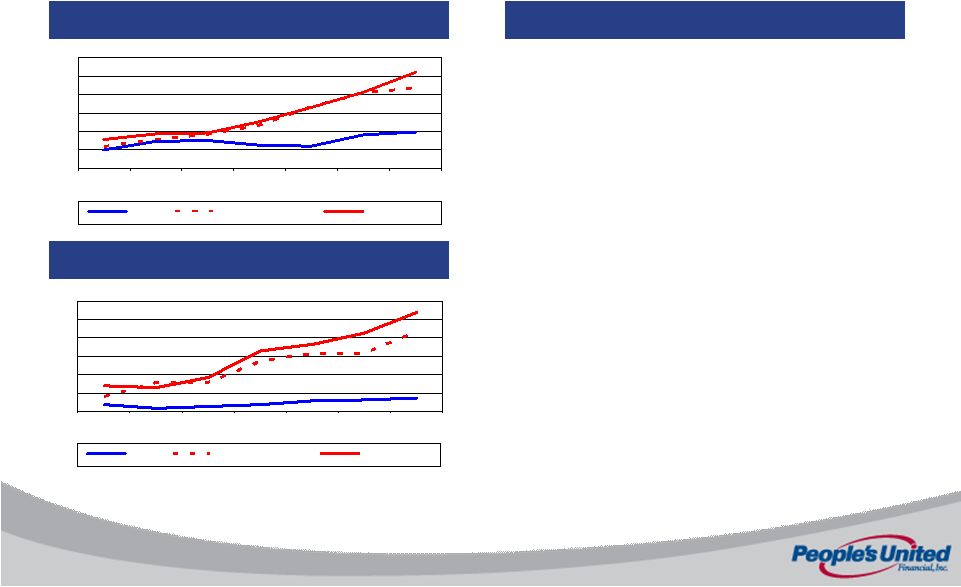 9 Commercial & Industrial Loans Historical Credit Performance NPAs (%) NCOs (%) Commentary • Well diversified portfolio • Focused on core middle market customers, where larger banks can not benefit from economies of scale • Equipment Finance arm focused on mission critical equipment with good resale values • Core portfolio is all self-originated, with rigorous underwriting and ongoing credit administration 0.99 2.16 2.59 0.00 0.50 1.00 1.50 2.00 2.50 3.00 Q1 2008 Q2 2008 Q3 2008 Q4 2008 Q1 2009 Q2 2009 Q3 2009 PBCT Peer Group Mean Top 50 Banks 0.35 2.16 2.68 0.00 0.50 1.00 1.50 2.00 2.50 3.00 Q1 2008 Q2 2008 Q3 2008 Q4 2008 Q1 2009 Q2 2009 Q3 2009 PBCT Peer Group Mean Top 50 Banks |
 10 Commercial Real Estate Loans Historical Credit Performance Commentary • CRE portfolio totals $5.4BN, 94% was originated by us, $306MM represents shared national credits, which we fully underwrote • All CRE loans are underwritten on a cash flow basis • Portfolio is well diversified • Construction portfolio is $855MM down 8% from $925MM at 12/31/08 • Florida construction represents less than $30MM • Over 80% of the CRE charge-offs relates to one shared national credit NPAs (%) NCOs (%) 1.49 3.26 4.05 0.00 0.50 1.00 1.50 2.00 2.50 3.00 3.50 4.00 4.50 Q1 2008 Q2 2008 Q3 2008 Q4 2008 Q1 2009 Q2 2009 Q3 2009 PBCT Peer Group Mean Top 50 Banks 0.57 0.55 1.14 0.00 0.25 0.50 0.75 1.00 1.25 Q1 2008 Q2 2008 Q3 2008 Q4 2008 Q1 2009 Q2 2009 Q3 2009 PBCT Peer Group Mean Top 50 Banks |
 11 The Shared National Credits portfolio was initially established to expand geographic diversity in the loan portfolio, and has been in run-off mode since the beginning of 2008. Shared National Credits Outstandings, as of ($ in millions) 31-Dec-07 31-Dec-08 31-Mar-09 30-Jun-09 30-Sep-09 Commercial Lending 456.3 $ 393.7 $ 398.2 $ 328.1 $ 308.2 $ Commercial Real Estate 284.2 289.8 294.9 310.8 306.0 Total loans 740.5 $ 683.5 $ 693.1 $ 638.9 $ 614.2 $ Aggregate Exposure, as of ($ in millions) 31-Dec-07 31-Dec-08 31-Mar-09 30-Jun-09 30-Sep-09 Commercial Lending 747.1 $ 784.8 $ 767.4 $ 711.4 $ 703.4 $ Commercial Real Estate 577.0 417.0 403.6 401.8 384.1 Total loans 1,324.1 $ 1,201.8 $ 1,171.0 $ 1,113.2 $ 1,087.5 $ Current Maturity Schedule (based on Outstanding balances) 2009 2010 2011 2012 2013 + Commercial Lending 2% 11% 15% 16% 6% Commercial Real Estate 13% 22% 13% - 2% Total loans 15% 33% 28% 16% 8% |
 12 Wholesale trade 4% Professional services 10% Arizona 6% Colorado 6% Shared National Credits The portfolio is broadly diversified by both geography and industry CRE – Geography C&I – Industry $ 306.0 million $ 308.2 million Ent. 12% Manufacturing 26% REITs 37% Washington 31% New York 21% Other (<5%) 14% Florida 9% Virginia 13% Other 11% |
 13 Retail & Small Business |
 14 Retail & Small Business Relationship and service focus translates to low deposit rates Highly developed model in southern New England Core deposit gathering Multiple products and cross selling – 4.6 products per customer #1 deposit market share in Fairfield County Westchester, NY expansion over the past 2 years now represents 4 branches and over $250 million of deposits Retail-focused branch experience rolling out in northern New England Increase penetration from 3.0 products per customer Deposit pricing discipline and high-quality consumer lending expansion will allow a continued focus on margin management |
 15 Stop & Shop Partnership Complementary to the traditional branch network Approximately half of our CT branches are in Stop & Shop Exclusive partnership with the leading grocery chain in CT Stop & Shop has the #1 grocery market share in CT Partnership runs through 2022 Full-service branches that now account for: 55% of new retail checking and savings accounts 40% of new commercial checking accounts 32% of home equity loan originations The Stop & Shop partnership allows People’s United to provide extended hours and convenience while limiting cost |
 16 Residential Loans Historical Credit Performance NPAs (%) NCOs (%) Commentary • Low LTV at origination • Current FICO of 725 • Stopped portfolioing residential mortgages in Q4 2006 • Of the $49.8MM in NPLs, two-thirds have current LTV of <90% • Strength of original underwriting should continue to minimize loss content in NPAs 1.88 2.43 3.11 0.00 0.50 1.00 1.50 2.00 2.50 3.00 3.50 Q1 2008 Q2 2008 Q3 2008 Q4 2008 Q1 2009 Q2 2009 Q3 2009 PBCT Peer Group Mean Top 50 Banks 0.39 0.10 1.39 1.72 0.00 0.50 1.00 1.50 2.00 Q1 2008 Q2 2008 Q3 2008 Q4 2008 Q1 2009 Q2 2009 Q3 2009 PBCT Peer Group Mean Top 50 Banks |
 17 Home Equity Historical Credit Performance Commentary 0.27 0.99 1.24 0.00 0.50 1.00 1.50 2.00 Q1 2008 Q2 2008 Q3 2008 Q4 2008 Q1 2009 Q2 2009 Q3 2009 PBCT Peer Group Mean Top 50 Banks NPAs (%) NCOs (%) 0.20 1.89 2.26 0.00 0.50 1.00 1.50 2.00 2.50 Q1 2008 Q2 2008 Q3 2008 Q4 2008 Q1 2009 Q2 2009 Q3 2009 PBCT Peer Group Mean Top 50 Banks • As of Q3 2009, Home Equity loans stood at $2.0BN, flat from Q2 2009 levels • Q3 2009 utilization rate was 47.5%, compared to Q2 2009 rate of 47.6% • NPAs upticked this quarter, while charge-offs have remained low • While volume has slowed, Home equity remains an important part of our retail relationships |
 18 Wealth Management Offer a full array of services to businesses and individuals Expand brokerage and asset management across the People's United footprint Continue to grow individual and business relationships through private banking, brokerage and retirement planning services Focus on offering insurance services to commercial customers Assets managed and administered totaled $16.4 billion Wealth Management offers significant growth potential as services are expanded across the franchise |
 19 Third Quarter Results Net income of $26.8 million or $0.08 per share Net interest margin of 3.19% Net loan charge-offs of 0.44% of average loans NPAs to loans, REO & repossessed assets of 1.35% Tangible equity ratio of 18.6% Results reflect continued discipline in a difficult economy |
 20 Net Interest Margin The core margin was able to expand in 3Q09 due to better spreads in new loan originations as well as a continued reduction in deposit costs . 3Q08 4Q08 1Q09 2Q09 3Q09 3.99% 3.94% 3.66% 3.58% 3.65% 3.71% 3.55% 3.25% 3.12% 3.19% 2.00% 1.25% 0.78% 0.25% 0.25% |
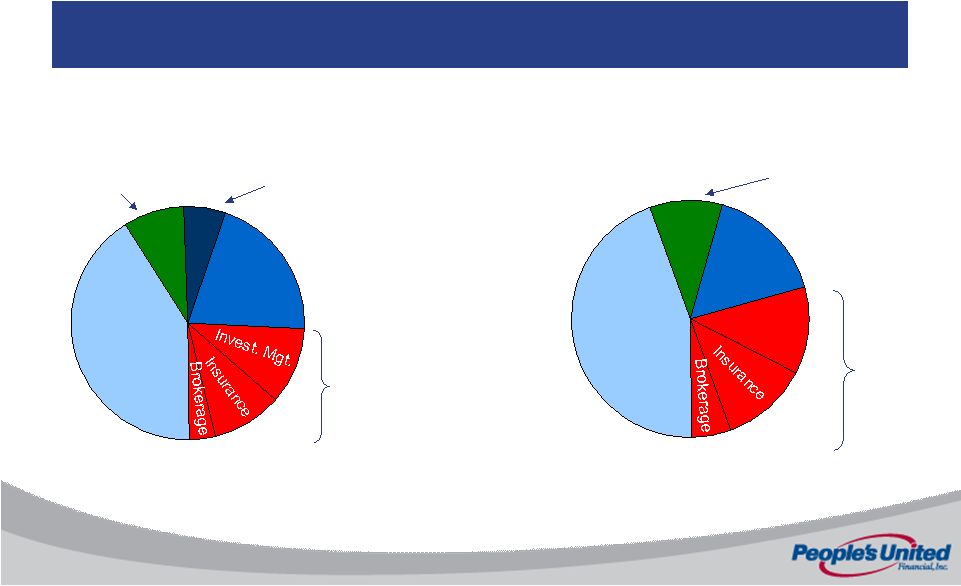 21 Non-Interest Income Wealth Management fees have declined due to market conditions, and bank service charges due to change in customer behavior 3Q 09 3Q 08 Service Charges 43% Other 20% Service charges 44% Other 16% Invest. Mgt. Merchant Processing 8% Wealth Management 23% Wealth management 30% $80.2 million $74.2 million Merchant processing 10% Securities Gains 6% |
 22 Leading Equipment Finance Company Lending to Middle-Market Businesses Across U.S. $1.5 billion in assets with ~200 employees Serves 5,000 customers across 49 states Secured lender 91% of receivables are loans No residual risk Customers are primarily end users, dealers and manufacturers Compete on service, not rate Senior management team with over 30+ years experience 20+ years of consistent profitable financial performance 44% 7% 13% 36% Construction Transportation Refuse Other Focus on Construction, Road Transportation and Refuse Industries Geographic Diversification Southwest: 30% Southeast: 25% Northeast: 19% Central: 13% West: 13% Financial Federal Overview |
 23 Earnings accretion of approximately 25% through the cycle based on 2010 consensus estimates Tangible book value dilution recovered in less than 4 years in current rate environment Tangible common equity ratio grows to 19.0% from 18.6% due to excess capital at FIF EPS Accretion / (Dilution) $MM Pro Forma Operating Earnings Adjustments (1) 25% Operating EPS accretion $0.39 PBCT Wall Street EPS $0.49 Pro forma operating EPS 178 Pro forma net income 9 Net benefit of repaying borrowings and opportunity cost of cash (2) 0 Cost savings 37 FIF 2010 standalone net income (Wall Street consensus) 132 PBCT 2010 standalone net income (Wall Street consensus) (1) Pro forma operating earnings adjustments assume full year impact. Excludes estimated one-time pre-tax expenses of ~$55 million, which includes prepayment penalty to repay borrowings (2) 100% of FIF’s borrowings repaid at a positive pre-tax spread of ~1.8% based on 2-year LIBOR. Actual spread improvement will be greater given cash currently invested in Fed Funds earning 25bps. Significantly Accretive to Earnings |
 24 Strategically Compelling, Not Distracting Combines People’s United significant excess liquidity and low cost funding with a premier asset generation platform Significantly expands highly profitable equipment finance business FIF’s platform provides leverage in economic recovery Retention of key management Conservative credit culture consistent with People’s United underwriting philosophy Limited integration risk will not distract us from continuing to focus on FDIC and whole bank opportunities Financially Compelling IRR greater than 20% Significantly accretive to operating earnings: 25% through the cycle based on consensus estimates Tangible book value dilution payback period conservatively less than 4 years Acquisition preserves industry-leading tangible common equity ratio Financial Federal Acquisition Transaction Rationale |
 25 Evolving Acquisition Strategy Our preference remains whole bank transactions: Commercially-oriented franchises with a strong core deposit base Attractive markets of the Northeast United States, including contiguous, in- market and new markets FDIC assisted deals in geographies where we could establish or enhance a strong market share Primary deal hurdles: IRR substantially higher than our cost of capital Significantly enhances our long-term earnings power Attractive upside/downside return profile Our Approach: Patient and Opportunistic |
 26 Announced opportunistic acquisition of Financial Federal Look forward to taking additional market share in equipment finance industry Conducted due diligence on several franchises and evaluated many traditional bank opportunities Continue to evaluate alternative and creative strategies to help move the ball along with “open” transactions Actively participating in the FDIC resolution process, and look forward to completing a “closed” FDIC assisted transaction Continue measured de novo expansion into attractive contiguous markets Continue to use our capital and brand to lend to our existing and new customers Capital Deployment Activities |
 27 Conclusion Shareholders are protected by continued strength in underwriting and asset quality Significant capital reserves will be used primarily to fund future growth Management remains aligned with shareholders in building long-term value Will continue to maintain focus on driving financial performance People’s United remains committed to continuing to increase shareholder value |
 Appendix |
 29 High Quality Consumer Portfolio Total Portfolio $4.9 billion (as of September 30, 2009) Residential Mortgage Portfolio Credit Statistics Weighted Average: Loan to value 51% FICO scores 725 Net charge-offs: 0.39% Non-accrual: 1.88% Home Equity Portfolio Credit Statistics Weighted Average: Combined LTV 55% FICO scores 751 Net charge-offs: 0.26% Non-accrual: 0.27% (1) Excludes the impact of the former Chittenden Corp. 1-4 Family Residential 54% Home Equity Loans & Lines 40% Indirect Auto 5% Other 1% 1 1 1 1 |
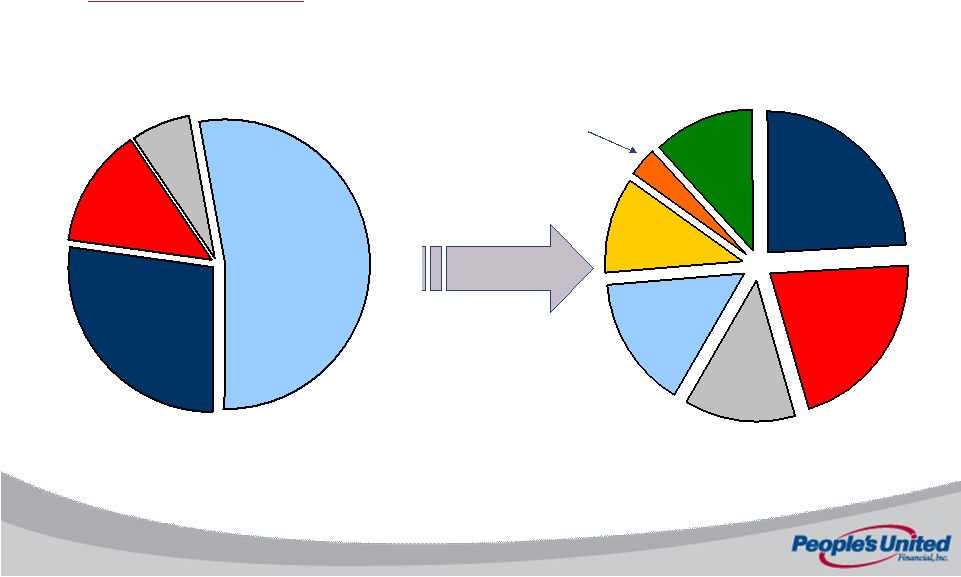 30 Well Balanced Commercial Portfolio Retail 25% Office 24% Industrial 12% Residential 15% Hospitality 10% Other 11% Land 3% As of September 30, 2009 Total Portfolio $9.4 billion $5.4 billion CRE 1 * Includes the Commercial Real Estate portion of the Shared National Credit portfolio of $306 million CRE, By Sector General C&I 26% SNC 7% Commercial Real Estate 54% PCLC 13% |
 31 Construction Lending Detail Total Construction Portfolio $855 million As of September 30, 2009 Our construction exposure is modest at less than 6% of the total loan portfolio, and is a diverse mix of geographies and sectors. Residential 45% Land 11% Retail 21% Office 8% 15% Other Total Loans $14.3 billion By Geography By Sector Connecticut / New York 43% Other New England 32% 15% Other |
 32 Peer Group Company Name Ticker State Associated Banc-Corp ASBC WI Astoria Financial Corporation AF NY BOK Financial Corporation BOKF OK City National Corporation CYN CA Comerica Incorporated CMA TX Commerce Bancshares, Inc. CBSH MO Cullen/Frost Bankers, Inc. CFR TX First Horizon National Corporation FHN TN Flagstar Bancorp, Inc. FBC MI Fulton Financial Corporation FULT PA Hudson City Bancorp, Inc. HCBK NJ M&T Bank Corporation MTB NY Marshall & Ilsley Corporation MI WI New York Community Bancorp, Inc. NYB NY Synovus Financial Corp. SNV GA TCF Financial Corporation TCB MN Valley National Bancorp VLY NJ Webster Financial Corporation WBS CT Zions Bancorporation ZION UT |
 For more information, investors may contact: Jared Shaw jared.shaw@peoples.com (203) 338-4130 |