 Second Quarter 2010 Earnings Review and Acquisition Announcements July 16, 2010 Exhibit 99.1 |
1 Certain comments made in the course of this presentation by People's United Financial are forward- looking in nature. These include all statements about People's United Financial's operating results or financial position for periods ending or on dates occurring after June 30, 2010 and usually use words such as "expect", "anticipate", "believe", and similar expressions. These comments represent management's current beliefs, based upon information available to it at the time the statements are made, with regard to the matters addressed. All forward-looking statements are subject to risks and uncertainties that could cause People's United Financial's actual results or financial condition to differ materially from those expressed in or implied by such statements. Factors of particular importance to People’s United Financial include, but are not limited to: (1) failure of the parties to satisfy the closing conditions in either merger agreement in a timely manner or at all; (2) failure of the shareholders of Smithtown Bancorp or LSB Corporation to approve the applicable merger agreement; (3) failure to obtain governmental approvals for one or both mergers; (4) disruptions to the parties’ businesses as a result of the announcement and pendency of one or both mergers; (5) costs or difficulties related to the integration of the businesses following one or both mergers; (6) changes in general, national or regional economic conditions; (7) the risk that the anticipated benefits, cost savings and any other savings from either transaction may not be fully realized or may take longer than expected to realize (8) changes in loan default and charge-off rates; (9) reductions in deposit levels necessitating increased borrowings to fund loans and investments; (10) changes in interest rates or credit availability; (11) possible changes in regulation resulting from or relating to the pending financial reform legislation; (12) People’s United’s success in addressing management succession issues in a timely and effective manner; (13) changes in levels of income and expense in noninterest income and expense related activities; (14) competition and its effect on pricing, spending, third-party relationships and revenues. Forward Looking Statement |
 2 Agenda Second Quarter 2010 Results Acquisition Announcements Smithtown Bancorp (SMTB) LSB Corp. (LSBX) Q&A |
 3 Operating results reflect NIM improvement partially offset by higher net charge-offs Net income of $16.0 million, or $0.04 per share Operating income of $31.8 million, or $0.09 per share excluding former CEO separation costs, merger-related costs and system conversion costs Net interest margin of 3.68%; up 21 bps from Q1 2010 Net charge-offs of average loans increased to 0.46% from 0.26% in Q1 2010 Both non-interest income and non-interest expense reflect the acquisitions of Financial Federal and Butler Bank Second Quarter 2010 Results Overview |
 4 Systems conversion for Northern New England franchise scheduled to take place this weekend Re-branding Northern New England franchise underway – all branches will now operate under People’s United name Negotiated leases for 2 branches in downtown Boston – Prudential Center and Financial District Repurchased $52 million of stock (3.7 million shares at an average price of $13.98) Initiatives Operational milestones and changes in approach to capital deployment |
 5 The core margin reflects the benefit of the Financial Federal (FIF) acquisition completed in February 2010. Second Quarter 2010 Results Net Interest Margin . 2Q09 3Q09 4Q09 1Q10 2Q10 3.58% 3.65% 3.65% 3.96% 4.16% 3.12% 3.19% 3.19% 3.47% 3.68% 0.25% 0.25% 0.25% 0.25% 0.25% |
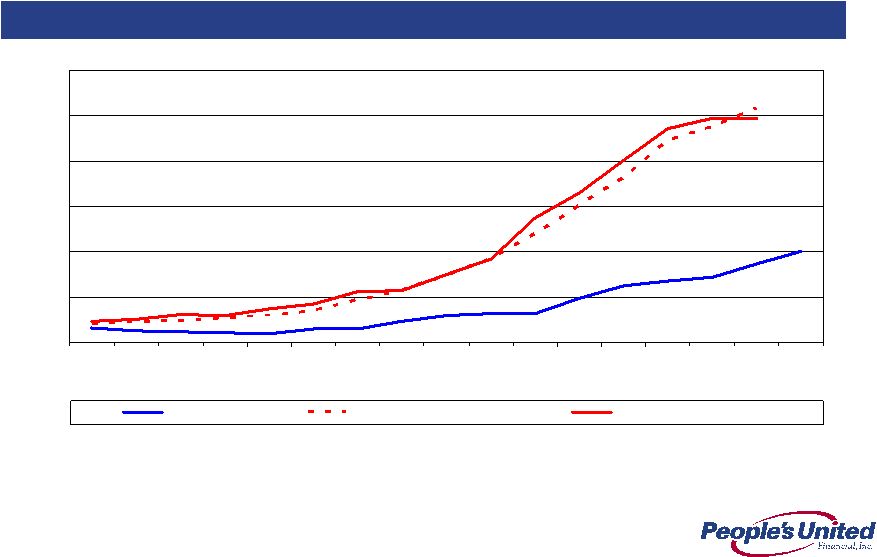 6 2006-2010 2.01 1.74 5.15 4.95 0.00 1.00 2.00 3.00 4.00 5.00 6.00 Q2 2006 Q3 2006 Q4 2006 Q1 2007 Q2 2007 Q3 2007 Q4 2007 Q1 2008 Q2 2008 Q3 2008 Q4 2008 Q1 2009 Q2 2009 Q3 2009 Q4 2009 Q1 2010 Q2 2010 PBCT Peer Group Mean Top 50 Banks by Assets Second Quarter 2010 Results NPA / Loans & REO* (%) * Non-performing assets (excluding acquired non-performing loans) as a percentage of originated loans plus all REO and repossessed assets; acquired non-performing loans excluded as risk of loss has been considered by virtue of our estimate of acquisition-date fair value and/or the existence of an FDIC loss sharing agreement |
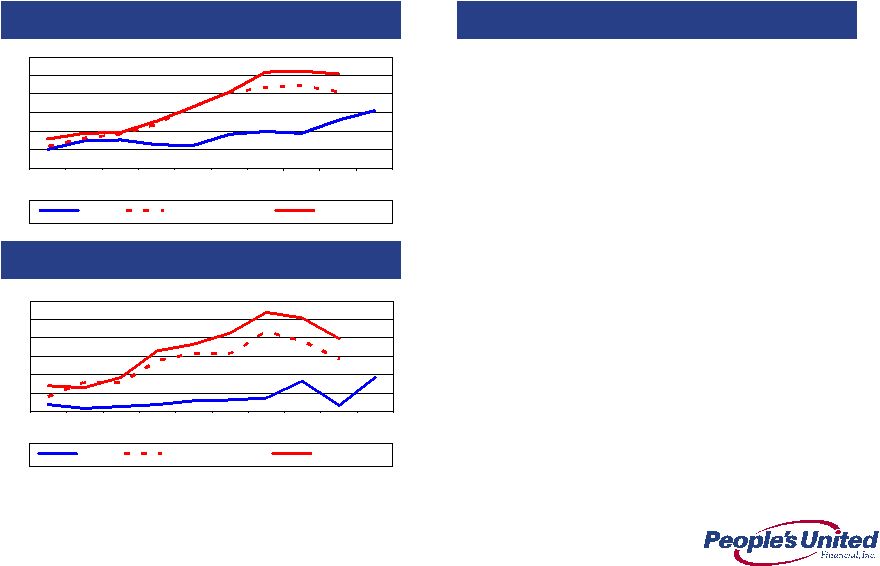 7 Commercial & Equipment Financing Historical Credit Performance NPLs * (%) NCOs (%) Commentary • Portfolio remains well diversified • Continue to see growth in core middle market segment • Core portfolio is self- originated, with rigorous underwriting and ongoing credit administration • Equipment Financing focused on mission critical equipment with good resale values 1.54 1.29 2.06 2.55 0.00 0.50 1.00 1.50 2.00 2.50 3.00 Q1 2008 Q2 2008 Q3 2008 Q4 2008 Q1 2009 Q2 2009 Q3 2009 Q4 2009 Q1 2010 Q2 2010 PBCT Peer Group Mean Top 50 Banks 0.92 0.15 1.40 1.97 0.00 0.50 1.00 1.50 2.00 2.50 3.00 Q1 2008 Q2 2008 Q3 2008 Q4 2008 Q1 2009 Q2 2009 Q3 2009 Q4 2009 Q1 2010 Q2 2010 PBCT Peer Group Mean Top 50 Banks * Excludes acquired non-performing loans |
 8 Commercial Real Estate Loans Historical Credit Performance Commentary • CRE portfolio totals $5.5BN • All CRE loans are underwritten on a cash flow basis • Portfolio is well diversified • Loss content is limited • Strong CRE portfolio growth opportunities continue to exist NPLs * (%) NCOs (%) 1.23 1.21 3.29 4.03 0.00 0.50 1.00 1.50 2.00 2.50 3.00 3.50 4.00 4.50 Q1 2008 Q2 2008 Q3 2008 Q4 2008 Q1 2009 Q2 2009 Q3 2009 Q4 2009 Q1 2010 Q2 2010 PBCT Peer Group Mean Top 50 Banks 0.35 0.43 1.08 1.37 0.00 0.25 0.50 0.75 1.00 1.25 1.50 1.75 Q1 2008 Q2 2008 Q3 2008 Q4 2008 Q1 2009 Q2 2009 Q3 2009 Q4 2009 Q1 2010 Q2 2010 PBCT Peer Group Mean Top 50 Banks * Excludes acquired non-performing loans |
 9 Residential Loans Historical Credit Performance NPLs * (%) NCOs (%) Commentary • Resolution of NPLs is limited by a much slower foreclosure process • Low LTV at origination • 83% of NPLs have LTVs <90%; should insure continued low loss content • Given attractive spreads, we began portfolioing some residential mortgages this quarter 3.40 2.70 3.01 3.45 0.00 0.50 1.00 1.50 2.00 2.50 3.00 3.50 4.00 Q1 2008 Q2 2008 Q3 2008 Q4 2008 Q1 2009 Q2 2009 Q3 2009 Q4 2009 Q1 2010 Q2 2010 PBCT Peer Group Mean Top 50 Banks 0.07 0.01 1.07 1.90 0.00 0.50 1.00 1.50 2.00 2.50 Q1 2008 Q2 2008 Q3 2008 Q4 2008 Q1 2009 Q2 2009 Q3 2009 Q4 2009 Q1 2010 Q2 2010 PBCT Peer Group Mean Top 50 Banks * Excludes acquired non-performing loans |
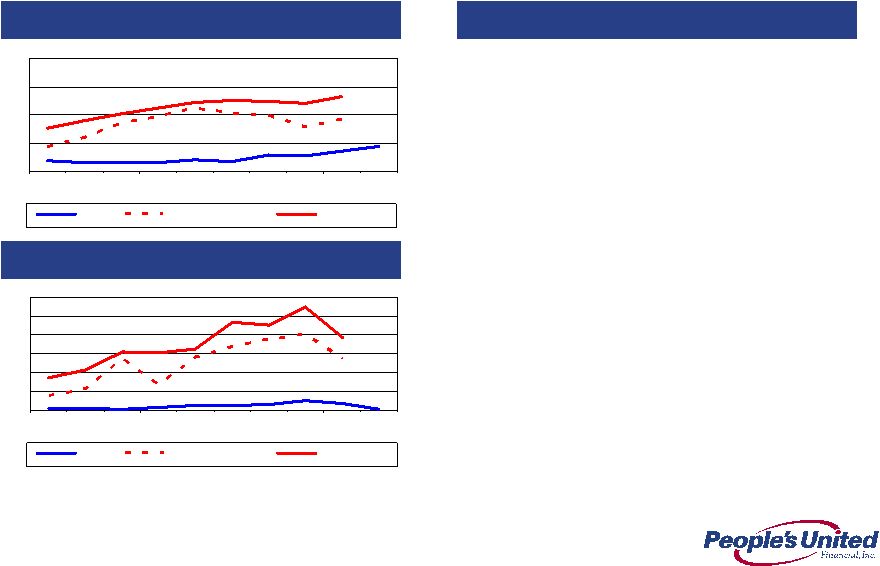 10 Home Equity Historical Credit Performance Commentary NPLs * (%) NCOs (%) 0.03 0.17 1.37 1.93 0.00 0.50 1.00 1.50 2.00 2.50 3.00 Q1 2008 Q2 2008 Q3 2008 Q4 2008 Q1 2009 Q2 2009 Q3 2009 Q4 2009 Q1 2010 Q2 2010 PBCT Peer Group Mean Top 50 Banks • As of Q2 2010, Home Equity loans stood at $2.0BN, flat from Q1 2010 levels • Q2 2010 utilization rate was 48.2%, flat with Q1 2010 and Q4 2009 • Asset quality remains high, as measured by low NPLs and NCOs • Home Equity remains an important part of our retail relationships 0.44 0.35 0.91 1.33 0.00 0.50 1.00 1.50 2.00 Q1 2008 Q2 2008 Q3 2008 Q4 2008 Q1 2009 Q2 2009 Q3 2009 Q4 2009 Q1 2010 Q2 2010 PBCT Peer Group Mean Top 50 Banks * Excludes acquired non-performing loans |
 11 2006-2010 0.46 0.26 1.60 2.40 -0.50 0.00 0.50 1.00 1.50 2.00 2.50 3.00 Q1 2006 Q2 2006 Q3 2006 Q4 2006 Q1 2007 Q2 2007 Q3 2007 Q4 2007 Q1 2008 Q2 2008 Q3 2008 Q4 2008 Q1 2009 Q2 2009 Q3 2009 Q4 2009 Q1 2010 Q2 2010 PBCT Peer Group Mean Top 50 Banks Second Quarter 2010 Results Net Charge-Offs / Avg. Loans (%) |
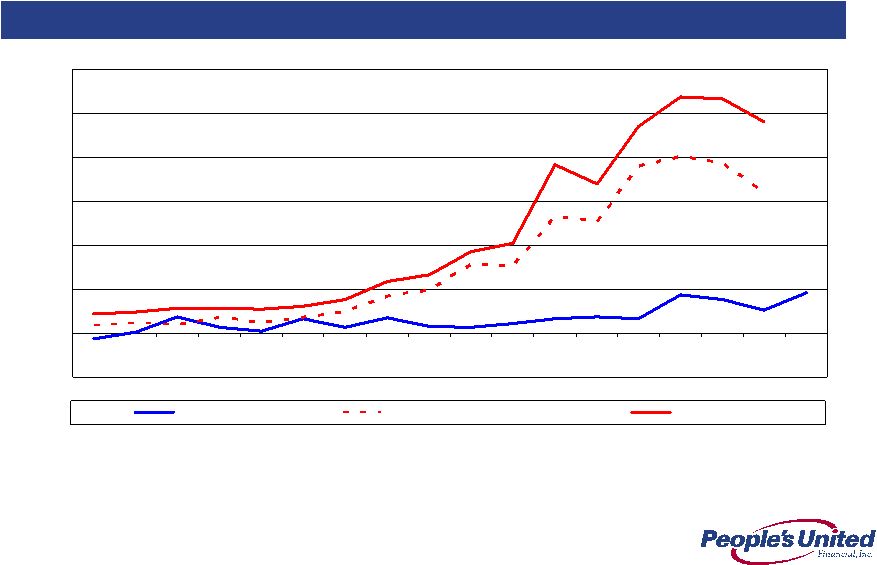
 12 2006-2010 7.5 6.4 33.6 32.1 0 5 10 15 20 25 30 35 40 Q1 2006 Q2 2006 Q3 2006 Q4 2006 Q1 2007 Q2 2007 Q3 2007 Q4 2007 Q1 2008 Q2 2008 Q3 2008 Q4 2008 Q1 2009 Q2 2009 Q3 2009 Q4 2009 Q1 2010 Q2 2010 PBCT Peer Group Mean Top 50 Banks Second Quarter 2010 Results NPAs* / (Tangible Equity + LLR)* (%) * Non-performing assets exclude acquired non-performing loans as risk of loss has been considered by virtue of our estimate of acquisition-date fair value and/or the existence of an FDIC loss sharing agreement |
 People’s United Financial Acquires Smithtown Bancorp and LSB Corp. |
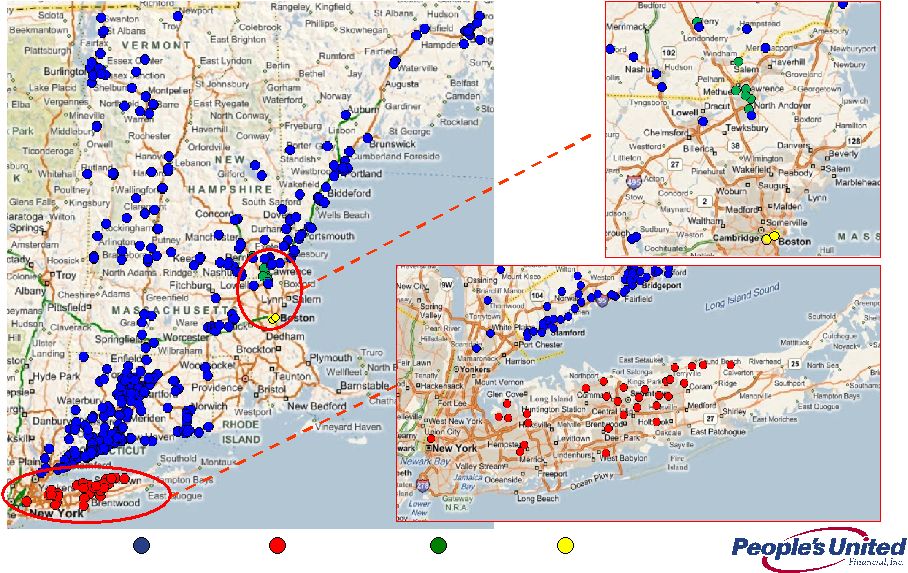 14 Expanding Geographic Footprint Acquisition Announcements: Smithtown Bancorp (SMTB) and LSB Corp. (LSBX) Source: SNL Financial PBCT SMTB LSBX De Novo Branches |
 15 7 30 Branches 807 2,430 Assets ($MM) 544 2,041 Loans ($MM) 504 1,873 Deposits ($MM) 10 42 ATMs LSB Corp. * Smithtown Bancorp * Largest commercial bank headquartered on Long Island, NY operating as Bank of Smithtown High quality branch network Commercial bank headquartered in North Andover, MA operating as RiverBank Operates in attractive markets north of Boston Description Business Profiles * Financial data as of March 31, 2010 |
 16 Strategic Rationale Expansion into densely populated, contiguous markets Expansion into attractive Long Island market Increases presence in Boston area Continuing to build the premier regional bank in the Northeast Provides platforms for increased market share in new markets Significant opportunity to lower deposit costs to PBCT levels Leverages excess capital Exceeds financial hurdles >15% IRR Significant operating EPS accretion in year 1 |
 17 Loan Portfolio Composition Balance: $2.0 billion Yield: 5.32% NPAs / Loans + REO: 10.3% LTM NCOs / Avg Loans: 1.77% Loan Mark: 10.4% 16% 24% 11% 47% Construction & Development Multi-Family C&I 2% Commercial Real Estate 1-4 Family Smithtown Bancorp * Consumer <1% Balance: $0.5 billion Yield: 5.79% NPAs / Loans + REO: 2.0% LTM NCOs / Avg Loans: 0.18% Loan Mark: 3.0% 11% 6% 7% 30% 46% Multi-Family C&I Commercial Real Estate 1-4 Family LSB Corp. * Construction & Development Consumer <1% Completed extensive due diligence and loan file review Conservative estimate of remaining cumulative losses * Financial data as of March 31, 2010 |
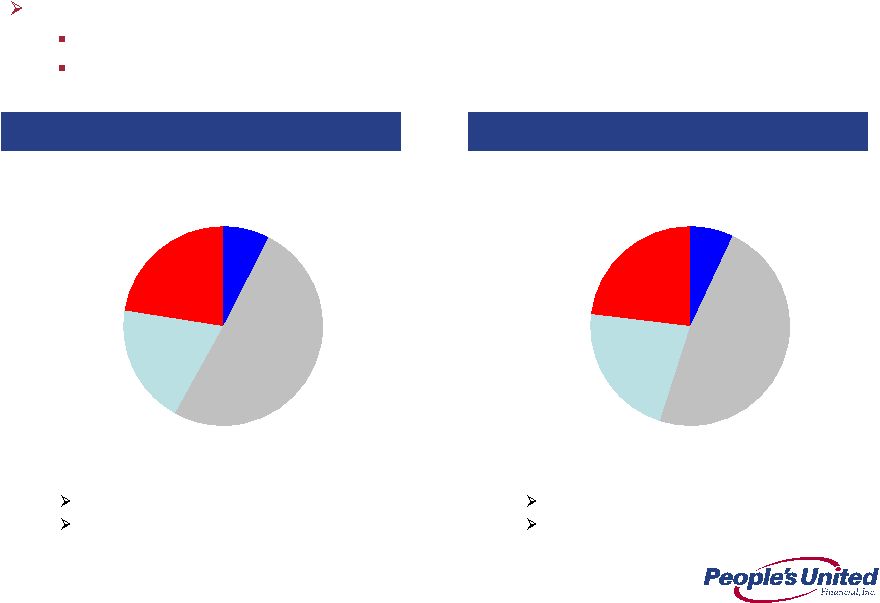 18 Deposit Mix Balance: $1.9 billion Cost: 1.7% 8% 22% 20% 50% Time Deposits < $100K Savings, Now & MMDA Smithtown Bancorp * Noninterest-bearing Balance: $0.5 billion Cost: 1.8% 7% 23% 22% 48% LSB Corp. * Time Deposits > $100K Savings, Now & MMDA Noninterest-bearing Time Deposits < $100K Time Deposits > $100K Analyzed deposit retention risks and evaluated retail distribution network Mystery shopped all branches Significant opportunity to lower deposit costs to PBCT levels over time * Financial data as of March 31, 2010 |
 19 Completed Completed Extensive due diligence 4 th quarter 2010 4 th quarter 2010 Expected close LSB Corp. Smithtown Bancorp Smithtown shareholders Regulatory approvals 50% stock* / 50% cash $60 million $4.00 LSB shareholders Regulatory approvals 100% cash $96 million $21.00 Price per share Approvals Consideration Deal value Summary of Key Terms * People’s United current intention is to repurchase the shares being issued in the transaction |
 20 9% (4%) Core deposit premium 30% or $3 million after-tax 15% or $5 million after-tax Cost savings N/A Repurchase shares issued Stock buyback Identified but not assumed Identified but not assumed Revenue synergies LSB Corp. Smithtown Bancorp 10.4% $25 - $35 million after-tax 0.5x 3.0% $5 million after-tax 1.5x Price / tangible book Loan mark Merger-related expenses Summary of Key Metrics and Assumptions |
 21 Pro Forma Impact >15% >15% Internal rate of return ~$0.10 ~$0.01 ~$0.09 2011 operating EPS accretion *** ~$9.65 $10.14 Tangible book value per share 30 1.9 2.0 2.4 SMTB* ~15.0% 18.0% Tangible common equity ratio 7 0.5 0.5 0.8 LSBX* 333 296 Branches 25.1 21.9 Assets ($Bn) 18.3 15.8 Deposits ($Bn) 17.6 15.2 Loans ($Bn) PBCT Pro Forma ** * Financial data as of March 31, 2010 ** Pro forma for purchase accounting adjustments. Assumes stock issued to SMTB is repurchased *** Excludes one-time merger related expenses |
 22 Summary Strong balance sheet with significant capital surplus Pro forma Tangible Capital Ratio of 15.0% Beginning to execute on strong opportunity set Actively evaluating acquisitions - pipeline remains robust Driving growth and profitability improvements within the core business, recently completed acquisitions (FIF and Butler) as well as newly announced acquisitions (SMTB, LSBX) Constantly considering returns available via share repurchases or dividend payouts We are excited about growth and confident in our position |
 Appendix |
 24 Average Earning Assets $ Inc/(Dec) % Commercial real estate 5,216 $ 5,137 $ 4,802 $ 79 $ 2 Commercial lending 4,852 4,250 3,809 602 14 Shared national credits 505 551 719 (46) (8) Total Commercial 10,573 9,938 9,330 635 6 Residential mortgage 2,537 2,507 2,989 30 1 Home equity and other loans 2,209 2,235 2,276 (26) (1) Total loans 15,319 14,680 14,595 639 4 Investments 3,630 3,789 3,615 (159) (4) Total earning assets 18,949 $ 18,469 $ 18,210 $ 480 $ 3 vs. Q1 2010 ($'s in millions) Q2 2010 Q1 2010 Q2 2009 |
  25 Average Funding Mix Loan portfolio is funded by core deposits $ Inc/(Dec) % Deposits: Non-interest-bearing 3,357 $ 3,271 $ 3,192 $ 86 $ 3 Savings/Now/PMA 7,818 7,414 6,600 404 5 Time 4,529 4,517 5,094 12 0 Total deposits 15,704 15,202 14,886 502 3 Sub-debt / Other borrowings 348 371 351 (23) (6) Total funding liabilities 16,052 15,573 15,237 479 3 Stockholders' equity 5,458 5,275 5,162 183 3 Total Funding 21,510 $ 20,848 $ 20,399 $ 662 $ 3 Average deposit cost 0.74% 0.78% 1.26% (0.04)% (5.1)% vs. Q1 2010 Q1 2010 Q2 2009 ($'s in millions) Q2 2010 |
 26 Quarterly Income Statement vs. Q1 2010 $ Fav(Unf) % Inc/(Dec) Net Interest Income 173.8 $ 159.6 $ 141.2 $ 14.2 $ 9 Provision for Loan Losses 17.8 9.5 14.0 (8.3) 87 Non-Interest Income 76.8 70.6 85.0 6.2 9 Non-interest Expense: Operating 186.6 176.9 167.8 (9.7) (5) Merger/One Time Expense 23.2 23.4 8.4 0.2 1 Total Non-Interest Expense 209.8 200.3 176.2 (9.5) 5 Income Before Taxes 23.0 20.4 36.0 2.6 13 Net Income 16.0 13.6 25.3 2.4 18 Earnings Per Share 0.04 0.04 0.08 - - Operating Earnings Per Share 0.09 0.08 0.07 0.01 13 ($'s in millions, except EPS) Q2 2010 Q1 2010 Q2 2009 |
 27 Non-Interest Income $ Inc/(Dec) % Investment management fees 8.6 $ 7.9 $ 8.6 $ 0.7 $ 9 Insurance revenue 6.3 7.3 6.8 (1.0) (14) Brokerage commissions 2.8 2.8 3.2 - - Total wealth management 17.7 18.0 18.6 (0.3) (2) Bank service charges 32.9 31.2 32.9 1.7 5 Merchant services income 6.4 5.8 6.1 0.6 10 Net security gains - - 12.0 - - Operating lease income 4.2 3.8 3.6 0.4 11 Loan Penalties/Late Charges 5.1 3.0 1.1 2.1 70 Other non-interest income 10.5 8.8 10.7 1.7 19 Total non-interest income 76.8 $ 70.6 $ 85.0 $ 6.2 $ 9 Total non-interest income ex security gains 76.8 $ 70.6 $ 73.0 $ 6.2 $ 9 vs. Q1 2010 ($'s in millions) Q2 2010 Q1 2010 Q2 2009 |
  28 Non-Interest Expense vs. Q1 2010 $ Inc % Compensation and benefits 92.6 $ 96.3 $ 86.6 $ (3.7) $ (4) Occupancy and equipment 28.5 29.8 26.3 (1.3) (4) Professional/outside service fees 20.8 13.6 11.7 7.2 53 Other non-interest expense 67.9 60.6 51.6 7.3 12 Total non-interest expense 209.8 $ 200.3 $ 176.2 $ 9.5 $ 5 Operating non-interest expense 186.6 $ 176.9 $ 167.8 $ 9.7 $ 5 Q2 2010 Q1 2010 Q2 2009 ($'s in millions) |
 29 We expect that interest rates will not rise in 2010. However, we do expect rates to rise in 2011 and beyond Given short term interest rates are 0-25bps, we are not taking asymmetrical risk with our securities book For Q4 2009 (the most recent peer data available at time of Q1 2010 earnings) we were ~7-8x as asset sensitive as the peers, now we are ~4x as asset sensitive, this primarily reflects a move by peers to better position themselves for rate increases For every 100bps increase in the Fed Funds rate, our net interest income will increase by ~$50MM on an annualized basis Notes: 1. Analysis is as of 3/31/10 filings 2. Data as of 3/31/10 SEC filings, where exact +100bps shock up scenario data was not provided PBCT interpolated based on data disclosed 3. Data as of 3/30/10 filings, where exact +200bps shock up scenario data was not provided PBCT interpolated based on data disclosed Second Quarter 2010 Results Asset Sensitivity Net Interest Income at Risk 1 Analysis involves PBCT estimates, see notes below Lowest Amongst Highest Amongst Core PBCT Multiple to Scenario Our Peers Our Peers Peer Median PBCT Peer Median Shock Up 100bps 2 -1.4% 4.5% 1.8% 7.0% 4.0x Shock Up 200bps 3 -2.7% 9.0% 3.6% 15.9% 4.4x Change in Net Interest Income |
 30 High Quality Consumer Portfolio Total Portfolio $4.7 billion (as of June 30, 2010) Residential Mortgage Portfolio Credit Statistics Weighted Average: Loan to value¹ 54% FICO scores¹ 727 Net charge-offs: 0.07% Non-accrual: 3.40% Home Equity Portfolio Credit Statistics Weighted Average: Combined LTV¹ 55% FICO scores¹ 751 Net charge-offs: 0.03% Non-accrual: 0.44% (1) Excludes the impact of the former Butler Bank and the former Chittenden Corp. 1-4 Family Residential 53% Home Equity Loans & Lines 42% Indirect Auto 4% Other 1% |
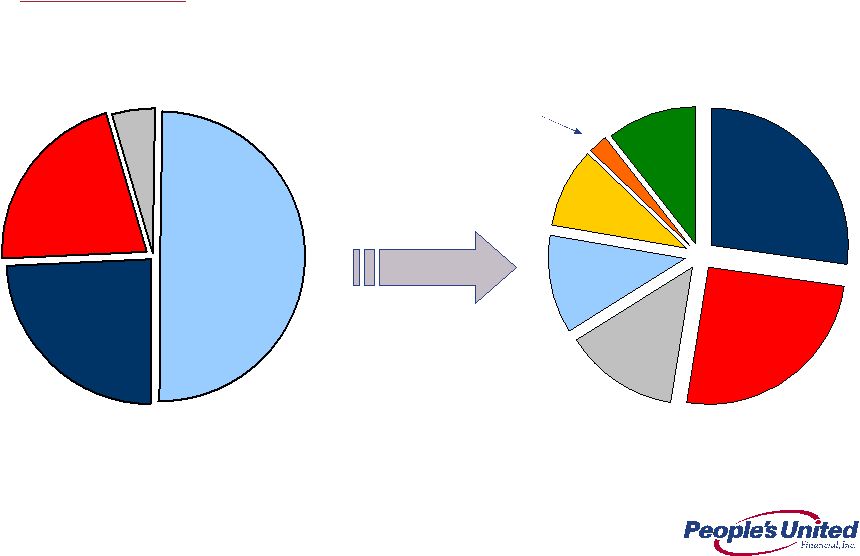 31 Retail 27% Office 25% Industrial 12% Residential 14% Hospitality 9% Other 11% Land 2% Well Balanced Commercial Portfolio As of June 30, 2010 Total Portfolio $10.5 billion $5.5 billion CRE¹ (1) Includes the Commercial Real Estate portion of the Shared National Credit portfolio of $229 million CRE, By Sector SNC 4% Equip. Fin. 22% Commercial Real Estate 50% General C&I 24% |
 32 Peer Group Company Name Ticker State Associated Banc-Corp ASBC WI Astoria Financial Corporation AF NY BOK Financial Corporation BOKF OK City National Corporation CYN CA Comerica Incorporated CMA TX Commerce Bancshares, Inc. CBSH MO Cullen/Frost Bankers, Inc. CFR TX First Horizon National Corporation FHN TN Flagstar Bancorp, Inc. FBC MI Fulton Financial Corporation FULT PA Hudson City Bancorp, Inc. HCBK NJ M&T Bank Corporation MTB NY Marshall & Ilsley Corporation MI WI New York Community Bancorp, Inc. NYB NY Synovus Financial Corp. SNV GA TCF Financial Corporation TCB MN Valley National Bancorp VLY NJ Webster Financial Corporation WBS CT Zions Bancorporation ZION UT |
 For more information, investors may contact: Peter Goulding, CFA peter.goulding@peoples.com (203) 338-6799 |