 KBW Boston Bank Conference March 1, 2011 * * * * * Exhibit 99.1 * * * * * * * * * |
 1 Forward Looking Statement Certain comments made in the course of this presentation by People’s United Financial are forward-looking in nature These include all statements about People’s United Financial’s operating results or financial position for periods ending or on dates occurring after December 31, 2010 and usually use words such as “expect”, “anticipate”, “believe”, and similar expressions. These comments represent management’s current beliefs, based upon information available to it at the time the statements are made, with regard to the matters addressed. All forward-looking statements are subject to risks and uncertainties that could cause People’s United Financial’s actual results or financial condition to differ materially from those expressed in or implied by such statements. Factors of particular importance to People’s United Financial include, but are not limited to: (1) failure of People’s United Financial and Danvers Bancorp to satisfy the closing conditions in the merger agreement in a timely manner or at all; (2) failure of the shareholders of Danvers Bancorp to approve the merger agreement; (3) failure to obtain governmental approvals for the merger; (4) disruptions to the parties’ businesses as a result of the announcement and pendency of the merger; (5) costs or difficulties related to the integration of the businesses following the merger with Danvers Bancorp and recent acquisitions; (6) changes in general, national or regional economic conditions; (7) the risk that the anticipated benefits, cost savings and any other savings from the merger may not be fully realized or may take longer than expected to realize (8) changes in loan default and charge-off rates; (9) reductions in deposit levels necessitating increased borrowings to fund loans and investments; (10) changes in interest rates or credit availability; (11) possible changes in regulation resulting from or relating to the recently enacted financial reform legislation; (12) changes in levels of income and expense in noninterest income and expense related activities; (13) competition and its effect on pricing, spending, third-party relationships and revenues. |
 2 Corporate Overview Snapshot, as of December 31, 2010 1842 Founded: 518 ATMs: 339 Branches: $17.9 billion Deposits: $17.5 billion Loans: $25.0 billion Assets: $4.7 billion Market Capitalization (2/25/11) NASDAQ (PBCT) People’s United Financial, Inc. |
 3 Primary Objectives Optimize the existing business + Deploy capital in high risk-adjusted return initiatives Return the franchise to >1.25% ROAA |
 4 Strengthening the Leadership Team Executive Management Committee Changes Name Position As of: Years in Banking Professional Experience Kirk Walters SEVP & CFO, Director Mar. 2011 25 Sovereign, Chittenden, Northeast Financial Jeff Tengel SEVP & Head of Commercial Banking Jan. 2011 30+ People’s United Bank, NationalCity Jack Barnes * President & CEO, Director July 2010 30+ People’s United Bank (SEVP, CAO), Chittenden Bank, FDIC Dave Norton SEVP & Chief HR Officer Oct. 2009 1 New York Times, Starwood, PepsiCo Chantal Simon SEVP & Chief Risk Officer May 2009 20+ Merrill Lynch US Bank Entities Prospective Additions to Board of Directors Name Position As of: Years in Banking Professional Experience Kirk Walters SEVP & CFO, Director Mar. 2011 25 Sovereign, Chittenden, Northeast Financial Kevin Bottomley Director Upon completion of merger 30+ Danvers Bancorp, Boston Private, 1 st National Bank of Boston, Banker’s Trust * Became interim President & CEO in April 2010 |
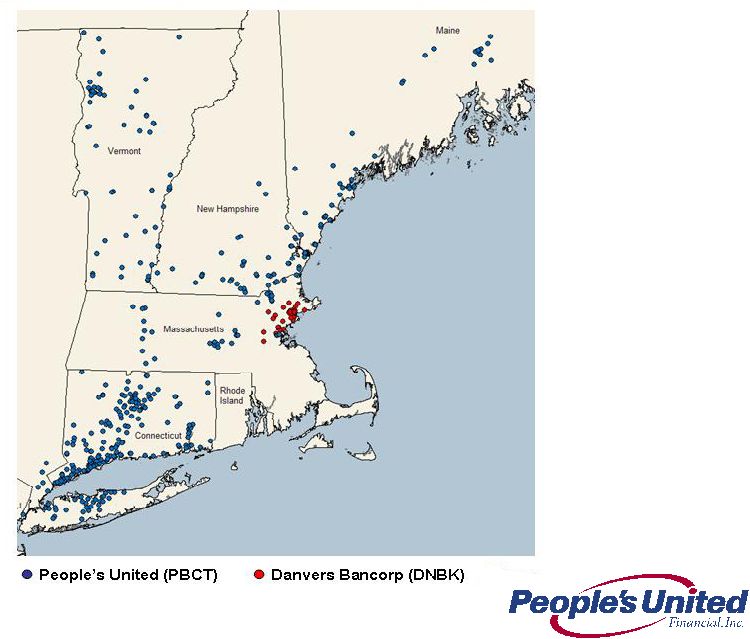 5 Deepening Presence in NYC Metro and Boston MSA |
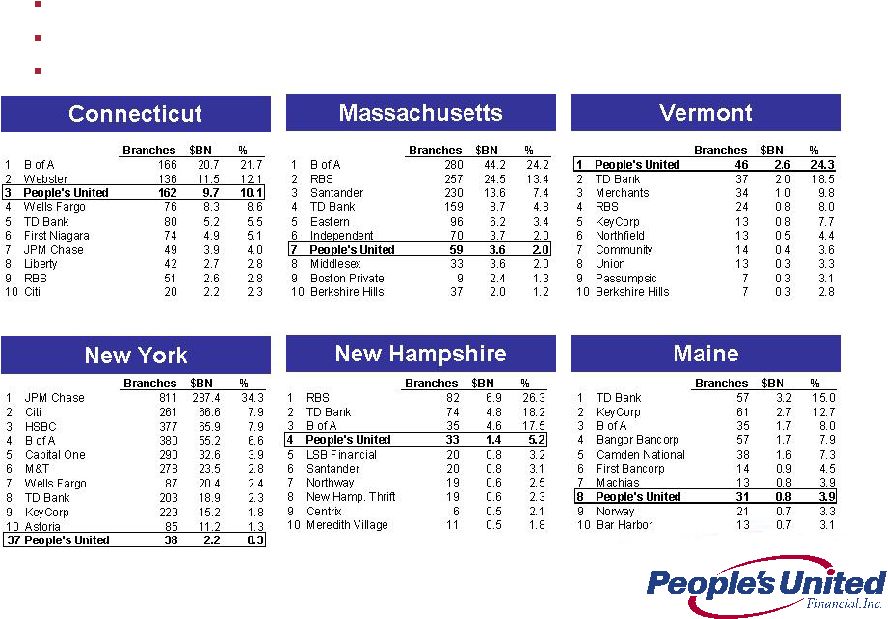 6 Strong Pro Forma Deposit Market Position Deposits of $20.2BN #1 in Fairfield County, CT, 64 branches, $5.4BN, 17.8% market share #2 in Essex County, MA, 24 branches, $2.0BN, 12.3% market share Source: SNL Financial |
 7 7 Low Cost of Deposits Publicly Traded Banks, $5BN < Assets <$100BN Source: SNL Financial Total Cost of Assets ($BN) Deposits (%) Company Name City State 2010Q4 2010Q4 1 M&T Bank Corporation Buffalo NY 68.0 0.35 2 First Niagara Financial Group, Inc. Buffalo NY 21.1 0.51 3 People's United Financial, Inc. Bridgeport CT 25.0 0.64 4 NBT Bancorp Inc. Norwich NY 5.3 0.64 5 Boston Private Financial Holdings, Inc. Boston MA 6.2 0.69 6 Community Bank System, Inc. De Witt NY 5.4 0.70 7 Webster Financial Corporation Waterbury CT 18.0 0.70 8 Valley National Bancorp Wayne NJ 14.1 0.72 9 New York Community Bancorp, Inc. Westbury NY 41.2 0.84 10 Provident Financial Services, Inc. Jersey City NJ 6.8 0.85 11 National Penn Bancshares, Inc. Boyertown PA 8.8 0.85 12 Fulton Financial Corporation Lancaster PA 16.3 0.86 13 First Commonwealth Financial Corporation Indiana PA 5.8 0.93 14 NewAlliance Bancshares, Inc. New Haven CT 9.0 0.94 15 Signature Bank New York NY 11.7 0.95 16 Susquehanna Bancshares, Inc. Lititz PA 14.0 1.02 17 Northwest Bancshares, Inc. Warren PA 8.1 1.18 18 Investors Bancorp, Inc. (MHC) Short Hills NJ 9.6 1.38 19 Hudson City Bancorp, Inc. Paramus NJ 61.2 1.38 20 Astoria Financial Corporation Lake Success NY 18.1 1.41 21 F.N.B. Corporation Hermitage PA 9.0 NA |
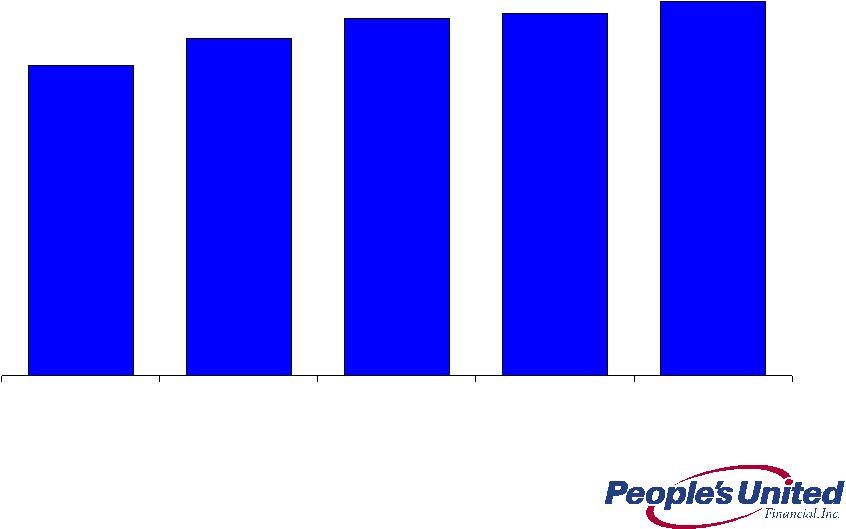 8 Net Interest Margin 8 3.19% 3.47% 3.68% 3.73% 3.85% Q4 2009 Q1 2010 Q2 2010 Q3 2010 Q4 2010 |
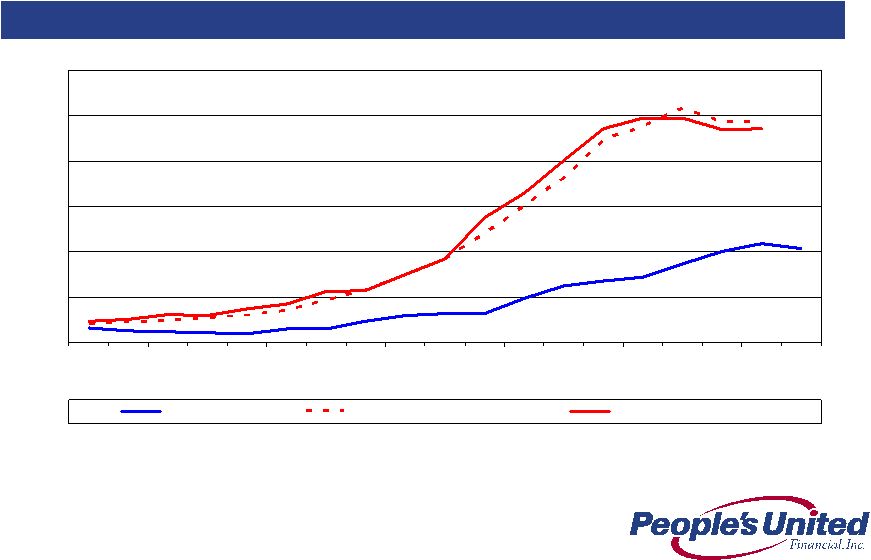
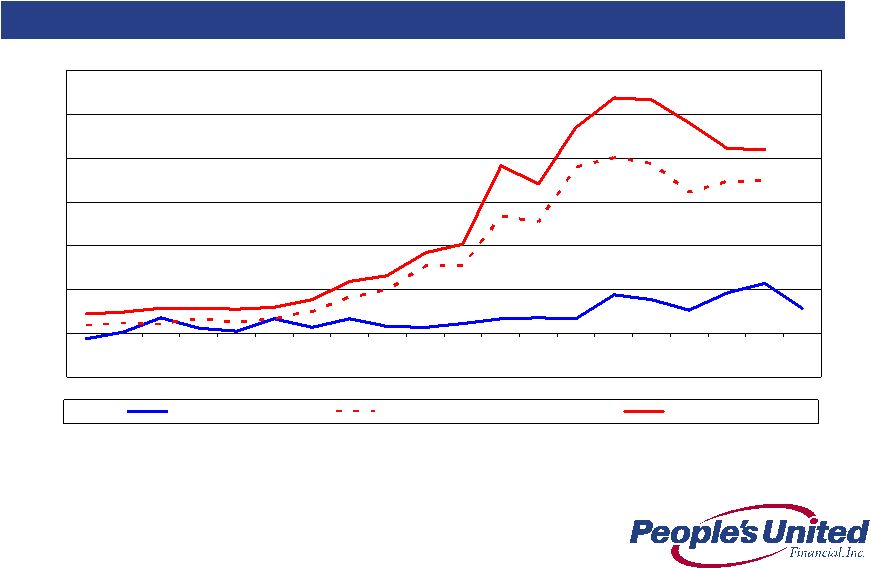 9 2006-2010 0.28 0.57 1.74 2.10 -0.50 0.00 0.50 1.00 1.50 2.00 2.50 3.00 Q1 2006 Q2 2006 Q3 2006 Q4 2006 Q1 2007 Q2 2007 Q3 2007 Q4 2007 Q1 2008 Q2 2008 Q3 2008 Q4 2008 Q1 2009 Q2 2009 Q3 2009 Q4 2009 Q1 2010 Q2 2010 Q3 2010 Q4 2010 PBCT Peer Group Mean Top 50 Banks Asset Quality Net Charge-Offs / Avg. Loans (%) Source: SNL Financial and Company filings |
 10 2006-2010 2.07 2.18 4.86 4.72 0.00 1.00 2.00 3.00 4.00 5.00 6.00 Q2 2006 Q3 2006 Q4 2006 Q1 2007 Q2 2007 Q3 2007 Q4 2007 Q1 2008 Q2 2008 Q3 2008 Q4 2008 Q1 2009 Q2 2009 Q3 2009 Q4 2009 Q1 2010 Q2 2010 Q3 2010 Q4 2010 PBCT Peer Group Mean Top 50 Banks by Assets Asset Quality NPAs / Loans & REO* (%) Source: SNL Financial and Company filings * Non-performing assets (excluding acquired non-performing loans) as a percentage of originated loans plus all REO and repossessed assets; acquired non-performing loans excluded as risk of loss has been considered by virtue of our estimate of acquisition-date fair value and/or the existence of an FDIC loss sharing agreement |
 11 Focused on Revenue Synergies Throughout the Franchise By Pursuing Best Practices in All Markets Northern New England Retail Banking and Brokerage Enhance our industry leading loyalty by initiating a New Customer Experience program – on-boarding and retention focused Invest in securities and life insurance licensing, product and sales training in retail bank Introduced People’s Securities brokerage model Objective is to increase cross-selling to 4.6 products and services per customer (the current level in Southern NE franchise) from 3.6 products and services (the current level in Northern NE franchise) Upper Middle-Market Commercial Banking Larger corporate lending capabilities >$25MM per loan Insurance brokerage capability Southern New England Build out small business capabilities Market business services: payroll processing, merchant services, business credit card, 401k administration Emphasize private banking and wealth management |
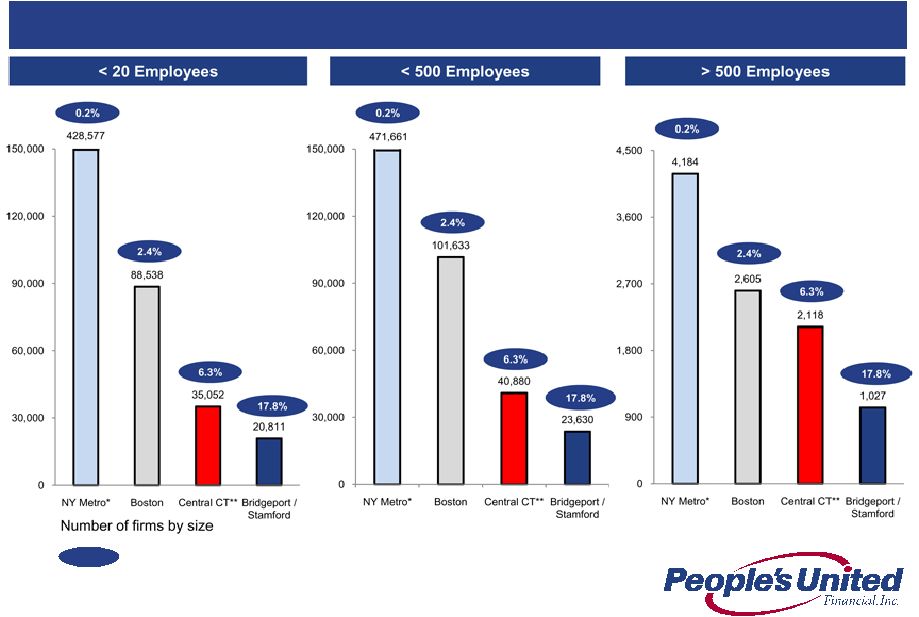 12 Commercial Market Opportunity by MSA Source: SBA firms and employment by MSA 2007 * NY Metro area includes New York, Northern New Jersey, and Long Island MSA ** Central Connecticut includes New Haven and Hartford MSAs Pro Forma Deposit Market Share People’s United is growing in NYC Metro and Boston Metro, areas rich with potential commercial, non-commodity relationships |
 13 New Markets Boston ~75% of economic activity within New England takes place inside the Rt. 128 loop. Boston MSA has a population of ~4.5MM In just two months our two de novo branches have gathered $33MM in deposits 70% are non-CDs 23% are commercial deposits Expanded commercial lending efforts are progressing well $78MM in loan balances targeted by year end 2011 1Q11 balances will likely total >$50MM Recent commitments average ~$10MM Borrower industries include: food distribution and healthcare Pipeline is strong |
 14 New Markets Boston / Danvers Bancorp Danvers - An excellent platform for commercial loan growth Boston is the second largest MSA within our footprint behind New York City MSA 49% of Danverbank’s loans are C&I loans Adds 23 commercial lenders to the 10 we now have based in Boston MSA Asset-based lending unit can be expanded significantly Complements our existing Massachusetts and New Hampshire footprint Danvers Timing Update Transaction expected to close late 2Q10 |
 15 New Markets Long Island If Long Island were a state it would rank 12 th in population (~7.5MM) and 1 st in population density Since our acquisition closed, core deposits have grown 4% or $60MM (excluding municipal deposits and CDARS) C&I Lending is progressing well Expect >$20MM in loans outstanding by end of first quarter Regional manager in place, recently hired an experienced in-market C&I lender and 2 experienced in-market small business lenders Actively meeting with companies and professionals in the business community Deepening our understanding of the existing CRE portfolio Significant investor and related party interest in legacy Smithtown non- performers |
 16 Capital Deployment Acquisition activity is focused on New England and the Mid-Atlantic Building relationships with banks $1BN - $20BN in asset size Maintaining price discipline in light of challenging industry conditions Effectively deploying capital via organic loan growth - “new markets and new products” Repurchased $191MM of stock in 2010 at a weighted average price of $13.35 In January 2011, Board authorized a new share repurchase program for another 5% of shares outstanding Volume of repurchases constrained by SEC regulations due to stock issuance in Danvers Bancorp deal – expected to close in late 2Q11 Our dividend yield is ~4.7% |
 17 Acquisition Discipline Geographic and/or product/service fit with existing franchise Potential for significant revenue synergies Preference for relationship-based, commercially oriented franchises Valuation models are based on: Thorough due diligence including detailed loan file review Conservative credit marks, cost savings and profitability assumptions Valuation models do not include revenue synergies Financial Hurdles: IRR must exceed 15% Cash on cash returns of ~10% or greater Deal-specific TBV dilution earn back period of less than 10 years |
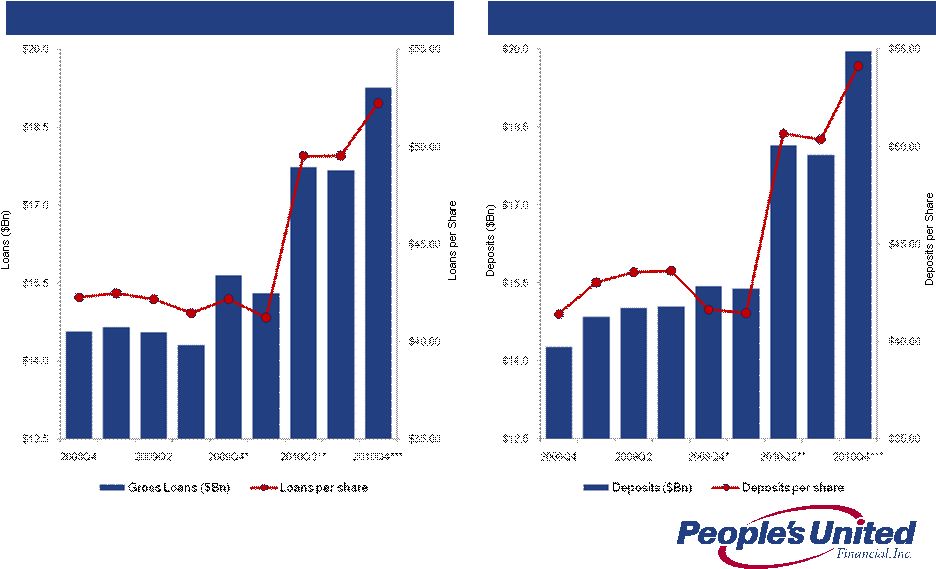 18 Loans Deposits Growing Future Earnings Per Share Loans and Deposits per Share * Pro forma for FIF acquisition * *Pro forma for SMTB & LSBX acquisitions ** *Pro forma for DNBK acquisition |
 19 Summary Premium brand built over 169 years High quality Northeast footprint characterized by wealth, density and commercial activity Strengthened leadership team Low cost of deposits Strong net interest margin Superior asset quality Focus on non-commodity/relationship based lending Growing loans and deposits within footprint - in two of the largest MSAs in the country (New York City, #1 and Boston, #10) Efficiently growing loans and deposits per share Significantly more asset sensitive than peers Pro forma tangible common equity ratio of 12.0% Sustainable Competitive Advantage |
Q & A * * * * * * * * * * * * * |
APPENDIX * * * * * * * * * * * * |
 22 Completed October 2009 Loans $263M Deposits $415M Danvers Bancorp - Overview ROAA 0.71 ROAE 6.7 Net Interest Margin 3.53 Efficiency Ratio 67.0 TCE / TA 8.94 NPA / (Loans + OREO) 0.83 LLR / Loans 1.00 LTM NCO / Avg. Loans 0.12 Select Balance Sheet Ratios (%) Profitability (%) Source: SNL Financial Financial data as of 12/31/2010 Headquarters Danvers, MA Established March 1850 Branches 28 Conversion Date 12/13/2007 Overview Recent Acquisition: Beverly National Bank Chairman, President & CEO Kevin T. Bottomley EVP & COO James J. McCarthy EVP & Chief Lending Officer John O’Neill Executive VP & CFO L. Mark Panella Executive Management Assets $2,853 Net Loans 1,768 Deposits 2,100 Tangible Common Equity 252 Balance Sheet ($MM) |
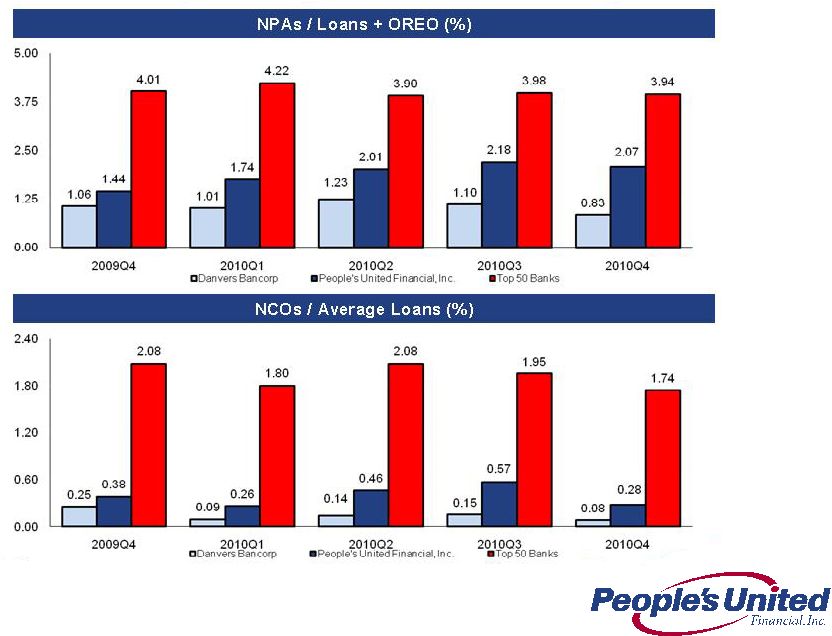 23 Danvers Bancorp - Exceptional Asset Quality Source: SNL Financial Note: PBCT Non-performing assets (excluding acquired non-performing loans) as a percentage of originated loans plus all REO and repossessed assets; acquired non-performing loans excluded as risk of loss has been considered by virtue of our estimate of acquisition-date fair value and/or the existence of an FDIC loss sharing agreement |
 24 People’s United / Danvers Bancorp - Pro Forma Impact * PBCT financials as of 12/31/2010; DNBK financials as of 12/31/2010 ** Balance sheet figures do not include the impact of purchase accounting adjustments ^ Pro forma levels at estimated close of transaction PBCT* DNBK* Pro Forma** Assets ($Bn) 25.0 2.9 27.9 Loans ($Bn) 17.5 1.8 19.3 Deposits ($Bn) 17.9 2.1 20.0 Branches 341 28 369 Tangible common equity ratio 14.1% ~12.0% Tangible book value per share $9.30 ~$8.67 2012 operating EPS accretion ~$0.08 TBV dilution value earn back period ~7 years Internal rate of return >15% ^ ^ |
 25 We expect that interest rates will not rise in 2011. However, we do expect rates to rise in 2012 and beyond Given short term interest rates are so low and are expected to remain low this year, we have again added to our securities portfolio For Q3 2010 we were 3.0x as asset sensitive as our peers For every 100bps increase in the Fed Funds rate, our net interest income will increase by ~$40MM on an annualized basis Notes: 1. Analysis is as of 9/30/10 filings 2. Data as of 9/30/10 SEC filings, where exact +100bps shock up scenario data was not provided PBCT interpolated based on data disclosed 3. Data as of 9/30/10 filings, where exact +200bps shock up scenario data was not provided PBCT interpolated based on data disclosed People’s United - Current Asset Sensitivity Net Interest Income at Risk 1 Analysis involves PBCT estimates, see notes below Lowest Amongst Highest Amongst Core PBCT Multiple to Scenario Our Peers Our Peers Peer Median PBCT Peer Median Shock Up 100bps 2 -0.6% 4.8% 2.0% 6.0% 3.0x Shock Up 200bps 3 0.4% 9.6% 4.4% 13.3% 3.0x Change in Net Interest Income |
 26 Peer Group Company Name Ticker State 1 Associated Banc-Corp ASBC WI 2 Astoria Financial Corporation AF NY 3 BOK Financial Corporation BOKF OK 4 City National Corporation CYN CA 5 Comerica Incorporated CMA TX 6 Commerce Bancshares, Inc. CBSH MO 7 Cullen/Frost Bankers, Inc. CFR TX 8 First Horizon National Corporation FHN TN 9 Flagstar Bancorp, Inc. FBC MI 10 Fulton Financial Corporation FULT PA 11 Hudson City Bancorp, Inc. HCBK NJ 12 M&T Bank Corporation MTB NY 13 Marshall & Ilsley Corporation MI WI 14 New York Community Bancorp, Inc. NYB NY 15 Synovus Financial Corp. SNV GA 16 TCF Financial Corporation TCB MN 17 Valley National Bancorp VLY NJ 18 Webster Financial Corporation WBS CT 19 Zions Bancorporation ZION UT |
 For more information, investors may contact: Peter Goulding, CFA 203-338-6799 peter.goulding@peoples.com * * * * * * * * * * * * * * * * |