|
Exhibit 99.2 
|
4th Quarter 2011 Earnings Conference Call January 19, 2012
Forward-Looking Statement
Certain statements contained in this release are forward-looking in nature. These include all statements about People’s United Financial’s plans, objectives, expectations and other statements that are not historical facts, and usually use words such as “expect,” “anticipate,” “believe” and similar expressions. Such statements represent management’s current beliefs, based upon information available at the time the statements are made, with regard to the matters addressed. All forward-looking statements are subject to risks and uncertainties that could cause People’s United Financial’s actual results or financial condition to differ materially from those expressed in or implied by such statements. Factors of particular importance to People’s United Financial include, but are not limited to: (1) changes in general, national or regional economic conditions; (2) changes in interest rates; (3) changes in loan default and charge-off rates; (4) changes in deposit levels; (5) changes in levels of income and expense in non-interest income and expense related activities; (6) residential mortgage and secondary market activity; (7) changes in accounting and regulatory guidance applicable to banks; (8) price levels and conditions in the public securities markets generally; (9) competition and its effect on pricing, spending, third-party relationships and revenues; (10) the successful integration of acquired companies; and (11) changes in regulation resulting from or relating to financial reform legislation. People’s United Financial does not undertake any obligation to update or revise any forward-looking statements, whether as a result of new information, future events or otherwise.
1
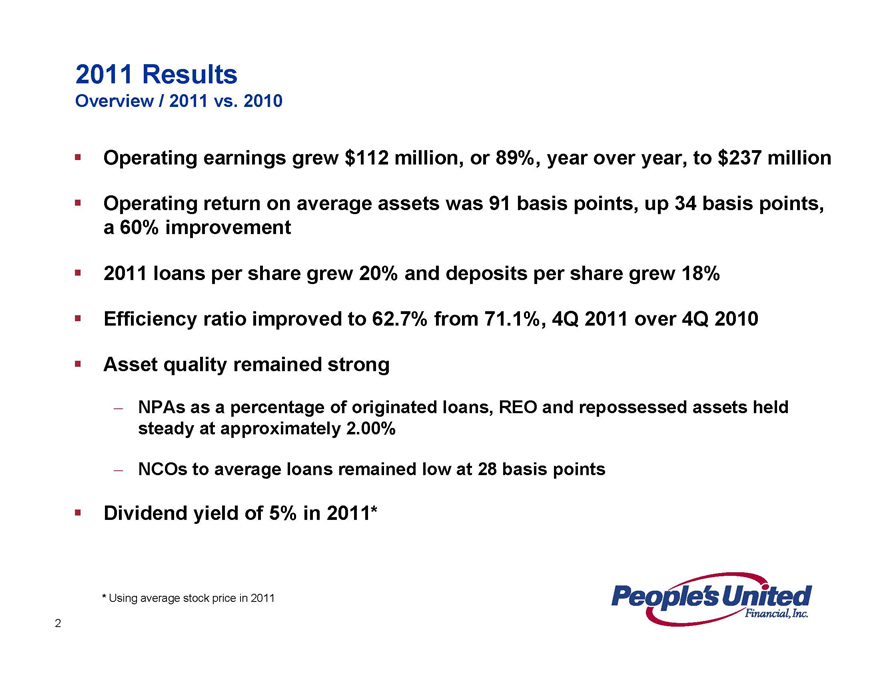
2011 Results
Overview / 2011 vs. 2010
Operating earnings grew $112 million, or 89%, year over year, to $237 million
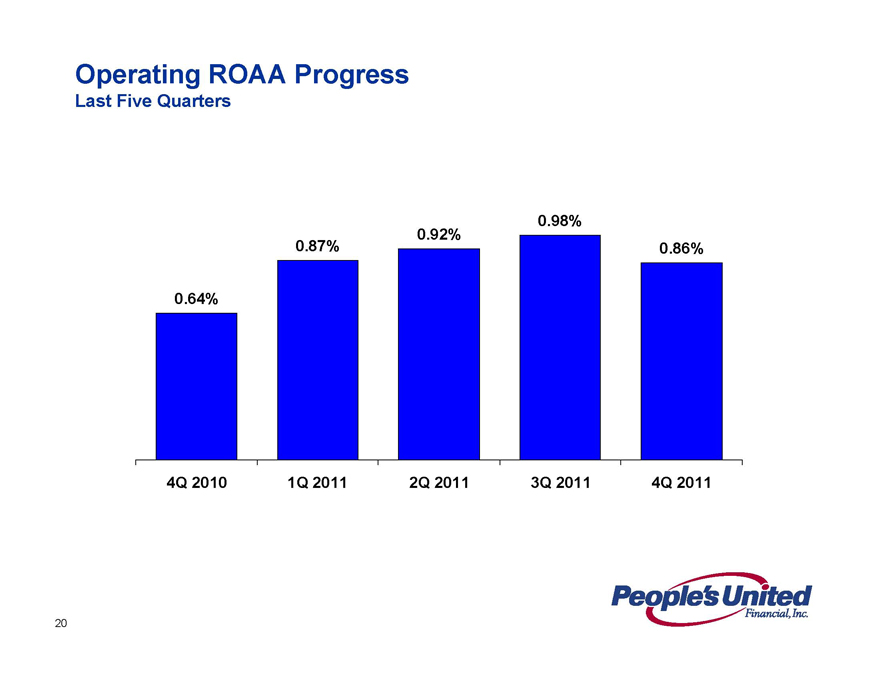
Operating return on average assets was 91 basis points, up 34 basis points, a 60% improvement
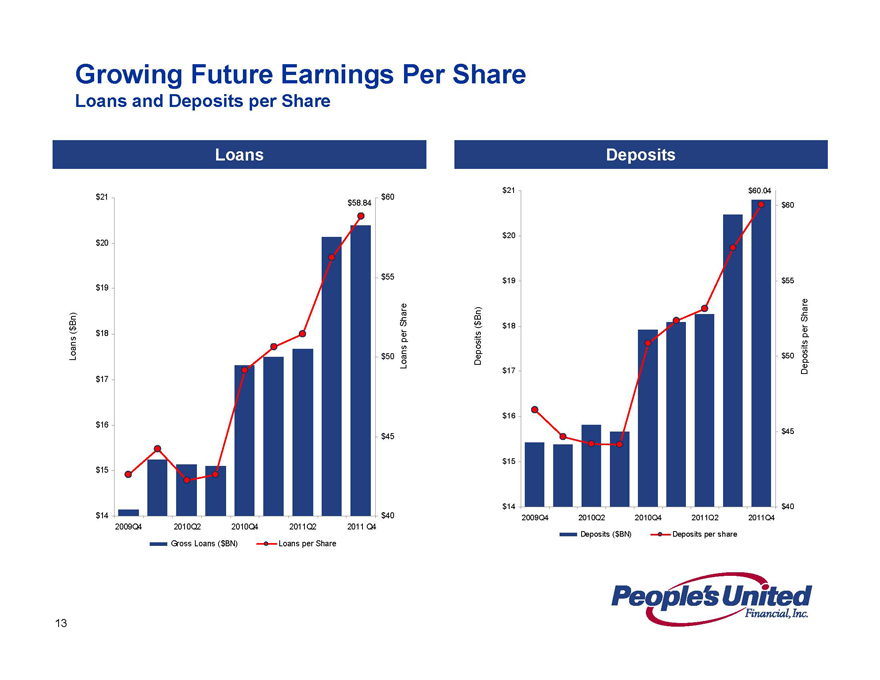
2011 loans per share grew 20% and deposits per share grew 18%
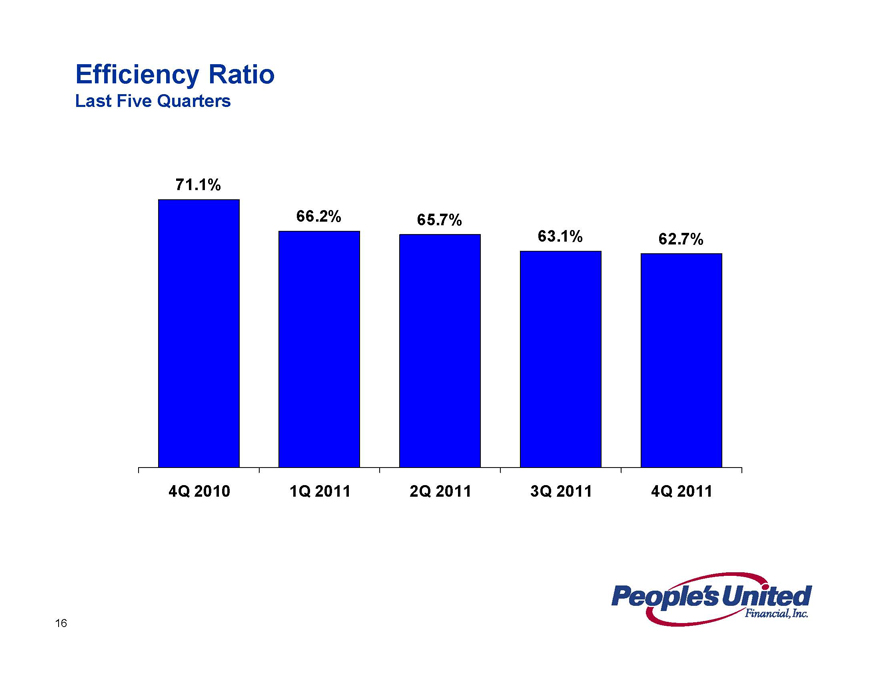
Efficiency ratio improved to 62.7% from 71.1%, 4Q 2011 over 4Q 2010Asset quality remained strong
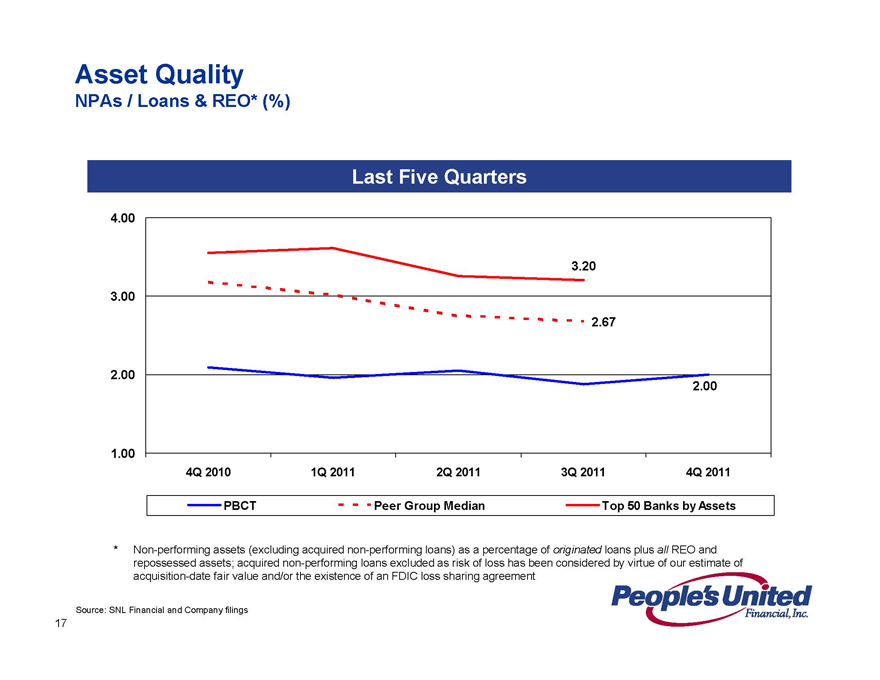
NPAs as a percentage of originated loans, REO and repossessed assets held steady at approximately 2.00%
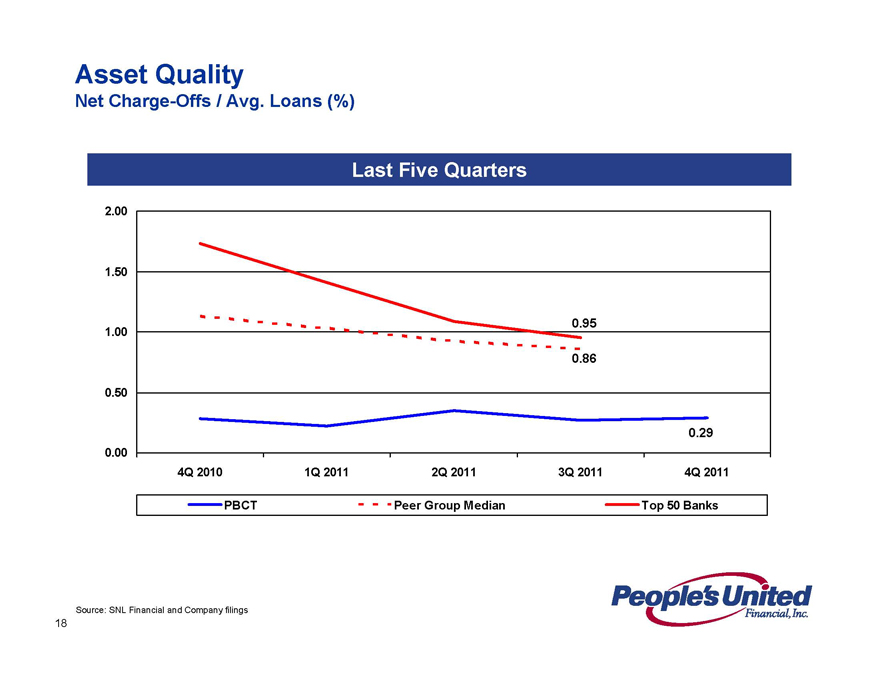
NCOs to average loans remained low at 28 basis points
Dividend yield of 5% in 2011*
* Using average stock price in 2011
2
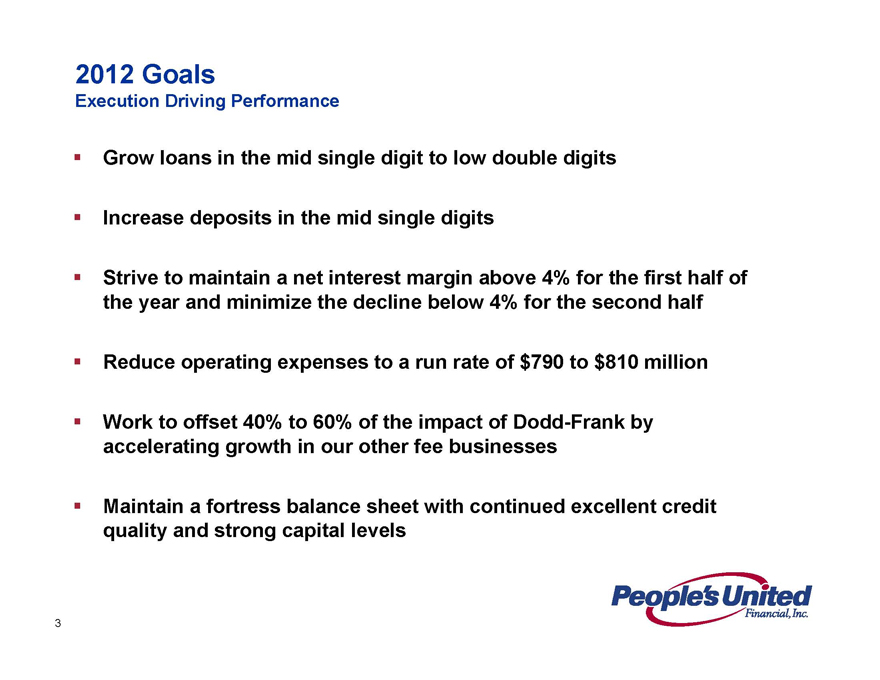
2012 Goals
Execution Driving Performance
Grow loans in the mid single digit to low double digits
Increase deposits in the mid single digits
Strive to maintain a net interest margin above 4% for the first half of the year and minimize the decline below 4% for the second half
Reduce operating expenses to a run rate of $790 to $810 million
Work to offset 40% to 60% of the impact of Dodd-Frank by accelerating growth in our other fee businesses
Maintain a fortress balance sheet with continued excellent credit quality and strong capital levels
3
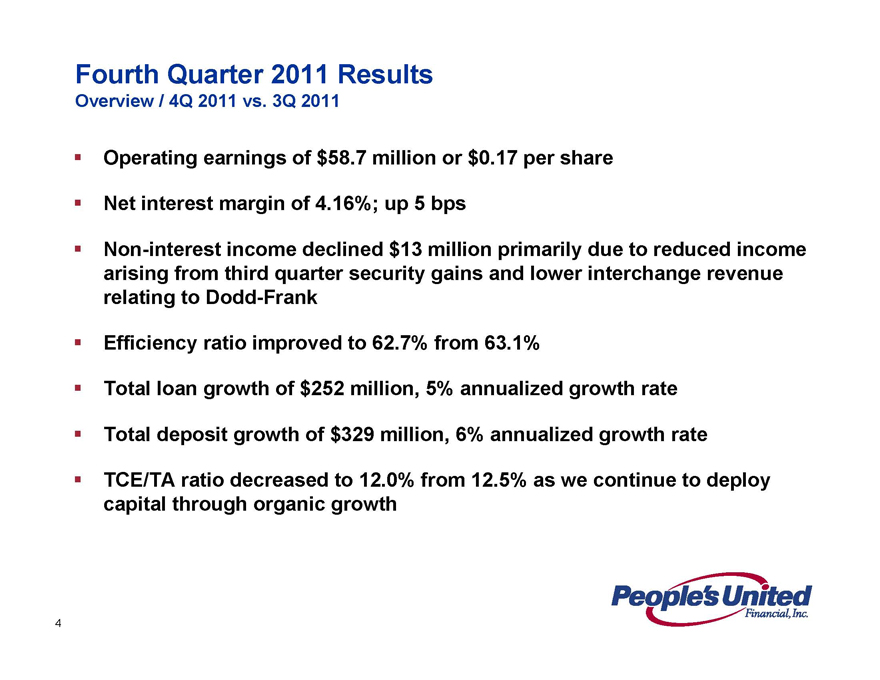
Fourth Quarter 2011 Results
Overview / 4Q 2011 vs. 3Q 2011
Operating earnings of $58.7 million or $0.17 per share
Net interest margin of 4.16%; up 5 bps
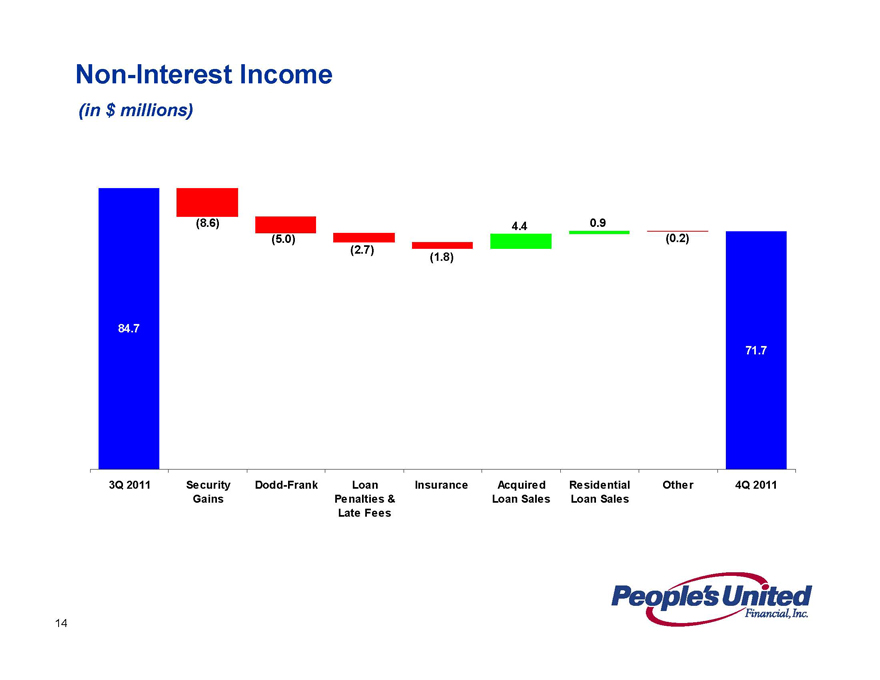
Non-interest income declined $13 million primarily due to reduced income arising from third quarter security gains and lower interchange revenue relating to Dodd-Frank
Efficiency ratio improved to 62.7% from 63.1%
Total loan growth of $252 million, 5% annualized growth rate
Total deposit growth of $329 million, 6% annualized growth rate
TCE/TA ratio decreased to 12.0% from 12.5% as we continue to deploy capital through organic growth
4
Recent Initiatives
Focused on Revenue Growth
Healthy commercial growth given strength throughout the crisis, larger balance sheet, broad operational capabilities and new markets
Increase asset based lending penetration – an under-represented asset class on our balance sheet
Build upon renewed residential mortgage and home equity momentum –leveraging expanded footprint (Boston MSA and Long Island)
Better leverage broad fee income product set: cash management, asset management, brokerage, insurance, merchant services, payroll, etc.
Redesigning incentive plans to objectively reward cross-selling within and across division lines
5
Recent Initiatives
Focused on Cost Reduction
Expense reduction of 4% to 6% to achieve a run rate in the $790 to $810 million range for 2012
Successfully completed the Danvers core system conversion – our fourth successful core system conversion in 2011
Right-sized our employee base following the four acquisitions we closed in 2010 and the Danvers transaction in 2011
Continue to realign our branch network following acquisitions and de novo expansion efforts—expect to consolidate approximately 15 branches during 2012
Consolidating redundant office space and actively marketing unused facilities
Identified IT contractor and other consultant savings
Identified another approximately $9 million of annual savings throughout the franchise
6
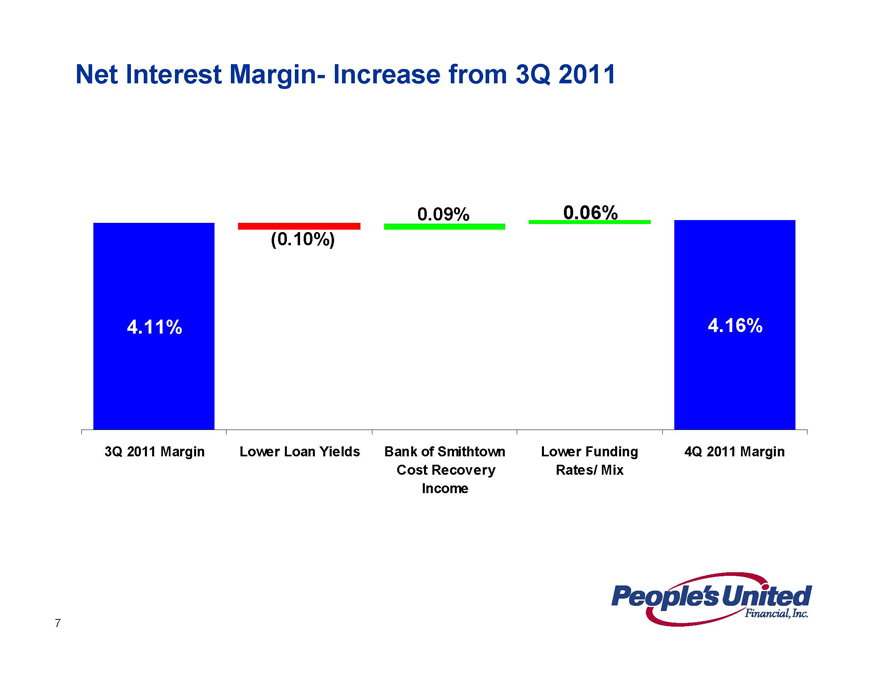
Net Interest Margin- Increase from 3Q 2011
4.11%
3Q 2011 Margin
(0.10%)
Lower Loan Yields
0.09%
Bank of Smithtown Cost Recovery Income
0.06%
Lower Funding Rates/ Mix
4.16%
4Q 2011 Margin
7
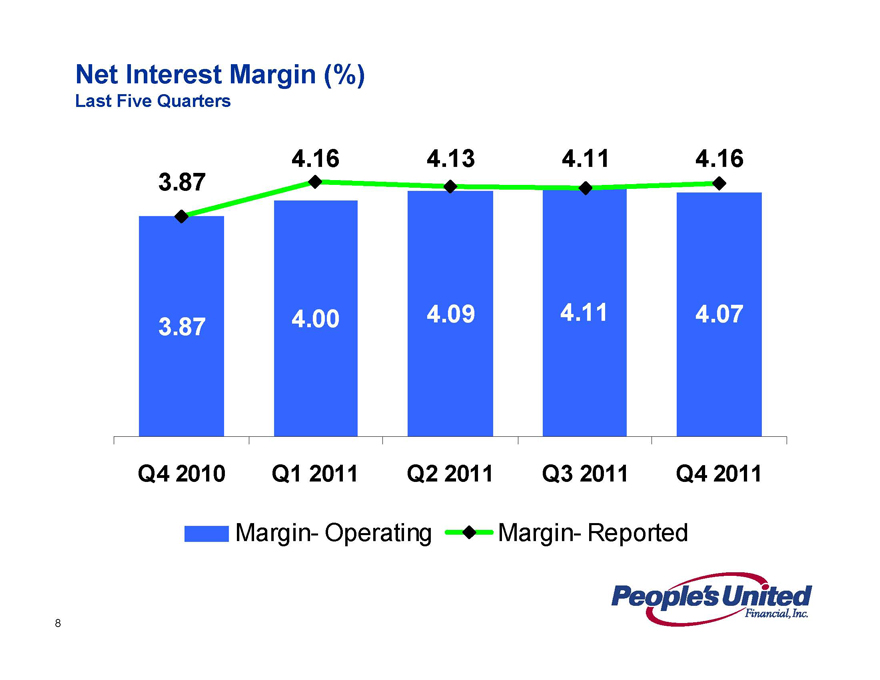
Net Interest Margin (%)
Last Five Quarters
3.87
4.16
4.13
4.11
4.16
3.87
4.00
4.09
4.11
4.07
Q4 2010
Q1 2011
Q2 2011
Q3 2011
Q4 2011
Margin- Operating
Margin- Reported
8
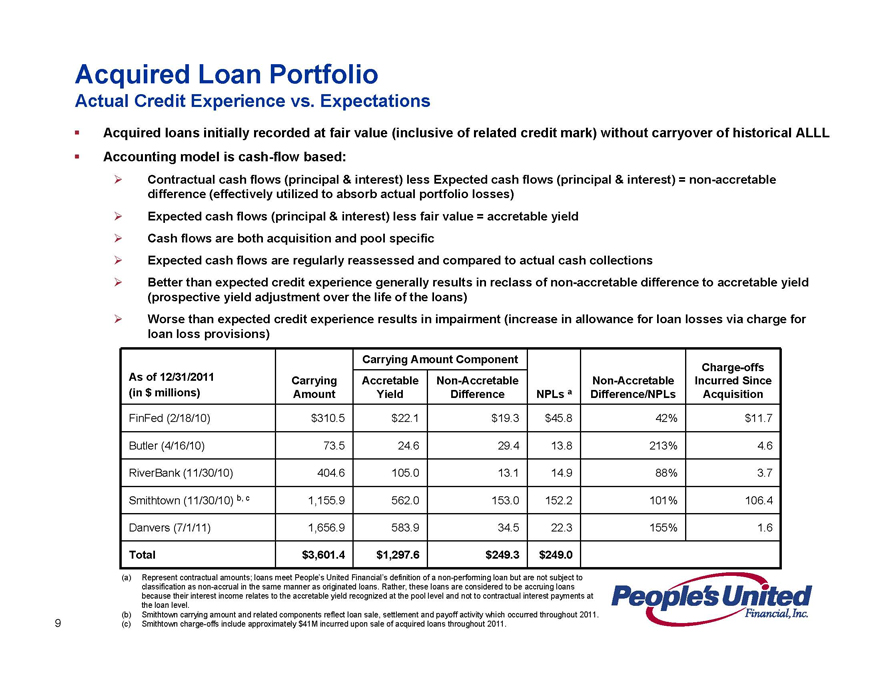
Acquired Loan Portfolio
Actual Credit Experience vs. Expectations
Acquired loans initially recorded at fair value (inclusive of related credit mark) without carryover of historical ALLL Accounting model is cash-flow based:
Contractual cash flows (principal & interest) less Expected cash flows (principal & interest) = non-accretable difference (effectively utilized to absorb actual portfolio losses)
Expected cash flows (principal & interest) less fair value = accretable yield
Cash flows are both acquisition and pool specific
Expected cash flows are regularly reassessed and compared to actual cash collections Better than expected credit experience generally results in reclass of non-accretable difference to accretable yield (prospective yield adjustment over the life of the loans)
Worse than expected credit experience results in impairment (increase in allowance for loan losses via charge for loan loss provisions)
Carrying Amount Component
Charge-offs
As of 12/31/2011 Carrying Accretable Non-Accretable Non-Accretable Incurred Since
(in $ millions) Amount Yield Difference NPLs a Difference/NPLs Acquisition
FinFed (2/18/10) $310.5 $22.1 $19.3 $45.8 42% $11.7
Butler (4/16/10) 73.5 24.6 29.4 13.8 213% 4.6
RiverBank (11/30/10) 404.6 105.0 13.1 14.9 88% 3.7
Smithtown (11/30/10) b, c 1,155.9 562.0 153.0 152.2 101% 106.4
Danvers (7/1/11) 1,656.9 583.9 34.5 22.3 155% 1.6
Total $3,601.4 $1,297.6 $249.3 $249.0
(a) Represent contractual amounts; loans meet People’s United Financial’s definition of a non-performing loan but are not subject to classification as non-accrual in the same manner as originated loans. Rather, these loans are considered to be accruing loans because their interest income relates to the accretable yield recognized at the pool level and not to contractual interest payments at the loan level.
(b) Smithtown carrying amount and related components reflect loan sale, settlement and payoff activity which occurred throughout 2011. (c) Smithtown charge-offs include approximately $41M incurred upon sale of acquired loans throughout 2011.
9
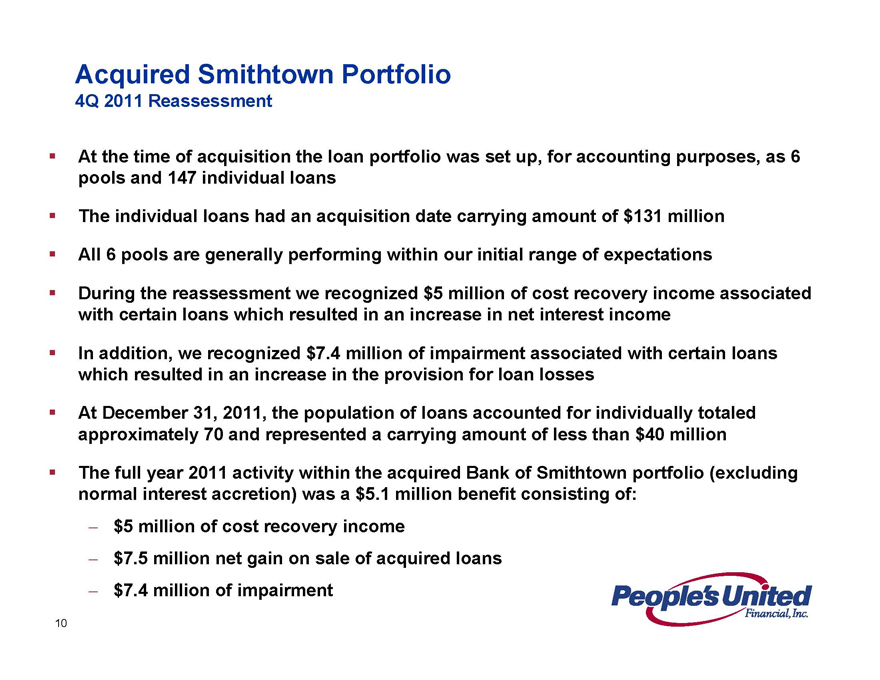
Acquired Smithtown Portfolio
4Q 2011 Reassessment
At the time of acquisition the loan portfolio was set up, for accounting purposes, as 6 pools and 147 individual loans
The individual loans had an acquisition date carrying amount of $131 million
All 6 pools are generally performing within our initial range of expectations
During the reassessment we recognized $5 million of cost recovery income associated with certain loans which resulted in an increase in net interest income
In addition, we recognized $7.4 million of impairment associated with certain loans which resulted in an increase in the provision for loan losses
At December 31, 2011, the population of loans accounted for individually totaled approximately 70 and represented a carrying amount of less than $40 million
The full year 2011 activity within the acquired Bank of Smithtown portfolio (excluding normal interest accretion) was a $5.1 million benefit consisting of:
$5 million of cost recovery income $7.5 million net gain on sale of acquired loans $7.4 million of impairment
10
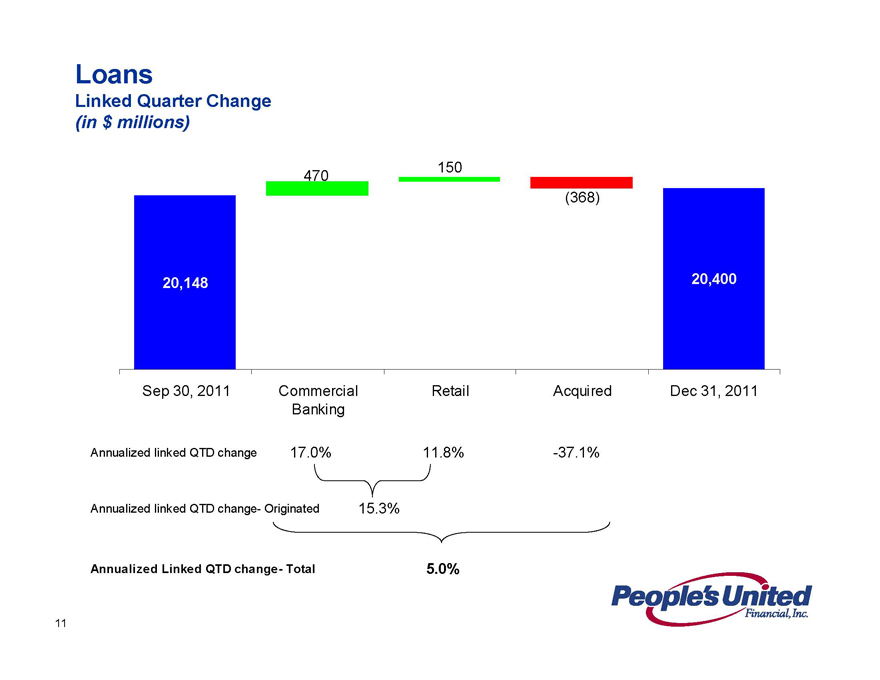
Loans
Linked Quarter Change
(in $ millions)
20,148
470
150
(368)
20,400
Sep 30, 2011 Commercial Retail Acquired Dec 31, 2011 Banking
Annualized linked QTD change 17.0% 11.8% -37.1%
Annualized linked QTD change- Originated 15.3%
Annualized Linked QTD change- Total 5.0%
11
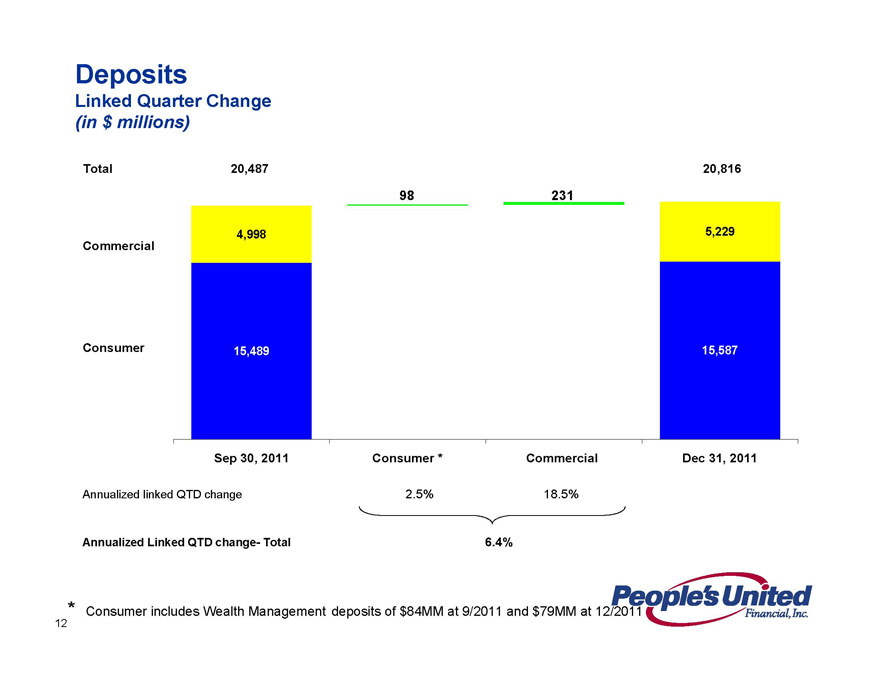
Deposits
Linked Quarter Change
(in $ millions)
Total Commercial Consumer
20,487 4,998 15,489
98
231
20,816 5,229 15,587
Sep 30, 2011 Consumer * Commercial Dec 31, 2011
Annualized linked QTD change 2.5% 18.5%
Annualized Linked QTD change- Total 6.4%
* Consumer includes Wealth Management deposits of $84MM at 9/2011 and $79MM at 12/2011
12
Growing Future Earnings Per Share
Loans and Deposits per Share
Loans
Loans ($Bn)
$21 $20 $19 $18 $17 $16 $15 $14
$58.84
$60 $55 $5
0 $45 $40
Loans per Share
2009Q4 2010Q2 2010Q4 2011Q2 2011 Q4
Gross Loans ($BN)
Loans per Share
Deposits
Deposits ($Bn)
$21 $20 $19 $18 $17 $16 $15
$14
$60.04
$60 $55 $50 $45 $40
Deposits per Share
2009Q4 2010Q2 2010Q4 2011Q2 2011Q4
Deposits ($BN)
Deposits per share
13
Non-Interest Income
(in $ millions)
84.7
(8.6)
(5.0)
(2.7)
(1.8)
4.4
0.9
(0.2)
71.7
3Q 2011
Security Gains
Dodd-Frank
Loan Penalties & Late Fees
Insurance
Acquired Loan Sales
Residential Loan Sales
Other
4Q 2011
14
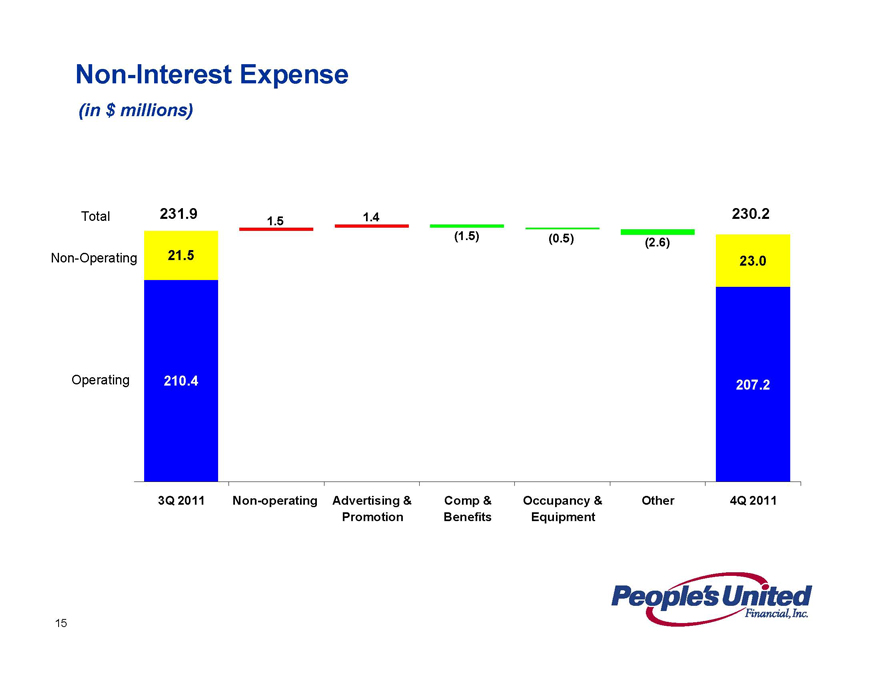
Non-Interest Expense
(in $ millions)
Total Non-Operating Operating
231.9 21.5 210.4
1.5 1.4 (1.5) (0.5) (2.6) 230.2 23.0 207.2
3Q 2011 Non-operating
Advertising & Promotion
Comp & Benefits
Occupancy & Equipment
Other 4Q 2011
15
Efficiency Ratio
Last Five Quarters
71.1%
66.2% 65.7%
63.1% 62.7%
4Q 2010 1Q 2011 2Q 2011 3Q 2011 4Q 2011
16
Asset Quality
NPAs / Loans & REO* (%)
Last Five Quarters
4.00
3.20
3.00
2.67
2.00
2.00
1.00
4Q 2010 1Q 2011 2Q 2011 3Q 2011 4Q 2011
PBCT Peer Group Median Top 50 Banks by Assets
* Non-performing assets (excluding acquired non-performing loans) as a percentage of originated loans plus all REO and repossessed assets; acquired non-performing loans excluded as risk of loss has been considered by virtue of our estimate of acquisition-date fair value and/or the existence of an FDIC loss sharing agreement
Source: SNL Financial and Company filings
17
Asset Quality
Net Charge-Offs / Avg. Loans (%)
Last Five Quarters
2.00
1.50
1.00 0.95
0.86
0.50
0.29
0.00
4Q 2010 1Q 2011 2Q 2011 3Q 2011 4Q 2011
PBCT Peer Group Median Top 50 Banks
Source: SNL Financial and Company filings
18
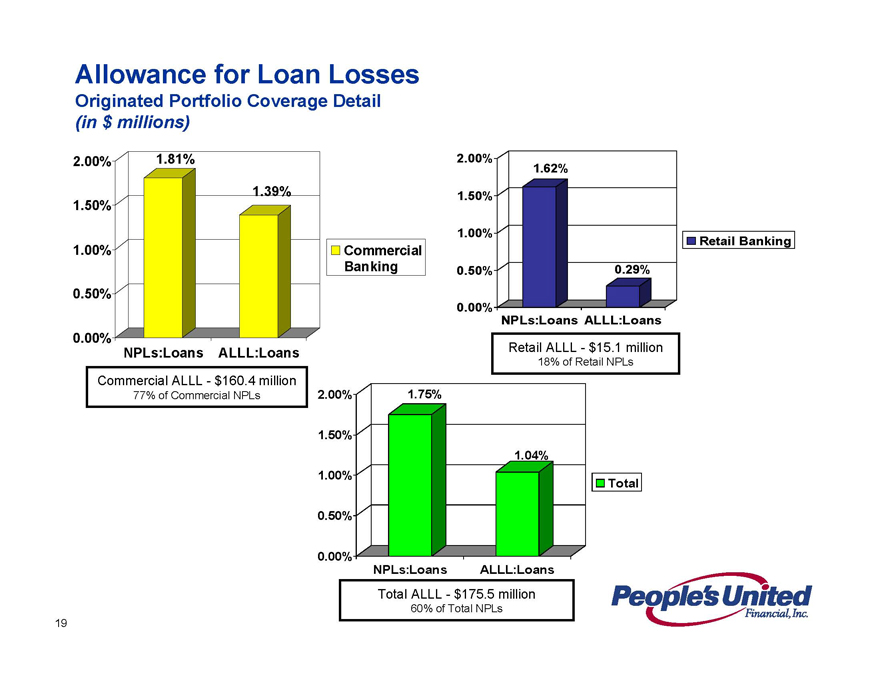
Allowance for Loan Losses
Originated Portfolio Coverage Detail
(in $ millions)
2.00% 1.81%
1.39%
1.50%
1.00%
0.50%
0.00%
NPLs: Loans ALLL:Loans
Commercial Banking
Commercial ALLL—$160.4 million 77% of Commercial NPLs
2.00%
1.62%
1.50% 1.00% Retail Banking 0.50% 0.29%
0.00%
NPLs:Loans ALLL: Loans
Retail ALLL—$15.1 million
18% of Retail NPLs
2.00% 1.75%
1.50%
1.04% 1.00% Total
0.50%
0.00%
NPLs: Loans ALLL: Loans
Total ALLL—$175.5 million
60% of Total NPLs
19
Operating ROAA Progress
Last Five Quarters
0.98%
0.92% 0.87% 0.86%
0.64%
4Q 2010 1Q 2011 2Q 2011 3Q 2011 4Q 2011
20
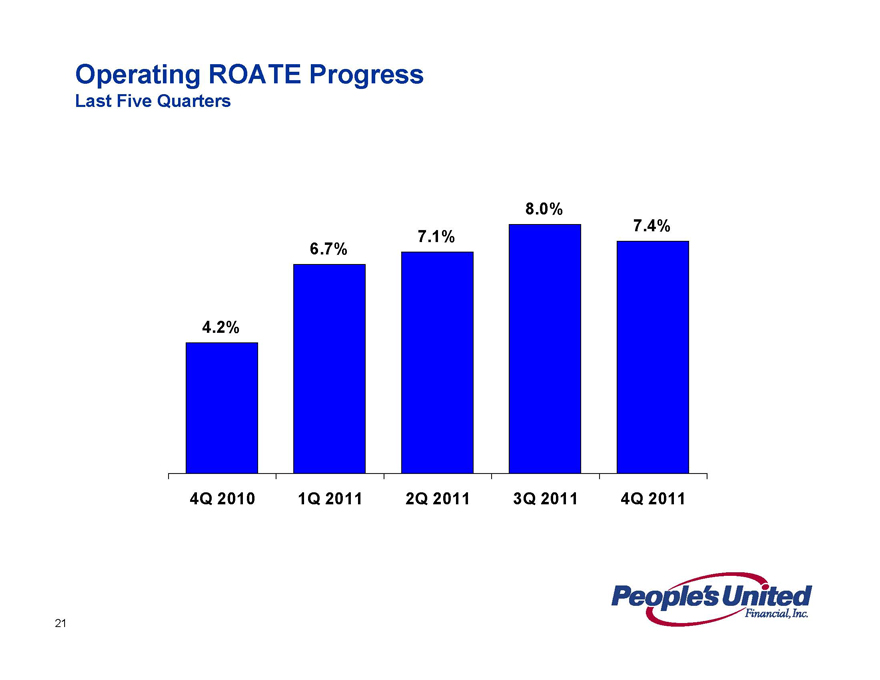
Operating ROATE Progress
Last Five Quarters
8.0% 7.1% 7.4%
6.7%
4.2%
4Q 2010 1Q 2011 2Q 2011 3Q 2011 4Q 2011
21
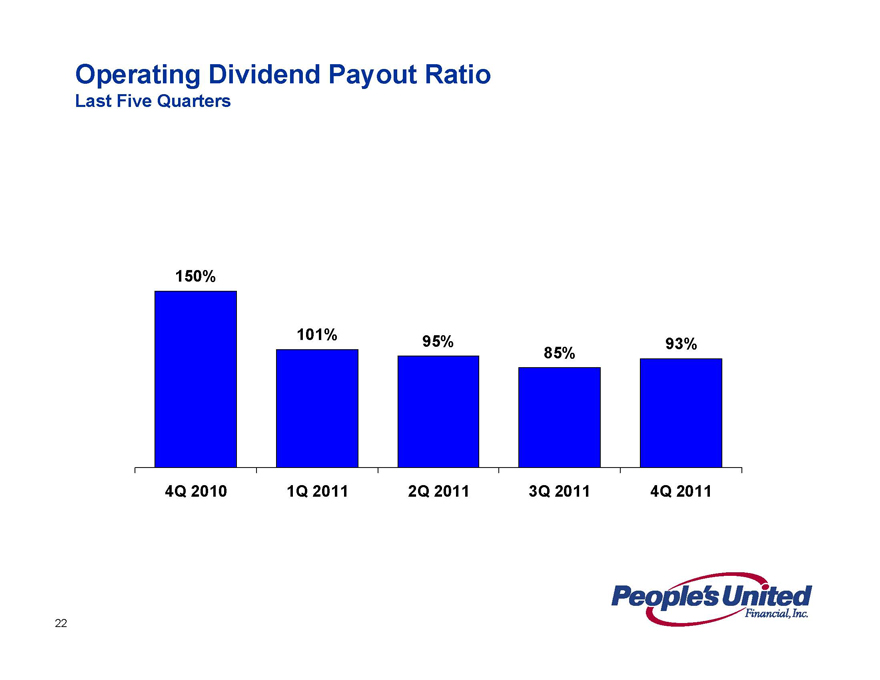
Operating Dividend Payout Ratio
Last Five Quarters
150%
101% 95% 93%
85%
4Q 2010 1Q 2011 2Q 2011 3Q 2011 4Q 2011
22
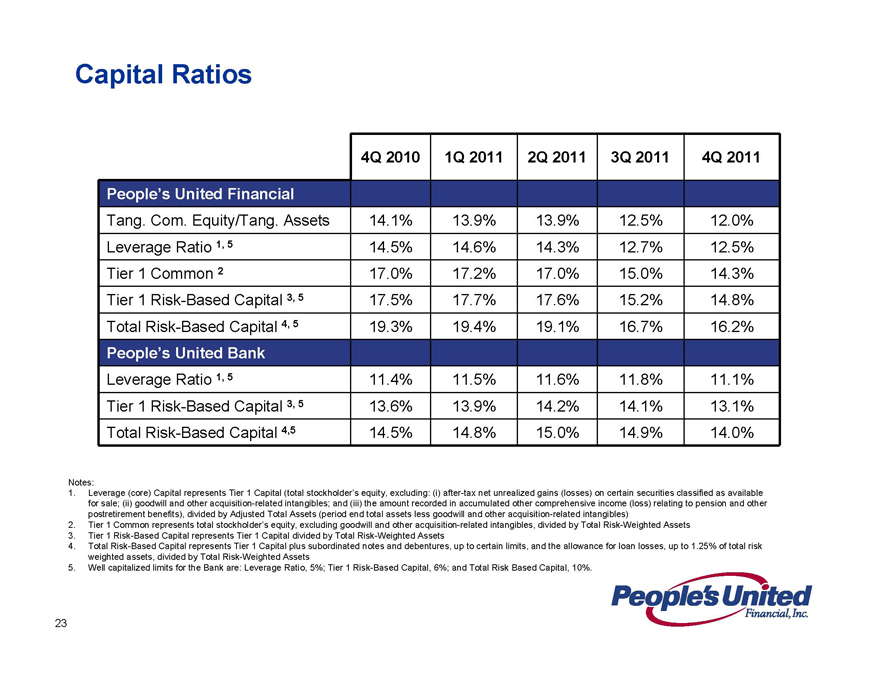
Capital Ratios
4Q 2010 1Q 2011 2Q 2011 3Q 2011 4Q 2011
People’s United Financial
Tang. Com. Equity/Tang. Assets 14.1% 13.9% 13.9% 12.5% 12.0%
Leverage Ratio 1, 5 14.5% 14.6% 14.3% 12.7% 12.5%
Tier 1 Common 2 17.0% 17.2% 17.0% 15.0% 14.3%
Tier 1 Risk-Based Capital 3, 5 17.5% 17.7% 17.6% 15.2% 14.8%
Total Risk-Based Capital 4, 5 19.3% 19.4% 19.1% 16.7% 16.2%
People’s United Bank
Leverage Ratio 1, 5 11.4% 11.5% 11.6% 11.8% 11.1%
Tier 1 Risk-Based Capital 3, 5 13.6% 13.9% 14.2% 14.1% 13.1%
Total Risk-Based Capital 4,5 14.5% 14.8% 15.0% 14.9% 14.0%
Notes:
1. Leverage (core) Capital represents Tier 1 Capital (total stockholder’s equity, excluding: (i) after-tax net unrealized gains (losses) on certain securities classified as available for sale; (ii) goodwill and other acquisition-related intangibles; and (iii) the amount recorded in accumulated other comprehensive income (loss) relating to pension and other postretirement benefits), divided by Adjusted Total Assets (period end total assets less goodwill and other acquisition-related intangibles)
2. Tier 1 Common represents total stockholder’s equity, excluding goodwill and other acquisition-related intangibles, divided by Total Risk-Weighted Assets
3. Tier 1 Risk-Based Capital represents Tier 1 Capital divided by Total Risk-Weighted Assets
4. Total Risk-Based Capital represents Tier 1 Capital plus subordinated notes and debentures, up to certain limits, and the allowance for loan losses, up to 1.25% of total risk weighted assets, divided by Total Risk-Weighted Assets
5. Well capitalized limits for the Bank are: Leverage Ratio, 5%; Tier 1 Risk-Based Capital, 6%; and Total Risk Based Capital, 10%.
23
Summary
Sustainable Competitive Advantage
Premium brand built over 170 years
High quality Northeast footprint characterized by wealth, density and commercial activity
Strengthened leadership team Low cost of deposits
Strong net interest margin
Superior asset quality
Focus on relationship-based banking
Growing loans and deposits within footprint—in two of the largest MSAs in the country (New York City, #1 and Boston, #10)
Moving to a 55% efficiency ratio
Returning capital to shareholders
Tangible Common Equity ratio of 12.0%, Tier 1 Common of 14.3%
24
Appendix
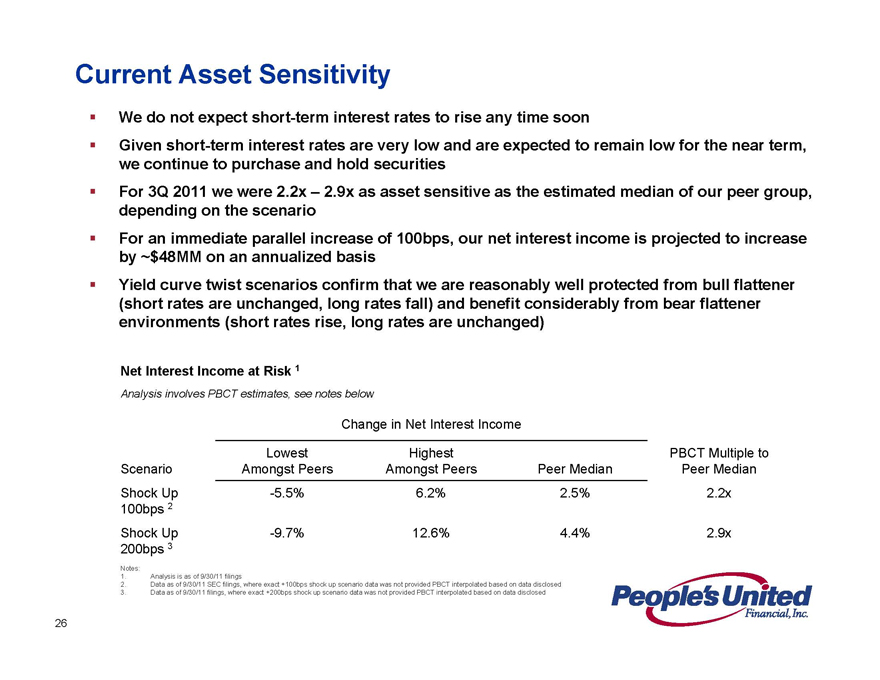
Current Asset Sensitivity
We do not expect short-term interest rates to rise any time soon
Given short-term interest rates are very low and are expected to remain low for the near term, we continue to purchase and hold securities For 3Q 2011 we were 2.2x – 2.9x as asset sensitive as the estimated median of our peer group, depending on the scenario For an immediate parallel increase of 100bps, our net interest income is projected to increase by ~$48MM on an annualized basis Yield curve twist scenarios confirm that we are reasonably well protected from bull flattener (short rates are unchanged, long rates fall) and benefit considerably from bear flattener environments (short rates rise, long rates are unchanged)
Net Interest Income at Risk 1
Analysis involves PBCT estimates, see notes below
Change in Net Interest Income
Lowest Highest PBCT Multiple to
Scenario Amongst Peers Amongst Peers Peer Median Peer Median
Shock Up -5.5% 6.2% 2.5% 2.2x
100bps 2
Shock Up -9.7% 12.6% 4.4% 2.9x
200bps 3
Notes:
1. Analysis is as of 9/30/11 filings
2. Data as of 9/30/11 SEC filings, where exact +100bps shock up scenario data was not provided PBCT interpolated based on data disclosed
3. Data as of 9/30/11 filings, where exact +200bps shock up scenario data was not provided PBCT interpolated based on data disclosed
26
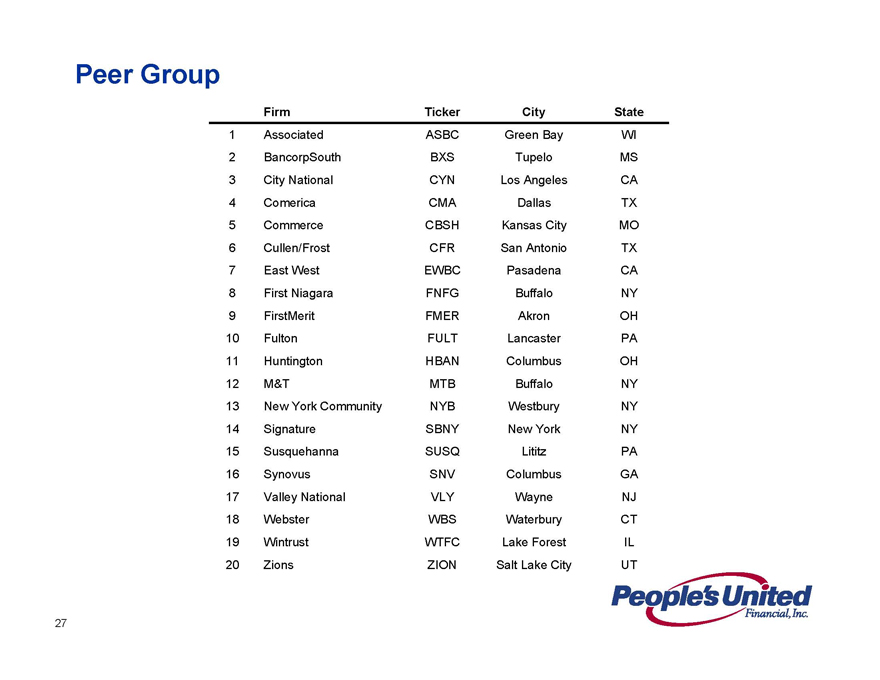
Peer Group
Firm Ticker City State
1 Associated ASBC Green Bay WI
2 BancorpSouth BXS Tupelo MS
3 City National CYN Los Angeles CA
4 Comerica CMA Dallas TX
5 Commerce CBSH Kansas City MO
6 Cullen/Frost CFR San Antonio TX
7 East West EWBC Pasadena CA
8 First Niagara FNFG Buffalo NY
9 FirstMerit FMER Akron OH
10 Fulton FULT Lancaster PA
11 Huntington HBAN Columbus OH
12 M&T MTB Buffalo NY
13 New York Community NYB Westbury NY
14 Signature SBNY New York NY
15 Susquehanna SUSQ Lititz PA
16 Synovus SNV Columbus GA
17 Valley National VLY Wayne NJ
18 Webster WBS Waterbury CT
19 Wintrust WTFC Lake Forest IL
20 Zions ZION Salt Lake City UT
27
For more information, investors may contact:
Peter Goulding, CFA
203-338-6799
peter.goulding@peoples.com