 Investor Presentation May 2013 Investor Contact: Peter Goulding, CFA 203-338-6799 peter.goulding@peoples.com Exhibit 99.1 ************************ ************************ ************************ ************************ ************************ ************************ ************************ ************************ ************************ ************************ ************************ ************************ ************************ ************************ ************************ ************************ ************************ ************************ ************************ ************************ ************************ ************************ ************************ ************************ ******************************** ******************************** ******************************** ******************************** ******************************** ******************************** ******************************** ******************************** |
 1 Certain statements contained in this release are forward-looking in nature. These include all statements about People's United Financial's plans, objectives, expectations and other statements that are not historical facts, and usually use words such as "expect," "anticipate," "believe," "should" and similar expressions. Such statements represent management's current beliefs, based upon information available at the time the statements are made, with regard to the matters addressed. All forward-looking statements are subject to risks and uncertainties that could cause People's United Financial's actual results or financial condition to differ materially from those expressed in or implied by such statements. Factors of particular importance to People’s United Financial include, but are not limited to: (1) changes in general, national or regional economic conditions; (2) changes in interest rates; (3) changes in loan default and charge-off rates; (4) changes in deposit levels; (5) changes in levels of income and expense in non- interest income and expense related activities; (6) residential mortgage and secondary market activity; (7) changes in accounting and regulatory guidance applicable to banks; (8) price levels and conditions in the public securities markets generally; (9) competition and its effect on pricing, spending, third-party relationships and revenues; (10) the successful integration of acquisitions; and (11) changes in regulation resulting from or relating to financial reform legislation. People's United Financial does not undertake any obligation to update or revise any forward-looking statements, whether as a result of new information, future events or otherwise. Forward-Looking Statement |
 2 Table of Contents 1. First Quarter 2013 Overview 2. Strategic Position 3. Retail Banking 4. Balance Sheet Management 5. Appendix |
 First Quarter 2013 Overview *************************************************************************************************** *************************************************************************************************** *************************************************************************************************** *************************************************************************************************** *************************************************************************************************** *************************************************************************************************** *************************************************************************************************** *************************************************************************************************** *************************************************************************************************** *************************************************************************************************** |
 4 First Quarter 2013 Results Overview / 1Q 2013 vs. 4Q 2012 Operating earnings of $57.9 million or $0.18 per share Operating net interest margin of 3.38%, down 25 bps Loan growth of $424 million, 8% annualized growth rate Deposit growth of $41 million, 1% annualized growth rate Non-interest income decreased $1.4 million to $82.9 million Operating non-interest expense decreased $0.5 million to $204.0 million Efficiency ratio was 64.1% compared to 63.1% last quarter Net charge-offs were 24 bps compared to 19 bps last quarter Continued optimization of capital Repurchased 11.1 million shares, or $144 million, at a weighted average price of $12.96 per share 22.3 million shares of common stock remain available for repurchase TCE/TA ratio decreased to 9.6% from 10.2% as we continued to efficiently deploy capital |
 Strategic Position **************************************************************************************************** **************************************************************************************************** **************************************************************************************************** **************************************************************************************************** **************************************************************************************************** **************************************************************************************************** **************************************************************************************************** **************************************************************************************************** **************************************************************************************************** **************************************************************************************************** **************************************************************************************************** |
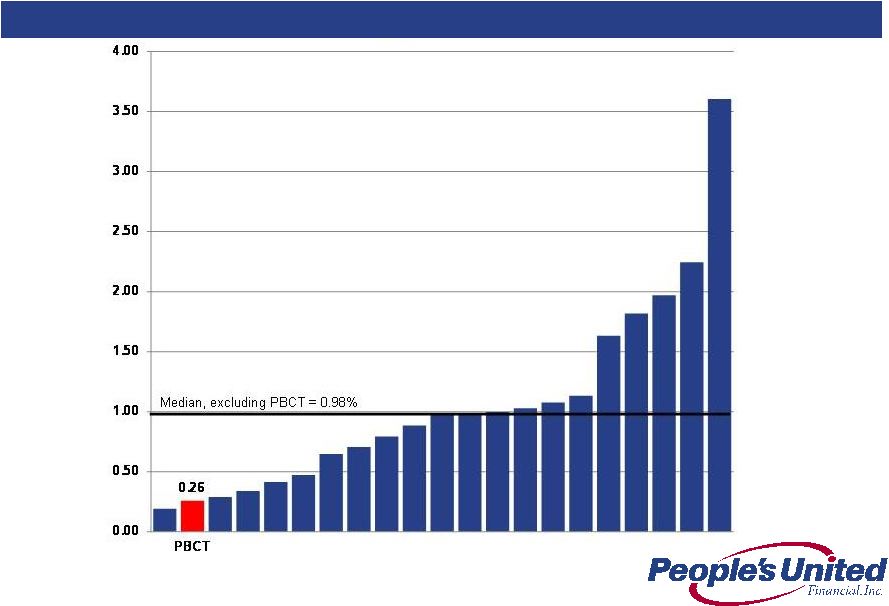 6 Average Annual Net Charge Offs / Average Loans (%) Peer Group Comparison, 2008-2012 Conservative underwriting is a hallmark of this institution Source: SNL Financial |
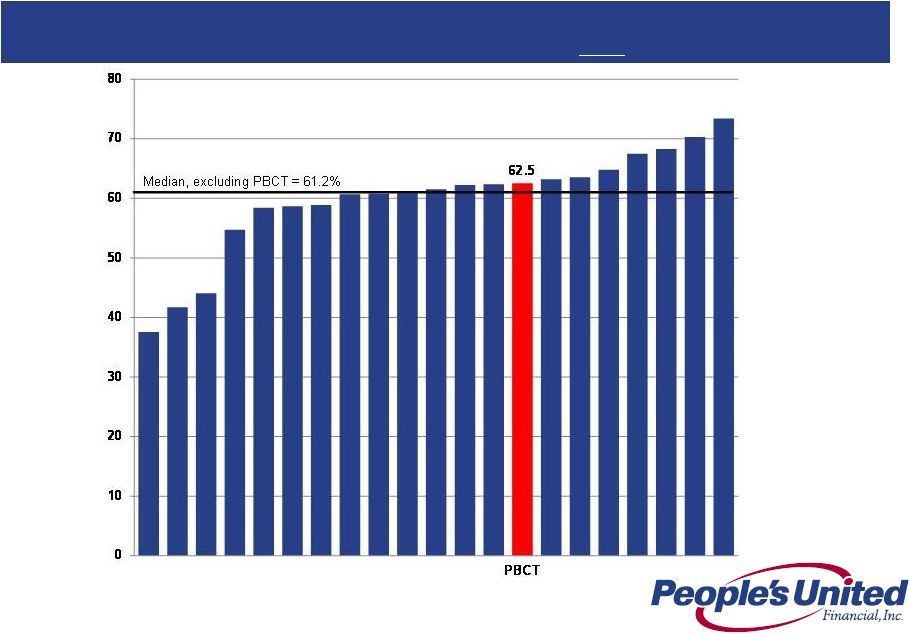 7 Efficiency Ratio Peer Group Comparison, Last Twelve Months Ending 1Q 2013 Low cost producers tend to yield the best returns to shareholders. Efficiency progress requires both revenue growth AND expense discipline Source: SNL Financial |
 |
 9 Large and Attractive Markets NYC-Northern NJ-LI Population: 19.0MM Median HH Income: $60,512 Businesses: 781,444 Population Density (#/sq miles): 2,847 Unemployment Rate (%): 8.1 $100K+ Households (%): 30.8 Boston, MA Population: 4.6MM Median HH Income: $67,700 Businesses: 203,770 Population Density (#/sq miles): 1,319 Unemployment Rate (%): 5.9 $100K+ Households (%): 33.8 Hartford, CT Population: 1.2MM Median HH Income: $63,997 Businesses: 52,315 Population Density (#/sq miles): 803 Unemployment Rate (%): 8.2 $100K+ Households (%): 30.4 Bridgeport-Stamford, CT Population: 922,000 Median HH Income: $80,342 Businesses: 49,392 Population Density (#/sq miles): 1,476 Unemployment Rate (%): 7.7 $100K+ Households (%): 41.5 New Haven, CT Population: 863,000 Median HH Income: $58,598 Businesses: 36,800 Population Density (#/sq miles): 1,427 Unemployment Rate (%): 8.5 $100K+ Households (%): 28.1 Burlington, VT Population: 215,000 Median HH Income: $55,875 Businesses: 10,846 Population Density (#/sq miles): 171 Unemployment Rate (%): 3.6 $100K+ Households (%): 21.9 Notes: The current national unemployment rate is 7.5% The current national population density is 89 (#/sq miles) The population densities of NYC, Boston, Bridgeport and New Haven MSAs are over ten times the national average |
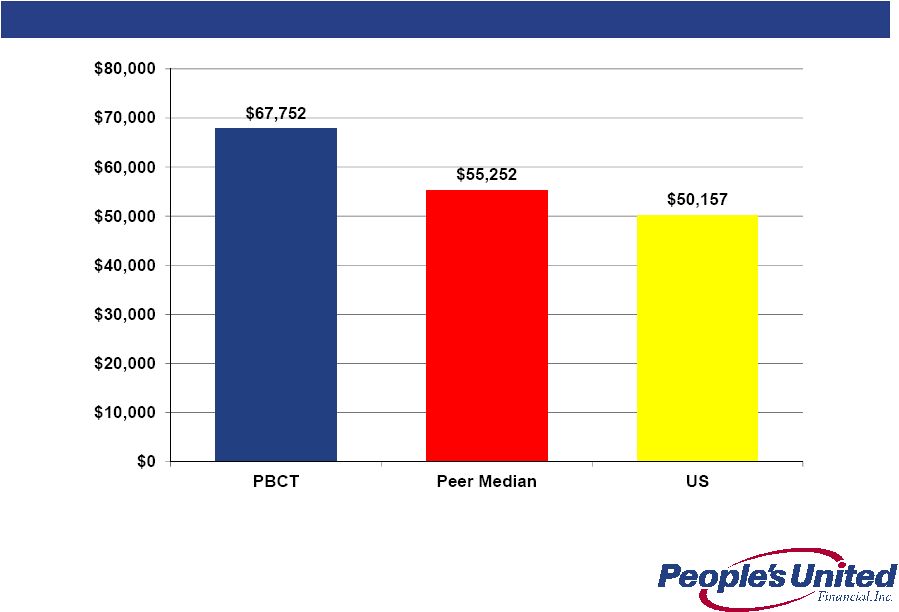 10 Strong Market Demographic Profile Source: SNL Financial, US Census data for 2012 Weighted Average Median Household Income |
 11 Revenue Opportunities Continue to deepen our presence in heritage markets such as Connecticut and Vermont Substantial growth prospects in larger markets such as New York metro and the Boston market Under-represented asset classes ramping up Asset-based lending: focused on in-footprint companies with sales of $15MM-$250MM; credit needs range from $5MM-$35MM; $600BN market, 70% of which is located in the Northeast Mortgage Warehouse lending: $1.2BN in commitments and $659MM in outstandings; estimated market size is over $28BN in outstandings New York Commercial Real Estate: hiring talent in the New York metro area, which is a $30BN annual market with a population of 19.0MM, 6.9MM housing units and 3.4MM rental units Private Banking: hired senior executive from mega-cap bank with ~20 years managing private banking in the Northeast with initial focus on CT, metro New York and metro Boston |
 12 Revenue Opportunities Enhancing wealth management offering Proprietary asset allocation and risk management strategies are implemented with a suite of external managers who represent our "best in class" recommendations • Proprietary asset allocation allows us to “rent” intellectual capital – no customer funds leave the bank Hired executive from PNC as Senior Vice President and Chief Investment Officer Increasing momentum in other fee income businesses with a focus on cross-sell Commercial insurance: revamped systems and combined all agencies into a single entity; focused on our deep commercial customer base as well as the education sector Hired executive from TD to lead cash management business Growing merchant and payroll services |
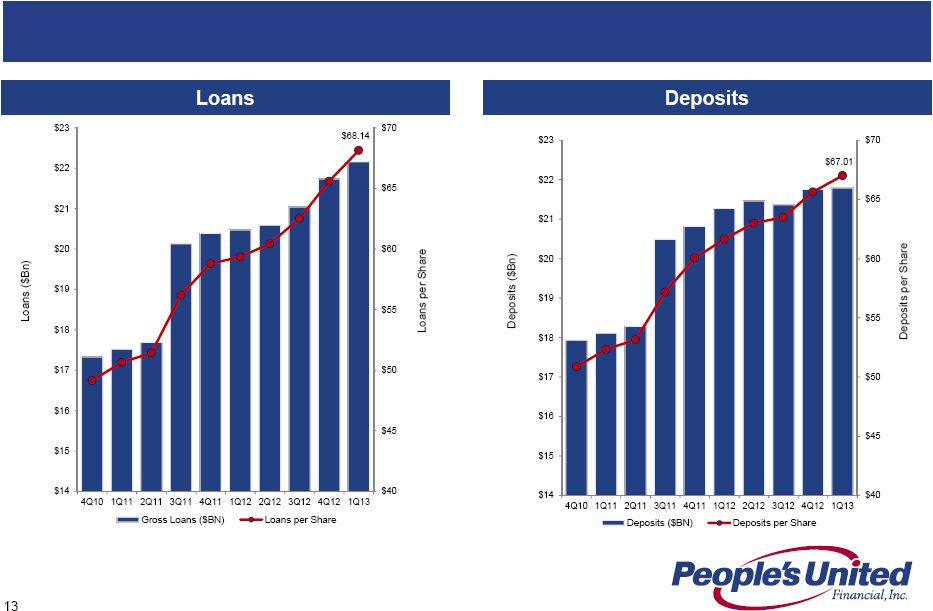 Growing Future Earnings Per Share Loans and Deposits per Share Over the past two years, loans per share and deposits per share have grown at compound annual rates of 16% and 13% |
 14 EMOC has been fully operational since November 2011 Three person committee comprised of the CFO, Chief Administrative Officer and Chief HR Officer EMOC oversees PBCT’s noninterest expense management, implements strategies to ensure attainment of expense management targets and oversees revenue initiatives that require expenditures Provides a horizontal view of the organization Expense Management Units (EMUs) established to facilitate EMOC functions Defined EMUs include: • Technology • Operations • Real Estate Services Spending requests above $25,000 are submitted by EMU owners for approval Staffing models, staffing replacements and additions for mid-level positions and above require approval by the Committee Introduction to EMOC Expense Management Oversight Committee (EMOC) • Employment/Benefits • Marketing • Regulatory/Institutional • Depreciation/Equipment • Decentralized • Intangible Amortization |
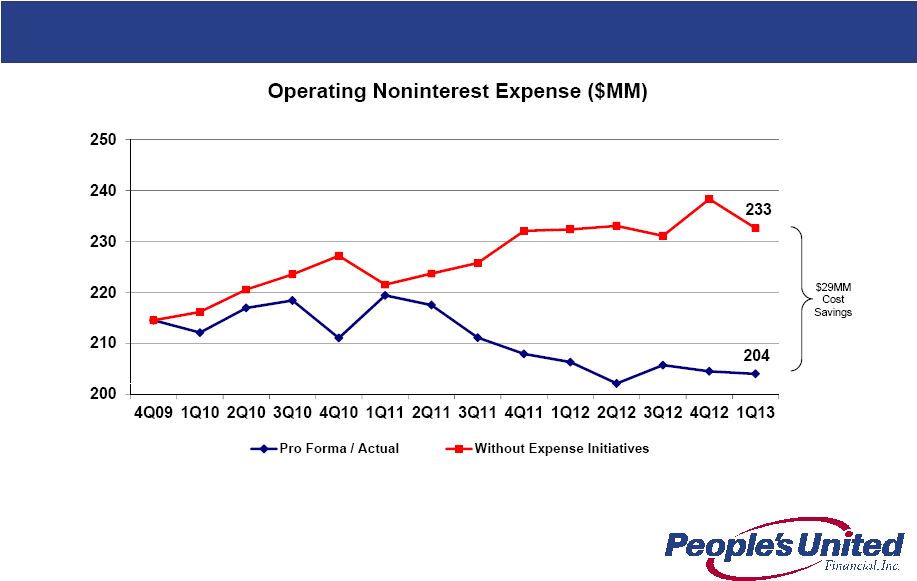 15 Expense Progress Estimated Cost Savings Analysis Our Q1 2013 operating expense base of $204MM reflects $29MM (~$114MM annualized) savings from successfully-executed expense initiatives Source: SNL Financial Note: “Pro Forma / Actual” represents PBCT operating noninterest expense and the actual expenses at the acquired institutions. Acquisition target costs fall away as the acquisitions are completed. “Without Expense Initiatives” represents PBCT operating noninterest expense and the actual expenses at the acquired institutions in 4Q09, and then applies the peer median expense growth rate in each subsequent quarter. |
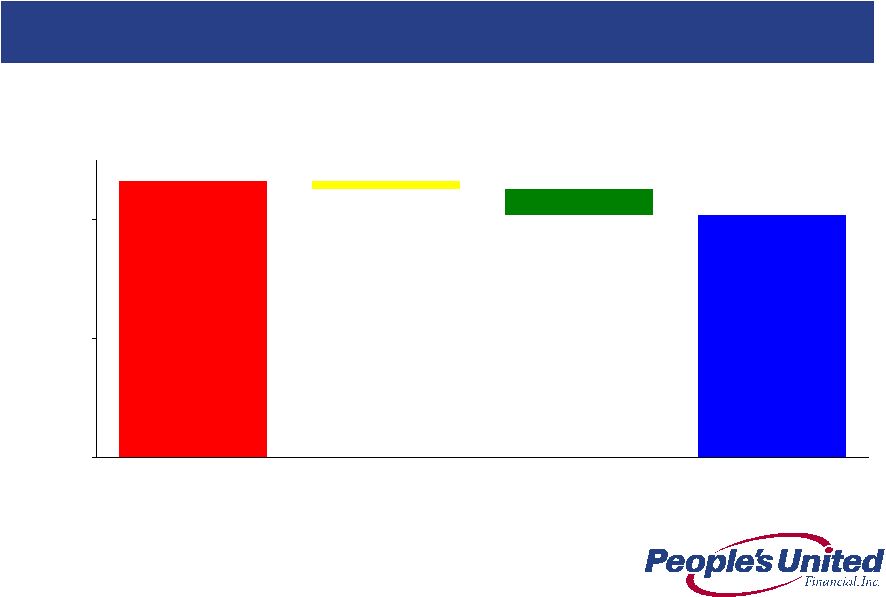 16 233 204 7 22 $0 $50 $100 $150 $200 $250 Without Expense Initiatives Announced Acquisition Savings Other Initiatives Pro Forma / Actual Operating Noninterest Expense ($MM) Expense Progress Estimated Cost Savings Analysis The $29MM in quarterly cost reductions is attributable to efforts related to acquisition cost savings and other initiatives Source: SNL Financial Note: “Pro Forma / Actual” represents PBCT operating noninterest expense and the actual expenses at the acquired institutions. Acquisition target costs fall away as the acquisitions are completed “Without Expense Initiatives” represents PBCT operating noninterest expense and the actual expenses at the acquired institutions in 4Q09, and then applies the peer median expense growth rate in each subsequent quarter |
 Retail Banking *************************************************************************************************** *************************************************************************************************** *************************************************************************************************** *************************************************************************************************** *************************************************************************************************** *************************************************************************************************** *************************************************************************************************** *************************************************************************************************** *************************************************************************************************** *************************************************************************************************** *************************************************************************************************** |
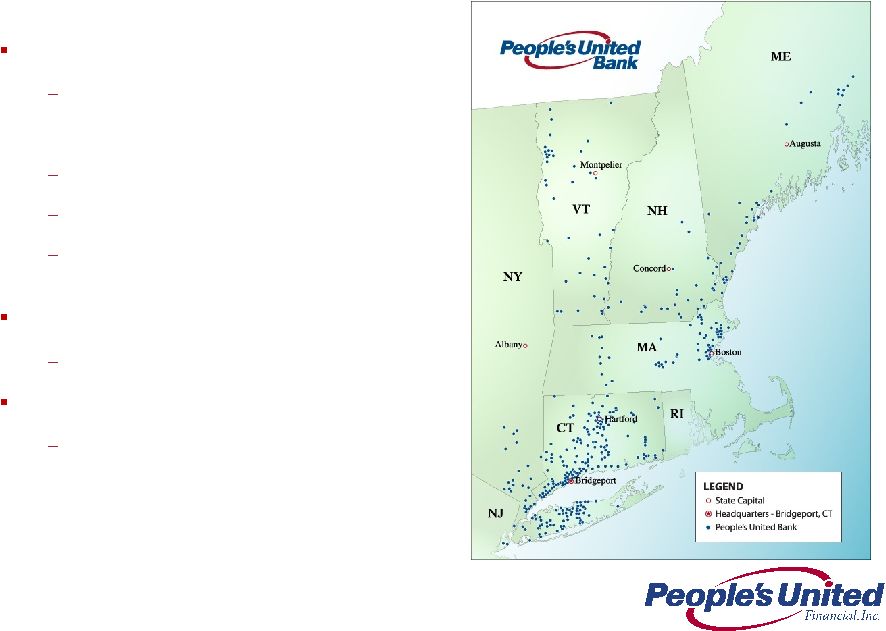 18 Retail & Business Banking Franchise Distribution 400+ branches over 6 states • ~33% of branches are in-store 600+ ATMs Online & mobile banking Call center operations located in Bridgeport, CT and Burlington, VT Scale 5 in deposit market share in New England Customer base Approximately 800,000 commercial, business banking and consumer relationships th |
 19 Strategic Focus of Deposit Franchise Growth Core customers and deposits Multiple product households Leverage employee expertise to drive sales Brand execution Employee expertise Superior customer experience In-store supermarket strategy Leveraging the Citizen’s branch acquisition Navigating a low rate environment Balancing growth, retention and cost of funds Constant evaluation of branch-level profitability • Consolidated 18 branches in 2011 and 2012, or ~5% of our franchise, which is in-line with peers • Selective de novo branches in key markets: Prudential Center in Boston, MA; Lexington, MA; Wellesley, MA; and Park Ave in Manhattan |
 20 Deepening Market Presence Connecticut Massachusetts Vermont New York New Hampshire Maine Leading market position in the best commercial banking market in the US #1 in Fairfield County, CT, 65 branches, $6.1BN, 18.2% market share Source: SNL Financial Branches $BN % 1 B of A 155 24.5 24.0 2 Webster 124 12.1 11.8 3 People's United 165 10.9 10.7 4 Wells Fargo 76 7.3 7.2 5 TD Bank 81 5.9 5.8 6 First Niagara 86 4.6 4.5 7 JPM Chase 52 4.5 4.4 8 Citi 20 3.0 2.9 9 Liberty 48 2.9 2.8 10 RBS 50 2.6 2.5 Branches $BN % 1 B of A 262 54.6 25.0 2 RBS 254 30.9 14.1 3 Santander 229 18.9 8.6 4 TD Bank 157 10.8 5.0 5 Eastern Bank 99 6.8 3.1 6 Independent Bank 78 4.5 2.0 7 Middlesex 30 3.5 1.6 8 People's United 56 3.2 1.5 9 Boston Private 11 2.9 1.3 10 Century 28 2.4 1.1 Branches $BN % 1 People's United 42 2.6 22.4 2 TD Bank 34 2.6 22.0 3 Merchants 33 1.2 10.6 4 RBS 21 0.9 7.3 5 KeyCorp 13 0.8 6.7 6 Northfield 13 0.5 4.3 7 Community 14 0.4 3.7 8 Union 13 0.4 3.4 9 Passumpsic 7 0.3 2.9 10 Berkshire Hills 7 0.3 2.8 Branches $BN % 1 JPM Chase 804 393.1 38.3 2 Citi 268 69.6 6.8 3 B of A 365 60.6 5.9 4 HSBC 164 57.3 5.6 5 Capital One 277 39.0 3.8 6 M&T 299 33.3 3.3 7 TD Bank 222 22.4 2.2 8 KeyCorp 269 18.3 1.8 9 Wells Fargo 87 18.0 1.8 10 First Niagara 212 16.1 1.6 35 People's United 97 2.5 0.2 Branches $BN % 1 RBS 80 6.8 24.3 2 TD Bank 72 5.4 19.3 3 B of A 29 4.9 17.5 4 People's United 29 1.4 4.9 5 Merrimack 18 1.0 3.6 6 BNH 23 0.9 3.2 7 Santander 20 0.8 2.9 8 NH Thrift 20 0.8 2.8 9 Northway 17 0.7 2.4 10 Centrix 6 0.7 2.3 Branches $BN % 1 TD Bank 55 3.7 16.4 2 KeyCorp 60 2.7 11.7 3 Bangor Bancorp 58 2.0 8.9 4 Camden National 50 1.8 8.1 5 B of A 19 1.4 6.0 6 First Bancorp 15 1.0 4.6 7 Machias 14 0.8 3.6 8 People's United 28 0.8 3.5 9 Bar Harbor 16 0.8 3.4 10 Norway 21 0.7 3.2 |
 21 Total Deposits ($MM) 6,053 2,926 2,479 2,063 1,970 1,241 Market Total Deposits ($MM) 33,334 117,089 556,863 25,508 17,111 4,499 Branch Count 65 51 91 45 34 12 18.2 2.5 0.5 8.1 11.5 27.6 0.0 5.0 10.0 15.0 20.0 25.0 30.0 Bridgeport- Stamford, CT Boston, MA NYC-Northern NJ-LI Hartford, CT New Haven, CT Burlington, VT Deposit Market Share by MSA (%) * We hold significant market share in several key northeast MSAs and are building our presence in areas with substantial growth potential, such as the Boston and New York City MSAs Source: SNL Financial * Excludes deposits from trust institutions and branches with over $750MM deposits ** Excludes six of the acquired Citizens branches located outside the NYC MSA ** ** Large New Markets |
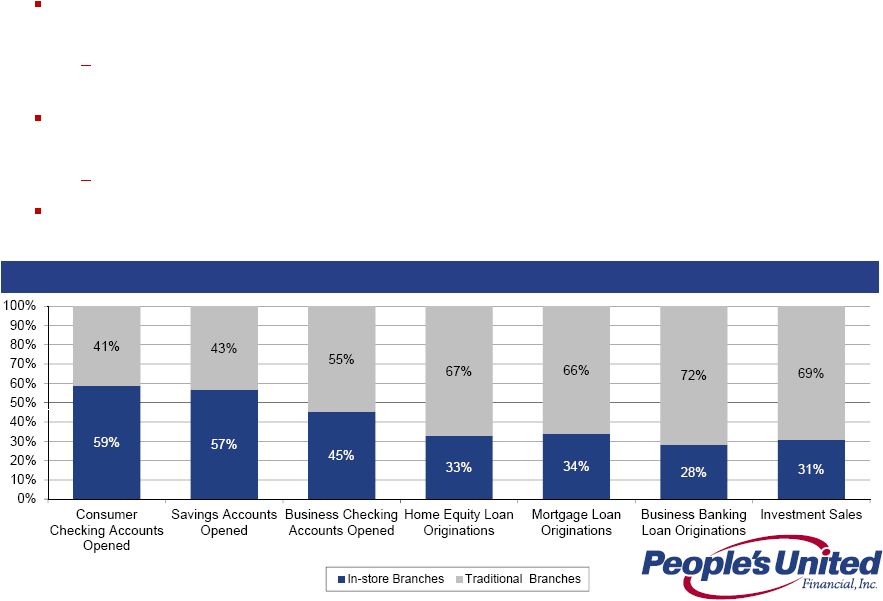 22 Connecticut In-store Versus Traditional Branch Business (Last Twelve Months Through 3/31/13) In-store Versus Traditional Branches Connecticut On average, in-store locations are open 37% more hours per week than traditional branches (56 hours vs. 41 hours) but are 30% less expensive to operate Partnership allows us to leverage our brand with the ~1.8 million shoppers who visit Connecticut Stop & Shop stores every week In-store locations operate under the same business model as traditional branches and sell all the Bank’s products and services Mortgages, Home Equity Loans, Business Loans and Investments Connecticut in-store branches accounted for a significant portion of the new branch business booked in the market |
 23 Business Banking Overview Business Banking target customer has credit needs up to $1.5 million and/or annual sales up to $5 million Over 60 Business Banking professionals currently serving customers across the 6- state footprint Comprehensive credit, deposit, insurance, investment and specialized services available (includes payroll, merchant, cash management, retirement) Credit products include business lines of credit and term loans plus commercial real estate-secured mortgage loans, typically secured and personally guaranteed Leverage the combination of local, executive-level line leadership (i.e., Market Presidents), strong lending & relationship management capability, and market- leading retail banking focus to solidify our reputation with small business customers |
 Balance Sheet Management **************************************************************************************************** **************************************************************************************************** **************************************************************************************************** **************************************************************************************************** **************************************************************************************************** **************************************************************************************************** **************************************************************************************************** **************************************************************************************************** **************************************************************************************************** **************************************************************************************************** **************************************************************************************************** |
 25 Securities Portfolio Summary The duration of the securities portfolio as of 3/31/13 is approximately 3.7 years, up slightly from prior quarters in conjunction with the addition of municipal bonds to the portfolio In 3Q 2011, we took action to reduce the premium on our books and protect against prepayment exposure 82% of the securities portfolio is in MBS and CMOs with a book price of $100.71 An additional 12% of the securities portfolio is invested in municipal bonds with a book price of $111.90. While the book price is well above par, these bonds do not have pre-payment risk and represent attractive value with a book yield of 3.78% on a tax-equivalent basis |
 26 Strong Sources of Liquidity PBCT maintains high levels of liquidity and is over 90% funded by deposits, retail repurchase agreements, senior debt and common equity Strong branch franchise and commercial customer base predominantly funds loan base without use of brokered borrowings Citizens transaction provides a significant long-term opportunity to grow deposits and customer relationships in southern New York, specifically on Long Island and in Westchester County Additional liquidity of $2.5BN exists in the form of unpledged U.S. Agency MBS & CMO’s Federal Home Loan Bank (FHLB) relationship enables up to $2.4BN of additional borrowings |
 27 For 4Q 2012 we were more than twice as asset sensitive as the estimated median of our peer group Currently for an immediate parallel increase of 100bps, our net interest income is projected to increase by ~$49MM on an annualized basis Yield curve twist scenarios confirm that we are reasonably well protected from bull flattener (short rates are unchanged, long rates fall) and benefit considerably from bear flattener environments (short rates rise, long rates are unchanged) Notes: 1. Analysis is as of 12/31/12 filings 2. Data as of 12/31/12 SEC filings; where exact +100bps shock up scenario data was not provided, PBCT interpolated based on data disclosed 3. Data as of 12/31/12 SEC filings; where exact +200bps shock up scenario data was not provided, PBCT interpolated based on data disclosed Current Asset Sensitivity Net Interest Income at Risk ¹ Analysis involves PBCT estimates, see notes below Change in Net Interest Income Scenario Lowest Amongst Peers Highest Amongst Peers Peer Median PBCT Multiple to Peer Median Shock Up 100bps ² -2.9% 5.5% 2.0% 2.6x Shock Up 200bps ³ -4.8% 11.0% 4.5% 2.6x |
 28 Share Repurchase Activity The prolonged period of near zero short-term interest rates and above average capital levels presents us with the opportunity to repurchase shares at a discount to earnings power in a normalized rate environment Share repurchases also help normalize both dividend payout ratio and ROATE Repurchased 11.1 million shares, or $144 million, at a weighted average price of $12.96 per share in 1Q 2013 Increased share repurchase activity from 4.7 million shares in 4Q 2012 Expect to complete latest share repurchase authorization (10% of shares outstanding) within 2013 Over the last five years PBCT has repurchased over $800 million of shares Share repurchases at the current stock price have a tangible book value dilution earnback period of ~5 years and no execution risk Year to date through May 6, 2013, 14.3 million shares, or $186 million, have been repurchased |
 Appendix **************************************************************************************************** **************************************************************************************************** **************************************************************************************************** **************************************************************************************************** **************************************************************************************************** **************************************************************************************************** **************************************************************************************************** **************************************************************************************************** **************************************************************************************************** **************************************************************************************************** |
 30 Allowance for Loan Losses Originated Portfolio Coverage Detail (in $ millions) 1.13% 1.11% 0.00% 0.50% 1.00% 1.50% 2.00% NPLs:Loans ALLL:Loans Commercial Banking 1.57% 0.32% 0.00% 0.50% 1.00% 1.50% 2.00% NPLs:Loans ALLL:Loans Retail Banking Commercial ALLL - $159.5 million 98% of Commercial NPLs Retail ALLL - $18.0 million 20% of Retail NPLs Total ALLL - $177.5 million 71% of Total NPLs 1.25% 0.88% 0.00% 0.50% 1.00% 1.50% 2.00% NPLs:Loans ALLL:Loans Total |
 Capital Ratios Since 1Q 2010 1Q 2010 1Q 2011 1Q 2012 2Q 2012 3Q 2012 4Q 2012 1Q 2013 People’s United Financial Tang. Com. Equity/Tang. Assets 18.7% 13.9% 11.7% 11.4% 11.2% 10.2% 9.6% Leverage Ratio 1, 5 19.2% 14.5% 12.1% 11.8% 11.5% 10.6% 10.0% Tier 1 Common ² 23.1% 17.1% 13.9% 13.6% 13.6% 12.7% 12.0% Tier 1 Risk-Based Capital 3, 5 23.9% 17.9% 14.4% 14.1% 14.1% 13.2% 12.5% Total Risk-Based Capital 4, 5 25.6% 19.4% 16.0% 15.6% 15.6% 14.7% 13.7% People’s United Bank Leverage Ratio 1, 5 12.3% 11.4% 11.0% 10.9% 10.8% 9.8% 9.7% Tier 1 Risk-Based Capital 3, 5 15.4% 13.9% 13.1% 13.0% 13.2% 12.2% 12.1% Total Risk-Based Capital 4,5 16.3% 14.8% 14.0% 14.0% 14.1% 13.1% 13.5% |
 32 Name Position Years in Banking Professional Experience Jack Barnes President & CEO, Director 30+ People’s United Bank (SEVP, CAO), Chittenden, FDIC Kirk Walters SEVP & CFO, Director 25+ People’s United Bank, Santander, Sovereign, Chittenden, Northeast Financial Jeff Tengel SEVP Commercial Banking 30+ People’s United Bank, PNC, National City Bob D’Amore SEVP Retail & Business Banking 30+ People’s United Bank Louise Sandberg SEVP Wealth Management 30+ People’s United Bank, Chittenden Lee Powlus SEVP & Chief Administrative Officer 25+ People’s United Bank, Chittenden, Alltel Chantal Simon SEVP & Chief Risk Officer 20+ People’s United Bank, Merrill Lynch US Bank, Lazard Freres & Co. Dave Norton SEVP & Chief HR Officer 2+ People’s United Bank, New York Times, Starwood, PepsiCo Bob Trautmann SEVP & General Counsel 20+ People’s United Bank, Tyler Cooper & Alcorn Management Committee |
 33 Peer Group Firm Ticker City State 1 Associated ASBC Green Bay WI 2 BancorpSouth BXS Tupelo MS 3 City National CYN Los Angeles CA 4 Comerica CMA Dallas TX 5 Commerce CBSH Kansas City MO 6 Cullen/Frost CFR San Antonio TX 7 East West EWBC Pasadena CA 8 First Niagara FNFG Buffalo NY 9 FirstMerit FMER Akron OH 10 Fulton FULT Lancaster PA 11 Huntington HBAN Columbus OH 12 M&T MTB Buffalo NY 13 New York Community NYCB Westbury NY 14 Signature SBNY New York NY 15 Susquehanna SUSQ Lititz PA 16 Synovus SNV Columbus GA 17 Valley National VLY Wayne NJ 18 Webster WBS Waterbury CT 19 Wintrust WTFC Lake Forest IL 20 Zions ZION Salt Lake City UT |
 34 In addition to evaluating People’s United Financial’s results of operations in accordance with U.S. generally accepted accounting principles (“GAAP”), management routinely supplements this evaluation with an analysis of certain non-GAAP financial measures, such as the efficiency and tangible equity ratios, tangible book value per share and operating earnings metrics. Management believes these non-GAAP financial measures provide information useful to investors in understanding People’s United Financial’s underlying operating performance and trends, and facilitates comparisons with the performance of other banks and thrifts. Further, the efficiency ratio and operating earnings metrics are used by management in its assessment of financial performance, including non-interest expense control, while the tangible equity ratio and tangible book value per share are used to analyze the relative strength of People’s United Financial’s capital position. The efficiency ratio, which represents an approximate measure of the cost required by People’s United Financial to generate a dollar of revenue, is the ratio of (i) total non-interest expense (excluding goodwill impairment charges, amortization of other acquisition-related intangible assets, losses on real estate assets and non-recurring expenses) (the numerator) to (ii) net interest income on a fully taxable equivalent ("FTE") basis plus total non-interest income (including the FTE adjustment on bank-owned life insurance ("BOLI") income, and excluding gains and losses on sales of assets other than residential mortgage loans, and non- recurring income) (the denominator). People’s United Financial generally considers an item of income or expense to be non-recurring if it is not similar to an item of income or expense of a type incurred within the last two years and is not similar to an item of income or expense of a type reasonably expected to be incurred within the following two years. Non-GAAP Financial Measures and Reconciliation to GAAP |
 35 Operating earnings exclude from net income those items that management considers to be of such a non- recurring or infrequent nature that, by excluding such items (net of income taxes), People’s United Financial’s results can be measured and assessed on a more consistent basis from period to period. Items excluded from operating earnings, which include, but are not limited to, merger-related expenses, charges related to executive-level management separation costs, severance-related costs and writedowns of banking house assets, are generally also excluded when calculating the efficiency ratio. Operating earnings per share is derived by determining the per share impact of the respective adjustments to arrive at operating earnings and adding (subtracting) such amounts to (from) GAAP earnings per share. Operating return on average assets is calculated by dividing operating earnings (annualized) by average assets. Operating return on average tangible stockholders' equity is calculated by dividing operating earnings (annualized) by average tangible stockholders' equity. The operating dividend payout ratio is calculated by dividing dividends paid by operating earnings for the respective period. Operating net interest margin excludes from the net interest margin those items that management considers to be of such a discrete nature that, by excluding such items, People’s United Financial’s net interest margin can be measured and assessed on a more consistent basis from period to period. Items excluded from operating net interest margin include cost recovery income on acquired loans and changes in the accretable yield on acquired loans stemming from periodic cash flow reassessments. Operating net interest margin is calculated by dividing operating net interest income (annualized) by average earning assets. Non-GAAP Financial Measures and Reconciliation to GAAP |
 36 The tangible equity ratio is the ratio of (i) tangible stockholders’ equity (total stockholders’ equity less goodwill and other acquisition-related intangible assets) (the numerator) to (ii) tangible assets (total assets less goodwill and other acquisition-related intangible assets) (the denominator). Tangible book value per share is calculated by dividing tangible stockholders’ equity by common shares (total common shares issued, less common shares classified as treasury shares and unallocated Employee Stock Ownership Plan ("ESOP") common shares). In light of diversity in presentation among financial institutions, the methodologies used by People’s United Financial for determining the non-GAAP financial measures discussed above may differ from those used by other financial institutions. Please refer to People’s United Financial’s latest Form 10-Q regulatory filing for detailed reconciliations to GAAP figures. Non-GAAP Financial Measures and Reconciliation to GAAP |
 For more information, investors may contact: Peter Goulding, CFA 203-338-6799 peter.goulding@peoples.com * * * * * * * * * * * * * |