 Investor Presentation July/August 2013 Investor Contact: Peter Goulding, CFA 203-338-6799 peter.goulding@peoples.com Exhibit 99.1 |
 Certain statements contained in this release are forward-looking in nature. These include all statements about People's United Financial's plans, objectives, expectations and other statements that are not historical facts, and usually use words such as "expect," "anticipate," "believe," "should" and similar expressions. Such statements represent management's current beliefs, based upon information available at the time the statements are made, with regard to the matters addressed. All forward-looking statements are subject to risks and uncertainties that could cause People's United Financial's actual results or financial condition to differ materially from those expressed in or implied by such statements. Factors of particular importance to People’s United Financial include, but are not limited to: (1) changes in general, national or regional economic conditions; (2) changes in interest rates; (3) changes in loan default and charge-off rates; (4) changes in deposit levels; (5) changes in levels of income and expense in non- interest income and expense related activities; (6) residential mortgage and secondary market activity; (7) changes in accounting and regulatory guidance applicable to banks; (8) price levels and conditions in the public securities markets generally; (9) competition and its effect on pricing, spending, third-party relationships and revenues; (10) the successful integration of acquisitions; and (11) changes in regulation resulting from or relating to financial reform legislation. People's United Financial does not undertake any obligation to update or revise any forward-looking statements, whether as a result of new information, future events or otherwise. Forward-Looking Statement 1 |
 Table of Contents 1. Strategic Position 2. Income Statement Improvements 3. Interest Rate Risk Profile 4. Summary 5. Appendix 2 |
 Strategic Position |
 Corporate Overview Snapshot as of June 30, 2013 People’s United Financial, Inc. NASDAQ (PBCT) Headquarters: Bridgeport, CT Chief Executive Officer: Jack Barnes Chief Financial Officer: Kirk Walters Market Capitalization (7/25/13): $4.9 billion Assets: $31.3 billion Loans: $22.9 billion Deposits: $22.0 billion Branches: 418 ATMs: 638 Standalone ATMs:* 109 Founded: 1842 * Includes 25 ATMs in Stop & Shop locations where a branch is not present 4 |
 Compelling Investment Opportunity Leading market position in the best commercial banking market in the US Significant growth runway within existing markets – expanding in two of the largest MSAs in the US (New York City, #1, Boston, #10) Dividend yield in excess of 4% Ability to maintain pristine credit quality – no credit “events” Improving profitability High levels of liquidity Capital deployment (organic growth, dividends, share repurchases, M&A) – TCE/TA 8.7% vs. ~8.0% for peers 5 |
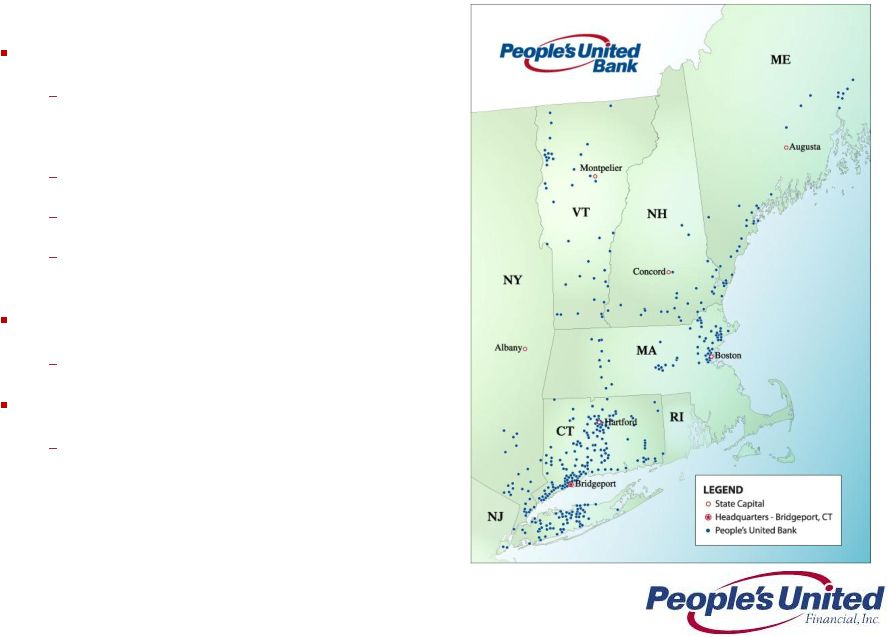 Retail & Business Banking Franchise Distribution 400+ branches over 6 states • ~33% of branches are in-store 600+ ATMs Online & mobile banking Call center operations located in Bridgeport, CT and Burlington, VT Scale 5 in deposit market share in New England * Customer base Approximately 800,000 commercial, business banking and consumer relationships * Source: SNL Financial 6 th |
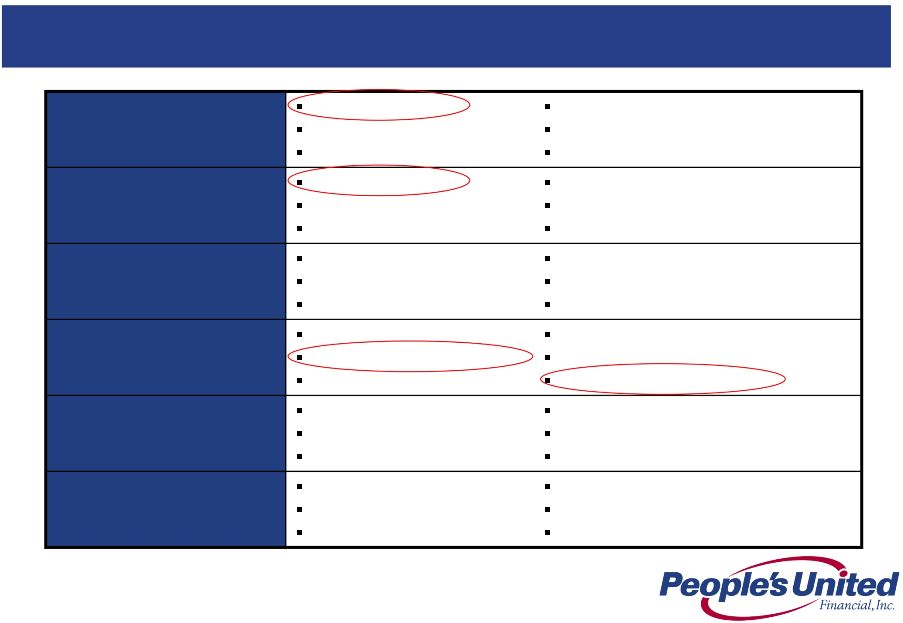
 Strategic Focus of Deposit Franchise Growth Core customers and deposits Multiple product households Leverage employee expertise to drive sales Brand execution Employee expertise Superior customer experience In-store supermarket strategy Leveraging the Citizen’s branch acquisition Navigating a low rate environment Balancing growth, retention and cost of funds Constant evaluation of branch-level profitability • Consolidated 18 branches in 2011 and 2012, or ~5% of our franchise, which is in-line with peers • Selective de novo branches in key markets: Prudential Center in Boston, MA; Lexington, MA; Wellesley, MA; and Park Ave in Manhattan 7 |
 8 Deepening Market Presence Connecticut Massachusetts Vermont New York New Hampshire Maine Source: SNL Financial Branches $BN % 1 B of A 151 24.4 24.0 2 Webster 123 12.0 11.8 3 People's United 165 10.9 10.8 4 Wells Fargo 76 7.3 7.2 5 TD Bank 81 5.9 5.8 6 First Niagara 85 4.6 4.5 7 JPM Chase 53 4.5 4.4 8 Citi 20 3.0 2.9 9 Liberty 48 2.9 2.8 10 RBS 47 2.5 2.5 Branches $BN % 1 B of A 255 54.3 20.0 2 RBS 253 30.9 11.4 3 Santander 229 18.9 7.0 4 TD Bank 157 10.6 3.9 5 Eastern Bank 98 6.7 2.5 6 Independent Bank 85 4.7 1.7 7 Middlesex 31 3.5 1.3 8 People's United 56 3.2 1.2 9 Boston Private 11 2.9 1.1 10 Brookline 29 2.4 0.9 Branches $BN % 1 People's United 42 2.6 22.4 2 TD Bank 34 2.6 22.0 3 Merchants 33 1.2 10.6 4 RBS 21 0.9 7.3 5 KeyCorp 13 0.8 6.7 6 Northfield 13 0.5 4.3 7 Community 14 0.4 3.7 8 Union 13 0.4 3.4 9 Berkshire Hills 7 0.3 2.9 10 Passumpsic 7 0.3 2.8 Branches $BN % 1 JPM Chase 802 392.9 37.1 2 Citi 269 69.6 6.6 3 B of A 352 60.1 5.7 4 HSBC 162 57.0 5.4 5 Capital One 274 38.8 3.7 6 M&T 298 33.3 3.1 7 TD Bank 228 22.4 2.1 8 KeyCorp 260 18.2 1.7 9 Wells Fargo 86 17.9 1.7 10 First Niagara 209 16.1 1.5 35 People's United 98 2.5 0.2 Branches $BN % 1 RBS 80 6.8 24.4 2 TD Bank 72 5.4 19.3 3 B of A 28 4.8 17.4 4 People's United 29 1.4 4.9 5 NH Mutual 18 1.0 3.7 6 BNH 23 0.9 3.2 7 Santander 20 0.8 2.9 8 NH Thrift 20 0.8 2.8 9 Northway 18 0.7 2.4 10 Centrix 6 0.7 2.3 Branches $BN % 1 TD Bank 56 14.4 43.3 2 KeyCorp 59 2.6 7.9 3 Bangor Bancorp 60 2.0 6.1 4 Camden National 44 1.8 5.3 5 B of A 19 1.4 4.1 6 First Bancorp 16 1.0 3.1 7 Machias 14 0.8 2.4 8 People's United 28 0.8 2.4 9 Bar Harbor 16 0.8 2.3 10 Norway 22 0.7 2.2 8 Leading market position in the best commercial banking market in the US #1 in Fairfield County, CT, 65 branches, $6.1BN, 18.4% market share |
 Large and Attractive Markets NYC-Northern NJ-LI Population: 19.0MM Median HH Income: $60,512 Businesses: 781,444 Population Density (#/sq miles): 2,847 Unemployment Rate (%): 7.9 $100K+ Households (%): 30.8 Boston, MA Population: 4.6MM Median HH Income: $67,700 Businesses: 203,770 Population Density (#/sq miles): 1,319 Unemployment Rate (%): 6.1 $100K+ Households (%): 33.8 Hartford, CT Population: 1.2MM Median HH Income: $63,997 Businesses: 52,315 Population Density (#/sq miles): 803 Unemployment Rate (%): 8.1 $100K+ Households (%): 30.4 Bridgeport-Stamford, CT Population: 922,000 Median HH Income: $80,342 Businesses: 49,392 Population Density (#/sq miles): 1,476 Unemployment Rate (%): 7.5 $100K+ Households (%): 41.5 New Haven, CT Population: 863,000 Median HH Income: $58,598 Businesses: 36,800 Population Density (#/sq miles): 1,427 Unemployment Rate (%): 8.4 $100K+ Households (%): 28.1 Burlington, VT Population: 215,000 Median HH Income: $55,875 Businesses: 10,846 Population Density (#/sq miles): 171 Unemployment Rate (%): 3.5 $100K+ Households (%): 21.9 Notes: The current national unemployment rate is 7.6% The current national population density is 89 (#/sq miles) Source: SNL Financial, US Census data for 2012 The population densities of NYC, Boston, Bridgeport and New Haven MSAs are each over ten times the national average 9 |
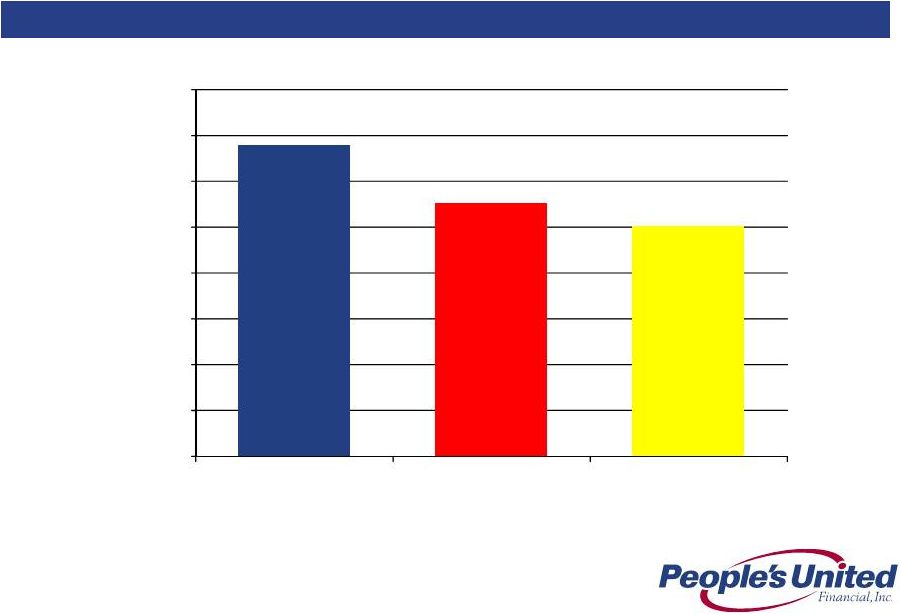 Strong Market Demographic Profile Source: SNL Financial, US Census data for 2012 Weighted Average Median Household Income 10 $67,752 $55,252 $50,157 $0 $10,000 $20,000 $30,000 $40,000 $50,000 $60,000 $70,000 $80,000 PBCT Peer Median US |
 Total Deposits ($MM) 6,053 2,926 2,479 2,063 1,970 1,241 Market Total Deposits ($MM) 33,037 117,693 555,811 25,438 17,069 4,499 Branch Count 65 51 92 45 34 12 18.3 2.5 0.5 8.1 11.5 27.6 0.0 5.0 10.0 15.0 20.0 25.0 30.0 Bridgeport- Stamford, CT Boston, MA NYC-Northern NJ-LI Hartford, CT New Haven, CT Burlington, VT Deposit Market Share by MSA (%) * We hold significant market share in several key northeast MSAs and are building our presence in areas with substantial growth potential, such as the Boston and New York City MSAs Source: SNL Financial * Excludes deposits from trust institutions and branches with over $750MM deposits ** Excludes six New York branches located outside the NYC MSA ** ** Large New Markets 11 |
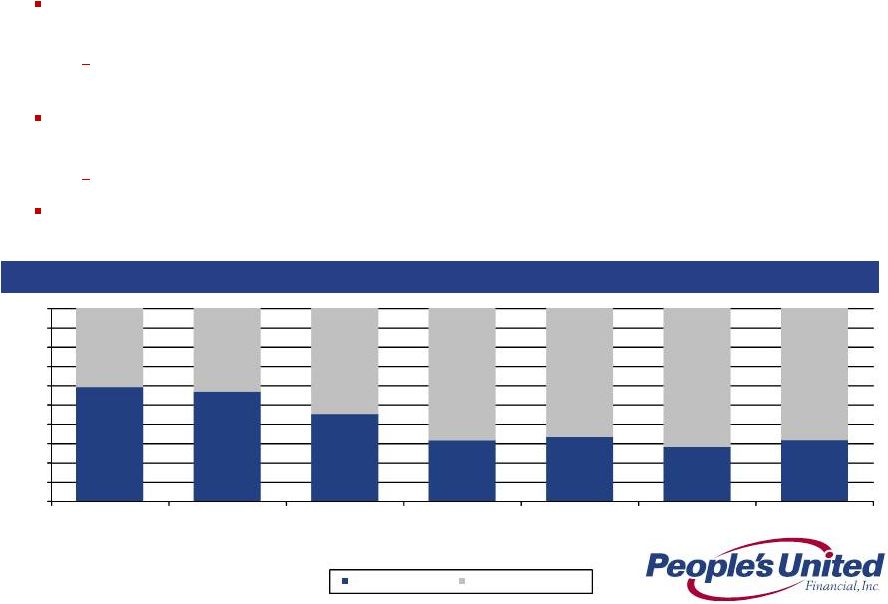
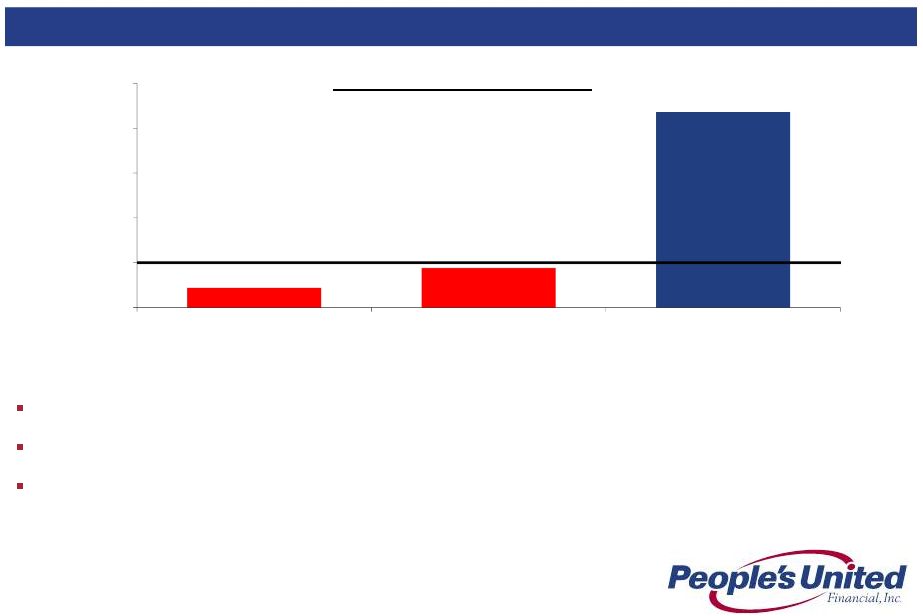 12 Southern New York Branch Update One Year Performance Review Deposits as of 6/30/13 totaled $591 million, up $269 million or 84% since close Branches provide significant support to our commercial and retail banking efforts Strengthened brand awareness in the New York market is also accelerating the expansion of fee income businesses “Break-even” Originally Forecast to Occur at 6/30/14 The acquired Southern New York branches have surpassed expectations Acquired NY In-store Branches at 6/25/12 Acquired NY In-store Branches at 6/30/13 PBCT CT In-store Branches at 6/30/13 Note: Represents an activity-based approach versus a branch of origination approach as reported by the FDIC $4 $9 $44 $0 $10 $20 $30 $40 $50 Average Deposits Per Branch ($MM) |
 13 In-store Versus Traditional Branches Connecticut On average, in-store locations are open 37% more hours per week than traditional branches (56 hours vs. 41 hours) but are 30% less expensive to operate Partnership allows us to leverage our brand with the ~1.8 million shoppers who visit Connecticut Stop & Shop stores every week In-store locations operate under the same business model as traditional branches and sell all the Bank’s products and services Mortgages, Home Equity Loans, Business Loans and Investments* Connecticut in-store branches accounted for a significant portion of the new branch business booked in the market * Sold by employees who are also licensed representatives of our brokerage affiliate 0% 10% 20% 30% 40% 50% 60% 70% 80% 90% 100% Consumer Checking Accounts Opened Savings Accounts Opened Business Checking Accounts Opened Home Equity Loan Originations Mortgage Loan Originations Business Banking Loan Originations Investment Sales In-store Branches Traditional Branches 59% 57% 45% 32% 34% 28% 32% 41% 43% 55% 68% 66% 72% 68% Connecticut In-store Versus Traditional Branch Business (Last Twelve Months Through 6/30/13) |
 Income Statement Improvements |
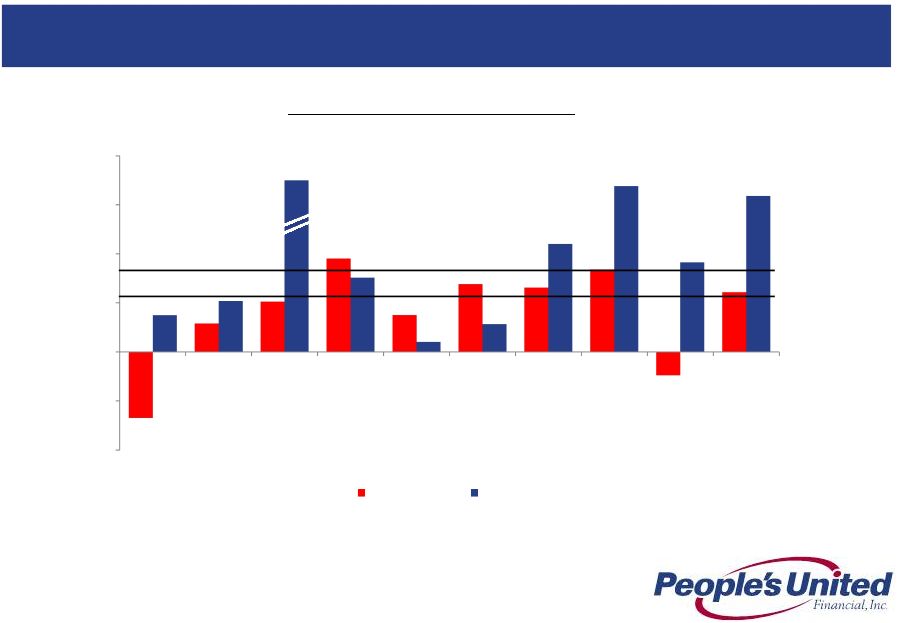 15 Consistent Loan Growth Since the end of 2010, People’s United is one of only six banks within the top 50 by assets that have grown loans in each quarter Source: SNL Financial. Excludes trust banks. Statements based on Total Gross Loans and Finance Leases, as reported, net of unearned discounts and gross of loss reserves. Does not include accrued interest on loans Notes: 1 Includes People’s United, First Niagara, First Republic, Signature, UMB and Prosperity 2 Reflects completion of Danvers Bancorp acquisition in 2Q 2011 3 Based on 41 of the top 50 banks reporting Quarterly Loan Growth Since 1Q 2011 PBCT Median = 1.67% Top 50 Median = 1.12% -1.34% 0.58% 1.03% 1.90% 0.75% 1.38% 1.31% 1.69% -0.48% 1.22% 0.75% 1.04% 1.52% 0.21% 0.57% 2.20% 3.38% 1.82% 3.18% -2% -1% 0% 1% 2% 3% 4% 2011Q1 2011Q2 2011Q3 2011Q4 2012Q1 2012Q2 2012Q3 2012Q4 2013Q1 2013Q2 Top 50 Median PBCT 13.86% 2 3 1 |
 Revenue Opportunities Continue to deepen our presence in heritage markets such as Connecticut and Vermont Substantial growth prospects in larger markets such as New York metro and Boston Total New York 1Q 2013 loan originations run-rate ~$2.1BN represents a +492% CAGR since 1Q 2010 • Increased New York relationship managers to 14 from zero since 1Q 2010 • Significant branch expansion in New York with 98 branches up from 5 in 1Q 2010; 58 branches, or 59%, are in- store locations Total Massachusetts 1Q 2013 loan originations run-rate ~$650MM represents a +36% CAGR since 1Q 2010 • Increased Massachusetts relationship managers to 31 from 14 since 2010 • Solid branch foundation in Massachusetts with 56 branches up from 19 in 1Q 2010 • Currently 3 de novo branches with over $40MM deposits: Prudential Center in Boston (opened November 2010); Milk Street in Boston (opened December 2010); Lexington, MA (opened July 2011) 16 |
 Revenue Opportunities Under-represented asset classes ramping up Asset-based lending: focused on in-footprint companies with sales of $15MM-$250MM; credit needs range from $5MM-$35MM; $600BN market, 70% of which is located in the Northeast Mortgage Warehouse lending: estimated market size is over $28BN in outstandings New York Commercial Real Estate: hiring talent in the New York metro area, which is a $30BN annual market with a population of 19.0MM, 6.9MM housing units and 3.4MM rental units Private Banking: hired senior executive from mega-cap bank with ~20 years managing private banking in the Northeast with initial focus on CT, metro New York and metro Boston Enhancing wealth management offering Proprietary asset allocation and risk management strategies are implemented with a suite of external managers who represent our "best in class" recommendations • Proprietary asset allocation allows us to “rent” intellectual capital – no customer funds leave the bank Hired executive as Senior Vice President and Chief Investment Officer Increasing momentum in other fee income businesses with a focus on cross-sell Commercial insurance: revamped systems and combined all agencies into a single entity; focused on our deep commercial customer base as well as the education sector Hired executive to lead cash management business Growing merchant and payroll services 17 |
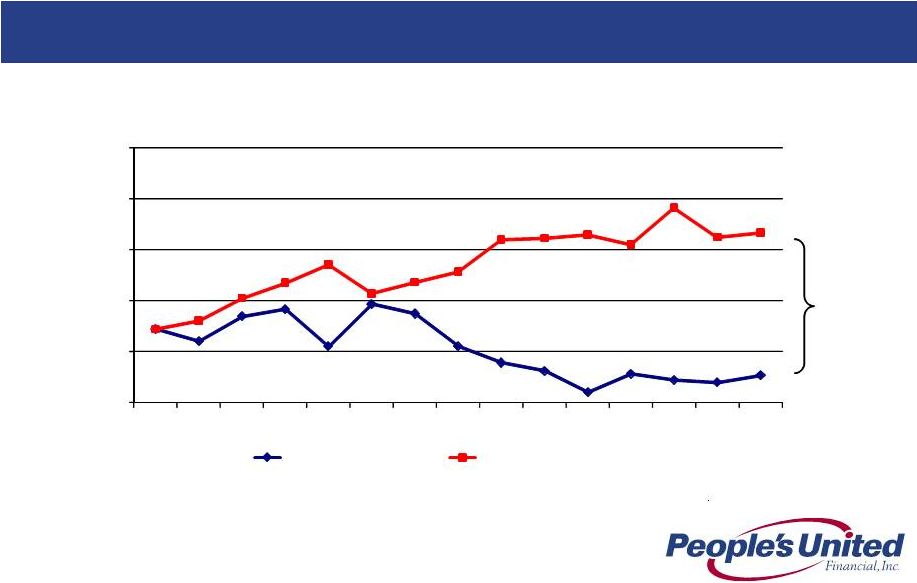
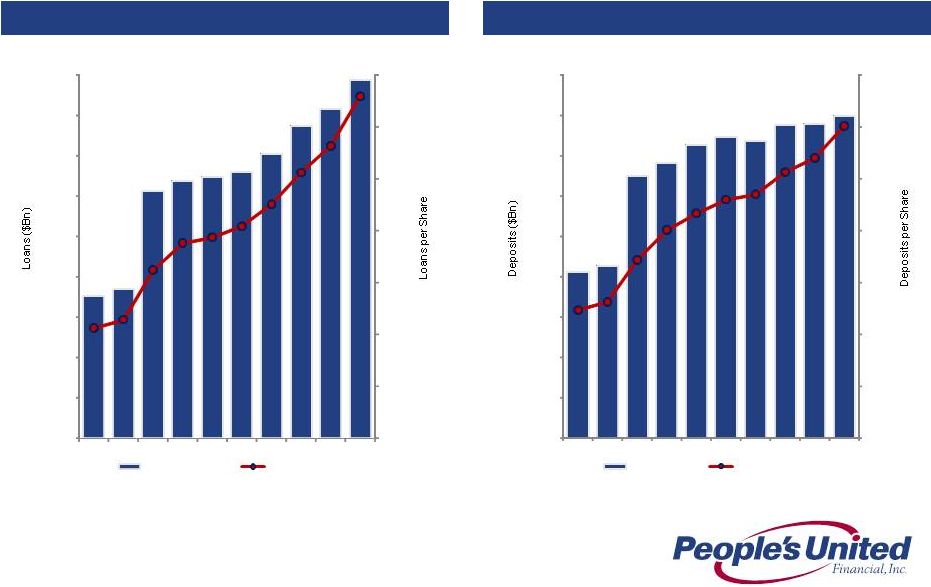 18 Loans Deposits Growing Future Earnings Per Share Loans and Deposits per Share $72.93 $40 $45 $50 $55 $60 $65 $70 $75 $14 $15 $16 $17 $18 $19 $20 $21 $22 $23 1Q11 2Q11 3Q11 4Q11 1Q12 2Q12 3Q12 4Q12 1Q13 2Q13 Gross Loans ($BN) Loans per Share $70.11 $40 $45 $50 $55 $60 $65 $70 $75 $14 $15 $16 $17 $18 $19 $20 $21 $22 $23 1Q11 2Q11 3Q11 4Q11 1Q12 2Q12 3Q12 4Q12 1Q13 2Q13 Deposits ($BN) Deposits per Share |
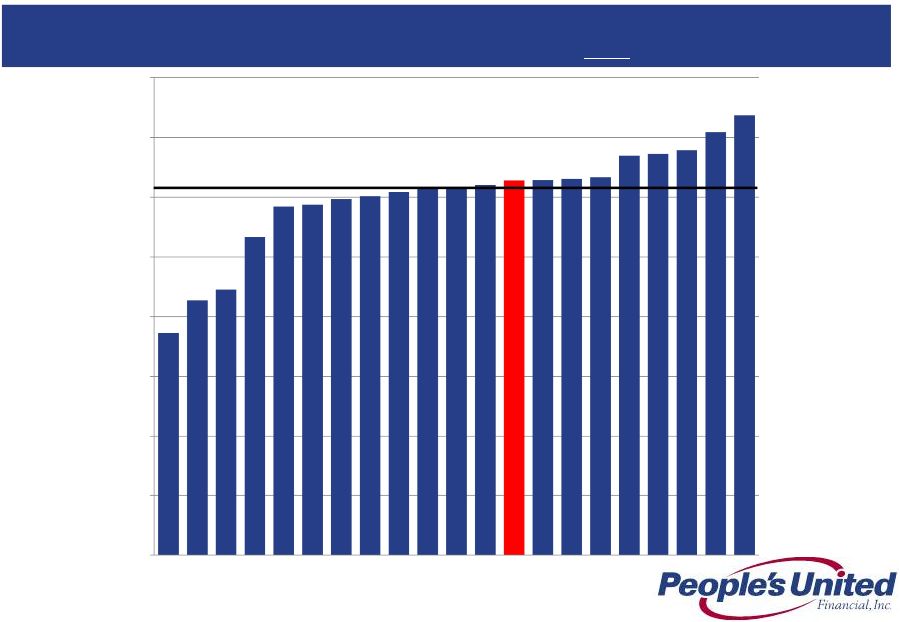 Efficiency Ratio Peer Group Comparison, Last Twelve Months Ending 2Q 2013 Low cost producers tend to yield the best returns to shareholders. Efficiency progress requires both revenue growth AND expense discipline Median, excluding PBCT = 61.5% Source: SNL Financial 80 70 60 50 40 30 20 10 0 62.8 PBCT 19 |
 20 EMOC has been fully operational since November 2011 Three person committee comprised of the CFO, Chief Administrative Officer and Chief HR Officer EMOC oversees PBCT’s noninterest expense management, implements strategies to ensure attainment of expense management targets and oversees revenue initiatives that require expenditures Provides a horizontal view of the organization Expense Management Units (EMUs) established to facilitate EMOC functions Defined EMUs include: • Technology • Operations • Real Estate Services Spending requests above $25,000 are submitted by EMU owners for approval Staffing models, staffing replacements and additions for mid-level positions and above require approval by the Committee Introduction to EMOC Expense Management Oversight Committee (EMOC) • Employment/Benefits • Marketing • Regulatory/Institutional • Depreciation/Equipment • Decentralized • Intangible Amortization |
 Expense Progress Estimated Cost Savings Analysis Our 2Q 2013 operating expense base of $205MM reflects $28MM ($112MM annualized) savings from successfully-executed expense initiatives 205 233 200 210 220 230 240 250 4Q09 1Q10 2Q10 3Q10 4Q10 1Q11 2Q11 3Q11 4Q11 1Q12 2Q12 3Q12 4Q12 1Q13 2Q13 Operating Noninterest Expense ($MM) Pro Forma / Actual Without Expense Initiatives . $28MM Cost Savings 21 Source: SNL Financial Note: “Pro Forma / Actual” represents PBCT operating noninterest expense and the actual expenses at the acquired institutions. Acquisition target costs fall away as the acquisitions are completed. “Without Expense Initiatives” represents PBCT operating noninterest expense and the actual expenses at the acquired institutions in 4Q09, and then applies the peer median expense growth rate in each subsequent quarter |
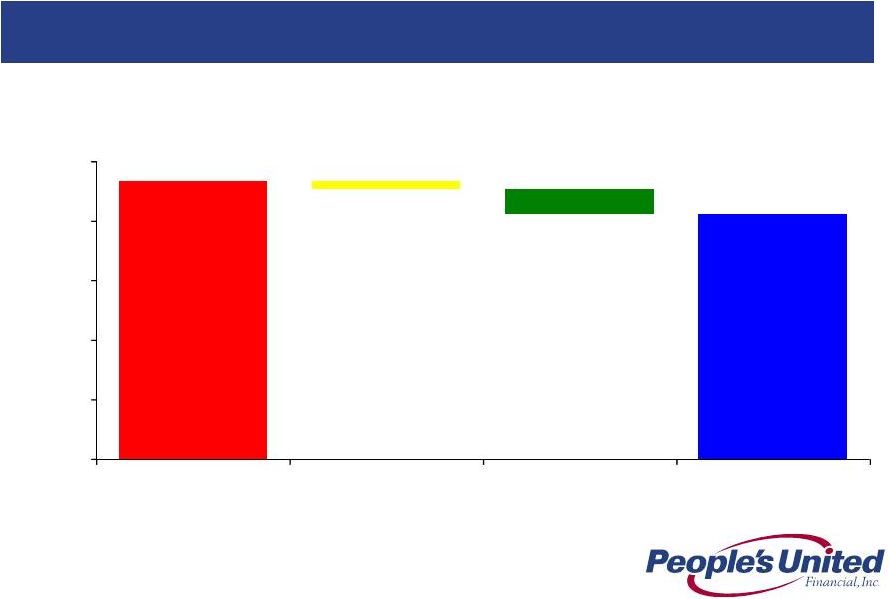 Expense Progress Estimated Cost Savings Analysis The $28MM in quarterly cost reductions is attributable to efforts related to acquisition cost savings and other initiatives 22 Source: SNL Financial Note: “Pro Forma / Actual” represents PBCT operating noninterest expense and the actual expenses at the acquired institutions. Acquisition target costs fall away as the acquisitions are completed. “Without Expense Initiatives” represents PBCT operating noninterest expense and the actual expenses at the acquired institutions in 4Q09, and then applies the peer median expense growth rate in each subsequent quarter 233 205 7 21 $0 $50 $100 $150 $200 $250 Without Expense Initiatives Announced Acquisition Savings Other Initiatives Pro Forma / Actual Operating Noninterest Expense ($MM) |
 Average Annual Net Charge Offs / Average Loans (%) Peer Group Comparison, 2008-2012 Conservative underwriting is a hallmark of this institution Median, excluding PBCT = 0.98% Source: SNL Financial 23 0.26 0.00 0.50 1.00 1.50 2.00 2.50 3.00 3.50 4.00 PBCT |
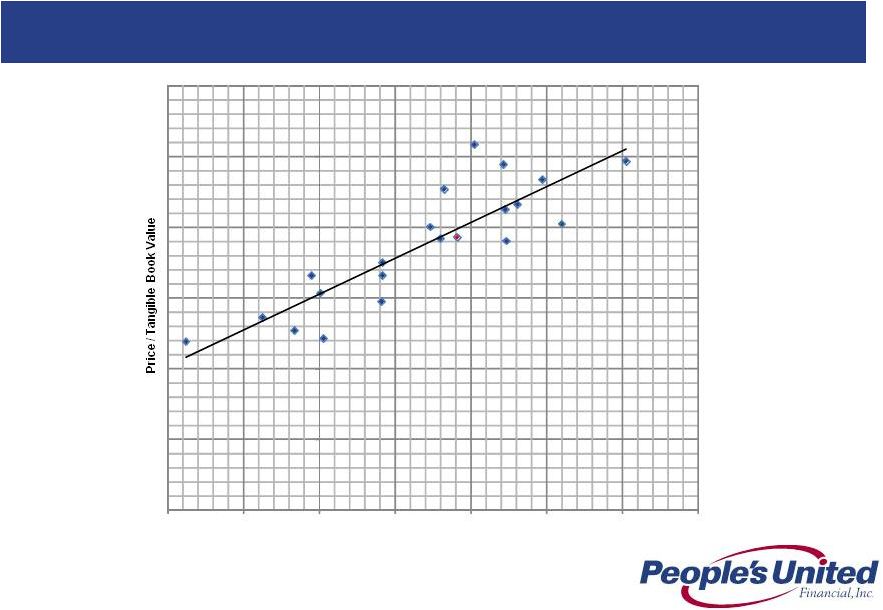 P/TBV vs. ROATE Peer Group Regression Analysis Improved profitability, enhanced predictability of earnings and transparent capital allocation will create additional shareholder value PBCT Source: SNL Financial Note: Analysis utilizes Bloomberg 3 Year Adjusted Betas, as of July 25, 2013 R² = 0.75 0 50 100 150 200 250 300 -4.0% -2.0% 0.0% 2.0% 4.0% 6.0% 8.0% 10.0% 2014E Return on Average Tangible Equity Less Cost of Equity 24 |
 Interest Rate Risk Profile |
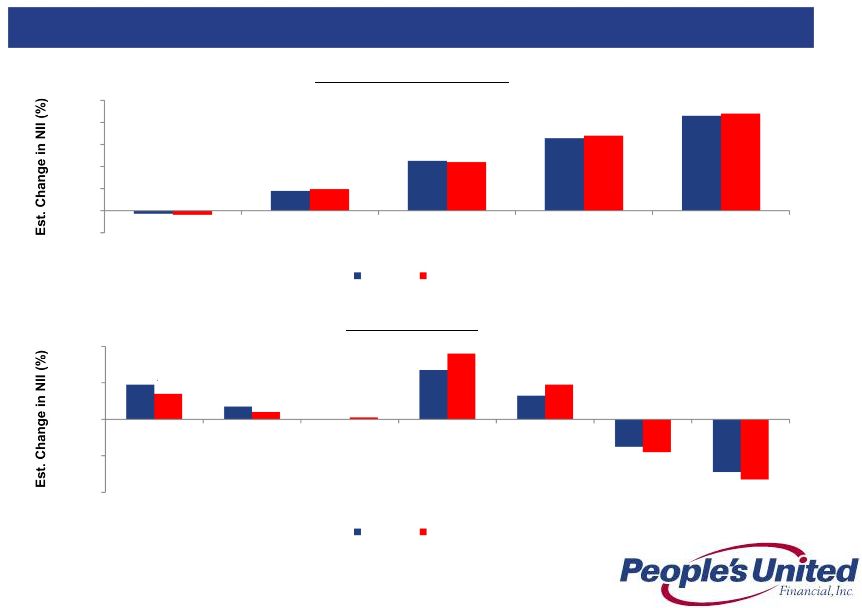 26 Net Interest Income (NII) Sensitivity Interest Rate Risk Profile 1 -0.7% 4.5% 11.3% 16.4% 21.5% -0.9% 4.9% 11.0% 17.0% 22.0% -5.0% 0.0% 5.0% 10.0% 15.0% 20.0% 25.0% Dn25 Up100 Up200 Up300 Up400 Immediate Parallel Shock 6/30/13 3/31/13 1.9% 0.7% 0.0% 2.7% 1.3% -1.5% -2.9% 1.4% 0.4% 0.1% 3.6% 1.9% -1.8% -3.3% -4.0% -2.0% 0.0% 2.0% 4.0% Short End +100 Short End +50 Short End -25 Long End +100 Long End +50 Long End -50 Long End -100 Yield Curve Twist 6/30/13 3/31/13 Notes: 1. Yield curve twist pivot point is 18 month point on yield curve. Short End defined as overnight to 18 months. Long End defined as terms greater than 18 months |
 27 For 1Q 2013 we were twice as asset sensitive as the estimated median of our peer group Notes: 1. Analysis is as of 03/31/13 filings 2. Data as of 03/31/13 SEC filings; where exact +100bps shock up scenario data was not provided, PBCT interpolated based on data disclosed 3. Data as of 03/31/13 SEC filings; where exact +200bps shock up scenario data was not provided, PBCT interpolated based on data disclosed Interest Rate Sensitivity vs. Peers Net Interest Income at Risk Analysis involves PBCT estimates, see notes below Change in Net Interest Income Scenario Lowest Amongst Peers Highest Amongst Peers Peer Median PBCT Multiple to Peer Median Shock Up 100bps -2.5% 7.9% 2.7% 1.8x Shock Up 200bps -4.0% 15.8% 5.2% 2.1x 1 2 3 |
 Summary |
 29 Summary Sustainable Competitive Advantage Premium brand built over 170 years High quality Northeast footprint characterized by wealth, density and commercial activity Strong leadership team Solid net interest margin Superior asset quality Focus on relationship-based banking Growing loans and deposits within footprint - in two of the largest MSAs in the country (New York City, #1 and Boston, #10) Improving profitability Returning capital to shareholders Strong capital base |
 Appendix |
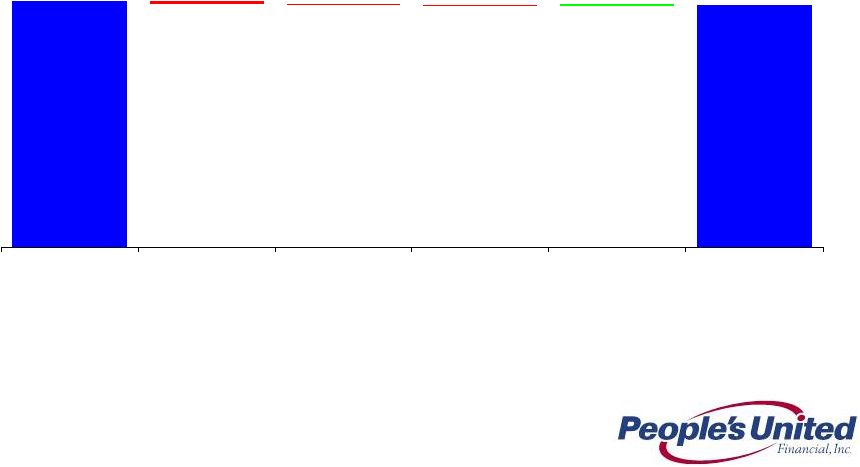 Operating Net Interest Margin Linked Quarter Change (%) 3.38% 3.33% (0.05%) (0.01%) (0.01%) 0.02% 1Q 2013 New Loan Volume Loan Repricing / Amort Increased Borrowings Calendar Days 2Q 2013 31 |
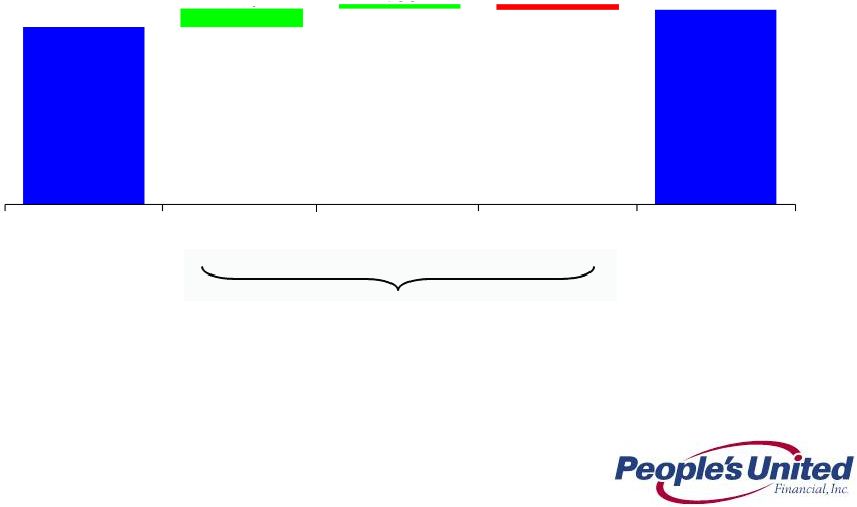 Loans Linked Quarter Change (in $ millions) 22,161 22,866 32 Annualized Linked QTD change 12.7% 22,161 746 160 (201) 22,866 Mar 31, 2013 Commercial Banking Retail Acquired Jun 30, 2013 |
 2Q13 Total Loan Portfolio $22.9 BN Loans by Business Line CRE $7.6 33% C&I $5.4 24% Residential Mortgage $4.1 18% Home Equity & Other $2.1 9% PCLC $1.6 7% Business Banking $1.1 5% PUEFC $0.8 4% 33 |
 34 Loans by Geography Excluding equipment finance loans, ~95% of our 2Q13 loan portfolio is within the Northeast 2Q13 Total Loan Portfolio $22.9 BN Connecticut $6.8 29% Massachusetts $4.1 18% New York $3.5 15% Vermont $1.7 8% New Hampshire $1.3 6% Maine $0.9 4% New Jersey $0.7 3% Pennsylvania $0.2 1% Maryland $0.2 1% Other $3.4 15% Notes: Reporting is based on the collateral property address for the following: SNE Residential Mortgage, Consumer Home equity, Consumer Other and CRE. Reporting is based on borrower address for the following: C&I, Residential construction and NNE loans. |
 35 Acquired Loan Portfolio (a) Initial carrying amounts of acquired portfolios are as follows: FinFed, $1.2BN; Butler, $141MM; RiverBank, $518MM; Smithtown, $1.6BN; and Danvers, $1.9BN. (b) Carrying amount and related components reflect loan sale, settlement and payoff activity which have occurred since acquisition. (c) Represent contractual amounts; loans meet People’s United Financial’s definition of a non-performing loan but are not subject to classification as non-accrual in the same manner as originated loans. Rather, these loans are considered to be accruing loans because their interest income relates to the accretable yield recognized at the pool level and not to contractual interest payments at the loan level. (d) Includes approximately $6.7MM of charge-offs applied against reserves established subsequent to acquisition. As of 6/30/13 (in $ millions) Carrying Amount a, b Carrying Amount Component b NPLs Non-Accretable Difference/NPLs Charge-offs Incurred Since Acquisition d Accretable Yield Non-Accretable Difference Danvers (7/1/11) $884.7 $273.7 $14.2 $42.1 34% $22.7 Smithtown (11/30/10) 645.5 325.4 104.4 74.7 140% 126.9 Others (various dates) 351.4 85.3 23.7 42.2 56% 29.6 Total $1,881.6 $684.4 $142.3 $159.0 c Contractual cash flows (principal & interest) less expected cash flows (principal & interest) = non-accretable difference (effectively utilized to absorb actual portfolio losses) Expected cash flows (principal & interest) less fair value = accretable yield Expected cash flows are regularly reassessed and compared to actual cash collections Acquired loans initially recorded at fair value (inclusive of related credit mark) without carryover of historical ALLL Accounting model is cash-flow based: |
 36 Acquired Loan Portfolio Amortization of Original Discount on Acquired Loan Portfolio $ in millions, except per share data Impact on Net Interest Margin Impact on Earnings Per Share 2Q13 Total Accretion (All interest income on acquired loans) 34 Interest Income from Amortization of Original Discount on Acq. Loan Portfolio 9.2 1Q13 Acquired Loan Portfolio Carrying Amount 2,083 2Q13 Effective Tax Rate 32.5% 2Q13 Acquired Loan Portfolio Carrying Amount 1,882 2Q13 Average Acquired Loan Portfolio 1,982 2Q13 Earnings from Amortiz. of Original Discount on Acq. Loan Portfolio 6.2 Effective Yield on Acquired Loan Portfolio 6.86% 2Q13 Weighted Average Shares Outstanding 313.5 5.01% 2Q13 EPS Impact from Amortiz. of Discount on Acq. Loan Portfolio $0.02 Incremental Yield Attributable to Amortiz. of Discount on Acq. Loan Portfolio 1.85% Incremental Interest Income from Amortiz. of Discount on Acq. Loan Portfolio 9.2 2Q13 Average Earning Assets 27,079 Add: Average unamortized loan discount 2 42 Adjusted 2Q13 Average Earning Assets 27,121 Impact on Overall Net Interest Margin (bps) 14 Operating Net Interest Margin 3.33% Adjusted Net Interest Margin 3.19% Amortization of Original Discount on Acquired Loan Portfolio Amortization of Original Discount on Acquired Loan Portfolio Note: 1. Excluding FinFed, the weighted average coupon on the acquired loan portfolio is 4.76% 2. Represents the difference between the outstanding balance of the acquired loan portfolio and the carrying amount of the acquired loan portfolio Weighted Average Coupon on Acquired Loan Portfolio 1 |
 37 Summary of Acquired Loan Accounting Events (in $ millions) Period Cost Recovery Income Gain (Loss) on Sale of Acquired Loans Acquired Loan Impairment Net Impact 2011 Q1 0.0 5.5 0.0 5.5 Q2 0.0 7.2 0.0 7.2 Q3 0.0 (4.8) 0.0 (4.8) Q4 5.0 (0.4) (7.4) (2.8) 2012 Q1 0.0 0.0 (0.3) (0.3) Q2 4.7 0.7 0.2 5.6 Q3 4.1 0.0 (5.7) (1.6) Q4 0.0 0.3 0.0 0.3 2013 Q1 0.0 0.0 (2.6) (2.6) Q2 0.0 5.8 0.9 6.7 Total $13.8 $14.3 ($14.9) $13.2 Since 2010, we have acquired $5.4BN of loans, approximately 35% of which remain in our portfolio. We did not recognize cost recovery income, gains (losses) on sale or impairment in 2010. Since 1Q 2011, the net impact of such activity is +$13.2MM |
 38 Deposits Linked Quarter Change (in $ millions) Total 21,792 21,982 Commercial Retail Annualized Linked QTD change 3.5% 16,178 16,196 5,614 5,786 172 18 Mar 31, 2013 Retail Commercial Jun 30, 2013 |
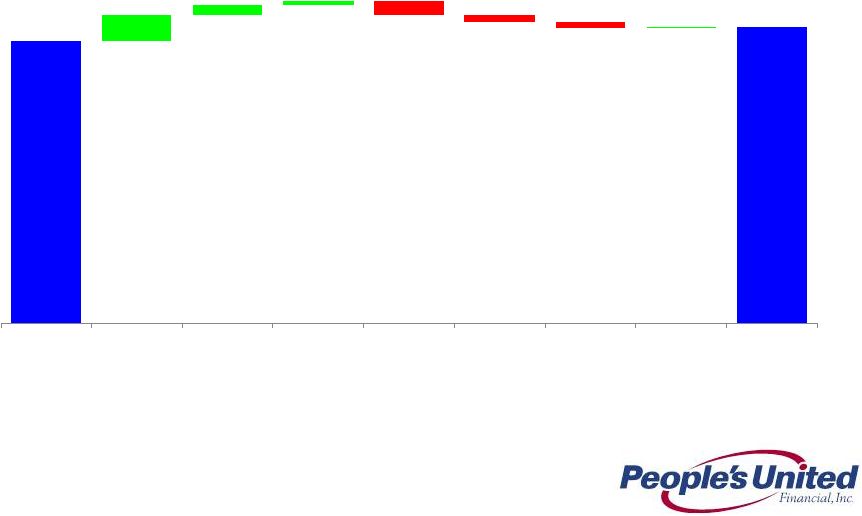 39 Non-Interest Income Linked Quarter Change (in $ millions) 82.9 86.1 5.8 2.0 1.1 (1.5) (1.2) 0.2 (3.2) 1Q 2013 Gain on Acq Loan Sales Bank Service Charges Customer Derivative Income Loan Prepayment Fees Gain on Resi Mtg Loan Sales Insurance Other 2Q 2013 |
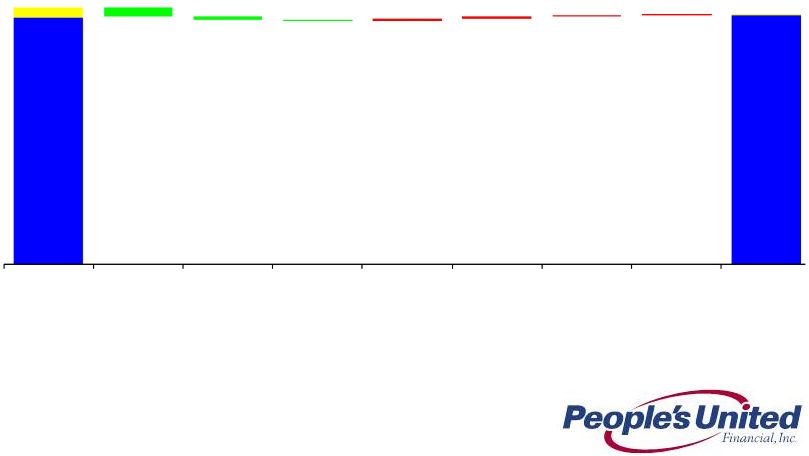 40 Total Non-Operating Operating Non-Interest Expense Linked Quarter Change (in $ millions) 212.0 205.8 204.0 (7.6) (2.8) (1.0) 2.0 1.9 1.2 0.1 205.4 8.0 0.4 1Q 2013 Non- Operating Comp & Bene Occ & Equip REO Adv & Pro Prof & Outside Other 2Q 2013 |
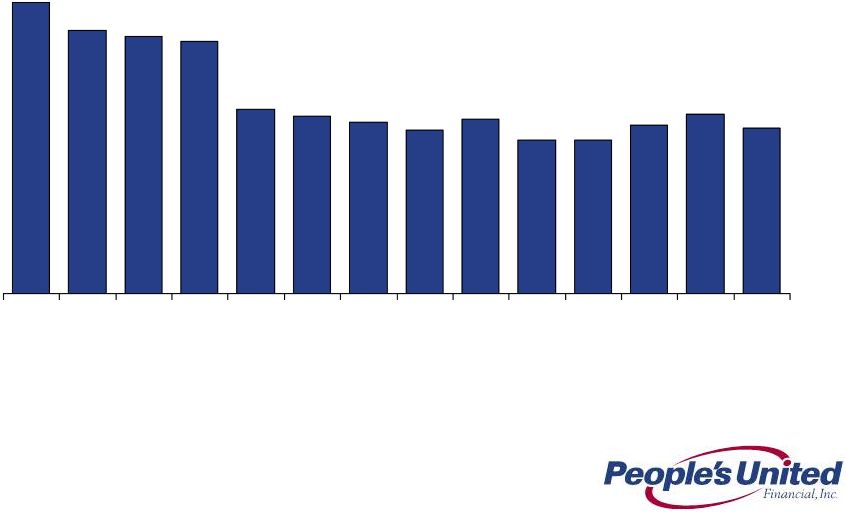 41 Efficiency Ratio (%) Since 1Q 2010 76.1% 73.1% 72.4% 71.9% 64.7% 63.9% 63.3% 62.4% 63.6% 61.4% 61.4% 63.0% 64.1% 62.7% 1Q 2010 2Q 2010 3Q 2010 4Q 2010 1Q 2011 2Q 2011 3Q 2011 4Q 2011 1Q 2012 2Q 2012 3Q 2012 4Q 2012 1Q 2013 2Q 2013 |
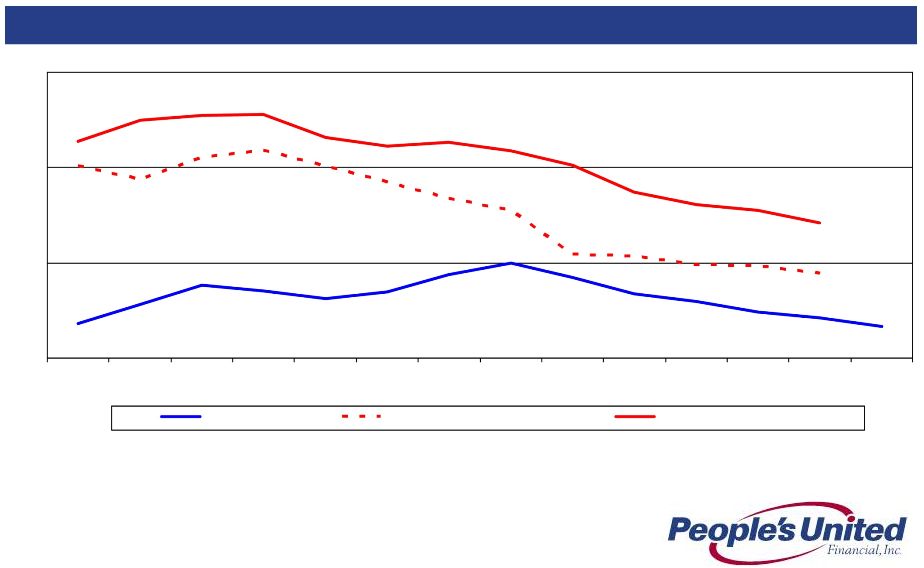 42 Since 1Q 2010 Asset Quality NPAs / Loans & REO* (%) * Non-performing assets (excluding acquired non-performing loans) as a percentage of originated loans plus all REO and repossessed assets; acquired non-performing loans excluded as risk of loss has been considered by virtue of (i) our estimate of acquisition-date fair value, (ii) the existence of an FDIC loss sharing agreement, and/or (iii) allowance for loan losses established subsequent to acquisition Source: SNL Financial and Company filings 1.33 1.42 1.89 2.42 1.00 2.00 3.00 4.00 1Q 2010 2Q 2010 3Q 2010 4Q 2010 1Q 2011 2Q 2011 3Q 2011 4Q 2011 1Q 2012 2Q 2012 3Q 2012 4Q 2012 1Q 2013 2Q 2013 PBCT Peer Group Median Top 50 Banks by Assets |
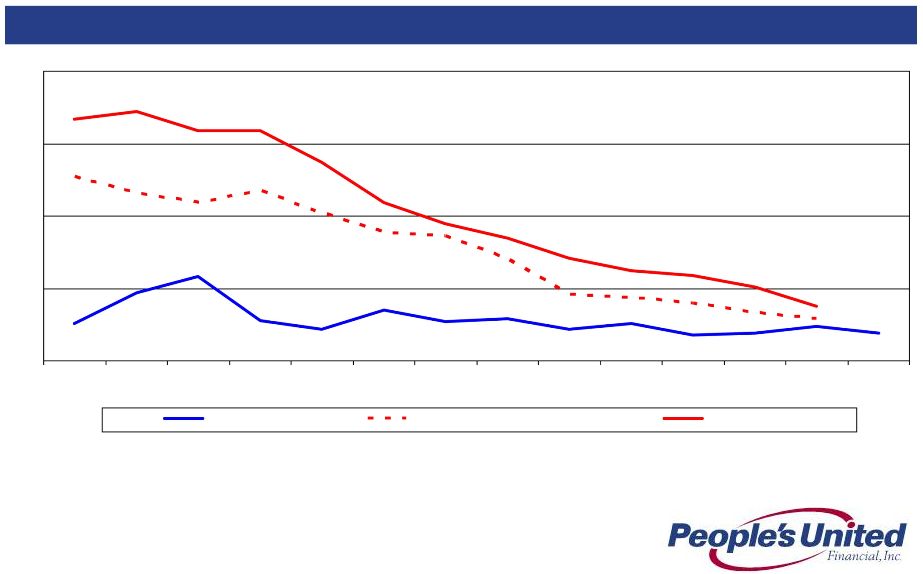 43 Asset Quality Net Charge-Offs / Avg. Loans (%) Source: SNL Financial and Company filings * Excluding acquired loan charge-offs, PBCT’s charge-off ratio was 0.18% in both 2Q 2013 and 1Q 2013 Since 1Q 2010 0.00 0.50 1.00 1.50 2.00 PBCT Peer Group Median Top 50 Banks 1Q 2010 2Q 2010 3Q 2010 4Q 2010 1Q 2011 2Q 2011 3Q 2011 4Q 2011 1Q 2012 2Q 2012 3Q 2012 4Q 2012 1Q 2013 2Q 2013 0.24 0.19 0.29 0.38 * * |
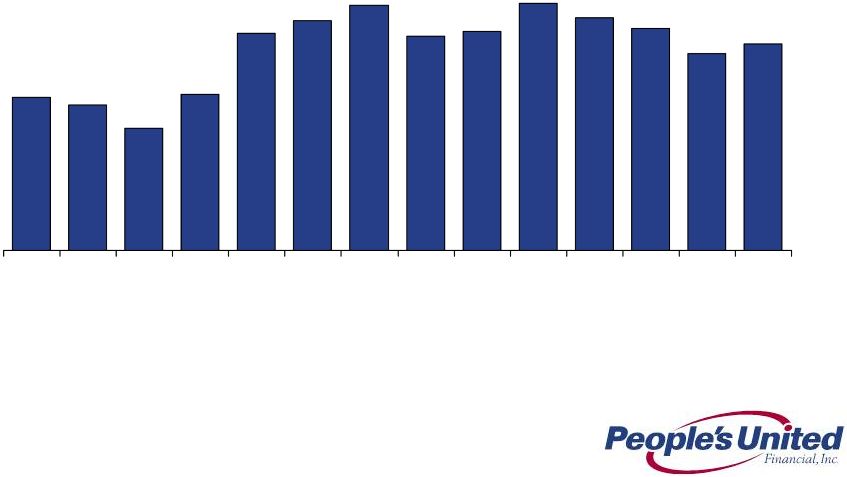 44 Operating ROAA Progress Since 1Q 2010 0.60% 0.57% 0.48% 0.61% 0.85% 0.90% 0.96% 0.84% 0.86% 0.97% 0.91% 0.87% 0.77% 0.81% 1Q 2010 2Q 2010 3Q 2010 4Q 2010 1Q 2011 2Q 2011 3Q 2011 4Q 2011 1Q 2012 2Q 2012 3Q 2012 4Q 2012 1Q 2013 2Q 2013 |
 45 Operating ROATE Progress Since 1Q 2010 3.5% 3.4% 2.9% 4.0% 6.4% 6.9% 7.8% 7.2% 7.8% 8.9% 8.6% 8.6% 8.1% 9.3% 1Q 2010 2Q 2010 3Q 2010 4Q 2010 1Q 2011 2Q 2011 3Q 2011 4Q 2011 1Q 2012 2Q 2012 3Q 2012 4Q 2012 1Q 2013 2Q 2013 |
 46 Operating Dividend Payout Ratio Since 1Q 2010 180% 209% 157% 104% 98% 87% 96% 93% 82% 84% 85% 91% 83% 175% 1Q 2010 2Q 2010 3Q 2010 4Q 2010 1Q 2011 2Q 2011 3Q 2011 4Q 2011 1Q 2012 2Q 2012 3Q 2012 4Q 2012 1Q 2013 2Q 2013 |
 47 Substantial Progress in the Midst of a Financial Crisis Growing Loans, Deposits and Returning Capital to Shareholders Growth has outpaced peers on the key metrics of loans per share and deposits per share This has occurred while we have returned $2.1BN to shareholders during this period. Returns of capital were in the form of both dividends ($1.1BN) and share repurchases ($1.0BN) which represents over 40% of our current market capitalization Line Item PBCT Peer Median PBCT Vs. Peers 5-Year Loans Per Share CAGR 11.0% -1.3% +12.3% 5-Year Deposits Per Share CAGR 9.8% 2.5% +7.3% Notes: 5-Year CAGR figures based on 2Q 2008 to 2Q 2013 data |
 48 Capital Ratios Since 1Q 2010 1Q 2010 1Q 2011 1Q 2012 2Q 2012 3Q 2012 4Q 2012 1Q 2013 2Q 2013 People’s United Financial Tang. Com. Equity/Tang. Assets 18.7% 13.9% 11.7% 11.4% 11.2% 10.2% 9.6% 8.7% Leverage Ratio 1, 5 19.2% 14.5% 12.1% 11.8% 11.5% 10.6% 10.0% 9.3% Tier 1 Common 23.1% 17.1% 13.9% 13.6% 13.6% 12.7% 12.0% 10.8% Tier 1 Risk-Based Capital 3, 5 23.9% 17.9% 14.4% 14.1% 14.1% 13.2% 12.5% 11.6% Total Risk-Based Capital 4, 5 25.6% 19.4% 16.0% 15.6% 15.6% 14.7% 13.7% 12.8% People’s United Bank Leverage Ratio 1, 5 12.3% 11.4% 11.0% 10.9% 10.8% 9.8% 9.7% 9.5% Tier 1 Risk-Based Capital 3, 5 15.4% 13.9% 13.1% 13.0% 13.2% 12.2% 12.1% 11.9% Total Risk-Based Capital 4,5 16.3% 14.8% 14.0% 14.0% 14.1% 13.1% 13.5% 13.2% Notes: 1. Leverage (core) Capital represents Tier 1 Capital (total stockholder’s equity, excluding: (i) after-tax net unrealized gains (losses) on certain securities classified as available for sale; (ii) goodwill and other acquisition-related intangibles; and (iii) the amount recorded in accumulated other comprehensive income (loss) relating to pension and other postretirement benefits), divided by Adjusted Total Assets (period end total assets less goodwill and other acquisition-related intangibles) 2. Tier 1 Common represents total stockholder’s equity, excluding goodwill and other acquisition-related intangibles, divided by Total Risk-Weighted Assets 3. Tier 1 Risk-Based Capital represents Tier 1 Capital divided by Total Risk-Weighted Assets 4. Total Risk-Based Capital represents Tier 1 Capital plus subordinated notes and debentures, up to certain limits, and the allowance for loan losses, up to 1.25% of total risk weighted assets, divided by Total Risk-Weighted Assets 5. Well capitalized limits for the Bank are: Leverage Ratio, 5%; Tier 1 Risk-Based Capital, 6%; and Total Risk-Based Capital, 10% 2 |
 Allowance for Loan Losses Originated Portfolio Coverage Detail (in $ millions) Commercial ALLL - $159.3 million 96% of Commercial NPLs Retail ALLL - $18.2 million 23% of Retail NPLs Total ALLL - $177.5 million 72% of Total NPLs 0.00% 0.50% 1.00% 1.50% 2.00% 1.10% 1.05% NPLs:Loans ALLL:Loans Commercial Banking 49 0.00% 0.50% 1.00% 1.50% 2.00% 1.38% 0.31% Retail Banking NPLs:Loans ALLL:Loans 0.00% 0.50% 1.00% 1.50% 2.00% 1.18% 0.85% NPLs:Loans ALLL:Loans Total |
 50 Name Position Years in Banking Professional Experience Jack Barnes President & CEO, Director 30+ People’s United Bank (SEVP, CAO), Chittenden, FDIC Kirk Walters SEVP & CFO, Director 25+ People’s United Bank, Santander, Sovereign, Chittenden, Northeast Financial Jeff Tengel SEVP Commercial Banking 30+ People’s United Bank, PNC, National City Bob D’Amore SEVP Retail & Business Banking 30+ People’s United Bank Lee Powlus SEVP & Chief Administrative Officer 25+ People’s United Bank, Chittenden, Alltel Chantal Simon SEVP & Chief Risk Officer 20+ People’s United Bank, Merrill Lynch US Bank, Lazard Freres & Co. Dave Norton SEVP & Chief HR Officer 3+ People’s United Bank, New York Times, Starwood, PepsiCo Bob Trautmann SEVP & General Counsel 20+ People’s United Bank, Tyler Cooper & Alcorn Management Committee 50 |
 51 Peer Group Firm Ticker City State 1 Associated ASBC Green Bay WI 2 BancorpSouth BXS Tupelo MS 3 City National CYN Los Angeles CA 4 Comerica CMA Dallas TX 5 Commerce CBSH Kansas City MO 6 Cullen/Frost CFR San Antonio TX 7 East West EWBC Pasadena CA 8 First Niagara FNFG Buffalo NY 9 FirstMerit FMER Akron OH 10 Fulton FULT Lancaster PA 11 Huntington HBAN Columbus OH 12 M&T MTB Buffalo NY 13 New York Community NYCB Westbury NY 14 Signature SBNY New York NY 15 Susquehanna SUSQ Lititz PA 16 Synovus SNV Columbus GA 17 Valley National VLY Wayne NJ 18 Webster WBS Waterbury CT 19 Wintrust WTFC Lake Forest IL 20 Zions ZION Salt Lake City UT |
 52 Non-GAAP Financial Measures and Reconciliation to GAAP In addition to evaluating People’s United Financial’s results of operations in accordance with U.S. generally accepted accounting principles (“GAAP”), management routinely supplements this evaluation with an analysis of certain non-GAAP financial measures, such as the efficiency and tangible equity ratios, tangible book value per share and operating earnings metrics. Management believes these non-GAAP financial measures provide information useful to investors in understanding People’s United Financial’s underlying operating performance and trends, and facilitates comparisons with the performance of other banks and thrifts. Further, the efficiency ratio and operating earnings metrics are used by management in its assessment of financial performance, including non-interest expense control, while the tangible equity ratio and tangible book value per share are used to analyze the relative strength of People’s United Financial’s capital position. The efficiency ratio, which represents an approximate measure of the cost required by People’s United Financial to generate a dollar of revenue, is the ratio of (i) total non-interest expense (excluding goodwill impairment charges, amortization of other acquisition-related intangible assets, losses on real estate assets and non-recurring expenses) (the numerator) to (ii) net interest income on a fully taxable equivalent ("FTE") basis plus total non-interest income (including the FTE adjustment on bank-owned life insurance ("BOLI") income, and excluding gains and losses on sales of assets other than residential mortgage loans and acquired loans, and non-recurring income) (the denominator). People’s United Financial generally considers an item of income or expense to be non-recurring if it is not similar to an item of income or expense of a type incurred within the last two years and is not similar to an item of income or expense of a type reasonably expected to be incurred within the following two years. |
 53 Operating earnings exclude from net income those items that management considers to be of such a non- recurring or infrequent nature that, by excluding such items (net of income taxes), People’s United Financial’s results can be measured and assessed on a more consistent basis from period to period. Items excluded from operating earnings, which include, but are not limited to, merger-related expenses, charges related to executive-level management separation costs, severance-related costs and writedowns of banking house assets, are generally also excluded when calculating the efficiency ratio. Operating earnings per share is derived by determining the per share impact of the respective adjustments to arrive at operating earnings and adding (subtracting) such amounts to (from) GAAP earnings per share. Operating return on average assets is calculated by dividing operating earnings (annualized) by average assets. Operating return on average tangible stockholders' equity is calculated by dividing operating earnings (annualized) by average tangible stockholders' equity. The operating dividend payout ratio is calculated by dividing dividends paid by operating earnings for the respective period. Operating net interest margin excludes from the net interest margin those items that management considers to be of such a discrete nature that, by excluding such items, People’s United Financial’s net interest margin can be measured and assessed on a more consistent basis from period to period. Items excluded from operating net interest margin include cost recovery income on acquired loans and changes in the accretable yield on acquired loans stemming from periodic cash flow reassessments. Operating net interest margin is calculated by dividing operating net interest income (annualized) by average earning assets. Non-GAAP Financial Measures and Reconciliation to GAAP |
 54 Non-GAAP Financial Measures and Reconciliation to GAAP The tangible equity ratio is the ratio of (i) tangible stockholders’ equity (total stockholders’ equity less goodwill and other acquisition-related intangible assets) (the numerator) to (ii) tangible assets (total assets less goodwill and other acquisition-related intangible assets) (the denominator). Tangible book value per share is calculated by dividing tangible stockholders’ equity by common shares (total common shares issued, less common shares classified as treasury shares and unallocated Employee Stock Ownership Plan ("ESOP") common shares). In light of diversity in presentation among financial institutions, the methodologies used by People’s United Financial for determining the non-GAAP financial measures discussed above may differ from those used by other financial institutions. Please refer to People’s United Financial’s latest Form 10-Q regulatory filing for detailed reconciliations to GAAP figures. |
 For more information, investors may contact: Peter Goulding, CFA 203-338-6799 peter.goulding@peoples.com |